perinatal mortality in belarus and ukraine before and after chernobyl alfred körblein munich...
TRANSCRIPT
Perinatal mortality in Belarus and Ukraine before and after Chernobyl
Alfred Körblein
Munich Environmental InstituteMunich, Germany

Objective of the study
To test perinatal mortality rates in highly contaminated regions of Belarus and Ukraine for a possible association
with the radiation burden of pregnant women

Caesium burden in pregnant women
0
50
100
150
200
250
300
350
400
86 87 88 89calendar years
cs in
co
w m
ilk [B
q p
er
l]
0
5
10
15
20
25
30
35
40
cs b
urd
en
[B
q p
er
kg
]

Perinatal mortality in Germany
4
5
6
7
8
9
10
11
12
13
80 81 82 83 84 85 86 87 88 89 90 91 92 93
calendar years
mo
rta
lity
rate
pe
r 1
00
0

Perinatal mortality in Poland
12
13
14
15
16
17
18
19
81 82 83 84 85 86 87 88 89 90 91
calendar years
mo
rta
lity
rate
per
10
00
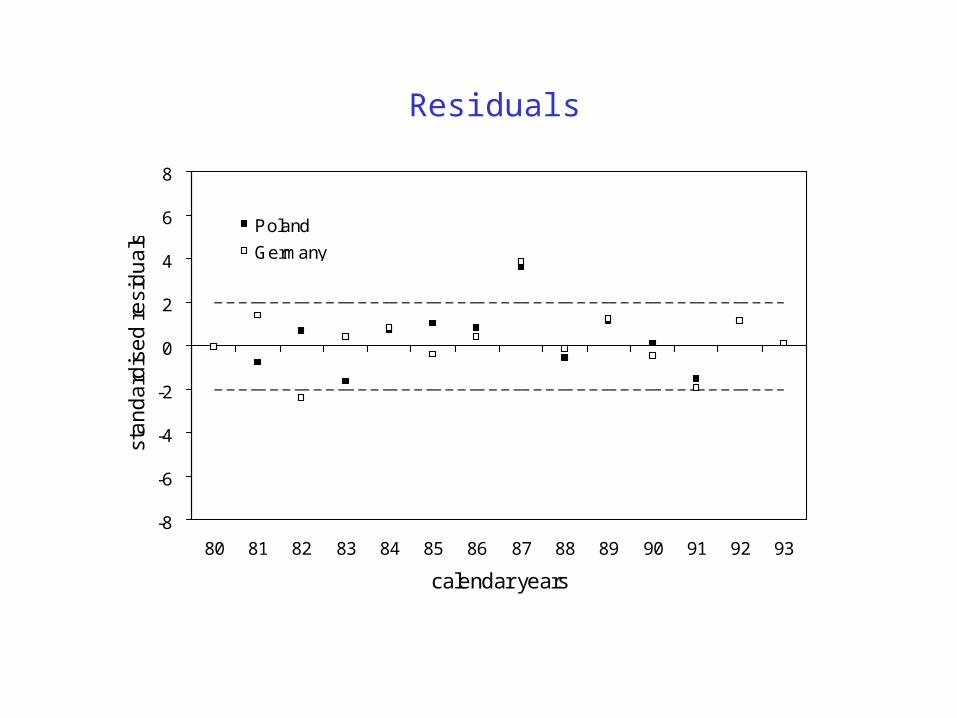
Residuals
-8
-6
-4
-2
0
2
4
6
8
80 81 82 83 84 85 86 87 88 89 90 91 92 93
calendar years
sta
nd
ard
ise
d r
esi
du
als
Poland
Germany

Perinatal mortality in England and Wales
6
7
8
9
10
11
12
13
81 82 83 84 85 86 87 88 89 90 91 92
calendar years
mo
rta
lity
rate
pe
r 1
00
0
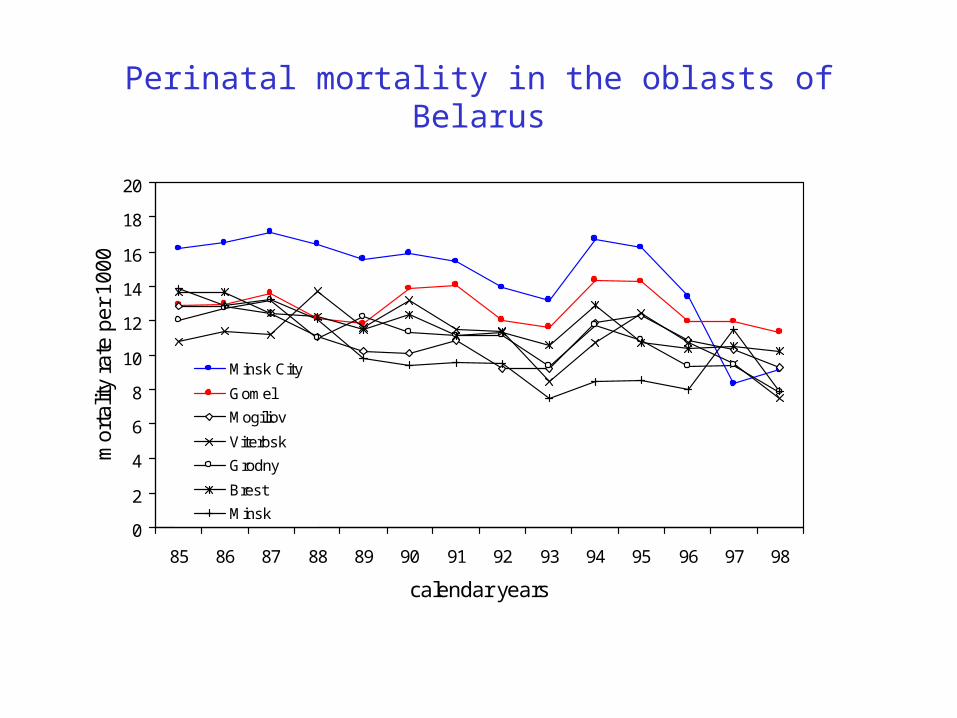
Perinatal mortality in the oblasts of Belarus
0
2
4
6
8
10
12
14
16
18
20
85 86 87 88 89 90 91 92 93 94 95 96 97 98
calendar years
mor
talit
y ra
te p
er 1
000
Minsk City
Gomel
Mogiliov
Viterbsk
Grodny
Brest
Minsk

Problems with trend analysis:
1. Definition change of stillbirths in 1994
2. Possible influence of socio-economic factors after the break-up of Soviet Union in 1991
Therefore:
Comparison of perinatal motality rates in Gomel to the rates in the rest of Belarus except Minsk City, assuming that other influencing factors act equally in study and control region

Study and control area
4
6
8
10
12
14
16
18
85 86 87 88 89 90 91 92 93 94 95 96 97 98
calendar years
mo
rta
lity
rate
pe
r 1
00
0
Minsk City
Gomel (study)
Belarus minus Gomel and Minsk City (control)
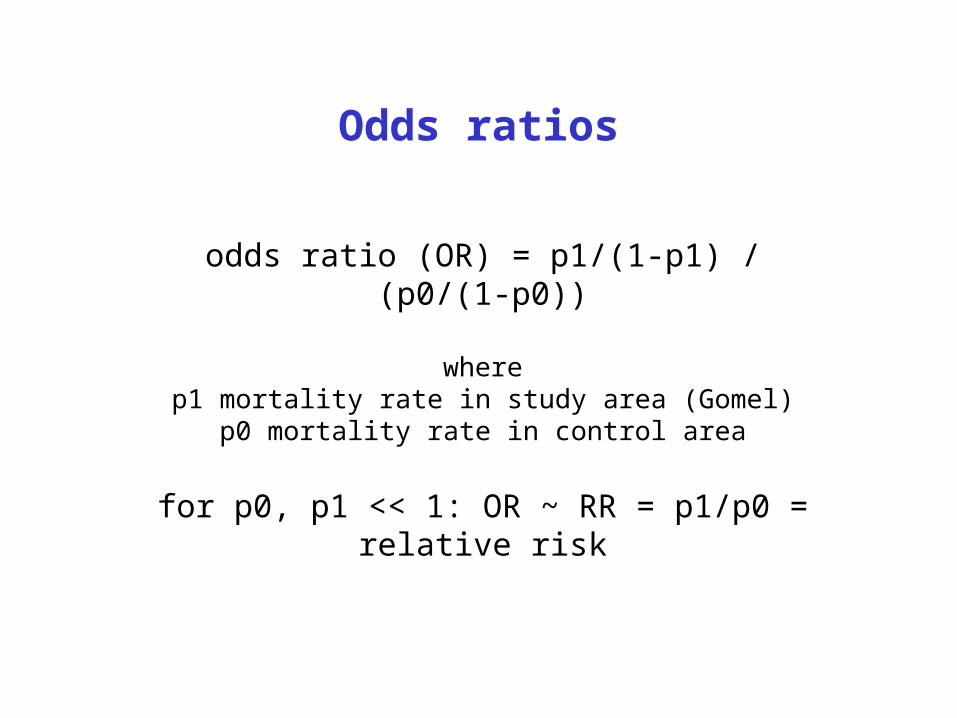
Odds ratios
odds ratio (OR) = p1/(1-p1) / (p0/(1-p0))
wherep1 mortality rate in study area (Gomel)
p0 mortality rate in control area
for p0, p1 << 1: OR ~ RR = p1/p0 = relative risk

Ratio of mortality rate in Gomel to rate in control area
1,0
1,1
1,2
1,3
1,4
1,5
85 86 87 88 89 90 91 92 93 94 95 96 97 98
calendar years
od
ds
ratio
(re
lativ
e r
isk)

Increased perinatal mortality in the 1990‘s – a late effect from Chernobyl?
Hypothesis:Increase of perinatal mortality is associated with
strontium burden of pregnant women

Strontium deposition near the Chernobyl site
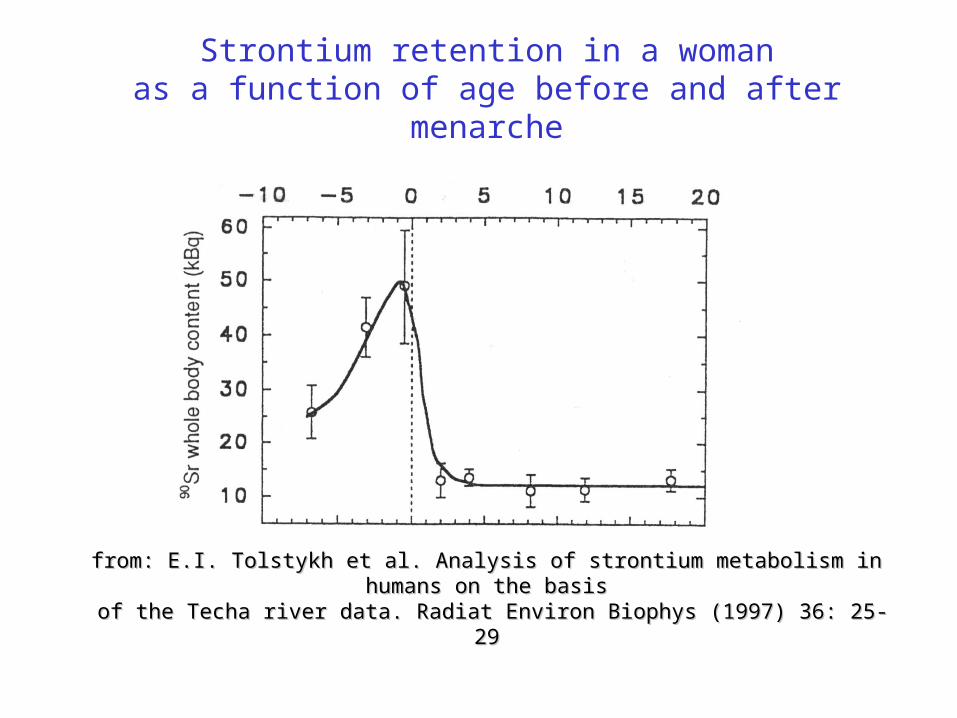
Strontium retention in a womanas a function of age before and after menarche
from: E.I. Tolstykh et al. Analysis of strontium metabolism in humans on the basisfrom: E.I. Tolstykh et al. Analysis of strontium metabolism in humans on the basis of the Techa river data. Radiat Environ Biophys (1997) 36: 25-29 of the Techa river data. Radiat Environ Biophys (1997) 36: 25-29

Calculation of strontium burden of pregnant women
Approximation:Strontium uptake at age 14 (menarche) and in 1986 only
Average strontium concentration Sr(t) depends on:
1. percentage of pregnant women aged 14 in 1986, i.e. born in 1972: Sr(t) ~ (t-1972),where t is calendar year and A(age) is the maternal age distribution
2. strontium excretion, determined by biological half-life T½:Sr(t) ~ exp(-ln(2)·(t-1986)/ T½)

Maternal age distribution in Belarus
0,0
0,1
0,2
0,3
0,4
0,5
0,6
15 20 25 30 35 40 45
maternal age [years]
pro
po
rtio
n

Regression model
ln(OR) = ln(1+c0+c1·d87+c2·Sr(t))
with d87 = dummy variable for 1987
Sr(t) = calculated strontium concentration in pregnant women
and weights:
σ² = 1/n1 + 1/(N1-n1) + 1/n0 + 1/(N0-n0)
n1, n0 = number of perinatal deathsN1, N0 = number of births
in Gomel (1) and rest of Belarus minus Minsk City (0)

Odds ratios of perinatal mortality(Gomel vs. Belarus minus Gomel and Minsk City)
1,0
1,1
1,2
1,3
1,4
1,5
85 86 87 88 89 90 91 92 93 94 95 96 97 98
calendar years
od
ds
ratio
(re
lativ
e r
isk)
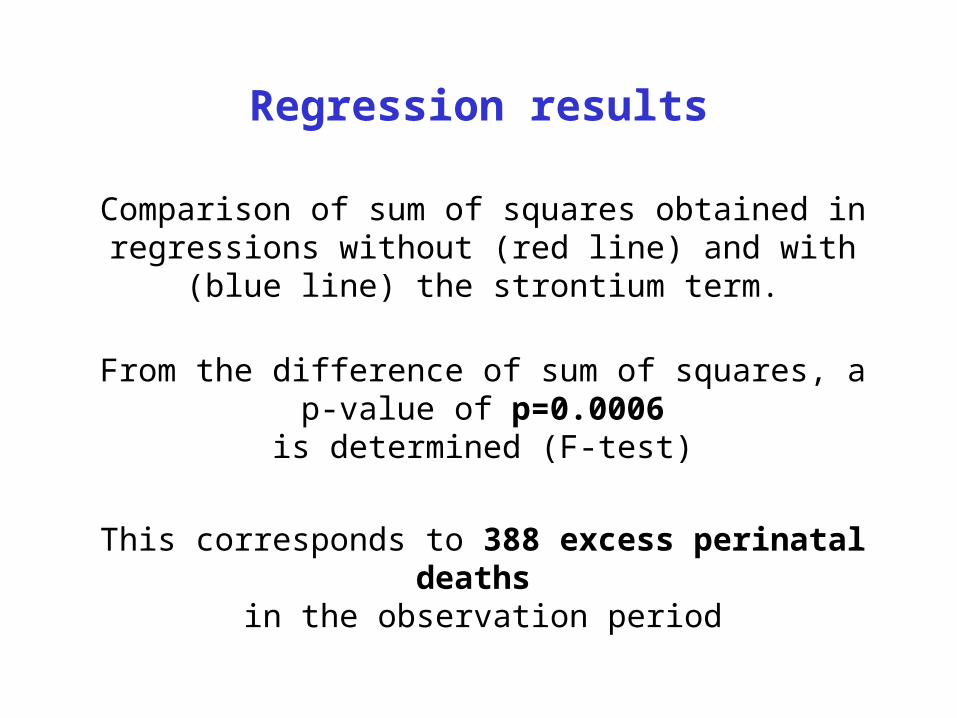
Regression results
Comparison of sum of squares obtained in regressions without (red line) and with (blue line) the strontium term.
From the difference of sum of squares, a p-value of p=0.0006
is determined (F-test)
This corresponds to 388 excess perinatal deaths in the observation period

Ukraine
Data:
Monthly data of perinatal mortality, 1985-91,
for three oblasts:
Kiev region, Kiev City, Zhytomyr

Perinatal mortality in Kiev, Kiev City, Zhytomyr
0
5
10
15
20
25
30
35
85 86 87 88 89 90 91 92
calendar years
mor
talit
y ra
te p
er 1
000
Kiev City
Kiev region
Zhytomyr
Germany

Combined regression model
Linear logistic regression model for perinatal mortality E(Y(t)) + seasonal components + strontium effect Data from 5/1986-12/1988 are omitted (possible caesium influence)
E(Y(t)) =1/(1+1/exp((c1+c4·Sr(t))·city+(c2+c5·Sr(t))·kiev +(c3+c6·Sr(t))·zhytomyr+
c7·t +(c8·cos(2π·(t-c9))·(city+region) +c10·cos(2π·(2t-c11)))·city))
with parametersc1,c2,c3: interceptsc4,c5,c6: strontium terms c7: slopec8 - c11: seasonal components (12 and 6 months period)
city, kiev, zhytomyr are dummy variables identifing the data sets

Regression results for Ukraine
parameter estimate SD t-value p-value c1 -3.7829 0.0339 -111.6770 <0.0001 c2 -4.1316 0.0418 -98.8280 <0.0001 c3 -4.3466 0.0478 -90.8500 <0.0001 c4 0.0328 0.0468 0.7010 0.4843
c5 0.1312 0.0495 2.6480 0.0089
c6 0.3122 0.0490 6.3760 <0.0001
c7 -0.0657 0.0137 -4.7930 <0.0001 c8 0.0713 0.0223 3.2010 0.0016 c9 0.0399 0.0502 0.7950 0.4277 c10 0.0614 0.0276 2.2190 0.0278 c11 0.6514 0.0730 8.9280 <0.0001
Kiev CityKiev regionZhytomyr

Kiev City
0
5
10
15
20
25
30
85 86 87 88 89 90 91 92
calendar years
mo
rta
lity
rate
pe
r 1
00
0

Kiev City
-8
-6
-4
-2
0
2
4
6
8
85 86 87 88 89 90 91 92
calendar years
sta
nd
ard
ise
d r
esi
du
als

Kiev region
0
5
10
15
20
25
85 86 87 88 89 90 91 92
calendar years
mo
rta
lity
rate
pe
r 1
00
0

Kiev region
-8
-6
-4
-2
0
2
4
6
8
85 86 87 88 89 90 91 92
calendar years
sta
nd
ard
ise
d r
esi
du
als

Zhytomyr
0
5
10
15
20
25
85 86 87 88 89 90 91 92
calendar years
mor
talit
y ra
te p
er 1
000
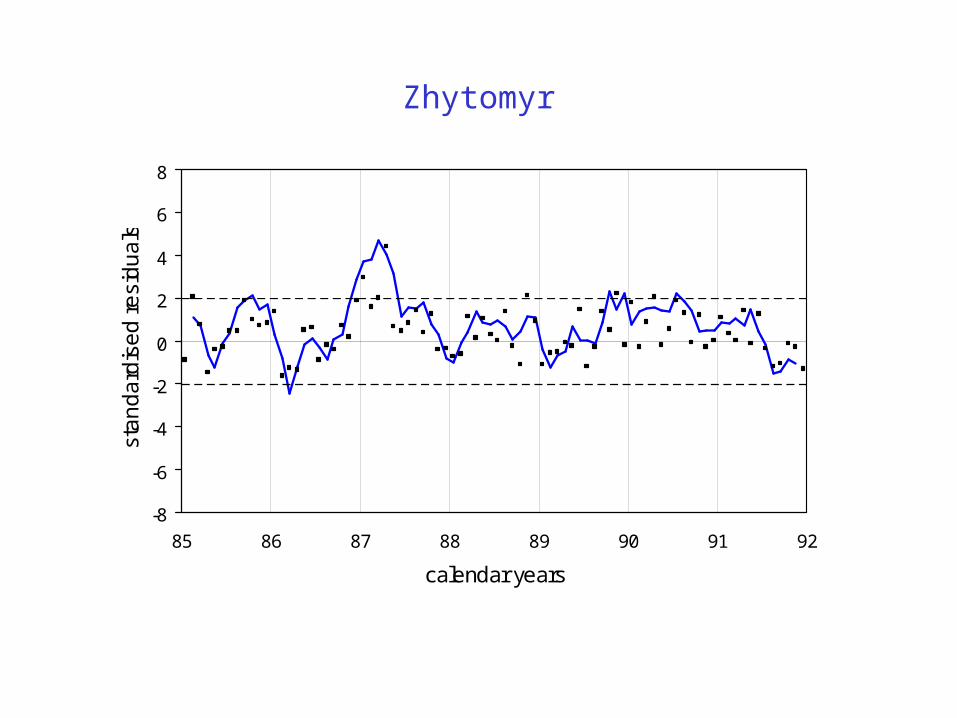
Zhytomyr
-8
-6
-4
-2
0
2
4
6
8
85 86 87 88 89 90 91 92
calendar years
sta
nd
ard
ise
d r
esi
du
als

Infant mortality in Poland
-8
-6
-4
-2
0
2
4
6
8
85 86 87 88 89 90 91
calendar years
sta
nd
ard
ise
d r
esi
du
als
0
10
20
30
40
50
60
70
80
cae
siu
m b
urd
en
[Bq
/kg
]

Conclusion
• Perinatal mortality in Gomel is associated with strontium burden in pregnant women
• Strontium effect on perinatal mortality in Ukraine is greater in Zhytomyr than in Kiev region and is not significant in Kiev City
• Perinatal mortality in Zhytomyr exhibits a peak in the beginning of 1987 which is associated with the caesium burden in pregnant women

Thank you for your attention!