health system prevention strategy for cambridgeshire … · web viewpotential net savings to the...
TRANSCRIPT

Health system prevention strategy for Cambridgeshire and Peterborough
January 2016

Version 2.0 –18 December2015
ContentsGlossary of terms.....................................................................................................................2
1. Executive summary: headlines and recommendations.......................................................5
2. Introduction.......................................................................................................................12
3. Obesity, diet and physical activity.....................................................................................15
4. Diabetes.............................................................................................................................25
5. Cardiovascular disease......................................................................................................32
Cardiac Rehabilitation............................................................................................................34
Atrial Fibrillation.....................................................................................................................37
Hypertension..........................................................................................................................42
6. Long term conditions.........................................................................................................50
7. Workplace health..............................................................................................................59
8. Smoking.............................................................................................................................68
9. Alcohol...............................................................................................................................75
10. Falls..................................................................................................................................80
11. Malnutrition in older people...........................................................................................98
12. Sexual health.................................................................................................................102
13. Breastfeeding................................................................................................................ 106
14. Appendices....................................................................................................................110
1

Version 2.0 –18 December2015
Glossary of termsAnti-coagulants Medicines that help prevent blood clots.Atrial Fibrillation (AF) Heart condition that causes an irregular and often abnormally fast
heart rate.BA Brief adviceBody Mass Index (BMI)
BMI is a simple index of weight-for-height that is commonly used to classify underweight, overweight and obesity in adults. It is defined as the weight in kilograms divided by the square of the height in metres (kg/m2).
BPSLB Blood Pressure System Leadership BoardCardiac rehabilitation (CR)
Cardiac rehabilitation is a programme of exercise and information sessions to help people recover after a heart attack, heart surgery or procedure.
Cardiovascular disease (CVD)
Cardiovascular disease (CVD) is an umbrella term for all disease of the circulatory system including coronary heart disease (CHD), heart failure, stroke and peripheral arterial disease.
CCG Clinical Commissioning GroupCerebrovascular disease
Cerebrovascular diseases are conditions caused by problems that affect the blood supply to the brain.
CHD Coronary heart diseaseCOPD Chronic obstructive pulmonary disease (COPD) is the name for a
collection of lung diseases including chronic bronchitis, emphysema and chronic obstructive airways disease.
People with COPD have difficulties breathing, primarily due to the narrowing of their airways, this is called airflow obstruction.
Disability-adjusted life year (DALY)
The disability-adjusted life year (DALY) is a measure of overall disease burden, expressed as the number of years lost due to ill-health, disability or early death.
DSN Diabetes specialist nurseFINDRISC Finnish Diabetes Risk ScoreHbA1c Glycated haemoglobin (HbA1c) is a specialised blood test used to
determine if someone has diabetes.Health check The NHS Health Check programme aims to help prevent heart
disease, stroke, diabetes, kidney disease and certain types of dementia. People between the ages of 40 and 74, who have not already been diagnosed with one of these conditions or have certain risk factors, is invited (once every five years) to have a check to assess their risk of heart disease, stroke, kidney disease and diabetes and is given support and advice to help them reduce or manage that risk.
Hyperlipidaemia High blood fatsHypertension High blood pressure.IAPT Improving Access to Psychological Therapies
2

Version 2.0 –18 December2015
IBA Information and brief adviceICERs Incremental cost effectiveness ratio - the ratio of the change in
costs of a therapeutic intervention (compared to the alternative, such as doing nothing or using the best available alternative treatment) to the change in effects of the intervention.
Ischaemic heart disease
Ischaemic heart disease is a disease of the blood vessels supplying the heart muscles with oxygen that is severe enough to cause temporary strain on the heart or even permanent damage to the muscle. When the heart muscle becomes ischemic, a person may experience angina or a heart attack.
Joint Strategic Needs Assessment (JSNA)
The means by which CCGs and local authorities describe the future health, care and wellbeing needs of local populations and identify the strategic direction of service delivery to meet those needs.
LARCs Long acting reversible contraceptives, such as contraceptive implant or injection.
LCG Local Commissioning Group Let’s Get Moving initiative
A physical activity care pathway. Supporting financial balance and transforming the provision of care, the Let’s Get Moving programme provides a vehicle for commissioners to move towards lower-cost, more efficient and effective services.
Lipids Lipids are a group of naturally occurring molecules that include fats, waxes, sterols, fat-soluble vitamins (such as vitamins A, D, E, and K), monoglycerides, diglycerides, triglycerides, phospholipids, and others.
LTCs Long term conditions, for example, heart disease, asthma or diabetes (amongst others).
Making Every Contact Count (MECC)
Making every contact count towards encouraging healthierlifestyle choices has become known by the term MECC. It aims to help all organisations responsible for the health, wellbeing, care and safety of the public to implement and deliver healthy messages systematically.
MDT Multi-disciplinary teamNephropathy Kidney disease, also known as Nephropathy, means damage to or
disease of a kidney.Neuropathy Disease or dysfunction of one or more peripheral nerves, typically
causing numbness or weakness.NICE The National Institute for Health and Care Excellence. NICE's role is
to improve outcomes for people using the NHS and other public health and social care services by: producing evidence based guidance and advice for health, public health and social care practitioners; developing quality standards and performance metrics for those providing and commissioning health, public health and social care services; and, providing a range of informational services for commissioners, practitioners and managers across the spectrum of health and social care.
Peripheral vascular, or peripheral arterial
Peripheral arterial disease (PAD) is a common condition, in which a build-up of fatty deposits in the arteries restricts blood supply to leg
3
Version 2.0 –18 December2015
disease muscles. It is also known as peripheral vascular disease (PVD).Population attributable fraction (PAF)
An estimate of the proportion of the burden of disease that is attributable for a factor, eg obesity.
Potential Years of Life Lost (PYLL)
Potential years of life lost (PYLL), is an estimate of the average years a person would have lived if he or she had not died prematurely. It is, therefore, a measure of premature mortality.
QALY (quality-adjusted life year)
The quality-adjusted life year or quality-adjusted life-year (QALY) is a generic measure of disease burden, including both the quality and the quantity of life lived. It is used in assessing the value for money of a medical intervention.
Retinopathy Disease of the retina which results in impairment or loss of vision.WHO World Health OrganisationYears of life lost (YLLs)
Years of life lost (YLLs) are years lost due to premature mortality. YLLs are calculated by subtracting the age at death from the longest possible life expectancy for a person at that age.
4
Version 2.0 –18 December2015
1. Executive summary: headlines and recommendations
Headlines
5
Actions proposed Maximise the opportunities for lifestyle interventions identified through health
checks across Cambridgeshire and Peterborough. Expand Peterborough weight management services to reach NICE
recommended levels. Extend the health check to those aged 25-39 in the Peterborough South Asian
population. Focus on the most deprived areas first. Increase the lifestyle interventions for those with diagnosed hypertension, and
at high risk of diabetes. Expand workplace health initiatives within NHS employers to reduce
absenteeism. Expand malnutrition screening and treatment in older people. Increase the number of people accessing stop smoking services (adults, older
people and pregnant women). Increase the proportion of people receiving information and brief advice about
alcohol in GP practices and A&E. Increase the number of women with LARCs Improve referral and uptake of IAPT services for people with Long Term
Conditions. Expand falls prevention work in the older population (aged 75 years and over). Increase the uptake to % of people eligible accessing and completing cardiac
rehabilitation. Improve diagnosis and treatment for Atrial Fibrillation, and hypertension. Increase the numbers of people with COPD (chronic obstructive pulmonary
disease) on a self-management programme and/or accessing pulmonary .rehabilitation
Version 2.0 –18 December2015
Obesity, diet and physical activity Current weight management services see approximately 1-2% of the population who
are obese. For a variety of reasons it is not currently possible to robustly estimate the cost
savings to the NHS of reductions in weight loss, although we can estimate the effectiveness of some current programmes.
There is little information about the long term impact of weight management programmes. However, recent health economic modelling of ‘lifestyle interventions’ focused on support to change lifestyle behaviour (notably diet, and physical exercise) have been found to be potentially cost saving to the NHS, with the largest savings from intensive interventions over the lifetime horizon.
Peterborough weight management services are currently limited and should be immediately expanded to reach NICE recommended levels.
We need to ensure that we maximise the opportunities for lifestyle interventions identified through health checks across Cambridgeshire and Peterborough.
It is recommended that ‘lifestyle interventions’ are available on a much larger scale, including intensive health trainer options, for those identified as at risk of diabetes, or with hypertension through a health check or opportunistically. This should be underpinned by initiatives which help create an environment which encourages a healthy weight. These initiatives should include the promotion of active travel.
Diabetes prevention People at high risk of developing Type 2 diabetes can be identified through the NHS
Health Check and the disease could be prevented in 30-60% through appropriate behaviour change support.1
Improve screening and lifestyle interventions for populations with high risk of hypertension, high glucose levels and South Asian population. Focus on the most deprived areas first.
Cardiovascular disease Current uptake for Cardiac Rehabilitation is 48.3% in line with the national average.
However, there may be cost savings associated with increasing this to 65%. There are opportunities to improve the diagnosis and treatment of Atrial Fibrillation.
This is potentially cost saving to the NHS as well as local authorities. Initial modelling suggests that additional treatment of 1,527 people would avoid 61 strokes and
1 PHE Cardiovascular intelligence pack.
6
Version 2.0 –18 December2015
produce net savings of £389k to the NHS over the next seven to eight years, as well as substantial savings to local authorities.
Work should focus on increasing the number of patients diagnosed and treated for AF with warfarin, and reducing variation between GP practices. Peterborough should be the initial focus of this work.
Modelling work finds the national interventions to reduce salt intake are cost saving at all-time horizons including year one.
Lifestyle interventions, general adult population and focused on those with diagnosed hypertension, have been shown to be potentially cost saving at 10 years and over a lifetime horizon.
Potential net savings to the NHS are approximately £425k over three years from improving the diagnosis and management of hypertension by 15%. This would require a potential investment of up to £1.2m over three years, however a proportion of this work already takes place through the health check. There would be additional social care savings from strokes avoided.
Maximising the opportunity provided in the health check to diagnose and treat hypertension, including through lifestyle interventions, should be maximised.
A variety of lifestyle interventions for those diagnosed with hypertension should be available. This would mean an expansion to existing lifestyle services, such as health trainer/coaches.
Work to increase diagnosis and management of those with hypertension should focus initially on Peterborough, and Fenland.
Long term conditions (LTCs) International evidence finds that psychological interventions for long term
conditions, can reduce average health care costs in the range of 20-30% across studies.
Self-management programmes in patients with COPD have been found to reduce all cause hospitalisations by up to 40%.
A self-management programme should be offered to those diagnosed with COPD. This should be evaluated for its economic impact on health costs.
Work should also ensure that pulmonary rehabilitation is maximised for COPD patients.
Routine management of LTCs should include the identification of those requiring further assessment for depression and anxiety early in the pathway. Physical and mental health pathways should be integrated to facilitate this.
There should be maximum utilisation of the IAPT LTC team, and there should continue to be a focus on rapidly increasing referrals. There should be a focus on those with multiple long term conditions.
7
Version 2.0 –18 December2015
There should be an economic evaluation of the impact on healthcare costs of identification and treatment for common mental health disorders in those with multiple long term conditions.
Workplace health The potential mental health productivity savings, assuming no current action in this
area, amount to nearly £5.7m across the large NHS employers in Cambridgeshire and Peterborough.
The evidence and modelling is clear that investing in workforce health will generate short term productivity savings to the NHS. These are estimated, with the package modelled here to be approximately £3.9m over three years, with an investment of £335k.
NHS employers should see considerable productivity savings from investing in workplace health. In particular this needs to focus on improved management and awareness of mental health and illness.
Smoking There are an estimated 105,548 people across Cambridgeshire and Peterborough
who smoke. There is high quality, high ranking evidence that stop smoking services are cost effective, are good value for money and provide a good return on investment.
Sub-national programme work, such as tobacco control, is critical to ensuring savings to the NHS. Nationally and locally we should continue to invest in this.
We should maximise our prevention opportunities and increase the number of people setting a quit date through stop smoking services (adults, older people and pregnant women) in Cambridgeshire by 5%, and in Peterborough to the Cambridgeshire average.
An additional investment of £346k, only £175k of which is new investment, is needed to generate a saving over £356k over the next two years.
There are additional savings to the NHS to be made from stopping people smoking before operations, and this group should be a target population.
Alcohol Maximise opportunities to provide brief advice on alcohol to more GP practice
patients, at new registrations and/or next appointment. If 10,000 more patients were to receive this advice, it is estimated this would save the NHS £217k (above the cost of the intervention) over seven years with the vast majority of the savings in years 2-5.
8
Version 2.0 –18 December2015
Monitor the GP provision of brief advice on alcohol, now provided through the core GP contract, and provide training as necessary
Focus a larger proportion of training for information and brief advice in A&E.Agree a training model and associated costs for information and brief advice in primary care and A&E, and expand the provision of this advice in A&E.
Falls Injurious falls in older people have a high cost impact for health and social care
services locally, estimated at £83m for 2016, with increasing costs forecast for the ageing population.
There is important and robust evidence indicating net savings for falls interventions targeted at both community dwelling older adults and older adults in residential or nursing care across a range of UK and international settings.
In particular three areas of intervention for preventing falls in community-living older people have been trialled and indicated cost savings: home-based exercise (the Otago Exercise Programme) in over 80-year-olds, home safety assessment and modification in those with a previous fall, and specific multi-factorial programmes.
Potential savings may require delivery of preventative approaches at a much wider scale than current provision.
This proposal advocates a strategic focus on older people aged 75 years and over; the role of multifactorial assessments and specifically participation in group–based strength and balance (Otago exercise) classes in the community (which are comparatively as effective as home-based models)
The role of allied health professionals and fundamental function of strong system coordination and integration is described for maximising the impact of the interventions in the target groups, and greatest return on investment.
An action-oriented systems perspective is needed to address the challenges inherent in preventing falls. Many sectors have a role to play, all need to be engaged in this process.
Malnutrition in older people An estimated 13,000 to 18,300 older people are malnourished in the Cambridgeshire
& Peterborough population, and more are at risk Potential cost savings may be achieved by increasing proportion screened for
malnutrition among inpatients, outpatients and new GP registrations to 90% and providing appropriate treatment; investment of £524k and savings in the order of £543k primarily from reducing length of stay in acute care. At worst this intervention should not cost the NHS additional funding, and will improve quality of life for older people.
9

Version 2.0 –18 December2015
Sexual health For every £1 invested in contraception services, there is a £11.09 saving to the NHS,
rising to £13.42 for LARCs. It is proposed that we increase the number of women with long-acting reversible
contraceptives (LARCs) by approximately 859 a year in Cambridgeshire & Peterborough. This should generate savings of £935k in 2016/17, £1.15m in 2017/18 and £1.26m in 2018/19.
This would require an additional investment of £115k. However, the additional investment needed for Cambridgeshire, is already within the Council budget proposals for 2016/17.
Breastfeeding – promoting initiation and duration Low breastfeeding rates in the UK lead to an increased incidence of illness that has a
significant cost to the health service. Investment in evidence-based multi-faceted interventions has been shown to generate savings to the health economy in the short term by reducing hospital admissions for four acute childhood illnesses2.
There is evidence to suggest that breastfeeding can contribute to longer term savings through its impact on key health outcomes including childhood obesity, but this is difficult to quantify.
The focus should be on joint commissioning with local authorities to improve breastfeeding support, implementing or piloting interventions in both acute and community settings. These interventions should include strengthening breastfeeding support and advice in acute settings, and easily accessible breastfeeding peer support programmes focused on the most deprived areas of the CCG.
2 Renfrew MJ, et al. ‘‘Preventing disease and saving resources: the potential contribution of increasing breastfeeding rates in the UK’ (2012) UNICEF. Available at: http://www.google.co.uk/url?sa=t&rct=j&q=&esrc=s&source=web&cd=2&ved=0CCcQFjABahUKEwjxtcW__PHIAhXLtxQKHRZqBNk
10

Investment and saving opportunities identifiedThe two tables below summarise the short term savings identified through work to date.
Short Term Total Potential Net Savings Summary Table (savings after costs have been removed)
16/17 17/18 18/19NHS activity saving £1.10m £1.61m £2.21mNHS productivity saving £0.16m £1.8m £1.8mTotal £1.26m £3.5m £4.09m
Version 2.0 –18 December2015
Comments
Lifestyle Intervention Area 2016/17 2017/18 2018/19 Total 2016/17 2017/18 2018/19 Total
Increase uptake in Local Stop Smoking Services by 5% (includes subnational £136k per year)
CCC £21,904 £21,904 £43,808 £161,250 £161,250 £322,499
Increase uptake in Local Stop Smoking Services to CCC levels (includes subnational £35k per year)
PCC £65,589 £65,589 £131,178 £16,307 £16,307 £32,614
CCC £70,000 £90,000 £100,000 £260,000 £770,000 £990,000 £1,100,000 £2,860,000 £260k of CCC LARC investment is not new NHS investment
PCC £15,000 £15,000 £15,000 £45,000 £165,000 £165,000 £165,000 £495,000
WorkplaceMental health promotion, increase in healthy lifestyles and weight management
NHS Trust £111,580 £111,580 £111,580 £334,741 £163,500 £1,887,070 £1,887,070 £3,937,640 NB: These are productivity savings to the NHS
Cardiac rehabilitation Work to date indicates that this will break even for the NHS
Atrial fibrillation CCG £491,543 £737,315 £245,772 £1,474,629 -£242,653 -£289,484 £64,913 -£467,224 This becomes cost saving to the NHS after 6 years. Additional savings to social care are not shown here
Hypertension CCG £421,660 £421,660 £421,681 £1,265,002 -£83,659 £254,342 £254,321 £425,003 Additonal savings to social care are not shown hereOlder people Falls CCG £293,152 £293,152 £586,303 £1,172,606 £310,894 £310,894 £621,788 £1,243,575 Additional savings to social care not shown here.
Malnutrition Work to date indicates that this will break even for the NHS CCC £91,904 £111,904 £100,000 £303,808 £931,250 £1,151,250 £1,100,000 £3,182,499 New invesment in fact £179,808 see above on LARCsPCC £80,589 £80,589 £15,000 £176,178 £181,307 £181,307 £165,000 £527,614NHS Trust £111,580 £111,580 £111,580 £334,741 £163,500 £1,887,070 £1,887,070 £3,937,640CCG £1,206,355 £1,452,127 £1,253,756 £3,912,238 -£15,419 £275,752 £941,022 £1,201,355
Total £1,490,428 £1,756,200 £1,480,337 £4,726,965 £1,260,638 £3,495,378 £4,093,091 £8,849,107 NB: £3.9m of this net saving is in productivity savings to the NHS.
Diabetes Focus on South Asian population aged 15-39 years for diabetes interventions
PCC £33,839 £33,839 £33,839 £101,517 This includes a targetted focus using health check plus referral to a health trainer where diabetes is diagnosed
PCC & CCC
Further work possible on potential increase in interventions for long term savings.
£33,839 £33,839 £33,839 £101,517 £0 £0 £0 £0
Net NHS Savings
Shor
t ter
m
Smoking cessation
Sexual Health
Increase uptake of LARC's
Cardiovascular disease
SHORT TERM TOTAL
Long
er te
rm
Lifestyle interventions & environment to support healthy weight
LONGER TERM TOTAL
Investment
12
Version 2.0 –18 December2015
2. IntroductionWhy have we produced a health system prevention strategy?The Cambridgeshire and Peterborough health economy has been identified as one of England’s 11 most challenged health economies and faces a funding shortfall of at least £250m by 2019.
Prevention, at all levels has been recognised as critical to building a sustainable health system, through reducing demand on the health system. NHS England’s Five Year Forward View states that ‘The future health of millions of children, the sustainability of the NHS, and the economic prosperity of Britain all now depend on a radical upgrade in prevention and public health.’
It is well understood, that significant proportions of ill health and health service activity are potentially preventable. A recent Public Health England Lancet publication about the global burden of disease found that 40% of the NHS workload is potentially preventable, yet the proportion of health expenditure directed at prevention, although hard to estimate reliably, is probably closer to 4%3.
Preventing ill health involves many actions, some of which are under the control of health services and some are not. The interaction of these factors can be complex, but estimates from studies on major disease, such as coronary heart disease, show that approximately half the interventions that reduce ill health occur in the health system. So although the health system only forms part of the prevention picture, in many cases it is a critical part.
Objectives of the strategyThe objectives of producing the strategy were to do the following:
To identify the savings to the NHS, where possible, from current and planned prevention initiatives.
To identify areas/interventions for potential additional NHS investment in prevention which would maximise savings to the local NHS over the next three, five, 10 years and beyond.
Identify areas and initiatives for potential stretch and outline the strategy for delivering these including projected savings to the NHS, where possible.
3 Changes in health in England, with analysis by English regions and areas of deprivation, 1990-2013: a systematic analysis for the Global Burden of Disease Study 2013. John N Newton et al. The Lancet. September 15, 2015 http://dx.doi.org/10.1016/S0140-6736(15)00195-6.
13

Version 2.0 –18 December2015
What are the areas of focus?This strategy specifically focuses on the contribution prevention can make to closing the financial gap across the Cambridgeshire and Peterborough health system. This is essentially about how we can improve the health of the population and use NHS resources for maximum impact. It focuses on initiatives where there is evidence that a particular prevention initiative can save the NHS money, and this can be quantified. It proposes areas where the NHS could ‘invest to save’ to maximise its prevention opportunities. It does not therefore focus on quality of life improvements which are not shown to be cost saving to the NHS, although all the proposals in this document show evidence that they will improve quality of life.
Therefore the areas of focus have been carefully chosen for the following reasons:
The interventions have the best evidence that they work. They are the interventions with the greatest potential to generate NHS savings. Information is available to model reasonable estimates of NHS savings. The scale of the issue suggests interventions will have an impact (even if the
evidence is not currently conclusive).
This strategy does not start from a blank piece of paper. It builds on current local authority and NHS joint based Public Health Transformation programmes.
What is included and what is not in this strategy? There are many prevention initiatives where we have a strong evidence base, however we simply do not have the information to enable us to estimate savings to the NHS, but we think there are likely to be some. Support for post-natal depression is a good example. Equally there are prevention initiatives that will produce savings in terms of reduced disability to social care, such as stop smoking initiatives or diabetes prevention, as well as to the NHS. This strategy does not try to quantify savings, other than to the NHS. It is also unlikely to be entirely comprehensive, in that there are other interventions we have not had time to address in this strategy. Equally this document does not outline the health of the local population. This is covered in depth in the Joint Strategic Needs Assessments (JSNA).
Additionally there are many initiatives, often for children and young people, which are cost saving to the wider public sector (employment, economy and criminal justice) although not necessarily directly to the NHS, but will undoubtedly improve overall health. Parenting programmes focusing on the early identification and management of conduct disorder are a good example. Initiatives for children with strong evidence of an NHS saving have been hard to identify although there are many that show a benefit to longer term life chances which will in turn impact on long term health.
There are also prevention initiatives which are not within the scope of this work, as they are being taken forward through other programmes of work. In particular integrating care for
14

Version 2.0 –18 December2015
older people and resulting reductions in emergency admissions not included here, as it is being taken forward through the Uniting Care Partners (UCP) contract. There are other areas within this strategy however that highlight and attempt to quantify the potential opportunities with the UCP contract.
There is an overlap between this strategy and the work streams of the System Transformation Programme and the Emergency Care Vanguard. The strategy set out in this document will therefore be taken forward through a range of work programmes.
Details of the prevention initiatives considered in this work and the reasons for including or not including them are provided in the table at Appendix A.
Where interventions have been excluded, they have simply been found to be out of scope for this work. It does not mean that they are not effective or worthwhile interventions.
15

Version 2.0 –18 December2015
3. Obesity, diet and physical activityHeadlines
Current weight management services see approximately 1-2% of the population who are obese.
Peterborough weight management services are currently limited and should be immediately expanded to reach NICE recommended levels.
We need to ensure that we maximise the opportunities for lifestyle interventions identified through health checks across Cambridgeshire and Peterborough.
For a variety of reasons it is not currently possible to robustly estimate the cost savings to the NHS of reductions in weight loss, although we can estimate the effectiveness of some current programmes.
There is little information about the long term impact of weight management programmes. However, recent health economic modelling of ‘lifestyle interventions’ focused on support to change lifestyle behaviour (notably diet, and physical exercise) have been found to be potentially cost saving to the NHS, with the largest savings from intensive interventions over the lifetime horizon.
It is recommended that ‘lifestyle interventions’ are available on a much larger scale, including intensive health trainer options, for those identified as at risk of diabetes, or with hypertension through a health check or opportunistically. This should be underpinned by initiatives that help create an environment which encourages a healthy weight. These initiatives should include the promotion of active travel.
BackgroundExcess weight, diet and physical activity all have a significant impact on health. Obesity is a major determinant of premature mortality and avoidable ill health, increasing the risk of diabetes, heart disease, cancer, muscle and joint problems and depression.
Key Facts
It is estimated that being moderately obese reduces life expectancy by about three years and being severely obese by 10 years or more.
In England, and in Cambridgeshire and Peterborough, most people are overweight or obese.
Obesity is estimated to cost the NHS £5bn a year and Type 2 diabetes (often caused by obesity) a further £9bn.
Physically active people have a 20-35% lower risk of cardiovascular disease, reduced risk of diabetes, obesity, osteoporosis and colon/breast cancer, and better mental health.
16

Version 2.0 –18 December2015
Current position
What is the scale of the problem?Overall levels of adult obesity in Cambridgeshire and Peterborough are in line with the national average. This masks variation within the CCG. For example there are higher than average percentages in Fenland (72%) and Huntingdonshire (69%) and lower than average percentages in Cambridge (54%), and there is similar variation within Peterborough. Obesity is highly correlated with deprivation and black and Asian ethnic backgrounds associated with higher risks of obesity and obesity related co-morbidities.
Table 1: Proportion of adults and children overweight or obese in Cambridgeshire and Peterborough
Age Classification Time period Source Cambridgeshire Peterborough England
Adults Excess weight * 2012 1 65% 66% 64%Obese only 2012 1 23% 24% 23%
Children Excess weight * 2013/14 2 21% 25% 23%(4-5 years old) Obese only 2013/14 2 8% 11% 10%Children Excess weight * 2013/14 2 29% 30% 34%(10/11 years old) Obese only 2013/14 2 16% 17% 19%
Source: 1. Public Health Outcome Framework, Fingertips, PHE2. NCMP Local Authority Profile, Fingertips, PHE
How is the prevalence of obesity expected to change locally?
The prevalence of obesity (BMI≥30) is forecast to continue to rise, however the latest data suggest the increase may be slower than previous national forecasts suggested.
The projected rise for Cambridgeshire and Peterborough is from a baseline of 22.2% in 2012 to 23.8% in 2018, reaching nearly 28% by 2031.
The greatest increase will be in the over 75s and 45-54s, with the prevalence in adults aged 25-44 remaining relatively stable.
The following figure and table show the proportional increase and the number of people this represents in our population. The estimates in Table 2 below take account of the fact that our population is growing.
17

Version 2.0 –18 December2015
Table 2: Projected prevalence of obesity (BMI>30) and overweight (BMI>25) in C&P (% of >16s)
2012 2013 2014 2015 2016 2017 2018 2021 2026 2031
% adults with BMI >30 22.2 22.5 22.8 23.1 23.3 23.6 23.8 24.6 26.0 27.7
% adults with BMI >25 65.1 65.4 65.6 65.8 66.0 66.1 66.3 66.9 68.1 69.4
Source: Cambridgeshire and Peterborough CCG estimates based on 2003-2012 data.
Table 3: Estimates of the number of people who will be obese by 2021 in Cambridgeshire and Peterborough
2012 Actual 2013 2014 2015 2016 2017 2018 2019 2020 2021165,820 167,839 171,389 174,991 178,687 182,265 185,789 189,287 192,874 196,502
The health consequences and costs of rising obesity
Sixteen percent of NHS costs relate to diseases associated with overweight/obesity. Of these, 60% relate to diabetes, coronary heart disease and stroke; 30% to osteoarthritis and 10% to cancers. These diseases are complex and their causes are multi-factorial. While around 80% of the disease burden due to diabetes can be attributed to overweight/obesity, for heart disease and stroke the proportion is closer to one third and for osteoarthritis it is around 20%.
The population attributable fraction (PAF) below (an estimate of the proportion of the burden of that disease that is attributable to obesity) illustrates how we cannot think about tackling obesity separately from preventing diabetes, hypertension and other diseases. Diabetes has the highest obesity PAF; nearly 80% of the burden of the disease can be attributed to overweight and obesity (note that the PAF for Type 1 Diabetes alone would be low; this figure is driven by the predominance of Type 2 Diabetes).
Table 4: Fraction of disease attributable to overweight and obesity (from WHO Burden of Disease, based on PAF for DALYs lost for specific diseases to overweight and obesity)
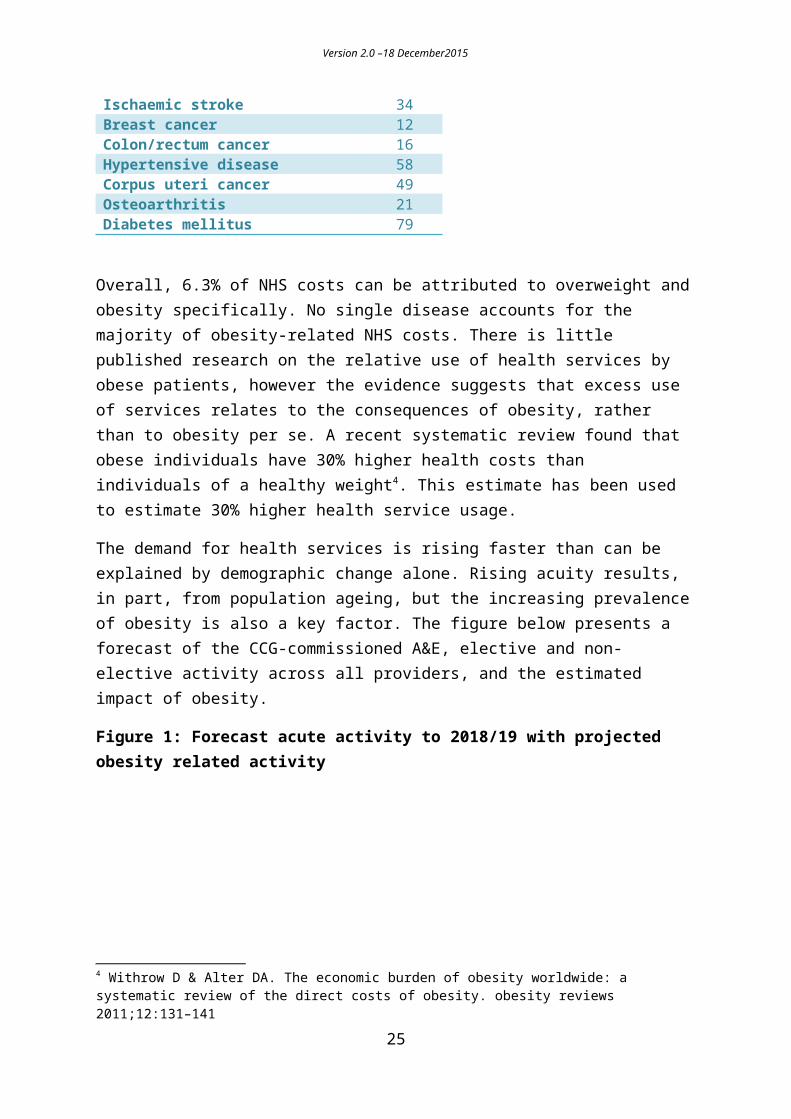
Disease PAFIschaemic heart disease 34Ischaemic stroke 34Breast cancer 12Colon/rectum cancer 16Hypertensive disease 58Corpus uteri cancer 49Osteoarthritis 21Diabetes mellitus 79
18

Version 2.0 –18 December2015
Overall, 6.3% of NHS costs can be attributed to overweight and obesity specifically. No single disease accounts for the majority of obesity-related NHS costs. There is little published research on the relative use of health services by obese patients, however the evidence suggests that excess use of services relates to the consequences of obesity, rather than to obesity per se. A recent systematic review found that obese individuals have 30% higher health costs than individuals of a healthy weight4. This estimate has been used to estimate 30% higher health service usage.
The demand for health services is rising faster than can be explained by demographic change alone. Rising acuity results, in part, from population ageing, but the increasing prevalence of obesity is also a key factor. The figure below presents a forecast of the CCG-commissioned A&E, elective and non-elective activity across all providers, and the estimated impact of obesity.
Figure 1: Forecast acute activity to 2018/19 with projected obesity related activity
The table below shows how many people would need to be moved out of the obese category to keep obesity levels static, and reduce related NHS costs. For 2016 the number of people is 5,524 and for 2019 it would be 11,216.
4 Withrow D & Alter DA. The economic burden of obesity worldwide: a systematic review of the direct costs of obesity. obesity reviews 2011;12:131–141
19

Version 2.0 –18 December2015
Table 5: Obesity prevalence
2012 Actual 2013 2014 2015 2016 2017 2018 2019 2020 2021
Static prev 165,820 167,519 169,393 171,256 173,163 174,911 176,534 178,071 179,646 181,208Increase prev 165,820 167,839 171,389 174,991 178,687 182,265 185,789 189,287 192,874 196,502Difference 0 320 1,995 3,734 5,524 7,354 9,255 11,216 13,228 15,294
0.0% 0.2% 1.2% 2.2% 3.2% 4.2% 5.2% 6.3% 7.4% 8.4%
Interventions and cost savings to the NHS
Current public health spend and activityThere are an estimated 165,820 people within the CCG population who are obese. We know the following about our current weight management services:
Weight management services in Cambridgeshire are multi-component in design and offer services to people with obesity as outlined in NICE guidelines and The Department of Health (2006).
Services are much more limited in Peterborough. NICE estimates of activity levels are based on average national activity at 2011 and so do not address the scale of the issue described above.
We estimate that current weight management services (Tiers 2 and 3) are currently reaching 1-2% of the obese population across the CCG.
We know that there is activity taking place within GP practices in relation to diet, weight and physical activity. Approximately 20,000 health checks are undertaken a year across Cambridgeshire and Peterborough.
In Cambridgeshire 2014/15, 83% of the target was achieved and the percentage of health checks offered and converted into completed was 38%. There has been a considerable improvement in the quality of data returned and numbers referred onwards to services following a health check; which has been attributed to the ongoing training programme.
Health check completion (45.8% of eligible population) and uptake (48%) in Peterborough is above or on average with England, with good onward referral to available lifestyle services.
Many people choose to access evidence based commercial weight management programmes (such as Weight Watchers) independently of anything offered through the NHS.
In Cambridgeshire, annual Public Health spend on diet, physical activity and obesity is £1,005,000.
An evaluation of weight management services (Tiers 1-3) in Cambridgeshire (June 2011-May 2013) found that:
20

Version 2.0 –18 December2015
All services have good outcomes as far as weight loss in people completing the programmes, and the results are comparable with those reported in studies used for benchmarking obesity services.
On average 25-30% of participants achieved over a 5% weight loss on completion (average of approx. 4kg), as well as an increase in active days and average daily vegetable consumption.
The cost effectiveness of the services is difficult to determine without long term follow up. However, the services are likely to be cost effective if weight loss >5% of body weight is maintained.
Current weight management and obesity services are limited in Peterborough.
A return on investment model for health trainers developed by a lecturer at the Judge Institute found that for the £488k invested by Cambridgeshire, they estimated that there would be a net saving to the NHS of £372k. The savings were largely from behaviour change processes. The vast majority of the work of the health trainers is on weight management, promoting physical activity and diet.
The cost effectiveness of weight management programmesSignificant health benefits can be achieved from modest amounts of weight loss. Realistic targets for weight loss for adults are usually seen to be a maximum weekly weight loss of 0.5–1 kg, and a total loss of 5–10% of original body weight over the period of the intervention.
The NICE economic models estimate that a 12-week programme costing £100 or less will be cost-effective for adults who are overweight or obese under two conditions. First, the weight loss, compared with what it would have been without the intervention, must be maintained for life. Second, at least 1 kg of weight is lost and this weight difference is maintained for life (that is, the person's lifetime weight trajectory is lowered by at least 1 kg). [PH42 costing report]
In a hypothetical scenario, only used to give an indication of the scale of the issue, where we wanted to reduce the weight in an additional obese 11,216 people by 2019, the number to keep obesity static, there would need to be an additional 37,386 referrals to weight management services and services would need to be seven and a half times the size they are now. This would not necessarily lead to a situation where obesity would be kept static; it would instead lead to some weight reduction within this group. It is not possible to estimate what proportion of the additional 30% health costs associated with obesity would be reduced through this weight loss. It is also not clear from the evidence whether this weight loss would be maintained.
21

Version 2.0 –18 December2015
Physical ActivityIllness as an outcome of physical inactivity has been conservatively calculated to be between £0.9-1bn per annum in direct costs to the NHS (in 2006-07 prices), mainly based on costs associated with ischaemic heart disease and stroke (Scarborough 2011).
Active transport (cycling or walking to work) is a key way of increasing individual daily activity. Active travel schemes have been found to have a cost benefit of between five to six to one (DfT 2014).
However many cost benefit models focus on reductions in premature mortality (eg WHO Health Economic Assessment Tool) or wider benefits such as absenteeism, productivity and quality of life rather than specific cost savings to the NHS. It has been possible to model the impact of brief advice to improve physical activity in the workplace section of this report, as the cost savings are in improved productivity to the NHS.
Jarrett (2012) estimated the NHS costs that could be averted by a large shift towards active travel in England and Wales, based on reducing incidence of key diseases and therefore the costs of treating these conditions. A shift in walking from 0.6 km/day to 1.6 km/day, and in cycling from 0.4 km/day to 3.4 km/day (similar to current levels in Copenhagen) could result in changes in numbers of incident cases of Type 2 diabetes, dementia, cerebrovascular disease, breast and colorectal cancer, depressions and ischaemic heart disease. The study estimated that over 20 years, the expenditure averted would be over £17bn. Most of these savings are due to a decrease in the expected number of cases of Type 2 diabetes. Reductions in incidence of Type 2 diabetes, cerebrovascular disease, depression and ischaemic heart disease would be seen over a shorter time period than cancers and dementia. The model did not include any impact for existing diagnosed patients.
Work already planned
Peterborough weight management servicesAn obesity needs assessment for the Peterborough and Borderline system has been completed, and outlines the tiered weight management services needed to meet NICE standards in Peterborough. The model proposed builds upon existing services in Peterborough that encourage physical activity, weight loss and healthy lifestyles. A CCG investment of £100k has been agreed to support the development of Tier 3 weight management services and this will be taken forward as part of broader integrated lifestyle and behaviour change service developments over the coming year.
Encouraging a healthy weightIt is widely recognised that at the whole population level, obesity prevention and health promotion advice, support, information and incentives should be available to encourage a
22

Version 2.0 –18 December2015
healthy weight. These should include factors that affect the wider determinants of health including environment design and planning.
The model should work across the life course and therefore include support to children and young people for weight management from Tier 1 through to Tier 3.
Many partners, including district councils and the voluntary sector, fund initiatives to promote healthy lifestyle and reduce the number of people who are overweight and obese.
A Public Health Reference Group (PHRG) has been set up in Cambridgeshire and Peterborough to provide whole system leadership and multi-agency co-ordination for public health initiatives), focused on improving outcomes for residents and reducing health inequalities. Its membership includes District Councils, local academics, the voluntary sector, Police and Crime Commissioners office, HealthWatch, the CCG and both local authorities. It reports to the Health and Wellbeing Boards.
The PHRG has chosen to focus on obesity, diet and physical exercise initially. Working with the public health team the PHRG has undertaken a review of the evidence in these areas. The summary of this is attached at Appendix B. Given the gaps in evidence around long term impact, the group has chosen to focus on a wide range of initiatives that will support creating an environment that promotes a healthy weight.
This review has led to a draft action plan for the next six months (October 2015-March 2016). Currently this work programme focuses on Cambridgeshire only.
The draft plan includes work in the following areas:
Commissioning of a package of initiatives that will enable early years’ services to provide children/families/carers with access to and information about a healthy diet.
A package of interventions as part of a Workplace Programme for Local Authorities over two years.
Increasing community engagement in physical activity programmes through a range of initiatives that could be supported or provided by different organisations.
Training of staff in primary care to make brief interventions for lifestyle behaviour change
This work is funded through the Public Health grant, as outlined in the Cambridgeshire County Council business plan and is subject to council approval of the budget early next year.
Point of Care testing for lipids and HbA1c has been commissioned and will be available in all GP practices providing health checks from 2015/16. This will improve patient experience through the whole health check being completed in one practice visit and enable better recording. Secondly the introduction of a new data collection system in practices will improve the accuracy of the patient invite system, data recording and collation. A range of
23

Version 2.0 –18 December2015
outreach health checks is also being provided, there is staff training from a commissioned Coronary Heart Disease specialist nurse, and in Fenland a mobile service has been established and is visiting factories to offer health checks especially to those more hard to reach groups.
Recent NICE guidance for mid-life approaches to prevent or delay dementia, disability and frailty in later life in October 2015i focuses on changes to modifiable risk factors that are shared with other non-communicable diseases such as cardiovascular disease and Type 2 diabetes. It also estimates that for every 1% of the population for whom dementia could be delayed for one year (4033 people), a NHS saving of £21m per annum could be achieved (£60m if Local Authorities and Central Government are included). These figures do not take account of costs.
In Cambridgeshire and Peterborough health checks include a dementia component for those aged 65 to 74 in line with national guidance. There are a number of uncertainties around the potential cost effectiveness of including dementia awareness in all health checks, however health checks can be used to raise awareness of the association between modifiable risk factors and dementia, which may influence people to change their behaviour.
Where should the strategic focus be to reduce obesity related NHS service demand?
We need to continue to provide high quality weight management programmes within Cambridgeshire and to maximise the opportunity of health checks to refer people onto weight management programmes.
We need to provide multi-component weight management services to people with obesity as outlined in NICE guidelines to people living in Peterborough.
It is clear that these current weight management programmes, which reach 1-2% of the obese population, are not provided to a scale which would mean they could influence obesity related demand curves.
The Public Health Reference Group has developed a strategy influencing the wider determinants of obesity. Many of the initiatives the group is taking forward may not show evidence of short term or direct NHS savings, but overall will help create an environment which supports a healthy weight. Again, arguably these current initiatives are not at a scale where they will be large enough to influence the overall obesity and overweight prevalence level within the population.
Initiatives to create a wider environment that supports a healthy weight should include active travel initiatives.
Some of the most cost saving interventions are more effective when introduced as national initiatives, such as reducing salt content within food and sugar levels within drinks.
24
Version 2.0 –18 December2015
RecommendationThat the health system consider investing in ‘lifestyle’ interventions, to reduce the overweight and obese population, including weight management, so that the scale of the interventions available better reflects the needs of the population.
The details of how lifestyle interventions influence diabetes and hypertension and have been found to be cost saving are outlined in the following sections.
The overall changes reflect the best evidence of where lifestyle interventions are cost saving to the NHS and the proposal would consist of:
A range of lifestyle interventions, including intensive health trainer options, available for those identified as at risk of diabetes, or with hypertension through a health check. In Cambridgeshire this would mean scaling up the current health trainer service, to provide more ‘health coaches’ and a range of other initiatives for people to access to reduce and maintain a healthy weight. A corresponding increase in specialist weight management services would also be needed.
In Peterborough this would mean: A health trainer/coach programme introduced as well as a wide range of initiatives
to help people maintain a healthy weight. Specialist weight management services would also need to be expanded to meet the additional population entering the pathway.
Ensuring full GP practice engagement with MECC and Let’s Get Moving initiatives. Exploring point of care testing for Peterborough GP practices providing health
checks, as this makes onward referral to other services quicker and easier.
25

Version 2.0 –18 December2015
4. DiabetesHeadlines
People at high risk of developing Type 2 diabetes can be identified through the NHS Health Check and the disease could be prevented in 30-60% through appropriate behaviour change support.5
Improve screening and lifestyle interventions for populations with high risk of hypertension, high glucose levels and South Asian population. Focus on the most deprived areas first.
BackgroundDiabetes mellitus is a chronic and complex multi-system disorder of glucose metabolism requiring medical input throughout the life-course. Diabetes is associated with serious complications including coronary heart disease, stroke, peripheral vascular disease and retinopathy, nephropathy, and neuropathy. It is important to note that there are two predominant types of diabetes.
Key Facts
Type 1 diabetes typically occurs in children and young adults, is due to absolute insulin deficiency and contributes to approximately 10% of total diabetes prevalence; Type 2 diabetes makes up approximately 85-90% of total diabetes prevalence, is associated with obesity and insulin resistance, and typically occurs in older adults aged over 35 years. Type 2 diabetes is the type of diabetes discussed here.
If current trends persist, one in three people will be obese by 2034 and one in 10 will develop Type 2 diabetes.
Type 2 diabetes is often preventable. People at high risk of developing Type 2 diabetes can be identified through the NHS Health Check and the disease could be prevented in 30-60% through appropriate behaviour change support.6
There is strong international evidence which demonstrates how behavioural interventions, which support people to maintain a healthy weight and be more active, can significantly reduce the risk of developing the condition.
The cost of treating overweight patients with diabetes is about one and a half times that of treating normal-weight patients with diabetes. The cost of treating patients with diabetes who are obese is more than three times as high as for treating patients without diabetes who are of normal weight.7
5 PHE Cardiovascular intelligence pack.6 PHE Cardiovascular intelligence pack.7 PHE Cardiovascular intelligence pack.
26

Version 2.0 –18 December2015
Current positionIn 2013/14 5.4% of people aged 17+ years were recorded as having a diabetes diagnoses in Cambridgeshire and 6.3% in Peterborough. It is estimated that there are 7,304 people with undiagnosed diabetes in NHS Cambridgeshire and Peterborough CCG. GP practice prevalence of observed diabetes ranges from 1.2% to 12.0%.
The focus here is on the prevention of diabetes rather than the management of diabetes once diagnosed. However, the National Diabetes Audit Data shows that many of the eight care processes recommended by NICE do not appear to be being provided in Cambridgeshire and Peterborough to the same level as elsewhere in the county, and the CCG does not rank well in comparison with other areas. Overall in 2012/13 54.9% of people with diabetes had the eight recommended care processes in NHS Cambridgeshire and Peterborough CCG compared to 59.5% in England. This means that at least 12,953 people did not receive the eight care processes.
For example, reporting on people with diabetes whose blood glucose levels are well controlled for 2013/14 there were 58.3% of people in this group in Cambridgeshire, and 47.9% in Peterborough. Cambridgeshire ranked 128th out of 152 counties and Peterborough was the bottom of the table nationally. The England average was 61.5%. There were similar results for blood pressure control in people with diabetes.
The focus here is on diabetes prevention however, intensive blood glucose control can reduce the risk of diabetic complications and decrease treatment costs over periods from 10 years to a lifetime, and some US studies showing a quicker return on investment.8 There may therefore be opportunities related to intensive blood glucose control and blood pressure control amongst diabetics, to improve care and reduce overall NHS costs.
Interventions and cost savings to the NHSNICE guidance on diabetes prevention highlights many interventions which are cost effective in the short term. It was not able to estimate long-term savings for the guidance.
However, it argues that the main savings are anticipated to arise as a result of providing intensive lifestyle-change programmes. Some and, in time, possibly all the costs of assessment and lifestyle interventions may be offset by delaying someone’s progression to Type 2 diabetes. In the short term, savings will relate mainly to the costs that would otherwise have been incurred in monitoring and treating people who have progressed to Type 2 diabetes. Savings will increase in the longer term, as the number of complications and related medical conditions (such as stroke and heart disease) are reduced.
There are a couple of interventions which the costing and modelling work commissioned for the development of the guidance, and some more recent work, which show interventions which are potentially cost saving. 8 Evidence based diabetes care in Cambridgeshire: clinical and cost issues for a diabetes service. A commentary based on a review of the literature, Nita Forouhi
27

Version 2.0 –18 December2015
a) Large-scale, region-wide multi-component programme (Hartslag Limburg) was found to be highly cost-effective but possibly cost-saving (depending on assumptions around cost of maintenance intervention9). Hartslag Limburg was a programme which targeted a regional population of 185,000 with a mix of 590 lifestyle programmes including low cost lifestyle seminars and cycle tours to high cost exercise and diet programmes. Sixty percent of the investment was on improving exercise. The more intensive interventions produced the greatest weight loss, and significant improvements in health were found between the intervention and reference group after five years.
b) A US study (Zhou et al. 2012) projected long-term savings from implementing a community-based diabetes prevention programme nationwide. The modelling in this study identified that a cumulative break-even point would be achieved in year 13.
c) Recently, Breeze et al10 compared the cost-effectiveness of lifestyle interventions, designed to prevent diabetes, across different high-risk population sub-groups and different intervention intensities. Overall, they found the diabetes prevention interventions are likely to be cost-saving. The six population sub-groups defined as at high risk for diabetes used were adults aged 40-65 years, low socio-economic status, HbA1c>42mmol/mol (6%), Finnish Diabetes Risk score >0.1, BMI >35 kg/m2, South-Asian.
They found that diabetes prevention programmes are potentially cost-saving over a lifetime horizon, regardless of risk criteria or intervention intensity. Cost-effectiveness increases with intervention intensity. The most cost-effective options were to target South-Asian people and those with HbA1c levels >42 mmol/mol (6%) over a lifetime. However, there are net savings in the first 10 years from targeting people with HbA1c and with high value Finnish risk score, but the other groups targeted cost more than their savings over 10 years. However, all the groups targeted offer a return on investment over a lifetime. The low socio-economic status and South Asian groups take longer to recover costs despite generating high lifetime costs savings.
They argue that combining criteria could optimise health savings. They found that interventions for individuals identified by FINDRISC score>0.1 or HbA1c>42 mmol/mol (6%) have the greatest cost savings after one - 10 years.
9 SHAR Prevention of type 2 diabetes: preventing pre-diabetes among adults in high-risk groups Report on Use of Evidence from Effectiveness Reviews and Cost-effectiveness Modelling10 SHAR Prevention of type 2 diabetes: preventing pre-diabetes among adults in high-risk groups Report on Use of Evidence from Effectiveness Reviews and Cost-effectiveness Modelling
28

Version 2.0 –18 December2015
The long term benefits are as much about reducing the risk of other diseases as well as diabetes. The health benefits of interventions in the South Asian population had a large impact on reducing cardiovascular disease but less impact on lifetime diabetes. By contrast, intervening with those with HBA1c>42 mmol/mol (6%) has a large impact in reducing diabetes diagnosis, but it is slightly less effective in reducing CVD events.
They used a meta-analysis of lifestyle interventions (Dunkley et al), which means that their exact definition of a lifestyle intervention is difficult to establish, as there was a large range of interventions included in the meta-analysis. However, intervention costs, with intensive lifestyle support costing £157 per person, are broadly in line with our existing Tier 2 health trainer costs. The modelling work assumes that the benefits of lifestyle interventions are sustained over a lifetime.
d) Risk assessment and intervention in South Asians of 25-39 years of age appears to be cost-effective and cost-saving over the longer term (20 years +), with future cost savings more than offsetting the cost of finding, testing and undertaking intensive lifestyle-change interventions with this group. NICE modelling found that even assuming a 50% higher intervention cost (to take account of longer course delivery times for non-English speaking participants) makes little difference to the results and would not alter the conclusion.11
Work already plannedThe NHS Diabetes Prevention Programme aims to identify those at high risk and refer them into an evidence-based behavioural intervention to help them reduce their risk. The CCG and Local Authority public health team submitted an expression of interest to be part of the first wave of national implementation of the Programme.
There is also an Integrated Community Diabetes Service which has been introduced in CamHealth LCG. The service consists of a number of inter-related components including a diabetes specialist nurse (DSN) clinic at all practices, home visits by a DSN and Healthcare Assistant when requested by the practice, dietician clinics at all practices, podiatrist support and access to Podiatrist’s clinics, virtual case reviews and MDT clinics both led by consultant diabetologist. Supporting work in primary care includes the identification, review and referral of at risk patients, diabetes prevention and management work, and self-management through personal health plans.
11 NICE PH38 and SHAR Prevention of type 2 diabetes: risk identification and interventions for individuals at high risk
29

Version 2.0 –18 December2015
Where should the strategic focus be?The evidence suggests that interventions that:
maximise the opportunity that the health check provides to identify people at risk of diabetes, particularly with HbA1c>42mmol/mol (6%);
provide intensive lifestyle change programmes for those at high risk; focus on high risk population groups such as those from the South Asian, and low
socio-economic status population.
What would this mean for Cambridgeshire and Peterborough?
Table 6: Numbers in the South Asian population in Cambridgeshire and Peterborough aged 25-39
South Asian population aged 25-39Cambridgeshire 4,512Peterborough 4,854Total 9,366
Source: 2011 census resident population
The highest concentration of the South Asian population, also in the more deprived areas of the CCG with the poorest health, is in Peterborough. This would therefore be the priority group to focus on initially.
A health check currently costs approximately £26, so it would cost approximately £126,204 to extend health checks to the South Asian population aged 25-39. Given the scale of the additional checks this is likely to be split across three to five years with people in the South Asian population reaching age 25 joining the cohort to receive a heath check. The aim would be for all those in the age group to receive one health check over the next three to five years.
Table 7: Estimate of diabetes prevalence in South Asian populations aged 25-39
Diabetes Type II (90%)Estimate of Diabetes in South Asian pops 25-39 Cambridgeshire 632 569(Diagnosed and Undiagnosed) Peterborough 680 612
Total 1311 1180Rounded up 1300 1200
Source: Holman 2010 for diagnosed/undiagnosed within South Asian population
The model assumes that an additional 4,854 health checks would be offered, and based on current take up rates, 2,354 would be undertaken. From these we estimate that there will be 165 cases of potential future diabetes identified and that 50% of this group will accept a health trainer style intervention. The figures below are all approximate costs.
30
Version 2.0 –18 December2015
There would also need to be point of care testing available for health checks. This would cost approximately £243k over three years (£81k a year), based on Cambridgeshire costs, for all 25 practices.
Table 8: costs of health checks
Peterborough NumberSouth Asian population aged 25-39 years 4,854Annual uptake of health check 2014/15 48.5%Estimated number of health checks 2,354Average cost of a health check £25.60Total cost for health checks £60,267Estimated prevalence of diabetes in South Asian population 14.0%Estimated number of people to refer to health trainers 330Assume 50% uptake to health trainer 165Average cost of health trainer (caseload approx 110 people per trainer) £41,250Total cost of package £101,517
The figure below shows how the ‘catch up’ for the 25-39 year olds in Peterborough could be spread over three years. After then the numbers drop to only those reaching the age of 25.
Figure 2: Peterborough – South Asian population, diabetes intervention
The evidence suggests that this programme may prevent over 470 cardiac events, and 10 diabetes diagnosis, and certainly be cost saving over a lifetime.
31

Version 2.0 –18 December2015
Where should the strategic focus be?People at high risk of developing Type 2 diabetes can be identified through the NHS Health Check and the disease could be prevented in 30-60% through appropriate behaviour change support.12 The strategic focus and recommendations in the obesity section should help prevent diabetes.
In addition, it is clear that there are long term NHS savings to be gained from screening and providing an intensive lifestyle intervention for the South Asian population aged 25-39.
Recommendations Health checks should be extended to those aged 25-39 years from the South Asian
population in Peterborough, with the initial focus in the GP practices with the highest concentration of the South Asian population in the most deprived areas. This will cost approximately £100k over the first three years (excluding point of care testing) but will be cost saving in the long term.
12 PHE Cardiovascular intelligence pack.
32

Version 2.0 –18 December2015
5. Cardiovascular diseaseHeadlines
Current uptake for Cardiac Rehabilitation is 48.3% in line with the national average. However, there may be cost savings associated with increasing this to 65%.
There are opportunities to improve the diagnosis and treatment of Atrial Fibrillation. This is potentially cost saving to the NHS as well as local authorities. Initial modelling suggests that additional treatment of 1,527 people would avoid 61 strokes and produce net savings of £389k to the NHS over the next seven to eight years, as well as substantial savings to local authorities.
Work should focus on increasing the number of patients diagnosed and treated for AF with warfarin, and reducing variation between GP practices. Peterborough should be the initial focus of this work.
Modelling work finds the national interventions to reduce salt intake are cost saving at all time horizons including year one.
Lifestyle interventions, general adult population and focused on those with diagnosed hypertension, have been shown to be potentially cost saving at 10 years and over a lifetime horizon.
Potential net savings to the NHS are approximately £425k over three years from improving the diagnosis and management of hypertension by 15%. This would require a potential investment of up to £1.2m over three years, however a proportion of this work already takes place through the health check. There would be additional social care savings from strokes avoided.
Maximising the opportunity provided in the health check to diagnose and treat hypertension, including through lifestyle interventions, should be maximised.
A variety of lifestyle interventions for those diagnosed with hypertension should be available. This would mean an expansion to existing lifestyle services, such as health trainer/coaches.
Work to increase diagnosis and management of those with hypertension should focus initially on Peterborough, and Fenland.
BackgroundCardiovascular disease (CVD) is an umbrella term for all disease of the circulatory system including coronary heart disease (CHD), heart failure, stroke and peripheral arterial disease. CVD causes more than a quarter of all deaths (160, 000) in the UK each year and there are an estimated 7m people living with CVD in the UK.
CVD is generally due to reduced blood flow to the heart, brain or part of the body caused by atheroma (fatty deposits) or thrombosis (blood clots) which block the arteries. Having one cardiovascular condition increases the risk of developing another. The assessment and
33

Version 2.0 –18 December2015
management of risk and access to prevention and treatment services influences mortality rates and need for care and support.
A number of common risk factors are recognised as increasing the likelihood of developing CVD:
Fixed factors such as family history, gender, ethnicity and ageing; Lifestyle factors such as smoking, obesity, nutrition, lack of physical activity, high
alcohol consumption; Wider determinants such as deprivation, poverty, poor education and working
conditions; Physiological metabolic risk factors, which may develop in response to those above,
such as high blood pressure (hypertension), diabetes (high blood sugar), and hyperlipidaemia (high blood fats).
There is evidence that interventions at the level of the population at risk, and with individuals, can be effective in changing behaviour; clinical interventions and treatments can be effective in managing the metabolic risk factors.13
Current position
CambridgeshireCVD causes around 300 deaths every year in people aged under 75 in Cambridgeshire, and we estimate that 190 of these are preventable. This rate is lower than the national average, other than in Fenland.
PeterboroughPeterborough has significantly high mortality rates for cardiovascular deaths under the age of 75 and for all causes of mortality considered preventable.
The prevalence of CVD rises with age and is also higher in more deprived populations. South Asian populations in the UK are known to have higher rates of premature coronary heart disease (CHD).
The data on prevalence shows that CVD risk factors are relatively high in the younger and more deprived population in Borderline and Peterborough LCGs, who may not be diagnosed with CVD yet, but are at high risk of developing disease and requiring services as they age.
The figure below illustrates the position in Peterborough.
13 https://www.peterborough.gov.uk/upload/www.peterborough.gov.uk/healthcare/public-health/CardiovascularDiseaseJSNASummary-October2015.pdf?inline=true)
34

Version 2.0 –18 December2015
Figure 3: Public health outcome framework – health care and premature mortality
Interventions and cost savings to the NHS
Cardiac Rehabilitation
Key FactsA range of NICE guidelines and quality standards recommend cardiac rehabilitation (CR) for specific cardiac conditions and treatments based on range of research evidence demonstrating the positive outcomes of CR. These include:
a 26% relative reduction in cardiac mortality over five years; a reduction in cardiac-related morbidity; an improvement in functional capacity and quality of life.
35

Version 2.0 –18 December2015
Current activityIn Cambridgeshire and Peterborough in 2014/15:
62% of the population eligible for CR are being referred appropriately. Of in-scope and appropriate referrals, 78% started CR. Uptake is 48.3%, similar to the uptake for England reported by NACR 2014 (46%)
Around 66% of patients starting CR complete the programme in-year; this is 31% of the eligible (baseline) population.
Research has also suggested that the delivery of a comprehensive CR service has the potential to reduce unplanned cardiac readmissions by 30%. However, uptake rates remain well below this 65% nationally and locally. The indicative cost of delivering good quality CR is £498 per patient. The Department of Health’s ‘Cardiac Rehabilitation Commissioning Pack’ gives the average weighted cost of a cardiac re-admission as £3,637.
Potential cost savingsThere has been national work which modelled the potential impact of increasing uptake on unplanned cardiac re-admissions14 estimating the number and cost of emergency cardiac readmissions reduced by increasing uptake to 65%. It estimated that in the cohort of eligible patients for CR in the East of England the cost of re-admissions was approximately £37m (2009/10), and that with a 65% uptake this would fall by £11.2m. These savings are offset by the cost of this increased uptake which is estimated to be £8.2m. This suggests there is a potential net saving of approximately £3m across the East of England from a 0% uptake baseline. The table below shows the results of this modelling work.
14 Making the Case for cardiac rehabilitation: modelling potential impact on readmissions. NHS Improvement. March 2013.
36

Version 2.0 –18 December2015
Table 9: Modelled reduction in cardiac readmissions and associated financial savings
Initial local modelling work suggests that patients readmitted (within 365 days) with a diagnosis which was eligible for cardiac rehabilitiation cost an average over 2013-2015 of £2.45m a year (non-elective cost only), for an average of 972 patients a year. We do not know which of these patients had already attended cardiac rehabilitation and what proportion would not be suitable. However, a 30% reduction in admission costs in this group would be approximately a £735k saving. Further work is needed to establish the exact savings position locally given that this does not take account of those already receiving cardiac rehabilitation and therefore overestimates the savings, however overall this indicates that cardiac rehabilitation should break even at worst for the NHS.
RecommendationThere should continue to be a focus on increasing the CR uptake to 65% and number of eligible people who complete a cardiac rehabilitation programme.
37

Version 2.0 –18 December2015
Atrial Fibrillation
Key Facts Atrial Fibrillation (AF) increases the risk of stroke by about six fold, and strokes
caused by AF are often more severe with higher mortality and greater disability. Anticoagulation substantially reduces the risk of stroke in people with AF.
Despite this, AF is underdiagnosed and undertreated. Around 25-30% of people with AF are unaware they have the condition and less than half of patients are adequately treated – many do not receive anticoagulants and of those who do, many are undertreated.
AF is an important risk factor for stroke and is associated with about 15% of all strokes. Only 30% of people with known AF admitted with a stroke are on anticoagulant treatment at the time of their stroke.
AF is one of the top 10 reasons for hospital admissions in the UK, and the prevalence of AF roughly doubles with each decade from age 50-59.
Current activityIn 2013/14 there were 12,941 people diagnosed with a stroke within Cambridgeshire and Peterborough CCG, with around 7,500 people with undiagnosed atrial fibrillation, known to be one of the significant contributory factors of stroke in patients.
The diagnosed prevalence of AF in the CCG is 1.5% and the estimated prevalence is 2.3%, therefore there is some opportunity to improve diagnosis and management of AF with the expectation of reducing the incidence of stroke in our local population. The figures below benchmark the CCG against other CCGs and illustrate that:
There are 1,120 people diagnosed with AF who appear to be untreated in Cambridgeshire and Peterborough.
There were 147 strokes in 2014/15 in people with known AF not on anticoagulation. The CCG appears to be a low user of GRASP-AF.
38

Version 2.0 –18 December2015
Figure 4: inpatients with AF
Source: CVD Intelligence Pack. PHE March 2015
Figure 5: AF strokes in CCG
39

Version 2.0 –18 December2015
Figure 6: Case finding of AF
Source: AF How can we do better? Stroke Association Partnership
Potential cost savingsNHS England estimates the cost of increasing the prescription of anti-thrombotics (warfarin) by supporting GPs to identify patients with atrial fibrillation, to be £169k per 100,000 population.
Warfarin tablets are inexpensive. The main costs of anti-coagulation with warfarin relate to the cost of anti-coagulant monitoring. NICE estimates that the total cost of maintaining one patient on warfarin for one year, including monitoring, is £383. The number of patients needed to treat (NNT) for one year to prevent one stroke is approximately 37 for primary prevention and 12 for secondary prevention. NNT for one year for a mixed population comprising primary and secondary prevention patients is 25.
Based on these figures and the cost of one year’s anti-coagulant therapy, the cost of preventing one stroke is estimated at £10,000 to £14,000 per annum.
The cost benefits of stroke prevention are more difficult to calculate. The management of patients following a stroke is very expensive for the NHS and Personal Social Services (PSS). The Department of Health estimate that the total costs in the first year of care for treating the 12,500 strokes in England that are attributable to AF to be £148m. This comprises:
£103m of direct hospital costs. £45m of additional costs for care requirements post-discharge, such as district
nursing, community based rehabilitation and pharmaceuticals prescribed in the community.
The National Audit Office reported in 2005 that stroke care, costs the NHS about £2.8bn a year in direct care costs. This is more than the cost of treating coronary heart disease and
40

Version 2.0 –18 December2015
costs the wider economy some £1.8bn more in lost productivity and disability. In addition, the annual informal care costs (costs of home nursing and care borne by patient’s families) are around £2.4bn.
Based on the above figures, it is estimated that the cost of each stroke due to AF is £11,900 in the first year after stroke. These figures suggest that anti-coagulant treatment of AF is not only cost effective but that it is associated with an overall cost saving when its benefits in stroke prevention are taken into account.
More recent analysis of the acute and long-term costs of a stroke in atrial fibrillation patients found that the costs for the three months post stroke on average were £10,413, and annual health care costs after this time were non-significantly smaller than those incurred before the event (£2400 vs. £3356). After stroke 13% of patients were newly admitted into long-term warden, nursing, or residential care, resulting in annual costs of £6880 (averaged across the 136 patients surviving past the acute period).
The work concluded that although annual post-acute phase hospital and primary health-care costs in stroke patients with prior atrial fibrillation were not significantly different to those incurred before the stroke, long-term nursing/residential care costs were substantial.15
Local Modelling
We have developed a model to show the costs and savings associated with the CCG increasing its diagnosis rate to the best performing CCG comparator (NHS Somerset) and increasing the proportion of those diagnosed treated with warfarin to NICE recommended levels (46.7% treated with warfarin), including those newly diagnosed. This would result in an additional 1,527 people treated with warfarin in Cambridgeshire and Peterborough and 61 strokes avoided over the next two to three years.
This additional treatment would cost approximately £1.47m including drug, monitoring and adverse event costs, and is estimated to make £389k net NHS savings over the next two to seven years. There are acute and longer term costs associated with stroke and this is why the savings are over a longer period.
There are additional savings to social care from stroke avoidance. Provisional estimates suggest that social care savings from strokes avoided would result in approximately £753k savings over eight years, with £272k of these within the first three years.
It is important to note that this model only focuses on warfarin treatment, and those patients suitable for warfarin treatment, and excludes treatment with other more expensive drugs for newly diagnosed patients.
15 Population-based study of acute- and long-term care costs after stroke in patients with AF.Luengo-Fernandez R1, Yiin GS, Gray AM, Rothwell PM. Int J Stroke. 2013 Jul;8(5):308-14.
41

Version 2.0 –18 December2015
Figure 7: C&PCCG increasing the proportion of AF diagnosed and treated with warfarin
Sources: PHE NCVIN AF prevalence estimates, March 2015. NICE Costing template - Atrial Fibrillation CG180, June 2014. Quality and Outcomes Framework, 2014/15. The Number Needed to Treat (NNT) - http://www.thennt.com/nnt/warfarin-for-atrial-fibrillation-stroke-prevention/. NICE Prevention of Cardiovascular Disease Costing Report June 2010.
Recommendation There are opportunities to improve the diagnosis and treatment of Atrial Fibrillation.
This is potentially cost saving to the NHS as well as local authorities. Initial modelling suggests that additional treatment of 1,527 people would avoid 61 strokes and produce net savings of £389k to the NHS over the next seven to eight years, as well as substantial savings to local authorities.
Work should focus on increasing the numbers of patients diagnosed and treated for AF with warfarin, and reducing variation between GP practices. Peterborough should be the initial focus of this work.
42

Version 2.0 –18 December2015
Hypertension
Key FactsIn England it is estimated that:
Hypertension, or high blood pressure, affects more than one in four adults in England.
5m people have undiagnosed and untreated hypertension. 40% of people with diagnosed hypertension receive sub-optimal treatment. Only one in five people whose 10 year CVD risk exceeds 20% receive statins.
Hypertension means that blood pressure is consistently higher than the recommended level. If it is not treated, it can lead to heart failure, and/or increases the chance of having a heart attack or stroke.Coronary heart disease (CHD), stroke, vascular dementia (VaD) and chronic kidney disease (CKD) are the main conditions attributable to hypertension. The NHS cost burden resulting from hypertension in England is estimated to be £2.1bn, looking at these four diseases.
Current ActivityIn 2013/14 approximately 55% of people with hypertension were diagnosed in Cambridgeshire and Peterborough, compared to 56% nationally. It is estimated that there are 92,241 people with undiagnosed hypertension in NHS Cambridgeshire and Peterborough CCG. There is considerable variation in GP practice diagnosis of hypertension.
In total, including exceptions, there are 22,023 people (excluding exemptions) whose blood pressure is not <= 150/90 in Cambridgeshire and Peterborough at their latest blood pressure reading. There is a GP practice range of between 10.2% and 44.9%. If all practices were to achieve as well as the average of the best achieving practices, in terms of treating hypertension, then an additional 6,641 people would have their hypertension controlled.
43

Version 2.0 –18 December2015
Figure 8: Percentage of patients with hypertension whose last blood pressure reading is 150/90 mmHg or less by CCG
Source: Cardiovascular Intelligence pack March 2015
In 2013/14 there were 889 people with a new diagnosis of hypertension who have been given a CVD risk assessment whose CVD risk exceeds 20%. 125 of these people were not already on statins, or exempted from statins. If all practices were to achieve as well as the average of the best achieving practices, then an additional 195 people would be treated (this is above 125 as it includes exceptions).
Potential cost savingsLooking at cost effectiveness work on hypertension prevention, there is recent work which demonstrates the potential impact of lifestyle change interventions across the population and within high risk groups.
A cost-effectiveness review of blood pressure interventions (A Report to the Blood Pressure System Leadership Board), finds that models of ‘lifestyle interventions’ focused on support to change lifestyle behaviour (notably diet, and physical exercise), are potentially cost saving to the NHS at 10 years and over the lifetime horizon. National interventions to reduce salt in food were found to be cost saving at all time horizons, including at one year.
The cost effectiveness findings of the review are summarised below:
44

Version 2.0 –18 December2015
Based on commonly accepted thresholds of value for money for health investments, the key findings in relation to cost effectiveness are that:
The ICERs (see below for definition) for many of the included interventions increase substantially over longer time horizons.
National interventions to reduce salt in food are cost saving across all time horizons, both in the general adult population and in adults diagnosed with high blood pressure.
In the general adult population, health lifestyle changes are potentially cost-effective at 10 years and cost saving over the lifetime time horizon. Testing is more cost effective in GP and Pharmacy settings rather than in community settings. Education and awareness campaigns are cost effective over a lifetime time horizon.
In adults with diagnosed high blood pressure health, lifestyle improvement interventions become cost effective within five years, and potentially cost saving within 10 years. Drug therapy adherence interventions become cost saving over a lifetime but are not cost effective in shorter time horizons. Similarly, self-management support programmes are only cost effective over the lifetime time horizon. Surprisingly primary care management programme interventions (over and above standard care) are not cost-effective at any time horizon. This appears to be due to their high cost in the studies found.
Sensitivity analysis found that the vast majority of the ICER findings were robust when the costs and benefits were varied.
Source: Cost Effectiveness Review of Blood Pressure Interventions. A report to the Blood Pressure System Leadership Board. November 2014.Optomity Matrix.
ICER: Incremental cost effectiveness ratio - the ratio of the change in costs of a therapeutic intervention (compared to the alternative, such as doing nothing or using the best available alternative treatment) to the change in effects of the intervention.
This paper also modelled three implementation scenarios and found the following:
Implementation scenarios Modelling of the impact of three implementation scenarios specified by the Blood Pressure System Leadership Board found that in England, over 10 years:
1. A 5mmHg reduction in average population blood pressure would result in a gain of 45,000 QALYs and 140,000 life years, and a reduction of £800m in health care costs and £60m in social care costs. 2. A 15% increase in the proportion of adults who have had their high blood pressure diagnosed would result in a gain of 7,000 QALYs and 22,000 life years, and a reduction of £112m in health care costs and £11m in social care costs. 3. A 15% increase in the proportion of adults on treatment controlling their blood pressure to 140/90mmHg or less would also result in a gain of 7,000 QALYs and 22,000 life years, and a reduction of £112m in health care costs and £11m in social care costs.
45

Version 2.0 –18 December2015
The interventions to achieve health lifestyle changes found to be potentially cost saving at 10 years are a mixture interventions (largely from a meta-analysis of 105 trials in 2006) including a mixture of advice and supervised activities, related diet, physical activity, relaxation, alcohol restriction, and salt restriction.
Local modelling
Increased diagnosis
Using the NICE costing toolkit it is possible to estimate that improving the proportion of people diagnosed with hypertension by 15% in the population over three years, would generate net savings to the NHS of approximately £353k. These are savings from reductions in stroke and CVD events. This model assumes that the increase in 15% activity is spread over three years and that there is only a half year effect for any savings in year one.
Table 10: Additional diagnosis NHS costs and savings for a 15% increase in diagnosis in Cambridgeshire and Peterborough
Source: NICE costing templates, and Suffolk County Council Annual Public Health Report ‘Is prevention better than cure?’ November 2015.
The costs here are made up of an annual GP check-up and drugs costs. The costs and savings here are taken from the NICE Atrial Fibrillation costing template 2014, and NICE Prevention of Cardiovascular Disease Costing Report June 2010. The table and chart below illustrate these savings in more detail.
It is important to note that when the avoidance costs of social care are also taken into account (as priced by Suffolk County Council) for both improved diagnosis and management, savings are found in the first year with total savings from increasing prevalence and improving management to be over an estimated £1.2m. The timescale for generating the social care element of these savings is not clear from work to date.
46

Version 2.0 –18 December2015
Figure 9: C&PCCG increase number of people diagnosed with hypertension by 15%
Improved management for those already diagnosedImproved management for 15% of those already diagnosed with hypertension would lead to net NHS savings of approximately £72k. The costs and savings are calculated in the same way as above, and the same assumptions have been made about activity and savings.
Table 11: Savings for improved management for 15% of those already diagnosed with hypertension
2013/14 2014/152016/17 2017/18 2018/19 Total
Management of hypertension 23,713 22,527 21,342 20,156Increased management 1,186 1,186 1,186 3,557Cost at £60.47 per patient per year £71,696 £71,696 £71,717 £215,110Savings based on avoided strokes and heart attacks £57,471 £114,943 £114,943 £287,357Net savings -£14,225 £43,247 £43,225 £72,247
15% increase by 2018/19
Source: NICE costing templates, and Suffolk County Council Annual Public Health Report ‘Is prevention better than cure?’ November 2015.
47

Version 2.0 –18 December2015
Figure 10: C&PCCG decrease number of people with diagnosed hypertension and blood pressure more than 150/90 in last 12 months by 15%
There are potential savings estimated to be approximately £425k over three years from improving the diagnosis and management of hypertension as described above. This would require a potential investment of up to £1.2m over three years, however a proportion of this work already takes place through the health check.
Recommendations Lifestyle interventions, general population, and focused on those with diagnosed
hypertension have been shown to be potentially cost saving at 10 years and over a lifetime horizon.
Opportunities provided in the health check to diagnose and treat hypertension, including through lifestyle interventions as well as drugs, should be maximised.
A variety of lifestyle interventions for those diagnosed with hypertension should be available. This would mean an expansion to existing lifestyle services, such as health trainer/coaches.
Work to increase diagnosis and management of those with hypertension should focus initially on Peterborough and Fenland.
48

Version 2.0 –18 December2015
Work already plannedWork to date
The CCG Tackling Health Inequalities in Coronary Heart Disease Programme Work stream priorities for 2015/16 are:
a) Lifestyle Management (including monitoring of the health check programme and smoking cessation programme).
b) Primary Care interventions. Risk reduction in CVD through BP/lipid management.c) Stroke Prevention through effective management of Atrial Fibrillation.d) Cardiac Rehabilitation - The Programme Board will continue to have a watching brief
on this programme of work until full transfer of the data and reporting to Uniting Care from April 2016. Further work has already been identified for 2015/16 on data and reporting, developing a further understanding of referral patterns, reasons for non-referral of eligible patients, up-take and non-completion of the programme also needs to be addressed across providers.
Where should the strategic focus be?The evidence suggests that CR, AF diagnosis and management, and hypertension diagnosis, management and prevention are potentially cost saving and there is scope to improve performance locally.
Recommendations There should continue to be a focus on increasing the CR uptake to 65% and number
of eligible people who complete a cardiac rehabilitation programme. There are opportunities to improve the diagnosis and treatment of Atrial Fibrillation.
This is potentially cost saving to the NHS as well as local authorities. Initial modelling suggests that additional treatment of 1,527 people would avoid 61 strokes and produce net savings of £389k to the NHS over the next seven to eight years, as well as substantial savings to local authorities.
Work should focus on increasing the number of patients diagnosed and treated for AF with warfarin, and reducing variation between GP practices. Peterborough should be the initial focus of this work.
Lifestyle interventions, general population, and focused on those with diagnosed hypertension, have been shown to be potentially cost saving at 10 years and over a lifetime horizon.
Maximising the opportunity provided in the health check to diagnose and treat hypertension, including through lifestyle interventions should be maximised.
49

Version 2.0 –18 December2015
A variety of lifestyle interventions for those diagnosed with hypertension should be available. This would mean an expansion to existing lifestyle services, such as health trainer/coaches. Work to target this group should focus initially on Peterborough and Fenland.
50

Version 2.0 –18 December2015
6. Long term conditionsHeadlines
International evidence finds that psychological interventions for long term conditions (LTCs) can reduce average health care costs in the range of 20-30% across studies.
Self-management programmes in patients with COPD have been found to reduce all cause hospitalisations by up to 40%.
A self-management programme should be offered to those diagnosed with COPD. This should be evaluated for its economic impact on health costs.
Work should also ensure that pulmonary rehabilitation is maximised for COPD patients.
Routine management of LTCs should include the identification of those requiring further assessment for depression and anxiety early in the pathway. Physical and mental health pathways should be integrated to facilitate this.
There should be maximum utilisation of the IAPT LTC team; and there should continue to be a focus on rapidly increasing referrals and there should be a focus on those with multiple LTCs.
There should be an economic evaluation of the impact on healthcare costs of identification and treatment for common mental health disorders in those with multiple LTCs.
BackgroundLong Term ConditionsLong term conditions (LTCs) include any ongoing, long term or recurring condition requiring constant care that can have a significant impact on people’s lives, limiting their quality of life.16 Those with multiple long term conditions are at a higher risk of poor health outcomes. Recent studies have found the prevalence of multi-morbidity (the co-existence of two or more LTCs) varied from 12.9% in participants 18 years and older, to 95.1% in a population aged 65 years and older. The Department of Health estimates that those with multiple LTCs are due to rise from 1.9m in 2008 to 2.9m in 2018.
Long Term Conditions and Mental Health Common mental disorders (CMDs), which include depression and anxiety, are highly prevalent with long term conditions. Evidence consistently demonstrates that people with long term physical health conditions (LTCs) are two to three times more likely to experience mental health problems than the general population, with much of the evidence relating to common mental health disorders such as anxiety and depression.
16 CCC/C&P CCG (2015). Long Term Conditions Across the Life Course JSNA
51

Version 2.0 –18 December2015
Compared with the general population, people with diabetes, hypertension and coronary artery disease have double the rate of mental health problems, and those with chronic obstructive pulmonary disease, cerebrovascular disease and other chronic conditions have triple the rate. People with two or more long term conditions are seven times more likely to have depression.17
The additional impact of mental illness, which can exacerbate physical health problems, is estimated to raise the total health care costs by at least 45% for each person with a long-term condition and co-morbid mental health problem. This would result in 12-18% of all NHS expenditure on long-term conditions being linked to poor mental health (£8-13bn each year.18)
Current position
Local contextLong Term ConditionsBased on national prevalence data applied to the CCG population, 108,700 (18.8%) 18-64 year olds are living with one longstanding illness, a further 56,800 (9.8%) are thought to be living with two or more.19 Long term conditions are more prevalent in older age groups, and Figure 11 shows the proportion of people with 1 or multiple longstanding illnesses by age group. The proportion of people living with more than one longstanding illness rises with increasing age.
Figure 11: The proportion of people with one, two, three or four or more longstanding illnesses by age group, Health Survey for England (2012)
17 The King’s Fund. (2012) Long-term conditions and mental health: The cost of co-morbidities.18 The King’s Fund. (2012) Long-term conditions and mental health: The cost of co-morbidities.19 Health Survey for England (2012) estimates applied to registered population. FHS Registration System (Exeter) April 2015.
52

Version 2.0 –18 December2015
Source: Health Survey for England (2012)
Long Term Conditions and mental healthThose with LTCs are at a higher risk of developing a mental illness; Table 12 shows the proportion of the CCG population aged 18-64 years that have multiple longstanding illnesses with and without limitation and/or mental ill health. 3.4% (1,900 people) are estimated to have two or more LTCs and mental ill health, whereas 28.4% (16,100 people) are thought to have two or more LTCs, mental ill health and limitation.
Table 12: Proportion of people aged 18-64 years with multiple (two or more) long standing illnesses with and without limitation and/or mental ill health (based on GHQ-12 score of four or more)
Figure 12 shows data from a local study for over 65s with two or more LTCs. The data suggests that there are around 38,600 people aged 65 and over with two or more LTCs and limitation, an additional 3,600 people with mental ill health and an additional 6,900 with multiple LTCs, limitation and mental ill health (dementia, anxiety and depression). In total, it is estimated that 65,800 people aged 65 and over in C&P CCG have two or more LTCs.
53

Version 2.0 –18 December2015
Figure 12: Proportion of people aged 65 and over with multiple (two or more) LTCs with and without limitation and/or depression or anxiety (based on GMS AGECAT)
Source: MRC Cognitive Function and Ageing Study (CFAS II) (100% = people with two or more LTCs)
Overall this means that locally there are an estimated 18,000 adults with two or more long term conditions with mental ill health and/or limitation, and a further 10,500 people aged 65 and over in these groups. Prevalence of common mental health disorders is 16% in the adult population, and 10.6% in those aged 65-75 years.20 Even at the population level of risk 3,993 people (2,880 adults and 1,113 older people) amongst this group will have common mental health disorder. Given that the risk of common mental health disorders in this group is a minimum of two of three times higher than the general population, these figures are likely to be much higher than this estimate.
Interventions and cost savings to NHSSelf-Management for Long Term ConditionsThere are substantial costs associated with long-term conditions that will vary depending on the setting and condition, for example the total annual cost of COPD to the NHS is over £800m.21 COPD is the second most common cause of emergency admissions to hospital and one of the most costly inpatient conditions to be treated by the NHS.22 Asthma is also responsible for large numbers of attendances to Emergency Departments, and admissions,
20 Psychiatric Morbidity Survey 2010.21 NHS Medical Directorate (2012). COPD Commissioning Toolkit A Resource for Commissioners.22 Department of Health (2011) An Outcomes Strategy for Chronic Obstructive Pulmonary Disease (COPD) and Asthma in England.
54

Version 2.0 –18 December2015
the majority of which are emergency admissions, and 70% of which may have been preventable with appropriate early interventions.23
An evidence review was carried out as part of the Long Term Conditions JSNA to consider self-management support interventions, particularly exploring which self-management support interventions may improve health outcomes for those with multiple conditions.24 The review highlighted that evidence for significant reductions in utilisation following self-management support interventions was strongest for respiratory disorders and cardiovascular disorders. The evidence surrounding cost savings was more limited.
Chronic Obstructive Pulmonary Disease (COPD)Locally, self-management programmes for COPD have been run as part of a Health Foundation funded programme. The evaluation does not provide detail on the cost-effectiveness or cost savings of this work, and indicates that this is an area for further work.
A Cochrane Review has, however, shown that self-management programmes in patients with COPD are associated with improved health-related quality of life and a reduction in respiratory-related and all cause hospital admissions.25 They looked at a wide range of self-management programmes, and there was considerable heterogeneity of studies within this review. Respiratory-related hospital admissions were 43% less likely in the intervention compared to control groups, and all cause hospitalisations were 40% less likely. Since this Cochrane Review, several studies have been published regarding the contents of self-management interventions for patients with COPD, it is now thought education alone is not sufficient to achieve behaviour change.26
The use of psychological interventions for those with COPD is being utilised in some areas of the UK. Data from unpublished work shows a respiratory wellbeing clinic in the London Borough of Sutton and Merton using cognitive behavioural therapy, psycho-education and physical health promotion for people with COPD. The service has reported a reduction in depression and anxiety symptoms, improved quality of life and better management of the condition. Cost savings have also been reported that, if applied to high-cost users, could save £5 for every £1 invested in the clinic.27 This data is not from a published study, therefore should be interpreted with caution.
23 An Outcomes Strategy for COPD and Asthma in England (2011) https://www.gov.uk/government/uploads/system/uploads/attachment_data/file/216139/dh_128428.pdf24 CCC/C&P CCG (2015). Long Term Conditions Across the Life Course JSNA.25 The Cochrane Collaboration (2014) Self management for patients with chronic obstructive pulmonary disease (Review).26 The Cochrane Collaboration (2014) Self management for patients with chronic obstructive pulmonary disease (Review).27 Mental Health Network NHS Confederation (2012). Long-term health gains. Briefing Issue 237.
55

Version 2.0 –18 December2015
COPD is costly to the local health care system; around 14,400 people (aged 40 and over) are recorded on disease registers for COPD in general practices across the CCG.28 Within the CCG, of the 1,660 hospital episodes where COPD was the primary diagnosis, 1,480 (89%) were emergency admissions. Emergency admissions with COPD as primary diagnosis resulted in 9,150 bed days and a cost of £3.6m in 2013/14, and 52% of emergency admissions occur in people aged under 75 years.
This suggests there may be a potential reduction in healthcare costs of up to £1.4m by introducing self-management interventions in patients with COPD. The NHS savings would depend on the cost of the intervention put in place.
AsthmaStudies have shown that education or self-management programmes can have a significant impact on hospital admissions for adults with asthma in particular. However, not all studies of self-management demonstrate reduced hospital or A&E department use, and it is as yet unclear as to what the key elements of a self-management intervention for asthma are.
DiabetesDAFNE and DESMOND are structured education programmes for diabetic management. There is some evidence to suggest that DAFNE may be cost effective and cost saving for Type 1 diabetes mellitus, although the evidence is limited and not sufficiently robust to model for the local population.
Psychological Interventions for those with Long Term ConditionsThose with long term conditions are known to be at higher risk of developing a mental illness which contributes to greater costs to the health service. Poor mental health, in the presence of a long term physical health condition, is associated with an approximate 45% increase in service usage costs to the NHS.29 In terms of Type 2 diabetes, £1.8bn of the cost can be attributed to poor psychological health. Mental health co-morbidity increases physical costs by 50% per diabetes patient.
Robust UK evidence establishing cost savings for psychological interventions and screening for those with long term conditions is not available. However, on the basis of studies undertaken outside of the UK it is evident that savings sufficient to cover the cost of the intervention are likely. From a large US meta-analytical study of psychological interventions for long term conditions, average health care cost savings were found to be in the range of 20-30% across studies.30 Psychological interventions ranged from psycho-education treatments to those categorised as behavioural medicine interventions. Only a small proportion of studies reported that the costs of psychological treatment exceeded the cost 28 Quality and Outcomes Framework (2013/14).29 The King’s Fund. (2012) Long-term conditions and mental health: The cost of co-morbidities.30 Chiles et al. (1999) The Impact of Psychological Interventions on Medical Cost Offset: A Meta-analytic Review. American Psychological Association.
56

Version 2.0 –18 December2015
savings. Most of the psychological interventions lead to reductions in health care costs, and these reductions were typically large enough to fully cover the costs of the psychological interventions themselves.
A recent local review of the evidence base for the inclusion of mental health interventions in the management of long term physical health conditions (LTC) recommended that:
The routine clinical management of long term health conditions should include the successful identification of those requiring individual assessment for depression/anxiety. NICE recommend the use of depression identification questions for this purpose and these should be incorporated into the initial patient assessment within pathways of care for long term health conditions.
Across most of the conditions, evidence supports the beneficial role of psychological interventions, but is inconclusive in determining the most effective intervention for a specified patient group.
It is recommended that NICE guidance be applied, offering a choice of psychological intervention dependent on patient preference and assessed severity of depression/anxiety.
Access to commissioned psychological interventions directly from care pathways for long term health conditions should be reviewed to ensure that direct and timely access is available.
Pulmonary Rehabilitation has been shown as an effective management strategy to improve symptoms of depression/anxiety in those with Chronic Obstructive Pulmonary Disease (COPD). Evidence would support a recommendation that patients diagnosed with COPD should have un-delayed access to a programme of Pulmonary Rehabilitation.
The use of a multicomponent cardiac rehabilitation programme for those patients with heart failure and post myocardial infarction will improve quality of life. Evidence supports the inclusion of exercise and psychological interventions to improve outcomes for depression and anxiety.
A full list of the review findings are attached at Appendix B.
Work already plannedCurrent Public Health spend and activityThere is no direct Public Health spend on self-management of long-term conditions or mental health interventions for those specifically with LTCs, however, there is a range of assets available to support self-management, as identified in more detail in the Long Term Conditions JSNA.31 The CCG commission an IAPT Long Term Conditions Team, and there are currently four pulmonary rehabilitation providers across the CCG. The Eastern Region
31 CCC/C&P CCG (2015). Long Term Conditions Across the Life Course JSNA. Section 8.4.
57
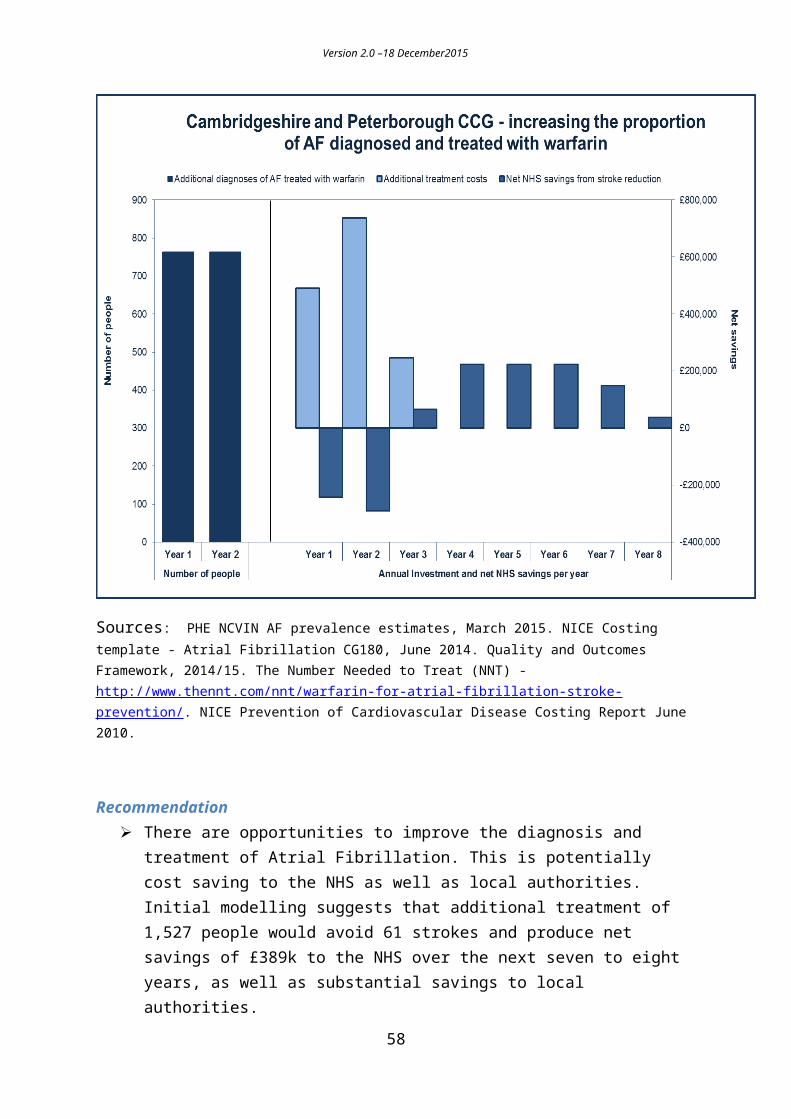
Version 2.0 –18 December2015
Pulmonary Rehabilitation Network estimates there is a total of 870 places throughout the CCG and that this is 56% of the local target of 1,557 places.
Self-Management for Long Term ConditionsThere are a range of assets available for supporting self-management in Cambridgeshire including, but not limited to:
Support groups for specific conditions in the county and regionally eg Breathe Easy and Diabetes groups. These groups operate in different ways and provide many different arrays of support.
A strong and active voluntary and community sector that provide social and practical support in multiple forms.
Provision of rehabilitation, including pulmonary rehabilitation and cardiac rehabilitation.
IAPT Long Term Conditions Team Since February 2014, Cambridgeshire and Peterborough NHS Foundation Trust (CPFT) ‘Increasing Access to Psychological Therapies’ (IAPT) service has included the IAPT Long Term (physical health) conditions team to offer specialist input. The IAPT LTC team includes three high intensity CBT therapists and three psychological wellbeing practitioners, working to address psychological needs in patients with LTCs.
Early service data shows in total, 690 IAPT patients had an LTC recorded against their case from April to October 2014. Of the 690 patients, 575 were seen by CPFT Adult IAPT and 197 were seen specifically by the specialist LTCs team in IAPT.
Where should the strategic focus be?The evidence suggests that there is a high level of common mental health disorders amongst those with long term conditions, and particularly those with multiple long term conditions.
The evidence to date, which is largely non-UK evidence, finds that psychological interventions can reduce healthcare costs by 20-30%. There is good evidence that rehabilitation programmes such as cardiac rehabilitation and pulmonary rehabilitation which include psychological and physical exercise components can be cost saving.
Where a common mental health disorder is identified treatment as usual, through psychological therapies, such as IAPT, and drug treatment should be maximised.
58
Version 2.0 –18 December2015
Recommendations A self-management programme should be offered to those diagnosed with COPD,
this should include psychological interventions and a clear pathway to IAPT. This should be evaluated for its economic impact on health costs.
Work should also ensure that pulmonary rehabilitation is maximised for COPD patients.
Routine management of LTCs should include the identification of those requiring further assessment for depression and anxiety early in the pathway. Physical and mental health pathways should be integrated to facilitate this.
There should be maximum utilisation of the IAPT LTC team, and there should continue to be a focus on rapidly increasing referrals. There should be a focus on those with multiple long term conditions.
There should be an economic evaluation of the impact on healthcare costs of identification and treatment for common mental health disorders in those with multiple long term conditions.
59

Version 2.0 –18 December2015
7. Workplace healthHeadlines
The potential mental health productivity savings, assuming no current action in this area, amount to nearly £5.7m across the large NHS employers in Cambridgeshire and Peterborough.
The evidence and modelling is clear that investing in workforce health will generate short term productivity savings to the NHS. These are estimated, with the package modelled here to be approximately £3.9m over three years, with an investment of £335k.
NHS employers should see considerable productivity savings from investing in workplace health. In particular this needs to focus on improve management and awareness of mental health and illness.
BackgroundWorkplace health is a significant public health issue. Every year more than a million working people in the UK experience a work-related illness. This leads to around 27m lost working days, costing the economy an estimate £13.4bn. Estimates from Public Health England put the cost to the NHS of staff absence due to poor health at £2.4bn a year – accounting for around £1 in every £40 of the total budget. This figure is before the cost of agency staff to fill in gaps, as well as the cost of treatment, is taken into account.
There are a number of large NHS employers in Cambridgeshire and Peterborough:
Cambridge University Hospitals NHS Foundation Trust Peterborough and Stamford Hospitals Trust Cambridgeshire and Peterborough NHS Foundation Trust Cambridgeshire Community Services NHS Trust Papworth Hospital Hinchingbrooke Health Care NHS Trust
As of June 2015, in total these organisations employed 22,738 people.32
There is a high level of evidence that workplace initiatives can improve people’s health and wellbeing, and deliver cost savings. NICE has developed and issued a series of guidance documents on workplace health and in September 2015, Simon Stevens, Chief Executive of NHS England announced the launch of a programme to improve the health of the NHS workforce.
32 Health and Social Care Information Centre - http://www.hscic.gov.uk/
60
“Health-promoting workplaces are obviously good for millions of employees and ultimately for taxpayers too, so the time is right for all employers – including the NHS – to raise our game.”
Simon Stevens, Chief Executive of NHS England
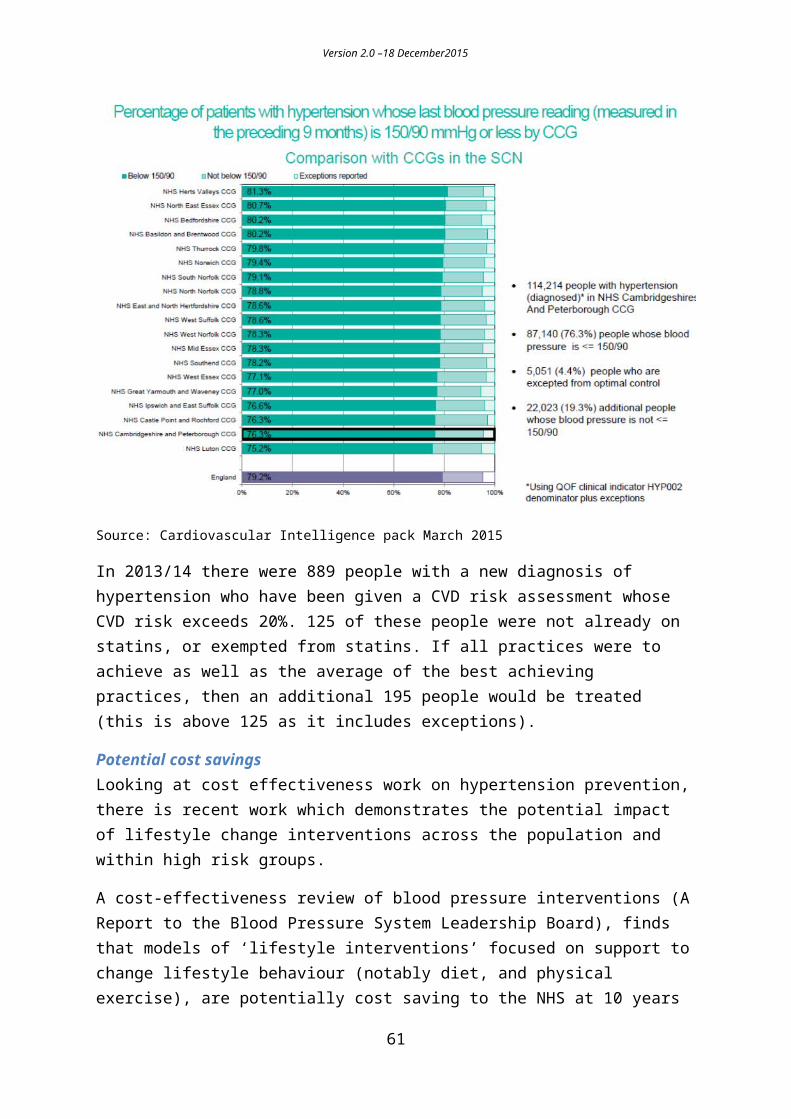
Version 2.0 –18 December2015
Current positionThe table below shows the number of people employed in each of the main NHS employers in Cambridgeshire and Peterborough, as of June 2015.
Table 13 – Headcount of NHS employees by NHS organisation, as of June 2015
NHS employer Abbreviation Headcount as of June
2015Cambridge University Hospitals NHS Foundation Trust CUHFT 9,509Peterborough and Stamford Hospitals Trust PSHFT 4,021Cambridgeshire and Peterborough NHS Foundation Trust CPFT 3,665Cambridgeshire Community Services NHS Trust CCS 1,955Papworth Hospital Papworth 1,899Hinchingbrooke Health Care NHS Trust Hinchinbrooke 1,689
TOTAL - 22,738Source: Health and Social Care Information Centre
Table 14 shows the average absence rate by organisation, as well as the estimated prevalence rates for smoking, excess weight, obesity, physical inactivity, alcohol, not eating five a day and mental illness.
Table 14: average absence rate by organisation, with estimated prevalence
Trust Headcount Absence %Average 12
months (Jun14 - May 15)
Smoking Excess weight
Obese Inactive Higher risk drinking
Estimated not eating 5
a day (CCG level)
Mental Illness
CUHFT 9,509 3.0% 1,284 6,181 2,054 2,339 2,273 6,514 1,540CPFT 3,665 4.5% 556 2,386 813 957 851 2,511 594Hinchingbrooke 1,689 3.8% 256 1,100 375 441 392 1,157 274PSHFT 4,021 3.9% 836 2,634 969 1,255 844 2,754 651CCS 1,955 4.7% 297 1,273 434 511 454 1,339 317Papworth 1,899 3.6% 288 1,237 421 496 441 1,301 308Total 22,738 3,518 14,810 5,065 5,999 5,256 15,576 3,684
Estimated number
Interventions and cost savings to NHS
Mental health interventionsThere is strong evidence that mental health interventions in the workplace can improve people’s wellbeing and there is potential to deliver cost savings.
61

Version 2.0 –18 December2015
The NICE business case tool for promoting mental wellbeing at work estimated that mental ill health costs UK employers almost £1m per year. For an organisation with 1000 employees, the annual cost of mental ill health was estimated to be more than £835,000. Identifying problems early – or preventing them in the first place, could result in cost savings, largely as a result of reduced absenteeism, of 30%. This is equivalent to cost savings of more than £250,000 per year.
Knapp (2011)33 looked at a workplace-based enhanced depression care intervention consisting of the completion by employees of a screening questionnaire, followed by care management for those found to be suffering from, or at risk of developing depression and/or anxiety disorders. Using a model based on a white collar organisation of 500 employees, this found that in year two there is a cost saving of £63,578. This figure incorporates health and social care costs, absenteeism and presenteeism, and productivity losses.
Weight management and physical activityIn 2010, 26% of adults in England were obese. On average, obese people take four extra sick days per year.34 In an organisation of 1,000 employees who work the national average week of 39.1 hours35 and are paid the national average hourly wage of £15.52,36 this equates to more than £126,000 a year in lost productivity.
Physical activity counselling and activity programmes are modelled in two ways: disease-specific cost effective evidence, and cost savings are based on the absenteeism model. York Health Economics has identified a study that modelled a 20% to 25% level of improvement in physical activity as cost saving for the employer at 1 year (absenteeism only).37
SmokingNICE advice suggests reducing levels of smoking among workers will help reduce cardiorespiratory diseases, which is one of the largest causes of sickness absence. Some evidence suggests that, on average, a person who smokes will have 33 more hours off sick per year than a non-smoker.38 For an organisation of 1,000 people, in which 25% smoke and are paid the national average hourly wage of £15.52, this absence equates to a loss of more than £128,000 a year.
There is a high quality, high ranking evidence that stop smoking services are cost effective, good value for money and have a good return on investment.
33 Knapp, 2011: Mental health promotion and mental illness prevention: The economic case. https://www.gov.uk/government/uploads/system/uploads/attachment_data/file/215626/dh_126386.pdf34 Obesity and sickness absence: results from the CHAP study.35 2011 annual survey of hours and earnings.36 NICE business case tool for workplace interventions to promote smoking cessation.37 An Economic Analysis of Workplace Interventions that Promote Physical Activity, 2008 - https://www.nice.org.uk/guidance/ph13/evidence/economic-modelling-report-36993927738 NICE business case tool for workplace interventions to promote smoking cessation.
62

Version 2.0 –18 December2015
Figure 13 below, produced by the Work Foundation in 2014, illustrates the outputs and outcomes of broad interventions such as lifestyle change and line manager awareness of mental health.
Figure 13 – Change diagram illustrating outputs and outcomes of interventions to improve line manager awareness and lifestyle change programmes
63
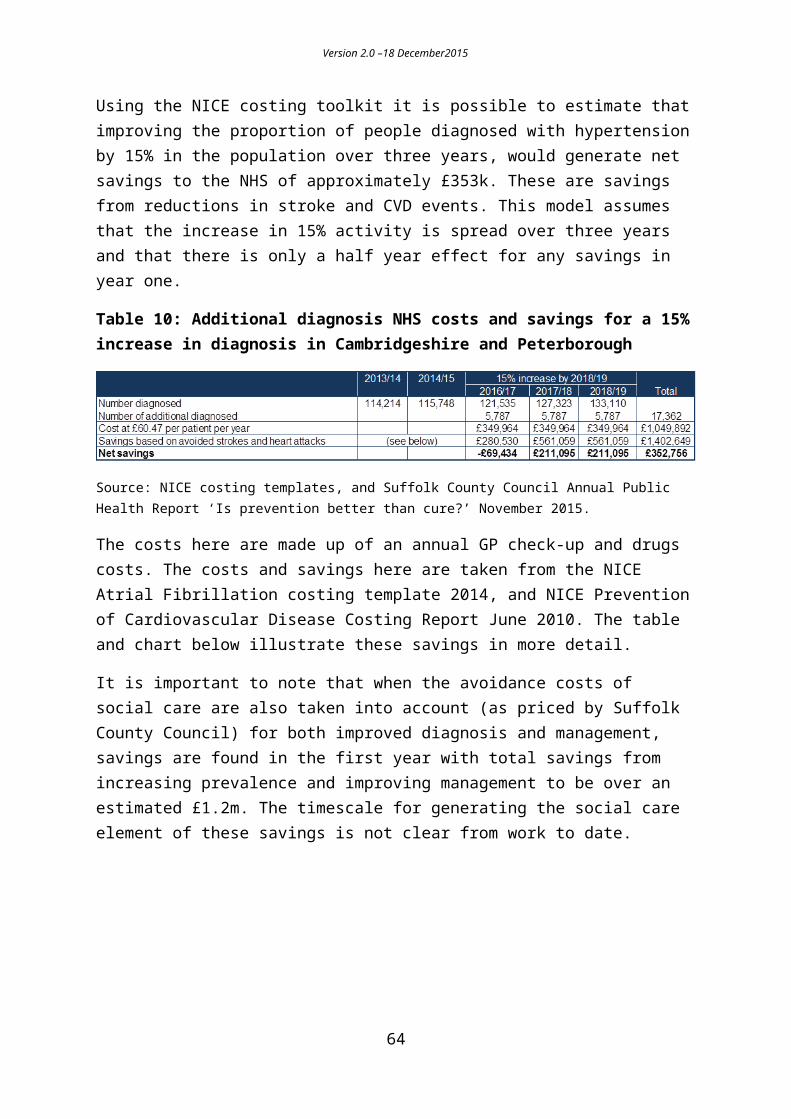
Version 2.0 –18 December2015
Current public health spend and activityIn Cambridgeshire, annual public health spend on general workplace health in the population is £45,000.
Peterborough carried over a small reserve, £90,000 of which is committed in principle for a workplace health programme over the next two years.
Interventions and cost savings to the NHSInformation in this section sets out the costs and potential savings for potential interventions in the workplace. It should be noted, however, that the savings figures presented in this section are based on the assumption that organisations do not currently deliver preventative interventions. This may not be the case, as it is possible organisations already invest in similar initiatives via occupational health departments. The information presented below also does not take into account the potential impact of increasing stress levels in the workplace. It is also important to note that the Mental ill health potential savings are calculated using the NICE ROI tool which is based on similar, but not identical set of interventions. As a result of all the above caveats - all the figures below are provisional, and require local interpretation.
64
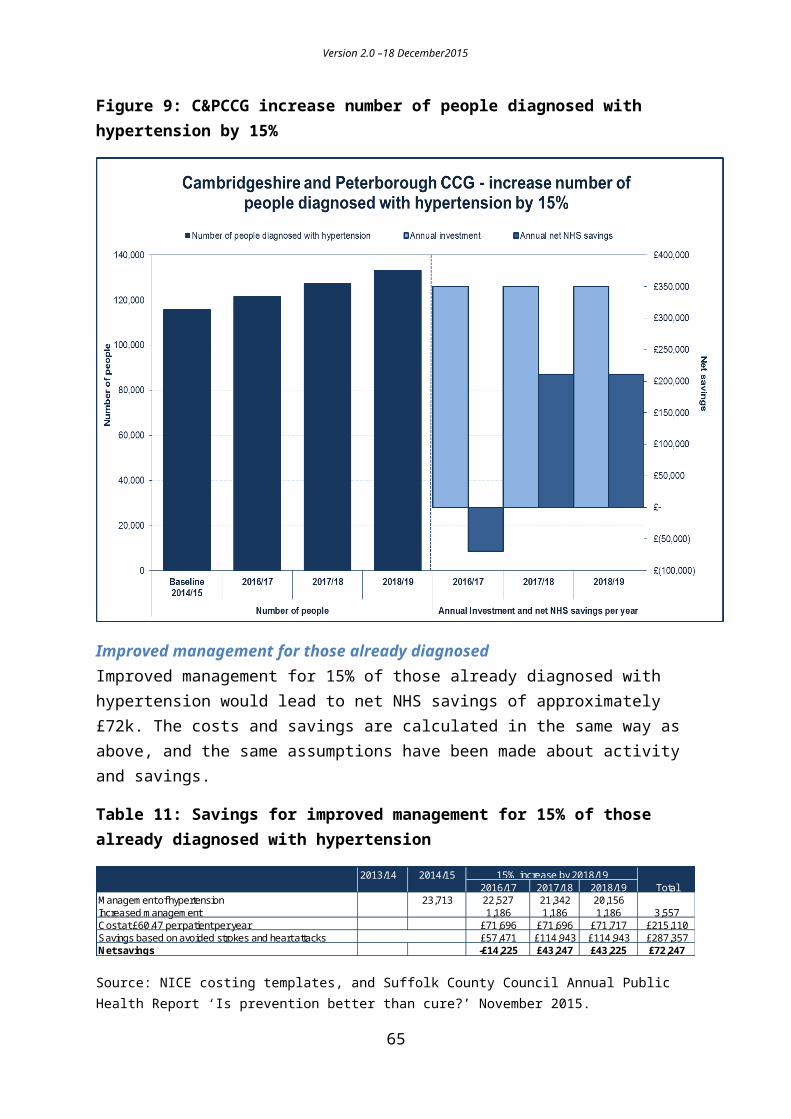
Version 2.0 –18 December2015
Table 15 shows the estimated productivity loss for mental ill health, obesity and smoking to each of the main local NHS employers and, the potential savings related to mental health. It is only possible to calculate these robustly for mental health. Broad potential savings are given for smoking and obesity above. The potential mental health productivity savings, assuming no current action in this area, amount to nearly £5.7m across the large NHS employers in Cambridgeshire and Peterborough.
Table 15: estimated productivity loss for mental ill health, obesity and smoking
Productivity costs Potential savingsMental Ill Health Obesity Smoking Mental Ill Health
CUHFT £7,940,015 £995,373 £657,262 £2,382,005CPFT £3,060,275 £383,641 £253,325 £918,083Hinchingbrooke £1,410,315 £176,799 £116,744 £423,095PSHFT £3,357,535 £420,906 £277,932 £1,007,261CCS £1,632,425 £204,643 £135,130 £489,728
Papworth £1,585,665 £198,781 £131,259 £475,700Total £18,986,230 £2,380,144 £1,571,651 £5,695,869
Costs / Loss of productivity
Mental healthBased on our local experience, and the evidence base, we have put together a suggested mental health intervention package. The package would include:
Mental Health First Aid Lite Training (a cost of £450 per 25 people). This is an evidence based package that raises awareness of mental health and illness.
Health Champions (training costs £1,000 per day for 20 people). A Health Champion is a volunteer who acts as a point of contact and health promoter within the organisation. They are trained to have a basic understanding of the principles of health and wellbeing and how best to promote them with their colleagues. There would also be a health champions’ peer support network.
ACAS training for managers . This is to enable managers to support people with a long term condition (including mental health) to make a successful return to work and manage their condition within their working lives. Training costs £1,000 per day for 12 people and the figures below are based on 25 people being trained for every 500 employees.
Physical activityThe package also includes physical activity interventions. Physical activity has been shown to improve productivity and the savings from a programme to increase physical activity by 10% in the inactive are estimated below. This assumes there are no current interventions in place to address this inactive proportion.
65

Version 2.0 –18 December2015
The return on investment (ROI) tool classes a brief intervention as ‘verbal advice, discussion, negotiation or encouragement with or without written or other support or follow up. It could be opportunistic and can take between 1-20 minutes’.
Table 16: Estimated savings from a programme to increase physical activity by 10% in the inactive
Trust Number of targetted people Cost (@ £9.92 per
person)
2 year 5 year 10 year 2 year 5 year 10 year
CUHFT 234 £2,321 £31,496 £76,693 £137,002 £29,175 £74,372 £134,681CPFT 96 £950 £12,140 £28,789 £52,804 £11,190 £27,839 £51,854Hinchingbrooke 44 £438 £5,595 £13,267 £24,335 £5,157 £12,829 £23,897PSHFT 125 £1,245 £13,319 £31,585 £57,933 £12,074 £30,340 £56,688CCS 51 £507 £6,476 £15,357 £28,167 £5,969 £14,850 £27,660Papworth 50 £492 £6,290 £14,917 £27,360 £5,798 £14,424 £26,868Total 600 £5,951 £75,314 £178,608 £327,599 £69,363 £172,657 £321,648
Productivity savings Net productivity savings
Weight managementThe table below estimates the number of obese people in each organisation. It makes a number of assumptions about the proportion who might wish to attend weight management services. The costs here reflect a combination of group weight management as well as one-to-one health trainer costs.
Table 17: Estimated number of obese people in each organisation
Trust Estimated number of obese people
Estimated cost of weight
management Tier 1-2 service
CUHFT 2054 £41,079CPFT 813 £16,254Hinchingbrooke 375 £7,491PSHFT 969 £19,381CCS 434 £8,670Papworth 421 £8,422Total 5065 £101,298
The table below provides a summary of the costs and savings to the NHS of implementing a workforce health programme.
There are a number of key assumptions behind this table:
That there is no current activity in these areas.
66

Version 2.0 –18 December2015
That savings are spread over three years with 20% of savings in year one, and remaining savings split between years two and three.
That physical activity is increased by 10% in the inactive.
67

Version 2.0 –18 December2015
Table 18: summary costs/savings of workforce health programme
68
NHS Trust Training 2016/17 2017/18 2018/19 Total 2016/17 2017/18 2018/19 TotalMental Health First Aid Lite £11,411 £11,411 £11,411 £34,232Health champions £7,924 £7,924 £7,924 £23,773ACAS £13,207 £13,207 £13,207 £39,621Weight management £13,693 £13,693 £13,693 £41,079Total cost £46,235 £46,235 £46,235 £138,705Mental Health First Aid Lite £4,398 £4,398 £4,398 £13,194Health champions £3,054 £3,054 £3,054 £9,163ACAS £5,090 £5,090 £5,090 £15,271Weight management £5,418 £5,418 £5,418 £16,254Total cost £17,961 £17,961 £17,961 £53,882Mental Health First Aid Lite £2,027 £2,027 £2,027 £6,080Health champions £1,408 £1,408 £1,408 £4,223ACAS £2,346 £2,346 £2,346 £7,038Weight management £2,497 £2,497 £2,497 £7,491Total cost £8,277 £8,277 £8,277 £24,831Mental Health First Aid Lite £4,825 £4,825 £4,825 £14,476Health champions £3,351 £3,351 £3,351 £10,053ACAS £5,585 £5,585 £5,585 £16,754Weight management £6,460 £6,460 £6,460 £19,381Total cost £20,221 £20,221 £20,221 £60,663Mental Health First Aid Lite £2,346 £2,346 £2,346 £7,038Health champions £1,629 £1,629 £1,629 £4,888ACAS £2,715 £2,715 £2,715 £8,146Weight management £2,890 £2,890 £2,890 £8,670Total cost £9,581 £9,581 £9,581 £28,742Mental Health First Aid Lite £2,279 £2,279 £2,279 £6,836Health champions £1,583 £1,583 £1,583 £4,748ACAS £2,638 £2,638 £2,638 £7,913Weight management £2,807 £2,807 £2,807 £8,422Total cost £9,306 £9,306 £9,306 £27,918Mental Health First Aid Lite £27,286 £27,286 £27,286 £81,857Health champions £18,948 £18,948 £18,948 £56,845ACAS £31,581 £31,581 £31,581 £94,742Weight management £33,766 £33,766 £33,766 £101,298Total cost £111,580 £111,580 £111,580 £334,741
Net NHS savings based on Mental Health savings and productivity savings from
increased physical activityInvestment
Cambridge United Foundation Trust
Cambridgeshire and Peterborough Foundation Trust
Hinchingbrooke
£762,354 £1,640,192
£311,622 £667,609
£143,610 £307,665
Cambridgeshire Community Services
Papworth
Total
£115,483 £762,354
£44,364 £311,622
Peterborough and Stamford Foundation Trust
£20,445 £143,610
£48,137 £341,790 £341,790 £731,718
£163,500 £1,887,070 £1,887,070 £3,937,640
£23,665 £166,227 £166,227 £356,119
£22,987 £161,465 £161,465 £345,918

Version 2.0 –18 December2015
Work already plannedThe Cambridgeshire and Peterborough Public Health Reference Group has already identified workplace interventions as a priority area, with a number of projects and programmes outlined in the group’s action plan for the next six months, which is currently being refined.
The plan includes the offer of a package of interventions as part of a Workplace Programme for Local Authorities over two years. It will include policy development, leadership and capacity development, direct provision, and network facilitation. Although the programme will promote diet and physical activity it will also offer obesity, mental health, smoking and alcohol related initiatives as part of an holistic workplace programme. It will also include the development of individual workplace champions and a peer support network. This is also the type of model which has been used to estimate costs here.
The package of interventions suggested by the Public Health Reference Group is broadly in line with those outlined in the NHS England workplace programme.
Where should the strategic focus be?The evidence and modelling is clear that investing in workforce health will generate short term productivity savings to the NHS. These are estimated, with the package modelled here to be approximately £3.9m over three years.
Recommendations NHS employers should see considerable productivity savings from investing in
workplace health. In particular this needs to focus on improved management and awareness of mental health and illness.
69

Version 2.0 –18 December2015
8. SmokingHeadlines
There are an estimated 105,548 people across Cambridgeshire and Peterborough who smoke. There is a high quality, high ranking evidence that stop smoking services are cost effective, are good value for money and provide a good return on investment.
Sub-national programme work, such as tobacco control, is critical to ensuring savings to the NHS. Nationally and locally we should continue to invest in this.
We should maximise our prevention opportunities and increase the number of people setting a quit date through stop smoking services (adults, older people and pregnant women) in Cambridgeshire by 5%, and in Peterborough to the Cambridgeshire average.
An additional investment of £346k, only £175k of which is new investment, is needed to generate a saving over £356k over the next two years.
There are additional savings to the NHS to be made from stopping people smoking before operations, and this group should be a target population.
BackgroundSmoking is still one of the most important causes of preventable ill health and early death in the UK. A recent study found that in the UK out of 40% of the potentially preventable NHS workload, 10% was attributable to smoking. This was the highest contributing factor along with sub-optimal diet.39 Additionally we know that high numbers of hospital admissions are caused by smoking related conditions.
Local contextIn Cambridgeshire, around 16% of adults are estimated to smoke. Although this is below the national average of 18%, it represents around 79,000 smokers across the county. There are approximately 27,000 smokers in Peterborough.
The prevalence of smoking in Cambridgeshire has fallen, as it has nationally. Rates are consistently higher though in Fenland, compared to the other districts, and up until 2012 were increasing, although more recent data suggests a fall in 2013 and 2014.
Smoking is more common among people working in routine or manual professions. 27% of these workers are estimated to smoke in the county, similar to the national average of 29%.
39 PHE Lancet Changes in health in England, with analysis by English regions and areas of deprivation, 1990–2013: a systematic analysis for the Global Burden of Disease Study 2013. September 15, 2015http://dx.doi.org/10.1016/S0140-6736(15)00195-6
70

Version 2.0 –18 December2015
Data suggests smoking rates have been higher in this group in Fenland and East Cambridgeshire. In Peterborough, 35% of routine and manual workers smoke.
Data from GP practices across the county also show us that smoking prevalence is strongly linked to levels of deprivation. Practices serving more deprived areas, regardless of district, tend to have higher rates of smoking. There is also a strong relationship between smoking and people living with mental health problems. People with mental health conditions are twice as likely to be smokers.
Smoking is a major risk factor for many diseases, such as lung cancer and many other cancers, chronic obstructive pulmonary disease and heart disease. Over 200 people in Peterborough die due to smoking every year, including 45 people from lung cancer.
Current position
What is the scale of the problem?The data in Table 19 shows the estimated prevalence of smoking amongst adults (aged 18 years and above) in Cambridgeshire and Peterborough between 2010 and 2014, compared to the average for England.
The red, amber and green status indicates whether local prevalence is statistically significantly higher, similar or lower than the average for England.
Table 19 – Estimated smoking prevalence in Cambridgeshire and Peterborough
ENGLANDEstimated prevalence
Estimated prevalence
95% CIEstimated prevalence
95% CI
2010 20.8 19.0 17.4 to 20.6 25.2 23.0 to 27.42011 20.2 19.2 17.3 to 21.0 24.3 22.0 to 26.72012 19.5 17.9 15.8 to 19.9 21.1 18.7 to 23.42013 18.4 13.5 11.7 to 15.3 20.8 18.6 to 23.12014 18.0 15.5 13.5 to 17.4 18.6 16.4 to 20.8
YearCAMBRIDGESHIRE PETERBOROUGH
Source: Public Health England Public Health Outcomes Framework (using data from the Integrated Household Survey)
Statistical significance compared with the England average:
LowerSimilarHigher
CI = confidence interval: a range of values so defined that there is a specified probability that the value of a parameter lies within it.
71

Version 2.0 –18 December2015
For 2014, these prevalence rates equate to the following estimated numbers of smokers of:
Cambridgeshire - 78,791 Peterborough - 26,757
There is high smoking in pregnancy rates in Peterborough. In 2014, the most recent data showed that 18% of mothers were smokers at the time of delivery in Peterborough compared to 13% in Cambridgeshire and in England as a whole.40
A local survey undertaken by over 8,500 Year 8 and Year 10 pupils in Cambridgeshire every two years found that in 2014, 1% of Year 8 and 7% of Year 10 pupils reported that they smoked regularly, with around half wishing to give up. Prevalence is higher in girls than boys, in children in care and in children in single parent families. One out of ten young people in Peterborough are regular smokers by the age of 15, and two out of three smokers began smoking before they were 18.
The proportion of Year 10 children in Cambridgeshire who reported never having smoked, however, has increased from 54% in 2008 to 65% in 2014 and positive trends are seen across the districts.
Future smoking prevalence It is difficult to predict the future behaviour of smokers given new innovations such as e-cigarettes and their unknown effect on smoking behaviours. The current trend nationally is a reduction in smoking prevalence; however the pace of this reduction is likely to slow as the smoking population contracts to include mostly determined smokers. GP practices and community pharmacies report continued difficulty with recruiting smokers to make quit attempts.
We have seen a fall, which is reflected nationally, in the number of people setting a four week quit date, and the number of four week quitters. There were 1,805 less four week quitters in 2014/15 compared to 2012/13 across Cambridgeshire and Peterborough. The number setting a quit date in 2014/15 is projected to be lower than the previous two years. This is particularly the case in Peterborough, where the number setting a quit date is projected to be 850 by the end of 2015/16 compared to 1,213 in 2014/15. This is in part due to a reduction in specialist stop smoking provision, as well as the impact of e-cigarettes.
Current public health spendIn Cambridgeshire, annual public health spend on smoking and tobacco control is £1,167,000. In Peterborough, spend per head on smoking and tobacco control is £1.84 per head, compared with a national average of £3.36 and an average for Peterborough’s deprivation decile of £3.38. Despite this the number of people who set a quit date and go on to quit in Peterborough is above the Cambridgeshire rate.
40 Public Health Outcomes Framework, available at http://www.phoutcomes.info. Accessed 10/04/15
72

Version 2.0 –18 December2015
Interventions and cost savings to the NHSThere is a high quality, high ranking evidence that stop smoking services are cost effective, and provide a good return on investment. As well as savings to the NHS, there are also wider savings to social care through reduced disability resulting in lower social care need in later life. These are outlined in multiple NICE guidance documents.
We have used the NICE smoking return on investment tool to estimate the savings to the NHS from the current programme, and to estimate what an increase in activity would generate in savings. Population level work (sub-national work on tobacco control) is the most cost effective of all interventions and this is also reflected in the modelling below.
CambridgeshireFor Cambridgeshire we have modelled the impact of increasing local stop smoking service uptake up 5% from 2014/15, as well as continuing to invest in the sub-national programme which focuses on tobacco control and other prevention initiatives.
The figure and table below show that an investment of £157k a year generates a net saving (above this cost) of £161k. It is important to note that £136k of this investment is already invested, and remains part of the local authority budget, and therefore the actual new investment needed is approximately £22k. The mix of sub-national programme work as well as specialist stop smoking work is critical to generate savings for the NHS. The impact of specialist stop smoking work is not estimated by the tool to generate savings until year five, but the investment in the sub-national programme generates the early savings. It is, therefore, critical that local authority investment levels in sub-national work remain at this level to generate NHS savings. We have only modelled two year savings as there is a fast changing smoking pattern and the tool allows for a calculation of two years of isolated NHS savings.
To increase smoking uptake we plan to focus on groups within the population with higher prevalence levels, such as those with serious mental illness and also those people about to have an operation. There is high quality, high ranking evidence that stopping smoking prior to an operation can reduce the risks associated with surgery. There is also evidence that short term costs, such as length of stay can be reduced.
Some studies have found that stopping smoking before an operation can reduce operative and post-operative hospital costs. Extrapolating one such study on hip and knee replacement surgery we found a short-term cost-benefit per patient can be estimated as £65 per patient undergoing intervention (not per patient quitting) in Cambridgeshire and Peterborough. This would be in addition to any savings estimate through the NICE ROI tool modelling below.
There is also evidence from the trials of pre-operative smoking cessation interventions, two, four that the quit rate at 12 months follow up was 30% versus 10% in the intervention and
73
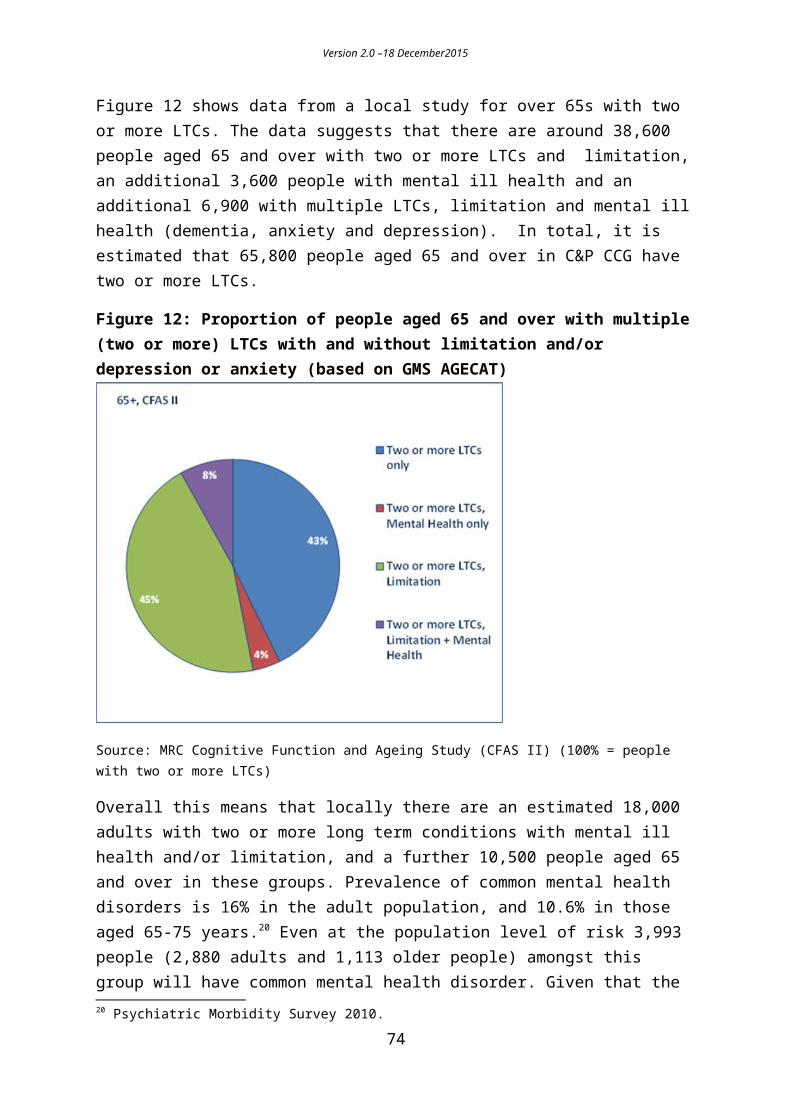
Version 2.0 –18 December2015
control groups respectively, showing that some difference in long-term quit rates is likely to be maintained.
Using the rewards intervention for pregnant women, which gave quit rates of 9% versus 3% for intervention versus control at one year, as a conservative proxy for pre-operative quits, the cost-benefit to women (excluding child cost-benefit and excluding the cost of the intervention) was £144 per patient undergoing the intervention. A conservative estimate of the total cost benefit of pre-operative smoking cessation intervention is £209 per patient undergoing the intervention.
Figure 14: Expected impact of increasing local stop smoking service uptake in Cambridgeshire by 5% and investing £136,000 in the sub-national programme
Table 20: Quit date information for Cambridgeshire
Baseline 2014/15
2015/16 Forecast outturn
2016/17 2017/18
Number of people who set a quit date 4,777 4,000 4,900 5,022Annual investment £157,904 £157,904(Annual new investment) £21,904 £21,904Annual net NHS savings £161,250 £161,250
Smoking rates are much higher in Peterborough than in Cambridgeshire and so the model proposed here is to increase the number of people setting a quit date in Peterborough to
74

Version 2.0 –18 December2015
the same as the Cambridgeshire average. The table and figure below show how new investment of £65,589 a year, will lead to a saving of £16,307.
PeterboroughFigure 15: Expected impact of increasing local stop smoking service uptake the current Cambridgeshire levels and investing £35,000 in the sub-national programme
Table 21: Quit date information for Peterborough
Baseline 2014/15
2015/16 Forecast outturn
2016/17 2017/18
Number of people who set a quit date 1,213 850 1,648 2,082Annual investment £100,589 £100,589(Annual new investment) £65,589 £65,589Annual net NHS savings £16,307 £16,307
It is important to note that our projections suggest that the number of people setting a quit date in Cambridgeshire and Peterborough will fall considerably from 2014/15, which is used as the baseline in these projections in terms of activity and investment. Given the scale of the projected fall in numbers in Peterborough the increase needed to reach the Cambridgeshire average requires the service to more than double its activity. The overall drop in activity, and associated investment, in 2015/16 is a risk to achieving targets for 2016/17 and 2017/18.
75

Version 2.0 –18 December2015
Work already plannedThere is an ongoing programme to improve performance that includes targeting routine and manual workers and the Fenland area. CamQuit, the core Stop Smoking service in Cambridgeshire, is providing increasingly higher levels of support to the other providers along with promotional activities. Practices and community pharmacies are regularly visited with poor performers being targeted. During 2014/15 social marketing research was undertaken which is informing activities to promote Stop Smoking Services. Other activities introduced recently include a mobile workplace service, a migrant worker Health Trainer post that will target these communities where smoking rates are high, a wide ranging promotional campaign and the recruitment of an additional Stop Smoking Advisor to focus upon Fenland.
Going forward, Cambridgeshire and Peterborough will be working with neighbouring local authorities on tobacco related campaigns and engagement work, including a focus on illicit tobacco sales.
Where should the strategic focus be?There are an estimated 105,548 people across Cambridgeshire and Peterborough who smoke. There is a high quality, high ranking evidence that stop smoking services are cost effective, are good value for money and provide a good return on investment.
Recommendations Sub-national programme work, such as tobacco control, is critical to ensuring savings
to the NHS. Nationally and locally we should continue to invest in this. There are additional savings to the NHS to be made from stopping people smoking
before operations, and this along with sub-groups in the population with high prevalence levels should be a focus for the additional numbers setting a quit date.
An additional investment of £346k, only £175k of which is new investment, is needed to generate a saving over £356k over the next two years.
76

Version 2.0 –18 December2015
9. AlcoholHeadlines
Maximise opportunities to provide brief advice on alcohol to more GP practice patients, at new registrations and/or next appointment. If 10,000 more patients were to receive this advice, it is estimated this would save the NHS £217k (above the cost of the intervention) over seven years with the vast majority of the savings in years two to five.
Monitor the GP provision of brief advice on alcohol, now provided through the core GP contract, and provide training as necessary.
Focus a larger proportion of training for information and brief advice in A&E. Agree a training model and associated costs for information and brief advice in
primary care and A&E, and expand the provision of this advice in A&E.
The consumption of alcohol contributes to a range of health conditions and admissions to hospital. Alcohol-related conditions include liver disease, hypertension, oesophageal and other cancers and mental and behavioural disorders. Drinking alcohol is also linked to hospital admissions due to accidents and injuries and toxic effects of consumption, and causes considerable costs to the NHS.
It is estimated that 6.6m adults in England currently consume alcohol at hazardous levels and 2.3m at harmful levels. The total costs of alcohol misuse in England are estimated to be around £23.1bn of which £0.3m is NHS costs. Overall average annual costs of a harmful drinker are around 3.4 times that of a hazardous drinker.
Current position
Cambridgeshire contextIn 2012/13, alcohol-related hospital admissions for men were lower than the national average across Cambridgeshire but highest in Cambridge and Fenland. In 2012/13, alcohol-related hospital admissions for women were higher than the England average in Cambridge and Huntingdonshire.
In Cambridgeshire it is estimated that there are 114,000 hazardous drinkers and 40,000 harmful drinkers.
Peterborough contextOne in five people in Peterborough (23,000 people) drink above the recommended levels. 7,500 people in Peterborough drink heavily at levels which have, or risk, damaging their health.
77

Version 2.0 –18 December2015
There were 1,171 alcohol-related hospital admissions in Peterborough in 2012-13, which is the highest in the East of England. The cost to the local NHS system is £1.8m a year or £244 per person for the 7,500 people in Peterborough who drink heavily.
Interventions and cost savings to NHS
Current public health spend and activityIn Cambridgeshire, annual Public Health spend on drug and alcohol services is £5,964,000. This is broken down for specific spend on alcohol as:
Adult alcohol treatment - £961,000 Young people’s drug and alcohol service - £315,000 Inpatient beds, recovery hub, service users’ network, controlled drinkers project
Alcohol screening takes place through NHS Health Checks, and for all new adult patients of GP practices through a national DES.
The Cambridgeshire Drug and Alcohol Action Team (DAAT) records show that during 2014/15, 106 individuals were trained in identification and brief advice during the year. This comprised of 12 health and 94 non-health staff. In addition, there was a large scale health session in September 2014 (contributed to, but not organised by, the DAAT) at Hinchingbrooke Hospital which was attended by approximately 70 health staff. Two smaller sessions during the year were held with GP practices. The DAAT has been active in delivering identification and brief advice training in 2015/16. In October 2015, 35 staff from CPFT were trained in a single session. Further training dates are planned for 2016 and will be promoted widely, including to primary care.
In Peterborough, combined spend on substance misuse (drug, alcohol and young people) is £16.73 per head, compared with a national average of £17.36 and a deprivation decile average of £21.25.
Peterborough commission Drink Sense as an alcohol interventions service, which inevitably includes brief and extended interventions. In 2014/15 190 people were referred for Brief Advice and a further 152 received Brief interventions.
The Hospital Alcohol Liaison Project (HALP) also commissioned through CCG, set a target for 480 Brief Advice interventions at Peterborough City Hospital, and in fact 2014/15 made 746 interventions. This service then follows up relevant patients with further brief interventions.
DrinkSense adult service is commissioned primarily to deliver alcohol treatment interventions, of which Brief Advice and Brief Interventions form only a part. Activity in Q1 shows 160 people receiving brief interventions.
78
Version 2.0 –18 December2015
Work already plannedHALP target for Brief Advice increased to 720, with Brief Interventions increased to 1,200.
Work is currently underway on a Drugs and Alcohol JSNA in Cambridgeshire. This detailed analysis is due to be completed in July 2015.
Cost saving prevention initiatives – possible areas of focusThere are a number of national initiatives such as minimum unit pricing that have been shown to be potentially cost saving to a range of organisations, and would reduce alcohol consumption. A recent NICE evidence update (PH24) on Alcohol-use disorders highlighted evidence that affordability, minimum pricing, taxation and location of outlets can all influence drinking levels.
Minimum Unit Pricing has been recommended in Scotland as a way of increasing the price of drinks such as own-brand spirits and white cider, which have high alcohol content but are usually very cheap. Minimum unit pricing would set a floor price for a unit of alcohol, meaning it cannot be sold for lower than that. The more alcohol a drink contains, the stronger it is and therefore the more expensive it would be.
The Alcohol (Minimum Pricing) (Scotland) Act 2012 was passed in June 2012. It has not yet been implemented due to a legal challenge led by the Scotch Whisky Association.
Scotland’s Chief Medical Officer concluded that - like the smoking ban - minimum unit pricing would save lives within a year. Research by the University of Sheffield estimated that the proposed minimum price of 50p per unit would result in the following benefits:
Alcohol related deaths would fall by about 60 in the first year and 318 by year ten of the policy.
A fall in hospital admission of 1,600 in year one, and 6,500 per year by year ten of the policy.
A fall in crime volumes by around 3,500 offences per year. A financial saving from harm reduction (health, employment, crime etc) of £942m
over ten years.
In terms of local initiatives we have focused here on the cost effectiveness of screening and brief advice for alcohol.
The costs and benefits of GPs using the Alcohol use disorders identification test (AUDIT) have been modelled using a representative sample of 1,000 adults attending their next GP consultation, followed by five minutes of advice for those identified as hazardous or harmful drinkers (£17.41 cost per person screened). The model assumes that 20% of relevant individuals are missed in the screening, and the effectiveness of the intervention is assumed to decline to zero in seven years.
79

Version 2.0 –18 December2015
Table 22: Costs/pay off per head for screening and brief advice based on a representative sample of 1000 adults attending their next GP consultation (2009/10 prices)
Source: Mental health promotion and prevention: the economic case. 2011. Knapp & Parsonage.
Taking these figures, if 10,000 more people in Cambridgeshire and Peterborough were screened and received brief advice, it is estimated that there would be net savings at over seven years of £216,600 with the vast majority of these in years two to five. The overall cost of the programme would be £174k and the total return £390,700.
The existing activity and capacity within the health system to take on this additional work (roughly two additional patients per week for 50 weeks of the year per practice), would need to be considered in any model. This model also assumes this activity is undertaken by GPs, not practice nurses, and it is also not clear if the costs include any initial training costs.
More recent modelling work41 continues to find that screening and brief interventions at registration are potentially cost saving to the NHS and social services, with the majority of savings in the NHS.
Alcohol brief advice became a part of the core GP contract from 2015/16. It will be important to monitor these changes to ensure levels of brief advice are maintained or improved.
Further work is underway to calculate the potential savings from improving brief alcohol advice through A&E locally.
Where should the strategic focus be?There is good evidence that brief interventions for alcohol are cost saving to the NHS in the short term. The focus should be on maximising opportunities to ensure this screening takes place with as large a proportion of the population as possible, particularly in GP practices and A&E.
41 Modelling the Cost-Effectiveness of Alcohol Screening and Brief Interventions in Primary Care in England. Purshouse, R et al (2012) Alcohol and Alcoholism Vol.48, no 2 pp 180-188.
80

Version 2.0 –18 December2015
Recommendation Maximise opportunities to provide brief advice on alcohol to more GP practice
patients, at new registrations and/or next appointment. If 10,000 more patients were to receive this advice, it is estimated this would save the NHS £217k (above the cost of the intervention) over seven years with the vast majority of the savings in years two to five.
Monitor the GP provision of brief advice on alcohol, now provided through the core GP contract, and provide training as necessary.
Focus a larger proportion of training for information and brief advice in A&E. Agree a training model and associated costs for information and brief advice in
primary care and A&E, and expand the provision of this advice in A&E.
81

Version 2.0 –18 December2015
10. FallsHeadlines
Injurious falls in older people have a high cost impact for health and social care services locally, estimated at £83m for 2016, with increasing costs forecast for the ageing population.
There is important and robust evidence indicating net savings for falls interventions targeted at both community dwelling older adults and older adults in residential or nursing care across a range of UK and international settings.
In particular three areas of intervention for preventing falls in community-living older people have been trialled and indicated cost savings: home-based exercise (the Otago Exercise Programme) in over 80-year-olds, home safety assessment and modification in those with a previous fall, and specific multi-factorial programmes.
Potential savings may require delivery of preventative approaches at a much wider scale than current provision.
This proposal advocates a strategic focus on older people aged 75 years and over; the role of multifactorial assessments and specifically participation in group–based strength and balance (Otago Exercise) classes in the community (which are comparatively as effective as home-based models).
The role of allied health professionals and fundamental function of strong system coordination and integration is described for maximising the impact of the interventions in the target groups, and greatest return on investment.
An action-oriented systems perspective is needed to address the challenges inherent in preventing falls. Many sectors have a role to play, all need to be engaged in this process.
BackgroundA fall is defined as an unplanned descent to the floor with or without injury to the patient.42 Falls are the commonest cause of accidental injury in older people and the commonest cause of accidental death in the population aged 75 and over in the UK. A significant number of falls result in death or severe or moderate injury, at an estimated cost of £15m per annum for immediate healthcare treatment alone.43 This is a significant underestimation of the overall burden from falls once the costs of rehabilitation and social care are taken into account, as up to 90% of older patients who fracture their neck of femur fail to recover their previous level of mobility or independence.44 In addition to these financial costs, there are additional costs that are more difficult to quantify. The intangible
42 National Database of Nursing Quality Indicators (2011).43 NPSA 2007 Slips, trips and falls in hospitals www.npsa.nhs.uk44 Murray GR, Cameron ID, Cumming RG. The consequences of falls in acute and subacute hospitals in Australia that result in proximal femoral fracture. Journal of the American Geriatrics Society. 2007; 55(4): 577-82
82

Version 2.0 –18 December2015
human costs of falling includes distress, pain, injury, loss of confidence and loss of independence, as well as the anxiety caused to patients, relatives, carers, and hospital staff.45
The majority of fractures in older people occur as a result of a fall from standing height. These are low trauma fragility fractures commonly affecting the pelvis, wrist, upper arm or hip. Falls in older people can potentially be predicted by assessing a number of risk factors including conditions that affect balance, chronic health conditions, physical and cognitive impairments, and multiple medications - there is an increased risk of falling, and of injurious falls correlated with increased age.464748
Multi-faceted interventions can prevent falls in the general community, in those at greater risk of falls, and in residential care facilities.49 Well organised services, based on national standards and evidence-based guidelines can prevent future falls, and reduce death and disability from fractures.50 Recognition of the substantial burden and cost of falls, and the identification of consistent and modifiable risk factors for these injuries demands a pro-active approach to falls prevention, particularly in older and frailer populations.
Current position
What is the scale of the problem?Figures 16 and 17, demonstrate rates of emergency admission for injuries due to falls, and for fracture of the hip between 2010/11 and 2013/14 in Cambridgeshire and Peterborough. Rates are generally higher in women than in men (data not shown) and increase substantially with age. Rates for emergency admissions in Cambridgeshire as a whole are similar to the national average whilst rates in Peterborough have been higher than the national average.
From the below data it is clear that in Cambridgeshire the impact of falls is disproportionately greater in those aged 80 years and above. This pattern accentuates the case for a dual approach to falls prevention with preventive interventions targeted at age-bands preceding the rise in incidence of hip fractures and frailty from 65 years and over, and an emphasis on effective approaches tailored to those aged over 75 years who are older and frailer, and have increasing risk of injurious falls and associated poor outcomes.
45 Patient Safety First Campaign 2010. Reducing Harm from Falls.46 Gillespie LD, Gillespie WJ, Robertson MC et al. Interventions for preventing falls in elderly people. Cochrane Database Syst Rev 2003;Issue 4.47 Ganz DA, Bao Y, Shekelle PG et al. Will my patient fall? JAMA 2007;297:77–86.48 Clinical Guideline 21. Falls: The Assessment and Prevention of Falls in Older People. London, UK: National Institute for Clinical Excellence, 2004.49 Gillespie LD, Gillespie WJ, Robertson MC et al. Interventions for preventing falls in elderly people. Cochrane Database Syst Rev 2003;Issue 4.50 Royal College of Physicians.Falling standards, broken promises.Report of the national audit of falls and bone health in older people 2010. Available at http://www.rcplondon.ac.uk/sites/default/files/national_report.pdf
83

Version 2.0 –18 December2015
Figure 16: Emergency admissions for injury due to falls in people aged 65+
Source: Public Health England (PHE) Fingertips http://www.phoutcomes.info/ Primary diagnosis code for Injury (ICD 10 S00-T19) with falls code (WOO-W19) anywhere in diagnostic string.
Figure 17: Hip fractures in people aged 65+, 65-79 and 80+
Source: Public Health England (PHE) Fingertips http://www.phoutcomes.info/Primary diagnosis ICD 10 S72.0, S72.1, S72.2.
It should be noted that falls are events rather than conditions or diseases thus coding of falls-related health data can be potentially problematic. The data shown above from the Public Health Outcomes Framework (PHOF) are considerably clearer as ‘falls’ are coded where the primary reason for admission is due to an “injury”. Even then, coding of falls can be variable across hospital trusts. The apparent decline in admissions for “injury” due to
84

Version 2.0 –18 December2015
falls in the oldest age-group (80+) in Peterborough is striking and currently being explored further.
How is this expected to change locally?The number of older people aged 65 and over is forecast to increase significantly across the CCG population, with an increase of 42% in Peterborough and 48% in Cambridgeshire by 2031. In Cambridgeshire, amongst the oldest, the number of people aged 90 years and over is forecast to nearly double in the next 15 years. In addition, a more than doubling of numbers in the 75-84 year age band who have an increased risk of injurious falls is anticipated across both Cambridgeshire and Peterborough.
Table 23: number of older people
The health consequences and costs In 2013, results were published from a Scottish study which aimed to estimate the costs to health and social care services in managing older people who fall in the community.51 The study used predominantly national databases and cost of illness methodologies and the authors noted that costs, while specific to Scotland, were generalisable to other parts of the UK. The study demonstrated that 34% of people aged 65 years and over living in the community fall at least once a year, of which 20% contacted a medical service for assistance. Applying the results from the Scottish study to local population figures for Cambridgeshire & Peterborough CCG, we can estimate the costs of falls across health and social care.
It is estimated that in 2016, falls will result in over 5,500 GP attendances, over 8,700 ambulance call outs, and more than 6,300 A&E attendances resulting in over 3,000 inpatient admissions across the CCG (numbers per year). The associated costs are high and estimated 51 Craig J, Murray A, Mitchell S et al. The high cost to health and social care of managing falls in older adults living in the community in Scotland. Scottish Medical Journal 2013;58(4):198-203. Available at: http://scm.sagepub.com/content/58/4/198.
85

Version 2.0 –18 December2015
to be over £83m. Costs at discharge are predominantly associated with social care but not from the funder perspective.
Table 24 demonstrates the figures from the Scottish study applied to the forecast population of Cambridgeshire and Peterborough Clinical Commissioning Group for 2016.
Table 24: Estimated number and cost of fall related events, Cambridgeshire & Peterborough CCG 2016, based on study estimates applied to local population figures.
Clinical event Number Cost per event
Total cost (2016)
Total percentage
Population aged 65+ 166,039 Total people falling 34% of population 56,453 Of whom serious 7% of population 11,623 GP attendances 51% of serious falls 5,928 £36 £213,393 0.3Ambulance callouts 61% of serious falls 7,090 £257 £1,822,090 2.2A&E attendances 80% of serious falls 9,298 £101 £939,114 1.1
Inpatient admissions 35% of A&E attendances 3,254
Falls (non hip fractures) 69% of admissions 2,246 £7,406 £16,630,208 20.1 Hip fracture 31% of admissions 1,009 £14,528 £14,656,572 17.7
Discharge falls Home 64% 1,439 £1,776 £2,556,323 3.1 Residential: short term 21% 480 £8,406 £4,033,619 4.9 Long term 15% 326 £65,942 £21,515,799 25.9
Discharge fractures Home 34% 345 £1,776 £612,321 0.7 Residential: short term 47% 470 £8,406 £3,952,282 4.8 Long term 19% 194 £65,942 £12,786,202 15.4
Re-admissions 7% of admissions 391 £7,406 £2,892,210 2.1Mortality at one year 12% of admissions 228 £3,703 £843,561 1.8
Total cost £83,453,695 100
Source: CCC PHI. ONS population projections applied to FHS Registration System (Exeter) April 2015 (Costs and estimates modelled using Craig et al.).
Table 25 provides an additional breakdown of NHS costs associated with falls and fractures and indicates the financial impact assuming no change in prevention up until 2020. This is a conservative estimate as numbers have been applied on the risk across the 65+ age group and not specifically adjusted for the increased risk inherent in the oldest old (greatest falls burden). Note that these tables do not include the costs incurred post hospital discharge (60% of total described above). There is some distribution of these costs between health and social care though the majority will be to social care.
Table 25: Estimated number and NHS costs of fall related events, Cambridgeshire & Peterborough CCG 2016, based on study estimates applied to local population figures.
86

Version 2.0 –18 December2015
Breakdown of costs to NHS - Cambridgeshire & Peterborough CCG - no change in prevention
2016 2020 2016 2017 2018 2019 2020
Population 65+ 166,039 181,667 Estimated falls in the community 56,453 61,767 of which serious 11,623 12,717 GP attendances 5,928 6,486 £.2M £.2M £.2M £.2M £.2MAmbulance callouts 7,090 7,757 £1.8M £1.9M £1.9M £2.M £2.MA&E attendances 9,298 10,173 £.9M £1.M £1.M £1.M £1.M
Costs GP/Amb/A&E £3.M £3.M £3.1M £3.19M £3.25MInpatient admissions 3,254 3,561 Of which non hip fx 2,246 2,457 £16.6M £17.M £17.4M £17.8M £18.2M Of which hip fractures 1,009 1,104 £14.7M £15.M £15.4M £15.7M £16.04M
Costs of admission £31.3M £32.1M £32.8M £33.5M £34.2MReadmissions 228 249 £.8M £.9M £.9M £.9M £.9M
Total £35.1M £36.M £36.8M £37.6M £38.4M
Source: CCC PHI. ONS population projections applied to FHS Registration System (Exeter) April 2015 (Costs and estimates modelled using Craig et al
Interventions and cost savings to the NHSThe cost implications for the health and care system of falls are evident and a ‘do nothing’ option incurs increasing costs to all components and partners of the health and care system in addition to the devastating impacts on quality of life and independence of our growing older populations.
Table 26 demonstrates the impact of applying conservative (10% and 15%) reductions in falls-related events on overall costs. Potential cost reductions are substantial. By applying a 10% reduction in falls-related events, a reduction in NHS costs of over £3.5m can be achieved per year.
Table 26: Potential cost savings across health from 10% and 15% reduction in falls related events
87

Version 2.0 –18 December2015
Clinical event Total cost (2016)
10% reduction
15% reduction
Population aged 65+Total people falling 34% of population Of whom serious 7% of populationGP attendances 51% of serious falls £213,393 £192,053 £181,384Ambulance callouts 61% of serious falls £1,822,090 £1,639,881 £1,548,776A&E attendances 80% of serious falls £939,114 £845,202 £798,247
Inpatient admissions 35% of A&E attendances Falls (non hip fractures) 69% of admissions £16,630,208 £14,967,187 £14,135,677 Hip fracture 31% of admissions £14,656,572 £13,190,915 £12,458,086
Re-admissions 7% of admissions £2,708,552 £2,892,210 £2,302,270
Total cost £36,969,929 £33,272,936 £31,424,440
Source: (Costs and estimates modelled using Craig et al
Falls prevention is multi-faceted with varying phases of need across the population, ranging from older people who are well and mobile with no risks identified; those complaining of unsteadiness; those who have fallen and injured themselves; and those with significant frailty and multi-morbidities that may have already had interventions related to falls.
Therefore an array of evidence-based interventions is necessary, targeted to specific population groups and needs. There is a large body of research literature, including several systematic reviews of robust clinical trials completed, and meta-analyses to provide pooled estimates of the effect sizes for the interventions. Overall, the trialled interventions demonstrate clinical effectiveness and the outcomes include reduced rate of falls, and reduced risk of serious falls.
In light of this evidence, a framework has been developed locally to describe evidence-based interventions across the population which are demonstrably effective in preventing falls (and therefore may incur cost savings for the NHS). This framework is summarised below:
88

Version 2.0 –18 December2015
The framework also provides a foundation for potential roles and leadership actions across sectors. Further information can also be gleaned from examples of falls services delivered elsewhere in the UK. ‘Gold standard’ falls preventions packages typically include strong pathways between the relevant agencies. The Greater Glasgow and Clyde model,52 which has evidence of actual realised savings, includes the following key components.53
52 This programme is the only UK model to have evidence of realised savings, finding over a 10 year period the service has achieved a reduction in falls in the home of 32%, a reduction of falls in residential institutions of 27% and a reduction of falls in the street of almost 40%. However there may be some concerns about the analysis, and the ability to extrapolate for local models.53 Greater Glasgow and Clyde Falls Prevention and Osteoporosis Services. Available at: http://www.nhsggc.org.uk/CONTENT/default.asp?page=s1361
89
Single point of referral in each locality for triage and onward referral.
Multi-factorial falls assessments (all assessments in the home).
Data recording of patients using the service.
Programme of exercise classes run in community centres by trained specialist
therapists (held immediately after rehabilitation classes).
Integration: Close partnership-working between the NHS and local council.
Falls service widely promoted in GP practices, libraries, and other public settings.
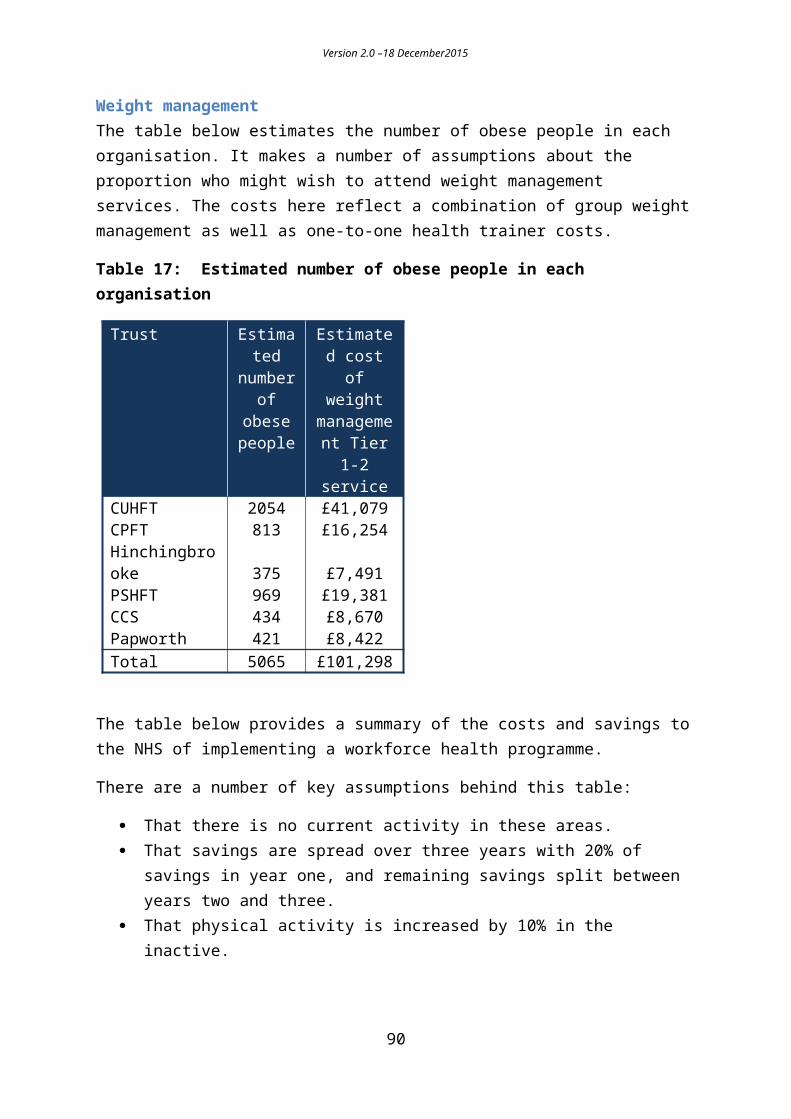
Version 2.0 –18 December2015
While it is not easy to clarify precisely which, and at what scale, of interventions and components, are required to achieve a 10% or 15% reduction in the costs of falls-related injuries as modelled above locally, the interventions described are all known to be effective and recommended.
Current public health spend and activity There is some existing provision of interventions to reduce falls in older people as outlined in the framework above. Detailed mapping of stakeholder activity is underway, so descriptions of current provision must be considered estimates.
However it is apparent the current interventions lack the appropriate scale and coordination described in the framework and exemplified in other successful programmes.
Currently evidence-based community exercise provision (strength and balance and tai chi) across the county reaches fewer than 200 people aged 50 and over across the county on a weekly basis. Adaptations to reduce hazards in the home environment are delivered through handyperson schemes, or funded by disability facilities grants, and other local provision, again with limited reach. GPs provide an important coordination role in primary care, ensuring medication reviews, hearing and sight checks, foot health and other key risk factors, but referral patterns have not been clearly established and often not known. Secondary preventative work with fallers (falls prevention services/intervention) is held within Older People health services (CPFT) neighbourhood teams, however this model is still developing and building on prior provision which has been inconsistent across the county.
Work already plannedA current business case for Cambridgeshire County Council (April 2015 – March 2017) includes:
Increasing provision of evidence-based community exercise to increase reach and uptake in the over 65 population, particularly targeted at those aged 75 and over.
Primary preventative awareness raising (campaigns, information) to reach those 75 years and over, and their family and carers.
Training and awareness raising of actions to reduce falls for the health, social care, voluntary sector and wider workforces.
Building system level partnership to reduce falls
Within this, there are two important measures planned to extend local falls prevention activity:
90

Version 2.0 –18 December2015
1. An extended role of health trainers/health coaches to increase awareness of falls, and use motivational interviewing skills to support behaviour change in older people in relation to participation in activities to reduce their falls risks.
2. Increased provision of strength and balance classes locally – and a pathway of progressive chair based exercises. This should help to address issues of inequity in the availability of classes across the county, and provide quality-assured step down and sustained support following falls specialist interventions by health professionals.
Cost saving prevention initiatives – possible areas of focusA Cochrane Review in 201254 on interventions for preventing falls in community-living older people identified thirteen trials providing a comprehensive economic evaluation. Three of these indicated cost savings for their interventions during the trial period: home-based exercise (the Otago Exercise Programme) in over 80-year-olds, home safety assessment and modification in those with a previous fall, and one multifactorial programme targeting eight specific risk factors. In the multi-factorial programme, total average costs were approximately US$2000 [~GBP £1310] less per subject in the intervention group than the usual care group, largely reflecting lower hospitalization costs in those who received the intervention.55
A prior review in New Zealand identified the same three cost-saving approaches as Cochrane, and found that best value for money came from effective single factor interventions such as the Otago Exercise Programme in adults 80 years and older. A cost-benefit analysis in 2014 of three specific exercise interventions demonstrated positive net benefits for each programme.56 The Otago Exercise Programme provided a return on investment of 36% for each dollar invested when delivered to persons aged 65 and over, and an ROI of 127% when delivered to 80 year olds and over (comprising a net benefit of $429.15). The highest ROI was found for Tai Chi at 509%. The ROI for the Australian Stepping On programme (21 hours of occupational therapist-led group exercises, and falls prevention advice) was 64%.
Alongside the evidence for single factor interventions, modelling by the Center for Disease Control has identified that community-based multi-disciplinary programmes are well tolerated and their potential offer in terms of health economics is great.57
54 Gillespie LD, Robertson MC, Gillespie WJ, Sherrington C, Gates S, Clemson LM, Lamb SE. Interventions for preventing falls in older people living in the community. Cochrane Database of Systematic Reviews 2012, Issue 9. Art. No.: CD007146. doi: 10.1002/14651858..55 Rizzo JA, Baker DI, McAvay G, Tinetti ME. The cost effectiveness of a multi-factorial targeted prevention program for falls among community elderly persons. Medical Care 1996;34(9):954–69.56 Carande-Kulis V, Stevens JA, Florence CS, Beattie BL, Arias I. 2015 A cost-benefit analysis of three older adult fall prevention interventions.J Safety Res. 2015 Feb;52:65-70. doi: 10.1016/j.jsr.2014.12.007.57 Hanley, A., Silke, C., & Murphy, J. (2011). Community-based health efforts for the prevention of falls in the elderly. Clinical Interventions in Aging, 6, 19–25. doi.org/10.2147/CIA.S9489
91

Version 2.0 –18 December2015
Cost savings associated with the implementation of interventions have been reported at population scale; a multi-disciplinary programme in a population of 400,000 in New South Wales, Australia showed a benefit to cost ratio of 20.6:1.58 Over a four-year period, the programme generated savings of up to A$16.9m [~GBP £7.91m].
In the US, a cohort study demonstrated savings of US$938 [~GBP £615] per person at one year among older people participating in the ‘Matter of Balance’ intervention which addresses fear of falling and activity limitation.59 The majority of the savings (US$517) amount from reduced unplanned hospitalisations. The programme is currently delivered in 38 of the 50 United States. A study modelling the potential for savings from Matter of Balance for Massachusetts calculated a return on investment of 144%. As there is no current uptake data available, savings were calculated for three participation levels: 25%, 50% and 75%, and found to range from US$2.79m to $8.37m.
Further detail from economic modelling for a population health falls prevention programme60 shows a high incremental cost-effectiveness ratio (ICER) of $A28,631 [GBP£13577] per QALY gained. Sensitivity analyses indicated that the public health outcomes were greater and less costly than no programme, when programme costs were $A500 or lower and risk ratio for falls was 0.70 or lower, indicating that a population-wide approach will be most appropriate, and cost-saving, with effective and relatively low cost interventions.
Where should the strategic focus be?Local analysis has identified potential areas for further investment in falls prevention across varying stages of risk.
The local framework suggests various population groups within the older population that could be targeted more effectively. The target population that has been modelled below is the 75+ population at high risk of falls including serious injury. ‘Serious’ is defined as those requiring attention from either the GP, via A&E or as an inpatient. This definition is therefore quite broad – and summarised as those requiring medical attention. By increasing identification and assessment in this target group (by health professionals) and following evidence-based guidelines which include appropriate referrals to both specialised and community exercise for specific falls prevention interventions, the potential reduction in falls and subsequent costs can be demonstrated.
58 Hanley, A., Silke, C., & Murphy, J. (2011). Community-based health efforts for the prevention of falls in the elderly. Clinical Interventions in Aging, 6, 19–25. doi.org/10.2147/CIA.S948959 Ghimire E, Colligan EM, Howell B, Perlroth D, Marrufo G, Rusev E, Packard M. (2015) Effects of a Community-Based Fall Management Program on Medicare Cost Savings. Am J Prev Med. 2015 Sep 15. doi: 10.1016/j.amepre.2015.07.004.60 Farag I., Howard K., Ferreira ML., Sherrington C. (2015) Economic modelling of a public health programme for fall prevention. Age and Ageing 2015; 44: 409–414. doi: 10.1093/ageing/afu195
92

Version 2.0 –18 December2015
The current scale of provision in terms of number of people reached is low (see description of current activity). Table 27 extends the analysis to demonstrate the scale of identification and assessment necessary to recruit and maintain a sufficient number of people to impact on the cost of falls to the NHS.
The target group has been selected in response to at higher risk indicators and to ensure that the ‘scale’ is realistic and that the potential target group can be readily and feasibly identified (via those in contact with health professionals or MDT working, and A&E attendances for fall related injuries and discharges following inpatient episodes for falls). Even if offered, not all will accept or comply with the intervention, thus the modelling takes this into account using information from research literature and current programmes as to what is likely to be achieved.
If 2,643 people are assessed and considered suitable to refer, it is likely that 1,319 people will have full advantage from the intervention. The cost per person of the intervention has been applied to this figure (from a fully costed source).61
Table 27: Scale of target population, assessment and referral: subsequent uptake, adherence and cost per person of Otago Exercise Programme targeted to high risk population (75+)
Target population Intervention Yr1 Yr2 Yr3 Yr4 Yr5 10,
570a Physically frail 75+ Otago 25% 25% 50% 50% 50%
Reachb,c 2,6
43 2,6
43 5,2
85 5,2
85 5,2
85
Uptake 64.2%d 1,6
96 1,6
96 3,3
93 3,3
93 3,3
93
Adherence (ave) 78%e 1,3
19 1,3
19 2,6
38 2,6
38 2,6
38
Cost per person £222.25f £293,152 £293,152 £586,303 £586,303 £586,303a. CFAS study estimates of physical frailty in people aged 75+ as ‘base’ target population identified via
A&E attendances for falls, admissions (discharges), MDT working, frailty scoresb. Assumption that people can be identified via various health professionals and appropriately assessed
and referredc. % of target group approached based on pragmatic choice (Reach)d. Uptake from Nyman (2011) median uptake62 e. Adherence from Nyman (2011)63
f. Cost per person of Otago programme (Carande-Kulis 2015)64
61 Carande-Kulis V, Stevens JA, Florence CS, Beattie BL, Arias I. 2015 A cost-benefit analysis of three older adult fall prevention interventions.J Safety Res. 2015 Feb;52:65-70. doi: 10.1016/j.jsr.2014.12.007.62 Nyman SR, Victor CR (2011). Older people’s participation in and engagement with falls prevention interventions in community settings: an augment to the Cochrane systematic review. Age and Ageing 2011; 0: 1–7.63 Nyman SR, Victor CR (2011). Older people’s participation in and engagement with falls prevention interventions in community settings: an augment to the Cochrane systematic review. Age and Ageing 2011; 0: 1–7.64 Carande-Kulis V, Stevens JA, Florence CS, Beattie BL, Arias I. 2015 A cost-benefit analysis of three older adult fall prevention interventions.J Safety Res. 2015 Feb;52:65-70. doi: 10.1016/j.jsr.2014.12.007.
93

Version 2.0 –18 December2015
This target population is at higher risk than the general over 65 population on two counts, firstly age – falls risk increases exponentially with age; and secondly physical frailty- a high proportion (estimated over 80% given target group) of these people will have already fallen, denoting their risk of a subsequent fall substantially higher.6566 By selecting this target group – the majority of whom will already be in contact with health professionals – the impact on the cost of falls – and the effectiveness of the intervention in this group, can be demonstrated.
The cost of a fall to the NHS is shown below from Craig et al.67 In terms of the effectiveness of the intervention, the ‘low’ figure of a reduction in falls by 32% has been used (high figure of 35%).
Table 28: Cost of a fall to the NHS
Three distinct scenarios are shown below indicating the scale of the net cost savings that could be made. Assuming that 30%, 60% or 100% of the falls that are prevented are ‘serious’ and incur GP or A&E or inpatient costs (average cost to NHS only and excluding costs across other systems such as social care) accordingly, the cost without intervention, with intervention and potential change in cost is shown. Costs of intervention are shown as in Table 27.
65 Skelton D, Todd C. What are the main risk factors for falls amongst older people and what are the most effective interventions to prevent these falls? Health Evidence Network, 2004.66 NSW Ministry of Health (2011). An economic evaluation of community and residential aged care falls prevention strategies in NSW. 67 Craig J, Murray A, Mitchell S et al. The high cost to health and social care of managing falls in older adults living in the community in Scotland. Scottish Medical Journal 2013;58(4):198-203. Available at: http://scm.sagepub.com/content/58/4/198.
94
Cost per community fall £700 NHS£1,021 Post discharge
Total £1,721 Total
Cost of serious fall (GP/A&E/Admission) £3,466 NHS£5,141 Post discharge£8,607 Total

Version 2.0 –18 December2015
Scenario 1: Effectiveness of intervention – 32% reduction in falls to those who complete – 35% of falls prevented are serious (requiring medical attention – average cost)
Falls (no intervention) Yr1 Yr2 Yr3 Yr4 Yr5 5 year total% serious 35.00% Serious 280 280 560 560 560
Not serious 520 520 1,040 1,040 1,040 Reduced falls
effectiveness 32% Serious 190 190 381 381 381 Not serious 354 354 707 707 707
Original cost Serious £970,460 £970,460 £1,940,921 £1,940,921 £1,940,921 Not serious £363,993 £363,993 £727,985 £727,985 £727,985
Total £1,334,453 £1,334,453 £2,668,906 £2,668,906 £2,668,906 £10,675,625
Reduced cost Serious £659,913 £659,913 £1,319,826 £1,319,826 £1,319,826Not serious £247,515 £247,515 £495,030 £495,030 £495,030Total £907,428 £907,428 £1,814,856 £1,814,856 £1,814,856 £7,259,425
Cost saving Difference £427,025 £427,025 £854,050 £854,050 £854,050 £3,416,200NET -£133,873 -£133,873 -£267,747 -£267,747 -£267,747 -£1,070,988
Scenario 2: Effectiveness of intervention – 32% reduction in falls to those who complete – 60% of falls prevented are serious (requiring medical attention – average cost)
Falls (no intervention) Yr1 Yr2 Yr3 Yr4 Yr5 5 year total% serious 60.00% Serious 480 480 960 960 960
Not serious 320 320 640 640 640 Reduced falls
effectiveness 32% Serious 326 326 653 653 653 Not serious 218 218 435 435 435
Original cost Serious £1,663,646 £1,663,646 £3,327,293 £3,327,293 £3,327,293 Not serious £223,995 £223,995 £447,991 £447,991 £447,991
Total £1,887,642 £1,887,642 £3,775,284 £3,775,284 £3,775,284 £15,101,135
Reduced cost Serious £1,131,280 £1,131,280 £2,262,559 £2,262,559 £2,262,559Not serious £152,317 £152,317 £304,634 £304,634 £304,634Total £1,283,597 £1,283,597 £2,567,193 £2,567,193 £2,567,193 £10,268,772
Cost saving Difference £604,045 £604,045 £1,208,091 £1,208,091 £1,208,091 £4,832,363NET -£310,894 -£310,894 -£621,788 -£621,788 -£621,788 -£2,487,151
95

Version 2.0 –18 December2015
Scenario 3: Effectiveness of intervention – 32% reduction in falls to those who complete – 100% of falls prevented are serious (requiring medical attention – average cost)
Falls (no intervention) Yr1 Yr2 Yr3 Yr4 Yr5 5 year total% serious 100.00% Serious 800 800 1,600 1,600 1,600
Not serious - - - - - Reduced falls
effectiveness 32% Serious 544 544 1,088 1,088 1,088 Not serious - - - - -
Original cost Serious £2,772,744 £2,772,744 £5,545,488 £5,545,488 £5,545,488 Not serious £0 £0 £0 £0 £0
Total £2,772,744 £2,772,744 £5,545,488 £5,545,488 £5,545,488 £22,181,953
Reduced cost Serious £1,885,466 £1,885,466 £3,770,932 £3,770,932 £3,770,932Not serious £0 £0 £0 £0 £0Total £1,885,466 £1,885,466 £3,770,932 £3,770,932 £3,770,932 £15,083,728
Cost saving Difference £887,278 £887,278 £1,774,556 £1,774,556 £1,774,556 £7,098,225NET -£594,127 -£594,127 -£1,188,253 -£1,188,253 -£1,188,253 -£4,753,012
The rationale for the proposed strategic focus can be further described in light of published evidence. As the Otago Exercise Programme (both home-based and group-based) has demonstrably reduced falls and mortality risk in older populations, including those over 80 years of age, with increased frailty (and also cognitive impairment), the strategic option of extending this provision further scaled to the population of older people in Cambridgeshire and Peterborough exists.
Comparative studies of the Otago Exercise (or equivalent strength and balance programmes) in Scandinavian contexts have not found large notable differences in falls-related outcomes between home-based and group-based delivery; indications are that group setting exercises are more cost-effective for community-dwelling falls-prone older people and support broad functional outcomes for independent living.6869 With some current local assets in the delivery of equivalent strength and balance classes in Cambridgeshire and Peterborough, there are opportunities to increase the scale of provision and support for delivery of these community-based interventions to those at higher risk of falls.
Of note, qualitative evidence suggests higher participation in falls-prevention exercise when older people are invited to attend by a health professional. Therefore the proposed extension of community provision would be absolutely dependent on a strong and coherent clinical response to the risk of falls in the older population, with appropriate case finding
68 Pitkälä KH, Pöysti MM, Laakkonen M, et al. (2013) Effects of the Finnish Alzheimer Disease Exercise Trial (FINALEX): A Randomized Controlled Trial. JAMA Intern Med.;173(10):894-901.69 Kyrdalen, I. L., Moen, K., Røysland, A. S. and Helbostad, J. L. (2014), The Otago Exercise Program Performed as Group Training Versus Home Training in Fall-prone Older People: A Randomized Controlled Trial. Physiother. Res. Int., 19: 108–116.
96

Version 2.0 –18 December2015
and targeting, referrals, supportive interventions and record keeping. Findings that demonstrate that falls risk is not well understood and personalised by the older population suggest the wrap-around skills of health trainers, health coaches and other behaviour change specialists will also be essential in ensuring that provision is accessed by those who stand to benefit.
Learning applied from other service models for falls prevention would indicate significant advantages in single points of access, triage, and coordination of interventions.
The community-based offer of falls prevention activities is only one element of the system. The NICE guideline70 for assessing risk and preventing falls centres on the delivery of multi-factorial assessment of risk of falling in older people in contact with healthcare professionals (therefore representing the majority of the population aged 75 years and over) , and in light of the assessment the implementation of multifactorial interventions addressing:
In addition, those who are discharged from acute care following medical intervention for a serious fall (estimated as 3,250 people locally) are an important population group known to be at very high risk of injurious falls. Approximately a third of patients admitted for a fall and two thirds of those admitted for a fracture from the community are discharged to a residential care setting. For those returning to living in a community setting, key interventions as identified in the local framework include the assessments of home hazards by an occupational therapist.
An analysis across studies of the impact of interventions to adapt and modify the environment in community-dwelling participants at high risk of falls generated a clinically significant effect size of a 39% reduction of falls.71 There may be additional benefits in ensuring that the highest risk groups are offered and supported in accessing effective interventions.
70 Clinical Guideline 161 on Falls: Older People living in the community, 2013. Available at: http://www.nice.org.uk/guidance/cg161/resources71 Clemson L, Mackenzie L, Ballinger C, Close JC, Cumming RG. (2008) Environmental interventions to prevent falls in community-dwelling older people: a meta-analysis of randomized trials. J Aging Health. 2008;20(8):954-71. doi: 10.1177/0898264308324672.
97
Strength and balance training.
Home hazard assessment and intervention.
Vision assessment and referral.
Medication review with modification/withdrawal.

Version 2.0 –18 December2015
The role of allied health professionals can be demonstrated throughout the falls prevention pathway - they may play a vital role in recognising those at higher risk of falls; ensuring they receive the assessments and interventions that offer the highest net savings due to the risk profile of the target groups as well as acting as strong advocates and leaders in implementing and sustaining falls prevention action locally. Appropriate training and professional development, as well as system-wide championing of falls awareness will continue to facilitate this.
Specific components of falls prevention eg medication reviews are also likely to generate cost saving but our current models are not sufficiently sophisticated to fully identify these.
RecommendationReducing fall rates and the resultant harm is complex. On the basis of strong evidence from systematic reviews and meta-analyses, this proposal identifies important opportunities to deliver cost-effective interventions at scale with indications of cost saving and effective opportunities for action. There is clear evidence that falls prevention interventions are cost saving when modelled across the population.72
Additional actions include:
Recognising that potential savings may require delivery of preventative approaches at much wider scale than current provision – a health-system wide emphasis on falls prevention is advocated.
Collaboration across sectors to agree which combination of clinical and population health interventions are needed locally to achieve population reductions in the incidence and consequences of falls – which would serve to consolidate the mix of interventions required.
Ensuring delivery of evidence-based interventions, for example, strength and balance exercise targeted at people with heightened risk of falling, are delivered at appropriate scale and quality.
Having a system-wide approach to ensure that local assets are as effective as possible, notably, that health professionals are undertaking appropriate assessments and referring on through a consistent, comprehensive & integrated falls prevention pathway.
Integrated and high quality reporting of falls and outcomes linked to falls is fundamental to understanding where improvements can be made to reduce harm and cost.
Building on powerful strategic opportunities locally to ensure leadership, integration and sustainability.
72 Farag I., Howard K., Ferreira ML., Sherrington C. (2015) Economic modelling of a public health programme for fall prevention. Age and Ageing 2015; 44: 409–414. doi: 10.1093/ageing/afu195.
98

Version 2.0 –18 December2015
Falls prevention efforts are unlikely to be successful unless they are sustained at a systems level. The opportunities identified to deliver cost-effective interventions and outcomes among our older populations at risk of falling are not simply stand-alone strategies. Rather, they comprise component parts that ideally, interact synergistically to create an effective falls prevention system that will make a real difference in an area that causes pain and distress to many people every day.
99

Version 2.0 –18 December2015
11. Malnutrition in older peopleHeadlines
An estimated 13,000 to 18,300 older people are malnourished in the Cambridgeshire & Peterborough population, and more are at risk.
Potential cost savings may be achieved by increasing proportion screened for malnutrition among inpatients, outpatients and new GP registrations to 90% and appropriate treatment; with investment of £524k and savings in the order of £543k primarily from reducing length of stay in acute care. At worst this intervention should not cost the NHS additional funding, and will improve quality of life for older people.
BackgroundMalnutrition is measured as a Body Mass Index (BMI) lower than 18.5kg/m2 or unintentional 10% weight loss. The annual health care costs associated with malnutrition are primarily due to more frequent and expensive hospital in-patient admissions, more primary care consultations and the greater long-term care needs of malnourished individuals. About two thirds of cases of malnutrition are not recognised.
Current position
What is the scale of the problem?It is estimated that there are around 1m older people in the UK who are malnourished or at risk of malnutrition. The vast majority (93%) of people who are malnourished or at risk of malnutrition are living in the community, with a minority in care homes (5%) or in hospital (2%). It is estimated that 25-28% of admissions to hospital and 30-41% of admissions to care homes are at risk of malnutrition.
There is a paucity of local data about the prevalence or costs of malnutrition, so local estimates are drawn from risk factors, or applying national estimates to the population; it is estimated that 10-14% of the population aged 65 years and over in England are malnourished.
CambridgeshireIn Cambridgeshire, life expectancy at birth is significantly higher for both males and females compared to the national average, so there is potential for high prevalence of malnutrition. Applying national estimates there is an estimated 10,000 to 14,000 older residents of Cambridgeshire, or about one in 50 people in the general population, who are malnourished. In terms of lifestyle and psychosocial risk factors, approximately 29% of older people live alone in Cambridgeshire (29,000 people), and these people may also be at increased risk of malnutrition.
100

Version 2.0 –18 December2015
Peterborough In 2016 in Peterborough, 15% of the population will be aged 65 years and over (30,416 people), indicating an estimated 3000 to 4300 older people who are malnourished.
Population changes in older people are described in the section on falls.
The health consequences and costs Disease-related malnutrition costs in excess of £13bn per annum based on malnutrition prevalence figures and the associated costs of both health care and social care.73 The annual health care costs associated with malnutrition are primarily due to more frequent and expensive hospital in-patient admissions, more primary care consultations and the greater long-term care needs of malnourished individuals.74
Interventions and cost savings to the NHSOn a national level in 2013 NICE identified malnutrition as the sixth largest source for potential NHS savings.75 Early identification and treatment of malnutrition in adults could save the NHS £45.5m a year even after costs of training and screening.76
The interventions centre on screening eligible population groups, and for those identified, dietetic assessments and interventions. The cost impact of modelling for increasing the proportion of the local population screened is shown in Table 29.
73 Brotherton A, Simmonds N & Stroud M. Malnutrition Matters. Meeting Quality Standards in Nutritional Care. BAPEN. 2012.74 Brotherton A, Simmonds N & Stroud M. Malnutrition Matters. Meeting Quality Standards in Nutritional Care. BAPEN. 2012.75 Benefits of Implementation: Cost saving guidance, NICE, (updated) 201376 National cost impact report to accompany CG32, NICE, 2006
101
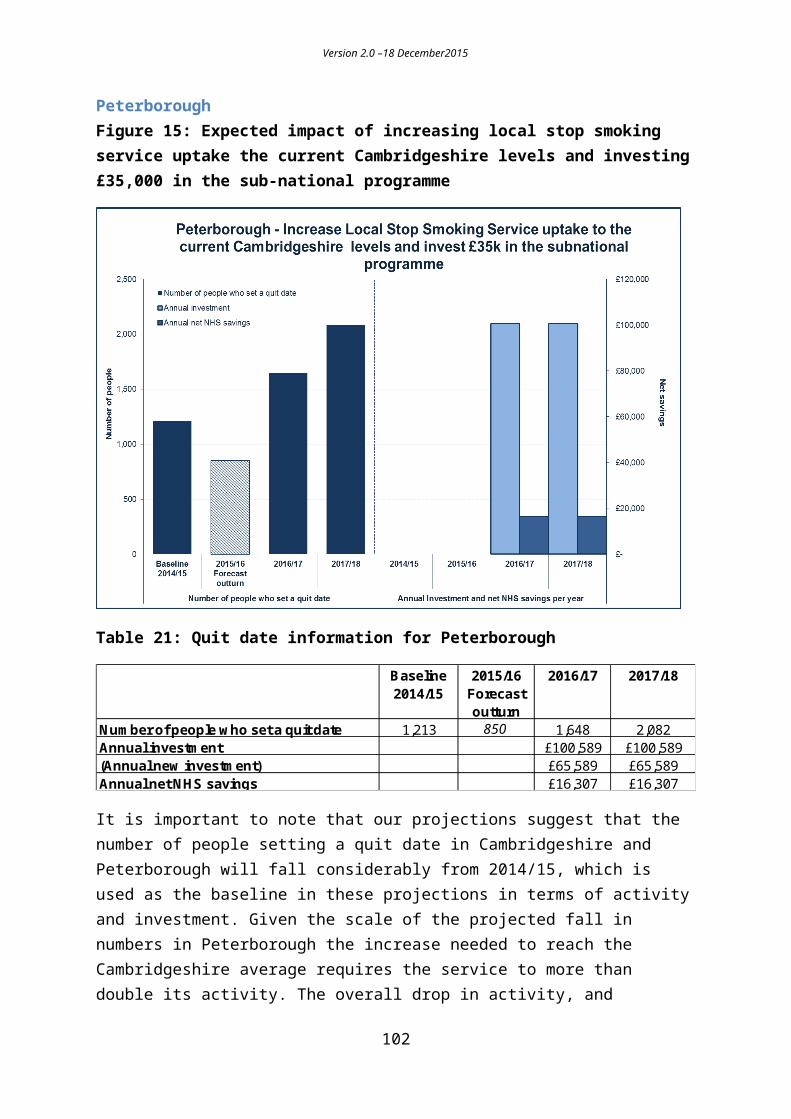
Version 2.0 –18 December2015
Table 29: Cost impact of increasing proportion screened to 90% from current (national) estimates of 65% of inpatients 15% of outpatients and 10% of GP new registrations. National estimates based on expert opinion (NICE)
Cost impact (£000s)
Cost impact C&P
CCG (£)
Increase in screenings - direct costs £38.9 £294,528
5-minute 'MUST' screening by a nurse in various settings
Increase in nutritional assessments - direct costs £10.8 £81,771
45 minute assessment by a dietician, in the community or secondary care
Increase in nutritional interventions £22.0 £166,571
Includes net ingredient costs and costs associated with administration of oral supplements, enteral and parenteral nutrition
Additional annual investment cost £542,870
Decrease in secondary care activity £143.6 £1,087,254Primarily from decreased length of stays
Net cost £71.8 £543,627
Source: Implementation Programme: NICE support for commissioners using the quality standard on nutrition support in adults November 2012. Applied to CCG Population April 2015 (FHS Registration System (Exeter)
There are important limitations in the model. As noted, the baseline screening proportions are based on national expert opinion; it is not known how well these align with local practice. The cost savings are realised through improved secondary care outcomes i.e. a reduction of the level of malnutrition in the population. The NICE template does not detail the inter-relationship of the elements eg proportion screened and proportion referred for a nutritional assessment, to allow more precise adjustments in line with local activity. The costing model does also not take into account specific interdependencies, such as the fact that those who are malnourished are less likely to respond well to treatment for other conditions, and therefore are likely to cost the NHS and social care more.
An indicative trajectory may be described as:
102
Version 2.0 –18 December2015
Figure 18: Cost of identifying and treating malnutrition and NHS savings
Work already plannedCurrent activity to identify malnutrition and improve nutritional status in older people is not known in detail. Good practice in acute settings was highlighted in the work on malnutrition for the Cambridgeshire JSNA Primary Prevention of Ill health in older people 2014. The training of care staff and the provision of general services in the community by voluntary care organisations (VCOs) such as transport schemes, hot meal delivery schemes, and lunch clubs, are significant local assets.
Cost saving prevention initiatives – possible areas of focusAs suggested by the model, focus is required on screening at key junctures, referral for assessment, and the appropriate interventions.
Recommendations Potential cost savings may be achieved by increasing proportion screened for
malnutrition among inpatients, outpatients and new GP registrations to 90% and appropriate treatment; investment of £524k and savings in the order of £543k primarily from reducing length of stay in acute care. At worst this intervention should not cost the NHS additional funding, and will improve quality of life for older people.
103

Version 2.0 –18 December2015
12. Sexual healthHeadlines
For every £1 invested in contraception services, there is a £11.09 saving to the NHS, rising to £13.42 for long-acting reversible contraceptives (LARCs).
It is proposed that we increase the number of women with LARCs by approximately 859 a year in Cambridgeshire & Peterborough. This should generate savings of £935k in 2016/17, £1.15m in 2017/18 and £1.26m in 2018/19.
This would require an additional investment of £115k. However, the additional investment needed for Cambridgeshire, is already within the Council budget proposals for 2016/17.
BackgroundLong-acting reversible contraception (LARC) is a method of contraception that requires administering less than once per cycle or month. Included in the category of LARC are the copper intrauterine devices (non-hormonal) and three progestogen-only methods of contraception (intrauterine system, injectables and the implants).
It is clear that investment in contraception services not only helps to avoid the personal and social costs of unintended pregnancies, but is also economically effective. According to the Government, the prevention of unintended pregnancy by NHS contraception services probably saves the NHS over £2.5bn a year, and research has shown that every £1 spent on contraception services saves the NHS £117.
There is widespread agreement that increasing use of LARC in women at all stages of their reproductive lives is a vital component of the strategy to reduce unwanted fertility. Improving both access to and provision of LARC methods was recommended by the 2005 NICE guideline on LARC,1 which was updated in 2014. It highlighted that these contraceptive methods were both more effective and cost efficient when compared with the most popular user-dependent methods. Long-acting reversible contraceptive methods consistently achieve superior efficacy by reducing user error.
Current position In 2015/16 we have seen a considerable drop in LARC activity in Cambridgeshire. This is largely due to a gap in trained GPs retiring and a new cohort of GPs being trained. This has brought the rate of LARCs down in Cambridgeshire to 68 per 1000 population, or 8,168 LARCs, compared to 82 per 1,000 population, or 3,101 LARCs in Peterborough.
104

Version 2.0 –18 December2015
Interventions and cost savings to the NHSFor every £1 invested in contraception services there is a £11.09 saving, rising to £13.42 for LARCs.77 NICE estimated in 2005 that 8% shift to the use of LARCs from other types of contraception would result in £102m savings nationally (more if those not using any contraception were factored in) eg population of 40,000 15-49 year old females could produce £300,000 savings at one year.
There are also costs saved to social care and longer term educational and employment outcomes.
Work already plannedThe shortfall in the sexual health budget related to the decrease in LARC activity in Cambridgeshire has been identified by the Health Committee as an area of focus, where they would like to see increased activity. The saving from this drop in activity is not anticipated for 2016/17.
Cost saving prevention initiatives – possible areas of focusThe following two graphs and tables set out the planned future activity for LARC, the additional investment and the NHS savings per year. We have used conservative estimates of the impact of costs saved to the NHS.
For Cambridgeshire where activity levels have fallen, the ambition is to increase the number of LARCs by approximately 747 a year by 2018/19. The additional investment needed for Cambridgeshire has already been identified within the 2016/17 Public Health budget, and the savings to the NHS are estimated to be £1.1m by 2018/19.
Cost saving prevention initiatives – possible areas of focus.
The following two graphs and tables set out the planned future activity for LARC, the additional investment and the NHS savings per year. We have used conservative estimates of the impact of costs saved to the NHS.
For Cambridgeshire where activity levels have fallen, the ambition is to increase the number of LARCs by approximately 747 a year by 2018/19. The additional investment needed for Cambridgeshire has already been identified within the 2016/17 Public Health budget, and the savings to the NHS are estimated to be £1.1m by 2018/19.
Figure 19: Cambridgeshire planned number of LARCs, investment and NHS savings77 The Cost Effectiveness of family planning service provision. D Hughes and A McGuire. Journal of Public Health medicine vol 18 No 2, pp189-196 (1996).
105

Version 2.0 –18 December2015
Table 30: Cambridgeshire planned number of LARCs, investment and NHS savings
Cambridgeshire 2014/15 2015/16 2016/17 2017/18 2018/19
Current activity 8,168Current investment £1,094,125
Additional number of LARCs - 523 672 747Additional investment - £70,000 £90,000 £100,000Savings - £770,000 £990,000 £1,100,000Number of LARCs per year - 8,691 8,840 8,915
Projections suggest that this years activity will be broadly in line with 2014/15 or marginally lower.
Peterborough activity on LARCs is already fairly high and so this additional activity is based on a small increase in LARC activity of 112 LARCs a year, and additional investment of £15,000 a year. The net savings (savings after the investment costs) are £165m by 2018/19.
Figure 20: Peterborough planned number of LARCs, investment and NHS savings
106

Version 2.0 –18 December2015
Table 31: Peterborough planned number of LARCs, investment and NHS savings
Peterborough 2014/15 2015/16 2016/17 2017/18 2018/19
Current activity 3,101Current investment £415,387
Additional number of LARCs - 112 112 112Additional investment - £15,000 £15,000 £15,000Savings - £165,000 £165,000 £165,000Number of LARCs per year - 3,213 3,213 3,213
Projections suggest that this years activity will be broadly in line
with 2014/15.
It is important to note that the estimated number of additional LARCS is based on an average cost for the device and fitting and therefore the final number will vary depending on the type of LARC chosen.
RecommendationsLARCs are highly cost saving to the NHS. An additional investment of £115k will generate savings of £935k in 2016/17, £1.15m in 2017/18 and £1.26m in 2018/19.
107

Version 2.0 –18 December2015
13. BreastfeedingHeadlines
Low breastfeeding rates in the UK lead to an increased incidence of illness that has a significant cost to the health service. Investment in evidence-based multi-faceted interventions has been shown to generate savings to the health economy, in the short term, by reducing hospital admissions for four acute childhood illnesses.78
There is evidence to suggest that breastfeeding can contribute to longer term savings through its impact on key health outcomes, including childhood obesity, but this is difficult to quantify.
The focus should be on joint commissioning with local authorities to improve breastfeeding support, and implementing or piloting interventions in both acute and community settings. These interventions should include strengthening breastfeeding support and advice in acute settings, and easily accessible breastfeeding peer support programmes focused on the most deprived areas of the CCG.
BackgroundBreast milk is the best form of nutrition for infants, and exclusive breastfeeding is recommended for the first six months (26 weeks) of an infant’s life.79
Breastfeeding contributes to various important public health outcomes including:80
reduction of the infant mortality rate; reduction of preventable infections and unnecessary paediatric admissions in
infancy; the halting of the rise in obesity in under 11s; improving children’s life outcomes and general wellbeing; and breaking the cycle of deprivation and reducing the impact of health inequalities.
Despite the overwhelming health benefits and cost savings of breastfeeding, initiation rates in the UK are around the lowest in Europe, and worldwide, with rapid discontinuation rates for those who do start.81
78 Renfrew MJ, et al. ‘‘Preventing disease and saving resources: the potential contribution of increasing breastfeeding rates in the UK’ (2012) UNICEF. Available at: http://www.google.co.uk/url?sa=t&rct=j&q=&esrc=s&source=web&cd=2&ved=0CCcQFjABahUKEwjxtcW__PHIAhXLtxQKHRZqBNk79 http://www.nhs.uk/conditions/pregnancy-and-baby/pages/why-breastfeed.aspx80 NICE. Dyson, L. et al. ‘Promotion of breastfeeding initiation and duration Evidence into practiceBriefing’ (2006). Available at: https://www.nice.org.uk/proxy/?sourceUrl=http%3a%2f%2fwww.nice.org.uk%2fnicemedia%2fpdf%2fEAB_Breastfeeding_final_version.pdf81 DH/DCSF. (2009) ‘Commissioning local breastfeeding support services’. Available at: http://webarchive.nationalarchives.gov.uk/20130107105354/http://www.dh.gov.uk/prod_consum_dh/groups/dh_digitalassets/documents/digitalasset/dh_106497.pdf
108

Version 2.0 –18 December2015
Young mothers with a lower level of education and low income are the least likely to breastfeed their baby. Ethnicity is also a key factor. Across the UK, at three months, the number of mothers breastfeeding exclusively was 17% (up from 13% in 2005) and at four months, it was 12% (up from 7% in 2005). Breastfeeding initiation and prevalence of breastfeeding at six to eight weeks is a key health improvement indicator measured in the Public Health Outcomes framework.82
Key Facts
Breastfed babies have a reduced risk of respiratory infections, gastroenteritis, ear infections, allergic disease and Sudden Infant Death Syndrome. Breastfed babies may have better neurological development and be at lower risk of tooth decay and cardiovascular disease in later life.
There is evidence to suggest that breastfed babies may experience benefits that continue into later life, including being less likely to be overweight or obese.
Breastfeeding has been shown to have benefits for both mother and baby including promoting emotional attachment between them. Women who breastfeed are at lower risk of breast cancer, ovarian cancer and hip fractures/reduced bone density.
Current positionBreastfeeding rates at six to eight weeks after birth are monitored through the Health Visiting contract and reported nationally to Public Health England.
Figures for quarter 1 of 2015-2016 show that; 55.4% of mothers in Cambridgeshire, and 44% in Peterborough, report that they are breastfeeding at six to eight weeks compared to 43.4% in England. Breastfeeding levels remain lowest in areas of highest deprivation. Therefore, although rates in Cambridgeshire are better than the England average, there remains significant room for improvement.
Interventions and cost savings to the NHSNICE Public Health Guidance 11 on maternal and infant nutrition83 identifies key interventions to improve breastfeeding initiation and duration as a priority and recommends the following. These include adopting a multi-faceted approach or a co-ordinated programme of interventions across different settings to increase breastfeeding rates.
A systematic review published by UNICEF in 2012 identified economic savings from a multi-faceted intervention based on evidence-based guidelines including this NICE guidance. The study made a conservative estimate that assuming a moderate increase in breastfeeding rates, if 45% of women exclusively breastfed for four months, and if 75% of babies in
82 Public Health Outcomes Framework web tool: 2.02 Breastfeeding. Available at: http://www.phoutcomes.info/public-health-outcomes-framework#page/7/gid/1000042/pat/6/par/E12000006/ati/102/are/E10000003/iid/20202/age/170/sex/483 NICE Guidance PH11: Maternal and child nutrition (2008). Available at: http://www.nice.org.uk/guidance/ph11/chapter/1-Key-priorities#breastfeeding
109

Version 2.0 –18 December2015
neonatal units were breastfed at discharge, every year there could be an estimated £17m gained nationally by avoiding the costs of treating four acute diseases:
3,285 fewer gastrointestinal infection-related hospital admissions and 10,637 fewer GP consultations, with over £3.6m saved in treatment costs annually;
5,916 fewer lower respiratory tract infection related hospital admissions and 22,248 fewer GP consultations, with around £6.7m saved in treatment costs annually;
21,045 fewer acute otitis media (AOM) related GP consultations, with over £750,000 saved in treatment costs annually;
361 fewer cases of necrotizing enterocolitis (NEC or bacterial infection or viral invasion of vulnerable intestinal tissues), with over £6m saved in treatment costs annually.
There were also found to be cost savings to the NHS of over £21m nationally, due to fewer cases of breast cancer, if half of those mothers who currently do not breastfeed were to do so for up to 18 months of their lifetime. This was based on an estimated 865 fewer cases of breast cancer nationally.
Further evidence suggests that savings could be made in relation to reducing obesity, although insufficient data was available for sophisticated economic modelling. It was estimated that increasing breastfeeding rates could lead to around a 5% reduction in childhood obesity, which would save around £1.6m each year across the UK.
Very crude modelling using these conservative national figures can be used to extrapolate possible cost savings per head of the UK population to our local population. In total the savings from the UNICEF report for the UK is £17.1m if 45% of mothers were to exclusively breastfeed at four months. If this is divided by the number of UK births (45% of 776,352) you could estimate £48.80 would be saved for every baby exclusively breastfed to four months. If we assume an average breastfeeding rate of 15% at four months at present (based on the UNICEF report), it could be extrapolated that £155k might therefore be saved across Cambridgeshire and Peterborough by increasing this rate to 45%. It should be emphasised that this is a very crude calculation and estimate, and also that the economic modelling on which it is based was very conservative.
A case study in the UNICEF report of multi-faceted interventions in Lancashire (population 1.5m, 13,000 births, deprivation, breastfeeding initiation rates 66-68%, and rates 32-39% at six weeks) found there was an annual cost saving of between £82-553k depending on the range of improvement in breastfeeding rates, assuming approximately £446k was spent on interventions.
110

Version 2.0 –18 December2015
Work already plannedPromotion and support for breastfeeding is one of six key high impact priorities for health visitors and is specified in the Health Visiting Contract for Cambridgeshire and Peterborough services.84
Currently in Peterborough, the NCT are commissioned to co-ordinate the provision of four Baby Cafés across Peterborough and to train and manage peer supporters, working in partnership with midwifery and health visitors. In Cambridgeshire, peer support groups are largely volunteer run and led, with focus on Cambridge city and there is limited support in areas of deprivation.
However, key opportunities exist to build on the support from health visitors and provide community support and actions across health and other agencies to achieve maximum impact, and a multi-agency forum in Cambridgeshire has been working on a draft Breastfeeding strategy for Cambridgeshire.
With significant budget cuts to local authority funding, there are important opportunities for the Clinical Commissioning Group (CCG), to jointly commission relatively low cost interventions to invest in training and workforce development in acute trusts, to build community resilience and support and to focus on areas of high deprivation.
Where should the strategic focus be?Strategic focus should be on the core objectives outlined in NICE to achieve a multi-faceted intervention programme, which also focuses resources on parents in the most deprived areas.
RecommendationsThe focus should be on joint commissioning with local authorities to improve breastfeeding support and, implementing or piloting interventions in both acute and community settings. These interventions should include strengthening breastfeeding support and advice in acute settings, and easily accessible breastfeeding peer support programmes focused on the most deprived areas of the CCG.
84 NHS England. ‘2015 – 16 National Heath Visiting Core Service Specification ‘ (2014) Available at: https://www.england.nhs.uk/wp-content/uploads/2014/12/hv-serv-spec-dec14-fin.pdf
111

Version 2.0 –18 December2015
112

Version 2.0 –18 December2015
14. AppendicesAppendix A: What is included and what is not in this strategy
Areas of focus and rationaleArea in scope Intervention in scope RationaleObesity, weight management, diet and physical activity (adults and older people)
Adult weight management services (non-surgical) Tiers 2 and 3
Evidence strength – High Cost saving to NHS Can calculate short term effectiveness
Breastfeeding support Evidence strength – High Can calculate global savings only.
Physical activity and brief advice Evidence strength – High Cost saving to NHS Savings long term to NHS, majority of
savings in increased productivity.Physical activity and walking interventions
Evidence strength – Medium Cost saving to NHS Savings long term to NHS, majority of
savings in increased productivityDiabetes prevention
Management of hyperglycaemia Management once diagnosed not addressed here. However, high level evidence supports impact of lifestyle interventions.
Focused screening/lifestyle interventions with South Asian population.
High level evidence from NICE guidance economic modelling and subsequent modelling that this is cost saving in the long term.
Cardiovascular disease
Cardiac rehabilitation High level evidence can reduces readmissions by 30%. Can model potential savings.
Atrial fibrillation (AF) management
High level evidence can reduce stroke risk. Can model potential savings.
Hypertension management High level evidence can manage risk through lifestyle management. Can model potential savings.
Supported self-care for long term conditions (LTCs)
Mental health screening and treatment for comorbid LTCs
Currently insufficient evidence to support the implementation of routine screening for depression/anxiety.
Medium level evidence from outside of the UK that psychological interventions for those with LTCs may be cost saving, or at least cost neutral.
113
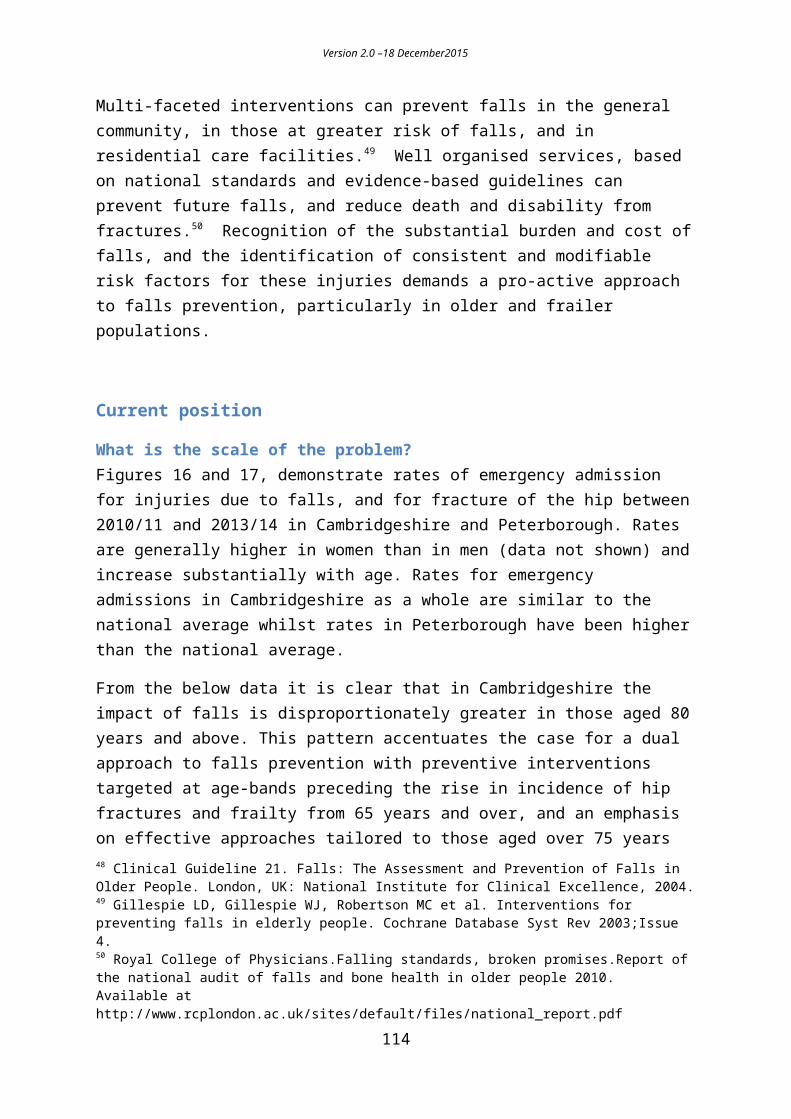
Version 2.0 –18 December2015
Other LTC self-management programmes – diabetes, asthma management / chronic obstructive pulmonary disease (COPD), cardiac best evidence
Evidence strength – full range from low to high.
High level evidence COPD and cardiac rehab can reduce healthcare costs.
Possible to model potential COPD savings.
Workplace health for NHS as an employer
Mental health interventions Evidence strength – High Potential saving to NHS Can calculate NHS productivity savings
Stop smoking interventions Evidence strength – High Cost saving to NHS Savings in line with smoking section
Physical activity interventions in the workplace
Cost saving to NHS as an employer Can calculate productivity savings
Smoking and tobacco control
Specialist smoking cessation services
Evidence strength – High Savings to NHS Can calculate savings
Stop before the op Evidence strength – High Likely to be cost saving above standard
smoking cessationSmoking cessation in pregnancy Evidence strength – High
Savings to NHS Can calculate savings
Alcohol Screening for the identification of people at risk of or misusing alcohol and brief interventions and extended brief interventions.
Evidence strength – High Potentially cost saving to NHS Can calculate savings
Falls in older people
Falls in older people Evidence strength – High Cost saving to NHS Can model potential savings
Malnutrition in older people
Malnutrition in older people Evidence strength – Medium Can model potential savings using
NICE tool.Sexual health Contraception – Long-acting
reversible contraception (LARC) Cost saving to NHS Can calculate savings
114
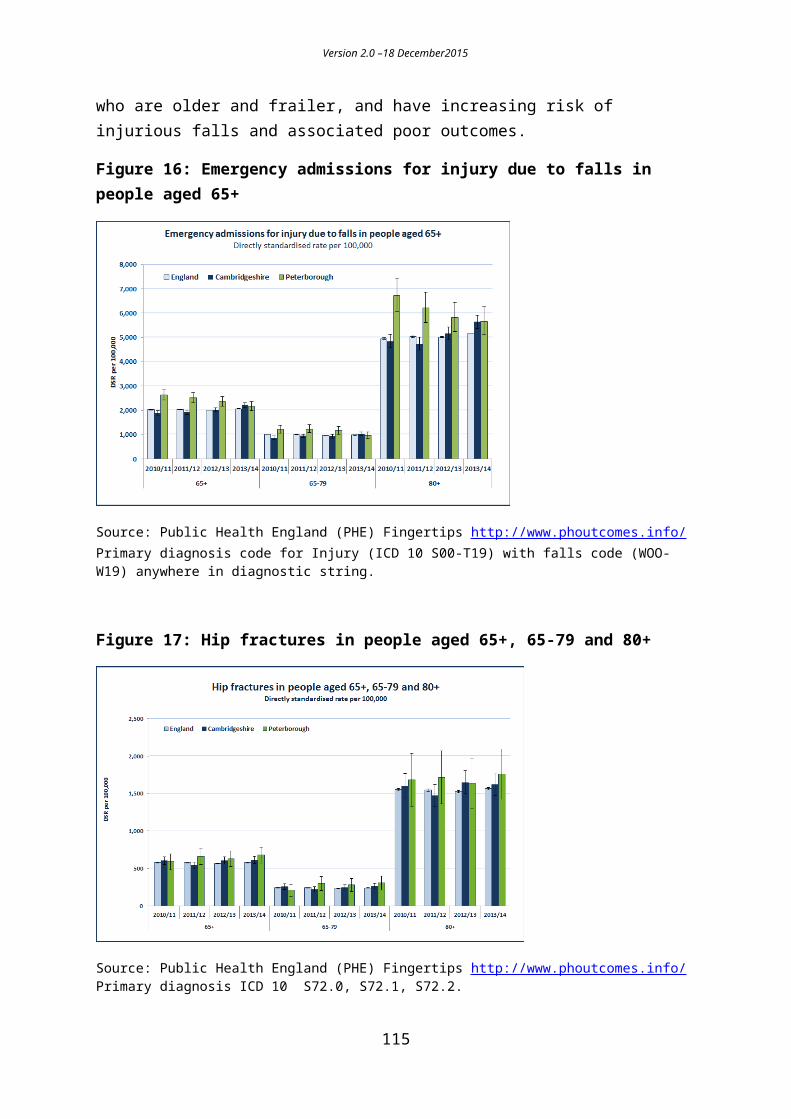
Version 2.0 –18 December2015
Areas and interventions out of scopeThere are also a number of areas and interventions that have been considered, but are not within the scope of this plan. These areas and interventions are generally where the evidence base is not so strong, where there is less potential financial impact (or savings are not to the NHS), and/or the information is not available to model reasonable estimates of NHS savings, within the timescales of this work. This does not mean that those interventions excluded here are not effective and worthwhile interventions, they have simply been found to be out of scope for this piece of work.
Area out of scope Intervention out of scope RationaleMental health Preventing postpartum
depression through psychosocial and psychological interventions
Evidence strength – High Limited cost effectiveness evidence. Savings wider than NHS.
Physical health interventions for those with severe mental illness eg smoking cessation/diet/physical activity
Evidence strength – Medium No specific additional NHS savings above
general lifestyle management interventions.
Tier 2 & 3 mental health services for children and young people.
Evidence strength – High Possibly cost saving (early intervention)
but levels of unmet need high Not possible to model NHS cost reduction
as a result of intervention. Early intervention in psychosis an exception to this.
Suicide prevention – GP Suicide Prevention Training
No cost saving to NHS Vast majority of savings to wider
economy.Obesity and weight management
Oral health NICE didn’t find initiatives cost saving.Children’s weight management programmes
Evidence strength – Medium Potentially cost saving to NHS, but no
long term evidence to base this on. Can calculate intervention effectiveness
but not long term savings.Physical activity and school playgrounds
Evidence strength – Medium Evidence of cost savings to NHS
inconclusive.Physical activity Brief intervention and
referral in primary care Evidence strength – High Cost saving Cost saving in v long term potentially.
115

Version 2.0 –18 December2015
Can’t quantify currently.
Other Older people
Reablement Lack of robust evidence of NHS savings.Flu uptake in workforce Lack of robust evidence of NHS savings
Children Early years centres’ nutrition policy
Evidence strength – High Probable cost savings to NHS, but no
evidence No economic modelling
Parenting programmes Cost savings but mainly to criminal justice, education and social services
Other parenting support in early years – intensive home visiting/FNP
Family Nurse partnership Recent evidence finds FNP not cost effective.
Diet Domestic violence interventions (IDVAs)
Evidence strength – medium. Small cost savings to the NHS, majority to
CJS. Chronically excluded adults Evidence strength – Medium
Possible savings to NHS but very small. Majority savings to criminal justice system.
Social prevention Debt advice Evidence strength – Medium (Low for primary care)
Small savings to NHS but majority to wider economy.
Warm homes / reduction in fuel poverty
Evidence strength – high. NHS savings difficult to calculate (are
some related to COPD). Majority wider savings, and difficulties with varying intervention definitions.
Local Sugar Tax Issues with local implementation
Local alcohol licensing approaches
Issues with local implementation, particularly costs of legal challenge.
Reducing social isolation Medium level evidence. Likely to be some NHS savings, but
evidence not strong enough to model these. Community navigator type programmes promising.
116

Appendix B: Public Health Reference Group evidence review - matrix indicating Agency Involvement and quality of evidence (Nesta Scale) Note: Lower quality of evidence may be due to the nature of the intervention and how easy it is to research, rather than its overall effectiveness and impact.
Key: Quality of EvidenceHigh Ranking H Middle Ranking – M Lower Ranking - L
No. Intervention CCG/NHS CCC Public Health
CCCChildren’s Services
CCCAdult Services
CCCEnviron-Ment/Planning
DistrictCouncils
VoluntarySector
Police
1 Diet
1.1 Breastfeeding peer support H H H H
1.2 Early years centres nutrition policy
H H H
1.3 Reducing socio-economic inequalities in obesity in children and adults
1.3.1 Targeted school based approaches
M M
1.3.2 Workplace health (as employer) M M M M M M M M
1.3.3 Workplace health as commissioner for private sector workplaces
M M M
1.4 Targeted primary care-delivered weight loss programmes
M M
1.5 Group based counselling and community engagement approaches
L L L L
2 Weight Management

Version 2.0 –18 December2015
Interventions2.1 Weight Management during and
after pregnancyM M
2.2 Children’s Weight Management Services
M M
2.3 Adult Weight Management Services (non-surgical)
H H
Intervention CCG/NHS CCC Public Health
CCCChildren’s Services
CCCAdult Services
CCCEnviron-ment & Planning
DistrictCouncils
VoluntarySector
Police
3 Physical Activity programmes
3.1 Physical Activity and Young Children
M M M M
3.2 Physical Activity and Workplaces
3.2.1 Workplace health (as employer) M M M M M M M M
3.2.2 Workplace health as commissioner for private sector workplaces
M M M
3.3 Physical activity in the community Increasing accessibility/community engagement
L L L L
3.4 Exercise Referral L L L
3.5 Physical Activity and Brief Advice
H H H
3.6 Physical activity and technology L L
3.7 Physical activity and walking interventions
M M M M
118
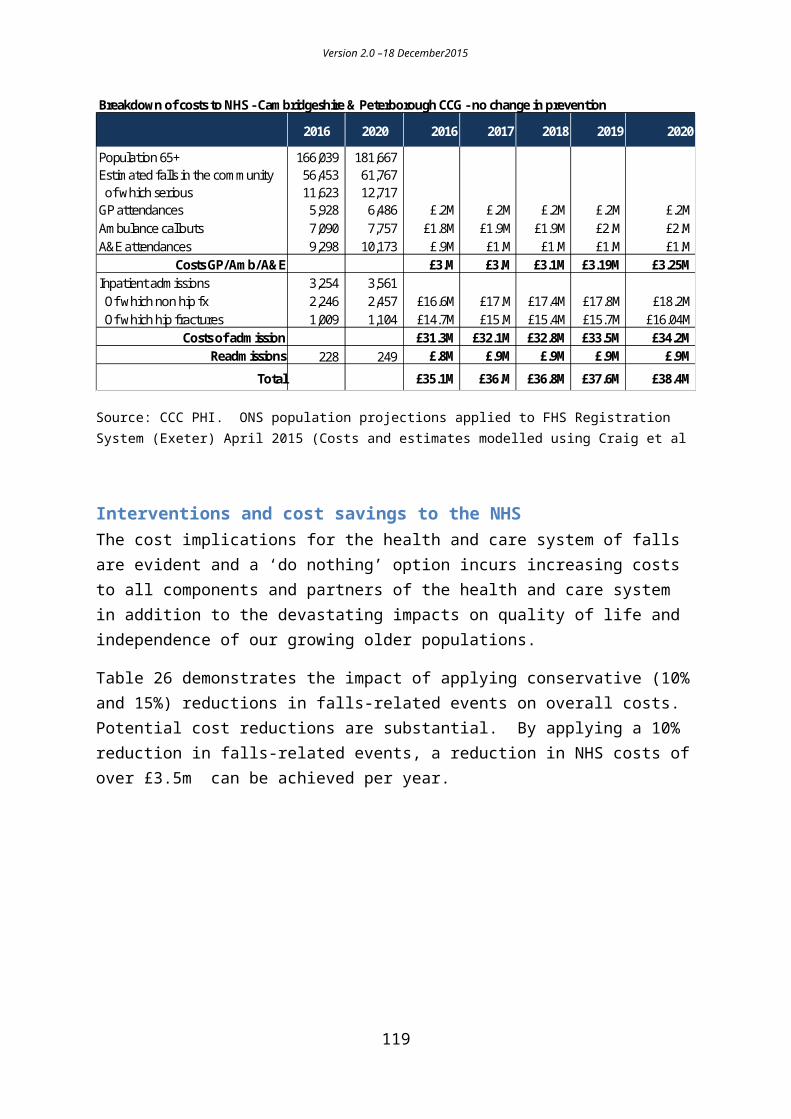
Version 2.0 –18 December2015
4 Physical Activity and the Physical Environment
4.1 Physical Activity and Planning L L L L4.2 Physical Activity and Transport L L L
Intervention CCG/NHS CCC Public Health
CCCChildren’s Services
CCCAdult Services
CCCEnviron-ment & Planning
DistrictCouncils
VoluntarySector
Police
4.3 Physical Activity and Cycling L L
4.4 Physical Activity and Walking (infrastructure)
L L L
4.5 Physical Activity and Public Open Spaces
L L L
4.6 Public Open Spaces and Public Paths
L L
4.7 Physical Activity and Workplaces
4.7.1 Workplace health (as employer) M M M M M M M M
4.7.2 Workplace health as commissioner for private sector workplaces
M M M
4.8 Physical Activity and School Playgrounds
M M M
5. Older People – prevention5.1 Older People and Malnutrition M M5.2 Older People and Physical
Activity interventions H H
119

i Dementia, disability and frailty in later life – mid-life approaches to delay or prevent onset. NICE guideline. October 2015.