business people place cambridge south cambridgeshire · cambridgeshire local economic assessment...
TRANSCRIPT
Cambridgeshire Local Economic Assessment 2011
Business
People
Place
Cambridge
South Cambridgeshire

Cambridgeshire’s Economic Assessment
- 1 -
Business Business...................................................................................................................................... 1
List of figures, maps and tables ................................................................................................ 2
Business SWOT .......................................................................................................................... 3
Business sectors and occupational profile ............................................................................. 4
Business by sector ....................................................................................................................... 4 Jobs by sector .............................................................................................................................. 5 Change in jobs and businesses .................................................................................................... 6 Public sector and knowledge intensive employment .................................................................... 7 Sector niches ................................................................................................................................ 9 The hi-tech ‘community’ in Cambridgeshire and Peterborough .................................................. 11 Cambridge Cluster at 50 ............................................................................................................. 14 Clean technology ........................................................................................................................ 15 Pharmaceuticals ......................................................................................................................... 16 Businesses in creative industries ............................................................................................... 17 Advanced manufacturing ............................................................................................................ 19 Digital economy .......................................................................................................................... 20 Agri-food ..................................................................................................................................... 21
Business Activity and Demography ....................................................................................... 22
Business size and numbers ........................................................................................................ 22 Business density......................................................................................................................... 26 Businesses by employment and turnover ................................................................................... 27 Business age and survival .......................................................................................................... 28 Business creation ....................................................................................................................... 29 Innovation ................................................................................................................................... 31 Employment growth of small businesses ................................................................................... 34
Jobs, Earnings and Productivity ............................................................................................. 35
Total jobs and jobs density ......................................................................................................... 35 Employee jobs and part-time working ........................................................................................ 36 Job growth .................................................................................................................................. 37 Earnings of employees ............................................................................................................... 38 Employment forecasts ................................................................................................................ 40 Cambridgeshire’s gross value added ......................................................................................... 41 Health and productivity ............................................................................................................... 42 GVA forecasts ............................................................................................................................ 43 Trade value................................................................................................................................. 44
Skills Profile and Employer Demand ...................................................................................... 46
Key areas of unmet demand articulated by employers .............................................................. 46 Projected replacement and expansion demand by sector and occupation ................................ 49 Skills for current vacancies ......................................................................................................... 50 Mismatches in skills profile and demand .................................................................................... 50 Key skills challenges .................................................................................................................. 51
Cambridgeshire’s Economic Assessment
- 2 -
List of figures, maps and tables Figure 1: Businesses in Greater Cambridge by district and industry sector in 2011 at local unit (site) level .................. 4 Figure 2: Employee jobs in Greater Cambridge by district and industry sector in 2010 ................................................. 5 Figure 3: Change in jobs and businesses in Cambridgeshire by industry sector over one year .................................... 6 Figure 4: Workplace population in Greater Cambridge by district and occupation group in Jul 2010-Jun 2011 ............ 8 Figure 5: Growth in GVA and employment in Cambridgeshire between 2001 and 2008 (size of each circle indicates employment within the sector in 2008) ......................................................................................................................... 10 Figure 6: Hi-tech employment and businesses in Cambridgeshire and Peterborough in 2008 .................................... 12 Figure 7: Employment in the hi-tech ‘community’ in Cambridgeshire and Peterborough in 2000 to 2008 ................... 12 Figure 8: Greater Cambridge Area Cleantech sub-sectors by market value (size of bubble), employment numbers (horizontal axis) and 2008/09 growth (vertical axis) ..................................................................................................... 15 Figure 9: Employees and local units in pharmaceuticals by county in 2008 ................................................................ 16 Figure 10: Employees in pharmaceuticals in Cambridgeshire, East of England and England by year ........................ 16 Figure 11: Employees in creative industries in Cambridgeshire, East of England and England by year ...................... 18 Figure 12: Employees and local units in creative industries by county in 2008 ............................................................ 18 Figure 13: Employees in creative industries in Greater Cambridge by district in 2010 ................................................ 18 Figure 14: Employees and local units in advanced manufacturing by county in 2008 ................................................. 19 Figure 15: Employees in advanced manufacturing in Cambridgeshire, East of England and England by year ........... 19 Figure 16: Employees and local units in digital economy industries by county in 2008 ............................................... 20 Figure 17: Employees in digital economy industries in Cambridgeshire, East of England and England by year ......... 20 Figure 18: Business density (per 10,000 residents aged 16-64) in Greater Cambridge by district in 2011 .................. 26 Figure 19: Average employment and turnover (£ thousand) per enterprise in Greater Cambridge by district in 2009 . 27 Figure 20: Survival of enterprises born in 2005 in Cambridgeshire, East of England and England ............................. 28 Figure 21: Enterprises in Greater Cambridge in 2010 by district and age of business ................................................. 28 Figure 22: Births per 10,000 adult residents in Cambridgeshire, East of England and England by year ..................... 30 Figure 23: Births per 10,000 adult residents in Greater Cambridge by district in 2010 ................................................ 30 Figure 24: Percentage of small businesses in Cambridgeshire, East of England and England showing employment growth by year ............................................................................................................................................................. 34 Figure 25: Percentage of small businesses in Greater Cambridge showing employment growth in 2008 by district ... 34 Figure 26: Jobs density in Greater Cambridge by district in 2009 ................................................................................ 35 Figure 27: Change in total jobs since 2001 in Cambridgeshire, East of England and England .................................... 37 Figure 28: Change in total jobs since 2001 in Cambridgeshire by district .................................................................... 37 Figure 29: Median full-time gross weekly workplace and resident (circle) employee earnings in Greater Cambridge by district in 2011 .............................................................................................................................................................. 39 Figure 30: Employment growth forecasts for Cambridgeshire, Greater Cambridge and East of England .................... 40 Figure 31: Employment growth forecasts for Cambridgeshire by district ..................................................................... 40 Figure 32: GVA per head in Cambridgeshire, East of England and England by year .................................................. 41 Figure 33: GVA in Cambridgeshire by year and industry ............................................................................................. 42 Figure 34: GVA per capita and labour productivity in Greater Cambridge by district in 2009 ...................................... 42 Figure 35: GVA growth forecasts for Cambridgeshire, Greater Cambridge and East of England ................................ 43 Figure 36: GVA growth forecasts for Cambridgeshire by district.................................................................................. 43 Figure 37: East of England export value by year ......................................................................................................... 44 Figure 38: Total export value by SITC section in 2010 ................................................................................................ 45 Figure 39: Total import value by SITC section in 2010 ................................................................................................ 45 Map 1: The geographic spread of creative industry businesses across Greater Cambridge ....................................... 17 Map 2: Cambridgeshire's workplaces in 2010 .............................................................................................................. 23 Map 3: Cambridgeshire's workplaces with 0 to 9 persons employed ........................................................................... 24 Map 4: Cambridgeshire's workplaces with 10 or more persons employed ................................................................... 25 Table 1: Jobs in Cambridgeshire by district and public/private breakdown in 2009 and 2010 ....................................... 6 Table 2: Workers in high value and knowledge intensive occupations, and workers in public sector and service sector industries, in Greater Cambridge by district in Jul 2010-Jun 2011 ................................................................................. 7 Table 3: Occupational structure of the employed resident population in Apr 2010-Mar 2011 ........................................ 8 Table 4: Hi-tech employment in Cambridgeshire and Peterborough by district in 2008 ............................................... 11 Table 5: Hi-tech businesses and employment in Cambridgeshire and Peterborough by year ..................................... 12 Table 6: Hi-tech employment in Cambridgeshire and Peterborough by key industry sector in 2008 ........................... 13 Table 7: Businesses in Greater Cambridge by district in 2011 at local unit (site) level ................................................ 22 Table 8: Business density (per 10,000 residents aged 16-64) in Greater Cambridge by district and year ................... 26 Table 9: Businesses in Greater Cambridge by district in 2009 & 2011 at enterprise & local unit level ......................... 27 Table 10: Enterprise births and deaths in Greater Cambridge by district in 2010 ........................................................ 29 Table 11: Total jobs and jobs density in Greater Cambridge by district in 2001 and 2009 ........................................... 35 Table 12: Employee jobs and employment in Greater Cambridge by district in 2010 .................................................. 36 Table 13: Median full-time gross weekly employee earnings in Greater Cambridge by district of workplace and gender in 2011 ......................................................................................................................................................................... 38 Table 14: Median full-time gross weekly employee earnings in Greater Cambridge by district of residence and gender in 2011 ......................................................................................................................................................................... 39
Cambridgeshire’s Economic Assessment
- 3 -
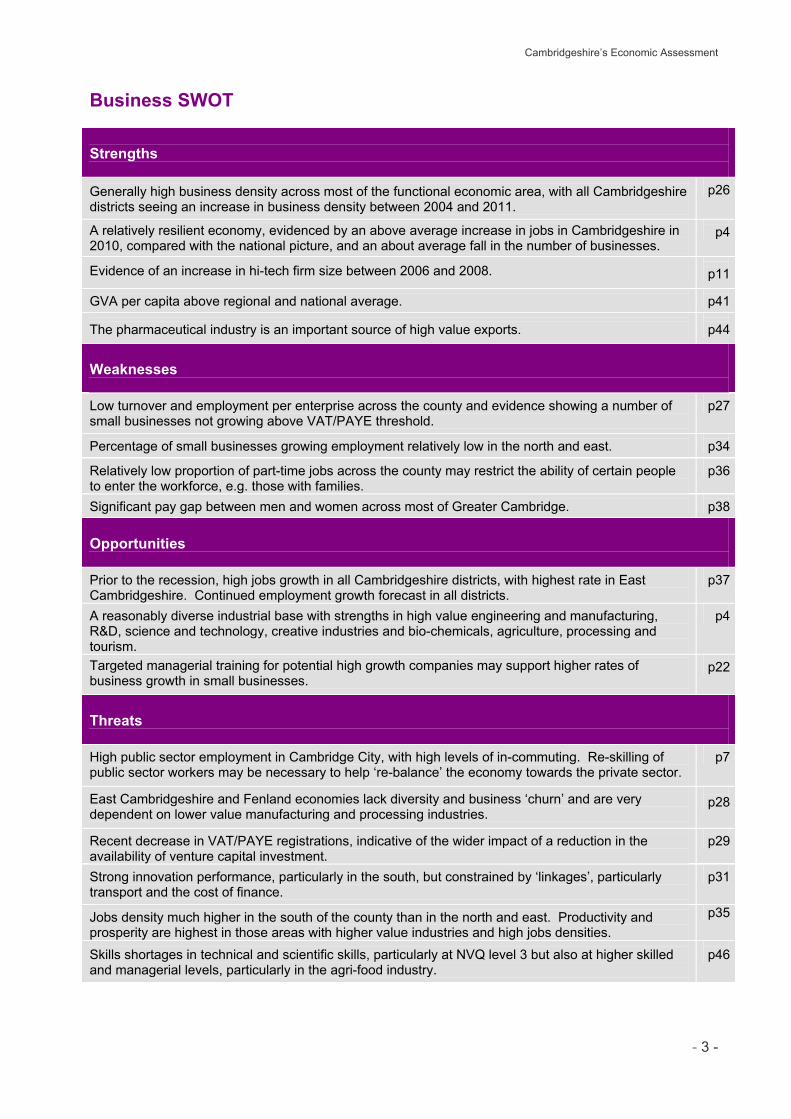
Business SWOT Strengths
Generally high business density across most of the functional economic area, with all Cambridgeshire districts seeing an increase in business density between 2004 and 2011.
p26
A relatively resilient economy, evidenced by an above average increase in jobs in Cambridgeshire in 2010, compared with the national picture, and an about average fall in the number of businesses.
p4
Evidence of an increase in hi-tech firm size between 2006 and 2008.
p11
GVA per capita above regional and national average.
p41
The pharmaceutical industry is an important source of high value exports.
p44
Weaknesses
Low turnover and employment per enterprise across the county and evidence showing a number of small businesses not growing above VAT/PAYE threshold.
p27
Percentage of small businesses growing employment relatively low in the north and east.
p34
Relatively low proportion of part-time jobs across the county may restrict the ability of certain people to enter the workforce, e.g. those with families.
p36
Significant pay gap between men and women across most of Greater Cambridge.
p38
Opportunities
Prior to the recession, high jobs growth in all Cambridgeshire districts, with highest rate in East Cambridgeshire. Continued employment growth forecast in all districts.
p37
A reasonably diverse industrial base with strengths in high value engineering and manufacturing, R&D, science and technology, creative industries and bio-chemicals, agriculture, processing and tourism.
p4
Targeted managerial training for potential high growth companies may support higher rates of business growth in small businesses.
p22
Threats
High public sector employment in Cambridge City, with high levels of in-commuting. Re-skilling of public sector workers may be necessary to help ‘re-balance’ the economy towards the private sector.
p7
East Cambridgeshire and Fenland economies lack diversity and business ‘churn’ and are very dependent on lower value manufacturing and processing industries.
p28
Recent decrease in VAT/PAYE registrations, indicative of the wider impact of a reduction in the availability of venture capital investment.
p29
Strong innovation performance, particularly in the south, but constrained by ‘linkages’, particularly transport and the cost of finance.
p31
Jobs density much higher in the south of the county than in the north and east. Productivity and prosperity are highest in those areas with higher value industries and high jobs densities.
p35
Skills shortages in technical and scientific skills, particularly at NVQ level 3 but also at higher skilled and managerial levels, particularly in the agri-food industry.
p46
Cambridgeshire’s Economic Assessment
- 4 -
0%
20%
40%
60%
80%
100%
Cam
brid
ge C
ity
Eas
t Cam
bs
Fenl
and
Hun
tingd
onsh
ire
Sou
th C
ambs
Cam
brid
gesh
ire
Fore
st H
eath
Nor
th H
erts
St E
dmun
dsbu
ry
Uttl
esfo
rd
Eas
t of E
ngla
nd
Eng
land
% o
f loc
al u
nits
Agriculture, forestry & fishing Production
Construction Motor trades
Wholesale Retail
Transport & storage (inc. postal) Accommodation & food services
Information & communication Finance & insurance
Property Professional, scientific & technical
Business administration and support services Public administration and defence
Education Health
Arts, entertainment, recreation and other services
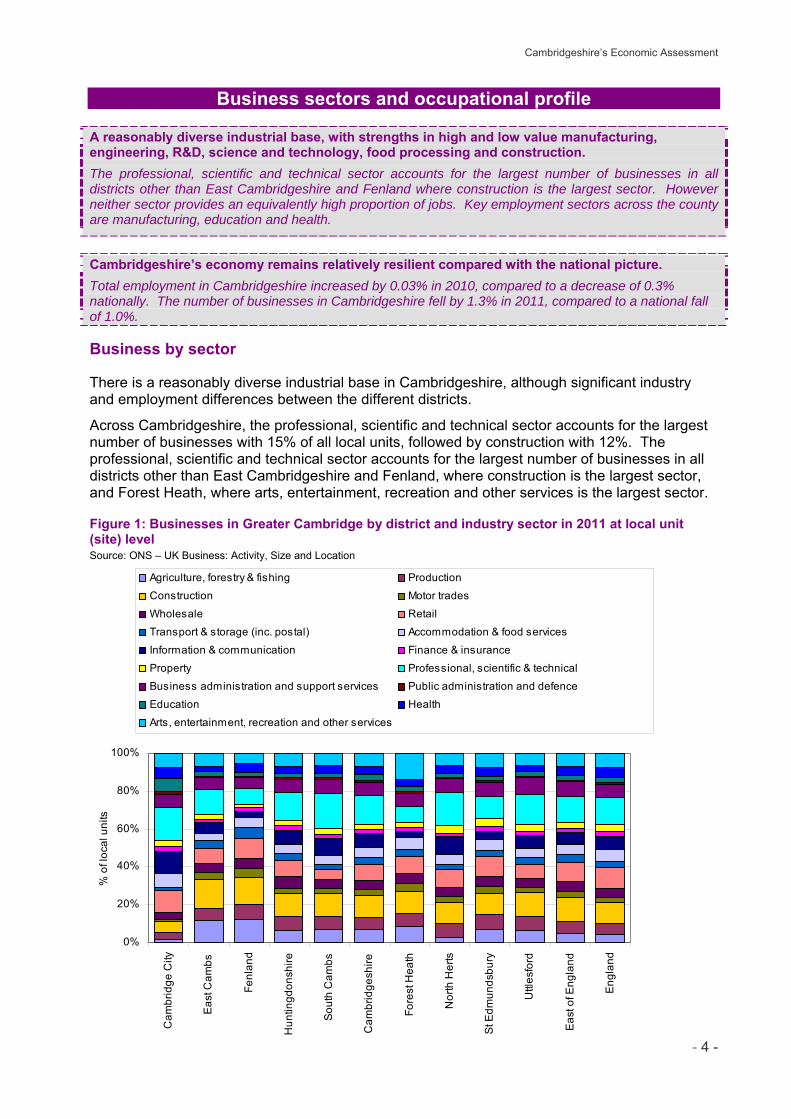
Business sectors and occupational profile A reasonably diverse industrial base, with strengths in high and low value manufacturing, engineering, R&D, science and technology, food processing and construction.
The professional, scientific and technical sector accounts for the largest number of businesses in all districts other than East Cambridgeshire and Fenland where construction is the largest sector. However neither sector provides an equivalently high proportion of jobs. Key employment sectors across the county are manufacturing, education and health.
Cambridgeshire’s economy remains relatively resilient compared with the national picture.
Total employment in Cambridgeshire increased by 0.03% in 2010, compared to a decrease of 0.3% nationally. The number of businesses in Cambridgeshire fell by 1.3% in 2011, compared to a national fall of 1.0%. Business by sector
There is a reasonably diverse industrial base in Cambridgeshire, although significant industry and employment differences between the different districts.
Across Cambridgeshire, the professional, scientific and technical sector accounts for the largest number of businesses with 15% of all local units, followed by construction with 12%. The professional, scientific and technical sector accounts for the largest number of businesses in all districts other than East Cambridgeshire and Fenland, where construction is the largest sector, and Forest Heath, where arts, entertainment, recreation and other services is the largest sector. Figure 1: Businesses in Greater Cambridge by district and industry sector in 2011 at local unit (site) level Source: ONS – UK Business: Activity, Size and Location
Cambridgeshire’s Economic Assessment
- 5 -
0%
20%
40%
60%
80%
100%
Cam
brid
ge C
ity
Eas
t Cam
bs
Fenl
and
Hun
tingd
onsh
ire
Sou
th C
ambs
Cam
brid
gesh
ire
Fore
st H
eath
Nor
th H
erts
St E
dmun
dsbu
ry
Uttl
esfo
rd
Eas
t of E
ngla
nd
Eng
land
% o
f em
ploy
ee jo
bs
Primary Manufacturing
Construction Motor trades
Wholesale Retail
Transport & storage (inc. postal) Accommodation & food services
Information & communication Finance & insurance
Property Professional, scientific & technical
Business administration and support services Public administration and defence
Education Health
Arts, entertainment, recreation and other services
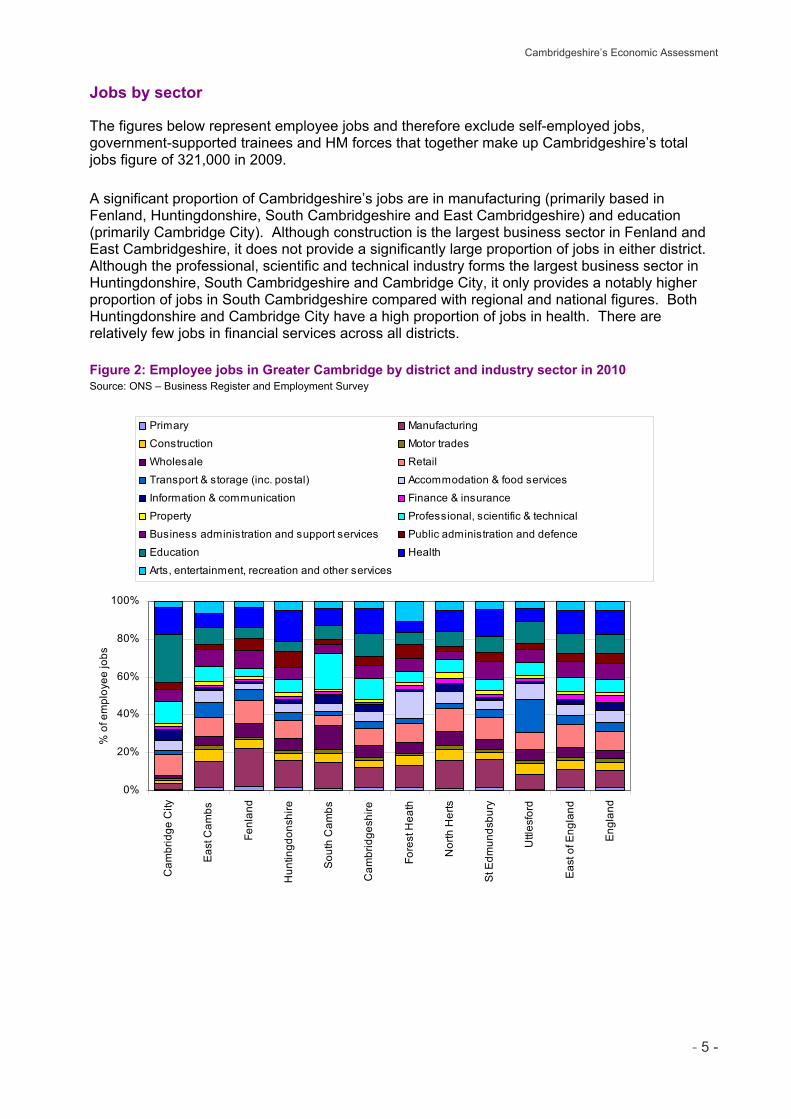
Jobs by sector
The figures below represent employee jobs and therefore exclude self-employed jobs, government-supported trainees and HM forces that together make up Cambridgeshire’s total jobs figure of 321,000 in 2009. A significant proportion of Cambridgeshire’s jobs are in manufacturing (primarily based in Fenland, Huntingdonshire, South Cambridgeshire and East Cambridgeshire) and education (primarily Cambridge City). Although construction is the largest business sector in Fenland and East Cambridgeshire, it does not provide a significantly large proportion of jobs in either district. Although the professional, scientific and technical industry forms the largest business sector in Huntingdonshire, South Cambridgeshire and Cambridge City, it only provides a notably higher proportion of jobs in South Cambridgeshire compared with regional and national figures. Both Huntingdonshire and Cambridge City have a high proportion of jobs in health. There are relatively few jobs in financial services across all districts. Figure 2: Employee jobs in Greater Cambridge by district and industry sector in 2010 Source: ONS – Business Register and Employment Survey
Cambridgeshire’s Economic Assessment
- 6 -
-3,000
-2,000
-1,000
0
1,000
2,000
3,000
Agr
icul
ture
, for
estry
& fi
shin
g
Prod
uctio
n
Con
stru
ctio
n
Mot
or tr
ades
Who
lesa
le
Ret
ail
Tran
spor
t & s
tora
ge (i
nc. p
osta
l)
Acc
omm
odat
ion
& fo
od s
ervi
ces
Info
rmat
ion
& c
omm
unic
atio
n
Fina
nce
& in
sura
nce
Pro
perty
Pro
fess
iona
l, sc
ient
ific
& te
chni
cal
Bus
ines
s ad
min
istra
tion
& s
uppo
rtse
rvic
es
Pub
lic a
dmin
istra
tion
& d
efen
ce
Edu
catio
n
Hea
lthA
rts, e
nter
tain
men
t, re
crea
tion
& o
ther
serv
icesCha
nge
in jo
bs S
ep 2
009
to S
ep 2
010
-150
-100
-50
0
50
100
150
Cha
nge
in b
usin
esse
s M
ar 2
010
to M
ar 2
011
JobsBusinesses
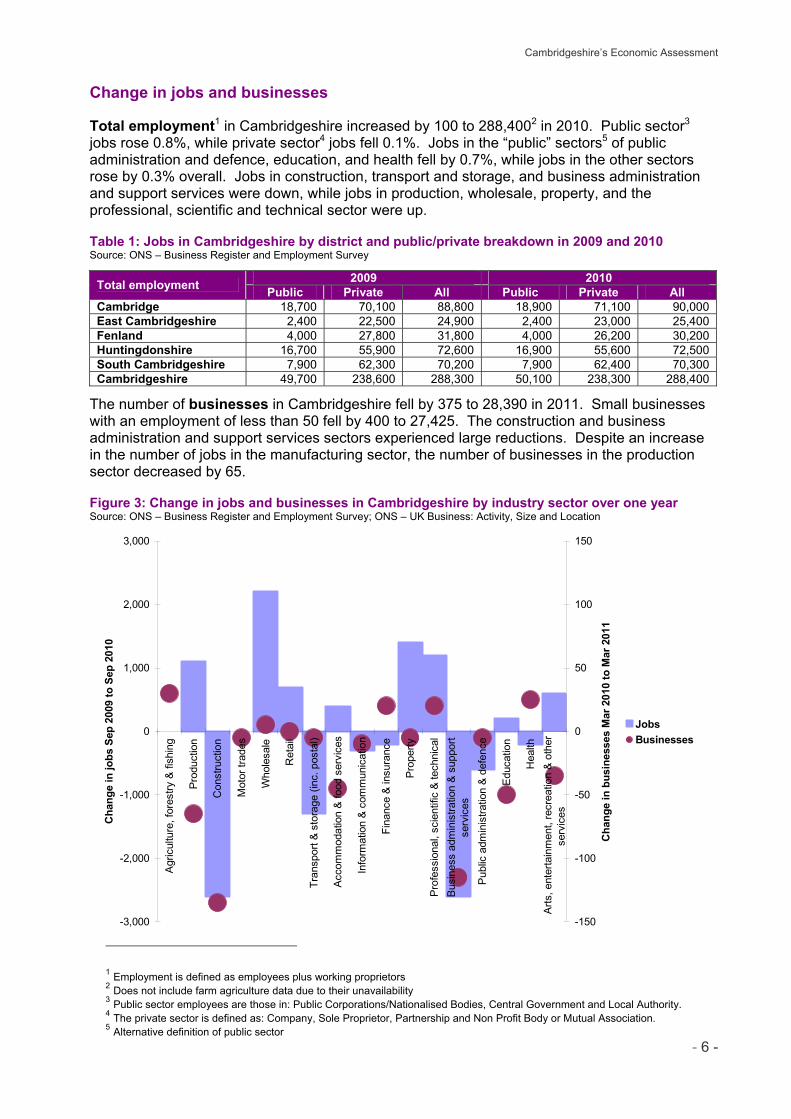
Change in jobs and businesses
Total employment1 in Cambridgeshire increased by 100 to 288,4002 in 2010. Public sector3 jobs rose 0.8%, while private sector4 jobs fell 0.1%. Jobs in the “public” sectors5 of public administration and defence, education, and health fell by 0.7%, while jobs in the other sectors rose by 0.3% overall. Jobs in construction, transport and storage, and business administration and support services were down, while jobs in production, wholesale, property, and the professional, scientific and technical sector were up. Table 1: Jobs in Cambridgeshire by district and public/private breakdown in 2009 and 2010 Source: ONS – Business Register and Employment Survey
Total employment 2009 2010 Public Private All Public Private All
Cambridge 18,700 70,100 88,800 18,900 71,100 90,000 East Cambridgeshire 2,400 22,500 24,900 2,400 23,000 25,400 Fenland 4,000 27,800 31,800 4,000 26,200 30,200 Huntingdonshire 16,700 55,900 72,600 16,900 55,600 72,500 South Cambridgeshire 7,900 62,300 70,200 7,900 62,400 70,300 Cambridgeshire 49,700 238,600 288,300 50,100 238,300 288,400
The number of businesses in Cambridgeshire fell by 375 to 28,390 in 2011. Small businesses with an employment of less than 50 fell by 400 to 27,425. The construction and business administration and support services sectors experienced large reductions. Despite an increase in the number of jobs in the manufacturing sector, the number of businesses in the production sector decreased by 65. Figure 3: Change in jobs and businesses in Cambridgeshire by industry sector over one year Source: ONS – Business Register and Employment Survey; ONS – UK Business: Activity, Size and Location
1 Employment is defined as employees plus working proprietors 2 Does not include farm agriculture data due to their unavailability 3 Public sector employees are those in: Public Corporations/Nationalised Bodies, Central Government and Local Authority. 4 The private sector is defined as: Company, Sole Proprietor, Partnership and Non Profit Body or Mutual Association. 5 Alternative definition of public sector
Cambridgeshire’s Economic Assessment
- 7 -
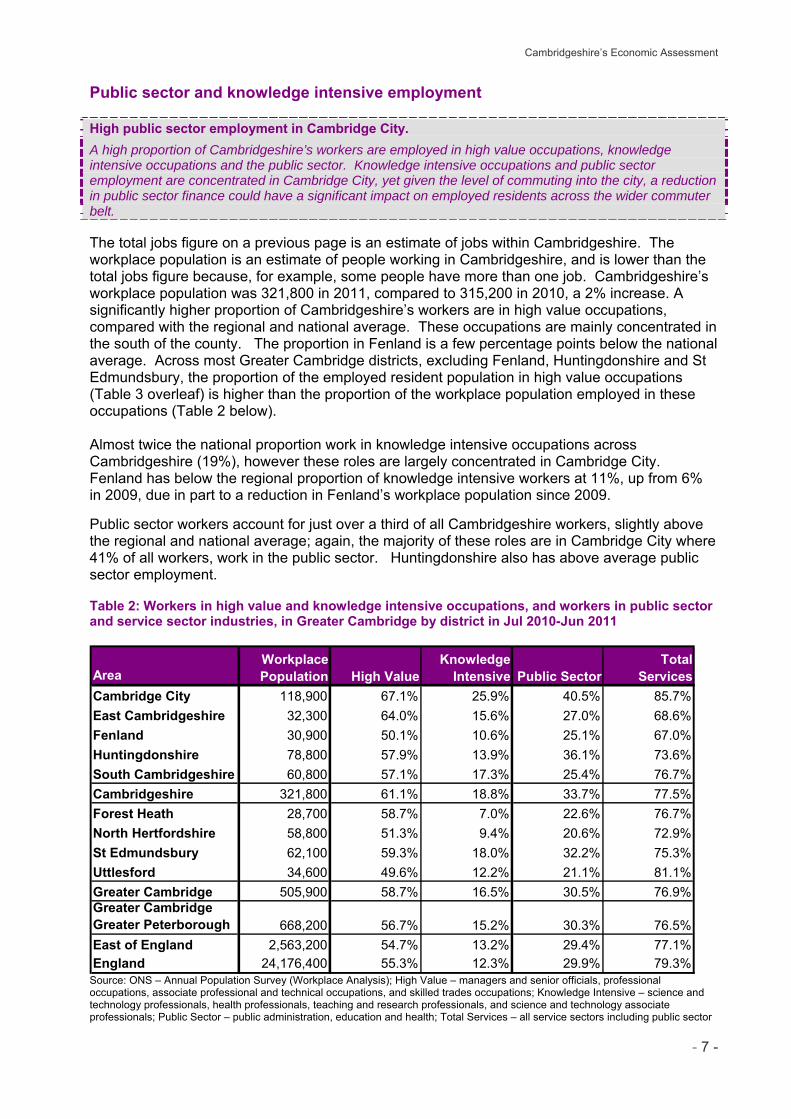
Public sector and knowledge intensive employment
High public sector employment in Cambridge City.
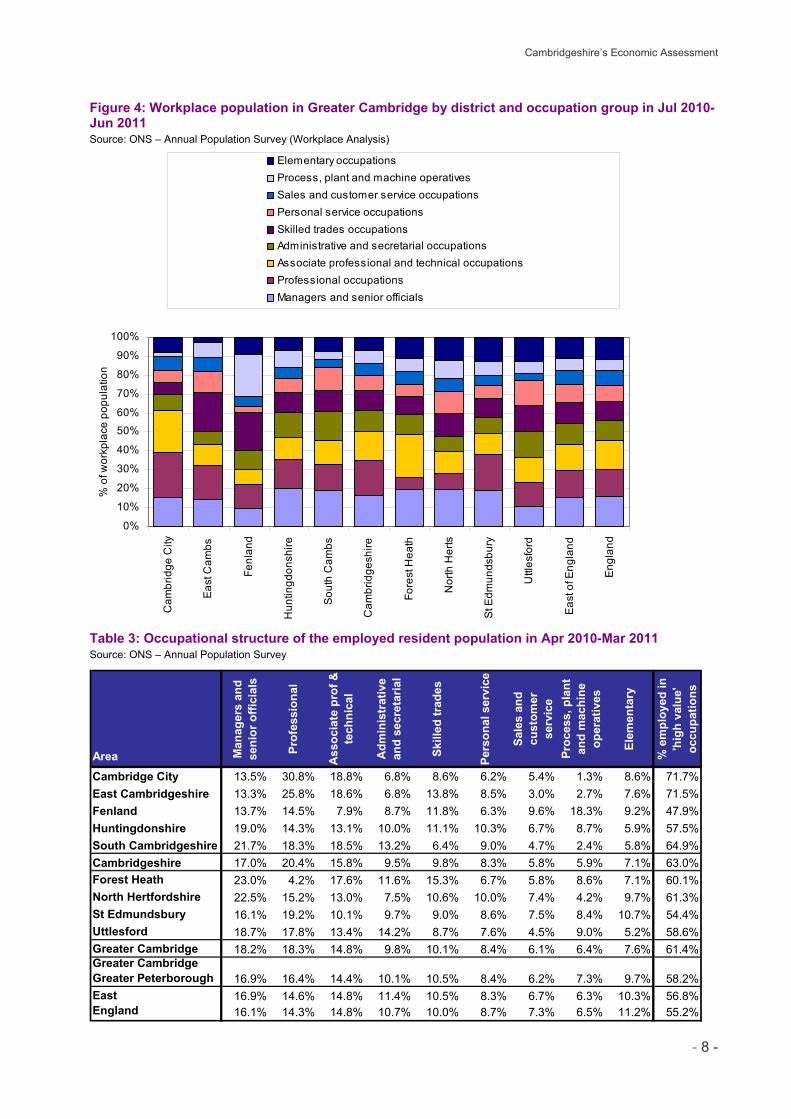
A high proportion of Cambridgeshire’s workers are employed in high value occupations, knowledge intensive occupations and the public sector. Knowledge intensive occupations and public sector employment are concentrated in Cambridge City, yet given the level of commuting into the city, a reduction in public sector finance could have a significant impact on employed residents across the wider commuter belt. The total jobs figure on a previous page is an estimate of jobs within Cambridgeshire. The workplace population is an estimate of people working in Cambridgeshire, and is lower than the total jobs figure because, for example, some people have more than one job. Cambridgeshire’s workplace population was 321,800 in 2011, compared to 315,200 in 2010, a 2% increase. A significantly higher proportion of Cambridgeshire’s workers are in high value occupations, compared with the regional and national average. These occupations are mainly concentrated in the south of the county. The proportion in Fenland is a few percentage points below the national average. Across most Greater Cambridge districts, excluding Fenland, Huntingdonshire and St Edmundsbury, the proportion of the employed resident population in high value occupations (Table 3 overleaf) is higher than the proportion of the workplace population employed in these occupations (Table 2 below). Almost twice the national proportion work in knowledge intensive occupations across Cambridgeshire (19%), however these roles are largely concentrated in Cambridge City. Fenland has below the regional proportion of knowledge intensive workers at 11%, up from 6% in 2009, due in part to a reduction in Fenland’s workplace population since 2009. Public sector workers account for just over a third of all Cambridgeshire workers, slightly above the regional and national average; again, the majority of these roles are in Cambridge City where 41% of all workers, work in the public sector. Huntingdonshire also has above average public sector employment. Table 2: Workers in high value and knowledge intensive occupations, and workers in public sector and service sector industries, in Greater Cambridge by district in Jul 2010-Jun 2011
AreaCambridge City 118,900 67.1% 25.9% 40.5% 85.7%East Cambridgeshire 32,300 64.0% 15.6% 27.0% 68.6%Fenland 30,900 50.1% 10.6% 25.1% 67.0%Huntingdonshire 78,800 57.9% 13.9% 36.1% 73.6%South Cambridgeshire 60,800 57.1% 17.3% 25.4% 76.7%Cambridgeshire 321,800 61.1% 18.8% 33.7% 77.5%Forest Heath 28,700 58.7% 7.0% 22.6% 76.7%North Hertfordshire 58,800 51.3% 9.4% 20.6% 72.9%St Edmundsbury 62,100 59.3% 18.0% 32.2% 75.3%Uttlesford 34,600 49.6% 12.2% 21.1% 81.1%Greater Cambridge 505,900 58.7% 16.5% 30.5% 76.9%Greater CambridgeGreater Peterborough 668,200 56.7% 15.2% 30.3% 76.5%East of England 2,563,200 54.7% 13.2% 29.4% 77.1%England 24,176,400 55.3% 12.3% 29.9% 79.3%
Total Services
Workplace Population High Value
Knowledge Intensive Public Sector
Source: ONS – Annual Population Survey (Workplace Analysis); High Value – managers and senior officials, professional occupations, associate professional and technical occupations, and skilled trades occupations; Knowledge Intensive – science and technology professionals, health professionals, teaching and research professionals, and science and technology associate professionals; Public Sector – public administration, education and health; Total Services – all service sectors including public sector
Cambridgeshire’s Economic Assessment
- 8 -
Figure 4: Workplace population in Greater Cambridge by district and occupation group in Jul 2010-Jun 2011 Source: ONS – Annual Population Survey (Workplace Analysis)
0%
10%
20%
30%
40%
50%
60%
70%
80%
90%
100%
Cam
brid
ge C
ity
East
Cam
bs
Fenl
and
Hun
tingd
onsh
ire
Sou
th C
ambs
Cam
brid
gesh
ire
Fore
st H
eath
Nor
th H
erts
St E
dmun
dsbu
ry
Uttl
esfo
rd
Eas
t of E
ngla
nd
Eng
land
% o
f wor
kpla
ce p
opul
atio
n
Elementary occupationsProcess, plant and machine operativesSales and customer service occupationsPersonal service occupationsSkilled trades occupationsAdministrative and secretarial occupationsAssociate professional and technical occupationsProfessional occupationsManagers and senior officials
Table 3: Occupational structure of the employed resident population in Apr 2010-Mar 2011 Source: ONS – Annual Population Survey
Area Man
ager
s an
d se
nior
offi
cial
s
Prof
essi
onal
Ass
ocia
te p
rof &
te
chni
cal
Adm
inis
trat
ive
and
secr
etar
ial
Skill
ed tr
ades
Pers
onal
ser
vice
Sale
s an
d cu
stom
er
serv
ice
Proc
ess,
pla
nt
and
mac
hine
op
erat
ives
Elem
enta
ry
% e
mpl
oyed
in
'hig
h va
lue'
oc
cupa
tions
Cambridge City 13.5% 30.8% 18.8% 6.8% 8.6% 6.2% 5.4% 1.3% 8.6% 71.7%East Cambridgeshire 13.3% 25.8% 18.6% 6.8% 13.8% 8.5% 3.0% 2.7% 7.6% 71.5%Fenland 13.7% 14.5% 7.9% 8.7% 11.8% 6.3% 9.6% 18.3% 9.2% 47.9%Huntingdonshire 19.0% 14.3% 13.1% 10.0% 11.1% 10.3% 6.7% 8.7% 5.9% 57.5%South Cambridgeshire 21.7% 18.3% 18.5% 13.2% 6.4% 9.0% 4.7% 2.4% 5.8% 64.9%Cambridgeshire 17.0% 20.4% 15.8% 9.5% 9.8% 8.3% 5.8% 5.9% 7.1% 63.0%Forest Heath 23.0% 4.2% 17.6% 11.6% 15.3% 6.7% 5.8% 8.6% 7.1% 60.1%North Hertfordshire 22.5% 15.2% 13.0% 7.5% 10.6% 10.0% 7.4% 4.2% 9.7% 61.3%St Edmundsbury 16.1% 19.2% 10.1% 9.7% 9.0% 8.6% 7.5% 8.4% 10.7% 54.4%Uttlesford 18.7% 17.8% 13.4% 14.2% 8.7% 7.6% 4.5% 9.0% 5.2% 58.6%Greater Cambridge 18.2% 18.3% 14.8% 9.8% 10.1% 8.4% 6.1% 6.4% 7.6% 61.4%Greater CambridgeGreater Peterborough 16.9% 16.4% 14.4% 10.1% 10.5% 8.4% 6.2% 7.3% 9.7% 58.2%East 16.9% 14.6% 14.8% 11.4% 10.5% 8.3% 6.7% 6.3% 10.3% 56.8%England 16.1% 14.3% 14.8% 10.7% 10.0% 8.7% 7.3% 6.5% 11.2% 55.2%
Cambridgeshire’s Economic Assessment
- 9 -
Sector niches
Strengths in education, R&D, high value manufacturing, bio-chemicals, agriculture, processing and tourism.
Cambridge City is a key centre of employment for education and R&D, Huntingdonshire has many niches in manufacturing, both high and low value, South Cambridgeshire is a regional and national centre for R&D, its wide, mainly knowledge intensive industrial mix, means that this district is the key driver of productivity within Cambridgeshire and the wider region. The economies of Fenland and East Cambridgeshire are lower value, with strengths in agriculture, low value manufacturing, construction and wholesale, reflecting their more rural nature. North Herts and Uttlesford have higher value economies displaying strengths in R&D, bio-chemicals (North Herts), high value manufacturing and air transport (Uttlesford). Forest Heath and St Edmundsbury have lower value economies with key niches in tourism, sporting activities (Forest Heath), meat processing and lower value manufacturing (St Edmundsbury).
The Annual Business Inquiry allows us to highlight a number of niches within Cambridgeshire using location quotients. The quotient states the share of employment in a sector compared to the national average – any figure greater than 1 means a sector has a share greater than the national level.
Cambridgeshire’s major niche is within R&D activity, with over 7 times the national average, with the largest employer in the sub-region being higher education (17,600). Software consultancy is also a niche and a major employer (7,000), as are agricultural activities (4,800) and wholesale of household goods. There is also a very diverse range of manufacturing employment across the sub-region, a mix between high and low value activity. Overall the specialisms point to a diverse economic base, albeit with a considerable concentration in education. Tourism is also an important sector of employment with around 21,500 full time equivalents in 2009 and supporting an estimated £1,500m of business turnover. Within districts: Cambridge is a key centre for both higher education and R&D (over 10 and 8 times higher than the national shares of employment respectively), together with a range of high value manufacturing activity. Another major specialism is within software consultancy, 2.5 times the national quotient, and employing around 3,000 people in the city.
Huntingdonshire has a range of niches, many within manufacturing, some high value and some low value. Most notable in terms of employment within this sector is the manufacture of plastic products and the knowledge intensive technical testing and analysis (the latter over 11 times the national average and employing over 1,000).
South Cambridgeshire is both a regional and national centre for R&D (much of it private sector led), this employs over 5,000 and has a share of employment nearly 20 times the national average. There is a very diverse private sector economy, with manufacturing activity ranging from pharmaceuticals, aircraft (an important employer), to manufacture of concrete and cement and to electrical equipment. There are many other elements of high value activity, including software consultancy (employing 2,500) and architectural activities (employing 2,000). This wide, mainly knowledge intensive industrial mix, means that this district is the key driver of productivity within Cambridgeshire and the wider region which is positive for future growth within the locality and the sub-region – a more diverse industry mix means the greater the ability to withstand external shocks.
East Cambridgeshire’s economy is a key centre for manufacturing (mainly lower value) and processing. Employment in the manufacture of agricultural and forest machinery in particular is 29 times higher than the national average. There are some employment concentrations apparent in higher value manufacturing, namely the manufacture of chemical products, instruments and television/radio receivers. Aside from manufacturing, other significant niches are the recycling of metal waste and scrap and various construction related industries.
Cambridgeshire’s Economic Assessment
- 10 -
Fenland has a very high share of employment in food processing, construction based manufacturing and other manufacturing activities, mainly lower down the value chain. Other significant niches include food wholesale and tourism (camping), reflecting the importance of the agricultural industry and the rural nature of the district. Higher value activity includes technical testing and machinery manufacture.
The rural nature of Forest Heath is emphasised with the two highest quotients (tourism? ?, 23 times higher than the national average, and other short stay accommodation and forestry activities, 22 times higher than the national average). Other key niches which also employ significant numbers are sporting activities (employing over 2,000, with Newmarket a major employer) and veterinary activities, reflecting Newmarket’s horse racing heritage. This is generally a lower value economy, one which builds upon its own local strengths and geography.
In St Edmundsbury, like Forest Heath, the sub-sector niches highlight a generally lower value economy, with the key niches being in preserving of meat (a quotient 11 times the national level) and a range of manufacturing activities, mainly lower down the value chain. Again, this profile highlights a rural place that is disengaged (physically and economically) from major economic activity in the Greater Cambridge core.
North Hertfordshire has a diverse, high value economy with key niches in R&D and high value engineering and manufacturing, including bio-chemicals, instruments and industrial equipment, mechanical engineering and electronics. The district also has a significant share of employment in hardware and software consultancy and motor vehicle related industries.
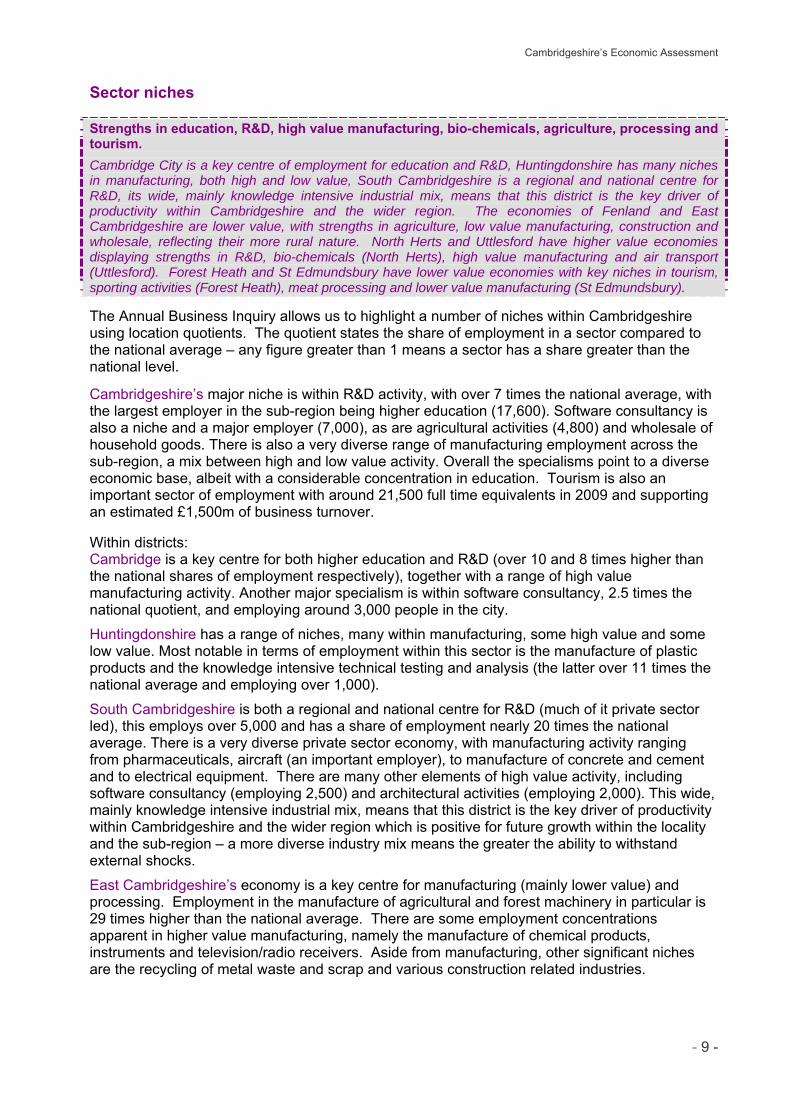
The influence of Stansted airport on Uttlesford’s economy is clear with air transport and aircraft manufacture being two significant employment niches. The district also has a high share of employment in a range of manufacturing industries including chemicals, instruments and electricity distribution through to clothing and rubber. Agriculture is also an important source of employment in the district, mainly crop growing with some animal husbandry. Growth sectors within Cambridgeshire are diverse, with prominent growth within construction, hotels and restaurants, business activities and education. Notably, public admin functions have declined across most areas, although this has been offset to some extent by increases in education and health. A key issue therefore for Cambridgeshire will be how its employment rates are affected by cuts in public spending in an economy that has become increasingly reliant upon public sector employment. Figure 5: Growth in GVA and employment in Cambridgeshire between 2001 and 2008 (size of each circle indicates employment within the sector in 2008) Source: Annual Business Inquiry 2008; EEFM 2009

Cambridgeshire’s Economic Assessment
- 11 -
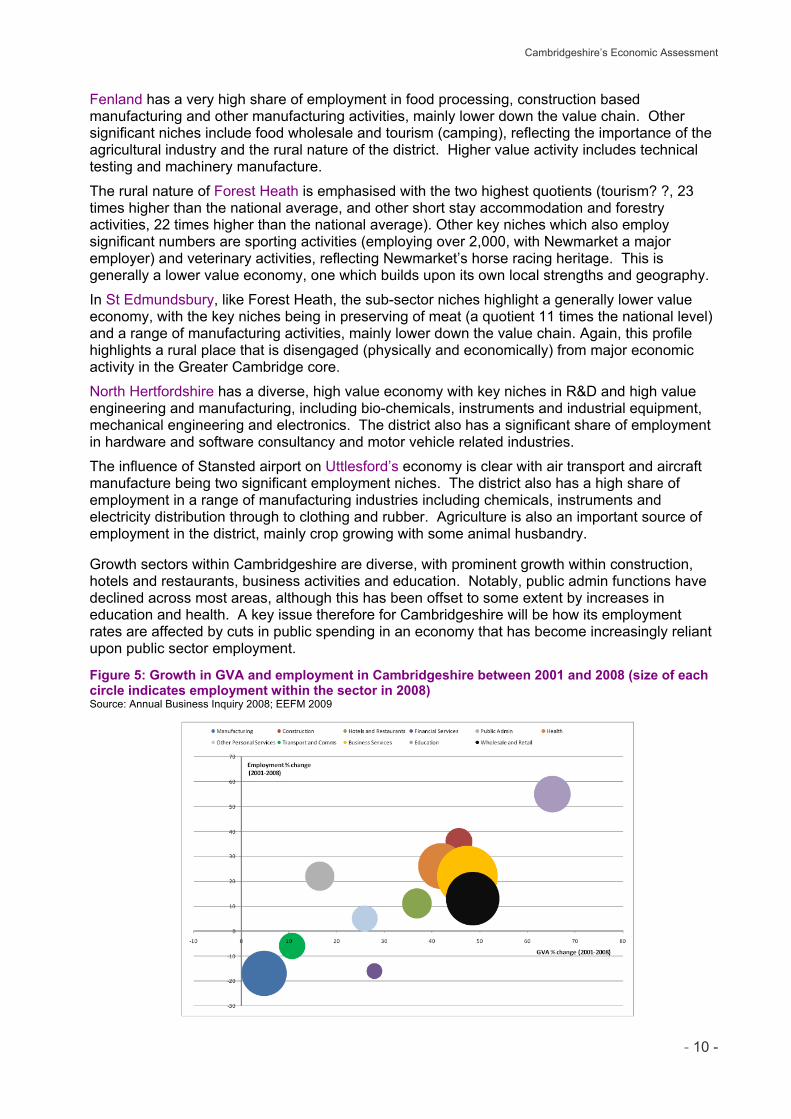
The hi-tech ‘community’ in Cambridgeshire and Peterborough
Hi-tech community accounted for 12% of jobs in 2008. Evidence of increase in firm size between 2006 and 2008.
The wider hi-tech ‘community’ provided 51,400 jobs at the start of 2008, and the overall share of jobs covered by the broad ‘hi-tech community’ definition was estimated to be 12%. Hi-tech employment grew by over 3,000 jobs between early 2006 and early 2008, while at the same time the number of hi-tech businesses fell, leading to an increase in the average employment size of hi-tech businesses. Cambridge appears to act as an ‘incubator’ of firms, exporting firms to other districts, particularly South Cambridgeshire. The hi-tech ‘community’ in Cambridgeshire and Peterborough is the subject of considerable interest and debate. Its high profile has resulted in numerous studies and investigations into the nature of growth in ‘knowledge-based’ industries. Studies of cluster development regard the area as a model for replication elsewhere in the UK. The vital importance of the businesses comprising the ‘community’ is recognised as a key national asset – and considerable emphasis is placed on nurturing the sector, both through indigenous growth and through selective inward investment. Cambridgeshire County Council’s database of employment in the hi-tech ‘community’ provides key statistical information which helps describe the community and recent developments in detail. It is based on a survey, by both post and telephone, of over 1,900 businesses, agencies and research institutes operating in Cambridgeshire and Peterborough. (Has this been carried out since 2008 – if not don’t think we should refer to it) Hi-tech employment in early 2008 (This whole section seems a bit heavy and dated if its based on 2008 info and there is nothing more recent – is it exactly same as last years?) Responses to the County Council’s survey of hi-tech businesses and employers indicate that the wider hi-tech ‘community’ provided 51,400 jobs at the start of 2008. The definition of the hi-tech ‘community’ is very broad, encompassing all employment concerned with the development, production, marketing and support of products and services which can be classified as ‘hi-tech’. The overall share of jobs in Cambridgeshire and Peterborough covered by the broad ‘hi-tech community’ definition is estimated to be 12%. The table and maps below show the concentration of jobs in the Cambridge / South Cambridgeshire area – 36,800 in all, almost three-quarters of the total. Huntingdonshire is the third focus in district terms, with almost 8,900 hi-tech jobs. Table 4: Hi-tech employment in Cambridgeshire and Peterborough by district in 2008 Source: Cambridgeshire County Council – Research Group
District Hi-tech employment
2008 % share % all jobs Cambridge City 16,577 32.2% 17.1% East Cambridgeshire 1,630 3.2% 5.1% Fenland 849 1.7% 2.2% Huntingdonshire 8,868 17.2% 10.7% Peterborough 3,337 6.5% 3.0% South Cambridgeshire 20,175 39.2% 26.9% Cambridgeshire and Peterborough 51,436 100.0% 11.7% Cambridgeshire 48,099 93.5% 14.8%
Cambridgeshire’s Economic Assessment
- 12 -
Figure 6: Hi-tech employment and businesses in Cambridgeshire and Peterborough in 2008 Source: Cambridgeshire County Council – Research Group
As well as a snapshot of the hi-tech ‘community’ at the start of 2008, the County Council’s database provides an overview of changes occurring between 2006 and 2008. The table below shows that hi-tech employment grew by over 3,000 jobs between early 2006 and early 2008, while at the same time, the number of hi-tech businesses fell – from 1,570 to 1,517 – leading to an increase in the average employment size of hi-tech businesses in Cambridgeshire and Peterborough.
Table 5: Hi-tech businesses and employment in Cambridgeshire and Peterborough by year Source: Cambridgeshire County Council – Research Group
Year Hi-tech businesses Hi-tech employment 2000 1,618 46,745 2002 1,718 50,239 2004 1,733 49,066 2006 1,570 48,275 2008 1,517 51,436
Figure 7: Employment in the hi-tech ‘community’ in Cambridgeshire and Peterborough in 2000 to 2008 Source: Cambridgeshire County Council – Research Group
Hi-tech Businesses and Employment, 2000 to 2008
1,400
1,450
1,500
1,550
1,600
1,650
1,700
1,750
1,800
1,850
1,900
2000 2002 2004 2006 2008
Num
ber o
f hi-t
ech
busi
ness
es
35,000
37,000
39,000
41,000
43,000
45,000
47,000
49,000
51,000
53,000
55,000
Empl
oym
ent i
n hi
-tech
bus
ines
ses
Hi-tech businesses Hi-tech employment
Cambridgeshire’s Economic Assessment
- 13 -
The research suggests there was significant growth in hi-tech employment across all Cambridgeshire districts apart from Cambridge City, where numbers of jobs remained little changed in 2008 as compared with 2006. However it appears that Cambridge City effectively ‘exported’ a significant number of firms and jobs to other parts of the county between 2006 and 2008, most notably to South Cambridgeshire. The district consequently plays an important role as ‘incubator’ of hi-tech firms and employment for a wider area. Within the hi-tech community, strengths in R&D, computer services, higher education, consultancy, electronics and mechanical engineering, chemicals and instruments.
Key industry sectors within the hi-tech community are research and development, computer services and consultancy, higher education and technical services (including consultancy). Manufacturing and production employment accounted for just under 31% of the total hi-tech community jobs. Electronics engineering is the biggest manufacturing sector, contributing more than 4,100 jobs in the county as a whole. Other significant manufacturing sectors include chemicals and instrument engineering. Of the manufacturing sectors the largest increases between 2006 and 2008 were in chemicals and specialist mechanical engineering. Service sectors were dominated by an increase in R&D employment.
A breakdown by key industry sector is shown in the table below for Cambridgeshire and Peterborough as a whole. Research and development businesses account for over 12,300 jobs, 24% of the total. Computer services and consultancy contribute over 8,400 jobs (16% of all). Two other sectors each provide around 5,000 jobs – education (just under 11%) and electronics engineering (just under 9%).
Table 6: Hi-tech employment in Cambridgeshire and Peterborough by key industry sector in 2008 Source: Cambridgeshire County Council – Research Group
Industry sector Hi-tech employment 2008 % share 2008 Chemicals 2,894 5.6% Specialist mechanical engineering 1,522 3.0% Computer and office hardware 1,855 3.6% Electronic engineering 4,429 8.6% Instrument engineering 2,587 5.0% Aero engineering 1,660 3.2% Publishing 293 0.6% Other manufacture 555 1.1% Specialist wholesaling 2,491 4.8% Specialist retailing 813 1.6% Telecommunications 1,730 3.4% Technical services and consultancy 3,466 6.7% Computer software and services 8,405 16.3% Research and development 12,327 24.0% Education and training 5,418 10.5% Other services 991 1.9% All manufacturing 15,795 30.7% All services 35,641 69.3% All biotech (manufacturing and services) 14,712 28.6% All sectors 51,436 100.0%
Between 2006 and 2008, the research suggests that the manufacturing sectors to experience a significant increase in hi-tech employment were chemicals, (up by over 220, or 5.9%) and specialist mechanical engineering, (up by 205 or 5.5%). The ‘services’ sectors were dominated by an increase in employment in research and development, increasing by over 1,900 jobs at the county level.
Cambridgeshire’s Economic Assessment
- 14 -
Cambridge Cluster at 50
‘The Cambridge economy: retrospect and prospect’ (March 2011) was commissioned by the East of England Development Agency (EEDA) and local partners to better understand the state of the economy in and around Cambridge, and the challenges and issues it faces, in order to inform future interventions and policy decisions to ensure it reaches its full economic potential. The main focus of the report6 is the high tech cluster, which includes high tech firms, Cambridge University and related research institutions, and specialist services which are located in Cambridge principally to support these core activities. The study also took a broader view of the Cambridge economy, examining five distinct roles that were chosen because of their economic significance:
Cambridge as a high tech business hub Cambridge as a ‘research community’ (focusing on science and technology research) Cambridge as a city economy Cambridge as a regional centre for public sector Cambridge as an international visitor destination
The importance and relative strength of the Greater Cambridge economy, and its contribution to the national economy, is widely recognised. The UK Competitiveness Index identifies Cambridge as ‘One of the most competitive cities in the UK’, and in the Cities Outlook 2010, Cambridge was highlighted as one of the most recession-proof cities in the UK and one of the most likely places to lead Britain back to growth. The growth in the high tech sector and knowledge based industries has contributed to much of this success over the last 50 years. But the continued success of the Cambridge Cluster and its contribution to the local and national economy cannot be assumed. The high tech sector is projected to grow more slowly than in the past and forecasts suggest that the Greater Cambridge area may not be making the best use of its knowledge-based assets. The report proposes an ambitious Agenda for Action in order to address the barriers to growth being faced by businesses in and around the city. It provides recommendations to central government and local private and public sector partners on the actions needed to ensure the high tech cluster can reach its economic potential, such as:
improving connectivity between the city, key employment sites - such as the Science Park - and the railway station (and London);
a change in approach to planning new developments outside the city centre – creating
social spaces rather than locations for smart, new office buildings – recognising the important role networking has played and will continue to play in the Cambridge Cluster;
developing a strategy and masterplan for the city centre which recognises the changing
nature of ‘doing business’ in the 21st century knowledge economy, whilst preserving the physical character of the city;
national policy changes on migration, healthcare regulation and access to finance which
make it easier for high tech businesses to start-up, and access global talent and finance.
6 https://www.cambridge.gov.uk/sites/default/files/docs/Cambridge_cluster_at_50_report_06042011.pdf
Cambridgeshire’s Economic Assessment
- 15 -
Clean technology
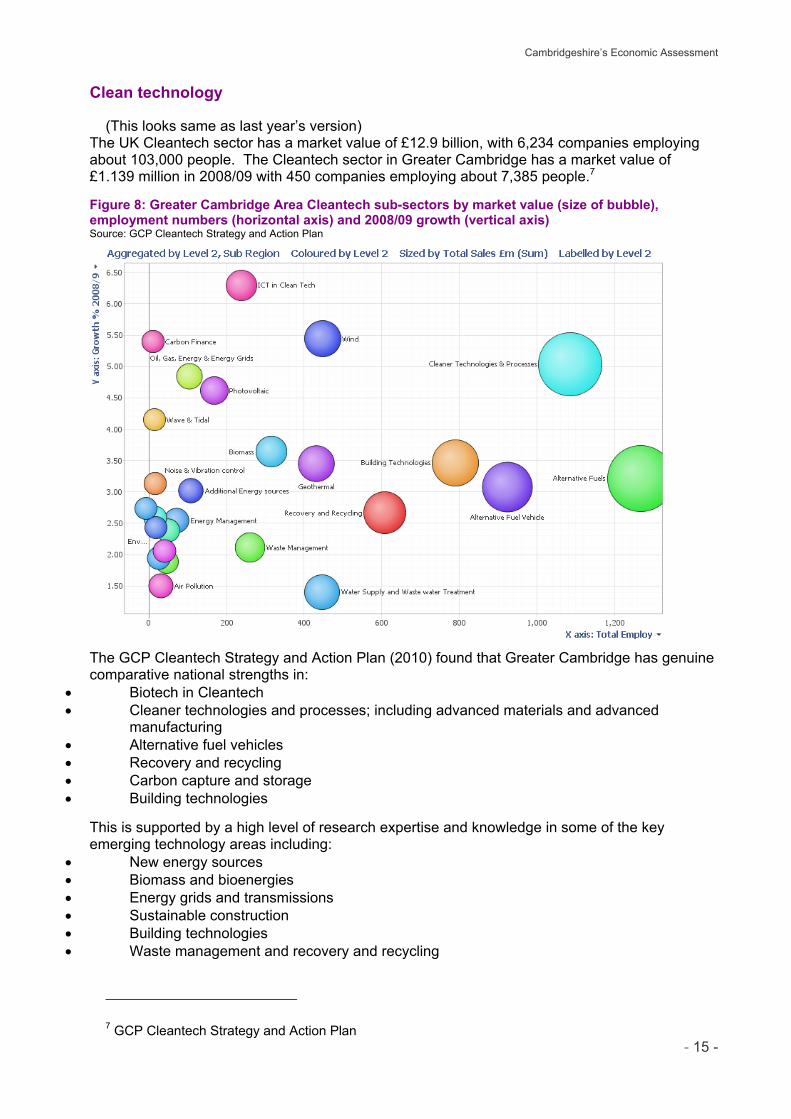
(This looks same as last year’s version) The UK Cleantech sector has a market value of £12.9 billion, with 6,234 companies employing about 103,000 people. The Cleantech sector in Greater Cambridge has a market value of £1.139 million in 2008/09 with 450 companies employing about 7,385 people.7
Figure 8: Greater Cambridge Area Cleantech sub-sectors by market value (size of bubble), employment numbers (horizontal axis) and 2008/09 growth (vertical axis) Source: GCP Cleantech Strategy and Action Plan
The GCP Cleantech Strategy and Action Plan (2010) found that Greater Cambridge has genuine comparative national strengths in:
Biotech in Cleantech Cleaner technologies and processes; including advanced materials and advanced
manufacturing Alternative fuel vehicles Recovery and recycling Carbon capture and storage Building technologies
This is supported by a high level of research expertise and knowledge in some of the key emerging technology areas including:
New energy sources Biomass and bioenergies Energy grids and transmissions Sustainable construction Building technologies Waste management and recovery and recycling
7 GCP Cleantech Strategy and Action Plan
Cambridgeshire’s Economic Assessment
- 16 -
0.0%
1.0%
2.0%
3.0%
4.0%
5.0%
6.0%
2008 2009 2010
% o
f em
ploy
ee jo
bs
Cambridgeshire
East of EnglandEngland
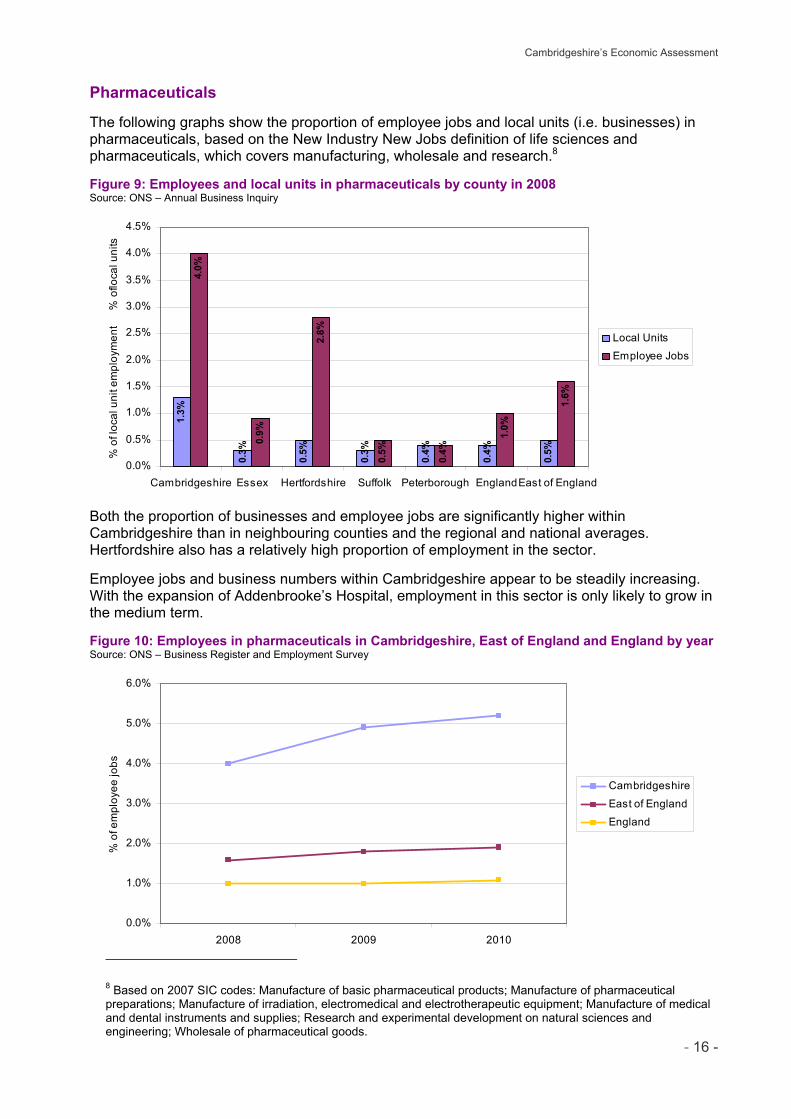
Pharmaceuticals The following graphs show the proportion of employee jobs and local units (i.e. businesses) in pharmaceuticals, based on the New Industry New Jobs definition of life sciences and pharmaceuticals, which covers manufacturing, wholesale and research.8 Figure 9: Employees and local units in pharmaceuticals by county in 2008 Source: ONS – Annual Business Inquiry
1.3%
0.3%
0.5%
0.3%
0.4%
0.4%
0.5%
4.0%
0.9%
2.8%
0.5%
0.4%
1.0%
1.6%
0.0%
0.5%
1.0%
1.5%
2.0%
2.5%
3.0%
3.5%
4.0%
4.5%
Cambridgeshire Essex Hertfordshire Suffolk Peterborough EnglandEast of England
% o
f loc
al u
nit e
mpl
oym
ent
%
of lo
cal u
nits
Local Units
Employee Jobs
Both the proportion of businesses and employee jobs are significantly higher within Cambridgeshire than in neighbouring counties and the regional and national averages. Hertfordshire also has a relatively high proportion of employment in the sector. Employee jobs and business numbers within Cambridgeshire appear to be steadily increasing. With the expansion of Addenbrooke’s Hospital, employment in this sector is only likely to grow in the medium term. Figure 10: Employees in pharmaceuticals in Cambridgeshire, East of England and England by year Source: ONS – Business Register and Employment Survey
8 Based on 2007 SIC codes: Manufacture of basic pharmaceutical products; Manufacture of pharmaceutical preparations; Manufacture of irradiation, electromedical and electrotherapeutic equipment; Manufacture of medical and dental instruments and supplies; Research and experimental development on natural sciences and engineering; Wholesale of pharmaceutical goods.
Cambridgeshire’s Economic Assessment
- 17 -
Businesses in creative industries
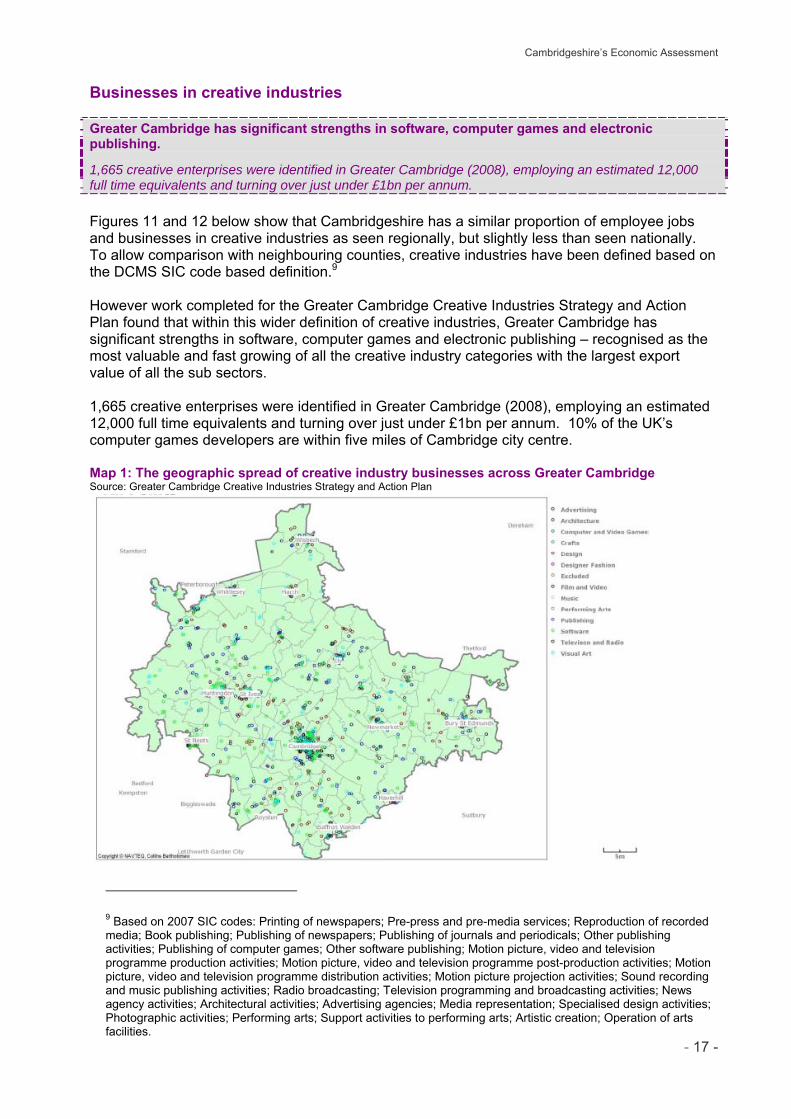
Greater Cambridge has significant strengths in software, computer games and electronic publishing. 1,665 creative enterprises were identified in Greater Cambridge (2008), employing an estimated 12,000 full time equivalents and turning over just under £1bn per annum.
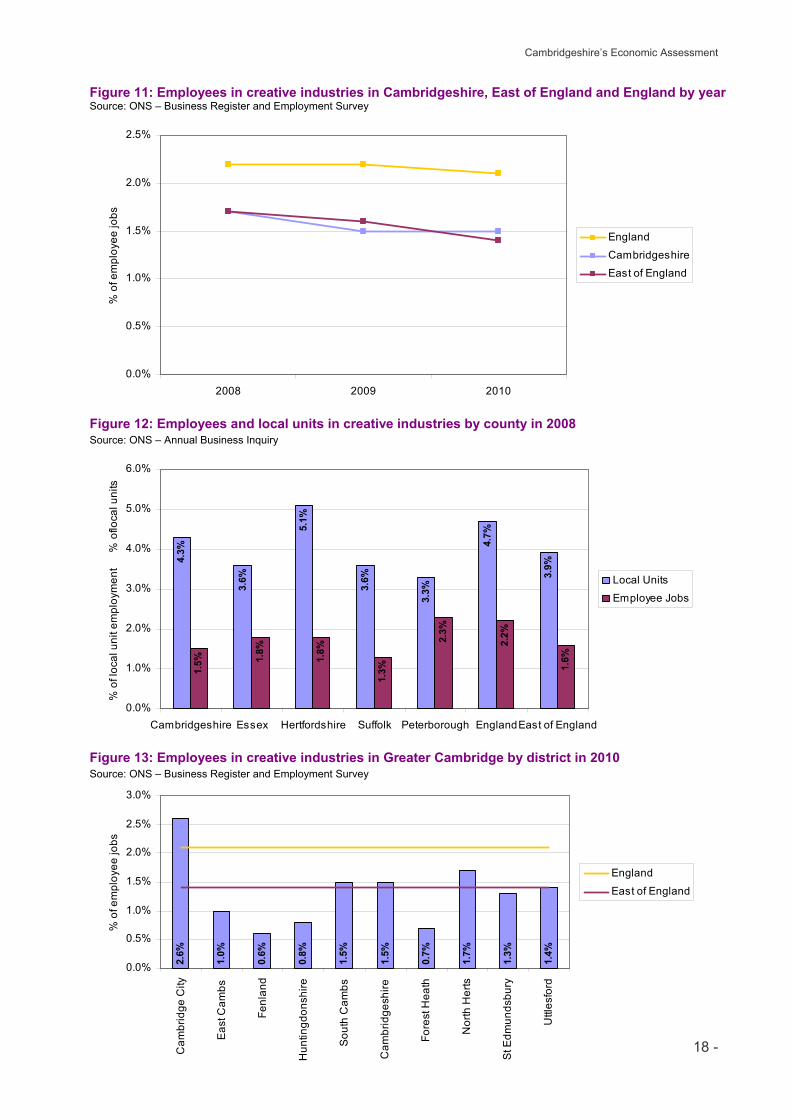
Figures 11 and 12 below show that Cambridgeshire has a similar proportion of employee jobs and businesses in creative industries as seen regionally, but slightly less than seen nationally. To allow comparison with neighbouring counties, creative industries have been defined based on the DCMS SIC code based definition.9 However work completed for the Greater Cambridge Creative Industries Strategy and Action Plan found that within this wider definition of creative industries, Greater Cambridge has significant strengths in software, computer games and electronic publishing – recognised as the most valuable and fast growing of all the creative industry categories with the largest export value of all the sub sectors. 1,665 creative enterprises were identified in Greater Cambridge (2008), employing an estimated 12,000 full time equivalents and turning over just under £1bn per annum. 10% of the UK’s computer games developers are within five miles of Cambridge city centre. Map 1: The geographic spread of creative industry businesses across Greater Cambridge Source: Greater Cambridge Creative Industries Strategy and Action Plan
9 Based on 2007 SIC codes: Printing of newspapers; Pre-press and pre-media services; Reproduction of recorded media; Book publishing; Publishing of newspapers; Publishing of journals and periodicals; Other publishing activities; Publishing of computer games; Other software publishing; Motion picture, video and television programme production activities; Motion picture, video and television programme post-production activities; Motion picture, video and television programme distribution activities; Motion picture projection activities; Sound recording and music publishing activities; Radio broadcasting; Television programming and broadcasting activities; News agency activities; Architectural activities; Advertising agencies; Media representation; Specialised design activities; Photographic activities; Performing arts; Support activities to performing arts; Artistic creation; Operation of arts facilities.
Cambridgeshire’s Economic Assessment
- 18 -
2.6%
1.0%
0.6%
0.8%
1.5%
1.5%
0.7%
1.7%
1.3%
1.4%
0.0%
0.5%
1.0%
1.5%
2.0%
2.5%
3.0%
Cam
brid
ge C
ity
Eas
t Cam
bs
Fenl
and
Hun
tingd
onsh
ire
Sou
th C
ambs
Cam
brid
gesh
ire
Fore
st H
eath
Nor
th H
erts
St E
dmun
dsbu
ry
Uttl
esfo
rd
% o
f em
ploy
ee jo
bs
England
East of England
Figure 11: Employees in creative industries in Cambridgeshire, East of England and England by year Source: ONS – Business Register and Employment Survey
0.0%
0.5%
1.0%
1.5%
2.0%
2.5%
2008 2009 2010
% o
f em
ploy
ee jo
bs
England
Cambridgeshire
East of England
Figure 12: Employees and local units in creative industries by county in 2008 Source: ONS – Annual Business Inquiry
4.3%
3.6%
5.1%
3.6%
3.3%
4.7%
3.9%
1.5% 1.
8%
1.8%
1.3%
2.3%
2.2%
1.6%
0.0%
1.0%
2.0%
3.0%
4.0%
5.0%
6.0%
Cambridgeshire Essex Hertfordshire Suffolk Peterborough EnglandEast of England
% o
f loc
al u
nit e
mpl
oym
ent
%
of lo
cal u
nits
Local Units
Employee Jobs
Figure 13: Employees in creative industries in Greater Cambridge by district in 2010 Source: ONS – Business Register and Employment Survey
Cambridgeshire’s Economic Assessment
- 19 -
0.0%
0.5%
1.0%
1.5%
2.0%
2.5%
3.0%
3.5%
4.0%
4.5%
2008 2009 2010
% o
f em
ploy
ee jo
bs
Cambridgeshire
East of England
England
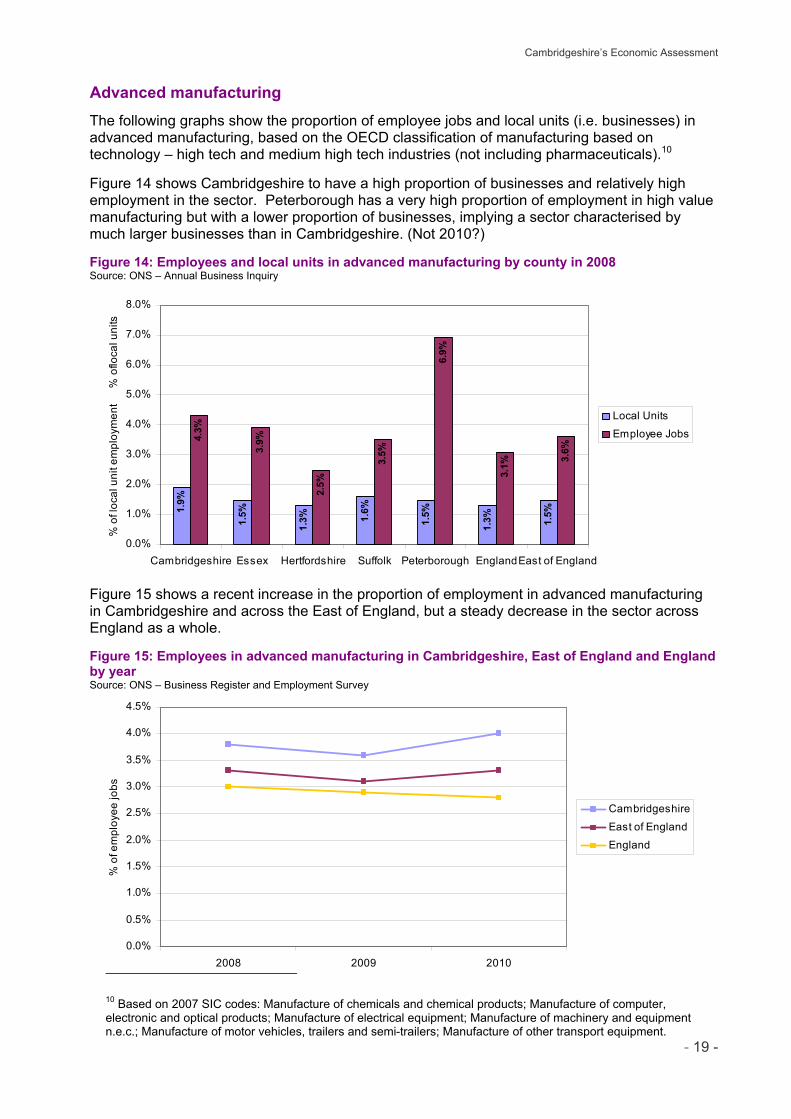
Advanced manufacturing The following graphs show the proportion of employee jobs and local units (i.e. businesses) in advanced manufacturing, based on the OECD classification of manufacturing based on technology – high tech and medium high tech industries (not including pharmaceuticals).10 Figure 14 shows Cambridgeshire to have a high proportion of businesses and relatively high employment in the sector. Peterborough has a very high proportion of employment in high value manufacturing but with a lower proportion of businesses, implying a sector characterised by much larger businesses than in Cambridgeshire. (Not 2010?) Figure 14: Employees and local units in advanced manufacturing by county in 2008 Source: ONS – Annual Business Inquiry
1.9%
1.5%
1.3% 1.
6%
1.5%
1.3% 1.5%
4.3%
3.9%
2.5%
3.5%
6.9%
3.1%
3.6%
0.0%
1.0%
2.0%
3.0%
4.0%
5.0%
6.0%
7.0%
8.0%
Cambridgeshire Essex Hertfordshire Suffolk Peterborough EnglandEast of England
% o
f loc
al u
nit e
mpl
oym
ent
%
of lo
cal u
nits
Local Units
Employee Jobs
Figure 15 shows a recent increase in the proportion of employment in advanced manufacturing in Cambridgeshire and across the East of England, but a steady decrease in the sector across England as a whole. Figure 15: Employees in advanced manufacturing in Cambridgeshire, East of England and England by year Source: ONS – Business Register and Employment Survey
10 Based on 2007 SIC codes: Manufacture of chemicals and chemical products; Manufacture of computer, electronic and optical products; Manufacture of electrical equipment; Manufacture of machinery and equipment n.e.c.; Manufacture of motor vehicles, trailers and semi-trailers; Manufacture of other transport equipment.
Cambridgeshire’s Economic Assessment
- 20 -
0.0%
1.0%
2.0%
3.0%
4.0%
5.0%
6.0%
7.0%
8.0%
2008 2009 2010
% o
f em
ploy
ee jo
bs
Cambridgeshire
England
East of England
Digital economy
The following graphs show the proportion of employee jobs and local units (i.e. businesses) in the digital economy, based on the New Industry New Jobs definition, which includes manufacture of computers and related goods, telecommunications, printing, publishing and digital content.11
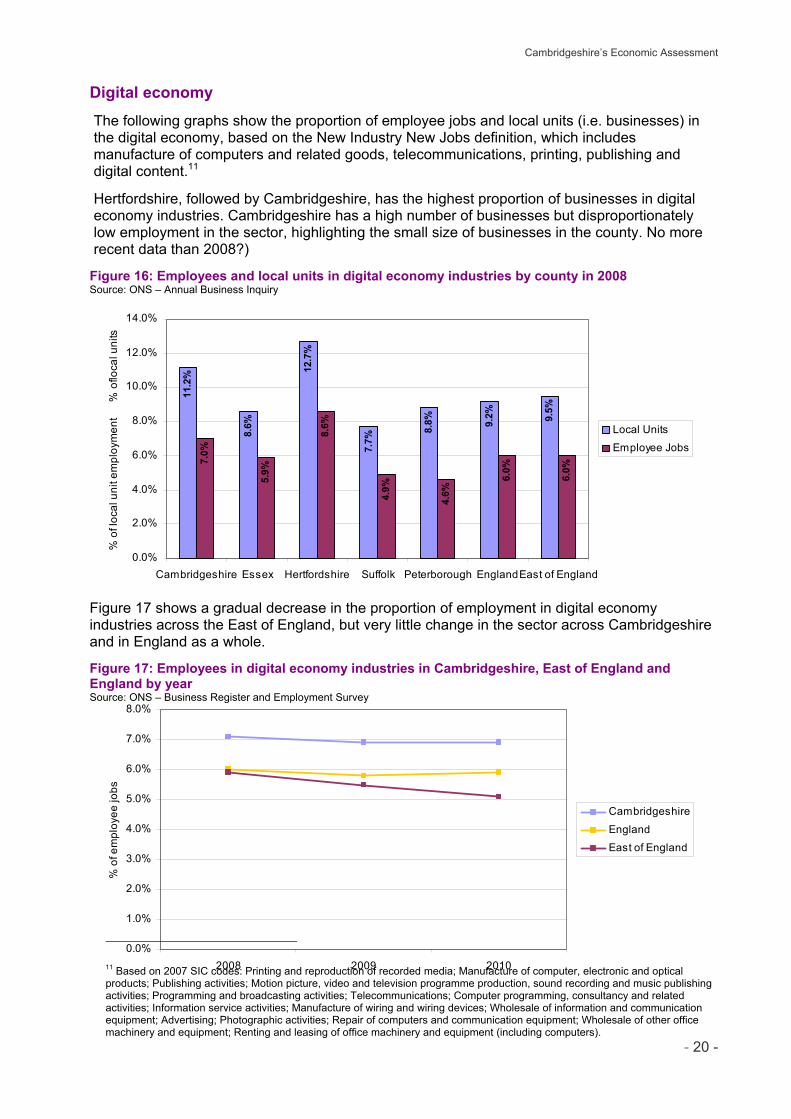
Hertfordshire, followed by Cambridgeshire, has the highest proportion of businesses in digital economy industries. Cambridgeshire has a high number of businesses but disproportionately low employment in the sector, highlighting the small size of businesses in the county. No more recent data than 2008?) Figure 16: Employees and local units in digital economy industries by county in 2008 Source: ONS – Annual Business Inquiry
11.2
%
8.6%
12.7
%
7.7%
8.8% 9.
2% 9.5%
7.0%
5.9%
8.6%
4.9%
4.6%
6.0%
6.0%
0.0%
2.0%
4.0%
6.0%
8.0%
10.0%
12.0%
14.0%
Cambridgeshire Essex Hertfordshire Suffolk Peterborough EnglandEast of England
% o
f loc
al u
nit e
mpl
oym
ent
%
of lo
cal u
nits
Local Units
Employee Jobs
Figure 17 shows a gradual decrease in the proportion of employment in digital economy industries across the East of England, but very little change in the sector across Cambridgeshire and in England as a whole. Figure 17: Employees in digital economy industries in Cambridgeshire, East of England and England by year Source: ONS – Business Register and Employment Survey
11 Based on 2007 SIC codes: Printing and reproduction of recorded media; Manufacture of computer, electronic and optical products; Publishing activities; Motion picture, video and television programme production, sound recording and music publishing activities; Programming and broadcasting activities; Telecommunications; Computer programming, consultancy and related activities; Information service activities; Manufacture of wiring and wiring devices; Wholesale of information and communication equipment; Advertising; Photographic activities; Repair of computers and communication equipment; Wholesale of other office machinery and equipment; Renting and leasing of office machinery and equipment (including computers).
Cambridgeshire’s Economic Assessment
- 21 -
Agri-food
Agri-food is an important source of employment in Greater Cambridge but the sector faces significant recruitment difficulties, particularly for higher skilled workers. The agri-food sector is a very important source of employment in the north of the county. Recent reports suggest that the future workforce is unlikely to fall and may rise due to increased production. However the sector finds it very hard to recruit qualified workers and has become increasingly dependent on migrant workers to the extent that many employers are concerned about where their future workforce will come from.
The Fens contain around half of the grade 1 agricultural land in England and produce 24% of all potatoes grown in the UK. In the East of England the agri-food sector is a major employer with a labour force in excess of 375,000 people, of whom 122,000 are employed in agriculture, food processing and ancillary businesses, 115,000 in food retail and 139,000 in the catering sector (DEFRA 2009). The food chain thus represents 1 in 7 jobs in the region’s economy. Within some Greater Cambridge districts the concentration of employment is very high, for example Fenland has 37 times the national proportion of employment in the processing and preserving of fruit and vegetables. However, evidence suggests the sector has struggled to attract enough good new people and is not seen as a career of choice by many people, and levels of progression and formal qualifications are low by comparison with many other sectors. There is also a need for skilled technologists and those with higher level management skills able to run increasingly large and complex business operations. In part the skills gap in the sector has been met by migrants who have become an increasingly important component of the food and farming sector’s workforce, with many now progressing into management roles and becoming part of the long term workforce. However, most employers have concerns about how dependent they have become on this source of new recruits, and have expressed worries about where their future workforce will come from.12 The issues identified regionally are aligned with national research, which has highlighted a need to increase UK food production to deliver food security by increasing the focus on research and skills. But, this challenge occurs at the end of a 20 year period in which agricultural student numbers declined until 2005, with only small improvements being seen in the last few years, and then only in part time student numbers. Agricultural and food related research has also been cut and many former research facilities have closed. To address the challenges outlined above in relation to production and sustainability many reports have highlighted the need to increase recruitment to the sector (LANTRA 2006), improve technology transfer, develop the science base and increase skill levels. Whilst direct agricultural employment had been declining for many years, 2008 saw the first recent significant rise (+3%) in employment due to increased production. Whilst there remains scope for some further mechanisation on some farms, many larger (in particular) arable businesses, feel that the future workforce will not fall as we are approaching the limit of machinery size which can be used. (No data for 2010?)
12 The Skills Challenge for the East of England’s Food & Farming Sector to 2020 (2010)
Cambridgeshire’s Economic Assessment
- 22 -
Business Activity and Demography Business size and numbers
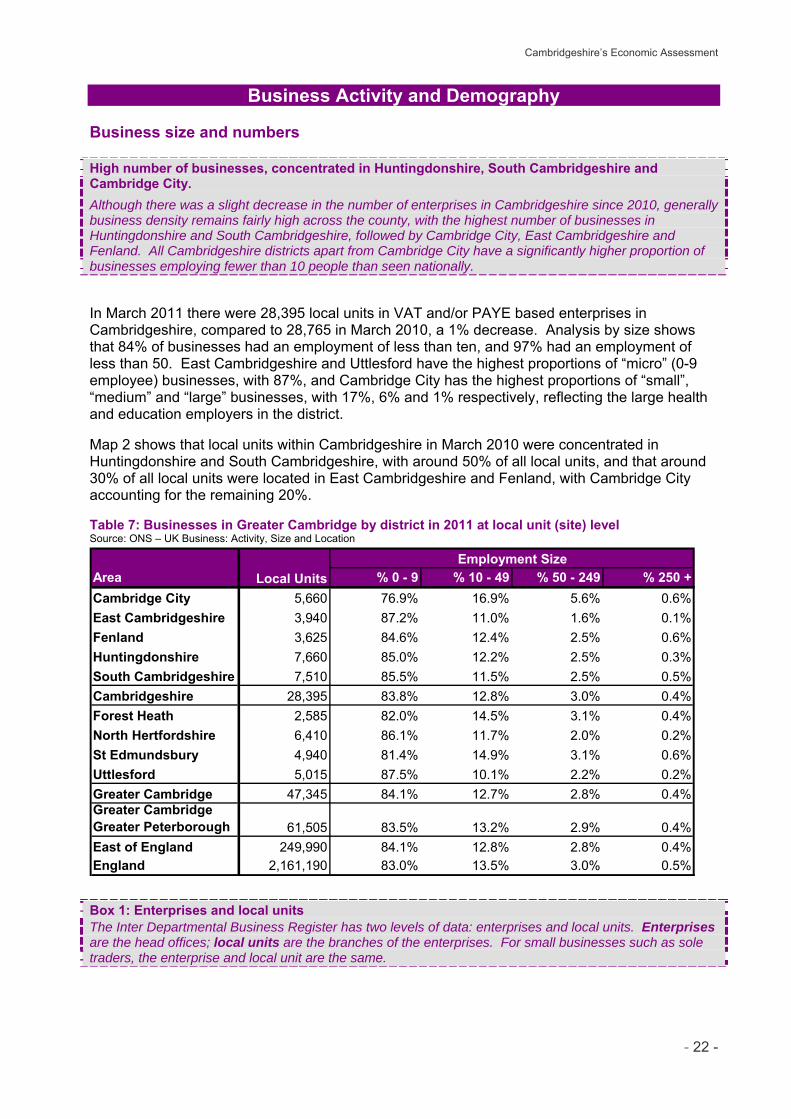
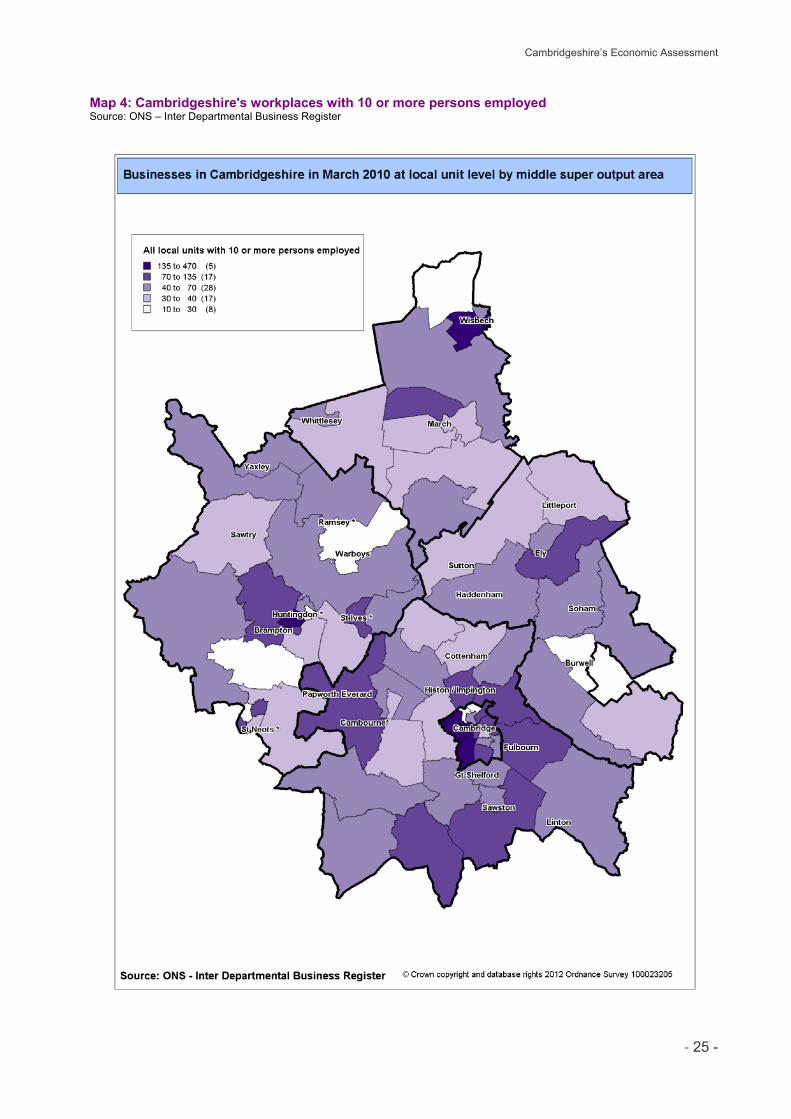
High number of businesses, concentrated in Huntingdonshire, South Cambridgeshire and Cambridge City.
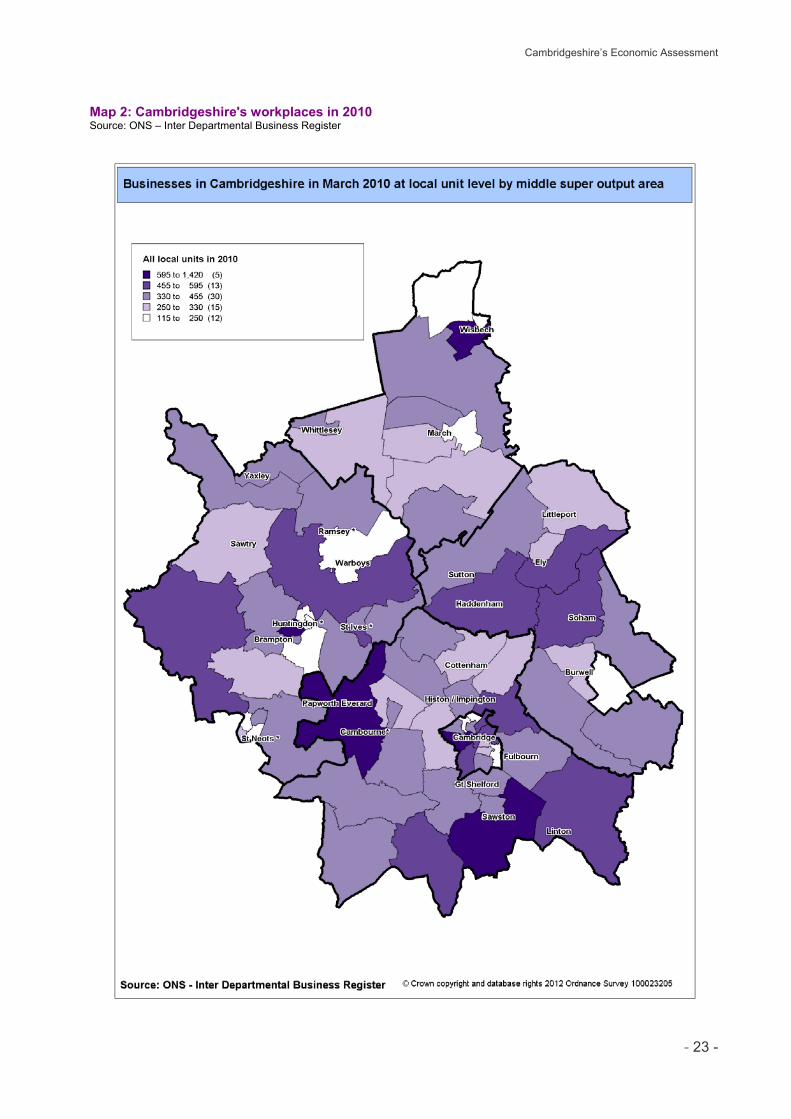
Although there was a slight decrease in the number of enterprises in Cambridgeshire since 2010, generally business density remains fairly high across the county, with the highest number of businesses in Huntingdonshire and South Cambridgeshire, followed by Cambridge City, East Cambridgeshire and Fenland. All Cambridgeshire districts apart from Cambridge City have a significantly higher proportion of businesses employing fewer than 10 people than seen nationally. In March 2011 there were 28,395 local units in VAT and/or PAYE based enterprises in Cambridgeshire, compared to 28,765 in March 2010, a 1% decrease. Analysis by size shows that 84% of businesses had an employment of less than ten, and 97% had an employment of less than 50. East Cambridgeshire and Uttlesford have the highest proportions of “micro” (0-9 employee) businesses, with 87%, and Cambridge City has the highest proportions of “small”, “medium” and “large” businesses, with 17%, 6% and 1% respectively, reflecting the large health and education employers in the district. Map 2 shows that local units within Cambridgeshire in March 2010 were concentrated in Huntingdonshire and South Cambridgeshire, with around 50% of all local units, and that around 30% of all local units were located in East Cambridgeshire and Fenland, with Cambridge City accounting for the remaining 20%. Table 7: Businesses in Greater Cambridge by district in 2011 at local unit (site) level Source: ONS – UK Business: Activity, Size and Location
Employment SizeArea % 0 - 9 % 10 - 49 % 50 - 249 % 250 +Cambridge City 5,660 76.9% 16.9% 5.6% 0.6%East Cambridgeshire 3,940 87.2% 11.0% 1.6% 0.1%Fenland 3,625 84.6% 12.4% 2.5% 0.6%Huntingdonshire 7,660 85.0% 12.2% 2.5% 0.3%South Cambridgeshire 7,510 85.5% 11.5% 2.5% 0.5%Cambridgeshire 28,395 83.8% 12.8% 3.0% 0.4%Forest Heath 2,585 82.0% 14.5% 3.1% 0.4%North Hertfordshire 6,410 86.1% 11.7% 2.0% 0.2%St Edmundsbury 4,940 81.4% 14.9% 3.1% 0.6%Uttlesford 5,015 87.5% 10.1% 2.2% 0.2%Greater Cambridge 47,345 84.1% 12.7% 2.8% 0.4%Greater CambridgeGreater Peterborough 61,505 83.5% 13.2% 2.9% 0.4%East of England 249,990 84.1% 12.8% 2.8% 0.4%England 2,161,190 83.0% 13.5% 3.0% 0.5%
Local Units
Box 1: Enterprises and local units
The Inter Departmental Business Register has two levels of data: enterprises and local units. Enterprises are the head offices; local units are the branches of the enterprises. For small businesses such as sole traders, the enterprise and local unit are the same.
Cambridgeshire’s Economic Assessment
- 23 -
Map 2: Cambridgeshire's workplaces in 2010 Source: ONS – Inter Departmental Business Register
Cambridgeshire’s Economic Assessment
- 24 -
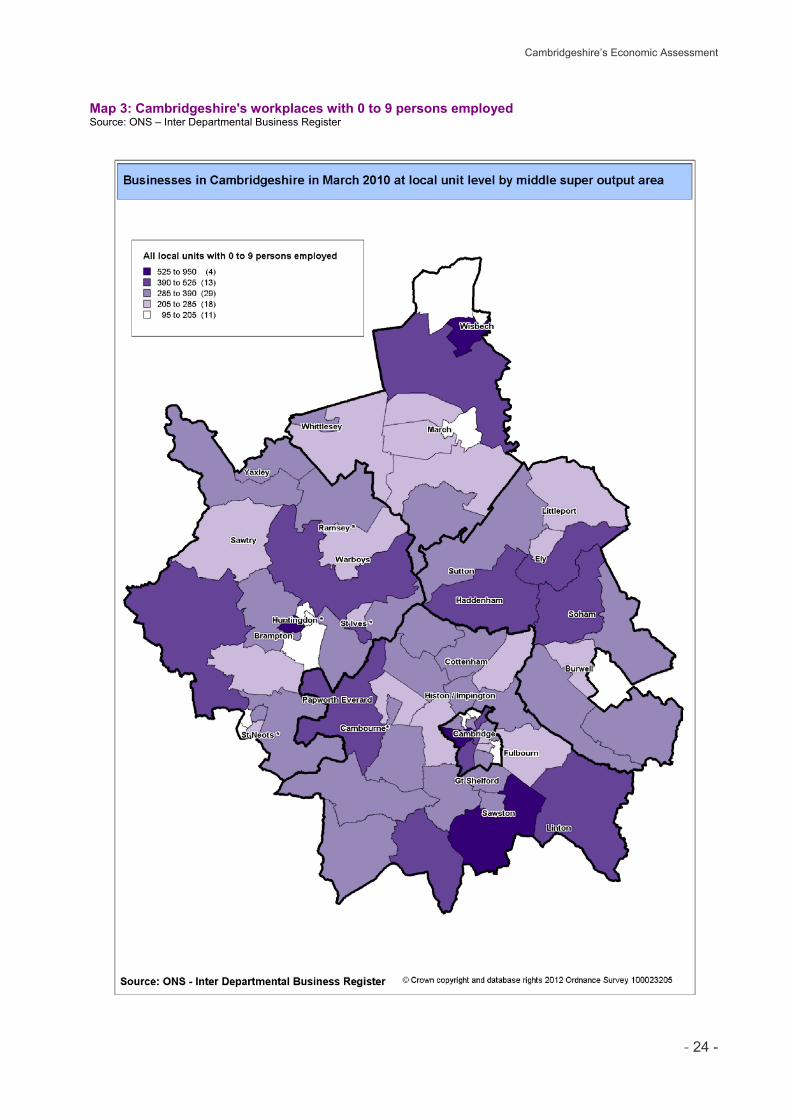
Map 3: Cambridgeshire's workplaces with 0 to 9 persons employed Source: ONS – Inter Departmental Business Register
Cambridgeshire’s Economic Assessment
- 25 -
Map 4: Cambridgeshire's workplaces with 10 or more persons employed Source: ONS – Inter Departmental Business Register
Cambridgeshire’s Economic Assessment
- 26 -
0
200
400
600
800
1000
1200
Cam
brid
ge C
ity
Eas
t Cam
bs
Fenl
and
Hun
tingd
onsh
ire
Sou
th C
ambs
Cam
brid
gesh
ire
Fore
st H
eath
Nor
th H
erts
St E
dmun
dsbu
ry
Uttl
esfo
rd
Bus
ines
s D
ensi
ty
East of England
England
Business density
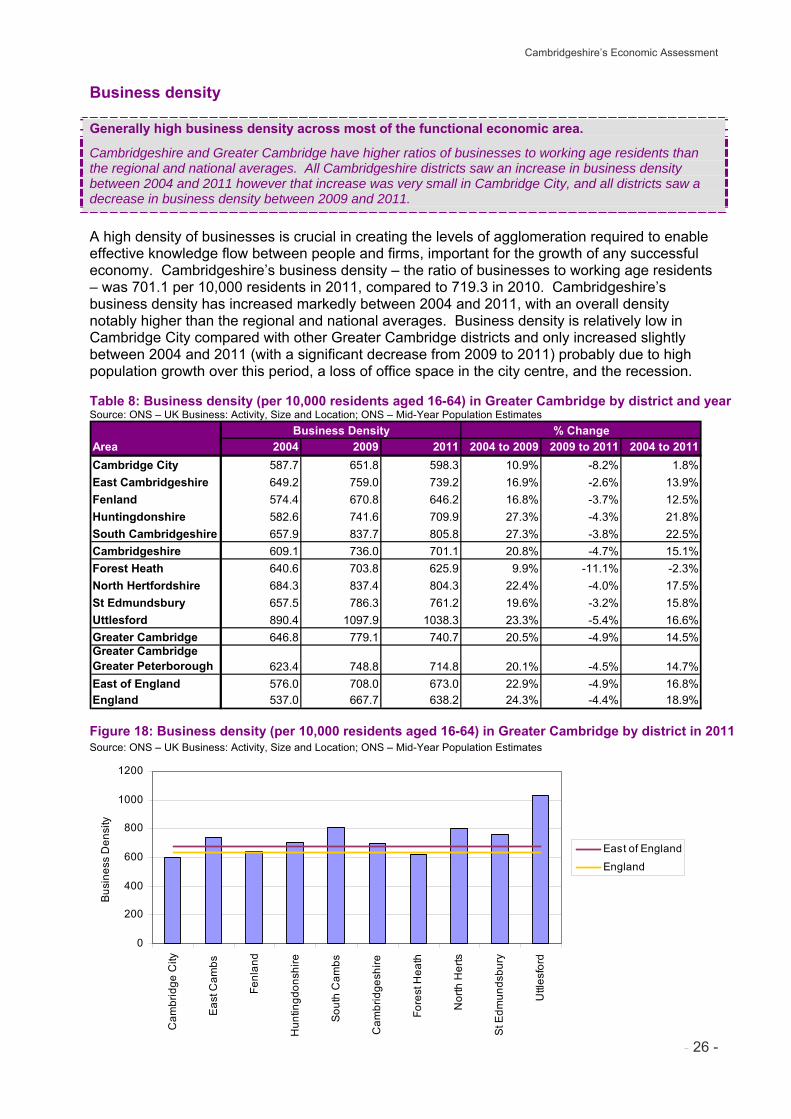
Generally high business density across most of the functional economic area.
Cambridgeshire and Greater Cambridge have higher ratios of businesses to working age residents than the regional and national averages. All Cambridgeshire districts saw an increase in business density between 2004 and 2011 however that increase was very small in Cambridge City, and all districts saw a decrease in business density between 2009 and 2011.
A high density of businesses is crucial in creating the levels of agglomeration required to enable effective knowledge flow between people and firms, important for the growth of any successful economy. Cambridgeshire’s business density – the ratio of businesses to working age residents – was 701.1 per 10,000 residents in 2011, compared to 719.3 in 2010. Cambridgeshire’s business density has increased markedly between 2004 and 2011, with an overall density notably higher than the regional and national averages. Business density is relatively low in Cambridge City compared with other Greater Cambridge districts and only increased slightly between 2004 and 2011 (with a significant decrease from 2009 to 2011) probably due to high population growth over this period, a loss of office space in the city centre, and the recession. Table 8: Business density (per 10,000 residents aged 16-64) in Greater Cambridge by district and year Source: ONS – UK Business: Activity, Size and Location; ONS – Mid-Year Population Estimates
Business Density % ChangeArea 2004 2009 2011 2004 to 2009 2009 to 2011 2004 to 2011Cambridge City 587.7 651.8 598.3 10.9% -8.2% 1.8%East Cambridgeshire 649.2 759.0 739.2 16.9% -2.6% 13.9%Fenland 574.4 670.8 646.2 16.8% -3.7% 12.5%Huntingdonshire 582.6 741.6 709.9 27.3% -4.3% 21.8%South Cambridgeshire 657.9 837.7 805.8 27.3% -3.8% 22.5%Cambridgeshire 609.1 736.0 701.1 20.8% -4.7% 15.1%Forest Heath 640.6 703.8 625.9 9.9% -11.1% -2.3%North Hertfordshire 684.3 837.4 804.3 22.4% -4.0% 17.5%St Edmundsbury 657.5 786.3 761.2 19.6% -3.2% 15.8%Uttlesford 890.4 1097.9 1038.3 23.3% -5.4% 16.6%Greater Cambridge 646.8 779.1 740.7 20.5% -4.9% 14.5%Greater CambridgeGreater Peterborough 623.4 748.8 714.8 20.1% -4.5% 14.7%East of England 576.0 708.0 673.0 22.9% -4.9% 16.8%England 537.0 667.7 638.2 24.3% -4.4% 18.9%
Figure 18: Business density (per 10,000 residents aged 16-64) in Greater Cambridge by district in 2011 Source: ONS – UK Business: Activity, Size and Location; ONS – Mid-Year Population Estimates
Cambridgeshire’s Economic Assessment
- 27 -
02468
101214161820
Cam
brid
ge C
ity
Eas
t Cam
bs
Fenl
and
Hun
tingd
onsh
ire
Sou
th C
ambs
Cam
brid
gesh
ire
Fore
st H
eath
Nor
th H
erts
St E
dmun
dsbu
ry
Uttl
esfo
rd
Eas
t of E
ngla
nd
Eng
land
Ave
rage
ent
erpr
ise
empl
oym
ent
0
500
1,000
1,500
2,000
2,500
Ave
rage
ent
erpr
ise
turn
over
Employment
Turnover
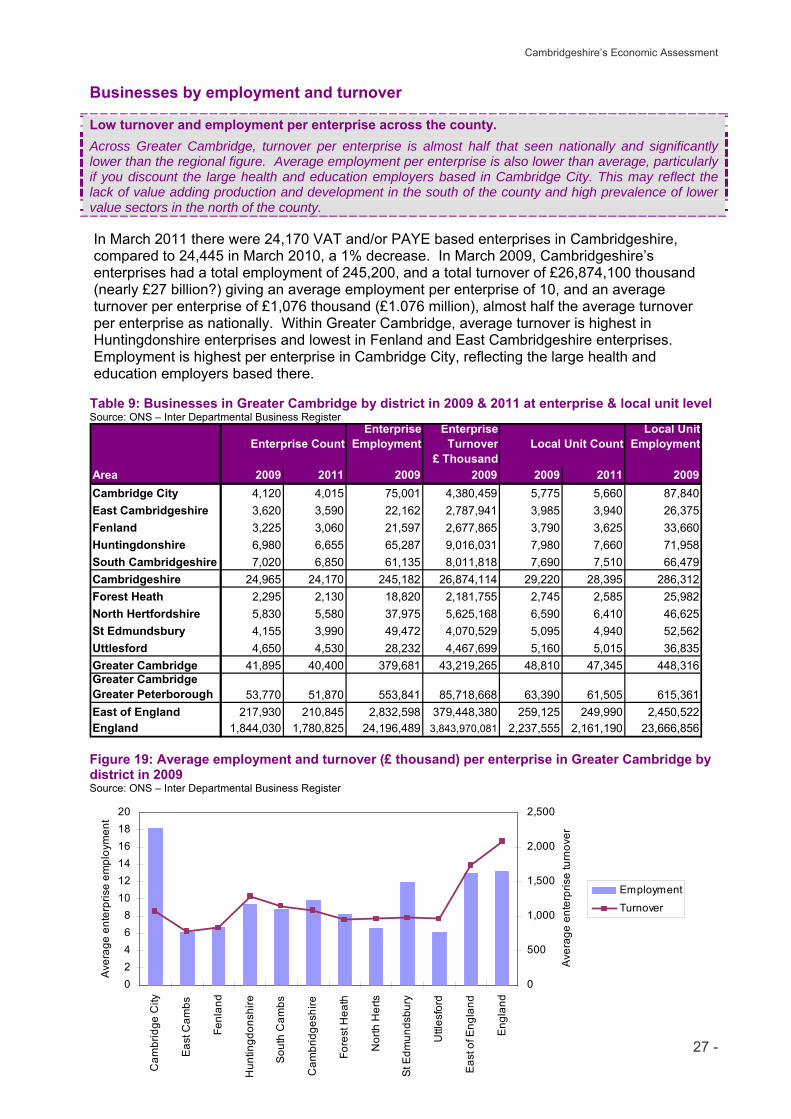
Businesses by employment and turnover Low turnover and employment per enterprise across the county.
Across Greater Cambridge, turnover per enterprise is almost half that seen nationally and significantly lower than the regional figure. Average employment per enterprise is also lower than average, particularly if you discount the large health and education employers based in Cambridge City. This may reflect the lack of value adding production and development in the south of the county and high prevalence of lower value sectors in the north of the county. In March 2011 there were 24,170 VAT and/or PAYE based enterprises in Cambridgeshire, compared to 24,445 in March 2010, a 1% decrease. In March 2009, Cambridgeshire’s enterprises had a total employment of 245,200, and a total turnover of £26,874,100 thousand (nearly £27 billion?) giving an average employment per enterprise of 10, and an average turnover per enterprise of £1,076 thousand (£1.076 million), almost half the average turnover per enterprise as nationally. Within Greater Cambridge, average turnover is highest in Huntingdonshire enterprises and lowest in Fenland and East Cambridgeshire enterprises. Employment is highest per enterprise in Cambridge City, reflecting the large health and education employers based there. Table 9: Businesses in Greater Cambridge by district in 2009 & 2011 at enterprise & local unit level Source: ONS – Inter Departmental Business Register
Area 2009 2011 2009 2009 2009 2011 2009Cambridge City 4,120 4,015 75,001 4,380,459 5,775 5,660 87,840East Cambridgeshire 3,620 3,590 22,162 2,787,941 3,985 3,940 26,375Fenland 3,225 3,060 21,597 2,677,865 3,790 3,625 33,660Huntingdonshire 6,980 6,655 65,287 9,016,031 7,980 7,660 71,958South Cambridgeshire 7,020 6,850 61,135 8,011,818 7,690 7,510 66,479Cambridgeshire 24,965 24,170 245,182 26,874,114 29,220 28,395 286,312Forest Heath 2,295 2,130 18,820 2,181,755 2,745 2,585 25,982North Hertfordshire 5,830 5,580 37,975 5,625,168 6,590 6,410 46,625St Edmundsbury 4,155 3,990 49,472 4,070,529 5,095 4,940 52,562Uttlesford 4,650 4,530 28,232 4,467,699 5,160 5,015 36,835Greater Cambridge 41,895 40,400 379,681 43,219,265 48,810 47,345 448,316Greater CambridgeGreater Peterborough 53,770 51,870 553,841 85,718,668 63,390 61,505 615,361East of England 217,930 210,845 2,832,598 379,448,380 259,125 249,990 2,450,522England 1,844,030 1,780,825 24,196,489 3,843,970,081 2,237,555 2,161,190 23,666,856
Local Unit Employment
Enterprise Employment
Enterprise Turnover
£ ThousandEnterprise Count Local Unit Count
Figure 19: Average employment and turnover (£ thousand) per enterprise in Greater Cambridge by district in 2009 Source: ONS – Inter Departmental Business Register
Cambridgeshire’s Economic Assessment
- 28 -
14% 12% 11% 13% 13% 13% 13% 15% 12% 15% 15% 15%
14% 13% 13% 14% 13% 13% 13% 15%12% 14% 14% 15%
30%27% 28%
29% 27% 28% 27%27%
28%28% 28% 28%
43% 48% 49% 44% 46% 46% 48% 43% 48% 44% 43% 42%
0%
10%
20%
30%
40%
50%
60%
70%
80%
90%
100%
Cam
brid
ge C
ity
Eas
t Cam
bs
Fenl
and
Hun
tingd
onsh
ire
Sou
th C
ambs
Cam
brid
gesh
ire
Fore
st H
eath
Nor
th H
erts
St E
dmun
dsbu
ry
Uttl
esfo
rd
Eas
t of E
ngla
nd
Eng
land
% o
f ent
erpr
ises 10+ years
4-9 years
2-3 years
<2 years
Business age and survival
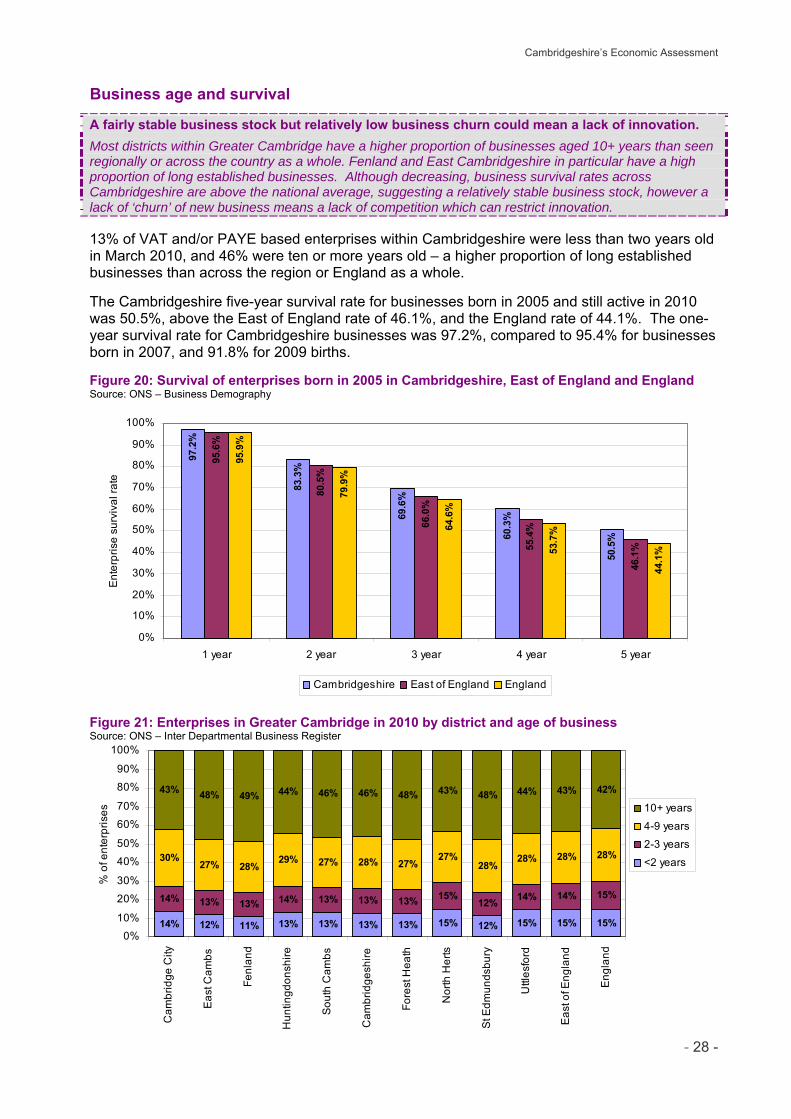
A fairly stable business stock but relatively low business churn could mean a lack of innovation.
Most districts within Greater Cambridge have a higher proportion of businesses aged 10+ years than seen regionally or across the country as a whole. Fenland and East Cambridgeshire in particular have a high proportion of long established businesses. Although decreasing, business survival rates across Cambridgeshire are above the national average, suggesting a relatively stable business stock, however a lack of ‘churn’ of new business means a lack of competition which can restrict innovation. 13% of VAT and/or PAYE based enterprises within Cambridgeshire were less than two years old in March 2010, and 46% were ten or more years old – a higher proportion of long established businesses than across the region or England as a whole. The Cambridgeshire five-year survival rate for businesses born in 2005 and still active in 2010 was 50.5%, above the East of England rate of 46.1%, and the England rate of 44.1%. The one-year survival rate for Cambridgeshire businesses was 97.2%, compared to 95.4% for businesses born in 2007, and 91.8% for 2009 births. Figure 20: Survival of enterprises born in 2005 in Cambridgeshire, East of England and England Source: ONS – Business Demography
97.2
%
83.3
%
69.6
%
60.3
%
50.5
%
95.6
%
80.5
%
66.0
%
55.4
%
46.1
%
95.9
%
79.9
%
64.6
%
53.7
%
44.1
%
0%
10%
20%
30%
40%
50%
60%
70%
80%
90%
100%
1 year 2 year 3 year 4 year 5 year
Ent
erpr
ise
surv
ival
rate
Cambridgeshire East of England England
Figure 21: Enterprises in Greater Cambridge in 2010 by district and age of business Source: ONS – Inter Departmental Business Register
Cambridgeshire’s Economic Assessment
- 29 -
Business creation
Recent decrease in VAT/PAYE registrations with some evidence suggesting a large number of micro businesses are not growing to VAT registration/PAYE size.
The recent decrease in enterprise births is concerning, as business start up levels are a good indicator of future economic growth. Within Cambridgeshire, the ‘birth rate’ of new enterprises in 2010 was highest in Cambridge City, yet still below the national figure across all Greater Cambridge districts. Per capita VAT/PAYE registrations had generally remained higher than average, but 2008 saw a significant drop in many districts, with South Cambridgeshire being the only Cambridgeshire district to perform above regional and national levels. 2009 and 2010 saw further drops, and despite falls in the regional and national levels, Cambridgeshire’s new business registration rate remained below average in 2010. Business start-up levels are a good indicator of future economic growth. In addition to the direct employment they bring, new businesses help foster innovation and can have a beneficial effect through enhancing competition, helping improve efficiency. During 2010 there were 2,330 births of new enterprises in Cambridgeshire, compared to 2,405 during 2009, a 3% decrease. There were 2,710 deaths of enterprises in 2010, compared to 2,825 in 2009, a 4% decrease. The stocks of active enterprises were 25,595 in 2010 and 26,145 in 2009, giving birth and death rates per 100 active enterprises of 9.1% and 10.6% in 2010, and 9.2% and 10.8% in 2009. The ‘birth rate’ of new enterprises per 100 active enterprises in 2010 was highest in Cambridge City (unlike the ‘birth rate’ per 10,000 adult residents, which is low due to the high ratio of residents to businesses), North Hertfordshire and Huntingdonshire, yet below the national figure across all Greater Cambridge districts. Table 10: Enterprise births and deaths in Greater Cambridge by district in 2010 Source: ONS – Business Demography
Per 100 active enterprisesArea Births DeathsCambridge City 450 495 4,540 9.9% 10.9%East Cambridgeshire 310 370 3,595 8.6% 10.3%Fenland 280 370 3,130 8.9% 11.8%Huntingdonshire 650 745 7,075 9.2% 10.5%South Cambridgeshire 640 730 7,255 8.8% 10.1%Cambridgeshire 2,330 2,710 25,595 9.1% 10.6%Forest Heath 180 245 2,215 8.1% 11.1%North Hertfordshire 595 675 6,240 9.5% 10.8%St Edmundsbury 330 460 4,225 7.8% 10.9%Uttlesford 425 530 4,835 8.8% 11.0%Greater Cambridge 3,860 4,620 43,110 9.0% 10.7%Greater CambridgeGreater Peterborough 4,935 6,085 55,250 8.9% 11.0%East of England 22,580 27,915 233,090 9.7% 12.0%England 207,520 261,880 2,001,885 10.4% 13.1%
Births of New Enterprises
Deaths of Enterprises
Active Enterprises
Enterprise births are defined as new businesses registering for either VAT and/or PAYE for the first time. Figure 22 shows Cambridgeshire had a birth rate of 46.2 new enterprises per 10,000 adult residents aged 16+ in 2010, compared to 48.4 in 2009. Within Greater Cambridge, Figure 23 shows Uttlesford has the highest new business registration rate, with 69.3, and Forest Heath has the lowest, with 35.3.
Cambridgeshire’s Economic Assessment
- 30 -
Figure 22 shows Cambridgeshire experienced a sharp drop in enterprise births in 2008, while regional and national birth rates remained high. Two reasons suggested for the sharp drop were that the Cambridgeshire knowledge based businesses were disproportionately affected by the credit crunch, and that the skills of those being made redundant in Cambridgeshire, especially from the public sector were less well suited to self employment. The regional and national birth rates experienced a similar drop in 2009, as businesses outside Cambridgeshire were affected by the credit crunch, but the drop was not as sharp, and Cambridgeshire’s birth rate remains below the regional and national rates.
Figure 22: Births per 10,000 adult residents in Cambridgeshire, East of England and England by year Source: ONS – Business Demography
45
47
49
51
53
55
57
59
61
63
65
2004 2005 2006 2007 2008 2009 2010
New
bus
ines
s re
gist
ratio
n ra
te
England
East of England
Cambridgeshire
Figure 23: Births per 10,000 adult residents in Greater Cambridge by district in 2010 Source: ONS – Business Demography
0
10
20
30
40
50
60
70
80
Cam
brid
ge C
ity
Eas
t Cam
bs
Fenl
and
Hun
tingd
onsh
ire
Sou
th C
ambs
Cam
brid
gesh
ire
Fore
st H
eath
Nor
th H
erts
St E
dmun
dsbu
ry
Uttl
esfo
rd
New
bus
ines
s re
gist
ratio
n ra
te
England
East of England
Cambridgeshire’s Economic Assessment
- 31 -
Innovation
Strong innovation performance but constrained by linkages.
Cambridgeshire has the highest share of employment in R&D in the region and attracts a high proportion of public and private investment in R&D. There is concern that private sector R&D investment is highly dependent on a small number of globally significant companies – a structure that lacks long term resilience. Of the three categories of indicator identified in the East of England Innovation Baseline, Cambridgeshire performs the least strongly on ‘linkages’ – particularly transport infrastructure.
East of England Innovation Baseline In 2009 EEDA published the East of England Innovation Baseline which reviews the nature, scale and scope of innovation in the East of England relative to other UK and international regions. Most of the baseline information is available at regional level rather than local authority level, but such information still can reflect the position of innovation in Cambridgeshire given the county’s contribution to the region’s innovation status. The study sets out three broad categories of indicators with a number of sub-categories to measure the level of innovation of the region. These three categories are Input, Linkages and Output. Input indicators include Research & Development investment, education and skills. Linkages indicators highlight the interactions between businesses and universities as well as transport and communication infrastructure. The output indicators measure innovative activities as well as novel innovations. The findings of the study indicate that the overall performance of the East of England is very good across these innovation indicators. The region has a strong research-intensive economy with particular strengths in research and development, the commercial exploitation of new knowledge via patents, and connectivity to London. National comparison puts the region as one of the most innovative regions in the UK. There are however some indicators that present a challenge to the long-term innovation performance for the region. The study recognises the strong contribution that Cambridgeshire makes to the region’s innovative performance. Inputs Within the region, Cambridgeshire has the highest share of employment in R&D, including a distinct niche in life science and biotechnology which employs 7 times the national average. Cambridge attracts a large proportion of government funding such as health research - several Medical Research Council establishments are located near Cambridge. Private sector investment in R&D in Cambridge makes up a large proportion of the total amount in the region. However there is a concern that business R&D investment is heavily dependent on the investment decisions of a small number of global companies, which may not be resilient in the longer term. Education and qualification performance are also important indicators within the Input category which ensure an area’s long-term innovative ability. 53% of pupils in Cambridgeshire achieve 5 or more A* to C grades in English & Mathematics GCSEs, which is above the regional and national averages. The University of Cambridge and Anglia Ruskin University perform the highest in the region in terms of the total number of higher education qualifications obtained. Cambridgeshire is one of the two counties in the region to perform above the national average on the Human Capital Index. The index is a weighted average of NVQs which provides an indication of the skill profile in the area.
Cambridgeshire’s Economic Assessment
- 32 -
Linkages Cambridge is relatively well connected to London and other places in the region by both road and railway, however the county’s performance under this indicator is not a strong as its performance in the other two indicators. Cambridge railway station has the highest usage among all the stations in the region. The strong regional performance on business – university research and consultancy is driven by the University of Cambridge’s strong interactions with business communities. The University of Cambridge accounts for about 60% of the total value of collaborative research and research/consultancy contracts in the region, of which the total amount is the highest level in the UK. Outputs Cambridgeshire performs strongly with high knowledge-intensive business densities; the second highest county in the East of England behind Hertfordshire and above the national average. University impact Universities contribute to an area’s economic growth and prosperity in different ways including creating jobs, expenditure in the area, providing knowledge transfer/high-skilled labour, supporting innovation and entrepreneurship. There are two universities in Cambridgeshire; the University of Cambridge and Anglia Ruskin University. The Higher Education Business and Community Interaction Survey 2007/2008 indicates that the two universities play very different roles in the economic development of the area. The University of Cambridge as a global research leader attracts inward investment to the area, meets national skills needs particularly highly-skilled labour, and performs strongly in research collaboration with industry, for example knowledge transfer and spin-out activities. By 2005, 51 companies had spun-out directly from the University of Cambridge alone and 250 companies had been created based on knowledge transfer from the University of Cambridge. In 2005 those companies employed 3,990 people and generated revenues of £574 million. Furthermore, the University of Cambridge is a major attraction for tourists, an industry that generated expenditure of £196 million for Cambridge in 2006. Anglia Ruskin University has a much greater local focus, centred on improving local accessibility to higher education, supporting small and medium size enterprises and meeting local skills needs.
Cambridgeshire’s Economic Assessment
- 33 -
Community Innovation Survey
The East of England exhibits a high level of innovation activity and international working, primarily driven by product related factors such as services or goods quality improvements but limited by the cost of finance.
There is a high level of innovation activity among East of England businesses, particularly the acquisition of computer hardware and software driven by product related factors such as services or goods quality improvements. 40% of businesses have international business links. Skill levels of employees are above average compared with other regions. The cost of finance is perceived as the biggest barrier to innovation.
The Community Innovation Survey is a Europe-wide survey giving information on the innovation of different sectors and regions in the member states of the EU. The latest survey was conducted in 2009. The 2009 survey was sent to 28,000 UK enterprises with 10 or more employees and achieved a 50% response rate. Innovation active enterprises The 2009 results show that 59% of businesses in the East of England were innovation active in the period 2006-2008, the fourth highest level among the regions in the UK after the South East, Yorkshire and The Humber, and the North East. In contrast the East of England had the highest proportion of innovation active businesses in the 2007 survey, but the lowest proportion in the 2005 survey.
Innovation activities There are many innovation-related activities including internal and external R&D, and the acquisition of equipment and external knowledge. In the East of England, the most commonly reported innovation activities were acquisition of computer hardware and software. Compared to other regions, the East of England has the second highest proportion of businesses engaged in changes to product or service design, and the fourth highest proportion engaged in internal R&D, changes to marketing methods, and launch advertising.
Export markets 24% of enterprises in the East of England operated the business at a European level and 16% of enterprises operated the business worldwide, which means 40% of East of England businesses have international business links. This figure is above the national average and just behind London and the South East region.
Skills Skill levels in East of England enterprises are above average compared with other regions, second only to Scotland. The survey shows that 5% of employees had degree level qualifications in Science or Engineering subjects and 6% had degree level qualifications in other subjects.
Innovation cooperation In the East of England 46% of innovation active enterprises had cooperation arrangements on innovation activities with clients or customers. The second most common cooperation partners were suppliers (42%). 16% of innovation active enterprises in the East of England had collaborations with universities, about average compared with other regions. 35% of innovators had cooperation agreements that operated at an international level (Europe or the rest of the world), the highest of all regions. Factors driving innovation and barriers to innovation Innovation active enterprises in the East of England considered product-related factors more important in driving innovation than process-related factors. Improving the quality of goods or services was the most commonly mentioned factor by enterprises in the East of England. In terms of factors constraining innovation, the 2009 results show an overall fall in the perception of barriers to innovation for businesses in the East of England. However cost factors were considered the strongest barriers, particularly the cost of finance, the direct innovation cost, and the perceived economic risks.

Cambridgeshire’s Economic Assessment
- 34 -
Employment growth of small businesses
Employment growth in small businesses is relatively low, particularly in the north and east.
In 2008, most districts had employment growth between the regional and national averages, other than Cambridge City, which was above the national average, and Fenland, which was below the regional average. 3,180 of the 22,765 registered enterprises in Cambridgeshire with employment of less than 50 in 2007 showed an increase in employment by 2008, meaning the percentage of small businesses showing employment growth in 2008 was 14.0%, compared to 14.2% in 2007 – a slight drop reflecting the national trend. The percentage of enterprises with employment growth was highest in Cambridge City, with 14.5%, and lowest in Fenland, with 13.6%. Figure 24: Percentage of small businesses in Cambridgeshire, East of England and England showing employment growth by year Source: BIS – Data for National Indicator 172 (discontinued)
8.0%
9.0%
10.0%
11.0%
12.0%
13.0%
14.0%
15.0%
16.0%
2002_03 2003_04 2004_05 2005_06 2006_07 2007_08
Sm
all b
usin
esse
s w
ith e
mpl
oym
ent g
row
th
England
Cambridgeshire
East of England
Figure 25: Percentage of small businesses in Greater Cambridge showing employment growth in 2008 by district Source: BIS – Data for National Indicator 172 (discontinued)
13.0%
13.2%
13.4%
13.6%
13.8%
14.0%
14.2%
14.4%
14.6%
Cam
brid
ge C
ity
Eas
t Cam
bs
Fenl
and
Hun
tingd
onsh
ire
Sou
th C
ambs
Cam
brid
gesh
ire
Fore
st H
eath
Nor
th H
erts
St E
dmun
dsbu
ry
Uttl
esfo
rdSm
all b
usin
esse
s w
ith e
mpl
oym
ent g
row
th
England
East of England
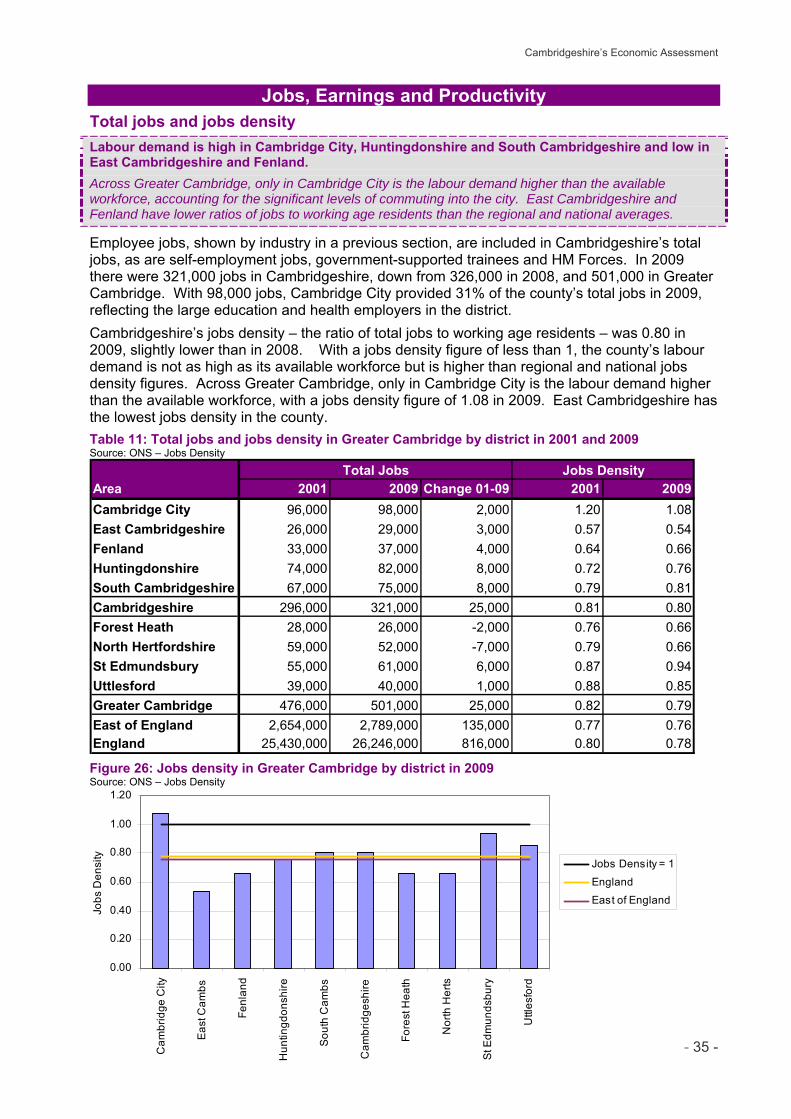
Cambridgeshire’s Economic Assessment
- 35 -
0.00
0.20
0.40
0.60
0.80
1.00
1.20
Cam
brid
ge C
ity
Eas
t Cam
bs
Fenl
and
Hun
tingd
onsh
ire
Sou
th C
ambs
Cam
brid
gesh
ire
Fore
st H
eath
Nor
th H
erts
St E
dmun
dsbu
ry
Uttl
esfo
rd
Jobs
Den
sity
Jobs Density = 1
England
East of England
Jobs, Earnings and Productivity
Total jobs and jobs density Labour demand is high in Cambridge City, Huntingdonshire and South Cambridgeshire and low in East Cambridgeshire and Fenland.
Across Greater Cambridge, only in Cambridge City is the labour demand higher than the available workforce, accounting for the significant levels of commuting into the city. East Cambridgeshire and Fenland have lower ratios of jobs to working age residents than the regional and national averages.
Employee jobs, shown by industry in a previous section, are included in Cambridgeshire’s total jobs, as are self-employment jobs, government-supported trainees and HM Forces. In 2009 there were 321,000 jobs in Cambridgeshire, down from 326,000 in 2008, and 501,000 in Greater Cambridge. With 98,000 jobs, Cambridge City provided 31% of the county’s total jobs in 2009, reflecting the large education and health employers in the district.
Cambridgeshire’s jobs density – the ratio of total jobs to working age residents – was 0.80 in 2009, slightly lower than in 2008. With a jobs density figure of less than 1, the county’s labour demand is not as high as its available workforce but is higher than regional and national jobs density figures. Across Greater Cambridge, only in Cambridge City is the labour demand higher than the available workforce, with a jobs density figure of 1.08 in 2009. East Cambridgeshire has the lowest jobs density in the county.
Table 11: Total jobs and jobs density in Greater Cambridge by district in 2001 and 2009 Source: ONS – Jobs Density
Total Jobs Jobs DensityArea 2001 2009 Change 01-09 2001 2009Cambridge City 96,000 98,000 2,000 1.20 1.08East Cambridgeshire 26,000 29,000 3,000 0.57 0.54Fenland 33,000 37,000 4,000 0.64 0.66Huntingdonshire 74,000 82,000 8,000 0.72 0.76South Cambridgeshire 67,000 75,000 8,000 0.79 0.81Cambridgeshire 296,000 321,000 25,000 0.81 0.80Forest Heath 28,000 26,000 -2,000 0.76 0.66North Hertfordshire 59,000 52,000 -7,000 0.79 0.66St Edmundsbury 55,000 61,000 6,000 0.87 0.94Uttlesford 39,000 40,000 1,000 0.88 0.85Greater Cambridge 476,000 501,000 25,000 0.82 0.79East of England 2,654,000 2,789,000 135,000 0.77 0.76England 25,430,000 26,246,000 816,000 0.80 0.78
Figure 26: Jobs density in Greater Cambridge by district in 2009 Source: ONS – Jobs Density
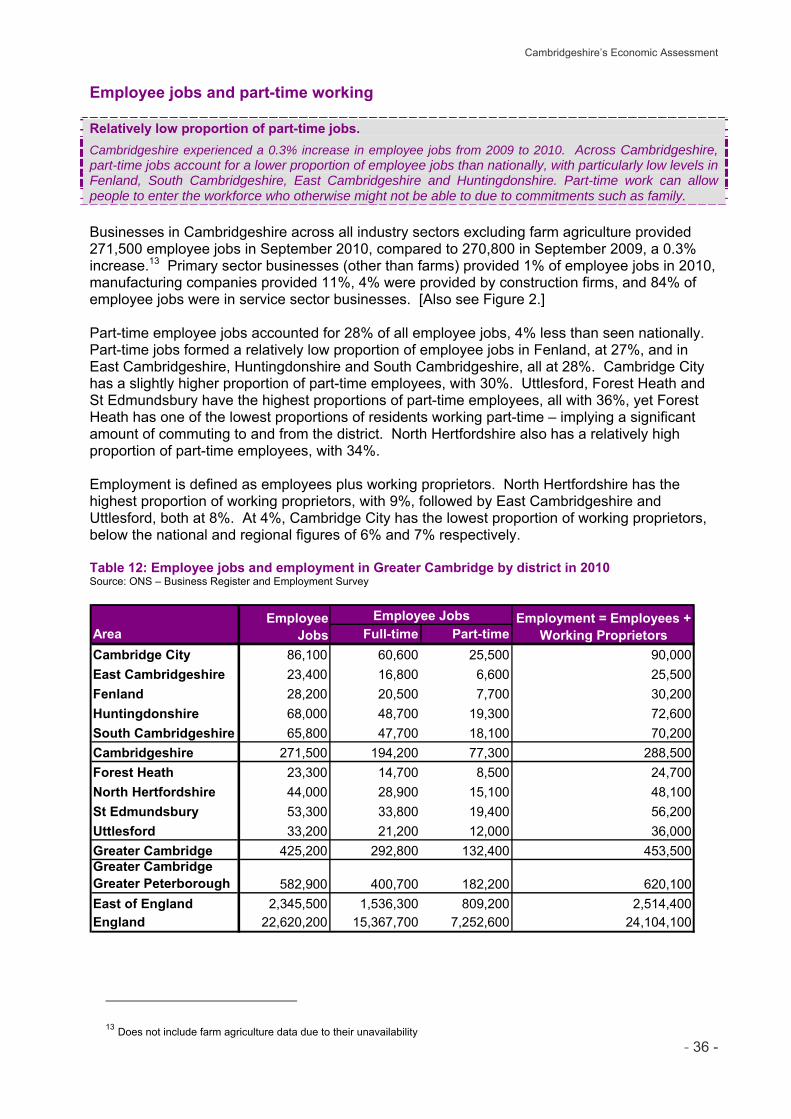
Cambridgeshire’s Economic Assessment
- 36 -
Employee jobs and part-time working
Relatively low proportion of part-time jobs.
Cambridgeshire experienced a 0.3% increase in employee jobs from 2009 to 2010. Across Cambridgeshire, part-time jobs account for a lower proportion of employee jobs than nationally, with particularly low levels in Fenland, South Cambridgeshire, East Cambridgeshire and Huntingdonshire. Part-time work can allow people to enter the workforce who otherwise might not be able to due to commitments such as family.
Businesses in Cambridgeshire across all industry sectors excluding farm agriculture provided 271,500 employee jobs in September 2010, compared to 270,800 in September 2009, a 0.3% increase.13 Primary sector businesses (other than farms) provided 1% of employee jobs in 2010, manufacturing companies provided 11%, 4% were provided by construction firms, and 84% of employee jobs were in service sector businesses. [Also see Figure 2.] Part-time employee jobs accounted for 28% of all employee jobs, 4% less than seen nationally. Part-time jobs formed a relatively low proportion of employee jobs in Fenland, at 27%, and in East Cambridgeshire, Huntingdonshire and South Cambridgeshire, all at 28%. Cambridge City has a slightly higher proportion of part-time employees, with 30%. Uttlesford, Forest Heath and St Edmundsbury have the highest proportions of part-time employees, all with 36%, yet Forest Heath has one of the lowest proportions of residents working part-time – implying a significant amount of commuting to and from the district. North Hertfordshire also has a relatively high proportion of part-time employees, with 34%. Employment is defined as employees plus working proprietors. North Hertfordshire has the highest proportion of working proprietors, with 9%, followed by East Cambridgeshire and Uttlesford, both at 8%. At 4%, Cambridge City has the lowest proportion of working proprietors, below the national and regional figures of 6% and 7% respectively. Table 12: Employee jobs and employment in Greater Cambridge by district in 2010 Source: ONS – Business Register and Employment Survey
Area Full-time Part-timeCambridge City 86,100 60,600 25,500 90,000East Cambridgeshire 23,400 16,800 6,600 25,500Fenland 28,200 20,500 7,700 30,200Huntingdonshire 68,000 48,700 19,300 72,600South Cambridgeshire 65,800 47,700 18,100 70,200Cambridgeshire 271,500 194,200 77,300 288,500Forest Heath 23,300 14,700 8,500 24,700North Hertfordshire 44,000 28,900 15,100 48,100St Edmundsbury 53,300 33,800 19,400 56,200Uttlesford 33,200 21,200 12,000 36,000Greater Cambridge 425,200 292,800 132,400 453,500Greater CambridgeGreater Peterborough 582,900 400,700 182,200 620,100East of England 2,345,500 1,536,300 809,200 2,514,400England 22,620,200 15,367,700 7,252,600 24,104,100
Employment = Employees +Working Proprietors
Employee Jobs
Employee Jobs
13 Does not include farm agriculture data due to their unavailability
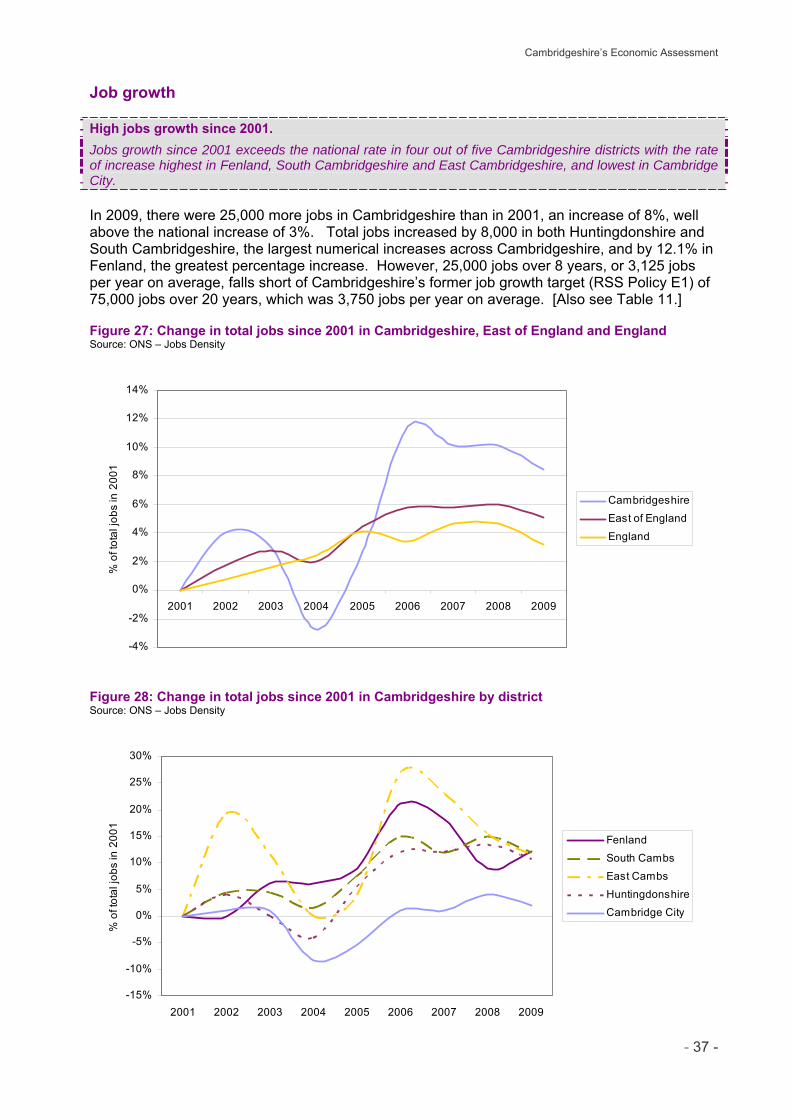
Cambridgeshire’s Economic Assessment
- 37 -
Job growth
High jobs growth since 2001.
Jobs growth since 2001 exceeds the national rate in four out of five Cambridgeshire districts with the rate of increase highest in Fenland, South Cambridgeshire and East Cambridgeshire, and lowest in Cambridge City.
In 2009, there were 25,000 more jobs in Cambridgeshire than in 2001, an increase of 8%, well above the national increase of 3%. Total jobs increased by 8,000 in both Huntingdonshire and South Cambridgeshire, the largest numerical increases across Cambridgeshire, and by 12.1% in Fenland, the greatest percentage increase. However, 25,000 jobs over 8 years, or 3,125 jobs per year on average, falls short of Cambridgeshire’s former job growth target (RSS Policy E1) of 75,000 jobs over 20 years, which was 3,750 jobs per year on average. [Also see Table 11.] Figure 27: Change in total jobs since 2001 in Cambridgeshire, East of England and England Source: ONS – Jobs Density
-4%
-2%
0%
2%
4%
6%
8%
10%
12%
14%
2001 2002 2003 2004 2005 2006 2007 2008 2009
% o
f tot
al jo
bs in
200
1
Cambridgeshire
East of England
England
Figure 28: Change in total jobs since 2001 in Cambridgeshire by district Source: ONS – Jobs Density
-15%
-10%
-5%
0%
5%
10%
15%
20%
25%
30%
2001 2002 2003 2004 2005 2006 2007 2008 2009
% o
f tot
al jo
bs in
200
1
Fenland
South Cambs
East Cambs
Huntingdonshire
Cambridge City
Cambridgeshire’s Economic Assessment
- 38 -
Earnings of employees
Wages are high in South Cambridgeshire. Significant pay gap across all districts between men and women.
Wages are high in South Cambridgeshire and Cambridge City, with wages across the other districts being more similar to the national level. Fenland is the only Greater Cambridge district with wages significantly below the national average. The difference in earnings between females and males is significant, but similar to the difference seen nationally, reflecting the pattern seen in residential earnings.
The median gross weekly pay for full-time employee jobs in Cambridgeshire in 2011 was £527.60, compared to £520.40 in 2010. The average wage across Cambridgeshire has remained above regional and national figures over the last ten years and has steadily increased, in line with the national trend for the past four years, and by more than the national trend over the last twelve months. Median earnings of full-time employees are lowest in Fenland, and highest in South Cambridgeshire. South Cambridgeshire jobs pay on average 46% more than Fenland jobs. The difference in earnings between females and males is high across the county, particularly in South Cambridgeshire, reflecting the pattern of residential earnings across the country. However the difference between male and female workplace earnings in Cambridgeshire is slightly less than the national difference, whereas the difference in resident earnings is slightly greater than the difference nationally. The differentials between resident (Table 13) and workplace (Table 12) earnings in Huntingdonshire and East Cambridgeshire suggest high levels of out-commuting to higher paid, higher value jobs. The differential in workplace earnings in Forest Heath suggests out-commuting to lower paid, lower value jobs. The percentage increase in workplace employee wages over the last five years has been highest in Cambridge City, followed by Huntingdonshire, East Cambridgeshire, South Cambridgeshire and Fenland.
Table 13: Median full-time gross weekly employee earnings in Greater Cambridge by district of workplace and gender in 2011 Source: ONS – Annual Survey of Hours and Earnings (Workplace Analysis)
AreaCambridge City £553.00 £584.40 £495.10East Cambridgeshire £462.80 £498.40 £388.00Fenland £400.50 £441.00 £361.50Huntingdonshire £497.90 £531.90 £431.40South Cambridgeshire £586.00 £657.90 £480.20Cambridgeshire £527.60 £572.30 £472.50Forest Heath £479.50 £542.40 £356.20North Hertfordshire £495.50 £556.10 £437.80St Edmundsbury £455.00 £482.80 £414.20Uttlesford £512.70 £594.80 £444.30Greater Cambridge - - -Greater CambridgeGreater Peterborough - - -East of England £494.50 £535.50 £432.10England £507.20 £547.80 £448.50 81.9%
85.8%74.7%
-
80.7%
73.0%82.6%65.7%78.7%
84.7%77.8%82.0%81.1%
Female Earnings as % of Male Earnings
All Full-time Workers
Male Full-time Workers
Female Full-time Workers
-
Cambridgeshire’s Economic Assessment
- 39 -
Figure 29: Median full-time gross weekly workplace and resident (circle) employee earnings in Greater Cambridge by district in 2011 Source: ONS – Annual Survey of Hours and Earnings (Workplace and Resident Analysis)
£0
£100
£200
£300
£400
£500
£600
£700C
ambr
idge
City
Eas
t Cam
bs
Fenl
and
Hun
tingd
onsh
ire
Sou
th C
ambs
Cam
brid
gesh
ire
Fore
st H
eath
Nor
th H
erts
St E
dmun
dsbu
ry
Uttl
esfo
rd
Med
ian
gros
s w
eekl
y pa
y
England
East of England
Table 14: Median full-time gross weekly employee earnings in Greater Cambridge by district of residence and gender in 2011 Source: ONS – Annual Survey of Hours and Earnings (Resident Analysis)
AreaCambridge City £574.40 £683.40 £507.60East Cambridgeshire £553.80 £568.30 £441.20Fenland £444.10 £480.00 £362.20Huntingdonshire £551.90 £607.10 £439.00South Cambridgeshire £607.90 £686.20 £483.80Cambridgeshire £550.30 £597.10 £469.30Forest Heath £417.40 £517.80 £385.50North Hertfordshire £619.40 £663.90 £538.80St Edmundsbury £497.40 £526.50 £420.10Uttlesford £578.10 £585.40 £550.50Greater Cambridge - - -Greater CambridgeGreater Peterborough - - -East of England £528.50 £574.90 £460.00England £507.60 £548.10 £449.30
-
Female Earnings as % of Male Earnings
All Full-time Workers
Male Full-time Workers
Female Full-time Workers
74.3%77.6%75.5%72.3%70.5%78.6%74.4%81.2%
82.0%
79.8%94.0%
-
80.0%
Cambridgeshire’s Economic Assessment
- 40 -
Employment forecasts
Forecasts to 2021 suggest growth in employment across all Greater Cambridge districts. Cambridgeshire’s employment is forecast to grow by 16% between 2009 and 2021, with the most significant increase in Cambridge City, where employment is forecast to grow by 22% relative to total employment in 2009. Forecasts from Insight East suggest that Cambridgeshire’s total employment (jobs) will increase from 325,900 in 2009 to 376,800 by 2021, a rise of 16%. Total employment across Greater Cambridge will increase by 13% over 12 years, compared to a 10% rise across the East of England. (Use latest run figures to 2031) Figure 30: Employment growth forecasts for Cambridgeshire, Greater Cambridge and East of England Source: Insight East – East of England Forecasting Model Autumn 2010 Baseline Forecast
0%
2%
4%
6%
8%
10%
12%
14%
16%
18%
20%
2009 2010 2011 2012 2013 2014 2015 2016 2017 2018 2019 2020 2021
% o
f tot
al e
mpl
oym
ent (
jobs
) in
2009
Cambridgeshire
Greater Cambridge
East of England
Figure 31: Employment growth forecasts for Cambridgeshire by district Source: Insight East – East of England Forecasting Model Autumn 2010 Baseline Forecast
-5%
0%
5%
10%
15%
20%
25%
30%
2009 2010 2011 2012 2013 2014 2015 2016 2017 2018 2019 2020 2021
% o
f tot
al e
mpl
oym
ent (
jobs
) in
2009
Cambridge City
South Cambs
East Cambs
Fenland
Huntingdonshire
Cambridgeshire’s Economic Assessment
- 41 -
Cambridgeshire’s gross value added
Productivity and prosperity are highest in areas with higher value industries and high jobs density. Cambridgeshire has a GVA per head of population above the regional and national averages, predominantly caused by high value added activity in South Cambridgeshire and a high jobs density in Cambridge City pushing up the county average. Productivity is highest in South Cambridgeshire, reflecting the concentration of high value industry in this district. Since 2001 public administration, education and health, financial and insurance activities and business service activities have provided the largest increases in their contribution to total GVA. Information and communication, production, and distribution, transport, accommodation and food industries have seen a decrease in their contribution to total GVA. Productivity of the economy is measured by GVA (Gross Value Added), and GVA per head. Calculated on a workplace basis, Cambridgeshire’s GVA (at current basic prices) was £13,111 million in 2009, compared to £13,526 million in 2008, a 3% decrease. Cambridgeshire’s GVA per head of population was £21,598 in 2009, 17% above the East of England average of £18,536 per head, and 5% above the England average of £20,498 per head. (More recent data?) Figure 32: GVA per head in Cambridgeshire, East of England and England by year Source: ONS – Regional Gross Value Added
£0
£5,000
£10,000
£15,000
£20,000
£25,000
2001 2002 2003 2004 2005 2006 2007 2008 2009
GV
A p
er h
ead
Cambridgeshire
England
East of England
Figure 33 overleaf shows that since 2001 the largest increase in GVA contribution within Cambridgeshire has come from the public administration, education and health industry. The production sector, information and communication sector, and distribution, transport, accommodation and food sector have all seen their contribution to total GVA decrease since 2001. Those districts most dependent on these industries, particularly East Cambridgeshire and Fenland with regard to the production industry, may face increasing difficulties if these industries continue to decline in importance. Figure 34 illustrates labour productivity levels for each of the districts, which provides a basic assessment of how productive these places are. Cambridgeshire’s productivity level is slightly below the regional and national averages, which is due to the lower value added employment in Fenland, East Cambridgeshire and to a lesser extent, Huntingdonshire, although the dynamism and well established clusters of high value added activity within South Cambridgeshire and to a lesser extent, Cambridge City, push up the Cambridgeshire average. Workplace based GVA per capita is a key measure of prosperity across each of the districts, and measures the amount of gross value added within an area (by all those who work within the area, including those who commute into the area to work) per head of the resident population.
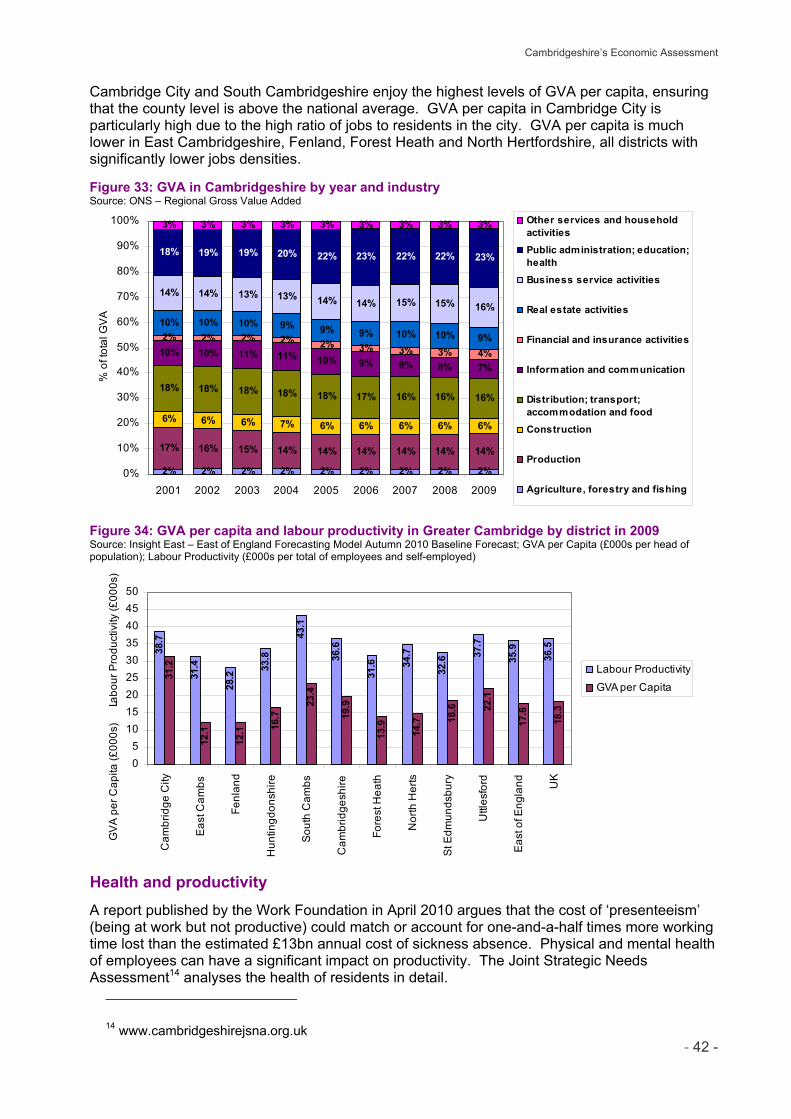
Cambridgeshire’s Economic Assessment
- 42 -
Cambridge City and South Cambridgeshire enjoy the highest levels of GVA per capita, ensuring that the county level is above the national average. GVA per capita in Cambridge City is particularly high due to the high ratio of jobs to residents in the city. GVA per capita is much lower in East Cambridgeshire, Fenland, Forest Heath and North Hertfordshire, all districts with significantly lower jobs densities. Figure 33: GVA in Cambridgeshire by year and industry Source: ONS – Regional Gross Value Added
2% 2% 2% 2% 2% 2% 2% 2% 2%
17% 16% 15% 14% 14% 14% 14% 14% 14%
6% 6% 6% 7% 6% 6% 6% 6% 6%
18% 18% 18% 18% 18% 17% 16% 16% 16%
10% 10% 11% 11% 10% 9% 9% 8% 7%
2% 2% 2% 2% 2% 3% 3% 3% 4%
10% 10% 10% 9% 9% 9% 10% 10% 9%
14% 14% 13% 13% 14% 14% 15% 15% 16%
18% 19% 19% 20% 22% 23% 22% 22% 23%
3% 3% 3% 3% 3% 3% 3% 3% 3%
0%
10%
20%
30%
40%
50%
60%
70%
80%
90%
100%
2001 2002 2003 2004 2005 2006 2007 2008 2009
% o
f tot
al G
VA
Other services and householdactivitiesPublic administration; education;health Business service activities
Real estate activities
Financial and insurance activities
Information and communication
Distribution; transport;accommodation and foodConstruction
Production
Agriculture, forestry and fishing
Figure 34: GVA per capita and labour productivity in Greater Cambridge by district in 2009 Source: Insight East – East of England Forecasting Model Autumn 2010 Baseline Forecast; GVA per Capita (£000s per head of population); Labour Productivity (£000s per total of employees and self-employed)
38.7
31.4
28.2
33.8
43.1
36.6
31.6 34
.7
32.6 37
.7
35.9
36.5
31.2
12.1
12.1 16
.7
23.4
19.9
13.9
14.7 18
.6 22.1
17.6
18.3
05
101520253035404550
Cam
brid
ge C
ity
Eas
t Cam
bs
Fenl
and
Hun
tingd
onsh
ire
Sou
th C
ambs
Cam
brid
gesh
ire
Fore
st H
eath
Nor
th H
erts
St E
dmun
dsbu
ry
Uttl
esfo
rd
Eas
t of E
ngla
nd UK
GV
A p
er C
apita
(£00
0s)
La
bour
Pro
duct
ivity
(£00
0s)
Labour Productivity
GVA per Capita
Health and productivity A report published by the Work Foundation in April 2010 argues that the cost of ‘presenteeism’ (being at work but not productive) could match or account for one-and-a-half times more working time lost than the estimated £13bn annual cost of sickness absence. Physical and mental health of employees can have a significant impact on productivity. The Joint Strategic Needs Assessment14 analyses the health of residents in detail.
14 www.cambridgeshirejsna.org.uk
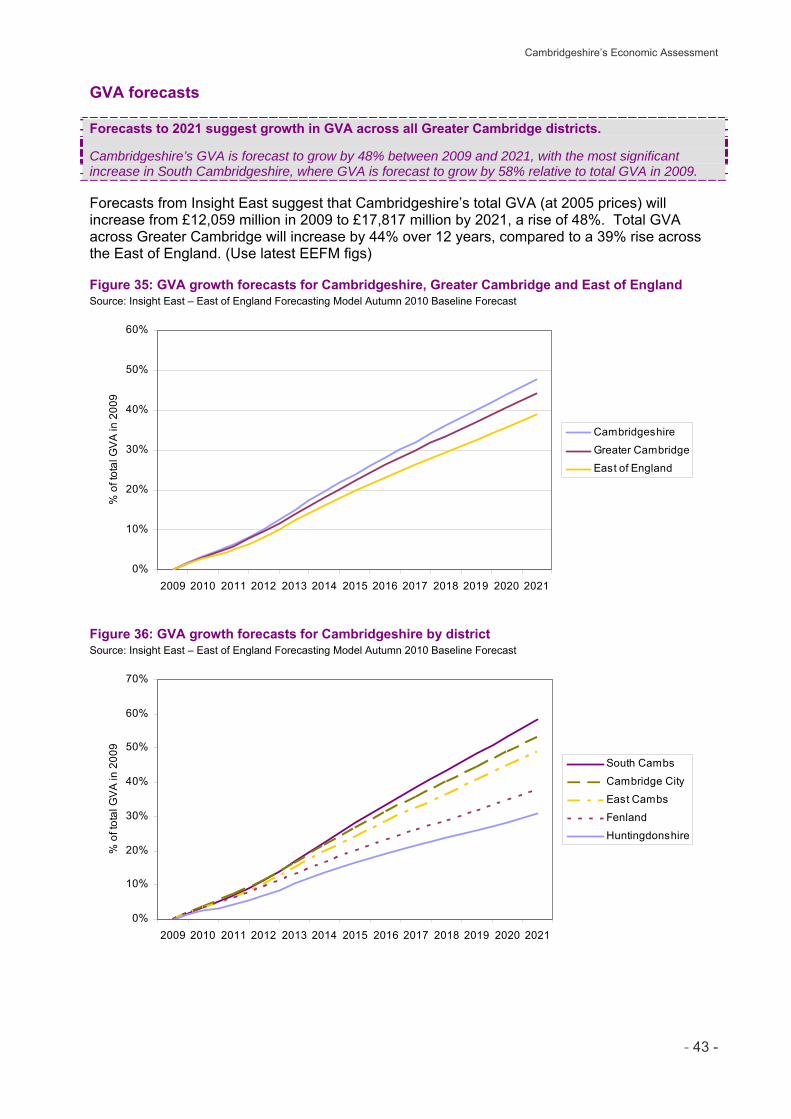
Cambridgeshire’s Economic Assessment
- 43 -
GVA forecasts
Forecasts to 2021 suggest growth in GVA across all Greater Cambridge districts. Cambridgeshire’s GVA is forecast to grow by 48% between 2009 and 2021, with the most significant increase in South Cambridgeshire, where GVA is forecast to grow by 58% relative to total GVA in 2009. Forecasts from Insight East suggest that Cambridgeshire’s total GVA (at 2005 prices) will increase from £12,059 million in 2009 to £17,817 million by 2021, a rise of 48%. Total GVA across Greater Cambridge will increase by 44% over 12 years, compared to a 39% rise across the East of England. (Use latest EEFM figs) Figure 35: GVA growth forecasts for Cambridgeshire, Greater Cambridge and East of England Source: Insight East – East of England Forecasting Model Autumn 2010 Baseline Forecast
0%
10%
20%
30%
40%
50%
60%
2009 2010 2011 2012 2013 2014 2015 2016 2017 2018 2019 2020 2021
% o
f tot
al G
VA
in 2
009
Cambridgeshire
Greater Cambridge
East of England
Figure 36: GVA growth forecasts for Cambridgeshire by district Source: Insight East – East of England Forecasting Model Autumn 2010 Baseline Forecast
0%
10%
20%
30%
40%
50%
60%
70%
2009 2010 2011 2012 2013 2014 2015 2016 2017 2018 2019 2020 2021
% o
f tot
al G
VA
in 2
009
South Cambs
Cambridge City
East Cambs
Fenland
Huntingdonshire
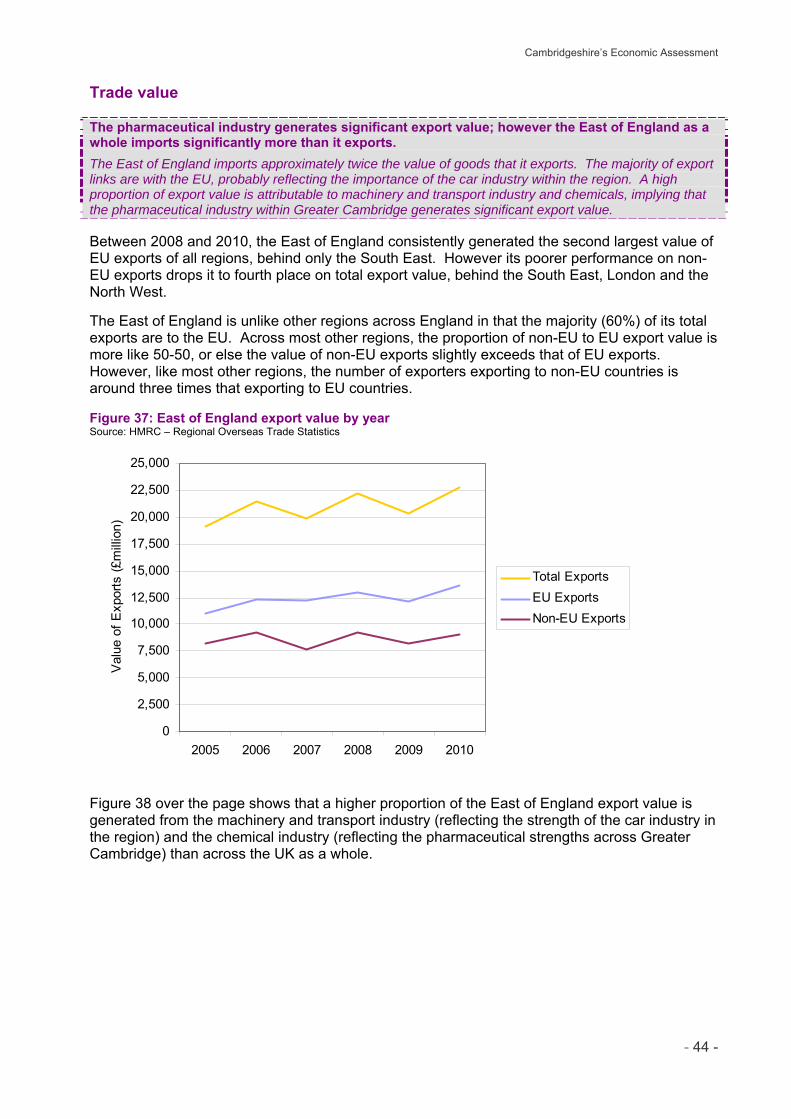
Cambridgeshire’s Economic Assessment
- 44 -
Trade value
The pharmaceutical industry generates significant export value; however the East of England as a whole imports significantly more than it exports.
The East of England imports approximately twice the value of goods that it exports. The majority of export links are with the EU, probably reflecting the importance of the car industry within the region. A high proportion of export value is attributable to machinery and transport industry and chemicals, implying that the pharmaceutical industry within Greater Cambridge generates significant export value. Between 2008 and 2010, the East of England consistently generated the second largest value of EU exports of all regions, behind only the South East. However its poorer performance on non-EU exports drops it to fourth place on total export value, behind the South East, London and the North West. The East of England is unlike other regions across England in that the majority (60%) of its total exports are to the EU. Across most other regions, the proportion of non-EU to EU export value is more like 50-50, or else the value of non-EU exports slightly exceeds that of EU exports. However, like most other regions, the number of exporters exporting to non-EU countries is around three times that exporting to EU countries. Figure 37: East of England export value by year Source: HMRC – Regional Overseas Trade Statistics
0
2,500
5,000
7,500
10,000
12,500
15,000
17,500
20,000
22,500
25,000
2005 2006 2007 2008 2009 2010
Val
ue o
f Exp
orts
(£m
illio
n)
Total ExportsEU ExportsNon-EU Exports
Figure 38 over the page shows that a higher proportion of the East of England export value is generated from the machinery and transport industry (reflecting the strength of the car industry in the region) and the chemical industry (reflecting the pharmaceutical strengths across Greater Cambridge) than across the UK as a whole.
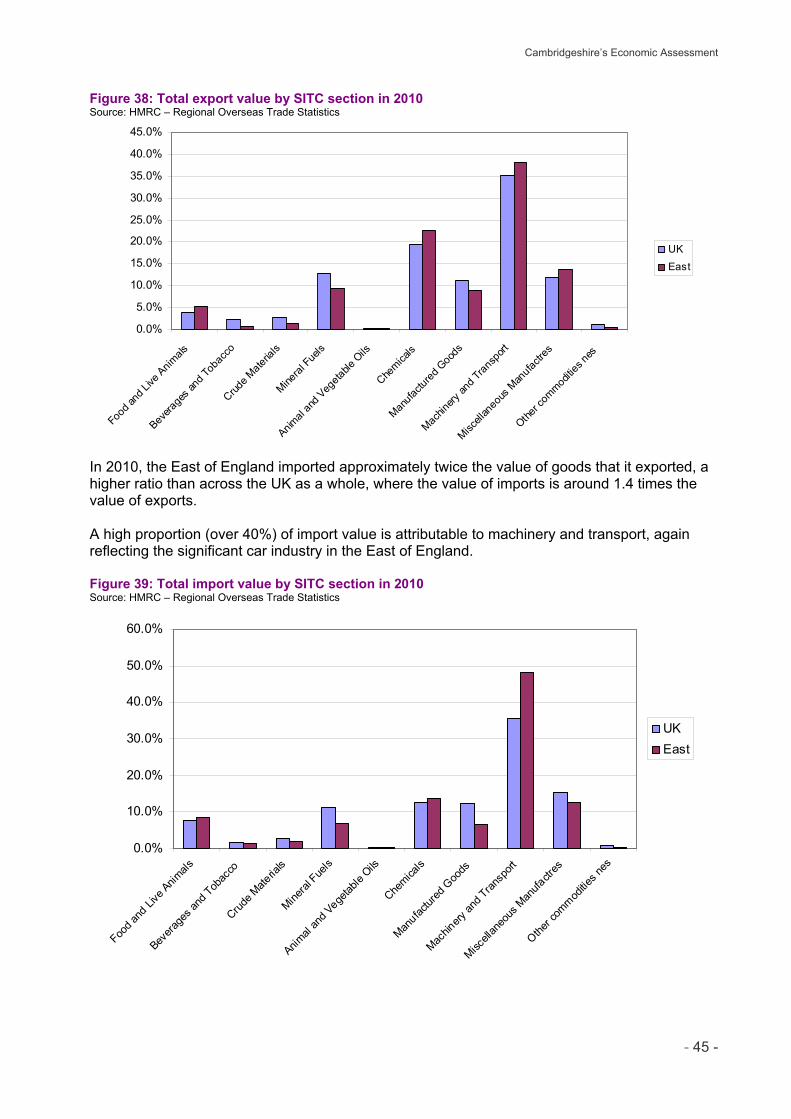
Cambridgeshire’s Economic Assessment
- 45 -
Figure 38: Total export value by SITC section in 2010 Source: HMRC – Regional Overseas Trade Statistics
0.0%
5.0%
10.0%
15.0%
20.0%
25.0%
30.0%
35.0%
40.0%
45.0%
Food
and L
ive Anim
als
Bevera
ges a
nd To
bacc
o
Crude M
ateria
ls
Mineral
Fuels
Animal
and V
egeta
ble O
ils
Chemica
ls
Manufa
ctured
Goo
ds
Machin
ery an
d Tran
sport
Miscell
aneo
us M
anufa
ctres
Other c
ommod
ities n
es
UKEast
In 2010, the East of England imported approximately twice the value of goods that it exported, a higher ratio than across the UK as a whole, where the value of imports is around 1.4 times the value of exports. A high proportion (over 40%) of import value is attributable to machinery and transport, again reflecting the significant car industry in the East of England. Figure 39: Total import value by SITC section in 2010 Source: HMRC – Regional Overseas Trade Statistics
0.0%
10.0%
20.0%
30.0%
40.0%
50.0%
60.0%
Food a
nd Li
ve Anim
als
Bevera
ges a
nd Tob
acco
Crude M
ateria
ls
Mineral
Fuels
Animal
and V
egetab
le Oils
Chemica
ls
Manufac
tured
Goo
ds
Machin
ery an
d Tran
sport
Miscell
aneo
us M
anufa
ctres
Other c
ommod
ities n
es
UKEast
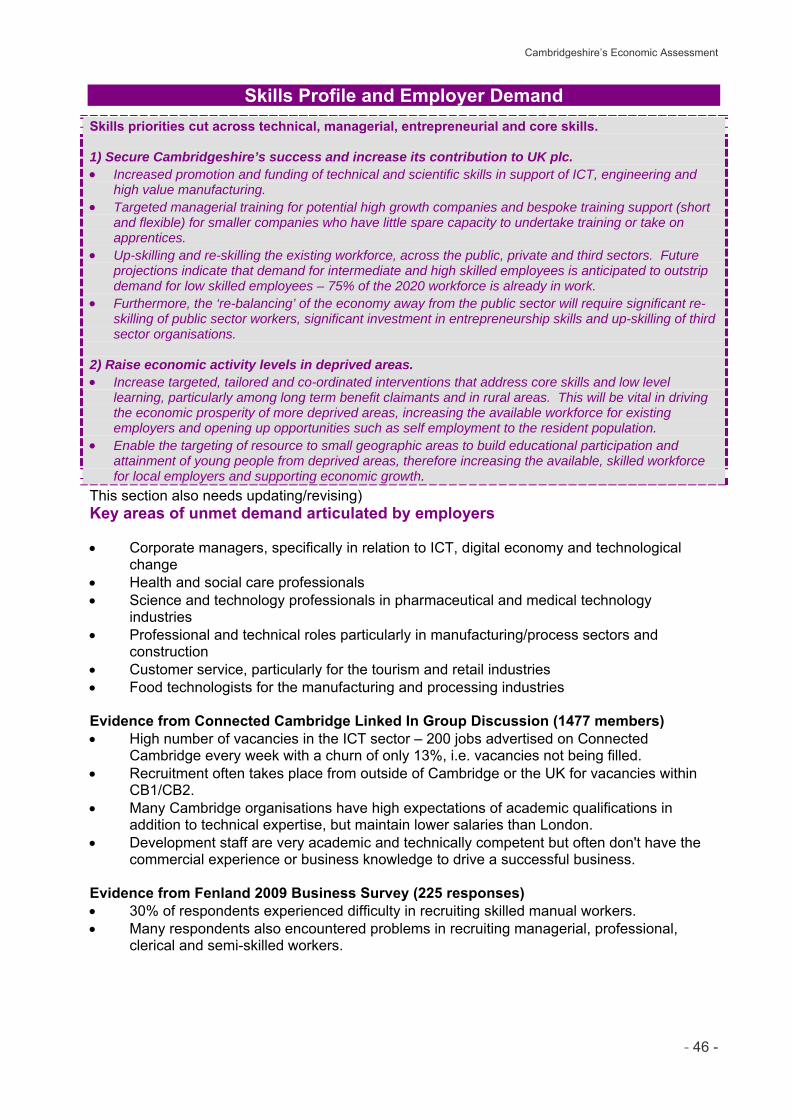
Cambridgeshire’s Economic Assessment
- 46 -
Skills Profile and Employer Demand
Skills priorities cut across technical, managerial, entrepreneurial and core skills. 1) Secure Cambridgeshire’s success and increase its contribution to UK plc. Increased promotion and funding of technical and scientific skills in support of ICT, engineering and
high value manufacturing. Targeted managerial training for potential high growth companies and bespoke training support (short
and flexible) for smaller companies who have little spare capacity to undertake training or take on apprentices.
Up-skilling and re-skilling the existing workforce, across the public, private and third sectors. Future projections indicate that demand for intermediate and high skilled employees is anticipated to outstrip demand for low skilled employees – 75% of the 2020 workforce is already in work.
Furthermore, the ‘re-balancing’ of the economy away from the public sector will require significant re-skilling of public sector workers, significant investment in entrepreneurship skills and up-skilling of third sector organisations.
2) Raise economic activity levels in deprived areas. Increase targeted, tailored and co-ordinated interventions that address core skills and low level
learning, particularly among long term benefit claimants and in rural areas. This will be vital in driving the economic prosperity of more deprived areas, increasing the available workforce for existing employers and opening up opportunities such as self employment to the resident population.
Enable the targeting of resource to small geographic areas to build educational participation and attainment of young people from deprived areas, therefore increasing the available, skilled workforce for local employers and supporting economic growth.
This section also needs updating/revising) Key areas of unmet demand articulated by employers
Corporate managers, specifically in relation to ICT, digital economy and technological change
Health and social care professionals Science and technology professionals in pharmaceutical and medical technology
industries Professional and technical roles particularly in manufacturing/process sectors and
construction Customer service, particularly for the tourism and retail industries Food technologists for the manufacturing and processing industries Evidence from Connected Cambridge Linked In Group Discussion (1477 members) High number of vacancies in the ICT sector – 200 jobs advertised on Connected
Cambridge every week with a churn of only 13%, i.e. vacancies not being filled. Recruitment often takes place from outside of Cambridge or the UK for vacancies within
CB1/CB2. Many Cambridge organisations have high expectations of academic qualifications in
addition to technical expertise, but maintain lower salaries than London. Development staff are very academic and technically competent but often don't have the
commercial experience or business knowledge to drive a successful business. Evidence from Fenland 2009 Business Survey (225 responses) 30% of respondents experienced difficulty in recruiting skilled manual workers. Many respondents also encountered problems in recruiting managerial, professional,
clerical and semi-skilled workers.
Cambridgeshire’s Economic Assessment
- 47 -
GCP Employer Skills Forum Construction sector skills gaps/needs The highest numbers of skills gaps are within skilled trade professions (LSC Employer
Skills Survey 2007). Management skills gaps (oral communication; team working; delegating; supervising;
writing; IT customer focus; and finance) exist in the industry in Greater Cambridge. The sector requires low carbon/BREEAM excellent building training targeted at small sub
contractors. Food processing sector skills gaps/needs ESOL provision is a priority for the sector, both for safety and to ensure migrant workers
are fulfilling their economic potential. 11% of employers in the region state skills gaps are most prominent in the machine
operative/production line worker area – the bulk of the need is for technical and practical skills.
The sector has struggled to attract enough good new people and is not seen as a career of choice by many people, and levels of progression and formal qualifications are low by comparison with many other sectors.15
It is recognized that there will be demand for skills at all levels, but businesses are anticipating a larger increase in the demand for higher level and technical skills in subjects as diverse as electronics, mechanization, quality control, ICT and production science as the industry becomes more sophisticated.
The 2010 Skills Challenge report found that, looking forward, businesses highlighted particular needs in relation to: o Finding young highly skilled operators for large, complex and computerised
machinery; o Managers with a balance of technical and management skills to promote growth and
efficiency; o Finding enough scientists and professionals who wish to specialize in the sector e.g.
engineers, bankers, accountants and solicitors; o Finding new leaders and entrepreneurs to drive the sector forward and create new
products and enterprises, as well as supporting the growth needs of existing entrepreneurs.
The report identified four areas that need to be addressed: o Attracting young people - who have an increasingly wide range of careers available
to them. To compete, the sector must be clear on the career potential it offers, dispel the myth that it is a closed shop and focus on the 14-16 age group as they make career choices. The sector needs to use routes such as partnerships with schools or Young Farmers to reach out into non-traditional markets and develop innovative ways into the sector for the young. A full range of routes is required including the 14-19 diploma (funding permitting) as well as both academic and vocational routes.
o Attracting career changers - who in many industries are an increasing source of new recruits. To do this the industry has to encourage people in by clearly explaining the benefits of the sector and selling the sector as a career of choice, helping them to make the transition and by clearly explaining how their transferable skills are valuable within the sector. Some businesses are already doing this and finding it an effective way to obtain skills in areas such as supply chain management or mechanization. Flexible post-graduate provision is also vital to provide the routes for professionals to retrain within the sector.
15 The Skills Challenge for the East of England’s Food & Farming Sector to 2020 (2010)

Cambridgeshire’s Economic Assessment
- 48 -
o Selling a positive message to key influencers - most people, whether young or old are influenced heavily by those around them, and in relation to careers this includes family, friends, colleagues and services such as the careers service and teachers. It is critical that these people also understand the benefits of working within the industry and are positive about it.
o Promoting attractive conditions - the sector has to ensure that its conditions of employment are competitive, and then promote the rewards which the sector offers to potential new entrants. By investing in new technology the value added per employee can be increased and this can lead to more attractive conditions, both physically and financially, being provided.
High value manufacturing sector skills gaps/needs 64% of companies in the East of England reported skills gaps in mechanical engineering,
general engineering and electronics (SEMTA) and this appears to reflect local needs. On generic skills, SEMTA found staff lacked core personal skills, management skills, ICT
skills and marketing/selling skills. All four universities operating in the sub-region are involved in collaborative initiatives with
local businesses. However, research from both the Institute for Manufacturing (Cambridge University) and the University of Hertfordshire points to the need for bespoke support for smaller companies – identifying problems and working through individual solutions outside of a business improvement framework or any other generic model. A clear distinction between the needs of medium and small companies needs to be made and a move away from a ‘one size fits all’ approach to training.
GCP Tourism Strategy and Action Plan – Survey for the strategy identified: Business advice, especially marketing for smaller enterprises. Customer care training across attractions and accommodation providers. GCP Cleantech Strategy and Action Plan – Opportunities for the sub-region include: Building technologies, recycling, ICT in Cleantech and biotech in Cleantech, all of which
are sectors which demand technical, engineering or ICT skills. GCP Creative Industries Strategy and Action Plan Identified shortage of media professionals (e.g. marketing, PR, advertising, branding). Identified need for bridge between academia and real world, i.e. apprenticeships. Cambridgeshire County Council Workforce Development Plan (New version of this) Cambridgeshire County Council is the largest single employer in the county. Some roles at the Council are more difficult to fill than others due to a variety of reasons including skills shortages, salary levels and cost of living in the area. Hard to fill posts for the Council based on 2009 data and market intelligence include: Social workers. Other social care posts, including youth work roles, community support and some children
and families’ posts. Technical roles including engineers, planners and some qualified accountancy roles. Social worker recruitment and retention issues have been addressed very successfully to date, however work continues to take place within this area to eradicate any recruitment and retention issues as it is seen to be a priority by the Council.
Cambridgeshire’s Economic Assessment
- 49 -
Projected replacement and expansion demand by sector and occupation
Pre-recession, employment growth in Cambridgeshire was greatest in: By industry: public administration, education and health; financial and business services;
construction By occupation: professional occupations; managers and senior officials Occupational forecasts for Cambridgeshire based on both the East of England Forecasting Model and the Local Economy Forecasting Model estimate that over the next five years replacement demand is likely to be strongest in: Professional occupations (particularly teaching and research professionals) Managers and senior officials Caring personal service occupations Associate technical and professional occupations However all professions are likely to experience a significant level of replacement demand that outstrips any projected decline in total employment resulting in a net requirement in all professions. Focus groups that took place as part of part of the Cambridgeshire Work and Skills Plan development pointed to likely future growth in health, software, creative industries (including games and sound and imaging), R&D and advanced manufacturing (including biotechnology, pharmaceuticals, ICT, instruments and engineering, materials, printing and packaging and recycling), tourism and hospitality (linked to the Olympic games) and environmental goods and services. Local economic development policy seeks to encourage hi-tech employment, creative industries, tourism, clean technologies and high value manufacturing. The East of England Forecasting Model (Spring 2010 run) forecasts that between 2010 and 2015 the largest increases in employment in Cambridgeshire will be in business services, retail, transport and communications, financial intermediation, hotels, distribution and construction. Occupational forecasts for Cambridgeshire based on both the East of England Forecasting Model and the Local Economy Forecasting Model estimate that over the next five years expansion demand is likely to be strongest in: Caring personal service occupations Managers and senior officials Associate technical and professional occupations Professional occupations Sales and customer service occupations All other occupations are projected to experience very little, or negative expansion demand.
Cambridgeshire’s Economic Assessment
- 50 -
Skills for current vacancies
Jobcentre Plus vacancy figures (2007-2011) – which relate just to vacancies notified to Jobcentre Plus – show that the greatest numbers of opportunities currently or recently available are in: Health and social work. The number of notified vacancies in this sector has remained
consistently high year on year since 2007. Wholesale and retail distribution. The retail sector has been affected by the recession but
the high turnover rates within the sector mean there is a regular flow of entry-level vacancies in Cambridgeshire.
Public administration. Despite the recession and public sector cuts, notified vacancies in this sector have remained consistently high since 2007.
The largest number of vacancies is consistently in the financial and business services sector. The sector, which spans ICT, legal, finance and accounting, marketing and advertising, and real estate services, is a major employer in Cambridgeshire.
The highest number of unfilled vacancies is consistently in elementary occupations, with a high proportion of vacancies for process, plant and machine operatives in the north of the county, and a recent increase in opportunities for associate professional and technical workers in the south.
The National Employer Skills Survey 2009 found education and health and social work employers report above-average levels of hard-to-fill vacancies and skill-shortage vacancies, as do those operating in hotels and catering.
Mismatches in skills profile and demand
The unemployment rate in Fenland is close to the national average of around 8% however a high (over 7% but stable) proportion of Fenland’s working age residents claim Employment and Support Allowance/Incapacity Benefit (ESA/IB) compared with local, regional and national figures. There are also significant concentrations of ESA/IB claimants in Cambridge City, north Huntingdon and St Neots. A high proportion of these individuals have been out of work for a long period of time but Annual Population Survey data suggest that many would be willing to work, given the right training and opportunities. Cambridgeshire has a significant Gypsy/Traveller population. Very little research relating to Gypsies and Travellers and skills and employment exists. What research does exist suggests that there is a strong preference for self employment among communities and there is a broad skill base that goes unrecognised. Opportunities to develop social enterprise, recycling initiatives and support for small businesses with Gypsy and Traveller groups should be explored further. Current provision of targeted training opportunities to Gypsies and Travellers are limited. First hand work experience is recognised to be the preferred method of training for employment among many young Travellers and felt by many to be the most beneficial preparation for adult roles. Local Futures (2010) predict a reduction in Cambridge City of between 3.25% and 4% in public sector jobs as a proportion of the overall employment base by 2016, a higher proportion of losses than is anticipated nationally or elsewhere in the county. For Cambridge City this equates to around 4,000 job losses for the city’s workers between 2010 and 2016, many of whom will seek retraining for employment in the private sector. With public sector cuts, more will be asked from the voluntary and community sector in terms of service delivery – the skills needs and capacity building of this sector therefore take on increased importance.

Cambridgeshire’s Economic Assessment
- 51 -
Key skills challenges
Overall, participation and levels of attainment are again high across Cambridgeshire for 16-19 and 14-16 year olds; however this masks significant variation by pupil background. Across the county, the achievement gap between pupils in receipt of free school meals (disadvantaged learners) and those who are not (non-disadvantaged learners) in terms of the proportion of 19 year olds qualified to level 2 or higher is 27 percentage points wider than the gap nationally. Cambridgeshire residents are on average more qualified than across the country as a whole, however a higher proportion of Fenland residents have no qualifications than is the case nationally. Fenland also performs well below the national average in terms of the proportion of residents qualified to NVQ levels 2, 3 and 4. The high level of inequality in skills levels between residents in the north and south of the county is illustrated by those educated to degree level, where Fenland ranks 7th lowest of all local authorities in the country while Cambridge City ranks 14th highest. Three out of five districts in Cambridgeshire have lower than average proportions of their population holding level 3 (recognised as ‘intermediate level’) as their highest qualification. The National Skills Audit 2010 found that the highest ‘densities’ of skills shortages (i.e. relative to the numbers in the occupation) are found in associate professional/technical, skilled trades and personal service occupations, all of which require predominantly intermediate level skills. Associate technical/professional and skilled trade occupations are essential in many advanced manufacturing sectors; skills shortages in these areas could be restricting their growth in the sub-region. This situation is already apparent in the construction industry: the SmartLIFE project was established to help address a shortage of skilled construction workers and tradesmen to help us build the homes and communities of the future. 84% of Cambridgeshire’s VAT/PAYE registered businesses have an employment of less than ten, a slightly higher percentage than seen nationally. The National Skills Audit 2010 recognises that skills shortages predominantly affect small organisations. The birth rate of new enterprises is lower than average across most of Cambridgeshire and self-employment is lower than average in three out of five districts. Enhancing entrepreneurship skills, starting at school, would provide a major boost to the area. Across Cambridgeshire, turnover per enterprise is over half that seen nationally and significantly lower than the regional figure. Average employment per enterprise is also lower than average. This aligns with a general perception that management and commercial skills are not strong among leaders of Cambridgeshire companies, particularly hi-tech, knowledge based businesses in the south of the county that have significant potential to grow.
Cambridgeshire’s Economic Assessment
- 1 -
People
List of figures, maps and tables ........................................................................................................ 2
People SWOT ...................................................................................................................................... 4
Population ........................................................................................................................................... 5 Labour Market ................................................................................................................................................... 5 The Population of Cambridgeshire .................................................................................................................... 5 Forecast Population Change ............................................................................................................................. 7 Migration and Migrant Workers ....................................................................................................................... 10 Gypsies and Travellers .................................................................................................................................... 12 Traveller Skills ................................................................................................................................................. 13
Economic Activity and Employment ............................................................................................... 14 Economic Activity and Employment ................................................................................................................ 14 Employment by Ethnic Group .......................................................................................................................... 15 Self-employment and Part-time Working ........................................................................................................ 16 Access to Employment .................................................................................................................................... 18
Occupations, Earnings and Income ................................................................................................ 19 Occupational Structure .................................................................................................................................... 19 Residents’ Weekly Pay .................................................................................................................................... 21 Median Household Income .............................................................................................................................. 23
Qualifications, Aspirations and Skills ............................................................................................. 27 Qualifications of the Working Age Population ................................................................................................. 27 Participation in Education, Employment and Training .................................................................................... 30 Participation and Attainment of Young People in Education ........................................................................... 31 Apprenticeships and Sector Subject Areas of Learners ................................................................................. 34 Higher Education in the County....................................................................................................................... 35 Access to Education ........................................................................................................................................ 36 Skills Demand and Forecasting ....................................................................................................................... 36 Accessibility and Quality of Life ....................................................................................................................... 37
Unemployment, Economic Inactivity and Receipt of Benefits ..................................................... 38 Unemployment and Economic Inactivity ......................................................................................................... 38 Economic Inactivity and Unemployment by Ethnic Group .............................................................................. 40 Disability .......................................................................................................................................................... 42 Out-of-Work Benefits Claimants ...................................................................................................................... 43 Jobseeker’s Allowance Claimants ................................................................................................................... 44 Incapacity Benefit, Severe Disablement Allowance & Employment and Support Allowance Claimants ........ 48
Indices of Deprivation 2010 ............................................................................................................. 51
Cambridgeshire’s Economic Assessment
- 2 -
List of figures, maps and tables Figure 1: Forecast % population change 2011-2021 ............................................................................ 7 Figure 2: Population change by age 2010-2021, Cambridgeshire districts .......................................... 9 Figure 3: Age structure of Cambridgeshire’s population in 2010 and 2021 (% of population) .............. 9 Figure 4: Number of NINo and WRS registrations in Cambridgeshire ................................................ 10 Figure 5: Percentage of population aged 16-64 in employment (employment rate) ........................... 14 Figure 6: Regional employment rate (% of population aged 16-64) by ethnic group .......................... 15 Figure 7: Cambridgeshire employment rates among 16-74 year olds by ethnic group ...................... 15 Figure 8: Proportion of employed residents who are self-employed ................................................... 16 Figure 9: Proportion of employed residents working part-time ........................................................... 16 Figure 10: Total early-stage Entrepreneurial Activity (TEA) in participating G7 (2002-2009) ............. 17 Figure 11: Total early-state Entrepreneurial Activity in participating UK and BRIC Countries (2002-2009) ................................................................................................................................................... 17 Figure 12: Cambridgeshire & England’s occupational structure (% of employed population) ............ 19 Figure 13: Median gross weekly full-time employee pay (£) by district of residence in 2011 ............. 21 Figure 14: Median gross weekly full-time employee pay by district of residence, 2002-2011 ............ 22 Figure 15: Median household income ................................................................................................. 23 Figure 16: Low income households - % households with annual income under £20,000 .................. 23 Figure 17: % of 19-59/64 population qualified to different NVQ levels in 2010 ................................... 28 Figure 18: % of 19-59/64 population with Level 2 or higher qualifications, 2001-2010 ....................... 29 Figure 19: % of 19-59/64 population with no qualifications in 2010 .................................................... 29 Figure 20: % of 16-19 year olds NEET by Cambridgeshire district, December 2010 ......................... 30 Figure 21: % of people studying in a district at age 15 reaching Level 2/Level 3 by age 19 .............. 32 Figure 22: % of pupils at end of Key Stage 4 achieving 5+ GCSEs A*-C inc. Maths & English, by location of residence in 2009/10 ......................................................................................................... 32 Figure 23: Unemployment rate (% of economically active population aged 16+) ............................... 39 Figure 24: Workless households as percentage of all households, 2004-2010 .................................. 39 Figure 25: Economic inactivity by ethnic group, East of England and England .................................. 41 Figure 26: Unemployment by ethnic group, East of England and England ........................................ 41 Figure 27: Jobseeker's Allowance claimants as % of population aged 16-64, 2001-2011 ................. 44 Figure 28: Cambridgeshire's Jobseeker's Allowance claimants as % of population aged 16-64 ....... 45 Figure 29: Incapacity Benefit & Employment and Support Allowance claimants as % of population aged 16-64, 2000-2011....................................................................................................................... 48 Figure 30: % of population aged 16-64 claiming IB/SDA/ESA by district in May 2011 ....................... 49 Figure 31: Duration of IB/SDA/ESA claims in Cambridgeshire in May 2011 ...................................... 49 Figure 32: Incapacity Benefit and Severe Disablement Allowance claimants by age and gender in May 2011 ............................................................................................................................................ 50
Map 1: Median annual household income by ward ............................................................................. 24 Map 2: % of households with an annual income of less than £20,000 by ward .................................. 25 Map 3: % of households with an annual income of more than £75,000 by ward ................................ 26 Map 4: % of population aged 16-64 (working age) claiming JSA by ward, November 2011 .............. 46 Map 5: Percentage point change in the JSA claimant rate by ward, November 2009 - 2011 ............. 47 Map 6: Index of Multiple Deprivation 2010 .......................................................................................... 52 Map 7: Employment Deprivation 2010 ................................................................................................ 53 Map 8: Education, Skills and Training Deprivation 2010 .................................................................... 54
Table 1: Mid-2010 population of Greater Cambridge and its constituent districts ................................ 6 Table 2: Future population change by district and source of forecast/projection .................................. 8 Table 3: Accessibility of employment .................................................................................................. 18 Table 4: Occupational structure of the employed population .............................................................. 20 Table 5: % of area’s employed population working in ‘high value’ occupations ................................. 20
Cambridgeshire’s Economic Assessment
- 3 -
Table 6: Median gross weekly full-time employee pay (£) by district of residence and gender in 2011 ............................................................................................................................................................ 22 Table 7: Qualifications of people aged 19-59/64 (NVQ equivalents) in 2010 ..................................... 27 Table 8: Participation of 16 and 17 year olds in education or work-based learning (WBL) ................ 31 Table 9: % of pupils at end of Key Stage 4 achieving 5+ GCSEs A*-C inc. Maths & English, by location of school and location of residence in 2009/10 ..................................................................... 33 Table 10: % of pupils at end of Key Stage 4 achieving 5+ GCSEs A*-C inc. Maths & English, by pupil characteristics in 2009/10 ................................................................................................................... 33 Table 11: Number of workless households and workless households as % of all households, 2004-2010 .................................................................................................................................................... 40 Table 12: Economic inactivity and unemployment by ethnicity ........................................................... 42 Table 13: Economic activity and employment among disabled people (% of population aged 16-64) ............................................................................................................................................................ 42 Table 14: Out-of-work benefits claimants and claimants as % of population aged 16-64 in May 2011 ............................................................................................................................................................ 43 Table 15: Number of Jobseeker’s Allowance claimants, November 2010 to November 2011 ........... 45 Table 16: Incapacity Benefit and Severe Disablement Allowance claimants by condition in May 2011 ............................................................................................................................................................ 50 Table 17: Number of LSOAs among most deprived 20% nationally ................................................... 51
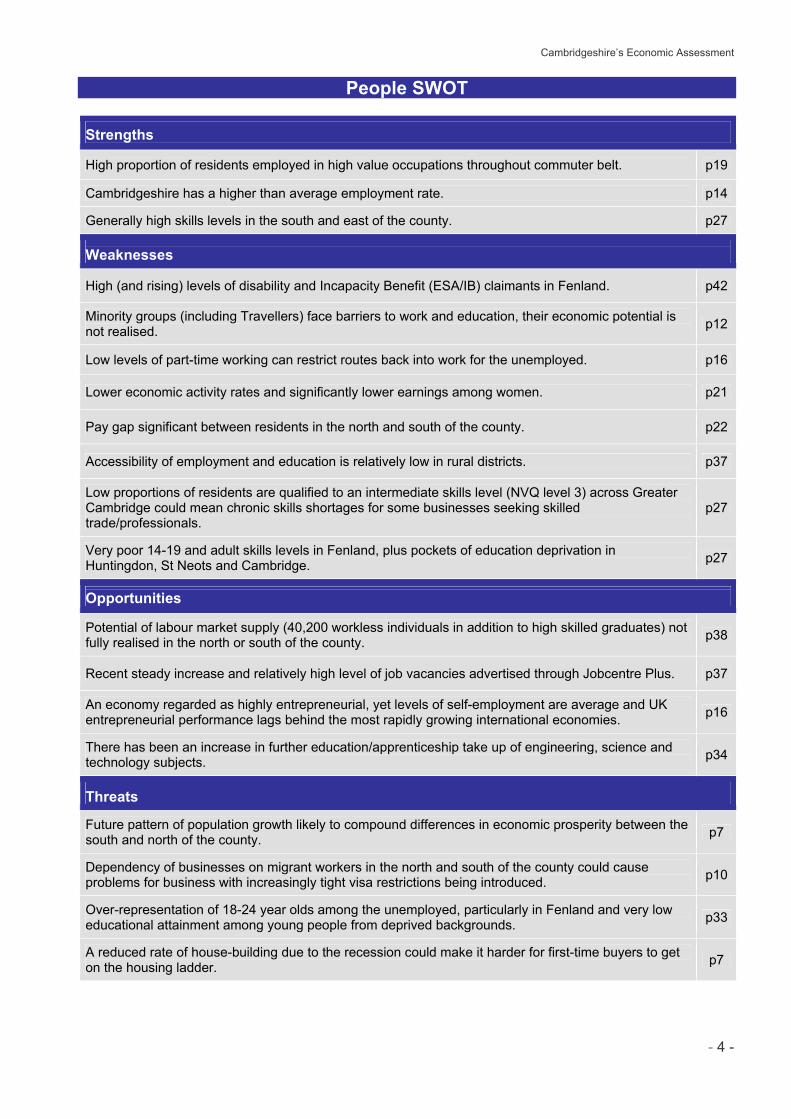
Cambridgeshire’s Economic Assessment
- 4 -
People SWOT
Strengths
High proportion of residents employed in high value occupations throughout commuter belt. p19
Cambridgeshire has a higher than average employment rate. p14
Generally high skills levels in the south and east of the county. p27
Weaknesses
High (and rising) levels of disability and Incapacity Benefit (ESA/IB) claimants in Fenland. p42
Minority groups (including Travellers) face barriers to work and education, their economic potential is not realised. p12
Low levels of part-time working can restrict routes back into work for the unemployed. p16
Lower economic activity rates and significantly lower earnings among women. p21
Pay gap significant between residents in the north and south of the county. p22
Accessibility of employment and education is relatively low in rural districts. p37
Low proportions of residents are qualified to an intermediate skills level (NVQ level 3) across Greater Cambridge could mean chronic skills shortages for some businesses seeking skilled trade/professionals.
p27
Very poor 14-19 and adult skills levels in Fenland, plus pockets of education deprivation in Huntingdon, St Neots and Cambridge.
p27
Opportunities
Potential of labour market supply (40,200 workless individuals in addition to high skilled graduates) not fully realised in the north or south of the county.
p38
Recent steady increase and relatively high level of job vacancies advertised through Jobcentre Plus. p37
An economy regarded as highly entrepreneurial, yet levels of self-employment are average and UK entrepreneurial performance lags behind the most rapidly growing international economies. p16
There has been an increase in further education/apprenticeship take up of engineering, science and technology subjects. p34
Threats
Future pattern of population growth likely to compound differences in economic prosperity between the south and north of the county.
p7
Dependency of businesses on migrant workers in the north and south of the county could cause problems for business with increasingly tight visa restrictions being introduced.
p10
Over-representation of 18-24 year olds among the unemployed, particularly in Fenland and very low educational attainment among young people from deprived backgrounds.
p33
A reduced rate of house-building due to the recession could make it harder for first-time buyers to get on the housing ladder. p7
Cambridgeshire’s Economic Assessment
- 5 -
Population Labour Market
Labour markets cross local authority boundaries.
Although Cambridgeshire as a whole has a relatively self contained labour market, the north of the county has strong commuting links with Peterborough and West Norfolk; East Cambridgeshire has strong commuting links with Forest Heath; and Cambridge acts as a regional centre of employment, with nearly 20% of its workforce residing outside the county.
Cambridgeshire’s labour market is relatively self-contained, with 80% of Cambridgeshire’s residents working in the county, and 81% of Cambridgeshire’s workers living in the county. These figures have not changed significantly since 2001, however there has been a slight increase in the number of residents commuting to London, mainly from South Cambridgeshire and Huntingdonshire. Most other areas of the region have also experienced increased levels of commuting to London. Cambridgeshire’s most significant out-commuter flows continue, however, to be to Peterborough and Forest Heath. Around 30% of out-commuters (6% of residents) commute to Peterborough, and around 15% to Forest Health (3% of residents). Strong two way commuting links exist between Peterborough, Fenland and Huntingdonshire (nearly a third of Fenland residents commute to Peterborough and Huntingdonshire to work), and between Forest Heath and East Cambridgeshire. In addition, Fenland draws a significant number of workers from King’s Lynn and West Norfolk. Cambridge and South Cambridgeshire together have a relatively self contained labour market with 87% of Cambridge residents and 85% of South Cambridgeshire residents working in Cambridge or South Cambridgeshire. However, both districts also draw significant numbers of workers from Huntingdonshire, East Cambridgeshire and St Edmundsbury. Approximately 60% of Cambridge workers reside outside the district and nearly 20% reside outside the county, underlining Cambridge’s importance as a regional centre of employment.
The Population of Cambridgeshire Potential of labour market not fully realised in north or south of county.
While Cambridgeshire has a similar age structure to the region and country as a whole, Cambridge City’s large student population significantly raises the proportion of the resident population who are of working age. Economic activity among the City’s students is much lower than nationally. Although Fenland has a lower proportion of working age residents than the national average, a large workless population means there is plenty of labour supply in the medium term. However, there is a significant risk that the workless population do not have the skills required by the businesses seeking to grow in Fenland.
Potential competition for part time work in Cambridge.
While Cambridgeshire has a similar age structure to the region and country as a whole, Cambridge City’s large student population significantly raises the proportion of the resident population who are of working age. Although undergraduate students at Cambridge University are not permitted to work during term time (and economic activity among the City’s students is therefore much lower than among students nationally), the student population of both Cambridge universities may still exert a supply influence on the labour market for part-time work – to the potential detriment of unemployed people seeking similar openings. In 2010, 22,745 students attended Cambridge University and Anglia Ruskin had a student population of 7,566 at the Cambridge Campus.
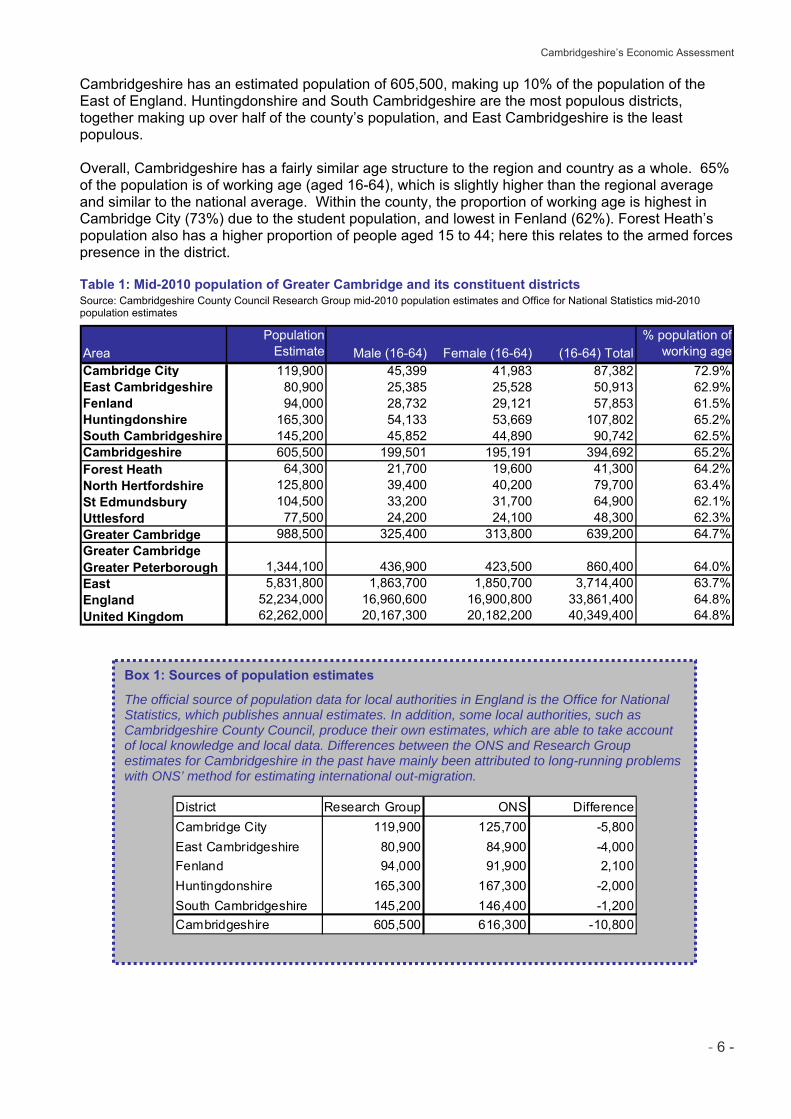
Cambridgeshire’s Economic Assessment
- 6 -
Cambridgeshire has an estimated population of 605,500, making up 10% of the population of the East of England. Huntingdonshire and South Cambridgeshire are the most populous districts, together making up over half of the county’s population, and East Cambridgeshire is the least populous. Overall, Cambridgeshire has a fairly similar age structure to the region and country as a whole. 65% of the population is of working age (aged 16-64), which is slightly higher than the regional average and similar to the national average. Within the county, the proportion of working age is highest in Cambridge City (73%) due to the student population, and lowest in Fenland (62%). Forest Heath’s population also has a higher proportion of people aged 15 to 44; here this relates to the armed forces presence in the district.
Table 1: Mid-2010 population of Greater Cambridge and its constituent districts Source: Cambridgeshire County Council Research Group mid-2010 population estimates and Office for National Statistics mid-2010 population estimates
AreaPopulation
Estimate Male (16-64) Female (16-64) (16-64) Total% population of
working ageCambridge City 119,900 45,399 41,983 87,382 72.9%East Cambridgeshire 80,900 25,385 25,528 50,913 62.9%Fenland 94,000 28,732 29,121 57,853 61.5%Huntingdonshire 165,300 54,133 53,669 107,802 65.2%South Cambridgeshire 145,200 45,852 44,890 90,742 62.5%Cambridgeshire 605,500 199,501 195,191 394,692 65.2%Forest Heath 64,300 21,700 19,600 41,300 64.2%North Hertfordshire 125,800 39,400 40,200 79,700 63.4%St Edmundsbury 104,500 33,200 31,700 64,900 62.1%Uttlesford 77,500 24,200 24,100 48,300 62.3%Greater Cambridge 988,500 325,400 313,800 639,200 64.7%Greater Cambridge Greater Peterborough 1,344,100 436,900 423,500 860,400 64.0%East 5,831,800 1,863,700 1,850,700 3,714,400 63.7%England 52,234,000 16,960,600 16,900,800 33,861,400 64.8%United Kingdom 62,262,000 20,167,300 20,182,200 40,349,400 64.8%
Box 1: Sources of population estimates
The official source of population data for local authorities in England is the Office for National Statistics, which publishes annual estimates. In addition, some local authorities, such as Cambridgeshire County Council, produce their own estimates, which are able to take account of local knowledge and local data. Differences between the ONS and Research Group estimates for Cambridgeshire in the past have mainly been attributed to long-running problems with ONS’ method for estimating international out-migration.
District Research Group ONS DifferenceCambridge City 119,900 125,700 -5,800East Cambridgeshire 80,900 84,900 -4,000Fenland 94,000 91,900 2,100Huntingdonshire 165,300 167,300 -2,000South Cambridgeshire 145,200 146,400 -1,200Cambridgeshire 605,500 616,300 -10,800
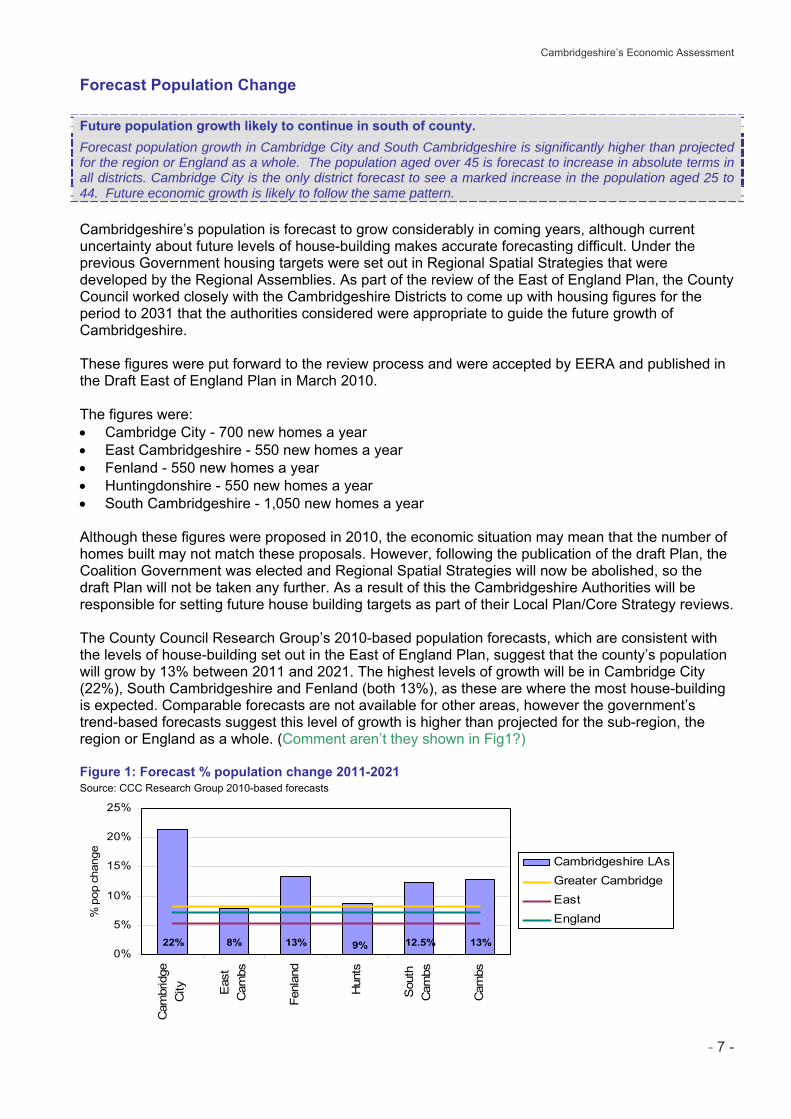
Cambridgeshire’s Economic Assessment
- 7 -
Forecast Population Change Future population growth likely to continue in south of county.
Forecast population growth in Cambridge City and South Cambridgeshire is significantly higher than projected for the region or England as a whole. The population aged over 45 is forecast to increase in absolute terms in all districts. Cambridge City is the only district forecast to see a marked increase in the population aged 25 to 44. Future economic growth is likely to follow the same pattern.
Cambridgeshire’s population is forecast to grow considerably in coming years, although current uncertainty about future levels of house-building makes accurate forecasting difficult. Under the previous Government housing targets were set out in Regional Spatial Strategies that were developed by the Regional Assemblies. As part of the review of the East of England Plan, the County Council worked closely with the Cambridgeshire Districts to come up with housing figures for the period to 2031 that the authorities considered were appropriate to guide the future growth of Cambridgeshire. These figures were put forward to the review process and were accepted by EERA and published in the Draft East of England Plan in March 2010. The figures were: Cambridge City - 700 new homes a year East Cambridgeshire - 550 new homes a year Fenland - 550 new homes a year Huntingdonshire - 550 new homes a year South Cambridgeshire - 1,050 new homes a year Although these figures were proposed in 2010, the economic situation may mean that the number of homes built may not match these proposals. However, following the publication of the draft Plan, the Coalition Government was elected and Regional Spatial Strategies will now be abolished, so the draft Plan will not be taken any further. As a result of this the Cambridgeshire Authorities will be responsible for setting future house building targets as part of their Local Plan/Core Strategy reviews. The County Council Research Group’s 2010-based population forecasts, which are consistent with the levels of house-building set out in the East of England Plan, suggest that the county’s population will grow by 13% between 2011 and 2021. The highest levels of growth will be in Cambridge City (22%), South Cambridgeshire and Fenland (both 13%), as these are where the most house-building is expected. Comparable forecasts are not available for other areas, however the government’s trend-based forecasts suggest this level of growth is higher than projected for the sub-region, the region or England as a whole. (Comment aren’t they shown in Fig1?) Figure 1: Forecast % population change 2011-2021 Source: CCC Research Group 2010-based forecasts
13%12.5%9%13%8%22%0%
5%
10%
15%
20%
25%
Cam
brid
geC
ity Eas
tC
ambs
Fenl
and
Hun
ts
Sou
thC
ambs
Cam
bs
% p
op c
hang
e
Cambridgeshire LAsGreater CambridgeEastEngland
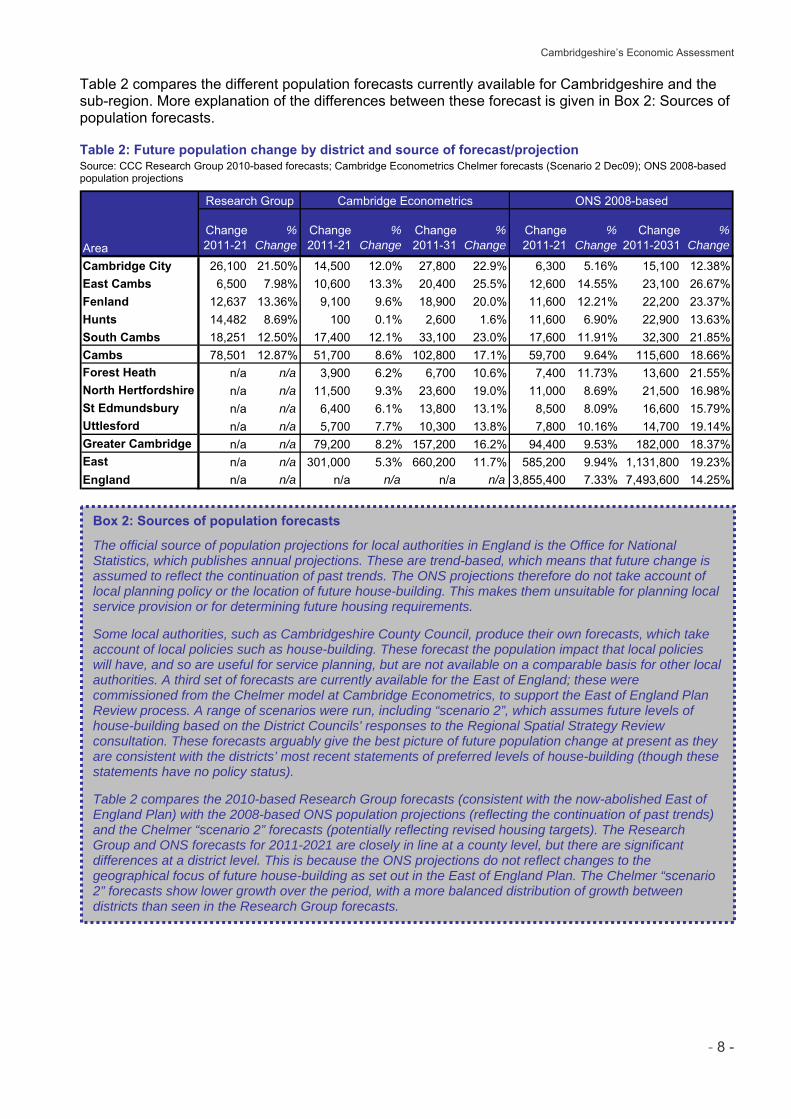
Cambridgeshire’s Economic Assessment
- 8 -
Table 2 compares the different population forecasts currently available for Cambridgeshire and the sub-region. More explanation of the differences between these forecast is given in Box 2: Sources of population forecasts.
Table 2: Future population change by district and source of forecast/projection Source: CCC Research Group 2010-based forecasts; Cambridge Econometrics Chelmer forecasts (Scenario 2 Dec09); ONS 2008-based population projections
Research Group Cambridge Econometrics ONS 2008-based
Change 2011-21
% Change
Change 2011-21
% Change
Change 2011-31
% Change
Change 2011-21
% Change
Change 2011-2031
% Change
Cambridge City 26,100 21.50% 14,500 12.0% 27,800 22.9% 6,300 5.16% 15,100 12.38%East Cambs 6,500 7.98% 10,600 13.3% 20,400 25.5% 12,600 14.55% 23,100 26.67%Fenland 12,637 13.36% 9,100 9.6% 18,900 20.0% 11,600 12.21% 22,200 23.37%Hunts 14,482 8.69% 100 0.1% 2,600 1.6% 11,600 6.90% 22,900 13.63%South Cambs 18,251 12.50% 17,400 12.1% 33,100 23.0% 17,600 11.91% 32,300 21.85%Cambs 78,501 12.87% 51,700 8.6% 102,800 17.1% 59,700 9.64% 115,600 18.66%Forest Heath n/a n/a 3,900 6.2% 6,700 10.6% 7,400 11.73% 13,600 21.55%North Hertfordshire n/a n/a 11,500 9.3% 23,600 19.0% 11,000 8.69% 21,500 16.98%St Edmundsbury n/a n/a 6,400 6.1% 13,800 13.1% 8,500 8.09% 16,600 15.79%Uttlesford n/a n/a 5,700 7.7% 10,300 13.8% 7,800 10.16% 14,700 19.14%Greater Cambridge n/a n/a 79,200 8.2% 157,200 16.2% 94,400 9.53% 182,000 18.37%East n/a n/a 301,000 5.3% 660,200 11.7% 585,200 9.94% 1,131,800 19.23%England n/a n/a n/a n/a n/a n/a 3,855,400 7.33% 7,493,600 14.25%
Area
Box 2: Sources of population forecasts
The official source of population projections for local authorities in England is the Office for National Statistics, which publishes annual projections. These are trend-based, which means that future change is assumed to reflect the continuation of past trends. The ONS projections therefore do not take account of local planning policy or the location of future house-building. This makes them unsuitable for planning local service provision or for determining future housing requirements. Some local authorities, such as Cambridgeshire County Council, produce their own forecasts, which take account of local policies such as house-building. These forecast the population impact that local policies will have, and so are useful for service planning, but are not available on a comparable basis for other local authorities. A third set of forecasts are currently available for the East of England; these were commissioned from the Chelmer model at Cambridge Econometrics, to support the East of England Plan Review process. A range of scenarios were run, including “scenario 2”, which assumes future levels of house-building based on the District Councils' responses to the Regional Spatial Strategy Review consultation. These forecasts arguably give the best picture of future population change at present as they are consistent with the districts’ most recent statements of preferred levels of house-building (though these statements have no policy status). Table 2 compares the 2010-based Research Group forecasts (consistent with the now-abolished East of England Plan) with the 2008-based ONS population projections (reflecting the continuation of past trends) and the Chelmer “scenario 2” forecasts (potentially reflecting revised housing targets). The Research Group and ONS forecasts for 2011-2021 are closely in line at a county level, but there are significant differences at a district level. This is because the ONS projections do not reflect changes to the geographical focus of future house-building as set out in the East of England Plan. The Chelmer “scenario 2” forecasts show lower growth over the period, with a more balanced distribution of growth between districts than seen in the Research Group forecasts.
Cambridgeshire’s Economic Assessment
- 9 -
Figure 2 compares future population change by age across the Cambridgeshire districts. This shows that only Cambridge City will experience an absolute increase in the population of all age groups. Additionally, all districts will see an increase in the number of people in their population aged over 45. The increase will be most marked in the population aged over 65. In East Cambridgeshire and South Cambridgeshire, these increases will be offset by decreases in the number of people aged 25-44, and by those aged 15-24 in Huntingdonshire. Cambridge City is the only district forecast to see a large rise in the population aged 25-44. Figure 2: Population change by age 2010-2021, Cambridgeshire districts Source: CCC Research Group 2010-based forecasts
-10,000
0
10,000
20,000
30,000
CambridgeCity
EastCambs
Fenland Hunts SouthCambs
Cha
nge
in p
opul
atio
n 65+45-6425-4415-240-14
Figure 3 shows the effect that these changes have on Cambridgeshire’s overall age structure. Most age groups make up broadly similar proportions of the population in 2021. The most marked change is in the 65+ population. In 2010 this formed 16% of the population but by 2021 is forecast to form 21%. The impact of this ageing will be felt in all districts except Cambridge City. Conversely, the proportion aged 25-44 is forecast to fall from 27% to 25%. Falls in the proportion of other age groups are modest. Figure 3: Age structure of Cambridgeshire’s population in 2010 and 2021 (% of population) Source: CCC Research Group 2010-based forecasts (totals may not equal 100% due to rounding)
17%
17%
13%
12%
27%
25%
26%
25%
16%
21%
0% 20% 40% 60% 80% 100%
2010
2021
0-14 15-24 25-44 45-64 65+
Cambridgeshire’s Economic Assessment
- 10 -
Migration and Migrant Workers
Dependency on migrant workers in north and south of county.
International migration and migration within the UK are and will continue to be, important drivers of population and economic growth in Cambridgeshire; the high tech and health sectors are highly dependent on a supply of skilled labour, which cannot be met within the region or country. There are risks that these sectors may face further skill shortages in the future due to visa restrictions and competition from London. In the north of the county, migrant workers generally stay temporarily, working in seasonal employment such as farming and low value manufacturing. Evidence suggests that businesses in some sectors would not be able to function to full capacity if migrant workers were not available;, however it is acknowledged that migrant workers have increased competition for work in traditional areas of work for lower skilled workers, particularly Cambridgeshire’s Gypsy/Traveller population. The increase in NINo (National Insurance Number) registrations will mean that there is an impact on labour supply competition and if the trend continues, the level of competition may increase over the longer term.
Cambridgeshire County Council Research Group estimates that net migration (both internal and international) accounted for 70% of the county’s population change between 2001 and 2010. Indicative figures from ONS suggest that around half of net migration was internal (from within the rest of the UK) and half was international. Migration is expected to remain an important driver for population growth in Cambridgeshire in the future. The Research Group’s 2010-based forecasts indicate that migration will account for 66% of population growth between 2010 and 2021. International migration would be expected to remain a significant element of this. The level of international migration into the UK, and into Cambridgeshire, has increased since 2001, and with it the level of public and media interest. Between 2002/03 and 2010/11, 65,910 overseas people registered for a National Insurance Number (NINo) in Cambridgeshire. Of these, 47% registered in Cambridge City, 16% in Fenland and approximately 12% each in Huntingdonshire, South Cambridgeshire and East Cambridgeshire. 45% of registrations were by Eastern Europeans, 23% were by Western Europeans and 16% were by Asians. The sharp increase in registrations between 2004/5 and 2005/6 reflects EU expansion. The rise from 2007/8 to 2008/9 runs counter to regional and national trends where migration declined following the recession. Both locally and nationally, the number of NINo registrations increased between 2009/10 and 2010/11. Figure 4: Number of NINo and WRS registrations in Cambridgeshire Source: DWP and Home Office (via Local Government Analysis and Research)
0
2,000
4,000
6,000
8,000
10,000
12,000
2002
/03
2003
/04
2004
/05
2005
/06
2006
/07
2007
/08
2008
/09
2009
/10
2010
/11
No
regi
stra
tions
NINo WRS
Cambridgeshire’s Economic Assessment
- 11 -
Worker Registration Scheme (WRS) figures for Cambridgeshire show the highest numbers of WRS registrations were in Fenland, East Cambridgeshire and Cambridge City. In all districts, the highest number of registrations was from Polish migrants. The main sectors of employment were administration, business and managerial industries and agriculture in the north of the county and the hospitality sector in Cambridge City. From 2004/05 to 2008/09 approximately 20,200 A8 nationals registered with the WRS. Apart from Fenland, in 2008 all districts experienced their lowest levels of registration since the start of the Scheme. These decreases are generally in line with national trends. The worker registration scheme for A8 countries was closed on the 30th of April 2011 as the A8 countries became full members of the European Union. The 2001 Census recorded 91% of Cambridgeshire residents as White British, 5% White Irish or White other and 4% from ethnic groups other than White. The highest proportion of ethnic minority groups was found in Cambridge City, most likely reflecting the high number of international students, and the lowest was in Fenland. Cambridgeshire’s largest ethnic minority group was Asian/Asian British. There are no sources showing the number of migrant workers leaving the county therefore no accurate way of establishing how many migrant workers reside in the county, however the Annual Population Survey estimates that the proportion of residents born abroad has risen by 4% since the 2001 census, compared with 3% nationally. This would imply there are now an additional 25-30,000 migrants living in Cambridgeshire compared to 2001. The highest percentage point increase in the county has been in Cambridge City and the lowest in Fenland. The low increase in Fenland is interesting as there have been a relatively high number of NINo and WRS registrations in the district. This implies that many migrants in the north do not remain in the area very long, reflecting the fact that many work in agriculture and low value manufacturing, which experience a high demand for seasonal employment. The Working Lives Institute, in undertaking research for the East of England Development Agency (EEDA) in 2005, found that the largest employers of migrant workers in agriculture and horticulture were based around Ely and Wisbech, which have a high demand for seasonal employment at peak times of the year. These workers tended to be a relatively young group, often working below their skills level due to language issues or lack of transferability of qualifications (Working Lives Institute, 2005). The increase in the proportion of residents born abroad in Cambridge City may reflect the settling of highly skilled migrants who were originally recruited into the high tech, academic and health industries - industries that are highly dependent on a supply of skilled labour which cannot be met within the region or country. There is a risk that the high-tech sector might face increased labour and skills shortages in the future. Overseas students have traditionally filled a proportion of vacancies in the high-tech sector but tighter new work visa and student visa regimes restrict their opportunities to work in the UK. Furthermore, there are significant numbers of migrants in Cambridge who initially worked in the area, but now commute out due to higher salaries (IPPR, Migrant Worker Availability in the East of England, 2009). Migrant workers also play important roles in innovation and entrepreneurship, which increase competitive advantage and productivity.
Cambridgeshire’s Economic Assessment
- 12 -
Gypsies and Travellers Significant economic and educational disadvantage among Travellers.
Travellers are estimated to form the second largest ethnic minority group in the Cambridgeshire area, yet suffer severe levels of economic and educational disadvantage. Migrant workers working in seasonal employment such as farming has meant increased competition in traditional areas of work.
The 2001 Census did not allow Gypsies or Travellers to identify themselves as belonging to distinct ethnic groups. This means that the Census cannot provide a count of the size of Cambridgeshire’s Traveller population, however a Traveller Needs Assessment completed in 2006 estimated the local population to be at 6500-70001. This made them potentially the second largest ethnic minority in the study area, similar in size to the Indian population. The Communities and Local Government (CLG) bi-annual count of Gypsy and Traveller caravans across England shows a decline over the last two years in the number of caravans within the county, counter to an increasing trend regionally and nationally. This decrease may be due to a decline in traditional farm work and increased competition from cheaper immigrant labour. The majority of sites (both authorized and unauthorized) are based in South Cambridgeshire and Fenland. The following information is taken from paragraphs 2.2.4 and 2.3.1 of the Need Assessment: Most Gypsies/Travellers prefer self-employment, in such occupations as farm and land work, tree-lopping, vehicle trading, tarmacking, carpet-dealing and external building work. The survey found evidence that: a) Types of work had changed over the years, with a decline in traditional farm work, and increased competition from cheaper immigrant labour. b) Gypsies/Travellers find it increasingly difficult to make a living from traditional occupations, contributing to severe economic disadvantage and social exclusion. c) Difficulties in travelling, and being moved frequently, made it harder to get work. Some Gypsies now travel more to continental Europe, and Irish Travellers have entered the sub-region in search of work. d) Family networks and informal reciprocal arrangements are important for encouraging and sustaining economic activity. e) Seasonal social security benefits are important income sources, especially for those on council sites. f) Difficulties with the theory part of the driving test (because of low literacy levels) is affecting younger Gypsies/Travellers. Further reported issues amongst the Traveller community include a high incidence of serious health problems (especially children’s special educational and care needs) and educational disadvantage, high levels of racism from neighbours, feelings of isolation and loss of identity and drug abuse on estates.
1 The Needs Assessment estimated the Gypsy/Traveller population in Cambridgeshire together with Peterborough, Forest Heath, St Edmundsbury and King’s Lynn and West Norfolk.
Cambridgeshire’s Economic Assessment
- 13 -
Traveller Skills Future economic opportunities for Traveller communities are strongly linked to access to flexible training and education. Traveller communities have a strong preference for self employment, however a recent reduction in some employment opportunities has caused high levels of unemployment. Focus group work suggests that future economic opportunities were strongly linked to access to training and education that takes account of the difficulties of travellers in accessing mainstream service provision.
A piece of research undertaken in 2006 by the Ormiston Trust looked at skills and employment among Traveller communities. For many Gypsies and Travellers, school is only one aspect within a broader concept of education. Some Travellers note that time spent in school is at the expense of “learning to be a successful Traveller”. Teachers also need to recognise the ‘adult’ status of young people from Gypsy and Traveller communities and the importance to some pupils of learning the family business. Boys in particular are often encouraged to work with their fathers and learn life skills rather than stay in school. Evidence from France, where distance learning materials have been more fully developed, has reported high levels of success in delivering education to Travelling families. Very little research or consultation relating to Gypsies and Travellers and skills and employment exists. What research does exist suggests that there is a strong preference for self employment among communities and there is a broad skill base that goes unrecognised. There has been a reduction in some employment opportunities (such as agriculture) traditionally filled by Gypsies and Travellers. There is evidence of high levels of unemployment among those living on local authority sites. Opportunities to develop social enterprise, recycling initiatives and support for small businesses with Gypsy and Traveller groups should be explored further. Focus group work with travellers identified that future economic opportunities were strongly linked to access to training and education. Among the focus group members there was unanimous support for greater access to adult learning opportunities, particularly in relation to basic skills and IT. Current uptake by Gypsies and Travellers of existing training provision and further education appears to be extremely low. However this does not appear to reflect a lack of interest but rather a difficulty in accessing existing service provision. Studies examining post-16 learning opportunities within Hertfordshire highlighted a range of barriers. Of these, respondents identified childcare and family commitments as the major barrier (this could be reflective of a respondent group in which 80% were female). Other reasons given included a lack of access to transport, a lack of confidence, a lack of support, financial reasons, and a lack of time. In identifying strategies to help participation in formal learning opportunities, respondents identified the key factors as flexible times, childcare provision, transport, one to one lessons and personal support. First hand work experience was recognised to be the preferred method of training for employment among many young Travellers and felt by many to be the most beneficial preparation for adult roles.
Cambridgeshire’s Economic Assessment
- 14 -
Economic Activity and Employment Economic Activity and Employment
Box 3: Economic activity
A person is economically active if they are either employed or unemployed and have been actively seeking work in the last four weeks or are available to start work in the next two weeks. People are economically inactive if they are out of work and not seeking or available for work. This may include students, those looking after their home or family and those unable to work through sickness or disability. Traditionally, the economically active population was thought to form the potential labour supply in an area, however it is now acknowledged that a proportion of the economically inactive may wish/be able to work if they were given the right opportunity. Lower economic activity rates among women.
Levels of economic activity and employment across the county are relatively high, although higher among men than women. Fenland has the lowest employment rates in the county for both men and women.
In 2011, 79% of Cambridgeshire’s working age population was economically active, which is slightly higher than the national average of 76%. This amounts to a potential labour supply of 311,900 people. The only district showing lower than average levels of economic activity is Fenland, although economic activity is relatively low in Cambridge City due to the number of students. Undergraduate students at Cambridge University are generally not permitted to work during term time. Across the county, rates of economic activity were higher for men than women, at 87% compared to 71%, reflecting national trends. Economic activity varies by age as well as by gender. Economic activity is highest across all areas among men aged 25-49 and lowest among those aged 16-19 and over retirement age. Economic activity is slightly higher in Cambridgeshire than regionally and nationally for most age-groups. Exceptions to this are 16-19 and 20-24 year olds, presumably because of students in full time education. Estimates from the Annual Population Survey suggest Cambridgeshire has a total employed population of around 291,800. This equates to employment rates of 80% among men and 68% among women of working age which are above the averages for England as a whole, although the employment rates of men and women in Fenland are below the national average at 71% and 57% respectively. Since 2007, Cambridgeshire’s employment rate has been falling, indicating a decrease in the amount of jobs available. Figure 5: Percentage of population aged 16-64 in employment (employment rate) Source: ONS Annual Population Survey
60%
65%
70%
75%
80%
85%
90%
Apr 2004-Mar 2005
Apr 2005-Mar 2006
Apr 2006-Mar 2007
Apr 2007-Mar 2008
Apr 2008-Mar 2009
Apr 2009-Mar 2010
Apr 2010-Mar 2011
East CambridgeshireSouth CambridgeshireHuntingdonshireCambridgeshireCambridgeFenland
Cambridgeshire’s Economic Assessment
- 15 -
73%
55% 58% 61%
45%59%
49% 52%
29%
54%42%
55%
0%10%20%30%40%50%60%70%80%90%
100%
White Mixed Indian Pakistani/Bangladeshi
Black/ BlackBritish
Other
% o
f 16-
74 y
ear o
lds
Males Females
Employment by Ethnic Group
As is the case nationally, ethnic minority groups are under-represented in the employed population, with particularly low employment rates in Pakistani and Bangladeshi groups.
Nationally and regionally, ethnic minority groups make up a smaller proportion of the employed population than the working age population. This means that ethnic minority groups are under-represented in the employed population. This is at least partly due to the large proportion of Cambridgeshire’s ethnic minority population that are students. Similarly, as shown in Figure 6, each ethnic minority group has a lower employment rate than the White population. The regional employment rates are higher than nationally among most groups. Overall, the employment rate among ethnic minorities in the region is above that seen nationally. Figure 6: Regional employment rate (% of population aged 16-64) by ethnic group Source: ONS Annual Population Survey, April 2010 to March 2011
74%
62%71%
67% 69%
72%62% 70%
47%60% 58%
48%
0%10%20%30%40%50%60%70%80%90%
100%
White Mixed Indian Pakistani/Bangladeshi
Black/ BlackBritish
Other ethnicgroup
% o
f wor
king
age
pop
ulat
ion
East of England England
To allow consideration of employment rates by ethnic group at a local level, Figure 7 presents data from the 2001 Census. These rates cannot be compared directly with those from the Annual Population Survey as they are calculated using different population denominators, however they allow comparison between ethnic groups. The Census showed lower employment rates among all males and females from all ethnic minority groups when compared to the White population. The lowest rates overall were found among Pakistani/Bangladeshi women, of whom under 30% were in employment. Figure 7: Cambridgeshire employment rates among 16-74 year olds by ethnic group Source: 2001 Census ST108
Cambridgeshire’s Economic Assessment
- 16 -
Self-employment and Part-time Working
Self employment is higher in Huntingdonshire than other districts in the county. The region is regarded as highly entrepreneurial, however, in comparison with the fastest growing economies, the UK performs poorly. Levels of part time working are relatively low across the county. The proportion of people working part time is generally lower in Cambridgeshire than nationally. Part time work can be an important route back into work for the unemployed including parents.
13% of Cambridgeshire’s employed residents are self-employed. This the same proportion as nationally. Within the county proportions vary from 18% in Huntingdonshire, an increase from 11% in 2009, to 10% in Cambridge City, as shown in Figure 8. Figure 8: Proportion of employed residents who are self-employed Source: ONS Annual Population Survey, April 2010 to March 2011
0%
5%
10%
15%
20%
25%
Cam
brid
geC
ity Eas
tC
ambs
Fenl
and
Hun
ts
Sou
thC
ambs
Fore
stH
eath
Nor
thH
erts
St E
ds
Uttl
esfo
rd
% s
elf-e
mpl
oyed
Greater Cambridge LAs East of England England
Part-time working is slightly less common in Cambridgeshire than nationally, with 22% of local residents working part-time compared to 26% nationally. Fenland, North Hertfordshire and Uttlesford have a higher proportion of part-time workers than nationally. Forest Heath has a particularly low proportion of part-time workers at just 19%. A lack of available part time work could act to the detriment of unemployed people, particularly parents, seeking more flexible hours and the ways in which people offer jobs (i.e. flexibly) can have a significant impact on worklessness. Figure 9: Proportion of employed residents working part-time Source: ONS Annual Population Survey, April 2010 to March 2011
0%
5%
10%
15%20%
25%
30%
35%
40%
Cam
brid
geC
ity Eas
tC
ambs
Fenl
and
Hun
ts
Sou
thC
ambs
Fore
stH
eath
Nor
thH
erts
St E
ds
Uttl
esfo
rd
% w
orki
ng p
art-t
ime
Greater Cambridge LAs East of England England
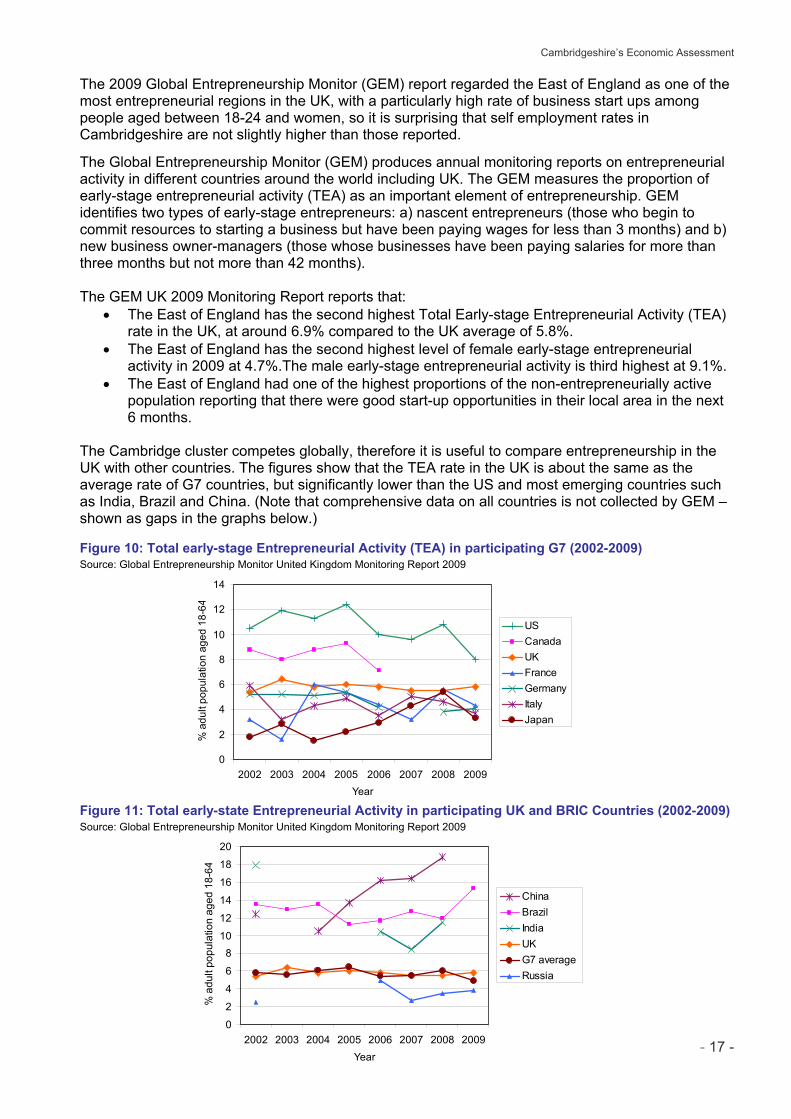
Cambridgeshire’s Economic Assessment
- 17 -
0
2
4
6
810
12
14
16
18
20
2002 2003 2004 2005 2006 2007 2008 2009Year
% a
dult
popu
latio
n ag
ed 1
8-64
China Brazil India UK G7 average Russia
0
2
4
6
8
10
12
14
2002 2003 2004 2005 2006 2007 2008 2009Year
% a
dult
popu
latio
n ag
ed 1
8-64
US Canada UK France Germany Italy Japan
The 2009 Global Entrepreneurship Monitor (GEM) report regarded the East of England as one of the most entrepreneurial regions in the UK, with a particularly high rate of business start ups among people aged between 18-24 and women, so it is surprising that self employment rates in Cambridgeshire are not slightly higher than those reported.
The Global Entrepreneurship Monitor (GEM) produces annual monitoring reports on entrepreneurial activity in different countries around the world including UK. The GEM measures the proportion of early-stage entrepreneurial activity (TEA) as an important element of entrepreneurship. GEM identifies two types of early-stage entrepreneurs: a) nascent entrepreneurs (those who begin to commit resources to starting a business but have been paying wages for less than 3 months) and b) new business owner-managers (those whose businesses have been paying salaries for more than three months but not more than 42 months). The GEM UK 2009 Monitoring Report reports that:
The East of England has the second highest Total Early-stage Entrepreneurial Activity (TEA) rate in the UK, at around 6.9% compared to the UK average of 5.8%.
The East of England has the second highest level of female early-stage entrepreneurial activity in 2009 at 4.7%.The male early-stage entrepreneurial activity is third highest at 9.1%.
The East of England had one of the highest proportions of the non-entrepreneurially active population reporting that there were good start-up opportunities in their local area in the next 6 months.
The Cambridge cluster competes globally, therefore it is useful to compare entrepreneurship in the UK with other countries. The figures show that the TEA rate in the UK is about the same as the average rate of G7 countries, but significantly lower than the US and most emerging countries such as India, Brazil and China. (Note that comprehensive data on all countries is not collected by GEM – shown as gaps in the graphs below.) Figure 10: Total early-stage Entrepreneurial Activity (TEA) in participating G7 (2002-2009) Source: Global Entrepreneurship Monitor United Kingdom Monitoring Report 2009 Figure 11: Total early-state Entrepreneurial Activity in participating UK and BRIC Countries (2002-2009) Source: Global Entrepreneurship Monitor United Kingdom Monitoring Report 2009
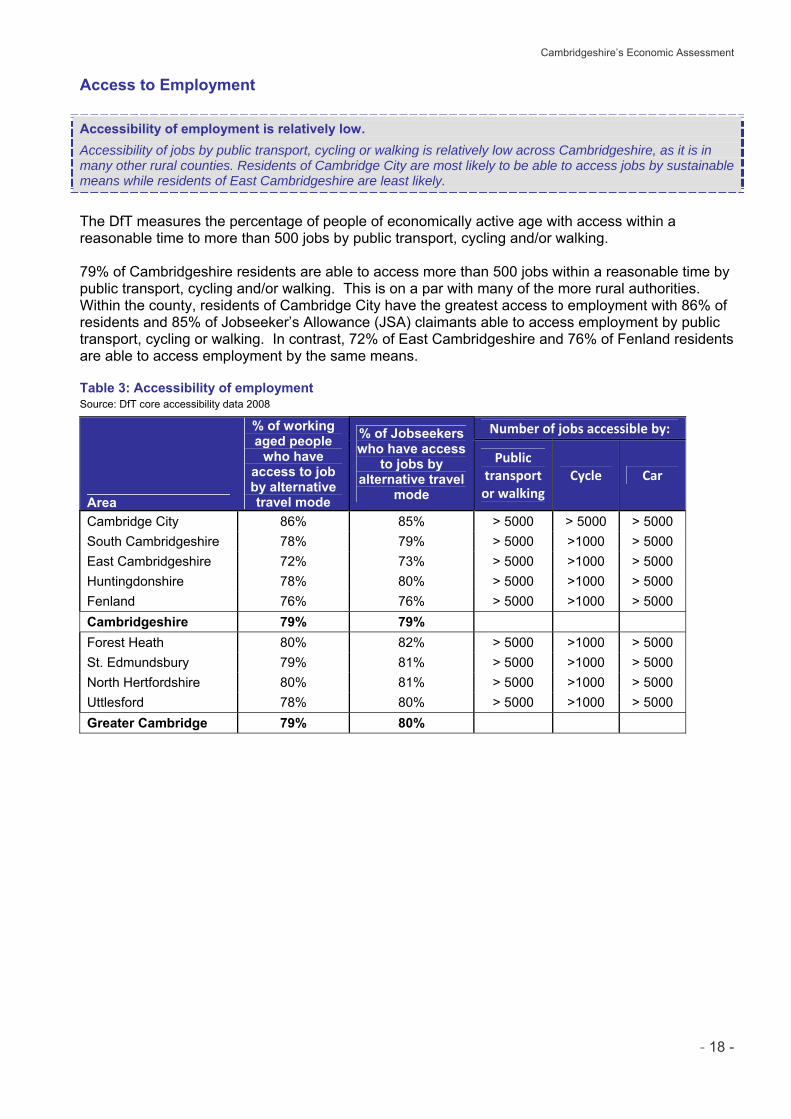
Cambridgeshire’s Economic Assessment
- 18 -
Access to Employment
Accessibility of employment is relatively low.
Accessibility of jobs by public transport, cycling or walking is relatively low across Cambridgeshire, as it is in many other rural counties. Residents of Cambridge City are most likely to be able to access jobs by sustainable means while residents of East Cambridgeshire are least likely.
The DfT measures the percentage of people of economically active age with access within a reasonable time to more than 500 jobs by public transport, cycling and/or walking. 79% of Cambridgeshire residents are able to access more than 500 jobs within a reasonable time by public transport, cycling and/or walking. This is on a par with many of the more rural authorities. Within the county, residents of Cambridge City have the greatest access to employment with 86% of residents and 85% of Jobseeker’s Allowance (JSA) claimants able to access employment by public transport, cycling or walking. In contrast, 72% of East Cambridgeshire and 76% of Fenland residents are able to access employment by the same means.
Table 3: Accessibility of employment Source: DfT core accessibility data 2008
Area
% of working aged people
who have access to job by alternative travel mode
% of Jobseekers who have access
to jobs by alternative travel
mode
Number of jobs accessible by:
Public transport or walking
Cycle Car
Cambridge City 86% 85% > 5000 > 5000 > 5000 South Cambridgeshire 78% 79% > 5000 >1000 > 5000 East Cambridgeshire 72% 73% > 5000 >1000 > 5000 Huntingdonshire 78% 80% > 5000 >1000 > 5000 Fenland 76% 76% > 5000 >1000 > 5000 Cambridgeshire 79% 79% Forest Heath 80% 82% > 5000 >1000 > 5000 St. Edmundsbury 79% 81% > 5000 >1000 > 5000 North Hertfordshire 80% 81% > 5000 >1000 > 5000 Uttlesford 78% 80% > 5000 >1000 > 5000 Greater Cambridge 79% 80%
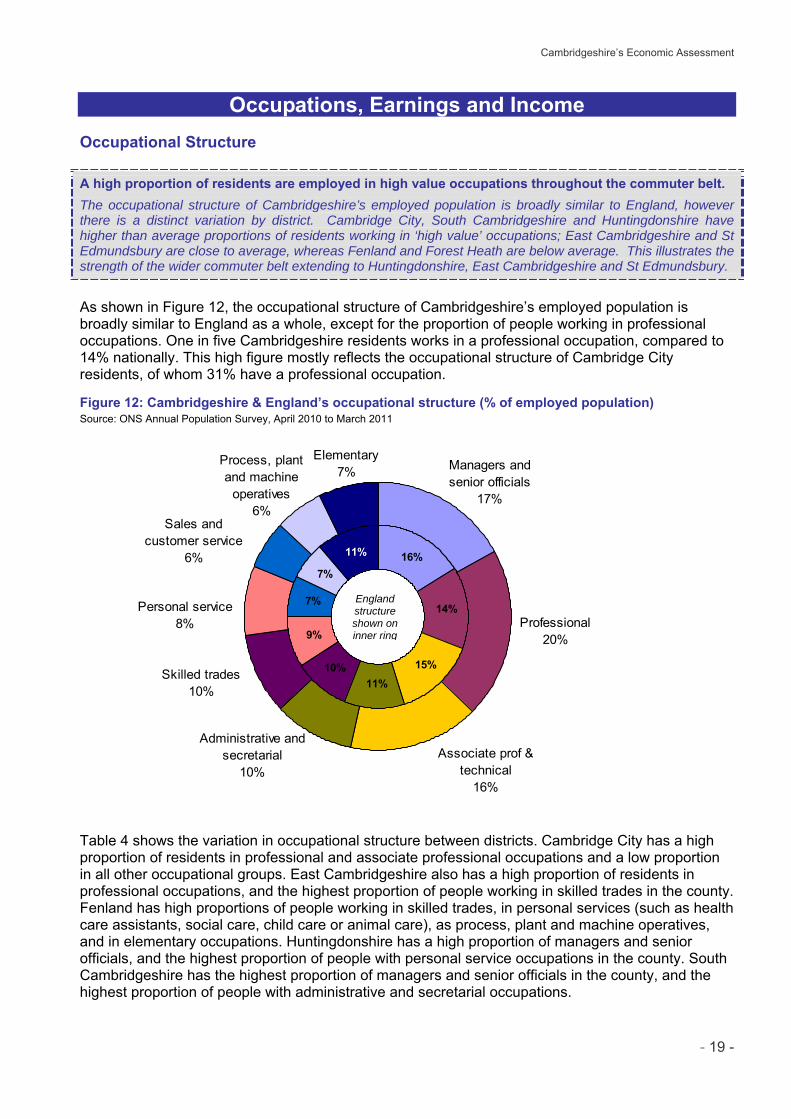
Cambridgeshire’s Economic Assessment
- 19 -
Occupations, Earnings and Income
Occupational Structure
A high proportion of residents are employed in high value occupations throughout the commuter belt.
The occupational structure of Cambridgeshire’s employed population is broadly similar to England, however there is a distinct variation by district. Cambridge City, South Cambridgeshire and Huntingdonshire have higher than average proportions of residents working in ‘high value’ occupations; East Cambridgeshire and St Edmundsbury are close to average, whereas Fenland and Forest Heath are below average. This illustrates the strength of the wider commuter belt extending to Huntingdonshire, East Cambridgeshire and St Edmundsbury.
As shown in Figure 12, the occupational structure of Cambridgeshire’s employed population is broadly similar to England as a whole, except for the proportion of people working in professional occupations. One in five Cambridgeshire residents works in a professional occupation, compared to 14% nationally. This high figure mostly reflects the occupational structure of Cambridge City residents, of whom 31% have a professional occupation. Figure 12: Cambridgeshire & England’s occupational structure (% of employed population) Source: ONS Annual Population Survey, April 2010 to March 2011
16%
14%
15%11%
10%
9%
7%
7%
11%
Managers and senior officials
17%
Professional20%
Associate prof & technical
16%
Administrative and secretarial
10%
Skilled trades10%
Personal service8%
Sales and customer service
6%
Process, plant and machine
operatives6%
Elementary7%
Table 4 shows the variation in occupational structure between districts. Cambridge City has a high proportion of residents in professional and associate professional occupations and a low proportion in all other occupational groups. East Cambridgeshire also has a high proportion of residents in professional occupations, and the highest proportion of people working in skilled trades in the county. Fenland has high proportions of people working in skilled trades, in personal services (such as health care assistants, social care, child care or animal care), as process, plant and machine operatives, and in elementary occupations. Huntingdonshire has a high proportion of managers and senior officials, and the highest proportion of people with personal service occupations in the county. South Cambridgeshire has the highest proportion of managers and senior officials in the county, and the highest proportion of people with administrative and secretarial occupations.
England structure shown on inner ring
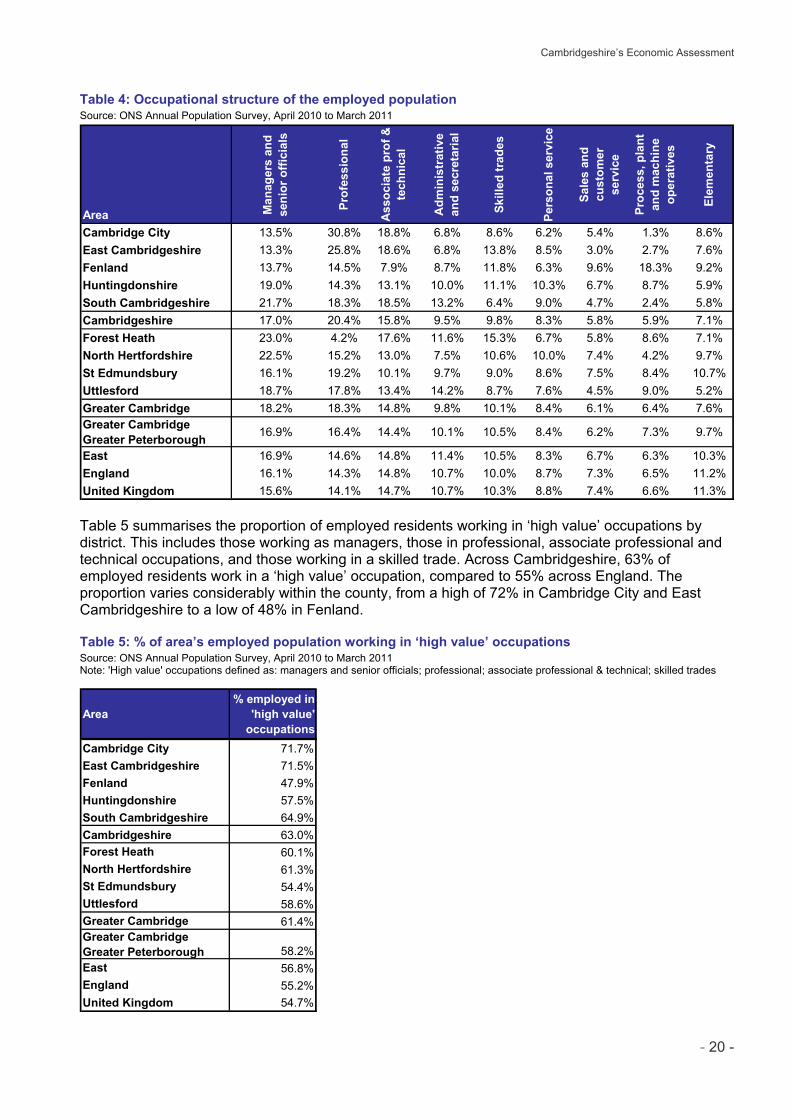
Cambridgeshire’s Economic Assessment
- 20 -
Table 4: Occupational structure of the employed population Source: ONS Annual Population Survey, April 2010 to March 2011
Area Man
ager
s an
d se
nior
offi
cial
s
Prof
essi
onal
Ass
ocia
te p
rof &
te
chni
cal
Adm
inis
trat
ive
and
secr
etar
ial
Skill
ed tr
ades
Pers
onal
ser
vice
Sale
s an
d cu
stom
er
serv
ice
Proc
ess,
pla
nt
and
mac
hine
op
erat
ives
Elem
enta
ry
Cambridge City 13.5% 30.8% 18.8% 6.8% 8.6% 6.2% 5.4% 1.3% 8.6%East Cambridgeshire 13.3% 25.8% 18.6% 6.8% 13.8% 8.5% 3.0% 2.7% 7.6%Fenland 13.7% 14.5% 7.9% 8.7% 11.8% 6.3% 9.6% 18.3% 9.2%Huntingdonshire 19.0% 14.3% 13.1% 10.0% 11.1% 10.3% 6.7% 8.7% 5.9%South Cambridgeshire 21.7% 18.3% 18.5% 13.2% 6.4% 9.0% 4.7% 2.4% 5.8%Cambridgeshire 17.0% 20.4% 15.8% 9.5% 9.8% 8.3% 5.8% 5.9% 7.1%Forest Heath 23.0% 4.2% 17.6% 11.6% 15.3% 6.7% 5.8% 8.6% 7.1%North Hertfordshire 22.5% 15.2% 13.0% 7.5% 10.6% 10.0% 7.4% 4.2% 9.7%St Edmundsbury 16.1% 19.2% 10.1% 9.7% 9.0% 8.6% 7.5% 8.4% 10.7%Uttlesford 18.7% 17.8% 13.4% 14.2% 8.7% 7.6% 4.5% 9.0% 5.2%Greater Cambridge 18.2% 18.3% 14.8% 9.8% 10.1% 8.4% 6.1% 6.4% 7.6%Greater Cambridge Greater Peterborough 16.9% 16.4% 14.4% 10.1% 10.5% 8.4% 6.2% 7.3% 9.7%
East 16.9% 14.6% 14.8% 11.4% 10.5% 8.3% 6.7% 6.3% 10.3%England 16.1% 14.3% 14.8% 10.7% 10.0% 8.7% 7.3% 6.5% 11.2%United Kingdom 15.6% 14.1% 14.7% 10.7% 10.3% 8.8% 7.4% 6.6% 11.3% Table 5 summarises the proportion of employed residents working in ‘high value’ occupations by district. This includes those working as managers, those in professional, associate professional and technical occupations, and those working in a skilled trade. Across Cambridgeshire, 63% of employed residents work in a ‘high value’ occupation, compared to 55% across England. The proportion varies considerably within the county, from a high of 72% in Cambridge City and East Cambridgeshire to a low of 48% in Fenland.
Table 5: % of area’s employed population working in ‘high value’ occupations Source: ONS Annual Population Survey, April 2010 to March 2011 Note: 'High value' occupations defined as: managers and senior officials; professional; associate professional & technical; skilled trades
Area% employed in
'high value' occupations
Cambridge City 71.7%East Cambridgeshire 71.5%Fenland 47.9%Huntingdonshire 57.5%South Cambridgeshire 64.9%Cambridgeshire 63.0%Forest Heath 60.1%North Hertfordshire 61.3%St Edmundsbury 54.4%Uttlesford 58.6%Greater Cambridge 61.4%Greater Cambridge Greater Peterborough 58.2%East 56.8%England 55.2%United Kingdom 54.7%
Cambridgeshire’s Economic Assessment
- 21 -
Residents’ Weekly Pay
Wide pay gap between north and south. Women earn significantly less than men.
Median weekly pay in South Cambridgeshire is nearly 40% higher than in Fenland and Forest Heath although the gap, which steadily increased between 2002 and 2009, has decreased slightly in recent years. The wide gap indicates a much higher demand for labour coupled with higher value activities in the south of the county than in the north. In all five Cambridgeshire districts, women earn 20%-30% less than men. This is a greater disparity than seen across England.
Wage earnings are a key indicator of the interaction between labour supply and demand in an economy, and the living standards of its employees. High earnings can be an indicator of strong labour demand as well as higher value activities in an economy, whilst low wages could imply either low demand for labour or lower value added activities. Across Cambridgeshire, the full-time workers’ median weekly pay of £550.30 is higher than the England average of £507.60. Within the county pay varies considerably, as shown in Figure 13, from a low of £444.10 in Fenland to a high of £607.90 in South Cambridgeshire. Median weekly pay in South Cambridgeshire is therefore nearly 40% higher than in Fenland. Pay across the broader sub-region is similar, although median pay in Forest Heath is slightly lower than Fenland, suggesting lower demand for labour and lower value jobs in both Fenland and Forest Heath. Within both East Cambridgeshire and Huntingdonshire, there is a considerable difference between the earnings of employed residents and the earnings of those working in the district, suggesting high levels of out-commuting to higher paid, higher value jobs. Figure 13: Median gross weekly full-time employee pay (£) by district of residence in 2011 Source: ONS Annual Survey of Hours and Earnings (Resident Analysis)
£0
£100
£200
£300
£400
£500
£600
£700
Cam
brid
geC
ity
Eas
t Cam
bs
Fenl
and
Hun
ts
Sou
thC
ambs
Fore
stH
eath
Nor
th H
erts
St E
ds
Uttl
esfo
rd
Gro
ss W
eekl
y E
arni
ngs
Greater Cambridge LAs East of England England
Median weekly pay is higher among men than women in all areas. Across most of the county women earn around 25% less than men, which is a greater disparity than seen nationally, though this disparity has been decreasing slightly in recent years. Note that these figures are for full-time workers only, so are not affected by higher levels of part-time working among women. Within the county, pay is most equitable in East Cambridgeshire and least equitable in South Cambridgeshire, where women earn around 30% less than men.
Cambridgeshire’s Economic Assessment
- 22 -
Table 6: Median gross weekly full-time employee pay (£) by district of residence and gender in 2011 Source: ONS Annual Survey of Hours and Earnings (Resident Analysis)
AreaAll Full-Time
workersMale Full-
TimeFemale Full-
TimeFemale earnings as % of male earnings
Cambridge City £574.40 £683.40 £507.60 74.3%East Cambridgeshire £553.80 £568.30 £441.20 77.6%Fenland £444.10 £480.00 £362.20 75.5%Huntingdonshire £551.90 £607.10 £439.00 72.3%South Cambridgeshire £607.90 £686.20 £483.80 70.5%Cambridgeshire £550.30 £597.10 £469.30 78.6%Forest Heath £417.40 £517.80 £385.50 74.4%North Hertfordshire £619.40 £663.90 £538.80 81.2%St Edmundsbury £497.40 £526.50 £420.10 79.8%Uttlesford £578.10 £585.40 £550.50 94.0%Greater Cambridge - - - -Greater Cambridge Greater Peterborough - - - -East £528.50 £574.90 £460.00 80.0%England £507.60 £548.10 £449.30 82.0%United Kingdom £500.70 £538.50 £445.10 82.7% Figure 14 compares median weekly pay among the Cambridgeshire districts between 2002 and 2011. At the start of the time-series, pay was similar in South Cambridgeshire, Cambridge City and Huntingdonshire, but pay has since risen faster in South Cambridgeshire than elsewhere. In 2002 the pay gap between the districts with the highest and lowest median pay was just under £88 per week; by 2009 this had more than doubled to £187 but has decreased slightly in 2011 to £164. Figure 14: Median gross weekly full-time employee pay by district of residence, 2002-2011 Source: ONS Annual Survey of Hours and Earnings (Resident Analysis)
£250
£300
£350
£400
£450
£500
£550
£600
£650
2002 2003 2004 2005 2006 2007 2008 2009 2010 2011
Med
ian
gros
s w
eekl
y pa
y
South CambsCambridge CityHuntsEast CambsFenland
Cambridgeshire’s Economic Assessment
- 23 -
Median Household Income
Single-person or single-income households in Cambridge City may lower median household income relative to weekly pay.
Patterns of household income are broadly similar to those shown by median weekly pay, however annual household income is relatively low in Cambridge City, suggesting more single-person or single-income households. Overall, there is a clear geographic trend in income levels, with households in the south and west of the sub region having higher incomes and households to the north and east having lower incomes.
Figure 15 compares median annual household income by district. These figures take into account all salaries in a household, together with income from investments, welfare support and means-tested benefits. Median income in Cambridgeshire is higher than across England as a whole; within the county income is highest in South Cambridgeshire and lowest in Fenland. Cambridge City performs differently under the two pay/income measures: while gross weekly pay is the second highest in the county, annual household income is the second lowest in the county. This may be because there are more single-person households in the city so there are fewer households with a joint income.
Figure 15: Median household income (Comment - is 2009 most recent data?) Source: CACI PayCheck 2009
£0
£5,000
£10,000
£15,000
£20,000
£25,000
£30,000
£35,000
£40,000
Cam
brid
geC
ity Eas
tC
ambs
Fenl
and
Hun
ts
Sou
thC
ambs
Fore
stH
eath
Nor
thH
erts
St E
ds
Uttl
esfo
rd
Med
ian
hous
ehol
d in
com
e
Greater Cambridge LAs East of England England
Figure 16 shows that the districts vary considerably in terms of the proportion of households with low incomes. While around one in three households in Fenland has an income below £20,000, in South Cambridgeshire the proportion is less than one in five.
Figure 16: Low income households - % households with annual income under £20,000 Source: CACI PayCheck 2009
0%
5%
10%
15%
20%
25%
30%
35%
Cam
brid
geC
ity Eas
tC
ambs
Fenl
and
Hun
ts
Sou
thC
ambs
Fore
stH
eath
Nor
thH
erts
St E
ds
Uttl
esfo
rd% h
ouse
hold
s w
ith in
com
e un
der £
20k
Greater Cambridge LAs East of England England
Cambridgeshire’s Economic Assessment
- 24 -
Maps 1 to 3 show household income data by electoral ward. Map 1 compares median income by ward, with areas of lower income shaded darker than areas of higher income. This shows a clear geographical pattern across the county, with lower income areas concentrated in the north and east and higher income areas to the south and west. This pattern also applies within Cambridge City. The highest median income in the county is found in Bourn ward in South Cambridgeshire (£44,900) and the lowest is in Medworth ward in Wisbech (£22,800). On average, the income of households in Bourn is almost double that of households in Medworth.
Map 1: Median annual household income by ward Source: CACI PayCheck 2009
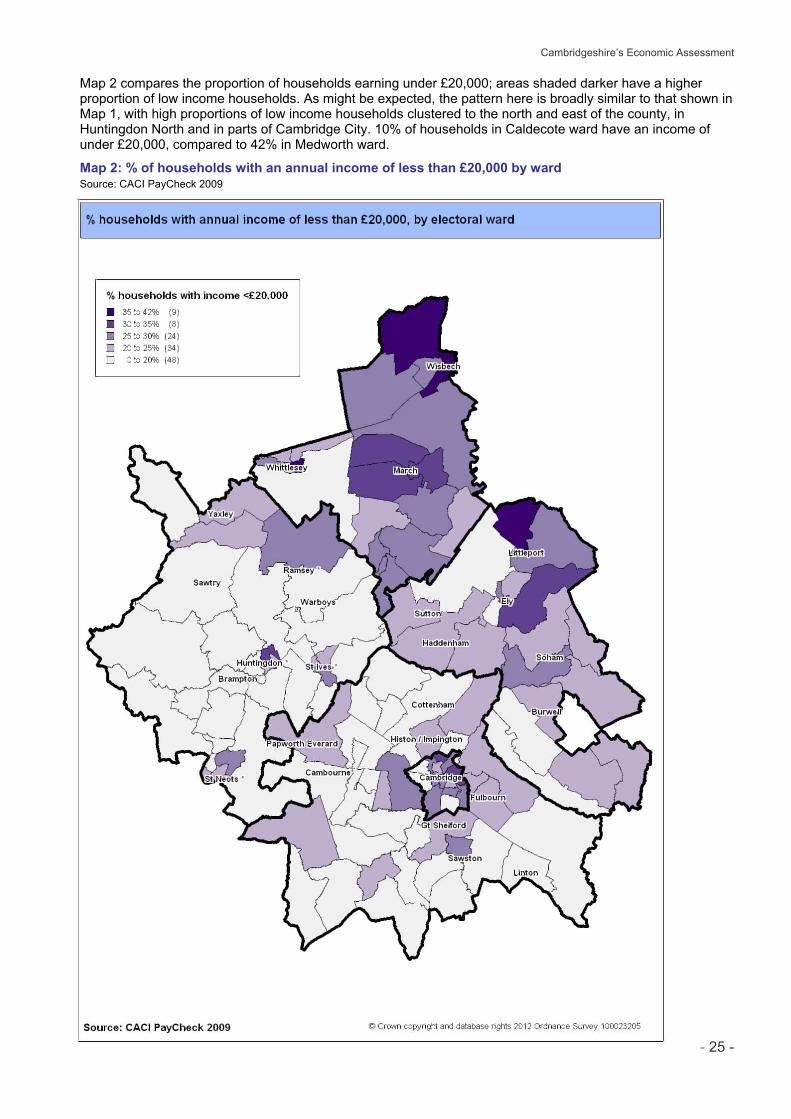
Cambridgeshire’s Economic Assessment
- 25 -
Map 2 compares the proportion of households earning under £20,000; areas shaded darker have a higher proportion of low income households. As might be expected, the pattern here is broadly similar to that shown in Map 1, with high proportions of low income households clustered to the north and east of the county, in Huntingdon North and in parts of Cambridge City. 10% of households in Caldecote ward have an income of under £20,000, compared to 42% in Medworth ward.
Map 2: % of households with an annual income of less than £20,000 by ward Source: CACI PayCheck 2009
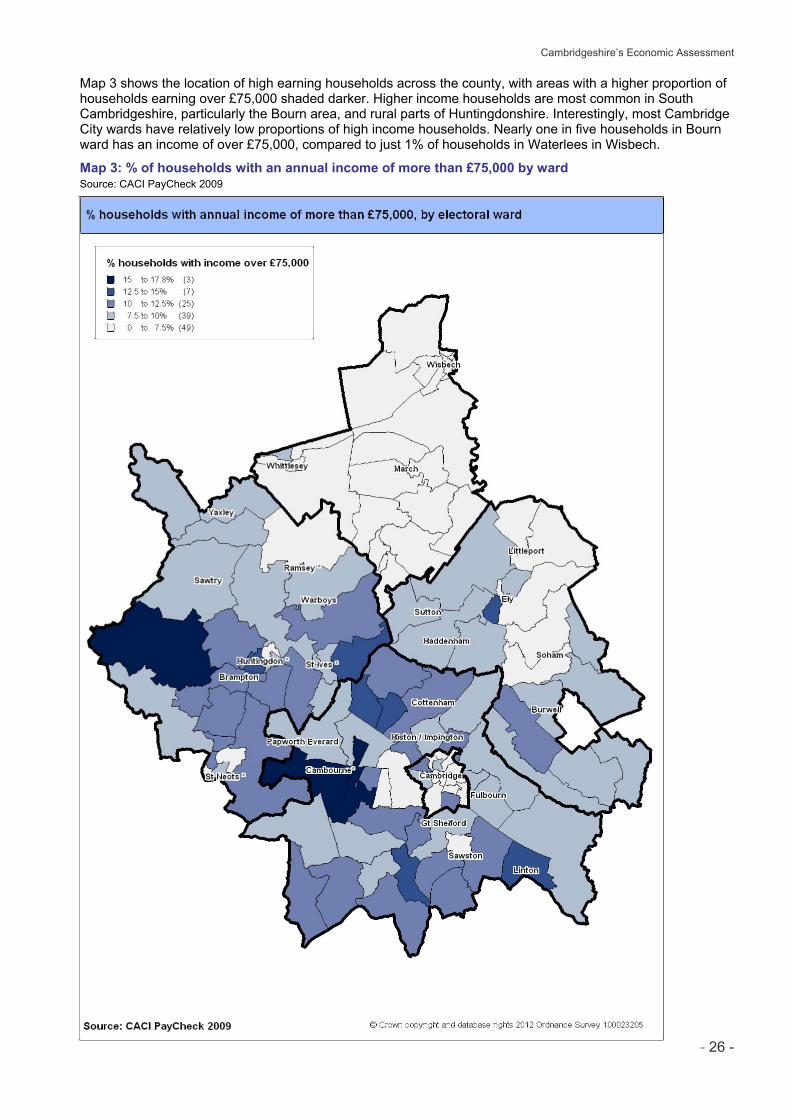
Cambridgeshire’s Economic Assessment
- 26 -
Map 3 shows the location of high earning households across the county, with areas with a higher proportion of households earning over £75,000 shaded darker. Higher income households are most common in South Cambridgeshire, particularly the Bourn area, and rural parts of Huntingdonshire. Interestingly, most Cambridge City wards have relatively low proportions of high income households. Nearly one in five households in Bourn ward has an income of over £75,000, compared to just 1% of households in Waterlees in Wisbech.
Map 3: % of households with an annual income of more than £75,000 by ward Source: CACI PayCheck 2009
Cambridgeshire’s Economic Assessment
- 27 -
Qualifications, Aspirations and Skills Qualifications of the Working Age Population
Very poor skills levels in the north – significant at a national level of comparison.
Cambridgeshire residents are on average more qualified than across the region or country as a whole, however there is significant variation by district, with particular skills issues in the north of the county. A higher proportion of Fenland residents have no qualifications than is the case nationally. Fenland also performs well below the national average in terms of the proportion of residents qualified to NVQ levels 2, 3 and 4. The high level of inequality in skills levels between residents in the north and south of the county is illustrated by those educated to degree level, where Fenland ranks 7th lowest of all local authorities in the country while Cambridge City ranks 14th highest.
Low levels of intermediate skills.
Three out of five districts in Cambridgeshire have lower than average proportions of their population holding level 3 as their highest qualification. Nationally, skills shortages are most acute in skilled trade occupations, where the typical qualification is NVQ level 3. It is therefore likely that the recruitment problem at this level of occupation, is even more acute across Cambridgeshire.
Cambridgeshire residents aged between 19 and retirement-age are, on average, more qualified than across the region or country as a whole. 39% of Cambridgeshire residents are qualified to NVQ level 4 or higher (broadly equivalent to a degree or higher qualification), compared to 31% across England. Just 5% of Cambridgeshire residents have no qualifications, compared to 9% nationally.
Table 7: Qualifications of people aged 19-59/64 (NVQ equivalents) in 2010 Source: DUIS derived from ONS Annual Population Survey Note: NVQ levels are defined as follows: Level 1: Foundation GNVQ; 4-5 GCSEs grade D-E or equivalents; Level 2: Intermediate GNVQ; 5 GCSEs A*-C; 2 A/S Levels or equivalents; Level 3: 2 A Levels A-E; 4 A/S Levels or equivalents; Level 4+: Foundation or first degree; degree level professional qualifications; HNC/HND; higher degrees
Proportion of 19-59/64 year olds qualified to level:
NVQ4+ NVQ3 NVQ2 NVQ1 No qualificationsCambridge City 52.4% 14.6% 14.6% 15.9% 2.4%East Cambridgeshire 38.3% 14.9% 21.3% 19.1% 6.4%Fenland 17.4% 21.7% 23.9% 23.9% 13.0%Huntingdonshire 30.9% 20.2% 22.3% 22.3% 4.3%South Cambridgeshire 48.2% 16.9% 15.7% 14.5% 4.8%Cambridgeshire 39.4% 17.3% 19.3% 18.7% 5.4%Forest Heath 25.7% 20.0% 22.9% 20.0% 11.4%North Hertfordshire 41.2% 14.7% 20.6% 19.1% 4.4%St Edmundsbury 27.6% 22.4% 22.4% 19.0% 8.6%Uttlesford 45.0% 20.0% 15.0% 15.0% 5.0%Greater Cambridge 37.2% 17.6% 20.0% 18.8% 6.4%Greater Cambridge Greater Peterborough 34.2% 17.5% 20.8% 19.5% 7.9%East 26.2% 17.3% 23.0% 21.5% 12.0%England 30.9% 19.3% 21.3% 19.8% 8.7%
Area
Cambridgeshire’s Economic Assessment
- 28 -
There is significant variation in qualification levels within the county, however, and Figure 17 shows how each district compares in terms of the proportion of the population reaching each of the qualification levels. Figure 17: % of 19-59/64 population qualified to different NVQ levels in 2010 Source: DUIS derived from ONS Annual Population Survey
38%
17%31%
48%
26%41%
28%
45%33%
95%91%
96%89%
95%96%
87%94%
98%90%
82%74%
63%
73%81%
69%76%
72%80%
73%67%
53%
39%
51%
65%
46%
56%50%
65%
53%
52%
0%10%20%30%40%50%60%70%80%90%
100%C
ambr
idge
City
East
Cam
bs
Fenl
and
Hun
ts
Sout
h C
ambs
Fore
st H
eath
Nor
th H
erts
St E
ds
Uttl
esfo
rd
Engl
and
% q
ualif
ied
to le
vel Level 1+
Level 2+Level 3+Level 4+
Within Cambridgeshire, the highest proportion of the population with Level 2 or higher qualifications is in Cambridge City, where 82% of people have these qualifications, followed by South and East Cambridgeshire. The proportion in Huntingdonshire is the same as the national average however in Fenland, just 63% of people have Level 2 qualifications or higher, which is well below the national average. In terms of proportions reaching Level 3 or higher, all Cambridgeshire districts except Fenland fall above or about equal to the national average, with levels highest in Cambridge City and South Cambridgeshire. This broadly corresponds to people with A-Level or equivalent qualifications. Variation in the proportion reaching Level 4 or higher is particularly interesting. This broadly corresponds to people educated to degree-level or equivalent and is generally recognised as the skill level required to drive innovation and leadership within an economy and to enable businesses to compete globally. Just over half the population in Cambridge City is qualified to this level, and just under half in South Cambridgeshire. On this measure, Cambridge City ranks 14th highest of all local authorities in the country; one of the most qualified outside London. In contrast, just 17% of people in Fenland are qualified to this level; the district ranks 7th lowest of all local authorities in the country. There is therefore a great deal of inequality in terms of high level qualifications within the county.
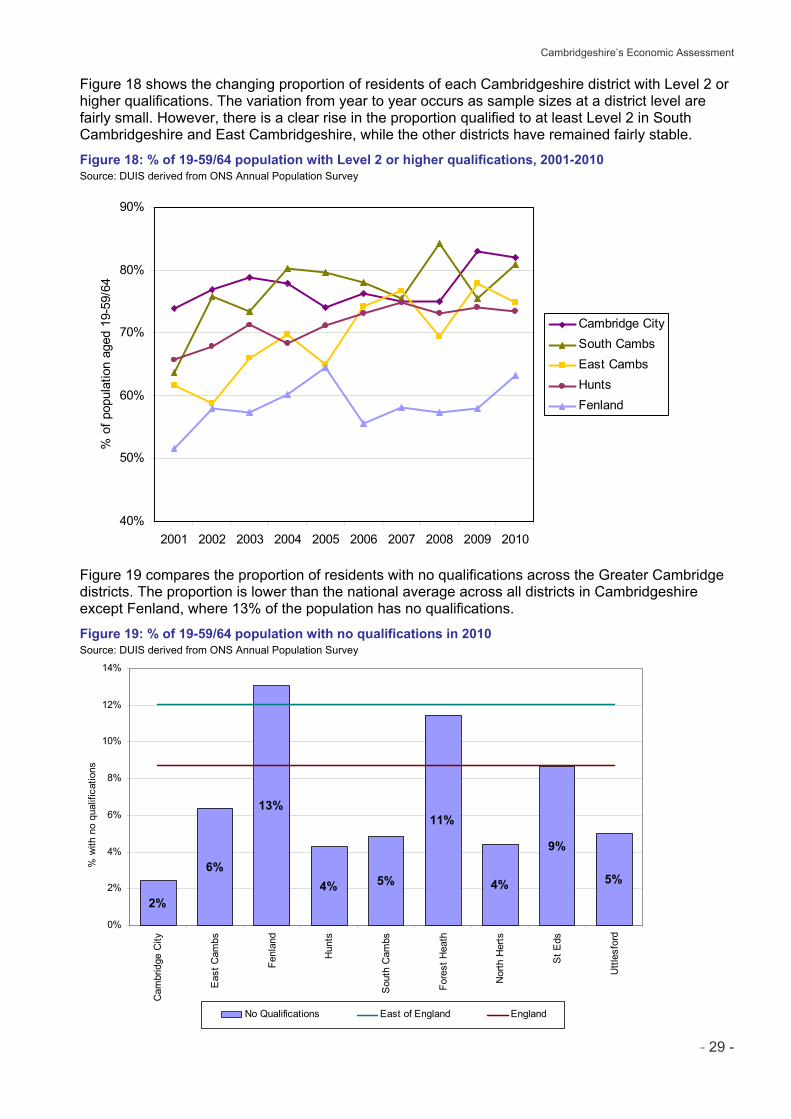
Cambridgeshire’s Economic Assessment
- 29 -
Figure 18 shows the changing proportion of residents of each Cambridgeshire district with Level 2 or higher qualifications. The variation from year to year occurs as sample sizes at a district level are fairly small. However, there is a clear rise in the proportion qualified to at least Level 2 in South Cambridgeshire and East Cambridgeshire, while the other districts have remained fairly stable.
Figure 18: % of 19-59/64 population with Level 2 or higher qualifications, 2001-2010 Source: DUIS derived from ONS Annual Population Survey
40%
50%
60%
70%
80%
90%
2001 2002 2003 2004 2005 2006 2007 2008 2009 2010
% o
f pop
ulat
ion
aged
19-
59/6
4
Cambridge CitySouth CambsEast CambsHuntsFenland
Figure 19 compares the proportion of residents with no qualifications across the Greater Cambridge districts. The proportion is lower than the national average across all districts in Cambridgeshire except Fenland, where 13% of the population has no qualifications.
Figure 19: % of 19-59/64 population with no qualifications in 2010 Source: DUIS derived from ONS Annual Population Survey
5%
9%
4%
11%
5%4%
13%
6%
2%0%
2%
4%
6%
8%
10%
12%
14%
Cam
brid
ge C
ity
Eas
t Cam
bs
Fenl
and
Hun
ts
Sou
th C
ambs
Fore
st H
eath
Nor
th H
erts
St E
ds
Uttl
esfo
rd
% w
ith n
o qu
alifi
catio
ns
No Qualifications East of England England
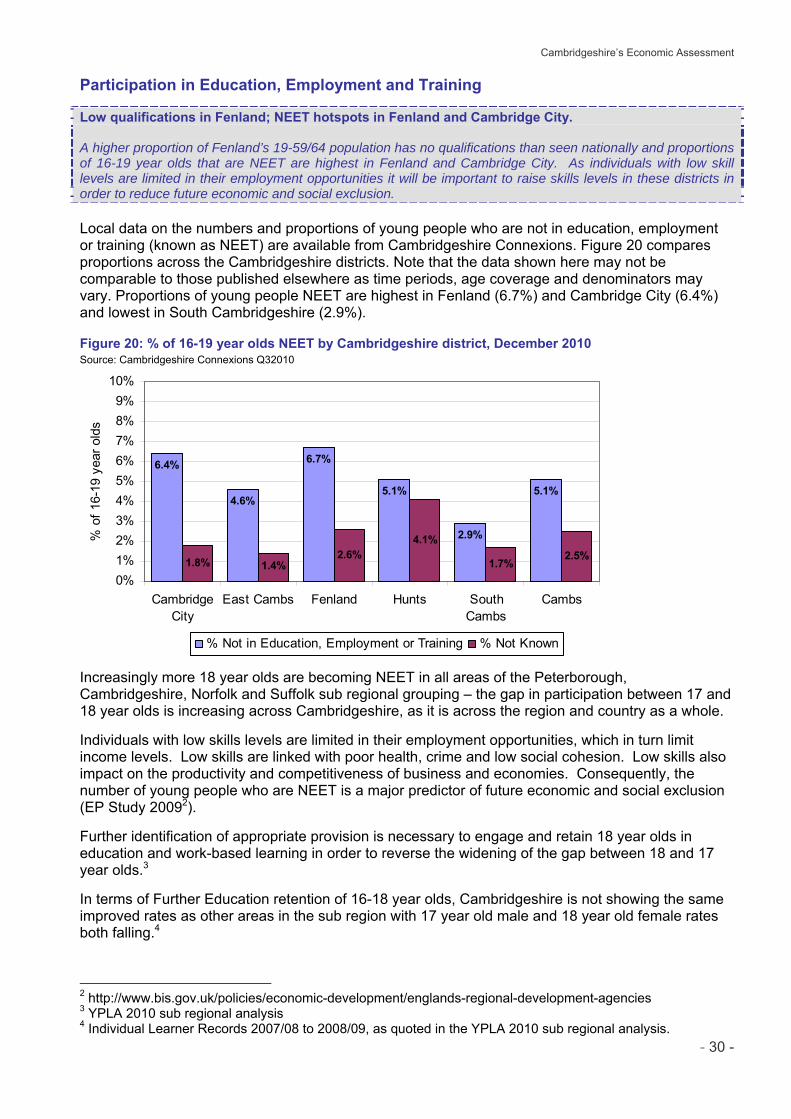
Cambridgeshire’s Economic Assessment
- 30 -
Participation in Education, Employment and Training
Low qualifications in Fenland; NEET hotspots in Fenland and Cambridge City. A higher proportion of Fenland’s 19-59/64 population has no qualifications than seen nationally and proportions of 16-19 year olds that are NEET are highest in Fenland and Cambridge City. As individuals with low skill levels are limited in their employment opportunities it will be important to raise skills levels in these districts in order to reduce future economic and social exclusion.
Local data on the numbers and proportions of young people who are not in education, employment or training (known as NEET) are available from Cambridgeshire Connexions. Figure 20 compares proportions across the Cambridgeshire districts. Note that the data shown here may not be comparable to those published elsewhere as time periods, age coverage and denominators may vary. Proportions of young people NEET are highest in Fenland (6.7%) and Cambridge City (6.4%) and lowest in South Cambridgeshire (2.9%). Figure 20: % of 16-19 year olds NEET by Cambridgeshire district, December 2010 Source: Cambridgeshire Connexions Q32010
6.4%
4.6%
6.7%
5.1%
2.9%
5.1%
1.8%2.6%
4.1%
1.7%2.5%
1.4%0%1%2%3%4%5%6%7%8%9%
10%
CambridgeCity
East Cambs Fenland Hunts SouthCambs
Cambs
% o
f 16-
19 y
ear o
lds
% Not in Education, Employment or Training % Not Known
Increasingly more 18 year olds are becoming NEET in all areas of the Peterborough, Cambridgeshire, Norfolk and Suffolk sub regional grouping – the gap in participation between 17 and 18 year olds is increasing across Cambridgeshire, as it is across the region and country as a whole. Individuals with low skills levels are limited in their employment opportunities, which in turn limit income levels. Low skills are linked with poor health, crime and low social cohesion. Low skills also impact on the productivity and competitiveness of business and economies. Consequently, the number of young people who are NEET is a major predictor of future economic and social exclusion (EP Study 20092). Further identification of appropriate provision is necessary to engage and retain 18 year olds in education and work-based learning in order to reverse the widening of the gap between 18 and 17 year olds.3 In terms of Further Education retention of 16-18 year olds, Cambridgeshire is not showing the same improved rates as other areas in the sub region with 17 year old male and 18 year old female rates both falling.4
2 http://www.bis.gov.uk/policies/economic-development/englands-regional-development-agencies 3 YPLA 2010 sub regional analysis 4 Individual Learner Records 2007/08 to 2008/09, as quoted in the YPLA 2010 sub regional analysis.
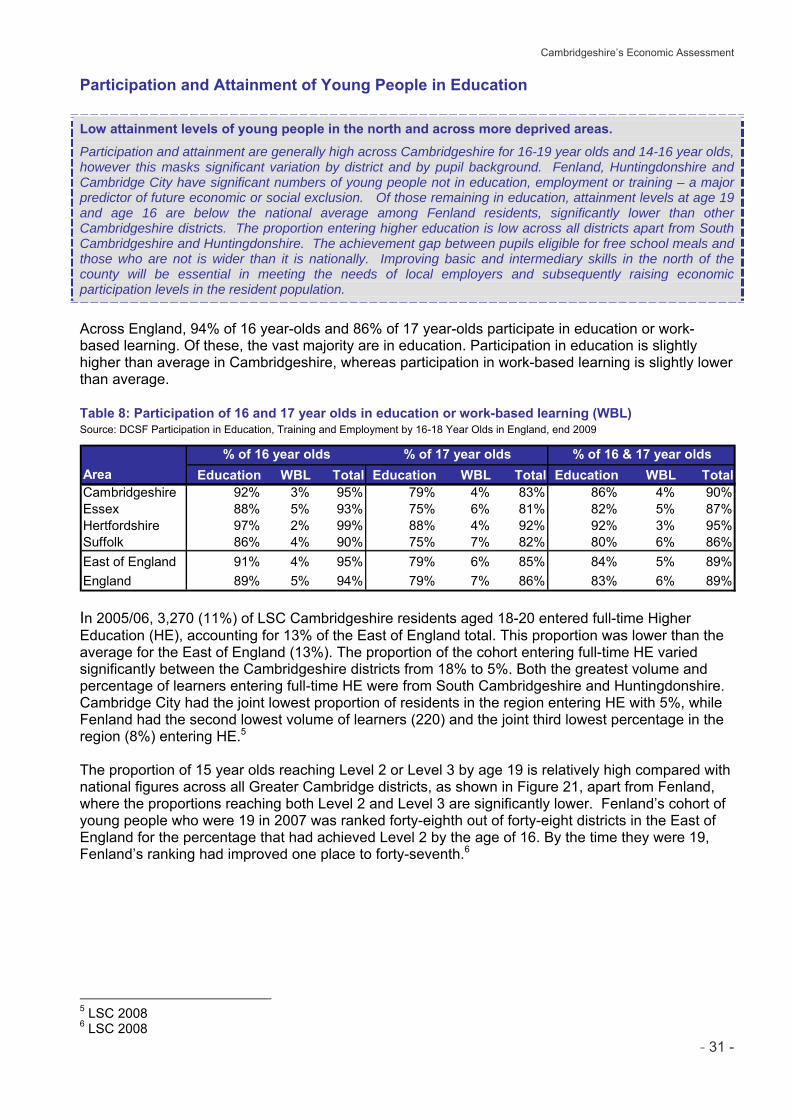
Cambridgeshire’s Economic Assessment
- 31 -
Participation and Attainment of Young People in Education
Low attainment levels of young people in the north and across more deprived areas.
Participation and attainment are generally high across Cambridgeshire for 16-19 year olds and 14-16 year olds, however this masks significant variation by district and by pupil background. Fenland, Huntingdonshire and Cambridge City have significant numbers of young people not in education, employment or training – a major predictor of future economic or social exclusion. Of those remaining in education, attainment levels at age 19 and age 16 are below the national average among Fenland residents, significantly lower than other Cambridgeshire districts. The proportion entering higher education is low across all districts apart from South Cambridgeshire and Huntingdonshire. The achievement gap between pupils eligible for free school meals and those who are not is wider than it is nationally. Improving basic and intermediary skills in the north of the county will be essential in meeting the needs of local employers and subsequently raising economic participation levels in the resident population.
Across England, 94% of 16 year-olds and 86% of 17 year-olds participate in education or work-based learning. Of these, the vast majority are in education. Participation in education is slightly higher than average in Cambridgeshire, whereas participation in work-based learning is slightly lower than average. Table 8: Participation of 16 and 17 year olds in education or work-based learning (WBL) Source: DCSF Participation in Education, Training and Employment by 16-18 Year Olds in England, end 2009
% of 16 year olds % of 17 year olds % of 16 & 17 year oldsArea Education WBL Total Education WBL Total Education WBL TotalCambridgeshire 92% 3% 95% 79% 4% 83% 86% 4% 90%Essex 88% 5% 93% 75% 6% 81% 82% 5% 87%Hertfordshire 97% 2% 99% 88% 4% 92% 92% 3% 95%Suffolk 86% 4% 90% 75% 7% 82% 80% 6% 86%East of England 91% 4% 95% 79% 6% 85% 84% 5% 89%England 89% 5% 94% 79% 7% 86% 83% 6% 89% In 2005/06, 3,270 (11%) of LSC Cambridgeshire residents aged 18-20 entered full-time Higher Education (HE), accounting for 13% of the East of England total. This proportion was lower than the average for the East of England (13%). The proportion of the cohort entering full-time HE varied significantly between the Cambridgeshire districts from 18% to 5%. Both the greatest volume and percentage of learners entering full-time HE were from South Cambridgeshire and Huntingdonshire. Cambridge City had the joint lowest proportion of residents in the region entering HE with 5%, while Fenland had the second lowest volume of learners (220) and the joint third lowest percentage in the region (8%) entering HE.5 The proportion of 15 year olds reaching Level 2 or Level 3 by age 19 is relatively high compared with national figures across all Greater Cambridge districts, as shown in Figure 21, apart from Fenland, where the proportions reaching both Level 2 and Level 3 are significantly lower. Fenland’s cohort of young people who were 19 in 2007 was ranked forty-eighth out of forty-eight districts in the East of England for the percentage that had achieved Level 2 by the age of 16. By the time they were 19, Fenland’s ranking had improved one place to forty-seventh.6
5 LSC 2008 6 LSC 2008
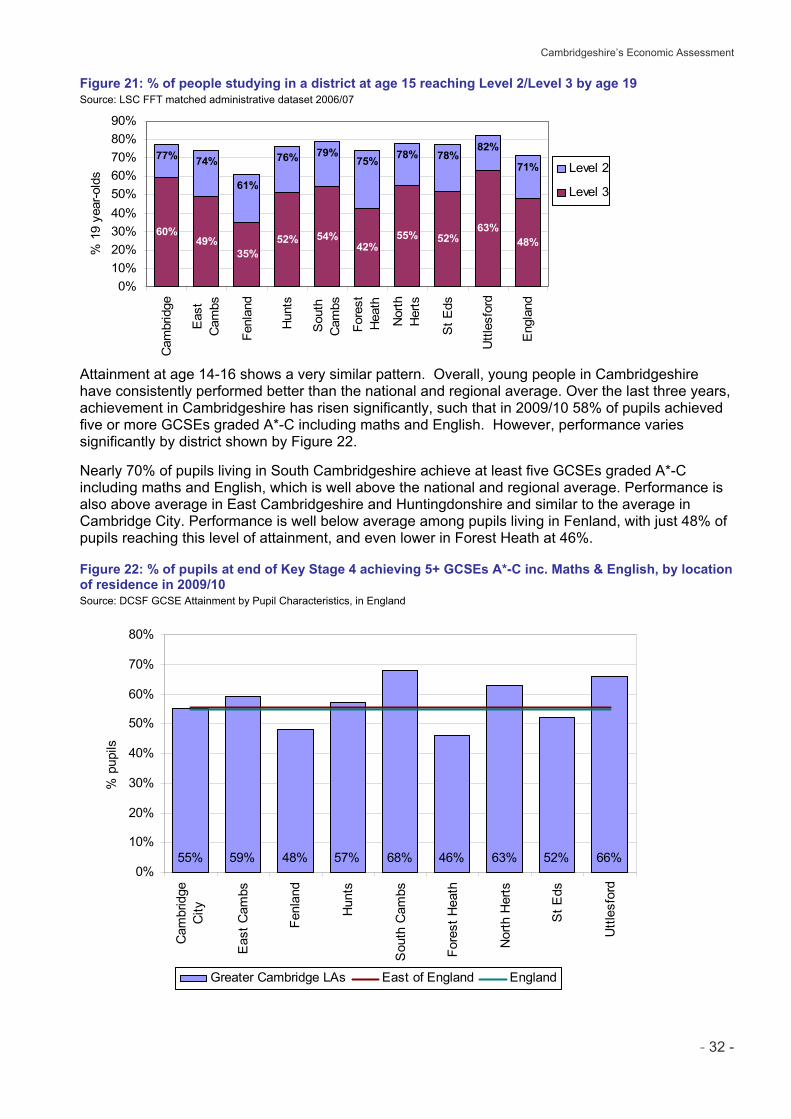
Cambridgeshire’s Economic Assessment
- 32 -
77% 74%
61%
76% 79%75% 78% 78%
82%
71%
60%49%
35%52% 54%
42%55% 52%
63%48%
0%10%20%30%40%50%60%70%80%90%
Cam
brid
ge
Eas
tC
ambs
Fenl
and
Hun
ts
Sou
thC
ambs
Fore
stH
eath
Nor
thH
erts
St E
ds
Uttl
esfo
rd
Eng
land
% 1
9 ye
ar-o
lds Level 2
Level 3
Figure 21: % of people studying in a district at age 15 reaching Level 2/Level 3 by age 19 Source: LSC FFT matched administrative dataset 2006/07
Attainment at age 14-16 shows a very similar pattern. Overall, young people in Cambridgeshire have consistently performed better than the national and regional average. Over the last three years, achievement in Cambridgeshire has risen significantly, such that in 2009/10 58% of pupils achieved five or more GCSEs graded A*-C including maths and English. However, performance varies significantly by district shown by Figure 22. Nearly 70% of pupils living in South Cambridgeshire achieve at least five GCSEs graded A*-C including maths and English, which is well above the national and regional average. Performance is also above average in East Cambridgeshire and Huntingdonshire and similar to the average in Cambridge City. Performance is well below average among pupils living in Fenland, with just 48% of pupils reaching this level of attainment, and even lower in Forest Heath at 46%. Figure 22: % of pupils at end of Key Stage 4 achieving 5+ GCSEs A*-C inc. Maths & English, by location of residence in 2009/10 Source: DCSF GCSE Attainment by Pupil Characteristics, in England
55% 48% 57% 68% 46% 63% 52% 66%59%0%
10%
20%
30%
40%
50%
60%
70%
80%
Cam
brid
geC
ity
Eas
t Cam
bs
Fenl
and
Hun
ts
Sou
th C
ambs
Fore
st H
eath
Nor
th H
erts
St E
ds
Uttl
esfo
rd
% p
upils
Greater Cambridge LAs East of England England
Cambridgeshire’s Economic Assessment
- 33 -
Table 9 compares pupil attainment by local authority district of residence with attainment by local authority district of school location. In most districts these figures are broadly similar, however there are some notable differences. In Cambridge City, pupils attending schools in Cambridge perform better than pupils living in Cambridge. This implies that school performance in the City may be boosted by pupils living outside Cambridge. Conversely, performance is higher among pupils living in Fenland than is reflected by the performance of those attending schools in Fenland. This implies that Fenland pupils opting out of local schools tend to do better.
Table 9: % of pupils at end of Key Stage 4 achieving 5+ GCSEs A*-C inc. Maths & English, by location of school and location of residence in 2009/10 Source: DCSF GCSE Attainment by Pupil Characteristics, in England
LA District By local authority of residence
By local authority of school
Cambridge City 55% 58%East Cambridgeshire 59% 60%Fenland 48% 46%Huntingdonshire 57% 58%South Cambridgeshire 68% 69%Forest Heath 46% 41%North Hertfordshire 63% 65%St Edmundsbury 52% 54%Uttlesford 66% 64%East of England 56% 56%England 55% 53% Table 10 compares pupil attainment in terms of certain pupil characteristics. In Cambridgeshire, as nationally, pupils whose first language was not English perform slightly less well on average than pupils whose first language was English. Girls outperform boys in all local authorities. The greatest disparity in Key Stage 4 attainment is between those who are eligible for free school meals and those who are not. To be eligible for free school meals, pupils’ parents must receive a means-tested benefit such as Income Support or Jobseeker’s Allowance. Within Cambridgeshire, the achievement gap is wider than seen nationally, at just 28% among eligible pupils compared to 61% among those who are not eligible. This shows that while Cambridgeshire pupils enjoy high levels of achievement on average, those pupils growing up in families at risk of income or employment deprivation perform far less well, leaving them more vulnerable to these types of deprivation in their own adult lives. Table 10: % of pupils at end of Key Stage 4 achieving 5+ GCSEs A*-C inc. Maths & English, by pupil characteristics in 2009/10 Source: DCSF GCSE Attainment by Pupil Characteristics, in England
1st language Free school meal eligibility Gender
Area EnglishOther than
English Eligible Not eligible Boys GirlsCambridgeshire 59% 57% 28% 61% 55% 62%Essex 55% 48% 28% 57% 50% 59%Hertfordshire 64% 64% 31% 66% 60% 68%Suffolk 52% 43% 28% 54% 47% 56%East of England 56% 51% 28% 59% 52% 60%Total England 55% 53% 31% 59% 51% 59%
Cambridgeshire’s Economic Assessment
- 34 -
The same gap exists when viewing figures for Level 2 achievement at age 19. In Cambridgeshire, the gap in achievement between disadvantaged learners and non-disadvantaged learners is 11 percentage points higher than the national average of 22 percentage points7. This is higher than all other authorities in the Sub Regional Grouping, and includes particularly poor performance in 2009. Suffolk, however, is improving more rapidly than nationally, beginning at a higher level than the national benchmark in 2005 and reaching a lower level than had been reached nationally in 2009. The gap in Cambridgeshire at Level 3 is particularly wide and growing, reaching 14 percentage points above the national figure in 2009. In comparison with its statistical neighbours8, Cambridgeshire also performs poorly on this measure. It is obviously a priority within Cambridgeshire to engage and retain disadvantaged learners and support them to achieve their full potential. Disadvantaged young people need to have access to a good range of curriculum opportunities and, if the current offer is not engaging them, further action may be required to widen their choice and recognise the difficulties that they face in participating and achieving9. Apprenticeships and Sector Subject Areas of Learners
Increased take up of engineering, science and technology in both apprenticeships and further education but recent decrease in apprenticeship take up and significant under representation of females.
There has been a recent decrease in the number of apprenticeships started across Cambridgeshire and Peterborough. Of those apprenticeships started, engineering and hairdressing saw a significant increase in participation between 2007/08 and 2009/10. Females are significantly underrepresented in the learners undertaking apprenticeships. Within further education, science and mathematics saw an increase in the proportion of learners from 2008/09 to 2009/10.
Within the Sub Regional Group (Cambridgeshire, Peterborough, Norfolk and Suffolk), apprenticeships account for 8% of 16-18 learners in 2009/10, down from 12% in 2008/09. (Comment – can we add latest Q1 11/12 stats on this received from Andy Sanders)The largest decline in starts and participation is found among residents in Peterborough and Cambridgeshire. Females are significantly underrepresented in the learners undertaking Apprenticeships.10 The success rate for Cambridgeshire resident learners has shown the most improvement within the Sub Regional Grouping, increasing from 60% in 2006/07 to 73% in 2008/09. The top five (of over 80) apprenticeship frameworks for the Cambridgeshire, Peterborough, Norfolk and Suffolk Sub Region were: Construction; Hairdressing; Engineering; Vehicle Maintenance and Repair; and Electrotechnical. These accounted for around 50% of apprenticeships in 2009/10. Of these subjects, engineering, followed by hairdressing, saw the largest increases in proportion of learners from 2007/08 to 2009/10. The top five (of 17) aims in further education by sector subject area for the Peterborough, Cambridgeshire, Norfolk and Suffolk Sub Region are: Arts, Media and Publishing; Science and Mathematics; Health, Public Services and Care; Retail and Commercial Enterprise; and Languages, Literature and Culture. These made up 38% of aims in 2009/10. Of these sector subject areas, science and mathematics saw the largest increase in proportion of learner aims from 2008/09 to 2009/10 (8.6% to 10.1%). Further Education participation in health, public services and care and retail and commercial enterprise does, to some degree, reflect some of the main employment sectors and areas where
7 Fisher Family Trust matched administrative data set 2008/2009, quoted in YPLA Strategic Analysis 2010. 8 “Statistical neighbours” refers to LAs that are considered ‘similar’ in terms of the socio-demographic composition. Some consider this a more meaningful comparison than comparison with geographical neighbours. 9 YPLA 2010 Strategic Analysis 10 National Apprenticeship Service 2009/10, quoted in YPLA 2010 Strategic Analysis.
Cambridgeshire’s Economic Assessment
- 35 -
growth and opportunity are expected. However, more could be done to promote education within the main occupational areas available within the Sub Regional Grouping.
Higher Education in the County
Lack of retention of skilled graduates.
Few highly skilled graduates of Cambridge University or Anglia Ruskin University appear to seek employment within the county; potentially a missed opportunity in terms of growing a hi-tech economy experiencing skills shortages. Both universities exert a significant influence as an employer in the sub region, leading to concerns over what impact government cuts in Higher Education and publicly funded R&D will have on the area.
Cambridgeshire is home to two universities, both located in Cambridge City: the University of Cambridge and Anglia Ruskin University (ARU). The 2008 Research Assessment Exercise shows the University of Cambridge to have 49 out of 50 subjects rated as world-leading quality (grade 4*) or internationally excellent quality (grade 3*) and ARU to have 2 out of 9 subjects achieving world-leading or internationally excellent quality. Both universities also provide good business education, with the Judge Business School of Cambridge University (recognised as one of the top business schools in the world) and Ashcroft International Business School of ARU. Both business schools attract students from across the world. They also have established global networks of businesses and academic partnerships. Both universities have a large number of students every academic year (in 2009/10 ARU had around 8,000 students at its Cambridge Campus, Cambridge University had around 23,000 students). There are no published data on numbers of students from within the local area, however it is widely recognised that ARU takes a high proportion of ‘local’ students whereas Cambridge University takes very few. In 2008/09 around 25% of Cambridge University students were international, 15% from non-EU countries. Around 10% of ARU students were international, around 5% from non-EU countries. Both universities experienced an increase in the number of international students between 2007/08 and 2008/09. The large student population has a significant impact on the local economy, both positive (spending on goods and services, highly skilled labour force) and negative (increased competition for housing in the city centre and some increased competition for part-time work). Anecdotal information suggests that the majority of graduates leave the area after completing their studies and London is their first destination area. Of those that do stay within the East of England region, most of them are employed in the city of Cambridge and its immediate surrounding (i.e. CB postcode). Although the population in the south of the county is very high skilled, anecdotally many businesses still experience skills shortages, therefore finding ways to retain the graduate population would potentially benefit the local economy. A significant proportion of the local population is employed by the universities, with over 25% of Cambridge City employees working in education. Employment in Education and Health has grown significantly over the last 10 years, particularly in Huntingdonshire? and South Cambridgeshire. This increased dependency on public sector employment leads to concerns over what impact the government cuts in Higher Education and publicly funded R&D will have on the area.
Cambridgeshire’s Economic Assessment
- 36 -
Access to Education
Accessibility data collected by the DfT suggests that ease of access to both secondary and further education is lowest in East Cambridgeshire, Fenland, South Cambridgeshire and Forest Heath.
85% of Cambridgeshire residents participating in Further Education do so in Cambridgeshire, with 11% travelling to surrounding counties, predominantly to Peterborough Regional College, the Norfolk Campus of the College of West Anglia and Bedford College. Early year data for 2009/10 shows that Cambridgeshire residents were more likely to leave the area to take Level 2 courses, with 22% attending FE provision outside the area, compared with 13% travelling for Level 3 courses and 11% travelling for Level 1 courses. However, the main reason for the travel to learn patterns appears to be geographical proximity, with some element of choice around Level 2. The proportion of Cambridgeshire residents that travel out of the area to study in school sixth forms is much higher than the other Local Authorities in the Peterborough, Cambridgeshire?, Norfolk and Suffolk Sub Region. 9% of Cambridgeshire residents travel to neighbouring counties, predominantly to Stanground College, the Kings School in Peterborough, King Edward VII School in Norfolk and Newmarket College in Suffolk.11
Most of the out-commuting for learning seems to be to counties to the north of Cambridgeshire, suggesting movement out from Fenland. It is currently unclear whether young people who travel out of an area to study are more likely to drop out than people who do not. Skills Demand and Forecasting Skills demand in health, retail, tourism, creative industries, agriculture, and manufacturing. Pre-recession, education and health, business services and construction saw the largest growth, however the recession hit construction and business services hard, and higher education budgets have recently been significantly reduced. In the short and medium term, health, retail and business services are likely to provide the greatest number of opportunities for employment however recent vacancy levels are significantly lower than those previously seen, limiting the opportunities available for the unemployed. Longer term, health, tourism, creative industries, agriculture and high value manufacturing may be the sectors that pull Cambridgeshire out of the recession.
Drawing on labour market statistics, local strategic documentation and a focus group with local stakeholders, this section considers where future employment opportunities are most likely so that future provision can be designed to support and prepare workless individuals towards and into real, sustainable jobs. Recent Employment Trends Learning first from the five years leading up to the start of the recession, employment growth in Cambridgeshire was greatest in:
By industry: public administration; education and health; financial and business services; and construction.
By occupation: professional occupations; and managers and senior officials. In contrast, manufacturing employment declined but by only 4% suggesting that Cambridgeshire’s high-tech manufacturing is more robust than the traditional manufacturing functions elsewhere. By occupation declines were greatest in lower-skilled service sector occupations such as administrative and secretarial, sales and customer service, and personal service occupations. Current and Short-Term Opportunities Using Jobcentre Plus vacancy data and local input, the greatest numbers of opportunities currently or recently available are in:
11 ILR LO1 and Termly School Census SO2, quoted in YPLA Strategic Analysis 2010.
Cambridgeshire’s Economic Assessment
- 37 -
Health and care sector. The sector is widely viewed as a growing employment sector but struggles to recruit and retain staff due to the perceived negative image of the sector.
Retail sector. The retail sector has been affected by the recession with a number of prominent high street chains closing, but the high turnover rates within the sector mean there is a regular flow of entry-level vacancies in Cambridgeshire.
Business and professional services. The sector, which spans ICT, legal, finance and accounting, marketing and advertising, and real estate services, is a major employer in Cambridgeshire and had a high number of vacancies in 2009. (Comment - Is this the latest info for this sector?)
Elementary occupations. Jobs such as seasonal agricultural jobs in Fenland and security jobs will continue to become available. However, in mid-late 2010 the number of vacancies advertised through Jobcentre Plus had significantly reduced. During 2011, however, the number of notified vacancies across Cambridgeshire has been increasing steadily with a peak of 4,000 full-time vacancies in October, although this has dipped slightly in recent months. Longer-Term Opportunities Looking further forward, the local focus group highlighted opportunities from the New Industry, New Jobs growth sectors and a ‘high-tech’ cluster sectors of biotechnology, software, instruments and engineering, ICT non-software, sound and imaging, materials, printing and packaging, and environmental goods and services. However, it was recognised that the number of lower-skilled jobs within these sectors may be limited. The local construction industry is also expected to pick up – especially the first phase of the ecotown development at Northstowe, where there are plans for approximately 9,500 new homes ultimately. Beyond these, the Greater Cambridge Sub-Regional Economic Strategy 2009-2012 put forward the following potentially important sectors.
Health – linked to the biotechnology cluster. Tourism and hospitality – with particular benefits flowing from the 2012 Olympics and
legacy. Creative industries – in particular publishing, computer games and software. Agriculture – remains an important sector with future opportunities from building on the
existing success of the agri-business sector and in diversifying into biorenewables. Accessibility and Quality of Life Cambridgeshire is partly a rural county. The rural geographies have low population densities and this impacts on residents’ access to jobs and education, training and employability services (EP Study 200912). Rural communities are characterised by low levels of economic participation due to the lack of local opportunities. Limited access to jobs and education, training and employability services means individuals without access to private transport and on low incomes are particularly affected. Many young people move away from rural areas because of the limited job opportunities. Access to transport is likely to be a key barrier to the economic participation rate in rural areas. In Cambridgeshire 17% of the economically inactive 16 to 74 year olds live in a household without access to a private car (2001).
12 http://www.eeda.org.uk/3411.asp
Cambridgeshire’s Economic Assessment
- 38 -
Unemployment, Economic Inactivity and Receipt of Benefits
Unemployment and Economic Inactivity
Box 4: The workless population The workless population is defined as all those people who are out of work but would like a job. This can include those labelled as ‘economically inactive’ in addition to the unemployed, labelled as ‘economically active’. A person is economically inactive if they are out of work and not seeking or available for work. This may be because, for example, they are a student; they are looking after their home or family or unable to work through sickness or disability. People who are unemployed are considered economically active. To be unemployed, a person must be out of work but available to start work in the next two weeks. They may be waiting to start a job or they may have been actively seeking work in the last four weeks. Traditionally, the economically active population was thought to form the potential labour supply in an area, however more recently it has been acknowledged that a proportion of the economically inactive may wish/be able to work if they were given the right opportunity.
Box 5: Sources of unemployment estimates A number of different data sources can be used to measure or track unemployment. The Jobseeker’s Allowance claimant count has traditionally been the official measure of unemployment. This is, however, a ‘narrow’ measure of unemployment, as it only includes those people who are actually entitled to claim, and do claim, Jobseeker’s Allowance. This measure does not include those people who do not claim or are not entitled to claim, but who are actively seeking work. The Jobseeker’s Allowance claimant count remains a useful indicator as counts are released monthly and for small areas; this data source will therefore be considered later in this section. Unemployment in labour market terms has an internationally agreed definition as recommended by the International Labour Organisation (ILO). Unemployment in this context refers to people without a job, who want a job, who have actively sought work within the last four weeks and are available to start work in the next two weeks; it also refers to people who have found a job and are waiting to start in the next two weeks. The percentage of economically active people who are unemployed by this definition is now considered to provide a more realistic indication and measure of ‘true’ unemployment. The ONS Annual Population Survey provides estimates of unemployment along with data on economic activity and inactivity as presented elsewhere in this report. As the APS has a relatively small sample size, however, and as the unemployed form only a small proportion of the population, measures from the APS can be prone to fluctuation and unreliability. To overcome this, the Office for National Statistics has developed a statistical model that provides more robust estimates of unemployment for local authorities by ‘borrowing strength’ from claimant count data. The model-based unemployment estimates cannot be broken down by population characteristics; however, therefore although the model-based estimates are the most reliable, data from the APS are also presented in this section.
40,200 workless individuals and 26,500 workless households. The unemployment rate in Fenland is close to the national average of around 8%. Unemployment across the rest of the county is relatively low and relatively low economic inactivity rates across most Cambridgeshire districts means that there should be more opportunity to get the estimated 40,200 residents who are workless into jobs when the economy recovers, providing they have the right skills. There are currently 26,500 households within the county that include at least one person aged 16 to 64, where no individuals aged 16 and over are in employment.
In 2011, unemployment across most Cambridgeshire districts was well below the national average of 7.5%. The only district above the national average is Fenland, where 8.0% of the economically active population aged 16+ is unemployed. Within the county, unemployment is lowest in South Cambridgeshire at 4.1%.
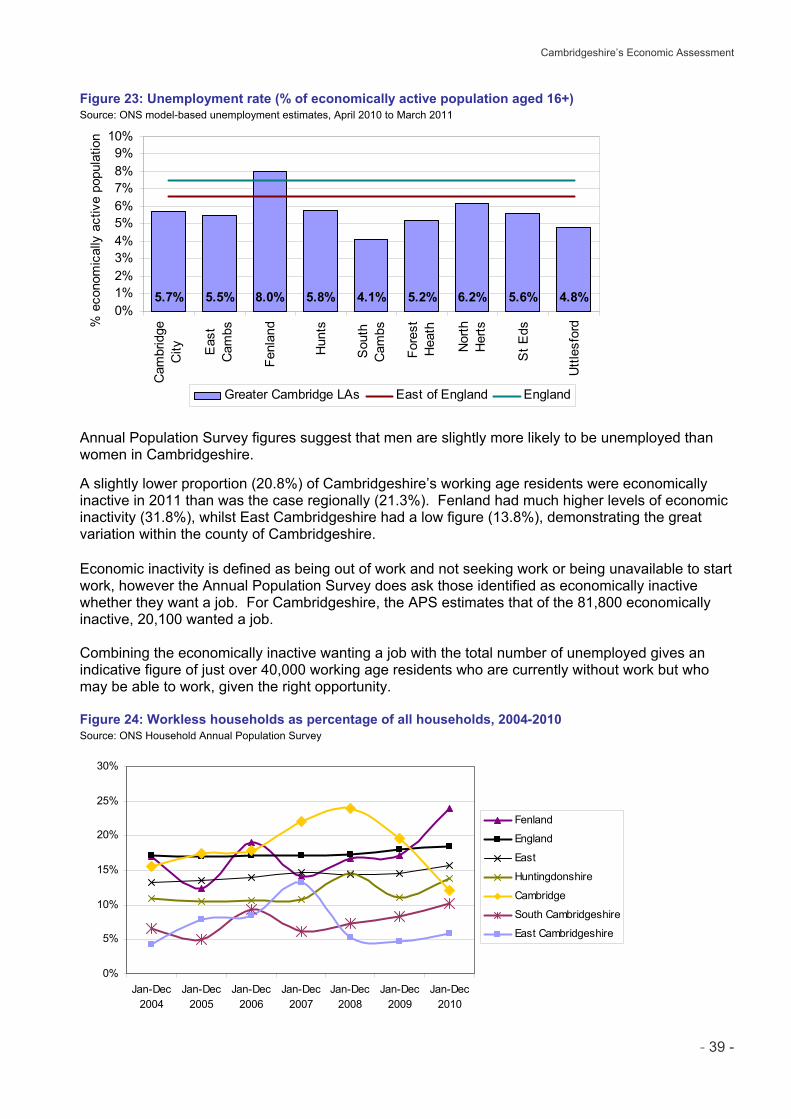
Cambridgeshire’s Economic Assessment
- 39 -
Figure 23: Unemployment rate (% of economically active population aged 16+) Source: ONS model-based unemployment estimates, April 2010 to March 2011
5.7% 5.5% 8.0% 5.8% 4.1% 5.2% 6.2% 5.6% 4.8%0%1%2%3%4%5%6%7%8%9%
10%
Cam
brid
geC
ity Eas
tC
ambs
Fenl
and
Hun
ts
Sou
thC
ambs
Fore
stH
eath
Nor
thH
erts
St E
ds
Uttl
esfo
rd% e
cono
mic
ally
act
ive
popu
latio
n
Greater Cambridge LAs East of England England
Annual Population Survey figures suggest that men are slightly more likely to be unemployed than women in Cambridgeshire.
A slightly lower proportion (20.8%) of Cambridgeshire’s working age residents were economically inactive in 2011 than was the case regionally (21.3%). Fenland had much higher levels of economic inactivity (31.8%), whilst East Cambridgeshire had a low figure (13.8%), demonstrating the great variation within the county of Cambridgeshire. Economic inactivity is defined as being out of work and not seeking work or being unavailable to start work, however the Annual Population Survey does ask those identified as economically inactive whether they want a job. For Cambridgeshire, the APS estimates that of the 81,800 economically inactive, 20,100 wanted a job. Combining the economically inactive wanting a job with the total number of unemployed gives an indicative figure of just over 40,000 working age residents who are currently without work but who may be able to work, given the right opportunity. Figure 24: Workless households as percentage of all households, 2004-2010 Source: ONS Household Annual Population Survey
0%
5%
10%
15%
20%
25%
30%
Jan-Dec2004
Jan-Dec2005
Jan-Dec2006
Jan-Dec2007
Jan-Dec2008
Jan-Dec2009
Jan-Dec2010
Fenland
England
East
Huntingdonshire
Cambridge
South Cambridgeshire
East Cambridgeshire
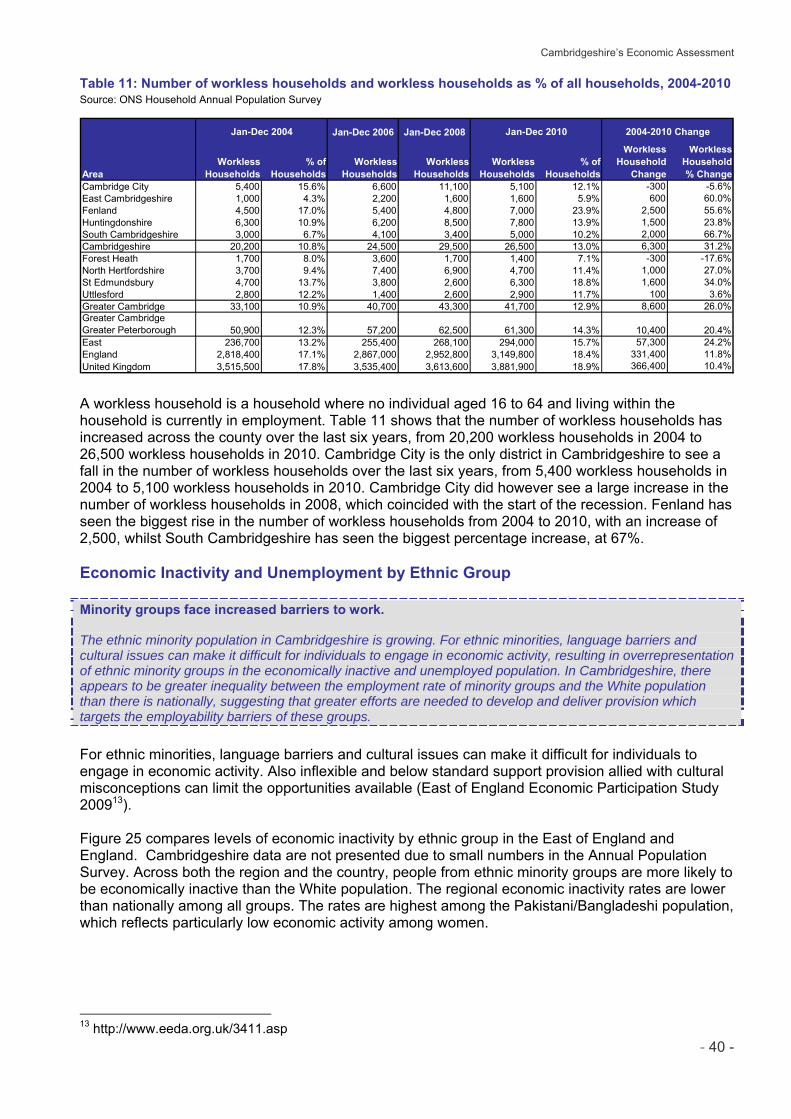
Cambridgeshire’s Economic Assessment
- 40 -
Table 11: Number of workless households and workless households as % of all households, 2004-2010 Source: ONS Household Annual Population Survey
Jan-Dec 2006 Jan-Dec 2008
Workless Households
% of Households
Workless Households
Workless Households
Workless Households
% of Households
Workless Household
Change
WorklessHousehold% Change
Cambridge City 5,400 15.6% 6,600 11,100 5,100 12.1% -300 -5.6%East Cambridgeshire 1,000 4.3% 2,200 1,600 1,600 5.9% 600 60.0%Fenland 4,500 17.0% 5,400 4,800 7,000 23.9% 2,500 55.6%Huntingdonshire 6,300 10.9% 6,200 8,500 7,800 13.9% 1,500 23.8%South Cambridgeshire 3,000 6.7% 4,100 3,400 5,000 10.2% 2,000 66.7%Cambridgeshire 20,200 10.8% 24,500 29,500 26,500 13.0% 6,300 31.2%Forest Heath 1,700 8.0% 3,600 1,700 1,400 7.1% -300 -17.6%North Hertfordshire 3,700 9.4% 7,400 6,900 4,700 11.4% 1,000 27.0%St Edmundsbury 4,700 13.7% 3,800 2,600 6,300 18.8% 1,600 34.0%Uttlesford 2,800 12.2% 1,400 2,600 2,900 11.7% 100 3.6%Greater Cambridge 33,100 10.9% 40,700 43,300 41,700 12.9% 8,600 26.0%Greater Cambridge Greater Peterborough 50,900 12.3% 57,200 62,500 61,300 14.3% 10,400 20.4%East 236,700 13.2% 255,400 268,100 294,000 15.7% 57,300 24.2%England 2,818,400 17.1% 2,867,000 2,952,800 3,149,800 18.4% 331,400 11.8%United Kingdom 3,515,500 17.8% 3,535,400 3,613,600 3,881,900 18.9% 366,400 10.4%
Jan-Dec 2004 Jan-Dec 2010
Area
2004-2010 Change
A workless household is a household where no individual aged 16 to 64 and living within the household is currently in employment. Table 11 shows that the number of workless households has increased across the county over the last six years, from 20,200 workless households in 2004 to 26,500 workless households in 2010. Cambridge City is the only district in Cambridgeshire to see a fall in the number of workless households over the last six years, from 5,400 workless households in 2004 to 5,100 workless households in 2010. Cambridge City did however see a large increase in the number of workless households in 2008, which coincided with the start of the recession. Fenland has seen the biggest rise in the number of workless households from 2004 to 2010, with an increase of 2,500, whilst South Cambridgeshire has seen the biggest percentage increase, at 67%. Economic Inactivity and Unemployment by Ethnic Group Minority groups face increased barriers to work. The ethnic minority population in Cambridgeshire is growing. For ethnic minorities, language barriers and cultural issues can make it difficult for individuals to engage in economic activity, resulting in overrepresentation of ethnic minority groups in the economically inactive and unemployed population. In Cambridgeshire, there appears to be greater inequality between the employment rate of minority groups and the White population than there is nationally, suggesting that greater efforts are needed to develop and deliver provision which targets the employability barriers of these groups.
For ethnic minorities, language barriers and cultural issues can make it difficult for individuals to engage in economic activity. Also inflexible and below standard support provision allied with cultural misconceptions can limit the opportunities available (East of England Economic Participation Study 200913). Figure 25 compares levels of economic inactivity by ethnic group in the East of England and England. Cambridgeshire data are not presented due to small numbers in the Annual Population Survey. Across both the region and the country, people from ethnic minority groups are more likely to be economically inactive than the White population. The regional economic inactivity rates are lower than nationally among all groups. The rates are highest among the Pakistani/Bangladeshi population, which reflects particularly low economic activity among women.
13 http://www.eeda.org.uk/3411.asp
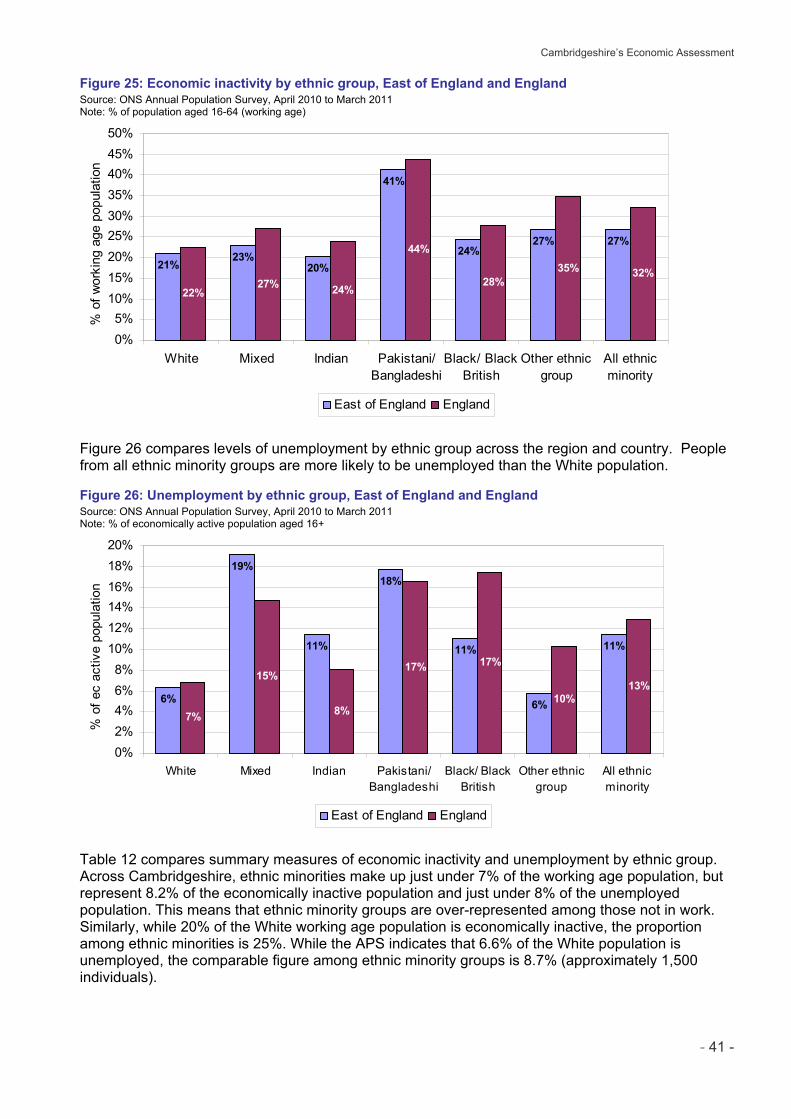
Cambridgeshire’s Economic Assessment
- 41 -
Figure 25: Economic inactivity by ethnic group, East of England and England Source: ONS Annual Population Survey, April 2010 to March 2011 Note: % of population aged 16-64 (working age)
21%23%
20%
41%
24%27% 27%
22%27% 24%
44%
28%35% 32%
0%5%
10%15%20%25%30%35%40%45%50%
White Mixed Indian Pakistani/Bangladeshi
Black/ BlackBritish
Other ethnicgroup
All ethnicminority
% o
f wor
king
age
pop
ulat
ion
East of England England
Figure 26 compares levels of unemployment by ethnic group across the region and country. People from all ethnic minority groups are more likely to be unemployed than the White population. Figure 26: Unemployment by ethnic group, East of England and England Source: ONS Annual Population Survey, April 2010 to March 2011 Note: % of economically active population aged 16+
6%
19%
11%
18%
11%
6%
11%
7%
15%
8%
17% 17%
10%13%
0%2%4%6%8%
10%12%14%16%18%20%
White Mixed Indian Pakistani/Bangladeshi
Black/ BlackBritish
Other ethnicgroup
All ethnicminority
% o
f ec
activ
e po
pula
tion
East of England England
Table 12 compares summary measures of economic inactivity and unemployment by ethnic group. Across Cambridgeshire, ethnic minorities make up just under 7% of the working age population, but represent 8.2% of the economically inactive population and just under 8% of the unemployed population. This means that ethnic minority groups are over-represented among those not in work. Similarly, while 20% of the White working age population is economically inactive, the proportion among ethnic minorities is 25%. While the APS indicates that 6.6% of the White population is unemployed, the comparable figure among ethnic minority groups is 8.7% (approximately 1,500 individuals).
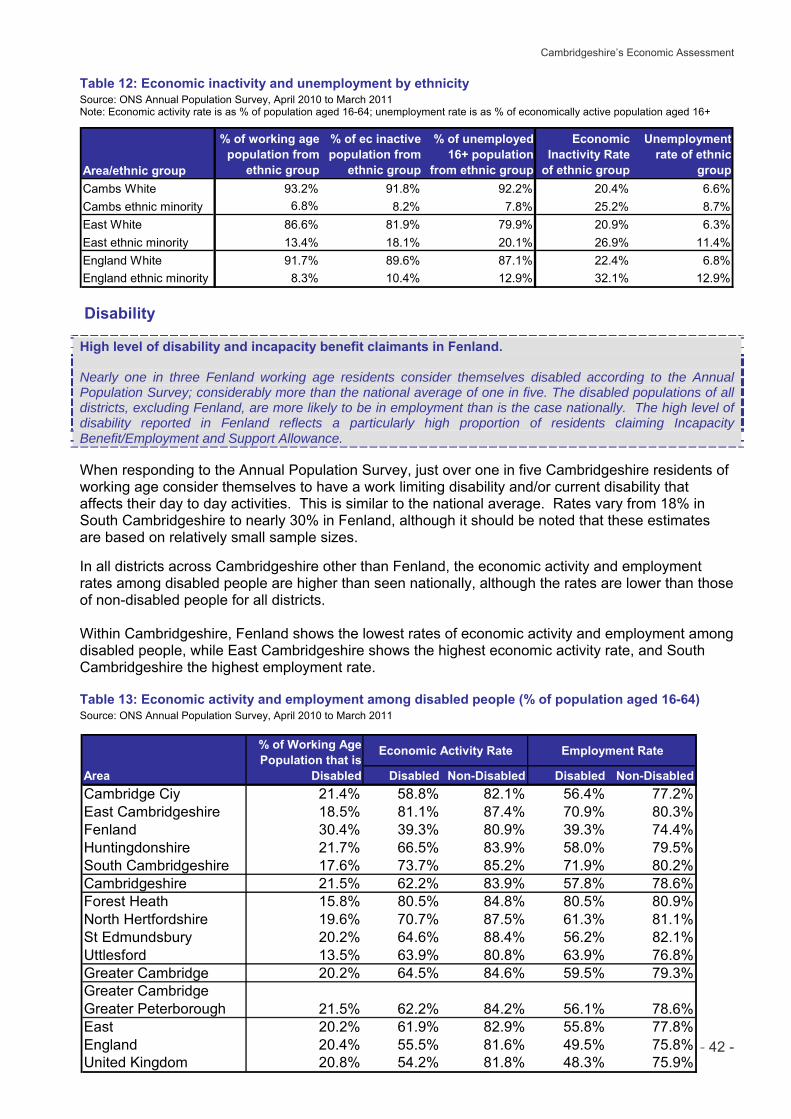
Cambridgeshire’s Economic Assessment
- 42 -
Table 12: Economic inactivity and unemployment by ethnicity Source: ONS Annual Population Survey, April 2010 to March 2011 Note: Economic activity rate is as % of population aged 16-64; unemployment rate is as % of economically active population aged 16+
Area/ethnic group
% of working age population from
ethnic group
% of ec inactive population from
ethnic group
% of unemployed 16+ population
from ethnic group
Economic Inactivity Rate
of ethnic group
Unemployment rate of ethnic
groupCambs White 93.2% 91.8% 92.2% 20.4% 6.6%Cambs ethnic minority 6.8% 8.2% 7.8% 25.2% 8.7%East White 86.6% 81.9% 79.9% 20.9% 6.3%East ethnic minority 13.4% 18.1% 20.1% 26.9% 11.4%England White 91.7% 89.6% 87.1% 22.4% 6.8%England ethnic minority 8.3% 10.4% 12.9% 32.1% 12.9%
Disability
High level of disability and incapacity benefit claimants in Fenland. Nearly one in three Fenland working age residents consider themselves disabled according to the Annual Population Survey; considerably more than the national average of one in five. The disabled populations of all districts, excluding Fenland, are more likely to be in employment than is the case nationally. The high level of disability reported in Fenland reflects a particularly high proportion of residents claiming Incapacity Benefit/Employment and Support Allowance. When responding to the Annual Population Survey, just over one in five Cambridgeshire residents of working age consider themselves to have a work limiting disability and/or current disability that affects their day to day activities. This is similar to the national average. Rates vary from 18% in South Cambridgeshire to nearly 30% in Fenland, although it should be noted that these estimates are based on relatively small sample sizes. In all districts across Cambridgeshire other than Fenland, the economic activity and employment rates among disabled people are higher than seen nationally, although the rates are lower than those of non-disabled people for all districts. Within Cambridgeshire, Fenland shows the lowest rates of economic activity and employment among disabled people, while East Cambridgeshire shows the highest economic activity rate, and South Cambridgeshire the highest employment rate.
Table 13: Economic activity and employment among disabled people (% of population aged 16-64) Source: ONS Annual Population Survey, April 2010 to March 2011
Economic Activity Rate Employment Rate
Area Disabled Non-Disabled Disabled Non-DisabledCambridge Ciy 21.4% 58.8% 82.1% 56.4% 77.2%East Cambridgeshire 18.5% 81.1% 87.4% 70.9% 80.3%Fenland 30.4% 39.3% 80.9% 39.3% 74.4%Huntingdonshire 21.7% 66.5% 83.9% 58.0% 79.5%South Cambridgeshire 17.6% 73.7% 85.2% 71.9% 80.2%Cambridgeshire 21.5% 62.2% 83.9% 57.8% 78.6%Forest Heath 15.8% 80.5% 84.8% 80.5% 80.9%North Hertfordshire 19.6% 70.7% 87.5% 61.3% 81.1%St Edmundsbury 20.2% 64.6% 88.4% 56.2% 82.1%Uttlesford 13.5% 63.9% 80.8% 63.9% 76.8%Greater Cambridge 20.2% 64.5% 84.6% 59.5% 79.3%Greater CambridgeGreater Peterborough 21.5% 62.2% 84.2% 56.1% 78.6%East 20.2% 61.9% 82.9% 55.8% 77.8%England 20.4% 55.5% 81.6% 49.5% 75.8%United Kingdom 20.8% 54.2% 81.8% 48.3% 75.9%
% of Working Age Population that is
Disabled
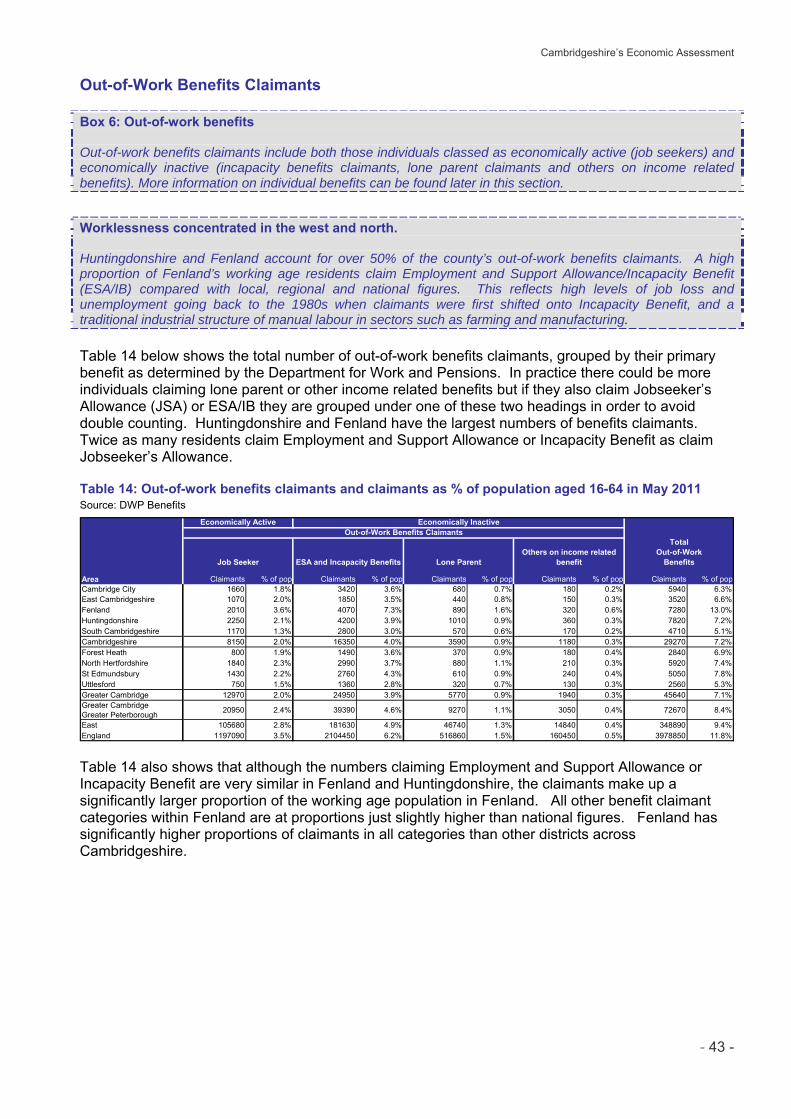
Cambridgeshire’s Economic Assessment
- 43 -
Out-of-Work Benefits Claimants Box 6: Out-of-work benefits Out-of-work benefits claimants include both those individuals classed as economically active (job seekers) and economically inactive (incapacity benefits claimants, lone parent claimants and others on income related benefits). More information on individual benefits can be found later in this section.
Worklessness concentrated in the west and north. Huntingdonshire and Fenland account for over 50% of the county’s out-of-work benefits claimants. A high proportion of Fenland’s working age residents claim Employment and Support Allowance/Incapacity Benefit (ESA/IB) compared with local, regional and national figures. This reflects high levels of job loss and unemployment going back to the 1980s when claimants were first shifted onto Incapacity Benefit, and a traditional industrial structure of manual labour in sectors such as farming and manufacturing.
Table 14 below shows the total number of out-of-work benefits claimants, grouped by their primary benefit as determined by the Department for Work and Pensions. In practice there could be more individuals claiming lone parent or other income related benefits but if they also claim Jobseeker’s Allowance (JSA) or ESA/IB they are grouped under one of these two headings in order to avoid double counting. Huntingdonshire and Fenland have the largest numbers of benefits claimants. Twice as many residents claim Employment and Support Allowance or Incapacity Benefit as claim Jobseeker’s Allowance.
Table 14: Out-of-work benefits claimants and claimants as % of population aged 16-64 in May 2011 Source: DWP Benefits
Claimants % of pop Claimants % of pop Claimants % of pop Claimants % of pop Claimants % of popCambridge City 1660 1.8% 3420 3.6% 680 0.7% 180 0.2% 5940 6.3%East Cambridgeshire 1070 2.0% 1850 3.5% 440 0.8% 150 0.3% 3520 6.6%Fenland 2010 3.6% 4070 7.3% 890 1.6% 320 0.6% 7280 13.0%Huntingdonshire 2250 2.1% 4200 3.9% 1010 0.9% 360 0.3% 7820 7.2%South Cambridgeshire 1170 1.3% 2800 3.0% 570 0.6% 170 0.2% 4710 5.1%Cambridgeshire 8150 2.0% 16350 4.0% 3590 0.9% 1180 0.3% 29270 7.2%Forest Heath 800 1.9% 1490 3.6% 370 0.9% 180 0.4% 2840 6.9%North Hertfordshire 1840 2.3% 2990 3.7% 880 1.1% 210 0.3% 5920 7.4%St Edmundsbury 1430 2.2% 2760 4.3% 610 0.9% 240 0.4% 5050 7.8%Uttlesford 750 1.5% 1360 2.8% 320 0.7% 130 0.3% 2560 5.3%Greater Cambridge 12970 2.0% 24950 3.9% 5770 0.9% 1940 0.3% 45640 7.1%Greater Cambridge Greater Peterborough 20950 2.4% 39390 4.6% 9270 1.1% 3050 0.4% 72670 8.4%
East 105680 2.8% 181630 4.9% 46740 1.3% 14840 0.4% 348890 9.4%England 1197090 3.5% 2104450 6.2% 516860 1.5% 160450 0.5% 3978850 11.8%
Area
Total Out-of-Work
Benefits
Economically Active Economically InactiveOut-of-Work Benefits Claimants
Job Seeker ESA and Incapacity Benefits Lone ParentOthers on income related
benefit
Table 14 also shows that although the numbers claiming Employment and Support Allowance or Incapacity Benefit are very similar in Fenland and Huntingdonshire, the claimants make up a significantly larger proportion of the working age population in Fenland. All other benefit claimant categories within Fenland are at proportions just slightly higher than national figures. Fenland has significantly higher proportions of claimants in all categories than other districts across Cambridgeshire.

Cambridgeshire’s Economic Assessment
- 44 -
Jobseeker’s Allowance Claimants Box 7: Jobseeker’s Allowance Jobseeker’s Allowance (JSA) is the main benefit for people of working age who are out of work. To qualify, recipients must be: available for and actively seeking work; between 18 and State Pension age; and working less than 16 hours per week on average. Recipients must be capable of work – those too ill to work may now receive Employment and Support Allowance (ESA) or other benefits for people who are sick or disabled. JSA claimants are considered a ‘narrow’ measure of unemployment. As not all unemployed people claim JSA, claimant rates are lower than shown by ‘broad’ measures such as the ONS model-based estimates.
Increasing employment inequalities. The highest increases in JSA claimant rate have occurred in those areas with the highest rates, notably Fenland, Huntingdon North, Arbury and King’s Hedges, along with parts of St Neots and Littleport. The recession is therefore likely to have increased employment inequalities across the county and employability service provision needs to reflect this. Younger (18-24) claimants are over-represented within the JSA claimant population, particularly in Fenland where the resident age profile is older than average. Data suggests that a significant proportion of ethnic minority unemployed people are not claiming benefits, meaning they are unlikely to be engaging with mainstream employability provision. One impact of the recession has been many people taking jobs lower than their skill level, impacting negatively on people with lower skills levels competing for the same jobs. Figure 27 shows the trend in the proportion of the working age population claiming Jobseeker’s Allowance over the last eleven years. JSA claimant rates in Cambridgeshire continue to be below the national average, however nationally, the claimant rate fell slightly over much of the decade, narrowing the gap relative to Cambridgeshire, and then increased sharply in 2008/09 as the effects of the recession were felt throughout the country. Post recession, rates in Cambridgeshire have been consistently lower and have increased less than nationally but still continue to rise. Figure 27: Jobseeker's Allowance claimants as % of population aged 16-64, 2001-2011 Source: ONS Claimant Count
0.0
0.5
1.0
1.5
2.0
2.5
3.0
3.5
4.0
4.5
Jan-
01
Jan-
02
Jan-
03
Jan-
04
Jan-
05
Jan-
06
Jan-
07
Jan-
08
Jan-
09
Jan-
10
Jan-
11
% o
f wor
king
age
pop
ulat
ion
EnglandEastCambridgeshire
As displayed in Table 15 and Figure 28, the recession has had varying impacts on the Cambridgeshire districts in terms of the claimant count rate.

Cambridgeshire’s Economic Assessment
- 45 -
Table 15: Number of Jobseeker’s Allowance claimants, November 2010 to November 2011 Source: ONS Claimant Count
Area Nov-10 Feb-10 May-10 Aug-11 Nov-11Cambridge City 1,651 1,771 1,659 1,735 1,715 3.9%East Cambridgeshire 933 1,040 1,060 1,082 1,102 18.1%Fenland 1,882 2,066 2,027 2,136 2,131 13.2%Huntingdonshire 2,222 2,456 2,449 2,585 2,509 12.9%South Cambridgeshire 1,242 1,333 1,220 1,251 1,301 4.8%Cambridgeshire 7,930 8,666 8,415 8,789 8,758 10.4%Forest Heath 838 906 834 848 853 1.8%North Hertfordshire 1,915 1,948 1,929 1,946 1,913 -0.1%St Edmundsbury 1,395 1,563 1,488 1,547 1,559 11.8%Uttlesford 812 827 766 839 825 1.6%Greater Cambridge 12,890 13,910 13,432 13,969 13,908 7.9%Greater Cambridge Greater Peterborough 20,214 22,322 21,521 22,493 22,139 9.5%East 103,483 113,166 109,148 113,981 113,868 10.0%England 1,156,394 1,253,469 1,234,189 1,289,549 1,285,145 11.1%
Number of Claimants % Change Nov-10
to Nov-11
All Greater Cambridge districts except Fenland have shown a lower percentage point increase in the claimant rate than the national average over the year. The increases in Cambridge City, South Cambridgeshire, Forest Heath, North Hertfordshire and Uttlesford have been low, at 0.1 percentage points or less. North Hertfordshire has bucked the trend by seeing a 0.1% decrease in the number of JSA claimants, whilst claimant numbers have increased across all other districts. Fenland is the only district to show a percentage point increase in the claimant rate on a par with the national increase (0.4), taking the overall claimant rate in November 2011 to 3.8%, equal to the national figure. Figure 28: Cambridgeshire's Jobseeker's Allowance claimants as % of population aged 16-64 Source: ONS Claimant Count
0.0
0.5
1.0
1.5
2.0
2.5
3.0
3.5
4.0
4.5
Jan-
08
Apr
-08
Jul-0
8
Oct
-08
Jan-
09
Apr
-09
Jul-0
9
Oct
-09
Jan-
10
Apr
-10
Jul-1
0
Oct
-10
Jan-
11
Apr
-11
Jul-1
1
Oct
-11
% o
f wor
king
age
pop
ulat
ion
Fenland
Hunts
East Cambs
Cambridge
South Cambs
Another impact of the recession has been underemployment. The recession has caused more people to take on jobs below their skill level, impacting negatively on individuals with lower skills competing for the same jobs. Furthermore, many individuals are being encouraged or choosing to undertake Level 4 qualifications even when their desired job doesn’t require it.
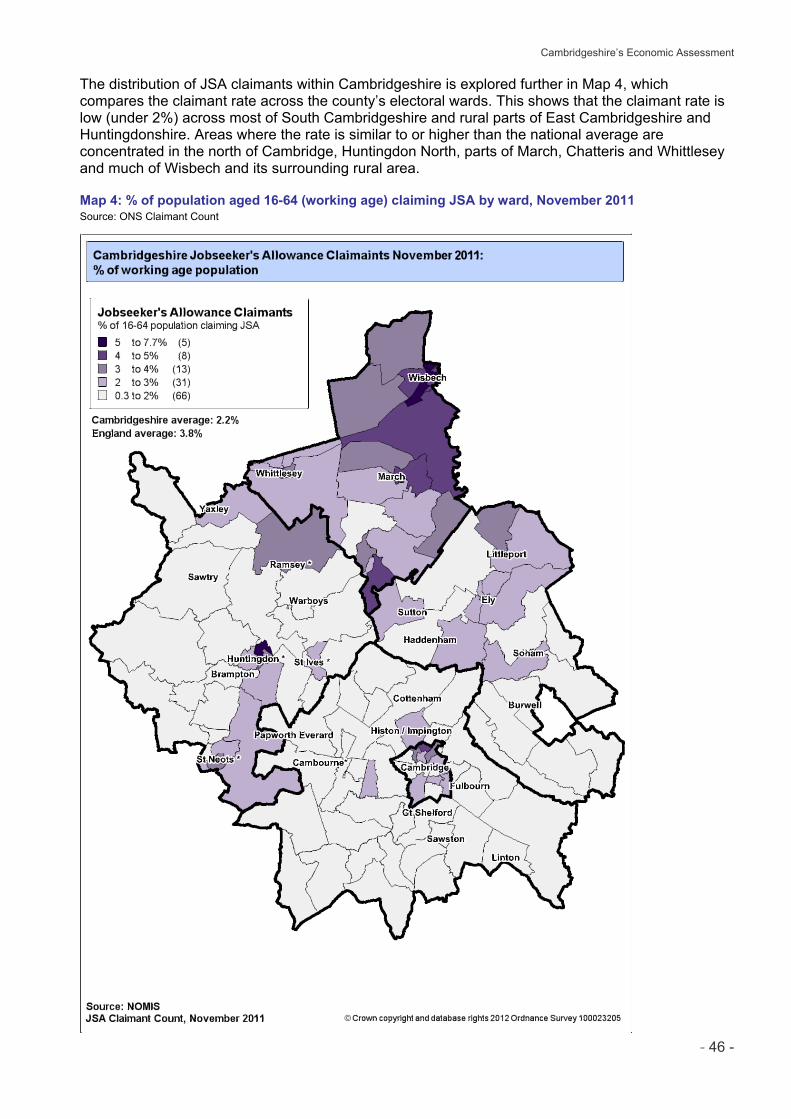
Cambridgeshire’s Economic Assessment
- 46 -
The distribution of JSA claimants within Cambridgeshire is explored further in Map 4, which compares the claimant rate across the county’s electoral wards. This shows that the claimant rate is low (under 2%) across most of South Cambridgeshire and rural parts of East Cambridgeshire and Huntingdonshire. Areas where the rate is similar to or higher than the national average are concentrated in the north of Cambridge, Huntingdon North, parts of March, Chatteris and Whittlesey and much of Wisbech and its surrounding rural area.
Map 4: % of population aged 16-64 (working age) claiming JSA by ward, November 2011 Source: ONS Claimant Count
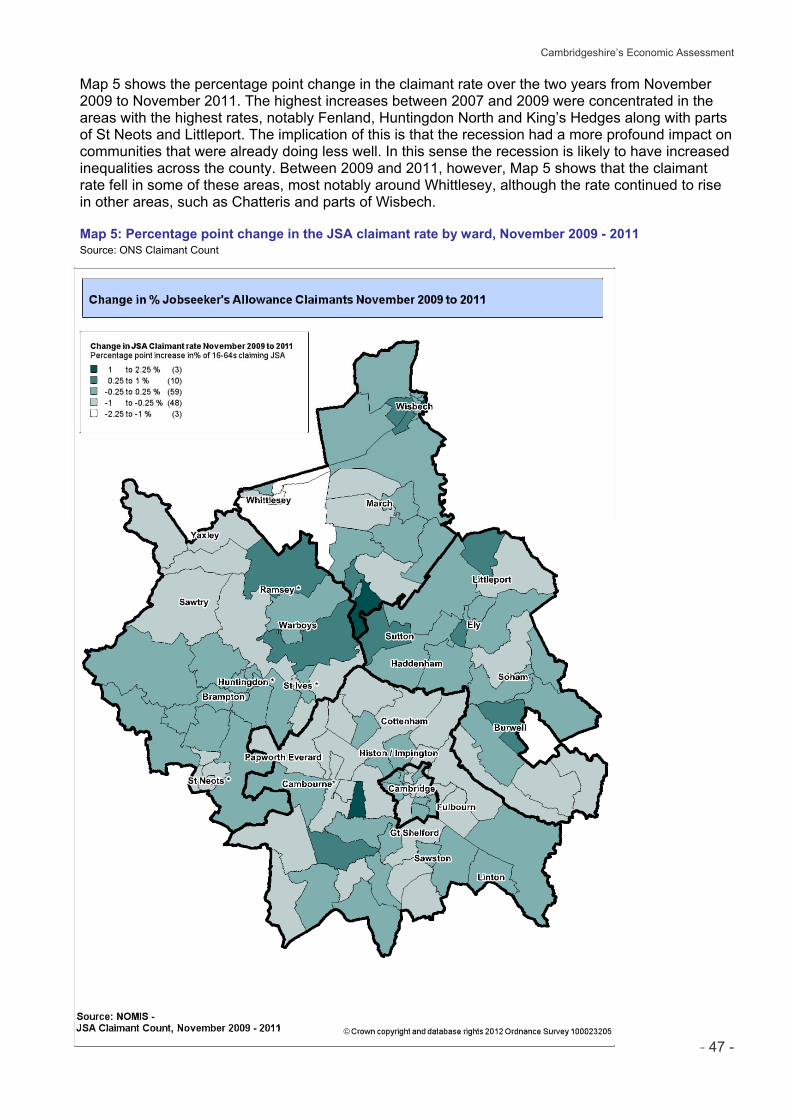
Cambridgeshire’s Economic Assessment
- 47 -
Map 5 shows the percentage point change in the claimant rate over the two years from November 2009 to November 2011. The highest increases between 2007 and 2009 were concentrated in the areas with the highest rates, notably Fenland, Huntingdon North and King’s Hedges along with parts of St Neots and Littleport. The implication of this is that the recession had a more profound impact on communities that were already doing less well. In this sense the recession is likely to have increased inequalities across the county. Between 2009 and 2011, however, Map 5 shows that the claimant rate fell in some of these areas, most notably around Whittlesey, although the rate continued to rise in other areas, such as Chatteris and parts of Wisbech.
Map 5: Percentage point change in the JSA claimant rate by ward, November 2009 - 2011 Source: ONS Claimant Count
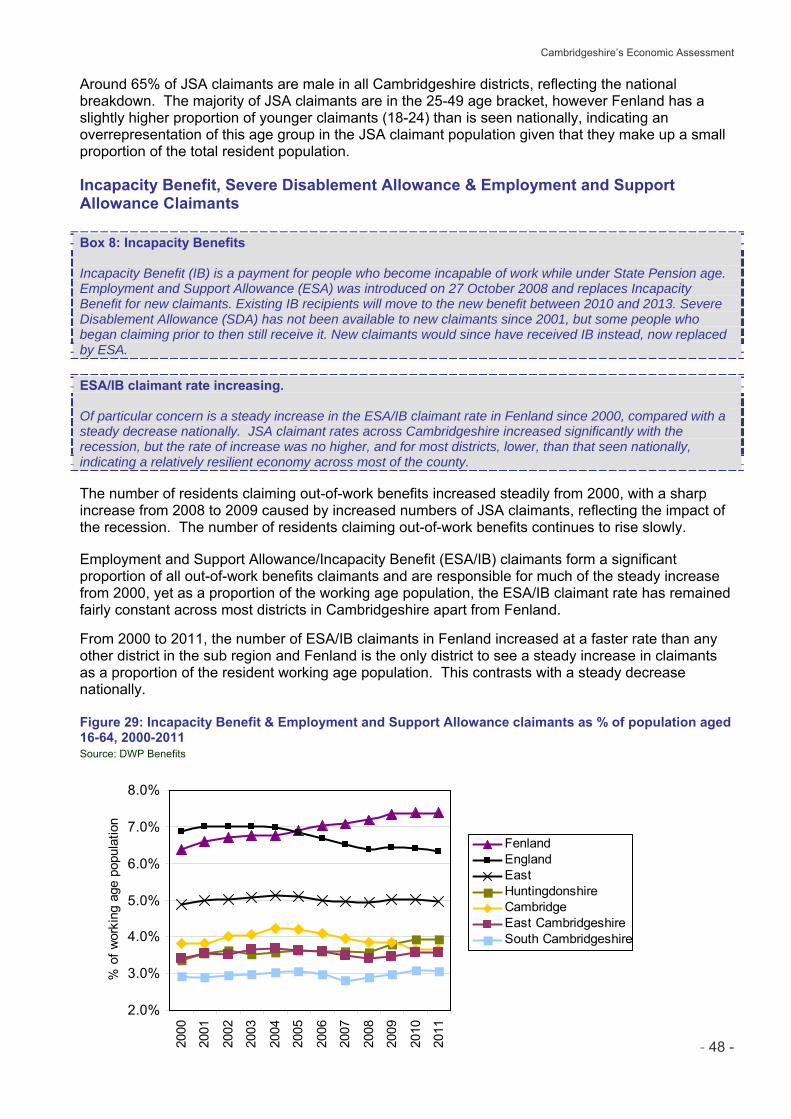
Cambridgeshire’s Economic Assessment
- 48 -
Around 65% of JSA claimants are male in all Cambridgeshire districts, reflecting the national breakdown. The majority of JSA claimants are in the 25-49 age bracket, however Fenland has a slightly higher proportion of younger claimants (18-24) than is seen nationally, indicating an overrepresentation of this age group in the JSA claimant population given that they make up a small proportion of the total resident population.
Incapacity Benefit, Severe Disablement Allowance & Employment and Support Allowance Claimants
Box 8: Incapacity Benefits Incapacity Benefit (IB) is a payment for people who become incapable of work while under State Pension age. Employment and Support Allowance (ESA) was introduced on 27 October 2008 and replaces Incapacity Benefit for new claimants. Existing IB recipients will move to the new benefit between 2010 and 2013. Severe Disablement Allowance (SDA) has not been available to new claimants since 2001, but some people who began claiming prior to then still receive it. New claimants would since have received IB instead, now replaced by ESA. ESA/IB claimant rate increasing. Of particular concern is a steady increase in the ESA/IB claimant rate in Fenland since 2000, compared with a steady decrease nationally. JSA claimant rates across Cambridgeshire increased significantly with the recession, but the rate of increase was no higher, and for most districts, lower, than that seen nationally, indicating a relatively resilient economy across most of the county. The number of residents claiming out-of-work benefits increased steadily from 2000, with a sharp increase from 2008 to 2009 caused by increased numbers of JSA claimants, reflecting the impact of the recession. The number of residents claiming out-of-work benefits continues to rise slowly. Employment and Support Allowance/Incapacity Benefit (ESA/IB) claimants form a significant proportion of all out-of-work benefits claimants and are responsible for much of the steady increase from 2000, yet as a proportion of the working age population, the ESA/IB claimant rate has remained fairly constant across most districts in Cambridgeshire apart from Fenland. From 2000 to 2011, the number of ESA/IB claimants in Fenland increased at a faster rate than any other district in the sub region and Fenland is the only district to see a steady increase in claimants as a proportion of the resident working age population. This contrasts with a steady decrease nationally. Figure 29: Incapacity Benefit & Employment and Support Allowance claimants as % of population aged 16-64, 2000-2011 Source: DWP Benefits
2.0%
3.0%
4.0%
5.0%
6.0%
7.0%
8.0%
2000
2001
2002
2003
2004
2005
2006
2007
2008
2009
2010
2011
% o
f wor
king
age
pop
ulat
ion
FenlandEnglandEastHuntingdonshireCambridgeEast CambridgeshireSouth Cambridgeshire
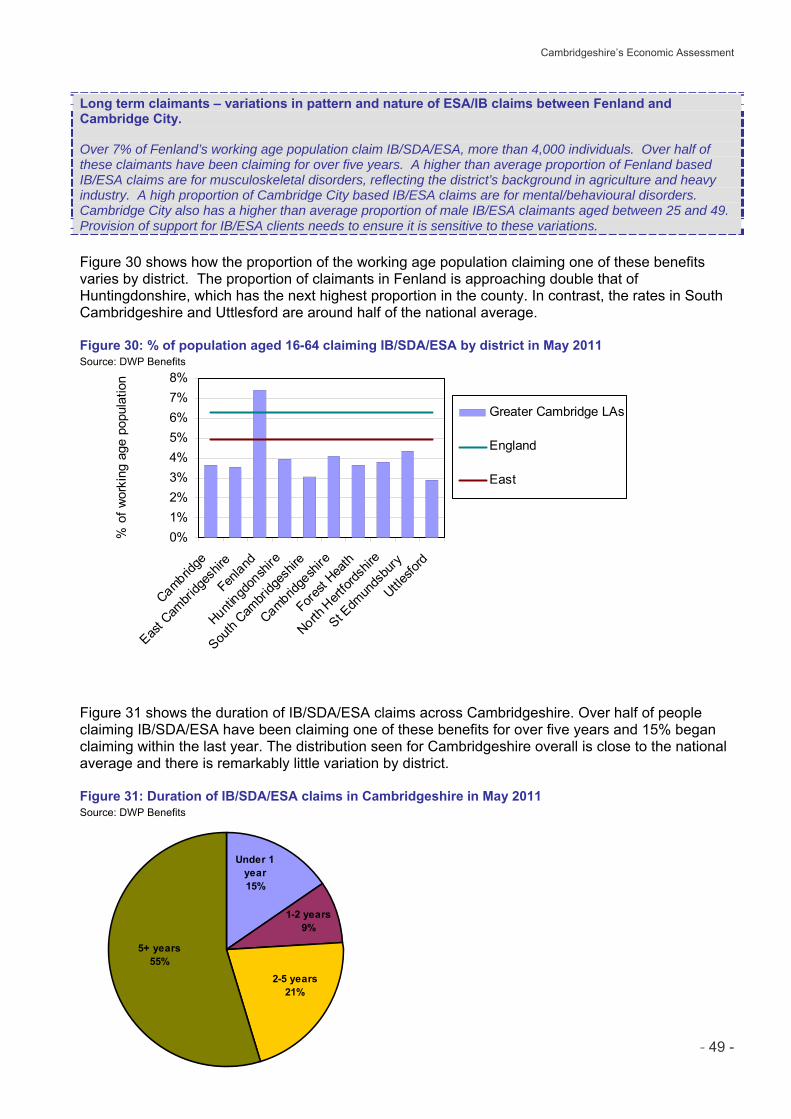
Cambridgeshire’s Economic Assessment
- 49 -
Under 1 year15%
1-2 years9%
2-5 years21%
5+ years55%
0%1%2%3%4%5%6%7%8%
Cambridge
East C
ambri
dges
hire
Fenland
Huntingd
onsh
ire
South
Cambri
dges
hire
Cambridge
shire
Forest
Heath
North H
ertfor
dshir
e
St Edm
unds
bury
Uttlesfo
rd
% o
f wor
king
age
pop
ulat
ion
Greater Cambridge LAs
England
East
Long term claimants – variations in pattern and nature of ESA/IB claims between Fenland and Cambridge City. Over 7% of Fenland’s working age population claim IB/SDA/ESA, more than 4,000 individuals. Over half of these claimants have been claiming for over five years. A higher than average proportion of Fenland based IB/ESA claims are for musculoskeletal disorders, reflecting the district’s background in agriculture and heavy industry. A high proportion of Cambridge City based IB/ESA claims are for mental/behavioural disorders. Cambridge City also has a higher than average proportion of male IB/ESA claimants aged between 25 and 49. Provision of support for IB/ESA clients needs to ensure it is sensitive to these variations.
Figure 30 shows how the proportion of the working age population claiming one of these benefits varies by district. The proportion of claimants in Fenland is approaching double that of Huntingdonshire, which has the next highest proportion in the county. In contrast, the rates in South Cambridgeshire and Uttlesford are around half of the national average. Figure 30: % of population aged 16-64 claiming IB/SDA/ESA by district in May 2011 Source: DWP Benefits Figure 31 shows the duration of IB/SDA/ESA claims across Cambridgeshire. Over half of people claiming IB/SDA/ESA have been claiming one of these benefits for over five years and 15% began claiming within the last year. The distribution seen for Cambridgeshire overall is close to the national average and there is remarkably little variation by district. Figure 31: Duration of IB/SDA/ESA claims in Cambridgeshire in May 2011 Source: DWP Benefits
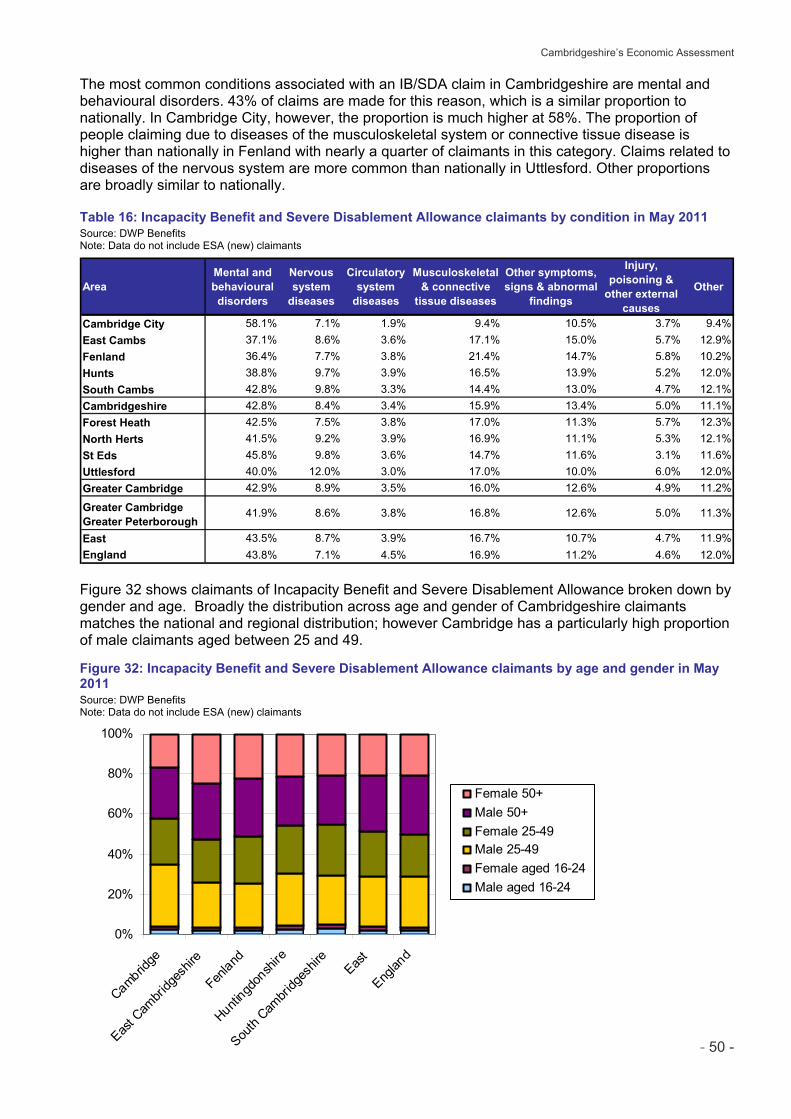
Cambridgeshire’s Economic Assessment
- 50 -
0%
20%
40%
60%
80%
100%
Cambridge
East C
ambri
dges
hire
Fenland
Huntingd
onsh
ire
South
Cambri
dges
hire
East
Englan
d
Female 50+Male 50+Female 25-49Male 25-49Female aged 16-24Male aged 16-24
The most common conditions associated with an IB/SDA claim in Cambridgeshire are mental and behavioural disorders. 43% of claims are made for this reason, which is a similar proportion to nationally. In Cambridge City, however, the proportion is much higher at 58%. The proportion of people claiming due to diseases of the musculoskeletal system or connective tissue disease is higher than nationally in Fenland with nearly a quarter of claimants in this category. Claims related to diseases of the nervous system are more common than nationally in Uttlesford. Other proportions are broadly similar to nationally.
Table 16: Incapacity Benefit and Severe Disablement Allowance claimants by condition in May 2011 Source: DWP Benefits Note: Data do not include ESA (new) claimants
AreaMental and behavioural disorders
Nervous system
diseases
Circulatory system
diseases
Musculoskeletal & connective
tissue diseases
Other symptoms, signs & abnormal
findings
Injury, poisoning &
other external causes
Other
Cambridge City 58.1% 7.1% 1.9% 9.4% 10.5% 3.7% 9.4%East Cambs 37.1% 8.6% 3.6% 17.1% 15.0% 5.7% 12.9%Fenland 36.4% 7.7% 3.8% 21.4% 14.7% 5.8% 10.2%Hunts 38.8% 9.7% 3.9% 16.5% 13.9% 5.2% 12.0%South Cambs 42.8% 9.8% 3.3% 14.4% 13.0% 4.7% 12.1%Cambridgeshire 42.8% 8.4% 3.4% 15.9% 13.4% 5.0% 11.1%Forest Heath 42.5% 7.5% 3.8% 17.0% 11.3% 5.7% 12.3%North Herts 41.5% 9.2% 3.9% 16.9% 11.1% 5.3% 12.1%St Eds 45.8% 9.8% 3.6% 14.7% 11.6% 3.1% 11.6%Uttlesford 40.0% 12.0% 3.0% 17.0% 10.0% 6.0% 12.0%Greater Cambridge 42.9% 8.9% 3.5% 16.0% 12.6% 4.9% 11.2%
Greater CambridgeGreater Peterborough
41.9% 8.6% 3.8% 16.8% 12.6% 5.0% 11.3%
East 43.5% 8.7% 3.9% 16.7% 10.7% 4.7% 11.9%England 43.8% 7.1% 4.5% 16.9% 11.2% 4.6% 12.0% Figure 32 shows claimants of Incapacity Benefit and Severe Disablement Allowance broken down by gender and age. Broadly the distribution across age and gender of Cambridgeshire claimants matches the national and regional distribution; however Cambridge has a particularly high proportion of male claimants aged between 25 and 49. Figure 32: Incapacity Benefit and Severe Disablement Allowance claimants by age and gender in May 2011 Source: DWP Benefits Note: Data do not include ESA (new) claimants
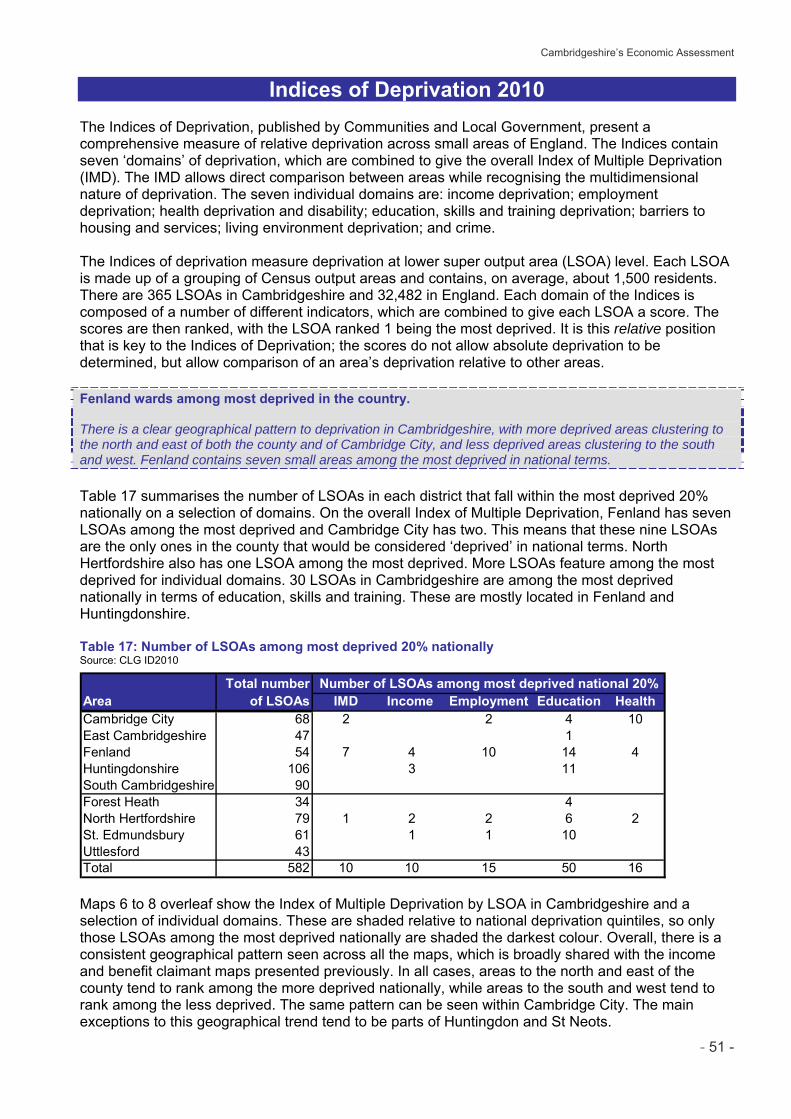
Cambridgeshire’s Economic Assessment
- 51 -
Indices of Deprivation 2010 The Indices of Deprivation, published by Communities and Local Government, present a comprehensive measure of relative deprivation across small areas of England. The Indices contain seven ‘domains’ of deprivation, which are combined to give the overall Index of Multiple Deprivation (IMD). The IMD allows direct comparison between areas while recognising the multidimensional nature of deprivation. The seven individual domains are: income deprivation; employment deprivation; health deprivation and disability; education, skills and training deprivation; barriers to housing and services; living environment deprivation; and crime. The Indices of deprivation measure deprivation at lower super output area (LSOA) level. Each LSOA is made up of a grouping of Census output areas and contains, on average, about 1,500 residents. There are 365 LSOAs in Cambridgeshire and 32,482 in England. Each domain of the Indices is composed of a number of different indicators, which are combined to give each LSOA a score. The scores are then ranked, with the LSOA ranked 1 being the most deprived. It is this relative position that is key to the Indices of Deprivation; the scores do not allow absolute deprivation to be determined, but allow comparison of an area’s deprivation relative to other areas. Fenland wards among most deprived in the country. There is a clear geographical pattern to deprivation in Cambridgeshire, with more deprived areas clustering to the north and east of both the county and of Cambridge City, and less deprived areas clustering to the south and west. Fenland contains seven small areas among the most deprived in national terms.
Table 17 summarises the number of LSOAs in each district that fall within the most deprived 20% nationally on a selection of domains. On the overall Index of Multiple Deprivation, Fenland has seven LSOAs among the most deprived and Cambridge City has two. This means that these nine LSOAs are the only ones in the county that would be considered ‘deprived’ in national terms. North Hertfordshire also has one LSOA among the most deprived. More LSOAs feature among the most deprived for individual domains. 30 LSOAs in Cambridgeshire are among the most deprived nationally in terms of education, skills and training. These are mostly located in Fenland and Huntingdonshire. Table 17: Number of LSOAs among most deprived 20% nationally Source: CLG ID2010
Total number Number of LSOAs among most deprived national 20%Area of LSOAs IMD Income Employment Education HealthCambridge City 68 2 2 4 10East Cambridgeshire 47 1Fenland 54 7 4 10 14 4Huntingdonshire 106 3 11South Cambridgeshire 90Forest Heath 34 4North Hertfordshire 79 1 2 2 6 2St. Edmundsbury 61 1 1 10Uttlesford 43Total 582 10 10 15 50 16 Maps 6 to 8 overleaf show the Index of Multiple Deprivation by LSOA in Cambridgeshire and a selection of individual domains. These are shaded relative to national deprivation quintiles, so only those LSOAs among the most deprived nationally are shaded the darkest colour. Overall, there is a consistent geographical pattern seen across all the maps, which is broadly shared with the income and benefit claimant maps presented previously. In all cases, areas to the north and east of the county tend to rank among the more deprived nationally, while areas to the south and west tend to rank among the less deprived. The same pattern can be seen within Cambridge City. The main exceptions to this geographical trend tend to be parts of Huntingdon and St Neots.
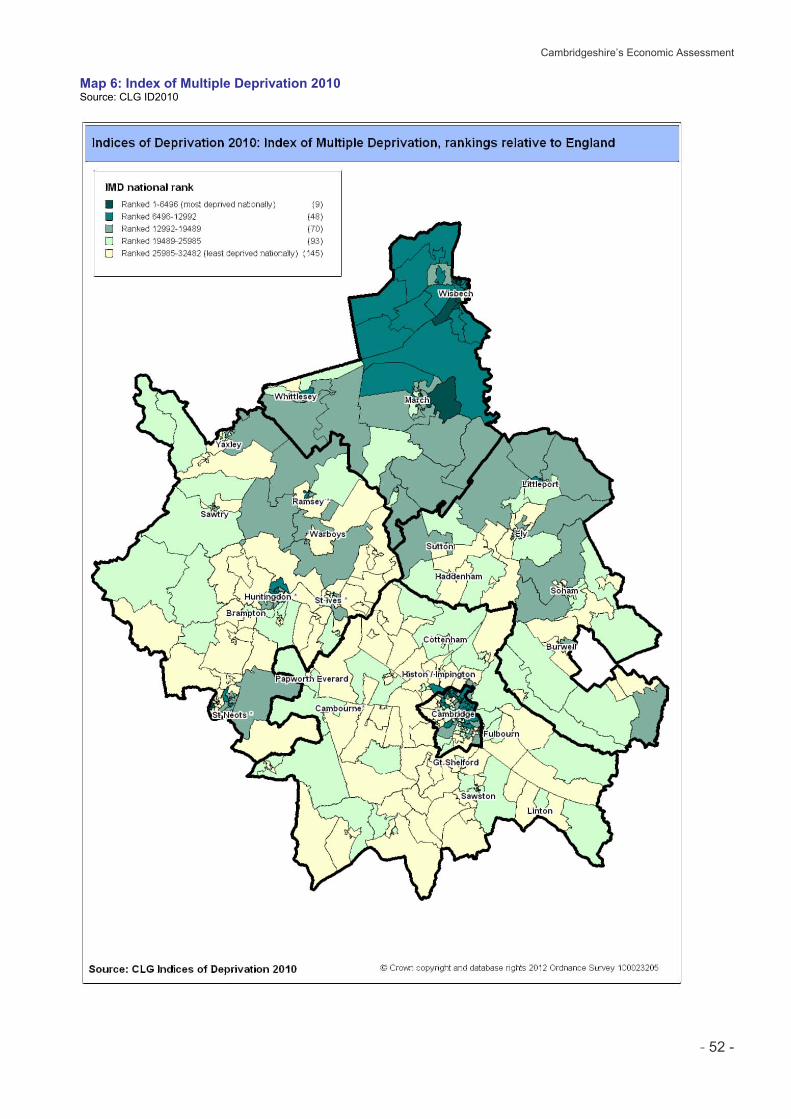
Cambridgeshire’s Economic Assessment
- 52 -
Map 6: Index of Multiple Deprivation 2010 Source: CLG ID2010
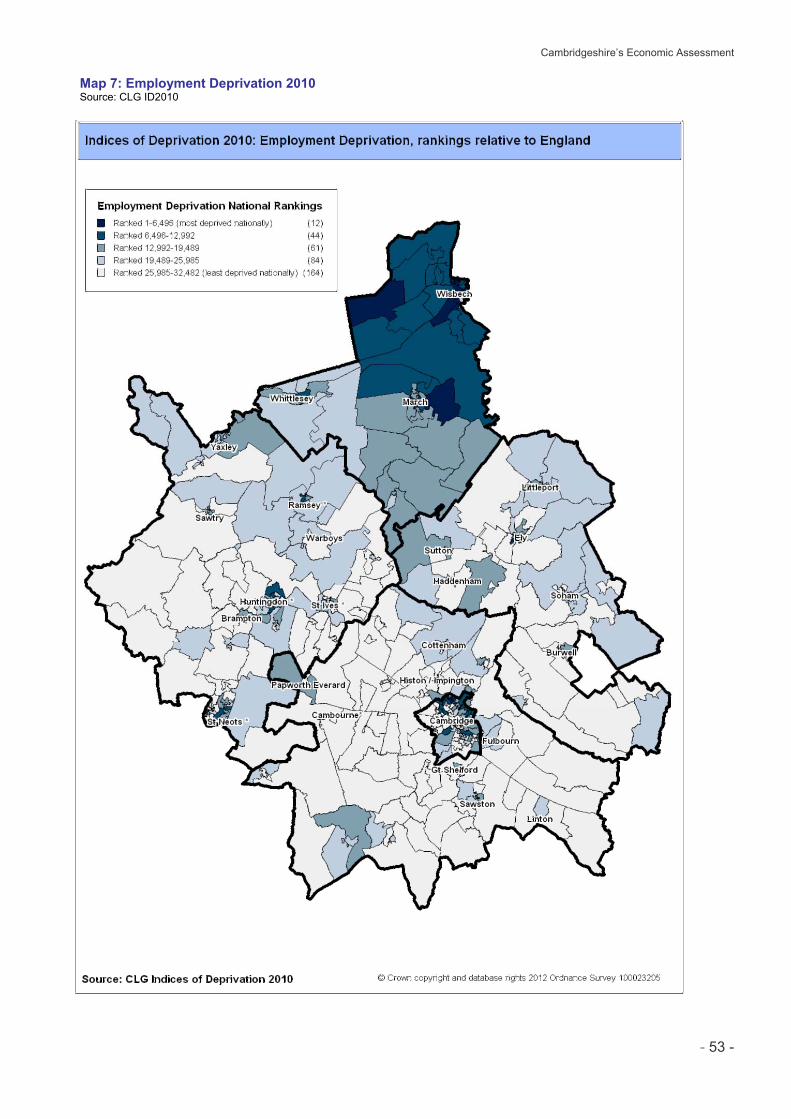
Cambridgeshire’s Economic Assessment
- 53 -
Map 7: Employment Deprivation 2010 Source: CLG ID2010
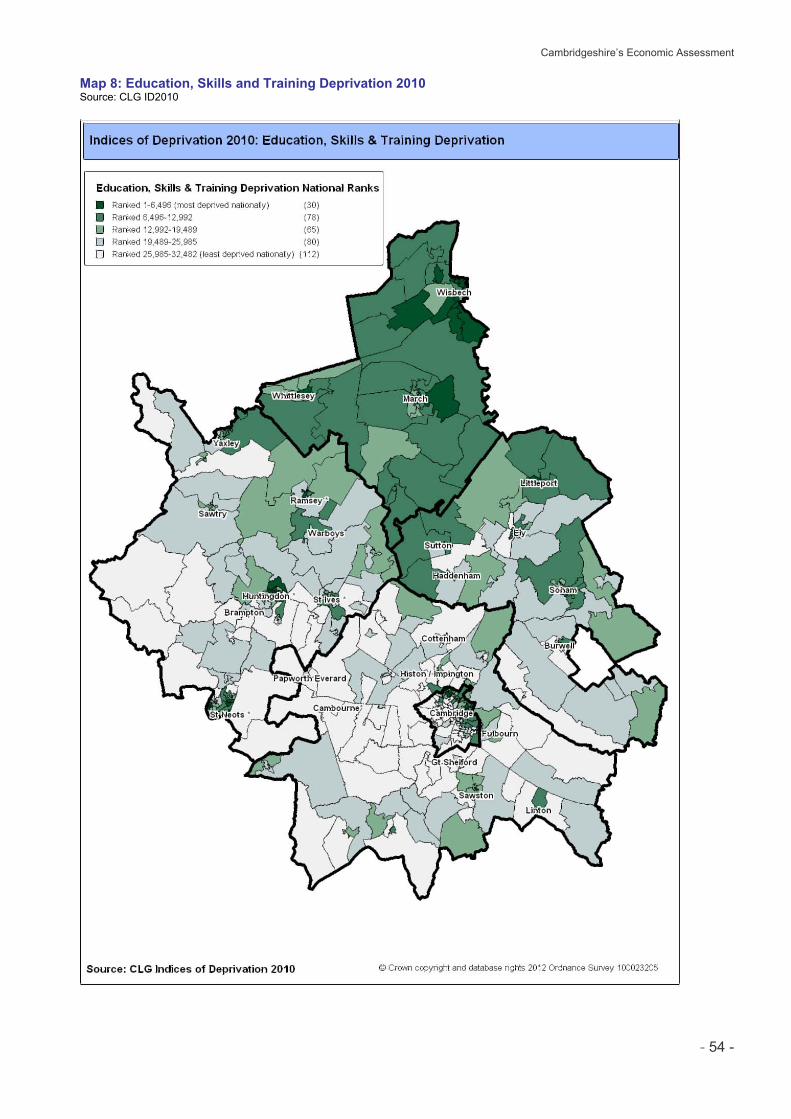
Cambridgeshire’s Economic Assessment
- 54 -
Map 8: Education, Skills and Training Deprivation 2010 Source: CLG ID2010
Cambridgeshire’s Economic Assessment
- 1 -
PLACE PLACE ............................................................................................................................ 1 List of figures, maps and tables .................................................................................. 2 Place SWOT ................................................................................................................... 3 The Functional Economic Area ................................................................................... 4 Housing .......................................................................................................................... 6 Housing Stock and Tenure ............................................................................................. 6 Housing Development .................................................................................................... 7 Housing Stock Condition .............................................................................................. 10 House Prices and Sales ............................................................................................... 11 Affordability ................................................................................................................... 12 Business and Retail .................................................................................................... 14 Business Development ................................................................................................. 14 Retail and Town Centre Development .......................................................................... 16 Employment Land ......................................................................................................... 18 Cambridgeshire’s Commercial and Industrial Properties .............................................. 20 Infrastructure ............................................................................................................... 24 Broadband .................................................................................................................... 24 Transport ...................................................................................................................... 25 Energy, Environment and Climate Change .............................................................. 28 Fuel Poverty ................................................................................................................. 28 Renewable Energy ....................................................................................................... 28 CO2 Emissions ............................................................................................................. 30 Climate Change Adaptation .......................................................................................... 31 Quality of Life .............................................................................................................. 32 Satisfaction with the Local Area ................................................................................... 32 Crime in Cambridgeshire .............................................................................................. 34

Cambridgeshire’s Economic Assessment
- 2 -
List of figures, maps and tables Figure 1: Illustrative diagram showing approximate commuting numbers into Cambridge and Peterborough .. 5 Figure 2: Dwelling completions (net) by district ................................................................................................. 7 Figure 3: Affordable dwelling completions (gross) in Cambridgeshire ............................................................... 8 Figure 4: Dwelling completions by district and number of bedrooms, 2001-2011 ............................................. 9 Figure 5: Average house price and number of sales, 2001-2010 .................................................................... 11 Figure 6: Net business completions, 1999-2011 ............................................................................................. 14 Figure 7: Commercial and industrial properties in Greater Cambridge by property type and district in 2008 .. 20 Figure 8: Commercial and industrial floorspace in Greater Cambridge by property type and district in 2008 . 21 Figure 9: Commercial and industrial rateable value in Greater Cambridge by property type and district in 2008 ........................................................................................................................................................................ 22 Figure 10: Commercial and industrial rateable value per m2 in Greater Cambridge by property type and district in 2008 ................................................................................................................................................. 23 Figure 11: Total (and forecast) carbon emissions per head by Cambridgeshire district .................................. 30 Figure 12: Total carbon emissions per head by Greater Cambridge district ................................................... 30 Figure 13: Percentage who are satisfied with their local area as a place to live .............................................. 32 Figure 14: Percentage satisfied with the way the council runs things ............................................................. 33 Figure 15: Percentage who have given unpaid help at least once per month over the last 12 months ........... 33 Figure 16: Cambridgeshire compared to the East of England, rate for all crime ............................................. 34 Figure 17: Cambridgeshire wards: Relative deprivation and crime rates ........................................................ 36 Map 1: Lower quartile house price to lower quartile income ratio by ward 12 Map 2: Town Centres in Cambridgeshire 17 Map 3: Next Generation Broadband Access rollout at 65% of market potential 24 Map 4: Total crime rate per 1,000 population for Cambridgeshire wards (Sep 2010 – Aug 2011) 35 Table 1: Proportion of residents/workers commuting in/out of the district to work ............................................. 5 Table 2: Tenure by district ................................................................................................................................. 6 Table 3: Stock profile by district ........................................................................................................................ 6 Table 4: Average house price, 2010 and 2011 ................................................................................................ 11 Table 5: Top ten “most affordable” wards ....................................................................................................... 13 Table 6: Top ten “least affordable” wards ........................................................................................................ 13 Table 7: Net business completions in Cambridgeshire by use class and district in 2010-2011 ....................... 15 Table 8: Commercial and industrial properties in Greater Cambridge by property type and district in 2008 ... 20 Table 9: Commercial and industrial floorspace in Greater Cambridge by property type and district in 2008 .. 21 Table 10: Commercial and industrial rateable value in Greater Cambridge by property type and district in 2008 ................................................................................................................................................................ 22 Table 11: Commercial and industrial rateable value per m2 in Greater Cambridge by property type and district in 2008 ............................................................................................................................................................ 23 Table 12: All vehicle rural traffic growth by route ............................................................................................. 26 Table 13: Urban centre average & maximum motor vehicle flow per outer cordon road 2010 ........................ 26 Table 14: Households in fuel poverty, Cambridge sub-region 2009 estimates................................................ 28 Table 15: Rate of total crime per 1000 population for 12 months September to August ................................. 34 Table 16: Selected crime by district recorded between September 2010 & August 2011 ............................... 37
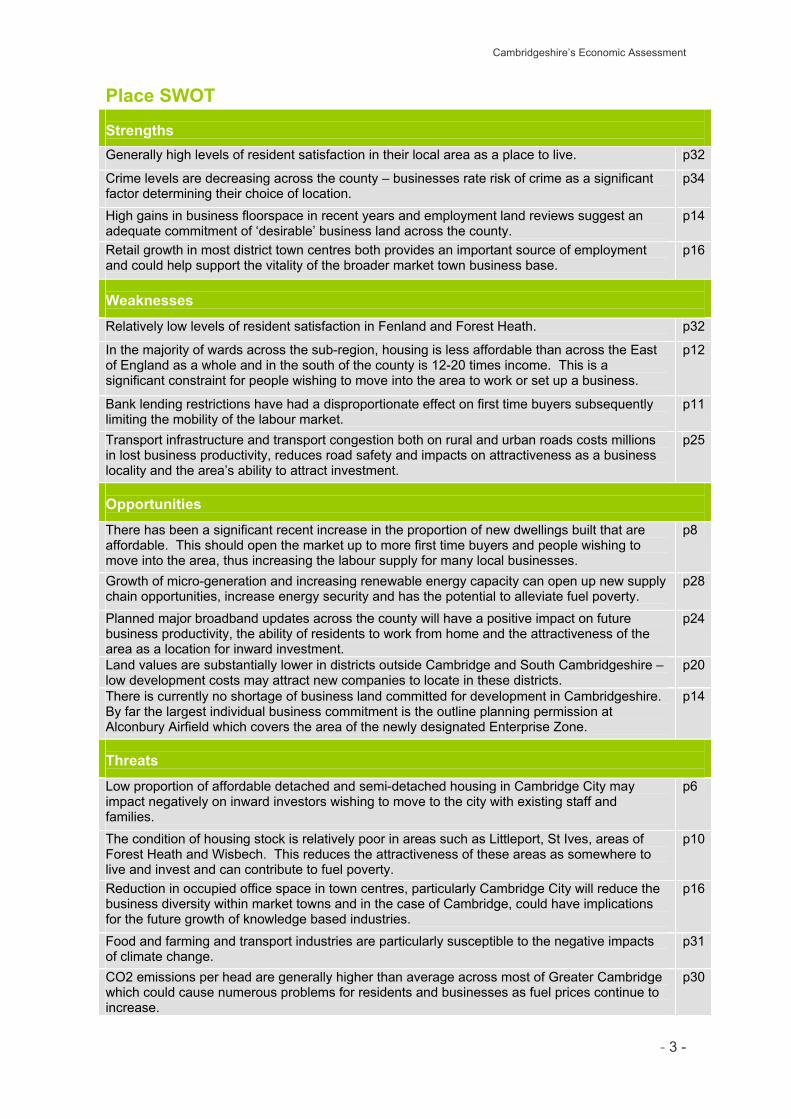
Cambridgeshire’s Economic Assessment
- 3 -
Place SWOT Strengths
Generally high levels of resident satisfaction in their local area as a place to live.
p32
Crime levels are decreasing across the county – businesses rate risk of crime as a significant factor determining their choice of location.
p34
High gains in business floorspace in recent years and employment land reviews suggest an adequate commitment of ‘desirable’ business land across the county.
p14
Retail growth in most district town centres both provides an important source of employment and could help support the vitality of the broader market town business base.
p16
Weaknesses
Relatively low levels of resident satisfaction in Fenland and Forest Heath.
p32
In the majority of wards across the sub-region, housing is less affordable than across the East of England as a whole and in the south of the county is 12-20 times income. This is a significant constraint for people wishing to move into the area to work or set up a business.
p12
Bank lending restrictions have had a disproportionate effect on first time buyers subsequently limiting the mobility of the labour market.
p11
Transport infrastructure and transport congestion both on rural and urban roads costs millions in lost business productivity, reduces road safety and impacts on attractiveness as a business locality and the area’s ability to attract investment.
p25
Opportunities
There has been a significant recent increase in the proportion of new dwellings built that are affordable. This should open the market up to more first time buyers and people wishing to move into the area, thus increasing the labour supply for many local businesses.
p8
Growth of micro-generation and increasing renewable energy capacity can open up new supply chain opportunities, increase energy security and has the potential to alleviate fuel poverty.
p28
Planned major broadband updates across the county will have a positive impact on future business productivity, the ability of residents to work from home and the attractiveness of the area as a location for inward investment.
p24
Land values are substantially lower in districts outside Cambridge and South Cambridgeshire – low development costs may attract new companies to locate in these districts.
p20
There is currently no shortage of business land committed for development in Cambridgeshire. By far the largest individual business commitment is the outline planning permission at Alconbury Airfield which covers the area of the newly designated Enterprise Zone.
p14
Threats
Low proportion of affordable detached and semi-detached housing in Cambridge City may impact negatively on inward investors wishing to move to the city with existing staff and families.
p6
The condition of housing stock is relatively poor in areas such as Littleport, St Ives, areas of Forest Heath and Wisbech. This reduces the attractiveness of these areas as somewhere to live and invest and can contribute to fuel poverty.
p10
Reduction in occupied office space in town centres, particularly Cambridge City will reduce the business diversity within market towns and in the case of Cambridge, could have implications for the future growth of knowledge based industries.
p16
Food and farming and transport industries are particularly susceptible to the negative impacts of climate change.
p31
CO2 emissions per head are generally higher than average across most of Greater Cambridge which could cause numerous problems for residents and businesses as fuel prices continue to increase.
p30
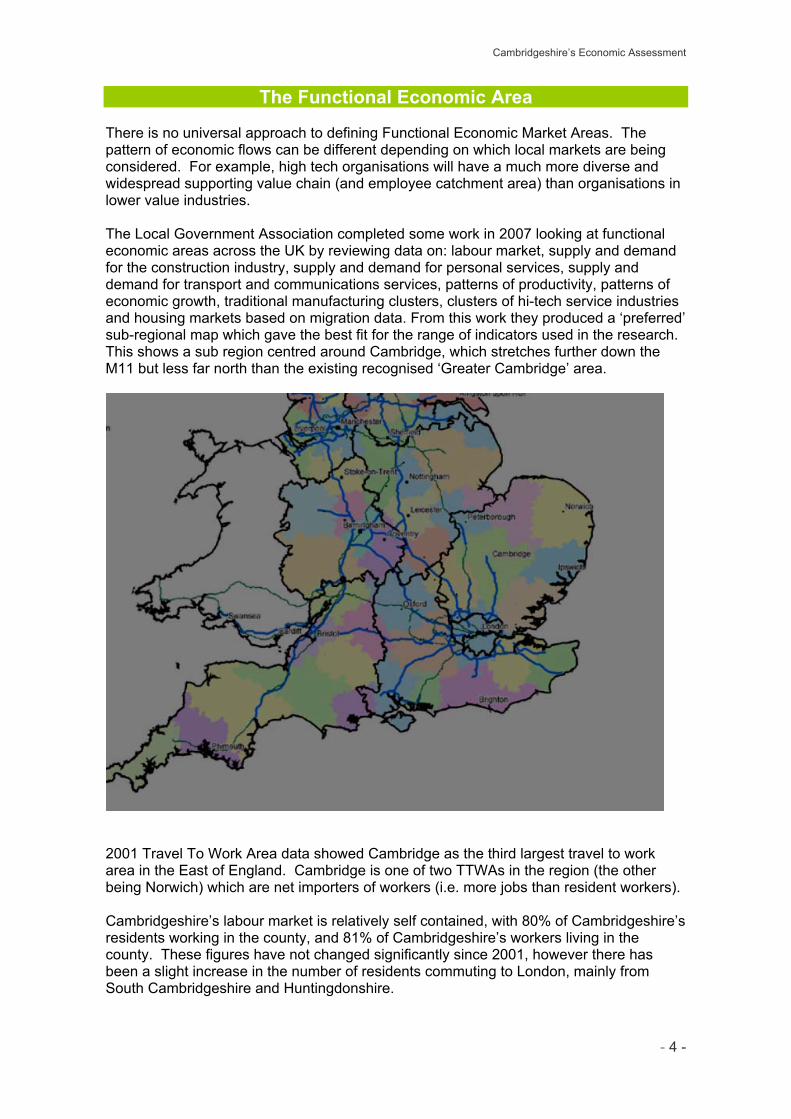
Cambridgeshire’s Economic Assessment
- 4 -
The Functional Economic Area There is no universal approach to defining Functional Economic Market Areas. The pattern of economic flows can be different depending on which local markets are being considered. For example, high tech organisations will have a much more diverse and widespread supporting value chain (and employee catchment area) than organisations in lower value industries. The Local Government Association completed some work in 2007 looking at functional economic areas across the UK by reviewing data on: labour market, supply and demand for the construction industry, supply and demand for personal services, supply and demand for transport and communications services, patterns of productivity, patterns of economic growth, traditional manufacturing clusters, clusters of hi-tech service industries and housing markets based on migration data. From this work they produced a ‘preferred’ sub-regional map which gave the best fit for the range of indicators used in the research. This shows a sub region centred around Cambridge, which stretches further down the M11 but less far north than the existing recognised ‘Greater Cambridge’ area.
2001 Travel To Work Area data showed Cambridge as the third largest travel to work area in the East of England. Cambridge is one of two TTWAs in the region (the other being Norwich) which are net importers of workers (i.e. more jobs than resident workers). Cambridgeshire’s labour market is relatively self contained, with 80% of Cambridgeshire’s residents working in the county, and 81% of Cambridgeshire’s workers living in the county. These figures have not changed significantly since 2001, however there has been a slight increase in the number of residents commuting to London, mainly from South Cambridgeshire and Huntingdonshire.
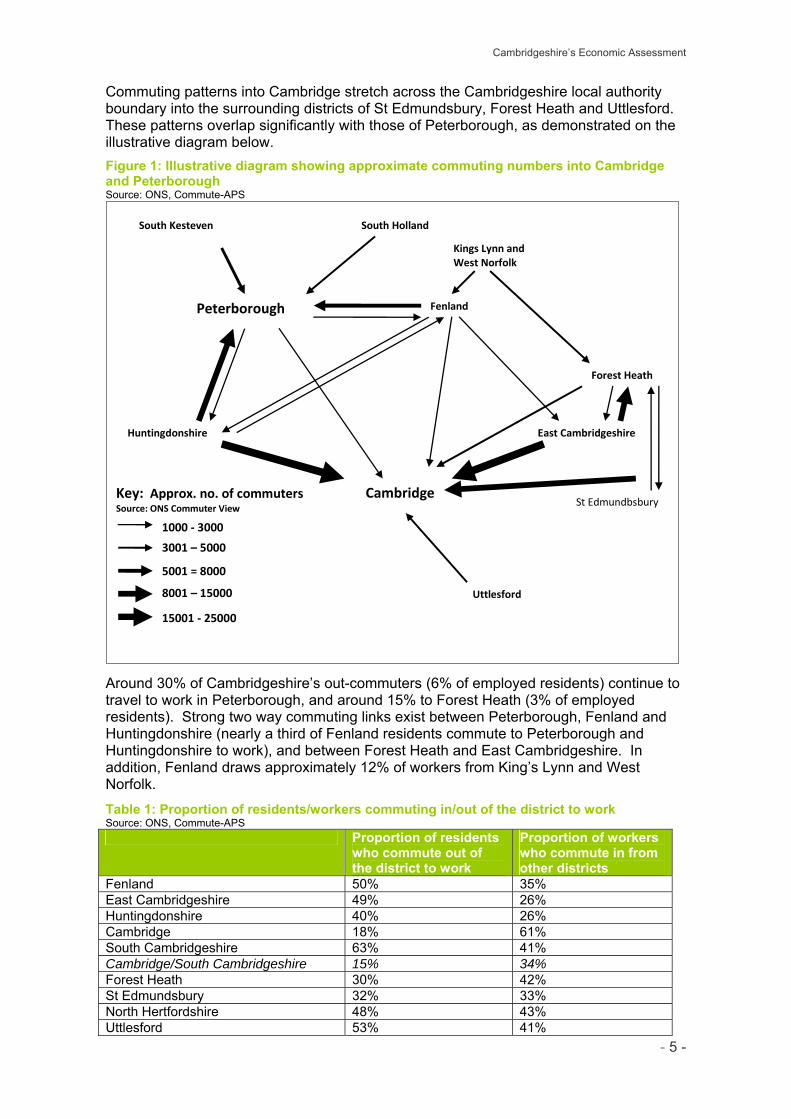
Cambridgeshire’s Economic Assessment
- 5 -
Commuting patterns into Cambridge stretch across the Cambridgeshire local authority boundary into the surrounding districts of St Edmundsbury, Forest Heath and Uttlesford. These patterns overlap significantly with those of Peterborough, as demonstrated on the illustrative diagram below.
Figure 1: Illustrative diagram showing approximate commuting numbers into Cambridge and Peterborough Source: ONS, Commute-APS
Huntingdonshire
Forest Heath
Key: Approx. no. of commuters Source: ONS Commuter View
1000 ‐ 3000
3001 – 5000
5001 = 8000
8001 – 15000
15001 ‐ 25000
St Edmundbsbury
South Kesteven
Peterborough
Cambridge
Fenland
East Cambridgeshire
South Holland
Uttlesford
Kings Lynn and West Norfolk
Around 30% of Cambridgeshire’s out-commuters (6% of employed residents) continue to travel to work in Peterborough, and around 15% to Forest Heath (3% of employed residents). Strong two way commuting links exist between Peterborough, Fenland and Huntingdonshire (nearly a third of Fenland residents commute to Peterborough and Huntingdonshire to work), and between Forest Heath and East Cambridgeshire. In addition, Fenland draws approximately 12% of workers from King’s Lynn and West Norfolk.
Table 1: Proportion of residents/workers commuting in/out of the district to work Source: ONS, Commute-APS Proportion of residents
who commute out of the district to work
Proportion of workers who commute in from other districts
Fenland 50% 35% East Cambridgeshire 49% 26% Huntingdonshire 40% 26% Cambridge 18% 61% South Cambridgeshire 63% 41% Cambridge/South Cambridgeshire 15% 34% Forest Heath 30% 42% St Edmundsbury 32% 33% North Hertfordshire 48% 43% Uttlesford 53% 41%
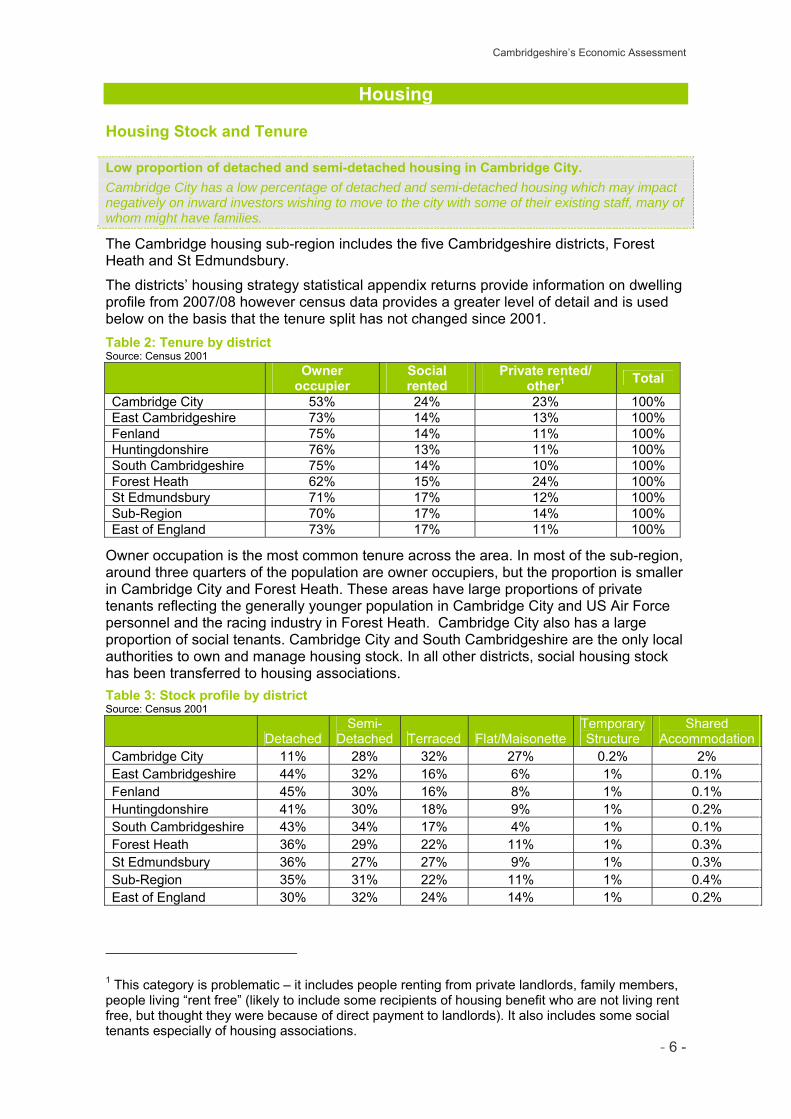
Cambridgeshire’s Economic Assessment
- 6 -
Housing
Housing Stock and Tenure
Low proportion of detached and semi-detached housing in Cambridge City.
Cambridge City has a low percentage of detached and semi-detached housing which may impact negatively on inward investors wishing to move to the city with some of their existing staff, many of whom might have families.
The Cambridge housing sub-region includes the five Cambridgeshire districts, Forest Heath and St Edmundsbury.
The districts’ housing strategy statistical appendix returns provide information on dwelling profile from 2007/08 however census data provides a greater level of detail and is used below on the basis that the tenure split has not changed since 2001.
Table 2: Tenure by district Source: Census 2001
Owner
occupier Social rented
Private rented/ other1 Total
Cambridge City 53% 24% 23% 100% East Cambridgeshire 73% 14% 13% 100% Fenland 75% 14% 11% 100% Huntingdonshire 76% 13% 11% 100% South Cambridgeshire 75% 14% 10% 100% Forest Heath 62% 15% 24% 100% St Edmundsbury 71% 17% 12% 100% Sub-Region 70% 17% 14% 100% East of England 73% 17% 11% 100%
Owner occupation is the most common tenure across the area. In most of the sub-region, around three quarters of the population are owner occupiers, but the proportion is smaller in Cambridge City and Forest Heath. These areas have large proportions of private tenants reflecting the generally younger population in Cambridge City and US Air Force personnel and the racing industry in Forest Heath. Cambridge City also has a large proportion of social tenants. Cambridge City and South Cambridgeshire are the only local authorities to own and manage housing stock. In all other districts, social housing stock has been transferred to housing associations.
Table 3: Stock profile by district Source: Census 2001
Detached Semi-
Detached Terraced Flat/Maisonette Temporary Structure
Shared Accommodation
Cambridge City 11% 28% 32% 27% 0.2% 2% East Cambridgeshire 44% 32% 16% 6% 1% 0.1% Fenland 45% 30% 16% 8% 1% 0.1% Huntingdonshire 41% 30% 18% 9% 1% 0.2% South Cambridgeshire 43% 34% 17% 4% 1% 0.1% Forest Heath 36% 29% 22% 11% 1% 0.3% St Edmundsbury 36% 27% 27% 9% 1% 0.3% Sub-Region 35% 31% 22% 11% 1% 0.4% East of England 30% 32% 24% 14% 1% 0.2%
1 This category is problematic – it includes people renting from private landlords, family members, people living “rent free” (likely to include some recipients of housing benefit who are not living rent free, but thought they were because of direct payment to landlords). It also includes some social tenants especially of housing associations.
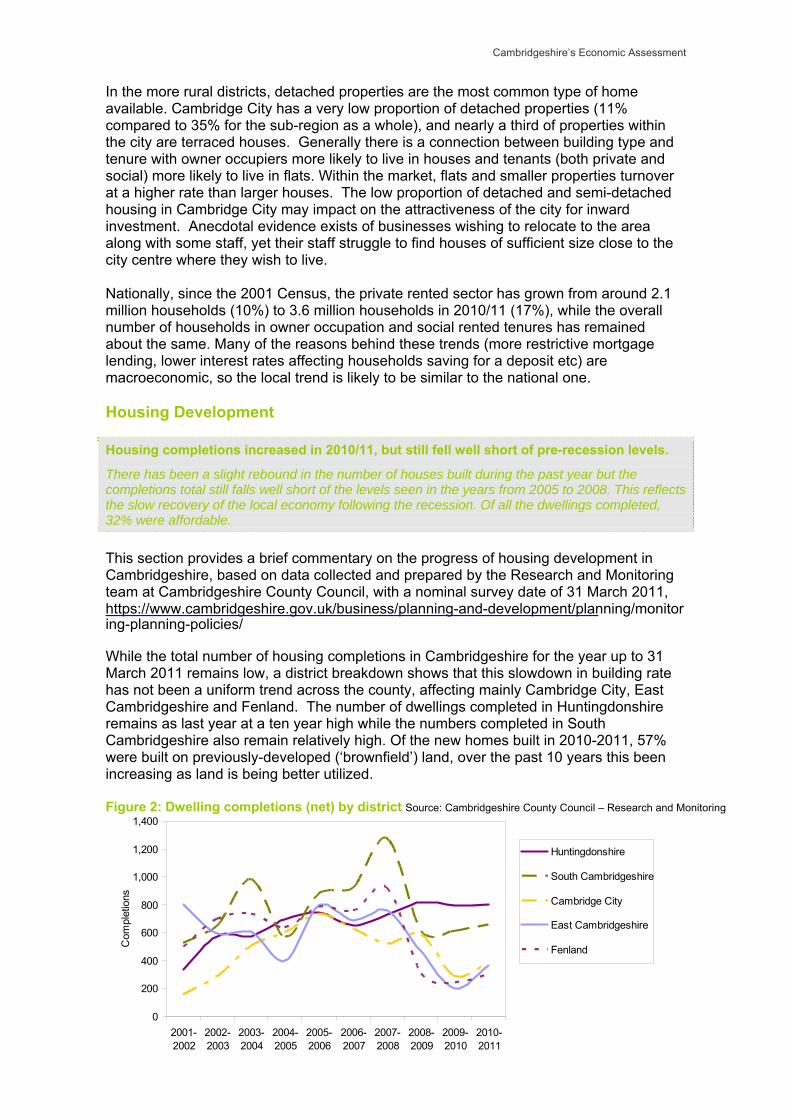
Cambridgeshire’s Economic Assessment
- 7 -
0
200
400
600
800
1,000
1,200
1,400
2001-2002
2002-2003
2003-2004
2004-2005
2005-2006
2006-2007
2007-2008
2008-2009
2009-2010
2010-2011
Com
plet
ions
Huntingdonshire
South Cambridgeshire
Cambridge City
East Cambridgeshire
Fenland
In the more rural districts, detached properties are the most common type of home available. Cambridge City has a very low proportion of detached properties (11% compared to 35% for the sub-region as a whole), and nearly a third of properties within the city are terraced houses. Generally there is a connection between building type and tenure with owner occupiers more likely to live in houses and tenants (both private and social) more likely to live in flats. Within the market, flats and smaller properties turnover at a higher rate than larger houses. The low proportion of detached and semi-detached housing in Cambridge City may impact on the attractiveness of the city for inward investment. Anecdotal evidence exists of businesses wishing to relocate to the area along with some staff, yet their staff struggle to find houses of sufficient size close to the city centre where they wish to live. Nationally, since the 2001 Census, the private rented sector has grown from around 2.1 million households (10%) to 3.6 million households in 2010/11 (17%), while the overall number of households in owner occupation and social rented tenures has remained about the same. Many of the reasons behind these trends (more restrictive mortgage lending, lower interest rates affecting households saving for a deposit etc) are macroeconomic, so the local trend is likely to be similar to the national one. Housing Development
Housing completions increased in 2010/11, but still fell well short of pre-recession levels.
There has been a slight rebound in the number of houses built during the past year but the completions total still falls well short of the levels seen in the years from 2005 to 2008. This reflects the slow recovery of the local economy following the recession. Of all the dwellings completed, 32% were affordable.
This section provides a brief commentary on the progress of housing development in Cambridgeshire, based on data collected and prepared by the Research and Monitoring team at Cambridgeshire County Council, with a nominal survey date of 31 March 2011, https://www.cambridgeshire.gov.uk/business/planning-and-development/planning/monitoring-planning-policies/ While the total number of housing completions in Cambridgeshire for the year up to 31 March 2011 remains low, a district breakdown shows that this slowdown in building rate has not been a uniform trend across the county, affecting mainly Cambridge City, East Cambridgeshire and Fenland. The number of dwellings completed in Huntingdonshire remains as last year at a ten year high while the numbers completed in South Cambridgeshire also remain relatively high. Of the new homes built in 2010-2011, 57% were built on previously-developed (‘brownfield’) land, over the past 10 years this been increasing as land is being better utilized. Figure 2: Dwelling completions (net) by district Source: Cambridgeshire County Council – Research and Monitoring
Cambridgeshire’s Economic Assessment
- 8 -
The number of dwelling starts, while remaining comparatively low, has increased compared to the two previous years. This increase is significant as it leads to the possibility that we will see a comparative increase in dwelling completions for the current year. There are also some major developments on the southern fringe of Cambridge that are due to start construction in the coming months.
Affordable Dwellings A lot of progress has been made in increasing the supply of affordable housing in all districts in Cambridgeshire. In 2010-2011 the percentage of affordable completions was over 30%. The higher numbers perhaps demonstrate that planning policy requirements by Cambridgeshire County Council and the districts for affordable housing are being adhered to by developers. Following the financial crisis late in 2008 it became evident on several larger construction sites that there was increased focus on completing the affordable dwellings as opposed to the market housing which became increasingly difficult to sell. Figure 3: Affordable dwelling completions (gross) in Cambridgeshire Source: Cambridgeshire County Council – Research and Monitoring
0
200
400
600
800
1,000
1,200
2001-2002
2002-2003
2003-2004
2004-2005
2005-2006
2006-2007
2007-2008
2008-2009
2009-2010
2010-2011
Affo
rdab
le C
ompl
etio
ns
0%
5%
10%
15%
20%
25%
30%
35%
40%
45%
% A
fford
able
Affordable% Affordable
Since 2001 there has been a substantial increase in the average density of new housing. The dwelling density in Cambridge City has risen to an average of between 80 and 100 dwellings per hectare (dph). In the rural districts, densities are much lower, but have risen from averages of around 25 dph in 2001 to a figure closer to 35 dph.
Cambridgeshire’s Economic Assessment
- 9 -
New Dwellings by Type and Size Figure 4: Dwelling completions by district and number of bedrooms, 2001-2011 Source: Cambridgeshire County Council – Research and Monitoring
0%
10%
20%
30%
40%
50%
60%
70%
80%
90%
100%
Cambridge City EastCambridgeshire
Fenland Huntingdonshire SouthCambridgeshire
U/K Beds4+ Bed3 Bed2 Bed1 Bed
Figure 4 gives an indication of the distribution of new dwellings by type and size. The proportion of one and two bedroom dwellings that have been completed in Cambridge City is much higher than in the other four more rural districts where there are much higher proportions of three and four-plus bedroom dwellings. This is likely to be due to a number of factors, such as the size and value of sites, as well as the demand for higher number of flats and smaller residences within the urban area. Over the whole county, the proportion of one and two bedroom dwelling completions steadily increased from approximately 25% in 2001-2002, to over 55% in recent years mainly at the expense of the larger four or more bedroom houses, although in the past year this proportion has fallen again to just below 50%.
Cambridgeshire’s Economic Assessment
- 10 -
Housing Stock Condition
Condition of housing stock relatively good but with some poorer pockets and risks of fuel poverty in some rural areas.
Generally housing stock condition is equal to or better than the national average, although with some issues around energy efficiency and fuel poverty in rural areas. Within districts there exist pockets of poorer condition housing; such as in Littleport, St Ives, Iceni and Manor wards in Forest Heath and Wisbech.
Housing stock condition was examined as part of the Strategic Housing Market Assessment. The key elements considered included fabric cost of repair, level of unfitness, facilities and services, energy efficiency, houses in multiple occupation, health and safety and environmental assessment. The general condition of housing stock can have a significant impact on the perceived attractiveness of an area to locate to, the general level of satisfaction of residents within an area and carbon emissions. The following conclusions were made regarding housing stock condition: Cambridge City: Generally similar dwelling conditions and better energy performance to that found nationally – possibly due in part to the universal access of areas to mains gas. East Cambridgeshire: The highest rate of ‘unfitness’ was found to be in the Littleport and north area – the poorest condition housing appeared to be in isolated pockets rather than across a broad area. Many occupiers of dwellings requiring extensive repair and renewal were found to have low household incomes. Huntingdonshire: Stock was of poorer condition in St Ives and the north sub-area however generally housing condition was above the national average, particularly across rural areas. South Cambridgeshire: The vast majority of stock was found to be in good condition. Energy efficiency was the most common problem identified by the stock condition survey. Forest Heath: Particular problems were found in Iceni and Manor wards, particularly with respect to energy efficiency. Fenland: In many respects, the condition of dwellings in Fenland follows the national profile however the district as a whole had levels of ‘unfitness’ slightly above the national rate – mainly due to disrepair. The Wisbech sub-area had an unfitness level above the district average and the lowest levels of energy efficiency. Not all rural parishes had a mains gas supply. St Edmundsbury: Homes in rural parishes were found to consume far more energy than the urban centres; the report identified fuel poverty as a specific issue for the district. For more information on housing stock, condition and tenure type, see chapters 11 and 12 of the Strategic Housing Market Assessment (SHMA). 2
2 https://www.cambridge.gov.uk/public/ldf/coredocs/RD-STRAT-090.pdf
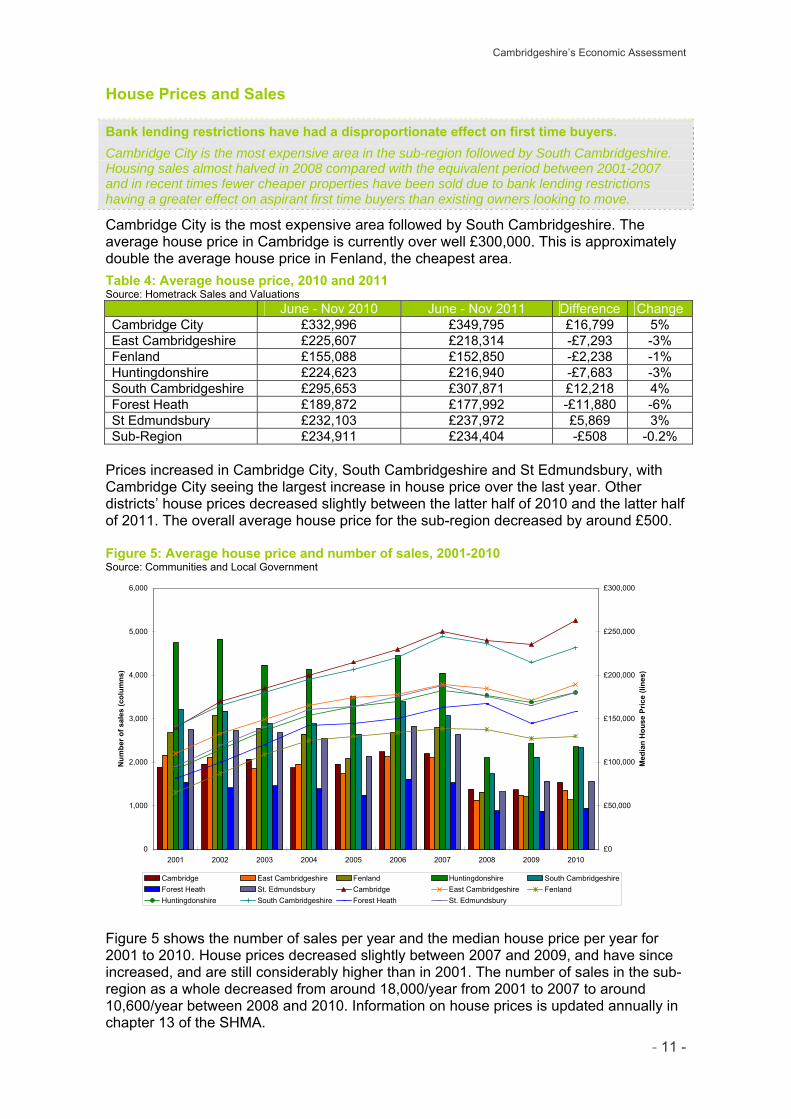
Cambridgeshire’s Economic Assessment
- 11 -
House Prices and Sales
Bank lending restrictions have had a disproportionate effect on first time buyers.
Cambridge City is the most expensive area in the sub-region followed by South Cambridgeshire. Housing sales almost halved in 2008 compared with the equivalent period between 2001-2007 and in recent times fewer cheaper properties have been sold due to bank lending restrictions having a greater effect on aspirant first time buyers than existing owners looking to move.
Cambridge City is the most expensive area followed by South Cambridgeshire. The average house price in Cambridge is currently over well £300,000. This is approximately double the average house price in Fenland, the cheapest area.
Table 4: Average house price, 2010 and 2011 Source: Hometrack Sales and Valuations June - Nov 2010 June - Nov 2011 Difference Change Cambridge City £332,996 £349,795 £16,799 5% East Cambridgeshire £225,607 £218,314 -£7,293 -3% Fenland £155,088 £152,850 -£2,238 -1% Huntingdonshire £224,623 £216,940 -£7,683 -3% South Cambridgeshire £295,653 £307,871 £12,218 4% Forest Heath £189,872 £177,992 -£11,880 -6% St Edmundsbury £232,103 £237,972 £5,869 3% Sub-Region £234,911 £234,404 -£508 -0.2%
Prices increased in Cambridge City, South Cambridgeshire and St Edmundsbury, with Cambridge City seeing the largest increase in house price over the last year. Other districts’ house prices decreased slightly between the latter half of 2010 and the latter half of 2011. The overall average house price for the sub-region decreased by around £500. Figure 5: Average house price and number of sales, 2001-2010 Source: Communities and Local Government
0
1,000
2,000
3,000
4,000
5,000
6,000
2001 2002 2003 2004 2005 2006 2007 2008 2009 2010
Num
ber o
f sal
es (c
olum
ns)
£0
£50,000
£100,000
£150,000
£200,000
£250,000
£300,000
Med
ian
Hou
se P
rice
(line
s)
Cambridge East Cambridgeshire Fenland Huntingdonshire South CambridgeshireForest Heath St. Edmundsbury Cambridge East Cambridgeshire FenlandHuntingdonshire South Cambridgeshire Forest Heath St. Edmundsbury
Figure 5 shows the number of sales per year and the median house price per year for 2001 to 2010. House prices decreased slightly between 2007 and 2009, and have since increased, and are still considerably higher than in 2001. The number of sales in the sub-region as a whole decreased from around 18,000/year from 2001 to 2007 to around 10,600/year between 2008 and 2010. Information on house prices is updated annually in chapter 13 of the SHMA.
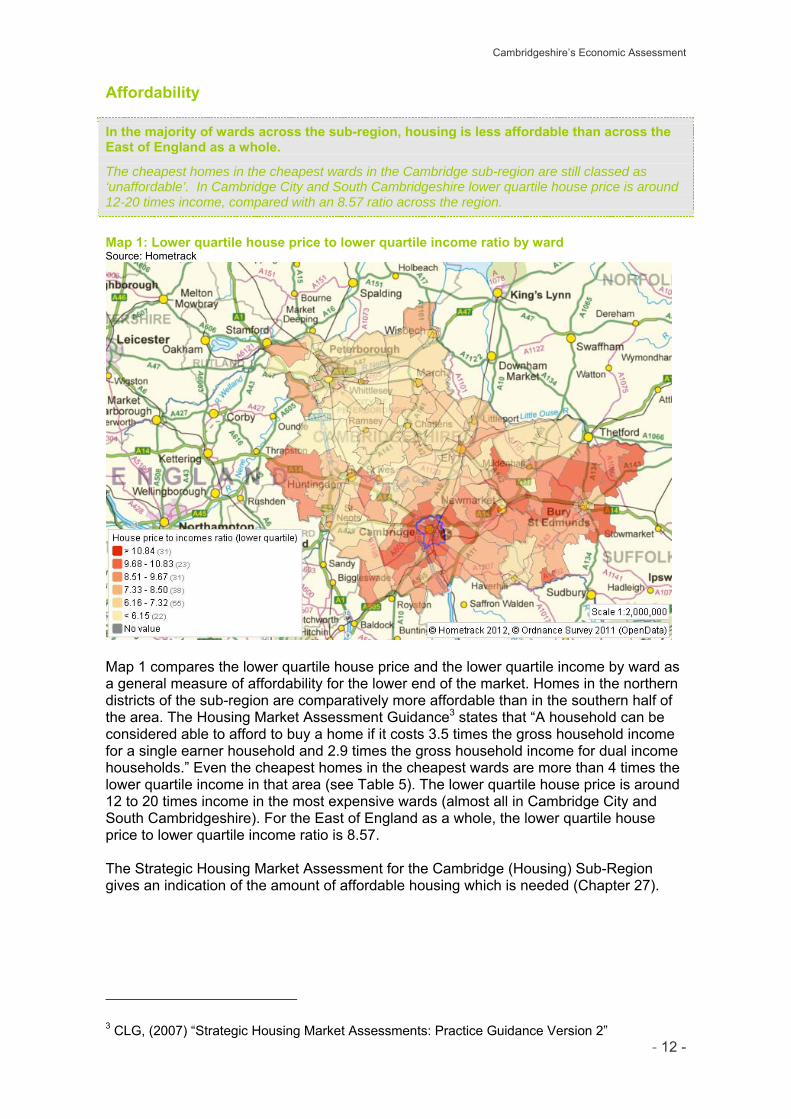
Cambridgeshire’s Economic Assessment
- 12 -
Affordability
In the majority of wards across the sub-region, housing is less affordable than across the East of England as a whole.
The cheapest homes in the cheapest wards in the Cambridge sub-region are still classed as ‘unaffordable’. In Cambridge City and South Cambridgeshire lower quartile house price is around 12-20 times income, compared with an 8.57 ratio across the region.
Map 1: Lower quartile house price to lower quartile income ratio by ward Source: Hometrack
Map 1 compares the lower quartile house price and the lower quartile income by ward as a general measure of affordability for the lower end of the market. Homes in the northern districts of the sub-region are comparatively more affordable than in the southern half of the area. The Housing Market Assessment Guidance3 states that “A household can be considered able to afford to buy a home if it costs 3.5 times the gross household income for a single earner household and 2.9 times the gross household income for dual income households.” Even the cheapest homes in the cheapest wards are more than 4 times the lower quartile income in that area (see Table 5). The lower quartile house price is around 12 to 20 times income in the most expensive wards (almost all in Cambridge City and South Cambridgeshire). For the East of England as a whole, the lower quartile house price to lower quartile income ratio is 8.57. The Strategic Housing Market Assessment for the Cambridge (Housing) Sub-Region gives an indication of the amount of affordable housing which is needed (Chapter 27).
3 CLG, (2007) “Strategic Housing Market Assessments: Practice Guidance Version 2”
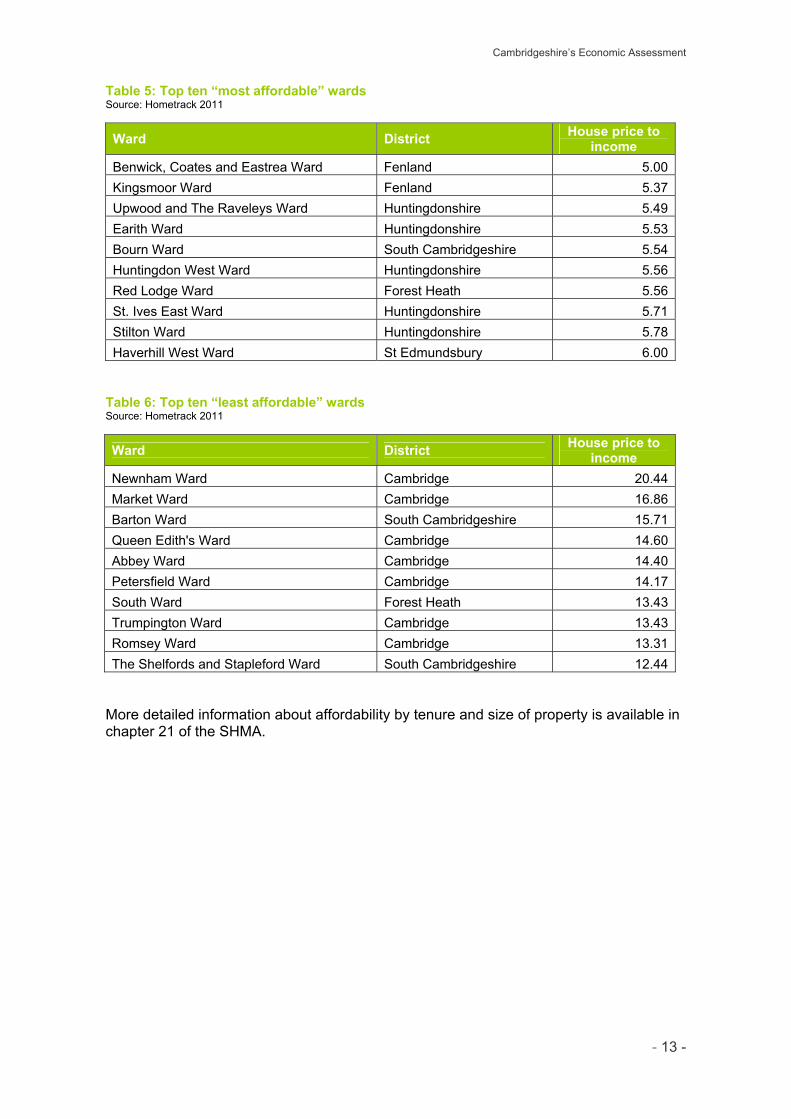
Cambridgeshire’s Economic Assessment
- 13 -
Table 5: Top ten “most affordable” wards Source: Hometrack 2011
Ward District House price to income
Benwick, Coates and Eastrea Ward Fenland 5.00Kingsmoor Ward Fenland 5.37Upwood and The Raveleys Ward Huntingdonshire 5.49Earith Ward Huntingdonshire 5.53Bourn Ward South Cambridgeshire 5.54Huntingdon West Ward Huntingdonshire 5.56Red Lodge Ward Forest Heath 5.56St. Ives East Ward Huntingdonshire 5.71Stilton Ward Huntingdonshire 5.78Haverhill West Ward St Edmundsbury 6.00
Table 6: Top ten “least affordable” wards Source: Hometrack 2011
Ward District House price to income
Newnham Ward Cambridge 20.44Market Ward Cambridge 16.86Barton Ward South Cambridgeshire 15.71Queen Edith's Ward Cambridge 14.60Abbey Ward Cambridge 14.40Petersfield Ward Cambridge 14.17South Ward Forest Heath 13.43Trumpington Ward Cambridge 13.43Romsey Ward Cambridge 13.31The Shelfords and Stapleford Ward South Cambridgeshire 12.44
More detailed information about affordability by tenure and size of property is available in chapter 21 of the SHMA.
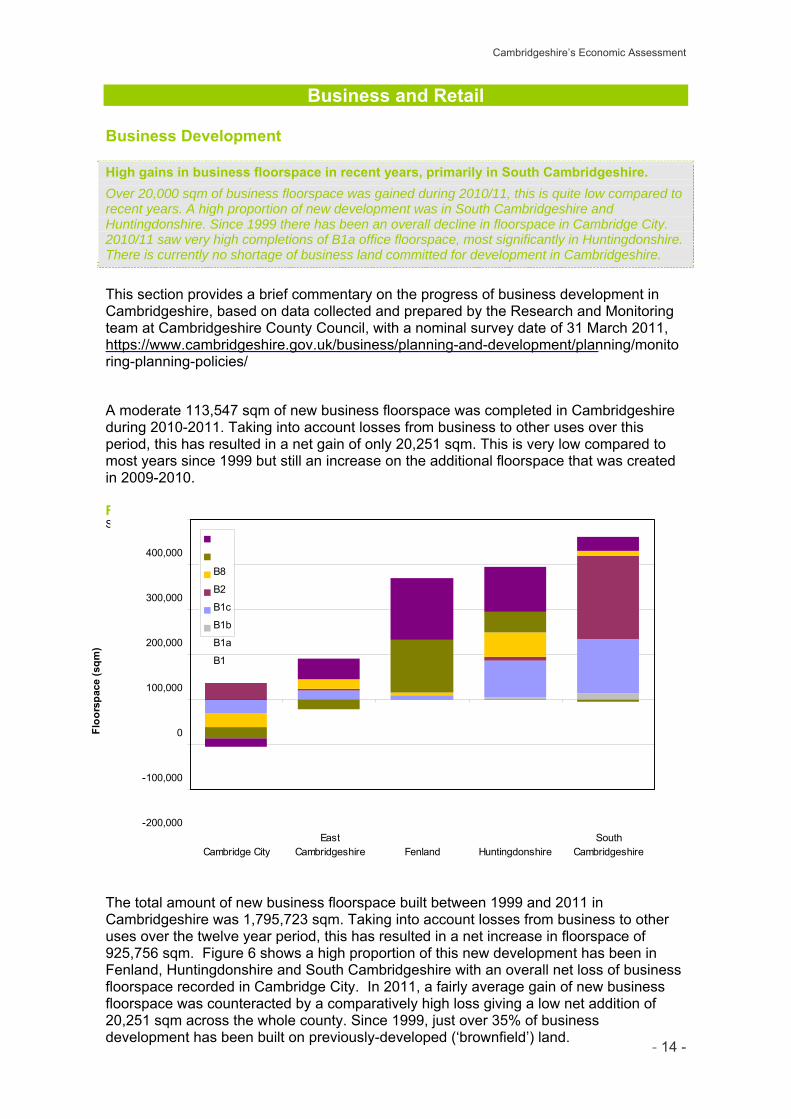
Cambridgeshire’s Economic Assessment
- 14 -
Business and Retail
Business Development
High gains in business floorspace in recent years, primarily in South Cambridgeshire.
Over 20,000 sqm of business floorspace was gained during 2010/11, this is quite low compared to recent years. A high proportion of new development was in South Cambridgeshire and Huntingdonshire. Since 1999 there has been an overall decline in floorspace in Cambridge City. 2010/11 saw very high completions of B1a office floorspace, most significantly in Huntingdonshire. There is currently no shortage of business land committed for development in Cambridgeshire.
This section provides a brief commentary on the progress of business development in Cambridgeshire, based on data collected and prepared by the Research and Monitoring team at Cambridgeshire County Council, with a nominal survey date of 31 March 2011, https://www.cambridgeshire.gov.uk/business/planning-and-development/planning/monitoring-planning-policies/ A moderate 113,547 sqm of new business floorspace was completed in Cambridgeshire during 2010-2011. Taking into account losses from business to other uses over this period, this has resulted in a net gain of only 20,251 sqm. This is very low compared to most years since 1999 but still an increase on the additional floorspace that was created in 2009-2010. Figure 6: Net business completions, 1999-2011 Source: Cambridgeshire County Council – Research and Monitoring
-200,000
-100,000
0
100,000
200,000
300,000
400,000
Cambridge CityEast
Cambridgeshire Fenland HuntingdonshireSouth
Cambridgeshire
Floo
rspa
ce (s
qm)
B8
B2
B1c
B1b
B1a
B1
The total amount of new business floorspace built between 1999 and 2011 in Cambridgeshire was 1,795,723 sqm. Taking into account losses from business to other uses over the twelve year period, this has resulted in a net increase in floorspace of 925,756 sqm. Figure 6 shows a high proportion of this new development has been in Fenland, Huntingdonshire and South Cambridgeshire with an overall net loss of business floorspace recorded in Cambridge City. In 2011, a fairly average gain of new business floorspace was counteracted by a comparatively high loss giving a low net addition of 20,251 sqm across the whole county. Since 1999, just over 35% of business development has been built on previously-developed (‘brownfield’) land.
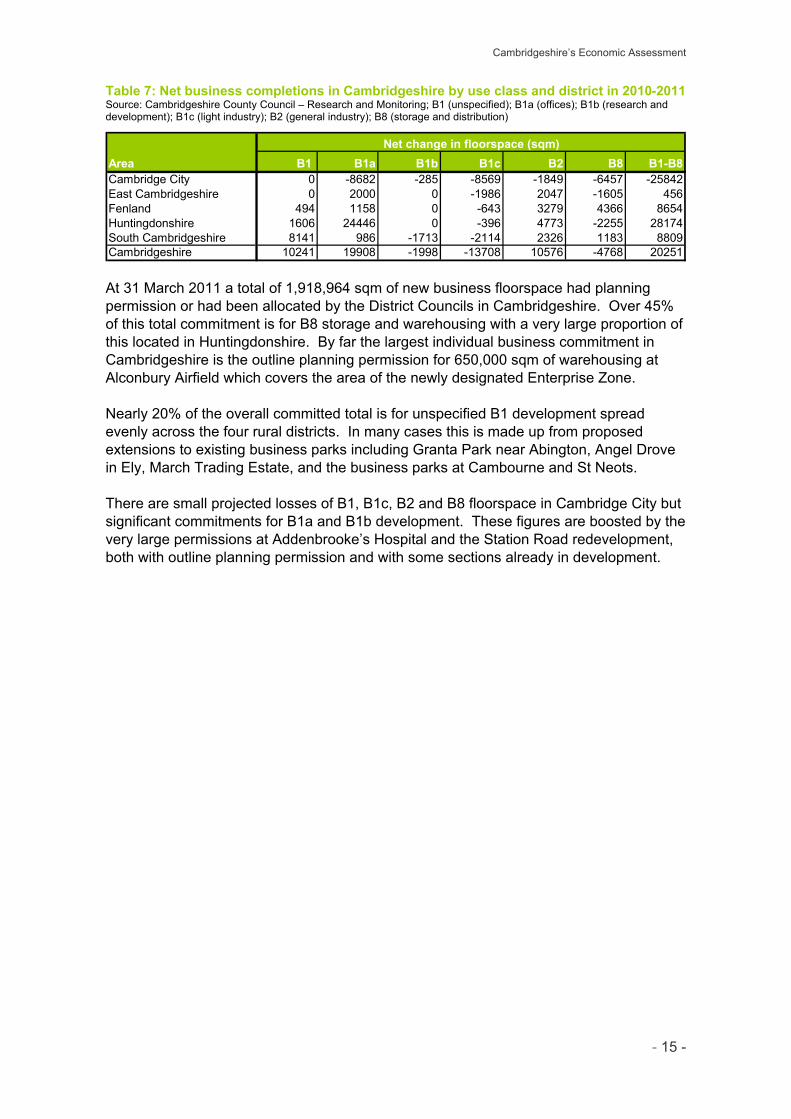
Cambridgeshire’s Economic Assessment
- 15 -
Table 7: Net business completions in Cambridgeshire by use class and district in 2010-2011 Source: Cambridgeshire County Council – Research and Monitoring; B1 (unspecified); B1a (offices); B1b (research and development); B1c (light industry); B2 (general industry); B8 (storage and distribution)
Area B1 B1a B1b B1c B2 B8 B1-B8Cambridge City 0 -8682 -285 -8569 -1849 -6457 -25842East Cambridgeshire 0 2000 0 -1986 2047 -1605 456Fenland 494 1158 0 -643 3279 4366 8654Huntingdonshire 1606 24446 0 -396 4773 -2255 28174South Cambridgeshire 8141 986 -1713 -2114 2326 1183 8809Cambridgeshire 10241 19908 -1998 -13708 10576 -4768 20251
Net change in floorspace (sqm)
At 31 March 2011 a total of 1,918,964 sqm of new business floorspace had planning permission or had been allocated by the District Councils in Cambridgeshire. Over 45% of this total commitment is for B8 storage and warehousing with a very large proportion of this located in Huntingdonshire. By far the largest individual business commitment in Cambridgeshire is the outline planning permission for 650,000 sqm of warehousing at Alconbury Airfield which covers the area of the newly designated Enterprise Zone. Nearly 20% of the overall committed total is for unspecified B1 development spread evenly across the four rural districts. In many cases this is made up from proposed extensions to existing business parks including Granta Park near Abington, Angel Drove in Ely, March Trading Estate, and the business parks at Cambourne and St Neots. There are small projected losses of B1, B1c, B2 and B8 floorspace in Cambridge City but significant commitments for B1a and B1b development. These figures are boosted by the very large permissions at Addenbrooke’s Hospital and the Station Road redevelopment, both with outline planning permission and with some sections already in development.
Cambridgeshire’s Economic Assessment
- 16 -
Retail and Town Centre Development
Retail growth and office space reductions in town centres. Over the last twelve years town centres in all districts have seen small reductions in office space and most (apart from Fenland) have seen an increase in retail floorspace. The highest increases in retail floorspace were in Cambridge City and Huntingdonshire town centres. Future increases are projected in Cambridge City, Fenland and South Cambridgeshire. Less that 5,000 sqm of new retail floorspace was built across Cambridgeshire between 2010 and 2011 compared to nearly 15,000 sqm in the previous year, however there has been a large increase in the amount of land committed for retail development in Cambridgeshire in the past year (104,000 sqm), especially when compared to 69,000 sqm the year before, with large commitments for retail development in Cambridge City and South Cambridgeshire. The reduction in office space in Cambridge City could have negative implications for the growth of knowledge based industries, with a new generation of owners seeking city centre locations.
This section provides a brief commentary on the progress of retail and town centre development in Cambridgeshire, based on data collected and prepared by the Research and Monitoring team at Cambridgeshire County Council, with a nominal survey date of 31 March 2011, https://www.cambridgeshire.gov.uk/business/planning-and-development/planning/monitoring-planning-policies/ The total amount of new retail floorspace built between 1999 and 2011 in Cambridgeshire was 230,663 sqm. Taking into account losses of floorspace over the twelve year period, this has provided a net increase of 101,057 sqm. Just over a third of the total increase has been within Cambridge City, while East Cambridgeshire has seen very low increases in retail development compared to the other districts. In Cambridge City, nearly all of the additional floorspace was within the town centre area. In Huntingdonshire there were moderate increases in retail floorspace within the town centres, matched by increases out of centre. All additional retail floorspace in Fenland was completed outside town centre areas with a net loss of floorspace of nearly 3,000 sqm in the town centres. Development within the town centre areas has varied considerably across the county. In Cambridge City there have been large overall net gains of retail use within the centre with quite a significant decline in both professional services and offices. In fact all districts, except for Huntingdonshire, have seen small reductions in town centre office space. Fenland is the only district where there has been an overall reduction in the amount of retail space in its town centres. Between 1999 and 2011 there was a net gain of 5,059 sqm of A2 (financial and professional services) floorspace, although there have been no major scale developments, the vast majority of developments being changes to or from this use, particularly in town centres. Changes to the amounts of town centre floorspace in Cambridgeshire show no clear trend over time. Much involves the re-development of land and existing buildings as sites become vacant and opportunities come forward. In 2010-2011 only a small amount of floorspace was built in town centres (2,445 sqm) and there were losses of 4,510 sqm resulting in a net loss of floorspace. There were no significant town centre completions in the county over the last year, just a lot of small schemes. In previous years, the completion of The Grand Arcade (37,500 sqm) and Bradwells Court (7,300 sqm) in Cambridge town centre contributed to the very large retail completions figures in 2007-2008. This re-development also accounts for most of the retail losses in 2005-2006, as existing shops were lost to create the new schemes.
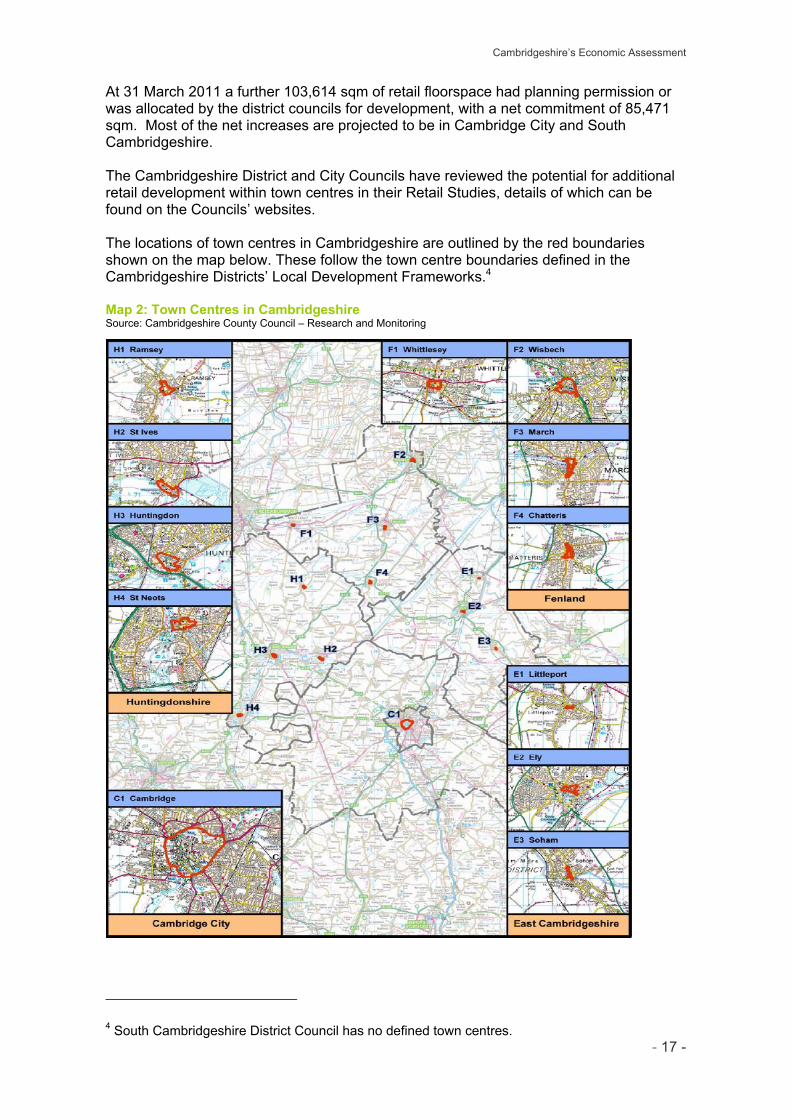
Cambridgeshire’s Economic Assessment
- 17 -
At 31 March 2011 a further 103,614 sqm of retail floorspace had planning permission or was allocated by the district councils for development, with a net commitment of 85,471 sqm. Most of the net increases are projected to be in Cambridge City and South Cambridgeshire. The Cambridgeshire District and City Councils have reviewed the potential for additional retail development within town centres in their Retail Studies, details of which can be found on the Councils’ websites. The locations of town centres in Cambridgeshire are outlined by the red boundaries shown on the map below. These follow the town centre boundaries defined in the Cambridgeshire Districts’ Local Development Frameworks.4 Map 2: Town Centres in Cambridgeshire Source: Cambridgeshire County Council – Research and Monitoring
4 South Cambridgeshire District Council has no defined town centres.
Cambridgeshire’s Economic Assessment
- 18 -
Employment Land
District employment land reviews suggest an adequate supply of land across the county however it is important that that land is somewhere that businesses would wish to locate. Most districts appear to have taken this into consideration and are now looking at future sites for employment land. All the districts within Cambridgeshire have maintained employment land reviews which indicate the availability of allocated employment sites and the future potential employment sites in the Local Development Frameworks. However because the work on the reviews had been done separately in the different years, there has been little consistency of the review methodology and criteria for assessing the ‘desirable’ employment sites from a business/developer perspective. All the District Councils are currently reviewing their Local Plans and Core Strategy and these will look at sites in the future that can be used for housing and employment allocations. The following sections present the methodology and criteria for assessing the desirable employment sites that the local planning authorities applied in their employment land reviews. Cambridge City and South Cambridgeshire
Cambridge City Council and South Cambridgeshire District Council worked together to produce a single Employment Land Review in 2008 for both the city and the surrounding district. They assessed both the existing allocated employment sites in the Local Plans which had not been developed and the potential employment sites which were nominated by land owners, agents and local authorities. The review applied various criteria to assess the sites which included:
• Developer demand • Business demand • Location sequential test • Sustainable access • Strategic and local planning issues South Cambridgeshire and Cambridge City are currently reviewing their Local Plans and will be looking at the land that can be allocated for employment and housing sites in the future, the reviews of their Local Plans are due to be completed in Summer 2014. East Cambridgeshire
East Cambridgeshire undertook an employment land study alongside a labour market study in 2005. For the existing allocated sites, 10 out of 12 total sites were considered as desirable employment land. The criteria were: • Location of site to main roads and access • Location of site to facilities and labour force • Visibility of the site and its environment • Size of site and ability to create synergy • Developability of the site East Cambridgeshire District Council is currently reviewing its Local Plan in response to the Government's abolition of top-down regional housing targets, and the Government's commitment to 'localism' and will be looking at the land that can be allocated for employment and housing sites in the future, the review and adoption of the Local Plan is due to be completed in Summer 2013.
Cambridgeshire’s Economic Assessment
- 19 -
Fenland
Fenland District Council undertook an Employment Land Review in 2007 which assessed both the existing employment sites and the potential sites. The criteria that were applied for assessing the existing sites were: • Location sequential test • Accessibility and transport mode • Utilities supply and infrastructure provisions • Environment constraints For the potential sites, Fenland District Council invited land submissions on the sites above 0.25 ha. The assessment criteria for potential sites were: • Location sequential test • Accessibility and transport mode • Utilities supply and infrastructure provisions • Environment constraints • Land ownership • Strategic importance Fenland District Council is also currently reviewing its Core Strategy in response to the Government's abolition of top-down regional housing targets, and the Government's commitment to 'localism' and will be looking at the land that can be allocated for employment and housing sites in the future, the review of the Core Strategy is due to be completed in Autumn 2013. Huntingdonshire
Huntingdonshire’s Employment Review was finished in 2007. It assessed both the existing allocated sites that remained as undeveloped and the potential sites that were nominated by land owners, land agents and the local authority itself. The criteria applied to existing sites were: Market Assessment: Developer and Business Demand Sustainable Development and Planning Policy Assessment - previously-developed,
sustainable accessibility, strategic and local planning policies For the potential sites, two rounds of the assessment covered the following criteria: Sequential Test: 8 location categories Accessibility Test: proximity to workforce, reduce need for travel, travel mode Site Information Market Attractiveness Quality of the Wider Environment Policy Issues On the 8th of December 2011 the Huntingdonshire District Council Cabinet endorsed the proposal for the Council to produce a new Local Plan. The Local Plan will cover the period up to 2036 and, once adopted, will replace all current parts of the development plan, including the Core Strategy 2009 and the saved policies of the Local Plan 1995 and Local Plan Alteration 2002. The Local Plan will be looking at the land that can be allocated for employment and housing sites in the future.
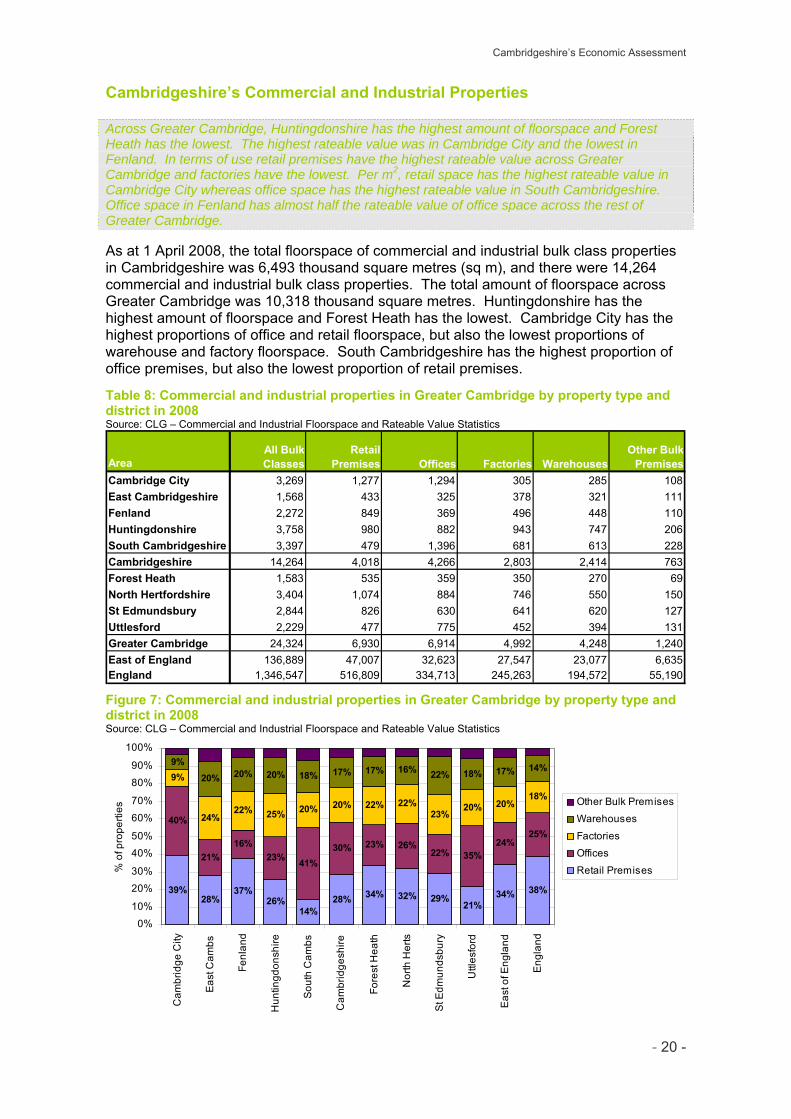
Cambridgeshire’s Economic Assessment
- 20 -
Cambridgeshire’s Commercial and Industrial Properties
Across Greater Cambridge, Huntingdonshire has the highest amount of floorspace and Forest Heath has the lowest. The highest rateable value was in Cambridge City and the lowest in Fenland. In terms of use retail premises have the highest rateable value across Greater Cambridge and factories have the lowest. Per m2, retail space has the highest rateable value in Cambridge City whereas office space has the highest rateable value in South Cambridgeshire. Office space in Fenland has almost half the rateable value of office space across the rest of Greater Cambridge. As at 1 April 2008, the total floorspace of commercial and industrial bulk class properties in Cambridgeshire was 6,493 thousand square metres (sq m), and there were 14,264 commercial and industrial bulk class properties. The total amount of floorspace across Greater Cambridge was 10,318 thousand square metres. Huntingdonshire has the highest amount of floorspace and Forest Heath has the lowest. Cambridge City has the highest proportions of office and retail floorspace, but also the lowest proportions of warehouse and factory floorspace. South Cambridgeshire has the highest proportion of office premises, but also the lowest proportion of retail premises. Table 8: Commercial and industrial properties in Greater Cambridge by property type and district in 2008 Source: CLG – Commercial and Industrial Floorspace and Rateable Value Statistics
AreaCambridge City 3,269 1,277 1,294 305 285 108East Cambridgeshire 1,568 433 325 378 321 111Fenland 2,272 849 369 496 448 110Huntingdonshire 3,758 980 882 943 747 206South Cambridgeshire 3,397 479 1,396 681 613 228Cambridgeshire 14,264 4,018 4,266 2,803 2,414 763Forest Heath 1,583 535 359 350 270 69North Hertfordshire 3,404 1,074 884 746 550 150St Edmundsbury 2,844 826 630 641 620 127Uttlesford 2,229 477 775 452 394 131Greater Cambridge 24,324 6,930 6,914 4,992 4,248 1,240East of England 136,889 47,007 32,623 27,547 23,077 6,635England 1,346,547 516,809 334,713 245,263 194,572 55,190
Other Bulk Premises
All Bulk Classes Offices Factories Warehouses
Retail Premises
Figure 7: Commercial and industrial properties in Greater Cambridge by property type and district in 2008 Source: CLG – Commercial and Industrial Floorspace and Rateable Value Statistics
39%28%
37%26%
14%28% 34% 32% 29%
21%34% 38%
40%
21%16%
23% 41%30% 23% 26%
22% 35%24%
25%
9%
24%22% 25% 20% 20% 22% 22%
23%20% 20%
18%
9%20% 20% 20% 18% 17% 17% 16% 22% 18% 17% 14%
0%
10%
20%30%
40%50%
60%
70%
80%
90%
100%
Cam
brid
ge C
ity
Eas
t Cam
bs
Fenl
and
Hun
tingd
onsh
ire
Sou
th C
ambs
Cam
brid
gesh
ire
Fore
st H
eath
Nor
th H
erts
St E
dmun
dsbu
ry
Uttl
esfo
rd
East
of E
ngla
nd
Engl
and
% o
f pro
perti
es
Other Bulk PremisesWarehouses
FactoriesOffices
Retail Premises
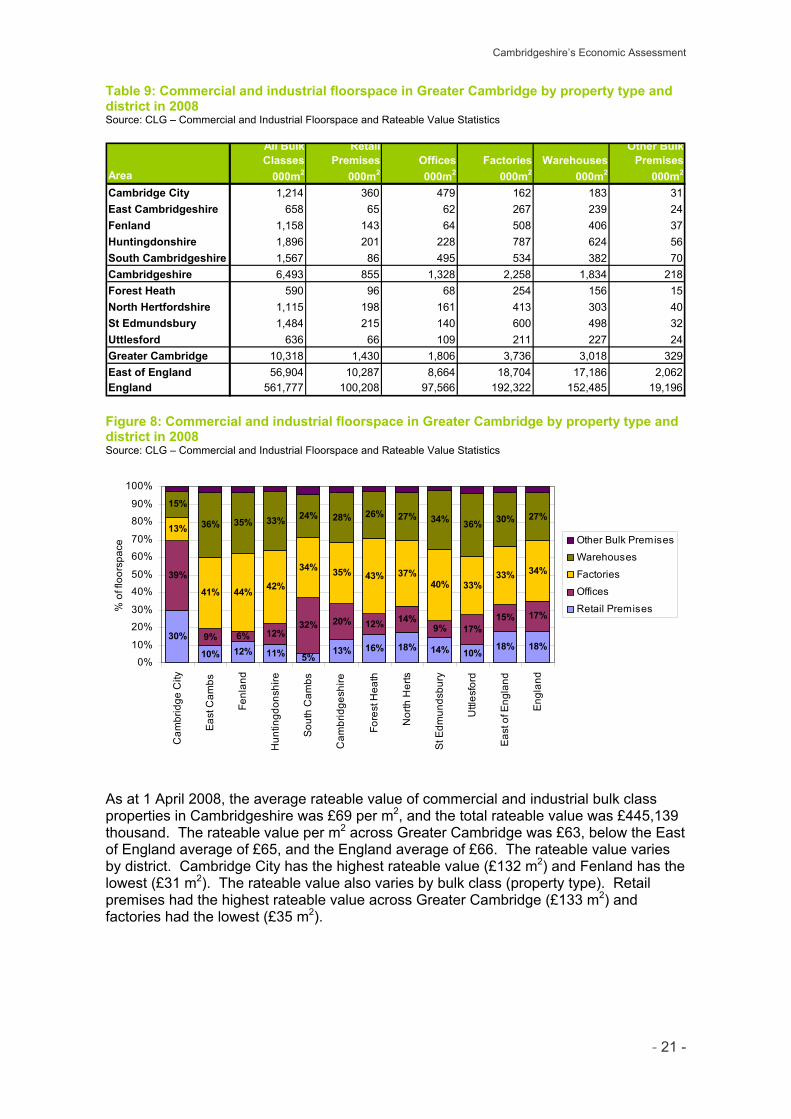
Cambridgeshire’s Economic Assessment
- 21 -
Table 9: Commercial and industrial floorspace in Greater Cambridge by property type and district in 2008 Source: CLG – Commercial and Industrial Floorspace and Rateable Value Statistics
AreaCambridge City 1,214 360 479 162 183 31East Cambridgeshire 658 65 62 267 239 24Fenland 1,158 143 64 508 406 37Huntingdonshire 1,896 201 228 787 624 56South Cambridgeshire 1,567 86 495 534 382 70Cambridgeshire 6,493 855 1,328 2,258 1,834 218Forest Heath 590 96 68 254 156 15North Hertfordshire 1,115 198 161 413 303 40St Edmundsbury 1,484 215 140 600 498 32Uttlesford 636 66 109 211 227 24Greater Cambridge 10,318 1,430 1,806 3,736 3,018 329East of England 56,904 10,287 8,664 18,704 17,186 2,062England 561,777 100,208 97,566 192,322 152,485 19,196
Other Bulk Premises
000m2
All Bulk Classes
000m2Offices000m2
Factories000m2
Warehouses000m2
Retail Premises
000m2
Figure 8: Commercial and industrial floorspace in Greater Cambridge by property type and district in 2008 Source: CLG – Commercial and Industrial Floorspace and Rateable Value Statistics
30%
10% 12% 11% 5%13% 16% 18% 14% 10%
18% 18%
39%
9% 6% 12%32% 20% 12% 14%
9% 17%15% 17%
13%
41% 44% 42%
34% 35% 43% 37%40% 33%
33% 34%
15%
36% 35% 33% 24% 28% 26% 27% 34% 36% 30% 27%
0%
10%
20%30%
40%50%
60%
70%
80%
90%
100%
Cam
brid
ge C
ity
Eas
t Cam
bs
Fenl
and
Hun
tingd
onsh
ire
Sou
th C
ambs
Cam
brid
gesh
ire
Fore
st H
eath
Nor
th H
erts
St E
dmun
dsbu
ry
Uttl
esfo
rd
East
of E
ngla
nd
Engl
and
% o
f flo
orsp
ace Other Bulk PremisesWarehouses
FactoriesOffices
Retail Premises
As at 1 April 2008, the average rateable value of commercial and industrial bulk class properties in Cambridgeshire was £69 per m2, and the total rateable value was £445,139 thousand. The rateable value per m2 across Greater Cambridge was £63, below the East of England average of £65, and the England average of £66. The rateable value varies by district. Cambridge City has the highest rateable value (£132 m2) and Fenland has the lowest (£31 m2). The rateable value also varies by bulk class (property type). Retail premises had the highest rateable value across Greater Cambridge (£133 m2) and factories had the lowest (£35 m2).
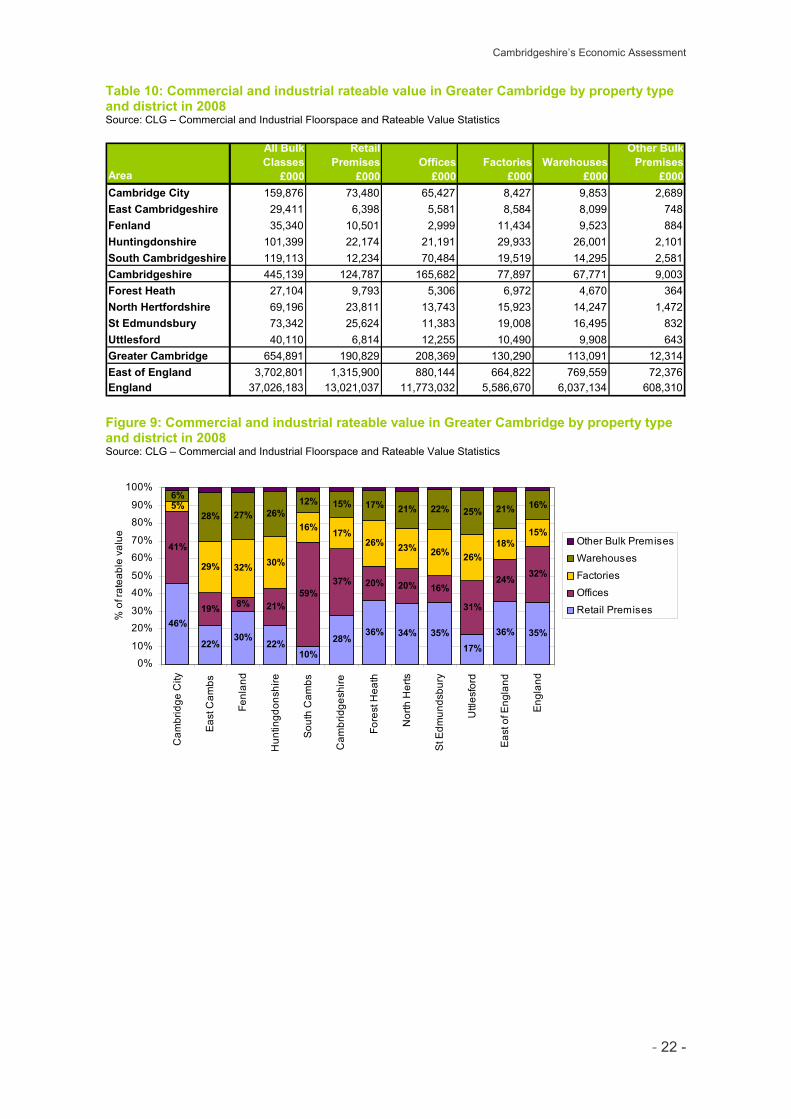
Cambridgeshire’s Economic Assessment
- 22 -
Table 10: Commercial and industrial rateable value in Greater Cambridge by property type and district in 2008 Source: CLG – Commercial and Industrial Floorspace and Rateable Value Statistics
AreaCambridge City 159,876 73,480 65,427 8,427 9,853 2,689East Cambridgeshire 29,411 6,398 5,581 8,584 8,099 748Fenland 35,340 10,501 2,999 11,434 9,523 884Huntingdonshire 101,399 22,174 21,191 29,933 26,001 2,101South Cambridgeshire 119,113 12,234 70,484 19,519 14,295 2,581Cambridgeshire 445,139 124,787 165,682 77,897 67,771 9,003Forest Heath 27,104 9,793 5,306 6,972 4,670 364North Hertfordshire 69,196 23,811 13,743 15,923 14,247 1,472St Edmundsbury 73,342 25,624 11,383 19,008 16,495 832Uttlesford 40,110 6,814 12,255 10,490 9,908 643Greater Cambridge 654,891 190,829 208,369 130,290 113,091 12,314East of England 3,702,801 1,315,900 880,144 664,822 769,559 72,376England 37,026,183 13,021,037 11,773,032 5,586,670 6,037,134 608,310
Other Bulk Premises
£000
All Bulk Classes
£000Offices
£000Factories
£000Warehouses
£000
Retail Premises
£000
Figure 9: Commercial and industrial rateable value in Greater Cambridge by property type and district in 2008 Source: CLG – Commercial and Industrial Floorspace and Rateable Value Statistics
46%
22%30%
22%10%
28%36% 34% 35%
17%36% 35%
41%
19% 8% 21%59%
37% 20% 20% 16%
31%
24% 32%
5%
29% 32% 30%
16% 17%26% 23% 26% 26%
18%15%
6%
28% 27% 26%12% 15% 17% 21% 22% 25% 21% 16%
0%
10%
20%30%
40%50%
60%
70%
80%
90%
100%
Cam
brid
ge C
ity
Eas
t Cam
bs
Fenl
and
Hun
tingd
onsh
ire
Sou
th C
ambs
Cam
brid
gesh
ire
Fore
st H
eath
Nor
th H
erts
St E
dmun
dsbu
ry
Uttl
esfo
rd
East
of E
ngla
nd
Engl
and
% o
f rat
eabl
e va
lue
Other Bulk PremisesWarehouses
FactoriesOffices
Retail Premises
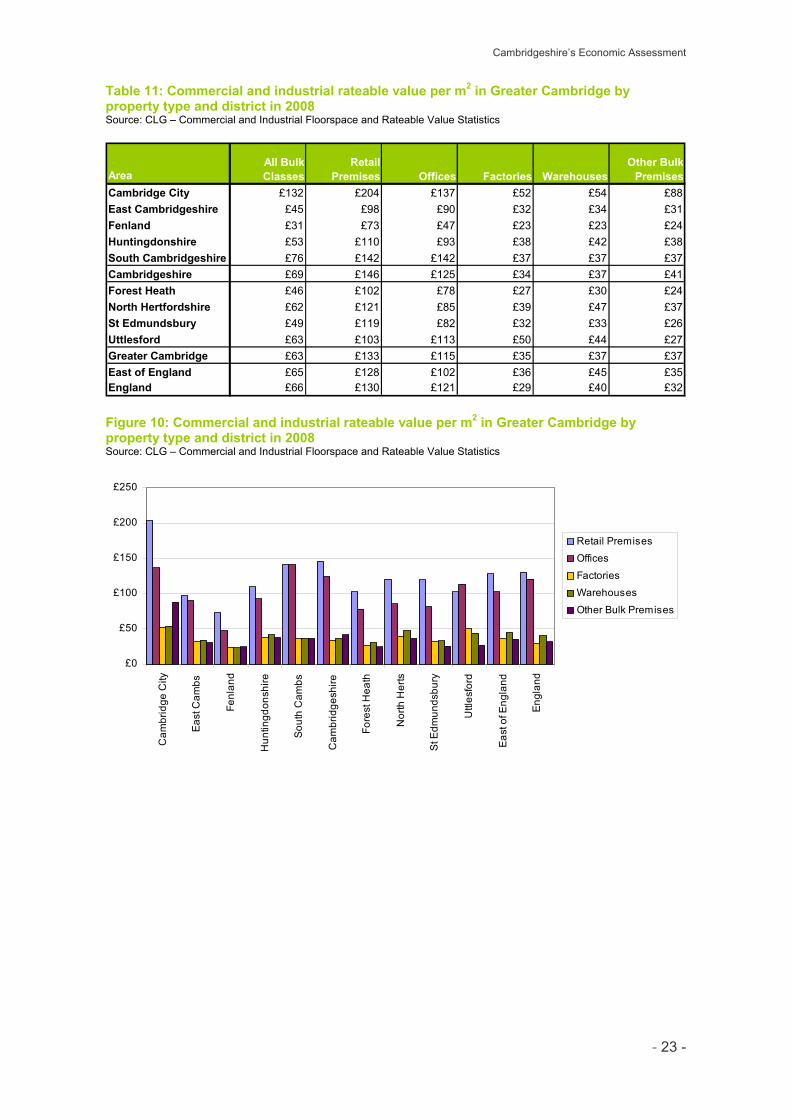
Cambridgeshire’s Economic Assessment
- 23 -
Table 11: Commercial and industrial rateable value per m2 in Greater Cambridge by property type and district in 2008 Source: CLG – Commercial and Industrial Floorspace and Rateable Value Statistics
AreaCambridge City £132 £204 £137 £52 £54 £88East Cambridgeshire £45 £98 £90 £32 £34 £31Fenland £31 £73 £47 £23 £23 £24Huntingdonshire £53 £110 £93 £38 £42 £38South Cambridgeshire £76 £142 £142 £37 £37 £37Cambridgeshire £69 £146 £125 £34 £37 £41Forest Heath £46 £102 £78 £27 £30 £24North Hertfordshire £62 £121 £85 £39 £47 £37St Edmundsbury £49 £119 £82 £32 £33 £26Uttlesford £63 £103 £113 £50 £44 £27Greater Cambridge £63 £133 £115 £35 £37 £37East of England £65 £128 £102 £36 £45 £35England £66 £130 £121 £29 £40 £32
Other Bulk Premises
All Bulk Classes Offices Factories Warehouses
Retail Premises
Figure 10: Commercial and industrial rateable value per m2 in Greater Cambridge by property type and district in 2008 Source: CLG – Commercial and Industrial Floorspace and Rateable Value Statistics
£0
£50
£100
£150
£200
£250
Cam
brid
ge C
ity
Eas
t Cam
bs
Fenl
and
Hun
tingd
onsh
ire
Sou
th C
ambs
Cam
brid
gesh
ire
Fore
st H
eath
Nor
th H
erts
St E
dmun
dsbu
ry
Uttl
esfo
rd
East
of E
ngla
nd
Engl
and
Retail PremisesOffices
FactoriesWarehouses
Other Bulk Premises
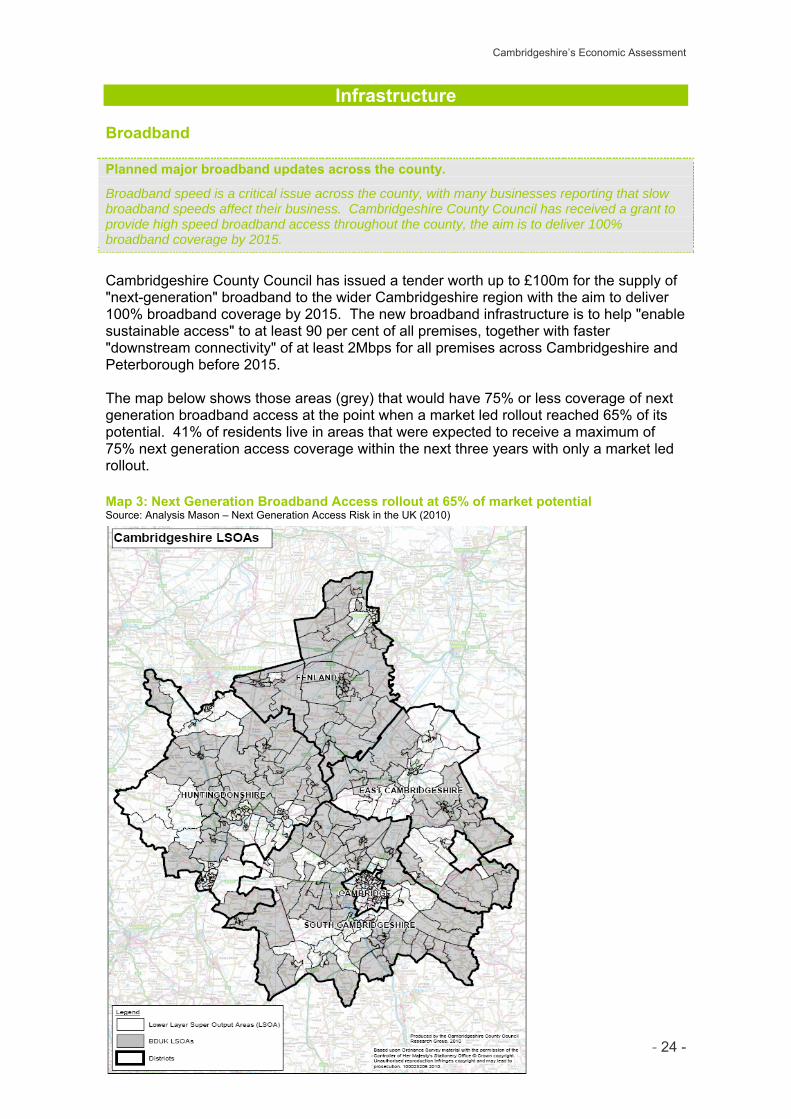
Cambridgeshire’s Economic Assessment
- 24 -
Infrastructure
Broadband
Planned major broadband updates across the county.
Broadband speed is a critical issue across the county, with many businesses reporting that slow broadband speeds affect their business. Cambridgeshire County Council has received a grant to provide high speed broadband access throughout the county, the aim is to deliver 100% broadband coverage by 2015.
Cambridgeshire County Council has issued a tender worth up to £100m for the supply of "next-generation" broadband to the wider Cambridgeshire region with the aim to deliver 100% broadband coverage by 2015. The new broadband infrastructure is to help "enable sustainable access" to at least 90 per cent of all premises, together with faster "downstream connectivity" of at least 2Mbps for all premises across Cambridgeshire and Peterborough before 2015. The map below shows those areas (grey) that would have 75% or less coverage of next generation broadband access at the point when a market led rollout reached 65% of its potential. 41% of residents live in areas that were expected to receive a maximum of 75% next generation access coverage within the next three years with only a market led rollout.
Map 3: Next Generation Broadband Access rollout at 65% of market potential Source: Analysis Mason – Next Generation Access Risk in the UK (2010)

Cambridgeshire’s Economic Assessment
- 25 -
Transport
Transport congestion costs local businesses millions in lost productivity.
Cambridgeshire’s roads are very congested. The latest evidence shows that traffic flow is double the national average on rural trunk ‘A’ roads in Cambridgeshire and this is expected to increase in the future. The local travel to work area increased significantly from 1991 to 2001. More people are commuting further than ever before exacerbating congestion on roads such as the A14. Economic Impact Traffic congestion in the East of England currently costs business and residents £1bn a year and this is expected to double by 2021. The Greater Cambridge economy is already being limited by current congestion levels and this situation is expected to worsen in the future as overall traffic levels continue to rise.5 Key Transport Corridors The Transport in the East of England study completed in September 2008 identified a number of priority transport corridors for intervention through investigating where the direct costs of transport congestion (i.e. lost travel time) and the foregone wider economic benefits (i.e. agglomeration and labour force impacts) were greatest. Three of the six corridors identified were around Cambridge (A428/A421, M11 and West Anglia Mainline corridor and the A14 corridor). Furthermore several property agents believe that congestion within Cambridge City will soon start to exert a negative influence on business decisions as to where they wish to locate. Cambridgeshire County Council recently re-submitted a bid to the Government’s Local Sustainable Transport Fund (LSTF) to improve the A14 transport corridor and A10 transport corridor. These are locations most expected to see an increase in traffic due to a large amount of proposed housing development (17,500+ dwellings) in these areas.6 Local Traffic Data
The County Council undertakes an annual Network Monitoring Report that draws together information on road casualties, road safety and traffic and travel trends for both rural and urban roads.7 Rural Traffic
The highest growth since 2000 on national routes within the county has occurred on the A428 (40%), which is related to the development of Cambourne, although the A14 at Swavesey continues to have the highest daily traffic flows. On the county principal road network (A roads), the highest growth over the past ten years has occurred on the A428 (40%), the A47 (27%), the A141 (26%), and the A142 (25%).
5 http://www.cambridgeshire.gov.uk/transport/strategies/currenttransportplans/local+transport+plan.htm
6 http://www.cambridgeshire.gov.uk/transport/strategies/fundingbids/LSTF.htm
7 http://www.cambridgeshire.gov.uk/transport/monitoring/Traffic+Monitoring+Report.htm
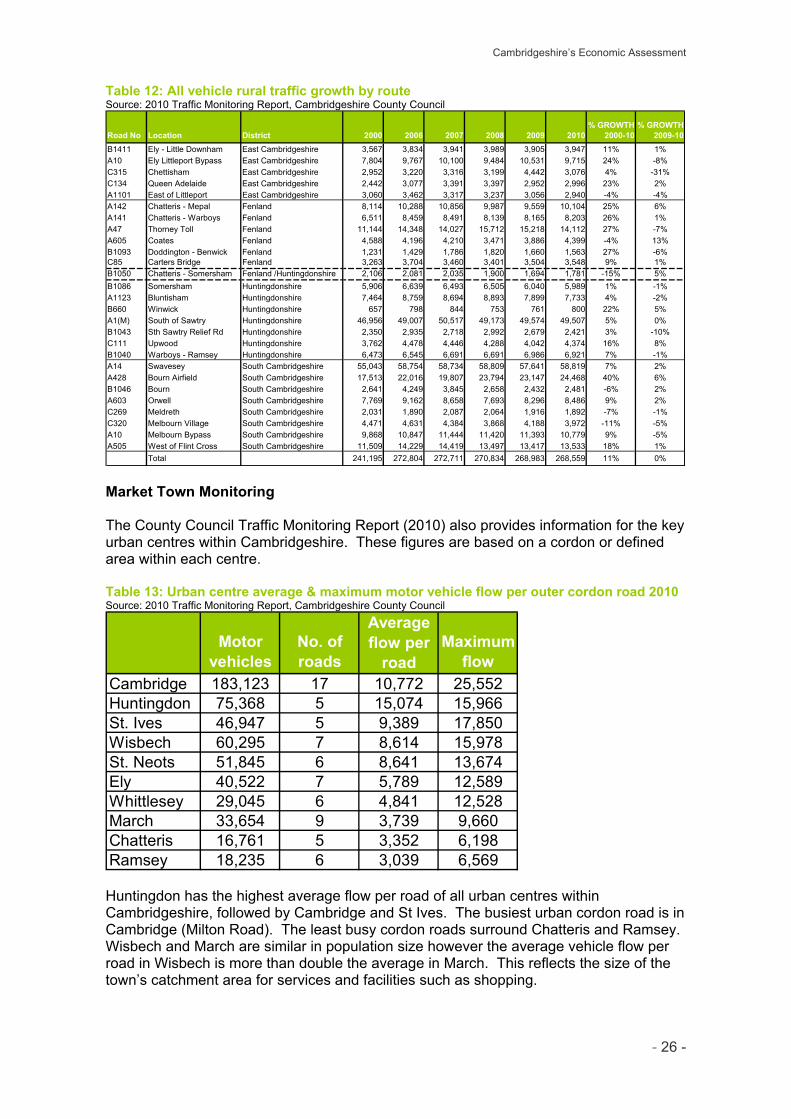
Cambridgeshire’s Economic Assessment
- 26 -
Table 12: All vehicle rural traffic growth by route Source: 2010 Traffic Monitoring Report, Cambridgeshire County Council
Road No Location District 2000 2006 2007 2008 2009 2010% GROWTH
2000-10% GROWTH
2009-10B1411 Ely - Little Downham East Cambridgeshire 3,567 3,834 3,941 3,989 3,905 3,947 11% 1%A10 Ely Littleport Bypass East Cambridgeshire 7,804 9,767 10,100 9,484 10,531 9,715 24% -8%C315 Chettisham East Cambridgeshire 2,952 3,220 3,316 3,199 4,442 3,076 4% -31%C134 Queen Adelaide East Cambridgeshire 2,442 3,077 3,391 3,397 2,952 2,996 23% 2%A1101 East of Littleport East Cambridgeshire 3,060 3,462 3,317 3,237 3,056 2,940 -4% -4%A142 Chatteris - Mepal Fenland 8,114 10,288 10,856 9,987 9,559 10,104 25% 6%A141 Chatteris - Warboys Fenland 6,511 8,459 8,491 8,139 8,165 8,203 26% 1%A47 Thorney Toll Fenland 11,144 14,348 14,027 15,712 15,218 14,112 27% -7%A605 Coates Fenland 4,588 4,196 4,210 3,471 3,886 4,399 -4% 13%B1093 Doddington - Benwick Fenland 1,231 1,429 1,786 1,820 1,660 1,563 27% -6%C85 Carters Bridge Fenland 3,263 3,704 3,460 3,401 3,504 3,548 9% 1%B1050 Chatteris - Somersham Fenland /Huntingdonshire 2,106 2,081 2,035 1,900 1,694 1,781 -15% 5%B1086 Somersham Huntingdonshire 5,906 6,639 6,493 6,505 6,040 5,989 1% -1%A1123 Bluntisham Huntingdonshire 7,464 8,759 8,694 8,893 7,899 7,733 4% -2%B660 Winwick Huntingdonshire 657 798 844 753 761 800 22% 5%A1(M) South of Sawtry Huntingdonshire 46,956 49,007 50,517 49,173 49,574 49,507 5% 0%B1043 Sth Sawtry Relief Rd Huntingdonshire 2,350 2,935 2,718 2,992 2,679 2,421 3% -10%C111 Upwood Huntingdonshire 3,762 4,478 4,446 4,288 4,042 4,374 16% 8%B1040 Warboys - Ramsey Huntingdonshire 6,473 6,545 6,691 6,691 6,986 6,921 7% -1%A14 Swavesey South Cambridgeshire 55,043 58,754 58,734 58,809 57,641 58,819 7% 2%A428 Bourn Airfield South Cambridgeshire 17,513 22,016 19,807 23,794 23,147 24,468 40% 6%B1046 Bourn South Cambridgeshire 2,641 4,249 3,845 2,658 2,432 2,481 -6% 2%A603 Orwell South Cambridgeshire 7,769 9,162 8,658 7,693 8,296 8,486 9% 2%C269 Meldreth South Cambridgeshire 2,031 1,890 2,087 2,064 1,916 1,892 -7% -1%C320 Melbourn Village South Cambridgeshire 4,471 4,631 4,384 3,868 4,188 3,972 -11% -5%A10 Melbourn Bypass South Cambridgeshire 9,868 10,847 11,444 11,420 11,393 10,779 9% -5%A505 West of Flint Cross South Cambridgeshire 11,509 14,229 14,419 13,497 13,417 13,533 18% 1%
Total 241,195 272,804 272,711 270,834 268,983 268,559 11% 0% Market Town Monitoring The County Council Traffic Monitoring Report (2010) also provides information for the key urban centres within Cambridgeshire. These figures are based on a cordon or defined area within each centre. Table 13: Urban centre average & maximum motor vehicle flow per outer cordon road 2010 Source: 2010 Traffic Monitoring Report, Cambridgeshire County Council
Motor vehicles
No. of roads
Average flow per
roadMaximum
flowCambridge 183,123 17 10,772 25,552Huntingdon 75,368 5 15,074 15,966St. Ives 46,947 5 9,389 17,850Wisbech 60,295 7 8,614 15,978St. Neots 51,845 6 8,641 13,674Ely 40,522 7 5,789 12,589Whittlesey 29,045 6 4,841 12,528March 33,654 9 3,739 9,660Chatteris 16,761 5 3,352 6,198Ramsey 18,235 6 3,039 6,569 Huntingdon has the highest average flow per road of all urban centres within Cambridgeshire, followed by Cambridge and St Ives. The busiest urban cordon road is in Cambridge (Milton Road). The least busy cordon roads surround Chatteris and Ramsey. Wisbech and March are similar in population size however the average vehicle flow per road in Wisbech is more than double the average in March. This reflects the size of the town’s catchment area for services and facilities such as shopping.
Cambridgeshire’s Economic Assessment
- 27 -
Road Safety & Accidents (taken from 2010 Road Safety Monitoring Report, Cambridgeshire County Council)
The rate of death and serious injury per head of population in Cambridgeshire is 29% above the national average. However this is related to the county having a significant volume of through traffic and higher than average traffic flows, and as a result of this Cambridgeshire’s rate of KSI (killed or seriously injured) casualties per km travelled is less than the national average. Above average traffic density on rural roads is a significant factor in Cambridgeshire’s high per capita casualty rate. The latest available figures show that traffic flow is 94% above the national average on rural trunk ‘A’ roads in Cambridgeshire and 40% on other rural main roads in the county. Cambridgeshire Integrated Development Programme The Cambridgeshire Integrated Development Programme (2009) identifies and costs the interventions required to deliver a joint vision for long term, sustainable, high quality growth. Within the programme is an evidence base on sub-regional infrastructure needs. £3.9 billion of infrastructure investment in transport, education, community facilities, health, open space, waste and utilities is needed to deliver Cambridgeshire’s vision for sustainable economic and housing growth.
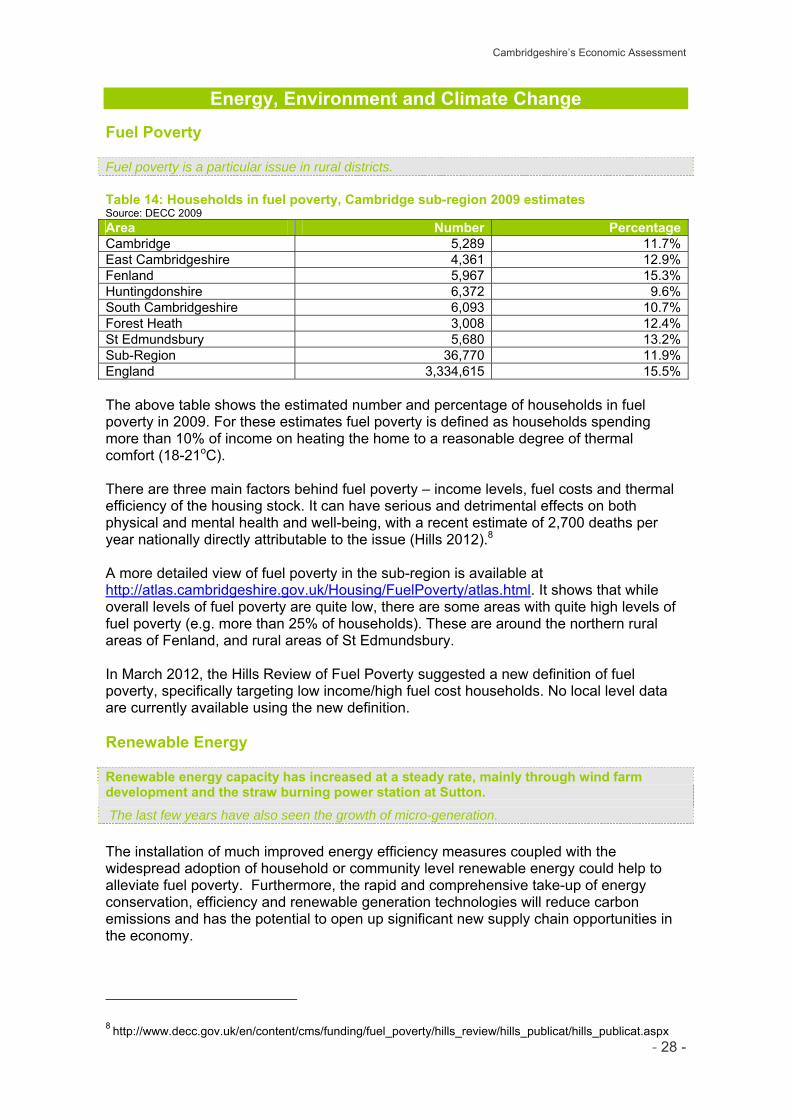
Cambridgeshire’s Economic Assessment
- 28 -
Energy, Environment and Climate Change Fuel Poverty
Fuel poverty is a particular issue in rural districts. Table 14: Households in fuel poverty, Cambridge sub-region 2009 estimates Source: DECC 2009 Area Number PercentageCambridge 5,289 11.7%East Cambridgeshire 4,361 12.9%Fenland 5,967 15.3%Huntingdonshire 6,372 9.6%South Cambridgeshire 6,093 10.7%Forest Heath 3,008 12.4%St Edmundsbury 5,680 13.2%Sub-Region 36,770 11.9%England 3,334,615 15.5% The above table shows the estimated number and percentage of households in fuel poverty in 2009. For these estimates fuel poverty is defined as households spending more than 10% of income on heating the home to a reasonable degree of thermal comfort (18-21oC). There are three main factors behind fuel poverty – income levels, fuel costs and thermal efficiency of the housing stock. It can have serious and detrimental effects on both physical and mental health and well-being, with a recent estimate of 2,700 deaths per year nationally directly attributable to the issue (Hills 2012).8 A more detailed view of fuel poverty in the sub-region is available at http://atlas.cambridgeshire.gov.uk/Housing/FuelPoverty/atlas.html. It shows that while overall levels of fuel poverty are quite low, there are some areas with quite high levels of fuel poverty (e.g. more than 25% of households). These are around the northern rural areas of Fenland, and rural areas of St Edmundsbury. In March 2012, the Hills Review of Fuel Poverty suggested a new definition of fuel poverty, specifically targeting low income/high fuel cost households. No local level data are currently available using the new definition. Renewable Energy
Renewable energy capacity has increased at a steady rate, mainly through wind farm development and the straw burning power station at Sutton.
The last few years have also seen the growth of micro-generation.
The installation of much improved energy efficiency measures coupled with the widespread adoption of household or community level renewable energy could help to alleviate fuel poverty. Furthermore, the rapid and comprehensive take-up of energy conservation, efficiency and renewable generation technologies will reduce carbon emissions and has the potential to open up significant new supply chain opportunities in the economy.
8 http://www.decc.gov.uk/en/content/cms/funding/fuel_poverty/hills_review/hills_publicat/hills_publicat.aspx
Cambridgeshire’s Economic Assessment
- 29 -
Various policies exist and are emerging from central government that are setting new standards, direction and guidance and will inevitably lead towards increased energy efficiency and renewable energy generation. These include: production of 15% of all the UK’s energy consumption from renewable sources by
2020 (this will include 30% of the UK’s electricity supply); the introduction of a ‘renewable heat incentive’ to subsidise the cost of renewable
heat generation (from 2011); maintaining subsidies on home energy efficiency measures; setting deadlines to eradicate fuel poverty in the Warm Homes and Energy
Conservation Act 2000; the use of Energy Performance Certificates for all buildings; using the Building Regulations to deliver zero-carbon homes from 2016 (and 2019 for
all other buildings); continuing support for the European Emissions Trading Scheme and introduction of
the Carbon Reduction Commitment as cap and trade mechanisms for the largest of the UK’s organisational carbon emitters;
strengthening of climate change objectives through the land-use planning system and the introduction of the eco-towns concept.
This section provides a brief commentary on the progress of renewable energy development in Cambridgeshire, based on data collected and prepared by the Research and Monitoring team at Cambridgeshire County Council, with a nominal survey date of 31 March 2011, https://www.cambridgeshire.gov.uk/business/planning-and-development/planning/monitoring-planning-policies/ . The total amount of new renewable energy capacity installed between 1999 and 2011 in Cambridgeshire was 164.23 MW. Prior to 1999 only 3.92 MW capacity existed. Development of renewables had taken place at a fairly steady rate in the years from 2005 to 2008 mainly due to the building of a number of wind farms in Fenland and Huntingdonshire. In the last three years this rate of installation slowed to the point where in 2010-2011 hardly any new capacity was installed. A large completion in 2001-2002 is mainly down to the building of a 36.85 MW straw burning power station at Sutton in East Cambridgeshire. Over half (90 MW) of renewable energy capacity installed in Cambridgeshire since 1999 is located in the district of Fenland – particularly due to the large number of wind turbines installed (48 in all). East Cambridgeshire also has a fairly high proportion of the renewable energy capacity due to the straw burning power station at Sutton. At 31 March 2011 a total figure of 72.99 MW of renewable energy capacity had been granted planning permission. This compares to only 38.61 MW with planning permission at 31 March 2010. Of the committed total, 60.05 MW is for wind power generation from 43 turbines. Thirteen of these turbines will be located at South Cambrigeshire’s first wind farm at Wadlow Farm in West Wratting. The rest of the total is made up of 2.03 MW for biomass and 10.91 MW for photovoltaic power (including two new solar farms of 5 MW each at Wilburton and at Waterbeach). The last few years has seen the growth of micro-generation – domestic wind turbines and photovoltaic cells using the power of the sun. In fact the solar market is the fastest growing area in the renewable energy sector nationally, and this is reflected in the planning commitments. The rise in photovoltaics is partly due to the Government’s feed-in tariff which is a policy mechanism designed to accelerate investment in solar photovoltaic technologies. However the Government is to cut by half the feed-in tariff paid to property owners for electricity they generate for the National Grid unless the solar panels are installed and registered by 12 December 2011; so it is envisaged the amount of photovoltaics installed may fall considerably in future years.
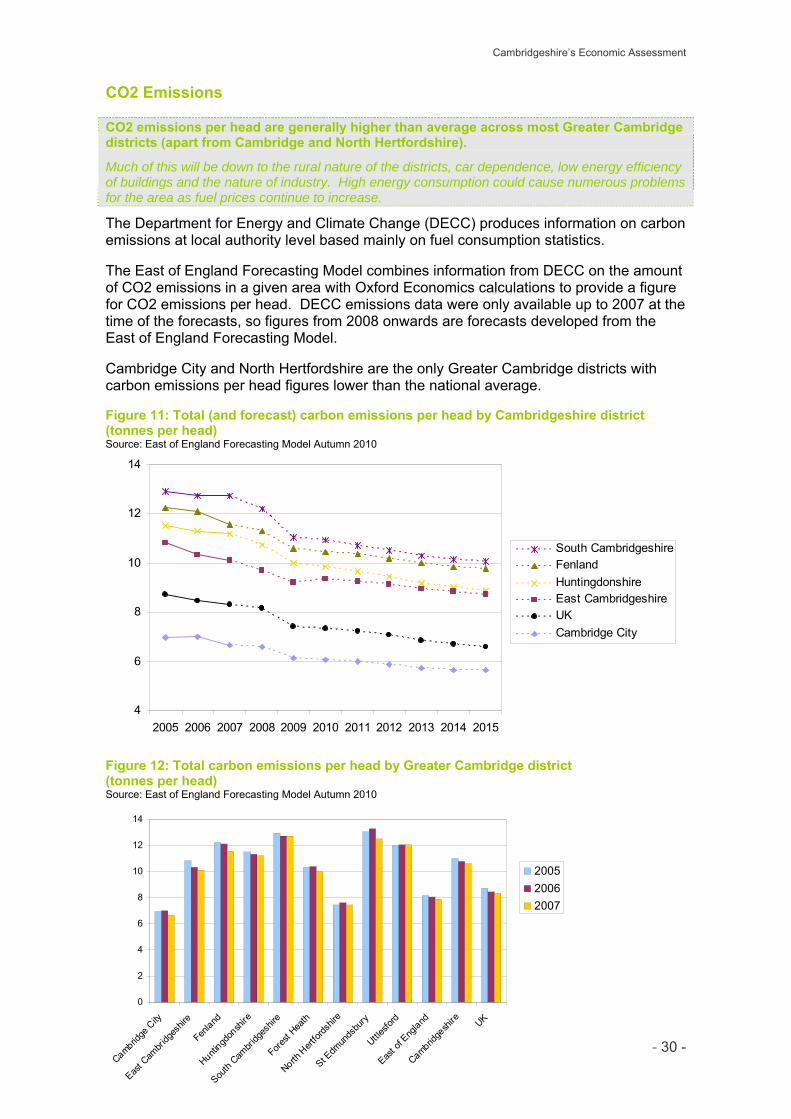
Cambridgeshire’s Economic Assessment
- 30 -
0
2
4
6
8
10
12
14
Cambridge
City
East C
ambri
dges
hire
Fenland
Huntingd
onsh
ire
South
Cambri
dges
hire
Forest
Heath
North H
ertfor
dshir
e
St Edm
unds
bury
Uttlesfo
rd
East o
f Eng
land
Cambridge
shire UK
200520062007
CO2 Emissions
CO2 emissions per head are generally higher than average across most Greater Cambridge districts (apart from Cambridge and North Hertfordshire).
Much of this will be down to the rural nature of the districts, car dependence, low energy efficiency of buildings and the nature of industry. High energy consumption could cause numerous problems for the area as fuel prices continue to increase.
The Department for Energy and Climate Change (DECC) produces information on carbon emissions at local authority level based mainly on fuel consumption statistics. The East of England Forecasting Model combines information from DECC on the amount of CO2 emissions in a given area with Oxford Economics calculations to provide a figure for CO2 emissions per head. DECC emissions data were only available up to 2007 at the time of the forecasts, so figures from 2008 onwards are forecasts developed from the East of England Forecasting Model. Cambridge City and North Hertfordshire are the only Greater Cambridge districts with carbon emissions per head figures lower than the national average. Figure 11: Total (and forecast) carbon emissions per head by Cambridgeshire district (tonnes per head) Source: East of England Forecasting Model Autumn 2010
4
6
8
10
12
14
2005 2006 2007 2008 2009 2010 2011 2012 2013 2014 2015
South CambridgeshireFenlandHuntingdonshireEast CambridgeshireUKCambridge City
Figure 12: Total carbon emissions per head by Greater Cambridge district (tonnes per head) Source: East of England Forecasting Model Autumn 2010
Cambridgeshire’s Economic Assessment
- 31 -
Climate Change Adaptation
Negative impact of climate change on food and farming and transport.
Climate change could have and is having a particularly negative impact on the transport and food and farming industries, however there is little evidence of long term adaptation planning, particularly in the transport sector, or other affected sectors such as tourism, construction or IT.
A report on the adaptation to climate change by businesses in the East of England was completed by SQW in March 2010, funded by the regional Climate Change Partnership. The report found that the climate in the East of England has changed measurably over the past forty years. There is a clear trend of hotter summers and wetter winters which is expected to continue into the next few decades. The East of England is particularly vulnerable to climate change impacts. Water shortages in summer are already a major issue and economic and housing growth in the region may create more demand. Important economic activities in the region are heavily dependent upon weather and climate; for example, tourism and farming and food. The study focused on five business sectors and on two counties – Suffolk and Cambridgeshire. The sectors were Farming and Food, Tourism, Construction, Transport and IT-Telecoms. The main finding of the study was that the extent of adaptation amongst small businesses is very limited. When hit by a severe weather event, the typical response is to tolerate the set-back rather than adapt the business. For specific industries the opportunities and threats of climate change and the level of adaptation planning were investigated: Tourism: opportunities included extended season, increased demand for outdoor tourism and threats included natural environments adversely affected, water shortages, transport infrastructure interrupted for the tourism industry. ICT/Telecomms: opportunities included disruption of commuting by bad weather encourages use of homeworking, video-conferencing etc, new monitoring and risk management markets and threats included overheating servers, disruption of energy/telecoms infrastructure. Transport sector: opportunities included development of sophisticated vehicle and freight tracking systems could make it easier to avoid transport disruptions caused by weather and threats included road and transport hub closures, danger of heat to livestock, drivers put at risk in dangerous conditions. Food and farming: opportunities included longer growing season, new crops and new markets and threats included droughts and flooding, increase in pests and diseases. Construction: opportunities included new markets for sustainable buildings and water saving technologies, need for additional repair work caused by severe weather damage and threats included heavy rainfall causing delays on site, increased hazards to workers. Across all sectors apart from food and farming, there was little evidence of adaptation to climate change or recognition of the need for longer term planning to address climate change. Within the food and farming sector some adaptation is more reactive and incremental and not requiring support. However actions to manage water represent a very substantial area of activity that relates to climate change and involves major schemes at farm level such as reservoir construction, new boreholes or coastal defences.
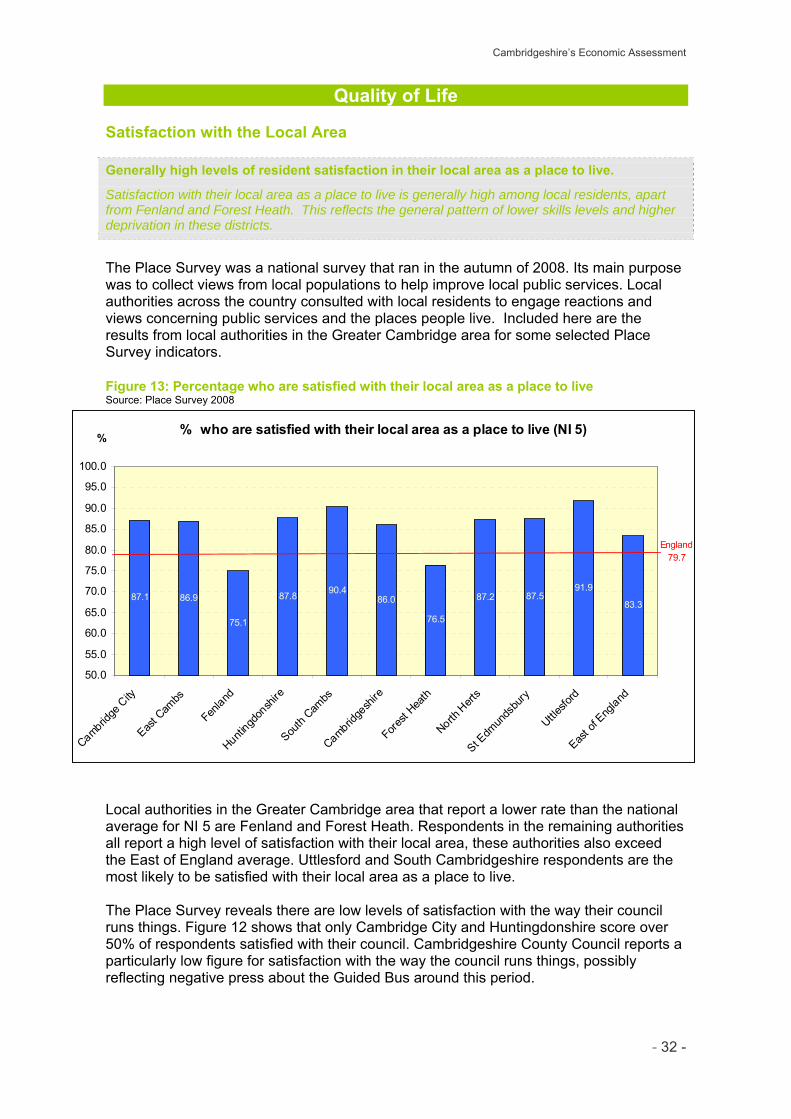
Cambridgeshire’s Economic Assessment
- 32 -
Quality of Life Satisfaction with the Local Area
Generally high levels of resident satisfaction in their local area as a place to live.
Satisfaction with their local area as a place to live is generally high among local residents, apart from Fenland and Forest Heath. This reflects the general pattern of lower skills levels and higher deprivation in these districts.
The Place Survey was a national survey that ran in the autumn of 2008. Its main purpose was to collect views from local populations to help improve local public services. Local authorities across the country consulted with local residents to engage reactions and views concerning public services and the places people live. Included here are the results from local authorities in the Greater Cambridge area for some selected Place Survey indicators. Figure 13: Percentage who are satisfied with their local area as a place to live Source: Place Survey 2008
% who are satisfied with their local area as a place to live (NI 5)
87.1 86.9
75.1
87.8 90.486.0
76.5
87.2 87.591.9
83.3
50.0
55.0
60.0
65.0
70.0
75.0
80.0
85.0
90.0
95.0
100.0
Cambridge
City
East C
ambs
Fenland
Huntingd
onsh
ire
South
Cambs
Cambridge
shire
Forest
Heath
North H
erts
St Edm
unds
bury
Uttlesfo
rd
East o
f Eng
land
England 79.7
%
Local authorities in the Greater Cambridge area that report a lower rate than the national average for NI 5 are Fenland and Forest Heath. Respondents in the remaining authorities all report a high level of satisfaction with their local area, these authorities also exceed the East of England average. Uttlesford and South Cambridgeshire respondents are the most likely to be satisfied with their local area as a place to live. The Place Survey reveals there are low levels of satisfaction with the way their council runs things. Figure 12 shows that only Cambridge City and Huntingdonshire score over 50% of respondents satisfied with their council. Cambridgeshire County Council reports a particularly low figure for satisfaction with the way the council runs things, possibly reflecting negative press about the Guided Bus around this period.

Cambridgeshire’s Economic Assessment
- 33 -
Figure 14: Percentage satisfied with the way the council runs things Source: Place Survey 2008
% who are satisfied with the way the council runs things
50.343.9 42.6
50.443.5 40.8
45.641.4 43.4
48.7 46.7
20.0
25.0
30.0
35.0
40.0
45.0
50.0
55.0
60.0
65.0
70.0
Cambridge
City
East C
ambs
Fenland
Huntingd
onsh
ire
South
Cambs
Cambridge
shire
Forest
Heath
North H
erts
St Edm
unds
bury
Uttlesfo
rd
East o
f Eng
land
England 45.4
Figure 15: Percentage who have given unpaid help at least once per month over the last 12 months Source: Place Survey 2008
% who have given unpaid help at least once per month over the last 12 months (NI 6)
26.9 26.721.1
30.9 33.028.4
23.530.8
24.8
32.325.1
10.0
15.0
20.0
25.0
30.0
35.0
40.0
45.0
50.0
55.0
60.0
Cambridge
City
East C
ambs
Fenland
Huntingd
onsh
ire
South
Cambs
Cambridge
shire
Forest
Heath
North H
erts
St Edm
unds
bury
Uttlesfo
rd
East o
f Eng
land
England 23.2
The Place Survey reveals that people living in the districts South Cambridgeshire, Uttlesford, Huntingdonshire and North Hertfordshire are more likely to do volunteer work in their communities. Fenland is the only authority in the Greater Cambridge area below the national average for those giving unpaid help at least once a month in their local areas.
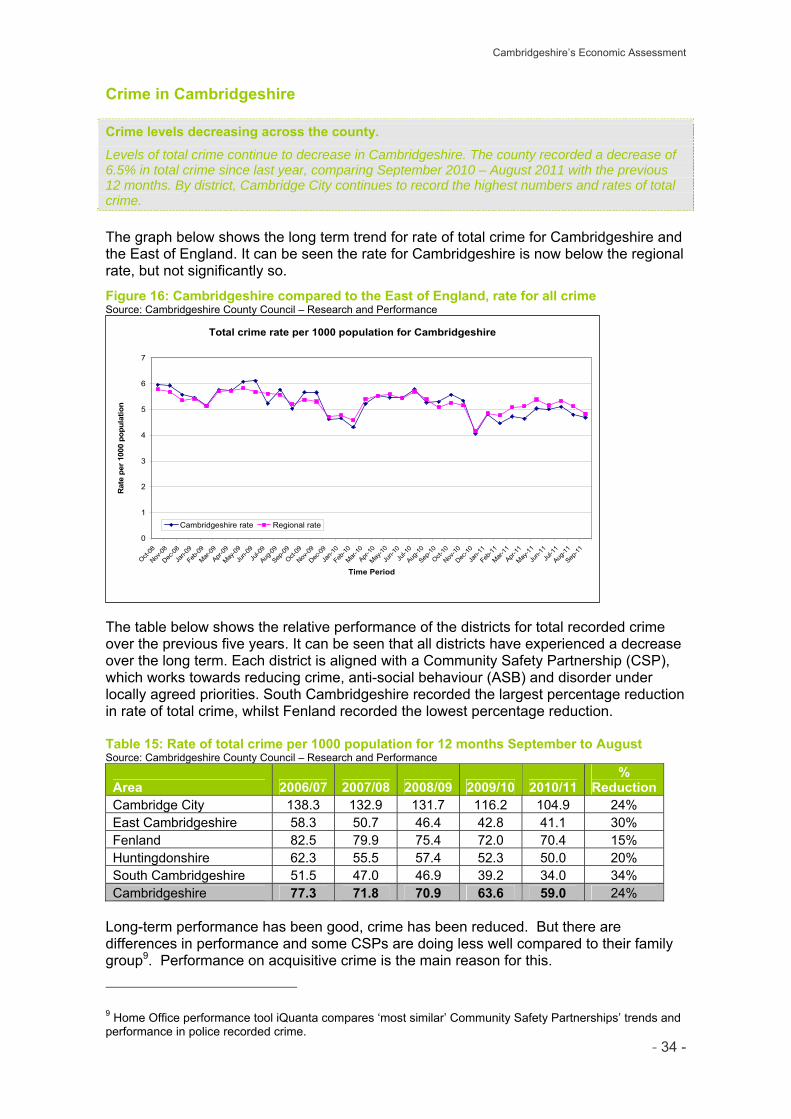
Cambridgeshire’s Economic Assessment
- 34 -
Total crime rate per 1000 population for Cambridgeshire
0
1
2
3
4
5
6
7
Oct-08
Nov-08
Dec-08
Jan-0
9
Feb-0
9
Mar-09
Apr-09
May-09
Jun-0
9Ju
l-09
Aug-09
Sep-09
Oct-09
Nov-09
Dec-09
Jan-1
0
Feb-1
0
Mar-10
Apr-10
May-10
Jun-1
0Ju
l-10
Aug-10
Sep-10
Oct-10
Nov-10
Dec-10
Jan-1
1
Feb-1
1
Mar-11
Apr-11
May-11
Jun-1
1Ju
l-11
Aug-11
Sep-11
Time Period
Rat
e pe
r 100
0 po
pula
tion
Cambridgeshire rate Regional rate
Crime in Cambridgeshire
Crime levels decreasing across the county.
Levels of total crime continue to decrease in Cambridgeshire. The county recorded a decrease of 6.5% in total crime since last year, comparing September 2010 – August 2011 with the previous 12 months. By district, Cambridge City continues to record the highest numbers and rates of total crime.
The graph below shows the long term trend for rate of total crime for Cambridgeshire and the East of England. It can be seen the rate for Cambridgeshire is now below the regional rate, but not significantly so.
Figure 16: Cambridgeshire compared to the East of England, rate for all crime Source: Cambridgeshire County Council – Research and Performance The table below shows the relative performance of the districts for total recorded crime over the previous five years. It can be seen that all districts have experienced a decrease over the long term. Each district is aligned with a Community Safety Partnership (CSP), which works towards reducing crime, anti-social behaviour (ASB) and disorder under locally agreed priorities. South Cambridgeshire recorded the largest percentage reduction in rate of total crime, whilst Fenland recorded the lowest percentage reduction. Table 15: Rate of total crime per 1000 population for 12 months September to August Source: Cambridgeshire County Council – Research and Performance
Area 2006/07 2007/08 2008/09 2009/10 2010/11 %
ReductionCambridge City 138.3 132.9 131.7 116.2 104.9 24% East Cambridgeshire 58.3 50.7 46.4 42.8 41.1 30% Fenland 82.5 79.9 75.4 72.0 70.4 15% Huntingdonshire 62.3 55.5 57.4 52.3 50.0 20% South Cambridgeshire 51.5 47.0 46.9 39.2 34.0 34% Cambridgeshire 77.3 71.8 70.9 63.6 59.0 24%
Long-term performance has been good, crime has been reduced. But there are differences in performance and some CSPs are doing less well compared to their family group9. Performance on acquisitive crime is the main reason for this.
9 Home Office performance tool iQuanta compares ‘most similar’ Community Safety Partnerships’ trends and performance in police recorded crime.
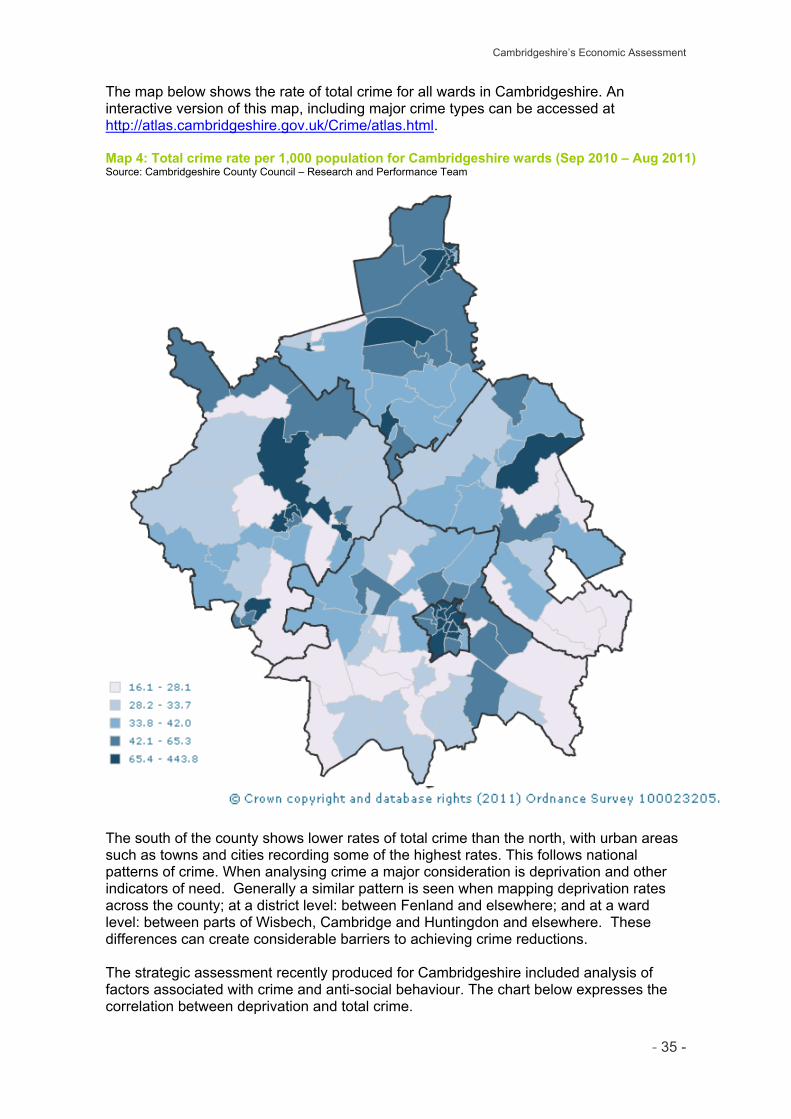
Cambridgeshire’s Economic Assessment
- 35 -
The map below shows the rate of total crime for all wards in Cambridgeshire. An interactive version of this map, including major crime types can be accessed at http://atlas.cambridgeshire.gov.uk/Crime/atlas.html. Map 4: Total crime rate per 1,000 population for Cambridgeshire wards (Sep 2010 – Aug 2011) Source: Cambridgeshire County Council – Research and Performance Team
The south of the county shows lower rates of total crime than the north, with urban areas such as towns and cities recording some of the highest rates. This follows national patterns of crime. When analysing crime a major consideration is deprivation and other indicators of need. Generally a similar pattern is seen when mapping deprivation rates across the county; at a district level: between Fenland and elsewhere; and at a ward level: between parts of Wisbech, Cambridge and Huntingdon and elsewhere. These differences can create considerable barriers to achieving crime reductions. The strategic assessment recently produced for Cambridgeshire included analysis of factors associated with crime and anti-social behaviour. The chart below expresses the correlation between deprivation and total crime.
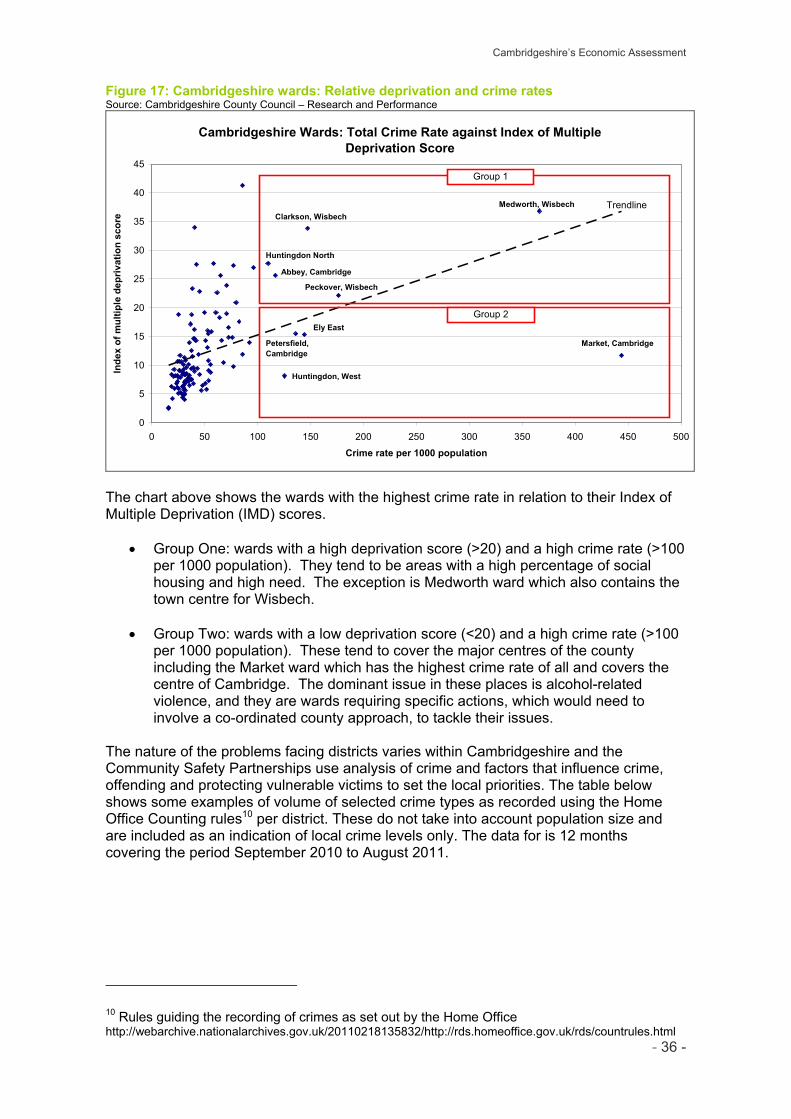
Cambridgeshire’s Economic Assessment
- 36 -
Figure 17: Cambridgeshire wards: Relative deprivation and crime rates Source: Cambridgeshire County Council – Research and Performance
Cambridgeshire Wards: Total Crime Rate against Index of Multiple Deprivation Score
0
5
10
15
20
25
30
35
40
45
0 50 100 150 200 250 300 350 400 450 500
Crime rate per 1000 population
Inde
x of
mul
tiple
dep
rivat
ion
scor
e
Medworth, Wisbech
Market, Cambridge
Peckover, Wisbech
Ely East
Petersfield, Cambridge
Clarkson, Wisbech
Huntingdon, West
Abbey, Cambridge
Huntingdon North
Trendline
Group 1
Group 2
The chart above shows the wards with the highest crime rate in relation to their Index of Multiple Deprivation (IMD) scores.
Group One: wards with a high deprivation score (>20) and a high crime rate (>100 per 1000 population). They tend to be areas with a high percentage of social housing and high need. The exception is Medworth ward which also contains the town centre for Wisbech.
Group Two: wards with a low deprivation score (<20) and a high crime rate (>100 per 1000 population). These tend to cover the major centres of the county including the Market ward which has the highest crime rate of all and covers the centre of Cambridge. The dominant issue in these places is alcohol-related violence, and they are wards requiring specific actions, which would need to involve a co-ordinated county approach, to tackle their issues.
The nature of the problems facing districts varies within Cambridgeshire and the Community Safety Partnerships use analysis of crime and factors that influence crime, offending and protecting vulnerable victims to set the local priorities. The table below shows some examples of volume of selected crime types as recorded using the Home Office Counting rules10 per district. These do not take into account population size and are included as an indication of local crime levels only. The data for is 12 months covering the period September 2010 to August 2011.
10 Rules guiding the recording of crimes as set out by the Home Office http://webarchive.nationalarchives.gov.uk/20110218135832/http://rds.homeoffice.gov.uk/rds/countrules.html
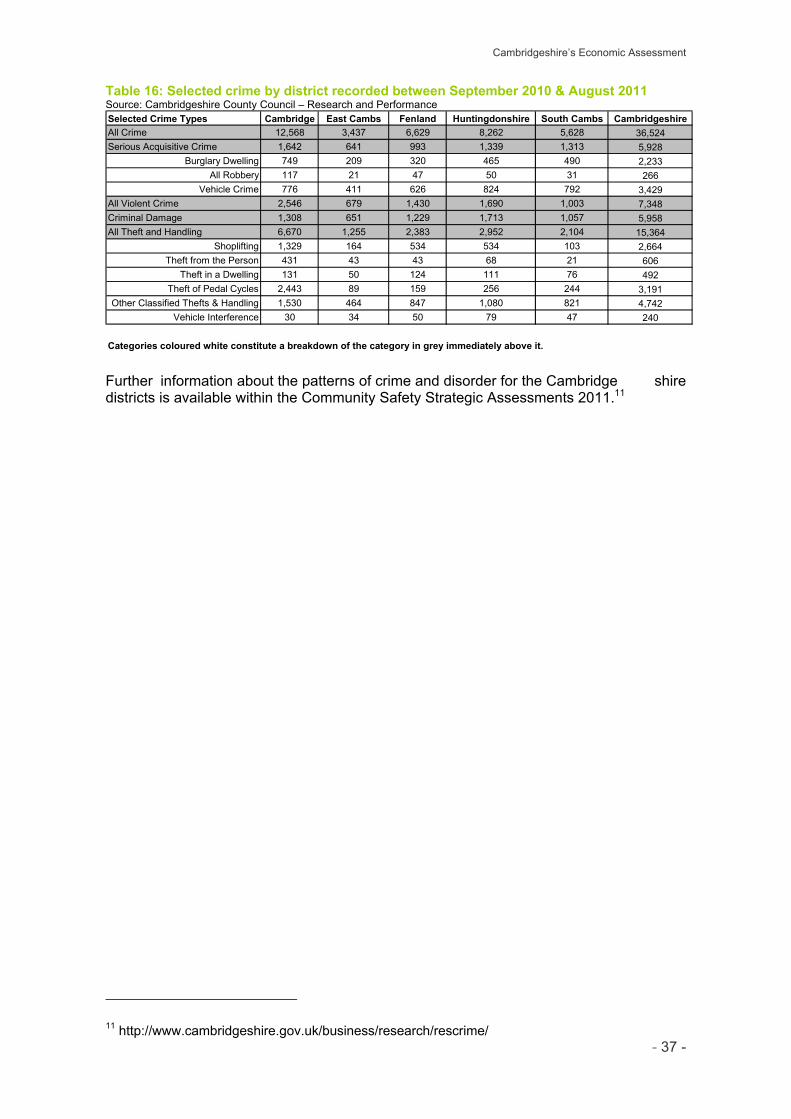
Cambridgeshire’s Economic Assessment
- 37 -
Table 16: Selected crime by district recorded between September 2010 & August 2011 Source: Cambridgeshire County Council – Research and Performance Selected Crime Types Cambridge East Cambs Fenland Huntingdonshire South Cambs CambridgeshireAll Crime 12,568 3,437 6,629 8,262 5,628 36,524Serious Acquisitive Crime 1,642 641 993 1,339 1,313 5,928
Burglary Dwelling 749 209 320 465 490 2,233All Robbery 117 21 47 50 31 266
Vehicle Crime 776 411 626 824 792 3,429All Violent Crime 2,546 679 1,430 1,690 1,003 7,348Criminal Damage 1,308 651 1,229 1,713 1,057 5,958All Theft and Handling 6,670 1,255 2,383 2,952 2,104 15,364
Shoplifting 1,329 164 534 534 103 2,664Theft from the Person 431 43 43 68 21 606
Theft in a Dwelling 131 50 124 111 76 492Theft of Pedal Cycles 2,443 89 159 256 244 3,191
Other Classified Thefts & Handling 1,530 464 847 1,080 821 4,742Vehicle Interference 30 34 50 79 47 240
Categories coloured white constitute a breakdown of the category in grey immediately above it. Further information about the patterns of crime and disorder for the Cambridge shire districts is available within the Community Safety Strategic Assessments 2011.11
11 http://www.cambridgeshire.gov.uk/business/research/rescrime/
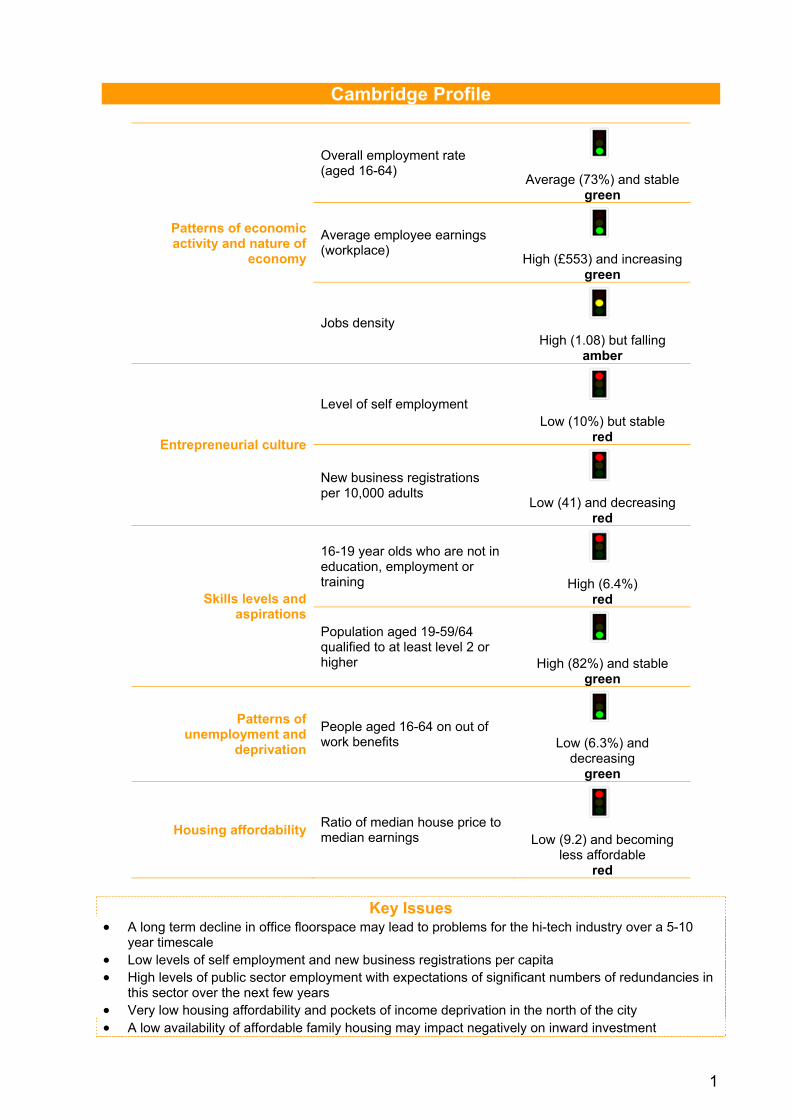
1
Cambridge Profile
Patterns of economic activity and nature of
economy
Overall employment rate (aged 16-64)
Average (73%) and stable green
Average employee earnings (workplace)
High (£553) and increasing green
Jobs density
High (1.08) but falling
amber
Entrepreneurial culture
Level of self employment Low (10%) but stable
red
New business registrations per 10,000 adults
Low (41) and decreasing
red
Skills levels and aspirations
16-19 year olds who are not in education, employment or training
High (6.4%)
red
Population aged 19-59/64 qualified to at least level 2 or higher
High (82%) and stable
green
Patterns of unemployment and
deprivation People aged 16-64 on out of work benefits
Low (6.3%) and
decreasing green
Housing affordability
Ratio of median house price to median earnings
Low (9.2) and becoming
less affordable red
Key Issues
A long term decline in office floorspace may lead to problems for the hi-tech industry over a 5-10 year timescale
Low levels of self employment and new business registrations per capita High levels of public sector employment with expectations of significant numbers of redundancies in
this sector over the next few years Very low housing affordability and pockets of income deprivation in the north of the city A low availability of affordable family housing may impact negatively on inward investment
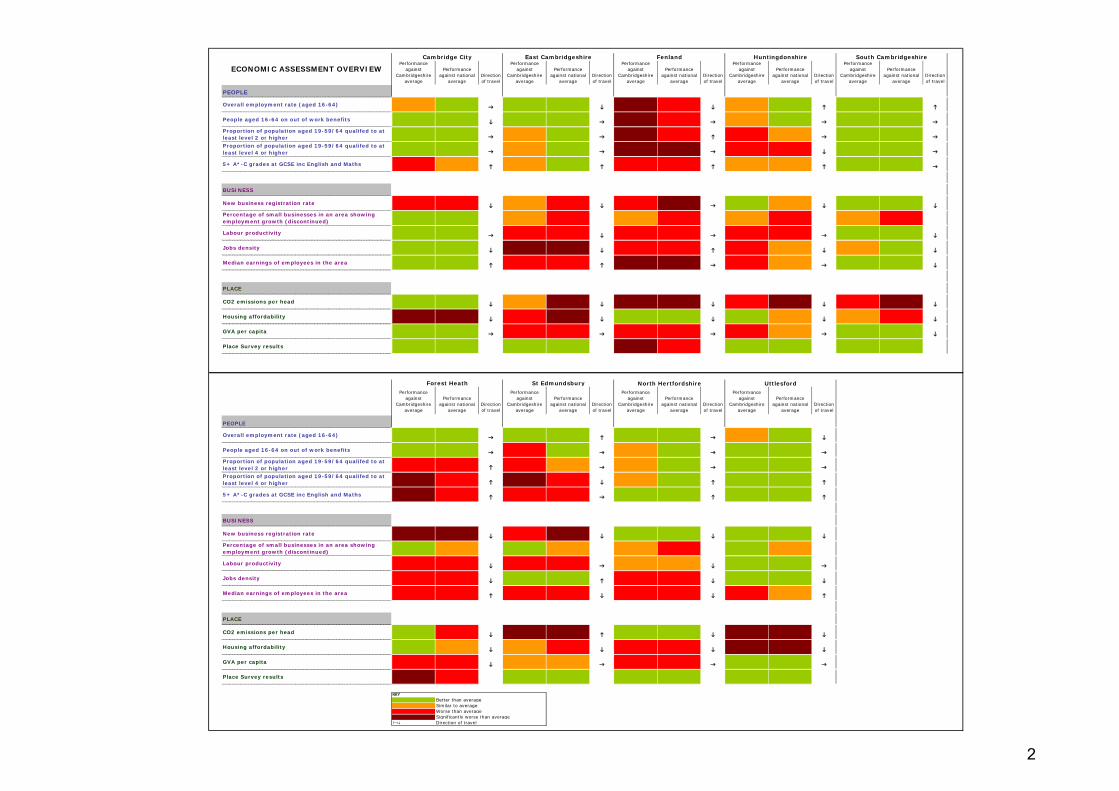
2
Performance against
Cambridgeshire average
Performance against national
averageDirection of travel
Performance against
Cambridgeshire average
Performance against national
averageDirection of travel
Performance against
Cambridgeshire average
Performance against national
averageDirection of travel
Performance against
Cambridgeshire average
Performance against national
averageDirection of travel
Performance against
Cambridgeshire average
Performance against national
averageDirection of travel
PEOPLE
Overall employment rate (aged 16-64)
People aged 16-64 on out of work benefits Proportion of population aged 19-59/64 qualifed to at least level 2 or higher Proportion of population aged 19-59/64 qualifed to at least level 4 or higher
5+ A*-C grades at GCSE inc English and Maths
BUSINESS
New business registration rate Percentage of small businesses in an area showing employment growth (discontinued)
Labour productivity
Jobs density
Median earnings of employees in the area
PLACE
CO2 emissions per head
Housing affordability
GVA per capita
Place Survey results
Performance against
Cambridgeshire average
Performance against national
averageDirection of travel
Performance against
Cambridgeshire average
Performance against national
averageDirection of travel
Performance against
Cambridgeshire average
Performance against national
averageDirection of travel
Performance against
Cambridgeshire average
Performance against national
averageDirection of travel
PEOPLE
Overall employment rate (aged 16-64)
People aged 16-64 on out of work benefits Proportion of population aged 19-59/64 qualifed to at least level 2 or higher Proportion of population aged 19-59/64 qualifed to at least level 4 or higher
5+ A*-C grades at GCSE inc English and Maths
BUSINESS
New business registration rate Percentage of small businesses in an area showing employment growth (discontinued)
Labour productivity
Jobs density
Median earnings of employees in the area
PLACE
CO2 emissions per head
Housing affordability
GVA per capita
Place Survey results
KEYBetter than averageSimilar to averageWorse than averageSignificantly worse than average
Direction of travel
ECONOMIC ASSESSMENT OVERVIEWEast Cambridgeshire
North Hertfordshire UttlesfordForest Heath St Edmundsbury
South CambridgeshireFenlandCambridge City Huntingdonshire
3
Cambridge SWOT
Strengths
A national centre for higher education and R&D, with employment in these sectors over 10 and 8 times higher than the national shares of employment respectively.
A globally significant hi-tech economy that provides around 15% of employment in the city. Cambridge acts as an ‘incubator’ of firms, and exports businesses to other districts, particularly South Cambridgeshire.
A substantial tourism industry that generated £196m of expenditure in 2006.
Relatively high levels of resident satisfaction in Cambridge as a place to live.
Over half of residents are employed to NVQ level 4+; generally recognised as the skill level required to drive innovation and leadership within an economy and to enable businesses to compete globally.
Residents have high educational attainment levels, however performance may be boosted by pupils living outside Cambridge.
Average businesses size is larger than that seen nationally and employment growth among smaller businesses is strong, helping to create a high jobs density.
The city has seen a significant recent increase in retail floorspace, supporting a growing retail sector.
A high level of in-commuting causes significant levels of congestion within the city.
The city has fairly high but recently decreasing levels of crime.
Weaknesses
Relatively high proportion of young people not in education, employment or training.
Low levels of self employment and new business registrations per capita.
Housing affordability within the city is very low and housing completions have steadily declined since 2004.
Opportunities
The hi-tech sector is generating national strengths in creative industries and clean technologies; important growth sectors in their own rights.
The area is perceived as very entrepreneurial and the birth rate of new enterprises is high compared with local figures however remains below the national average. This may be due to various reasons such as the high cost of living increasing the perceived risk of starting up a business and the high value nature of the economy meaning there are fewer but higher value start ups.
Future supply of housing sites on the edges of the city.
Threats
High levels of traffic congestion may start to influence the attractiveness of the area as a place to invest.
A high dependence on high skilled migrant workers in the hi-tech and health sectors could cause problems with increasingly tight visa restrictions.
Generally high levels of prosperity but pockets of income deprivation in the north of the city.
Likely intermediate level skills shortages, particularly in technical and skilled trade occupations.
Some evidence of recruitment difficulties in the ICT sector, particularly around commercial expertise.
Low levels of unemployment and benefit claimants, however the recession has increased employment disparities within the district.
High levels of public sector employment with expectations of significant numbers of redundancies in this sector over the next few years.
Relatively low business density, exacerbated by a long term decline in office floorspace leading to a recent shortage against demand that may be partially met by CB1 but the likely remaining shortage may lead to problems over a 5-10 year timescale.
Innovation strengths are concentrated within the University of Cambridge and a small number of global companies – a situation that may not be resilient in the longer term.
A low availability of affordable family housing in Cambridge may impact negatively on inward investment and the ability of firms to move existing staff into the area.
4
Labour market, prosperity and crime
Large working age population, but high student numbers reduce levels of economic activity Cambridge has an estimated population of around 119,900 of which 73% are of working age, the
highest proportion in Greater Cambridge due to the large student population. High level of in-commuting, particularly to fill managerial posts A higher proportion of the workplace population are managers than the resident population implying
that people are commuting into the district to work in managerial roles. 2001 Travel to Work Area (TTWA) data showed Cambridge as the third largest travel to work area in
the East of England. Cambridge is one of two TTWAs in the region (the other being Norwich) which are net importers of workers (i.e. more jobs than resident workers).
Commuting patterns into Cambridge stretch across the Cambridgeshire local authority boundary into the surrounding districts of St Edmundsbury, Forest Heath and Uttlesford.
A higher proportion of the resident population than the workplace population work in professional occupations implying residents commute out of the district to work in these roles.
High dependence on high skilled migrant workers in the hi-tech and health sectors Between 2002/03 and 2010/11, 65,910 overseas people registered for a National Insurance Number
(NINo) in Cambridgeshire. Of these, 47% registered in Cambridge City. The Annual Population Survey suggests an increase over the last ten years in the proportion of
residents born abroad, just over a quarter of residents are foreign born in Cambridge City. This may reflect the settling of skilled migrants who were originally recruited into the hi-tech, academic and health industries - industries that are highly dependent on a supply of skilled labour which cannot fully be met within the region or country.
There is a risk that the hi-tech sector might face increased labour and skills shortages in the future. Overseas students have traditionally filled a proportion of vacancies in the hi-tech sector but tighter new work visa and student visa regimes restrict their opportunities to work in the UK. Furthermore, there are significant numbers of migrants in Cambridge who initially worked in the area, but now commute out due to higher salaries (IPPR 2009).
Generally high levels of prosperity but pockets of income deprivation in the north The East of England Forecasting Model estimates that Gross Value Added (GVA) per capita (a
measure of general prosperity) is the highest in Cambridge City of all Greater Cambridge districts, significantly higher than the average UK figure, possibly reflecting the high jobs density in the district.
Median weekly resident pay increased steadily between 2006 and 2011. Two of Cambridge’s Lower Super Output Areas are just outside the most deprived 20% nationally in
terms of income – these are both located in the north of the city (in Abbey and King’s Hedges). [Map 3]
A high number of single-person households While gross weekly pay is the second highest in the county, annual household income is the second
lowest in the county. This may be because there are more single-person households in the city so there are fewer households with a joint income.
Relatively high levels of resident satisfaction The 2008 Place Survey recorded that 87% of Cambridge City residents were satisfied with their
local area as a place to live, third highest in the county and above the national average of 80%. Cambridge was also one of the few Cambridgeshire districts with above average levels of
satisfaction with the way the council runs things. Relatively high levels of crime but decreasing Cambridgeshire Police collate data for the county’s Crime and Disorder Reduction Partnerships. Across Cambridgeshire the highest numbers of crimes are recorded in Cambridge City and
Huntingdonshire. The level of crime in Cambridge has decreased in the 2010/11 period and there has been a
good reduction across most types of crime, including violent crime. However sexual assaults are up by 7.8% and drug related crime has also increased by 27.4%.
5
Skills levels, education and skills demand
Very highly skilled resident population but few residents qualified to ‘intermediate’ level A very high proportion (53%) of Cambridge City residents are qualified to NVQ level 4+ or degree
level and above. This is 19 percentage points higher than the national average. Only 2% of Cambridge City residents aged 19-59/64 have no qualifications. Likely intermediate level skills shortages, particularly in technical and skilled trade occupations East Cambridgeshire, South Cambridgeshire and Cambridge City all have a lower than average
proportion of their population holding level 3 (recognised as ‘intermediate level’) as their highest qualification. This is lowest in Cambridge City where the proportion is 5 percentage points lower than the national average.
The National Skills Audit 2010 found that the highest ‘densities’ of skills shortages (i.e. relative to the numbers in the occupation) are found in associate professional/technical, skilled trades and personal service occupations, all of which require predominantly intermediate level skills.
Associate technical/professional and skilled trade occupations are essential in many advanced manufacturing sectors; skills shortages in these areas could be restricting their growth in the sub-region.
Some evidence of recruitment difficulties in the ICT sector, particularly around commercial expertise [business discussion via Connected Cambridge linked in group] High number of vacancies in the ICT sector – 200 jobs advertised on Connected Cambridge every
week with a churn of only 13%, i.e. vacancies not being filled. Recruitment often takes place from outside of Cambridge or the UK for vacancies within CB1/CB2. Many Cambridge organisations have high expectations of academic qualifications in addition to
technical expertise, but maintain lower salaries than London. Development staff are very academic and technically competent but often don't have the commercial
experience or business knowledge to drive a successful business. Relatively high proportions of young people not in education, employment or training (NEET) Proportions of 16-19 year olds NEET are highest in Fenland and Cambridge City. The proportion of
young people NEET in Cambridge City is 6.4%, which is about 410 16-19 year olds. High educational attainment levels, but performance may be boosted by pupils living outside Cambridge Of those pupils studying in the district a high proportion have good attainment levels with 60%
reaching level 3 by age 19, compared with 48% nationally. Pupils attending schools in Cambridge perform better than pupils living in Cambridge. This implies
that school performance in the city may be boosted by pupils living outside Cambridge.
Patterns of unemployment and deprivation
Low levels of unemployment and benefit claimants, however the recession has increased employment disparities within the district The unemployment rate among the economically active across Cambridge City is low at 6%
(compared with a national level of 8%). However, the Jobseeker’s Allowance (JSA) claimant rate is similar to or higher than the national
average in the north of Cambridge. Since the onset of the recession, the increase in the JSA claimant rate in Cambridge City has been
particularly low at just 0.4 percentage points however, the highest increases were concentrated in King’s Hedges, Cherry Hinton, Arbury and East Chesterton.
Relatively low levels of incapacity benefit claimants Just under 4% of Cambridge City residents claim Incapacity Benefit/Employment and Support
Allowance (IB/ESA) – a moderate proportion in Greater Cambridge and lower than the national average.
As a proportion of the working age population, IB/ESA claimants have been decreasing since 2006, similar to the pattern seen nationally.
6
Nature of the economy
A high value economy dominated by knowledge intensive industries and occupations Knowledge intensive occupations are concentrated in Cambridge City where they represent 26% of
employment (reflecting high employment in teaching, research and health professions). The professional, scientific and technical sector accounts for the largest number of businesses in the
city, followed by retail, information and communication, and accommodation and food services. The dominant sectors of employment are education (accounting for approximately 25% of all
employment compared with a national average of 10%), health, professional, scientific and technical, and retail. 67% of employment is in ‘high value’ occupations.
The East of England Forecasting Model estimates that labour productivity in Cambridge City is the second highest of all Greater Cambridge districts (behind South Cambridgeshire).
Cambridge City saw the highest percentage increase in employee wages (among Cambridgeshire districts) over the last five years.
High levels of public sector employment 41% of Cambridge workers work in the public sector (11 percentage points higher than the national
average). A national centre for higher education and research & development (R&D) Cambridge is a key centre for both higher education and R&D (over 10 and 8 times higher than the
national shares of employment respectively), together with a range of high value manufacturing activity. Another major specialism is within software consultancy, 2.5 times the national quotient, and employing around 3,000 people in the city.
Globally significant hi-tech and bio-tech economy, leading to strengths in creative industries and clean-tech Responses to the County Council’s survey of hi-tech businesses and employers indicate that the
wider hi-tech ‘community’ provided 51,400 jobs at the start of 2008. Almost three quarters of the total are employed in Cambridge City and South Cambridgeshire, 36,800 in all, 16,577 in Cambridge City representing nearly 15% of total employment. [Maps 1 and 2]
Evidence suggests that Cambridge acts as an ‘incubator’ of firms, exporting firms to other districts, particularly South Cambridgeshire.
10% of the UK’s computer games developers are within five miles of Cambridge city centre. National strengths in software, computer games and electronic publishing. National strengths in advanced materials and bio-tech in clean-tech. Average business size larger than seen nationally In March 2011 there were 5,660 local units in VAT and/or PAYE based enterprises in Cambridge,
and there were 98,000 jobs in 2009, a third of the county’s total jobs. The size of businesses in the district is generally larger than across the wider sub-region or across
England as a whole with 17% employing between 10 and 49 people compared with a comparative figure of 13% across Greater Cambridge and 14% across England as a whole.
The proportion of enterprises with employment less than 50 showing employment growth in 2008 was the highest among Greater Cambridge districts at 14.5% and above the national proportion.
Tourism The tourism industry generated expenditure of £196m million for Cambridge in 2006. The University
of Cambridge is a major attraction for tourists. Relatively low business density but high (decreasing) jobs density A high density of businesses is crucial in creating the levels of agglomeration required to enable
effective knowledge flow between people and firms, important for the growth of any successful economy.
Business density is relatively low in Cambridge City compared with other districts across Greater Cambridge and only increased by a very small amount between 2004 and 2011 probably due to a combination of high population growth over this period and a general decrease in office space in the city centre.
Across Greater Cambridge, only in Cambridge City is the labour demand higher than the available workforce, with a jobs density figure of 1.08 in 2009. This figure decreased between 2001 and 2009, reflecting an increase in population over this period.
7
Relatively high ‘birth rate’ of new enterprises but below national figures The ‘birth rate’ of new enterprises (measured as births per 100 active enterprises) in 2010 was
relatively high in Cambridge City compared with most other Greater Cambridge districts, yet still below the national figure. This may be due to various reasons such as the high cost of living increasing the perceived risk of starting up a business and the high value nature of the economy meaning there are fewer but higher value start ups.
Around 10% of Cambridge residents are self employed; this is one of the lowest levels within Greater Cambridge and lower than the national average, suggesting there may not be a significantly large number of businesses sitting below the VAT/PAYE threshold.
Many innovation strengths, driven by the University of Cambridge and a small number of global companies The East of England Innovation Baseline (2009) found that private sector investment in R&D in
Cambridge makes up a large proportion of the total amount in the East of England. However there is a concern that business R&D investment is heavily dependent on the investment
decisions of a small number of global companies, which may not be resilient in the longer term. The report found that strong regional performance on business – university research and
consultancy is driven by the University of Cambridge’s strong interactions with business communities. The University of Cambridge accounts for about 60% of the total value of collaborative research and research/consultancy contracts in the region of which the total amount is the highest level in the UK.
By 2005, 51 companies had spun-out directly from the University of Cambridge alone and 250 companies had been created based on knowledge transfer from the University of Cambridge. In 2005 those companies employed 3,990 people and generated revenues of £574m.
8
Business development, infrastructure and housing
Low availability of affordable family housing in Cambridge may impact negatively on inward investment There is a low proportion of detached and semi-detached housing in Cambridge City. This may
impact on the attractiveness of the city for inward investment. Property agents are increasingly reporting a high demand for family houses in the centre of
Cambridge.
Very low housing affordability Cambridge City is the most expensive area in the sub-region followed by South Cambridgeshire. The
average house price in Aug 2011 to Jan 2012 was £337,654. This is more than double the average house price in Fenland which has the cheapest house prices in Cambridgeshire.
The lower quartile house price to lower quartile income ratio for Cambridge City is 12.11, compared to 8.57 for the East of England as a whole.
Seven of the ten least affordable wards in the sub-region are in Cambridge City, including the least affordable – Newnham where the average house price is around 20 times the average income.
The most affordable ward in the city is King’s Hedges which has a lower quartile house price to lower quartile income ratio of 9.26.
Fall in housing completions Like most other districts, Cambridge saw a significant fall in the number of dwellings completed
over 2008-2010, however this followed a more steady decrease from 2004 onwards but there was a slight rise in 2010-2011.
Long term decline in office floorspace leading to a recent shortage against demand that may be partially met by CB1, but the likely remaining shortage may lead to problems over a 5-10 year timescale Since 1999 there has been an overall decline in business floorspace (B1-B8 use) in Cambridge
City, much of this was converted into land used for dwellings. Between 2010 and 2011 Cambridge City was the only Cambridgeshire district to see a net
decrease in business floorspace, with a loss of almost 26,000 sqm. Much of this loss has been former business land cleared for housing and retail developments. Property agents report a demand for city centre office space, predominantly from the
professional business market requiring good quality space close to the centre and the railway station for access to London.
Significant increase in retail floorspace Cambridge accounted for just over a third of the total increase in Cambridgeshire’s new retail
floorspace between 1999 and 2011. Cambridge City and Huntingdon town centres have seen the largest growth in retail floorspace over the period 1999-2011.
Most of the additional floorspace was within the town centre area, compared to out of centre development.
From 2011 most of the increases in retail floorspace are projected to be in Cambridge City and South Cambridgeshire.
Increasing traffic congestion as the Cambridge travel to work area expands 2010 figures show the busiest urban road within Cambridgeshire is Milton Road in Cambridge. The A14, A428 and M11 were identified as three of the six ‘priority’ corridors for intervention in the
East of England, based on the direct costs of transport congestion and the foregone wider economic benefits.
Furthermore several property agents believe that congestion within Cambridge City will soon start to exert a negative influence on business decisions as to where they wish to locate.
CO2 emissions per head are lower than the UK average Fuel consumption within Cambridge is lower per capita than the UK average and the lowest of all the
Greater Cambridge districts, and has been decreasing since 2006.
Relatively low levels of fuel poverty Fuel poverty is influenced by three factors: low incomes, high fuel costs and thermal efficiency of the
housing stock. Despite more older, less efficient stock in Cambridge, there is relatively less fuel poverty in the city than the country as a whole, with the exception of parts of Market ward (DECC 2009).
9
Future prospects
Increase in employment The East of England Forecasting Model forecasts that of the Cambridgeshire districts, Cambridge
City will see the highest level of employment growth in percentage terms between 2009 and 2021. Increase in population The now-abolished East of England Plan identified Cambridgeshire, and in particular Cambridge City
and South Cambridgeshire, as key locations for future house-building. The County Council Research Group’s 2010-based population forecasts, which are consistent with
the levels of house-building set out in the East of England Plan, suggest the highest levels of population growth will be in Cambridge City (22%) and South Cambridgeshire (13%), as these are where the most house-building is expected.
Cambridge City is the only Cambridgeshire district anticipated to see a substantial increase in population aged 25-44 between 2010 and 2021.
Increase in GVA GVA growth forecasts suggest GVA growth will be highest for both South Cambridgeshire and
Cambridge City. Employment demand in associate technical and professional occupations Occupational forecasts for Cambridgeshire based on both the East of England Forecasting Model
and the Local Economy Forecasting Model estimate that over the next five years expansion demand is likely to be strongest in:
Caring personal service occupations Managers and senior officials Associate technical and professional occupations Professional occupations Sales and customer service occupations
All other occupations are projected to experience very little, or negative expansion demand.
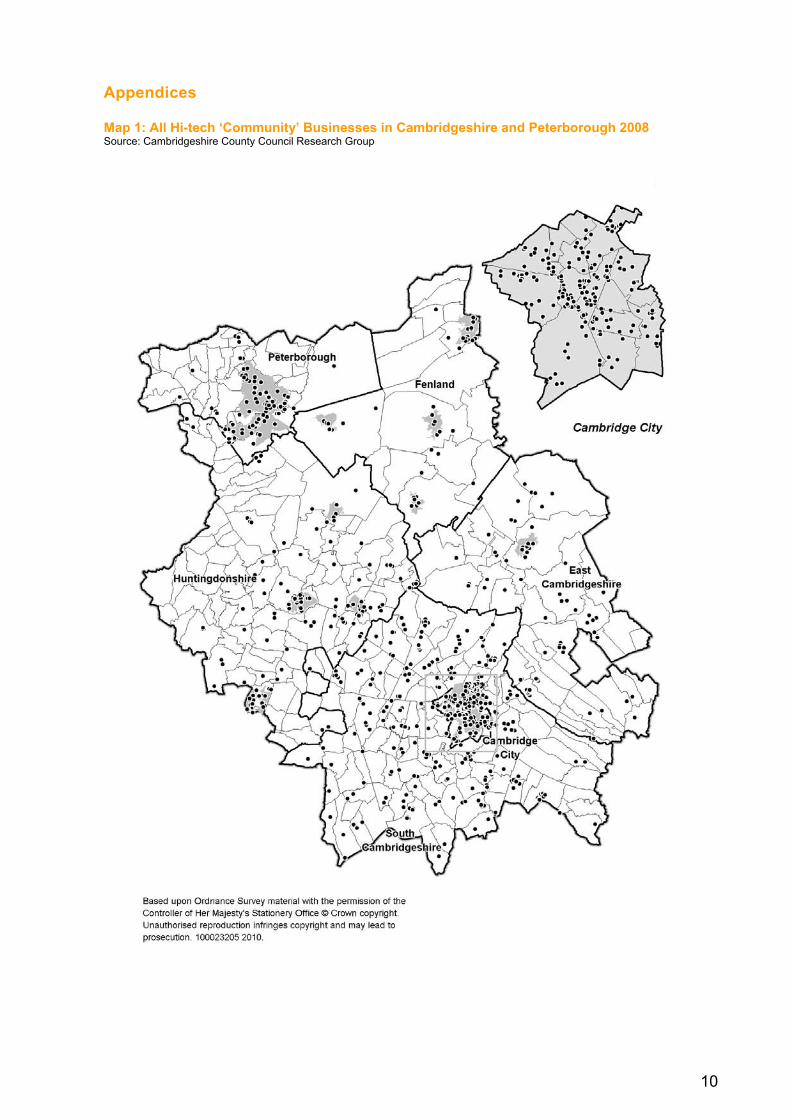
10
Appendices Map 1: All Hi-tech ‘Community’ Businesses in Cambridgeshire and Peterborough 2008 Source: Cambridgeshire County Council Research Group
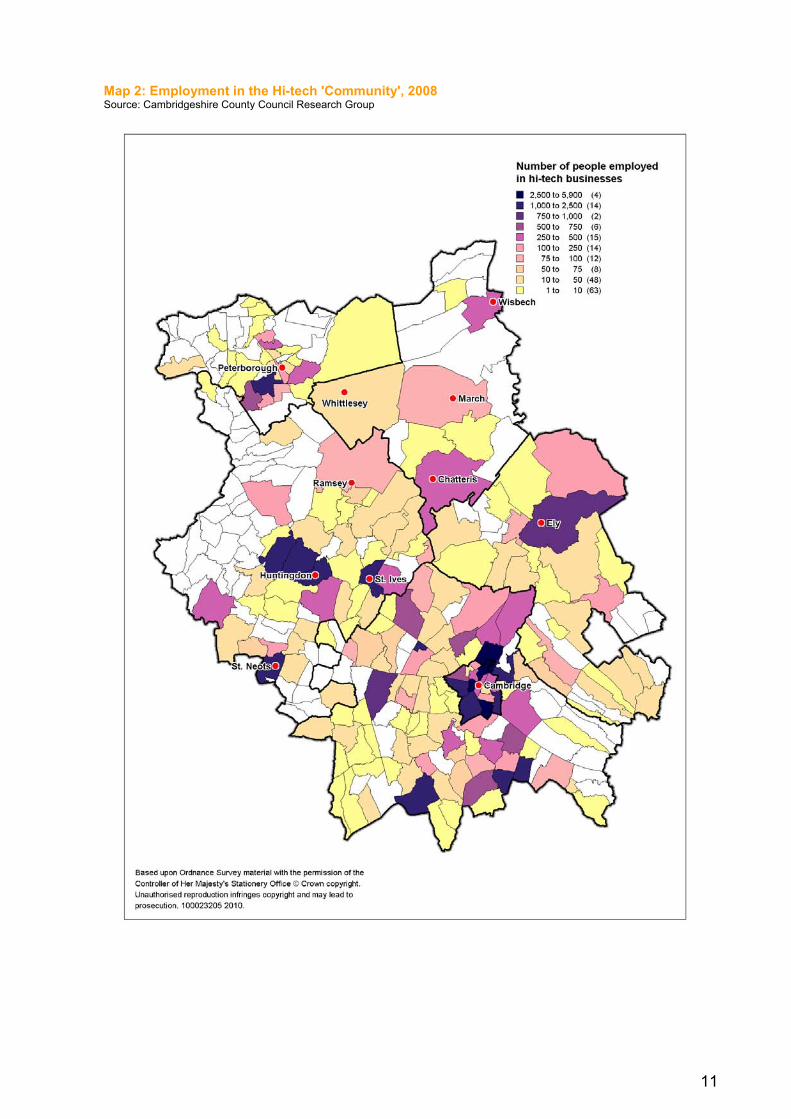
11
Map 2: Employment in the Hi-tech 'Community', 2008 Source: Cambridgeshire County Council Research Group
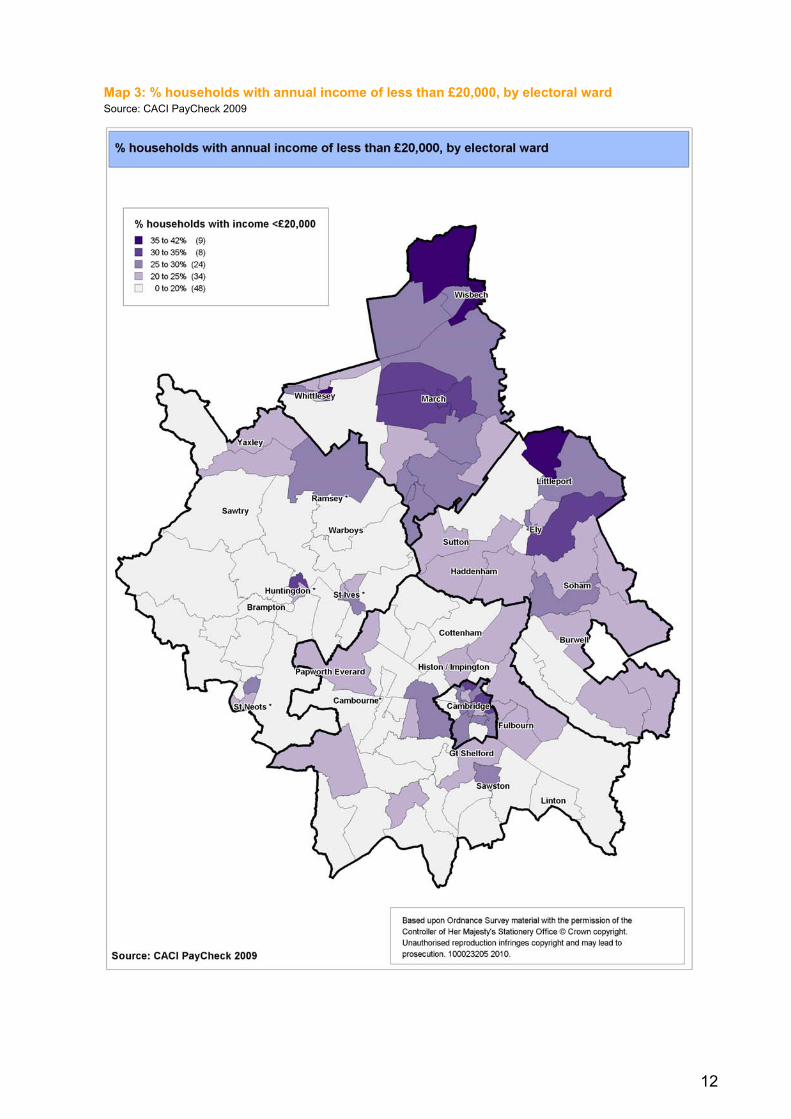
12
Map 3: % households with annual income of less than £20,000, by electoral ward Source: CACI PayCheck 2009
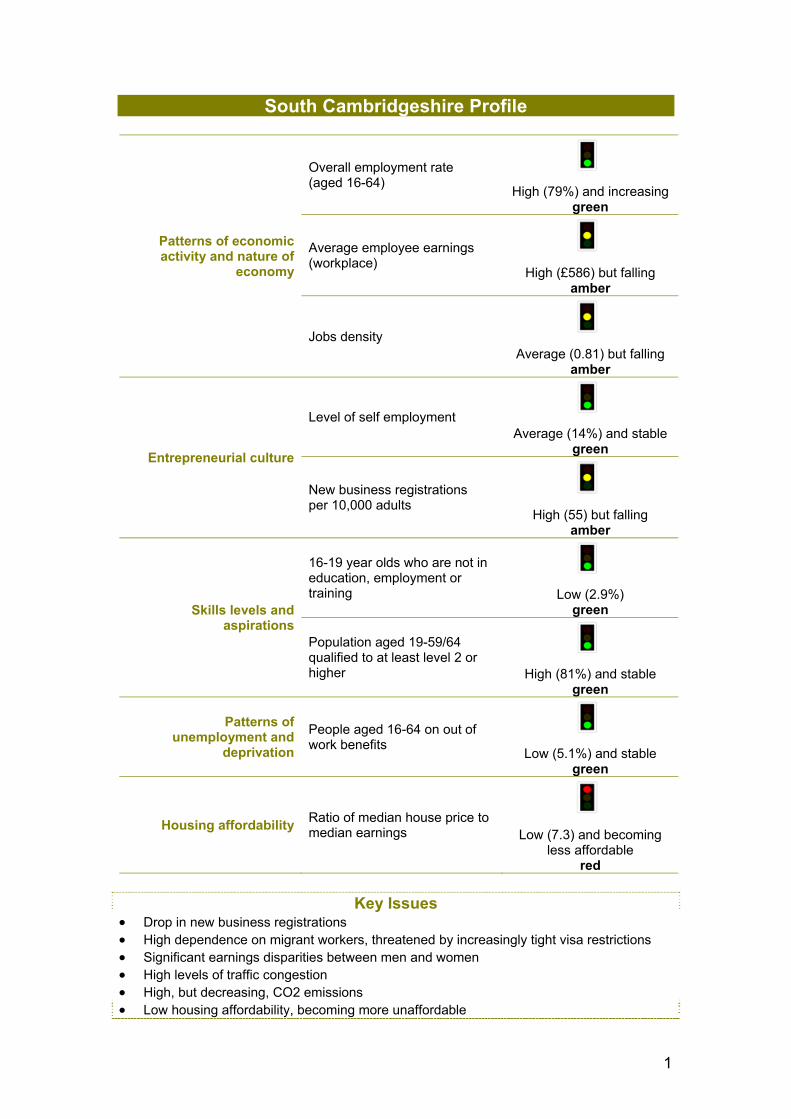
1
South Cambridgeshire Profile
Patterns of economic activity and nature of
economy
Overall employment rate (aged 16-64)
High (79%) and increasing green
Average employee earnings (workplace)
High (£586) but falling amber
Jobs density
Average (0.81) but falling
amber
Entrepreneurial culture
Level of self employment Average (14%) and stable
green
New business registrations per 10,000 adults
High (55) but falling amber
Skills levels and aspirations
16-19 year olds who are not in education, employment or training
Low (2.9%)
green
Population aged 19-59/64 qualified to at least level 2 or higher
High (81%) and stable
green
Patterns of unemployment and
deprivation People aged 16-64 on out of work benefits
Low (5.1%) and stable green
Housing affordability Ratio of median house price to median earnings
Low (7.3) and becoming
less affordable red
Key Issues
Drop in new business registrations High dependence on migrant workers, threatened by increasingly tight visa restrictions Significant earnings disparities between men and women High levels of traffic congestion High, but decreasing, CO2 emissions Low housing affordability, becoming more unaffordable
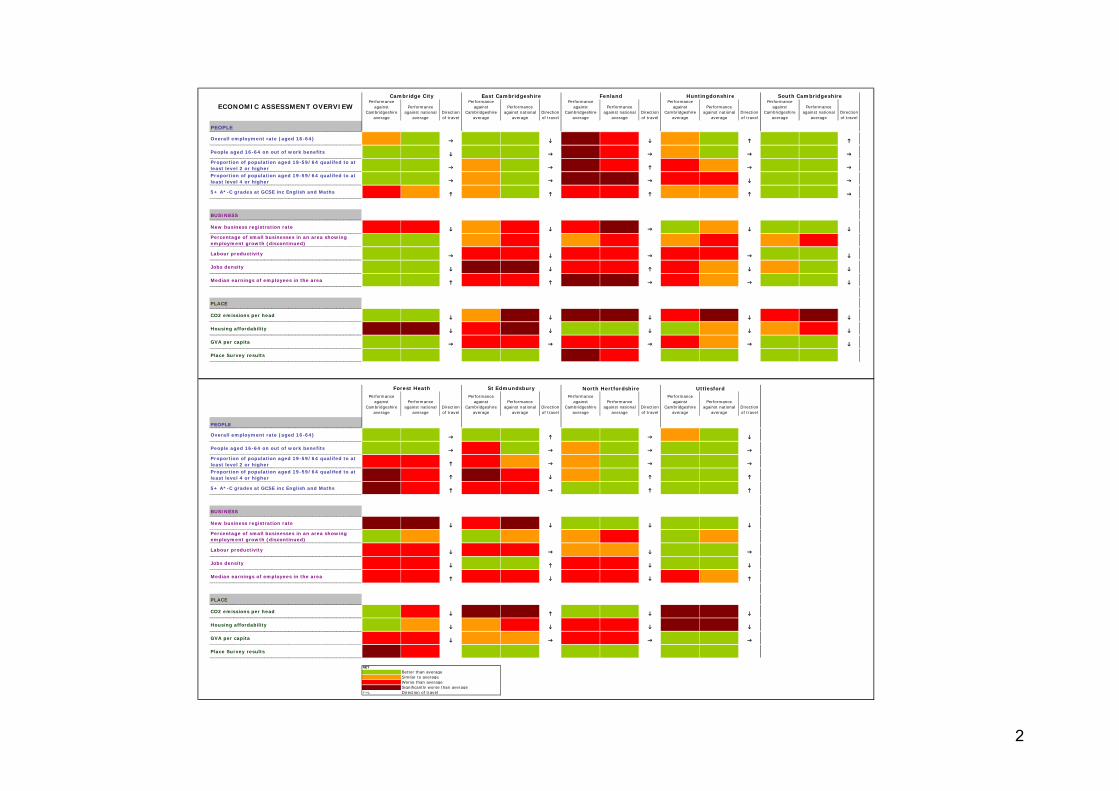
2
Performance against
Cambridgeshire average
Performance against national
averageDirection of travel
Performance against
Cambridgeshire average
Performance against national
averageDirection of travel
Performance against
Cambridgeshire average
Performance against national
averageDirection of travel
Performance against
Cambridgeshire average
Performance against national
averageDirection of travel
Performance against
Cambridgeshire average
Performance against national
averageDirection of travel
PEOPLE
Overall employment rate (aged 16-64)
People aged 16-64 on out of work benefits Proportion of population aged 19-59/64 qualifed to at least level 2 or higher Proportion of population aged 19-59/64 qualifed to at least level 4 or higher
5+ A*-C grades at GCSE inc English and Maths
BUSINESS
New business registration rate Percentage of small businesses in an area showing employment growth (discontinued)
Labour productivity
Jobs density
Median earnings of employees in the area
PLACE
CO2 emissions per head
Housing affordability
GVA per capita
Place Survey results
Performance against
Cambridgeshire average
Performance against national
averageDirection of travel
Performance against
Cambridgeshire average
Performance against national
averageDirection of travel
Performance against
Cambridgeshire average
Performance against national
averageDirection of travel
Performance against
Cambridgeshire average
Performance against national
averageDirection of travel
PEOPLE
Overall employment rate (aged 16-64)
People aged 16-64 on out of work benefits Proportion of population aged 19-59/64 qualifed to at least level 2 or higher Proportion of population aged 19-59/64 qualifed to at least level 4 or higher
5+ A*-C grades at GCSE inc English and Maths
BUSINESS
New business registration rate Percentage of small businesses in an area showing employment growth (discontinued)
Labour productivity
Jobs density
Median earnings of employees in the area
PLACE
CO2 emissions per head
Housing affordability
GVA per capita
Place Survey results
KEYBetter than averageSimilar to averageWorse than averageSignificantly worse than average
Direction of travel
ECONOMIC ASSESSMENT OVERVIEWEast Cambridgeshire
North Hertfordshire UttlesfordForest Heath St Edmundsbury
South CambridgeshireFenlandCambridge City Huntingdonshire
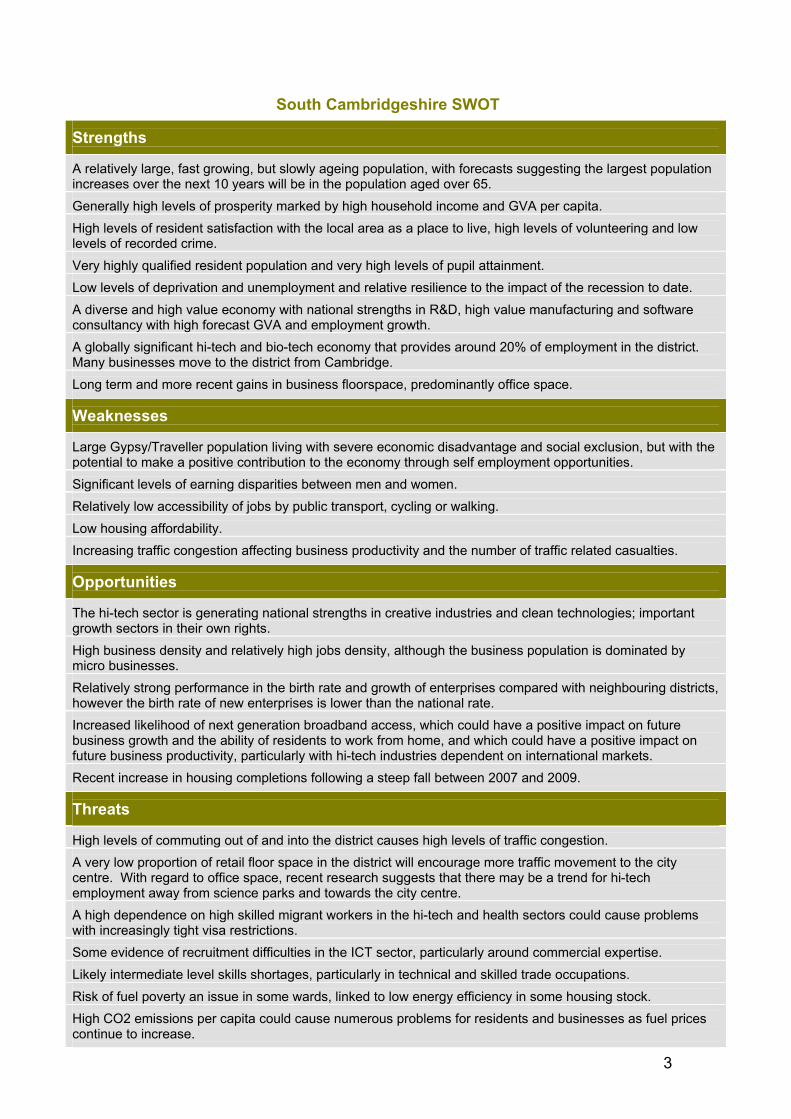
3
South Cambridgeshire SWOT
Strengths
A relatively large, fast growing, but slowly ageing population, with forecasts suggesting the largest population increases over the next 10 years will be in the population aged over 65.
Generally high levels of prosperity marked by high household income and GVA per capita.
High levels of resident satisfaction with the local area as a place to live, high levels of volunteering and low levels of recorded crime.
Very highly qualified resident population and very high levels of pupil attainment.
Low levels of deprivation and unemployment and relative resilience to the impact of the recession to date.
A diverse and high value economy with national strengths in R&D, high value manufacturing and software consultancy with high forecast GVA and employment growth.
A globally significant hi-tech and bio-tech economy that provides around 20% of employment in the district. Many businesses move to the district from Cambridge.
Long term and more recent gains in business floorspace, predominantly office space.
Weaknesses
Large Gypsy/Traveller population living with severe economic disadvantage and social exclusion, but with the potential to make a positive contribution to the economy through self employment opportunities.
Significant levels of earning disparities between men and women.
Relatively low accessibility of jobs by public transport, cycling or walking.
Low housing affordability.
Increasing traffic congestion affecting business productivity and the number of traffic related casualties.
Opportunities
The hi-tech sector is generating national strengths in creative industries and clean technologies; important growth sectors in their own rights.
High business density and relatively high jobs density, although the business population is dominated by micro businesses.
Relatively strong performance in the birth rate and growth of enterprises compared with neighbouring districts, however the birth rate of new enterprises is lower than the national rate.
Increased likelihood of next generation broadband access, which could have a positive impact on future business growth and the ability of residents to work from home, and which could have a positive impact on future business productivity, particularly with hi-tech industries dependent on international markets.
Recent increase in housing completions following a steep fall between 2007 and 2009.
Threats
High levels of commuting out of and into the district causes high levels of traffic congestion.
A very low proportion of retail floor space in the district will encourage more traffic movement to the city centre. With regard to office space, recent research suggests that there may be a trend for hi-tech employment away from science parks and towards the city centre.
A high dependence on high skilled migrant workers in the hi-tech and health sectors could cause problems with increasingly tight visa restrictions.
Some evidence of recruitment difficulties in the ICT sector, particularly around commercial expertise.
Likely intermediate level skills shortages, particularly in technical and skilled trade occupations.
Risk of fuel poverty an issue in some wards, linked to low energy efficiency in some housing stock.
High CO2 emissions per capita could cause numerous problems for residents and businesses as fuel prices continue to increase.
4
Labour market, prosperity and crime
A relatively large, fast growing, but gradually ageing population South Cambridgeshire is the second most populous of the Greater Cambridge districts with an
estimated population of 145,200. 62.5% of the population is of working age – a slightly lower proportion than seen nationally (64.8%). According to forecasts based on the levels of house-building set out in the East of England Plan,
South Cambridgeshire will see its population grow by over 10% between 2011 and 2021, however the largest increase is likely to be in the population aged over 65.
Strong labour market links with Cambridge City and significant in-commuting from the surrounding districts Cambridge and South Cambridgeshire together have a relatively self contained labour market
with 87% of Cambridge residents and 85% of South Cambridgeshire residents working in Cambridge or South Cambridgeshire.
However, both districts also draw significant numbers of workers from Huntingdonshire, East Cambridgeshire and St Edmundsbury.
High dependence on migrant workers in the health and hi-tech industries The hi-tech and health sectors are highly dependent on a supply of skilled labour. There is a risk that the hi-tech sector might face increased labour and skills shortages in the future.
Overseas students have traditionally filled a proportion of vacancies in the hi-tech sector but tighter new work visa and student visa regimes restrict their opportunities to work in the UK. Furthermore, there are significant numbers of migrants in Cambridge who initially worked in the area, but now commute out due to higher salaries (IPPR 2009).
Large Gypsy/Traveller population living with severe economic disadvantage and social exclusion The Communities and Local Government bi-annual count of Gypsy and Traveller caravans shows
the majority of sites are based in South Cambridgeshire and Fenland. The Gypsy/Traveller population in Cambridgeshire is estimated to be between 6,500 and 7,000, the second largest ethnic minority in the area.
Most Gypsies/Travellers prefer self-employment, in such occupations as farm and land work. A decline in traditional farm work and increased competition from cheaper immigrant labour means
Gypsies/Travellers find it increasingly difficult to make a living from traditional occupations, contributing to severe economic disadvantage and social exclusion.
Significant levels of earning disparities between men and women Women, both resident and workplace, earn around 30% less than men, the greatest disparity in the
county and greater than within England as a whole where the gap is 20%. Generally high levels of prosperity 40% of residents are employed in managerial or professional occupations and 65% of residents are
employed in ‘high value’ occupations, higher proportions than seen nationally. Median weekly pay and average household income in South Cambridgeshire are the highest in the
county; weekly pay, both resident and workplace, is around 40% higher than in Fenland. GVA per capita, a measure of general prosperity, is also high, but is slightly lower than that of
Cambridge City, reflecting the high jobs density in Cambridge City. High levels of resident satisfaction and high levels of volunteering The 2008 Place Survey recorded that 90% of residents were satisfied with their local area as a
place to live, highest in the county, second to Uttlesford within Greater Cambridge and above the national average of 80%.
The survey also revealed a relatively high proportion of residents had given unpaid help at least once per month over the last 12 months.
Low levels of recorded crime Cambridgeshire Police collate data for the county’s Crime and Disorder Reduction Partnerships. Across Cambridgeshire the lowest numbers of crimes are recorded in South Cambridgeshire
and East Cambridgeshire and the level of crime in South Cambridgeshire is steadily decreasing.
5
Skills levels, education and skills demand
Very highly qualified resident population South Cambridgeshire residents are the second best qualified of all Greater Cambridge districts after
Cambridge City, with nearly 50% of residents aged 19-59/64 qualified to degree level or above, compared to 34% nationally.
Only 5% of residents aged 19-59/64 have no qualifications, which is half the national average.
Very high levels of pupil attainment In terms of pupil attainment at Key Stage 4, nearly 70% of pupils living in South Cambridgeshire
achieve at least five GCSEs graded A*-C including Maths and English, which is well above the national and regional averages of 53% and 56% respectively.
The district has the lowest proportion of 16-19 year olds not in education, employment or training in the county, at 3%.
Some evidence of recruitment difficulties in the ICT sector, particularly around commercial expertise [business discussion via Connected Cambridge linked in group] High number of vacancies in the ICT sector – 200 jobs advertised on Connected Cambridge every
week with a churn of only 13%, i.e. vacancies not being filled. Recruitment often takes place from outside of Cambridge or the UK for vacancies within CB1/CB2. Many Cambridge organisations have high expectations of academic qualifications in addition to
technical expertise, but maintain lower salaries than London. Development staff are very academic and technically competent but often don't have the commercial
experience or business knowledge to drive a successful business.
Likely intermediate level skills shortages, particularly in technical and skilled trade occupations East Cambridgeshire, South Cambridgeshire and Cambridge City all have a lower than average
proportion of their population holding level 3 (recognised as ‘intermediate level’) as their highest qualification.
The National Skills Audit 2010 found that the highest ‘densities’ of skills shortages (i.e. relative to the numbers in the occupation) are found in associate professional/technical, skilled trades and personal service occupations, all of which require predominantly intermediate level skills.
Associate technical/professional and skilled trade occupations are essential in many advanced manufacturing sectors; skills shortages in these areas could be restricting their growth in the sub-region.
Patterns of unemployment and deprivation
Low levels of unemployment and out-of-work benefits claimants South Cambridgeshire has a low proportion of unemployed residents, with an unemployment rate of
4%. The proportion of the population claiming out-of-work benefits is very low at 5%, less than half of the national average.
Evidence of some resilience to the impact of the recession to date South Cambridgeshire continues to have the lowest proportion of Jobseeker’s Allowance claimants
in the county, although since the recession, numbers have increased at a slightly higher rate than in Cambridge City, but are now levelling off.
Between 2007 and 2009 the recession appeared to have the greatest impact in wards to the west of the district, bordering with Huntingdonshire and North Hertfordshire. However between 2009 and 2011 the wards towards the south of the district have been most affected with Comberton, Orwell and Barrington having been most impacted in terms of population claiming Jobseeker’s Allowance.
Low levels of deprivation South Cambridgeshire is the only district in Cambridgeshire to have no areas scoring among the
most deprived in terms of income, employment, education and health.
Risk of fuel poverty an issue in some wards Fuel poverty is influenced by three factors: low incomes, high fuel costs and thermal efficiency of the
housing stock. Because incomes are relatively high and thermal efficiency is relatively good, there is less fuel poverty in South Cambridgeshire than in the country as a whole (DECC 2009).
In two South Cambridgeshire Lower Super Output Areas (in Gamlingay and Balsham) more than 25% of households are in fuel poverty.
6
Nature of the economy
A diverse economy with national strengths in R&D, high value manufacturing and software consultancy South Cambridgeshire is both a regional and national centre for R&D. The sector employs over
5,000 and has a share of employment around 18 times the national average. There is a very diverse private sector economy, with manufacturing activity ranging from
pharmaceuticals, aircraft (an important employer), to manufacture of concrete and cement and to electrical equipment.
There are many other elements of high value activity, including software consultancy (employing 2,500) and architectural activities (employing 2,000).
The district also has a significant number of businesses in the construction and agriculture industries.
The professional, scientific and technical sector accounts for the largest proportion of employee jobs (more than twice the national average at around 18%) followed by manufacturing (at around 14%).
A high value, productive and resilient economy The wide, mainly knowledge intensive industrial mix, means that the district is the key driver of
productivity within Cambridgeshire and the wider region. A more diverse industry mix means the greater the ability to withstand external shocks.
The East of England Forecasting Model estimates that labour productivity in South Cambridgeshire is higher than any other Greater Cambridge district and significantly above the national figure for labour productivity.
Globally significant hi-tech and bio-tech economy, leading to strengths in creative industries and clean-tech Responses to the County Council’s survey of hi-tech businesses and employers indicate that the
wider hi-tech ‘community’ provided 51,400 jobs at the start of 2008. Almost three quarters of the total are employed in Cambridge City and South Cambridgeshire, 36,800 in all, 20,175 in South Cambridgeshire representing around 27% of total employment in the district. [Maps 1 and 2]
Evidence suggests that Cambridge acts as an ‘incubator’ of firms, exporting firms to other districts, particularly South Cambridgeshire.
10% of the UK’s computer games developers are within five miles of Cambridge city centre. National strengths in software, computer games and electronic publishing. National strengths in advanced materials and bio-tech in clean-tech.
High business density and high jobs density, although a high proportion of micro businesses and falling business and jobs densities A high density of businesses is crucial in creating the levels of agglomeration required to enable
effective knowledge flow between people and firms, important for the growth of any successful economy. Business density in South Cambridgeshire has been consistently high since 2001 and saw a particularly high increase between 2004 and 2009, but has seen a small decrease between 2009 and 2011.
In March 2011 South Cambridgeshire had around 7,510 local units in VAT and/or PAYE based enterprises, and the district had 75,000 total jobs in 2009. PACEC research completed for the district council shows that following a decline of circa 5,000 jobs in the recession (2008-2010), total jobs are predicted to rise to c. 77,000 in 2014.
85.5% of businesses have an employment size of 0-9 – a slightly higher proportion of micro businesses than seen regionally or nationally.
With a jobs density figure of 0.81, the district’s labour demand is not quite as high as its available workforce but is still among the highest in Greater Cambridge, despite the recent fall in jobs density.
Relatively strong performance in the birth rate of enterprises and employment growth Per capita VAT/PAYE registrations have generally remained higher than average, but 2008 saw
a significant drop in many districts, with South Cambridgeshire being the only Cambridgeshire district to perform above regional and national levels. Although still above average, the district’s new business registration rate has continued to fall in 2009 and 2010.
The birth rate of new enterprises (measured as births per 100 active enterprises) in 2010 was similar in South Cambridgeshire to that across the wider Greater Cambridge area, yet lower than the regional and national rates.
The proportion of enterprises with employment less than 50 showing employment growth was around 14% in 2008, very similar to regional and national figures.
7
Business development, infrastructure and housing
Relatively low accessibility of jobs Accessibility of jobs by public transport, cycling or walking is relatively low across
Cambridgeshire, as it is in many other rural counties. South Cambridgeshire performs relatively well compared with the other rural Cambridgeshire
districts, however the proportion of working age people who have access to jobs by alternative travel modes is still estimated to be relatively low at 78%.
Long term and more recent gains in business floorspace 59% of the total net increase in business floor space between 1999 and 2011 occurred in
Huntingdonshire and South Cambridgeshire, and between 2010 and 2011, South Cambridgeshire had the highest net increase in business floorspace of all Cambridgeshire districts.
In 2011 the majority of this was B1 office space, specifically B1b (Research and Development), most significantly at Villa Road Impington, and also a large amount of B1 General (Office or Research) floorspace at Syngenta Crop Protection in Whittlesford.
High proportion of office space, low proportion of retail space In terms of total business floorspace in 2008, South Cambridgeshire had one of the highest
proportions of office space across the Greater Cambridge districts. The proportion of retail space was half that of any other Greater Cambridge district and over three
times less than the proportion seen nationally.
Increased likelihood of next generation broadband access Around two thirds of South Cambridgeshire wards, particularly those furthest from Cambridge are at
risk of not receiving next generation broadband access through likely future market rollout. However Cambridgeshire County Council has received a grant to provide high speed broadband access throughout the county, with the aim of to deliver 100% broadband coverage by 2015 with a minimum 90% being superfast broadband.
Low housing affordability South Cambridgeshire is the second most expensive area in the sub-region after Cambridge City.
The average house price in Aug 2011 to Jan 2012 was £306,747. The lower quartile house price to lower quartile income ratio for South Cambridgeshire as a whole is
8.67, compared to 12.11 for Cambridge City and 8.57 for the East of England as a whole. Two of the ten least affordable wards in the sub-region are in South Cambridgeshire – Barton and
The Shelfords and Stapleford. Bourn ward is the fifth most affordable ward in the sub-region with a ratio of 5.54, which is still
greater than the 3.5 house price to income ratio defined as affordable by Communities and Local Government. [Map 3]
Recent increase in housing completions following a steep fall between 2007 and 2009 Huntingdonshire is the only Cambridgeshire district to have seen a steady increase in the number of
dwelling completions from 2001 to 2011. South Cambridgeshire saw a steep fall in the number of dwellings completed annually over the
2007-2009 period with a small increase in annual dwelling completions between 2009 and 2011.
Increasing traffic congestion affecting business productivity and number of casualties The Transport in the East of England study completed in September 2008 identified a number of
priority transport corridors for intervention through investigating where the direct costs of transport congestion (i.e. lost travel time) and the foregone wider economic benefits (i.e. agglomeration and labour force impacts) were greatest. Three of the six corridors identified were around Cambridge (A428/A421, M11 and West Anglia Mainline corridor and the A14 corridor).
The highest growth since 1999 on national routes within the county has occurred on the A428 (40%), which is related to the development of Cambourne, although the A14 at Swavesey continues to have the highest daily traffic flows.
Above average traffic density on rural roads is a significant factor in Cambridgeshire’s high per capita casualty rate. The latest available figures show that traffic flow is 94% above the national average on rural trunk ‘A’ roads in Cambridgeshire and 40% on other rural main roads in the county.
High CO2 emissions per capita South Cambridgeshire has high, but decreasing, CO2 emissions per capita.
8
Future prospects
A rapidly growing, gradually ageing, resident population Cambridgeshire’s population is forecast to grow considerably in coming years, although current
uncertainty about future levels of house-building makes accurate forecasting difficult. The now-abolished East of England Plan identified Cambridgeshire, and in particular Cambridge City and South Cambridgeshire, as key locations for future house-building.
The County Council Research Group’s 2010-based population forecasts, which are consistent with the levels of house-building set out in the East of England Plan, suggest that the county’s population will grow by 13% between 2011 and 2021. The highest levels of growth will be in Cambridge City (22%) and South Cambridgeshire (13%), as these are where the most house-building is expected.
By 2021 forecasts suggest the district will experience an absolute increase in the population of all age groups, but the increase will be largest in the population aged over 65. It is anticipated that the over 65s will make up 24% of the county’s resident population, up from 18% in 2011.
High forecast GVA and employment growth based on past trends The East of England Forecasting Model forecasts that of the Cambridgeshire districts, South
Cambridgeshire will see one of the highest levels of employment growth in percentage terms between 2009 and 2021.
Employment demand in managers and professional occupations Occupational forecasts for Cambridgeshire based on both the East of England Forecasting Model
and the Local Economy Forecasting Model estimate that over the next five years expansion demand is likely to be strongest in:
Caring personal service occupations Managers and senior officials Associate technical and professional occupations Professional occupations Sales and customer service occupations
All other occupations are projected to experience very little, or negative expansion demand.
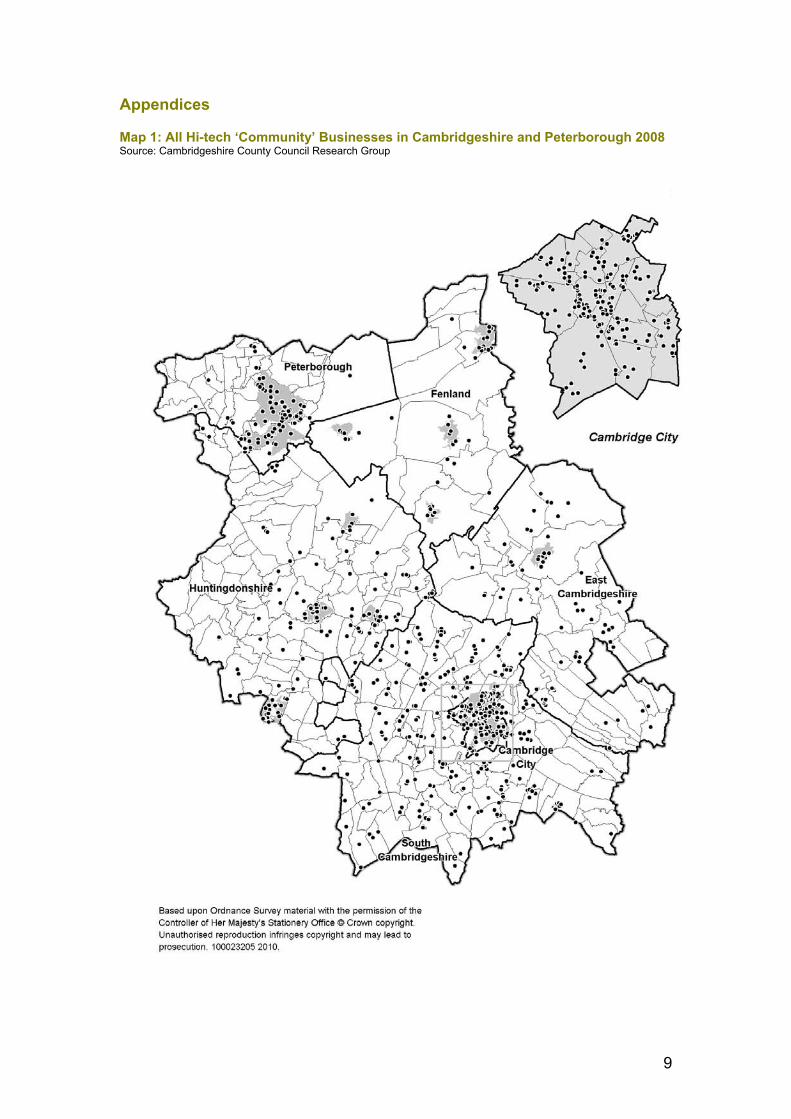
9
Appendices
Map 1: All Hi-tech ‘Community’ Businesses in Cambridgeshire and Peterborough 2008 Source: Cambridgeshire County Council Research Group
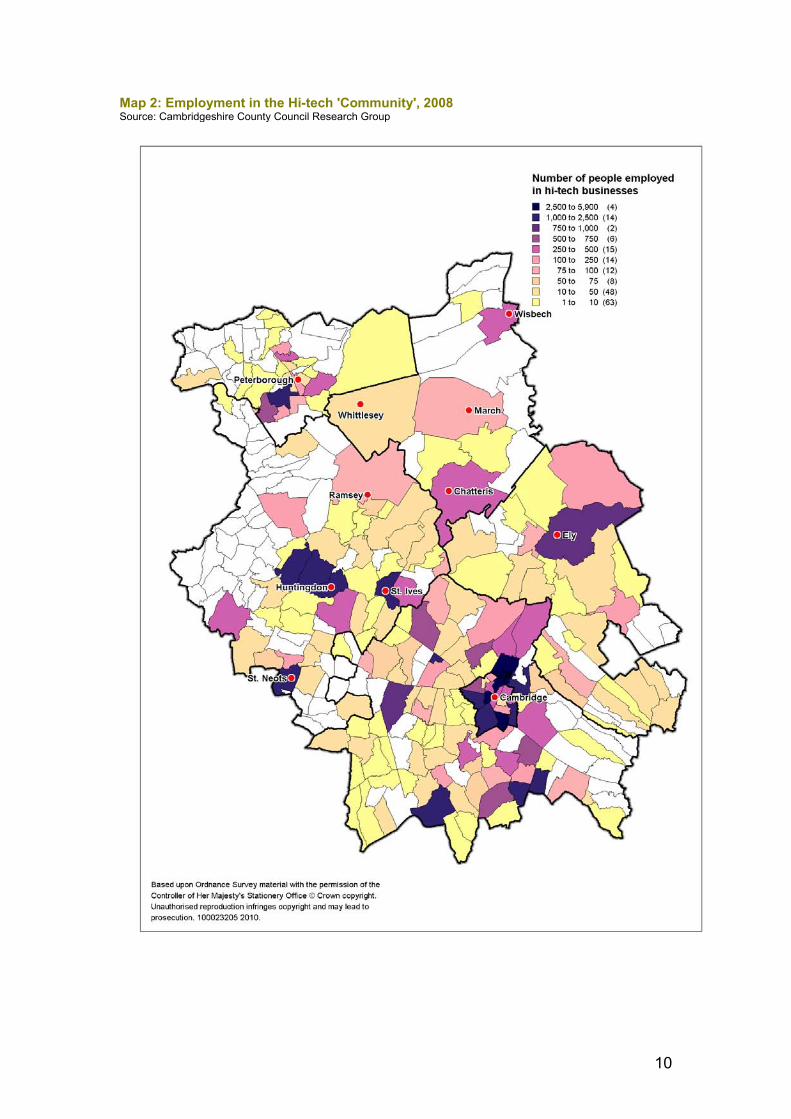
10
Map 2: Employment in the Hi-tech 'Community', 2008 Source: Cambridgeshire County Council Research Group
11
Map 3: Lower quartile house price to lower quartile income ratio by ward Source: Hometrack