fact bkb ook 2008 2009 - bloomsburg university of...
TRANSCRIPT

F B kF B kFact BookFact Book20082008‐‐20092009
Office of Institutional ResearchOffice of Institutional ResearchBloomsburg University of PennsylvaniaBloomsburg University of Pennsylvania
400 East Second Street400 East Second StreetBloomsburg, PA 17815Bloomsburg, PA 17815
(570) 389(570) 389‐‐40544054


Bloomsburg University Fact Book – Table of ContentsGeneral Information Page
Institutional Summary 1‐1
History 1‐2
g y
Presidents 1‐3
Mission Statement 1‐4
University Goals and Objectives 1‐5
Academic Calendar 1‐9
Academic Programs & Accreditation Page
Approved Degree Programs By College 2‐1
Approved Minors By College 2‐6
A dit ti 2 8Accreditation 2‐8
Enrollment Page
Official Enrollment Data – Headcount Vs. FTE, Fall 1998 through Fall 2008 (Graphic) 3‐1
Official Enrollment Data By Student Level, Fall 1998 through Fall 2008 (Graphic) 3‐2
Official Enrollment Data By Full‐Time/Part‐Time, Fall 1998 through Fall 2008 (Graphic) 3‐3
Official Enrollment Data By Gender, Fall 1998 through Fall 2008 (Graphic) 3‐4
Official Enrollment Data, Fall 1999 through Fall 2008 3‐5
Official Enrollment Data Spring 2000 through Spring 2009 3‐7Official Enrollment Data, Spring 2000 through Spring 2009 3‐7
Official Enrollment Data, Summer 2004 through Summer 2008 3‐9
Enrollment History, Fall Semesters 1926 to Present 3‐10

Bloomsburg University Fact Book – Table of Contents (continued)Enrollment (continued) Page
Enrollment Data By Racial/Ethnic Status, Fall 1998 through Fall 2008 (Graphic) 3‐13
Total Enrollment By Race, Fall 1999 through Fall 2008 3‐14
g y
County Enrollment, Fall 2008 (Map) 3‐15
Total Enrollment By County, Fall 1999 through Fall 2008 3‐16
Total Enrollment By State, Fall 2008 (Map) 3‐18
Total Enrollment By State, Fall 1999 through Fall 2008 3‐19
Total Enrollment By Country, Fall 2008 (Map) 3‐21
Total Enrollment By Country, Fall 2002 through Fall 2009 3‐22
Undergraduate
T t l E ll t B Cl L l F ll 2000 th h F ll 2008 3 26Total Enrollment By Class Level, Fall 2000 through Fall 2008 3‐26
Undergraduate Enrollment By Race, Fall 1999 through Fall 2008 3‐27
Undergraduate Enrollment By County, Fall 1999 through Fall 2008 3‐28
Undergraduate Majors, Fall 1998 through Fall 2008 3‐30
Graduate
Graduate Enrollment By Race, Fall 1999 through Fall 2008 3‐39
Graduate Enrollment By County, Fall 1999 through Fall 2008 3‐40
Graduate Enrollment By Program of Study Fall 1998 through Fall 2008 3‐42Graduate Enrollment By Program of Study, Fall 1998 through Fall 2008 3‐42

Bloomsburg University Fact Book – Table of Contents (continued)Admissions Page
Admissions Statistics, Fall 2000 through 2008, Regular Admit Freshmen (Graphic) 4‐1
Admissions Statistics By Admission Category, Fall 2000 through 2008 4‐2
g y
Freshmen Applications, Acceptances, and Enrollment Data By Race, Fall 1999 through 2008 4‐3
Freshmen Profile, First‐Time Entering Freshmen, Fall 2008 4‐6
SAT Average Scores, Fall 2000 through 2008 4‐7
First‐Time Freshmen Enrollment By County, Fall 1999 through 2008 4‐8First Time Freshmen Enrollment By County, Fall 1999 through 2008
First‐Time Freshmen By High School Type, Fall 2008 4‐10
Top Ten High Schools, First‐Time Freshmen, Fall 2008 4‐10
Admissions Statistics, Fall 2000 through 2008, Transfer Students (Graphic) 4‐11
4 12Transfer Applications, Acceptances, and Enrollment Data By Race, Fall 1999 through 2008 4‐12
Institutions From Which Students Transfer To Bloomsburg, Fall 2008 4‐15
Top Ten Institutions From Which Students Transferred To Bloomsburg, Fall 2008 4‐15
Degrees Granted Page
Degrees Granted By Degree Type, 2003‐2004 through 2007‐2008 (Graphic) 5‐1
Bachelor’s Degrees Granted By Gender, 2003‐2004 through 2007‐2008 (Graphic) 5‐2
Bachelor’s Degrees Granted By College & Gender, 2003‐2004 through 2007‐2008 5‐3
B h l ’ D G t d B R i l/Eth i C t 2003 2004 th h 2007 2008 (G hi ) 5‐4Bachelor’s Degrees Granted By Racial/Ethnic Category, 2003‐2004 through 2007‐2008 (Graphic) 5‐4
Bachelor’s Degrees Granted By College & Racial/Ethnic Category, 2003‐2004 through 2007‐2008 5‐5
Bachelor’s Degrees Granted, 2003‐2004 through 2007‐2008 5‐6

Bloomsburg University Fact Book – Table of Contents (continued)
Degrees Granted Page
Graduate Degrees Granted By Gender, 2003‐2004 through 2007‐2008 5‐11
Graduate Degrees Granted By Racial/Ethnic Category, 2003‐2004 through 2007‐2008 5‐11
g y
Graduate Degrees Granted, 2003‐2004 through 2007‐2008 5‐12
Retention & Graduation Rates Page
Second Year Persistence Rates (Graphic) 6‐1
Second Year Persistence Rates By Gender (Graphic) 6‐2Second Year Persistence Rates By Gender (Graphic)
Second Year Persistence Rates By Race (Graphic) 6‐3
Second Year Persistence Rates By Admission Category (Graphic) 6‐4
Second Year Persistence Rates By College of Admission (Graphic) 6‐5
6 6Six‐Year Graduation Rates (Graphic) 6‐6
Six‐Year Graduation Rates By Gender(Graphic) 6‐7
Six‐Year Graduation Rates By Race(Graphic) 6‐8
Six‐Year Graduation Rates By Admission Category (Graphic) 6‐9
Six‐Year Graduation Rates By College of Admission(Graphic) 6‐10
Retention and Graduation Rates By Gender, First‐Time, Full‐Time Freshmen Fall 2000 through 2007 6‐11
Retention and Graduation Rates By Race, First‐Time, Full‐Time Freshmen Fall 2000 through 2007 6‐12
Retention and Graduation Rates By Admission Category, First‐Time, Full‐Time Freshmen Fall 2000 6‐15Retention and Graduation Rates By Admission Category, First Time, Full Time Freshmen Fall 2000 through 2007
6‐15
Retention and Graduation Rates By College of Admission, First‐Time, Full‐Time Freshmen Fall 2000 through 2007
6‐16

Bloomsburg University Fact Book – Table of Contents (continued)
Placement Page
Placement Statistics, Class of 2007 (Graphic) 7‐1
Placement Statistics By College, Graduating Classes of 2003 through 2007 7‐2
g y
Productivity Page
Student Credit Hour Production By College, Academic Year 2007‐2008 (Graphic) 8‐1
FTE Instructional Faculty By College, Academic Year 2007‐2008 (Graphic) 8‐2
SCH Per FTE Instructional Faculty By College, Academic Year 2007‐2008 (Graphic) 8‐3SCH Per FTE Instructional Faculty By College, Academic Year 2007 2008 (Graphic)
Faculty Productivity By College & Department, 2007‐2008 8‐4
Section Size of Lectures, Fall 2004 through 2008 8‐11
Faculty/Staff Data Page
9 1Full‐Time Employees By Gender, Race & EEO Category, Fall 1998 through Fall 2008 9‐1
Full‐Time Employees By Gender, Fall 1998 through Fall 2008 (Graphic) 9‐2
Full‐Time Employees By Gender By EEO Categories, Fall 1998 through Fall 2008 (Graphics) 9‐3
Full‐Time Employees By Race, Fall 1998 through Fall 2008 (Graphic) 9‐10
Full‐Time Employees By Race BY EEO Categories, Fall 1998 through Fall 2008 (Graphics) 9‐11
Full‐Time Faculty By Gender By Rank, Fall 1998 through Fall 2008 (Graphics) 9‐18
Full‐Time Faculty By Gender By Tenure Status, Fall 1998 through Fall 2008 (Graphics) 9‐22
Lib PageLibrary Page
Library Staff, Expenditures and Collections 10‐1
Library Services 10‐2

Bloomsburg University Fact Book – Table of Contents (continued)
Financial Data Page
Financial Assistance to Students In Institutions of Higher Education, 1998‐99 through 2007‐08Total Dollars Awarded (Graphic)
11‐1
Financial Assistance to Students In Institutions of Higher Education, 1998‐99 through 2007‐08T t l N b f A d (G hi )
11‐2
g y
Total Number of Awards (Graphic)Financial Assistance to Students In Institutions of Higher Education, 1998‐99 through 2007‐08Unduplicated Number of Recipients(Graphic)
11‐3
Financial Assistance to Students By Award Category, 1998‐99 through 2007‐08 11‐4
Basic Annual Charges of Full‐Time Students 1998‐99 through 2008‐09 11‐5Basic Annual Charges of Full‐Time Students, 1998‐99 through 2008‐09
Net Tuition & Fees Revenues vs. State Appropriations, 2003‐2004 Through 2007‐2008 (Graphic) 11‐6
2007‐2008 Operating Expenses (Graphic) 11‐7
Revenues & Expenses, 2003‐2004 Through 2007‐2008 11‐8
Facilities Page
Physical Plant Data, 2007‐08 12‐1
Physical Plant Square Footage Data, 2007‐08 12‐3
Housing Data, Fall 2008 12‐5g ,

General General InformationInformation


Institutional Summary
Bloomsburg University of Pennsylvania, a public, four‐year institution, is one of 14 members of the Pennsylvania State System of Higher Education. Founded in 1839 as the Bloomsburg Literary Institute, the university currently enrolls nearly 8,000 undergraduate students in the Colleges of Professional Studies, Business, Liberal Arts and Science and Technology and more than 800 graduate students in upper‐level programs, including a doctoral program in clinical audiology. Ninety percent of the university’s students are Pennsylvania residents and 7 percent hail from neighboring New Jersey. The top majors in fall 2007, in order were biology and allied health sciences early childhood and elementary education managementorder, were biology and allied health sciences, early childhood and elementary education, management, secondary education, exceptionality programs and sociology, social welfare and criminal justice.
Bloomsburg University offers a wide array of student activities and programs, modern residence halls, a well‐equipped Student Recreation Center and restaurant‐quality dining, including an on‐campus Starbucks. The university has 18 intercollegiate athletic programs, more than 160 organizations to provide opportunities for leadership and growth and11 Living Learning Communities that bring together students with common academic interests who live in the same residence hall, participate in activities and enroll in a cluster of related courses. The university actively supports an atmosphere of civic engagement, encouraging students to get involved through political and volunteer activities. More than 750 companies,encouraging students to get involved through political and volunteer activities. More than 750 companies, organizations and agencies provide academic internships to Bloomsburg students. Students also may take advantage of support offerings provided through Academic Advisement, Accommodative Services, Act 101/Educational Opportunity Program, Developmental Instruction, Student Support Services, University Tutorial Services and other programs.
1‐1

HistoryHistory
An academy "to teach youth the elements of a classical education" was established in Bloomsburg in 1839. The academy continued with varied fortunes until 1856 when a charter was prepared and stock issued to reorganize it as the Bloomsburg Literary Institute. Institute Hall, later renamed Carver Hall after Henry Carver, an early principal, architect, and teacher, was erected in 1867. Today, the gold‐domed, red brick building is the university's landmark.
Largely through the efforts of J.P. Wickersham, superintendent of public instruction, the Bloomsburg Literary Institute became the Bloomsburg Literary Institute and State Normal School in 1869; it continued under this name and organization until 1916 when it was purchased by the Commonwealth of Pennsylvania and named Bloomsburg State Normal School.
The emphasis at the Normal School changed during the early 1920s from secondary and college‐preparatory courses for special teachers to full‐time teacher education In May 1927 the institutional name was changed to Bloomsburg State Teachers College and the school was authorized to grantteacher education. In May 1927, the institutional name was changed to Bloomsburg State Teachers College and the school was authorized to grant the Bachelor of Science in education for teachers in elementary and secondary schools.
Under the administration of President Francis B. Haas (1927‐1939), great progress was made in the teacher education program, and a new degree program in business education was initiated.
Upon the naming of Dr. Haas as state superintendent of public instruction, Dr. Harvey A. Andruss, then dean of instruction and a former director of the Business Education Department, was appointed president, a position he held until his retirement in 1969. During World War II, the U.S. Navy V‐12 Office Training Program was conducted on the Bloomsburg campus. As a result, a campus building was renamed Navy Hall. In 1957, a division of special education was instituted, and today, Navy Hall still houses that program.
Major expansion in facilities, faculty, and student body followed. Undergraduate full‐time enrollment rose from 1,743 in 1960 to 6,812 undergraduates in 1996.
In 1960, the institution's name was changed to Bloomsburg State College. Authorization soon followed to grant baccalaureate degrees for liberal arts programs in humanities, social sciences, and natural sciences/mathematics. Graduate study, leading to the Master of Education, was inaugurated. In 1968, approval was received for the Master of Arts, in 1970 for the Master of Science, in 1976 for the Master of Business Administration, and in 1982 for the Master of Science in Nursing. A cooperative doctoral program in elementary education began in 1982.
Commonwealth legislation enacted on July 1, 1983, established the State System of Higher Education, and Bloomsburg State College became Bloomsburg University of Pennsylvania. Bloomsburg's president, Dr. James H. McCormick, became the system's interim chancellor and later its first permanent chancellor.
1‐2

Presidents
Name and Term Name and TermHenry Carver(1866‐1871)
Dr. Harvey A. Andruss(1939‐1969)
Charles B. Barkley(1871‐1872)
Dr. Robert J. Nossen(1969‐1972)
Rev. John Hewitt(1872‐1873)
Dr. Charles H. Carlson(1972‐1973)
Dr. T. L. Griswold(1873‐1877)
Dr. James H. McCormick(1973‐1983)
Dr. David J. Waller Jr.(1877‐1890)
Dr. Larry W. Jones(1983‐1985)
Dr. Judson P. Welsh(1890‐1906)
Dr. Harry Ausprich(1985‐1993)
Dr. David J. Waller(1906‐1920)
Dr. Curtis R. English(1993‐1994)
Dr. Charles H. Fisher(1920‐1923)
Dr. Jessica S. Kozloff(1994‐2007)
Dr. G. C. L. Reimer(1923‐1927)
Dr. David L. Soltz(2008‐present)
1‐3
Dr. Francis B. Haas(1927‐1939)

Mission Statement
Bloomsburg University, as one of the 14 institutes in the State System of Higher Education of the Commonwealth of Pennsylvania, embraces the general mission of the system to assure excellence in higher education at an affordable cost. The campus is accessible and attractive, located in the Town of Bloomsburg near the Susquehanna River and Interstate 80.
Bloomsburg is a coeducation institution serving students of diverse backgrounds from Pennsylvania, its surrounding states, and foreign countries. To its community and region, the university is an artistic and educational resource that serves a broad range of community needs in education, health care, business‐related services, library resources, and cultural activities. It offers undergraduate programs as well as graduate programs in select areas of strength. There is an emphasis on a strong liberal arts preparation. The university is committed to a program of affirmative action in order to provide equal educational opportunity to all persons.
It is a goal of the university to integrate academic programs, cultural activities, and interpersonal relations to promote intellectual growth and social responsibility among students. The university seeks to promote intellectual growth and social responsibility among students. The university seeks to extend the academic environment from the classroom into other student activities **It strives to foster openness in communication and involvement in decision making through astudent activities. **It strives to foster openness in communication and involvement in decision making through a participatory governance structure. In this atmosphere, faculty, administration, staff and students attain a genuine respect for one another, a concern for the enrichment of their experience, and the achievement of their common purpose. The university community is committed to the principle of personal and academic freedom within the framework of ethical responsibilities.
By emphasizing the assimilation, synthesis, and integration of information, it is a goal of the university to develop in its students the characteristics of mental resourcefulness and responsible self‐expression as well as the abilities to think critically, clarify values, and demonstrate problem‐solving skills. While maintaining programs for which Bloomsburg has been traditionally recognized, such as those in business and education, the university has identified strategic directions that include programs in health‐related fields; programs that promote student‐faculty interaction in teaching, learning and
1‐4
research; programs that emphasize regional, national, international, and environmental concerns; and programs that incorporate the application of technology into instruction

University Goals and ObjectivesUniversity Goals and Objectives
Critical Area Goal ObjectiveAcademic Program Directions Develop and refine academic programs,
general education and other experiencesMaintain the strength and diversity of the existing undergraduate and graduate programsgeneral education, and other experiences
to meet the needs of our commonwealth, nation, and global society.
undergraduate and graduate programs.
Develop new degrees (including undergraduate, graduate, and certificate programs), minors, and areas of concentration.
Maintain the strength of the general education curriculum.
Strengthen non‐credit and for‐credit continuing education offerings.
Encourage the development of collaborative programs where appropriate.
Teaching and Learning (including Technology) Provide instructional experiences that produce optimum student achievement.
Continue and expand faculty professional development services and opportunities across all disciplines.
Provide experiences, services and advisement to d i f dpromote academic success of students.
Encourage students to model good citizenship and social responsibility.
1‐5

University Goals and Objectives
Critical Area Goal ObjectiveStudent Growth and Development Offer co‐curricular programs that enhance living and
learning and support the academic mission.Expand the current co‐curricular transcript and raise awareness of the value of co‐curricular transcripts.
Provide an environment that strengthens all aspects of student learning beyond the formal classroom.
Create programs or opportunities that enhance the development of student leadership skills and values.
Enrollment Planning Attract and enroll undergraduate and graduate d h h h i l d i h i
Increase the number of academically talented d d d i hi h d dstudents who have the potential to succeed in their
area of study and contribute to society upon graduation.
students, and students in high‐demand programs enrolled at the university.
Civil and Inclusive Community Attract a diverse population of faculty, staff and students, and provide a campus climate that promotes diversity, equity, and civility for all.
Develop programs that facilitate the professional advancement of individuals from historically underrepresented groups.
Increase the diversity of applicants for all faculty, staff and administrative positions.
Increase the retention/graduation rate of historically underrepresented students to PASSHE performance targets.
Increase the University’s commitment to multi‐cultural programming and support services.
1‐6

University Goals and Objectives
Critical Area Goal ObjectiveUniversity as a State and Regional Resource
Provide economic and cultural resources to the state and the region.
Add new partnerships with off‐campus entities to help ensure that students are prepared for jobs and to aid the transfer of knowledge for economic and workforce development.
Add new credit and non‐credit programs to meet economic and workforce development needs.
Add new citizen service programs that link students, faculty, and staff with regional communities.
Expand the number of cultural development activities and improve awareness of them in the region.
Work collaboratively with the Office of the Chancellor to develop opportunities for alumni, volunteers and other external constituencies to contribute time, expertise or other resources to the universityexpertise or other resources to the university.
Continue to achieve the highest quality in offering academic programs while maintaining the highest productivity.
Continue to achieve the highest productivity in administrative support processes while maintaining pp p gthe highest level of service to students, faculty and staff.
Continue to manage fixed costs including utilities and insurance.
Continue to effect cost savings through collaborative
1‐7
efforts with other State System universities.

University Goals and Objectives
Critical Area Goal ObjectiveOptimize Fiscal Resources Including Fund Raising
Ensure that University resources are used effectively and efficiently.
Continue to increase the level of annual giving by alumni, faculty, staff and friends of the university.
Continue to identify Federal State and other grantContinue to identify Federal, State, and other grant programs for funding program initiatives.
Work in tandem with Chancellor’s Office to increase state support for public higher education.
Ensure that all qualified students may take advantage of educational opportunities, regardless of theirof educational opportunities, regardless of their ability to pay, by increasing endowed and annual funds for scholarships.
Continue implementation of the finance, materials management, and human resource modules of the shared administrative system.
Implement the campus management module of the shared administrative system.
Regularly assess and evaluate institutional effectiveness.
Implement the campus facilities plan.
1‐8

Academic Calendar2008 20092008‐2009
Fall 2008 Classes Begin August 25 (8am)Labor Day ‐ No class September 1Reading Day ‐ No classes October 10 & 11Mid‐Term October 14Mid Term October 14 Thanksgiving Recess Begins November 25 (10pm)Classes Resume December 1 (8am)Fall 2008 Classes End December 6Reading Day December 7Finals Begin December 8Graduate Commencement December 12Finals End December 13Undergraduate Commencement December 13
Spring 2009 Classes Begin January 12Martin Luther King Day ‐ No Classes January 19Spring Break Begins February 28Classes Resume March 9 (8 am)Mid T M h 9 (8 )Mid‐Term March 9 (8 am)Spring 2009 Classes End April 25Reading Day April 26Finals Begin April 27Finals End May 2
1‐9
Graduate Commencement May 1Undergraduate Commencement May 2

Academic Calendar2009 20102009‐2010
Fall 2009 Classes Begin August 31 (8am)Labor Day ‐ No class September 7Mid‐Term October 20 Thanksgiving Recess Begins November 23 (10pm)Thanksgiving Recess Begins November 23 (10pm)Classes Resume November 30 (8am)Classes End December 11Finals Begin December 14Finals End December 18Graduate Commencement December 18Undergraduate Commencement December 19
Spring 2010 Classes Begin January 19Spring Break Begins March 6Sp g ea eg s a c 6Classes Resume March 15 (8 am)Mid‐Term March 16 (8 am)Classes End May 3Finals Begin May 4G d t C t M 7Graduate Commencement May 7Finals End May 8Undergraduate Commencement May 8
1‐10

A d iA d iAcademic Academic P &P &Programs & Programs &
AccreditationAccreditationAccreditationAccreditation

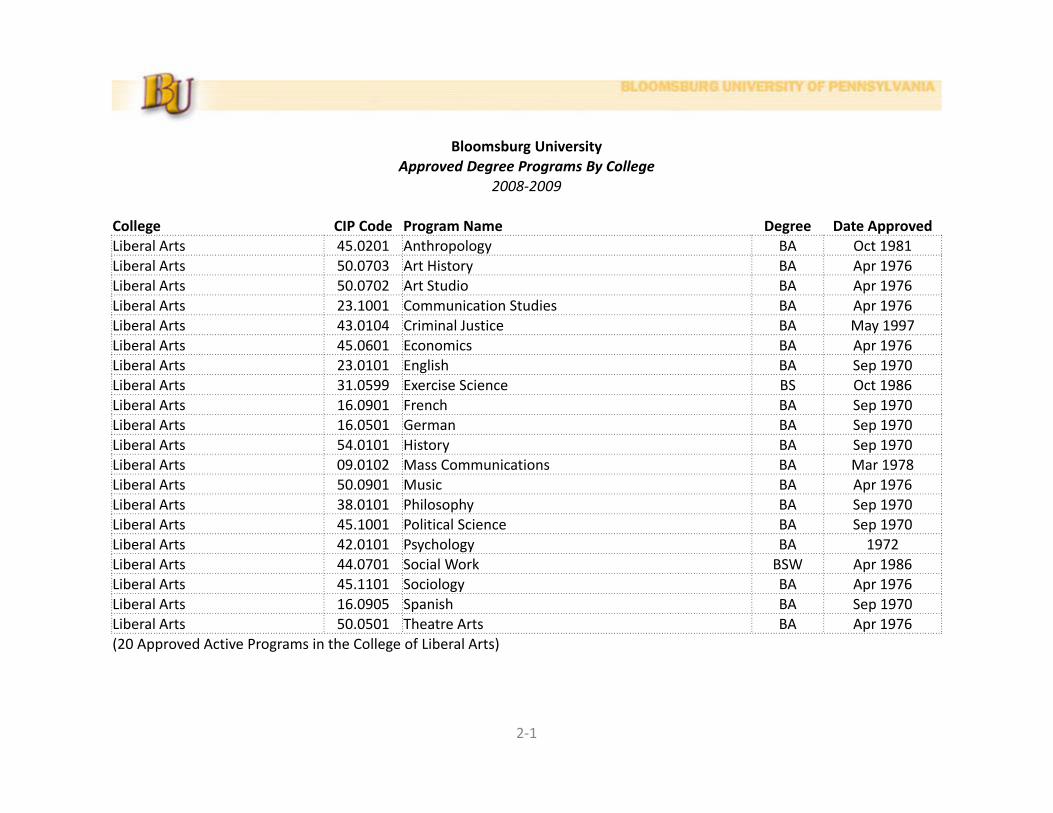
Bloomsburg UniversityBloomsburg UniversityApproved Degree Programs By College
2008‐2009
College CIP Code Program Name Degree Date ApprovedLiberal Arts 45.0201 Anthropology BA Oct 1981p gyLiberal Arts 50.0703 Art History BA Apr 1976Liberal Arts 50.0702 Art Studio BA Apr 1976Liberal Arts 23.1001 Communication Studies BA Apr 1976Liberal Arts 43.0104 Criminal Justice BA May 1997Liberal Arts 45.0601 Economics BA Apr 1976Liberal Arts 23.0101 English BA Sep 1970Liberal Arts 31.0599 Exercise Science BS Oct 1986Liberal Arts 16.0901 French BA Sep 1970Liberal Arts 16.0501 German BA Sep 1970Liberal Arts 54.0101 History BA Sep 1970Liberal Arts 09.0102 Mass Communications BA Mar 1978Liberal Arts 50.0901 Music BA Apr 1976Liberal Arts 38.0101 Philosophy BA Sep 1970Liberal Arts 45.1001 Political Science BA Sep 1970Liberal Arts 42.0101 Psychology BA 1972Lib l A t 44 0701 S i l W k BSW A 1986Liberal Arts 44.0701 Social Work BSW Apr 1986Liberal Arts 45.1101 Sociology BA Apr 1976Liberal Arts 16.0905 Spanish BA Sep 1970Liberal Arts 50.0501 Theatre Arts BA Apr 1976(20 Approved Active Programs in the College of Liberal Arts)
2‐1
Bloomsburg UniversityBloomsburg UniversityApproved Degree Programs By College
2008‐2009
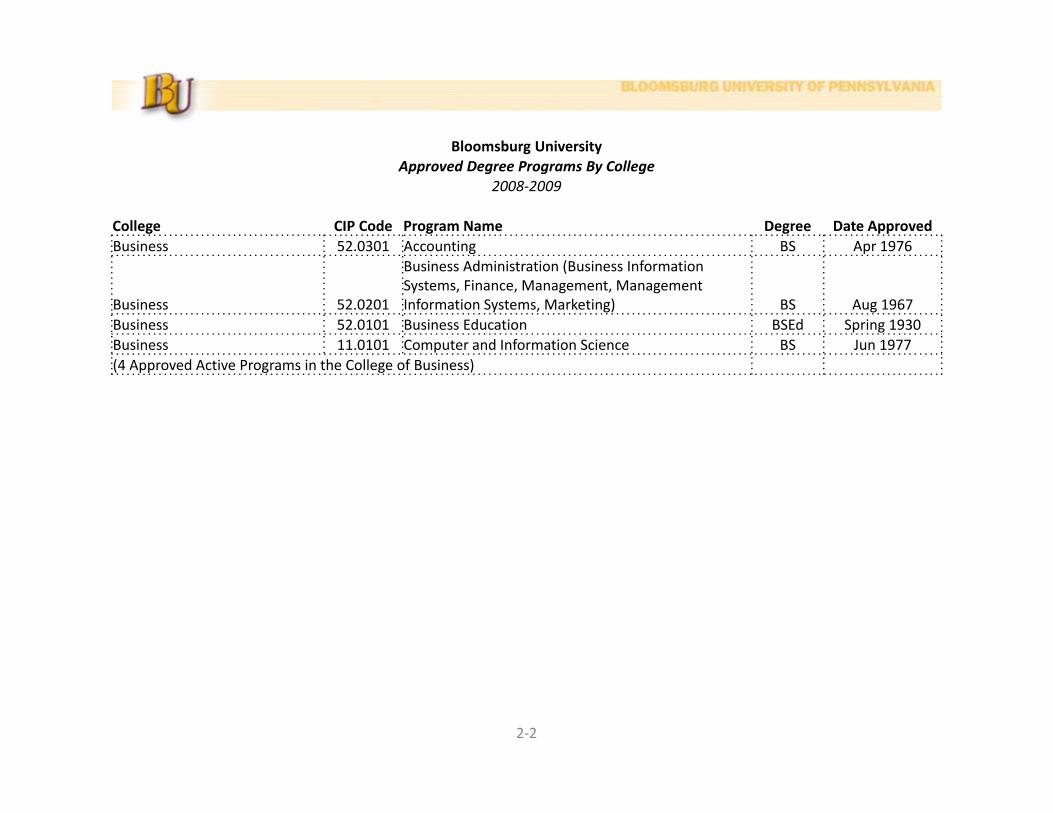
College CIP Code Program Name Degree Date ApprovedBusiness 52.0301 Accounting BS Apr 1976g p
Business 52.0201
Business Administration (Business Information Systems, Finance, Management, Management Information Systems, Marketing) BS Aug 1967
Business 52.0101 Business Education BSEd Spring 1930Business 11.0101 Computer and Information Science BS Jun 1977(4 Approved Active Programs in the College of Business)
2‐2

Bloomsburg UniversityBloomsburg UniversityApproved Degree Programs By College
2008‐2009
College CIP Code Program Name Degree Date ApprovedProfessional Studies 16.1603 ASL/English Interpreting BS Jun 1983/ g p gProfessional Studies 51.0204 Audiology & Speech Pathology BS Fall 1947Professional Studies 13.1210 Early Childhood Education BSEd Fall 1975Professional Studies 13.1202 Elementary Education BSEd Fall 1927Professional Studies 51.1601 Nursing BSN Fall 1975Professional Studies 26.0101 Secondary Ed., Biology BSEd Fall 1951Professional Studies 40.0501 Secondary Ed., Chemistry BSEd Fall 1957Professional Studies 45.9999 Secondary Ed., Citizenship BSEd Fall 1938Professional Studies 09.0101 Secondary Ed., Communication BSEd Summer 1972Professional Studies 40.0601 Secondary Ed., Earth Science BSEd Fall 1961Professional Studies 23.0101 Secondary Ed., English BSEd Fall 1938Professional Studies 16.0901 Secondary Ed., French BSEd Fall 1938Professional Studies 16.0501 Secondary Ed., German BSEd Jun 1999Professional Studies 27.0101 Secondary Ed., Mathematics BSEd Fall 1938Professional Studies 40.0801 Secondary Ed., Physics BSEd Fall 1957Professional Studies 16.0905 Secondary Ed., Spanish BSEd Fall 1942Professional Studies 13.1001 Special Education BSEd Dec 1976(17 Approved Active Programs in the College of Professional Studies)
2‐3

Bloomsburg UniversityBloomsburg UniversityApproved Degree Programs By College
2008‐2009
College CIP Code Program Name Degree Date ApprovedScience & Technology 26.0101 Biology, General BA Sep 1970gy gy, pScience & Technology 26.0101 Biology, General BS Sep 1970Science & Technology 40.0501 Chemistry BA Sep 1970Science & Technology 40.0501 Chemistry BS Sep 1970Science & Technology 51.1005 Health Sciences BS Fall 1971Science & Technology 11.9999 Computer Forensics BS Apr 2006Science & Technology 11.0701 Computer Science BS Jun 1977Science & Technology 14.1001 Electronics Engineering Technology BS May 2000Science & Technology 40.0601 Geocience BS Dec 1971Science & Technology 45.0701 Geography BA Sep 1970Science & Technology 51.2205 Health Physics BS Fall 1987Science & Technology 27.0101 Mathematics BA Sep 1970Science & Technology 27.0101 Mathematics BS Sep 1970Science & Technology 51.0907 Medical Imaging BS Aug 1979Science & Technology 40.0801 Physics BA Sep 1970Science & Technology 40.0801 Physics BS Sep 1970(16 Approved Active Programs in the College of Science & Technology)
2‐4

Bloomsburg UniversityBloomsburg UniversityApproved Degree Programs By College
2008‐2009
College CIP Code Program Name Degree Date ApprovedGraduate Studies 51.0202 Audiology AUD Jan 2003gyGraduate Studies 26.0101 Biology Education MEd Aug 1965Graduate Studies 26.0101 Biology, General MS May 1971Graduate Studies 52.0201 Business Administration MBA Mar 1976Graduate Studies 52.0101 Business Education, General MEd Apr 1960Graduate Studies 51.0913 Clinical Athletic Training MS Oct 2007Graduate Studies 13.0301 Curriculum and Instruction MEd Jun 1905Graduate Studies 13.1210 Early Childhood Education MS Jan 1978Graduate Studies 13.1003 Education of Deaf Hard Hearing MS Oct 1976Graduate Studies 13.1202 Elementary Education MEd Apr 1960Graduate Studies 31.0505 Exercise Science MS Oct 1991Graduate Studies 13.1101 Guidance Counseling & Student Affairs MED Jan 2007Graduate Studies 13.0501 Instructional Technology MS May 1985Graduate Studies 51.1601 Nursing MSN Jun 1983Graduate Studies 51.0911 Radiologist Assistant MS Jan 2005Graduate Studies 13.1315 Reading Education MEd Aug 1968Graduate Studies 13.1001 Special Education MS Dec 1978Graduate Studies 51.0203 Speech Pathology MS Oct 197618 Approved Graduate Degree Programs, (17 Master’s, 1 Doctorate)
2‐5

Bloomsburg UniversityBloomsburg UniversityApproved Minors By College
2008‐2009
College CIP Code Program Name Program CategoryLiberal Arts 45.0201 Anthropology MinorLiberal Arts 45.0201 Anthropology MinorLiberal Arts 50.0703 Art History MinorLiberal Arts 50.0702 Art Studio MinorLiberal Arts 05.0123 Chinese Studies MinorLiberal Arts 23.1001 Communication Studies MinorLiberal Arts 23.0501 Creative Writing MinorgLiberal Arts 43.0104 Criminal Justice MinorLiberal Arts 45.0601 Economics MinorLiberal Arts 23.0101 English MinorLiberal Arts 05.0299 Ethnic Studies MinorLiberal Arts 16.0901 French MinorLiberal Arts 05.0207 Gender and Women's Studies MinorLiberal Arts 16.0501 German MinorLiberal Arts 54.0101 History MinorLiberal Arts 05.0107 Latin American Studies MinorLiberal Arts 50.0901 Music MinorLiberal Arts 38.0101 Philosophy MinorLiberal Arts 45.1001 Political Science MinorLiberal Arts 23.1101 Professional Writing MinorLiberal Arts 42.0101 Psychology MinorLiberal Arts 45.1101 Sociology Minor
2‐6
Liberal Arts 16.0905 Spanish MinorLiberal Arts 50.0501 Theatre Arts Minor(23 Approved Active Minors)

Bloomsburg UniversityApproved Minors By College
2008‐2009College CIP Code Program Name Program CategoryBusiness 52.0301 Accounting MinorBusiness 52.0201 Business MinorBusiness 52.0204 Business Information Systems MinorBusiness 11 0101 Computer and Information Science MinorBusiness 11.0101 Computer and Information Science MinorBusiness 22.9999 Legal Studies MinorBusiness 52.0201 Management MinorBusiness 52.1401 Marketing Minor(7 Approved Active Minors)
Professional Studies 51.0204 Audiology & Speech Pathology MinorProfessional Studies 13.0501 Educational Technology Minor(2 Approved Active Minors)
Science & Technology 26.0101 Biology, General MinorScience & Technology 40.0501 Chemistry MinorScience & Technology 40.0501 Chemistry MinorScience & Technology 11.9999 Computer Forensics MinorScience & Technology 11.0701 Computer Science MinorScience & Technology 11.0801 Computer Science ‐Web Development MinorScience & Technology 14.1001 Electronics MinorScience & Technology 40.0601 Geocience MinorScience & Technology 45.0701 Geography MinorScience & Technology 40.0601 Geology MinorScience & Technology 27.0101 Mathematics MinorScience & Technology 40.0801 Physics MinorScience & Technology 27.0501 Statistics Minor(12 Approved Active Minors)
2‐7
(12 Approved Active Minors)
44 Approved Active Minors

Accreditation
Bloomsburg University is Accredited By…Middle States Association of Colleges and Schools
Accreditation
Association to Advance Collegiate Schools of Business (AACSB)
American Speech‐Language‐Hearing Association (ASHA)
National Council for Accreditation of Teacher Education (NCATE)
Accreditation Board for Engineering and Technology (ABET)
National Association of Schools of Music (NASM)
Commission on Collegiate Nursing Education (CCNE)Commission on Collegiate Nursing Education (CCNE)
Council on Social Work Education (CSWE)
Commission on Accreditation of Allied Health Education Programs (CAAHEP)
Council on Education of the Deaf (CED)
National Association of Schools of Theatre (NAST)
2‐8

EnrollmentEnrollment(Overall)(Overall)


Official Enrollment Data – Headcount Vs. FTEFall 1998 through Fall 2008Fall 1998 through Fall 2008
9000
9500
7500
8000
8500
6500
7000
5000
5500
6000
1998 1999 2000 2001 2002 2003 2004 2005 2006 2007 2008
Headcount 7648 7567 7548 7916 8039 8284 8305 8570 8723 8745 8855
FTE 6891 6844 6855 7265 7390 7563 7621 7818 7988 8011 8104
ll
3‐1
Fall Semester

Official Enrollment Data By Student LevelFall 1998 through Fall 2008Fall 1998 through Fall 2008
8000
9000
10000
5000
6000
7000
8000
2000
3000
4000
5000
1998 1999 2000 2001 2002 2003 2004 2005 2006 2007 20080
1000
2000
Graduate 684 689 704 693 741 763 781 787 846 807 774
UG Non‐Degree 397 325 284 246 253 213 200 208 244 271 241
UG Degree 6567 6553 6560 6977 7045 7308 7324 7575 7633 7667 7840
ll
3‐2
Fall Semester

Official Enrollment Data By Full‐Time/Part‐Time StatusFall 1998 through Fall 2008Fall 1998 through Fall 2008
8000
9000
10000
6000
7000
8000
3000
4000
5000
0
1000
2000
1998 1999 2000 2001 2002 2003 2004 2005 2006 2007 2008
Part‐Time 1221 1125 1092 1064 1043 997 937 969 1029 1027 1003
Full‐Time 6427 6442 6456 6852 6996 7287 7368 7601 7694 7718 7852
ll
3‐3
Fall Semester

Official Enrollment Data By GenderFall 1998 through Fall 2008Fall 1998 through Fall 2008
8000
9000
10000
6000
7000
8000
3000
4000
5000
0
1000
2000
1998 1999 2000 2001 2002 2003 2004 2005 2006 2007 2008
Male 2781 2794 2827 3022 3111 3162 3196 3327 3422 3521 3611
Female 4867 4773 4721 4894 4928 5122 5109 5243 5301 5224 5244
ll
3‐4
Fall Semester

Official Enrollment DataFall 1999 through Fall 2003
Full‐Time Full‐Time Full‐Time Part‐Time Part‐Time Part‐Time Total Total StudentMale Female Total Male Female Total Male Female Total Credit
Session Category Headcount Headcount Headcount Headcount Headcount Headcount Headcount Headcount Headcount Hours F.T.E.
Fall 1999 U.G. Degree 2316 3885 6201 121 231 352 2437 4116 6553 95833 6388.87
Fall 1999 through Fall 2003
U.G. Non‐Degree 22 14 36 122 167 289 144 181 325 1898 126.53Total Undergraduate 2338 3899 6237 243 398 641 2581 4297 6878 97731 6515.40Total Graduate 68 137 205 145 339 484 213 476 689 3941 328.42TOTAL 2406 4036 6442 388 737 1125 2794 4773 7567 101672 6843.82
Fall 2000 U.G. Degree 2388 3814 6202 127 231 358 2515 4045 6560 96011 6400.73U G N D 20 20 40 101 143 244 121 163 284 1620 108 00U.G. Non‐Degree 20 20 40 101 143 244 121 163 284 1620 108.00Total Undergraduate 2408 3834 6242 228 374 602 2636 4208 6844 97631 6508.73Total Graduate 55 159 214 136 354 490 191 513 704 4153 346.08TOTAL 2463 3993 6456 364 728 1092 2827 4721 7548 101784 6854.82
Fall 2001 U.G. Degree 2607 4019 6626 116 235 351 2723 4254 6977 102569 6837.93U G Non Degree 13 18 31 91 124 215 104 142 246 1426 95 07U.G. Non‐Degree 13 18 31 91 124 215 104 142 246 1426 95.07Total Undergraduate 2620 4037 6657 207 359 566 2827 4396 7223 103995 6933.00Total Graduate 60 135 195 135 363 498 195 498 693 3984 332.00TOTAL 2680 4172 6852 342 722 1064 3022 4894 7916 107979 7265.00
Fall 2002 U.G. Degree 2658 4053 6711 114 220 334 2772 4273 7045 103568 6904.53U.G. Non‐Degree 14 15 29 99 125 224 113 140 253 1504 100 27U.G. Non Degree 14 15 29 99 125 224 113 140 253 1504 100.27Total Undergraduate 2672 4068 6740 213 345 558 2885 4413 7298 105072 7004.80Total Graduate 88 168 256 138 347 485 226 515 741 4627 385.58TOTAL 2760 4236 6996 351 692 1043 3111 4928 8039 109699 7390.38
Fall 2003 U.G. Degree 2727 4213 6940 118 250 368 2845 4463 7308 105590 7039.33U.G. Non‐Degree 20 14 34 76 103 179 96 117 213 1289 85.93gTotal Undergraduate 2747 4227 6974 194 353 547 2941 4580 7521 106879 7125.27Total Graduate 98 215 313 123 327 450 221 542 763 5251 437.58TOTAL 2845 4442 7287 317 680 997 3162 5122 8284 112130 7562.85
3‐5

Official Enrollment DataFall 2004 through Fall 2008
Full‐Time Full‐Time Full‐Time Part‐Time Part‐Time Part‐Time Total Total StudentMale Female Total Male Female Total Male Female Total Credit
Session Category Headcount Headcount Headcount Headcount Headcount Headcount Headcount Headcount Headcount Hours F.T.E.
Fall 2004 U.G. Degree 2795 4201 6996 94 234 328 2889 4435 7324 106052 7070.13
Fall 2004 through Fall 2008
U.G. Non‐Degree 15 17 32 78 90 168 93 107 200 1265 84.33Total Undergraduate 2810 4218 7028 172 324 496 2982 4542 7524 107317 7154.47Total Graduate 94 246 340 120 321 441 214 567 781 5603 466.92TOTAL 2904 4464 7368 292 645 937 3196 5109 8305 112920 7621.38
Fall 2005 U.G. Degree 2873 4340 7213 125 237 362 2998 4577 7575 109018 7267.87U.G. Non‐Degree 16 28 44 64 100 164 80 128 208 1337 89.13Total Undergraduate 2889 4368 7257 189 337 526 3078 4705 7783 110355 7357.00Total Graduate 98 246 344 151 292 443 249 538 787 5531 460.92TOTAL 2987 4614 7601 340 629 969 3327 5243 8570 115886 7817.92
Fall 2006 U.G. Degree 2976 4320 7296 105 232 337 3081 4552 7633 110821 7388.07U.G. Non‐Degree 9 33 42 75 127 202 84 160 244 1499 99.93Total Undergraduate 2985 4353 7338 180 359 539 3165 4712 7877 112320 7488.00Total Graduate 106 250 356 151 339 490 257 589 846 5999 499.92TOTAL 3091 4603 7694 331 698 1029 3422 5301 8723 118319 7987.92
Fall 2007 U.G. Degree 3078 4237 7315 110 242 352 3188 4479 7667 111377 7425.13U.G. Non‐Degree 20 24 44 72 155 227 92 179 271 1548 103.20Total Undergraduate 3098 4261 7359 182 397 579 3280 4658 7938 112925 7528.33Total Graduate 108 251 359 133 315 448 241 566 807 5790 482.50TOTAL 3206 4512 7718 315 712 1027 3521 5224 8745 118715 8010.83
Fall 2008 U.G. Degree 3163 4329 7492 122 226 348 3285 4555 7840 113330 7555.33U G N D 15 23 38 69 134 203 84 157 241 1396 93 07U.G. Non‐Degree 15 23 38 69 134 203 84 157 241 1396 93.07Total Undergraduate 3178 4352 7530 191 360 551 3369 4712 8081 114726 7648.40Total Graduate 112 210 322 130 322 452 242 532 774 5470 455.83TOTAL 3290 4562 7852 321 682 1003 3611 5244 8855 120196 8104.23
3‐6

Official Enrollment DataSpring 2000 through Spring 2004
Full‐Time Full‐Time Full‐Time Part‐Time Part‐Time Part‐Time Total Total StudentMale Female Total Male Female Total Male Female Total Credit
Session Category Headcount Headcount Headcount Headcount Headcount Headcount Headcount Headcount Headcount Hours F.T.E.
Spr 2000 U.G. Degree 2206 3616 5822 148 239 387 2354 3855 6209 89637 5975.80
Spring 2000 through Spring 2004
U.G. Non-Degree 20 24 44 102 117 219 122 141 263 1663 110.87Total Undergraduate 2226 3640 5866 250 356 606 2476 3996 6472 91300 6086.67Total Graduate 77 118 195 135 353 488 212 471 683 3895 324.58TOTAL 2303 3758 6061 385 709 1094 2688 4467 7155 95195 6411.25
Spr 2001 U.G. Degree 2216 3526 5742 139 248 387 2355 3774 6129 88579 5905.27U G N D 19 22 41 80 125 205 99 147 246 1536 102 40U.G. Non-Degree 19 22 41 80 125 205 99 147 246 1536 102.40Total Undergraduate 2235 3548 5783 219 373 592 2454 3921 6375 90115 6007.67Total Graduate 53 123 176 145 399 544 198 522 720 3969 330.75TOTAL 2288 3671 5959 364 772 1136 2652 4443 7095 94084 6338.42
Spr 2002 U.G. Degree 2449 3712 6161 130 254 384 2579 3966 6545 95354 6356.93U G Non Degree 13 18 31 79 113 192 92 131 223 1304 86 93U.G. Non-Degree 13 18 31 79 113 192 92 131 223 1304 86.93Total Undergraduate 2462 3730 6192 209 367 576 2671 4097 6768 96658 6443.87Total Graduate 79 115 194 128 407 535 207 522 729 4116 343.00TOTAL 2541 3845 6386 337 774 1111 2878 4619 7497 100774 6786.87
Spr 2003 U.G. Degree 2466 3785 6251 129 260 389 2595 4045 6640 94817 6321.13U.G. Non-Degree 14 16 30 70 92 162 84 108 192 1222 81.47gTotal Undergraduate 2480 3801 6281 199 352 551 2679 4153 6832 96039 6402.60Total Graduate 79 142 221 148 370 518 227 512 739 4468 372.33TOTAL 2559 3943 6502 347 722 1069 2906 4665 7571 100507 6774.93
Spr 2004 U.G. Degree 2535 3913 6448 131 263 394 2666 4176 6842 97817 6521.13U.G. Non-Degree 14 15 29 62 69 131 76 84 160 1043 69.53Total Undergraduate 2549 3928 6477 193 332 525 2742 4260 7002 98860 6590.67Total Graduate 87 179 266 110 348 458 197 527 724 4809 400.75TOTAL 2636 4107 6743 303 680 983 2939 4787 7726 103669 6991.42
3‐7

Official Enrollment DataSpring 2005 through Spring 2009
Full‐Time Full‐Time Full‐Time Part‐Time Part‐Time Part‐Time Total Total StudentMale Female Total Male Female Total Male Female Total Credit
Session Category Headcount Headcount Headcount Headcount Headcount Headcount Headcount Headcount Headcount Hours F.T.E.
Spr 2005 U.G. Degree 2609 3937 6546 140 254 394 2749 4191 6940 98241 6549.40
Spring 2005 through Spring 2009
U.G. Non-Degree 17 15 32 65 88 153 82 103 185 1131 75.40Total Undergraduate 2626 3952 6578 205 342 547 2831 4294 7125 99372 6624.80Total Graduate 96 195 291 131 356 487 227 551 778 5247 437.25TOTAL 2722 4147 6869 336 698 1034 3058 4845 7903 104619 7062.05
Spr 2006 U.G. Degree 2684 4077 6761 110 246 356 2794 4323 7117 101161 6744.07U G N D 12 28 40 76 135 211 88 163 251 1482 98 80U.G. Non-Degree 12 28 40 76 135 211 88 163 251 1482 98.80Total Undergraduate 2696 4105 6801 186 381 567 2882 4486 7368 102643 6842.87Total Graduate 98 213 311 167 328 495 265 541 806 5400 450.00TOTAL 2794 4318 7112 353 709 1062 3147 5027 8174 108043 7292.87
Spr 2007 U.G. Degree 2791 4036 6827 127 240 367 2918 4276 7194 102569 6837.93U G Non Degree 18 28 46 90 120 210 108 148 256 1543 102 87U.G. Non-Degree 18 28 46 90 120 210 108 148 256 1543 102.87Total Undergraduate 2809 4064 6873 217 360 577 3026 4424 7450 104112 6940.80Total Graduate 103 192 295 146 396 542 249 588 837 5473 456.08TOTAL 2912 4256 7168 363 756 1119 3275 5012 8287 109585 7396.88
Spr 2008 U.G. Degree 2869 3997 6866 123 232 355 2992 4229 7221 103494 6899.60U.G. Non-Degree 26 27 53 60 137 197 86 164 250 1546 103.07gTotal Undergraduate 2895 4024 6919 183 369 552 3078 4393 7471 105040 7002.67Total Graduate 98 185 283 150 371 521 248 556 804 5295 441.25TOTAL 2993 4209 7202 333 740 1073 3326 4949 8275 110335 7443.92
Spr 2009 U.G. Degree 2982 4084 7066 123 233 356 3105 4317 7422 106071 7071.40U.G. Non-Degree 10 22 32 79 142 221 89 164 253 1404 93.60Total Undergraduate 2992 4106 7098 202 375 577 3194 4481 7675 107475 7165.00Total Graduate 98 188 286 140 393 533 238 581 819 5341 445.08TOTAL 3090 4294 7384 342 768 1110 3432 5062 8494 112816 7610.08
3‐8

Official Enrollment Data, Summer 2004 through Summer 2008
Summer 1 Summer 2 Total SummerSummer Session (Sessions 1, 4 & 5) (Sessions 2, 3, 6, 7, and 8) Unduplicated
Headcount SCH Headcount SCH Headcount SCHSummer 2004
Undergraduate Degree 1164 5280 1531 9105 2148 14385Undergraduate Non‐Degree 172 631 126 488 247 1119Undergraduate Non Degree 172 631 126 488 247 1119
Undergraduate Total 1336 5911 1657 9593 2395 15504Graduate 492 2058 589 3032 712 5090Total 1828 7969 2246 12625 3107 20594
Summer 2005Undergraduate Degree 1121 5352 1658 8816 2242 14168
Undergraduate Non‐Degree 148 554 114 475 227 1029Undergraduate Total 1269 5906 1772 9291 2469 15197Undergraduate Total 1269 5906 1772 9291 2469 15197
Graduate 436 1785 551 2997 693 4782Total 1705 7691 2323 12288 3162 19979
Summer 2006Undergraduate Degree 1167 5541 1672 8755 2325 14296
Undergraduate Non‐Degree 158 593 134 514 248 1107Undergraduate Total 1325 6134 1806 9269 2573 15403
Graduate 528 2223 579 3126 768 5349Graduate 528 2223 579 3126 768 5349Total 1853 8357 2385 12395 3341 20752
Summer 2007Undergraduate Degree 1268 5823 1764 9113 2450 14936
Undergraduate Non‐Degree 144 516 153 610 245 1126Undergraduate Total 1412 6339 1917 9723 2695 16062
Graduate 518 2058 594 3146 749 5204Total 1930 8397 2511 12869 3444 21266Total 1930 8397 2511 12869 3444 21266
Summer 2008Undergraduate Degree 1293 6035 1858 9744 2621 15779
Undergraduate Non‐Degree 166 673 137 496 263 1169Undergraduate Total 1459 6708 1995 10240 2884 16948
Graduate 463 2034 644 3093 780 5127Total 1922 8742 2639 13333 3664 22075
3‐9
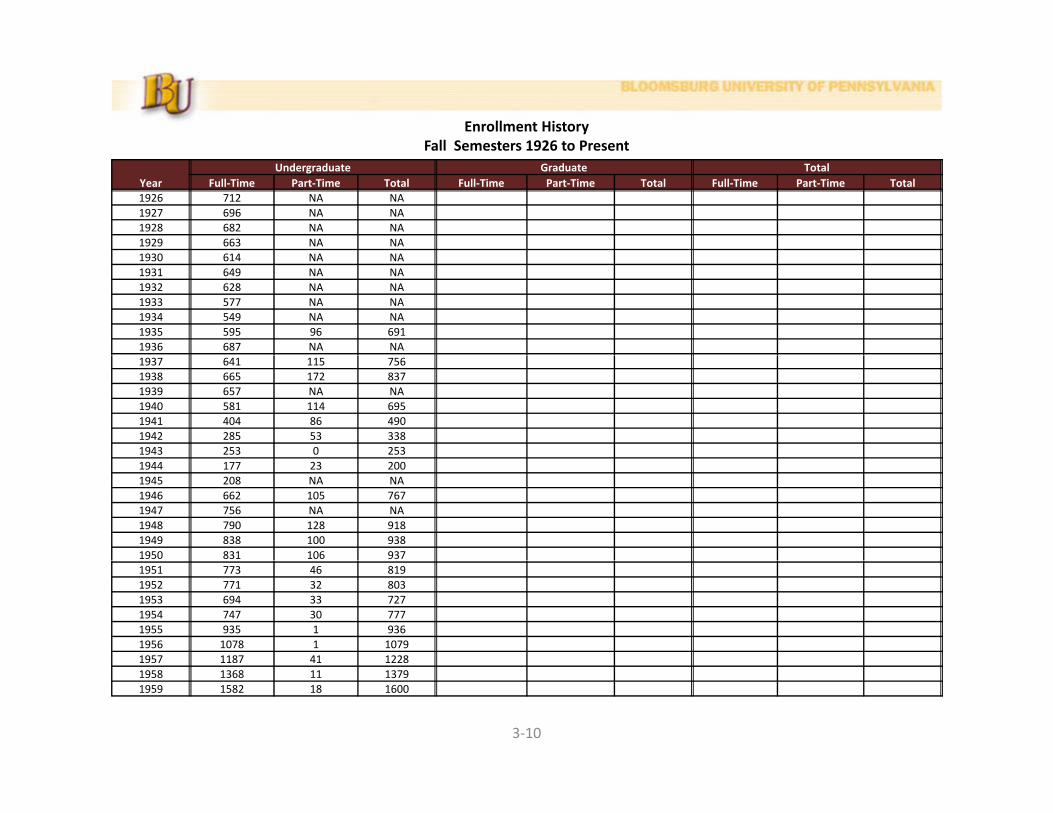
Enrollment HistoryFall Semesters 1926 to PresentFall Semesters 1926 to Present
YearUndergraduate Graduate Total
Full‐Time Part‐Time Total Full‐Time Part‐Time Total Full‐Time Part‐Time Total1926 712 NA NA1927 696 NA NA1928 682 NA NA1929 663 NA NA1930 614 NA NA1931 649 NA NA1932 628 NA NA1933 577 NA NA1934 549 NA NA1935 595 96 6911936 687 NA NA1937 641 115 7561938 665 172 8371939 657 NA NA1940 581 114 6951941 404 86 4901942 285 53 3381943 253 0 2531944 177 23 2001945 208 NA NA1946 662 105 7671947 756 NA NA1948 790 128 9181949 838 100 9381950 831 106 9371951 773 46 8191952 771 32 8031953 694 33 7271954 747 30 7771955 935 1 9361956 1078 1 10791957 1187 41 1228
3‐10
1958 1368 11 13791959 1582 18 1600

Enrollment HistoryFall Semesters 1926 to PresentFall Semesters 1926 to Present
YearUndergraduate Graduate Total
Full‐Time Part‐Time Total Full‐Time Part‐Time Total Full‐Time Part‐Time Total1960 1737 19 17561961 1932 35 19671962 1971 18 19891963 2167 35 22021964 2430 48 2478 5 109 114 2435 157 25921965 2828 115 2943 6 140 146 2834 255 30891966 3095 80 3175 15 180 195 3110 260 33701967 3202 187 3389 13 218 231 3215 405 36201968 3392 159 3551 20 296 316 3412 455 38671969 3550 210 3760 24 341 365 3574 551 41251970 3907 123 4030 36 389 425 3943 512 44551970 3907 123 4030 36 389 425 3943 512 44551971 4239 287 4526 44 372 416 4283 659 49421972 4310 240 4550 58 445 503 4368 685 50531973 4315 337 4652 47 456 503 4362 793 51551974 4417 476 4893 50 538 588 4467 1014 54811975 4681 572 5253 67 643 710 4748 1215 59631976 4773 632 5405 72 626 698 4845 1258 61031977 4992 685 5677 75 648 723 5067 1333 64001977 4992 685 5677 75 648 723 5067 1333 64001978 4844 827 5671 69 581 650 4913 1408 63211979 4904 899 5803 65 664 729 4969 1563 65321980 4940 807 5747 85 671 756 5025 1478 65031981 4942 816 5758 81 500 581 5023 1316 63391982 4879 867 5746 105 389 494 4984 1256 62401983 4959 850 5809 99 408 507 5058 1258 63161984 5045 719 5764 93 332 425 5138 1051 61891985 5133 769 5902 108 429 537 5241 1198 64391986 5332 818 6150 120 487 607 5452 1305 67571987 5452 900 6352 122 462 584 5574 1362 69361988 5470 834 6304 115 385 500 5585 1219 68041989 5698 908 6606 127 410 537 5825 1318 71431990 5869 939 6808 147 509 656 6016 1448 7464
3‐11
1991 6016 1026 7042 170 508 678 6186 1534 77201992 5944 1034 6978 173 400 573 6117 1434 75511993 5848 945 6793 166 416 582 6014 1361 7375
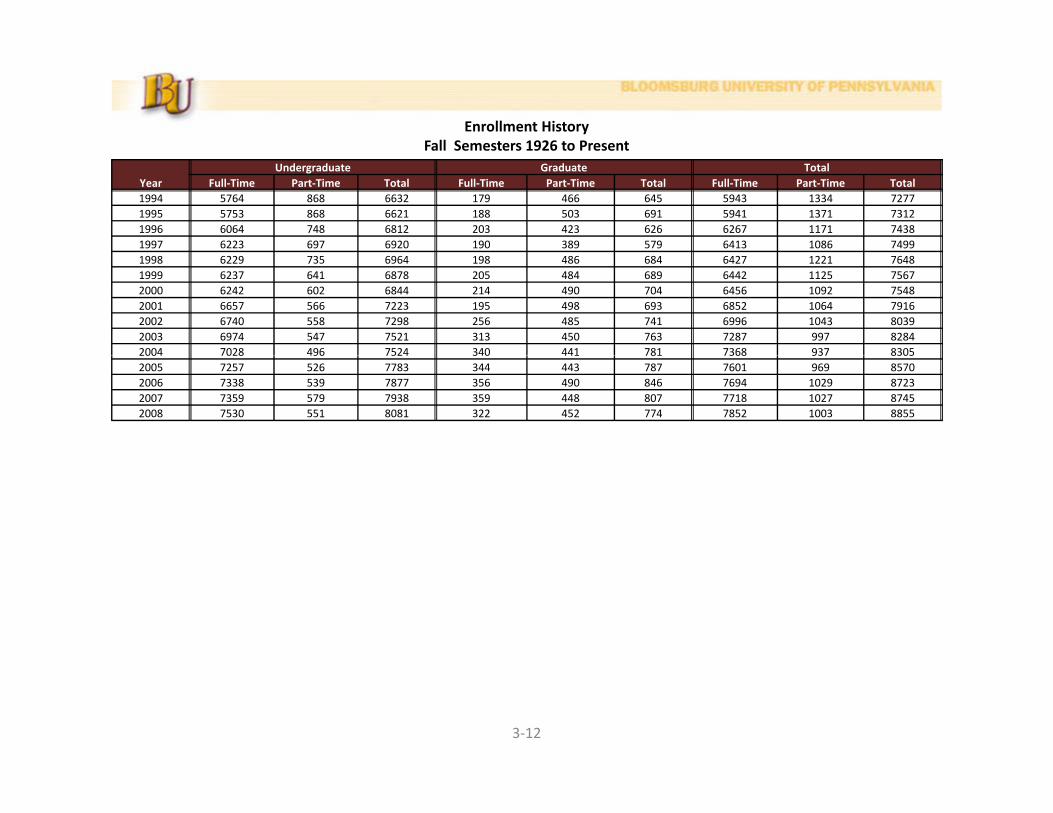
Enrollment HistoryFall Semesters 1926 to PresentFall Semesters 1926 to Present
YearUndergraduate Graduate Total
Full‐Time Part‐Time Total Full‐Time Part‐Time Total Full‐Time Part‐Time Total1994 5764 868 6632 179 466 645 5943 1334 72771995 5753 868 6621 188 503 691 5941 1371 73121996 6064 748 6812 203 423 626 6267 1171 74381997 6223 697 6920 190 389 579 6413 1086 74991998 6229 735 6964 198 486 684 6427 1221 76481999 6237 641 6878 205 484 689 6442 1125 75672000 6242 602 6844 214 490 704 6456 1092 75482001 6657 566 7223 195 498 693 6852 1064 79162002 6740 558 7298 256 485 741 6996 1043 80392003 6974 547 7521 313 450 763 7287 997 82842004 7028 496 7524 340 441 781 7368 937 83052004 7028 496 7524 340 441 781 7368 937 83052005 7257 526 7783 344 443 787 7601 969 85702006 7338 539 7877 356 490 846 7694 1029 87232007 7359 579 7938 359 448 807 7718 1027 87452008 7530 551 8081 322 452 774 7852 1003 8855
3‐12
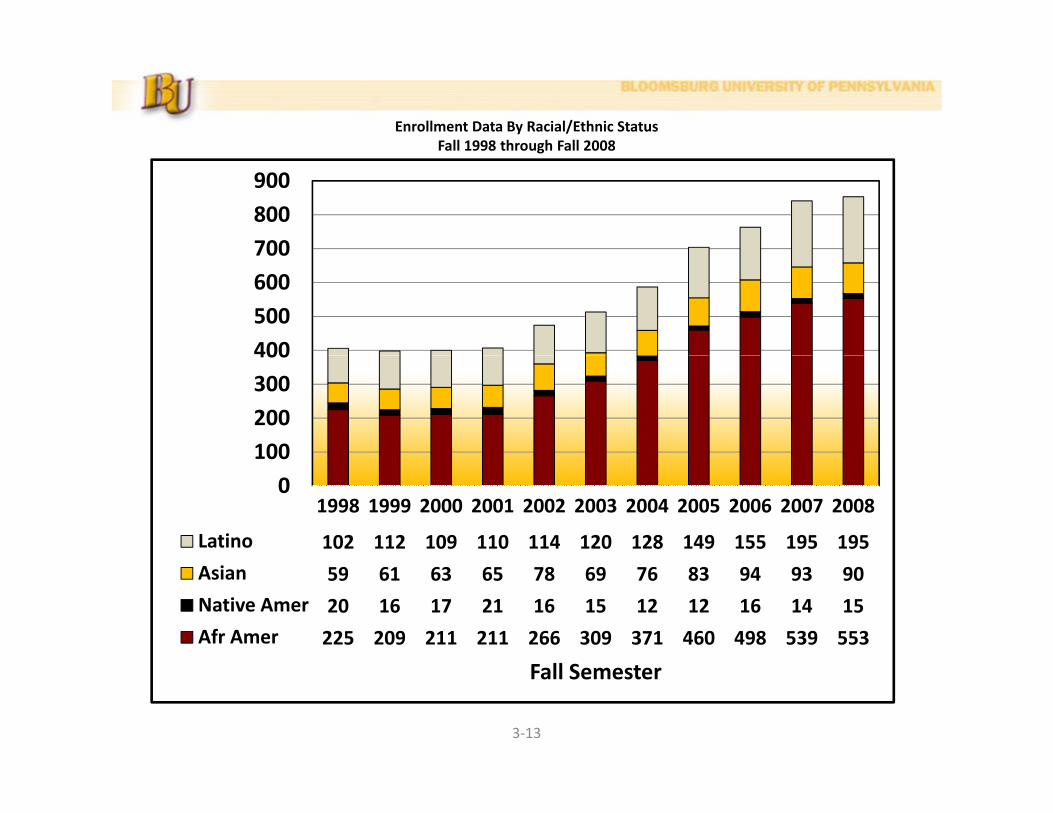
Enrollment Data By Racial/Ethnic StatusFall 1998 through Fall 2008Fall 1998 through Fall 2008
700800900
400500600700
100200300400
1998 1999 2000 2001 2002 2003 2004 2005 2006 2007 2008
Latino 102 112 109 110 114 120 128 149 155 195 195
0100
Asian 59 61 63 65 78 69 76 83 94 93 90
Native Amer 20 16 17 21 16 15 12 12 16 14 15
Afr Amer 225 209 211 211 266 309 371 460 498 539 553
ll
3‐13
Fall Semester

Total Enrollment By RaceFall 1999 through Fall 2008Fall 1999 through Fall 2008
Asian orAfrican American Pacific Minority
American Indian Islander Latino Foreign White Unknown Total Total
1999 209 16 61 112 58 7111 7567 3982000 211 17 63 109 81 7067 7548 4002000 211 17 63 109 81 7067 7548 4002001 211 21 65 110 79 7428 7914 4072002 266 16 78 114 69 7342 154 8039 4742003 309 15 69 120 94 7514 161 8282 5132004 371 12 76 128 71 7376 270 8304 5872005 460 12 83 149 93 7427 346 8570 7042006 498 16 94 155 88 7354 518 8723 7632006 498 16 94 155 88 7354 518 8723 7632007 539 14 93 195 89 7145 670 8745 8412008 553 15 90 233 76 7119 769 8855 891
PERCENT COMPOSITION BY RACE
% % % Asian or% % % Asian orAfrican American Pacific % % % % %
American Indian Islander Latino Foreign White Unknown Total Minority
1999 2.76 0.21 0.81 1.48 0.77 93.97 100.00 5.262000 2.80 0.23 0.83 1.44 1.07 93.63 100.00 5.302001 2.67 0.27 0.82 1.39 1.00 93.86 100.00 5.142002 3.31 0.20 0.97 1.42 0.86 91.33 1.92 100.00 5.902003 3.73 0.18 0.83 1.45 1.13 90.73 1.94 100.00 6.192004 4.47 0.14 0.92 1.54 0.86 88.82 3.25 100.00 7.072005 5.37 0.14 0.97 1.74 1.09 86.66 4.04 100.00 8.212006 5.71 0.18 1.08 1.78 1.01 84.31 5.94 100.00 8.752007 6.16 0.16 1.06 2.23 1.02 81.70 7.66 100.00 9.62
3‐14
2008 6.25 0.17 1.02 2.63 0.86 80.40 8.68 100.00 10.06

3‐143‐15
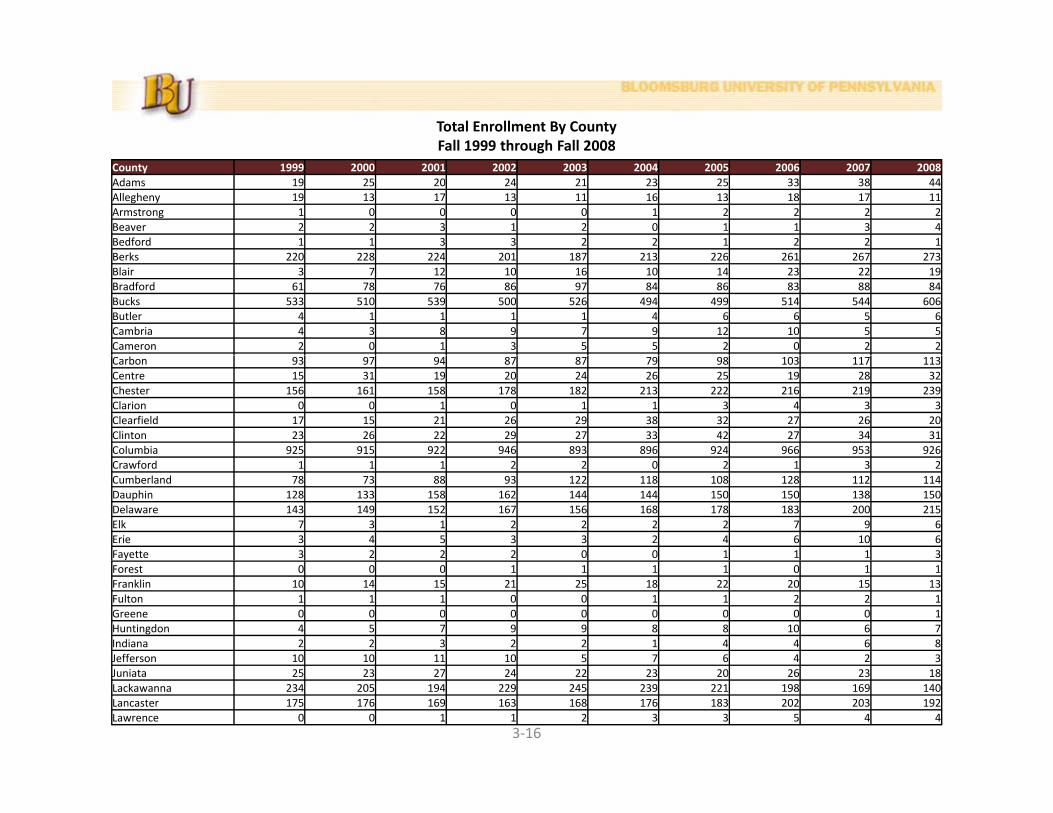
Total Enrollment By CountyFall 1999 through Fall 2008Fall 1999 through Fall 2008
County 1999 2000 2001 2002 2003 2004 2005 2006 2007 2008Adams 19 25 20 24 21 23 25 33 38 44Allegheny 19 13 17 13 11 16 13 18 17 11Armstrong 1 0 0 0 0 1 2 2 2 2Beaver 2 2 3 1 2 0 1 1 3 4Bedford 1 1 3 3 2 2 1 2 2 1B k 220 228 224 201 187 213 226 261 267 273Berks 220 228 224 201 187 213 226 261 267 273Blair 3 7 12 10 16 10 14 23 22 19Bradford 61 78 76 86 97 84 86 83 88 84Bucks 533 510 539 500 526 494 499 514 544 606Butler 4 1 1 1 1 4 6 6 5 6Cambria 4 3 8 9 7 9 12 10 5 5Cameron 2 0 1 3 5 5 2 0 2 2Carbon 93 97 94 87 87 79 98 103 117 113Centre 15 31 19 20 24 26 25 19 28 32Chester 156 161 158 178 182 213 222 216 219 239Clarion 0 0 1 0 1 1 3 4 3 3Clearfield 17 15 21 26 29 38 32 27 26 20Clinton 23 26 22 29 27 33 42 27 34 31Columbia 925 915 922 946 893 896 924 966 953 926Crawford 1 1 1 2 2 0 2 1 3 2Cumberland 78 73 88 93 122 118 108 128 112 114Dauphin 128 133 158 162 144 144 150 150 138 150Delaware 143 149 152 167 156 168 178 183 200 215Elk 7 3 1 2 2 2 2 7 9 6Erie 3 4 5 3 3 2 4 6 10 6Fayette 3 2 2 2 0 0 1 1 1 3Forest 0 0 0 1 1 1 1 0 1 1Franklin 10 14 15 21 25 18 22 20 15 13Fulton 1 1 1 0 0 1 1 2 2 1Greene 0 0 0 0 0 0 0 0 0 1Huntingdon 4 5 7 9 9 8 8 10 6 7Indiana 2 2 3 2 2 1 4 4 6 8Jefferson 10 10 11 10 5 7 6 4 2 3
3‐16
Juniata 25 23 27 24 22 23 20 26 23 18Lackawanna 234 205 194 229 245 239 221 198 169 140Lancaster 175 176 169 163 168 176 183 202 203 192Lawrence 0 0 1 1 2 3 3 5 4 4

Total Enrollment By CountyFall 1999 through Fall 2008Fall 1999 through Fall 2008
County 1999 2000 2001 2002 2003 2004 2005 2006 2007 2008Lebanon 68 62 63 62 71 68 61 65 61 79Lehigh 196 196 219 221 243 262 283 277 258 275Luzerne 682 680 695 698 714 712 713 692 678 648Lycoming 229 236 279 308 359 335 319 339 325 265McKean 6 4 4 1 3 4 6 6 5 10Mercer 3 3 2 3 2 4 7 7 6 5Mercer 3 3 2 3 2 4 7 7 6 5Mifflin 13 16 17 22 21 28 27 34 35 45Monroe 94 91 110 103 115 117 137 144 149 176Montgomery 448 420 440 445 462 461 462 448 482 554Montour 154 182 200 202 219 224 221 214 234 229Northampton 231 210 238 243 228 238 267 262 278 279Northumberland 648 656 651 658 674 666 656 674 670 646P 17 24 36 38 35 40 33 40 37 31Perry 17 24 36 38 35 40 33 40 37 31Philadelphia 261 228 227 235 255 312 383 400 413 430Pike 29 36 41 41 42 42 56 68 76 81Potter 3 2 3 5 6 7 7 7 10 9Schuylkill 360 358 392 368 352 316 312 307 306 342Snyder 122 107 130 126 137 140 139 135 127 112Somerset 3 4 5 4 4 4 3 2 3 3Sullivan 17 24 19 21 24 18 19 16 11 6Susquehanna 52 54 60 59 57 52 50 48 47 42Tioga 17 19 16 18 22 22 28 25 33 24Union 118 128 129 141 121 134 126 138 120 123Venango 4 2 2 2 1 2 2 1 1 0Warren 5 3 4 2 2 1 3 9 10 7Washington 2 2 2 3 3 4 4 1 2 2Washington 2 2 2 3 3 4 4 1 2 2Wayne 52 50 57 47 51 39 37 50 59 54Westmoreland 10 10 8 6 9 9 7 6 4 4Wyoming 29 30 28 27 27 32 31 31 28 29York 104 108 111 143 157 147 145 151 138 142
State Total 6899 6859 7164 7280 7442 7498 7691 7859 7885 7957
3‐17
Out‐of‐State 668 689 750 759 840 806 879 864 860 898
Overall Total 7567 7548 7914 8039 8282 8304 8570 8723 8745 8855

Total Enrollment By StateFall 2008Fall 2008
3‐18

Total Enrollment By StateFall 1999 through Fall 2008Fall 1999 through Fall 2008
Fall Fall Fall Fall Fall Fall Fall Fall Fall FallState 1999 2000 2001 2002 2003 2004 2005 2006 2007 2008Alabama 1 2 1 0 1 0 0 1 1 0Alaska 1 0 0 0 0 0 0 0 0 0Arizona 1 0 0 2 1 1 2 0 0 0Arizona 1 0 0 2 1 1 2 0 0 0California 3 3 2 3 2 1 1 3 2 2Colorado 0 0 1 0 0 0 0 0 0 0Connecticut 9 10 14 10 11 12 11 12 10 13Delaware 11 13 14 7 10 13 10 13 14 22District of Columbia 0 0 1 0 0 2 2 1 2 2Florida 1 2 3 3 2 2 6 4 1 1Georgia 0 0 0 0 0 0 1 0 0 0Hawaii 0 0 1 0 0 0 0 0 0 0Idaho 0 0 0 0 0 0 0 0 1 0Illinois 0 1 1 0 1 0 1 2 2 3Indiana 1 1 1 0 0 0 0 1 0 0Iowa 0 0 0 0 0 0 0 1 2 1Kentucky 0 0 0 0 0 0 0 0 1 1Louisiana 1 1 0 0 0 0 0 0 0 0Maine 1 1 3 2 0 1 0 0 1 1Maryland 14 16 17 18 21 22 22 27 30 34Massachusetts 3 2 1 2 2 1 2 2 3 7Michigan 0 1 0 0 0 0 2 2 1 1Minnesota 0 1 1 2 0 0 0 0 0 0Mississippi 0 0 0 0 1 1 1 1 0 0Mi i 1 0 0 1 1 1 1 0 0 0
3‐19
Missouri 1 0 0 1 1 1 1 0 0 0Nebraska 1 1 1 0 0 0 0 0 0 0New Hampshire 3 1 2 1 2 2 1 1 1 1
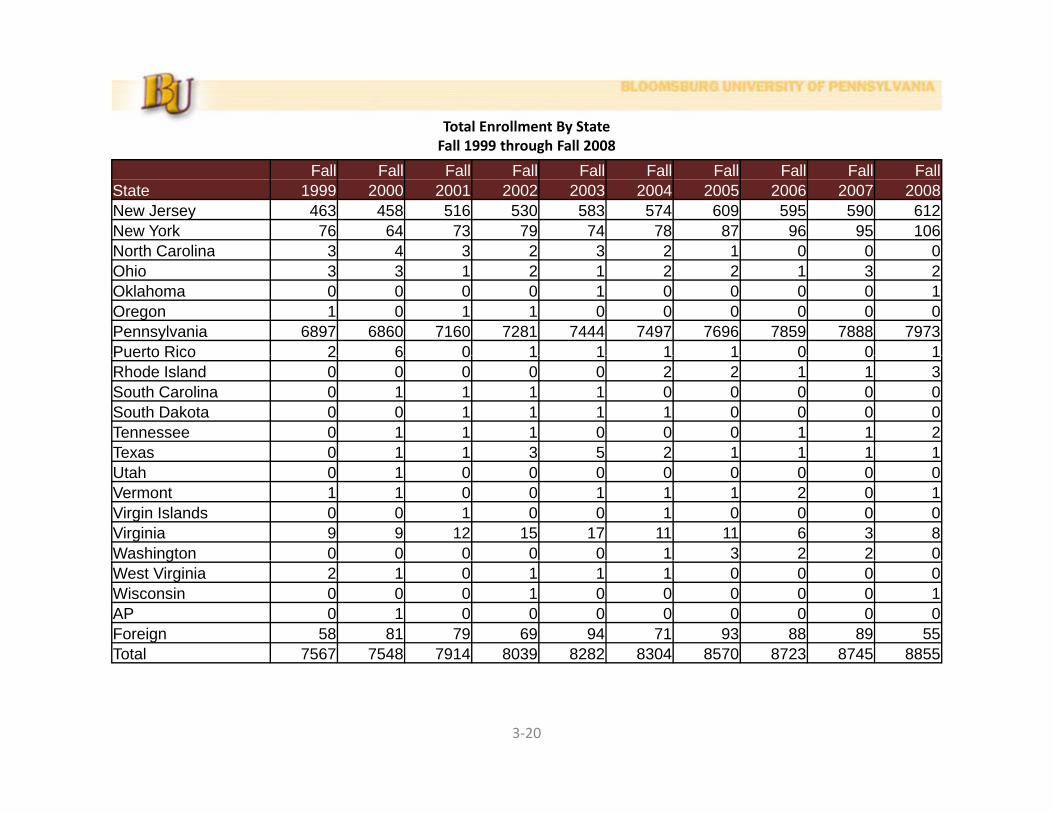
Total Enrollment By StateFall 1999 through Fall 2008Fall 1999 through Fall 2008
Fall Fall Fall Fall Fall Fall Fall Fall Fall FallState 1999 2000 2001 2002 2003 2004 2005 2006 2007 2008New Jersey 463 458 516 530 583 574 609 595 590 612New York 76 64 73 79 74 78 87 96 95 106North Carolina 3 4 3 2 3 2 1 0 0 0North Carolina 3 4 3 2 3 2 1 0 0 0Ohio 3 3 1 2 1 2 2 1 3 2Oklahoma 0 0 0 0 1 0 0 0 0 1Oregon 1 0 1 1 0 0 0 0 0 0Pennsylvania 6897 6860 7160 7281 7444 7497 7696 7859 7888 7973Puerto Rico 2 6 0 1 1 1 1 0 0 1Puerto Rico 2 6 0 1 1 1 1 0 0 1Rhode Island 0 0 0 0 0 2 2 1 1 3South Carolina 0 1 1 1 1 0 0 0 0 0South Dakota 0 0 1 1 1 1 0 0 0 0Tennessee 0 1 1 1 0 0 0 1 1 2Texas 0 1 1 3 5 2 1 1 1 1Utah 0 1 0 0 0 0 0 0 0 0Vermont 1 1 0 0 1 1 1 2 0 1Virgin Islands 0 0 1 0 0 1 0 0 0 0Virginia 9 9 12 15 17 11 11 6 3 8Washington 0 0 0 0 0 1 3 2 2 0gWest Virginia 2 1 0 1 1 1 0 0 0 0Wisconsin 0 0 0 1 0 0 0 0 0 1AP 0 1 0 0 0 0 0 0 0 0Foreign 58 81 79 69 94 71 93 88 89 55Total 7567 7548 7914 8039 8282 8304 8570 8723 8745 8855
3‐20

3‐21

Total Enrollment By CountryFall 2002 through Fall 2008
Fall Fall Fall Fall Fall Fall FallCountry 2002 2003 2004 2005 2006 2007 2008Austria 0 1 1 1 1 0 0Bangladesh 5 1 5 6 5 7 5Bosnia and Herzegovina 0 0 0 0 1 0 0Brazil 1 1 1 3 2 2 3Bulgaria 0 0 0 0 1 1 0Burkina Faso 1 0 1 0 0 0 0Cameroon 1 0 0 0 0 0 0Canada 2 2 3 2 2 3 5China 3 7 9 14 15 13 14Chile 0 0 0 0 0 1 1Costa Rica 0 0 1 0 0 0 0Cyprus 0 0 0 1 1 0 0Czech Republic 0 1 1 1 0 0 0Ecuador 4 4 4 3 1 0 0Egypt 0 0 0 0 0 1 0Finland 0 1 1 3 2 3 2France 3 0 1 2 2 0 2Germany 4 4 0 3 2 4 3Gh 1 3 3 6 4 2 1Ghana 1 3 3 6 4 2 1Greece 1 0 2 0 0 0 0Guinea 1 1 1 1 1 0 0
3‐22

Total Enrollment By CountryFall 2002 through Fall 2008
Fall Fall Fall Fall Fall Fall FallCountry 2002 2003 2004 2005 2006 2007 2008Haiti 1 0 0 0 1 1 1Hungary 1 0 0 0 0 0 0diIndia 7 6 9 9 10 8 5
Indonesia 1 0 0 0 0 0 0Ireland 0 1 0 0 0 0 0Isreal 0 0 0 0 1 0 0Jamaica 0 0 0 0 1 0 0J 1 1 1 1 0 0 0Japan 1 1 1 1 0 0 0Jordan 0 0 0 1 0 0 0Kenya 2 3 2 3 2 3 2Korea, Republic Of 1 0 0 0 2 3 2Kuwait 0 1 0 0 0 0 0Liberia 0 0 0 0 0 1 1Liberia 0 0 0 0 0 1 1Lithuania 1 1 0 0 0 0 0Malawi 0 0 1 1 1 1 0Mexico 1 0 2 0 2 0 2Nepal 6 5 4 5 5 3 3Nigeria 0 1 1 0 1 1 1Nigeria 0 1 1 0 1 1 1Pakistan 1 2 0 0 0 1 1Philippines 0 1 0 0 0 1 0Poland 1 1 2 1 0 0 0Romania 0 0 1 0 0 0 0Russia 4 25 3 9 7 14 12
3‐23
Russia 4 25 3 9 7 14 12

Total Enrollment By CountryFall 2002 through Fall 2008
Fall Fall Fall Fall Fall Fall FallCountry 2002 2003 2004 2005 2006 2007 2008Samoa 0 0 1 1 0 0 0Saudia Arabia 0 1 0 0 0 0 0Singapore 0 0 0 1 0 0 0Slovenia 0 0 0 0 1 1 1South Africa 1 1 1 2 1 1 1Spain 0 1 2 2 0 1 2Sri Lanka 0 0 0 1 0 0 0St. Lucia 0 0 1 1 1 1 0Sweden 0 1 0 0 0 0 0Taiwan 0 0 0 0 0 1 0Tanzania, United Republic Of 1 0 0 0 0 0 0Thailand 2 1 0 0 0 0 0Trinidad and Tobago 1 1 1 2 2 2 1Tunisia 0 0 0 1 1 1 0Turkey 1 1 0 0 0 0 0Ukraine 0 0 1 1 1 2 1United Kingdom 2 9 2 2 4 3 2Uzbekistan 1 1 0 1 1 0 0Venezuela 3 1 1 1 0 0 0Vietnam 0 0 0 0 1 1 1Yugoslavia 2 2 1 1 2 1 0Zambia 0 0 0 0 0 0 1
3‐24
Total 69 94 71 93 88 89 76

EnrollmentEnrollment(Undergraduate)(Undergraduate)
3‐25

Total Enrollment By Class LevelFall 2000 through Fall 2008Fall 2000 through Fall 2008
Undergraduate Degree2000 2001 2002 2003 2004 2005 2006 2007 2008
Freshman 2444 2703 2511 2389 2345 2452 2433 2396 2532Sophomore 1475 1567 1684 1690 1754 1886 1868 1911 1860Junior 1263 1355 1462 1559 1636 1630 1690 1724 1730Junior 1263 1355 1462 1559 1636 1630 1690 1724 1730Senior 1378 1351 1389 1671 1590 1607 1642 1636 1718Total 6560 6976 7046 7309 7325 7575 7633 7667 7840
Undergraduate Non-Degree2000 2001 2002 2003 2004 2005 2006 2007 20082000 2001 2002 2003 2004 2005 2006 2007 2008
Freshman 233 200 211 178 171 174 214 242 216Sophomore 23 24 14 15 7 8 11 12 9Junior 3 9 9 6 6 3 1 4 2Senior 24 13 18 12 15 23 18 13 14Total 283 246 252 211 199 208 244 271 241Total 283 246 252 211 199 208 244 271 241
Total Undergraduate2000 2001 2002 2003 2004 2005 2006 2007 2008
Freshman 2677 2903 2722 2567 2516 2626 2647 2638 2748Sophomore 1498 1591 1698 1705 1761 1894 1879 1923 1869Sophomore 1498 1591 1698 1705 1761 1894 1879 1923 1869Junior 1266 1364 1471 1565 1642 1633 1691 1728 1732Senior 1402 1364 1407 1683 1605 1630 1660 1649 1732Total 6843 7222 7298 7520 7524 7783 7877 7938 8081
From 2000 to 2002, class levels were defined as freshman (0-31 credits), sophomore (32-63 credits), junior (64-95 credits),
3‐26
From 2000 to 2002, class levels were defined as freshman (0 31 credits), sophomore (32 63 credits), junior (64 95 credits), and senior (96 credits and above).Since 2003, class levels are defined as freshman (0-29 credits), sophomore (30-59 credits), junior (60-89 credits), and senior (90 credits and above) due to the 120 credit requirement for graduation.

Undergraduate Enrollment By RaceFall 1999 through Fall 2008Fall 1999 through Fall 2008
Asian orAfrican American Pacific Minority
American Indian Islander Latino Foreign White Unknown Total Total
1999 201 15 51 108 41 6462 6878 3752000 202 16 50 105 46 6424 6843 3732000 202 16 50 105 46 6424 6843 3732001 204 20 57 107 47 6787 7222 3882002 253 16 67 109 38 6686 129 7298 4452003 298 15 62 114 69 6829 133 7520 4892004 361 12 71 122 43 6667 248 7524 5662005 446 12 81 142 58 6715 329 7783 6812006 484 16 89 151 50 6599 488 7877 7402006 484 16 89 151 50 6599 488 7877 7402007 522 14 87 189 57 6421 648 7938 8122008 535 15 82 229 54 6416 750 8081 861
PERCENT COMPOSITION BY RACE
% % % Asian or% % % Asian orAfrican American Pacific % % % % %
American Indian Islander Latino Foreign White Unknown Total Minority
1999 2.92 0.22 0.74 1.57 0.60 93.95 100.00 5.452000 2.95 0.23 0.73 1.53 0.67 93.88 100.00 5.452001 2 82 0 28 0 79 1 48 0 65 93 98 100 00 5 372001 2.82 0.28 0.79 1.48 0.65 93.98 100.00 5.372002 3.47 0.22 0.92 1.49 0.52 91.61 1.77 100.00 6.102003 3.96 0.20 0.82 1.52 0.92 90.81 1.77 100.00 6.502004 4.80 0.16 0.94 1.62 0.57 88.61 3.30 100.00 7.522005 5.73 0.15 1.04 1.82 0.75 86.28 4.23 100.00 8.752006 6.14 0.20 1.13 1.92 0.63 83.78 6.20 100.00 9.392007 6 58 0 18 1 10 2 38 0 72 80 89 8 16 100 00 10 23
3‐27
2007 6.58 0.18 1.10 2.38 0.72 80.89 8.16 100.00 10.232008 6.62 0.19 1.01 2.83 0.67 79.40 9.28 100.00 10.65
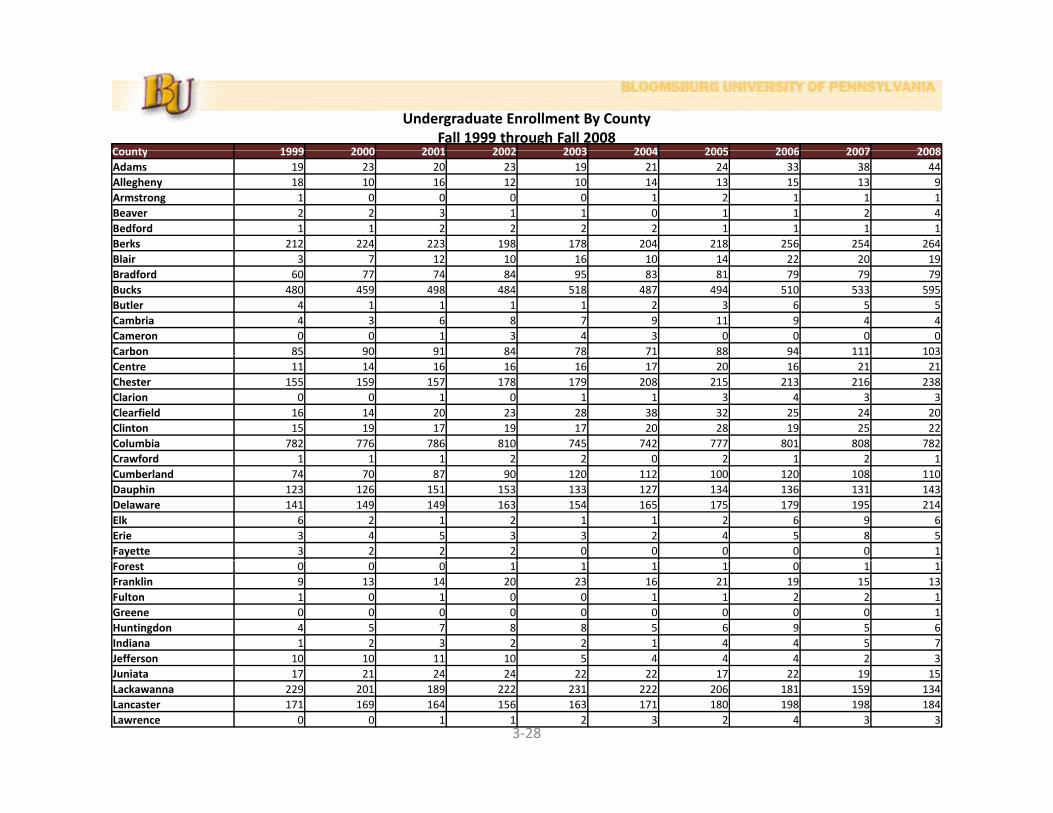
Undergraduate Enrollment By CountyFall 1999 through Fall 2008
County 1999 2000 2001 2002 2003 2004 2005 2006 2007 2008County 1999 2000 2001 2002 2003 2004 2005 2006 2007 2008Adams 19 23 20 23 19 21 24 33 38 44Allegheny 18 10 16 12 10 14 13 15 13 9Armstrong 1 0 0 0 0 1 2 1 1 1Beaver 2 2 3 1 1 0 1 1 2 4Bedford 1 1 2 2 2 2 1 1 1 1Berks 212 224 223 198 178 204 218 256 254 264Blair 3 7 12 10 16 10 14 22 20 19Bradford 60 77 74 84 95 83 81 79 79 79Bucks 480 459 498 484 518 487 494 510 533 595Butler 4 1 1 1 1 2 3 6 5 5Cambria 4 3 6 8 7 9 11 9 4 4Cameron 0 0 1 3 4 3 0 0 0 0Carbon 85 90 91 84 78 71 88 94 111 103Centre 11 14 16 16 16 17 20 16 21 21Chester 155 159 157 178 179 208 215 213 216 238Clarion 0 0 1 0 1 1 3 4 3 3Clearfield 16 14 20 23 28 38 32 25 24 20Clinton 15 19 17 19 17 20 28 19 25 22Columbia 782 776 786 810 745 742 777 801 808 782Crawford 1 1 1 2 2 0 2 1 2 1Crawford 1 1 1 2 2 0 2 1 2 1Cumberland 74 70 87 90 120 112 100 120 108 110Dauphin 123 126 151 153 133 127 134 136 131 143Delaware 141 149 149 163 154 165 175 179 195 214Elk 6 2 1 2 1 1 2 6 9 6Erie 3 4 5 3 3 2 4 5 8 5Fayette 3 2 2 2 0 0 0 0 0 1Forest 0 0 0 1 1 1 1 0 1 1Franklin 9 13 14 20 23 16 21 19 15 13Fulton 1 0 1 0 0 1 1 2 2 1Greene 0 0 0 0 0 0 0 0 0 1Huntingdon 4 5 7 8 8 5 6 9 5 6Indiana 1 2 3 2 2 1 4 4 5 7Jefferson 10 10 11 10 5 4 4 4 2 3
3‐28
Juniata 17 21 24 24 22 22 17 22 19 15Lackawanna 229 201 189 222 231 222 206 181 159 134Lancaster 171 169 164 156 163 171 180 198 198 184Lawrence 0 0 1 1 2 3 2 4 3 3
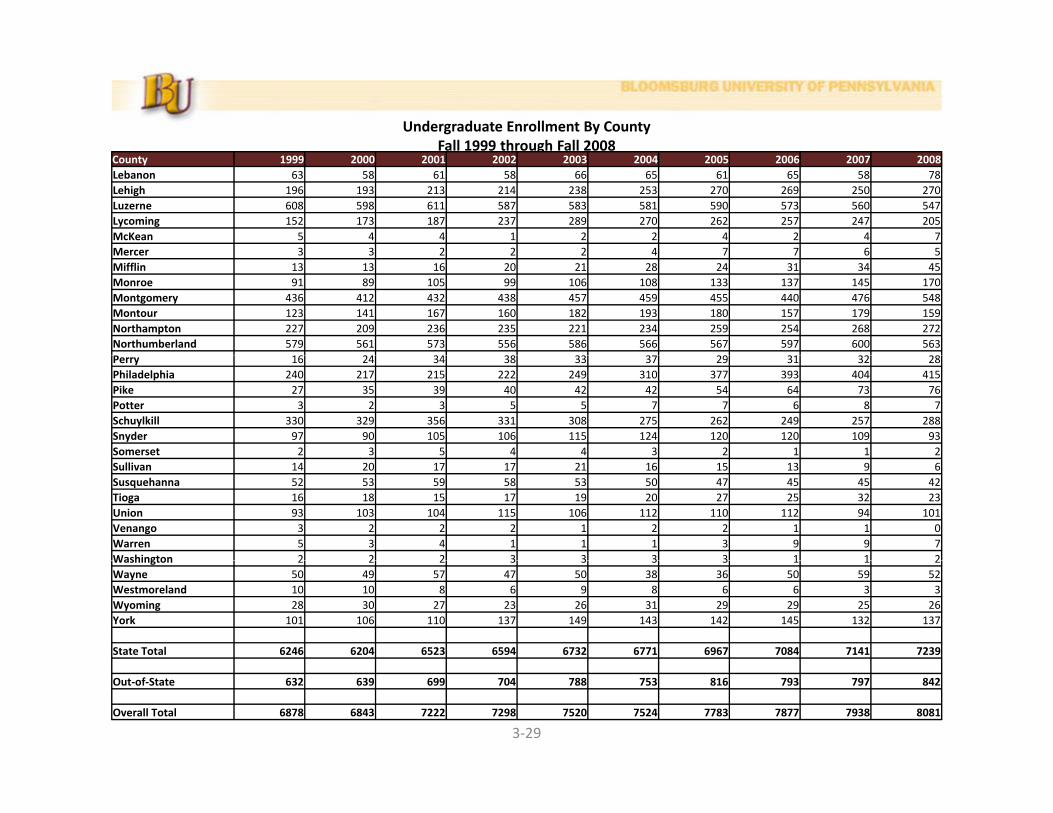
Undergraduate Enrollment By CountyFall 1999 through Fall 2008Fall 1999 through Fall 2008
County 1999 2000 2001 2002 2003 2004 2005 2006 2007 2008Lebanon 63 58 61 58 66 65 61 65 58 78Lehigh 196 193 213 214 238 253 270 269 250 270Luzerne 608 598 611 587 583 581 590 573 560 547Lycoming 152 173 187 237 289 270 262 257 247 205McKean 5 4 4 1 2 2 4 2 4 7Mercer 3 3 2 2 2 4 7 7 6 5Mercer 3 3 2 2 2 4 7 7 6 5Mifflin 13 13 16 20 21 28 24 31 34 45Monroe 91 89 105 99 106 108 133 137 145 170Montgomery 436 412 432 438 457 459 455 440 476 548Montour 123 141 167 160 182 193 180 157 179 159Northampton 227 209 236 235 221 234 259 254 268 272Northumberland 579 561 573 556 586 566 567 597 600 563P 16 24 34 38 33 37 29 31 32 28Perry 16 24 34 38 33 37 29 31 32 28Philadelphia 240 217 215 222 249 310 377 393 404 415Pike 27 35 39 40 42 42 54 64 73 76Potter 3 2 3 5 5 7 7 6 8 7Schuylkill 330 329 356 331 308 275 262 249 257 288Snyder 97 90 105 106 115 124 120 120 109 93Somerset 2 3 5 4 4 3 2 1 1 2Sullivan 14 20 17 17 21 16 15 13 9 6Susquehanna 52 53 59 58 53 50 47 45 45 42Tioga 16 18 15 17 19 20 27 25 32 23Union 93 103 104 115 106 112 110 112 94 101Venango 3 2 2 2 1 2 2 1 1 0Warren 5 3 4 1 1 1 3 9 9 7Washington 2 2 2 3 3 3 3 1 1 2Washington 2 2 2 3 3 3 3 1 1 2Wayne 50 49 57 47 50 38 36 50 59 52Westmoreland 10 10 8 6 9 8 6 6 3 3Wyoming 28 30 27 23 26 31 29 29 25 26York 101 106 110 137 149 143 142 145 132 137
State Total 6246 6204 6523 6594 6732 6771 6967 7084 7141 7239
3‐29
Out‐of‐State 632 639 699 704 788 753 816 793 797 842
Overall Total 6878 6843 7222 7298 7520 7524 7783 7877 7938 8081

Undergraduate MajorsFall Semesters 1998 through 2008Fall Semesters 1998 through 2008
COLLEGE/DEPARTMENT/ FALL FALL FALL FALL FALL FALL FALL FALL FALL FALL FALLDEGREE PROGRAM 1998 1999 2000 2001 2002 2003 2004 2005 2006 2007 2008College of Liberal ArtsAnthropology 57 62 66 71 89 78 76 73 80 89 72Anthropology 40 46 49 53 69 62 65 50 64 86 72Social Science 17 16 17 18 20 16 11 23 16 3Social Science 17 16 17 18 20 16 11 23 16 3
Art 100 86 77 102 100 97 104 103 104 86 76Art History 25 19 16 25 22 19 16 23 28 21 17Studio Art 75 67 61 77 78 78 88 80 76 65 59
Communication Studies & Theater Arts 156 238 236 217 262 283 267 233 251 234 237Communication Studies & Theater Arts 156 238 236 217 262 283 267 233 251 234 237Communication Studies 93 52 47 44 71 57 89 114 136 132 89Comm Studies*Interper Relation 4 57 55 44 61 60 50 34 32 30 50Comm Studies*Leader & Soc Infl 5 20 31 32 28 29 25 11 12 9 20Comm Studies*Organized Communication 9 65 68 59 59 95 66 39 35 31 51Speech/Communication*Inter & Organ 10 5 1Speech/Communication*Public Comm. 2 1 1 1p /Theater Arts 33 38 34 36 43 42 37 35 36 32 27
Economics 22 18 18 29 30 59 39 53 59 48 43Economics 7 6 4 9 13 24 9 15 28 14 15Econ Business Minor (formerly Business Econ) 10 9 12 19 17 31 21 33 25 30 27Political Economics 5 3 2 1 4 9 5 6 4 1
English 84 89 88 104 129 153 186 185 153 158 171English 84 89 88 104 129 146 99 90 65 59 72English*Secondary English 77 77 69 79 69English*Creative Writing 7 10 18 19 20 30
3‐30
Exercise Science & Athletics 140 103 79 87 104 115 134 157 152 139 166
History 138 124 109 121 199 217 262 282 295 294 272

Undergraduate MajorsFall Semesters 1998 through 2008Fall Semesters 1998 through 2008
COLLEGE/DEPARTMENT/ FALL FALL FALL FALL FALL FALL FALL FALL FALL FALL FALLDEGREE PROGRAM 1998 1999 2000 2001 2002 2003 2004 2005 2006 2007 2008
Languages & Cultures 35 40 49 59 69 80 66 66 75 77 69French 10 11 12 14 13 11 11 11 18 22 17German 6 6 10 16 13 16 12 12 12 11 6Spanish 19 23 27 29 43 53 43 43 45 44 46
Mass Communications 214 177 158 183 196 186 174 184 183 194 196Mass Communications 178 145 113 139 140 142 141 184 34 97 124Mass Comm*Journalism 10
* d lMass Comm*News Editorial 9 8 11 12 20 10 11 42 31 12Mass Comm*Public Relations 15 15 22 19 23 16 9 30 16 16Mass Comm*Telecommunications 12 9 12 13 13 18 13 77 50 34
Music 19 26 23 32 50 69 81 70 60 76 61Music 12 15 15 9 2 20 17 12 10M i *A li d 3 3 6 7 6 6 5 4 3Music*Applied 3 3 6 7 6 6 5 4 3Music*Music History & Literature 2 3 1 6 1Music*Audio‐Video Recording 5 5 4 7 25 24 31 27 20 31 25Music*Education K‐12 4 15 19 27 26 22 31 24Music*Music Liberal Arts 4 11 12
Philosophy 25 16 20 30 32 40 39 40 33 36 32Philosophy 25 16 20 30 32 40 39 40 33 36 32Philosophy 19 11 13 19 22 30 25 30 30 35 31Humanities 6 5 7 11 10 10 14 10 3 1 1
Political Science 92 93 89 122 147 132 121 129 124 103 97Political Science 92 93 89 113 136 125 115 126 120 100 94Political Science*Legal Studies Option 9 11 7 6 3 4 3 3
3‐31
Political Science Legal Studies Option 9 11 7 6 3 4 3 3
Psychology 312 341 335 372 332 315 279 308 317 294 298

Undergraduate MajorsFall Semesters 1998 through 2008Fall Semesters 1998 through 2008
COLLEGE/DEPARTMENT/ FALL FALL FALL FALL FALL FALL FALL FALL FALL FALL FALLDEGREE PROGRAM 1998 1999 2000 2001 2002 2003 2004 2005 2006 2007 2008
Sociology, Social Work & Criminal Justice 346 315 301 318 330 371 412 377 432 388 383Sociology 92 104 108 85 98 138 166 172 141 101 85Criminal Justice 178 142 147 158 167 174 161 134 153 143 148Social Work 76 69 46 75 65 59 85 71 84 73 78Pre‐Social Work 54 71 72
Undeclared 620 726 871 802 724 781 924 1054 1045 1136 1250
College of Liberal Arts Total 2360 2454 2519 2649 2793 2976 3164 3314 3363 3352 3423
College of Science & TechnologyBiological & Allied Health Sciences 411 385 343 345 375 512 537 578 585 623 627Biology 41 25 26Biology (BS) 161 159 164 181 209 239 209 194 166 127 83Biology*Biotechnology (BS) 1 2 2 5 6 1Biology*Environmental Biology(BS) 1 8 16Biology*Environmental Biology(BS) 1 8 16Biology*Marine Biology (BS) 11 11 6 6 7 5 7 4 4 1Biology*Microbiology (BS) 2 1 1 1 2 4 3 6 4Biology*Molecular Biology (BS) 4Biology*Pre‐Medical Sci (BS) 20 79 90Biology (BA) 8 8 7 3 3 11 29 54 31 26 45Biology*Marine Biology (BA) 6 5 1 3 3 2 1 1Biology Marine Biology (BA) 6 5 1 3 3 2 1 1Biology*Microbiology(BA) 2 1 1Biology*Natural History(BA) 2 4 4Biology*Pre‐Physical Therapy(BA) 55 46 31 29 35 47 56 59 61 72 88Biology*Pre‐Physician Asst (BA) 19 26 55Medical Imaging (BS) 72 92 73 89 98 167 187 221 236 206 188Clinical Laboratory Science (BS) 29 15 19 24 13 18 18 24 22 25 19
3‐32
Clinical Laboratory Science (BS) 29 15 19 24 13 18 18 24 22 25 19Pre‐Cytotechnology 1 1 1 1 2 1Pre‐Occupational Therapy 21 18 14 7 5 10 6 5 8 17 10Pre‐Pharmacy 3 3 1 3 2 11 20 11 4 17 18

Undergraduate MajorsFall Semesters 1998 through 2008Fall Semesters 1998 through 2008
COLLEGE/DEPARTMENT/ FALL FALL FALL FALL FALL FALL FALL FALL FALL FALL FALLDEGREE PROGRAM 1998 1999 2000 2001 2002 2003 2004 2005 2006 2007 2008
Chemistry 39 39 42 46 51 46 50 49 58 69 75Chemistry 13 21 18Chemistry (BA) 3 2 5 8 8 9 12Chemistry (BS) 19 14 19 41 44 42 38 33 45 43 43Chemistry*Biochemistry(BS) 2 6 5 4 16 18Chemistry*Clinical Chemistry(BS) 7 4 5 5 4 1 3 1 1 2
Geography and Geosciences 102 94 89 80 99 96 110 120 124 115 133Geoscience*Earth Science 23 23 17 17 20 24 30 27 35 34 21G i *E i S i 4 13 10 21 19 12 9 24Geoscience*Environ Sci 4 13 10 21 19 12 9 24Geoscience*Planetary Sci 1 7 7Geoscience*Geology 4 14Geology 22 17 12 6 13 11 16 21 13 10 3Geography*General 10 9 14 19 21 23 15 16 17 13 16Geography*Urban/Regional Planning 1 2 6 1 3 4 3 3 3 4 6Geography*Environmental Planning 46 43 40 33 29 24 25 34 43 34 42Geography Environmental Planning 46 43 40 33 29 24 25 34 43 34 42
Mathematics, Computer Science and Statistics 175 182 210 257 278 268 271 261 278 359 388Mathematics (BA) 39 35 50 77 101 113 133 133 130 138 143Mathematics (BS) 19 20 14 20 26 32 25 27 29 38 26Mathematics*Statistics (BA) 3 1 1 4 4 7 6 4 3Computer Science 117 127 143 159 150 119 109 94 90 92 98Computer Science 117 127 143 159 150 119 109 94 90 92 98Computer Forensics (BS) 23 87 118
3‐33

Undergraduate MajorsFall Semesters 1998 through 2008Fall Semesters 1998 through 2008
COLLEGE/DEPARTMENT/ FALL FALL FALL FALL FALL FALL FALL FALL FALL FALL FALLDEGREE PROGRAM 1998 1999 2000 2001 2002 2003 2004 2005 2006 2007 2008
Physics 72 55 73 112 114 107 114 137 145 147 149Physics 6 8 10Physics (BA) 11 6 10 34 31 25 29 34 40 34 28Physics (BS) 7 7 7 16 12 17 14 14 10 18 14Health Physics 5 3 3 5 10 7 6 12 18 14 9Electrical & Electronics Engineering Technology 4 20 27 29 40 43 37 42 48Engineering Science 3+2 38 30 36 35 33 27 25 33 39 39 50Natural Sciences and Mathematics 5 1 3 2 1 2 1 1
U d l d 11 17Undeclared 11 17
College of Science & Technology Total 799 755 757 840 917 1029 1082 1145 1190 1324 1389
COLLEGE OF BUSINESS
Acco nting 358 309 275 277 262 265 239 292 313 353 372Accounting 358 309 275 277 262 265 239 292 313 353 372
Business Education & Office Info. Systems 82 98 112 128 114 117 86 87 94 93 103Accounting 25 30 41 11 4Accounting(PTE) 30 33 5Business Education 1 5 10 14 10 9 9Business Education(PTE) 6 38 46 43 48 51 46Business Education(PTE) 6 38 46 43 48 51 46Data Processing 17 21 20 7 2Data Processing(PTE) 15 8 2Marketing 10 10 12 3 4Marketing(PTE) 16 16 3Office Administration 1 1Bus Adm*Bus Info Systems 29 35 39 46 49 56 30 30 36 33 48
3‐34
Bus Adm Bus. Info Systems 29 35 39 46 49 56 30 30 36 33 48

Undergraduate MajorsFall Semesters 1998 through 2008Fall Semesters 1998 through 2008
COLLEGE/DEPARTMENT/ FALL FALL FALL FALL FALL FALL FALL FALL FALL FALL FALLDEGREE PROGRAM 1998 1999 2000 2001 2002 2003 2004 2005 2006 2007 2008
Computer & Information Systems 211 261 253 220 175 113 83 73 79 78 55Computer & Information Science 152 205 215 203 171 113 83 66 69 64 46Business Admin. ‐Mgt. Info. Systems 59 56 38 17 4 7 10 14 9
Finance & Legal Studies 123 118 128 131 126 120 111 124 144 168 176Business Admin. ‐ Economics 11 12 12 15 4 1Finance 112 106 116 116 122 119 111 124 144 168 176
Management 372 405 415 468 474 496 501 519 550 499 455
Marketing 302 295 263 291 339 368 353 352 350 357 397
General Business Advisement 148 125 127 133 108 78 71 86 20 3 4
College of Business Total 1596 1611 1573 1648 1598 1557 1444 1533 1550 1551 1562
COLLEGE OF PROFESSIONAL STUDIES
Exceptionality Programs 320 312 307 334 333 371 396 410 391 393 408Interpreter Training 73 80 91 78 79 9 13 14 10 7ASL/English Interpreting 85 85 57 35 13 27Mental/Physical Handicapped 247 213 181 69 52 54 50 43 13 5 2Mental/Physical Handicapped 247 213 181 69 52 54 50 43 13 5 2Mental/Physical Handicapped(PTE) 123 120 122 102 78 48 24 28Special Ed/Elementary Ed 19 35 58 64 81 86 96 145 187 207Special Ed/Elementary Ed(PTE) 6 18 20 60 122 140 157 144
Speech Pathology & Audiology 176 172 147 135 157 158 183 246 277 280 285
3‐35

Undergraduate MajorsFall Semesters 1998 through 2008Fall Semesters 1998 through 2008
COLLEGE/DEPARTMENT/ FALL FALL FALL FALL FALL FALL FALL FALL FALL FALL FALLDEGREE PROGRAM 1998 1999 2000 2001 2002 2003 2004 2005 2006 2007 2008
Early Childhood & Elementary Education 874 796 738 781 756 834 673 677 632 578 577Elementary Education 579 515 469 190 150 176 225 196 190 175 166Elementary Education(PTE) 323 362 383 213 235 179 186 196N‐K‐3 71 56 46 9 3 4 9 7 5 1 4N‐K‐3(PTE) 51 53 75 53 74 68 24 31N‐K‐3/Elementary Education 224 225 223 111 79 77 82 73 93 98 116N‐K‐3/Elementary Education(PTE) 97 109 119 91 92 97 94 64
Educational Studies & Secondary Education 334 360 450 476 493 476 419 423 390 413 398S d Ed*Bi l 24 31 41 6 9 8 6 5 3 1Secondary Ed*Biology 24 31 41 6 9 8 6 5 3 1Secondary Ed*Biology(PTE) 34 30 26 25 26 15 15 19Secondary Ed*Chemistry 9 12 10 1 2 1 2Secondary Ed*Chemistry(PTE) 9 10 7 5 7 10 11 9Secondary Ed*Citizenship 2 16 17 22 26Secondary Ed*Citizenship(PTE) 34 70 101 111 123 120Secondary Ed*Communication Studies 9 8 19 6 9 7 7 2 1 1Secondary Ed Communication Studies 9 8 19 6 9 7 7 2 1 1Secondary Ed*Communication Studies(PTE) 12 11 13 10 6 4 4 3Secondary Ed*Comp. Social Studies 88 97 137 22 42 45 32 10 1Secondary Ed*Comp. Social Studies(PTE) 120 96 44 17 4 1Secondary Ed*Earth Science 9 8 5 1 2 3 2 2 2 2 3Secondary Ed*Earth Science(PTE) 9 11 8 6 10 13 16 13Secondary Ed*English 62 67 78 12 32 35 26 20 11 16 20Secondary Ed English 62 67 78 12 32 35 26 20 11 16 20Secondary Ed*English(PTE) 73 66 63 54 66 65 65 51Secondary Ed*French 6 3 3 1 4 2 1 1 2 5 1Secondary Ed*French(PTE) 7 6 2 3 4 4 6Secondary Ed*General Science 15 19 20 7 6 8 3 5 3 3Secondary Ed*General Science(PTE) 14 7 13 10 15 10 5 1Secondary Ed*German 1 1 2 1 1
3‐36
ySecondary Ed*German(PTE) 2 5 5 2 1 1Secondary Ed*Mathematics 70 78 94 18 26 28 32 19 11 11 22Secondary Ed*Mathematics(PTE) 79 85 84 71 78 81 93 82
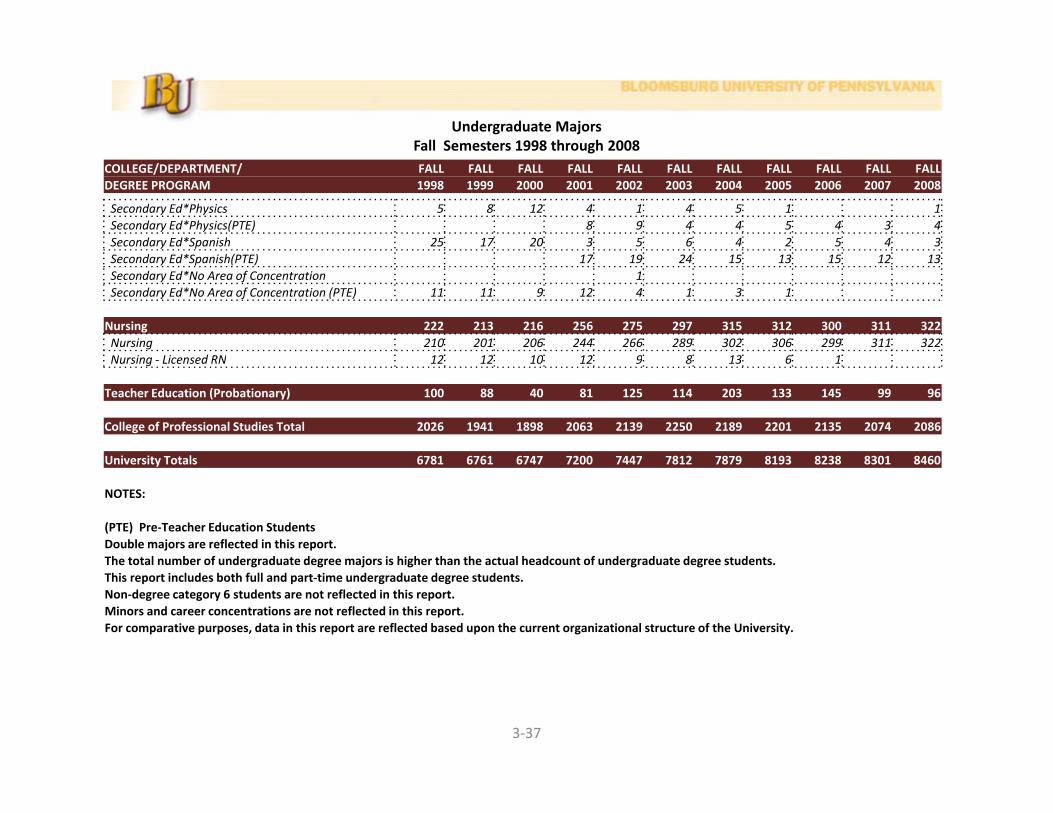
Undergraduate MajorsFall Semesters 1998 through 2008Fall Semesters 1998 through 2008
COLLEGE/DEPARTMENT/ FALL FALL FALL FALL FALL FALL FALL FALL FALL FALL FALLDEGREE PROGRAM 1998 1999 2000 2001 2002 2003 2004 2005 2006 2007 2008
Secondary Ed*Physics 5 8 12 4 1 4 5 1 1Secondary Ed*Physics(PTE) 8 9 4 4 5 4 3 4Secondary Ed*Spanish 25 17 20 3 5 6 4 2 5 4 3Secondary Ed*Spanish(PTE) 17 19 24 15 13 15 12 13Secondary Ed*No Area of Concentration 1Secondary Ed*No Area of Concentration (PTE) 11 11 9 12 4 1 3 1
Nursing 222 213 216 256 275 297 315 312 300 311 322Nursing 210 201 206 244 266 289 302 306 299 311 322N i Li d RN 12 12 10 12 9 8 13 6 1Nursing ‐ Licensed RN 12 12 10 12 9 8 13 6 1
Teacher Education (Probationary) 100 88 40 81 125 114 203 133 145 99 96
College of Professional Studies Total 2026 1941 1898 2063 2139 2250 2189 2201 2135 2074 2086
Uni ersit Totals 6781 6761 6747 7200 7447 7812 7879 8193 8238 8301 8460University Totals 6781 6761 6747 7200 7447 7812 7879 8193 8238 8301 8460
NOTES:
(PTE) Pre‐Teacher Education StudentsDouble majors are reflected in this report. The total number of undergraduate degree majors is higher than the actual headcount of undergraduate degree studentsThe total number of undergraduate degree majors is higher than the actual headcount of undergraduate degree students.This report includes both full and part‐time undergraduate degree students.Non‐degree category 6 students are not reflected in this report.Minors and career concentrations are not reflected in this report.For comparative purposes, data in this report are reflected based upon the current organizational structure of the University.
3‐37

EnrollmentEnrollment(Graduate)(Graduate)
3‐38

Graduate Enrollment By RaceFall 1998 through Fall 2008Fall 1998 through Fall 2008
Asian orAfrican American Pacific Minority
American Indian Islander Latino Foreign White Unknown Total Total
1998 17 0 11 6 10 639 683 341999 8 1 10 4 17 649 689 231999 8 1 10 4 17 649 689 232000 9 1 13 4 35 643 705 272001 7 1 8 3 32 641 692 192002 13 0 11 5 31 656 25 741 292003 11 0 7 6 25 685 28 762 242004 10 0 5 6 28 709 22 780 212005 14 0 2 7 35 712 17 787 232005 14 0 2 7 35 712 17 787 232006 14 0 5 4 38 755 30 846 232007 17 0 6 6 32 724 22 807 292008 18 0 8 4 22 703 19 774 30
PERCENT COMPOSITION BY RACE
% % % Asian orAfrican American Pacific % % % % %
American Indian Islander Latino Foreign White Unknown Total Minority
1998 2.49 0.00 1.61 0.88 1.46 93.56 100.00 4.981999 1 16 0 15 1 45 0 58 2 47 94 19 100 00 3 341999 1.16 0.15 1.45 0.58 2.47 94.19 100.00 3.342000 1.28 0.14 1.84 0.57 4.96 91.21 100.00 3.832001 1.01 0.14 1.16 0.43 4.62 92.63 100.00 2.752002 1.75 0.00 1.48 0.67 4.18 88.53 3.37 100.00 3.912003 1.44 0.00 0.92 0.79 3.28 89.90 3.67 100.00 3.152004 1.28 0.00 0.64 0.77 3.59 90.90 2.82 100.00 2.692005 1 78 0 00 0 25 0 89 4 45 90 47 2 16 100 00 2 92
3‐39
2005 1.78 0.00 0.25 0.89 4.45 90.47 2.16 100.00 2.922006 1.65 0.00 0.59 0.47 4.49 89.24 3.55 100.00 2.722007 2.11 0.00 0.74 0.74 3.97 89.71 2.73 100.00 3.592008 2.33 0.00 1.03 0.52 2.84 90.83 2.45 100.00 3.88

Graduate Enrollment By CountyFall 1999 through Fall 2008Fall 1999 through Fall 2008
County 1999 2000 2001 2002 2003 2004 2005 2006 2007 2008Adams 0 2 0 1 2 2 1 0 0 0Allegheny 1 3 1 1 1 2 0 3 4 2Armstrong 0 0 0 0 0 0 0 1 1 1Beaver 0 0 0 0 1 0 0 0 1 0Bedford 0 0 1 1 0 0 0 1 1 0Berks 8 4 1 3 9 9 8 5 13 9Blair 0 0 0 0 0 0 0 1 2 0Bradford 1 1 2 2 2 1 5 4 9 5Bucks 53 51 41 16 8 7 5 4 11 11Butler 0 0 0 0 0 2 3 0 0 1Cambria 0 0 2 1 0 0 1 1 1 1Cameron 2 0 0 0 1 2 2 0 2 2Carbon 8 7 3 3 9 8 10 9 6 10Carbon 8 7 3 3 9 8 10 9 6 10Centre 4 17 3 4 8 9 5 3 7 11Chester 1 2 1 0 3 5 7 3 3 1Clarion 0 0 0 0 0 0 0 0 0 0Clearfield 1 1 1 3 1 0 0 2 2 0Clinton 8 7 5 10 10 13 14 8 9 9Columbia 143 139 136 136 148 154 147 165 145 144Crawford 0 0 0 0 0 0 0 0 1 1Crawford 0 0 0 0 0 0 0 0 1 1Cumberland 4 3 1 3 2 6 8 8 4 4Dauphin 5 7 7 9 11 17 16 14 7 7Delaware 2 0 3 4 2 3 3 4 5 1Elk 1 1 0 0 1 1 0 1 0 0Erie 0 0 0 0 0 0 0 1 2 1Fayette 0 0 0 0 0 0 1 1 1 2Forest 0 0 0 0 0 0 0 0 0 0Forest 0 0 0 0 0 0 0 0 0 0Franklin 1 1 1 1 2 2 1 1 0 0Fulton 0 1 0 0 0 0 0 0 0 0Greene 0 0 0 0 0 0 0 0 0 0Huntingdon 0 0 0 1 1 3 2 1 1 1Indiana 1 0 0 0 0 0 0 0 1 1Jefferson 0 0 0 0 0 3 2 0 0 0J i t 8 2 3 0 0 1 3 4 4 3
3‐40
Juniata 8 2 3 0 0 1 3 4 4 3Lackawanna 5 4 5 7 14 17 15 17 10 6Lancaster 4 7 5 7 5 5 3 4 5 8Lawrence 0 0 0 0 0 0 1 1 1 1

Graduate Enrollment By CountyFall 1999 through Fall 2008Fall 1999 through Fall 2008
County 1999 2000 2001 2002 2003 2004 2005 2006 2007 2008Lebanon 5 4 2 4 5 3 0 0 3 1Lehigh 0 3 6 7 5 9 13 8 8 5Luzerne 74 82 84 111 131 131 123 119 118 101Lycoming 77 63 92 71 70 65 57 82 78 60McKean 1 0 0 0 1 2 2 4 1 3Mercer 0 0 0 1 0 0 0 0 0 0Mercer 0 0 0 1 0 0 0 0 0 0Mifflin 0 3 1 2 0 0 3 3 1 0Monroe 3 2 5 4 9 9 4 7 4 6Montgomery 12 8 8 7 5 2 7 8 6 6Montour 31 41 33 42 37 31 41 57 55 70Northampton 4 1 2 8 7 4 8 8 10 7Northumberland 69 95 78 102 88 100 89 77 70 83P 1 0 2 0 2 3 4 9 5 3Perry 1 0 2 0 2 3 4 9 5 3Philadelphia 21 11 12 13 6 2 6 7 9 15Pike 2 1 2 1 0 0 2 4 3 5Potter 0 0 0 0 1 0 0 1 2 2Schuylkill 30 29 36 37 44 41 50 58 49 54Snyder 25 17 25 20 22 16 19 15 18 19Somerset 1 1 0 0 0 1 1 1 2 1Sullivan 3 4 2 4 3 2 4 3 2 0Susquehanna 0 1 1 1 4 2 3 3 2 1Tioga 1 1 1 1 3 2 1 0 1 0Union 25 25 25 26 15 22 16 26 26 22Venango 1 0 0 0 0 0 0 0 0 0Warren 0 0 0 1 1 0 0 0 1 0Washington 0 0 0 0 0 1 1 0 1 2Washington 0 0 0 0 0 1 1 0 1 2Wayne 2 1 0 0 1 1 1 0 0 0Westmoreland 0 0 0 0 0 1 1 0 1 1Wyoming 1 0 1 4 1 1 2 2 3 3York 3 2 1 6 8 4 3 6 6 5
State Total 653 655 641 686 710 727 724 775 744 718
3‐41
Out‐of‐State 36 50 51 55 52 53 63 71 63 56
Overall Total 689 705 692 741 762 780 787 846 807 774

Graduate Enrollment By Program of StudyFall Semesters 1998 through 2008Fall Semesters 1998 through 2008
Department/Program of Study DEGREE 1998 1999 2000 2001 2002 2003 2004 2005 2006 2007 2008
College of Liberal ArtsArt 3 7 11 8 5 4 3 0
ART HISTORY MA 2 6 7 5 3 2 2 0ART STUDIO MA 1 1 4 3 2 2 1 0ART STUDIO MA 1 1 4 3 2 2 1 0
Clinical Athletic Training 2CLINICAL ATHLETIC TRAINING MS 2
Communication Studies 7 1 2COMMUNICATION MA 7 1 2COMMUNICATION MA 7 1 2
Exercise Science & Adult Fitness 14 14 16 22 21 13 19 21 22 18 18EXERCISE SCIENCE & ADULT FITNESS MS 14 14 16 22 3EXERCISE SCIENCE & ADULT FITNESS (1 YEAR) MS 8 7 13 18 16 14 12EXERCISE SCIENCE & ADULT FITNESS (2 YEARS) MS 10 6 6 3 6 4 6
College of BusinessAccounting 5 4 4 3 6 5 4 1
ACCOUNTING MAcc 5 4 4 3 6 5 4 1
Business Administration 63 66 72 68 72 69 80 73 62 61 42BUSINESS ADMINISTRATION MBA 63 66 72 68 72 43 62 55 57 61 42BUSINESS ADM (ACCOUNTING) MBA 1 2 3 1BUSINESS ADM (LEADERSHIP) MBA 21 14 12 3BUSINESS ADM (MGT SCI/OPR MGT) MBA 4 2 3 1
Business Education 14 14 13 9 13 24 29 28 21 19 32BUSINESS EDUCATION MEd 14 14 13 9 13 24 29 28BUSINESS EDUCATION/BIS MEd 8 5 10
3‐42
BUSINESS EDUCATION/BIS MEd 8 5 10BUSINESS EDUCATION/BIS (CERT) MEd 13 14 22

Graduate Enrollment By Program of StudyFall Semesters 1998 through 2008
Department/Program of St d DEGREE 1998 1999 2000 2001 2002 2003 2004 2005 2006 2007 2008Department/Program of Study DEGREE 1998 1999 2000 2001 2002 2003 2004 2005 2006 2007 2008
College of Professional StudiesAudiology 15 17 22 15 21 29 44 56 53 46 48
AUDIOLOGY AUD 29 43 55 53 46 48COMM DIS*AUDIOLOGY MS 15 17 22 15 21 0 1 1
Curriculum & Instruction 40 63 51 46 57 90 99 99 149 116 109CURRICULUM & INSTRUCTION MEd 40 63 51 46 46 31 40 33 67 74 63CURRICULUM & INSTRUCTION (PTE) ‐ 10 52 55 60 74 29 44CURRICULUM & INSTRUCTION (CERT) MEd 1 7 4 6 8 13 2
Early Childhood Education 9 14 24 23 11 11 11 7 2 7 7EARLY CHILDHOOD EDUCATION MS 9 14 24 23 11 11 11 7 2 7 7EARLY CHILDHOOD EDUCATION MS 9 14 24 23 11 11 11 7 2 7 7
Elementary Education 40 39 34 42 57 52 59 52 52 52 52ELEMENTARY EDUCATION MEd 40 39 34 42 48 21 17 9 12 12 9ELEMENTARY EDUCATION (CERT) MEd 9 31 42 43 40 40 43
Education of the Deaf/Hard of Hearing 10 11 13 9 9 10 16 15 10 15 6Education of the Deaf/Hard of Hearing 10 11 13 9 9 10 16 15 10 15 6ED. DEAF/HARD HEARING MS 10 11 13 9 9 10 16 15 10 15 6
ESL Certificate Program Specialist 5ESL CERTIFICATE 5
Guidance Counseling & Student Affairs 7 35Guidance Counseling & Student Affairs 7 35ELEMENTARY SCHOOL COUNSELING MED 10SECONDARY SCHOOL COUNSELING MED 15STUDENT PERSONNEL SERVICES MED 7 10
Nursing 27 24 21 23 32 31 44 38 36 43 41NURSING MSN 23 22 21 22 29 30 40 32 32 36 37
3‐43
NURS*NURSE PRACTITIONER MSN 1 0 0 0 0 0 0 0 0 0NURS*NURSE PRACT*CERT 3 2 0 1 3 1 1 0 0 1 1RN TO MSN PROGRAM MSN 3 6 4 6 3
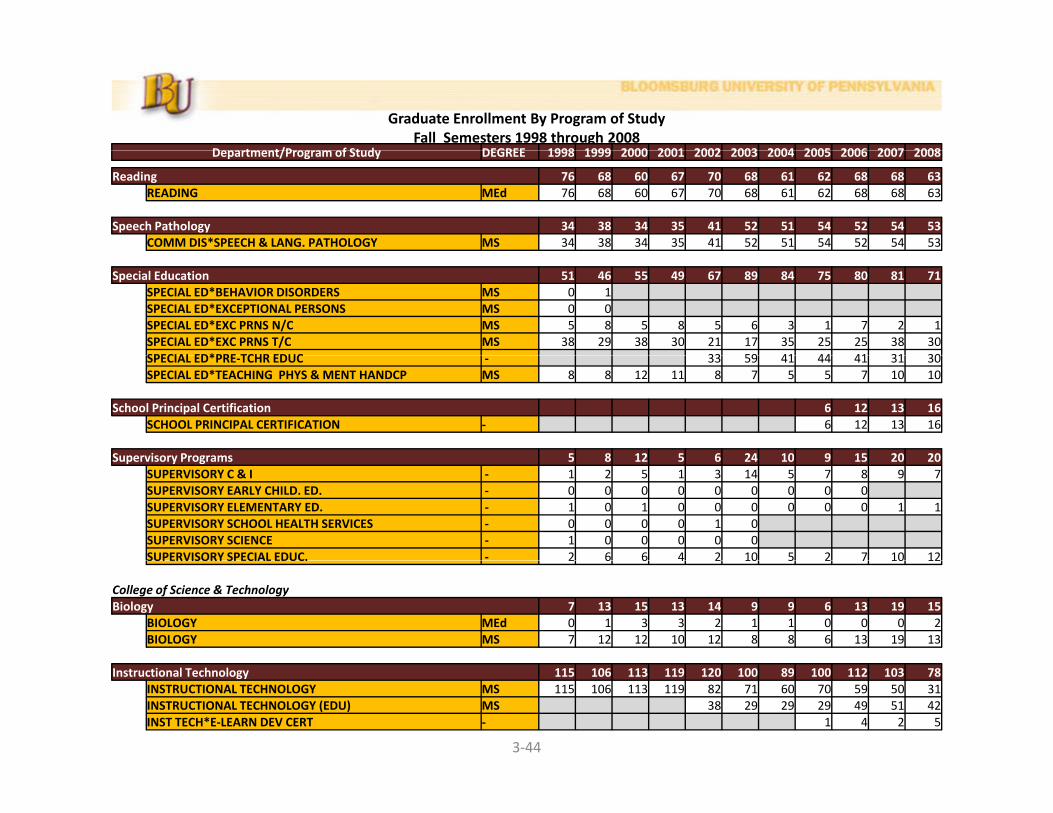
Graduate Enrollment By Program of StudyFall Semesters 1998 through 2008
Department/Program of St d DEGREE 1998 1999 2000 2001 2002 2003 2004 2005 2006 2007 2008Department/Program of Study DEGREE 1998 1999 2000 2001 2002 2003 2004 2005 2006 2007 2008
Reading 76 68 60 67 70 68 61 62 68 68 63READING MEd 76 68 60 67 70 68 61 62 68 68 63
Speech Pathology 34 38 34 35 41 52 51 54 52 54 53COMM DIS*SPEECH & LANG. PATHOLOGY MS 34 38 34 35 41 52 51 54 52 54 53
Special Education 51 46 55 49 67 89 84 75 80 81 71SPECIAL ED*BEHAVIOR DISORDERS MS 0 1SPECIAL ED*EXCEPTIONAL PERSONS MS 0 0SPECIAL ED*EXC PRNS N/C MS 5 8 5 8 5 6 3 1 7 2 1SPECIAL ED*EXC PRNS T/C MS 38 29 38 30 21 17 35 25 25 38 30SPECIAL ED*PRE TCHR EDUC 33 59 41 44 41 31 30SPECIAL ED*PRE‐TCHR EDUC ‐ 33 59 41 44 41 31 30SPECIAL ED*TEACHING PHYS & MENT HANDCP MS 8 8 12 11 8 7 5 5 7 10 10
School Principal Certification 6 12 13 16SCHOOL PRINCIPAL CERTIFICATION ‐ 6 12 13 16
Supervisory Programs 5 8 12 5 6 24 10 9 15 20 20Supervisory Programs 5 8 12 5 6 24 10 9 15 20 20SUPERVISORY C & I ‐ 1 2 5 1 3 14 5 7 8 9 7SUPERVISORY EARLY CHILD. ED. ‐ 0 0 0 0 0 0 0 0 0SUPERVISORY ELEMENTARY ED. ‐ 1 0 1 0 0 0 0 0 0 1 1SUPERVISORY SCHOOL HEALTH SERVICES ‐ 0 0 0 0 1 0SUPERVISORY SCIENCE ‐ 1 0 0 0 0 0SUPERVISORY SPECIAL EDUC. ‐ 2 6 6 4 2 10 5 2 7 10 12SUPERVISORY SPECIAL EDUC. 2 6 6 4 2 10 5 2 7 10 12
College of Science & TechnologyBiology 7 13 15 13 14 9 9 6 13 19 15
BIOLOGY MEd 0 1 3 3 2 1 1 0 0 0 2BIOLOGY MS 7 12 12 10 12 8 8 6 13 19 13
3‐44
Instructional Technology 115 106 113 119 120 100 89 100 112 103 78INSTRUCTIONAL TECHNOLOGY MS 115 106 113 119 82 71 60 70 59 50 31INSTRUCTIONAL TECHNOLOGY (EDU) MS 38 29 29 29 49 51 42INST TECH*E‐LEARN DEV CERT ‐ 1 4 2 5
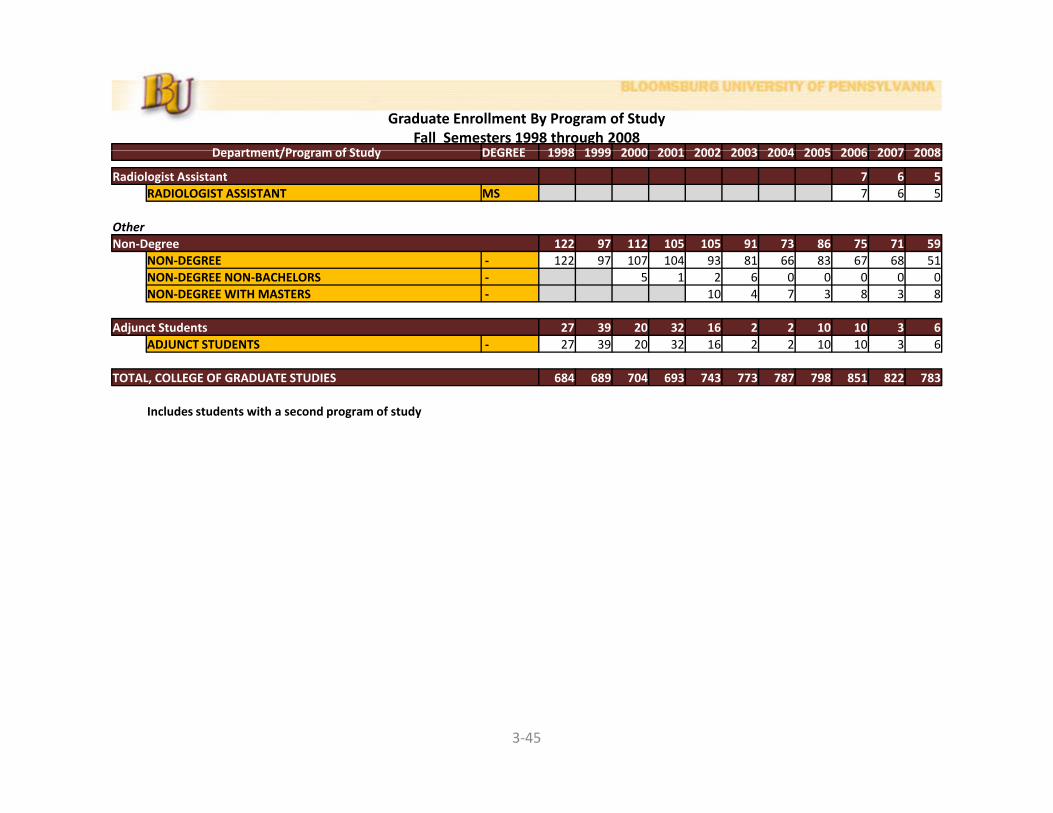
Graduate Enrollment By Program of StudyFall Semesters 1998 through 2008
Department/Program of St d DEGREE 1998 1999 2000 2001 2002 2003 2004 2005 2006 2007 2008Department/Program of Study DEGREE 1998 1999 2000 2001 2002 2003 2004 2005 2006 2007 2008
Radiologist Assistant 7 6 5RADIOLOGIST ASSISTANT MS 7 6 5
OtherNon‐Degree 122 97 112 105 105 91 73 86 75 71 59
NON‐DEGREE ‐ 122 97 107 104 93 81 66 83 67 68 51NON‐DEGREE NON‐BACHELORS ‐ 5 1 2 6 0 0 0 0 0NON‐DEGREE WITH MASTERS ‐ 10 4 7 3 8 3 8
Adjunct Students 27 39 20 32 16 2 2 10 10 3 6ADJUNCT STUDENTS ‐ 27 39 20 32 16 2 2 10 10 3 6
TOTAL, COLLEGE OF GRADUATE STUDIES 684 689 704 693 743 773 787 798 851 822 783
Includes students with a second program of study
3‐45


Admissions Admissions DataData


Admissions Statistics By Admission CategoryF ll S t 2000 th h 2008Fall Semesters 2000 through 2008Regular Admit New Freshmen*
10 00011,00012,000
7,0008,0009,000
10,000
3 0004,0005,0006,000
2000 2001 2002 2003 2004 2005 2006 2007 20080
1,0002,0003,000
2000 2001 2002 2003 2004 2005 2006 2007 2008Applied 6281 6413 6888 7274 7820 8237 8943 9868 10840Accepted 3403 3883 3533 3974 3833 4215 3957 4271 4390Enrolled 1198 1435 1260 1435 1280 1400 1302 1352 1399Enrolled 1198 1435 1260 1435 1280 1400 1302 1352 1399
*Excludes*Excludes ActAct 101101/EOP/EOP andand SummerSummer FreshmenFreshmen44‐‐11
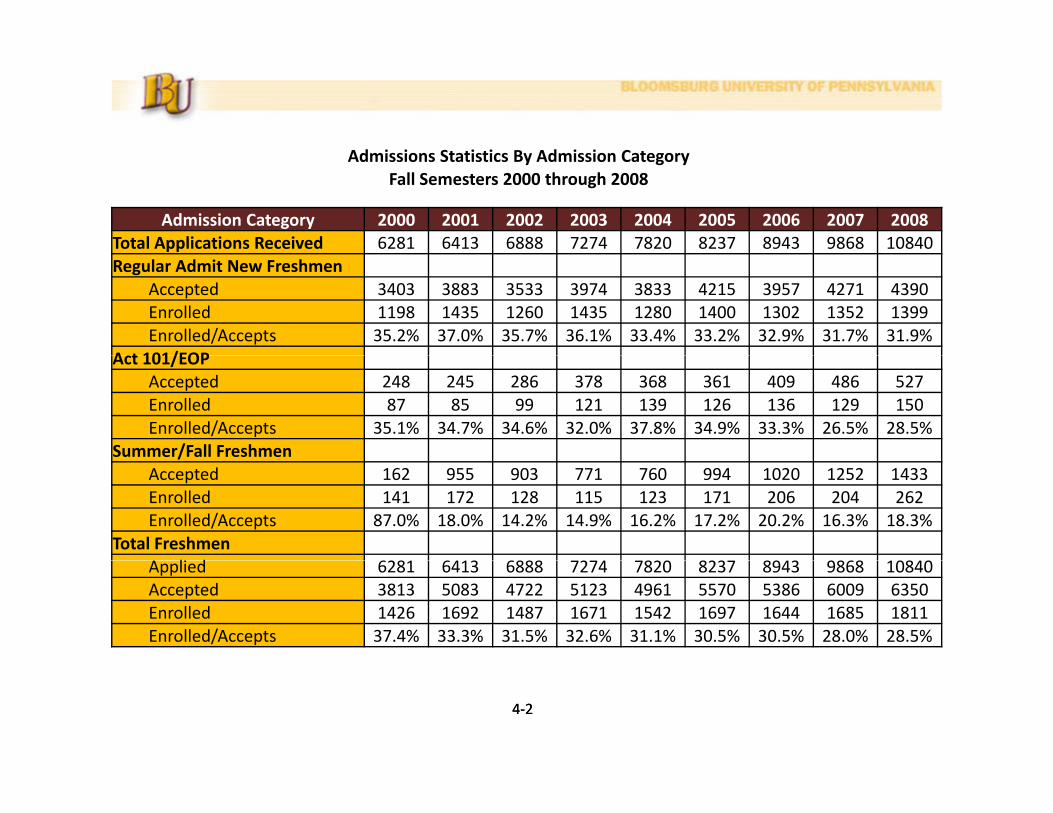
Ad i i S i i B Ad i i C
Admission Category 2000 2001 2002 2003 2004 2005 2006 2007 2008Total Applications Received 6281 6413 6888 7274 7820 8237 8943 9868 10840
Admissions Statistics By Admission CategoryFall Semesters 2000 through 2008
Regular Admit New Freshmen Accepted 3403 3883 3533 3974 3833 4215 3957 4271 4390Enrolled 1198 1435 1260 1435 1280 1400 1302 1352 1399Enrolled/Accepts 35.2% 37.0% 35.7% 36.1% 33.4% 33.2% 32.9% 31.7% 31.9%
Act 101/EOPAct 101/EOPAccepted 248 245 286 378 368 361 409 486 527Enrolled 87 85 99 121 139 126 136 129 150Enrolled/Accepts 35.1% 34.7% 34.6% 32.0% 37.8% 34.9% 33.3% 26.5% 28.5%
Summer/Fall Freshmen /Accepted 162 955 903 771 760 994 1020 1252 1433Enrolled 141 172 128 115 123 171 206 204 262Enrolled/Accepts 87.0% 18.0% 14.2% 14.9% 16.2% 17.2% 20.2% 16.3% 18.3%
Total Freshmenli d 6281 6 13 6888 2 820 823 89 3 9868 108 0Applied 6281 6413 6888 7274 7820 8237 8943 9868 10840
Accepted 3813 5083 4722 5123 4961 5570 5386 6009 6350Enrolled 1426 1692 1487 1671 1542 1697 1644 1685 1811Enrolled/Accepts 37.4% 33.3% 31.5% 32.6% 31.1% 30.5% 30.5% 28.0% 28.5%
44‐‐22
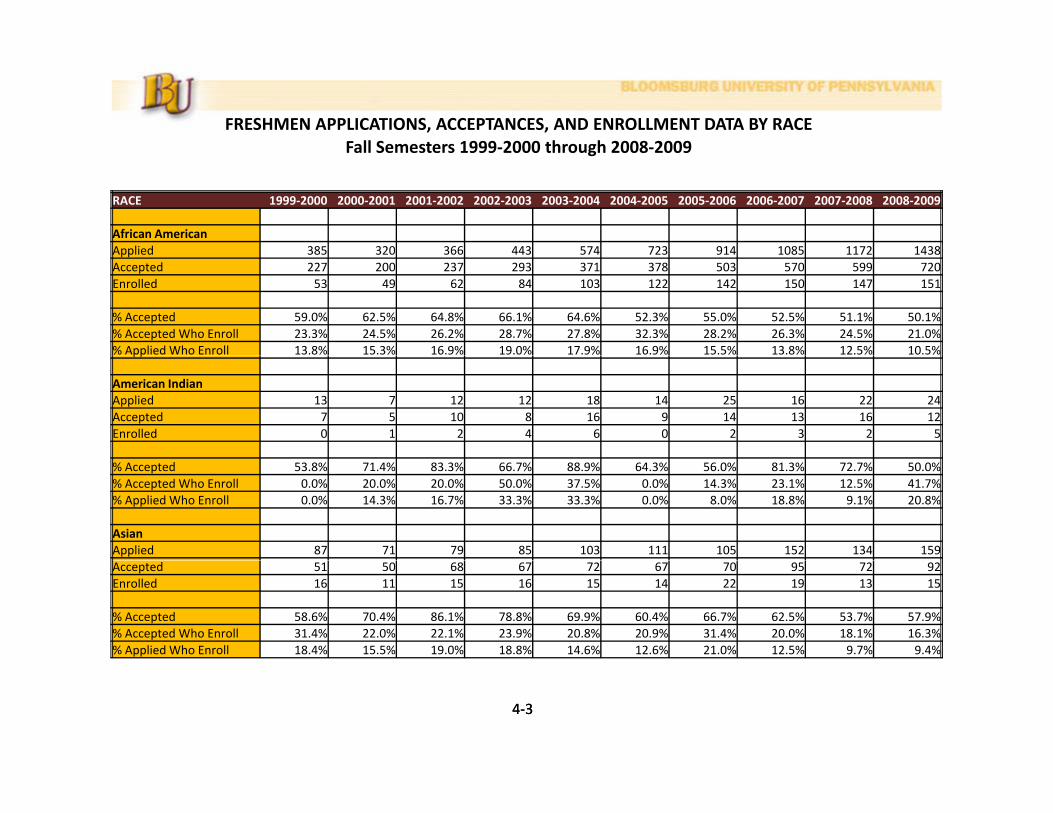
FRESHMEN APPLICATIONS, ACCEPTANCES, AND ENROLLMENT DATA BY RACEFall Semesters 1999‐2000 through 2008‐2009Fall Semesters 1999 2000 through 2008 2009
RACE 1999‐2000 2000‐2001 2001‐2002 2002‐2003 2003‐2004 2004‐2005 2005‐2006 2006‐2007 2007‐2008 2008‐2009
African AmericanApplied 385 320 366 443 574 723 914 1085 1172 1438Applied 385 320 366 443 574 723 914 1085 1172 1438Accepted 227 200 237 293 371 378 503 570 599 720Enrolled 53 49 62 84 103 122 142 150 147 151
% Accepted 59.0% 62.5% 64.8% 66.1% 64.6% 52.3% 55.0% 52.5% 51.1% 50.1%% Accepted Who Enroll 23.3% 24.5% 26.2% 28.7% 27.8% 32.3% 28.2% 26.3% 24.5% 21.0%% Applied Who Enroll 13.8% 15.3% 16.9% 19.0% 17.9% 16.9% 15.5% 13.8% 12.5% 10.5%pp
American IndianApplied 13 7 12 12 18 14 25 16 22 24Accepted 7 5 10 8 16 9 14 13 16 12Enrolled 0 1 2 4 6 0 2 3 2 5
% Accepted 53.8% 71.4% 83.3% 66.7% 88.9% 64.3% 56.0% 81.3% 72.7% 50.0%% Accepted Who Enroll 0.0% 20.0% 20.0% 50.0% 37.5% 0.0% 14.3% 23.1% 12.5% 41.7%% Applied Who Enroll 0.0% 14.3% 16.7% 33.3% 33.3% 0.0% 8.0% 18.8% 9.1% 20.8%
AsianApplied 87 71 79 85 103 111 105 152 134 159Accepted 51 50 68 67 72 67 70 95 72 92Enrolled 16 11 15 16 15 14 22 19 13 15
% Accepted 58.6% 70.4% 86.1% 78.8% 69.9% 60.4% 66.7% 62.5% 53.7% 57.9%% Accepted Who Enroll 31.4% 22.0% 22.1% 23.9% 20.8% 20.9% 31.4% 20.0% 18.1% 16.3%% Applied Who Enroll 18.4% 15.5% 19.0% 18.8% 14.6% 12.6% 21.0% 12.5% 9.7% 9.4%
44‐‐33

FRESHMEN APPLICATIONS, ACCEPTANCES, AND ENROLLMENT DATA BY RACEFall Semesters 1999‐2000 through 2008‐2009Fall Semesters 1999 2000 through 2008 2009
RACE 1999‐2000 2000‐2001 2001‐2002 2002‐2003 2003‐2004 2004‐2005 2005‐2006 2006‐2007 2007‐2008 2008‐2009
LatinoApplied 114 113 129 135 160 219 261 275 332 425Applied 114 113 129 135 160 219 261 275 332 425Accepted 71 84 104 102 109 152 171 151 209 256Enrolled 28 24 33 26 31 43 50 35 64 69
% Accepted 62.3% 74.3% 80.6% 75.6% 68.1% 69.4% 65.5% 54.9% 63.0% 60.2%% Accepted Who Enroll 39.4% 28.6% 31.7% 25.5% 28.4% 28.3% 29.2% 23.2% 30.6% 27.0%% Applied Who Enroll 24 6% 21 2% 25 6% 19 3% 19 4% 19 6% 19 2% 12 7% 19 3% 16 2%% Applied Who Enroll 24.6% 21.2% 25.6% 19.3% 19.4% 19.6% 19.2% 12.7% 19.3% 16.2%
WhiteApplied 5962 5746 5792 6142 6242 6329 6490 6569 7043 7344Accepted 3402 3460 4648 4211 4452 4135 4553 4120 4492 4521Enrolled 1300 1334 1574 1346 1488 1304 1412 1329 1311 1393
% Accepted 57.1% 60.2% 80.2% 68.6% 71.3% 65.3% 70.2% 62.7% 63.8% 61.6%% Accepted Who Enroll 38.2% 38.6% 33.9% 32.0% 33.4% 31.5% 31.0% 32.3% 29.2% 30.8%% Applied Who Enroll 21.8% 23.2% 27.2% 21.9% 23.8% 20.6% 21.8% 20.2% 18.6% 19.0%
ForeignApplied 44 24 35 22 21 28 27 34 32 18Applied 44 24 35 22 21 28 27 34 32 18Accepted 17 14 16 14 15 13 16 20 9 11Enrolled 6 7 6 5 7 5 5 12 3 3
% Accepted 38.6% 58.3% 45.7% 63.6% 71.4% 46.4% 59.3% 58.8% 28.1% 61.1%% Accepted Who Enroll 35.3% 50.0% 37.5% 35.7% 46.7% 38.5% 31.3% 60.0% 33.3% 27.3%% Applied Who Enroll 13.6% 29.2% 17.1% 22.7% 33.3% 17.9% 18.5% 35.3% 9.4% 16.7%pp
44‐‐44

FRESHMEN APPLICATIONS, ACCEPTANCES, AND ENROLLMENT DATA BY RACEFall Semesters 1999‐2000 through 2008‐2009Fall Semesters 1999 2000 through 2008 2009
RACE 1999‐2000 2000‐2001 2001‐2002 2002‐2003 2003‐2004 2004‐2005 2005‐2006 2006‐2007 2007‐2008 2008‐2009
UnknownApplied 49 156 396 415 812 1133 1432Applied 49 156 396 415 812 1133 1432Accepted 27 88 207 243 417 612 738Enrolled 6 21 54 64 96 145 175
% Accepted 55.1% 56.4% 52.3% 58.6% 51.4% 54.0% 51.5%% Accepted Who Enroll 22.2% 23.9% 26.1% 26.3% 23.0% 23.7% 23.7%% Applied Who Enroll 12 2% 13 5% 13 6% 15 4% 11 8% 12 8% 12 2%% Applied Who Enroll 12.2% 13.5% 13.6% 15.4% 11.8% 12.8% 12.2%
TotalApplied 6605 6281 6413 6888 7274 7820 8237 8943 9868 10840Accepted 3775 3813 5083 4722 5123 4961 5570 5386 6009 6350Enrolled 1403 1426 1692 1487 1671 1542 1697 1644 1685 1811
% Accepted 57.2% 60.7% 79.3% 68.6% 70.4% 63.4% 67.6% 60.2% 60.9% 58.6%% Accepted Who Enroll 37.2% 37.4% 33.3% 31.5% 32.6% 31.1% 30.5% 30.5% 28.0% 28.5%% Applied Who Enroll 21.2% 22.7% 26.4% 21.6% 23.0% 19.7% 20.6% 18.4% 17.1% 16.7%
Source: Applications, Acceptances, and Actual Enrollments, Fall Semesters 1999 through 2008
Applied includes all students who applied for fall freshmen admission but may have been accepted as an Act 101 /EOP or summer freshmen admission.Accepted includes all students who were accepted for fall admission, Act 101/EOP or summer‐fall admission.Enrolled includes all students who were enrolled in the fall.
44‐‐55

Freshmen ProfileFirst‐Time Entering Freshmen Fall 2008First‐Time Entering Freshmen, Fall 2008
Category First-TimeRegular Admit
All First-Time FreshmenRegular Admit Freshmen
(includes Act 101/EOP & Summer Freshmen)
SAT Verbal Average 518 502SAT M th A 539 519SAT Math Average 539 519SAT Average 1057 1021High School Average 89.5 88.3Median Class Rank 27% 32%
44‐‐66

SAT Average ScoresFirst‐Time Entering Freshmen By Cohort
First‐Time, Regular Admit Fall Freshmen Only**Cohort Average Verbal Average Math Average Total SAT
Fall 2000 521 525 1045Fall 2001 517 523 1040
First‐Time Entering Freshmen By Cohort
Fall 2001 517 523 1040Fall 2002 516 526 1042Fall 2003 518 526 1044Fall 2004 517 529 1046Fall 2005 517 525 1042Fall 2006 514 530 1044Fall 2006 514 530 1044Fall 2007 515 534 1049Fall 2008 518 539 1057
** Excludes Act 101, EOP, and summer freshmen students.
All First Time Freshmen*All First‐Time Freshmen*Cohort Average Verbal Average Math Average Total SAT
Fall 2000 509 511 1020Fall 2001 506 510 1016Fall 2002 503 511 1014Fall 2003 506 512 1017Fall 2003 506 512 1017Fall 2004 501 512 1013Fall 2005 503 510 1013Fall 2006 497 510 1007Fall 2007 499 516 1015F ll 2008 502 519 1021Fall 2008 502 519 1021
*Includes Regular Admit New Freshmen, ACT 101, EOP, and Summer Freshmen44‐‐77

First‐time Freshmen Enrollment By CountyFall 1999 through Fall 2008
County 1999 2000 2001 2002 2003 2004 2005 2006 2007 2008Adams 5 6 6 6 7 8 7 12 13 11Allegheny 6 0 3 3 0 8 2 7 1 4Armstrong 0 0 0 0 0 1 0 0 0 0Beaver 1 0 0 0 0 0 0 0 1 1Bedford 0 1 0 1 0 0 0 1 0 1Berks 61 48 45 40 52 57 65 76 60 62Blair 0 4 6 1 7 3 4 7 2 2Bradford 19 23 19 15 27 12 17 16 18 20Bucks 107 100 149 110 145 92 147 115 140 165Butler 0 0 0 0 1 1 1 1 0 1Cambria 0 2 1 3 1 2 4 2 0 1Cameron 0 0 1 1 2 0 0 0 0 0Carbon 24 16 15 11 14 14 19 20 18 16Carbon 24 16 15 11 14 14 19 20 18 16Centre 2 6 6 5 2 2 4 6 5 4Chester 35 39 52 63 46 66 48 64 70 76Clarion 0 0 1 0 1 0 2 2 0 1Clearfield 3 2 8 9 11 13 5 3 6 6Clinton 1 6 5 8 3 4 11 3 7 4Columbia 94 108 116 92 104 86 109 122 106 95Crawford 1 0 0 1 2 0 1 0 1 0Crawford 1 0 0 1 2 0 1 0 1 0Cumberland 16 23 28 20 39 20 17 31 24 31Dauphin 31 22 37 35 26 33 27 33 24 42Delaware 45 41 44 44 43 45 45 37 69 62Elk 3 0 0 0 1 0 0 3 3 1Erie 1 1 1 0 1 1 2 1 2 1Fayette 2 0 0 0 0 0 0 0 0 1Forest 0 0 0 1 0 0 0 0 1 0Forest 0 0 0 1 0 0 0 0 1 0Franklin 1 4 3 7 5 4 5 2 4 3Fulton 0 0 1 0 0 1 0 0 0 0Greene 0 0 0 0 0 0 0 0 0 1Huntingdon 2 2 2 1 3 3 2 4 1 1Indiana 0 2 1 0 1 0 2 1 2 1Jefferson 5 1 2 2 0 1 2 1 0 0J i t 7 3 2 5 4 5 1 9 3 3
44‐‐88
Juniata 7 3 2 5 4 5 1 9 3 3Lackawanna 47 36 49 62 61 31 35 34 35 26Lancaster 35 39 46 33 56 50 44 54 43 41Lawrence 0 0 1 0 1 0 1 1 0 0

First‐time Freshmen Enrollment By CountyFall 1999 through Fall 2008
County 1999 2000 2001 2002 2003 2004 2005 2006 2007 2008Lebanon 19 14 18 15 17 12 9 19 11 29Lehigh 43 47 61 48 63 69 67 53 50 80Luzerne 98 96 88 76 99 95 84 69 71 82Lycoming 41 48 54 60 60 49 41 50 55 45McKean 1 1 2 0 1 0 2 0 3 2Mercer 1 1 0 0 1 2 0 1 0 2Mercer 1 1 0 0 1 2 0 1 0 2Mifflin 4 2 6 6 2 7 4 9 7 13Monroe 29 25 37 24 25 23 46 38 35 46Montgomery 113 98 120 97 105 98 113 108 132 161Montour 10 16 28 16 22 29 23 16 23 17Northampton 60 42 58 53 39 57 56 56 70 58Northumberland 74 87 89 72 91 81 90 82 100 74Perry 2 11 9 5 4 13 6 8 5 4Perry 2 11 9 5 4 13 6 8 5 4Philadelphia 55 42 58 81 91 118 135 118 105 113Pike 3 12 16 9 7 11 16 13 15 22Potter 0 0 0 4 0 2 2 2 3 1Schuylkill 77 68 69 49 43 27 45 48 49 60Snyder 11 16 14 14 17 24 23 13 8 10Somerset 1 2 2 0 0 0 0 1 0Sullivan 2 2 1 3 2 1 2 0 1 1Sullivan 2 2 1 3 2 1 2 0 1 1Susquehanna 11 14 18 9 8 11 11 10 8 9Tioga 6 9 5 3 4 6 13 8 10 2Union 6 15 19 21 22 12 16 12 9 18Venango 1 0 0 1 0 1 0 0 0Warren 2 0 1 0 1 0 1 3 2Washington 0 0 1 1 1 0 0 0 1 1W 13 15 16 4 11 9 6 14 12 8Wayne 13 15 16 4 11 9 6 14 12 8Westmoreland 0 3 1 1 4 3 1 1 0Wyoming 6 6 7 3 5 9 6 4 2 7York 18 31 36 45 39 33 32 33 29 31
State Total 1261 1258 1484 1299 1450 1365 1479 1457 1475 1580
44‐‐99
Out‐of‐State 142 168 208 188 221 177 218 187 210 231
Overall Total 1403 1426 1692 1487 1671 1542 1697 1644 1685 1811
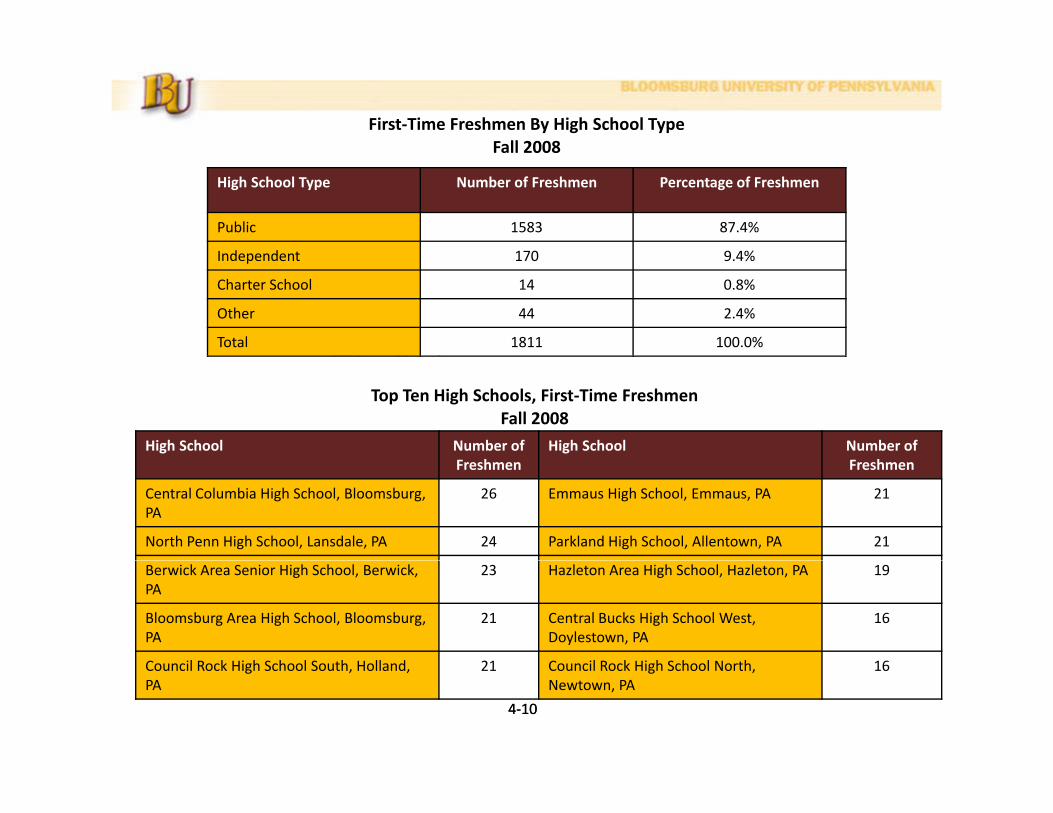
First‐Time Freshmen By High School TypeFall 2008Fall 2008
High School Type Number of Freshmen Percentage of Freshmen
Public 1583 87.4%
I d d t 170 9 4%Independent 170 9.4%
Charter School 14 0.8%
Other 44 2.4%
Total 1811 100.0%
High School Number of High School Number of
Top Ten High Schools, First‐Time FreshmenFall 2008
Freshmen Freshmen
Central Columbia High School, Bloomsburg, PA
26 Emmaus High School, Emmaus, PA 21
North Penn High School, Lansdale, PA 24 Parkland High School, Allentown, PA 21
Berwick Area Senior High School, Berwick, PA
23 Hazleton Area High School, Hazleton, PA 19
Bloomsburg Area High School, Bloomsburg, PA
21 Central Bucks High School West, Doylestown, PA
16
C il R k Hi h S h l S th H ll d 21 C il R k Hi h S h l N th 16
44‐‐1010
Council Rock High School South, Holland, PA
21 Council Rock High School North, Newtown, PA
16

Admissions Statistics By Admission CategoryF ll S t 2000 th h 2008Fall Semesters 2000 through 2008
Transfer Students
1 200
1,400
800
1,000
1,200
400
600
1999 2000 2001 2002 2003 2004 2005 2006 2007 20080
200
1999 2000 2001 2002 2003 2004 2005 2006 2007 2008Applied 902 920 939 884 988 1047 1014 1096 1190 1311Accepted 550 543 619 567 640 622 629 627 685 703Enrolled 282 315 360 333 374 352 413 399 422 418Enrolled 282 315 360 333 374 352 413 399 422 418
44‐‐1111
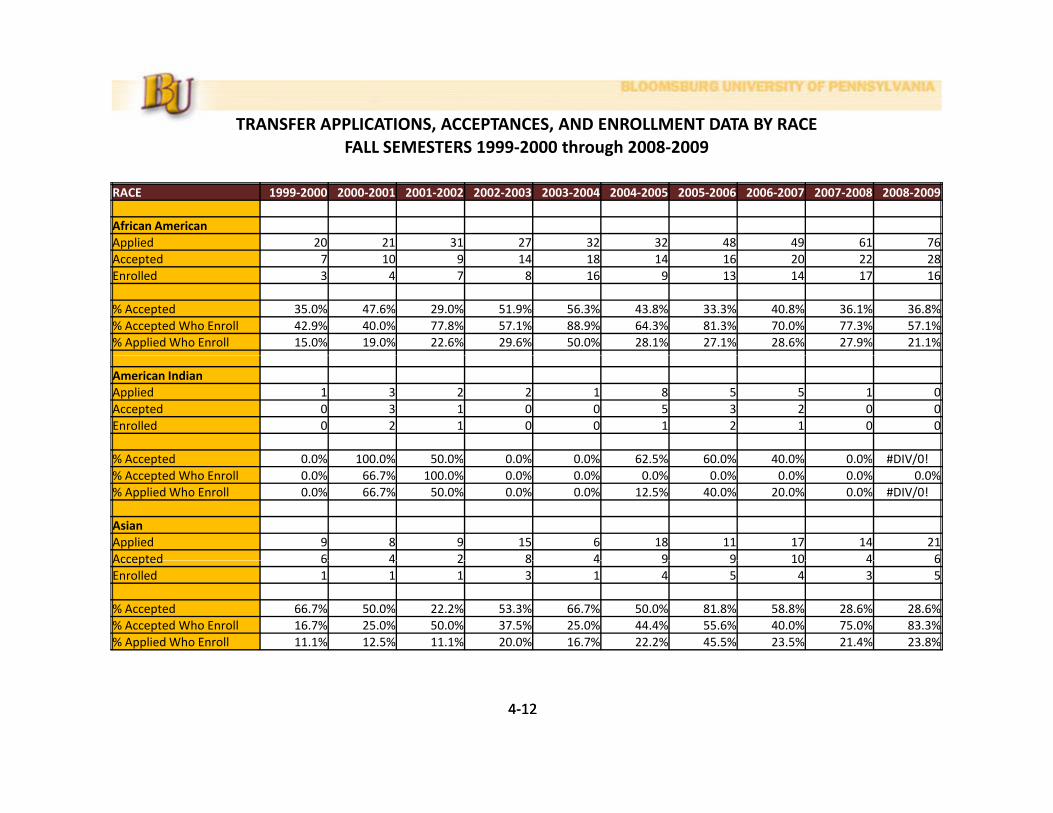
TRANSFER APPLICATIONS, ACCEPTANCES, AND ENROLLMENT DATA BY RACEFALL SEMESTERS 1999‐2000 through 2008‐2009FALL SEMESTERS 1999 2000 through 2008 2009
RACE 1999‐2000 2000‐2001 2001‐2002 2002‐2003 2003‐2004 2004‐2005 2005‐2006 2006‐2007 2007‐2008 2008‐2009
African AmericanApplied 20 21 31 27 32 32 48 49 61 76Accepted 7 10 9 14 18 14 16 20 22 28Enrolled 3 4 7 8 16 9 13 14 17 16
% Accepted 35.0% 47.6% 29.0% 51.9% 56.3% 43.8% 33.3% 40.8% 36.1% 36.8%% Accepted Who Enroll 42.9% 40.0% 77.8% 57.1% 88.9% 64.3% 81.3% 70.0% 77.3% 57.1%% Applied Who Enroll 15.0% 19.0% 22.6% 29.6% 50.0% 28.1% 27.1% 28.6% 27.9% 21.1%
American IndianApplied 1 3 2 2 1 8 5 5 1 0Accepted 0 3 1 0 0 5 3 2 0 0Enrolled 0 2 1 0 0 1 2 1 0 0
% Accepted 0 0% 100 0% 50 0% 0 0% 0 0% 62 5% 60 0% 40 0% 0 0% #DIV/0!% Accepted 0.0% 100.0% 50.0% 0.0% 0.0% 62.5% 60.0% 40.0% 0.0% #DIV/0!% Accepted Who Enroll 0.0% 66.7% 100.0% 0.0% 0.0% 0.0% 0.0% 0.0% 0.0% 0.0%% Applied Who Enroll 0.0% 66.7% 50.0% 0.0% 0.0% 12.5% 40.0% 20.0% 0.0% #DIV/0!
AsianApplied 9 8 9 15 6 18 11 17 14 21Accepted 6 4 2 8 4 9 9 10 4 6Accepted 6 4 2 8 4 9 9 10 4 6Enrolled 1 1 1 3 1 4 5 4 3 5
% Accepted 66.7% 50.0% 22.2% 53.3% 66.7% 50.0% 81.8% 58.8% 28.6% 28.6%% Accepted Who Enroll 16.7% 25.0% 50.0% 37.5% 25.0% 44.4% 55.6% 40.0% 75.0% 83.3%% Applied Who Enroll 11.1% 12.5% 11.1% 20.0% 16.7% 22.2% 45.5% 23.5% 21.4% 23.8%
44‐‐1212

TRANSFER APPLICATIONS, ACCEPTANCES, AND ENROLLMENT DATA BY RACEFALL SEMESTERS 1999‐2000 through 2008‐2009FALL SEMESTERS 1999 2000 through 2008 2009
RACE 1999‐2000 2000‐2001 2001‐2002 2002‐2003 2003‐2004 2004‐2005 2005‐2006 2006‐2007 2007‐2008 2008‐2009
LatinoApplied 8 10 22 17 17 19 22 33 35 40Accepted 5 3 9 9 8 7 9 20 19 21Enrolled 2 1 5 5 5 4 1 11 13 9
% Accepted 62.5% 30.0% 40.9% 52.9% 47.1% 36.8% 40.9% 60.6% 54.3% 52.5%% Accepted Who Enroll 40.0% 33.3% 55.6% 55.6% 62.5% 57.1% 11.1% 55.0% 68.4% 42.9%% Applied Who Enroll 25.0% 10.0% 22.7% 29.4% 29.4% 21.1% 4.5% 33.3% 37.1% 22.5%
WhiteApplied 855 865 862 802 879 910 836 894 947 1011Accepted 526 516 595 527 572 552 540 518 567 559Enrolled 273 304 344 311 322 312 357 335 345 335
% Accepted 61.5% 59.7% 69.0% 65.7% 65.1% 60.7% 64.6% 57.9% 59.9% 55.3%% Accepted Who Enroll 51.9% 58.9% 57.8% 59.0% 56.3% 56.5% 66.1% 64.7% 60.8% 59.9%% Applied Who Enroll 31.9% 35.1% 39.9% 38.8% 36.6% 34.3% 42.7% 37.5% 36.4% 33.1%
ForeignApplied 9 13 13 9 36 6 13 4 25 25Accepted 6 7 3 3 29 4 12 3 23 20Enrolled 3 3 2 3 26 2 10 3 16 13
% Accepted 66.7% 53.8% 23.1% 33.3% 80.6% 66.7% 92.3% 75.0% 92.0% 80.0%% Accepted Who Enroll 50.0% 42.9% 66.7% 100.0% 89.7% 50.0% 83.3% 100.0% 69.6% 65.0%% Applied Who Enroll 33.3% 23.1% 15.4% 33.3% 72.2% 33.3% 76.9% 75.0% 64.0% 52.0%
44‐‐1313
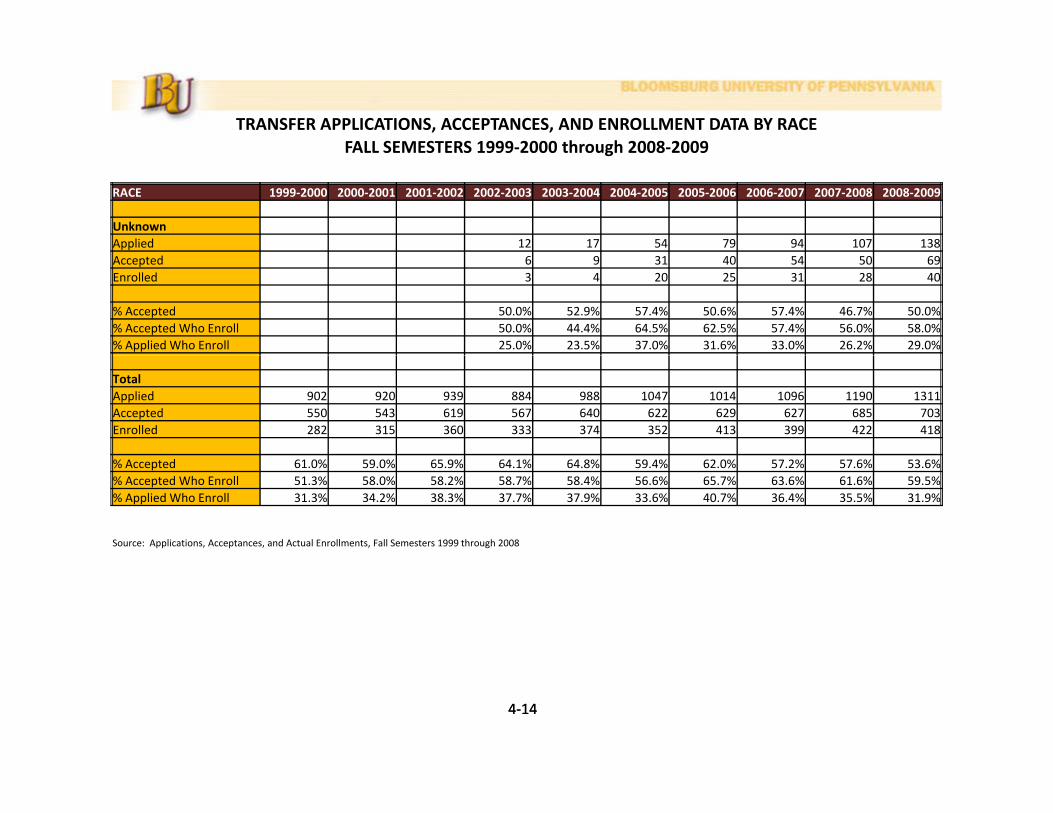
TRANSFER APPLICATIONS, ACCEPTANCES, AND ENROLLMENT DATA BY RACEFALL SEMESTERS 1999‐2000 through 2008‐2009FALL SEMESTERS 1999 2000 through 2008 2009
RACE 1999‐2000 2000‐2001 2001‐2002 2002‐2003 2003‐2004 2004‐2005 2005‐2006 2006‐2007 2007‐2008 2008‐2009
UnknownApplied 12 17 54 79 94 107 138Accepted 6 9 31 40 54 50 69Enrolled 3 4 20 25 31 28 40
% Accepted 50.0% 52.9% 57.4% 50.6% 57.4% 46.7% 50.0%% Accepted Who Enroll 50.0% 44.4% 64.5% 62.5% 57.4% 56.0% 58.0%% Applied Who Enroll 25.0% 23.5% 37.0% 31.6% 33.0% 26.2% 29.0%
TotalApplied 902 920 939 884 988 1047 1014 1096 1190 1311Accepted 550 543 619 567 640 622 629 627 685 703Enrolled 282 315 360 333 374 352 413 399 422 418
% Accepted 61.0% 59.0% 65.9% 64.1% 64.8% 59.4% 62.0% 57.2% 57.6% 53.6%% Accepted Who Enroll 51.3% 58.0% 58.2% 58.7% 58.4% 56.6% 65.7% 63.6% 61.6% 59.5%% Applied Who Enroll 31.3% 34.2% 38.3% 37.7% 37.9% 33.6% 40.7% 36.4% 35.5% 31.9%
Source: Applications, Acceptances, and Actual Enrollments, Fall Semesters 1999 through 2008
44‐‐1414

Institutions From Which Students Transfer To BloomsburgFall 2008Fall 2008
Institution Type Number of Transfers Percentage of Transfers
2‐Year Public 213 51.0%
2 Y P i t 9 2 2%2‐Year Private 9 2.2%
4‐Year Public 102 24.4%
4‐Year Private 77 18.4%
Other 17 4.0%
Total 418 100.0%
Top Ten Institutions From Which Students Transferred To BloomsburgFall 2008
Institution Name Number of Transfers
Institution Name Number of Transfers
Luzerne County Community College 83 Pennsylvania College of Technology 13
Pennsylvania State University 36 Kutztown University of PA 11y y y
Lehigh Carbon Community College 25 Montgomery County Community College
10
Northampton County Area Community College
21 Bucks County Community College 9
44‐‐1515
Harrisburg Area Community College 18 Shippensburg University of PA 9


DegreesDegreesggGrantedGranted


Degrees Granted By Degree Type2003‐2004 through 2007‐2008
160018002000
2003 2004 through 2007 2008
1000120014001600
4006008001000
2003‐2004 2004‐2005 2005‐2006 2006‐2007 2007‐20080
200
Doctorate 7 6 10
Master's 308 337 325 316 335
Bachelor's 1539 1403 1491 1516 1545
dAcademic Year
5‐1

Bachelor’s Degrees Granted By Gender2003‐2004 through 2007‐2008
1600
1800
2003 2004 through 2007 2008
1000
1200
1400
600
800
0
200
400
2003‐2004 2004‐2005 2005‐2006 2006‐2007 2007‐2008
Men 573 502 568 563 609
Women 966 901 923 953 936
dAcademic Year
5‐2

Bachelor’s Degrees Granted By College & Gender2003‐2004 through 2007‐20082003 2004 through 2007 2008
Academic Year
College Gender 2003‐2004 2004‐2005 2005‐2006 2006‐2007 2007‐2008
Professional Studies Women 409 377 383 381 399
Men 87 87 69 67 84
Total 496 464 452 448 483
Liberal Arts Women 354 344 335 353 317
Men 203 176 217 202 229Men 03 76 7 0 9
Total 557 520 552 555 546
Business Women 147 118 136 134 131
Men 206 171 191 200 208
Total 353 289 327 334 339
Science & Technology Women 56 62 69 85 89
Men 77 68 91 94 88
Total 133 130 160 179 177
Total Bachelor's Women 966 901 923 953 936
Men 573 502 568 563 609
Total 1539 1403 1491 1516 1545
5‐3
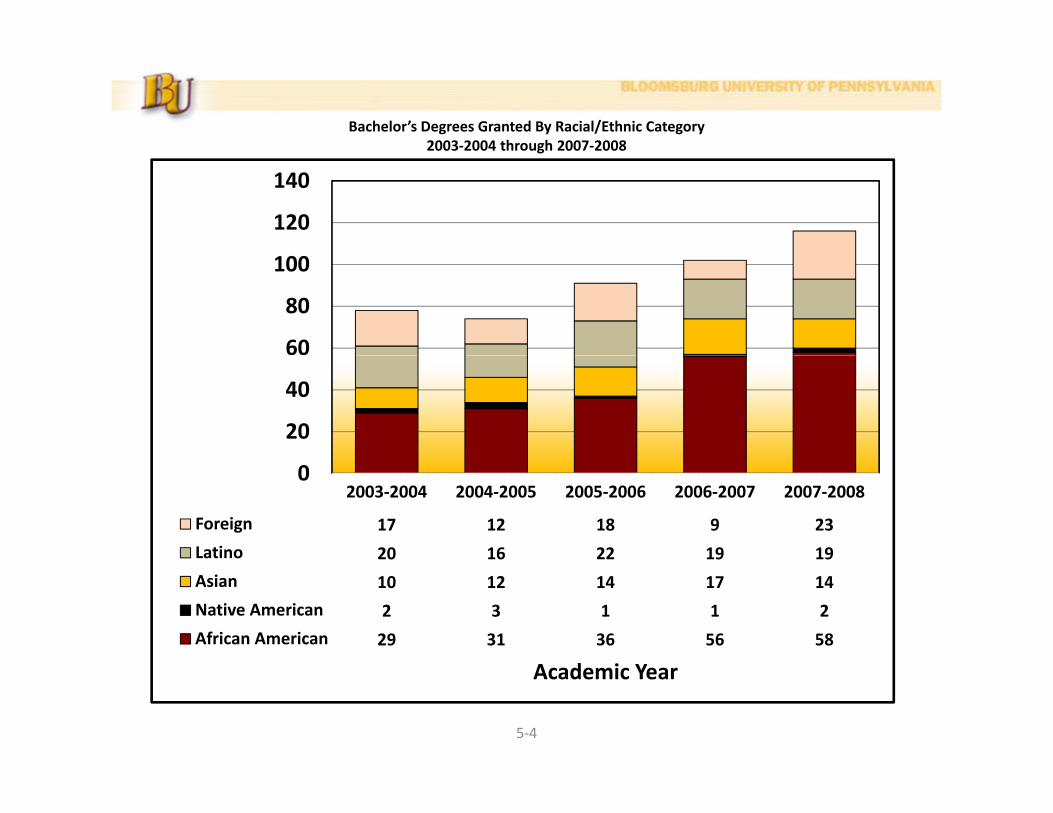
Bachelor’s Degrees Granted By Racial/Ethnic Category2003‐2004 through 2007‐2008
120
140
2003 2004 through 2007 2008
60
80
100
20
40
2003‐2004 2004‐2005 2005‐2006 2006‐2007 2007‐2008
Foreign 17 12 18 9 23
Latino 20 16 22 19 19
0
Asian 10 12 14 17 14
Native American 2 3 1 1 2
African American 29 31 36 56 58
dAcademic Year
5‐4

Bachelor’s Degrees Granted By College & Racial/Ethnic Category, 2003‐2004 through 2007‐2008Academic YearAcademic Year
College Race/Ethnicity 2003‐2004 2004‐2005 2005‐2006 2006‐2007 2007‐2008
Professional Studies
African American 5 3 1 6 6Native American 0 1 0 0 1Asian or Pacific Islander 1 3 5 2 5Latino 2 1 1 2 2White 480 451 439 430 454Foreign 1 1 1gUnknown 8 4 5 8 14Total 496 464 452 448 483
Liberal Arts
African American 17 14 29 32 31Native American 0 2 0 1 1Asian or Pacific Islander 5 4 6 6 5Latino 12 10 13 10 12White 507 483 489 490 460Foreign 14 7 11 7 15Foreign 14 7 11 7 15Unknown 2 0 4 9 22Total 557 520 552 555 546
Business
African American 6 8 4 13 16Native American 2 0 0 0 0Asian or Pacific Islander 2 4 2 7 2Latino 4 3 8 7 5White 332 269 304 300 303F i 3 2 4 1 4Foreign 3 2 4 1 4Unknown 4 3 5 6 9Total 353 289 327 334 339
Science & Technology
African American 1 6 2 5 5Native American 0 0 1 0 0Asian or Pacific Islander 2 1 1 2 2Latino 2 2 0 0 0White 124 117 153 167 159Foreign 0 2 2 1 3Unknown 4 2 1 4 8Total 133 130 160 179 177
Total Bachelor's
African American 29 31 36 56 58Native American 2 3 1 1 2Asian or Pacific Islander 10 12 14 17 14Latino 20 16 22 19 19White 1443 1320 1385 1387 1376
5‐5
Foreign 17 12 18 9 23Unknown 18 9 15 27 53Total 1539 1403 1491 1516 1545

Bachelor’s Degrees Granted, College of Business2003‐2004 through 2007‐20082003 2004 through 2007 2008
Academic Year
Business Degree 2003‐2004 2004‐2005 2005‐2006 2006‐2007 2007‐2008BUS*BUSINESS ADM*ACCOUNTING BS 58 32 56 45 48BUS*BUSINESS ADM*BUSINESS INFOR SYST BS 0 0 8 16 7BUS*BUSINESS ADM*ECONOMICS BS 0 0 0 0 0BUS*BUSINESS ADM*FINANCE BS 34 18 27 37 26BUS*BUSINESS ADM*MANAGEMENT BS 100 102 105 131 147BUS*BUSINESS ADM*MARKETING BS 96 86 106 87 80BUS*BUSINESS ADM*MGT INFO SYTEMS BS 0 0 0 0 2BUS BUSINESS ADM MGT INFO SYTEMS BS 0 0 0 0 2BUS*BUSINESS ADM*OFFICE INFO SYSTEM BS 25 14 0 0 0BUS*BUSINESS ED*ACCOUNTING BSED 5 0 0 0 0BUS*BUSINESS ED*DATA PROCESSING BSED 0 0 0 0 0BUS*BUSINESS ED*MARKETING BSED 4 0 0 0 0BUS*BUSINESS EDUCATION BSED 0 9 12 9 10BUS*OFFICE ADM BSOA 1 0 0 0 0BUS*COMPUTER & INFORMATION SCI BS 30 28 13 9 19Total 353 289 327 334 339
5‐6
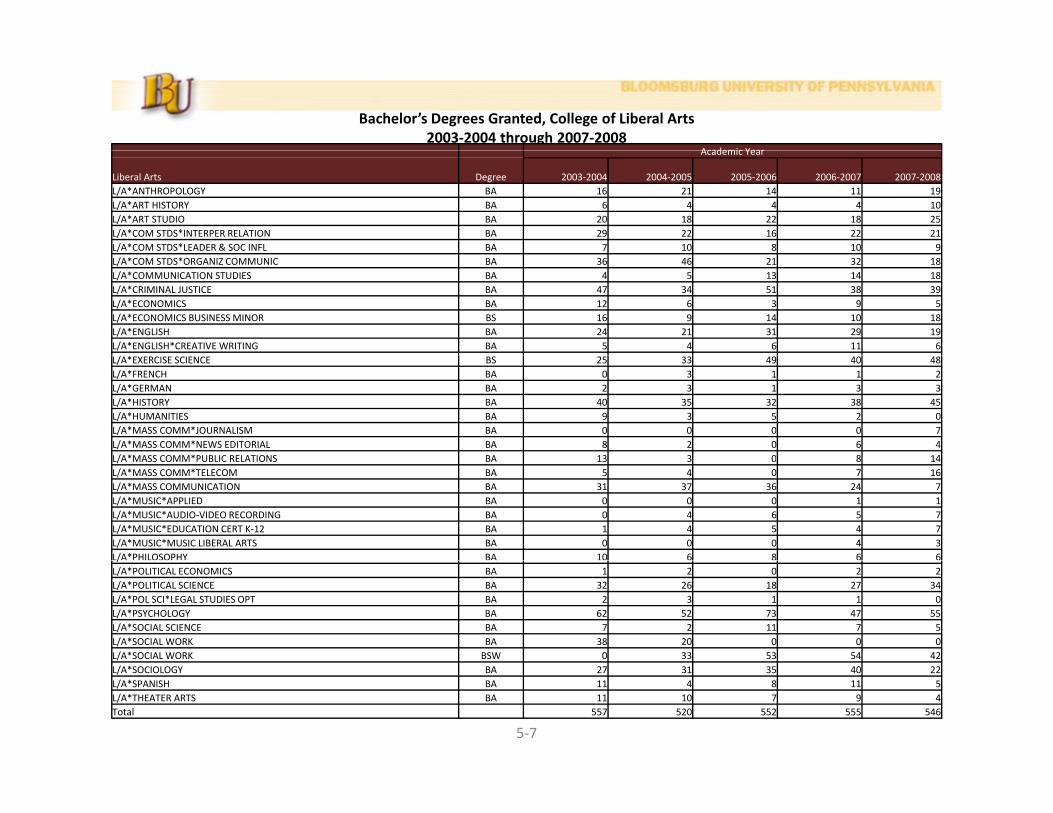
Bachelor’s Degrees Granted, College of Liberal Arts2003‐2004 through 2007‐2008
Academic YearAcademic Year
Liberal Arts Degree 2003‐2004 2004‐2005 2005‐2006 2006‐2007 2007‐2008L/A*ANTHROPOLOGY BA 16 21 14 11 19L/A*ART HISTORY BA 6 4 4 4 10L/A*ART STUDIO BA 20 18 22 18 25L/A*COM STDS*INTERPER RELATION BA 29 22 16 22 21L/A*COM STDS*LEADER & SOC INFL BA 7 10 8 10 9L/A*COM STDS*ORGANIZ COMMUNIC BA 36 46 21 32 18L/A*COMMUNICATION STUDIES BA 4 5 13 14 18L/A*CRIMINAL JUSTICE BA 47 34 51 38 39L/A*ECONOMICS BA 12 6 3 9 5L/A*ECONOMICS BUSINESS MINOR BS 16 9 14 10 18L/A*ENGLISH BA 24 21 31 29 19L/A*ENGLISH*CREATIVE WRITING BA 5 4 6 11 6L/A*EXERCISE SCIENCE BS 25 33 49 40 48L/A*FRENCH BA 0 3 1 1 2L/A*GERMAN BA 2 3 1 3 3L/A*HISTORY BA 40 35 32 38 45L/A*HUMANITIES BA 9 3 5 2 0L/A*MASS COMM*JOURNALISM BA 0 0 0 0 7L/A*MASS COMM*NEWS EDITORIAL BA 8 2 0 6 4L/A*MASS COMM*PUBLIC RELATIONS BA 13 3 0 8 14L/A*MASS COMM*PUBLIC RELATIONS BA 13 3 0 8 14L/A*MASS COMM*TELECOM BA 5 4 0 7 16L/A*MASS COMMUNICATION BA 31 37 36 24 7L/A*MUSIC*APPLIED BA 0 0 0 1 1L/A*MUSIC*AUDIO‐VIDEO RECORDING BA 0 4 6 5 7L/A*MUSIC*EDUCATION CERT K‐12 BA 1 4 5 4 7L/A*MUSIC*MUSIC LIBERAL ARTS BA 0 0 0 4 3L/A*PHILOSOPHY BA 10 6 8 6 6/L/A*POLITICAL ECONOMICS BA 1 2 0 2 2L/A*POLITICAL SCIENCE BA 32 26 18 27 34L/A*POL SCI*LEGAL STUDIES OPT BA 2 3 1 1 0L/A*PSYCHOLOGY BA 62 52 73 47 55L/A*SOCIAL SCIENCE BA 7 2 11 7 5L/A*SOCIAL WORK BA 38 20 0 0 0L/A*SOCIAL WORK BSW 0 33 53 54 42
5‐7
L/A*SOCIOLOGY BA 27 31 35 40 22L/A*SPANISH BA 11 4 8 11 5L/A*THEATER ARTS BA 11 10 7 9 4Total 557 520 552 555 546
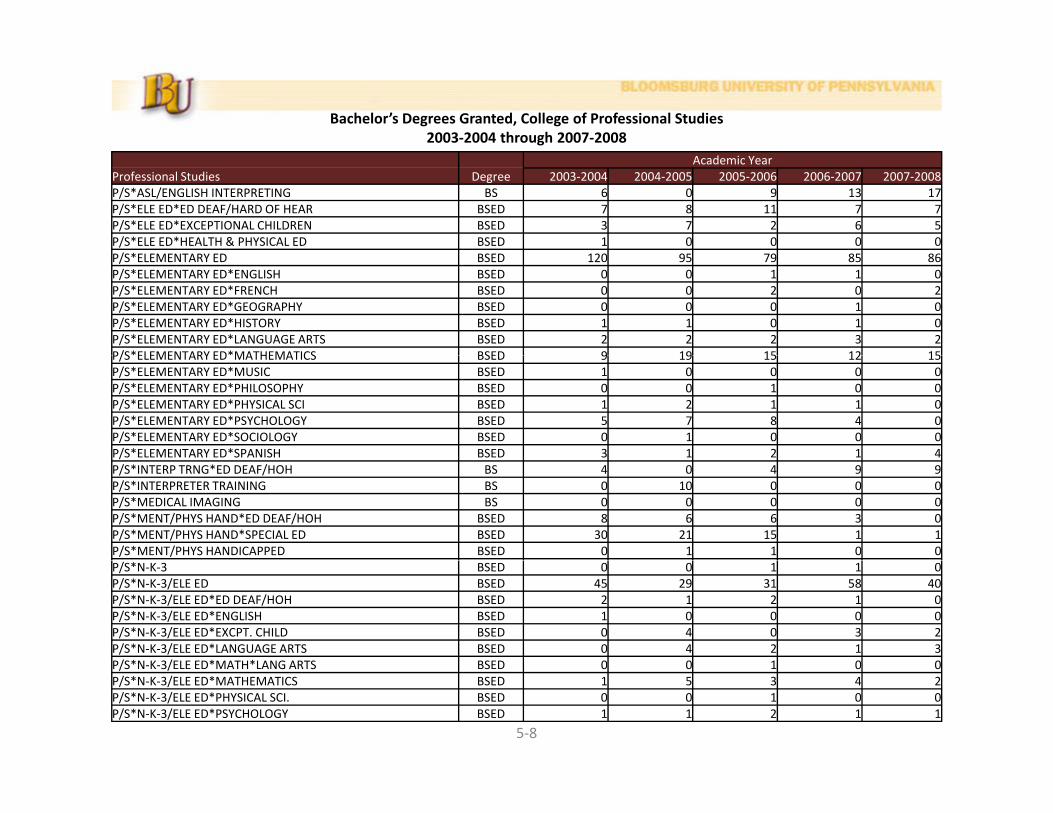
Bachelor’s Degrees Granted, College of Professional Studies2003‐2004 through 2007‐2008
Academic YearProfessional Studies Degree 2003‐2004 2004‐2005 2005‐2006 2006‐2007 2007‐2008P/S*ASL/ENGLISH INTERPRETING BS 6 0 9 13 17P/S*ELE ED*ED DEAF/HARD OF HEAR BSED 7 8 11 7 7P/S*ELE ED*EXCEPTIONAL CHILDREN BSED 3 7 2 6 5P/S*ELE ED*HEALTH & PHYSICAL ED BSED 1 0 0 0 0/ *P/S*ELEMENTARY ED BSED 120 95 79 85 86
P/S*ELEMENTARY ED*ENGLISH BSED 0 0 1 1 0P/S*ELEMENTARY ED*FRENCH BSED 0 0 2 0 2P/S*ELEMENTARY ED*GEOGRAPHY BSED 0 0 0 1 0P/S*ELEMENTARY ED*HISTORY BSED 1 1 0 1 0P/S*ELEMENTARY ED*LANGUAGE ARTS BSED 2 2 2 3 2P/S*ELEMENTARY ED*MATHEMATICS BSED 9 19 15 12 15P/S ELEMENTARY ED MATHEMATICS BSED 9 19 15 12 15P/S*ELEMENTARY ED*MUSIC BSED 1 0 0 0 0P/S*ELEMENTARY ED*PHILOSOPHY BSED 0 0 1 0 0P/S*ELEMENTARY ED*PHYSICAL SCI BSED 1 2 1 1 0P/S*ELEMENTARY ED*PSYCHOLOGY BSED 5 7 8 4 0P/S*ELEMENTARY ED*SOCIOLOGY BSED 0 1 0 0 0P/S*ELEMENTARY ED*SPANISH BSED 3 1 2 1 4/P/S*INTERP TRNG*ED DEAF/HOH BS 4 0 4 9 9P/S*INTERPRETER TRAINING BS 0 10 0 0 0P/S*MEDICAL IMAGING BS 0 0 0 0 0P/S*MENT/PHYS HAND*ED DEAF/HOH BSED 8 6 6 3 0P/S*MENT/PHYS HAND*SPECIAL ED BSED 30 21 15 1 1P/S*MENT/PHYS HANDICAPPED BSED 0 1 1 0 0P/S*N‐K‐3 BSED 0 0 1 1 0P/S*N‐K‐3/ELE ED BSED 45 29 31 58 40P/S*N‐K‐3/ELE ED*ED DEAF/HOH BSED 2 1 2 1 0P/S*N‐K‐3/ELE ED*ENGLISH BSED 1 0 0 0 0P/S*N‐K‐3/ELE ED*EXCPT. CHILD BSED 0 4 0 3 2P/S*N‐K‐3/ELE ED*LANGUAGE ARTS BSED 0 4 2 1 3P/S*N K 3/ELE ED*MATH*LANG ARTS BSED 0 0 1 0 0
5‐8
P/S*N‐K‐3/ELE ED*MATH*LANG ARTS BSED 0 0 1 0 0P/S*N‐K‐3/ELE ED*MATHEMATICS BSED 1 5 3 4 2P/S*N‐K‐3/ELE ED*PHYSICAL SCI. BSED 0 0 1 0 0P/S*N‐K‐3/ELE ED*PSYCHOLOGY BSED 1 1 2 1 1
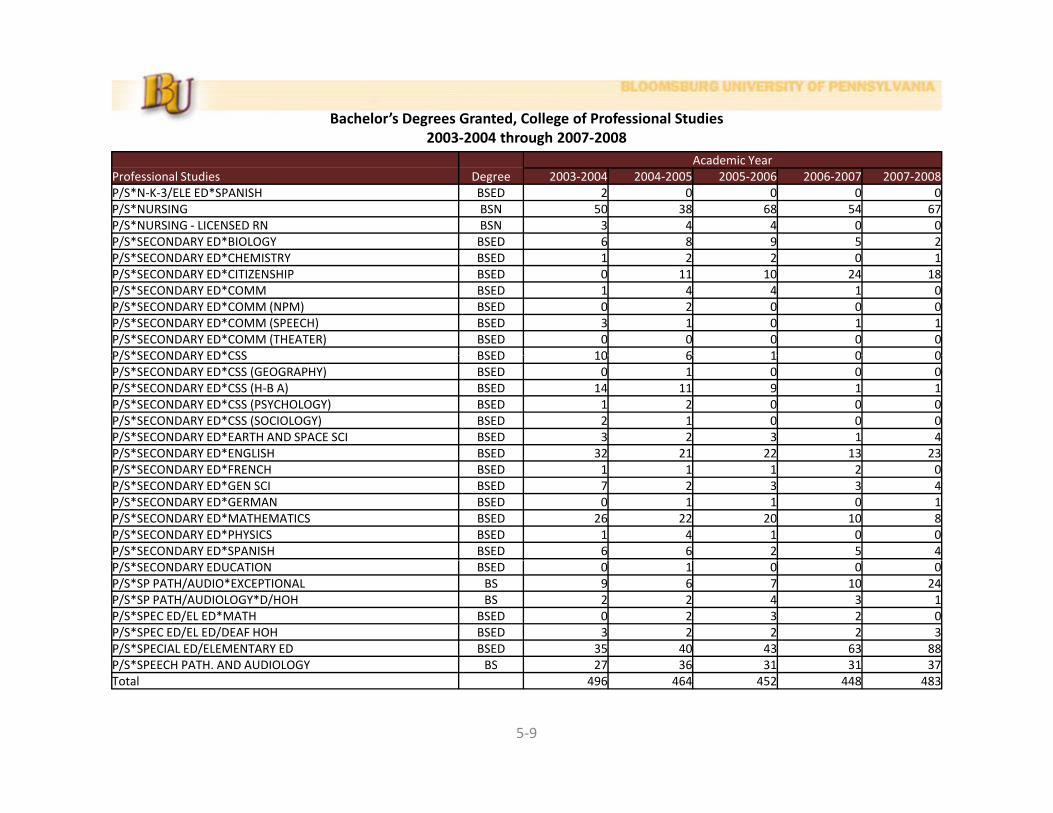
Bachelor’s Degrees Granted, College of Professional Studies2003‐2004 through 2007‐2008
Academic YearProfessional Studies Degree 2003‐2004 2004‐2005 2005‐2006 2006‐2007 2007‐2008P/S*N‐K‐3/ELE ED*SPANISH BSED 2 0 0 0 0P/S*NURSING BSN 50 38 68 54 67P/S*NURSING ‐ LICENSED RN BSN 3 4 4 0 0P/S*SECONDARY ED*BIOLOGY BSED 6 8 9 5 2/ * *P/S*SECONDARY ED*CHEMISTRY BSED 1 2 2 0 1
P/S*SECONDARY ED*CITIZENSHIP BSED 0 11 10 24 18P/S*SECONDARY ED*COMM BSED 1 4 4 1 0P/S*SECONDARY ED*COMM (NPM) BSED 0 2 0 0 0P/S*SECONDARY ED*COMM (SPEECH) BSED 3 1 0 1 1P/S*SECONDARY ED*COMM (THEATER) BSED 0 0 0 0 0P/S*SECONDARY ED*CSS BSED 10 6 1 0 0P/S SECONDARY ED CSS BSED 10 6 1 0 0P/S*SECONDARY ED*CSS (GEOGRAPHY) BSED 0 1 0 0 0P/S*SECONDARY ED*CSS (H‐B A) BSED 14 11 9 1 1P/S*SECONDARY ED*CSS (PSYCHOLOGY) BSED 1 2 0 0 0P/S*SECONDARY ED*CSS (SOCIOLOGY) BSED 2 1 0 0 0P/S*SECONDARY ED*EARTH AND SPACE SCI BSED 3 2 3 1 4P/S*SECONDARY ED*ENGLISH BSED 32 21 22 13 23/P/S*SECONDARY ED*FRENCH BSED 1 1 1 2 0P/S*SECONDARY ED*GEN SCI BSED 7 2 3 3 4P/S*SECONDARY ED*GERMAN BSED 0 1 1 0 1P/S*SECONDARY ED*MATHEMATICS BSED 26 22 20 10 8P/S*SECONDARY ED*PHYSICS BSED 1 4 1 0 0P/S*SECONDARY ED*SPANISH BSED 6 6 2 5 4P/S*SECONDARY EDUCATION BSED 0 1 0 0 0P/S*SP PATH/AUDIO*EXCEPTIONAL BS 9 6 7 10 24P/S*SP PATH/AUDIOLOGY*D/HOH BS 2 2 4 3 1P/S*SPEC ED/EL ED*MATH BSED 0 2 3 2 0P/S*SPEC ED/EL ED/DEAF HOH BSED 3 2 2 2 3P/S*SPECIAL ED/ELEMENTARY ED BSED 35 40 43 63 88P/S*SPEECH PATH AND AUDIOLOGY BS 27 36 31 31 37
5‐9
P/S*SPEECH PATH. AND AUDIOLOGY BS 27 36 31 31 37Total 496 464 452 448 483
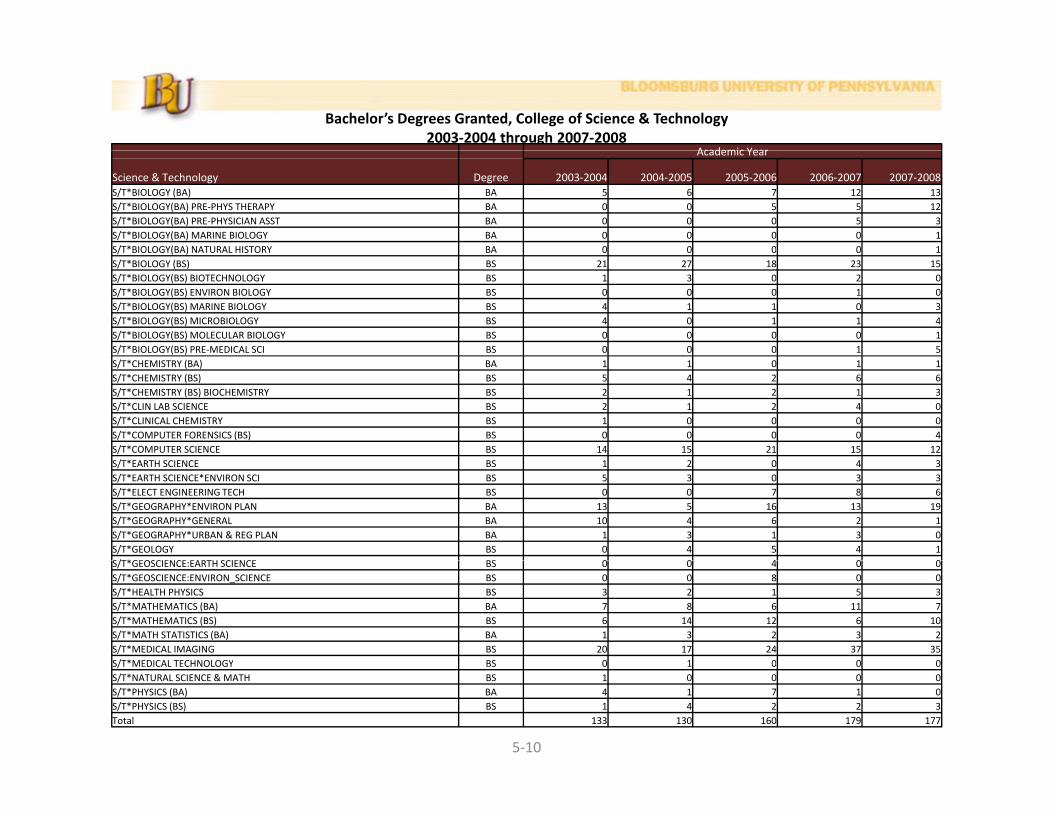
Bachelor’s Degrees Granted, College of Science & Technology2003‐2004 through 2007‐2008
Academic YearAcademic Year
Science & Technology Degree 2003‐2004 2004‐2005 2005‐2006 2006‐2007 2007‐2008S/T*BIOLOGY (BA) BA 5 6 7 12 13S/T*BIOLOGY(BA) PRE‐PHYS THERAPY BA 0 0 5 5 12S/T*BIOLOGY(BA) PRE‐PHYSICIAN ASST BA 0 0 0 5 3S/T*BIOLOGY(BA) MARINE BIOLOGY BA 0 0 0 0 1S/T*BIOLOGY(BA) NATURAL HISTORY BA 0 0 0 0 1S/ O OG ( ) U S O 0 0 0 0S/T*BIOLOGY (BS) BS 21 27 18 23 15S/T*BIOLOGY(BS) BIOTECHNOLOGY BS 1 3 0 2 0S/T*BIOLOGY(BS) ENVIRON BIOLOGY BS 0 0 0 1 0S/T*BIOLOGY(BS) MARINE BIOLOGY BS 4 1 1 0 3S/T*BIOLOGY(BS) MICROBIOLOGY BS 4 0 1 1 4S/T*BIOLOGY(BS) MOLECULAR BIOLOGY BS 0 0 0 0 1S/T*BIOLOGY(BS) PRE‐MEDICAL SCI BS 0 0 0 1 5S/T*CHEMISTRY (BA) BA 1 1 0 1 1S/T*CHEMISTRY (BS) BS 5 4 2 6 6S/T*CHEMISTRY (BS) BIOCHEMISTRY BS 2 1 2 1 3S/T*CLIN LAB SCIENCE BS 2 1 2 4 0S/T*CLINICAL CHEMISTRY BS 1 0 0 0 0S/T*COMPUTER FORENSICS (BS) BS 0 0 0 0 4S/T*COMPUTER SCIENCE BS 14 15 21 15 12S/T*EARTH SCIENCE BS 1 2 0 4 3S/T*EARTH SCIENCE*ENVIRON SCI BS 5 3 0 3 3S/T*ELECT ENGINEERING TECH BS 0 0 7 8 6S/T*GEOGRAPHY*ENVIRON PLAN BA 13 5 16 13 19S/T*GEOGRAPHY*GENERAL BA 10 4 6 2 1S/T*GEOGRAPHY*URBAN & REG PLAN BA 1 3 1 3 0S/T*GEOLOGY BS 0 4 5 4 1S/T*GEOSCIENCE EARTH SCIENCE BS 0 0 4 0 0S/T*GEOSCIENCE:EARTH SCIENCE BS 0 0 4 0 0S/T*GEOSCIENCE:ENVIRON_SCIENCE BS 0 0 8 0 0S/T*HEALTH PHYSICS BS 3 2 1 5 3S/T*MATHEMATICS (BA) BA 7 8 6 11 7S/T*MATHEMATICS (BS) BS 6 14 12 6 10S/T*MATH STATISTICS (BA) BA 1 3 2 3 2S/T*MEDICAL IMAGING BS 20 17 24 37 35S/T*MEDICAL TECHNOLOGY BS 0 1 0 0 0
5‐10
S/T*MEDICAL TECHNOLOGY BS 0 1 0 0 0S/T*NATURAL SCIENCE & MATH BS 1 0 0 0 0S/T*PHYSICS (BA) BA 4 1 7 1 0S/T*PHYSICS (BS) BS 1 4 2 2 3Total 133 130 160 179 177
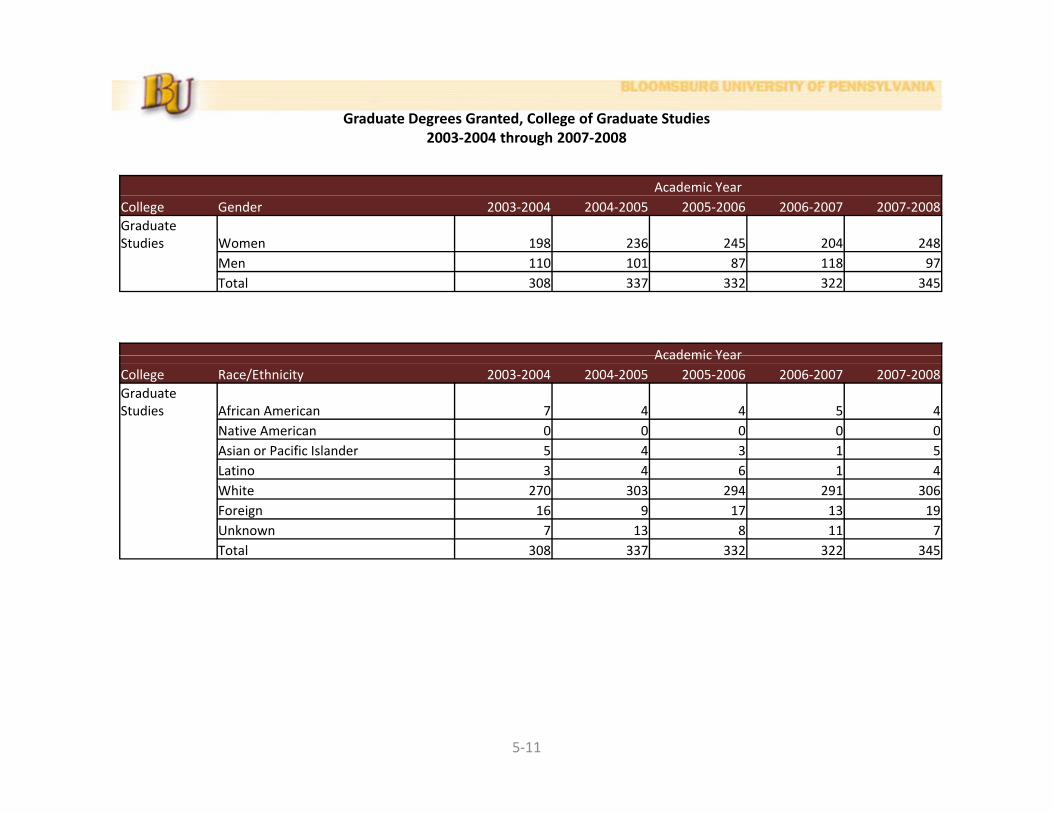
Graduate Degrees Granted, College of Graduate Studies2003‐2004 through 2007‐2008
Academic YearCollege Gender 2003‐2004 2004‐2005 2005‐2006 2006‐2007 2007‐2008Graduate Studies Women 198 236 245 204 248
Men 110 101 87 118 97Total 308 337 332 322 345
Academic YearAcademic YearCollege Race/Ethnicity 2003‐2004 2004‐2005 2005‐2006 2006‐2007 2007‐2008Graduate Studies African American 7 4 4 5 4
Native American 0 0 0 0 0Asian or Pacific Islander 5 4 3 1 5Latino 3 4 6 1 4White 270 303 294 291 306Foreign 16 9 17 13 19Unknown 7 13 8 11 7Total 308 337 332 322 345
5‐11
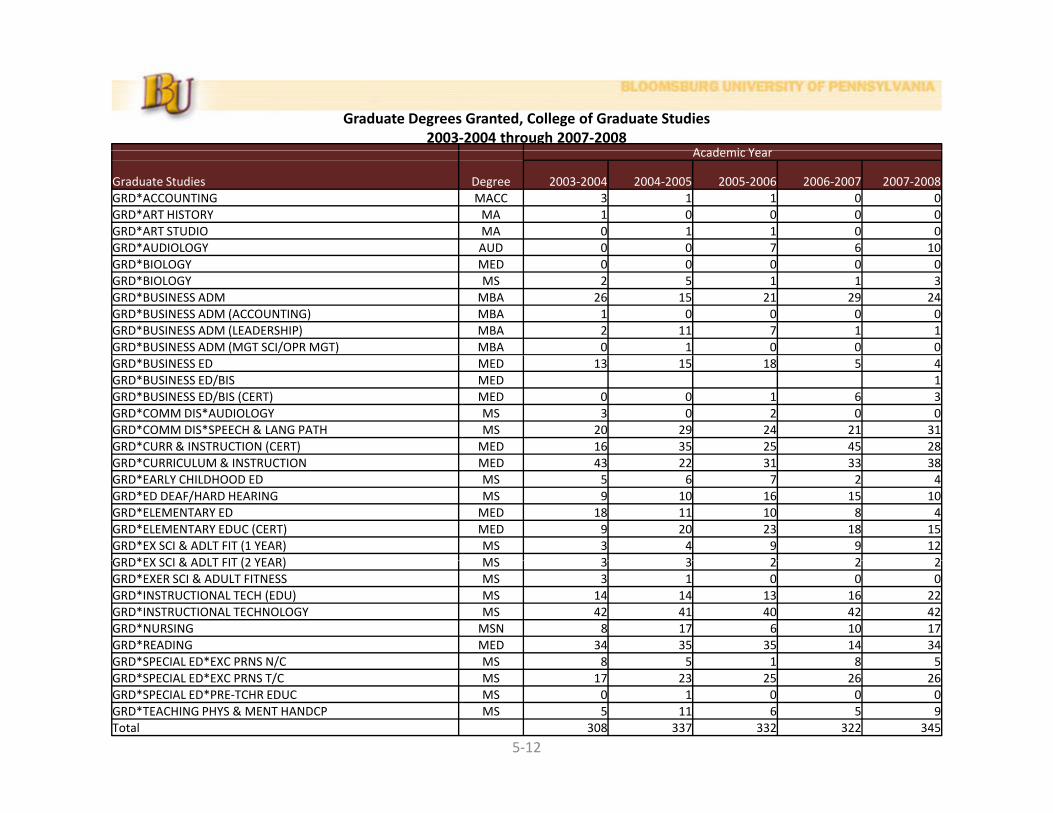
Graduate Degrees Granted, College of Graduate Studies2003‐2004 through 2007‐2008
Academic YearAcademic Year
Graduate Studies Degree 2003‐2004 2004‐2005 2005‐2006 2006‐2007 2007‐2008GRD*ACCOUNTING MACC 3 1 1 0 0GRD*ART HISTORY MA 1 0 0 0 0GRD*ART STUDIO MA 0 1 1 0 0GRD*AUDIOLOGY AUD 0 0 7 6 10GRD*BIOLOGY MED 0 0 0 0 0GRD*BIOLOGY MS 2 5 1 1 3GRD*BUSINESS ADM MBA 26 15 21 29 24GRD*BUSINESS ADM (ACCOUNTING) MBA 1 0 0 0 0GRD*BUSINESS ADM (LEADERSHIP) MBA 2 11 7 1 1GRD*BUSINESS ADM (MGT SCI/OPR MGT) MBA 0 1 0 0 0GRD*BUSINESS ED MED 13 15 18 5 4GRD*BUSINESS ED/BIS MED 1GRD*BUSINESS ED/BIS (CERT) MED 0 0 1 6 3GRD*COMM DIS*AUDIOLOGY MS 3 0 2 0 0GRD*COMM DIS*SPEECH & LANG PATH MS 20 29 24 21 31GRD*CURR & INSTRUCTION (CERT) MED 16 35 25 45 28
*GRD*CURRICULUM & INSTRUCTION MED 43 22 31 33 38GRD*EARLY CHILDHOOD ED MS 5 6 7 2 4GRD*ED DEAF/HARD HEARING MS 9 10 16 15 10GRD*ELEMENTARY ED MED 18 11 10 8 4GRD*ELEMENTARY EDUC (CERT) MED 9 20 23 18 15GRD*EX SCI & ADLT FIT (1 YEAR) MS 3 4 9 9 12GRD*EX SCI & ADLT FIT (2 YEAR) MS 3 3 2 2 2GRD*EX SCI & ADLT FIT (2 YEAR) MS 3 3 2 2 2GRD*EXER SCI & ADULT FITNESS MS 3 1 0 0 0GRD*INSTRUCTIONAL TECH (EDU) MS 14 14 13 16 22GRD*INSTRUCTIONAL TECHNOLOGY MS 42 41 40 42 42GRD*NURSING MSN 8 17 6 10 17GRD*READING MED 34 35 35 14 34GRD*SPECIAL ED*EXC PRNS N/C MS 8 5 1 8 5
5‐12
GRD SPECIAL ED EXC PRNS N/C MS 8 5 1 8 5GRD*SPECIAL ED*EXC PRNS T/C MS 17 23 25 26 26GRD*SPECIAL ED*PRE‐TCHR EDUC MS 0 1 0 0 0GRD*TEACHING PHYS & MENT HANDCP MS 5 11 6 5 9Total 308 337 332 322 345

Retention & Retention & Graduation Graduation
RatesRates


Second-Year Persistence Rates
90%95%
100%Second-Year Persistence Rates
CSRDE CSRDE Peers Peers ––
75%80%85%90%Moderately Moderately
Selective Selective Institutions Institutions
from the from the Consortium Consortium for Studentfor Student
60%65%70%
for Student for Student Retention Retention
Data Data Exchange Exchange
(SAT (SAT Composite Composite
2000 2001 2002 2003 2004 2005 2006 2007Bloomsburg 80 1%79 2%80 8%81 9%82 4%79 1%80 8%80 0%
50%55%
pp990990--1044)1044)
Bloomsburg 80.1%79.2%80.8%81.9%82.4%79.1%80.8%80.0%PASSHE 75.6%76.1%76.2%76.6%76.4%76.6%76.4%CSRDE Peers 73.6%73.6%74.2%74.6%74.3%73.5%73.6%
Entering Cohort YearEntering Cohort Year
66‐‐11

95%100%
Second-Year Persistence Rates By Gender
80%85%90%
65%70%75%
50%55%60%
%
2000 2001 2002 2003 2004 2005 2006 2007Female 81.8% 81.8% 83.5% 82.8% 83.2% 80.9% 81.3% 80.1%Male 76.9% 75.1% 76.1% 80.5% 81.2% 76.3% 80.1% 80.0%
50%
CEntering Cohort Year66‐‐22

Second Year Persistence Rates By Race
90%95%
100%Second-Year Persistence Rates By Race
75%80%85%90%
60%65%70%75%
2000 2001 2002 2003 2004 2005 2006 200750%55%60%
Latino 69.6% 64.7% 69.2% 65.6% 69.8% 80.0% 71.4% 82.5%Afr Amer 69.4% 74.2% 73.8% 83.5% 86.8% 74.3% 78.7% 75.2%White 80.6% 79.6% 81.3% 82.0% 82.6% 79.7% 81.3% 81.0%
Entering Cohort YearEntering Cohort Year
66‐‐33

95%100%
Second-Year Persistence RatesBy Admission Category
80%85%90%95%
%65%70%75%80%
2000 2001 2002 2003 2004 2005 2006 200750%55%60%
New Fresh 82.4% 80.0% 82.1% 82.3% 83.1% 80.8% 81.5% 80.9%Sum Fresh 64.7% 74.3% 74.4% 81.6% 77.5% 69.4% 79.2% 78.9%101/EOP 71.8% 75.6% 72.3% 77.3% 80.4% 74.2% 77.4% 73.2%
CEntering Cohort Year66‐‐44

95%100%
Second-Year Persistence RatesBy College of Admission
75%80%85%90%95%
50%55%60%65%70%75%
2000 2001 2002 2003 2004 2005 2006 2007Prof Stud 87.2% 87.5% 86.0% 84.2% 85.2% 85.5% 89.5% 86.0%Lib Arts 79.0% 75.7% 81.7% 83.7% 86.4% 79.0% 74.6% 83.5%
50%
Business 78.8% 78.9% 79.0% 80.3% 81.0% 78.5% 83.2% 78.8%Sci Tech 80.3% 71.6% 77.7% 79.7% 76.0% 76.2% 78.9% 76.2%Undeclared 75.1% 76.4% 75.1% 79.7% 80.7% 73.4% 74.8% 76.0%
CEntering Cohort Year66‐‐55

Six-Year Graduation Rates
65%
75%Six-Year Graduation Rates
55%
65%
35%
45%
1995 1996 1997 1998 1999 2000 2001 200225%
35%
Bloomsburg 61.2% 61.2% 58.7% 62.0% 62.9% 63.5% 61.5% 65.5%PASSHE 52.4% 52.1% 53.4% 52.7% 53.4% 54.2% 54.9%CSRDE Peers 43.1% 43.8% 45.7% 46.6% 46.2% 47.0% 46.8%
Entering Cohort YearEntering Cohort YearCSRDECSRDE PeersPeers –– ModeratelyModerately SelectiveSelective InstitutionsInstitutions fromfrom thethe ConsortiumConsortium forfor StudentStudent RetentionRetention DataDataExchangeExchange (SAT(SAT CompositeComposite 990990--10441044)) 66‐‐66

Six-Year Graduation Rates By Gender
65%
75%Six-Year Graduation Rates By Gender
55%
65%
35%
45%
1995 1996 1997 1998 1999 2000 2001 200225%
35%
1995 1996 1997 1998 1999 2000 2001 2002Female 65.9% 64.4% 59.8% 62.4% 63.6% 67.7% 65.8% 69.9%Male 52.2% 55.5% 56.7% 61.4% 61.6% 56.0% 54.9% 57.8%
Entering Cohort YearEntering Cohort Year
66‐‐77

Six-Year Graduation Rates By Race
65%
75%Six-Year Graduation Rates By Race
55%
65%
35%
45%
1995 1996 1997 1998 1999 2000 2001 2002Latino 47 1% 64 3% 46 7% 48 3% 67 9% 34 8% 35 3% 50 0%
25%
Latino 47.1% 64.3% 46.7% 48.3% 67.9% 34.8% 35.3% 50.0%Afr Amer 34.3% 30.2% 29.5% 37.9% 32.7% 30.6% 48.4% 51.2%White 62.7% 62.4% 60.4% 63.7% 64.0% 65.1% 62.6% 66.9%
Entering Cohort YearEntering Cohort Year
66‐‐88
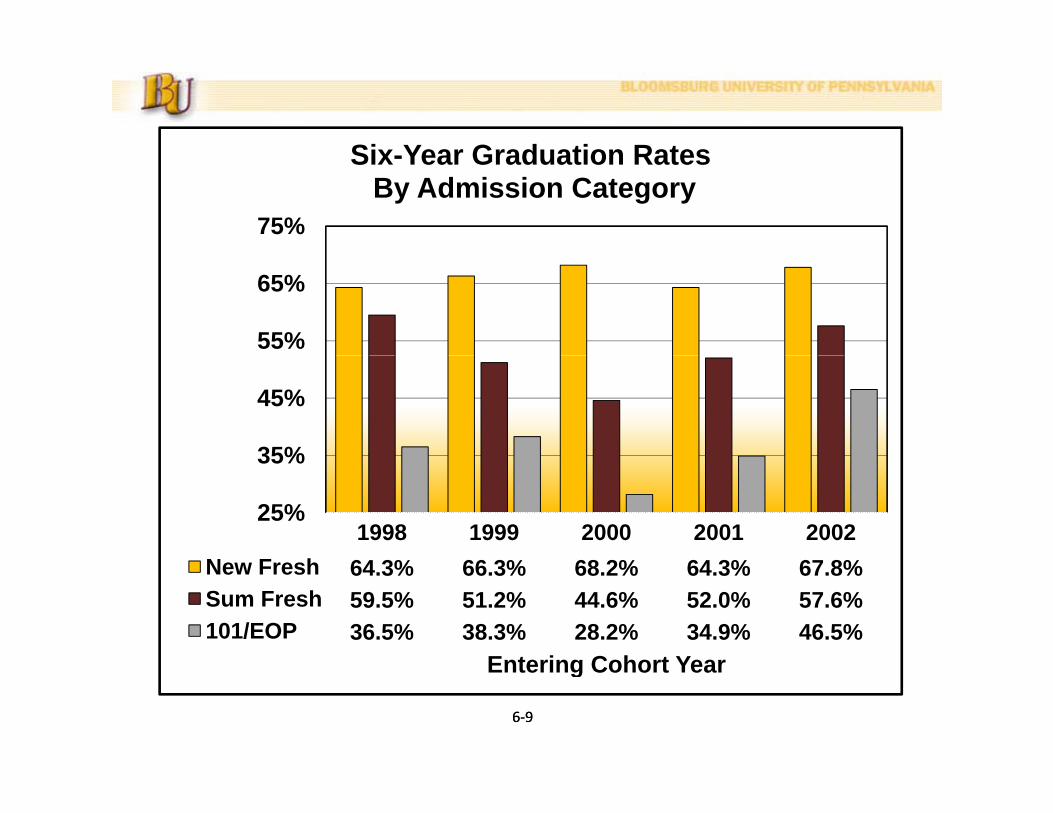
Six Year Graduation Rates
75%
Six-Year Graduation RatesBy Admission Category
55%
65%
35%
45%
1998 1999 2000 2001 2002N F h 64 3% 66 3% 68 2% 64 3% 67 8%
25%
35%
New Fresh 64.3% 66.3% 68.2% 64.3% 67.8%Sum Fresh 59.5% 51.2% 44.6% 52.0% 57.6%101/EOP 36.5% 38.3% 28.2% 34.9% 46.5%
Entering Cohort YearEntering Cohort Year
66‐‐99

Six Year Graduation Rates
90%100%
Six-Year Graduation RatesBy College of Admission
60%70%80%90%
30%40%50%60%
1998 1999 2000 2001 2002Prof Stud 69.1% 76.9% 74.4% 73.1% 76.3%Lib Arts 59.7% 63.8% 67.6% 57.1% 64.2%B i 67 0% 60 5% 62 6% 62 2% 62 9%Business 67.0% 60.5% 62.6% 62.2% 62.9%Sci Tech 56.8% 60.0% 61.2% 56.4% 58.1%Undeclared 51.8% 53.7% 53.2% 52.6% 56.1%
Entering Cohort YearEntering Cohort Year
66‐‐1010

Retention and Graduation Rates By GenderRetention and Graduation Rates By GenderFirstFirst‐‐Time, FullTime, Full‐‐Time Freshmen Fall 2000 through Fall 2007Time Freshmen Fall 2000 through Fall 2007
‐‐ Continuation Rates ‐‐‐‐‐‐‐‐‐‐‐ Cumulative Graduation Rates and Continuation Rates ‐‐‐‐‐‐‐‐
‐‐Cohort Cohort Head %Enrolled %Enrolled %Enrolled %Grad %Enrolled %Grad %Enrolled %Grad %EnrolledType Year Count Year 2 Year 3 Year 4 in 4 Years Year 5 in 5 Years Year 6 in 6 Years Year 7Total 2000 1414 80.1% 72.3% 66.3% 41.5% 23.8% 60.7% 4.2% 63.5% 1.2%Total 2001 1684 79.2% 69.4% 65.6% 38.4% 24.4% 58.8% 4.2% 61.5% 1.7%Total 2002 1478 80.8% 72.2% 68.9% 44.0% 22.1% 63.7% 2.5% 65.5% 0.9%Total 2003 1665 81.9% 72.7% 68.9% 40.7% 24.9% 60.7% 3.3%Total 2004 1534 82.4% 71.2% 66.9% 40.7% 22.8%Total 2005 1691 79.1% 68.8% 65.4%Total 2006 1630 80.8% 70.9%Total 2007 1679 80.0%Female 2000 912 81.8% 74.2% 69.3% 47.6% 20.9% 65.2% 3.3% 67.7% 0.9%Female 2001 1021 81.8% 72.5% 69.0% 45.3% 20.6% 63.7% 3.2% 65.8% 1.1%Female 2002 938 83.5% 74.8% 72.4% 51.3% 18.3% 68.6% 1.6% 69.9% 0.4%Female 2003 1000 82.8% 74.3% 70.8% 47.6% 19.5% 63.4% 2.9%Female 2004 948 83.1% 71.6% 67.6% 45.5% 19.2%Female 2005 1050 80.9% 71.1% 67.8%Female 2006 987 81.3% 73.4%Female 2007 969 80.1%Male 2000 502 76.9% 68.9% 60.8% 30.5% 28.9% 52.4% 5.8% 56.0% 1.8%Male 2001 663 75.1% 64.6% 60.5% 27.6% 30.3% 51.4% 5.6% 54.9% 2.6%Male 2002 540 76.1% 67.6% 63.0% 31.3% 28.7% 55.2% 4.1% 57.8% 1.7%Male 2003 665 80.5% 70.2% 66.2% 30.2% 32.9% 56.5% 3.9%Male 2004 586 81.2% 70.5% 65.9% 33.1% 28.5%Male 2005 641 76.3% 65.1% 61.5%Male 2006 643 80.1% 67.2%
66‐‐1111
Male 2007 710 80.0%

Retention and Graduation Rates By Racial/Ethnic CategoryRetention and Graduation Rates By Racial/Ethnic CategoryFirstFirst‐‐Time, FullTime, Full‐‐Time Freshmen Fall 2000 through Fall 2007Time Freshmen Fall 2000 through Fall 2007FirstFirst Time, FullTime, Full Time Freshmen Fall 2000 through Fall 2007Time Freshmen Fall 2000 through Fall 2007
‐‐ Continuation Rates ‐‐‐‐‐‐‐‐‐‐‐ Cumulative Graduation Rates and Continuation Rates ‐‐‐
‐‐‐‐‐‐‐Cohort Cohort Head %Enrolled %Enrolled %Enrolled %Grad %Enrolled %Grad %Enrolled %Grad %EnrolledType Year Count Year 2 Year 3 Year 4 in 4 Years Year 5 in 5 Years Year 6 in 6 Years Year 7African American 2000 49 69.4% 63.3% 49.0% 12.2% 26.5% 30.6% 10.2% 30.6% 2.0%African American 2001 62 74.2% 69.4% 61.3% 19.4% 35.5% 40.3% 8.1% 48.4% 3.2%African American 2002 84 73.8% 64.3% 63.1% 14.3% 45.2% 45.2% 6.0% 51.2% 3.6%African American 2003 103 83.5% 68.0% 54.4% 11.7% 39.8% 35.9% 9.7%African American 2004 121 86.8% 61.2% 52.1% 13.2% 31.4%African American 2005 140 74.3% 59.3% 52.9%African American 2006 150 78 7% 61 3%African American 2006 150 78.7% 61.3%African American 2007 145 75.2%Amer Ind/Alaska Native 2000 1 100.0% 100.0% 100.0% 100.0% 0.0% 100.0% 0.0% 100.0% 0.0%Amer Ind/Alaska Native 2001 3 100.0% 100.0% 100.0% 33.3% 66.7% 66.7% 0.0% 66.7% 0.0%Amer Ind/Alaska Native 2002 4 50.0% 25.0% 25.0% 0.0% 25.0% 0.0% 0.0% 25.0% 0.0%Amer Ind/Alaska Native 2003 5 80.0% 40.0% 60.0% 20.0% 40.0% 40.0% 20.0%A I d/Al k N i 2004 0Amer Ind/Alaska Native 2004 0Amer Ind/Alaska Native 2005 2 50.0% 50.0% 50.0%Amer Ind/Alaska Native 2006 3 100.0% 66.7%Amer Ind/Alaska Native 2007 2 50.0%Asian or Pacific Islander 2000 10 90.0% 80.0% 70.0% 20.0% 50.0% 70.0% 0.0% 70.0% 0.0%Asian or Pacific Islander 2001 15 93.3% 73.3% 60.0% 33.3% 33.3% 60.0% 0.0% 60.0% 0.0%Asian or Pacific Islander 2002 16 100.0% 87.5% 75.0% 43.8% 37.5% 75.0% 6.3% 75.0% 0.0%Asian or Pacific Islander 2003 15 93.3% 86.7% 86.7% 46.7% 33.3% 66.7% 0.0%Asian or Pacific Islander 2004 14 78.6% 78.6% 78.6% 42.9% 35.7%Asian or Pacific Islander 2005 22 81.8% 77.3% 68.2%Asian or Pacific Islander 2006 19 84.2% 68.4%Asian or Pacific Islander 2007 13 84.6%
66‐‐1212

Retention and Graduation Rates By Racial/Ethnic CategoryRetention and Graduation Rates By Racial/Ethnic CategoryFirstFirst‐‐Time, FullTime, Full‐‐Time Freshmen Fall 2000 through Fall 2007Time Freshmen Fall 2000 through Fall 2007FirstFirst Time, FullTime, Full Time Freshmen Fall 2000 through Fall 2007Time Freshmen Fall 2000 through Fall 2007
‐‐ Continuation Rates ‐‐‐‐‐‐‐‐‐‐‐ Cumulative Graduation Rates and Continuation Rates ‐‐‐‐‐‐‐
‐‐‐Cohort Cohort Head %Enrolled %Enrolled %Enrolled %Grad %Enrolled %Grad %Enrolled %Grad %EnrolledType Year Count Year 2 Year 3 Year 4 in 4 Years Year 5 in 5 Years Year 6 in 6 Years Year 7Latino 2000 23 69.6% 56.5% 43.5% 26.1% 17.4% 30.4% 8.7% 34.8% 4.3%Latino 2001 34 64 7% 41 2% 44 1% 20 6% 11 8% 35 3% 0 0% 35 3% 0 0%Latino 2001 34 64.7% 41.2% 44.1% 20.6% 11.8% 35.3% 0.0% 35.3% 0.0%Latino 2002 26 69.2% 50.0% 50.0% 30.8% 15.4% 46.2% 3.8% 50.0% 0.0%Latino 2003 32 65.6% 56.3% 50.0% 28.1% 25.0% 40.6% 6.3%Latino 2004 43 69.8% 48.8% 46.5% 14.0% 30.2%Latino 2005 50 80.0% 64.0% 56.0%Latino 2006 35 71.4% 62.9%Latino 2007 63 82 5%Latino 2007 63 82.5%White 2000 1325 80.6% 72.9% 67.3% 42.9% 23.6% 62.2% 3.9% 65.1% 1.1%White 2001 1564 79.6% 69.8% 66.2% 39.6% 24.0% 60.0% 4.2% 62.6% 1.7%White 2002 1338 81.3% 73.2% 70.0% 46.4% 20.6% 65.4% 2.2% 66.9% 0.7%White 2003 1481 82.0% 73.5% 70.2% 43.3% 23.4% 63.1% 2.7%White 2004 1297 82.6% 73.3% 69.7% 44.5% 21.8%White 2005 1408 79 7% 70 2% 67 5%White 2005 1408 79.7% 70.2% 67.5%White 2006 1315 81.3% 72.4%White 2007 1308 81.0%Foreign 2000 6 66.7% 66.7% 50.0% 50.0% 16.7% 66.7% 0.0% 66.7% 0.0%Foreign 2001 6 50.0% 83.3% 66.7% 16.7% 50.0% 66.7% 0.0% 66.7% 0.0%Foreign 2002 4 50.0% 50.0% 50.0% 50.0% 0.0% 50.0% 0.0% 50.0% 0.0%Foreign 2003 7 71 4% 57 1% 57 1% 14 3% 42 9% 28 6% 14 3%Foreign 2003 7 71.4% 57.1% 57.1% 14.3% 42.9% 28.6% 14.3%Foreign 2004 5 60.0% 40.0% 40.0% 40.0% 20.0%Foreign 2005 5 40.0% 40.0% 20.0%Foreign 2006 12 41.7% 33.3%Foreign 2007 3 100.0%
66‐‐1313

Retention and Graduation Rates By Racial/Ethnic CategoryRetention and Graduation Rates By Racial/Ethnic CategoryFirstFirst‐‐Time, FullTime, Full‐‐Time Freshmen Fall 2000 through Fall 2007Time Freshmen Fall 2000 through Fall 2007FirstFirst Time, FullTime, Full Time Freshmen Fall 2000 through Fall 2007Time Freshmen Fall 2000 through Fall 2007
‐‐ Continuation Rates ‐‐‐‐‐‐‐‐‐‐‐ Cumulative Graduation Rates and Continuation Rates ‐‐‐‐‐‐
‐‐‐‐Cohort Cohort Head %Enrolled %Enrolled %Enrolled %Grad %Enrolled %Grad %Enrolled %Grad %EnrolledType Year Count Year 2 Year 3 Year 4 in 4 Years Year 5 in 5 Years Year 6 in 6 Years Year 7Unknown 2000 0Unknown 2000 0Unknown 2001 0Unknown 2002 6 100.0% 50.0% 33.3% 0.0% 33.3% 33.3% 0.0% 33.3% 0.0%Unknown 2003 22 81.8% 68.2% 72.7% 27.3% 36.4% 50.0% 4.5%Unknown 2004 54 81.5% 61.1% 50.0% 33.3% 16.7%Unknown 2005 64 79.7% 62.5% 56.3%Unknown 2006 96 84 4% 74 0%Unknown 2006 96 84.4% 74.0%Unknown 2007 145 74.5%
66‐‐1414

Retention and Graduation Rates By Admission CategoryRetention and Graduation Rates By Admission CategoryFirstFirst‐‐Time, FullTime, Full‐‐Time Freshmen Fall 2000 through Fall 2007Time Freshmen Fall 2000 through Fall 2007FirstFirst Time, FullTime, Full Time Freshmen Fall 2000 through Fall 2007Time Freshmen Fall 2000 through Fall 2007
‐‐ Continuation Rates ‐‐‐‐‐‐‐‐‐‐‐ Cumulative Graduation Rates and Continuation Rates ‐‐‐‐‐‐‐‐
‐‐Cohort Cohort Head %Enrolled %Enrolled %Enrolled %Grad %Enrolled %Grad %Enrolled %Grad %EnrolledType Year Count Year 2 Year 3 Year 4 in 4 Years Year 5 in 5 Years Year 6 in 6 Years Year 7New Freshman 2000 1190 82.4% 74.9% 70.2% 45.7% 23.7% 65.5% 3.7% 68.2% 1.1%New Freshman 2001 1427 80 0% 71 0% 67 8% 42 0% 23 7% 61 9% 4 1% 64 3% 1 7%New Freshman 2001 1427 80.0% 71.0% 67.8% 42.0% 23.7% 61.9% 4.1% 64.3% 1.7%New Freshman 2002 1252 82.1% 74.1% 71.2% 46.3% 21.9% 66.2% 2.0% 67.8% 0.6%New Freshman 2003 1419 82.3% 73.8% 70.9% 44.3% 23.5% 64.4% 2.6%New Freshman 2004 1266 83.1% 73.8% 70.0% 45.7% 21.5%New Freshman 2005 1393 80.8% 71.4% 68.7%New Freshman 2006 1289 81.5% 73.5%New Freshman 2007 1348 80 9%New Freshman 2007 1348 80.9%Summer‐Fall Freshmen 2000 139 64.7% 56.8% 48.9% 24.5% 22.3% 41.0% 2.9% 44.6% 0.7%Summer‐Fall Freshmen 2001 171 74.3% 63.2% 57.9% 21.1% 29.8% 46.8% 4.7% 52.0% 1.8%Summer‐Fall Freshmen 2002 125 74.4% 64.0% 56.8% 41.6% 15.2% 56.0% 3.2% 57.6% 0.8%Summer‐Fall Freshmen 2003 114 81.6% 67.5% 62.3% 29.8% 25.4% 49.1% 2.6%Summer‐Fall Freshmen 2004 120 77.5% 60.0% 54.2% 22.5% 25.0%Summer Fall Freshmen 2005 169 69 2% 58 0% 52 7%Summer‐Fall Freshmen 2005 169 69.2% 58.0% 52.7%Summer‐Fall Freshmen 2006 195 79.0% 62.1%Summer‐Fall Freshmen 2007 204 78.9%Act 101/EOP 2000 85 71.8% 62.4% 40.0% 10.6% 27.1% 25.9% 12.9% 28.2% 3.5%Act 101/EOP 2001 86 75.6% 54.7% 44.2% 11.6% 25.6% 31.4% 4.7% 34.9% 1.2%Act 101/EOP 2002 101 72.3% 58.4% 56.4% 17.8% 33.7% 41.6% 7.9% 46.5% 4.0%Act 101/EOP 2003 132 77 3% 65 2% 53 8% 10 6% 38 6% 30 3% 11 4%Act 101/EOP 2003 132 77.3% 65.2% 53.8% 10.6% 38.6% 30.3% 11.4%Act 101/EOP 2004 148 80.4% 58.1% 51.4% 12.8% 31.8%Act 101/EOP 2005 128 74.2% 54.7% 46.1%Act 101/EOP 2006 141 77.3% 59.6%Act 101/EOP 2007 127 73.2%
66‐‐1515

Retention and Graduation Rates By College of AdmissionRetention and Graduation Rates By College of AdmissionFirstFirst‐‐Time, FullTime, Full‐‐Time Freshmen Fall 2000 through Fall 2007Time Freshmen Fall 2000 through Fall 2007FirstFirst Time, FullTime, Full Time Freshmen Fall 2000 through Fall 2007Time Freshmen Fall 2000 through Fall 2007
‐‐ Continuation Rates ‐‐‐‐‐‐‐‐‐‐‐ Cumulative Graduation Rates and Continuation Rates ‐‐‐‐‐‐‐‐
‐‐Cohort Cohort Head %Enrolled %Enrolled %Enrolled %Grad %Enrolled %Grad %Enrolled %Grad %EnrolledType Year Count Year 2 Year 3 Year 4 in 4 Years Year 5 in 5 Years Year 6 in 6 Years Year 7Professional Studies 2000 359 87.2% 80.5% 75.8% 51.8% 24.0% 71.9% 3.3% 74.4% 0.6%Professional Studies 2001 464 87 5% 79 5% 75 9% 50 4% 24 6% 70 3% 3 9% 73 1% 1 1%Professional Studies 2001 464 87.5% 79.5% 75.9% 50.4% 24.6% 70.3% 3.9% 73.1% 1.1%Professional Studies 2002 473 86.0% 81.2% 79.3% 55.0% 22.8% 75.5% 1.1% 76.3% 0.6%Professional Studies 2003 532 84.2% 75.4% 73.1% 47.7% 22.9% 67.9% 2.6%Professional Studies 2004 506 85.2% 77.3% 72.3% 48.2% 21.7%Professional Studies 2005 511 85.5% 77.9% 74.2%Professional Studies 2006 455 89.5% 82.0%Professional Studies 2007 443 86 0%Professional Studies 2007 443 86.0%Liberal Arts 2000 219 79.0% 74.0% 68.9% 50.2% 18.3% 65.8% 2.7% 67.6% 1.4%Liberal Arts 2001 333 75.7% 64.0% 61.3% 40.8% 17.4% 56.2% 2.7% 57.1% 1.5%Liberal Arts 2002 246 81.7% 69.5% 67.5% 47.2% 18.3% 61.8% 2.4% 64.2% 0.4%Liberal Arts 2003 258 83.7% 77.5% 73.3% 48.4% 21.7% 65.5% 0.8%Liberal Arts 2004 213 86.4% 76.1% 73.2% 54.5% 17.8%Liberal Arts 2005 257 79 0% 66 1% 64 6%Liberal Arts 2005 257 79.0% 66.1% 64.6%Liberal Arts 2006 241 74.7% 65.6%Liberal Arts 2007 206 83.5%Business 2000 278 78.8% 69.8% 66.9% 45.7% 20.1% 60.4% 3.6% 62.6% 1.8%Business 2001 331 78.9% 69.5% 67.4% 37.8% 26.9% 59.8% 4.8% 62.2% 1.8%Business 2002 291 79.0% 72.5% 67.4% 43.3% 19.6% 61.9% 2.4% 62.9% 1.0%Business 2003 279 80 3% 72 4% 71 0% 47 0% 21 1% 65 6% 2 2%Business 2003 279 80.3% 72.4% 71.0% 47.0% 21.1% 65.6% 2.2%Business 2004 231 81.0% 72.7% 71.9% 50.6% 18.6%Business 2005 298 78.5% 70.1% 68.1%Business 2006 273 83.2% 73.6%Business 2007 269 78.8%
66‐‐1616

Retention and Graduation Rates By College of AdmissionRetention and Graduation Rates By College of AdmissionFirstFirst‐‐Time, FullTime, Full‐‐Time Freshmen Fall 2000 through Fall 2007Time Freshmen Fall 2000 through Fall 2007FirstFirst Time, FullTime, Full Time Freshmen Fall 2000 through Fall 2007Time Freshmen Fall 2000 through Fall 2007
‐‐ Continuation Rates ‐‐‐‐‐‐‐‐‐‐‐ Cumulative Graduation Rates and Continuation Rates ‐‐‐‐‐‐‐
‐‐‐Cohort Cohort Head %Enrolled %Enrolled %Enrolled %Grad %Enrolled %Grad %Enrolled %Grad %EnrolledType Year Count Year 2 Year 3 Year 4 in 4 Years Year 5 in 5 Years Year 6 in 6 Years Year 7Science & Technology 2000 152 80.3% 72.4% 63.8% 33.6% 28.9% 55.9% 7.9% 61.2% 0.7%Science & Technology 2001 225 71.6% 62.2% 58.7% 31.6% 25.3% 52.4% 6.2% 56.4% 2.7%Science & Technology 2002 179 77.7% 67.6% 61.5% 30.7% 24.6% 55.3% 3.4% 58.1% 1.1%Science & Technology 2003 231 79.7% 70.1% 68.0% 29.4% 32.0% 55.0% 5.6%Science & Technology 2004 196 76.0% 64.3% 59.7% 29.1% 25.5%Science & Technology 2005 189 76.2% 66.7% 61.9%Science & Technology 2006 223 78.9% 70.0%Science & Technology 2007 273 76.2%Undeclared 2000 406 75.1% 66.0% 56.9% 27.8% 27.1% 50.0% 4.7% 53.2% 1.5%Undeclared 2001 331 76.4% 65.3% 58.6% 24.2% 28.1% 48.9% 3.9% 52.6% 1.8%Undeclared 2002 289 75.1% 62.3% 59.5% 32.2% 25.3% 52.9% 4.5% 56.1% 1.4%Undeclared 2003 365 79.7% 67.1% 58.9% 27.1% 28.2% 46.6% 5.5%Undeclared 2004 388 80.7% 63.1% 57.2% 23.5% 27.8%Undeclared 2005 436 73.4% 59.9% 55.3%Undeclared 2006 432 74.8% 61.1%Undeclared 2007 488 76.0%
66‐‐1717

Placement Placement StatisticsStatistics


Placement StatisticsPlacement StatisticsClass of 2007
Professional Employment
Teaching15.0%
Continued52.6%
Continued Education21.5%
Seeking10.9%
89.1% of graduates are placed
7‐1
This chart excludes non‐respondents and graduates not available for employment.Source: Career Development Center Post‐Graduation Activities Reports

Placement StatisticsGraduating Classes from 2003 to 2007Graduating Classes from 2003 to 2007
CollegeNumber of Graduates
Number of Respondents
Professional Employment Teaching
Continued Education Military Seeking
Not Available
Graduates Placed
Percentage Placed
Business2003 330 307 212 12 27 2 46 8 253 84.6%2004 351 315 228 8 27 1 46 5 264 85.2%2005 285 249 185 9 26 1 24 4 221 90.2%2006 310 285 236 12 18 17 2 266 94.0%2007 324 308 239 6 31 30 2 276 90.2%
Liberal Arts2003 470 427 236 6 101 7 54 23 350 86.6%2004 499 441 245 8 89 5 61 33 347 85.0%2005 498 429 260 10 101 1 38 19 372 90.7%2006 509 445 265 8 111 38 23 384 91.0%2007 532 488 290 6 130 47 15 426 90.1%
Professional Studies
2003 408 388 69 192 59 3 51 14 323 86.4%2004 487 434 72 228 80 2 46 6 382 89.3%2005 456 404 70 207 69 0 48 10 346 87.8%2006 450 410 108 182 69 47 4 359 88.4%2007 445 424 93 183 85 58 5 361 86.2%
Science & Technology
2003 144 137 85 1 21 1 23 6 108 82.4%2004 114 96 54 0 25 1 13 3 80 86.0%2005 127 117 60 5 29 0 19 4 94 83.2%2006 137 121 68 3 30 20 0 101 83.5%2007 159 152 87 7 43 12 3 137 91.9%
Totals2003 1352 1259 602 211 208 13 174 51 1034 85.6%2004 1451 1286 599 244 221 9 166 47 1073 86.6%2005 1366 1199 575 231 225 2 129 37 1033 88.9%2006 1406 1261 677 205 228 122 29 1110 90.1%2007 1460 1372 709 202 289 147 25 1200 89.1%
7‐2
Source: Career Development Center Post‐Graduation Activities Reports
2007 1460 1372 709 202 289 147 25 1200 89.1%

ProductivityProductivityyy


Student Credit Hour Production By CollegeStudent Credit Hour Production By CollegeAcademic Year 2007‐2008
SCH
Liberal Arts44.3%
Professional Studies18 9%
B siness
18.9%
Science & Technology
Business12.5%
gy22.7%
Other1.6%
8‐1
Source: Snyder Report Data File, 2007‐2008

FTE Instructional Faculty By CollegeFTE Instructional Faculty By CollegeAcademic Year 2007‐2008
Liberal Arts44.3%
Professional Studies18.9%
Business
Science & Technology
21 8%12.1% 21.8%
Other1.9%
8‐2
FTE Instructional Faculty includes overloads.Source: Snyder Report Data File, 2007‐2008

SCH Per FTE Instructional Faculty By CollegeSCH Per FTE Instructional Faculty By CollegeAcademic Year 2007‐2008
636.59 665.89 640.6
600
700 University Average
500.17
400
500
600 Average 615.38
200
300
0
100
Business Liberal Arts Professional Science &Business Liberal Arts Professional Studies
Science & Technology
8‐3
FTE Instructional Faculty includes overloads.Source: Snyder Report Data File, 2007‐2008
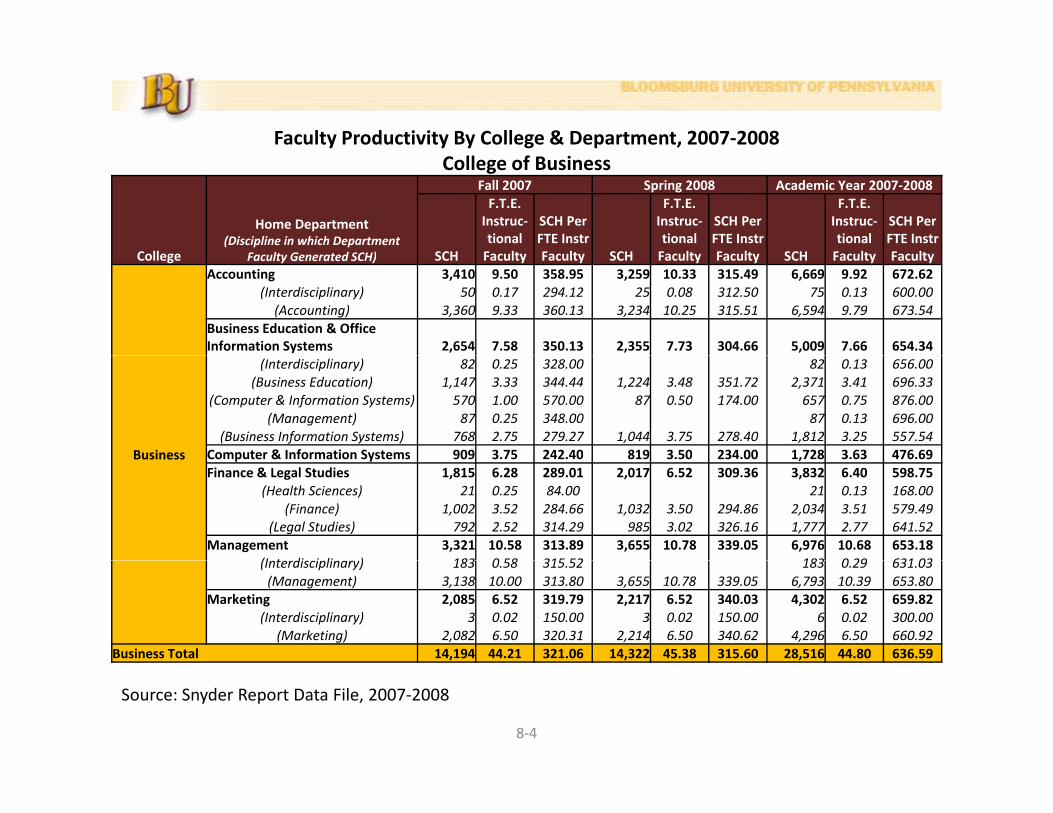
Faculty Productivity By College & Department, 2007‐2008
C ll
Home Department(Discipline in which Department
F l G d SCH)
Fall 2007 Spring 2008 Academic Year 2007‐2008
SCH
F.T.E. Instruc‐tionalF lt
SCH Per FTE Instr F lt SCH
F.T.E. Instruc‐tionalF lt
SCH Per FTE Instr F lt SCH
F.T.E. Instruc‐tionalF lt
SCH Per FTE Instr F lt
College of Business
College Faculty Generated SCH) SCH Faculty Faculty SCH Faculty Faculty SCH Faculty FacultyAccounting 3,410 9.50 358.95 3,259 10.33 315.49 6,669 9.92 672.62
(Interdisciplinary) 50 0.17 294.12 25 0.08 312.50 75 0.13 600.00(Accounting) 3,360 9.33 360.13 3,234 10.25 315.51 6,594 9.79 673.54
Business Education & Office Information Systems 2,654 7.58 350.13 2,355 7.73 304.66 5,009 7.66 654.34
Business
(Interdisciplinary) 82 0.25 328.00 82 0.13 656.00(Business Education) 1,147 3.33 344.44 1,224 3.48 351.72 2,371 3.41 696.33
(Computer & Information Systems) 570 1.00 570.00 87 0.50 174.00 657 0.75 876.00(Management) 87 0.25 348.00 87 0.13 696.00
(Business Information Systems) 768 2.75 279.27 1,044 3.75 278.40 1,812 3.25 557.54Computer & Information Systems 909 3.75 242.40 819 3.50 234.00 1,728 3.63 476.69Business Computer & Information Systems 909 3.75 242.40 819 3.50 234.00 1,728 3.63 476.69Finance & Legal Studies 1,815 6.28 289.01 2,017 6.52 309.36 3,832 6.40 598.75
(Health Sciences) 21 0.25 84.00 21 0.13 168.00(Finance) 1,002 3.52 284.66 1,032 3.50 294.86 2,034 3.51 579.49
(Legal Studies) 792 2.52 314.29 985 3.02 326.16 1,777 2.77 641.52Management 3,321 10.58 313.89 3,655 10.78 339.05 6,976 10.68 653.18
(I t di i li ) 183 0 58 315 52 183 0 29 631 03(Interdisciplinary) 183 0.58 315.52 183 0.29 631.03(Management) 3,138 10.00 313.80 3,655 10.78 339.05 6,793 10.39 653.80
Marketing 2,085 6.52 319.79 2,217 6.52 340.03 4,302 6.52 659.82(Interdisciplinary) 3 0.02 150.00 3 0.02 150.00 6 0.02 300.00
(Marketing) 2,082 6.50 320.31 2,214 6.50 340.62 4,296 6.50 660.92Business Total 14,194 44.21 321.06 14,322 45.38 315.60 28,516 44.80 636.59
8‐4
Source: Snyder Report Data File, 2007‐2008

Faculty Productivity By College and Department, 2007‐2008College of Liberal Arts
C ll
Home Department(Discipline in which Department
F l G d SCH)
Fall 2007 Spring 2008 Academic Year 2007‐2008
SCH
F.T.E. Instruc‐tionalF lt
SCH Per FTE Instr F lt SCH
F.T.E. Instruc‐tionalF lt
SCH Per FTE Instr F lt SCH
F.T.E. Instruc‐tionalF lt
SCH Per FTE Instr F ltCollege Faculty Generated SCH) SCH Faculty Faculty SCH Faculty Faculty SCH Faculty Faculty
Anthropology 3,306 6.57 503.20 2,889 6.82 423.61 6,195 6.70 925.32(Interdisciplinary) 3 0.02 150.00 3 0.02 150.00 6 0.02 300.00(Anthropology) 3,303 6.55 504.27 2,886 6.80 424.41 6,189 6.68 927.19
Art 3,210 10.75 298.60 2,529 10.52 240.40 5,739 10.64 539.63(Honors) 18 0.31 58.06 18 0.16 116.13
(Interdisciplinary) 3 0.02 150.00 3 0.01 300.00(Art) 1,794 1.50 1196.00 3 0.00 1,797 0.75 2396.00
(Art History) 594 2.25 264.00 1,752 3.75 467.20 2,346 3.00 782.00(Art Studio) 822 7.00 117.43 753 6.44 116.93 1,575 6.72 234.38
Communication Studies & Theater Arts 6,294 16.33 385.43 5,322 15.52 342.91 11,616 15.93 729.42
Liberal ArtsArts 6,294 16.33 385.43 5,322 15.52 342.91 11,616 15.93 729.42
(Interdisciplinary) 23 0.08 287.50 3 0.02 150.00 26 0.05 520.00(Communication Studies) 4,114 12.50 329.12 3,795 12.25 309.80 7,909 12.38 639.11
(Theater Arts) 2,157 3.75 575.20 1,524 3.25 468.92 3,681 3.50 1051.71Economics 3,540 9.08 389.87 3,305 8.12 407.02 6,845 8.60 795.93
(Honors) 54 0.25 216.00 54 0.13 432.00(I t di i li ) 90 0 33 272 73 29 0 08 362 50 119 0 21 580 49(Interdisciplinary) 90 0.33 272.73 29 0.08 362.50 119 0.21 580.49
(Economics) 3,450 8.75 394.29 3,222 7.78 414.14 6,672 8.27 807.26English 6,311 23.25 271.44 6,589 23.90 275.69 12,900 23.58 547.19
(Honors) 45 0.25 180.00 45 0.13 360.00(Interdisciplinary) 165 0.73 226.03 181 0.63 287.30 346 0.68 508.82
(English) 6,059 22.02 275.16 6,408 23.27 275.38 12,467 22.65 550.54
8‐5
Source: Snyder Report Data File, 2007‐2008(Secondary Education) 42 0.25 168.00 42 0.13 336.00

Faculty Productivity By College and Department, 2007‐2008College of Liberal Arts
C ll
Home Department(Discipline in which Department
F l G d SCH)
Fall 2007 Spring 2008 Academic Year 2007‐2008
SCH
F.T.E. Instruc‐tionalF lt
SCH Per FTE Instr F lt SCH
F.T.E. Instruc‐tionalF lt
SCH Per FTE Instr F lt SCH
F.T.E. Instruc‐tionalF lt
SCH Per FTE Instr F ltCollege Faculty Generated SCH) SCH Faculty Faculty SCH Faculty Faculty SCH Faculty Faculty
Exercise Science & Athletics 3,377 11.63 290.37 3,245 10.41 311.72 6,622 11.02 600.91(Exercise Science & Athletics) 3,309 11.43 289.50 3,209 10.13 316.78 6,518 10.78 604.64
(Honors) 30 0.25 30 0.13 240.00(Interdisciplinary) 68 0.20 340.00 6 0.03 200.00 74 0.12 643.48
History 4,064 12.17 333.94 3,837 11.50 333.65 7,901 11.84 667.60(Interdisciplinary) 47 0.17 276.47 47 0.09 552.94
(History) 3,933 11.75 334.72 3,837 11.50 333.65 7,770 11.63 668.39(Secondary Education) 84 0.25 336.00 84 0.13 672.00
Languages & Cultures 2,943 9.60 306.56 2,264 9.63 235.10 5,207 9.62 541.55(Interdisciplinary) 30 0.08 375.00 17 0.08 212.50 47 0.08 587.50
(French) 447 1.75 255.43 447 2.00 223.50 894 1.88 476.80
Liberal Arts
(French) 447 1.75 255.43 447 2.00 223.50 894 1.88 476.80(German) 570 1.75 325.71 267 1.27 210.24 837 1.51 554.30(Spanish) 1,482 4.75 312.00 1,152 4.77 241.51 2,634 4.76 553.36(Russian) 75 0.25 300.00 75 0.13 600.00(Italian) 183 0.50 366.00 42 0.25 168.00 225 0.38 600.00
(Languages & Cultures) 3 0.02 150.00 3 0.01 300.00(L ti ) 69 0 25 276 00 69 0 13 552 00(Latin) 69 0.25 276.00 69 0.13 552.00
(Chinese) 231 0.77 300.00 192 0.75 256.00 423 0.76 556.58Mass Communications 2,209 5.75 384.17 1,588 5.58 284.59 3,797 5.67 670.26
(Interdisciplinary) 18 0.08 225.00 18 0.04 450.00(Mass Communications) 2,191 5.67 386.42 1,588 5.58 284.59 3,779 5.63 671.82
Music 2,093 8.55 244.80 2,254 8.55 263.63 4,347 8.55 508.42
8‐6Source: Snyder Report Data File, 2007‐2008
(Honors) 57 0.25 228.00 57 0.13 456.00(Music) 2,036 8.30 245.30 2,254 8.55 263.63 4,290 8.43 509.20
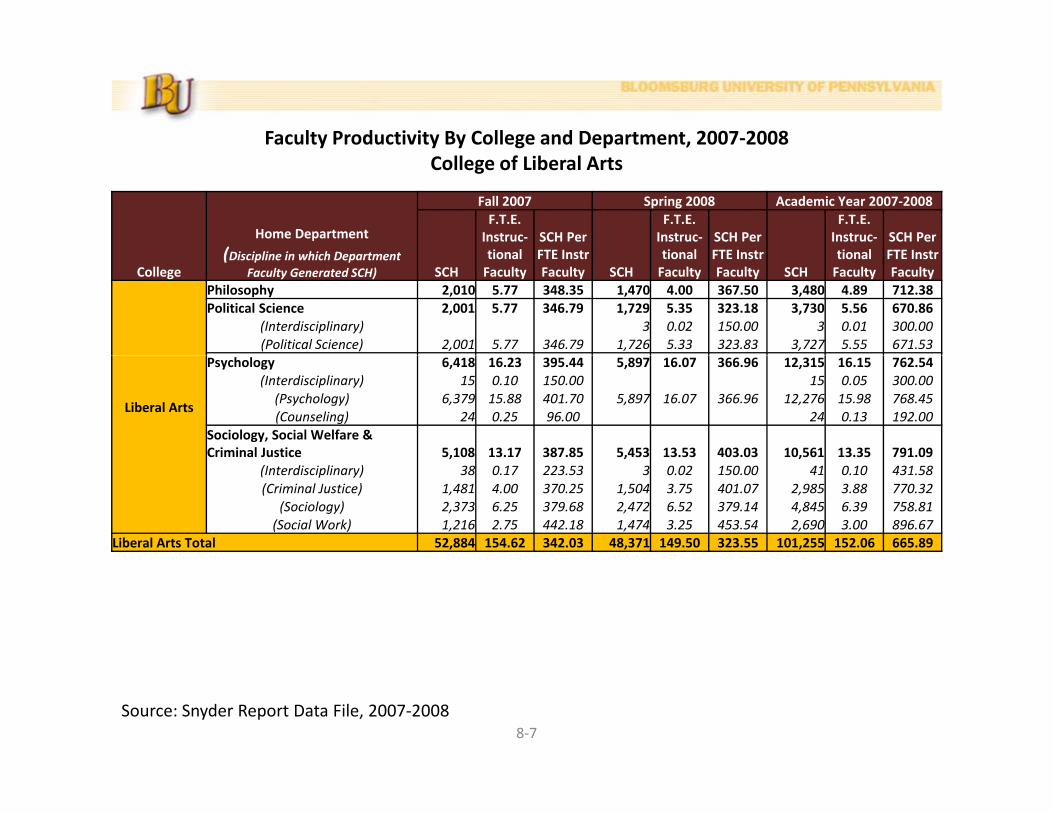
Faculty Productivity By College and Department, 2007‐2008College of Liberal Arts
Home Department
(Di i li i hi h D t t
Fall 2007 Spring 2008 Academic Year 2007‐2008F.T.E. Instruc‐tional
SCH Per FTE Instr
F.T.E. Instruc‐tional
SCH Per FTE Instr
F.T.E. Instruc‐tional
SCH Per FTE Instr
College(Discipline in which Department
Faculty Generated SCH) SCHtionalFaculty
FTE Instr Faculty SCH
tionalFaculty
FTE Instr Faculty SCH
tionalFaculty
FTE Instr Faculty
Philosophy 2,010 5.77 348.35 1,470 4.00 367.50 3,480 4.89 712.38Political Science 2,001 5.77 346.79 1,729 5.35 323.18 3,730 5.56 670.86
(Interdisciplinary) 3 0.02 150.00 3 0.01 300.00(Political Science) 2,001 5.77 346.79 1,726 5.33 323.83 3,727 5.55 671.53
Liberal Arts
Psychology 6,418 16.23 395.44 5,897 16.07 366.96 12,315 16.15 762.54(Interdisciplinary) 15 0.10 150.00 15 0.05 300.00(Psychology) 6,379 15.88 401.70 5,897 16.07 366.96 12,276 15.98 768.45(Counseling) 24 0.25 96.00 24 0.13 192.00
Sociology, Social Welfare & Criminal Justice 5,108 13.17 387.85 5,453 13.53 403.03 10,561 13.35 791.09, , ,
(Interdisciplinary) 38 0.17 223.53 3 0.02 150.00 41 0.10 431.58(Criminal Justice) 1,481 4.00 370.25 1,504 3.75 401.07 2,985 3.88 770.32
(Sociology) 2,373 6.25 379.68 2,472 6.52 379.14 4,845 6.39 758.81(Social Work) 1,216 2.75 442.18 1,474 3.25 453.54 2,690 3.00 896.67
Liberal Arts Total 52,884 154.62 342.03 48,371 149.50 323.55 101,255 152.06 665.89
8‐7Source: Snyder Report Data File, 2007‐2008

Faculty Productivity By College and Department, 2007‐2008College of Professional StudiesCollege of Professional Studies
College
Home Department(Discipline in which Department Faculty
Generated SCH)
Fall 2007 Spring 2008 Academic Year 2007‐2008
SCH
F.T.E. Instruc‐tionalFaculty
SCH Per FTE Instr Faculty SCH
F.T.E. Instruc‐tionalFaculty
SCH Per FTE Instr Faculty SCH
F.T.E. Instruc‐tionalFaculty
SCH Per FTE Instr Faculty
Early Childhood & Elementary Education 5,130 16.00 320.63 4,374 14.38 304.17 9,504 15.19 625.67(I t di i li ) 129 0 50 258 00 129 0 25 516 00(Interdisciplinary) 129 0.50 258.00 129 0.25 516.00
(Educational Foundations) 90 0.25 360.00 291 0.81 359.26 381 0.53 718.87(Elementary & Early Childhood Education) 4,590 14.27 321.65 3,870 12.93 299.30 8,460 13.60 622.06
(Secondary Education) 24 0.20 120.00 18 0.14 128.57 42 0.17 247.06(Professional Studies) 297 0.78 380.77 195 0.50 390.00 492 0.64 768.75
Educational Studies & Secondary Education 4,295 13.83 310.56 4,921 17.18 286.44 9,216 15.51 594.39
(I di i li ) 114 0 25 456 00 114 0 13 912 00
Professional
(Interdisciplinary) 114 0.25 456.00 114 0.13 912.00(Educational Foundations) 3,629 9.98 363.63 3,508 10.12 346.64 7,137 10.05 710.15
(Elementary & Early Childhood Education) 42 0.35 120.00 990 4.50 220.00 1,032 2.43 425.57(Secondary Education) 210 0.90 233.33 123 0.80 153.75 333 0.85 391.76
(Counseling) 75 1.00 75.00 192 1.25 153.60 267 1.13 237.33(Professional Studies) 225 1.35 166.67 108 0.52 207.69 333 0.94 356.15
Exceptionality Programs 5,603 19.62 285.58 5,647 21.43 263.51 11,250 20.53 548.11Professional
Studies(Interdisciplinary) 65 0.17 382.35 65 0.09 764.71
(Educational Foundations) 36 0.25 144.00 51 0.25 204.00 87 0.25 348.00(Reading) 312 2.00 156.00 372 2.00 186.00 684 2.00 342.00
(Special Education) 4,355 13.43 324.27 4,396 15.05 292.09 8,751 14.24 614.54(Speech Pathology & Audiology) 139 0.25 556.00 139 0.13 1112.00
(Education of Deaf/HH) 429 1.75 245.14 555 2.50 222.00 984 2.13 463.06(Interpreter Training) 168 1.28 131.25 240 1.60 150.00 408 1.44 283.33(Professional Studies) 99 0.50 198.00 33 0.03 1100.00 132 0.27 498.11
Nursing 3,789 23.22 163.18 3,471 26.70 130.00 7,260 24.96 290.87(Honors) 51 0.25 204.00 51 0.13 408.00
(Interdisciplinary) 35 0.17 205.88 35 0.09 411.76(Professional Studies) 9 0.05 180.00 9 0.05 180.00 18 0.05 360.00
(Nursing) 3,694 22.75 162.37 3,462 26.65 129.91 7,156 24.70 289.72Speech Pathology & Audiology 3,081 10.51 293.15 2,909 9.95 292.36 5,990 10.23 585.53
8‐8Source: Snyder Report Data File, 2007‐2008
(Speech Pathology & Audiology) 3,075 10.48 293.42 2,903 9.92 292.64 5,978 10.20 586.08(Professional Studies) 6 0.03 200.00 6 0.03 200.00 12 0.03 400.00
Professional Studies Total 21,898 83.18 263.26 21,322 89.64 237.86 43,220 86.41 500.17

Faculty Productivity By College and Department, 2007‐2008College of Science and TechnologyCollege of Science and Technology
College
Home Department(Discipline in which Department Faculty
Generated SCH)
Fall 2007 Spring 2008 Academic Year 2007‐2008
SCH
F.T.E. Instruc‐tionalFaculty
SCH Per FTE Instr Faculty SCH
F.T.E. Instruc‐tionalFaculty
SCH Per FTE Instr Faculty SCH
F.T.E. Instruc‐tionalFaculty
SCH Per FTE InstrFaculty
Biological & Allied Health Sciences 7,959 20.83 382.09 6,428 19.55 328.80 14,387 20.19 712.58g , , ,(Interdisciplinary) 140 0.50 280.00 140 0.25 560.00
(Biology) 7,759 19.08 406.66 6,353 17.93 354.32 14,112 18.51 762.60(Natural Science & Math) 9 0.00 9 0.00
(Audiology & Speech Pathology) 27 0.25 108.00 27 0.13 216.00(Health Sciences) 51 1.25 40.80 48 1.38 34.78 99 1.32 75.29
Chemistry 3,644 11.53 316.05 3,048 10.83 281.44 6,692 11.18 598.57(Honors) 10 0.08 125.00 11 0.08 137.50 21 0.08 262.50
Science &
(Honors) 10 0.08 125.00 11 0.08 137.50 21 0.08 262.50(Interdisciplinary) 25 0.08 312.50 25 0.04 625.00
(Chemistry) 3,609 11.37 317.41 3,037 10.75 282.51 6,646 11.06 600.90Geography & Geosciences 4,113 12.98 316.87 4,237 13.14 322.45 8,350 13.06 639.36
(Honors) 60 0.25 240.00 60 0.13 480.00(Geography) 2,347 6.86 342.13 2,464 6.61 372.77 4,811 6.74 714.33(Biology) 3 0.02 150.00 3 0.01 300.00
(Geosciences) 1 680 5 93 283 31 1 680 2 97 566 61Science & Technology
(Geosciences) 1,680 5.93 283.31 1,680 2.97 566.61(Marine Science) 1,766 6.12 288.56 30 0.33 90.91 1,796 3.23 556.90
Instructional Technology 702 3.83 183.29 666 4.10 162.44 1,368 3.97 345.02Mathematics, Computer Science and Statistics 7,406 22.07 335.57 7,457 22.02 338.65 14,863 22.05 674.21
(Developmental Studies) 291 1.00 291.00 291 0.50 582.00(Honors) 54 0.25 216.00 54 0.13 432.00
(Interdisciplinary) 223 1 17 190 60 285 1 00 285 00 508 1 09 468 20(Interdisciplinary) 223 1.17 190.60 285 1.00 285.00 508 1.09 468.20(Mathematics) 5,523 14.82 372.67 5,148 13.35 385.62 10,671 14.09 757.61
(Computer Science) 1,606 5.83 275.47 1,733 6.67 259.82 3,339 6.25 534.24Physics 3,458 11.03 313.51 2,758 10.05 274.43 6,216 10.54 589.75
(Honors) 18 0.17 105.88 18 0.09 211.76(Biology) 78 0.25 312.00 78 0.13 624.00(Physics) 3,163 8.37 377.90 2,557 7.80 327.82 5,720 8.09 707.48
(E i i T h l ) 199 2 25 88 44 189 2 00 94 50 388 2 13 182 59
8‐9Source: Snyder Report Data File, 2007‐2008
(Engineering Technology) 199 2.25 88.44 189 2.00 94.50 388 2.13 182.59(Health Sciences) 12 0.25 48.00 12 0.13 96.00
Science & Technology Total 27,282 82.27 331.62 24,594 79.69 308.62 51,876 80.98 640.60

Faculty Productivity By College and Department, 2007‐2008Other Faculty & University TotalOther Faculty & University Total
College
Home Department(Discipline in which Department
Faculty Generated SCH)
Fall 2007 Spring 2008 Academic Year 2007‐2008
SCH
F.T.E. Instruc‐tionalFaculty
SCH Per FTE Instr Faculty SCH
F.T.E. Instruc‐tionalFaculty
SCH Per FTE Instr Faculty SCH
F.T.E. Instruc‐tionalFaculty
SCH Per FTE Instr Facultyg Faculty Generated SCH) y y y y y y
Other
Developmental Instruction 2,045 8.00 255.63 1,253 5.58 224.55 3,298 6.79 485.71(Developmental Courses) 1,748 7.17 243.79 1,071 5.00 214.20 2,819 6.09 463.27(Interdisciplinary Courses) 93 0.08 1162.50 29 0.08 362.50 122 0.08 1525.00
(English Courses) 204 0.75 272.00 153 0.50 306.00 357 0.63 571.20Military Science 62 0.00 59 0.00 121 0.00
(Air Force ROTC) 7 0 00 10 0 00 17 0 00(Air Force ROTC) 7 0.00 10 0.00 17 0.00(Army ROTC) 55 0.00 49 0.00 104 0.00
Other Interdisciplinary 155 0.42 369.05 41 0.08 512.50 196 0.25 784.00Other Total 2,262 8.42 268.65 1,353 5.66 239.05 3,615 7.04 513.49
Total 118,520 372.70 318.00 109,962 369.87 297.30 228,482 371.29 615.38
8‐10Source: Snyder Report Data File, 2007‐2008
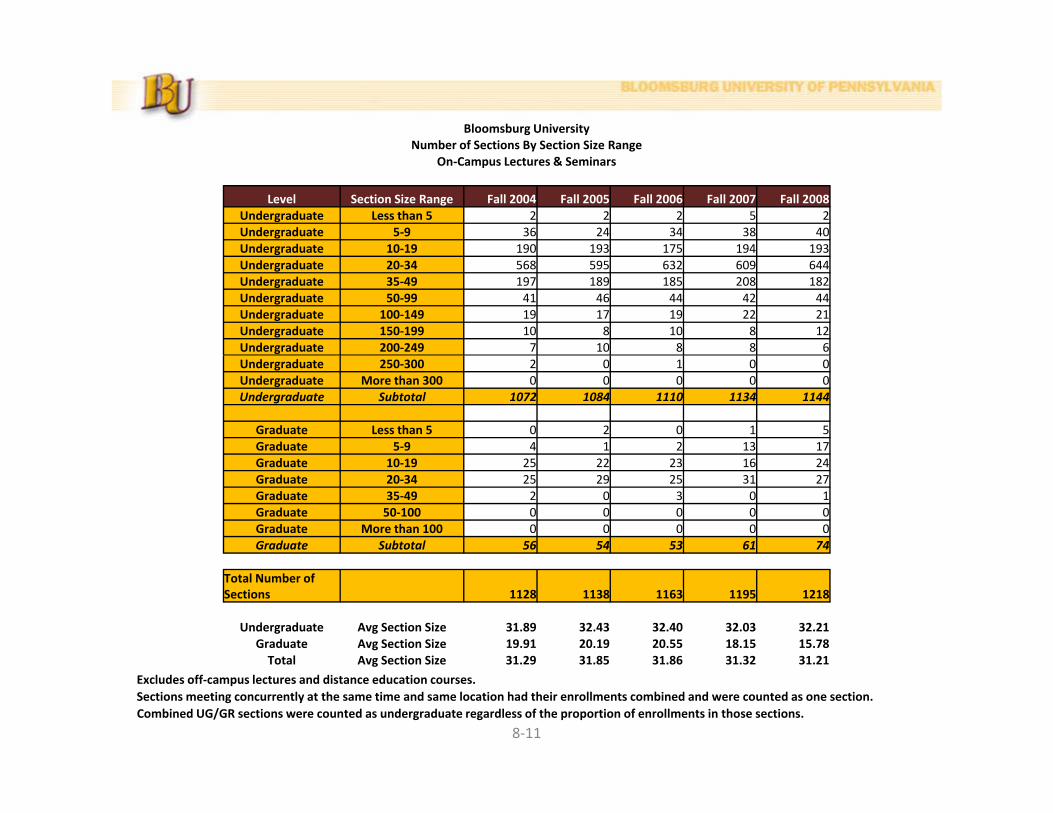
Bloomsburg UniversityNumber of Sections By Section Size Rangey g
On‐Campus Lectures & Seminars
Level Section Size Range Fall 2004 Fall 2005 Fall 2006 Fall 2007 Fall 2008Undergraduate Less than 5 2 2 2 5 2Undergraduate 5‐9 36 24 34 38 40Undergraduate 10‐19 190 193 175 194 193gUndergraduate 20‐34 568 595 632 609 644Undergraduate 35‐49 197 189 185 208 182Undergraduate 50‐99 41 46 44 42 44Undergraduate 100‐149 19 17 19 22 21Undergraduate 150‐199 10 8 10 8 12Undergraduate 200‐249 7 10 8 8 6Undergraduate 250‐300 2 0 1 0 0Undergraduate More than 300 0 0 0 0 0Undergraduate Subtotal 1072 1084 1110 1134 1144
Graduate Less than 5 0 2 0 1 5Graduate 5‐9 4 1 2 13 17
dGraduate 10‐19 25 22 23 16 24Graduate 20‐34 25 29 25 31 27Graduate 35‐49 2 0 3 0 1Graduate 50‐100 0 0 0 0 0Graduate More than 100 0 0 0 0 0Graduate Subtotal 56 54 53 61 74
Total Number of Sections 1128 1138 1163 1195 1218
Undergraduate Avg Section Size 31.89 32.43 32.40 32.03 32.21Graduate Avg Section Size 19.91 20.19 20.55 18.15 15.78Total Avg Section Size 31.29 31.85 31.86 31.32 31.21
8‐11
Total Avg Section Size 31.29 31.85 31.86 31.32 31.21
Excludes off‐campus lectures and distance education courses.Sections meeting concurrently at the same time and same location had their enrollments combined and were counted as one section.Combined UG/GR sections were counted as undergraduate regardless of the proportion of enrollments in those sections.


Faculty/StaffFaculty/StaffyyDataData


Full‐Time Employees By Gender, Race & EEO CategoryFall 1998 through Fall 2008Fall 1998 through Fall 2008
Gender 1998 1999 2000 2001 2002 2003 2004 2005 2006 2007 2008Men 472 462 458 470 461 454 460 461 461 471 461Women 390 399 405 402 413 415 421 422 442 461 471Total 862 861 863 872 874 869 881 883 903 932 932
Racial/Ethnic Category 1998 1999 2000 2001 2002 2003 2004 2005 2006 2007 2008Black, non‐Hispanic 33 32 30 30 30 32 28 32 33 40 33Asian or Pacific Islander 22 22 25 27 29 32 30 31 32 33 36Hispanic 9 11 11 10 10 11 10 11 11 11 11Hispanic 9 11 11 10 10 11 10 11 11 11 11American Indian/Alaska Native 2 2 2 2 1 0 0 1 2 3 4White, non‐Hispanic 796 794 795 803 804 794 813 808 825 845 848Total 862 861 863 872 874 869 881 883 903 932 932
EEO Category 1998 1999 2000 2001 2002 2003 2004 2005 2006 2007 2008Exec/adm/mgr 80 36 36 36 34 36 32 33 32 33 31Faculty 383 381 381 386 377 378 379 383 395 408 408Oth P f i l 68 109 116 119 123 128 130 125 126 141 146Other Professional 68 109 116 119 123 128 130 125 126 141 146Technical/Paraprofessional 37 37 32 32 32 27 27 27 28 25 27Clerical/Secretarial 120 124 124 125 134 135 142 142 149 149 152Skilled Crafts 58 57 54 53 53 49 51 53 53 48 47
9‐1
Service/Maintenance 116 117 120 121 121 116 120 120 120 128 121Total 862 861 863 872 874 869 881 883 903 932 932
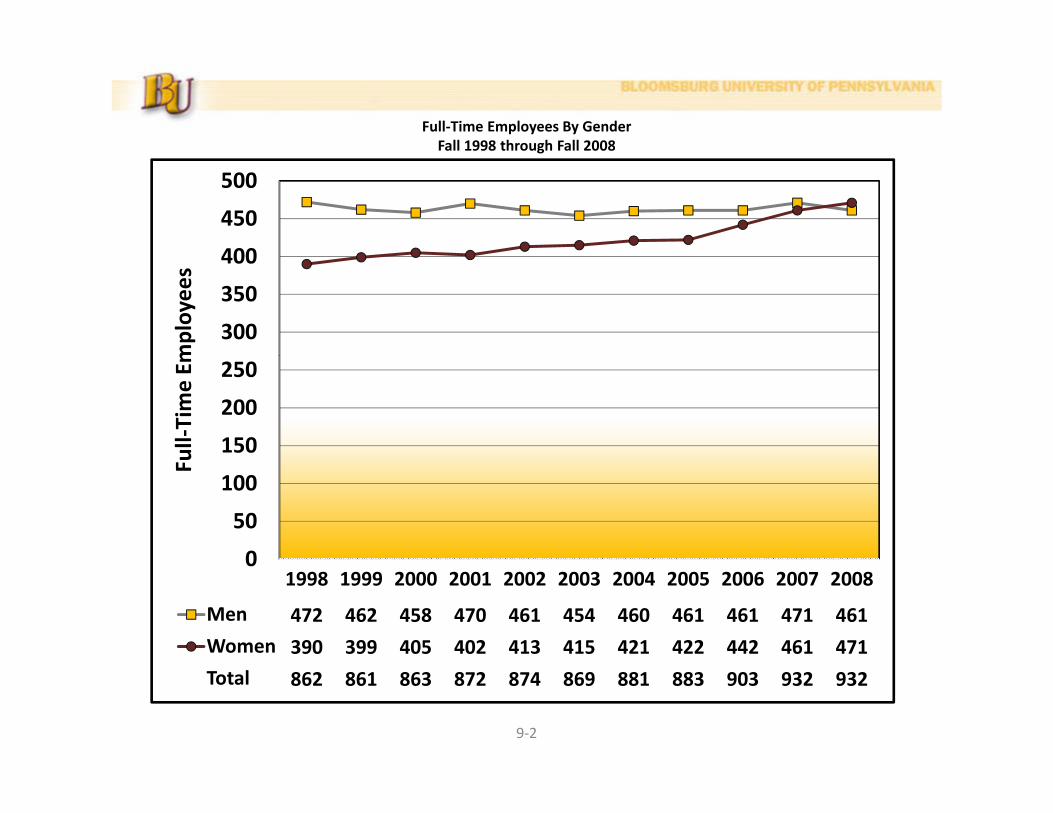
Full‐Time Employees By GenderFall 1998 through Fall 2008Fall 1998 through Fall 2008
400
450
500
300
350
400
mployees
150
200
250
ull‐T
ime Em
0
50
100
Fu
1998 1999 2000 2001 2002 2003 2004 2005 2006 2007 2008
Men 472 462 458 470 461 454 460 461 461 471 461
Women 390 399 405 402 413 415 421 422 442 461 471
0
9‐2
Total 862 861 863 872 874 869 881 883 903 932 932

Full‐Time Executive/Administrative/Managerial Employees By GenderFall 1998 through Fall 2008Fall 1998 through Fall 2008
40
45
50
30
35
40
mployees
15
20
25
ull‐T
ime Em
0
5
10
Fu
1998 1999 2000 2001 2002 2003 2004 2005 2006 2007 2008
Men 48 28 28 27 26 27 24 24 23 23 22
Women 32 8 8 9 8 9 8 9 9 10 9
0
9‐3
Total 80 36 36 36 34 36 32 33 32 33 31
In 1999, upon review of the EEO categories, many EAM positions were moved to the Other Professionals EEO code.

Full‐Time Faculty By GenderFall 1998 through Fall 2008Fall 1998 through Fall 2008
250
300
200
mployees
100
150
ull‐T
ime Em
0
50
Fu
1998 1999 2000 2001 2002 2003 2004 2005 2006 2007 2008
Men 240 232 233 242 229 228 230 227 236 236 230
Women 143 149 148 144 148 150 149 156 159 172 178
0
9‐4
Total 383 381 381 386 377 378 379 383 395 408 408

Full‐Time Other Professional Employees By GenderFall 1998 through Fall 2008Fall 1998 through Fall 2008
80
90
100
60
70
80
mployees
30
40
50
ull‐T
ime Em
0
10
20
Fu
1998 1999 2000 2001 2002 2003 2004 2005 2006 2007 2008
Men 39 58 58 62 65 67 67 67 65 73 76
Women 29 51 58 57 58 61 63 58 61 68 70
0
9‐5
Total 68 109 116 119 123 128 130 125 126 141 146
In 1999, upon review of the EEO categories, many EAM positions were moved to the Other Professionals EEO code.

Full‐Time Other Technical/Paraprofessional Employees By GenderFall 1998 through Fall 2008Fall 1998 through Fall 2008
35
40
25
30
mployees
10
15
20
ull‐T
ime Em
0
5
10Fu
1998 1999 2000 2001 2002 2003 2004 2005 2006 2007 2008
Men 18 17 14 14 14 10 10 10 9 8 9
Women 19 20 18 18 18 17 17 17 19 17 18
0
9‐6
Total 37 37 32 32 32 27 27 27 28 25 27

Full‐Time Other Clerical/Secretarial Employees By GenderFall 1998 through Fall 2008Fall 1998 through Fall 2008
140
160
100
120
mployees
40
60
80
ull‐T
ime Em
0
20
40Fu
1998 1999 2000 2001 2002 2003 2004 2005 2006 2007 2008
Men 10 11 11 11 14 16 18 18 18 19 19
Women 110 113 113 114 120 119 124 124 131 130 133
0
9‐7
Total 120 124 124 125 134 135 142 142 149 149 152

Full‐Time Other Skilled Crafts Employees By GenderFall 1998 through Fall 2008Fall 1998 through Fall 2008
60
70
40
50
mployees
20
30
ull‐T
ime Em
0
10
0
Fu
1998 1999 2000 2001 2002 2003 2004 2005 2006 2007 2008
Men 56 55 52 53 52 49 51 53 52 48 47
Women 2 2 2 0 1 0 0 0 1 0 0
0
9‐8
Total 58 57 54 53 53 49 51 53 53 48 47
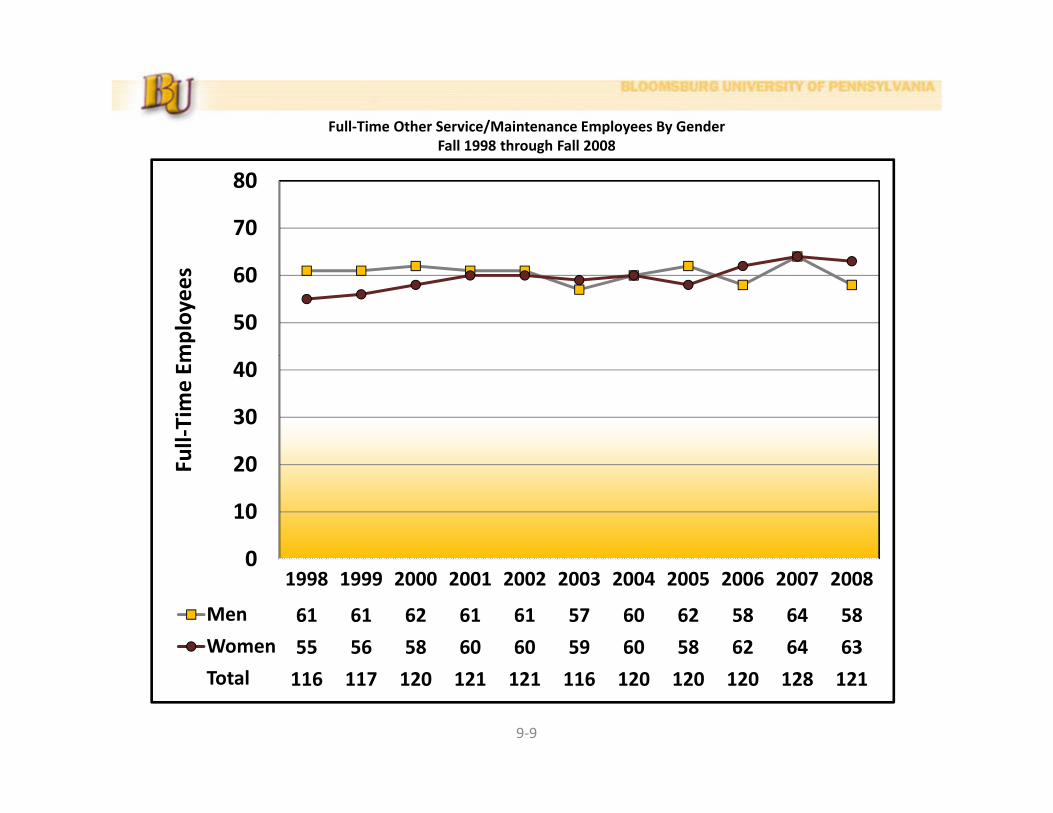
Full‐Time Other Service/Maintenance Employees By GenderFall 1998 through Fall 2008Fall 1998 through Fall 2008
70
80
50
60
mployees
20
30
40
ull‐T
ime Em
0
10
20Fu
1998 1999 2000 2001 2002 2003 2004 2005 2006 2007 2008
Men 61 61 62 61 61 57 60 62 58 64 58
Women 55 56 58 60 60 59 60 58 62 64 63
0
9‐9
Total 116 117 120 121 121 116 120 120 120 128 121

Full‐Time Employees By Racial CategoryFall 1998 through Fall 2008Fall 1998 through Fall 2008
708090
100yees
40506070
me Em
ploy
0102030
Full‐Ti
1998 1999 2000 2001 2002 2003 2004 2005 2006 2007 2008
Total 862 861 863 872 874 869 881 883 903 932 932
White 796 794 795 803 804 794 813 808 825 845 848
0
Amer Ind 2 2 2 2 1 0 0 1 2 3 4
Hispanic 9 11 11 10 10 11 10 11 11 11 11
Asian 22 22 25 27 29 32 30 31 32 33 36
l k
9‐10
Black 33 32 30 30 30 32 28 32 33 40 33

Full‐Time Executive/Administrative/Managerial Employees By Racial CategoryFall 1998 through Fall 2008Fall 1998 through Fall 2008
8
9
10s
5
6
7
Employee
2
3
4
Full‐Time
1998 1999 2000 2001 2002 2003 2004 2005 2006 2007 20080
1
Total 80 36 36 36 34 36 32 33 32 33 31
White 72 33 35 34 32 34 31 32 32 32 29
Asian 1 1 1 1 1 1 1 1 0 0 0
l k
9‐11
Black 7 2 0 1 1 1 0 0 0 1 2In 1999, upon review of the EEO categories, many EAM positions were moved to the Other Professionals EEO code.

Full‐Time Faculty By Racial CategoryFall 1998 through Fall 2008Fall 1998 through Fall 2008
60
70
80yees
30
40
50
me Em
ploy
0
10
20
30
Full‐Ti
1998 1999 2000 2001 2002 2003 2004 2005 2006 2007 2008
Total 383 381 381 386 377 378 379 383 395 408 408
White 345 342 338 343 333 329 334 335 343 350 351
0
Amer Ind 1 1 1 1 0 0 0 1 2 2 3
Hispanic 6 6 7 6 7 8 7 8 8 8 8
Asian 18 18 21 23 25 28 25 25 28 29 32
l k
9‐12
Black 13 14 14 13 12 13 13 14 14 19 14

Full‐Time Other Professional Employees By Racial CategoryFall 1998 through Fall 2008Fall 1998 through Fall 2008
14161820
yees
8101214
me Em
ploy
0246
Full‐Ti
1998 1999 2000 2001 2002 2003 2004 2005 2006 2007 2008
Total 68 109 116 119 123 128 130 125 126 141 146
White 64 99 107 110 113 117 121 115 115 129 136
0
Amer Ind 1 1 1 1 1 0 0 0 0 0 0
Hispanic 0 2 1 1 1 1 1 1 1 1 1
Asian 1 1 1 1 1 1 1 1 1 1 1
l k
9‐13
Black 2 6 6 6 7 9 7 8 9 10 8
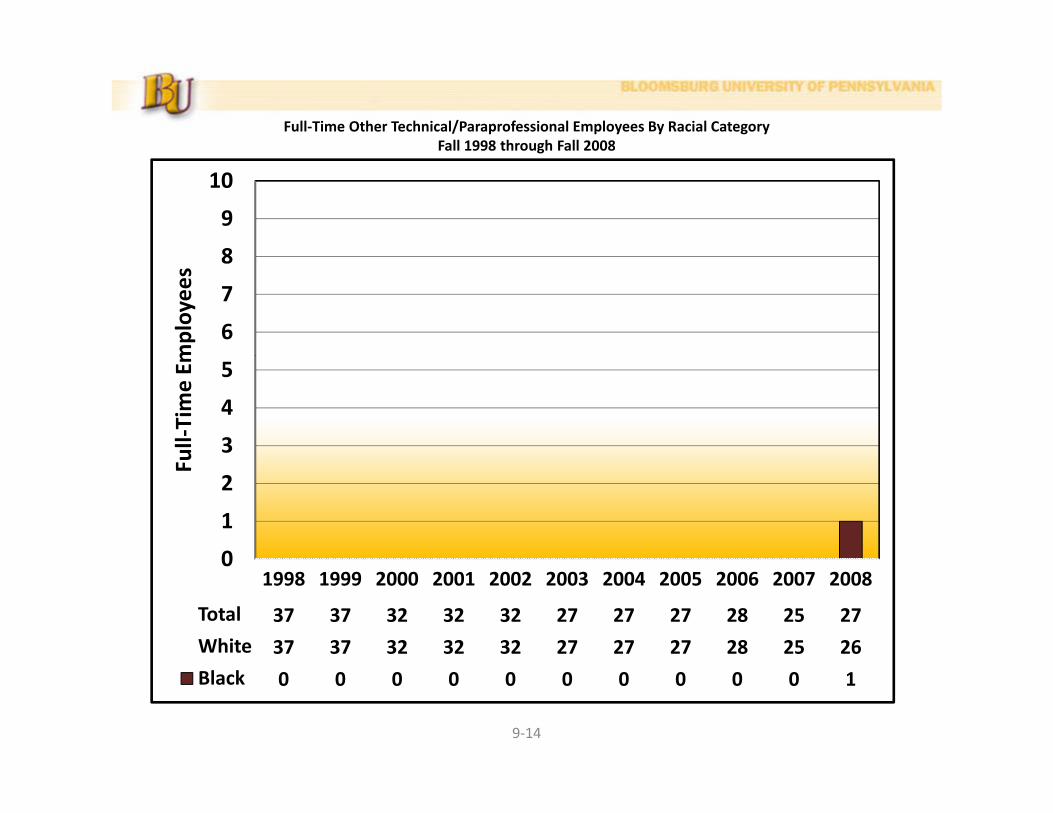
Full‐Time Other Technical/Paraprofessional Employees By Racial CategoryFall 1998 through Fall 2008Fall 1998 through Fall 2008
8
9
10
6
7
8
mployees
3
4
5
ull‐T
ime Em
0
1
2
Fu
1998 1999 2000 2001 2002 2003 2004 2005 2006 2007 2008
Total 37 37 32 32 32 27 27 27 28 25 27
White 37 37 32 32 32 27 27 27 28 25 26
0
9‐14
Black 0 0 0 0 0 0 0 0 0 0 1

Full‐Time Other Clerical/Secretarial Employees By Racial CategoryFall 1998 through Fall 2008Fall 1998 through Fall 2008
89
10ees
4567
me Em
ploye
1234
Full‐Tim
1998 1999 2000 2001 2002 2003 2004 2005 2006 2007 2008
Total 120 124 124 125 134 135 142 142 149 149 152
01
White 113 118 118 119 129 130 138 137 143 143 148
Hispanic 1 1 1 1 0 0 0 0 0 0 0
Asian 1 1 1 1 1 1 1 2 2 2 2
l k
9‐15
Black 5 4 4 4 4 4 3 3 4 4 2
Full‐Time Other Skilled Crafts Employees By Racial CategoryFall 1998 through Fall 2008Fall 1998 through Fall 2008
8
9
10
5
6
7
8
mployees
3
4
5
Full‐Time E
0
1
2
F
1998 1999 2000 2001 2002 2003 2004 2005 2006 2007 2008
Total 58 57 54 53 53 49 51 53 53 48 47
White 57 56 53 52 52 48 50 52 52 47 46
l k
9‐16
Black 1 1 1 1 1 1 1 1 1 1 1
Full‐Time Other Service/Maintenance Employees By Racial CategoryFall 1998 through Fall 2008Fall 1998 through Fall 2008
789
10yees
4567
me Em
ploy
0123
Full‐Ti
1998 1999 2000 2001 2002 2003 2004 2005 2006 2007 2008
Total 116 117 120 121 121 116 120 120 120 128 121
White 108 109 112 113 113 109 112 110 112 119 112
0
Amer Ind 0 0 0 0 0 0 0 0 0 1 1
Hispanic 2 2 2 2 2 2 2 2 2 2 2
Asian 1 1 1 1 1 1 2 2 1 1 1
l k
9‐17
Black 5 5 5 5 5 4 4 6 5 5 5

Full‐Time Professors By GenderFall 1998 through Fall 2008Fall 1998 through Fall 2008
80
90
100
60
70
80
mployees
30
40
50
ull‐T
ime Em
0
10
20
Fu
1998 1999 2000 2001 2002 2003 2004 2005 2006 2007 2008
Men 79 78 83 84 86 89 92 91 94 92 90
Women 29 30 33 36 36 34 30 30 30 34 32
0
9‐18
Total 108 108 116 120 122 123 122 121 124 126 122

Full‐Time Associate Professors By GenderFall 1998 through Fall 2008Fall 1998 through Fall 2008
80
90
100
60
70
80
mployees
30
40
50
ull‐T
ime Em
0
10
20
Fu
1998 1999 2000 2001 2002 2003 2004 2005 2006 2007 2008
Men 90 84 79 80 79 73 66 57 62 64 63
Women 39 38 37 36 35 38 41 42 42 43 43
0
9‐19
Total 129 122 116 116 114 111 107 99 104 107 106

Full‐Time Assistant Professors By GenderFall 1998 through Fall 2008Fall 1998 through Fall 2008
80
90
100
60
70
80
mployees
30
40
50
ull‐T
ime Em
0
10
20
Fu
1998 1999 2000 2001 2002 2003 2004 2005 2006 2007 2008
Men 58 60 59 64 54 55 57 61 63 70 67
Women 55 56 60 57 58 56 58 56 66 71 75
0
9‐20
Total 113 116 119 121 112 111 115 117 129 141 142

Full‐Time Instructors By GenderFall 1998 through Fall 2008Fall 1998 through Fall 2008
80
90
100
60
70
80
mployees
30
40
50
ull‐T
ime Em
0
10
20
Fu
1998 1999 2000 2001 2002 2003 2004 2005 2006 2007 2008
Men 13 10 12 14 10 11 15 18 17 10 10
Women 20 25 18 15 19 22 20 28 21 24 27
0
9‐21
Total 33 35 30 29 29 33 35 46 38 34 37

Full‐Time Tenured Faculty By GenderFall 1998 through Fall 2008Fall 1998 through Fall 2008
160
180
200
120
140
160
mployees
60
80
100
ull‐T
ime Em
0
20
40
Fu
1998 1999 2000 2001 2002 2003 2004 2005 2006 2007 2008
Men 183 176 178 178 173 163 160 155 157 157 157
Women 95 96 99 96 94 89 89 85 88 93 93
0
9‐22
Total 278 272 277 274 267 252 249 240 245 250 250

Full‐Time Tenure‐Track Faculty By GenderFall 1998 through Fall 2008Fall 1998 through Fall 2008
160
180
200
120
140
160
mployees
60
80
100
ull‐T
ime Em
0
20
40
Fu
1998 1999 2000 2001 2002 2003 2004 2005 2006 2007 2008
Men 41 45 41 44 43 50 48 53 58 68 57
Women 31 31 32 33 38 46 45 46 53 61 57
0
9‐23
Total 72 76 73 77 81 96 93 99 111 129 114

Full‐Time Not On Tenure‐Track Faculty By GenderFall 1998 through Fall 2008Fall 1998 through Fall 2008
160
180
200
120
140
160
mployees
60
80
100
ull‐T
ime Em
0
20
40
Fu
1998 1999 2000 2001 2002 2003 2004 2005 2006 2007 2008
Men 16 11 14 20 13 15 22 19 21 11 16
Women 17 22 17 15 16 15 15 25 18 18 27
0
9‐24
Total 33 33 31 35 29 30 37 44 39 29 43

Library Library yyStatisticsStatistics

Library Staff, Expenditures and Collections
StaffFall 2008
Full‐Time Equivalent (FTE)
Librarians 10.00
Amount (wholeOther Professional Staff
1.00
All other paid staff 13.00
Student Assistants 8.90
Library Expenditures, Fiscal Year 2008Amount (whole
dollars only)Total salaries and wages $1,385,839 Information resources:Books, serial backfiles and other materials (one‐time purchases) $272,952
Total FTE Staff 32.90
p ) ,Current serial subscriptions (ongoing commitments) $973,383 Other information resources:Document delivery/interlibrary loan $12,428 Preservation $29,047 Other expenditures for information resources $1,166 Held at
end of Operating expenditures:Computer hardware and software (include maintenance) $448,594 Bibliographic utilities, networks and consortia $36,322 All other operating expenditures $186,052
TOTAL EXPENDITURES $3 345 783
Collections, Fiscal Year 2008end of
Fiscal YearBooks, serial backfiles and other paper materials (include government documents) 520,287 E‐Books 12 202 TOTAL EXPENDITURES $3,345,783 E Books 12,202 Microforms 2,133,713 Audiovisual materials 13,543 Current serial subscriptions 46,736
10‐1
Source: 2008 Academic Libraries Survey

Library Services
Library ServicesFiscal Year 2008
Number
Interlibrary loans provided to other libraries 9,375
Interlibrary loans received from other libraries 4,341
General Circulation Transactions 31,304
Reserve Circulation Transactions 242
Presentations to Groups 167
Total Attendance at All Presentations 3,548
Library ServicesTypical Week, Fall 2008
Number
Hours Open in a Typical Week 95
G t C t i T i l W k 7 714Gate Count in a Typical Week 7,714
Reference Transactions in a Typical Week 253
10‐2
Source: 2008 Academic Libraries Survey

FinancialFinancialDataData


Financial Assistance to Students In Institutions of Higher Educationg1998‐99 through 2007‐08
$40 000 000
$45,000,000
$30,000,000
$35,000,000
$40,000,000
arde
d
$20,000,000
$25,000,000
Dollars Awa
$5 000 000
$10,000,000
$15,000,000
Total D
$0
$5,000,000
1998‐99 1999‐00 2000‐01 2001‐02 2002‐03 2003‐04 2004‐05 2005‐06 2006‐07 2007‐08
11‐1
Grants Loans Scholarships Student Employment
Source: Office of Financial Aid (Financial Assistance to Students in Institutions of Higher Education Reports – former OCR reports)
Financial Assistance to Students In Institutions of Higher Educationg1998‐99 through 2007‐08
9,000
10,000
7,000
8,000
,
Awards
4,000
5,000
6,000
umbe
r of A
2,000
3,000
Total N
0
1,000
1998‐99 1999‐00 2000‐01 2001‐02 2002‐03 2003‐04 2004‐05 2005‐06 2006‐07 2007‐08
11‐2
Grants Loans Scholarships Student Employment
Source: Office of Financial Aid (Financial Assistance to Students in Institutions of Higher Education Reports – former OCR reports)

Financial Assistance to Students In Institutions of Higher Educationg1998‐99 through 2007‐08
6,000
nts
4,000
5,000
of Recipien
3,000
d Num
ber o
1,000
2,000
ndup
licated
0
1998‐99 1999‐00 2000‐01 2001‐02 2002‐03 2003‐04 2004‐05 2005‐06 2006‐07 2007‐08
Un
11‐3
Grants Loans Scholarships Student Employment
Source: Office of Financial Aid (Financial Assistance to Students in Institutions of Higher Education Reports – former OCR reports)
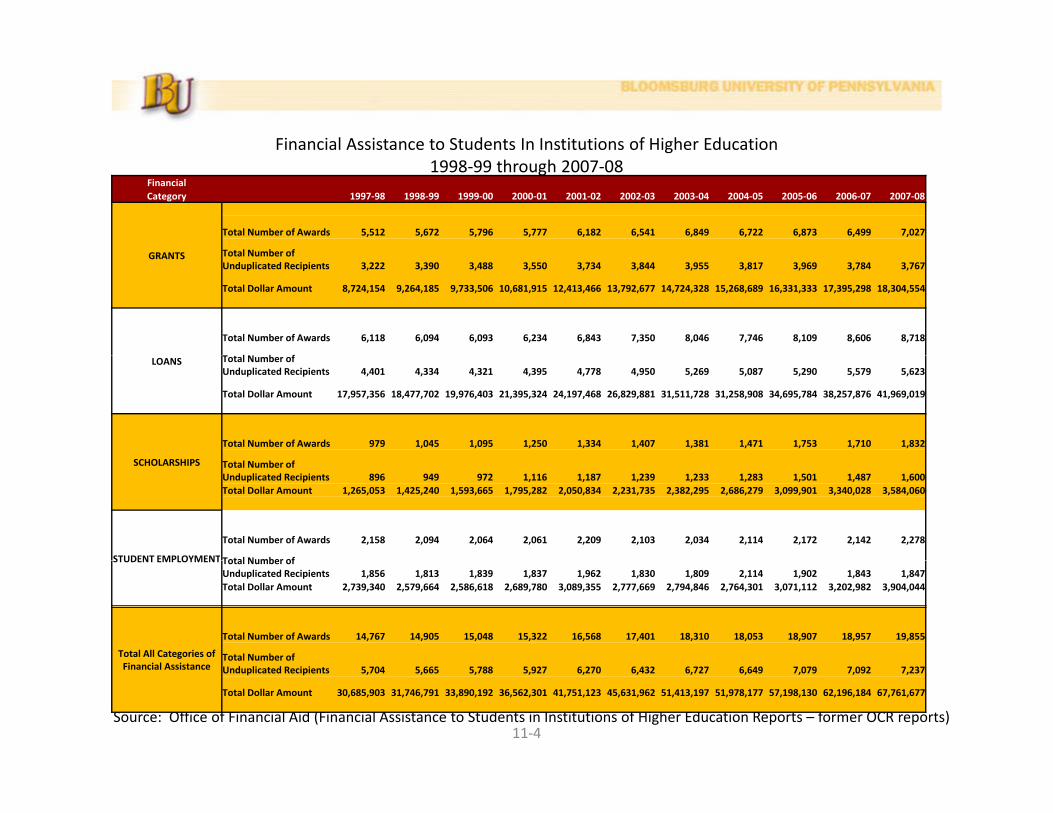
Financial Assistance to Students In Institutions of Higher Educationg1998‐99 through 2007‐08
FinancialCategory 1997‐98 1998‐99 1999‐00 2000‐01 2001‐02 2002‐03 2003‐04 2004‐05 2005‐06 2006‐07 2007‐08
GRANTS
Total Number of Awards 5,512 5,672 5,796 5,777 6,182 6,541 6,849 6,722 6,873 6,499 7,027
Total Number ofGRANTS Total Number of Unduplicated Recipients 3,222 3,390 3,488 3,550 3,734 3,844 3,955 3,817 3,969 3,784 3,767
Total Dollar Amount 8,724,154 9,264,185 9,733,506 10,681,915 12,413,466 13,792,677 14,724,328 15,268,689 16,331,333 17,395,298 18,304,554
Total Number of Awards 6,118 6,094 6,093 6,234 6,843 7,350 8,046 7,746 8,109 8,606 8,718
T l N b fLOANS Total Number of Unduplicated Recipients 4,401 4,334 4,321 4,395 4,778 4,950 5,269 5,087 5,290 5,579 5,623
Total Dollar Amount 17,957,356 18,477,702 19,976,403 21,395,324 24,197,468 26,829,881 31,511,728 31,258,908 34,695,784 38,257,876 41,969,019
Total Number of Awards 979 1,045 1,095 1,250 1,334 1,407 1,381 1,471 1,753 1,710 1,832
SCHOLARSHIPS Total Number of Unduplicated Recipients 896 949 972 1,116 1,187 1,239 1,233 1,283 1,501 1,487 1,600Total Dollar Amount 1,265,053 1,425,240 1,593,665 1,795,282 2,050,834 2,231,735 2,382,295 2,686,279 3,099,901 3,340,028 3,584,060
STUDENT EMPLOYMENT
Total Number of Awards 2,158 2,094 2,064 2,061 2,209 2,103 2,034 2,114 2,172 2,142 2,278
Total Number ofSTUDENT EMPLOYMENT Total Number of Unduplicated Recipients 1,856 1,813 1,839 1,837 1,962 1,830 1,809 2,114 1,902 1,843 1,847Total Dollar Amount 2,739,340 2,579,664 2,586,618 2,689,780 3,089,355 2,777,669 2,794,846 2,764,301 3,071,112 3,202,982 3,904,044
Total All Categories of Fi i l A i
Total Number of Awards 14,767 14,905 15,048 15,322 16,568 17,401 18,310 18,053 18,907 18,957 19,855
Total Number of
Source: Office of Financial Aid (Financial Assistance to Students in Institutions of Higher Education Reports – former OCR reports)11‐4
Financial Assistance Unduplicated Recipients 5,704 5,665 5,788 5,927 6,270 6,432 6,727 6,649 7,079 7,092 7,237
Total Dollar Amount 30,685,903 31,746,791 33,890,192 36,562,301 41,751,123 45,631,962 51,413,197 51,978,177 57,198,130 62,196,184 67,761,677

BASIC ANNUAL CHARGES OF FULL‐TIME STUDENTS1998‐99 THROUGH 2008‐09
Level/Residency/Category 1998-99 1999-00 2000-01 2001-02 2002-03 2003-04 2004-05 2005-06 2006-07 2007-08 2008-09Undergraduate
In-StateTuition $3,468 $3,618 $3,792 $4,016 $4,378 $4,598 $4,810 $4,906 $5,038 $5,177 $5,358Out-of-State Tuition $8,824 $9,046 $9,480 $10,040 $10,946 $11,496 $12,026 $12,266 $12,598 $12,944 $13,396Total Mandatory Fees $810 $837 $876 $976 $1,172 $1,246 $1,279 $1,320 $1,374 $1,446 $1,490Student Union Fee $120 $120 $120 $120 $120 $120 $120 $120 $120 $120 $120
1998 99 THROUGH 2008 09
Student Union Fee $120 $120 $120 $120 $120 $120 $120 $120 $120 $120 $120Health Service Fee $74 $74 $74 $74 $74 $114 $114 $114 $114 $114 $124Academic Enhancement Fee $272 $284 $298 $360 $438 $460 $481 $490.50 $503.50 $517.50 $535.50Community Activities Fee $145 $151.50 $158 $170 $184 $192 $201.50 $206 $211 $217 $224.50Recreation Fee $145 $151.50 $158 $158 $158 $158 $158 $158 $182 $182 $182Stud. Union Operating Fee $53.50 $56 $58 $64 $68 $72 $74.50 $76 $78 $80 $83p g $ $ $ $ $ $ $ $ $ $ $Registration/Transcript Fee $10 $10 $10 $10 $10 $10 $10 $10 $10Transportation Fee $20 $20 $20 $20 $20 $30 $30 $30Technology Fee* $100 $100 $100 $125 $125 $175 $181
GraduateIn-StateTuition $3,468 $3,780 $4,138 $4,600 $5,254 $5,518 $5,772 $5,888 $6,048 $6,214 $6,430Out-of-State Tuition $6,236 $6,610 $7,008 $7,554 $8,408 $8,830 $9,236 $9,422 $9,678 $9,944 $10,288Total Mandatory Fees $665 $686 $718 $834 $1,052 $1,201 $1,318 $1,359 $1,415 $1,488 $1,534Student Union Fee $120 $120 $120 $120 $120 $120 $120 $120 $120 $120 $120Health Service Fee $74 $74 $74 $74 $74 $114 $114 $114 $114 $114 $124Academic Enhancement Fee $272 $284 $298 $388 $502 $607 $721.50 $736 $755.50 $776.50 $803.50Recreation Fee $145 $151.50 $158 $158 $158 $158 $158 $158 $182 $182 $182Stud. Union Operating Fee $53.50 $56 $58 $64 $68 $72 $74.50 $76 $78 $80 $83Registration/Transcript Fee $10 $10 $10 $10 $10 $10 $10 $10 $10Transportation Fee $20 $20 $20 $20 $20 $30 $30 $30Technology Fee* $100 $100 $100 $125 $125 $175 $181
Room Charge (Double) $1,994 $2,174 $2,326 $2,516 $2,772 $2,896 $3,012 $3,126 $3,282 $3,610 $3,750B d Ch (7 D ) $1 556 $1 610 $1 706 $1 926 $2 004 $2 104 $2 188 $2 250 $2 334 $2 420 $2 542
11‐5
Board Charge (7 Day) $1,556 $1,610 $1,706 $1,926 $2,004 $2,104 $2,188 $2,250 $2,334 $2,420 $2,542
* Out-of-State students pay $273 per year in technology fees during 2008-09.

Net Tuition & Fees Revenues vs. State Appropriations2003‐2004 THROUGH 2007‐20082003 2004 THROUGH 2007 2008
$55,000,000
$50,000,000
$40,000,000
$45,000,000
Dollars
$35,000,000
$30,000,000
2003‐04 2004‐05 2005‐06 2006‐07 2007‐08
11‐6
Net Tuition & Fees State Appropriations
Source: Audited Financial Statements

2007‐2008 Operating Expenses
Depreciation 5%
Student Aid 4% Auxiliary Enterprises 14%
2007‐2008 Operating Expenses
Instruction 37%Operations & Maintenance of
Plant 8%
Institutional Support 13%
Research 0%
Public Service 2%Academic Support
9%
Student Services 8%
11‐7
9%
Source: Audited Financial Statement, 2007‐2008

Revenues & Expenses2003‐2004 THROUGH 2007‐20082003 2004 THROUGH 2007 2008
Description 2003‐2004 2004‐2005 2005‐2006 2006‐2007 2007‐2008
Operating Revenues
Net Tuition & Fees $41,338,546 $44,235,803 $47,171,890 $47,880,901 $49,280,122
Federal Grants & Contracts $6,790,378 $7,102,684 $6,552,348 $7,218,697 $7,928,944Federal Grants & Contracts $6,790,378 $7,102,684 $6,552,348 $7,218,697 $7,928,944
State Grants & Contracts $6,847,138 $6,786,405 $7,234,456 $8,557,785 $8,693,433
Nongovernmental Grants & Contracts $438,760 $1,167,274 $989,261 $978,035 $910,560
Sales & Services of Educational Departments $1,880,084 $1,696,416 $1,878,504 $1,969,719 $2,524,001
Auxiliary Enterprises $20,219,657 $22,443,307 $23,228,453 $23,581,158 $25,292,606
O h R $563 933 $727 066 $632 682 $649 797 $1 506 071Other Revenues $563,933 $727,066 $632,682 $649,797 $1,506,071
Total Operating Revenues $78,078,496 $84,158,955 $87,687,594 $90,836,092 $96,135,737
Nonoperating Revenues
State Appropriations $31,776,302 $33,652,907 $35,419,417 $37,183,999 $37,594,467
Investment Income $1,185,171 $1,427,874 $2,022,750 $3,371,410 $3,109,508
Gifts for other than capital purposes $253,483 $249,607 $214,360 $253,898 $211,062
Interest Expense ($1,393,100) ($1,384,078) ($1,418,763) ($1,504,216) ($1,451,553)
(Loss) Gain on disposal of assets $7,849 $3,009 $81,420 ($10,901) ($11,241)
Other nonoperating revenue $134,254 $103,484 $116,595 $129,643 $124,833
Total Nonoperating Revenues $31 963 959 $34 052 803 $36 435 779 $39 423 833 $39 577 076Total Nonoperating Revenues $31,963,959 $34,052,803 $36,435,779 $39,423,833 $39,577,076
Other Revenues
Capital Appropriations $785,854 $1,390,189 $1,665,430 $1,381,063 $1,443,170
Capital Grants & Gifts $450,943 $512,253 $55,624 $465,693 $176,740
Commonwealth Capital Asset Additions
11‐8
Total Other Revenues $1,236,797 $1,902,442 $1,721,054 $1,846,756 $1,619,910
Total Revenues $111,279,252 $120,114,200 $125,844,427 $132,106,681 $137,332,723

Revenues & Expenses2003‐2004 THROUGH 2007‐20082003 2004 THROUGH 2007 2008
Description 2003‐2004 2004‐2005 2005‐2006 2006‐2007 2007‐2008
Operating Expenses
Instruction $42,338,176 $42,952,466 $44,047,657 $47,729,965 $50,703,938
Research $201 985 $311 788 $358 738 $285 563 $382 212Research $201,985 $311,788 $358,738 $285,563 $382,212
Public Service $1,940,208 $2,221,883 $1,938,022 $2,039,738 $2,422,234
Academic Support $8,861,218 $9,423,767 $10,255,180 $10,210,733 $11,808,986
Student Services $7,370,998 $7,794,695 $8,429,530 $9,279,375 $10,156,672
Institutional Support $15,971,549 $15,721,452 $16,573,922 $18,001,995 $17,970,693
Operations & Maintenance of Plant $7 634 439 $8 237 823 $9 233 024 $9 555 840 $10 905 723Operations & Maintenance of Plant $7,634,439 $8,237,823 $9,233,024 $9,555,840 $10,905,723
Depreciation $5,339,081 $5,460,485 $5,595,951 $6,111,932 $6,627,438
Student Aid $3,460,946 $3,858,755 $4,039,325 $4,495,007 $4,746,000
Auxiliary Enterprises $15,417,809 $16,364,400 $17,153,307 $19,068,119 $19,617,079
Total Operating Expenses $108,536,409 $112,347,514 $117,624,656 $126,778,267 $135,340,975
Increase in Net Assets $2,742,843 $7,766,686 $8,219,771 $5,328,414 $1,991,748
Net Assets Beginning of Year $29,866,671 $32,609,514 $40,376,200 $48,595,971 $53,924,385
Net Assets End of Year $32,609,514 $40,376,200 $48,595,971 $53,924,385 $55,916,133
Source: Audited Financial Statements, 2003‐2004 through 2007‐2008
11‐9


FacilitiesFacilities

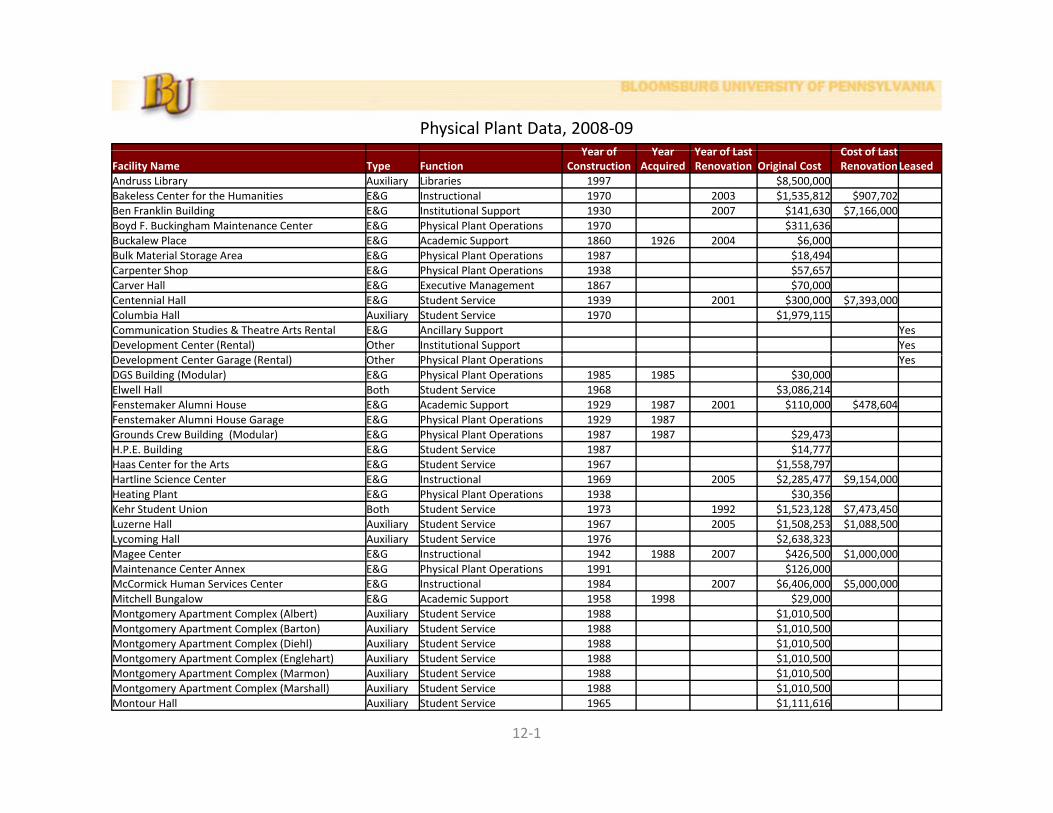
Year of Year Year of Last Cost of Last
Physical Plant Data, 2008‐09
Facility Name Type FunctionYear of
ConstructionYear
AcquiredYear of Last Renovation Original Cost
Cost of Last RenovationLeased
Andruss Library Auxiliary Libraries 1997 $8,500,000Bakeless Center for the Humanities E&G Instructional 1970 2003 $1,535,812 $907,702Ben Franklin Building E&G Institutional Support 1930 2007 $141,630 $7,166,000Boyd F. Buckingham Maintenance Center E&G Physical Plant Operations 1970 $311,636Buckalew Place E&G Academic Support 1860 1926 2004 $6,000B lk M t i l St A E&G Ph i l Pl t O ti 1987 $18 494Bulk Material Storage Area E&G Physical Plant Operations 1987 $18,494Carpenter Shop E&G Physical Plant Operations 1938 $57,657Carver Hall E&G Executive Management 1867 $70,000Centennial Hall E&G Student Service 1939 2001 $300,000 $7,393,000Columbia Hall Auxiliary Student Service 1970 $1,979,115Communication Studies & Theatre Arts Rental E&G Ancillary Support YesDevelopment Center (Rental) Other Institutional Support Yes
( )Development Center Garage (Rental) Other Physical Plant Operations YesDGS Building (Modular) E&G Physical Plant Operations 1985 1985 $30,000Elwell Hall Both Student Service 1968 $3,086,214Fenstemaker Alumni House E&G Academic Support 1929 1987 2001 $110,000 $478,604Fenstemaker Alumni House Garage E&G Physical Plant Operations 1929 1987Grounds Crew Building (Modular) E&G Physical Plant Operations 1987 1987 $29,473H.P.E. Building E&G Student Service 1987 $14,777Haas Center for the Arts E&G Student Service 1967 $1,558,797Hartline Science Center E&G Instructional 1969 2005 $2,285,477 $9,154,000Heating Plant E&G Physical Plant Operations 1938 $30,356Kehr Student Union Both Student Service 1973 1992 $1,523,128 $7,473,450Luzerne Hall Auxiliary Student Service 1967 2005 $1,508,253 $1,088,500Lycoming Hall Auxiliary Student Service 1976 $2,638,323Magee Center E&G Instructional 1942 1988 2007 $426,500 $1,000,000Maintenance Center Annex E&G Physical Plant Operations 1991 $126,000McCormick Human Services Center E&G Instructional 1984 2007 $6,406,000 $5,000,000Mitchell Bungalow E&G Academic Support 1958 1998 $29,000Montgomery Apartment Complex (Albert) Auxiliary Student Service 1988 $1,010,500Montgomery Apartment Complex (Barton) Auxiliary Student Service 1988 $1,010,500Montgomery Apartment Complex (Diehl) Auxiliary Student Service 1988 $1,010,500Montgomery Apartment Complex (Englehart) Auxiliary Student Service 1988 $1,010,500g y p p ( g ) y $ , ,Montgomery Apartment Complex (Marmon) Auxiliary Student Service 1988 $1,010,500Montgomery Apartment Complex (Marshall) Auxiliary Student Service 1988 $1,010,500Montour Hall Auxiliary Student Service 1965 $1,111,616
12‐1
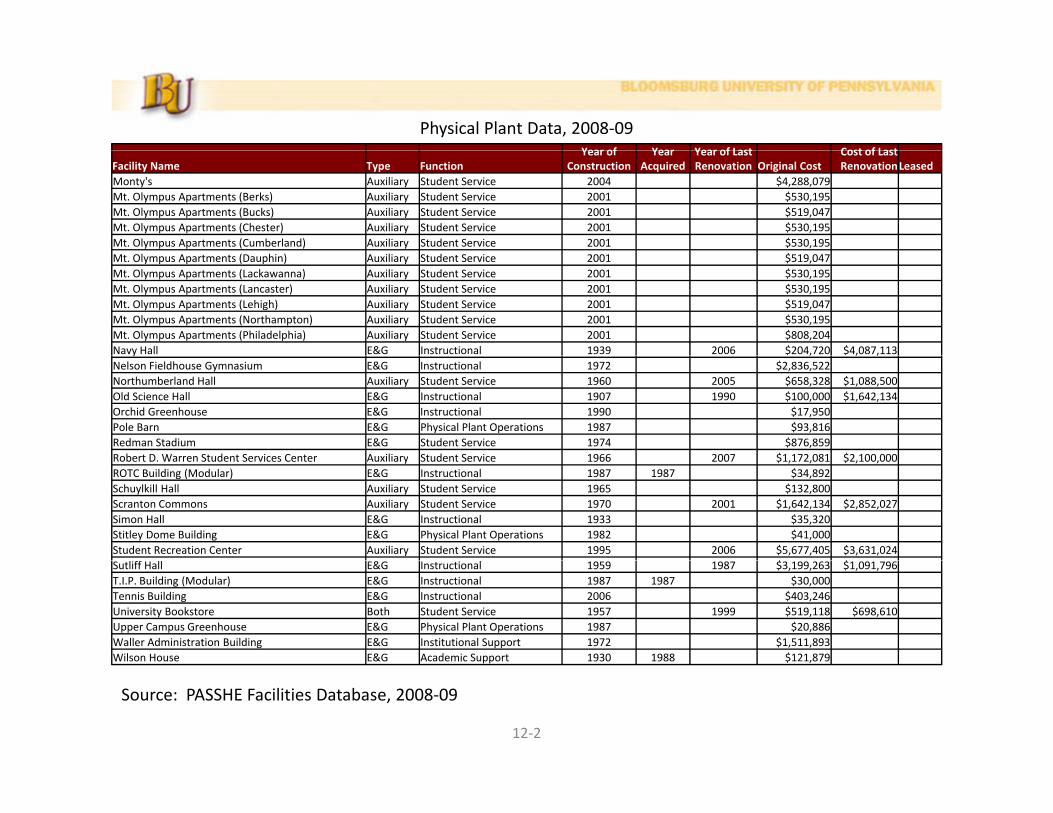
Year of Year Year of Last Cost of Last
Physical Plant Data, 2008‐09
Facility Name Type FunctionYear of
ConstructionYear
AcquiredYear of Last Renovation Original Cost
Cost of Last RenovationLeased
Monty's Auxiliary Student Service 2004 $4,288,079Mt. Olympus Apartments (Berks) Auxiliary Student Service 2001 $530,195Mt. Olympus Apartments (Bucks) Auxiliary Student Service 2001 $519,047Mt. Olympus Apartments (Chester) Auxiliary Student Service 2001 $530,195Mt. Olympus Apartments (Cumberland) Auxiliary Student Service 2001 $530,195Mt. Olympus Apartments (Dauphin) Auxiliary Student Service 2001 $519,047Mt. Olympus Apartments (Lackawanna) Auxiliary Student Service 2001 $530,195Mt. Olympus Apartments (Lancaster) Auxiliary Student Service 2001 $530,195Mt. Olympus Apartments (Lehigh) Auxiliary Student Service 2001 $519,047Mt. Olympus Apartments (Northampton) Auxiliary Student Service 2001 $530,195Mt. Olympus Apartments (Philadelphia) Auxiliary Student Service 2001 $808,204Navy Hall E&G Instructional 1939 2006 $204,720 $4,087,113y , , ,Nelson Fieldhouse Gymnasium E&G Instructional 1972 $2,836,522Northumberland Hall Auxiliary Student Service 1960 2005 $658,328 $1,088,500Old Science Hall E&G Instructional 1907 1990 $100,000 $1,642,134Orchid Greenhouse E&G Instructional 1990 $17,950Pole Barn E&G Physical Plant Operations 1987 $93,816Redman Stadium E&G Student Service 1974 $876,859Robert D Warren Student Services Center Auxiliary Student Service 1966 2007 $1 172 081 $2 100 000Robert D. Warren Student Services Center Auxiliary Student Service 1966 2007 $1,172,081 $2,100,000ROTC Building (Modular) E&G Instructional 1987 1987 $34,892Schuylkill Hall Auxiliary Student Service 1965 $132,800Scranton Commons Auxiliary Student Service 1970 2001 $1,642,134 $2,852,027Simon Hall E&G Instructional 1933 $35,320Stitley Dome Building E&G Physical Plant Operations 1982 $41,000Student Recreation Center Auxiliary Student Service 1995 2006 $5,677,405 $3,631,024
$ $Sutliff Hall E&G Instructional 1959 1987 $3,199,263 $1,091,796T.I.P. Building (Modular) E&G Instructional 1987 1987 $30,000Tennis Building E&G Instructional 2006 $403,246University Bookstore Both Student Service 1957 1999 $519,118 $698,610Upper Campus Greenhouse E&G Physical Plant Operations 1987 $20,886Waller Administration Building E&G Institutional Support 1972 $1,511,893Wilson House E&G Academic Support 1930 1988 $121,879pp
12‐2
Source: PASSHE Facilities Database, 2008‐09

Assignable Assignable SQFT
Physical Plant Square Footage Data, 2008‐09
Facility Name Type Function Gross SQFTAssignable
SQFTAssignable SQFT
PercentageAndruss Library Auxiliary Libraries 108,173 85,125 78.69%Bakeless Center for the Humanities E&G Instructional 54,864 30,886 56.30%Ben Franklin Building E&G Institutional Support 33,869 17,844 52.69%Boyd F. Buckingham Maintenance Center E&G Physical Plant Operations 10,565 8,996 85.15%Buckalew Place E&G Academic Support 8,746 7,299 83.46%Bulk Material Storage Area E&G Physical Plant Operations 1,322 1,162 87.90%Carpenter Shop E&G Physical Plant Operations 7,471 5,928 79.35%Carver Hall E&G Executive Management 26,812 13,334 49.73%Centennial Hall E&G Student Service 72,494 40,542 55.92%Columbia Hall Auxiliary Student Service 84,639 54,761 64.70%Communication Studies & Theatre Arts Rental E&G Ancillary Support 2,100 2,100 100.00%Development Center (Rental) Other Institutional Support 3,792 2,953 77.87%p ( ) pp , ,Development Center Garage (Rental) Other Physical Plant Operations 510 473 92.75%DGS Building (Modular) E&G Physical Plant Operations 1,523 1,233 80.96%Elwell Hall Both Student Service 150,470 104,543 69.48%Fenstemaker Alumni House E&G Academic Support 6,871 4,766 69.36%Fenstemaker Alumni House Garage E&G Physical Plant Operations 449 414 92.20%Grounds Crew Building (Modular) E&G Physical Plant Operations 3,943 3,380 85.72%H P E Building E&G Student Service 2 072 1 716 82 82%H.P.E. Building E&G Student Service 2,072 1,716 82.82%Haas Center for the Arts E&G Student Service 66,359 40,172 60.54%Hartline Science Center E&G Instructional 124,991 74,559 59.65%Heating Plant E&G Physical Plant Operations 33,190 26,798 80.74%Kehr Student Union Both Student Service 90,569 57,395 63.37%Luzerne Hall Auxiliary Student Service 74,331 45,259 60.89%Lycoming Hall Auxiliary Student Service 58,311 37,662 64.59%Magee Center E&G Instructional 28,043 12,336 43.99%Maintenance Center Annex E&G Physical Plant Operations 3,472 3,026 87.15%McCormick Human Services Center E&G Instructional 104,756 63,232 60.36%Mitchell Bungalow E&G Academic Support 1,309 935 71.43%Montgomery Apartment Complex (Albert) Auxiliary Student Service 15,126 12,974 85.77%Montgomery Apartment Complex (Barton) Auxiliary Student Service 15,126 12,974 85.77%Montgomery Apartment Complex (Diehl) Auxiliary Student Service 15,126 12,974 85.77%g y p p ( ) y , ,Montgomery Apartment Complex (Englehart) Auxiliary Student Service 15,126 12,974 85.77%Montgomery Apartment Complex (Marmon) Auxiliary Student Service 15,126 12,974 85.77%Montgomery Apartment Complex (Marshall) Auxiliary Student Service 15,126 12,974 85.77%Montour Hall Auxiliary Student Service 62,923 38,954 61.91%
12‐3

Assignable Assignable SQFT
Physical Plant Square Footage Data, 2008‐09
Facility Name Type Function Gross SQFTAssignable
SQFTAssignable SQFT
PercentageMonty's Auxiliary Student Service 19,010 12,046 63.37%Mt. Olympus Apartments (Berks) Auxiliary Student Service 5,929 5,288 89.19%Mt. Olympus Apartments (Bucks) Auxiliary Student Service 5,818 5,092 87.52%Mt. Olympus Apartments (Chester) Auxiliary Student Service 5,929 5,288 89.19%Mt. Olympus Apartments (Cumberland) Auxiliary Student Service 5,929 5,288 89.19%Mt. Olympus Apartments (Dauphin) Auxiliary Student Service 5,818 5,189 89.19%Mt. Olympus Apartments (Lackawanna) Auxiliary Student Service 5,929 5,288 89.19%Mt. Olympus Apartments (Lancaster) Auxiliary Student Service 5,929 5,288 89.19%Mt. Olympus Apartments (Lehigh) Auxiliary Student Service 5,818 5,189 89.19%Mt. Olympus Apartments (Northampton) Auxiliary Student Service 5,929 5,288 89.19%Mt. Olympus Apartments (Philadelphia) Auxiliary Student Service 9,026 8,079 89.51%Navy Hall E&G Instructional 27,456 14,685 53.49%y , ,Nelson Fieldhouse Gymnasium E&G Instructional 99,324 67,072 67.53%Northumberland Hall Auxiliary Student Service 48,708 31,007 63.66%Old Science Hall E&G Instructional 44,748 30,381 67.89%Orchid Greenhouse E&G Instructional 775 755 97.42%Pole Barn E&G Physical Plant Operations 10,786 10,470 97.07%Redman Stadium E&G Student Service 18,455 12,429 67.35%Robert D Warren Student Services Center Auxiliary Student Service 63 204 42 019 66 48%Robert D. Warren Student Services Center Auxiliary Student Service 63,204 42,019 66.48%ROTC Building (Modular) E&G Instructional 3,370 3,100 91.99%Schuylkill Hall Auxiliary Student Service 62,611 38,974 62.25%Scranton Commons Auxiliary Student Service 60,049 40,892 68.10%Simon Hall E&G Instructional 5,803 4,549 78.39%Stitley Dome Building E&G Physical Plant Operations 2,034 1,917 94.25%Student Recreation Center Auxiliary Student Service 74,442 69,365 93.18%Sutliff Hall E&G Instructional 29,628 16,906 57.06%T.I.P. Building (Modular) E&G Instructional 1,522 1,119 73.52%Tennis Building E&G Instructional 1,920 1,006 52.40%University Bookstore Both Student Service 28,659 22,257 77.66%Upper Campus Greenhouse E&G Physical Plant Operations 1,031 1,007 97.67%Waller Administration Building E&G Institutional Support 48,637 34,243 70.41%Wilson House E&G Academic Support 3,205 2,584 80.62%pp , ,
12‐4
Source: PASSHE Facilities Database, 2008‐09
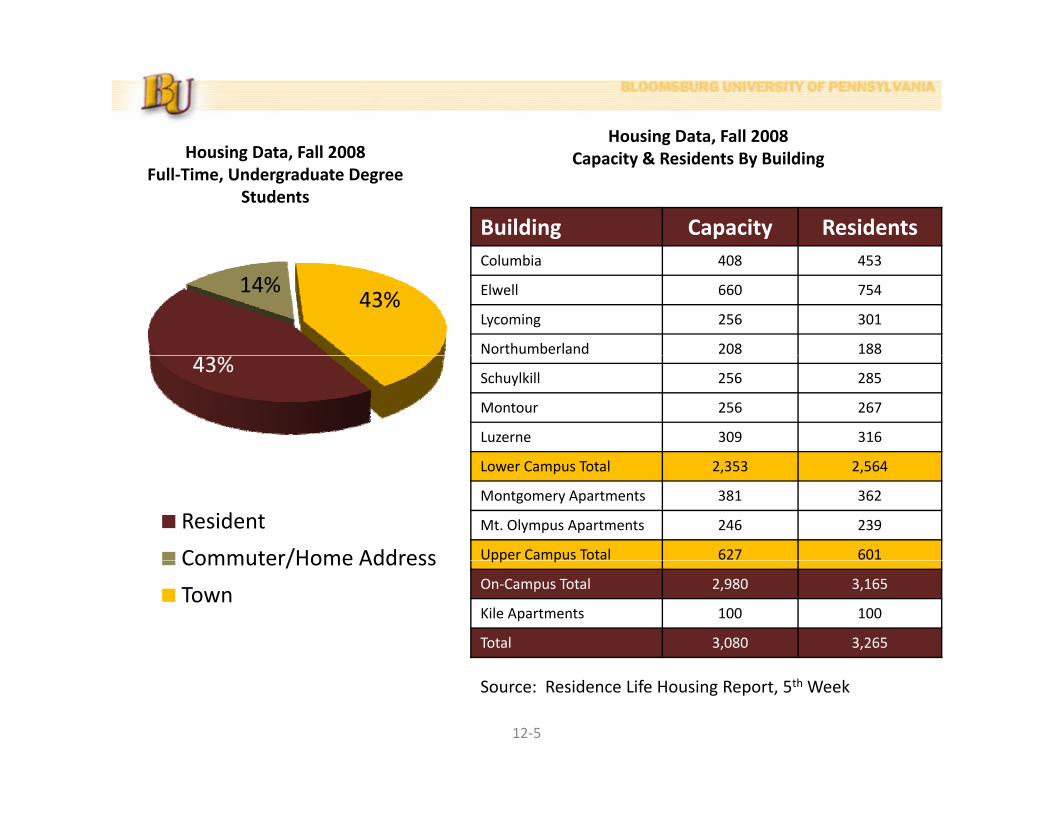
Housing Data Fall 2008Housing Data, Fall 2008
Housing Data, Fall 2008Full‐Time, Undergraduate Degree
Students
Building Capacity Residents
Capacity & Residents By Building
14%43%
Columbia 408 453
Elwell 660 754
Lycoming 256 301
Northumberland 208 18843%
Schuylkill 256 285
Montour 256 267
Luzerne 309 316
Resident
Commuter/Home Address
Lower Campus Total 2,353 2,564
Montgomery Apartments 381 362
Mt. Olympus Apartments 246 239
Upper Campus Total 627 601Commuter/Home Address
Town
pp p
On‐Campus Total 2,980 3,165
Kile Apartments 100 100
Total 3,080 3,265
12‐5
Source: Residence Life Housing Report, 5th Week
