evalutation of thermal comfort in semi-outdoor …
TRANSCRIPT
EVALUATION OF THERMAL COMFORT IN SEMI-OUTDOOR ENVIRONMENT
半屋外環境における熱的快適性評価に関する研究
March 2003
Junta Nakano
1

2

EVALUATION OF THERMAL COMFORT IN SEMI-OUTDOOR ENVIRONMENT
半屋外環境における熱的快適性評価に関する研究
March 2003
Junta Nakano
Waseda University Major in Architecture and Civil Engineering,
Architecture Specialization
1

2 2
TABLE OF CONTENTS ACKNOWLEDGEMENT ................................................................................................ 9
Chapter 1 GENERAL INTRODUCTION
1.1 OBJECTIVE OF RESEARCH ...................................................................................... 13 1.2 DEFINITION OF SEMI-OUTDOOR ENVIRONMENT............................................. 14 1.3 BACKGROUND ........................................................................................................... 16 1.4 LITERATURE REVIEW OF RELATED RESEARCH................................................ 18
1.4.1 Existing Thermal Comfort Standards and Their Basis............................................. 18 1.4.1.1 The New Effective Temperature and Standard New Effective Temperature .... 19 1.4.1.2 Predicted Mean Vote (PMV) ............................................................................. 20
1.4.2 Empirically Derived Design Criteria for Atrium Buildings ..................................... 22 1.4.3 The Adaptive Model................................................................................................. 24 1.4.4 Thermal Comfort During Environmental Step Changes.......................................... 27 1.4.5 Mobile Measurement Apparatus for Thermal Environment .................................... 29
1.4.5.1 Standards for Measurement of Thermal Environment ...................................... 30 1.4.5.2 Mobile Measurement Apparatus ....................................................................... 32
1.5 OUTLINE OF RESEARCH............................................................................................ 34 Chapter 2
EVALUATION OF TRANSIENT THERMAL COMFORT USING NUMERICAL THERMOREGULATION MODEL (65MN)
2.1 INTRODUCTION.......................................................................................................... 39 2.2 65 NODE THERMOREGULATION MODEL ............................................................. 40
2.2.1 Heat Balance Equations of 65MN............................................................................ 41 2.2.2 Control System of 65MN ......................................................................................... 47 2.2.3 Thermoregulatory System of 65MN ........................................................................ 49 2.2.4 Calculation of SET* by 65MN................................................................................. 51
2.3 DEVELOPMENT OF MOBILE MEASUREMENT CART ......................................... 52 2.4 FIELD MEASUREMENT OF TRANSITIONAL THERMAL ENVIRONMENT....... 54
3

2.4.1 Method ..................................................................................................................... 54 2.4.2 Results of Field Measurements ................................................................................ 57
2.5 65MN SIMULATION WITH FIELD MEASUREMENT DATA ................................. 61 2.5.1 The Summer Pool Route (Case 1)............................................................................ 61 2.5.2 Seasonal Variation and Space Composition (Case 2) .............................................. 63
2.6 CONCLUSION.............................................................................................................. 67 Chapter 3
TRANSIENT THERMAL COMFORT SUCCEEDING A SHORT WALK IN A BUFFER SPACE FROM OUTDOOR TO INDOOR
3.1 INTRODUCTION .......................................................................................................... 71 3.2 OUTLINE OF EXPERIMENT....................................................................................... 72
3.2.1 Experimental Schedule ............................................................................................ 72 3.2.2 Subjects .................................................................................................................... 73 3.2.3 Experimental Conditions ......................................................................................... 74 3.2.4 Experimental Method............................................................................................... 75
3.3 RESULTS........................................................................................................................ 78 3.3.1 Psychological Variables ........................................................................................... 78
3.3.1.1 Transition Phase ................................................................................................ 78 3.3.1.2 Occupancy Phase .............................................................................................. 82
3.3.2 Physiological Variables ............................................................................................ 83 3.3.2.1 Mean Skin Temperature .................................................................................... 83 3.3.2.2 Vapor Pressure Inside Clothing......................................................................... 85
3.3.3 Effect of Environmental Condition of Buffer Space................................................ 88 3.3.3.1 Psychological Variables .................................................................................... 88 3.3.3.2 Physiological Variables ..................................................................................... 91
3.4 DISCUSSION ................................................................................................................. 93 3.4.1 Environmental Temperature Sensation and Whole Body Thermal Sensation ......... 93 3.4.2 Characteristic Difference Between Males and Females .......................................... 93 3.4.3 Comfort Sensation.................................................................................................... 94 3.4.4 Optimum Environmental Condition of Buffer Space .............................................. 95
3.5 CONCLUSION............................................................................................................... 96
4

Chapter 4 DIFFERENCES IN PERCEPTION OF INDOOR ENVIRONMENT BETWEEN JAPANESE AND NON-JAPANESE WORKERS
4.1 INTRODUCITON........................................................................................................... 101 4.2 METHODS...................................................................................................................... 102
4.2.1 Thermal Environment Measurement........................................................................ 104 4.2.2 Indoor Air Quality Measurement ............................................................................. 104 4.2.3 Questionnaire Survey ............................................................................................... 104
4.3 RESULTS OF PHYSICAL MEASUREMNT ................................................................ 107 4.3.1 Thermal Environment .............................................................................................. 107 4.3.2 Indoor Air Quality .................................................................................................... 111
4.4 RESULTS OF QUESTIONNAIRE SURVEY................................................................ 113 4.4.1 Thermal Sensation.................................................................................................... 113 4.4.2 Humidity Sensation .................................................................................................. 116 4.4.3 Frequency of SBS Related Symptoms ..................................................................... 117
4.5 DISCUSSION ................................................................................................................. 120 4.5.1 Neutral Temperature................................................................................................. 120 4.5.2 Frequency of SBS Related Symptoms ..................................................................... 122
4.6 CONCLUSION ............................................................................................................... 123 Chapter 5
THERMAL COMFORT CONDITION IN SEMI-OUTDOOR ENVIRONMENT FOR SHORT-TERM OCCUPANCY
5.1 INTRODUCTION........................................................................................................... 127 5.2 METHODS...................................................................................................................... 128
5.2.1 Survey Area .............................................................................................................. 128 5.2.2 Survey Period ........................................................................................................... 129 5.2.3 Survey Design .......................................................................................................... 130 5.2.4 Calculation of Mean Radiant Temperature .............................................................. 134
5.3 RESULTS AND DISCUSSIONS.................................................................................... 136 5.3.1 Outdoor Climatic Conditions ................................................................................... 136 5.3.2 Thermal Environmental Characteristics................................................................... 138 5.3.3 Occupancy Condition............................................................................................... 141 5.3.4 Clothing Adjustment ................................................................................................ 148
5

5.3.5 Neutral Temperature................................................................................................. 153 5.3.6 Thermal Comfort Condition .................................................................................... 157 5.3.7 Implications for Environmental Design................................................................... 159
5.4 CONCLUSION............................................................................................................... 160 Chapter 6
CONCLUSIVE SUMMARY ................................................................................... 163 REFERENCES .................................................................................................................. 171 NOMENCLATURE ......................................................................................................... 183 APPENDIX.......................................................................................................................... 189
6

ACKNOWLEDGEMENT
7

8

ACKNOWLEDGEMENT
The present thesis is based on the research works conducted during the last 4 years at
Tanabe Laboratory and the preceding 3 years at Kimura Laboratory, Department of
Architecture, Waseda University.
For the completion of this dissertation, I would like to express my sincere gratitude to
Professor S. Tanabe, Department of Architecture, Waseda University, who offered me all the
opportunity to start and carry on with my research career. His precise advices have kept me
from losing my way when the walls obstructed the course of my research work.
I thank warmly Professor K. Kimura, Research Institute of Science and Engineering,
Waseda University, who introduced me into the research field. His devoted interest had an
overwhelming influence on my attitude towards research.
I would also like to thank Professor T. Ojima and Professor Y. Hasemi, Department of
Architecture, Waseda University, for their sharp and constructive suggestions.
My stay in 2000 at the International Centre for Indoor Climate and Energy, Technical
University of Denmark, was very fruitful, and I wish to express my heartful thanks for their
hospitality and inspiring discussions. Heartful thanks are due to Professor P. O. Fanger,
Professor D. P. Wyon, Dr. G. Clausen, Dr. A. Melikov, Dr. J. Toftum, Dr. P. Wargocki, Dr. L.
Fang, and all the staffs and colleagues at the Centre.
I appreciate very much the following people who have generously spent their time and
effort to realize successful field surveys described in the present thesis (alphabetical order of
their affiliation): Mr. M. Inoue, Mr. T. Wada, Mr. S. Izumo, and Mr. M. Nakajima of
Kanomax Japan, Inc., Mr. K. Matsunawa, Mr. K. Ootaka, Mr. S. Horikawa, Mr. T. Kawase,
Mr. M. Kohyama of Nikken Sekkei, Ltd., Dr. M. Yoshimura of NTT Facilities, Inc., Mr. M.
Watai of Takashimaya Co., Ltd., Mr. Y. Koyama of Tokyo Gas Co., Ltd., Mr. H. Nakajima of
Tokyo Gas Urban Development Co., Ltd, Mr. N. Shimazaki of Tokyo Opera City Building
Co., Ltd., Mr. K. Okubo and Mr. K. Oda, Omori Bellport Co. Ltd., Mr. Y. Sekine of
Yamashita Sekkei, Inc..
I wish to acknowledge my thanks to Dr. T. Nobe of Kogauin University, Dr. T. Akimoto of
Kanto Gakuin University, Dr. Y. Ozeki and Mr. M. Konishi of Asahi Glass Co., Ltd. for their
inspiring suggestions and discussions.
9

Sincere gratitude is due to Mr. K. Kumagai of University of Tokyo, Dr. Y. Shiraishi of
University of Kitakyushu, and Dr. C. Narita of Japan Women’s University for their
encouraging advices and support during the days of hardships.
Special thanks are due to Mr. J. Kim of Yasui Architects and Engineers, Inc., Mr. A. Okuda
of Tokyo Gas Co., Ltd., Mr. K. Kobayashi of Nikken Sekkei, Ltd., Ms. Y. Kitahara of Tokyo
Electric Power Company, Ltd., Mr. H. Sato of Otsuka Corp., Mr. K. Harayama of University
of Tokyo, Mr. E. Tamaru of INCS, Inc., and Mr. K. Tanaka of Waseda University who have
supported me carry out the field surveys and experiments during the course of my work.
I am also grateful to my dear colleagues at the Tanabe Laboratory, Ms. N. Suzuki, Mr. S.
Lee, Dr. N. Nishihara, Ms. R. Funaki and Ms. H. Tsutsumi, for their warm help and
discussions in and out of the laboratory.
I would like to express my sincere gratitude to the members of THE FIELD TEAM, Mr. K.
Goto of Tokyo Electric Power Company, Ltd., Mr. M. Noguchi, Mr. H. Fujii, Mr. T. Shimoda,
Mr. T. Morii of Waseda University, and Mr. R. Shirai of U.C. Berkeley for assisting me plan
and successfully carry out the year long field survey.
I appreciate very much the colleagues, present and past, of the Tanabe Laboratory and the
Kimura Laboratory of Waseda University and Ochanomizu University for their help and
friendship at various aspects of my life at Waseda University.
Finally, I would like to express sincere appreciation to my beloved family for their
generosity, patience, and unlimited support.
March 2003
Junta Nakano
10

CHAPTER 1
GENERAL INTRODUCION
11

12
CHAPTER 1 GENERAL INTRODUCTION
1.1 OBJECTIVE OF RESEARCH
Remarkable progress in heating, ventilating, and air-conditioning (HVAC) engineering
during the 20th century following W. H. Carrier’s epoch making invention in 1902 has
brought about a new philosophy into the environmental design, hitherto based on passive
architectural approach. Primary design objective for indoor environments became the
creation of a constant thermal environment at a given target value, defined in terms of air
temperature, mean radiant temperature, humidity, and air velocity, independent of the
outdoor climate and the configuration of the building.
On the other hand, atria or terraces designed to introduce natural outdoor elements such as
sunlight and fresh air remain a popular technique in modern architecture to attract people
from aesthetic aspects or to add diversity to the architectural environments. These
moderately controlled semi-outdoor environments, often annexed to large-scale buildings
such as hotels, offices, and shopping malls today, offer the occupants with the amenity of
naturalness within an artificial environment, a temporal refuge from tightly controlled indoor
working environment, and a thermal buffer to mitigate the large environmental step change
during transition from indoor to outdoor.
Although HVAC engineering itself is a mature technology specialized in controlling
indoor environment isolated from outdoor environment, the knowledge is limited on thermal
comfort characteristics and environmental design strategies for semi-outdoor environments.
The objective of this study is to evaluate the thermal comfort conditions of semi-outdoor
environment from the two primary design requirements in modern architecture, passage
space and short-term occupancy space.
13

1.2 DEFINITION OF SEMI-OUTDOOR ENVIRONMENT
Gehl (1987) indicated in his book Life Between Buildings the importance of environmental
quality in outdoor public spaces to attract people and their social activities within, and thus to
vitalize the entire community. Semi-outdoor environments lie in the same continuum, with a
slight difference in the range of environmental control.
Thermal environment surrounding a man could be classified into several layers from an
environmental engineering point of view according to the level of environmental control
applied. The layers of thermal environment are described in Figure 1-1.
Outdoor environment is the outermost layer where no artificial adjustments are made.
People would need to adjust themselves to the environment in order to achieve comfort.
HVAC engineers have mainly dealt with the indoor environment enclosed within to provide
desired thermal environment for occupants, and it is commonly further classified into
occupied zone and personal / task zone to realize higher quality and efficiency of
environmental control. As opposed to indoor environment subject to control at a given target
value, moderately controlled environment located in between indoor and outdoor layers will
be referred to as “semi-outdoor environment” in this study, and defined as “an architectural
environment where natural outdoor elements are designedly introduced with the aid of
environmental control”. The level of control in semi-outdoor environment may range from
Personal /Task Zone
Occupied Zone
INDOOR ENVIRONMENT
SEMI-OUTDOOR ENVIRONMENT
OUTDOOR ENVIRONMENT
Figure 1-1. Layers of thermal environment
surrounding a man
14

simple shading and wind shielding in an open structured terrace to mechanical heating,
cooling, and ventilation in a closed glazing structure of an atrium. Of the numerous
features for semi-outdoor environments, the scope of this study is focused on the typical
application in modern architecture, large-scale urban precincts where visitors are allowed to
pass through or stay at their will.
15

1.3 BACKGROUND
Thermal comfort design standards for semi-outdoor environment have not been organized
except for the existing indoor thermal comfort standards for human occupancy such as ISO
7730 (1993) by International Organization for Standardization and ASHRAE Standard 55-92
(1992) by American Society of Heating, Refrigerating, Air conditioning Engineers. These
standards do not specify the use of HVAC systems for environmental control, but narrow
range of thermal comfort and constant nature of the thermal environment suggested by the
standards are difficult to fulfill without the use of mechanical engineering. Instead, engineers
have empirically derived environmental criteria for designing semi-outdoor spaces
appropriate for the scope of their application (Mills, 1990) (SHASE, 2002). These practical
criteria aimed for the design of atrium buildings have not been validated from the thermal
comfort point of view. Further understanding of thermal comfort characteristics in the
semi-outdoor environments would complement the design methods fostered by the
practitioners.
Thermal comfort indices such as Predicted Mean Vote (PMV) (Fanger, 1970) and New
Effective Temperature (ET*) (Gagge et al., 1971) underlying the current thermal comfort
standards were developed from the principle of heat exchange between man and the thermal
environment, associated with the results of subjective sensation votes. Votes were collected
from subjective experiments conducted in climate chambers where subjects were exposed to
a given combination of air temperature, mean radiant temperature, air velocity, humidity,
clothing, and metabolic rate for several hours. These methods and results may apply to
air-conditioned indoor environment such as offices or theaters due to the similarity in
occupancy conditions. However, numerous differences exist in occupancy conditions of
semi-outdoor environment. In many cases, occupants are not required to stay in semi-outdoor
environments for hours, and the main use would be a passage or an agora where people are
free to stay or leave at their will. Thermal comfort conditions should be investigated with
regard to how the semi-outdoor architectural environments are actually used, from the
viewpoint of transition phase while walking through and the short-term occupancy phase for
a period of less than an hour.
While passing through different spaces, people experience continuous environmental step
16
changes in a short amount of time. The heat exchange between man and the environment
would not reach steady state during that period, and transient thermal conditions should be
considered for evaluation of transition phase through semi-outdoor environments. Thermal
comfort within the semi-outdoor environment during transition would be less of a concern
due to the short occupancy time, but the influence on thermal comfort in the succeeding
environment should be investigated to evaluate the effects of semi-outdoor environment as
the thermal buffer.
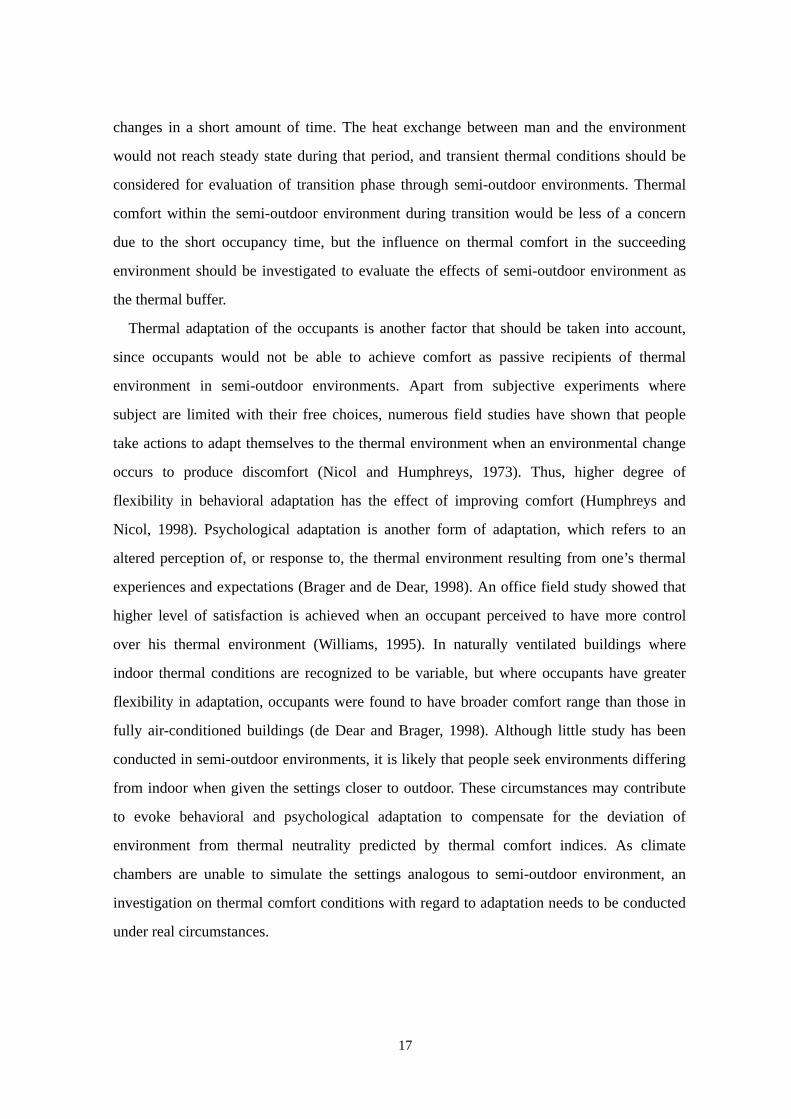
Thermal adaptation of the occupants is another factor that should be taken into account,
since occupants would not be able to achieve comfort as passive recipients of thermal
environment in semi-outdoor environments. Apart from subjective experiments where
subject are limited with their free choices, numerous field studies have shown that people
take actions to adapt themselves to the thermal environment when an environmental change
occurs to produce discomfort (Nicol and Humphreys, 1973). Thus, higher degree of
flexibility in behavioral adaptation has the effect of improving comfort (Humphreys and
Nicol, 1998). Psychological adaptation is another form of adaptation, which refers to an
altered perception of, or response to, the thermal environment resulting from one’s thermal
experiences and expectations (Brager and de Dear, 1998). An office field study showed that
higher level of satisfaction is achieved when an occupant perceived to have more control
over his thermal environment (Williams, 1995). In naturally ventilated buildings where
indoor thermal conditions are recognized to be variable, but where occupants have greater
flexibility in adaptation, occupants were found to have broader comfort range than those in
fully air-conditioned buildings (de Dear and Brager, 1998). Although little study has been
conducted in semi-outdoor environments, it is likely that people seek environments differing
from indoor when given the settings closer to outdoor. These circumstances may contribute
to evoke behavioral and psychological adaptation to compensate for the deviation of
environment from thermal neutrality predicted by thermal comfort indices. As climate
chambers are unable to simulate the settings analogous to semi-outdoor environment, an
investigation on thermal comfort conditions with regard to adaptation needs to be conducted
under real circumstances.
17
1.4 LITERATURE REVIEW OF RELATED RESEARCH
1.4.1 Existing Thermal Comfort Standards and Their Basis
In ASHRAE Standard 55-92, thermal comfort is defined as “the condition of mind that
expresses satisfaction with the thermal environment”. The thermal comfort conditions are
defined in both ASHRAE 55-92 and annex of ISO 7730, and recommend less than 10 % of
the occupants dissatisfied within a space as one of the guidelines. The optimum operative
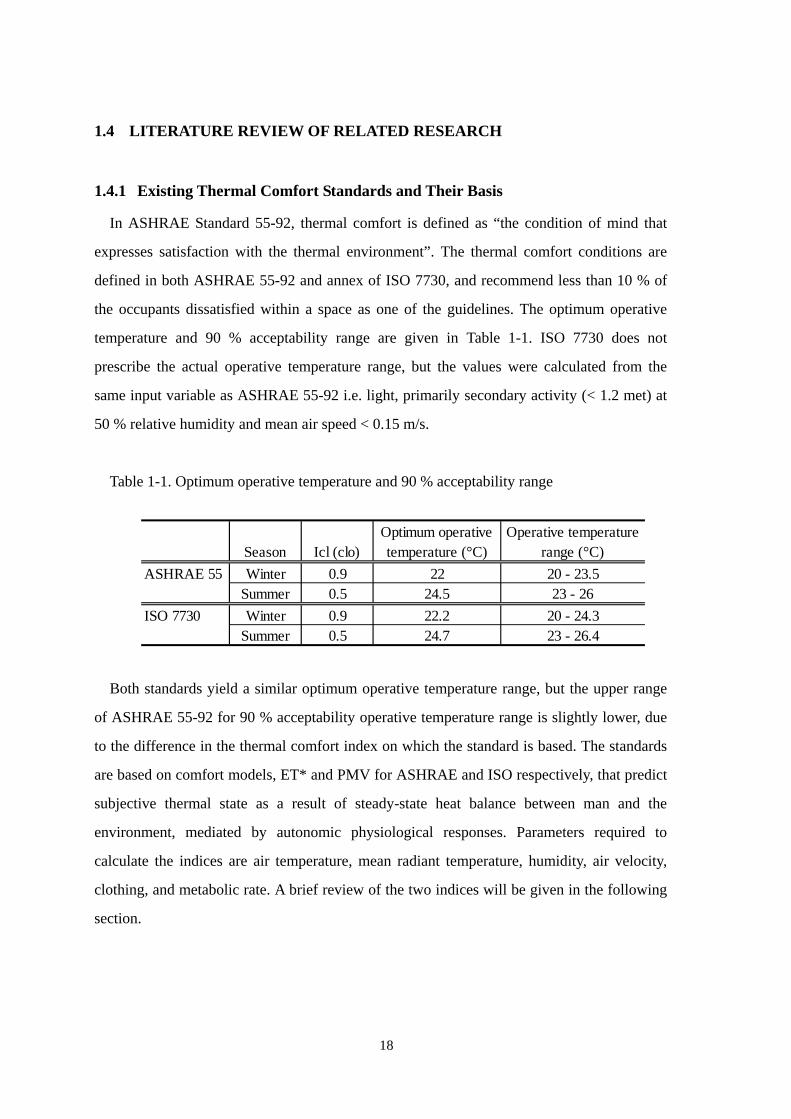
temperature and 90 % acceptability range are given in Table 1-1. ISO 7730 does not
prescribe the actual operative temperature range, but the values were calculated from the
same input variable as ASHRAE 55-92 i.e. light, primarily secondary activity (< 1.2 met) at
50 % relative humidity and mean air speed < 0.15 m/s.
Table 1-1. Optimum operative temperature and 90 % acceptability range
Season Icl (clo)Optimum operativetemperature (°C)
Operative temperaturerange (°C)
ASHRAE 55 Winter 0.9 22 20 - 23.5Summer 0.5 24.5 23 - 26
ISO 7730 Winter 0.9 22.2 20 - 24.3Summer 0.5 24.7 23 - 26.4
Both standards yield a similar optimum operative temperature range, but the upper range
of ASHRAE 55-92 for 90 % acceptability operative temperature range is slightly lower, due
to the difference in the thermal comfort index on which the standard is based. The standards
are based on comfort models, ET* and PMV for ASHRAE and ISO respectively, that predict
subjective thermal state as a result of steady-state heat balance between man and the
environment, mediated by autonomic physiological responses. Parameters required to
calculate the indices are air temperature, mean radiant temperature, humidity, air velocity,
clothing, and metabolic rate. A brief review of the two indices will be given in the following
section.
18

1.4.1.1 The New Effective Temperature (ET*) and Standard New Effective Temperature (SET*)
Houghton and Yaglou (1923) developed the original Effective Temperature (ET), one of
the earliest thermal comfort indices, as a part of the American Society for Heating and
Ventilating Engineers (ASHVE) projects for defining the thermal comfort conditions in
air-conditioned spaces. Subjects entered back and forth the two climate chambers controlled
at different sets of air temperature and humidity, and found the combination of air
temperature and humidity that produced the equal thermal sensation. Although this
empirically based index was adopted by many authorities and widely used by HVAC
engineers for nearly 50 years, it was recognized to overestimate the effect of humidity at low
temperatures and underestimate the effect at high temperatures. In 1971, Gagge et al. (1971)
proposed the new effective temperature ET* based on the physics of heat transfer and
physiology of thermoregulation. Two-node model of human thermoregulation consisting of a
core layer and a shell layer was utilized to simulate the mean skin temperature and skin
wettedness of a man in a given environment. Skin wettedness underlying this index is the
ratio of the actual evaporative heat loss at the skin surface to the maximum loss, and is found
to be an excellent predictor of warm discomfort. ET* indicates the value which produces the
same thermal sensation for different sets of temperature and humidity, provided that air
velocity, clothing, and activity were the same. The index was incorporated into ASHRAE 55
in 1974 in its restricted form of sedentary activities, and the 90 % acceptability range in the
standard is based on this index. The standard new effective temperature (SET*) was
proposed later in 1986, which was defined as the equivalent temperature of an isothermal
environment at 50 %rh in which a subject, while wearing clothing standardized for the
activity concerned, has the same heat stress and thermoregulatory strain as in the actual
environment. The effect of humidity, especially in its high regions, has been the main scopes
of the three effective temperatures due to the cooling requirements in hot and humid areas
within the United States.
19

1.4.1.2 Predicted Mean Vote (PMV)
Fanger (1970) introduced the comfort equation, a heat balance equation between the
generated heat within human body and the actual heat loss to the surrounding environment,
as one of the requirements for thermal neutrality.
M – W = C + R + E + K + RES (1-1)
where
M: Metabolic rate [W/m2]
W: External work [W/m2]
C: Heat loss by convection [W/m2]
R: Heat loss by radiation [W/m2]
E: Heat loss by evaporation [W/m2]
K: Heat loss by conduction [W/m2]
RES: Heat loss by respiration [W/m2]
If the equation is not satisfied, the man is in either warm or cool thermal discomfort
according to the excess or deficit of the heat balance. The residual of the comfort equation,
termed the thermal load, is related to the degree of thermal sensation away from thermal
neutrality, and a thermal sensation index, PMV, was formulated. PMV is defined as the
predicted mean value of the vote by a large group of persons if exposed to the actual
environment to be expressed on the following seven-point ASHRAE psychophysical scale:
+3 hot
+2 slightly warm
+1 warm
0 neutral
-1 slightly cool
-2 cool
-3 cold
20

PMV itself is unable to predict the degree of occupant satisfaction in a given thermal
environment. Predicted Percentage of Dissatisfied (PPD), the percentage of a group of
occupants predicted to be dissatisfied with the thermal environment, was proposed in relation
to PMV, standing on an assumption that a person who voted ±2 or greater was dissatisfied.
PMV and PPD became the standardized method to evaluate thermal comfort as ISO 7730 in
1984. PMV is found to yield good results around sedentary comfort condition, but less
accurate when the metabolic rate is high, clothing is heavy, or environmental conditions are
away from comfort.
The term “TSV” which is the abbreviation for “(whole body) thermal sensation vote” is
used in Chapter 3 of this thesis. While PMV refers to the theoretically derived index, TSV
refers to the mean thermal sensation vote of actual subjects made during a particular
experiment. Although the two terms are easily confounded, the conceptual difference needs
to be recognized for interpretation of the results.
21

1.4.2 Empirically Derived Design Criteria for Atrium Buildings
Semi-outdoor environment often appears in the form of an atrium building in modern
architecture. Atrium in modern architecture gained its fame in the 1960’s when architect John
Portman designed a series of large-scale atrium hotels in the United States. The number of
newly built atria with various design concepts grew rapidly from the 1970’s, and it still is a
popular design strategy today.
Design concept of an atrium from environmental engineering point of view varies
dramatically depending on the climate of the building location and the comfort level aimed
for inside. Climate has a large influence on the amount of cooling or heating load of an
atrium, and the basic structure is chosen by the orientation of environmental control: heating,
cooling, or both. The comfort level is largely divided into four categories of “canopy”,
“buffer”, “tempered buffer” and “full comfort” (Saxon, 1983). Very few literature provide the
actual target value for these specifications, but two empirically derived design criteria, one
from UK and the other from Japan, are given in Tables 1-2 and 1-3 respectively. The
characteristic difference between the two criteria is that the former is winter oriented and the
latter is summer oriented. Although the winter climate is similar in both countries, Japan has
a hot and humid summer compared to moderate summer in the UK. Summer target
temperatures are generally lower in Japan due to the difference in humidity. Winter target
temperature is also higher in Japan, suggesting that higher comfort level is generally required
for an atrium in Japan.
Twenty percent of atrium buildings in Japan are office buildings. Integrated facilities
follow with 16 %, and hotels and public facilities with 13 % respectively. The main use of
atrium is entrance hall, 40 %, and agora, 24 % (Yoshino et al., 1996). Most of atria are
expected to fall in between the categories of “tempered buffer” and “partial comfort”, where
indoor air temperature would range from 18 to 28 °C throughout the year. Although many
studies have dealt with heat load calculation and detailed thermal environment prediction
techniques for thermal system design of atria to accomplish these values (Kato et al., 1995),
actual comfort conditions resulting from the particularly controlled environment have not
been investigated in large numbers.
22

Table 1-2. Environmental criteria for UK atrium (Mills, 1990)
Heating (Winter) Cooling (Summer)
CanopyShelter, shade. No aircontainment.
Shopping precincts. Linksbetween buildings, or alongsidebuildings.
Ambient air tempperature.No heating.
Ambient air temperature.No cooling.
Buffer
Winter air containment.Shelter, shade, summernatural ventilation
Conservatory link. Coveredcourtyard. Covered shoppingcenter.
No heating. Airtemperature aboveambient due to internalsolar gains by 5°C+
No cooling. Naturalventilation used to removeexcess heat. Peak airtemperature around 30 to35 °C
Tempered Buffer
Winter air containment.Shelter, shade, backgroundheating. Summer naturalventilation
Office entrance halls. Enclosedshopping centers.
Air temperature heated to10 °C in occupancy zone.
As above.
Partial Comfort
Winter air containment.Shelter, shade, heating.Summer natural and/ormechanical ventilation.
Office entrances and meetinghalls. Enclosed shoppingcenters. Hotels. Restaurants,hospital. Glazed links.
Air temperature heated to19 °C in occupancy zone.Radinat heating to offsetcold glazing.
As above.
Full Comfort
Winter air containment.Shelter, shade, heatingventilation and mechanicalcooling
Office space, banking halls.Enclosed shopping centers.Prestige hotels, restaurants.
Winter design 19 °Cminimum.
Summer design 25 °Cmaximum. Mechanicalcooling.
Passive Solar
Can be between buffer andfull comfort according todesign approach.
Any. Design approach seeks tooptimize solar gains duringwinter and maximize naturalventilation effects in summer.
Winter design up to 19 °Cas designed. Heating tosupplement solar gains.
No mechanical cooling.Thermal stack effectsoptimized to achieve highair changes Peaktemperatures around 27 to30 °C.
Atrium Type Performance Level Applications Comfort Criteria
Table 1-3. Environmental criteria for Japanese atrium (SHASE, 2002) (modified by Nakano, 2002)
23
Operativetemp.
HumidityOperative
temp.Humidity
Canopy -Buffer
Openness of oudoorsetting required. Avoidrain for activity within.
28°C-outdoor
Drift18°C
approx.Drift
28°C-outdoor
Drift18°C
approx.Drift
26-28°C Drift 18-22°C Drift
Full comfortSofas and tablesinstalled for long termoccupancy.
26°Capprox.
Drift22°C
approx.Drift
Full comfortNormal indoor comfortcondition.
26°C Drift 22°C Drift
Full comfortNormal indoor comfortcondition.
Merchandise 26°C Drift 22°C Drift
Full comfortNormal indoor comfortcondition.
Café,restautrant
24-26°C Drift 22°C Drift
*Modification made by author
Tempered buffer
Partial comfort -Full comfort
Tempered buffer
Atrium type*
Intermediate environment between indoorand outdoor.
Thermal environmentSummer WinterApplicationPerformance level
Lobby,meeting space
PassageNo requirements. Semi-outdoor environment forpleasure.
EntranceConsidered as part ofindoor space.
No severe requirements.
AgoraOpenness and oudoorsetting required.
No severe requirements.
Exhibition space
Shops
Recreation groundMay range form outdoor level to indoorlevel due to concept.
1.4.3 The Adaptive Model
Field survey is an alternative approach to study thermal comfort besides subjective
experiment on which the current thermal comfort standards are based. Although subjective
experiments have the merit of controlling intended variables, care must be taken to interpret
the results for practical use because of the artificial settings created for the experiment.
Various researchers have conducted field surveys at homes, offices, schools, etc. to compare
the results with the prediction of thermal comfort indices. Nicol and Humphreys (1973)
pointed out that mean thermal sensation votes of indoor occupants collected from various
field studies showed a poor correlation with the mean indoor temperatures. Based on the
observations on clothing adjustments and environmental adjustments by operable windows,
they have concluded that occupants were adapting to the given thermal environment to
produce comfort, and that thermal comfort was a part of a self-regulating system. This
philosophy, named the Adaptive Model, is contrary to the heat balance equation based
thermal comfort indices where a man is considered to be a passive recipient of a given
thermal environment.
Adaptation can be divided into three categories: behavioral adaptation, physiological
adaptation and psychological adaptation (Brager and de Dear, 1998). Behavioral adaptation
includes all actions to retain comfort, such as clothing adjustment, metabolic rate adjustment,
turning on a fan, opening windows, finding a better location to stay, etc. Behavioral
adjustments offer the greatest opportunity to maintain body heat balance. Physiological
adaptation may range from fairly short-term seasonal acclimatization to genetic heritage
lasting for several generations. However, the neutral temperature derived for Danish (Fanger,
1970), Singaporean (de Dear et al., 1991) and Japanese (Tanabe and Kimura, 1994) subjects
yielded insignificant differences, suggesting that the effect of physiological adaptation is
small near thermally neutral conditions. Psychological adaptation refers to the adjustment in
perception of a given condition. Situation deviating from one’s expectations would evoke
discomfort, but when a person becomes accustomed to a given situation, he would gradually
relax his expectation and know what to expect. Although little work is documented for the
psychological adaptation process in thermal comfort, it is thought to play a significant role in
explaining the differences in observed and predicted thermal sensation.
24

The Adaptive Model does not maintain that any thermal condition would become
acceptable for all occupants at all times. Circumstances such as climate, affluence, culture
and social contexts restrict certain adaptive actions, and thus restrain the “adaptive
opportunity” (Humphreys and Nicol, 1998). Greater freedom in adaptation would enhance
comfort, but restrained adaptation would lead to further discomfort. It could also be said that
imposed variation produces discomfort, while chosen variation is likely to reduce discomfort.
De Dear and Brager (1998) assembled a large database of office field survey around the
world, comprised of over 20,000 observations of subjective votes and corresponding sets of
environmental variables, to conduct statistical test between the thermal comfort conditions of
naturally ventilated buildings and air-conditioned buildings. Although the degree of variation
was greater for occupants of naturally ventilated buildings, behavioral adaptation in terms of
clothing and air movement adjustments was observed as a function of indoor operative
temperature in both types of buildings. Indoor comfort temperature was found to correlate
well with prevailing outdoor temperature. By taking the behavioral adaptation into account,
comfort temperature predicted by PMV matched the observed comfort temperatures in
air-conditioned buildings, while large discrepancies were found for naturally ventilated
buildings. These results suggest that comfort conditions in naturally ventilated buildings,
which has a broader adaptive opportunity than air conditioned buildings, could not be
predicted by the heat balance equation. Behavioral adaptation was taken into account.
Thermal environment in the measured buildings are too moderate to give rise to
physiological adaptation. The process of elimination gave psychological adaptation the
rationale to explain the discrepancy between predicted and observed comfort temperature in
naturally ventilated buildings. It was concluded that thermal comfort is achieved by correctly
matching indoor thermal conditions and expectations based on past experiences and
architectural norms. The Adaptive Model is being incorporated in to the revision to ASHRAE
Standard 55 as “optional method for determining acceptable thermal conditions in naturally
conditioned spaces”, and is currently undergoing the public review process (de Dear and
Brager, 2001).
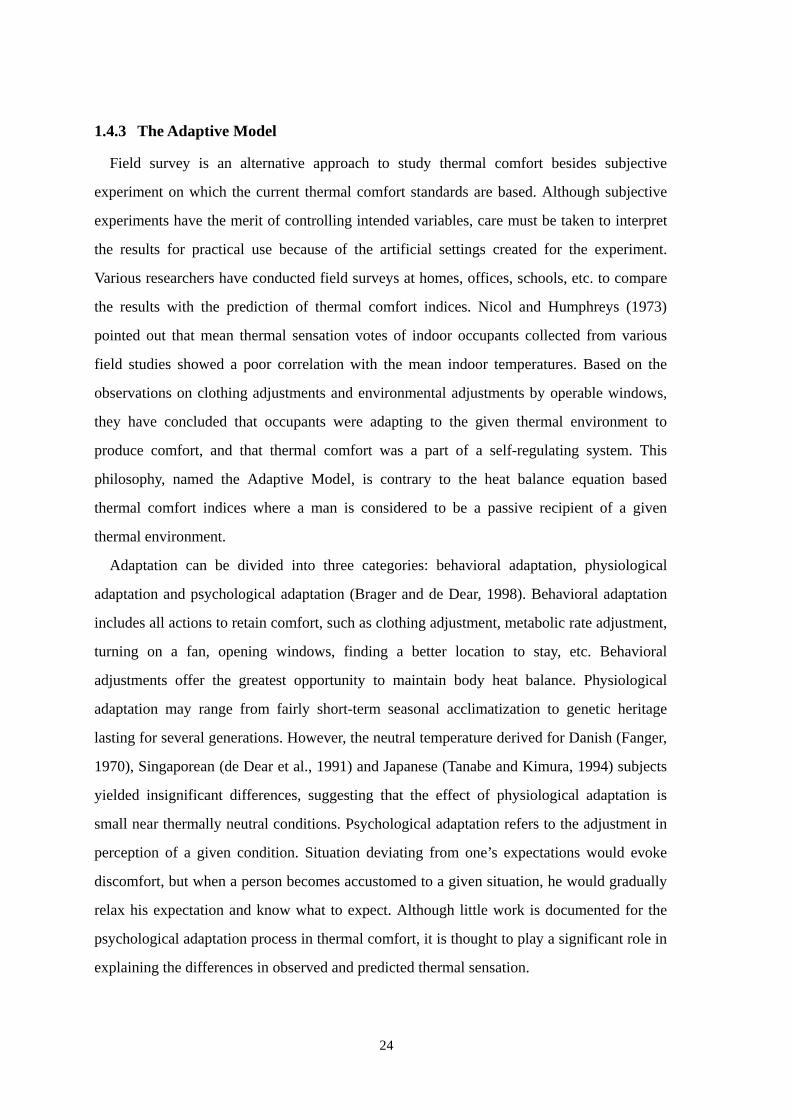
The role of adaptation on thermal comfort is depicted in Figure 1-2 (de Dear, 2002). The
most important implication of the Adaptive Model is that factors beyond fundamental
physics and physiology affect perception of thermal environment and condition for comfort.
25
Thermal sensations, satisfactions, and acceptability are all influenced by the match between
one’s expectation about the thermal conditions in a particular context, and what really exists.
Common findings on adaptation by the various researchers identify that outdoor climate, not
immediate indoor climate, has large influence on behavioral and psychological adaptation.
Figure 1-2. Role of adaptation on thermal comfort by de Dear (2002)
26
1.4.4 Thermal Comfort During Environmental Step Changes
Semi-outdoor environment acts as a thermal buffer space between indoor and outdoor for
occupants walking in and out of the building to mitigate the sudden change in thermal
environment. Transition process through a buffer space such as entrance halls and atria may
be regarded as a series of environmental step changes through indoor, buffer space and
outdoors. Although a standard evaluation method for transient thermal comfort has not been
defined in the literature, numerous subjective experiments have been conducted from as early
as 1960’s to indicate the characteristic difference between steady state and transient thermal
comfort.
Gagge et al. (1967) conducted a series of subjective experiments where subjects moved
from comfortable thermal condition (28 or 29 °C) to hot (48 °C) or cold (17.5 °C)
environments and back. He reported that thermal sensation and comfort sensation could be
explained with physiological variables such as mean skin temperature and sweating
conditions when moving from comfortable to uncomfortable thermal environments, but
sensations quickly reached the steady state neutral values leading the physiological
conditions in the adverse transition, describing the latter phenomenon as “anticipatory”.
Rohles et al. (1977) have conducted a similar experiment, 23.2 °C neutral condition +9 °C
and –7.6 °C, to investigate the “supermarket experience” which refers to the feeling of
coldness that customers experience when they go into an air-conditioned store during the
summer. He also concluded that thermal and comfort sensations quickly reached the steady
state when entering the comfortable environment, and thermal comfort was not affected by
previous uncomfortable environment the subjects experienced. The occupancy period for
each environment exceeded more than an hour for the above experiments, and it would be
difficult to apply these results directly to the situation in semi-outdoor environment.
Knudsen et al. (1990) reported the results on relatively shorter transitions. Subjects stayed
in a standard comfortable environment for an hour and moved through an environment of
+2 °C and –2 °C every 30 minutes for a total of 4 transitions. Thermal sensation votes
immediately reached the steady state values after step-up changes, but an overshoot of
thermal sensation was observed upon experiencing step-down changes, suggesting that
humans were more sensitive to lower temperature changes.
Kuno et al. (1987) indicated the presence of 2 different types of comfort, negative comfort
27

and positive comfort (pleasantness). Negative comfort describes the state of no thermal strain
during steady-state condition, and positive comfort describes the state mind accompanying
the dismissal of thermal strain during transient conditions. A step change transition from
uncomfortable to comfortable environment is expected to result in positive comfort, and this
may needed to be considered when evaluating the semi-outdoor environment during
transition phase.
28

1.4.5 Mobile Measurement Apparatus for Thermal Environment
Measurement of thermal environment is critical for assessment of thermal comfort. As it is
unrealistic to measure every point on the coordinate of an environment in interest,
representative points must be chosen to fit the objective of the measurement. Thermal
environment in the actual architectural environments is complex compared to uniform and
constant conditions in climate chambers. Windows introduce solar radiation and draft into
the perimeter zone, and furniture or heat generating equipments form an intricate indoor
landscape to create heterogeneous indoor thermal environment. Air temperature and
humidity are comparatively uniform in semi-outdoor environments, but radiation and air
velocity differ dramatically depending on the shade or wind obstruction around the
measurement location. Inappropriate selection of representative points or systematic errors in
measurement devices would lead to illogical evaluation. On the other hand, circumstances
such as time, cost, and personnel often restrict large-scale measurement plans, enabling only
a limited number of items and measurement points. A practical measurement apparatus is
required to carry out effective evaluation of thermal environment. The scope of measurement
will be focused on immediate thermal environment around a walking or a seated man to
assess thermal comfort in semi-outdoor and indoor environments.
29

1.4.5.1 Standards for Measurement of Thermal Environment
ISO 7726 (1998) and ASHRAE 55-92 (1992) specify the protocols for determining the
combination of environmental parameters (air temperature, mean radiant temperature,
humidity and air velocity) in the built environment, including the necessary specifications for
measurement devices and measurement heights. Compliance with these protocols would
ensure accuracy comparable to laboratory measurements and thus allows for the rational
comparison between thermal comfort indices derived from subjective experiments and
occupant responses in the field.
The specifications for the measurement devices are given in Table 1-4 for both standards.
ISO 7726 gives a more detailed prescription according to two environmental classifications,
Class C for thermal comfort and Class S for heat stress. Desired values for Class C are
analogous to that of ASHRAE 55-92, and evaluation of thermal comfort in indoor
environments designed for occupancy would require fulfillment of these values. Additional
care is needed for evaluation of radiation and air velocity in semi-outdoor environments due
to a wider range of environmental variables.
Four measurement heights around a man are specified to assess local thermal discomfort
resulting from vertical temperature difference or draught. The ankle level is defined as 0.1 m
above floor level, abdomen of a seated person as 0.6 m, head level of a seated man or
abdomen level of a standing man as 1.1 m, and head level of standing man as 1.7 m. Thermal
environment defined at these heights can be regarded as representative environment of a
seated and standing man.
30
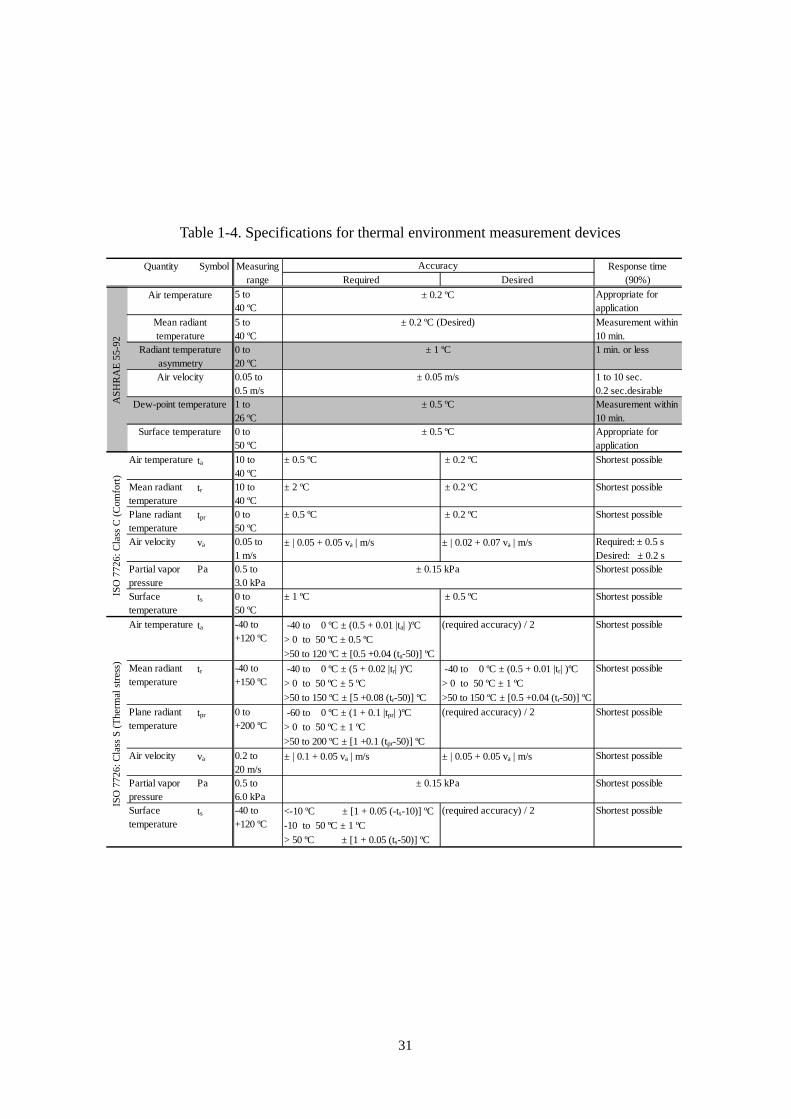
Table 1-4. Specifications for thermal environment measurement devices
Quantity Symbol Measuring Response timerange Required Desired (90%)
5 to40 ºC
Appropriate forapplication
5 to40 ºC
Measurement wit10 min.
0 to20 ºC
1 min. or less
0.05 to0.5 m/s
1 to 10 sec.0.2 sec.desirable
1 to26 ºC
Measurement wit10 min.
0 to50 ºC
Appropriate forapplication
Air temperature ta 10 to40 ºC
± 0.5 ºC ± 0.2 ºC Shortest possible
Mean radianttemperature
tr 10 to40 ºC
± 2 ºC ± 0.2 ºC Shortest possible
Plane radianttemperature
tpr 0 to50 ºC
± 0.5 ºC ± 0.2 ºC Shortest possible
Air velocity va 0.05 to1 m/s
± | 0.05 + 0.05 va | m/s ± | 0.02 + 0.07 va | m/s Required: ± 0.5 sDesired: ± 0.2 s
Partial vaporpressure
Pa 0.5 to3.0 kPa
Shortest possible
Surfacetemperature
ts 0 to50 ºC
± 1 ºC ± 0.5 ºC Shortest possible
Air temperature ta -40 to+120 ºC
-40 to 0 ºC ± (0.5 + 0.01 |ta| )ºC> 0 to 50 ºC ± 0.5 ºC>50 to 120 ºC ± [0.5 +0.04 (ta-50)] ºC
(required accuracy) / 2 Shortest possible
Mean radianttemperature
tr -40 to+150 ºC
-40 to 0 ºC ± (5 + 0.02 |tr| )ºC> 0 to 50 ºC ± 5 ºC>50 to 150 ºC ± [5 +0.08 (tr-50)] ºC
-40 to 0 ºC ± (0.5 + 0.01 |tr| )ºC> 0 to 50 ºC ± 1 ºC>50 to 150 ºC ± [0.5 +0.04 (tr-50)] ºC
Shortest possible
Plane radianttemperature
tpr 0 to+200 ºC
-60 to 0 ºC ± (1 + 0.1 |tpr| )ºC> 0 to 50 ºC ± 1 ºC>50 to 200 ºC ± [1 +0.1 (tpr-50)] ºC
(required accuracy) / 2 Shortest possible
Air velocity va 0.2 to20 m/s
± | 0.1 + 0.05 va | m/s ± | 0.05 + 0.05 va | m/s Shortest possible
Partial vaporpressure
Pa 0.5 to6.0 kPa
Shortest possible
Surfacetemperature
ts -40 to+120 ºC
<-10 ºC ± [1 + 0.05 (-ts-10)] ºC-10 to 50 ºC ± 1 ºC> 50 ºC ± [1 + 0.05 (ts-50)] ºC
(required accuracy) / 2 Shortest possible
± 0.15 kPa
± 0.15 kPa
Accuracy
± 0.5 ºC
± 0.2 ºC
± 0.5 ºC
± 0.2 ºC (Desired)
± 1 ºC
± 0.05 m/s
ISO
772
6: C
lass
C (C
omfo
rt)A
SHR
AE
55-9
2IS
O 7
726:
Cla
ss S
(The
rmal
stre
ss)
Air temperature
Mean radianttemperature
Radiant temperatureasymmetryAir velocity
Surface temperature
Dew-point temperature
hin
hin
31
1.4.5.2 Mobile Measurement Apparatus
Benton et al. (1990) developed a mobile measurement cart for thermal comfort field
survey in offices. The cart was equipped with air temperature, globe temperature, air velocity,
and humidity sensors at 0.1, 0.6, and 1.1 m above floor level. A chair was attached in front to
simulate the configuration of a chair for a seated person. All the devices were powered with
batteries to enable smooth cordless relocation from one workstation to another. The cart was
placed in the seat position of an office worker at desk to measure the thermal environment
for 5 minutes, while the occupant answered the thermal comfort questionnaire. By this
procedure, the cart was able to record the immediate thermal environment of a questionnaire
respondent, which was then used to calculate thermal comfort indices for comparison with
actual sensation votes. Early thermal comfort field studies had been criticized for crudeness
of thermal environment measurement, but this survey protocol realized the laboratory grade
measurement in the field. The use of mobile measurement cart became a popular technique
in office surveys, and various types of carts have been built for the purpose (U.C.Berkley,
1991) (Cena and de Dear, 1999). The use of mobile measurement apparatus in urban outdoor
environments have also been reported in several studies. Matzarakis et al. (1999) used a
small handcart equipped with revolving pyranometer and pyrgeometer for radiation
measurement to assess heat stress in the urban environment. Hoyano et al. (1998) developed
a portable cylinder type apparatus for a surveyor to carry around throughout the day to
examine the thermal environment an urban resident would experience during everyday life.
Fast-response globe thermometer and pyranometer were used for estimation of radiant
environment. Similar investigation was conducted by Song et al. (2001) using a cart with
ability to measure thermal variables at 4 heights defined in ISO and ASHRAE standards.
Measurement of radiation was conducted by globe thermometer, ellipsoid operative
temperature sensor, and pyranometer. Measurement protocols for the latter two apparatuses
were aimed for measurement of continuous thermal environment, while others were designed
for quasi-steady state assessment in discrete measurement points. Pictures and drawings of
the above apparatuses are presented in Figure 1-3Very few of these mobile apparatuses had
considered the evaluation of thermal comfort in both indoor and semi-outdoor environments,
covering a wide range of environmental variables and measurement points.
32

Data lo
Globe temperature seAir temperature se
Data lo
Operative temperature seAnemom
Globe temperature seAir temperature se
Radiation seIlluminom
Sound level m
Globe temperature seAir temperature se
PyranomAir temperature se
Globe temperature se
Logger
Pulse generator
Converter
Anemometer
Measurement cylinder
Pulse switch
Air outlet
Thermocouple (dry bulb) Thermocouple (wet bulb)
Air intake Battery Humidity sensor
Pyranometer Heated globe
Figure 1-3. Mobile me
(Hoyano et al., 1990)
33
gger
nsornsor
gger
nsoreter
nsornsor
nsoretereter
nsornsor
eternsornsor
(Song et al., 2001) asurement apparatuses for thermal environment

1.5 OUTLINE OF RESEARCH
Thermal comfort characteristics and thermal comfort conditions in large-scale urban
semi-outdoor environments were investigated from the two primary design requirements in
modern architecture, passage space and short-term occupancy space. Assessment of passage
phase was conducted by regarding the transition process through semi-outdoor environment
as successive environmental step changes. Environments were considered to be steady state,
and transient evaluation was focused on physiological and psychological characteristics of a
person walking through. Numerical simulation of human thermoregulation, subjective
experiments, and field surveys were utilized for the purpose. Adaptation of occupants was
taken into account for short-term occupancy evaluation. The thermal environments were
regarded as quasi-steady state, and psychological and physiological adaptation in relation to
thermal environment were observed through field surveys.
In Chapter 1, the purpose of this study and the definition of “semi-outdoor environment”
are described. Background of the research and the literature review on related researches are
also presented.
In Chapter 2, transient thermal comfort of a passer-by was investigated for passage phase
of semi-outdoor environment using numerical simulation of human physiology. The structure
of the thermoregulation model, 65MN, is presented in the first section. A mobile
measurement cart was developed to conduct seasonal field measurements in the actual
semi-outdoor environment. The measured environmental data were used as boundary
conditions for physiological simulation of an imaginary visitor.
In Chapter 3, the influence of environmental condition on transient thermal comfort was
investigated for semi-outdoor environment acting as a buffer space from indoor to outdoor.
Subjective experiments were conducted to examine how transient thermal comfort
succeeding a short walk was affected by the environmental condition of the buffer space. A
total of 120 subjects participated in the experiment conducted in a climate chamber
controlled to simulate indoor, buffer, and outdoor environments. Transient characteristics
were examined physiologically and psychologically.
In Chapter 4, the results of seasonal field surveys conducted in an office environment with
multi-national workers are described. The influence of limited adaptation on thermal comfort
34

condition in indoor environment was examined from physical measurements and 406
questionnaire responses on thermal comfort.
In Chapter 5, a series of seasonal field surveys conducted in 4 semi-outdoor architectural
environments to evaluate the thermal comfort characteristics for short-term occupancy is
described. Investigation of occupancy condition, measurement of thermal environment, and
questionnaire survey were integrated into the survey design, yielding 2248 sets of data for
analysis.
In Chapter 6, the findings from each chapter are summarized.
The flow of the present thesis is summarized in Figure 1-4.
35

Chapter 1
Short-term OccpuancyPhase
Chapter 2
Passage Phase
Semi-Outdoor Environment
Adaptation
Evaluation of Transient Physiological Conditions
Physiological simulation model combined with fieldmeasurement data of semi-outdoor environment
Transient ThermalComfort
Chapter 3Evaluation of Transient Physiological and
Psychological Conditions
Subjective experiment under different environemntalconditions of buffer zone
Chapter 4Thermal Comfort Evaluation of Occupancy
Environment with Limited Adaptive Opportunity
Seasonal field surveys of comfort conditions in an officeenvironment with multi-national workers
Chapter 5Thermal Comfort Evaluation of Semi-Outdoor
Environment for Short-Term Occupancy
Seasonal field surveys of comfort conditions andadaptation in semi-outdoor environments with differentlevels of environmental control
Chapter 6Conclusive Summary
Figure 1-4. Research flow36

CHAPTER 2
EVALUATION OF TRANSIENT THERMAL COMFORT USING
NUMERICAL THERMOREGULATION MODEL (65MN)
37

38
CHAPTER 2 EVALUATION OF TRANSIENT THERMAL COMFORT USING NUMERICAL THERMOREGULATION MODEL (65MN)
2.1 INTRODUCTION
Low energy consumption of the buildings is one of the key issues in sustainable
development in the field of architecture. It is not always necessary to keep constant optimal
temperature by HVAC system especially in the buffer zones between indoor and outdoor.
These buffer zones are usually discussed from aesthetic point of view, but Hayashi et al.
(1996) have reported that a large atrium located at the entrance of the office building
functioned to mitigate the heat stress of a person upon entering or leaving the building.
Evaluation of transient spaces should not be performed only by conventional indoor
environment evaluation schemes applied to individual spaces, but also by considering the
sequential space composition. It is considered necessary, therefore, to make a seasonal
evaluation of the thermal environment in transient spaces from indoor to outdoor and from
outdoor to indoor. A combination of field surveys using a mobile instrumental cart and a
numerical simulation by human thermoregulation model was proposed for this purpose.
39

2.2 65-NODE THEMOREGULATION MODEL
The 65 Multi-Node Thermoregulation Model, 65MN, is a mathematical model of human
thermoregulation based on the Stolwijk model (Stolwijk, 1971). 65MN represents the
anthropometric data of an averaged man with the body weight of 74.430kg and the body
surface area of 1.870m2. The whole body is divided into 16 body segments (head, chest, back,
pelvis, left shoulder, right shoulder, left arm, right arm, left hand, right hand, left thigh, right
thigh, left leg, right leg, left foot, and right foot) corresponding to the thermal manikin, Anne
(Tanabe et al, 1994). The subscript “i”(1-16) represents the segment number in the following
equations. Individual body segment consists of core, muscle, fat and skin layers. This layer
division is expressed with the subscript “j”(1-4). The layers add up to a total of 64, and each
layer is represented by a node. In addition, the central blood compartment represents the 65th
node, and 65MN has a total of 65 nodes. The control volume method is used for
mathematical modeling of heat exchange. The conceptual figure of the 65MN is illustrated in
Figure 2-1. Heat is transferred through the tissues within individual segment by conduction.
The body and the environment exchange heat by convection, radiation, evaporation, and
respiration. Heat exchange between local tissues and blood flow is simplified as the heat
exchange between local tissues and the central blood compartment. All the specific
physiological parameters given as constants were assumed after the Stolwijk model weighted
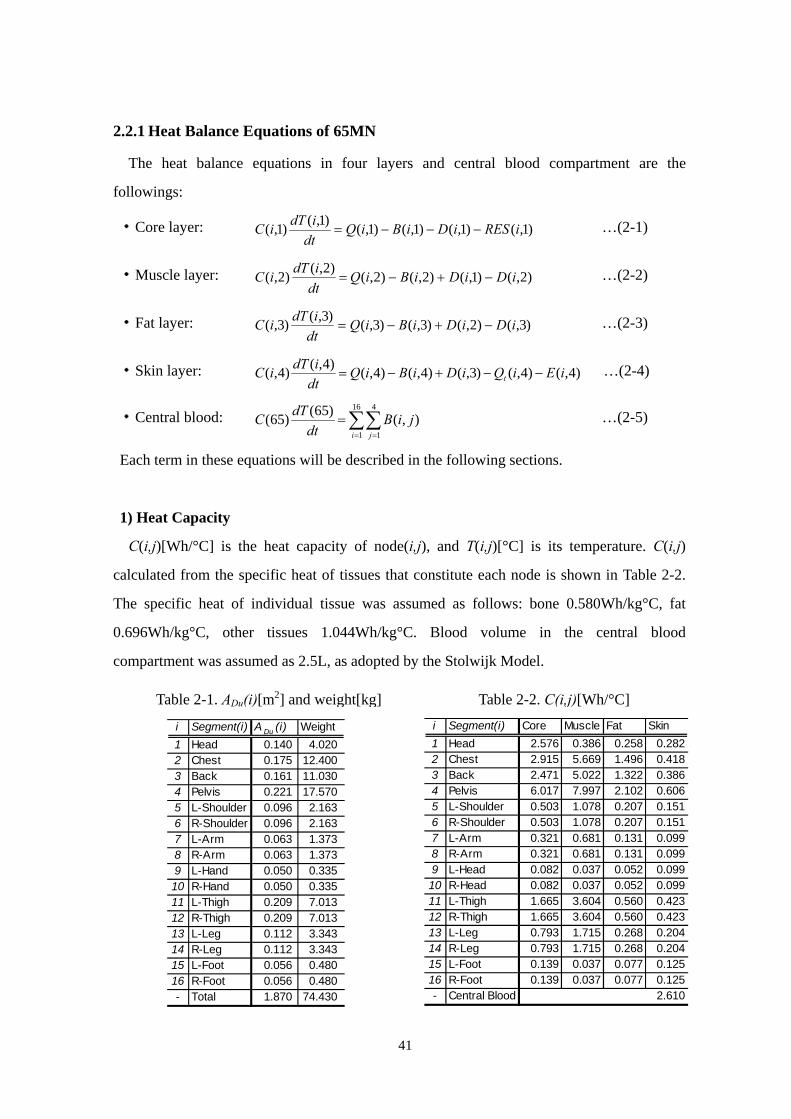
according the surface area ratio of further divided body segments. Surface area ADu(i)[m2]
and weight[kg] of each body segment are shown in Table 2-1.
40
Core j=1
Muscle j=2
Fat j=3
Clothing
Environment
Skin j=4
Conduction
Respiration(Chest)
Bloodstream
Convection / Radiation / Evaporation
Central Blood (65th node)
Segment(i)
Bloodstream
Bloodstream
Bloodstream
Conduction
Conduction
Figure 2-1. Conceptual figure of 65 MN
2.2.1 Heat Balance Equations of 65MN
The heat balance equations in four layers and central blood compartment are the
followings:
・Core layer: )1,()1,()1,()1,()1,()1,( iRESiDiBiQd
tidTiC −−−= …(2-1)
・Muscle layer: )2,()1,()2,()2,()2,()2,( iDiDiBiQd
tidTiC −+−= …(2-2)
・Fat layer: )3,()2,()3,()3,()3,()3,( iDiDiBiQd
tidTiC −+−= …(2-3)
・Skin layer: )4,()4,()3,()4,()4,()4,()4,( iEiQiDiBiQdtidTiC t −−+−= …(2-4)
・Central blood: ∑∑= =
=16
1
4
1),()65()65(
i jjiB
dtdTC …(2-5)
Each term in these equations will be described in the following sections.
1) Heat Capacity
C(i,j)[Wh/°C] is the heat capacity of node(i,j), and T(i,j)[°C] is its temperature. C(i,j)
calculated from the specific heat of tissues that constitute each node is shown in Table 2-2.
The specific heat of individual tissue was assumed as follows: bone 0.580Wh/kg°C, fat
0.696Wh/kg°C, other tissues 1.044Wh/kg°C. Blood volume in the central blood
compartment was assumed as 2.5L, as adopted by the Stolwijk Model.
Table 2-2. C(i,j)[Wh/°C]
Table 2-1. ADu(i)[m2] and weight[kg] i Segment(i) Core Muscle Fat Skin1 Head 2.576 0.386 0.258 0.2 Chest 2.915 5.669 1.496 0.3 Back 2.471 5.022 1.322 0.4 Pelvis 6.017 7.997 2.102 0.5 L-Shoulder 0.503 1.078 0.207 0.6 R-Shoulder 0.503 1.078 0.207 0.7 L-Arm 0.321 0.681 0.131 0.8 R-Arm 0.321 0.681 0.131 0.9 L-Head 0.082 0.037 0.052 0.10 R-Head 0.082 0.037 0.052 0.11 L-Thigh 1.665 3.604 0.560 0.12 R-Thigh 1.665 3.604 0.560 0.13 L-Leg 0.793 1.715 0.268 0.14 R-Leg 0.793 1.715 0.268 0.15 L-Foot 0.139 0.037 0.077 0.16 R-Foot 0.139 0.037 0.077 0.- Central Blood 2.282418386606151151099099099099423423204204125125610
i Segment(i) A Du (i) Weight1 Head 0.140 4.0202 Chest 0.175 12.4003 Back 0.161 11.0304 Pelvis 0.221 17.5705 L-Shoulder 0.096 2.1636 R-Shoulder 0.096 2.1637 L-Arm 0.063 1.3738 R-Arm 0.063 1.3739 L-Hand 0.050 0.33510 R-Hand 0.050 0.33511 L-Thigh 0.209 7.01312 R-Thigh 0.209 7.01313 L-Leg 0.112 3.34314 R-Leg 0.112 3.34315 L-Foot 0.056 0.48016 R-Foot 0.056 0.480- Total 1.870 74.430
41
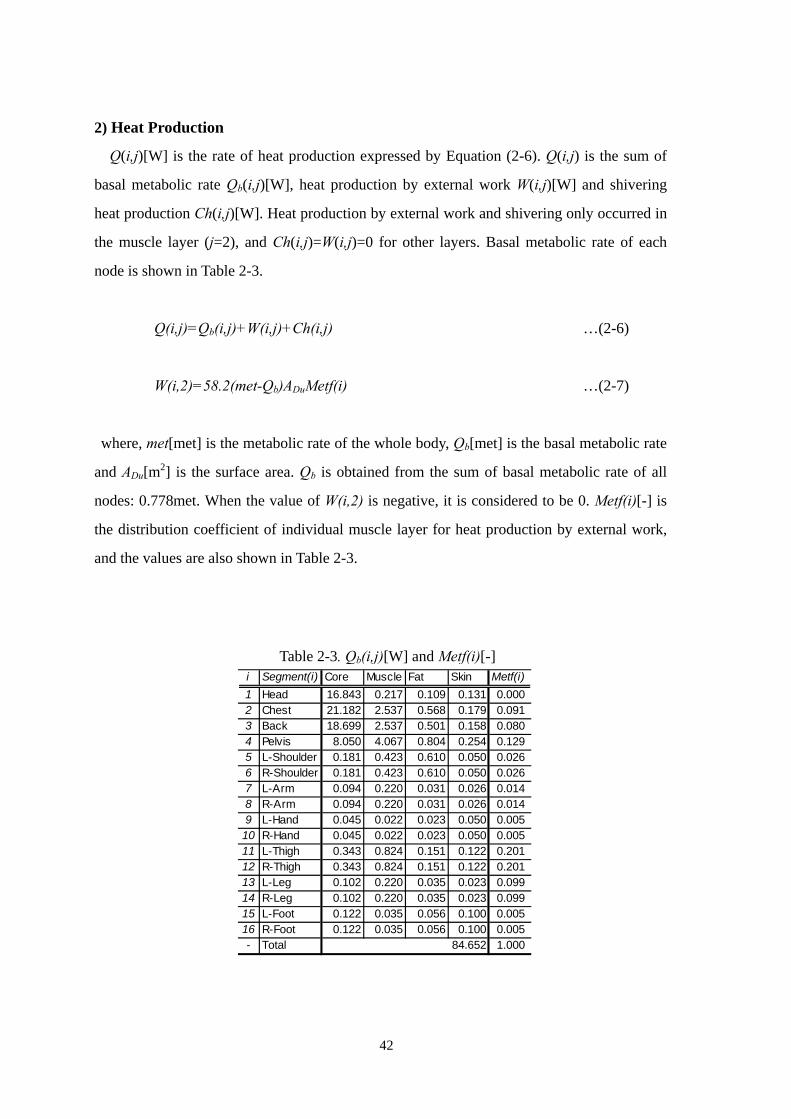
2) Heat Production
Q(i,j)[W] is the rate of heat production expressed by Equation (2-6). Q(i,j) is the sum of
basal metabolic rate Qb(i,j)[W], heat production by external work W(i,j)[W] and shivering
heat production Ch(i,j)[W]. Heat production by external work and shivering only occurred in
the muscle layer (j=2), and Ch(i,j)=W(i,j)=0 for other layers. Basal metabolic rate of each
node is shown in Table 2-3.
Q(i,j)=Qb(i,j)+W(i,j)+Ch(i,j) …(2-6)
W(i,2)=58.2(met-Qb)ADuMetf(i) …(2-7)
where, met[met] is the metabolic rate of the whole body, Qb[met] is the basal metabolic rate
and ADu[m2] is the surface area. Qb is obtained from the sum of basal metabolic rate of all
nodes: 0.778met. When the value of W(i,2) is negative, it is considered to be 0. Metf(i)[-] is
the distribution coefficient of individual muscle layer for heat production by external work,
and the values are also shown in Table 2-3.
Table 2-3. Qb(i,j)[W] and Metf(i)[-] i Segment(i) Core Muscle Fat Skin Metf(i)1 Head 16.843 0.217 0.109 0.131 0.0002 Chest 21.182 2.537 0.568 0.179 0.0913 Back 18.699 2.537 0.501 0.158 0.0804 Pelvis 8.050 4.067 0.804 0.254 0.1295 L-Shoulder 0.181 0.423 0.610 0.050 0.0266 R-Shoulder 0.181 0.423 0.610 0.050 0.0267 L-Arm 0.094 0.220 0.031 0.026 0.0148 R-Arm 0.094 0.220 0.031 0.026 0.0149 L-Hand 0.045 0.022 0.023 0.050 0.005
10 R-Hand 0.045 0.022 0.023 0.050 0.00511 L-Thigh 0.343 0.824 0.151 0.122 0.20112 R-Thigh 0.343 0.824 0.151 0.122 0.20113 L-Leg 0.102 0.220 0.035 0.023 0.09914 R-Leg 0.102 0.220 0.035 0.023 0.09915 L-Foot 0.122 0.035 0.056 0.100 0.00516 R-Foot 0.122 0.035 0.056 0.100 0.005- Total 1.00084.652
42

3) Heat Transfer by Blood Flow
B(i,j)[W] is the heat exchanged between each node and central blood compartment, and is
expressed by Equation (2-8). α[-] is the ratio of counter-current heat exchange, and
ρC[Wh/L°C] is the volumetric specific heat of blood. In this paper, it is assumed that
α=1.000, ρC=1.067Wh/L°C. BF(i,j)[L/h] is the blood flow rate. Equation (2-9) expresses the
blood flow rate for each layer except for skin. T(65)[°C] is the blood temperature in central
blood compartment.
B(i,j)= α ρ C BF(i,j)(T(i,j)-T(65)) …(2-8)
BF(i,j)=BFB(i,j)+(W(i,j)+Ch(i,j))/1.16 …(2-9)
In Equation (2-9), BFB(i,j)[L/h] is the basal blood flow rate, and values used in this model
are shown in Table 2-4. It is assumed that the blood flow of 1.0L/h was required for 1.16W
heat production.
Table 2-4. BFB(i,j)[L/h]i Segment(i) Core Muscle Fat Skin1 Head 45.000 0.870 0.340 2.2402 Chest 77.850 7.660 1.340 1.8003 Back 76.340 7.660 1.340 1.3504 Pelvis 18.190 12.280 2.160 2.0805 L-Shoulder 0.320 1.280 0.160 0.8606 R-Shoulder 0.320 1.280 0.160 0.8607 L-Arm 0.160 0.670 0.085 0.4508 R-Arm 0.160 0.670 0.085 0.4509 L-Hand 0.091 0.078 0.042 0.91010 R-Hand 0.091 0.078 0.042 0.91011 L-Thigh 0.364 0.855 0.150 0.38012 R-Thigh 0.364 0.855 0.150 0.38013 L-Leg 0.071 0.070 0.019 0.11014 R-Leg 0.071 0.070 0.019 0.11015 L-Foot 0.049 0.010 0.019 0.45016 R-Foot 0.049 0.010 0.019 0.450- Total 273.805
43

4) Heat Exchange by Conduction
D(i,j)[W] is the heat transmitted by conduction to the adjacent layer within the same
segment, and is expressed by Equation (2-10). Cd(i,j)[W/°C] is the thermal conductance
between the node and its adjacent node. The values shown in Table 2-5 were used in this
model.
D(i,j)=Cd(i,j)(T(i,j)-T(i,j+1)) …(2-10)
Table 2-5. Cd(i,j)[W/°C]i Segment(i) Core-Muscle Muscle-Fat Fat-Skin1 Head 1.601 13.224 16.0082 Chest 0.616 2.100 9.1643 Back 0.594 2.018 8.7004 Pelvis 0.379 1.276 5.1045 L-Shoulder 0.441 2.946 7.3086 R-Shoulder 0.441 2.946 7.3087 L-Arm 0.244 2.227 7.8888 R-Arm 0.244 2.227 7.8889 L-Hand 2.181 6.484 5.85810 R-Hand 2.181 6.484 5.85811 L-Thigh 2.401 4.536 30.16012 R-Thigh 2.401 4.536 30.16013 L-Leg 1.891 2.656 7.54014 R-Leg 1.891 2.656 7.54015 L-Foot 8.120 10.266 8.17816 R-Foot 8.120 10.266 8.178
5) Heat Loss by Respiration
The heat loss by respiration is assumed to occur only at the core layer of the chest segment,
node(2,1). RES(2,1)[W] is expressed by Equation (2-11).
( ) ( )( ) ( )( ){ } ∑∑= =
⋅−+−=16
1
4
1,1867.5017.01340014.01,2
i jaa jiQptRES ( ) …(2-11)
where, ta(1)[°C] and pa(1)[kPa] are air temperature and vapor pressure at the head segment
respectively.
44

6) Evaporative Heat Loss at Skin Surface
E(i,4)[W] is evaporative heat loss at skin surface, and is expressed by Equation (2-12).
Eb(i,4)[W] is the heat loss by water vapor diffusion through the skin. The skin diffusion is
assumed to be 6% of Emax(i), as shown in Equation (2-13). In the Stolwijk model, values of
Eb(i,4) are given as constants, which correspond to about 3-4% of Emax(i). Esw(i,4)[W] is the
heat loss by evaporation of sweat.
E(i,4)=Eb(i,4)+Esw(i,4) …(2-12)
Eb(i,4)=0.06(1-Esw(i,4)/Emax(i)) Emax(i) …(2-13)
where, Emax(i)[W] is maximum evaporative heat loss, and is shown by Equation (2-14).
Emax(i)=he(i) (psk,s(i)-pa(i))ADu (i) …(2-14)
( ) ( ) ( ) ( )( ) ( )
⋅
+=ifih
iiiIiiLRihclc
clclcle 155.0・ …(2-15)
where, he(i)[W/m2kPa] is the evaporative heat transfer coefficient from the skin surface to
the environment, expressed as a function of clothing vapor permeation efficiency icl(i)[-] by
Equation (2-15). psk,s(i)[kPa] is the saturated vapor pressure on the skin surface, pa(i)[kPa] is
the ambient vapor pressure, and ADu(i)[m2] is the surface area of the body segment.
In Equation (2-15), Icl(i)[clo] and fcl(i)[-] are clothing insulation and clothing area factor
for individual segment respectively, derived from the thermal manikin experiment. The
Stolwijk model does not take into account the clothing insulation. hc(i)[W/m2°C] is the
convective heat transfer coefficient between the clothing and the environment, and
LR[°C/kPa] is the Lewis relation coefficient.
45

7) Sensible Heat Exchange at Skin Surface
Qt(i,4)[W] is convective and radiant heat exchange rate between the skin surface and the
environment, described by Equation (2-16). ht(i)[W/m2°C] is the total heat transfer
coefficient from the skin surface to the environment, and is expressed by Equation (2-17) in
which to(i)[ °C] is the operative temperature, and hr(i)[W/m2°C] is the radiant heat transfer
coefficient. Convective and radiant heat transfer coefficients were derived from the thermal
manikin experiment [6].
Qt(i,4)=ht(i)(T(i,4)- to (i))ADu (i) …(2-16)
)())()((1)(155.0
)(1
ifihihiI
ih clrccl
t ++= …(2-17)
46

2.2.2 Control System of 65MN
1) Sensor Signals
The error signal Err(i, j)[°C] is calculated by Equation (2-18). The set-point temperature
Tset(i,j)[°C], which plays a role of “control target temperature”, is determined on Table 2-6.
Err(i,j)=(T(i,j)-Tset (i,j))+RATE(i,j) F(i,j) …(2-18)
where, RATE(i,j)[h] is the dynamic sensitivity of thermoreceptor, and F(i j)[°C/h] is the
temperature change rate. Since quantitative analysis of the value for RATE (i,j) is not clear
yet, it is set to be 0 in this paper.
Warm signal Wrm(i,j)[°C] and cold signal Cld(i,j)[°C], corresponding to warm and cold
receptors respectively, are defined by Equation (2-19) (when Err(i, j)>0) and Equation (1-20)
(when Err(i, j)<0).
Wrm(i,j)=Err(i,j), Cld(i,j)=0 …(2-19)
Cld(i,j)= - Err(i,j),Wrm(i,j)=0 …(2-20)
Table 2-6. Tset(i,j)[°C] i Segment(i) Core Muscle Fat Skin1 Head 36.9 36.1 35.8 35.62 Chest 36.5 36.2 34.5 33.63 Back 36.5 35.8 34.4 33.24 Pelvis 36.3 35.6 34.5 33.45 L-Shoulder 35.8 34.6 33.8 33.46 R-Shoulder 35.8 34.6 33.8 33.47 L-Arm 35.5 34.8 34.7 34.68 R-Arm 35.5 34.8 34.7 34.69 L-Hand 35.4 35.3 35.3 35.210 R-Hand 35.4 35.3 35.3 35.211 L-Thigh 35.8 35.2 34.4 33.812 R-Thigh 35.8 35.2 34.4 33.813 L-Leg 35.6 34.4 33.9 33.414 R-Leg 35.6 34.4 33.9 33.415 L-Foot 35.1 34.9 34.4 33.916 R-Foot 35.1 34.9 34.4 33.9- Central Blood 36.7(Initial Temperature)
47
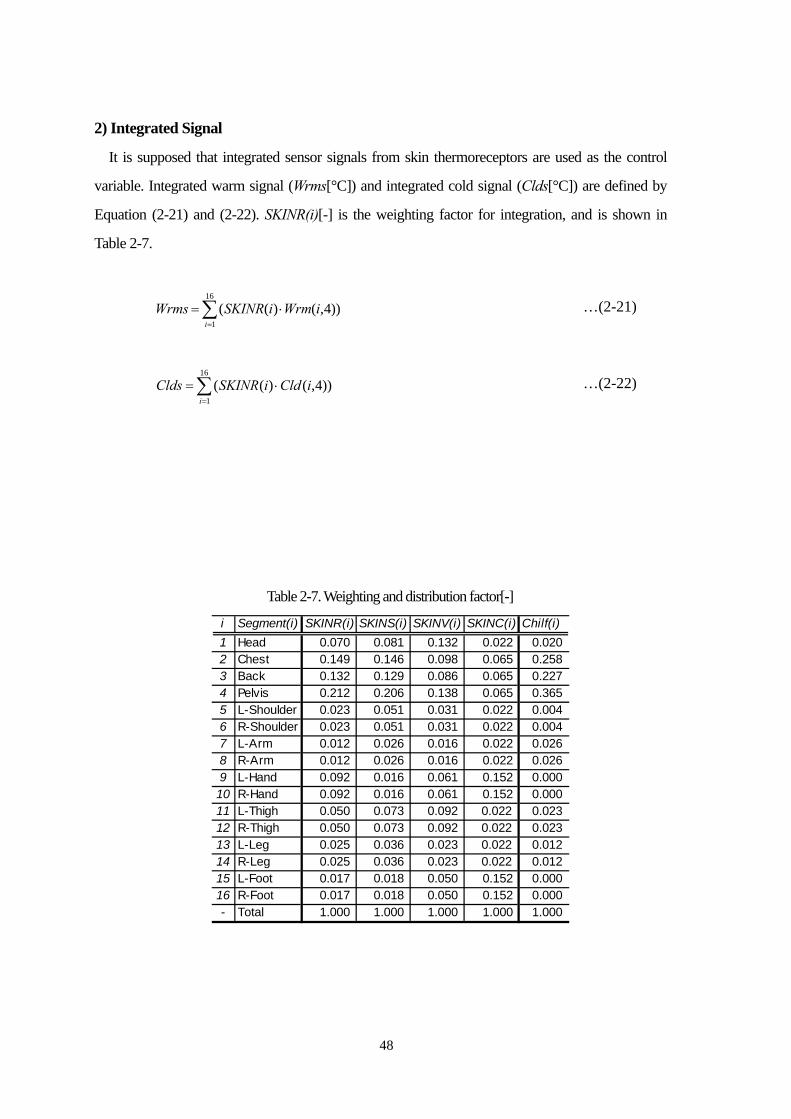
2) Integrated Signal
It is supposed that integrated sensor signals from skin thermoreceptors are used as the control
variable. Integrated warm signal (Wrms[°C]) and integrated cold signal (Clds[°C]) are defined by
Equation (2-21) and (2-22). SKINR(i)[-] is the weighting factor for integration, and is shown in
Table 2-7.
∑=
⋅=16
1))4,()((
iiWrmiSKINRWrms …(2-21)
∑=
⋅=16
1))4,()((
iiCldiSKINRClds …(2-22)
Table 2-7. Weighting and distribution factor[-]
i Segment(i) SKINR(i) SKINS(i) SKINV(i) SKINC(i) Chilf(i)1 Head 0.070 0.081 0.132 0.022 0.0202 Chest 0.149 0.146 0.098 0.065 0.2583 Back 0.132 0.129 0.086 0.065 0.2274 Pelvis 0.212 0.206 0.138 0.065 0.3655 L-Shoulder 0.023 0.051 0.031 0.022 0.0046 R-Shoulder 0.023 0.051 0.031 0.022 0.0047 L-Arm 0.012 0.026 0.016 0.022 0.0268 R-Arm 0.012 0.026 0.016 0.022 0.0269 L-Hand 0.092 0.016 0.061 0.152 0.00010 R-Hand 0.092 0.016 0.061 0.152 0.00011 L-Thigh 0.050 0.073 0.092 0.022 0.02312 R-Thigh 0.050 0.073 0.092 0.022 0.02313 L-Leg 0.025 0.036 0.023 0.022 0.01214 R-Leg 0.025 0.036 0.023 0.022 0.01215 L-Foot 0.017 0.018 0.050 0.152 0.00016 R-Foot 0.017 0.018 0.050 0.152 0.000- Total 1.000 1.000 1.000 1.000 1.000
48

2.2.3 Thermoregulatory System of 65MN
All control equations consist of 3 terms. One is related with head core signal, another with
skin signal, and the third term is related with both. The thermoregulatory system is
constituted of four control processes: vasodilation, vasoconstriction, perspiration, and
shivering heat production. The distribution coefficient [-] of individual segment for each
control process is also shown in Table 2-8. The control coefficients are shown in Table 8,
used in Equations (2-24), (2-25), (2-27) and (2-28). When the values for DL, ST, Esw(i.4),
Ch(i,2) calculated from control equations become negative, they are set to be 0.
Table 2-8. Control coefficients
Sw eat(sw) Csw [W/°C] 371.2 Ssw [W/°C] 33.6 Psw [W/°C2] 0Shivering(ch ) Cch [W/°C] 0.0 Sch [W/°C] 0.0 Pch [W/°C2] 2Vasodilation(dl ) Cdl [L/h°C] 117.0 Sdl [L/h°C] 7.5 Pdl [L/h°C2] 0Vasoconstriction(st ) Cst [1/°C] 11.5 Sst [1/°C] 11.5 Pst [1/°C2] 0
Core(C ) Skin(S ) Core×Skin(P ).0
4.4.0.0
49
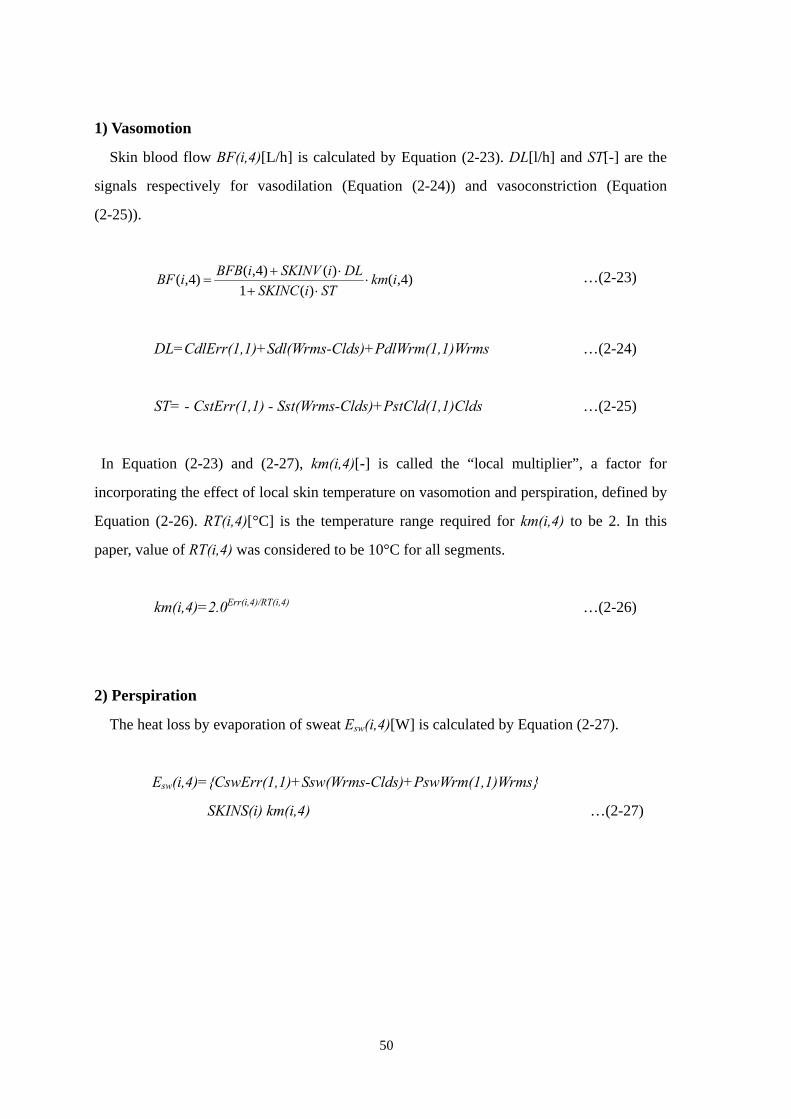
1) Vasomotion
Skin blood flow BF(i,4)[L/h] is calculated by Equation (2-23). DL[l/h] and ST[-] are the
signals respectively for vasodilation (Equation (2-24)) and vasoconstriction (Equation
(2-25)).
)4,()(1
)()4,()4,( ikmSTiSKINC
DLiSKINViBFBiBF ⋅⋅+
⋅+= …(2-23)
DL=CdlErr(1,1)+Sdl(Wrms-Clds)+PdlWrm(1,1)Wrms …(2-24)
ST= - CstErr(1,1) - Sst(Wrms-Clds)+PstCld(1,1)Clds …(2-25)
In Equation (2-23) and (2-27), km(i,4)[-] is called the “local multiplier”, a factor for
incorporating the effect of local skin temperature on vasomotion and perspiration, defined by
Equation (2-26). RT(i,4)[°C] is the temperature range required for km(i,4) to be 2. In this
paper, value of RT(i,4) was considered to be 10°C for all segments.
km(i,4)=2.0Err(i,4)/RT(i,4) …(2-26)
2) Perspiration
The heat loss by evaporation of sweat Esw(i,4)[W] is calculated by Equation (2-27).
Esw(i,4)={CswErr(1,1)+Ssw(Wrms-Clds)+PswWrm(1,1)Wrms}
SKINS(i) km(i,4) …(2-27)
50

3) Shivering Heat Production
The shivering heat production Ch(i,2)[W] is calculated by Equation (2-28).
Ch(i,2)={ - CchErr(1,1) - Sch(Wrms-Clds)+PchCld(1,1)Clds} Chilf(i) …(2-28)
Chilf(i)[-] is the distribution coefficient of individual muscle layer for the shivering heat
production, shown in Table 2-7.
2.2.4 Calculation of SET* by 65MN
65MNSET* is calculated from the output values of mean skin temperature, skin wettedness,
and total heat loss from skin surface, based on 65MN. 65MNSET*, derived from the
calculation with constants and coefficients in this paper, agreed well with conventional SET*
under uniform thermal environment. Moreover, 65MNSET* can be applied to the
non-uniform thermal conditions.
51
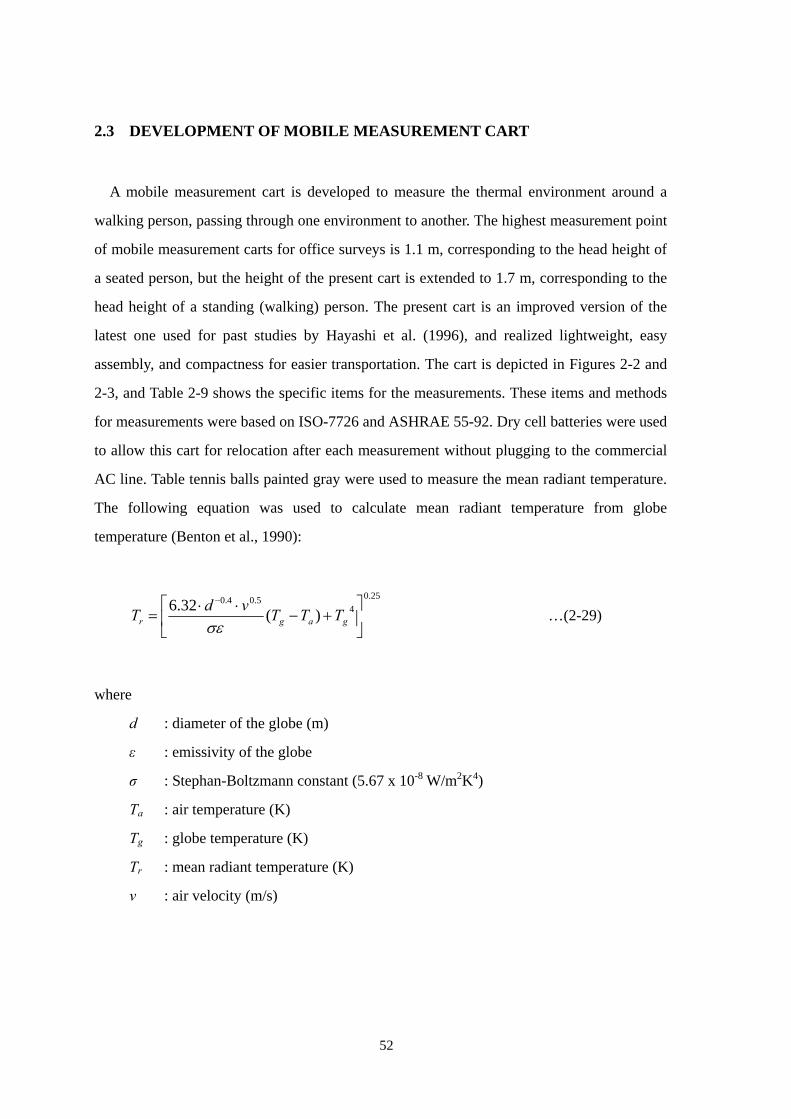
2.3 DEVELOPMENT OF MOBILE MEASUREMENT CART
A mobile measurement cart is developed to measure the thermal environment around a
walking person, passing through one environment to another. The highest measurement point
of mobile measurement carts for office surveys is 1.1 m, corresponding to the head height of
a seated person, but the height of the present cart is extended to 1.7 m, corresponding to the
head height of a standing (walking) person. The present cart is an improved version of the
latest one used for past studies by Hayashi et al. (1996), and realized lightweight, easy
assembly, and compactness for easier transportation. The cart is depicted in Figures 2-2 and
2-3, and Table 2-9 shows the specific items for the measurements. These items and methods
for measurements were based on ISO-7726 and ASHRAE 55-92. Dry cell batteries were used
to allow this cart for relocation after each measurement without plugging to the commercial
AC line. Table tennis balls painted gray were used to measure the mean radiant temperature.
The following equation was used to calculate mean radiant temperature from globe
temperature (Benton et al., 1990):
25.04
5.04.0
)(32.6
+−
⋅⋅=
−
gagr TTTvdTσε
…(2-29)
where
d : diameter of the globe (m)
ε : emissivity of the globe
σ : Stephan-Boltzmann constant (5.67 x 10⁻⁸ W/m2K4)
Ta : air temperature (K)
Tg : globe temperature (K)
Tr : mean radiant temperature (K)
v : air velocity (m/s)
52
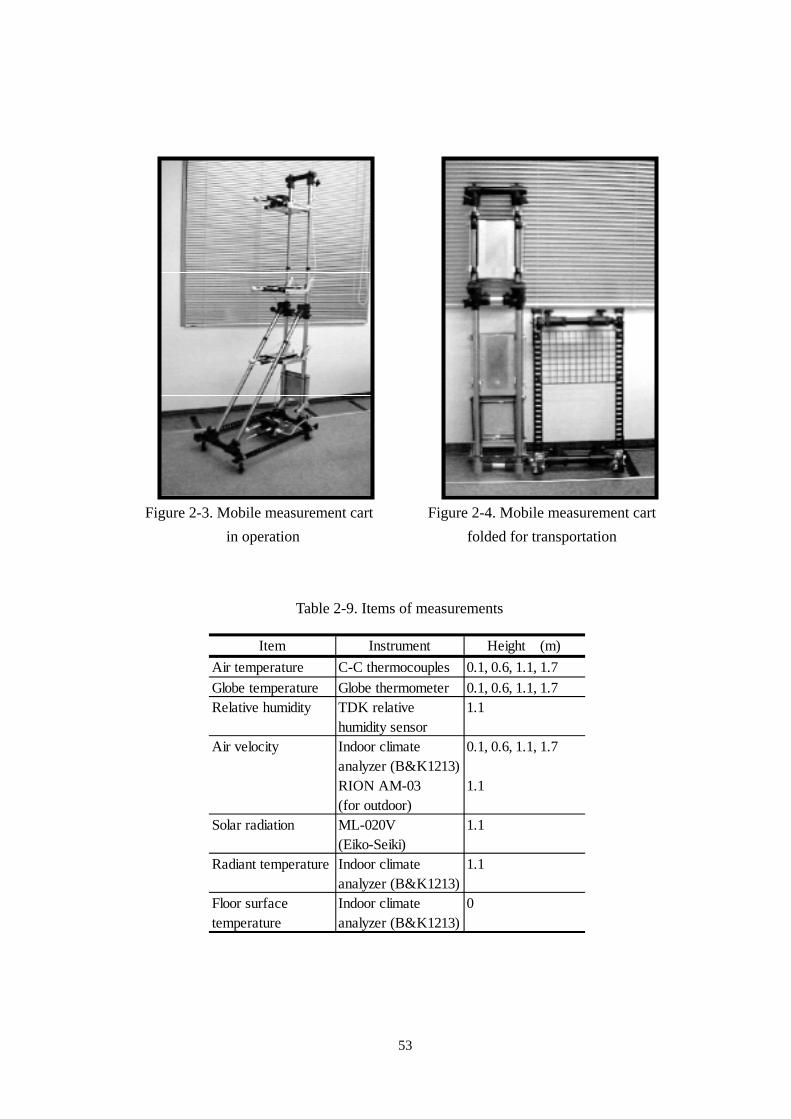
Figure 2-3. Mobile measurement cart in operation
Figure 2-4. Mobile measurement cart folded for transportation
Table 2-9. Items of measurements
Item Instrument Height (m)Air temperature C-C thermocouples 0.1, 0.6, 1.1, 1.7Globe temperature Globe thermometer 0.1, 0.6, 1.1, 1.7Relative humidity TDK relative
humidity sensor1.1
Indoor climateanalyzer (B&K1213)
0.1, 0.6, 1.1, 1.7
RION AM-03(for outdoor)
1.1
Solar radiation ML-020V(Eiko-Seiki)
1.1
Radiant temperature Indoor climateanalyzer (B&K1213)
1.1
Floor surfacetemperature
Indoor climateanalyzer (B&K1213)
0
Air velocity
53

2.4 FIELD MEASUREMENT OF TRANSITIONAL THERMAL ENVIRONMENT
2.4.1 Method
The objective of the present survey was to investigate how different routes affected the
thermal environment experienced by a walking person, and to collect environmental data of
semi-outdoor environment for boundary conditions of numerical simulation with 65MN.
Total of three seasonal field measurements were conducted at an integrated facility located
in Hyogo Prefecture (long. 134° 50’E, lat. 34° 45’N), Japan. Summer survey was conducted
from August 20 to 22, 1997, autumn survey on October 27 and 28, 1997, and winter survey
on January 8 and 9, 1998. The site plan of the entire facility is given in Figure 2-4. This
facility was placed on the south side of a hill, consisting of a central building with fitness
club, a library, and a music hall. The three buildings were connected by open corridors. The
main entrance of the central building was located on the second floor, facing northeast.
Second floor lobby and first floor lobby, connected by slope way, formed an atrium with
huge windows facing east. Floor plans are illustrated in Figure 2-5.
Measurement points were determined along several virtual routes, supposing a visitor
moving through the facility for different destinations. Mobile measurement cart was utilized
to quantify the thermal environment at representative points along the route. At each point,
environmental variables given in Table 2-11 were measured every 30 seconds for 10 minutes.
Average values of whose within the last three minutes were used for analysis. The results of
the “pool route” and the “library route” are reported. The “pool route” simulated a visitor
heading towards the indoor swimming pool on the first floor through the main entrance on
the second floor of the central building. The “library route” starts from the library building,
passing through the central building, and going out of the main entrance. The measurement
points are described in detail in Figures 2-4 and 2-5.
54
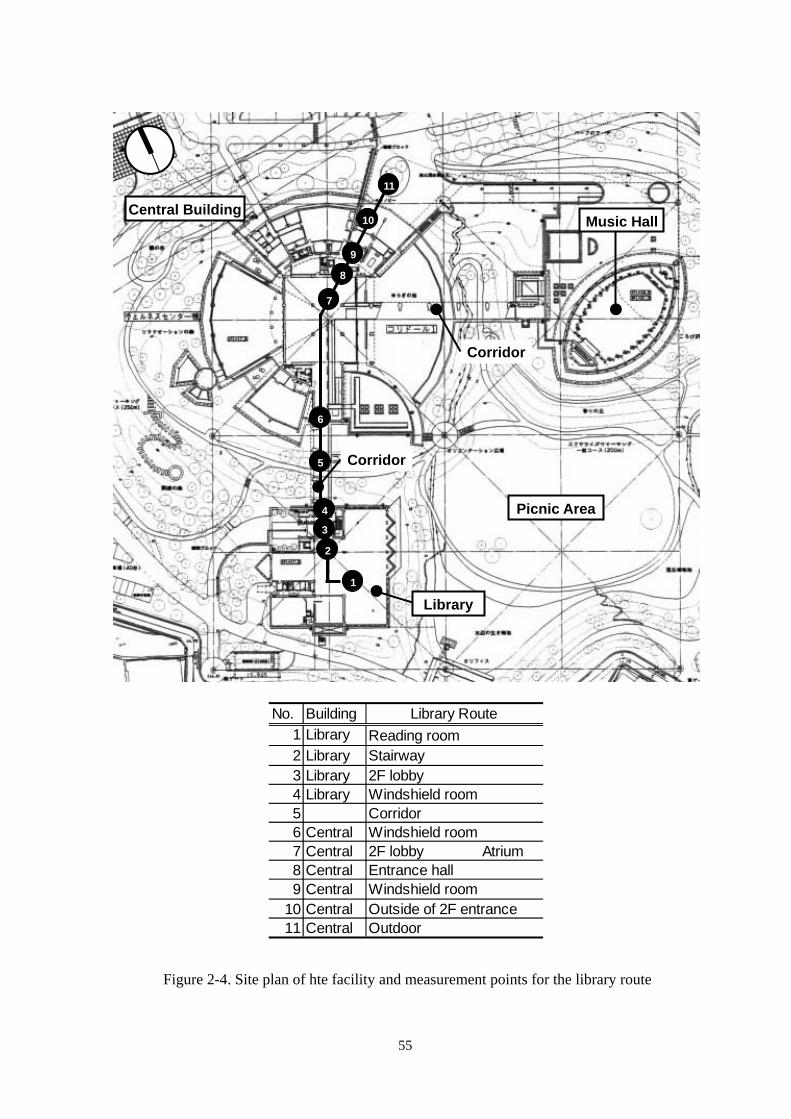
Table 2-13. Measurement points of the “library route”.
11
10
9
8
7
3
6
4
5
2
1
Central Building
Picnic Area
Corridor
Music Hall
Corridor
Library
No. Building1 Library2 Library3 Library4 Library56 Central7 Central 2F lobby Atrium8 Central9 Central
10 Central11 Central
Outside of 2F entranceOutdoor
Entrance hallWindshield room
Library RouteReading roomStairway2F lobbyWindshield roomCorridorWindshield room
Figure 2-4. Site plan of hte facility and measurement points for the library route
55

1F
2F
1F Lobby
2F Lobby
No.12345 2F lobby6 Slope Atrium7 1F lobby89
Pool RouteOutdoorOutside of 2F entranceWindshield roomEntrance hall
Locker roomIndoor swimming pool
Figure 2-5. Second and first floor plans of the facility. The numbers indicate the measurement points of the “pool route”.
56
2.4.2 Results of Field Measurement
1) Environmental Variation Profiles for the Two Routes
The results of thermal environment measurement of the pool route and the library route in
winter are presented in Figures 2-6 and 2-7 respectively. Air temperature and air velocity at
four heights, and mean radiant temperature and humidity at 1.1m are presented. The distance
between each measurement point is reflected on the X-axis. The pool route is a transition
process within the central building. Gradual rises of air temperature and mean radiant
temperature was observed as the distance from the entrance was longer, and the environment
was deeper into the core of the building. Maximum vertical temperature difference was
observed in 2F lobby, 3.1 °C between 0.1 and 1.1 m above floor level. The measurement was
conducted before noon, and the space was in the midst of rapid preheating process. Air
velocity was also observed to be higher than other spaces due to the same reason. The library
route requires transitions in and out of the building, resulting in air temperature step changes
of more than 10 °C for a total of 3 times. Mean radiant temperature and air velocity were
high in the corridor. The afternoon-measurement of this route was the reason for large mean
radiant temperature difference between corridor and outside of the 2F entrance. The 10
minutes required for measurement of each representative environment had caused a time lag
of more than an hour between the 2 outdoor measurements, and the setting winter sun had
lost its effect at the entrance facing northeast. Shorter measurement period is desired for
mobile measurement of long routes. Nevertheless, differences in thermal environment
variation profile could be quantified using the mobile measurement cart.
The air temperature of the non air-conditioned windshield rooms were found to be the
intermediate value of the adjacent indoor and outdoor environments, confirming its effect on
the spaces as thermal buffer zones.
57

0
5
10
15
20
25
30
35
ta 1.7m ta 1.1mta 0.6m ta 0.1mMRT
0.0
0.5
1.0
1.5
2.0
2.5
3.0
20
30
40
50
60
70
80RH va 1.7mva 1.1m va 0.6mva 0.1m
Tem
pera
ture
(°C
)
Rel
ativ
e hu
mid
ity (%
)
Air
velo
city
(m/s
)
Out
door
Out
side
of 2
F en
tran
ceen
tran
ceW
inds
hiel
d ro
omW
inds
hiel
d ro
omll ll
Figure 2-6. Environ
Entr
ance
hal
Entr
ance
hal
2F lo
bby
2F lo
bby
Slop
eSl
ope
1F lo
bby
1F lo
bby
Lock
er ro
omLo
cker
room
Swim
min
g po
oSw
imm
ing
poo
mental variation profile of the pool route in winter
58

(L) R
eadi
ng ro
om
(L)
Sta
irway
(L) 2
F lo
bby r l r
0
5
10
15
20
25
30
35ta 1.7m ta 1.1mta 0.6m ta 0.1mMRT
0.0
0.5
1.0
1.5
2.0
2.5
3.0
20
30
40
50
60
70
80RH va 1.7mva 1.1m va 0.6mva 0.1m
Tem
pera
ture
(°C
)
Rel
ativ
e hu
mid
ity (%
)
Air
velo
city
(m/s
)
Figure 2-7. Environmental
(L) W
inds
hiel
d ro
om
Cor
rido
(C) W
inds
hiel
d ro
om
(C
) 2F
lobb
y(C
) Ent
ranc
e ha
l(C
) Win
dshi
eld
room
(C) O
utsi
de o
f 2F
entr
ance
(C) O
utdo
o
variation profile of the library route in winter
59

2) Seasonal Differences
Figure 2-8 shows the comparison of three seasonal results of pool route measured in
summer, autumn, and winter. The air temperature and mean radiant temperature measured at
the height of 1.1 m are plotted. The seasonal differences of air temperature and mean radiant
temperature measured at 1F lobby, locker room, and indoor swimming pool were small,
indicating sufficiently controlled thermal environment throughout the year. In summer, the
values of air temperature and mean radiant temperature fell gradually as the cart moved
inside of the facility. On the other hand, the temperatures were observed to rise in winter. In
autumn, the change of thermal environment was relatively smaller, owing to the natural
ventilation utilized during the intermediate seasons. Although the thermal environments were
quite different at the beginning of the route among the three seasons, air temperature and
mean radiant temperature became closer after passing through the 1F lobby.
0
10
20
30
40
Summer ta Summer MRT
Autumn ta Autumn MRT
Winter ta Winter MRT
Out
door
Out
side
of 2
F en
tran
ceW
inds
hiel
d ro
omEn
tran
ce h
all
2F lo
bby
Slop
e
1F lo
bby
Lock
er ro
om
Swim
min
g po
ol
Figure 2-8. Seasonal differences of air temperature (ta) and mean radiant temperature (MRT) for the pool route
60
2.5 65MN SIMULATION WITH FIELD MEASUREMENT DATA
The discrete measurement data acquired from the filed survey was used as boundary
conditions of the numerical simulation by 65MN to simulate the transient physiological
conditions of a person undergoing continuous environmental step changes. The
environmental variables at four heights were applied to each of the 16 body segments for
corresponding heights. Clothing insulation measured by thermal manikin (Tanabe et al.,
1994) was used for clo values. The duration of each environment was given according to the
distance between each representative measurement points, divided by walking speed of 0.89
m/s (3.2 km/h). The initial warm up conditions were set at the environment of 25 °C air
temperature and mean radiant temperature, 50 % rh, and 0.10 m/s air velocity with 1.0 met.
Considering the relative increase of air velocity, 0.89 m/s was added while walking. The
effect of environmental composition on transient physiological conditions was investigated
2.5.1 The Summer Pool Route (Case 1)
The environmental data of the pool route was used to compare the physiological
conditions between a passer-by and an occupant staying in the environment. The boundary
conditions are given in Table 2-10. The first two phases will be referred to as “outdoor”, the
next 4 phases from windshield room to slope as “buffer”, and the rest as “indoor”. A
passer-by was simulated to pass through the environment for the period given in the table,
while an occupant was supposed to stay in the environment for 60 minutes. The results of
mean skin temperature (Msk) and evaporative heat loss (E) are given in Figure 2-9. Discrete
plots represent the physiological variable of an occupant. Fast Msk rise of a passer-by in the
first 15 minutes was regulated by the start of sweat secretion. The rapid decrease began as a
passer-by entered the buffer environment, and the value was stable when entering indoor
environment. Although the evaporative heat loss of a passer-by closely matched with that of
an occupant, Msk tended to be higher for a passer-by due to the residual heat stored outside.
Alternative conditions were examined, supposing that thermal environment of outdoor was
under the thermally comfortable conditions, same as the warm up conditions. Msk of
comfortable conditions coincided with the initial outdoor conditions at the end of buffer
phases. The buffer environment was able to cancel out body-stored heat in 15 minutes.
61

Table 2-10. Boundary condition for Case 1
Indo
or
Buf
r fe
r O
utdo
o
Phaseno.
Measurement point Durationperiod
Metabolicrate
Clothing(clo)
Change
(min.) (met) Summer1 Outdoor 30 2.0 0.55 env.2 Outside of 2F entrance 2 2.0 0.55 env.3 Windshield room 1 2.0 0.55 env.4 Entrance hall 2 2.0 0.55 env.5 2F lobby 4 2.0 0.55 env.6 Slope 3 2.0 0.55 env.7 1F lobby 3 2.0 0.55 env.8 5 1.6 0.55 env.9 5 1.6 0 clo.10 5 1.2 0 env.11 5 2.4 0 met.
Locker room
Indoor swimming pool
Outdoor Buffer Indoor
32
33
34
35
36
0 10 20 30 40 50 600
10
20
30
40
50
60
70
80
Msk of passer-by Msk of occupant E of passer-by E of occupant Msk of outdoor comfort
Evap
orat
ive
heat
loss
(W/m
2 )
Mea
n sk
in te
mpe
ratu
re (°
C)
Figure 2-9. Calculated mean skin temperature and evaporative heat loss for Case 1
62

2.5.2 Seasonal Variation and Space Composition (Case 2)
Two virtual “pool routes” were supposed for each season: the long route and the short
route. The long route allowed the visitor to pass through the buffer zones before reaching the
swimming pool, while the short route visitor entered the 1F lobby straight from outdoor.
Tables 2-11 and 2-12 show the boundary conditions for two routes consisting of several
phases. Figure 2-10 presents the mean skin temperature and evaporative heat loss of an
imaginary visitor heading for the swimming pool along two different routes. “Season-L” and
“Season-S” in the figure represent the results for long route and short route in each season
respectively. Msk at the end of outdoor phase, just before entering indoor, and at the
beginning of pool phase, the destination of the visitor, are given in Table 2-13 for each route.
Msk variation rates are also presented. Because of the differences in clothing, initial Msk and
E in each season were slightly different. In summer and autumn when indoor and outdoor air
temperatures were close, slight difference was observed between the short route and the long
route. In winter, on the other hand, higher Msk was observed for the long route visitor at the
beginning of the pool phase. Msk variation rate was also smaller, indicating a gradual change
of the thermal environment as opposed to the short route. The buffer zones were confirmed
to alleviate heat shocks upon entering or leaving indoor and this function became more
effective when differences in thermal environment were large between indoor and outdoor.
The results of the local skin temperature simulation for Cases 1 and 2 are depicted in
Figures 2-11 and 2-12.
63
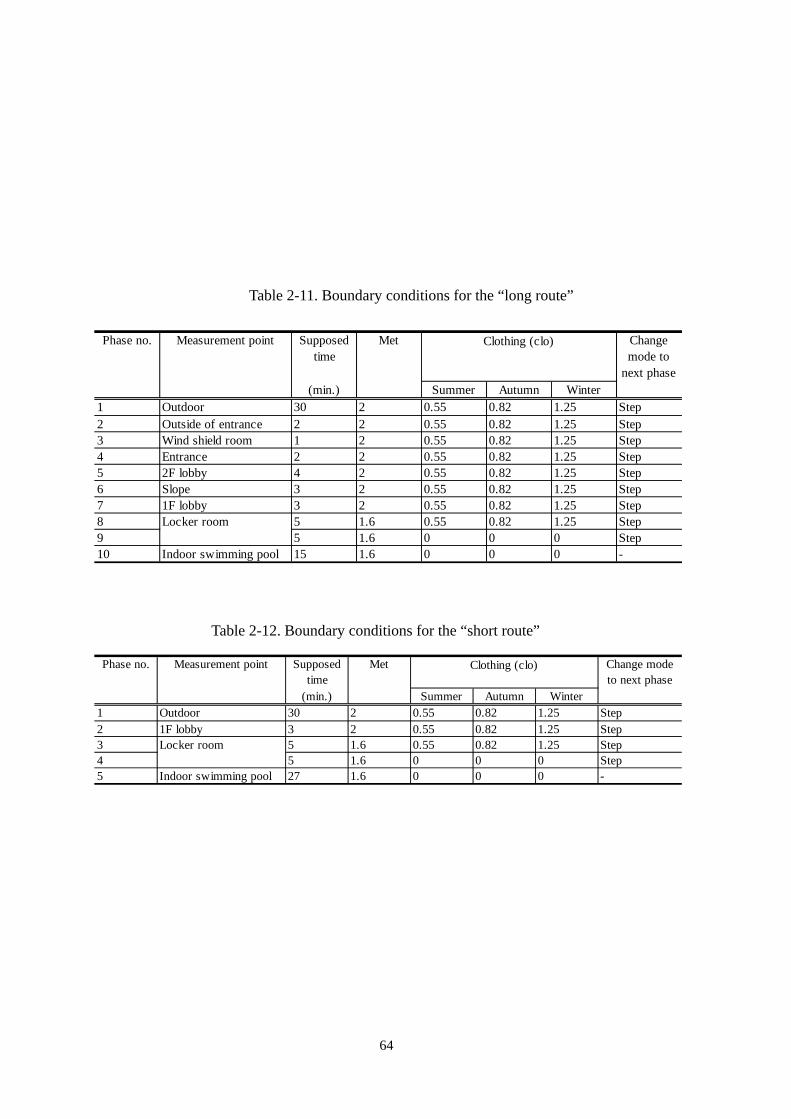
Table 2-11. Boundary conditions for the “long route”
64
Step
Table 2-12. Boundary conditions for the “short route”
Phase no. Measurement point Supposedtime
Met Change modeto next phase
(min.) Summer Autumn Winter1 Outdoor 30 2 0.55 0.82 1.25 Step2 1F lobby 3 2 0.55 0.82 1.25 Step3 5 1.6 0.55 0.82 1.25 Step4 5 1.6 0 0 0 Step5 Indoor swimming pool 27 1.6 0 0 0 -
Clothing (clo)
Locker room
Phase no. Measurement point Supposedtime
Met Changemode to
next phase(min.) Summer Autumn Winter
1 Outdoor 30 2 0.55 0.82 1.25 Step2 Outside of entrance 2 2 0.55 0.82 1.25 Step3 Wind shield room 1 2 0.55 0.82 1.25 Step4 Entrance 2 2 0.55 0.82 1.25 Step5 2F lobby 4 2 0.55 0.82 1.25 Step6 Slope 3 2 0.55 0.82 1.25 Step7 1F lobby 3 2 0.55 0.82 1.25 Step8 5 1.6 0.55 0.82 1.25 Step9 5 1.6 0 0 010 Indoor swimming pool 15 1.6 0 0 0 -
Locker room
Clothing (clo)
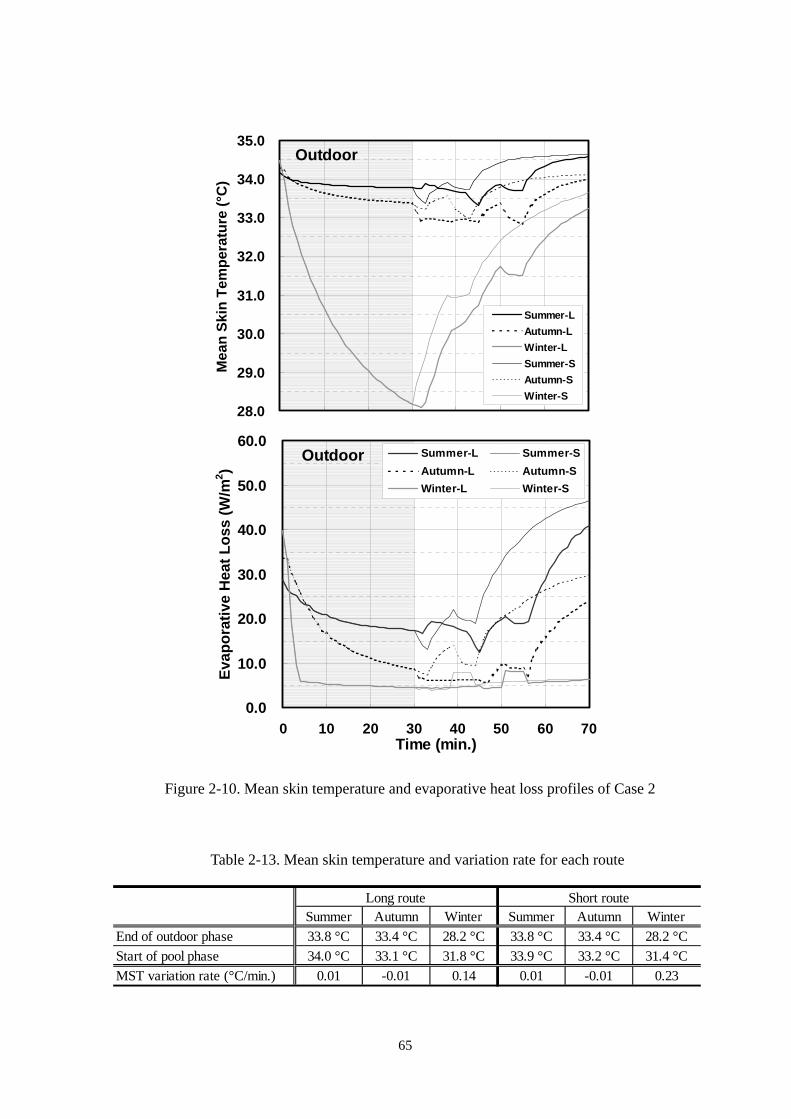
28.0
29.0
30.0
31.0
32.0
33.0
34.0
35.0
Mea
n Sk
in T
empe
ratu
re (°
C)
Summer-LAutumn-LWinter-LSummer-SAutumn-SWinter-S
Outdoor
0.0
10.0
20.0
30.0
40.0
50.0
60.0
0 10 20 30 40 50 60 70Time (min.)
Evap
orat
ive
Hea
t Los
s (W
/m2 )
Summer-L Summer-SAutumn-L Autumn-SWinter-L Winter-S
Outdoor
End of Start ofMST v
Figure 2-10. Mean skin temperature and evaporative heat loss profiles of Case 2
Table 2-13. Mean skin temperature and variation rate for each route
Summer Autumn Winter Summer Autumn Winteroutdoor phase 33.8 °C 33.4 °C 28.2 °C 33.8 °C 33.4 °C 28.2 °C pool phase 34.0 °C 33.1 °C 31.8 °C 33.9 °C 33.2 °C 31.4 °Cariation rate (°C/min.) 0.01 -0.01 0.14 0.01 -0.01 0.23
Long route Short route
65
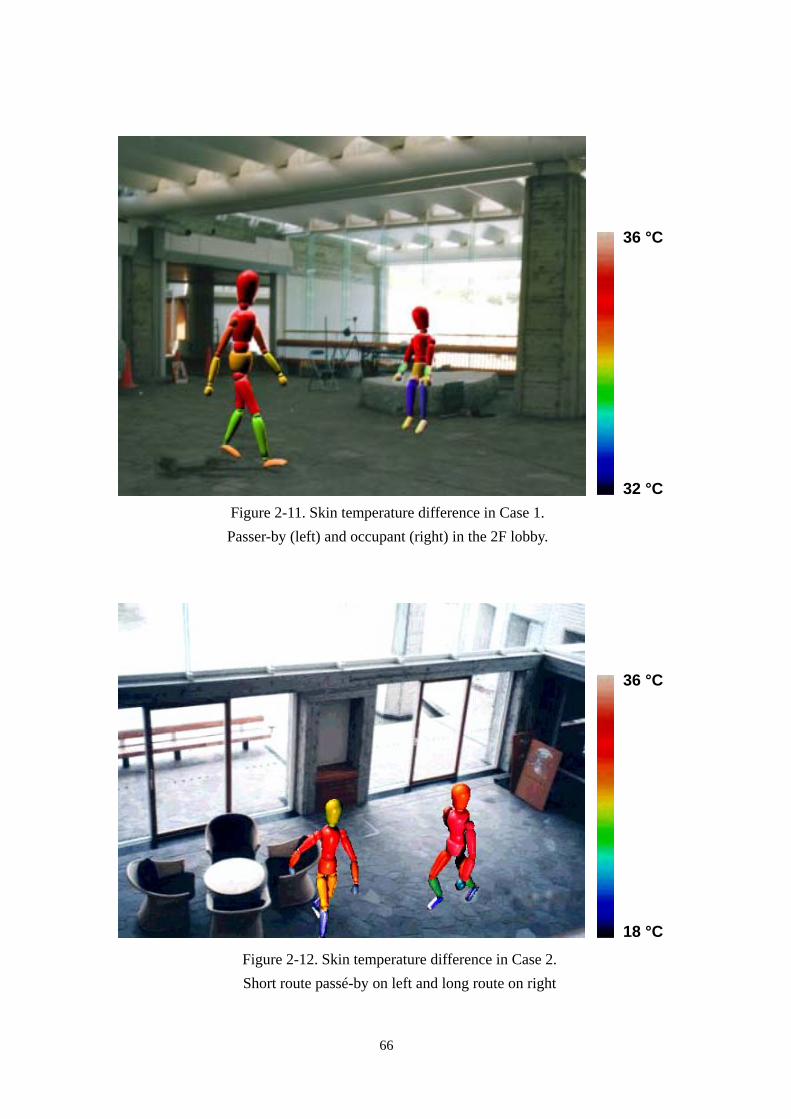
36 °C
32 °CFigure 2-11. Skin temperature difference in Case 1. Passer-by (left) and occupant (right) in the 2F lobby.
36 °C
18 °CFigure 2-12. Skin temperature difference in Case 2. Short route passé-by on left and long route on right
66

2.6 CONCLUSION
Evaluation method for transient thermal comfort was proposed, integrating field
measurement of environmental variables and numerical simulation of human
thermoregulation. Numerical thermoregulation model, 65MN, was presented to examine the
transient physiological response during transition. The mobile field measurement apparatus
for acquisition of thermal environmental variables in successive environments was developed.
Seasonal field measurements were carried out along several imaginary routes for summer,
autumn, and winter at an integrated public facility in Hyogo, Japan. Using these physical
data as boundary conditions, numerical simulation of physiological conditions was
performed utilizing the 65-node model. The buffer zones were confirmed to reduce the
influence of outdoor thermal environment especially when the differences were large
between outdoor and indoor. Because outdoor conditions of the summer measurements were
moderate, distinct effects of buffer zones could not be explicitly confirmed in summer. The
results were interpreted from the mean skin temperature variation rates of a simulated visitor,
but further investigation is required to clarify the relationship between simulated
physiological variables and the actual thermal sensation or comfort sensation.
67

68

CHAPTER 3
TRANSIENT THERMAL COMFORT SUCCEEDING A SHORT WALK IN A BUFFER
SPACE FROM OUTDOOR TO INDOOR
69

70
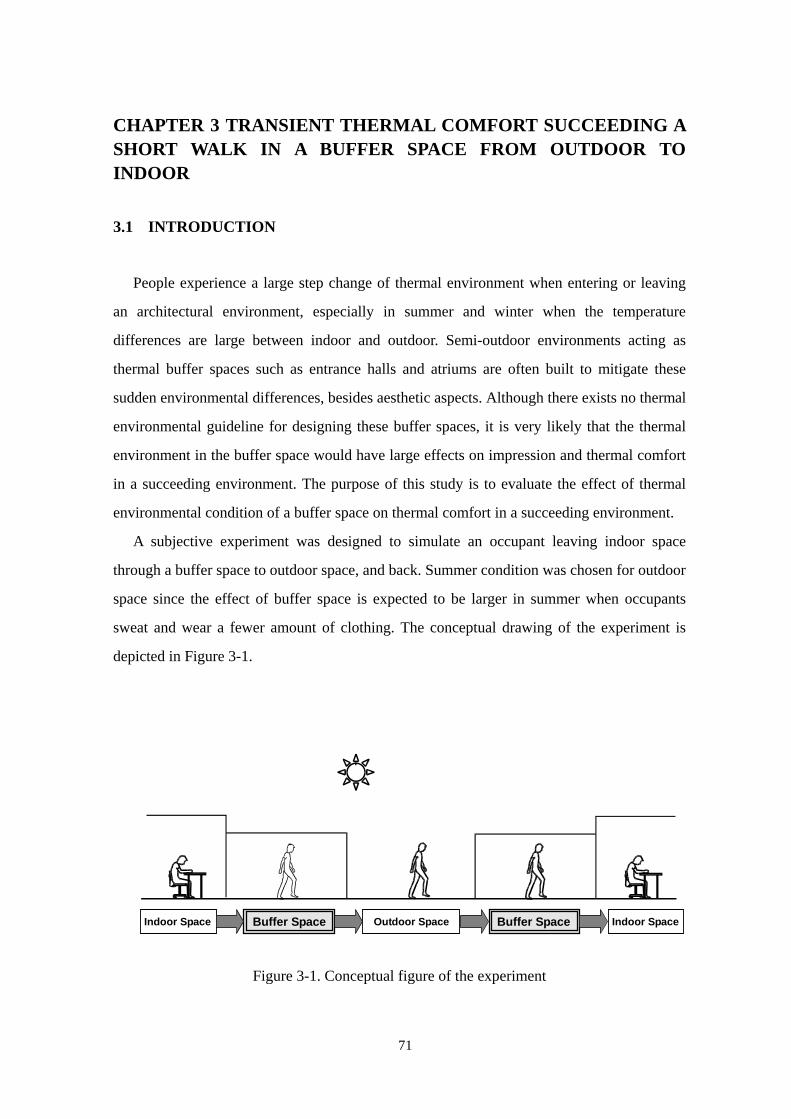
CHAPTER 3 TRANSIENT THERMAL COMFORT SUCCEEDING A SHORT WALK IN A BUFFER SPACE FROM OUTDOOR TO INDOOR
3.1 INTRODUCTION
People experience a large step change of thermal environment when entering or leaving
an architectural environment, especially in summer and winter when the temperature
differences are large between indoor and outdoor. Semi-outdoor environments acting as
thermal buffer spaces such as entrance halls and atriums are often built to mitigate these
sudden environmental differences, besides aesthetic aspects. Although there exists no thermal
environmental guideline for designing these buffer spaces, it is very likely that the thermal
environment in the buffer space would have large effects on impression and thermal comfort
in a succeeding environment. The purpose of this study is to evaluate the effect of thermal
environmental condition of a buffer space on thermal comfort in a succeeding environment.
A subjective experiment was designed to simulate an occupant leaving indoor space
through a buffer space to outdoor space, and back. Summer condition was chosen for outdoor
space since the effect of buffer space is expected to be larger in summer when occupants
sweat and wear a fewer amount of clothing. The conceptual drawing of the experiment is
depicted in Figure 3-1.
Indoor SpaceBuffer Space Buffer Space Outdoor SpaceIndoor Space
Figure 3-1. Conceptual figure of the experiment
71

3.2 OUTLINE OF EXPERIMENT
3.2.1 Experimental Schedule
Experiments were conducted from September 21 to October 21, 2000, in a climate
chamber in Waseda University, Japan. Every experimental day was divided into 3 sessions
starting from 9:00, 13:00 and 17:00. Subjects participated in the same period for all the
experimental conditions. The climate chamber was divided into 3 spaces to simulate the
thermal environment for indoors, buffer space and outdoors. Plan of the climate chamber and
pictures from the experiment are depicted in Figure 3-2.
2,
385
230
785
2,700
3,60
0 7,
000
6,000
step
partition
step
desk
HVAC control unit
Outdoor
Buffer Space
Indoor
Figure 3-2. Plan of the climate chamber and pictures from the experiment
72

3.2.2 Subjects
The body-build data of the subjects, 6 males and 6 females, are given in Table 3-1.
Subjects wore a set of typical office attire prepared by the experimenter: long sleeved Y shirt,
sleeveless undershirt, tie, pants, sox, underwear, and leather shoes for males and long sleeved
blouse, underwear, skirt, pantyhose, and leather shoes for females. The clothing ensemble
was measured with a thermal manikin and found to be 0.72 clo (standing), 0.77 clo (seated,
chair included) for males and 0.58 clo (standing), 0.64 clo (seated, chair included) for
females.
Table 3-1. Body-build data of the subjects
Mean S.D. Mean S.D. Mean S.D.Male 1.74 0.05 60.2 5.1 1.73 0.09
Female 1.61 0.06 50.6 5.6 1.52 0.11
Height (m) Weight (kg) ADu (m2)
73

3.2.3 Experimental Conditions
The thermal environment of the spaces were controlled at 32 °C, 70 %RH for outdoors
and 25 °C, 50-60 %RH for indoors. Buffer space was controlled at 3 conditions of 22, 25,
28 °C, and transition period was set at 3, 5, and 10 minutes. A combination of these variables
and a condition without a buffer zone yielded a total of 10 experimental conditions as given
in Table 3-2. Other thermal environment variables of the buffer space were controlled as
follows: air temperature = mean radiant temperature, 50-60 %RH, still air. The average
environmental data of each space measured every 2 minutes are given in Table 3-3.
Table 3-2. Experimental condition codes
0 min. 3 min. 5 min. 10 min.22 ºC 22-3 22-5 22-1025 ºC 25-0 25-3 25-5 25-1028 ºC 28-3 28-5 28-10
Air temp.
Duration
Table 3-3. Average environmental data of each space
Target Mean (S.D.) Target Mean (S.D.) Target Mean (S.D.)
25.0 (0.7) 28 28.1 (0.2) 32.2 (0.1)25 24.9 (0.5) 25 25.0 (0.2) 32 32.0 (0.2)
24.9 (0.5) 22 21.9 (0.3) 32.1 (0.6)53 (5) 56 (1) 70 (1)58 (3) 59 (1) 70 70 (2)53 (2) 58 (2) 68 (1)
Buffer Space Outdo or Space
Air temp. (oC)
Relativehumidity
(%)
Indo o r Space
74

3.2.4 Experimental Method
Subjects made a series of transition in the following order: indoor space (60 min.) – buffer
space (3, 5, or 10 min.) – outdoor space (15 min.) – buffer space (3, 5, or 10 min.) – indoor
space (60 min.). Transition period of the buffer zone was fixed for each experimental
condition. No more than 2 subjects participated in each session. Metabolic rate was
controlled by step exercise (Arens et al., 1993) at 2.0 met in buffer space and outdoor space
to simulate walking at the speed of 3.2 km/h (ASHRAE, 2002), and 1.2 met to simulate
regular office work in indoor space. In “23-0” condition, subjects walked through the buffer
space controlled at 25 °C to make a transition from indoor to outdoor space. Following the
time schedule given in Figure 3-3, subjects were asked to mark a line on the questionnaire
given in Figure 3-4. Questionnaire items were defined as “environmental temperature
sensation vote (ESV)”, “whole body thermal sensation vote (TSV)”, “comfort sensation vote
(CSV)”, “sweat sensation”, “clothing acceptability”, “wet body part”, and “thermal
acceptability” in the order presented in the questionnaire. When the subjects returned to the
indoor space after a series of transitions, they were asked to vote every minute for a period of
10 minutes to follow the rapid variation in sensation.
A concept of “environmental temperature sensation vote (ESV)” and “whole body thermal
sensation vote (TSV)” was introduced in this experiment. TSV is the widely accepted
concept to describe the thermal state of the subject in a given thermal environment. However,
when a subject undergoes a step change through different thermal environments, the rapid
environmental change itself may be sensed as hot / warm / cool / cold in comparison to the
preceding environment and consequently affect the thermal sensation vote. In order for
subjects to consciously distinguish the 2 different concepts of thermal sensation, two separate
scales were used.
Mean skin temperatures of all the subjects were measured every 10 seconds with C-C
thermocouples attached to forehead, abdomen, left thigh, left leg, left foot, left arm and left
hand. Vapor pressures within clothing were recorded simultaneously by attaching relative
humidity sensors at chest and back. Body temperature at armpit and weight were also
measured at the beginning and end of each experiment.
75
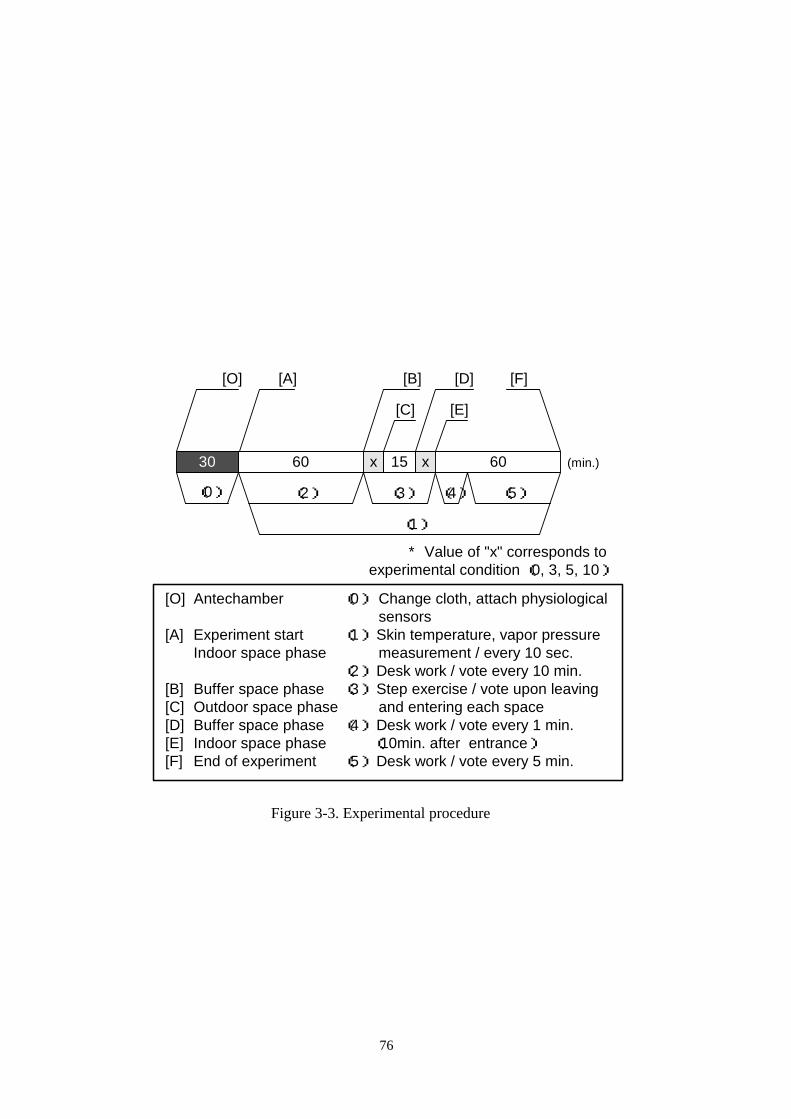
* Value of "x" corresponds toexperimental condition (0, 3, 5, 10)
(min.)
[B]
60 60x x1530
[A]
[C]
[D]
[E]
[F][O]
(0)
(1)
(3)(2) (4) (5)
[O] Antechamber
[A] Experiment startIndoor space phase
[B] Buffer space phase[C] Outdoor space phase[D] Buffer space phase[E] Indoor space phase[F] End of experiment
(0) Change cloth, attach physiologicalsensors
(1) Skin temperature, vapor pressure measurement / every 10 sec.
(2) Desk work / vote every 10 min.(3) Step exercise / vote upon leaving
and entering each space(4) Desk work / vote every 1 min. (10min. after entrance)(5) Desk work / vote every 5 min.
Figure 3-3. Experimental procedure
76
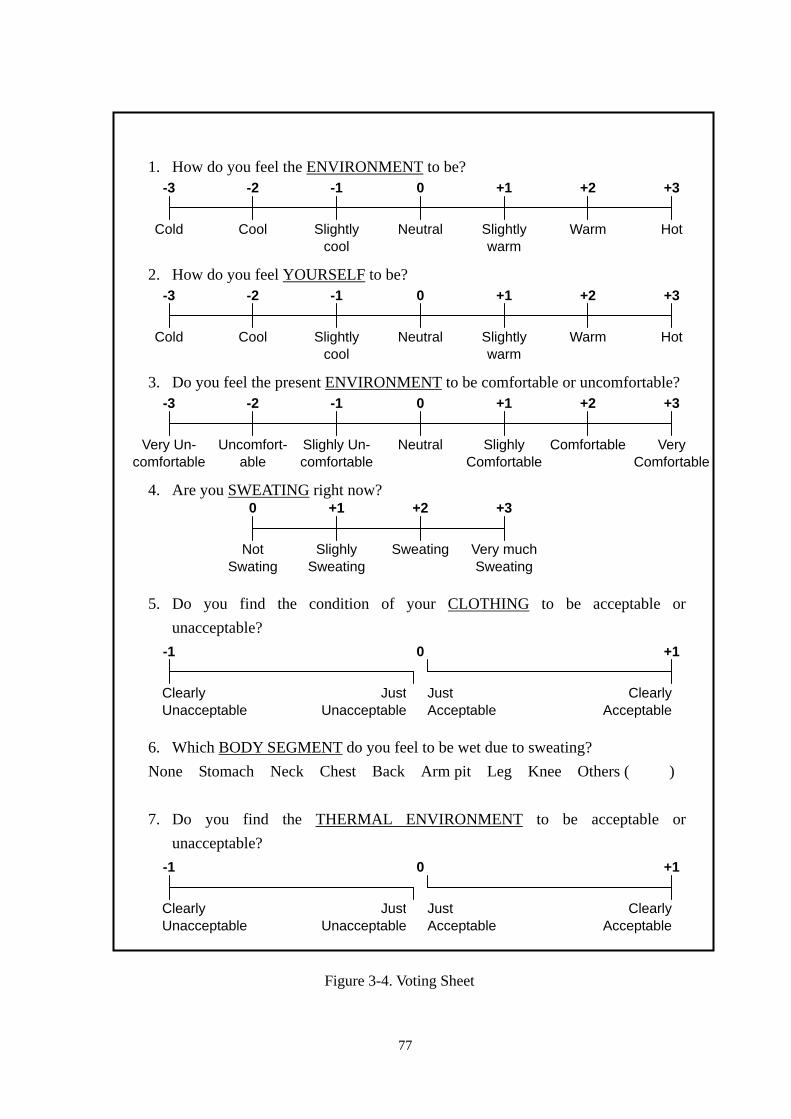
1. How do you feel the ENVIRONMENT to be?
77
2. How do you feel YOURSELF to be?
3. Do you feel the present ENVIRONMENT to be comfortable or uncomfortable?
Very Un- comfortable
4. Are you SWEATING right now?
5. Do you find the condition of your CLOTHING to be acceptable or unacceptable?
6. Which BODY SEGMENT do you feel to be wet due to sweating? None Stomach Neck Chest Back Arm pit Leg Knee Others ( ) 7. Do you find the THERMAL ENVIRONMENT to be acceptable or
unacceptable?
-3 -2 -1 0 +1 +2 +3
Cold Cool Slightlycool
Neutral Slightlywarm
Warm Hot
-3 -2 -1 0 +1 +2 +3
Cold Cool Slightlycool
Neutral Slightlywarm
Warm Hot
Uncomfort- able
Slighly Un-comfortable
Slighly Comfortable
Comfortable Very Comfortable
-3 -2 -1 0 +1 +2 +3
Neutral
Slighly Sweating
Sweating Very much Sweating
0 +1 +2 +3
Not Swating
Clearly Unacceptable
JustUnacceptable
-1 0 +1
Just Acceptable
ClearlyAcceptable
Clearly Unacceptable
JustUnacceptable
-1 0 +1
Just Acceptable
ClearlyAcceptable
Figure 3-4. Voting Sheet
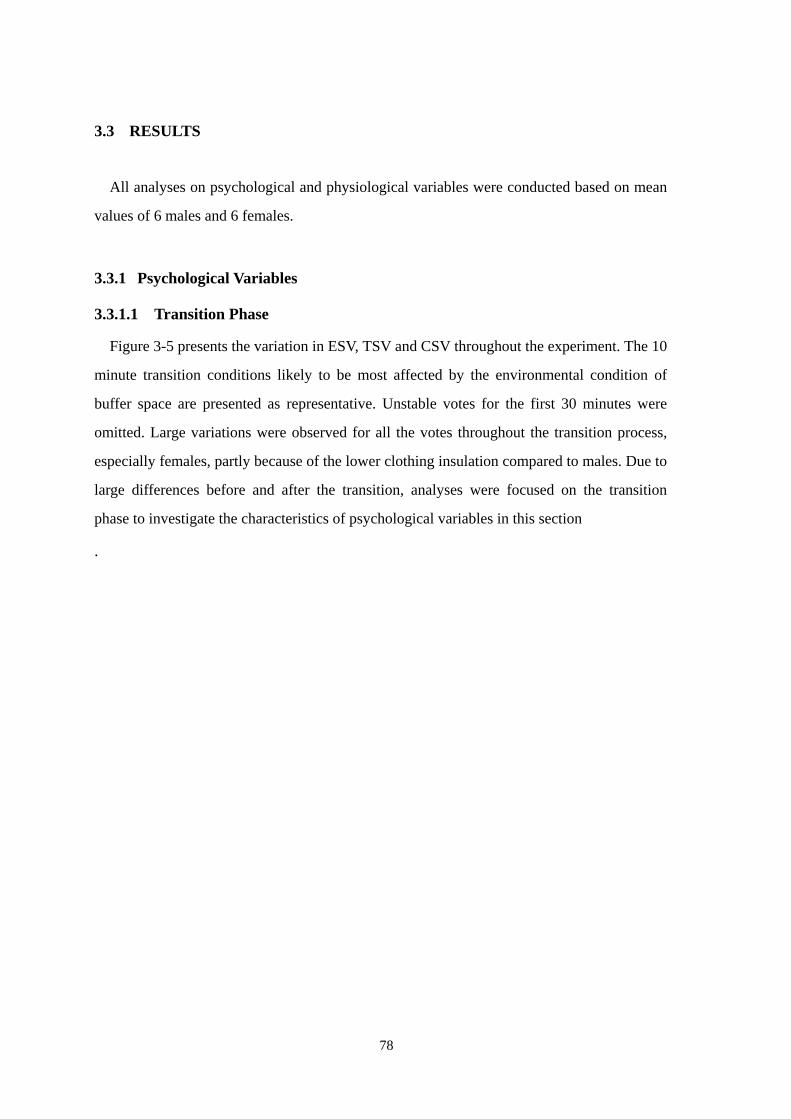
3.3 RESULTS
All analyses on psychological and physiological variables were conducted based on mean
values of 6 males and 6 females.
3.3.1 Psychological Variables
3.3.1.1 Transition Phase
Figure 3-5 presents the variation in ESV, TSV and CSV throughout the experiment. The 10
minute transition conditions likely to be most affected by the environmental condition of
buffer space are presented as representative. Unstable votes for the first 30 minutes were
omitted. Large variations were observed for all the votes throughout the transition process,
especially females, partly because of the lower clothing insulation compared to males. Due to
large differences before and after the transition, analyses were focused on the transition
phase to investigate the characteristics of psychological variables in this section
.
78

-3-2-10123
22_1025_1028_10
-3-2-10123
22_1025_1028_10
-3-2-10123
0:30 1:00 1:30
22_1025_1028_10
1:00 1:30 2:0
22_1025_1028_10
22_1025_1028_10
22_1025_1028_10
FemaleMale
FemaleMale
FemaleMale
Buffer Buffer Buffer Buffer
Indoor Outdoor Indoor Indoor Outdoor Indoor
0:300:30 2:002:00
ESV
TSV
CSV
Figure 3-5. ESV, TSV, and CSV during transition phase (10 minute transition)
79
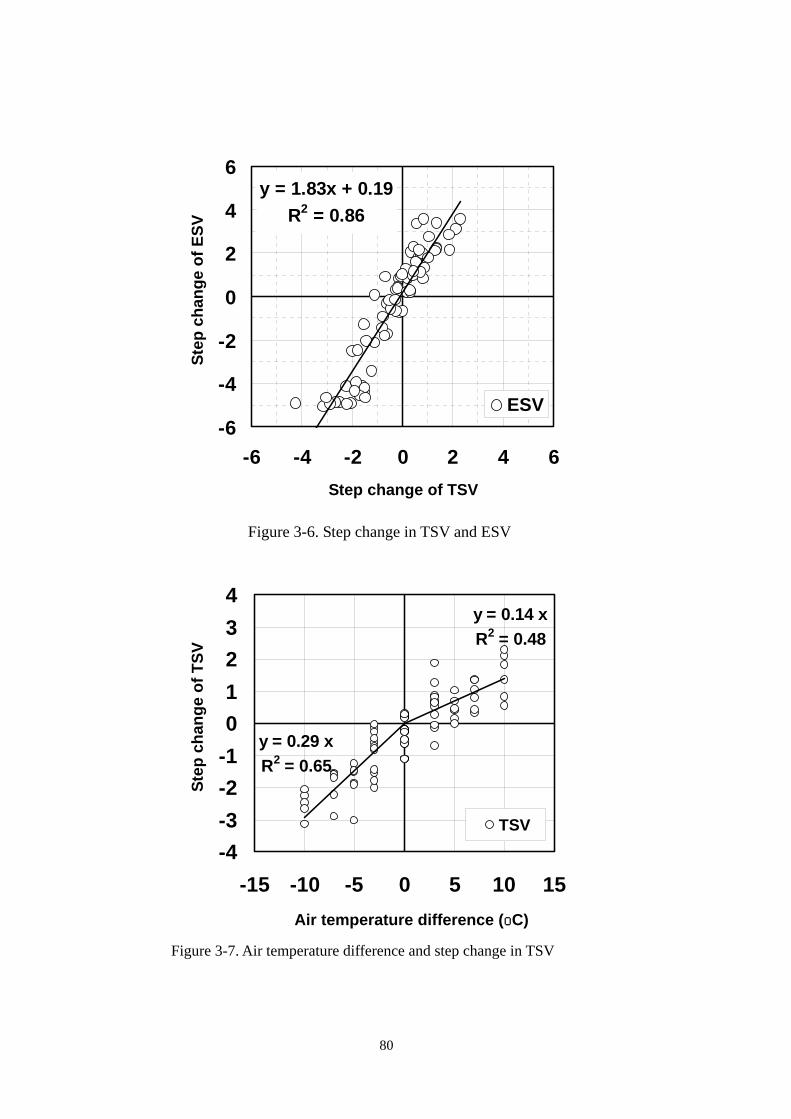
y = 1.83x + 0.19R2 = 0.86
-6
-4
-2
0
2
4
6
-6 -4 -2 0 2 4 6
ESV
St
ep c
hang
e of
ESV
Step change of TSV
Figure 3-6. Step change in TSV and ESV
y = 0.29 xR2 = 0.65
y = 0.14 xR2 = 0.48
-4-3-2-101234
-15 -10 -5 0 5 10 15
TSV
Step
cha
nge
of T
SV
Air temperature difference (oC)
Figure 3-7. Air temperature difference and step change in TSV
80

The differences in ESV before and after the transition of each space are plotted against
differences in TSV in Figure 3-6. The change in scale unit is twice as large for ESV than TSV,
indicating that ESV is more sensitive to a given step change in thermal environment. Figure
3-7 depicts the TSV against temperature change, showing that subjects were more sensitive
to lower temperature changes than higher temperature changes.
Relationship between ESV, TSV and CSV are presented in Figure 3-8 for step changes
toward 22, 25, and 28 °C. No correlation was found between the voted values, but a high
correlation in scale unit difference was found for both thermal sensation votes and CSV
during transition to thermally neutral condition (25 °C), especially when the differences were
larger. CSV seems to increase when ESV and TSV changes are negative due to the present
experimental condition, but correlation is lower on step changes towards 22 and 28 °C. The
difference in transition time accounts to the difference in the amount of activity, and this may
have effected how the subjects felt the same temperature change.
-2
-6
-4
0
2
4
6
-6 -4 -2 0 2 4 6
28ºC25ºC22ºC
6
4
4
6
-6 -4 -2 0 2 4
1
28ºC25ºC22ºC
6
Step
cha
nge
of C
SV
Step change of ESV Step change of TSV
Figure 3-8. Step change of CSV against step change of ESV and TSV
81
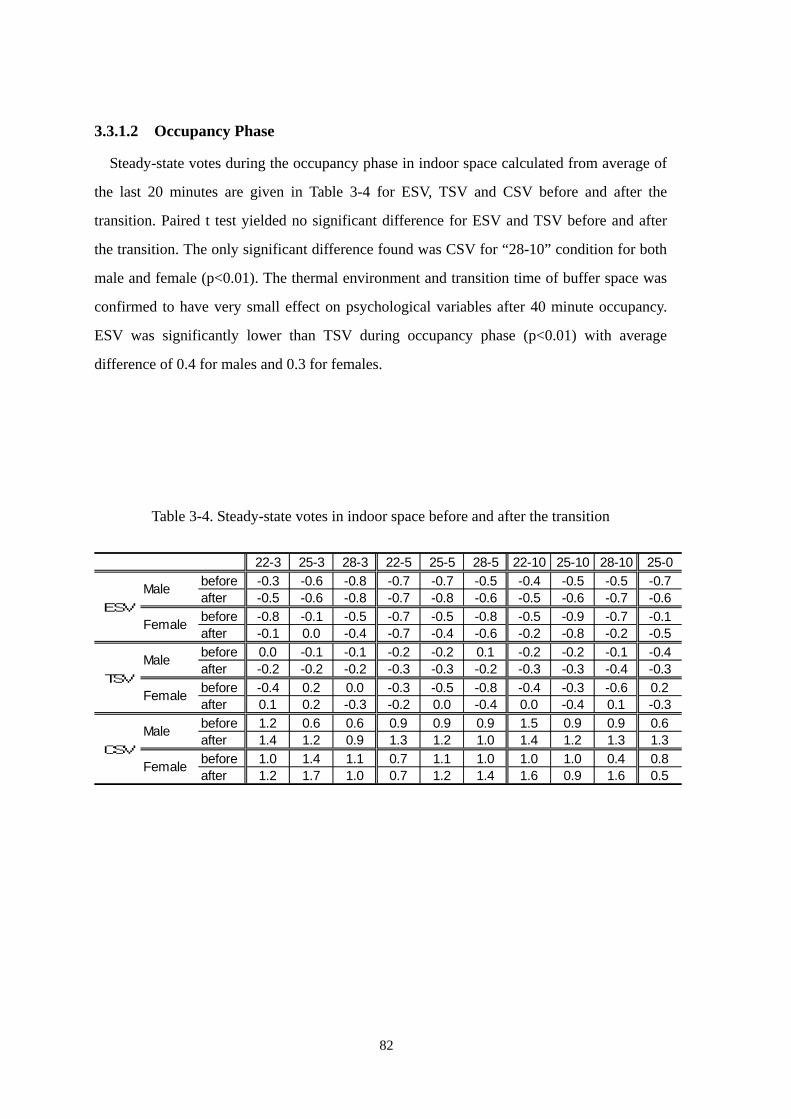
3.3.1.2 Occupancy Phase
Steady-state votes during the occupancy phase in indoor space calculated from average of
the last 20 minutes are given in Table 3-4 for ESV, TSV and CSV before and after the
transition. Paired t test yielded no significant difference for ESV and TSV before and after
the transition. The only significant difference found was CSV for “28-10” condition for both
male and female (p<0.01). The thermal environment and transition time of buffer space was
confirmed to have very small effect on psychological variables after 40 minute occupancy.
ESV was significantly lower than TSV during occupancy phase (p<0.01) with average
difference of 0.4 for males and 0.3 for females.
Table 3-4. Steady-state votes in indoor space before and after the transition
22-3 25-3 28-3 22-5 25-5 28-5 22-10 25-10 28-10 25-0before -0.3 -0.6 -0.8 -0.7 -0.7 -0.5 -0.4 -0.5 -0.5 -0.7after -0.5 -0.6 -0.8 -0.7 -0.8 -0.6 -0.5 -0.6 -0.7 -0.6before -0.8 -0.1 -0.5 -0.7 -0.5 -0.8 -0.5 -0.9 -0.7 -0.1after -0.1 0.0 -0.4 -0.7 -0.4 -0.6 -0.2 -0.8 -0.2 -0.5before 0.0 -0.1 -0.1 -0.2 -0.2 0.1 -0.2 -0.2 -0.1 -0.4after -0.2 -0.2 -0.2 -0.3 -0.3 -0.2 -0.3 -0.3 -0.4 -0.3before -0.4 0.2 0.0 -0.3 -0.5 -0.8 -0.4 -0.3 -0.6 0.2after 0.1 0.2 -0.3 -0.2 0.0 -0.4 0.0 -0.4 0.1 -0.3before 1.2 0.6 0.6 0.9 0.9 0.9 1.5 0.9 0.9 0.6after 1.4 1.2 0.9 1.3 1.2 1.0 1.4 1.2 1.3 1.3before 1.0 1.4 1.1 0.7 1.1 1.0 1.0 1.0 0.4 0.8after 1.2 1.7 1.0 0.7 1.2 1.4 1.6 0.9 1.6 0.5
CSV
ESV
TSV
Female
Male
Male
Female
Male
Female
82

3.3.2 Physiological Variables
3.3.2.1 Mean Skin Temperature
Steady-state values during the occupancy phase in indoor space calculated from the
average of the last 20 minutes and maximum values in outdoor space are given in Table 3-4
for all experimental conditions. Mean skin temperature of females was significantly 1 °C
lower than males. Random differences were also found between experimental conditions
before the transition. Therefore, analyses on mean skin temperature were based on the
variation from the steady state value in indoor space before the transition. Mean skin
temperature variation are given in Figure 3-9 for 10 minute transition conditions without
buffer condition.
Mean skin temperature began to rise upon entering the buffer zone, with the exception
22 °C conditions and “23-10” of males. The values reached maximum before leaving outdoor
space, decreased rapidly in the order of 28, 25, 22 °C on entering the buffer space, and
gradually reached the steady-state value in the indoor space. The maximum values in the
outdoor space were similar for all conditions with the average of 35.4 °C for males and
35.0 °C for females. Mean skin temperature of females in indoor space was significantly
higher after the transition (p<0.01). The step exercise throughout the experiment has
contributed to the noticeable rise in lower body parts such as legs, thighs, and foot.
83
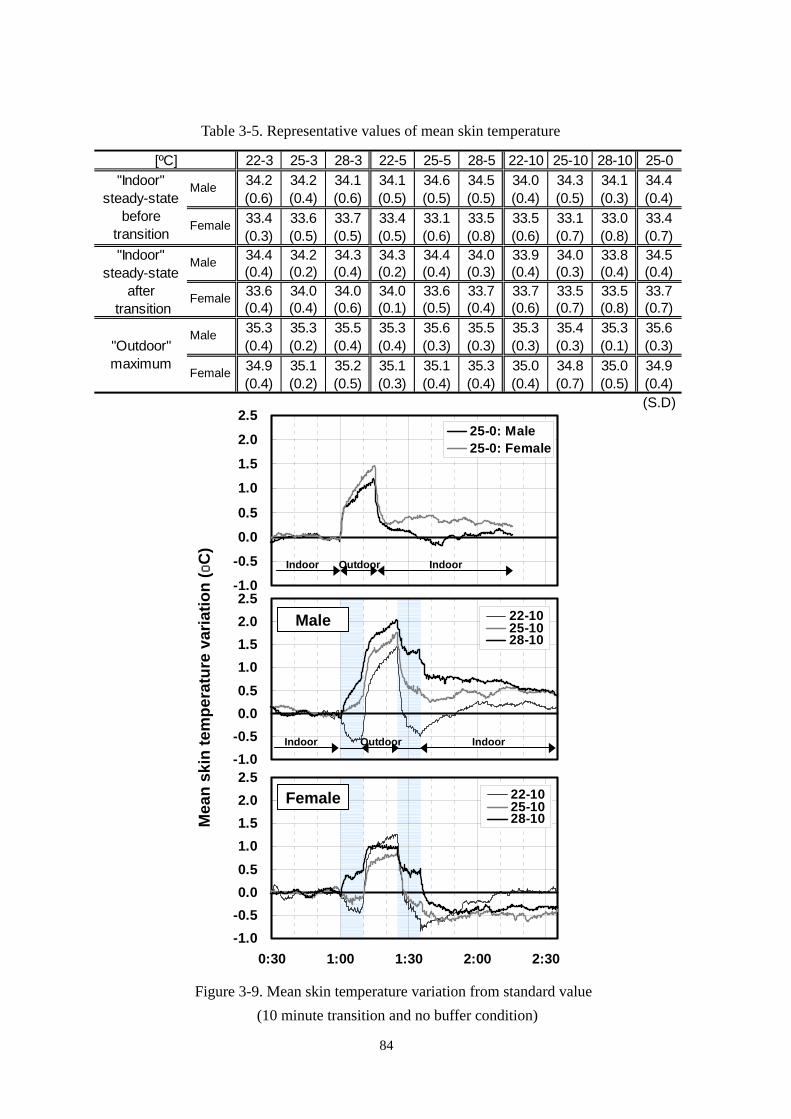
Table 3-5. Representative values of mean skin temperature
22-3 25-3 28-3 22-5 25-5 28-5 22-10 25-10 28-10 25-034.2 34.2 34.1 34.1 34.6 34.5 34.0 34.3 34.1 34.4(0.6) (0.4) (0.6) (0.5) (0.5) (0.5) (0.4) (0.5) (0.3) (0.4)33.4 33.6 33.7 33.4 33.1 33.5 33.5 33.1 33.0 33.4(0.3) (0.5) (0.5) (0.5) (0.6) (0.8) (0.6) (0.7) (0.8) (0.7)34.4 34.2 34.3 34.3 34.4 34.0 33.9 34.0 33.8 34.5(0.4) (0.2) (0.4) (0.2) (0.4) (0.3) (0.4) (0.3) (0.4) (0.4)33.6 34.0 34.0 34.0 33.6 33.7 33.7 33.5 33.5 33.7(0.4) (0.4) (0.6) (0.1) (0.5) (0.4) (0.6) (0.7) (0.8) (0.7)35.3 35.3 35.5 35.3 35.6 35.5 35.3 35.4 35.3 35.6(0.4) (0.2) (0.4) (0.4) (0.3) (0.3) (0.3) (0.3) (0.1) (0.3)34.9 35.1 35.2 35.1 35.1 35.3 35.0 34.8 35.0 34.9(0.4) (0.2) (0.5) (0.3) (0.4) (0.4) (0.4) (0.7) (0.5) (0.4)
(S.D)
[ºC]
Male
Female
Male
Female
Male
Female
"Indoor"steady-state
beforetransition"Indoor"
steady-stateafter
transition
"Outdoor"maximum
-1.0-0.50.00.51.01.52.02.5
22-1025-1028-10
-1.0-0.50.00.51.01.52.02.5
0:30 1:00 1:30 2:00 2:30
22-1025-1028-10
-1.0-0.50.00.5
1.01.52.02.5
25-0: Male25-0: Female
IndoorIndoor Outdoor
IndoorIndoor Outdoor
Female
Male
Mea
n sk
in te
mpe
ratu
re v
aria
tion
(oC
)
Figure 3-9. Mean skin temperature variation from standard value (10 minute transition and no buffer condition)
84

3.3.2.2 Vapor Pressure Inside Clothing
The representative values calculated in the same way as mean skin temperature are given
in Table 3-6. The steady state value before the transition were similar for all conditions.
Average values were 2.2 kPa for males and 1.9 kPa for females, and significant difference
were found between males and females (p<0.01).
Variation in vapor pressure inside clothing is given in Figure 3-10. The value for both
males and females started to rise as the transition started, and maximum value was observed
before leaving outdoor space, similar to mean skin temperature. The vapor pressure dropped
in the buffer zone after outdoor space due to the change in environmental humidity, but
shortly started to rise again due to the step exercise before entering indoor space. At this
point, vapor pressure inside clothing was higher in the order of environmental temperature of
buffer space. The decrease of females was greater than males in indoor space, and reached
the steady state value by the end of experiment. Males had approximately 1 kPa higher
values than pre-transition indoor space. Males were wearing cotton undershirt which
absorbed their sweat, and consequently resulted in a slow decrease of vapor pressure inside
clothing.
Vapor pressure inside clothing had strong correlation with sweat sensation and clothing
acceptability as depicted in Figure 11. Females had a high clothing acceptability rate when
the vapor pressure was low, but when it exceeded 4.0 kPa, sweat sensation was higher than 1
and clothing acceptability was voted on the unacceptable side. On the other hand, males
mainly voted sweat sensation to be higher than 1 and clothing acceptability to be acceptable
at even 4.5 kPa. Males were found to be more tolerant of the vapor pressure inside clothing,
but clothing acceptability was never fully acceptable, supposedly due to uneasiness caused
by the clothing itself such as necktie.
85

Table 3-6. Representative values of vapor pressure inside clothing
22-3 25-3 28-3 22-5 25-5 28-5 22-10 25-10 28-10 25-02.1 2.3 2.0 2.3 2.2 2.1 2.1 2.2 2.2 2.2
(0.4) (0.4) (0.2) (0.3) (0.0) (0.3) (0.1) (0.3) (0.4) (0.2)1.8 2.0 1.8 1.9 2.0 1.8 1.9 1.8 1.8 2.0
(0.1) (0.2) (0.1) (0.1) (0.2) (0.1) (0.1) (0.1) (0.2) (0.1)2.7 3.1 3.2 2.9 3.5 3.9 3.0 3.9 4.1 2.9
(0.7) (0.8) (0.8) (0.6) (0.6) (0.8) (0.8) (0.8) (0.6) (0.8)1.7 2.0 1.8 2.0 2.2 2.0 2.1 2.5 2.3 2.1
(0.1) (0.2) (0.1) (0.1) (0.3) (0.2) (0.1) (0.3) (0.2) (0.1)4.9 5.0 5.2 4.9 5.5 5.4 5.0 5.3 5.5 4.8
(0.5) (0.4) (0.7) (0.4) (0.3) (0.5) (0.5) (0.5) (0.4) (0.7)4.4 4.9 4.9 4.8 4.9 4.9 4.8 5.0 5.2 4.9
(0.1) (0.2) (0.4) (0.4) (0.4) (0.4) (0.3) (0.2) (0.3) (0.3)(S.D)
[kPa]
Male
Female
Male
Female
Male
Female
"Indoor"steady-state
beforetransition"Indoor"
steady-stateafter
transition
"Outdoor"maximum
0.0
1.0
2.0
3.0
4.0
5.0
6.025-0: Male25-0: Female
0.0
1.0
2.0
3.0
4.0
5.0
6.0
22-1025-1028-10
0.0
1.0
2.0
3.0
4.0
5.0
6.0
0:30 1:00 1:30 2:00 2:30
22-1025-1028-10
IndoorIndoor Outdoor
Female
Male
IndoorIndoor Outdoor
IndoorIndoor Outdoor
Vapo
r pre
ssur
e in
side
clo
thin
g (k
Pa)
Figure 3-10. Variation in vapor pressure inside clothing (10 minute transition and no buffer condition)
86

0
1
2
3
0.0 1.0 2.0 3.0 4.0 5.0 6.0-1
0
1
SweatsensationClothingAcceptability
0
1
2
3
-1
0
1Male
Female
Clo
thin
g ac
cept
abili
ty
Swea
t sen
satio
n
Vapor pressure inside clothing (kPa)
Figure 3-11. Sweat sensation and clothing acceptability against vapor pressure inside clothing
87

3.3.3 Effect of Environmental Condition of Buffer Space
In every experimental condition, psychological and physiological variables were found to
be maximum or minimum when leaving the outdoor space, and the values were similar.
Effects of environmental conditions of buffer space was investigated focusing on the latter
transition process from outdoor space to indoor space through buffer space. Slight difference
was found between 3 minute and 5 minute transition conditions, and comparison was sought
between 3 minute, 10 minute condition and no buffer condition.
3.3.3.1 Psychological Variables
Figure 3-12 presents the variation of ESV, TSV, and CSV in post-transition indoor space,
with the point of entrance as being 0 minute.
1) Environmental Temperature Sensation Vote
In such conditions as no buffer (23-0) and 28 °C where the indoor space temperature is
relatively lower than the preceding environment, votes were low upon entrance, but
gradually reached neutrality. On the other hand, votes of 25 °C and 28 °C conditions except
for 23-10 of females were observed to be nearly constant at all times. Significant difference
in the first vote upon entrance was found between the no buffer condition and 25 and 28 °C
conditions except for 23-10 of females (paired t test, p<0.01). Effect of transition time was
not significant within the same temperature conditions. Temperature of the buffer space was
found to have the dominating effects on ESV.
2) Whole body Thermal Sensation Vote
Male votes decayed gradually to reach thermal neutrality within 10 minutes after entrance
for all conditions. Female votes were observed to drop after about 5 minutes and rise again to
reach thermal neutrality except for 22-3. Decay of vapor pressure inside clothing was greater
for females than males, and rapid evaporative heat loss caused the vote to drop in the early
period after entrance. The largest vapor pressure drop of 1.4 kPa in the first 5 minutes was
observed for 23-0 condition, and TSV at fifth minute was found to have a significant
88

difference with all 3 minute conditions (p<0.05).
3) Comfort Sensation Vote
All votes of males and females in indoor space were within the comfortable side of the
neutral for all conditions. None of the experimental conditions were found to have a
significant difference with 23-0, but several patterns in CSV variation were observed during
the first 20 minutes: 1) High upon entrance, sudden drop, and recovery, 2) low upon entrance
and gradual recovery, 3) constant throughout at a certain level.
89

-2
-1
0
1
2
25-0 22-1025-10 28-10
-2
-1
0
1
2
25-0 22-1025-10 28-10
-2
-1
0
1
2
25-0 22-1025-10 28-10
-2
-1
0
1
2
25-0 22-325-3 28-3
-2
-1
0
1
2
25-0 22-325-3 28-3
-2
-1
0
1
2
25-0 22-325-3 28-3
-2
-1
0
1
2
25-0 22-325-3 28-3
-2
-1
0
1
2
25-0 22-325-3 28-3
-2
-1
0
1
2
25-0 22-325-3 28-3
-2
-1
0
1
2
0:00 0:10 0:20
25-0 22-1025-10 28-10
-2
-1
0
1
2
0:10 0:20
25-0 22-1025-10 28-10
-2
-1
0
1
2
0:10 0:20 0:30
25-0 22-1025-10 28-10
ESV TSV CSV
Male 3min.
Male 10min.
Female 3min.
Female 10min.
0:300:000:30 0:000:300:000:30 0:00
Figure 3-12. Variation of ESV, TSV, and CSV in post-transition indoor space
90

3.3.3.2 Physiological Variables
Figure 3-13 shows the deviation of mean skin temperature from the standard value and
Figure 3-14 shows the vapor pressure variation inside clothing for 3 minute transition
conditions. Results of the 10 minute transition condition are given in Figures 3-9 and 3-10.
-1.0-0.50.00.51.01.52.02.5
25-0 22-325-3 28-3
-1.0-0.50.00.51.01.52.02.5
0:00 0:10 0:20 0:30 0:40 0:50 1:
25-0 22-325-3 28-3
00
Mea
n sk
in te
mpe
ratu
re d
evia
tion
from
sta
ndar
d va
lue
(oC
)
Figure 3-13. Mean skin temperature deviation from standard value (3 minute transition)
0.0
1.0
2.0
3.0
4.0
5.0
6.0
0:00 0:10 0:20 0:30 0:40 0:50 1:0
25-0 22-325-3 28-3
0.0
1.0
2.0
3.0
4.0
5.0
6.0
25-0 22-325-3 28-3
Vapo
r pre
ssur
e (k
Pa)
0
Figure 3-14. Vapor pressure variation inside clothing (3 minute transition)
91

1) Mean Skin Temperature:
The starting mean skin temperature was high in the order of 23-0, 28 °C conditions, 25 °C
conditions, and 22 °C conditions, which was same as the order of preceding environment
(32 °C for 23-0). The difference between conditions became larger when the transition time
was longer, and the effect of buffer space condition was evident. Values of males and females
reached a steady state value after 20 minutes for 3 minute transition conditions, but nearly 40
minutes were required for 10 minute conditions. Steady state mean skin temperature for
28-10 and 23-10 of males were about 0.5 °C lower than the pre-transition indoor space due to
sweat accumulated in the undershirt which resulted in evaporative heat loss greater than
under other conditions.
2) Vapor Pressure inside Clothing
Starting values were higher in the order of 28 °C, 25 °C, and 22 °C, but 23-0 was not the
highest condition. Longer transition time within the same temperature condition resulted in
higher vapor pressure. The total step exercise during the entire experimental process for 10
minute transition condition was 14 minutes longer than the 3 minute transition condition, and
difference in accumulated amount of exercise may have affected the sweat rate before
entering the post-transition indoor space. Vapor pressure of males were still in the process of
decay at the end of experiment while females reached a steady state value for most of the
conditions. The decay was quickest at 22 °C condition.
92
3.4 DISCUSSION
3.4.1 Environmental Temperature Sensation and Whole Body Thermal Sensation
Two separate thermal sensation scales, ESV and TSV, were introduced in the present
experiment to avoid the confusion of two different concepts. ESV change was twice as large
as TSV during transition phase, and ESV was significantly lower than TSV during
occupancy phase. Subjects were able to distinguish the two different thermal sensation scales
due to the fact that the two scales showed different characteristics. When evaluating thermal
sensation during large environmental step changes, it is better to use two separate scales or to
explain to the subjects clearly the difference between “sensation which describes the state of
thermal environment” and “sensation which describes the thermal state of yourself” to avoid
any confusion upon evaluation.
ESV variation and CSV variation during the environmental step change towards thermally
neutral condition was found to correlate well, suggesting that ESV is an effective detector in
evaluating the impression of the environment upon the step change.
3.4.2 Characteristic Difference Between Males and Females
In this experiment, both male and female subjects wore typical clothing ensembles for
office work. The results showed the difference in physiological and psychological variables.
Females were found to have larger step changes in sensation votes, and larger individual
differences. The differences in clothing cannot explain all of the characteristic differences,
but they need to be taken into consideration when specifying the optimum thermal condition
for a buffer space.
93

3.4.3 Comfort Sensation
Kuno et al. (1987) indicated the presence of 2 different types of comfort, negative comfort
and positive comfort (pleasantness). Negative comfort describes the state of no thermal strain,
and positive comfort describes the state of mind accompanying the dismissal thermal strain.
Gagge (1967) explained the manner of comfort sensation as anticipatory to physiological
change during environmental step change towards thermally neutral condition by using the
4-point “discomfort” scale. Kuno et al. suggested that Gagge’s interpretation of anticipation
was a seeming description, which really is the positive comfort in earlier stage during relief
from thermal strain gradually altering into negative comfort in the later stage.
A symmetrical 7-point “comfort” scale with “neutral” in the central category was used for
the present experiment, and simple “anticipation” was not observed. During the
environmental step change towards thermally neutral condition (25 °C), variation in ESV
was associated with variation in CSV, which suggests that larger deviation from comfort
leads to larger positive comfort. Several patterns of CSV variation in the comfort region
above neutral was observed in the post-transition indoor space: 1) High upon entrance,
sudden drop, and recovery, 2) low upon entrance and gradual recovery, 3) constant
throughout at a certain level. It was difficult to assign the optimum CSV variation pattern for
a given period of time from the present experiment, and further knowledge on positive
comfort is required to determine the optimum CSV variation pattern.
94

3.4.4 Optimum Environmental Conditions of Buffer Space
Environmental condition of buffer space was found to have only minor influence on ESV,
TSV, and CSV in post-transition indoor space after 40 minutes. This result corresponds to the
result of Rohles et al. (1977), and environmental conditions of buffer space can be assumed
irrelevant when evaluated for occupancy periods longer than 30 minutes.
Environmental condition of buffer space had a clear impact on physiological variables
such as mean skin temperature and vapor pressure inside clothing. Mean skin temperature
and vapor pressure inside clothing were higher when the air temperature of buffer space was
higher and transition time was longer. Time required to reach steady state was also longer in
post-transition indoor space. However, these influence were not prominent for psychological
variables, and the only significant difference with no buffer condition (23-0) was found for
ESV for the first vote upon entering post-transition indoor space. Related researches depicted
in section 5.2 suggest that the transition from outdoor space through buffer space to indoor
space is a transition towards thermally neutral condition, and that TSV leads the change in
physiological variables. Simple anticipation was not observed for CSV due to the difference
in comfort scale used, and several variation patterns were observed, though no significant
difference from no buffer condition.
Optimum environmental condition may change depending on which period to be focused
for the evaluation. The first 20 minutes after entrance especially requires further knowledge
on positive comfort to determine the optimum environmental condition of buffer space.
95

3.5 CONCLUSION
Subjective experiments were conducted to investigate the effects of environmental
conditions of the buffer space on thermal comfort in the succeeding environment, simulating
a transition of an office worker from the office space to the outdoor space through the buffer
space. Following conclusions were drawn.
1) Two separate scales of thermal sensation, environmental temperature sensation (ESV)
and whole body thermal sensation (TSV), were used to distinguish the two different
concepts of thermal sensation under transient conditions. Subjects were able to
distinguish the two concepts owing to the fact that ESV and TSV showed different
characteristics.
2) Variation in ESV was twice as large as TSV during the environmental step change.
Variations in ESV and CSV correlated well during the environmental step change
towards the thermally neutral condition. ESV was significantly lower than TSV by 0.3 -
0.4 scale units during the occupancy phase in the indoor space.
3) Sweat sensation and clothing acceptability was highly correlated with vapor pressure
within clothing. Female responses for sweat sensation and clothing acceptability were
more sensitive to a given vapor pressure than males.
4) Environmental conditions of the buffer space was found to have only minor influence on
ESV, TSV, and CSV in the post-transition indoor space after 40 minutes. Environmental
conditions of the buffer space were negligible when evaluated for occupancy periods
longer than 30 minutes.
5) Environmental conditions of the buffer space had a clear impact on physiological
variables such as mean skin temperature and vapor pressure inside clothing. Mean skin
temperature and vapor pressure inside clothing were higher when the air temperature of
the buffer space was higher and transition time was longer. Time required to reach steady
state was also longer in post-transition indoor space.
6) The influence of environmental conditions of a buffer space was not prominent for
psychological variables, and the only significant difference found with no buffer
condition (23-0) was the first vote of ESV upon entering the post-transition indoor space.
7) Several fluctuation profiles were observed for comfort sensation votes after entering the
96

post-transition indoor space. Further investigation is required to specify the suitable
profile for optimum thermal comfort conditions.
97

98
CHAPTER 4
DIFFERENCES IN PERCEPTION OF INDOOR ENVIRONMENT BETWEEN
JAPANESE AND NON-JAPANESE WORKERS
99

100

CHAPTER 4 DIFFERENCES IN PERCEPTION OF INDOOR ENVIRONMENT BETWEEN JAPANESE AND NON-JAPANESE WORKERS 4.1 INTRODUCTION
The office is a place where the office workers spend most of their time, 10 hours per day
on average according to the present survey, and have less control over their own environment.
Therefore, a comfortable and healthy environment should be provided to this group in order
for office workers to remain comfortable during their working day. When designing the
environment, however, it should be taken into account that an optimum environment for one
group of occupants may not be the optimum for all, and that such environments may become
the cause of discomfort for other groups. The objective of this study is to investigate the
differences in the way groups of occupants perceive the environment under real working
conditions. Four seasonal surveys integrating physical measurements with questionnaires
were conducted at an office building in Tokyo, Japan, where Japanese and non-Japanese
occupants worked together on the same floor.
101
4.2 METHODS
Four seasonal surveys were carried out on 3 floors (I, II, III) of an office building located
in Tokyo, Japan. The survey periods and corresponding outdoor conditions are presented in
Table 4-1. The offices were located in the middle of a 37 story tenant building, consisting of
a fully open plan office area of 1480 m2 per floor subdivided by 1.1 m high private partitions.
The offices were air conditioned with the centralized HVAC system of the building and
additional supplementary cooling units. Office plan and cooling load for each zone are
shown in Figure 4-1. The computer terminals were widely used throughout the space to
produce heat and one of the floors, where difference in heat load distribution was the largest,
was measured in detail. The floor was divided into 4 zones upon evaluation according to the
arrangement of the workstations. The heat generating office equipment were clustered
intensively at zone C, where a maximum use of 8 video display terminals per person was
observed. Zone B had the second largest cooling load, and zone A and B were much less
crowded compared to the others. The nationality of the workers was 60 % Japanese and 40 %
non-Japanese, which is not so common in Japanese firms where most of the workers are
usually Japanese. Majority of the Japanese workers and non-Japanese female workers were
engaged in regular desk works while non-Japanese male workers mainly took part in an
intensive trading business.
102

Table 4-1. Survey period and outdoor conditions
SeasonAir temp. Humidit
(℃) (%rh)Summer Aug.13 - 15, 1997 24.8 71Autumn Oct.30 - 31, 1997 16.4 41Winter Jan.20 - 22, 1998 6.0 35Spring May.12 - 13, 1997 20.2 69
periodMeasurement Outdoor conditions
y*
*Mean value of the survey period
17,000
IAQ
Thermal environment
N
51,0
00
Zone D:61 W/m2
15 workers
Zone C:209 W/m2
63 workers
Zone B:183 W/m2
34 workers
Zone A: 95 W/m2
21 workers
Figure 4-1. Office plan and measurement points
103

4.2.1 Thermal Environment Measurement Spot measurements were conducted at representative points in the office area, five to ten
per floor, utilizing a mobile instrumental cart. Measurement points of a representative floor
are shown in Figure 4-1. The mobile measurement cart depicted in Figure 4-2 was utilized
for spot measurements. The cart enabled a simultaneous evaluation of air temperature, globe
temperature, air velocity, and relative humidity at 4 different heights as defined in ISO 7726
(1998) and ASHRAE 55-92 (1992). Measurement items, devices, and heights are given in
Table 4-2. Diurnal fluctuations of air temperature and relative humidity were also recorded
every five minutes for each floor during the survey period.
4.2.2 Indoor Air Quality Measurement Concentrations of carbon dioxide (CO2), carbon monoxide (CO), formaldehyde (HCHO),
ozone (O3), and suspended particles were measured at 1.1 m above floor level, two to four
points per floor. Outdoor concentrations were also recorded at the end of every survey day.
Diurnal fluctuations of CO2 were also recorded on one of the floors.
4.2.3 Questionnaire Survey The occupants were asked to assess their working environment for general comfort,
thermal comfort, humidity sensation, and draft sensation. A part of questionnaire concerning
comfort assessments is given in Figure 4-3. Unidirectional discomfort scale proposed by
Gagge was used for comfort evaluation. Adding to the ASHRAE 7 point thermal sensation
scale, McIntyre scale was used to assess thermal preference. The frequency of SBS related
symptoms the occupants may have experienced at their working environment was also asked.
Background information on sex, nationality, working hours, and the years they have stayed in
Japan was also included. Questionnaires were handed out to all the occupants at the
beginning of each survey, and were collected at the end of the survey. Analyses were made
based on 406 questionnaires collected throughout the year.
104

Figure 4-2. Measurement of workstation with mobile measurement cart
Table 4-2. Measurement item, device and height
105
77
7
Measurement item Measurement device Height (m)Air temperature C-C thermocouples 0.1 / 0.6 / 1.1 / 1.Globe temperauture Small globe 0.1 / 0.6 / 1.1 / 1.Plane radianttemperature B&K1213 1.1 / 6 sidesAir velocity B&K1213 0.1 / 0.6 / 1.1 / 1.Relative humidity TDK RH sensor 1.1Carbon dioxide CO2 detector 1.1Carbon monoxide CO detector 1.1Suspended particles Shibata P5 H-2 1.1Formaldehyde HCHO detector 1.1Ozone O3 detector 1.1
Ther
mal
Indo
or a
iren
viro
nmen
tqu
ality

Q12. Please complete each of the following statements by checking the box that best expresses yourpersonal feelings or preferences.
1) On average, I perceive my work area to be: (check one) comfortable slightly uncomfortable uncomfortable very uncomfortable
2) On average, I perceive the TEMPERATURE of my work area to be: (disregarding the effects of air movement, lighting and humidity)
hot warm slightly warm neutral slightly cool cool cold
3) How do you prefer the temperature to be? warmer no change cooler
4) Do you feel any AIR MOVEMENT in the work area? Yes No
5) If yes, do you find the AIR MOVEMENT uncomfortable? Yes No
6) On average, I perceive the HUMIDITY of my work area to be: (disregarding the effects of temperature, air movement and lighting)
very humid slightly humid neutral slightly dry very dry
Q13. Below are some symptoms that people experience at different times. Please indicate how oftenYOU HAVE EXPERIENCED EACH SYMPTOM IN THE PAST MONTH by circling the appropriatenumber from the scale below. (Please circle one number for each symptom) Never Very often
a) Headache............................................................... 1 2 3 4 5 b) Dizziness ........................................................ 1 2 3 4 5 c) Sleepiness.............................................................. 1 2 3 4 5 d) Sore or irritated throat......................................... 1 2 3 4 5 e) Nose irritation (itch or running)........................... 1 2 3 4 5 f) Eye irritation......................................................... 1 2 3 4 5 g) Trouble focusing eyes............................................ 1 2 3 4 5 h) Difficulty concentrating........................................ 1 2 3 4 5 i) Skin dryness.......................................................... 1 2 3 4 5 j) Skin rash or itch.................................................... 1 2 3 4 5 k) Fatigue................................................................... 1 2 3 4 5 l) Unpleasant Odor.................................................... 1 2 3 4 5
Figure 4-3. Questionnaire sheet
106

4.3 RESULTS OF PHYSICAL MEASUREMENTS
4.3.1 Thermal Environment
Indoor air temperature and humidity observations are plotted against outdoor condition at
the time of measurement in Figure 4-4. The indoor temperature was controlled throughout
the year, irrespective of the outdoor temperature. Indoor humidity was mainly controlled in
between 5 to 10 g/kg, although a slight influence of outdoor conditions was confirmed. Mean
air temperature profiles of each zone on the floor are plotted in Figure 4-5 for each season.
Temperatures were inconsistent throughout the year, and showed no relationship with the
outdoor conditions. Though vertical temperature difference was within 1.5 °C, horizontal
temperature difference of more than 2.5 °C was observed throughout all seasons, with the
maximum difference of 4.6 °C in spring. The only exception appeared in autumn. The office
environment was controlled with the centralized HVAC system of the building, called the
landlord system, and additional cooling units, called the tenant system. The landlord system
was set to control the air temperature at 23 °C, while set point of the tenant system, divided
into 8 independent control areas, was allowed for free access of occupants until summer. This
resulted in creating uneven distribution and fluctuation of air temperature as shown in Figure
4-6, since occupants feeling cold and those feeling hot kept turning on or off the air
conditioning. The controllers were disabled after summer, and corporate service manager
altered the settings at the request of the occupants. In winter and spring, some of the areas
were heated while others were cooled, causing large horizontal differences and fluctuation.
The differences in air temperature and globe temperature were less than 1.0 °C. Air velocities
were mostly below 0.25 m/s in the occupied area, except that some occupants near the outlet
grills reported their environment to be drafty. Though the relative humidity was kept around
50 % in summer and spring, the values were lower in autumn and winter, with the minimum
of 24 % rh in winter. The cause was found in the air conditioning system, where landlord
system introduced mixed air of indoor and outdoor, while the tenant system used recirculated
air only. The ratio of outdoor air was increased in cool seasons and decreased in warm
seasons from energy conservation point of view. As shown in Figure 4-7, mean indoor
humidity had the same tendency as the outdoor humidity. The air was dehumidified in
107

summer and spring, but not so much humidification was made in autumn and winter.
108

50
5
10
15
20
0 5 10 15 20Outdoor humidity ratio (g/kg)
Indo
or h
umid
ity ra
tio (g
/kg)
SummerAutumnWinterSpring
5
10
15
20
25
30
35
5 10 15 20 25 30 3Outdoor air temperature (°C)
Indo
or a
ir te
mpe
ratu
re (°
C)
SummerAutumnWinterSpring
Figure 4-4. Indoor air temperature and humidity ratio in relation to outdoor conditions
J
J
J
J
B
B
B
B
F
F
F
F
H
H
H
H
0.0
0.5
1.0
1.5
2.0
J
J
J
J
B
B
B
B
F
F
F
F
H
H
H
H
J
J
J
J
B
B
B
B
F
F
F
F
H
H
H
H
0.0
0.5
1.0
1.5
2.0
21 22 23 24 25 26J
J
J
J
B
B
B
B
F
F
F
F
H
H
H
H
21 22 23 24 25 26
Air Temperature (°C)
J ZONE A B ZONE B F ZONE C H ZONE D
Figure 4-5. Vertical air temperature profiles for each zone
109

20
21
22
23
24
25
26
27
28
6:00 7:00 8:00 9:00 10:00 11:00 12:00 13:00 14:00 15:00 16:00
Air
Tem
pera
ture
(°C
)
SUMMER AUTUMN
WINTER SPRING
Figure 4-6. Diurnal air temperature fluctuation
0
20
40
60
80
100
SUMMER AUTUMN WINTER SPRING
Rel
ativ
e H
umid
ity a
t 24
°C (%
)
INDOOR
OUTDOOR
Figure 4-7. Seasonal variation of indoor and outdoor relative humidity converted at 24 °C
110
4.3.2 Indoor Air Quality
Diurnal fluctuation of CO2 concentration is shown in Figure 4-8. Due to malfunctions of
the measurement device, data on winter were not recorded. Overall concentration was rather
high in summer and spring, exceeding the limit of 1000 ppm defined in the Law for
Maintenance of Sanitation in Buildings, Japan, while the values were much lower in autumn.
Sudden rise at 18:00 was also significant. As mentioned in the earlier section, landlord
system introduced mixed air, and the tenant system used recirculated air only. When the
landlord system was shut down at 18:00, the supply of fresh air was also cut, resulting in a
sudden rise of CO2 concentration. The peaks were observed at around 19:00, when many
occupants were still working. The ratio of outdoor air was increased in cool seasons, and CO2
concentration was kept lower in autumn compared to other seasons. Formaldehyde
concentration did not correspond with the seasonal difference of fresh air introduction, as
presented in Figure 4-9. On one of the floors, mean value of formaldehyde concentration
exceeded the WHO limit (1987) of 0.08 ppm in spring. Renewal of some of the furniture
took place in spring, and the concentration was generally higher compared to other seasons.
General guidelines on VOC emission of materials has not been issued in Japan, and some of
the newly installed furniture still emit high concentration of VOCs. Smoking was not
allowed in the office spaces, and CO concentration was kept below 2 ppm. The detector with
the minimum range of 0.025 ppm could not detect ozone throughout the year. Suspended
particles were also low, 0.015 mg/m3 at the highest in spring.
111

0
200
400
600
800
1000
1200
1400
12:00 18:00 0:00 6:00 12:00 18:00 0:00
CO
2 Con
cent
ratio
n (p
pm)
SUMMERAUTUMNSPRING
Figure 4-8. Diurnal carbon dioxide concentration fluctuation of floor “ I ”
0.00
0.05
0.10
SUMMER AUTUMN WINTER SPRING
HC
HO
Con
cent
ratio
n (p
pm)
Floor IFloor IIFloor III
Figure 4-9. Seasonal variation in formaldehyde concentration
112

4.4 RESULTS OF QUESTIONNAIRE SURVEY
4.4.1 Thermal Sensation
Of all the 406 returned questionnaires throughout the year, only 26 % rated their working
environment to be “comfortable”. As shown in Figure 4-10, comfort votes showed a good
correlation with the thermal sensation votes. Because the percentage of occupants who voted
their thermal environment to be “neutral” was also low indicating only 26 %, individual
differences in thermal preference were suspected to be the cause of low comfort ratings. The
relationship between operative temperature and mean thermal sensation vote was sought
among several groups of occupants. The occupants were grouped into male, female, Japanese,
and non-Japanese. Among the non-Japanese nationalities were 35 % North Americans, 26 %
Europeans, 22 % Asians other than Japanese, and 17 % others. The average years the
non-Japanese workers have stayed in Japan were 4.7 years (SD=5.5), and 61 % of them have
stayed in Japan for less than 5 years. Since 88 % of the workers were in their twenties and
thirties, age groups were not considered. The number of replies for each group is given in
Table 4-3. The non-Japanese female group was omitted from an independent group analysis
due to small number of replies. The thermal environment of each occupant was assigned
according to the nearest measurement point of that season, and mean operative temperature
of the seasonal measurement was used to represent the value of the specific location. The
mean operative temperatures were binned into 0.5 °C increments, and corresponding thermal
sensation votes were used for analysis. Weighted linear regression analysis was applied to
each group and the neutral temperature for the mean thermal sensation vote of 0 was
calculated. The results are presented in Table 4-3 and Figure 4-11. The size of the plot in the
figure represents the number of replies. Significant differences in neutral temperature were
found between occupant groups of “Japanese male - Non-Japanese males” (p<0.01),
“Japanese females - Non-Japanese males” (p<0.01), and “Japanese females - Japanese
males” (p<0.05). The largest difference was observed between Japanese females and
non-Japanese males, reaching 3.1°C. These results suggest the presence of diverse neutral
temperatures among individual occupants working in the same area, causing difficulties in
realizing a thermally comfortable environment for everybody simultaneously.
113

-3 -2 -1 0 1 2 3Thermal sensation vote
Gen
eral
com
fort
Comfortable
Slightlyuncomfortable
Uncomfortable
Veryuncomfortable
Figure 4-10. Thermal sensation votes and corresponding mean comfort votes
Janeutral te
Non-neutral te
neutral te
Table 4-3. Number of returned questionnaires and
neutral temperature for each occupant groupMale Female Totalpanese n=97 n=161 n=258mperature (°C) 24.3 25.2 24.8Japanese n=125 n=23 n=148
mperature (°C) 22.1 -- 22.7Total n=222 n=184 n=406mperature (°C) 22.9 25.1 23.9
114

-3
-2
-1
0
1
2
3
All
-3
-2
-1
0
1
2
3
21 22 23 24 25 26 27Operative Temperature (°C)
Japanese Female Non-Japanese male
50 10 20
Ther
mal
sen
satio
n vo
te
Figure 4-11. Operative temperature and corresponding thermal sensation votes
115
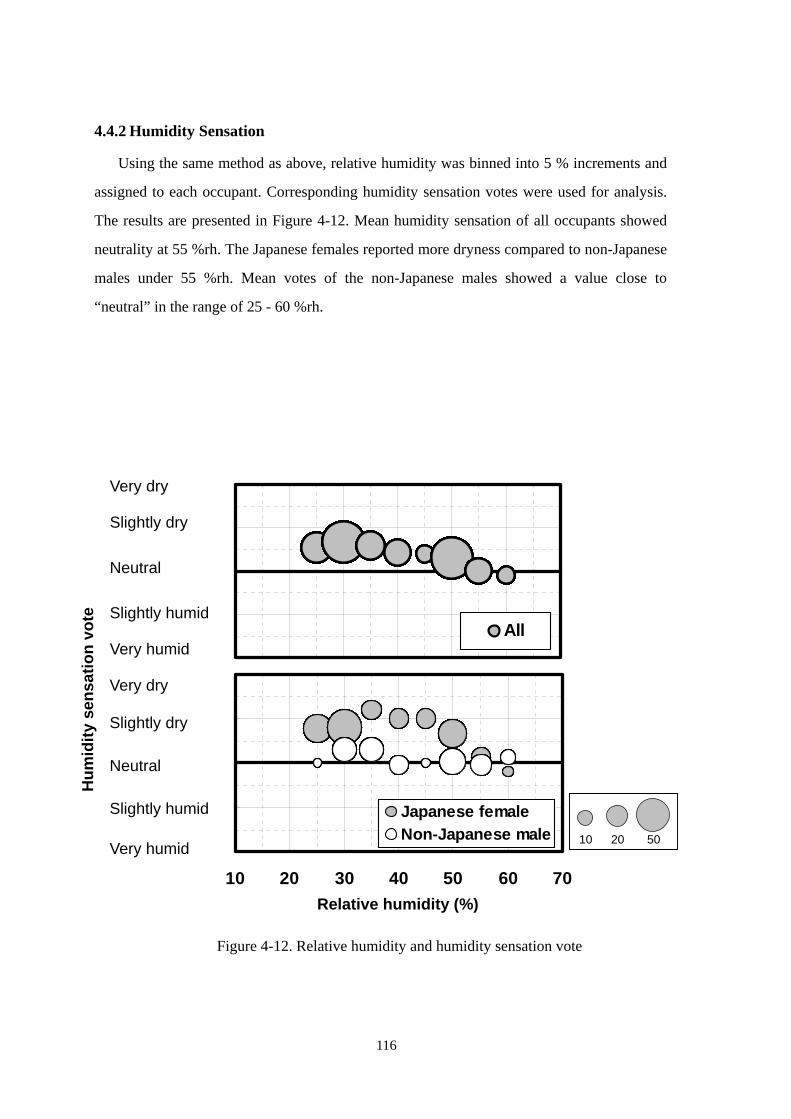
4.4.2 Humidity Sensation
Using the same method as above, relative humidity was binned into 5 % increments and
assigned to each occupant. Corresponding humidity sensation votes were used for analysis.
The results are presented in Figure 4-12. Mean humidity sensation of all occupants showed
neutrality at 55 %rh. The Japanese females reported more dryness compared to non-Japanese
males under 55 %rh. Mean votes of the non-Japanese males showed a value close to
“neutral” in the range of 25 - 60 %rh.
-2
-1
0
2All
-2
-1
0
210 20 30 40 50 60 70
Japanese femaleNon-Japanese male 50 10 20
1Slightly humid
1Slightly humid
Very dry
Slightly dry
Neutral
Hum
idity
sen
satio
n vo
te
Very humid
Very dry
Slightly dry
Neutral
Very humid
Relative humidity (%)
Figure 4-12. Relative humidity and humidity sensation vote
116
4.4.3 Frequency of SBS Related Symptoms
The five-point frequency scale used in the questionnaire was converted to a relative
frequency scale of 0 - 1.0 upon analysis. The relative frequencies of SBS related symptoms
for each group of occupants are shown in Figure 4-13. Of the three groups, Japanese females
reported the highest frequency of symptoms. The Japanese female group reported higher
frequency of physical symptoms such as “eye irritation” and “skin dryness”, while male
occupant groups reported more mental symptoms such as “sleepiness” or “fatigue”.
A poor correlation was found between the frequency of SBS symptoms and CO2, CO,
and HCHO concentrations inside the office. Significant correlations (p<0.01) were found
with relative humidity for symptoms such as “eye irritation”, “sore or irritated throat”, and
“skin dryness”. The results are shown in figure 4-14.
A higher correlation was found with thermal sensation votes rather than with the physical
state of the environment. Individual symptoms such as “headache” and “fatigue” showed a
close relationship as well as the average frequency of all symptoms, as presented in Figure
4-14.
The correlation of comfort votes and thermal sensation votes was mentioned in the
earlier section, but a strong correlation between comfort votes and average frequency of SBS
symptoms was also observed. Figure 4-15 shows the drop in comfort scales corresponding to
the increase in relative frequency.
117

0.0
0.2
0.4
0.6
0.8
1.0
Eye
irrita
tion
Skin
dry
ness
Slee
pine
ss
Fatig
ue
Sore
or i
rrita
ted
thro
at
Trou
ble
focu
sing
eye
s
Diff
icul
ty c
once
ntra
ting
Nos
e irr
itatio
n
Hea
dach
e
Skin
rash
or i
tch
Unp
leas
ant o
dor
Diz
zine
ss
Japanese femaleJapanese male
Rel
ativ
e fr
eque
ncy
Non-Japanese male
Figure -13. Relative frequency of SBS related symptoms for 3 occupant groups
118
0.0
0.2
0.4
0.6
0.8
1.0
20 30 40 50 60 70
Eye irritation
-4 -3 -2 -1 0 1 2 3 4
SBS
Headache
Fatigue1.0
Sore or irritated throat
0.00.20.40.60.8
20 30 40 50 60 70
Skin dryness
0.00.20.40.60.8
1.0Rel
ativ
e fr
eque
ncy
50 10 20
Relative humidity (%) Thermal sensation vote Figure 4-14. Relative frequency of SBS related symptoms against relative humidity
and thermal sensation vote
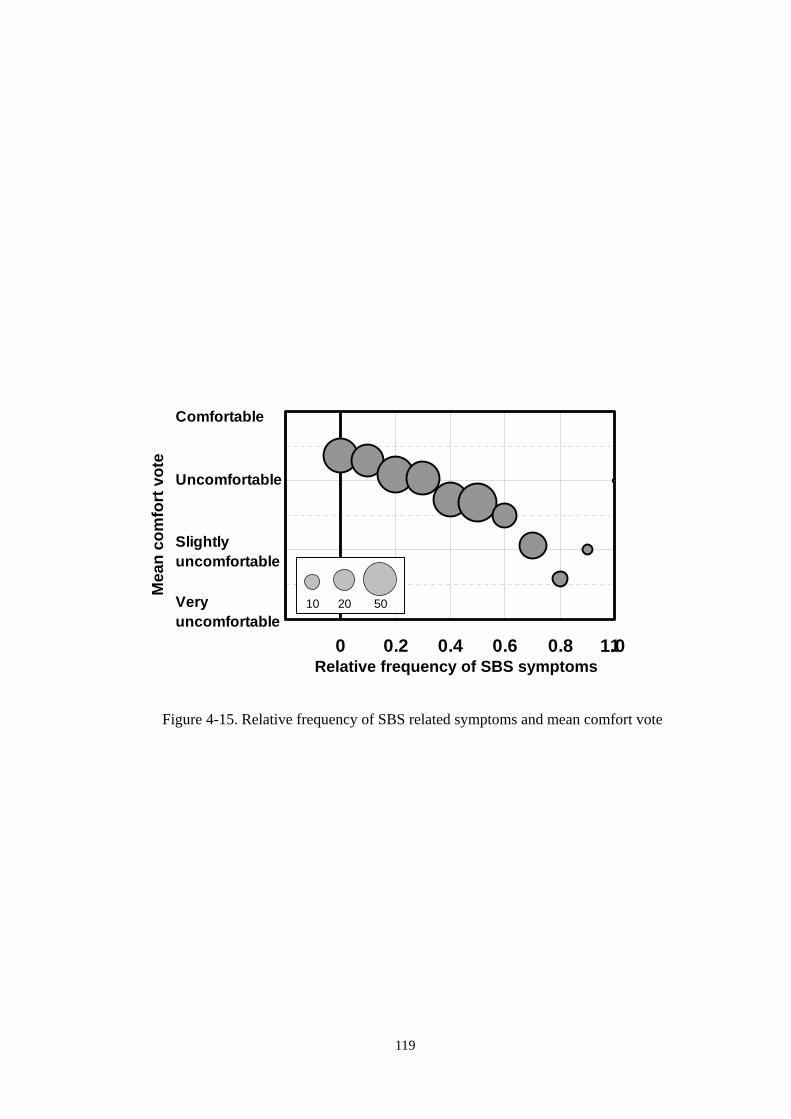
-0.2 0 0.2 0.4 0.6 0.8
Comfortable
Uncomfortable
Slightlyuncomfortable
Veryuncomfortable
50 10 20
11.0 Relative frequency of SBS symptoms
Mea
n co
mfo
rt v
ote
Figure 4-15. Relative frequency of SBS related symptoms and mean comfort vote
119

4.5 DISCUSSION
4.5.1 Neutral Temperature As a result of extensive subjective experiments conducted in the climate chamber, Fanger
(1970) concluded that age, sex, and national- geographic differences did not influence the
neutral temperature of the subjects. Laboratory tests conducted by Tanabe et al. (1994) and
de Dear et al. (1991a) (1991b) also showed that there was no significant difference in thermal
neutrality between Caucasian and Japanese. However, from the analysis of the current survey,
a neutral temperature difference of 3.1°C was observed among the Japanese females and
non-Japanese males. Though the classification of nationality may be questioned, the
Japanese was a dominant group of the occupants and other nationalities could not be
classified into smaller groups. Three factors are considered as the cause of difference in
neutral temperature: clothing, type of work, and expectation.
1) Clothing: Present survey was conducted during the working hours. Because the number
of questions was limited on a questionnaire, detailed survey on clothing could not be
conducted. Although clothing of male and female occupant groups was visually confirmed to
be different, male occupant groups all wore business suits. Clothing alone is unlikely to be
the sole factor causing the large difference in thermal sensation within the male group.
2) Type of work: As opposed to most of the Japanese male and female workers who were
engaged in regular desk works, non-Japanese male workers mainly took part in an intensive
trading work. The latter type of work forces mental stress during the working hours, and
bodily movements resulting from stress or stress itself might have well influenced the
perception of thermal environment. Little work has been done on thermal comfort under
conditions of mental stress, and the degree of its influence was not clear here.
3) Expectation: Environments deviating from expectations are likely to result in
discomfort. According to a series of office surveys conducted from 1995 to 1998 in Japan,
the yearly average office temperature was found to be 24.5 – 25.0 °C (SHASE, 1993). This
value is quite close to neutral temperature of 24.8 °C found for Japanese occupants. Also, on
120

the basis of extensive office surveys conducted mainly in the US and Australia, de Dear et al.
(1998) proposed the optimum indoor operative temperature of buildings with centralized
HVAC to be 23.5°C in summer and 22.5°C in winter. The neutral temperature for the
non-Japanese occupant group was found to be 22.7°C, falling within the 90 % acceptability
operative temperature range for both summer and winter. These facts suggest that the neutral
temperatures found for each of the groups are reasonable, and that the air temperature
settings the occupants are accustomed to may have influenced the degree of expectation for
the office environment.
The present study was based on a field survey, and measurement items were limited.
Although the factors resulting in the neutral temperature difference could not be specified
from the present survey, the existence of diverse neutral temperatures was confirmed under
usual working conditions. These occupants working together in the same room is supposed to
have led to the low thermal comfort ratings in the present office.
121
4.5.2 Frequency of SBS Related Symptoms
Frequency of SBS related symptoms overall was found to be more highly correlated with
the thermal sensation votes, rather than the physical state of the environment. Jaakkola et al.
(1989) reported that an indoor temperature rise from 22°C resulted in the rise of SBS related
symptoms. However, this was because the perception of the thermal environment was similar
among the occupants. As can be seen from the results of the present survey where significant
differences in neutral temperature were confirmed between the groups, SBS related
symptoms are more related to their thermal sensation votes rather than the temperature itself.
The report of the high frequency of SBS related symptoms could be considered to be an
indication of dissatisfaction for the given environment.
Comfort votes were confirmed to drop as the relative frequency of symptoms rose. By
observing the overall results of the questionnaire survey, it was concluded that the main
factor causing dissatisfaction in the present office was the thermal environment, which
consequently influenced the ratings on the frequency of SBS related symptoms and general
comfort in the working environment
122

4.6 CONCLUSION
Field surveys were conducted at an office with Japanese and non-Japanese workers to
investigate the differences in the way groups of occupants perceive the environment under
real working conditions. Returned questionnaires were divided into 3 groups according to
their nationality and sex. The results are summarized as follows.
1) Only 26% of workers reported their working environment to be “comfortable”. At the
same time, only 26% voted their thermal environment to be “neutral”.
2) A significant neutral temperature difference of 3.1 °C was observed between the
Japanese female occupant group and the non-Japanese male group.
3) Japanese female occupants felt the air to be dry below 55 %rh, while male occupants
were less sensitive to low humidity.
4) Japanese female groups reported a higher frequency of SBS related symptoms compared
to the other occupant groups. Male groups tended to report mental symptoms such as
"sleepiness" and "fatigue", while females reported more physical symptoms such as "skin
dryness" and "eye irritation".
5) The comfort votes and the reported frequency of SBS related symptoms were closely
related to the deviation of thermal sensation vote from neutral.
6) The thermal environment was found to be the major factor affecting occupant comfort in
the particular office.
7) Occupants in the present office were relying on the adjustment of thermal environment to
achieve comfort, and the differences in the perception of the indoor environment were
negatively affecting the ratings of their working environment. The results indicate the
importance of personal adaptation such as clothing adjustment to achieve comfort even
in the air-conditioned indoor environment.
123

124

CHAPTER 5
THERMAL COMFORT CONDITION IN SEMI-OUTDOOR ENVIRONMENT FOR
SHORT-TERM OCCUPANCY
125

126

CHAPTER 5 THERMAL COMFORT CONDITION IN SEMI-OUTDOOR ENVIRONMENT FOR SHORT-TERM OCCUPANCY
5.1 INTRODUCTION
The term “semi-outdoor space” refers to an architectural environment where outdoor
elements are designedly introduced with the aid of environmental control. The level of control
in semi-outdoor environment may range from simple shading and wind shielding in an open
structured terrace to mechanical heating, cooling, and ventilation in a closed glazing structure
of an atrium. These spaces such as an atrium or terrace are designed often from an aesthetic
point of view or to add diversity to the architectural environments. However, main use is
usually not for long-term occupancy lasting for hours, and tight control of thermal environment
by the HVAC system as described in existing indoor thermal comfort standards may not be
required. Although little work has been done on thermal comfort in semi-outdoor environments,
it is likely that people expect circumstances differing from indoors, and the thermal comfort
condition in terms of short-term occupancy may differ from that of indoor steady state.
The purpose of this study is to investigate the actual occupancy condition, thermal
adaptation process and thermal comfort condition in relation to the level of environmental
control applied. A series of seasonal field surveys was designed and carried out in four
semi-outdoor architectural environments from the summer of 2001 to spring of 2002.
127
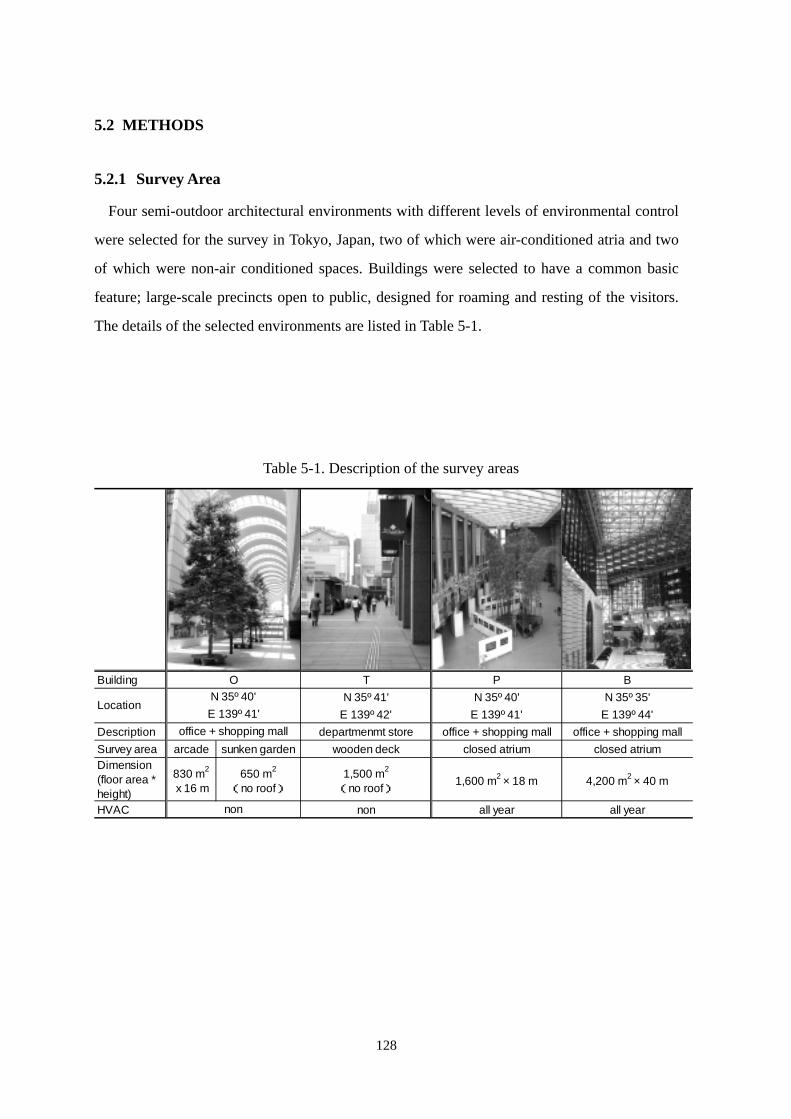
5.2 METHODS
5.2.1 Survey Area
Four semi-outdoor architectural environments with different levels of environmental control
were selected for the survey in Tokyo, Japan, two of which were air-conditioned atria and two
of which were non-air conditioned spaces. Buildings were selected to have a common basic
feature; large-scale precincts open to public, designed for roaming and resting of the visitors.
The details of the selected environments are listed in Table 5-1.
Table 5-1. Description of the survey areas
Bu
S
(he
ilding T P BN 35º 41' N 35º 40' N 35º 35'
E 139º 42' E 139º 41' E 139º 44'Description departmenmt store office + shopping mall office + shopping mall
urvey area arcade sunken garden wooden deck closed atrium closed atriumDimensionfloor area *
ight)
830 m2
x 16 m650 m2
(no roof)1,500 m2
(no roof) 1,600 m2 × 18 m 4,200 m2 × 40 m
HVAC non all year all year
office + shopping mall
non
O
LocationN 35º 40'E 139º 41'
128

5.2.2 Survey Period
Japan has a distinctive seasonal climate, and influence of seasonal change is expected to be
large on thermal condition of semi-outdoor environments. In order to examine the seasonal
average characteristic independent of hourly or daily changes of occupancy condition, surveys
were conducted from 10:00 to 18:00 for four weekdays per building per season for four
seasons. The survey periods, a total of 64 days, are given in Table 5-2. All surveys were
conducted regardless of the weather conditions except for Building T where major part of
survey area was uncovered, and visitors were unable to occupy the area due to wet furniture.
Table 5-2. Survey periods
Building20, 21 15, 16 10, 11 8, 924, 25 18, 19 13, 14 11, 12
Aug. 27, 28 22, 23 11, 15 22, 23Sep. 3, 4 25, 26 17, 18 25, 26
6, 7 Oct. 30, 31 Jan. 29, 31 15, 1626, 27 Nov. 6, 19 Feb. 1, 4 18, 1913, 14 12, 13 21, 22 13, 1418, 19 15, 16 24, 25 16, 17
May
SpringApr.
Apr.
Apr.
Dec.
Jan.
Jan.
WinterAutumnOct.
Oct.
Nov.
O
P
T
B
SummerAug.
Sep.
Sep.
129

5.2.3 Survey Design
Three survey methods were integrated into the survey design: 1) investigation of the
occupancy condition, 2) questionnaire survey and 3) measurement of the thermal environment.
The present survey was focused on “short-term occupants” defined as the visitor who actually
sat down in the survey area, and a passer-by or a standing person was left out of scope.
For the first objective, occupancy period was measured throughout the day by randomly
selecting the visitors upon sitting in the area and recording the time of arrival and departure.
The number of occupants within the survey area was also counted every ten minutes.
Questions concerning the background information, purpose of stay and frequency of visit were
included in the questionnaire.
Questionnaire sheet written in plain Japanese also included questions concerning
approximate length of stay, activity within 15 minutes, clothing items, general comfort,
thermal sensation, thermal preference, and thermal acceptability. In order to avoid any apparent
errors, a surveyor also recorded the basic background information and clothing items of the
respondent that could be confirmed visually. Questionnaire sheet translated into English is
presented in Figures 5-1 and 5-2.
A mobile measurement cart was devised to measure the thermal environment around the
occupants at heights of 0.1, 0.6, 1.1, 1.7 m above ground. Measurement items are given in
Table 5-3. The radiant environment was evaluated by measuring the directional total radiation
and solar radiation separately for six directions (up, down, front, back, left, right) at 1.1m
above floor level. Orientation of the sensors was also recorded. Outdoor conditions were
recorded separately.
After earning the consent of an occupant to answer the questionnaire, another surveyor drove
the cart near the respondent to measure the surrounding environment for ten minutes as
depicted in Figure 5-4. Five minute average prior to the end of each measurement was
regarded as the representative value of thermal environment for that respondent. A total of
2248 occupant responses and corresponding sets of thermal environment data were collected
throughout the four seasonal surveys. The collected number for each building and season is
presented in Table 5-4. Surveys were carried out with 4 personnel each day.
130

Thermal Comfort Questionnaire Survey Number
Dept. of Architecture, WASEDA University.
Please write in or mark a check on the box. ① What is your sex and age?
□Male □Female □ < 20 □20-29 □30-39 □40-49 □50-59 □60-69 □ 70 <
② What is your occupation?
□Business man / woman □Housewife □Part timer □Student □Others( )
③ Please check the clothing items you are wearing at this moment.
Under Sleeve: Long Short None Lite Heavy □Necktie□Top wear [□ □ □] Pants / [□ □] □Leather □Hat/cap□Socks Trousers Short Knee Ankle shoe □Muffler□Stocking [□ □ □] □Gym shoes □Shawl□Tights Short Knee Ankle Lite Heavy □Sandals □Scarf□Bottom wear [□ □ □] Skirt [□ □] □Short boots □Gloves
Short Knee Ankle □Long boots □Ear pads[□ □ □]
Top Long Short None Lite Heavy Short Knee Ankle Lite Heavy Coat Lite Heavy
Button-down [□ □ □] [□ □] Vest [■ ■ □] [□ □] Long coat [□ □](Y shirt / blouse) Sweater [□ □ □] [□ □] Half coat [□ □]Shirt [□ □ □] [□ □] Sweat shirt [□ □ □] [□ □] Leather [□ □](Tshirt / Polo shirt) (Fleece, etc.) jacketOther shirt [□ □ □] [□ □] Cardigan [□ □ □] [□ □] Windbreaker [□ □](Turtle neck, etc.) Turtle neck [□ □ □] [□ □] Down jacket [□ □]One-piece [□ □ □] [□ □] sweater Trench coat [□ □]
Jacket [□ □ □] [□ □]
Bottom Shoes Others
④ What is the purpose of your stay here? □Resting □Meal □Waiting □Reading □Computer □Smoking □Mobile phone □Others( )
⑤ Are you sweating right now?
□Not sweating □Slightly sweating □Sweating □Very much sweating
⑥ How long have you been here? □ < 5 min. □5-10 min. □10-15 min. □15 min. <
⑦ What were you doing just before this survey?
□Resting □Meal □Waiting □Reading □Computer □Smoking □Mobile phone □Others( )
⑧ What were you doing 15 minutes ago? □Indoor work □Outdoor work □Meal □Shopping □Walking □Exercise □Staying here □Moving by foot □Moving by transportation □Others( )
⑨ How is your health condition today?
□Good □Fair □Not good □Bad
⑩ Have you drunk any alcoholic beverage in the past two hours? □Yes □No
⑪ Do you know the weather forecast for today?
□Yes □No
⑫ How many times have you visited this place in the past? □0 □ < 5 □ < 10 □ 11 <
Figure 5-2. Questionnaire sheet (front)
131

Please answer the questions below with regard to the environment you are sitting right now. ⑬-1 How comfortable is the present environment?
□ □ □ □ □ □ □ Slightly
ComfortableSlightly Uncomfortable
Comfortable Very Comfortable
Neutral Uncomfortable Very Uncomfortable
-1 -2 -3 +3 +2 0 +1 ⑬-2 If you answered “Very comfortable”, “Comfortable”, or “Slightly comfortable” on question ⑬‐1,
what elements below contributed to your comfort? (multiple answers) □Temperature □Humidity □Sunlight □Wind □Sound □Smell □Vegetation □Furniture □Openness □Spaciousness □Brightness □Smoking □Presence of others □Others( )
⑬-3 If you answered “Very uncomfortable”, “Uncomfortable”, or “Slightly uncomfortable” on question
⑬‐1, what elements below contributed to your discomfort? (multiple answers) □Temperature □Humidity □Sunlight □Wind □Sound □Smell □Vegetation □Furniture □Openness □Spaciousness □Brightness □Smoking □Presence of others □Others( )
⑭ How do you feel the present environment to be?
□Hot □Warm □Slighlt warm □Neutral □Slightly cool □Cool □Cold
-1 +2 +3 +1 0 -2 -3
⑮ How do you want the temperature to be? □Warmer □No change □Cooler
⑯-1 Do you feel any air movement?
□Yes □No
⑯-2 How do you want the air movement to be? □Stronger □No change □Weaker
⑰-1 How do you feel the humidity to be?
□Very humid □Humid □Neutral □Dry □Very dry
⑰-2 How do you want the humidity to be? □Higher □No change □Weaker
⑱-1 Do you feel the direct solar radiation?
□Yes □No
⑱-2 How do you want the solar radiation to be? □Stronger □No change □Weaker
⑲ Is the present thermal environment acceptable?
□Acceptable □Unacceptable
⑳ Do you have any other comments about this environment?
Figure 5-3. Questionnaire sheet (back)
132

Table 5-3. Mobile measurement cart and measurement items for thermal environment
Measurement items Instruments Height (m)
Air temperature C-Cthermocouples 0.1 / 0.6 / 1.1 / 1.7
Air velocityOmnidirectionalheatedanemometer 0.1 / 0.6 / 1.1 / 1.7
Humidity RH sensor 0.1 / 1.1
Total radiation Directional radio-meter (0.3-4.0µm) 1.1 (6 directions)
Solar radiationSiliconpyranometer (0.4-1.1µm) 1.1 (6 directions)
Surface temperature C-Cthermocouples Seat and ground
Air temperature ThermisterHumidity RH sensorSolar radiation Solar meter
Occupiedzone
Outdoorcondition
Figure 5-4. Questionnaire survey and measurement of thermal environment
Table 5-4. Collected number of questionnaire responses
Building Summer Autumn Winter Spring TotalO 137 143 49 119 448T 183 191 132 144 650P 151 167 122 140 580B 160 155 130 125 570
Total 631 656 433 528 2248
133

5.2.4 Calculation of Mean Radiant Temperature (MRT)
Long wave radiation: Directional long wave radiation Lk [W/m2] was calculated by
subtracting the measurement value of the pyranometer Inet,k [W/m2] from the measured total
radiation Rnet,k [W/m2] for each direction. The subscript k represents the six directions for up,
down, right, left, front, and back.
knetknetk IRL ,, −= (5-1)
Solar radiation: In HVAC buildings P and B where direct solar radiation rarely reached the
occupant, the measured solar radiation was considered to be diffuse radiation. For non-HVAC
buildings O and T, direct solar radiation normal to the sunray Idir,n [W/m2] was calculated from
the global radiation (Udagawa and Kimura, 1978). Time, date, location, and readings of the
upward direction of the pyranometer Inet,up were used as the input variable. From the orientation
of each sensor, direct solar radiation entering each direction Idir,k was calculated by
trigonometric function. These values were subtracted from each directional pyranometer
reading Inet,k to derive diffuse solar radiation Idif,k [W/m2].
(5-2) kdirknetkdif III ,,, −=
Net radiation on man: Long wave radiation and diffuse solar radiation was assumed to be
absorbed by the effective radiation area. Since all respondents were seated, a value of 0.696
was used as effective radiation area factor Aeff [-] (Fanger, 1970). Short wave absorptance a [-]
of clothed body was assumed to be 0.66. Directional diffuse total radiation Rdif,k [W/m2] was
weighted according to the projected area of the human body (Olesen et al., 1989) and averaged
for diffuse total radiation Rdif [W/m2].
(5-3) kdifkkdif aILR ,, +=
)(186.0)(127.0 ,,,,,, backdiffrontdifleftdifrightdifdowndifupdifdif RRRRRRR +++++= (5-4)
134

The direct total radiation on man Rdir [W/m2] was assumed to be Idir,n absorbed by the body
surface area directly lit by the sun. A constant value of 0.2 was used for γp [-], irradiated area
expressed as fraction of Dubois area, since only small differences existed for irradiated area of
a seated man for different solar altitudes (Breckenridge and Goldman, 1972).
ndirpdir IaR ,γ= (5-5)
Net radiation on man R [W/m2] was calculated by the sum of equations (5-4) and (5-5).
difeffdir RARR += (5-6)
Surface temperature of an imaginary uniform enclosure MRT [°C] was derived from the
following equation. σis the Stefan Boltzmann constant (5.67 x 10⁻⁸ [W/m2K4]).
difeffdireff RARMRTA +=+ 4)15.273(σ (5-7)
15.273/ 25.0
, −
+=
σγ difeffndirp RAIa
MRT (5-8)
135

5.3 RESULTS AND DISCUSSION
5.3.1 Outdoor Climatic Conditions
Figure 5-5 shows the daily mean outdoor temperature and humidity of all survey days
calculated from the meteorological data of Tokyo. Tokyo area belongs to the temperate climate
zone having four distinctive seasons. The climate is hot and humid in summer, cold and dry in
winter, and intermediate during spring and autumn. The general seasonal description applies to
the seasonal classification of the present survey.
Daily fluctuation of outdoor temperature was calculated for each season from the
meteorological data of survey days. The results are given in Figure 5-6. Daily minimum
temperature was generally observed at around 6:00 and maximum at 14:00. Difference in daily
maximum and minimum temperature was approximately 5.5 °C in autumn and winter and 4 °C
in summer and spring, showing that temperature variation was larger during autumn and winter
seasons.
136

0
5
10
15
20
25
30Summer AutumnWinter Spring
0
5
10
15
20
8 109 11 12 1 2 3 4 5 6
Mea
n ou
tdoo
r te
mp.
[oC
]
Mea
n ou
tdoo
r hum
idity
ra
tio [g
/kg]
Month
Figure 5-5. Daily mean outdoor temperature and humidity of all survey days
0
5
10
15
20
25
30
Summer AutumnWinter Spring
Out
door
air
tem
pera
ture
(°C
)
0:00 3:00 6:00 9:00 12:00 15:00 18:00 21:00 0:00Figure 5-6. Seasonal average daily fluctuation of outdoor temperature
137

5.3.2 Thermal Environmental Characteristics
Thermal environmental characteristics of the occupied zone were analyzed according to the
environmental classification of the 4 semi-outdoor environments. Air conditioned atria will be
referred to as “HVAC” and non-air conditioned spaces as “non-HVAC”.
Relationship between outdoor air temperatures and air temperatures of the occupied zone
measured around the questionnaire respondent with mobile measurement cart are given in
Figure 5-7. Air temperature closely coincided the outdoor temperature in non-HVAC buildings.
Links between the two temperatures were also observed in HVAC buildings, but occupied zone
was generally kept between 15-29 °C.
Mean radiant temperatures of the occupied zone are plotted against air temperature of the
occupied zone in Figure 5-8. MRT close to air temperature was observed in HVAC buildings
while prominently higher values were recorded in non-HVAC buildings due to solar radiation.
Humidity ratio of occupied zone and outdoor are presented in Figure 5-9. Mild humidity
control was confirmed in both HVAC buildings, especially when outdoor humidity was high.
Live plants grown in the atrium of building P contributed to keep the humidity higher in lower
ranges as opposed to building B.
Relative frequency of air velocity observed within the occupied zone is shown in Figure
5-10. Majority of mean air velocity measured in HVAC buildings were below 0.3 m/s, while
the peak frequency of 0.6 m/s and maximum value of 2.6 m/s was observed in non-HVAC
buildings.
All four thermal parameters showed similar characteristics within each environmental
category, and this classification of “non-HVAC” and “HVAC” will be employed for the further
analyses.
138

Outdoor air temperature (°C) 0 10 20 30
PB
0
10
20
30
40
0 10 20 30 40
OT
HVAC Non-HVAC
40
Air
tem
p. o
f occ
upie
d zo
ne (°
C)
0
10
20
30
40
50
60
70
80
0
MR
T of
occ
upie
d zo
ne (°
C)
Figure 5-7. Outdoor air temperature and air temperature of occupied zone
10 20 30 4
OT
Non-HVAC
0 0 10 20 30 4
PB
HVAC
0
Air temperature of occupied zone (°C)
Figure 5-8. Air temperature and mean radiant temperature of occupied zone139
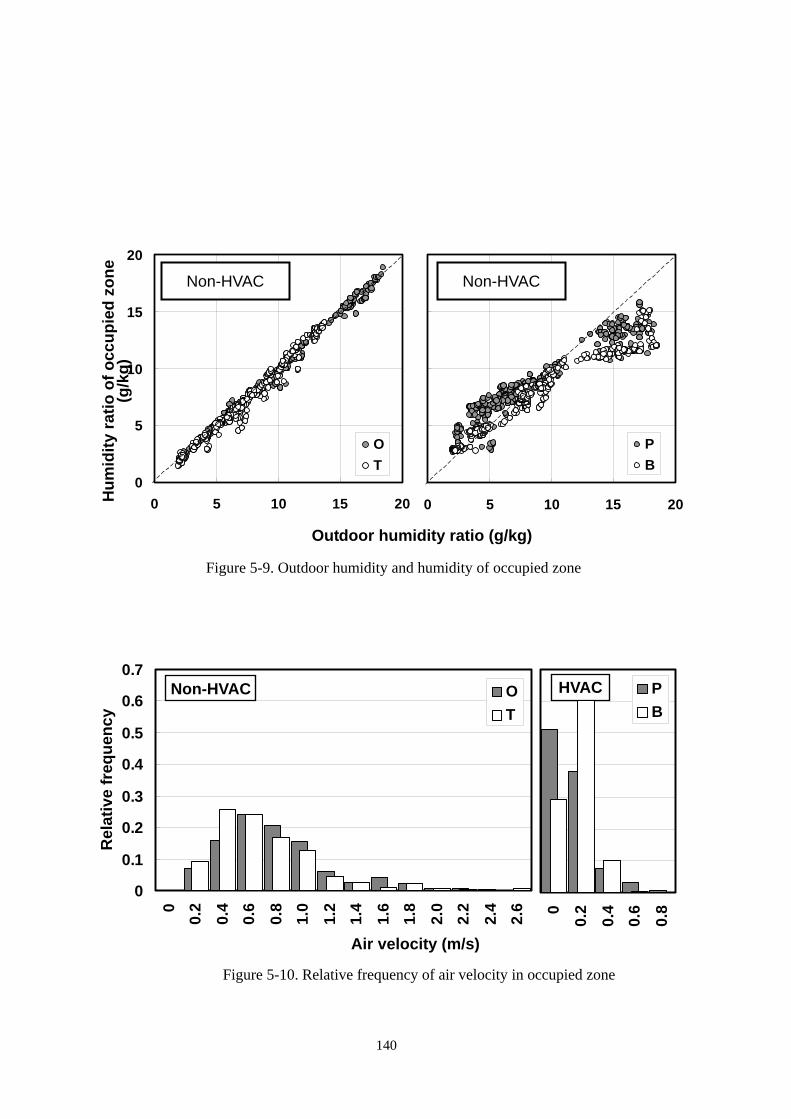
Hum
idity
ratio
of o
ccup
ied
zone
(g
/kg)
10
0 5 10 15 20
PB
0
5
15
20
0 5 10 15 20
OT
Non-HVAC
Non-HVAC
Outdoor humidity ratio (g/kg)
0
0.1
0.2
0.3
0.4
0.5
0.6
0.7
00.
2
Non-
Rel
ativ
e fr
eque
ncy
Figure 5-9. Outdoor humidity and humidity of occupied zone
0.4
0.6
0.8
1.0
1.2
1.4
1.6
1.8
2.0
2.2
2.4
2.6
OT
00.
20.
40.
60.
8PB
HVAC HVAC
Air velocity (m/s)
Figure 5-10. Relative frequency of air velocity in occupied zone
140

5.3.3 Occupancy Conditions
Questionnaire results concerning the background information of the respondents are given in
Figure 5-11. Occupation of respondents was asked to illustrate the degree of freedom in
clothing, as business man/woman would be restricted of their clothing selection on working
days.
In buildings O, P and B annexed to an office building, 70 % or more of the occupants were
in their 30’s or younger, and more than 60 % were business man/woman. Population in
building T annexed to a department store was slightly different, with larger percentage of
students, 40 %. The ratio of males to females was approximately 50 to 50 in all buildings
except building P, where 70 % were females.
Over 60 % of occupants answered the purpose of their stay to be “resting” or “meal (lunch)”
in all buildings. Other purposes included in the questionnaire such as “reading”, “chatting”,
“smoking” and “mobile phone” along with the two given above could be regarded as voluntary
activities. The contrary would be “waiting”, where an occupant is required to wait in the
environment regardless of his/her comfort condition. The percentage of “waiting” plus “others”
was 17 % of entire respondents, and majority of occupant activities, 83%, is considered to be
voluntary.
Occupancy in present semi-outdoor environments can be regarded as arbitrary, as opposed to
imposed occupancy in climate chambers or other scenes of indoor environment such as offices
or schools. This implies that occupants in semi-outdoor environments have greater freedom in
selection of their own occupancy condition than indoor environments.
141

B
P
T
O
B
P
T
O
B
P
T
O
0% 20% 40% 60% 80% 100%
B
P
T
O
Sex Male Female
Age 10’s 20’s 30’s 40’s 50’s 60’s 70’s
Occupation Business man/woman Part timer House wife Student Others
Purpose Resting Meal Chatting Reading Smoking Mobile phone Waiting Others
Figure 5-11. Questionnaire results on background information of respondents
142

Average occupancy periods for each building are given in Table 5-5. Although slight
decrease was observed in winter, occupancy periods in non-HVAC buildings were
approximately 10 minutes all year round for both O and T. The values were not consistent in
HVAC buildings, 20 minutes and 15 minutes for buildings P and B respectively. Average
occupancy period was longer in building P where a section of the area was equipped with
lounge chairs compared to metal meshed benches in building B. Quality of the furniture may
have an impact on occupancy period in close structured HVAC buildings, while the effect
could be considered to be smaller in open structured semi-outdoor environment where
installation of high quality comfort chairs would be unrealistic.
Diurnal variation in the number of occupants, seasonal average of four days, is presented
in Figure 5-12 to 5-15 for buildings O, T, P and B respectively. Evident peak was observed
around 12:30 in office buildings O, P and B when office workers occupied the area for
lunchtime. Number of females was greater during that period. Unique profile was confirmed in
department store T where the number grew from morning towards the afternoon, and remained
constant or even higher until the end of survey. Majority of occupants were males in Building T.
Apparent decrease was observed during winter in both non-HVAC buildings, while the profile
remained fairly constant throughout the year in HVAC buildings.
Table 5-5. Average occupancy period
Summer Autumn Winter Spring All0:11 0:10 0:06 0:09 0:09(551) (503) (327) (617) (1998)0:13 0:11 0:08 0:12 0:11(592) (534) (383) (217) (1726)0:17 0:27 0:26 0:18 0:21(539) (447) (383) (551) (1920)0:17 0:14 0:13 0:15 0:15(431) (358) (440) (324) (1552)
*(population)
Non-HVAC
HVAC
O
T
P
B
143

MaleFemale
Non-HVAC
AutumnSummer
0
10
20
30
40
50
60
0
10
20
30
40
50
60
10:0
0
11:0
0
12:0
0
13:0
0
14:0
0
15:0
0
16:0
0
17:0
0
18:0
010
:00
11:0
0
12:0
0
13:0
0
14:0
0
15:0
0
16:0
0
17:0
0
18:0
0
Spring Winter
Num
ber o
f occ
upan
ts
Figure 5-12. Variation in number of occupants in non-HVAC building O (seasonal average of 4 days)
020406080
100120140
020406080
000
10:0
0
11:0
0
12:0
0
13:0
0
14:0
0
15:0
0
16:0
0
17:0
0
18:0
0
10:0
0
11:0
0
12:0
0
13:0
0
14:0
0
15:0
0
16:0
0
17:0
0
18:0
0
MaleFemale
Non-HVAC
Spring
Autumn
Winter
Summer
101214
Num
ber o
f occ
upan
ts
Figure 5-13. Variation in number of occupants in non-HVAC building T (seasonal average of 4 days)
144

020406080
100120140
020406080
10:0
0
11:0
0
12:0
0
13:0
0
14:0
0
15:0
0
16:0
0
17:0
0
18:0
0
10:0
0
11:0
0
12:0
0
13:0
0
14:0
0
15:0
0
16:0
0
17:0
0
18:0
0
MaleFemale
0
10
20
30
40
50
60
0
10
20
30
40
50
60
10:0
0
11:0
0
12:0
0
13:0
0
14:0
0
15:0
0
16:0
0
17:0
0
18:0
010
:00
11:0
0
12:0
0
13:0
0
14:0
0
15:0
0
16:0
0
17:0
0
18:0
0
MaleFemale
HVAC
HVAC
Figure 5-14. Variation in number of occupants in HVAC building P (seasonal average of 4 days)
Spring
Autumn
Winter
Summer
Spring
Autumn
Winter
Summer
100120140
Num
ber o
f occ
upan
ts
Num
ber o
f occ
upan
ts
Figure 5-15. Variation in number of occupants in HVAC building B (seasonal average of 4 days)
145
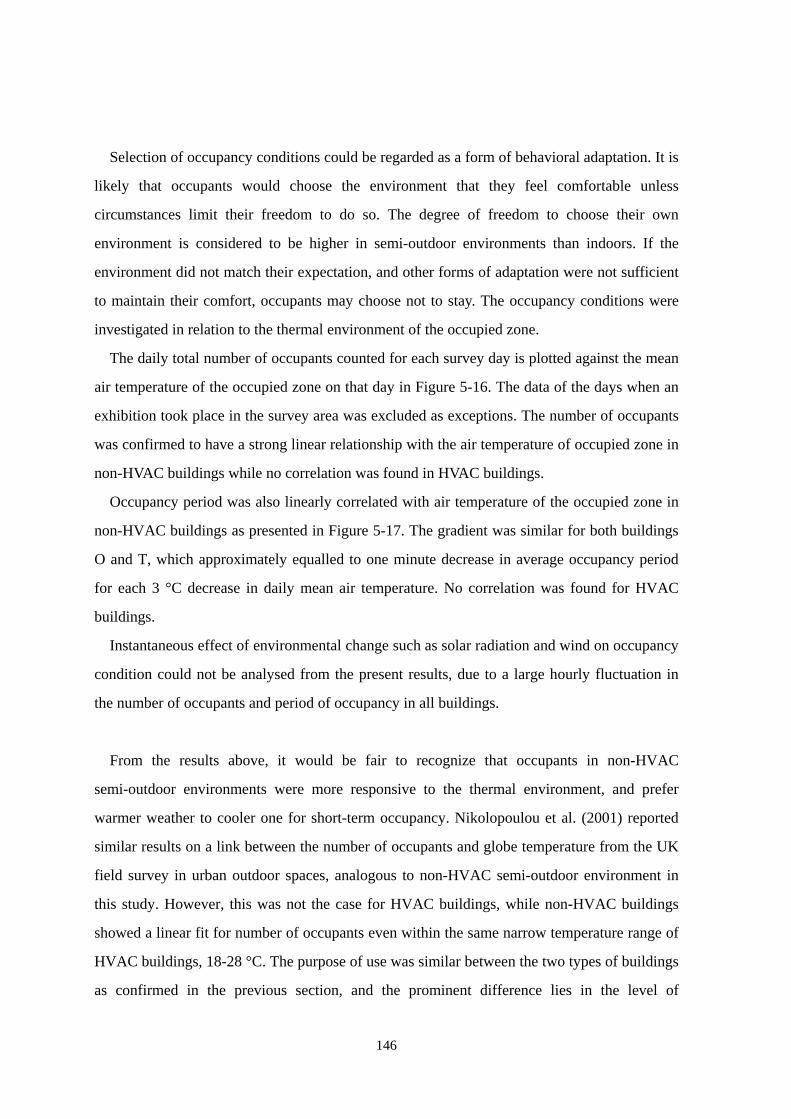
Selection of occupancy conditions could be regarded as a form of behavioral adaptation. It is
likely that occupants would choose the environment that they feel comfortable unless
circumstances limit their freedom to do so. The degree of freedom to choose their own
environment is considered to be higher in semi-outdoor environments than indoors. If the
environment did not match their expectation, and other forms of adaptation were not sufficient
to maintain their comfort, occupants may choose not to stay. The occupancy conditions were
investigated in relation to the thermal environment of the occupied zone.
The daily total number of occupants counted for each survey day is plotted against the mean
air temperature of the occupied zone on that day in Figure 5-16. The data of the days when an
exhibition took place in the survey area was excluded as exceptions. The number of occupants
was confirmed to have a strong linear relationship with the air temperature of occupied zone in
non-HVAC buildings while no correlation was found in HVAC buildings.
Occupancy period was also linearly correlated with air temperature of the occupied zone in
non-HVAC buildings as presented in Figure 5-17. The gradient was similar for both buildings
O and T, which approximately equalled to one minute decrease in average occupancy period
for each 3 °C decrease in daily mean air temperature. No correlation was found for HVAC
buildings.
Instantaneous effect of environmental change such as solar radiation and wind on occupancy
condition could not be analysed from the present results, due to a large hourly fluctuation in
the number of occupants and period of occupancy in all buildings.
From the results above, it would be fair to recognize that occupants in non-HVAC
semi-outdoor environments were more responsive to the thermal environment, and prefer
warmer weather to cooler one for short-term occupancy. Nikolopoulou et al. (2001) reported
similar results on a link between the number of occupants and globe temperature from the UK
field survey in urban outdoor spaces, analogous to non-HVAC semi-outdoor environment in
this study. However, this was not the case for HVAC buildings, while non-HVAC buildings
showed a linear fit for number of occupants even within the same narrow temperature range of
HVAC buildings, 18-28 °C. The purpose of use was similar between the two types of buildings
as confirmed in the previous section, and the prominent difference lies in the level of
146

environmental control. The cause of variation in the occupancy conditions in HVAC buildings
could not be specified from the present survey, but factors other than thermal environment
such as type of furniture seems to have a greater impact.
y = 122.4 x + 578.7R2 = 0.87
y = 35.2 x - 279.3R2 = 0.91
0
1000
2000
3000
4000
5 15 25 35
OT
5 15 25
PB
35
Dai
ly to
tal n
umbe
r of
occu
pant
s
Daily mean air temperature of occupied zone (°C) Figure 5-16. Daily mean outdoor air temperature and daily total number of occupants
Daily mean air temperature of occupied zone (°C)
y = 0.31 x + 5.63R2 = 0.71
y = 0.33 x + 1.78R2 = 0.78
0
10
20
30
40
5 15 25 35
OT
5 15 25
PB
35
Dai
ly m
ean
occu
panc
y pe
riod
(min
.)
Figure 5-17. Daily mean outdoor air temperature and daily mean occupancy period
147

5.3.4 Clothing Adjustment
Clothing adjustment is probably the most documented form of behavioral adaptation.
Humphreys (1977) indicated that clothing of visitors at zoo closely related to any other
environmental variables, and that people were less successful in adjusting their clothing to
radiation, humidity, or air velocity. Field studies on clothing are typically conducted by
surveyor’s visual observation or using a garment checklist of specific clothing items. A
combination of both methods was employed in this survey for precise examination of clothing
adjustment. The questionnaire sheet presented in Figure 5-2 asked specifically on the clothing
items worn “at the moment” to observe the correspondence with immediate thermal
environment measured by the mobile measurement cart. However, mistakes could happen
especially in short-term occupancy spaces where a respondent may have worn a coat prior to
occupancy and have it in hand at the time of questionnaire. In order to avoid apparent mistakes,
visual observation of a surveyor was also recorded simultaneously using the same checklist.
Each clothing item in the questionnaire was assigned an insulation value according to ISO
9920 (1995) and summed for total insulation. Representative values and results of the t-test
conducted between males and females are given in Table 5-6. Female clothing was
significantly smaller than males in HVAC building throughout the year, while the difference
was insignificant in autumn and winter in non-HVAC buildings. Results of the field studies in
offices indicated that females generally have smaller clothing insulation than males (Schiller et
al., 1988), but it was not found to apply for non-HVAC semi-outdoor environments in cool
seasons.
Seasonal distributions of clothing in 0.1 clo intervals are presented in Figure 5-18. Normal
distribution was observed in non-HVAC buildings for all seasons. The values were widely
spread in HVAC buildings, illustrating the variety in clothing patterns. Spikes in certain
clothing insulation were observed in HVAC buildings due to typical business attire for office
work. Clothing with the highest frequency was the same for all seasons between non-HVAC
and HVAC buildings, 0.4, 0.9, 1.1 and 0.9 clo respectively for summer, autumn, winter and
spring.
148

Table 5-6. Average clothing insulation (clo)
Male Female All Male Female AllSummer **0.54 0.46 0.49 **0.67 0.49 0.56Autumn 0.90 0.94 0.92 **0.94 0.86 0.89Winter 1.28 1.26 1.27 **1.34 1.08 1.21Spring *0.90 0.85 0.88 **0.86 0.73 0.78
*: p<0.05, **: p<0.01
Non-HVAC HVAC
40
0.0 0.2 0.4 0.6 0.8 1.0 1.2 1.4 1.6 1.8 2.0
HVAC
Non-HVAC
Spring
Winter
Autumn
Summer
30
20
Rel
ativ
e fr
eque
ncy
(%)
10
0
40
30
20
10
0
Clothing insulation (clo) Figure 5-18. Daily mean outdoor air temperature and daily mean occupancy period
149

Air temperatures of the occupied zone measured simultaneously with questionnaire were
rounded into 0.5 °C increments and corresponding mean clothing insulation values were
calculated to examine the clothing adjustment for a given thermal environment. The results are
presented in Figure 5-19. The size of the plot represents the number of population used to
calculate each mean value. Weighted linear regression was applied for each season separately.
Clothing was linearly correlated with the air temperature of the occupied zone in both
non-HVAC and HVAC buildings. Seasonal differences in the gradient of linear regression were
found for both non-HVAC buildings and HVAC buildings. The gradient of linear regression
denotes the degree of clothing change against air temperature change of the occupied zone.
Summer and spring showed a similar gradient as well as autumn and winter. Gradients were
found to be larger in HVAC buildings.
Note that the profile of HVAC buildings would appear quite similar to non-HVAC if the
temperature range were stretched to that of non-HVAC. Relationship was sought among mean
clothing insulation and mean outdoor temperature for each day. The results are presented in
Figure 5-20. Clothing adjustment in relation to outdoor temperature was almost identical for
HVAC buildings and non-HVAC buildings, with the slight difference of 0.05 in the intercept
of regression fit. Decrease of 2.5 °C in daily mean outdoor temperature equaled a 0.1 clo
increase in clothing insulation. Morgan et al. (2002) conducted a series of measurements on
clothing of the visitors at the department store, and concluded that clothing worn was
irrespective of indoor temperature and dependant on outdoor temperature. Air temperature of
the occupied zone in HVAC buildings was linked with outdoor temperature as presented in
Figure 5-7, and clothing seemingly linked with environment in occupied zone. When examined
for a year-round period, occupants were adjusting their clothing mainly for outdoor condition
in semi-outdoor environments, whether they were air conditioned or not.
The gradient of seasonal clothing change against air temperature could be divided into two
groups; summer-spring and autumn-winter. The gradient was larger for autumn-winter group,
suggesting a more delicate clothing adjustment in these seasons. Figure 5-6 of average daily air
temperature variation depicts the fact that temperature changes are larger in autumn and winter
during the day. The occupants were dressed for the lower end of the daily temperature range.
Seasonal climatic characteristic, not only in terms of mean outdoor temperature, would need to
be considered for finer prediction of clothing.
150

y = -0.04 x + 1.64
y = -0.02 x + 1.16
y = -0.03 x + 1.55
y = -0.01 x + 0.81
0.00.20.40.60.81.01.21.41.61.8
y = -0.06 x + 2.33
y = -0.03 x + 1.40
y = -0.05 x + 2.12
y = -0.02 x + 1.08
0.00.20.40.60.81.01.21.41.61.8
5 10 15 20 25 30 35
50 10 20
HVAC
Non-HVAC
SpringWinterAutumn
Summer
Clo
thin
g in
sula
tion
(clo
)
Air temperature of occupied zone (°C)
Figure 5-19. Daily mean outdoor air temperature and daily mean occupancy period
151
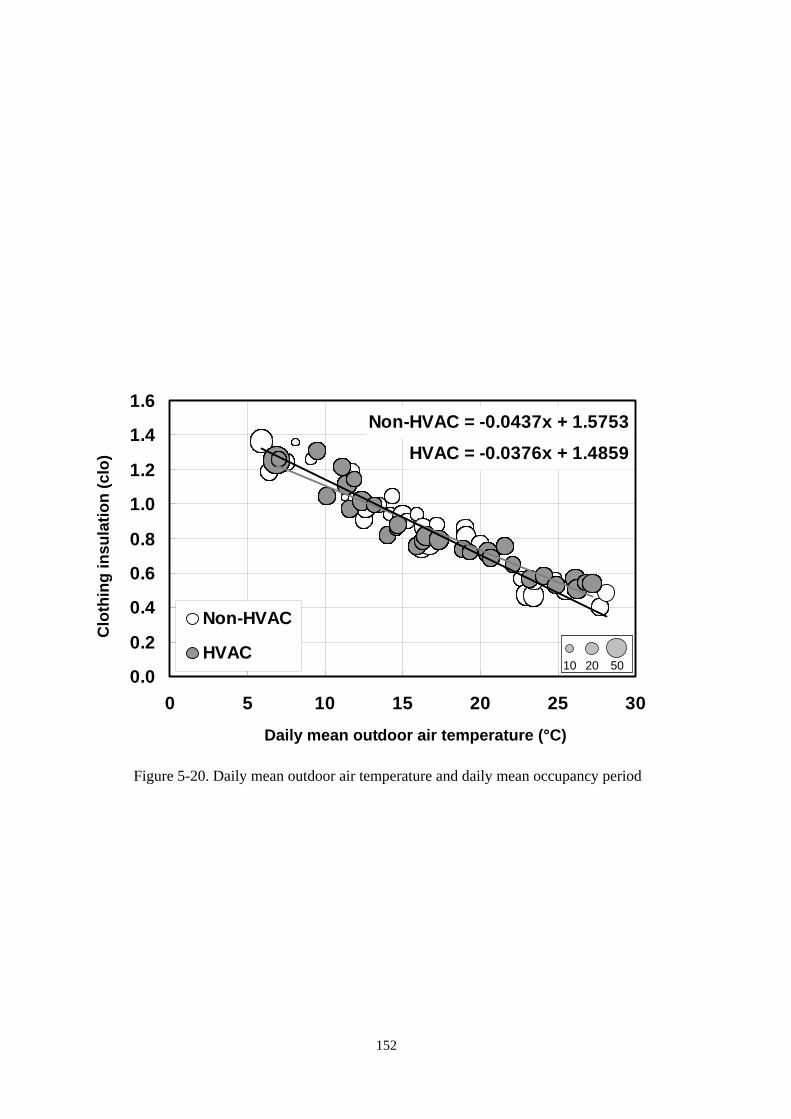
HVAC = -0.0376x + 1.4859Non-HVAC = -0.0437x + 1.5753
0.0
0.2
0.4
0.6
0.8
1.0
1.2
1.4
1.6
0 5 10 15 20 25 30
Non-HVAC
HVAC50 10 20
Clo
thin
g in
sula
tion
(clo
)
Daily mean outdoor air temperature (°C)
Figure 5-20. Daily mean outdoor air temperature and daily mean occupancy period
152

5.3.5 Neutral Temperature
Thermal indices, namely Predicted Mean Vote (PMV), Standard New Effective Temperature
(SET*), New Effective Temperature (ET*) and operative temperature, were calculated for each
respondent from the environmental variables measured by mobile measurement cart. Metabolic
rate and clothing insulation were estimated from the questionnaire. Each clothing item was
assigned an insulation value (ISO 9920, 1995) and summed for total insulation. Occupants
sitting in the cushioned lounge chair of building P were added 0.15 clo for insulation of the
chair (ASHRAE, 2001). No increase was considered for occupants in other buildings sitting on
wooden or metal meshed benches, assuming that slight increase was compensated by the
decrease of boundary air layer (McCullough et al., 1994). Little work has been done on
estimation of transient metabolic rate, which may be affected by such factors as food
consumption, precedent activity, and duration of the present activity. Instead of applying
numerous assumptions, a constant metabolic rate of 1.1 met, a value slightly higher than
sedentary seated condition, was assumed for all occupants.
Of all the thermal indices calculated for analysis, SET* achieved the highest correlation with
observed thermal sensation votes as opposed to operative temperature adopted by various field
studies in office environments (de Dear and Brager, 1998). Wider range of thermal
environmental variables were observed in the semi-outdoor spaces compared to indoors, and a
more complex thermal index which can incorporate the effects of 4 environmental variables
was effective in describing the thermal environment of the occupied zone. The calculated
SET* were rounded into 1.0 °C increments, and corresponding mean thermal sensation votes
were derived. Weighted linear regression analysis was applied for each season and the neutral
temperature (Tn) for the mean thermal sensation vote of 0 was calculated. The results are
presented in Figures 5-21 and 5-22.
153
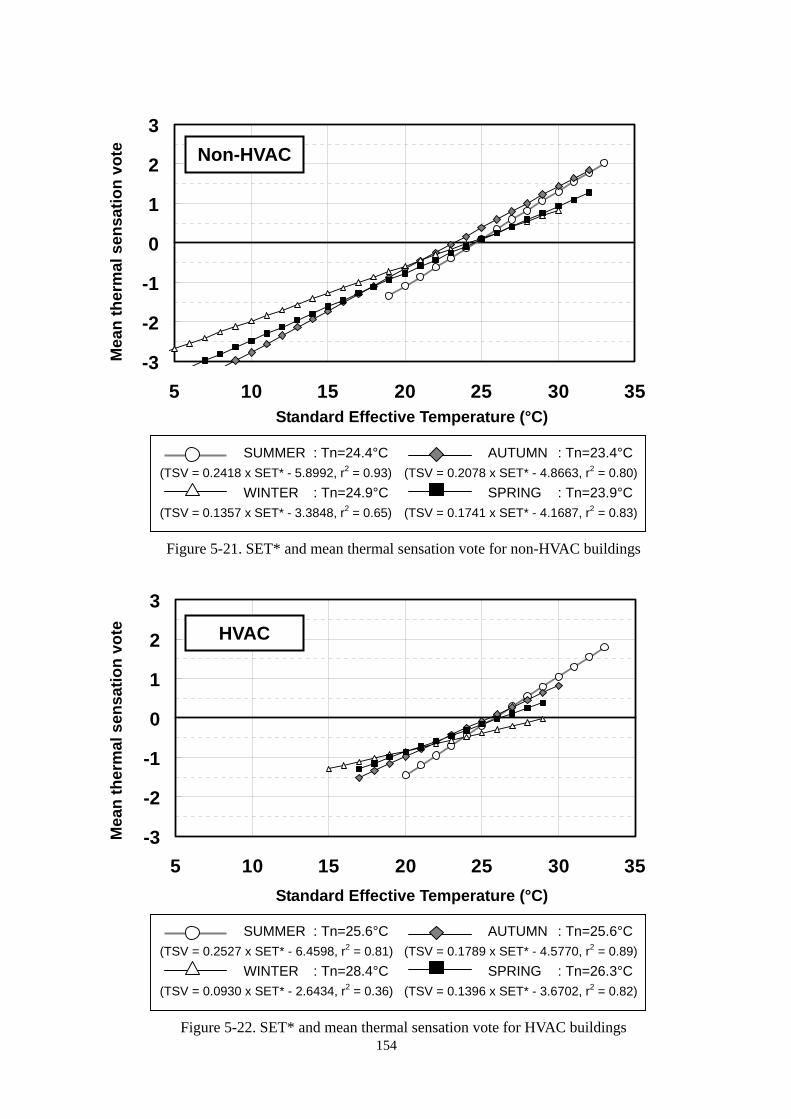
SUMMER : Tn=24.4°C(TSV = 0.2418 x SET* - 5.8992, r2 = 0.93)
WINTER : Tn=24.9°C(TSV = 0.1357 x SET* - 3.3848, r2 = 0.65)
AUTUMN : Tn=23.4°C (TSV = 0.2078 x SET* - 4.8663, r2 = 0.80)
SPRING : Tn=23.9°C (TSV = 0.1741 x SET* - 4.1687, r2 = 0.83)
-3
-2
-1
0
1
2
3
5 10 15 20 25 30 35
Non-HVAC
Standard Effective Temperature (°C)
Mea
n th
erm
al s
ensa
tion
vote
Figure 5-21. SET* and mean thermal sensation vote for non-HVAC buildings
154
-3
-2
-1
0
1
2
3
5 10 15 20 25 30 35
Figure 5-22. SET* and mean thermal sensation vote for HVAC buildings
HVAC
Standard Effective Temperature (°C)
AUTUMN : Tn=25.6°C (TSV = 0.1789 x SET* - 4.5770, r2 = 0.89)
SPRING : Tn=26.3°C (TSV = 0.1396 x SET* - 3.6702, r2 = 0.82)
SUMMER : Tn=25.6°C(TSV = 0.2527 x SET* - 6.4598, r2 = 0.81)
WINTER : Tn=28.4°C(TSV = 0.0930 x SET* - 2.6434, r2 = 0.36)
Mea
n th
erm
al s
ensa
tion
vote
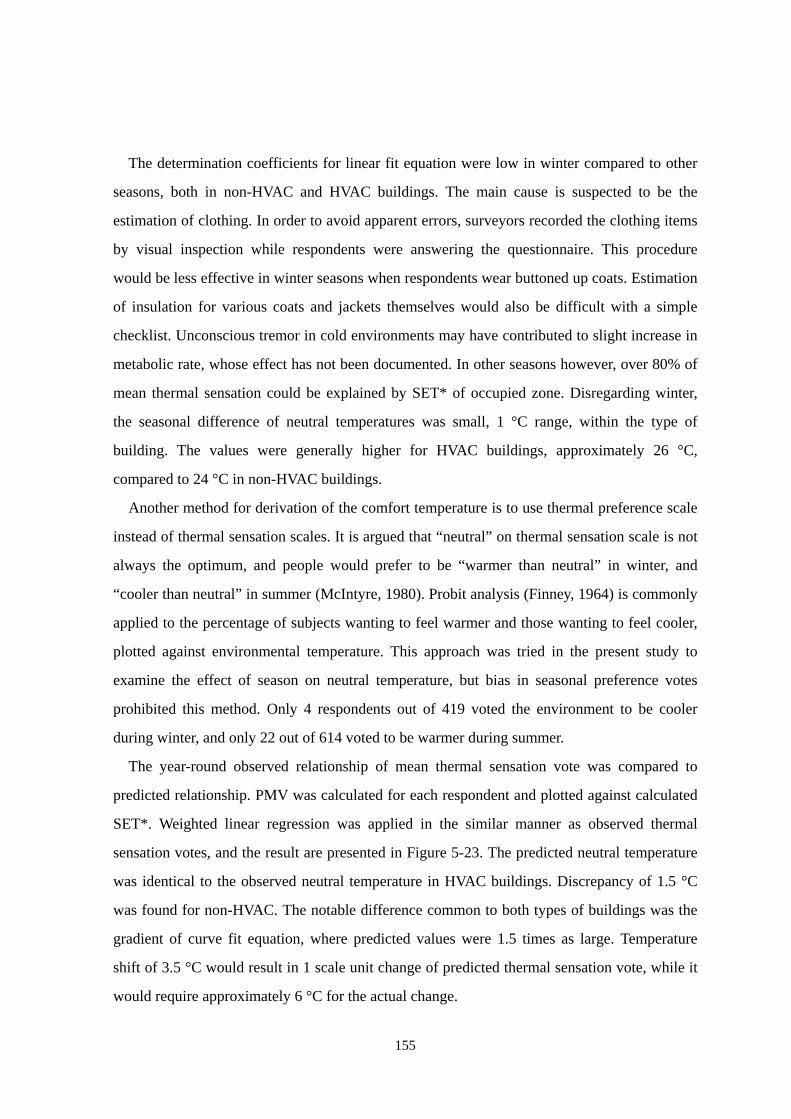
The determination coefficients for linear fit equation were low in winter compared to other
seasons, both in non-HVAC and HVAC buildings. The main cause is suspected to be the
estimation of clothing. In order to avoid apparent errors, surveyors recorded the clothing items
by visual inspection while respondents were answering the questionnaire. This procedure
would be less effective in winter seasons when respondents wear buttoned up coats. Estimation
of insulation for various coats and jackets themselves would also be difficult with a simple
checklist. Unconscious tremor in cold environments may have contributed to slight increase in
metabolic rate, whose effect has not been documented. In other seasons however, over 80% of
mean thermal sensation could be explained by SET* of occupied zone. Disregarding winter,
the seasonal difference of neutral temperatures was small, 1 °C range, within the type of
building. The values were generally higher for HVAC buildings, approximately 26 °C,
compared to 24 °C in non-HVAC buildings.
Another method for derivation of the comfort temperature is to use thermal preference scale
instead of thermal sensation scales. It is argued that “neutral” on thermal sensation scale is not
always the optimum, and people would prefer to be “warmer than neutral” in winter, and
“cooler than neutral” in summer (McIntyre, 1980). Probit analysis (Finney, 1964) is commonly
applied to the percentage of subjects wanting to feel warmer and those wanting to feel cooler,
plotted against environmental temperature. This approach was tried in the present study to
examine the effect of season on neutral temperature, but bias in seasonal preference votes
prohibited this method. Only 4 respondents out of 419 voted the environment to be cooler
during winter, and only 22 out of 614 voted to be warmer during summer.
The year-round observed relationship of mean thermal sensation vote was compared to
predicted relationship. PMV was calculated for each respondent and plotted against calculated
SET*. Weighted linear regression was applied in the similar manner as observed thermal
sensation votes, and the result are presented in Figure 5-23. The predicted neutral temperature
was identical to the observed neutral temperature in HVAC buildings. Discrepancy of 1.5 °C
was found for non-HVAC. The notable difference common to both types of buildings was the
gradient of curve fit equation, where predicted values were 1.5 times as large. Temperature
shift of 3.5 °C would result in 1 scale unit change of predicted thermal sensation vote, while it
would require approximately 6 °C for the actual change.
155
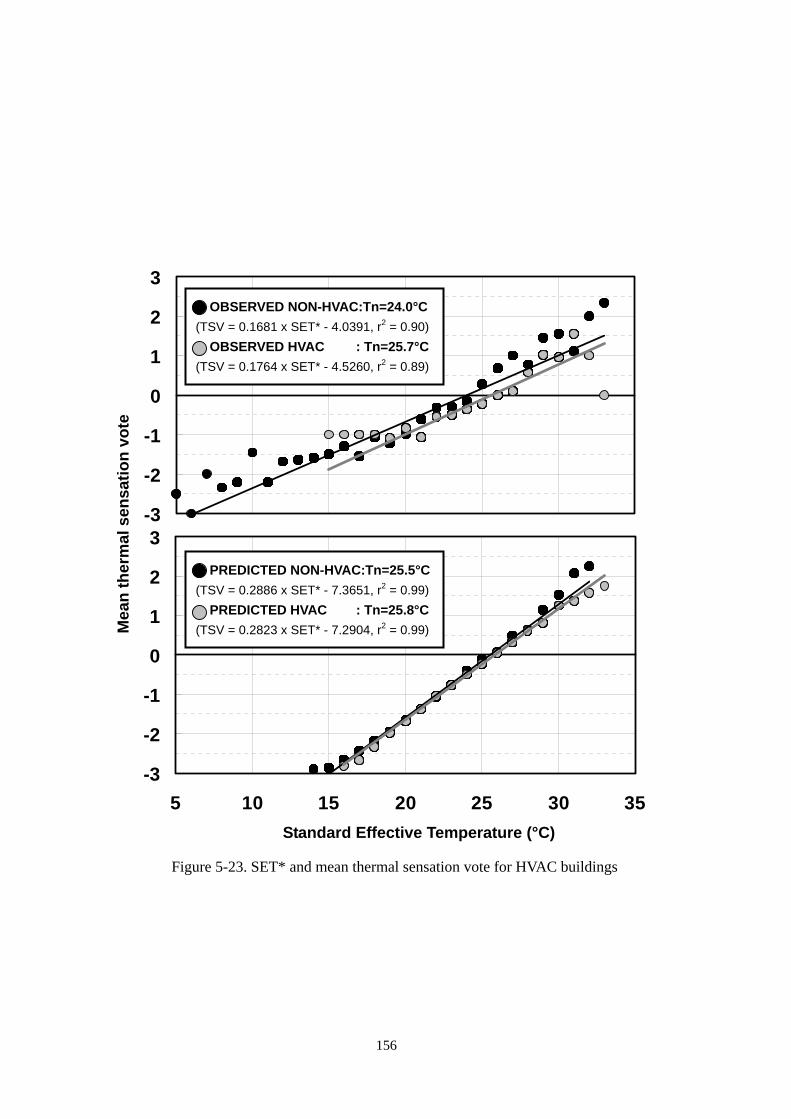
-3
-2
-1
0
1
2
3
-3
-2
-1
0
1
2
3
5 10 15 20 25 30 3
PREDICTED NON-HVAC:Tn=25.5°C(TSV = 0.2886 x SET* - 7.3651, r2 = 0.99)
PREDICTED HVAC : Tn=25.8°C(TSV = 0.2823 x SET* - 7.2904, r2 = 0.99)
5
Mea
n th
erm
al s
ensa
tion
vote
OBSERVED NON-HVAC:Tn=24.0°C(TSV = 0.1681 x SET* - 4.0391, r2 = 0.90)
OBSERVED HVAC : Tn=25.7°C(TSV = 0.1764 x SET* - 4.5260, r2 = 0.89)
Standard Effective Temperature (°C)
Figure 5-23. SET* and mean thermal sensation vote for HVAC buildings156
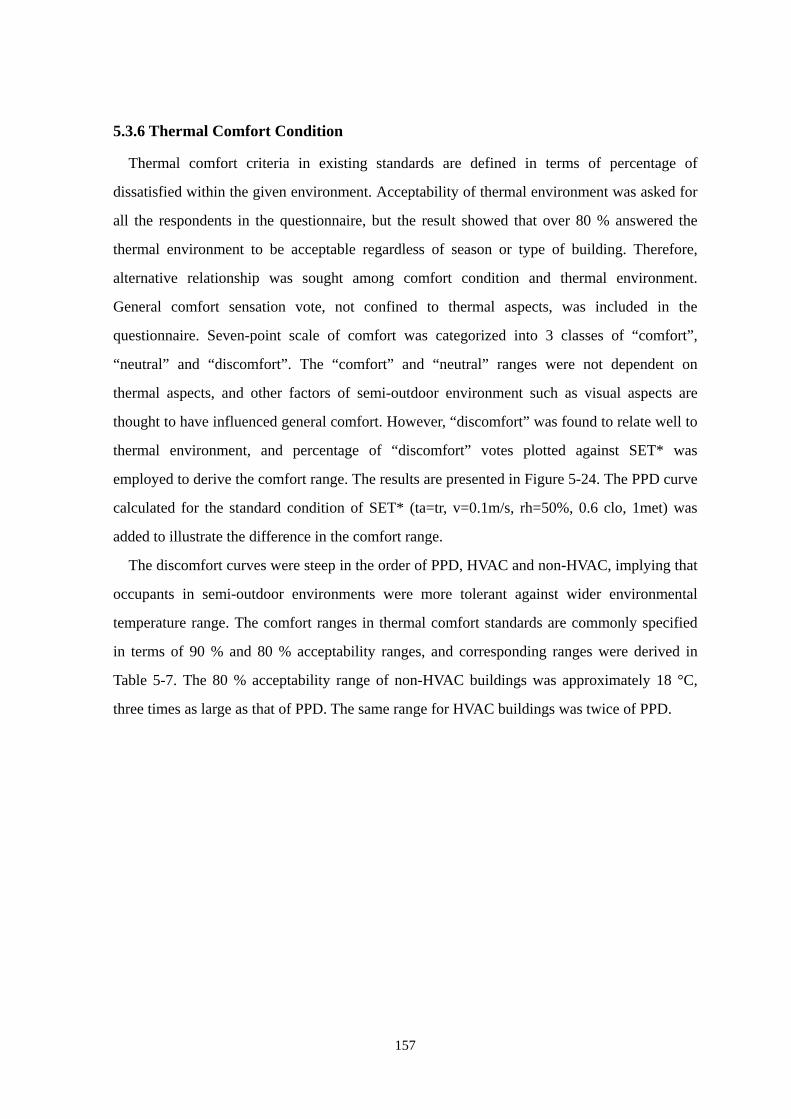
5.3.6 Thermal Comfort Condition
Thermal comfort criteria in existing standards are defined in terms of percentage of
dissatisfied within the given environment. Acceptability of thermal environment was asked for
all the respondents in the questionnaire, but the result showed that over 80 % answered the
thermal environment to be acceptable regardless of season or type of building. Therefore,
alternative relationship was sought among comfort condition and thermal environment.
General comfort sensation vote, not confined to thermal aspects, was included in the
questionnaire. Seven-point scale of comfort was categorized into 3 classes of “comfort”,
“neutral” and “discomfort”. The “comfort” and “neutral” ranges were not dependent on
thermal aspects, and other factors of semi-outdoor environment such as visual aspects are
thought to have influenced general comfort. However, “discomfort” was found to relate well to
thermal environment, and percentage of “discomfort” votes plotted against SET* was
employed to derive the comfort range. The results are presented in Figure 5-24. The PPD curve
calculated for the standard condition of SET* (ta=tr, v=0.1m/s, rh=50%, 0.6 clo, 1met) was
added to illustrate the difference in the comfort range.
The discomfort curves were steep in the order of PPD, HVAC and non-HVAC, implying that
occupants in semi-outdoor environments were more tolerant against wider environmental
temperature range. The comfort ranges in thermal comfort standards are commonly specified
in terms of 90 % and 80 % acceptability ranges, and corresponding ranges were derived in
Table 5-7. The 80 % acceptability range of non-HVAC buildings was approximately 18 °C,
three times as large as that of PPD. The same range for HVAC buildings was twice of PPD.
157
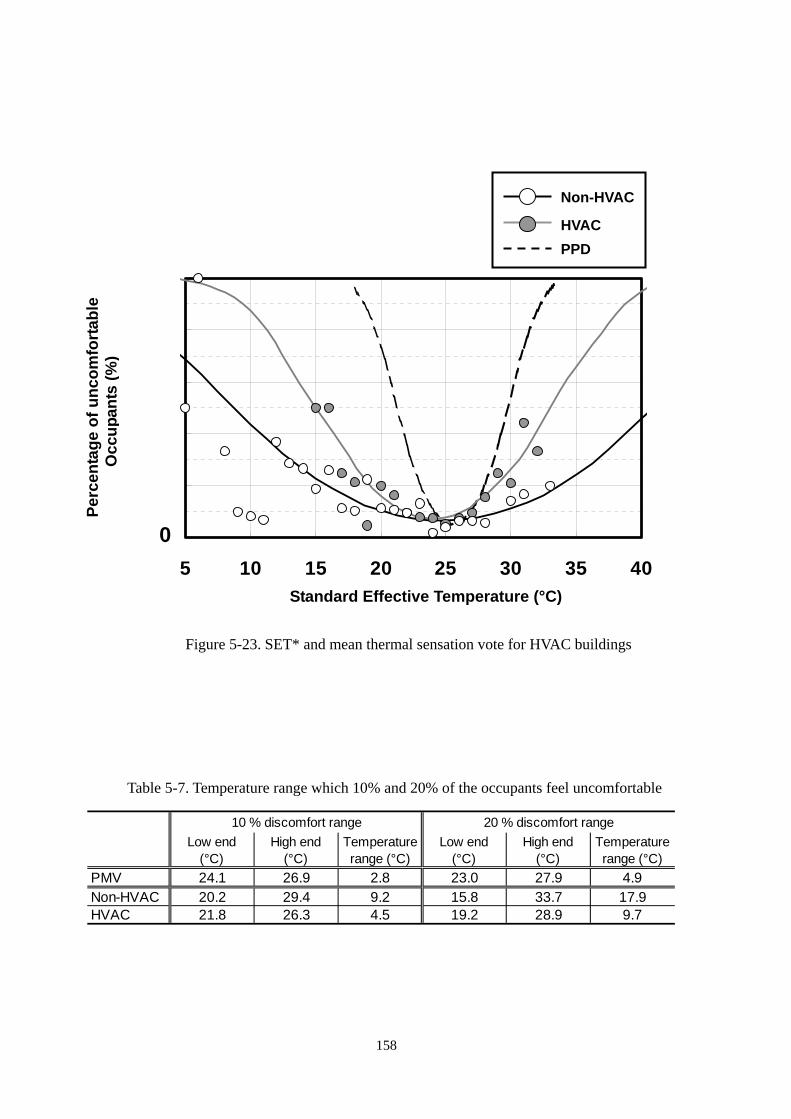
Per
cent
age
of u
ncom
forta
ble
O
ccup
ants
(%)
0.0
0
0
0
0
5 10 15 20 25 30 35 40
0
1.0100
Non-HVAC
HVAC PPD
.880
.660
.440
.220
Standard Effective Temperature (°C)
Table 5-
PMVNon-HVACHVAC
Figure 5-23. SET* and mean thermal sensation vote for HVAC buildings
7. Temperature range which 10% and 20% of the occupants feel uncomfortable
Low end(°C)
High end(°C)
Temperaturerange (°C)
Low end(°C)
High end(°C)
Temperaturerange (°C)
24.1 26.9 2.8 23.0 27.9 4.920.2 29.4 9.2 15.8 33.7 17.921.8 26.3 4.5 19.2 28.9 9.7
10 % discomfort range 20 % discomfort range
158
5.3.7 Implications for Environmental Design
Adaptive model implies an environmental design method taking into account the behavioral
and psychological adaptation of the occupants for the particular environment. This approach
seems effective in semi-outdoor spaces designed for arbitrary occupancy where occupants seek
environments different from indoors. Difference in seasonal thermal comfort condition could
not be derived from the present study, and further investigation would be required in that
respect.
Although only minor difference was found for predicted and observed neutral temperatures
based on year-round observations, occupants in semi-outdoor spaces were found to have a
wider tolerance against environmental conditions. It should be noted that the acceptability
range was derived based on votes of occupants who were present at site, and votes of those
who chose not to stay were excluded. However, percentage of occupants choosing not to stay
can be estimated from the linear relationship between occupancy conditions and outdoor air
temperature. If the objective of a particular semi-outdoor environment was to retain a certain
number of people, the above relationship should be taken into account.
Behavioural adaptation in the form of clothing adjustments and selection of occupancy
conditions was found to be a function of outdoor temperature in these spaces. Knowledge on
what kind of environmental condition to expect would afford the occupants with a greater
degree of behavioural and psychological adaptation. Environmental labelling is considered to
be effective in the design stage. Abundant adaptive opportunity is another key to enhance
satisfaction in a given situation. For designing comfortable thermal environment in
semi-outdoor environments for arbitrary occupancy, control of environmental variable should
not be aimed, but preparation of diverse occupancy environments created by such techniques
as shades and windshields would likely to realize high comfort ratings by the occupants.
159
5.4 CONCLUSION
Thermal comfort conditions in 4 semi-outdoor spaces with different levels of environmental
control were investigated from the viewpoint of short-term occupancy. Investigation of
occupancy conditions, thermal environment, and occupant responses were integrated in the
seasonal survey design conducted for a total of 64 days. The following conclusions were
drawn.
1) Over 80% of occupants described the purpose of their stay to be voluntary activities,
suggesting that their occupancy in semi-outdoor environments were arbitrary.
2) Average occupancy period was approximately 11 minutes for non-HVAC buildings
and 19 minutes for HVAC buildings.
3) In non-HVAC buildings, occupancy conditions, defined in terms of number of
occupants and average occupancy period, showed a linear relationship with mean outdoor
temperature of the day. Decrease in outdoor temperature resulted in decrease in number and
occupancy period. No link was found for occupancy conditions in HVAC buildings.
4) Daily mean clothing insulation was found to be a linear function of outdoor air
temperature of the day in both HVAC buildings and non-HVAC buildings.
5) SET* was confirmed to be the best predictor of observed thermal sensation votes in
semi-outdoor environments, due to the wide range of environmental parameters observed.
6) PMV was able to predict the neutral temperature of HVAC buildings based on
year-round observation. Discrepancy of 1.5 °C was found for non-HVAC buildings. The
predicted gradient of thermal sensation change was 1.5 times greater than that observed.
7) Occupants in semi-outdoor environments were more tolerant against a wider range of
environmental conditions compared to that predicted by PPD. Eighty percent acceptability
range of 17.9 °C and 9.7 °C was confirmed for non-HVAC and HVAC buildings respectively,
as opposed to 4.9 °C of PPD.
160
CHAPTER 6
CONCLUSIVE SUMMARY
161

162
CHAPTER 6 CONCLUSIVE SUMMARY
Atria or terraces designed to introduce natural outdoor elements such as sunlight and fresh
air are built in modern architecture to attract people from aesthetic aspects or to add diversity
to the architectural environments. These moderately controlled semi-outdoor environments
offer the occupants with the amenity of naturalness within an artificial environment, a
temporal refuge from tightly controlled indoor working environment, and a thermal buffer to
mitigate the large environmental step change during a transition from indoor to outdoor.
Planning of the semi-outdoor environments is distinct in a way that comfort should be
achieved without deteriorating the benefits of natural outdoor elements. In this thesis, the
thermal comfort conditions of semi-outdoor environment were evaluated from the two
primary design requirements in modern architecture, a passage space and a short-term
occupancy space.
In Chapter 1, the definition of semi-outdoor environment was given, and the outline of this
thesis was described. Semi-outdoor environment was defined as “an architectural
environment designed to introduce natural outdoor elements with the aid of environmental
control”. Semi-outdoor environment falls in between the indoor environment where thermal
environment is controlled to satisfy the thermal comfort of the occupants, and the outdoor
environment where occupants need to adjust themselves to achieve thermal comfort. Existing
thermal comfort criteria are based on steady-state comfort models such as PMV (Predicted
Mean Vote) and ET* (the New Effective Temperature) designed to evaluate the thermal
comfort of occupants staying in the given thermal environment for more than an hour.
Thermal comfort conditions in semi-outdoor environment should be investigated with respect
to how they are actually used, from the transition phase and the short-term occupancy phase.
While passing through different spaces, people experience continuous environmental step
changes in a short amount of time. The heat exchange between man and the environment
would not reach steady state during that period, and transient thermal conditions need to be
considered for the evaluation of transition phase through semi-outdoor environments.
Adaptation, the potential ability of the occupants to achieve comfort themselves, also needs
to be recognized to evaluate thermal comfort under short short-term occupancy conditions.
163

In Chapter 2, the effect of semi-outdoor space as a thermal buffer for transition from
outdoor to indoor was evaluated from the viewpoint of transient thermal comfort by
physiological simulation of a passer-by. The numerical thermoregulation model based on the
Stolwijk model, 65MN, was developed to simulate the heat exchange and the physiological
state of the human body under transient conditions. The model consists of 16 body segments
corresponding to a thermal manikin, and each consists of 4 layers for core, muscle, fat and
skin. Environmental data collected from the field surveys were used as boundary conditions
for the simulation of an imaginary passer-by. Seasonal surveys were conducted in an
integrated public facility for summer, autumn of 1997 and winter of 1998. Assuming several
imaginary routes of a visitor through an atrium, environmental measurements were
conducted for the representative points along the routes. Mobile measurement cart with the
capability of recording air temperature, globe temperature, relative humidity, and air velocity
at four specific heights around a walking person was developed for the purpose. Numerical
simulations were conducted for routes with and without an atrium along the way. It was
confirmed that the presence of semi-outdoor environment as a buffer space mitigated the rate
of mean skin temperature change after entrance from outdoor, especially when the
temperature difference was large between indoor and outdoor.
In Chapter 3, subjective experiments were conducted to investigate the influence of
environmental conditions of a buffer zone on thermal comfort in a succeeding environment.
Transient thermal comfort votes and their relation to physiological variables were examined.
Subjective experiments were conducted in a climate chamber divided into 3 spaces whose
environmental conditions were controlled to represent an indoor space, a buffer space and an
outdoor space. Air temperature of indoor space was kept at 25 °C to represent an office
environment. Outdoor space was controlled at 32 °C, 70% rh for summer outdoor conditions.
Environmental conditions of the buffer space were altered from the combination of 22, 25,
28 °C air temperature and 0, 3, 5, 10 minute of transition period. After 1-hour occupancy in
the indoor space, subjects dressed in office work attire walked through the buffer space to the
outdoor space, and returned through the same process after a 15 minute walk in the outdoor
space. Two separate scales of thermal sensation, the environmental temperature sensation
vote (ESV) and the whole body thermal sensation vote (TSV), were employed for subjective
164

evaluation of thermal comfort during step changes. Environmental conditions of buffer space
were found to have a minor influence on ESV, TSV, and CSV in post-transition indoor space
after 40 minutes. On the other hand, a clear impact on physiological variables such as mean
skin temperature and vapor pressure inside clothing was confirmed. Mean skin temperature
and vapor pressure inside clothing were higher when the air temperature of buffer space was
higher and the transition time was longer. However, the effects were not significant for
psychological variables except for the first ESV upon entering the post-transition indoor
space. Environmental conditions of buffer space were found to be irrelevant in the
succeeding environment when evaluated for occupancy periods longer than 30 minutes.
In Chapter 4, field surveys were conducted to investigate the thermal comfort conditions in
an office environment where the adaptive opportunity was limited compared to semi-outdoor
environment. An office located in Tokyo with multi-national workers was selected to conduct
4 seasonal surveys from summer to spring, integrating questionnaire surveys and physical
measurements for thermal environment and indoor air quality. A large amount of heat
generating office equipments and free access of occupants to the room temperature control
resulted in an air temperature difference up to 4.6 °C among the same working floor. Out of
406 returned questionnaires throughout the survey, only 26% of workers reported their
working environment to be “comfortable”, and only 26% voted their thermal environment to
be “neutral”. A significant neutral temperature difference of 3.1 °C was observed between the
Japanese female occupant group and the non-Japanese male group. Differences in clothing,
the type of work and the expectation for the room temperature based on their national
backgrounds were suspected to be the cause of the deviation. The comfort votes and the
reported frequency of SBS related symptoms were closely related to the deviation of thermal
sensation vote from neutral. The thermal environment was found to be the major factor
affecting occupant comfort. Occupants in the present office were relying on the adjustment
of thermal environment to achieve thermal comfort, and the differences in the perception of
the indoor environment were found to be negatively affecting the ratings of their working
environment.
In Chapter 5, seasonal surveys were conducted in semi-outdoor architectural environments
165

to investigate the thermal comfort characteristics and the thermal comfort conditions, taking
into account the adaptation of occupants. Four semi-outdoor architectural environments with
different levels of environmental control were selected for the survey in Tokyo, Japan, two of
which were air-conditioned atria and two of which were non air-conditioned spaces.
Buildings were selected to have a common basic feature; large-scale precincts open to public,
designed for roaming and resting of the visitors. Field surveys were designed to examine the
following factors: 1) the actual occupancy conditions, 2) the thermal environment, 3) the
behavioral adaptation of occupants to a given thermal environment, and 4) the psychological
response. Observation on the purpose of occupancy showed that the majority of activities in
the semi-outdoor environments were arbitrary, and that the occupants were free to choose
their own occupancy conditions. Average occupancy period in non air-conditioned buildings
was approximately 10 minutes, while the values ranged from 15 to 20 minutes in
air-conditioned buildings. A strong linear relationship was confirmed between the occupancy
conditions and the daily mean air temperature of the survey area in non air-conditioned
buildings. The number of occupants and the time of occupancy decreased following the air
temperature decrease. Occupancy conditions in air-conditioned buildings showed no relation
with the thermal environment. The clothing insulation of the occupants was found to
correlate linearly with mean daily outdoor air temperature on yearly observation, both in
air-conditioned and non air-conditioned buildings. When observed separately for each season,
clothing change against air temperature change was greater in autumn and winter when daily
air temperature fluctuation was greater compared to summer and spring. Of all the measured
thermal variables and thermal indices calculated from these data, SET* achieved the highest
correlation with the thermal sensation vote of occupants. Most of the field studies in offices
employ operative temperature as the predictor of thermal sensation, but a more complex
index was appropriate for a wider range of environmental parameters observed in
semi-outdoor environments. Neutral temperature was calculated for both types of buildings
from the linear regression equation of SET* and the mean thermal sensation vote. The
neutral temperature predicted by PMV and the values derived from the actual votes were
nearly equal at 25.8 °C in air-conditioned buildings. Similar neutral temperature of 25.5 °C
was predicted for non air-conditioned buildings, but observed value was 1.5 °C lower.
Temperature shift of 3.5 °C would equal to 1 scale unit change of the predicted thermal
166
sensation, while it would require approximately 6 °C for the actual change. Occupants in
semi-outdoor environments were more tolerant of a wider range of environmental conditions
compared to that predicted by PPD (Predicted Percentage of Dissatisfied). Eighty percent
acceptability range of 17.9 °C and 9.7 °C was confirmed for non air-conditioned and
air-conditioned buildings respectively, as opposed to 4.9 °C of PPD.
Thermal conditions of semi-outdoor environment were confirmed to cast a prominent
influence on physiological parameters of a person passing through. However, psychological
effects in the succeeding environment were negligible 30 minutes after transition. If the
objective of the semi-outdoor environment was to alleviate environmental step changes from
indoor to outdoor, and immediate psychological response upon entrance was not of concern,
the thermal environment should be designed for occupancy purposes.
Occupants of an office environment, limited with the adaptive opportunity, were mainly
relying on the adjustment of thermal environment to achieve comfort, and were found to rate
the comfort conditions more severely than the comfort range predicted by the thermal
comfort index. On the other hand, occupants in semi-outdoor environments designed for
arbitrary occupancy were able to achieve comfort in the range 2 to 3.5 times wider than that
predicted by the thermal comfort index.
167

168

REFERENCES
5-169

5-170
REFERENCES
Arens, E., Bauman, F., Baughman, A. et al. 1993: Comfort and health considerations: Air
movement and humidity constraints, Final Report - Phase 1, Univrsity of California,
Berkley
ASHRAE 1992: ANSI/ASHRAE Standard 55-1992, Thermal Environmental Conditions for
Human Occupancy, Atlanta: American Society of Heating, Refrigerating, and
Air-conditioning Engineers, Inc.,
ASHRAE 2001: ASHRAE Fundamentals, Chapter 8, Thermal comfort,
Benton, C.C., Bauman, F.S., Fountain, M. 1990: A field measurement system for the study of
thermal comfort, ASHRAE Trans., pp.623-633
Breckenridge, J.R. and Goldman, R.F. 1972. Human solar heat load, Proceedings of
ASHRAE semiannual meeting, New Orleans, pp.110-119
Cena, K., de Dear, R.J. 1999: Field study of occupant thermal comfort and office thermal
environments in a hot, arid climate, ASHRAE Trans., Vol. 105, pp.204-217
de Dear, R.J., Leow, K.G., Ameen, A., (1991a), Thermal comfort in the humid tropics – Part
I: Climate chamber experiments on temperature preferences in Singapore. ASHRAE Trans.
Vol.97(1) pp.874-879
de Dear, R.J., Leow, K.G., Ameen, A., (1991b), Thermal comfort in the humid tropics – Part
II: Climate chamber experiments on thermal acceptability in Singapore. ASHRAE Trans.
Vol.97(1) pp.880-886
de Dear, R.J., Brager, G.S. 1998: Developing an adaptive model of thermal comfort and
preference, ASHRAE Trans. Vol.104(1A) pp.145-167
171
de Dear, R.J., Brager, G.S. 2002: Thermal comfort in naturally ventilated buildings: revisions
to ASHRAE Standard 55, Energy and Buildings, Vol.34, pp.549-561
Fanger, PO. 1970: Thermal Comfort. Copenhagen, Danish Technical Press.
Finney, D.J. 1964: Probit Analysis, Cambridge University Press,
Gagge, A.P., Fobelets, A.P., Berglund, L.G. 1986: A standard predictive index of human
resposes to the thermal environment, ASHRAE Transactions, Vol.92(1), pp.709-731
Gagge, A.P., Stolwijk, J.A., Nishi,Y. 1971: An effective temperature scale based on a simple
model of human physiological regulatory responses, ASHRAE Transactions, Vol.77,
pp.247-262
Gagge, A.P., Stolwijk, J.A.J., Hardy, J.D. 1967: Comfort and thermal sensations and
associated physiological responses at various ambient temperature, Environmental
Research, vol. 1, pp.1-20
Gail S. Brager and Richard J. de Dear 1998: Thermal adaptation in the built environment: a
literature review, Energy and Buildings, Volume 27, Issue 1, Pages 83-96
Gehl, J. 1987: Life between buildings: Using public spaces, New York: Van Nostrand
Reinhold.
Hayashi, T., Shibayama, A., Hasebe, R., et al. 1996: Field study on thermal comfort in
transient spaces from outdoor to indoor, Proceedings of INDOOR AIR’96, Vol.1,
pp.293-298
Houghton, F.C., Yaglou, C.P. 1923: Determination of the comfort zone, ASHVE Trans.,
Vol.29, pp.515-536
172
Hoyano, A., Miyanaga, T., Toyozumi, A. 1998: Moving observation of thermal environment
in urban living spaces Part II, Summaries of Technical Papers of Annual Meeting,
Architectural Institute of Japan, pp.693-694 (in Japanese)
Humphreys, M.A., 1977: Clothing and the Outdoor Microclimate in Summer, Building and
Environment, Vol.12, pp.137-142
Humphreys, M.A., Nicol, J.F. 1998: Understanding the adaptive approach to thermal
comfort,
Ichihara, M., Saitou, M., Nishimura, M., Tanabe, S. 1997: Measurement of Convective and
Radiative Heat Transfer Coefficients of Standing and Sitting Human Body by Using a
Thermal Manikin, Journal of Arch. Plan. Environ. Eng., AIJ, No.501, pp.45-51 (in
Japanese)
ISO. 1995. ISO 9920, Ergonomics of the thermal environment - Estimation of the thermal
insulation and evaporative resistance of a clothed ensemble, Geneva: International
Organization for Standardization
ISO 1998: International Standard 7726: Thermal environment- instruments and methods for
measuring physical quantities, Geneva: International Standards Organization.,
Jaakkola, J.J.K., Heinonen, O.P., Seppanen, O., (1989), Sick Building Syndrome, Sensation
of Dryness and Thermal Comfort in Relation to Room Temperature in an Office Building:
Need for Individual Control of Temperature, Environmental International, Vol.15,
pp.163-168, 1989
Kato, S., Murakami, S., Shoya, S., Hanyu, F., Zeng, J. 1995: CFD Analysis of Flow and
Temperature Fields in Atrium with Ceiling Height of 130 M , ASHRAE Trans., Vol.101(2),
pp.1-14
173

Knudsen, H.N., Fanger, P.O. 1990: The impact of temperature step-changes on thermal
comfort, Indoor Air‘90, Vol.1, pp.757-761
Kuno, S., Ohno, H., Nakahara, N. 1987: A two-dimensional model expressing thermal
sensation in transitional conditions, ASHRAE Trans. Vol.93(2), pp.396-406
Matzarakis, A., Bauer, B., Breuste, J., Mayer, H. 1999: Micro-meteorological measurements
in small urban structures, Proceedings of the 15th International Congress of
Biometeorology & International Conference on Urban Climatology
McCullough, E.A., Olesen, B。W.,Hong, S. 1994: Thermal insulation provided by chairs,
ASHRAE Trans., Vol.100(1), pp.795-802
McIntyre, D.A. 1980: Indoor Climate, Applied Science Publishers,
Mills, F. 1990: Environmental design of atrium buildings in the UK, ASHRAE Trans.,
Vol.96(1), pp.14-22
Morgan, C.A., de Dear, R., Brager, G. 2002: Climate, clothing and adaptation in the built
environment, Proceedings of Indoor Air 2002, Vol.I, pp.98-103
Nicol, J.F., 1971: A Simple Theoretical Derivation of Thermal Comfort Conditions, BRE
CP14/71, vol.0, pp.0-0
Nicol, J.F., Humphreys, M.A. 1972: Thermal comfort as part of a self-regulating system, CIB
commission W45- Symposium thermal comfort and moderate heat stress
Nikolopoulou, M., Baker, N., Steemers, K. 2001: Thermal comfort in outdoor urban spaces:
understanding the human parameter, Solar Energy, Vol.70, No.3, pp.227-235
174

Olesen, B.W., Rosendahl, J. et al. 1989. Methods for measuring and evaluating the thermal
radiation in a room, ASHRAE Transactions, Vol.95(1), pp.1028-1044
Rohles, F.H., Wells, W.V. 1977: The role of environmental antecedents on subsequent
thermal environment, ASHRAE Trans., Vol.83(2), pp.21-29
Saxon, R. 1983: Atrium buildings: Development and design, butterworths,
Schiller, G.E., Arens, E.A., Bauman, F.S., Benton, C., Fountain, M., Doherty, T. 1988: A field
study of thermal enviornments and comfort in office buildings, ASHRAE Trans., Vol.94(2),
pp.280-308
SHASE 2000: Working group on thermal environmental design of atrium buildings, Report
on design and evaluation method for thermal environment of atrium and glazing
architecture, The Society of Heating, Air-conditioning, and Sanitary Engineering of Japan.
(in Japanese)
SHASE Working group on thermal environment guidelines for low humidity air conditioning
system in offices, (1993), Report on thermal environment guidelines for low humidity air
conditioning system in offices Part 4, The Society of Heating, Air-conditioning, and
Sanitary Engineering of Japan. (in Japanese)
Song, D., Kato, S., Murakami, S., Shiraishi, Y., Chikamoto, T., Nakano, R. 2001: Continuous
measurement of thermal environment around moving person and his thermal adaptation,
Summaries of Technical Papers of Annual Meeting, Architectural Institute of Japan,
pp.359-360 (in Japanese)
Stolwijk, J.A.J. 1970: Mathematical Model of Thermoregulation, Physiological and
Behavioral Temperature Regulation, Chapter 48, Charles C.Thomas Pub., pp.703-721
Stolwijk, J.A.J. 1971: A Mathematical Model of Physiological Temperature Regulation in
Man, NASA, CR-1855
175
Tanabe, S., Arens, E.A., Bauman, F.S., Zhang, H., Madsen, T.L. 1994: Evaluating Thermal
Environments by Using a Thermal Manikin With Controlled Skin Surface Temperature,
ASHRAE Transactions, Vol.100, Part 1, pp.39-48
Tanabe, S., Arens, E.A., Bauman, F.S.et al. 1994: Evaluation of thermal environments by
using a thermal manikin with controlled skin surface temperature, ASHRAE Transactions.
Vol. 100 part1 pp.39-48
Tanabe, S., Kimura, K. 1994. Effect of air temperature, humidity, and air movement on
thermal comfort under hot and humid conditions. ASHARE Trans. Vol.100(2) pp.953-969
Udagawa, M and Kimura, K. 1978. The estimation of direct solar radiation from global
radiation, Transaction of Architectural Institute of Japan, Vol.267, pp.83-90
WHO 1987: European Series No.23: Air quality guidelines for Europe, Copenhagen: World
Health Organization Regional Office for Europe
Williams, R.N. 1995: Field investigation of thermal comfort, environmental satisfaction and
perceived control levels in UK office buildings, ASHRAE Trans., Vol. 105, pp.204-217
176

RELATED PAPERS
Chapter 2
Tanabe, S., Kobayashi, K., Nakano, J., Konishi, M., Ozeki, Y. 2002: Evaluation of thermal
comfort using combined multi-node thermoregulation (65MN) and radiation models and
computational fluid dynamics (CFD), Energy and Buildings, Vol.34, pp.637-646
Tanabe, S., Kobayashi, K., Nakano, J. 2001: Development of 65-node thermoregulation
model for evaluation of thermal environment, Transactions of AIJ, Vol.541, pp.9-16 (in
Japanese)
Tanabe, S., Kobayashi, K., Nakano, J., Ozeki, Y., Konishi, M. 2001: A comprehensive
combined analysis with multi-node thermoreguration model (65MN), radiation model and
CFD for evaluation of thermal comfort, Moving Thermal Comfort Standards into the 21st
Century, Windsor, UK, pp.122-134
Kobayashi, K., Nakano, J., Tanabe, S. 2000: Development of 65-node Thermoregulation
Model for Evaluation of Thermal Environment, Healthy Buildings 2000, Proceedings
Vol.2, pp.563-568
Nakano, J., Tsutsumi, H., Horikawa, S., Tanabe, S., Kimura, K. 1999: Field Investigation on
the Transient Thermal Comfort in Buffer Zones from Outdoor to Indoor, Indoor Air ’99,
vol.2, pp.172-177
Nakano, J., Kim, J., Iwata, Y., Tsutsumi, H., Kouyama, M., Horikawa, S., Ootaka, K., Tanabe,
S., Kimura, K. 1998: Evaluation of Thermal Environment in Transient Spaces from
Outdoor to Indoor: Part 1. Measurement Method and Results in Winter, Annual Meeting of
AIJ, pp.375-376 (in Japanese)
Iwata, Y., Kim, J., Nakano, J., Tsutsumi, H., Kouyama, M., Horikawa, S., Ootaka, K., Tanabe,
S., Kimura, K. 1998: Evaluation of Thermal Environment in Transient Spaces from
Outdoor to Indoor: Part 2. Measurement Results in Three Seasons, Annual Meeting of AIJ,
177

pp.377-378 (in Japanese)
Kim, J., Nakano, J., Iwata, Y., Tsutsumi, H., Kouyama, M., Horikawa, S., Ootaka, K., Tanabe,
S., Kimura, K. 1998: Evaluation of Thermal Environment in Transient Spaces from
Outdoor to Indoor: Part 3. Evaluation by Utilizing a 65 Node Thermoregulation Model,
Annual Meeting of AIJ, pp.379-380 (in Japanese)
Chapter 3
Nakano J., and Tanabe S. 2003: Transient thermal comfort succeeding a short walk from
indoor to outdoor, Transactions of AIJ (in press) (in Japanese)
Noguchi, M., Nakano, J., Goto, K., Tanaka, K., Tanabe, S. 2001: Numerical comfort
simulator for thermal environment (Part 15) Transient thermal comfort succeeding a short
walk in a buffer space – Summary of the experiments and results for psychological
response, Annual Meeting of AIJ, pp.345-346 (in Japanese)
Tanaka, K., Nakano, J., Goto, K., Noguchi, M., Tanabe, S. 2001: Numerical comfort
simulator for thermal environment (Part 16) Transient thermal comfort succeeding a short
walk in a buffer space – Physiological and psychological difference between males and
females, Annual Meeting of AIJ, pp.347-348 (in Japanese)
Goto, K., Nakano, J., Tanaka, K., Noguchi, M., Tanabe, S. 2001: Numerical comfort
simulator for thermal environment (Part 17) Transient thermal comfort succeeding a short
walk in a buffer space – Comparison of the summer and winter experiments, Annual
Meeting of AIJ, pp.349-350 (in Japanese)
Nakano, J., Goto, K., Tanaka, K., Noguchi, M., Tanabe, S. 2001: Numerical comfort
simulator for thermal environment (Part 18) Transient thermal comfort succeeding a short
walk in a buffer space – Effects of temperature and duration time on transient thermal
comfort, Annual Meeting of AIJ, pp.351-352 (in Japanese)
178

Chapter 4
Nakano, J., Tanabe, S., Kimura, K. 2002: Differences in perception of indoor environment
between Japanese and non-Japanese workers, Energy and Buildings, Vol..34, pp.615-621
Nakano, J., Lee, S., Tanabe, S., Kimura, K. 2001: Field survey on thermal environment, air
quality, and occupant comfort in a high density heat load office occupied by multi-national
workers, Transactions of AIJ, Vol.545, pp.45-50 (in Japanese)
Nakano, J., Tanabe, S., Kimura, K. 2001: Differences in perception of indoor environment
between Japanese and non-domestic workers, Moving Thermal Comfort Standards into the
21st Century, Windsor, UK, pp.273-271
Nakano, J., Okuda, A., Lee, S., Tanabe, S., Kimura, K. 1999: Seasonal Survey of Office
Environment with High Amount of Heat Load, Indoor Air ’99, vol.2, pp.314-319
Okuda, A., Lee, S., Nakano, J., Tanabe, S., Kimura, K. 1999: Evaluation of Indoor
Environment and Occupant Comfort in Office with a High Amount of Heat Load: Part 1.
Evaluation of Indoor Thermal Environment and Air Quality Before and After
Refurbishment, Annual Meeting of AIJ, pp.359-360 (in Japanese)
Nakano, J., Okuda, A., Lee, S., Tanabe, S., Kimura, K. 1999: Evaluation of Indoor
Environment and Occupant Comfort in an Office with High Amount of Heat Load: Part 2.
Differences in Questionnaire Responses of Japanese and Non-Domestic Occupants,
Annual Meeting of AIJ, pp.361-362 (in Japanese)
Nakano, J., Lee, S., Okuda, A., Tanabe, S., Kimura, K. 1999: Field Survey on Occupant
Comfort in an Office with Japanese and Non-Domestic Workers, Annual Meeting of
SHASE, pp.1521-1524 (in Japanese)
Chapter 5
Nakano, J., Goto, K., Noguchi, M., Fujii, H., Shimoda, T., Tanabe, S. 2002: Seasonal field
179
survey on thermal comfort conditions in semi-outdoor spaces, Proceedings of Indoor Air
2002, pp.1107-1112
Goto, K., Nakano, J., Noguchi, M., Fujii, H., Shimoda, T., Tanabe, S. 2002: Seasonal field
survey on thermal comfort conditions in semi-outdoor spaces (Part1) Outline of the field
survey, Annual Meeting of AIJ, pp.383-384 (in Japanese)
Shimoda, T., Nakano, J., Goto, K., Noguchi, M., Fujii, H., Tanabe, S. 2002: Seasonal field
survey on thermal comfort conditions in semi-outdoor spaces (Part2) Investigation of the
occupancy condition, Annual Meeting of AIJ, pp.385-386 (in Japanese)
Fujii, H., Nakano, J., Goto, K., Noguchi, M., Shimoda, T., Tanabe, S. 2002: Seasonal field
survey on thermal comfort conditions in semi-outdoor spaces (Part3) Clothing and
behavioral adaptation of occupants, Annual Meeting of AIJ, pp.387-388 (in Japanese)
Noguchi, M., Nakano, J., Goto, K., Fujii, H., Shimoda, T., Tanabe, S. 2002: Seasonal field
survey on thermal comfort conditions in semi-outdoor spaces (Part4) Thermal
environment and elements for comfort, Annual Meeting of AIJ, pp.389-390 (in Japanese)
Nakano, J., Goto, K., Noguchi, M., Fujii, H., Shimoda, T., Tanabe, S. 2002: Seasonal field
survey on thermal comfort conditions in semi-outdoor spaces (Part5) Thermal sensation
and thermal environment, Annual Meeting of AIJ, pp.391-392 (in Japanese)
Noguchi, M., Nakano, J., T., Tanabe, S. 2002: Field survey on adaptive thermal comfort,
(Part1) Outline of the survey and occupancy condition, Annual Meeting of SHASE,
pp.1681-1684 (in Japanese)
Nakano, J., Noguchi, M., T., Tanabe, S. 2002: Field survey on adaptive thermal comfort,
(Part2) Clothing adaptation and thermal sensation, Annual Meeting of SHASE,
pp.1685-1688 (in Japanese)
180

NOMENCLATURE
181

182 182
i = subscript for segment number (1-16)
j = subscript for layer number (1-4)
k = subscript for direction of radiometer (up, down, left, right, forward, back)
65MNSET* = SET* calculated by the 65MN model [°C]
a = Short wave absorptance [-]
ADu = surface area of whole body [m2]
ADu(i) = surface area of segment i [m2]
Aeff = Effective radiation area factor [-]
B(i,j) = heat exchange rate between central blood compartment and node(i,j) [W]
BF(i,j) = blood flow rate [L/h]
BFB(i,j) = basal blood flow rate [L/h]
C = heat loss by convection [W/m2]
C(i,j) = heat capacity [Wh/°C]
Cch = shivering control coefficient for core layer of head segment [W/°C]
Cd(i,j) = thermal conductance between node(i,j) and its neighbor [W/°C]
Cdl = vasodilation control coefficient for core layer of head segment [L/h°C]
Ch(i,j) = shivering heat production [W]
Chilf(i) = distribution coefficient of muscle layer for shivering heat production [-]
Cld(i,j) = cold signal [°C]
Clds = integrated cold signal [°C]
Cst = vasoconstriction control coefficient for core layer of head segment [1/°C]
Csw = sweat control coefficient for core layer of head segment [W/°C]
D(i,j) = conductive heat exchange rate with neighboring layer [W]
DL = vasodilation signal [L/h]
E = heat loss by evaporation [W/m2]
E(i,4) = evaporative heat loss at skin surface [W]
Eb(i,4) = heat loss by water vapor diffusion through skin [W]
Emax(i) = maximum evaporative heat loss [W]
Esw(i,4) = heat loss by evaporation of sweat at skin layer [W]
Err(i,j) = error signal [°C]
183

F(i,j) = temperature change rate [°C /h]
Icl(i) = clothing insulation [clo]
Idif,k = Diffuse solar radiation for each direction [W/m2].
Idir,k = Direct solar radiation for each direction [W/m2]
Idir,n = Solar radiation normal to the sunray for each direction [W/m2]
Inet,k = Net solar radiation for each direction [W/m2]
K = heat loss by conduction [W/m2]
Lk = Net long wave radiation for each direction [W/m2]
LR = Lewis ratio [°C /kPa]
M = metabolic rate [W/m2]
Metf(I) = distribution coefficient of muscle layer for heat production by external
work [-]
MRT = Mean radiant temperature [°C]
Pch = shivering control coefficient for core layer of head segment and skin layer
of each segment [W/°C 2]
Pdl = vasodilation control coefficient for core layer of head segment and skin
layer of each segment [L/h°C 2]
Pst = vasoconstriction control coefficient for core layer of head segment and skin
layer of each segment [1/°C 2]
Psw = sweat control coefficient for signals from core layer of head segment and
skin layer of each segment [W/°C 2]
Q(i,j) = rate of heat production [W]
Qb = basal metabolic rate of whole body [met]
Qb(i,j) = basal metabolic rate [W]
Qt(i,4) = convective and radiant heat exchange rate between skin surface and
environment [W]
R = heat loss by radiation [W/m2]
RATE(i,j) = dynamic sensitivity of thermoreceptor [h]
RES = heat loss by respiration [W/m2]
RES(2,1) = heat loss by respiration at core layer of chest segment [W]
RT(i,4) = temperature width required for km(i,4) to be 2 [°C]
184

Sch = shivering control coefficient for skin layer of each segment [W/°C]
Sdl = vasodilation control coefficient for skin layer of each segment [L/h°C]
SKINC(i = distribution coefficient of skin layer for ST [-]
SKINR(i = weighting coefficient for integration of sensor signals [-]
SKINS(i) = distribution coefficient of skin layer for sweat [-]
SKINV(i = distribution coefficient of skin layer for DL [-]
Sst = vasoconstriction control coefficient for skin layer of each segment [1/°C]
Ssw = sweat control coefficient for skin layer of each segment [W/°C]
ST = vasoconstriction signal [-]
T(65) = blood temperature in central blood compartment [°C]
T(i,j) = temperature [°C]
Tset(i,j) = set-point temperature [°C]
W = external work [W/m2]
W(i,j) = external work [W]
Wrm(i,j) = warm signal [°C]
Wrms = integrated warm signal [°C]
fcl(i) = clothing area factor [-]
hc(i) = convective heat transfer coefficient [W/m2°C]
he(i) = evaporative heat transfer coefficient from skin surface to the environment
[W/m2kPa]
hr(i) = radiant heat transfer coefficient [W/m2°C]
ht(i) = total heat transfer coefficient from the skin surface to the environment
[W/m2°C]
icl(i) = vapor permeation efficiency of clothing [-]
km(i,4) = local multiplier [-]
met = metabolic rate of whole body [met]
pa(1) = vapor pressure at head segment [kPa]
pa(i) = ambient vapor pressure [kPa]
psk,s(i) = saturate vapor pressure on skin surface [kPa]
R = Net radiation [W/m2]
Rdif = Net diffuse radiation [W/m2].
185
Rdif,k = Net diffuse radiation for each direction [W/m2]
Rdir = Net direct radiation [W/m2]
Rnet,k = Net radiation (long wave and solar) for each direction [W/m2]
ta(1) = air temperature at head segment [°C]
to(i) = operative temperature [°C]
α = ratio of counter current heat exchange [-]
γp = Irradiated area as fraction of Dubois area [-]
ρC = volumetric specific heat of blood [Wh/L°C]
σ = Stefan Boltzmann constant (5.67 x 10⁻⁸ [W/m2K4]).
186

APPENDIX
Original Questionnaires in Japanese
187

188
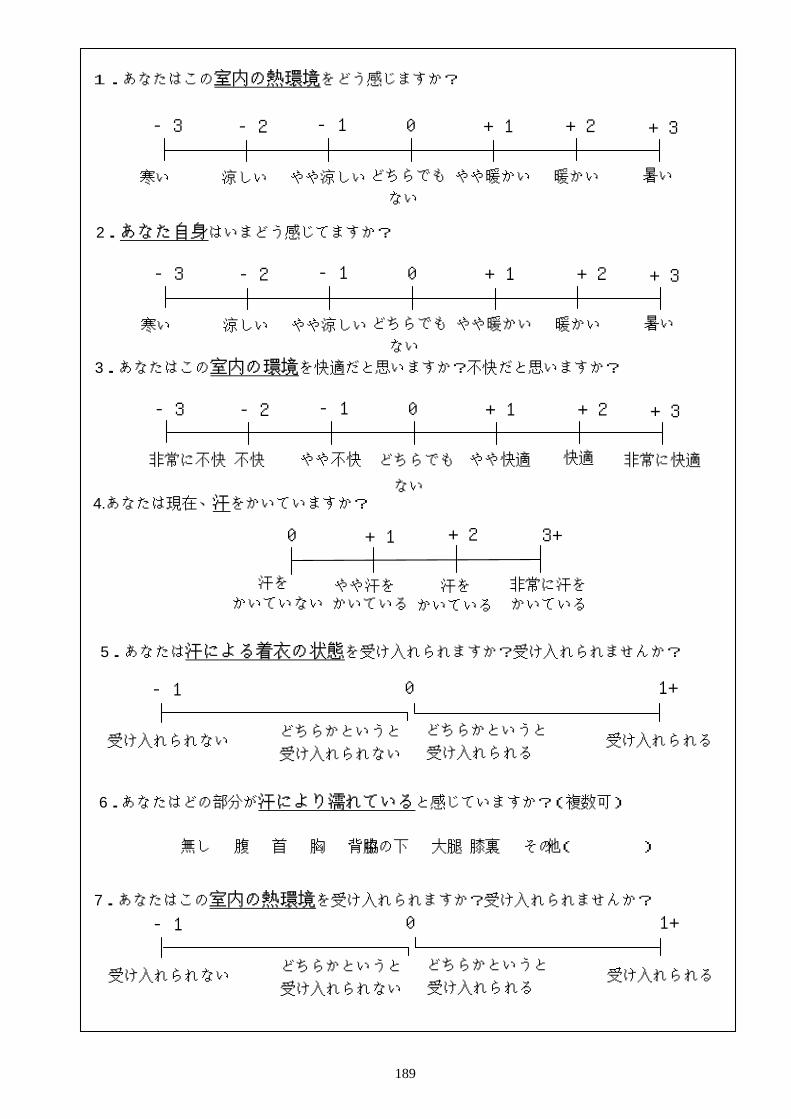
1.あなたはこの室内の熱環境をどう感じますか?
3.あなたはこの室内の環境を快適だと思いますか?不快だと思いますか?
7.あなたはこの室内の熱環境を受け入れられますか?受け入れられませんか?
6.あなたはどの部分が汗により濡れていると感じていますか?(複数可)
5.あなたは汗による着衣の状態を受け入れられますか?受け入れられませんか?
4.あなたは現在、汗をかいていますか?
2.あなた自身はいまどう感じてますか?
+2 +1 0 +3
かいている 非常に汗を
かいている 汗を
かいている やや汗を
かいていない 汗を
非常に不快 快適 やや不快 不快 やや快適 非常に快適
無し 腹 首 胸 背中 脇の下 大腿 膝裏 その他( )
どちらでも ない
やや暖かい 暖かい やや涼しい
-3 -2 -1 0 +1 +2 +3
寒い 涼しい 暑い どちらでも ない
やや暖かい 暖かい やや涼しい
-3 -2 -1 0 +1 +2 +3
寒い 涼しい 暑い どちらでも ない
-3 -2 -1 0 +1 +2 +3
-1 0 +1
受け入れられない 受け入れられる どちらかというと 受け入れられない
どちらかというと 受け入れられる
-1 0 +1
受け入れられない 受け入れられる どちらかというと 受け入れられない
どちらかというと 受け入れられる
189

半屋外環境に関するアンケート調査 Survey Number
早稲田大学理工学部建築学科田辺研究室
基本的事項についてボックスにチェックを入れるか、必要事項を記入して下さい。 ① 性別、年齢をお聞かせください。
□男性 □女性 □20 才未満 □20-29 才 □30-39 才 □40-49 才 □50-59 才 □60-69 才 □70 才以上
② 職業をお聞かせください。
□会社員 □自営業 □専業主婦 □パート/アルバイト □学生 □その他( )
③ あなたが今着用している衣服の組み合わせについてボックスにチェックをつけて下さい。
肌着 長袖半袖 袖なし 薄 厚 □ネクタイ□肌着(上) [□ □ □] ズボン・パンツ [□ □] □革靴 □帽子□靴下 膝上 膝丈 膝下 □スニーカー □マフラー□ストッキング [□ □ □] □サンダル □ストール□腹巻き 薄 厚 □ショートブーツ □スカーフ□タイツ 膝上膝丈膝下 スカート [□ □] □ロングブーツ □手袋□肌着(下) [□ □ □] 膝上 膝丈 膝下 □耳あて
(下着以外) [□ □ □] □カイロ
上半身 長袖半袖 袖なし 薄 厚 長袖 半袖 袖なし 薄 厚 コート類 薄 厚
襟付きシャツ [□ □ □] [□ □] ベスト [■ ■ □] [□ □] ロングコート [□ □](Yシャツ/ブラウス類) セーター [□ □ □] [□ □] ハーフコート [□ □]シャツ [□ □ □] [□ □] トレーナー [□ □ □] [□ □] ジャンパー [□ □](Tシャツ/ポロシャツ類) (パーカー/フリース類含む) ウィンドブレーカ [□ □]その他シャツ [□ □ □] [□ □] カーディガン [□ □ □] [□ □] ダウンジャケット [□ □](タートル/ニット類) タートルネック [□ □ □] [□ □] トレンチコート [□ □]ワンピース [□ □ □] [□ □] セーター
ジャケット [□ □ □] [□ □]
下半身 靴類 小物類
④ あなたが現在座っている場所の利用目的は何ですか? □休憩 □食事 □待ち合わせ □読書 □パソコン □喫煙 □電話/メール □談話 □その他( )
⑤ あなたは今汗をかいていますか?
□かいていない □ややかいている □かいている □非常にかいている
⑥ あなたはどのくらいここにいましたか? □5 分未満 □5~10 分 □10~15 分 □15 分以上
⑦ あなたはここでなにをしていましたか?
□休憩 □食事 □待ち合わせ □読書 □パソコン □喫煙 □電話/メール □談話 □その他( )
⑧ あなたは 15 分前、なにをしていましたか? □仕事・授業(屋内) □仕事・授業(屋外) □食事 □買物 □散歩 □運動 □ここにいた □歩いて移動 □乗り物で移動 □その他( )
⑨ あなたの現在の健康状態はどうですか?
□良い □普通 □あまり良くない □悪い
⑩ ここ 2 時間の間にお酒を飲みましたか? □飲んだ □飲んでいない
⑪ あなたは今日の天気予報を知っていますか?
□はい □いいえ
⑫ この場所に来るのは何回目ですか? □初めて □5 回以下 □10 回以下 □それ以上 ▼裏面へ
190
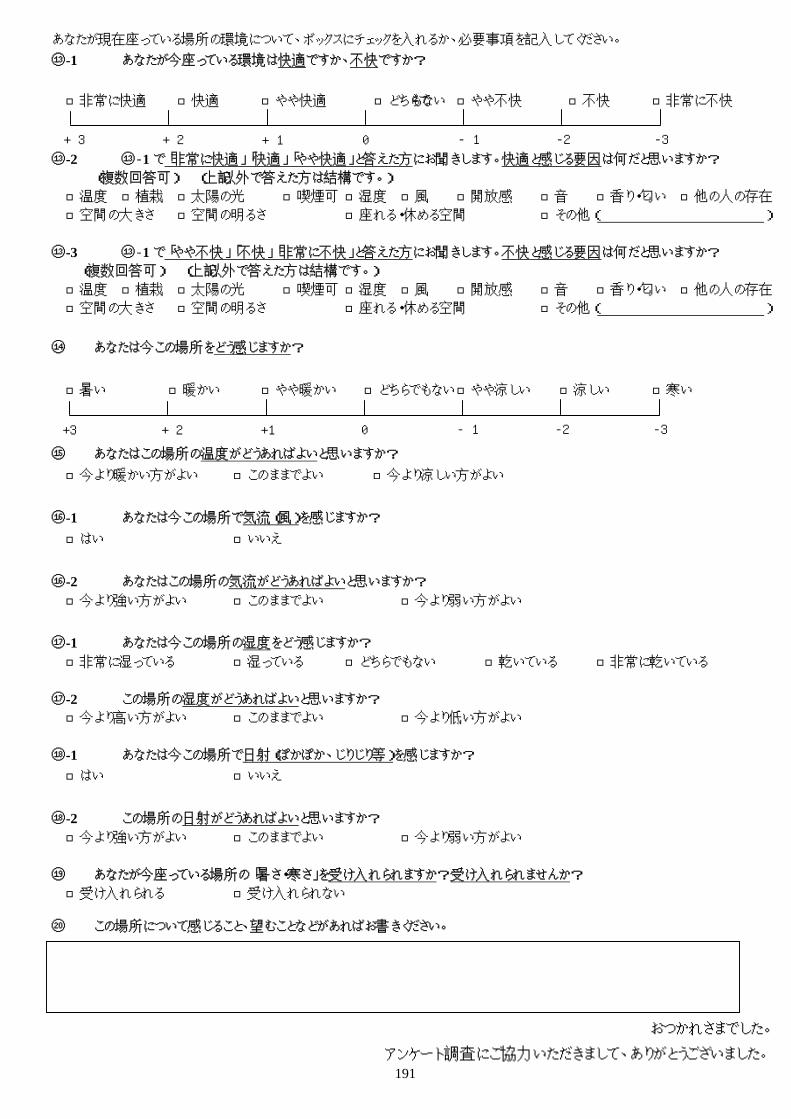
あなたが現在座っている場所の環境について、ボックスにチェックを入れるか、必要事項を記入してください。 ⑬-1 あなたが今座っている環境は快適ですか、不快ですか?
□非常に快適 □快適 □やや快適 □どちらでもない □やや不快 □不快 □非常に不快
-1 -2 -3 +3 +2 0 +1
⑬-2 ⑬‐1 で「非常に快適」「快適」「やや快適」と答えた方にお聞きします。快適と感じる要因は何だと思いますか? (複数回答可) (上記以外で答えた方は結構です。)
□温度 □植栽 □太陽の光 □喫煙可 □湿度 □風 □開放感 □音 □香り・匂い □他の人の存在 □空間の大きさ □空間の明るさ □座れる・休める空間 □その他( )
⑬-3 ⑬‐1 で「やや不快」「不快」「非常に不快」と答えた方にお聞きします。不快と感じる要因は何だと思いますか?
(複数回答可) (上記以外で答えた方は結構です。) □温度 □植栽 □太陽の光 □喫煙可 □湿度 □風 □開放感 □音 □香り・匂い □他の人の存在 □空間の大きさ □空間の明るさ □座れる・休める空間 □その他( )
⑭ あなたは今この場所をどう感じますか?
□暑い □暖かい □やや暖かい □どちらでもない □やや涼しい □涼しい □寒い
-1 +2 +3 +1 0 -2 -3
⑮ あなたはこの場所の温度がどうあればよいと思いますか? □今より暖かい方がよい □このままでよい □今より涼しい方がよい
⑯-1 あなたは今この場所で気流(風)を感じますか?
□はい □いいえ
⑯-2 あなたはこの場所の気流がどうあればよいと思いますか? □今より強い方がよい □このままでよい □今より弱い方がよい
⑰-1 あなたは今この場所の湿度をどう感じますか?
□非常に湿っている □湿っている □どちらでもない □乾いている □非常に乾いている
⑰-2 この場所の湿度がどうあればよいと思いますか? □今より高い方がよい □このままでよい □今より低い方がよい
⑱-1 あなたは今この場所で日射(ぽかぽか、じりじり等)を感じますか?
□はい □いいえ
⑱-2 この場所の日射がどうあればよいと思いますか? □今より強い方がよい □このままでよい □今より弱い方がよい
⑲ あなたが今座っている場所の「暑さ・寒さ」を受け入れられますか?受け入れられませんか?
□受け入れられる □受け入れられない
⑳ この場所について感じること、望むことなどがあればお書きください。
おつかれさまでした。 アンケート調査にご協力いただきまして、ありがとうございました。
191
