whole genome scan for obstructive sleep apnea and obesity in african-american families
TRANSCRIPT
Am. J. Hum. Genet. 72:340–350, 2003
340
A Whole-Genome Scan for Obstructive Sleep Apnea and ObesityLyle J. Palmer,1,2 Sarah G. Buxbaum,2 Emma Larkin,2,3,4 Sanjay R. Patel,1 Robert C. Elston,2Peter V. Tishler,1 and Susan Redline2,3,4
1Channing Laboratory, Department of Medicine, Brigham and Women’s Hospital and Harvard Medical School, Boston; and Departmentsof 2Epidemiology and Biostatistics and 3Pediatrics, Case Western Reserve University, and 4Rainbow Babies and Children’s Hospital, Cleveland
Obstructive sleep apnea (OSA) is a common, chronic, complex disease associated with serious cardiovascular andneuropsychological sequelae and with substantial social and economic costs. Along with male gender, obesity isthe most characteristic feature of OSA in adults. To identify susceptibility loci for OSA, we undertook a 9-cMgenome scan in 66 white pedigrees ( subjects) ascertained on the basis of either an affected individual withn p 349laboratory-confirmed OSA or a proband who was a neighborhood control individual. Multipoint variance-com-ponent linkage analysis was performed for the OSA-associated quantitative phenotypes apnea-hypopnea index(AHI) and body mass index (BMI). Candidate regions on chromosomes 1p (LOD score 1.39), 2p (LOD score1.64), 12p (LOD score 1.43), and 19p (LOD score 1.40) gave the most evidence for linkage to AHI. BMI was alsolinked to multiple regions, most significantly to markers on chromosomes 2p (LOD score 3.08), 7p (LOD score2.53), and 12p (LOD score 3.41). Extended modeling indicated that the evidence for linkage to AHI was effectivelyremoved after adjustment for BMI, with the exception of the candidate regions on chromosomes 2p (adjusted LODscore 1.33) and 19p (adjusted LOD score 1.45). After adjustment for AHI, the primary linkages to BMI remainedsuggestive but were roughly halved. Our results suggest that there are both shared and unshared genetic factorsunderlying susceptibility to OSA and obesity and that the interrelationship of OSA and obesity in white individualsmay be partially explained by a common causal pathway involving one or more genes regulating both AHI andBMI levels.
Introduction
Obstructive sleep apnea (OSA [MIM 107650]) is a com-mon disorder characterized by recurrent episodes of ap-nea (no airflow) and hypopnea (partially obstructed air-flow) that occur during sleep and is associated withoxygen desaturation, sleep fragmentation, and symp-toms of disruptive snoring and daytime sleepiness. Di-agnosis is straightforward and is generally validated bylaboratory sleep studies (Flemons et al. 1999). The pri-mary measure of OSA is the apnea-hypopnea index(AHI) (Redline et al. 1991). OSA is now recognized asa common clinical entity with serious cardiovascular andneuropsychological sequelae and substantial social andeconomic costs (Redline and Young 1993a). In the de-veloped nations, sleep apnea is increasing in prevalenceand has been estimated to affect 2% of middle-agedwomen and 4% of middle-aged men (Young et al. 1993),�1% of preschool children (Ali et al. 1993; Guillemi-
Received September 23, 2002; accepted for publication October 29,2002; electronically published December 23, 2002.
Address for correspondence and reprints: Dr. Lyle Palmer, ChanningLaboratory, Brigham and Women’s Hospital and Harvard MedicalSchool, 181 Longwood Avenue, Boston, MA 02115. E-mail: [email protected]
� 2003 by The American Society of Human Genetics. All rights reserved.0002-9297/2003/7202-0016$15.00
nault and Pelayo 1998), and �11% of the elderly (An-coli-Israel et al. 1991; Janssens et al. 2000). Annual costsrelated to the diagnosis and treatment of severe OSA inthe United States are estimated to be �$3 million, withmuch higher costs projected for treatment of the largenumber of individuals with mild-to-moderate disease(Redline and Young 1993b).
Clinical disease likely results from multiple interact-ing genetic and environmental factors (Redline et al.1995), and OSA has been associated with a number of“intermediate” pathogenic pathways, including centralobesity, craniofacial morphology, muscle and connec-tive tissue factors, and control of ventilation (Redlineand Young 1993a). Along with male gender, obesity(MIM 601665) is the most characteristic feature of OSAin adults and is most commonly measured as an elevatedBMI (Strohl and Redline 1996). However, the nature ofthe causal pathways involved in the relationship be-tween BMI and AHI is uncertain (Redline and Tishler2000).
Both nontwin family and twin studies have suggestedan important genetic component to snoring, sleepingpatterns, and OSA (Ferini-Strambi et al. 1995; Redlineet al. 1995; Heath et al. 1998; Linkowski 1999; Bux-baum et al. 2002). The molecular genetics of OSA hasreceived little attention to date, and previous investi-gations have been limited to candidate-gene association
Palmer et al.: Genomewide Scan for OSA 341
studies (Redline and Tishler 2000; Kadotani et al.2001).
To identify susceptibility loci for OSA, we conducteda genomewide scan in 66 pedigrees of European Amer-ican origin, comprising 349 subjects. To maximize theinformativity and power of our study, families weresampled from 1,349 white participants in the ClevelandFamily Study, a genetic-epidemiological study of OSA(Redline et al. 1995). In these families, we have previ-ously demonstrated increased risk of disease and ele-vated levels of OSA-associated pathophysiological traitsamong first-degree relatives of probands with OSA(Redline et al. 1995). Since the mode of inheritance ofOSA is complex and AHI and BMI are highly corre-lated, we conducted a multipoint model-free linkageanalysis of both AHI and BMI. A variance-componentapproach appropriate for extended pedigrees was em-ployed that utilized all of the available phenotypic andgenotypic information (Almasy and Blangero 1998).Given the close association of obesity and OSA, weperformed linkage analysis of the AHI with and withoutBMI adjustment, and vice versa.
Subjects and Methods
Families
The data analyzed are from the Cleveland FamilyStudy, a cohort that was assembled to study the geneticepidemiology of OSA and was followed longitudinally.This sample includes 179 white pedigrees; methods ofrecruitment and clinical evaluation have been describedelsewhere (Redline et al. 1995). In brief, the ascertain-ment criteria for probands with OSA was laboratory-confirmed OSA (with either an AHI �20 or symptomsconsidered severe enough to warrant therapy). Duringthe first 5 years of the study, control families were alsostudied. Control families were identified by randomlyselecting an individual from a list provided by the pro-bands of three neighbors who had at least two familymembers residing in the metropolitan area (Redline etal. 1995). All available first-degree relatives and selectedsecond-degree relatives (half-sibs, aunts, uncles, andgrandparents) of the ascertained probands with OSA orcontrol individuals were invited to participate. Second-degree relatives were studied if they lived in the samehousehold as members of the nuclear family or if pre-viously sampled members of the family had been foundto include two or more relatives with OSA.
Families were subselected for a whole-genome scan onthe basis of expected informativity. To enhance statisticalpower, we chose only sibships with members in the ex-tremes of the sample’s AHI distribution. Subjects wereconsidered to be in the high AHI extreme if they (i) wereovertly affected with OSA (lab-confirmed, requiring
treatment) or had AHIs that exceeded community age-specific threshold levels for identifying OSA (AHI 15 forthose aged !25 years, AHI 110 for those aged 25–65years, and AHI 115 for those aged 165 years) or (ii) hadAHIs that exceeded the sex- and age-adjusted 80th per-centile. The lower extreme consisted of those below the20th percentile. A sibship was chosen for genotyping ifat least two siblings were in either of the extremes andif at least one was in the high extreme. A three-gener-ation family was selected for genotyping if a grandparentwas in the high extreme and one or more grandchildrenwere in either extreme. A total of 349 subjects in 66pedigrees were studied in the genome-screen linkageanalysis (mean pedigree size 5.3; range 4–14).
The subjects analyzed had undergone two assessmentsat an average interval of 4.05 years (SD 2.16 years). Thephenotypic data analyzed in the whole-genome scan re-lates to the most recent survey.
Participants gave written informed consent and com-pleted a protocol that included questionnaires, an in-home sleep study, anthropometry, and a blood sample.All protocols were approved by the institutional reviewboards of local hospitals.
Questionnaire
Each participant aged �13 years completed a modifiedversion of the SCOR Sleep and Health Questionnaire(Kump et al. 1994), as described elsewhere (Redline et al.1995); parents completed the SCOR Questionnaire forsubjects aged !13 years. Pack-years of cigarette smokingwere calculated as the product of the average number ofcigarettes smoked per day (divided by 20, to convert topacks) and the duration of smoking (in years).
In-Home Sleep Studies (Polysomnography)
The major outcome variable was the AHI, the numberof respiratory events (either cessations [apneas] or dis-crete discernible reductions [hypopneas] in airflow orchest wall impedance lasting �10 s associated with a�2.5% fall in oxygen saturation) per hour of estimatedsleep time. AHI was determined using in-home, over-night polysomnography with a portable monitor (Ed-entec Model 1 or 2), measuring nasal/oral thermistry,chest wall impedance, finger pulse oximetry, and heartrate, as described elsewhere (Redline et al. 1995). Thismethod has been shown to yield estimates of the AHIthat have high night-to-night reproducibility and thatcorrelate well with values obtained using in-laboratorypolysomnography (Redline et al. 1991). Probands whowere under treatment with nasal continuous airwaypressure (CPAP) ( ; 16.8%) were assessed whenn p 63not wearing CPAP.
342 Am. J. Hum. Genet. 72:340–350, 2003
Anthropometry
Height and weight were measured in stocking feet ona flat surface, through use of a tape measure and leveland a portable scale, respectively. BMI was defined asthe weight/height2 (in kg/m2).
Genotyping and Data Management
All subjects ( ) were genotyped by the Na-n p 349tional Heart, Lung, and Blood Institute Mammalian Ge-notyping Service (Center for Medical Genetics), usingDNA that was extracted from whole blood or buccalscraping samples with Puregene Kits (Gentra Systems).We analyzed 375 autosomal STR markers, with a sex-averaged mean spacing of 9.1 cM, derived from WeberMarker Set 10. Marker and gene locations were deter-mined using the Human Genome Working Draft (UCSCGenome Bioinformatics Web site) and SNPper (Univer-sity of Arizona/Channing Labs Web site). The Kosambimapping function was used for all multipoint analyses.
Possible errors in our pedigree and genotype data wereassessed using the RELCHECK (Broman and Weber1998), PEDCHECK (O’Connell and Weeks 1998), andMERLIN (Abecasis et al. 2002) programs. The mean rateof pedigree inconsistencies was less than one inconsistencyper marker (0.75). Marker-allele frequencies were esti-mated, using the SOLAR program, by maximum-likeli-hood estimation (Almasy and Blangero 1998).
Statistical Analysis
The quantitative phenotypes included in the linkageanalysis were AHI and BMI. AHI was skewed with a longright-hand tail and was therefore loge transformed priorto analysis. Formal tests of model fit using the FISHERprogram (Lange et al. 1988) suggested that the ln (AHI)and BMI were acceptably close to multivariate normality.Covariate adjustments were performed within the linkageanalysis, as described below. Modeling included the in-vestigation of polynomial and interaction terms amongcovariates.
Two-point and multipoint linkage analysis of the ge-nome-scan data was performed using a variance-com-ponent method, as implemented in the SOLAR program(version 1.7.4 running under Linux Mandrake version8.0) (Almasy and Blangero 1998). SOLAR partitions theobserved phenotypic variance into additive genetic andnongenetic components, by maximum-likelihood meth-ods. Each model assumed that the distribution of theresponse phenotype in a pedigree was multivariate nor-mal, with a mean that depended upon a particular setof explanatory covariates. Genotypes were imputed foruntyped individuals, conditional on all other markerdata and pedigree structure; and marker-specific iden-tical-by-descent (IBD) matrices among all relative pairs
were estimated independently for all autosomal markers.Multipoint IBD matrices were then generated at 1-cMresolution. Expected genetic covariances among relativeswere specified as a function of the fixed effects of co-variates, residual error, and random effects reflectingpolygenic factors and an unobserved quantitative-traitlocus (QTL) linked to an observed marker locus. Thenarrow-sense heritability ( ) was defined as the ratio2hN
of variance due to additive genetic effects ( ) to the2jA
total phenotypic variance of each trait (Khoury et al.1993): .2 2 2h p j /jN A Total
Covariates potentially modeled in the variance-com-ponent analyses included age, age2, sex, age*sex, historyof surgery that may modify upper-airway patency (uvu-lopalatopharyngoplasty, tonsillectomy, or nasal septalsurgery [ ; 39.5%]), self-reported alcohol con-n p 138sumption, pack-years, pack-years2, height, and height2.In certain analyses, or BMI were modeled asln (AHI)covariates. Covariates that were significant at P ! .05were retained in the models.
The statistical associations between covariates enteredas fixed effects and the response variable were assessedby removal of terms from the mean model and calcu-lation of a likelihood-ratio x2 test statistic. The sameapproach was used as an approximate guide to the “sig-nificance” of a departure of the value of a variance com-ponent from its null value (zero).
The null hypothesis of no linkage at a specific chro-mosomal location was tested by comparison of a poly-genic model to a model with genetic variance compo-nents for both a QTL and polygenic factors. Twice thedifference in loge likelihood of these two models gives atest statistic that is asymptotically distributed as a 1/2:1/2 mixture of a and a point mass at zero (Self and2x1
Liang 1987). The difference between these two log10 like-lihood values corresponds to a LOD score for linkage.
The single ascertainment scheme was corrected for inthe SOLAR program by conditioning the pedigree like-lihood on the probability of the proband’s phenotypefor each outcome (Lange et al. 1988).
Simulations were performed using SOLAR, to assessthe statistical significance of the linkage results. Geno-types for a fully informative unlinked marker were cre-ated, and the evidence for linkage was assessed in100,000 replicates. The number of times that a LODscore exceeded a specified threshold provides an empir-ical P value for that LOD score threshold.
Results
Demographics in Families with OSA
A total of 349 individuals were included in the ge-nome-scan data set. The characteristics of the study pop-ulation included in the genome-scan linkage analyses are
Palmer et al.: Genomewide Scan for OSA 343
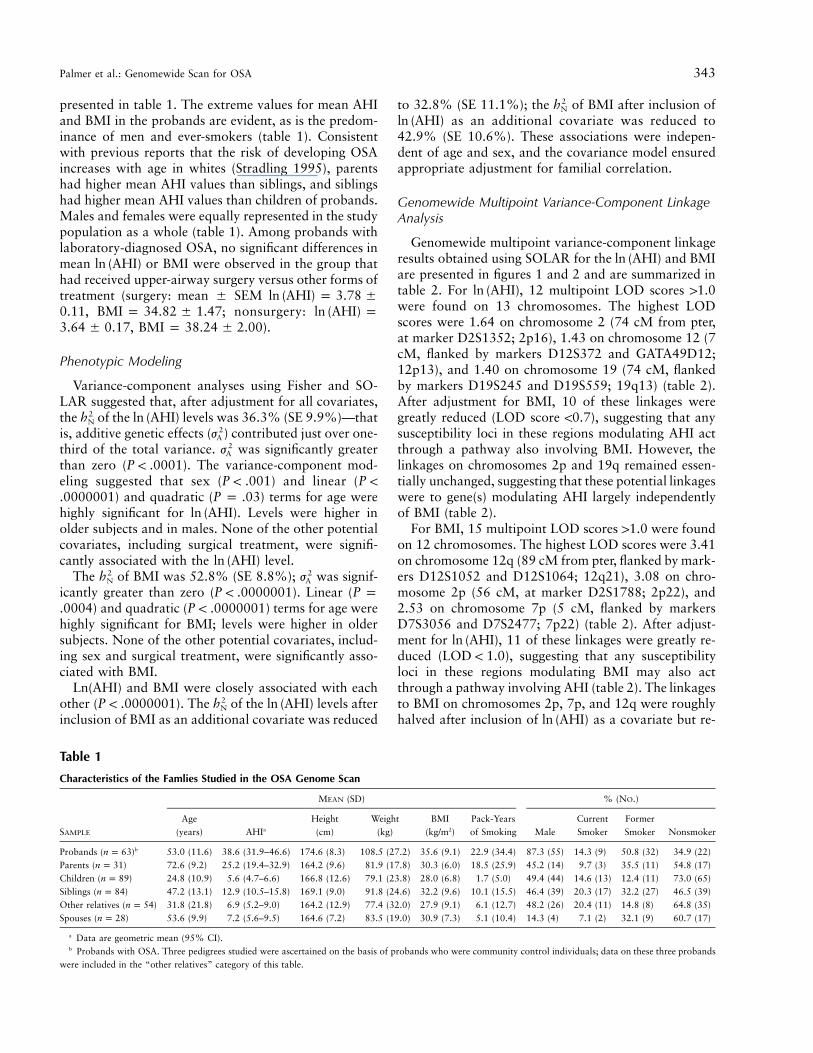
Table 1
Characteristics of the Famlies Studied in the OSA Genome Scan
SAMPLE
MEAN (SD) % (NO.)
Age(years) AHIa
Height(cm)
Weight(kg)
BMI(kg/m2)
Pack-Yearsof Smoking Male
CurrentSmoker
FormerSmoker Nonsmoker
Probands ( )bn p 63 53.0 (11.6) 38.6 (31.9–46.6) 174.6 (8.3) 108.5 (27.2) 35.6 (9.1) 22.9 (34.4) 87.3 (55) 14.3 (9) 50.8 (32) 34.9 (22)Parents ( )n p 31 72.6 (9.2) 25.2 (19.4–32.9) 164.2 (9.6) 81.9 (17.8) 30.3 (6.0) 18.5 (25.9) 45.2 (14) 9.7 (3) 35.5 (11) 54.8 (17)Children ( )n p 89 24.8 (10.9) 5.6 (4.7–6.6) 166.8 (12.6) 79.1 (23.8) 28.0 (6.8) 1.7 (5.0) 49.4 (44) 14.6 (13) 12.4 (11) 73.0 (65)Siblings ( )n p 84 47.2 (13.1) 12.9 (10.5–15.8) 169.1 (9.0) 91.8 (24.6) 32.2 (9.6) 10.1 (15.5) 46.4 (39) 20.3 (17) 32.2 (27) 46.5 (39)Other relatives ( )n p 54 31.8 (21.8) 6.9 (5.2–9.0) 164.2 (12.9) 77.4 (32.0) 27.9 (9.1) 6.1 (12.7) 48.2 (26) 20.4 (11) 14.8 (8) 64.8 (35)Spouses ( )n p 28 53.6 (9.9) 7.2 (5.6–9.5) 164.6 (7.2) 83.5 (19.0) 30.9 (7.3) 5.1 (10.4) 14.3 (4) 7.1 (2) 32.1 (9) 60.7 (17)
a Data are geometric mean (95% CI).b Probands with OSA. Three pedigrees studied were ascertained on the basis of probands who were community control individuals; data on these three probands
were included in the “other relatives” category of this table.
presented in table 1. The extreme values for mean AHIand BMI in the probands are evident, as is the predom-inance of men and ever-smokers (table 1). Consistentwith previous reports that the risk of developing OSAincreases with age in whites (Stradling 1995), parentshad higher mean AHI values than siblings, and siblingshad higher mean AHI values than children of probands.Males and females were equally represented in the studypopulation as a whole (table 1). Among probands withlaboratory-diagnosed OSA, no significant differences inmean or BMI were observed in the group thatln (AHI)had received upper-airway surgery versus other forms oftreatment (surgery: mean � SEM ln (AHI) p 3.78 �
, ; nonsurgery:0.11 BMI p 34.82 � 1.47 ln (AHI) p, ).3.64 � 0.17 BMI p 38.24 � 2.00
Phenotypic Modeling
Variance-component analyses using Fisher and SO-LAR suggested that, after adjustment for all covariates,the of the levels was 36.3% (SE 9.9%)—that2h ln (AHI)N
is, additive genetic effects ( ) contributed just over one-2jA
third of the total variance. was significantly greater2jA
than zero ( ). The variance-component mod-P ! .0001eling suggested that sex ( ) and linear (P ! .001 P !
) and quadratic ( ) terms for age were.0000001 P p .03highly significant for . Levels were higher inln (AHI)older subjects and in males. None of the other potentialcovariates, including surgical treatment, were signifi-cantly associated with the level.ln (AHI)
The of BMI was 52.8% (SE 8.8%); was signif-2 2h jN A
icantly greater than zero ( ). Linear (P ! .0000001 P p) and quadratic ( ) terms for age were.0004 P ! .0000001
highly significant for BMI; levels were higher in oldersubjects. None of the other potential covariates, includ-ing sex and surgical treatment, were significantly asso-ciated with BMI.
and BMI were closely associated with eachLn(AHI)other ( ). The of the levels after2P ! .0000001 h ln (AHI)N
inclusion of BMI as an additional covariate was reduced
to 32.8% (SE 11.1%); the of BMI after inclusion of2hN
as an additional covariate was reduced toln (AHI)42.9% (SE 10.6%). These associations were indepen-dent of age and sex, and the covariance model ensuredappropriate adjustment for familial correlation.
Genomewide Multipoint Variance-Component LinkageAnalysis
Genomewide multipoint variance-component linkageresults obtained using SOLAR for the and BMIln (AHI)are presented in figures 1 and 2 and are summarized intable 2. For , 12 multipoint LOD scores 11.0ln (AHI)were found on 13 chromosomes. The highest LODscores were 1.64 on chromosome 2 (74 cM from pter,at marker D2S1352; 2p16), 1.43 on chromosome 12 (7cM, flanked by markers D12S372 and GATA49D12;12p13), and 1.40 on chromosome 19 (74 cM, flankedby markers D19S245 and D19S559; 19q13) (table 2).After adjustment for BMI, 10 of these linkages weregreatly reduced (LOD score !0.7), suggesting that anysusceptibility loci in these regions modulating AHI actthrough a pathway also involving BMI. However, thelinkages on chromosomes 2p and 19q remained essen-tially unchanged, suggesting that these potential linkageswere to gene(s) modulating AHI largely independentlyof BMI (table 2).
For BMI, 15 multipoint LOD scores 11.0 were foundon 12 chromosomes. The highest LOD scores were 3.41on chromosome 12q (89 cM from pter, flanked by mark-ers D12S1052 and D12S1064; 12q21), 3.08 on chro-mosome 2p (56 cM, at marker D2S1788; 2p22), and2.53 on chromosome 7p (5 cM, flanked by markersD7S3056 and D7S2477; 7p22) (table 2). After adjust-ment for , 11 of these linkages were greatly re-ln (AHI)duced ( ), suggesting that any susceptibilityLOD ! 1.0loci in these regions modulating BMI may also actthrough a pathway involving AHI (table 2). The linkagesto BMI on chromosomes 2p, 7p, and 12q were roughlyhalved after inclusion of as a covariate but re-ln (AHI)
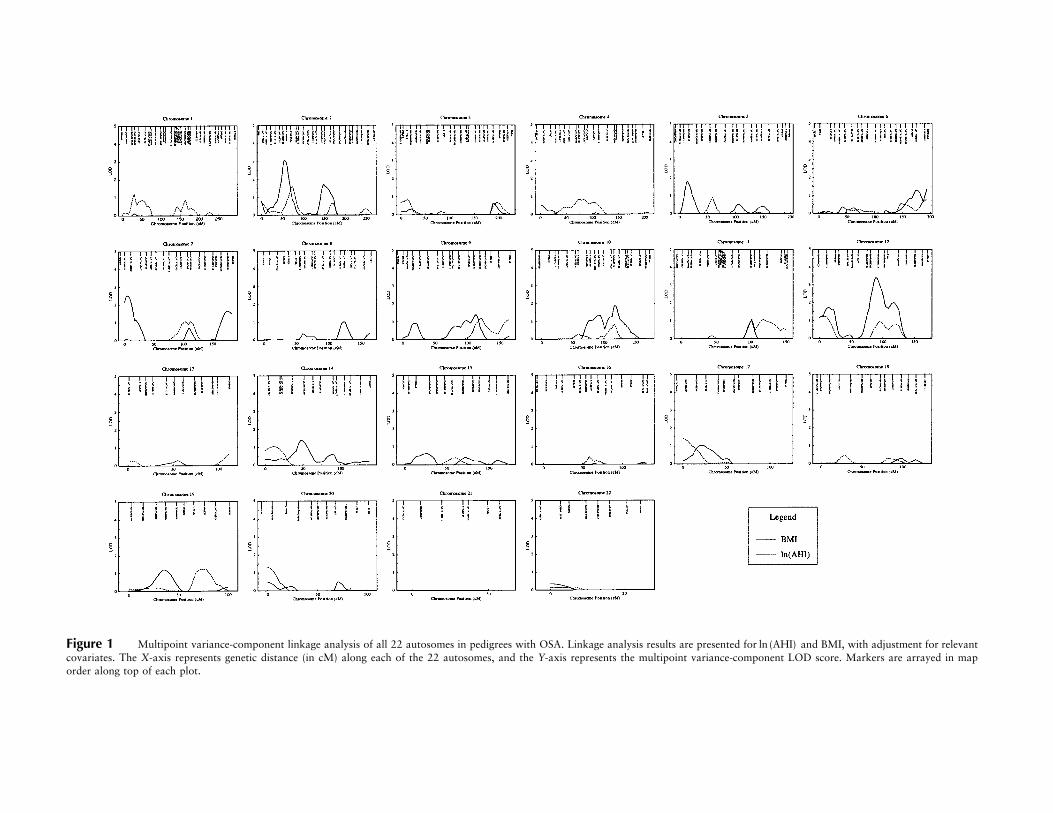
Figure 1 Multipoint variance-component linkage analysis of all 22 autosomes in pedigrees with OSA. Linkage analysis results are presented for and BMI, with adjustment for relevantln (AHI)covariates. The X-axis represents genetic distance (in cM) along each of the 22 autosomes, and the Y-axis represents the multipoint variance-component LOD score. Markers are arrayed in maporder along top of each plot.
Palmer et al.: Genomewide Scan for OSA 345
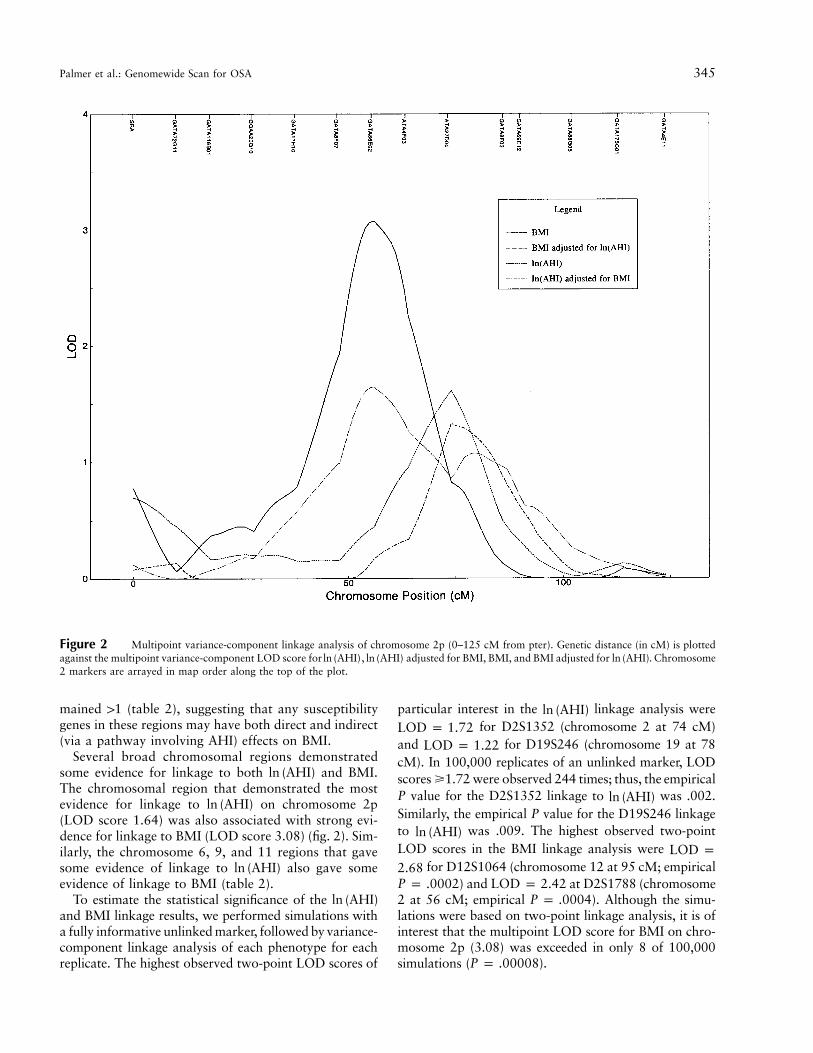
Figure 2 Multipoint variance-component linkage analysis of chromosome 2p (0–125 cM from pter). Genetic distance (in cM) is plottedagainst the multipoint variance-component LOD score for , adjusted for BMI, BMI, and BMI adjusted for . Chromosomeln (AHI) ln (AHI) ln (AHI)2 markers are arrayed in map order along the top of the plot.
mained 11 (table 2), suggesting that any susceptibilitygenes in these regions may have both direct and indirect(via a pathway involving AHI) effects on BMI.
Several broad chromosomal regions demonstratedsome evidence for linkage to both and BMI.ln (AHI)The chromosomal region that demonstrated the mostevidence for linkage to on chromosome 2pln (AHI)(LOD score 1.64) was also associated with strong evi-dence for linkage to BMI (LOD score 3.08) (fig. 2). Sim-ilarly, the chromosome 6, 9, and 11 regions that gavesome evidence of linkage to also gave someln (AHI)evidence of linkage to BMI (table 2).
To estimate the statistical significance of the ln (AHI)and BMI linkage results, we performed simulations witha fully informative unlinked marker, followed by variance-component linkage analysis of each phenotype for eachreplicate. The highest observed two-point LOD scores of
particular interest in the linkage analysis wereln (AHI)for D2S1352 (chromosome 2 at 74 cM)LOD p 1.72
and for D19S246 (chromosome 19 at 78LOD p 1.22cM). In 100,000 replicates of an unlinked marker, LODscores �1.72 were observed 244 times; thus, the empiricalP value for the D2S1352 linkage to was .002.ln (AHI)Similarly, the empirical P value for the D19S246 linkageto was .009. The highest observed two-pointln (AHI)LOD scores in the BMI linkage analysis were LOD p
for D12S1064 (chromosome 12 at 95 cM; empirical2.68) and at D2S1788 (chromosomeP p .0002 LOD p 2.42
2 at 56 cM; empirical ). Although the simu-P p .0004lations were based on two-point linkage analysis, it is ofinterest that the multipoint LOD score for BMI on chro-mosome 2p (3.08) was exceeded in only 8 of 100,000simulations ( ).P p .00008
346 Am. J. Hum. Genet. 72:340–350, 2003
Table 2
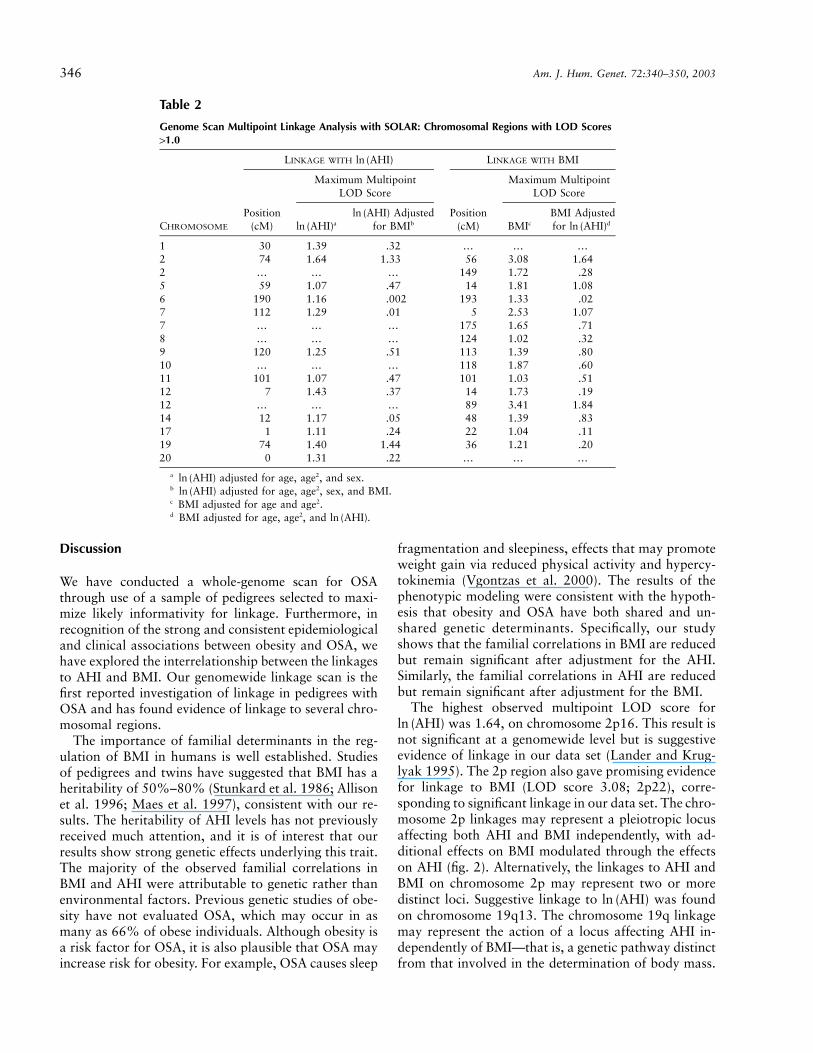
Genome Scan Multipoint Linkage Analysis with SOLAR: Chromosomal Regions with LOD Scores11.0
CHROMOSOME
LINKAGE WITH ln (AHI) LINKAGE WITH BMI
Position(cM)
Maximum MultipointLOD Score
Position(cM)
Maximum MultipointLOD Score
aln (AHI)Adjustedln (AHI)
for BMIb BMIc
BMI Adjustedfor dln (AHI)
1 30 1.39 .32 … … …2 74 1.64 1.33 56 3.08 1.642 … … … 149 1.72 .285 59 1.07 .47 14 1.81 1.086 190 1.16 .002 193 1.33 .027 112 1.29 .01 5 2.53 1.077 … … … 175 1.65 .718 … … … 124 1.02 .329 120 1.25 .51 113 1.39 .8010 … … … 118 1.87 .6011 101 1.07 .47 101 1.03 .5112 7 1.43 .37 14 1.73 .1912 … … … 89 3.41 1.8414 12 1.17 .05 48 1.39 .8317 1 1.11 .24 22 1.04 .1119 74 1.40 1.44 36 1.21 .2020 0 1.31 .22 … … …
a adjusted for age, age2, and sex.ln (AHI)b adjusted for age, age2, sex, and BMI.ln (AHI)c BMI adjusted for age and age2.d BMI adjusted for age, age2, and .ln (AHI)
Discussion
We have conducted a whole-genome scan for OSAthrough use of a sample of pedigrees selected to maxi-mize likely informativity for linkage. Furthermore, inrecognition of the strong and consistent epidemiologicaland clinical associations between obesity and OSA, wehave explored the interrelationship between the linkagesto AHI and BMI. Our genomewide linkage scan is thefirst reported investigation of linkage in pedigrees withOSA and has found evidence of linkage to several chro-mosomal regions.
The importance of familial determinants in the reg-ulation of BMI in humans is well established. Studiesof pedigrees and twins have suggested that BMI has aheritability of 50%–80% (Stunkard et al. 1986; Allisonet al. 1996; Maes et al. 1997), consistent with our re-sults. The heritability of AHI levels has not previouslyreceived much attention, and it is of interest that ourresults show strong genetic effects underlying this trait.The majority of the observed familial correlations inBMI and AHI were attributable to genetic rather thanenvironmental factors. Previous genetic studies of obe-sity have not evaluated OSA, which may occur in asmany as 66% of obese individuals. Although obesity isa risk factor for OSA, it is also plausible that OSA mayincrease risk for obesity. For example, OSA causes sleep
fragmentation and sleepiness, effects that may promoteweight gain via reduced physical activity and hypercy-tokinemia (Vgontzas et al. 2000). The results of thephenotypic modeling were consistent with the hypoth-esis that obesity and OSA have both shared and un-shared genetic determinants. Specifically, our studyshows that the familial correlations in BMI are reducedbut remain significant after adjustment for the AHI.Similarly, the familial correlations in AHI are reducedbut remain significant after adjustment for the BMI.
The highest observed multipoint LOD score forwas 1.64, on chromosome 2p16. This result isln (AHI)
not significant at a genomewide level but is suggestiveevidence of linkage in our data set (Lander and Krug-lyak 1995). The 2p region also gave promising evidencefor linkage to BMI (LOD score 3.08; 2p22), corre-sponding to significant linkage in our data set. The chro-mosome 2p linkages may represent a pleiotropic locusaffecting both AHI and BMI independently, with ad-ditional effects on BMI modulated through the effectson AHI (fig. 2). Alternatively, the linkages to AHI andBMI on chromosome 2p may represent two or moredistinct loci. Suggestive linkage to was foundln (AHI)on chromosome 19q13. The chromosome 19q linkagemay represent the action of a locus affecting AHI in-dependently of BMI—that is, a genetic pathway distinctfrom that involved in the determination of body mass.
Palmer et al.: Genomewide Scan for OSA 347
Multiple genomic regions have been linked to obesity-related phenotypes in genome-scan linkage studies (Co-muzzie and Allison 1998); as of October 2001, 59 locihad been linked to obesity measures in genomewidescans of humans (Rankinen et al. 2002). Evidence forlinkage of obesity-related phenotypes to the three mostpromising regions for BMI in the present study, chro-mosomes 2p, 7p, and 12q, has been reported in previousstudies. The chromosome 2p region has been linked toBMI, fat mass, and skinfold thickness in previous link-age studies (Wilson et al. 1991; Bailey-Wilson et al.1993; Comuzzie et al. 1997; Rotimi et al. 1999; Del-planque et al. 2000). The 7p (Bray et al. 1999; Chagnonet al. 2000) and 12q (Sun et al. 1999; Perusse et al.2001) regions have also been previously linked to obe-sity measures.
Several biologically plausible candidate genes are lo-cated within the most promising chromosomal regionsin our analysis (candidate-gene locations were obtainedfrom the June 2002 freeze at the UCSC Genome Bioin-formatics Web site). The chromosome 2p region con-tains acid phosphatase 1 (MIM 171500), apolipopro-tein B precursor (MIM 107730), proopiomelanocortin(MIM 176830), and the alpha-2B-adrenergic receptor(MIM 104260), all of which are biologically plausiblecandidates for obesity and have been previously asso-ciated with BMI, percentage of body fat, and/or serumleptin levels (Rajput-Williams et al. 1988; Lucarini etal. 1990; Saha et al. 1993; Pouliot et al. 1994; Lucariniet al. 1997; Krude et al. 1998; Heinonen et al. 1999;Hixson et al. 1999; Miraglia del Giudice et al. 2001).The 7p region contains the neuropeptide Y (MIM162640) gene, which has been associated with BMI andwaist:hip ratio (Bray et al. 2000). The 12q region con-tains the vitamin D receptor (MIM 601769) and insulin-like growth factor 1 (MIM 147440) genes, which havebeen associated with BMI and percentage body fat (Sunet al. 1999; Ye et al. 2001). The chromosome 19q regioncontains the apolipoprotein E (MIM 107741) gene,which regulates lipid metabolism and has been associ-ated with serum leptin levels, measures of obesity, andelevated AHI (Kadotani et al. 2001; Oh and Barrett-Connor 2001; Yanagisawa et al. 2001).
Obesity appears to increase risk of OSA ∼10–14-fold,with the most marked effects observed in middle-agedsubjects (Guilleminault et al. 1976; Strohl and Redline1996; Redline et al. 1998). Furthermore, weight loss,even of modest amounts, may reduce the severity ofOSA (Smith et al. 1985). Obesity may increase suscep-tibility to OSA through fat deposition in upper-airwaytissues, reducing nasopharyngeal caliber, and/or fromhypoventilation occurring in association with reducedchest wall compliance. It is also possible that the as-sociation between obesity and OSA may be partly basedon pleiotropic effects, as may occur if the same gene or
set of genes influences ponderosity and ventilatory con-trol and/or craniofacial morphology. The co-occurrenceof OSA, central obesity, hypertension, and type 2 dia-betes suggests that OSA may be part of a “metabolic”syndrome (Catterrall et al. 1984; Katsumada et al.1991; Strohl et al. 1994; Strohl 1996; Ficker et al. 1998;Elmasry et al. 2000, 2001; Al-Delaimy et al. 2002),which may be largely influenced by genes that influenceinsulin resistance and body fat distribution (McCarthy2002). Candidate genes for obesity are therefore rele-vant for studies of the genetics of OSA, both becauseof the prominence of obesity in the OSA phenotype andbecause of the potential impact that these genes haveon the expression of other traits of potential relevanceto OSA.
There is growing evidence that leptin, an adipose-de-rived circulating hormone, may have such pleiotropic ef-fects (Boston 2001). In addition to the role of leptin inappetite regulation and energy expenditure, mouse mod-els suggest that it also influences lung growth (Tsuchiyaet al. 1999) and respiratory control (O’Donnell et al.1999). Studies after leptin replacement in mutant obesemice (Lepob) suggest that leptin deficiency causes de-pressed ventilatory responses to hypercapnia in bothwakefulness and sleep (O’Donnell et al. 1999). Althoughleptin-deficient mouse models have not been studied forOSA per se, these studies provide important supportingdata implicating the pleiotropic effects that a single pro-tein has on several aspects of the OSA phenotype (obesity,abnormal ventilatory control, and disturbed sleep archi-tecture) (O’Donnell et al. 1999; Sinton et al. 1999; Tsu-chiya et al. 1999). Of great interest in this context, thesame marker giving maximal evidence of linkage to BMIin the 2p region in our study (D2S1788) has also shownevidence of significant linkage to leptin levels in multiplestudies (maximum LOD score 2.8–7.5) (Comuzzie et al.1997; Hixson et al. 1999; Rotimi et al. 1999), as havenearby markers (Hager et al. 1998; Delplanque et al.2000). This region on chromosome 2 encompasses thegene encoding POMC, which may be important in theregulation of appetite, obesity, and variation in leptinlevels (Hixson et al. 1999; Miraglia del Giudice et al.2001). Given that we found linkage to both AHI andBMI on chromosome 2p, POMC is a biologically plau-sible candidate that could explain the observed resultsand would be consistent with a genetically regulated met-abolic component to OSA pathogenesis.
In general, we observed stronger evidence of linkagefor BMI than AHI. We hypothesize that this is not dueto a larger contribution of environmental influences onAHI than BMI, since most known environmental influ-ences on OSA have relatively modest effects (Redlineand Young 1993a). Rather, it is likely that BMI is as-sessed with less measurement error and greater day-to-day consistency than is AHI, which is derived from an
348 Am. J. Hum. Genet. 72:340–350, 2003
overnight recording and processing of multiple channelsof physiological data (Redline et al. 1991). Future ge-netic studies of OSA may benefit from ongoing advancesin the physiological processing of polysomnographicdata.
The present study has several potential limitations.Our sample, although intensively phenotyped, was ofmoderate size. Our limited power to detect modest ef-fects may at least partially explain the modest linkageswe found to AHI. The generalizability of linkage resultsin the families with OSA that we studied to OSA inother populations with different exposures is undeter-mined. There are well-described ethnic differences inupper-airway anatomy that may alter the expression ofthe genetic determinants of OSA among other ethnicgroups (Redline et al. 1997). We have included potentialenvironmental determinants of OSA, such as cigarettesmoking and alcohol consumption, as covariates in ouranalyses, but we have not formally tested for genotype-by-environment interactions. Although the quantitativetrait that we analyzed (AHI) is the most common metricused to identify and quantify OSA, it is possible thatmore sophisticated indices of overnight breathing andsleep disruption may be more informative. Finally, wehave not adjusted for the multiple phenotypes analyzed,because these OSA-associated quantitative phenotypesare significantly correlated.
The present study suggests the presence of multiplegenetic determinants of the pathophysiological traits as-sociated with OSA and suggests that two of the im-portant phenotypes associated with OSA (AHI andBMI) are distinct traits with both shared and unsharedgenetic determinants. There are likely multiple geneticdeterminants of OSA, and these linkage analyses ofquantitative phenotypes have identified several regionsof interest on which to focus fine-mapping efforts. Eval-uation of the regions of linkage within our studythrough use of additional STR markers will be required,and replication of our findings in other samples willbe necessary. Investigation of candidate genes in theregions of linkage will also be necessary. If novel geneticdeterminants of OSA can be identified, important newinsights into OSA pathophysiology—and, ultimately,treatment—could result.
Acknowledgments
We are indebted to the dedicated staff of the Cleveland Fam-ily Study, including the superb field team: Kathy Clark, GregGraham, Barbara O’Malia, Sunny Morton, Heather Rose-brock, and our study coordinator, Joan Aylor. We are gratefulfor the genotyping performed by the National Heart, Lung,and Blood Institute Mammalian Genotyping Service. We areespecially thankful for the participation of the members of thefamilies with OSA. This study was supported by National In-
situtes of Health grants HL43680, HL07567, and GM28356and by Program in Genomic Applications grant U01 HL66795.
Electronic-Database Information
Accession numbers and URLs for data presented herein areas follows:
Center for Medical Genetics, Marshfield Medical ResearchFoundation, http://research.marshfieldclinic.org/genetics/ (forthe NHLBI mammalian genotyping service)
Online Mendelian Inheritance in Man (OMIM), http://www.ncbi.nlm.nih.gov/Omim/ (for OSA [MIM 107650],obesity [MIM 601665], acid phosphatase 1 [MIM 171500],apolipoprotein B precursor [MIM 107730], proopiomelan-ocortin [MIM 176830], alpha-2B-adrenergic receptor [MIM104260], neuropeptide Y [MIM 162640], vitamin D recep-tor [MIM 601769], insulin-like growth factor 1 [MIM147440], and apolipoprotein E [MIM 107741])
UCSC Genome Bioinformatics, http://genome.cse.ucsc.edu/(for Human Genome Working Draft “Golden Path”)
University of Arizona/Channing Labs, Programs for GenomicApplications, http://pga.bwh.harvard.edu/ (for SNPper)
References
Abecasis GR, Cherny SS, Cookson WO, Cardon LR (2002)Merlin—rapid analysis of dense genetic maps using sparsegene flow trees. Nat Genet 30:97–101
Al-Delaimy WK, Manson JE, Willett WC, Stampfer MJ, HuFB (2002) Snoring as a risk factor for type II diabetes mel-litus: a prospective study. Am J Epidemiol 155:387–393
Ali NJ, Pitson DJ, Stradling JR (1993) Snoring, sleep distur-bance, and behaviour in 4–5 year olds. Arch Dis Child 68:360–366
Allison DB, Kaprio J, Korkeila M, Koskenvuo M, Neale MC,Hayakawa K (1996) The heritability of body mass indexamong an international sample of monozygotic twins rearedapart. Int J Obes Relat Metab Disord 20:501–506
Almasy L, Blangero J (1998) Multipoint quantitative-trait link-age analysis in general pedigrees. Am J Hum Genet 62:1198–211
Ancoli-Israel S, Kripke DF, Klauber MR, Mason WJ, Fell R,Kaplan O (1991) Sleep-disordered breathing in communitydwelling elderly. Sleep 14:486–495
Bailey-Wilson JE, Wilson AF, Bamba V (1993) Linkage anal-ysis in a large pedigree ascertained due to essential familialhypercholesterolemia. Genet Epidemiol 10:665–669
Boston BA (2001) Pro-opiomelanocortin and weight regula-tion: from mice to men. J Pediatr Endocrinol Metab 14:1409–1416
Bray MS, Boerwinkle E, Hanis CL (1999) Linkage analysis ofcandidate obesity genes among the Mexican-American pop-ulation of Starr County, Texas. Genet Epidemiol 16:397–411
——— (2000) Sequence variation within the neuropeptide Ygene and obesity in Mexican Americans. Obes Res 8:219–226
Broman KW, Weber JL (1998) Estimation of pairwise rela-
Palmer et al.: Genomewide Scan for OSA 349
tionships in the presence of genotyping errors. Am J HumGenet 63:1563–1564
Buxbaum SG, Elston RC, Tishler PV, Redline S (2002) Geneticsof the apnea hypopnea index in Caucasians and AfricanAmericans. I. Segregation analysis. Genet Epidemiol 22:243–253
Catterrall JR, Calverley PMA, Ewing DL, Douglas NJ (1984)Breathing, sleep, and diabetic autonomic neuropathy. Dia-betes 33:1025–1027
Chagnon YC, Borecki IB, Perusse L, Roy S, Lacaille M, Chag-non M, Ho-Kim MA, Rice T, Province MA, Rao DC, Bou-chard C (2000) Genome-wide search for genes related tothe fat-free body mass in the Quebec family study. Metab-olism 49:203–207
Comuzzie AG, Allison DB (1998) The search for human obe-sity genes. Science 280:1374–1377
Comuzzie AG, Hixson JE, Almasy L, Mitchell BD, MahaneyMC, Dyer TD, Stern MP, MacCluer JW, Blangero J (1997)A major quantitative trait locus determining serum leptinlevels and fat mass is located on human chromosome 2. NatGenet 15:273–276
Delplanque J, Barat-Houari M, Dina C, Gallina P, Clement K,Guy-Grand B, Vasseur F, Boutin P, Froguel P (2000) Linkageand association studies between the proopiomelanocortin(POMC) gene and obesity in Caucasian families. Diabeto-logia 43:1554–1557
Elmasry A, Janson C, Lindberg E, Gislason T, Tageldin MA,Boman G (2000) The role of habitual snoring and obesityin the development of diabetes: a 10-year follow-up studyin a male population. J Intern Med 248:13–20
Elmasry A, Lindberg E, Berne C, Janson C, Gislason T, AwadTageldin M, Boman G (2001) Sleep-disordered breathingand glucose metabolism in hypertensive men: a population-based study. J Intern Med 249:153–161
Ferini-Strambi L, Calori G, Oldani A, Della Marca G, ZucconiM, Castronovo V, Gallus G, Smirne S (1995) Snoring intwins. Respir Med 89:337–340
Ficker JH, Dertinger SH, Siegfried W, Konig HJ, Pentz M,Sailer D, Katalinic A, Hahn EG (1998) Obstructive sleepapnoea and diabetes mellitus: the role of cardiovascular au-tonomic neuropathy. Eur Respir J 11:14–19
Flemons WW, Buysse D, Redline S, Pack A, Strohl KP, Wheat-ley J, Young T, Douglas N, Levy P, McNicholas W, FleethamJ, White D, Schmidt-Nowarra W, Carley D, Romaniuk J(1999) Sleep-related breathing disorders in adults: recom-mendations for syndrome definition and measurement tech-niques in clinical research: the report of an American Acad-emy of Sleep Medicine Task Force. Sleep 22:667–689
Guilleminault C, Pelayo R (1998) Sleep-disordered breathingin children. Ann Med 30:350–356
Guilleminault C, Tilkian A, Dement WC (1976) The sleepapnea syndromes. Annu Rev Med 27:465–484
Hager J, Dina C, Francke S, Dubois S, Houari M, Vatin V,Vaillant E, Lorentz N, Basdevant A, Clement K, Guy-GrandB, Froguel P (1998) A genome-wide scan for human obesitygenes reveals a major susceptibility locus on chromosome10. Nat Genet 20:304–308
Heath AC, Eaves LJ, Kirk KM, Martin NG (1998) Effects oflifestyle, personality, symptoms of anxiety and depression,
and genetic predisposition on subjective sleep disturbanceand sleep pattern. Twin Res 1:176–188
Heinonen P, Koulu M, Pesonen U, Karvonen MK, RissanenA, Laakso M, Valve R, Uusitupa M, Scheinin M (1999)Identification of a three-amino acid deletion in the a2B-ad-renergic receptor that is associated with reduced basal met-abolic rate in obese subjects. J Clin Endocrinol Metab 84:2429–2433
Hixson JE, Almasy L, Cole S, Birnbaum S, Mitchell BD, Ma-haney MC, Stern MP, MacCluer JW, Blangero J, ComuzzieAG (1999) Normal variation in leptin levels in associatedwith polymorphisms in the proopiomelanocortin gene,POMC. J Clin Endocrinol Metab 84:3187–3191
Janssens JP, Pautex S, Hilleret H, Michel JP (2000) Sleep dis-ordered breathing in the elderly. Aging (Milano) 12:417–429
Kadotani H, Kadotani T, Young T, Peppard PE, Finn L, ColrainIM, Murphy GM, Mignot E (2001) Association betweenapolipoprotein E e4 and sleep-disordered breathing inadults. JAMA 285:2888–2890
Katsumada K, Okada T, Miyao M, Katsumata Y (1991) Highincidence of sleep apnea syndrome in a male diabetic pop-ulation. Diabetes Res Clin Pract 13:45–52
Khoury M, Beaty T, Cohen B (1993) Fundamentals of geneticepidemiology. Oxford University Press, Oxford
Krude H, Biebermann H, Luck W, Horn R, Brabant G, GrutersA (1998) Severe early-onset obesity, adrenal insufficiencyand red hair pigmentation caused by POMC mutations inhumans. Nat Genet 19:155–157
Kump K, Whalen C, Tishler PV, Browner I, Ferrette V, StrohlKP, Rosenberg C, Redline S (1994) Assessment of the va-lidity and utility of a sleep-symptom questionnaire. Am JRespir Crit Care Med 150:735–741
Lander E, Kruglyak L (1995) Genetic dissection of complextraits: guidelines for interpreting and reporting linkage re-sults. Nat Genet 11:241–247
Lange K, Weeks D, Boehnke M (1988) Programs for pedigreeanalysis: MENDEL, FISHER and dGENE. Genetic Epide-miology 5:471–472
Linkowski P (1999) EEG sleep patterns in twins. J Sleep Res8 Suppl 1:11–13
Lucarini N, Antonacci E, Bottini N, Gloria Bottini F (1997)Low-molecular-weight acid phosphatase (ACP1), obesity,and blood lipid levels in subjects with non-insulin-dependentdiabetes mellitus. Hum Biol 69:509–515
Lucarini N, Finocchi G, Gloria-Bottini F, Macioce M, BorgianiP, Amante A, Bottini E (1990) A possible genetic componentof obesity in childhood. Observations on acid phosphatasepolymorphism. Experientia 46:90–91
Maes HH, Neale MC, Eaves LJ (1997) Genetic and environ-mental factors in relative body weight and human adiposity.Behav Genet 27:325–351
McCarthy MI (2002) Susceptibility gene discovery for com-mon metabolic and endocrine traits. J Mol Endocrinol 28:1–17
Miraglia del Giudice E, Cirillo G, Santoro N, D’Urso L, Car-bone MT, Di Toro R, Perrone L (2001) Molecular screeningof the proopiomelanocortin (POMC ) gene in Italian obesechildren: report of three new mutations. Int J Obes RelatMetab Disord 25:61–67
350 Am. J. Hum. Genet. 72:340–350, 2003
O’Connell JR, Weeks DE (1998) PedCheck: a program foridentification of genotype incompatibilities in linkage anal-ysis. Am J Hum Genet 63:259–266
O’Donnell CP, Schaub CD, Haines AS, Berkowitz DE, Tank-ersley CG, Schwartz AR, Smith PL (1999) Leptin preventsrespiratory depression in obesity. Am J Respir Crit Care Med159:1477–1484
Oh JY, Barrett-Connor E (2001) Apolipoprotein E polymor-phism and lipid levels differ by gender and family historyof diabetes: the Rancho Bernardo Study. Clin Genet 60:132–137
Perusse L, Rice T, Chagnon YC, Despres JP, Lemieux S, RoyS, Lacaille M, Ho-Kim MA, Chagnon M, Province MA, RaoDC, Bouchard C (2001) A genome-wide scan for abdominalfat assessed by computed tomography in the Quebec FamilyStudy. Diabetes 50:614–621
Pouliot MC, Despres JP, Dionne FT, Vohl MC, Moorjani S,Prud’homme D, Bouchard C, Lupien PJ (1994) ApoB-100gene EcoRI polymorphism. Relations to plasma lipoproteinchanges associated with abdominal visceral obesity. Arter-ioscler Thromb 14:527–533
Rajput-Williams J, Knott TJ, Wallis SC, Sweetnam P, YarnellJ, Cox N, Bell GI, Miller NE, Scott J (1988) Variation ofapolipoprotein-B gene is associated with obesity, high bloodcholesterol levels, and increased risk of coronary heart dis-ease. Lancet 2:1442–1446
Rankinen T, Perusse L, Weisnagel SJ, Snyder EE, Chagnon YC,Bouchard C (2002) The human obesity gene map: the 2001update. Obes Res 10:196–243
Redline S, Adams N, Strauss ME, Roebuck T, Winters M,Rosenberg C (1998) Improvement of mild sleep-disorderedbreathing with CPAP compared with conservative therapy.Am J Respir Crit Care Med 157:858–865
Redline SR, Tishler PV (2000) The genetics of sleep apnea.Sleep Med Rev 4:583–602
Redline S, Tishler PV, Hans MG, Tosteson TD, Strohl KP, SpryK (1997) Racial differences in sleep-disordered breathing inAfrican-Americans and Caucasians. Am J Respir Crit CareMed 155:186–192
Redline S, Tishler PV, Tosteson TD, Williamson J, Kump K,Browner I, Ferrette V, Krejci P (1995) The familial aggre-gation of obstructive sleep apnea. Am J Respir Crit CareMed 151:682–687
Redline S, Tosteson T, Boucher MA, Millman RP (1991) Mea-surement of sleep-related breathing disturbances in epide-miologic studies: assessment of the validity and reproduci-bility of a portable monitoring device. Chest 100:1281–1286
Redline S, Young T (1993a) Epidemiology and natural historyof obstructive sleep apnea. Ear Nose Throat J 72:20–21,24–26
——— (1993b) National Commission on Sleep Disorders re-search report. National Institutes of Health, Bethesda, MD
Rotimi CN, Comuzzie AG, Lowe WL, Luke A, Blangero J,Cooper RS (1999) The quantitative trait locus on chro-mosome 2 for serum leptin levels is confirmed in African-Americans. Diabetes 48:643–644
Saha N, Tay JS, Heng CK, Humphries SE (1993) DNA poly-morphisms of the apolipoprotein B gene are associated withobesity and serum lipids in healthy Indians in Singapore.Clin Genet 44:113–120
Self SG, Liang KY (1987) Asymptotic properties of maximumlikelihood estimators and likelihood ratio tests under non-standard conditions. J Am Stat Assoc 82:605–610
Sinton CM, Fitch TE, Gershenfeld HK (1999) The effects ofleptin on REM sleep and slow wave delta in rats are reversedby food deprivation. J Sleep Res 8:197–203
Smith PL, Gold AR, Meyers DA, Haponik EF, Bleeker ER(1985) Weight loss in mild to moderately obese patients withobstructive sleep apnea. Ann Intern Med 103:850–855
Stradling JR (1995) Sleep-related breathing disorders: obstruc-tive sleep apnoea: definitions, epidemiology, and natural his-tory. Thorax 50:683–689
Strohl KP (1996) Diabetes and sleep apnea. Sleep 19 Suppl10:S225–S228
Strohl KP, Novak RD, Singer W, Cahan C, Boehm KD, DenkoCW, Hoffstem VS (1994) Insulin levels, blood pressure andsleep apnea. Sleep 17:614–618
Strohl K, Redline S (1996) Recognition of obstructive sleepapnea. Am J Respir Crit Care Med 154:279–289
Stunkard AJ, Foch TT, Hrubec Z (1986) A twin study of hu-man obesity. JAMA 256:51–54
Sun G, Gagnon J, Chagnon YC, Perusse L, Despres JP, LeonAS, Wilmore JH, Skinner JS, Borecki I, Rao DC, BouchardC (1999) Association and linkage between an insulin-likegrowth factor-1 gene polymorphism and fat free mass in theHERITAGE Family Study. Int J Obes Relat Metab Disord23:929–935
Tsuchiya T, Shimizu H, Horie T, Mori M (1999) Expressionof leptin receptors in lung: leptin as a growth factor. Eur JPharmacol 365:273–279
Vgontzas AN, Papanicolaou DA, Bixler EO, Hopper K, Lot-sikas A, Lin HM, Kales A, Chrousos GP (2000) Sleep apneaand daytime sleepiness and fatigue: relation to visceral obe-sity, insulin resistance, and hypercytokinemia. J Clin En-docrinol Metab 85:1151–1158
Wilson AF, Elston RC, Tran LD, Siervogel RM (1991) Use ofthe robust sib-pair method to screen for single-locus, mul-tiple-locus, and pleiotropic effects: application to traits re-lated to hypertension. Am J Hum Genet 48:862–872
Yanagisawa Y, Hasegawa K, Dever GJ, Otto CT, Sakuma M,Shibata S, Miyagi S, Kaneko Y, Kagawa Y (2001) Uncoup-ling protein 3 and peroxisome proliferator-activated recep-tor g2 contribute to obesity and diabetes in palauans.Biochem Biophys Res Commun 281:772–778
Ye WZ, Reis AF, Dubois-Laforgue D, Bellanne-Chantelot C,Timsit J, Velho G (2001) Vitamin D receptor gene poly-morphisms are associated with obesity in type 2 diabeticsubjects with early age of onset. Eur J Endocrinol 145:181–186
Young T, Palta M, Dempsey J, Skatrud J, Weber S, Badr S(1993) The occurrence of sleep-disordered breathing amongmiddle-aged adults. N Engl J Med 328:1230–1235