global brain blood-oxygen level responses to autonomic challenges in obstructive sleep apnea
TRANSCRIPT
Global Brain Blood-Oxygen Level Responses toAutonomic Challenges in Obstructive Sleep ApneaPaul M. Macey1,2*, Rajesh Kumar3,4, Jennifer A. Ogren1, Mary A. Woo1, Ronald M. Harper2,5
1UCLA School of Nursing, University of California Los Angeles, Los Angeles, California, United States of America, 2 Brain Research Institute, University of California Los
Angeles, Los Angeles, California, United States of America, 3Department of Anesthesiology, David Geffen School of Medicine at UCLA, University of California Los Angeles,
Los Angeles, California, United States of America, 4Department of Radiological Sciences, David Geffen School of Medicine at UCLA, University of California Los Angeles,
Los Angeles, California, United States of America, 5Department of Neurobiology, David Geffen School of Medicine at UCLA, University of California Los Angeles, Los
Angeles, California, United States of America
Abstract
Obstructive sleep apnea (OSA) is accompanied by brain injury, perhaps resulting from apnea-related hypoxia or periods ofimpaired cerebral perfusion. Perfusion changes can be determined indirectly by evaluation of cerebral blood volume andoxygenation alterations, which can be measured rapidly and non-invasively with the global blood oxygen level dependent(BOLD) signal, a magnetic resonance imaging procedure. We assessed acute BOLD responses in OSA subjects to pressorchallenges that elicit cerebral blood flow changes, using a two-group comparative design with healthy subjects as areference. We separately assessed female and male patterns, since OSA characteristics and brain injury differ between sexes.We studied 94 subjects, 37 with newly-diagnosed, untreated OSA (6 female (age mean6 std: 52.168.1 yrs; apnea/hypopneaindex [AHI]: 27.7615.6 events/hr and 31 male 54.368.4 yrs; AHI: 37.4619.6 events/hr), and 20 female (age 50.568.1 yrs) and37 male (age 45.669.2 yrs) healthy control subjects. We measured brain BOLD responses every 2 s while subjectsunderwent cold pressor, hand grip, and Valsalva maneuver challenges. The global BOLD signal rapidly changed after thefirst 2 s of each challenge, and differed in magnitude between groups to two challenges (cold pressor, hand grip), but notto the Valsalva maneuver (repeated measures ANOVA, p,0.05). OSA females showed greater differences from males inresponse magnitude and pattern, relative to healthy counterparts. Cold pressor BOLD signal increases (mean 6 adjustedstandard error) at the 8 s peak were: OSA 0.1460.08% vs. Control 0.3160.06%, and hand grip at 6 s were: OSA 0.0860.03%vs. Control at 0.3060.02%. These findings, indicative of reduced cerebral blood flow changes to autonomic challenges inOSA, complement earlier reports of altered resting blood flow and reduced cerebral artery responsiveness. Females aremore affected than males, an outcome which may contribute to the sex-specific brain injury in the syndrome.
Citation: Macey PM, Kumar R, Ogren JA, Woo MA, Harper RM (2014) Global Brain Blood-Oxygen Level Responses to Autonomic Challenges in Obstructive SleepApnea. PLoS ONE 9(8): e105261. doi:10.1371/journal.pone.0105261
Editor: Michael Bader, Max-Delbruck Center for Molecular Medicine (MDC), Germany
Received May 5, 2014; Accepted July 22, 2014; Published August 28, 2014
Copyright: � 2014 Macey et al. This is an open-access article distributed under the terms of the Creative Commons Attribution License, which permitsunrestricted use, distribution, and reproduction in any medium, provided the original author and source are credited.
Data Availability: The authors confirm that all data underlying the findings are fully available without restriction. All relevant data are within the paper and itsSupporting Information files.
Funding: This study was supported by NR 013693, National Institute of Nursing Research (https://www.ninr.nih.gov/). The funders had no role in study design,data collection and analysis, decision to publish, or preparation of the manuscript.
Competing Interests: The authors have declared that no competing interests exist.
* Email: [email protected]
Introduction
Obstructive sleep apnea (OSA) is present in approximately 10%
of the adult population, and is accompanied by symptoms related
to central nervous system dysfunction, including excessive daytime
sleepiness, high levels of depression and anxiety, elevated
sympathetic tone, and memory deficits [1,2]. These symptoms
likely derive from changes to brain structure and function in the
condition [3–10]. The causes of the brain impairments remain
unclear; in addition to damaging effects of repeated hypoxic
episodes, injury from impaired cerebral blood flow (CBF)
regulation is a possibility. Ischemic conditions could arise from
lower resting CBF [11–16], or from inadequate responses to
changes in metabolic demand or physiological state, for example,
the blood pressure changes elicited by standing or straining which
are normally accompanied by CBF increases [17]. Weaker short-
term CBF velocity responses to autonomic challenges appear in
OSA in transcranial Doppler ultrasound recordings of limited
cerebral arteries [18,19], with measures taken external to the skull,
but direct observations of responses within the brain tissue to acute
challenges are lacking.
Rapid changes in CBF occur in response to blood pressure
alterations. However, in subjects with OSA, the heart rate
responses to blood pressure changes are time-lagged and weaker
than in their healthy counterparts. In a companion paper, we
showed that peripheral vascular responses to typical autonomic
challenges (straining, temperature change) are impaired [20].
Early studies in OSA of autonomic responses to the Valsalva
maneuver, a forced expiratory strain, showed reduced heart rate
changes, which were interpreted as arising from impaired central
nervous system regulation [9,21]. Other challenges demonstrate
similar patterns of reduced heart rate changes and altered neural
responses in OSA [3,6,8]. Such autonomic impairments could
contribute to cerebral injury. Brain tissue, in particular, is sensitive
to acute periods of ischemia and rapid reperfusion [22,23]; thus, a
negative feedback cycle of brain injury resulting in impaired
PLOS ONE | www.plosone.org 1 August 2014 | Volume 9 | Issue 8 | e105261

autonomic regulation, leading to inadequate vascular responses to
daily demands, and further brain injury. However, the presence of
impaired acute cerebral perfusion changes has only been shown in
surface cerebral arteries, but not directly within brain tissue.
Rapid and non-invasive measures sensitive to changes in
cerebral blood volume and oxygenation are available. Arterial
spin labeling is a non-invasive magnetic resonance imaging (MRI)
technique that enables absolute blood flow quantification, but at
an effective time resolution of a minute or longer [24]. An indirect
measure that can detect acute whole brain vascular changes is the
global, whole-brain average of the blood oxygen level dependent
(BOLD) magnetic resonance signal [25]. A BOLD signal,
measured across the entire brain, can be recorded at a time
resolution of less than two seconds with current technology,
resulting in acquisition rates of 30 measurements per minute. The
BOLD signal is sensitive to multiple phenomena, including levels
of deoxyhemoglobin [25], which are related to blood oxygenation,
CBF, cerebral metabolic rate of oxygen consumption (CMRO2),
and cerebral blood volume (CBV) [26–28]. An increase in the
concentration of deoxyhemoglobin, a paramagnetic substance,
decreases the BOLD signal. Thus, a change in deoxyhemoglobin
will be detected as a change in the BOLD signal from one
measurement to the next, and the global (i.e., whole-brain) BOLD
signal measured over time will reflect relative changes in
deoxyhemoglobin concentration. Large CBF increases elevate
the inflow of oxygenated blood and dilute deoxyhemoglobin,
increasing the BOLD signal throughout the brain. Local changes
in CBF, CMRO2, and CBV occur due to metabolic demands of
neural activation, and can result in localized BOLD signal changes
[25,29]. However, during manipulations that grossly alter CBF
[29–31], the influences of these localized effects on the whole-
brain BOLD signal are minimal [32], and thus, changes in the
global BOLD signal, i.e., the average signal value across the brain,
provide a measure that principally reflects overall changes in
volume and, to a lesser extent, oxygenation of blood.
To address the question of whether cerebral blood volume and
oxygenation responses within brain tissue in OSA were impaired,
we described whole-brain changes in global BOLD signal to
transient blood pressure increases that normally elicit changes in
cerebral blood flow and volume. The intention was not to mimic
apneic stimuli, but to identify potential waking state impairments.
We selected three autonomic stimuli that mimic daily challenges
eliciting pressor responses, the cold pressor (cold temperature and
pain or discomfort), the hand grip (muscle contraction), and the
Valsalva maneuver, a forced expiratory effort that raises thoracic
pressure (straining, lifting). These standard challenges elicit
cerebral autoregulatory responses in healthy people [33–39], and
impaired peripheral cardiovascular responses in OSA populations
[20,40,41]. The objective was to assess the global BOLD signal
during these three tasks, the cold pressor, hand grip, and Valsalva
maneuver, in OSA and control populations, with additional
separation by sex. Although not originally a focus of this
investigation, the role of sex in brain and autonomic symptoms
in OSA has emerged as an important factor [20,42]. Thus,
findings were also considered in females and males separately. We
hypothesized that the BOLD changes in OSA would be muted
and delayed, relative to controls. We further hypothesized that the
pattern of impaired signals of OSA relative to controls would be
similar in each of the sexes, but that systematic male-female
differences would appear in BOLD responses.
Methods
SubjectsWe recruited OSA patients from the UCLA Sleep Laboratory,
and control subjects from the local community. No OSA subjects
had started treatment for the sleep disorder, and all were recently-
diagnosed. OSA patients were classified as either moderate based
on an apnea/hypopnea index (AHI) between 15 and 29 events/
hour, or severe based on an AHI.30 events/hour. No subjects
were using psychotropic or cardiovascular medications, and none
had a history of psychiatric disorders, cardiovascular disease,
stroke, or other major illness. In particular, no subjects had a
diagnosis of hypertension or atherosclerosis. Diabetes mellitus type
2 was confirmed in four patients and suspected in one. Scanner
limitations precluded patients with metallic implants or weight
over 125 kg. Subjects were classified as female or male according
to their self-identified response on a screening questionnaire. All
procedures were in accordance with the Declaration of Helsinki
and approved by the UCLA Office of the Human Research
Protection Program Medical Institutional Review Board 3, and
subjects provided written, informed consent. These subjects
overlap samples from other papers [5,20,42].
ProtocolSubjects were asked to refrain from coffee and other substances
with stimulants for the 24 hours prior to the study. After
completion of screening and enrollment, subjects practiced the
Valsalva maneuver and the hand grip challenges. The sequence of
challenges was hand grip, Valsalva maneuver, and cold pressor.
For the hand grip challenge, subjects were instructed to squeeze an
inflated bag with the right hand. They were initially directed to
briefly squeeze at maximum effort as a reference. The challenge
consisted of a 16 s strain period (indicated by a blue light) at a
subjective 80% of maximum. Subjects practiced this task outside,
then inside the scanner. For the Valsalva maneuver, subjects were
instructed to wait for a visual signal (blue light), then take a deep
breath and expire from their chest (i.e., not from their oral cavity)
until they achieved a pressure of 30 mmHg (indicated by a green
light). Subjects were to maintain this pressure until the end of the
18 s challenge period (indicated by blue light being turned off), at
which point they would breathe normally. Once subjects could
perform the task, they were moved into the scanner, where they
further practiced the challenge.
After practice, subjects were scanned with anatomical protocols,
which allowed their physiologic functions to return to a baseline
state. Following a minimum of 30 minutes of such scanning, the
BOLD protocols were started, consisting of 436 s scans, including
a 1 minute baseline, followed by four Valsalva challenges
1 minute apart, and a final 1 minute recovery. A similar pattern
was followed for the hand grip challenge. The cold pressor
challenge consisted of a 108 s baseline, 60 s foot immersion to
approximately ankle height in cold water (4uC, verified by digital
thermometer), and a 60 s recovery. Two investigators held the foot
throughout the protocol, and lifted the foot into and out of the
water at the appropriate times.
Measurements: MRI and Physiologic SignalsWe collected BOLD and anatomical scans with a 3.0 Tesla
MRI scanner (Siemens Magnetom Tim-Trio, 8 channel head coil).
The BOLD scans were collected with an echo-planar sequence in
the axial plane [64664 matrix size, 43 slices, no interslice gap,
repetition time (TR)= 2000 ms, effective echo-time (TE) = 30 ms,
FOV=2306230 mm, slice thickness = 3.6 mm]. Two high-reso-
lution, three-dimensional T1-weighted anatomical scans were
Global BOLD Responses to Autonomic Stimuli in OSA
PLOS ONE | www.plosone.org 2 August 2014 | Volume 9 | Issue 8 | e105261

collected sequentially using a magnetization-prepared-rapid-ac-
quisition-gradient-echo pulse sequence (TR=2200 ms;
TE= 2.2 ms; inversion time= 900 ms; flip angle = 9u; matrix
size = 2566256; FOV=2306230 mm; slice thickness = 1.0 mm;
number of slices = 176).
Physiological signals were recorded on a laptop with an a/d
converter synchronized with the scanning signal. The expiratory
pressure for the Valsalva maneuver was measured with a pressure
sensor outside the scanner room, connected via a low-compliance
tube into which a subject created expiratory pressure. Change in
hand grip pressure was measured with a pressure sensor connected
to a compressible bag which the subjects’ squeezed. This signal
was not absolute; thus, only the presence or absence of pressure
could be identified.
Data Checking: Task Performance and Data QualityThe scans were checked for non-physiologic changes in signal
intensity by plotting the global BOLD signal, and excluding series
with step changes in intensity of more than 0.5%. Motion between
scans of more than 4 mm in any direction, as calculated using the
‘‘Realign’’ procedure in SPM8 [43], was also cause for exclusion.
The T1 anatomical scans were visually checked at the time of
collection, and repeated if visible motion artifacts were observed.
Performance of each autonomic task was verified by inspecting
the physiologic signals. For the Valsalva maneuver, subjects who
did not achieve a sustained 30 mmHg pressure for the duration of
each of the four challenges were excluded. The signals were
checked to ensure all subjects exerted force during the four hand
grip periods. Since the cold pressor was a passive challenge, no
series were excluded based on performance.
Analysis: PreprocessingPreprocessing of the MRI images was performed using SPM8
and custom MATLAB software. Each subject’s two T1 anatomical
scans were realigned and averaged, resulting in a higher signal-to-
noise ratio relative to a single scan. Any series with motion greater
than 4 mm in any direction, as identified by the SPM realignment
procedure, was excluded. A brain mask was generated based on
segmentation of the T1 image using the SPM procedures ‘‘unified
segmentation’’ and ‘‘DARTEL’’ normalization [44,45]. Voxels
were classified as ‘‘brain’’ based on a combined probability of
being gray or white matter of $0.5. The BOLD scans were
realigned and linearly detrended to remove the typical gradual,
but consistent, intensity increases in the scans (due to heating of
the coils). The mean BOLD image was mapped to the T1 image,
so that the brain mask derived from the high resolution scan could
be applied to the BOLD sequence to exclude (mask) non-brain
regions. The global BOLD signal was calculated based on the
mean of each masked BOLD scan, thus representing signal within
the brain.
Analysis: StatisticsWe used repeated measures ANOVA to assess global BOLD
time trends in a mixed linear model implemented in SAS software
(‘‘proc mixed’’) [46]. Random effects across subjects and groups
were accounted for, and time was binned into baseline (single bin)
and 2 s epochs corresponding to each scan. Overall model effects
were tested, and according to the Tukey-Fisher criterion for
multiple comparisons, only significant models and effects were
assessed for within group (i.e., increases or decreases relative to
baseline) or between group (i.e., differences in magnitude of
response) signal differences at each time-point in the challenge and
recovery. The analysis of each repeated task (Valsalva and hand
grip) was performed on data grouped over the four challenges.
Results
SubjectsDetailed characteristics of the subjects are shown in Table 1. Of
110 subjects originally studied, 16 were excluded following data
checking, resulting in a final sample of 94. Male subjects showed
higher average severity of OSA than females, although only SAO2
nadir was significantly different.
Time trends and time points of within- and between-group
differences are shown for OSA and control groups in Figs 1–6,
and corresponding raw data are in file S1 (cold pressor), S2 (hand
grip), and S3 (Valsalva).
Cold Pressor: Foot Movement ArtifactsLarge signal changes, considered artifacts due to foot movement
in and out of the cold water, were apparent in all subjects at the
onset and termination of the challenge period (Figs. 1, 2). The
movement lasted from 4 s to 6 s, with the BOLD signal showing
large (.0.5%) declines immediately after insertion and removal
from the water. The descriptions of results below exclude these
periods, and address only signals considered reflective of changes
in brain blood volume and oxygenation arising from the cold
challenge per se. The outcomes are unlikely to have been
systematically altered by the motion artifacts, as the recovery
period showed signal values returning to baseline levels. If there
had been a systematic shift caused by the movement, a difference
in mean signals should have remained after the end of the tasks. If
non-systematic, but large alterations that varied in direction across
subjects had been present, the differences in the mean signals
would have been masked, and statistical separation between
groups not possible.
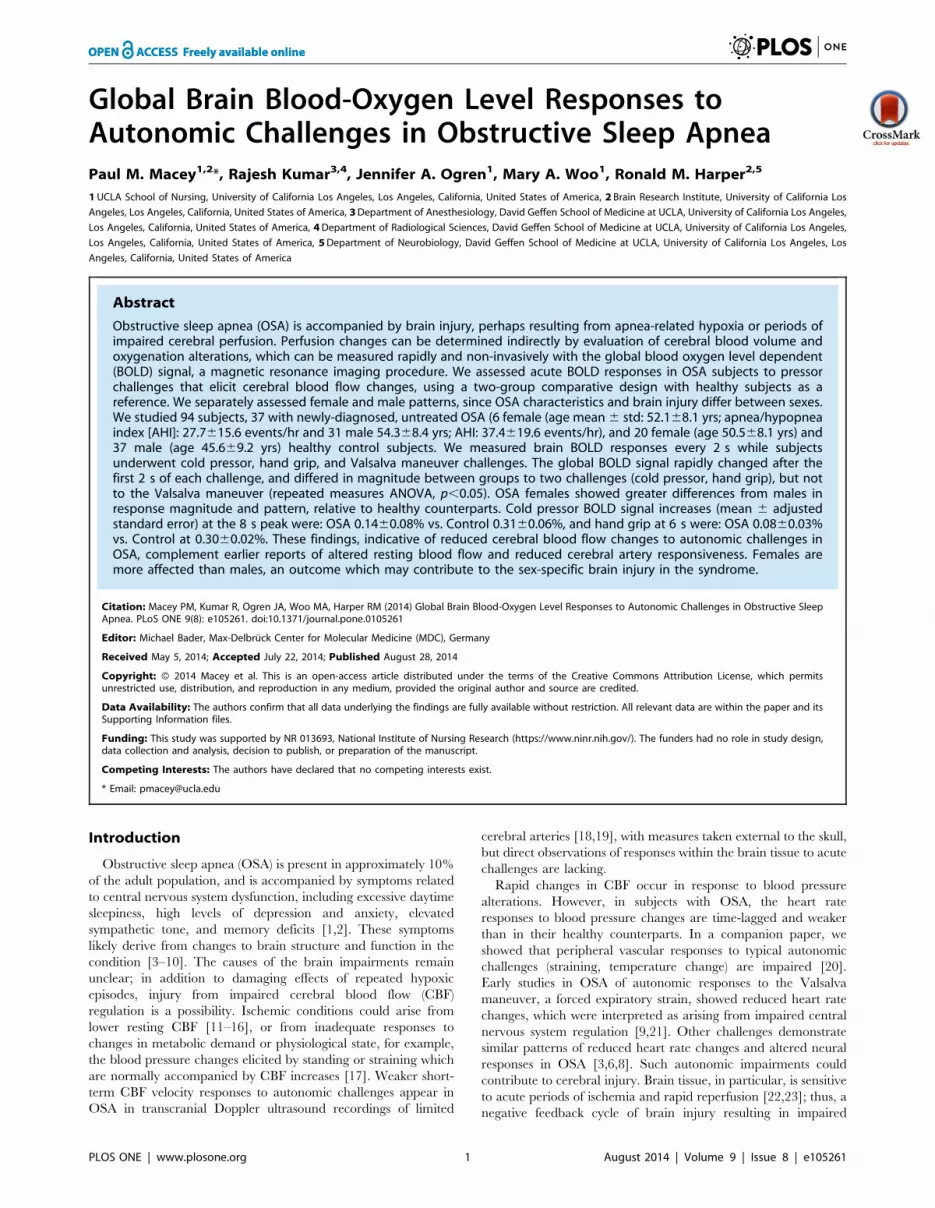
Cold Pressor: OSA vs. ControlThe global BOLD signal showed a rapid increase in both
groups to a peak at 8 s (Fig. 1), but the magnitude of change was
lower in OSA (0.14% vs. 0.31% in controls). The signal rapidly
decreased to a minimum below baseline at time 20–22 s, to a
lower value in OSA than control (20.30% vs. 20.02%). For the
remainder of the challenge, the signal increased, and then
declined, but the OSA group remained at a lower magnitude
than the controls. The signal returned to baseline 10–12 s after the
challenge offset.
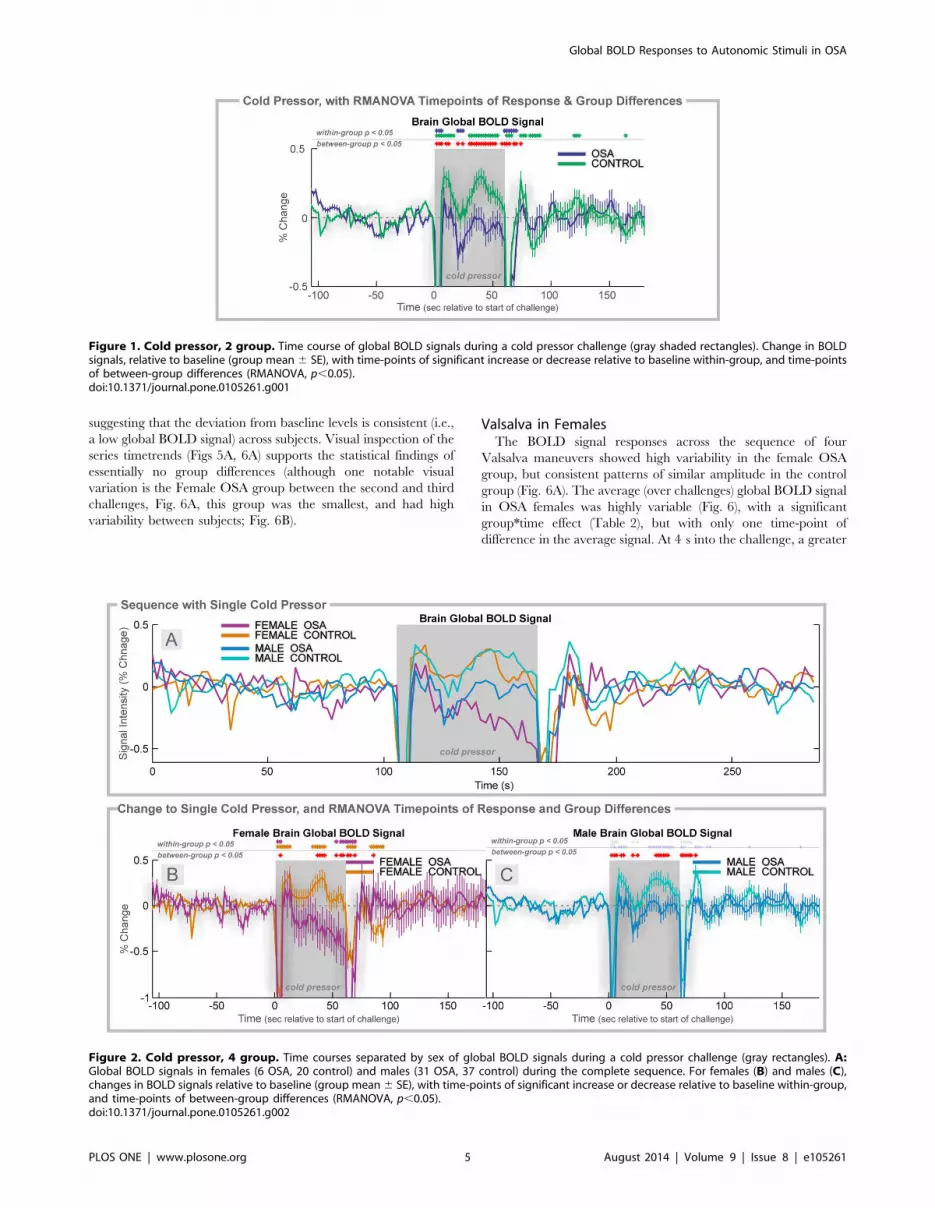
Cold Pressor in FemalesThe global BOLD signal showed a slightly earlier and lower
peak in female OSA than control subjects (0.19% at 8 s vs. 0.35 at
12 s; Fig. 2A, B). The control females showed higher global
BOLD in the middle of the challenge period (32–42 s), whereas
the OSA group showed declines, especially in the last 10 s. During
recovery, the signals returned to similar values in both groups,
although the control females showed below-baseline values 20–
32 s into the recovery.
Cold Pressor in MalesThe global BOLD in OSA males increased to a lower peak than
control males at time 8 s (0.13% vs. 0.34% in controls; Fig. 2A, C).
Thereafter, both groups declined to baseline, but the control group
showed a return to elevated values from 34–54 s into the challenge
period, whereas the OSA males remained at baseline levels.
During recovery, control males showed a transient increase
(peaking at 0.37% at 14 s after the end of the challenge period);
the OSA male global BOLD signal remained at baseline levels.
Global BOLD Responses to Autonomic Stimuli in OSA
PLOS ONE | www.plosone.org 3 August 2014 | Volume 9 | Issue 8 | e105261

Cold Pressor VariabilityStandard deviations of responses to cold pressor application are
shown for each time point as a measure of across-subject
variability in File S1. Average values across all time points of the
standard deviations are: OSA 0.60%; Control 0.56%; Female
OSA 0.63%; Female Control 0.57%; Male OSA 0.59%; and Male
Controls 0.57%.
Hand grip: OSA vs. ControlThe pattern of BOLD signal responses across the sequence of
four challenges was consistent within each group, albeit with more
variation in the OSA group (Fig. 3A). In contrast to the earlier-
described heart rate values, the average (over challenges) global
BOLD signal did not overlap between groups during the grip
period (Fig. 3B). The OSA group showed sustained declines below
baseline, whereas the control group signal increased to a peak at
6 s. The control group then showed a decline below baseline from
12 s, but the OSA group remained significantly lower (time 4–16 s
of challenge). Both groups returned to baseline 20 s after the
challenge.
Hand Grip in FemalesThe pattern of BOLD signal responses across the sequence of
four challenges was relatively consistent in the control group, but
more variable in the OSA females (Fig. 4A). The average global
BOLD signal in females showed a transient increase to a peak 6 s
into the challenge, with a decline to baseline and rebound peak
12–16 s into the recovery (Fig. 4B). There were no significant
group differences (the group6time effect was not significant; see
Table 2).
Hand Grip in MalesThe pattern of BOLD signal responses across the sequence of
four challenges was most consistent in the control group, and
moderately variable in the OSA males (Fig. 4A). The average
(over challenges) global BOLD signal in males showed a transient
increase to a peak 6 s into the challenge in both groups, but the
peak was significantly lower in OSA than controls (0.04% vs.
0.30%; Fig. 4C). The signal was lower for most of the challenge in
OSA vs. controls, but no group differences remained present
during recovery.
Hand Grip VariabilityStandard deviations of responses to hand grip are shown for
each time point as a measure of across-subject variability in File
S2. Average values across all time points of the standard deviations
are: OSA 0.50%; Control 0.43%; Female OSA 0.32%; Female
Control 0.30%; Male OSA 0.53%; and Male Controls 0.50%.
Valsalva Maneuver: OSA vs. ControlThe BOLD signal responses across the sequence of four
Valsalva maneuvers showed a consistent pattern, but with
increasing magnitude from the first to last challenge, with similar
time courses in both groups (Fig. 5A). The average (over
challenges) global BOLD signal showed large, rapid changes in
both groups, with no between-group differences (Fig. 5). Visual-
izing the sequence (Fig. 5A) shows that the one-minute recovery
period was insufficient for the physiologic signals to return to
baseline, which resulted in a below-zero baseline of the global
BOLD signal over four averaged challenges (Fig. 5C). This
variation was similar in both groups. The baseline and recovery
periods in the average across challenges (e.g., Fig. 5B) show
baseline values below 0 (0% represents the series baseline),
Table
1.Su
bject
inform
ationwithgroupaveragesan
dstan
darddeviations(6
std).
Female
Male
ANOVA
Control
OSA
Control
OSA
p(F-test)
N20
637
31
Age(years)
50.5
68.1
52.1
68.1
45.6
69.2
45.3
68.4
0.06
BMI(m
2/kg)
24.1
65.3
32.4
63.2
25.1
62.8
30.2
64.8
,0.001
OSA
Parameters
AHI(events/hour)
-27.7
615.6
-37.4
619.6
0.1
SAO
2nadir
-86.0
61.5
-77.0
69.2
0.03
SAO
2base
line
-94.3
61.5
-94.8
62.1
0.8
Groupeffectswere
testedwithANOVA(four-way
forag
ean
dBMI,an
dtw
o-w
ayforOSA
param
eters).
doi:10.1371/journal.pone.0105261.t001
Global BOLD Responses to Autonomic Stimuli in OSA
PLOS ONE | www.plosone.org 4 August 2014 | Volume 9 | Issue 8 | e105261
suggesting that the deviation from baseline levels is consistent (i.e.,
a low global BOLD signal) across subjects. Visual inspection of the
series timetrends (Figs 5A, 6A) supports the statistical findings of
essentially no group differences (although one notable visual
variation is the Female OSA group between the second and third
challenges, Fig. 6A, this group was the smallest, and had high
variability between subjects; Fig. 6B).
Valsalva in FemalesThe BOLD signal responses across the sequence of four
Valsalva maneuvers showed high variability in the female OSA
group, but consistent patterns of similar amplitude in the control
group (Fig. 6A). The average (over challenges) global BOLD signal
in OSA females was highly variable (Fig. 6), with a significant
group*time effect (Table 2), but with only one time-point of
difference in the average signal. At 4 s into the challenge, a greater
Figure 1. Cold pressor, 2 group. Time course of global BOLD signals during a cold pressor challenge (gray shaded rectangles). Change in BOLDsignals, relative to baseline (group mean6 SE), with time-points of significant increase or decrease relative to baseline within-group, and time-pointsof between-group differences (RMANOVA, p,0.05).doi:10.1371/journal.pone.0105261.g001
Figure 2. Cold pressor, 4 group. Time courses separated by sex of global BOLD signals during a cold pressor challenge (gray rectangles). A:Global BOLD signals in females (6 OSA, 20 control) and males (31 OSA, 37 control) during the complete sequence. For females (B) and males (C),changes in BOLD signals relative to baseline (group mean6 SE), with time-points of significant increase or decrease relative to baseline within-group,and time-points of between-group differences (RMANOVA, p,0.05).doi:10.1371/journal.pone.0105261.g002
Global BOLD Responses to Autonomic Stimuli in OSA
PLOS ONE | www.plosone.org 5 August 2014 | Volume 9 | Issue 8 | e105261

than 1% difference in signal was present between the groups,
reflecting primarily a control increase.
Valsalva in MalesThe BOLD signal responses across the sequence of four
Valsalva maneuvers were very similar in both groups, with a
similar pattern, but of increasing magnitude from first to last
challenge (Fig. 6A). The average (over challenges) global BOLD
signals did not significantly differ between groups, and the male
OSA group did not show the high variability of the female patients
(Fig. 6). Of note, the global BOLD signal in males declined below
baseline for the latter period of the challenge (phase II); whereas,
in females this decline was not present. A drift due to lack of return
to baseline in the 1 minute recovery periods is also most apparent
in males rather than females (Fig. 6C, baseline/recovery periods).
Valsalva VariabilityStandard deviations of responses to the Valsalva maneuver are
shown for each time point as a measure of across-subject
variability in File S3. Average values across all time points of the
standard deviations are: OSA 1.05%; Control 0.95%; Female
OSA 1.01%; Female Control 0.78%; Male OSA 1.05%; and Male
Controls 1.04%.
Discussion
The amplitude of the global BOLD signal, indicative of brain
blood volume and oxygenation, is altered in OSA patients relative
to healthy control subjects during hand grip and cold pressor
autonomic challenges, and the disruption differs by sex. Two
unexpected findings emerged. Firstly, the OSA vs control
amplitude differences did not appear for the Valsalva challenges.
Secondly, in contrast with heart rate changes to these same three
challenges [20], the OSA subjects did not show delayed timing of
the global BOLD signal responses. Separation by sex highlighted
differing female and male patterns in healthy control subjects, with
greater OSA-related impairments in female vs male patients.
These findings suggest OSA is associated with a failure to
adequately adapt cerebral perfusion to certain typical day-to-day
challenges (e.g., gripping, temperature change), as mimicked by
the standard tests used in this study. Presumably, the blood volume
and oxygenation impairments would also be present during sleep,
especially during obstructive apneas, which are accompanied by
large, acute blood pressure changes [47,48]. Impaired cerebral
blood regulation would likely lead to acute periods of reduced
tissue perfusion or oxygenation, which could be a potential source
of the structural injury found in OSA [4,5,49].
The lack of a delay in the global BOLD responses in OSA
relative to control subjects was surprising, given the timing
differences in heart rate changes to the same challenges [20].
While the temporal resolution of the BOLD measurements may
have masked shorter delays in cerebral vascular changes, some of
the heart rate delays are over 2 s (temporal resolution of BOLD
signal), thus the present findings show a lack of direct coupling
between cerebral autoregulatory responses and heart rate. If the
heart rate responses are driven by vagal and sympathetic
regulatory brain areas, the data here suggest that cerebral
autoregulatory mechanisms adapt more quickly than the auto-
Figure 3. Hand grip, 2 group. Time course of global BOLD signals over four hand grip challenges (Grip effort; gray rectangles). A: Global BOLDsignal in 37 OSA and 57 control subjects during the complete sequence. B: Average over four challenges of percent change in BOLD signals relativeto baseline (group mean 6 SE), with time-points of significant increase or decrease relative to baseline within-group, and time-points of between-group differences (RMANOVA, p,0.05).doi:10.1371/journal.pone.0105261.g003
Global BOLD Responses to Autonomic Stimuli in OSA
PLOS ONE | www.plosone.org 6 August 2014 | Volume 9 | Issue 8 | e105261

Table
2.Statistics
formixedmodels.
OverallModel
Effects
Gro
up
Tim
eGro
up*T
ime
ChiSquare
pF
pF
pF
p
Cold
Pressor
All(m
ixed)Fig.1
347
,0.0001
20
,0.0001
22
,0.0001
3,0.0001
Female
Fig.4
140
,0.0001
40.05
7,0.0001
2160
,0.0001
Male
Fig.4
201
,0.0001
17
0.0001
16
,0.0001
2,0.0001
HandGrip
All(m
ixed)Fig.2
8192
,0.0001
30.1
17
,0.0001
4,0.0001
Female
Fig.5
952
,0.0001
20.2
6,0.0001
10.1
Male
Fig.5
6238
,0.0001
10.3
13
,0.0001
3,0.0001
Valsalva
All(m
ixed)Fig.3
7529
,0.0001
01
105
,0.0001
10.3
Female
Fig.6
3261
,0.0001
01
20
,0.0001
3,0.0001
Male
Fig.6
4449
,0.0001
0.3
0.6
80
,0.0001
0.7
0.9
ChiSq
uarestatistics
andpvaluearereportedforrepeatedmeasuresANOVA,im
plementedas
amixedlin
ear
modelwithgroup,timean
dgroupbytimeas
effectsofinterest
(SASprocmixed).
doi:10.1371/journal.pone.0105261.t002
Global BOLD Responses to Autonomic Stimuli in OSA
PLOS ONE | www.plosone.org 7 August 2014 | Volume 9 | Issue 8 | e105261

nomic regulatory pathways. (For review, see Winklewski 2013
[50].).
The brain global BOLD responses were lower to the foot cold
pressor and hand grip challenges in OSA, relative to control
subjects, but did not differ between groups to the Valsalva
maneuver. The signal changes to the challenges principally reflect
alterations in the volume of blood in the brain, with only modest
influence of changes in blood oxygenation levels [32]. Thus, from
the findings, we can assume that the cold pressor challenge elicits a
modest initial peak in brain blood volume in the OSA group, but
at a much lower magnitude than the control group. For the latter
period of the challenge, the control group showed a sustained
elevation of signal, whereas the OSA patients showed no increase,
and even declines for a few seconds (,10 s). The OSA response to
the hand grip was a weaker initial increase, followed by a similar
decline in the global BOLD signal, such that the levels were lower
throughout the challenge in the patient group. These OSA-control
pattern differences contrast with the Valsalva responses, which
showed similar large variations in both groups. The Valsalva
maneuver elicits changes in arterial blood pressure from direct
mechanical forces (thoracic pressure changes), and cerebral
autoregulation during such blood pressure changes appears to be
less impacted in OSA, relative to other types of pressor challenges.
If cerebral autoregulation operates similarly in all challenges,
and the BOLD signal response is driven by blood pressure
changes, the question that arises is whether the pressure changes in
OSA were lower to the hand grip and cold pressor, but similar to
the Valsalva maneuver, relative to the control group. Given the
weaker heart rate changes in OSA to the hand grip and cold
pressor, it is possible that blood pressure in the patient group does
not increase as much [51], and hence, the observed smaller global
BOLD response might simply reflect an appropriate autoregula-
tory response to a smaller change in pressure. However, the
Valsalva maneuver also elicits a lower heart rate responses, so
there is little evidence to support the possibility that lower BOLD
signal changes in OSA are only related to lower blood pressure
changes in that group.
One possible explanation for the muted responses in OSA is a
ceiling effect, whereby a high resting cerebral blood volume in the
patient group would limit the capacity for further transient
increases. In theory, the higher blood gas CO2 levels typical in the
sleep condition would be associated with vasodilation, and hence,
larger vessel volume in OSA vs controls, but there is no evidence
of such differences. On the other hand, OSA patients show lower
resting CBF in several brain regions [11,12,16,52], a variable
closely related to brain blood volume. Furthermore, there is no
reason to believe that a ceiling effect would be present during
responses to hand grip and foot cold pressor, but not Valsalva
challenges. If anything, the Valsalva challenge should have
highlighted greater differences in the presence of a ceiling effect,
since the magnitude of changes is much greater with that task,
compared with the limb-initiated challenges. The combined
evidence suggests that the present findings are unlikely to result
from a ceiling effect.
The most notable difference in the global BOLD signal between
sexes appeared in the cold pressor challenge, which was also
reflected in very different heart rate responses in female vs. male
OSA patients [20]. The cold pressor involves a combination of
temperature and pain stimulation, and since females and males
respond differently to objectively similar painful stimuli [53,54], it
Figure 4. Hand grip, 4 group. Time courses, separated by sex, of global BOLD signals over four hand grip challenges (Grip effort; gray rectangles).A: Average global BOLD signal in females (6 OSA, 20 control) and males (31 OSA, 37 control) during the complete sequence. For females (B) andmales (C), average over four challenges of change in global BOLD signals relative to baseline (group mean 6 SE), with time-points of significantincrease or decrease relative to baseline within-group, and time-points of between-group differences (RMANOVA, p,0.05).doi:10.1371/journal.pone.0105261.g004
Global BOLD Responses to Autonomic Stimuli in OSA
PLOS ONE | www.plosone.org 8 August 2014 | Volume 9 | Issue 8 | e105261

is conceivable that the pain component contributes to those
vascular differences. Sex differences in healthy populations appear
in resting cerebral perfusion [55,56]. Resting blood flow is higher
in females [55,56], which presumably is protective against
ischemic conditions. However, whether this female advantage is
also present in OSA is unknown. Acute blood flow responses in
female patients appear not to be advantageous compared to those
in males, in the light of both the weaker global BOLD responses
reported here, and greater brain injury in OSA females [42].
Cerebral blood flow, measured indirectly here with the global
BOLD signal, is a function of blood pressure and cerebral vascular
resistance, factors regulated by chemical, hormonal, mechanical,
and neural factors [57,58]. The Valsalva maneuver activates
thoracic, oral, and vascular pressure receptors, and includes a
central voluntary effort component. Those elements did not affect
the global BOLD signal in OSA, in spite of greatly muted heart
rate responses [20]. The similar Valsalva BOLD responses in OSA
and controls, and equivalent return to baseline in the other
challenges, suggest that CBF changes to some pressure stimuli are
relatively less impacted in OSA than to other demands. The
findings from the other challenges suggest that specific aspects of
the hand effort and cold sensory stimuli, possibly the central
elements mediating those components, exert essential roles in
modulating the BOLD response.
Whether physiology during these awake challenges parallels the
cerebrovascular patterns during obstructive events in sleep is
unknown, given the state-dependence of cerebral hemodynamics
[48,59–61]. The impaired reactivity found in OSA patients during
wakefulness may be exacerbated during sleep [62], and especially
in REM sleep, where substantial reorganization of vascular control
and chemoreception occurs relative to non-REM states [63–65].
Further changes in hemodynamic organization may also occur
during apneic episodes [59,66–68], and there is evidence that
reduced CBF can contribute to breathing instability during sleep,
including the occurrence of apneas [69,70]. Finally, the dysfunc-
tion observed here in the awake state may differ from that found in
particular sleep states [71,72].
Figure 5. Valsalva, 2 group. Time course of global BOLD signals over four Valsalva maneuvers (Val; gray rectangles). A: Global BOLD signal, and B:expiratory pressure in 37 OSA and 57 control subjects during the complete sequence. C: Average over four challenges of change in BOLD signalsrelative to baseline (group mean 6 SE), with time-points of significant increase or decrease relative to baseline within-group, and time-points ofbetween-group differences (RMANOVA, p,0.05).doi:10.1371/journal.pone.0105261.g005
Global BOLD Responses to Autonomic Stimuli in OSA
PLOS ONE | www.plosone.org 9 August 2014 | Volume 9 | Issue 8 | e105261

Impaired perfusion may contribute to the structural brain injury
found in OSA, especially during the large blood pressure changes
associated with obstructive events. Cerebral blood volume dips
after obstructive events [73], presumably reducing perfusion below
optimal levels. Indirect evidence using near-infrared spectroscopy
suggests that CBF is insufficiently increased to compensate for the
rapid blood pressure changes during obstructive events [48]. Many
of the brain areas affected in OSA have a greater oxygen demand
in response to challenges, based on observations in healthy subjects
[74,75]. While lower perfusion does not necessarily mean lower
oxygen delivery, the damage found in OSA, particularly in limbic
regions mediating pressor challenges, may result from insufficient
perfusion at a time of the greater demand specific to those areas.
LimitationsThe hand grip was a subjective, non-isometric challenge,
whereas ideally, the protocol would involve sustaining a grip
pressure at a predetermined, quantified percentage of measured,
as opposed to perceived, maximum. Thus, unlike the Valsalva and
cold pressor challenges, the hand grip effort may not be considered
a strictly equivalent challenge across subjects or groups. However,
the timing and pattern of physiologic responses were consistent
across subjects within groups. The generalizability of the sex-
specific findings is limited, since the female OSA group had only
six subjects. No delay was found in the BOLD responses in OSA
to any challenge, in contrast with the slowed heart rate changes (1–
2 s late); however, the time resolution for the BOLD signal was
2 s, whereas the heart rate was 1 s, so it is possible that short delays
(,2 s) were also present in the cerebral responses. The BOLD
signal is an average of signals over the whole brain, but regional
variations may exist. Thus, for example, the absence of differences
between OSA and control subjects to the Valsalva maneuver could
potentially result from masking by increases in some regions
canceling declines in others. The confounding effects of changes in
oxygen consumption due to neural activation (or deactivation) are
likely modest, since neural effects are local, whereas the global
BOLD signal is measured across all brain tissue. Caution should
be used when interpreting a lower global BOLD signal as
reflecting lower oxygen delivery or consumption, since changes in
CBF and perfusion are possible without changes in metabolism
due to compensatory changes in oxygen extraction.
Possible subject classification confounds include the presence of
diabetes in four (likely five) OSA patients, as well as the potential
for undiagnosed hypertension, with both conditions associated
with neural deficits [76,77] and altered cerebral blood flow
regulation in hypertension especially [78–80], and to some stimuli
in diabetes mellitus type 2 [81–83]. The OSA and control groups
were not matched for BMI, although the extent to which obesity
influences cerebral perfusion is unclear [84].
Conclusions
Whole brain blood volume and oxygenation responses to hand
grip and cold pressor autonomic challenges are blunted in OSA
patients; these differences are exacerbated in female subjects. The
brain vascular responses, likely reflecting changes in CBF to
various stimuli, are less affected in OSA by the stimuli associated
with the Valsalva maneuver than by cold and hand grip
challenges. The exacerbation of impairments in female vs. male
Figure 6. Valsalva, 4 group. Time courses, separated by sex of heart rate and global BOLD signals over four Valsalva maneuvers (Val; grayrectangles). A: Global BOLD signals in females (6 OSA, 20 control) and males (31 OSA, 37 control) during the complete sequence. For females (B) andmales (C), global BOLD signal averages over four challenges of change relative to baseline (group mean6 SE), with time-points of significant increaseor decrease relative to baseline within-group, and time-points of between-group differences (RMANOVA, p,0.05).doi:10.1371/journal.pone.0105261.g006
Global BOLD Responses to Autonomic Stimuli in OSA
PLOS ONE | www.plosone.org 10 August 2014 | Volume 9 | Issue 8 | e105261

OSA may contribute to the additional brain injury found in female
patients.
Supporting Information
File S1 Cold pressor global BOLD raw data, in Excel format.
Individual subject values are in worksheets specific to sleep status
and sex (CONFEMALE, CONMALE, OSAFEMALE, OSA-
MALE), and group means (Y) and standard deviations
(STDEV(Y)) are in the ‘‘Group Means’’ worksheet. Values are
recorded every 2 s (‘‘X’’ column in ‘‘Group Means’’ worksheet).
(XLSX)
File S2 Hand grip global BOLD raw data, in Excel format.
Individual subject values are in worksheets specific to sleep status
and sex (CONFEMALE, CONMALE, OSAFEMALE, OSA-
MALE), and group means (Y) and standard deviations
(STDEV(Y)) are in the ‘‘Group Means’’ worksheet. Values are
recorded every 2 s (‘‘X’’ column in ‘‘Group Means’’ worksheet).
(XLSX)
File S3 Valsalva global BOLD raw data, in Excel format.
Individual subject values are in worksheets specific to sleep status
and sex (CONFEMALE, CONMALE, OSAFEMALE, OSA-
MALE), and group means (Y) and standard deviations
(STDEV(Y)) are in the ‘‘Group Means’’ worksheet. Values are
recorded every 2 s (‘‘X’’ column in ‘‘Group Means’’ worksheet).
(XLSX)
Acknowledgments
We thank Ms. Rebecca K. Harper for support with recruitment and data
collection.
Author Contributions
Conceived and designed the experiments: PMM RK MAW RMH.
Performed the experiments: PMM RK MAW RMH. Analyzed the data:
PMM RK JO RMH. Contributed reagents/materials/analysis tools: PMM
RK RMH. Contributed to the writing of the manuscript: PMM RK JO
MAW RMH.
References
1. Young T, Peppard PE, Gottlieb DJ (2002) Epidemiology of obstructive sleep
apnea: a population health perspective. Am J Respir Crit Care Med 165: 1217–
1239.
2. Somers VK, Dyken ME, Clary MP, Abboud FM (1995) Sympathetic neural
mechanisms in obstructive sleep apnea. J Clin Invest 96: 1897–1904.
3. Macey KE, Macey PM, Woo MA, Henderson LA, Frysinger RC, et al. (2006)
Inspiratory loading elicits aberrant fMRI signal changes in obstructive sleep
apnea. Respir Physiol Neurobiol 151: 44–60.
4. Macey PM, Henderson LA, Macey KE, Alger JR, Frysinger RC, et al. (2002)
Brain morphology associated with obstructive sleep apnea. Am J Respir Crit
Care Med 166: 1382–1387.
5. Macey PM, Kumar R, Woo MA, Valladares EM, Yan-Go FL, et al. (2008)
Brain structural changes in obstructive sleep apnea. Sleep 31: 967–977.
6. Macey PM, Macey KE, Henderson LA, Alger JR, Frysinger RC, et al. (2003)
Functional magnetic resonance imaging responses to expiratory loading in
obstructive sleep apnea. Respir Physiol Neurobiol 138: 275–290.
7. Joo EY, Tae WS, Lee MJ, Kang JW, Park HS, et al. (2010) Reduced brain gray
matter concentration in patients with obstructive sleep apnea syndrome. Sleep
33: 235–241.
8. Harper RM, Macey PM, Henderson LA, Woo MA, Macey KE, et al. (2003)
fMRI responses to cold pressor challenges in control and obstructive sleep apnea
subjects. J Appl Physiol 94: 1583–1595.
9. Henderson LA, Woo MA, Macey PM, Macey KE, Frysinger RC, et al. (2003)
Neural responses during Valsalva maneuvers in obstructive sleep apnea
syndrome. J Appl Physiol 94: 1063–1074.
10. Kumar R, Chavez AS, Macey PM, Woo MA, Yan-Go FL, et al. (2012) Altered
global and regional brain mean diffusivity in patients with obstructive sleep
apnea. J Neurosci Res 90: 2043–2052.
11. Yadav SK, Kumar R, Macey PM, Richardson HL, Wang DJ, et al. (2013)
Regional cerebral blood flow alterations in obstructive sleep apnea. Neurosci
Lett 555: 159–164.
12. Joo EY, Tae WS, Han SJ, Cho JW, Hong SB (2007) Reduced cerebral blood
flow during wakefulness in obstructive sleep apnea-hypopnea syndrome. Sleep
30: 1515–1520.
13. Meyer JS, Sakai F, Karacan I, Derman S, Yamamoto M (1980) Sleep apnea,
narcolepsy, and dreaming: regional cerebral hemodynamics. Ann Neurol 7:
479–485.
14. Meyer JS, Ishikawa Y, Hata T, Karacan I (1987) Cerebral blood flow in normal
and abnormal sleep and dreaming. Brain Cogn 6: 266–294.
15. Daly JA, Giombettis R, Miller B, Garrett K (1990) Impaired awake cerebral
perfusion in sleep apnea. Am Rev Respir Dis 141: A376.
16. Ficker JH, Feistel H, Moller C, Merkl M, Dertinger S, et al. (1997) [Changes in
regional CNS perfusion in obstructive sleep apnea syndrome: initial SPECT
studies with injected nocturnal 99mTc-HMPAO]. Pneumologie 51: 926–930.
17. Durgan DJ, Bryan RM Jr. (2012) Cerebrovascular consequences of obstructive
sleep apnea. J Am Heart Assoc 1: e000091.
18. Urbano F, Roux F, Schindler J, Mohsenin V (2008) Impaired cerebral
autoregulation in obstructive sleep apnea. J Appl Physiol 105: 1852–1857.
19. Nasr N, Traon AP, Czosnyka M, Tiberge M, Schmidt E, et al. (2009) Cerebral
autoregulation in patients with obstructive sleep apnea syndrome during
wakefulness. Eur J Neurol 16: 386–391.
20. Macey PM, Kumar R, Woo MA, Yan-Go FL, Harper RM (2013) Heart rate
responses to autonomic challenges in obstructive sleep apnea. PLoS One 8:
e76631.
21. Sachs C, Kaijser L (1982) Autonomic regulation of cardiopulmonary functions
in sleep apnea syndrome and narcolepsy. Sleep 5: 227–238.
22. Globus MY, Busto R, Martinez E, Valdes I, Dietrich WD, et al. (1991)
Comparative effect of transient global ischemia on extracellular levels of
glutamate, glycine, and gamma-aminobutyric acid in vulnerable and nonvulner-
able brain regions in the rat. J Neurochem 57: 470–478.
23. Chesler M (2005) Failure and function of intracellular pH regulation in acute
hypoxic-ischemic injury of astrocytes. Glia 50: 398–406.
24. Williams DS, Detre JA, Leigh JS, Koretsky AP (1992) Magnetic resonance
imaging of perfusion using spin inversion of arterial water. Proc Natl Acad
Sci U S A 89: 212–216.
25. Ogawa S, Lee TM, Kay AR, Tank DW (1990) Brain magnetic resonance
imaging with contrast dependent on blood oxygenation. Proc Natl Acad
Sci U S A 87: 9868–9872.
26. Ogawa S, Menon RS, Tank DW, Kim SG, Merkle H, et al. (1993) Functional
brain mapping by blood oxygenation level-dependent contrast magnetic
resonance imaging. A comparison of signal characteristics with a biophysical
model. Biophys J 64: 803–812.
27. Bandettini PA, Wong EC (1997) A hypercapnia-based normalization method for
improved spatial localization of human brain activation with fMRI. NMR in
biomedicine 10: 197–203.
28. Ulatowski JA, Oja JM, Suarez JI, Kauppinen RA, Traystman RJ, et al. (1999) In
vivo determination of absolute cerebral blood volume using hemoglobin as a
natural contrast agent: an MRI study using altered arterial carbon dioxide
tension. J Cereb Blood Flow Metab 19: 809–817.
29. Fox PT, Raichle ME, Mintun MA, Dence C (1988) Nonoxidative glucose
consumption during focal physiologic neural activity. Science 241: 462–464.
30. Kety SS, Shenkin HA, Schmidt CF (1948) The Effects of Increased Intracranial
Pressure on Cerebral Circulatory Functions in Man. J Clin Invest 27: 493–499.
31. Kastrup A, Li TQ, Glover GH, Moseley ME (1999) Cerebral blood flow-related
signal changes during breath-holding. AJNR Am J Neuroradiol 20: 1233–1238.
32. Kim SG, Rostrup E, Larsson HB, Ogawa S, Paulson OB (1999) Determination
of relative CMRO2 from CBF and BOLD changes: significant increase of
oxygen consumption rate during visual stimulation. Magn Reson Med 41: 1152–
1161.
33. Sohn YH (1998) Cerebral hemodynamic changes induced by sympathetic
stimulation tests. Yonsei Med J 39: 322–327.
34. Ikemura T, Someya N, Hayashi N (2012) Autoregulation in the ocular and
cerebral arteries during the cold pressor test and handgrip exercise. Eur J Appl
Physiol 112: 641–646.
35. Nogueira RC, Bor-Seng-Shu E, Santos MR, Negrao CE, Teixeira MJ, et al.
(2013) Dynamic cerebral autoregulation changes during sub-maximal handgrip
maneuver. PLoS One 8: e70821.
36. Ogoh S, Sato K, Akimoto T, Oue A, Hirasawa A, et al. (2010) Dynamic cerebral
autoregulation during and after handgrip exercise in humans. J Appl Physiol
(1985) 108: 1701–1705.
37. Pott F, van Lieshout JJ, Ide K, Madsen P, Secher NH (2000) Middle cerebral
artery blood velocity during a valsalva maneuver in the standing position. J Appl
Physiol 88: 1545–1550.
38. Tiecks FP, Douville C, Byrd S, Lam AM, Newell DW (1996) Evaluation of
impaired cerebral autoregulation by the Valsalva maneuver. Stroke 27: 1177–
1182.
39. Zhang R, Crandall CG, Levine BD (2004) Cerebral hemodynamics during the
Valsalva maneuver: insights from ganglionic blockade. Stroke 35: 843–847.
Global BOLD Responses to Autonomic Stimuli in OSA
PLOS ONE | www.plosone.org 11 August 2014 | Volume 9 | Issue 8 | e105261
40. Veale D, Pepin JL, Wuyam B, Levy PA (1996) Abnormal autonomic stress
responses in obstructive sleep apnoea are reversed by nasal continuous positiveairway pressure. Eur Respir J 9: 2122–2126.
41. Woodson BT, Brusky LT, Saurajen A, Jaradeh S (2004) Association of
autonomic dysfunction and mild obstructive sleep apnea. Otolaryngology - Headand Neck Surgery 130: 643–648.
42. Macey PM, Kumar R, Yan-Go FL, Woo MA, Harper RM (2012) Sexdifferences in white matter alterations accompanying obstructive sleep apnea.
Sleep 35: 1603–1613.
43. Friston KJ, Holmes AP, Poline JB, Grasby PJ, Williams SC, et al. (1995) Analysisof fMRI time-series revisited. Neuroimage 2: 45–53.
44. Ashburner J, Friston KJ (2005) Unified segmentation. NeuroImage 26: 839–851.45. Ashburner J (2007) A fast diffeomorphic image registration algorithm. Neuro-
image 38: 95–113.46. Littell RC, Milliken GA, Stroup WW, Wolfinger RD (1996) SAS System for
Mixed Models. Cary, NC: SAS Institute Inc.
47. Weiss JW, Remsburg S, Garpestad E, Ringler J, Sparrow D, et al. (1996)Hemodynamic consequences of obstructive sleep apnea. Sleep 19: 388–397.
48. Hayakawa T, Terashima M, Kayukawa Y, Ohta T, Okada T (1996) Changes incerebral oxygenation and hemodynamics during obstructive sleep apneas. Chest
109: 916–921.
49. Kumar R, Birrer BV, Macey PM, Woo MA, Gupta RK, et al. (2008) Reducedmammillary body volume in patients with obstructive sleep apnea. Neurosci Lett
438: 330–334.50. Winklewski PJ, Frydrychowski AF (2013) Cerebral blood flow, sympathetic nerve
activity and stroke risk in obstructive sleep apnoea. Is there a direct link? BloodPress 22: 27–33.
51. Williams B, Lacy PS, Cafe, the AI (2009) Impact of heart rate on central aortic
pressures and hemodynamics: analysis from the CAFE (Conduit Artery FunctionEvaluation) study: CAFE-Heart Rate. J Am Coll Cardiol 54: 705–713.
52. Kiratli PO, Demir AU, Volkan-Salanci B, Demir B, Sahin A (2010) Cerebralblood flow and cognitive function in obstructive sleep apnea syndrome.
Hell J Nucl Med 13: 138–143.
53. Mogil JS (2012) Sex differences in pain and pain inhibition: multipleexplanations of a controversial phenomenon. Nat Rev Neurosci 13: 859–866.
54. Woodrow KM, Friedman GD, Siegelaub AB, Collen MF (1972) Pain tolerance:differences according to age, sex and race. Psychosom Med 34: 548–556.
55. Mathew RJ, Wilson WH, Tant SR (1986) Determinants of resting regionalcerebral blood flow in normal subjects. Biol Psychiatry 21: 907–914.
56. Gur RC, Gur RE, Obrist WD, Hungerbuhler JP, Younkin D, et al. (1982) Sex
and handedness differences in cerebral blood flow during rest and cognitiveactivity. Science 217: 659–661.
57. McHedlishvili G (1980) Physiological mechanisms controlling cerebral bloodflow. Stroke 11: 240–248.
58. Koller A, Toth P (2012) Contribution of flow-dependent vasomotor mechanisms
to the autoregulation of cerebral blood flow. J Vasc Res 49: 375–389.59. Balfors EM, Franklin KA (1994) Impairment of cerebral perfusion during
obstructive sleep apneas. Am J Respir Crit Care Med 150: 1587–1591.60. Netzer N, Werner P, Jochums I, Lehmann M, Strohl KP (1998) Blood flow of
the middle cerebral artery with sleep-disordered breathing: correlation withobstructive hypopneas. Stroke 29: 87–93.
61. Corfield DR, Meadows GE (2006) Control of cerebral blood flow during sleep
and the effects of hypoxia. Adv Exp Med Biol 588: 65–73.62. Furtner M, Staudacher M, Frauscher B, Brandauer E, Esnaola y Rojas MM, et
al. (2009) Cerebral vasoreactivity decreases overnight in severe obstructive sleepapnea syndrome: a study of cerebral hemodynamics. Sleep Med 10: 875–881.
63. Cajochen C, Pischke J, Aeschbach D, Borbely AA (1994) Heart rate dynamics
during human sleep. Physiol Behav 55: 769–774.
64. Silvani A (2008) Physiological sleep-dependent changes in arterial blood
pressure: central autonomic commands and baroreflex control. Clin ExpPharmacol Physiol 35: 987–994.
65. Coote JH (1982) Respiratory and circulatory control during sleep. J Exp Biol
100: 223–244.66. Bangash MF, Xie A, Skatrud JB, Reichmuth KJ, Barczi SR, et al. (2008)
Cerebrovascular response to arousal from NREM and REM sleep. Sleep 31:321–327.
67. Urlesberger B, Pichler G, Gradnitzer E, Reiterer F, Zobel G, et al. (2000)
Changes in cerebral blood volume and cerebral oxygenation during periodicbreathing in term infants. Neuropediatrics 31: 75–81.
68. Munger DM, Bucher HU, Duc G (1998) Sleep state changes associated withcerebral blood volume changes in healthy term newborn infants. Early Hum
Dev 52: 27–42.69. Xie A, Skatrud JB, Barczi SR, Reichmuth K, Morgan BJ, et al. (2009) Influence
of cerebral blood flow on breathing stability. J Appl Physiol (1985) 106: 850–
856.70. Burgess KR, Fan JL, Peebles K, Thomas K, Lucas S, et al. (2010) Exacerbation
of obstructive sleep apnea by oral indomethacin. Chest 137: 707–710.71. Cassaglia PA, Griffiths RI, Walker AM (2009) Cerebral sympathetic nerve
activity has a major regulatory role in the cerebral circulation in REM sleep.
J Appl Physiol (1985) 106: 1050–1056.72. Loos N, Grant DA, Wild J, Paul S, Barfield C, et al. (2005) Sympathetic nervous
control of the cerebral circulation in sleep. J Sleep Res 14: 275–283.73. Virtanen J, Noponen T, Salmi T, Toppila J, Merilainen P (2012) Impaired
cerebral vasoreactivity may cause cerebral blood volume dip followingobstructive sleep apnea termination. Sleep Breath 16: 309–312.
74. Binks AP, Cunningham VJ, Adams L, Banzett RB (2008) Gray matter blood
flow change is unevenly distributed during moderate isocapnic hypoxia inhumans. J Appl Physiol (1985) 104: 212–217.
75. Horsfield MA, Jara JL, Saeed NP, Panerai RB, Robinson TG (2013) Regionaldifferences in dynamic cerebral autoregulation in the healthy brain assessed by
magnetic resonance imaging. PLoS One 8: e62588.
76. Rodrigue KM, Haacke EM, Raz N (2011) Differential effects of age and historyof hypertension on regional brain volumes and iron. Neuroimage 54: 750–759.
77. Devisser A, Yang C, Herring A, Martinez JA, Rosales-Hernandez A, et al.(2011) Differential impact of diabetes and hypertension in the brain: adverse
effects in grey matter. Neurobiol Dis 44: 161–173.78. Fujishima M, Ibayashi S, Fujii K, Mori S (1995) Cerebral blood flow and brain
function in hypertension. Hypertens Res 18: 111–117.
79. Katsuta T (1997) Decreased local cerebral blood flow in young and agedspontaneously hypertensive rats. Fukuoka Igaku Zasshi 88: 65–74.
80. Shaul ME, Hallacoglu B, Sassaroli A, Shukitt-Hale B, Fantini S, et al. (2014)Cerebral Blood Volume and Vasodilation are Independently Diminished by
Aging and Hypertension: A Near InfraRed Spectroscopy Study. J Alzheimers
Dis.81. Huq R, Philbey CE, Mistri AK, Panerai RB, Robinson TG (2012) Dynamic
cerebral autoregulation assessed by respiratory manoeuvres in non-insulin-treated Type 2 diabetes mellitus. Diabet Med 29: 609–613.
82. Kim YS, Immink RV, Stok WJ, Karemaker JM, Secher NH, et al. (2008)Dynamic cerebral autoregulatory capacity is affected early in Type 2 diabetes.
Clin Sci (Lond) 115: 255–262.
83. Asil T, Utku U, Balci K, Uzunca I (2007) Changing cerebral blood flow velocityby transcranial Doppler during head up tilt in patients with diabetes mellitus.
Clin Neurol Neurosurg 109: 1–6.84. Lee JF, Harrison ML, Christmas KM, Kim K, Hurr C, et al. (2014) Elevated
resting heart rate and reduced orthostatic tolerance in obese humans. Clin
Auton Res 24: 39–46.
Global BOLD Responses to Autonomic Stimuli in OSA
PLOS ONE | www.plosone.org 12 August 2014 | Volume 9 | Issue 8 | e105261