interaction between obstructive sleep apnea and short sleep
TRANSCRIPT

RESEARCH Open Access
Interaction between obstructive sleepapnea and short sleep duration on insulinresistance: a large-scale studyOSA, short sleep duration and insulin resistanceHuajun Xu1,2,3†, Chen Liang4†, Jianyin Zou1,2,3, Hongliang Yi1,2,3, Jian Guan1,2,3*, Meizhen Gu5*, Yanhong Feng6* andShankai Yin1,2,3
Abstract
Objectives: Both short sleep duration and obstructive sleep apnea (OSA) seem to be associated with insulin resistance.We aimed to explore whether short sleep duration modifies the relationship between OSA and insulin resistance.
Methods: Participants were consecutively enrolled from our sleep center during the period from 2007 to 2017. Theindex of homeostasis model assessment insulin resistance (HOMA-IR) was calculated from insulin and glucose. Sleepduration was determined by standard polysomnography. The associations between sleep duration and insulinresistance were estimated by logistic regression analyses.
Results: A total of 5447 participants (4507 OSA and 940 primary snorers) were included in the study. OSA wasindependently correlated with insulin resistance after adjusting for all potential confounders (OR, 1.319; 95% CI, 1.088–1.599),but not short sleep duration. In stratified analysis by sleep duration, compared with primary snorers, in the OSA group onlyextremely short sleep duration (< 5 h) was significantly associated with insulin resistance after adjusting for all covariates (OR,2.229; 95% CI, 1.283–3.874). Rapid eye movement predominant OSA was significantly associated with insulin resistance (OR=1.355, 95% CI: 1.019–1.802) after adjustment for confounding factors including age, sex and body mass index.
(Continued on next page)
© The Author(s). 2020 Open Access This article is licensed under a Creative Commons Attribution 4.0 International License,which permits use, sharing, adaptation, distribution and reproduction in any medium or format, as long as you giveappropriate credit to the original author(s) and the source, provide a link to the Creative Commons licence, and indicate ifchanges were made. The images or other third party material in this article are included in the article's Creative Commonslicence, unless indicated otherwise in a credit line to the material. If material is not included in the article's Creative Commonslicence and your intended use is not permitted by statutory regulation or exceeds the permitted use, you will need to obtainpermission directly from the copyright holder. To view a copy of this licence, visit http://creativecommons.org/licenses/by/4.0/.The Creative Commons Public Domain Dedication waiver (http://creativecommons.org/publicdomain/zero/1.0/) applies to thedata made available in this article, unless otherwise stated in a credit line to the data.
* Correspondence: [email protected]; [email protected];[email protected] work was performed at Shanghai Jiao Tong University Affiliated SixthPeople’s Hospital†Huajun Xu and Chen Liang contributed equally to this work.1Department of Otolaryngology Head and Neck Surgery & Center of SleepMedicine, Shanghai Jiao Tong University Affiliated Sixth People’s Hospital,Yishan Road 600, Shanghai 200233, China5Department of Otolaryngology-Head & Neck Surgery, Shanghai Children’sHospital, Shanghai Jiao Tong University, Huding Road 355, Shanghai 200062,China6Department of Ultrasound, The First Affiliated Hospital of Jinzhou MedicalUniversity, No. 2, 5 Duan, Renmin Street, Guta District, Jinzhou 121000,Liaoning Province, ChinaFull list of author information is available at the end of the article
Xu et al. Respiratory Research (2020) 21:151 https://doi.org/10.1186/s12931-020-01416-x

(Continued from previous page)
Conclusions: OSA, but not short sleep duration, was independently associated with insulin resistance. It is worth noting thatOSA combined with extremely short sleep duration showed a greater detrimental effect than OSA itself with regard toinsulin resistance.
Keywords: Obstructive sleep apnea, Insulin resistance, Sleep duration
IntroductionObstructive sleep apnea (OSA), which is the most com-mon form of sleep-disordered breathing, affects about34% of men and 17% of women in middle to older agegroups [1]. A recent meta-analysis estimated that 936million adults worldwide aged 30–69 years have mild tosevere OSA. In parallel, the prevalence of insufficientsleep duration due to bedtime restriction, short-termsleep fragmentation, and sleep deprivation is also in-creasing in modern societies. Both OSA and short sleepduration have attracted a great deal of attention, notonly as they are common globally, but also as they areconsidered to be independent risk factors for cognitive,metabolic, and cardiovascular problems [2–6].One study showed that short sleep duration is independ-
ently associated with hypertension in OSA patients [7].However, another study indicated that OSA, but not shortsleep duration, was independently associated with obesity,hypertension, and dyslipidemia [8]. In patients with pre-diabetes, self-reported short sleep duration was associatedwith adverse measures of glycemia [9]. However, after con-sidering the effect of OSA, sleep duration was not signifi-cantly associated with an abnormal fasting glucose level[10]. Considering these inconsistent results, studies onOSA should account for sleep duration and vice versa.Several cross-sectional and longitudinal studies showed
that OSA was independently correlated with insulin resist-ance [11, 12]. Insulin resistance may also mediate the rela-tionships of common cardiovascular risk factors withOSA. Similarly, short sleep duration is also correlated withlower insulin sensitivity [13] and increased insulin resist-ance, even after adjusting for adiposity [14]. Recently, in-sulin resistance, characterized by a decreased cellularresponse to insulin, was shown to have a significant im-pact on various adverse clinical outcomes, includinghypertension, diabetes mellitus, nonalcoholic fatty liverdisease, cardiovascular diseases, and even kidney diseases[15]. However, few recent studies have explored whetherOSA and short sleep duration are independently corre-lated with insulin resistance. One study showed that sub-jects in the shortest sleep duration group (< 5 h) had14.5% higher fasting insulin level and 16.3% higherhomeostasis model assessment (HOMA)-β; these associa-tions disappeared after adjustment for body mass index(BMI) and sleep apnea [16]. However, this previous studydid not assess OSA by standard polysomnography (PSG)
and included no objective measure of sleep duration. Inaddition, these associations have not been explored inHan Chinese populations.We used a large-scale hospital-based cross-sectional
dataset, including 5447 participants, to examine 1)whether objectively measured short sleep duration andOSA are independently associated with insulin resistance,and 2) whether the presence of OSA modulates the associ-ation between sleep duration and insulin resistance.
MethodsThis cross-sectional study enrolled consecutive patientsreferred to the sleep center of Shanghai Jiao Tong Uni-versity Affiliated Sixth People’s Hospital. The study pro-cedure was approved by the Ethics Committee ofShanghai Jiao Tong University Affiliated Sixth People’sHospital in accordance with the Declaration of Helsinki(Trial registration number: ChiCTR1900025714). In-formed consent was obtained from all subjects.
ParticipantsAll potential participants completed a comprehensivequestionnaire regarding their general health status, in-cluding smoking and alcohol use (never, past, orcurrent), and medication use. Smoking were defined ascurrent smokers or subjects who smoked cigarettes be-fore. Non-smoking were defined as subjects who hadnever smoked cigarettes. The exclusion criteria were asfollows: 1) aged < 18 years; 2) previous treatment forOSA; 3) absence of full-lead PSG data; 4) chronic dis-eases, such as hepatic, pulmonary, or cardiac disease; 5)comorbid sleep disorders, such as insomnia, centralsleep apnea (CSA), upper airway resistance syndrome(UARS), restless leg syndrome (RLS), and narcolepsy; 6)current use of anxiolytics, hypnotics, antidepressants, orother antipsychotics; and 7) had anti-diabetes drugs.
Clinical and biochemical measurementsHeight, weight, waist circumference (WC), neck circum-ference (NC), and hip circumference (HC) were measuredas described previously, without shoes and while wearinglightweight clothing [17]. BMI was calculated as weight inkilograms divided by height in meters squared. After a restperiod of about 15min, the systolic blood pressure (SBP)and diastolic blood pressure (DBP) were measured using astandard mercury sphygmomanometer. All of the above
Xu et al. Respiratory Research (2020) 21:151 Page 2 of 11

indices were measured twice and mean values of the twomeasurements were calculated.Fasting venous blood was collected from each partici-
pant at 07:00. The lipid profile [total cholesterol (TC),triglycerides (TG), high-density lipoprotein cholesterol(HDL-C), low-density lipoprotein cholesterol (LDL-C),apolipoprotein A-I (ApoA-I), apolipoprotein B (ApoB),apolipoprotein E (ApoE), and lipoprotein(a) (Lp(a))] wasmeasured in the clinical laboratory of our hospital. Fast-ing serum glucose was determined using an H-7600autoanalyzer (Hitachi, Tokyo, Japan), and serum insulinwas determined by an immunoradiological method. Theindex of homeostasis model assessment insulin resist-ance (HOMA-IR) was calculated as fasting insulin (μU/mL) × fasting glucose (mmol/L)/22.5 [18]. Insulin resist-ance was defined as HOMA-IR ≥ 2.5 [19]. Hypertensionwas defined as diagnosis provided by the referring phys-ician, and by the use of cardiovascular medications thatwere specifically used as antihypertensive medications.Diabetes was defined as the use of antidiabetic medica-tion and fasting plasma glucose ≥7.0 mmol/L. Dyslipid-emia was defined as use of lipid-lowering medication orserum TC level > 200 mg/dL, LDL-C level > 130 mg/dL,HDL-C level < 39.8 mg/dL, or TG level > 150mg/dL, ac-cording to the diagnostic criteria of the National Choles-terol Education Program Adult Treatment Panel III(NCEP ATP III) [20].
Sleep evaluationAll participants completed the Chinese version of theEpworth Sleepiness Scale (ESS) to evaluate daytimesleepiness; the total ESS scores range from 0 to 24 [21].An ESS score > 10 was defined as excessive daytimesleepiness (EDS) [22].All participants underwent overnight standard PSG in a
sound-attenuated, light- and temperature-controlled roomin our sleep center. Participants were asked to arrive atleast 2 h before the sleep study to familiarize themselveswith the sleep environment. Bedtime was adjusted accord-ing to participants’ habitual sleep time, with the recordingtime ranging from 21:00–22:00 to 06:00–07:00.Objective sleep data were obtained via standard PSG
(Alice 4 or 5; Respironics, Pittsburgh, PA). Polysomno-graphic monitoring was performed in accordance withthe 2007 guidelines of the American Academy of SleepMedicine (AASM) [23]. The PSG was equipped with sixelectroencephalography (EEG) channels (F3–F4, C3–C4,and O1–O2), submental electromyography (EMG) chan-nels, bilateral electrooculogram (EOG) channels, andelectrocardiography (ECG) channels, as well as a nasalpressure transducer, oronasal thermistor, piezo belts,and snoring sound and pulse oximetry sensors. Apneawas defined as an at-least 90% reduction in airflow for atleast 10 s; hypopnea was defined as an at-least 50%
reduction in airflow for at least 10 s, accompanied by anat-least 3% reduction in oxygen saturation or arousal.The indices derived from full-night PSG included totalsleep time (TST), percentage of each sleep stage (N1,N2, N3, and REM), sleep efficiency, apnea hypopneaindex (AHI) [23], lowest oxygen saturation (LSpO2),oxygen desaturation index (ODI), mean oxygen satur-ation, and microarousal index (MAI). Sleep duration wasdefined according to the TST, as described previously [[7, 24]]. The sleep duration was divided into five cat-egories: > 8, 7–8, 6–7, 5–6, and < 5 h. OSA was classifiedinto four classes: < 5, 5 ≤AHI < 15, 15 ≤AHI < 30, andAHI ≥ 30. AHIREM and AHINREM were calculated as thenumber of apnea and hypopnea events per hour of REMand NREM sleep, respectively. REM predominant OSAwas defined as AHIREM ≥ 5 and AHINREM < 5. A skilledtechnician manual checked the data according to theAASM 2007 guidelines [23].
Statistical analysisAll statistical analyses were performed using SPSS soft-ware (version 22.0; IBM SPSS Statistics, IBM Corp.,Armonk, NY). Normally distributed continuous data areshown as means ± SD and were analyzed using one-wayanalysis of variance (ANOVA) and the independent-samples t test. Skewed data are presented as interquartilerange (IQR) and were compared by the Mann–WhitneyU test. Categorical data are presented as percentagesand were analyzed using the χ2 test. P-values for lineartrends across groups were calculated using the polyno-mial linear trend test.Independent associations of OSA and sleep duration
with insulin resistance were assessed by logistic regression.The covariates adjusted for in our study included age, gen-der, BMI, smoking, alcohol consumption, hypertension,hyperlipidemia, time in bed, time in sleep stage N3 (%),ESS, AHI (or TST), waist hip ratio, diabetes mellitus,ApoA-I, ApoB, ApoE, and Lp(a). The adjusted odds ratio(ORs) and 95% confidence intervals (CIs) for insulin re-sistance were calculated according to OSA status andsleep duration. Finally, the joint effects of OSA and sleepduration were examined using primary snorers with asleep duration of 7–8 h as the reference group. In all ana-lyses, P < 0.05 was taken to indicate statistical significance.
ResultsA total of 5447 participants (4507 OSA and 940 primarysnorers) were included in this study; their demographicand sleep characteristics by OSA severity are presentedin Table 1. Patients with OSA were predominantly male,more obese, older, and had poorer metabolic and sleepprofiles. Table 2 presents the demographic characteris-tics and sleep parameters by sleep duration. Patientswith shorter sleep duration were older, less obese, had
Xu et al. Respiratory Research (2020) 21:151 Page 3 of 11
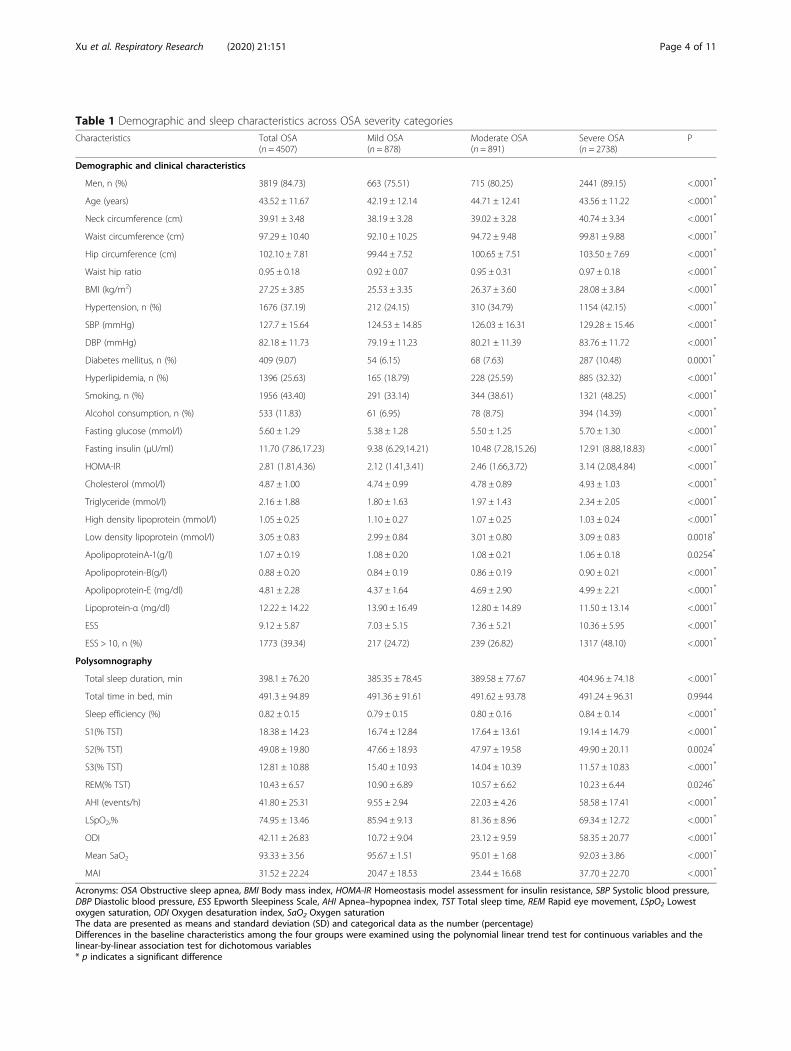
Table 1 Demographic and sleep characteristics across OSA severity categoriesCharacteristics Total OSA
(n = 4507)Mild OSA(n = 878)
Moderate OSA(n = 891)
Severe OSA(n = 2738)
P
Demographic and clinical characteristics
Men, n (%) 3819 (84.73) 663 (75.51) 715 (80.25) 2441 (89.15) <.0001*
Age (years) 43.52 ± 11.67 42.19 ± 12.14 44.71 ± 12.41 43.56 ± 11.22 <.0001*
Neck circumference (cm) 39.91 ± 3.48 38.19 ± 3.28 39.02 ± 3.28 40.74 ± 3.34 <.0001*
Waist circumference (cm) 97.29 ± 10.40 92.10 ± 10.25 94.72 ± 9.48 99.81 ± 9.88 <.0001*
Hip circumference (cm) 102.10 ± 7.81 99.44 ± 7.52 100.65 ± 7.51 103.50 ± 7.69 <.0001*
Waist hip ratio 0.95 ± 0.18 0.92 ± 0.07 0.95 ± 0.31 0.97 ± 0.18 <.0001*
BMI (kg/m2) 27.25 ± 3.85 25.53 ± 3.35 26.37 ± 3.60 28.08 ± 3.84 <.0001*
Hypertension, n (%) 1676 (37.19) 212 (24.15) 310 (34.79) 1154 (42.15) <.0001*
SBP (mmHg) 127.7 ± 15.64 124.53 ± 14.85 126.03 ± 16.31 129.28 ± 15.46 <.0001*
DBP (mmHg) 82.18 ± 11.73 79.19 ± 11.23 80.21 ± 11.39 83.76 ± 11.72 <.0001*
Diabetes mellitus, n (%) 409 (9.07) 54 (6.15) 68 (7.63) 287 (10.48) 0.0001*
Hyperlipidemia, n (%) 1396 (25.63) 165 (18.79) 228 (25.59) 885 (32.32) <.0001*
Smoking, n (%) 1956 (43.40) 291 (33.14) 344 (38.61) 1321 (48.25) <.0001*
Alcohol consumption, n (%) 533 (11.83) 61 (6.95) 78 (8.75) 394 (14.39) <.0001*
Fasting glucose (mmol/l) 5.60 ± 1.29 5.38 ± 1.28 5.50 ± 1.25 5.70 ± 1.30 <.0001*
Fasting insulin (μU/ml) 11.70 (7.86,17.23) 9.38 (6.29,14.21) 10.48 (7.28,15.26) 12.91 (8.88,18.83) <.0001*
HOMA-IR 2.81 (1.81,4.36) 2.12 (1.41,3.41) 2.46 (1.66,3.72) 3.14 (2.08,4.84) <.0001*
Cholesterol (mmol/l) 4.87 ± 1.00 4.74 ± 0.99 4.78 ± 0.89 4.93 ± 1.03 <.0001*
Triglyceride (mmol/l) 2.16 ± 1.88 1.80 ± 1.63 1.97 ± 1.43 2.34 ± 2.05 <.0001*
High density lipoprotein (mmol/l) 1.05 ± 0.25 1.10 ± 0.27 1.07 ± 0.25 1.03 ± 0.24 <.0001*
Low density lipoprotein (mmol/l) 3.05 ± 0.83 2.99 ± 0.84 3.01 ± 0.80 3.09 ± 0.83 0.0018*
ApolipoproteinA-1(g/l) 1.07 ± 0.19 1.08 ± 0.20 1.08 ± 0.21 1.06 ± 0.18 0.0254*
Apolipoprotein-B(g/l) 0.88 ± 0.20 0.84 ± 0.19 0.86 ± 0.19 0.90 ± 0.21 <.0001*
Apolipoprotein-E (mg/dl) 4.81 ± 2.28 4.37 ± 1.64 4.69 ± 2.90 4.99 ± 2.21 <.0001*
Lipoprotein-α (mg/dl) 12.22 ± 14.22 13.90 ± 16.49 12.80 ± 14.89 11.50 ± 13.14 <.0001*
ESS 9.12 ± 5.87 7.03 ± 5.15 7.36 ± 5.21 10.36 ± 5.95 <.0001*
ESS > 10, n (%) 1773 (39.34) 217 (24.72) 239 (26.82) 1317 (48.10) <.0001*
Polysomnography
Total sleep duration, min 398.1 ± 76.20 385.35 ± 78.45 389.58 ± 77.67 404.96 ± 74.18 <.0001*
Total time in bed, min 491.3 ± 94.89 491.36 ± 91.61 491.62 ± 93.78 491.24 ± 96.31 0.9944
Sleep efficiency (%) 0.82 ± 0.15 0.79 ± 0.15 0.80 ± 0.16 0.84 ± 0.14 <.0001*
S1(% TST) 18.38 ± 14.23 16.74 ± 12.84 17.64 ± 13.61 19.14 ± 14.79 <.0001*
S2(% TST) 49.08 ± 19.80 47.66 ± 18.93 47.97 ± 19.58 49.90 ± 20.11 0.0024*
S3(% TST) 12.81 ± 10.88 15.40 ± 10.93 14.04 ± 10.39 11.57 ± 10.83 <.0001*
REM(% TST) 10.43 ± 6.57 10.90 ± 6.89 10.57 ± 6.62 10.23 ± 6.44 0.0246*
AHI (events/h) 41.80 ± 25.31 9.55 ± 2.94 22.03 ± 4.26 58.58 ± 17.41 <.0001*
LSpO2,% 74.95 ± 13.46 85.94 ± 9.13 81.36 ± 8.96 69.34 ± 12.72 <.0001*
ODI 42.11 ± 26.83 10.72 ± 9.04 23.12 ± 9.59 58.35 ± 20.77 <.0001*
Mean SaO2 93.33 ± 3.56 95.67 ± 1.51 95.01 ± 1.68 92.03 ± 3.86 <.0001*
MAI 31.52 ± 22.24 20.47 ± 18.53 23.44 ± 16.68 37.70 ± 22.70 <.0001*
Acronyms: OSA Obstructive sleep apnea, BMI Body mass index, HOMA-IR Homeostasis model assessment for insulin resistance, SBP Systolic blood pressure,DBP Diastolic blood pressure, ESS Epworth Sleepiness Scale, AHI Apnea–hypopnea index, TST Total sleep time, REM Rapid eye movement, LSpO2 Lowestoxygen saturation, ODI Oxygen desaturation index, SaO2 Oxygen saturationThe data are presented as means and standard deviation (SD) and categorical data as the number (percentage)Differences in the baseline characteristics among the four groups were examined using the polynomial linear trend test for continuous variables and thelinear-by-linear association test for dichotomous variables* p indicates a significant difference
Xu et al. Respiratory Research (2020) 21:151 Page 4 of 11

Table 2 Demographic and sleep characteristics of all participants stratified by total sleep duration categories
Characteristics > 8 h(n = 538)
7-8 h(n = 1757)
6-7 h(n = 1710)
5-6 h(n = 841)
≤5 h(n = 601)
P
Demographic and clinical characteristics
Men,n(%) 441 (81.97) 1457 (82.93) 1387 (81.11) 676 (80.38) 471 (78.37) 0.1297
Age (years) 42.88 ± 11.53 42.18 ± 11.50 42.24 ± 11.59 43.02 ± 12.03 44.11 ± 13.05 0.0045*
Neck circumference (cm) 39.91 ± 3.92 39.47 ± 3.52 39.35 ± 3.77 39.18 ± 3.70 38.78 ± 3.65 <.0001*
Waist circumference (cm) 97.78 ± 12.15 96.09 ± 10.50 95.31 ± 11.16 94.86 ± 11.48 93.27 ± 11.20 <.0001*
Hip circumference (cm) 102.63 ± 8.28 101.57 ± 7.77 101.26 ± 8.05 100.77 ± 8.01 99.83 ± 7.51 <.0001*
Waist hip ration 0.95 ± 0.07 0.95 ± 0.22 0.94 ± 0.22 0.94 ± 0.07 0.93 ± 0.07 0.2733
BMI (kg/m2) 27.44 ± 4.37 26.89 ± 3.91 26.69 ± 4.04 26.42 ± 3.88 25.99 ± 3.80 <.0001*
Hypertension, n (%) 154 (28.62) 459 (26.12) 431 (25.20) 199 (23.66) 153 (25.46) 0.0005*
SBP (mmHg) 127.84 ± 15.31 127.36 ± 15.86 125.46 ± 15.38 126.24 ± 15.76 125.57 ± 15.91 0.3267
DBP (mmHg) 82.90 ± 11.81 81.96 ± 11.68 80.77 ± 11.66 81.07 ± 11.57 80.09 ± 11.01 <.0001*
Diabetes mellitus, n (%) 54 (10.04) 158 (8.99) 132 (7.72) 61 (7.25) 42 (6.99) 0.1603
Hyperlipidemia,n (%) 421 (78.25) 1410 (80.25) 1304 (76.26) 641 (76.22) 451 (75.04) 0.0160*
Smoking, n (%) 250 (46.47) 765 (43.54) 697 (40.76) 314 (37.34) 178 (29.62) <.0001*
Alcohol consumption, n(%) 69 (12.83) 181 (10.30) 203 (11.87) 80 (9.51) 43 (7.15) 0.0059*
Fasting glucose (mmol/l) 5.67 ± 1.38 5.57 ± 1.30 5.47 ± 1.22 5.48 ± 1.22 5.40 ± 1.15 0.0006*
Fasting insulin (μU/ml) 10.93 (7.74,16.52) 11.20 (7.59,16.22) 10.89 (7.13,16.26) 11.11 (7.04,16.90) 10.47 (6.96,15.61) 0.1768
HOMA-IR 2.57 (1.78,4.19) 2.65 (1.73,4.17) 2.56 (1.60,4.03) 2.63 (1.59,4.14) 2.50 (1.55,3.94) 0.0313*
Cholesterol (mmol/l) 4.85 ± 0.94 4.80 ± 1.02 4.75 ± 0.96 4.81 ± 1.02 4.81 ± 1.12 0.2433
Triglyceride (mmol/l) 2.17 ± 2.03 2.11 ± 1.88 2.01 ± 1.80 2.03 ± 1.83 1.91 ± 1.46 0.0633
High density lipoprotein (mmol/l) 1.04 ± 0.23 1.04 ± 0.24 1.07 ± 0.25 1.10 ± 0.26 1.12 ± 0.30 <.0001*
Low density lipoprotein (mmol/l) 2.95 ± 0.76 2.97 ± 0.82 2.99 ± 0.82 3.03 ± 0.83 3.07 ± 0.97 0.0471*
ApolipoproteinA-1(g/l) 1.06 ± 0.18 1.05 ± 0.18 1.08 ± 0.20 1.09 ± 0.21 1.10 ± 0.21 <.0001*
Apolipoprotein-B (g/l) 0.88 ± 0.21 0.88 ± 0.21 0.85 ± 0.20 0.85 ± 0.20 0.85 ± 0.22 <.0001*
Apolipoprotein-E (mg/dl) 4.76 ± 2.14 4.72 ± 2.56 4.61 ± 1.96 4.75 ± 2.10 4.61 ± 1.70 0.3730
Lipoprotein-α (mg/dl) 13.78 ± 15.85 12.59 ± 15.06 11.99 ± 13.93 12.52 ± 14.71 13.50 ± 16.72 0.0839
ESS 9.01 ± 5.70 8.97 ± 5.96 8.55 ± 5.83 7.97 ± 5.76 7.73 ± 5.74 <.0001*
ESS > 10, n(%) 203 (37.73) 670 (38.13) 629 (36.78) 259 (30.80) 179 (29.78) <.0001*
Polysomnography
Total sleep duration, min 501.31 ± 17.48 447.95 ± 16.64 394.27 ± 17.51 333.97 ± 16.91 235.34 ± 58.19 <.0001*
Total time in bed, min 547.02 ± 71.76 512.54 ± 89.05 480.98 ± 83.65 472.24 ± 99.31 445.39 ± 124.62 <.0001*
Sleep efficiency,% 0.92 ± 0.07 0.89 ± 0.09 0.84 ± 0.11 0.73 ± 0.12 0.56 ± 0.18 <.0001*
S1(% TST) 16.08 ± 12.44 16.50 ± 13.11 17.04 ± 13.70 20.47 ± 13.99 22.70 ± 16.36 <.0001*
S2(% TST) 53.30 ± 16.15 50.09 ± 19.99 47.61 ± 20.75 48.46 ± 17.41 46.74 ± 19.14 <.0001*
S3(% TST) 15.24 ± 11.36 13.42 ± 10.52 12.70 ± 10.64 13.69 ± 10.80 13.17 ± 12.04 0.0001*
REM(% TST) 12.23 ± 6.49 10.89 ± 6.56 10.60 ± 6.76 10.15 ± 6.35 9.38 ± 7.42 <.0001*
AHI (events/h) 40.93 ± 27.23 37.10 ± 27.51 34.97 ± 27.60 31.08 ± 27.10 28.66 ± 26.16 <.0001*
Lowest-SpO2,% 74.05 ± 13.93 75.96 ± 14.47 77.81 ± 13.97 79.87 ± 14.58 81.65 ± 15.00 <.0001*
ODI 41.40 ± 29.11 37.32 ± 28.60 35.17 ± 28.66 32.76 ± 28.96 31.33 ± 28.31 <.0001*
Mean SaO2 93.11 ± 3.93 93.62 ± 3.55 93.83 ± 3.68 94.34 ± 2.94 94.60 ± 2.71 <.0001*
OSA, n (%) 466 (86.62) 1493 (84.97) 1411 (82.51) 680 (80.86) 457 (76.04) <.0001*
Mild OSA, n (%) 57 (10.59) 262 (14.90) 284 (16.61) 163 (19.38) 112 (18.64) <.0001*
Moderate OSA, n (%) 80 (14.87) 268 (15.25) 273 (15.96) 164 (19.50) 106 (17.64) 0.0514
Xu et al. Respiratory Research (2020) 21:151 Page 5 of 11

lower AHI, and lower likelihood of insulin resistance(Table 2).In whole cohort, compared with primary snorers (non-
OSA), OSA was independently correlated with insulinresistance after adjusting for all potential confounders(OR, 1.319; 95% CI, 1.088–1.599) (Table 3). Taking asleep duration of 7–8 h (optimal sleep time) as the refer-ence, 5–6 h and < 5 h of sleep were associated with anincreased risk of insulin resistance (OR, 1.127; 95% CI,0.921–1.379; and OR, 1.167; 95% CI, 0.927–1.417, re-spectively) after adjusting for all potential confounders,but not significantly (Table 3).In stratified analysis by sleep duration, we performed
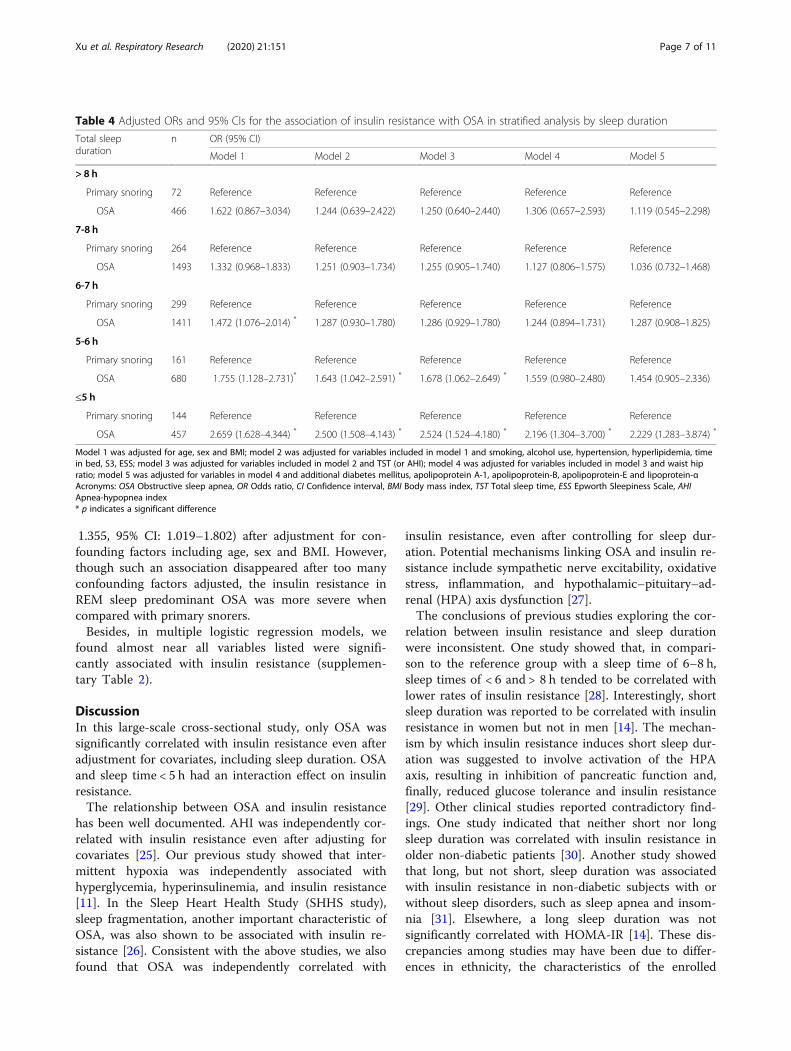
logistic regression analyses to evaluate the correlationbetween insulin resistance and OSA in each subgroup(in > 8, 7–8, 6–7, 5–6, and < 5 h). Compared with pri-mary snorers (non-OSA), in the OSA group only ex-tremely short sleep duration (< 5 h: OR, 2.229; 95% CI,1.283–3.874) was significantly associated with insulin re-sistance after adjusting for all covariates (Table 4).In stratified analysis by OSA severity, we performed lo-
gistic regression analyses to evaluate the correlation
between insulin resistance and sleep duration in each sub-group (in mild, moderate and severe OSA). When we useprimary snorers (non-OSA) as a reference, no significantdifferences were found in each OSA group (Table 5).Besides, we performed a subgroup analysis by sex (male,
female), age (< 60 years, ≥60 years) and BMI (< 28 kg/m2,≥28 kg/m2), only sleep duration was independently corre-lated with insulin resistance in younger patients with sleeptime < 5 h (OR, 1.35; 95% CI, 1.00–1.83) (Table 6).In order to explore the effect of interaction between OSA
and sleep duration on insulin resistance, multiplicativeinteraction was evaluated with logistic regressions. Afteradjusting for age, sex, BMI, smoking, alcohol use, hyperten-sion, hyperlipidemia, time in bed, S3, ESS and waist hip ra-tio, an interaction effect of OSA and extremely short sleepduration (< 5 h) on insulin resistance was found (OR, 1.467;95% CI, 1.018–2.116), taking primary snorers with a sleeptime of 7–8 h as the reference group (Table 7). This inter-action disappeared after additional adjustment for diabetesmellitus, ApoA-I, ApoB, ApoE, and Lp(a).In supplementary Table 1, REM predominant OSA
was significantly associated with insulin resistance (OR =
Table 2 Demographic and sleep characteristics of all participants stratified by total sleep duration categories (Continued)
Characteristics > 8 h(n = 538)
7-8 h(n = 1757)
6-7 h(n = 1710)
5-6 h(n = 841)
≤5 h(n = 601)
P
Severe OSA, n (%) 329 (61.15) 963 (54.81) 854 (49.94) 353 (41.97) 239 (39.77) <.0001*
MAI 31.44 ± 21.41 28.78 ± 21.37 29.24 ± 22.57 28.86 ± 22.19 27.70 ± 20.03 0.0552
Acronyms: OSA Obstructive sleep apnea, BMI Body mass index, HOMA-IR Homeostasis model assessment for insulin resistance, SBP Systolic blood pressure, DBPDiastolic blood pressure, ESS Epworth Sleepiness Scale, AHI Apnea–hypopnea index, TST Total sleep time, REM Rapid eye movement, LSpO2 Lowest oxygensaturation, ODI Oxygen desaturation index, SaO2 Oxygen saturationThe data are presented as means and standard deviation (SD) and categorical data as the number (percentage)Differences in the baseline characteristics among the five groups were examined using the polynomial linear trend test for continuous variables and the linear-by-linear association test for dichotomous variables* p indicates a significant difference
Table 3 adjusted ORs and 95% CIs for the association of insulin resistance and OSA (primary snoring as reference) or sleep duration(sleep time:7-8 h as reference)
predictors n OR (95% CI)
Model 1 Model 2 Model 3 Model 4 Model 5
OSA
Primary snoring 940 Reference Reference Reference Reference Reference
OSA 4507 1.593 (1.336–1.900)* 1.450 (1.210–1.737) * 1.467 (1.224–1.758) * 1.375 (1.143–1.654) * 1.319 (1.088–1.599) *
Sleep duration
> 8 h 538 0.792 (0.635–0.987) * 0.807 (0.645–1.010) * 0.769 (0.613–0.965) * 0.746 (0.592–0.940) * 0.758 (0.597–0.936) *
7-8 h 1757 Reference Reference Reference Reference Reference
6-7 h 1710 0.897 (0.771–1.042) 0.936 (0.802–1.091) 0.954 (0.817–1.114) 0.948 (0.810–1.109) 0.972 (0.826–1.144)
5–6 841 1.005 (0.835–1.209) 1.070 (0.885–1.294) 1.122 (0.926–1.359) 1.105 (0.909–1.344) 1.127 (0.921–1.379)
≤ 5 h 601 1.039 (0.843–1.281) 1.085 (0.873–1.348) 1.158 (0.930–1.442) 1.137 (0.909–1.421) 1.167 (0.927–1.417)
P for linear trend 0.1809 0.0716 0.0079 0.0107 0.0076
Model 1 was adjusted for age, sex and BMI; model 2 was adjusted for variables included in model 1 and smoking, alcohol use, hypertension, hyperlipidemia, timein bed, S3, ESS; model 3 was adjusted for variables included in model 2 and TST (or AHI); model 4 was adjusted for variables included in model 3 and waist hipratio; model 5 was adjusted for variables in model 4 and additional diabetes mellitus, apolipoprotein A-1, apolipoprotein-B, apolipoprotein-E and lipoprotein-αAcronyms: OSA Obstructive sleep apnea, OR Odds ratio, CI Confidence interval, BMI Body mass index, TST Total sleep time, ESS Epworth Sleepiness Scale, AHIApnea-hypopnea index* p indicates a significant difference
Xu et al. Respiratory Research (2020) 21:151 Page 6 of 11
1.355, 95% CI: 1.019–1.802) after adjustment for con-founding factors including age, sex and BMI. However,though such an association disappeared after too manyconfounding factors adjusted, the insulin resistance inREM sleep predominant OSA was more severe whencompared with primary snorers.Besides, in multiple logistic regression models, we
found almost near all variables listed were signifi-cantly associated with insulin resistance (supplemen-tary Table 2).
DiscussionIn this large-scale cross-sectional study, only OSA wassignificantly correlated with insulin resistance even afteradjustment for covariates, including sleep duration. OSAand sleep time < 5 h had an interaction effect on insulinresistance.The relationship between OSA and insulin resistance
has been well documented. AHI was independently cor-related with insulin resistance even after adjusting forcovariates [25]. Our previous study showed that inter-mittent hypoxia was independently associated withhyperglycemia, hyperinsulinemia, and insulin resistance[11]. In the Sleep Heart Health Study (SHHS study),sleep fragmentation, another important characteristic ofOSA, was also shown to be associated with insulin re-sistance [26]. Consistent with the above studies, we alsofound that OSA was independently correlated with
insulin resistance, even after controlling for sleep dur-ation. Potential mechanisms linking OSA and insulin re-sistance include sympathetic nerve excitability, oxidativestress, inflammation, and hypothalamic–pituitary–ad-renal (HPA) axis dysfunction [27].The conclusions of previous studies exploring the cor-
relation between insulin resistance and sleep durationwere inconsistent. One study showed that, in compari-son to the reference group with a sleep time of 6–8 h,sleep times of < 6 and > 8 h tended to be correlated withlower rates of insulin resistance [28]. Interestingly, shortsleep duration was reported to be correlated with insulinresistance in women but not in men [14]. The mechan-ism by which insulin resistance induces short sleep dur-ation was suggested to involve activation of the HPAaxis, resulting in inhibition of pancreatic function and,finally, reduced glucose tolerance and insulin resistance[29]. Other clinical studies reported contradictory find-ings. One study indicated that neither short nor longsleep duration was correlated with insulin resistance inolder non-diabetic patients [30]. Another study showedthat long, but not short, sleep duration was associatedwith insulin resistance in non-diabetic subjects with orwithout sleep disorders, such as sleep apnea and insom-nia [31]. Elsewhere, a long sleep duration was notsignificantly correlated with HOMA-IR [14]. These dis-crepancies among studies may have been due to differ-ences in ethnicity, the characteristics of the enrolled
Table 4 Adjusted ORs and 95% CIs for the association of insulin resistance with OSA in stratified analysis by sleep duration
Total sleepduration
n OR (95% CI)
Model 1 Model 2 Model 3 Model 4 Model 5
> 8 h
Primary snoring 72 Reference Reference Reference Reference Reference
OSA 466 1.622 (0.867–3.034) 1.244 (0.639–2.422) 1.250 (0.640–2.440) 1.306 (0.657–2.593) 1.119 (0.545–2.298)
7-8 h
Primary snoring 264 Reference Reference Reference Reference Reference
OSA 1493 1.332 (0.968–1.833) 1.251 (0.903–1.734) 1.255 (0.905–1.740) 1.127 (0.806–1.575) 1.036 (0.732–1.468)
6-7 h
Primary snoring 299 Reference Reference Reference Reference Reference
OSA 1411 1.472 (1.076–2.014) * 1.287 (0.930–1.780) 1.286 (0.929–1.780) 1.244 (0.894–1.731) 1.287 (0.908–1.825)
5-6 h
Primary snoring 161 Reference Reference Reference Reference Reference
OSA 680 1.755 (1.128–2.731)* 1.643 (1.042–2.591) * 1.678 (1.062–2.649) * 1.559 (0.980–2.480) 1.454 (0.905–2.336)
≤5 h
Primary snoring 144 Reference Reference Reference Reference Reference
OSA 457 2.659 (1.628–4.344) * 2.500 (1.508–4.143) * 2.524 (1.524–4.180) * 2.196 (1.304–3.700) * 2.229 (1.283–3.874) *
Model 1 was adjusted for age, sex and BMI; model 2 was adjusted for variables included in model 1 and smoking, alcohol use, hypertension, hyperlipidemia, timein bed, S3, ESS; model 3 was adjusted for variables included in model 2 and TST (or AHI); model 4 was adjusted for variables included in model 3 and waist hipratio; model 5 was adjusted for variables in model 4 and additional diabetes mellitus, apolipoprotein A-1, apolipoprotein-B, apolipoprotein-E and lipoprotein-αAcronyms: OSA Obstructive sleep apnea, OR Odds ratio, CI Confidence interval, BMI Body mass index, TST Total sleep time, ESS Epworth Sleepiness Scale, AHIApnea-hypopnea index* p indicates a significant difference
Xu et al. Respiratory Research (2020) 21:151 Page 7 of 11

participants, and gender ratios, as well to insufficientsample sizes and inadequate adjustment for con-founders. In the present study, we used data from a largeHan Chinese population and found that OSA was inde-pendently associated with insulin resistance, but notsleep duration. All of the participants were enrolled from
our sleep center and most had severe OSA. Thus, OSAmay have masked the small effect of sleep duration oninsulin resistance.Interestingly, the risk of insulin resistance in those
with OSA and extremely short sleep duration (< 5 h) wascomparable to that of primary snorers with the same
Table 5 Adjusted odd ratios (ORs) and 95% confidence interval (CIs) of insulin resistance associated with total sleep duration instratified analysis by OSA severity
predictors n OR(95% CI)
Model 1 Model 2 Model 3 Model 4 Model 5
Primary snoring 940 Reference Reference Reference Reference Reference
Mild OSA
> 8 h 57 0.942 (0.501–1.774) 0.999 (0.523–1.909) 0.920 (0.438–1.930) 0.934 (0.436–1.999) 0.896 (0.402–1.997)
7-8 h 262 1.208 (0.882–1.655) 1.142 (0.828–1.575) 1.055 (0.659–1.688) 1.052 (0.652–1.698) 1.012 (0.613–1.668)
6-7 h 284 0.953 (0.696–1.304) 0.917 (0.665–1.264) 0.845 (0.530–1.352) 0.821 (0.511–1.320) 0.856 (0.521–1.405)
5–6 163 1.163 (0.794–1.705) 1.155 (0.783–1.705) 1.069 (0.639–1.788) 1.054 (0.621–1.788) 1.017 (0.581–1.779)
≤ 5 h 112 1.903 (1.213–2.986) * 1.735 (1.104–2.784) * 1.621 (0.913–2.875) 1.582 (0.876–2.856) 1.693 (0.921–3.112)
Moderate OSA
> 8 h 80 1.150 (0.690–1.920) 1.102 (0.656–1.850) 1.114 (0.494–2.515) 1.164 (0.509–2.664) 1.156 (0.490–2.729)
7-8 h 268 1.325 (0.966–1.816) 1.253 (0.910–1.726) 1.268 (0.620–2.592) 1.270 (0.612–2.635) 1.170 (0.548–2.497)
6-7 h 273 1.300 (0.953–1.773) 1.268 (0.922–1.743) 1.282 (0.626–2.627) 1.343 (0.649–2.777) 1.399 (0.658–2.974)
5–6 164 1.735 (1.183–2.544) * 1.736 (1.176–2.563) 1.755 (0.831–3.707) 1.889 (0.883–4.042) 1.961 (0.893–4.308)
≤ 5 h 106 1.808 (1.154–2.832) * 1.781 (1.128–2.813) * 1.801 (0.817–3.970) 1.824 (0.816–4.076) 2.039 (0.889–4.678)
Severe OSA
> 8 h 329 1.535 (1.131–2.084) * 1.249 (0.912–1.711) 0.510 (0.330–0.788) 0.486 (0.312–0.757) 0.503 (0.318–0.795)
7-8 h 963 1.944 (1.551–2.436) * 1.668 (1.318–2.110) * 0.699 (0.481–1.015) 0.698 (0.478–1.020) 0.718 (0.486–1.063)
6-7 h 854 1.847 (1.464–2.331) * 1.654 (1.298–2.109) * 0.689 (0.471–1.007) 0.683 (0.465–1.004) 0.709 (0.476–1.057)
5–6 353 2.200 (1.637–2.957) * 1.978 (1.459–2.683) * 0.833 (0.548–1.267) 0.787 (0.514–1.205) 0.818 (0.528–1.269)
≤ 5 h 239 2.141 (1.531–2.994)* 1.970 (1.389–2.793) * 0.845 (0.539–1.326) 0.823 (0.521–1.300) 0.813 (0.507–1.302)
Model 1 was adjusted for age, sex and BMI; model 2 was adjusted for variables included in model 1 and smoking, alcohol use, hypertension, hyperlipidemia, timein bed, S3, ESS; model 3 was adjusted for variables included in model 2 and TST (or AHI); model 4 was adjusted for variables included in model 3 and waist hipratio; model 5 was adjusted for variables in model 4 and additional diabetes mellitus, apolipoprotein A-1, apolipoprotein-B, apolipoprotein-E and lipoprotein-αAcronyms: OSA Obstructive sleep apnea, OR Odds ratio, CI Confidence interval, BMI Body mass index, ESS Epworth Sleepiness Scale, AHI Apnea-hypopnea index* p indicates a significant difference
Table 6 Adjusted odd ratios (ORs) and 95% confidence intervals (CIs) of insulin resistance associated with total sleep duration indifferent subgroups
predictors Sex Age BMI
Men(n = 4432)
Women(n = 1015)
< 60 y(n = 4866)
≥60 y(n = 581)
< 28 kg/m2
(n = 3653)≥28 kg/m2
(n = 1794)
Primary snoring Reference Reference Reference Reference Reference Reference
> 8 h 0.683 (0.491–0.949) * 1.087 (0.543–2.177) 0.760 (0.558–1.036) 0.975 (0.336–2.858) 0.743 (0.521–1.061) 0.644 (0.352–1.179)
7-8 h 0.875 (0.677–1.132) 1.549 (0.936–2.566) 0.936 (0.740–1.184) 1.951 (0.793–4.795) 0.957 (0.739–1.240) 0.825 (0.484–1.408)
6-7 h 0.842 (0.651–1.089) 1.439 (0.872–2.377) 0.899 (0.711–1.137) 1.855 (0.753–4.571) 0.916 (0.707–1.186) 0.787 (0.461–1.345)
5-6 h 1.100 (0.826–1.465) 1.454 (0.817–2.589) 1.145 (0.877–1.493) 2.004 (0.781–5.140) 1.141 (0.855–1.524) 1.024 (0.566–1.852)
≤5 h 1.235 (0.897–1.699) 1.752 (0.933–3.288) 1.351 (1.000–1.826)* 1.985 (0.753–5.231) 1.223 (0.886–1.689) 1.440 (0.742–2.798)
P for linear trend 0.0018* 0.4108 0.0096* 0.8965 0.0495* 0.0187*
Model was adjusted for age, sex, BMI, smoking, alcohol use, hypertension, hyperlipidemia, time in bed, S3, ESS, AHIAcronyms: OSA Obstructive sleep apnea, OR Odds ratio, CI Confidence interval, BMI Body mass index, TST Total sleep time, ESS Epworth Sleepiness Scale, AHIApnea-hypopnea index* p indicates a significant difference
Xu et al. Respiratory Research (2020) 21:151 Page 8 of 11

sleep duration. These observations suggested that OSAcombined with extremely short sleep duration had agreater detrimental effect on insulin resistance thanOSA alone. Improving extremely short sleep durationmay also improve insulin resistance in OSA.REM sleep accounts for about 25% of the TST and is
associated with distinct physiologic alterations. Few pre-vious studies explored the associations of insulin resist-ance with respiratory events and sleep duration duringREM sleep period in OSA. In our study, we preliminaryfound that REM predominant OSA was associated withinsulin resistance to some extent. However, prospectivestudies with larger sample size are warranted to verifyour findings.The main finding of our study is that OSA is inde-
pendently associated with insulin resistance rather thanshort sleep duration. Continuous positive airway pres-sure (CPAP) is the first-line treatment of OSA and itcould improve insulin resistance through abolishing dis-turbed respiratory events during sleep. Besides, we alsofound that REM predominant OSA was associated withinsulin resistance to some extent. Thus, clinicians shouldpay more attention to increase CPAP usage time duringREM sleep alleviate insulin resistance of OSA.Despite the large sample size, our study had several
limitations. First, as this was a cross-sectional study, itwas not possible to determine the causal relationships ofshort sleep duration, OSA, and insulin resistance. Sec-ond, our sample was composed predominantly of malepatients, who typically had OSA. This imbalance mayhave led to bias in the prediction models. Third, as thiswas a hospital-based study, the generalizability of our
conclusions to asymptomatic patients, such as those res-iding in the community, is unclear. Fourth, though wecarefully excluded participants who had medicationwhich could affect sleep or insulin resistance, however,other drugs such as anti-hypertension and lipid-loweringdrugs might also potentially influence the reported asso-ciations. Fifth, sleep duration was determined based onone overnight PSG session, but night-to-night variabilityand first-night effects cannot be excluded. In contrast,actigraphy performed using a simple portable can recordsleep duration continuously for 7 days. Although PSGwas not the optimal choice, good agreement betweenactigraphy and PSG with respect to the monitoring ofsleep duration has been established in OSA [32].
ConclusionIn conclusion, the results of the present study suggestedthat OSA, but not short sleep duration, is correlated withinsulin resistance. It is worth noting that short and ex-tremely short sleep durations (< 5 h) combined with OSAhave a more detrimental effect than OSA alone with re-gard to insulin resistance. Further prospective cohortstudies are warranted to determine the causal relation-ships between OSA, short sleep duration, and insulin re-sistance, and to ascertain whether improving sleep time inturn improves insulin resistance in patients with OSA.
Supplementary informationSupplementary information accompanies this paper at https://doi.org/10.1186/s12931-020-01416-x.
Additional file 1.
Table 7 Adjusted odd ratios (ORs) and 95% confidence intervals (CIs) of interaction between OSA and sleep duration on insulinresistance
predictors n OR (95% CI)
Model 1 Model 2 Model 3 Model 4
> 8 h*Primary snoring 72 0.633 (0.334–1.200) 0.735 (0.382–1.413) 0.622 (0.338–1.299) 0.670 (0.334–1.343)
> 8 h*OSA 466 1.094 (0.769–1.556) 1.034 (0.723–1.479) 0.931 (0.647–1.340) 0.860 (0.590–1.255)
7-8 h*Primary snoring 264 Reference Reference Reference Reference
7-8 h*OSA 1493 1.338 (0.985–1.818) 1.272 (0.932–1.737) 1.176 (0.858–1.613) 1.070 (0.772–1.485)
6-7 h*Primary snoring 299 0.854 (0.577–1.264) 0.969 (0.650–1.445) 0.936 (0.623–1.405) 0.867 (0.569–1.322)
6-7 h*OSA 1411 1.215 (0.893–1.652) 1.190 (0.869–1.629) 1.099 (0.799–1.510) 1.046 (0.752–1.454)
5-6 h*Primary snoring 161 0.782 (0.489–1.250) 0.836 (0.517–1.350) 0.829 (0.510–1.347) 0.836 (0.509–1.371)
5–6*OSA 680 1.428 (1.027–1.987) * 1.442 (1.030–2.021) * 1.314 (0.933–1.850) 1.224 (0.858–1.744)
≤5 h*Primary snoring 144 0.628 (0.380–1.040) 0.647 (0.387–1.081) 0.638 (0.379–1.072) 0.604 (0.349–1.043)
≤5 h*OSA 457 1.622(1.143–2.303) * 1.615(1.127–2.315) * 1.467(1.018–2.116) * 1.384(0.949–2.020)
Model 1 was adjusted for age, sex and BMI; model 2 was adjusted for variables included in model 1 and smoking, alcohol use, hypertension, hyperlipidemia, timein bed, S3, ESS; model 3 was adjusted for variables included in model 3 and waist hip ratio; model 4 was adjusted for variables in model 4 and additional diabetesmellitus, apolipoprotein A-1, apolipoprotein-B, apolipoprotein-E and lipoprotein-αAcronyms: OSA Obstructive sleep apnea, OR Odds ratio, CI Confidence interval, BMI Body mass index, ESS Epworth Sleepiness Scale, AHI Apnea-hypopnea index* p indicates a significant difference
Xu et al. Respiratory Research (2020) 21:151 Page 9 of 11

AbbreviationsOSA: Obstructive sleep apnea; PSG: Polysomnography; CVD: Cardiovasculardiseases; BMI: Body mass index; NC: Neck circumference; WC: Waistcircumference; HC: Hip circumference; WHR: Waist/hip ratio; HOMA-IR: Homeostasis model assessment for insulin resistance; SBP: Systolic bloodpressure; DBP: Diastolic blood pressure; TC: Total cholesterol; TG: Triglyceride;HDL-C: High-density lipoprotein cholesterol; LDL-C: Low-density lipoproteincholesterol; ApoA-I: Apolipoprotein A-I; ApoB: Apolipoprotein B;ApoE: Apolipoprotein E; Lp(a): Lipoprotein (a); ESS: Epworth Sleepiness Scale;AHI: Apnoea–hypopnea index; ODI: Oxygen desaturation index; MAI: Micro-arousal index; REM: Rapid eye movement
AcknowledgementsThe authors acknowledge the help of Prof. Heinzer R for revising ourmanuscript.
Authors’ contributionsThe authors take responsibility and vouch for the accuracy andcompleteness of the data and analyses. Prof. SY, JG and HY had full access toall of the data in the study and took responsibility for the integrity of thedata and the accuracy of the data analysis. Study design: HX, JG and SY; Datacollection: HX, JG, MG and JZ; Statistical analysis: HX, CL, YF; Manuscript draft:HX, JG, HY and SY. The authors have seen and approved the manuscript.
FundingThis study was supported by grants-in-aid from Shanghai Municipal Commis-sion of Science and Technology (Grant No.18DZ2260200); Natural ScienceFoundation of Liaoning Province (20180530009); Innovative research team ofhigh-level local universities in Shanghai; National Key R&D Program of China(2017YFC0112500); Innovation Program of Shanghai Municipal EducationCommission (2017-01-07-00-02-E00047); National Natural Science Foundationof China (81700896, 81770987, 81701306, 81770988); Shanghai Sailing Pro-gram (17YF1414300); multi-center clinical research project from school ofmedicine, Shanghai Jiao Tong University (DLY201502) and Shanghai Shen-Kang Hospital Management Center Project (SHDC12015101; 16CR3103B).
Availability of data and materialsThe datasets used and/or analysed during the current study are availablefrom the corresponding author on reasonable request.
Ethics approval and consent to participateThe study was conducted according to the World Medical AssociationDeclaration of Helsinki in 1975, as revised in 1983, and was approved by theEthic Committee of Shanghai Jiao Tong University Affiliated Sixth People’sHospital (Trial registration number: ChiCTR1900025714). All subjects providedtheir informed written consent.
Consent for publicationNot applicable.
Competing interestsThe authors declare that they have no competing interests.
Author details1Department of Otolaryngology Head and Neck Surgery & Center of SleepMedicine, Shanghai Jiao Tong University Affiliated Sixth People’s Hospital,Yishan Road 600, Shanghai 200233, China. 2Otolaryngological Institute ofShanghai Jiao Tong University, Yishan Road 600, Shanghai 200233, China.3Shanghai Key Laboratory of Sleep Disordered Breathing, Yishan Road 600,Shanghai 200233, China. 4Drug clinical trial institution, Shanghai Jiao TongUniversity Affiliated Sixth People’s Hospital, Yishan Road 600, Shanghai200233, China. 5Department of Otolaryngology-Head & Neck Surgery,Shanghai Children’s Hospital, Shanghai Jiao Tong University, Huding Road355, Shanghai 200062, China. 6Department of Ultrasound, The First AffiliatedHospital of Jinzhou Medical University, No. 2, 5 Duan, Renmin Street, GutaDistrict, Jinzhou 121000, Liaoning Province, China.
Received: 16 March 2020 Accepted: 8 June 2020
References1. Heinzer R, Vat S, Marques-Vidal P, Marti-Soler H, Andries D, Tobback N, et al.
Prevalence of sleep-disordered breathing in the general population: theHypnoLaus study. Lancet Respir Med. 2015;3(4):310–8.
2. Barger LK, Rajaratnam SMW, Cannon CP, Lukas MA, Im K, Goodrich EL, et al.Short sleep duration, obstructive sleep apnea, shiftwork, and the risk ofadverse cardiovascular events in patients after an acute coronary syndrome.J Am Heart Assoc. 2017;6(10):e006959.
3. Wang F, Xiong X, Xu H, Huang H, Shi Y, Li X, et al. The association betweenobstructive sleep apnea syndrome and metabolic syndrome: a confirmatoryfactor analysis. Sleep Breath. 2019;23(3):1011-9.
4. Whitaker KM, Lutsey PL, Ogilvie RP, Pankow JS, Bertoni A, Michos ED, et al.Associations between polysomnography and actigraphy-based sleep indicesand glycemic control among those with and without type 2 diabetes: themulti-ethnic study of atherosclerosis. Sleep. 2018;41(11):zsy172.
5. Leng Y, McEvoy CT, Allen IE, Yaffe K. Association of Sleep-DisorderedBreathing with cognitive function and risk of cognitive impairment: asystematic review and meta-analysis. JAMA Neurol. 2017;74(10):1237–45.
6. Wu L, Sun D, Tan Y. A systematic review and dose-response meta-analysisof sleep duration and the occurrence of cognitive disorders. SleepBreathing = Schlaf & Atmung. 2018;22(3):805–14.
7. Ren R, Covassin N, Yang L, Li Y, Zhang Y, Zhou J, et al. Objective but notsubjective short sleep duration is associated with hypertension inobstructive sleep apnea. Hypertension. 2018;72(3):610–7.
8. Drager LF, Santos RB, Silva WA, Parise BK, Giatti S, Aielo AN, et al. OSA, shortsleep duration, and their interactions with sleepiness and Cardiometabolicrisk factors in adults: the ELSA-Brasil study. Chest. 2019;155(6):1190–8.
9. Mokhlesi B, Temple KA, Tjaden AH, Edelstein SL, Utzschneider KM, NadeauKJ, et al. Association of Self-Reported Sleep and Circadian Measures withGlycemia in adults with prediabetes or recently diagnosed untreated type 2diabetes. Diabetes Care. 2019;42(7):1326–32.
10. Bakker JP, Weng J, Wang R, Redline S, Punjabi NM, Patel SR. Associationsbetween obstructive sleep apnea, sleep duration, and abnormal fastingglucose. The multi-ethnic study of atherosclerosis. Am J Respir Crit CareMed. 2015;192(6):745–53.
11. Zou J, Xia Y, Xu H, Fu Y, Qian Y, Li X, et al. Independent relationshipsbetween cardinal features of obstructive sleep apnea and glycometabolism:a cross-sectional study. Metab Clin Exp. 2018;85:340–7.
12. Iftikhar IH, Hoyos CM, Phillips CL, Magalang UJ. Meta-analyses of theAssociation of Sleep Apnea with insulin resistance, and the effects of CPAPon HOMA-IR, adiponectin, and visceral adipose fat. J Clin Sleep Med. 2015;11(4):475–85.
13. van Dijk D, Balkau B, Segrestin B, Gottsater M, Gabriel R, Hatunic M, et al.Associations between sleep duration and sleep debt with insulin sensitivityand insulin secretion in the EGIR-RISC study. Diabetes Metab. 2019;45(4):375-81.
14. Liu R, Zee PC, Chervin RD, Arguelles LM, Birne J, Zhang S, et al. Short sleepduration is associated with insulin resistance independent of adiposity inChinese adult twins. Sleep Med. 2011;12(9):914–9.
15. Artunc F, Schleicher E, Weigert C, Fritsche A, Stefan N, Haring HU. Theimpact of insulin resistance on the kidney and vasculature. Nat Rev Nephrol.2016;12(12):721–37.
16. Bos MM, van Heemst D, Donga E, de Mutsert R, Rosendaal FR, Blauw GJ,et al. The association between habitual sleep duration and sleep qualitywith glycemic traits: assessment by cross-sectional and Mendelianrandomization analyses. J Clin Med. 2019;8(5):682.
17. Xu H, Zhao X, Shi Y, Li X, Qian Y, Zou J, et al. Development and validationof a simple-to-use clinical nomogram for predicting obstructive sleepapnea. BMC Pulm Med. 2019;19(1):18.
18. Bonora E, Targher G, Alberiche M, Bonadonna RC, Saggiani F, Zenere MB,et al. Homeostasis model assessment closely mirrors the glucose clamptechnique in the assessment of insulin sensitivity: studies in subjects withvarious degrees of glucose tolerance and insulin sensitivity. Diabetes Care.2000;23(1):57–63.
19. McAuley KA, Williams SM, Mann JI, Walker RJ, Lewis-Barned NJ, Temple LA,et al. Diagnosing insulin resistance in the general population. Diabetes Care.2001;24(3):460–4.
Xu et al. Respiratory Research (2020) 21:151 Page 10 of 11

20. Expert Panel on Detection E, Treatment of High Blood Cholesterol In.Executive summary of the third report of the National CholesterolEducation Program (NCEP) expert panel on detection, evaluation, andtreatment of high blood cholesterol in adults (adult treatment panel III).Jama. 2001;285(19):2486–97.
21. Chung KF. Use of the Epworth sleepiness scale in Chinese patients withobstructive sleep apnea and normal hospital employees. J Psychosom Res.2000;49(5):367–72.
22. Johns M, Hocking B. Daytime sleepiness and sleep habits of Australianworkers. Sleep. 1997;20(10):844–9.
23. Ho V, Crainiceanu CM, Punjabi NM, Redline S, Gottlieb DJ. Calibration modelfor apnea-hypopnea indices: impact of alternative criteria for hypopneas.Sleep. 2015;38(12):1887–92.
24. Fan TT, Chen WH, Shi L, Lin X, Tabarak S, Chen SJ, et al. Objective sleepduration is associated with cognitive deficits in primary insomnia: BDNFmay play a role. Sleep. 2019;42(1).
25. Ip MS, Lam B, Ng MM, Lam WK, Tsang KW, Lam KS. Obstructive sleep apneais independently associated with insulin resistance. Am J Respir Crit CareMed. 2002;165(5):670–6.
26. Punjabi NM, Shahar E, Redline S, Gottlieb DJ, Givelber R, Resnick HE, et al.Sleep-disordered breathing, glucose intolerance, and insulin resistance: thesleep heart health study. Am J Epidemiol. 2004;160(6):521–30.
27. Gaines J, Vgontzas AN, Fernandez-Mendoza J, Bixler EO. Obstructive sleepapnea and the metabolic syndrome: the road to clinically-meaningfulphenotyping, improved prognosis, and personalized treatment. Sleep MedRev. 2018;42:211–9.
28. Baoying H, Hongjie C, Changsheng Q, Peijian W, Qingfei L, Yinghua L, et al.Association of napping and night-time sleep with impaired glucoseregulation, insulin resistance and glycated haemoglobin in Chinese middle-aged adults with no diabetes: a cross-sectional study. BMJ Open. 2014;4(7):e004419.
29. Spiegel K, Leproult R, Van Cauter E. Impact of sleep debt on metabolic andendocrine function. Lancet. 1999;354(9188):1435–9.
30. Damanti S, Bourron O, Doulazmi M, Mandengue Sosso AL, Nguyen-MichelVH, Mariani J, et al. Relationship between sleep parameters, insulinresistance and age-adjusted insulin like growth factor-1 score in nondiabetic older patients. PLoS One. 2017;12(4):e0174876.
31. Pyykkonen AJ, Isomaa B, Pesonen AK, Eriksson JG, Groop L, Tuomi T, et al.Sleep duration and insulin resistance in individuals without type 2 diabetes:the PPP-Botnia study. Ann Med. 2014;46(5):324–9.
32. Gagnadoux F, Nguyen XL, Rakotonanahary D, Vidal S, Fleury B. Wrist-actigraphic estimation of sleep time under nCPAP treatment in sleepapnoea patients. Eur Respir J. 2004;23(6):891–5.
Publisher’s NoteSpringer Nature remains neutral with regard to jurisdictional claims inpublished maps and institutional affiliations.
Xu et al. Respiratory Research (2020) 21:151 Page 11 of 11