validation of microbiological assay design of neomycin
TRANSCRIPT
J. Adv. Biomed. & Pharm. Sci .
J. Adv. Biomed. & Pharm. Sci. 5 (2022) 54-63
Validation of Microbiological Assay Design of Neomycin Sulfate in 30 x 30 cm
Rectangular Antibiotica Plate Dalia E. Eissa
1, Engy R. Rashed
2, Mostafa E. Eissa
3*
Royal Oldham Hospital, Oldham, United Kingdom. 1 National Centre for Radiation Research and Technology, Cairo, Egypt 2 Independent Researcher, Faculty of Pharmacy, Cairo University, Cairo, Egypt.3
Received: November 08, 2021; revised: December 15, 2021; accepted: December 16, 2021
Abstract
The microbiological assay is one of the most commonly used techniques for potency determination using biological means through
indicator microorganisms in research, clinical, industrial and quality control activities. The current work aimed to validate the determination of Neomycin Sulfate potency through the agar diffusion method using the 2 x 2 Parallel Line Model. The study
investigates both the quality of results as a zone of inhibition and the inspected validation parameters which consist of specificity,
linearity, accuracy, precision (in terms of repeatability and intermediate precision) and robustness. The initial step determined the
validity of raw data for further analysis in terms of normality using QQ plot, homoscedasticity by Cochran’s test and the absence of
true outlier values through both G statistics (USP), Robust regression and Outlier removal tests. The assay design and procedure
showed selectivity towards the intended antibiotic and the calibration curve showed acceptable linearity (r = 0.998) without any fixed
or relative concentration-related bias. Accuracy profile covering 50, 100 and 150% of the target concentration demonstrated potencies
with a confidence interval that is contained within the acceptance limits. Results of the precision and robustness showed RSD%
˂2.00. The assay design is suitable for the assay of Neomycin Sulfate.
Keywords
Neomycin Sulfate, Linearity, Accuracy, Precision, Robustness
Journal of Advanced Biomedical and Pharmaceutical Sciences
Journal Homepage: http://jabps.journals.ekb.eg
* Correspondence: Mostafa Essam Eissa
Tel.: +2 01006154853
Email Addresses: [email protected]
J. Adv. Biomed. & Pharm. Sci .
Eissa et al .
Introduction
Antimicrobial drugs are one of the important and widely
consumed medications that are used in combating microbial
infection which impact human health may be life-threatening in
extreme cases [1,2]. The safety and efficacy of medicinal
products are crucial requirements to achieve the target aim from
their use without losing therapeutic value and with minimal
toxicity exposure [3]. Aminoglycoside antibiotics are one of the
important classes of antimicrobials that found their use in topical
and parenteral administration [4,5]. Neomycin Sulfate is one of these antimicrobials which are listed in the well-known national
and international pharmacopeia [6].
The potency of the Active Pharmaceutical Ingredient (API) -
which is antibacterial - is determined by microbiological
antibiotic assay using the zone of inhibition technique [7,8].
There is a limited linear relationship between the biological effect
(i.e. clear halo diameter) and the concentration of the antibiotic
or its transformed dose levels [9]. This linearity is found within
relatively small range of the antimicrobial concentration and
appropriate determination of this limitation is important in the
design of Parallel Line Model (PLM) when the potency of the
sample should be determined [10]. In order to quantify the biological potency of the antimicrobial
compounds and obtain reproducible results with reasonable
quality and confidence an appropriate antibiotic assay design
should be established and examined for its suitability and must
be validated to ensure that the proposed design has fulfilled its
target and met the validation acceptance criteria [11]. Thus, it can
be used for routine testing of that antibiotic either as a raw
material or incorporated in formulated consumable products for
medical use.
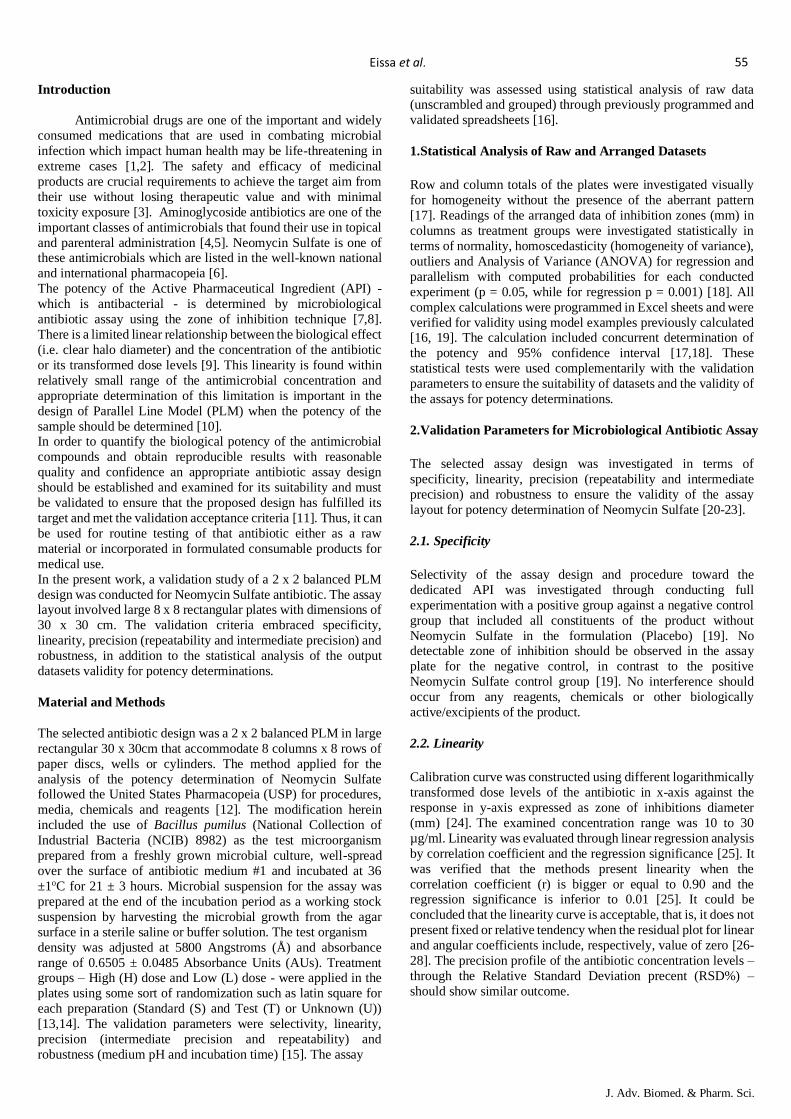
In the present work, a validation study of a 2 x 2 balanced PLM
design was conducted for Neomycin Sulfate antibiotic. The assay layout involved large 8 x 8 rectangular plates with dimensions of
30 x 30 cm. The validation criteria embraced specificity,
linearity, precision (repeatability and intermediate precision) and
robustness, in addition to the statistical analysis of the output
datasets validity for potency determinations.
Material and Methods
The selected antibiotic design was a 2 x 2 balanced PLM in large
rectangular 30 x 30cm that accommodate 8 columns x 8 rows of
paper discs, wells or cylinders. The method applied for the
analysis of the potency determination of Neomycin Sulfate followed the United States Pharmacopeia (USP) for procedures,
media, chemicals and reagents [12]. The modification herein
included the use of Bacillus pumilus (National Collection of
Industrial Bacteria (NCIB) 8982) as the test microorganism
prepared from a freshly grown microbial culture, well-spread
over the surface of antibiotic medium #1 and incubated at 36
±1oC for 21 ± 3 hours. Microbial suspension for the assay was
prepared at the end of the incubation period as a working stock
suspension by harvesting the microbial growth from the agar
surface in a sterile saline or buffer solution. The test organism
density was adjusted at 5800 Angstroms (Å) and absorbance
range of 0.6505 ± 0.0485 Absorbance Units (AUs). Treatment groups – High (H) dose and Low (L) dose - were applied in the
plates using some sort of randomization such as latin square for
each preparation (Standard (S) and Test (T) or Unknown (U))
[13,14]. The validation parameters were selectivity, linearity,
precision (intermediate precision and repeatability) and
robustness (medium pH and incubation time) [15]. The assay
suitability was assessed using statistical analysis of raw data (unscrambled and grouped) through previously programmed and
validated spreadsheets [16].
1.Statistical Analysis of Raw and Arranged Datasets
Row and column totals of the plates were investigated visually
for homogeneity without the presence of the aberrant pattern
[17]. Readings of the arranged data of inhibition zones (mm) in
columns as treatment groups were investigated statistically in
terms of normality, homoscedasticity (homogeneity of variance),
outliers and Analysis of Variance (ANOVA) for regression and
parallelism with computed probabilities for each conducted
experiment (p = 0.05, while for regression p = 0.001) [18]. All
complex calculations were programmed in Excel sheets and were
verified for validity using model examples previously calculated [16, 19]. The calculation included concurrent determination of
the potency and 95% confidence interval [17,18]. These
statistical tests were used complementarily with the validation
parameters to ensure the suitability of datasets and the validity of
the assays for potency determinations.
2.Validation Parameters for Microbiological Antibiotic Assay
The selected assay design was investigated in terms of
specificity, linearity, precision (repeatability and intermediate
precision) and robustness to ensure the validity of the assay
layout for potency determination of Neomycin Sulfate [20-23].
2.1. Specificity
Selectivity of the assay design and procedure toward the
dedicated API was investigated through conducting full
experimentation with a positive group against a negative control
group that included all constituents of the product without
Neomycin Sulfate in the formulation (Placebo) [19]. No detectable zone of inhibition should be observed in the assay
plate for the negative control, in contrast to the positive
Neomycin Sulfate control group [19]. No interference should
occur from any reagents, chemicals or other biologically
active/excipients of the product.
2.2. Linearity
Calibration curve was constructed using different logarithmically
transformed dose levels of the antibiotic in x-axis against the
response in y-axis expressed as zone of inhibitions diameter
(mm) [24]. The examined concentration range was 10 to 30
µg/ml. Linearity was evaluated through linear regression analysis
by correlation coefficient and the regression significance [25]. It
was verified that the methods present linearity when the
correlation coefficient (r) is bigger or equal to 0.90 and the regression significance is inferior to 0.01 [25]. It could be
concluded that the linearity curve is acceptable, that is, it does not
present fixed or relative tendency when the residual plot for linear
and angular coefficients include, respectively, value of zero [26-
28]. The precision profile of the antibiotic concentration levels –
through the Relative Standard Deviation precent (RSD%) –
should show similar outcome.
55
Eissa et al .
J. Adv. Biomed. & Pharm. Sci .
2.3. Accuracy
The accuracy was determined by adding known amount of
Neomycin Sulfate with known potency to the samples of the
formulated product under investigation [20]. Accuracy was
evaluated in relation to theoretical doses and was determined
through accuracy profile analysis, by plotting theoretical
concentrations versus experimentally determined relative error
percent (RE%) [29]. The tolerance interval, concerning the
accuracy of the 2 x 2 experimental design, was estimated through
experimental determinations in three levels of concentration
(50%, 100%, and 150% of the reference dose) in the medicinal
formulated products. It has been concluded that the method is
accurate, that is, the assay and the estimated confidence values from the calculated potencies of Neomycin Sulfate should be
confined within the acceptance criteria at all concentration levels
for accurate quantification of the dedicated API [25, 29].
2.4. Precision and Robustness
The precision of the assay was determined by repeatability (intra-
assay) and intermediate precision (inter-assay) [20].
Repeatability was evaluated by assaying three samples at the
same concentration and under identical working conditions. The
intermediate precision was verified by comparing the assays on
two different occasions. The precision is calculated as RSD%
[30, 31]. The robustness of the method was determined by
analyzing the same sample under a variety of conditions [22]. The
significant factors considered – herein in this study - were
incubation time and pH of the antibiotic medium through small modifications. The test smaples were assay aginst against the
Neomycin Sulfate standard material of known activity. The
obtained responses were evaluated according to the RSD
calculated among the experimental groups [23]. The RSD%
values obtained were investigated to be lower than 5%
Results and Discussion
Neomycin Sulfate is an aminoglycoside antibiotic that consists of
a mixture of five related microbiologically active compounds
[32]. The proportion of these materials are fairly variable
between different commercial products of this API [32]. While several chemical analysis techniques involving rapid and
automated methods such as HPLC could be developed, yet the
microbiological assay using inhibition zone retains its value as a
cheap, simple and safer approach as it does not include complex
instrumentation, toxic or hazardous chemicals [11]. Moreover,
the true combined antimicrobial effect would be easily measured
using the biological method. This is despite the fact that
individual active components might be determined with high
precision and accuracy using chemical means.
Official international monographs showed detailed procedures
for conducting microbiological potency determinations for compendial antimicrobial materials listed under those tested
using the antibiotic assay technique [12, 32]. However, each
laboratory should select a convenient layout design that is
deemed suitable for the aim of this activity and the nature of this
work. However, the appropriately selected design should be
validated to ensure its suitability for activity determination with
reasonable confidence [33]. The investigated parameters in the
current validation study embrace the selectivity, linearity,
accuracy, precision (repeatability and intermediate precision) and
robustness, in addition to the examination of raw data suitability
and the validity of the conducted test.
Preliminary Dataset Assessement
Before conducting complex statistical analysis and result
interpretation for the assay, the initial raw data should be
reviewed for suitability of further processing [16, 18]. Examining
unscrambled data for row and column totals of each conducted
experiment should return homogenous outcome without any
aberrant pattern which was observed in this study through
calculation in a previously programmed spreadsheets [18].
Moreover, four assumptions must be basically fulfilled for a valid assay, namely: linear dose-response relationship and ensuring
randomization allocation of groups across the assay plate [17].
Other aspects that should be investigated were reasonable
normality of the recorded data distribution, true outlier
detection/omitting and homogentiy of variances [17].
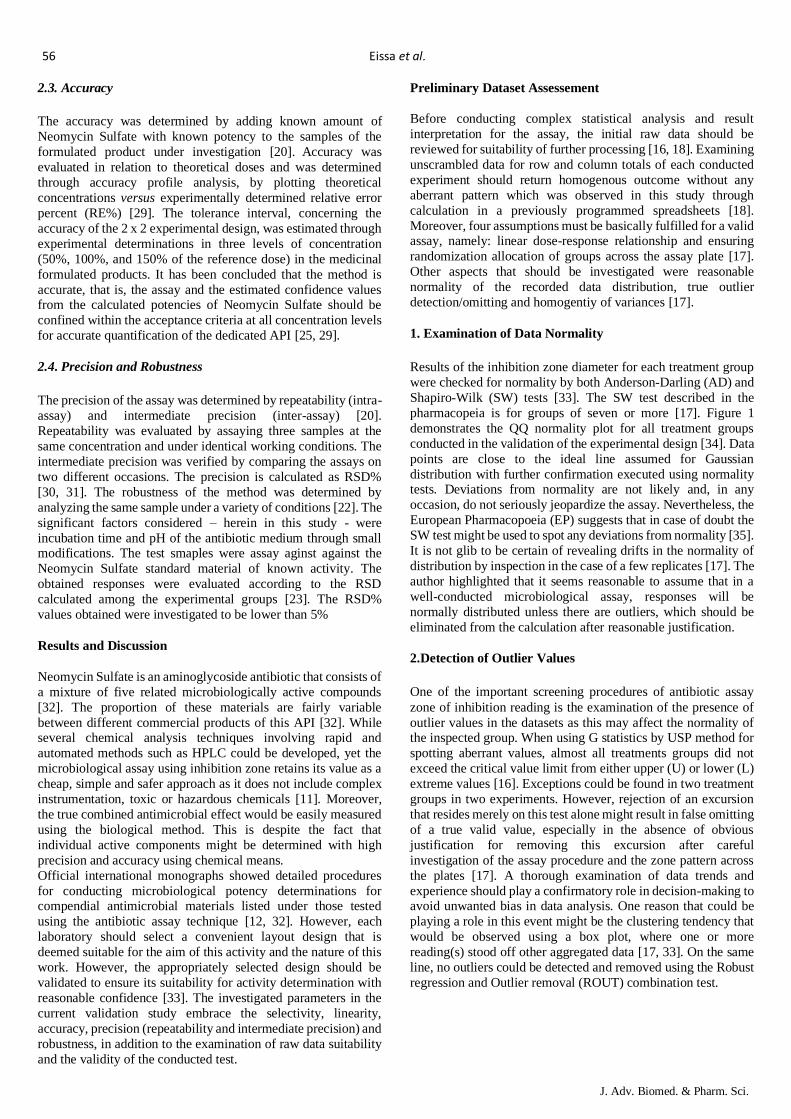
1. Examination of Data Normality
Results of the inhibition zone diameter for each treatment group
were checked for normality by both Anderson-Darling (AD) and
Shapiro-Wilk (SW) tests [33]. The SW test described in the
pharmacopeia is for groups of seven or more [17]. Figure 1
demonstrates the QQ normality plot for all treatment groups
conducted in the validation of the experimental design [34]. Data
points are close to the ideal line assumed for Gaussian
distribution with further confirmation executed using normality tests. Deviations from normality are not likely and, in any
occasion, do not seriously jeopardize the assay. Nevertheless, the
European Pharmacopoeia (EP) suggests that in case of doubt the
SW test might be used to spot any deviations from normality [35].
It is not glib to be certain of revealing drifts in the normality of
distribution by inspection in the case of a few replicates [17]. The
author highlighted that it seems reasonable to assume that in a
well-conducted microbiological assay, responses will be
normally distributed unless there are outliers, which should be
eliminated from the calculation after reasonable justification.
2.Detection of Outlier Values
One of the important screening procedures of antibiotic assay
zone of inhibition reading is the examination of the presence of
outlier values in the datasets as this may affect the normality of the inspected group. When using G statistics by USP method for
spotting aberrant values, almost all treatments groups did not
exceed the critical value limit from either upper (U) or lower (L)
extreme values [16]. Exceptions could be found in two treatment
groups in two experiments. However, rejection of an excursion
that resides merely on this test alone might result in false omitting
of a true valid value, especially in the absence of obvious
justification for removing this excursion after careful
investigation of the assay procedure and the zone pattern across
the plates [17]. A thorough examination of data trends and
experience should play a confirmatory role in decision-making to avoid unwanted bias in data analysis. One reason that could be
playing a role in this event might be the clustering tendency that
would be observed using a box plot, where one or more
reading(s) stood off other aggregated data [17, 33]. On the same
line, no outliers could be detected and removed using the Robust
regression and Outlier removal (ROUT) combination test.
56
J. Adv. Biomed. & Pharm. Sci .
Eissa et al .
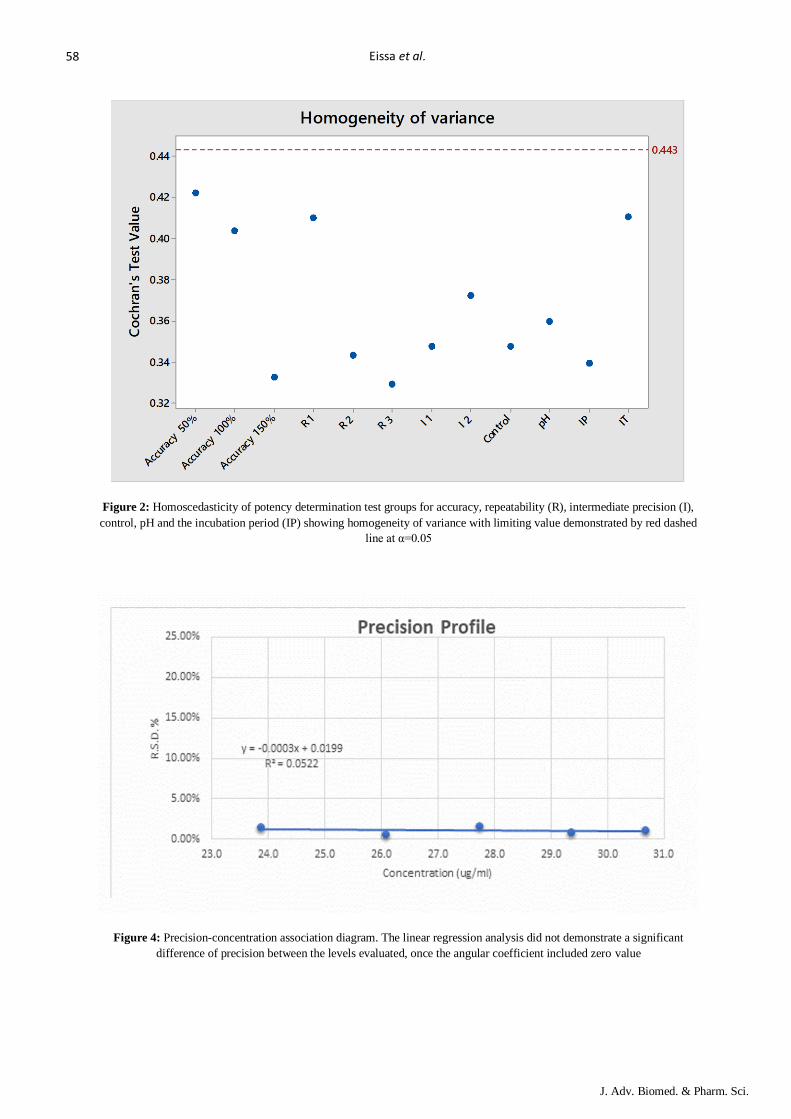
3.Test of Homoscedasticity (Homogeneity of Variance)
This inspection characteristic - homogeneity of variance
(homoscedasticity)- might be checked by either Bartlett’s test or
Cochran’s test [17]. However, it is noteworthy that Bartlett’s
procedure was criticized by Box (1953) as being very sensitive to
non-normality. So, Bartlett’s test was not used in the present
analysis [36]. Figure 2 illustrates the implementation of the
homogeneity of variances test. None of the experimental
validation groups showed Cochran’s value (blue dots) that
exceeds the critical limiting value (red dashed line) at α = 0.05. All tests in the 2 x 2 PLM assay design showed homogenous
variances. Thus, the homoscedasticity condition was fulfilled. No
evidence of abnormality in the raw data could be detected.
Accordingly, validation of the assay design was conducted by
inspecting the necessary parameters of specificity, linearity,
accuracy, precision and robustness.
Specificity of Antibiotic Assay Design
To ensure that the assay procedure is selective toward the
dedicated API only, a full and exact analysis process with
conducted using postulated 2 x 2 PLM design in the large
rectangular assay plate but without inclusion of Neomycin
Sulfate antibiotic in the test group components [19]. Absence of
any detectable zone of inhibition from the test samples in the
presence of well-defined inhibition zones from the positive control group is an indication of the selectivity of the designed
layout and procedure of the investigated balanced assay.
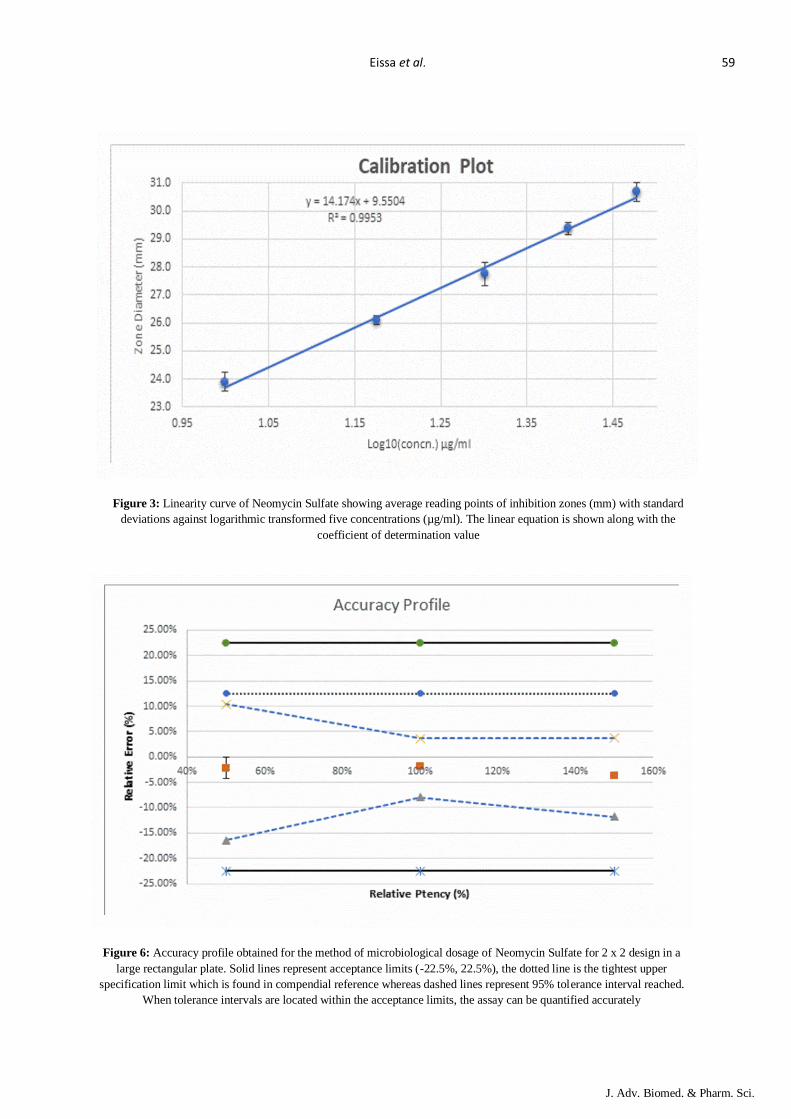
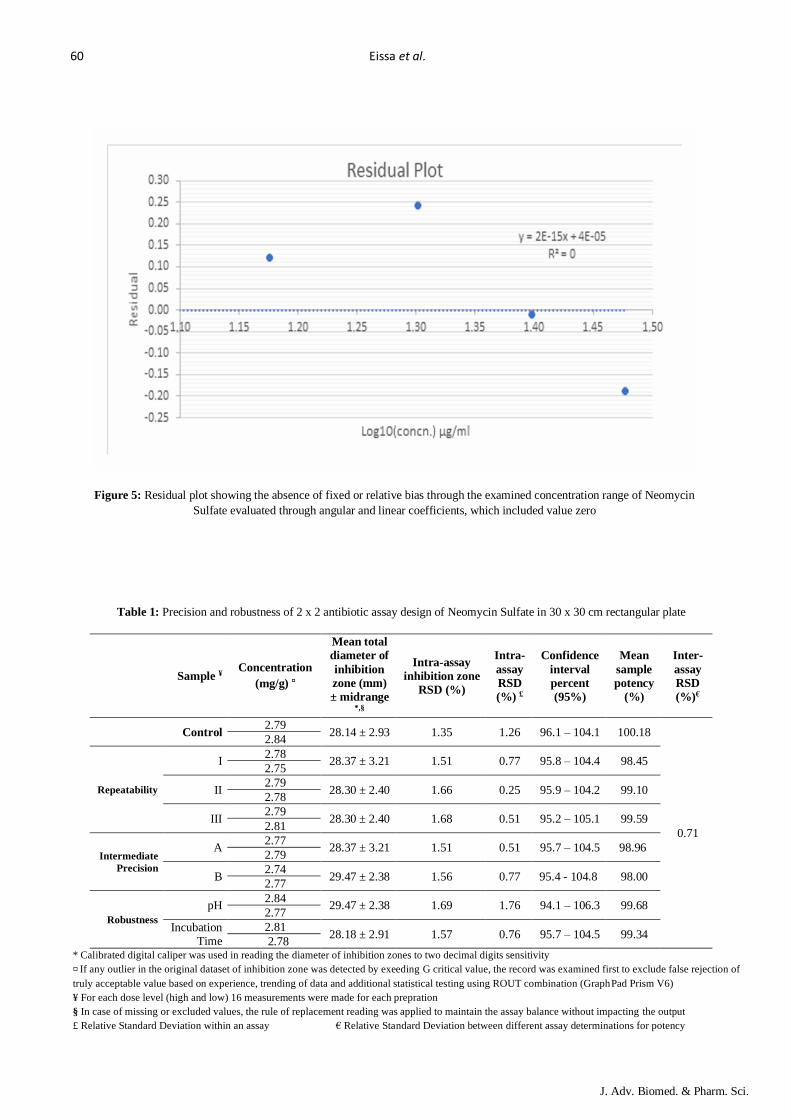
Linearity of Antibiotic Assay Design
A calibration curve was constructed using five concentration
levels for the zone of inhibition (in mm) vs. logarithmically
transformed concentrations [34]. The plot showed acceptable
linearity with r = 0.998 as could be found in Figure 3. The
precision diagram is demonstrated in Figure 4 without any
significant sign of either fixed or relative bias. The angular
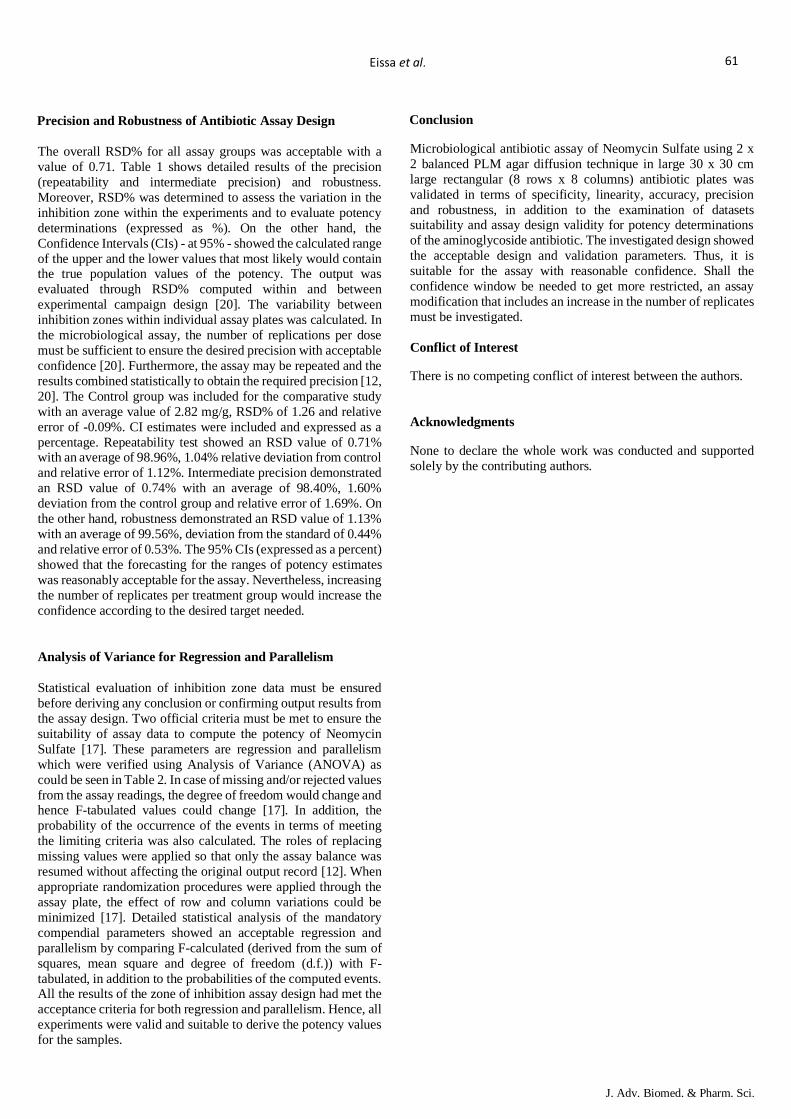
coefficient included a zero value without any detectable trend associated with the concentration [37]. The same outcome could
be observed in Figure 5 with the residual plot after evaluation of
both angular and linear coefficients. Thus, the inspected
concentration range would reasonably cover the required linear
requirement of the PLM assay of Neomycin Sulfate antibiotic.
For a total Degree of Freedom (df) 4, Sum of Squares (SS0 was
28.65238, with residual df = 3, SS = 0.13466 and Mean Square
(MS) = 0.04489. The regression analysis with a df of one showed
SS and MS = 28.51772, F = 635.3315 and F-significance =
0.00014 which is lower than 0.01 value.
Accuracy of Antibiotic Assay Design
The accuracy was proved by recovery tests that are designed
experiments to ensure the agreement between the actual values
found for the analyte and the true added amount of that analysis
[20-22]. The recovery test was performed at three different
concentrations. The reported results obtained from the bioassay
were close to the true concentration values of the samples. The
method had appropriate accuracy, as can be seen by the values
calculated for the β-tolerance interval (Figure 6) for each
concentration level, which showed a maximum coefficient of
variation not exceeding 15% for concentration range including 50, 100 and 150% [29, 38]. The mean potency was shown at each
concentration level as square dots in the graph. Accuracy is
represented by the combination of the random (precision) and systematic (trueness) errors, which were considered in the β-
tolerance interval calculation [29, 39]. Relative bias and recovery
were calculated to assess the trueness of the method. This
represents the interval in which β% of the future individual
results is expected [40]. As shown in this figure, the tolerance
limits remained within the acceptance limits - including tighter
upper limit for parenteral preparations - on the whole,
experimental concentration range for the analyte. Thus, the
accuracy of the microbiological method was demonstrated over
investigated concentration levels.
Figure 1: QQ normality plot showing the distribution trend of
datasets of each treatment group in validation study campaign
57
Eissa et al .
J. Adv. Biomed. & Pharm. Sci .
Figure 2: Homoscedasticity of potency determination test groups for accuracy, repeatability (R), intermediate precision (I),
control, pH and the incubation period (IP) showing homogeneity of variance with limiting value demonstrated by red dashed
line at α=0.05
Figure 4: Precision-concentration association diagram. The linear regression analysis did not demonstrate a significant
difference of precision between the levels evaluated, once the angular coefficient included zero value
58
J. Adv. Biomed. & Pharm. Sci .
Eissa et al .
Figure 3: Linearity curve of Neomycin Sulfate showing average reading points of inhibition zones (mm) with standard
deviations against logarithmic transformed five concentrations (µg/ml). The linear equation is shown along with the
coefficient of determination value
Figure 6: Accuracy profile obtained for the method of microbiological dosage of Neomycin Sulfate for 2 x 2 design in a
large rectangular plate. Solid lines represent acceptance limits (-22.5%, 22.5%), the dotted line is the tightest upper
specification limit which is found in compendial reference whereas dashed lines represent 95% tolerance interval reached.
When tolerance intervals are located within the acceptance limits, the assay can be quantified accurately
59
Eissa et al .
J. Adv. Biomed. & Pharm. Sci .
Figure 5: Residual plot showing the absence of fixed or relative bias through the examined concentration range of Neomycin
Sulfate evaluated through angular and linear coefficients, which included value zero
Table 1: Precision and robustness of 2 x 2 antibiotic assay design of Neomycin Sulfate in 30 x 30 cm rectangular plate
¥Sample Concentration
¤(mg/g)
Mean total
diameter of
inhibition
zone (mm)
± midrange *,§
Intra-assay
inhibition zone
RSD (%)
Intra-
assay
RSD £(%)
Confidence
interval
percent
(95%)
Mean
sample
potency
(%)
Inter-
assay
RSD €(%)
Control 2.79
28.14 ± 2.93 1.35 1.26 96.1 – 104.1 100.18
0.71
2.84
Repeatability
I 2.78
28.37 ± 3.21 1.51 0.77 95.8 – 104.4 98.45 2.75
II 2.79
28.30 ± 2.40 1.66 0.25 95.9 – 104.2 99.10 2.78
III 2.79
28.30 ± 2.40 1.68 0.51 95.2 – 105.1 99.59 2.81
Intermediate
Precision
A 2.77
28.37 ± 3.21 1.51 0.51 95.7 – 104.5 98.96 2.79
B 2.74
29.47 ± 2.38 1.56 0.77 95.4 - 104.8 98.00 2.77
Robustness
pH 2.84
29.47 ± 2.38 1.69 1.76 94.1 – 106.3 99.68 2.77
Incubation Time
2.81 28.18 ± 2.91 1.57 0.76 95.7 – 104.5 99.34
2.78 * Calibrated digital caliper was used in reading the diameter of inhibition zones to two decimal digits sensitivity
¤ If any outlier in the original dataset of inhibition zone was detected by exeeding G critical value, the record was examined first to exclude false rejection of
truly acceptable value based on experience, trending of data and additional statistical testing using ROUT combination (GraphPad Prism V6)
¥ For each dose level (high and low) 16 measurements were made for each prepration
§ In case of missing or excluded values, the rule of replacement reading was applied to maintain the assay balance without impacting the output
£ Relative Standard Deviation within an assay € Relative Standard Deviation between different assay determinations for potency
60
J. Adv. Biomed. & Pharm. Sci .
Eissa et al .
Precision and Robustness of Antibiotic Assay Design
The overall RSD% for all assay groups was acceptable with a
value of 0.71. Table 1 shows detailed results of the precision
(repeatability and intermediate precision) and robustness.
Moreover, RSD% was determined to assess the variation in the
inhibition zone within the experiments and to evaluate potency
determinations (expressed as %). On the other hand, the
Confidence Intervals (CIs) - at 95% - showed the calculated range
of the upper and the lower values that most likely would contain the true population values of the potency. The output was
evaluated through RSD% computed within and between
experimental campaign design [20]. The variability between
inhibition zones within individual assay plates was calculated. In
the microbiological assay, the number of replications per dose
must be sufficient to ensure the desired precision with acceptable
confidence [20]. Furthermore, the assay may be repeated and the
results combined statistically to obtain the required precision [12,
20]. The Control group was included for the comparative study
with an average value of 2.82 mg/g, RSD% of 1.26 and relative
error of -0.09%. CI estimates were included and expressed as a
percentage. Repeatability test showed an RSD value of 0.71% with an average of 98.96%, 1.04% relative deviation from control
and relative error of 1.12%. Intermediate precision demonstrated
an RSD value of 0.74% with an average of 98.40%, 1.60%
deviation from the control group and relative error of 1.69%. On
the other hand, robustness demonstrated an RSD value of 1.13%
with an average of 99.56%, deviation from the standard of 0.44%
and relative error of 0.53%. The 95% CIs (expressed as a percent)
showed that the forecasting for the ranges of potency estimates
was reasonably acceptable for the assay. Nevertheless, increasing
the number of replicates per treatment group would increase the
confidence according to the desired target needed.
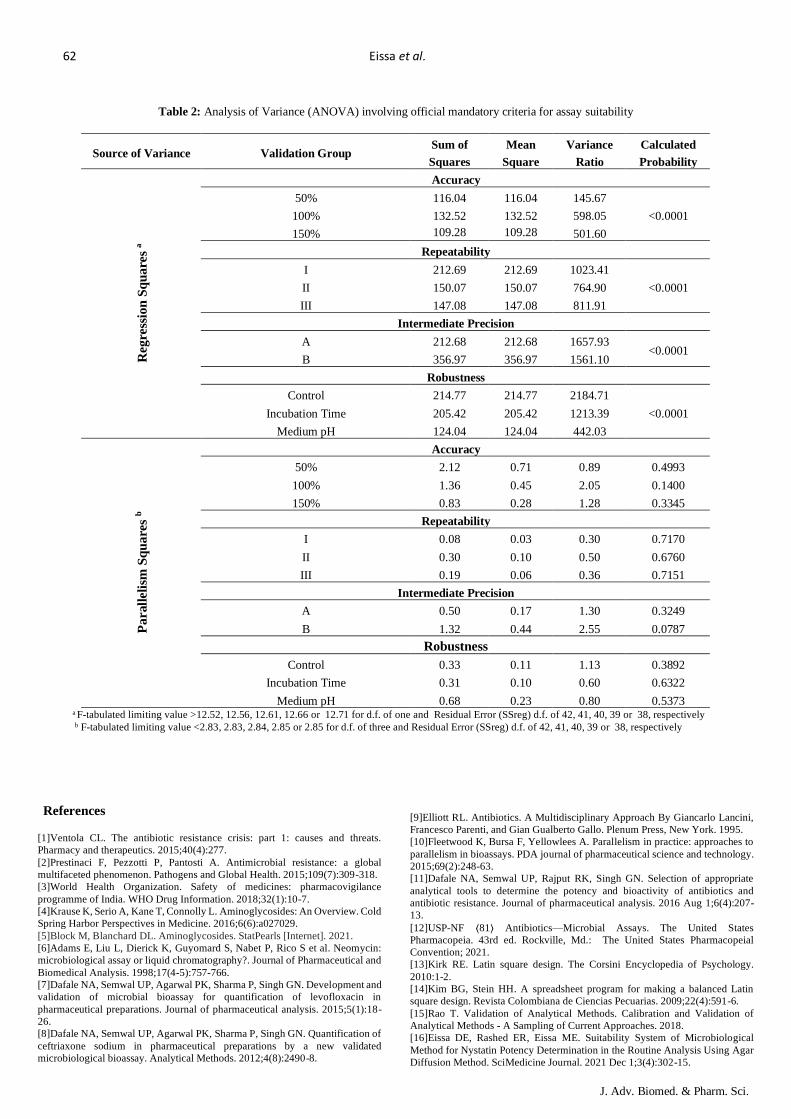
Analysis of Variance for Regression and Parallelism
Statistical evaluation of inhibition zone data must be ensured
before deriving any conclusion or confirming output results from
the assay design. Two official criteria must be met to ensure the
suitability of assay data to compute the potency of Neomycin
Sulfate [17]. These parameters are regression and parallelism
which were verified using Analysis of Variance (ANOVA) as
could be seen in Table 2. In case of missing and/or rejected values
from the assay readings, the degree of freedom would change and hence F-tabulated values could change [17]. In addition, the
probability of the occurrence of the events in terms of meeting
the limiting criteria was also calculated. The roles of replacing
missing values were applied so that only the assay balance was
resumed without affecting the original output record [12]. When
appropriate randomization procedures were applied through the
assay plate, the effect of row and column variations could be
minimized [17]. Detailed statistical analysis of the mandatory
compendial parameters showed an acceptable regression and
parallelism by comparing F-calculated (derived from the sum of
squares, mean square and degree of freedom (d.f.)) with F-
tabulated, in addition to the probabilities of the computed events. All the results of the zone of inhibition assay design had met the
acceptance criteria for both regression and parallelism. Hence, all
experiments were valid and suitable to derive the potency values
for the samples.
Conclusion
Microbiological antibiotic assay of Neomycin Sulfate using 2 x
2 balanced PLM agar diffusion technique in large 30 x 30 cm
large rectangular (8 rows x 8 columns) antibiotic plates was
validated in terms of specificity, linearity, accuracy, precision
and robustness, in addition to the examination of datasets suitability and assay design validity for potency determinations
of the aminoglycoside antibiotic. The investigated design showed
the acceptable design and validation parameters. Thus, it is
suitable for the assay with reasonable confidence. Shall the
confidence window be needed to get more restricted, an assay
modification that includes an increase in the number of replicates
must be investigated.
Conflict of Interest
There is no competing conflict of interest between the authors.
Acknowledgments
None to declare the whole work was conducted and supported
solely by the contributing authors.
61
Eissa et al .
J. Adv. Biomed. & Pharm. Sci .
References
[1]Ventola CL. The antibiotic resistance crisis: part 1: causes and threats.
Pharmacy and therapeutics. 2015;40(4):277.
[2]Prestinaci F, Pezzotti P, Pantosti A. Antimicrobial resistance: a global
multifaceted phenomenon. Pathogens and Global Health. 2015;109(7):309-318.
[3]World Health Organization. Safety of medicines: pharmacovigilance
programme of India. WHO Drug Information. 2018;32(1):10-7.
[4]Krause K, Serio A, Kane T, Connolly L. Aminoglycosides: An Overview. Cold
Spring Harbor Perspectives in Medicine. 2016;6(6):a027029.
[5]Block M, Blanchard DL. Aminoglycosides. StatPearls [Internet]. 2021.
[6]Adams E, Liu L, Dierick K, Guyomard S, Nabet P, Rico S et al. Neomycin:
microbiological assay or liquid chromatography?. Journal of Pharmaceutical and
Biomedical Analysis. 1998;17(4-5):757-766.
[7]Dafale NA, Semwal UP, Agarwal PK, Sharma P, Singh GN. Development and
validation of microbial bioassay for quantification of levofloxacin in
pharmaceutical preparations. Journal of pharmaceutical analysis. 2015;5(1):18-
26.
[8]Dafale NA, Semwal UP, Agarwal PK, Sharma P, Singh GN. Quantification of
ceftriaxone sodium in pharmaceutical preparations by a new validated
microbiological bioassay. Analytical Methods. 2012;4(8):2490-8.
[9]Elliott RL. Antibiotics. A Multidisciplinary Approach By Giancarlo Lancini,
Francesco Parenti, and Gian Gualberto Gallo. Plenum Press, New York. 1995.
[10]Fleetwood K, Bursa F, Yellowlees A. Parallelism in practice: approaches to
parallelism in bioassays. PDA journal of pharmaceutical science and technology.
2015;69(2):248-63.
[11]Dafale NA, Semwal UP, Rajput RK, Singh GN. Selection of appropriate
analytical tools to determine the potency and bioactivity of antibiotics and
antibiotic resistance. Journal of pharmaceutical analysis. 2016 Aug 1;6(4):207-
13.
[12]USP-NF ⟨81⟩ Antibiotics—Microbial Assays. The United States
Pharmacopeia. 43rd ed. Rockville, Md.: The United States Pharmacopeial
Convention; 2021.
[13]Kirk RE. Latin square design. The Corsini Encyclopedia of Psychology.
2010:1-2.
[14]Kim BG, Stein HH. A spreadsheet program for making a balanced Latin
square design. Revista Colombiana de Ciencias Pecuarias. 2009;22(4):591-6.
[15]Rao T. Validation of Analytical Methods. Calibration and Validation of
Analytical Methods - A Sampling of Current Approaches. 2018.
[16]Eissa DE, Rashed ER, Eissa ME. Suitability System of Microbiological
Method for Nystatin Potency Determination in the Routine Analysis Using Agar
Diffusion Method. SciMedicine Journal. 2021 Dec 1;3(4):302-15.
Table 2: Analysis of Variance (ANOVA) involving official mandatory criteria for assay suitability
Source of Variance Validation Group Sum of
Squares
Mean
Square
Variance
Ratio
Calculated
Probability
a R
egre
ssio
n S
qu
are
s
Accuracy
50% 116.04 116.04 145.67
<0.0001 100% 132.52 132.52 598.05
150% 109.28 109.28 501.60
Repeatability
I 212.69 212.69 1023.41
<0.0001 II 150.07 150.07 764.90
III 147.08 147.08 811.91
Intermediate Precision
A 212.68 212.68 1657.93 <0.0001
B 356.97 356.97 1561.10
Robustness
Control 214.77 214.77 2184.71
<0.0001 Incubation Time 205.42 205.42 1213.39
Medium pH 124.04 124.04 442.03
b P
arall
eli
sm S
qu
are
s
Accuracy
50% 2.12 0.71 0.89 0.4993
100% 1.36 0.45 2.05 0.1400
150% 0.83 0.28 1.28 0.3345
Repeatability
I 0.08 0.03 0.30 0.7170
II 0.30 0.10 0.50 0.6760
III 0.19 0.06 0.36 0.7151
Intermediate Precision
A 0.50 0.17 1.30 0.3249
B 1.32 0.44 2.55 0.0787
Robustness
Control 0.33 0.11 1.13 0.3892
Incubation Time 0.31 0.10 0.60 0.6322
Medium pH 0.68 0.23 0.80 0.5373 38, respectively ord.f. of 42, 41, 40, 39 Residual Error (SSreg) and for d.f. of one 12.71 or, 12.61, 12.66 12.5612.52, limiting value >tabulated -Fa
38, respectively ord.f. of 42, 41, 40, 39 and Residual Error (SSreg) for d.f. of three2.85 or2.83, 2.84, 2.85 ,tabulated limiting value <2.83-F b
62
J. Adv. Biomed. & Pharm. Sci .
Eissa et al .
[17]Hewitt W. Microbiological assay for pharmaceutical analysis. Boca Raton:
Interpharm/CRC; 2004.
[18]Eissa M, R Rashed ER, Eissa DE. Statistical Comparison of Parallel-Line
Symmetrical Microbiological Models: Analysis of Agar Diffusion Assay in 8 x 8
Large Rectangular Plates. Journal of Statistics and Applied Sciences. 2021 (In-
Press).
[19]Eissa M, R Rashed ER, Eissa DE. Validation of Symmetrical Two-Dose
Parallel Line Assay Model for Nystatin Potency Determination in Pharmaceutical
Product. Journal of Advanced Pharmacy Research. 2021.
[20]Oppe TP, Menegola J, Schapoval EE. Microbiological assay for the
determination of cefpirome in raw material and injectable preparation. Drug
Analytical Research. 2018;2(1):29-35.
[21]Oppe T, Menegola J, Schapoval E. Development and Validation of UV
Spectrophotometry and Liquid Chromatography Methods for Determination Of
Cefpirome in Raw Material and Pharmaceutical Dosage. Drug Analytical
Research. 2019;3(1):42-50.
[22]Cazedey EC, Salgado H. Development and validation of a microbiological
agar assay for determination of orbifloxacin in pharmaceutical preparations.
Pharmaceutics. 2011;3(3):572-81.
[23]Vieira D, Fiuza TF, Salgado H. Development and validation of a rapid
turbidimetric assay to determine the potency of cefuroxime sodium in powder for
dissolution for injection. Pathogens. 2014;3(3):656-66.
[24]Nahar S, Khatun M, Kabir M. Application of microbiological assay to
determine the potency of intravenous antibiotics. Stamford Journal of
Microbiology. 2020;10(1):25-29.
[25]Lourenço FR, Pinto TD. Comparison of three experimental designs employed
in gentamicin microbiological assay through agar diffusion. Brazilian Journal of
Pharmaceutical Sciences. 2009;45:559-66.
[26]Caulcutt R, Boddy R. Statistics for analytical chemists. London: Chapman
and Hall/CRC; 1983.
[27]Beiguelman B. Curso prático de bioestatística. 5th ed.; Ribeirão Preto: Revista
Brasileira de Genética; 2002; pp.1-35, 117-263.
[28]Jacques C, Sidia M. Bioestatística: princípios e aplicações. InBioestatística:
princípios e aplicações 2003; pp. 255-255.
[29]Solano AG, Pereira LD, Leonel MD, Nunan ED. Development of agar
diffusion method for dosage of gramicidin. Brazilian Journal of Pharmaceutical
Sciences. 2011;47:564-72.
[30]Guideline IH. Validation of analytical procedures: text and methodology. Q2
(R1). In: ICH Harmonised Tripartite Guideline. International Conference on
Harmonisation of Technical Requirements for registration of Pharmaceuticals for
Human Use. 2005;1(20):05.
[31]Vieira DC, Salgado HR. Comparison of HPLC and UV spectrophotometric
methods for the determination of cefuroxime sodium in pharmaceutical products.
Journal of chromatographic science. 2011;49(7):508-11.
[32]British Pharmacopoeia Commission. British Pharmacopoeia (BP) 2016:
volume III.London: TSO; 2016.
[33]Leonel M, Soares C, Siqueira A. Comparison of pharmacopeial statistical
methods applied in microbiological assay for antibiotics potency determination
using parallel lines and three-dose level. Brazilian Journal of Pharmaceutical
Sciences. 2012;48(3):565-576.
[34]Eissa D, Rashed E, Eissa M. Microbiological Antibiotic Assay Validation of
Gentamicin Sulfate Using Two-Dose Parallel Line Model in Large 8 x 8
Rectangular Plate. 2021 (Under Revision).
[35]European pharmacopoeia. Strassbourg: Council of Europe; 2019.
[36]Box GE. Non-normality and tests on variances. Biometrika. 1953 Dec
1;40(3/4):318-35.
[37]Loureno FR, Kaneko TM, Pinto TD. Validation of erythromycin
microbiological assay using an alternative experimental design. Journal of AOAC
International. 2007 Jul 1;90(4):1107-10.
[38]FDA F. Guidance for industry: bioanalytical method validation. http://www.
fda. gov/cder/Guidance/4252fnl. pdf. 2001.
[39]Hubert P, Nguyen-Huu JJ, Boulanger B, Chapuzet E, Chiap P, Cohen N,
Compagnon PA, Dewé W, Feinberg M, Lallier M, Laurentie M. Harmonization
of strategies for the validation of quantitative analytical procedures: a SFSTP
proposal–part II. Journal of pharmaceutical and biomedical analysis.
2007;45(1):70-81.
[40]Hubert P, Nguyen-Huu JJ, Boulanger B, Chapuzet E, Cohen N, Compagnon
PA, Dewé W, Feinberg M, Laurentie M, Mercier N, Muzard G. Harmonization
of strategies for the validation of quantitative analytical procedures: A SFSTP
proposal–Part III. Journal of pharmaceutical and biomedical analysis. 2007 Sep
21;45(1):82-96.
63