rapid coliphage detection assay
TRANSCRIPT
DEVELOPMENT OF A RAPID COLIPHAGE DETECTION ASSAY
by
James Emmett Stanek
Thesis submitted to the Faculty of the
Virginia Polytechnic Institute and State University
in partial fulfillment of the requirements for the degree of
Master of Science
in
Microbiology
APPROVED:
____________________________Joseph O. Falkinham III, Chairman
______________________ ______________________ Stephen M. Boyle George H. Lacy
January 24, 1997
Blacksburg, Virginia
keywords: coliphage, virus, water, method
ii
DEVELOPMENT OF A RAPID COLIPHAGE DETECTION ASSAYby
James Emmett StanekJoseph O Falkinham III, Chairman
Microbiology and Genetics Section, Biology Department(Abstract)
A rapid coliphage detection assay (RCDA), based on the phage-inducedrelease of β-galactosidase from cells of Escherichia coli (Ijzerman, M., J.O.Falkinham III and C. Hagedorn. (1993) [A liquid, colorimetric presence-absencecoliphage detection method. J. Virol. Meth. 45:229-234] was modified to reducethe number of steps required to perform the assay, remove the need forspecialized media and buffers, reduce the volumes required, and simplifygrowth and reaction conditions. Tolerances of the assay were defined at eachstep of the assay. The number of steps has been reduced from 12 to 7. The β-galactosidase reaction buffer was eliminated. Culture volumes were reducedfrom 25 ml to 5 ml and reaction volumes were reduced from 10 ml to 0.5 ml.Optimal growth conditions were 37o C with orbital shaking at 200 rpm, a onehour subculture time and an incubation of subculture with water sample for twohours. Color development occurred at 37o C in 30 minutes. The changes andmodifications of the assay increased the ease of its performance withoutsacrificing the ability of the assay to detect as few as two phage particles persample. By understanding the tolerances of the assay, technical supportrepresentatives of companies producing kits modeled after the assay will beprepared to answer questions from customers concerning possible kit failuresor user error.

iii
ACKNOWLEDGMENTS
I have been a member of the Virginia Tech community since 1987, whenI arrived as a freshman. Over the years, it has been my pleasure to meet manyfine people and, I would like to take this opportunity to thank them for the impactthey have had on shaping my life.
First, I would like to thank Joe Falkinham for allowing me the honor ofworking in his lab and, to double the thanks for his patience with me as I wrotethis thesis. Sometimes, the demands Joe made upon me were difficult anddid not seem to make sense at the time, but now that I am working in the “real-world” his hard won lessons have prepared me well. Thank you.
I would also like to thank Drs. George Lacy and Stephen Boyle forserving on my committee. I appreciated their ideas, encouragements and, theirwillingness to allow me to move in different directions.
There are several faculty members who were selflessly giving to mewhile I conducted my work. To Drs. Muriel Lederman, Brenda Shirley, BillClaus, Noel Krieg and Bruce Parker, thank you for sharing your ideas, help, andsympathy. I could not have done it alone.
Laura Via described graduate school as a circus in her dissertation.With the group of friends I made while working in 4014 Derring Hall I wouldhave to agree. Thanks to all the graduate students in the microbiology sectionfor their friendship and help, especially; John Mayo, Twilla Eaton, DonnaJensen, Laura Via, Marcus Jucker, Ross Zirkle, Cody Cain, and Lori Brookman.
The three people who helped me to complete the work in this thesis areDr. Jane Duncan, Scott Burian, and Whitney Emsch. These three peoplehelped me get my start in this project and with the collection of data. I wouldalso like to thank Dominion BioSciences for funding this work.
I would like to thank my parents, Larry and Donna Stanek, for their loveand support and, the occasional kick in the pants to keep me on track. I hope Ihave made you proud. I love you both.
Finally, I owe a tremendous debt to my wife Shannon. She alwaysencouraged my successes and nursed me through my failures. Simple wordscannot express my gratitude to you, “I love you” will have to do.
I would like to dedicate this work to the memory of Dr. John L. Johnson.Dr. Johnson best represents science to me. He was a gentleman and adedicated scientist who shared his passion with students freely. He shouldserve as a role model for us all.
iv
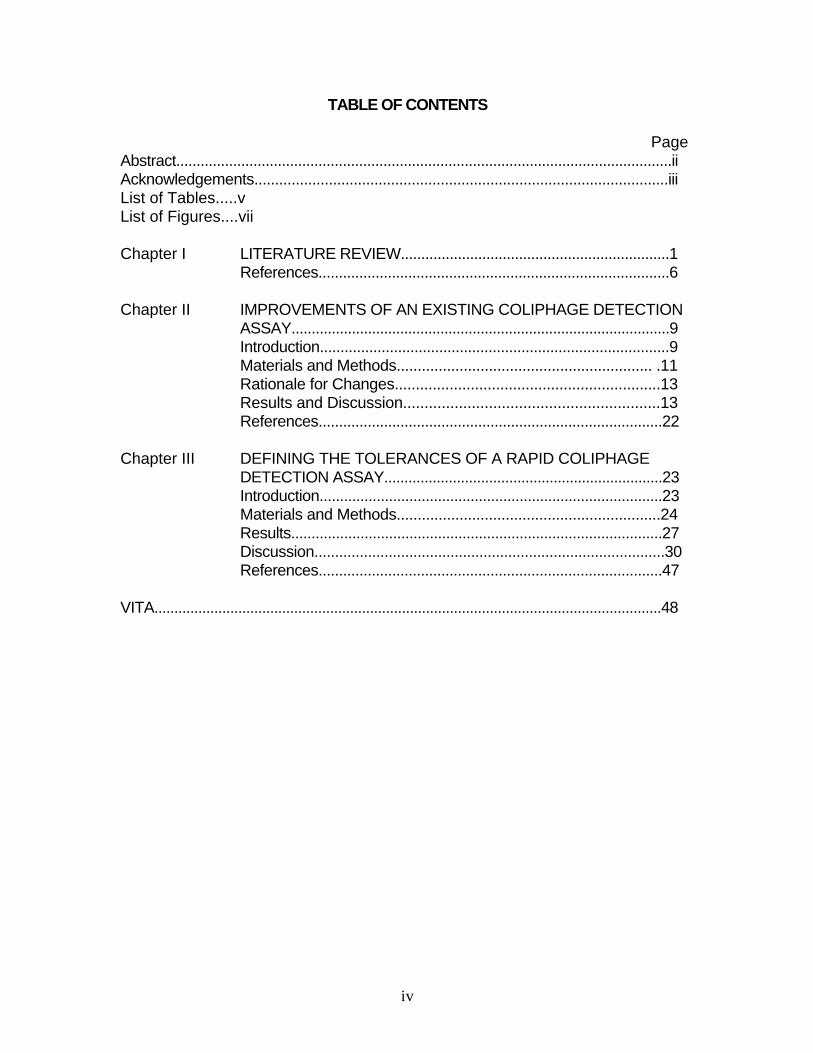
TABLE OF CONTENTS
PageAbstract..........................................................................................................................iiAcknowledgements....................................................................................................iiiList of Tables.....vList of Figures....vii
Chapter I LITERATURE REVIEW..................................................................1References......................................................................................6
Chapter II IMPROVEMENTS OF AN EXISTING COLIPHAGE DETECTION ASSAY..............................................................................................9Introduction.....................................................................................9Materials and Methods............................................................. .11Rationale for Changes...............................................................13Results and Discussion............................................................13References....................................................................................22
Chapter III DEFINING THE TOLERANCES OF A RAPID COLIPHAGEDETECTION ASSAY.....................................................................23Introduction....................................................................................23Materials and Methods...............................................................24Results...........................................................................................27Discussion.....................................................................................30References....................................................................................47
VITA...............................................................................................................................48
v
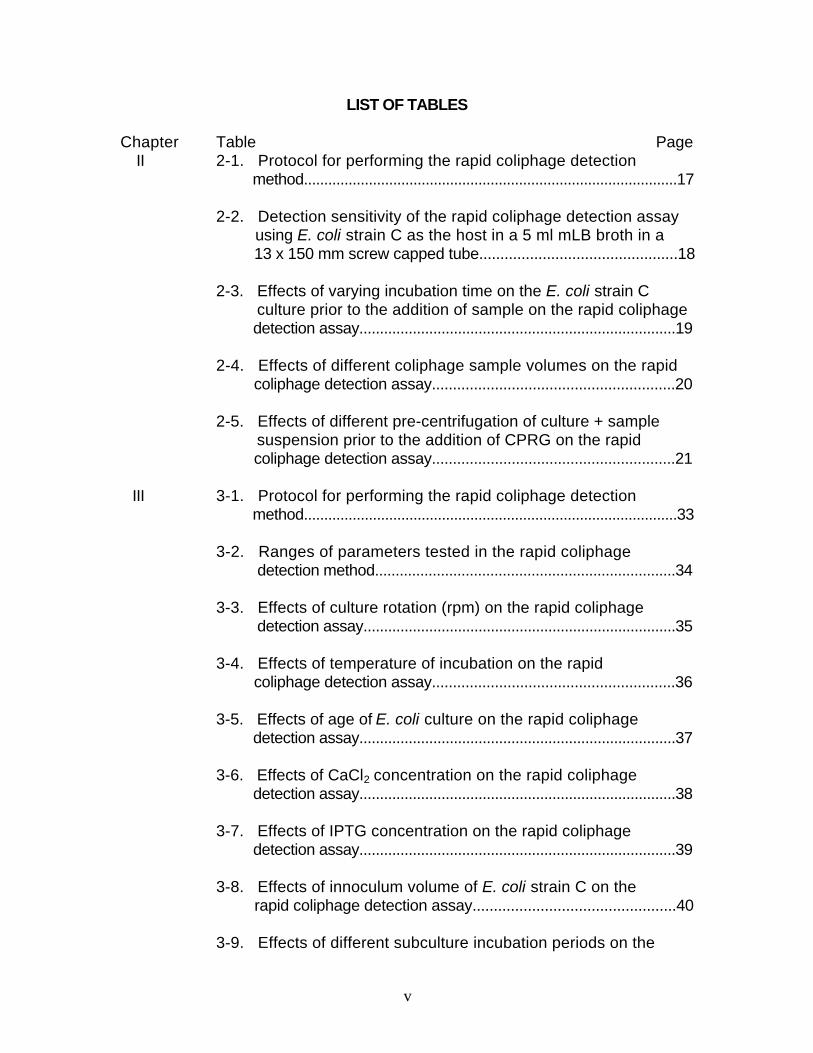
LIST OF TABLES
Chapter Table Page II 2-1. Protocol for performing the rapid coliphage detection
method............................................................................................17
2-2. Detection sensitivity of the rapid coliphage detection assay using E. coli strain C as the host in a 5 ml mLB broth in a 13 x 150 mm screw capped tube...............................................18
2-3. Effects of varying incubation time on the E. coli strain C culture prior to the addition of sample on the rapid coliphage detection assay.............................................................................19
2-4. Effects of different coliphage sample volumes on the rapid coliphage detection assay..........................................................20
2-5. Effects of different pre-centrifugation of culture + sample suspension prior to the addition of CPRG on the rapid coliphage detection assay..........................................................21
III 3-1. Protocol for performing the rapid coliphage detection method............................................................................................33
3-2. Ranges of parameters tested in the rapid coliphage detection method.........................................................................34
3-3. Effects of culture rotation (rpm) on the rapid coliphage detection assay............................................................................35
3-4. Effects of temperature of incubation on the rapid coliphage detection assay..........................................................36
3-5. Effects of age of E. coli culture on the rapid coliphage detection assay.............................................................................37
3-6. Effects of CaCl2 concentration on the rapid coliphage detection assay.............................................................................38
3-7. Effects of IPTG concentration on the rapid coliphage detection assay.............................................................................39
3-8. Effects of innoculum volume of E. coli strain C on the rapid coliphage detection assay................................................40
3-9. Effects of different subculture incubation periods on the
vi
rapid coliphage detection assay...............................................41
3-10. Effects of sample volume on the rapid coliphage detection assay.............................................................................42
3-11. Effects of varying length of phage + culture incubation periods on the rapid coliphage detection assay.....................43
3-12. Effects of different volumes of filtrate added to CPRG in the color development.............................................................44
3-13. Effects of different CPRG concentrations on the rapid coliphage detection assay..........................................................45
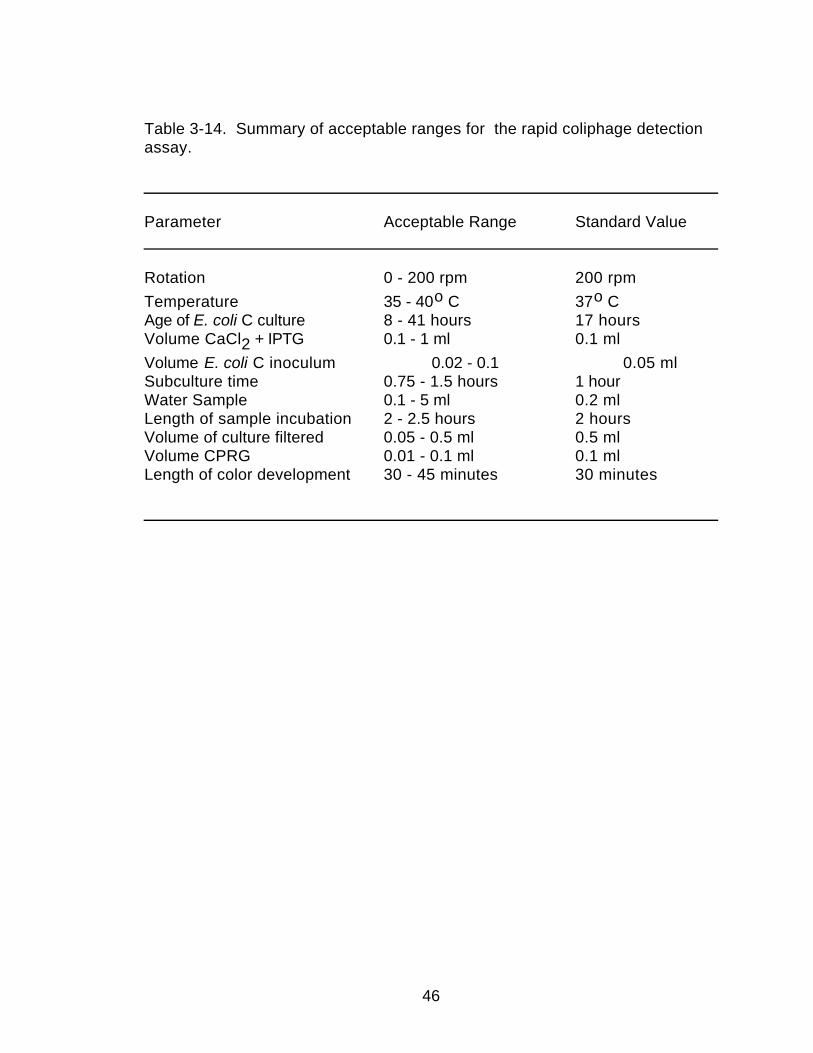
3-14 Summary of acceptable ranges for the rapid coliphage detection assay.............................................................................46

vii
LIST OF FIGURESChapter Figure Page II 1. A photograph of a coliphage negative test (left) and a
coliphage positive test (right) using the rapid coliphage detection method............................................................................16
1
Literature Review
The American Public Health Service first adopted fecal and totalcoliforms, the coliform bacterial group, as the bio-indicator of fecally-contaminated water in 1914 (Gerba, 1987). The coliform bacterial groupremains the standard indicator for fecal contamination even though it includesbacteria of other than those of fecal origin, [e.g. from plants and soils (Berg,1978)]. Although the coliform bacterial group and Escherichia coli specificallyserve as adequate indicators of bacterial contamination in water, they are notadequate as indicators of enteric viruses (Havelaar, 1993; Kott et al., 1974,Melnick et al., 1978, Stetler, 1984).
Over 120 different types of enteric viruses that cause disease in humansare excreted in human feces and urine (Melnick, 1984). The enteric virusesisolated from human feces include: adenoviruses, caliciviruses,cytomegaloviruses, enteroviruses, Norwalk viruses, reoviruses, androtaviruses (Havelaar, 1993; Rao and Melnick, 1986). These viruses cause avariety of illnesses including: congenital heart anomalies, conjunctivitis,diarrhea, encephalitis, fever, gastroenteritis, hepatitis, meningitis, myocarditis,nephritis, paralysis, pericarditis, respiratory illnesses, and skin rashes(Havelaar, 1993; Rao and Melnick, 1986). Epidemiologically, the mostimportant enteric viruses involved in human illnesses are the hepatitis A virus,rotaviruses, fecal adenoviruses, and caliciviruses (Havelaar, 1993). Virusesare important etiological agents due to the low number of infectious particlesrequired to cause disease. For example, as few as two plaque forming units(PFU) of the virus can cause the illness (Ward and Akin, 1984).
Viruses are more resistant to chlorination and other means of waterdisinfection than E. coli (Berg et al,, 1978). The simple structure of virusparticles, a nucleic acid genome surrounded by a protein coat, accounts fortheir greater resistance to methods of water disinfection (Melnick, 1984). Gerbaand Rose (1990) isolated viruses from finished drinking waters supplies thatwere free of indicator bacteria. These findings have prompted development oftesting methods for enteric viruses in treated waters. Only a few methods areavailable (Havelaar, 1993). Traditional methods for detecting enteric viruses inwater rely on tissue culture with the Buffalo Green Monkey cell culture line andtake several days to yield results (Havelaar, 1993; Kott et al., 1974). Primarytissue culture methods require a high degree of technical ability, and are tooexpensive to be used practically in many areas of the world (Kott et al., 1974;Havelaar, 1993).
The latest methods to be used in detecting human enteric viruses inwater are based on the polymerase chain reaction (PCR) (Schwab et al., 1993),nucleic acid hybridization (Margolin et al., 1989) and immunological methods(Kfir and Genthe, 1993). The use of nucleic acid probes and PCR to detectviruses in water has several limitations (Alvarez, et al., 1993). The use of these
2
methods requires high levels of technical skill, knowledge and expensivereagents which are prohibitive in most laboratories (Alvarez et al., 1993).
Virus detection methods share a common step of concentrating a largewater sample (up to 2000 liters) to as little as a few milliliters. One of thesemethods involves binding viruses to membrane filters and eluting viruses fromthe membrane with a beef extract solution (Stetler, 1984). Concentration isrequired because virus concentrations are low and samples must be of amanageable size. Unfortunately, beef extract contains high levels of proteinand salts that interfere with molecular biological methods of detectingcoliphage by stabilizing non-specific DNA binding or by destruction ofimmunoglobulins by proteases. The acceptance by diagnostic laboratories ofbeef extract as the virus eluant, makes the use of nucleic acid hybridization andPCR techniques even more difficult and time consuming to perform byrequiring low salt, and protease-free samples (Schwab et al., 1993). Due tothe high degree of specificity inherent in molecular techniques, a battery ofprobes or PCR primers would have to be used to detect a variety of entericviruses in waters because of the lack of agreement on an indicator enteric virus(Alvarez et al., 1993).
The use of immunological techniques such as enzyme linked immuno-sorbant assay (ELISA), radio-immuno assay (RIA) and immuno-fluorescent (IF)microscopy also present considerable problems (Kfir and Genthe, 1993). TheELISA method utilizes color-formation rather than radioisotopes used in RIA fordetecting viruses. Both the ELISA and the RIA methods are insensitive. Theycan only detect between 105 and 106 PFU/ ml as a minimum (Kfir and Genthe,1993). Further, both methods are expensive to perform and frequently yieldfalse positive results are obtained due to non-specific binding of antibody (Kfirand Genthe, 1993). Immuno-fluorescent techniques are as sensitive as otherhistochemical methods for detecting bacterial pathogens, although they have alimited range of viral detection (Kfir and Genthe, 1993). A disadvantage of boththe immunological and DNA-based technologies is their inability to distinguishbetween active and inactivated virus particles (Kfir and Genthe, 1993).
It has been proposed that coliphages, bacteriophages that infect E. coli,could serve as indicators for the presence of enteric viruses in a variety ofwaters (Havelaar, 1994; Palmateer et al., 1991; Stetler, 1984; Sikova andCervenka, 1981; Kott et al., 1974). Coliphages may be better suited asindicators of enteric viruses than indicator bacteria because their structure ismore similar to animal viruses than indicator bacteria and, they persist in theenvironment longer than do indicator bacteria (Grabow et al., 1984). Theacellular nature of coliphages (coliphages consist of a nucleic acid genomesurrounded by a protective protein coat) affords them resistance toenvironmental and water treatment methods equal to resistance levels inenteric viruses (Stetler, 1984).
3
In order for coliphage to serve as an adequate indicator for entericviruses, coliphages must be: (1) recovered from the same sources as entericviruses, (2) recovered in numbers greater than or equal to numbers of entericviruses, (3) share the same susceptibility to harsh environmental conditionsand water treatment processes as enteric viruses and (4) detected morerapidly and more inexpensively than enteric viruses (Kott et al., 1984).
Stetler (1984) showed that coliphage were always recovered along withenteric viruses throughout a water purification facility. E. coli hosts for bothsomatic and donor-specific coliphages were used. Somatic coliphage host E.coli strain C recovered 2.9 times more coliphage than the donor-phage-specifichost E. coli strain A-19 (Stetler, 1984). Moreover, coliphage enumerated with E.coli strain C were typically 13,870 times greater than enteric virus numbers(Stetler, 1984) Coliphage numbers diminished as water passed throughstages of the purification facility just as the enteric viruses did. Coliphageexhibited the same seasonal variation in numbers as did the enteric viruses(Stetler, 1984). Havelaar et al. (1986) reported that somatic coliphagesdetected by E. coli strain C were recovered in <70% of their samples of animaland human feces while donor specific phages weren’t detected using E. colistrain HfrH. Donor specific coliphage occurred mainly in young domestic farmanimals and are isolated in human feces only to a limited extent (Palmateer etal, 1991). In an Egyptian study of potable waters using E. coli strain C, 78 of147 (53%) samples yielded coliphages from drinking water samples that werefree of fecal and total coliforms (El-Abagy et al., 1988) Coliphage wererecovered in 65 of 147 (44%) of samples that were negative for total coliforms,and fecal coliforms. Four of 147 (3%) of the samples were positive for bothcoliphage and coliforms (El-Abagy et al., 1988).
Coliphage have also been proposed as indicator organisms of fecalcontamination in recreational and shell-fish harvesting waters (Palmateer etal., 1991; Vaughn and Metcalf, 1975). In 600 natural water samples numbersof, fecal coliform, total coliform and, coliphage exhibited the same linearresponse (Wentzel et al., 1982). Coliphage were detected in 5 of 5 (100%)Canadian beaches tested for the presence of coliphage, fecal coliforms and E.coli (Palmateer et al., 1991). Coliphage numbers in black mussels inshellfish-harvesting waters paralleled those of the fecal bacteria in the waterssurrounding them (Lucena et al., 1994). Additionally, Vaughn and Metcalf(1975) showed an equal linear response of coliphage and coxsackievirus inestuarine shell-fish raising waters during a year. Coliphage were alwaysrecovered even after coxsackievirus was no longer detectable (Vaughn andMetcalf, 1975).
The method first proposed for the detection of coliphage was describedin the 17th edition of Standard Methods for the Examination of Water andWastewater (APHA, 1989). It is a single-agar-layer infectivity method in whichplaques are visualized by the addition of 2,3,5-triphenyl tetrazolium chloride
4
(TPTZ). Coliphage are adsorbed to the E. coli strain C host cell; followinginjection of their nucleic acid into the host cell, where it replicates and directsthe synthesis of phage components and phage are released in a lytic burst.The lysis of host cells by coliphage results in a cleared zone, a plaque, on alawn of E. coli on the surface of a solid medium. In the APHA (1989) method, asuspension of E. coli C (ATCC 13706) able to detect only somatic coliphage, isadded to molten modified TSA. Then a water sample is added to the bacterial-agar suspension, mixed, and poured into a sterile Petri dish. Plaques aremore easily visualized by the reduction of TPTZ to a pinkish color on the lawn ofE. coli strain C. Plaques containing the contents of lysed cells are darker thanthe E. coli strain C lawn around them. E. coli strain C is used because it lacksa restriction modification system and is susceptible to a wide range of sewagecoliphages (Havelaar and Hogeboom, 1983). The lack of a restriction-modification system prevents the E. coli strain C from destroying injected DNA(Havelaar and Hogeboom, 1983).
Although this method is simple to perform, the interpretation of the dataobtained is not straight forward. The formation of plaque like zones due to non-viral cytotoxic compounds in the water sample can yield false-positive results(Ijzerman and Hagedorn, 1992). Further, plaques are not easily visualized evenwith TPTZ A modified agar agar-based plaque assay was developed based onthe release of β-galactosidase from coliphage-infected cells (Ijzerman andHagedorn, 1992). In that method, Ijzerman and Hagedorn (1992) used theoverproduction of β-galactosidase and its coliphage-induced release to cleave5-bromo-4-chloro-3-indoyl-β-D-galactopyranoside (X-gal), a chromogenic β-galactosidase substrate, in the agar medium. When X-gal is cleaved by β-galactosidase, the dark blue indoyl product accumulates in the medium insideand surrounding the plaque (Ijzerman and Hagedorn, 1992). Though, twice asmany coliphage were detected using the Ijzerman and Hagedorn (1992)method than in the APHA (1989) method in 5 parallel experiments, the assaystill required a 24 hour incubation.
A liquid based, presumptive coliphage detection assay, also based onthe phage-induced release of induced β-galactosidase, has also beendeveloped (Ijzerman et al, 1993) The liquid colorimetric presence-absence(LCPA) assay was developed to avoid the problem of false positive plaque likeareas and to shorten the time required for detection (Ijzerman et al., 1993).
IPTG was used as the inducer for over-expression of β-galactosidase inthe E. coli C (Miller, 1978). IPTG is a lactose analogue and it is not a substrateof β-galactosidase, unlike lactose. β-Galactosidase acts on lactose to produceallo-lactose, an isomer of lactose, that binds to the repressor of lac operonexpression and modifies its structure to prevent binding to the lac operatorregion, thus allowing the transcription of the lac operon. Free lactose iscleaved to galactose and glucose by β-galactosidase. IPTG binds to the lacoperon repressor as avidly as allo-lactose and induced β-galactosidase levels
5
are 10-fold higher than those found in lactose-induced cells at a 100 fold lowermolar concentration (Barkley and Bourgeois, 1970, Miller, 1978).
Because β-galactosidase is a large oligomeric protein it cannot diffusethrough the cell envelope of E. coli. Therefore, β-galactosidase in the mediumcan only come from lysed or damaged cells (Zabin and Fowler, 1970). In theLCPA method, cultures were filtered and 1 ml samples of the filtrate wereadded to 9 ml of Z buffer to assay β-galactosidase activity (Miller, 1972).Chlorophenol red -β-D galactopyranoside (CPRG) was added as achromogenic substrate for β-galactosidase. Filtrates were incubated at 37o C.CPRG is yellow and when cleaved by β-galactosidase releases the purplecolored chlorophenol red. Thus, any reaction that turns purple contains β-galactosidase while any reaction that remains yellow does not. Because β-galactosidase release requires the coliphage induced lysis, β-galactosidaseactivity is a reflection of coliphage in a sample. When using a concentratedwater sample, the LCPA method can detect as few as 2 plaque forming units/liter, compared to the APHA’s (1989) sensitivity to 5 PFU/ 100 ml (Ijzerman et al,1993). In field trials of the LCPA and APHA assays, of 90 samples of tap,spring, creek and wastewater samples the LCPA produced only 3.3% (3 of 90)false negative results compared to the APHA (1989) method. The falsenegative results only occured in samples with a very low coliphage titer(Ijzerman et al, 1994). The LCPA method was determined to be as sensitive asthe APHA (1989) method and the LCPA yielded results in 4.5 hours comparedto the 24 hours required to perform the APHA method.(Ijzerman et al, 1994).
The LCPA method offers several advantages over the APHA (1989)method. First, it is simpler to perform due to its lack of melted agar that canharden early resulting in a clear area easily mistaken for a plaque and makeinterpretation of data more difficult. Second, it is more sensitive and detectsfewer coliphage. And, finally, the LCPA method does not have the false-positiveresults associated with the APHA method.
6
References
Alverez, A. J., E. A. Hernandez-Delgado, and G. A. Toranzos. 1993. Advantages and disadvantages of traditional and molecular techniques applied to the detection of pathogens in waters. Water Sci. Technol. 27:253-256.
American Public Health Association. 1989. Standard Methods for the examination of water and wastewater. 17th ed. American Public Health Association, Washington, D.C.
Barkley, M. D. and S. Bourgeois. 1970. Repressor recognition of operator and effectors, p 177-220. In: Beckwith, J. R., and D. Zipster (eds.), The lactose operon. Cold Spring Harbor Laboratory, New York.
Berg, G. 1978. The indicator system, p 1-14. In: G. Berg (ed.), Indicators of viruses in water and food. Ann Arbor Science Publishing Co., Ann Arbor, MI,
Berg, G., D. R. Dahling, G. A. Brown, and D. Berman. 1978. Validity of fecal coliforms, total coliforms, and fecal streptococci as indicators of viruses
in chlorinated primary sewage effluents. Appl. Environ. Microbiol. 36:880-884.
El-Abagy, M. M., B. J. Dutka, and M. Kamel. 1988. Incidence of coliphage in potable water supplies. Appl. Environ. Microbiol. 54:1632-1633.
Gerba, C.P. 1987. Phage as indicators of fecal pollution, p 197-209. In: S.M. Goyal, C.P. Gerba, and G. Bitton (eds.) Phage Ecology., John Wiley andSons. Inc. New York.
Gerba, C. P. and J. B. Rose. 1990. Viruses in source and drinking water, p 381-396, In: G. A. McFeters (ed), Drinking water Microbiology. Springer-Verlag, New York.
Grabow, W. O. K., E. M. Nupen, and B. W. Bateman. 1984. South African research on enteric viruses in drinking water, p. 146-155. In: J. L. Melnick(ed.), Enteric viruses in water, Karger, Basel, Switzerland..
Havelaar, A. H. 1993. Bacteriophages as models of human enteric viruses inthe environment: Although imperfect, phages can act as sentinels for a safer
water supply. ASM News 12:614-619.Havelaar, A. H. and W. M. Hogeboom. 1983. Factors affecting the enumeration
of coliphages in sewage and sewage polluted water. Antonie van Leeuwenhoek 49:387-397.
Ijzerman, M. M., and C. Hagedorn. 1992. Improved method for coliphage detection based on β-galactosidase induction. J. Vir. Meth. 40:31-36.
Ijzerman, M. M., J. O. Falkinham III, and C. Hagedorn. 1993. A liquid colorimetric presence-absence coliphage detection method. J. Vir. Meth. 45:229-234.
7
Ijzerman, M. M., J. O. Falkinham III, R. B. Renaeu Jr, and C. Hagedron. 1994. Field evaluation of two colorimetric coliphage detection methods. Appl. Environ. Microbiol. 60:826-830.
Kfir, R., and B. Genthe. 1993. Advantages and disadvantages of the use of immunodetection techniques for the ennumeration of microorganisms
and toxins in water. Water Sci. Tech. 27:243-252.Kott, Y, N. Roze, S. Sperber, and N. Betzer. 1974. Bacteriophages as viral
pollution indicators. Water Res. 8:165-171.Kott, Y. 1984. Coliphages as reliable enteric virus indicators, p. 171-174. In: J.
L. Melnick (ed.), Enteric viruses in water, Karger, Basel, Switzerland.Lucena, F., J. Lasobras, D. McIntosh, M. Forcadell, and J. Jofre. 1994. Effect
of distance from the polluting focus on the relative concentrations of Bacteroides fragilis phages and coliphages in mussles. Appl. Environ. Microbiol. 60:2272-2277.
Margolin, A. B., K. J. Richardson, R. De Leon, C. P. Gerba. 1989. Application of gene probes to the detection of enteroviruses in water, p. 265-270. In:R. A. Larson (ed.), Biohazards of drinking water treatment, Lewis publishers, Chelsea, MI.
Melnick, J. L. 1984. Etiological agents and their potential for cuasing waterborne disease, p 1-16. In: J. L. Melnick (ed.), Enteric Viruses in Water. Karger, Basel, Switzerland.
Melnick, J. L., C.P. Gerba, and C. Wallis. 1978. Viruses in water. Bull. W.H.O. 56:499-508.
Miller, J. 1978 The lac I gene:its role in the lac operon and its use in genetic systems, p. 31-88. In: Miller J. H., and W. S. Reznikoff (eds.) The operon. Cold Spring Harbor Laboratory, New York
Palmateer, G. A., B.J. Dutka, E. M. Janzen, S. M. Meissner, and M. G. Sakellaris. 1991. Coliphage and bacteriophage as indicators of recreational water quality. Water Res. 25:355-357.
Rao, V. C. and J. L. Melnick. 1986. Environmental virology. American Society for Microbiology, Washington, D.C.
Sambrook, J., T. Maniatis, and E. F. Fritsch. 1989. Molecular cloning: a laboratory manual. Cold Spring Harbor Laboratory, New York.
Schwab, K. J., R. De Leon, and M. D. Sobsey. 1993. Development of PCR methods for enteric virus detection in water. Water Sci. Tech. 27:211-
218.Sikova, A., and J. Cervenka. 1981. Coliphages as ecological idicators of
enteroviruses in various water systems. Bull W.H.O. 59:611-618.Stetler, R. E. 1984. Coliphages as indicators of enteroviruses. Appl. Environ.
Microbiol.48:668-670.Vaughn, J. M., and T. G. Metcalf. 1975. Coliphages as indicators of enteric
viruses in shellfish raising estuarine waters. Water Res. 9:613-616.
8
Ward, R. L. and E. W. Akin. 1984. Minimum infective dose of animal viruses. CRC Crit. Rev. Environ. Contr. 14:297-301.
Wentzel, R. S., P. E. O’Niel, and J. F. Kitchens.1982. Evaluation of coliphage as a rapid indicator of water quality. Appl. Environ. Microbiol. 43:430-434.
Zabin, I., and A. V. Fowler. 1970. β-galactosidase and thiogalactoside transacetylase, p27-48 In: Beckwith, J. R., and D. Zipster (eds.),The lactose operon. Cold Spring Harbor Laboratory, New York.
9
Chapter II
IMPROVEMENTS OF AN EXISTING COLIPHAGE DETECTION ASSAY
Introduction
The first proposed method for the detection of coliphage was introducedin the 17th edition of Standard Methods for the Examination of Water andWastewater (APHA, 1989). It is a single-agar-layer infectivity method in whichplaques are visualized with the addition of 2,3,5-triphenyl tetrazolium chloride(TPTZ). In the APHA (1989) method, a suspension of E. coli strain C (ATCC13706) is added to molten (55o C) modified T-soy agar. Then a water sampleis added to the agar, mixed, and poured into a sterile Petri dish. Clear areas,plaques, with a pinkish tinge, form on the lawn of E. coli where coliphage haveinfected, replicated, and lysed cells releasing progeny phage.
The problems with the APHA (1989) method include low sensitivity,difficulty in visualizing plaques, and formation of plaque-like zones forming dueto non-viral cytotoxic compounds in the water sample (Ijzerman and Hagedorn,1992). To avoid these problems a liquid colorimetric presence-absencecoliphage detection (LCPA) method was developed (Ijzerman et al., 1994). TheLCPA method was based on the phage-induced release of β-galactosidasefrom isopropyl-β-D-galactopyranoside (IPTG)-induced Escherichia. coli strain C(ATCC 13706) cells.
The use of IPTG as the inducer for β-galactosidase in the E. coli C hostsis due to the virtually irreversible nature of its binding to the lac I repressormolecule (Miller, 1978). IPTG is a lactose analogue and it is not a substrate ofβ-galactosidase, unlike lactose. β-galactosidase acts on lactose to produceallo-lactose, an isomer of lactose, which binds to the lac repressor effecting aconformational change preventing its binding to the operator region of the lacoperon and allowing the transcription of the lac operon. Free lactose is cleavedto galactose and glucose by β-galactosidase. Because IPTG is not a substrateof β-galactosidase it cannot be removed from the repressor protein. Thisprevents repressor binding to the operator DNA and allows for production of β-galactosidase in E. coli induced with IPTG (Barkley and Bourgeois, 1970).IPTG binds to the repressor with comparable affinity as allo-lactose andincreases β-galactosidase levels in the cell 10-fold higher than found inlactose-induced cells (Miller, 1978) (Barkley and Bourgeois, 1970).
Because β-galactosidase is a large oligomeric protein (~116 KDa)molecule and it cannot diffuse out of E. coli, extracellular β-galactosidase in themedium can only come from lysed or damaged cells (Zabin and Fowler, 1970).Cultures were filtered and 1 ml samples of the filtrate added to 9 ml of Z bufferto detect β-galactosidase activity (Miller, 1972); chlorophenol red -β-D
10
galactopyranoside (CPRG) was added as a chromogenic substrate for β-galactosidase. Filtrates were allowed to incubate at 37o C. CPRG is yellow andwhen cleaved by β-galactosidase releases the purple colored chlorophenolred. Thus, any reaction that turns purple indicates coliphage while any reactionthat remains yellow indicates a lack of coliphage.
A liquid colorimetric, presence-absence coliphage detection methodwas modified for ease of use and lower cost. The objective of this study was toremove all unnecessary steps and minimize the amount of time required toperform the assay. These two goals would have the net effect of lowering thecost of performing the assay by removing unnecessary reagents and byreducing the amount of hands on time required to perform the assay.
11
Materials and Methods
Bacteria and phage. E. coli strain C (ATCC 13706) used in the LCPAmethod was chosen as the host organism for the RCDA due to itssusceptibility to a wide range of sewage coliphages because it lacksrestriction-modification system (Havelaar and Hogeboom, 1983).
The common sewage coliphage (ATCC 13706 β2) was the phage used.Media preparation. Luria Broth (LB) and Luria Agar (LA) were prepared
and sterilized as described in Sambrook et al. (1989). A modified LB (mLB)was prepared by adding 0.15 g magnesium sulfate (MgSO4)/ liter prior toautoclaving. Sterilized media were stored at 25o C.
A 0.25 M calcium chloride (CaCl2) solution was prepared by dissolving0.277 g CaCl2 in 10 ml distilled water, sterilized by filtration through a 0.2 µmfilter and stored at 4o C.
A 10 mM solution of isopropyl β-D thiogalactoside (IPTG) (Gibco BRL,Gaithersburg, MD) was prepared by dissolving 23 mg in 10 ml distilled water,sterilized by filtration through a 0.2 µm filter and stored at 4o C.
Z buffer for the β-galactosidase assay was made following the protocolof Miller (1972) and stored at 4o C..
A 5 mM solution of chlorophenol red β-D galactopyranoside (CPRG)(Boehringer-Mannheim Biochemicals, Indianapolis, IN) was made bydissolving 3 mg in 10 ml distilled water, sterilized by filtration through a 0.2 µmfilter and, stored at 4o C.
Growth of bacteria. E. coli C was grown at 37o C on LB agar medium(Sambrook et al., 1989) from lyophilized stocks purchased from the AmericanType Culture Collection (Rockville, MD). A single isolated colony was used toinoculate 5 ml LB broth (Sambrook et al., 1989) in a 13 x 150 mm screw-capped tube and grown overnight at 37o C at 200 rpm. This overnight culturewas used to inoculate 100 ml of LB broth in a 250 ml Erlenmeyer and grownovernight at 37o C to late log phase.
Storage of bacteria. Glycerol (Fisher Scientific, NJ) was added to LB toa final concentration of 20% (v/v) and 1 ml aliquots of E. coli strain C cellsuspension were flash frozen in liquid nitrogen and stored at -70o C. Freshstock plates of E. coli strain C were made from a thawed frozen samplestreaked onto LB agar and incubated at 37o C for isolated colonies.
Coliphage assay.(1.) Each assay was started by inoculating a single isolated colony (1-2 mmdiameter) into a 13 x 150 mm screw-capped tube containing 5 ml mLB broth.(2.) The culture was incubated overnight for 17 hours at 37o C at 200 rpm.(3.) 0.05 ml of the overnight was subcultured into 5 ml of mLB in a 13 x 150mm screw-capped tube for each sample as well as for the controls.(4.) To each subculture 0.1 ml of a solution containing 0.25 M CaCl2 (FisherScientific, NJ) and 10 mM IPTG (Gibco, BRL, Gaithersburg, MD) was added.
12
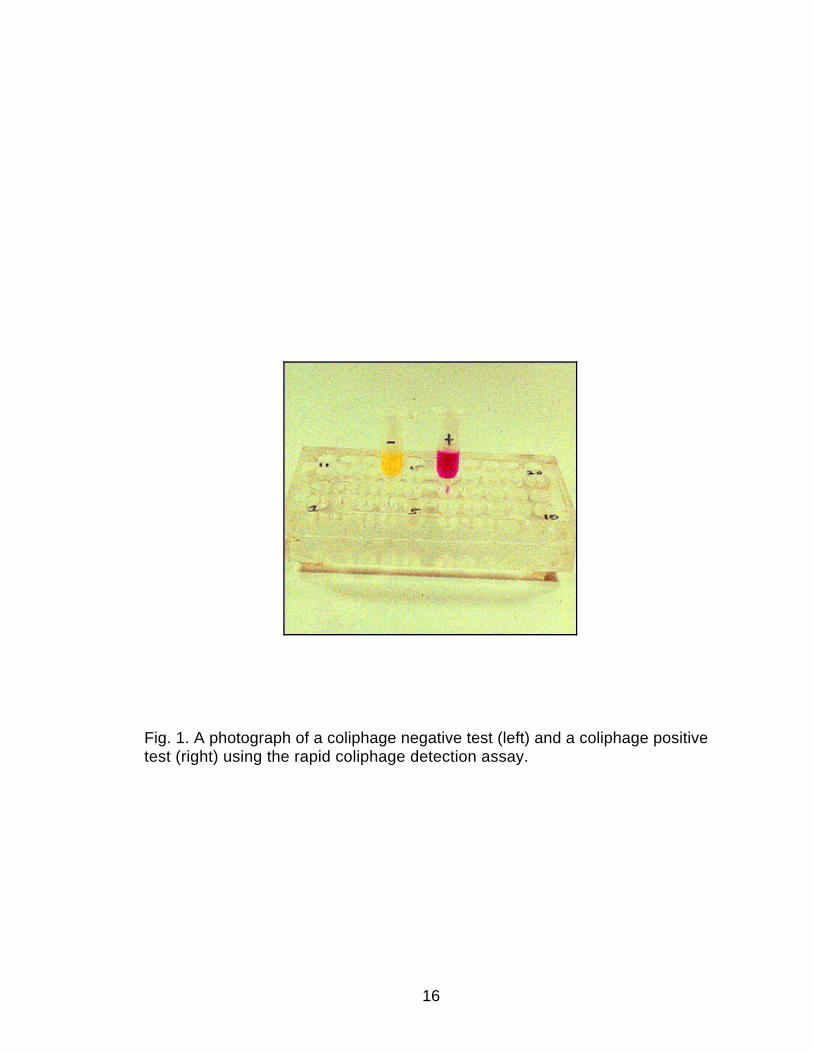
(5.) The resulting cultures were incubated at 37o C at 200 rpm.(6.) After 1 hour incubation between 0.1 and 10 ml of a suspension of phagewas added. A volume of sterile water equal to the volume of the phage-containing sample was added for a negative control. Suspensions were mixedthoroughly by inversion and incubated at 37o C with shaking (200 rpm).(7.) After 2 hours, a 0.5 ml sample of each culture was placed in the filtrationunit of a 0.2 µm Spin-X tube (Corning Costar, Cambridge, MA). The separatecollection unit of the Spin-X tube contained 0.1 ml of the 5 mM CPRG.(8.) The Spin-X tube was centrifuged at 16,000 x g in an Eppendorfmicrocentrifuge (Brinkman Instruments, Westbury, NY) for 2 minutes at roomtemperature to separate whole cells from the medium.(9.) The Spin-X tubes containing the filtrate and CPRG were incubated at 37o Cfor 30 minutes and then observed by eye for a color change. A tube with a deepred to purple color was scored a positive and any tube that was yellow orslightly orange in color was scored as negative for the presence of coliphage(Fig. 1).(10). To insure that coliphage were present in Spin-X tubes that were purpleand not present in tubes that were yellow, a 0.01 ml sample from each tubewas spotted onto a lawn of E. coli C on LB agar and incubated overnight at 37o
C to see if a plaque would form in areas spotted with positive and negativereacting filtrate. The protocol for the assay is presented on Table 2-1.
13
Rationale for Changes
The modifications of the LCPA method have increased the ease of theassays performance without sacrificing the sensitivity of the assay (Table 2-2).An initial goal was to reduce the culture size from 25 ml in the LCPA method to5 ml. The benefit of reducing culture volumes allows the assay to beperformed in 16 x 150 mm screw-capped tubes rather than 125 ml Erlenmeyershake flasks and thus more samples to be analyzed in a limited space.
A second goal of this project was to reduce the number of steps andmanipulations required to perform the assay. In attaining this goal thepossibility of contamination would be lowered by reducing the number of stepsand also by removing the need for micropipetors that become phagecontaminated due to aerosolization of phage suspensions. Also, a 0.1 mlsample allows for the use of a 1 ml glass pipet and not a micropipetor thatcould contaminate each tube with phage.
Results and Discussion
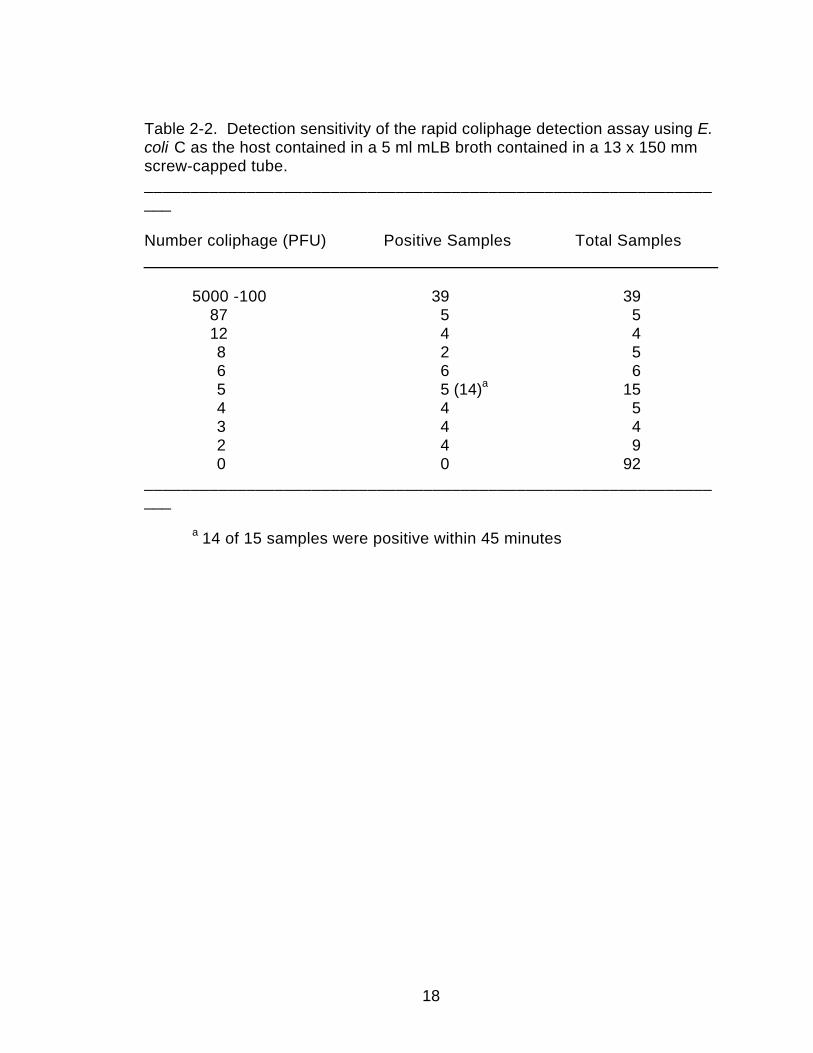
Culture volume. The culture volume was scaled down from 25 ml to 5ml and the assay remained able to detect as few as two coliphage particles;this allows for a more manageable transportation of cultures to and from theincubator in screw-capped tubes rather than in 125 ml Erlenmeyer flasks(Table 2-2).
Media additives. The LCPA method required the addition of CaCl2followed by a one hour incubation and then the addition of IPTG and a 30minute incubation to induce the β-galactosidase. In the RCDA method, theCaCl2 and IPTG were combined into one solution and the concentration of thestock was adjusted so addition of 0.1 ml would yield 5 mM CaCl2 and 1 mMIPTG. This modification removed one pipeting step from the LCPA method andallowed for the use of a single 1 ml glass pipet. In combining the mediaadditives into one solution the chance for introducing contaminating coliphageis decreased. By modifying the concentration of the additives a single 1 mlpipet is used. A goal of the assay was to use only one size of pipet thusreducing the possibility of pipeting an incorrect volume from another size pipet.
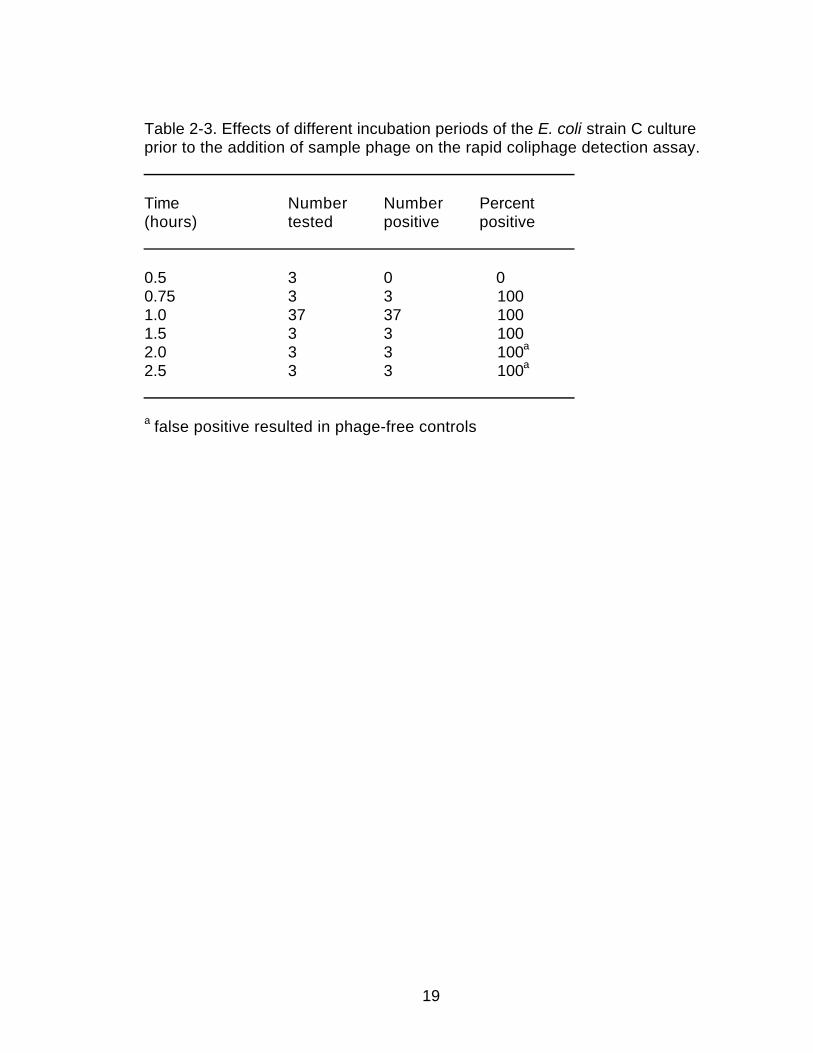
Subculture time. The initial incubation of the subculture was reducedfrom a total of 1.5 hours to 1 hour to maintain the cells in early log phase ratherthan in late log phase growth. We found that the longer incubation timeincreased the number of false positive results (Table 2-3) when the subcultureincubation period exceeds 1.5 hours. A 1 hour subculture gave sufficientnumbers of cells to give a positive reaction with 5 x 10³ coliphage particles.The culture would continue to grow at low coliphage titers to generate morehost cells as more coliphage particles are released upon lysis of each infected
14
host. The culture provided reproducible data for both high and low titersamples with the initial incubation time reduced to 1 hour (Table 2-2). The 1hour subculture time was used to fine tune the assay in the smaller culturevolume to allow enough cells to be present to yield positive results in highlycontaminated (high coliphage titer) samples, while allowing enough cells to beproduced to yield a positive result in less contaminated (low coliphage titer)samples.
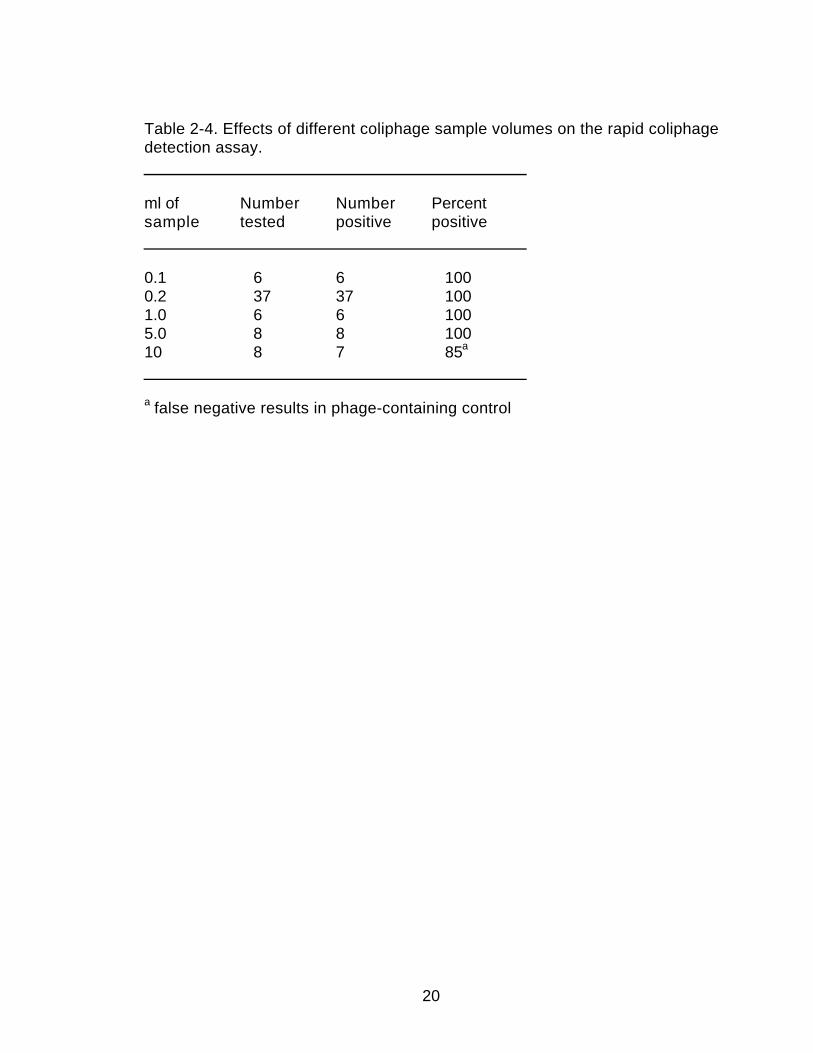
Sample size and pre-incubation. The coliphage sample was modifiedto a volume between 0.1 ml and 5 ml in the RCDA and gave accurate andreproducible data (Table 2-4). Increasing the sample volume to a volumeequal to the culture did not yield false positive results in phage-free tests orfalse negative results in phage containing tests. Further, the ratio of samplevolume to culture volume did not lower the sensitivity of the assay. As long astwo coliphage particles were present in a water sample of between 0.1 and 5ml, a positive result was consistently obtained. In the 10 ml sample volume,false negative results were seen in the phage containing samples. In none ofthe tests performed (N= 64) were any false positive results observed in phagefree samples. Also, the water samples were returned to the shaker without the15 minute-room temperature incubation as used in the LCPA. Presumably, inthe LCPA method that was used to allow coliphage to adsorb to the host cells.It was not required for the RCDA. By removing this step another source forhuman error was removed from the assay. The only sample volume stipulatedin the LCPA method was 1.25 ml.
Sample incubation. The incubation of water sample with the culturewas maintained for a total of 2 hours in both methods. This length of time wasfound to be essential in maintaining the assay’s sensitivity level of twocoliphage particles per water sample. The incubation period of 2 hours usedin the LCPA was maintained to allow for several lytic cycles to occur to increasethe amount of released β-galactosidase in the medium to insure positiveresults in low titer samples. Longer periods of incubation were avoided toprevent false positive results from occurring due to non-coliphage-induced celllysis.
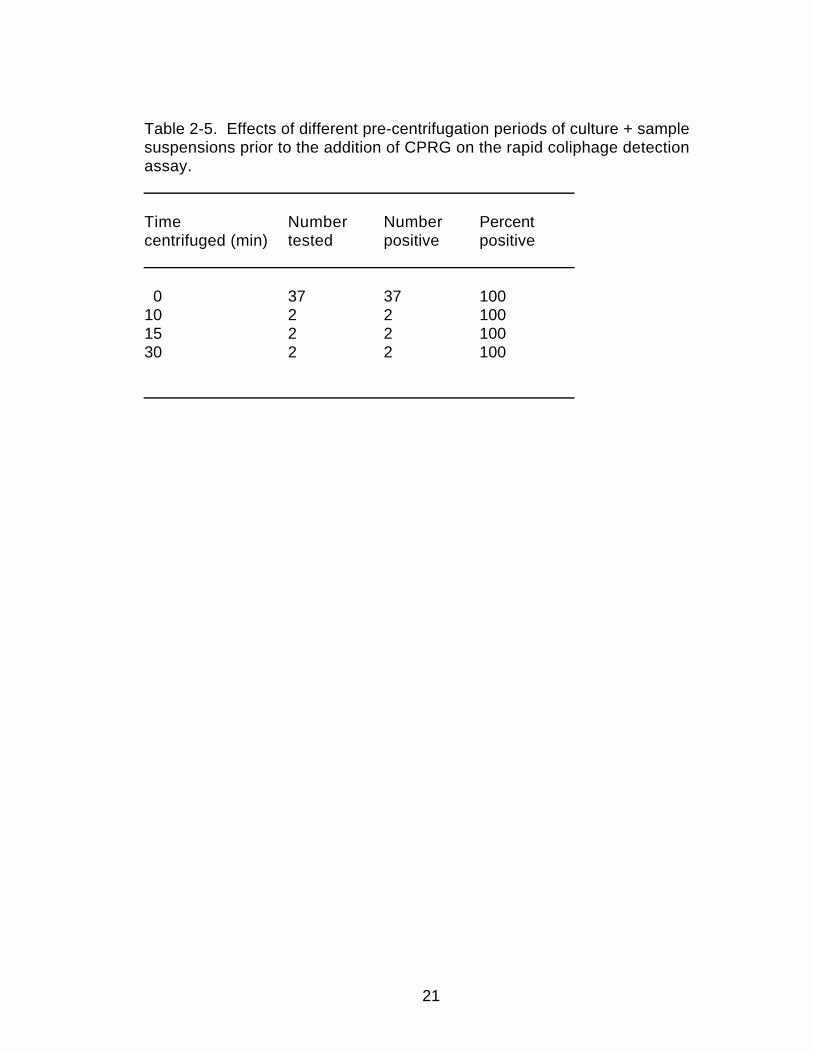
Centrifugation. Centrifugation of the culture prior to filtration as wasperformed in the LCPA method was found unnecessary in the RCDA method(Table 1-5). In the LCPA method, the centrifugation was required to removecells and cellular debris from the media prior to filtration of 25 ml of culture foruse in the β-galactosidase assay. In the RCDA, pre-centrifugation was notrequired and no false negative results were seen in phage containing samples(0 of 41) and no false positive results were seen in phage-free samples (0 of41). A 0.5 ml sample of culture material was filtered in a microcentrifuge filterunit (0.2 µm pore diameter) in the RCDA, rather than 25 ml of supernatantfiltered as required in the LCPA. Both of these modifications reduce theamount of time needed to perform the assay because a 15 minute
15
centrifugation is eliminated from the LCPA method. Further, as many as 18filtrations may be done all at once in a microcentrifuge, rather than individuallyby vacuum filtration. This also reduced the amount of glassware that requiredsterilization. The necessity for centrifugation prior to filtration was not requiredin the RCDA because the smaller volume of filtrate used in the assay did notclog up the membrane in the filter unit of the Spin-X column.
β-galactosidase buffer. The requirement for a β-galactosidase reactionbuffer (Z-buffer, Miller, 1972) was found to be unnecessary and removed fromthe assay. The medium alone had a sufficient buffer capacity and allowed forβ-galactosidase activity. Combination of 0.5 ml of filtrate and 0.1 ml of a 5 mMCPRG solution consistently yielded a purple color in reactions containingcoliphage (37 of 37). A yellow color was seen in samples containing nocoliphage (37 of 37). In 37 tests performed without Z-buffer none of theexperiments yielded a false negative result in phage-containing samples.There were no false positive results in 37 phage-free tests performed inparallel. The 30 minute incubation of culture filtrate with CPRG was maintainedto allow for color development. By removing the necessity for a β-galactosidase reaction buffer, the cost of the assay was lowered and removesthe necessity for another tube for the color development reaction..
16
Fig. 1. A photograph of a coliphage negative test (left) and a coliphage positivetest (right) using the rapid coliphage detection assay.
17
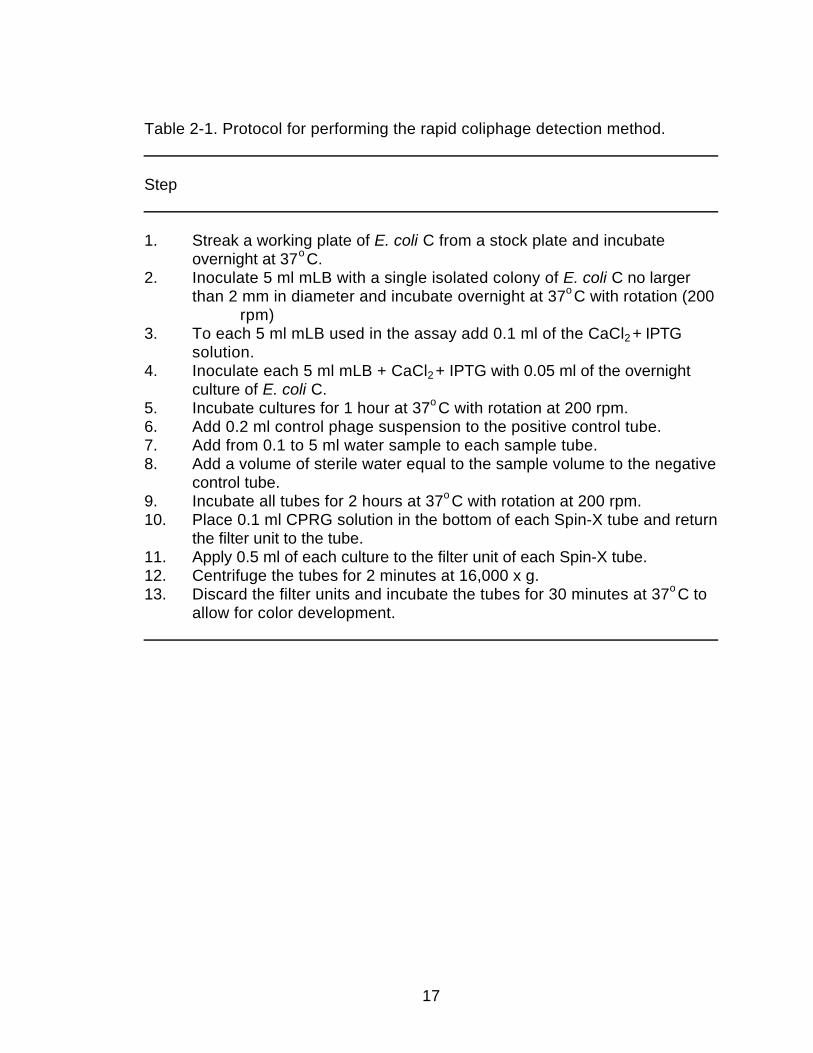
Table 2-1. Protocol for performing the rapid coliphage detection method.
Step
1. Streak a working plate of E. coli C from a stock plate and incubate overnight at 37o C.
2. Inoculate 5 ml mLB with a single isolated colony of E. coli C no larger than 2 mm in diameter and incubate overnight at 37o C with rotation (200
rpm)3. To each 5 ml mLB used in the assay add 0.1 ml of the CaCl2 + IPTG
solution.4. Inoculate each 5 ml mLB + CaCl2 + IPTG with 0.05 ml of the overnight
culture of E. coli C.5. Incubate cultures for 1 hour at 37o C with rotation at 200 rpm.6. Add 0.2 ml control phage suspension to the positive control tube.7. Add from 0.1 to 5 ml water sample to each sample tube.8. Add a volume of sterile water equal to the sample volume to the negative
control tube.9. Incubate all tubes for 2 hours at 37o C with rotation at 200 rpm.10. Place 0.1 ml CPRG solution in the bottom of each Spin-X tube and return
the filter unit to the tube.11. Apply 0.5 ml of each culture to the filter unit of each Spin-X tube.12. Centrifuge the tubes for 2 minutes at 16,000 x g.13. Discard the filter units and incubate the tubes for 30 minutes at 37o C to
allow for color development.
18
Table 2-2. Detection sensitivity of the rapid coliphage detection assay using E.coli C as the host contained in a 5 ml mLB broth contained in a 13 x 150 mmscrew-capped tube.________________________________________________________________
Number coliphage (PFU) Positive Samples Total Samples
5000 -100 39 39 87 5 5 12 4 4 8 2 5 6 6 6 5 5 (14)a 15 4 4 5 3 4 4 2 4 9 0 0 92
________________________________________________________________
a 14 of 15 samples were positive within 45 minutes
19
Table 2-3. Effects of different incubation periods of the E. coli strain C cultureprior to the addition of sample phage on the rapid coliphage detection assay.
Time Number Number Percent(hours) tested positive positive
0.5 3 0 00.75 3 3 1001.0 37 37 1001.5 3 3 1002.0 3 3 100a
2.5 3 3 100a
a false positive resulted in phage-free controls
20
Table 2-4. Effects of different coliphage sample volumes on the rapid coliphagedetection assay.
ml of Number Number Percentsample tested positive positive
0.1 6 6 1000.2 37 37 1001.0 6 6 1005.0 8 8 10010 8 7 85a
a false negative results in phage-containing control
21
Table 2-5. Effects of different pre-centrifugation periods of culture + samplesuspensions prior to the addition of CPRG on the rapid coliphage detectionassay.
Time Number Number Percentcentrifuged (min) tested positive positive
0 37 37 10010 2 2 10015 2 2 10030 2 2 100
22
References
American Public Health Association. 1989. Standard Methods for the examination of water and wastewater, 17th ed. American Public Health Association, Washington, DC
Barkley, M. D. and S. Bourgeois. 1970. Repressor recognition of operator and effectors, pp. 177-220 In: Beckwith, J. R., and D. Zipster (eds.),The lactose operon. Cold Spring Harbor Laboratory, New York.
Havelaar, A. H. and W. M. Hogeboom. 1983. Factors affecting the enumeration of coliphages in sewage and sewage polluted water. Antonie van Leeuwenhoek 49:387-397.
Havelaar, A. H., M. Van Oplhen, and Y. C. Drost. 1993. F- specific RNA bacteriophages are adequate model organisms for enteric viruses in
fresh water. Appl. Environ. Microbiol. 59:2956-2962.
Ijzerman, M. M., and C. Hagedorn. 1992. Improved method for coliphage detection based on β-galactosidase induction. J. Virol. Method. 40:31-36.
Ijzerman, M. M., J. O. Falkinham III, R. B. Renaeu Jr, and C. Hagedorn. 1994. Field evaluation of two colorimetric coliphage detection methods. Appl. Environ. Microbiol. 60:826-830.
Miller, J. 1978. The lac I gene:its role in the lac operon and its use in genetic systems, p. 31-88. In: Miller J. H., and W. S. Reznikoff (eds.) The operon. Cold Spring Harbor Laboratory, New York
Miller, J. H. 1972. Experiments in molecular genetics. Cold Spring Harbor Laboratory, New York.
Sambrook, J., T. Maniatis, and E. F. Fritsch. 1989. Molecular cloning: a laboratory manual. Cold Spring Harbor Laboratory, New York.
Zabin, I., and A. V. Fowler. 1970. β-galactosidase and thiogalactoside transacetylase, p27-48. In: Beckwith, J. R., and D. Zipster (ed.)The lactose operon. Cold Spring Harbor Laboratory, New York.
23
Chapter III
DEFINING THE TOLERANCES OF A RAPID COLIPHAGE DETECTION ASSAY
IntroductionA liquid colorimetric coliphage detection assay (LCPA) (Ijzerman et al.,
1994) was modified with the objective of simplifying its performance andreducing unnecessary steps and reagents. Further study of each parameter inthe Rapid Coliphage Detection Assay (RCDA) was performed to define theacceptable ranges at which the assay will still yield accurate and reproducibleresults and be as sensitive as the original test.
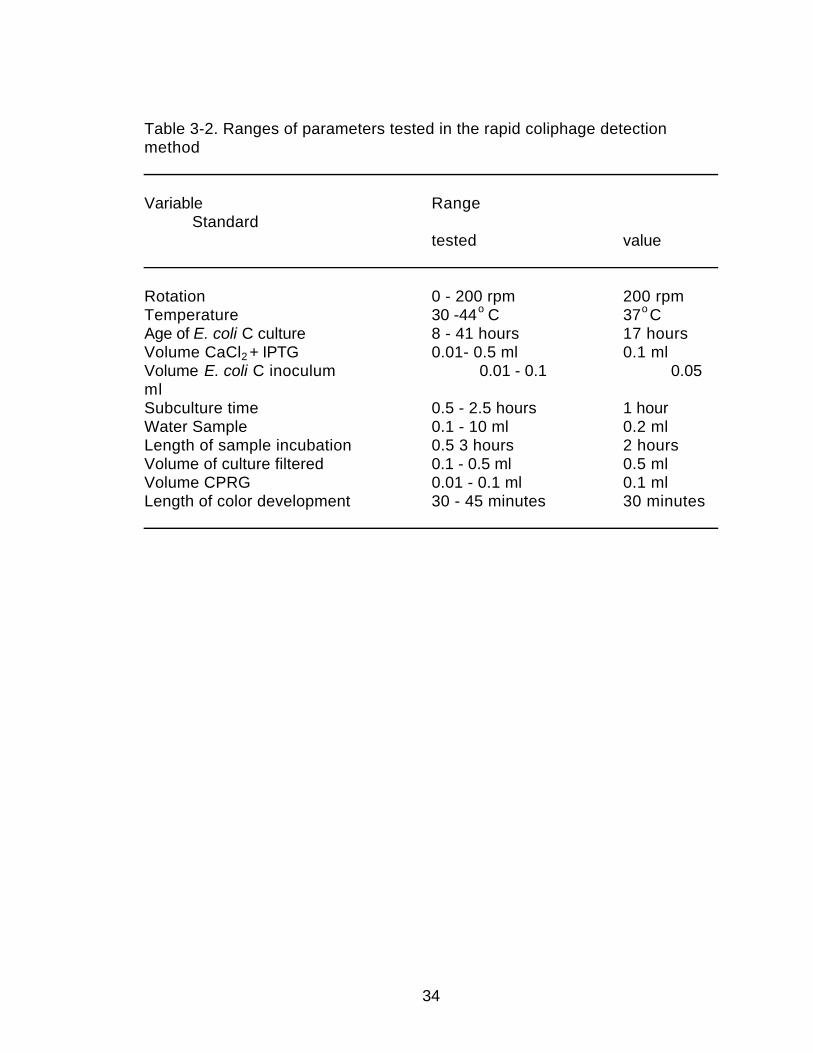
The objective of this study was to vary each parameter in theassay(Table 3-1) to determine its effects on the results of the assay. Theresults of this study define the acceptable parameters at which the RCDA maybe performed, and accurate and reproducible results obtained withoutsacrificing sensitivity.
24
Materials and MethodsBacteria and phage. E. coli strain C (ATCC 13706), used in the LCPA
method, remained the host organism for the RCDA because of its susceptibilityto a wide range of sewage coliphages as it lacks a restriction-modificationsystem (Havelaar and Hogeboom, 1983).
The common sewage coliphage (ATCC 13706 β2) was used as thephage.
Media preparation. Luria Broth (LB) and Luria Agar (LA) were preparedand sterilized as described in Sambrook et al. (1989). A modified LB (mLB)was prepared by adding 0.15 g magnesium sulfate (MgSO4)/ liter prior toautoclaving. Media were stored at 25o C.
A 0.25 M calcium chloride (CaCl2) solution was prepared by dissolving0.277 g CaCl2 in 10 ml distilled water, sterilized by filtration through a 0.2 mmfilter and, stored at 4o C.
A 10 mM solution of isopropyl β-D thiogalactoside (IPTG) (Gibco BRL,Gaithersburg, MD) was prepared by dissolving 23 mg in 10 ml distilled water,sterilized by filtration through a 0.2 µm filter and, stored at 4o C.
Z buffer for the β-galactosidase assay was made following the protocolof Miller (1972) and stored at 4o C..
A 5 mM solution of chlorophenol red β-D galactopyranoside (CPRG)(Boehringer-Mannheim Biochemicals, Indianapolis, IN) was made bydissolving 3 mg in 10 ml distilled water, sterilized by filtration through a 0.2 µmfilter and, stored at 4o C.
Growth of bacteria. E. coli strain C was grown on LB agar medium(Sambrook et al., 1989) from lyophilized stocks purchased from the AmericanType Culture Collection (Rockville, MD). A single isolated colony was used toinoculate 5 ml LB broth (Sambrook et al., 1989) and grown overnight at 37o Cwith rotation at 200 rpm. This overnight was used to inoculate 100 ml of LBbroth and grown overnight to late log phase.
Storage of bacteria. Glycerol (Fisher Scientific, NJ) was added to LB toa final concentration of 20% (v/v) and 1 ml aliquots of E. coli strain C cellsuspension were flash frozen in liquid nitrogen and stored at -70o C. Freshstock plates of E. coli C were made from a thawed frozen sample streaked ontoLB agar for isolated colonies.
Coliphage assay.(1.) Each assay was started from inoculating a 1-2 mm diameter singleisolated colony into a 13 x 150 mm screw-capped tube containing 5 ml mLBbroth.(2.) The culture was incubated overnight for 17 hours at 37o C with shaking(200 rpm).(3.) 0.05 ml of the overnight was subcultured into 5 ml of mLB for each sampleand for the controls.
25
(4.) To each subculture 0.1 ml of a solution containing 0.25 M CaCl2 (FisherScientific, NJ) and 10 mM IPTG (Gibco, BRL, Gaithersburg, MD) was added.(5.) The resulting cultures were incubated at 37o C with shaking (200 rpm).(6.) After 1 hour incubation between 0.1 and 10 ml of a suspension of phagewas added. A volume of sterile water equal to the volume of the phage-containing sample was added for a negative control. Suspensions were mixedthoroughly by inversion and incubated at 37o C with shaking (200 rpm).(7.) After 2 hours, a 0.5 ml sample of each culture was placed in the filtrationunit of a 0.2 µm Spin-X tube (Corning Costar, Cambridge, MA). The separatecollection unit of the Spin-X tube contained 0.1 ml of the 5 mM CPRG.(8.) The Spin-X tube was centrifuged at 16,000 x g in an Eppendorfmicrocentrifuge (Brinkman Instruments, Westbury, NY) for 2 minutes at roomtemperature to separate whole cells from the medium.(9.) The Spin-X tubes containing the filtrate and CPRG were incubated at 37o Cfor 30 minutes and then read for a color change. A tube with a deep red topurple color was scored a positive and any tube that was yellow or slightlyorange in color was scored as negative for the presence of coliphage. Theprotocol for the assay is presented on Table 3-1.
Experimental Variables Investigated. The parameters tested, theranges tested, and the standard values for each parameter are listed on Table3-2. In each experiment performed, the single step being varied wascompared with an assay performed under the standard conditions listed inTable 3-2. Each experiment was performed using the same E. coli overnightculture to inoculate each subculture and, only a single step was varied in eachexperiment. A false positive result is scored when the phage-free controlexhibit a purple (positive) color. A false negative result is scored when thephage-containing control exhibits a yellow (negative) color.
Stability of IPTG. A 10 mM IPTG solution was divided and samplesstored at 4o C, 25o C, and 37o C to determine the effects of these temperatureson its stability. Weekly samples were taken and used in the RCDA followingstandard assay protocol. Fresh IPTG was used as the control.
Stability of CPRG. A 5 mM CPRG solution was divided and samplesstored at 4o C, 25o C, and 37o C to determine the effects of these temperatureson its stability. Weekly samples were taken, absorbances measured, andused in the RCDA following standard assay protocol. Fresh CPRG was usedas the control.
Stability of E. coli strain C Lyophiles. A 5 ml E. coli strain C waslyophilized in 0.005 ml samples following the ATCC method (Simone andBrown, 1991) using a suspension of cells in either 20% (wt/vol) skim milksolution (Carnation, )or by diluting a culture 1:1 with fresh LB. Lyophiles werestored at 4o C. Lyophiles were rehydrated weekly with LB diluted andenumerated on LB agar to determine survival and a resulting colony from eachstorage type was used in the RCDA.

26
Stability of E. coli strain C suspensions. Stocks of E. coli strain C wereprepared from a overnight broth by inoculating LB agar plates, LB agar slants,by washing 5 ml broth in 0.1 M MgSO4 and suspending the washed cells in 0.5ml 0.1 M MgSO4. Each was tested for viability by streaking an LB agar plateweekly and using a single isolated colony from each resulting plate for use inthe RCDA. All stocks were stored at 4o C.
27
Results
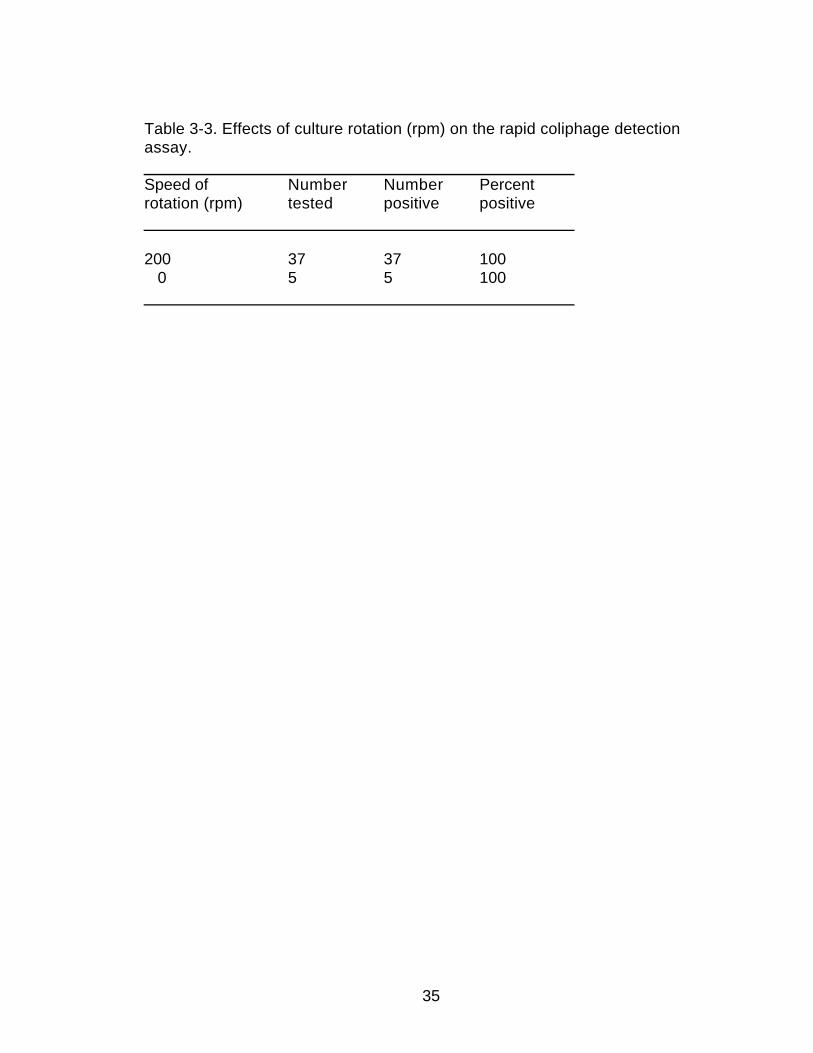
Culture Agitation. The speed of rotation used to agitate the culturesduring each incubation step was examined. The standard rate of rotation was200 rpm. Assays were performed in a 37o C incubator with or without rotation(orbital 200 rpm). The shaken culture was used as the standard control. Thedata from those experiments is presented in Table 3-3. Orbital shaking wasnot required for the assay to perform acceptably. The only difference was thatthe time required for a positive reaction to appear in tests performed withoutrotation was retarded by 5-10 minutes. However, a positive reaction was seenwithin 30 minutes.
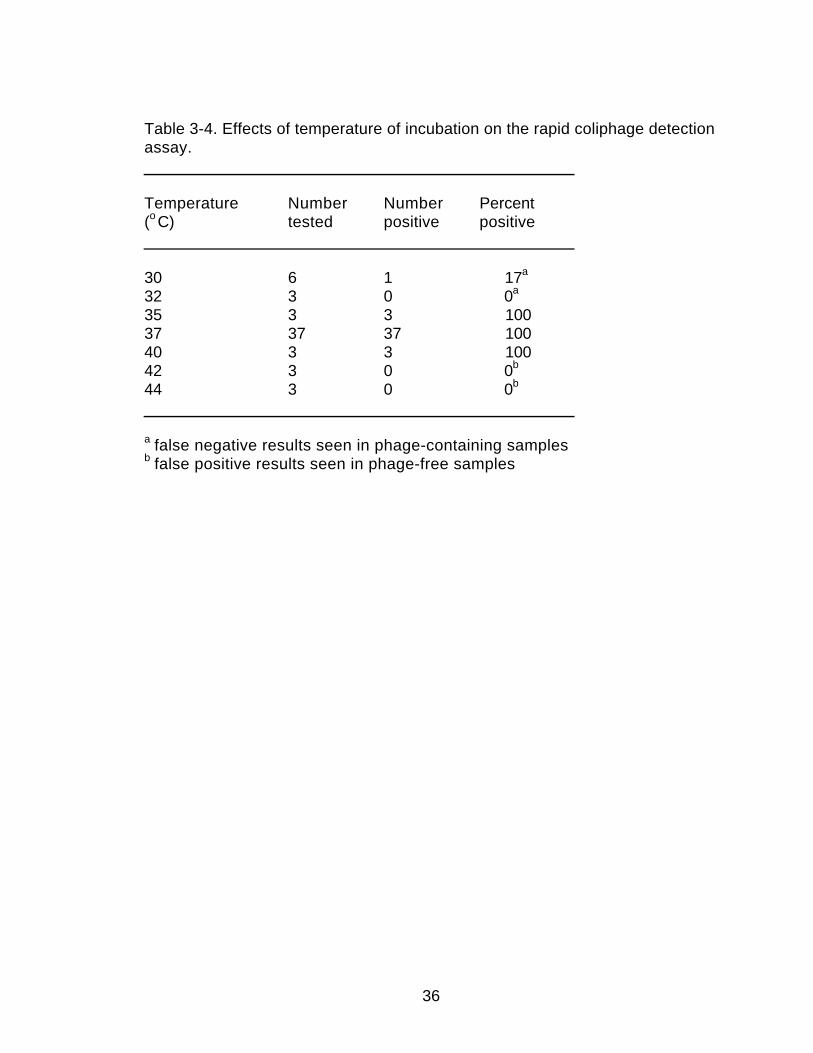
Temperature. The effects of temperature were examined to determine ifhigh temperature or low temperature affected the appearance of resultscompared to the control. The standard temperature used in the assay and asthe comparison control in each experiment was 37o C. The data are presentedin Table 3-4. The assays performed at 35o and 40o C were the same as thecontrol performed at 37o C. Temperatures below 35o C gave false negativeresults in phage-containing experiments and temperatures above 40o C gavefalse positive results in phage-free controls experiments.
Age of Overnight Cultures. The age of the overnight culture was testedto determine if the age of the culture used to inoculate the subcultures wouldeffect the assay results. The data are presented on Table 3-5. Overnightcultures from between 8 and 41 hours were compared to the standard 17 hrovernight control.
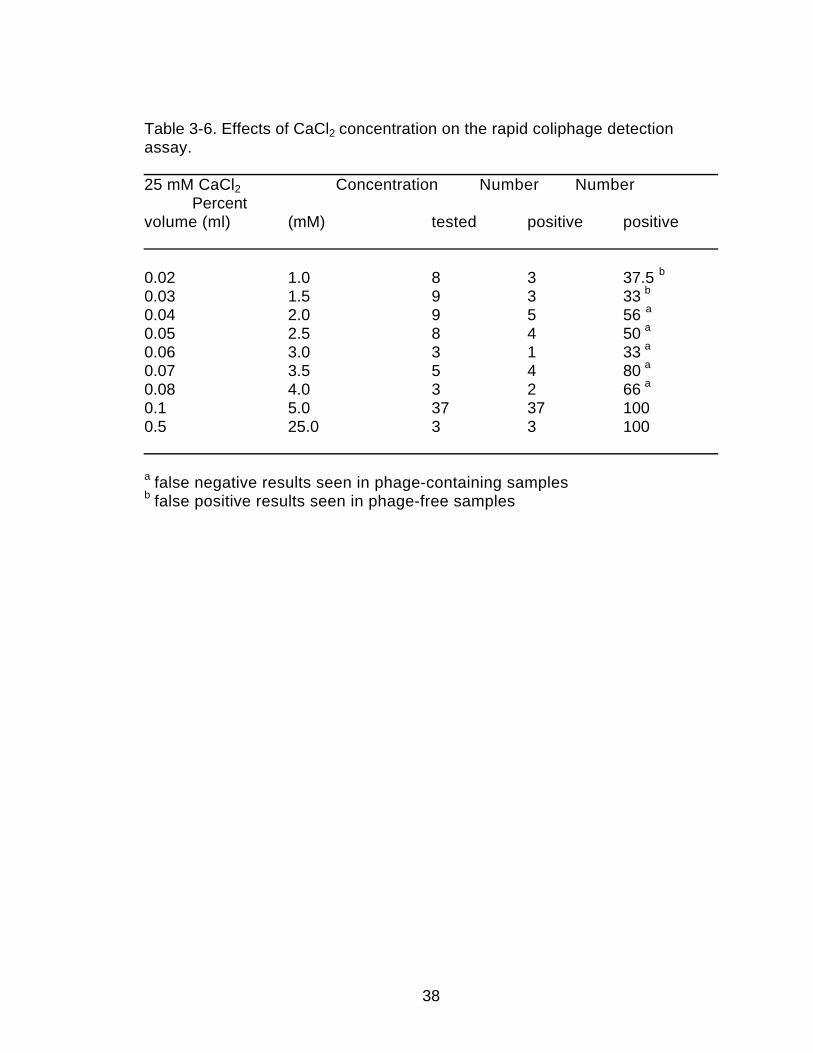
Volume of CaCl2. The volume of CaCl2 was examined to see if themolarity of CaCl2, which is required for coliphage adsorption (Adams, 1959),would effect the assay’s performance (Table 3-6). The standard volume of 0.1ml of 25 mM CaCl2 solution was used in the comparison control assay. Levelsof CaCl2 below 0.03 ml (1.5 mM CaCl2) gave false positive results. Volumesbetween 0.04 and 0.06 ml (2 mM and 3 mM) of CaCl2 yielded false negativeresult. Volumes of more than 0.07 ml (3.5 mM) of CaCl2 yielded resultsidentical to the standard volume.
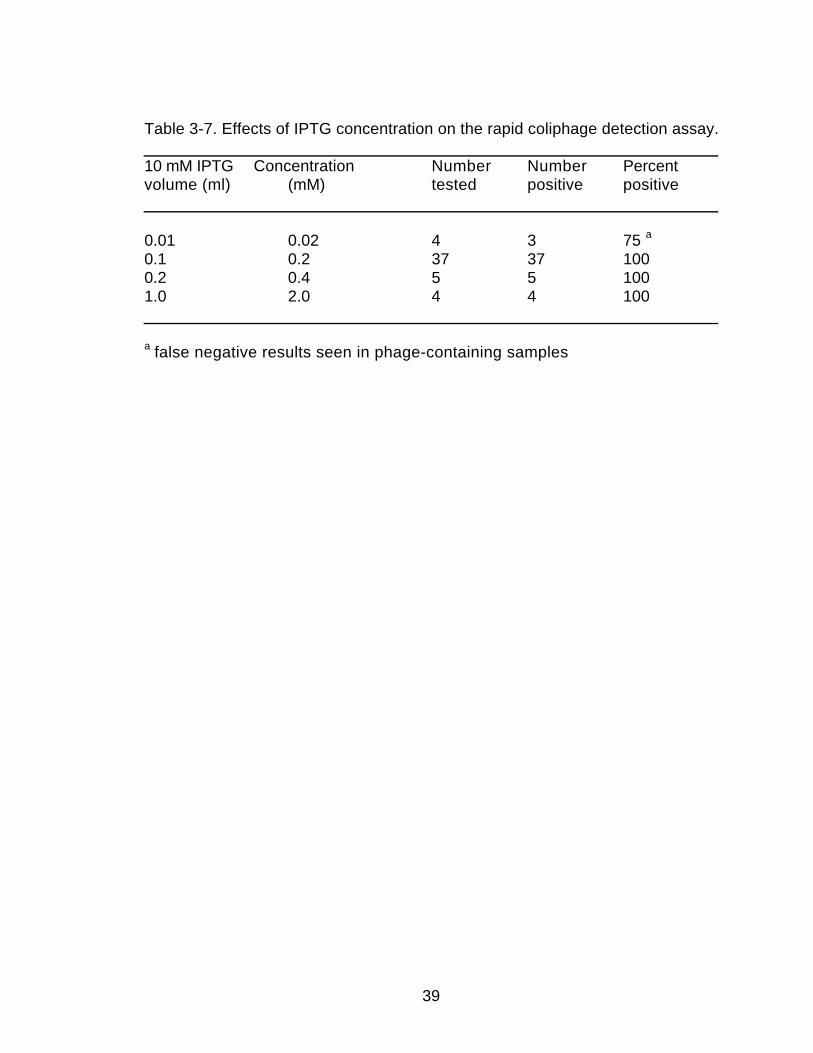
Concentration of Inducer. The effects of different volumes of IPTG onthe assay results were examined (Table 3-7). The standard volume of 0.1 ml ofa 10 mM IPTG was used as the comparison control (0.2 mM IPTG finalconcentration). Both 0.2 or 1.0 ml (0.4 mM and 2 mM) yielded results identicalto the results with the standard volume. The color development reaction wasslowed by 5-10 minutes when 0.01, 0.2 and 1.0 ml were used. However, thesevolumes still gave a positive result within 30 minutes.
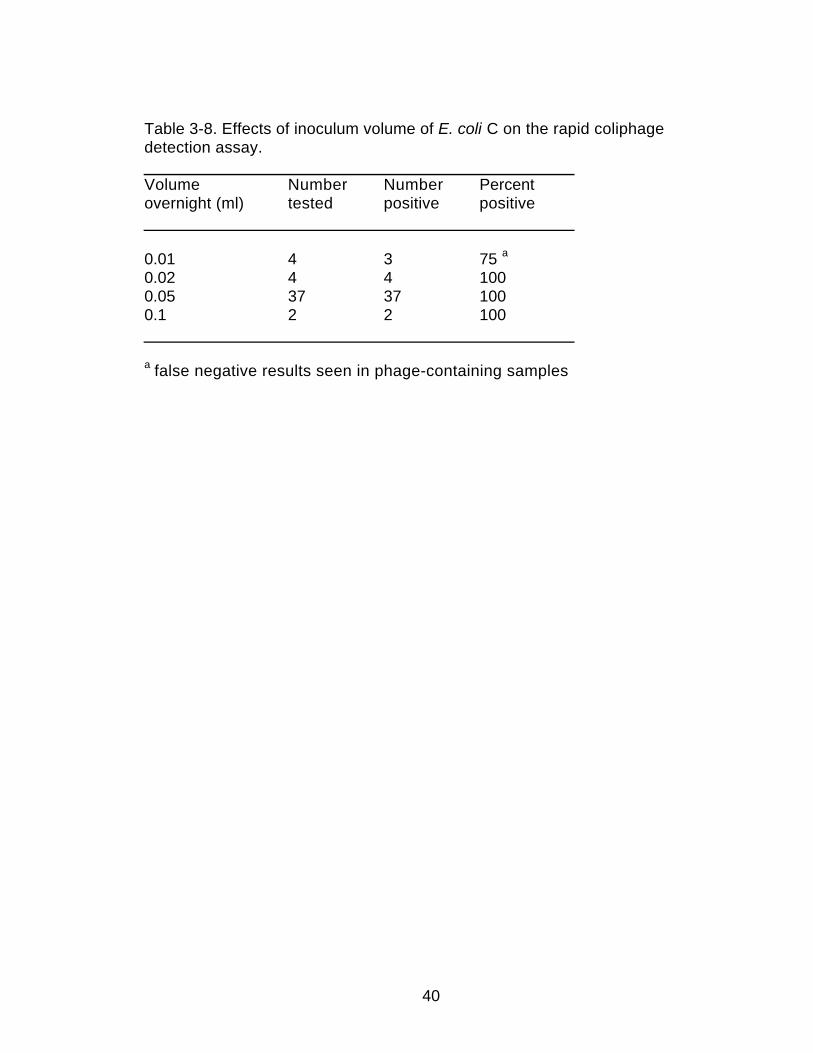
Volume of Overnight. The volume of overnight was varied to see if ahigher or lower inoculum would adversely affect the assay. The standardvolume of 0.05 ml of overnight was used to inoculate the comparison controls.
28
The data are presented in Table 3-8. Inocula of 0.01, 0.02, or 0.1 ml yieldedresults identical to the standard volume.
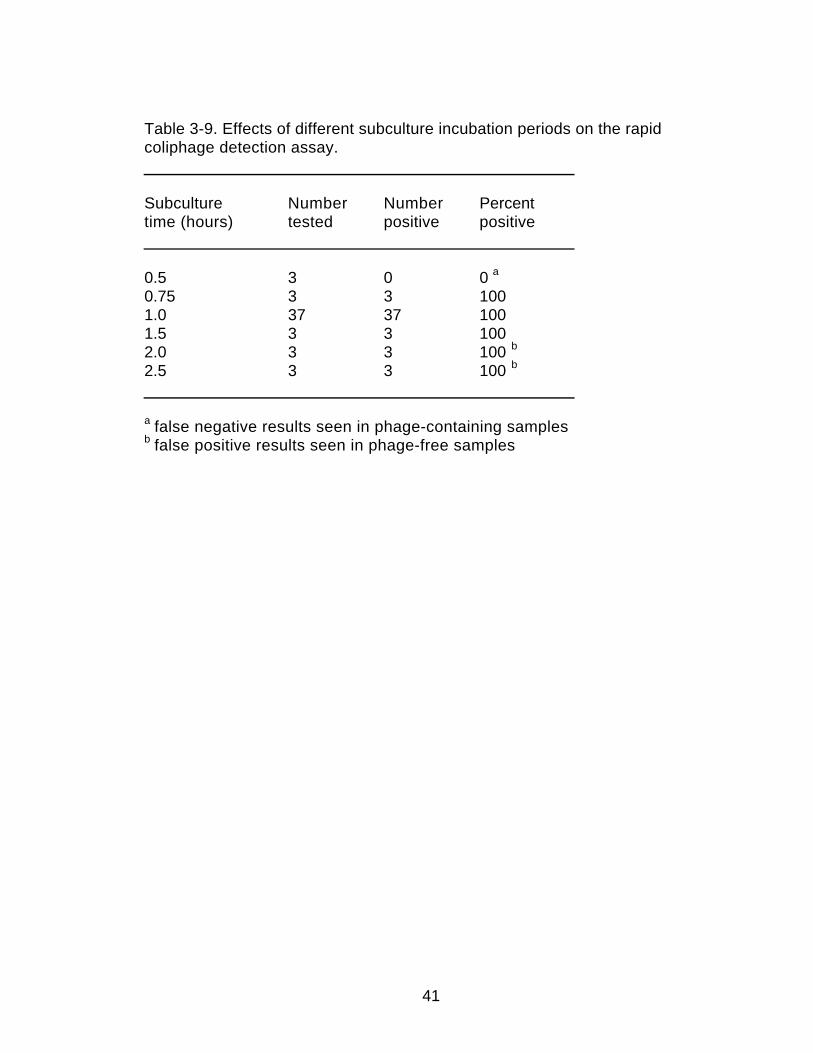
Subculture Incubation Period. The period of time the subculture wasincubated with CaCl2 and IPTG was examined to determine its effect on theassay. The standard incubation time of 1 hr was used in the comparisoncontrol. The data are presented in Table 3-9. If the culture was incubated lessthan 0.75 hr, there was no color change when coliphage were present. If thecells were incubated for over 1.5 hr, false positive results were seen in theabsence of coliphage.
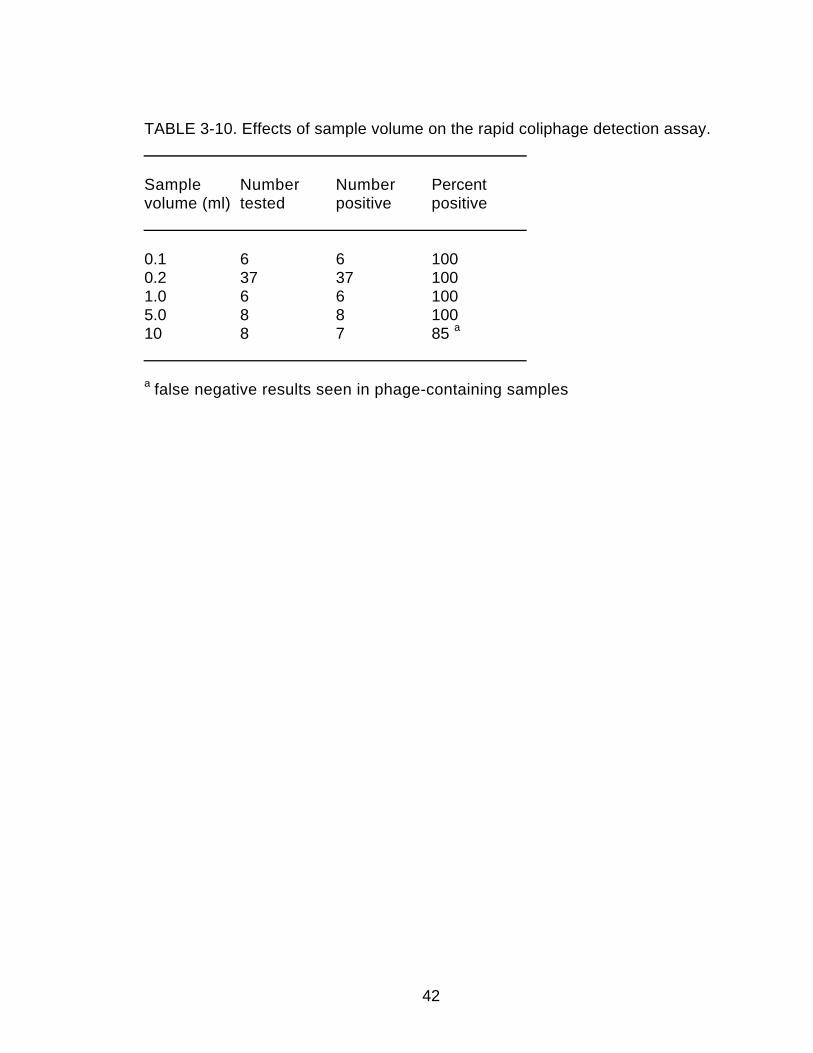
Sample Volume. The volume of water sample was varied to measureits effect on phage-containing (positive) or phage-free (negative) assays. Thedata are presented in Table 3-10. The standard volume of 0.2 ml was used asthe comparison control. As long as there were at least 10 plaque forming unitspresent in sample volume of up to 10 ml, the assay yielded results identical tothe standard control (i.e., 0.2 ml) within 30 minutes. When 10 ml of watersample was used in the assay color development was slowed by 5-15 minutesbut was still positive within 30 minutes in phage-containing experiments.
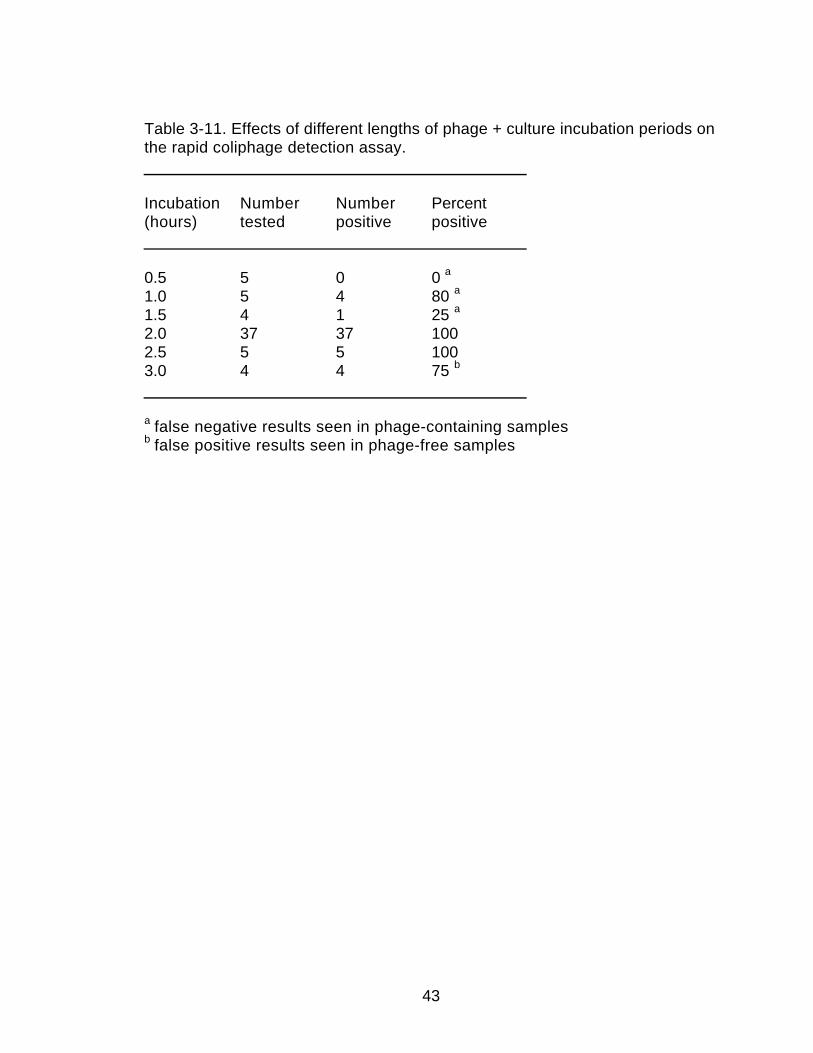
Length of Incubation of Induced Cells and Phage. The length ofincubation of the mixture of induced cells and phage on the assay wasmeasured. The standard incubation time of 2 hr was used in the comparisoncontrol. The data are presented in Table 3-11. Incubation periods less than 2hr were frequently negative in phage-containing experiments. Incubationperiods of 2 and 2.5 hr had normal color development. When the incubationwas increased beyond 2.5 hr, color developed in phage-free experiments (falsepositive).
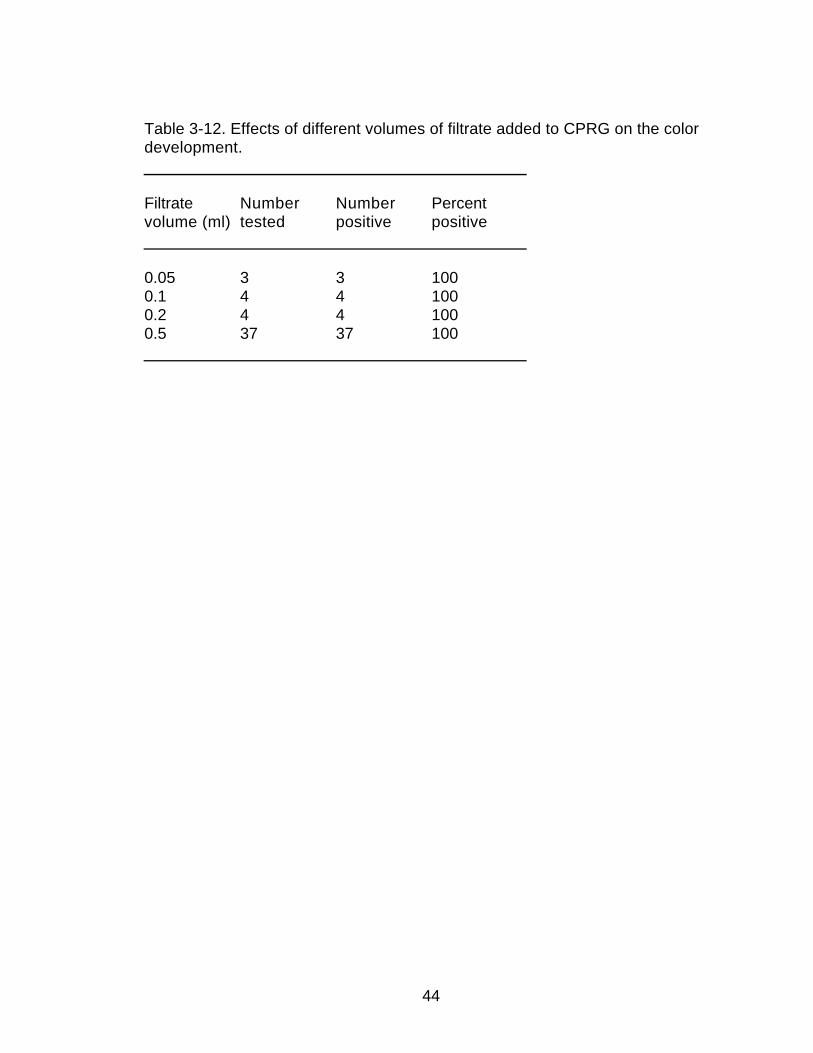
Volume of Filtrate. The amount of culture and water sample that wasrequired to be filtered into the CPRG solution was varied to determine itseffects on the results. The standard volume of 0.5 ml was used in thecomparison control. The data are presented on Table 3-12. As little as 0.05 mlof filtrate gave a deep purple color comparable to the standard control within 30minutes with approximately 100 coliphage per sample. Volumes greater than0.5 ml were not examined because they would exceed the capacity of thefiltration unit of the Spin-X tube.
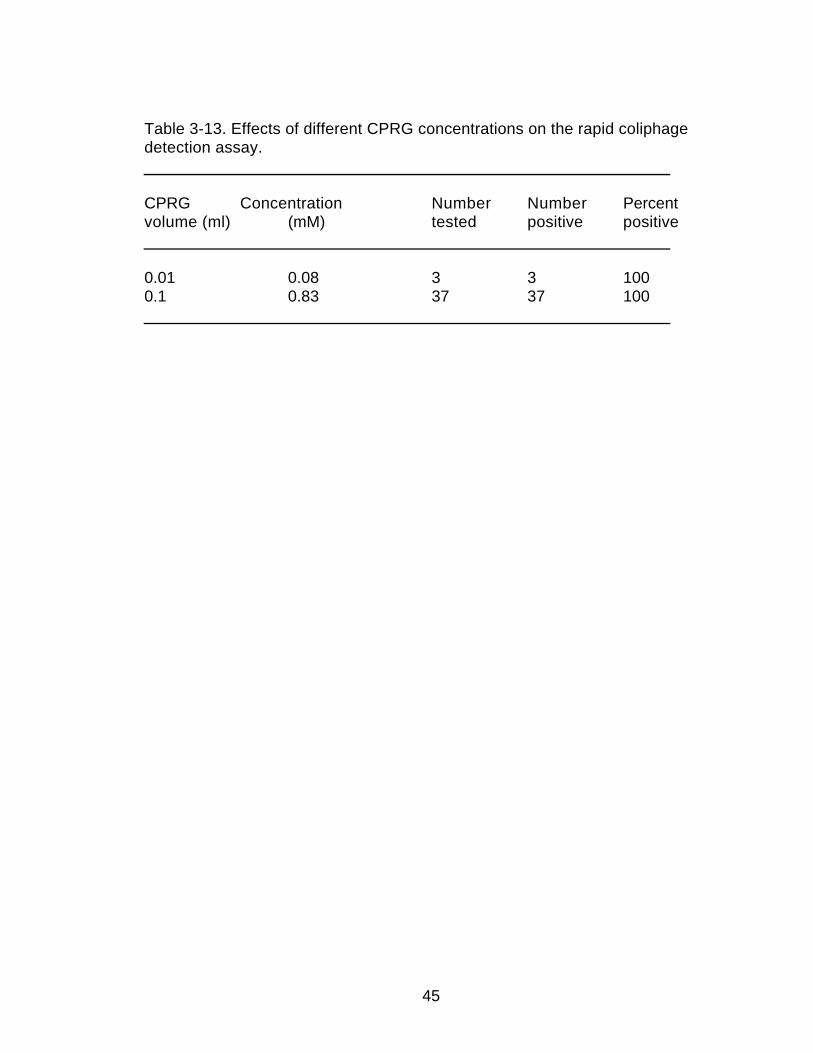
Volume of CPRG. The amount of CPRG was varied to determine itseffect on the assay results. The standard volume of 0.1 ml of the 5 mM CPRGsolution was used in the comparison control. The data are presented on Table3-13. As little as 0.01 ml yielded a color change in 30 minutes, although thecolor was not as intense as the standard control due lower concentration ofCPRG.
Alternative Inducer. The effect of using lactose as an inducer for theassay was performed. The standard inducer IPTG was used as thecomparison control. In the four experiments tested using 1 mM lactose (finalconcentration) only one yielded results identical to the standard IPTG control.
29
Alternative Substrates. The effect of using 5 mM 5-bromo-4-chloro-3-indoyl-β-D-galactopyranoside (Bluo-Gal, Boehringer-Mannheim Biochemicals,Indianapolis, IN) as a substrate for β-galactosidase on the assay wasmeasured. The standard control of 0.1 ml 5 mM CPRG was used as thestandard comparison. In the three experiments performed the Bluo-gal yieldeda color change from clear to blue following the color changes in the standardCPRG assay.
Stability of IPTG. Two assays were performed using a sample of IPTGfrom each storage condition weekly for 124 days. All assays performed withIPTG stored at 4o C and at room temperature yielded results identical to thefresh IPTG control results. Sample of IPTG stored at 37o C yielded falsenegative results in half (1 out of 2) assays performed weekly after 8 days.
Stability of CPRG. Two assays were performed using a sample ofCPRG from each storage condition weekly for 126 days. Results from bothassays performed weekly on CPRG stored at 4o C and room temperature wereidentical to the fresh CPRG controls results. CPRG stored at 37o C yieldedfalse negative results in half of each (1 of 2) weekly assays after 15 days.
Stability of E. coli strain C Lyophiles. The initial concentration of E. coliin the 20% skim milk suspension prior to lyophilization was 2.4 x 10⁹ colonyforming units/ ml (cfu/ ml). The initial concentration of cells suspended in LBprior to lyophilization was 2.0 x 10⁹ cfu/ ml. Immediately following lyophilizationof 20% skim milk and LB suspensions, the concentrations were 8.3 x 10⁸ cfu/ml and 4.4 x 10⁶ cfu/ ml, yielding survival percentages of 35 and 0.22,respectively. After 56 days the survival of 20% skim milk stored lyophilesremained approximately 10%. After 56 days the survival of LB stored lyophilesremained approximately 1%.
Stability of E. coli strain C stocks. All media provided adequate storagefor up to 57 days except the LB broth. The LB broth failed to yield any colonieswhen streaked onto LB agar plates after 21 days. The assay performednormally with each storage type (LB agar plate, LB agar slant, LB broth, andMgSO4 suspension) whenever colonies resulted from inoculated LB agarplates from and were used in the RCDA.
30
Discussion
The acceptable ranges at which the assay may be performed werestudied by assessing the effects of varying each step of the assay.
Agitation. Although agitation was not required for the assay to performnormally, agitation is beneficial in that the E. coli host cells grow at a morerapid rate because of better aeration. The higher growth rate will providegreater numbers of host cells for infection by coliphage in a shorter amount oftime. Therefore, it is recommended that all culture steps be performed withagitation (200 rpm).
Temperature. The effects of temperature on the assay were verypronounced. At temperatures below 35o C the assay frequently gave falsenegative results in phage-containing experiments. This is possibly due to thehost cell producing an extracellular slime that prevents phage adsorption. Attemperatures above 40o C, the assay always gave false positive (color change)in phage-free experiments. The higher temperatures appear to make the cellsleaky and induced β-galactosidase is released into the medium from cells thathave not been lysed by coliphage.
Overnight Culture Age. As little as 8 hr were required to yield sufficientgrowth in the overnight to provide an adequate inoculum for the assay. Inaddition, an overnight up to 41 hr old still functioned well in the assay.
Volume of CaCl2. The volume of CaCl2 added to the assay was critical. Ifvolumes less than 0.03 ml of the 25 mM CaCl2 solution were added to theassay, a color change was consistently observed in phage-free experimentspossibly due to cells leaking β-galactosidase due to a lack of calcium.Volumes between 0.04-0.06 ml (2 mM and 3 mM) of CaCl2 consistently yieldedno color change in phage-containing experiments due to a lack of calcium ionwhich is required for some coliphage for adsorption to the host cell (Adams,1959). Only when volumes greater than 0.07 ml (3.5 mM) of the CaCl2 solutionwere added to the assay were the results identical to standard results. Adding0.5 ml (25 mM) of CaCl2 gave identical results to the standard control.
Volume of Inducer. The volume of IPTG was not as critical to the assayas was the CaCl2. Volumes between 0.01 and 1.0 ml (0.02 mM and 2.0 mM) ofIPTG yielded results identical to the standard. By having the CaCl2 and IPTGsolutions combined, the volume required for the assay to perform optimally isdependent upon the CaCl2 concentration (see Volume of CaCl2 above). Aslong as 0.1 ml of the combined solution is added the assay will work optimally.
Volume of Overnight Culture. Volumes between 0.02 and 0.1 ml of E.coli overnight culture yielded results identical to the standard results. When0.01 ml of overnight was used as an inoculum, the assay gave a false negativeresult in phage-containing experiments. Possibly this was due to too few hostcells being lysed and not enough β-galactosidase released to be detected.
31
Length of Subculture Incubation. Incubation times between 0.75 and1.5 hr gave results identical to the standard results. When the subculture wasincubated for 0.5 hr, a false negative result was seen in the phage-containingexperiments due to too few host cells being present. If the subculture wasincubated for longer than 1.5 hr, by the end of the assay enough cells had lysedor leaked their β-galactosidase to yield false positive results in the phage-freeexperiments.
Volume of Sample. Volumes of water sample between 0.1-5.0 mlyielded results identical to the standard results. When a 10 ml samplecontained as many plaque forming units as the standard control, colordevelopment was usually slower by 5-15 minutes and occasionally yielded in afalse negative result within 30 minutes.
Length of Incubation of Induced Cells and Phage. The length ofincubation of induced cells with the water sample is critical. Incubation timesless than 2 hr yielded false negative results in phage-containing experiments.Possibly too few cells had been lysed and not enough β-galactosidase hadbeen released to yield a color change. When the incubation lasted longer that2.5 hr too many cells had lysed or leaked their β-galactosidase even in thephage-free experiments to yield a false positive result.
Volume of Filtrate. Filtrate volumes between 0.05 and 0.5 ml gave colorchanges identical to the standard results. If the assay is performed asdescribed in the Materials and Methods section, results will be accurately andreproducibly observed.
Volume of CPRG. Volumes of 5 mM CPRG between 0.01-0.1 ml yieldedidentical results to the standard results. When as little as 0.01 ml of CPRG isadded to the filtrate a color change is observed in the phage-containingexperiments. However, the color was not as intense as in the standard resultsdue to a lower concentration of chlorophenol red being released upon cleavageby β-galactosidase.
Alternative Inducer. The use of lactose as inducer is not favorable tothe assay. IPTG binds the lac repressor with equal affinity as lactose (Miller,1978) and results in 10 times more β-galactosidase induction compared tolactose (Miller, 1978). The use of lactose as inducer in the assay yielded falsenegative results in phage-containing tests due to a lowered level of β-galactosidase production in E. coli. Alternatively, it could be metabolized andnot be available as an inducer.
Alternative Substrate. Although Bluo-Gal yielded results identical to theCPRG standard, Bluo-Gal is not recommended for use in the assay because itmust be dissolved in dimethyl formamide while CPRG is soluble in water.Using Bluo-Gal would only increase the expense of performing the assay byrequiring an additional reagent.
Stability of IPTG. Temperatures above room temperature are notrecommended for the storage of IPTG. At temperatures above room
32
temperature IPTG may possibly hydrolyze and lose its ability to induce theproduction of β-galactosidase in E. coli C. Storage of IPTG at 4o C isrecommended to maintain exact control over the storage conditions as roomtemperatures may vary and adversely affect the IPTG.
Stability of CPRG. Use of CPRG stored for more than 15 days at 37o Cyielded false negative results in half of the samples tested. The samples thatfailed to yield acceptable results (i.e., false negative in phage-containingsamples) were stored in a cardboard box at 37o C, while the samples of CPRGstored at 37o C that gave acceptable results (i.e., identical to the fresh CPRGcontrol) were stored in a screw-capped polypropylene bottle. A possibleexplanation for the false negative results of samples stored in the cardboardbox could be in the extra oxidation from the constant exposure to fresh air andaccelerated desiccation of the CPRG samples contained in the box. Oxidationof the CPRG could possibly prevent β-galactosidase from being capable ofcleaving it.
Stability of E. coli strain C lyophiles. Although, the 20% skim milk-stored lyophiles had a higher survival percentage than the LB-stored lyophilesboth methods yielded viable cultures for up to 70 days that could be used in theRCDA.
Stability of E. coli strain C stocks. E. coli C was successfully recoveredfor at least 57 days from LB agar plates or slants stored at 4o C , and from cellswashed in 0.1 M MgSO4 and stored at 4o C. The use of LB broth to store thestock culture is not recommended because no viable cells were recovered after21 days.
The goal of defining the tolerances of the RCDA was to provide acommercial producer of the RCDA with a list of acceptable ranges that could beused by a technical support staff (Table 14). If a user performed the testdifferently than in the standard method, they could call a technical supportrepresentative and describe how the assay had been performed incorrectly. Ifthe incorrect procedure fell within the acceptable parameters of the assay, theincorrectly performed test could be accepted as giving acceptable results. Thiswould prevent the user from repeating the assay and would save both time andmoney. If the user performed the test outside of the acceptable parameters thetechnical support representative would recommend the assay be repeated.
33
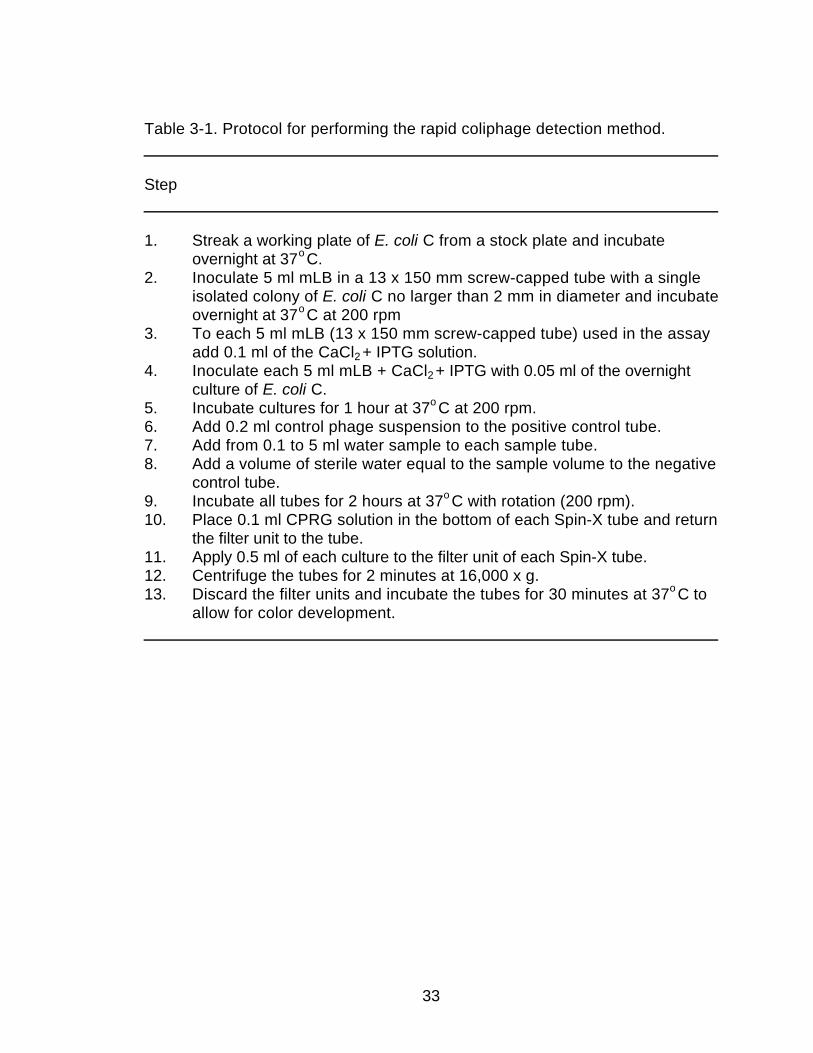
Table 3-1. Protocol for performing the rapid coliphage detection method.
Step
1. Streak a working plate of E. coli C from a stock plate and incubate overnight at 37o C.
2. Inoculate 5 ml mLB in a 13 x 150 mm screw-capped tube with a single isolated colony of E. coli C no larger than 2 mm in diameter and incubateovernight at 37o C at 200 rpm
3. To each 5 ml mLB (13 x 150 mm screw-capped tube) used in the assay add 0.1 ml of the CaCl2 + IPTG solution.
4. Inoculate each 5 ml mLB + CaCl2 + IPTG with 0.05 ml of the overnight culture of E. coli C.
5. Incubate cultures for 1 hour at 37o C at 200 rpm.6. Add 0.2 ml control phage suspension to the positive control tube.7. Add from 0.1 to 5 ml water sample to each sample tube.8. Add a volume of sterile water equal to the sample volume to the negative
control tube.9. Incubate all tubes for 2 hours at 37o C with rotation (200 rpm).10. Place 0.1 ml CPRG solution in the bottom of each Spin-X tube and return
the filter unit to the tube.11. Apply 0.5 ml of each culture to the filter unit of each Spin-X tube.12. Centrifuge the tubes for 2 minutes at 16,000 x g.13. Discard the filter units and incubate the tubes for 30 minutes at 37o C to
allow for color development.
34
Table 3-2. Ranges of parameters tested in the rapid coliphage detectionmethod
Variable RangeStandard
tested value
Rotation 0 - 200 rpm 200 rpmTemperature 30 -44o C 37o CAge of E. coli C culture 8 - 41 hours 17 hoursVolume CaCl2 + IPTG 0.01- 0.5 ml 0.1 mlVolume E. coli C inoculum 0.01 - 0.1 0.05mlSubculture time 0.5 - 2.5 hours 1 hourWater Sample 0.1 - 10 ml 0.2 mlLength of sample incubation 0.5 3 hours 2 hoursVolume of culture filtered 0.1 - 0.5 ml 0.5 mlVolume CPRG 0.01 - 0.1 ml 0.1 mlLength of color development 30 - 45 minutes 30 minutes
35
Table 3-3. Effects of culture rotation (rpm) on the rapid coliphage detectionassay. Speed of Number Number Percentrotation (rpm) tested positive positive
200 37 37 100 0 5 5 100
36
Table 3-4. Effects of temperature of incubation on the rapid coliphage detectionassay.
Temperature Number Number Percent(o C) tested positive positive
30 6 1 17a
32 3 0 0a
35 3 3 10037 37 37 10040 3 3 10042 3 0 0b
44 3 0 0b
a false negative results seen in phage-containing samplesb false positive results seen in phage-free samples

37
Table 3-5. Effects of age of E. coli culture on the rapid coliphage detectionassay.
Overnight Number Number Percentage (hours) tested positive positive
8 3 3 10017 37 37 10041 6 6 100
38
Table 3-6. Effects of CaCl2 concentration on the rapid coliphage detectionassay. 25 mM CaCl2 Concentration Number Number
Percentvolume (ml) (mM) tested positive positive
0.02 1.0 8 3 37.5 b
0.03 1.5 9 3 33 b
0.04 2.0 9 5 56 a
0.05 2.5 8 4 50 a
0.06 3.0 3 1 33 a
0.07 3.5 5 4 80 a
0.08 4.0 3 2 66 a
0.1 5.0 37 37 1000.5 25.0 3 3 100
a false negative results seen in phage-containing samplesb false positive results seen in phage-free samples
39
Table 3-7. Effects of IPTG concentration on the rapid coliphage detection assay. 10 mM IPTG Concentration Number Number Percentvolume (ml) (mM) tested positive positive
0.01 0.02 4 3 75 a
0.1 0.2 37 37 1000.2 0.4 5 5 1001.0 2.0 4 4 100
a false negative results seen in phage-containing samples
40
Table 3-8. Effects of inoculum volume of E. coli C on the rapid coliphagedetection assay. Volume Number Number Percentovernight (ml) tested positive positive
0.01 4 3 75 a
0.02 4 4 1000.05 37 37 1000.1 2 2 100
a false negative results seen in phage-containing samples
41
Table 3-9. Effects of different subculture incubation periods on the rapidcoliphage detection assay.
Subculture Number Number Percenttime (hours) tested positive positive
0.5 3 0 0 a
0.75 3 3 1001.0 37 37 1001.5 3 3 1002.0 3 3 100 b
2.5 3 3 100 b
a false negative results seen in phage-containing samplesb false positive results seen in phage-free samples
42
TABLE 3-10. Effects of sample volume on the rapid coliphage detection assay.
Sample Number Number Percentvolume (ml) tested positive positive
0.1 6 6 1000.2 37 37 1001.0 6 6 1005.0 8 8 10010 8 7 85 a
a false negative results seen in phage-containing samples
43
Table 3-11. Effects of different lengths of phage + culture incubation periods onthe rapid coliphage detection assay.
Incubation Number Number Percent(hours) tested positive positive
0.5 5 0 0 a
1.0 5 4 80 a
1.5 4 1 25 a
2.0 37 37 1002.5 5 5 1003.0 4 4 75 b
a false negative results seen in phage-containing samplesb false positive results seen in phage-free samples
44
Table 3-12. Effects of different volumes of filtrate added to CPRG on the colordevelopment.
Filtrate Number Number Percentvolume (ml) tested positive positive
0.05 3 3 1000.1 4 4 1000.2 4 4 1000.5 37 37 100
45
Table 3-13. Effects of different CPRG concentrations on the rapid coliphagedetection assay.
CPRG Concentration Number Number Percentvolume (ml) (mM) tested positive positive
0.01 0.08 3 3 1000.1 0.83 37 37 100
46
Table 3-14. Summary of acceptable ranges for the rapid coliphage detectionassay.
Parameter Acceptable Range Standard Value
Rotation 0 - 200 rpm 200 rpm
Temperature 35 - 40o C 37o CAge of E. coli C culture 8 - 41 hours 17 hoursVolume CaCl2 + IPTG 0.1 - 1 ml 0.1 ml
Volume E. coli C inoculum 0.02 - 0.1 0.05 mlSubculture time 0.75 - 1.5 hours 1 hourWater Sample 0.1 - 5 ml 0.2 mlLength of sample incubation 2 - 2.5 hours 2 hoursVolume of culture filtered 0.05 - 0.5 ml 0.5 mlVolume CPRG 0.01 - 0.1 ml 0.1 mlLength of color development 30 - 45 minutes 30 minutes
47
References
Adams, M. H. The bacteriophages. Interscience Publishers, New York
Havelaar, A. H. and W. M. Hogeboom. 1983. Factors affecting the enumeration of coliphages in sewage and sewage polluted water. Antonie van Leeuwenhoek 49:387-397.
Ijzerman, M., and C. Hagedorn. 1992. Improved method for coliphage detection based on β-galactosidase induction. J. Virol. Method. 40:31-36.
Ijzerman, M. M., J. O. Falkinham III, R. B. Renaeu Jr, and C. Hagedorn. 1994. Field evaluation of two colorimetric coliphage detection methods. Appl. Env. Microbiol. 60:826-830.
Miller, J. 1978 The lac I gene:its role in the lac operon and its use in genetic systems, pp. 31-88. In: Miller J. H., and W. S. Reznikoff (eds.) The
operon. Cold Spring Harbor Laboratory, New York
Sambrook, J., T. Maniatis, and E. F. Fritsch. 1989. Molecular cloning: a laboratory manual. Cold Spring Harbor Laboratory, New York.
Simone, F. P. and E. M. Brown. 1991. ATCC preservation methods: freezing and freeze drying. Second Edition. ATCC Publications, Rockville, MD.
48
Curricula Vitae
James Emmett Stanek
549 Tannery Lane #35 • Elkton, VA 22827 • (540) 298 1740
Education: Masters of Science, Microbiology and Genetics, January 1997. Virginia Tech.Thesis: Development of a Rapid Coliphage Detection AssayBachelor of Science, Biology, May 1992. Virginia Tech
Coursework: Topics in Microbial Genetics Prokaryotic Gene RegulationMicrobial Physiology VirologyMicrobial Physiology Lab Nucleic Acids with LabMolecular Biology for the Life Science Aquatic Microbiology
with Lab
TeachingExperience: Graduate Teaching Assistant, General Microbiology Lab, Biology
Dept. Virginia Tech 1993-94.Instructed four sections (~30 students per section) of the introductory microbiology lab course. Responsibilities included; assigning and grading projects, and determining final course grades.
GrantsReceived: “Use of Mini-Transposons to Create a Mycobacterium avium -
Mycobacterium smegmatis Shuttle Vector” Sigma Xi 1992. $600 withan additional $500 from the Virginia Tech Biology Dept.
PapersPresented: “Evaluation of an epifluorescence based method for enumeration of
microorganisms in pharmaceutical grade water.” Merck and Co., Inc.50 th Meeting of the Paraenternal Drug Association,
Philadelphia, November 1996.
PostersPresented: “Development of a Rapid Coliphage Detection Assay” J. Stanek, M.
Ijzerman, C. Hagedorn, and J. Falkinham. Virginia Polytechnic Inst.and State Univ. and US Environmental Protection Agency.American Society of Microbiologist General Meeting,Washington DC, May 1995
WorkExperience: Temporary Microbiologist, Merck & Co., Inc., 1995-Present.
Performed limit of detection assays on various microorganisms using the Chemunex ChemScan instrument to detect viable
organisms on a membrane filter. Correlated data from theChemScan with standard plate count method used in waterquality testing to generate data for instrument evaluation.
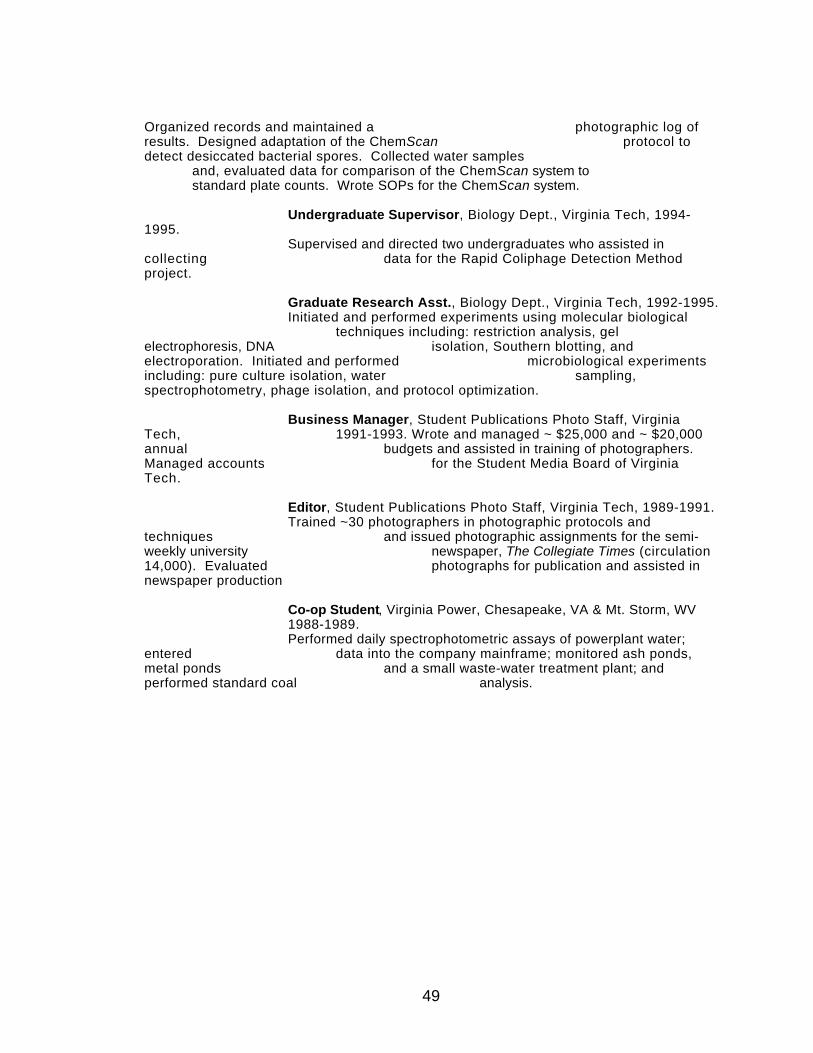
49
Organized records and maintained a photographic log ofresults. Designed adaptation of the ChemScan protocol todetect desiccated bacterial spores. Collected water samples
and, evaluated data for comparison of the ChemScan system to standard plate counts. Wrote SOPs for the ChemScan system.
Undergraduate Supervisor, Biology Dept., Virginia Tech, 1994-1995.
Supervised and directed two undergraduates who assisted incollecting data for the Rapid Coliphage Detection Methodproject.
Graduate Research Asst., Biology Dept., Virginia Tech, 1992-1995.Initiated and performed experiments using molecular biological
techniques including: restriction analysis, gelelectrophoresis, DNA isolation, Southern blotting, andelectroporation. Initiated and performed microbiological experimentsincluding: pure culture isolation, water sampling,spectrophotometry, phage isolation, and protocol optimization.
Business Manager, Student Publications Photo Staff, VirginiaTech, 1991-1993. Wrote and managed ~ $25,000 and ~ $20,000annual budgets and assisted in training of photographers.Managed accounts for the Student Media Board of VirginiaTech.
Editor, Student Publications Photo Staff, Virginia Tech, 1989-1991.Trained ~30 photographers in photographic protocols and
techniques and issued photographic assignments for the semi-weekly university newspaper, The Collegiate Times (circulation14,000). Evaluated photographs for publication and assisted innewspaper production
Co-op Student, Virginia Power, Chesapeake, VA & Mt. Storm, WV 1988-1989.Performed daily spectrophotometric assays of powerplant water;
entered data into the company mainframe; monitored ash ponds,metal ponds and a small waste-water treatment plant; andperformed standard coal analysis.