microbiological leaching of a zinc sulfide concentrate
TRANSCRIPT
MICROBIOLOGICAL LEACHING OF A ZINC SULFIDE CONCENTRATE
by
ARPAD EMIL TORMA
D i p l . Chem. Eng., Swiss Federal I n s t i t u t e of Technology, 19
M.Sc., Laval U n i v e r s i t y , 1962
A THESIS SUBMITTED IN PARTIAL FULFILMENT OF
THE REQUIREMENTS FOR THE DEGREE OF
DOCTOR OF PHILOSOPHY
i n the Department
of
CHEMICAL ENGINEERING
We accept t h i s thesis as conforming to the
required standard
THE UNIVERSITY OF BRITISH COLUMBIA
May, 1970
I n p r e s e n t i n g t h i s t h e s i s i n p a r t i a l f u l f i l m e n t o f t h e r e q u i r e m e n t s f o r
an advanced degree a t t h e U n i v e r s i t y o f B r i t i s h C o l u m b i a , I a g r e e t h a t
t h e L i b r a r y s h a l l make i t f r e e l y a v a i l a b l e f o r r e f e r e n c e and s t u d y .
I f u r t h e r ag ree t h a t p e r m i s s i o n f o r e x t e n s i v e c o p y i n g o f t h i s t h e s i s
f o r s c h o l a r l y p u r p o s e s may be g r a n t e d by t h e Head o f my Depar tment o r
by h i s r e p r e s e n t a t i v e s . I t i s u n d e r s t o o d t h a t c o p y i n g o r p u b l i c a t i o n
o f t h i s t h e s i s f o r f i n a n c i a l g a i n s h a l l no t be a l l o w e d w i t h o u t my
w r i t t e n p e r m i s s i o n .
Depar tment o f
The U n i v e r s i t y o f B r i t i s h Co lumbia Vancouver 8, Canada
Abstract • i
The applicability of microbiological oxidation for the
recovery of zinc from a high-grade zinc sulfide concentrate has been
investigated using a pure strain of Thiobacillus ferrooxidans. Factors
affecting the bacterial activity and consequently the rate and extent
of zinc extraction were studied. These factors were: temperature,
pH, nutrient and substrate concentrations, solid particle size and
surface area. The effect of carbon dioxide concentration in the air
supplied to the oxidation was also studied. Larger scale experiments
were carried out to simulate more closely possible industrial conditions.
The optimum temperature was found to be 35°C, the optimum pH
2.3 . Nutrient levels of 89 mg phosphate P/l and 636 mg ammonia N/1
were sufficient to avoid rate limitation and provide for maximum extrac
tion, respectively. Increasing the particle surface area, the pulp
density, or the total surface per unit volume of leach liquor increased
the rate of zinc'extraction up to a point beyond which further increases
were not effective. Increasing the carbon dioxide content of the air
had a similar effect.
The larger scale experiments gave similar extraction rates to
those observed in shake flasks but the extent of zinc extraction was
significantly higher. The final concentration of zinc in leach solutions
reached levels currently-employed in commercial electrowinning procedures.
A form of the generalized logistic equation was shown to be capable of
representing the complete extraction curve under a variety of experi
mental conditions.
i i
This d i s s e r t a t i o n i s dedicated
to my wi f e , K a t a l i n , to whom
sp e c i a l gratitude i s expressed
for her endless patience, under
standing and encouragement.
Acknowled gement s i i
The author wishes to express sincere appreciation to
Dr. C. Craig Walden and Dr. Richard M. R. Branion for t h e i r t i r e l e s s
i n t e r e s t , guidance and encouragement throughout t h i s study.
Also, the author wishes to thank Dr. Douglas W. Duncan,
B. C. Research, for h i s advice and suggestions i n the f i e l d of micro
b i o l o g i c a l leaching.
Thanks are due to Mr. Ron Orr for the use of the "Dynamic
Nitrogen Adsorption Apparatus"; to the B r i t i s h Columbia I n s t i t u t e of
Technology for the use of some of t h e i r equipment, and to B. C. Research
for providing the use of a l l of t h e i r f a c i l i t i e s necessitated by t h i s
i n v e s t i g a t i o n .
The author i s indebted to h i s employer, the Quebec Department
of Natural Resources, f o r providing him with a leave of absence for the
duration of t h i s study.
The work reported i n t h i s dissertation was supported by a
B. C. Research Fellowship.
Contents
Abstract i
Dedication . . . . i i
Acknowledgements i i i
Contents i v
L i s t of Figures . i x
L i s t of Tables x j _ Nomenclature x i i
I. INTRODUCTION 1
1. Nature of the problem 1 2. Objectives 1
I I . MICROBIOLOGICAL BACKGROUND 3
I I I . LITERATURE REVIEW 4
1. Description and physiology of T_. ferrooxidans 4 2. Occurrence of T_. ferrooxidans 5 3. Microbiology of T_. ferrooxidans 5 4. Biochemical a c t i v i t y of T?. ferrooxidans 10
4.1 Temperature 10 4.2 PH 10 4.3 Energy source 10 4.4 Surface a c t i v e agents 10 4.5 Carbon dioxide 11 4.6 Oxygen 11 4.7 Nutrients 11
5. M i c r o b i o l o g i c a l leach techniques 12
6. M i c r o b i o l o g i c a l leaching of mineral s u l f i d e s 14
IV. BI0KINETIC MODELING 18
1. Introduction 18 2. D i f f i c u l t i e s i n b i o k i n e t i c modeling 18 3. C l a s s i f i c a t i o n of fermentation processes . 18 4. Development of b a c t e r i a l k i n e t i c s 19 4.1 Orders of b i o l o g i c a l (enzymatic) reactions 19 4.2 Substrate l i m i t e d models . . . . . 21 4.3 Product l i m i t e d models . . . . 23 4.4 Substrate and product l i m i t e d models 24
Contents v
Page
5. Proposed models 25
V. MATERIALS AND METHODS 27
1. General 27 2. Organisms 27 3. Substrate 27
3.1 Substrate f r a c t i o n a t i o n . 28 3.2 Determination of p a r t i c l e s i z e 28 3.3 Determination of s p e c i f i c surface area . . . . . . . . . . 28
4. Culture techniques . . . 29
4.1 Shake technique 29
4.2 Tank leaching 30
5. Chemical analysis 30
5.1 Substrate . 30
5.2 Leach solutions 30
6. Modeling and curve f i t t i n g . 31
VI. RESULTS AND DISCUSSION . . . . . . . . 35
1. E f f e c t s of temperature 35 2. E f f e c t s of pH 39 2.1 E f f e c t of i n i t i a l pH 41 2.2 E f f e c t of constant pH . . . . . . . . . . . . 43 3. E f f e c t s of nutrient concentrations . 50 4. E f f e c t s of pulp density (solid'concentration) 53 5. E f f e c t s of i n i t i a l p a r t i c l e diameter and s p e c i f i c surface area 59 6. E f f e c t s of carbon dioxide concentration 69 7. E f f e c t s of i n i t i a l p a r t i c l e diameter and
surface area at 1.0% carbon dioxide 73 8. Larger scale experiments. . . . . . . . . . 78 9. Modelling 83
9.1 General 83 9.2 Determination of V m and K m values under normal a i r
conditions 86 9.3 Determination of V m and 1^ values under
carbon dioxide enriched a i r conditions . . . . . 90
10. Mathematical d e s c r i p t i o n of b a c t e r i a l leach curves .96
Contents v i
Page
VII. SUMMARY AND CONSLUSIONS 99
VIII. REFERENCES . . . 101
APPENDIX 1
Experimental data
Table 1A E f f e c t of temperature 1 Table IB E f f e c t of temperature 2 Table 2A E f f e c t of i n i t i a l pH 3 Table 2B E f f e c t of i n i t i a l pH 4 Table 2C E f f e c t of i n i t i a l pH . 5 Table 2D E f f e c t of i n i t i a l pH 6 Table 2E E f f e c t of i n i t i a l pH 7 Table 2F E f f e c t of i n i t i a l pH 8 Table 3A E f f e c t of constant pH 9 Table 3B E f f e c t of constant pH 10 Table 4 E f f e c t of nutrient concentrations 11 Table 5A E f f e c t of ammonium concentration 12 Table 5B E f f e c t of ammonium concentration 13 Table 5C E f f e c t of ammonium concentration 14 Table 6A E f f e c t of phosphate concentration 15 Table 6B E f f e c t of phosphate concentration 16 Table 6C E f f e c t of phosphate concentration 17 Table 7A E f f e c t of pulp density . . 18 Table 7B E f f e c t of pulp density 19 Table 7C E f f e c t of pulp density 20 Table 7D E f f e c t of pulp density 21 Table 7E E f f e c t of pulp density 22 Table 7F E f f e c t of pulp density . . .• 23 Table 7G E f f e c t of pulp density 24 Table 7H E f f e c t of pulp density at increased a g i t a t i o n . . 25 Table 8A E f f e c t of p a r t i c l e s i z e 26 Table 8B E f f e c t of p a r t i c l e s i z e 27
. Table 8C E f f e c t of p a r t i c l e s i z e 28 Table 9A E f f e c t of p a r t i c l e s i z e 29 Table 9B E f f e c t of p a r t i c l e s i z e 30 Table 9C E f f e c t of p a r t i c l e s i z e . . . 31 Table 9D E f f e c t of p a r t i c l e s i z e 32 Table' 10A E f f e c t of pulp density at 7.92% CO.2' 33 Table 10B E f f e c t of pulp density at 7.92% CO2 34 Table 11A E f f e c t of pulp density at 1.03% CO2 35 Table 11B E f f e c t of pulp density at 1.03% CO2 36 Table 12A E f f e c t of pulp density at 0.23% C0 2 37 Table 12B E f f e c t of pulp density at 0.23% CO2 38 Table 13A E f f e c t of pulp density at 0.13% CO2 • 39
Contents v i i
Page
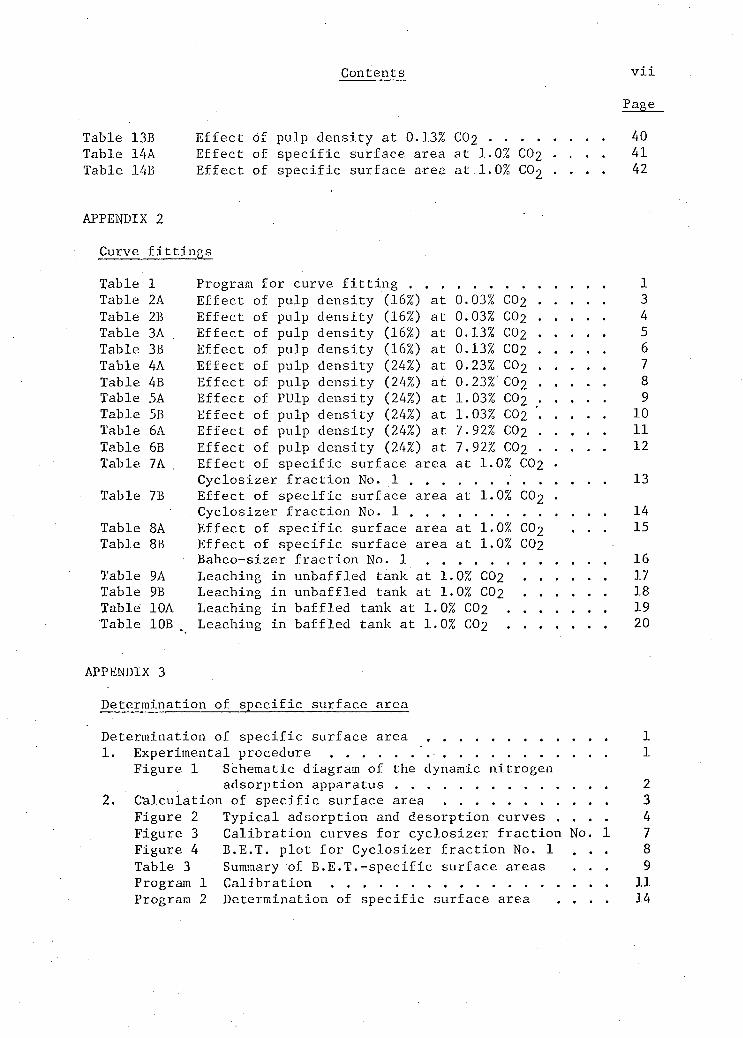
Table 13B Effect of pulp density at 0.13% CO2 40 Table 14A Effect of s p e c i f i c surface area at 1.0% CO2 - . . . 41 Table 14B Effect of s p e c i f i c surface area at 1.0% CO2 . . . . 42
APPENDIX 2
Curve f i t t i n g s
Table 1 Program for curve f i t t i n g 1 Table 2A Effect of pulp density (16%) at 0.03% CO2 3 Table 2B Effect of pulp density (16%) at 0.03% CO2 4 Table 3A . Effect of pulp density (16%) at 0.13% CO2 5 Table 3B Effect of pulp density (16%) at 0.13% C02 6 Table 4A Effect of pulp density (24%) at 0.23% C0 2 7 Table 4B Effect of pulp density (24%) at 0.23%'CO2 8 Table 5A Effect of PUlp density (24%) at 1.03% CO2 9 Table 5B Effect of pulp density (24%) at 1.03% C02 10 Table 6A Effect of pulp density (24%) at 7.92% CO2 11 Table 6B Effect of pulp density (24%) at 7.92% CO2 12 Table 7A . Effect of s p e c i f i c surface area at 1.0% CO2 •
Cyclosizer f r a c t i o n No. 1 13 Table 7B Effect of s p e c i f i c surface area at 1.0% CO2 •
Cyclosizer f r a c t i o n No. 1 14 Table 8A Effect of s p e c i f i c surface area at 1.0% CO2 . . . 15 Table 8B Effect of s p e c i f i c surface area at 1.0% C02
Bahco-sizer f r a c t i o n No. 1 16 Table 9A Leaching i n unbaffled tank at 1.0% C02 17 Table 9B Leaching i n unbaffled tank at 1.0% CO2 18 Table 10A Leaching i n baffled tank at 1.0% CO2 19 Table 10B Leaching i n baffled tank at 1.0% CO2 20
APPENDIX 3
Determination of s p e c i f i c surface area
Determination of s p e c i f i c surface area 1 1. Experimental procedure 1
Figure 1 Schematic diagram of the dynamic nitrogen adsorption apparatus 2
2. Calculation of s p e c i f i c surface area 3 Figure 2 Typical adsorption and desorption curves . . . . 4 Figure 3 Calibration curves for cyclosizer f r a c t i o n No. 1 7 Figure 4 B.E.T. plot for Cyclosizer f r a c t i o n No. 1 . . . 8 Table 3 Summary of B.E.T.-specific surface areas . . . 9 Program 1 Calibration 11 Program 2 Determination of s p e c i f i c surface area . . . . 14
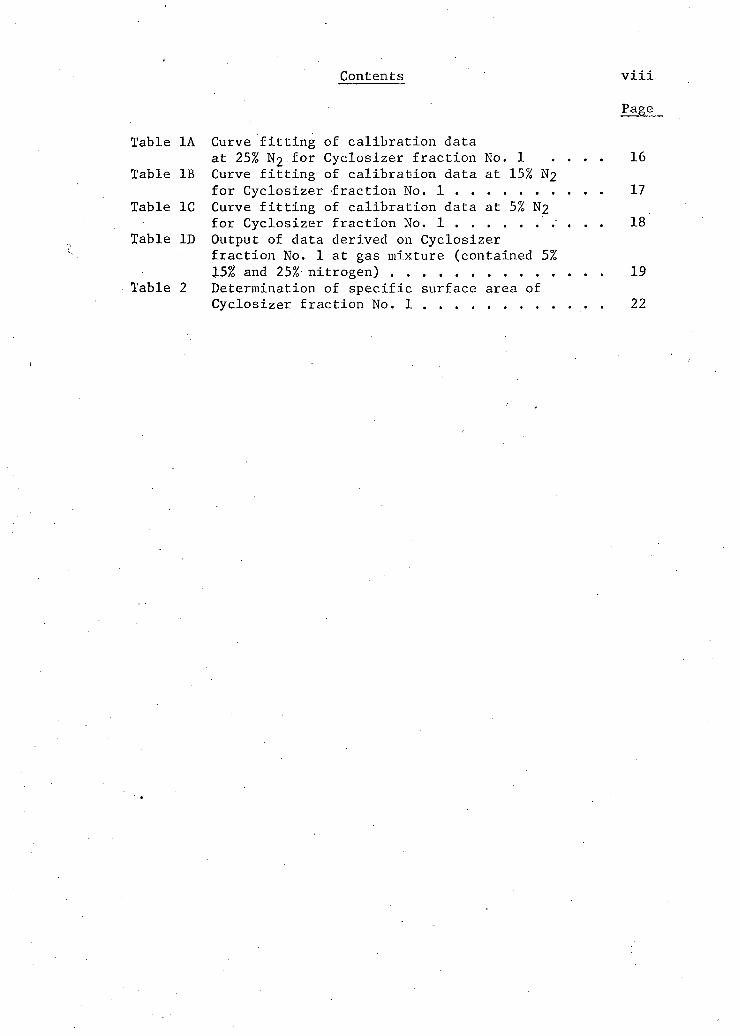
Contents v i i i
Page
Table 1A Curve f i t t i n g of c a l i b r a t i o n data at 25% N2 f o r Cycl o s i z e r f r a c t i o n No. 1 . . . . 16
Table IB Curve f i t t i n g of c a l i b r a t i o n data at 15% N2 f o r C y c l o s i z e r f r a c t i o n No. 1 17
Table IC Curve f i t t i n g of c a l i b r a t i o n data at 5% N2 for C y c l o s i z e r f r a c t i o n No. 1 18
Table ID Output of data derived on Cyclosizer f r a c t i o n No. 1 at gas mixture (contained 5% 15% and 25% nitrogen) 19
Table 2 Determination of s p e c i f i c surface area of Cyclo s i z e r f r a c t i o n No. 1 . 22
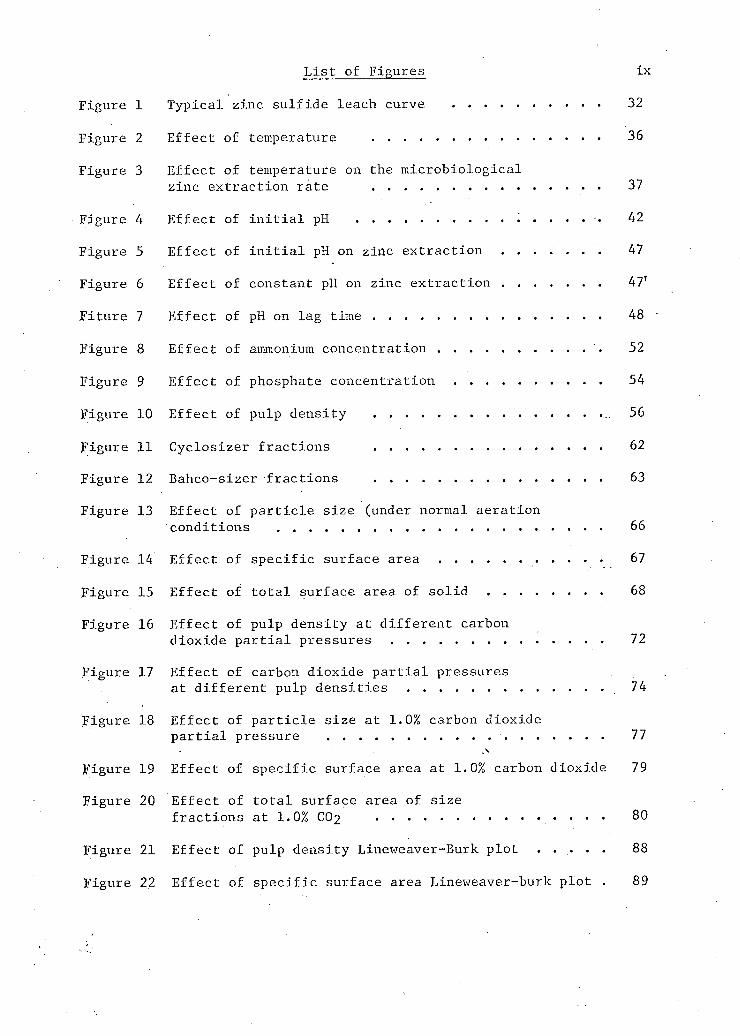
L i s t of Figures ix
Figure 1 T y p i c a l zinc s u l f i d e leach curve 32
Figure 2 E f f e c t of temperature • 36
Figure 3 E f f e c t of temperature on the m i c r o b i o l o g i c a l
zinc e x t r a c t i o n rate 37
Figure 4 E f f e c t of i n i t i a l pH . . . . . . . . 42
Figure 5 E f f e c t of i n i t i a l pH on zinc e x t r a c t i o n 47
Figure 6 E f f e c t of constant pH on zinc e x t r a c t i o n 47'
F i t u r e 7 E f f e c t of pH on lag time 48
Figure 8 E f f e c t of ammonium concentration '. 52
Figure 9 E f f e c t of phosphate concentration 54
Figure 10 E f f e c t of pulp density 56
Figure 11 C y c l o s i z e r f r a c t i o n s . . . . 62
Figure 12 Bahco-sizer f r a c t i o n s 63
Figure 13 E f f e c t of p a r t i c l e s i z e (under normal aeration
conditions 66
Figure 14 E f f e c t of s p e c i f i c surface area 67
Figure 15 E f f e c t of t o t a l surface area of s o l i d 68
Figure 16 E f f e c t of pulp density at d i f f e r e n t carbon dioxide p a r t i a l pressures 72
Figure 17 E f f e c t of carbon dioxide p a r t i a l pressures at d i f f e r e n t pulp d e n s i t i e s 74
Figure 18 E f f e c t of p a r t i c l e s i z e at 1.0% carbon dioxide
p a r t i a l pressure 77
Figure 19 E f f e c t of s p e c i f i c surface area at 1.0%.carbon dioxide 79
Figure 20 E f f e c t of t o t a l surface area of s i z e f r a c t i o n s at 1.0% CO2 • • • • 8 0
Figure 21 E f f e c t of pulp density Lineweaver-Burk p l o t . . . . . 88
Figure 22 E f f e c t of s p e c i f i c surface area Lineweaver-burk p l o t . 89
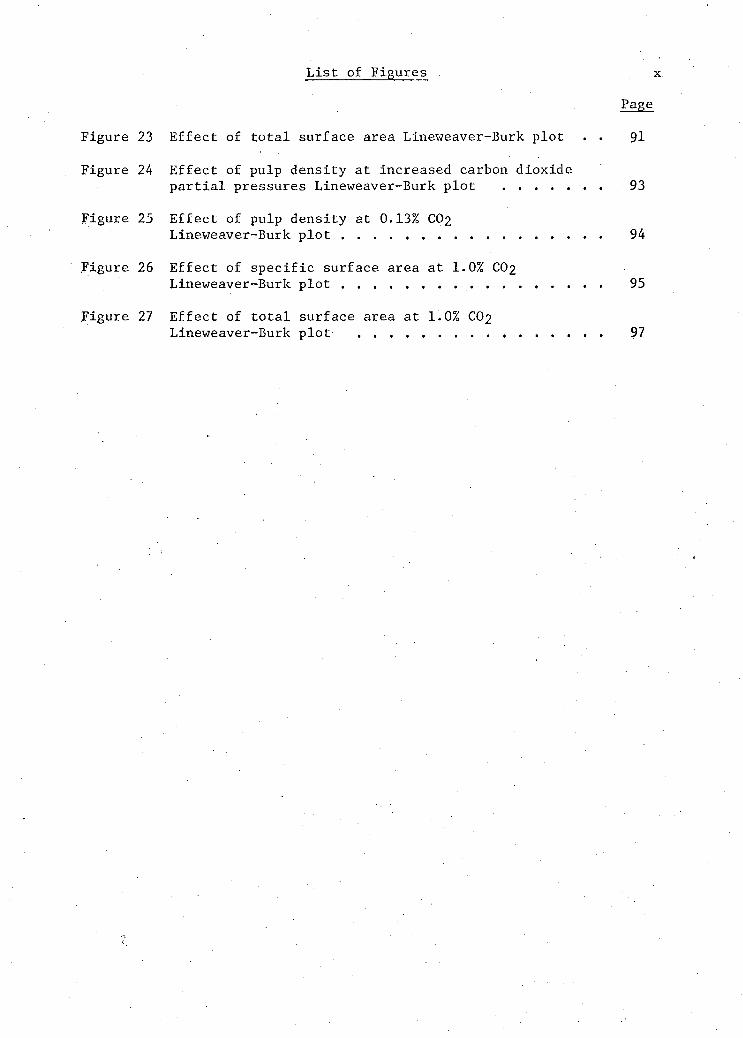
L i s t of Figures x
Page
Figure 23 E f f e c t of t o t a l surface area Lineweaver-Burk pl o t . . 91
Figure 24 E f f e c t of pulp density at increased carbon dioxide p a r t i a l pressures Lineweaver-Burk p l o t . . 93
Figure 25 E f f e c t of pulp density at 0.13% CO2 Lineweaver-Burk p l o t 94
Figure 26 E f f e c t of s p e c i f i c surface area at 1.0% CO2 Lineweaver-Burk pl o t 95
Figure 27 E f f e c t of t o t a l surface area at 1.0% C02
Lineweaver-Burk pl o t 97
L i s t of Tables x i
Page
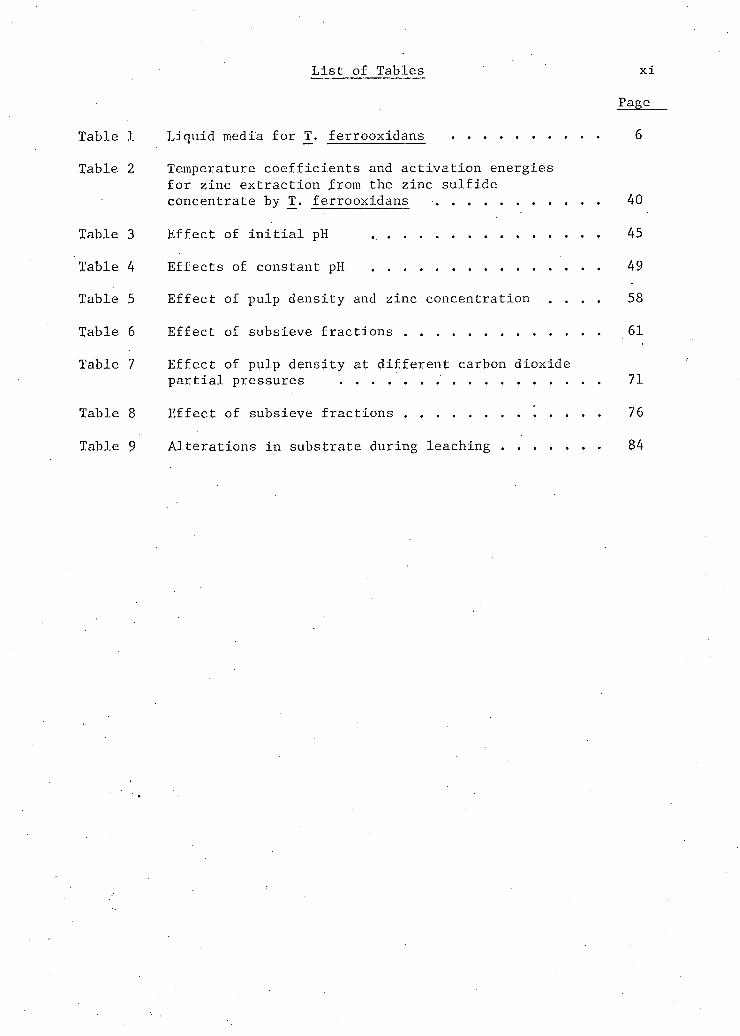
Table 1 L i q u i d media for T_. ferrooxidans 6
Table 2 Temperature c o e f f i c i e n t s and a c t i v a t i o n energies f o r zinc e x t r a c t i o n from the zinc s u l f i d e concentrate by T_. ferrooxidans 40
Table 3 E f f e c t of i n i t i a l pH 45
Table 4 E f f e c t s of constant pH 49
Table 5 E f f e c t of pulp density and zinc concentration . . . . 58
Table 6 E f f e c t of subsieve f r a c t i o n s 61
Table 7 E f f e c t of pulp density at d i f f e r e n t carbon dioxide
p a r t i a l pressures . . 71
Table 8 E f f e c t of subsieve f r a c t i o n s 76
Table 9 A l t e r a t i o n s i n substrate during leaching 84
Nomenclature x i i
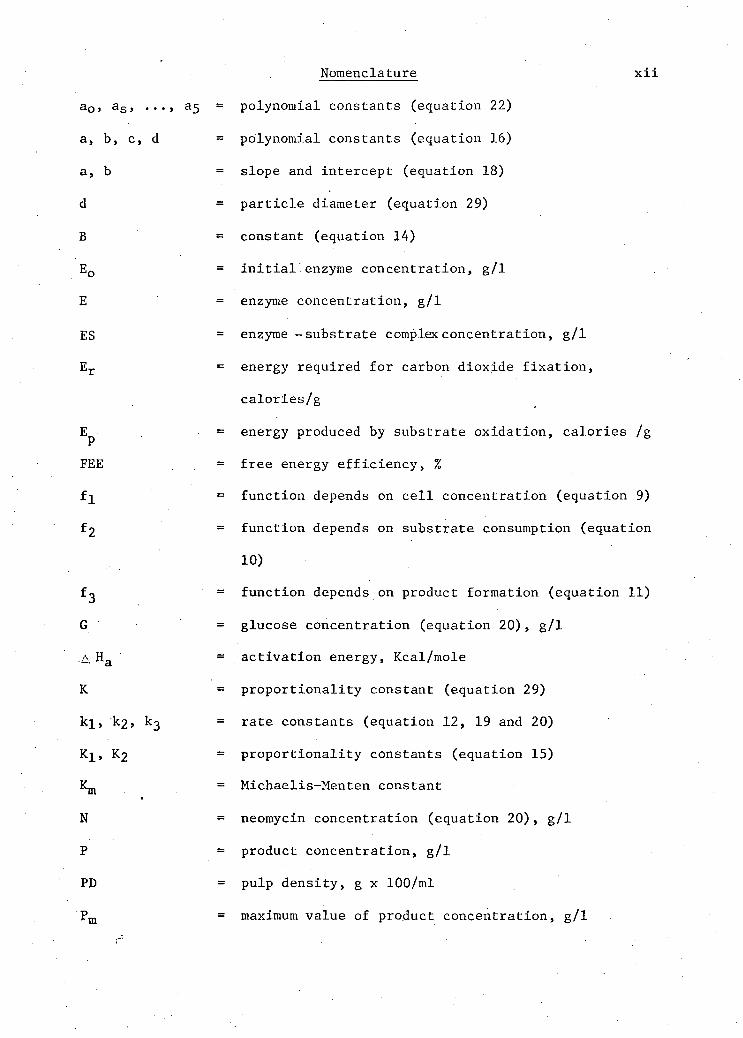
a c , a s , ..., a5 = polynomial constants (equation 22)
a, b, c, d = polynomial constants (equation 16)
a, b = slope and intercept (equation 18)
d = p a r t i c l e diameter (equation 29)
B = constant (equation 14)
E D = i n i t i a l enzyme concentration, g/1
E = enzyme concentration, g/1
ES = enzyme - substrate complex concentration, g/1
E r = energy required for carbon dioxide f i x a t i o n ,
c a l o r i e s / g
= energy produced by substrate oxidation, c a l o r i e s /g
= free energy e f f i c i e n c y , %
= function depends on c e l l concentration (equation 9)
= function depends on substrate consumption (equation
10)
fg = function depends on product formation (equation 11)
G = glucose concentration (equation 20), g/1
,A H a = a c t i v a t i o n energy, Kcal/mole
K = p r o p o r t i o n a l i t y constant (equation 29)
k i , k2j k-j = rate constants (equation 12, 19 and 20)
Kj_, K 2 = p r o p o r t i o n a l i t y constants (equation 15)
KJJJ = Michaelis-Menten constant
N = neomycin concentration (equation 20), g/1
P = product concentration, g/1
PD = pulp density, g x 100/ml
P m = maximum value of product concentration, g/1
P FEE
f l
*2
Nomenclature x i i i
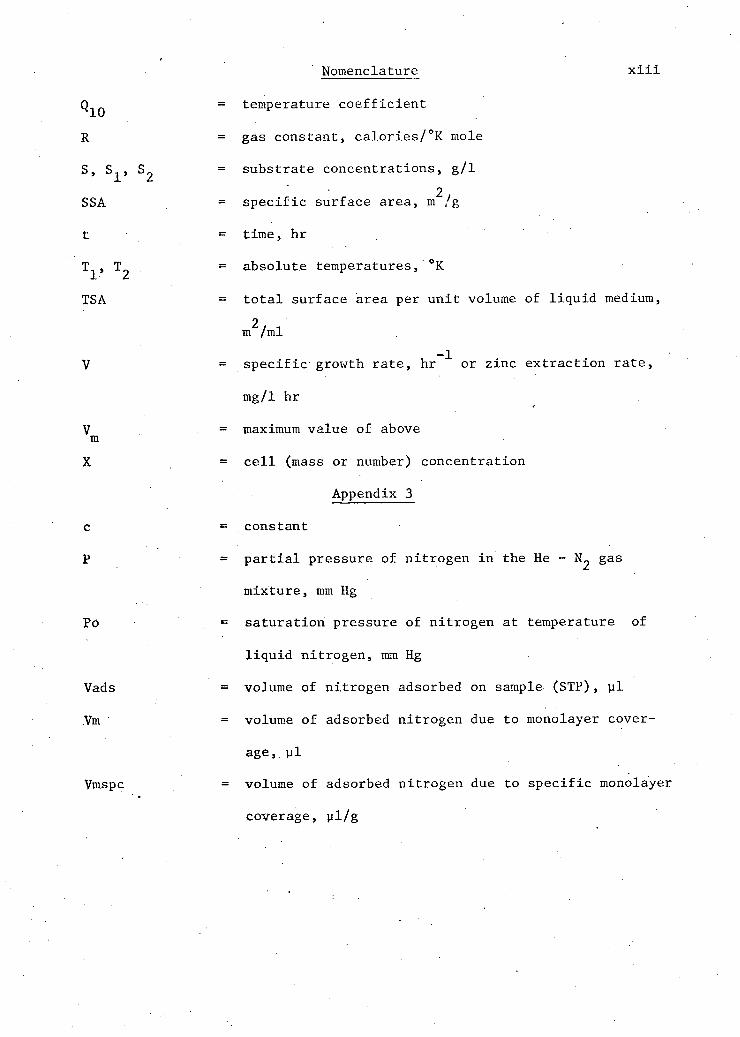
Q = temperature c o e f f i c i e n t
R = gas constant, calories/°K mole
S, S^, = substrate concentrations, g/1 2,
SSA = specxfxc surface area, m /g
t = time, hr
T^, = absolute temperatures, °K
TSA = t o t a l surface area per unit volume of l i q u i d medium,
m^/ml V = s p e c i f i c growth rate, hr ^ or zinc e x t r a c t i o n r a t e ,
mg/1 hr
V = maximum value of above m
X = c e l l (mass or number) concentration
Appendix 3
c = constant
P = p a r t i a l pressure of nitrogen i n the He - ^ gas
mixture, mm Hg
Pd = saturation pressure of nitrogen at temperature of
l i q u i d nitrogen, mm Hg
Vads = volume of nitrogen adsorbed on sample. (STP), p i
Vm = volume of adsorbed nitrogen due to monolayer cover
age, y l
Vmspc = volume of adsorbed nitrogen due to s p e c i f i c monolayer
coverage, y l / g
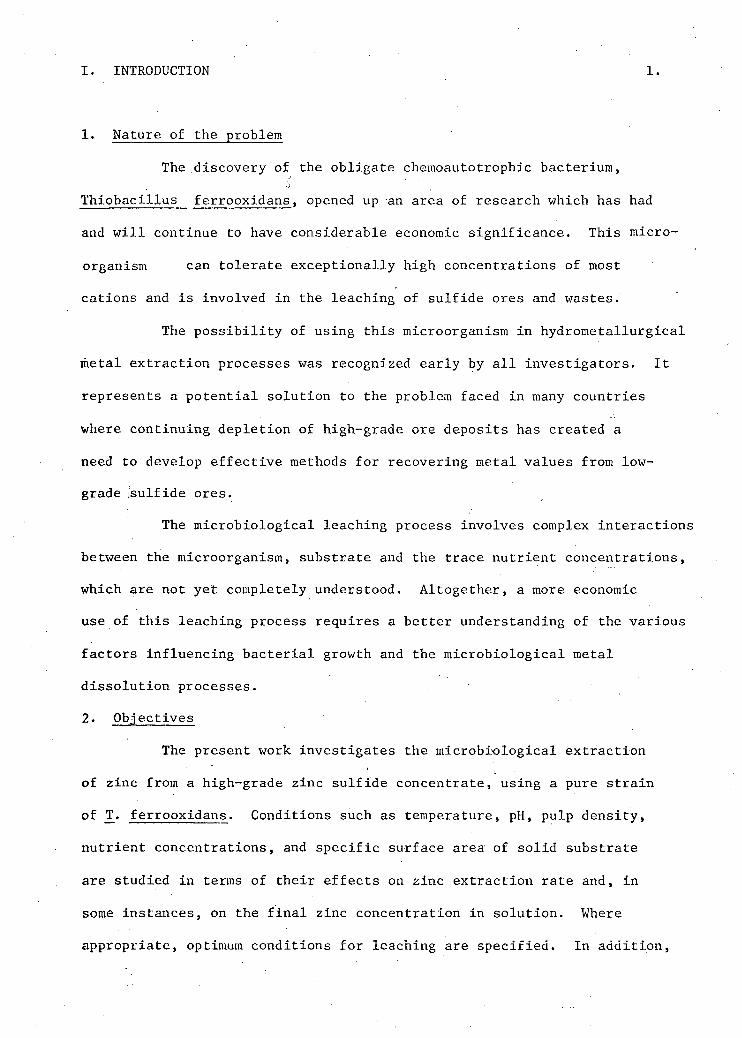
I. INTRODUCTION 1.
1. Nature of the problem
The discovery of the obligate chemoautotrophic bacterium,
Thiobacillus ferrooxidans, opened up an area of research which has had
and will continue to have considerable economic significance. This micro
organism can tolerate exceptionally high concentrations of most
cations and is involved in the leaching of sulfide ores and wastes.
The possibility of using this microorganism in hydrometallurgical
metal extraction processes was recognized early by a l l investigators. It
represents a potential solution to the problem faced in many countries
where continuing depletion of high-grade ore deposits has created a
need to develop effective methods for recovering metal values from low-
grade jsulfide ores.
The microbiological leaching process involves complex interactions
between the microorganism, substrate and the trace nutrient concentrations,
which are not yet completely understood. Altogether, a more economic
use of this leaching process requires a better understanding of the various
factors influencing bacterial grox̂ th and the microbiological metal
dissolution processes.
2 . Objectives
The present work investigates the microbiological extraction
of zinc from a high-grade zinc sulfide concentrate, using a pure strain
of T̂. ferrooxidans. Conditions such as temperature, pH, pulp density,
nutrient concentrations, and specific surface area of solid substrate
are studied in terms of their effects on zinc extraction rate and, in
some instances, on the final zinc concentration in solution. Where
appropriate, optimum conditions for leaching are specified. In addition,

factors l i m i t i n g the rate of zinc extraction are delineated as well as
those conditions under which they become l i m i t i n g . Further, an e f f o r t
i s made to describe the form of an equation s u i t a b l e for curve f i t t i n g
the data obtained i n these m i c r o b i o l o g i c a l leaching studies.
I I . MICROBIOLOGICAL BACKGROUND 3.
Most b a c t e r i a l species u t i l i z e complex organic compounds for
energy. Such organisms are c l a s s i f i e d as the heterotrophs. Only a few
species, c a l l e d autotrophic b a c t e r i a , are able to synthesize t h e i r carbo
hydrates, f a t s and proteins from carbon dioxide and inorganic sources of
nitrogen. The autotrophic c a p a b i l i t i e s of b a c t e r i a were established by (1 2)
Winogradsky ' i n 1887 and 1888. He concluded that b a c t e r i a e x i s t
which were able to grow by u t i l i z i n g the energy l i b e r a t e d by oxidation of
reduced forms of s u l f u r and ferrous i r o n . The b a c t e r i a may be distinguished
as obligate or f a c u l t a t i v e autotrophs. The obligate forms obtain t h e i r
energy s o l e l y from oxidation of inorganic compounds, whereas the f a c u l t a
t i v e forms also may u t i l i z e organic compounds, when inorganic compounds
are not a v a i l a b l e .
T. ferrooxidans, which i s responsible for m i c r o b i o l o g i c a l
leaching,has been placed i n the f i f t h genus, T h i o b a c i l l u s , of the family
(3) Thiobacteriaceae . This organism possesses the following morphologi-
, . ' • „. (3, 4, 5)
c a l c h a r a c t e r i s t i c s :
c e l l : short rod; 0.5 by 1.5 microns; motile; c e l l s occur s i n g l y or as
d i p l o b a c i l l i ; Gram stain-negative,
colony: (form when cultured on s o l i d media) minute; i r r e g u l a r edge;
f l a t ; granular surface; opaque. -v
I I I . LITERATURE REVIEW 4.
1. Description and physiology of T_. ferrooxidans
J_. ferrooxidans was discovered by Colmer and Hinkle i n the
ac i d , iron-containing drainage water of some bituminous coal mines, and
described l a t e r by Colmer et_ a l ^ ^ and Temple and Colmer as an
obligate, chemoautotrophic, a c i d o p h i l i c , i r o n o x i d i z i n g bacterium. I t
obtains carbon (in form of carbon dioxide) and oxygen from the atmosphere
and derives i t s metabolic energy from the oxidation of reduced i r o n and
su l f u r compounds.
This organism i s morphologically s i m i l a r to T h i o b a c i l l u s
thiooxidans. The fundamental d i f f e r e n c e between the two species i s
generally recognized to be the i n a b i l i t y of T_. thiooxidans to oxidize
ferrous i r o n and in s o l u b l e s u l f i d e s ̂ ' ~*' ̂ .
Leathen and B r a l e y ^ ^ and Leathen et_ a l / ^ studied an organism
which oxidized ferrous i r o n but not elemental s u l f u r or t h i o s u l f a t e .
Because of i t s i n a b i l i t y to u t i l i z e these reduced s u l f u r substrates, i t
was considered to be a new genus and assigned the name F e r r o b a c i l l u s
ferrooxidans. S i m i l a r l y , K i n s e l ^ ^ assigned the name F e r r o b a c i l l u s
sulfooxidans to an organism she i s o l a t e d , which u t i l i z e d ferrous i r o n
and elemental s u l f u r but not t h i o s u l f a t e .
Subsequent i n v e s t i g a t i o n s by Unz and Lundgren^"'"^ , Ivanov and /1 O \ / "I *3 "\ "V ( 1 / \
Lyalikova , Beck and Shaf i a and Hutchinson e_t jal indicated
that these organisms (T. f errooxidans, F_. f errooxidans and F_. s u l f ooxidans)
were i d e n t i c a l and should be c a l l e d T_. ferrooxidans. A l l these organisms
were capable of o x i d i z i n g elemental s u l f u r and t h i o s u l f a t e i n addition to
(14)
ferrous i r o n . In s p i t e of these conclusive data, some authors
continue to use the name F. ferrooxidans.
2. Occurrence of T. ferrooxidans 5.
The organism, T_. ferrooxidans, i s v i r t u a l l y ubiquitous i n
nature. Since i t s o r i g i n a l i s o l a t i o n ̂ '"''^, i t has been i s o l a t e d i n . . (15) _ , (16,17) . (18) „ ,(19) _ . ,(20) A u s t r a l i a , Canada , Congo , Denmark , England ,
Germany ( 2 1 ), J a p a n ( 2 2 ) , M e x i c o ( 2 3 ) , S c o t l a n d ( 2 1 ) , South A f r i c a ( 2 4 ) ,
c ."(16) o j (21) T T . . (7,8,10,25-31) , . ^ 7 T _ _ _ (32-36) Spam N , Sweden U.S.A. and i n the U.S.S.R.
3. Microbiology of T. ferrooxidans.
The a c t i v i t y of thesebacteria i s influenced by the nutrients
a v a i l a b l e for i t s growth and reproduction. The l i q u i d media most frequently
(9) used for T_. ferrooxidans are those of Leathen et a l and Silverman and
(37) Lundgren . These media are compared i n Table 1.
(37) Silverman and Lundgren designated t h e i r medium 9K. I t w i l l 8 8 6 support 2 x 10 to 4 x 10 c e l l s per ml compared to 7 x 10 c e l l s per ml
(9)
f o r the medium of Leathen et_ al_ .
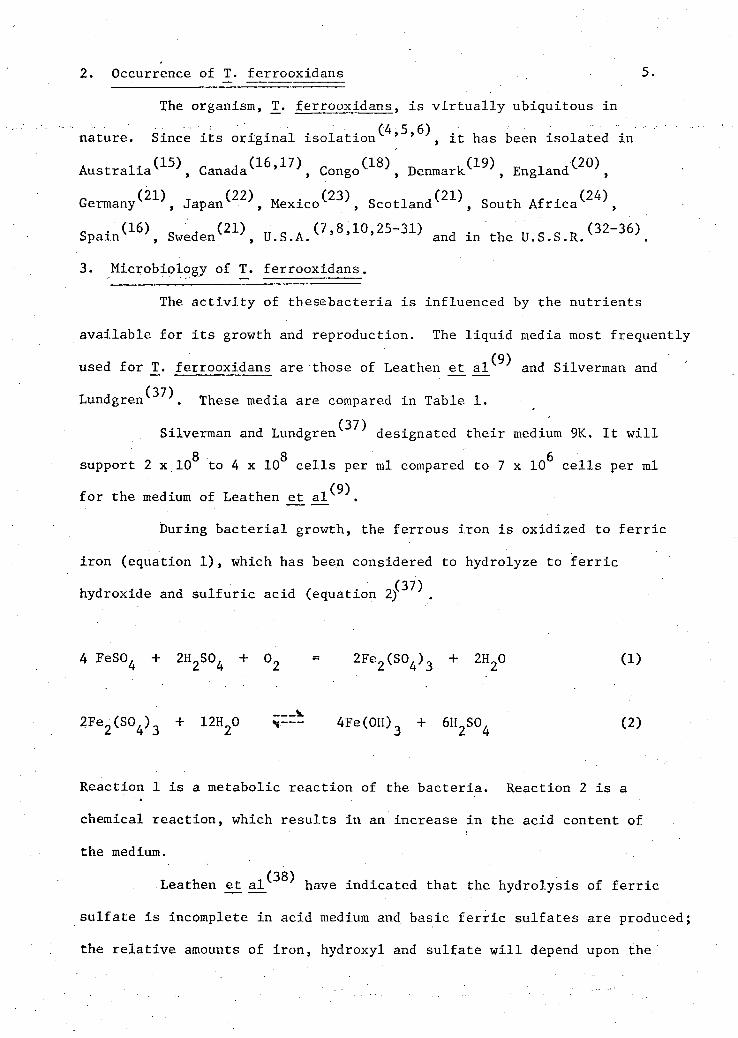
During b a c t e r i a l growth, the ferrous i r o n i s oxidized to f e r r i c
i r o n (equation 1), which has been considered to hydrolyze to f e r r i c (37)
hydroxide and s u l f u r i c acid (equation 2)
4 FeS0 4 + 2H 2S0 4 + 0 2 = 2 F e 2 ( S 0 4 ) 3 + 2H 20 (1)
2 F e 2 ( S 0 4 ) 3 + 12H20 v ~ - 4Fe(0H) 3 + 6H 2S0 4 (2)
Reaction 1 i s a metabolic reaction of the b a c t e r i a . Reaction 2 i s a
chemical reaction, which r e s u l t s i n an increase i n the acid content of
the medium.
Leathen et a l have indicated that the h y d r o l y s i s of f e r r i c
s u l f a t e i s incomplete i n acid medium and basic f e r r i c s u l f a t e s are produced;
the r e l a t i v e amounts of i r o n , hydroxyl and s u l f a t e w i l l depend upon the
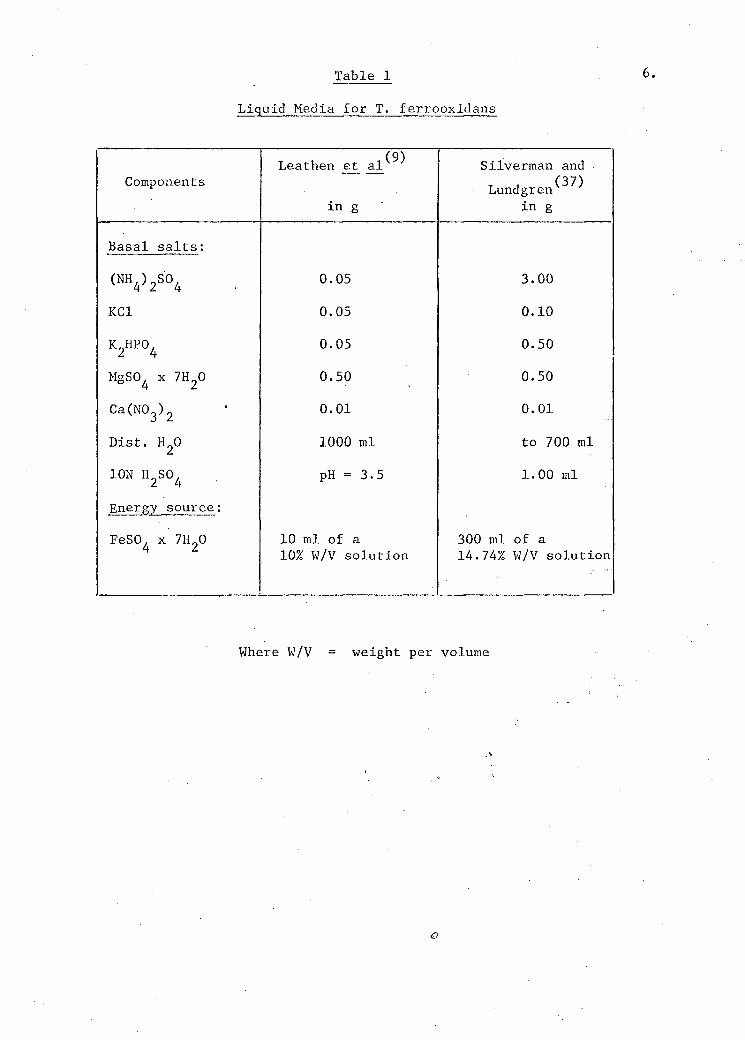
Table 1 6.
L i q u i d Media f o r T. ferrooxidans
Components
(9)
Leathen et a l
i n g
Silverman and Lundgren
i n g
Basal s a l t s :
(NH 4) 2S0 4 0.05 3.00
KC1 0.05 0.10
K 2HP0 4 0.05 0.50
MgS04 x 7H 20 0.50 0.50
Ca(N0 3) 2 0.01 0.01
Di s t . H 20 1000 ml to 700 ml
ION H oS0, 2 4 pH = 3.5 1.00 ml
Energy source:
FeSO. x 7H„0 4 2 10 ml of a 10% W/V s o l u t i o n
300 ml of a 14.74% W/V s o l u t i o n
Where W/V = weight per volume
d i l u t i o n and the a c i d i t y during hydrolysis. They represented the hydroly
s i s by the reaction of equation 3.
j>. F e 2 ( S 0 4 ) 3 + 2H20 \ — 2Fe(0H)S0 4 + H 2S0 4 (3)
The i r o n chemistry involved i s c e r t a i n l y more complex than i s indicated
by the foregoing equations. Observations on m i c r o b i o l o g i c a l chalcopyrite (39)
leaching in d i c a t e the following o v e r a l l r e a c t i o n f o r the formation
of i n s o l u b l e f e r r i c s u l f a t e :
6CuFeS_ + 25 1/2 0„ + 9Ho0 > 6CuS0, + I I I 4
2HF e 3 ( S 0 A ) 2 ( 0 H ) 6 + 2H 2S0 4 (4)
Reaction 4 r e s u l t s i n a reduction of pH and of f e r r i c and s u l f a t e ion
concentrations. The a c i d i t y of the s o l u t i o n i s s t a b i l i z e d near pH 2,
according to the equilibrium equation:
2 H F e 3 ( S 0 4 ) 2 ( 0 H ) 6 + 5H 2S0 4 v — - 3Fe^(S0 4) + 12H20 (5)
The e a r l y l i t e r a t u r e concerning the c a p a b i l i t y of t h i s microorganism to
u t i l i z e d i f f e r e n t energy sources i s somewhat confused. The a b i l i t y of
X_. ferrooxidans to oxidize ferrous i r o n has been demonstrated by numerous
a u t h o r s 5 , 1 4 , 3 7 ) s i m i l a r agreement has not been obtained concerning the
u t i l i z a t i o n of d i f f e r e n t s u l f u r compounds as substrates, because some
authors have f a i l e d to demonstrate the oxidation of elemental s u l f u r ^ ' " * ' ^ ' 9) . (8,9)
or t h i o s u l f a t e ' .A possible explanation of t h i s lack of success by (14)
c e r t a i n authors i s given by Hutchinson et_ a l , who pointed out the
importance of i n i t i a t i n g growth at the correct ph.
8. However, the majority of i n v e s t i g a t o r s have shown that T_.
ferrooxidans i s able to derive i t s energy from the oxidation of elemental
i f A - i , - u - ( 3 , 1 0 , 1 1 , 1 4 , 1 6 , 2 1 , 4 0 , 4 1 ) „ _ , s u l f u r and t h i o s u l f a t e . The pH optxmum for the
oxidation of elemental s u l f u r ranges from 1 . 7 5 to 5 ' and f o r
+u- i f , w / A c . ( 1 1 , 1 4 , 4 2 , 4 3 ) t h i o s u l f a t e between 4 and 5 . 5
These pH optima are higher than those found f o r b a c t e r i a l
a c t i v i t y on ferrous s u l f a t e media. I t should be noted that the i n t e r n a l
c e l l u l a r pH of these organisms normally i s higher than that of t h e i r ( 4 4 )
external environment . Recently, workers at B. C. Research ( 4 2 4 5 - 4 8 )
have published a s e r i e s of communications ' concerning substrate
u t i l i z a t i o n by T. ferrooxidans. They have found that these organisms
oxidize soluble and i n s o l u b l e ferrous i r o n , s u l f u r , i n s o l u b l e and soluble
s u l f i d e , t h i o s u l f a t e , t r i t h i o n a t e and tetrathionate. The oxidation rate ( 4 1 )
of s u l f u r was always slower than the rate of i r o n oxidation
Although the l i t e r a t u r e concerning the energy transfer
mechanisms of t h i o b a c i l l i i s growing r a p i d l y , only l i m i t e d information i s
a v a i l a b l e concerning e l e c t r o n t r a n s f e r from ferrous i r o n and s u l f u r
compounds to molecular oxygen. Various theories e x i s t i n v o l v i n g enzymes ( 4 4 4 9 - 6 3 ) ( 6 4 ) and proteins present i n the organisms ' . Trudinger has
published a review of the metabolism of inorganic s u l f u r compounds and
Peck^"^ one on energy coupling mechanisms. Nonetheless, no o v e r a l l
understanding of the energy transfer reactions i n T_. ferrooxidans has
yet been achieved.
B i o l o g i c a l c e l l s tend to lose energy at a l l s i t e s of energy
transf e r , a measure of t h e i r e f f i c i e n c y i n r e t a i n i n g the energy
a v a i l a b l e to them i s the free energy e f f i c i e n c y ( F E E ) . The F E E of carbon
dioxide f i x a t i o n by T_. ferrooxidans may be evaluated using a r e l a t i o n s h i p
proposed by Baas-Becking and Parks :
E FEE (%) = 100 Y~ (6)
P
where E r = energy used for carbon dioxide f i x a t i o n ;
Ep = energy produced by substrate oxidation.
Using ferrous i r o n as substrate, Temple and C o l m e r f o u n d
that the free energy e f f i c i e n c y of carbon dioxide f i x a t i o n f or _T. ( f.Q\
ferrooxidans was about 3.2%. Lyalikova observed that t h i s e f f i c i e n c y
decreases with the age of the c u l t u r e . An average value of 30% was
obtained with a two-day old culture. S i l v e r m a n ^ ^ reported values
ranging from 13.8 to 28.6% with an average value of free energy e f f i c i e n c y
of 20.5% for carbon dioxide f i x a t i o n .
Certain compounds synthesized by autotrophic organisms from
carbon dioxide are secreted into the medium to a s i g n i f i c a n t extent
For example, T;. thiooxidans releases amino acids and phosphatidyl com-' (209, 210) , _ , ., ^ (70) . . . . . pounds and _T. ferrooxidans pyruvate . Amino acids i n
s o l u t i o n may act as chelating agents and phosphatidyl compounds as a
wetting agent, possibly a s e l e c t i v e advantage for these microorganisms
i n attaching themselves to s o l i d surfaces.
Under completely anaerobic conditions, Pugh and Umbreit^"^ were
able to demonstrate carbon dioxide f i x a t ion that was associated with
oxidation of a s p e c i f i c substrate. For example, these authors using
jC. ferrooxidans (F. sulfooxidans)showed that carbon dioxide was f i x e d
when ferrous i r o n was oxidized to f e r r i c i r o n . Further, these authors
support the concept that an electron transport system i s interposed between
10. the inorganic substrate oxidized and the actual oxygen u t i l i z e d . No
mechanism was given to explain t h i s phenomenon.
4. Biochemical a c t i v i t y of T.. ferrooxidans
Ba c t e r i a are influenced markedly.by t h e i r e n v i r o n m e n t .
Factors such as temperature, pH, energy source, pulp density, p a r t i c l e
s i z e , oxygen, carbon dioxide, nutrient concentrations and a g i t a t i o n may
be expected e i t h e r to stimulate or suppress the microbial a c t i v i t y of
T. ferrooxidans•
For leaching of mineral s u l f i d e s by T_. ferrooxidans, the
following conditions are reported i n the l i t e r a t u r e :
4.1 Temperature
The optimum temperature has been found to be 35°C^^'^^', the
b a c t e r i a are i n h i b i t e d at 40°C^^'^'^^; no minimum temperature l i m i t
f o r growth has been established.
4.2 pH
The following pH-values were reported to be the l i m i t s f or
growth of T_. ferrooxidans: 2 and 4 by R a z z e l l ^ " ^ and 1 and 5 by
Silverman and E h r l i c h ^ ^ . The optimum pH i s below 3^^; more exactly
i t i s at 2.5^^'^'^^ . Above pH 6.0 b a c t e r i a l action i s almost com-(72)
p l e t e l y i n h i b i t e d and above pH 9.0, the b a c t e r i a are destroyed
4.3 Energy source
Substrate oxidation rates are said to be much higher on
ferrous i r o n than on inorganic s u l f i d e substrates. This organism often CJQ)
requires a period of adaptation to the new energy source . S u l f i d e minerals are more r a p i d l y leached as f i n e p a r t i c l e s than as coarse
(7,26,46,74,77) ' . . ^ A
ones ; no optimum p a r t i c l e s i z e data have been reported.
4.4 Surface active agents
Some surfactants exert a b e n e f i c i a l e f f e c t on metal e x t r a c t i o n
11. 79 —81) (82) rates and reduce the lag time ; but the presence of surfactants
( 83)
diminishes the l e v e l of f i n a l metal extraction , possibly through
l i m i t a t i o n of oxygen t r a n s f e r ^ ^ .
4.5 Carbon dioxide
Normal a i r concentrations are adequate ; up to 2% carbon dioxide (13)
concentration i n the gas phase may be desirable
4.6 Oxygen
Oxygen i s required i n large quantities (every pound of s u l f u r
as s u l f i d e , requires two pounds of oxygen f o r complete conversion to
s u l f a t e ) . The supply of t h i s oxygen i s the key problem i n the leaching (46 78)
process ' . The low s o l u b i l i t y of oxygen and carbon dioxide i n the
leaching medium means that high rates of gas transfer are necessary.
This necessitates the use.of some kind of a g i t a t i o n .
4.7 Nutrients
The nutrient requirements of T_. ferrooxidans are normal for a
chemosynthetic autotroph. E a r l y reports indicated a requirement for such
inorganic compounds as carbon dioxide (for c e l l growth), ammonium s u l f a t e
and dipotassium hydrogen phosphate (as nitrogen and phosphate sources),
ferrous i r o n and s u l f u r compounds (as energy sources), and magnesium (74)
s u l f a t e , potassium ch l o r i d e and calcium n i t r a t e (as growth factors) (39)
However, experiments c a r r i e d out at B. C. Research have demonstrated
that T_. ferrooxidans has no requirement for magnesium, calcium and
potassium ions beyond those l e v e l s contained i n reagent grade ammonium
s u l f a t e , dipotassium hydrogen phosphate and sulfide-minerals.
Of these f a c t o r s i n f l u e n c i n g m i c r o b i o l o g i c a l leaching, the most
important probably are temperature and pH. These d i r e c t l y a f f e c t a c t i v i t y
(metabolism) and growth of the bacteria.. Another requirement f o r the
oxidation of s u l f i d e s by the b a c t e r i a i s the a v a i l a b i l i t y of the substrate.
12. The most i d e a l condition e x i s t s when the substrate i s soluble such as
are ferrous i r o n s a l t s . For insolu b l e substrates, the s u l f i d e minerals
must have an adequate amount of exposed surface area.
Although the surface phenomena have been observed by many
... (7,26,46,77,78) . .. „. , , , , ,
authors , no in v e s t i g a t i o n s have been undertaken to
e s t a b l i s h the r e l a t i o n s h i p between the s p e c i f i c surface area and b a c t e r i a l
growth and the e f f e c t on the metal ex t r a c t i o n rate. (39)
However, experiments on m i c r o b i o l o g i c a l chalcopyrite leaching
have indicated that, below a c e r t a i n p a r t i c l e s i z e , no benefit i n extrac
t i o n rate i s achieved and, i n t h i s instance, only the t o t a l e x traction
i s enhanced.
5. M i c r o b i o l o g i c a l leach techniques (79)
P r i o r to 1964 , laboratory studies on the m i c r o b i o l o g i c a l
leaching of s u l f i d e ores were c a r r i e d out with a i r l i f t p e r colators,
described by Bryner et a l ^ ^ , the Warburg r e s p i r o m e t e r o r with
stationary leach b o t t l e s ^ ^ . The oxygen supply i s poor i n both the
percolator and the stationary leach b o t t l e techniques; whereas the s i z e
and the p r i n c i p l e of the Warburg apparatus render i t unsuitable f o r
p r a c t i c a l leaching. Using percolators f o r the b a c t e r i a l leaching of chalcopyrite,
(25) Bryner et a l found 2.7% of copper extracted from one sample and
(29 ) 6.1% of copper from another sample i n 70 days; Malouf and Prater reported about 40% a f t e r 70 days and 60% extraction a f t e r 470 days.
(79 ) Duncan, T r u s s e l l and Walden described a p r a c t i c a l method,
gyratory shaking, which produces rapid aeration and an accelerated rate (82)
of leaching. Using the shake-flask technique, Duncan and T r u s s e l l
reported that T_. ferrooxidans leached 72% of the copper from museum grade
chalcopyrite i n 12 days and 100% i n 26 days. This comparison shows the
s u p e r i o r i t y of the shaking technique. 13.
However, besides the gyratory shaking there are
many other types of mixers a v a i l a b l e for use i n laboratory leaching
experiments, e.g., a i r spargers, magnetic s t i r r e r s and re c i p r o c a t i n g
shakers. The e f f e c t s of these techniques on m i c r o b i o l o g i c a l copper
extraction are compared by Duncan et a l . They found that magnetic
s t i r r i n g and re c i p r o c a t i n g shaking gave r e s u l t s comparable with those
for gyratory shaking. ( 7 8 8 5 ^
Laboratory column leaching techniques ' may simulate the
commercial procedures f o r heap or dump leaching. A sample of ore i s
placed i n a column and the l i q u i d medium i s c i r c u l a t e d through i t con
tinuously by an a i r l i f t . One concurrent e f f e c t of t h i s technique i s to
provide the column with oxygen and CO2 saturated medium. Although,
because of the high oxygen requirement of the process, oxygen s t i l l may
be a l i m i t i n g f a c t o r .
Another leach technique which may be used for laboratory
m i c r o b i o l o g i c a l metal e x t r a c t i o n i s the tank leaching technique. This
method i s p a r t i c u l a r l y u s e f u l f o r evaluating high-grade materials and
provides f o r easy co n t r o l of a l l the important parameters i n f l u e n c i n g
t h i s type of leaching. The i n t e r p r e t a t i o n of the r e s u l t s of tank
leaching experiments also may contribute to a future acceptance of the
bioleaching technique for recovery of metals from c e r t a i n ore concen
t r a t e s , which are presently recovered by conventional hydro- or pyro-
metallurgy.
So f a r , only two m i c r o b i o l o g i c a l leach techniques have been
applied i n the commercial recovery of metals from s u l f i d e materials.
These are dump or heap leaching and i n s i t u leaching. The f i r s t . . , - (86-94.211) . technique i s used mainly tor copper recovery m the western
14. states of U.S.A., where now more than 100,000 tons/year of copper are
(78) produced in this manner . The only other metal which is being leached commercially is uranium . It is recovered by _in situ leaching in the
(95 96) Elliot Lake area of Ontario ' in amounts of 10,000 lbs of U o0 o per j o (24)
month, and in South Africa
6. Microbiological leaching of mineral sulfides
All living organisms require small quantities of trace elements
for protoplasm synthesis and for action of their enzyme systems. How
ever, transformation of appreciable quantities of minerals is restricted . . . (76) to certain groups of microorganisms Mineral transformations can be effected not only by direct
enzymatic interaction but also by interaction with the end product(s)
lie (4,5,6,
of metabolism^*^. This statement pertains also to the autotrophic
acidophilic organism, T?. ferrooxidans. For example, Temple et al 97 98)
' reported that T_. ferrooxidans and T_. thiooxidans were present in
the acid mine waters and were involved in acid formation in the coal
mines.
The process of the microbiological leaching of metal sulfides
may be defined as a biochemical (biogeochemical) oxidation process, (123)
catalyzed by a living organism . However , in nature, only the
insoluble sulfides are of consequence, and unless the oxidation product
is soluble, such an oxidation would be of l i t t l e commercial consequence.
T_. ferrooxidans oxidizes different mineral sulfides at
different rates, the rate of oxidation of the mixture being the sum of (83)
the rates of the individual components of the mixture _T. ferrooxidans has been found able to oxidize antimony sul-
... (25,8,3,99) . .... (99-101) , _ .... (18,99) fides , arsenic sulfides ,cobalt sulfides , copper s u l f i d e s < 1 6 ' 2 5 > 2 6 ' 2 8 - ^ s u l f i d e s t 7 ' 1 7 ' 2 4 -27,29,30,32,48,99,103-112) • f 26 28 29 85-113 114) • , -.
, molybdenum s u l f i d e ^ D ' z o > z y ' " > X X J ' ± X 4 ; , nickel
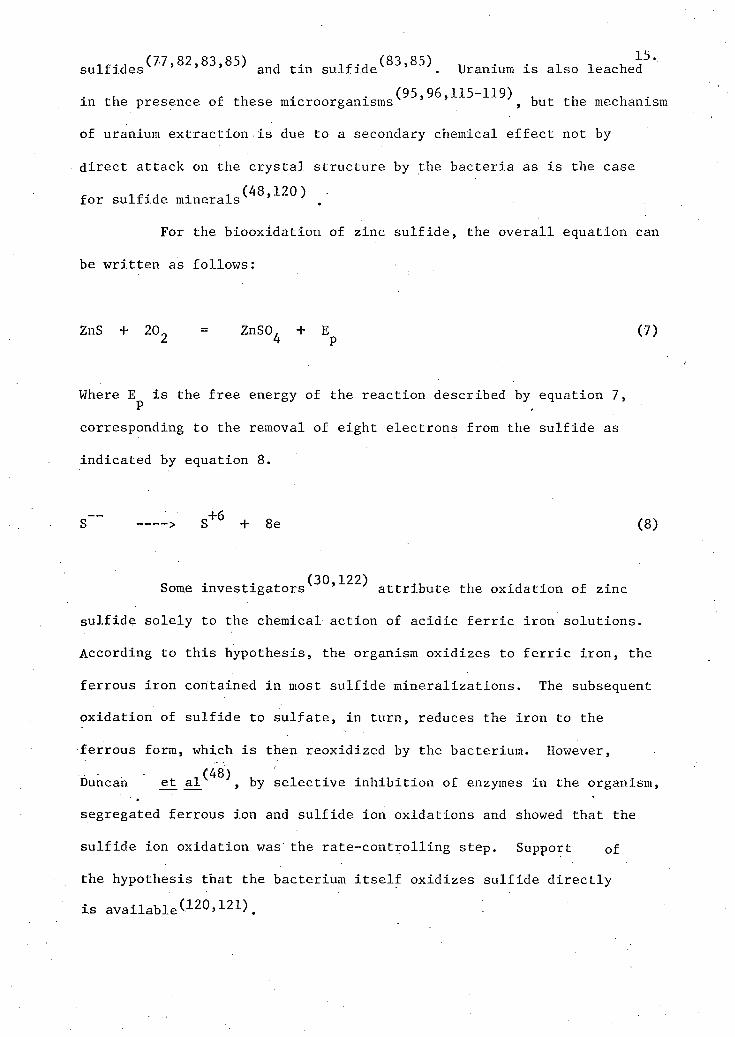
(7-7 82 83 85) (83 85) 15. s u l f i d e s ' > » > ' a r i ( j t i n s u l f i d e ' . Uranium i s also leached
• 4.1, r „!, • • (95,96,115-119) , ^ , . i n the presence of these microorganisms , but the mechanism
of uranium extraction i s due to a secondary chemical e f f e c t not by
d i r e c t attack on the c r y s t a l structure by the b a c t e r i a as i s the case
. -i (48,120) • fo r s u l f i d e minerals .
For the biooxidation of zinc s u l f i d e , the o v e r a l l equation can
be written as follows:
ZnS + 20„ = ZnSO. + E (7) 2 4 p
Where E^ i s the free energy of the reaction described by equation 7,
corresponding to the removal of eight electrons from the s u l f i d e as
indicated by equation 8.
S + 6 + 8e (8)
(30 122)
Some in v e s t i g a t o r s ' a t t r i b u t e the oxidation of zinc
s u l f i d e s o l e l y to the chemical action of a c i d i c f e r r i c i r o n s o l u t i o n s .
According to t h i s hypothesis, the organism oxidizes to f e r r i c i r o n , the
ferrous i r o n contained i n most s u l f i d e m i n e r a l i z a t i o n s . The subsequent
oxidation of s u l f i d e to s u l f a t e , i n turn, reduces the i r o n to the
ferrous form, which i s then reoxidized by the bacterium. However,
Duncan et_ a l ^ ^ , by s e l e c t i v e i n h i b i t i o n of enzymes i n the organism,
segregated ferrous ion and s u l f i d e ion oxidations and showed that the
s u l f i d e ion oxidation was the r a t e - c o n t r o l l i n g step. Support of
the hypothesis that the bacterium i t s e l f oxidizes s u l f i d e d i r e c t l y
i s a v a i l a b l e ^ 1 2 0 ' 1 2 1 ) .
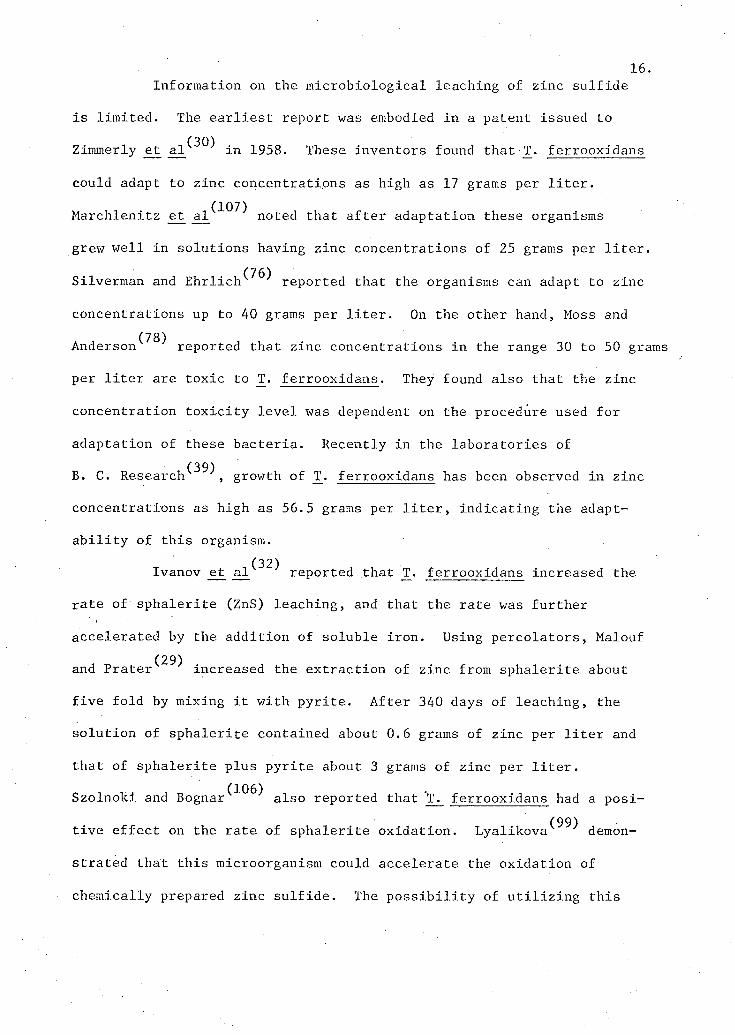
16. Information on the m i c r o b i o l o g i c a l leaching of zinc s u l f i d e
i s l i m i t e d . The e a r l i e s t report was embodied i n a patent issued to
Zimmerly et a l ^ ~ ^ i n 1958. These inventors found that T_. ferrooxidans
could adapt to zinc concentrations as high as 17 grams per l i t e r .
Marchlenitz et^ al^^^ noted that a f t e r adaptation these organisms
grew well i n solutions having zinc concentrations of 25 grams per l i t e r .
Silverman and E h r l i c h ^ 7 ^ reported that the organisms can adapt to zinc
concentrations up to 40 grams per l i t e r . On the other hand, Moss and (78)
Anderson reported that zinc concentrations i n the range 30 to 50 grams
per l i t e r are toxic to _T. ferrooxidans. They found also that the zinc
concentration t o x i c i t y l e v e l was dependent on the procedure used f o r
adaptation of these b a c t e r i a . Recently i n the lab o r a t o r i e s of (39)
B. C. Research , growth of T_. ferrooxidans has been observed i n zinc
concentrations as high as 56.5 grams per l i t e r , i n d i c a t i n g the adapt
a b i l i t y of t h i s organism. (32)
Ivanov ejt al reported that T_. ferrooxidans increased the rate of s p h a l e r i t e (ZnS) leaching, and that the rate was further accelerated by the addi t i o n of soluble i r o n . Using percolators, Malouf
(29)
and Prater increased the extraction of zinc from s p h a l e r i t e about
f i v e f o l d by mixing i t with p y r i t e . A f t e r 340 days of leaching, the
s o l u t i o n of s p h a l e r i t e contained about 0.6 grams of zinc per l i t e r and
that of s p h a l e r i t e plus p y r i t e about 3 grams of zinc per l i t e r .
Szolnoki and B o g n a r ^ ^ ^ also reported that ferrooxidans had a p o s i -(99)
t i v e e f f e c t on the rate of s p h a l e r i t e oxidation. Lyalikova demon
strated that t h i s microorganism could accelerate the oxidation of
chemically prepared zinc s u l f i d e . The p o s s i b i l i t y of u t i l i z i n g t h i s
17. organism i n the recovery of small q u a n t i t i e s of metals (copper, zinc)
from rougher t a i l i n g s has been considered by Duncan, Walden and
T r u s s e l l ^ ^ . Using a tank leaching technique and a zinc s u l f i d e ore (85)
containing 1.5 to 2.8% zinc, Duncan et _al obtained a zinc e x t r a c t i o n
rate of 14 mg per l i t e r per hour and, a f t e r 30 days of leaching, a
f i n a l zinc concentration of about 6 grams per l i t e r .
A l l of the foregoing data which are a v a i l a b l e i n references 29,
30, 32, 39, 46, 76, 78, 85, 99 and 106, have been derived from pre
liminary experiments. Altogether, these studies i n d i c a t e that zinc
concentrations are nontoxic to the leaching organism, _T. ferrooxidans,
at r e l a t i v e l y high concentrations and that the bioleaching of zinc
s u l f i d e ores i s t e c h n i c a l l y f e a s i b l e . However, these references con
t a i n l i m i t e d or no information on s p e c i f i c values for the important
f a c t o r s such as temperature, pH, pulp density, s p e c i f i c surface area of
s o l i d and nutrient concentrations which w i l l lead to maximum rates of
zinc extraction.
I V . BIOKINETIC MODELING 18.
1. Introduction
Use of mathematical models i n the d e s c r i p t i o n of the
mi c r o b i o l o g i c a l leach phenomena i s of great i n t e r e s t . For example, the
models based on the v a r i a b l e s i n f l u e n c i n g the metal s u l f i d e leaching could
permit one to study the e f f e c t of a v a r i a b l e without performing experi
mental work. Such t h e o r e t i c a l study could predict r e s u l t s and save
material and time, which are of economic s i g n i f i c a n c e , provided of
course that the model had been adequately tested with experimental data.
2. D i f f i c u l t i e s i n b i o k i n e t i c modeling
B i o k i n e t i c modeling i s e s p e c i a l l y d i f f i c u l t because of the
many d i f f e r e n t metabolic pathways and side reactions involved. Major
complications a r i s e because many of the reac t i o n mechanisms of the c e l l ' s
metabolic reactions are not completely understood. Factors i n f l u e n c i n g
b a c t e r i a l growth are numerous and the b i o l o g i c a l knowledge and mathemati
c a l tools necessary for the formulation and study of a completely
general model do not exist^"*" 2^ . An exact k i n e t i c model f or b a c t e r i a l
metabolism i s beyond the scope of the present study. Rather with respect
to m i c r o b i o l o g i c a l leaching of zinc s u l f i d e s , those v a r i a b l e s which have
the greatest economic i n t e r e s t have been investigated while holding
other v a r i a b l e s constant. '
The most commonly used v a r i a b l e s i n fermentation k i n e t i c s are
the concentrations of c e l l s , substrates and products. Recently, the c e l l
composition and the c e l l s i z e d i s t r i b u t i o n i n a given population have
been recognized as important f o r t h i s purpose.
3. C l a s s i f i c a t i o n of fermentation processes
The k i n e t i c character of i n d i v i d u a l fermentation processes
19. . d i f f e r s widely. However, c e r t a i n c h a r a c t e r i s t i c s permit c l a s s i f i c a t i o n
• „ v j . « _ u ' i • 0-25,126) , . (127) , xn three dxfferent ways; phenomenologxc , thermodynamxc and
(128 129)
k i n e t i c ' . The phenomenological approach i s based on a comparison
of s p e c i f i c product formation rate with associated growth phenomena. In
the thermodynamic approach the a c t i v a t i o n energies of growth, resp i r a t i o n
and biosynthesis are measured, whereas i n the k i n e t i c a n alysis the rate
of product formation i s studied i n respect to the fermentation
parameters.
Another basis for the c l a s s i f i c a t i o n of models of b a c t e r i a l
population has been given by Tsuchiya ej: al^^^. In t h e i r system, the
population model i s described as either " d i s t r i b u t e d " or "segregated".
The segregated model recognizes the d i s t r i b u t i o n of d i f f e r e n t p h y s i o l o g i
c a l states among the c e l l s i n the population, while the d i s t r i b u t e d
model'does not. In t h i s l a t t e r model, i t i s assumed that a l l the c e l l s
have the same properties. The d i s t r i b u t e d model i s the s i m p l i e r , since
the process of reproduction i s not involved i n the model. Further, i t
may be assumed that the c e l l i s e i t h e r structured or unstructured. The
structured model recognizes the d i f f e r e n t compounds present i n the c e l l
while the unstructured model does not.
4. Development of b a c t e r i a l k i n e t i c s (124-
Rather than summarize e x i s t i n g reviews of b a c t e r i a l k i n e t i c s , 126,130-133) _ , . . • . ,. ^ -
, thxs sectxon emphasxzes the steps leadxng to the evolutxon
of fermentation k i n e t i c s .
4•1 Orders of b i o l o g i c a l (enzymatic) reactions
I f the substrate l e v e l i s high the b i o l o g i c a l r e a c t i o n rate
follows a zero-order course (reaction rate i s constant). I f t h i s l e v e l
f a l l s , e i t h e r because substrate i s used up or i s inadequately replaced,
the rate more c l o s e l y approximates a f i r s t - o r d e r r e a c t i o n (the r e a c t i o n
20. rate i s proportional to the concentration of substrate). Therefore, i t
i s d i f f i c u l t to c l a s s i f y the o v e r a l l b a c t e r i a l (enzymatic) reaction as
, . ' ... , . . (134)
being of. a s p e c i f i c order or reaction
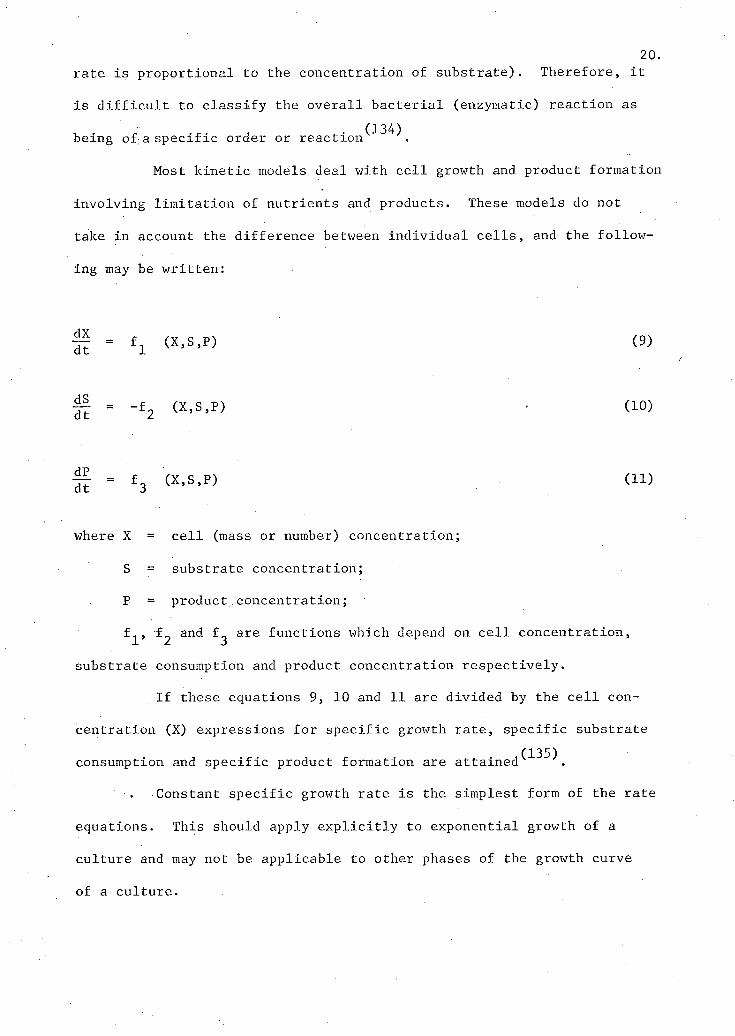
Most k i n e t i c models deal with c e l l growth and product formation
i n v o l v i n g l i m i t a t i o n of nutrients and products. These models do not
take i n account the d i f f e r e n c e between i n d i v i d u a l c e l l s , and the follow
ing may be written:
~ = f x (X,S,P) (9)
| | = - f 2 (X,S,P) • (10)
f = f 3 (X,S,P) (11)
where X = c e l l (mass or number) concentration;
S = substrate concentration;
P = product concentration;
f ^ , f 2 and f ^ are functions which depend on c e l l concentration,
substrate consumption and product concentration r e s p e c t i v e l y .
I f these equations 9, 10 and 11 are divided by the c e l l con
centration (X) expressions f o r s p e c i f i c growth rate, s p e c i f i c substrate
consumption and s p e c i f i c product formation are a t t a i n e d ^ ^ ^ ^ .
Constant s p e c i f i c growth rate i s the simplest form of the rate
equations. This should apply e x p l i c i t l y to exponential growth of a
culture and may not be applicable to other phases of the growth curve
of a c u l t u r e .
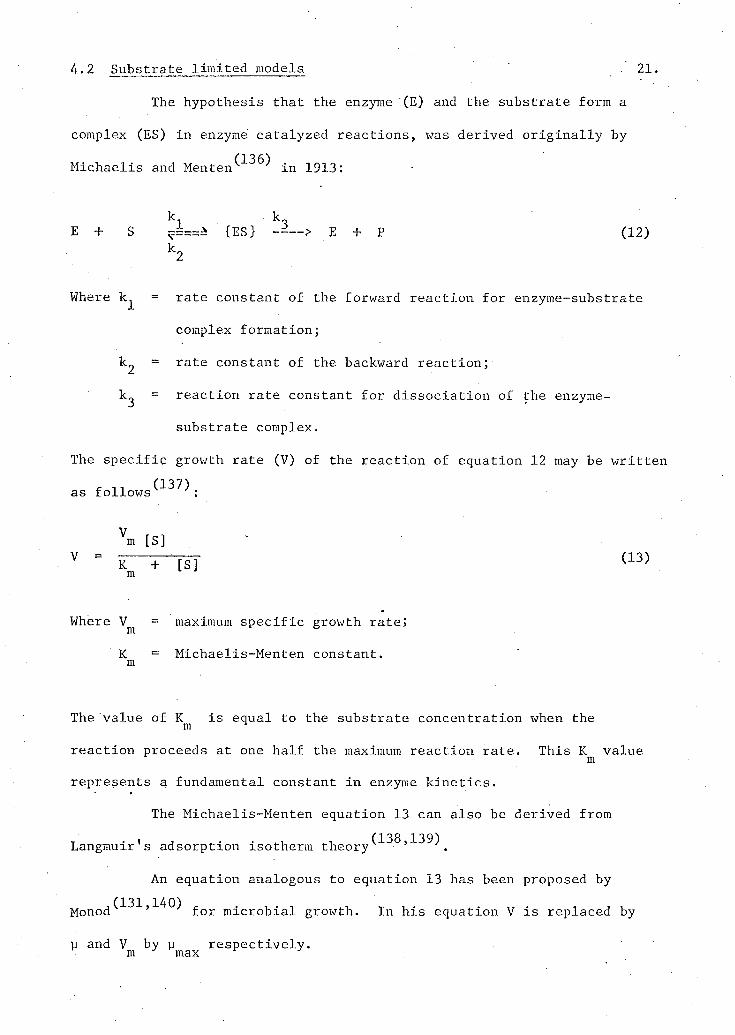
4.2 Substrate l i m i t e d models ' . 2 1 .
The hypothesis that the enzyme (E) and the substrate form a
complex (ES) i n enzyme catalyzed reactions, was derived o r i g i n a l l y by
Michaelis and Menten^*^^ i n 1913:
k k E + S ~ = = ± {ES} --—> E + . P (12)
k 2
Where k^ = rate constant of the forward r e a c t i o n for enzyme-substrate
complex formation;
k^ = rate constant of the backward reaction;
k^ = reaction rate constant for d i s s o c i a t i o n of the enzyme-
substrate complex.
The s p e c i f i c growth rate (V) of the reaction of equation 12 may be written
as follows :
Vm [S] V ' K + [S] <13> m
Where V = maximum s p e c i f i c growth rate; m ° K = Michaelis-Menten constant, m
The value of K i s equal to the substrate concentration when the m react i o n proceeds at one hal f the maximum reaction rate. This K value
m represents a fundamental constant i n enzyme k i n e t i c s .
The Michaelis-Menten equation 13 can also be derived from
T • ' A , • • -i, - i (138,139) Langmuir s adsorption isotherm theory
An equation analogous to equation 13 has been proposed by
,(131,140) - • r . , ^ T • xr • 1 J 1. Monod f o r mi c r o b i a l growth. In his equation V i s replaced by
u and V by y re s p e c t i v e l y , m J max r J
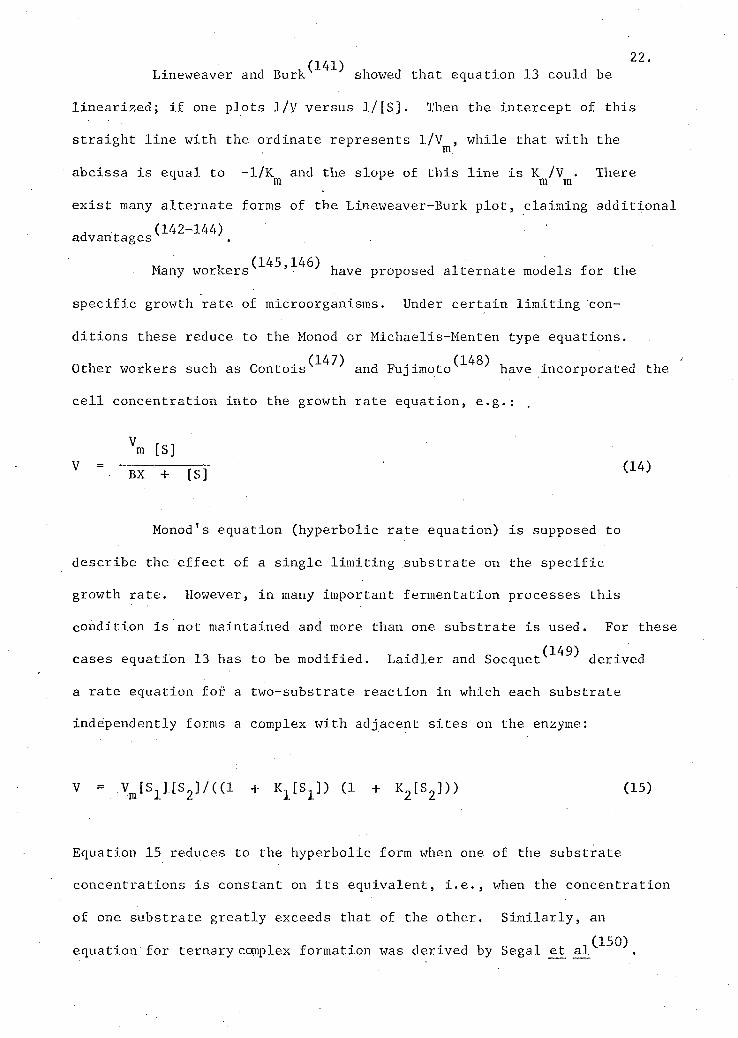
22 Lineweaver and Burk showed that equation 13 could be
l i n e a r i z e d ; i f one pl o t s 1/V versus 1/[S]. Then the intercept of t h i s
s t r a i g h t l i n e with the' ordinate represents 1/V^J while that with the
abcissa i s equal to -1/K and the slope of t h i s l i n e i s K /V . There m m m
e x i s t many alternate forms of the Lineweaver-Burk p l o t , claiming a d d i t i o n a l , . (142-144) advantages
Many workers ' x^6) k a v e proposed alternate models for the
s p e c i f i c growth rate of microorganisms. Under c e r t a i n l i m i t i n g con
d i t i o n s these reduce to the Monod or Michaelis-Menten type equations. (147) (148) Other workers such as Contois and Fujimoto have incorporated the
c e l l concentration into the growth rate equation, e.g.:
Vm [S] V = BX + [ S f ( 1 4 )
Monod's equation (hyperbolic rate equation) i s supposed to
describe the e f f e c t of a s i n g l e l i m i t i n g substrate on the s p e c i f i c
growth rate. However, i n many important fermentation processes t h i s
condition i s not maintained and more than one substrate i s used. For these (149)
cases equation 13 has to be modified. L a i d l e r and Socquet derived
a rate equation for a two-substrate reaction i n which each substrate
independently forms a complex with adjacent s i t e s on the enzyme:
V = V m f S 1 ] [ S 2 ] / ( ( l + K 1 [ S 1 ] ) (1 + K 2 [ S 2 ] ) ) (15)
Equation 15 reduces to the hyperbolic form when one of the substrate
concentrations i s constant on i t s equivalent, i . e . , when the concentration
of one substrate greatly exceeds that of the other. S i m i l a r l y , an
equation for ternary complex formation was derived by Segal et a l ^ ^ .
23.
Despite the fact that most workers(131,140,145,146,151 155)
have regarded the specific growth rate of a microbial population as a
single function of the concentration of the limiting substrate, Contois
and Fujimoto^"'"^^ were able to show that i t is also a function of the (212)
population density (X). More recent work suggests density effects are due to limitations of a number of other factors.
4.3 Product limited models
Inhibitory metabolic products normally are formed and accumulated
during any growth processes. These may compete with substrates for
active sites on the enzyme molecules and can thus result in a diminution
in the rate of product formation and in the number of viable organisms.
Several models have been proposed in the literature to describe this
relationship.
i In the area of population growth P r i t c h e t t u s e d a third
order polynomial to describe the growth as a function of time. The (122)
same order of polynomial has been applied by McDonald to describe the
bacterial ferrous iron oxidation curve. Pearl demonstrated the
applicability of a logarithmic form to growth curve representation. Numerous models have been proposed in describing sigmoid-shape
(158-172) growth curves which were found useful in studies of growth
phenomena. The logistic type equation, for example ̂ ^"^ : X » Xm/(1 + exp (a + bt + c t 2 + dt 3)) (16)
where a, b, c and d are constants and t the time, may be written in a
linearized form which is more adaptable to certain computational tech-
niques(173-180).
2 4 .
A generalized l o g i s t i c equation which can f i t many types of
growth curves has been proposed by Edirards^ ± 3"^ a n d Edwards and w i l k e ^ x 8 x ^
X = X / ( l + e x p ( f ( t ) ) ) (17) m
where f ( t ) i s a f i f t h order polynomial.
Leudeking and P i r e t have described a model f o r product
formation i n product l i m i t e d c u l t u r e s :
1 dP 1 dX , , ' • STQ\
X d F = a I d T + b ( 1 8 )
In equation 18 the f i r s t term on the r i g h t hand side i s an expression
for s p e c i f i c growth-associated product formation and the second term i s
a constant. Based on equation 18, a plot of the s p e c i f i c rate of product * 1 ' dP • : . . . ^ 1 dX . . . . . formation, T T — -J— , versus the s p e c i f i c growth rate, — - j — , should give X at X dt
a s t r a i g h t l i n e , where b i s the intercept and a the slope of the regression
l i n e .
4 . 4 Substrate and product l i m i t e d models
The simultaneous e f f e c t of product and substrate on the rate of (183)
product formation has been demonstrated by Chen e_t a l
k 2 EoS dt 1 + k 2S + k 3P v J
where k^ = reaction rate constant for enzyme-substrate complex formation;
k 2 = inverse of Michaelis-Menten constant;
k^ = desorption constant;
Eo = i n i t i a l enzyme concentration.
(183) 2.5 > The authors claim that equation 19 f i t their data better than the
simple substrate limited model.
Using enzyme kinetic models, Maxon and Chen^"^^ have been able
to solve complicated fermentation processes, such as semicontinuous
substrate addition. Their models are oriented towards description of
industrial fermentation processes (e.g., the production of neomycin) as
shown by equation 20.
j Y kn x G dX = 1 ( 2 Q )
dt 1 + k G + k N v 1
Where the growth rate is based on glucose (G) concentration and inhibition
is due to neomycin (N) concentration.
5. Proposed models
The current literature of biological kinetics contains many
examples of mathematical models derived for homogeneous systems. In
general, in the choice of a model which quantitatively describes the
biological phenomena, one has to be certain that i t has validity,
generality and prediction a b i l i t y ^ ^ " ^ . Further, the choice or design
of a valid mathematical model should depend on what is already known about
the system and on what type of results one expects to obtain.
A complete description of the bacterial kinetic processes will
not be possible until an exact and complete description of the metabolism
of the organism is available. This could also require new biological
principles which should be consistent with the physical principles but
perhaps not derivable from them^^"^.
In the case of the heterogeneous system of microbiological
leaching of zinc sulfide, there are problems which are not evident in
homogeneous systems. The availability of substrate in the sulfide is not
only a function of the mass but also of the s p e c i f i c surface area. 26.
Further, the surface area of the zinc s u l f i d e ore i s inhomogeneous i n
i t s energy c h a r a c t e r i s t i c s and thus only c e r t a i n s i t e s should be
considered a v a i l a b l e for b a c t e r i a l action.
The m i c r o b i o l o g i c a l oxidation of zinc s u l f i d e ores may be
considered as a multisubstrate system, i n which oxidation of s u l f i d e to
s u l f a t e and of ferrous i r o n to f e r r i c i r o n take place. Commercial zinc
s u l f i d e . o r e s always contain a c e r t a i n quantity of ferrous i r o n .
Another major problem involved i n t h i s system i s the a v a i l
a b i l i t y of the number of organisms. Unfortunately there e x i s t s no method
of estimating the number of organisms i n systems where s o l i d p a r t i c l e s
are involved.
From t h i s i n t r o d u c t i o n i t i s obvious that the mathematical
expressions derived so f a r for b a c t e r i a l k i n e t i c s are not applicable
to t h i s heterogeneous system of m i c r o b i o l o g i c a l zinc s u l f i d e oxidation.
Therefore, a l l k i n e t i c data throughout t h i s present work w i l l be expressed
i n terms of product formation (zinc e x t r a c t i o n ) .
V. MATERIALS AND METHODS 27.
1. General
Because the number of var i a b l e s under consideration i s large
(8 v a r i a b l e s ) , and because of the l i m i t e d a v a i l a b i l i t y of some subsieve
f r a c t i o n s of the substrate, s t a t i s t i c a l l y designed experiments were not
used. The procedure was to study one v a r i a b l e at a time. When the value
of the v a r i a b l e which gave maximum leaching rate was determined, i t was
held constant i n subsequent experiments while other v a r i a b l e s were
examined.
2. Organisms
An inoculum of T h i o b a c i l l u s ferrooxidans (N.C.I.B. No. 9490),
i s o l a t e d by Ra z z e l l and T r u s s e l l W a s adapted to a medium containing (37)
the basal s a l t s of the medium described by Silverman and Lundgren but
with zinc s u l f i d e concentrate replacing ferrous s u l f a t e as the energy
source. When growth i n batch culture reached the stationary phase the
ba c t e r i a were maintained by transfe r or were used as an experimental
inoculum.
3. Substrate
A l l work has been c a r r i e d out with a si n g l e l o t of high-grade
zinc s u l f i d e concentrate. This material was supplied by Cominco Ltd.,
T r a i l , B. C. af t e r s p e c i a l f l o t a t i o n to remove excess p y r i t e . This
marmatic preparation was wet b a l l - m i l l e d to pass a 400 mesh sieve. A f t e r
drying at 45°C, a chemical analysis gave the following composition:
60.78% zin c , 33.23% s u l f u r , 2.50% i r o n , 1.79% lead, 1.29% calcium oxide
and some impurities (Cd, Cu, Mg,...). Corresponding to t h i s a n a l y s i s ,
the zinc s u l f i d e concentrate i s 90.6% pure, as zinc s u l f i d e .
28.
The density of the subsieve material has been determined
pycnometrically to be 3.7990 gram per ml (186).
3.1 Substrate f r a c t i o n a t i o n
In order to study the e f f e c t of p a r t i c l e s i z e of substrate
on the m i c r o b i o l o g i c a l zinc e x t r a c t i o n , the subsieve zinc s u l f i d e
concentrate (-400 mesh) was fr a c t i o n a t e d i n t o d e f i n i t e s i z e f r a c t i o n s
using both a wet and a dry technique.
Wet subsieve f r a c t i o n a t i o n consisted of c o l l e c t i n g s i x subsieve
f r a c t i o n s , using a Warman Cyc l o s i z e r A p p a r a t u s ^ x 8 ^ . This i s a hydraulic
cyclone e l u t r i a t o r whose operating p r i n c i p l e s have been described by
K e l s a l l and McAdam^X^8^.
The dry technique consisted of c o l l e c t i n g eight subsieve
f r a c t i o n s using a Bahco No. 6000 M i c r o p a r t i c l e C l a s s i f i e r . This
device i s a combination of an a i r e l u t r i a t o r and a centrifuge.
3.2 Determination of p a r t i c l e s i z e
The main p a r t i c l e diameters (Stokesian diameters) of the Cyclo
s i z e r f r a c t i o n s were obtained from the operating curves of the Cyclo
s i z e r M a n u a l a n d by microscopic measurements, which consisted of
comparison of the p a r t i c l e images with a g r a t i c u l e . The Bahco-sizer
f r a c t i o n s were investigated by microscopic measurements only.
In these microscopic measurements, the p a r t i c l e diameter was
determined as the average of the two dimensions exhibited by the p a r t i c l e .
For each f r a c t i o n t h i r t y i n d i v i d u a l p a r t i c l e s were observed and the
average value of these measurements re g i s t e r e d .
3.3 Determination of s p e c i f i c surface area
S p e c i f i c surface area, which i s the surface area per u n i t mass
of s o l i d s , of the unfractionated zinc s u l f i d e concentrate (-400 mesh)
29. and of the various subsieve f r a c t i o n s mentioned above, was determined by
the B.E.T.-technique^"'"^"^ using a dynamic nitrogen adsorption apparatus. (192)
This apparatus was b u i l t by Orr , for surface area measurements of
paper samples, and was made a v a i l a b l e for t h i s study.
(193-199)
The dynamic nitrogen adsorption method i s e s s e n t i a l l y
a gas chromatographic technique i n which the sample powder replaces the
s o l i d i n the normal chromatographic column. Nitrogen i s adsorbed by
the sample at the temperature of l i q u i d nitrogen from a continuous gas
stream of nitrogen and helium, and desorbed upon warming the sample.
The d i f f e r e n c e i n nitrogen concentration of the gas mixture i s measured
by a c a l i b r a t e d thermal conductivity c e l l . The surface area of the s o l i d
i s evaluated by a p p l i c a t i o n of the B.E.T.-equation. D e t a i l s are given
i n Appendix.3.
4. Culture techniques
4.1 Shake technique
The m i c r o b i o l o g i c a l leaching experiments were c a r r i e d out on a gyratory shaker(200)^ u s - L n g a.batch technique developed by Duncan et
(79) a l . The desired quantity of zinc s u l f i d e concentrate and 70 ml of
(37)
i r o n free medium were placed i n b a f f l e d , 250 ml Erlenmeyer f l a s k s .
Then these f l a s k s were inoculated with 5 ml of an active culture of
T h i o b a c i l l u s ferrooxidans previously adapted to the zinc s u l f i d e con
centrate. In the s t e r i l e c o n t r o l f l a s k s instead of the inoculum, 5 ml
of a s o l u t i o n containing two per cent of thymol i n a l c o h o l , were added.
The f l a s k s were incubated at constant temperature on a
thermostated gyratory shaker. P e r i o d i c a l l y any water l o s t through
evaporation was replaced with d i s t i l l e d water and the pH adjusted with
s u l f u r i c acid (IN) or sodium hydroxide (IN) i f necessary. The f l a s k s
were not stoppered i n any manner.
30. Constant pH experiments were c a r r i e d out i n shake f l a s k s
equipped with a pH-stat^^"^ .
4.2 Tank leaching
Large scale experiments were c a r r i e d out at increased carbon
dioxide p a r t i a l pressure i n a temperature c o n t r o l l e d room:
a) i n an unbaffled s t a i n l e s s s t e e l tank (12 inches in s i d e diameter and
24 inches deep length) equipped with a marine-impeller, a i r containing
1% carbon dioxide was introduced into the medium under the impellers at
a flow rate of 10,000 ml per minute;
b) i n a b a f f l e d (three b a f f l e s 120° apart) p l e x i g l a s s tank (with the
same dimensions as the unbaffled one) equipped with p H - s t a t ^ 2 ^ ^ and a
turbine impeller, a i r supply was the same as i n the unbaffled tank.
5. Chemical analysis
5.1 Substrate .
Metal contents (Zn, Fe, Pb, CaO, and so on) of the zinc
s u l f i d e concentrate were determined on the solutions obtained by a c i d i c (202)
d i g e s t i o n using a Perkin Elmer Model 303 atomic absorption spectro
photometer.
The s u l f u r content of the zinc s u l f i d e concentrate was
determined gravimetrically(202)^
5.2 Leach solutions
The extracted zinc concentrations were determined p e r i o d i c a l l y
during the individua.l leaches by removing one ml samples and measuring
t h e i r zinc contents by atomic absorption spectrophotometry. The volume
removed for zinc determination was replaced with an equivalent volume , . f ,. (37)
of i r o n - f r e e medium
6. Modeling and curve f i t t i n g 31
In the work described l a t e r i n t h i s thesis a rate of zinc
e x t r a c t i o n i s related to a v a r i e t y of parameters. Figure 1 i s a plo t of
zinc concentration versus time and i s t y p i c a l of the leach curves
obtained. The slope of such a curve i s the rate of leaching or rate
of extraction. Obviously there i s a range of extraction rates obtain
able from such a curve. The one used l a t e r f o r c o r r e l a t i v e purposes i s
the slope of the l i n e a r region of the curve of Figure 1, that i s the
region between a and b. The slope of t h i s l i n e a r portion was determined
by a le a s t squares (203) computer program.
Attempts were made for some of the experimental runs, to f i t a
mathematical expression to the complete leaching curve. The express
ion chosen was the generalized l o g i s t i c equation employed by Edwards ^ 3 ~ ^
and Edwards and Wilke^"^"^ which i s written
P =. P m/(1 + e x p ( f ( t ) ) ) (21)
f ( t ) = a Q + a ^ + a 2 t 2 + a.^ 3 + a^t* + a^5 (22)
where P = product (zinc) concentration;
m̂ = maximum product concentration;
t = time;
a , a,, a„, a„, a., a r are constants f o r a p a r t i c u l a r leach. • o 1 2 3 4 5
Equation 21 i s very f l e x i b l e , having 7 constants, two obtainable from
the leach curve and f i v e of them adjustable. Thus i t i s able to
reproduce a v a r i e t y of sigmoid (S-shaped) curves(?Q4) . i t i s stated
to be e s p e c i a l l y useful f o r systems d i s p l a y i n g product i n h i b i t i o n ^ 8 " ^
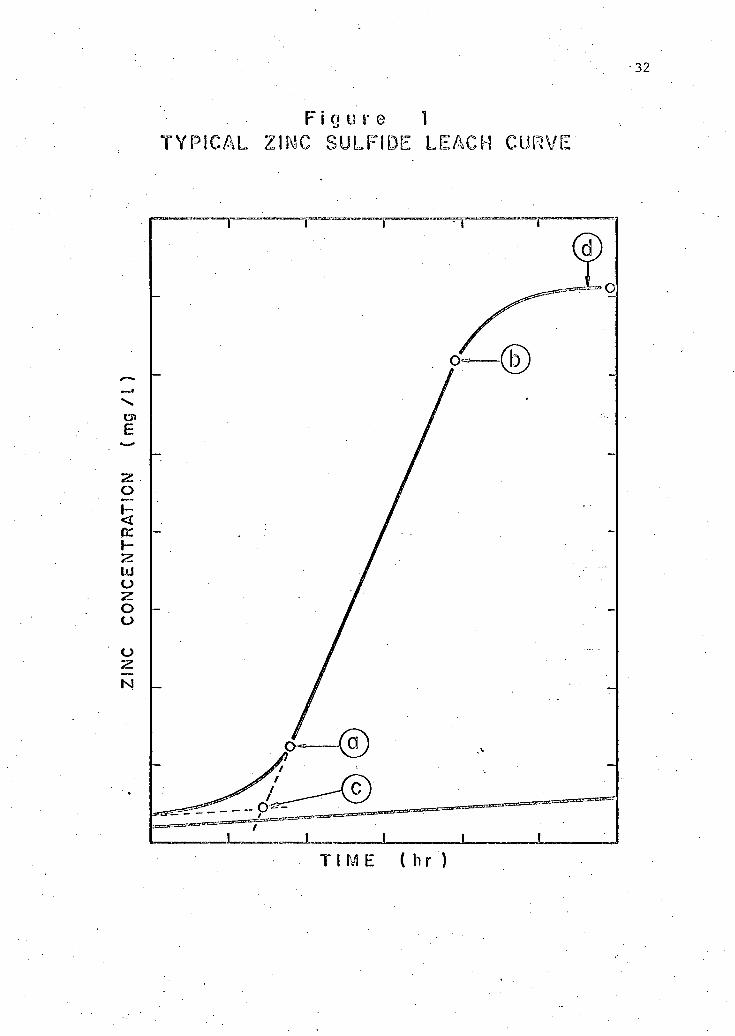
Pm the maximum product concentration i s obtainable d i r e c t l y from the 33
leach curve (e.g., i t i s the zinc concentration at point d on Figure 1).
At the s t a r t of the leach (time zero) there i s a small but
f i n i t e concentration of zinc (Po) which was introduced with the inoculum-
When t = 0, equation 21 reduces to:
P m
P ° ~ 1 + exp(a n ) ( 2 3 )
which allows estimation of a G from knowledge of P 0 and Pm. However, due
to the experimental d i f f i c u l t i e s involved i n the i n i t i a l part of the
leach curve a G was not measured i n t h i s work but was determined using a
le a s t squares technique described below.
Having f i t t e d an equation of the form of equation 21, one
could d i f f e r e n t i a t e i t to get the ext r a c t i o n rate thus
d t - p f > < 2*>
0 / • where f ' ( t ) = & l + 2 a 2 t + 3 a 3 t + 4a^t + 5 a 5 t (25)
The generalized l o g i s t i c equation, equation 21, may be conver
ted to a polynomial expression( x81) by taking logarithms. Thus,
y = l n ( P ) = a Q + a±t + ... + a 5 t 5 (26)
In the curve f i t t i n g procedure used P m was obtained from the leach curve
and the remaining s i x constants ( a Q , a^, ... , a^) were determined by a

least squares f i t t i n g technique using a multiple regression analysis
program written for the I.B.M. 360 d i g i t a l computer(205, 206)
Another program reproduced i n Table 1 of Appendix 2 was used to
calculate the f i t t e d values for the data and to tabulate them alongsid
of the measured values for comparison.
VI. RESULTS AND DISCUSSION 3 5
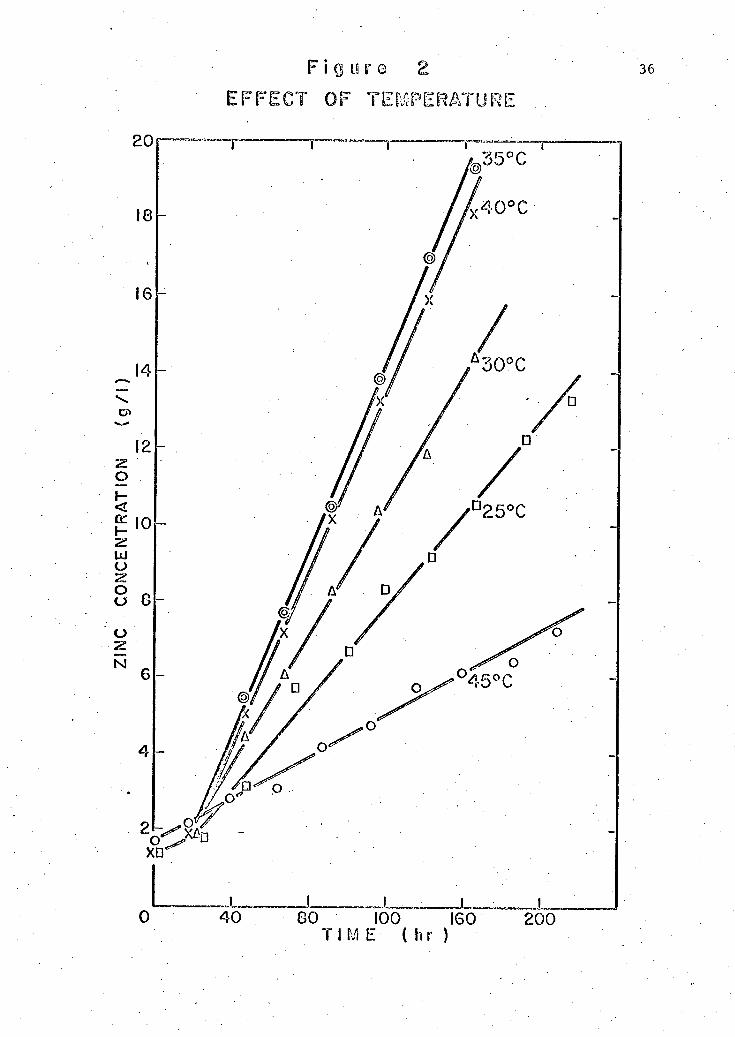
1. Effects of temperature
The effect of temperature variation on zinc extraction was
studied over a range of 25°C to 45°C. The leach suspensions contained c o<v i J / mass solids x 100 . . . ... , u 5.3% pulp density ( = ,- N . TZ ) with the i n i t i a l pH J volume of liquid medium adjusted to 2.5. A l l experiments were done in duplicate and with
st e r i l e controls. The experimental data are given in Table 1 (A and B)
of Appendix 1.
The s t e r i l e controls show the extent of chemical dissolution
of zinc from the zinc sulfide concentrate. The zinc concentrations in
there st e r i l e controls can be seen from Table 1 (A and B) of Appendix 1
to be much lower than those obtained in the presence of T\ ferrooxidans,
thus establishing the role of the bacteria in such leaching.
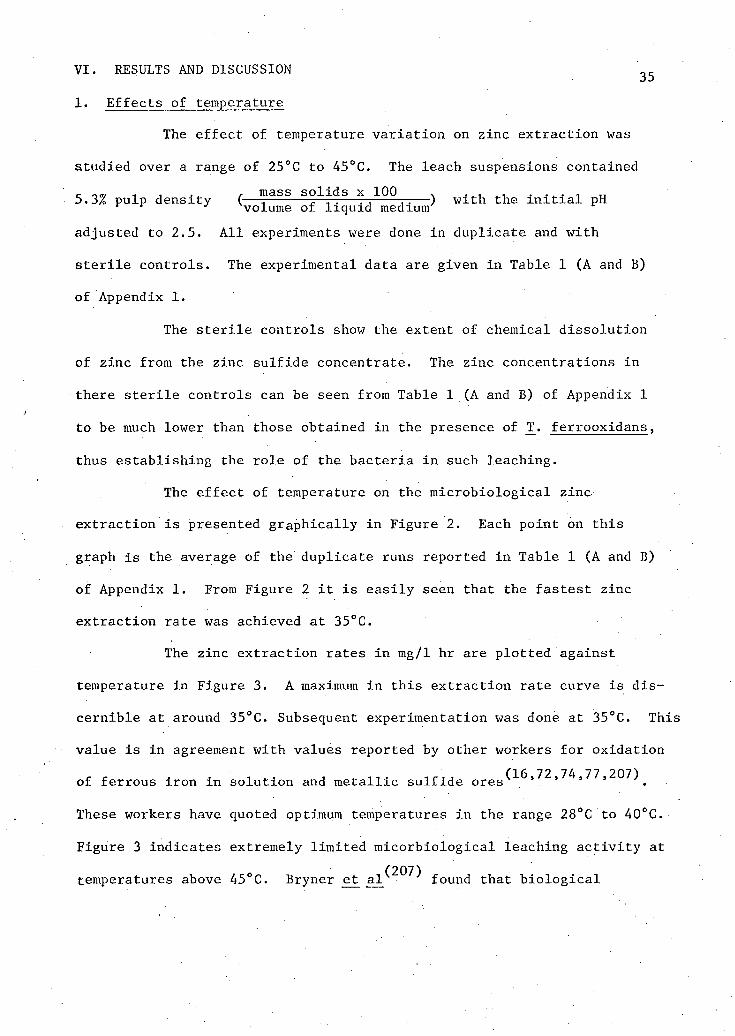
The effect of temperature on the microbiological zinc
extraction i s presented graphically in Figure 2. Each point on this
graph is the average of the duplicate runs reported in Table 1 (A and B)
of Appendix 1. From Figure 2 i t is easily seen that the fastest zinc
extraction rate was achieved at 35°C.
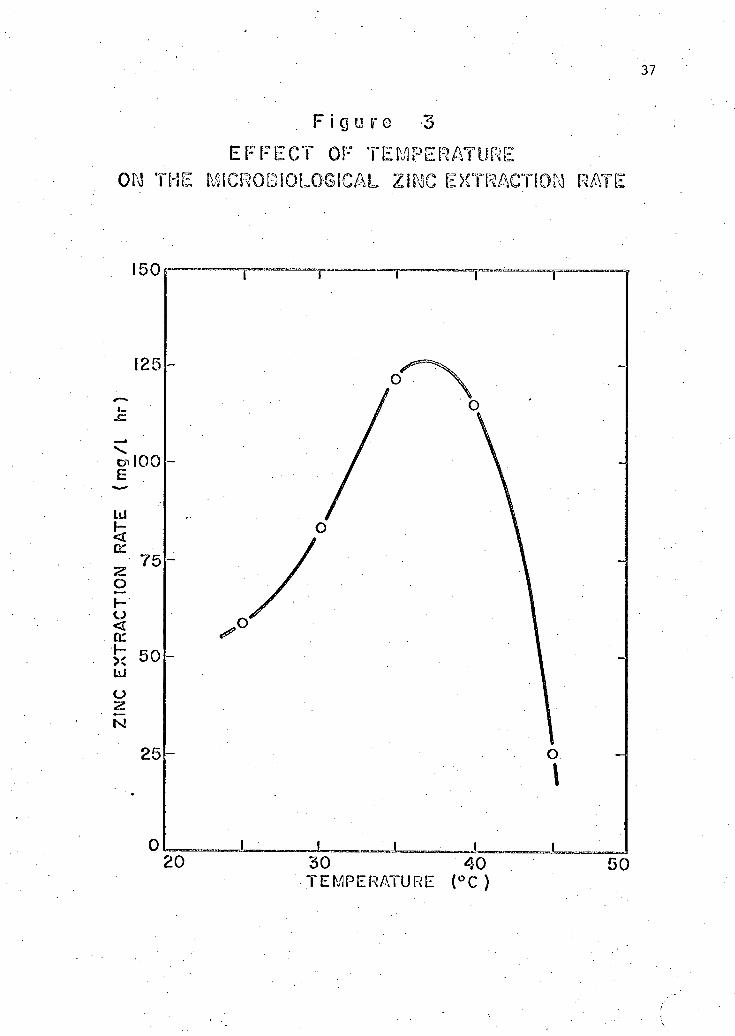
The zinc extraction rates in mg/1 hr are plotted against
temperature in Figure 3. A maximum in this extraction rate curve is dis
cernible at around 35°C. Subsequent experimentation was done at 35°C. This
value is in agreement with values reported by other workers for oxidation • • i A - n - U - J (16,72,74,77,207)
of ferrous iron m solution and metallic sulfide ores
These workers have quoted optimum temperatures in the range 28°C to 40°C.
Figure 3 indicates extremely limited micorbiological leaching activity at
temperatures above 45°C. Bryner e_t found that biological
F i g u r e 2
EFFECT OF TEMPERATURE
I . I JL _ _ - J _ _ _ _ _ _ ^ _ j _ _ J _ _ _
0 40 80 100 160 200 T I M E ( h r )
37
oxidation of chalcopyrite ceased at around 55°C and that at higher 38
temperatures only chemical oxidation occurred. The value obtained for
the optimum temperature (35°C) would place T_. ferrooxidans in that class
of organisms called mesophiles. This temperature optimum is greater than
the values usually found for soil microorganisms, which generally are
psychrophilic.
The shape of the zinc extraction rate versus temperature
plot is typical of biological reactions. There are two competing rate
processes to be considered, the usual kinetic rise in reaction rate with
increasing temperature and at the same time an increase in the rate of
thermal death of the microorganisms f Thus as
temperature increases the rate of thermal death of the microorganisms
increases more rapidly than does the increase in extraction rate. The net
result is a maximum in the extraction rate versus temperature plot.
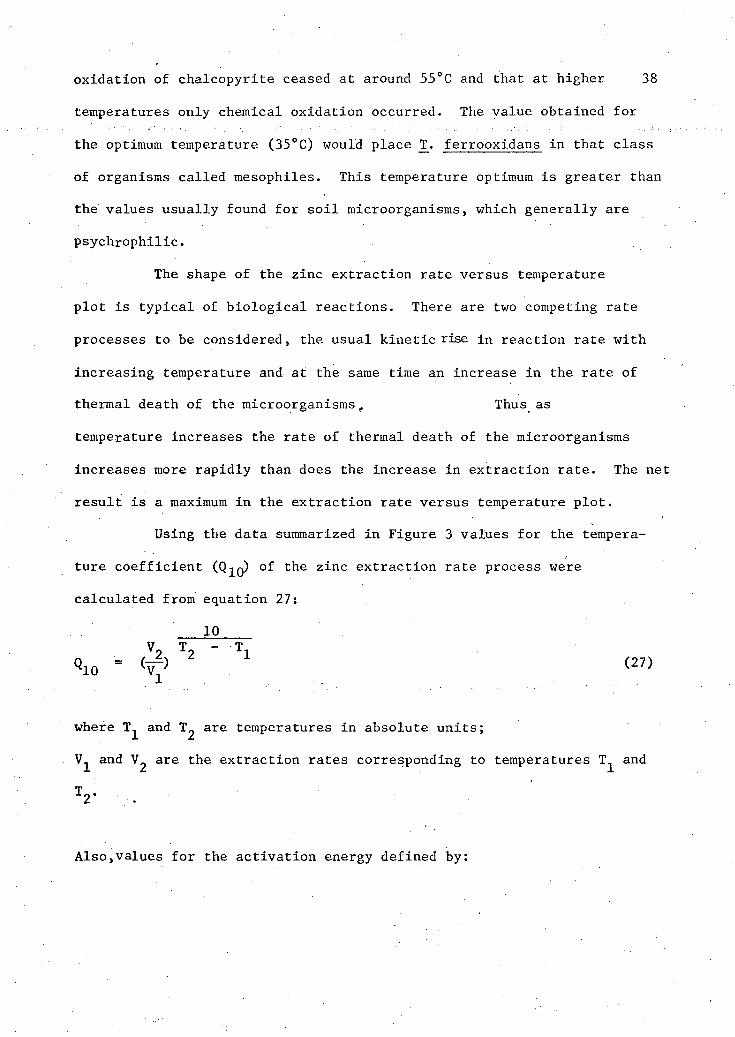
Using the data summarized in Figure 3 values for the tempera
ture coefficient (Q^Q) °f t n e zinc extraction rate process were
calculated from equation 27:
10
(27)
where T̂ and a r e temperatures in absolute units;
and are the extraction rates corresponding to temperatures T^ and
v ...
Also,values for the activation energy defined by:
39
A H a
1 2 T - T 2 1
ln(- ) (28)
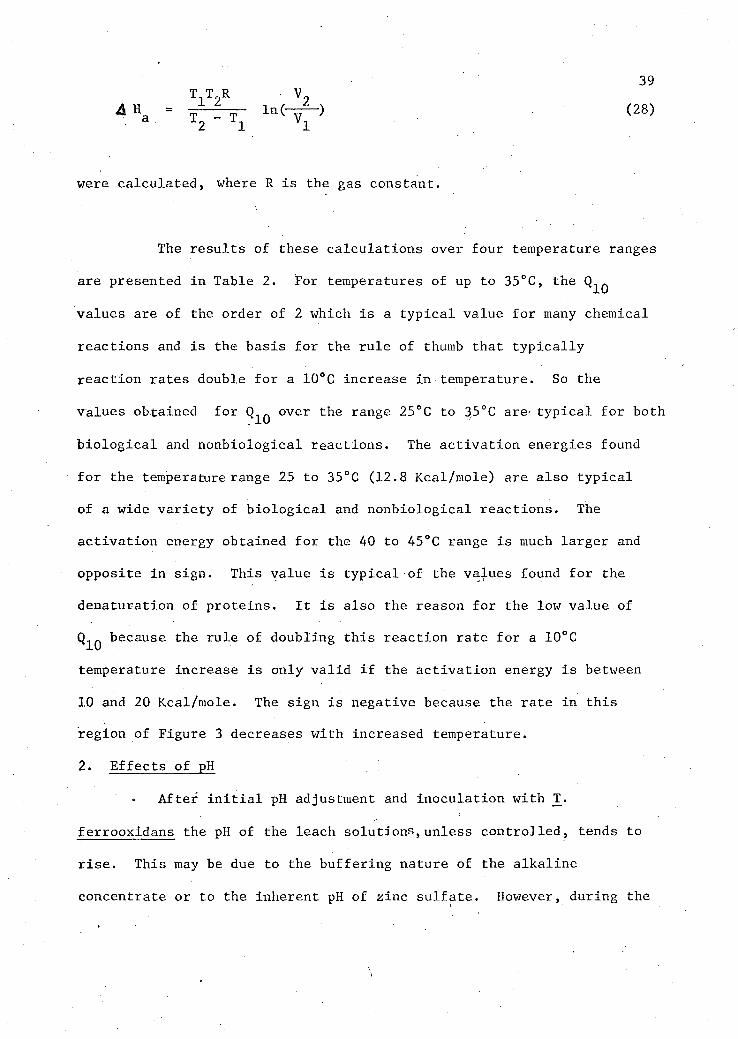
were calcul a t e d , where R i s the gas constant.
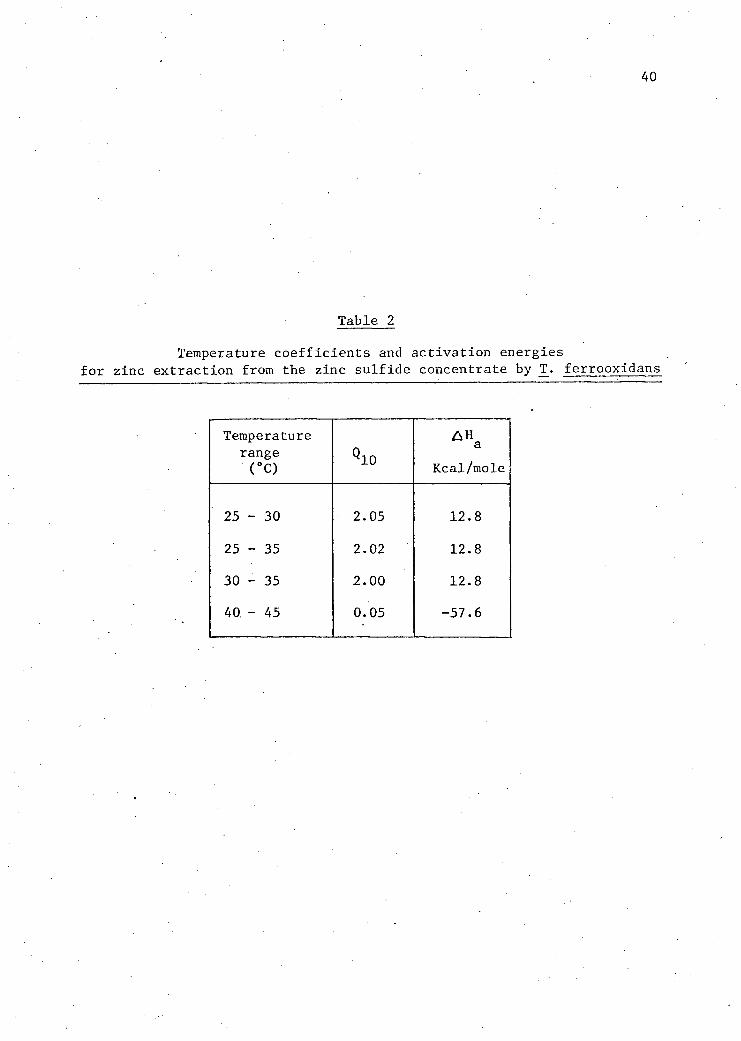
The r e s u l t s of these c a l c u l a t i o n s over four temperature ranges
are presented i n Table 2. For temperatures of up to 35°C, the Q ^ ^
values are of the order of 2 which i s a t y p i c a l value for many chemical
reactions and i s the basis f o r the r u l e of thumb that t y p i c a l l y
r e a c t i o n rates double f o r a 10°C increase i n temperature. So the
values obtained for Q^Q over the range 25°C to 35°C a r e " t y p i c a l f o r both
b i o l o g i c a l and nonb i o l o g i c a l reactions. The a c t i v a t i o n energies found
f o r the temperature range 25 to 35°C (12.8 Kcal/mole) are also t y p i c a l
of a wide v a r i e t y of b i o l o g i c a l and nonbiological reactions. The
a c t i v a t i o n energy obtained f o r the 40 to 45°C range i s much larger and
opposite i n sign. This value i s t y p i c a l of the values found f o r the
denaturation of proteins. I t i s also the reason for the low value of
Q^Q because the ru l e of doubling t h i s r e a c t i o n rate f o r a 10°C
temperature increase i s only v a l i d i f the a c t i v a t i o n energy i s between
10 and 20 Kcal/mole. The sign i s negative because the rate i n t h i s
region of Figure 3 decreases with increased temperature.
2. E f f e c t s of pH
ferrooxidans the pH of the leach solutions, unless c o n t r o l l e d , tends to
r i s e . This may be due to the bu f f e r i n g nature of the a l k a l i n e
concentrate or to the inherent pH of zinc s u l f a t e . However, during the
Af t e r i n i t i a l pH adjustment and i n o c u l a t i o n with T_.
40
Table 2
Temperature c o e f f i c i e n t s and a c t i v a t i o n energies for zinc extraction from the zinc s u l f i d e concentrate by T_. ferrooxidans
Temperature range (°C)
* H a Kcal/mole
25-30 2.05 12.8
25 - 35 2.02 12.8
30 - 35 2.00 12.8
40 - 45 0.05 -57.6
period of rapid metal release the pH, unless 'controlled, tends to ^
become more a c i d i c .
2.1 E f f e c t of i n i t i a l pH
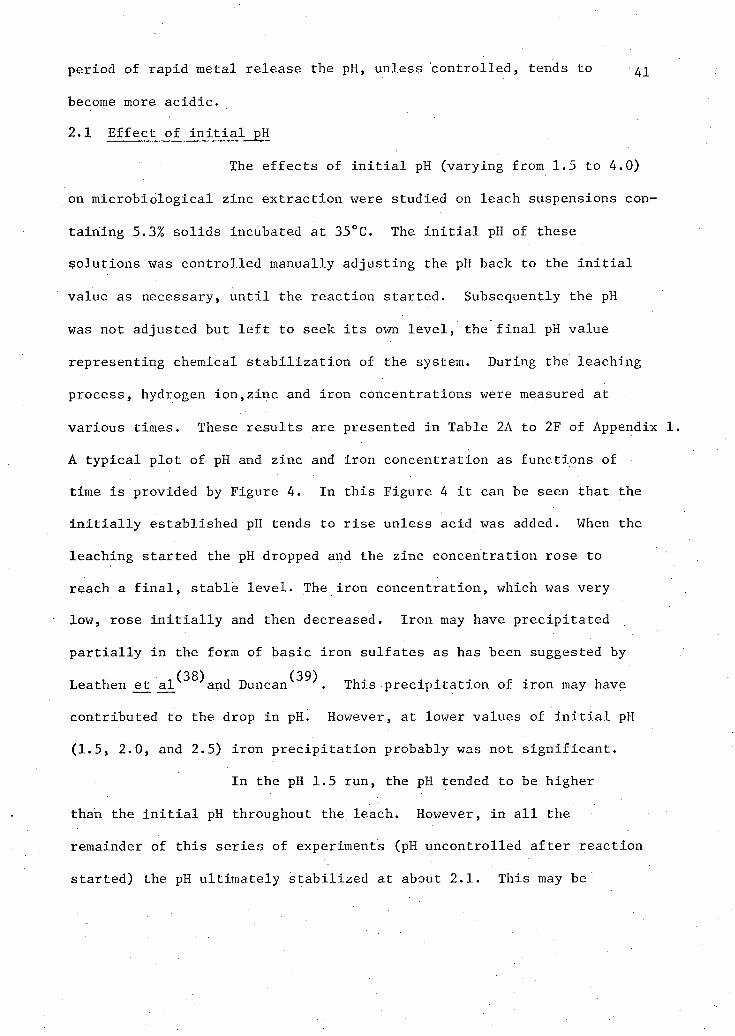
The e f f e c t s of i n i t i a l pH (varying from 1.5 to 4.0)
on m i c r o b i o l o g i c a l zinc e x t r a c t i o n were studied on leach suspensions con
t a i n i n g 5.3% s o l i d s incubated at 35°C. The i n i t i a l pH of these
solutions was c o n t r o l l e d manually adjusting the pH back to the i n i t i a l
value as necessary, u n t i l the reaction started. Subsequently the pH
was not adjusted but l e f t to seek i t s own l e v e l , the f i n a l pH value
representing chemical s t a b i l i z a t i o n of the system. During the leaching
process, hydrogen ion,zinc and i r o n concentrations were measured at
various times. These r e s u l t s are presented i n Table 2A to 2F of Appendix 1.
A t y p i c a l p l o t of pH and zinc and i r o n concentration as functions of
time i s provided by Figure 4. In t h i s Figure 4 i t can be seen that the
i n i t i a l l y established pH tends to r i s e unless acid was added. When the
leaching started the pH dropped and the zinc concentration rose to
reach a f i n a l , stable l e v e l . The i r o n concentration, which was very
low, rose i n i t i a l l y and then decreased. Iron may have p r e c i p i t a t e d
p a r t i a l l y i n the form of basic i r o n s u l f a t e s as has been suggested by (38) (39) Leathen et. al and Duncan . This p r e c i p i t a t i o n of i r o n may have
contributed to the drop i n pH. However, at lower values of i n i t i a l pH
(1.5, 2.0, and 2.5) i r o n p r e c i p i t a t i o n probably was not s i g n i f i c a n t .
In the pH 1.5 run, the pH tended to be higher
than the i n i t i a l pH throughout the leach. However, i n a l l the
remainder of t h i s s e r i e s of experiments (pH uncontrolled a f t e r reaction
started) the pH u l t i m a t e l y s t a b i l i z e d at about 2.1. This may be
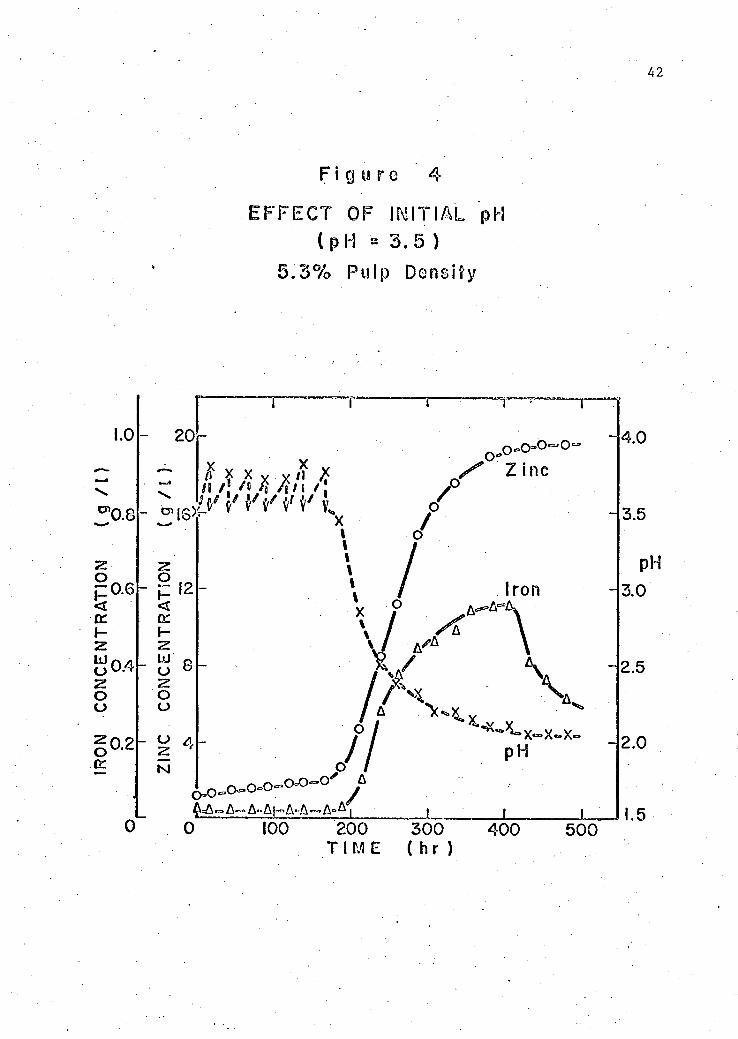
4 2
F i g u r e 4
E F F E C T O F I N I T I A L "pH
( p H • 3 . 5 )
5 . 3 % Pulp Density
1.0
0.8
•z-p 0 . 6 < cc
g 0.4
o o
z 0 2 o
0
20
f *
0 1 I G y ^ '
,x x X "
g i -
<
UJ o o o
N
12
8
,0-0-o O ~ o - o o
A ^ A - A - A H A - A — A ° A '
100 2 0 0 T I M E
3 0 0 ( h r )
4 0 0
4.0
3.5
pH
3.0
2.5
2.0
1.5 5 0 0
43
characteristic to a degree of this particular medium and strain of T_.
ferrooxidans for in other environments such as acid mine waters the pH
has been reported to be maintained at various values ranging from 1.5
to 3.5 .
Figure 5 presents plots of zinc concentration versus time for
various values of i n i t i a l pH. It shows that the most significant effect
of i n i t i a l pH is on the lag (initiation) time. The zinc extraction
rates are more or less constant. This lag time (defined in point c of
Figure 1) is the time i t takes for the reaction to reach the rapid, con
stant zinc extraction rate. It is a period in the microbiological growth
cycle wherein the organisms adapt themselves to their environment at the
end of the lag period or phase and rapid cell division of the organisms
begins. Although in this work cell reproduction rates were not measured,
the curves of Figure 4 would suggest that the lag phase ended at the
time that significant amounts of zinc begin to be released. Table 3
summarizes the data given in Figure 4 and in Tables 2A to 2F of Appendix
1. The shortest lag times were observed in leach solutions which were
initially at pH 2.0. The calculated extraction rates were only slightly
dependent on i n i t i a l pH. The fastest extraction rate (119.5 mg/1 hr)
in this series of experiments was observed with an i n i t i a l pH of 2.5 .
2.2 Effect of constant pH
The effects of controlled, constant pH oh microbial zinc
extraction were studied on leach suspensions containing 16% of solid
substrate. These suspensions were maintained at 35°C in shake flasks.
The 16% pulp density (solids concentration) is, as will be shown in
Section 4, an optimum value for substrate concentration. The pH values
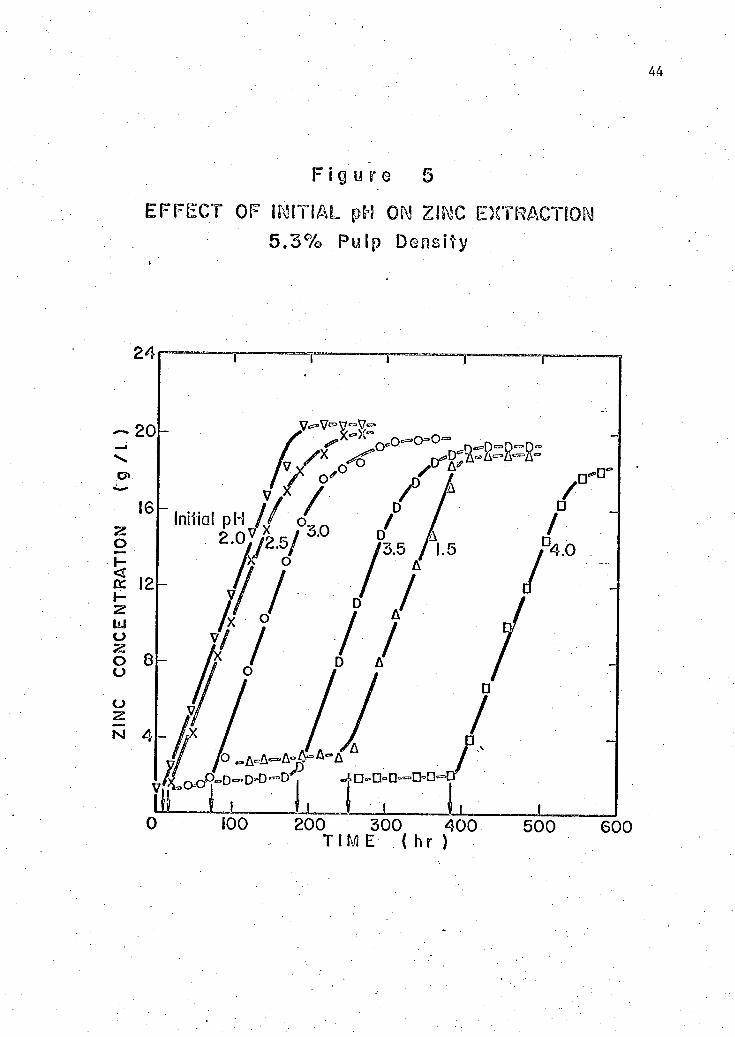
F i g u r e 5
E F F E C T OF INITIAL pH ON ZINC EXTRACTION
5 . 3 % Pulp Density
T I M E ( h r )
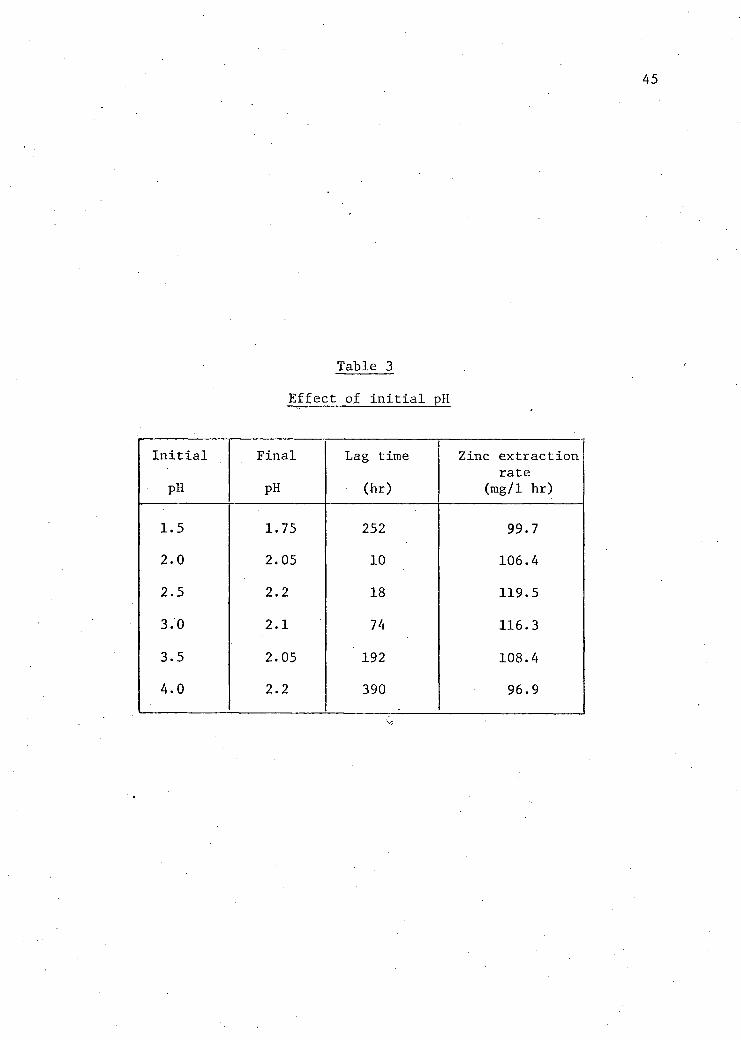
Table 3
E f f e c t of I n i t i a l pH
I n i t i a l
pH
F i n a l
pH
Lag time
(hr)
Zinc e x t r a c t i o n rate
(mg/1 hr)
1 . 5 1.75 252 99.7
2.0 2.05 10 106.4
2.5 2.2 18 119.5
3.0 2.1 74 116.3
3.5 2.05 192 108.4
4.0 2.2 390 96.9
46
of these solutions were i n i t i a l l y adjusted to values between 1.5 and 4.0
at 0.5 pH unit i n t e r v a l s and maintained to within - 0.1 pH u n i t s of these
values automatically using a pH stat^*"*"^ . This s e r i e s of experiments
was c a r r i e d out with s i n g l e samples only except for the run at pH 1.5
which was duplicated. No s t e r i l e c o n t r o l was made. The experimental
r e s u l t s are summarized i n Table 3 (A and B) of Appendix 1, and are
presented i n Figure 6. This f i g u r e shows that the ext r a c t i o n rate was
s i g n i f i c a n t l y affected only at the extreme values of the pH range
studied ( i . e . 1.5 to 4.0). The shortest lag time and maximum zinc con
centrations were obtained when the pH was co n t r o l l e d at 2.0 and 2.5.
Maximum zinc concentrations d i f f e r e d considerably i n those
experiments where pH was or was not co n t r o l l e d (Figures 5 and 6). These
d i f f e r e n c e s , i . e . 20 to 70 g/1, were a t t r i b u t e d almost e n t i r e l y to the
d i f f e r e n t pulp d e n s i t i e s employed and not to the di f f e r e n c e i n pH c o n t r o l .
However, when pH was controlled,the f i n a l zinc concentration and maximum
extraction dropped o f f sharply at pH values above and below the 2.0 to
2.5 range. No attempt was made to assess whether t h i s e f f e c t was on the
organism or was due to substrate m o d i f i c a t i o n or both.
The r e l a t i o n s between pH and lag time for both the i n i t i a l pH
runs and the constant pH runs are shown i n Figure 7. A d e f i n i t e minimum
lag time occurs at around pH 2.3 for both sets of data. This minimum i s
somewhat sharper f o r the i n i t i a l pH data than f o r the c o n t r o l l e d pH
data. This value (pH = 2.3) i s i n good agreement with the optimum
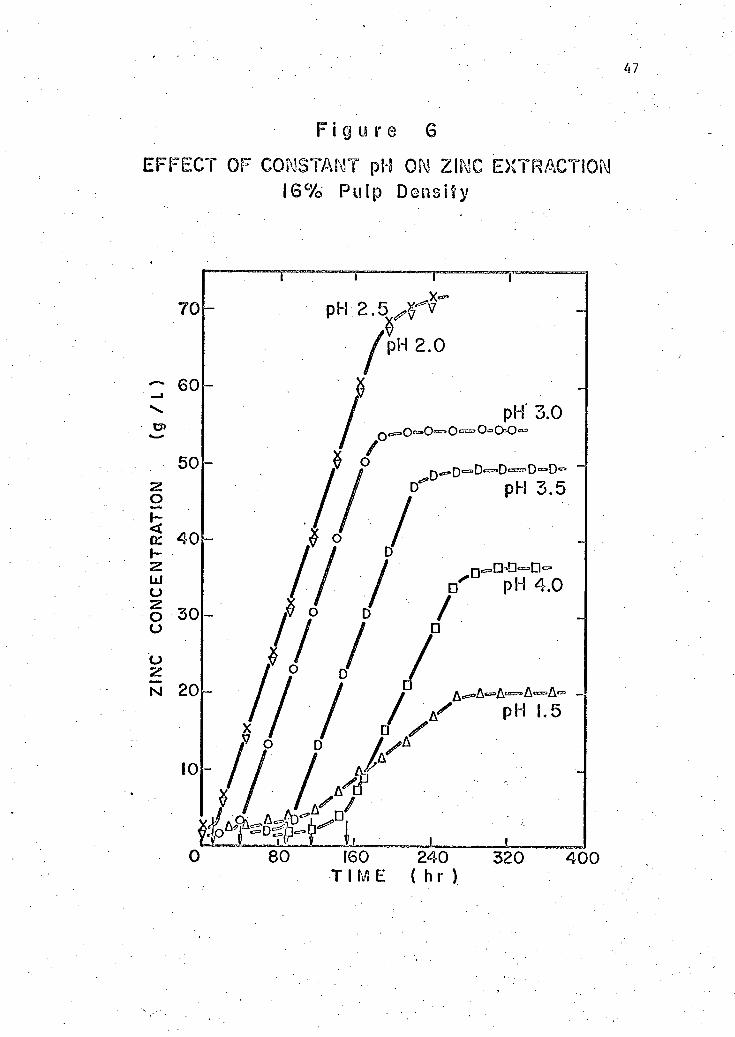
F i g u r e s
E F F E C T OF CONSTANT pH ON ZINC EXTRACTION
16% P u l p D e n s i t y
7 0
— 6 0
5 0
z o Si 4 0
o o 3 0 o o N 2 0
p H . 2 . 5 ^ V
y'pH 2 .0
pH' 3.0 0 = O a a a O ° 0=0 0 3
pH 3.5
o ' pH 4.0
A ^ A ^ A ^ A ^ A " -j
A - pH 1.5
0
8 0 160 2 4 0 3 2 0 4 0 0 T I M E ( h r )
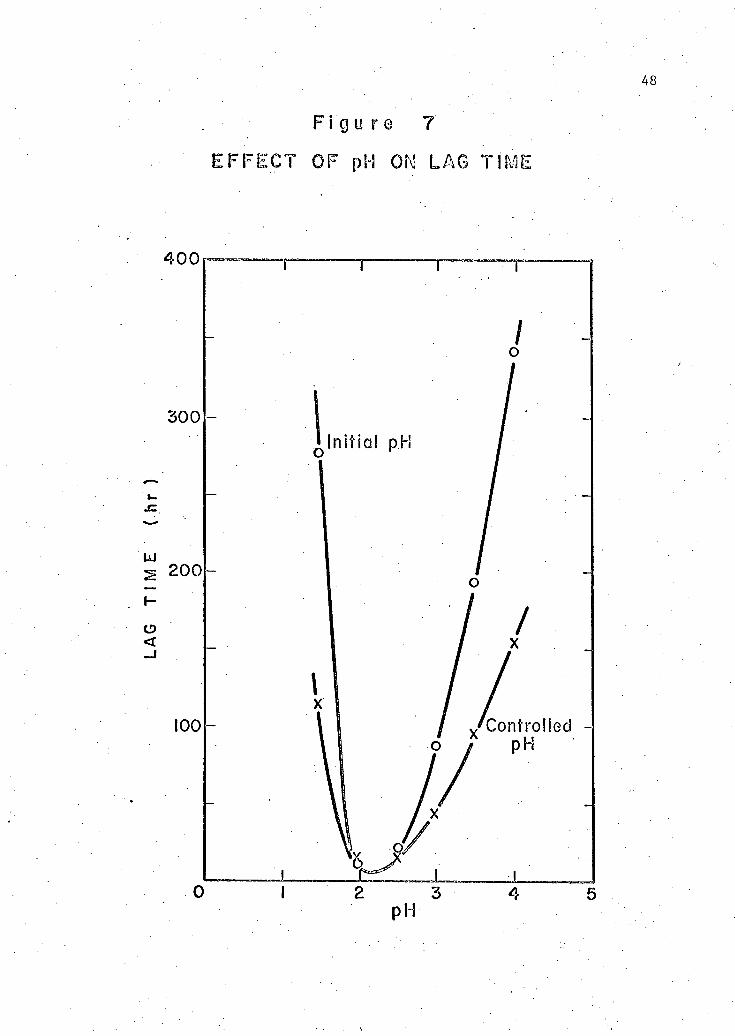
F i g u r e 7
E F F E C T O F pH ON L A G T I M E
0 1 2 3
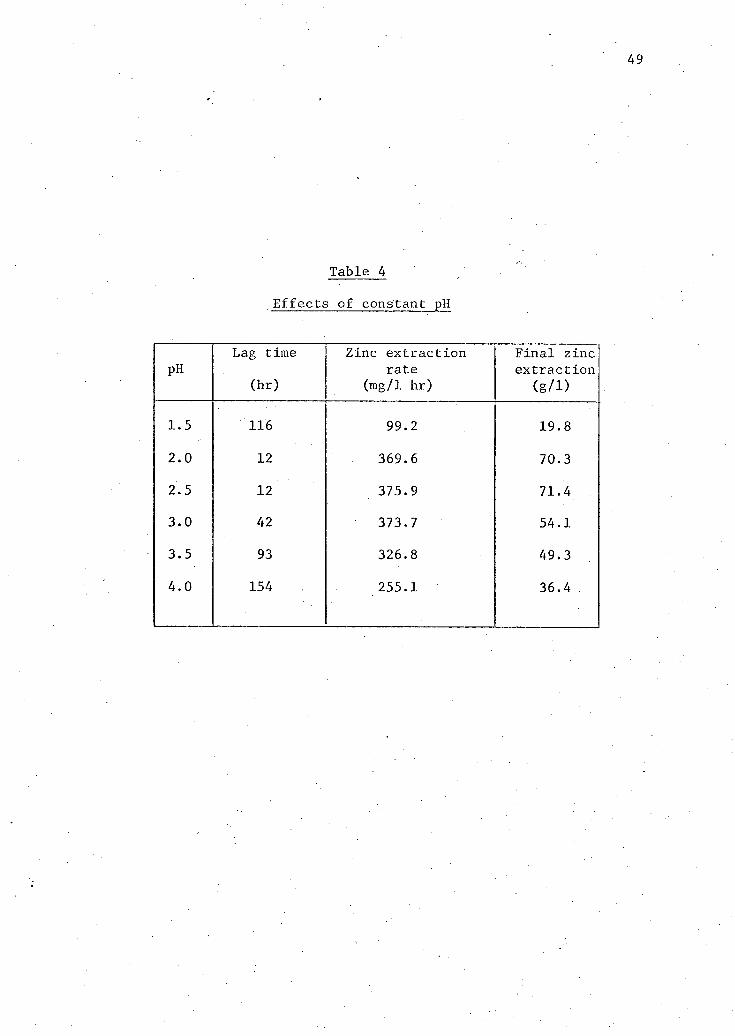
Table 4
E f f e c t s of constant pH
pH Lag time
(hr)
Zinc e x t r a c t i o n rate
(mg/1 hr)
F i n a l zinc e x t r a c t i o n
(g/D
1.5 116 99.2 19.8
2.0 12 369.6 70.3
2.5 12 375.9 71.4
3.0 42 373.7 54.1
3.5 93 326.8 49.3
4.0 154 255.1 36.4
50
* ^ i ( 1 6 , 7 2 , 7 7 , 1 2 2 , 207) , . pH's reported by other workers for the oxidation of
m e t a l l i c s u l f i d e s and ferrous i r o n by T_. ferrooxidans.
This minimum lag time i s of some p r a c t i c a l s i g n i f i c a n c e
since i n a commercial batch, m i c r o b i o l o g i c a l leaching of zinc, sufide
the lag time, which i s unproductive time, would be minimized.
At constant pH measurements, the f i n a l zinc concentrations
and the zinc e x t r a c t i o n rates were much higher than those derived
i n the i n i t i a l pH measurements. The improvements can be a t t r i b u t e d to
the increase i n substrate concentration from 5 . 3 to 16% pulp d e n s i t i e s .
The above data and those of others have shown the importance
of pH on T̂ . ferrooxidans. This organism i s r e l a t i v e l y unique i n
being able to survive at such low pH's. This f a c t i s of considerable
economic s i g n i f i c a n c e because, unlike many other fermentations, t h i s one
does not require an expensive s t e r i l i z a t i o n of the medium p r i o r to
i n o c u l a t i o n .
3 . E f f e c t s of nutrient concentrations
A study of the e f f e c t s of various concentrations of nutrients
(37)
i n the basal medium on zinc e x t r a c t i o n rates and f i n a l zinc con
centrations was performed using zinc s u l f i d e concentrate suspensions
maintained at pH 2 . 3 and 35°C. The pulp density was 16%. A l l experi
ments were c a r r i e d out i n duplicate.
The f i r s t group of these experiments demonstrates the e f f e c t s
on the leaching a c t i v i t y of T[. ferrooxidans of the absence of c e r t a i n
nutrients from the basal medium, which has been described i n Table 1 .
These experiments were c a r r i e d out by withdrawing ammonium s u l f a t e ,
dipotassium hydrogen phosphate, and the r e s t of the n u t r i e n t components
51
(potassium c h l o r i d e , magnesium s u l f a t e , and calcium n i t r a t e ) from the
l i q u i d medium^3?) one at a time. The r e s u l t i n g data are recorded i n
Table 4 of Appendix 1.
In the absence of potassium c h l o r i d e , magnesium s u l f a t e and
calcium n i t r a t e the f i n a l zinc concentration (69.5 g/1) and the zinc
e x t r a c t i o n rate (351.7 mg/1 hr) are comparable to those achieved when
these s a l t s were present; e.g., the data t y p i f i e d by Table 7E of
Appendix 1.
However, the absence of either ammonium s u l f a t e or dipotassium
hydrogen phosphate from the basal medium had a considerable, deleterious
e f f e c t on the a c t i v i t y of the organism. In both cases the measured zinc
concentration and the zinc extraction rate were reduced. The l i m i t e d
b a c t e r i a l a c t i v i t y that did occur in d i c a t e s that small q u a n t i t i e s of
nitrogen and phosphorus must have been a v a i l a b l e to the organism.
These small q u a n t i t i e s of nutrients probably were supplied with the
inoculum which constituted approximately 7% of the suspension volume.
The e f f e c t s of the concentrations of the nitrogen and
phosphorus sources were investigated further over a range encompassing
(37) 0 to 3.5 times the amounts contained i n the basal medium
The data on the v a r i a t i o n of ammonium s u l f a t e concentration are
given i n Table 5 (A to C) of Appendix 1 and are graphed i n Figure 8.
Ammonium s u l f a t e concentration had i t s p r i n c i p a l e f f e c t on the f i n a l
zinc concentration. I t s e f f e c t on the zinc e x t r a c t i o n rate was
v i r t u a l l y n e g l i g i b l e .
In studying the e f f e c t s of v a r i a t i o n s i n phosphate con
centration, the inoculum was grown on reduced phosphate l e v e l media
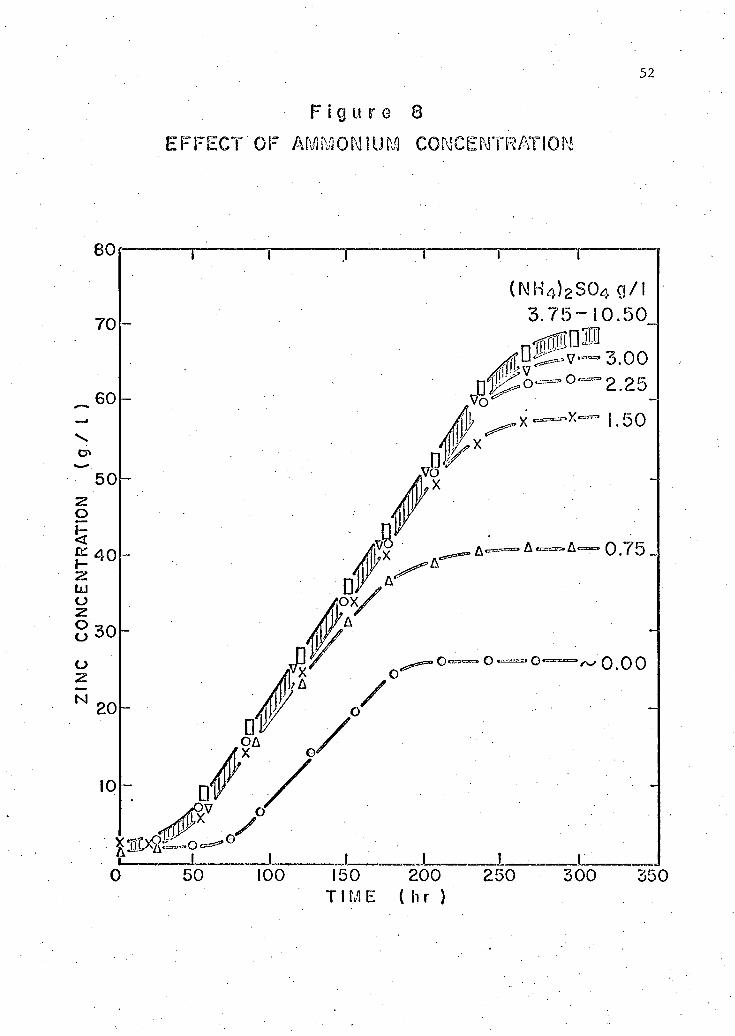
52
F i g u r e s
E F F E C T OF AMMONIUM CONCENTRATION
80(
7 0
( N H 4 ) 2 S 0 4 g/1
3 . 7 5 - 1 0 . 5 0
. 0 0
A — 0.75 J
0 . 0 0
150
TI M E
3 0 0 3 5 0
53
and was transferred twice before i n o c u l a t i o n into the leach suspension.
This ser i e s of i n v e s t i g a t i o n s indicated that dipotassium hydrogen phosph
ate concentration had l i t t l e e f f e c t on the f i n a l zinc concentration but
did influence the zinc e x t r a c t i o n rate. These statements are supported
by the data of Table 6 (A to C) of Appendix 1 and Figure 9. ( 3 7 )
Since the make up of the basal medium was presented i n 1959
only l i m i t e d information has been published concerning the n u t r i t i o n a l
requirements of T_. ferrooxidans. Studies have not been undertaken on
the n u t r i t i o n a l requirements of th i s organism while leaching zinc
s u l f i d e minerals. The data summarized i n Figures 8 and 9 in d i c a t e that
the n u t r i e n t l e v e l s c a l l e d f o r i n the basal medium (3 g/1 of ammonium
su l f a t e and 0.5 g/1 of dipotassium hydrogen phosphate) are adequate.
The minor nutrients (potassium c h l o r i d e , magnesium s u l f a t e , calcium
n i t r a t e ) were required by the organism i n such small q u a n t i t i e s that
any requirement beyond the amounts contained as impurities i n the ammon
ium and phosphate s a l t s or i n the zinc concentrate could not be
demonstrated.
Si m i l a r evidence f o r the e f f e c t s of ammonium s u l f a t e and
dipotassium hydrogen phosphate has been found f o r the oxidation of (208
chalcopyrite by T_. ferrooxidans i n the l a b o r a t o r i e s of B. C. Research
4. E f f e c t s of pulp density ( s o l i d concentration)
The influence of the i n i t i a l pulp density or s o l i d s concentra
t i o n on the rate of zinc e x t r a c t i o n has been studied over a range of 1 to
26.6%. A l l experiments were duplicated and s t e r i l e controls were
maintained i n almost a l l cases. No e f f o r t was made i n th i s s e r i e s of
experiments to determine the change i n pulp density during the course -
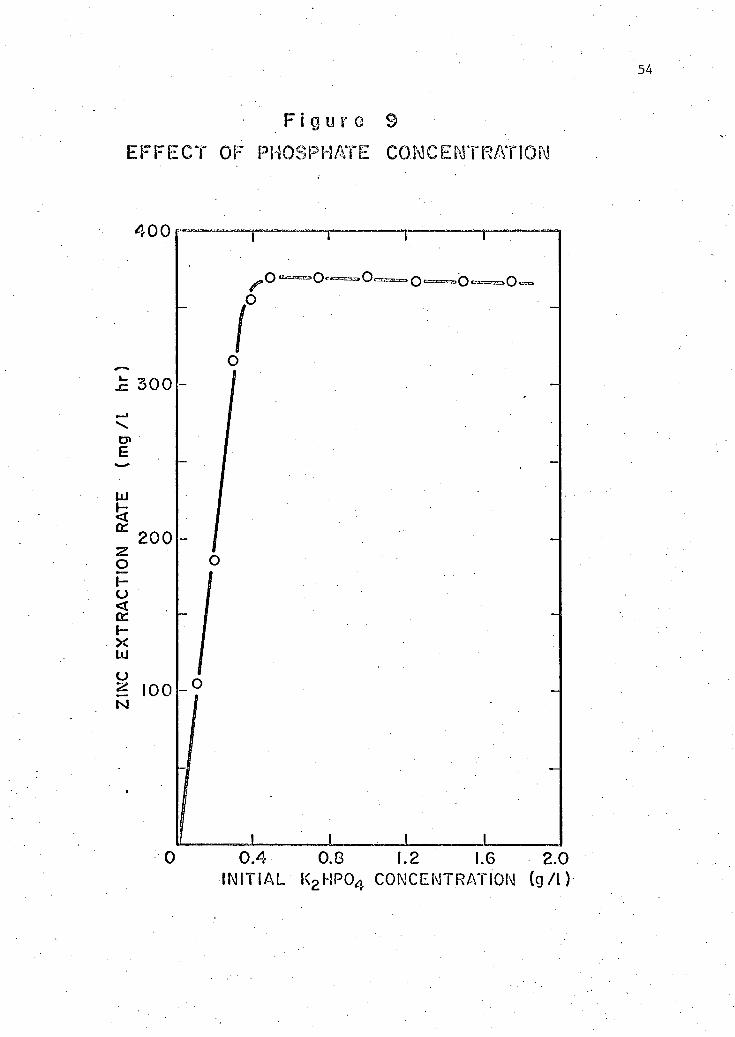
E F F E C T
F i g u r e 9 OF PHOSPHATE C O N C E N T R A T I O N
4 0 0
0 . 4 0.8 1.2 1.6 2.0
IN IT IAL K 2 H P 0 4 CONCENTRATION (g / I )
55
of a leach. The r e s u l t s of these experiments which were run at 35°C
and pH 2.3 are presented i n Table 7 (A to G) of Appendix 1. Table 7R of
Appendix 1 provides some data on a s e r i e s of leaches done by increasing
the speed of the gyratory incubator from the standard 280 to 400 rpm.
No s t e r i l e controls were run with the l a t t e r set.
The rates of zinc e x t r a c t i o n c a l c u l a t e d from the averaged
data from the duplicate runs are plotted versus pulp d e n s i t i e s i n .
Figure 10. As can be seen zinc e x t r a c t i o n rates increase with increas
ing pulp density up to about 16%. The improvement i n rate above pulp
d e n s i t i e s of 13% i s marginal. At low pulp d e n s i t i e s the zinc extrac
t i o n rate i s d i r e c t l y proportional to the pulp density but tends to
taper o f f at higher pulp d e n s i t i e s . At s t i l l higher values the e x t r a c t i o n
rate decreases.
At low s o l i d s concentration the e x t r a c t i o n rate of zinc i s no
doubt l i m i t e d by the amount of substrate (ZnS) a v a i l a b l e . That i s , the
rate of growth of the organism i s l i m i t e d by the a v a i l a b i l i t y of i t s
energy source. At higher pulp d e n s i t i e s there i s a s u r f e i t of energy
source and the rate bf organism growth and hence the zinc e x t r a c t i o n
rate, which we are assuming i s proportional to growth, becomes l i m i t e d
by some other f a c t o r .
I f t h i s other l i m i t i n g f a c t o r were the mass transfer rates
from a i r to the leach s o l u t i o n of the gases(carbon dioxide and oxygen)
which the organism requires one would a n t i c i p a t e that increasing the
shaker speed would increase the mass transfer rate due to an increased
degree of a g i t a t i o n . However, t h i s did not produce markedly d i f f e r e n t
r e s u l t s and the tentative conclusion was reached that such mass
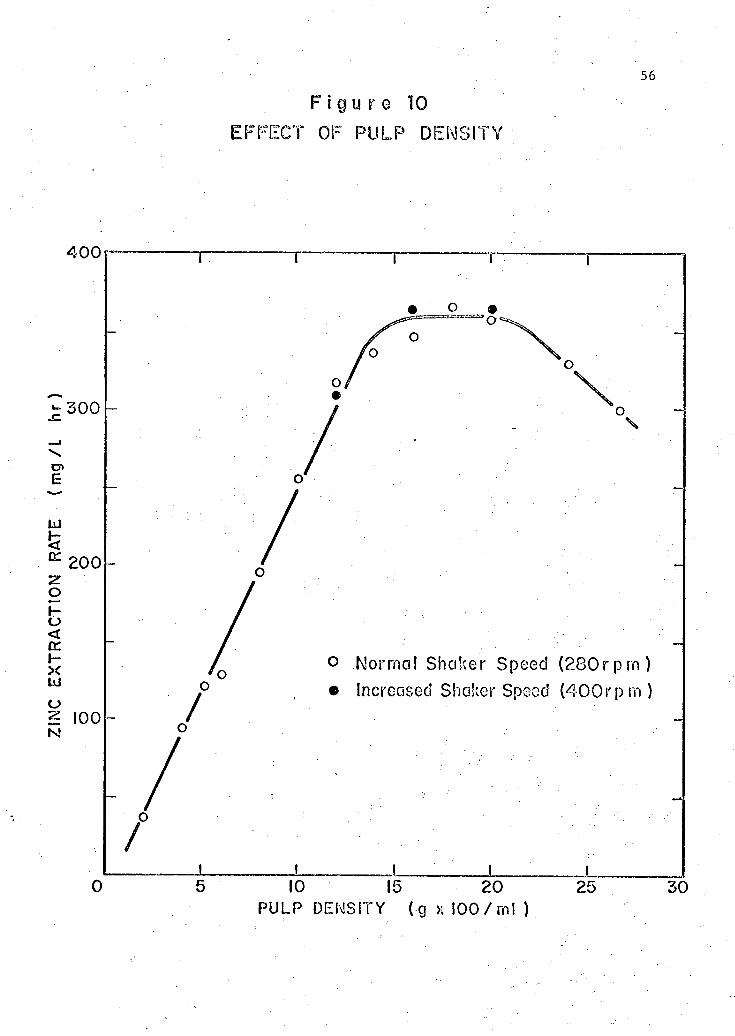
56
F i g u r e 10
OF P U L P DENSITY
4 0 0 i ~T
t 3 0 0
E
LU
200
o f-o < cc
X UJ o 2 1001 N
O
o Normal Shaker Speed ( 2 8 0 r p r n )
• Increased Shaker Speed ( 4 0 0 r p m )
i
0 J .
10 15 20 PULP DENSITY (g x 100 /ml )
25 30
57
transfer was not limiting. It should be noted that these experiments
were done before those reported in the previous section on nutrient
requirements. When i t became evident that under these conditions
nutrient concentrations were not limiting, further work on carbon dioxide
requirements was begun. This is repotted in section 6 of this work.
The decline in extraction rate at high pulp densities probably
can be attributed to the interference of the solids with the mass
transfer of oxygen or carbon dioxide to the organism.
At 16 - 20% solids the zinc extraction rates were highest
(ca 350 mg/1 hr) implying that if the i n i t i a l pulp density were 16% or
greater that pulp density would not be rate limiting. The final zinc
concentrations achieved were of the order of 50 to 70 g/1 for pulp
densities ranging from 16 to 26.6%.
! Behaviour of the organism at high i n i t i a l zinc concentrations
was studied by adding fresh quantities of the solid substrate (ZnS con
centrate) to liquors decanted from the leaches already carried out at
18 and 20% pulp density. In other words leaches were done at i n i t i a l
pulp densities of 18 and 20%. When extraction ceased the liquors were
separated from the leached solids and new solids added. The zinc
concentrations after the first leach were 70.1 g/1 for the 18% suspension
and 70.6 g/1 for the 20% one. The data given in Table 5 show that these
concentrations increased to 91.9 g/1 and 90.8 g/1 respectively during the
second extraction. These concentrations, as will subsequently be shown,
do not represent the maximum tolerance toward zinc of this organism.
These high zinc concentrations approach those used in direct recovery
of zinc from solution by electrowinning. Thus a new possibility for
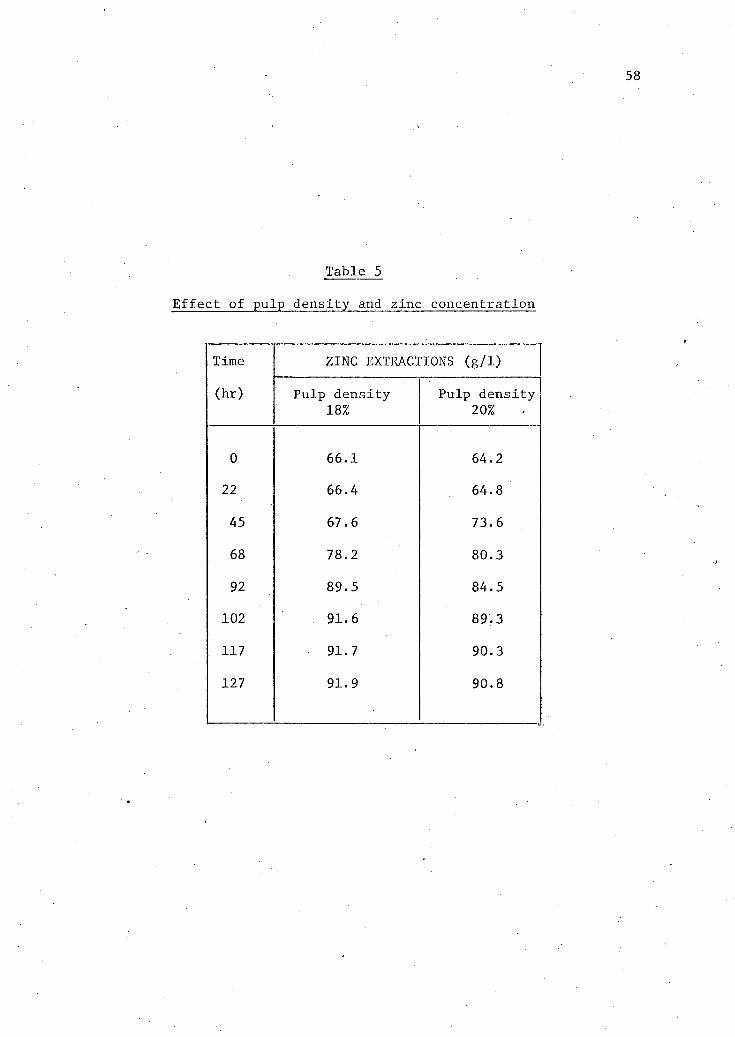
E f f e
Table 5
ct of pulp density and zinc concentration
Time ZINC EXTRACTIONS (g/1)
(hr) Pulp density 18%
Pulp density 20%
0 66.1 64.2
22 66.4 64.8
45 67.6 73.6
68 78.2 80.3
92 89.5 84.5
102 91.6 89.3
117 91.7 90.3
127 91.9 90.8
59 hydrometallurgical extraction has been demonstrated which involves a
m i c r o b i o l o g i c a l treatment i n the recovery of zinc from a high-grade zinc
s u l f i d e concentrate.
5. E f f e c t s of i n i t i a l p a r t i c l e diameter and s p e c i f i c surface area
In t h i s section of t h i s work we consider the e f f e c t s on
leaching of the p a r t i c l e s i z e and s p e c i f i c surface area of the s o l i d
zinc s u l f i d e concentrate. P a r t i c l e s of a v a r i e t y of si z e s and s p e c i f i c
surface areas were obtained from the unfractionated subsieve concentrate
by wet (Cyclosizer) and dry (Bahco-sizer) separation techniques. See
section V. 3.1 . A l l experiments were c a r r i e d out i n duplicate with
s t e r i l e c o n trols. The leach suspensions were maintained at pH 2.3, 35°C
and had a pulp density of 16%. The leaching data obtained with the
Cy c l o s i z e r f r a c t i o n s are given i n Table 8 (A to C) of Appendix 1 and
those obtained with the Bahco-sizer f r a c t i o n s i n Table 9 (A to D) of that
Appendix. Note that with the Cy c l o s i z e r f r a c t i o n s and with the f i r s t
four Bahco-sizer f r a c t i o n s the lag time was abnormally long. This can
be a t t r i b u t e d to the use of an old inoculum which required a prolonged
period of time f o r adaptation.
Table 6 summarizes the e f f e c t s of the subsieve f r a c t i o n s on the
m i c r o b i o l o g i c a l zinc extractions using normal a i r for aeration. The
f i n a l zinc concentrations of both the inoculated samples and the s t e r i l e
c ontrols as w e l l as the zinc e x t r a c t i o n rates were strongly dependent
on the s p e c i f i c surface area or the p a r t i c l e s i z e . Table 6 also includes
data taken from Table 7E of Appendix 1 which were obtained using the
unfractionated -400 mesh zinc s u l f i d e concentrate also having a pulp
density of 16%.
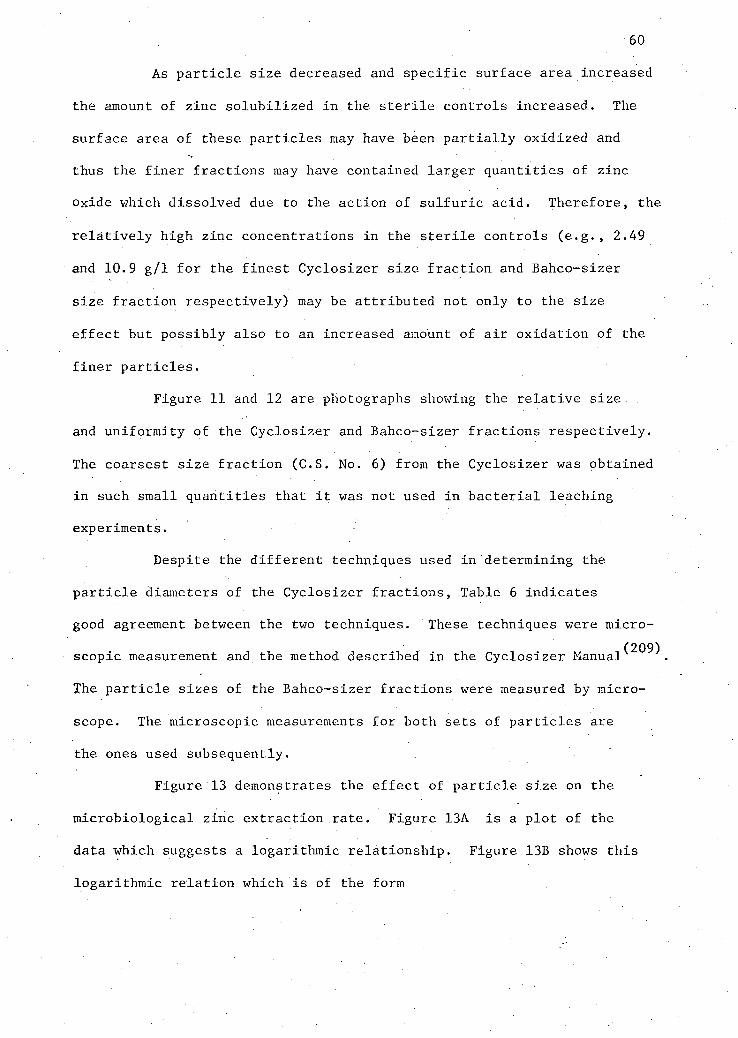
60
As p a r t i c l e s i z e decreased and s p e c i f i c surface area increased
the amount of zinc s o l u b i l i z e d i n the s t e r i l e controls increased. The
surface area of these p a r t i c l e s may have been p a r t i a l l y oxidized and
thus the f i n e r f r a c t i o n s may have contained larger q u a n t i t i e s of zinc
oxide which dissolved due to the action of s u l f u r i c acid. T n e r e f ° r e » the
r e l a t i v e l y high zinc concentrations i n the s t e r i l e controls (e.g., 2.49
and 10.9 g/1 f o r the f i n e s t C y c l o s i z e r s i z e f r a c t i o n and Bahco-sizer
s i z e f r a c t i o n r e s p e c t i v e l y ) may be a t t r i b u t e d not only to the s i z e
e f f e c t but possibly also to an increased amount of a i r oxidation of the
f i n e r p a r t i c l e s .
Figure 11 and 12 are photographs showing the r e l a t i v e s i z e .
and uniformity of the C y c l o s i z e r and Bahco-sizer f r a c t i o n s r e s p e c t i v e l y .
The coarsest s i z e f r a c t i o n ( C S . No. 6) from the C y c l o s i z e r was obtained
i n such small q u a n t i t i e s that i t was not used i n b a c t e r i a l leaching
experiments.
Despite the d i f f e r e n t techniques used i n determining the
p a r t i c l e diameters of the C y c l o s i z e r f r a c t i o n s , Table 6 i n d i c a t e s
good agreement between the two techniques. These techniques were micro-(209)
scopic measurement and the method described i n the C y c l o s i z e r Manual
The p a r t i c l e s i z e s of the Bahco-sizer f r a c t i o n s were measured by micro
scope. The microscopic measurements for both sets of p a r t i c l e s are
the ones used subsequently.
Figure 13 demonstrates the e f f e c t of p a r t i c l e s i z e on the
m i c r o b i o l o g i c a l zinc e x t r a c t i o n rate. Figure 13A i s a p l o t of the
data which suggests a logarithmic r e l a t i o n s h i p . Figure 13B shows t h i s
logarithmic r e l a t i o n which i s of the form
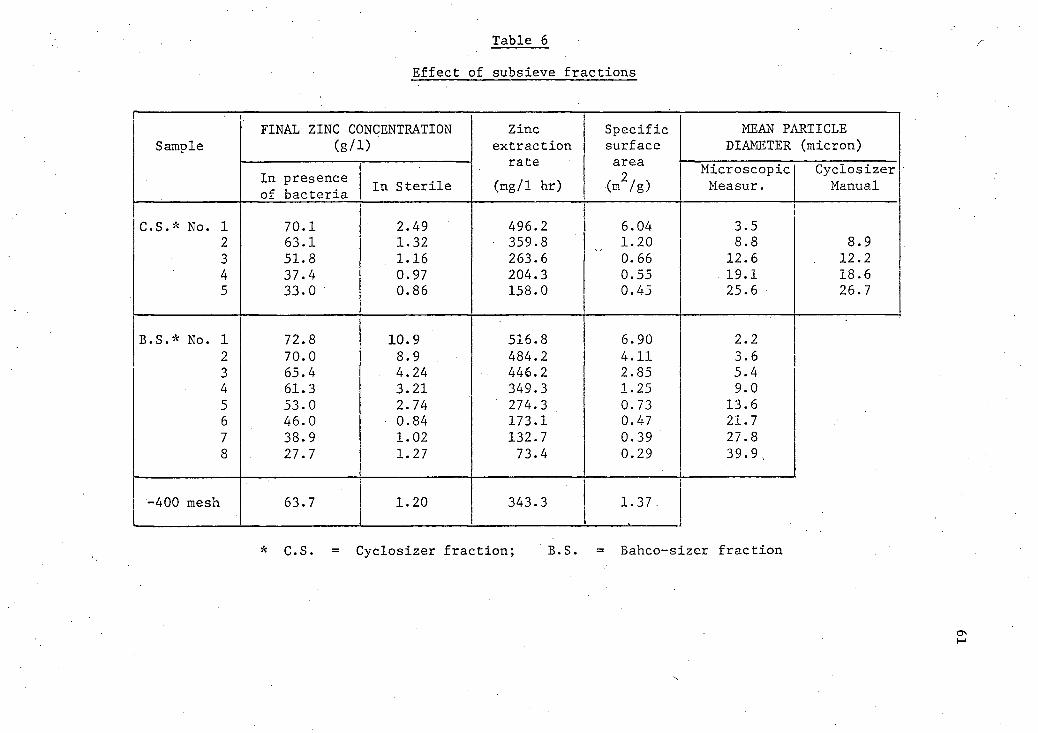
Table 6
Ef f e c t of subsieve f r a c t i o n s
•
FINAL ZINC CONCENTRATION Zinc S p e c i f i c MEAN PARTICLE Sample (g/D extraction
rate (mg/1 hr)
surface area
(m2/g)
DIAMETER (micron)
In presence of b a c t e r i a In S t e r i l e
extraction rate
(mg/1 hr)
surface area
(m2/g) Microscopic Measur.
Cyc l o s i z e r Manual
C.S.* No. 1 70.1 2.49 496.2 6.04 3.5 2 63.1 1.32 359.8 1.20 8.8 8.9 3 51.8 1.16 263.6 0.66 12.6 12.2 4 37.4 0.97 204.3 0.55 19.1 18.6 5 33.0 0.86 158.0 0.45 25.6 26.7
B.S.* No. 1 72.8 10.9 516.8 6.90 2.2 2 70.0 8.9 484.2 4.11 3.6 3 65.4 4.24 446.2 2.85 5.4 4 61.3 3.21 349.3 1.25 9.0 5 53.0 2.74 ' 274.3 0.73 13.6 6 46.0 0.84 173.1 0.47 21.7 7 38.9 1.02 132.7 0.39 27.8 8 27.7 1.27 73.4 0.29
•
39.9 .
-400 mesh 63.7 1.20 343.3 1.37 .
* C.S. = Cyclosizer f r a c t i o n ; B.S. = Bahco-sizer f r a c t i o n
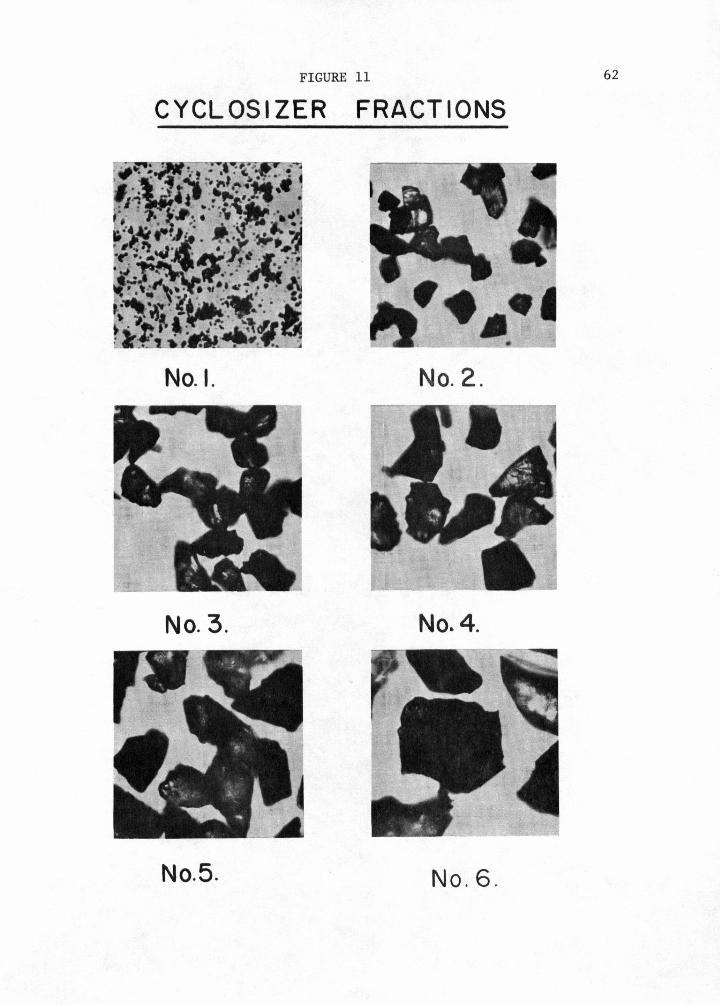
FIGURE 11
C Y C L O S I Z E R F R A C T I O N S
62
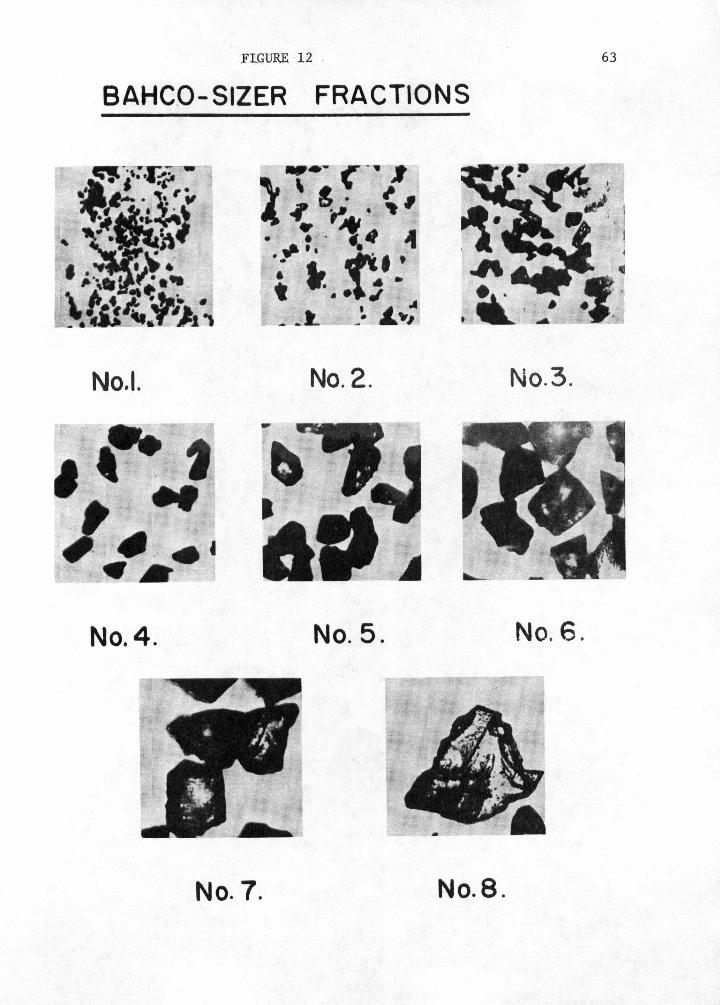
FIGURE 12
B A H C O - S I Z E R F R A C T I O N S
63
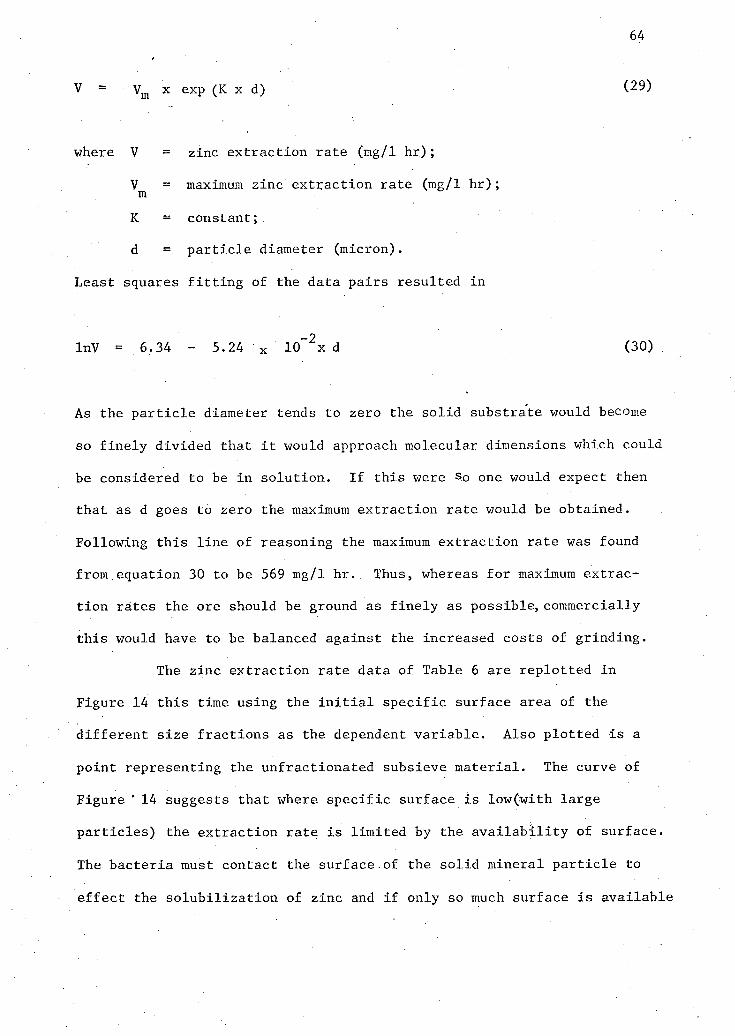
64
V = v m x exp (K x d) (29)
where V = zinc extraction rate (mg/1 hr ) ;
V = maximum zinc e x t r a c t i o n rate (mg/1 h r ) ; m
K = constant;
d =. p a r t i c l e diameter (micron).
Least squares f i t t i n g of the data p a i r s resulted i n
InV = 6.34 - 5.24 x 10~ 2x d (30) .
As the p a r t i c l e diameter tends to zero the s o l i d substrate would become
so f i n e l y divided that i t would approach molecular dimensions which could
be considered to be i n s o l u t i o n . I f t h i s were s 0 one would expect then
that as d goes to zero the maximum extraction rate would be obtained.
Following t h i s l i n e of reasoning the maximum extraction rate was found
from.equation 30 to be 569 mg/1 hr. Thus, whereas for maximum extrac
t i o n rates the ore should be ground as f i n e l y as possible, commercially
t h i s would have to be balanced against the increased costs of grinding.
The zinc extraction rate data of Table 6 are rep l o t t e d i n
Figure 14 t h i s time using the i n i t i a l s p e c i f i c surface area of the
d i f f e r e n t s i z e f r a c t i o n s as the dependent v a r i a b l e . Also plotted i s a
point representing the unfractionated subsieve material. The curve of
Figure ' 14 suggests that where s p e c i f i c surface i s low(with large
p a r t i c l e s ) the ext r a c t i o n rate i s l i m i t e d by the a v a i l a b i l i t y of surface.
The b a c t e r i a must contact the surface of the s o l i d mineral p a r t i c l e to
e f f e c t the s o l u b i l i z a t i o n of zinc and i f only so much surface i s a v a i l a b l e
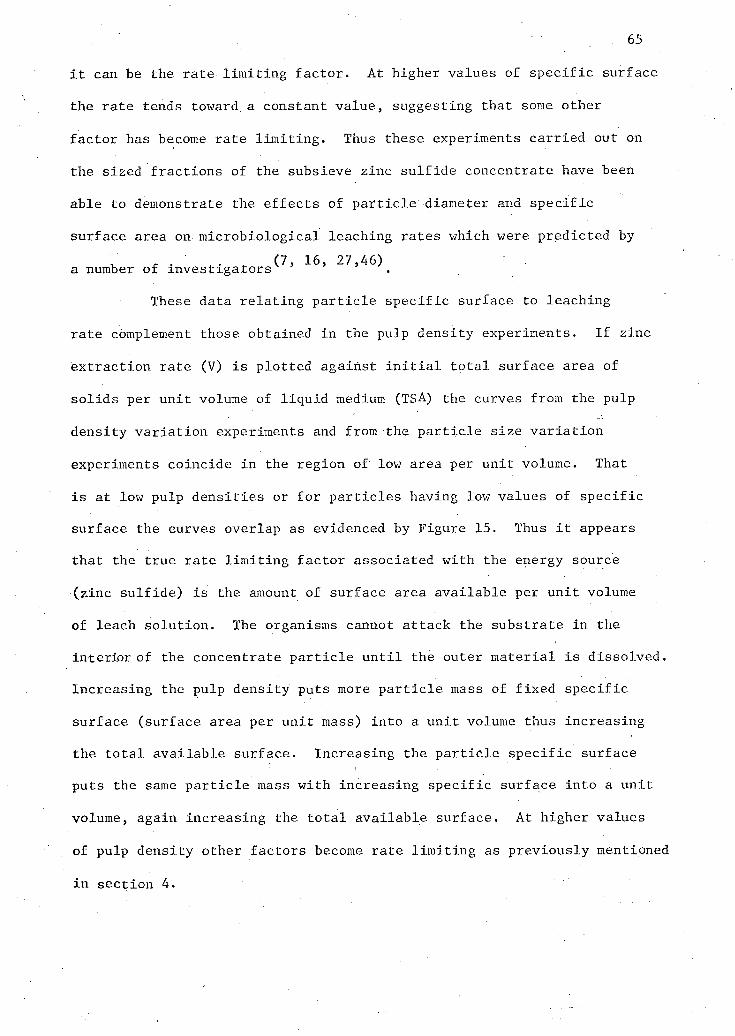
65
i t can be the rate l i m i t i n g f a c t o r . At higher values of s p e c i f i c surface
the rate tends toward, a constant value, suggesting that some other
factor has become rate l i m i t i n g . Thus these experiments c a r r i e d out on
the sized f r a c t i o n s of the subsieve zinc s u l f i d e concentrate have been
able to demonstrate the e f f e c t s of p a r t i c l e diameter and s p e c i f i c
surface area on m i c r o b i o l o g i c a l leaching rates which were predicted by
v ( 7 , 16, 27,46) a number of i n v e s t i g a t o r s
These data r e l a t i n g p a r t i c l e s p e c i f i c surface to leaching
rate complement those obtained i n the pulp density experiments. I f zinc
e x t r a c t i o n rate (V) i s plotted against i n i t i a l t o t a l surface area of
s o l i d s per unit volume of l i q u i d medium (TSA) the curves from the pulp
density v a r i a t i o n experiments and from the p a r t i c l e s i z e v a r i a t i o n
experiments coincide i n the region of low area per u n i t volume. That
i s at low pulp d e n s i t i e s or for p a r t i c l e s having low values of s p e c i f i c
surface the curves overlap as evidenced by Figure 15. Thus i t appears
that the true rate l i m i t i n g f a c t o r associated with the energy source
(zinc s u l f i d e ) i s the amount of surface area a v a i l a b l e per unit volume
of leach s o l u t i o n . The organisms cannot attack the substrate i n the
interior of the concentrate p a r t i c l e u n t i l the outer material i s dissolved.
Increasing the pulp density puts more p a r t i c l e mass of f i x e d s p e c i f i c
surface (surface area per unit mass) into a u n i t volume thus increasing
the t o t a l a v a i l a b l e surface. Increasing the p a r t i c l e s p e c i f i c surface
puts the same p a r t i c l e mass with increasing s p e c i f i c surface into a u n i t
volume, again increasing the t o t a l a v a i l a b l e surface. At higher values
of pulp density other factors become rate l i m i t i n g as previously mentioned
i n s ection 4.
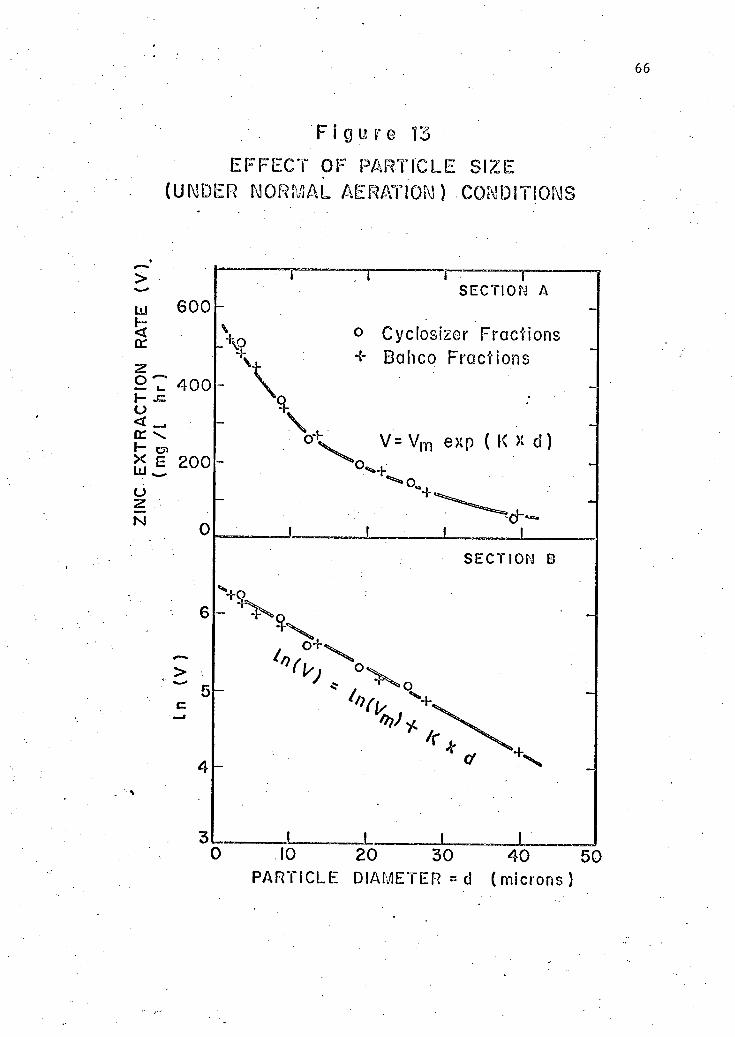
" F i g u r e 13 •
E F F E C T O F P A R T I C L E S I Z E
(UNDER N O R M A L AERATION) CONDITIONS
LU
CC
6 0 0
2 1* 4 0 0 I— -c O <
or \
* E 2 0 0 o
N 0
4
I i 1 S E C T I O N A
\ ° Cyclosizer Fract ions
+ Bahco Fract ions
V V= V m exp ( K x d )
I I |
S E C T I O N B
—
1 1 1 L 0 10 2 0 3 0 4 0 5 0
PARTICLE DIAMETER = d ( m i c r o n s )
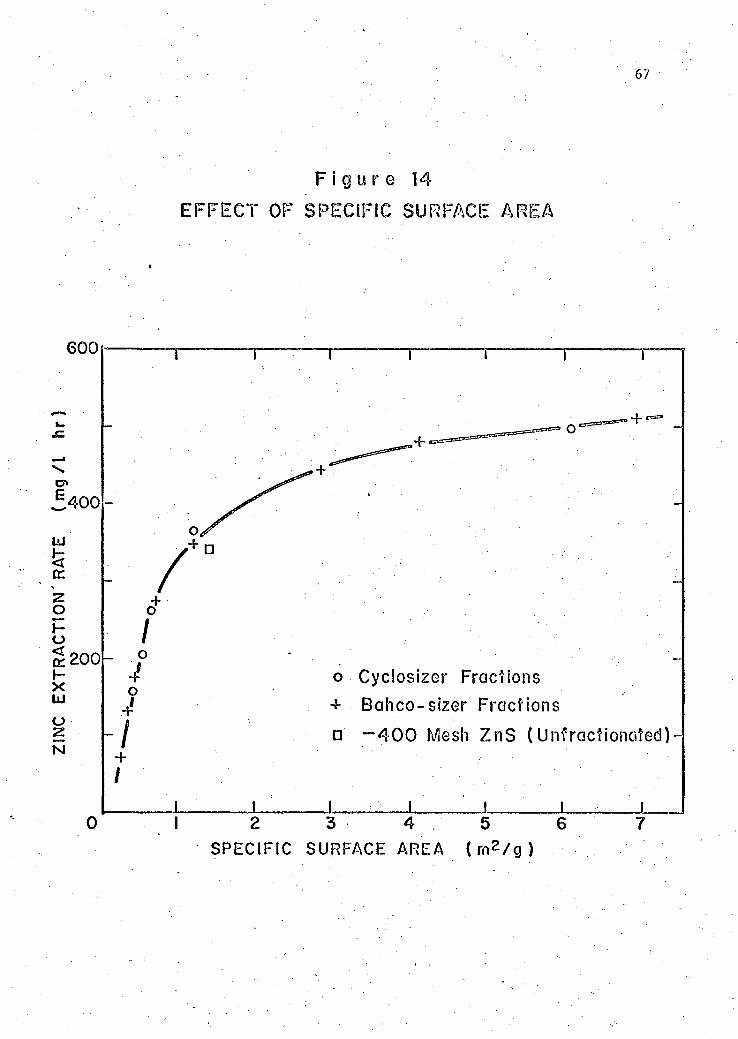
67
600
F i g u r e 14
E F F E C T OF SPECIFIC S U R F A C E A R E A
£ 4 0 0
LLI
!S
2 o 1— o
2 200 r-X Ul
u 2 N
L o 4 O
4 I
+
o Cyclosizer Fractions
.+ Bahco-sizer Fractions
• - 4 0 0 Mesh Z n S (Unf ractionated)
J_ 2 3 4 5
SPECIFIC SURFACE AREA ( r n 2 / g )
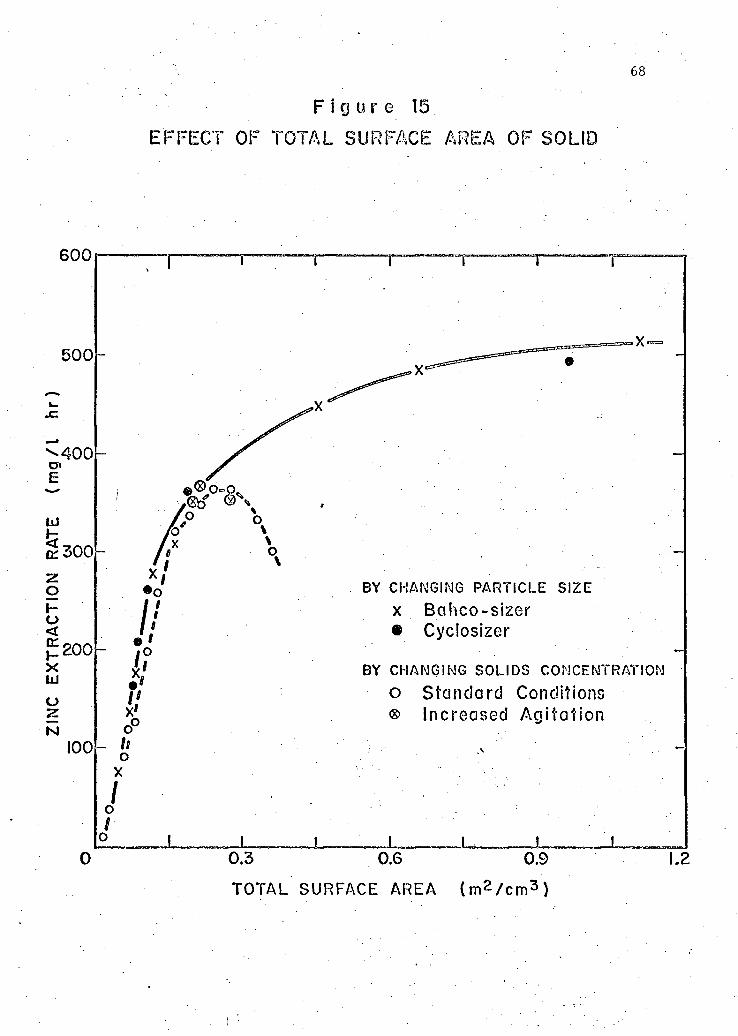
68
F i g u r e 15
E F F E C T OF T O T A L S U R F A C E A R E A OF SOLID
6 0 0
5 0 0
•400 Cft E
§ 3 0 0
z o \-o < £ 200 x UJ o 2 N
100
BY CHANGING P A R T I C L E S I Z E
x Bahco-sizer Cyclosizer
BY CHANGING S O L I D S CONCENTRATION
o Standard Conditions ® Increased Agi tat ion
o / o
0.3 0.6 0.9 1.2
TOTAL SURFACE AREA ( m 2 / c m 3 )
69
No s i g n i f i c a n t d i f f e r e n c e s were observed between the e f f e c t s
of the wet and dry c l a s s i f i e d subsieve f r a c t i o n s on the zinc e x t r a c t i o n
rate. Also the unfractionated material showed s i m i l a r behaviour to
the sized f r a c t i o n s when compared on a s p e c i f i c surface or t o t a l
surface per un i t volume basis. The maximum zinc extraction rates
observed were about 517 mg/1 hr which was obtained with the f r a c t i o n
having the la r g e s t s p e c i f i c surface. Extrapolation of the ra t e -
p a r t i c l e diameter curve suggested a maximum rate of about 570 mg/1 hr.
6. E f f e c t s of carbon dioxide concentration
In order to further delineate the rate l i m i t i n g f a c t o r s i n zinc
e x t r a c t i o n a serie s of experiments was c a r r i e d out aerating the leach
suspensions with a i r containing a v a r i e t y of concentrations of carbon
dioxide; the sole carbon source for T_. ferrooxidans. These experiments
were duplicated and were done at 35°C and pH 2.3 on leach suspensions
with various pulp d e n s i t i e s i n the range 5.3 to 26.6%. The carbon dioxide
concentrations i n the a i r supplied to the enclosed, thermostated, gyratory
shaker were c o n t r o l l e d at between 0.13 and 7.92 volume per cent.
The experimental data obtained at 7.92% carbon dioxide are
given i n Table 10 (A and B) of Appendix 1. The 16, 18, 20 and 24%
pulp density experiments were done i n duplicate with s t e r i l e c o n t rols.
The r e s u l t s obtained with the s t e r i l e controls showed no s i g n i f i c a n t
e f f e c t of increased carbon dioxide l e v e l (7.92%) on the zinc extraction
i n the con t r o l s , as can be seen by comparison of r e s u l t s to those
obtained with normal a i r (0.03% carbon di o x i d e ) , i . e . , i n Table 7 (A to
G) of Appendix 1.
The e f f e c t s of pulp density on zinc e x t r a c t i o n rate at the
70
d i f f e r e n t carbon dioxide l e v e l s [Table 10 to 13 (A and B) of Appendix 1]
are summarized i n Table 7. This table also includes the pulp density
study r e s u l t s under normal aeration conditions; transposed from Figure 10.
At carbon dioxide l e v e l s of 7.92%, 1.03% and 0.23% the zinc e x t r a c t i o n
rates are v i r t u a l l y i d e n t i c a l , i n d i c a t i n g that a carbon dioxide con
centration of 0.23% i n a i r i s s u f f i c i e n t to insure a maximum ext r a c t i o n
rate. The highest e x t r a c t i o n rate (about 640 mg/1 hr) was obtained
with leach suspensions of 24 and 26.6% pulp d e n s i t i e s . This value i s
about 280 mg/1 hr higher than obtained under normal aeration conditions
(360 mg/1 h r ) . At 0.13% carbon dioxide the maximum zinc e x t r a c t i o n rates
were s l i g h t l y i n f e r i o r to those maxima obtained at higher carbon dioxide
concentrations. For t h i s experiment the maximum rate was 570 mg/1 hr
obtained with pulp d e n s i t i e s of 24 and 26.6%.
These data are presented g r a p h i c a l l y i n Figure 16. . The zinc
e x t r a c t i o n rate versus pulp density curve increases l i n e a r l y up to pulp
d e n s i t i e s of about 22%. Atf higher pulp d e n s i t i e s t h i s rate l e v e l s out
suggesting that pulp density i s no longer l i m i t i n g . Note that with
carbon dioxide enriched a i r the l i n e a r portion of the plo t extends past
the l i n e a r portion of the zinc e x t r a c t i o n rate versus pulp density which
was obtained with normal a i r (Figure 10). This suggests that i n Figure
10 the carbon dioxide concentration was the l i m i t i n g f actor f o r pulp
d e n s i t i e s above 12%.
A l e a s t squares f i t of the l i n e a r part of Figure 16 (pulp
d e n s i t i e s up to 20%) gave
V = 30.0 x PD - 30.6 (31)
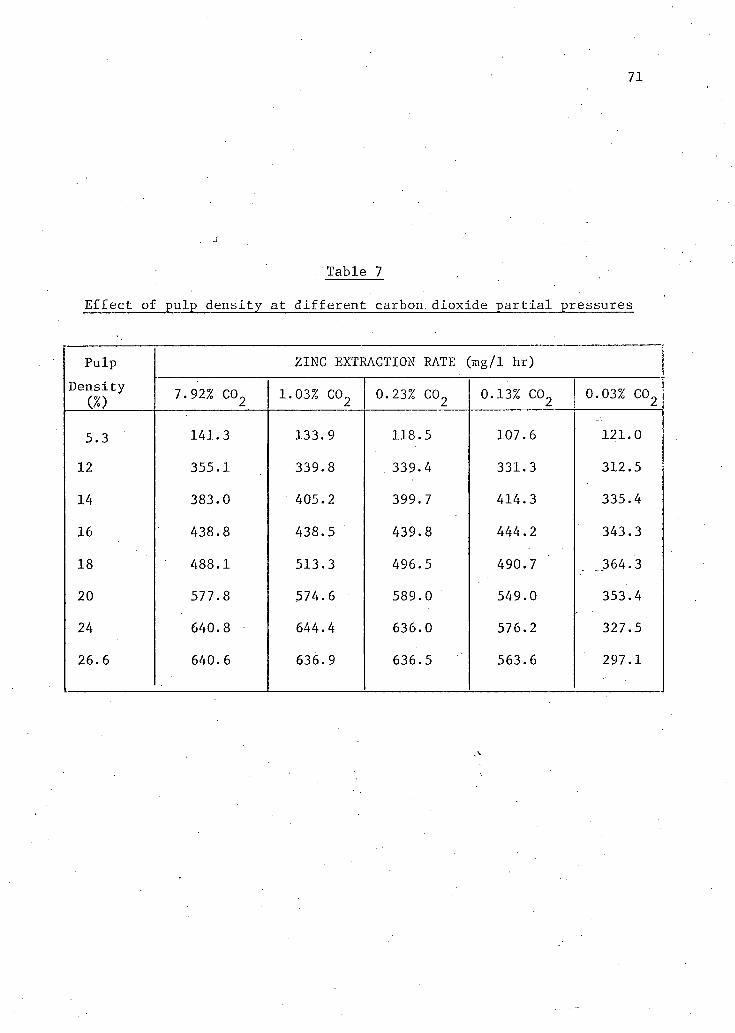
71
: Table 7
E f f e c t of pulp density at d i f f e r e n t carbon, dioxide p a r t i a l pressures
Pulp ZINC EXTRACTION RATE (mg/1 hr) Density
0 0 7.92% C0 2 1.03% C0 2 0.23% C0 2 0.13% C0 2 0.03% C0 2
5.3 141.3 133.9 118.5 107.6 121.0
12 355.1 339.8 339.4 331.3 312.5
14 383.0 405.2 399.7 414.3 335.4
16 438.8 438.5 439.8 444.2 343.3
18 488.1 513.3 496.5 490.7 364.3
20 577.8 574.6 589.0 549.0 353.4
24 640.8 644.4 636.0 576.2 327.5
26.6 640.6 636.9 636.5 563.6 297.1
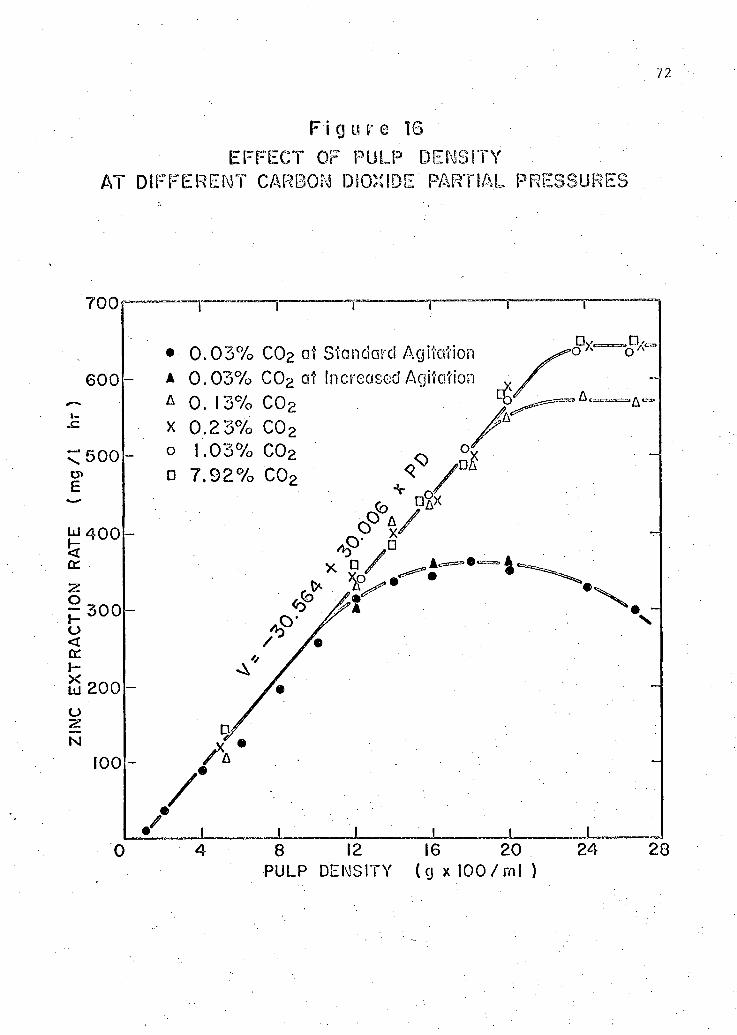
72
P i g u f e IS
E F F E C T OF P U L P DENSITY AT D I F F E R E N T CARBON DIOXIDE PARTIAL P R E S S U R E S
7 0 0
8 12
PULP DENSITY
16 2 0
( g x 100 / m l )
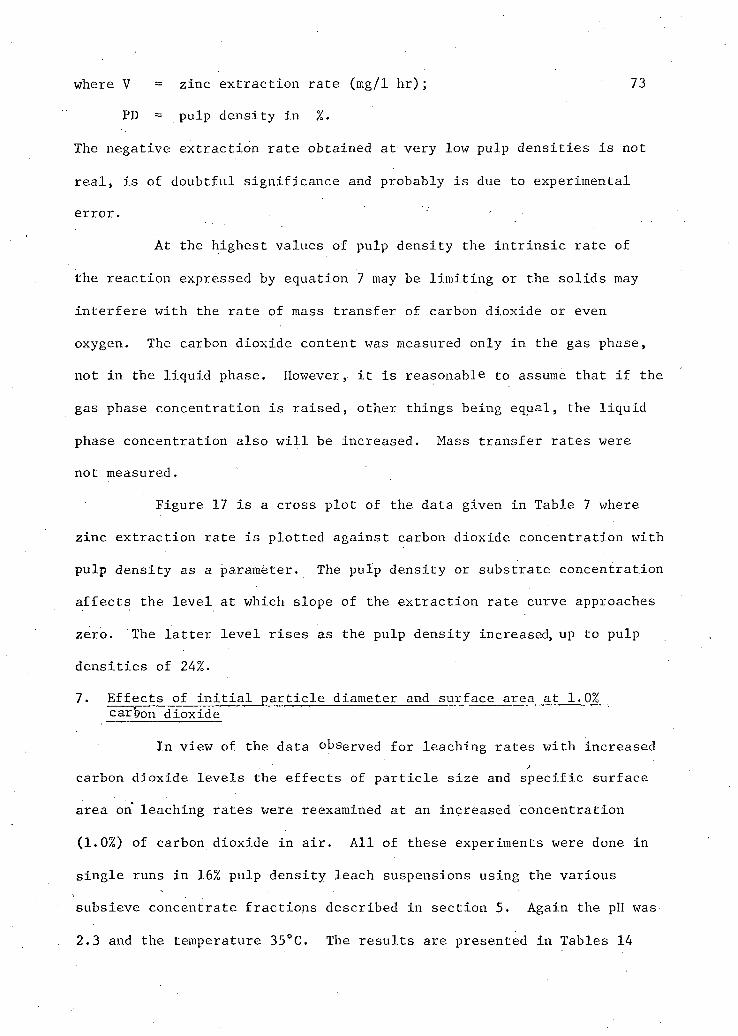
where V = zinc extraction rate (mg/1 h r ) ; 73
PD = pulp density i n %.
The negative extraction rate obtained at very low pulp d e n s i t i e s i s not
r e a l , i s of doubtful s i g n i f i c a n c e and probably i s due to experimental
error. ' -
At the highest values of pulp density the i n t r i n s i c rate of
the reaction expressed by equation 7 may be l i m i t i n g or the s o l i d s may
i n t e r f e r e with the rate of mass transfer of carbon dioxide or even
oxygen. The carbon dioxide content was measured only i n the gas phase,
not i n the l i q u i d phase. However, i t i s reasonable to assume that i f the
gas phase concentration i s ra i s e d , other things being equal, the l i q u i d
phase concentration also w i l l be increased. Mass transfer rates were
not measured.
Figure 17 i s a cross p l o t of the data given i n Table 7 where
zinc extraction rate i s pl o t t e d against carbon dioxide concentration with
pulp density as a parameter. The pulp density or substrate concentration
a f f e c t s the l e v e l at which slope of the ex t r a c t i o n rate curve approaches
zero. The l a t t e r l e v e l r i s e s as the pulp density increased, up to pulp
d e n s i t i e s of 24%.
7. E f f e c t s of i n i t i a l p a r t i c l e diameter and surface area at 1.0% carbon dioxide
In view of the data observed f or leaching rates with increased
carbon dioxide l e v e l s the e f f e c t s of p a r t i c l e s i z e and s p e c i f i c surface
area on leaching rates were reexamined at an increased concentration
(1.0%) of carbon dioxide i n a i r . A l l of these experiments were done i n
s i n g l e runs i n 16% pulp density leach suspensions using the various
subsieve concentrate f r a c t i o n s described i n section 5. Again the pH was
2.3 and the temperature 35°C. The r e s u l t s are presented i n Tables 14
74
F i g u r e 17
E F F E C T OF C A R B O N DIOXIDE P A R T I A L P R E S S U R E S
AT D I F F E R E N T P U L P DENSITIES
CARBON DIOXIDE IN VOLUME PERCENT
(A and B) of Appendix 1. 75
Table 8 summarizes the e f f e c t s of the various f r a c t i o n s and
unfractionated ore concentrate on the m i c r o b i o l o g i c a l zinc e x t r a c t i o n
rate; both under normal aeration and under aeration with carbon dioxide
enriched a i r . The r e s u l t s presented i n Table 8 i n d i c a t e that f o r the
smallest s i z e p a r t i c l e s the zinc extraction rates obtained with carbon
dioxide enriched a i r were more than double those obtained using normal
a i r . Thus for example, the highest zinc e x t r a c t i o n rate under normal
aeration was 516.8 mg/1 hr obtained with the f r a c t i o n having the 2
highest s p e c i f i c surface area (6.90 m /g) whereas when the a i r used f o r
aeration contained 1% carbon dioxide t h i s same s i z e f r a c t i o n gave r i s e
to an e x t r a c t i o n rate of 1,152.3 mg/1 hr. With the p a r t i c l e s i z e s having
lower s p e c i f i c surface areas the increases i n e x t r a c t i o n rate a t t r i b u t
able to increased a v a i l a b i l i t y of carbon dioxide became marginal. Under
these conditions the a v a i l a b i l i t y of surface i s r a t e l i m i t i n g rather
than the a v a i l a b i l i t y of carbon dioxide.
The p l o t of zinc extraction rate against p a r t i c l e diameter,
with carbon dioxide enriched a i r , i s given i n Figure 18. Figure 18A
shows that i n i t i a l l y the zinc extraction rate decreases r a p i d l y with an
increase i n p a r t i c l e diameter and subsequently more slowly. Unlike
Figure 13B a semilog p l o t of these data, as can be seen from Figure 18B,
does not produce a s t r a i g h t l i n e . In an attempt to predict a maximum
obtainable e x t r a c t i o n rate by extrapolating the e x t r a c t i o n rate versus
p a r t i c l e s i z e p l o t to zero p a r t i c l e diameter only those data for
p a r t i c l e diameters l e s s than 10 microns were used. This part of the curve
could be described by the following equation.
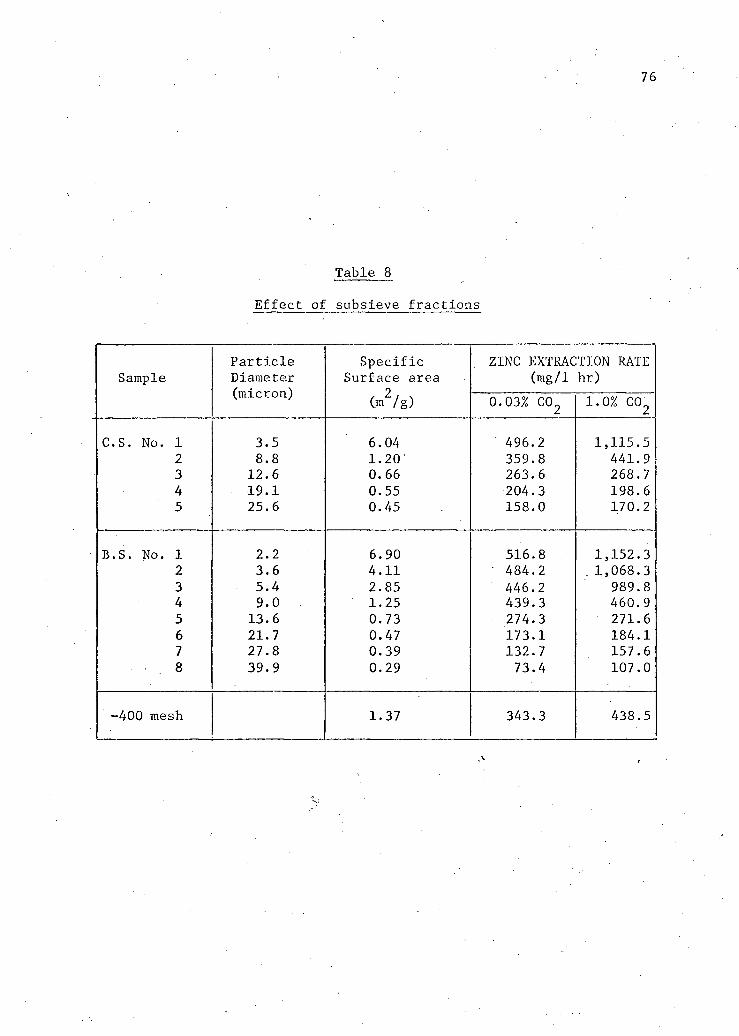
76
Table 8
E f f e c t of subsieve f r a c t i o n s
- — > — —
P a r t i c l e S p e c i f i c ZINC EXTRACTION RATE Sample Diameter Surface area (mg/1 hr)
(micron) (m2/g) 0.03% C0 2 1.0% co2
C.S. No. 1 3.5 6.04 ' 496.2 1,115.5 2 8.8 1.20' 359.8 441.9 3 12.6 0.66 263.6 268.7 4 19.1 0.55 204.3 198.6 5 25.6 0.45 158.0 170.2
B.S. No. 1 2.2 6.90 516.8 1,152.3 2 3.6 4.11 • 484.2 1,068.3 3 5.4 2.85 446.2 989.8 4 9.0 . 1.25 439.3 460.9 5 13.6 0.73 274.3 271.6 6 21.7 0.47 173.1 184.1 7 27.8 0.39 132.7 157.6 8 39.9 0.29 73.4 107.0
-400 mesh 1.37 343.3 438.5
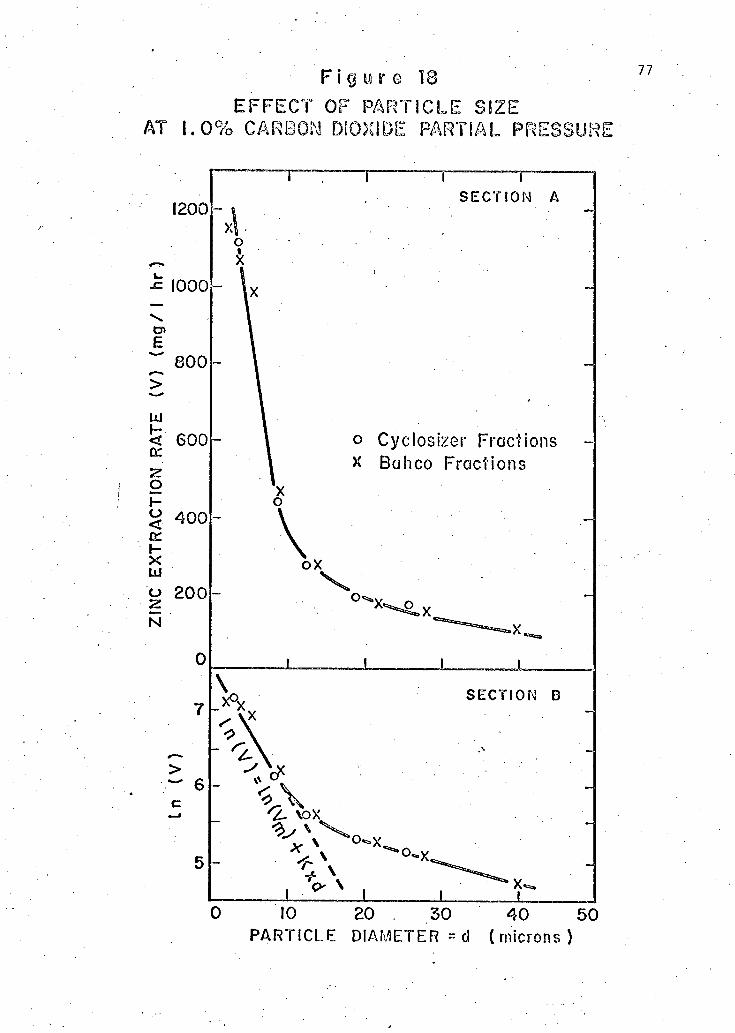
F i g u r e 18
E F F E C T OF P A R T I C L E S I Z E AT 1.0% C A R B O N DIOXIDE P A R T I A L ;SURI
1200
1000
v. cn E
8 0 0
> UJ
6 0 0 < 6 0 0 cc Z O h-O < 4 0 0 CC H X Ul o 2 0 0 2 0 0
N
> , w 6
c
T i ; f SECTION A
o Cyclosizer Fractions X Bah co Fractions
10 2 0 . 3 0 4 0 5 0
PARTICLE DIAMETER = cl ( m i c r o n s )
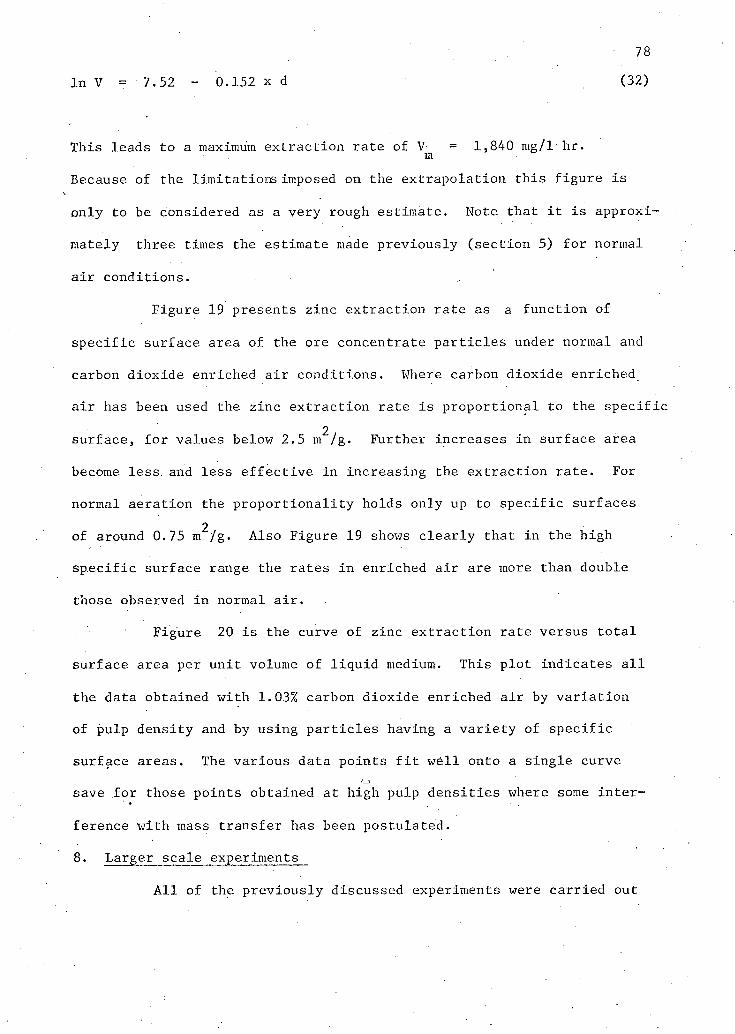
l n V = 7 . 5 2 - 0.152 x d
78
(32)
This leads to a maximum extraction rate of V = 1,840 mg/1 hr. m
Because of the limi t a t i o n s imposed on the extrapolation t h i s f i g u r e i s
only to be considered as a very rough estimate. Note that i t i s approxi
mately three times the estimate made previously (section 5) for normal
a i r conditions.
Figure 19 presents zinc e x t r a c t i o n rate as a function of
s p e c i f i c surface area of the ore concentrate p a r t i c l e s under normal and
carbon dioxide enriched a i r conditions. Where carbon dioxide enriched
a i r has been used the zinc extraction rate i s proportional to the specif 2
surface, f o r values below 2.5 m /g. Further increases i n surface area become less, and les s e f f e c t i v e i n increasing the extraction rate. For
normal aeration the p r o p o r t i o n a l i t y holds only up to s p e c i f i c surfaces 2
of around 0.75 m /g. Also Figure 19 shows c l e a r l y that i n the high
s p e c i f i c surface range the rates i n enriched a i r are more than double
those observed i n normal a i r .
Figure 20 i s the curve of zinc e x t r a c t i o n rate versus t o t a l
surface area per unit volume of l i q u i d medium. This p l o t indicates a l l
the data obtained with 1.03% carbon dioxide enriched a i r by v a r i a t i o n
of pulp density and by using p a r t i c l e s having a v a r i e t y of s p e c i f i c
surface areas. The various data points f i t well onto a sin g l e curve
save f o r those points obtained at high pulp d e n s i t i e s where some i n t e r
ference with mass transfer has been postulated.
8. Larger scale experiments
A l l of the previously discussed experiments were c a r r i e d out
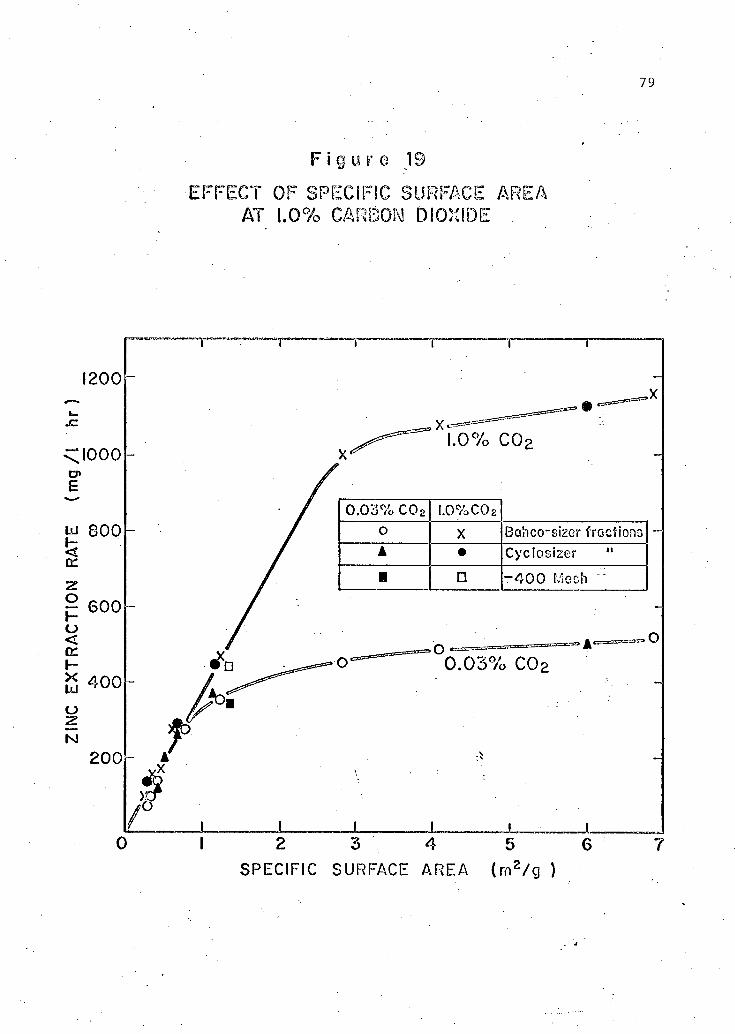
79
F i g u r e 19
E F F E C T OF SPECIFIC SURFACE A R E A A f 1.0% CARBON DIOXIDE
SPECIFIC SURFACE AREA ( m 2 / g )
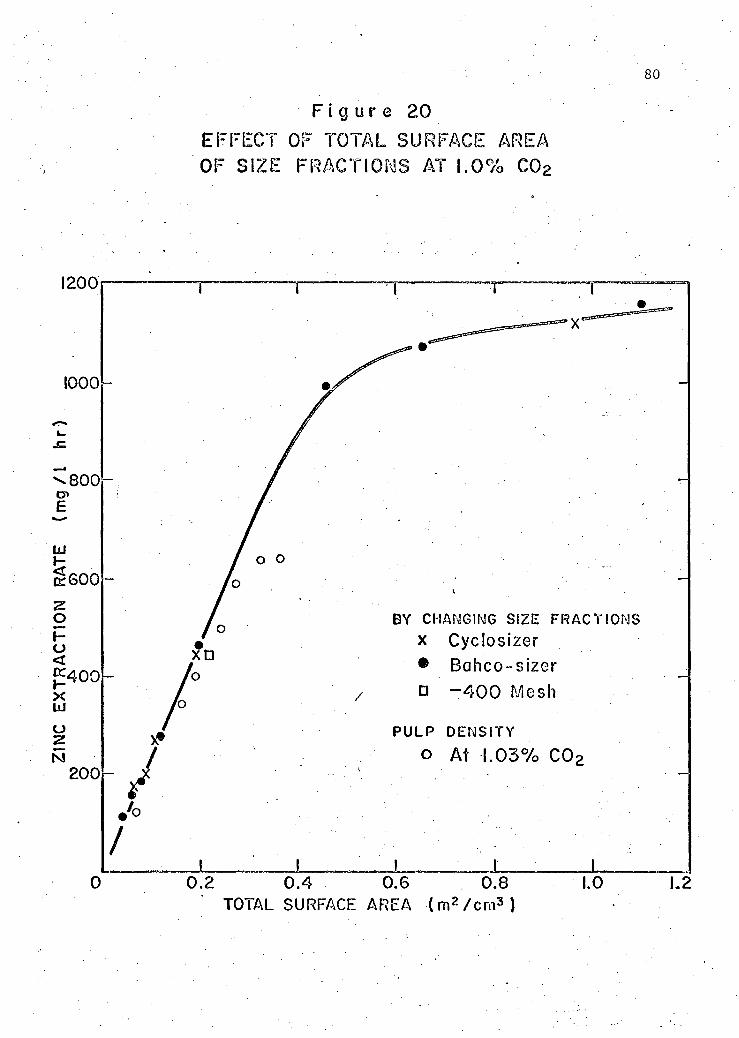
80
F i g u r e 2 0
E F F E C T OF T O T A L S U R F A C E A R E A
OF S I Z E F R A C T I O N S AT 1.0% C 0 2
l _ _ i I i l l
0 0 . 2 0 . 4 0 .6 0 .8 1.0 1.2
TOTAL SURFACE AREA ( m 2 / c m 3 )
i n Erlenmeyer f l a s k s on a gyratory shaker. As a preliminary scale-up
procedure to a p o t e n t i a l l y commercial-sized i n s t a l l a t i o n some e x p e r i
ments were undertaken i n s t i r r e d tanks, with much la r g e r volumes of
suspension. These were undertaken to as c e r t a i n the relevance of data
obtained i n shake f l a s k s f or scale-up purposes. These large scale
leaches were done at a pulp density of 24% using unfractioned -400 mesh
concentrate at pH 2.3, 35°C and with carbon dioxide enriched a i r (1%).
The f i r s t experiment was done with 30 l i t e r s of leach
suspension i n an unbaffled tank. The pH was c o n t r o l l e d manually. The
data obtained are presented i n Table 2 of Appendix 2. The zinc extrac
t i o n rate was calculated to be 635.3 mg/1 hr i n good agreement with the
636.9 mg/1 hr found for s i m i l a r conditions i n the shake f l a s k . However,
the f i n a l zinc concentration observed i n the s t i r r e d tank (112.2 g/1)
was s i g n i f i c a n t l y greater than that observed i n the shake f l a s k (70.4 g/1).
Another experiment was done i n a b a f f l e d , s t i r r e d tank using
12 l i t e r s of ore suspension (24% pulp density, pH 2.3, 35°C, 1% CO )
with automatic pH c o n t r o l . The r e s u l t s are noted i n Table 3 of
Appendix 2. The zinc e x t r a c t i o n rate observed (651.4 mg/1 hr) again
agreed well with the shake f l a s k r e s u l t . (636.9 mg/1 h r ) . The f i n a l
zinc concentration was measured as 119.8 g/1 s l i g h t l y superior to that
observed i n the unbaffled tank. The di f f e r e n c e s between b a f f l e d and
unbaffled tanks are minimal. Agitator power consumption might be
d i f f e r e n t but this was not measured.
These f i n a l zinc concentrations are the highest observed i n
t h i s work and are i n the range of zinc concentrations (80 - 160 g/1)
cur r e n t l y used i n .the commercial electrowinning of zinc from s o l u t i o n .
Samples of the leach l i q u o r s have been sent to Cominco Ltd. f o r 32
evaluation of t h e i r s u i t a b i l i t y f o r electrowinning. The zinc recoveries
or y i e l d s i n the unbaffled and b a f f l e d s t i r r e d tank leaches were 76.9
and 82.1% r e s p e c t i v e l y . Results obtained by Cominco Ltd. indicated a
s a t i s f a c t o r y q u a l i t y of cathode zi n c , produced a f t e r pretreatment to
remove i r o n by p r e c i p i t a t i o n of the f e r r i c form at pH 5 and cementation
of other minor impurities with zinc dust. Current e f f i c i e n c i e s of 79 -
83% were lower than acceptable commercial l e v e l s (90%). I t was con
sidered that t h i s d e f i c i e n c y could be overcome by minor modification of
p u r i f i c a t i o n procedures, p r i o r to electrowinning.
The reason f o r the d i f f e r e n c e i n the f i n a l zinc concentrations
i n the shake f l a s k and s t i r r e d tank leaches i s not r e a d i l y evident.
P e r i o d i c stopping of the shaker f o r sampling may have i n t e r f e r e d with
the extraction process or perhaps the d i f f e r e n t type of mixing i n the
s t i r r e d tanks resulted i n some s e l f - g r i n d i n g of the concentrate,
producing more surface. However, no d e f i n i t i v e explanation i s a v a i l
able.
During these large scale experiments a l t e r a t i o n s which occurred
as time progressed i n the s i z e d i s t r i b u t i o n and chemical composition
of the substrate ore p a r t i c l e s were investigated. A f t e r removal of
400 ml samples from the leach suspension, the s o l i d s were f i l t e r e d out
and were washed three times with one l i t e r of d i s t i l l e d water. A f t e r
drying at 45°C these s o l i d s were fract i o n a t e d on the Bahco-sizer
apparatus and the zinc contents of f r a c t i o n s 1, 3, 5 and 8 determined.
The r e s u l t s are i n Table 9. These were obtained from the leach done
i n the b a f f l e d tank.
From Table 9, most of the zinc i s leached from the smaller
p a r t i c l e s because t h e i r zinc concentration drops most r a p i d l y with time
Also there i s a smaller percentage of the smallest p a r t i c l e s remaining
a f t e r 338 hours of leaching. The r e l a t i v e proportion of the large
p a r t i c l e s increases and the composition remains more or l e s s constant.
These f a c t s are consistent with having an i n i t i a l p a r t i c l e d i s t r i b u t i o n
the smallest f r a c t i o n s of which are leached f a s t e r than the l a r g e s t
f r a c t i o n while those p a r t i c l e s i n the large f r a c t i o n diminish i n si z e
to become part of the smaller f r a c t i o n s . The smallest f r a c t i o n
p a r t i c l e s w i l l not completely disappear due to the i n e r t material
i n i t i a l l y present i n the ore concentrate.
9. Modelling
9.1 General
The shapes of the p l o t s of zinc extraction rates versus pulp
density, s p e c i f i c surface, and t o t a l surface area per unit volume of
leach l i q u o r are s i m i l a r both under normal and carbon dioxide enriched
a i r conditions. At r e l a t i v e l y low values of the various dependent
v a r i a b l e s the zinc e x t r a c t i o n rates are d i r e c t l y proportional to the
dependent v a r i a b l e s . At higher values of the dependent v a r i a b l e s the
zinc e x t r a c t i o n rates l e v e l o f f and tend to become independent. One of
the simplest equations which can be used to describe t h i s kind of
behaviour i s the hyperbolic equation (equation 13) suggested by Monod (131,140) m i . , . M . , . . • (136)
. • This i s also known as the Michaelis-Menten equation
(see section IV.4.2).
Equation 13 has been adapted i n t h i s work to describe the
e f f e c t s of various factors on the k i n e t i c s of m i c r o b i al zinc e x t r a c t i o n
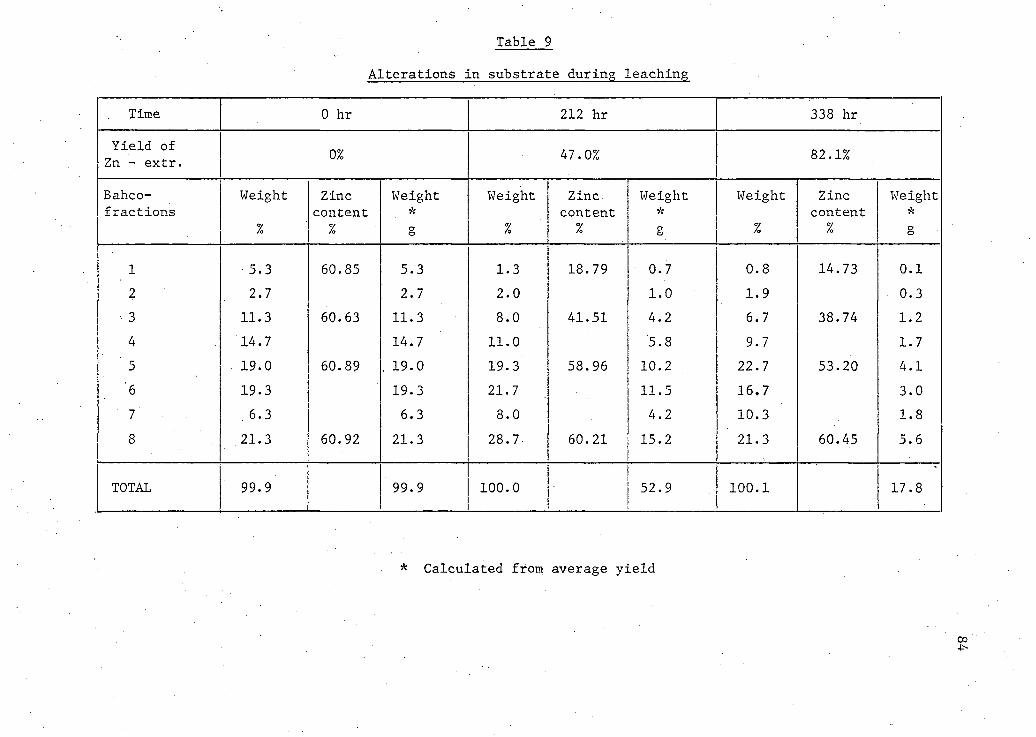
Table 9
Al t e r a t i o n s i n substrate during leaching
Time 0 hr 212 hr 338 hr
Y i e l d of Zn - extr. 0% 47.0% 82.1%
Bahco- Weight Zinc Weight Weight Zinc Weight Weight Zinc Weight f r a c t i o n s
% content
% g % content
% g % content
% g
1 • 5.3 60.85 5.3 1.3 18.79 0.7 0.8 14.73 0.1 2 2.7 2.7 2.0 1.0 1.9 0.3 3 11.3 60.63 11.3 8.0 41.51 4.2 6.7 38.74 1.2 4 14.7 14.7 11.0 5.8 9.7 1.7
. ' 5 ' . 19.0 60.89 , 19.0 19.3 58.96 10.2 22.7 53.20 4.1 '6 19.3 19.3 21.7 11.5 16.7 3.0 7 . 6.3 6.3 8.0 4.2 10.3 1.8 8 21.3 60.92 21.3 28.7 60.21 15.2 21.3 60.45 5.6
TOTAL 99.9 99.9 100.0 52.9 100.1 17.8
* Calculated from average y i e l d
oo
85 Thus the substrate concentration (S) i s replaced by pulp density (PD),
s p e c i f i c surface area (SSA), or t o t a l surface area per unit volume (TSA)
Equation 13 i s used i n t h i s work to estimate values for K and V , p a r t i ^ m m
c u l a r l y the l a t t e r which i s an i n d i c a t i o n of the maximum rate att a i n a b l e
This maximum rate would be of considerable importance i n an i n d u s t r i a l
scale operation.
Monod^ ± 3 ±' s p e c i f i e d a number of conditions which must be
met when using equation 13 to characterize b a c t e r i a l growth curves. Not
a l l of these are met i n the present work which renders treatment thereof
more empirical i n nature. In th i s work we were concerned with a
product (zinc) formation rate rather than a b a c t e r i a l c e l l growth rate.
In Monod's work the growth rate was the growth rate observed i n the
logarithmic phase of the c e l l population growth. In t h i s work the
product rate used was the product rate which appeared as the l i n e a r
p ortion of a p l o t of zinc concentration versus time.
Monod assumed that a l l nutrients and/or substrates were
present i n excess save one which was said to be the l i m i t i n g substrate.
The l i m i t i n g substrate concentration i s the one represented i n equation
13 by S. In the present study both the a v a i l a b i l i t y of energy source
and carbon dioxide can be l i m i t i n g . As has been shown i n section 4
there can be a t r a n s i t i o n from one l i m i t i n g f a c t o r to another. In
th i s study equation 13 was applied without regard to t h i s l i m i t a t i o n
as w i l l be shown below. Thus the V and K values observed may not m m
represent s o l e l y the e f f e c t s of a l i m i t i n g substrate. However, under
conditions where carbon dioxide was i n excess the Monod condition of a
si n g l e l i m i t i n g substrate probably i s met. In t h i s case the l i m i t i n g
substrate i s in s o l u b l e zinc s u l f i d e .
In t h i s heterogeneous system the substrate concentration
should be expressed as a surface because the energy source f o r the
organism i s only a v a i l a b l e through t h i s surface. Hence as suggested by (78)
Moss and Andersen s p e c i f i c surface or t o t a l surface areas have been
used as w e l l as zinc s u l f i d e concentrations expressed as pulp d e n s i t i e s .
Due to the complicating f a c t o r s l i s t e d above t h i s modelling
work should be regarded as preliminary. Further work should be under
taken to provide a more accurate simulation of the leaching curves.
In the following the values of the constants V and K were m m
estimated through l e a s t squares f i t t i n g of the data using the
Lineweaver and Burk t e c h n i q u e t o l i n e a r i z e equation 13. 9.2 Determination of V and K values under normal a i r conditions m m
The r e l a t i o n between zinc extraction rate (V) and pulp
density (PD) was written as
Vm x < r o>
V K + (PD) ( 3 3 )
m
V = maximum zinc e x t r a c t i o n rate (mg/1 h r ) : m ° . . .. .
K = Michaelis-Menten constant (% pulp density).
When the data of Figure 10 were plotted i n the l i n e a r i z e d 1 1
form (— vs ) a s t r a i g h t l i n e was not observed save i n the
r e l a t i v e l y narrow region between pulp d e n s i t i e s of .12 to 18%. From the
Lineweaver-Burk pl o t the value of V i s derived from the intercept m r
of the s t r a i g h t l i n e on the 1/V axis. I t was f e l t that the data points
from pulp d e n s i t i e s between 12% and 18% could be used to get a reason
able estimate of V . Data points for higher pulp d e n s i t i e s which lay
87 closer to the 1/V axis were not useful because the high solids concentra
tion apparently reduced the rate. The values found were V = 574 mg/1 hr
and = 10.1% pulp density; see Figure 21.
The Km value represents the pulp density which is half the
pulp density required to achieve maximum rate. Thus if this were the
correct model, the maximum rate should be achieved at a pulp density
of 20.2%. The fact that at this pulp density the rate was lower than
574 mg/1 hr means that some unaccounted for factor has interfered. This
has already been commented upon when discussing Figure 10.
The extraction rate data from Figure 14 were studied using
specific surface area (SSA) to represent substrate concentration in
equation 13. Thus
V x (SSA) V = j " . o c a (34) K + (SSA) m
From the plot of Figure 22 the maximum zinc extraction rate and Michaelis-2 Menten constant were determined to be V = 566 mg/1 hr and K = 0.77 m /g. m ° m
The data corresponding to particles having low surface areas deviated
from the straight line and were not used in drawing the straight line. In
Figure 22, similar extrapolation of the tangent to the dotted line,
suggests a difference in reactivity of large particle size substrates.
Similarly total surface area per unit volume (TSA) can
represent substrate concentration and \
V x (TSA) v = JE (35) V K + (TSA) V
m .
The linearized plot of equation 35 is given in Figure 23 which includes
points from the various pulp density experiments and points from the
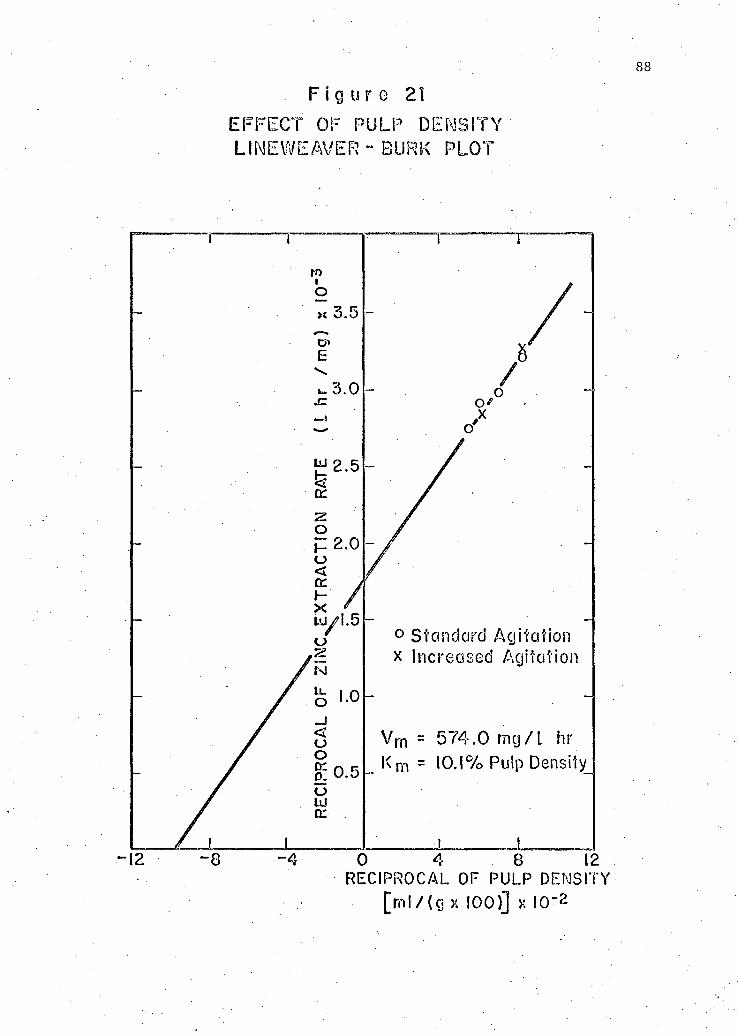
F i g u r e 21
E F F E C T OF P U L P DENSITY L I N E WE AVER - BURK P L O T
RECIPROCAL OF PULP DENSITY
[ m ! / ( g x 100) ] x I O " 2
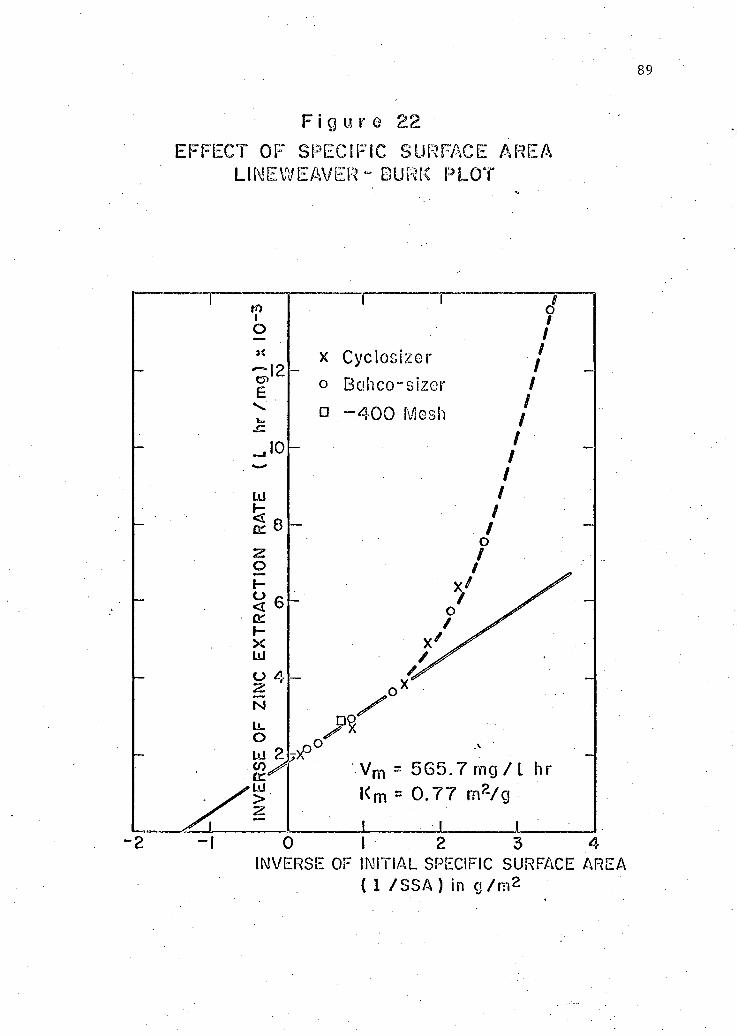
F i g u r e 22
E F F E C T OF S P E C I F I C S U R F A C E A R E A L I N E W E A V E R - B U R K P L O T
i O ><
E 12
,10
8
ui
6 CC
Z o I-o < cc H X UJ u 4 z N U. o UJ to vc
-UJ > 2
x Cyclosizer
Bahco-sizer
- 4 0 0 Mesh
5 6 5 . 7 rng / L
0 .77 rn?-/g
± - 2 - I 0 1 2 3 4
INVERSE OF INITIAL SPECIFIC SURFACE AREA ( 1 /SSA ) in g/m2
90 various subsieve f r a c t i o n experiments. In the 12 to 18% pulp density
range the data from the pulp density experiments agree well with those
from the subsieve f r a c t i o n experiments. The values found f o r V and 1 m
2 K were 566 mg/1 hr and 0.12 m /ml r e s p e c t i v e l y . Again the data which deviated markedly from the s t r a i g h t l i n e were not used i n the computat i o n of V and K . This V value i s the same as the one obtained for
m m m the zinc e x t r a c t i o n rate as a function of s p e c i f i c surface area equation (equation 34). However,.this i s not unexpected since much of the same
data were used. The di f f e r e n c e s i n the values of K are due to the m
d i f f e r e n t units used.
The values obtained for the maximum extraction r a t e , 574 mg/1 hr
from the pulp density experiments and 566 mg/1 hr from the s p e c i f i c
surface area and t o t a l surface area experiments, are i n good agreement
with the maximum ext r a c t i o n rate (569 mg/1 hr) obtained by extrapolating
the p a r t i c l e diameter versus e x t r a c t i o n rate curve to zero diameter.
A l l of these values were obtained from experiments done under normal
a i r condition. No l i t e r a t u r e data are a v a i l a b l e f or comparison. 9.3 Determination of V and K values under carbon dioxide m m .
enriched a i r conditions -
The e f f e c t s of pulp density on zinc e x t r a c t i o n rates under
carbon dioxide enriched a i r conditions have been demonstrated i n
Figure 16. The rates obtained at carbon dioxide l e v e l s of 0.23, 1.03,
and 7.92% are s i m i l a r . Thus these data are plotted i n Figure 24 f o r
the determination of the V and K constants of equation 33. Figure 25 m m
i s a s i m i l a r p l o t based on the data obtained at a carbon dioxide l e v e l
of 0.13%.
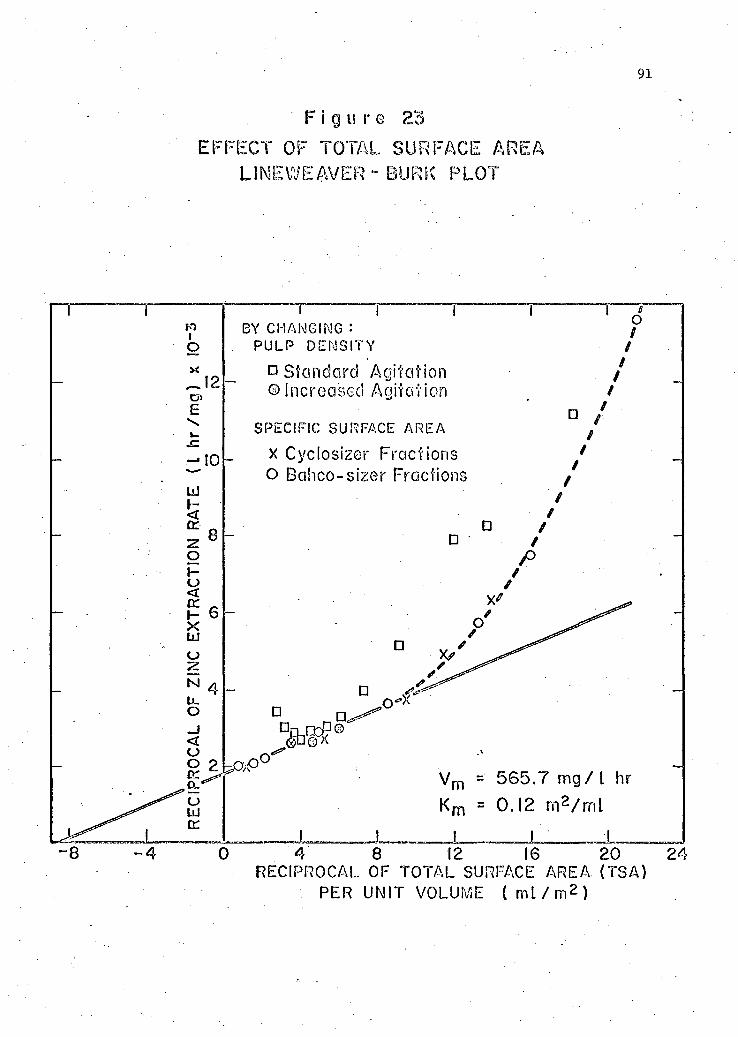
91
F i g u r e 23
E F F E C T OF TOTAL S U R F A C E A R E A
LINE WE AVER - BURK P L O T
ro i O x
E
12
- 1 0
o LU
I
BY CHANGING :
P U L P D E N S I T Y
• Standard Agitation ©Increased Agitation
SPECIFIC SURFACE A R E A
x Cyclosizer Fractions O Bahco-sizer Fractions
o /
•
V m =• 565.7 mg / L hr
K m = 0.12 r n 2 / m l
. J . J L _ _ ± _ „
0 4 8 12 16 20 24 RECIPROCAL OF TOTAL SURFACE AREA (TSA)
PER UNIT VOLUME ( m l / m 2 )
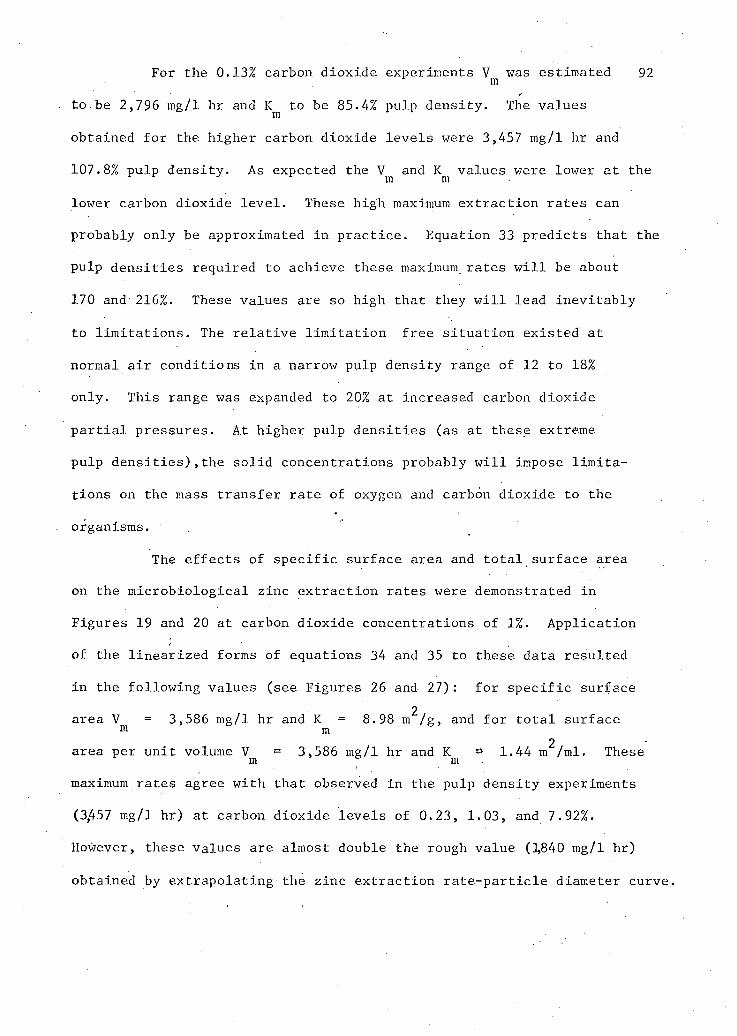
For the 0.13% carbon dioxide experiments V was estimated 92 m
to.be 2,796 mg/1 hr and K to be 85.4% pulp density. The values m
obtained f o r the higher carbon dioxide l e v e l s were 3,457 mg/1 hr and
107.8% pulp density. As expected the V and K values were lower at the r m m
lower carbon dioxide l e v e l . These high maximum extraction rates can
probably only be approximated i n p r a c t i c e . Equation 33 pr e d i c t s that the
pulp d e n s i t i e s required to achieve these maximum rates w i l l be about
170 and'216%. These values are so high that they w i l l lead i n e v i t a b l y
to l i m i t a t i o n s . The r e l a t i v e l i m i t a t i o n free s i t u a t i o n existed at
normal a i r conditions i n a narrow pulp density range of 12 to 18%
only. This range was expanded to 20% at increased carbon dioxide
p a r t i a l pressures. At higher pulp d e n s i t i e s (as at these extreme
pulp d e n s i t i e s ) , t h e s o l i d concentrations probably w i l l impose l i m i t a
tions on the mass transfer rate of oxygen and carbon dioxide to the
organisms.
The e f f e c t s of s p e c i f i c surface area and t o t a l surface area
on the m i c r o b i o l o g i c a l zinc e x t r a c t i o n rates were demonstrated i n
Figures 19 and 20 at carbon dioxide concentrations of 1%. A p p l i c a t i o n
of the l i n e a r i z e d forms of equations 34 and 35 to these data resulted
i n the following values (see Figures 26 and 27): for s p e c i f i c surface 2
area V = 3,586 mg/1 hr and K = 8.98 m /g, and for t o t a l surface m m
2 area per un i t volume V = 3,586 mg/1 hr and K » 1.44 m /ml. These
m m
maximum rates agree with that observed i n the pulp density experiments
(3,457 mg/1 hr) at carbon dioxide l e v e l s of 0.23, 1.03, and 7.92%.
However, these values are almost double the rough value (1840 mg/1 hr)
obtained by extrapolating the zinc e xtraction r a t e - p a r t i c l e diameter curve.
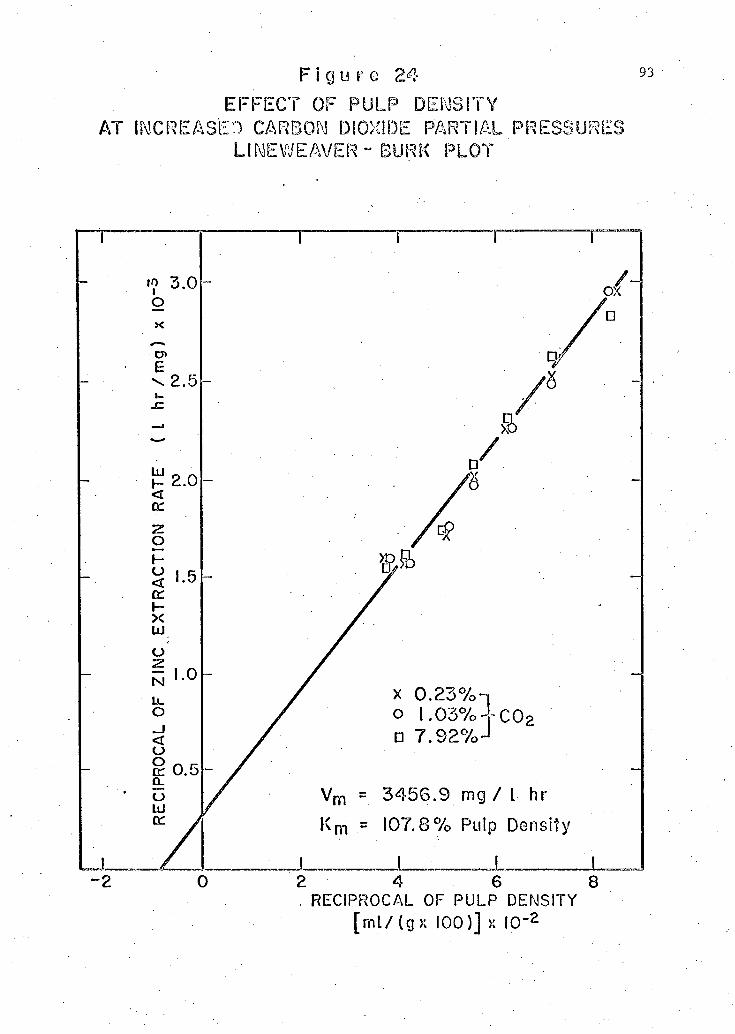
F i g u r e 2 4
E F F E C T OF P U L P DENSITY A T INCREASE*! CARBON DIOXIDE PARTIAL P R E S S U R E S
LINE WE AVER - BURK P L O T
1 i i i i
- ' to 3.0 o X
cn E
- \ 2.5 t»
_ • / / LU ^ „
- H 2.0 <
/ /
EX
TR
AC
TIO
N
o
N '-0 U . O
< U
§ 0.5 n
/ x 0.23%-! / o 1.03% 4-C0 2
/ • 7 . 9 2 % J
L J L .
O LU
/ v m = 3456.9 mg / L hr L J L .
O LU
K m = 107.8% Pulp Density
I....... .!.__ _ 1 1 - 2 0 2 4 6 8
. RECIPROCAL OF PULP DENSITY [ r n l / ( g x 100)] x IO" 2
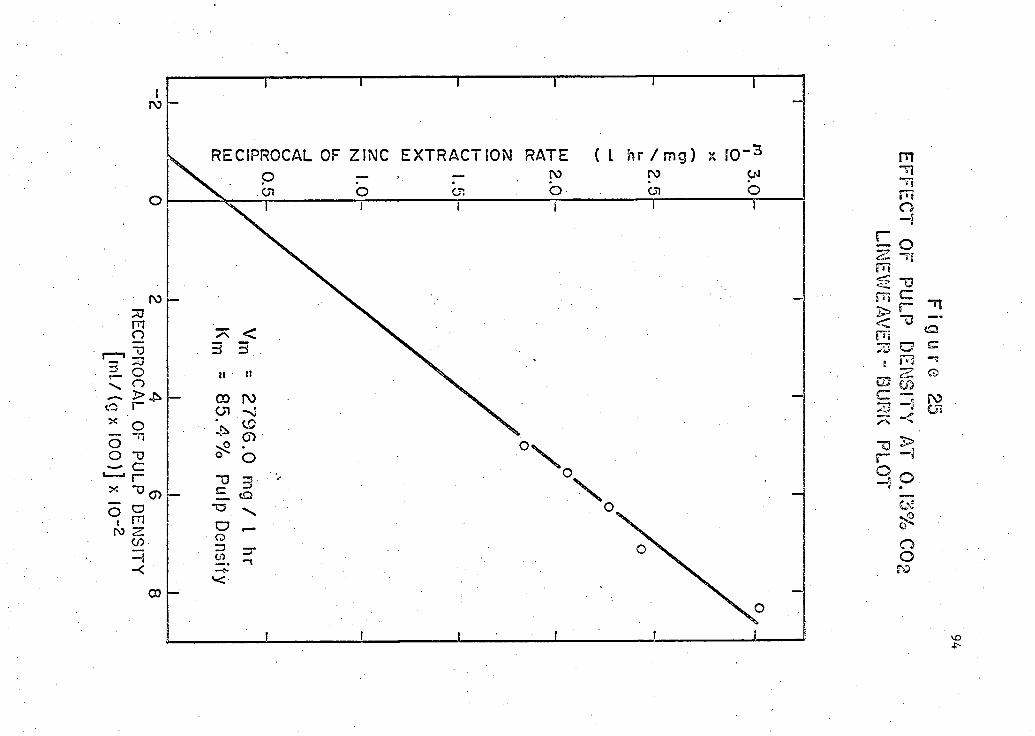
F i g u r e 2S E F F E C T OF S P E C I F I C S U R F A C E A R E A AT 1.0% CO
• L I N E W E A V E R - B U R K P L O T
-I . 0 . 1 - 2 3 4 RECIPROCAL OF SPECIFIC SURFACE AREA
( g / m 2 )
96 The pulp density data agree well with the data obtained with
the subsieve f r a c t i o n s , as shown i n Figure 27. Whereas pulp d e n s i t i e s
necessary to approach maximum rates are impractical excessive grinding
of the ore concentrate to increase the s p e c i f i c surface areas may be
more p r a c t i c a l . This could be combined with a higher pulp density.
However, the increased grinding costs would have to be balanced against
the improved rate of ex t r a c t i o n . The highest extraction rate observed
i n any of the work reported i n t h i s thesis was about 1,160 mg/1 hr;
achieved with the smallest s i z e f r a c t i o n having a s p e c i f i c surface 2
area of 6.90 m /g .
10. Mathematical d e s c r i p t i o n of b a c t e r i a l leach curves
The generalized l o g i s t i c equation (equation 21) was f i t t e d
to leach curves obtained under a v a r i e t y of conditions. The r e s u l t s
are presented i n Tables 2 (A .and B) to 10 (A and B) of Appendix 2.
The A tables contain the regression c o e f f i c i e n t s and
associated s t a t i s t i c a l parameters as computed by a multiple regression (205)
analysis program . Experimental data from a p a r t i c u l a r leach were
fed into the program^^"^ and f i t t e d to equation 26. The high values
obtained f o r the multiple c o r r e l a t i o n c o e f f i c i e n t s (R value) and for t h e i r
squares suggest a good f i t of the data by the generalized l o g i s t i c
equation. The goodness of t h i s f i t can be seen i n the B tables where
the experimental data are compared to the f i t t e d data. The program
reproduced i n Table .1 of Appendix 2 was.used to compute these B tables,
by f i t t i n g the equations recorded i n each A table. The independent
v a r i a b l e i s time (hr) and Y the dependent v a r i a b l e i s the zinc concen
t r a t i o n (mg/1) . The maximum deviation observed between f i t t e d and
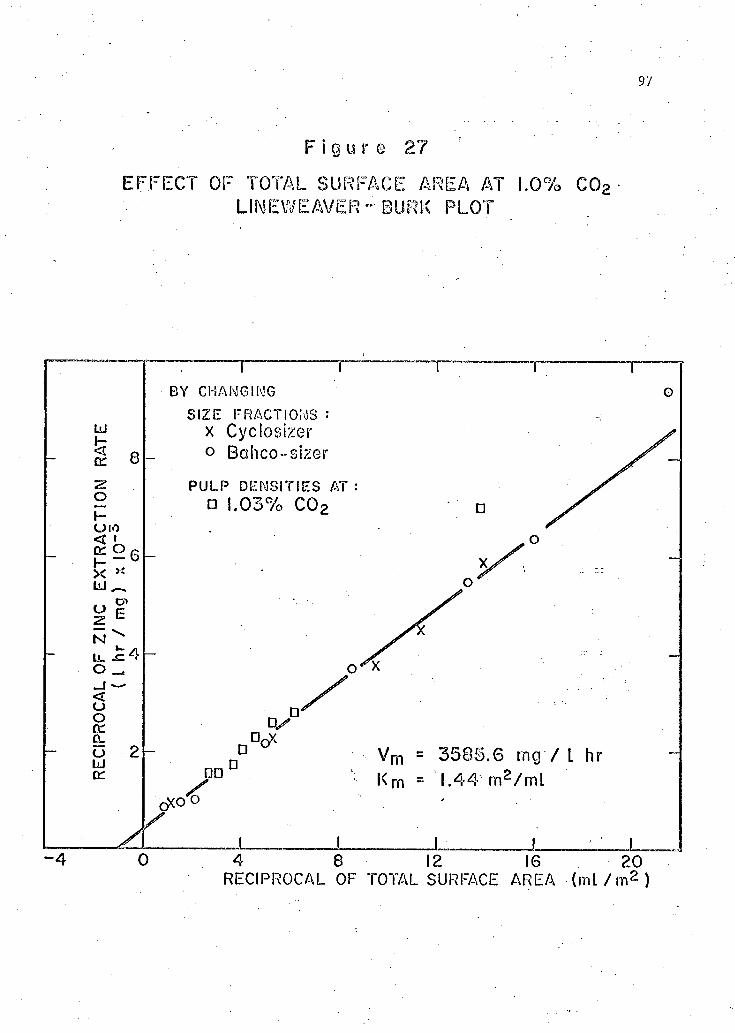
97
F i g u r e 27
E F F E C T OF TOTAL S U R F A C E A R E A AT 1.0% C 0 2
L I N E W E A V E R - B U R K P L O T
- 4
B Y C H A N G I N G
SIZE FRACTIONS : x Cyclosizer o Bahco-sizer
P U L P DENSITIES AT • 1.03% C 0 2
•
•
G
•
V m = 3 5 8 5 . 6 mg / L hr
K m = 1.44 m 2 /mL
J . 1 4 8 12 16 20 RECIPROCAL OF TOTAL SURFACE AREA -(ml/m 2)
98 observed values of zinc concentration was 5.5 g/1; agreement between most
other data p a i r s was better.
Thus the generalized l o g i s t i c equation as expressed by
equation 21 can be used to f i t a m i c r o b i o l o g i c a l leach curve. This
confirms the conclusions of E d w a r d s ^ 3 w h o suggested i t for use with
b a c t e r i a l growth curves. I t i s of some importance that t h i s kind of
curve can f i t the e n t i r e leach curve including the parts corresponding
to the lag phase and the stationary phase.
Leaching curves obtained under a v a r i e t y of conditions were
f i t t e d . The r e s u l t s i n Table 2 of Appendix 2 were obtained i n normal
a i r , those of Tables 3 to 10 with carbon dioxide enriched a i r and
various pulp d e n s i t i e s . Under them some were f i t t e d to data obtained
with various s i z e f r a c t i o n s (Table 7 and 8) and to data obtained i n the
larger scale, s t i r r e d tank experiments (Tables 9 and 10).
VII. SUMMARY AND CONCLUSIONS 99
The technological f e a s i b i l i t y of a batch microbiological leach
ing process using T_. ferrooxidans for extracting zinc from a high-grade
zinc s u l f i d e concentrate has been demonstrated. This study provides
useful information about the reaction mechanism involved i n the oxida
tio n process and explains certain phenomena, observed i n this and other
studies, which occur during the b i o l o g i c a l leaching of insoluble metal
sul f i d e s . These factors can be summarized as follows:
a) The zinc extraction rate was strongly dependent on temperature.
Best results were observed at around 35°C.
b) The optimum pH was observed using both manual and automatic pH
control to be about 2.3 . At pH 2.3 the lag time was shortest, the zinc
extraction rate was fastest and the f i n a l zinc concentration highest. ( 3 7 )
c) The nutrient concentrations present i n the l i q u i d medium
were found to be adequate and thus should not be rate l i m i t i n g . Ammonium
concentration controlled the f i n a l zinc concentration i n solution and
phosphate concentration controlled the rate of zinc extraction.
d) Zinc extraction rates were related to pulp density, s p e c i f i c
surface area of the ore p a r t i c l e s , mean diameter of the size f r a c t i o n s ,
and t o t a l surface area of .ore per unit volume of leach liquor under
various levels of carbon dioxide concentration i n a i r . The results
indicated that at low levels of these independent variables the extrac
tio n rates were proportional to these independent variables. At higher
values of the independent variable the influence on the zinc extraction
rates decreased. The use of t o t a l surface area permitted combination of
100 data from experiments on pulp density v a r i a t i o n s with those obtained
using ore p a r t i c l e s of various s p e c i f i c surfaces.
The maximum attainab l e zinc extraction rate increased as the
carbon dioxide content of the a i r used for. aeration of the fermentation
increased.
Attempts were made to use a form of the Michaelis-Menten or
Monod equation to c o r r e l a t e some of these data. This was reasonably
successful but i t should be considered as an empirical means only of
determining maximum ex t r a c t i o n rates. Maximum rates of 570 mg/1 hr,
2,796 mg/1 hr, 3,457 mg/1 hr were estimated for carbon dioxide l e v e l s
of normal a i r , 0.13%, and 0.23 to 7.92% r e s p e c t i v e l y . Probably these
rates are attaina b l e only t h e o r e t i c a l l y .
e) Larger scale experiments have shown that t h i s m i c r o b i o l o g i c a l
leaching technique could produce zinc concentrations of the order of
120 g/1 which are s u i t a b l e f o r d i r e c t electrowinning of zinc. These
la r g e r scale s t i r r e d tank experiments gave s i m i l a r zinc e x t r a c t i o n rates
to those observed i n shake f l a s k s f o r s i m i l a r conditions. The f i n a l
zinc concentrations were s i g n i f i c a n t l y higher i n the s t i r r e d tank
experiments. The a b i l i t y of the organism T_. ferrooxidans to grow
under such high zinc concentration conditions i s an important f i n d i n g .
f) The generalized l o g i s t i c equation 21 has been shown to be
a s u i t a b l e equation to use i n f i t t i n g a mathematical expression to a
complete, leach curve.
VIII. REFERENCES 1 0 1
1 . Winogradsky, S., Botan. Z. 1 5 , 4 8 9 ( 1 8 8 7 ) .
2 . Winogradsky, S., Botan. Z. 4 6 , 2 6 1 ( 1 8 8 8 ) .
3 . Breed, R. S., Murray, E.G.D. and Smith, N.R., Bergey's manual of determinative bacteriology. The Williams and Wilkins Co., Baltimore, Md., 7 t h E d i t i o n ( 1 9 5 7 ) .
4 . Colmer, A. R. , Temple, K. L. and Hinkle, M. E., J . B a c t e r i o l . 5 9 , 3 1 7 ( 1 9 5 0 ) .
5 . Temple, K. L. and Colmer, A. R., J . B a c t e r i o l . J52, 6 0 5 ( 1 9 5 1 ) .
6 . Colmer, A. R. and Hinkle, M. ,E. , S c i . JL06 , 2 5 3 ( 1 9 4 7 ) .
7 . Temple, K. L. and Delchamps, E. W., Appl. M i c r o b i o l . JL, 2 5 5 ( 1 9 5 3 ) .
8 . Leathen, W. W. and Braley, S. A., B a c t e r i o l . Prac. p. 4 4 ( 1 9 5 4 ) .
9 . Leathen, W. W., K i n s e l , N. A. and Braley, S. A., J . B a c t e r i o l . 7 2 , 7 0 0 ( 1 9 5 6 ) .
1 0 . K i n s e l , N. A. , J . B a c t e r i o l . J50, 6 2 8 ( 1 9 6 0 ) .
1 1 . Unz, R. F. and Lundgren, D. G. , S o i l S c i . 9J2, 3 0 2 ( 1 9 6 1 ) .
1 2 . Ivanov, V. I. and Lyalikova, N. N., Mikrobiologiya 3 1 , 3 8 2 ( 1 9 6 2 ) .
1 3 . Beck, J . V. and Shafia, F. M., J. B a c t e r i o l . J38, 8 5 0 ( 1 9 6 4 ) .
1 4 . Hutchinson, M., Johnstone, K. I. and White, P., J . Gen. M i c r o b i o l . 4 4 , 3 7 3 ( 1 9 6 6 ) .
1 5 . Anderson, J. E., Herwig, G. L. and M o f f i t t , R. B., Austr. Mining J. 5 8 , 35 ( 1 9 6 6 ) .
1 6 . Razzell, W. E. and T r u s s e l l , P. C. , J . B a c t e r i o l . 85_, 5 9 5 ( 1 9 6 3 ) .
1 7 . Harrison, V. F., Gow, W. A. and Ivarson, K. C., Can. Mining J . 8 7 , 6 4 ( 1 9 6 6 ) .
_\
1 8 . De Cuyper, J . A., Internat. Symp. for Unit Proc. i n Hydrometallurgy, Da l l a s , Texas, February ( 1 9 6 3 ) .
1 9 . Fjerdingstad, E., Schweiz. Z. Hydrologie 1 8 , 2 1 5 ( 1 9 5 6 ) .
2 0 . Ashmed, D., C o l l i e r y Guardian 1 9 0 , 6 9 4 ( 1 9 5 5 ) .
2 1 . Marchlenitz, B. and Schwartz, W., Z. A l l g . M i k r o b i o l . 1, 1 0 0 ( 1 9 6 1 ) .
102
22. I to, I., Wakazono, Y. and Takahata, T. , Suiyakaishi 15_, 233 (1964).
23. Bhappu, R. B., Reynolds, D. H., Roman, R.J, and Schwab, D. A., J . Metals 17, 1199 (1965).•
24. Matic, M. and Mrost, M. , The South A f r i c a n . Ind. Chemist 1_8, 127 (1964).
25. Bryner, L. C., Beck, J. V., Davis, D. B. and Wilson, D. G., Ind. Eng. Chem. 46, 2587 (1954).
26. Bryner, L. C. and Anderson, R., Ind. Eng. Chem. 49, 1721 (1957).
27. Leathen, W. W., Braley, S. A. and Mclntyre, L. P., Appl. M i c r o b i o l . 1, 65 (1953).
28. Bryner, L. C. and Jameson, A. K., Appl. M i c r o b i o l . j3, 281 (1958).
29. Malouf, E. E. and Prater, J . P., J . Metals 13, 353 (1961).
30. Zimmerly, S. R., Wilson, D. G. and Prater, J. D., U. S. Patent, 2,829,964, A p r i l 8 (1958).
31. Corrick, J . D. and Sutton, J. A., U. S. Bur. Min. Rept. Inv. 5718 (1961).
32. Ivanov, V. I., Nagirnyak, F. I. and Stepanov, B. A., Mikrobiologiya 30, 668 (1961).
33. Lyalikova, N. N., Mikrobiologiya 29, 773 (1960).
34. Ivanov, M. V. and Karavaiko, G. J . , Z. A l l g . M i k r o b i o l . _6, 10 (1966).
35. Zarubina, Z. M., Lyalikova, N. N. and Shmuk, E. I., Izvest. Akad. Nauk. S.S.S.R. Atdel.Tekh. Nauk, Metallurgiya i Toplivo, 1, 117 (1959).
36. Sokolova, G. A. and Karavaiko, G. I., Physiology and Geochemical a c t i v i t y of T h i o b a c i l l i . Translated from the Russian. U. S. Dept. of A g r i c u l t u r e , National Science Foundation, Washington, D. C. 283 pp. (1968). -%
37. Silverman, M. P. and Lundgren, D. G. , J . B a c t e r i o l . _7_7> 6 ^ 2 (1959).
38. Leathen, W. W., Braley, S. A. and Mclntyre, L. P., Appl. M i c r o b i o l . JL, 61 (1953).
.39. Personal Communication from Dr. D. W. Duncan, B. C. Research.
40. Beck, J. V., J . B a c t e r i o l . _79, 502 (1960).
41. Colmer, A. R., J. B a c t e r i o l . 761 (1962). 103
42. Landesman, J . , Duncan, D. W. and Walden, C. C., Can. J . M i c r o b i o l . 12, 957 (1966).
43. Postage, J. R. , Laboratory P r a c t i c e JL5, 1239 (1966).
44. Blaylock, B. A. and Nason, A., J. B i o l . Chem. 238, 3453 (1963).
45. Sinha, D. B. and Walden, C. C., Can. J . M i c r o b i o l . 12, 1041 (1966).
46. Duncan, D. W., Walden, C. C. and T r u s s e l l , P. C., Can. Mining Met. Buil t . 5 9 , 1075 (1966).
47. Landesman, J . , Duncan, D. W. and Walden, C. C., Can. J . M i c r o b i o l . 12, 25 (1966).
48. Duncan, D. W., Landesman, J . and Walden, C. C., Can. J . M i c r o b i o l .
13, 397 (1967).
49. Yates, M. G. and Nason, A., J . B i o l . Chem. 241, 4872 (1966).
50. Suzuki, I. and Werkman, C. H., M i c r o b i o l . 45, 239 (1959).
51. Suzuki, I. and S i l v e r , M., Biochem. Biophys. Acta 122, 22 (1966).
52. Trudinger, P. A., Aust. J. B i o l . S c i . 17, 577 (1964).
53. Peck, J r . , H. D. and Fisher J r . , E. , J. B i o l . Chem. 23_7, 190 (1961).
54. K e l l y , D. P. and Syrett, P. J . , J . Gen. M i c r o b i o l . 43, 109 (1966).
55. Dugan, P. R. and Lundgren, D. G., J . B a c t e r i o l . j$9, 825 (1965).
56.. Trudinger, P. A. , J. B a c t e r i o l . J39, 617 (1965).
57. S i l v e r , M. and Lundgren, D. G., Can. J . Biochem. jt6, 457 (1968).
58. S i l v e r , M. and Lundgren, D. G., Can. J . Biochem. 4£, 1215 (1968).
59. Kiesow, L., Nat. Acad. S c i . Proc. 52, 980 (1964). 60. Din, G. A., Suzuki, I. and Lees, H., Can. J . M i c r o b i o l . JL3, 1413
(1967).
61. Pugh, L. H. and Umbreit, W. W., Arch. Biochem. Biophys. 115, 122 (1966).
62. Gale, N. L. and Beck, J. V., J. B a c t e r i o l . 94, 1052 (1967).
63. K e l l y , D. P., S c i . Prog., Oxford 55. 35 (1967).
64. Trudinger, P. A., Rev. Pure and Appl. Chem. 17, 1 (1967). ^04
65. Peck, H. D., Ann. Rev. M i c r o b i o l . 22, 489 (1968).
66. McCarty, P. L, ., Proc. 2nd. Internat. Water P o l l u t i o n Res. Conference, Tokyo, pp 169--199 (1964).
67. Baas-Becking, L. and Parks, G. S., P h y s i o l . Rev. 7, 85 (1927).
68. Lyalikova, N. N., Microbiologiya 27, 556 (1958).
69. Silverman, M. P., Ph.D. t h e s i s , Syracuse U n i v e r s i t y , Syracuse, New York, (1959).
70. Schnaitman, C. and Lundgren, D. G., Can. J . M i c r o b i o l . 11, 23 (1965).
71. E h r l i c h , H. L. and Fox, S.I., Biotechn. Bioeng. _9» 471 (1967).
72. Malouf, E. E. and Prater, J. P., J. Metals 13, 353 (1961).
73. Silverman, M. P. and Lundgren, D. G. , J. B a c t e r i o l . 78., 326 (1959).
74. Corrick, J. D. and Sutton, J . A., U. S. Bur. Min.Rept. Inv. 6714 (1965).
75. R a z z e l l , W. E., T r a n s a c t i o n ^ , 135 (1962), Annual Western Meeting, Vancouver, B. C.
76. Silverman, M. P. and E h r l i c h , H. L., Adv. Appl. M i c r o b i o l . _6, 153 (1964).
77. R a z z e l l , W. E. and T r u s s e l l , P. C., Appl. M i c r o b i o l . 11, 105 (1963).
78. Moss, F. J. and Andersen, J . E., Proc. Aust. Inst. Min. Met. 225, 15 (1968).
79. Duncan, D. W., T r u s s e l l , P. C. and Walden, C. C., Appl. M i c r o b i o l . 12, 122 (1964).
80. Duncan, D. W. and Teather, C. J . , U. S. Patent, No. 3,266,889, August 16 (1966).
81. Duncan, D. W. and Teather, C. J . , Canadian Patent, No. 780,405, March (1968).
82. Duncan, D. W. and T r u s s e l l , P. C., Can. Met. Quart. 2> 43 (1964).
83. Duncan,D. W., Aust. Mining, Nov. (1967).
84. Aiba, S. and Toda, K., J. Gen. Appl. M i c r o b i o l . 9, 443 (1963).
85. Duncan, D. W., Walden, C. C., T r u s s e l l , P. C. and Lowe, E.A., Trans. Am. Inst. Mining Eng. 238, 1 (1967).
105 86. Malouf, E. E. and Prater, J. P., Mining Congress J . , Nov. p. 82
(1962).
87. A r g a l l , J r . , G. 0., Mining World, Oct., p. 22 (1963).
88. A r g a l l , J r . , G. 0., Mining World, Nov., p. 20 (1963).
89. Weed, R. C., Trans. Am. Inst. Met. Eng., July, p. 721 (1956).
90. Parker, G. W., Leach Dump Operation i n Butte, Montana, Paper presented at P a c i f i c Northwest Minerals and Metals Regional Conference of A.I.M.E. Meeting, A p r i l (1966).
91. Beck, J . V. , Biotech. Bioeng. 9_, 487 (1967).
92. Bhappu, R. B., Johnson, P. H., B r i e r l e y , J. A., and Reynolds, D. H., The o r e t i c a l and P r a c t i c a l Studies on Dump Leaching New Mexico Bur. Min. and Mineral Resources. A D i v i s i o n of New Mexico Inst, of Mining and Technology. September (1968).
93. Andersen, J. E. and Allman, M. B., Proc. Aust. Inst. Min. Met. 225, 27 (1968).
94- Shoemaker, R. S. and Darrah, R. M., Mining Eng. 20, 68 (1968).
95. Fisher, J . R., Lendrum, F. C. and MacDermid, B. C., Can. Min. Met. Built. 59, 588 (1966).
96. MacGregor, R. A., Can. Min. Met. B u l l . 59, 583 (1966).
97. Temple, K. L. and Colmer, A. R., Min. Eng. _3> 1090 (1951).
98. Temple, K. L. and Koehler, W. A., West V i r g i n i a Univ. Eng. Exp. Sta. Res. Built. 25 > 35 pp (1954).
99. Lyalikova, N. N., Tr. Nosk, Abshchest. Ispyt. P r i r . Otdel. B i o l . 2A, 211 (1966); Cited i n Chem. Abstr. j67, 950 t (1967).
100. E h r l i c h , H. L., Econ. Geol. 58, 991 (1963).
101. E h r l i c h , H. L. , Econ. Geol. 5_9, ,1306 (1964).
102. T r u s s e l l , P. C. , Duncan, D. W. and Walden, C.v C. , Can. Mining J . 85, 46 (1964).
103. Sutton, J . A. and Corrick, J . D., U. S. Bur. Min. Rept. Inv. 6423 (1964).
104. Sutton, J . A. and Corrick, J . P., Mining Eng. 15, 37 (1963).
105. Ivanov, V. I., Mikrobiologiya 31, 645 (1962).
106
106. Szolnoki, J. and Bognar, L. , Acta Geol. Acad. S c i . Hung. 8̂, 179 (1964) .
107. Marchlenitz, B., Hasche, D. and Schwartz, W. , Z. A l l g . M i k r o b i o l . 1, 179 (1961).
108. Silverman, M. P., Rogof£, M. H. and Wender, I., Fuel 42, 113 (1963).
109. Silverman, M. P., Rogoff, M. H. and Wender, I., Aopl. M i c r o b i o l . 9, 491 (1961).
110. M i l l e r , R. P., Napier, E., Wells, R. A., Audsley, A. and Daborn, G. R. , Trans. Inst. Mining. Met. ]_2, 217 (1962/63).
111. Lorenz, W. C. and Tarpley, E. C., U. S. Bur. Min. Rept. Inv. 6247 (1963).
112. Silverman, M. P., J. B a c t e r i o l . 94, 1046 (1967).
113. Kramarenko, L. E. , Mikrobiologiya _31_, 566 (1962).
114. Bhappu, R. B. , Reynolds, D. H. and Roman, R. J. , J . Metals 1_7, 1199 (1965) .
115. V i l l a r d , R., S c i . Progr. La Nature 3372, 138 (1966). Cited i n C. A. J54, 19045 f (1966).
116. Harrison, V. F., Gow, W. A. and Hughson, M. R., J . Metals 18, 1189 (1966).
117. Alexandre, D. and Michel-Briand, Y., Ind. Atomiques 11/12, 47 (1967).
118. Mouret, M., U t i l i s a t i o n des bacterie Ferrooxidans pour 1'extract i o n de 1'uranium des minerals pauvre. Section des Productions, Commissaria a l'Energie Atomique, March 15 (1968).
119. Bodu, R., Sugier, P., Chapot, G. and Blachon, G., Essais de l i x i v i a t i o n des minerals d'uranium sans broyage prealable. Paper presented at Session E - 4 , 8th Internat. Mineral Processing Conference, Leningrad (1968).
120. Beck, J. V. and Brown, D. G., J . B a c t e r i o l . 96, 1433 (1968).
121. McGoran, C.J.M., Duncan, D. W. and Walden, C. C., Can. J . M i c r o b i o l . 15, 135 (1969).
122. McDonald, D. G., Ph.D. Thesis, Queens U n i v e r s i t y (1968).
123. Z a j i c , J . E., M i c r o b i a l Biogeochemistry. Academic Press, New York and London (1969).
107 124. Tsuchiya, H. M. , Fredrickson, A. G. and A r i s , R. , Adv. Chem. Eng.
6, 125 (1966).
125. Gaden, J r . , E. L., Chem. Ind. (London) p. 145 (1955).
126. Maxon, W. D., Appl. M i c r o b i o l . _3, 110 (1955).
127. Calam, C. T. , Driver,N. and Bowers, R. H. , J . Appl. Chem. (London) 1, 209 (1951).
128. Luedeking, R. and P i r t e , E. L. , Paper presented at 128th Meeting, Am. Chem. S o c , Minneapolis, Minnesota (1955).
129. Deindoerfer, F. H. and Humphrey, A. E. , Ind. Eng. Chem. 5_1, 809 (1959).
130. Deindoerfer, F. H., Adv. Appl. M i c r o b i o l . 2, 321 (1960).
131. Monod, J . , Ann. Rev. M i c r o b i o l . j3> 371 (1949).
132. James, T. W., Ann. Rev. M i c r o b i o l . 15, 27 (1961).
133. Alberty, R. A., Adv. Enzymol. 17, 1 (1956).
134. Trumbore, R.H., The c e l l chemistry and function, the C. V. Mosby Co., Saint Louis (1966).
135. Edwards,.V. H., Ph.D. Thesis, U n i v e r s i t y of C a l i f o r n i a (1967).
136. Michaelis, L. and Menten, M. L. , Biochem. Z. 4_9, 333 (1913).
137. L a i d l e r , K. J . , Reaction k i n e t i c s , Vol. 2., Pergamon Press, The Macmillan Co., New York (1963).
138. Dean, A.C.R. and Hinshelwood, C. N., Growth, function and regulat i o n i n b a c t e r i a l c e l l s , Oxford, The Clarendon Press (1960).
139. Hinshelwood, C. N., The chemical k i n e t i c s of the b a c t e r i a l c e l l , Oxford, The Clarendon Press (1952).
140. Monod, J . , Recherches sur l a croissance des cultures bacteriennes, Masson et Cie., Paris (1942).
141. Lineweaver, H. and Burk, P., J . Am. Chem. Soc. 56, 658 (1934).
142. Hofstee, B.H.J., Science 116, 329 (1952).
143. Eadie, G. S., . Science 116, 688.(1952).
144. Hofstee, B.H.J., Enzymol. 17, 273 (1956).
145. Spicer, C. C., Biometrics 11, 225 (1955).
108 146. Moser, H., The dynamics of b a c t e r i a l populations maintained i n
the chemostat. Carnegie Inst. Wash., Publ. No. 614 (1958).
147. Contois, D. E., J. Gen. M i c r o b i o l . 21, 40 (1959).
148. Fu.jimoto, Y. , J. Theoret. B i o l . _5, 171 (1963).
149. L a i d l e r , K. J. and Socquet, I. M., J. Phys. C o l l . Chem. 54, 530 (1950).
150. Segal, H. L., Kachmar, J . F. and Boyer, P. H., Enzymol. 15, 187 (1952).
151. Monod, J. , Ann. Inst'. Pasteur, P a r i s , _79, 390 (1950).
152. Novick, A. and S z i l a r d , L., Science 112, 715 (1950).
153. Herbert, P., Elsworth, R. and T e l l i n g , R. C., J. Gen. M i c r o b i o l . 14, 601 (1956).
154. Novick, A. and S z i l a r d , L. , Proc. Nat. Acad. S c i . 3_6, 708 (1950)
155. Herbert, P., Soc. Chem. Ind. (London) 1_2, 21 (1961).
156. P r i t c h e t t , A. S., Quart. Publ. Am. Stat. Assoc. 2, 278 (1891).
157. P e a r l , R., Carnegie Inst. Washington 58, 136 (1907).
158. Verhulst, P. F., Mem. Acad. Royal B r u s s e l l e s 18, 1 (1844). Cited i n Ref. 161.
159. Verhulst, P. F., i b i d 20, 1 (1846). Cited i n Ref. 161;
160. P e a r l , R. and Reed, L. J . , Proc. Nat. Acad. S c i . j5, 275 (1920).
161. P e a r l , R. and Reed, L. J. , Metron 3_, 6 (1923).
162. Johnson, N. 0. , J. Am. Stat. Assoc. 3_0, 717 (1935).
163. Schumacher, F. X. , J. Forestry 3_7, 819 (1939).
164. Winsor, C. P., Proc. Nat. Acad. S c i . .18, 1 (1932).
165. Gompertz, B., Trans. Roy. Soc. (London) pp. 313 (1825), Cited i n Ref. 164.
166. B e r t a l a n f f y , L. von, Hum. B i o l . 10, 181 (1938).
167. Nelder, J . A., Biometrics 17, 89 (1961).
168. Nelder, J . A., Biometrics 18, 614 (1962).
169. B e r t a l a n f f y , L. von, B i o l . Z e n t r a l b l . 61, 510 (1941). 109
170. B e r t a l a n f f y , L. von, Quart. Rev. B i o l . J32, 218 (1957).
171. Richards, F. J., J. Exper. Bot. K), 290 (1959).
172. Grosenbaugh, L. R., Biometrics 21, 708 (1965).
173. Stevens, W. L., Biometrics 2> 247 (1951).
174. Hartley, H. 0. , Biometrika 4̂ 6, 293 (1959).
175. Hartley, H. 0., Biometrika 35, 32 (1948).
176. Pimentel-Gomes, F., Biometrics _9, 498 (1953).
177. Patterson, H. D., Biometrics 12, 323 (1956).
178. Finney, D. J., Biometrika 45, 370 (1958) .
179. Patterson, H. D., Biometrika 45, 389 (1958).
180. Patterson, H. D. and Lipton, S., Biometrika 46, 281 (1959).
181. Edwards, V. H. and Wilke, C. R., Biotechn. Bioeng. 10, 205 (1968)
182. Leudeking, R. and P i r e t , E. L., J. Biochem. M i c r o b i o l . Technol. Eng. JL, 393 (1959).
183. Chen, J. W., Koepsell, H. J. and Maxon, W. P., Biotechn. Bioeng. 4, 65 (1962).
184. Maxon, W. D. and Chen, J. W., J. Ferm. Technol. _44, 255 (1966).
185. Nooney, G. C. , J. Theoret. B i o l . 239 (1965).
186. Erdey-Gruz, T. and Proszt, J., Fi z i k a i - K e m i a i Praktikum, Budapest (1955).
187. Warman Int e r n a t i o n a l Pty. Ltd., Austr. Chem. Eng., Nov. (1964).
188. K e l s a l l , D. F. and McAdam, J.C.H., Trans. Inst. Chem. Eng. 41, 84 (1963).
189. M i c r o p a r t i c l e C l a s s i f i e r Bahco. S e r i a l No. 6000, Harry W. D i e t e r t Co., D e t r o i t 4, Michigan.
190. C y c l o s i z e r I n s t r u c t i o n Manual: Warman International Pty. Ltd., A u s t r a l i a (1965).
191. Brunauer, S., Emmett, P. H. and T e l l e r , E., J. Am. Chem. Soc. _60, 309 (1938).
110
192. Orr, R., Ph.D. Thesis, Dept. Chem. Eng., Univ e r s i t y of B, C.
193. Nelsen, F. M. and Eggertsen, F. T., Anal. Chem. 30, 1387 (1958).
194. Roth, J. F. and Ellewood, R. T., Anal. Chem. 31, 1738 (1959).
195. E l l i s , J. F., Forrest, C. W. and Howe, D. P., Atomic Energy Commission D.E.G., Rept. .229 (C.A.), H. M. Stationery O f f i c e (1960).
196. Wise, K. V. and Lee, E. H., Anal. Chem. 34, 301 (1962).
197. Deaschner, H. W. and Stross, F. H. , Anal. Chem. 3_4, 1150 (1962).
198. Stone, J . E. and Nickerson, L. F., Pulp and Paper Research I n s t i t u t e of Canada, Montreal, Techn. Rept. 310 (1962).
199. Atkins, J . H., Anal. Chem. 36, 579 (1964).
200. Gyratory and Reciprocating Incubator-Shakers, New Brunswick S c i e n t i f i c Co., Inc., New Brunswick, New Jersey (1967).
201. I n s t r u c t i o n Manual, Radiometer, pH-Meter 25-28 M, T i t r a t o r TTT11, Copenhagen, Denmark (1963).
202. Treadwell, W. D., Quantitative A n a l y s i s , 2nd E d i t i o n , Franz Deuticke, Wienna (1947).
203. Fowler, A. G., Least squares f i t routine. Subject code: E2 U.B.C. L.Q.F. (1966).
204. Dewitt, C. C. , Ind. Eng. Chem. 35_, 695 (1943).
205. Kozak, A., M u l t i p l e regression analysis program, Faculty of Forestry, University of B. C. (1969).
'206. Kozak, A. and Smith, J.H.G., Forestry Chronicle 41, 438 (1965).
207. Bryner, L. C , Walker, R. B. and Palmer, R. , Some f a c t o r s i n f l u e n c i n g the b i o l o g i c a l and non b i o l o g i c a l oxidation of s u l f i d e minerals. Paper presented at the meeting of Am. Inst. Min. Met. Petroleum Eng., New York, February 28 (1966).
208. Bruynesteyn, A., M i c r o b i a l leaching, research to date and future a p p l i c a t i o n . Paper presented at the A.I.M.E. Meeting, Tucson, Arizona, December 1 (1969).
209. Korczynski, M. S., Agate, A. D. and Lundgren, D. G., BBRC 29, 457(1967).
210. Shively, J . M. and Benson, A. A., J . B a c t e r i o l . 94, 1679(1967).
211. Sheffer, H. W. and Evans, L. G., Copper leaching p r a c t i c e s i n the western United States. U. S. Bur. Min. Inf. C i r c . 8341(1968).
212. Repaske, R. and Ambrose, C. A. ( B a c t e r i o l . Proceedings, 1970, GP 113).
APPENDIX 1.
Experimental data
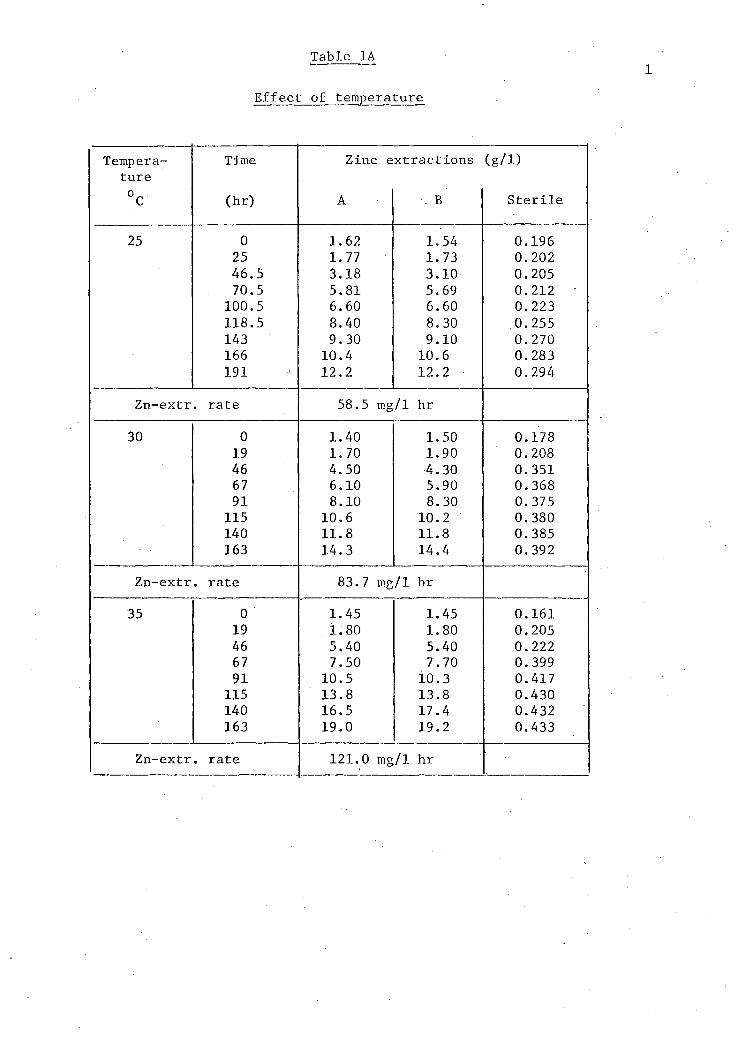
Table 1A
E f f e c t of temperature
Tempera Time Zinc extractions (g/D ture V (hr) A . B S t e r i l e
25 0 1.62 1.54 0.196 25 1.77 1.73 0.202 46.5 3.18 3.10 0.205 70.5 5.81 5.69 0.212 -
100.5 6.60 6.60 0.223 118.5 8.40 8.30 .0.255 143 9.30 9.10 0.270 166 10.4 10.6 0.283 191 12.2 12.2 0.294
Zn-extr . rate 58.5 mg/1 hr
30 0 1.40 1.50 0.178 19 1. 70 1.90 0.208 46 4.50 •4.30 0.351 67 6.10 5.90 0.368 91 8.10 8.30 0.375
115 10.6 10.2 0.380 140 11.8 11.8 0.385 163 14.3 14.4 0.392
Zn-extr . rate 83.7 mg/1 hr
35 0 1.45 1.45 0.161 19 1.80 1.80 0.205 46 5.40 5.40 0.222 67 7.50 7.70 0.399 91 10.5 10.3 0.417
115 13.8 13.8 0.430 140 16.5 17.4 0.432 163 19.0 19.2 0.433
Zn-extr. rate 121.0 mg/1 hr
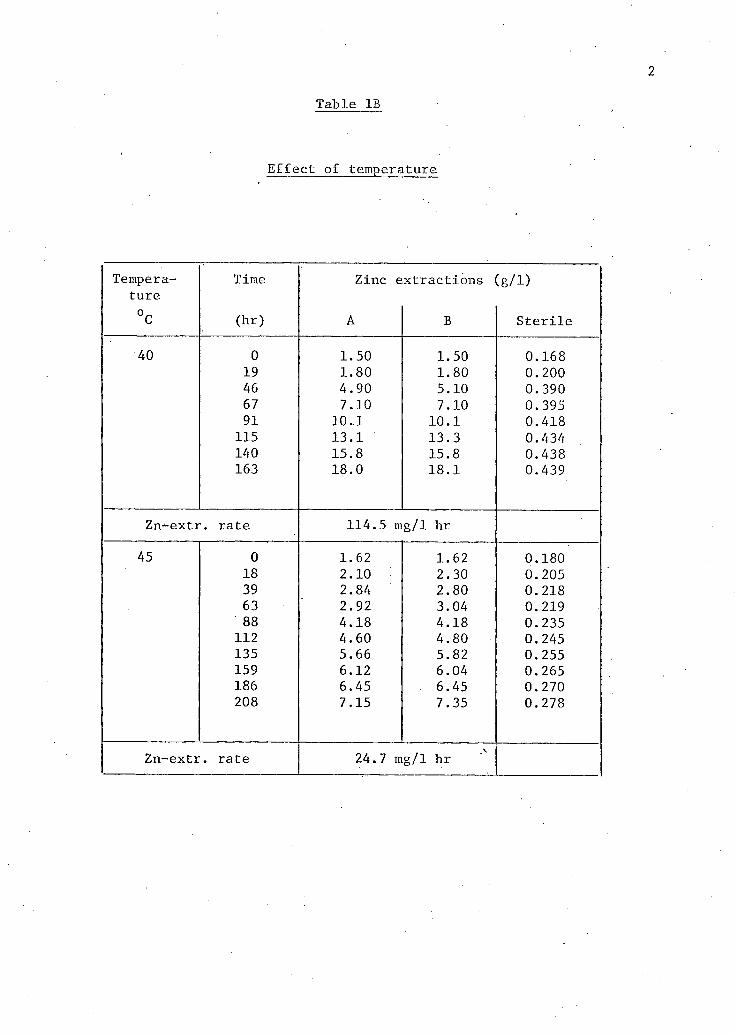
Table IB
E f f e c t of temperature
Tempera Time Zinc extractions (g/1) ture °C (hr) A B S t e r i l e
40 0 1.50 1.50 0.168 19 1.80 1.80 0.200 46 4.90 5.10 0.390 67 7.10 7.10 0.395 91 10.1 10.1 0.418
115 13.1 13.3 0.434 140 15.8 15.8 0.438 163 18.0 18.1 0.439
Zn^-extr. rate 114.5 mg/1 hr
45 0 1.62 1.62 0.180 18 2.10 2.30 0.205 39 2.84 2.80 0.218 63 2.92 3.04 0.219 88 4.18 4.18 0.235
112 4.60 4.80 0.245 135 5.66 5.82 0.255 159 6.12 6.04 0.265 186 6.45 6.45 0.270 208 7.15 7.35 0.278
Zn-extr . rate 24.7 m g/1 hr
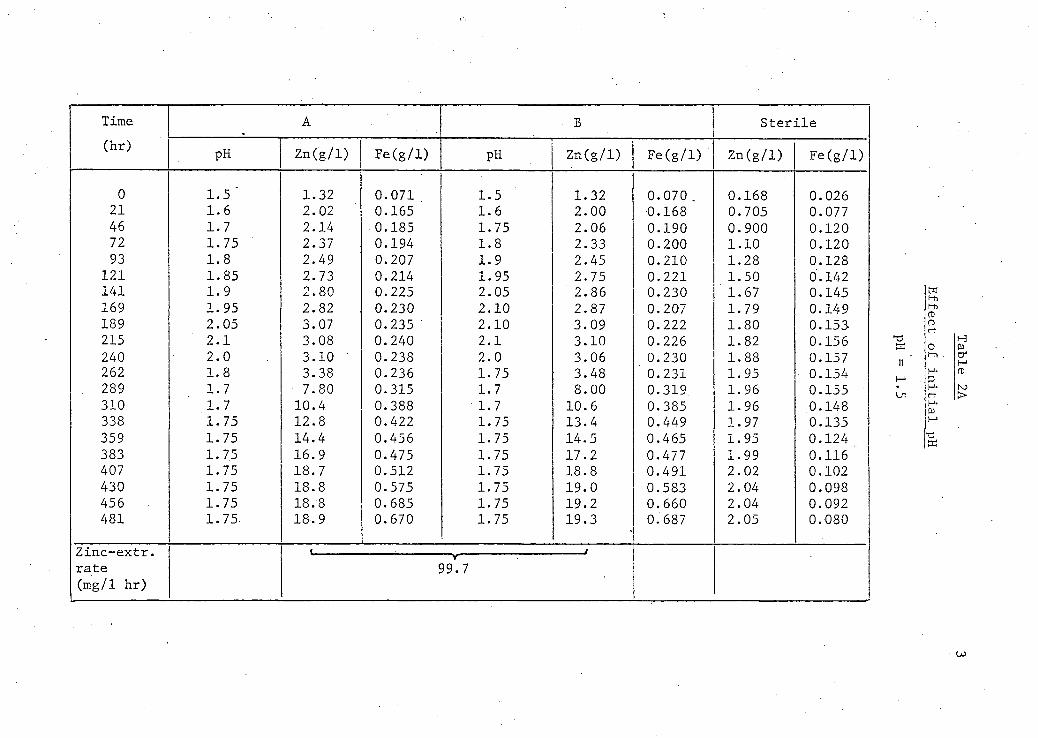
Time A B S t e r i l e (hr) PH Zn(g/1) Fe(g/1) pH Zn(g/1) Fe(g/1) Zn(g/1) Fe(g/1)
0 1.5 " 1.32 0.071 1.5 1.32 0.070 . 0.168 0.026 21 1.6 2.02 0.165 1.6 2.00 0.168 0.705 0.077 46 1.7 2.14 0.185 1.75 2.06 0.190 0.900 0.120 72 1.75 2.37 0.194 1.8 2.33 0.200 1.10 0.120 93 1.8 2.49 0.207 1.9 2.45 0.210 1.28 0.128
121 1.85 2.73 0.214 1.95 2.75 0.221 1.50 0.142 141 1.9 2.80 0.225 2.05 2.86 0.230 1.67 0.145 169 1.95 2.82 0.230 2.10 2.87 0.207 1.79 0.149 189 2.05 3.07 0.235 2.10 3.09 0.222 1.80 0.153 215 2.1 3.08 0.240 2.1 3.10 0.226 1.82 0.156 240 2.0 3.10 0.238 2.0 3.06 0.230 1.88 0.157 262 1.8 3.38 0.236 1.75 3.48 0.231 1.95 0.154 289 1.7 7.80 0.315 1.7 8.00 0.319 1.96 0.155 310 1.7 10.4 0.388 1.7 10.6 0.385 1.96 0.148 338 1.75 12.8 0.422 1.75 13.4 0.449 1.97 0.135 359 1.75 14.4 0.456 1.75 14.5 0.465 1.95 0.124 383 1.75 16.9 0.475 1.75 17.2 0.477 . 1.99 0.116 407 1.75 18.7 0.512 1.75 18.8 0.491 2.02 0.102 430 1.75 18.8 0.575 1.75 19.0 0.583 2.04 0.098 456 1.75 18.8 0.685 1.75 19.2 0.660 2.04 0.092 481 1.75- 18.9 0.670 1.75 19.3 0.687 2.05 0.-080
Zinc-extr. i. v •• /
rate 99.7 (mg/1 hr)
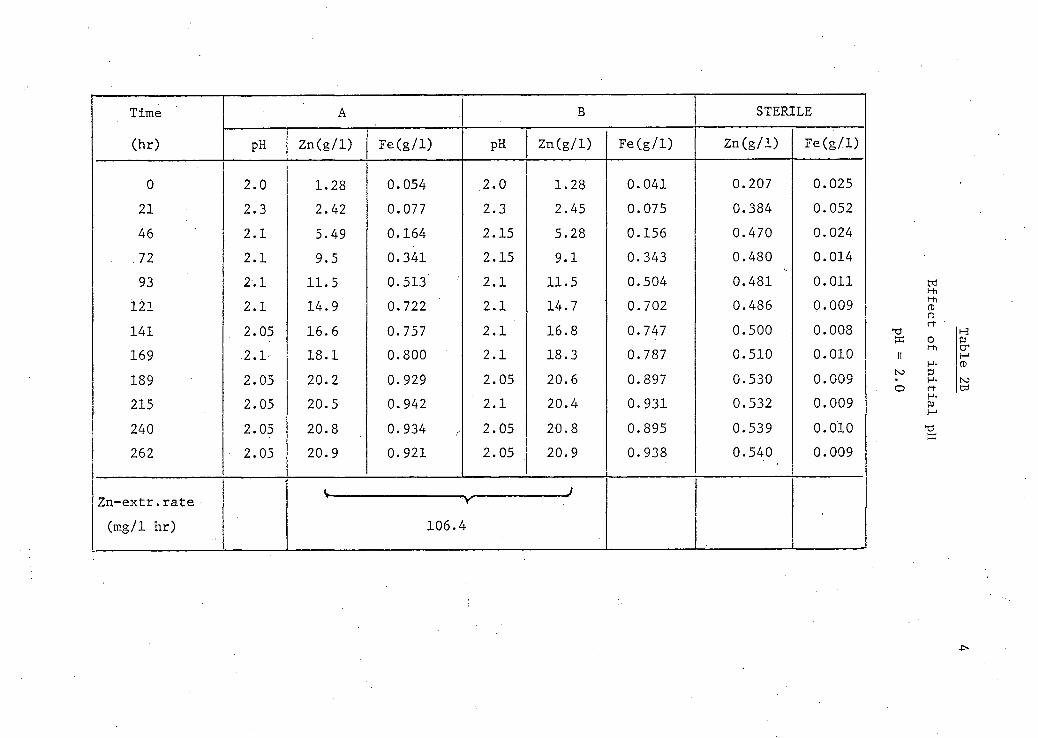
Time A B STERILE
(hr) pH Zn(g/1) Fe(g/1) pH Zn(g/1) Fe(g/1) Zn(g/1) Fe(g/1)
0 2.0 1.28 0.054 2.0 1.28 0.041 0.207 0.025 21 2.3 2.42 0.077 2.3 2.45 0.075 0.384 0.052 46 2.1 5.49 0.164 2.15 5.28 0.156 0.470 0.024 72 2.1 9.5 0.341 2.15 9.1 0.343 0.480 0.014 93 2.1 11.5 0.513 2.1 11.5 0.504 0.481 0.011 121 2.1 14.9 0.722 2.1 14.7 0.702 0.486 0.009 141 2.05 16.6 0.757 2.1 16.8 0.747 0.500 0.008 169 .2.1- 18.1 0.800 2.1 18.3 0.787 0.510 0.010 189 2.05 20.2 0.929 2.05 20.6 0.897 0.530 0.009 215 2.05 20.5 0.942 2.1 20.4 0.931 0.532 0.009 240 2.05 20.8 0.934 2.05 20.8 0.895 0.539 0.010 262 • 2.05 20.9 0.921 2.05 20.9 0.938 0.540 0.009
S- Y J Zn-extr.rate Y
(mg/1 hr) 106.4
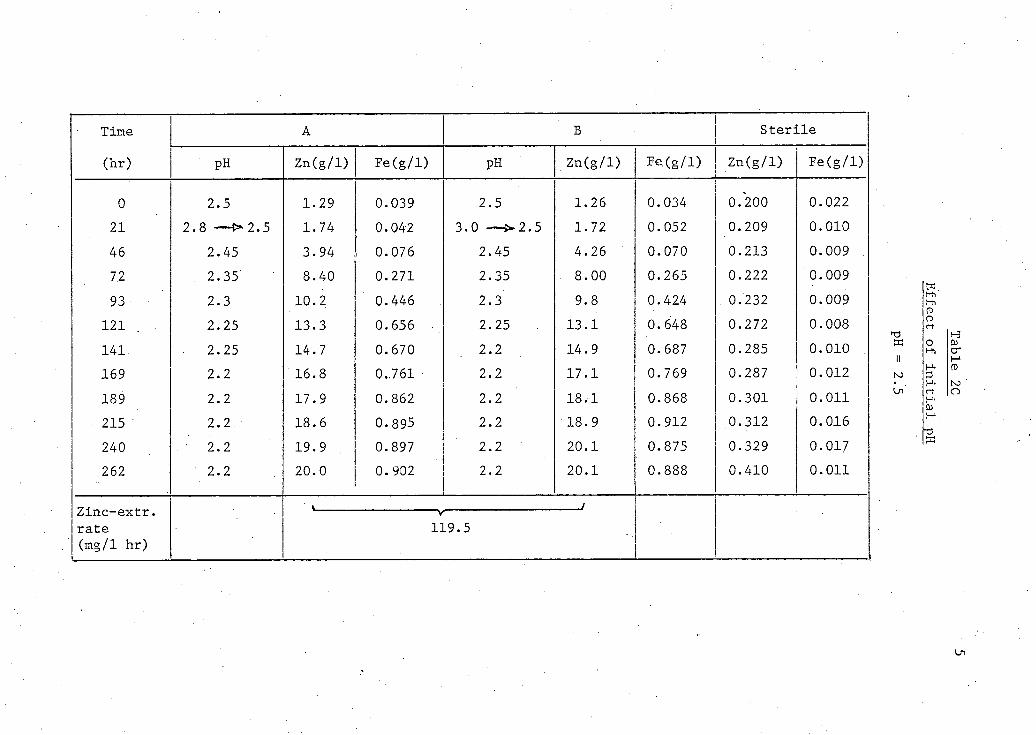
Time A B S t e r i l e
(hr) PH Zn(g/1) Fe(g/1) pH Zn(g/1) Fe.(g/1) Zn(g/1) Fe(g/1)
0 2.5 1.29 0.039 2.5 1.26 0.034 0.200 0.022
21 2.8 — > 2 . 5 1.74 0.042 3.0 — > 2 . 5 1.72 0.052 0.209 0.010
46 2.45 3.94 0.076 2.45 4.26 0.070 0.213 0.009 72 2.35' 8.40 0.271 2.35 8.00 0.265 0.222 0.009
93 2.3 10.2 0.446 2.3 9.8 0.424 0.232 0.009
121 2.25 13.3 0.656 2.25 13.1 0.648 0.272 0.008
141 2.25 14.7 0.670 2.2 14.9 0.687 0.285 0.010
169 2.2. 16.8 0..761 2.2 17.1 0.769 0.287 0.012
189 2.2 17.9 0.862 2.2 18.1 0.868 0.301 0.011
215 2.2. 18.6 0.895 2.2 ' 18.9 0.912 0.312 0.016
240 2.2 19.9 0.897 2.2 20.1 0.875 0.329 0 . 0 1 7
262 2.2 20.0 0. 902 2.2 20.1 0.888 0.410 0.011
Zinc-extr. rate (mg/1 hr)
Zinc-extr. rate (mg/1 hr)
V 119.5
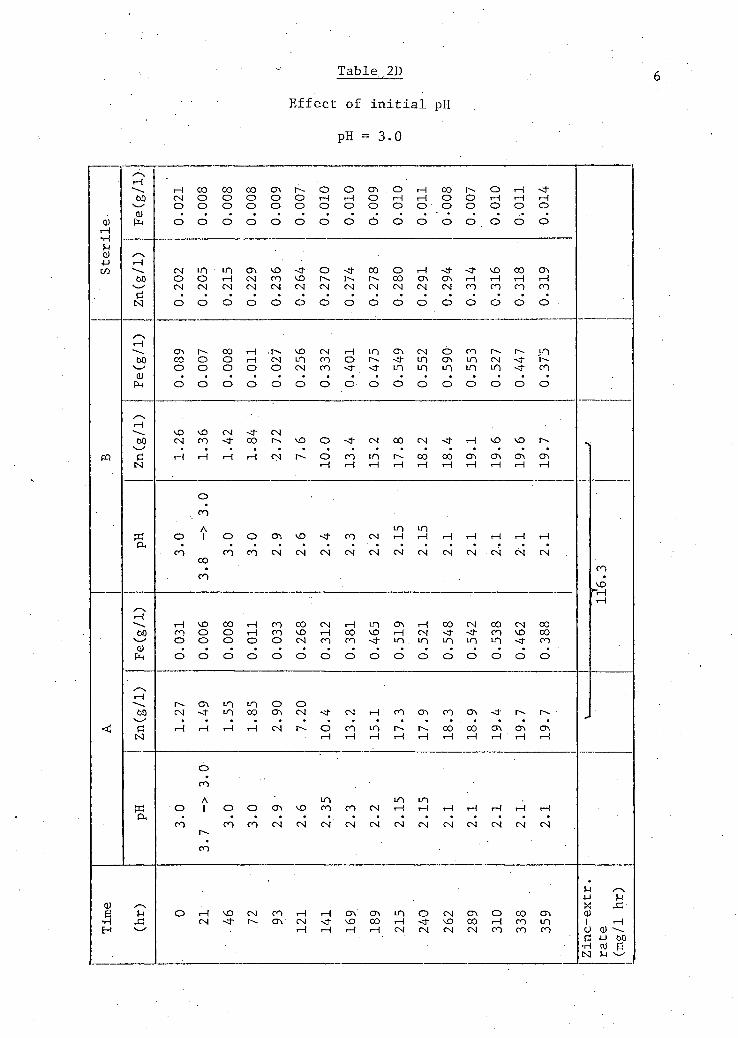
Table 2D
E f f e c t of i n i t i a l pH
pH = 3.0
•H f-i CD
60
QJ
60
rH CO oo 00 ON o o ON o rH 00 r s o rH s t CM o o o o o rH rH o rH rH o O rH rH rH O o o o o o O o o o O o o o o o
o o
m ON VO -tf O s t co o rH -tf vO oo ON O O rH C N co vD 00 ON ON rH rH rH rH C N C N C N C N C N C N C N C N C N C N C N C N C O C O C O C O
O O O O O O O o O O O O O o O O
rH
60
QJ
ON 00 rH ,r-~ vO C N rH in ON C N o C O jn 00 o o rH C N m C O o -tf in ON in C N -tf o o o o O C N C O -tf m in in m in • t f C O
o o o o o O o o o o o o o o O o
pq
60
a t N
vO vO C N -tf C N C N C O -tf 00
rH r-H rH rH C N
vO o S t CN oo CN -tf rH vO VO 'OT
CO rH
m rH rH
00 rH
00 rH
ON rH
ON rH
ON rH
ON rH
o CO
o CO
A I
CO
CO
o CO
o c o
ON
CN
VO
CN
S t
C N
C O
C N
CN
CN
in rH C N
in rH CN
rH
CN C N C N C N
60
Pn
r-H VO 00 rH CO CO CN rH in ON rH 00 CN 00 CN 00 ro O O rH CO vO r-H 00 vO rH CN -tf -tf CO VO 00 O O O O o CN CO CO sj- m . in in in in -tf co O O o O o o O o O o o o o o O O
rH
60
^0 C N
CN ON -tf
m m in 00
o ON
o CN -tf CN rH CO ON cn ON -tf
rH r H rH rH CN r^. O rH
CO rH
in rH rH rH
00 rH
00 rH
ON rH
ON rH
ON rH
o CO
o A 1 o o ON VO
in CO CO CN
in rH
in rH rH rH rH rH rH
CO CO CO CN CN CN CN CN CN CN CN CN CN CN CN
CO
QJ ^ e u •r l X EH w
VO s t
CN co ON
rH ON ON m O CN ON O 00 ON s t VO CO rH s t vO 00 rH CO in rH rH rH CN CN CN CN co CO CO
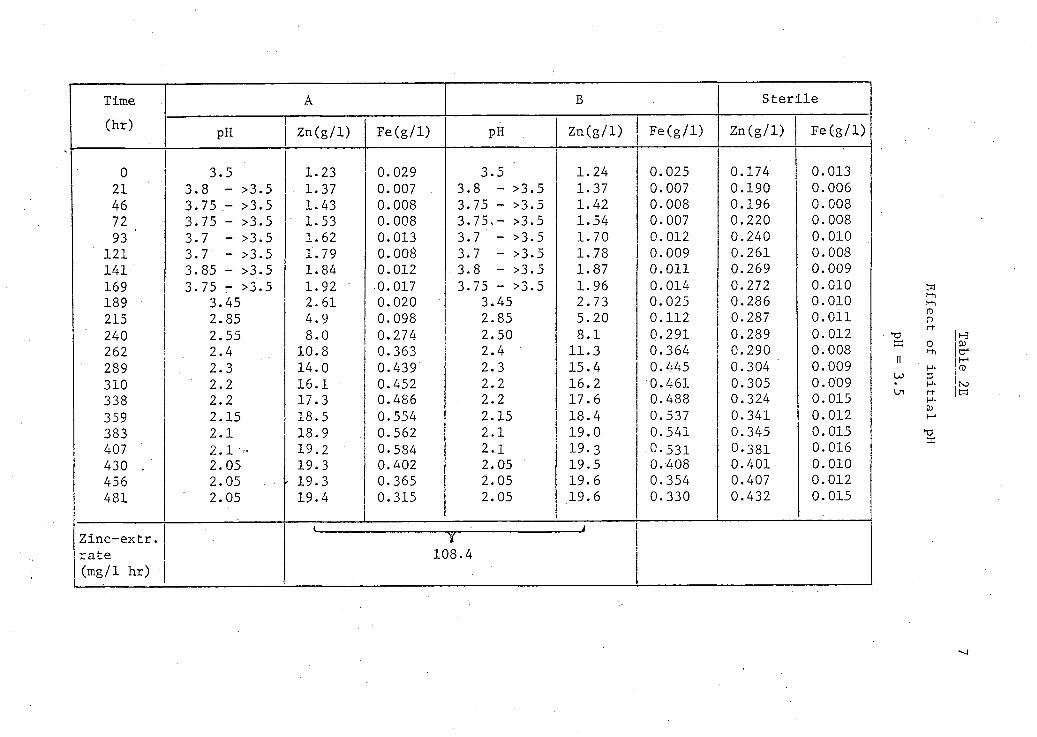
Time A B S t e r i l e
(hr) pH Zn(g/1) Fe(g/1) PH . Zn(g/1) Fe(g/1) Zn(g/1) Fe(g/1)
0 3.5 1.23 0.029 3.5 1.24 0.025 0.174 0.013 21 3. 8 - >3.5 1.37 0.007 . 3.8 - >3.5 1.37 0.007 0.190 0.006 46 3. 75 - >3.5 1.43 0.008 3.75 - >3.5 1.42 0.008 0.196 0.008 72 3. 75 - >3.5 1.53 0.008 3.75.- >3.5 1.54 0.007 0.220 0.008 93 ' 3. 7 - >3.5 1.62 0.013 3.7 - >3.5 1.70 0.012 0.240 0.010
121 3. 7 - >3.5 1.79 0.008 3.7 - >3.5 1.78 0.009 0.261 0.008 141 3. 85 - >3.5 1.84 0.012 3.8 - >3.5 1.87 0.011 0.269 0.009 169 3. 75 - >3.5 1.92 ' 0.017 3.75 - >3.5 1.96 0.014 0.272 0.010 189 3.45 2.61 0.020 3.45 2.73 0.025 0.286 0.010 215 2.85 4.9 0.098 2.85 5.20 0.112 0.287 0.011 240 2.55 8.0 0.274 2.50 8.1 0.291 0.289 0.012 262 2.4 10.8 0.363 2.4 11.3 0.364 0.290 0.008 289 2.3 14.0 0.439 2.3 15.4 0.445 0.304 ' 0.009 310 2.2 16.1 • 0.452 2.2 16.2 0.461 0.305 0.009 338 2.2 17.3 0.486 2.2 17.6 0.488 0.324 0.015 359 2.15 18.5 0.554 2.15 18.4 0.537 0.341 0.012 383 2.1 18.9 0.562 2.1 19.0 0.541 0.345 0.015 407 2.1 - 19.2 0.584 2.1 19.3 .0.531 0.381 0.016 430 . 2.05 19.3 0.402 2.05 19.5 0.408 0.401 0.010 456 2.05 - 19.3 0.365 2.05 19.6 0.354 0.407 0.012 481 2.05 19.4 0.315 2.05 19.6 0.330 0.432 0.015
Zinc-extr. V J
rate 108.4 (mg/1 hr)
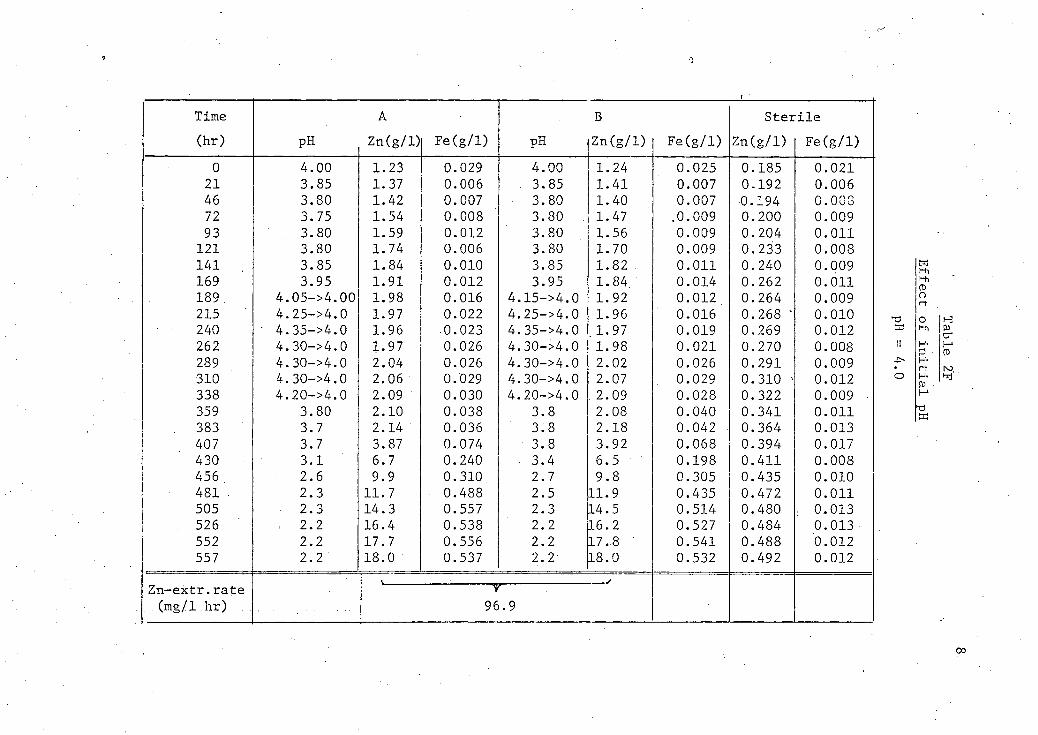
Time (hr) PH
A
Zn(g/1) Fe(g/1) pH B
Zn(g/1)
0 4.00 1.23 0.029 4.00 1.24 21 3.85 1.37 0.006 . 3.85 1.41 46 3.80 1.42 0.007 3.80 1.40 72 3.75 1.54 0.008 3.80 1.47 93 3.80 1.59 0.012 3.80 1.56
121 3.80 1.74 0.006 3.80 1.70 141 3.85 1.84 0.010 3.85 1.82 169 3.95 1.91 0.012 3.95 1.84. 189 4. 05->4. 00 1.98 0.016 4.15->4. 0 1.92 215 4. 25->4. 0 1.97 0.022 4.25->4. 0 1.96 240 - 4. 35->4. 0 1.96 0.023 4.35->4. 0 . 1-97 262 4. 30->4. 0 1.97 0.026 4.30->4. 0 1.98 289 4. 30->4. 0 2.04 0.026 4.30->4. 0 2.02 310 4. 30->4. 0 2.06 0.029 4.30->4. 0 2.07 338 4. 20->4. 0 2.09 0.030 4.20->4. 0 2.09 359 3.80 2.10 0.038 3.8 2.08 383 3.7 2.14 0.036 3.8 2.18 407 3.7 3.87 0.074 3.8 3.92 430 3.1 6.7 0.240 3.4 6.5 456 2.6 9.9 0.310 2.7 9.8 481 . 2.3 11.7 0.488 2.5 11.9 505 2.3 14.3 0.557 2.3 14.5 526 2.2 16.4 0.538 2.2 16.2 552 2.2 17.7 0.556 2.2 17.8 557 2.2 18.0 0.537 2.2 18.0
Fe(g/1)
0.025 0.007 0.007 .0.009 0.009 0.009 0.011 0.014 0.012 0.016 0.019 0.021 0.026 0.029 0.028 0.040 0.042 0.068 0.198 0.305 0.435 0.514 0.527 0.541 0.532
S t e r i l e Zn(g/1) Fe(g/1)
0.185 0.192 •0.194 0.200 0.204 0.233 0.240 0.262 0.264 0.268 0.269 0.270 0.291 0.310 0.322 0.341 0.364 0.394 0.411 0.435 0.472 0.480 0.484 0.488 0.492
0.021 0.006 0.008 0.009 0.011 0.008 0.009 0.011 0.009 0.010 0.012 0.008 0.009 0.012 0.009 0.011 0.013 0.017 0.008 0.010 0.011 0.013 0.013 0.012 0.012
Zn-extr.rate . . (mg/l.hr) .
~ T
96.9
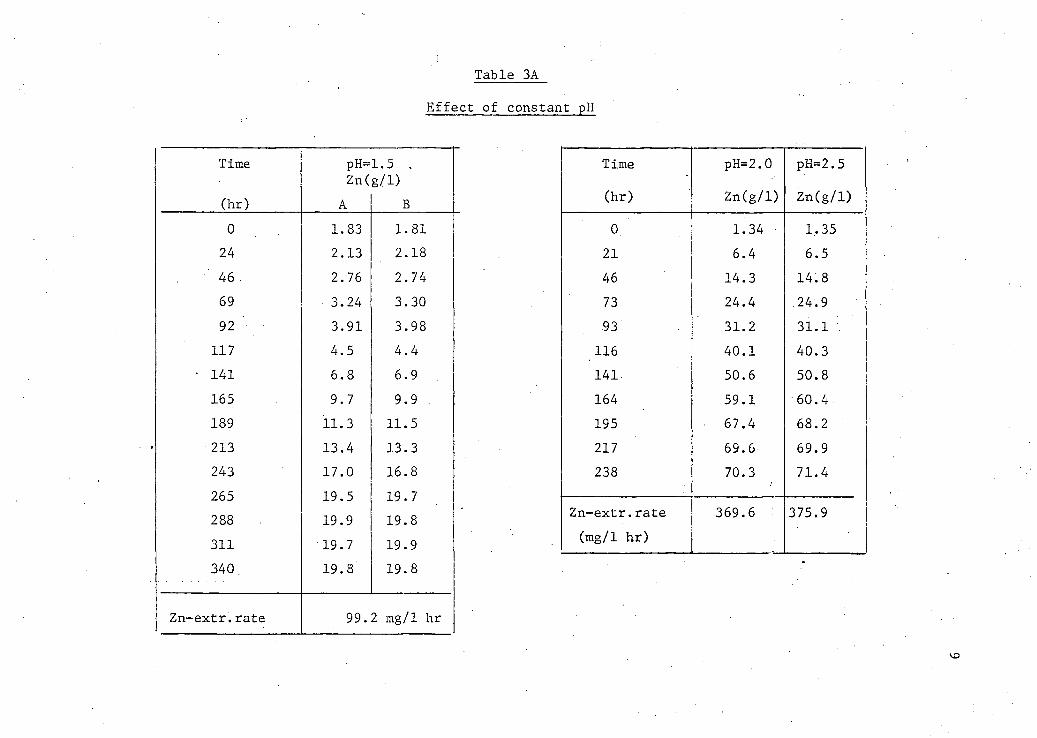
Table 3A
Ef f e c t of constant pH
Time
(hr)
pH= Zn(
A
1.5 . g/1)
B
Time
(hr)
pH=2.0
Zn(g/1)
pH=2.5
Zn(g/1)
0 1.83 1.81 0 1.34 • 1.35 24 2.13 2.18 21 6.4 6.5 46 2.76 2.74 46 14.3 14.8 69 3.24 3.30 73 24.4 24.9 92 ' 3.91 3.98 93 31.2 31.1 :
117 4.5 4.4 116 40.1 40.3 • 141 6.8 6.9 141- 50.6 50.8 165 9.7 9.9 164 59.1 •60.4 189 11.3 11.5 195 67.4 68.2 ' 213 13.4 13.3 217 69.6 69.9 243 17.0 16.8 238 70.3 71.4 265 288 311
19.5 19.9 19.7
19.7 19.8 19.9
265 288 311
19.5 19.9 19.7
19.7 19.8 19.9
Zn-extr.rate (mg/1 hr)
369.6 375.9
340. 19.8 19.8
Zn-extr.rate 99. 2 mg/1 hr
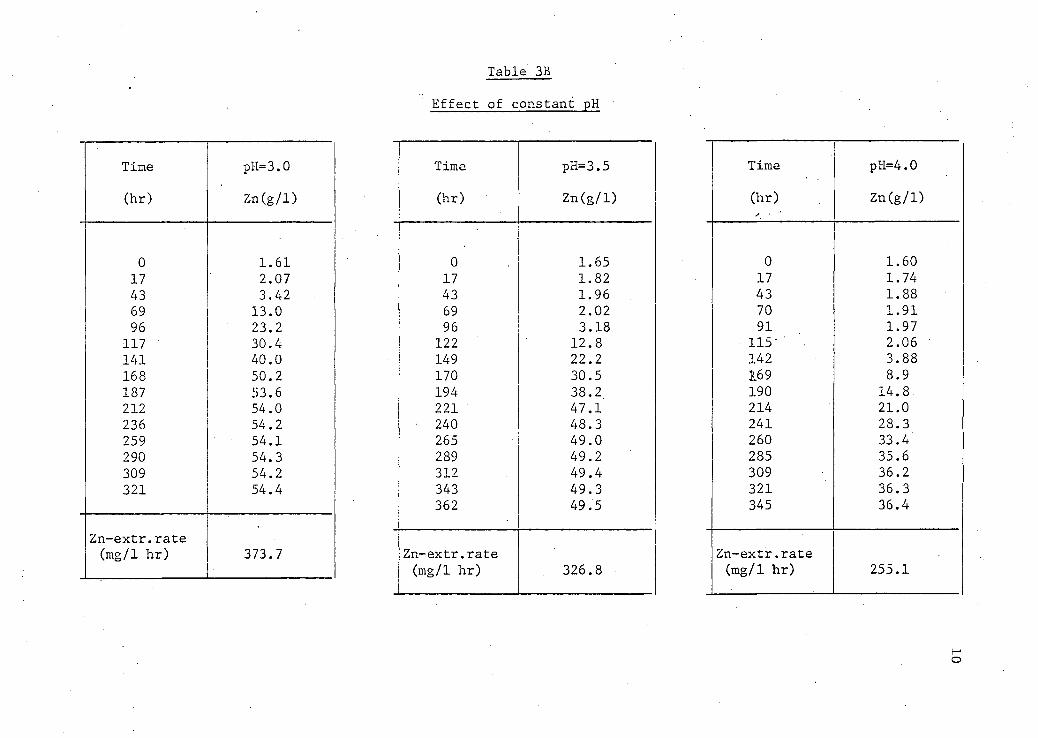
Table 3B
Ef f e c t of constant pH
Time pH=3.0
(hr) Zn(g/1)
0 1.61 17 2.07 43 3.42 69 13.0 96 23.2
117 • 30.4 141 40.0 168 50.2 187 53.6 212 54.0 236 54.2 259 54.1 290 54.3 309 54.2 321 54.4
Zn-extr.rate (mg/1 hr) 373.7
Time pH=3.5 Time pH=4.0
(hr) Zn(g/1) (hr) Zn(g/1)
0 1.65 0 1.60 17 1.82 17 1.74 43 1.96 43 1.88 69 2.02 70 1.91 96 3.18 91 1.97 122 12.8 115" ' 2.06 149 22.2 142 3.88 170 30.5 169 8.9 194 38.2 190 14.8. 221 47.1 214 21.0
• 240 48.3 241 28.3 265 49.0 260 33.4 289 49.2 285 35.6 312 49.4 309 36.2 343 49.3 321 36.3 362 49.5 345 36.4
Zn-extr.rate Zn-extr.rate (mg/1 hr) 326.8 (mg/1 hr) 255.1
o
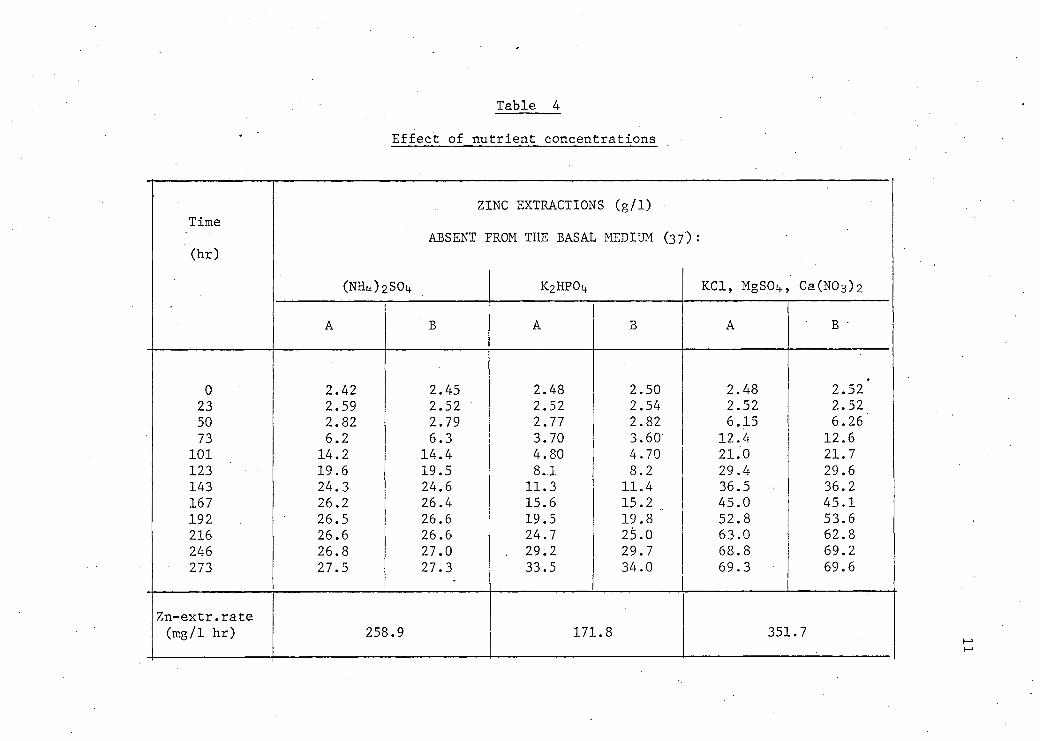
Table 4
E f f e c t of nutrient concentrations
ZINC EXTRACTIONS (g / 1 )
Time ABSENT FROM THE BASAL MEDIUM ( 3 7 ' ) :
(hr)
( N H O 2 S O 4 K 2 H P 0 4 K C 1 , MgSOit, C a ( N 0 3 ) 2
A B A B A B '
0 2.42 2.45 2.48 2.50 2.48 2.52* 23 2.59 2.52 2.52 2.54 2.52 . 2.52 50 2.82 2.79 2.77 2.82 6.15 6.26 73 6 . 2 6.3 3.70 3.60 1 2.4 1 2.6
1 0 1 14 . 2 14.4 4.80 4.70 2 1 . 0 - 2 1.7 123 19.6 19.5 8 , 1 8 . 2 29.4 29.6 143 24.3 24.6 11.3 11.4 36.5 36 . 2
167 26 . 2 26.4 15.6 15 . 2 45 . 0 45 . 1
192 26.5 26.6 19.5 19.8 52.8 53.6 216 26.6 26.6 24.7 25 . 0 63 . 0 62.8 246 26.8 27 . 0 . 29 . 2 29.7 68.8 69 . 2
273 27.5 27.3 33.5 34 . 0 69.3 69.6
Zn-extr.rate (mg/1 hr) 258.9 171.8 351.7
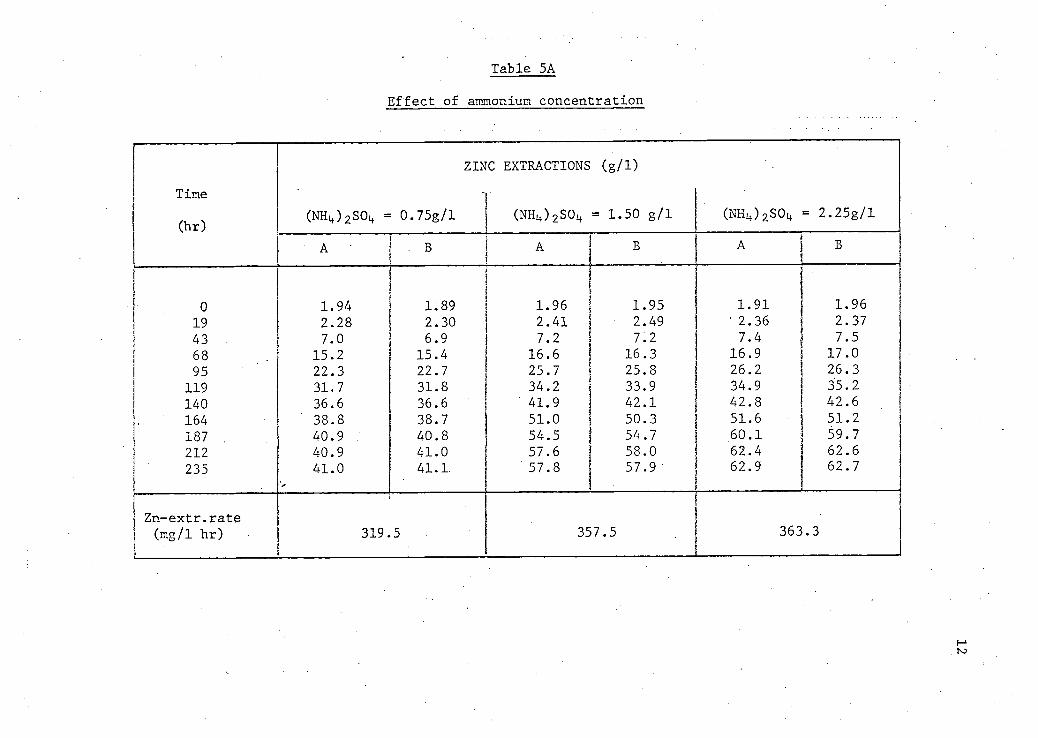
Table 5A
E f f e c t of ammonium concentration
ZINC EXTRACTIONS (g/D
Time -
(hr) (NH L f) 2S0^ = 0.75g/l (NH L f) 2S0 l f = 1.50 g/1 (NH L f) 2S0 4 = 2.25g/l
A . B A A B
0 1.94 1.89 1.96 1.95 1.91 1.96 19 2.28 2.30 2.41 2.49 • 2.36 2.37 43 7.0 6.9 7.2 7.2 7.4 7.5 68 15.2 15.4 16.6 16.3 16.9 17.0 95 22.3 22.7 25.7 25.8 26.2 26.3
119 31.7 31.8 34.2 33.9 34.9 35.2 140 36.6 36.6 ' 41.9 42.1 42.8 42.6 164 38.8 38.7 51.0 50.3 51.6 5.1.2 187 . 40.9 40.8 54.5 54.7 60.1 59.7 212 40.9 41.0 57.6 58.0 62.4 62.6 235 41.0 41.1 ' 57.8 57.9 62.9 62.7
Zn-extr.rate (mg/1 hr) 319. 5 357.5 363 .3
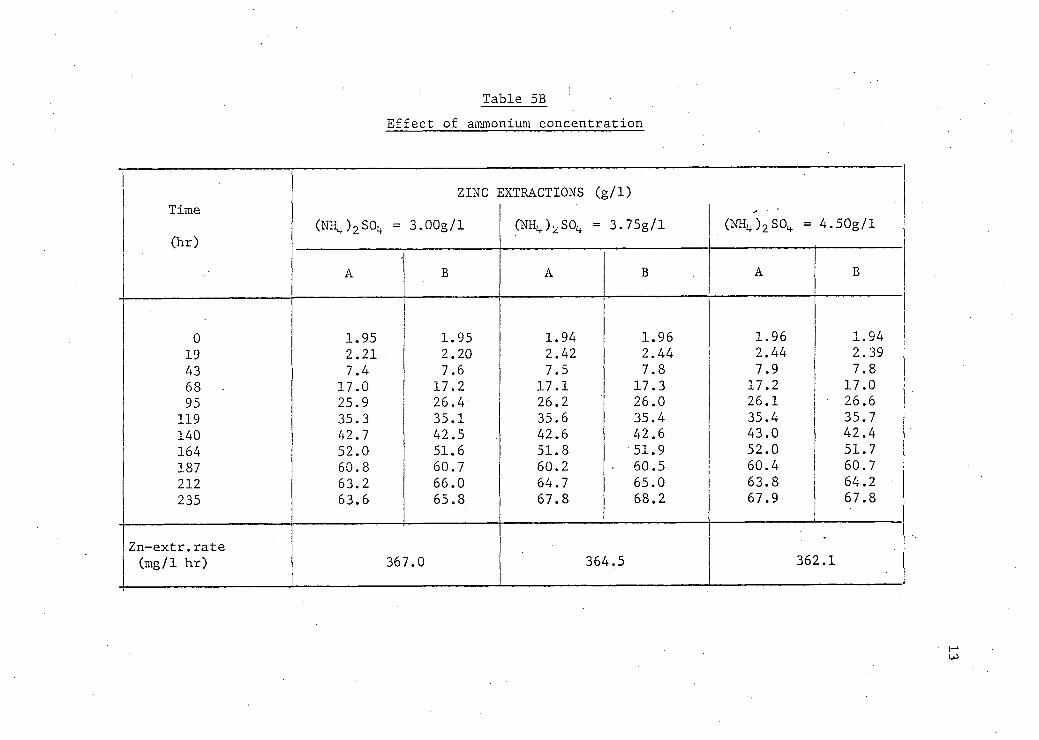
Table 5B E f f e c t of ammonium concentration
ZINC EXTRACTIONS (g/1) Time • •
(NH 4) 2S0^ = 3.00g/l (NH t +) 2S0 1 + = 3.75g/l 4.50g/l (hr)
(NH 4) 2S0^ =
A B A B A B
0 1.95 1.95 1.94 1.96 1.96 1.94 19 2.21 2.20 2.42 2.44 2.44 2.39 43 7.4 7.6 7.5 7.8 7.9 7.8 68 . 17.0 17.2 17.1 17.3 17.2 17.0 95 25.9 26.4 26.2 26.0 26.1 26.6
119 35.3 35.1 35.6 35.4 35.4 35.7 140 42.7 42.5 42.6 42.6 43.0 42.4 164 52.0 51.6 51.8 51.9 52.0 51.7 187 60.8 60.7 60.2 - 60.5 60.4 60.7 212 63.2 66.0 64.7 65.0 63.8 64.2 235 63.6 65.8 67.8 68.2 67.9 67.8
Zn-extr.rate •
(mg/1 hr) 367.0 364.5 362.1
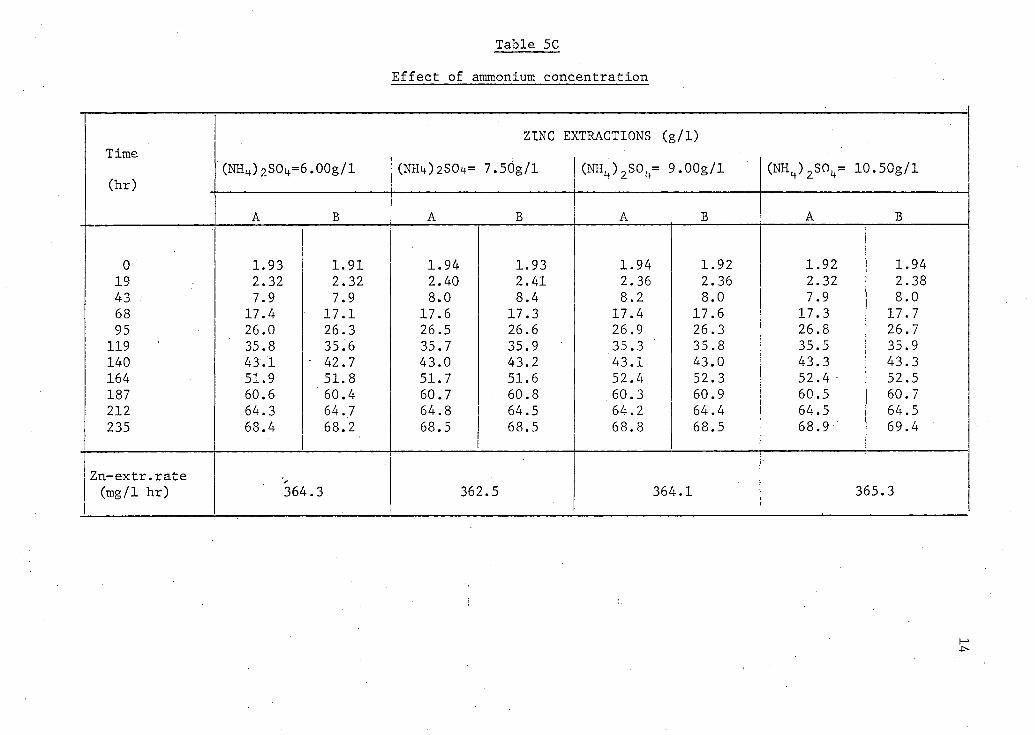
Table 5C
E f f e c t of ammonium concentration
Time
(hr) (NH^)250^=6.00g/l (NHtt)2S04=
ZINC EI
7.50g/l
{TRACTIONS (g/1)
(NH l f) 2S0 I t= 9.00g/l ( N H 4 ) 2 S 0 ^ 10.50g/l
A B A B A B A B
0 19 43 68 95
119 140 164 187 212 235
1.93 2.32 7.9
17.4 26.0 35.8 43.1 51.9 60.6 64.3 68.4
1.91 2.32 7.9
17.1 26.3 35.6
• 42.7 51.8 60.4 64.7 68.2
1.94 2.40 8.0
17.6 26.5 35.7 43.0 51.7 60.7 64.8 68.5
1.93 2.41 8.4
17.3 26.6 35.9 43.2 51.6 60.8 64.5 68.5
1.94 2.36 8.2
17.4 26.9 35.3 43.1 52.4 60.3 64.2 68.8
1.92 2.36 8.0
17.6 26.3 35.8 43.0 52.3 60.9 64.4 68.5
1.92 2.32 7.9
17.3 26.8 35.5 43.3 52.4 • 60.5 64.5 68.9-
1.94 2.38 8.0
17.7 26.7 35.9 43.3 52.5 60.7 64.5 69.4
Zn-extr.rate (mg/1 hr) 364.3 362.5 364.1 365.3
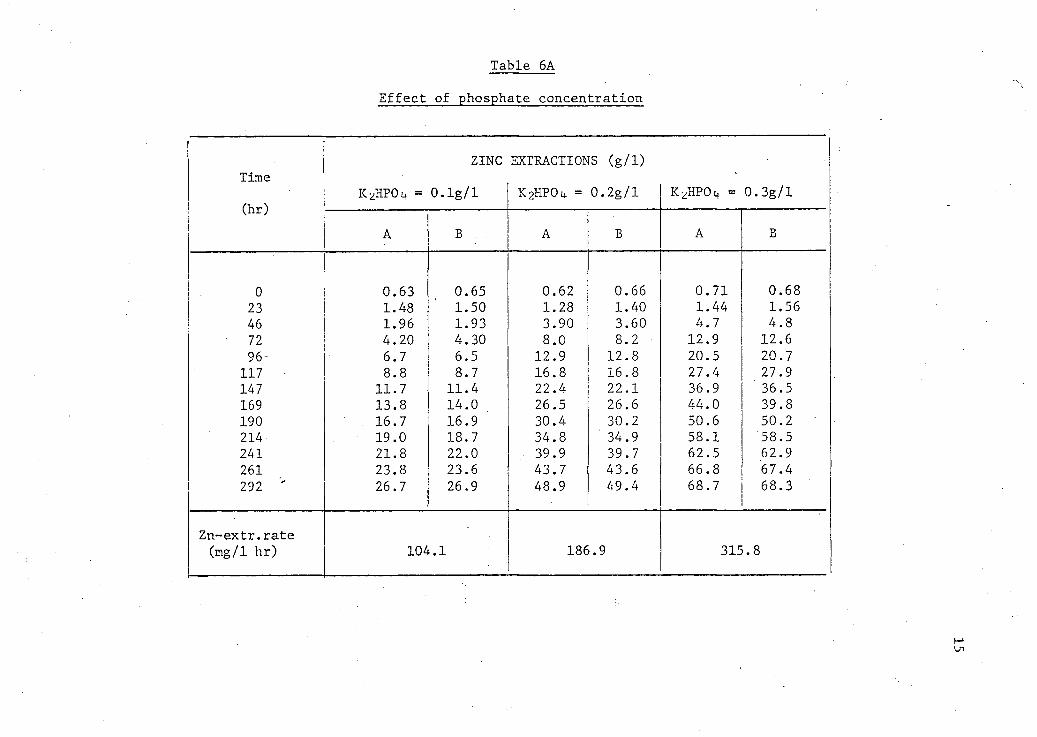
Table 6A
E f f e c t of phosphate concentration
Time
(hr) K z H P 0 4 =
ZINC
0.1g/l
EXTRACTIONS (g/1)
K 2 H P O 4 = 0 . 2 g / l KZHPOLJ = 0.3g/l Time
(hr)
A B A B A B
0 0.63 0 65 0 .62 0 . 66 0 71 0 . 68 23 1.48 1 50 1 .28 1. 40 1 44 1. 56 46 1.96 1 93 3 .90 3 60 4 7 4. 8 72 4.20 4 30 8 . 0 8 2 12 9 12. 6 96- 6.7 6 5 12 .9 12 8 20 5 20. 7 117 • 8.8 8 7 16 .8 16 8 27 4 27. 9 147 11.7 11 4 22 .4 22 1 36 9 36. 5 169 13.8 14 0 26 .5 26 6 44 0 39. 8 190 16.7 16 9 30 .4 30 2 50 6 50. 2 214 19 . 0 18 7 34 .8 ' 34 9 58 1 58. 5 241 21.8 22 0 39 .9 39 7 62 5 62. 9 261 23.8 23 6 43 .7 43 6 66 8 67. 4 292 ' 26.7 26 9 48 .9 49 4 68 7 68. 3
Zn-extr.rate (mg/1 hr) 104.1 186.9 315.8
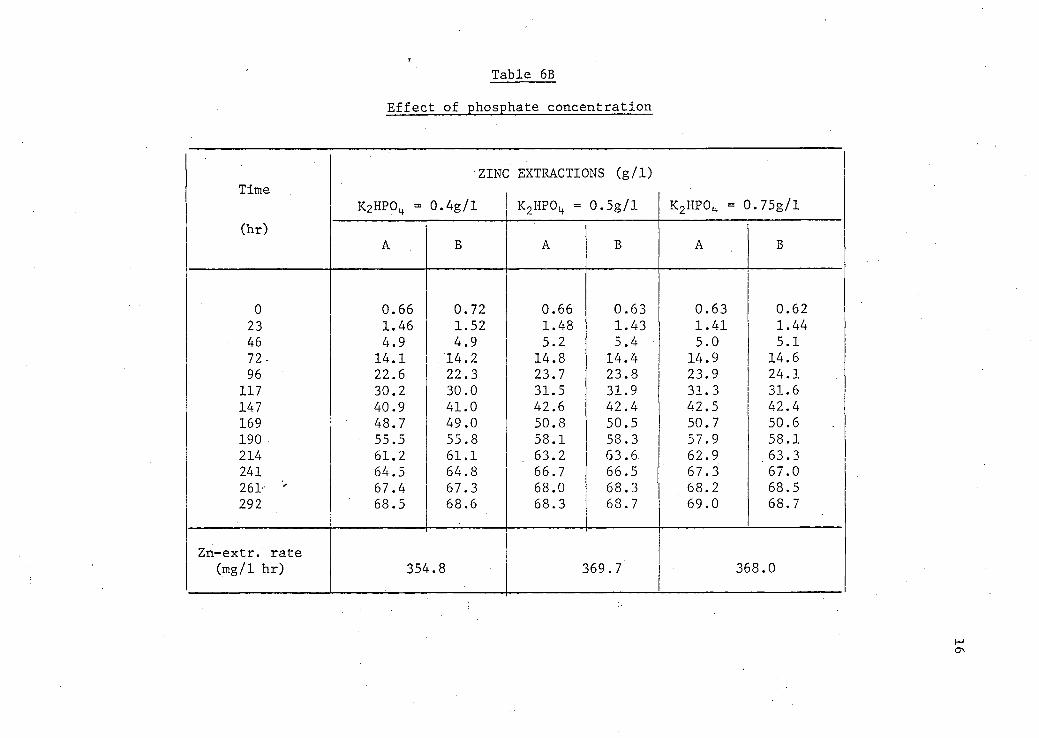
Table 6B
E f f e c t of phosphate concentration
ZINC EXTRACTIONS (g/1) Time
K 2HP0 4 = 0.4g/l K^HPO^ = 0.5g/l K^HPO^ = 0.75g/l (hr)
A B A B A B
0 0.66 0.72 0.66 0.63 0.63 0.62 23 1.46 1.52 1.48 1.43 1.41 1.44 46 4.9 4.9 5.2 5.4 5.0 5.1 72- 14.1 14.2 14.8 14.4 14.9 14.6 96 22.6 22.3 23.7 23.8 23.9 24.1
117 30.2 30.0 31.5 31.9 31.3 31.6 147 40.9 41.0 42.6 42.4 42.5 42.4 169 48.7 49.0 50.8 50.5 50.7 50.6 190 55.5 55.8 58.1 58.3 57.9 58.1 214 61.2 61.1 63.2 63.6 62.9 63.3 241 64.5 64.8 66.7 66.5 67.3 67.0 261 ' 67.4 67.3 68.0 68.3 68.2 68.5 292 68.5 68.6 68.3 68.7 69.0 68.7
Zn-extr. rate (mg/1 hr) 354.8 369.7 368.0
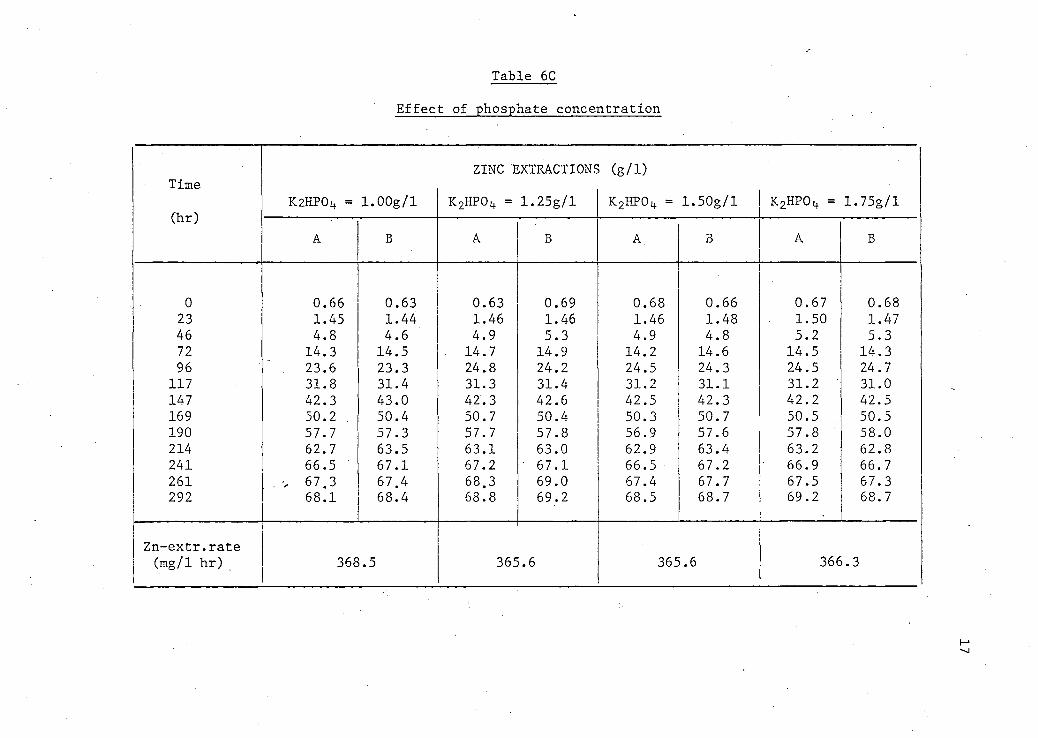
Table 6C
E f f e c t of phosphate concentration
ZINC EXTRACTIONS (g/1) Time
K2HP04 = 1.00g/l K 2HP0i t = 1.25g/l K 2HP0 4 = 1.50g/l K^HPO^ = 1.75g/l (hr) (hr)
A B A B A. B A B
0 0.66 0.63 0.63 0.69 0.68 0.66 0.67 0.68 23 1.45 1.44 1.46 1.46 1.46 1.48 1.50 1.47 46 4.8 4.6 4.9 5.3 4.9 4.8 5.2 5.3 72 14.3 14.5 14.7 14.9 14.2 14.6 14.5 14.3 96 23.6 23.3 24.8 24.2 24.5 24.3 24.5 24.7
117 31.8 31.4 31.3 31.4 31.2 31.1 31.2 • 31.0 147 42.3 43.0 42.3 42.6 42.5 42.3 42.2 42.5 169 50.2 50.4 50.7 50.4 50.3 50.7 50.5 50.5 190 57.7 57.3 57.7 57.8 56.9 57.6 57.8 ' 58.0 214 62.7 63.5 63.1 63.0 62.9 63.4 63.2 62.8 241 66.5 67.1 67.2 ' 67.1 66.5 67.2 66.9 66.7 261 . •, 67.3 67.4 68.3 69.0 67.4 67.7 67.5 67.3 292 68.1 68.4 68.8 69.2 68.5 68.7 69.2 68.7
Zn-extr.rate (mg/1 h r ) , 368.5 365.6 365.6 366.3

Table 7A
E f f e c t of pulp density
Pulp density = 1% Pulp density = 2%
ZINC EXTRACTIONS (g/1) ZINC EXTRACTIONS (g/1) Time Time (hr) (hr)
A B S t e r i l e A B S t e r i l e
0 1.34 1.34 0.050 0 1.41 1.31 0.069 13 1.77 1.74 0.155 13 2.04 2.05 0.174 37 2.24 2.19 0.239 37 2.68 2.62 0.250 61 2.38 2.31 0.240 . 61 3.40 3.32 0.320 85 2.35 2.45 0.242 85 4.60 4.65 0.346
109 2.68 2.71 0.258 109 5.40 5.60 • 0.387 134 2.98 2.95 0.305 134 6.40 6.20 0.412 158 3.20 3.25 0.338 158 7.20 7.30 0.428
Zn-extr.rate Zn-extr.rate (mg/1 hr) 8. 5 (mg/1 hr) 35.8
oo
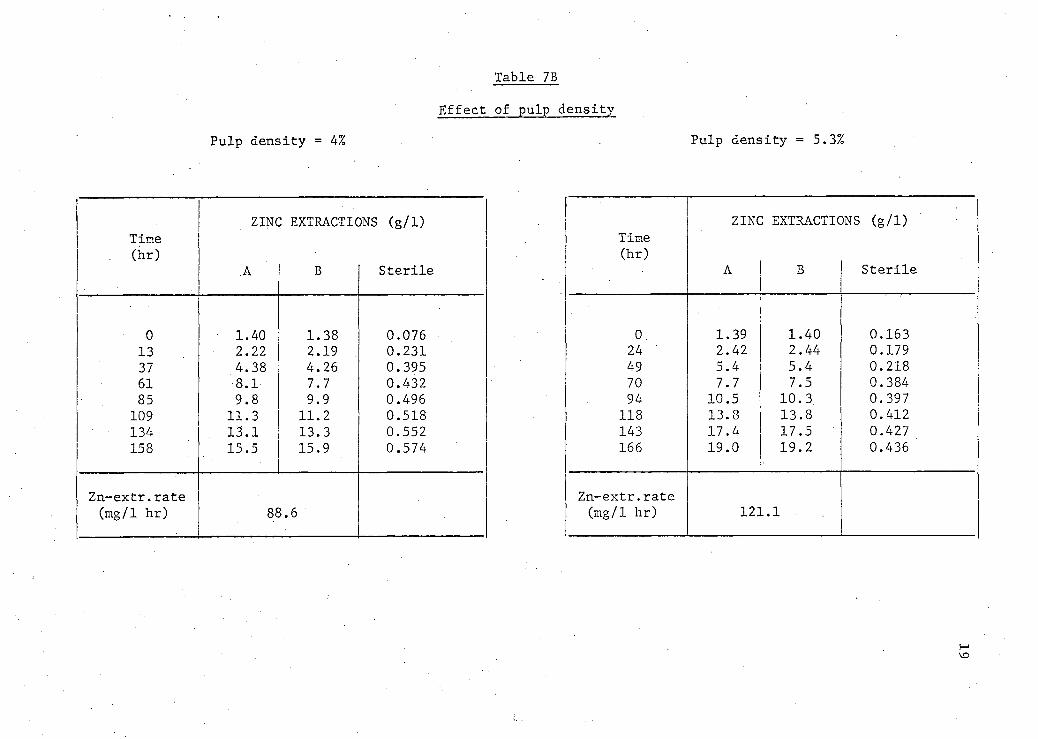
Table 7B
E f f e c t of pulp density
Pulp density = 4%
ZINC EXTRACTIONS (g/1) Time
. (hr) .A B S t e r i l e
0 1.40 1.38 0.076 13 2.22 2.19 0.231 37 4.38 4.26 0.395 61 8.1 7.7 0.432
• 8 5 9.8 9.9 0.496 109 11.3 11.2 0.518 134 13.1 13.3 0.552 158 15.5 15.9 0.574
Zn-extr.rate (mg/1 hr) 88.6
Pulp density = 5.3%
ZINC EXTRACTIONS (g/1) Time (hr)
A B S t e r i l e
0 1.39 1.40 0.163 24 2.42 2.44 0.179 49 5.4 5.4 0.218 70 7.7 7.5 0.384 94 10.5 10.3 0.397
118 13.8 13.8 0.412 143 17.4 17.5 0.427 166 19.0 19.2 0.436
Zn-extr.rate (mg/1 hr) 121.1
I—1
VO
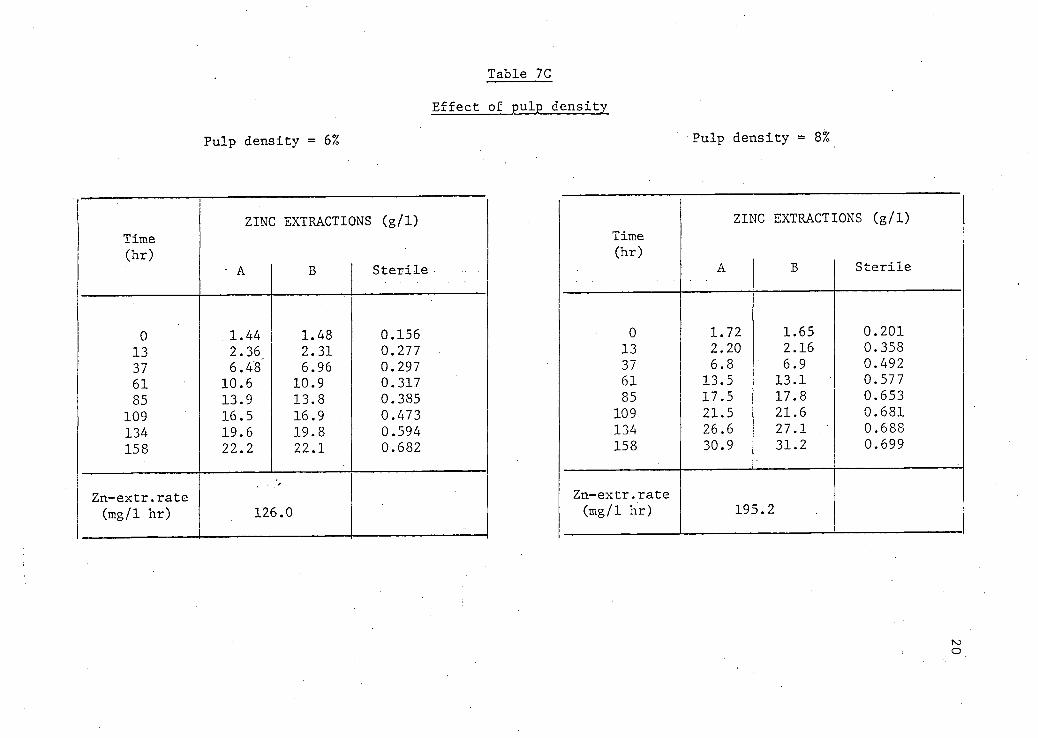
Table 7C
E f f e c t of pulp density
Pulp density = 6%
ZINC EXTRACTIONS (g/1) Time (hr)
- A B S t e r i l e
0 1.44 1.48 0.156 13 2.36 2.31 0.277 37 6.48 6.96 0.297 61 10.6 10.9 0.317 85 13.9 13.8 0.385
109 16.5 16.9 0.473 134 19.6 19.8 0.594 158 22.2 22.1 0.682
Zn-extr.rate >
(mg/1 hr) 126.0
Pulp density = 8%
ZINC EXTRACTIONS (g/1) Time (hr)
A B S t e r i l e
0 1.72 1.65 0.201 13 2.20 2.16 0.358 37 6.8 6.9 0.492 61 13.5 13.1 0.577 85 17.5 17.8 0.653
109 21.5 21.6 0.681 134 26.6 27.1 0.688 158 30.9 31.2 0.699
Zn-extr.rate (mg/1 hr) 195.2
O
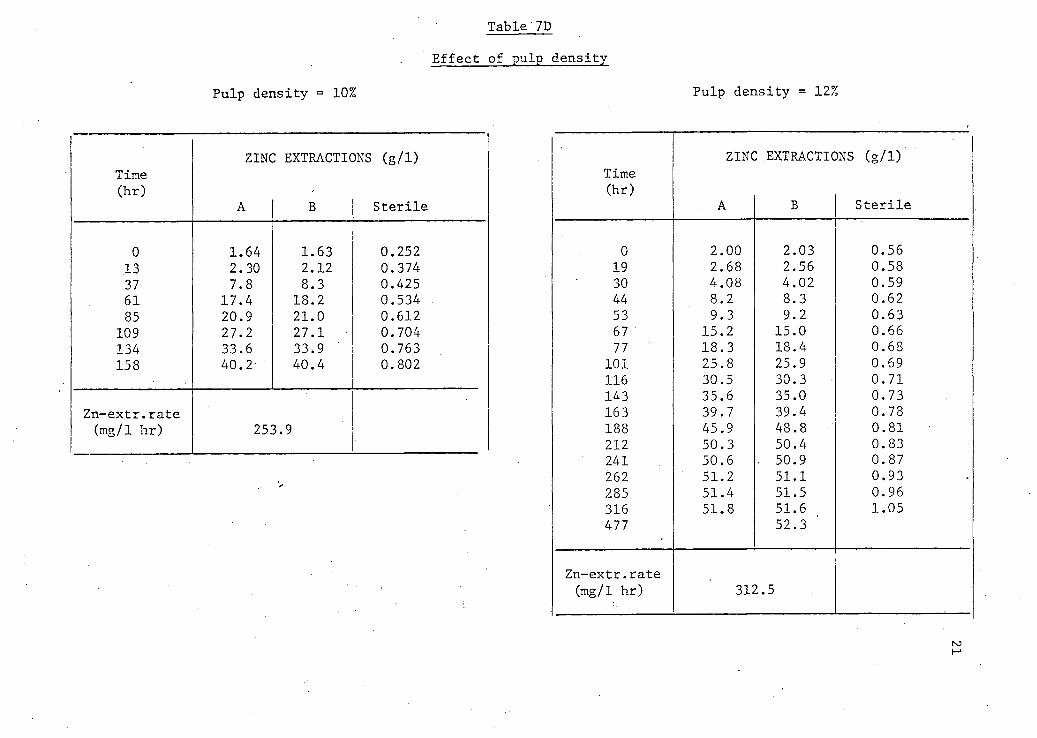
Table 7D
E f f e c t of pulp density
Pulp density = 10% Pulp density = 12%
ZINC EXTRACTIONS (g/1) Time (hr) -
A B S t e r i l e
0 1.64 1.63 0.252 13 2.30 2.12 0.374 37 7.8 8.3 0.425 61 17.4 18.2 0.534 . 85 20.9 21.0 0.612
109 27.2 27.1 0.704 134 33.6 33.9 0.763 158 40.2- ' 40.4 0.802
Zn-extr.rate (mg/1 hr) 253.9
ZINC EXTRACTIONS (g/1)' Time (hr)
A B S t e r i l e
0 2.00 2.03 0.56 19 2.68 2.56 0.58 30 4.08 4.02 0.59 44 8.2 8.3 0.62 53 9.3 9.2 0.63 67 15.2 15.0 0.66 77 18.3 18.4 0.68
101 25.8 25.9 0.69 116 30.5 30.3 0.71 143 35.6 35.0 0.73 163 39.7 39.4 0.78 188 45.9 48.8 0.81 212 50.3 50.4 0.83 241 50.6 . 50.9 0.87 262 51.2 51.1 0.93 285 51.4 51.5 0.96 316 51.8 51.6 1.05 477 52.3
Zn-extr.rate (mg/1 hr) 312.5
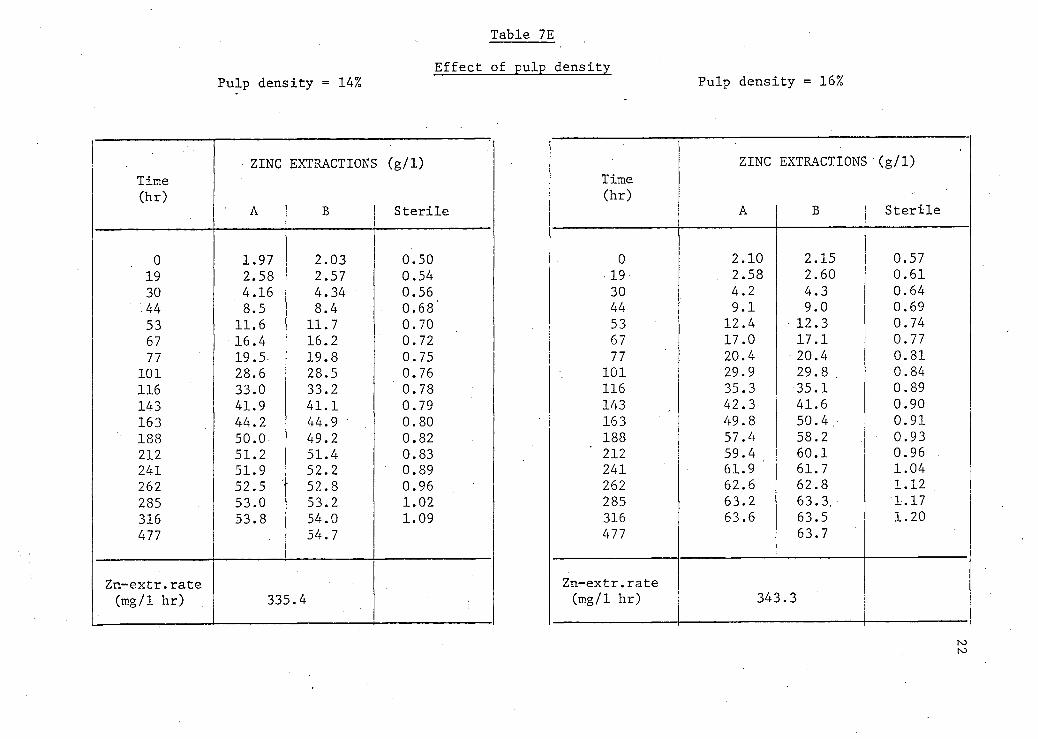
Table 7E
Pulp density = 14% E f f e c t of pulp density
Pulp density = 16%
ZINC EXTRACTIONS (g/1) ZINC EXTRACTIONS (g/1) Time Time (hr) (hr)
A B S t e r i l e A B S t e r i l e
0 1.97 2.03 0.50 0 2.10 2.15 0.57 19 2.58 2.57 0.54 19- 2.58 2.60 0.61 30 4.16 4.34 0.56 30 4.2 4.3 0.64 -44 8.5 8.4 0.68' 44 9.1 9.0 0.69 53 11.6 11.7 0.70 53 12.4 12.3 0.74 67 16.4 16.2 0.72 67 17.0 17.1 0.77 77 19.5-. 19.8 0.75 77 20.4 • 20.4 0.81
101 28.6 28.5 0.76 101 29.9 29.8 . 0.84 116 33.0 33.2 0.78 116 35.3 35.1 0.89 143 41.9 41.1 0.79 143 42.3 41.6 0.90 163 44.2 44.9 0.80 163 49.8 50.4 . 0.91
' 188 50.0 49.2 0.82 188 57.4 58.2 0.93 212 51.2 51.4 0.83 212 59.4 60.1 0.96 . 241 51.9 52.2 0.89 241 61.9 ' 61.7 1.04 262 52.5 ' 52.8 0.96 262 62.6 62.8 1.12 285 53.0 53.2 1.02 285 63.2 63.3. 1.17 316 53.8 54.0 1.09 316 63.6 63.5 1.20 477 54.7 477 63.7
Zn-extr.rate Zn-extr.rate (mg/1 hr) 335.4 (mg/1 hr) 343.3
ro to
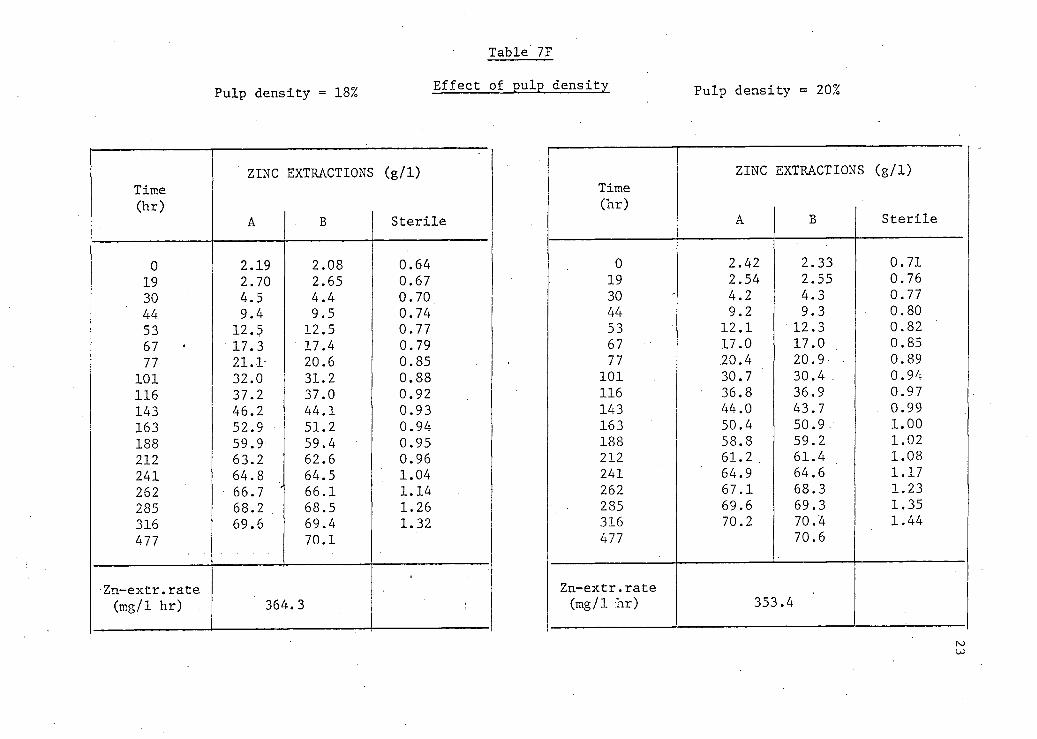
Table 7F
Pulp density = 18% E f f e c t of pulp density Pulp density = 20%
ZINC EXTRACTIONS (g/1) ZINC EXTRACTIONS (g/1) Time Time (hr) (hr)
A B S t e r i l e A B S t e r i l e
0 2.19 2.08 0.64 0 2.42 2.33 0.71 19 2.70 2.65 0.67 19 2.54 2.55 0.76 30 4.5 4.4 0.70. 30 4.2 4.3 0.77 44 9.4 9.5 0.74 44 9.2 9.3 0.80 53 12.5 12.5 0.77 53 12.1 • 12.3 0.82 67 • 17.3 17.4 0.79 67 17.0 17.0 0.85 77 21.1- 20.6 0.85 77 .20.4 20.9 • 0.89
101 32.0 31.2 0.88 101 30.7 30.4 . 0.94 116 37.2 37.0 0.92 116 • 36.8 36.9 0.97 143 46.2 44.1 0.93 143 44.0 43.7 0.99 163 52.9 51.2 0.94 163 50.4 50.9 • 1.00 188 59.9 59.4 0.95 188 58.8 59.2 1.02 212 63.2 62.6 0.96 212 61.2 . 61.4 1.08 241 64.8 64.5 1.04 241 64.9 64.6 1.17 262 66.7 ' 66.1 1.14 262 67.1 68.3 1.23 285 68.2 68.5 1.26 285 69.6 69.3 1.35 316 69.6 69.4 1.32 316 70.2 70.4 1.44 477 70.1 477 70.6
Zn-extr.rate Zn-extr.rate (mg/1 hr) 364.3 (mg/1 hr) 353.4
to
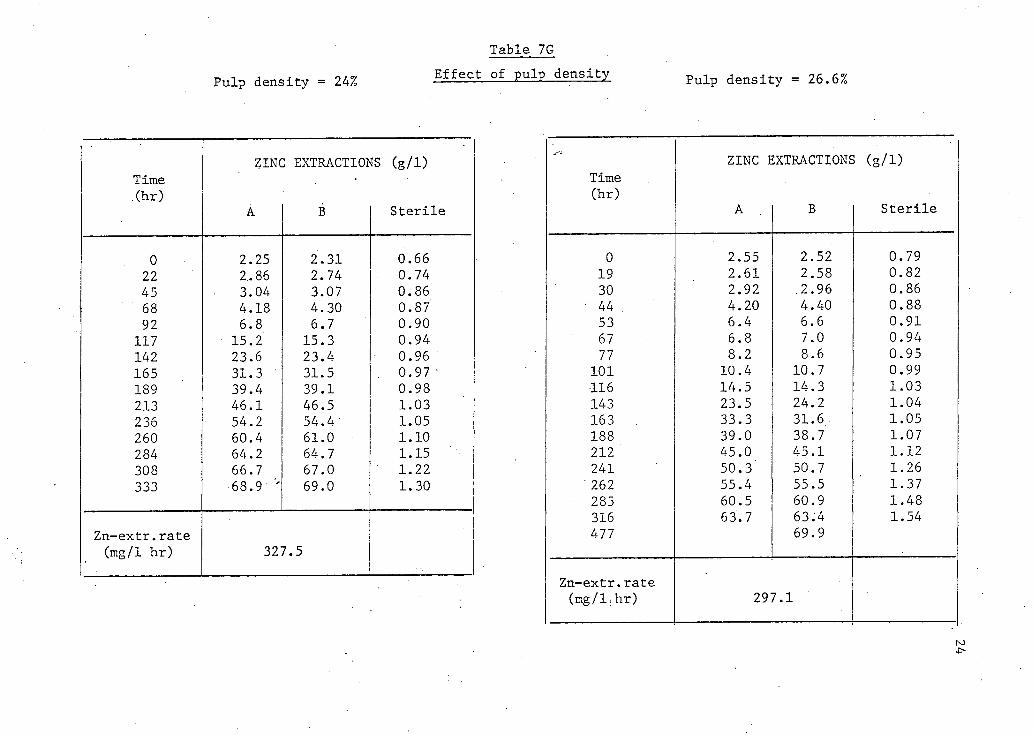
Pulp density = 24%
Table 7G E f f e c t of pulp density Pulp density = 26.6%
ZINC EXTRACTIONS (g/1) Time •
(hr) A B S t e r i l e
0 2.25 2.31 0.66 22 2.86 2.74 0.74 45 3.04 3.07 0.86 68 4.18 4.30 0.87' 92 6.8 6.7 0.90
117 15.2 15.3 0.94 142 23.6 23.4 0.96 165 31.3 31.5 0.97' 189 39.4 39.1 0.98 213 46.1 46.5 1.03 236 54.2 54.4 1.05 260 60.4 61.0 1.10 284 64.2 64.7 1.15 308 66.7 67.0 1.22 333 68.9 '' 69.0 1.30
Zn-extr.rate (mg/1 hr) 327.5
ZINC EXTRACTIONS (g/1) Time (hr)
A B S t e r i l e
0 2.55 2.52 0.79 19 2.61 2.58 0.82 30 2.92 2.96 0.86
• 44 . 4.20 4.40 0.88 53 6.4 6.6 0.91 67 6.8 7.0 0.94 77 8.2 8.6 0.95
101 10.4 10.7 0.99 •116 14.5 14.3' 1.03 143 23.5 24.2 1.04 163 33.3 31.6 1.05 188 39.0 38.7 1.07 212 45.0 45.1 1.12 241 50.3' 50.7 1.26
' 262 55.4 55.5 1.37 285 60.5 60.9 1.48 316 63.7 63.4 1.54 477 69.9
Zn-extr.rate (mg/l.hr) 297.1
N3
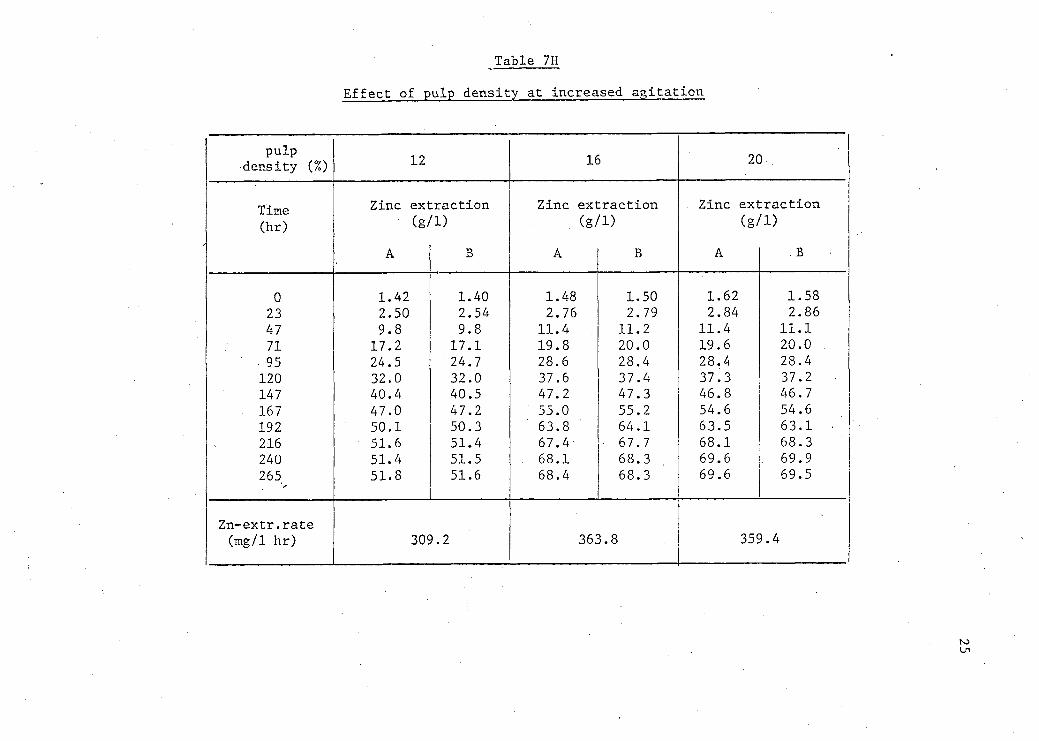
Table 7H
E f f e c t of pulp density at increased a g i t a t i o n
pulp density (%) 12 16 20
Time (hr)
Zinc extraction (g/D
B
Zinc e x t r a c t i o n (g/D
B
Zinc e x t r a c t i o n (g / D
A B
0 23 47 71
- 95 120 147 167 192 216 240 265
1.42 2.50 9.8 17.2 24.5 32.0 40.4 47.0 50.1 51.6 51.4 51.8
1.40 2.54 9.8
17.1 24.7 32.0 40.5 47.2 50.3 51.4 51.5 51.6
1.48 2.76
11.4 19.8 28.6 37.6 47.2 55.0 63.8 67.4 68.1 68.4
1.50 2.79
11.2 20.0 28.4 37.4 47.3 55.2 64.1 67.7 68.3 68.3
1 2
11 19 28 37
,62 ,84 ,4 ,6 ,4 ,3
46.8 54.6 63. 68. 69. 69.
1.58 2.86
11.1 20.0 28.4 37.2 46.7 54.6 63.1 68.3 69.9 69.5
Zn-extr.rate (mg/1 hr) 309.2 363.8 359.4
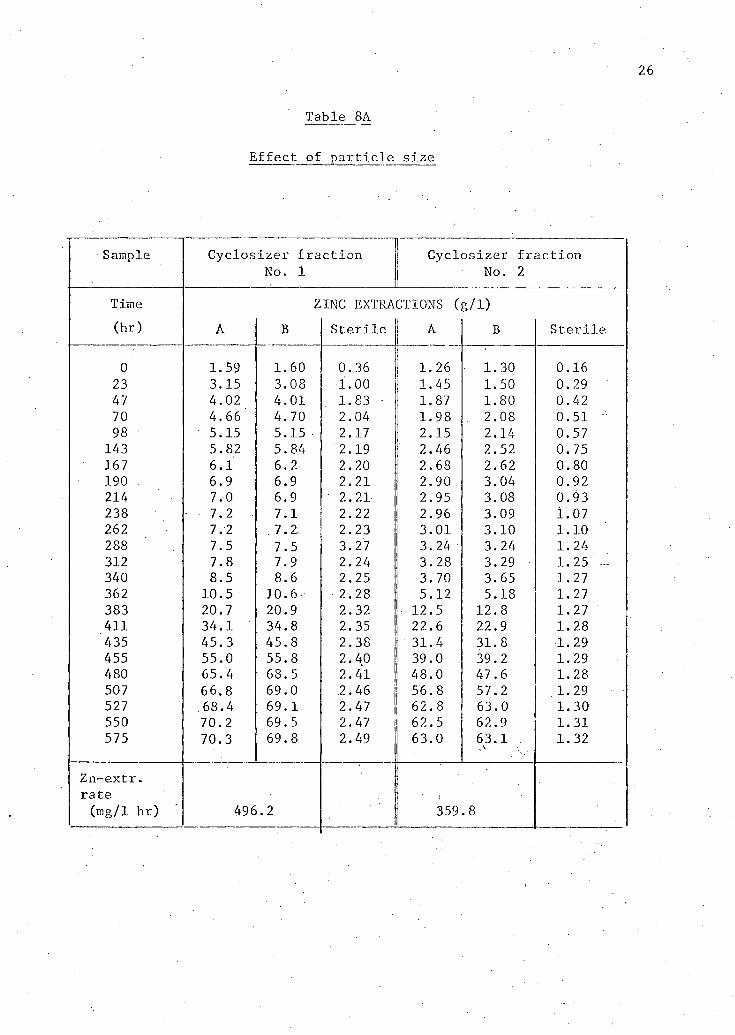
Table 8A
E f f e c t of p a r t i c l e s i z e
Sample Cy c l o s i z e r f r a c t i o n C y c l o s i z e r f r a c t i o n No. 1 No. 2
Time ZINC EXTRACTIONS (g/1) (hr) A B S t e r i l e A B S t e r i l e
0 1.59 1.60 0.36 1.26 1.30 0.16 23 3.15 3.08 1.00 1.45 1.50 0.29 47 4.02 4.01 1.83 • 1.87 1.80 0.42 70 4.66 4.70 2.04 1.98 . 2.08 0.51 98 • 5.15 5.15 2.17 2.15 2.14 0.57
143 5.82 5.84 2.19 2.46 2.52 0.75 167 6.1 6.2 2.20 2.68 2.62 0.80 190 6.9 6.9 2.21 2.90 3.04 0.92 214 7.0 6.9 2.21 2.95 3.08 0.93 238 7.2 7.1 2.22 2.96 3.09 1.07 262 7.2 7.2 2.23 3.01 3.10 1.10 288 7.5 7.5 3.27 3.24 3.24 1.24 312 7.8 7.9 2.24 3.28 3.29 1.25 340 8.5 8.6 2.25 3. 70 3.65 1.27 362 10.5 10.6 2.28 5.12 5.18 1.27 383 20.7 20.9 2.32 12.5 12. 8 1.27 411 34.1 34.8 2.35 22.6 22.9 1.28 435 45.3 45.8 2.38 31.4 31.8 1.29 455 55.0 55.8 2.40 39.0 39.2 1.29 480 65.4 68.5 2.41 48.0 47.6 1.28 507 66.8 69.0 2.46 56.8 57.2 1.29 527 .68.4 69.1 2.47 62.8 63.0 1.30 550 70.2 69.5 2.47 62.5 62.9 1.31 575 70.3 69.8 2.49 63.0 63.1 . 1.32
Zn-extr. rate (mg/1 hr) 496 .2 359 .8
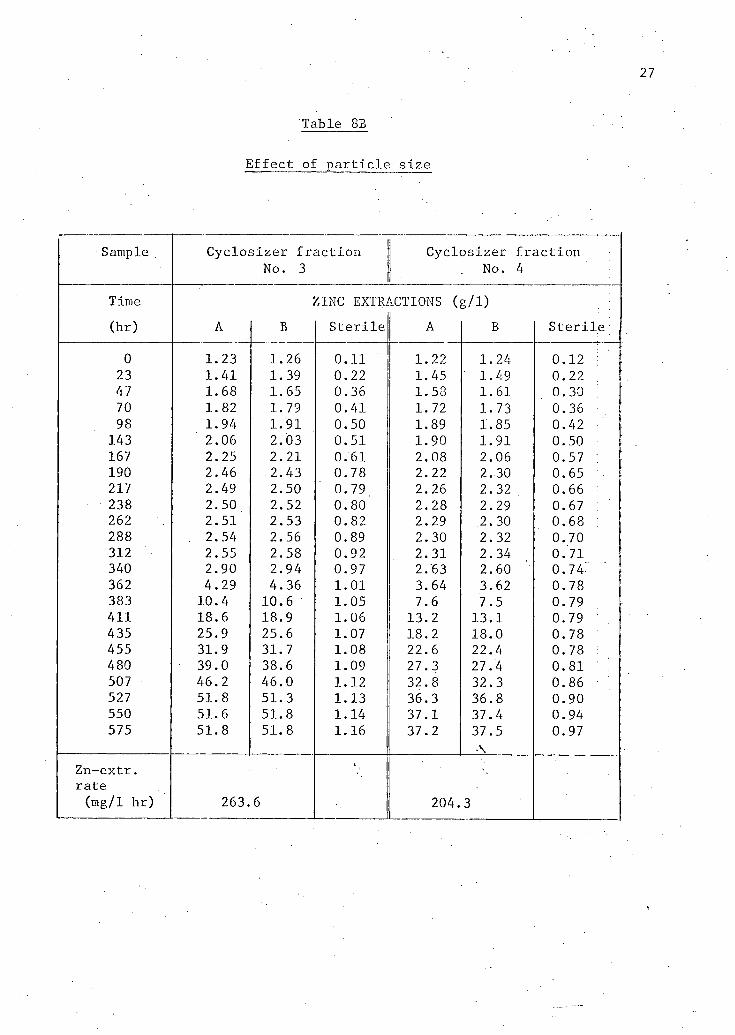
27
Table 8B
E f f e c t of p a r t i c l e s i z e
Sample Cy c l o s i z e r f r a c t i o n No. 3
Cyc l o s i z e r f r a c t i o n No. 4
Time
(hr) A B 1 I N C E X T R /
S t e r i l e V C T I O N S (
A g/D
B S t e r i l e
0 1. 23 1. 26 0 11 1. 22 1 24 0 12 23 1. 41 1. 39 0 22 1. 45 1 49 0 22 47 1. 68 1. 65 0 36 1. 58 1 61 0 30 70 1. 82 1. 79 0 41 1. 72 1 73 0 36 98 1. 94 1. 91 0 50 1 89 1 85 0 42
143 2. 06 2. 03 0 51 1. 90 1. 91 0 50 167 2. 25 2. 21 0 61 2 08 2 06 0 57 190 2. 46 2. 43 0 78 2 22 2 30 0 65 217 2. 49 2. 50 0 79 2 26 2 32 0 66 238 2. 50 2. 52 0 80 2 28 2 29 0 67 262 2. 51 2. 53 0 82 2 29 2 30 0 68 288 . 2. 54 2. 56 0 89 2 30 2 32 0 70 312 2. 55 2. 58 0 92 2. 31 2 34 0 71 340 2. 90 2. 94 0 97 2. '63 2 60 0 74" 362 4. 29 4. 36 1 01 3 64 3 62 0 78 383 10. 4 10. 6 1. 05 7 6 7 5 0 79 411 18. 6 18. 9 1 06 13 2 13. 1 0 79 435 25. 9 25. 6 1. 07 18 2 18. 0 0 78 455 31. 9 31. 7 1. 08 22. 6 22. 4 0 78 480 39. 0 38. 6 1. 09 27 3 27. 4 0. 81 507 46. 2 46. 0 1. 12 32 8 32 3 0 86 527 51. 8 51. 3 1. 13 36. 3 36 8 0 90 550 51. 6 51. 8 1. 14 37. 1 37. 4 0 94 575 51. 8 51. 8 1. 16 37 2 37
A 5 0. 97
Zn-extr. rate (mg/1 hr) 263. 6 204. 3
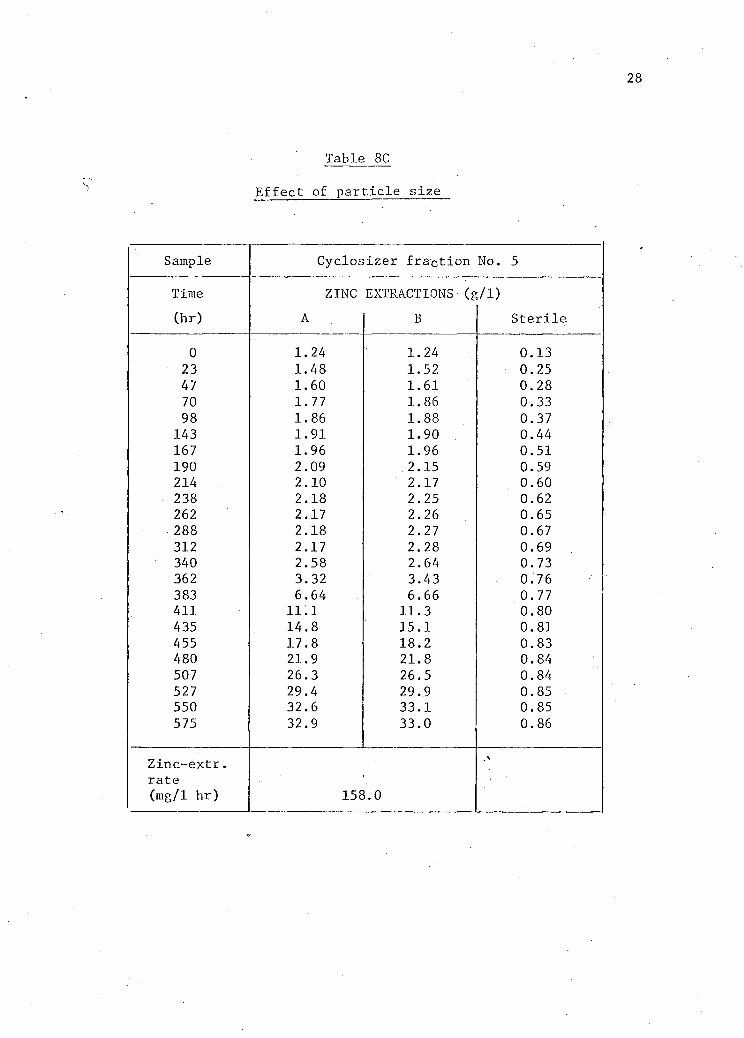
Table 8C
E f f e c t of p a r t i c l e s i z e
Sample Cyc l o s i z e r f r a c t i o n No. 5
Time ZINC EXTRACTIONS (g/D (hr) A B S t e r i l e
0 1.24 1.24 0.13 23 1.48 1.52 0.25 47 1.60 1.61 0.28 70 1.77 1.86 0.33 98 1.86 1.88 0.37
143 1.91 1.90 0.44 167 1.96 1.96 0.51 190 2.09 .2.15 0.59 214 2.10 2.17 0.60 238 2.18 2.25 0.62 262 2.17 2.26 0.65 288 2.18 2.27 0.67 312 2.17 2.28 0.69 340 2.58 2.64 0.73 362 3.32 3.43 0.76 383 6.64 6.66 0.77 411 11.1 11.3 0.80 435 14.8 15.1 0.81 455 17.8 18.2 0.83 480 21.9 21.8 0.84 507 26.3 26.5 0.84 527 29.4 29.9 0.85 550 32.6 33.1 0.85 575 32.9 33.0 0.86
Zinc-extr. rate (mg/1 hr) 158.0
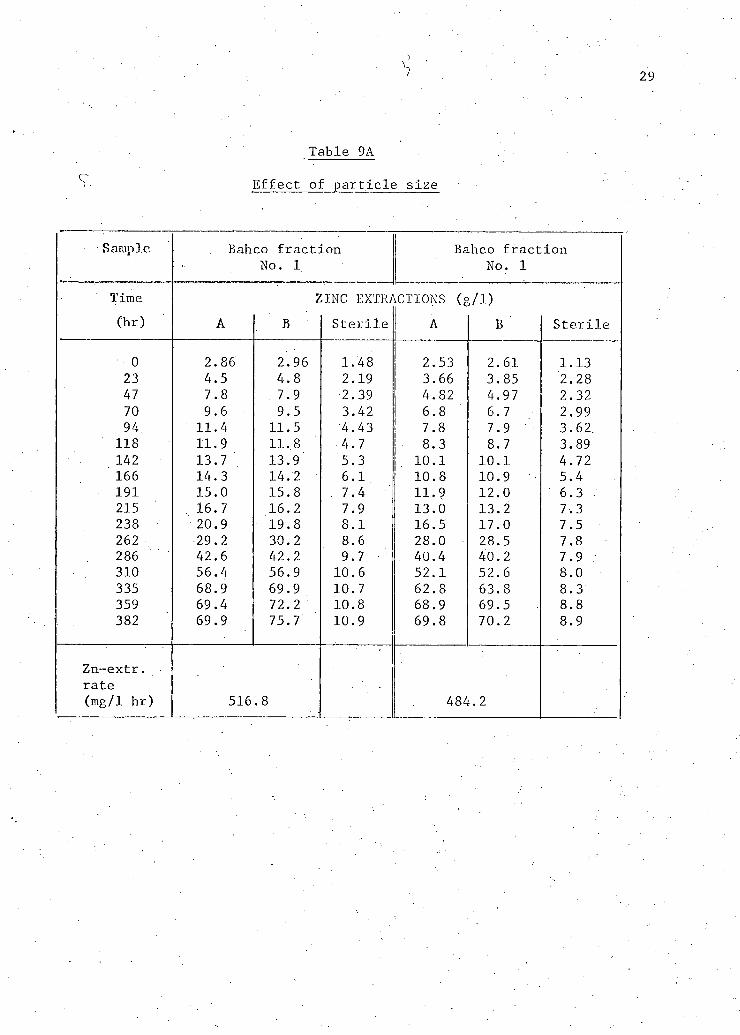
Table 9A
E f f e c t of p a r t i c l e s i z e
Sample Bahco f r a c t i o n Bahco f r a c t i o n No. 1 No. 1
Time ZINC EX'fR/ ACTIONS (g/1) (hr) A S t e r i l e A B S t e r i l e
0 2.86 2.96 1.48 2.53 2.61 1.13 23 4.5 4.8 2.19 3.66 3.85 2.28 47 7.8 . 7.9 2.39 4.82 4.97 2.32 70 9.6 9.5 3.42 6.8 6.7 2.99 94 11.4 11.5 4.43 7.8 7.9 3.62.
118 11.9 11.8 4.7 8.3 8.7 3.89 142 13.7 13.9 5.3 10.1 10.1 4.72 166 14.3 14.2 6.1 10.8 10.9 5.4 191 15.0 15.8 7.4 11.9 12.0 6.3 215 16.7 16.2 7.9 13.0 13.2 7.3 238 20.9 19.8 8.1 16.5 17.0 7.5 262 29.2 30.2 8.6 28.0 28.5 7.8 286 42.6 42.2 9.7 40.4 40.2 7.9 310 56.4 56.9 10.6 52.1 52.6 8.0 335 68.9 69.9 10.7 62.8 63.8 8.3 359 69.4 72.2 10.8 68.9 69.5 8.8 382 69.9 75.7 10.9 69.8 70.2 8.9
Zn-extr. rate (mg/1 hr) 516 .8 484.2
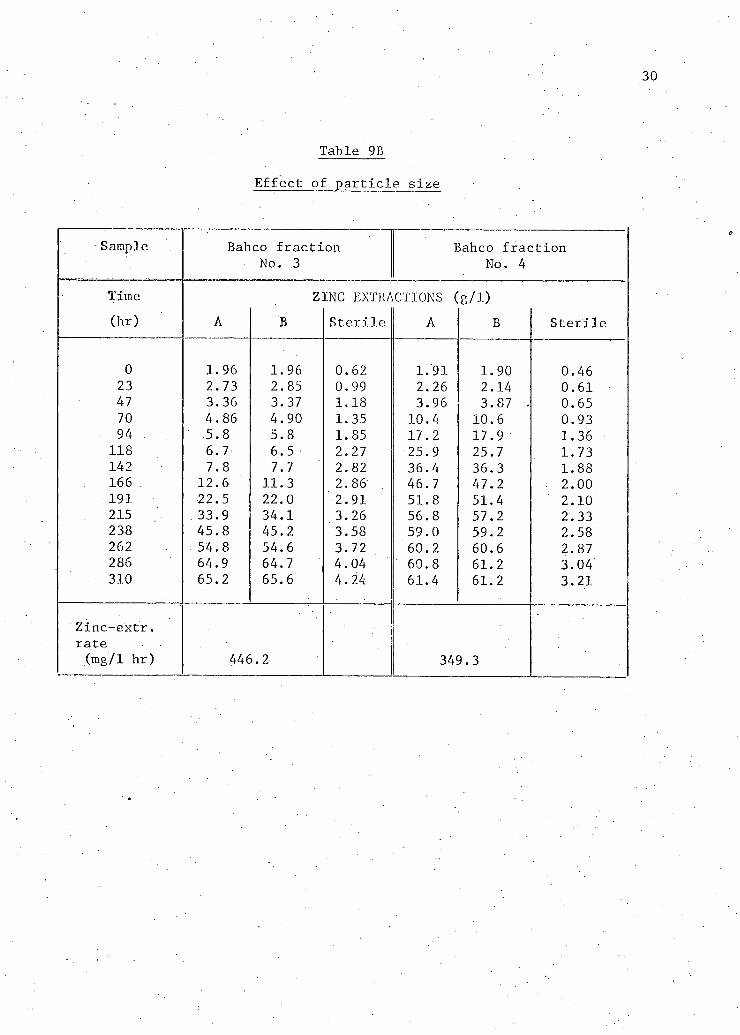
Table 9E
E f f e c t of p a r t i c l e s i z e
Sample Bahco f r a c t i o n Bahco f r a c t i o n No. .3 No. 4
Time ZINC EXTRACTIONS (g/1) (hr) A B S t e r i l e A B S t e r i l e
0 1.96 1.96 0.62 1.'91 1.90 0.46 23 2.73 2.85 0.99 2.26 2.14 0.61 47 3.36 3.37 1.18 3.96 3.87 . 0.65 70 4.86 4.90 1.35 10.4 10.6 0.93 94 5.8 5.8 1.85 17.2 17.9 1.36 118 6.7 6.5 2.27 25.9 25.7 1.73 142 7.8 7.7 2.82 36.4 36.3 1.88 166 12.6 11.3 2.86 46.7 47.2 2.00 191 22.5 22.0 2.91 51.8 51.4 2.10 215 . 33.9 34.1 3.26 56.8 57.2 2.33 238 45.8 45.2 3.58 59.0 59.2 2.58 262 54.8 54.6 3.72 60.2 60.6 2.87 286 64.9 64.7 4.04 60.8 61.2 3.04 310 65.2 65.6 4.24 61.4 61.2 3.21
Zinc-extr. rate (mg/1 hr) 446.2 349.3
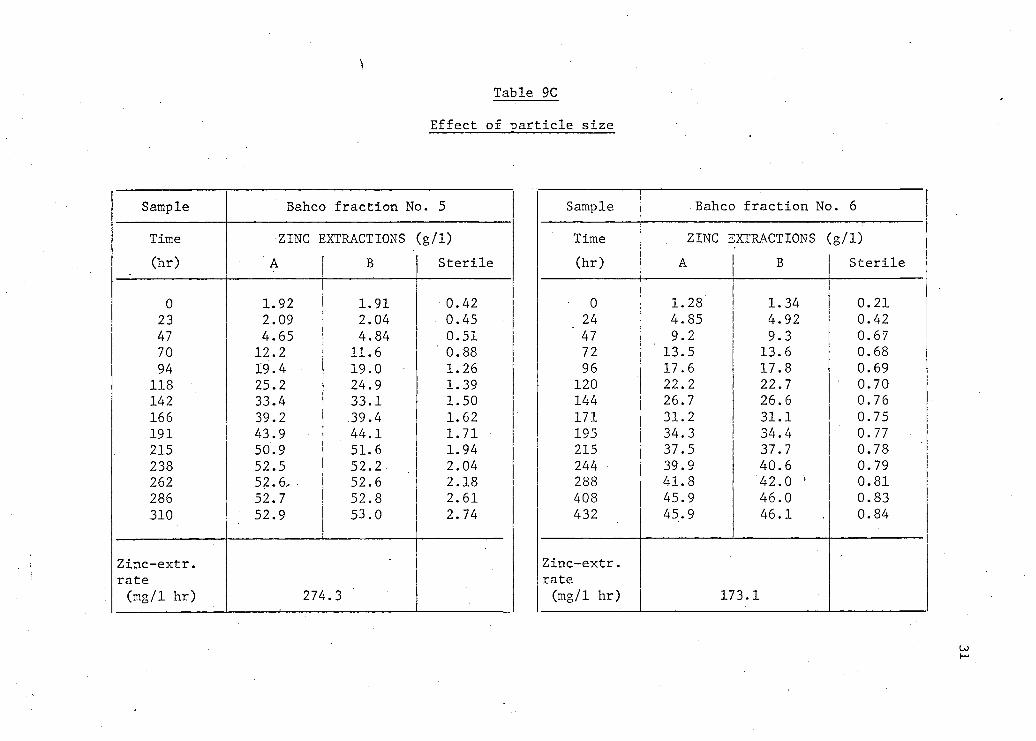
Table 9C
Ef f e c t of p a r t i c l e s i z e
Sample Bahco f r a c t i o n No. 5
Time ZINC EXTRACTIONS (g/D (hr) A B S t e r i l e
0 1.92 1.91 • 0.42 23 2.09 2.04 0.45 47 4.65 4.84 0.51 70 12.2 11.6 0.88 94 19.4 19.0 1.26
118 25.2 24.9 1.39 142 33.4 33.1 1.50 166 39.2 39.4 1.62 191 43.9 44.1 1.71 • 215 50.9 51.6 1.94 238 52.5 52.2 2.04 262 52.6, 52.6 2.18 286 52.7 52.8 2.61 310 52.9 53.0 2.74
Zinc-extr. •
rate (mg/1 hr) 274.3
Sample Bahco f r a c t i o n No. 6
Time ZINC EXTRACTIONS (g/1) (hr) A B S t e r i l e
• 0 1.28 1.34 0.21 24 4.85 4.92 0.42
" 47 9.2 9.3 0.67 72 ' 13.5 13.6 0.68 96 17.6 17.8 0.69
120 22.2 22.7 0.70 144 26.7 26.6 0.76 171 31.2 31.1 0.75 195 34.3 34.4 ' 0.77 215 37.5 37.7 0.78 244 39.9 40.6 0.79 288 41.8 42.0 * 0.81 408 45.9 46.0 0.83 432 45.9 46.1 0.84
Zinc-extr. rate (mg/1 hr) 173.1
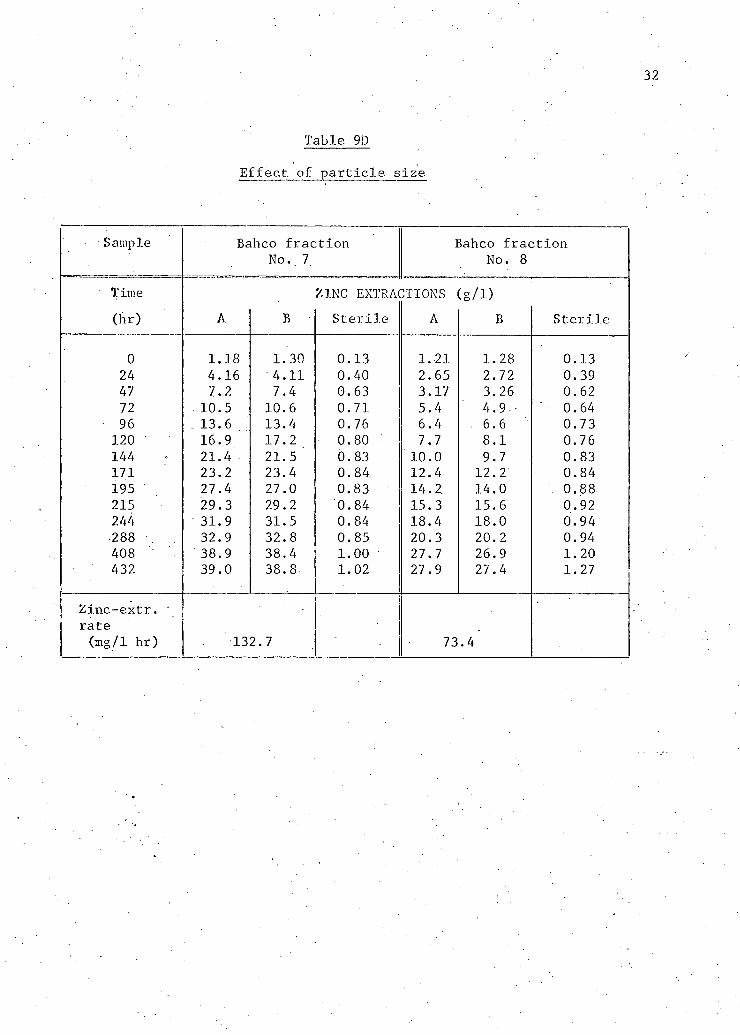
Table 9D
E f f e c t of p a r t i c l e s i z e
Sample Bahco f r a c t i o n Bahco f r a c t i o n No. 7 No. 8
Time ZINC EXTRAC DTIONS (g/1) (hr) A B S t e r i l e A B S t e r i l e
0 1.18 1.30 0.13 1.21 1.28 0.13 24 4.16 4.11 0.40 2.65 2.72 0.39 47 7.2 7.4 0.63 3.17 3.26 0.62 72 10.5 10.6 0.71 5.4 4.9 ' 0.64 96 . 13.6 . 13.4 0.76 6.4 6.6 0.73
120 16.9 17.2 0.80 7.7 8.1 0.76 144 21.4 21.5 ' 0.83 10.0 9.7 0.83 171 23.2 23.4 0.84 12.4 12.2 0.84 195 27.4 27.0 0.83 14.2. 14.0 0.88 215 29.3 29.2 0.84 15.3 15.6 0.92 244 31.9 31.5 0.84 18.4 18.0 0.94 288 32.9 32.8 0.85 20.3 20.2 0.94 408 38.9 38.4 1.00 27.7 26.9 1.20 432 39.0 38.8 1.02 27.9 27.4 1.27
Zinc-extr. ' rate (mg/1 hr) 132.7 73 .4
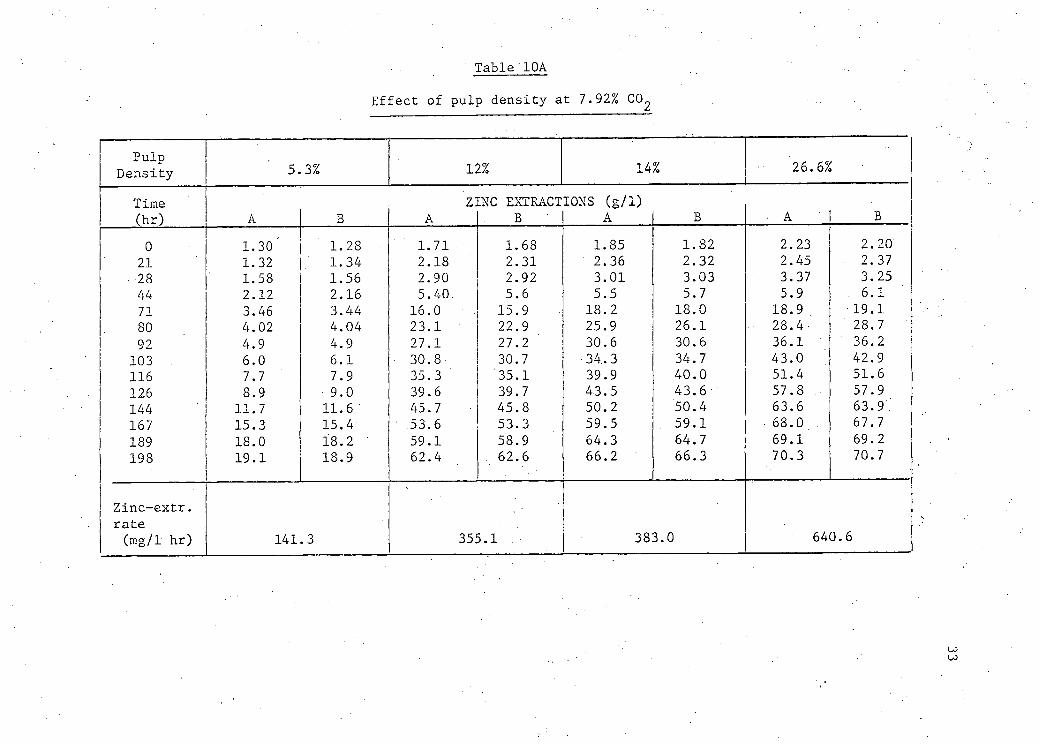
Table 10A
Ef f e c t of pulp density at 7.92% CO
Pulp Density 5. 3% 12% 14% 26.6%
• Time ZINC EXTRACTIONS (g/1) (hr) A B A B A B A B 0 1.30 ' 1.28 1.71 1.68 1.85 1.82 2.23 2.20
21 1.32 1.34 2.18 2.31 2.36 2.32 2.45 2.37 28 1.58 1.56 2.90 2.92 3.01 3.03 3.37 3.25 44 2.12 2.16 5.40 5.6 5.5 5.7 5.9 6.1 71 3.46 3.44 . 16.0 15.9 18.2 18.0 18.9 19.1 80 4.02 4.04 23.1 22.9 25.9 26.1 28.4- 28.7 92 4.9 4.9 27.1 27.2 30.6 30.6 36.1 36.2
103 . 6.0 6.1 30.8. 30.7 34. 3 34.7 43.0 42.9 116 7.7 7.9 35.3 35.1 39.9 40.0 51.4 51.6 126 8.9 9.0 39.6 39.7 43.5 43.6 57.8 57.9 144 11.7 11.6 45.7 45.8 50.2 50.4 63.6 63.9 . 167 15.3 15.4 53.6 53.3 59.5 59.1 68.0 67.7 189 18.0 18.2 59.1 58.9 64.3 64.7 69.1 69.2 198 19.1 18.9 62.4 62.6 66.2 66.3 70.3 70.7
Zinc-extr. rate (mg/1 hr) 141 .3 355.1 383. 0 640.6
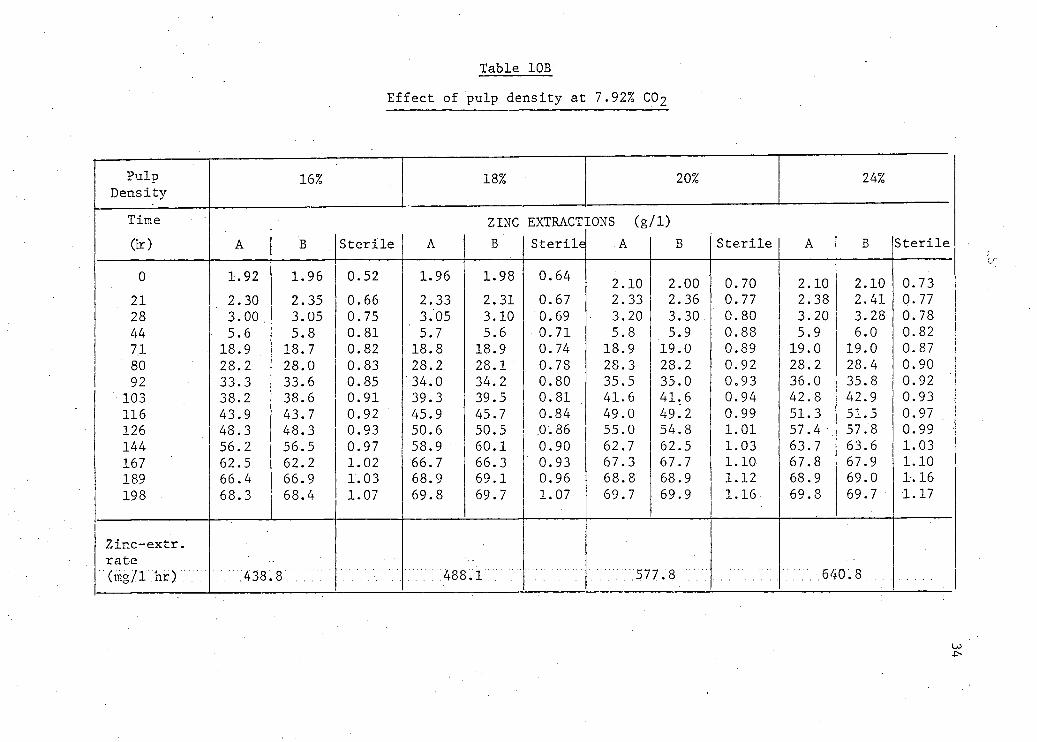
Table 10B
E f f e c t of pulp density at 7.92% C0 2
Pulp 16% 18% 20% 24% Density
Time ZINC EXTRACT IONS (g/1) (hr) A B S t e r i l e A B S t e r i l e A B S t e r i l e A B S t e r i l e
0 1.92 1.96 0.52 1.96 1.98 0.64 2.10 2.00 0.70 2.10 2.10 0.73 . 21 2.30 2.35 0.66 2.33 2.31 0.67 2.33 2.36 0.77 2.38 2.41 0.77 28 3.00 . 3.05 0.75 3.05 3.10 0.69 3.20 3.30 0.80 3.20 3.28 0.78 44 5.6 5.8 0.81 5.7 5.6 0.71 5.8 5.9 0.88 5.9 6.0 0.82 7.1 18.9 18.7 0.82 18.8 18.9 0.74 18.9 19.0 0.89 19.0 19.0 0.87 80 28.2 28.0 0.83 28.2 28.1 0.78 28.3 28.2 0.92 28.2 28.4 0.90 92 33.3 33.6 0.85 34.0 34.2 0.80 35.5 35.0 0.93 36.0 35.8 0.92
103 38.2 38.6 0.91 39.3 39.5 0.81 41.6 41.6 0.94 42.8 42.9 0.93 116 43.9 43.7 0.92 45.9 45.7 0.84 49.0 49^2 0.99 51.3 51.5 0.97 126 48; 3 48.3 0.93 50.6 50.5 .0. 86 55.0 54.8 1.01 57.4 •. 57.8 0.99 144 56.2 56.5 0.97 58.9 60.1 0.90 62.7 62.5 1.03 63.7 63.6 1.03 167 62.5 62.2 1.02 66.7 66.3 0.93 67.3 67.7 1.10 67.8 67.9 1.10 189 66.4 66.9 1.03 68.9 69.1 0.96 68.8 68.9 1.12 68.9 69.0 1-.16 198 68.3 68.4 1.07 69.8 69.7 1.07 69.7 69.9 1.16 69.8 69.7 1.17
Zinc-extr. rate (mo71 hr) 438 8 488.1 577.8 640.8
CO 4>-
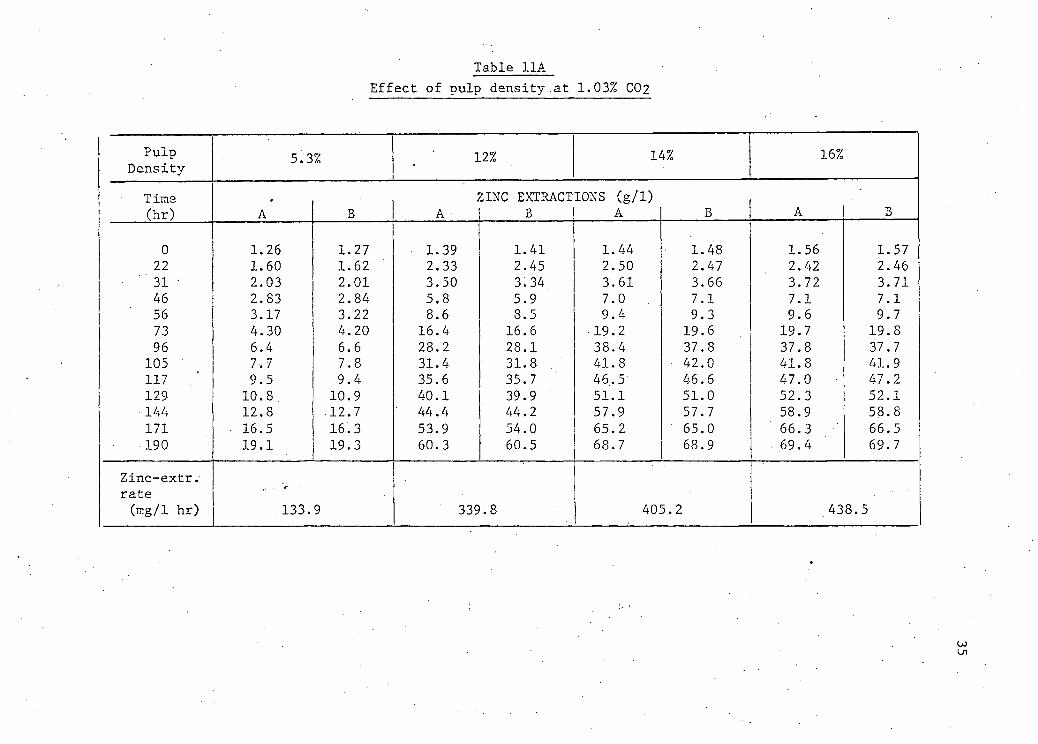
Table 11A E f f e c t of pulp density at 1.03% C02
Pulp 5.3% 12% 14% 16% Density
Time ZINC EXTRACTIONS (g/1) (hr) A B A 3 A B A B
0 1.26 1.27 1.39 1.41 1.44 1.48 1.56 1.57 22 1.60 1.62 2.33 2.45 2.50 2.47 2.42 2.46 31 ' 2.03 2.01 3.50 3.34 3.61 3.66 3.72 3.71 46 2.83 2.84 5.8 5.9 7.0 7.1 7.1 7.1 56 3.17 3.22 8.6 8.5 9.4 9.3 9.6 9.7 73 4.30 4.20 16.4 16.6 19.2 19.6 19.7 19.8 96 6.4 6.6 28.2 28.1 38.4 37.8 37.8 37.7
105 7.7 7.8 31.4 31.8 41.8 42.0 41.8 41.9 117 9.5 9.4 35.6 35.7 46.5 46.6 47.0 47.2 129 10.8 10.9 40.1 39.9 51.1 51.0 52.3 52.1 144 12.8 12.7 44.4 44.2 57.9 57.7 58.9 58.8 171 • 16.5 16.3 53.9 54.0 65.2 65.0 66.3 66.5 190 19.1 19.3 60.3 60.5 68.7 68.9 69.4 69.7
Zinc-extr. rate (mg/1 hr) 133. 9 339 .8 405.2 .438.5
CO
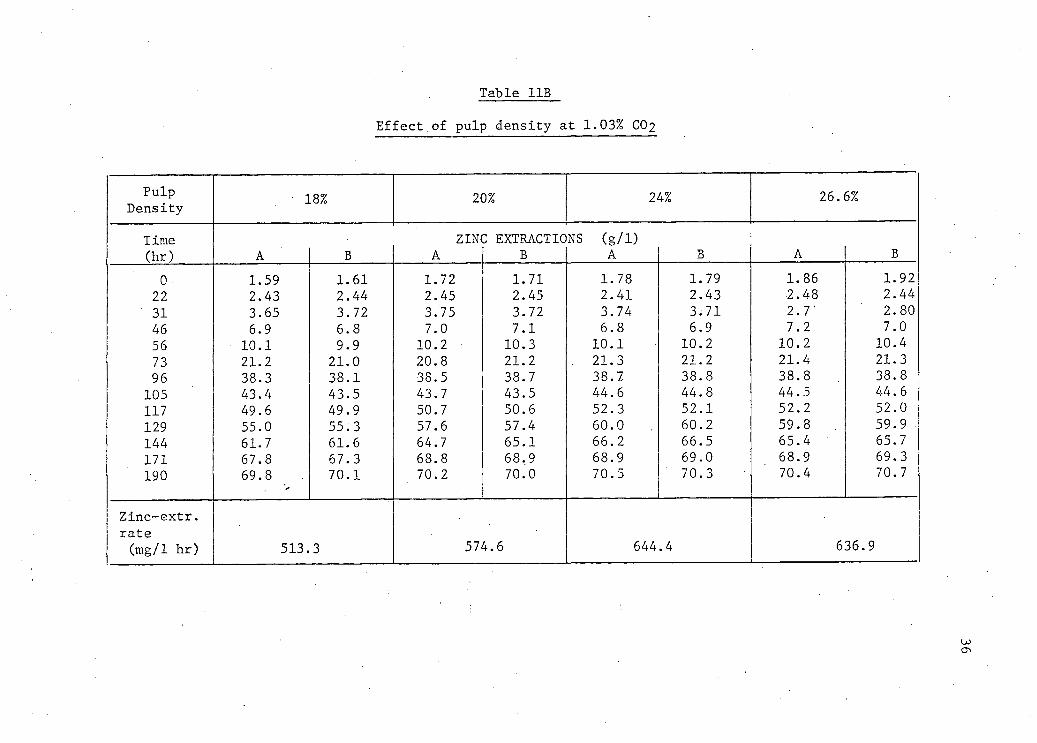
Table 11B
E f f e c t of pulp density at 1.03% CO2
Pulp Density
Time (hr)
18%
B
20%
ZINC EXTRACTIONS B
24% 26.6%
(g/D A B A B
0 22 31 46 56 73 96
105 117 129 144 171 190
Zinc-extr. rate (mg/1 hr)
1 2 3 6
10 21 38 43 49 55.0 61.7 67.8 69.8
59 43 65 9 1 2 3 4 6
1.61 2.44 3.72 6.8 9.9
21.0 38.1 43.5 49.9 55.3 61.6 67.3 70.1
1.72 2.45 3 7
10 20.8 38.5 43.7 50.7 57.6 64.7 68.8 70.2
75 0 2
1.71 2.45 3.72 7.1
10.3 21.2 38.7 43.5 50.6 57.4 65.1 68.9 70.0
1.78 2.41 3.74 6.8
10.1 21.3 38.7 44.6 52.3 60.0 66.2 68.9 70.5
1.79 2.43 3.71 6.9
10.2 21.2 38.8 44.8 52.1 60.2 66.5 69.0 70.3
1.86 -2.48 2.7' 7.2
10.2 21.4 38.8 44.5 52.2 59.8 65.4 68.9 70.4
1.92 2.44 2.80 7.0 10.4 21.3 38.8 44.6 52.0 59.9 65.7 69.3 70.7
513.3 574.6 6 4 4 . 4 636.9
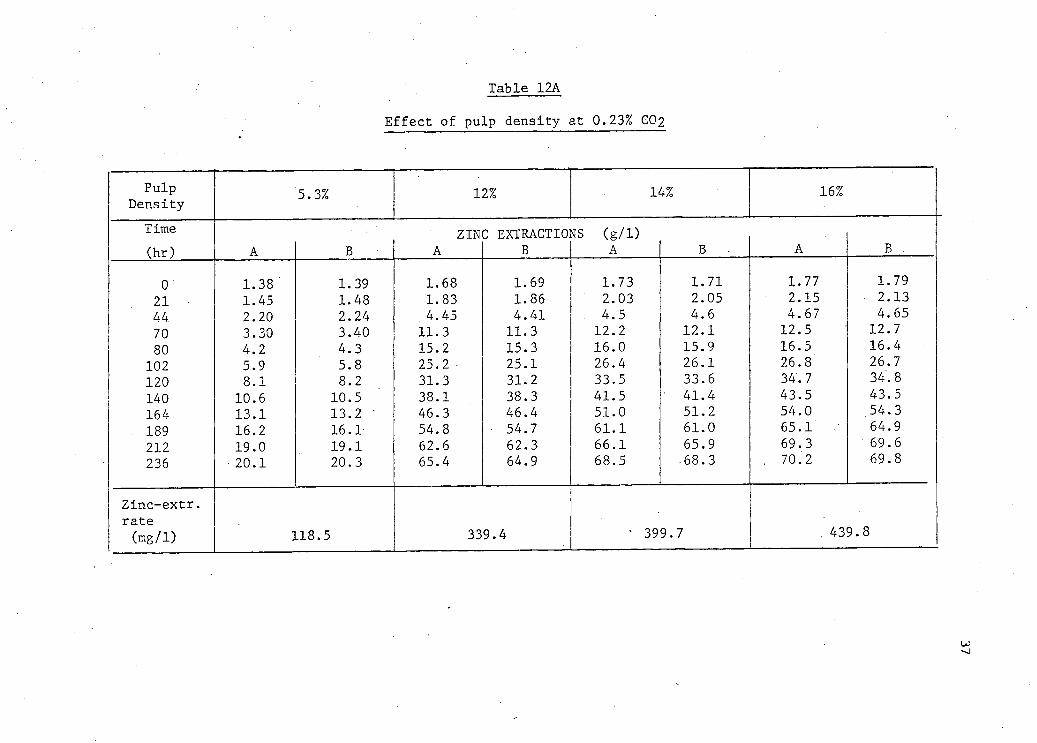
Table 12A
E f f e c t of pulp density at 0.23% C02
Pulp Density
Time (hr)
5 . 3 %
B
12%
ZINC EXTRACTIONS B
14% 16%
(g/D A B B
0 21 44. 70 80
102 120 140 164 189 212 236
Zinc-extr. rate (mg/1)
10 13 16 19.0 20.1
38 45 20 30 2 9 1 6 1 2
1.39 1.48 2.24 3. 4. 5. 8.
10. 13.
40 .3 .8 ,2 ,5 ,2 '
16.1-19.1 20.3
1.68 1.83 4.45
11.3 15.2 25.2 31.3 38.1 46.3 54.8 62.6 65.4
1.69 1.86 4.41 11.3 15.3 25.1 31.2 38.3 46.4 54.7 62.3 64.9
118.5 339.4
1.73 2.03 4.5
12.2 16.0 26.4 33.5 41.5 51.0 61.1 66.1 68.5
1.71 2.05 4.6
12.1 15.9 26.1 33.6 41.4 51.2 61.0 65.9 68.3
1.77 2.15 4.67 12.5 16.5 26.8 34.7 43.5 54.0 65.1 69.3 70.2
1.79 2.13 4.65
12.7 16.4 26.7 34.8 43.5 54.3 64.9 69.6 69.8
• 399.7 439.8
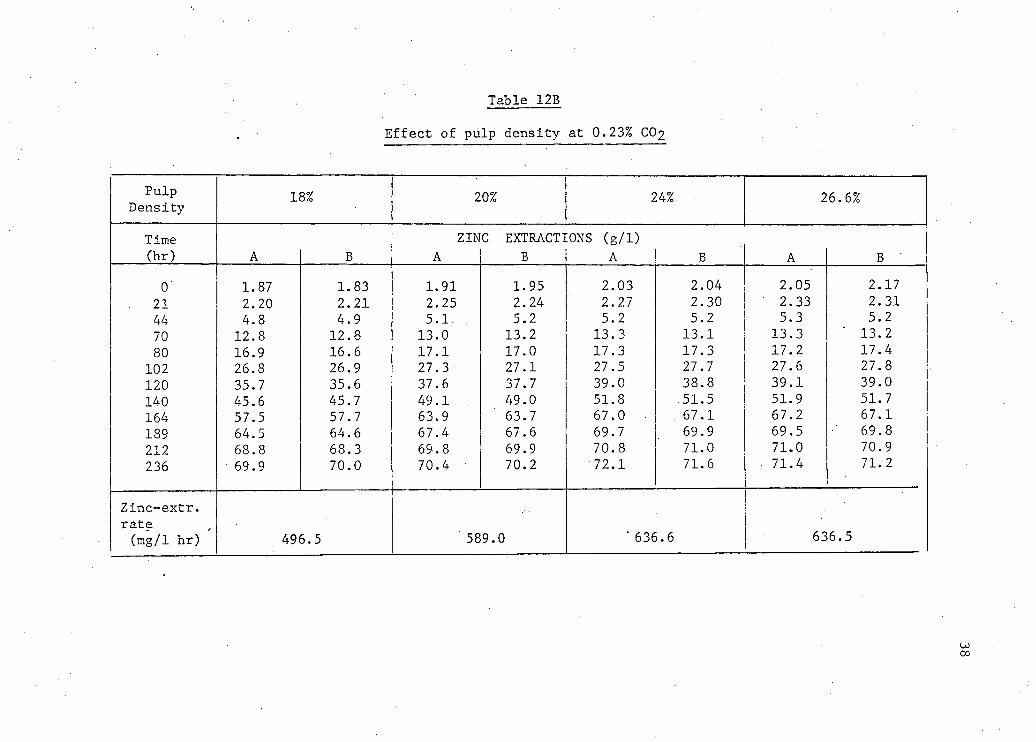
Table 12B
E f f e c t of pulp density at 0.23% CO2
Pulp 18% 20% 24% 26. 6% Density 6%
Time ZINC EXTRACT! ONS (g/1) (hr) A B A B A B A B '
0 1.87 1.83 1.91 1.95 2.03 2.04 2.05 2.17 21 2.20 2.21 2.25 2.24 2.27 2.30 2.33 2.31 44 4.8 4.9 5.1 5.2 5.2 5.2 5.3 5.2 70 12.8 12.8 13.0 13.2 13.3 13.1 13.3 13.2 80 16.9 16.6 17.1 17.0 17.3 17.3 17.2 17.4
102 26.8 26.9 27.3 27.1 27.5 27.7 27.6 27.8 120 35.7 35.6 37.6 37.7 39.0 38.8 39.1 39.0 140 45.6 45.7 49.1 49.0 51.8 51.5 51.9 51.7 164 57.5 57.7 63.9 63.7 67.0 67.1 67.2 67.1 189 64.5 64.6 67.4 67.6 69.7 69.9 69.5 69.8 212 68.8 68.3 69.8 69.9 70.8 71.0 71.0 70.9 236 69.9 70.0 70.4 70.2 72.1 71.6 • 71.4 71.2
Zinc-extr. rate (mg/1 hr) 496.5 589. 0 '636.6 636. 5
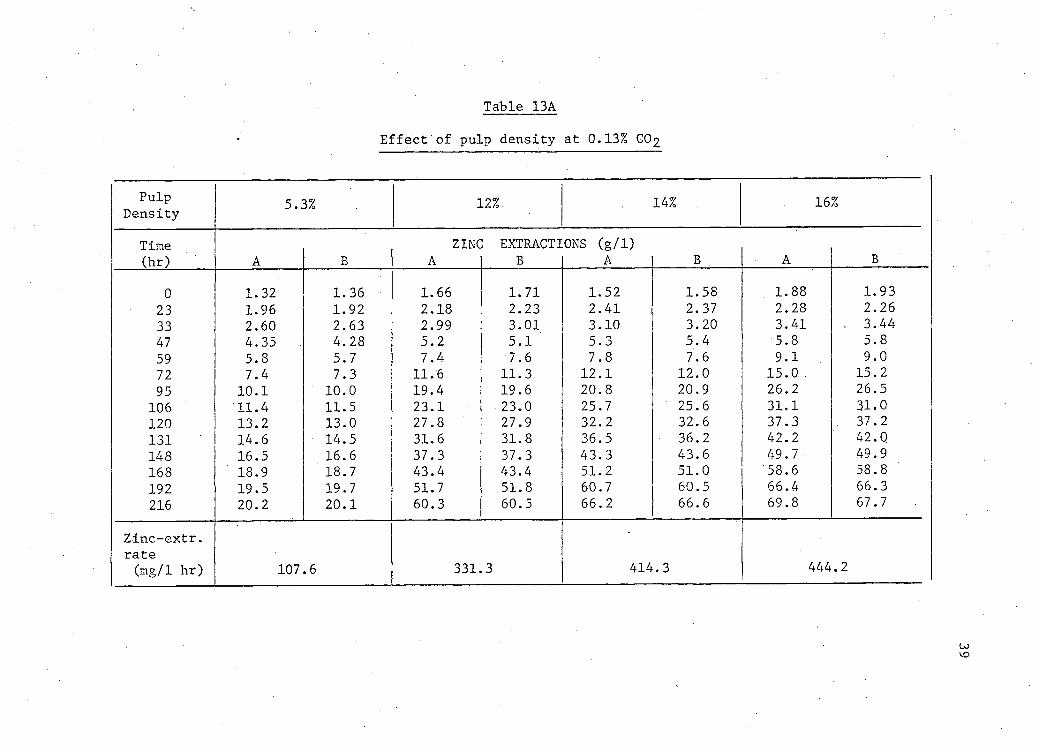
Table 13A
E f f e c t of pulp density at 0.13% G0 2
Pulp 5.3% 12%. 14% . 16% Density
Time ZINC EXTRACTIONS (g/1) (hr) A B A B A B A B
0 1.32 1.36 1.66 1.71 1.52 1.58 1.88 1.93 23 1.96 1.92 2.18 2.23 2.41 2.37 2.28 2.26 33 2.60 2.63 2.99 3.01 3.10 3.20 3.41 . 3.44 47 4.35 4.28 5.2 5.1 ' 5.3 5.4 5.8 5.8 59 5.8 5.7 7.4 7.6 7.8 7.6 9.1 9.0 72 7.4 7.3 11.6 11.3 12.1 12.0 15.0 . 15.2 95 10.1 10.0 19.4 19.6 20.8 20.9 26.2 26.5
106 11.4 11.5 23.1 23.0 25.7 25.6 31.1 31.0 120 13.2 13.0 27.8 27.9 32.2 32.6 37.3 . 37.2 131 14.6 14.5 31.6 31.8 36.5 36.2 42.2 42.0 148 16.5 16.6 37.3 37.3 43.3 43.6 49.7 49.9 168 18.9 18.7 43.4 43.4 51.2 51.0 58.6 58.8 192 19.5 19.7 51.7 51.8 60.7 60.5 66.4 66.3 216 20.2 20.1 60.3 60.5 66.2 66.6 69.8 67.7
Zinc-extr. rate (mg/1 hr) 107 .6 331. 3 414 .3 444 .2
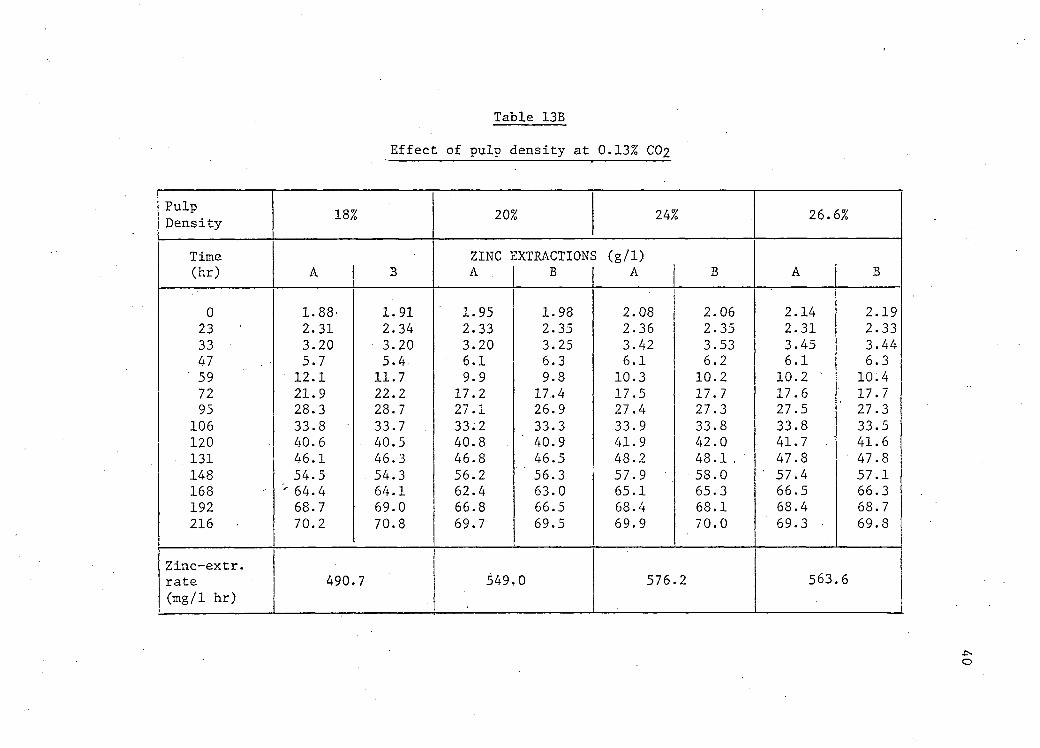
Table 13B
E f f e c t of pulp density at 0.13% CO2
Pulp 18% 20% 24% 26.6% Density
Time ZINC EXTRACTIONS (g/1) (hr) A B A B A B A B
0 1.88- 1.91 1.95 1.98 2.08 2.06 2.14 2.19 23 2.31 2.34 2.33 2.35 2.36 2.35 2.31 2.33 33 3.20 3.20 3.20 3.25 3.42 3.53 3.45 3.44 47 5.7 5.4, 6.1 6.3 6.1 6.2 6.1 6.3 59 12.1 11.7 9.9 9.8 10.3 10.2 10.2 ' 10.4 72 21.9 22.2 17.2 17.4 17.5 17.7 17.6 17.7 95 28.3 28.7 27.1 26.9 27.4 27.3 27.5 27.3
106 33.8 33.7 33.2 33.3 33.9 33.8 33.8 33.5 120 40.6 40.5 40.8 40.9 41.9 42.0 41.7 .• 41.6
. 131 46.1 46.3 46.8 46.5 48.2 48.1 . 47.8 • 47.8 148 54.5 54.3 56.2 56.3 57.9 58.0 ' 57.4 57.1 168 ' 64.4 64.1 62.4 63.0 65.1 65.3 66.5 66.3 192 68.7 69.0 66.8 66.5 68.4 68.1 68.4 68.7 216 70.2 70.8 69.7 69.5 69.9 70.0 69.3 • 69.8
Zinc-extr. rate 490 7 549. 0 576 2 563.6 (mg/1 hr)
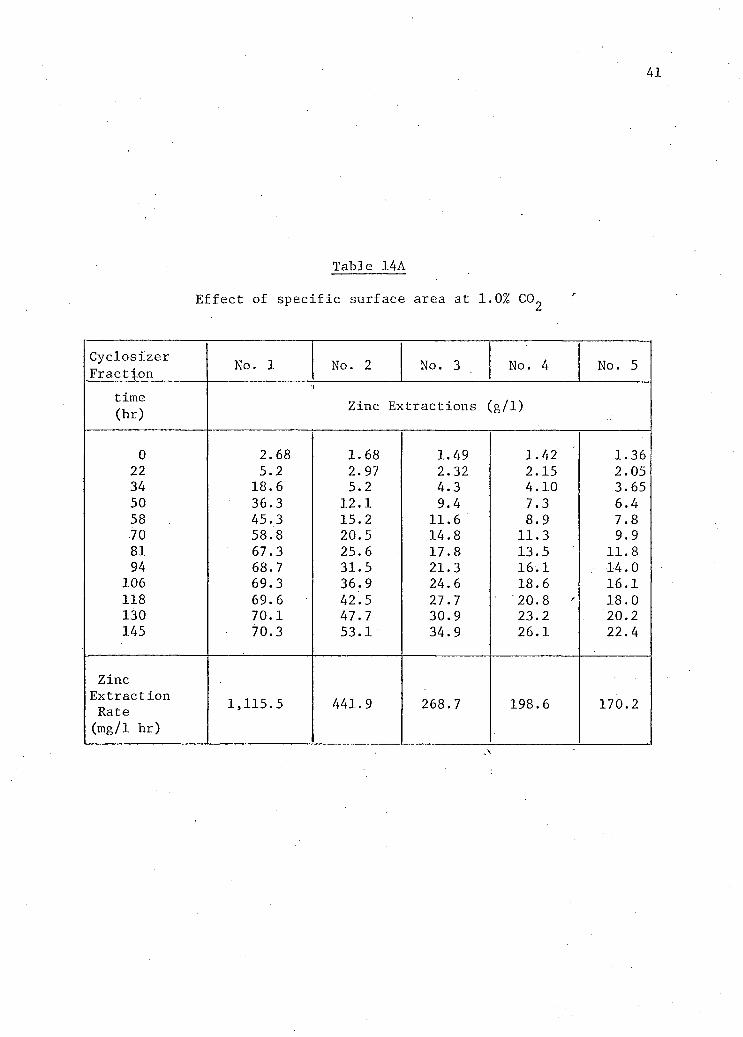
41
Table 14A
Effect of s p e c i f i c surface area at 1.0% CO
Cyclosizer Fraction No. 1 No. 2 No. 3 No. 4 No. 5
time (br) Zinc Extractions (g/1)
0 2.68 1.68 1.49 1.42 1.36 22 5.2 2.97 2.32 2.15 2.05 34 18.6 5.2 4.3 4.10 3.65 50 36.3 12.1 9.4 7.3 6.4 58 45.3 15.2 11.6 8.9 7.8 70 58.8 20.5 14.8 11.3 9.9 81 67.3 25.6 17.8 13.5 11.8 94 68.7 31.5 21.3 16.1 14.0
106 69.3 36.9 24.6 18.6 16.1 118 69.6 42.5 27.7 20.8 ' 18.0 130 70.1 47.7 30.9 23.2 20.2 145 70.3 53.1 34.9 26.1 22.4
Zinc Extraction Rate 1,115.5 441.9 268.7 198.6 170.2 (mg/1 hr)
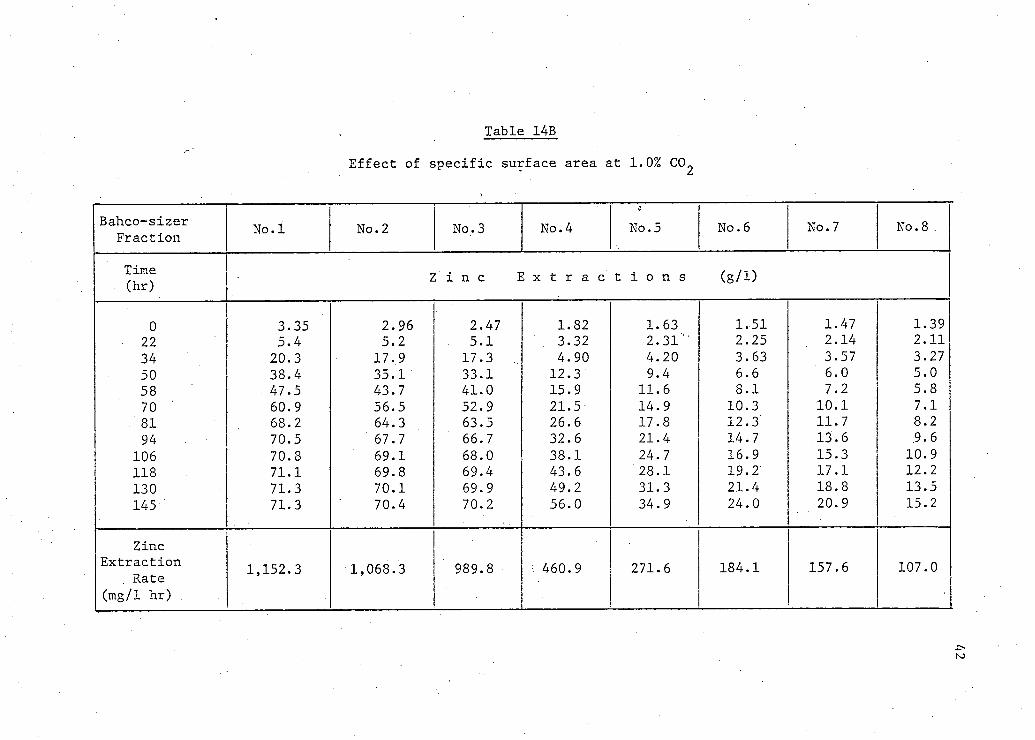
Table 14B
E f f e c t of s p e c i f i c surface area at 1.0% CO
j
Bahco-sizer F r a c t i o n No.l No.2 No. 3 No. 4
0
No. 5 No. 6 No. 7 No. 8 .
Time (hr) Z i n c E x t r a c t i o n s (g/D
0 3.35 2.96 2.47 1.82 1.63 1.51 1.47 1.39 22 5.4 5.2 5.1 3.32 • 2.31"' 2.25 2.14 2.11 34 20.3 17.9 17.3 4.90 4.20 3.63 3.57 3.27 50 38.4 35.1 33.1 12.3 9.4 6.6 6.0 5.0 58 47.5 43.7 41.0 15.9 11.6 8.1 7.2 5.8 70 60.9 56.5 52.9 21.5 14.9 10.3 10.1 7.1
.' 81 68.2 64.3 63.5 26.6 17.8 12.3 11.7 8.2 94 70.5 67.7 66.7 32.6 21.4 14.7 13.6 9.6
106 70.8 69.1 68.0 38.1 24.7 16.9 15.3 10.9 118 71.1 69.8 69.4 43.6 28.1 19.2" 17.1 12.2 130 71.3 70.1 69.9 49.2 31.3 21.4 18.8 13.5 145 71.3 70.4 70.2 56.0 34.9 24.0 20.9 15.2
Zinc E x t r a c t i o n
Rate 1,152.3 1,068.3 989.8 460.9 271.6 184.1 157.6 107.0
(mg/1 hr)

APPENDIX 2
Curve f i t t i n g s
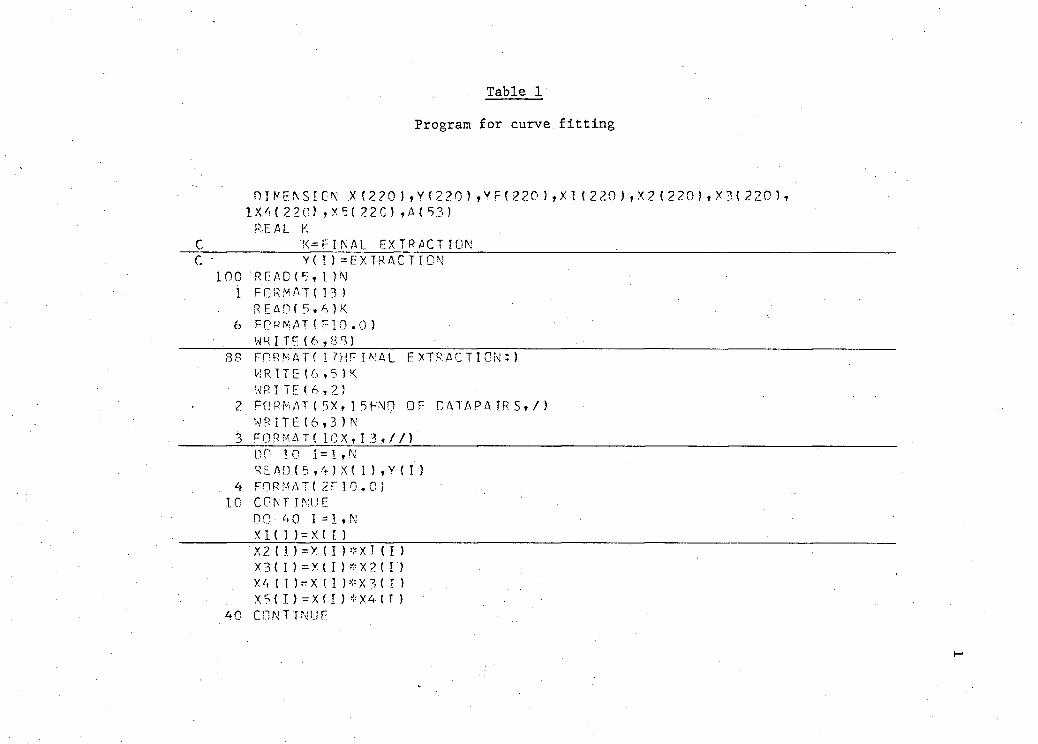
Table 1
Program f o r curve f i t t i n g
n i N E N S I CN X ( 2 ? 0 ) f Y < 2 2 0 ] , Y F ( 2 2 O J , X l ( 2 2 O ) , X 2 ( 2 2 0 ) , X 3 { 2 2 O ) , 1 X 4 ( 2 2 G ) , X 5 ( 2 2 C ) » A ( 5 3 )
REAL K C K-F I NAL EXTRACTION C • Y(I)^EXTRACTION
.100 RE AC (5, DN 1 FORMAT(13)
READ(5,6)K 6 FORMAT if 10.0)
WRI TE (6 ,8B) 88 FORMAT? 17'HF INAL EXTRACTION:)
WRTIE(6 ,5)K WRITE'. A,?!
2 FORMAT (5X ,15FN0 OF OATAPAIRS,/) WR IT!" (6,3 ) N
. . 3 FORMAT! 1QX,I 3,//) DO 10 1=1,N R E A o ( 5 ,4 ) X < I ! , Y { I )
4 FORMAT(2F10.C) • 10 C O M INOF ' '
DO 40 1=1, IM
X l ( I ) = X ( I ) 'X2 { I )=X ( I ) * X l ( I ) X3( I ) = X( I ) * X 2 M ' ) X'« ( I ) = X ( I )*X3( I ) X5( I ) = X ( I ) * X 4 (I )
40 CONTINUE
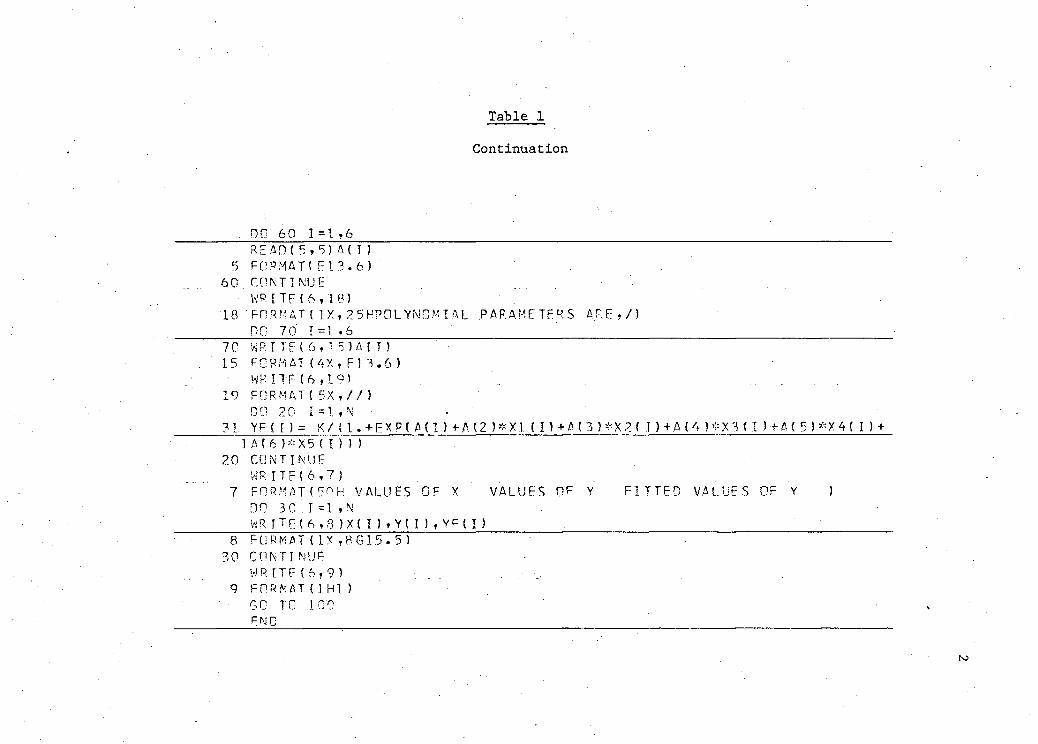
Table 1
Continuation
. DO 60 1=1 ,6 R F A D ( 5 , 5 ) A ( I )
5 FORMAT( E13.6 ) 60 CONTINUE
WRITE (6,18) 1 8 ' FORMAT(IX t 2 5HP0LYNQMIAL PARAMETERS ARE,/)
DO 70" I =1 .6 70 *RITF(6, 15 3A! T ) 15 FORMAT ( 4 X , F ] 3 .6 )
HP I TF (6,19) 19 FORMAT{5X,//)
DO 20 31. YF{ I ) = K/ (1 .+EXP( A( 1 ) + A (2 )*X1 ( I) + A ( 3 )*X2< I ) + A(4 )*X3 t I ) + A( 5 ) *X4( I ) •+
1 A(6 )*X5 ( I ) ! ) 20 CONTINUE
WR I T E ( 6 , 7 ) 7 FORMAT(50H VALUES OF X VALUES OF Y FITTED VALUES OF Y )
DO 3 0 .1-1 » N WR IT E ( 6 , 8 ) X ( I ) , Y ( I ) , Y F ( I ) .
8 FORMAT{IX,8G15.5) 30 CONTI NUE.
VJRITE(6,9) ... _ 9 FORtVAT ( 1 HI )
GO TO 100 P N C . '
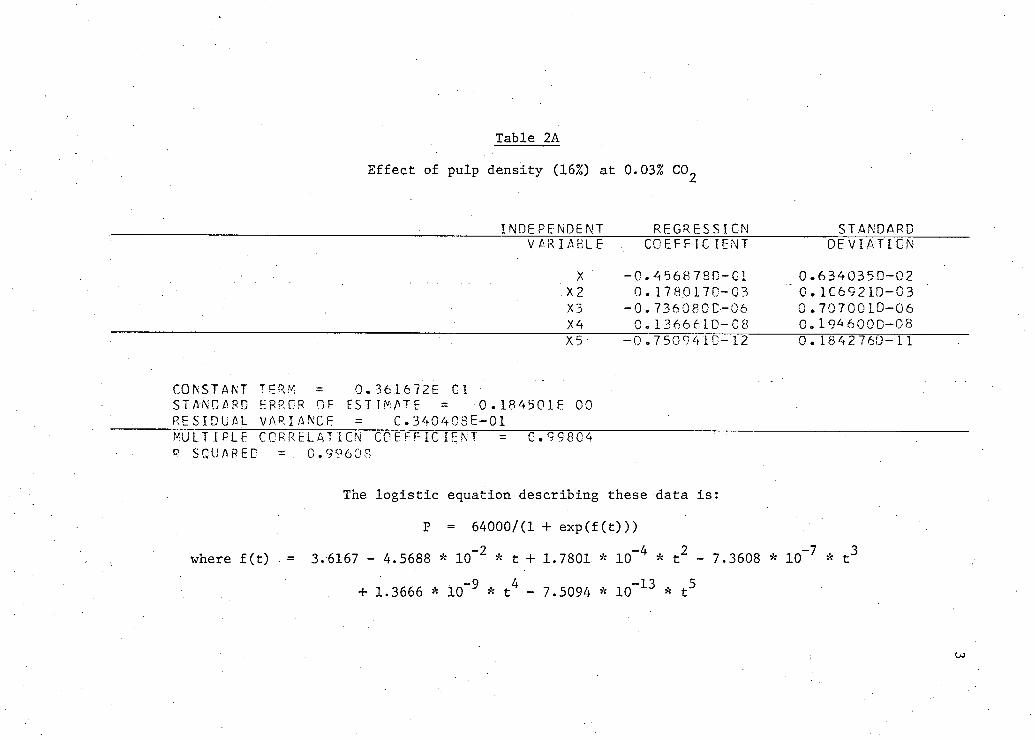
Table 2A
Effect of pulp density (16%) at 0.03% C0 2
INDEPENDENT REGRESSION STANDARD VARIABLE COEFFICIENT DEVIATION
X -0.456878D-01 0.6340350-02 X 2 0. 17 80170-03 " 0. 1G6921D-03 X3 -0. 7360800-06 0 .7070010-06 X4 0. 136661D-G8 0.19460QD-08 X5 -0.7 509410-12 0. 1842 760-11
CONSTANT TERM = 0.361672E Gl STANDARD ERROR OF ESTIMATE = 0.184501E 00 RESIDUAL VARIANCE •= C.340408E-01 MULTIPLE CORRELATION COEFFICIENT = C.99804 R . SQUARED = . 0.99603
The logistic equation describing these data is:
P = 64000/(1 + exp(f(t)))
where f(t) = 3.6167 - 4.5688 * IO - 2 * t + 1.7801 * IO - 4 * t 2 - 7.3608 * 10 _ 7 * t 3
+ 1.3666 * 10~9 * t 4 - 7.5094 * 10~ 1 3 * t 5
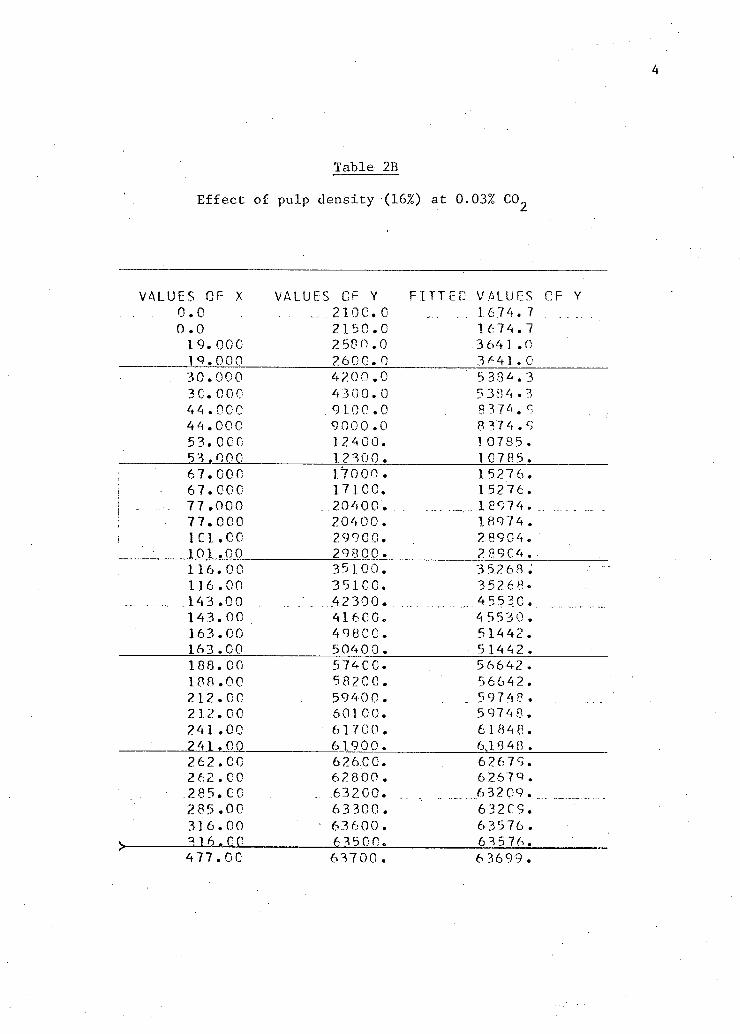
Table 2B
E f f e c t of pulp density (16%) at 0.03% CO
VALUES OF X VALUES CF Y FITTED VALUES OF Y . . 0.0 ... .2100. 0 .. . 1 6 74.7
0.0 2150.0 1674.7 19.000 2 58 0.0 3 641.0 19.000 2600.0 .3 641. 0
. 30.000 4200 .0 5 38 4.3 3G.000 4300.0 5384 .3 44.000 9100.0 8374.c 44.000 9 000 .0 8 3 74.9 53.000 12400. 1.0785 . 53.000 12300. 1 G 7 8 5 . 67.00 0 1.7000 . 15276. 67.000 17 1.00. 15276.
. .... 77.000 20400. 18974. 77.000 20400. 18974 . 1C1.C0 29900. 28904. 101 .00 29800 . 289 04. 116.00 35100. 3 52 68. 116.00 35100. 3526 8.
- 143.00 .. .' .42300. 45.5 30... 143.00 41600. 4 5530. 163.00 49800. 51442. 163.00 5040 0. 51442. 188.00 57400. 56642. 188 .00 58200. 56642. 212.00 . .59400. . . 59748. 212.00 60100. 5 974 0. 241 .00 61700. 61848. 241.00 61900. 6,18 48 . 262.00 626,00. 62679. 262.00 62800. 6 267 9 . .285. 00 632 00. 6 32 09.. 285.00 63 300. 632C9. 316.00 • 63600. 63576.
v 3 16.00 6^500. 63576. 4 77.OC 63700 . 6 3699.
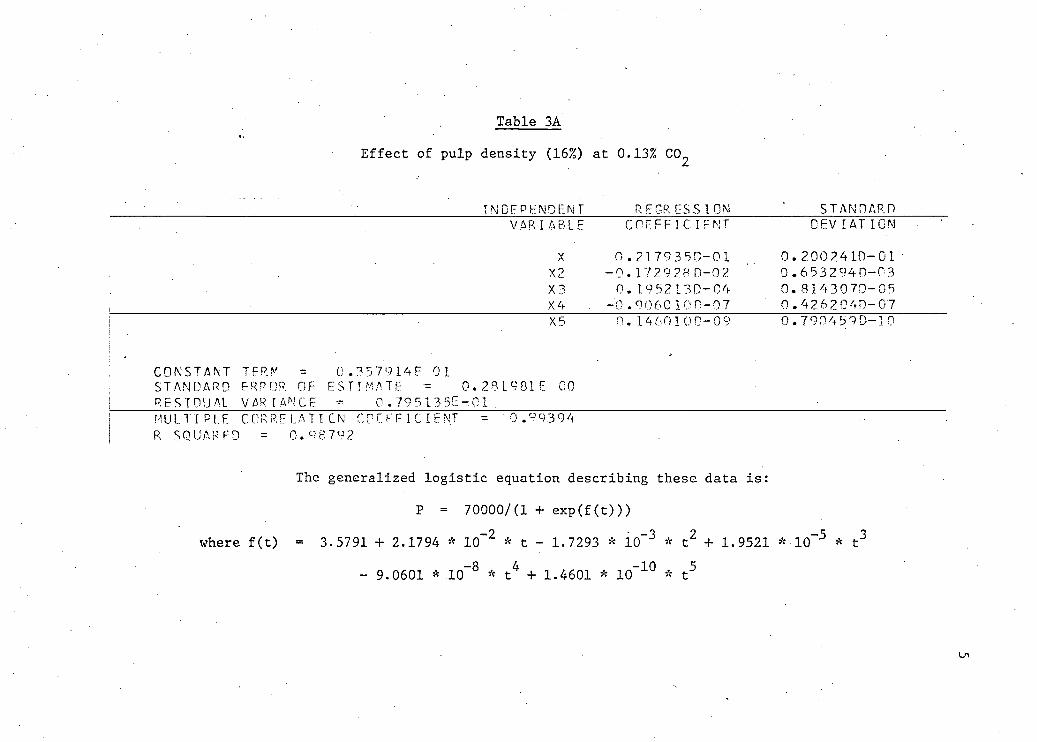
Table 3A
Effect of pulp density (16%) at 0.13% CO
INDEPENDENT R EGR ESS I ON STANDARD VARIABLE COEFFICI E NT DEVIATION
X 0.2179 350-01 0. 200241D-01 • X2 -0.172928 0-02 0.6532940-03 X3 0. 19 52130-04 0-81430 70-05
, X4 -0.906010 0-07 0.426204D-07 I X5 0. 146010 0-09 0.7904590-10
CONSTANT TERM = 0 .357914E 01 STANDARD ERROR OF ESTIMATE - 0.2S1981E 00 RESIDUAL VARIANCE •= 0 . 79 5 13 5E - 01 . MULTIPLE CCRREI.ATI CN COEFFICIENT = 0 . r j9394 R SQUARED = 0.98792
The generalized logistic equation describing these data i s :
P = 70000/(1 + exp(f(t)))
where f(t) - 3.5791 +2.1794 * IO - 2 * t - 1.7293 * IO - 3 * tZ + 1.9521'* 10~3 * t 3
- 9.0601 * 10~8 * t 4 + 1.4601 * IO - 1 0 * t 5
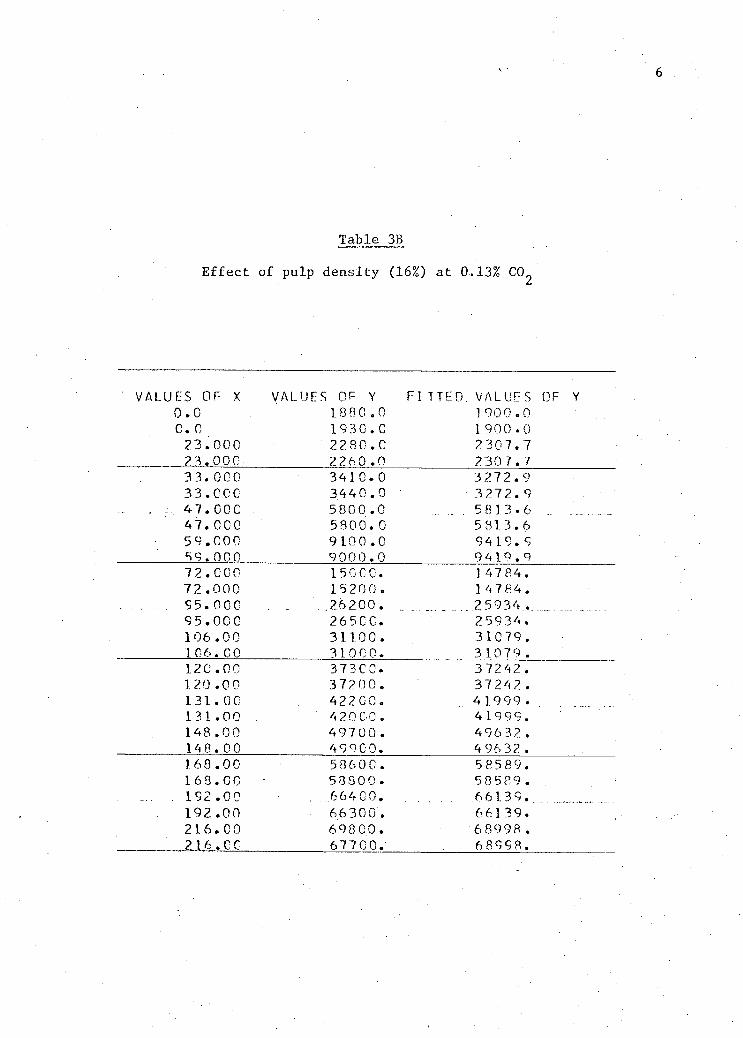
Table 3B
E f f e c t of pulp density (16%) at 0.13% CO
VALUES OF X VALUES OF Y FlTTED. VALUES OF Y 0.0 18 8 0.0 1900.0 0. 0 1930.0 1900 .0 23.000 2280.0 2 30 7.7 2 3.000 2260 .0 2 30 7.7 3 3.000 3410.0 3272.9 33.000 3.44 0.0 3272.9
... 47. GOG 5800 .0 5 813.6 . 47.000 5300.0 5 81.3.6 5 9.000 9 10 0.0 94 19.9 59.00 0 9000.0 9419.9 7 2.000 15000. 14784. 72 .000 15 200. 14 784. 95.0GC . .26200 . 2 5934.. 95.000 265CC. 2 59 34. 106 .00 31100. 3 10 79. 106.00 3100 0. 3 1079. 120.00 37300. 3 72 42. 120 .00 37200. 37242. 131.00 42200. . . 41999 . 131.00 4 20 00. 4 19 9 9. 148.00 497 00 . 49632 . 14 8.00 49900. 4 96 32. 1.68 .00 58600. 5 85 89. 168.00 53800. 58589. 192.00 . .66400. . . 66139. 192.00 66300. 66139. 216.00 6980.0 . 68998. 216.00 67700. 68998.
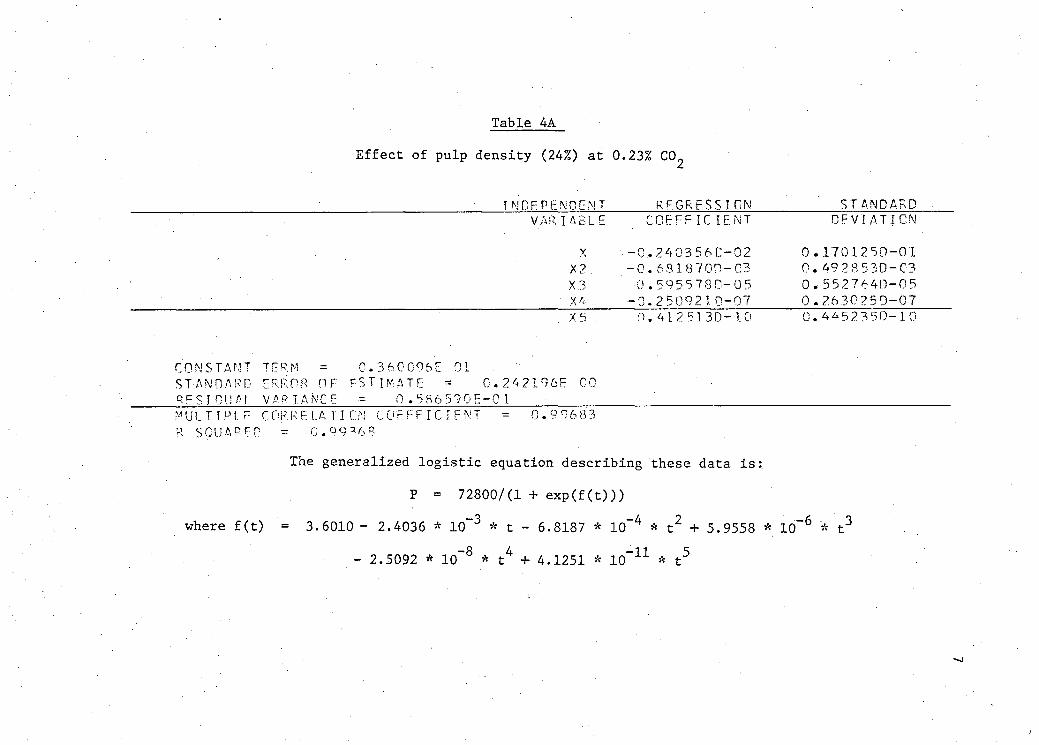
Table 4A
Effect of pulp density (24%) at 0.23% CO
INDEPENDENT REGRESS I ON STANDARD . VARIABLE CCEFFICIENT OFVI AT ION
X -Q..240356C-02 0 . 1701250-01 X 2 -0.6318 700-03 0.4928530-03 X3 •0 . 595578D-05 0. 55276413-05
-0.2 509210-07 0 . 2630250-07 X5 O.412513D-10 0.4452350-10
CONSTANT TERM = 0.360096E 01 STANDARD ERRO-R OF ESTIMATE = 0. 242196E 00 RESIDUAL VARIANCE -- 0 .5S6590E-01 MULTIPLE CORRELATION COEFFICIENT = 0.99583 R SQUARED - 0.99368
The generalized logistic equation describing these data i s :
P = 72800/(1 + exp(f(t)))
where f(t) = 3.6010 - 2.4036 * 10~3 * t - 6.8187 * 10~4 * t 2 + 5.9558 * 10~6 '* t
- 2.5092 * 10"8 * t 4 + 4.1251 * 10 _ 1 1 * t 3
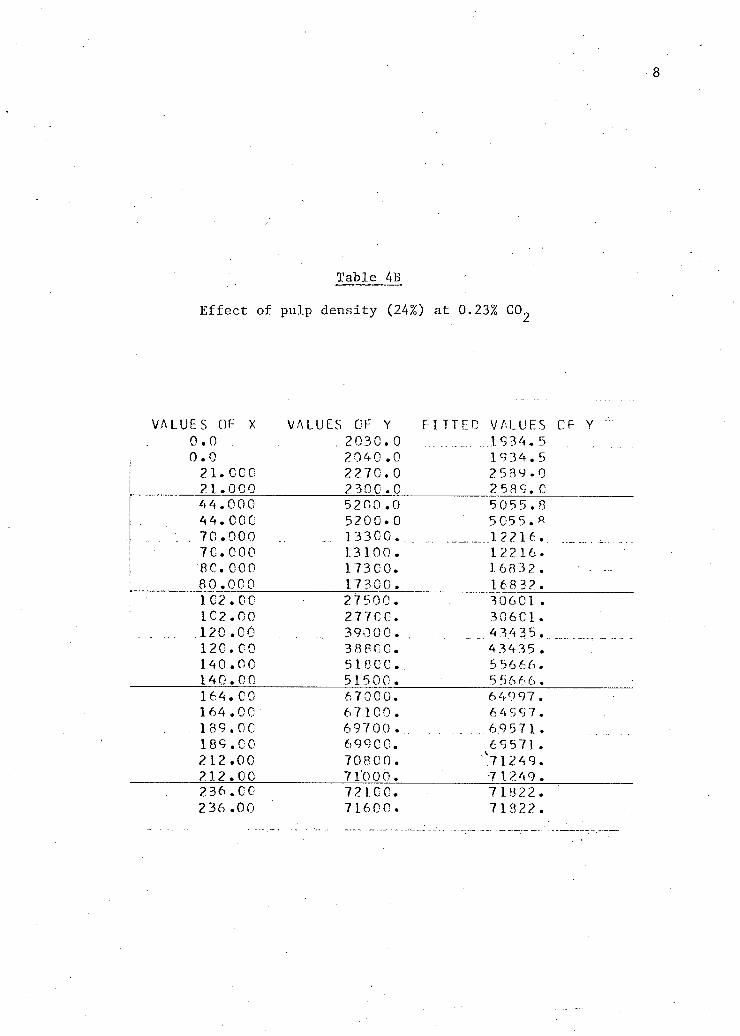
Table 4B
E f f e c t of pulp d e n s i t y (24%) at 0.23% CO
V A L U E S OF X V A L U E S OF Y F I T T E D V A L U E S OF Y
0 . 0 . 2 0 3 0 . 0 1 9 3 4 . 5
0 . 0 2 0 4 0 . 0 1 9 3 4 . 5
2 1 . CCO 2 2 7 0 . 0 2 5 3 9 . 0
2 1 . 0 0 0 2 3 0 0 . 0 2 5 8 9 . C
4 4 . 0 0 0 5 2 0 0 . 0 5 0 5 5 . 8
44.COO 5 2 0 0 . 0 5 0 5 5 . 8
. . . . 7 0 . 0 0 0 . 1 3 3 0 0 . . 1 2 2 1 6 . .._ ,
7 C . 0 0 0 1 3 1 0 0 . 1 2 2 1 6 .
ac .ooo 1 7 3 0 0 . 1 6 8 3 2 .
8 0 . 0 0 0 1 7 3 0 0 . 1 6 8 3 2 .
1 C 2 . 0 C 2 7 5 0 0 . 3 0 6 0 1 .
1 C 2 . 0 0 2 7 7 C G . 3 0 6 C 1 .
1 2 0 . 0 0 3 9 0 0 0 . . 4 3 4 3 5
1 2 0 . C O 3 fl F C C . 4 3 4 3 5 .
1 4 0 . 0 0 5 1 0 0 C . 5 5 6 6 6 . 1 4 0 . 0 0 5 1 5 0 0 . 5 5 6 6 6 .
1 6 4 . C O 6 7 0 0 0 . 6 4 9 9 7 .
1 6 4 . 0 0 6 7 1 0 0 . 6 4 9 9 7. 1 8 9 . 0 0 6 9 7 0 0 . . . 6 9 5 7 1 . .
1 8 9 . 0 0 6 9 9 0 0 . 6 9 5 7 1 .
2 1 2 . 0 0 7 0 8 0 0 . V 7 1 2 4 9 .
2 1 2 . 0 0 7 1 0 0 0 . 7 1 2 4 9 . 2 3 6 . 0 0 7 2 1 C O . 7 1 8 2 2 .
2 3 6 . 0 0 7 1 6 0 0 . 7 1 3 2 2 .
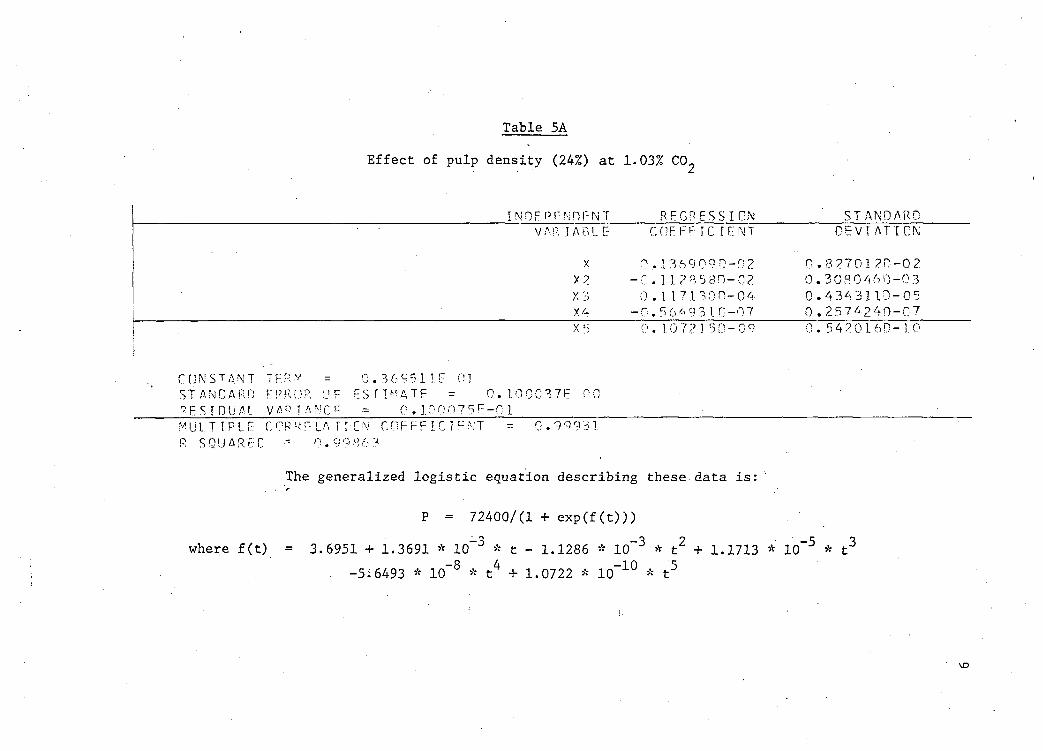
Table 5A
Effect of pulp density (24%) at 1.03% CO
I N 0 E P F N D P N T REGRESSION STANDARD • • VARIABLE COEFF IC IE NT DEVI AT ION
X 0.1369090-02 0.8270 120-0 2 X? -0. 1128580-02 0. 3080460-03 X3 0 .117 1^00-04 0.4343110-05 X 4 -0.56*931 0-07 0 . 2574240-07 X 5 0. 10 721 50-09 0.5420160-10
CONSTANT TER^ = 0.3695110 01. STANDARD ERROR OF ESTIMATE = 0.100037E 00 RESIDUAL VAR T AN Q F = 0 . 100075E-01 MULTIPLE C OR R E LA F r CN COEFFICIENT = 0.99931 R SQUARED = 0.99863
The generalized logistic equation describing these data i s :
P = 72400/(1 + exp(f(t)))
where f(t) = 3.6951 +.1.3691 * 10~3 * t - 1.1286 * 10~3 * t 2 + 1.1713 * 10~5 * t . -5i6493 * IO - 8 * t 4 + 1.0722 * 10 _ 1° * t 5
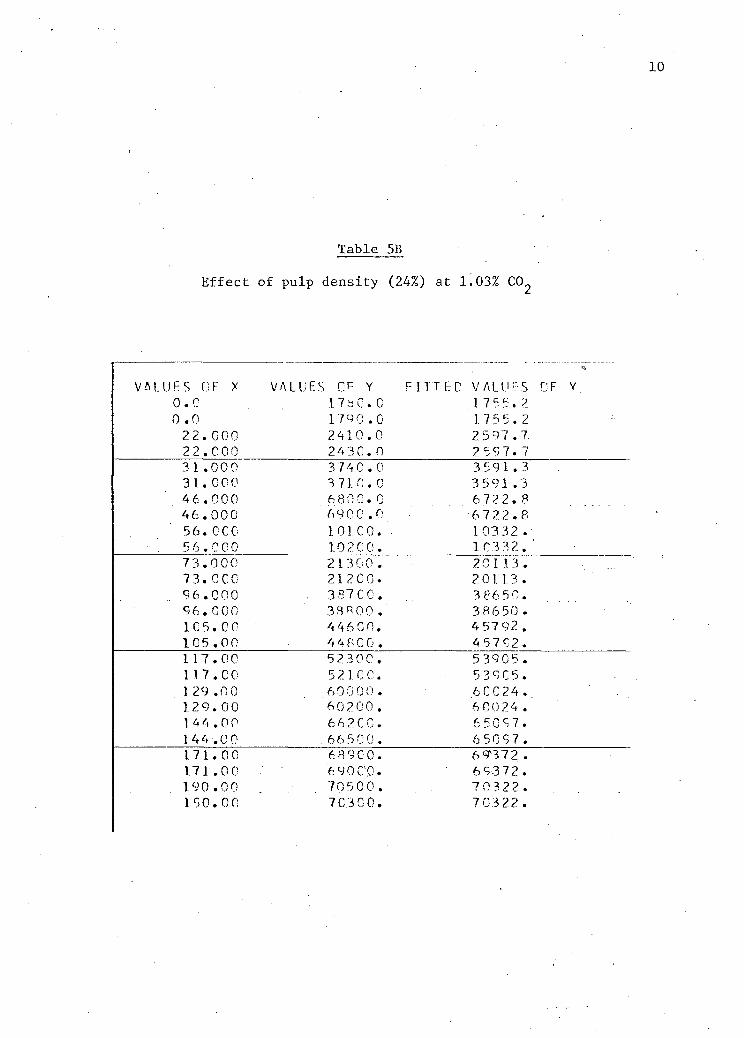
Table 5B
E f f e c t of pulp d e n s i t y (24%) at 1.03% CC>2
VALUES OF X VALUES OF Y FITTED VALUES OF Y. 0.0 17S0.C 17 5 5.2 0 .0 1790 .0 17 5 5.2 22.GOO 2410.0 2 5 97.7. 2 2.000 24 3 0.0 2 59 7. 7 3 1 .000 3 74 0 . 0 3 5 9 1.3 31.000 3 710.0 3 591.3 46.000 6800.0 6 72 2.8 46.000 6900 .0 6 7 2 2.8 56.GCC 101.00. 10332 . 56.000 102C0. 1 03 3 ?..' 7 3.0 00 21300. 201. 13 . 73.000 212 G 0 . 2 0113. 96.000 387 CO. 38650. 96.000 38800 . 3 8650. 1 C 5 . C 0 446C0. 4 57 92 . 105.00 44800. 45792. 117.00 52300. 53905. 1 17.00 521C0. 5 3 9 C 5 .
. 1 29 .0 0 .60000. 6GC24.. 129.00 60 200 . 6 00 24. 144.00 6 6 2 C 0. 65G97. 144 .00 .665CO. 6 5097. 17 1.00 6 8 9 C 0 . 6 9v37 2 . 1 7 1 .00 690 CO. 69372. 190.00 70500. 70 32 2. 190.on 7 C.3 0 0 . 7 0322.

Table 6A
Effect of pulp density (24%) at 7.92% CO
IM GF.P ENOENT RE ORE SSI OH STANDARD VARIABLE COEFE IC I ENT DEVIATION
X 0.156638D-G1 G. 8001850-02 - X2 -0.3 46 5 72 0-02 0 . 2 S l Q 4 2D-0.3
X3 0. I 4 46 63 0-04 n \J .
3876740-05 X 4 -0.627694D-07 0. 224352D-07 X5 0 . 101.0 64 C-0 9 0 . 4594 140-10
CC VST ANT T FR'M 0.3^9736F 01 STANDARD ERROT OF EST I MATE n . 106098E 00 R ES I DUAL VAR 1.1 *NCE •= 0. 1125 £ «F-.01 M M "I PLE OCR R.E LATI IN Cf-EFPIC i E "\ T = 0.99932 R SQUARE n • —
The generalized logistic equation describing these data is:
P = 70600/(1 + exp(f(t)))
where f(t) = 3.4974 + 1.5664 * 10~2 * t - 1.4657 * IO - 3 * t 2 + 1.4466 * 10~5 * t
- 6.2769 * 10 * t + 1.0106 * 10 * t
H 1
I—1
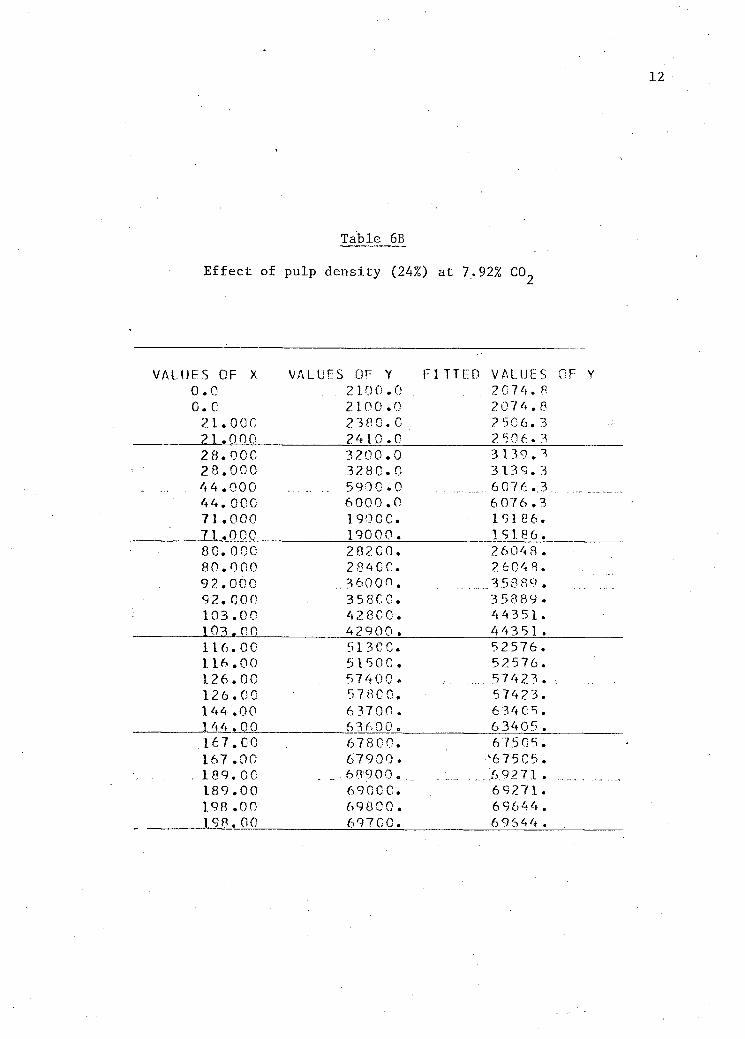
Table 6B
E f f e c t of pulp d e n s i t y (24%) at 7.92% CO
VALUES OF X VALUES OF Y FITTED VALUES OF Y 0 . 0 2 1 0 0 . 0 2 0 7 4 . 8
0 . c 2 1 0 0 . 0 2 0 7 4 . 6
2 1 . 0 0 0 2 3 8 0 . 0 2 5 0 6 . 3
2 1 . 0 0 0 2 4 1 0 . 0 2 5 0 6 . 3
2 8 . 0 0 0 3 2 0 0 . 0 3 1 3 9 . 3
2 8 . 0 0 0 3 2 8 0 . 0 3 1 3 9 . 3
4 4 . 0 0 0 . 5 9 0 0 . 0 6 0 7 6 . .3
4 4 . 0 C 0 6 0 0 0 . 0 6 0 7 6 . 3
7 1 . 0 0 0 1 9 0 C C . 1 9 1 8 6 .
7 1 . 0 0 0 1 9 0 0 0 . 1 9 1 8 6 .
8 0 . 0 0 0 . 2 8 2 C 0 . 2 6 0 4 8 .
8 0 . 0 0 0 2 8 4 C C 2 6 0 4 8 .
9 2 . 0 0 0 . . 3 6 0 0 0 . 3 , 5 8 8 9 . .
9 2 . 0 0 0 3 5 8 C 0 . 3 5 8 8 9 .
1 0 3 . 0 0 4 2 8 0 0 . 4 4 3 5 1 .
1 0 3 . 0 0 4 2 9 0 0 . 4 4 3 5 1 .
1 1 6 . 0 0 5 1 3 C 0 . 5 2 5 7 6 .
1 1 6 . 0 0 5 1 5 0 0 . 5 2 5 7 6 .
1 2 6 . 0 0 . . 5 7 4 0 0 . 5 7 4 2 3 .
1 2 6 . 0 0 5 7 8 0 0 . 5 7 4 2 3 .
1 4 4 . 0 0 6 3 7 0 0 . 6 3 4 C 5 .
1 4 4 . 0 0 6 3 6 0 0 . 6 3 4 0 5 .
1 6 7 . 0 0 6 7 8 0 0 . 6 7 5 0 5 .
1 6 7 . 0 0 6 7 9 0 0 . - V 6 7 5 G 5 .
•. . 1 8 9 . 0 0 „ 6 8 9 0 0 . ... . : 6 . 9 2 7 1 .
1 8 9 . 0 0 6 9 0 0 0 . 6 9 2 7 1 .
1 9 R . 0 0 6 9 8 0 0 . 6 9 6 4 4 .
1 9 8 . 0 0 6 9 7 C G . 6 9 6 4 4 .
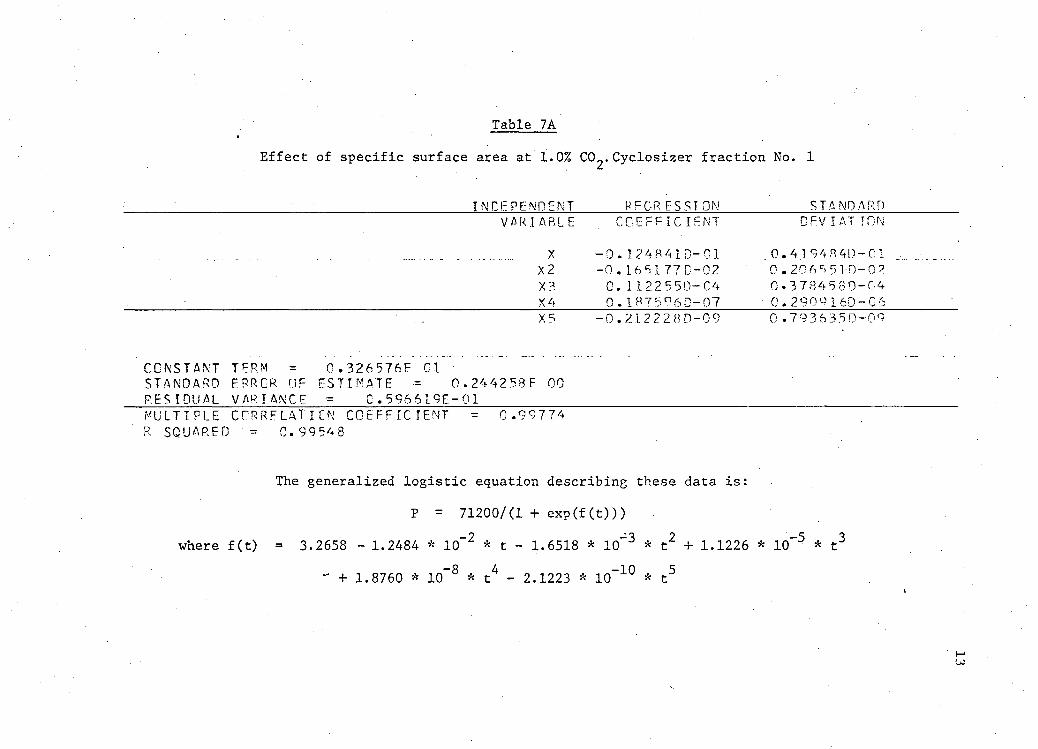
Table 7A
Effect of specific surface area at 1.0% C0„.Cyclosizer fraction No. 1
INDEPENDENT RFGR ESSI ON STA NOARO VARIABLE COEFFICIENT CF.V I AT FON
X -0. 124841D-C1 . 0.4.194840-01 _, X2 -0.165177D-02 0.20655 TO-0 2 X3 0. 1 122 5 50-04 0.3784580-04 X4 0 . 1 87 5960— 07 • 0. 2909160-06 X5 -0.2122280-09 0 .7936350-09
CONSTANT TERM = 0.326576E 01 STANDARD ERROR OF ESTIMATE •= 0. 2442 58 F 00 RESIDUAL VARIANCE = C.596519E-Q1 MULTIPLE CORRELATION COEFFICIENT = 0.99774 R SQUARED = 0.99543
The generalized logistic equation describing these data i s :
P = 71200/(1 + exp(f(t)))
where f(t) = 3.2658 - 1.2484 * IO - 2 * t - 1.6518 * IO - 3 * t 2 + 1.1226 * 10~5 * t
" + 1.8760 * 10~8 * t 4 - 2.1223 * 10 _ 1° * t 5
r—1
OO
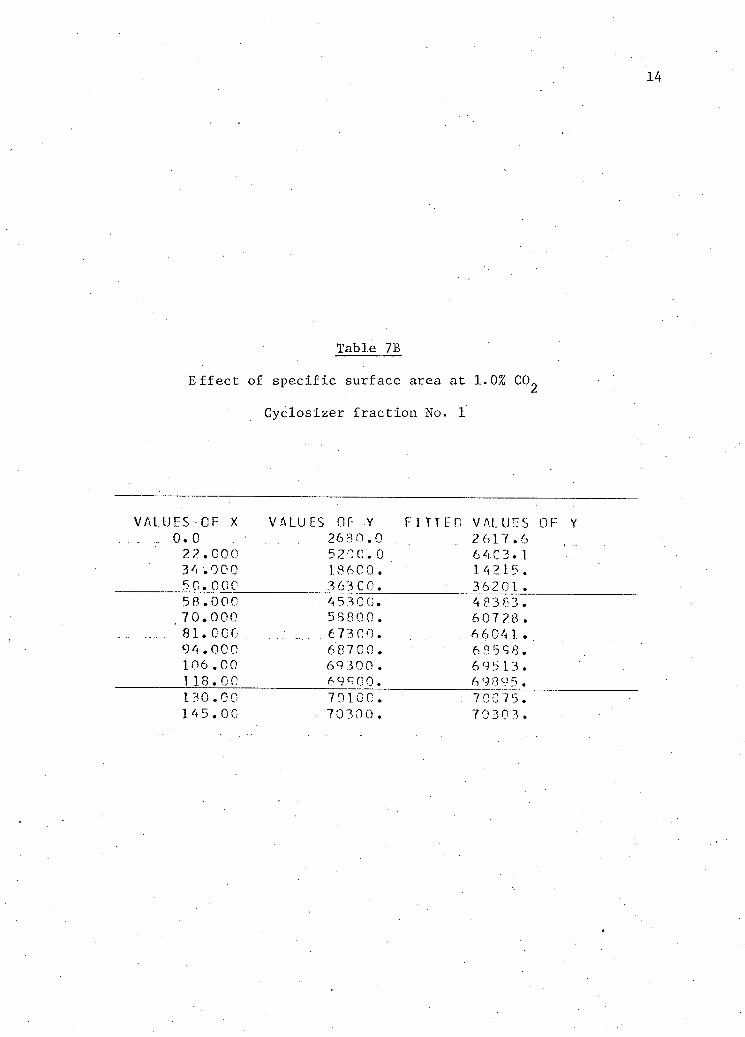
14
Table 7B
E f f e c t of s p e c i f i c surface area at 1.0% CO
Cyc l o s i z e r f r a c t i o n No. 1
VALUES OF X . ... .0.0
2 2.00 0 34.000 5 0.000
VALUES OF Y 26 8 0.0 520C.0 18600 . 363C0.
58.000 70.000 81.000 94.000 106.00 ]18.00 130 .00 14 5.00
FITTED VALUES OF V 2 617.6 6 4C3.1 14 215. 36201.
45300. 58800. 6 7300. 68700. 69300 . 69900. 70100 70300
4 83 83. 60728. 6 6 041 . 6 8 5 9 8. 6 9 5 13. 6 9895. 70075. 70303 .
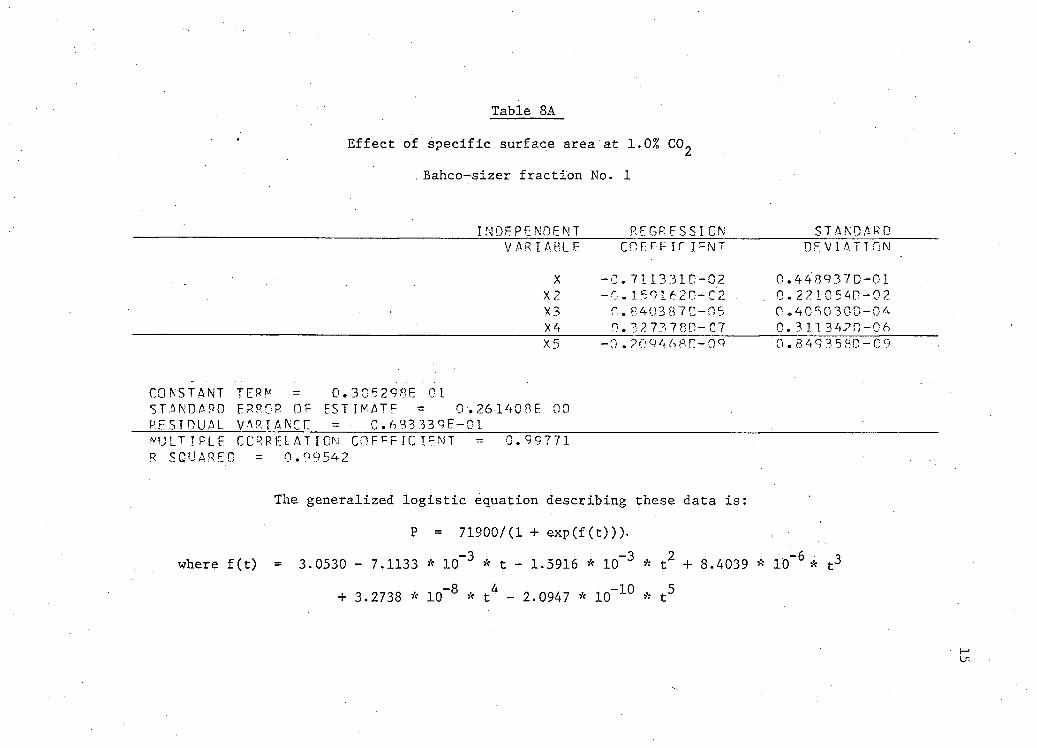
Table 8A
Effect of specific surface area at 1.0% CO
. Bahco-sizer fraction No. 1
INDEPENDENT REGRESSION STANDARD V ARI A BL E CCEFF 10 IFNT DEVIATION
• - x -Q.7113310-02 0.4489370-01 X2 -0. 1501620-02 . . .0. 2 2 10 5 40-0 2 X3 O.8403870-05 0 .4050300-04 X4 0.3273780-C7 0. 3 113470-06 X5 -0.2094680-09 0.849358D-C9
CONSTANT TERM = 0.305298E 01 STANDARD ERROR OE ESTIMATE •= 0 .261408E 00 RESIDUAL VARIANCE = C.633339E-Q1 MULTIPLE CORRELATION COEFFICIENT = 0.99771 R SQUARED = 0.99542
The generalized logistic equation describing these data is:
P = 71900/(1 + exp(f(t)))-
where f(t) = 3.0530 - 7.1133 * 10 _ 3 * t - 1.5916 * 10~3 * t 2 + 8.4039 * 10"6 * t 3
+ 3.2738 * 10"8 * t 4 - 2.0947 * 10~ 1 0 * t 5
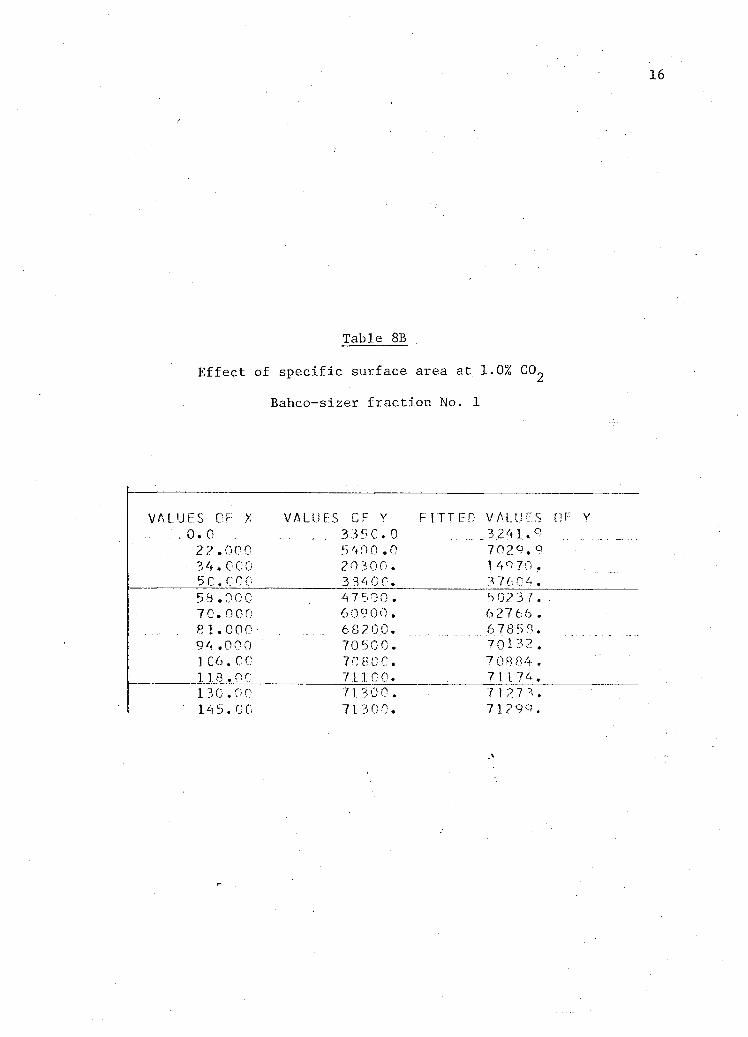
16
Table 8B
E f f e c t of s p e c i f i c surface area at 1.0% CO
Bahco-sizer f r a c t i o n No. 1
VALUES CF X VALUES OF Y FITTED V A L U E S OF v .. .0.0 ... 335C. 0 3 241.9
2?.000 5400 .0 7 02 9.9 34. 000 20300. . 149 70 . 5 0 . c o o 3 3 4 0 0. 37604. 58 .000 4 7500. 5 02 37.. 70.000 6 09 00. 6 27 66. 8 1.000 .6 8 2 0,0. 67858. 94 .000 70500. 70132. 1C6.00 70 80 0. 7 08 84. . 118.00 7110 0. 71174. 130.00 71 30 0 . 7 12 7 3. 14 5.0 0 71300. 7 1299.
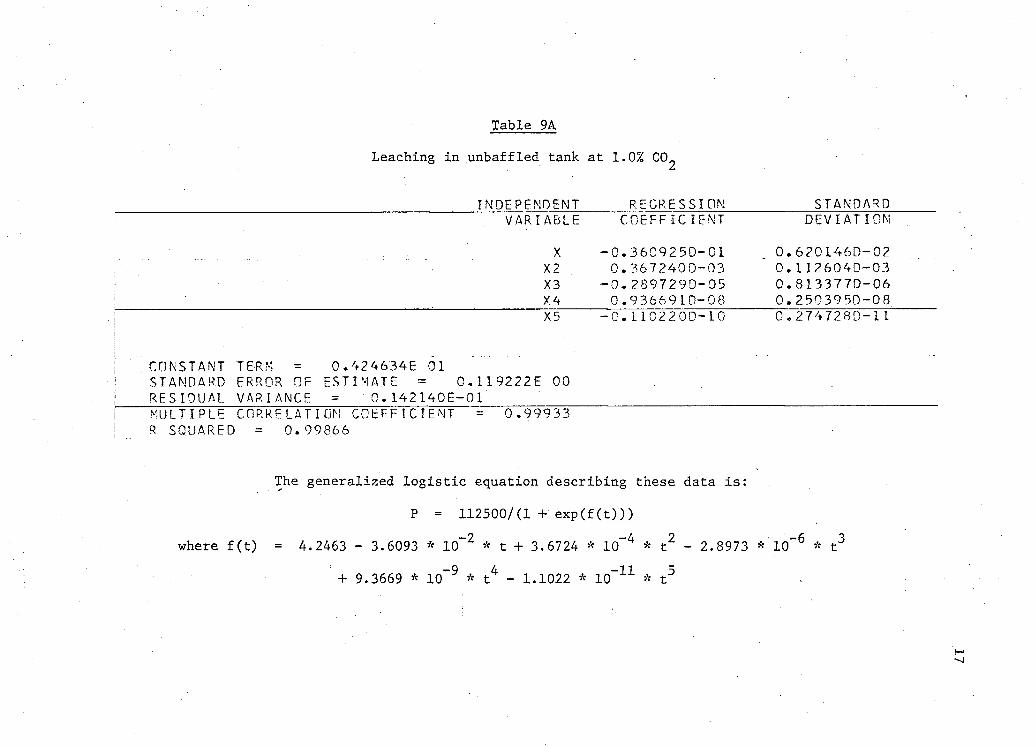
Table 9A
Leaching in unbaffled tank at 1.0% CO
INDEPENDENT REGRESSION STANDARD VARIABLE COEFFIC IENT DEVIATION
X -0.360925D-01 0.620146D-02 X2 0.3672400-03 0. 1 126040-03 X3 -0.2397290-05 0.813377D-06 X4 0.9366910-08 0.2503950-08 X5 -0.110220D-10 0,2747280-1L
CONSTANT TERM = 0.424634E 01 STANDARD ERROR OF ESTIMATE = 0.119222E 00 RESIDUAL VARIANCE = 0. 142140E-01 ' MULTIPLE CORRELATION COEFFICIENT = 0.99933 R SQUARED = 0.99866
The generalized logistic equation describing these data i s :
P = 112500/(1 + exp(f(t)))
where f(t) = 4.2463 - 3.6093 * 10~2 * t + 3.6724 * 10~4 * t 2 - 2.8973 * ' l ( f 6 * t
+ 9.3669 * 10~9 * t 4 - 1.1022 * 10 _ 1 1 * t 5
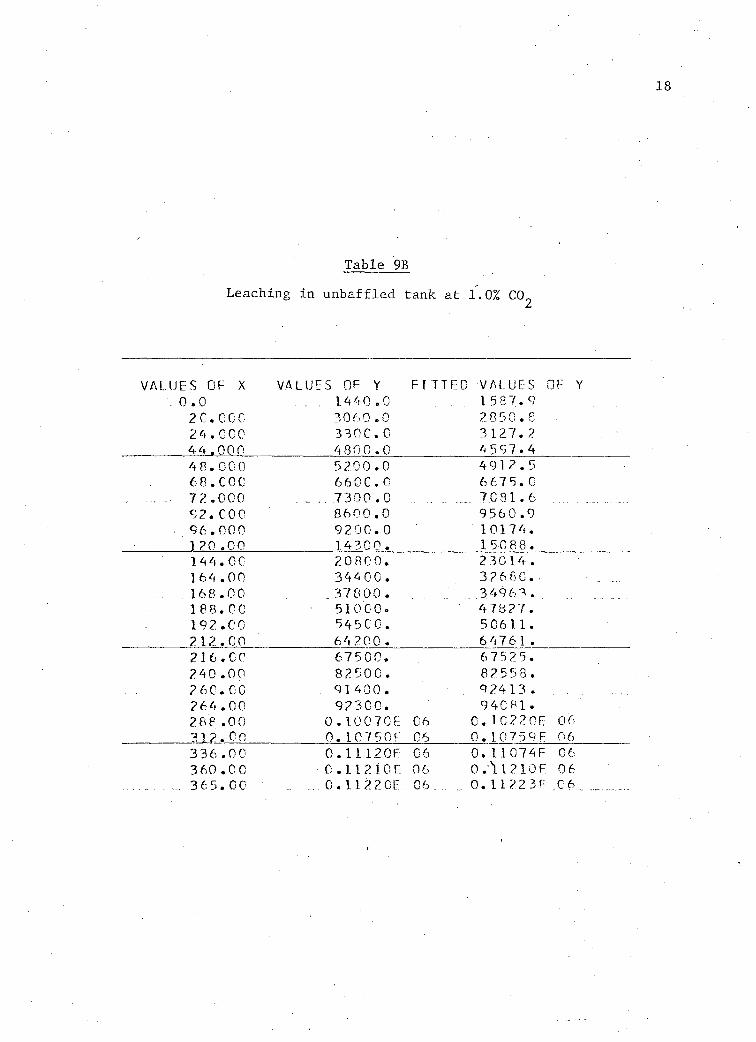
Table 9B
Leaching i n unbaffled tank at 1.0% CO
VALUES OF X VALUES OF Y FITTED VALUES 0 F Y . 0.0 . . 1440 .0 . . 158 7.9
2C. 000 3060 .0 2 0 50.e 24.000 330C.0 3127.2 44.000 4800 .0 4 55 7.4 4 8.000 5200 .0 4912.5 68.000 66CC.0 6 67 5.0 7 2.000 7300.0 7081.6 92. COO 8600.0 9560 .9
• 96.000 92 0 0.0 10174. 120 .00 14300. 150 8 8 . 144.00 20 8 0 0. 2 3014. 164.00 .344 00. 3268G.. 168.00 37 800. 34963. 188.00 510 00. 47827. 192.00 545C0. 50611. 212.00 64200. 6 4761 . 216.00 67500. 6 7 525. 240 .00 82500. 82558 . 2 6 0.00 .. 91400. 9 24 1 3 . 264 .00 92300. 940 81. 28 8 .00 0.10070E 06 0 . 10 2 2 0 E 06 312.00 0.107 50F 06 0. 10759E 06 336.00 0.U120E 06 0.11074F 06 3 60 . 0 0 0.11210E 06 0.112 10F 06 365.00 0. 11220E . 06 _ 0. 1 122 3 f-.06
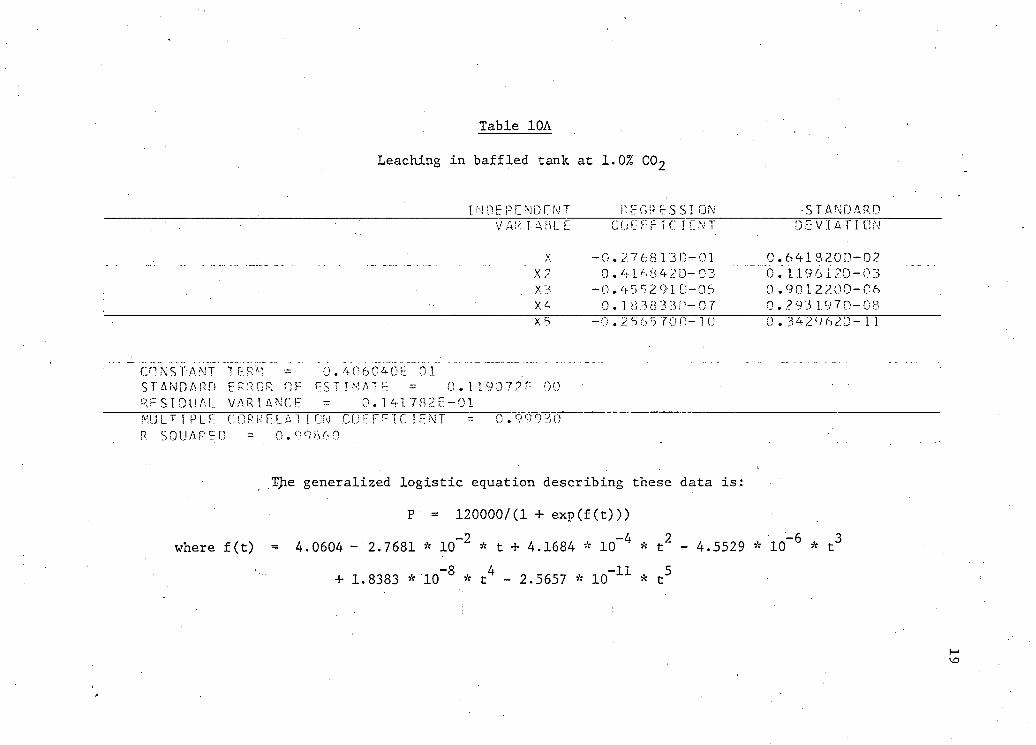
Table 10A
Leaching in baffled tank at 1.0% C02
INDEPENDENT RcGRESSION •STANDARD . V AR I 4P.L E COEFF I 0 I ENT DE VI AT I ON
X -0. 2768.13D-01 0.6418200-02 ' X 7 0.416 342 0-03 0. 1196120-03 X3 -0.45 5 2 910-05 0.9012200-06
'. X4 0.1836 330-07 0. 293 19 7 0-08 X 5 -0.2565700-10 0 . 34 29 620- 1. 1
CONSTANT'TERO~~ =" 0. 406040E"01 STANDARD ERROR OF ESTIMATE = 0. 119072E 00 R F S I DUAL VARIANCE = 0.I41782E-01 MULTIPLE CORRELATION COEFFICIENT = 0.99930 R SQUARED = 0.99860
The generalized logistic equation describing these data is:
P = 120000/(1 + exp(f(t)))
where f(t) = 4.0604 - 2.7681 * 10~2 * t + 4.1684 * 10~4 * t 2 - 4.5529 * 10 _ 6 * t
+ 1.8383 *10~ 8 * t 4 - 2.5657 * 10 _ 1 1 * t 5
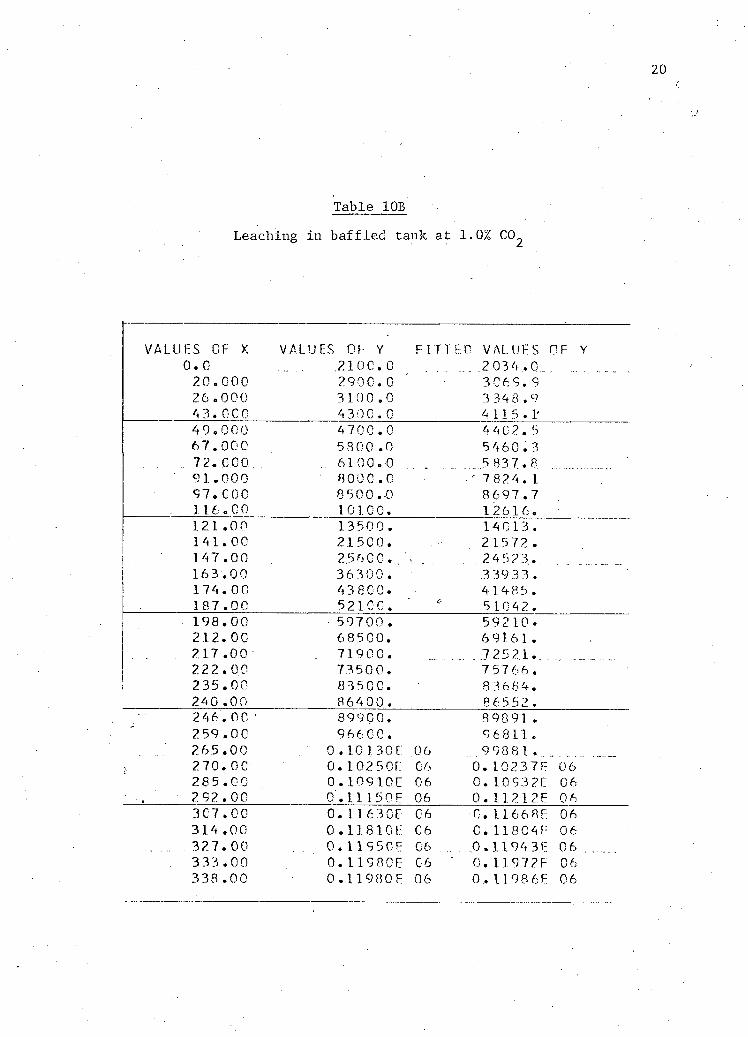
2 0 i
Table 1 0 B
Leaching i n baffled tank at 1 . 0 % CO
VALUES OF X VALUES OF Y FITTED VALUES OF Y 0.0 210C.0 2 034.0... 20.000 2900.0 3 069.9 26.000 310 0.0 3 348 .9 43.OCO 4300 . 0 4 115.1-49.000 4700.0 4 4 0 2.5 67.000 5800 .0 5460.3 72. COO .. 61.00.0 5 83 7.8 91.000 ' 8000.C 7 824. 1 97.COO 8 500 .-0 8 69 7.7 116.00 1010 0. 126 16. 121 .00 13500. 14 013. 141.00 21500. . 2 1.572 .
'. . 147 .00 2 560 0.. • . 24523.. 163.00 36300. 3 39 33. 174.00 4 3 8 0 0. 4 148 5. 187.00 52100. 5 1042. 198.00 59700 . 59 2 10. 212.00 68500. 6 916 1.
. . . 21.7 .00 .. 71900. 72521.. . 222.00 73500. 7 57 66. 2 35.00 83500. 33 6 84. 240 .00 86400 . 86552. 246.00 • 89900. 89891 . 259.OC 96600. 96811. 265.00 0 .10 1 30 E .06 9 98 8 1 . 270.0 0 0.10250E C6 0. 102.37E 0 6 2 8 5.00 0.1091.0E 06 0. 10 93 2E 06
. 292.00 0. L1150F 06 0. U212E 06 3C7.00 0.11630E C6 0. 1.166 8E 06 314 .00 0.11810E C6 C. 118C4F. 06 32 7.00 0.1195CE C6 0.1194 3 E 0 6 3 33.00 0.11980E C6 ' 0.11972F 06 338 .00 0.U980E 06 0,1198 6F 06
APPENDIX 3
Determination of s p e c i f i c surface area
APPENDIX 3 1
• Determination of s p e c i f i c surface area
The C y c l o s i z e r and Bahco-sizer subsieve f r a c t i o n s have been
characterized by determination of the mean p a r t i c l e diameter. However,
only regular p a r t i c l e s , e.g., spheres or c y l i n d e r s , possess a d e f i n i t e
diameter as well as known volume and surface area. Irregular p a r t i c l e s
such as those contained i n the s i z e f r a c t i o n s (see t h e i r microscopic
pi c t u r e s i n Figure 11 and 12)have a d e f i n i t e volume and surface area only.
Therefore, a better c h a r a c t e r i z a t i o n of the subsieve zinc s u l f i d e
m a t e r i a l can be achieved through determination of i t s s p e c i f i c surface
area, which i s the surface area per u n i t mass of s o l i d s .
Figure 1 i s a schematic representation of the dynamic nitrogen
adsorption apparatus used for determination of s p e c i f i c surface area of
the unfractionated -400 mesh subsieve zinc s u l f i d e concentrate and of
the d i f f e r e n t subsieve s i z e (Cyclosizer and Bahco-sizer) f r a c t i o n s .
1. Experimental procedure
Three d i f f e r e n t samples of known weight were introduced into
the sample-holders and placed i n the c i r c u i t as indicated i n Figure 1.
A known mixture of helium and nitrogen content was passed at a constant
flow (12 ml per minute) through the system to replace the a i r o r i g i n a l l y
present. When t h i s was achieved a steady base l i n e was obtained on the
recorder chart. Then the f i r s t sample was slowly-Immersed i n the l i q u i d ,
nitorgen bath. Adsorption of nitrogen by the s o l i d was indicated by a
peak on the recorder chart. A f t e r the recorder pen returned to i t s base
l i n e p o s i t i o n , the p o l a r i t y switch was reversed i n order to take
advantage of the f u l l range of the recorder scale, p r i o r to desorption
of nitrogen. The sample tube was then warmed up by removal from the
l i q u i d nitrogen bath, while the desorption peak for the nitrogen was
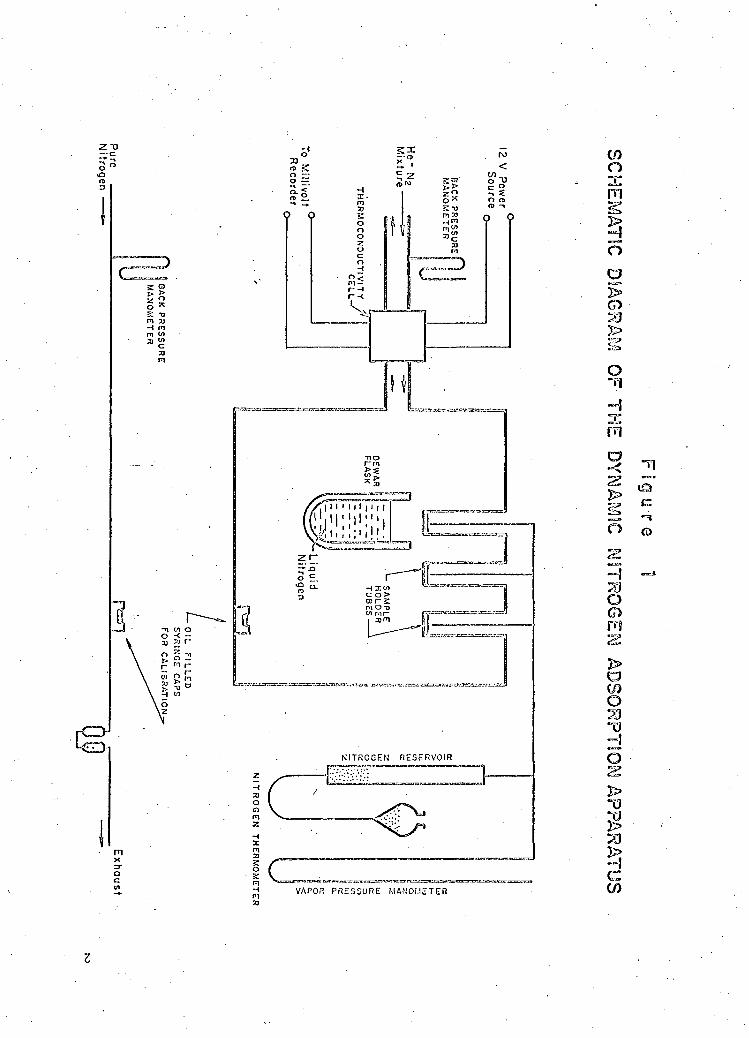
Z "O CO
q
m i
o a > o
o
m
1 O
H o m '2.
>
a o 73 13 -1
22 >
CO
r.
3
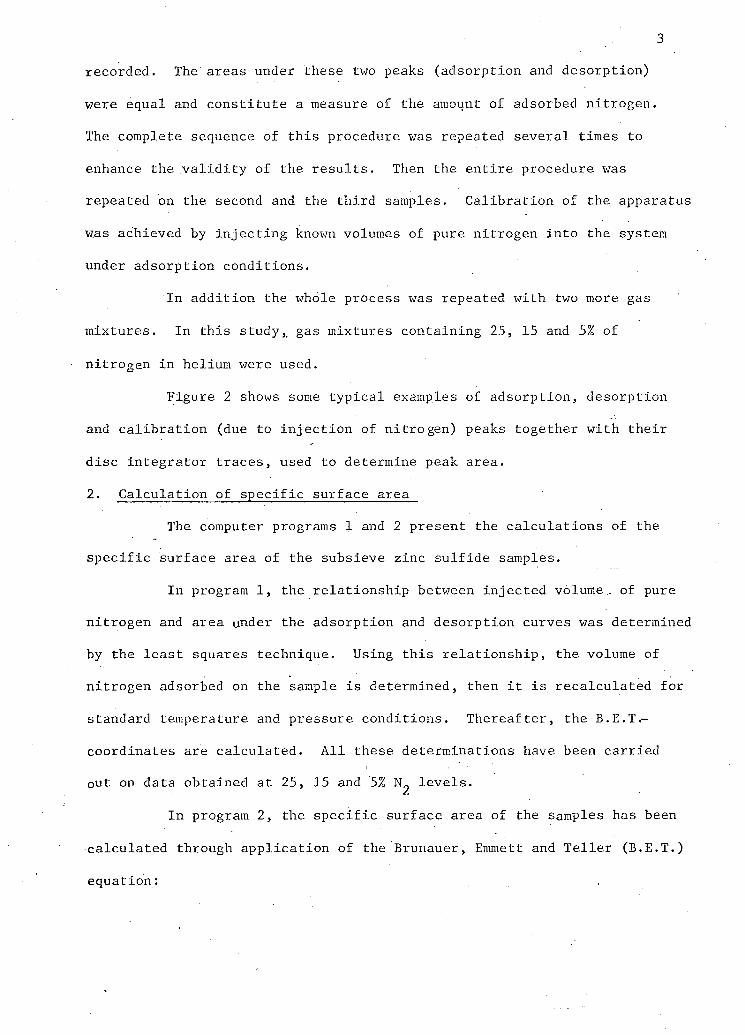
3
recorded. The areas under these txro peaks (adsorption and desorption)
were equal and c o n s t i t u t e a measure of the amount of adsorbed nitrogen.
The complete sequence of t h i s procedure was repeated several times to
enhance the v a l i d i t y of the r e s u l t s . Then the en t i r e procedure was
repeated on the second and the t h i r d samples. C a l i b r a t i o n of the apparatus
Was achieved by i n j e c t i n g known volumes of pure nitrogen i n t o the system
under adsorption conditions.
In ad d i t i o n the whole process was repeated with two more gas
mixtures. In this study, gas mixtures containing 25, 15 and 5% of
nitrogen i n helium were used.
Figure 2 shows some t y p i c a l examples of adsorption, desorption
and c a l i b r a t i o n (due to i n j e c t i o n of nitrogen) peaks together with t h e i r
d i s c integrator traces, used to determine peak area.
2. C a l c u l a t i o n of s p e c i f i c surface area
The computer programs 1 and 2 present the c a l c u l a t i o n s of the
s p e c i f i c surface area of the subsieve zinc s u l f i d e samples.
In program 1, the r e l a t i o n s h i p between injec t e d volume, of pure
nitrogen and area under the adsorption and desorption curves was determined
by the l e a s t squares technique. Using t h i s r e l a t i o n s h i p , the volume of
nitrogen adsorbed on the sample i s determined, then i t i s r e c a l c u l a t e d for
standard temperature and pressure conditions. Thereafter, the B.E.T.-
coordinates are c a l c u l a t e d . A l l these determinations have been c a r r i e d
out on data obtained at 25, 15 and 57* ^ l e v e l s .
In program 2, the s p e c i f i c surface area of the samples has been
calculated through a p p l i c a t i o n of the Brunauer, Emmett and T e l l e r (B.E.T.)
equation:
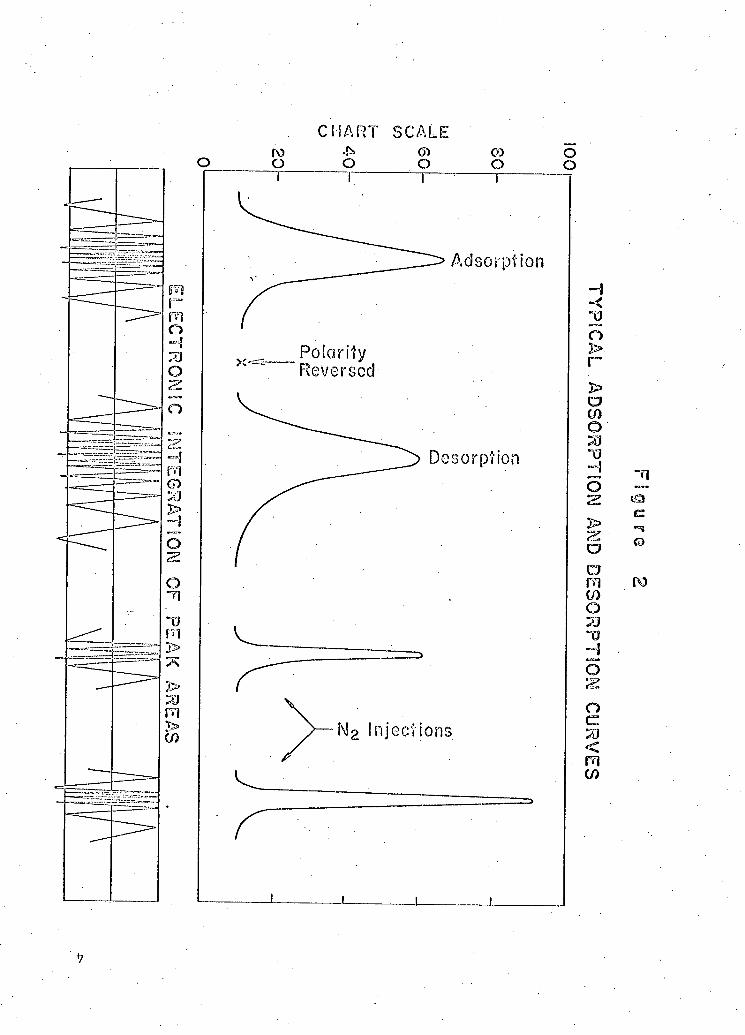
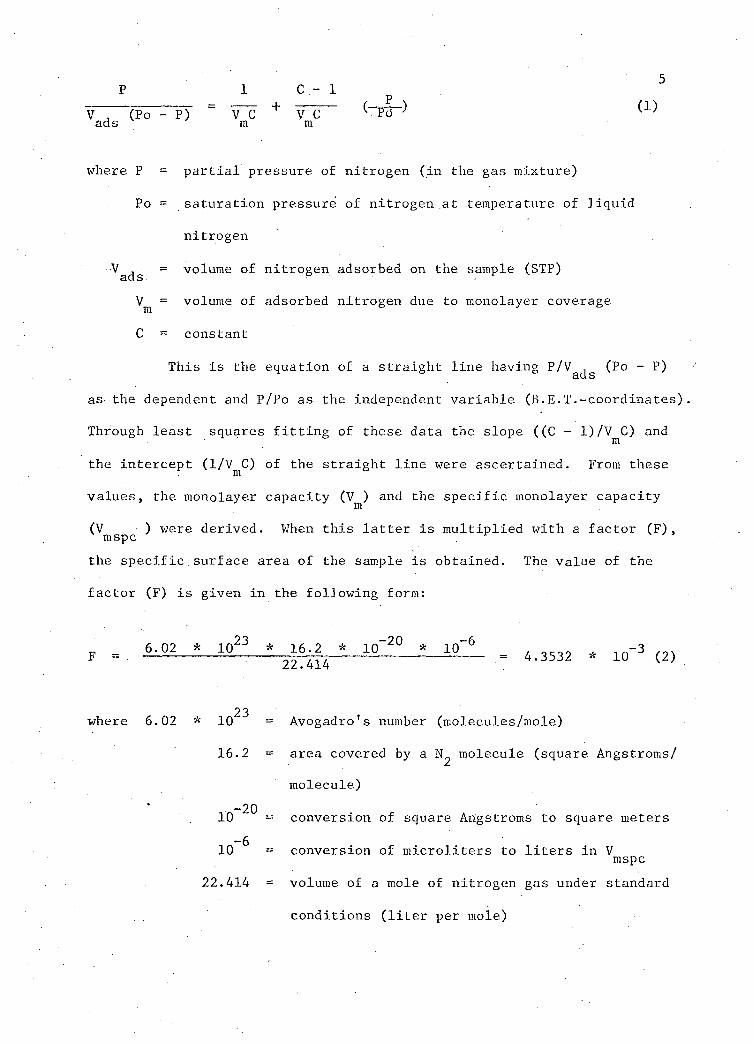
5 + Tr~n (1) V „ (Po - P) V C V C v Pci ads m m
where P = p a r t i a l pressure of nitrogen ( i n the gas mixture)
Po = saturation pressure of nitrogen at temperature of l i q u i d
nitrogen
^ads = v ° l u m e °f nitrogen adsorbed on the sample (STP)
= volume of adsorbed nitrogen due to monolayer coverage
C = constant
This i s the equation of a s t r a i g h t l i n e having P / ^ a c j g (P° ~ P)
as the dependent and P/Po as the independent v a r i a b l e (B.E.T.-coordinates)
Through l e a s t squares f i t t i n g of these data the slope ((C - 1)/V C) and m
the int e r c e p t (1/V C) of the s t r a i g h t l i n e were ascertained. From these
values, the monolayer capacity (V ) and the s p e c i f i c monolayer capacity
(V ) were derived. When t h i s l a t t e r i s m u l t i p l i e d with a f a c t o r (F), mspc . r
the s p e c i f i c surface area of the sample i s obtained. The value of the
f a c t o r (F) i s given i n the following form:
6.02 * 1 0 2 3 * 16.2 * 10 2 ^ * 10 ^ -3 F = i ^ — 22 414 = 4 , 3 5 3 2 * 1 0 < 2 )
23
where 6.02 * 10 = Avogadro's number (molecules/mole)
16.2 = area covered by a molecule (square Angstroms/
molecule) -20
10 = conversion of square Angstroms to square meters 10 ^ = conversion of m i c r o l i t e r s to l i t e r s i n V
mspc
22.414 = volume of a mole of nitrogen gas under standard
conditions ( l i t e r per mole)
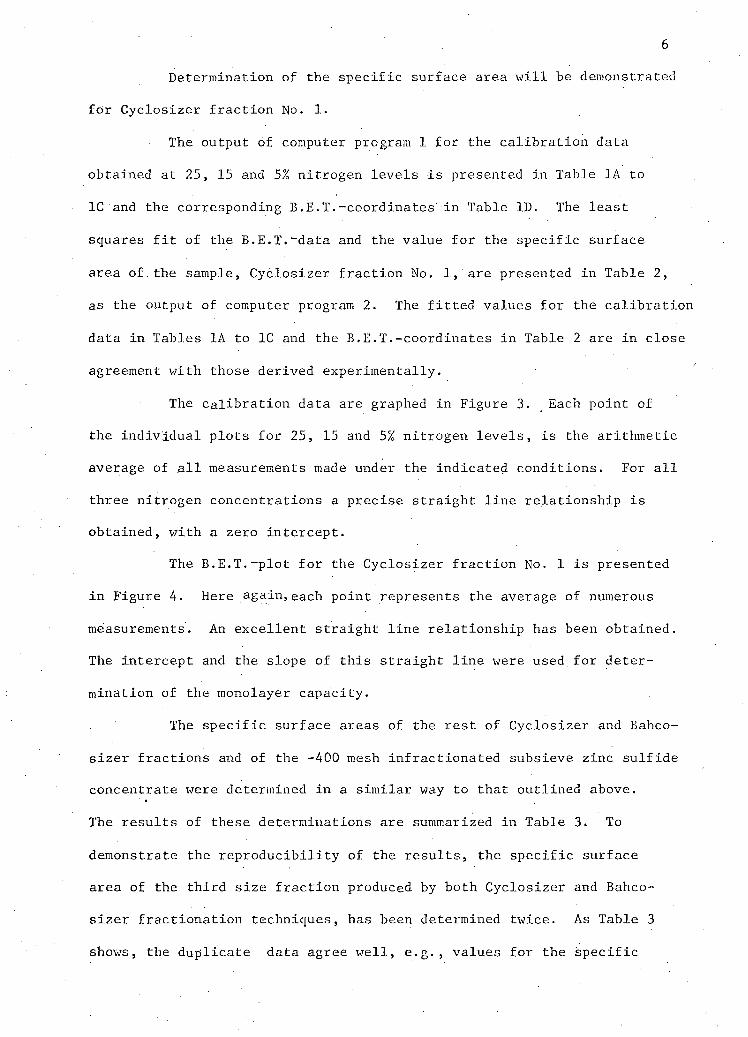
Determination of the s p e c i f i c surface area w i l l be demonstrated
f o r C y c l o s i z e r f r a c t i o n No. 1.
The output of computer program 1 for the c a l i b r a t i o n data
obtained at 25, 15 and 5% nitrogen l e v e l s i s presented i n Table 1A to
IC and the corresponding B.E.T.-coordinates i n Table ID. The l e a s t
squares f i t of the B.E.T."data and the value for the s p e c i f i c surface
area of the sample, Cy c l o s i z e r f r a c t i o n No. 1, are presented i n Table 2,
as the output of computer program 2. The f i t t e d values for the c a l i b r a t i o n
data i n Tables 1A to IC and the B.E.T.-coordinates i n Table 2 are i n close
agreement with those derived experimentally.
The c a l i b r a t i o n data are graphed i n Figure 3. Each point of
the i n d i v i d u a l p l o t s for 25, 15 and 5% nitrogen l e v e l s , i s the arithmetic
average of a l l measurements made under the indicated conditions. For a l l
three nitrogen concentrations a precise s t r a i g h t l i n e r e l a t i o n s h i p i s
obtained, with a zero i n t e r c e p t .
The B.E.T.-plot f o r the Cycl o s i z e r f r a c t i o n No. 1 i s presented
i n Figure 4. Here again,each point represents the average of numerous
measurements. An excellent s t r a i g h t l i n e r e l a t i o n s h i p has been obtained.
The int e r c e p t and the slope of t h i s s t r a i g h t l i n e were used f o r deter
mination of the monolayer capacity.
The s p e c i f i c surface areas of the r e s t of Cycl o s i z e r and Bahco-
s i z e r f r a c t i o n s and of the -400 mesh i n f r a c t i o n a t e d subsieve zinc s u l f i d e
concentrate were determined i n a s i m i l a r way to that outlined above.
The r e s u l t s of these determinations are summarized i n Table 3. To
demonstrate the r e p r o d u c i b i l i t y of the r e s u l t s , the s p e c i f i c surface
area of the t h i r d s i z e f r a c t i o n produced by both Cycl o s i z e r and Bahco-
s i z e r f r a c t i o n a t i o n techniques, has been determined twice. As Table 3
shows, the duplicate data agree w e l l , e.g., values for the s p e c i f i c
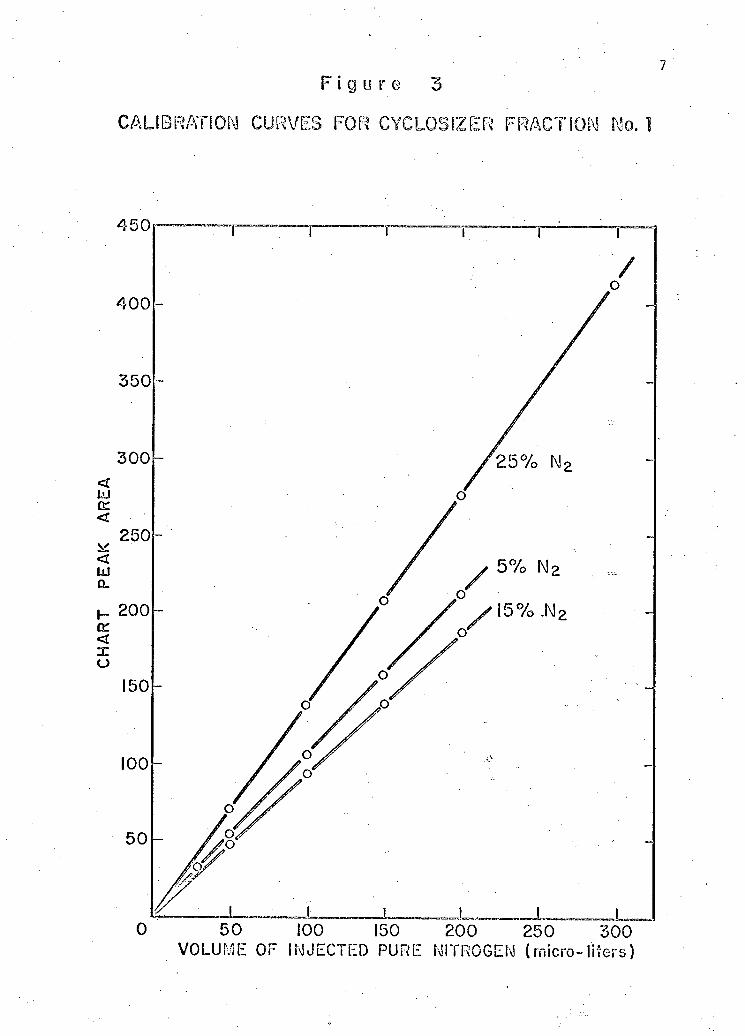
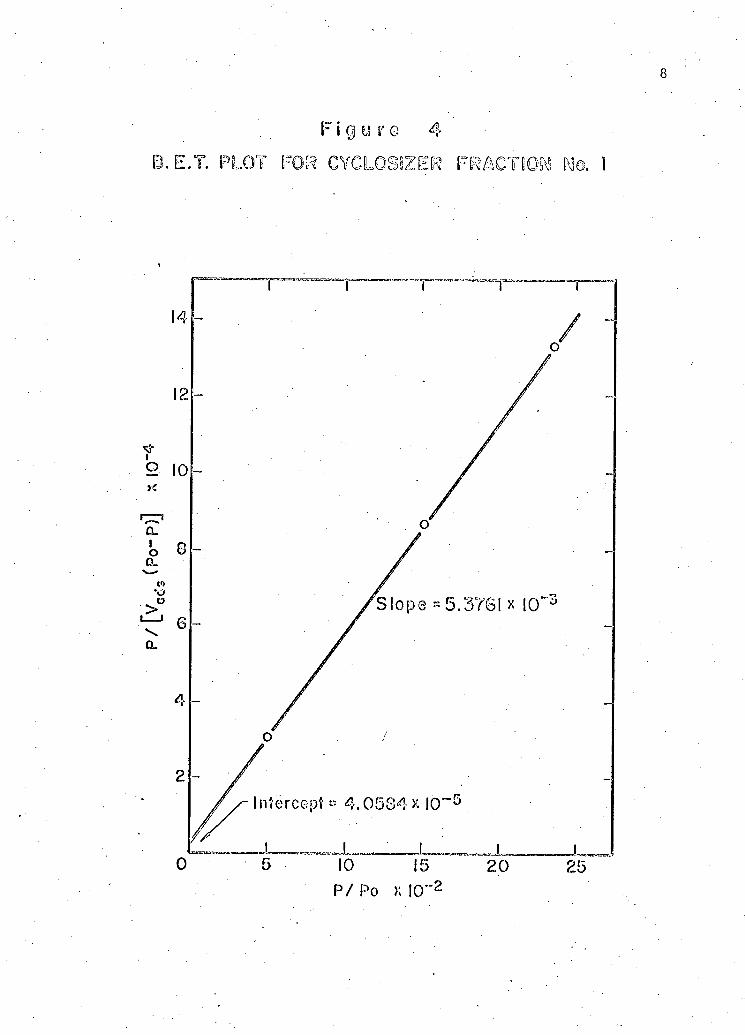
F i o ts i' o 4
B. E.T. PLOT FOR CYCLOSIZER FRACTION No.
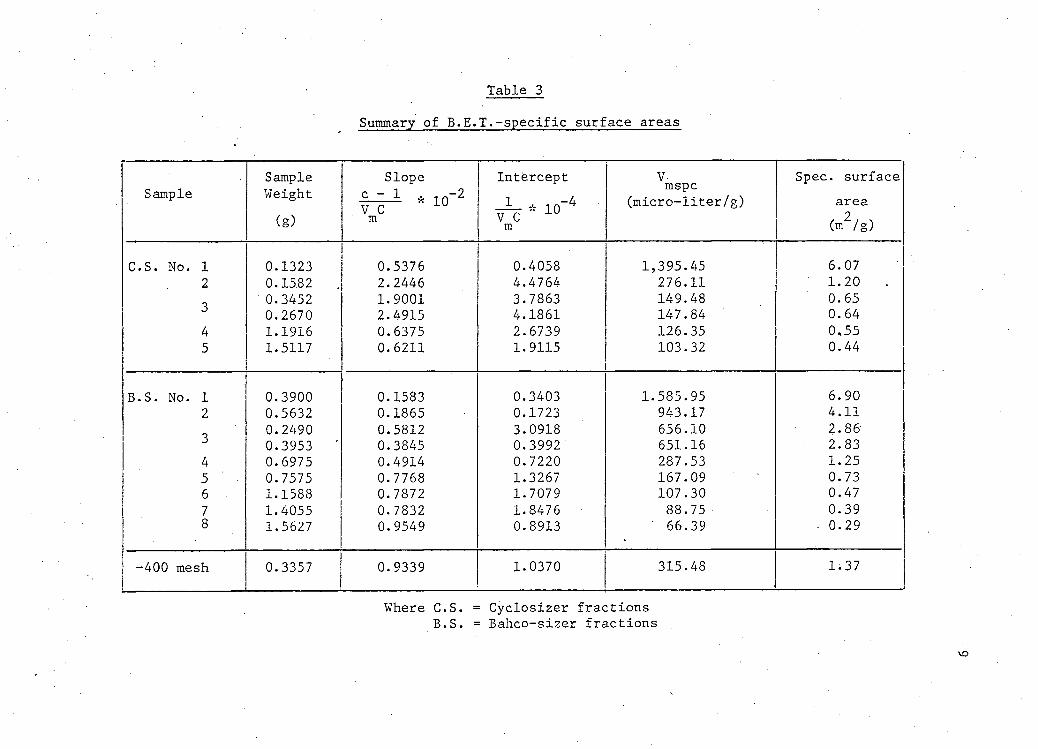
Table 3
Summary of B.E.T.-specific surface areas
Sample Slope Intercept V Spec, surface Sample Weight c " 1 * i o - 2
V c mspc
(mic r o - l i t e r / g ) area (g) m V c
m (m2/g)
C.S. No. 1 0.1323 0.5376 0.4058 1,395.45 6.07 2 0.1582 2.2446 4.4764 276.11 1.20 Q 0.3452 1.9001 3.7863 149.48 0.65 _> 0.2670 2.4915 4.1861 147.84 0.64 4 1.1916 0.6375 2.6739 126.35 0.55 5 1.5117. 0.6211 1.9115 103.32 0.44
B.S. No. 1 0.3900 0.1583 0.3403 1.585.95 6.90 2 0.5632 . 0.1865 0.1723 943.17 4.11
0.2490 0.5812 3.0918 656.10 2.86 3 0.3953 •' 0.3845 0.3992 651.16 2.83 4 0.6975 0.4914 0.7220 287.53 1.25 5 0.7575 0.7768 1.3267 167.09 0.73 6 1.1588 0.7872 1.7079 107.30 0.47 7 1.4055 0.7832 1.8476 88.75 0.39 8 1.5627 0.9549 0.8913 66.39 • 0.29
-400 mesh 0.3357 0.9339 1.0370 315.48 1.37
Where C.S. = Cyclosizer f r a c t i o n s B.S. = Bahco-sizer f r a c t i o n s
surface area of the C y c l o s i z e r f r a c t i o n No. 3 were 0.65 and 0.64 2
and f o r the corresponding Bahco-sizer f r a c t i o n , 2.86 and 2.83 m
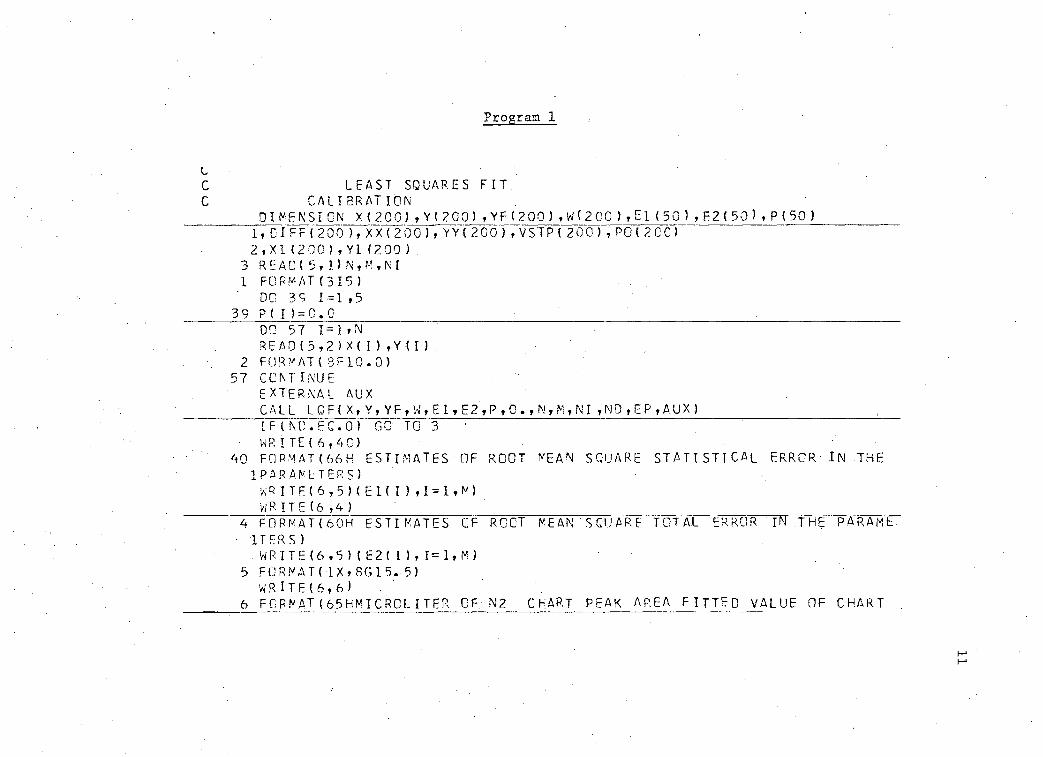
Program 1
C LEAST SQUARES FIT C CALIBRATION
DIMENSION X(200),Y(200) ,YF(200) ,W(2Q0),El(50) ,E2(50),P(50 ) 1,CIFF(200),XX(2 00),YY(200),VSTP(200) , P0(2CC) 2 i X l ( 2 0 0 ) , Y l (200)
3 R E A D ( 5 T 1 > N , M , N I 1 FORMAT(315)
DO 3 9 1=1,5 39 Pi I ) = C . 0
DO 57 I=1»N READ(5,2)X( I ) , Y I I )
2 FORMAT(8F10.0) 57 CONTINUE
EXTERNAL AUX CALL LQF( X, Y, Y F , W , E 1, E 2 , P , C » , N , H, NI ,N0,EP,AUX) ,_ IF(NC.EC.O) GO TO 3
• WRITE(6,40) 40 FORMAT(6 6 H ESTIMATES OF ROOT MEAN SQUARE STATISTICAL ERROR IN THE
1 PARAMETERS) WRITF(6,5)(E1( I ) ,I = 1,M) WRITE (6,4)
4 F 0 R M A T ( 6 0 H ESTIMATES OF ROOT MEAN ' S CU AR E TOTAL ERROR IN THE PARAME • ITERS)
. WRITE ( 6 T 5 M E 2 U ) t 1=1 fM) 5 F 0 R M A T( 1X,8G 1 5. 5 !
W R IT E ( 6 , 6 ) 6 FORMAT (65HMICRCL ITER CF N2 CHART PEAK AP.EA FITTED VALUE OF CHART
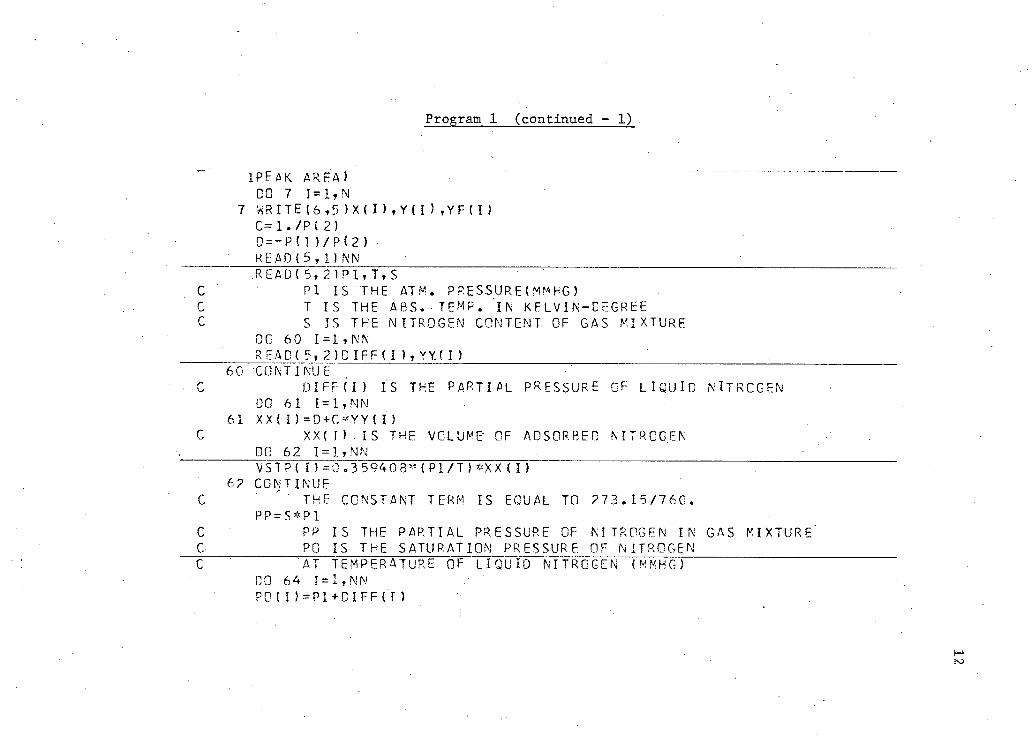
Program 1 (continued - 1)
1PEAK A R FA ) CO 7 1=1,N
7 WRITE(6,5 >X( I >,Y(I 5 ,YF(I) C=l./P(2) D = -P(1 )/Pi2) READ(5,1)NN • R E A D ( 5 , 2 ) P i t T t S
C P l IS THE AT M. PRESSURE(MMHG) C T IS THE A8S.TEMP. 'lN KELVIN-DEGREE C S IS THE NITROGEN CONTENT OF GAS MIXTURE
DO 60 I=1TNN READ(5,2) D I F F ( I ) , YY.( I ) ; .
60 CONTINUE" C D I F F ( I ) IS THE PARTIAL PRESSURE OF LIQUID NlTRCGEN
DO 6 1 1=1,NN 61 XX( I)=D+C*YY( I)
C X X I I ) . IS.THE VOLUME' OF ADSORBED NITROGEN DO 62 1 = 1, NN . V S T P ( I)=0.359408*(Pl/T)*XXm
62 CONTINUE C ' '' THE CONSTANT TERM IS EQUAL TO 273.15/760.
PP=S*P1 C PP IS THE PARTIAL PRESSURE OF NITROGEN IN GAS FIXTURE C PO IS THE SATURATION PRESSURE OF NITROGEN C "AT TEMPERATURE OF LIQUID NITROGEN (MNHG)
DO 64 I=1,NN PO ( I ) = P1 + D.I FF-("l )
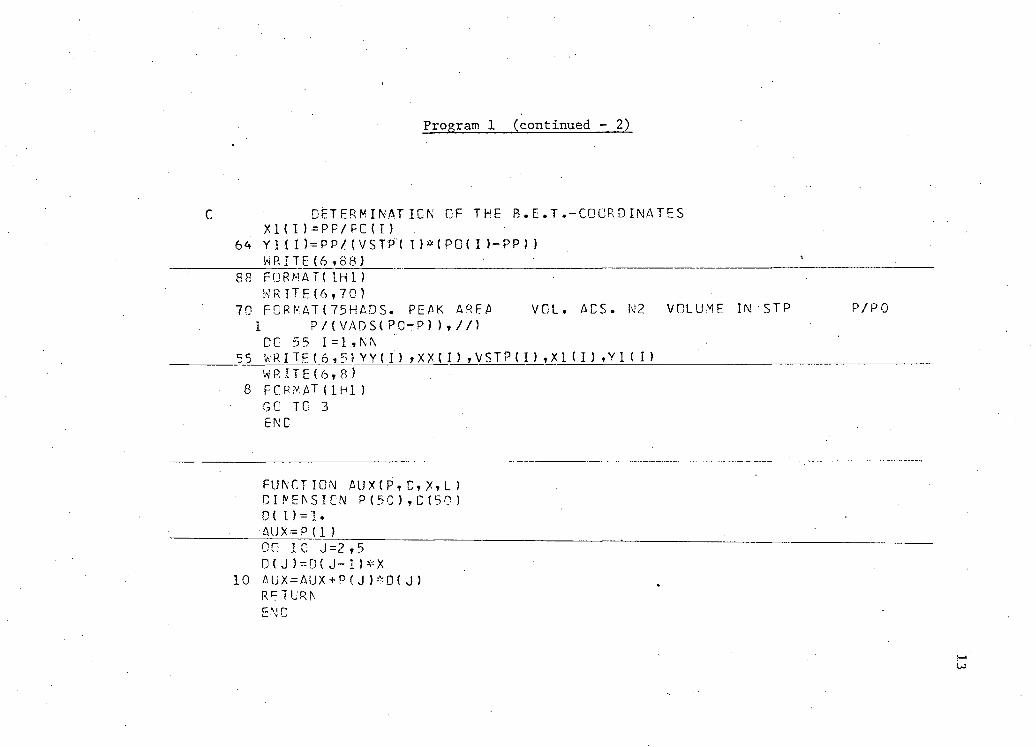
Program 1 (continued - 2)
DETERMINATION OF THE B.E.T.-COGRDINATES XI (I)=PP/FC<I)
64 Y1<I ) = P P /(VSTP( I )*(PO(I )-PP }) WRITE ( 6 1 8 8 )
8 8 FORMAT(1H1) WRITE (6, 70)
70 F 0 R Ri A T ( 7 5 H A D S. PEAK AREA VOL. ACS. N2 VOLUME IN ST P P/PO 1 P / ( V A D S i P C - P ) ) t / / ) DO 5 5 I = 1 , N N
55 WRIT E ( 6 5 5 ) Y Y ( I ) > X X ( I ) ,VSTP(I ) , X 1 ( I ) , Y 1 ( I ) W R I T E ( 6 , 8 )
FORMAT(1H1) GO TO 3
EN C
F U N C T I O N A U X ( P t C » X » L ) D I N E N S I C N P ( 5 0 ) , C ( 5 0 ) D ( 1 ) = 1. A U X = P ( 1 ) 00 10 J=2 T5 0( J )=D( J - l ) * X
10 A U X = A U X + P ( J ) * D ( J ) RETURN END
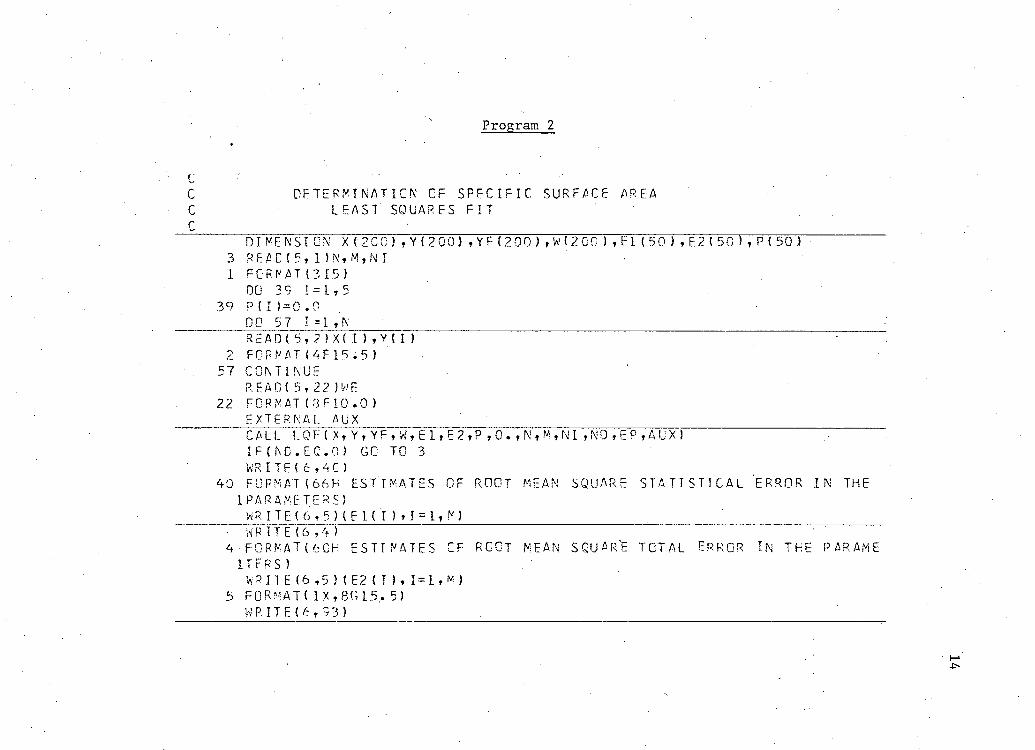
Program 2
r ' C DETERMINATION CF SPECIFIC. SURFACE AREA C LEAST SQUARES F I T ' C
. DIMENSION X( 200 ) , Y I 2 0 0 ) , YF ( 2 0 0 ) , W ( 2 C O ) , E 1 ( 5 0 ) , E 2 ( 5 0 ) t P(5 0 ) 3 READ ( 5 , 1 > N , M , N I 1 FORMAT(315)
DO 3 9 1 = 1 , 5 39 P ( I ) = 0 . 0
DO 5 7 1 = 1 , N R E A D ( 5 , 2 ) X ( I ) , Y { 1 )
2 FORMAT ( 4 F 1 5 . 5 ) 57 CONTINUE
R.EAD( 5 , 22 )WE 22 FORMAT (8F 1 0 . 0 )
EXTERNAL AUX CALL L Q F ( X , Y , Y F , W , 6 1 , E 2 , P , 0 . , N , M , N I , N D , E P , A U X ) IF ( h D . E C O ) GO TO 3 KR I T E ( 6 , 4 C )
40 FORMAT(66H ESTIMATES OF ROOT MEAN SQUARE STATIST ICAL ERROR I N THE 1PARAMETERS)
WR I TE-< 6 , 5 ) ( E 1 ( I ) , 1 = 1 , M) ;
• WR IT E (6 ,4 ) 4 FORMAT(6CH ESTIMATES CF ROOT MEAN SQUARE TOTAL ERROR IN THE P AR AM E
ITERS 5 WRIT E (6 ,5 ) ( E 2 ( I ) , 1 = 1,M)
5 FORMAT( 1 X , 8 G 1 5 . 5 ) W R I T E ( 6 , 9 3 )
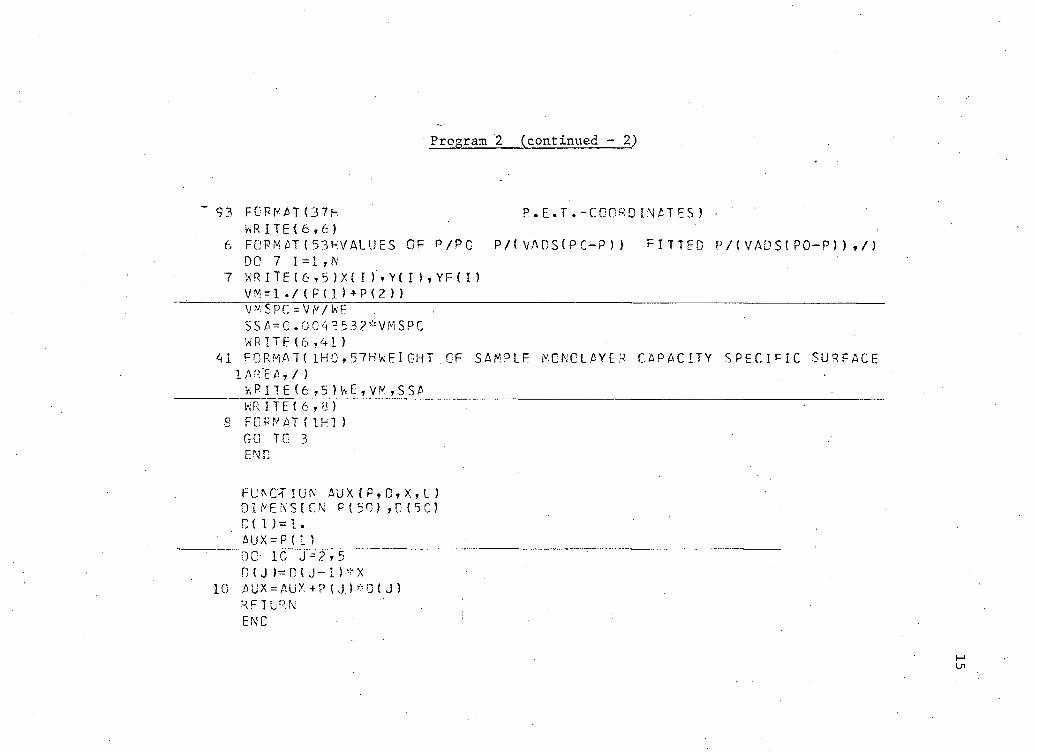
Program 2 (continued - 2)
~ 93 FCPMAT(37H E.E.T.-COORD INATESj < ' WRITE(6, 6)
6 FORM AT{53HVALUES OF P/PG P/(VADS(PC-P) ) FITTED P/(VADSIPO-P)) ,/) DC 7 I=1,N •
7 KR ITE ( 6 , 5 ) X ( I ) t V( I ) , YF{ I ) VM=1 ./<P(1)+P<2)) VM£PC=VM/KE SS A = 0 . 0 0 4 3 532*VM SPC WR ITE ( 6 ,41 )
41 FORMAT! 1H0, 57H'*EI GHT . CF SAMPLE MONOLAYER CAPACITY S P E C I F I C SURFACE lAR'EA,/)
h P I T E ( 6 T 5 ) V< E , V M , S S A • WRITE(6,8)
8 FORMAT C1F.1) GO TO 3 END
F U N C T I O N A U X ( P , D , X , L ) D I M E N S I O N P ( 5 0 ) ,C(5C5 D( 1 )=1. AUX = P (1 ) DC" 10 J = ? i 5
D U ) = D ( J - 1 ) * X
10 A U X = A U X + P ( J . ) * 0 ( J )
RETURN END
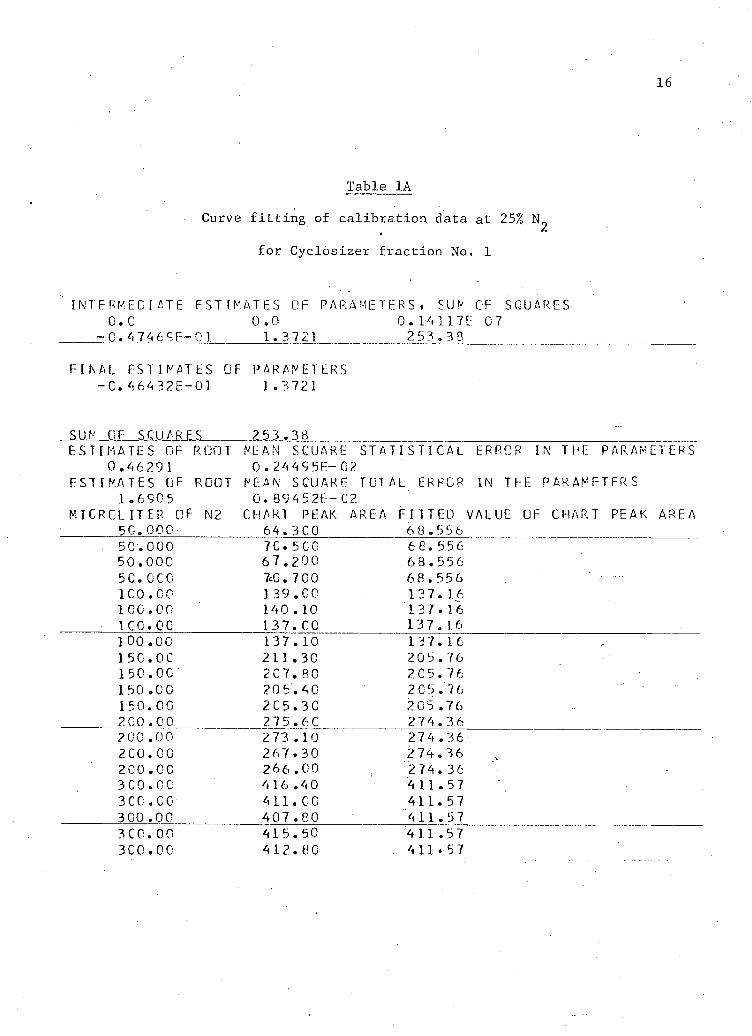
16
Table 1A
Curve f i t t i n g of c a l i b r a t i o n data at 25% N
fo r C y c l o s i z e r f r a c t i o n No. 1
INTEFMECIATE ESTIMATES OF PARAMETERS, SUM OF SQUARES C. C 0.0 0. 14 117E 07
-C.47469E- 01 1.3721 2 53.38
FINAL ESTIMATES OF PARAMETERS -C.46432E-01 1.3721
SUM OF SQUARES 253.38 ESTIMATES OF ROOT MEAN SQUARE STATISTICAL ERROR IN THE PARAMETERS
0 .46 29 1 0.24495E-C2 ESTIMATES OF ROOT MEAN SQUARE TOTAL ERROR IN THE PARAMETERS
1.690 5 0. 894 52E-C2 MICROLITER OF N2 CHART PEAK A RE A FITTED VALUE OF CHART PEAK AREA
50.000- 64.3C0 68 .556 . 50.000 7 C. 5 C 0 68.556 50.000 67.200 68.556 50.000 7c0. 7 00 68 . 556 ICO.00 1 39.00 137.16 100.00 140 . 10 137. 16 ICG.OC 137.CC 137.16 100.00 137. 10 13 7.16 150.CC 211.30 2 0 5.76 150.00 207.80 2C5.76 150 .00 205.40 2 0 5.76 150.00 2C5.3C 205.76 200 .00 275 .6C 274.36 200 .00 273 .10 274.36 2 CO.CO 267.30 274.36 200.00 266 .00 2 7 4.36 -
3C0.0C 416 .40 4 11.57 3CC .CO 4 11.CC 411.57 300 .00 407.80 411.57 3CC.00 415.50 411.57 3C0.0C 412.80 . 411.57
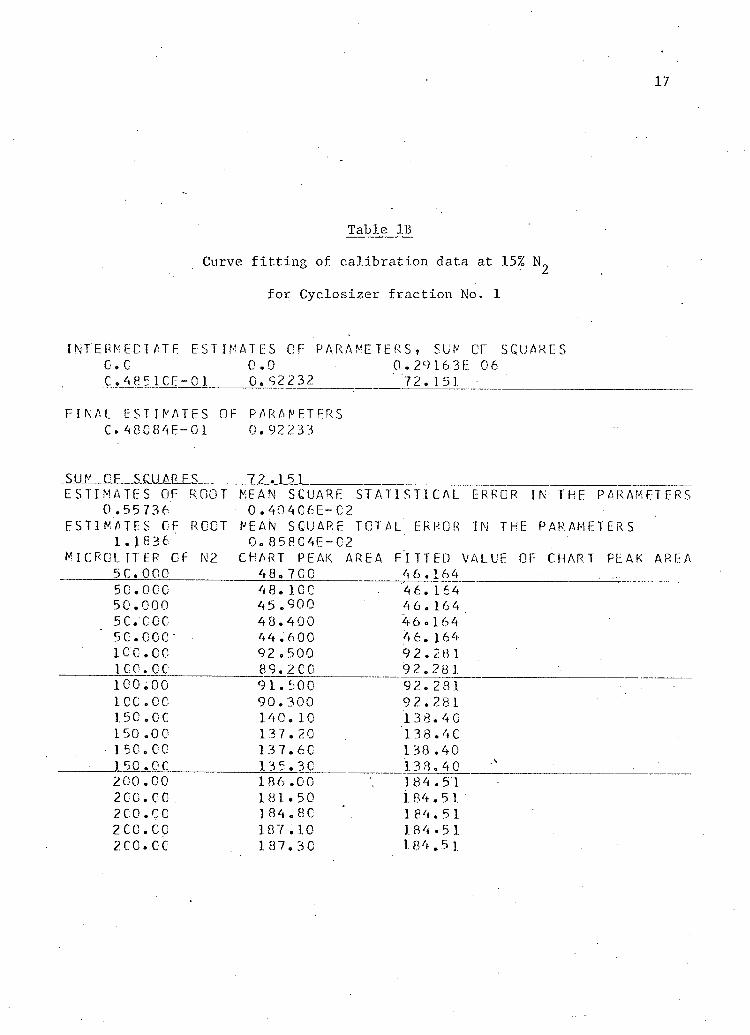
17
Table IB
Curve f i t t i n g of c a l i b r a t i o n data at 15% N
for C y c l o s i z e r f r a c t i o n No. 1
INTER?-PC I f i r ESTIMATES OF PARAMETERS? SUM OF SQUARES 0. C 0.0 0.29163E 0 6 C.485 ICE- 0 1 0.92 2 32 7 2.151
FINAL ESTIMATES OF PARAM ET ERS C 4 8G84E-01 0.92 23 3
SUM OF SCUARFS 72.151 ESTIMATES OF R 00 T MEAN SQUARE STATISTICAL ERROR IN THE PARAMETERS
0 .55 73 6 0.4O406E-C2 ESTIMATES CF ROOT MEAN SQUARE TOTAL ERROR IN THE PARAMETERS
1.18 36 0.858C4E-C2 MICROLITER OF N2 CHART PEAK AREA FITTED VALUE OF CHART PEAK AREA
5C.OCO 48.7GC 4 6.164 50.000 48. ICC 4 6.164 50.000 45 .900 4 6.164 5C.CCC 4 8.4 00 4 6.164 5 0.00 0- 4 4 .6 00 4 6. 164 10C.C0 92 .500 9 2.281 ICC.c c 8 9. 2 C 0 92.28 1 100.00 9 1. 500 9 2.281 ICO.00 90.300 9 2.28 1 150.CC 140. 10 13 8.40 150 .0 0 137.20 1 3 8 . 4 C 150.00 13 7.60 138.40 150. DC 13 5.30 13 3.40 200.00 186 .00 184.51 2CC.00 181.50 184.51 2C0.CC 184.ac 184.51 2C0.C0 187 .10 18 4.51 2C0.CC 187.3C 184.5 1
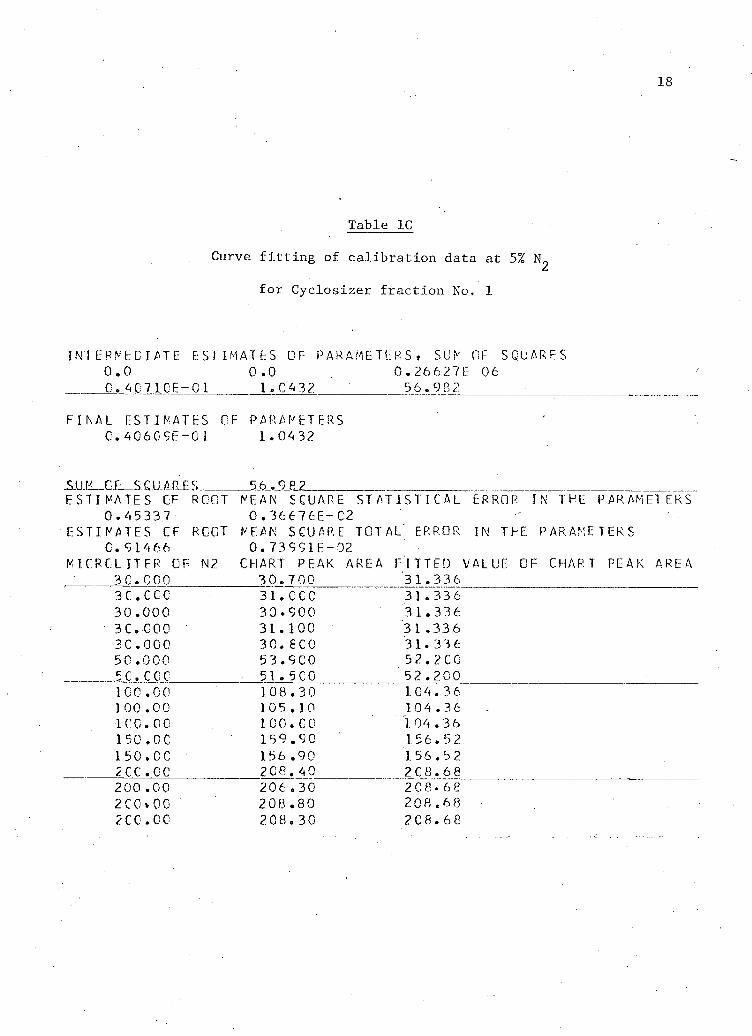
18
Table IC
Curve f i t t i n g of c a l i b r a t i o n data at 5% N
for C y c l o s i z e r f r a c t i o n No. 1
INTERMEDIATE ESTIMATES OF PARAMETERS, SUM OF SQUARES 0.0 0 .0 0.26627E 06 C. 407 10E-C1 1.0 4 32 56.982
FINAL ESTIMATES OF PARAMETERS C. 406C5E-0I 1 .0432
SUM OF SQUARES 56.982 EST I MATES CF ROOT MEAN S GUAR c STATISTICAL ERROR IN THE PARAMETERS
0.45337 0.36 67 6E- 02 ESTIMATES CF ROOT MEAN SQUARE TOTAL] ERROR IN THE PARAMETERS
C.51466 0.73991E- 02 MICROLITER OF N2 CHART PEAK AREA FITTED VALUE OF CHART PEAK AREA
30.000 3 0.7 00 31.336 3 C . 0 C C 31.CCC 31.336 30 .000 30.500 3 1.336 3C.-000 31.100 3 1 .33 6 30.000 30.£ CO 3 1.336 50.000 5 3.9 00 5 2 . 2 C 0 5 C. C C C 51.5C0 52.200 ICO.00 10 8.30 104.3 6 100.00 105 . 10 104.36 ICO.CO 100.GO 1.04 .36 150.0C 159.90 156.5 2 150.0C 156 .90 156.5 2 2CC.00 208'. 40 2 C 8 . 6 8 200 .00 206 .30 2 0 8-68 200*00 208.80 208.68 2C0.00 208.30 2 0 8.68
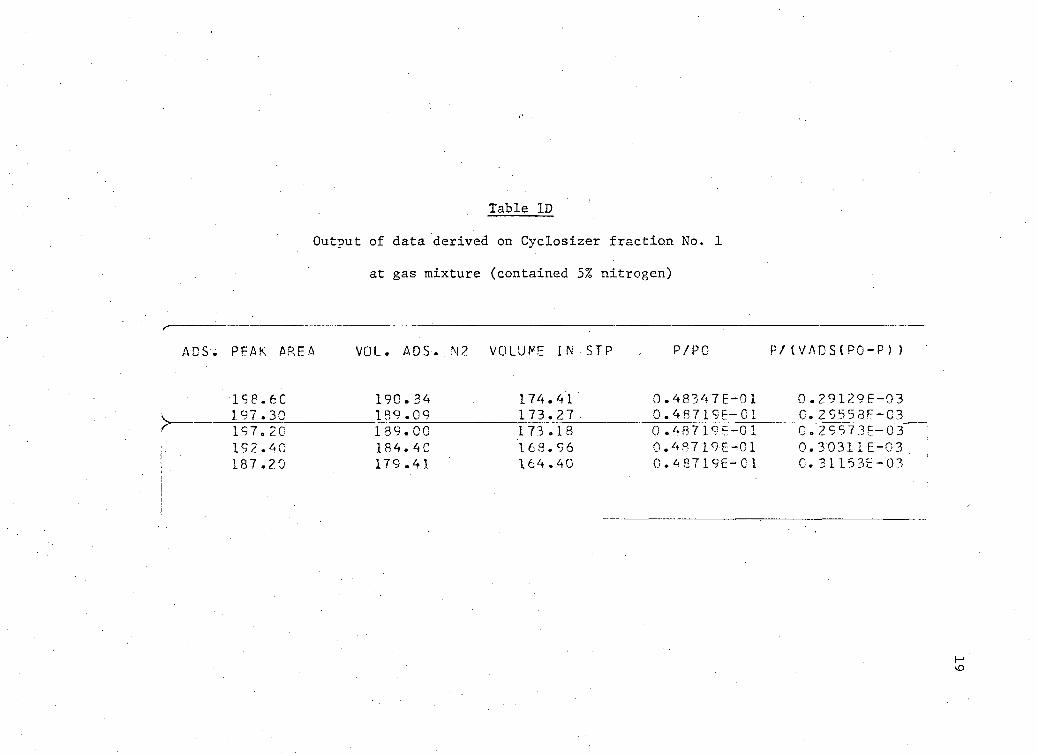
Table ID
Output of data derived on Cyclosizer f r a c t i o n No. 1
at gas mixture (contained 5% nitrogen)
ADS. PEAK AREA VOL. ADS..N2 VOLUME IN STP P/PO P/IVAD S ( PO-P ) )
198. 6 C 190.34 174.41 0.48347E-01 0.29129E-03 197 .30 189 .09 173.27 0.48719E-C1 0.2S558E-G3 "197.20 189.00 173 .18 0.48719E-01 0.29573E-03 192.40 184.40 168.96 0.48719E-01 0.3O311E-03 187 .20 179 .41 164.40 0.48719E-C1 C. 3 U 5 3 E - 0 3
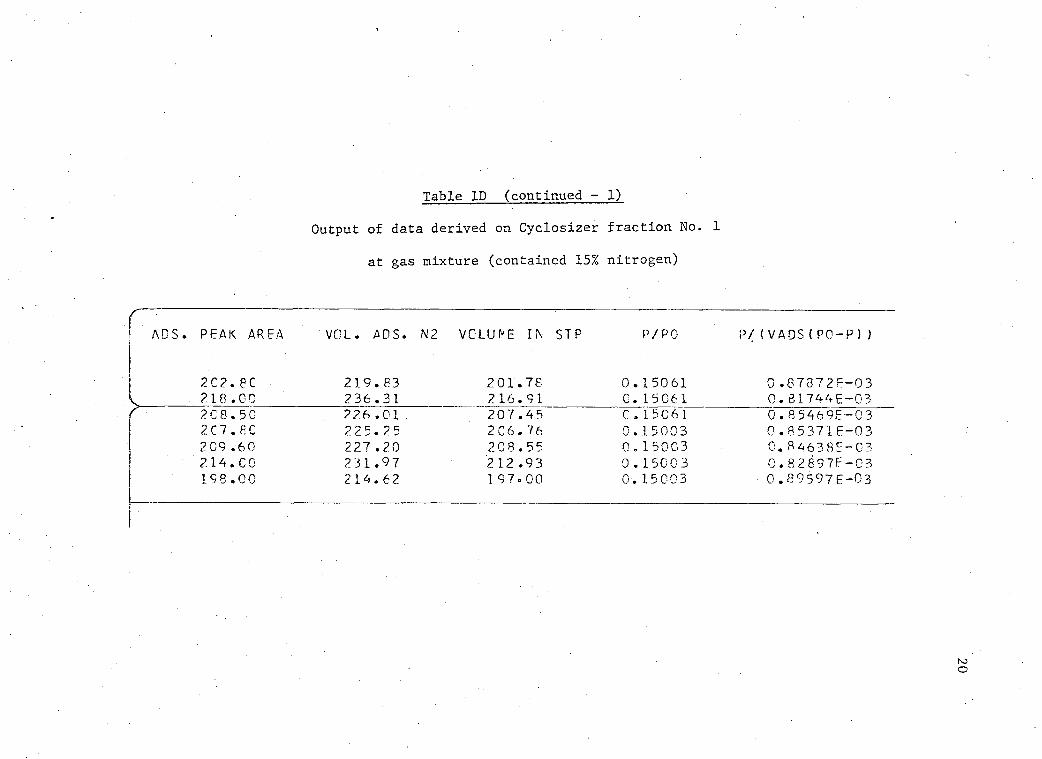
Table ID (continued - 1)
Output of data derived on Cyclosizer f r a c t i o n No. 1
at gas mixture (contained 15% nitrogen)
ADS. PEAK AREA VOL. ADS. N2 VOLUME IN STP P/PO P/(VADS{PO-P})
2C2.8C 219.83 201.78 0 . 15061 0 .87372E-03 218.00 236.31 216.91 r. 15061 0.81744E-03 2C8.5G 226 .01 . 207.45 o . 15061 0.85469E-03 2C7. F.C 225.25 206.76 0. 15003 0.8 5 371E-0 3 2 09 .60 227 .20 2 0 8.55 0. 150C3 0.84638E-03 2.14. CO 2 31.97 2 12.93 0 . 15003 0.82897F-03 198.00 214.62 197.00 0. 15003 • 0.89597E-03
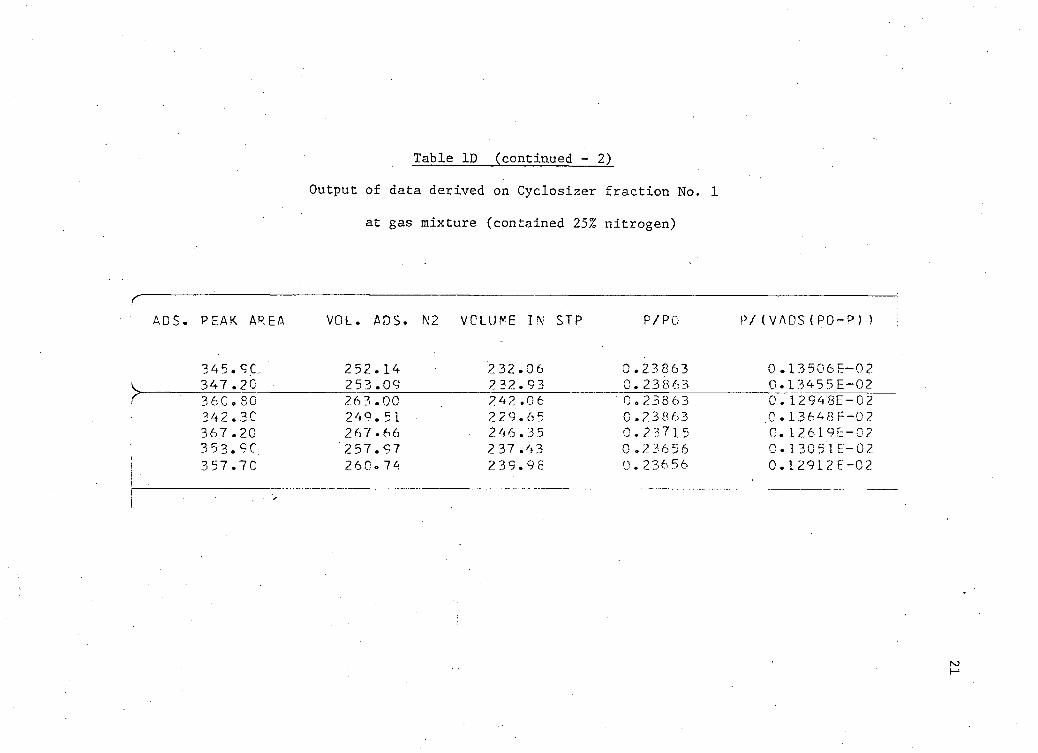
Table ID (continued - 2)
Output of data derived on Cyclosizer f r a c t i o n No. 1
at gas mixture (contained 25% nitrogen)
ADS. PEAK AREA VOL. ADS. N2 VOLUME IN STP P/PO P/(VADS(PO-P))
y 345. SC. 347 .20 360.SO 342.30 3 67 .20 353.9C 357.70
252.14 2 53.09
232.06 232.93
26 3 .00 249.51 26 7.66 257.97 2 60.7 4
242 .06 2 29.6 5 246.35 237 .43 239.96
0 .23863 0.23863 0.238 63 0.23863 0.23715 0 .2 3656 0.236 56
0 .13506E-02 0.1345 5E-02 0. 12948E-02 .0 . 13648 E-02 0. 12619E-02 C 13051E-02 0.12912E-02
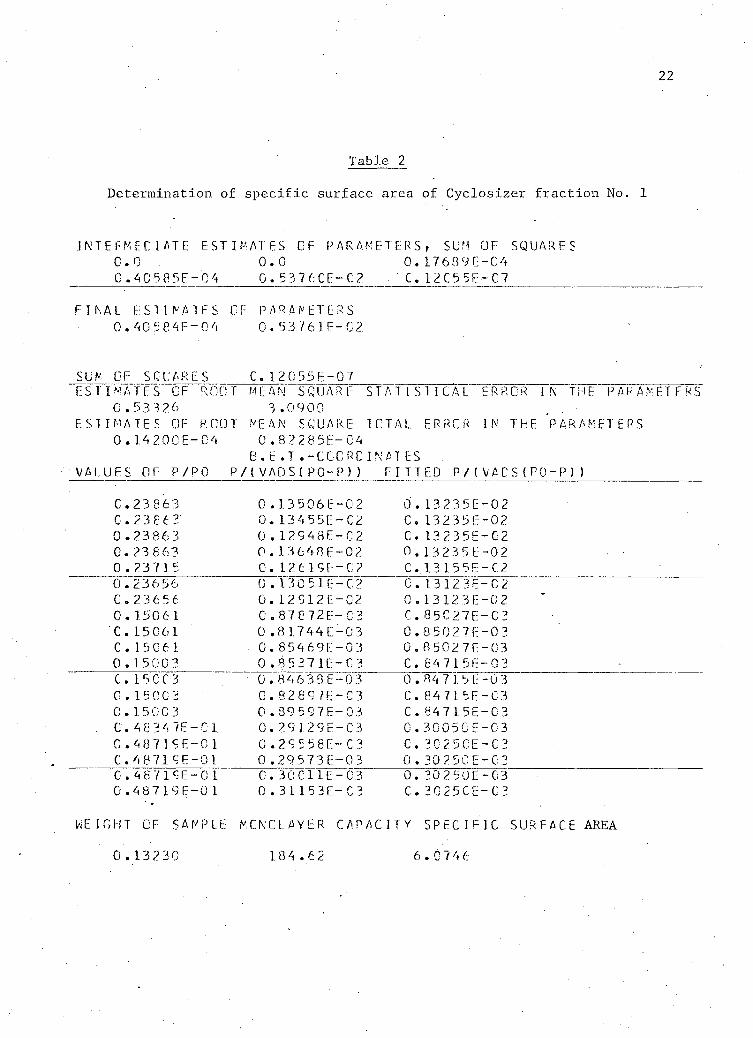
22
Table 2
Determination of s p e c i f i c surface area of Cyclos i z e r f r a c t i o n No. 1
INTER MFC I A T E ESTIMATES CF PARAMETERS, SUM OF SQUARES C O . 0.0 0.17639F-C4 0 .4C585E-04 0. 5376CE-C? •G.12C55E-G7
FINAL ESTIMATES C F PARAMETERS 0.40584F-04 0, 5376 IE-02
SUM OF SQUARES C. 12055E-0 7 ESTIMATES CF ROOT MEAN SQUARE STATISTICAL ERROR IN THE PARAMETERS
0 . 53 326 3 .0900 ESTIMATES OF ROOT MEAN SQUARE TOTAL ERROR IN THE 'PARAMETERS
0 . 142QCE-C4 0 . 82285E-04 E . E . T .-COORDINATES
VALUES OF P/PO P/[VADS(PO-P) ) FITTED P / ( V A C S ( P O - P ) )
C.23863 0 .13506E-02 0.13235E-02 C . 2 3 8 6 2 0. 13455E-C2 C. 13 235E-02 0.23863 0 . 12548E-C2 C. 12 2 3 5E-C2 0. 23863 0.13648E-02 0.13235E-0 2 0.237 15 0.12619E-C2 C..13 155E-C2 0 . 23656 0 . 130 5 I t - C 2 C.13123E-C2 C . 2 3 6 5 6 0.12512E-C2 0.13123E-02 0. 150 6 1 C.87872E-G3 C.85C27E-C3 C. 15061 0.81744E-03 0.35027E-03 C . 1 5 C 6 1 0.85469E-03 0.85027E-C3 0 . 15003 0 .8527 IE-C3 C.64715E-03 C. 1 5 C C 3 0.846 33E-03 0. 84 715E-0 3 0.15003 0.82897E-C3 C.64715E-C3 C. 15 003 0 .895 9 7 E-03 C.64715E-03
. 0.48 3 4 7E-C1. 0. 29T29E-C3 G.30050E-G3 0.48 7 19E-0 1 0 .295 5 8E-C3 C.2C25CE-C2 C.48719E-01 0 .295731-02 0.3025CE-C3 C.46719E-0 1 0.30Cl1E-C3 0.30250E-C3 0 .48719E-0 1 0 . 3 I 153E-C3 C.2C25CE-C3
WEIGHT OF SAMPLE MCNOLAYER CAP ACITY SPECIFIC SURFACE AREA
0.13230 18 4.62 6 . G746