using plant functional traits to explain diversity-productivity relationships
TRANSCRIPT

Using Plant Functional Traits to Explain Diversity–Productivity RelationshipsChristiane Roscher1*, Jens Schumacher2, Marlen Gubsch3, Annett Lipowsky4,5, Alexandra Weigelt6,
Nina Buchmann3, Bernhard Schmid5, Ernst-Detlef Schulze4
1Department of Community Ecology, Helmholtz Centre for Environmental Research, UFZ, Halle, Germany, 2 Institute of Stochastics, Friedrich Schiller University Jena,
Jena, Germany, 3 Institute of Agricultural Sciences, ETH Zurich, Zurich, Switzerland, 4Max Planck Institute for Biogeochemistry, Jena, Germany, 5 Institute of Evolutionary
Biology and Environmental Studies, University of Zurich, Zurich, Switzerland, 6University of Leipzig, Institute of Biology, Leipzig, Germany
Abstract
Background: The different hypotheses proposed to explain positive species richness–productivity relationships, i.e.selection effect and complementarity effect, imply that plant functional characteristics are at the core of a mechanisticunderstanding of biodiversity effects.
Methodology/Principal Findings:We used two community-wide measures of plant functional composition, (1) community-weighted means of trait values (CWM) and (2) functional trait diversity based on Rao’s quadratic diversity (FDQ) to predictbiomass production and measures of biodiversity effects in experimental grasslands (Jena Experiment) with differentspecies richness (2, 4, 8, 16 and 60) and different functional group number and composition (1 to 4; legumes, grasses, smallherbs, tall herbs) four years after establishment. Functional trait composition had a larger predictive power for communitybiomass and measures of biodiversitity effects (40–82% of explained variation) than species richness per se (,1–13% ofexplained variation). CWM explained a larger amount of variation in community biomass (80%) and net biodiversity effects(70%) than FDQ (36 and 38% of explained variation respectively). FDQ explained similar proportions of variation incomplementarity effects (24%, positive relationship) and selection effects (28%, negative relationship) as CWM (27% ofexplained variation for both complementarity and selection effects), but for all response variables the combination of CWMand FDQ led to significant model improvement compared to a separate consideration of different components of functionaltrait composition. Effects of FDQ were mainly attributable to diversity in nutrient acquisition and life-history strategies. Thelarge spectrum of traits contributing to positive effects of CWM on biomass production and net biodiversity effectsindicated that effects of dominant species were associated with different trait combinations.
Conclusions/Significance: Our results suggest that the identification of relevant traits and the relative impacts of functionalidentity of dominant species and functional diversity are essential for a mechanistic understanding of the role of plantdiversity for ecosystem processes such as aboveground biomass production.
Citation: Roscher C, Schumacher J, Gubsch M, Lipowsky A, Weigelt A, et al. (2012) Using Plant Functional Traits to Explain Diversity–ProductivityRelationships. PLoS ONE 7(5): e36760. doi:10.1371/journal.pone.0036760
Editor: Han Y.H. Chen, Lakehead University, Canada
Received September 30, 2011; Accepted April 8, 2012; Published May 18, 2012
Copyright: � 2012 Roscher et al. This is an open-access article distributed under the terms of the Creative Commons Attribution License, which permitsunrestricted use, distribution, and reproduction in any medium, provided the original author and source are credited.
Funding: The Jena Experiment is funded by the German Science Foundation (FOR456) with additional support from the University of Jena and the Max PlanckSociety. CR was additionally supported by the German Science Foundation (Ro2397/3-1). The funders had no role in study design, data collection and analysis,decision to publish, or preparation of the manuscript.
Competing Interests: The authors have declared that no competing interests exist.
* E-mail: [email protected]
Introduction
Rapid decline in biodiversity has motivated considerable
research directed towards understanding how changes in bio-
diversity affect ecosystem functioning [1,2]. Experimental bio-
diversity–ecosystem functioning research has demonstrated the
importance of biodiversity for a number of ecosystem processes
such as plant productivity, but it remains a central challenge to
identify the underlying mechanisms [2]. Two mutually non-
exclusive mechanisms are discussed as main drivers for greater
plant productivity as a function of increasing plant diversity: The
‘‘sampling effect hypothesis’’ states that in experiments where
species assemblages are randomly created, species-rich communi-
ties are more likely to include a species with disproportionate large
effects on properties at the community-level [3,4]. The ‘‘comple-
mentarity effect hypothesis’’ proposes that niche partitioning or
facilitation among species allow for a more complete use of
resources and therefore larger process rates at the community level
[5,6].
Mathematical partitioning of net biodiversity effects into
complementarity and selection effects (the latter similar to
sampling effects) as proposed by the ‘‘additive partitioning
method’’ [7] has shown that mostly both effects contribute to
positive species richness–productivity relationships in experimental
grasslands (e.g. [7–11]). Selection as well as complementarity
effects imply that ecosystem properties such as community
productivity strongly depend on the functional characteristics of
the constituent species. Functional traits are morphological,
physiological and phenological features measurable at the in-
dividual level which modulate plant performance and individual
PLoS ONE | www.plosone.org 1 May 2012 | Volume 7 | Issue 5 | e36760

fitness via their effects on growth, survival and reproductive output
[12]. Plant traits largely determine how individual plant species
contribute to processes at the community-level. However, plants
need to balance a number of functional requirements; therefore
the set of trait values realized by a species results from trade-offs
integrating different functions and may reflect species-specific
strategies.
Effects of functional traits on ecosystem properties have been
quantified by two conceptually different approaches. On the one
hand, community-weighted means of trait values ( = CWM) are
usually calculated as mean trait values weighted by species relative
abundances in a given community (e.g. [13,14]). This measure
quantifies the dominant trait values in a community and is
consequently closely related to the ‘‘mass ratio hypothesis’’ [15]
proposing that ecosystem processes are mainly determined by the
functional traits of dominant species in a community (i.e.
functional identity). CWM should therefore be related to sampling
and selection effects although the definition of the second (in
contrast to the first) originally does not require that species which
mostly affect ecosystem properties achieve dominance [4].
On the other hand, a number of continuous measures have
been developed which assess functional trait diversity of a com-
munity by quantifying the distribution of trait values among
species (see reviews in [16,17]). The concept of functional trait
diversity is based on the assumption that with increasing trait
dissimilarity among species the diversity in resource use strategies
increases as well and species overlap along resource axes decreases
[18]. Several criteria have been identified for a useful definition of
functional diversity [16,19], but all techniques sensitively depend
on which traits are included in analyses [20]. Rao’s quadratic
diversity FDQ (Rao’s Q, [21]), which is the sum of pairwise
functional distances between species weighted by their relative
abundances, has been advocated repeatedly as a suitable measure
for describing functional trait diversity (e.g. [22–24]). FDQ should
be closely related to complementarity effects and is largest when
functionally different species, i.e. with large trait differences, reach
similar high abundances [16].
Recent studies have shown that both, community-weighted
means of trait values and functional trait diversity, can jointly
explain variation in aboveground productivity in semi-natural
grasslands [25–27]. In experimental grasslands, a higher commu-
nity biomass has been shown to correlate positively with functional
trait diversity [20,28,29] or a combination of functional trait
diversity and community-weighted means of trait values [30].
However, so far none of the experimental studies considering
species richness effects on productivity has performed a systematic
analysis of how either community-weighted means of trait values
or functional trait diversity may explain variation in productivity
and the contribution of complementarity and selection effects on
mixture performance. Here, we present a study carried out four
years after establishment of a large grassland biodiversity
experiment (Jena Experiment; [31]) comprising 66 mixtures of
different species richness (2, 4, 8, 16, and 60 species) and different
functional group number (1 to 4; grasses, legumes, small herbs, tall
herbs) and respective monocultures of the 60 experimental species.
Plant traits were measured in monocultures and additionally
derived from the literature to characterize strategies of resource
capture and use as well as life-history features of all species. The
additive partitioning method [7] was used to partition net
biodiversity effects into selection and complementarity effects.
We applied a method proposed by Schumacher and Roscher [27]
which is flexible in testing competing hypotheses on the effects of
plant functional characteristics on ecosystem processes by using
two different measures, i.e. community-weighted means of trait
values (CWM) and functional trait diversity based on Rao’s
quadratic diversity (FDQ). This method is based on the separate
calculation of FDQ in single traits which are used as candidate
predictors in a multiple regression procedure, thus allowing for
a weighting of different functional traits and maximizing their
power to predict ecosystem processes. Firstly, we explored how the
60 experimental species assigned to different functional groups
spread in a multivariate functional trait space to compare their
resource acquisition and life-history strategies and trade-offs
between different functions. Secondly, we tested how the
experimental mixtures varied in their functional trait composition,
i.e. CWM and FDQ, and how this varation in trait composition is
related to sown species richness. Thirdly, we related community
biomass production as well as measures of biodiversity effects and
trait-based indices to assess whether community-weighted means
of trait values (CWM), i.e. functional identity of dominant species,
or functional trait diversity (FDQ), i.e. functional dissimilarity
among species, are better predictors for high mixture perfor-
mance.
Results
Species Characteristics in a Multivariate Trait SpaceThe two leading axes of a standardized PCA explained about
41% of variation (Fig. 1). Out of 153 correlations between traits 55
pairings were significant at P#0.050. The first principal compo-
nent accounting for 25% of species variation in multiple traits had
high positive loadings for leaf nitrogen concentrations and length
of the flowering period as well as high negative loadings for shoot
biomass:N ratios, stem and inflorescence mass fractions, foliar
d15N values, rooting type and the species ability for vegetative
reproduction. In spite of considerable overlap among species
assigned to different plant functional groups in the ordination
space, the first principal component clearly separated legumes
from grasses, while tall herbs and small herbs were more scattered
between these functional groups (F3,56 = 38.50, P,0.001; Tukeys
HSD test: P,0.001 for comparisons among legumes, grasses and
herbs; P = 0.357 for comparison between small herbs and tall
herbs). The second principal component accounted for 16% of
species variation in multiple traits. This axis had high negative
loadings for shoot length, seed mass, rooting depth and vertical
leaf distribution. Small herbs which occupied the upper quadrants
of the two-dimensional ordination space were separated from
other pre-defined functional groups (F3,56 = 18.34, P,0.001;
Tukeys HSD test: P,0.001 for comparisons of small herbs with
grasses, legumes and tall herbs).
Functional Trait Composition of MixturesThe first principal component of a standardized PCA of
community-weighted means of trait values (CWM) accounted for
30% of variation among mixtures. This axis had high positive
loadings for CWM of leaf nitrogen concentrations, seed mass as
well as rooting depth and high negative loading for CWM of foliar
d15N values, shoot biomass:N ratios, a species ability for vegetative
reproduction and seedling number (Fig. 2a). The second principal
component explained 23% of variation in CWM among mixtures
and was characterized by high positive loadings for CWM of
length of the flowering period and high negative loadings for
CWM of shoot length, stem mass fraction and shoot biomass:N
ratios. The third principal component accounted for 10% of
variation in CWM and had high positive loadings for foliar d13C
values (Fig. 2b). The first principal component of a standardized
PCA of functional trait diversity (FDQ) explained 33% of variation
in FDQ among mixtures and had high positive loadings for a larger
Plant Functional Trait-Productivity Relationships
PLoS ONE | www.plosone.org 2 May 2012 | Volume 7 | Issue 5 | e36760

set of traits, e.g. FDQ in shoot biomass:N ratios, shoot length, leaf
nitrogen concentrations or species ability for vegetative reproduc-
tion (Fig. 2c). The second principal component accounted for 14%
of variation among mixtures and was characterized by high
negative loadings for foliar d15N values, while 9% of variation in
FDQ was explained by the third principal component that had
high positive loadings for FDQ in life cycle (Fig. 2d). Out of a total
of 153 correlations in analyses of CWM and FDQ respectively,
approximately 50% of the pairings were significant at P#0.050 (76
for CWM, 79 for FDQ). CWM and FDQ were only weakly related
(Fig. 2e, f), and only 55 pairings out of 324 correlations were
significant. CWM of foliar d13C values was significantly correlated
with sown species richness, while FDQ of 14 out of 18 traits had
significant correlations with sown species richness.
Aboveground Biomass ProductionAboveground community biomass increased with increasing
mixture species richness (R2 = 0.11; Fig. 3a). In separate models,
CWM explained a larger proportion of variation in community
biomass (R2 = 0.80; model A) than a model based on pure
functional trait diversity effects (R2 = 0.36; model B, Table 1). In
total, 7 out of 18 candidate traits were selected into the model best
explaining variation in community biomass production purely
based on CWM, indicating that communities containing dominant
species with different trait combinations reached high productivity
in our experiment. The chosen trait combinations included shoot
length (long . short, i.e., longer shoot length was associated with
higher community productivity), vertical leaf distribution (rosette
. others), leaf nitrogen concentration (high . low), foliar d15N
values (low . high), ordering species along strategy spectra with
regard to nitrogen and light acquisition and use; as well as life
cycle (perennial . others), seasonality of foliage (summer- .
wintergreen) and number of seedlings (low . high), ordering
species along strategy spectra with regard to life-history and
seasonal niche use. The proportion of explained variation only
marginally increased in the model including CWM and FDQ
(R2 = 0.82; model C, Table 1) compared to the model purely based
on CWM. Partial R2 values also provided evidence that CWM
was the most important group of predictor variables in the
combined model (Table 1). Although this result suggests that
functional identity had the largest effects on community biomass
production, FDQ based on variability in foliar d15N values had
additional positive effects on community biomass production
(model C, Table 1).
Measures of Biodiversity EffectsThe net biodiversity effect (NE) was positive across all species-
richness levels (test for overall mean?0: F1,61 = 56.03, P,0.001).
Increasing mixture species richness had positive effects on NE
(R2 = 0.13). In separate models, CWM explained a larger pro-
portion of variation in net biodiversity effects (NE) (R2 = 0.70) than
did FDQ (R2 = 0.38). The proportion of explained variation
Figure 1. Standardized Principal Components Analysis (PCA; first vs. second axes) of 60 grassland species characterized by 18functional traits. Plant traits were measured in species monocultures in the Jena Experiment and derived from the literature. Symbols show speciesassignment to plant functional groups. For list of variables and abbreviations see Table 2.doi:10.1371/journal.pone.0036760.g001
Plant Functional Trait-Productivity Relationships
PLoS ONE | www.plosone.org 3 May 2012 | Volume 7 | Issue 5 | e36760
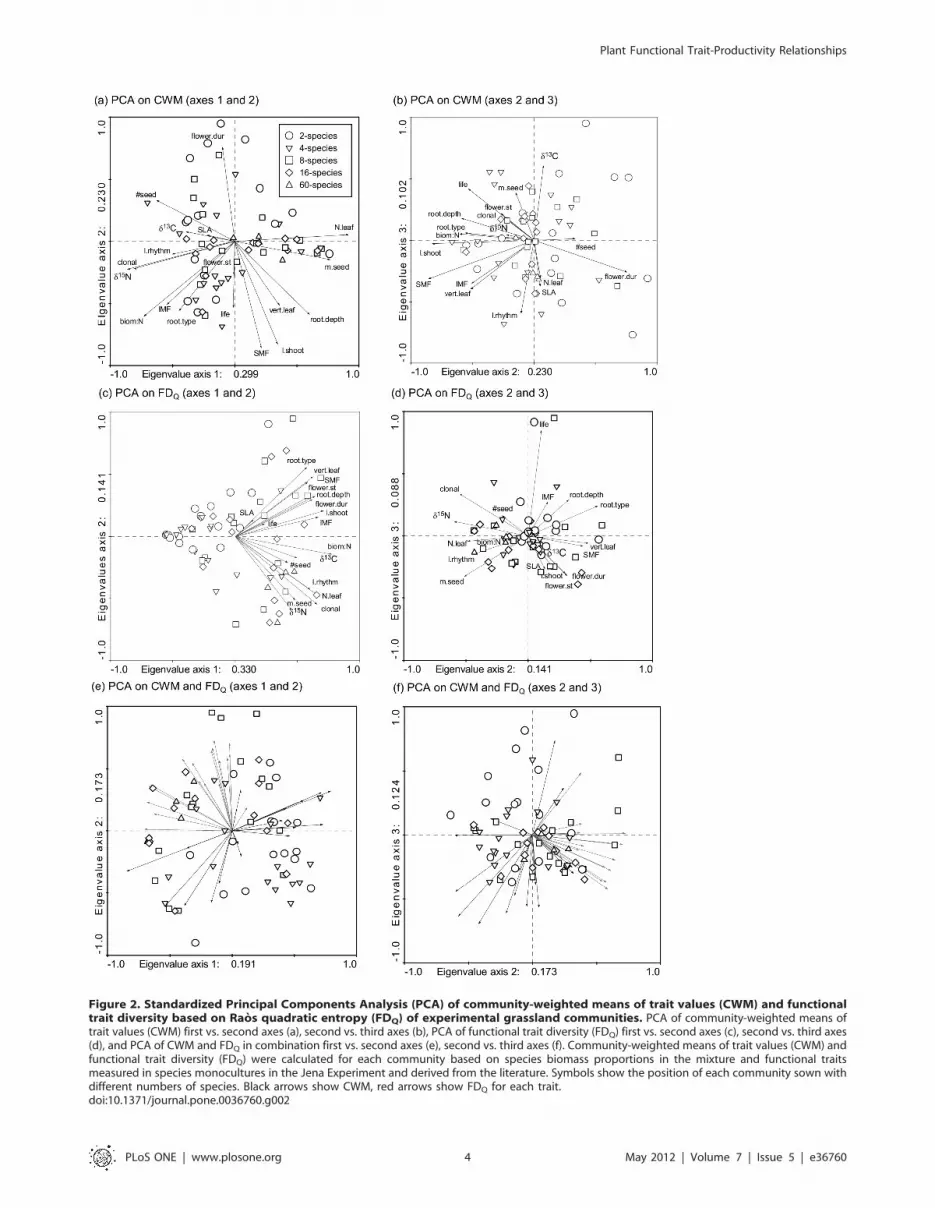
Figure 2. Standardized Principal Components Analysis (PCA) of community-weighted means of trait values (CWM) and functionaltrait diversity based on Raos quadratic entropy (FDQ) of experimental grassland communities. PCA of community-weighted means oftrait values (CWM) first vs. second axes (a), second vs. third axes (b), PCA of functional trait diversity (FDQ) first vs. second axes (c), second vs. third axes(d), and PCA of CWM and FDQ in combination first vs. second axes (e), second vs. third axes (f). Community-weighted means of trait values (CWM) andfunctional trait diversity (FDQ) were calculated for each community based on species biomass proportions in the mixture and functional traitsmeasured in species monocultures in the Jena Experiment and derived from the literature. Symbols show the position of each community sown withdifferent numbers of species. Black arrows show CWM, red arrows show FDQ for each trait.doi:10.1371/journal.pone.0036760.g002
Plant Functional Trait-Productivity Relationships
PLoS ONE | www.plosone.org 4 May 2012 | Volume 7 | Issue 5 | e36760

increased when models based on pure effects of CWM were
extended with FDQ (R2 = 0.78; model C). A combination of traits
characterising efforts in nutrient acquisition (high leaf nitrogen
concentrations, low foliar d15N values, large rooting depth and
extensive secondary root system), rosette-like vertical leaf distri-
bution, summer-green foliage and perennial life cycle were
selected for CWM, while variability in foliar d15N values, in
species’ ability for clonal reproduction and in investment into
Figure 3. Aboveground community biomass, net biodiversity effect, complementarity effect, and selection effect as a function ofspecies richness. Biomass data were recorded at estimated peak biomass in late May 2006 in the Jena Experiment. Lines show means across allmixtures per species-richness level.doi:10.1371/journal.pone.0036760.g003
Table 1. Summary of best statistical models based on different groups of predictor variables (community-weighted means of traitvalues (CWM) and functional trait diversity (FDQ)) for community biomass, net biodiversity effects, complementarity effects andselection effects.
Response variable R2 Selected traits Partial R2 Selected traitsPartialR2
Model A Community weighted mean (CWM)
Community biomass 0.796 l.shoot, vert.leaf, N.leaf, d15N, life, l.rhythm, #seed
Net biodiversity effect 0.696 vert.leaf, N.leaf, d15N, root.type, life, l.rhythm
Complementarity effect 0.266 SLA, root type, #seed
Selection effect 0.265 SLA, d15N, root.type, m.seed
Model B Functional trait diversity (FDQ)
Community biomass 0.356 l.rhythm, m.seed positive
Net biodiversity effect 0.378 N.leaf, d15N, m.seed positive
Complementarity effect 0.236 N.leaf positive
Selection effect 0.284 SMF, N.leaf, life negative
Model C Community weighted means of trait values (CWM) Functional trait diversity (FDQ)
Community biomass 0.818 l.shoot, vert.leaf, N.leaf, d15N, life, l.rhythm, #seed 0.797 d15N positive 0.162
Net biodiversity effect 0.776 vert.leaf, N.leaf, d15N, root.depth, root.type, life, l.rhythm 0.697 d15N, clonal, IMF positive 0.234
Complementarity effect 0.317 clonal 0.192 N.leaf positive 0.236
Selection effect 0.396 d15N, root.type, m.seed 0.252 N.leaf, life negative 0.246
Analyses are based on 66 experimental mixtures of varying species richness (2, 4, 8, 16 and 60 species). For estimated coefficients see (Table S1, S2, S3), abbreviations ofvariable names are explained in Table 2.doi:10.1371/journal.pone.0036760.t001
Plant Functional Trait-Productivity Relationships
PLoS ONE | www.plosone.org 5 May 2012 | Volume 7 | Issue 5 | e36760

reproductive structures were selected for FDQ. The comparison of partial R2 values showed that effects of the traits selected for CWM
Table 2. List of functional traits derived from measurements in monocultures of the Jena Experiment and from the literature.
Variable Abbreviation Unit Variable type
Descriptionand traitcategories
Source
Resource acquisition and use
(1) Shoot length l.shoot cm continuous stretched shoot length measurement
(2) Leaf distribution vert.leaf ordinal vertical leaf distribution literature
(0) whole phytomass near theground (rosette)
(1) main part of phytomass nearground, but minor part along the stem
(2) equal parts of phytomass near the ground and along the stem
(3) Stem mass fraction SMF mgstem mg21shoot continuous dry mass of supporting tissue per total shoot mass measurement
(4) Specific leaf area SLA mm2leaf mg21
leaf continuous leaf area per leaf dry mass measurement
(5) Foliar d13C d13C % continuous 13C isotopic signature of leaves measurement
(6) Leaf nitrogenconcentration
N.leaf mg N g21leaf continuous nitrogen mass per leaf dry mass measurement
(7) Biomass:N ratio biom:N g N g21shoot continuous unit nitrogen per unit shoot mass measurement
(8) Foliar d15N d15N % continuous 15N isotopic signature of leaves measurement
(9) Depth of the rootsystem
root.depth ordinal (1) up to 20 cm literature
(2) up to 40 cm
(3) up to 60 cm
(4) up to 100 cm
(5) .100 cm
(10) Type of the root system root.type ordinal (1) long-living primary root system (beet- or stake-like taproots) literature
(2) secondary fibrous roots in addition to the primary root system
(3) short-living primary root system, extensive secondary root system
Life history characteristics
(11) Life cycle life ordinal (1) annual literature
(2) biennial or monocarpic perennial
(3) perennial
(12) Clonal growth clonal ordinal (0) no clonal growth literature
(1) clonal growth
(13) Seasonality of foliage l.rhythm ordinal (1) deciduous literature
(2) partly deciduous (most foliage dies off in winter)
(3) evergreen (all-season with foliage)
(14) Start of flowering period flower.st ordinal (1) before May literature
(2) May
(3) June
(4) July
(15) Duration of floweringperiod
flower.dur ordinal (1) two months or less literature
(2) three months
(3) four months
(4) more than 4 months
(16) Inflorescence massfraction
IMF mginflorescencemg21
shoot
continuous dry mass of reproductive organs per total shoot mass measurement
(17) Seed mass m.seed mg continuous average seed mass measurement
(18) Seedling number #seed m22 continuous number of emerged seedlings based on three census measurement
doi:10.1371/journal.pone.0036760.t002
Plant Functional Trait-Productivity Relationships
PLoS ONE | www.plosone.org 6 May 2012 | Volume 7 | Issue 5 | e36760

exceeded effects of traits selected for FDQ in explaining variation
in net biodiversity effects (Table 1).
The complementarity effect (CE) was positive across all species-
richness levels (test for overall mean?0: F1,61 = 28.78, P,0.001;
Fig. 3c), while the selection effect did not differ significantly from
zero (test for overall mean?0: F1,61 = 1.13, P = 0.293; Fig. 3d). An
increasing species richness of mixtures did not affect CE and SE.
Positive effects of FDQ based on variabililty in leaf nitrogen
concentrations in the pure trait-diversity model explained a similar
proportion of variance (R2 = 0.24; model B) in the complemen-
tarity effect (CE) as the model solely based on CWM (R2 = 0.27;
model A), which included community-weighted means in SLA,
root type and seedling number. The proportion of explained
variation in CE increased in the model combining CWM and
FDQ (R2 = 0.32; model C, Table 1). This model included negative
effects for the ability for clonal reproduction as CWM, and positive
effects of diversity in leaf nitrogen concentrations. Partial R2 values
indicated that FDQ was more important than CWM in explaining
variation in CE, when both groups of predictor variables were
analysed in combination (Table 1).
CWM (R2 = 0.27; model A) and FDQ (R2 = 0.28; model B) also
explained a similar proportion of variation in the selection effect
(SE) when used separately as predictors (Table 1). The best model
explaining variation in SE contained both groups of predictor
variables (R2 = 0.40; model C). Low foliar d15N values, extensive
secondary root system and large seed mass as CWMs were
correlated with positive selection effects, while variability in leaf
nitrogen concentrations and life cycle as FDQ were correlated with
negative selection effects (Table 1).
Discussion
The increasing consensus that ecosystem processes are governed
by the functional traits of species, their abundance and distribution
in a community [32,33] has attracted growing attention on the use
of functional trait composition, rather than species richness, in the
exploration of biodiversity–ecosystem functioning relationships.
Community-weighted means of trait values (CWM) characterising
the functional identity of dominant species and different metrics of
functional trait diversity describing the average functional
dissimilarity among species, have rarely been incorporated in
combined analyses in natural ecosystems (but see [25–27]) and
have only recently been tested in a biodiversity experiment [30].
Our analyses of CWM and FDQ based on a large spectrum of
functional traits in a grassland biodiversity experiment (Jena
Experiment) provided evidence that both reflect different compo-
nents of functional trait composition (Fig. 2e, f). The step-wise
modelling procedure including both groups of predictor variables
(CWM, FDQ) applied to explore their relative contribution in
explaining variation in biomass production and measures of
biodiversity effects showed that in all cases the combination of
CWM and FDQ resulted in models with the largest explanatory
power, but the relative importance of both components of
functional trait composition depended on the analysed response
variable: CWM explained a larger proportion of variation in
community biomass and net biodiversity effects than did FDQ,
whereas FDQ explained a similar amount of variation in
complementarity and (negative) selection effects as did CWM for
variation in complementarity and (positive) selection effects. Thus,
our results clearly demonstrate the need to unite the conceptually
separate consideration of functional identity and functional
diversity to further advance the understanding of mechanisms
underlying biodiversity–ecosystem functioning relationships.
Species Characteristics in Multiple TraitsAlthough the 60 grassland species substantially differed in their
functional trait combinations (Fig. 1), the first principal component
separated species according to characteristics of their ‘‘nutrient
economy’’, i.e. the capture and use of nitrogen. This axis of
variation represented a gradient of species differing in their leaf
nitrogen concentrations and d15N values, shoot biomass:N ratios,
root type, seasonality of foliage and ability for clonal reproduction.
It differentiated species based on a functional trade-off in a set of
plant attributes that are either directed to optimize rapid resource
acquisition or permitting the conservation of resources, which is
largely congruent to previous work at different geographic scales
or locations (e.g. [34–36]). This trait axis distinguished the a priori
defined functional groups of grasses from legumes, while non-
leguminous herbaceous species had intermediate positions. The
second principal component was related to aboveground plant size
and structure (e.g. shoot length, stem mass fraction, vertical leaf
distribution) and rooting depth. A larger plant size correlated
positively with seed mass, which is consistent with results from
large-scale studies [37]. A trade-off in strategies of generative
reproduction distinguished species with heavier seeds and a later
starting, short period of flowering compared to species with
a longer, earlier starting flowering period and a larger number of
emerging seedlings. A larger seed mass generally conveys benefit in
seedling establishment [38]. Therefore, the higher number of
seedlings in small-seeded species is likely to be based on a trade-off
between seed mass and seed number, i.e. an inverse relation
between seed production and seed size [39].
The Role of Functional Traits in Explaining Variation inCommunity Biomass Production and Measures ofBiodiversity Effects
In natural communities, species are not assembled randomly
from a local species pool; thus particular ecological traits should be
selected for in the process of community assembly [40]. Bio-
diversity experiments have been criticized for their random species
selection, ignoring the impact of abiotic and biotic filters which
constrain diversity in natural ecosystems [41–43]. Jiang et al. [43]
argue that in natural communities abundant species are more
likely to be widespread, thus increasing the chance for a positive
selection effect. The design of the Jena Experiment ensures that
the number of functional groups is near-orthogonally crossed with
species richness [31]. Species combinations were randomly chosen
from the respective functional groups, which increases the chance
for each member of the species pool to be more frequent in multi-
species communities irrespective of its potential to become
dominant. Nevertheless, our analyses showed that increasing
community biomass production was best explained by CWM,
indicating that traits of the dominant species were most important
for high productivity. The selection of CWM in high foliar
nitrogen concentrations and low foliar d15N values, which
characterise legumes (Fig. 1; Table S3) showed that N2-fixing
legumes had positive effects on community biomass production.
However, the additional positive effects of diversity in foliar d15N
values suggest that a higher diversity in nitrogen acquisition
strategies increased community biomass. Our analyses also showed
that not only abundance-weighted means of leaf nitrogen
concentrations and foliar d15N values, but also CWM of a larger
suite of traits (Table 1), which were widely spread in the multiple
trait space (Fig. 1), explained variation in community biomass.
Additional analyses (not shown) to evaluate whether high CWMs
in different traits were associated with the occurrence of different
species, provided evidence that three legume species, i.e. Lathyrus
Plant Functional Trait-Productivity Relationships
PLoS ONE | www.plosone.org 7 May 2012 | Volume 7 | Issue 5 | e36760

pratensis L., Medicago lupulina L., Onobrychis viciifolia Scop., were not
only associated with CWM in nitrogen-related traits, but also with
CWM characterising life cycle (low seedling number, deciduous
leaves, and no ability for vegetative reproduction in case of M.
lupulina, O. viciifolia) and shoot length (O. viciifolia). In contrast, other
species were associated with CWM in single traits, e.g. low values
for CWM in vertical leaf distribution with the occurrence of the
rosette plants Plantago media L. and Primula veris L., large CWM in
shoot length with the occurrence of the grass species Bromus erectus
Huds. and Dactylis glomerata L.
In semi-natural grasslands, a tall growth usually associated with
competitive dominance [44], has been shown to be related with
high aboveground biomass production [27,42]. High community
mean values of shoot length also contributed to high community
biomass in our experimental grasslands, but in addition leaf
distribution along the stem (in favour of rosette plants) and life-
history traits such as a perennial life cycle, seasonality of foliage
(favouring summergreen species) and a low reproduction by seeds
characterized communities with high biomass production. Due to
the random allocation, species with traits favouring dominance in
semi-natural grasslands did not necessarily have a larger proba-
bility to be present in each experimental multi-species mixture.
Contrarily, species with traits which would not correlate with
a potential for dominance in natural environments may achieve
higher abundances in these artificially created experimental
grasslands because of a reduced likelihood for competitive
exclusion [43].
A higher importance of CWM and additional positive effects of
FDQ with a similar spectrum of selected traits also explained
variation in net biodiversity effects best. The replacement of shoot
length by root characteristics (i.e. larger rooting depth and a higher
proportion of species with an extensive secondary root system
which usually possess a higher root density [45]) suggested that the
exploitation of soil resources is important for positive net
biodiversity effects. The selection effect (Fig. 3d) was best
explained by a combination of negative functional trait diversity
effects and CWM. Higher selection effects were positively
correlated with high mean values of traits associated either with
particular resource acquisition strategies (grasses with an extensive
secondary root system, N2-fixing legumes with low d15N values
and high seed mass, Fig. 1), when combined with a low diversity of
traits associated with nitrogen use (leaf nitrogen concentrations),
light acquisition (stem mass fraction) and life cycle. In contrast,
a combination of CWM and positive trait diversity effects
explained variation in complementarity effects best. Positive effects
of legume presence on these measures have been reported from
several biodiversity experiments including the Jena Experiment
(e.g. [46–48]). The incorporation of diversity in leaf nitrogen
concentrations and CWM in species ability for vegetative spread
(low ability = characteristic of several herbs, Fig. 1) emphasized
that not only the presence of N2 fixing legumes with high foliar
nitrogen concentrations (Fig. 1), but species separation along trait
axes associated with nitrogen acquisition is important for positive
complementarity effects among grassland species.
In summary, our results show that traits may vary considerably
with respect to their relative importance as weighted mean trait
values (CWM) or trait variance (FDQ). Traits associated with
nitrogen acquisition and use as foliar d15N values and leaf nitrogen
concentrations were incorporated as FDQ and CWM in our
models, indicating that both diversity in strategies of nitrogen
acquisition and use (related to high FDQ) and high abundances of
legumes (expressed by high CWM in leaf nitrogen concentrations
and low CWM in foliar d15N values) are essential for a high
community biomass, positive complementarity and net diversity
effects in our study system. The larger set of morphological and
life-history traits which were additionally incorporated as CWM,
however, suggested that species identity expressed as high
proportions of species with different trait combinations are
important for a high performance of particular mixtures randomly
assembled from an experimental species pool.
Methodological AspectsThe importance of considering the functional diversity with
respect to individual traits when trying to explore biodiversity–
ecosystem functioning relationships was recently emphasized by
Spasojevic and Suding [49]. The calculation of functional diversity
indices is usually based on multiple traits. This approach is justified
particularly at larger environmental scales, where plant strategies
are reflected in functional trade-offs and a coordinated variation of
functional traits [34,50]. However, our analysis of 60 grassland
species (Fig. 1) provided evidence for a considerable variation in
their functional trait combinations. Therefore, the incorporation
of multiple traits in single multivariate indices of functional
diversity increases the chance to include functional traits that are
either irrelevant or have opposing effects which may mask
important diversity effects. In addition, single multivariate
functional diversity indices do not directly permit the identification
of functional traits relevant for a particular ecosystem process. So
far this problem has been circumvented by comparing alternative
models with different trait combinations [20,26]. We extended this
approach by estimating relative weights for individual traits [27].
The consideration of variability of each functional trait cannot
fully avoid multicollinearity among predictors and does not allow
for an unequivocal partitioning of sources of variability in
ecosystem processes. However, our approach of deriving the
importance of diversity with respect to different functional traits by
estimating relative weights implements a practical procedure to
identify the relevant traits. Despite the potential multicollinearity
problems, the statistical process of trait selection (CWM and FDQ)
for our best models seems to be relatively stable. Comparing sets of
three best models (see Tables S1, S2, S3), the combinations of
selected traits were always quite similar and replacements occurred
with traits which were closely related as revealed by detailed PCA
(Fig. 2). Although FDQ is not necessarily expected to strongly
correlate with species richness and may achieve maximum values
with two species only [16], the diversity of most traits was
positively correlated with species richness in our experiment.
Therefore, we expect that our approach would be even more
useful in identifying the relevant components of diversity in natural
ecosystems.
ConclusionsA number of recent studies on biodiversity–ecosystem function-
ing relationships have suggested that the functional composition is
a main driver of ecosystem processes, but so far the relative effects
of functional identity (or community-weighted mean traits) and
trait variation (or functional diversity) remained mostly untested
(but see [25–27,30]) and the identification of relevant functional
traits for different ecosystem processes has largely been ignored.
Our results clearly emphasize the need to incorporate different
aspects of functional composition (functional identity, functional
diversity) in studies of biodiversity–ecosystem functioning relation-
ships. In addition, the large dimensionality in species functional
trait composition and the differential importance of single traits
imply that the identification of key functional traits may contribute
to a better understanding of the drivers of different ecosystem
processes. Thus, our modelling framework may contribute to
resolve the controversy about mechanisms behind biodiversity–
Plant Functional Trait-Productivity Relationships
PLoS ONE | www.plosone.org 8 May 2012 | Volume 7 | Issue 5 | e36760

ecosystem functioning relationships in experimental biodiversity
research, but it is also a tool to identify the relevant components of
biodiversity for the maintenance of ecosystem functioning in
natural systems.
Materials and Methods
Study Area and Experimental DesignThe Jena Experiment was established in spring 2002 on former
arable land located in the floodplain of the river Saale near the city
of Jena (Thuringia, Germany; 50u559 N, 11u359 E, 130 m a.s.l.).
The soil of the experimental site is a Eutric Fluvisol developed
from up to 2 m-thick loamy fluvial sediments. Soil texture ranges
from sandy loam near the river to silty clay with increasing
distance from the river. The area around Jena has a mean annual
air temperature of 9.3uC, mean annual precipitation is 587 mm
[51].
The experimental species pool comprised 60 plant species
common to Central European mesophilic grasslands [52], which
were divided into four functional groups: 16 grasses, 12 small
herbs, 20 tall herbs and 12 legumes. In total, 82 plots of 20620 m
size were established. These plots vary in species richness (1, 2, 4,
8, 16 and 60) and functional group number (1 to 4) and
composition, whereby for each functional group composition as
many species richness levels as possible had been designed. In
total, each species-richness level had 16 plots, except for the 16-
species level with 14 plots because not enough species were
available to create pure legume and small herb mixtures at this
species-richness level. The 60-species mixture was established on 4
plots. Species were randomly selected from the species pool for
each particular community. In addition, each experimental species
was sown in two replicated smaller monocultures of 3.563.5 m
size. Initial sowing density amounted to 1000 viable seeds per m2.
In mixtures, all species were sown with equal proportions (for
further details, see [31]). To account for the gradient in soil
texture, the experimental area was divided into four blocks parallel
to the river, each containing an equal number of large plots per
species-richness level and of small monocultures per functional
group. All plots were mown twice per year in early June and
September as it is typical for the management of extensive hay
meadows in the region. No fertilizer was applied during the
experiment. Biannual weeding campaigns (April, July) served to
maintain the sown species combinations. Management was
organized block-wise.
Data CollectionAboveground biomass production. Aboveground biomass
production was assessed by cutting plants 3 cm above ground level
at estimated peak biomass in late May 2006. Four samples were
harvested in large mixture plots, and two samples were taken in
small monocultures in randomly selected subplots (20650 cm
size), excluding the outer 70 cm of the plots. Clipped plant
material was sorted to species sown into a particular community,
removing unsown species and detached dead material. Biomass of
all samples was determined after drying (48 h, 70uC). For further
details, see [53]. Aboveground community biomass was calculated
for each experimental community as the mean of replicated
samples per plot.
Trait data. Trait data were collected in monocultures of each
species in late May 2006 (corresponding to the time of biomass
harvest) with the exception of six species, which were sampled in
May 2008 or 2009 (Anthriscus sylvestris (L.) Hoffm., Bromus hordeaceus
L., Cynosurus cristatus L., Holcus lanatus L., Pastinaca sativa L.,
Sanguisorba officinalis L.). Three species could not be studied in
monoculture because they went extinct (Cardamine pratensis L.) or
their abundance was too low for destructive sampling (Campanula
patula L., Luzula campestris (L.) Dc.). Thus, trait data for these
species were recorded in a low-diversity mixture, where these
species were present. Single shoots were the basic unit for all
measurements because the vegetative spread of several species
with above- or belowground runners hampered the clear
identification of plant individuals in some cases. Shoots rooting
closest to regularly spaced points along a transect (each 25 cm
excluding the outer 70 cm of the plot margin) were chosen and cut
off at ground level. Shoots were immediately put into sealed plastic
bags and stored in a cool box. In the laboratory, maximum
stretched shoot length was measured. Then, shoots were separated
into biomass components: stems (including leaf sheaths in case of
grasses and secondary axes in case of herbs), leaves (being leaf
blades in case of grasses, including petioles and rhachis in case of
herbs with compound leaves) and reproductive parts (flowers,
fruits). A leaf area meter (LI-3100 Area Meter, Li-COR, Lincoln,
USA) was used to determine the area of three to four fully
developed leaves (leaf blades in case of grasses) per shoot. All
harvested material was dried at 70uC (48 h) and weighed. For
subsequent chemical analyses, the dry material of measured leaves
and bulk samples of the residual shoot material of each species
were pooled per plot and ground to a fine powder. Nitrogen and
carbon concentrations of the bulk samples were measured with an
elemental analyzer (Vario EL Element Analyzer, Elementar,
Hanau, Germany). Nitrogen concentrations as well as nitrogen
and carbon isotope ratios (d15N and d13C, respectively) were
determined from leaf samples with an isotope-ratio mass
spectrometer (IRMS, Delta plus XP and Delta C prototype
Finnigan MAT respectively, Bremen, Germany).
Seedlings (plant individuals with cotyledons) were counted three
times in 2006 (April, July, October) in all small monoculture plots
to account for species-specific differences of seedling emergence.
For each census, three quadrats (30630 cm) were randomly
placed and all emerged seedlings of the respective species were
counted. Cumulative seedling densities per m2 were calculated for
each monoculture based on pooled data from all census dates.
Data from species replicates were averaged when trait data in
both monoculture plots per species were sampled. Average seed
mass was determined by weighing 5 batches of 50 seeds per species
from seed material purchased from commercial suppliers (Rieger-
Hofmann GmbH, Blaufelden-Raboldshausen, Germany) used for
the establishment of the Jena Experiment. Further species
attributes characterising belowground morphology and life history
were derived from the literature [54–56] as categorical variables,
resulting in a matrix of 18 plant functional traits in total (see
Table 2).
Data AnalysesAboveground biomass production and measures of
biodiversity effects. Aboveground community biomass at the
time of harvest was calculated for each experimental community
as the mean of the four samples per large plot and the two samples
per small monoculture plot. Net biodiversity effects (NE),
complementarity effects (CE) and selection effects (SE) were
calculated for each mixture using the additive partitioning method
[7]. The net biodiversity is defined as
DY~X
YzM ð1Þ
where SY is the summed observed biomass for each species in
a mixture (i.e. community biomass) and M is the average
Plant Functional Trait-Productivity Relationships
PLoS ONE | www.plosone.org 9 May 2012 | Volume 7 | Issue 5 | e36760

monoculture biomass of all species in this mixture. The net
biodiversity effect can be partitioned into two additive compo-
nents.
DY~NDRYMzNcov(DRY ,M) ð2Þ
The selection effect is quantified as Ncov(DRY ,M), where N is
the number of species in mixture, M is a species monoculture
biomass, and DRY is the difference between the observed relative
yield (Y/M) and the expected relative yield (i.e. its sown proportion
1/N). The complementarity effect is measured as NDRYM,
where DRY is the average DRY of all species in the mixture.
Biomass data of the two small monocultures per species were
averaged for all calculations.Community-weighted means of trait values and
functional trait diversity. Community-weighted means of
trait values (CWM) were calculated for each community based
on species biomass proportions according to the equation
CWM~XS
i~1
pitið3Þ
where S is the number of species in the community, pi are the
species biomass proportions and ti are species-specific trait values.
Functional trait diversity was computed as Raos quadratic
entropy (FDQ)
FDQ~XS
i~1
XS
j~1
pipjdij ð4Þ
where S is the number of species in the community, pi and pj are
the relative abundances of species i and j, and dij is the trait
distance between species i and j in the community. Data on leaf
nitrogen concentration, seed mass, seedling number, inflorescence
mass fraction, foliar d15N and stretched shoot length were log-
transformed prior to analysis to meet the assumptions of
normality.Species and community characteristics in multivariate
trait space. A standardized principal components analysis
(PCA) was performed to explore species differences in multiple
trait space. In addition, standardized PCAs were applied to
investigate multiple relationships between mixture CWM and
FDQ based on single traits and species biomass proportions in
mixture.Predicting aboveground biomass production and
measures of biodiversity effects from plant functional
traits. FDQ can be interpreted as the average dissimilarity of
two randomly chosen individuals from the community, thus
comprising information about functional richness and functional
evenness of a community [57]. Since the trait distances dij strongly
depend on which functional traits are incorporated and on the
chosen distances measure, FDQ comprises a large number of
possible functional diversity measures. This flexibility has been
used to identify those functional traits whose diversity is most
relevant for particular ecosystem processes by comparing the
predictive performance of FDQ based on different suites of traits
[20,26]. When based on multiple traits and the squared Euclidean
distance as a dissimilarity measure, FDQ represents the sum of
variances of individual plant traits, thus relating FDQ to a common
measure of variability of single traits [19,27]. Exploiting this
additivity with respect to traits, the qualitative exclusion/inclusion
of traits has recently been generalized to a more quantitative
approach where additionally relative weights for the different traits
can be estimated [27]. Using this approach FDQ can be
interpreted as a weighted average of functional diversity measures
based on single traits (see Text S1, Supporting Information for
technical details). To allow the interpretation of weights as
measures of relative importance of traits all traits were standard-
ized to unit variance prior to calculating FDQ.
To study the relative contribution of community-weighted
means of trait values and functional diversity to the amount of
explained variation in aboveground biomass production and
measures of biodiversity effects we considered statistical models
with different combinations of explanatory variables (A) CWM, (B)
FDQ, and (C) CWM and FDQ. Within each class of models we
selected the best fit based on leave-one-out cross validation.
Detailed information on the three best models can be found in the
(Table S1, S2, S3). The coefficient of determination R2 is given as
a summary measure for explained variation.
All data analyses were performed with the statistical software R
2.11.1 (R Development Core Team, http://www.R-project.org)
and the implemented package leaps [58] and quadprog [59], and
CANOCO 4.5 [60] was used for PCA.
Supporting Information
Table S1 Summary of the best three models based on CWM.
(DOC)
Table S2 Summary of the best three models based on FDQ.
(DOC)
Table S3 Summary of the best three models based on CWM
and FDQ.
(DOC)
Text S1 Detailed method description on estimating the relative
importance of functional traits.
(PDF)
Acknowledgments
We thank W.W. Weisser for coordination of the Jena Experiment. We
thank all the people involved in the maintenance of the experiment,
biomass harvest, measurement of plant traits and sample preparation,
particularly U. Wehmeier, the gardeners and many student helpers. We
acknowledge I. Hilke, H. Geilmann and K. Sorgel for elemental and stable
isotope analyses of plant material. We thank two anonymous reviewers for
their comments which helped to improve the manuscript.
Author Contributions
Conceived and designed the experiments: CR JS MG AL BS NB EDS.
Performed the experiments: CR MG AL AW. Analyzed the data: JS CR.
Contributed reagents/materials/analysis tools: NB BS EDS. Wrote the
paper: CR JS BS NB MG AL AW EDS.
References
1. Loreau M, Naeem S, Inchausti P, Bengtsson J, Grime JP, et al. (2001)
Biodiversity and ecosystem functioning: current knowledge and future
challenges. Science 294: 804–808.
2. Hooper DU, Chapin FS, Ewel JJ, Hector A, Inchausti P, et al. (2005) Effects of
biodiversity on ecosystem functioning: A consensus of current knowledge. Ecol
Monogr 75: 3–35.
Plant Functional Trait-Productivity Relationships
PLoS ONE | www.plosone.org 10 May 2012 | Volume 7 | Issue 5 | e36760
3. Aarssen LW (1997) High productivity in grassland ecosystems: effected by
species diversity or productive species? Oikos 80: 183–184.
4. Huston MA (1997) Hidden treatments in ecological experiments: re-evaluating
the ecosystem function of biodiversity. Oecologia 110: 449–460.
5. Tilman D, Knops J, Wedin D, Reich P, Ritchie M, et al. (1997) The influence offunctional diversity and composition on ecosystem processes. Science 277:
1300–1302.
6. Loreau M (1998) Separating sampling and other effects in biodiversity
experiments. Oikos 82: 600–602.
7. Loreau M, Hector A (2001) Partitioning selection and complementarity inbiodiversity experiments. Nature 412: 72–76 [Erratum 413: 548].
8. van Ruijven J, Berendse F (2003) Positive effects of plant species diversity onproductivity in the absence of legumes. Ecol Lett 6: 170–175.
9. Roscher C, Temperton VM, Scherer-Lorenzen M, Schmitz M, Schumacher J,
et al. (2005) Overyielding in experimental grassland communities – irrespectiveof species pool or spatial scale. Ecol Lett 8: 419–429.
10. Fargione J, Tilman D, Dybzinski R, Hille Ris Lambers J, Clark C, et al. (2007)From selection to complementarity: shifts in the causes of biodiversity-
productivity relationships in a long-term biodiversity experiment. Proc R Soc
Lond B 274: 871–876.
11. Cardinale BJ, Wright JP, Cadotte MW, Carroll IT, Hector A, et al. (2007)
Impacts of plant diversity on biomass production increase through time becauseof species complementarity. Proc Natl Acad Sci USA 104: 18123–18128.
12. Violle C, Navas M-L, Vile D, Kazakou E, Fortunel C, et al. (2007) Let theconcept of trait be functional! Oikos 116: 882–892.
13. Garnier E, Cortez J, Billes G, Navas M-L, Roumet C, et al. (2004) Plant
functional markers capture ecosystem properties during secondary succession.Ecology 85: 2630–2637.
14. Shipley B, Vile D, Garnier E (2006) From plant traits to plant communities:a statistical mechanistic approach to biodiversity. Science 314: 812–814.
15. Grime JP (1998) Benefits of plant diversity to ecosystems: immediate, filter and
founder effects. J Ecol 86: 902–910.
16. Mouchet MA, Villeger S, Mason NWH, Mouillot D (2010) Functional diversity
measures: an overview of their redundancy and their ability to discriminatecommunity assembly rules. Funct Ecol 24: 867–876.
17. Petchey OL, Gaston KJ (2006) Functional diversity: back to basics and looking
forward. Ecol Lett 9: 741–758.
18. Tilman D (1997) Distinguishing between the effects of species diversity and
species composition. Oikos 80: 185.
19. Mason NWH, MacGillivray K, Steel JB, Wilson JB (2003) An index of
functional diversity. J Veg Sc 14: 571–578.
20. Petchey OL, Hector A, Gaston KJ (2004) How do different measures offunctional diversity perform? Ecology 85: 847–857.
21. Rao CR (1982) Diversity and dissimilarity coefficients: a unified approach.Theor Popul Biol 21: 24–43.
22. Botta-Dukat Z (2005) Raos quadratic entropy as a measure of functional
diversity based on multiple traits. J Veg Sc 16: 533–540.
23. Ricotta C (2005) A note on functional diversity measures. Basic Appl Ecol 6:
479–486.
24. Leps J, de Bello F, Lavoral S, Berman S (2006) Quantifying and interpreting
functional diversity of natural communities: practical consideration matter.
Preslia 78: 481–501.
25. Dıaz S, Lavorel S, de Bello F, Quetier F, Grigulis K, et al. (2007) Incorporating
plant functional diversity effects in ecosystem service assessments. Proc NatlAcad Sci USA 104: 20684–20689.
26. Mokany K, Ash J, Roxburgh S (2008) Functional identity is more importantthan diversity in influencing ecosystem processes in a temperate native grassland.
J Ecol 96: 884–893.
27. Schumacher J, Roscher C (2009) Differential effects of functional traits onaboveground biomass in semi-natural grasslands. Oikos 118: 1659–1668.
28. Cadotte MW, Cavender-Bares J, Tilman D, Oakley TH (2009) Usingphylogenetic, functional and trait diversity to understand patterns of plant
community productivity. PlosOne 4: e5695.
29. Wacker L, Baudois O, Eichenberger-Glinz S, Schmid B (2009) Diversity effectsin early- and mid-successional species pools along a nitrogen gradient. Ecology
90: 637–648.
30. Mouillot D, Villeger S, Scherer-Lorenzen M, Mason NWH (2011) Functional
structure of biological communities predicts ecosystem multifunctionality.
PlosOne 6: e17476.
31. Roscher C, Schumacher J, Baade J, Wilcke W, Gleixner G, et al. (2004) The role
of biodiversity for element cycling and trophic interactions: an experimentalapproach in a grassland community. Basic Appl Ecol 5: 107–121.
32. Dıaz S, Cabido M (2001) Vive la difference: plant functional diversity matters to
ecosystem processes. Trends Ecol Evol 16: 646–655.33. McGill BJ, Enquist BJ, Weiher E, Westoby M (2006) Rebuilding community
ecology from functional traits. Trends Ecol Evol 21: 178–185.
34. Grime JP, Thompson K, Hunt R, Hodgson JG, Cornelissen C, et al. (1997)Integrated screening validates primary axes of specialisation in plants. Oikos 79:
259–281.35. Dıaz S, Hodgson JP, Thompson K, Cabido M, Cornelissen C, et al. (2004) The
plant traits that drive ecosystems: evidence from three continents. J Veg Sc 15:
295–304.36. Tjoelker MG, Craine JM, Wedin D, Reich PB, Tilman D (2005) Linking leaf
and root trait syndromes among 39 grassland and savannah species. New Phytol167: 493–508.
37. Leishman MR, Westoby M, Jurado E (1995) Correlates of seed size variation:a comparison among five temperate floras. J Ecol 83: 517–530.
38. Westoby M, Leishman M, Lord J (1996) Comparative ecology of seed size and
dispersal. Phil Trans R Soc Lond B 351: 1309–1318.39. Eriksson O, Jakobsson A (1998) Abundance, distribution and life histories of
grassland plants: a comparative study of 81 species. J Ecol 86: 922–933.40. Weiher E, Clarke GDP, Keddy PA (1998) Community assembly rules,
morphological dispersion, and the coexistence of plant species. Oikos 81:
309–322.41. Leps J (2004) What do the biodiversity experiments tell us about consequences of
plant species loss in the real world? Basic Appl Ecol 5: 529–534.42. Thompson K, Askew AP, Grime JP, Dunnett NP, Willis AJ (2005) Biodiversity,
ecosystem function and plant traits in mature and immature plant communities.Funct Ecol 19: 355–358.
43. Jiang L, Wan S, Li L (2009) Species diversity and productivity: why do results of
diversity-manipulation experiments differ from natural patterns? J Ecol 97:603–608.
44. Gaudet CL, Keddy PA (1988) A comparative approach to predictingcompetitive ability from plant traits. Nature 334: 242–243.
45. Schwinning S, Weiner J (1998) Mechanisms determining the degree of size
asymmetry in competition among plants. Oecologia 113: 447–455.46. Hille Ris Lambers J, Harpole WS, Tilman D, Knops J, Reich PB (2004)
Mechanisms responsible for the positive diversity-productivity relationship inMinnesota grasslands. Ecol Lett 7: 661–668.
47. Spehn EM, Hector A, Joshi J, Scherer-Lorenzen M, Schmid B, et al. (2005)Ecosystem effects of biodiversity manipulations in European grasslands. Ecol
Monogr 75: 37–63.
48. Marquard E, Weigelt A, Temperton VM, Roscher C, Schumacher J, et al.(2009) Plant species richness and functional composition drive overyielding in
a 6-year grassland experiment. Ecology 90: 3290–3302.49. Spasojevic MJ, Suding KN (2012) Inferring community assembly mechanisms
from functional diversity patterns: the importance of multiple assembly
processes. J Ecol 100: 652–661.50. Reich PB, Walters MB, Ellsworth DS (1997) From tropics to tundra: global
convergence in plant functioning. Proc Natl Acad Sci USA 94: 13730–13734.51. Kluge G, Muller-Westermeier G (2000) Das Klima ausgewahlter Orte der
Bundesrepublik Deutschland: Jena. Ber Deutsch Wetterdienstes 213: 1–290.52. Ellenberg H (1988) Vegetation ecology of Central Europe. Cambridge:
Cambridge University Press. 731 p.
53. Weigelt A, Marquard E, Temperton VM, Roscher C, Scherber C, et al. (2010)The Jena-Experiment: 6-years of data from a grassland biodiversity experiment.
Ecology 91: 930.54. Kutschera L, Lichtenegger E (1982) Wurzelatlas mitteleuropaischer Grunlandp-
flanzen. Bd. 1. Monocotyledoneae. Stuttgart: Fischer. 516 p.
55. Kutschera L, Lichtenegger E (1992) Wurzelatlas mitteleuropaischer Grunlandp-flanzen. Morphologie Bd2PteridophytaundDicotyledoneae(Magnoliopsida)Teil1,
Anatomie, Okologie, Verbreitung, Soziologie, eds. Wirtschaft. Stuttgart: Fischer.851 p.
56. Rothmaler R (2005) Exkursionsflora von Deutschland. Bd. 4. Kritischer Band.
(eds. EJ Jager, Werner K), Heidelberg: Spektrum. 980 p.57. Mouillot D, Mason NWH, Dumay O, Wilson JB (2005) Functional regularity:
a neglected aspect of functional diversity. Oecologia 142: 353–359.58. Lumley T (2009) leaps: regression subset selection. R package version 2.9. http://
CRAN.R-project.org/package = leaps. Accessed 2012 Mar 23.59. Weingessel A (2011) quadprog: Functions to solve quadratic programming
problems. R package version 1.5–4. http://CRAN.R-project.org/
package = quadprog. Accessed 2012 Mar 23.60. ter Braak CJF, Smilauer P (2002) CANOCO reference manual and CanoDraw
for Windows user’s guide: software for canonical community ordination (version4.5). Ithaca: Microcomputer Power. 500 p.
Plant Functional Trait-Productivity Relationships
PLoS ONE | www.plosone.org 11 May 2012 | Volume 7 | Issue 5 | e36760