job embeddedness theory : can it help explain employee
TRANSCRIPT
University of Louisville University of Louisville
ThinkIR: The University of Louisville's Institutional Repository ThinkIR: The University of Louisville's Institutional Repository
Electronic Theses and Dissertations
5-2012
Job embeddedness theory : can it help explain employee Job embeddedness theory : can it help explain employee
retention?. retention?.
Jeffery A. Young University of Louisville
Follow this and additional works at: https://ir.library.louisville.edu/etd
Recommended Citation Recommended Citation Young, Jeffery A., "Job embeddedness theory : can it help explain employee retention?." (2012). Electronic Theses and Dissertations. Paper 1625. https://doi.org/10.18297/etd/1625
This Doctoral Dissertation is brought to you for free and open access by ThinkIR: The University of Louisville's Institutional Repository. It has been accepted for inclusion in Electronic Theses and Dissertations by an authorized administrator of ThinkIR: The University of Louisville's Institutional Repository. This title appears here courtesy of the author, who has retained all other copyrights. For more information, please contact [email protected].
JOB EMBEDDEDNESS THEORY: CAN IT HELP EXPLAIN EMPLOYEE RETENTION?
By
Jeffery A. Young B.S., University of Kentucky, 1985
M.P.A., University of Louisville, 1995
A Dissertation Submitted to the Faculty of the
College of Education and Human Development of the University of Louisville
in Partial Fulfillment of the Requirements for the Degree of
Doctor of Philosophy
Department of Leadership, Foundations and Human Resource Education
University of Louisville Louisville, KY
May 2012

Copyright 2012 by Jeffery A. Young
All rights reserved
JOB EMBEDDEDNESS THEORY: CAN IT HELP EXPLAIN EMPLOYEE RETENTION?
By
Jeffery A. Young
B.S., University of Kentucky, 1985 M.P.A., University of Louisville, 1995
A Dissertation Approved on
April 4, 2012
by the following Dissertation Committee:
Dissertation Director
Dr. James Stone
Dr. Oscar Aliaga Abanto
Dr. Brad Shuck
Dr. Ann M. Herd
Dr. Pradeep Kotamraju
ACKNOWLEDGMENTS
I want to express my deepest appreciation to my family, friends, colleagues, and
fellow doctoral students, without whose support I would not have been able to
accomplish this daunting task. Thanks especially to my wife, Sheila, for her
understanding and support. Thanks to my children for their patience when I was gone,
though in the same room. A special thanks to my parents who instilled in me a love for
learning.
In addition, I want to express my appreciation to the members of my dissertation
committee. Your professionalism is matched only by your enthusiasm and generosity.
Thank you, Dr. James Stone, for agreeing to walk this road with me. I have realized many
times throughout this process how fortunate I was to have you on my team. Thank you,
Dr. Oscar Aliaga Abanto, for your patience and willingness to share your wisdom,
knowledge, and experience regarding the dissertation process. Thank you, Dr. Brad
Shuck, for serving as "methodologist" and for being a reliable source of enthusiasm and
support whenever I needed either. Thank you, Dr. Pradeep Kotamraju and Dr. Ann Herd,
for agreeing to serve on my dissertation committee and for providing valuable feedback
and advice.
Thanks to Dr. Jimmy Henning, Associate Dean for the Extension and Director of
the University of Kentucky Cooperative Extension Service, and Dr. Daryl Buchholz,
Associate Director of Extension and Applied Research at Kansas State University, for
111
agreeing to support this study. It goes without saying that without your support, this work
would not have happened.
Thanks to Stacey Warner (Kansas State University), Dr. Kenneth Jones
(University of Kentucky), Dr. Charlene Jacobs (University of Kentucky), and Martha
Thompson (University of Kentucky) for serving as my panel of experts. Your insight into
shaping the data-collection instrument was extremely helpful.
Most important, thank you Father, God in Heaven. I could never have imagined
the life You have blessed me with, the opportunities You have brought my way, and the
wonderful, healthy family You have given me. Thank You.
IV
ABSTRACT JOB EMBEDDEDNESS THEORY: CAN IT HELP EXPLAIN EMPLOYEE
RETENTION?
Jeffrey A. Young
April 4, 2012
Job embeddedness theory, as introduced by Mitchell, Holtom, Lee, Sablynski, and
Erez (2001), offers a method of discovering why people stay in an organization. By
analyzing the construct's three dimensions (links, fit, and sacrifice) within community
and workplace contexts, an overall level of embeddedness was determined and then used
to examine retention among Extension agents (N = 454) in the Kansas and Kentucky
Extension Services systems. An Internet-based survey was used to gather background
data and responses to various scales (embeddedness, job satisfaction, organization
commitment, engagement, intent to stay, and discretionary effort). Research questions
were examined through the use of correlations, analyses of variance, and linear regression
analyses.
This dissertation is divided into five chapters. Chapter 1 gives a historical
overview of the problem of retention. Chapter 2 examines the major theories that scholars
have used to explain retention and the factors that influence it; particular attention is
given to job embeddedness theory. Chapter 3 contains a discussion of the research
design, study population and sample, sampling procedure, instrumentation, and data-
collection procedures. Chapter 4 presents the results ofthe study. The chapter presents
the main analysis and more specific analyses by the study population's demographics
v
(including comparisons ofnonrespondents, respondents, and late respondents). Chapter 5
provides a summary of the study; a discussion of the results; implications for theory,
research, and practice; and a discussion of the study's limitations.
In summary, Kansas and Kentucky Extension agents reported significantly
different levels of job embeddedness over the study period. Regression analyses showed
that job embeddedness was significantly correlated with and predicted unique variance in
intent to stay. An examination of the participants' background characteristics showed that
age, education level, and geographic state of employment significantly influenced certain
components of job embeddedness.
VI
TABLE OF CONTENTS
PAGE
ACKNOWLEDGMENTS ............................................................................................. iii ABSTRACT .................................................................................................................... v LIST OF TABLES .......................................................................................................... x
INTRODUCTION ........................................................................................................... 1
Retention of Extension Agents ................................................................................... 3
Retention Rates in Kansas and Kentucky .................................................................. .4
Extension Agents' Retention Rates Compared to Other Sectors ................................ .4
Problem Statement ..................................................................................................... 7
Purpose ...................................................................................................................... 7
Research Questions .................................................................................................... 8
Significance of Job Embeddedness .......................................................................... 10
Delimitations ........................................................................................................... 11
Defmitions of Key Terms ......................................................................................... 13
Organization ............................................................................................................ 16
Summary ................................................................................................................. 17
LITERATURE REVIEW .............................................................................................. 18
The Land-Grant University System and Cooperative Extensions .............................. 18
History of Retention Problems ................................................................................. 20
Wanted Versus Unwanted Tumover. ........................................................................ 25
Antecedents to Job Embeddedness ........................................................................... 26
Job Embeddedness ................................................................................................... 33
Vll
Prior Research on Job Embeddedness ...................................................................... 39
Research Gaps ......................................................................................................... 46
Study Model ............................................................................................................ 54
Summary ................................................................................................................. 54
METHOD ..................................................................................................................... 57
Research Method and Design ................................................................................... 57
Census Population ................................................................................................... 59
Variables and Instrumentation .................................................................................. 62
Data Collection ........................................................................................................ 69
Response Rate ......................................................................................................... 72
Scaled Items ............................................................................................................ 79
Composite Variables ................................................................................................ 81
Validity and Reliability ............................................................................................ 81
Data Analysis .......................................................................................................... 86
Summary ................................................................................................................. 88
RESULTS ..................................................................................................................... 89
Description of Respondents ..................................................................................... 89
Precautions and Assumptions ................................................................................. 102
Data Results and Analysis ...................................................................................... 103
Summary ............................................................................................................... 117
DISCUSSION ............................................................................................................. 118
Summary of the Study ........................................................................................... 118
Interpretation and Discussion ................................................................................. 120
Implications for Research ...................................................................................... 129
Imp lications for Practice ........................................................................................ 131
V111

Recommendation for Future Research ................................... ; ................................ 135
REFERENCES ............................................................................................................ 139
APPENDICES ............................................................................................................. 153
CURRICULUM VITAE .............................................................................................. 189
1X
LIST OF TABLES
TABLE PAGE
1.1. Retention of Agricultural Extension Agents for Five States Over 5 Years ........... 5
1.2. Retention Rates by Industry ................................................................................ 6
2.1. Job Embeddedness Components ......................................................................... 34
3.1. Population Description (Column Percentages) .................................................... 62
3.2. Scales and Corresponding Item Numbers ........................................................... 63
3.3. Survey schedule: Based on Dillman et al. (2009) ................................................ 71
3.4. Summary of Respondents by State and Week ..................................................... 73
3.5. Nonresponse Bias Analysis, by Gender, Race, Education, Age, and State .......... 80
3.6. Job Embeddedness Factor Analysis Composite Scores ....................................... 84
3.7. Alpha Coefficient Value Summary ..................................................................... 85
4.1. Cross-Tabulations of Gender and State ............................................................... 90
4.2. Cross-Tabulations of Race and State .................................................................. 91
4.3. Cross-Tabulations of Age and State ................................................................... 92
4.4. Cross-Tabulations of Education Level and State ................................................. 93
4.5. Cross-Tabulations of Program Area and State .................................................... 95
4.6. Cross-Tabulations of Years of Employment and State ........................................ 96
4. 7. Cross-Tabulations of Education Level and State ................................................. 97
4.8. Cross-Tabulations of Prior Professional Experience Type and State ................... 99
4.9. Cross-Tabulations of Agent Performance Review Responsibility and State ...... 100
x
4.1 o. Cross-Tabulations of County Population and State ........................................... 10 1
4.11. ANOV A Summary Table: Job Embeddedness and State .................................. 104
4.12. MANOV A Summary Table: Job Embeddedness Components and State .......... 106
4.13. Correlations between Job Embeddedness, Intent to Stay and Discretionary Effort ............................................................................................................... 107
4.14. Job Embeddedness (Six Components), Intent to Stay, and Discretionary Effort Descriptive Statistics .............................................................................. l 08
4.15. Regression Analysis of Employee Engagement, Organization Commitment, Job Satisfaction, Sacrifice Community, Sacrifice Organization, Fit Community, Fit Organization, Links Organization, and Links Community on Intent to Stay ............................................................................................... 11 0
4.16. Beta Coefficients From the Regression Analysis of Dummy Coded Variables .......................................................................................................... 114
Xl
CHAPTER I
INTRODUCTION
This study examined employee retention among Extension agents in Kansas and
Kentucky. Specifically, this study focused on the relationships between job
embeddedness theory and employees' intent to stay, discretionary effort, employee
engagement, job satisfaction, organization commitment, and background information.
The view of one's job has changed for the average American over the past
century. The strong philosophy of independence and pride in one's work that existed into
the early 1900s has been replaced by a reluctant dependence on employers and a culture
lacking in commitment and loyalty between the employer and employee, both of which
ultimately contribute to employee separation (Ciulla, 2000). The beginnings of this trend
can be traced to the early Industrial Revolution, with its focus on specialization of work.
In more recent decades, work culture has been further fractured by large-scale
downsizing in the name of productivity (Luthans & Sommers, 1999).
The problem of low retention is not new. It has been and will continue to be a
challenge for employers. Prior to the Industrial Revolution, employers in the United
States were relatively small and labor was readily available. Usually, these small
businesses were owned by experienced craftsmen. Young workers would gain knowledge
and experience in the apprentice relationship (Ciulla, 2000). Working conditions for
apprentices were generally poor and most were forced to enter into contractual
1
relationships with their employer. One well-known example of the apprentice
relationship involves Benjamin Franklin. At age 12, Franklin became a "bound"
apprentice to his older brother James, the printer of the New England Courant. The
relationship ended prematurely when Franklin ran away because of ill treatment by his
older brother. Franklin ultimately arrived in Philadelphia, where he used his acquired
knowledge and skills to publish his own paper The Pennsylvania Gazette (Franklin,
1793/1909).
As demands for products and services increased in the late 1800s, the size of the
urban workforce grew. The remnants ofthe apprentice system were still in place, with
new workers learning from more experienced ones for extended amounts of time. It is
also during this time that organized labor in the United States began. The U.S. Iron
Rollers, employees of the Columbus Iron Works, are an example of workers who
organized themselves to negotiate work quantities, time lines, and fees (Leab, 1985).
As demand for mass-produced products increased, so did tensions between
workers and management. This struggle was perpetuated because the know ledge and
skills related to various manufacturing trades was still controlled by the workers. This
created a sense of independence and defiance of the organization management. It is this
conflict that led Fredrick Taylor to study ways to design work so almost any person,
could do any job with maximum efficiency (Taylor, 1911). Taylor's theory of scientific
management regarding work specialization spread during the early 1900s, but not without
resistance on the part of workers and their unions. While efficiency was increasing,
worker commitment and loyalty hit new lows. Turnover rates during this period regularly
hit 100% or higher for many large manufacturers. The Ford Motor Company, for
2
example, was forced to hire 54,000 workers just to maintain their real workforce of
13,000, from October 1912 to October 1913 (Clothier, 1916).
In an effort to reduce the costs associated with rampant turnover and absenteeism
and to address increasingly influential trade unions, early industrialists began looking for
alternatives to the adversarial roles between labor and management. Addressing worker
wants and needs has been and continues to be one method that Human Resource
Development (HRD) professionals use to increase trust and commitment and to reduce
turnover (Jacoby, 1997). But, do these attempts improve retention? The answer depends
on each worker and organization (Maling, 2010).
Retention of Extension Agents
Recent studies have shown that "86% of employers experience difficulty
attracting new employees and 58% experience difficulty retaining their employees"
(Ramlall, 2003, p. 63). There are two primary perspectives of research regarding this
topic. Many have chosen to examine the reasons people leave; that is, the focus is on
turnover. This is fundamentally an employer perspective. The work on employee
turnover is exhaustive and will continue to be a highly researched topic. The other
perspective is to examine why people stay; that is, the focus is on retention. This is
mainly employee perspective. Both perspectives are valuable and help answer important
questions about the organization and work itself
According to the United States Department of Agriculture, National Institute of
Food and Agriculture (2010), there are approximately 8,000 Extension agents employed
in the U.S. Extension System, which includes the 50 states, Washington DC, and the
territories of Northern Marianas, Guam, Federal States of Micronesia, American Samoa,
3
Puerto Rico, and the Virgin Islands. The retention of these employees is important
because low retention represents a potentially large, yet controllable, organizational
expense. Although no national retention statistics for the Extension System are known,
the fiscal benefits of increasing retention are substantial. For instance, a 1-percentage
point increase in the overall retention rate of Extension agents nationwide (800 agents x
$80,000) could reduce organizational expenses by $6.4 million dollars annually (Kutilek,
2000).
Retention Rates in Kansas and Kentucky
An informal survey of Extension agents was conducted by Martha Thompson,
University of Kentucky (UK), Extension Employment Specialist. For the survey she
contacted colleagues in Midwestern and Southern states regarding the voluntary retention
rates within their Extension Services. Four states responded to her request for retention
rates. These rates, in addition to the Kentucky retention rate, are summarized in Table 1.1
(M. Thompson, personal communication, November 5, 2010). The rates were used to
identify states whose retention rates were lower than Kentucky'S retention rate. Louisiana
State University was contacted first; however, because the university was in the process
of a major reorganization, the administration declined to participate. Kansas State
University (KSU) was contacted next, and the KSU Director of Extension responded
positively to an invitation from Kentucky'S Director of Extension.
Extension Agents' Retention Rates Compared to Other Sectors
Retention among Extension agents has historically been high compared to most
other employee groups. Table 1.1 shows that Extension agent retention rates have ranged
between 95.12% - 97.23%. For instance, the Extension Service's high retention rates are
4
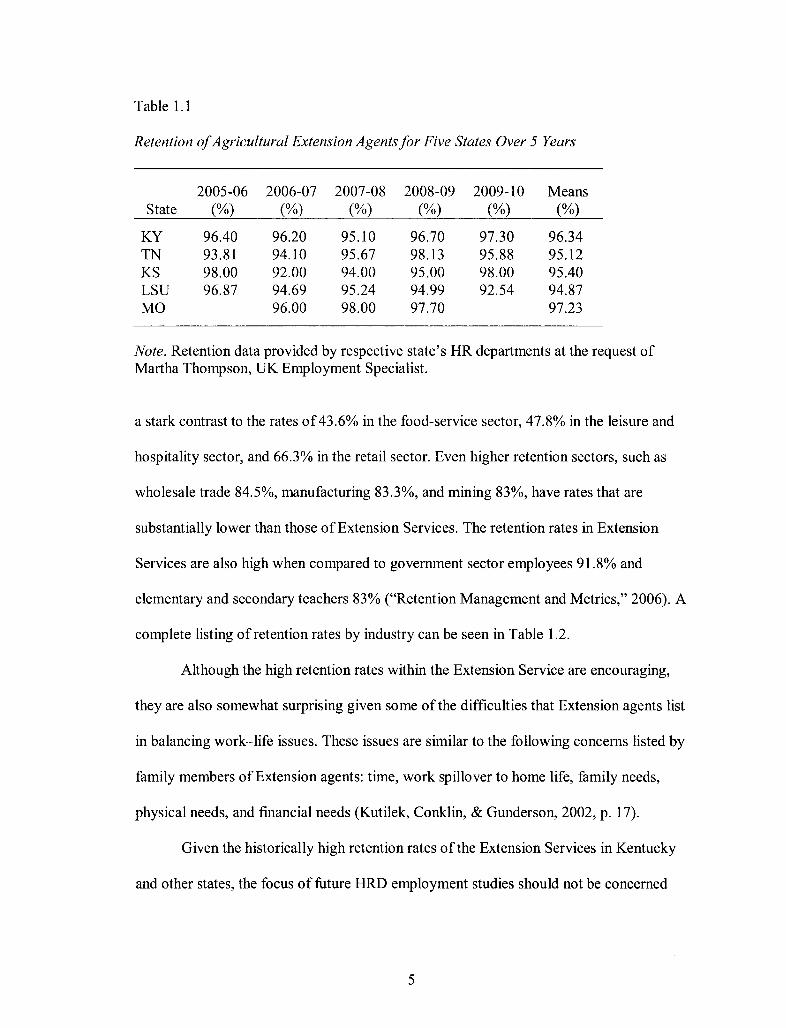
Table 1.1
Retention of Agricultural Extension Agents for Five States Over 5 Years
2005-06 2006-07 2007-08 2008-09 2009-10 Means State (%) (%) (%) (%) (%) (%)
KY 96.40 96.20 95.10 96.70 97.30 96.34 TN 93.81 94.10 95.67 98.13 95.88 95.12 KS 98.00 92.00 94.00 95.00 98.00 95.40 LSU 96.87 94.69 95.24 94.99 92.54 94.87 MO 96.00 98.00 97.70 97.23
Note. Retention data provided by respective state's HR departments at the request of Martha Thompson, UK Employment Specialist.
a stark contrast to the rates of 43.6% in the food-service sector, 47.8% in the leisure and
hospitality sector, and 66.3% in the retail sector. Even higher retention sectors, such as
wholesale trade 84.5%, manufacturing 83.3%, and mining 83%, have rates that are
substantially lower than those of Extension Services. The retention rates in Extension
Services are also high when compared to government sector employees 91.8% and
elementary and secondary teachers 83% ("Retention Management and Metrics," 2006). A
complete listing of retention rates by industry can be seen in Table 1.2.
Although the high retention rates within the Extension Service are encouraging,
they are also somewhat surprising given some of the difficulties that Extension agents list
in balancing work-life issues. These issues are similar to the following concerns listed by
family members of Extension agents: time, work spillover to home life, family needs,
physical needs, and fmancial needs (Kutilek, Conklin, & Gunderson, 2002, p. 17).
Given the historically high retention rates ofthe Extension Services in Kentucky
and other states, the focus of future HRD employment studies should not be concerned
5
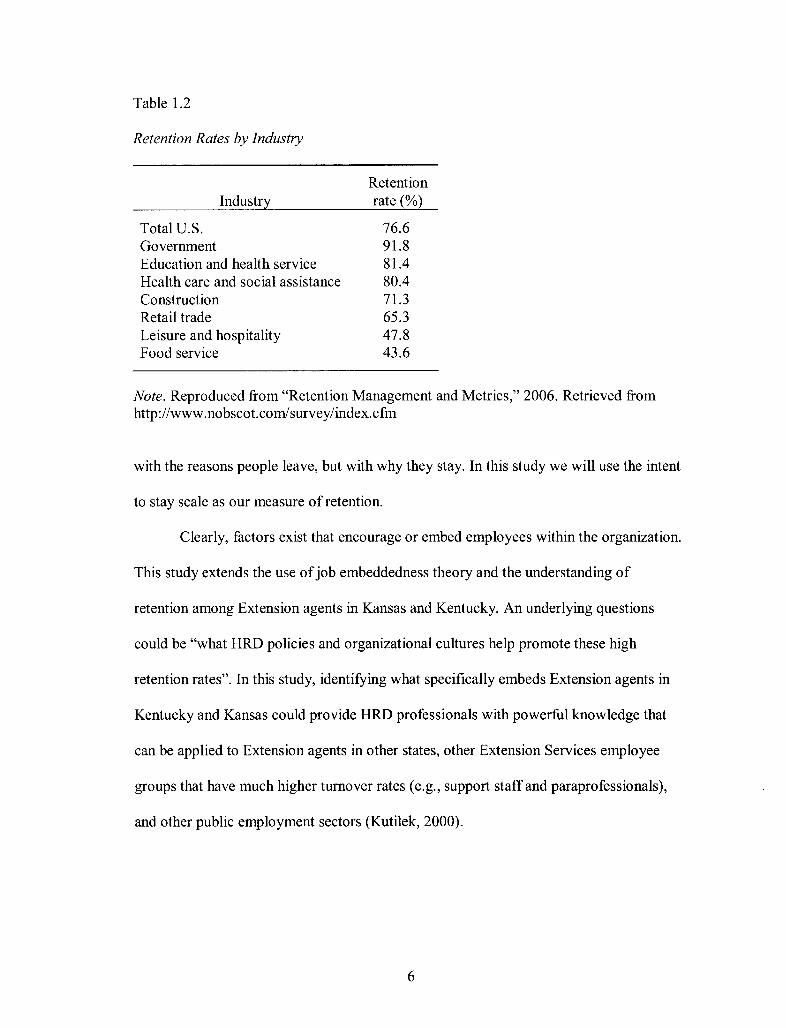
Table 1.2
Retention Rates by Industry
Total U.S. Government
Industry
Education and health service Health care and social assistance Construction Retail trade Leisure and hospitality Food service
Retention rate (%)
76.6 91.8 81.4 80.4 71.3 65.3 47.8 43.6
Note. Reproduced from "Retention Management and Metrics," 2006. Retrieved from http://www.nobscot.com/survey/index.cfm
with the reasons people leave, but with why they stay. In this study we will use the intent
to stay scale as our measure of retention.
Clearly, factors exist that encourage or embed employees within the organization.
This study extends the use of job embeddedness theory and the understanding of
retention among Extension agents in Kansas and Kentucky. An underlying questions
could be "what HRD policies and organizational cultures help promote these high
retention rates". In this study, identifying what specifically embeds Extension agents in
Kentucky and Kansas could provide HRD professionals with powerful knowledge that
can be applied to Extension agents in other states, other Extension Services employee
groups that have much higher turnover rates (e.g., support staff and paraprofessionals),
and other public employment sectors (Kutilek, 2000).
6
Problem Statement
Although, the HRD literature points to possible reasons for high Extension agent
retention (Kroth & Petuz, 2010), to date no research has been conducted examining the
issue through the lens of job embeddedness theory, which focuses on factors that might
encourage employees to stay in their organization and community (Mitchell et aI., 2001).
An organization's retention rate can lead to substantial negative consequences for
all organizations. These costs include lower quality products and services; higher
financial expenses in the areas of recruiting, hiring, and retaining employees; and losses
in productivity during the time a position is vacant. Low retention also interrupts the flow
of products and services, costing organizations thousands of dollars each year (Kutilek,
2000).
Understanding the relationships between job embeddedness and retention within
the population of Extension agents will assist HRD professional in formalizing policies
and procedures that embed employees to organizations and communities. I hope that the
results ofthis study will be useful in addressing retention among all Extension Service
employee groups (Kutilek, 2000). However, a direct analysis of the latter point is beyond
the scope of this study and should be the topic of further research.
Purpose
The purpose of this study was to understand retention among Extension agents in
the states of Kansas and Kentucky through the lens of job embeddedness. The study also
addresses a void in the literature by examining the relationships between job
embeddedness, intent to stay, discretionary effort, job satisfaction, organization
commitment, employee engagement and background information.
7
This study contributes empirical data to discussions on the impact of job
embeddedness on employee retention. The study was exploratory in nature and extended
the research of Mitchell et al. (2001) into the public employee sector, of which the
Cooperative Extension system is a small subset. Because each state is unique, the results
of this study should not be generalized to other state's Extension agents.
Research Questions
The four major research questions in this study focused on differences in the
embeddedness of UK and KSU Extension Service employees and the ability of job
embeddedness to predict intent to stay.
Research Question 1: Does job embeddedness differ between KSU and UK
Extension agents?
To examine this question, I used ANOVA and MANOVA tests, which are useful
when comparing means. In examining Research Question 1, the quantitative dependent
variables were the overall and composite scales of job embeddedness and the independent
variable was the geographic state of employment (Kansas or Kentucky; hereafter referred
to simply as state).
Research Question 2: What are the relationships between job embeddedness,
intent to stay and discretionary effort?
To test this question, correlation coefficients were used to examine relationships
between variables. Correlation coefficients are useful in testing for levels of significance,
direction of effect (positive or negative), and strength of relationship between the
variables, which in this case were job embeddedness, intent to stay, and discretionary
8
effort? A correlational analysis examines the relationships among the variables (Gravetter
& Wallnau, 1985).
Research Question 3: Can job embeddedness predict unique variance in the
outcome variables intent to stay and/or discretionary effort, after controllingfor job
satisfaction, organization commitment, and employee engagement?
To examine this question, linear regressions were utilized. The quantitative
dependent variables were intent to stay and discretionary effort, and the independent
variables were the overall job embeddedness mean and the six subcomponent means.
To examine the ability of job embeddedness to predict intent to stay or
discretionary effort, a linear regression analysis was performed. A linear regression
analysis is ''used to explain or predict the values of a dependent variable based on the
values of one or more independent variables" (Johnson & Christensen, 2007). Because
other mediating independent variables could have affected the dependent variables, it was
necessary to control for job satisfaction, organization commitment, and engagement. This
will allow the "unique variance" of job embeddedness to be viewed. Finally, I utilized a
step wise regression examining the influence of all variables mentioned above on intent
to stay. One of the most significant outputs of the linear regression tests are beta
coefficients. Beta coefficients give the relative strength of the predictive ability of each
independent variable.
Research Question 4: Are background variables significantly related to and able
to predict job embeddedness?
I analyzed the relationships between job embeddedness (total and six
components) and all levels of the background variable (gender, race, education-level, age,
9
program area, years in organization, years of prior work experience, type of prior work
experience, county population, and state). Dummy variables were created from these
categorical variables. This allows for linear regression tests to be used in addressing this
question.
Significance of Job Embeddedness
Turnover costs are difficult to determine. Research estimates range from $80,000
per employee (Kutilek, 2000) to 150% of position salary (Friedman, Galinsky, &
Plowden, 1992). The obvious implication is that as retention rates decrease, the
associated costs negatively affect an organization's bottom line.
Two primary areas of research have addressed the topics of attracting and
retaining employees: the reasons people leave their job (i.e., employee turnover) and the
reasons people stay (i.e., retention). Turnover has received more attention in the
literature; however, both perspectives are valuable and help answer important questions
about an organization's human capital. This study occasionally refers to studies on
turnover but will focus largely on retention specifically to test whether job embeddedness
theory helps explain the retention of Extension agents in Kansas and Kentucky.
Job embeddedness refers to a relatively new construct that examines an
individual's (a) links to other people, teams, and groups; (b) perceptions of their fit with
the job, organization, and community; and (c) beliefs about what they would have to
sacrifice if they left their jobs (Mitchell et aI., 2001).
Links are defmed as connections between people and institutions. Highly
embedded individuals have many links to the workplace, community, or both. Examples
10
oflinks include age, marital status, number of children and their ages, years of service,
hobbies, church-related activities, and membership in community organizations.
Fit can be seen as perceived comfort with an organization and community. The
closer that one's personal views, values, and goals are to the organizational culture of the
employer, the better the fit and the "higher the likelihood that an employee will feel
professionally and personally tied to the organization" (Mitchell et aI., 2001, p. 9).
Examples of community fit could include weather preferences, access to outdoor
activities, entertainment, and political and religious climates.
The final component of the job-embeddedness construct is sacrifice. In this study,
sacrifice refers to the material and psychological benefits that could be lost if an
employee leaves the organization. These sacrifices might include the comer office, health
and retirement benefits, sports tickets, length of time in residence, distance to work
location, safety, and leadership in the community.
The significant and unique aspect of job embeddedness is its ability to gauge the
impact of community factors on an employee's decision to leave or remain in the current
work situation. As indicated earlier, I found no studies on the ability of job embeddedness
to impact the retention of Extension agents. The present study of Kansas and Kentucky
Extension agents represents the initial work with this population.
Delimitations
Delimitations are factors affecting the study that are controllable by the author
(Mauch & Birch, 1993). Several delimitations were present in this study. The first
delimitation involved the timing of the study. In order to enhance response rate, I
followed Dillman's (2009) recommendation to administer the surveys so that they arrive
11
on Mondays, prior to the start of the work day. A second delimitation was the location
and population of the study. Only persons employed as Extension agents with the KSU
and UK were surveyed. The third delimitation was the limitations in the list of
independent variables considered in this study. Additional background data not collected
could include local employment opportunities, work performance, local employment
rates, and employment of family members in Extension Services. The final delimitation
was the decision to utilize an online census survey to collect data. A census survey ideal
because it seeks to gather data from all members of the population and allows for the
collecting of the maximum number of responses and gather large amounts of data at an
economical price.
Limitations
Limitations are weaknesses or problems within a study that are beyond the control
of those conducting the study (Roberts, 2004). Study weaknesses often relate to
"inadequate measures of variables, loss or lack of respondents, small sample sizes, errors
in measurement, and other factors typically related to data collection and analysis"
(Creswell, 2005, p. 198). The following limitations are enumerated in the hope of
benefiting future research.
1. Financial considerations and time limited this study to only 2 of the 50 states,
Washington D.C, and U.S. territories, which have Extension programs.
2. The work in examining job embeddedness within Cooperative Extension is
one of very few know efforts outside the private sector in the United States.
The lack of such studies in the public, educational, and nonprofit arenas
12
should be considered a limitation but also evidence ofthe timeliness of this
study.
3. The recession in the u.s. economy might have limited this study. Because
fewer job opportunities were available during the data-collection period,
Extension agents were less likely to leave and aspiring Extension agents were
more likely to be underemployed.
4. Finally, the very small differences between the two state's retention rates
could be a limitation.
Definitions of Key Terms
In the literature review that follows, I examined turnover, job embeddedness,
retention, job satisfaction, organization commitment, intent to stay, discretionary effort,
employee engagement, land-grant universities, the Cooperative Extension Service, and
Extension agents.
The Cooperative Extension Service was formalized in 1914, when Congress
enacted the Smith-Lever Act. The legislation provides for a comprehensive education
program in each state. The language of the original act called for the Extension Service to
"aid in diffusing among the people of the United States useful and practical information
on subjects related to agriculture and home economics, and to encourage the application
of the same" (Smith Lever Act, 1914, p.1).
Discretionary effort "is the difference in the level of effort one is capable of bring
to an activity or a task, and the effort required only to get by or make do" (Lloyd, 2003,
p.72).
13
Dysfunctional turnover can be defined as a level, somewhat unique to each
organization, that "produces a divergence between the organization's optimal balance of
costs associated with turnover and the costs associated with retaining employees"
(Abelson & Baysinger, 1984, p. 331). In simpler terms, dysfunctional turnover occurs
when high-performing employees choose to leave (Park, Ofori-Dankwa, & Bishop,
1994).
Employee engagement is generally defined as a "positive, fulfilling state of mind,
most commonly characterized by vigor, dedication, and absorption" (Halbesleben and
Wheeler, 2008, p. 242).
Employee retention policies are those policies and procedures put in place by
employers to entice employees to remain in the organization (Nair, 2009)
Extension agents, also referred to as county agents, are individuals employed by
their state's land-grant universities to aid in the dissemination ofresearch-based
information, at the county level, to the citizens of the state (Smith Lever Act, 1914).
Functional turnover can be thought of as turnover that is beneficial to the
organization. This could be the case with low or underperforming employees, whose
"desires to leave are not disrupted or hindered by the organization" (Dalton, Krackhardt,
& Porter, 1981, p. 716).
Intent to stay refers to the likelihood that an individual employee will remain in
the organization (Tett &Meyer, 1993).
Involuntary turnover involves an employee being forced to leave an organization.
Involuntary turnover can happen for various reasons but usually involves "economic
conditions and their effect on the organizational budget, changes in career or retirement"
14
(Thomas, 2009, p. 1). This paper considered both voluntary and involuntary turnover,
less retirement.
Job embeddedness as defmed by Mitchell et al. (2001) refers to the on-the-job and
off-the-job factors associated with individual links, fit, and sacrifice.
Job satisfaction can be defined as an "individual's attitude about work roles and
the relationship to worker motivation" (Scott, Swortzel, & Taylor, 2005, p. 89). The
general thought process is that if employees are satisfied, they will be less likely to leave
the organization.
Land-grant universities were created by the passage of the Morrill Act of 1862
the Morrill Act of 1890, and The Equity in Education Land-Grant Status Act of 1994.
These land-grant universities were based on the idea that U.S. higher education should be
doing more than producing doctors, lawyers, teachers, and ministers. Instead, land-grant
universities would be open to everyone and would focus on "promoting teaching,
research and public service" (Iverson, 2008, p. 1). Several land-grant universities have
developed into some of the nation's leading institutions of public learning and research.
Organization commitment has been defined as the "relative strength of an
individual's identification with and involvement in an organization" (Mowday, Porter, &
Steers, 1982, p. 43). Together, job satisfaction and organization commitment are two of
the most historically mature theories predating job embeddedness.
Retention refers to the ability of management to retain employees. Retention
policies are those put in place by employers to entice employees to remain in the
organization (Nair, 2009)
15
Turnover is generally discussed in the contexts of voluntary turnover, involuntary
turnover, functional turnover, and dysfunctional turnover.
The underemployment rate refers to "workers who are working part time (less
than 35 hours a week) but who both want and are available for full time work" (Sum &
Khatiwada, 2010, p. 10). Sum and Khatiwada (2010) noted that the underemployment
rate rose 112% between 2007 and 2009.
The unemployment rate describes the portion of the population that is without a
job, is actively looking for ajob, and is available to work. Also included in the
unemployment rate are those who are temporarily laid off and waiting to return to their
jobs. For most of the last decade, this rate has held relatively steady at 4 to 6%. However,
beginning in March 2008, the rate soared to its peak of 10.1 %. Throughout 2011 the
national unemployment rate has held at around 9%. Appendix A lists unemployment
rates for the past 10 years (U.S. Bureau of Labor Statistics, 2011).
Voluntary turnover is defmed by Maertz and Campion (1998) as "instances
wherein management agrees that the employee had the physical opportunity to continue
employment with the company, at the time of termination" (p. 50). Mowbray (2001) built
on this defmition, adding that "voluntary attrition assumes that the employee did not
leave because of internal transfer, promotion or moved to another position within the
organization" (p.2).
Organization
The remaining four chapters of this dissertation are organized as follows. The
second chapter contains a review of the literature pertaining to job embeddedness, job
satisfaction, organization commitment, engagement, discretionary effort, intent to stay,
16
and background variables and how they relate to employee retention. The third chapter
acquaints the reader with the dissertation model, research questions, hypotheses, research
design, and methodology. In addition, detailed discussions of the survey instrument, data
collection procedures, and study population are included. Chapter 4 contains an analysis
of the data and its implications. Chapter 5 includes contributions, limitations, practical
implications, and directions for future research. The study concludes with a reference
section and appendices.
Summary
Job embeddedness, as described in the current dissertation, makes new and
creative contributions to the literature regarding retention by expanding the study of job
embeddedness into the public sector, comparing job embeddedness between Extension
agents in Kansas and Kentucky, and tests the ability of job embeddedness to predict
intent to stay and discretionary effort. Given that the 2010 retention rates for both states
averaged 95.79% (Table 1.1) and that the starting salary in 2012 for Extension agents was
approximately $33,000, the average annual turnover costs to both states would be
$957,000 per year (Ramlall, 2003). Even though Extension Service retention rates are
substantially higher than the retention rates in other employment sectors of the economy,
they still represent a significant cost to the organizational budget. An alternative lens
could be to identify factors contributing to the high retention rates in Kansas and
Kentucky Extension Services so that other organizations can try to duplicate them.
17
CHAPTER II
LITERATURE REVIEW
The Land-Grant University System and Cooperative Extensions
In the mid-1800s, a group of forward thinking Congressmen led by
Representative Justin Smith Morrill of Vermont proposed the College Land Bill to
develop a different type of college, one devoted to educating the people whose lives
would not be spent in the professions of teaching, religion, or the law. The Morrill Act
was initially passed by Congress in 1859, but was vetoed by President James Buchanan.
Rep. Morrill resubmitted his legislation in 1861, with provisions to support military
education in addition to engineering and agriculture. President Abraham Lincoln signed
The Morrill Act of 1862 into law on July 2, 1862. The Act also allocated land to states
based on their representation in Congress (The Morrill Act of 1862). The institutions
created by this legislation are known as 1862 land-grant institutions, and both KSU and
UK are among them.
As land-grant colleges grew, they gradually realized that teaching "scientific
agriculture" required a strong research program. As the need and potential value of the
experiment station was recognized, federal support grew. In 1887, passage ofthe Hatch
Act created agricultural-experiment stations to conduct research, investigations, and
experiments to establish and maintain the agricultural industry of the United States.
These agricultural-experiment stations were patterned after the successful European
18
model of agricultural research, which had been thriving for over 50 years prior to 1887
(The Hatch Act of 1887).
In 1890, Morrill was successful in the passing and signing the second Morrill Act
into law. The act provided for additional funding to benefit agriculture and the mechanic
arts. Additionally, the Morrill Act of 1890 included a provision that led to the creation of
17 predominantly Black land-grant colleges in the southern states. In effect, the Morrill
Act of 1890 accomplished for Black citizens of the South what the first act of 1862 had
accomplished for White citizens (The Morrill Act of 1890).
Kentucky State University was created in response to the 1890 legislation.
Kentucky State University provides teaching, research, and Extension functions to the
people of Kentucky and works in concert with the 1862 land-grant institution, UK.
Kansas did not create an institution in response to the 1890 legislation.
In 1914, Congress passed the Smith-Lever Act, providing for a comprehensive
Extension-education program in each state. The language of the original act called for
Extension programs to "aid in diffusing among the people of the United States useful and
practical information on subjects related to agriculture and home economics, and to
encourage the application of the same" (Smith Lever Act, 1914, p. 1). Smith-Lever
funding (also referred to as formula funding) is based on the state's population size. This
Extension model for disseminating research-based knowledge to the general public has
been replicated in many countries around the world (Ludwig, 1995; Lundy, Place, Irani,
& Telg, 2005).
19
History of Retention Problems
Hale (1998) showed that attracting and retaining the best employees represented a
serious problem for organizations. According to Hale's study, 86% of employers found it
difficult to attract new employees, and 58% found it difficult to retain employees. Two
primary lines of research have addressed this topic. Much research has gone into the
examination of the reasons people leave their jobs. The other perspective is to examine
why people stay. Both perspectives are valuable and help answer important questions
about an organization's human capital.
Industrial Revolution
The work on employee retention is extensive and will continue to be a highly
researched topic. Welfare capitalism and its many facets developed into one way to
improve retention in the early industrialized workforces (Jacoby, 1997). Introduced
during the Industrial Revolution, welfare capitalism emphasized better pay, better
treatment of workers, and better public relations, largely to improve retention. Some of
the early examples of welfare capitalism include profit sharing at AT&T, Proctor and
Gamble and Sears Roebuck, pension plans at International Harvester (Ciulla, 2000),
health insurance at Baylor Hospital (Hague, 2010), and the model-town concept
implemented by Pennsylvania iron and steel industrialist George McMurtry (Mosher,
1995).
McCurtry, the son of poor Scottish farmers, immigrated to the U.S. in the late
1850's, beginning his career in the steel industry as a clerk, and later became a business
partner in numerous small to large companies. His model town was named Vandergrift
and was located near Pittsburgh (Mosher, 1995). According to Mosher, residents of
20
Vandergrift were so loyal to McMurtry that he "successfully used them in 1901 in
breaking one of the fIrst strikes waged against the entire system of mills owned by United
States Steel Corporation" (Mosher, 1995, p. 84).
Depression Era
The use of welfare capitalism to address the retention issues lost momentum
during the 1930s. The Great Depression brought lower profIts to companies and the
passing of the Wagner Act in 1935, led to the demise of company-sponsored unions and
worker councils (Grant, 1998, p. 71). However, the conflict between organized labor and
management raged on in spite of improved working conditions, an increasing variety of
benefIts, and a general decrease in union membership. The image of paternalistic
employers who provided for the needs oftheir employees was perpetuated, with workers
commonly staying with one employer their entire working lives (Gitelman, 1992).
Modern Era
There have been many examples of corporate downsizing throughout the last
century. Some of the nation's largest and more respected companies have instituted huge
layoffs in blue-collar and white-collar positions. The scope of the layoffs witnessed in the
1990s shocked the American work force and had chilling effects on the levels of
commitment and trust between employees and employers (Luthans & Sommers, 1999).
Herein lays a great irony and challenge for HRD professionals. How can HRD
positively affect retention levels of employees, by building trust and commitment in an
environment where employers are either unwilling or are unable to do the same (Ciulla,
2000). Many companies continue down the corporate-welfare path, adding more and
more creative benefIts to draw the best and brightest to their organizations. Fortune
21
Magazine conducts an annual study of the 100 best companies to work for. These
companies are listed by "big pay" and "best perks." Companies that spare no expense to
entice and pamper their employees include well-known names, such as Google and
Microsoft, and lesser known names, such as SAS and Zappos.com ("100 Best
Companies," 2009). What all these companies have in common is the belief that
employee loyalty and commitment can be purchased at the right price. They may be right.
A review of the human resources pages of these "100 Best Companies" reveals vast lists
of employee benefits. Some of the more creative include personal trainers, 24-hour gyms,
in-house doctors, dry cleaners, message services, swimming pools and spas, free gourmet
meals (breakfast, lunch, and dinner), and free shuttle transportation to and from work.
Employee stock-ownership plans, certainly not a new idea, are still being promoted as a
means of encouraging retention in private organizations (Marens, Wicks, & Huber,
1999). What this has done, according to Peter Cappelli (2007), is create a culture where
the employer provides for the wants and needs of every employee and where employees
willingly spend more and more time at work.
Public organizations are not exempt to using employee benefits as a means to
entice and retain the best employees. The foundation of the benefits programs at KSU
and UK includes health, dental, eye, life, and accident insurances and flexible-spending
accounts. From there the list of employee benefits grows to include vacations, holidays,
retirement plans, and discount programs. Both KSU and UK have employee-education
programs. In addition, UK offers employees a family-education program and the
possibility of paid study leave after a predetermined number of years of service. Work
life policies that were once reserved for private organizations are now found in many
22
public organizations. Work-life policies include but are not limited to flexible work
scheduling, child-care assistance, and family-leave policies (Roehling, Roehling, &
Moen, 2001).
But, do these modem attempts at welfare capitalism by organizations actually
improve employee trust and commitment? The answer depends on individual workers
and their personal lists of wants and needs. What is certain is that administrators want and
need to recruit and retain the best qualified workers and creative benefits are one way to
accomplish this goal (Maling, 2010).
In his book Human Resource Champions, Ulrich (1997) encouraged HRD leaders
to be active in the work lives of their employees. He labels this function "management of
employee contribution" and uses the metaphor of "employee champion" to describe the
role (Ulrich, 1997, p. 28). The practices of open communication, quality circles, and
focus groups between management and employees are being used by some organizations
to improve retention without breaking the bank. Similarly, retention building through
trust, commitment, and open communication can be a foundational competency, as
outlined in the competency model by the American Society of Training and
Development. This model has been widely accepted throughout the HRD field (Davis,
Naughton & Rothwell, 2004).
Ramlall (2003) identified factors influencing employee retention, including
compensation, lack of challenging work, and lack of career-advancement opportunities.
These factors also coincide with Mitchell et al. ' s (2001) on-the-job components of
embeddedness theory.
23
Plash (2006) examined the issues that impacted the attrition and retention of
special-education teachers in a southeastern Alabama county. Eleven factors were listed
as "major" contributors to special-education teacher attrition. The two most important
factors were judged to be "excessive paperwork" and "stress created by demands of the
job." The findings of this study were limited to a subpopulation of special-education
teachers and should not be generalized to other sectors, but the [mdings do provide a
consideration for future research.
Kroth and Peutz (2010) examined workplace issues related to attracting,
motivating, and retaining agents of the Cooperative Extension Service. The perceived
difficulty involving organizational change ranked first among many concerns, followed
by compensation and lack of adequate resources.
Although the issue of compensation has been difficult to address during the
current economic environment, retention can be encouraged in other ways. Work-life
policies have been shown to have a positive correlation to retention and the perceived
flexibility and supportive work-life policies significantly increased the likelihood of
expected retention (Richman, Civian, Shannon, Hill, & Brennan, 2008).
Another area of concern involves the retention of older workers. One study found
that training and development for older managers and professionals positively impacted
their perceptions of organizational support, whereas job plateauing negatively impacted
their perceptions of organizational support (Armstrong-Stassen and Ursel, 2009). In that
study, training and job plateauing were both related to a stronger intent to stay.
24
Wanted Versus Unwanted Turnover
When considering turnover within the Cooperative Extension Service or in any
other organization, it is important to distinguish between wanted and unwanted turnover.
As the previous terms imply, some turnover is desirable (i.e., wanted turnover). For
instance, the leaving costs of employees who perform to low or less-than-expected levels
are limited to replacement costs, which can be estimated to be $80,000 per employee
(Kutilek, 2000) to 150% of position salary (Friedman et ai., 1992).
A related conceptualization categorizes turnover as either "dysfunctional" or
"functional" (Dalton et ai., 1981). Dysfunctional turnover involves situations in which the
employee wishes to leave, but the employer would prefer them stay. Others have defined
dysfunctional turnover as "the level that produces a divergence between the
organization's optimal balance of costs associated with turnover and the costs associated
with retaining employees" (Abelson & Baysinger, 1984, p. 331). Alternatively,functional
turnover occurs in situations when the employee wishes to leave and the employer,
having a negative view of the employee, is "unconcerned" (Dalton et ai., p. 716). The
concept of turnover is further defined by Williams (2000), who divided turnover into four
categories: "poor performing leavers, good-performing leavers, poor-performing stayers
and good performing stayers" (p. 549). Park et al. (1994) found that functional turnover
was associated with levels of pay, unemployment, and individual-incentive programs,
whereas group-incentive programs and union presence were associated with
dysfunctional turnover.
Though the exact costs related to turnover are difficult to estimate, empirical
estimates range from $80,000 per employee (Kutilek, 2000) to 150% of the position's
25
salary (Friedman et aI., 1992). The obvious implication is that as turnover rates rise, the
associated costs negatively affect an organization's bottom line. Unwanted turnover is
much more expansive and includes "development costs, value of knowledge and
experience lost, and lost productivity" (Hauenstein, 1999, p. 3). Others (e.g., Tziner &
Birati, 1996) have divided unwanted turnover expense into the following categories.
• Separation costs
• exit interviews
• administrative
• severance pay
• Replacement costs
• advertising for position
• application processing
• screening and interviewing
• Training costs
• Core training
Antecedents to Job Embeddedness
Job satisfaction, organization commitment, discretionary effort, intent to stay,
and job engagement are all theoretical models used by HRD researchers to explain and
predict retention and can be considered antecedents of job embeddedness theory.
Job Satisfaction
Job satisfaction is one of the most researched antecedents used to explain
voluntary employee turnover (Rust & Stewart, 1995). Early work onjob satisfaction can
be traced to Roethlisberger and Dickson (1939) and their research onjob satisfaction and
26
dissatisfaction among employees of the Western Electric company. The authors
postulated that employee attitudes can be compared to the relationship between an
organism and its physical environment (pp. 261-262). In tum, Rosen and Rosen (1955)
viewed "job satisfaction as a consequence of the discrepancy between percepts and value
standards." Locke (1969, p. 316) defined job satisfaction as "the pleasurable emotional
state resulting from the appraisal of one's job as achieving or facilitating the achievement
of one's job values." Locke further notes that "job satisfaction and dissatisfaction are a
function of the perceived relationship between what one wants from one's job and what
on perceives it as offering or entailing."(p. 316). These fmdings are supported by the
work of Rust and Stewart (1995) who determined that intention to remain employed was
strongly influenced by the level of job satisfaction.
Scott et al. (2005) noted that "job satisfaction can be defmed as an individual's
attitude about work roles and the relationship to worker motivation" (p. 89). The general
thought process is that if employees are satisfied they will be less likely to leave the
organization. The authors examined Extension agents' perceptions of fundamental jo b
characteristics and their level of job satisfaction. Overall, Extension agents indicated that
they were satisfied with their jobs. Extension agents were most satisfied with the
opportunities that they had for personal learning and growth at work. These fmdings are
consistent with the fmdings from Barnett and Louderback's (1971) study, which
suggested that, in the context of organizational change, administrators should identify
opportunities for personal growth. Scott et al. 's study used a very small sample from one
state and the authors recommended that it be replicated in other states.
27
In another study involving Extension agents, Long and Swortzel (2007) identified
age as a significant contributing factor to the variance (7%) in jo b satisfaction. Generally,
as Extension agents grow older, they became more satisfied.
Vlosky and Dunn (2009) examined a diverse population of Cooperative Extension
Services workers in southeastern states and noted a statistically significant difference in
job satisfaction between White and non-White employees. Based on the findings of their
study, the authors emphasized that administrators and policy makers need to understand
the role that race plays in the satisfaction of Extension Services workers.
In a related article, Vlosky and Aguilar (2009) found that autonomy and
influence, challenge, performance, feedback, instrumentality, stability and security, and
satisfaction were all "highly significant in positively influencing" job satisfaction among
Extension Services employees (p. 9). The study showed no differences between genders
in regard to these variables.
Most job-satisfaction research follows similar lines of thinking as those discussed
previously, with more limited work regarding the effects of the employee's life outside of
work on their intent to stay (retention). This aspect of an employee's life can be examined
using job embeddedness theory, which will be discussed fully later in this chapter.
Organization Commitment
Various defmitions of organization commitment have been advanced in the field.
Wiener (1982) defmed commitment "as the totality of internalized normative pressures to
act in a way that meets organizational interests" (p. 418). Wiener's definition was based
on the notion that individuals were responsible (to some degree) to the organization.
Similarly, Mowday et al. (1982) defmed organization commitment as the "relative
28
strength of an individual's identification with and involvement in an organization" (p.
43). Smith, McCracken, and Suandl (1983) researched the concept of organization
commitment with Extension agents in Ohio (N = 108), and found that the variables "self
image reinforcement, personal importance, group attitudes and job autonomy" are
significantly related to organization commitment (p. 24).
Allen and Meyer (1990) argued that "the most prevalent approach to organization
commitment in the literature is one in which commitment is considered an affective or
emotional attachment to the organization such that the strongly committed individual
identifies with, is involved in, and enjoys membership in, the organization" (p. 2). In
Allen and Meyer's sample, institutionalized tactics were related to custodial orientation
and individualized tactics. Each socialization tactic was significantly correlated with
commitment. Institutional tactics also tended to be associated with higher levels of
commitment.
In an earlier examination of the roles of ambiguity and commitment, Morris and
Sherman (1981) found a negative correlation between the two, although the relationship
seemed to disappear within 1 year of employment. The findings suggested that, to foster
both innovativeness and commitment, one should use investiture tactics, but also that the
influences of seasoned workers could have negative impacts on the organization
commitment of newer workers. This can be a difficult challenge because long-term
employees are generally good mentors but may not be open to innovative work methods.
Allen and Meyer (1990) examined 256 employees in clerical, supervisory, and
managerial positions and found that institutionalized tactics correlated with organization
commitment, thus impacting intent to leave. Lee, Ashford, Walsh, and Mowday (1992)
29
examined commitment propensity, organization commitment, and voluntary turnover
within a population of cadets at the United States Air Force Academy from 1982 to 1986
and found that voluntary turnover may be predicted by measuring initial commitment.
High levels of organization socialization were shown to be significantly and negatively
correlated with turnover (Higgins, 2008).
Like job satisfaction, organization commitment predates job embeddedness and
ignores the potential effect of non work factors on an employee's intent to stay (retention).
Discretionary Effort
The intellectual concept of discretionary effort originated with the work of
Yankelovich and Immerwahr (1984). The authors describe discretionary effort as being
voluntary and beyond what is normally expected by the employer. It is this extra effort on
the part of the employee that helps some organizations "outperform" others (Lloyd,
2003). Lloyd (2008) built on her earlier work, which focused on intensity and
perseverance, and on work by Campbell, McCloy, Oppler, and Sager (1993), which
focused on effort, and created a 7-item discretionary effort scale. Because this scale was
found to be behavioral and measurable, it fulfills the definition of a performance measure
and was used in the present study.
Work on the topic of discretionary effort has taken many turns. Sleebos, Ellemers,
and Gilder (2010) examined employees with different levels of peer respect and found
that "the efforts of respected people were primarily motivated by affective commitment
to the group" and "the behavior of the disrespected people was driven by anxiety about
their acceptance into the group" (p. 244).
30
One of the advantages of evaluating discretionary effort in employee behavior
research is that it is "not job specific," "may have positive impact on organizational
commitment," and "tends to increase productivity and ability to adapt to environmental
changes" (Lloyd, 2008, p. 31). The limitations ofthe discretionary-effort construct are
that such behaviors tend to easily overlooked by supervisors, influenced by tenure and
impressions of work early in one's career (Lloyd, 2008). The current study helps address
these limitations.
Intent to Stay
Intent to stay refers to the likelihood that an individual employee will remain in
the organization (Tett & Meyer, 1993). Black and Stevens (1989) found a significant
negative relationship between intent to stay and turnover.
A study of private sector nurses (N = 303) found that job stress (higher levels
tended to decrease intent to stay), gender (females had higher stress levels than males),
and age (older workers had lower intent to stay) were the highest influences on nurses'
intent to stay (Letvak & Buck, 2008). In a U.S. Army Reserve retention study of nurses,
it was found that those who reported at least one mentoring experience had significantly
higher levels of job satisfaction and intent to stay (Prevosto, 1998). The impact of
mentors (organizational socialization) on intent to stay was corroborated in a study by
Gosser (2011), who examined hourly fast- food employees (N = 935).
The studies on intent to stay and other employee behaviors have two main
limitations: very few include analyses of public-sector employees or the impacts of
factors from employees' nonwork lives. This could be because retention rates tend to be
higher in the public sector and are not viewed as a critical issue.
31
Employee Engagement
The original concept of employee engagement was developed by Kahn (1990). He
defined engagement as "task behaviors that promote connections to work and to others"
(Kahn, 2010, p. 293). Kahn also noted that engagement has emotional, cognitive, and
physical components. Emotional engagement can be thought of as "meaningful
connections to others" (Kahn, 2010, p. 294). Cognitive engagement refers to an
employee's awareness of his or her "mission and role" in the organization" (Kahn, 2010,
p. 294). Physical engagement refers to the employee's "daily task performances"
(Luthans & Peterson, 2001, p. 378).
The appeal of the direct impact on organizational profit has led to the promotion
of employee engagement by HR consulting firms, which rely heavily on anecdotal
knowledge to support their claims. In recent years, a greater appreciation of the concept
of engagement has come from practitioners, who widely hold that an engaged workforce
leads to "competitive advantage," "ability to solve organizational problems," "decrease
turnover", "/increase retention" and "increased productivity" (Shuck, 2010, p. 20).
In an engagement study of Extension agents in Midwestern states, Weyhrauch,
Culbertson, Mills, and Fullagar (2010) found that those who were the most highly
engaged also reported high levels of "work-family facilitation, positive affectivity and
psychological capital" (p. 1). The authors also examined engagement by program area
(Agriculture, Family, & Consumer Sciences and 4-H Youth Development) and
determined that family and consumer science agents were more highly engaged in their
work. Furthermore, they found that workers who were highly engaged tended to have a
positive influence on workers who were less engaged. Mentoring programs and
32
collaborations were mentioned as tools available to influence engagement levels
(Weyhrauch et aI., 2010).
However, as a unique research construct, some gaps still remain in the
engagement literature (Macey & Schneider, 2008). This situation has produced an all
too-common conflict between researchers, who focus on scholarly research, and
practitioners, who are most concerned with concepts such as ''usability,'' "retention,"
"commitment," and "productivity" (Wefald & Downey, 2009).
Additional research is needed on the subject of employee engagement to validate
practitioner claims. Research should focus on generating a consistent defmition and
measure of employee engagement (Macey & Schneider, 2008). This study helps build the
empirical research base on employee engagement.
Job Embeddedness
In 2001, Mitchell et aI. (2001) introduced a new conceptual framework called job
embeddedness. Derived from Lewin's field theory, job embeddedness "represents a broad
constellation of influences" (Mitchell et aI., 2001, p. 7) on an employee's intent to stay
and can be thought of as "a net or a web in which one can become stuck" (Mitchell et aI.,
2001, p. 7).
Mitchell et al. (2001) clarified that "job embeddedness does not cause one to go
out and get married, buy a house, or increase linkages with the organization," but "those
activities cause a person to become embedded" (p. 25). They further proposed that job
embeddedness represented a unique factor in understanding why people stay at their jobs
and discussed ways in which employers can influence employees' embeddedness and
propensity to stay. They recommended examining three components-links, fit, and
33
sacrifice-each in an organizational and community context. It is this examination of
both the organization and community that makes job embeddedness unique in helping
explain employee retention.
In Mitchell et aI.' s (2001) original job embeddedness study, the authors used chi
square and correlational statistics and found that job embeddedness improved the
prediction of turnover over and above that provided by job satisfaction, organization
commitment, and intent to stay (Mitchell et aI., 2001, p. 30). The authors concluded that
the job-satisfaction and organization-commitment frameworks insufficiently explain why
people stay in an organization, because they ignore the effects of an employee's nonwork
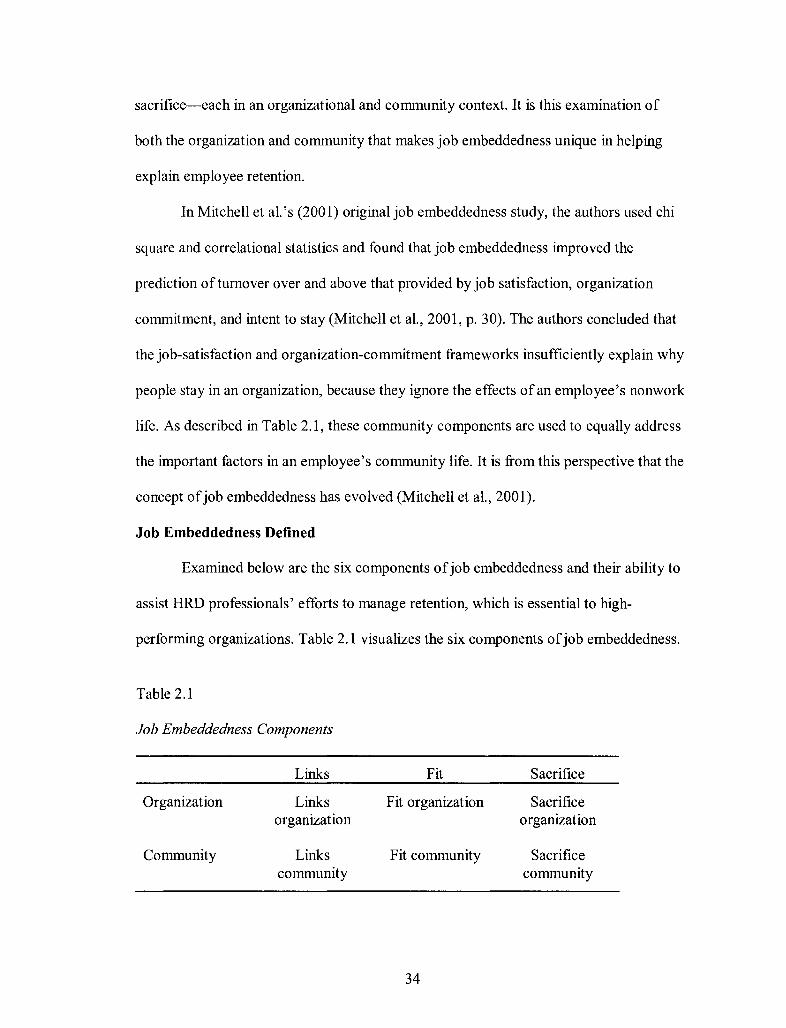
life. As described in Table 2.1, these community components are used to equally address
the important factors in an employee's community life. It is from this perspective that the
concept of job embeddedness has evolved (Mitchell et aI., 2001).
Job Embeddedness Defined
Examined below are the six components of job embeddedness and their ability to
assist HRD professionals' efforts to manage retention, which is essential to high-
performing organizations. Table 2.1 visualizes the six components of job embeddedness.
Table 2.1
Job Embeddedness Components
Links Fit Sacrifice
Organization Links Fit organization Sacrifice organization organization
Community Links Fit community Sacrifice community community
34
Links
Links are defmed as "discernible connections between people and institutions"
(Mitchell et at, 2001, p. 8). The more links to the workplace or community, the more
highly embedded individuals will become. Links can be social, psychological, or
financial and include age, marital status, number of children and their ages, years of
service, hobbies, church-related activities, and membership in community organizations.
The authors acknowledge that the relative importance of each ofthe previously
mentioned factors could differ by population and that there are inherent pressures to stay
at one's present work. These pressures can come from family members, team members at
work, or other people at work (Maertz, Stevens, Campion, & Fernandex, 1996).
Alternatively, the lack of marital or parental responsibilities or the failure to develop
meaningful work relationships could indicate that employees are less likely to stay with
their present work situation.
Organization. HRD professionals have a more direct influence on policies that
promote organizational links than community links. At the base level, organizational
links would include relationships with coworkers, members of work groups, and others.
These work relationships can influence personal embeddedness and intention to leave
both positively and negatively.
The links-organization component focuses on relationships between individuals
that evolve over time and that increase an employee's intention to stay in an organization.
Mitchell uses the links-organization component to explore questions about the "number
of coworkers, teams and committees" that the respondents may be involved with
(Mitchell et at, 2001, p. 17). The links-organization component is somewhat similar to
35
the "constituency commitment theory" as developed by Reichers (1985), which measures
attachment to specific people or groups in the organization.
Other organizational links include age, membership in professional organizations,
and tenure. Additional links that HRD professionals may champion include broader
benefits packages, employee education assistance, on-site child care, and paid
professional-development opportunities.
Community. Community links can be just as important to retention as
organizational links. The principal behind links-community is that activities,
relationships, and environmental factors can influence an individual's intent to stay and
are independent of one's work environment. This line of thinking is supported by the
work of Cohen (1995), who found that church-related activities and hobbies impacted
workers' commitment to their jobs.
Examples of community links would be hobbies, church-related activities,
involvement in the children's school, or involvement in community activities. Some
organizations have creative policies that tend to support community linkages. Examples
include home-buying assistance, discounts on various goods and services, and paid
community-service days.
Fit
Fit can be seen "as employee's perceived compatibility or comfort with an
organization and with his/her environment" (Mitchell et at., p. 9). As mentioned
previously, the closer that one's personal views, values, and goals are with those of the
organization and community cultures, the "higher the likelihood that an employee will
feel professionally and personally embedded" (Mitchell et ai., 2001, p. 9).
36
Organization. The fit-organization component examines how well an individual
views themselves as sharing compatible goals, values, and characteristics with the
potential employer and other employees within the organization. The better the fit, the
greater the likelihood the employee will stay.
At least two studies support the fit-organization principle. O'Reilly, Chatman, and
Caldwell (1991) found that misfits left organizations at a faster rate than fits. Cable and
Parsons (1999) reported that people gravitate toward jobs that they view as sharing some
or all of the personal goals and values.
Examples of organizational fit include individual "job knowledge, skills and
abilities" (Mitchell et aI., 2001, p. 9). According to Allen (2006), organizational
socialization tactics have a positive impact on job embeddedness and reduced turnover.
HRD professionals can help influence organizational fit by instituting formal employee
socialization processes, mentoring programs, and new-employee orientations. Policies
that encourage employees to join professional organizations and attend related
professional conferences can also playa role in promoting organizational fit.
Community. Mitchell, et aI., (2001) proposed a fit-community concept to address
nonwork factors that can help increase workers' intention to stay at their jobs. Fit
community factors could include, weather, available and convenient access to outdoor
activities and entertainment, community culture, and individuals (neighbors and nonwork
friends) who share similar political and religious views. It is important to note that fit
community factors can be inversely related to organizational fit. For example, an
individual may love Louisville, but hate working for XYZ company in the same city.
HRD efforts may be limited in their influence on factors related to fit community,
37
however fringe benefits such as county club membership, sports tickets, and access to the
local arts and humanities all help strengthen the fit-community component.
Sacrifice
Sacrifice is the final component of the job embeddedness construct. Here sacrifice
refers to the "material" and "psychological" benefits that an employee would lose at any
given time if he or she choose to leave the organization. The greater the sacrifice, the
more difficult the decision to leave will be (Shaw, Delery, Jenkins, & Gupta, 1998). As
with links and fit, sacrifice also has organization and community components.
Organization. Organizational sacrifices can take many forms. It may be possible
for an individual to locate a job with a similar salary and benefits. However, there are
many less obvious organizational sacrifices that employees should consider. There may
be new retirement and benefit restrictions or some benefits that may actually be
nonportable.
Job-related sacrifices might also include the loss of health and retirement benefits,
sports tickets, coworker relationships, educational benefits, advancement opportunities,
convenience and proximity to the work location, and perhaps even a loss of security.
HRD professionals should work to promote competitive, broad-based benefits packages
for employees, thereby making the decision to leave a costly one.
Another HR strategy is to provide accrued advantages to workers who choose to
stay. The advantages might include the ability to pick one's own office or take sabbatical
leave. These benefits are lost permanently to those who leave (Mitchell et aI., 2001, p.
10).
38
Community. Community sacrifices usually are an issue only if relocation is
required with a new position. In many cases, an individual's loss of community can
represent too great a sacrifice. The length of time and improvements in one's home,
convenience and proximity to the local amenities, community safety, and leadership
positions in the community often represent losses that workers are unwilling to bare, even
though links to the organization might be minimal. The HRD professional's ability to
influence the community-sacrifice component of embeddedness is often limited. On-site
child care, company vehicles, preferred parking or holding events that allow
professionals to network with other people in the community, such as an awards
ceremony for organizations that partner with the company are a few of the tools that
HRD professionals could utilize.
Prior Research on Job Embeddedness
Ramlall (2003) noted that people stay at an organization because ofthe location,
the compensation, and the work itself In Ramlall's study, the reasons employees chose to
leave were low compensation, lack of challenging work, and lack of opportunities for
career advancement. These results coincided with the links, fit, and sacrifice components
of job embeddedness outlined by Mitchell et al. (2001). In Ramlall's study, all of these
factors showed that, as overall embeddedness scores increased, the employee's intention
to leave decreased.
The initial study of job embeddedness conducted by Mitchell et al. (2001)
consisted of 700 grocery-store and 500 hospital employees who were randomly sampled
to participate. Both groups of employees were experiencing a tight labor market with
unemployment rates under 5%. The respondents were given a test instrument twice: once
39
during employment and once after separation from the organization. The hard-copy
surveys were mailed to managers who distributed to employees. The survey packets
included a stamped, self-addressed envelope for the convenience of respondents. Weekly
follow-up letters were sent to encourage participation.
The useable response rate for hospital employees was 46.4%, and the usable
response rate for grocery-store employees was 33.1 %. Some respondents failed to
identify themselves and were counted as nonrespondents. To test for nonresponse bias,
the authors used chi-square test to compare basic information collected prior to the
survey, between respondents and nonrespondents. No statistically significant differences
were detected in regard to age, tenure with the organization, or job level. However, the
two groups did differ in terms of gender, with females responding at a higher rate than
males. The authors concluded that the respondents appeared fairly representative of the
population.
The results of Mitchell's (2001) study supported the hypothesis that
embeddedness would be associated with reduced intent to leave and reduced actual
leaving. These fmdings were affirmed by Lee, Mitchell, Sablynski, Burton, and Holtom
(2004); specifically, they examined a sample of835 fmancial-service employees and
found that community embeddedness had a significant negative correlation with
voluntary turnover, but organizational embeddedness was not significantly correlated
with voluntary turnover. Lee et al. (2004) did note some limitations to this study.
• This study took a long period of time to complete.
• The construct for measuring the concept of job embeddedness was in a very
early stage of development when the article was published and much more
40
testing is needed of the construct and it's components.
• The analysis did not test against all alternative theories.
Still, the study suggested some new and intriguing ways to think about employee
retention. The results indicated that being embedded in an organization and a community
was associated with reduced intention to leave and reduced actual leaving. These findings
appear to support the current emphasis in the academic and popular press on the need for
organizations to be concerned with employees' lives both on and off the job. The findings
also suggest that a focus on money and job satisfaction as the primary factors for
retention may be too limited.
Mentors
Mentoring of newly hired by veteran employees has been found to be critical to
the employee-socialization process (Schlichte, Y sse 1, & Merbler, 2005). In that study,
mentoring helped negate feelings of isolation and helped novice workers through
teaching, sponsoring, encouraging, counseling, and befriending. These results closely
match the links-organization component developed by Mitchell et al. (2001).
Allen (2006) examined the effects of socialization tactics (links organization) on
newcomer turnover by embedding newcomers more extensively into the organization.
Utilizing a purposeful sample of222 fmancial-services employees, Allen found that all
six socialization tactics (collective-individual, formal-informal, sequential-random,
fixed-variable, serial-disjunctive, and investiture-divestiture) as classified by Van
Maanen and Schein (1979) were significantly and positively correlated with
organizational embeddedness, whereas none were significantly correlated with
41
community embeddedness. Additionally, organization embeddedness was significantly
and negatively correlated with turnover, whereas community embeddedness was not.
These six socialization tactics make practical implications rather straightforward.
Turnover among new employees is a critical issue for many organizations. Involving
experienced organization insiders in the socialization process as role models, mentors, or
trainers should directly reduce newcomer turnover. Organizations should not neglect the
importance of the social context of socialization. However, a potential limitation of
Allen's (2006) study was a lack of internal consistency in Jones's (1986) Socialization
Tactics Scale (Ashforth & Saks, 1996), indicating that new studies may need to consider
revising this scale.
Wheeler, Harris, and Harvey (2010) examined the relationships between human
resource management, job embeddedness, turnover intention, and impact of member
leader exchange in a population of2000 alumni of a private Midwestern university. The
authors reported that as organizational job embeddedness increased, turnover intention
decreased (Wheeler et aI., 2010). The authors acknowledged that the low response rate
for this study could be a limiting factor. In addition, the authors failed to collect data on
the influence of community job embeddedness. They recommend that future studies use a
full jo b embeddedness survey instrument.
Negative Shocks
Holtom et ai. (2005) defmed and examined the impact of significant
organizational or community events (shocks) as causes of staff turnover in organizations.
The authors looked at this new explanation rather than employee satisfaction,
commitment, and other older theories to significantly explain turnover. One benefit of
42
shock theory is its ability to help distinguish between functional and dysfunctional
turnover (Maertz & Campion, 1998). The results of the Holtom et al. 's study identified
four paths that Ie avers take:
1. In Path I, shocks triggered a preexisting plan. Little thought was given to
employee attachment to the organization. Further analysis revealed that
leavers experienced shocks that were primarily personal, positive, and
expected.
2. Path 2 leavers reconsidered organization attachment after experiencing shocks
that were organizational and negative, without conducting a job search. No
preexisting plan was developed.
3. Path 3 leavers tended to experience mostly unexpected, positive shocks (e.g.,
job offers). In this path, employees decided to leave after considering
alternatives.
4. In Path 4, employees generally decided to leave because of low job
satisfaction levels; some conducted a job search and others did not.
Holtom et al. (2005) stated that they did not intend for shock theory to replace any
other existing turnover theories, only that it should be utilized in conjunction with other
theories. In light of the significant impact ofthis theory, the authors suggest that
organizations incorporate the effect of shocks into retention plans.
Burton et al. (2010) examined the role that work enhancement played in creating
job embeddedness reactions. Specifically, the authors discovered that on-the-job
embeddedness helped reduce the impact of negative shocks on organizational citizenship
and overall job performance. The results indicated that high levels of job embeddedness
43
appeared to buffer the effect of thoughts of leaving associated with negative events. For
example, when someone experienced a negative event and thought about leaving, but was
highly embedded, they performed slightly better and engaged more. One potential
limitation of this study was the lag between the time ofleaving and survey completion.
This time lag could have resulted in recall bias in that the leavers may not have recalled
all details accurately.
Coworker Embeddedness
Felps et al. (2009) examined a model of turnover in which the decision to stay at
or leave a job is influenced by coworkers' job embeddedness and job-search behaviors.
The study found that coworker's job embeddedness explained variance in voluntary
turnover. In addition, as coworkers' job-search activity increased, an individual's
likelihood of turnover increased. The authors listed some specific interventions that
organizations might use to increase job embeddedness and retention: (a) providing
common learning experiences for new workers, (b) utilizing a careful selection process,
(c) improving perceived supervisor and organizational support, (d) being creative with
work scheduling, (e) offering creative benefits packages, (f) offering a variety of work
site food choices, (g) hiring locally, (h) supporting community service, (i) encouraging
involvement in professional organizations, and (j) providing home-buying assistance
(Felps et al. 2009, pp. 557-558). This study was limited in that the list of variables
examined was not exhaustive. The authors recommended that future studies include
variables such as "organizational support, leadership quality and compensation policies"
(Felps et al. 2009, p. 557).
44
Generational Differences
Giosan (2003) sought to identify predictors of job embeddedness and its six
dimensions. The author hypothesized that age, time, strength of attachment, number of
children, personality traits, perceptions about work, and perceptions about mating
opportunities would account for significant variance in embeddedness. To test these
hypotheses, Giosan utilized two samples of full-time workers from the same
organization, each of which were asked to complete an antecedents questionnaire and an
embeddedness survey. The first sample consisted of 172 respondents who completed the
survey instruments at different points in time. The second sample consisted of 129
respondents who completed survey instruments at a single point in time.
The author found that the links-community factors were predicted by age and
number of children and that links-organization factors were predicted by age (Giosam,
2003, p. 52). According to the authors, after initial employment, possible methods to
increase embeddedness could be increasing organizational and supervisor support,
training workers to become highly specialized, and selecting employees who perceive
that they lack job alternatives (Giosam, 2003).
Performance and Participation
Lee et al. (2004) extended theory and research on job embeddedness by
demonstrating how the concept's major components differentially predicted the decisions
to perform and to participate. In the study, Lee et al. surveyed 1,650 employees ofa
regional operations center of a large financial institution. In total, 829 usable responses
were collected, with a response rate of 50%. Next, the authors surveyed the employees'
45
immediate supervisor, and 636 supervisors completed their part in the study for a
response rate of76.7%.
The study also established conceptual and empirical mechanisms through which
certain components of embeddedness might influence the decisions to perform and to
participate. In particular, both organization and community embeddedness were
significantly correlated with turnover intention, citizenship behavior, performance,
satisfaction, and commitment. Community embeddedness (but not organizational
embeddedness) was correlated with the number of volitional absences.
Cultural Differences
Mallol, Holtom, and Lee (2007) assessed whether differences between Hispanics
and Caucasians existed with respect to job embeddedness and intention to leave. They
found that Hispanics demonstrated higher levels of fit-community and sacrifice
community than did Caucasians. In an interesting yet seemingly contradictory finding,
higher levels of job satisfaction did not predict lower intent to leave.
Because the demographic makeup ofthe Mallol et al. (2007) population was
predominately female, the results could be biased. Another possible limitation had to do
with the average educational background of the Southeastern Florida Hispanic
population, which, according to u.S. Census information, is above the national mean in
terms of education and income. Because of this, the study should not be generalized to
Hispanics in other parts of the U.S.
Research Gaps
Differences in gender, race, age, work location, and locus of control have not
been widely studied through the lens of job embeddedness. These topics represent gaps in
46
the existing job embeddedness research base and are addressed in the current study by
surveying background variables of Extension agents and their impact on job
embeddedness. Related research involving antecedent variables will be highlighted in this
section.
Gender Differences
Due to its relative newness, several gaps in Mitchell et al.' s (2001) job
embeddedness theory are evident. The fIrst of these gaps is gender. Although I was
unable to locate any specific studies involving gender and embeddedness, other studies
involving gender and turnover were discovered. In a large, nationally representative
quantitative study, Royalty (1998) examined gender, education level, and turnover. The
results indicated that women with a high-school education did not differ significantly
from either less educated or more educated men in their turnover likelihood. Royalty
further stated that educated women were more likely to stay on the job than women with
less than a high school education and men with any level of education.
Vlosky and Aguilar (2009) developed a model of employee satisfaction that was
tested with both male and female Extension Services employees. The results of the "study
showed that control/autonomy/influence, challenge, performance measures, feedback,
instrumentality, and stability/security" were "highly significant in positively influencing"
employee satisfaction among Extension Services employees and that no differences were
found between genders (Vlosky & Aguilar, 2009, p. 1). One limiting factor in relation to
the current study was that only organizational influences were examined.
47
Racial Differences
Another gap in the job-embeddedness literature involves race. Vlosky and Dunn
(2009) examined racial differences in Extension Services employees' perceptions of job
satisfaction. The independent variables were (a) control over one's job, (b) challenge of
the job, (c) feedback received onjob performance, (d) relevance of the job to society, and
(e) security and stability received from the job. The authors ran descriptive statistics on
race, gender, age, income, and community size. Likert-type scales (1 equaling strongly
disagree and 5 equaling strongly agree) and open-ended questions were used. The
findings suggested a statistically significant difference in job satisfaction between White
and non-White cooperative Extension Services employees. One implications of this study
was the need for administrators and policy makers to understand the driving factors of
satisfaction for both White and non-White employees.
A study of the differences in attrition between African American and Caucasian
nurses showed that African American nurses were less likely to be unemployed (9.2% vs.
18.1 %) and more likely to be employed in the nursing profession (69.6% vs. 57.3%).
Other observations showed that African American nurses preferred educational
institutions compared to Caucasian nurses. Finally, African American nurses comprised a
higher percentage of "non-USA born individuals" (Smith, Crowe, & Hartman, 2007).
The results of this study furthered the discussion of work preferences by race and culture,
and the study is one of a growing number of efforts on the retention problem in the
nursing field.
48
Generational Differences
Research examining the relationships between age and job embeddedness is
limited to Giosan (2003), who sought to identify predictors of six dimensions of job
embeddedness. However, a different study's examination of age and turnover has been
more widely documented. A study of2-year college faculty found that older faculty
members were less likely than younger members to leave their present employer. In
addition, as years in a position increased, intention to leave decreased (Rosser &
Townsend, 2006).
A similar study at an urban community college found that older faculty reported
lower levels of attrition intention than younger faculty (Dee, 2004). Furthermore, the
same study showed that faculty who perceived high levels of support for innovation,
communication, openness, and autonomy reported lower levels of attrition intention.
Long and Swortzel (2007) examined the relationship between personality type,
demographic characteristics, and job satisfaction of Extension agents in Mississippi. The
results indicated that age was the best predictor of job satisfaction. Specifically,
Extension agents between the ages of31 and 35 were most satisfied with their jobs. Job
dissatisfaction was almost nonexistent for Extension agents who had been employed for
more than 20 years. The results also suggested that companies should implement annual
performance reviews and that follow-up studies were needed to identify individual
demographic characteristics and other variables that might relate to job satisfaction. The
limitation to this study was that it only sampled Extension agents in Mississippi and
therefore should not be generalized to Extension agents in other states.
49
Armstrong-Stassen and Ursel (2009) examined the relationships between
organizational and career factors and older workers' intentions to remain with their
organization. According to the authors, relatively little research has focused on why
workers remain in an organization. The main finding from this study was that
respondents who felt that their organizations provided older managerial and professional
employees with opportunities to advance their existing skills and acquire new skills
perceived their organizations as more supportive. This result has several implications for
employers. First, organizations that engage in training and development practices
targeting older managerial and professional employees may be more successful in
retaining these employees than organizations that do not engaging in these practices. The
investment in training and development opportunities signals to these employees that
their organization values their contribution, cares about their well-being, and is
committed to them. However, an organization's provision of flexible work options may
have little impact on older managerial and professional employees' perceptions of
organizational support and decisions about remaining in the organization (Armstrong
Stassen & Ursel, 2009).
Differences in Work Location
Ramlall (2003) found that the location of the company, compensation, and the
work itself were the most significant factors in employees' decisions to stay. In Ramlall's
study, low pay, lack of challenge and opportunity, and lack of career advancement were
identified as possible reasons for leaving.
The organizational costs oflow employee retention have been noted above and
include a loss of knowledge and efficiency within the organization. To minimize the costs
50
associated with voluntary turnover, Ramlall (2003) suggested that employers should try
to understand both organizational and community employee needs. I will address this
issue in the current study by surveying the population of Extension agent's work
locations.
Stress and Compensation
Plash (2006) conducted a study to assess the issues that impact attrition and
retention of special-education teachers in a southeastern Alabama county. The author
concluded that the two most important factors were "excessive paperwork" and "stress
created by demands of the job" (p. 127). Ramlall (2003) cited salary, lack of challenge
and opportunity, and lack of career advancement as possible reasons for leaving an
organization. Kutilek et al. (2002) identified heavy workload, evening and weekend work
commitments, and lack of job autonomy as factors influencing the turnover of Extension
agents. Kroth and Peutz (2010) examined workplace issues related to attracting,
motivating, and retaining agents of the Cooperative Extension Service. The perceived
difficulty involving organizational change ranked first among many concerns, followed
by compensation and lack of adequate resources.
Although issues of compensation are difficult to address during the current, deep
recession, organizations can address retention in other ways. Richman et al. (2008) found
that policies that support work-life balance had a positive correlation with retention and
that perceived flexibility significantly increased the likelihood of expected retention.
Public verses private. There are few studies that focus on job embeddedness and
public-sector employees, Van Emmerik and Sanders (2004) examined how different
relationships in academic settings (i.e., tenured versus nontenured appointments) were
51
associated with different types of job-performance efforts. The results showed that
tenured faculty members' embeddedness was significantly related to compliance and
contextual performance, whereas the embeddedness of nontenured faculty members was
not related to efforts to perform well.
Van Emmerik and Sanders (2004) concluded that their results suggest that
different types of embeddedness could be a powerful instrument to encouraging both
compliance and contextual performance, such as facilitation of network development by
junior staff. Also, strategies to enhance the self-esteem and feelings of professionalism
may be a good choice to stimulate experienced prestige and thereby inclining compliance
and contextual performance at the individual level. For professional groups, and
especially for the faculty members, it holds that embeddedness is paramount for efforts to
perform well (p. 52). Because this study was conducted in a small university in the
Netherlands, the results should not be generalized to other higher education settings.
In a study of United State Air Force maintenance workers, it was found that job
embeddedness accounted for significant variance in their intent to leave. More
specifically, community job embeddedness was found to account for the total predictive
ability of job embeddedness to predict turnover intention (Fletcher, 2005).
Another line of research in the comparison of public and private-sector employees
has been in the area of values and motives. Public-sector managers tend to value "public
service, development of public policy, self-sacrifice, responsibility and integrity" to a
greater extent than private-sector managers (Rainey & Bozeman, 2000, p. 460).
The results of the two previously discussed studies involving public-sector
employees are consistent with the results of job embeddedness studies involving private-
52
sector employees. Although very limited and not generalizable to larger populations, the
initial results indicate that public employees can be similarly embedded in their work.
More research in this specific area of job embeddedness is recommended.
Empirical research on job satisfaction in public versus private employees has
shown some conflicting results. Most studies have found lower job satisfaction among
public employees (Rainey & Bozeman, 2000). However, some studies have shown the
opposite (Steel & Warner, 1990). At least part ofthe explanation can be found in the
nature of the survey questions used in each study. When asked in general terms, "Do you
like your job?" public-sector employees show job-satisfaction levels comparable to
private-sector employees. When asked about specific aspects of their jobs (promotion
prospects, autonomy in the job, pay levels) public employees (especially management)
tend to express lower levels of job satisfaction.
General Economic Conditions
It would be naive to ignore the impact that the current economic recession has had
on employees' retention decisions. As mentioned previously, retention rates are affected
by intent to stay in additional to an employer's decision to hire and maintain their
workforce. These employer decisions are affected by a number of different reasons,
mostly centered around performance and economic conditions. During recessionary
periods with high unemployment rates, there are more job seekers than available jobs
(Hall, 2005).
One interesting dichotomy in regard to the retention rates of Extension agents is
that, regardless of the economy's condition, retention is consistently higher than other
53
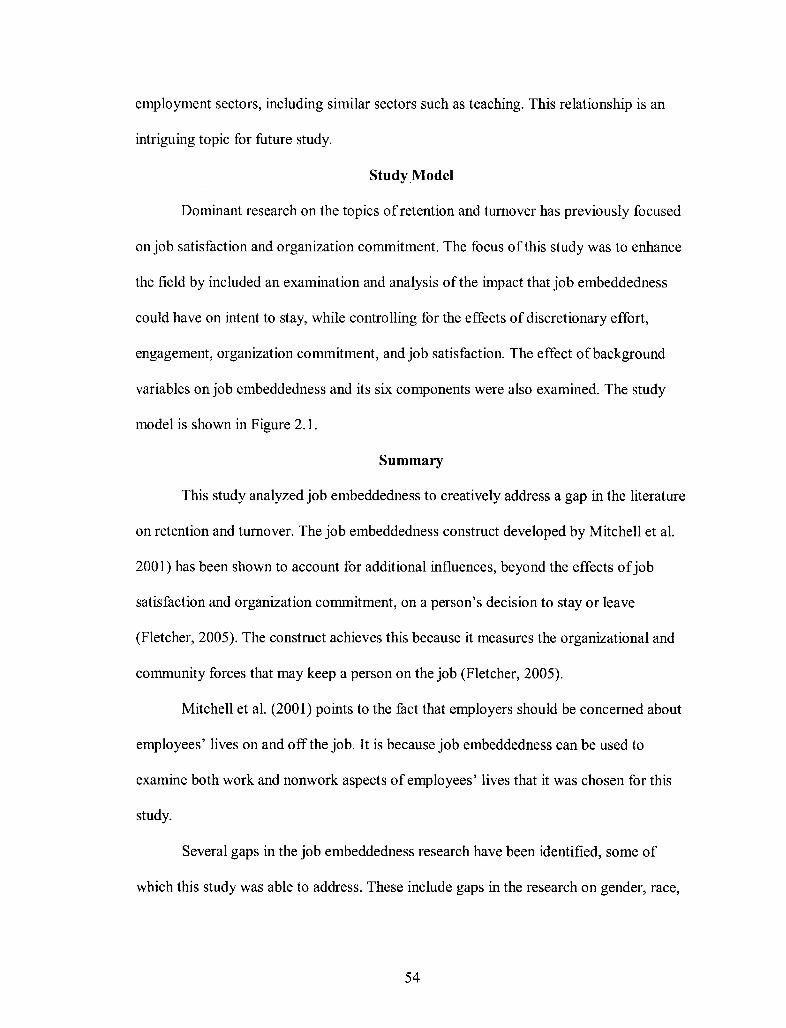
employment sectors, including similar sectors such as teaching. This relationship is an
intriguing topic for future study.
Study.Model
Dominant research on the topics of retention and turnover has previously focused
onjob satisfaction and organization commitment. The focus of this study was to enhance
the field by included an examination and analysis of the impact that job embeddedness
could have on intent to stay, while controlling for the effects of discretionary effort,
engagement, organization commitment, and job satisfaction. The effect of background
variables on job embeddedness and its six components were also examined. The study
model is shown in Figure 2.1.
Summary
This study analyzed job embeddedness to creatively address a gap in the literature
on retention and turnover. The job embeddedness construct developed by Mitchell et al.
2001) has been shown to account for additional influences, beyond the effects of job
satisfaction and organization commitment, on a person's decision to stay or leave
(Fletcher, 2005). The construct achieves this because it measures the organizational and
community forces that may keep a person on the job (Fletcher, 2005).
Mitchell et al. (2001) points to the fact that employers should be concerned about
employees' lives on and off the job. It is because job embeddedness can be used to
examine both work and nonwork aspects of employees' lives that it was chosen for this
study.
Several gaps in the job embeddedness research have been identified, some of
which this study was able to address. These include gaps in the research on gender, race,
54

employment longevity, and work sector (public vs. private). An analysis of these
variables within this study's population of public-sector Extension agents in Kansas and
Kentucky helps expand the research base of the job embeddedness construct.
55
, Q) ... one ro Q)
~E UJ
... >e ro Q) ... ... Vl e a - ...
I
N .~ e e E'" ro .2 E §j e.o~ a E 0' u
I::l Q)
e "'C
Q)
"'C "'C
Q)
..0 E
UJ
~Io--::l.:~ ~LJ~
"'C C V)
::l (])
0 -C !r.... ro b.O
..::::L. !r....
U ~ ro CO
....l Q.l
"CI 0 e >.
"CI = ... <LJ
<LJ <LJ Q.l
= "CI Q.l
"CI "CI Q.l
,Q
e ~ ...., ~
~ :::I .~ ~
56
CHAPTER III
METHOD
Research Method and Design
The method to be used in this study was quantitative. Quantitative research has
been described as "a means for testing objective theories by examining the relationship
among variables" (Creswell, 2008, p. 5). Quantitative research assumes that human
nature is regular and predictable under controlled conditions, generally has a narrow
focus, and provides results that are generalizable and objective (Johnson & Christensen,
2008). In general, quantitative designs have several advantages (Rozina, 2002).
• The research problem can be narrowly defined.
• Dependent and independent variables are clearly specified.
• Conclusions are objective and maybe generalizable.
• Higher levels of reliability may be more easily achieved due to controlling the
observations and experiments.
• Quantitative designs can be used longitudinally.
Additional determinations of method type can be made by answering two simple
questions: Is random assignment being used? and Is there a control group or multiple
measures? (Trochim, 2006). If the answer to both questions is no, then the method is
further classified as quantitative, nonexperimental. Because the current study does not
utilize random sampling or control groups, it is nonexperimental.
57
This study used a census design. Baffour & Paolo (2008) proposed six dimensions
that should be examined to evaluate the quality ofa census study: (a) the census data
should be relevant to the needs of the population; (b) the census should be accurate and
reliable; (c) census studies should be timely and conducted in a reasonable period; (d) the
results or data should be readily available to the population; (e) results ofa census study
should be easy to interpret and understand; and (f) the census data should be easily
integrated with other sources of information (p. 4).
The primary advantage of census research is that the entire population is studied,
rather than choosing a sample. Census studies tend to be "exhaustive" in nature (Baffour
& Paolo, 2008, p. 11) and the main advantage is greater accuracy. With the near
universal availability of the internet some organization are "eliminating sampling and
simply conducting censuses" (Fricker & Rand, 2002, p. 359). Census research often
results in much larger numbers of respondents and allows conclusions to be drawn about
the population without the use of random sampling and inferential statistical analyses
(Creswell, 2005). The benefits of census research should be balanced by the potential for
bias which is addressed later in this chapter.
I was able to gain access to the complete population of Extension agents in
Kansas and Kentucky, which allowed for a census study. An online survey was utilized to
gather data.
The best known census studies are those created by the U.S. Census Bureau every
10 years from data gathered about the country's population characteristics. The results of
these studies are used in many ways. Some of the more important ramifications include
the reapportioning of the U.S. House of Representatives, the redistricting of state
58
legislative boundaries, and the allocation of over $400 billion dollars of local, state, and
national aid. The average response rate for the previous three U.S. census surveys has
been 68% (U.S. Department of Commerce, 2010). Because the data in the current study
was collected during a specific time period, it can also be described as a cross-sectional
study (Johnson & Christensen, 2010).
Census Population
The population on which this study focuses includes KSU and UK Extension
agents. The choice of these two states was due in part to high retention rates in pre-study
data and in part because the directors of both organizations agreed to participate in this
research.
Retention rates were gathered from the respective human resource specialists of
both KSU and UK Extension. A 5-year summary of retention rates ofthe two states is
shown in Table 1.1. The retention rates were consistently high over the 5 study years
(2006 to 2010). Retention rates dropped slightly from 2006 to 2008, but even at their low
point they were higher than all other employment sectors (see Table 1.2). These
decreases in retention rates could be the result of periods of past economic strength, with
greater available job alternatives for Extension agents. An in-depth examination of this
point is beyond the scope of this study but should be addressed in future research.
59
Population Description
A profile of the "typical" Extension agent was developed by a team of Extension
Services researchers from Ohio State University in 2002. Their employee profile
concluded that the typical Extension agent was Caucasian, married, between 39 to 52
years of age, and a parent of two children; had a job tenure of 15 years; had completed a
Master's degree; and no longer lived at home (Kutilek et aI., 2002, p. 10). As Table 3.1
shows, this description is very similar to the population of Extension agents in the current
study.
The total population for the current study comprised 631 county Extension agents.
A substantial majority of the population of Extension agents were female (61.8%), and
the gender distribution was consistent between states. The population was
overwhelmingly White (96.3%) with Black individuals representing the largest group of
minority employees (3.1 %), followed by individuals who identified their race as "other"
« 1 %). KSU employs a smaller percentage of minorities than does Kentucky. The
average age of the total population was 43.9 years. On average, UK Extension agents
were 1.9 years younger than KSU Extension agents.
Overall, the education levels of the population were approximately split between
those with bachelor's degrees (46.4%) and master's degrees (52.9%). Further
examination showed that the educational levels ofKSU and UK Extension agents were
somewhat different; specifically, 37% of UK Extension agents held a bachelor's degree,
62.2% had attained a master's degree, and less than 1 % had a doctorate degree, whereas
62.8% ofKSU Extension agents held a bachelor's degree, 36.8% had attained a master's
degree, and less than 1 % had a doctorate degree.
60
Extension agents were overwhelmingly employed full-time. Kentucky does
employ a small number « 1 %) of part-time Extension agents, as does Kansas « 1 %).
Extension agents are generally employed to work in 1 of 4 program areas: agriculture and
natural resources, family and consumer sciences, 4-H youth development, and
horticulture. The minimum educational requirement for county Extension agents is a
bachelor's of arts or science degree in a field directly related to their area of work. In
addition, Kentucky agents are required to complete 12 credit hours in an approved
graduate program within 5 years of the start of employment ("Employment
Requirements," 2011). The University of Kentucky offers an employee-education plan
that covers the cost of up to 6 credit hours per semester at any publicly funded university
in the state ("Educational Benefits," 2011). KSU does not require agents to begin a
graduate program at any time. KSU does offer an employee tuition waiver of3 credit
hours per semester ("Division of Human Resources," 2011).
The typical Extension Service county-staffing model for the study population
consisted of three agents (one each in agriculture and natural resources, family and
consumer sciences, and 4-H youth development). However, other staffing models do
exist and range from two agents who share 4-H youth development responsibilities to 12
agents in larger urban centers.
A census of all county Extension agents, in both states, was utilized to help
ensure adequate statistical power and full representation of each state. In most studies,
when the population and response rate are large, statistical power is not an issue (Stevens,
2009).
61
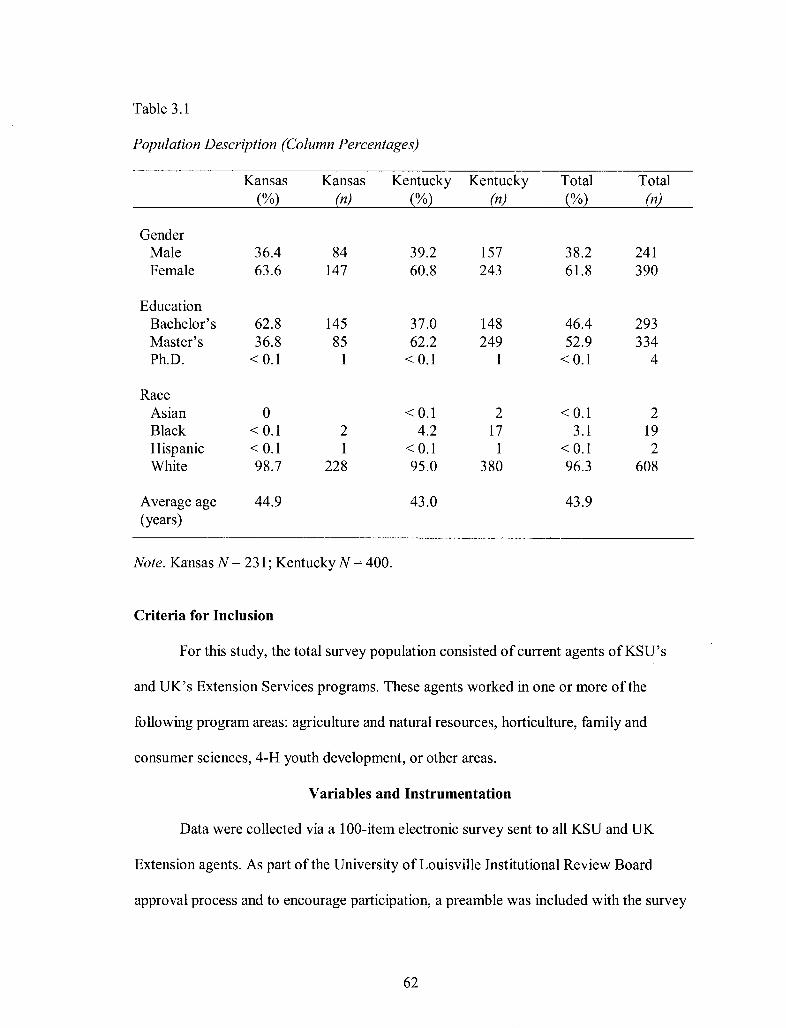
Table 3.1
Population Description (Column Percentages)
Kansas Kansas Kentucky Kentucky Total Total (%) (n) (%) (n) (%) (n)
Gender Male 36.4 84 39.2 157 38.2 241 Female 63.6 147 60.8 243 61.8 390
Education Bachelor's 62.8 145 37.0 148 46.4 293 Master's 36.8 85 62.2 249 52.9 334 Ph.D. < 0.1 1 < 0.1 1 < 0.1 4
Race Asian 0 < 0.1 2 < 0.1 2 Black < 0.1 2 4.2 17 3.1 19 Hispanic < 0.1 1 < 0.1 1 < 0.1 2 White 98.7 228 95.0 380 96.3 608
Average age 44.9 43.0 43.9 (years)
Note. Kansas N = 231; Kentucky N = 400.
Criteria for Inclusion
For this study, the total survey population consisted of current agents of KSU's
and UK's Extension Services programs. These agents worked in one or more of the
following program areas: agriculture and natural resources, horticulture, family and
consumer sciences, 4-H youth development, or other areas.
Variables and Instrumentation
Data were collected via a 100-item electronic survey sent to all KSU and UK
Extension agents. As part ofthe University of Louisville Institutional Review Board
approval process and to encourage participation, a preamble was included with the survey
62
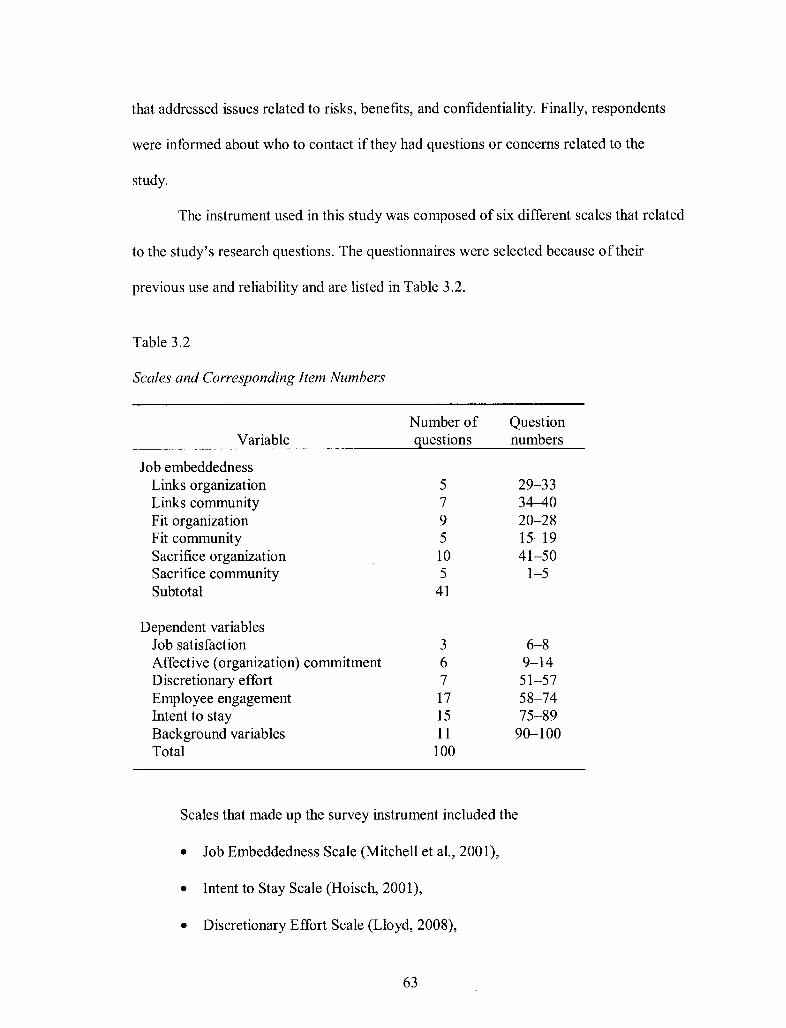
that addressed issues related to risks, benefits, and confidentiality. Finally, respondents
were informed about who to contact if they had questions or concerns related to the
study.
The instrument used in this study was composed of six different scales that related
to the study's research questions. The questionnaires were selected because of their
previous use and reliability and are listed in Table 3.2.
Table 3.2
Scales and Corresponding Item Numbers
Number of Question Variable questions numbers
Job embeddedness Links organization 5 29-33 Links community 7 34-40 Fit organization 9 20-28 Fit community 5 15-19 Sacrifice organization 10 41-50 Sacrifice community 5 1-5 Subtotal 41
Dependent variables Job satisfaction 3 6-8 Affective (organization) commitment 6 9-14 Discretionary effort 7 51-57 Employee engagement 17 58-74 Intent to stay 15 75-89 Background variables 11 90-100 Total 100
Scales that made up the survey instrument included the
• Job Embeddedness Scale (Mitchell et aI., 2001),
• Intent to Stay Scale (Hoisch, 2001),
• Discretionary Effort Scale (Lloyd, 2008),
63
• Job Satisfaction Scale (Luthans, Avilio, Avey, & Norman, 2007),
• Affective Commitment Scale (Allen & Meyer, 1990), and
• Job Engagement Scale (Rich, Lepine, & Crawford, 2010).
The six instruments and the demographic background items were incorporated into one
online instrument. Table 3.2 shows item numbers related to each scale. A copy of the
final survey instrument can be found in Appendix C.
Background variables are important to help understand the survey population.
Oftentimes, background variables can have a significant effect on the dependent
variables. In this study I examined the following background variables in relation to job
embeddedness: gender, race, highest education level achieved, age, program area, years
in organization, years of prior work experience, type of prior work experience, and state.
Since 2001, the embeddedness scale has been utilized in 12 studies, which are
included in the References section of this study. Most job embeddedness items were
measured using a Likert-type scale with the following range: 1 = strongly disagree, 2 =
disagree, 3 = neither agree nor disagree, 4 = agree, and 5= strongly agree. This scale
was also used in the current study to collect responses for intent to stay, discretionary
effort, job satisfaction, affective commitment, and employee engagement. The only
exceptions were for the links-community items 35 to 40 and background items 90 to 100,
which were in multiple-choice format.
Given that the individual Likert-scale items "presume the existence of an
underlying continuous variable whose value characterizes the respondents' attitudes and
opinion" (Clason & Dormody, 1994, p. 31), I treated the subscales as interval-level
variables.
64
Job Embeddedness
In 2001, Mitchell et al. introduced a new conceptual framework called job
embeddedness and proposed that this concept represented a unique factor in
understanding why people stay at their jobs. In their study, Mitchell et al. discussed three
influences on employees' embeddedness and propensity to stay at or leave a job: links,
fit, and sacrifice. Mitchell et al. recommended that each of these factors be considered
within organizational and community contexts. In the present study, the number of items
for each dimension ranged from 5 to 10, totaling 41 items overall.
Fit community. This sub-dimension consisted of five items developed by
Mitchell et al. (2001). Fit community can be seen as perceived comfort within the
community. Fit-community was measured by Survey Items 15, 16, 17, 18, and 19 and
included items such as "This community (where I live) is a good match for me" and "The
area where I live offers the leisure activities that I like (sports, outdoors, cultural, arts)."
Fit organization. This sub-dimension consisted of nine items developed by
Mitchell et al. (2001). Examples of organizational fit included individual "job knowledge,
skills and abilities" (Mitchell et aI., 2001, p. 9). HRD professionals can help influence
organizational fit by instituting formal employee socialization processes, mentoring
programs, and new-employee orientations. Fit organization was measured by Survey
Items 20,21,22,23,24,25,26,27, and 28 and included items such as "My values are
compatible with Extension's values" and "I feel good about my professional growth and
development. "
Links community. This sub-dimension consisted of seven items developed by
Mitchell et al. (2001). Examples of community links are hobby based groups, church-
65
related activities, involvement in children's school or involvement in community
activities. The measure was comprised of Survey Items 34, 35,36,37,38,39, and 40
including items such as "My family roots are in this community" and "I own the home I
live in (mortgaged or outright)."
Links organization. This sub-dimension is comprised of five items
developed by Mitchell et al. (2001). HRD professionals, among others, have a more
direct influence on policies that promote organizational links than on policies that
promote community links. At the base level, organizational links would include formal
and informal relationships with coworkers and others. These work relationships can
influence personal embeddedness and intention to stay both positively and negatively.
Typically, Senior HRD professionals may influence benefits packages, employee
education assistance, on-site child care, and paid professional-development opportunities.
Links organization was measured by Survey Items 29, 30, 31, 32, and 33, including items
such as "How many years have you been in your present position?" and "How many
coworkers (at county or district office) are highly'dependent on you?"
Sacrifice community. This sub-dimension consisted of five items
developed by Mitchell et al. (2001). The length of time and improvements in one's home,
convenience of and proximity to the local amenities, safety and positions of leadership in
the community often represent losses that workers are unwilling to bare, even though
links to the organization might be minimal. The HRD professional's ability to influence
the sacrifice-community component of embeddedness is limited. This construct was
measured by Survey Items 1,2,3,4, and 5 and included items such as "Leaving my
66
community would be very hard" and "If I were to leave the community, I would miss my
neighborhood. "
Sacrifice organization. This sub-dimension consisted of 10 items
developed by Mitchell et al. (2001). Examples of sacrifice organization include the loss
of the "corner office," health and retirement benefits, sports tickets, coworker
relationships, educational benefits, advancement opportunities, convenience of and
proximity to the work location, and perhaps security within the community. Human
resource professionals should work to promote competitive, broad-based benefits
packages for employees, thereby making the decision to leave a costly one. The sacrifice
organization construct was measured by Survey Items 41,42,43,44,45,46,47,48,49,
and 50 and included items such as "I would sacrifice a lot if! left this job" and "I believe
the prospects for continuing employment with this organization are excellent."
Job satisfaction. Locke (1969, p. 316) defined job satisfaction as "the pleasurable
emotional state resulting from the appraisal of one's job as achieving or facilitating the
achievement of one's job values." Scott et al. (2005, p. 89) noted that "job satisfaction
can be defined as an individual's attitude about work roles and the relationship to worker
motivation." The measure was comprised of Survey Items 6, 7, and 8 and included the
following three items from Luthans et al. (2007): "Generally speaking, I am very satisfied
with my job;" "I am generally satisfied with the feeling of worthwhile accomplishment I
get from doing my job;" and "I am generally satisfied with the kind of work I do in my
job." All items were measured on a 5-point Likert Scale.
Affective (organization) commitment. This scale consisted of six items. Allen
and Meyer (1990) argued that "the most prevalent approach to organization commitment
67
in the literature is one in which commitment is considered an affective or emotional
attachment to the organization such that the strongly committed individual identifies
with, is involved in, and enjoys membership in, the organization" (p. 2). In this study,
affective commitment was measured by Survey Items 9, 10, 11, 12, 13, and 14 and
included items such as "I feel a strong sense of belonging to Extension;" "I feel
personally attached to Extension" and "I am proud to tell others I work at Extension."
Discretionary effort. This scale consisted of seven items developed by Lloyd
(2008). The authors describe discretionary effort as being voluntary and beyond what is
normally expected by the employer. It is this extra effort on the part of employee that
helps some organizations outperform others (Lloyd, 2003). Discretionary effort was
measured by Survey Items 51, 52, 53, 54, 55, 56, and 57 and included items such as
"When I work, I really exert myself to the fullest, beyond that what is expected" and "I
fmish a job even if it means sacrificing breaks or lunches."
Employee engagement. This scale consisted of seventeen items developed by
Rich et al. (2010). The original concept of employee engagement was developed by Kahn
(1990). He defined engagement as "task behaviors that promote connections to work and
to others" (Kahn, 1990). Employee engagement was measured by Survey Items 58,59,
60,61,62,63,64,65,66,67,68,69, 70, 71, 72, 73, and 74 and included items such as "I
exert my full effort to my job" and "I devote a lot of energy to my job."
Intent to stay. This scale consisted of 15 items developed by Hoisch, (2001).
Intent to stay refers to the likelihood that an individual employee will remain in the
organization (Tett & Meyer, 1993). The construct was measured by Survey Items 75, 76,
77, 78, 79, 80, 81, 82, 83, 84, 85, 86,87, 87, 88, and 89 and included items such as "In
68
the past, it would have been easy to find a job good enough to consider leaving the
Cooperative Extension Service" and "It would be easy to [md a job now that is good
enough to consider leaving Cooperative Extension Service."
Data Collection
A census survey of KSU and UK Extension agents was used. Census research is
utilized to describe occasions in which all elements of a population are studied. Census
research can also be useful in discovering the desired descriptive characteristics of a
population (Johnson & Christensen, 2008).
For a study to be successful, a high response rate is crucial. Rosenthal and
Rosnow (1975) conducted a meta-analysis that assessed nonvolunteers and developed a
list of characteristics "that may reliably differentiate willing and unwilling subjects (p.
195). They argued that there can be high confidence of voluntary participation for
subjects who are of a higher social class and who possess higher levels of education,
higher social class, higher need for social approval, and sociability.
An examination of Census data from 2008 reveals that the general populations of
Kansas and Kentucky had bachelor's degree attainment rates of29.6% and 19.7%,
respectively (U.S. Census, 2008). The bachelor's degree attainment rate is always 100%
for both states because a bachelor's degree is the minimum education requirement for the
position of Extension agent. Agents also tend to hold high profile positions within their
local communities. This prominence could be interpreted as higher "social class" and
"sociability" (Rosenthal & Rosnow, 1975).
For the present study, surveys were conducted with all Extension agents in both
states. The Qualtrics® on-line survey management software was used to administer and
69
distribute the census survey instrument. Qualtrics® allows for unique identifiers to be
easily assigned and follow-up e-mails to be sent only to nonrespondents. Qualtrics also
enables the comparison late respondents with those who responded earlier in the survey
(Dillman, 2009).
The survey instrument was reviewed by a panel of experts consisting of Extension
professionals with KSU and UK. The panel reviewed all items to ensure that the content
was appropriate, that the items would not infringe upon the respondents' confidentiality,
and that the instrument would not place an undue burden on respondents.
The directors of the KSU Extension Service and UK Extension Service were
contacted to participate in the study. Each Director sent messages to their respective
Extension agents acknowledging their support for the study and the potential benefits it
had for their respective organizations (Dillman, Smyth, & Christian, 2009). The data
collection process began the following week. The use of this type of online survey makes
replication in additional states relatively simple.
During the months of October and November of2011, an e-mail message was
sent to Extension agents in Kansas and Kentucky outlining the voluntary nature ofthe
study, its objectives, confidentiality, and a link to the questionnaire, which included the
consent preamble. The first reminder message was sent 1 week later to those who had not
yet responded. A second reminder message was sent 14 days later, and a [mal reminder
message was sent 21 days after the initial message. All reminder messages contained a
link to the questionnaire (Dillman et aI., 2009). Copies of all correspondence can be
found in Appendices D to M.
70
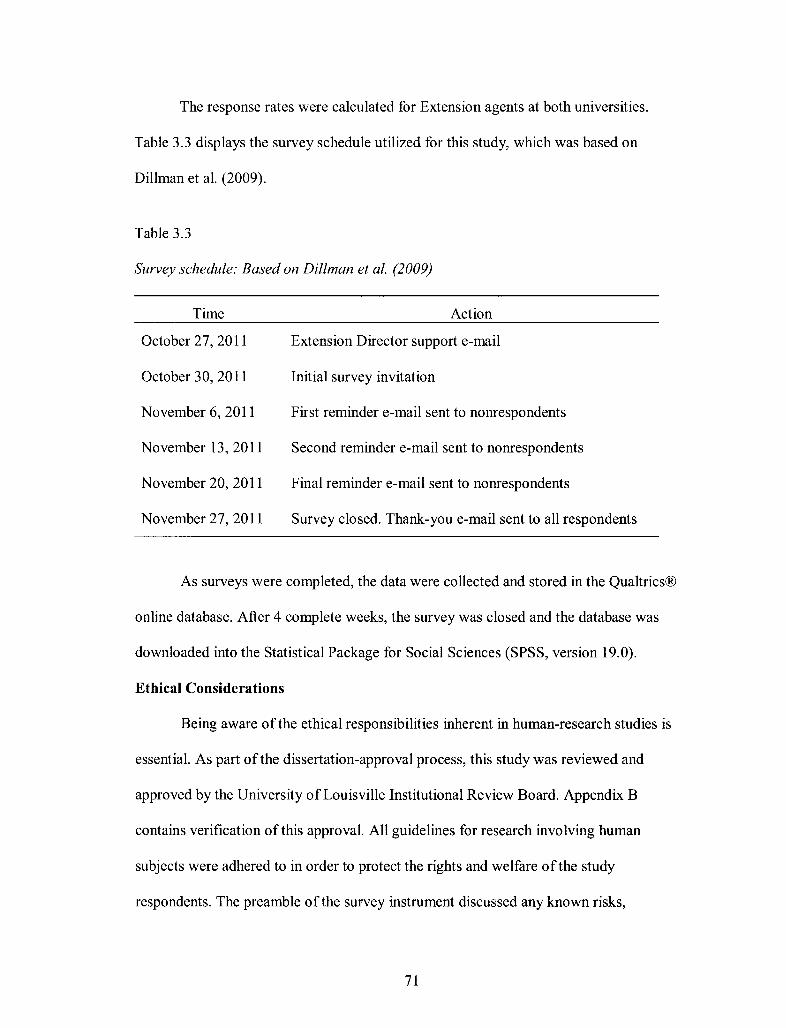
The response rates were calculated for Extension agents at both universities.
Table 3.3 displays the survey schedule utilized for this study, which was based on
Dillman et al. (2009).
Table 3.3
Survey schedule: Based on Dillman et al. (2009)
Time
October 27,2011
October 30,2011
November 6,2011
November l3, 2011
November 20, 2011
November 27,2011
Action
Extension Director support e-mail
Initial survey invitation
First reminder e-mail sent to nonrespondents
Second reminder e-mail sent to nonrespondents
Final reminder e-mail sent to nonrespondents
Survey closed. Thank-you e-mail sent to all respondents
As surveys were completed, the data were collected and stored in the Qualtrics®
online database. After 4 complete weeks, the survey was closed and the database was
downloaded into the Statistical Package for Social Sciences (SPSS, version 19.0).
Ethical Considerations
Being aware of the ethical responsibilities inherent in human-research studies is
essential. As part ofthe dissertation-approval process, this study was reviewed and
approved by the University of Louisville Institutional Review Board. Appendix B
contains verification of this approval. All guidelines for research involving human
subjects were adhered to in order to protect the rights and welfare of the study
respondents. The preamble of the survey instrument discussed any known risks,
71
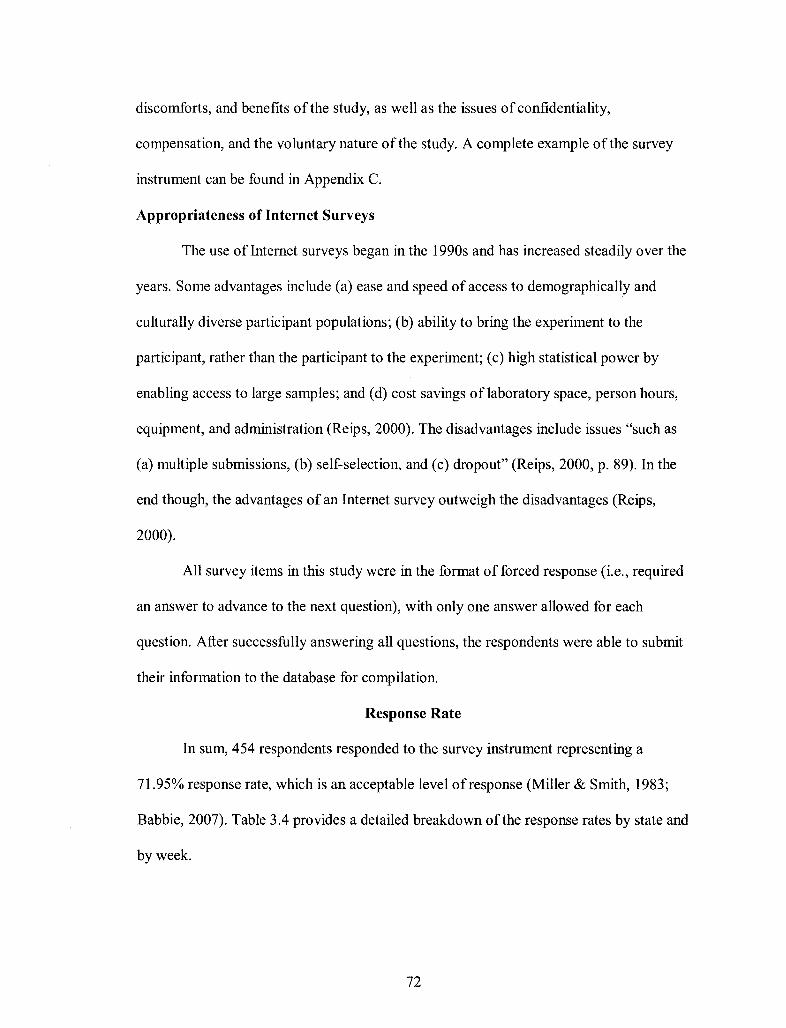
discomforts, and benefits of the study, as well as the issues of confidentiality,
compensation, and the voluntary nature of the study. A complete example of the survey
instrument can be found in Appendix C.
Appropriateness of Internet Surveys
The use of Internet surveys began in the 1990s and has increased steadily over the
years. Some advantages include (a) ease and speed of access to demographically and
culturally diverse participant populations; (b) ability to bring the experiment to the
participant, rather than the participant to the experiment; (c) high statistical power by
enabling access to large samples; and (d) cost savings of laboratory space, person hours,
equipment, and administration (Reips, 2000). The disadvantages include issues "such as
(a) multiple submissions, (b) self-selection, and (c) dropout" (Reips, 2000, p. 89). In the
end though, the advantages of an Internet survey outweigh the disadvantages (Reips,
2000).
All survey items in this study were in the format of forced response (i.e., required
an answer to advance to the next question), with only one answer allowed for each
question. After successfully answering all questions, the respondents were able to submit
their information to the database for compilation.
Response Rate
In sum, 454 respondents responded to the survey instrument representing a
71.95% response rate, which is an acceptable level of response (Miller & Smith, 1983;
Babbie, 2007). Table 3.4 provides a detailed breakdown of the response rates by state and
by week.
72
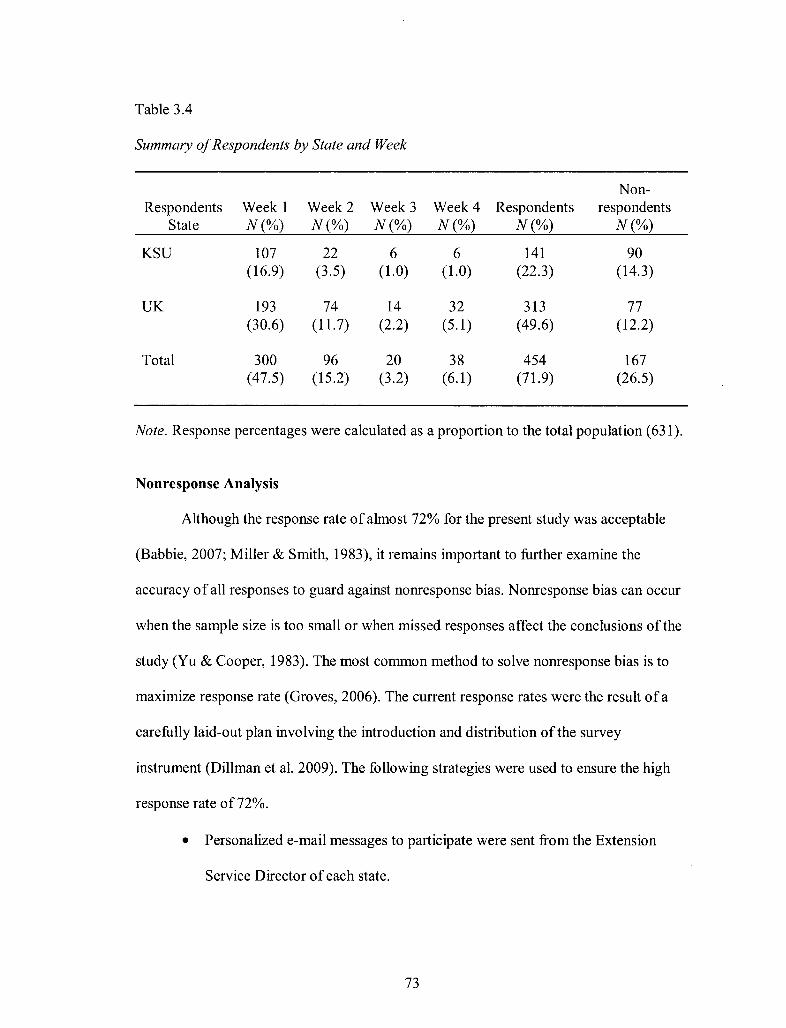
Table 3.4
Summary of Respondents by State and Week
Non-Respondents Week 1 Week 2 Week 3 Week 4 Respondents respondents
State N(%) N(%) N(%) N(%) N(%) N(%)
KSU 107 22 6 6 141 90 (16.9) (3.5) (1.0) (1.0) (22.3) (14.3)
UK 193 74 14 32 313 77 (30.6) (11.7) (2.2) (5.1) (49.6) (12.2)
Total 300 96 20 38 454 167 (47.5) (15.2) (3.2) (6.1) (71.9) (26.5)
Note. Response percentages were calculated as a proportion to the total population (631).
Nonresponse Analysis
Although the response rate of almost 72% for the present study was acceptable
(Babbie, 2007; Miller & Smith, 1983), it remains important to further examine the
accuracy of all responses to guard against nonresponse bias. Nonresponse bias can occur
when the sample size is too small or when missed responses affect the conclusions of the
study (Yu & Cooper, 1983). The most common method to solve nonresponse bias is to
maximize response rate (Groves, 2006). The current response rates were the result ofa
carefully laid-out plan involving the introduction and distribution of the survey
instrument (Dillman et al. 2009). The following strategies were used to ensure the high
response rate of72%.
• Personalized e-mail messages to participate were sent from the Extension
Service Director of each state.
73
• Personalized e-mail invitations to participate were delivered to Extension
agents on Monday mornings.
• Multiple reminder messages were sent. However, whereas up to six reminders
have been found to yield productive results in previous studies, this study only
utilized four reminder messages.
• The potential benefits of the study were included in all messages. (Miller &
Smith, 1983).
Miller and Smith (1983) recommended that background variables should be
compared between the population and study respondents. If the data for the respondents
are "similar to the population, the assumption could be made that the respondents are a
subpopulation of the total population" (Miller & Smith, 1983, p. 47).
Miller and Smith also recommended that respondents and nonrespondents should
be compared on a comprehensive set ofsocio-demographic-background characteristics. If
there are no statistically significant differences, the results can be generalizable to the
total population. Research has shown that late respondents tend to be similar to
nonrespondents (Miller & Smith, 1983). Therefore, responses received after November 6,
2012, were categorized as nonrespondents.
Nonresponse tests will be between (a) population verses respondents, and (b)
respondents verses nonrespondents. I employed a chi-square test (also called Pearson's
chi-square test) to examine statistical differences between the groups. Two general
assumptions must be met to employ chi square. The first is that all observations must be
independent. The second is that less than "20% of the expected counts must be less than
five and all counts must be greater than one" (Yates, Moore, & McCabe, 1999, p. 734).
74
Before actual numbers can be counted, the null hypothesis for the nonresponse
test must be stated. In the tests below, the nonresponse null hypothesis was that there
would be no differences between the groups. This analysis compared the total state
population with the respondents and the respondents with the nonrespondents.
Prior to collection of the main study data, I was able to gather data on the gender,
race, education level, age, and state of residence of the general state populations for
Kansas and Kentucky from the respective employment specialists of each state. Details of
each analysis appear in the following subsections.
Gender
The gender distribution for the population of Extension agents (Kansas and
Kentucky) was 36.75% male (231) and 60.75% female (390). When compared to the total
population to the number of respondents, the results showed that a slightly larger
proportion of males 41.9% (190) and a slightly smaller proportion of females 58.1 %
(264) participated in the survey.
A calculation of the Pearson chi-square test of the variable gender between total
population and respondents yielded a chi-square statistic of2.38, which did not exceed
the critical value of3.841 (.05 probability level). Therefore, it could be concluded that the
respondents group shared the same characteristics as the general population when
analyzed by gender.
A Pearson chi-square test was also used to test for gender between respondents
and nonrespondents. This test yielded a value of .86, which was not statistically
significant at alpha level.05. Therefore, it could be concluded that the respondents group
75
shared the same characteristics as the nonrespondents when analyzed by gender
(Creswell, 2005).
Race
Overall, 95.6% of respondents described themselves as White, 2.2% as Black,
0.4% as American Indian, and 1.5% as other. Among UK Extension agents, 95%
described themselves as White, 4.25% as Black, 0.5% as Hispanic, and 0.25% as Asian.
Most KSU Extension agents (99.7%) were also White, with less than 1% self-identifying
as a racial minority. There was a slight discrepancy between race data provided by the
universities and the survey race data. Our university data indicated that one Hispanic and
two Asian individuals were included in the population; however, there were no data in
those survey categories. A possible explanation for this is that these three individuals
chose not to participate in the study.
Two respondents self-identified as American Indian and seven identified as
"other." None of these individuals were included in the original data provided by the
universities. A possible explanation of this situation is that between April 2011 (time of
university race data collection) and November 20 11 (date census was conducted), the
actual population of minorities changed through attrition and staff changes.
A chi-square test of the variable race, between total population and respondents
yielded a coefficient of 0.61. This value did exceed the critical probability level of .05
(3.841). Again, this indicated no statistically significant difference between the total
population and the respondents when compared by race.
A Pearson chi-square test was also used to test for differences in race between
respondents and nonrespondents. The test yielded a value of 8.38, which was statistically
76
significant at alpha level .05. Therefore, it could be concluded that the respondents group
differed from nonrespondents when analyzed by race (Creswell, 2005).
Although the chi-square statistic can give a measure of statistical significance, it
is often beneficial to examine practical significance. Eta square is one measure of
practical significance that can be utilized to gain perspective when comparing two
groups. An examination of the eta square statistic for the respondents and nonrespondents
yielded a value of .01, which is considered a small effect size (Cohen, 1988). In
summary, although statistically significant, the respondents and nonrespondents did not
show a practical difference in terms of race.
Education Level
For the total population of Extension agents in both states, 46.9% held a
bachelor's degree, 52.4% held a master's degree, and less than 1 % held a doctoral degree.
In a comparison of Extension agents with a bachelor's degree, Kansas (N = 148) and
Kentucky (N = 144) agents had a similar frequency; however, the percentage of Kansas
Extension agents with a bachelor's degree was higher than the percentage in Kentucky.
An examination of agents with master's and doctorate degrees showed that
approximately 3 times as many Kentucky agents (N = 244) as Kansas agents (N = 86)
held a master's or doctorate degree.
The chi-square test of differences in education level between the total population
and respondents yielded a chi-square statistic of 4.70; this did exceed the critical
probability value of .05 (3.841). This indicated that statistically significant differences did
exist between groups. This difference was partially explained by comparing the actual
education level percentages for the two groups. The difference between the total
77
population with a bachelor's degree and respondents with a bachelor's degree (46.9%-
39.9%) was +7%. The difference between the total population and respondents with a
master's degree or higher (52.4%-59.2) was -6.8%. These two differences essentially
negate each other, mainly because of the overall higher number of Kentucky Extension
agents (313) in the study as compared to Kansas Extension agents (141) and because the
differences in education levels between states were statistically significant (X2 = 36.6)
and practically significant (Eta square = .08, small effect size). In summary, although
statistically significant, the differences in education level were partially explained by
differences between states and by the larger frequency of respondents from Kentucky.
A Pearson chi-square test was also used to check for differences in education
level between respondents and nonrespondents. The test yielded a value of 1.43, which
was not statistically significant at the .05 level. Therefore, the respondents group showed
no statistically significant difference from nonrespondents when analyzed by education
level (Creswell, 2005).
Age
The average age of the population of Extension agents was 43.95 years. A
comparison with the average age ofthe respondents yielded a chi-square statistic of 1.42.
This value did not exceed the critical probability value of .05 (3.841). Therefore, it could
be concluded that the population showed no statistically significant difference from
respondents when analyzed by age (Creswell, 2005).
A chi-square test was also run to check for differences in age between
respondents and nonrespondents; the test yielded a value of .17 at alpha level .05, which
was not statistically significant. Again it could be concluded that the respondents showed
78
no statistically significant difference from nonrespondents when analyzed by age
(Creswell, 2005).
Summary
To summarize, in establishing a cohort of Kansas and Kentucky Extension agents,
response bias was assessed by comparing respondents with the total population and
respondents with nonrespondents with regard to gender, education level, race, and age.
Respondents were not different from the total population in terms of gender, race, and
age. However, respondents did appear to differ from the total population in terms of
education level. Two possible explanations for this fmding are that there were more
Kentucky respondents than Kansas respondents and more of the Kentucky respondents
with a graduate degree.
Comparisons of respondents and nonrespondents showed no differences in
gender, education level, and age. Respondents did differ from nonrespondents in terms of
race, but further analysis with an Eta squared test indicated no practical significance.
In conclusion, study respondents appeared to be reasonably similar to both the
total population and to nonrespondents. Thus, responses were unlikely to be affected by
major bias (Groves, 2006). See Table 3.5 for further details.
Scaled Items
The developers of the original job embeddedness scale (Mitchell et aI., 2001)
created items to specifically measure each of its six dimensions (links organization, link
community, fit organization, fit community, sacrifice organization and sacrifice
community). However, they did not adequately describe how the links-organization items
should be scaled. Data for these particular items were not assessed using a 5-point Likert
79
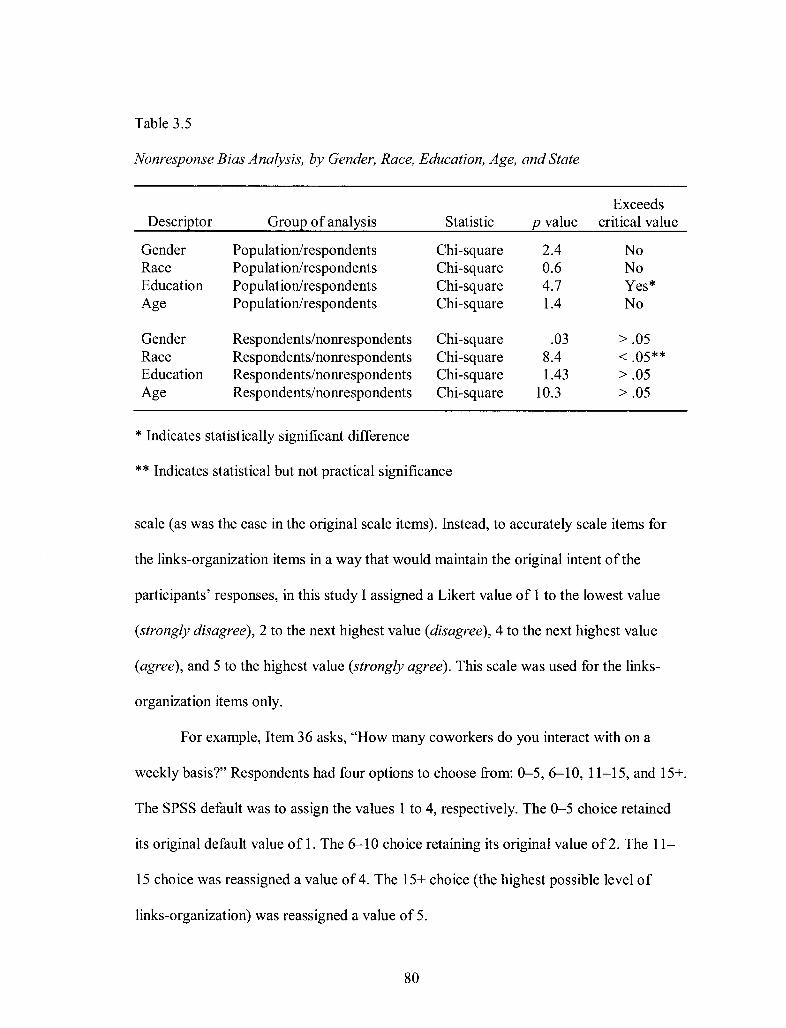
Table 3.5
Nonresponse Bias Analysis, by Gender, Race, Education, Age, and State
Exceeds Descriptor Group of analysis Statistic p value critical value
Gender Population/respondents Chi-square 2.4 No Race Population/respondents Chi-square 0.6 No Education Population/respondents Chi-square 4.7 Yes* Age Population/respondents Chi-square 1.4 No
Gender Respondents/nonrespondents Chi-square .03 >.05 Race Respondents/nonrespondents Chi-square 8.4 <.05** Education Respondents/nonrespondents Chi-square 1.43 >.05 Age Respondents/nonrespondents Chi-square 10.3 > .05
* Indicates statistically significant difference
** Indicates statistical but not practical significance
scale (as was the case in the original scale items). Instead, to accurately scale items for
the links-organization items in a way that would maintain the original intent of the
participants' responses, in this study I assigned a Likert value of 1 to the lowest value
(strongly disagree), 2 to the next highest value (disagree), 4 to the next highest value
(agree), and 5 to the highest value (strongly agree). This scale was used for the links-
organization items only.
For example, Item 36 asks, "How many coworkers do you interact with on a
weekly basis?" Respondents had four options to choose from: 0-5, 6-10, 11-15, and 15+.
The SPSS default was to assign the values 1 to 4, respectively. The 0-5 choice retained
its original default value of 1. The 6-10 choice retaining its original value of 2. The 11-
15 choice was reassigned a value of 4. The 15+ choice (the highest possible level of
links-organization) was reassigned a value of 5.
80
Composite Variables
For this study the following new composite variables were created: links
organization, links community, links total, fit organization, fit community, total fit,
sacrifice organization, sacrifice community, total sacrifice, total job embeddedness, job
satisfaction, organization commitment, discretionary effort scale, employee engagement,
intent to stay, and respondents and nonrespondents. These means of means were used in
Mitchell et aI. 's (2001) study and allowed me to gain further insight into the components
that impacted variance.
Validity and Reliability
Validity has been defmed by many authors. Shavelson, defmed validity as "the
extent to which the interpretation of the results of the study follows from the study itself
and the extent to which the results may be generalized to other situations with other
people" (Shavelson, 1988, p. 21). Shad ish, Cook, and Campbell (2002) added that
validity involves the strength of the study results or the best available approximation of
the truth. In other words, does the study gather the data that are desired and relevant to
the study as described? The discussion that follows explores the validity and reliability of
all six instruments.
Four different types of validity are generally examined in research studies:
statistical conclusion validity, internal validity, external validity, and construct validity
(Shadish et aI., 2002). In every study, including the present study, there are threats one or
more of these types of validity.
81
Statistical Conclusion Validity
Statistical-conclusion validity has been defmed as the "validity of inferences
about the correlation (co-variation) between treatment and outcome" (Shadish et aI.,
2002). The strengths of this study related to statistical-conclusion validity include the
potential for high power resulting from a high response rate and the documented
reliability of the embeddedness scale.
Some threats to this type of validity would be low power because of a poor
response from the study population. To address this threat, Dillman's (2009) suggested
methods for conducting survey research were followed. These methods included but were
not limited to personalizing emails, clearly stating the benefits to the individual and
organization, and the offer to provide an executive summary when study is completed.
Another potential threat to statistical-conclusion validity involves heterogeneity of units.
This study involved the population of Extension agents at UK and KSU, all of which had
similar job duties and expectations.
Internal Validity
Internal validity refers to the "validity of inferences about whether observed co
variation between A (the presumed treatment) and B (the presumed outcome) reflects a
causal relationship from A to B as those variables were manipulated or measured"
(Shadish et aI., 2002, p. 53). A large population sample size strengthens internal validity.
A threat involves nonresponses and incomplete responses of population members. This
has been a problem in previous embeddedness studies (Mitchell et al. 2001). To account
for this problem, the survey design outline by Dillman (2009) was followed strictly. To
reduce incomplete surveys, all questions were in a forced-response format. This means
82
that each question must be answered before the participant is allowed to advance to the
next one.
External Validity
External validity involves "inferences about whether the cause-effect relationship
holds over variation in persons, settings, treatment variables, and measurement variables"
(Shadish et aI., 2002. p. 38). Teddlie and Tashakkori list five threats to research involving
external validity:
• interaction of the causal relationship with units,
• interaction of the causal relationship over treatment variations,
• interaction of the causal relationship with outcomes,
• interaction of the causal relationship with settings, and
• context-dependent mediation.
To address the concerns of external validity I compared the population and
respondents and respondents and nonrespondents for response bias. The analyses
indicated that respondents were reasonably representative of the total population.
Construct Validity
Construct validity has been defined as "validity of inferences about the higher
order constructs that represent sampling particulars" (Shadish et aI., 2002. p. 38). The
construct validity of this study is strengthened by its past replication. An additional
method of validating this study is the ease with which it can be replicated. The replication
of research [mdings is another way to account for bias (Rosnow & Rosenthal, 1975).
83
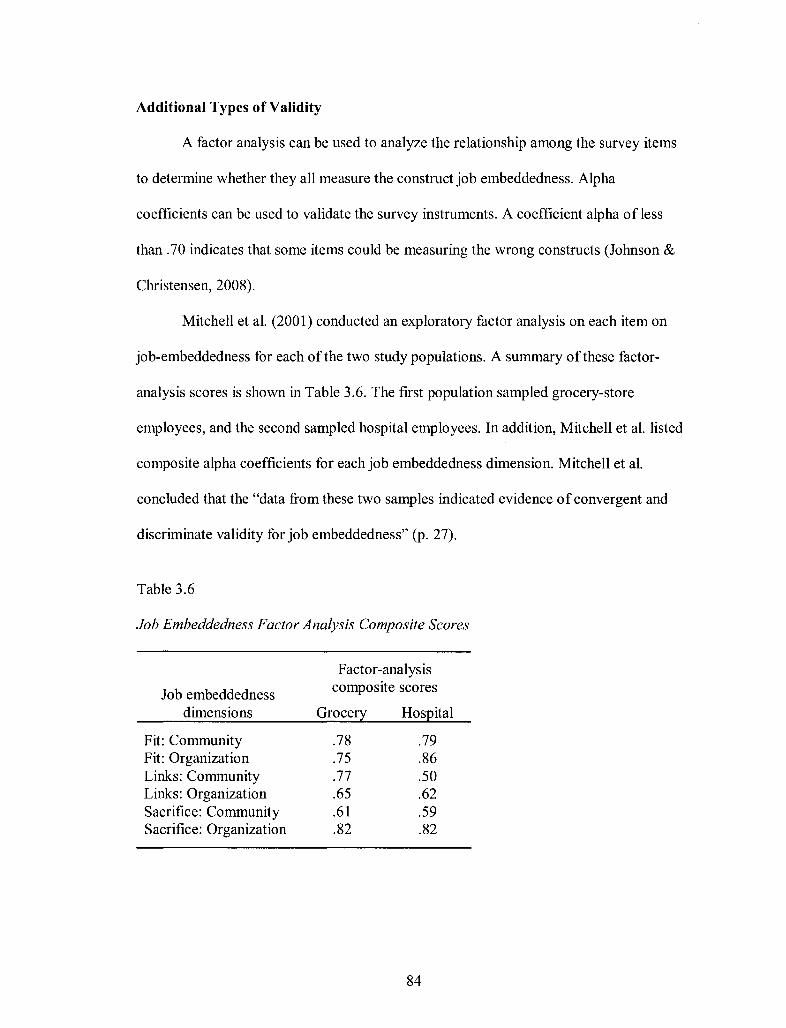
Additional Types of Validity
A factor analysis can be used to analyze the relationship among the survey items
to determine whether they all measure the construct job embeddedness. Alpha
coefficients can be used to validate the survey instruments. A coefficient alpha ofless
than .70 indicates that some items could be measuring the wrong constructs (Johnson &
Christensen, 2008).
Mitchell et al. (2001) conducted an exploratory factor analysis on each item on
job-embeddedness for each of the two study populations. A summary ofthese factor-
analysis scores is shown in Table 3.6. The ftrst population sampled grocery-store
employees, and the second sampled hospital employees. In addition, Mitchell et al. listed
composite alpha coefficients for each job embeddedness dimension. Mitchell et al.
concluded that the "data from these two samples indicated evidence of convergent and
discriminate validity for job embeddedness" (p. 27).
Table 3.6
Job Embeddedness Factor Analysis Composite Scores
Job embeddedness dimensions
Fit: Community Fit: Organization Links: Community Links: Organization Sacriftce: Community Sacriftce: Organization
Factor-analysis composite scores
Grocery
.78
.75
.77
.65
.61
.82
Hospital
.79
.86
.50
.62
.59
.82
84
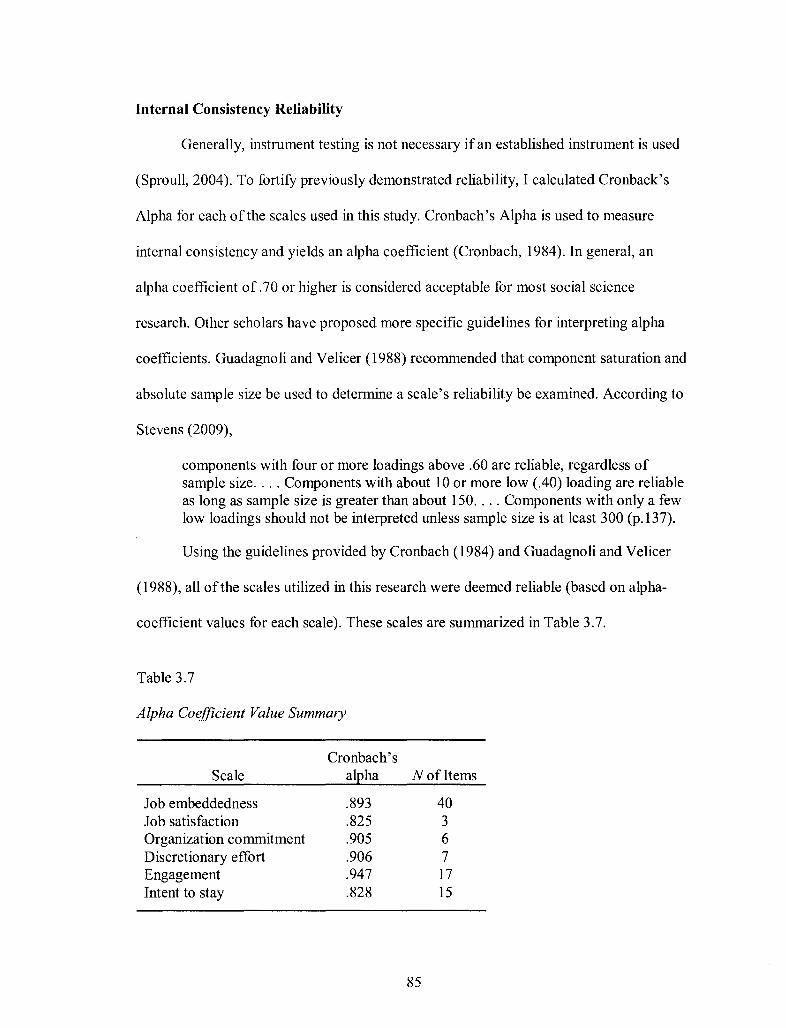
Internal Consistency Reliability
Generally, instrument testing is not necessary if an established instrument is used
(Sproull, 2004). To fortify previously demonstrated reliability, I calculated Cronback's
Alpha for each of the scales used in this study. Cronbach's Alpha is used to measure
internal consistency and yields an alpha coefficient (Cronbach, 1984). In general, an
alpha coefficient of. 70 or higher is considered acceptable for most social science
research. Other scholars have proposed more specific guidelines for interpreting alpha
coefficients. Guadagnoli and Velicer (1988) recommended that component saturation and
absolute sample size be used to determine a scale's reliability be examined. According to
Stevens (2009),
components with four or more loadings above .60 are reliable, regardless of sample size .... Components with about 10 or more low (040) loading are reliable as long as sample size is greater than about 150 .... Components with only a few low loadings should not be interpreted unless sample size is at least 300 (p.137).
Using the guidelines provided by Cronbach (1984) and Guadagnoli and Velicer
(1988), all of the scales utilized in this research were deemed reliable (based on alpha-
coefficient values for each scale). These scales are summarized in Table 3.7.
Table 3.7
Alpha Coefficient Value Summary
Cronbach's Scale alEha N of Items
Job embeddedness .893 40 Job satisfaction .825 3 Organization commitment .905 6 Discretionary effort .906 7 Engagement .947 17 Intent to stay .828 15
85
Data Analysis
I used SPSS analytical software to conduct separate data analyses to address the
research questions for the present study. These tests include descriptive statistics
(including means, medians, modes, standard deviations, chi squares, and correlations),
analyses of variance (ANOVAs), multiple analyses of variance (MANOVA), and linear
regression analyses needed to address the research questions and hypotheses. An alpha
level of .05 was used to test all hypothesis testing. Descriptions of each research question
and the data analyses are addressed next.
The four major research questions in this study focused on differences in the
embeddedness of UK and KSU Extension Service employees and the ability of job
embeddedness to predict intent to stay.
Research Question 1: Does Job embeddedness differ between KSU and UK
Extension agents?
To examine this question, I used ANOVA and MANOVA tests, which are useful
when comparing means. First, ANOVA was used to examine the job embeddedness
means of each state for differences. Next, I used MANOV A to test for differences in the
six job embeddedness component variables. In examining Research Question 1, the
quantitative dependent variables were the overall and composite scales of job
embeddedness and the independent variable was the geographic state of employment
(Kansas or Kentucky; hereafter referred to simply as state).
Research Question 2: What are the relationships between job embeddedness,
intent to stay, and discretionary effort?
86
To test this question, correlation coefficients were used to examine relationships
between variables. Correlation coefficients are useful in testing for levels of significance,
direction of effect (positive or negative), and strength of relationship between the
variables, which in this case were job embeddedness, intent to stay, and discretionary
effort? A correlational analysis examines the relationships among the variables (Gravetter
& Wallnau, 1985).
Research Question 3: Can job embeddedness predict unique variance in the
outcome variables intent to stay and/or discretionary effort, after controllingfor job
satisfaction, organization commitment, and employee engagement?
To examine this question, linear regressions were utilized. The quantitative
dependent variables were intent to stay and discretionary effort, and the independent
variables were the overall job embeddedness mean and the six subcomponent means.
To examine the ability of job embeddedness to predict intent to stay or
discretionary effort, a linear regression analysis was performed. A linear regression
analysis is "used to explain or predict the values of a dependent variable based on the
values of one or more independent variables" (Johnson & Christensen, 2007). Because
other mediating independent variables could have affected the dependent variables, it was
necessary to control for job satisfaction, organization commitment, and engagement. This
will allow the "unique variance" of job embeddedness to be viewed. Finally, I utilized a
step wise regression examining the influence of all variables mentioned above on intent
to stay. One of the most significant outputs of the linear regression tests are beta
coefficients. Beta coefficients give the relative strength of the predictive ability of each
independent variable.
87
Research Question 4: Are background variables significantly related to and able
to predict job embeddedness?
To examine Research Question 4, I analyzed the influence that and all levels of
the background variable (gender, race, education-level, age, program area, years in
organization, years of prior work experience, type of prior work experience, county
population) had on job embeddedness. Dummy variables were created from these
categorical variables, which allowed for linear regression tests to be used in addressing
this question.
Summary
Chapter 3 discussed the methodology used to conduct this study. This chapter also
included a discussion of the research design, sampling, population, instrumentation, data
collection procedures, data analysis, and limitations of the research. Chapter 4 presents
detailed fmdings, and chapter 5 includes an analysis ofthe results and implications for
theory, research, and practice.
88
CHAPTER IV
RESULTS
This study was designed to understand retention among Extension agents in
Kansas and Kentucky. This chapter contains the results obtained through quantitative
analyses of the survey instrument.
The instruments examined in the study were job embeddedness, job satisfaction,
organization commitment, job engagement, intent to stay, discretionary effort, and
background variables. Descriptive statistics (frequencies, means, medians, modes, and
standard deviations), chi squares, correlations, ANOVAs, MAN OVA, and linear
regression analyses were performed by SPSS and used to examine the relationships and
predictive influence between variables.
Description of Respondents
The following sections provide a detailed description of the respondents. In
addition, each background variable was examined for differences between states using a
chi-square test. These data are provided to give a clear picture of the respondent
population. The effect of each background variable on job embeddedness components is
examined thoroughly in Research Question 4.
Gender
Of the 454 Extension agents who chose to participate in this study, 141 resided in
Kansas and 313 resided in Kentucky. The total number of males was 190 and the total
89
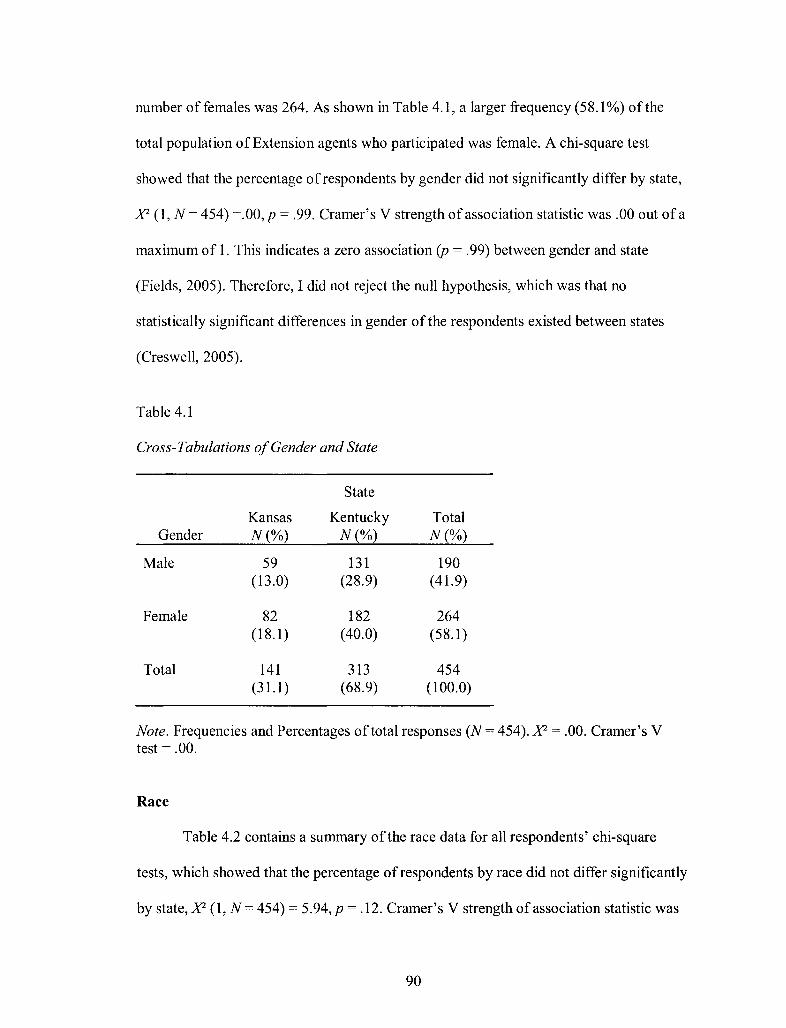
number of females was 264. As shown in Table 4.1, a larger frequency (58.1 %) of the
total population of Extension agents who participated was female. A chi-square test
showed that the percentage of respondents by gender did not significantly differ by state,
Xl (1, N = 454) =.OO,p = .99. Cramer's V strength of association statistic was .00 out of a
maximum of 1. This indicates a zero association (p = .99) between gender and state
(Fields, 2005). Therefore, I did not reject the null hypothesis, which was that no
statistically significant differences in gender of the respondents existed between states
(Creswell, 2005).
Table 4.1
Cross-Tabulations of Gender and State
State
Kansas Kentucky Total Gender N(%) N(%) N(%)
Male 59 131 190 (13.0) (28.9) (41.9)
Female 82 182 264 (18.1) (40.0) (58.1)
Total 141 313 454 (31.1 ) (68.9) (100.0)
Note. Frequencies and Percentages of total responses (N = 454). Xl = .00. Cramer's V test = .00.
Race
Table 4.2 contains a summary of the race data for all respondents' chi-square
tests, which showed that the percentage of respondents by race did not differ significantly
by state, Xl (1, N = 454) = 5.94, P = .12. Cramer's V strength of association statistic was
90
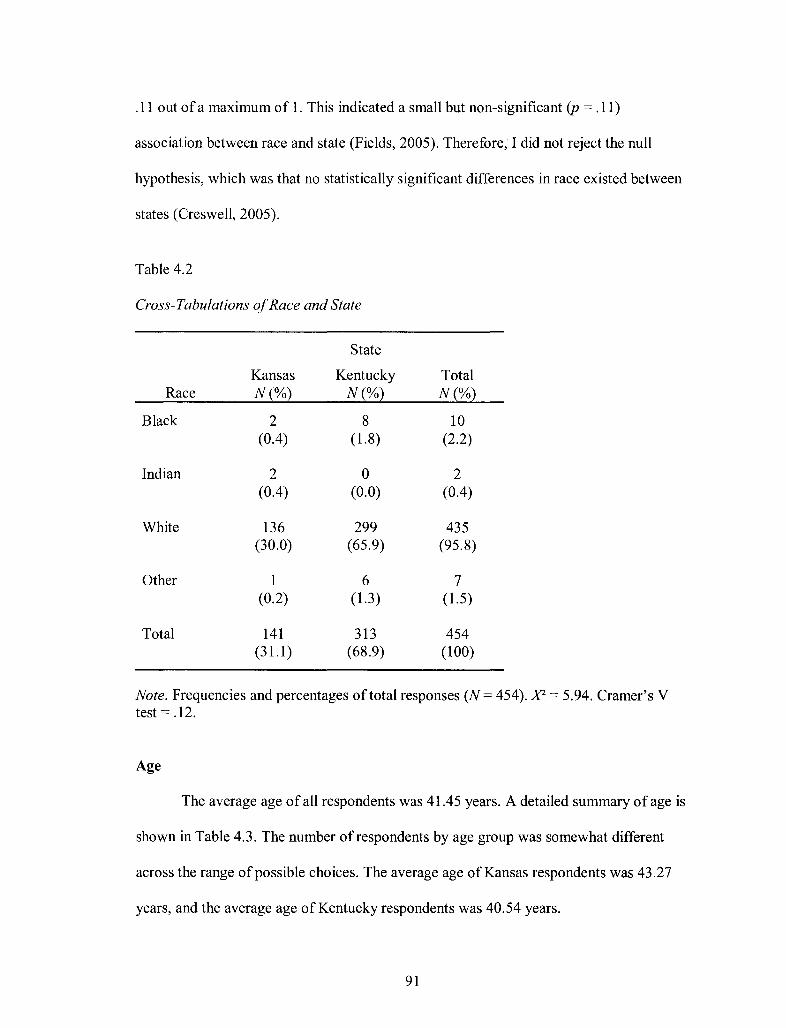
.11 out of a maximum of 1. This indicated a small but non-significant (p = .11)
association between race and state (Fields, 2005). Therefore, I did not reject the null
hypothesis, which was that no statistically significant differences in race existed between
states (Creswell, 2005).
Table 4.2
Cross-Tabulations of Race and State
State
Kansas Kentucky Total Race N(%) N{%l N(%l
Black 2 8 10 (0.4) (1.8) (2.2)
Indian 2 0 2 (0.4) (0.0) (0.4)
White 136 299 435 (30.0) (65.9) (95.8)
Other 1 6 7 (0.2) (1.3) (1.5)
Total 141 313 454 (31.1 ) (68.9) (100)
Note. Frequencies and percentages of total responses (N = 454). X2 = 5.94. Cramer's V test = .12.
Age
The average age of all respondents was 41.45 years. A detailed summary of age is
shown in Table 4.3. The number of respondents by age group was somewhat different
across the range of possible choices. The average age of Kansas respondents was 43.27
years, and the average age of Kentucky respondents was 40.54 years.
91
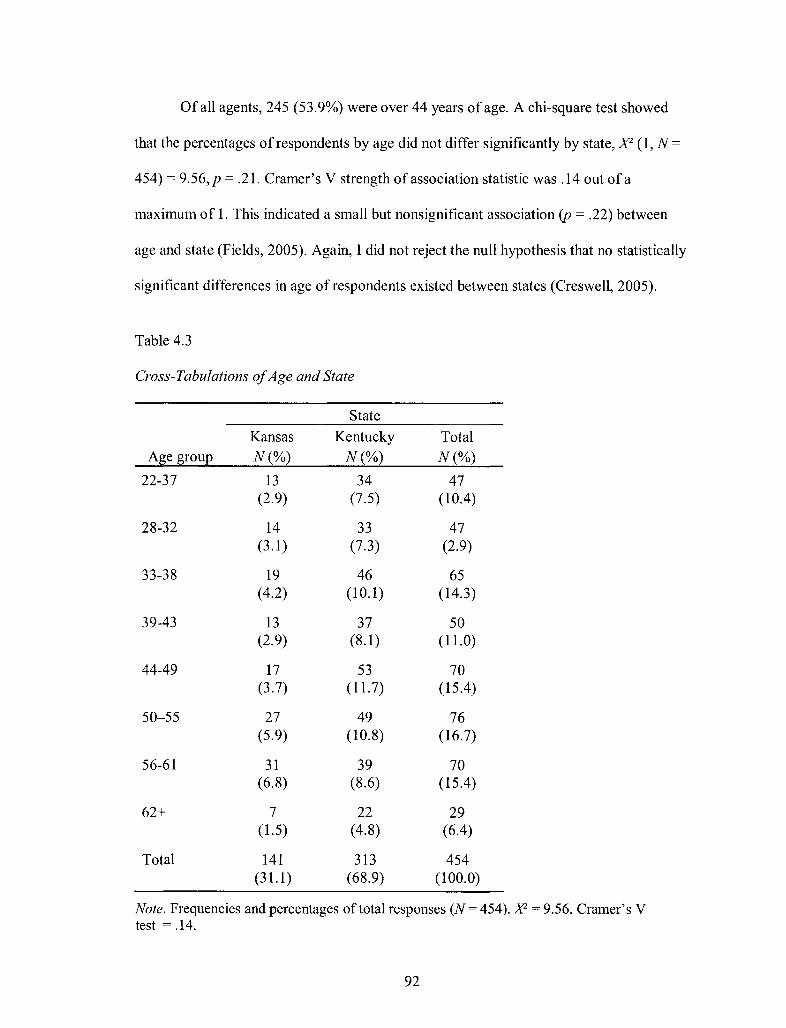
Of all agents, 245 (53.9%) were over 44 years of age. A chi-square test showed
that the percentages of respondents by age did not differ significantly by state, X2 (1, N =
454) = 9.56,p = .21. Cramer's V strength of association statistic was .14 out ofa
maximum of 1. This indicated a small but nonsignificant association (p = .22) between
age and state (Fields, 2005). Again, I did not reject the null hypothesis that no statistically
significant differences in age of respondents existed between states (Creswell, 2005).
Table 4.3
Cross- Tabulations of Age and State
State
Kansas Kentucky Total Age group N(%) N(%) N(%)
22-37 13 34 47 (2.9) (7.5) (10.4)
28-32 14 33 47 (3.1) (7.3) (2.9)
33-38 19 46 65 (4.2) (10.1) (14.3)
39-43 13 37 50 (2.9) (8.1) (11.0)
44-49 17 53 70 (3.7) (11.7) (15.4)
50-55 27 49 76 (5.9) (10.8) (16.7)
56-61 31 39 70 (6.8) (8.6) (15.4)
62+ 7 22 29 (1.5) (4.8) (6.4)
Total 141 313 454 (31.1 ) (68.9) (100.0)
Note. Frequencies and percentages of total responses (N = 454). Xl = 9.56. Cramer's V test = .14.
92
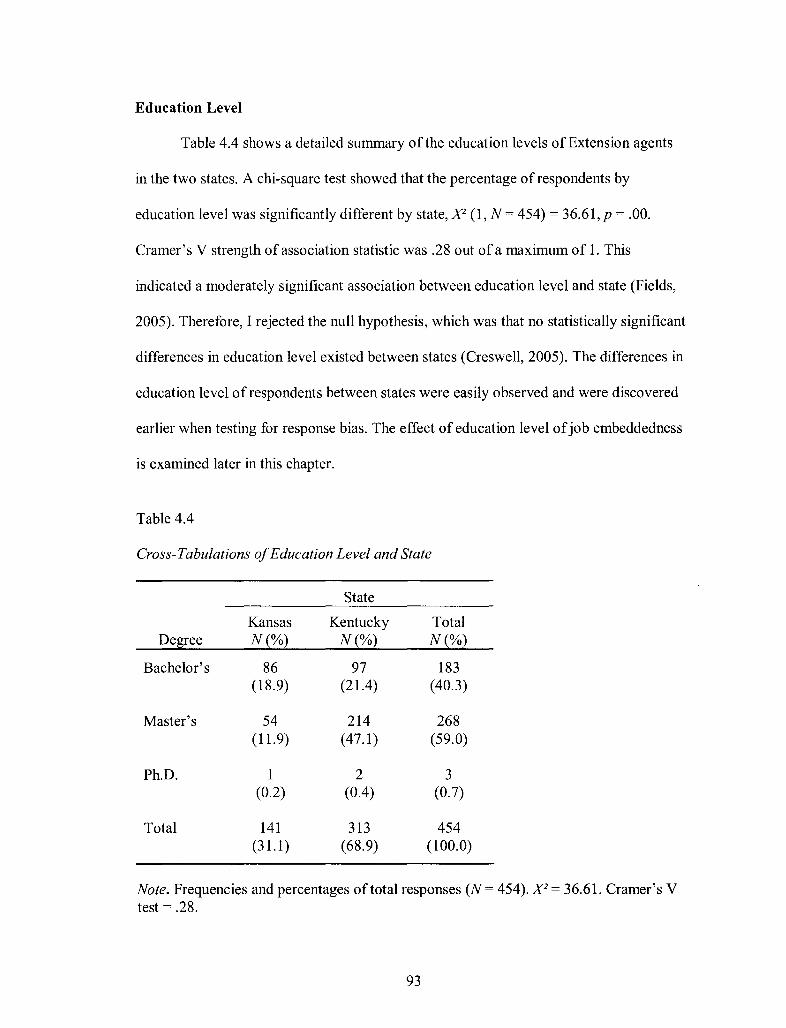
Education Level
Table 4.4 shows a detailed summary of the education levels of Extension agents
in the two states. A chi-square test showed that the percentage of respondents by
education level was significantly different by state, X2 (1, N = 454) = 36.61, p = .00.
Cramer's V strength of association statistic was .28 out of a maximum of 1. This
indicated a moderately significant association between education level and state (Fields,
2005). Therefore, I rejected the null hypothesis, which was that no statistically significant
differences in education level existed between states (Creswell, 2005). The differences in
education level of respondents between states were easily observed and were discovered
earlier when testing for response bias. The effect of education level of jo b embeddedness
is examined later in this chapter.
Table 4.4
Cross-Tabulations of Education Level and State
State
Kansas Kentucky Total Degree N(%) N(%) N(%)
Bachelor's 86 97 183 (18.9) (21.4) (40.3)
Master's 54 214 268 (11.9) (47.1) (59.0)
Ph.D. 1 2 3 (0.2) (0.4) (0.7)
Total 141 313 454 (31.1 ) (68.9) (100.0)
Note. Frequencies and percentages of total responses (N = 454). X 2 = 36.61. Cramer's V test = .28.
93
Program Area
Table 4.5 shows that Kansas respondents were more likely to be employed as
agriculture and natural resources Extension agents, whereas Kentucky respondents were
more likely to be employed as 4-H youth development Extension agents. A chi-square
test showed that the percentage of respondents by program area were significantly
different by state, X 2 (1, N = 454) = 23.54,p = .00. Cramer's V strength of association
statistic was .23 out of a maximum of 1. This indicated a moderately significant
association (sig. p = .00) between program area and state (Fields, 2005).Therefore, I
rejected the null hypothesis, which was that no statistically significant differences in
program area would exist between states (Creswell, 2005). The differences in the
program areas of respondents between states and the effect of program area onjob
embeddedness are examined later in this chapter.
Years of Extension Employment
A frequency analysis ofthe years of Extension Services employment in Table 4.6
showed a large proportion of Extension agents with fewer than 15 years of Extension
Services experience (57%). The newest group, those with 0-5 years of experience,
represented 19% (87) of the study respondents. The least experienced group was also the
largest subgroup in Kansas, representing 24.1 % of the state's total Extension agents.
Those with 6-10 years of Extension Services experience comprised the largest subgroup
in Kentucky, representing 22.4% of the state's total Extension agents.
A chi-square test showed that the percentage of respondents by years of Extension
Services employment were not significantly different by state, A.'2 (l, N = 454) = 6.24, p =
.51. Cramer's V strength of association test statistic was.12 out ofa maximum of 1 (p =
94
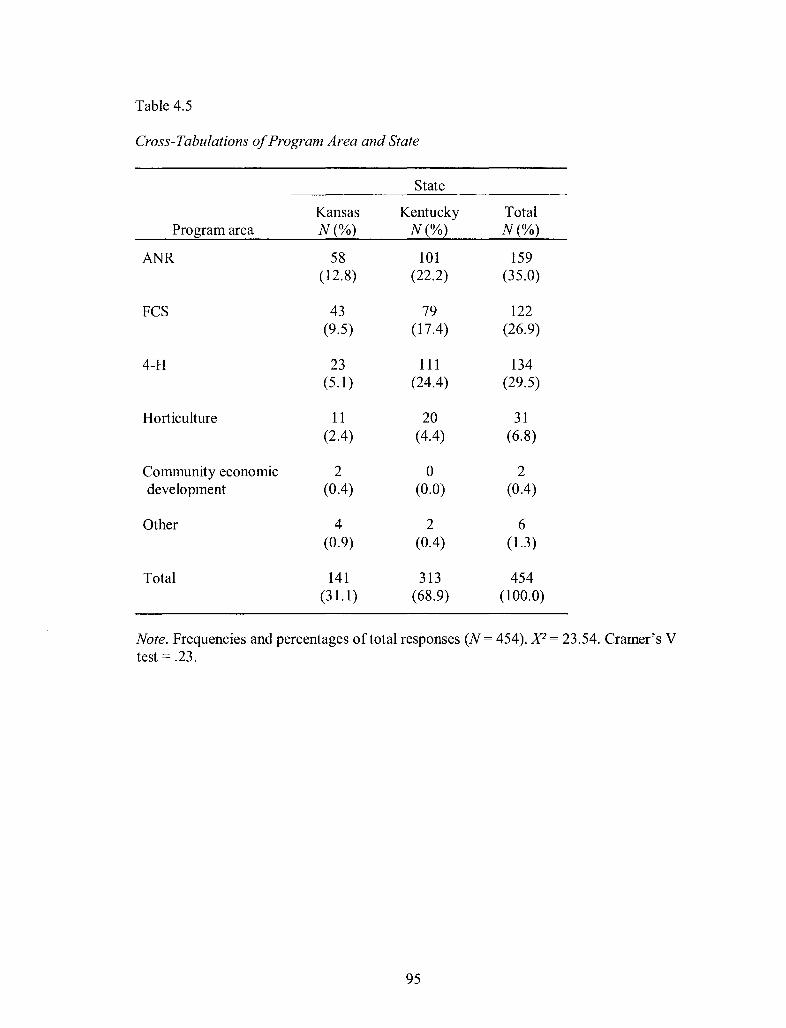
Table 4.5
Cross-Tabulations of Program Area and State
State
Kansas Kentucky Total Program area N(%) N(%) N(%)
ANR 58 101 159 (12.8) (22.2) (35.0)
FCS 43 79 122 (9.5) (17.4) (26.9)
4-H 23 111 134 (5.1) (24.4) (29.5)
Horticulture 11 20 31 (2.4) (4.4) (6.8)
Community economic 2 0 2 development (0.4) (0.0) (0.4)
Other 4 2 6 (0.9) (0.4) (1.3)
Total 141 313 454 (31.1 ) (68.9) (100.0)
Note. Frequencies and percentages of total responses (N = 454). Xl = 23.54. Cramer's V test = .23.
95
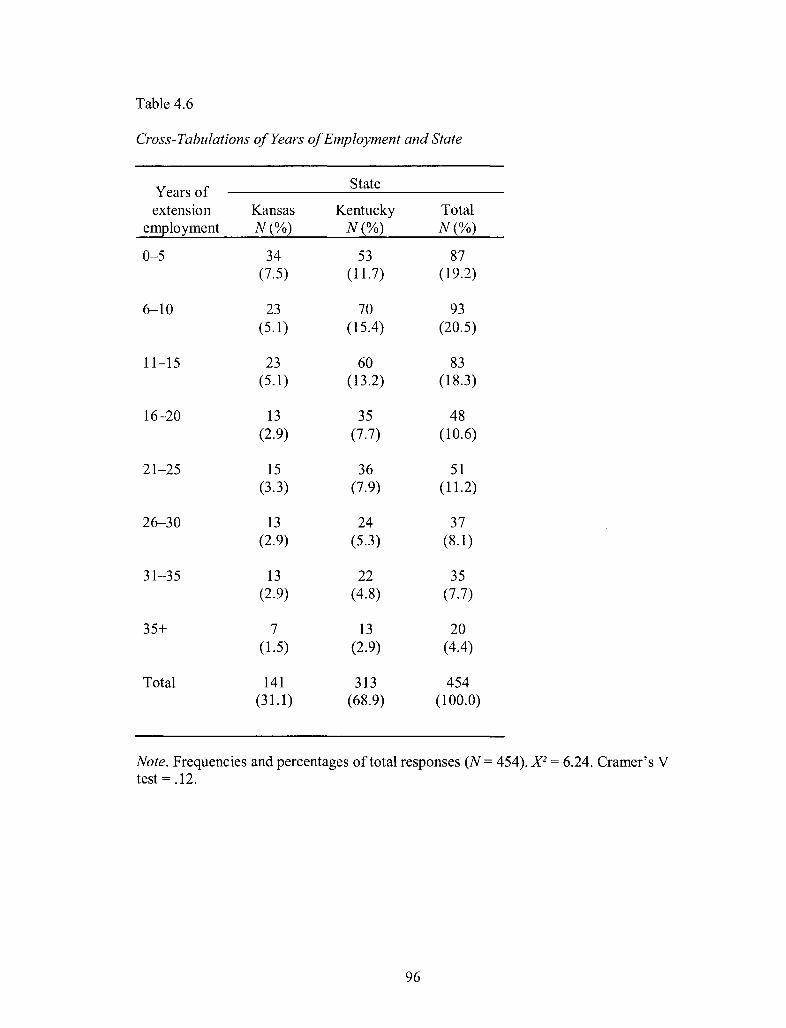
Table 4.6
Cross-Tabulations of Years of Employment and State
Years of State
extension Kansas Kentucky Total employment N(%) N(%) N(%)
0-5 34 53 87 (7.5) (11.7) (19.2)
6-10 23 70 93 (5.1 ) (15.4) (20.5)
11-15 23 60 83 (5.1) (13.2) (18.3)
16-20 13 35 48 (2.9) (7.7) (10.6)
21-25 15 36 51 (3.3) (7.9) (11.2)
26-30 13 24 37 (2.9) (5.3) (8.1)
31-35 13 22 35 (2.9) (4.8) (7.7)
35+ 7 13 20 (1.5) (2.9) (4.4)
Total 141 313 454 (31.1 ) (68.9) (100.0)
Note. Frequencies and percentages of total responses (N = 454). X 2 = 6.24. Cramer's V test = .12.
96
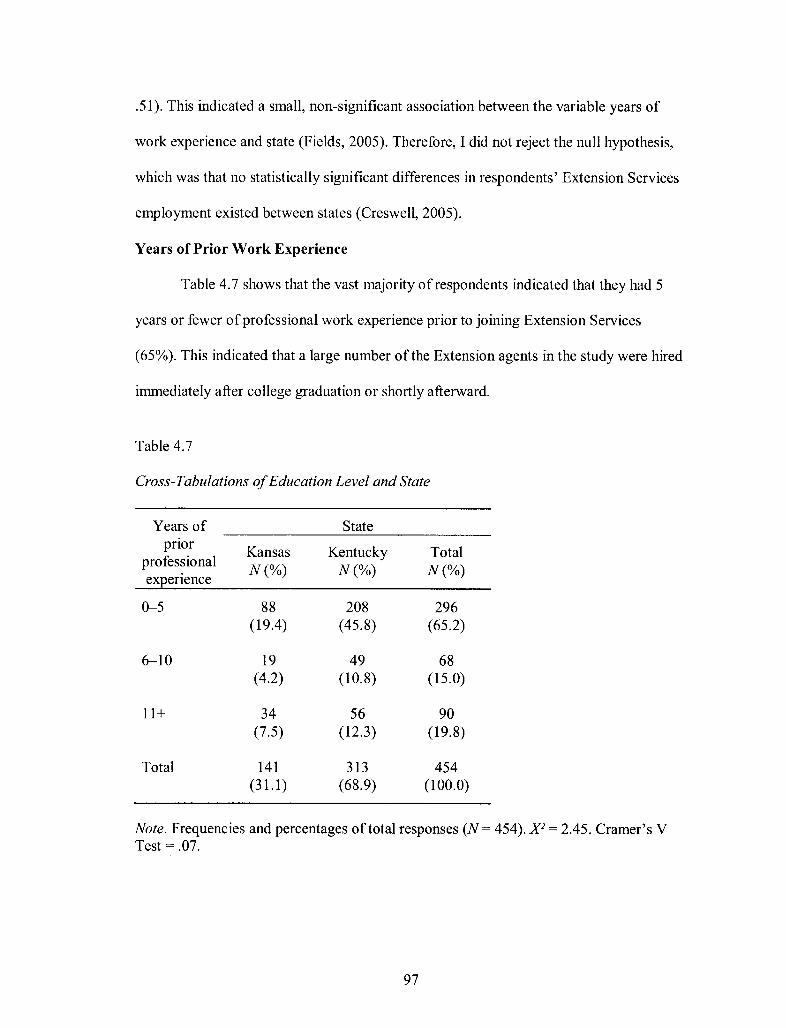
.51). This indicated a small, non-significant association between the variable years of
work experience and state (Fields, 2005). Therefore, I did not reject the null hypothesis,
which was that no statistically significant differences in respondents' Extension Services
employment existed between states (Creswell, 2005).
Years of Prior Work Experience
Table 4.7 shows that the vast majority of respondents indicated that they had 5
years or fewer of professional work experience prior to joining Extension Services
(65%). This indicated that a large number of the Extension agents in the study were hired
immediately after college graduation or shortly afterward.
Table 4.7
Cross-Tabulations of Education Level and State
Years of pnor
professional expenence
0-5
6-10
11+
Total
Kansas N(%)
88 (19.4)
19 (4.2)
34 (7.5)
141 (31.1 )
State
Kentucky Total N(%) N(%)
208 296 (45.8) (65.2)
49 68 (10.8) (15.0)
56 90 (12.3) (19.8)
313 454 (68.9) (100.0)
Note. Frequencies and percentages of total responses (N = 454). X 2 = 2.45. Cramer's V Test = .07.
97
A chi-square test showed that the percentage of respondents did not differ
significantly by previous work experience across states, X 2 (1, N = 454) = 2.45,p = .29.
Cramer's V strength of association test statistic was .07 out of a maximum of 1 (p =.29).
This indicated a small, non-significant association between years of prior work
experience and state (Fields, 2005). Therefore, I did not to reject the null hypothesis,
which was that no statistically significant differences in respondents' years of prior work
experience existed between states (Creswell, 2005).
Type of Prior Work Experience
Of the 454 total study respondents, 420 (95.2%) reported some sort of prior work
experience. The majority of respondents (223, or 53%) reported working for another
public organization prior to joining Extension Services, 156 (37%) came from the private
sector, and 41 (10%) came from a nonprofit organization. Table 4.8 shows that some
differences between states were present. The type of prior work experience of Kansas
Extension agents was about equally distributed among public and private jobs, whereas a
clear majority of Kentucky Extension agents came from the public sector. A chi-square
test showed that the percentage of respondents by type of prior work experience type was
significantly different by state, X2 (1, N = 454) = 8.47, p = .014. Cramer's V strength of
association statistic was .14 out of a maximum of 1. This indicated a small (sig. p = .01)
association between type of prior work experience and state (Fields, 2005). Therefore, I
rejected the null hypothesis, which was there would be no differences in type of prior
work experience between states (Creswell, 2005).
98
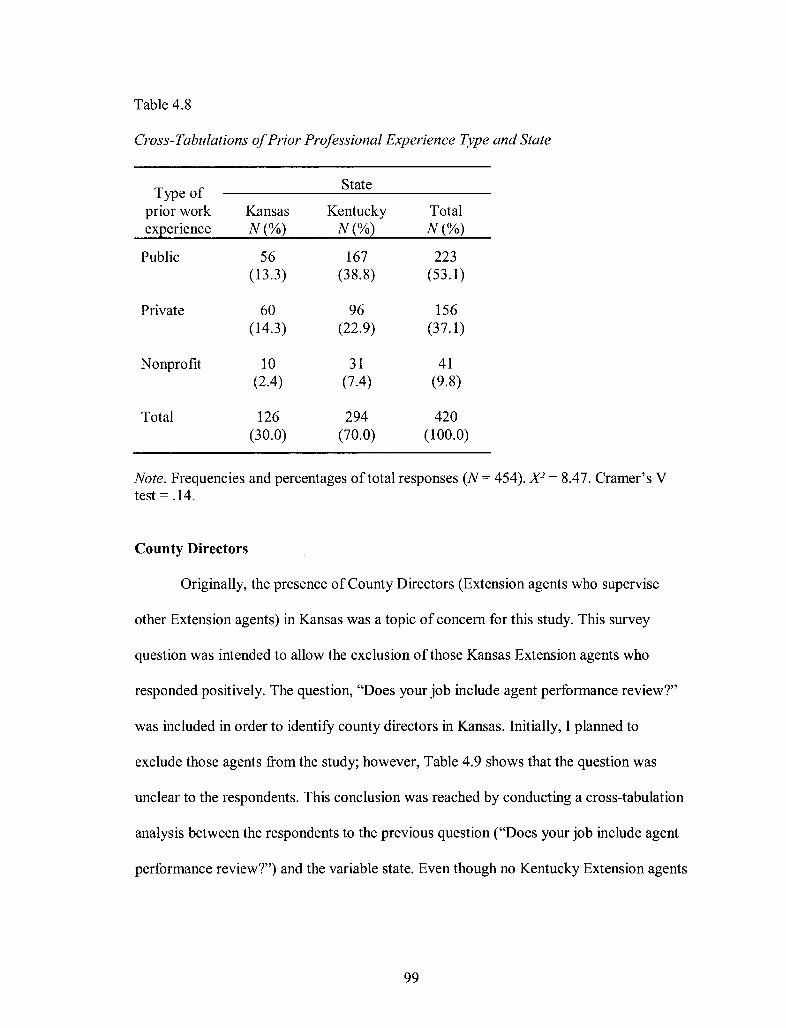
Table 4.8
Cross-Tabulations of Prior Professional Experience Type and State
Type of prior work expenence
Public
Private
Nonprofit
Total
Kansas N(%)
56 (13.3)
60 (14.3)
10 (2.4)
126 (30.0)
State
Kentucky Total N(%) N(%)
167 223 (38.8) (53.1)
96 156 (22.9) (37.1)
31 41 (7.4) (9.8)
294 420 (70.0) (100.0)
Note. Frequencies and percentages of total responses (N = 454). X 2 = 8.47. Cramer's V test = .14.
County Directors
Originally, the presence of County Directors (Extension agents who supervise
other Extension agents) in Kansas was a topic of concern for this study. This survey
question was intended to allow the exclusion of those Kansas Extension agents who
responded positively. The question, "Does your job include agent performance review?"
was included in order to identify county directors in Kansas. Initially, I planned to
exclude those agents from the study; however, Table 4.9 shows that the question was
unclear to the respondents. This conclusion was reached by conducting a cross-tabulation
analysis between the respondents to the previous question ("Does your job include agent
performance review?") and the variable state. Even though no Kentucky Extension agents
99
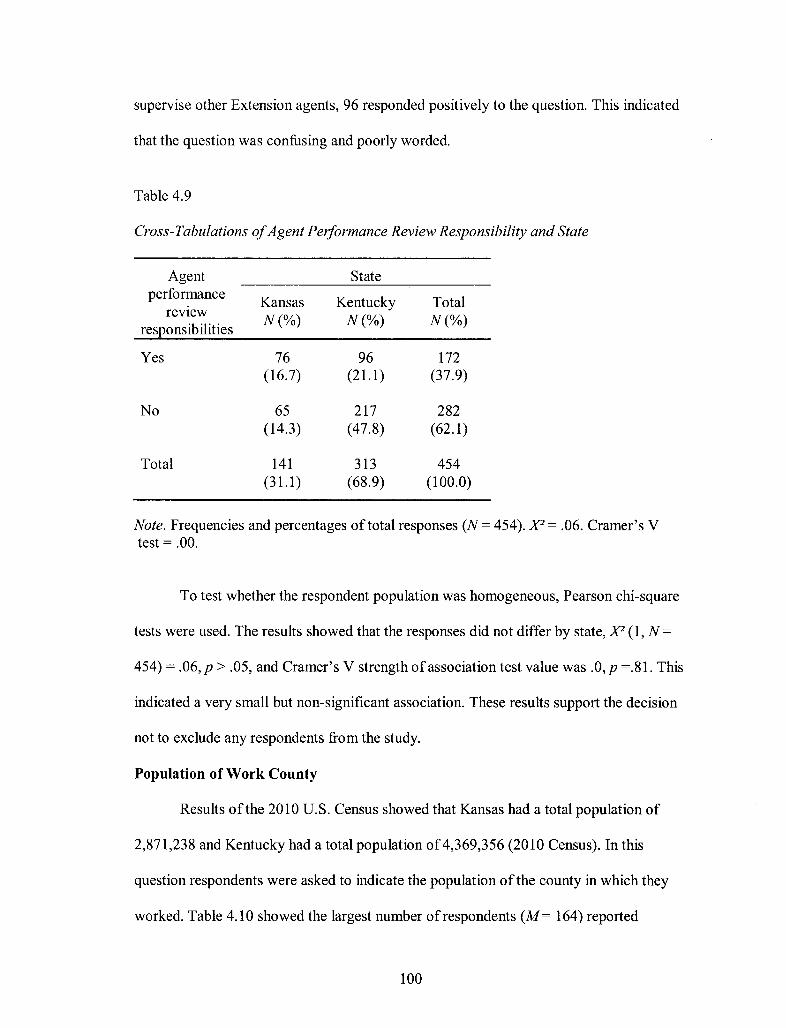
supervise other Extension agents, 96 responded positively to the question. This indicated
that the question was confusing and poorly worded.
Table 4.9
Cross- Tabulations of Agent Performance Review Responsibility and State
Agent State performance
Kansas Kentucky Total reVIew
N(%) N(%) N(%) responsib ilities
Yes 76 96 172 (16.7) (21.1) (37.9)
No 65 217 282 (14.3) (47.8) (62.1)
Total 141 313 454 (31.1 ) (68.9) (100.0)
Note. Frequencies and percentages of total responses (N = 454). X 2 = .06. Cramer's V test = .00.
To test whether the respondent population was homogeneous, Pearson chi-square
tests were used. The results showed that the responses did not differ by state, X2 (1, N =
454) = .06,p > .05, and Cramer's V strength of association test value was .O,p =.81. This
indicated a very small but non-significant association. These results support the decision
not to exclude any respondents from the study.
Population of Work County
Results of the 2010 U.S. Census showed that Kansas had a total population of
2,871,238 and Kentucky had a total population of 4,369,356 (2010 Census). In this
question respondents were asked to indicate the population of the county in which they
worked. Table 4.10 showed the largest number of respondents (M= 164) reported
100
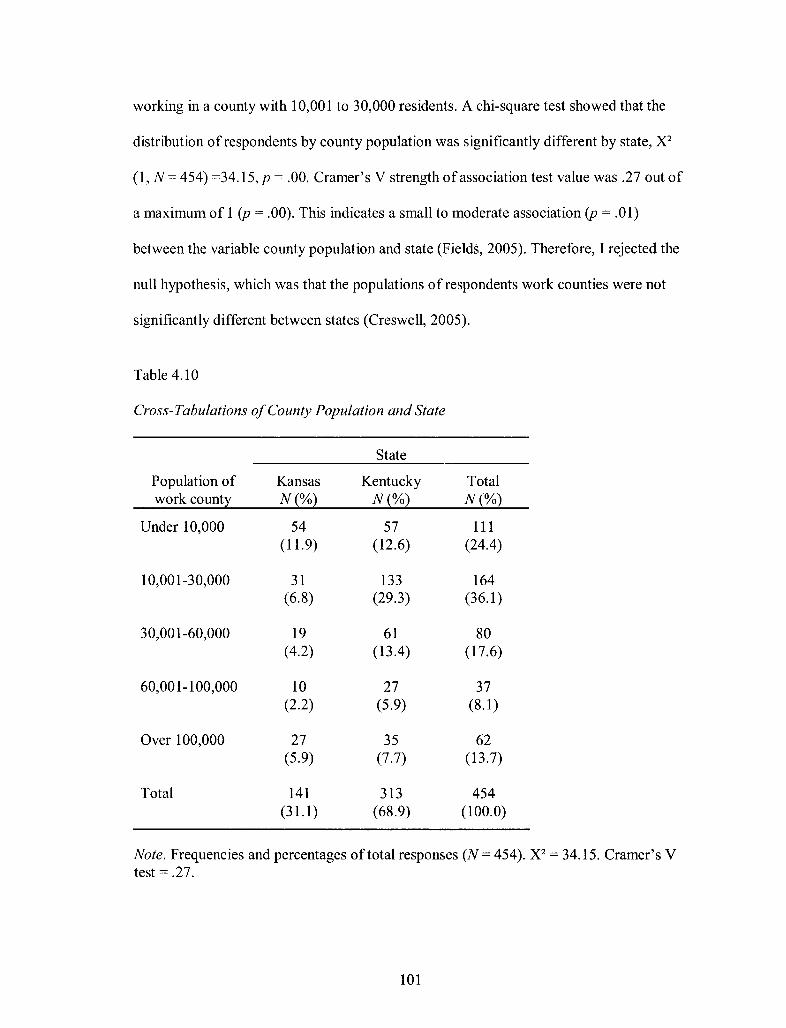
working in a county with 10,00 I to 30,000 residents. A chi-square test showed that the
distribution of respondents by county population was significantly different by state, X2
(1, N = 454) =34.15, p = .00. Cramer's V strength of association test value was .27 out of
a maximum of 1 (p = .00). This indicates a small to moderate association (p = .01)
between the variable county population and state (Fields, 2005). Therefore, I rejected the
null hypothesis, which was that the populations of respondents work counties were not
significantly different between states (Creswell, 2005).
Table 4.10
Cross-Tabulations of County Population and State
State
Population of Kansas Kentucky Total work county N(%) N(%) N(%)
Under 10,000 54 57 111 (11.9) (12.6) (24.4)
10,001-30,000 31 133 164 (6.8) (29.3) (36.1)
30,001-60,000 19 61 80 (4.2) (13.4) (17.6)
60,001-100,000 10 27 37 (2.2) (5.9) (8.1)
Over 100,000 27 35 62 (5.9) (7.7) (13.7)
Total 141 313 454 (31.1 ) (68.9) (100.0)
Note. Frequencies and percentages of total responses (N = 454). X2 = 34.15. Cramer's V test = .27.
101
Precautions and Assumptions
Several precautions and assumptions were observed to assure accuracy and
validity 0 f the statistical tests.
M ulticollinea rity
Multicollinearity refers to instances of moderate to high intercorrelations among
the predictor variables. Multicollinearity can present three problems when using
regression. First, multicollinearity can limit the size ofR, because the predictors are
influencing the same variance in the dependent variable (Stevens, 2009). Second, the
correlations between predictor variables make judging their relative importance difficult
(Stevens, 2009). Third, multicollinearity increases the variances of the regression
coefficients "resulting in unstable predictor equations" (Field, 2005, p. 175).
As proposed by the study model, I theorized that the background variables will
predict the six components of job embeddedness (links organization, links community, fit
organization, fit community, sacrifice organization, and sacrifice community). I
examined the model's variance inflation factors (VIF). "VIF indicates whether a predictor
has a strong linear relationship with other variables" (Field 2005, p. 175). In addition,
according to Myers (1990) researchers should pay close attention to VIF's of 10 or
above. Since no values higher than 10 were discovered, little interaction among variables
was assumed (Stevens, 2009).
A second stage of analysis, based on the study model, examined the research
question regarding the ability of job embeddedness to predict intent to stay, while
controlling for the effects of job satisfaction, organization commitment, and employee
102
engagement. A final examination of variance-inflation values of multi correlation again
showed no values higher than 10, indicating no cause for concern (Stevens, 2009).
Linearity
The assumption of linearity (linear relationships between the independent and
dependent variables) states that the "mean values of the outcome variable for each
increment of the predictor variable lie along straight line" and that "attempting to apply a
nonlinear relationship using a linear model limits generalizability of the findings" (Field,
2005, p. 170). The scatterplots for all combinations of independent and dependent
variables were examined, and showed linear relations.
Homoscedasticity
Homoscedasticity is one of the necessary assumptions when conducting a
regression analysis. Homoscedasticity "means that the residuals at each level of the
predictor(s) should have the same variance" (Field, 2005, p. 170). To test for
homoscedasticity, I examined probability plots and found them to be randomly dispersed
throughout the plot in a generally oval shape, which indicated that the assumptions of
linearity and homoscedasticity were met (Field, 2005, p. 203).
Data Results and Analysis
The four research questions focused on differences in the job embeddedness of
UK and KSU Extension Service employees and the relationships between and the ability
ofthe six components of job embeddedness to predict intent to stay and discretionary
effort. Additionally, the predictive ability ofbackground variables was studied.
103
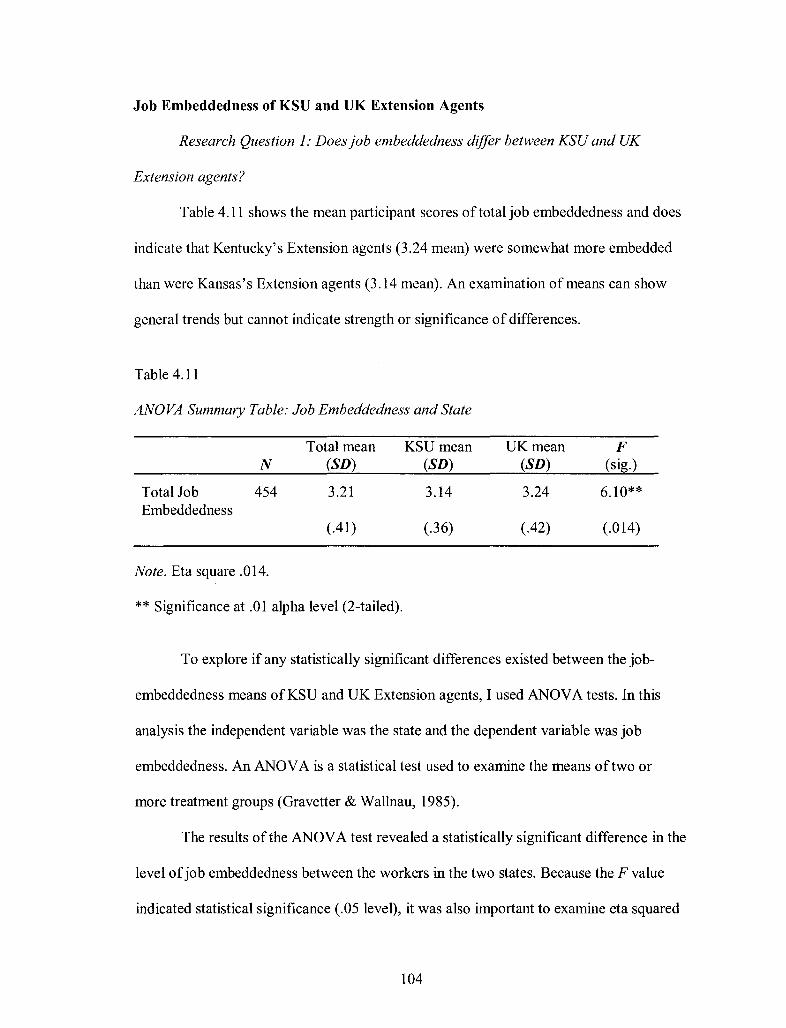
Job Embeddedness of KSU and UK Extension Agents
Research Question 1: Does job embeddedness differ between KSU and UK
Extension agents?
Table 4.11 shows the mean participant scores of total job embeddedness and does
indicate that Kentucky's Extension agents (3.24 mean) were somewhat more embedded
than were Kansas's Extension agents (3.14 mean). An examination of means can show
general trends but cannot indicate strength or significance of differences.
Table 4.11
ANOVA Summary Table: Job Embeddedness and State
Total mean KSU mean UK mean F N (SD) (SD) (SD) (sig.)
Total Job 454 3.21 3.14 3.24 6.10** Embeddedness
(AI) (.36) (042) (.014)
Note. Eta square .014.
** Significance at .01 alpha level (2-tailed).
To explore if any statistically significant differences existed between the job-
embeddedness means ofKSU and UK Extension agents, I used ANOVA tests. In this
analysis the independent variable was the state and the dependent variable was job
embeddedness. An ANOVA is a statistical test used to examine the means of two or
more treatment groups (Gravetter & Wallnau, 1985).
The results ofthe ANOVA test revealed a statistically significant difference in the
level of job embeddedness between the workers in the two states. Because the F value
indicated statistical significance (.05 level), it was also important to examine eta squared
104
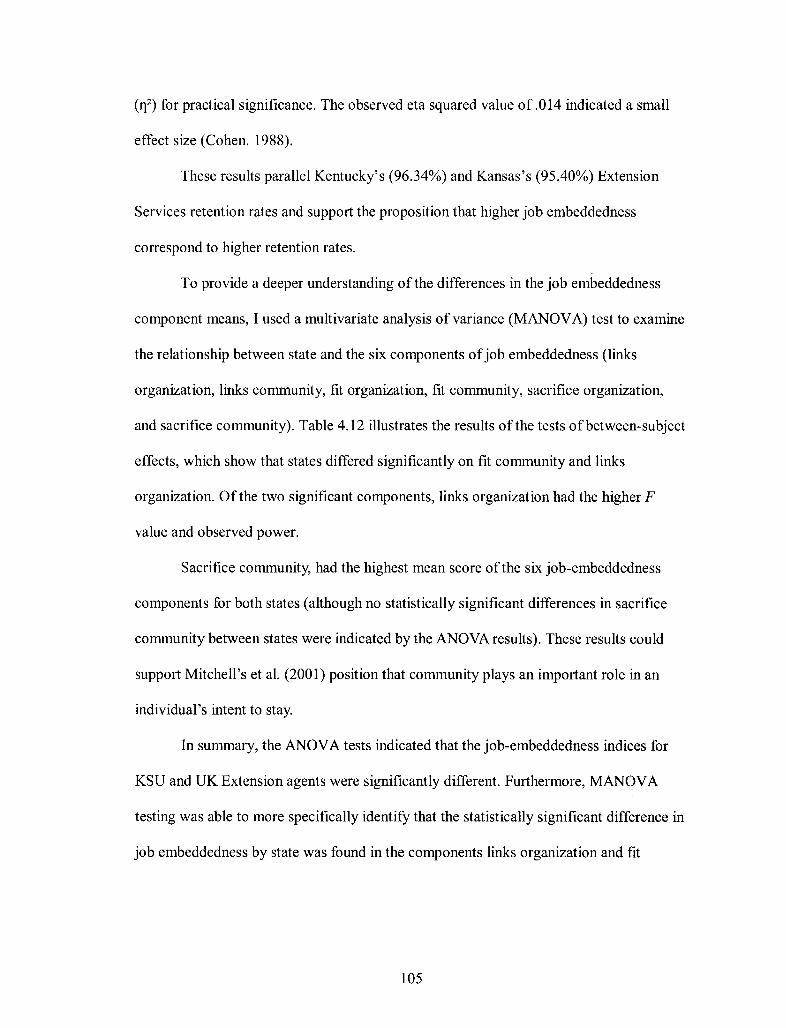
(re) for practical significance. The observed eta squared value of.014 indicated a small
effect size (Cohen. 1988).
These results parallel Kentucky's (96.34%) and Kansas's (95.40%) Extension
Services retention rates and support the proposition that higher job embeddedness
correspond to higher retention rates.
To provide a deeper understanding of the differences in the job embeddedness
component means, I used a multivariate analysis of variance (MANOY A) test to examine
the relationship between state and the six components of job embeddedness (links
organization, links community, fit organization, fit community, sacrifice organization,
and sacrifice community). Table 4.12 illustrates the results of the tests of between-subject
effects, which show that states differed significantly on fit community and links
organization. Of the two significant components, links organization had the higher F
value and observed power.
Sacrifice community, had the highest mean score of the six job-embeddedness
components for both states (although no statistically significant differences in sacrifice
community between states were indicated by the ANOYA results). These results could
support Mitchell's et al. (2001) position that community plays an important role in an
individual's intent to stay.
In summary, the ANOYA tests indicated that the job-embeddedness indices for
KSU and UK Extension agents were significantly different. Furthermore, MANOY A
testing was able to more specifically identify that the statistically significant difference in
job embeddedness by state was found in the components links organization and fit
105
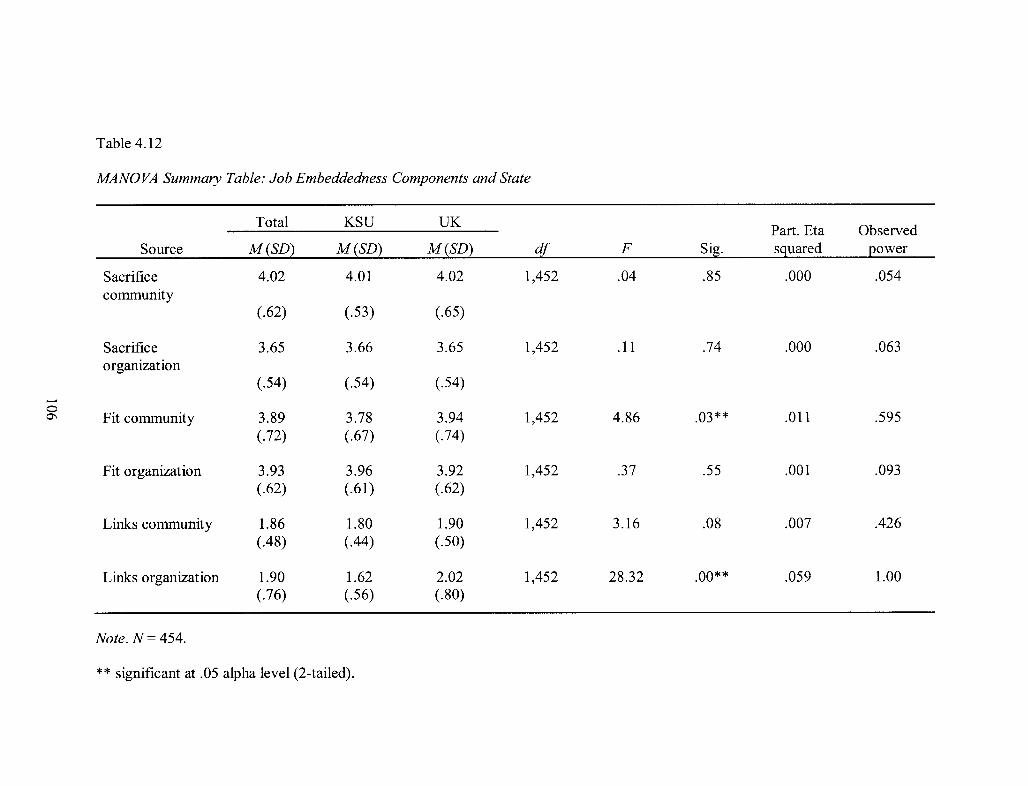
Table 4.12
MANOVA Summary Table: Job Embeddedness Components and State
Total KSU UK Part. Eta Observed
Source M(SD) M(SD) M{SD2 d{ F SiB· sguared Eower
Sacrifice 4.02 4.01 4.02 1,452 .04 .85 .000 .054 community
(.62) (.53) (.65)
Sacrifice 3.65 3.66 3.65 1,452 .11 .74 .000 .063 organization
(.54) (.54) (.54) ...... 0 0\ Fit community 3.89 3.78 3.94 1,452 4.86 .03** .011 .595
(.72) (.67) (.74)
Fit organization 3.93 3.96 3.92 1,452 .37 .55 .001 .093 (.62) (.61) (.62)
Links community 1.86 1.80 1.90 1,452 3.16 .08 .007 .426 (.48) (.44) (.50)
Links organization 1.90 1.62 2.02 1,452 28.32 .00** .059 1.00 (.76) (.56) (.80)
Note. N = 454.
** significant at .05 alpha level (2-tailed).
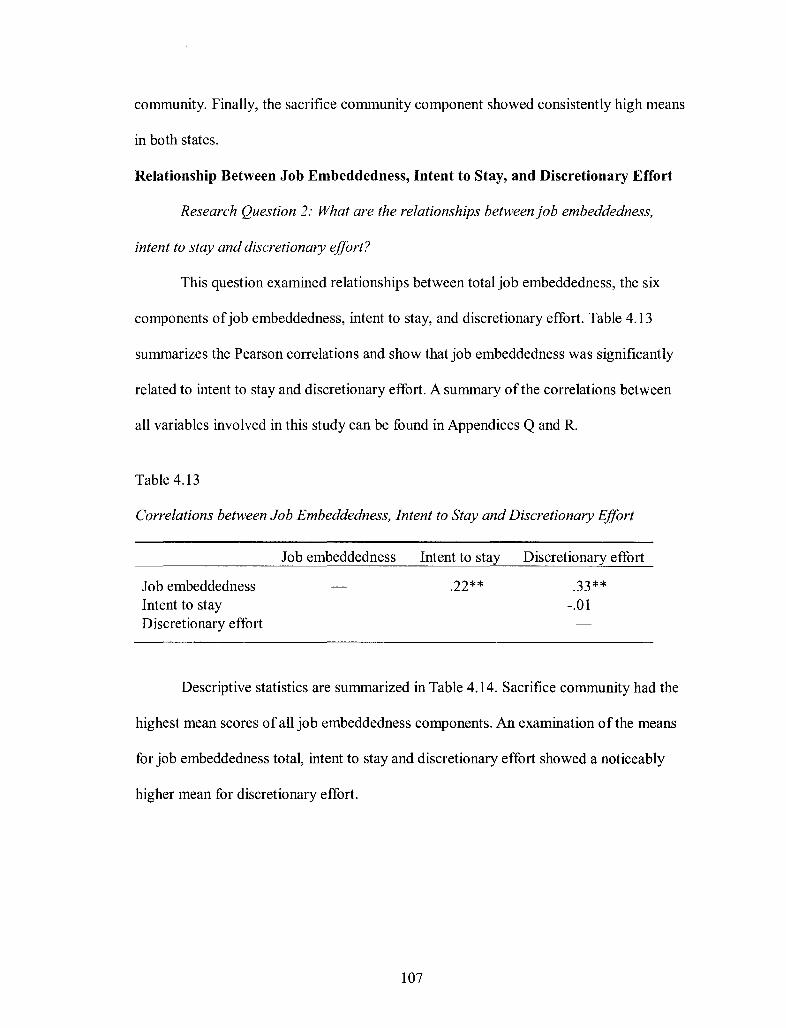
community. Finally, the sacrifice community component showed consistently high means
in both states.
Relationship Between Job Embeddedness, Intent to Stay, and Discretionary Effort
Research Question 2: What are the relationships between job embeddedness,
intent to stay and discretionary effort?
This question examined relationships between total job embeddedness, the six
components of job embeddedness, intent to stay, and discretionary effort. Table 4.13
summarizes the Pearson correlations and show that job embeddedness was significantly
related to intent to stay and discretionary effort. A summary of the correlations between
all variables involved in this study can be found in Appendices Q and R.
Table 4.13
Correlations between Job Embeddedness, Intent to Stay and Discretionary Effort
Job embeddedness Intent to stay Discretionary effort
Job embeddedness Intent to stay Discretionary effort
.22** .33** -.01
Descriptive statistics are summarized in Table 4.14. Sacrifice community had the
highest mean scores of all job embeddedness components. An examination ofthe means
for job embeddedness total, intent to stay and discretionary effort showed a noticeably
higher mean for discretionary effort.
107
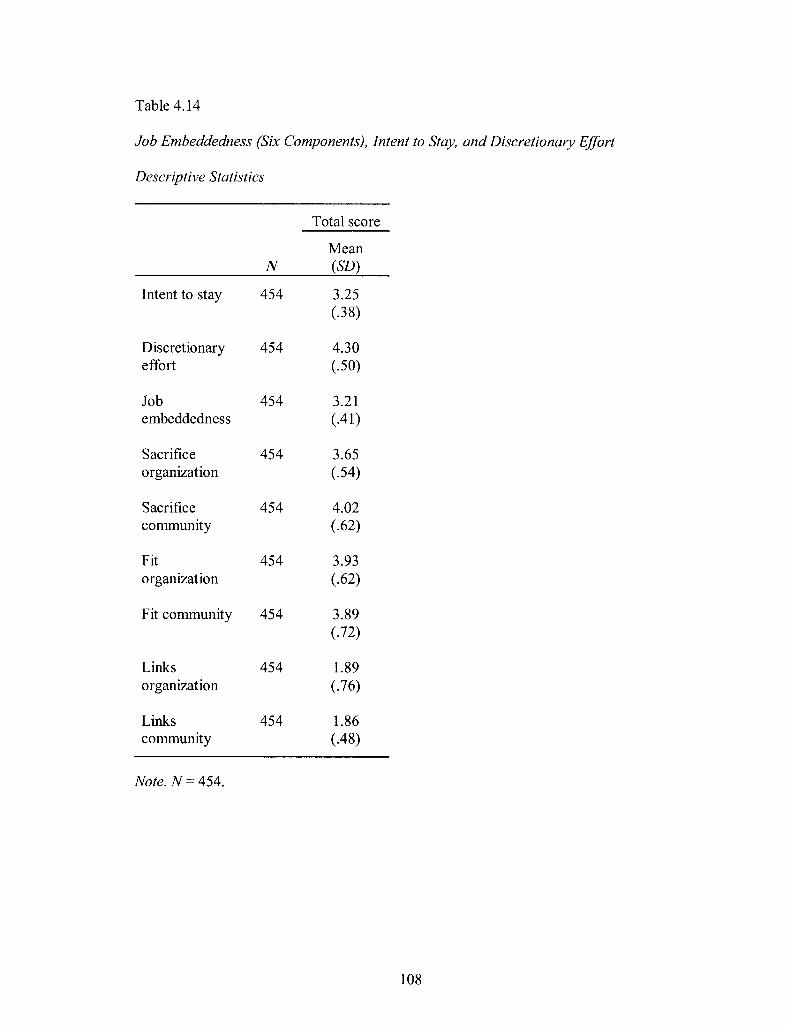
Table 4.14
Job Embeddedness (Six Components), Intent to Stay, and Discretionary Effort
Descriptive Statistics
Total score
Mean N (SD)
Intent to stay 454 3.25 (.38)
Discretionary 454 4.30 effort (.50)
Job 454 3.21 embeddedness (.41)
Sacrifice 454 3.65 organization (.54)
Sacrifice 454 4.02 community (.62)
Fit 454 3.93 organization (.62)
Fit community 454 3.89 (.72)
Links 454 1.89 organization (.76)
Links 454 1.86 community (.48)
Note. N = 454.
108
Predicting Unique Variance of Intent to Stay and Discretionary Effort
Research Question 3: Can job embeddedness predict unique variance in the
outcome variables intent to stay, after con tro llingfor job satisfaction, organization
commitment, and employee engagement?
This question examined the degree to which the six components of job
embeddedness predicted unique variance in the outcome variable intent to stay after
controlling for job satisfaction, organization commitment, and employee engagement.
The following section details the results of each outcome variable separately.
To examine the ability of the six job embeddedness components to predict intent
to stay, correlation and linear-regression analyses were performed (Johnson &
Christensen, 2007). First, Pearson correlations between the variables intent to stay, job
embeddedness links (organization and community), job-embeddedness fit (organization
and community), job-embeddedness sacrifice (organization and community), job
satisfaction, employee engagement, and organization commitment were examined. With
respect to multicollinearity, the data showed no values greater than .9; therefore,
multicollinearity was not an issue in this model (Field, 2005). Almost all variables were
significantly correlated, except that intent to stay was not correlated with links
organization and links community. A complete list of the Pearson correlations can be
found in Appendices P and Q. Of particular interest are the correlations of sacrifice
organization and fit organization with intent to stay. The correlations between the links
organization and links community were not significant.
109
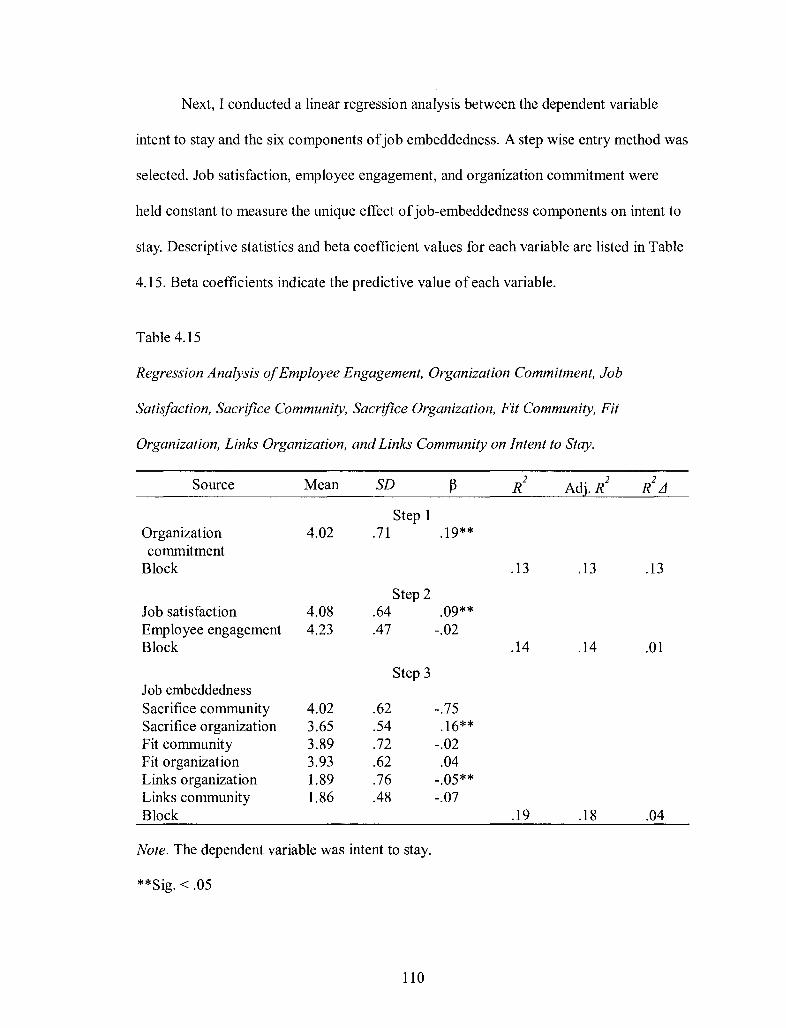
Next, I conducted a linear regression analysis between the dependent variable
intent to stay and the six components of job embeddedness. A step wise entry method was
selected. Job satisfaction, employee engagement, and organization commitment were
held constant to measure the unique effect of job-embeddedness components on intent to
stay. Descriptive statistics and beta coefficient values for each variable are listed in Table
4.15. Beta coefficients indicate the predictive value of each variable.
Table 4.15
Regression Analysis of Employee Engagement, Organization Commitment, Job
Satisfaction, Sacrifice Community, Sacrifice Organization, Fit Community, Fit
Organization, Links Organization, and Links Community on Intent to Stay.
Source Mean SD ~ R2 Adj. R2 R2
LJ
Step 1 Organization 4.02 .71 .19** commitment
Block .13 .13 .13
Step 2 Job satisfaction 4.08 .64 .09** Employee engagement 4.23 .47 -.02 Block .14 .14 .01
Step 3 Job embeddedness Sacrifice community 4.02 .62 -.75 Sacrifice organization 3.65 .54 .16** Fit community 3.89 .72 -.02 Fit organization 3.93 .62 .04 Links organization 1.89 .76 -.05** Links community 1.86 .48 -.07 Block .19 .18 .04
Note. The dependent variable was intent to stay.
**Sig. < .05
110
In Step 1 of the regression models, the independent variable organization
commitment was found to be a significant predictor of intent to stay. In Step 2, job
satisfaction was significant and added to the regression equation however employee
engagement was not. These variables were held constant in order to evaluate any unique
variance produced by the job-embeddedness components. In Step 3, the six components
of job embeddedness were entered in the regression equation. Of the six only sacrifice
organization and links organization were shown to significantly predict intent to stay and
added to the model summary. Sacrifice organization was the stronger predictor, while
links-organization was weaker and has negative predictive value.
The model summary yielded R2 and adjusted R2. R2 (multiple correlation
coefficient) is the proportion of variance in the dependent variable (intent to stay), which
can be explained by the independent variables Gob satisfaction, organization
commitment, employee engagement, sacrifice community, sacrifice organization, fit
community, fit organization, links community, and links organization). A summary of the
regression statistics revealed that sacrifice organization and links organization explained
4% of the unique variance in the dependent variable intent to stay (Field, 2005). In total,
the independent variables explained 18% of the variance in intent to stay. The addition of
the variable discretionary effort had no significant effect on the regression equation or
model summary.
Predicting Job Embeddedness With Background Characteristics
Research Question 4: Are background variables significantly related to and able
to predict job embeddedness?
111
In this study I hypothesized that background variables can have an influence on
job embeddedness. I began by examining the Pearson correlation values. Correlations
between job embeddedness, gender, race, education level, age, program area, years in
organization, years of prior work experience, type of prior work experience, county
population, and state were examined. I included the variable county population to
investigate whether the size ofthe community had an impact on job embeddedness
(retention). A study by Vlosky and Dunn (2009) found that community size was directly
correlated with income among White Extension agents and that income was one
significant factor in Extension-agent satisfaction. In other words, "the smaller the
community, the lower the average income" (Vlosky & Dunn, 2009, p. 4).
No values greater than .9 were observed, indicating that multicollinearity was not
an issue in this test (Field, 2005). All correlations are shown in Appendices P and Q. Age,
years of Extension and state, were all moderately correlated with job embeddedness at the
.05 alpha level. Job embeddedness was correlated with state, age, and years employed
with Extension Services. Age and years of experience had the highest correlation values.
The correlation between job embeddedness and state was previously noted during
discussion of Research Question 1.
Next, I used linear regressions to test the ability ofthe background variables to
predict total job embeddedness and each of the six components of job embeddedness and
examined each level of each background variables (Table 4.16) to discover more
specifically where predictive ability lies within that variable. Because our background
variables are categorical in nature and not continuous it was necessary to create dummy
variables to examine where the predictive power lies within the levels of our predictor
112
variables. "Dummy coding is a way of representing groups by using only zeros and ones"
(Field, 2005, p.208). In this case we will be creating k-l dummy variables for each
predictor variable (where k is the number oflevels), each of which will be compared to a
constant. For example, the predictor variable "program area" has six levels. Therefore,
one will be the constant (ANR) and five new variables would be created (FCS, 4-H,
Hort., CEO and other). The SPSS output yields a beta coefficient, showing the direction
(+, -) and statistical significance for each dummy variable. A negative statistically
significant beta coefficient is interpreted as having less (-) predictive power than the
constant (Stevens, 1999). The constant for each variable is shown on Table 4.16 in
parentheses.
After all linear-regression tests were completed, beta coefficients were -
summarized in Table 4.16. While interesting, the beta coefficients of the background
variables are of limited value to HRD professionals because there is little ability to
manipulate them.
As shown in Table 4.16, the background variables gender and program area did
not significantly predict any job embeddedness scores. In addition, no respondents
indicated their race to be either Asian or Hispanic. SPSS excluded these dummy variables
for the regression analysis.
Significant beta coefficients for race were found with the components sacrifice
organization and fit-organization components. The results indicate that both African
American and American Indian respondents have less predictive influence on sacrifice
organization and fit-organization component scores, than the constant (zero value)
113
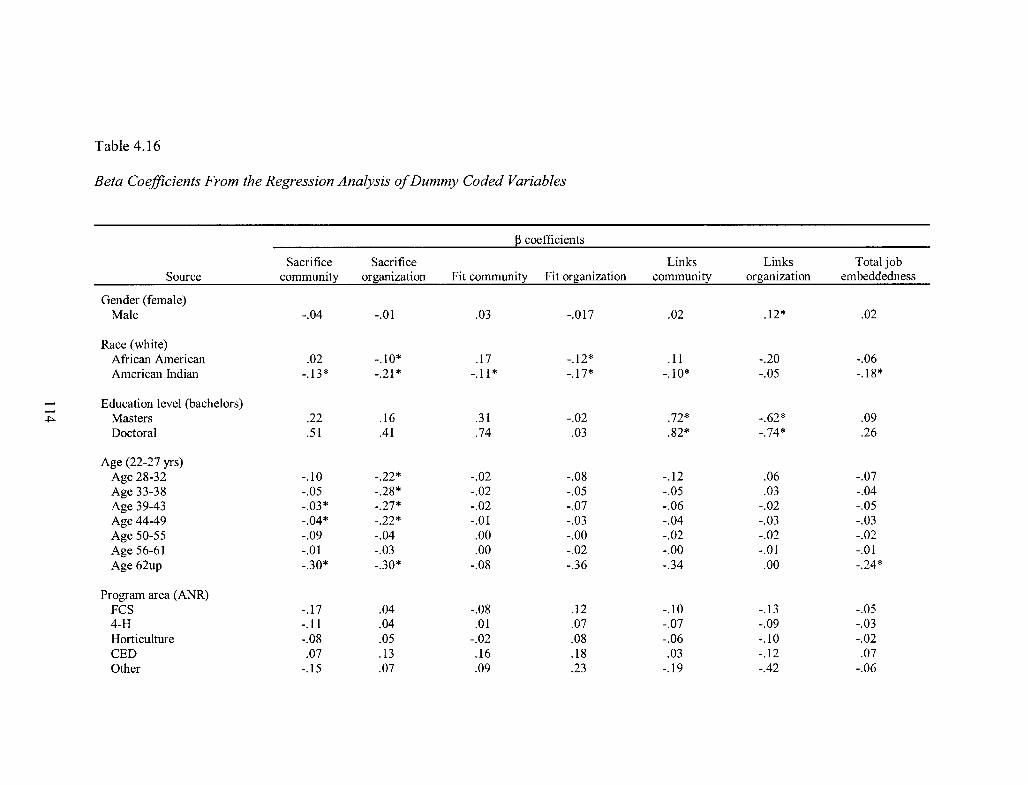
Table 4.16
Beta Coefficients From the Regression Analysis of Dummy Coded Variables
~ coefficients
Sacrifice Sacrifice Links Links Total job Source community oq:;anization Fit community Fit organization community organization embeddedness
Gender (female) Male -.04 -.01 .03 -.017 .02 .12* .02
Race (white) African American .02 -.10* .17 -.12* .11 -.20 -.06 American Indian -.13* -.21 * -.11 * -.17* -.10* -.05 -.18*
...... Education level (bachelors) ...... ~ Masters .22 .16 .31 -.02 .72* -.62* .09
Doctoral .51 Al .74 .03 .82* -.74* .26
Age (22-27 yrs) Age 28-32 -.10 -.22* -.02 -.08 -.12 .06 -.07 Age 33-38 -.05 -.28* -.02 -.05 -.05 .03 -.04 Age 39-43 -.03* -.27* -.02 -.07 -.06 -.02 -.05 Age 44-49 -.04* -.22* -.01 -.03 -.04 -.03 -.03 Age 50-55 -.09 -.04 .00 -.00 -.02 -.02 -.02 Age 56-61 -.01 -.03 .00 -.02 -.00 -.01 -.01 Age 62up -.30* -.30* -.08 -.36 -.34 .00 -.24*
Program area (ANR) FCS -.17 .04 -.08 .12 -.10 -.13 -.05 4-H -.11 .04 .01 .07 -.07 -.09 -.03 Horticulture -.08 .05 -.02 .08 -.06 -.10 -.02 CED .07 .13 .16 .18 .03 -.12 .07 Other -.15 .07 .09 .23 -.19 -042 -.06
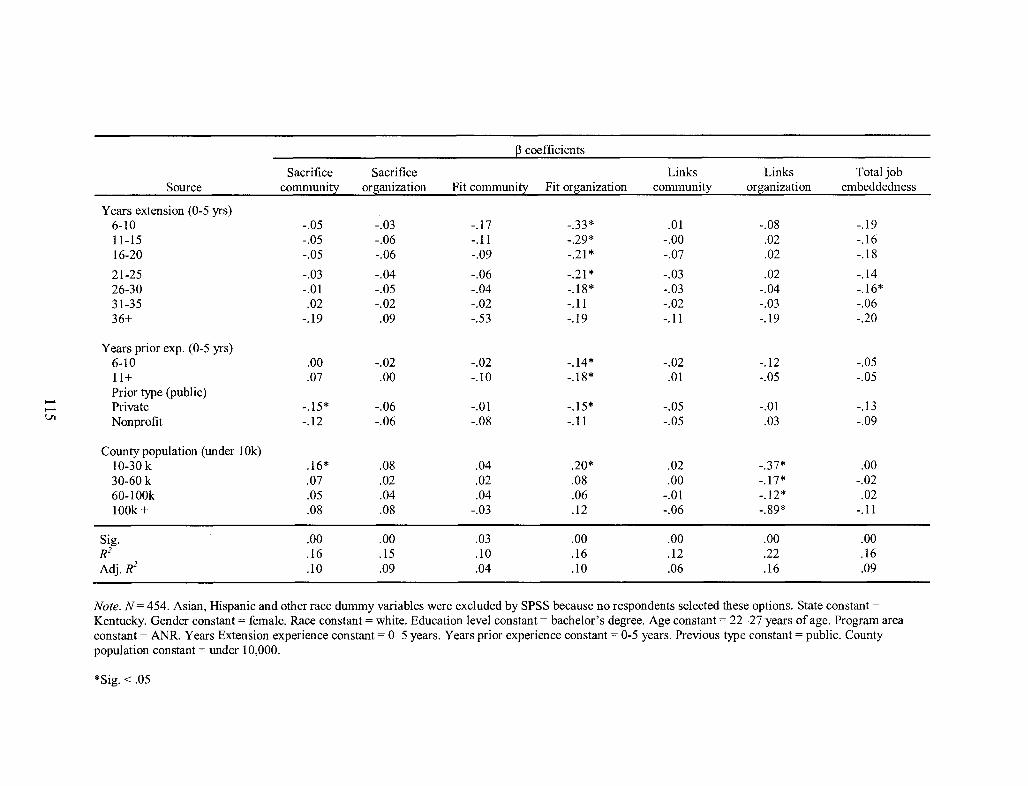
--Vl
~ coefficients
Sacrifice Sacrifice Links Links Total job Source community organization Fit community Fit organization community organization embeddedness
Years extension (0-5 yrs) 6-IO -.05 -.03 -.17 -.33* .01 -.08 -.19 11-15 -.05 -.06 -.11 -.29* -.00 .02 -.16 16-20 -.05 -.06 -.09 -.21 * -.07 .02 -.18
21-25 -.03 -.04 -.06 -.21 * -.03 .02 -.14 26-30 -.01 -.05 -.04 -.18* -.03 -.04 -.16* 31-35 .02 -.02 -.02 -.11 -.02 -.03 -.06 36+ -.19 .09 -.53 -.19 -.11 -.19 -.20
Years prior expo (0-5 yrs) 6-10 .00 -.02 -.02 -.14* -.02 -.12 -.05 11+ .07 .00 -.IO -.18* .01 -.05 -.05 Prior type (public) Private -.15* -.06 -.01 -.15* -.05 -.01 -.13 Nonprofit -.12 -.06 -.08 -.11 -.05 .03 -.09
County population (under IOk) IO-30 k .16* .08 .04 .20* .02 -.37* .00 30-60 k .07 .02 .02 .08 .00 -.17* -.02 60-IOOk .05 .04 .04 .06 -.01 -.12* .02 100k+ .08 .08 -.03 .12 -.06 -.89* -.11
Sig. .00 .00 .03 .00 .00 .00 .00 R2 .16 .15 .IO .16 .12 .22 .16 Adj. R2 .10 .09 .04 .10 .06 .16 .09
Note. N = 454. Asian, Hispanic and other race dummy variables were excluded by SPSS because no respondents selected these options. State constant = Kentucky. Gender constant = female. Race constant = white. Education level constant = bachelor's degree. Age constant = 22-27 years of age. Program area constant = ANR. Years Extension experience constant = 0-5 years. Years prior experience constant = 0-5 years. Previous type constant = public. County population constant = under 10,000.
*Sig. < .05
variable White. All significant levels of the variable race showed less predictive ability
than the race constant, which was white.
Education level showed significant predictive ability for Links-Community and
Links-Organization. This means that as employee education levels increase, their links to
the community increased, while their links to the organization decreased. Those with
Masters and Doctoral degrees showed greater ability to predict Links Community than
those with Bachelor's degrees and less ability than those with Bachelor's degrees for
Links Organization.
Years of Extension experience was a significant predictor for fit community. This
could indicate that as years worked increases, fit-community increases. Analysis ofthe
dummy variables indicated that all levels of this variable showed less predictive ability
than the constant (0-5 years 0 f experience).
Analysis of the dummy variables for age indicated that all age groups were less
likely to predict job embeddedness or its components than the constant (22-27 years of
age).
Finally, county population was a moderately significant predictor of links
organization. This would indicate that as population increases, links-organization
decreases. Put another way Extension agents in smaller counties are more linked to the
organization than those working in larger counties. As with the analyses of the previous
research questions, an examination ofthe data plots and residual statistics showed that no
linear-regression assumptions were violated. These results confirm that state, age, and
education level explained significant amounts of variance and are significant predictors
for the variable job embeddedness.
116
Summary
The results from Research Question 1 indicated that the job-embeddedness levels
ofKSU and UK Extension agents were significantly different. Testing identified a
significant main effect of state on the job-embeddedness components links organization
and fit community.
Pearson correlations between intent to stay and job embeddedness and between
discretionary effort and job embeddedness were significant.
A regression analysis indicated that the model of all variables was significant in
predicting a total of 16% of the variance in intent to stay Gob embeddedness components
predicted 4% of the unique variance after controlling for the effects of job satisfaction,
organization commitment, and employee engagement; Field, 2005). Finally, the results
indicated that the dummy levels of the background variables explained 9% of the
variance in job embeddedness.
Chapter 5 will explore the results in more detail and present conclusions and
recommendations based on the findings.
117
CHAPTER V
DISCUSSION
Low employee retention rates represent a substantial problem for all
organizations, costing them thousands of dollars per employee each year (Kutilek, 2000).
These costs include lower quality products and services; fmancial expenses related to
recruiting, hiring, and retraining employees; losses in productivity during the time a
position is vacant; and interruptions in the flow of products and services (Friedman et aI.,
1992).
The purpose of this study was to understand the impact of job embeddedness on
retention. Specific questions addressed differences in the job embeddedness of Extension
agents in Kansas and Kentucky; the relationships between job embeddedness, intent to
stay, and discretionary effort; the ability of job embeddedness to predict intent to stay and
discretionary effort; and the impact of background variables on workers' levels of job
embeddedness.
Summary of the Study
Job embeddedness refers to a relatively new construct that examines an
individual's (a) links to other people, teams, and groups; (b) perceptions of their fit with
the job, organization, and community; and (c) beliefs about what they would have to
sacrifice if they left their jobs (Mitchell et aI., 2001). Job embeddedness has been shown
to be positively correlated with performance (Emmerik & Sanders, 2004) and
118
organizational citizenship (Lee et ai., 2004). In addition, organizational-socialization
tactics have been shown to be positively correlated with organizational embeddedness
(Allen, 2006) and negatively correlated with employees' intentions to quit (Crossley et
ai., 2007). Coworkers' embeddedness has been found to be a valid predictor of voluntary
turnover (Felps et ai., 2009), and Hispanic employees have been shown to be
significantly more embedded in their communities than Caucasian employees (Mallo 1,
Holtom, & Lee, 2007).
Four major research questions guided this study.
1. Does job embeddedness differ between UK and KSU Extension agents?
2. What were the relationships between job embeddedness, intent to stay and
discretionary effort?
3. Can job embeddedness predict intent to stay even after controlling for job
satisfaction, organization commitment and engagement?
4. Are background variables significantly related to and able to predict job
embeddedness?
I utilized a census research design in the current study, and 454 Extension agents
completed the survey instrument. This represented a 72% response rate. The UK
Cooperative Extension Service currently employs 400 county Extension agents, of which
313 (78%) voluntarily participated in this study. This compares to 231 Extension agents
at KSU, of which 141 (61%) responded.
An array of scales was utilized to examine the relationships among variables.
Scales that made up the survey instrument included a 41-item embeddedness scale
(Mitchell et ai., 2001), a 15-item intent-to-stay scale (Hoisch, 2001), a 7 -item
119
discretionary-effort scale (Lloyd, 2008), a 3-item job-satisfaction scale (Luthans, 2007), a
6-item affective-commitment scale (Allen & Meyer, 1990), and a 17-item employee
engagement scale (Rich et aI., 2010). The six instruments and the demographic questions
were incorporated into one online instrument. Table 3.3 shows which items related to
each scale. A copy of the [mal survey instrument can be found in Appendix C.
The prevailing literature was examined and used to frame this research study. The
results indicated that statistically significant differences in embeddedness were present
between Kansas and Kentucky Extension agents.
Interpretation and Discussion
The following sections discuss the results of each research question. The analyses
of these questions suggest that there were statistically significant relationships among the
variables of interest.
Research Question 1: Job Embeddedness of Kansas and Kentucky Extension Agents
The first research question of the study examined whether job embeddedness
differed significantly between KSU and UK Extension agents. An examination of the
means of the individual states overall jo b-embeddedness scale did show some
differences, indicating that UK Extension agents (M = 3.24) were somewhat more
embedded than KSU Extension agents (M= 3.14). These results parallel the retention
rates for UK (96.34%) and KSU (95.40%) Extension Services and seem to support the
proposition that higher job embeddedness will correspond to higher retention rates. These
results are supported in the job embeddedness literature by the work of Mitchell, et al.
(2001); Lee, et at. (2004); and Allen, (2006).
120
ANOV A tests indicated statistically significant differences in job embeddedness
scores between Kansas and Kentucky Extension agents. To obtain a more detailed picture
of state differences, a MANOV A test examined the effects of state on the six components
of job embeddedness (links organization, links community, fit organization, fit
community, sacrifice organization, and sacrifice community). The tests of between
subject effects revealed statistically significant differences in fit community and links
organization by state.
The fit-community component of job embeddedness is designed to measure
perceived comfort in the community. This is significant because of the unique ability of
job embeddedness to identify important aspects of an employee's non-work life that
increase the likelihood they will stay with their present employer. In this study UK
Extension agents indicated a significantly higher mean score (M = 3.94) for fit
community than KSU Extension agents (M = 3.78). This would further indicate that UK
Extension agents see themselves as somewhat more assimilated into their community,
than KSU Extension agents. However, the differences in this analysis were small, and
further research involving other state's Extension agents is recommended.
The links-organization component was designed to measure formal and informal
relationships with coworkers and other connected to the organization. Results showed
that UK Extension agents mean score (M = 2.02) for links-organization was significantly
higher than that of KSU Extension agents (M = 1.62). These work relationships are very
important as shown in the work of Felps et al. (2009) who found a negative correlation
between coworker's job embeddedness and voluntary turnover. Generally, this means
that if coworkers are highly embedded, you are less likely to leave and vice versa.
121
Research Question 2: Relationships Among Job Embeddedness, Intent to Stay, and
Descritionary Effort
This question examined the relationships between job embeddedness and its six
components with intent to stay, and discretionary effort. First, I examined the mean
scores of each component variable. The sacrifice-community means from both states (M
= 4.02) were the highest among all job-embeddedness components. The sacrifice
community component was designed to measure the bonds within the community that
would be broken if individuals left and initially indicate the relative importance that
Extension agents in both states place on community linkages.
Pearson correlations were examined next. The analysis showed significant
positive correlations between job embeddedness and intent to stay and jo b embeddedness
and discretionary effort.
Finally, Pearson correlations were also used to test for relationships between
discretionary effort and the six previously mentioned job-embeddedness variables, all of
which were significantly related. Total job-embeddedness was significantly related to
discretionary effort (r = .34). The component variable with the highest Pearson
correlation was sacrifice community (r = .27), and the component with the lowest
Pearson correlation was links community (r = .13).
Some interesting topics for future research would be to examine job
embeddedness and discretionary effort levels over time. It would be interesting to know if
discretionary effort levels remain steady or do the levels peak and regress over time. It
would also be interesting to know ifprolonged high discretionary effort levels are
correlated with decreased retention and burnout.
122
Importantly, the difference between the intent-to-stay means was not significant,
and lower than I expected. This is concerning from an administrative perspective and
could indicate that Extension agents are not as embedded to the Extension organization as
I would have hoped, emphasizing the need to increase embeddedness levels in both
states. This point is supported by research examining the relationships between
professional and organizational loyalty and performance. Jauch, Glueck and Osborn
(1978) in a study of university professors, found that organizational loyalty was not
significantly related to productivity, however those with "strong professional
commitment had higher research productivity"(p. 84). Clearly, additional research is
needed to clear up this point.
The findings related to Research Question 2 indicate that as job embeddedness
increases, both intent to stay and discretionary effort also increase. These [mdings are
consistent with the research between job embeddedness (Mitchell et aI., 2001) and intent
to leave, which show negative correlations between variables, indicating that as job
embeddedness increases, intent-to-Ieave decreases (Lee et aI., 2004).
Research Question 3: Predicting Intent to Stay and Discretionary Effort
This question examined the ability of job embeddedness and its six
components to predict the outcome variable intent to stay after controlling for job
satisfaction, organization commitment, and employee engagement.
A regression analysis was conducted between the dependent variable intent to
stay and the predictor variables job satisfaction, organization commitment, employee
engagement, sacrifice community, sacrifice organization, fit community, fit organization,
links community, and links organization.
123
All variables, except links organization and links community, were significantly
related to intent to stay. Sacrifice organization had the highest correlation value (r = .38).
Next, I conducted a linear regression between intent to stay, total job
embeddedness, and its six components. Linear regression was used to help determine the
prediction power of the independent variables. An examination of the beta coefficients
showed that sacrifice organization and links organization were significant predictors of
intent to stay.
These results could illustrate the value that Extension agents place on the benefits
and relationships linking them to their organizations and the difficulty they may perceive
in finding similar positions.
The sacrifice-organization beta coefficient had the highest predictive strength (~ =
.16) of intent to stay. As the label implies, the sacrifice-organization items described
employee perceptions of what would be lost if they left their organization.
The results showed that sacrifice organization and links organization explained
4% of the unique variance of the dependent variable intent to stay, after controlling for
job satisfaction, organization commitment, and employee engagement. In total, the test
explained 18% of the variance in intent to stay (Field, 2005).
Programs and benefits that might increase the level of sacrifice among Extension
agents could include creative benefits packages, professional development, professional
freedom, employee education, sabbatical leave, and opportunities to gain respect among
peers (Mitchell et aI., 2001). Most importantly is the issue of "insufficient pay and the
amount of work expected" (Mowbray, 2001, p. 126). Mowbray found that Extension
124
agents viewed their salary as "insufficient to live off of' which lead them to seek other
job opportunities.
During recessionary periods with high unemployment rates, there are more job
seekers than available jobs (Hall, 2005). It is possible that with fewer job alternatives
available, Extension agents' perceived sacrifice ofleaving or losing their positions would
be magnified. However, this hypothesis contrasts with data regarding Extension agent
retention rates, which are generally higher than the retention rates in other employment
sectors, including similar sectors such as teaching, regardless of the larger economic
conditions.
Mentoring of the newly hired by veteran employees is critical to the employee
socialization process. Mentoring helps eliminate feelings of isolation and helps the novice
employee understand norms within the organization. Essential functions provided by the
mentor include teaching, sponsoring, encouraging, counseling, and befriending (Schlichte
et at., 2005). The relationships that are formed during the socialization process could
increase the level of sacrifice that Extension agents would experience if they chose to
leave their organization (Allen, 2006).
Giosan (2003) suggested that organizations hire individuals who perceive that
they lack job alternatives, which could work to increase sacrifice-organization. These
relationships would be an intriguing topic for future study.
The links-organization beta coefficient was relatively low and negative (~ = -.05).
The negative value of the links-organization component could have been caused by
individuals who were too heavily linked to their organization. Although this might not
seem intuitive, very strong links to the organization could lead to conflict in other areas
125
of one's life and eventually, lower levels of intent to stay (Mitchell, et aI., 2001). In
summary, at the .05 level of significance, the results provided sufficient evidence that
sacrifice organization was a useful predictor for the dependent variable intent to stay
(Fields, 2005).
Although HRD involves much more than implementing successful hiring
practices (Swanson & Holton, 2009), successful hiring is an essential organizational
function. Practices that can be implemented by the organization to increase fit
organization begin with clear and consistent recruitment, careful screening, and
productive interviews. Comp time, flex time and telecommuting are possible way to
address this issue and improve Extension agent's perception oftheir fit in the
organization, while demonstrating the organization's commitment to helping balance
one's nonwork life. Finally, providing a structured mentoring experience and positive
feedback, grouping structured orientation activities so that new employees can attend
together, and providing clear information about the stages ofthe socialization process
should also strengthen fit-organization (Allen, 2006).
Research Question 4: Can Background Variables Help Predict Job Embeddedness?
This question examined the relationships and predictive ability ofbackground
variables and job embeddedness. Only three correlations variables were correlated with
job embeddedness, these variables were correlated with state, age, and years employed
with Extension Services.
A regression analysis was utilized to examine the ability of the background
variables to predict job embeddedness. The model summary included the independent
variables age, education level, and state and yielded an adjusted R2 value of .074. This
126
means that 7.4% of the unique variance in the dependent variable job embeddedness was
explained by age, education level, and state. The regression output showed that age (~ =
.04), education level (~= -.08), and state (~= .14) all significantly predicted job
embeddedness scores.
The effect of the variable state onjob embeddedness has been addressed
previously in this chapter. In addition to being able to significantly predict job
embeddedness, state also predicted the fit-community, links-community and links
organization components of job embeddedness. This could be interpreted to mean that
Extension agents have strong affinity toward the community in which they live and the
Extension organization of their respective states.
Previous research supports the effect of employee age on job embeddedness. A
study by Abeslon (1987) found that older workers tended to have more organization-links
and community-links and were less likely to leave their current employer. In addition,
Giosam (2003) found that links-community and links-organization were predicted by age.
These findings are supported by previous research (Fetsch & Kennington, 1977; March &
Simon, 1958; Mobley et. AI, 1979; Muchinsky & Tuttle, 1979; Porter & Steers, 1973;
Price, 1977; Rousan, 1995; Scott, Swortzel & Taylor, 2005; VanTilburg, 1985; and
Vlosky & Dunn, 2009) that showed younger workers more likely to leave their positions
than older workers and that years of employment is a significant predictor of job
satisfaction (Long & Swortzel, 2007). Beta coefficients for age dummy variables
indicated that all were weaker predictor than the constant (22-27 years old) for sacrifice
community. This trend was strongest for the group 62 years and up. This would tend to
127
indicate that the negative influence of younger workers on job embeddedness outweighs
the positive predictive ability of those 62 and up.
The variable education level significantly predicted links-community and links
organization components. I was unable to locate studies on the effect of education level
onjob embeddedness in the United States. However, a large European-workforce study
found that higher education increased the likelihood of tum over (Tanova & Holtom,
2008). Tanova and Holtom (2008) found that higher education levels led to increased
career opportunities and a higher likelihood that individuals would be willing to risk
change careers. This would help explain the negative beta coefficient for links
organization, but runs contrary to the purpose of the employee tuition education benefit
provided by both universities. It could be that Extension agents take advantage of the
opportunity to further their education and then decide to explore other job opportunities,
including relocation to other communities, when degrees are completed. The dummy
variables for master's degree and doctoral degree levels were stronger predictors oflinks
community, but weaker than bachelor's degree for links organization. So perhaps the
time needed to complete advanced degrees serves to link Extension agents to their
communities.
These findings in regard to education level are supported in the literature by
studies which examined professional verses organizational commitment. An early study
by Lee (1970) noted the growing importance of organizational commitment among
industrial psychologists and found that among the study population of university
scientists, "those with high organizational identification were generally more productive,
128
better motived and rewarded, more satisfied and less propensity to leave the organization
than those scientists with low organizational identification" (p. 225).
Baugh & Roberts (1994), in a study of 114 engineers found that the highest
performers had high levels of both professional and organizational commitment, while
those with the "lowest levels of satisfaction and performance reported low organizational
commitment and high professional commitment" (p. 108).
County Population was not a significant predictor on total job embeddedness,
however it was shown to significantly predict the links-organization component. In
addition, regression analysis of the dummy variables showed that the predictive strength
ofthis variable lies with those who work in the most rural locations whose populations
are under 10,000. This could mean that as population ofthe community increases the
respondents links-organization scores would decrease. It is possible that in spite of
greater job opportunities and networking potential, respondents in counties with larger
populations fail to develop organizational links as strong as respondents in rural areas.
Implications for Research
An important implication regarding this study is that it expands job embeddedness
research involving public employees. The bulk of past research has been with employees
in the private sector. With that said, this study was only able to involve two of the fifty
states and U.S. territories that employee Extension agents. The expanded use of the job
embeddedness survey instrument to Extension agents in other states and territories would
provide additional data and could further clarify the relationships between job
embeddedness and retention rates and understand the variability between states and
territories. In addition, the list of pertinent background variables should be expanded
129
beyond those examined in this study. Such variables could include data on local
employment opportunities, local employment rates, performance ratings, availability of
employee and family tuition benefits, membership in professional organizations, and
employment of family members in Extension Services.
Longitudinal job-embeddedness research would also be useful in understanding
how embeddedness changes over time. A variety of time periods could be selected,
including monthly or yearly studies or studies based on particular events. Additionally,
the use of structured qualitative exit interviews or case studies could add more depth to
the field's understanding of job-embedded ness theory (Holtom et aI., 2006).
Experimental studies would also be useful in adding to the depth of knowledge of
job embeddedness. For example, an intervention effect related to job embeddedness
could be measured and compared against a control group. For example, a control group
could be made up of Extension agents with a bachelor's degree. The control group could
complete the initialjob-embeddedness survey instrument. Then, agents who later
complete a more advanced degree (intervention) could complete the survey again. This
would allow for comparisons between the two samples based on advanced degree
attainment
In addition, a comparison study of professional workers (Extension agents),
paraprofessional workers (program assistants), and office support staffwould add another
layer of understanding to the impact that job embeddedness has on employee retention.
130
Implications for Practice
Thoughtful organizations are looking to decrease unnecessary expenses. In many
organizations the expenses related to low employee retention represents an area worthy of
attention. Human resource professionals can play an important role in impacting the
organization's bottom line by understanding their retention challenges through the lens of
job embeddedness. This includes examining employee links, fit, and sacrifice in
organization and community contexts.
The results indicated that the largest variation of job embeddedness between
Kansas and Kentucky Extension agents occurred in the area of links organization. Links
organization considers the formal and informal connections that exist between an
employee, other people, or groups within the organization (Mitchell et aI., 2001). Along
with links community (M = 1.86), links organization (M = 1.90) had the lowest mean
scores out of the six job embeddedness components. For Kentucky Extension agents, the
means for both links community (M = 1.89) and links organization (M = 2.02) were
larger than those of Kansas Extension agents (M = 1.80 and M = 1.62, respectively).
Initially, this information seems to suggest that employees do not see themselves
as highly linked to either their organization or their communities. However, in the context
of community linkages, many Extension agents live and work in very rural areas, where
the opportunities for participation in workgroups and committee tend to be limited. This
does not necessarily mean that they are less embedded. Still, it seems that high
organizational retention rates are masking issues regarding Extension agent's intent to
stay.
131
One method that human resource professionals could implement to enhance
organization links would be to cultivate interaction and teamwork among Extension
agents. In a community context, Extension agent involvement and participation in local
service organizations, professional groups, and places of worship would tend to increase
their links to their community. Clearly, this is an area in need of further research.
Dwovedila & Bredillet (2010) studied 141 project managers and found that the formal
job orientation had an important role in reinforcing the employee's decision to join the
organization. The authors also found that workers "perceived professionalism helped
moderate the strength of their organizational commitment" (p. 12)
The mean scores of sacrifice community (M= 4.02) were somewhat higher than
the mean scores of sacrifice organization (M = 3.65). Sacrifice community is mostly an
issue if individuals are forced to relocate. Leaving a community that is attractive, safe,
and where one is liked or respected can be difficult. Of course, one can change jobs but
stay in the same home. But even then, various conveniences such as an easy commute or
flextime may be lost.
Sacrifice organization had the highest predictive ability on the variable intent to
stay. Sacrifice-organization captures the perceived cost of material or psychological
benefits forfeited by leaving one's job. For example, leaving an organization likely
promises personal losses (e.g., giving up colleagues, projects, or perks). The more an
employee gives up when leaving, the more difficult it is to sever employment with the
organization.
Extension agents indicated that the perceived costs of leaving their community
would be greater than the perceived costs ofleaving their organization. Given the high
132
profile that most Extension agents occupy within their local communities, this
observation was not unexpected.
Human-resource professionals should seek to increase the perceived organization
sacrifice of Extension agents; however, the scope of options available in public
organizations can be more limited than in private organizations, especially in the area of
salaries (M = 2.73) and promotional opportunities (M = 2.54). The mean scores for the
two survey questions related to salaries and promotions were the lowest within the job
embeddedness component sacrifice-organization. According to the 2010 USDA
Agricultural Research Service, Salary Analysis of Extension Service Positions, the
average Extension agent salary in the U.S. and its territories was $54,442. This compares
to $51,200 for Kansas Extension agents and $46,737 for Kentucky Extension agents.
Appendix P gives a national summary of Extension agent's salaries.
This suggests that Extension Services administrators should emphasize health and
retirement benefits (M = 4.23), freedom to pursue professional goals (M = 4.04), the
respect that Extension agents experience (M = 3.89), and prospects for continuing
employment (M = 3.75) in marketing Extension Services to potential employees.
Discretionary effort is voluntary and exceeds the employer's expectations. It is
this extra effort on the part of employees that helps some organizations "outperform"
others (Lloyd, 2003). To promote discretionary effort in Extension agents, human
resource professionals should emphasize the following sacrifice community items:
friendships that Extension agents build in their communities (M = 4.05), the respect that
Extension agents enjoy in their communities (M = 4.19), and neighborhood safety (M =
4.24).
133
Successful hiring is a key factor in how employees view themselves in an
organization. The fit-organization item "I feel like I'm a good match for Extension" (M =
4.26, SD .656) yielded an R2 change of .12; that is, this item explained 12% of the
variance in discretionary effort. Human resource professionals should continue to place
extreme importance on matching the right person to the organization.
Mowbray (2001, p. 142) noted the need for Extension administration to address
the following issues which were related to the retention of Extension agents:
• Explore ways to share or shift workloads. Suggestions included shared
positions, flexible work time and compensatory time.
• Explore new and creative delivery methods to decrease the number of night
and weekend activities.
• Starting salaries should be kept competitive with benchmark institutions and
similar jobs.
• Administration should do a better job in providing recruits with realistic
expectations about the job.
• Administration should develop a formal exit interviewing process.
In summary, this study found that Extension agents "fit" well within the
Extension organization and their local community. They also indicated that their
"sacrifice" would be high if they chose to leave. The area of alarm for Extension Services
HR professionals is the relatively low levels of "links" that Extension agents expressed
through the survey instrument. Although retention rates have been both high and stable
for Extension agents across various economic states, it is still quite possible that
Extension agents will begin to tum over more once the economy improves and more job
134
opportunities become available. These events and opportunities are described as shocks
and are mediated by higher job embeddedness levels (Holtom et aI., 2005). The study
results illustrate a gap among respondents between organizational commitment and
professional commitment.
Recommendation for Future Research
Job embeddedness may have organizational benefits other than helping to
improve retention. For instance, job embeddedness might be related to reduced
absenteeism, better job performance, and stronger organizational citizenship; such factors
should be a topic of future research Mitchell et aI. (2001).
There is also the possibility that high levels of embeddedness could decrease
retention (Mitchell et aI., 2001). For example, being highly linked within the organization
and community could lead to unexpected job alternatives (Holtom et aI., 2005). This is
supported by the research of Tanova and Holtom, (2008), who found that higher
education increased the likelihood of turnover. The authors reasoned that higher
education levels lead to increased career opportunities and possibly make workers with
additional education more likely to risk career changes.
Another possibility involves the difficulty that highly embedded employees could
have balancing work and family responsibilities. We assume that employees with higher
organizational embeddedness spend more oftheir available time involved in work related
activities. Given that time is limited, logically there must reach a point where work life
and personal life become unbalanced, leading to conflicts within the family and possibly
undesired turnover.
135
In a study of work-life issues, Beauregard & Henry (2009) found that there were
some ways that HRD could influence retention. They found that "the presence of
supportive managers and organizational climates was important in decreasing (work-life)
conflict (p. 30). They also found that work-life balance practices were often related to
improved organizational performance and competitive advantage in recruitment, while
"promoting employee interest in and obligation to the organization" (p. 30)
The successful response rate achieved in this study was made possible through the
use of a well-crafted data collection plan (Dillman, 2009). In addition, support from the
directors of the Kansas and Kentucky Extension services greatly helped communicate the
purpose and benefits of the study to the study population. Researchers in future studies
could use this tactic to improve response rates.
The list of independent variables considered in this study was limited by design.
Additional questions not asked could include data on local employment opportunities,
local employment rates, performance ratings, availability of employee- or family-tuition
benefits, membership in professional organizations, and whether other family members
were employed by Extension Services.
Research on the utility of age, tenure, and state of residence in predicting
embeddedness is limited and deserves further investigation. Giosan (2003) found that age
was a significant predictor of links community and links organization in a small urban
organization. In a nationwide study of Extension agents and job satisfaction, Vlosky and
Dunn (2009) found that age was correlated with satisfaction and income of Extension
agents. In a study of Mississippi Extension agents, Long and Swortzel (2007) discovered
that age was the best predictor of job satisfaction.
136
Upon review of the results of the study, I would recommend that the original
study model be amended as shown in Figure 5.1. The major change involved a stronger
focus on intent to stay (our measure of retention) and a more limited use of the
discretionary effort scale. This will allow future researchers to more clearly identify the
ability of each variable to impact intent to stay.
In conclusion, the results of this study show that job embeddedness was
significantly different between Kansas and Kentucky Extension agents. In addition,
correlations were found between job embeddedness, intent to stay, and discretionary
effort. Job embeddedness was also shown to explain unique variance in intent to stay and
discretionary effort. Finally, the background variables state, age, and education level
predicted variance in job embeddedness. The results ofthis study cannot be generalized
to other states because of the many unique and valuable differences that exist in
Extension Services organizations; however, the [mdings provide evidence of relationship
between job embeddedness and retention indicators and demonstrate the predictive value
of the job embeddedness construct.
137
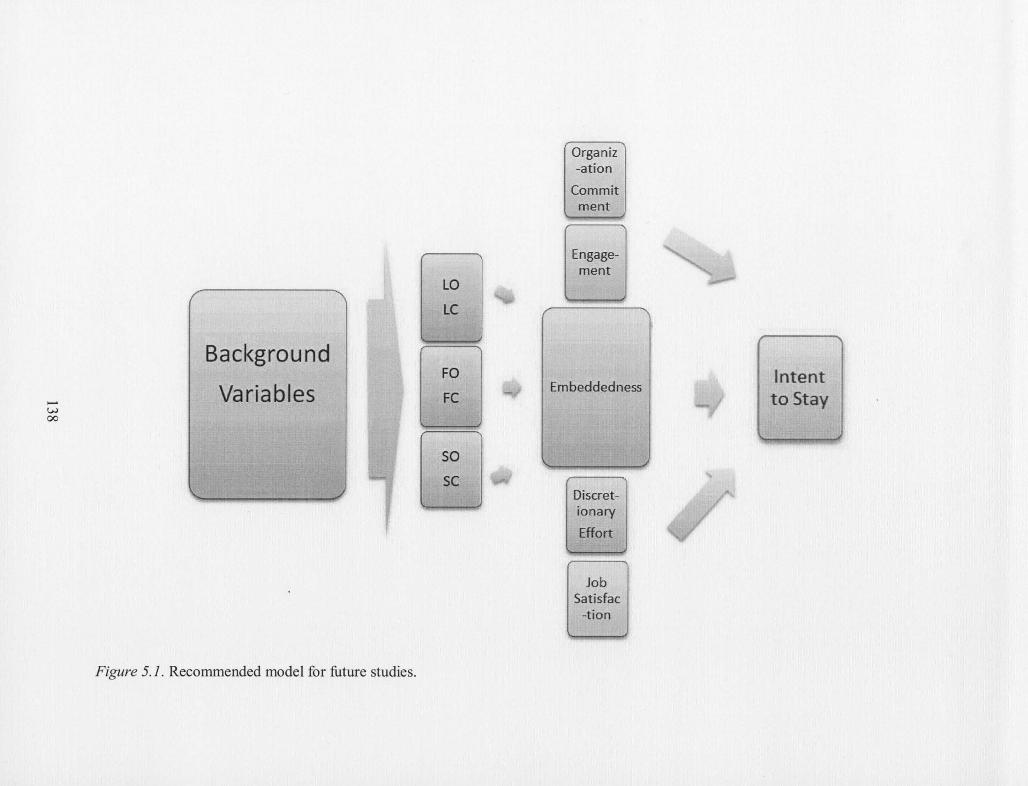
I-" l;.)
00
Background
Variables
Figure 5.1. Recommended model for future studies.
LO
LC
FO
FC
M ~
Organiz -ation
Commit ment
Engagement
Embeddedness
Discretionary
Effort
Job Satisfac
-tion
" Intent to Stay
~~
REFERENCES
Abelson, M. A., & Baysinger, B. D. (1984). Optimal and dysfunctional turnover: Toward an organizational level model. The Academy of Management Review, 9, 331-341.
Abelson, M. A. (1987). Examination of avoidable and unavoidable turnover. Journal of Applied Psychology, 72,382-386.
Allen, D. G. (2006). Do organization socialization tactics influence newcomer embeddedness and turnover? Journal of Management, 32, 237-256.
Allen, N. 1., & Meyer, 1. P. (1990). The measurement and antecedents of affective, continuance and normative commitment to the organization. Journal of Occupational Psychology, 63, 1-18.
Amason, A. C. (1996). Distinguishing the effects of functional and dysfunctional conflict on strategic decision making: Resolving a paradox for top management teams. The Academy of Management Journal, 39, 123-148.
Armstrong-Stassen, M., & Ursel, N. D. (2009). Perceived organizational support, career satisfaction, and the retention of older workers. Journal of Occupational and Organizational Psychology, 82, 201-220.
Arnold, S., & Place, N. (2010). What influences agents to pursue a career in Extension? Journal of Extension, 48, 1-6.
Ashforth, B. E., & Saks, A. M. (1996). Socialization tactics: Longitudinal effects on newcomer adjustment. Academy of Management Journal, 39, 149-178.
Ajzen, 1., & Fishbein, M. (1980). Understanding attitudes and predicting social behavior. Englewood Cliffs, NJ: Prentice Hall.
Babbie, E. (2007). The practice of social research (11th ed.). Belmont, CA: Wadsworth.
Baffour, B., & Valente, P. (2008). Census quality assurance and evaluation. Geneva, Switzerland. Economic Commission for Europe, Conference of European Statisticians.
Bares, A. (2009, September). Re: 2009 Turnover rates by industry [Web log message]. Retrieved from http://compforce. typepad.com/compensation _ force/2009109/2009-turnover-rates-by-industry.html
139
Barnett, R., & Louderback, L. (1971). When organizations change. Journal of Extension, 9,9-15.
Baugh, S. G., & Roberts, R. M. (1994). Professional and organizational commitment among engineers: conflicting or complementing? IEEE Transactions on Engineering Management, 4 J, 108-114.
Beauregard, T. A., & Henry, L. C. (2009). Making the link between work-life balance practices and organizational performance. Human Resource Management Review, J 9, 9-22. doi: http://dx.doi.org/l0.1016/j.hrmr.2008.09.001
Black, 1. S., & Stevens, G. K. (1989). The influence of spouse on expatriate adjustment and intent to stay in overseas assignments. International Journal of Human Resource Management, 3, 585-592.
Borr, M. L., & Young, R. B. (2010). Retirement and attrition trends of Extension professionals in North Dakota. Journal of Extension, 48, 1-8. Retrieved from http://www .joe. org/joe/20 1 Ofe bruary/rb4. php
Bredillet, C., & Dwivedula, R. (2010). The relation between organizational and professional commitment in case of project workers: Implicationsfor project management. PMI research conference: Defming the future of project management. Paper presented at the PMI Research Conference, Washington D.C. Retrieved from http://eprints.qut.edu.au/49519/
Burton, 1. P., Holtom, B. c., Sablynski, C. 1., Mitchell, T. R., & Lee, T. W. (2010). The buffering effects of job embeddedness on negative shocks. Journal of Vocational Behavior, 76,42-51.
Campion, M. A. (1991). Meaning and measurement of turnover: Comparison of alternative measures and recommendations for research. Journal of Applied Psychology, 76,199-212.
Cardy, R. L., & Lengnick-Hall, M. L. (2011). Will they stay or will then go? Exploring a customer-oriented approach to employee retention. Journal of Business Psychology, 26, 213-217.
Ciulla, 1. B. (2000). The working life. New York, NY: Random House.
Clason, D. L., & Dorrnody, T. 1. (1994). Analyzing data measured by individual Likerttype items. Journal of Agricultural Education, 35,31-35.
Clothier, R. C. (1916). Personnel and employment problems in industrial management. The American Academy of Political and Social Science, 65, 101. Retrieved from http://books.google.comibooks?id=bH8QAAAA Y AA1&dq=ford%20motor%20c ompany%20turnover&pg=P Al 0 1
140
Cohen, 1. (1988). Statistical power analysis for the behavioral sciences. San Diego, CA: Academic Press.
Colarelli, S. M. (1984). Methods of communication and mediating processes in realistic job previews. Journal of Applied Psychology, 69, 633-642.
Creswell, 1. W. (2005). Educational research: Planning conducting and evaluating quantitative and qualitative research. Upper Saddle River, NJ: Merrill Prentice Hall.
Creswell, 1. W. (2009). Research design: Qualitative, quantitative, and mixed methods approaches. Thousand Oaks, CA: Sage.
Crossley, C. D., Bennett, R. 1., Burnfield, 1. L., & Jex, S. M. (2007). Development ofa global measure of job embeddedness and integration into a traditional model of vo luntary turnover. Journal of Applied Psychology, 92, 1031-1042.
Dalton, D. R., Krackhardt, D. M., & Porter, L. W. (1981). Functional turnover: An empirical assessment. Journal of Applied Psychology, 66, 716-721.
Davis, P., Naughton, 1., & Rothwell, W. (2004). New roles and new competencies for the professional. TD, 58,26-36.
DeConinck, 1. B., & Johnson, 1. T. (2009). The effects of perceived supervisor support, perceived organizational support, and organizational justice on turnover among salespeople. Journal of Personal Selling and Sales Management, 29, 333-350.
Dee, J. R. (2004). Turnover intent in an urban community college: Strategies for faculty retention. Community College Journal of Research and Practice, 28, 593-607.
Dillman, D. A., Smyth, J. D., & Christian, L, M. (2009). Internet, mail and mixed-mode surveys. Hoboken, NJ: Wiley.
Discretionary effort. (n.d.). in Business Dictionary. Retrieved from http://www.businessdictionary.comldefinitionldiscretionary-effort.html
Division of Human Resources. Retrieved September 22, 2011, from http://www.kstate. edulhr /benefits/tuition. htm
Educational Benefits. (2011). In Extension Manual. Retrieved from: http://ces.ca.uky.edulExtensionmanual/node/6?q=node/52
Emmerik, H. V., & Sanders, K. (2004). Social embeddedness and job performance of tenured and non-tenured professionals. Human Resource Management Journal, 14,40-54.
Employment Requirements. (2011). In Extension Manual. Retrieved from: http://ces.ca.uky.edulExtensionmanual/node/3?q=nodeI21
141
Equity in Educational Land-Grant Status Act of 1994, 7 U.S.C. § 532 (2006).
Felps, W., Mitchell, T. R., Hekman, D. R, Lee, T. W., Holtom, B. C., & Harman, W. S. (2009). Turnover contagion: How coworkers' job embeddedness and job search behaviors influence quitting. Academy of Management Journal, 52,545-561.
Fetsch, R 1., & Kennington, M. S. (1997). Balancing work and family in cooperative Extension: History, effective programs, and future directions. Journal of Extension, 35(1), article 2.
Fletcher, R. E. A. (2005). Job embeddedness: A construct of organizational and community attachment utilized to assess voluntary turnover. Unpublished manuscript, Department of Systems and Engineering Management, Air Force Institute of Technology, Air University, Wright-Patterson Air Force Base, Ohio.
100 best companies to work for in 2009. (2009). Fortune magazine. Retrieved from http://money.cnn.comimagazines/fortune/bestcompanies/2009/full_list/index.html
Franklin, B. (1793/1909). The autobiography of Benjamin Franklin. New York, NY: Collier.
Fricker, RD., & Rand, M. S. (2002). Advantages and disadvantages of internet research surveys: Evidence from the literature. Field Methods, 14,347-367.
Friedman, D., Galinsky, E., & Plowden, V. (1992). Parental leave and productivity: Current research. New York, NY: Families and Work Institute.
Gitelman, H. M. (1992). Welfare capitalism reconsidered. Labor History, 33, 5-31.
Giosan, C. (2003). Predictors of job embeddedness (Bulletin no. 1). New York, NY: New School University.
Gravetter, F. 1., & Wallnau, L. B. (1985). Statistics for the behavioral sciences. St. Paul, MN: West.
Griffeth, R W., Hom, P. W., & Gaertner, S. (2000). A meta-analysis of antecedents and correlates of employee turnover: Update, moderator tests, and research implications for the next millennium. Journal of Management, 26(3), 463-488.
Groves, R M. (2006). Nonresponse rates and nonresponse bias in household surveys. Public Opinion Quarterly, 70,646-675.
Guthrie,1. P. (2000). Alternative pay practices and employee turnover: An organization economics perspective. Group and Organization Management, 45,419-442.
Hackett, RD. (1990). Age, tenure, and employee absenteeism. Human Relations, 42, 601-619.
142
Halbesleben, 1. R. B., & Wheeler, A. R. (2008). The relative roles of engagement and embeddedness in predicting job performance and intention to leave. Work and Stress, 22, 242-256.
Hale, 1. (1998). Strategic rewards: Keeping your best talent from walking out the door. Compensation & Benefits Management, 14(3),39-50.
Hall, R. E. (2006). Job loss, job finding and unemployment in the U.S. economy over the past 50 years. National Bureau of Economic Research, 20, 102-166.
Hannay, M., & Northam, M. (2000). Low-cost strategies for employee retention. Compensation and Benefits Review, 32,65-72.
Harman, W. S., Lee, T. W., Mitchell, T. R., Felps, W., & Owens, B. P. (2007). The psychology of voluntary employee turnover. Associationfor Psychological Science, 16,51-54.
Hauenstean, P. (1999). Understanding turnover. Advantage Hiring Newsletter Online. Retrieved from http://www.advantagehiring.cominewsletter/n99Q4 _1.html
Hoisch, M. (2001), Organizational factors influencing longevity in professional, managerial and administrative employee retention. UMI Dissertation Services, No. 3038765.
Holtom, B. c., Mitchell, T. R., Lee, T. W., & Inderrieden, E. J. (2005). Shocks as causes of turnover: what they are and how organizations can manage them Human Resource Management, 44, 337-352.
Holtom, B. C., Mitchell, T. R., & Lee, T. W. (2006). Increasing human and social capital by applying job embeddedness theory. Organizational Dynamics, 35,316-331.
Iglehart, A. P. (1990). Turnover in the social services: turning over to the benefits. Social Service Review, 64,649-657.
Introduction. (2009). In Extension manual: A reference on policies and procedures for Extension agents. Retrieved from: http://ces.ca.uky.edu/Extensionmanuali
Iverson, S. V. (2008, February 1). Now is the time for change: Reframing diversity planning at land-grant universities. Journal of Extension, 46( 1), 1-11.
Jacoby, S. M. (1997). Modern Manors: Welfare Capitalism since the New Deal. Princeton, New Jersey: Princeton University Press.
Jauch, L. R., Glueck, W. F., & Osborn, R. N. (1978). Organizational loyalty, professional commitment, and academic research productivity. Academy of Management Journal, 21,84-92.
143
Johnson, B., & Christensen, L. (2007). Educational Research: Quantitative, Qualitative, and Mixed Approaches. Thousand Oaks, California: Sage Publications.
Johnson, B., & Christensen, L. (2010). Educational Research: Quantitative, Qualitative, and Mixed Approaches. Thousand Oaks, California: Sage Publications.
Judge, T. A., & Cable Daniel M. (1997). Applicant personality, organizational culture, and organization attraction. Personnel Psychology, 50, 359-394.
Kahn, W. (1990). Psychological conditions of personal engagement and disengagement at work. Academy of Management Journal, 33,692-724.
Kim, S., Price, 1. L., Mueller, C. W., & Watson, T. W. (1996). The determinants of career intent among physicians at the U.S. Air Force Hospital. Human Relations, 49, 947-976.
Kroth, M., & Peutz, J. (2010). Workplace issues in Extension. Journal of Extension, 48, 1-9.
Kutilek, L. M. (2000). Learning from those who leave. Journal of Extension, 38. Retrieved from http://www.joe.org/joe/2000june/iw2.php
Kutilek, L. M., Conklin, N. L., & Gunderson, G. (2002). Investing in the future: Addressing work/life issues of employees. Journal of Extension, 40. Retrieved from http://www.joe.org/joe/2002february/a6.php
Letvak, S., & Buck, R (2008). Factors influencing work productivity and intent to stay in nursing. Nursing Economics, 26, 159-165.
Lee, S. M. (1971). An empirical analysis of organizational identification. The Academy of Management Journal, 14,213-223.
Lee, T. W., Mitchell, T. R, Holtom, B. C., McDaniel, L. S., & Hill, 1. W. (1999). The unfolding model of voluntary turnover: A replication and Extension. The Academy of Management Journal, 42, 450-462.
Lee, T. W., Mitchell, T. R, Holtom, B. c., Sablynski, 1. P., & Burton, 1. P. (2004). The effects of job embeddedness on organizational citizenship, job performance, volitional absences, and voluntary turnover. Academy of Management Journal, 47, 711-722.
Lee, T. W., & Mowday, R. T. (1987). Voluntarily Leaving an Organization: An Empirical Investigation of Steers and Mowday's Model of Turnover. The Academy of Management Journal, 30, 721-743.
Lloyd, R (2003). Discretionary effort in the workplace. Unpublished thesis, Macquarie University, Sydney, Australia.
144
Lloyd, R. (2008). Discretionary effort and the performance domain. Unpublished thesis, Macquarie University, Sydney, Australia.
Locke, E. A. (1969). What is job satisfaction? Organizational Behavior and Human Performance, 4, 309-336.
Long, J. L., & Swortzel, K. A. (2007). Factors influencing job satisfaction of Extension agents in Mississippi state university [Conference proceedings] AAAE Research Conference (Vol. 34, pp. 41-53). Minneapolis, Minnesota: American Associate of Agricultural Education. Retrieved from http:// aaae. okstate. edu/proceedings/2007/intro. pdf
Ludwig, B. G. (1995). What characterizes an internationalized U.S. Extension system? Journal of Agricultural and Extension Education, Fall, 28-32.
Lundy, L., Place, N. T., Irani, T., & Telg, R. (2005, May). What in the world are they thinking? Perceptions of Extension personnel regarding internationalizing agricultural Extension. Association of International Agricultural and Extension Education 2005. Proceedings of the 21st Conference, San Antonio, Texas.
Luthans, B. c., & Sommers, S. M. (1999). The impact of downsizing on workplace attitudes. Group and Organization Management, 24, 46-70.
Luthans, F., Norman, S. M., Avolio, B. 1., & Avey, J. B. (2008). The mediating role of psychological capital in the supportive organizational climate - employee performance relationship. Journal of Organizational Behavior, 29,219-238.
Macey, W. H., & Schneider, B. (2008). The meaning of employee engagement. Industrial and Organizational Psychology, 1, 3-30.
Maertz, C. P., & Campion, M. A. (1998). 25 years of voluntary turnover research: a review and critique. International Review of Industrial and Organizational Psychology, 13,49-81.
Mallol, C. M., Holtom, B. c., & Lee, T. W. (2007). Job embeddedness in a culturally diverse environment. Journal of Business Psychology, 22, 35-44.
Mating, B. (2010). Building company loyalty with unusual benefits. HR World, Features. Retrieved September 28,2010 from http://www.hrworld.comlfeatureslbuildloyalty-unusual-benefits
March, R., & Mannari, H. (1977). Organizational commitment and turnover: a predictive study. Administrative Science Quarterly, 22,57-75.
Marens, R. S., Wicks, A. c., & Huber, V. L. (1999). Cooperating with the disempowered using ESOP's to forge a stakeholder relationship by anchoring employee trust in workplace participation programs. Business Society, 38, 51-82.
145
Maslow, A (1954). Motivation and personality. New York, NY: Harper.
Mauch, 1. E., & Birch, 1. w. (1993). Guide to the successful thesis and dissertation. New York, NY: Marcel Dekker.
Miller, L. E., & Smith, K. L. (1983). Handling nonresponse issues. Journal of Extension, 21,45-50.
Mitchell, T. R., Holtom, B. C., & Lee, T. W. (2001). How to keep your best employees: Developing an effective retention policy. Academy of Management Executive, 15, 95-109.
Mitchell, T. R., Holtom, B. c., Lee, T. W., Sablynski, C. 1., & Erez, M. (2001). Why people stay: Using job embeddedness to predict voluntary turnover. The Academy of Management Journal, 44, 1102-1121.
Mobley, W. H., Griffeth, R. W., Hand, H. H., & Meglino, B. H. (1979). Review and conceptual analysis of the employee turnover process. Psychological Bulletin, 8, 493-522.
Morris,1. H., & Sherman, 1. D. (1981). Generalizability of an organizational commitment model. The Academy of Management Journal, 24, 512-526.
Mosher, A E. (1995). Something better than the best: Industrial restructuring. Annals of the Association of American Geographers, 85,84-107. Retrieved from http://www.jstor.org/stable/2564280?origin=JSTOR-pdf
Mowbray, J. (2001). Factors affecting turnover of county Extension agents in the University of Kentucky, Cooperative Extension Service (unpublished doctoral dissertation). University of Kentucky, Lexington, Kentucky.
Mowday, R. T., Porter, L. W., & Steers, R. M. (1982). Employee-organization linkages: the psychology of commitment, absenteeism, and turnover. New York, NY: Academic Press.
Muchinsky, P. M., & Tuttle, M. L. (1979). Employee turnover: An empirical and methodological assessment. Journal of Vocational Behavior, 14,37-43.
Mustapha, N., Ahmad, A, Uli, 1., & Idris, K. (2010). Job characteristics as antecedents of intention to stay and mediating effects of work family facilitation and family satisfaction among single mothers in Malaysia. International Journal of Business and Social Science, 3, 59-74.
Myers, R. (1990). Classical and modern regression with applications (2nd ed.). Boston, MA: Duxbury.
146
Nair, S. S. (2009, June 26). Employee retention. Articlesbase. Retrieved from http://www.articlesbase.comlhuman-resources-artic lesl emp loyee-retention-995426.html
Ng, T. W. H., & Feldman, D. C. (2010). Organizational tenure and job performance. Journal of Management, 36, 12220-1250. DOL: 10.1177/0149206309359809
Nobscot Corporation. (2006). Retention management and metrics. 2006 employee turnover rates by sector. Retrieved November 13, 2010, from Nobscot Corporation: http://www.nobscot.comlsurvey/index.cfm
Ng, T. W. H., & Butts, M. B. (2009). Effectiveness of organizational efforts to lower turnover intentions: The moderating role of employee locus of control. Human Resource Management, 48, 289-310.
Park, H. Y., Ofori-Dankwa, 1., & Bishop, D. R. (1994). Organizational and environmental determinants of functional and dysfunctional turnover: Practical and research implications. Human Relations, 47,353-366.
Perk place: The benefits offered by Google and others may be grand, but they're all business. (2007). Retrieved from http://knowledge.wharton.upenn.edularticle.cfm ?articleid= 1690
Plash, S., & Piotrowshi, C. (2006). Retention issues: A study of Alabama special education teachers. Education, 127, 125-128.
Porter, L. W., & Steers, R. M. (1973). Organizational, work and personal factors in employee turnover and absenteeism. Psychological Bulletin, 80, 151-176.
Price, 1. (1977). The study of turnover. Ames, LA: Iowa State Press.
Punch, K. F. (1998). Introduction to social research, quantitative and qualitative approaches. London, England: Sage.
Prevosto, P. E., (1998). The effect of "mentored" relationships on satisfaction and intent to stay of company grade us. Army Reserve (USAR) nurses. Carlisle Barracks, PA: U.S. Army War College.
Prugh, C. C. (1998). Managing the career-mobile workforce. Compensation & Benefits Management, 14,31-38.
Rainey, H. G., & Bozeman, B. (2000). Comparing public and private organizations: Empirical research and the power of the a priori. Journal of Public Administration Research and Theory, 10,447-469.
Ramage, K. (2010). Summary of staffing models for Extension. Unpublished raw data.
147
Ramlall, S. (2004). A review of employee motivation theories and their implications for employee retention within organizations. Journal of American Academy of Business, 5, 52-63.
Ramlall, S. (2003). Managing employee retention as a strategy for increasing organizational competitiveness. Applied HR.M Research, 8,63-72.
Reips, U. (2000). The web experiment method: advantages, disadvantages, and solutions. In M.H. Birnbaum (Ed.), Psychology experiments on the Internet. New York: Academic Press.
Rich, B. L., Lepine, 1. A., & Crawford, E. R. (2010). Job engagement: antecedents and effects onjob performance. Academy of Management Journal, 53,617-635.
Richman,A. L., Civian, 1. T., Shannon, L. L., Hill, E. 1., & Brennan, R. T. (2008). The relationship of perceived flexibility, supportive work-life policies, and use of formal flexible arrangements and occasional flexibility to employee engagement and expected retention. Community, Work and Family, 11, 183-197.
Roehling, P. V., Roehling, M. V., & Moen, P. (2001). The relationship between work-life policies and practices and employee loyalty: A life course perspective. Journal of Family and Economic Issues, 22, 141-170.
Roethlisberger, F. 1., & Dickson, W. J. (1939). Management and the worker. Harvard University Press. Oxford, England.
Rousan, L. (1995). Agent turnover in Ohio State University Extension. Unpublished doctoral dissertation, The Ohio State University, Columbus.
Rosen, R. A., & Rosen, H. (1955). A suggested modification in job satisfaction surveys. Personnel Psychology, 8,304-314.
Rosenthal, R., & Rosnow, R. L. (1975). The volunteer subject. New York, NY: Wiley.
Rosnow, R. L., & Rosenthal, R. (1997). People studying people: artifacts and ethics in behavioral research. New York, NY: Freeman.
Rosser, V. 1., & Townsend, B. K. (2006). Determining public 2-year college faculty's intent to leave: An empirical model. Journal of Higher Education, 77, 125-151.
Royalty, A. B. (1998). Job-to-job and job-to-non-employment turnover by gender and education level. Journal of Labor Economics, 16,392-433.
Rozina, 1. N. (2002). Theory of communication and applied communication. Russian Journal of Communication, 1,59-67.
148
Ruth, R. T., & Stewart, G. L. (1995). The satisfaction and retention of frontline employees: A customer satisfaction measurement approach. International Journal of Service Industry Management, 7, 62-80.
Safrit, R. D., & Owen, M. B. (2010). A conceptual model for retaining county Extension
program professionals. Journal of Extension, 48, 1-10.
Safrit, R. D., Gleim, R. R., Gleim, J. A., Owen, M., & Sykes, W. (2009). A qualitative study of retention of North Carolina cooperative Extension county program professionals. American Associationfor Agricultural Education Research Conference (pp. 198-213). Louisville, Kentucky: American Associate of Agricultural Education.
Saks, A M. (2006). Antecedents and consequences of employee engagement. Journal of Managerial Psychology, 21, 600-619.
Schlichte, 1., Yssel, N., & Merbler, J. (2005). Pathways to burnout: Case studies in teacher isolation and alienation. Preventing School Failure, 50,35-41.
Scott, M., Swortzel, K. A, & Taylor, W. N. (2005). Extension agents' perceptions of fundamental job characteristics and their level of job satisfaction. Journal of Southern Agricultural Education Research, 55, 88-101. Retrieved from http://www.jsaer.org/pdfiVoI55/55-01-088.pdf
Shadish, W. R., Cook, T. D., & Campbell, D. T. (2002). Experimental and quasiexperimental designs for generalized causal inference. Belmont, CA: Wadsworth.
Shavelson, R. 1. (1988). Statistical reasoning for the social sciences. Needham Heights, MA: Simon and Schuster.
Shaw,1. D., Delery, 1. E., Jenkins, G. D., & Gupta, N. (1998). An organization-level analysis of voluntary and involuntary turnover. The Academy of Management Journal, 41,511-525.
Shuck, M. B. (2010). Employee engagement: an examination of antecedent and outcome variables (Doctoral Dissertation). Retrieved from http://digitalcommons.fiu.edu/etdl235/
Sleebos, E., Ellemers, N., & Gilder, D. (2006). The carrot and the stick: affective commitment and acceptance anxiety as motives for discretionary group efforts by respected and disrespected group members. Personality and Social Psychology Bulletin, 32, pp. 244-255.
Smith Lever Act of 1914, 7 U.S.c. § 341 et seq.
Smith, S. A, Crow, S. M., & Hartman, S. J. (2007). Attrition in nursing among black and white nurses. Journal of Nursing Management, 15, 357-366.
149
Steers, R. M. (1977). Antecedents and outcomes of organizational commitment. Administrative Science Quarterly, 22, 46-56.
Stevens,1. P. (2009). Applied multivariate statistics for the social sciences. New York, NY: Rutledge.
Sum, A, & Khatiwada, 1. (2010). Underemployment in the "Great Recession." Monthly Labor Review, November, 3-15.
Tett, R. P., & Meyer, 1. P. (1993). Job satisfaction, organizational commitment, turnover intention, and turnover: Path analyses based on meta-analytic findings. Personnel Psychology, 46,259-293.
Tanova, c., & Holtom, B. C. (2008). Using job embeddedness factors to explain voluntary turnover in four European countries. The International Journal of Human Resource Management, 19, 1553-1568.
Morrill Act of1862, 7 U.S.c. § 301 (2006).
Morrill Act of 1890, 7 U.S.c. § 323 (2006).
Hatch Act of 1887, 7 U.S.C. § 361a (2006).
Smith Lever Act of 1914, 7 U.S.c. § 342 (2006).
Trochim, W. M. K. (2011). Types of Design. http://www.lib.wsc.ma.edu/webapa.htm
Tziner, A, & Birati, A (1996). Assessing employee turnover costs: A revised approach. Human Resource Management Review, 6, 113-122.
U. S. Census Bureau. (2009). Educational Attainment by state: 2009. Retrieved from: http://www.census.gov/compendia/statab/2011/tablesI11s0229.pd£
U.S. Department of Education Institute of Education Sciences. (2010). Fastfacts [Education statistics] (National center for education statistics). Retrieved November 13,2010, from U.S. Department of Education Institute of education sciences: http://nces.ed.gov/ fastfactsl disp lay .asp ?id=28
U.S. Department of Agriculture, National Institute of Food and Agriculture, Extension. (n.d.) About Us. Retrieved from http://www.csrees.usda.gov/qlinks/Extension.html#today
U.S. Department of Agriculture, National Institute of Food and Agriculture, Extension. (2000). Salary Analyses of Cooperative Extension Service Positions. Retrieved from http://www.csrees. usda. gov/abo utlhuman Jes/pdfs/report2000. pdf
150
u.s. Department of Agriculture, National Institute of Food and Agriculture, Extension. (2010). Salary Analyses of Cooperative Extension Service Positions. Retrieved from http://www.csrees. usda.gov/about/human Jes/pdfs/report20 1 O. pdf
u.s Department of Commerce, Census Bureau. (2010). 2010 Census: How are census data used? Retrieved from https://ask.census.gov/app/answers/detaiVa_id/73 8 8 /~/20 1 0-census%3A-how-are-census-data-used%3F
u.s Department of Commerce, Census Bureau. (2010). Census Participation. Retrieved from http://2010.census.gov/2010census/take10map/
U.S. Bureau of Labor Statistics (2011). Labor Force Statistics from the Current Population Survey. Retrieved from http://www.bls.gov/cps/lfcharacteristics.htm #unemp
Ulrich, D. (1997). Human resource champions: The next agendafor adding value and delivering results. Boston, MA: Harvard Business School Press.
Van Maanen, J., & Schein, E. H. 1979. Towards a theory of organizational socialization. In B. M. Staw (Ed.), Research in organizational behavior, (vol. 1; pp. 209-264). Greenwich, CT: lA!.
Van Tilburg, E.L. (1985). Factors associated with the turnover intention of Ohio Cooperative Extension county agents. Unpublished doctoral dissertation. The Ohio State University, Columbus.
Vernon, S., & Commander, C. (1998). Stay for pay: A retention solution. HR Focus, 75, 7-8.
Vlosky, R. P., & Aguilar, F. X. (2009). A model of employee satisfaction: Gender differences in Cooperative Extension. Journal of Extension, 47, 1-15.
Vlosky, R P., & Dunn, M. A. (2009). Cooperative Extension Services employee satisfaction in the workplace: Does race matter? Retrieved from http://www .lfpdc.lsu. edulpublications/working.-rapers/wp86. pdf
Wefald, A. J., & Downey, R G. (2009). The construct dimensionality of engagement and its relationship with satisfaction. The Journal of Psychology: Interdisciplinarym and Applied, 143,91-112.
Wiener, Y. (1982). Commitment in organizations: A normative view. The Academy of Management Review, 7, 418-428.
Wellins, R, & Concelman, J. (2005). Personal engagement: Driving growth at the seelevel. Retrieved from www.ddiworld.com/pdtJddi_personalengagement_ ar. pdf
151
Wheeler, A. R., Harris, K. 1., & Harvey, P. (2010). Moderating and mediating the HRM effectiveness-intent to turnover relationship: The roles of supervisors and job embeddedness. Journal of Managerial Issues.
Williams, C. R. (2000). Reward contingency, unemployment, and functional turnover. Human Resource Management Review, 9, 549-576.
Williams, L., & Anderson, 1. (1991). Job satisfaction and organizational commitment as predictors of organizational citizenship and in-role behaviors. Journal of Management, 17,601-617.
Yankelovich, D., & Immerwahr, 1. (1984). Putting the work ethic to work. Society, 21(2), 58-76.
Yates, D., Moore, D., & McCabe, G. (1999). The Practice of Statistics. New York, NY: Freeman.
Yu, 1., & Cooper, H. (1983). A quantitative review of the effects on response bias. Journal of Marketing Research, 20, 36-44.
152
APPENDIX A
u.s. UNEMPLOYMENT RATES
(U.S. BUREAU OF LABOR STATISTICS, 2011).
153
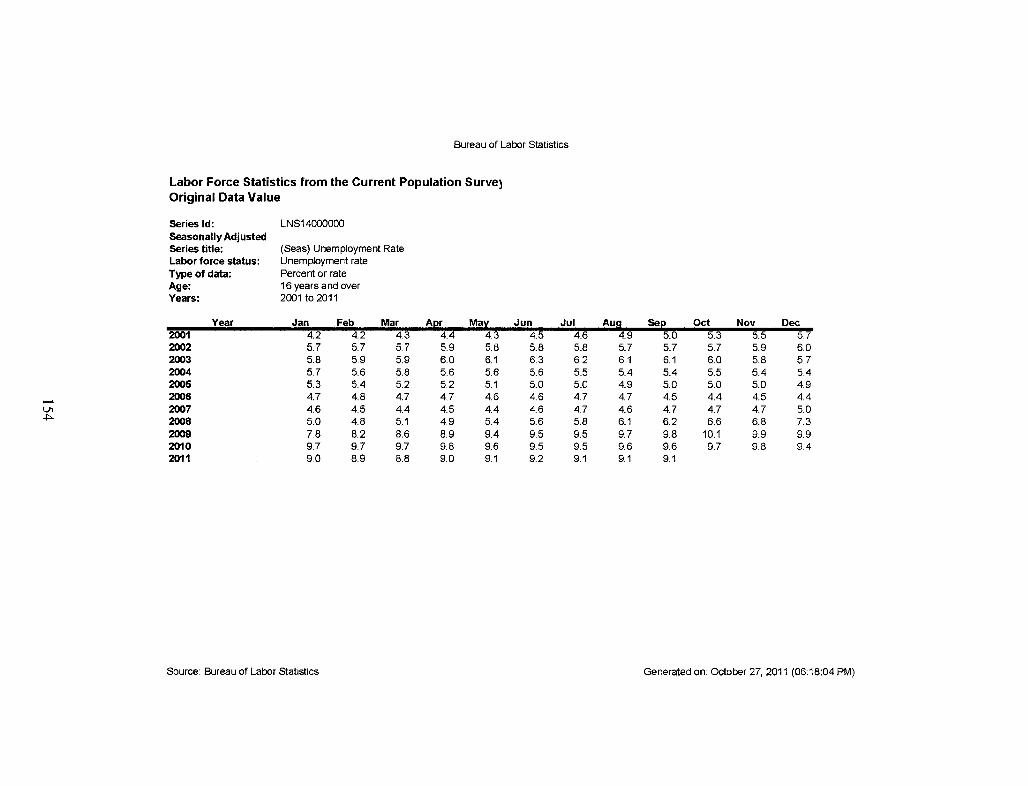
,..... VI .j:::..
Bureau of Labor Statistics
Labor Force Statistics from the Current Population Survel Original Data Value
Series Id: LNS14000000 Seasonally Adjusted Series title: (Seas) Unemployment Rate Labor force status: Unemployment rate Type of data: Percent or rate Age: 16 years and over Years: 2001 to 2011
Year Jan Feb Mar Aer Max 2001 4.2 4.2 4.3 4.4 4.3 2002 5.7 5.7 5.7 5.9 5.8 2003 5.8 5.9 5.9 6.0 6.1 2004 5.7 5.6 5.8 5.6 5.6 2005 5.3 5.4 5.2 5.2 5.1 2006 4.7 4.8 4.7 4.7 4.6 2007 4.6 4.5 4.4 4.5 4.4 2008 5.0 4.8 5.1 4.9 5.4 2009 7.8 8.2 8.6 8.9 9.4 2010 9.7 9.7 9.7 9.8 9.6 2011 9.0 8.9 8.8 9.0 9.1
Source: Bureau of Labor Statistics
Jun Jul 4.5 4.6 5.8 5.8 6.3 6.2 5.6 5.5 5.0 5.0 4.6 4.7 4.6 4.7 5.6 5.8 9.5 9.5 9.5 9.5 9.2 9.1
Aus See Oct Nov Dec 4.9 5.0 5.3 5.5 5.7 5.7 5.7 5.7 5.9 6.0 6.1 6.1 6.0 5.8 5.7 5.4 5.4 5.5 5.4 5.4 4.9 5.0 5.0 5.0 4.9 4.7 4.5 4.4 4.5 4.4 4.6 4.7 4.7 4.7 5.0 6.1 6.2 6.6 6.8 7.3 9.7 9.8 10.1 9.9 9.9 9.6 9.6 9.7 9.8 9.4 9.1 9.1
Generated on: October 27,2011 (06:18:04 PM)
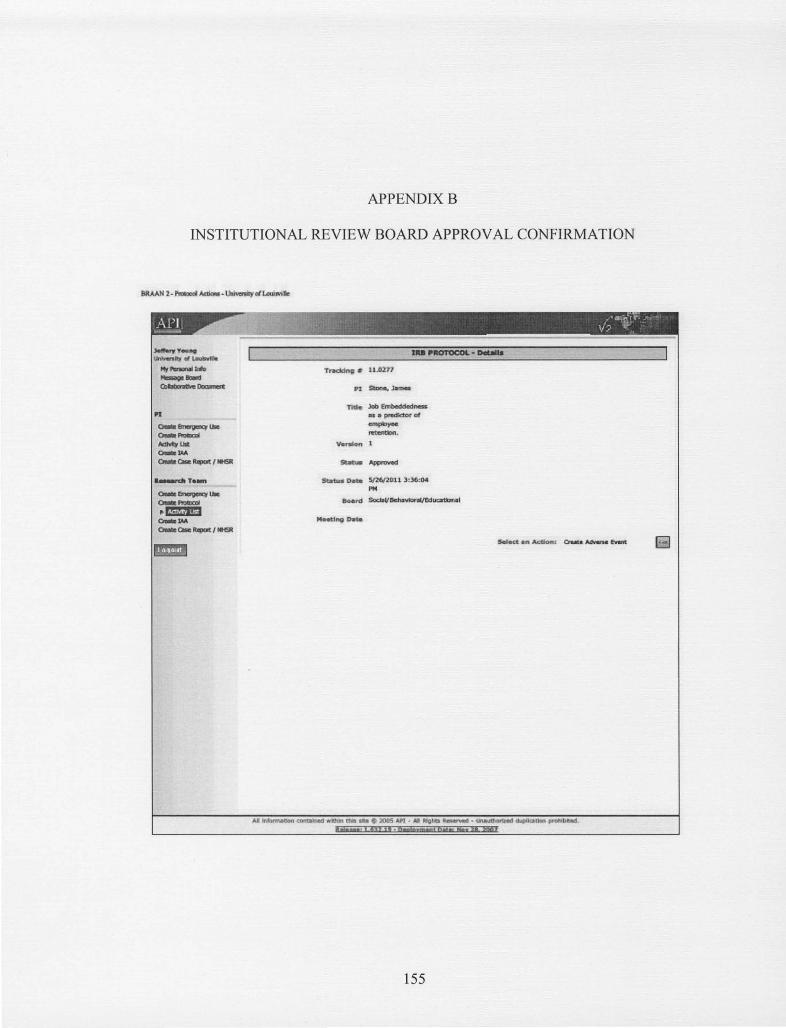
APPENDIXB
INSTITUTIONAL REVIEW BOARD APPROVAL CONFIRMATION
."."..,...1"1Iii" Ult.r.rsfty « Lou1Mn.
Hf""""""rnI\> .-.~~
PI 0..""",,- _
0.._ JodhtIfUst ~IM
c-.Oooo~'_
~~~~r:ll:m _1M _0000 ..... '_
nde JoG Embecidcdnesso as III Fftdk:lor of
"""*'~.
v. .... on 1:
5-..,... ~~Dll 3,3/;",.. I'M
'Board SiodallBeiua.'tItcr.JVEduatbull
155
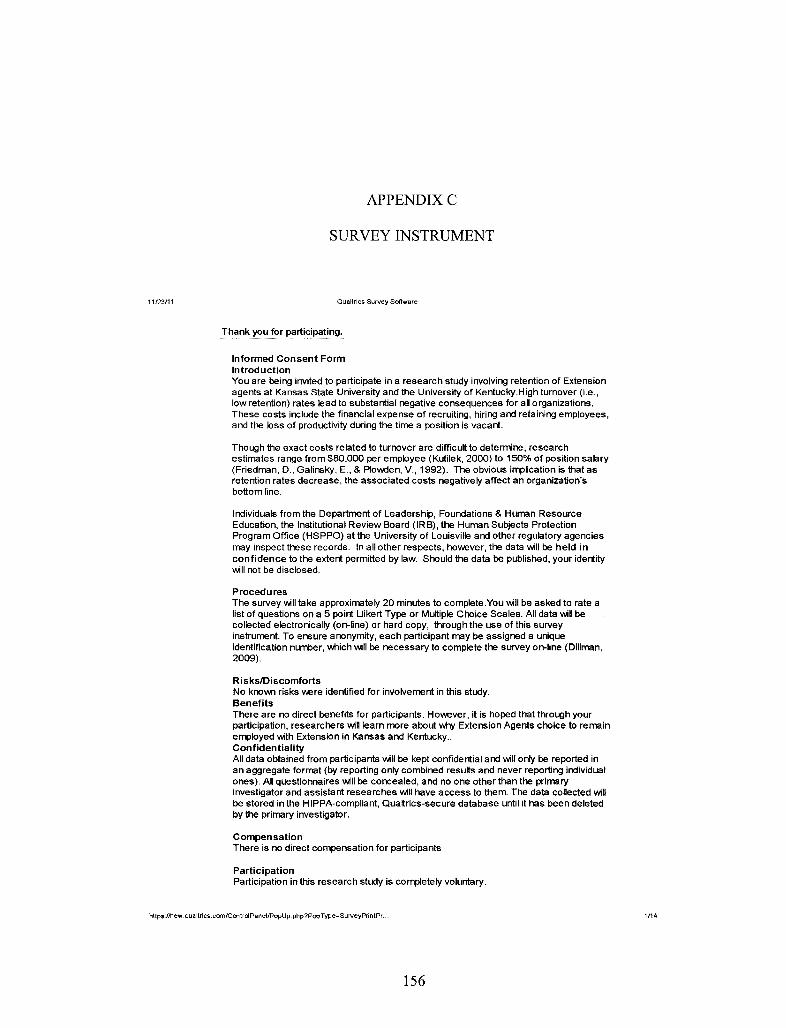
11123/11
APPENDIXC
SURVEY INSTRUMENT
Qualtrics Survey Software
Thank you for participating.
Informed Consent Form Introduction You are being invited to participate in a research study involving retention of Extension agents at Kansas State University and the University of Kentucky.High turnover (i.e., low retention) rates lead to substantial negative consequences for all organizations. These costs include the financial expense of recruiting, hiring and retaining employees, and the loss of productivity during the time a position is vacant.
Though the exact costs related to turnover are difficult to determine, research estimates range from $80,000 per employee (Kutilek, 2000) to 150% of position salary (Friedman, D., Galinsky, E., & Plo'Mlen, V., 1992). The obvious implication is that as retention rates decrease, the associated costs negatively affect an organization's bottom line.
Individuals from the Department of Leadership, Foundations & Human Resource Education, the Institutional Review Board (IRB), the Human Subjects Protection Program Office (HSPPO) at the University of Louisville and other regulatory agencies may inspect these records. In all other respects, however, the data will be held in confidence to the extent permitted by law. Should the data be published, your identity will not be disclosed.
Procedures The survey will take approximately 20 minutes to complete .You will be asked to rate a list of questions on a 5 point Llikert Type or Multiple Choice Scales. All data will be collected electronically (on-line) or hard copy, through the use of this survey instrument. To ensure anonymity, each participant may be assigned a unique identification number, which will be necessary to complete the survey on-line (Dillman, 2009).
RiskslDiscomforts No knoW'l risks were identified for involvement in this study. Benefits There are no direct benefits for participants. However, it is hoped that through your participation, researchers will learn more about why Extension Agents choice to remain employed with Extension in Kansas and Kentucky .. Confidentiality All data obtained from participants will be kept confidential and will only be reported in an aggregate format (by reporting only combined results and never reporting individual ones). All questionnaires will be concealed, and no one other than the primary investigator and assistant researches will have access to them. The data collected wiD be stored in the H IPPA-compliant, Qualtrics-secure database until it has been deleted by the primary investigator.
Compensation There is no direct compensation for participants
Participation Participation in this research study is completely voluntary.
https:/lnew.qualtrics.com/Controi PanellPopUp.php?Pop Type=SurveyPrintPr ...
156
1/14
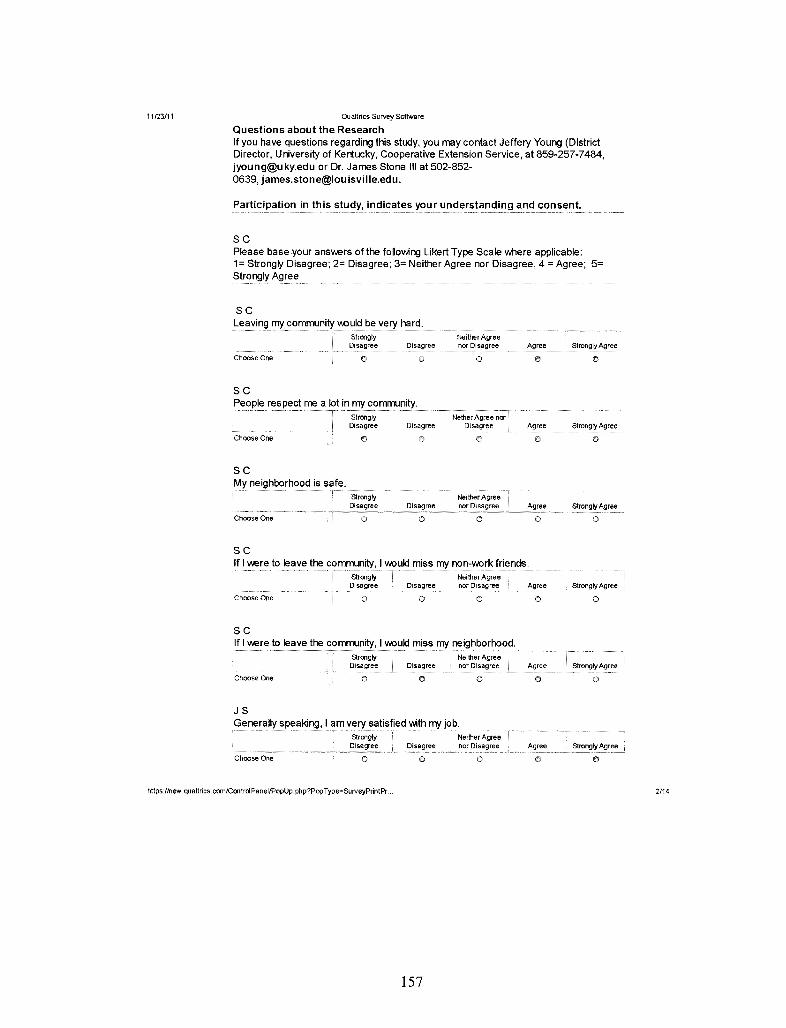
11123/11 Qualtrics Survey Software
Questions about the Research If you have questions regarding this study, you may contact Jeffery Young (District Director, University of Kentucky, Cooperative Extension Service, at 859-257-7484, [email protected] or Dr. James Stone III at 502-852-0639, [email protected].
Participation in this study, indicates your understanding and consent. ~ ,~, -~~
SC Please base your answers of the following Likert Type Scale lM1ere applicable: 1 = Strongly Disagree; 2= Disagree; 3= Neither Agree nor Disagree, 4 = Agree; 5= Strongly Agree
SC Leaving my community \M)uld be very hard.
",~~~,~ - ,-----~- ~--~~~~~-- ~~,~~,----
Choose One
SC
Strongly Disagree Disagree
o
People respect me a lot in my community.
Neither Agree nor Disagree
~,.-~-,.~-- ,- ---,-~~~~~, --~~--.~-~~"--~-~"-,-'""~""~~,,~,-
Choose One
SC My neighborhood is safe.
Strongly Disagree
CJ
Disagree Nether Agree nor
Disagree
o
strongly Neither Agree
Agree
Agree
o
strongly Agree
Strongly Agree
e)
__ ~_~_~~.~_~~~?~~gree .. ~,,, __ ,E.~~~gre~ __ ~~~~~~ree ~ __ ~rongIyAgree~ Choose One o
SC If I were to leave the community, I \M)uid miss my non-\M)rk friends.
Choose One
SC If I were to leave the
Strongly Disagree Disagree
o
Neither Agree nor Disagree Agree Strongly Agree
o
Agree Strongly Agree
Choose One o
JS Generally speaking, lam very satisfied with my job.
Strongly Neither Agree
___ • ____ .,~_. _"._" •• " ___ ~o ___ •• ~"_. __ Disag~e_~,~~~~~ee no!._~~~_~~~~ ___ .~~ __ ~_~gree strongly Agree
Choose One o o
https:llnew.qualtrics.com/ControlPanellPopUp.php ?Pop Type=SurveyPrintPr ...
157
2114
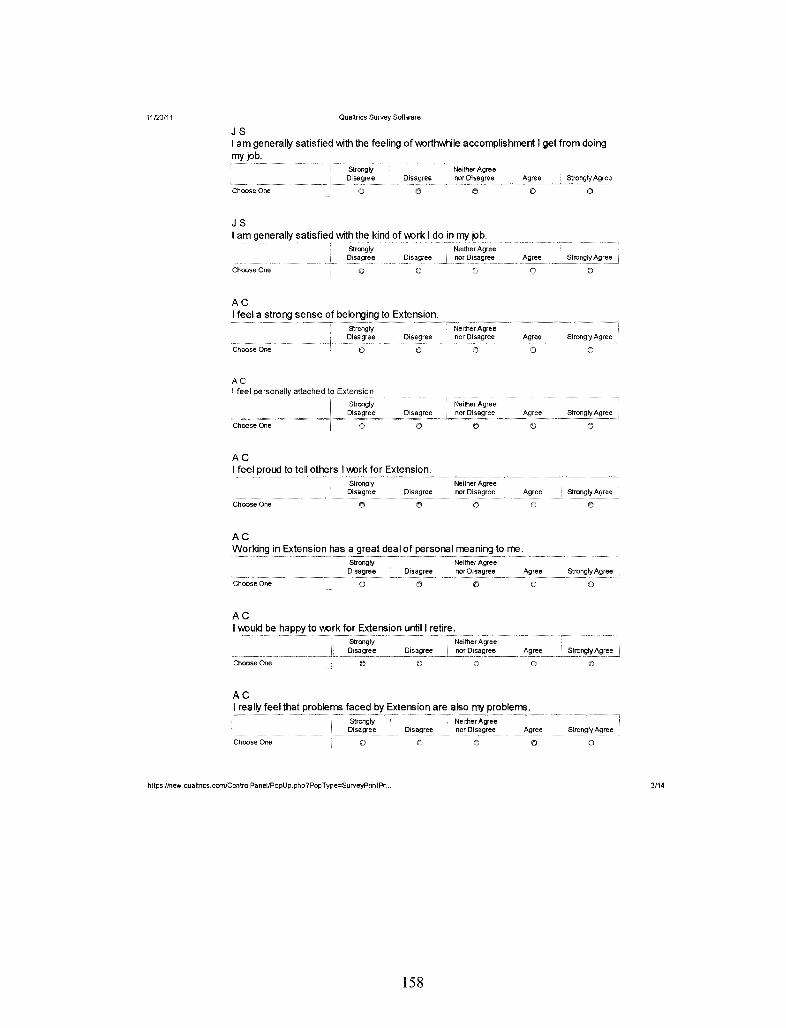
11123/11 Qualtrics Survey Software
JS I am generally satisfied vvith the feeling of \NOrthvvtlile accomplishment I get from doing my job.
Choose One
JS I am generally satisfied vvith the kind of \NOrk I do in my job.
strongly Neither Agree Disagree Disagree nor Disagree Agree
Choose One 0 0 0 0
AC I feel a strong sense of belonging to Extension. -~,---~~-~ ---~~--~~~ --~~~~--,-~
Strongly Neither Agree Disagree Disagree nor Disagree Agree
Choose One () 0 0 0
AC I feel personally attached to Extension
Neither Agree
Choose One 0
AC I feel
Neither Agree Disagree nor Disagree Agree
() 0
AC Working in Extension has a great deal of personal meaning to me. ~~-">----~--.- ,,~--~-~~..,,-, .. "" .--~-"-..... "~ ---. .-." ._ ..... -.-... - " ... -.- ,. -.~-.. ".
Choose One
AC
Strongly Disagree Disagree
Neither Agree nor Disagree
I \NOuld be happy to \NOrk for Extension until I retire.
Choose One
AC
Agree
o
I really feel that problems faced by Extension are also my problems.
Choose One
~-----.-.-~.-"
Strongly Disagree Disagree
o
Neither Agree nor Disagree
o Agree
Strongly Agree
0
Strongly Agr ••
0
strongly Agree
()
Strongly Agree
Strongly Agree
o
https:llnew.qualtrics.com/ControlPanellPopUp.php ?Pop Type=SurveyPrintPr ..
158
3/14
11123/11 Qu altrics Survey Software
F- C. Please continue to base your answers of the follolNing Likert Type Scale: 1 = Strongly Disagree; 2= Disagree; 3= Neither Agree nor Disagree, 4 = Agree; 5= Strongly Agree .-~~~." '". -_ .. - ---_.
Strongly Neither Agree Disagree Disagree nor Disagree
(5 0
FC The weather where I live is suitable for me.
Neither Agree nor Disagree
Choose One 0
match for me.
FC I think of the community where I live as home.
Choose One
FC
Strongly Disagree Disagree
Neither Agree nor Disagree
o
Neither Agree nor Disagree
o
Agree
0
Agree
Agree
Agree
o
Strongly Agree
CI
Strongly Agree ,~
Strongly Agree
o
Strongly Agree
The area where I live offers the leisure activities that I like. (sports, outdoors, cultural, arts)
Choose One
F - 0
strongly Disagree Disagree
Neither Agree nor Disagree Agree
o Strongly Agree
Please continue to base your answers of the follolNing Likert Type Scale: 1 = Strongly Disagree; 2= Disagree; 3= Neither Agree nor Disagree, 4 = Agree; 5=
FO I like the members of my county or district office.
Strongly Neilt1er Agree
j,_~,,_",9~~~~M __ ,,_".~isag~_ nor Disagree Agree Strongly Agree
Choose One o o
FO
https:llnew.qualtrics.comiControlPanel/PopUp.php ?Pop Type.SurveyPrintPr ..
159
4/14
11123/11
FO My Job utilizes my skills and talents well.
" ~,,~- ".- . ~
are similar to me. Neither Agree nor Disagree
o
Neither Agree Disagree nor Disagree +-.. ~.~~-.- ~-.---.-..
Choose One
FO I feel like I'm a good match for Extension.
Choose One
FO
Strongly Disagree Disagree
o
values are I"nrTl",,,,nlt> with Extension's values.
Choose One
FO
Neither Agree nor Disagree
o
Neither Agree nor Disagree
o
for Extension. I can reach ·-·-·:-:-····--,---~~·~-~--~··-~--·--·~N:e-i:~-er-A'g-r-ee
nor Disagree
Choose One o
FO I feel good about my professional groW:h and development.
Neither Agree
Agree
o
Agree
o
Agree
o
Agree
Agree
o
strongly Agree
Strongly Agree '"'----~~~~
Strongly Agree
o
Strongly Agree
o
strongly Agree
o
Strongly Disagree Disagree nor Disagree Agree strongly Agree
•• _~~~_,_." ""~·'~'<"'_H._H.
o
FO I fit with Extension's culture (shared attitudes, values and goals).
Agree Strongly Agree
Choose One
FO If I stay with Extension, I will be able to achieve most of my professional goals. -··--·-----"I"-~Str~~;_-~-·--~~·---··---·"'~"·-·-~N~;th~~ Agre;---~~~--~---·---
I Disagree Disagree nor Disagree Agree Strongly Agree
Choose One o () C)
LO Please choose the ansv.er that best describes you or your situation.
https:llnew.qualtries. eom/ControlPaneI/PopUp.php?Pop Type=SurveyPrintPr ...
160
5114
11123/11 Qualtrics Survey Software
LO How many years have you been in your present position? "~~~ __ ~ ,~~,_"~,~"~"'~_,~m_~ ~~~_~" ___ ,'.~_,~,~~ __ ._~~ ____ ~
LO
0-5
o 6-10
o 11-15 16-20
o 21-25 26-30
o 30-35 35+
o
How many cov.orkers (county or district office) do you interact v.ith on a Vleekly basis?
LO
0-5
o 6-10 11-15
o 15+
How many cov.orkers (at county or district office) are highly dependent on you? •••. ~~ •• ,.~, •.••••• ~,_~. ','~_'M_~ _.~_. ___ ,_._~_~,~~_. ______ , •. ______ '"~ ••• __ ~
0-5
LO
6-10
o 11-15
o
How many v.ork teams (permanent v.ork groups) are you on?
LO
1-2
o 3-4
o 5-6
o
How many v.ork committees (short term v.ork groups) are you on? 1-2 3-4
o 5-6
o
15+
o
7+
e
7+
I[)
L C Please continue to base your ansVlers of the follov.ing Likert Type or Single AnsVler Scale items where applicable: 1 = Strongly Disagree; 2= Disagree; 3= Neither Agree nor Disagree, 4 = Agree; 5= Strongly Agree
LC My family roots are in this community_
Choose One
LC I am currently married.
LC
Yes
o
If married, my spouse works outside the home. Yes
o
LC
No
o
I own the home I live in (mortgaged or outright) . . , -'" "- . --~,~." .. -. --- " .. , .. - .... .
No
o
N1A
e
https:llnewqualtricscomiContrC>PanellPopUp.php 'Pop Type=SurveyPrintPr ...
161
6/14
11123/11 Qualtrics Survey Software
~ ~
LC How many family members live nearby?
0-3
LC
4-6
o
How many of your close friends live nearby?
LC
0-3
o 4-6
How long have you lived in your community? 0-9 years 10-19 years
o
SO
2t}-29 years
6+
o
30+ years ,)
Please continue to base your answers of the following Likert Type Scale where applicable: 1 = Strongly Disagree; 2= Disagree; 3= Neither Agree nor Disagree, 4 = Agree; 5= Strongly Agree
SO I have a lot of freedom in my current job to decide how to pursue my goals.
Choose One
SO
strongly Disagree
o Disagree
o
The benefits of this job are good (retirement, health .. ).
Choose One
SO
Strongly Disagree
o
I feel that people at 'M)rk respect me a . _'"'_'H"_'_'_'_"' __ "' ___ ""~""
Choose One
SO
Strongly Disagree
I 'M)uld sacrifice a lot if I left this job.
Disagree
Disagree
o
Neither Agree nor Disagree
Neither Agree nor Disagree
o
Strongly Neither Agree
Agree
o
Agree
o
strongly Agree
o
strongly Agree
Disag:~~ __ 'M"_"~~~~~~~~:~~~~o~~~:~~~ __ . Agree _~~~.~:.~_ Choose One o
SO My promotional opportunities (Vvithin Extension) are excellent here.
https:llnew.qualtrics.com/ControlPanellPopUp.php?PopType;:;:SurveyPrintPr ...
162
7/14
11123111
Choose One T
SO
QUaltric5 Survey Software ~nonglY
I?!sagree Disagree
()
NelU1er Agree nor Disagree
()
I am VRII compensated for my level of performance.
Choose One
SO The perks on this job are good.
Stroogly
Choose One "', .. ~, ."+ ._.Disagree
SO
Disagree
o
Neither Agree nor Disagree
o
Agree
o
Agree
o
The hea~h-care benefits this nrr"!rli7.,tinn are excellent.
strongly Agree
o
Strongly Agree
o
..... - ....• ~-.----.~.--.--.~--------.----.".---..•.. , .. -,--.,'.--
Choose One
SO
Strongly Disagree Disagree
o
Neither Agree nor Disagree Agree
o
The retirement benefits provided by this organization are excellent.
Disagree
Choose One o
SO
Neither Agree nor Disagree Agree
o
strongly Agree
o
strongly Agree
o
I believe the prospects for continuing employment with this organization are excellent.
Choose One o
I really exert myself to the fullest, beyond what is expected. --'"r·-->-"----"~-·---""----"-"-----"--'---'-'''''-'--·---,--""- ~.~~
,~,~ Strongly Neither Agree Disagree Disagree nor Disagree
Choose One 0 0 0
Agree strongly Agree
DES I finish a job even if it means sacrificing breaks or lunches.
Choose One
DES I do more than is expected of me.
Strongly
https:llnew.qualtrics.com/ControlPaneJ/PopUp.php ?Pop Type=SurveyPrintPr. ..
Neither Agree
163
8/14
11123/11 Qualtrics Survey Soft-Nare ulsagree u!sagree nor ulsagree ...... gree .::::.trongty ..... gree
,·~ ___ ,."_"· ___ ,.N~' ___ ""'_M"_·N'_"_· _____ ~
o o o
DES I voluntarily put in extra hours to achieve a result faster.
Choose One
DES I persist in overcoming obstacles to complete an important task.
Neither Agree Strong~
Disagree Disagree nor Disagree Agree
Choose One
DES I put in extra effort when I find it necessary.
Choose One
DES
Strongly Disagree
o Disagree
."-."~-".-,,--
Neither Agree nor Disagree
o
I work harder than expected to help Extension be successful.
Neither Agree
o
Agree
o
Disagree nor Oi sagree Agree
Choose One
EES I work with intensity on my job.
Choose One
EES I exert
Choose One
EES
~, .. ~.- .. "" ..... --~.-Strong~
Disagree
o Disagree
o
Disagree
Neither Agree nor Disagree
o
Neither Agree nor Disagree
I devote a 10tof~~e~y~0_lT1')'job~ Strong~ Neither Agree Disagree Disagree nor Disagree ----,----,-,-,,-----,----,._,---'"
Choose One o o
<0
Agree
Agree
t)
o
Strongly Agree '" ~,.-.".~-.-~~
strongly Agree
strongly Agree
strongly Agree
Cl
Strongly Agree
httpsJ/new.qualtrics.com/ControlPanellPopUp.php ?Pop Type=SurveyPrintPr ...
164
9/14
11123/11 Qualtrics Survey Software
EES I try my hardest to perform well on my job.
","- , ~'"~ ~.~~~~~-~~ ~ ~- ~
Strong~
Disagree Disagree
Choose One 0
EES I strive as hard as I can to complete my job.
Strongly Disagree
Choose One
EES I exert a lot of energy on my job.
"-.~~"~-.-~~---
Strong~
Disagree
Choose One
EES I am enthusiastic in my job.
Strong~
Disagree
Choose One
EES I feel ener~etic~t rnyjo~~.
Choose One
EES I am interested in
Choose One
EES I am proud of my job.
Choose One
EES
Strong~ Disagree
0
Strong~ Disagree
Strong~
Disagree ,.-"-"-~-~~
I feel positive about my job.
Choose One
EES
Strong~ Disagree
Disagree
0
Disagree
Disagree
0
Disagree
0
Disagree
(')
Disagree
Disagree
https:/Inew.qualtrics.com/ControlPanellPopUp.php?PopType=SulVeypnntPr. ..
165
Neither Agree nor Di sagree Agree
""' ~""~~"" ,~-"~ ""'-,-,,-"-"-""'~-
Neither Agree nor Disagree
Neither Agree nor Disagree
0
Neither Agree nor Disagree
Neither Agree nor Disagree
0
Neither Agree nor Disagree
Neither Agree
~~,~?~p~~,~~,r~e o
Neither Agree nor Disagree
o
0
Agree
0
Agree
0
Agree
Agree
0
Agree
0
Agree
(')
Agree
o
Strongly Agree "~-,--,---"-~,-
0
Strongly Agree
0
Strongly Agree
(')
Strong~ Agree
Strong~ Agree
0
Strong~ Agree
0
Strongly Agree
o
Strongly Agree
10/14
11123/11 Qualtries Survey Soft'Nare I reel eXCllea aOOUl my JOO.
Choose One
EES
Strongly Disagree
At \NOrk, my mind is focused on my job.
Choose One
EES
Strongly Disagree
Disagree
Disagree
At \NOrk, I focus a great deal of attention on Strongly Disagree Disagree
Choose One
EES At I'm absorbed in my job.
Strongly Disagree Disagree
Choose One 0 e;
EES At \NOrk, I concentrate on my job.
Neither Agree nor Disagree
o
Neither Agree nor Disagree
Neither Agree nor Disagree
Neither Agree nor Disagree
0
Strongly Neither Agree Disagree Disagree nor Disagree
00"." •••• 0." ••• _ ••••••• __ ~ .• ~. _~ ___ ~ __ "0 •• _". __ .~"
Choose One
EES At
Choose One
ITS
o
o
Neither Agree nor Disagree
()
Agree
o
Agree
0
Agree
0
Agree
o
Agree
o
Strongly Agree
Strongly Agree
0
Strongly Agree
0
Strongly Agree
()
Strongly Agree
e>
For the folloVving questions, please choose the answer that best applies: 1 = Strongly Disagree; 2= Disagree; 3= Neither Agree nor Disagree, 4 = Agree; 5=
Strongly Agree
ITS In the past, it \';Quid have been easy to find a job that \';Quid make me consider leaving Extension.
Choose One
ITS
Strongly Disagree
o Disagree
Neither Agree nor Disagree
o Agree strongly Agree
~~ ~~- ~-~- -~,,~ ~ .. -~-... "- ---- ~-"~
o
II \NOuldbe easy !o fil'l~~job ~w.I~,:to~sJ!()()~_~f"lC)~g~~()_'?onsider leavi~~LExtension.:.
hltps:llnew .qualtrics. comlControl PanellPopUp. php ?Pop Type=SurveyPrintPr ...
166
11/14
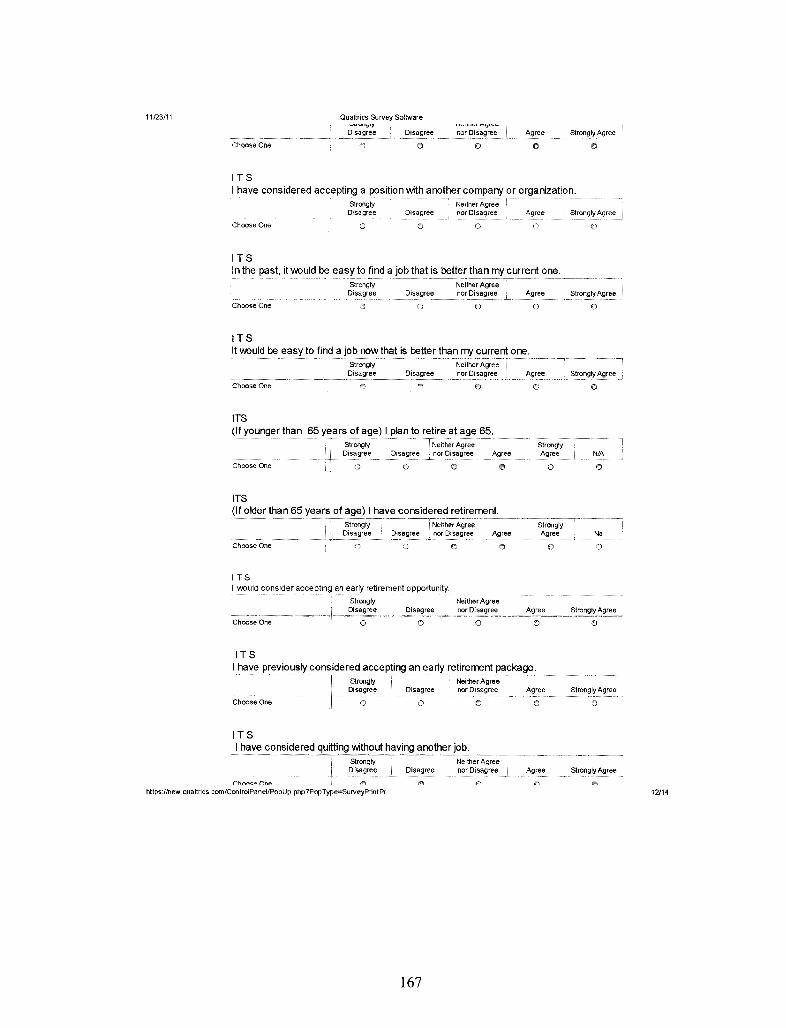
11123/11 Qualtrics Survey Software
Disagree Disagree nor Disagree Agree strongly Agree
a o
ITS I have considered accepting a position with another company or organization.
~~ . .. ._. .~
Choose One
ITS
Stroogly Disagree Disagree
o
Neither Agree nor Disagree
o Agree
()
In the past, it would be easy to find a job that is better than current one.
Choose One
ITS
Strongty Disagree
o Disagree
Neither Agree nor Disagree
o Agree
o
It would be easy to find a job now that is better than my current one.
Choose One
ITS (If younger than 65 yea rs of age) I plan to retire at age 65.
Choose One
ITS
ITS
Strongty Disagree
Neither Agree Disagree nor Disagree Agree
o
I have considered retirement. Neither Agree
Disagree nor Disagree Agree
I would consider accepting an early retirement opportunity.
Neither Agree
Agree
Stroogly Agree
o
Strongty Agree
Strongly Agree
Strongly Agree
a
Strongty Agree
o
NlA
Na
o
Strongly Disagree Disagree nor Disagree Agree Strongly Agree
'"-~"'~".,~~- "~,, '"~ -~~- ._- -----"'---,---~~,~~ .. ,----Choose One o o o
ITS I have previously considered accepting an early retirement package .
. ~ ~.. I g;;~~f~- DiSag~:e~ ~~~~~::g::: ~ Agree Strongly Agree
a Choose One o o o
ITS I have considered
-':-'T"'C-~"~"'~"-
Agree Strongly Agree
rhfY'lc:: ... n,.,... P'I
https:iinew.qualtrics.comiControiPanellPopUp.php ?Pop Type=SurveyPrintPr ..
167
12114
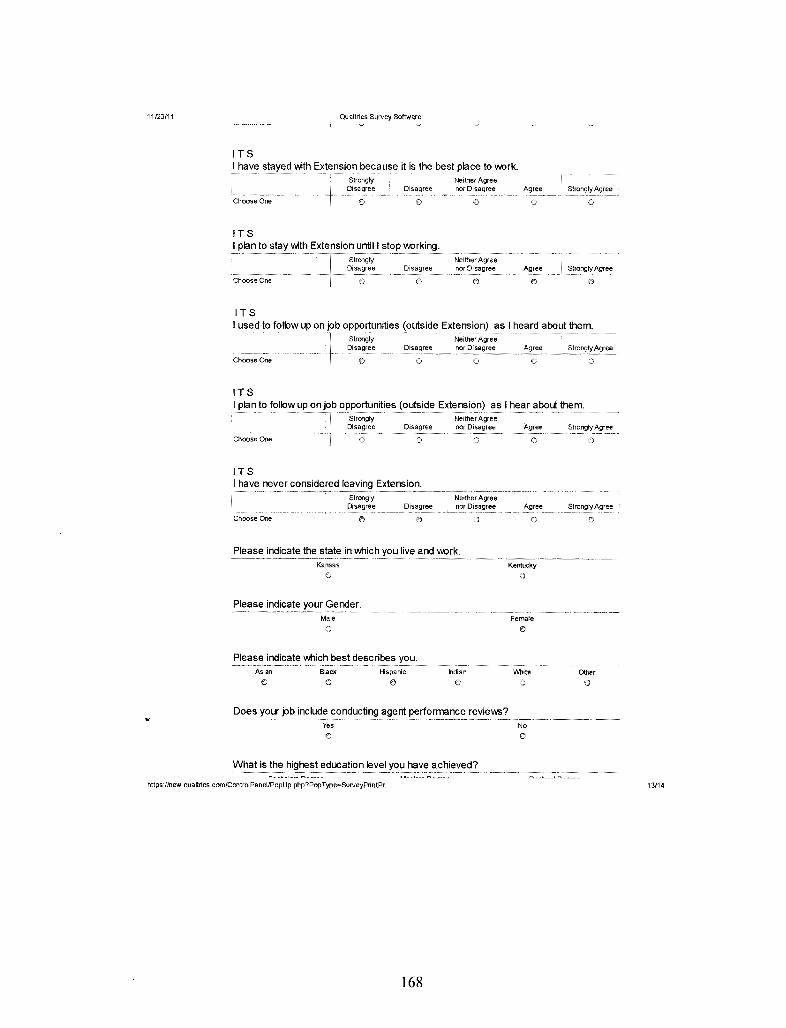
11123/11 Qualtries Survey Software
ITS I have stayed with Extension because it is the best place to V1K>rk.
ITS
Strongly Disagree
o Disagree
o
I plan to stay with Extension until I stop V1K>rking.
Choose One
ITS
Strongly Disagree Disagree
()
Neither Agree nor Disagree
Neither Agree nor Disagree
Agree
Agree
o
Strongly Agree
o
Strongly Agree
opportunities (outside Extension) as I heard about them. Neither Agree
Disagree nor Disagree Agree Strongly Agree
Choose One o
ITS I plan to follow up on job opportunities (outside Extension) as I hear about them.
Disagree
Choose One o
ITS I have never considered leaving Extension .
Choose One
• ~"'''.-"'-, .. ,""'-, ~ ""T-'~'~-""
Strongly Disagree
iC)
Please indicate the state in which Kansas
o
Please indicate your Gender. Male o
Disagree
Please indicate which best describes you. Asian Black
o Hispanic
Neither Agree nor Disagree
o
Neither Agree nor Disagree
Indian
Does your job include conducting agent performance review.;? • __ • _______ " .• __ ._~_ ... _ .. _._" ___ •• "~,,_'"_~ __ •• _. ,_~~.»h~_~.C. __ • .. ______ ~ •.• _ .. ~._ •.
Yes
What is the highest education level you have achieved? ~~~ ~,~~ __ ~, '''''~_ ~ "'"W""~_" __ ,_,~o,," __ '"_u~ •• _,,~ '"_ " _"~_"
Agree
Agree
o
Kentucky
0
Female
0
White 0
No
Strongty Agree
Strongly Agree
OIher
0
https:llnew qualtrics. com/Contre> PaneliPopUp.php ?Pop Type=SurveyPrintPr ..
168
13/14
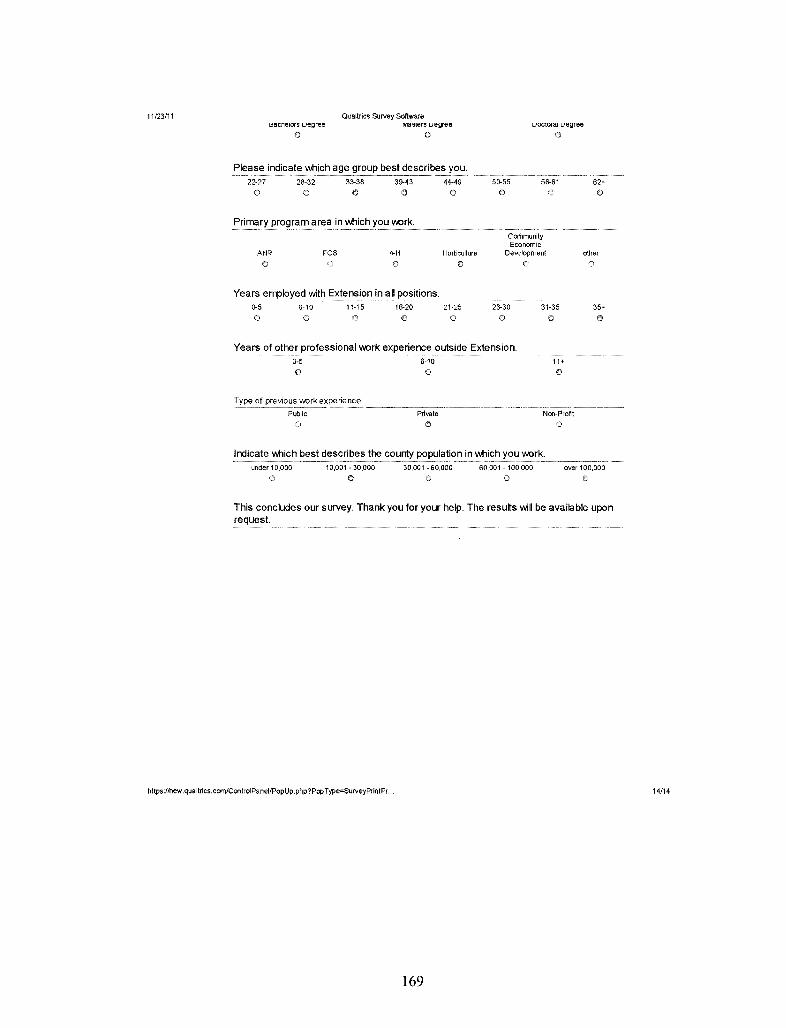
11123/11 t::Il:1cnelors uegree
o
Please indicate which
Qualtries Survey Software MI:ISlers uegree
o
.~~~~.~~.-~~~.--~-.-.----.--~-.-..... 22·27
C)
ANR
28-32
0 33-38
C!
FCS
39-43
0
oork.
4-H
0
Years employed with Extension in all positions. 0-5 6·10 11·15
C! 16-20
o
44-49
0
Horticulture
0
21·25
o
50-55
0
uQC[oral uegree ()
56-61
0
Community Economic
62+
0
Development other
26-30
o 31-35
0
35+
Years of other professional oork experience outside Extension. 0·5
o
Indicate lMlich best describes the under 1 0,000 10,001·30,000
o
6·10
Private (')
30,001 ·60,000
o
11+
o
Non-Profit
o
oork. 60,001 ·100,000 over 100,000
o
This concludes our survey, Thank you for your help. The resu~s will be available upon request.
https:llnew.qualtrics.com/ControlPanellPopUp. php?Pop Type=SurveyPrintPr. ..
169
14/14
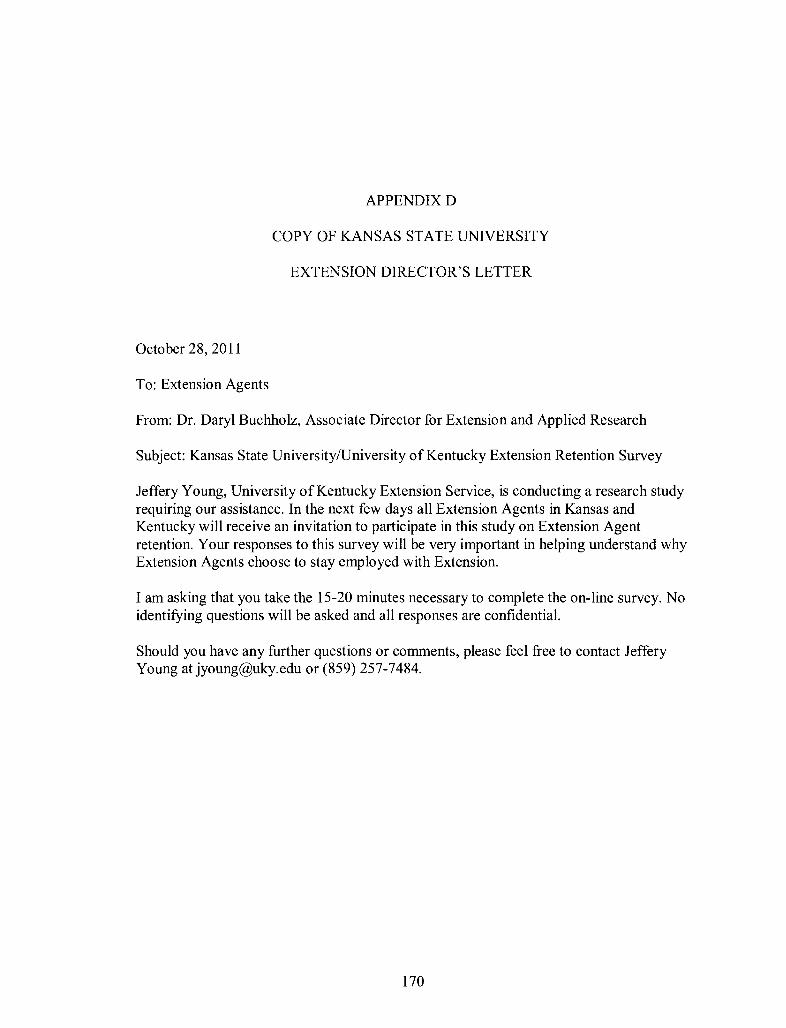
APPENDIXD
COPY OF KANSAS STATE UNIVERSITY
EXTENSION DIRECTOR'S LETTER
October 28, 2011
To: Extension Agents
From: Dr. Daryl Buchholz, Associate Director for Extension and Applied Research
Subject: Kansas State University/University of Kentucky Extension Retention Survey
Jeffery Young, University of Kentucky Extension Service, is conducting a research study requiring our assistance. In the next few days all Extension Agents in Kansas and Kentucky will receive an invitation to participate in this study on Extension Agent retention. Your responses to this survey will be very important in helping understand why Extension Agents choose to stay employed with Extension.
I am asking that you take the 15-20 minutes necessary to complete the on-line survey. No identifying questions will be asked and all responses are confidential.
Should you have any further questions or comments, please feel free to contact Jeffery Young [email protected] or (859) 257-7484.
170
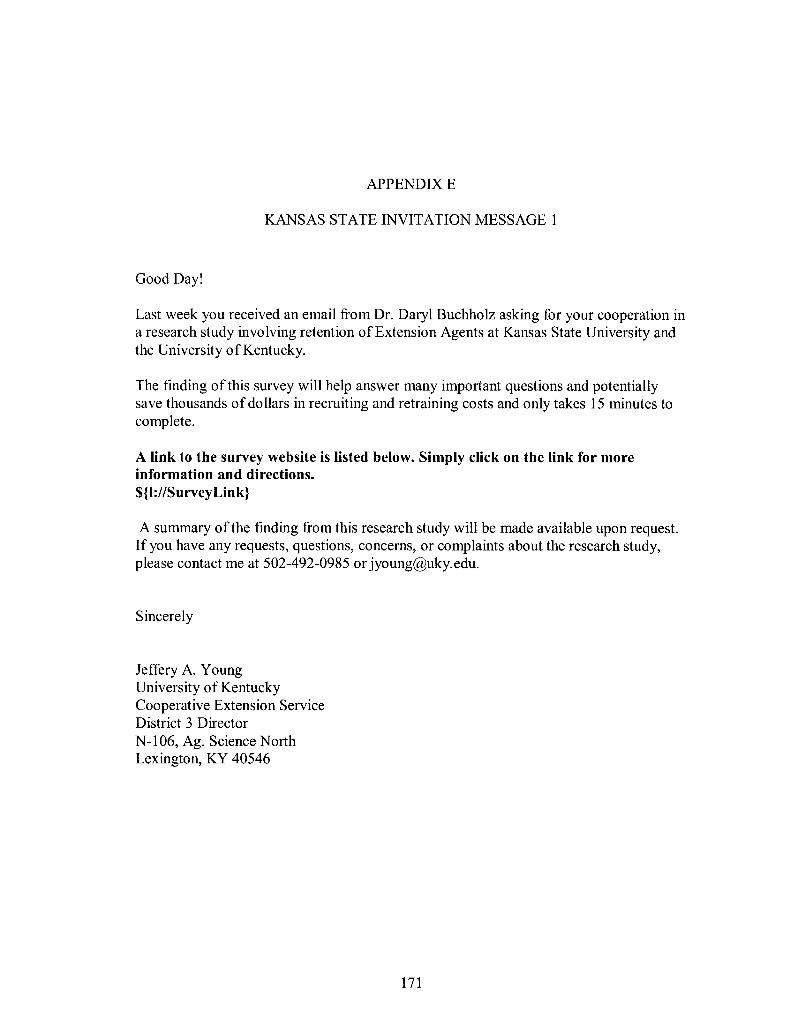
APPENDIX E
KANSAS STATE INVITATION MESSAGE 1
Good Day!
Last week you received an email from Dr. Daryl Buchholz asking for your cooperation in a research study involving retention of Extension Agents at Kansas State University and the University of Kentucky.
The fmding of this survey will help answer many important questions and potentially save thousands of dollars in recruiting and retraining costs and only takes 15 minutes to complete.
A link to the survey website is listed below. Simply click on the link for more information and directions. ${I:IISurveyLink}
A summary of the fmding from this research study will be made available upon request. If you have any requests, questions, concerns, or complaints about the research study, please contact me at 502-492-0985 or [email protected].
Sincerely
Jeffery A. Young University of Kentucky Cooperative Extension Service District 3 Director N-106, Ag. Science North Lexington, KY 40546
171
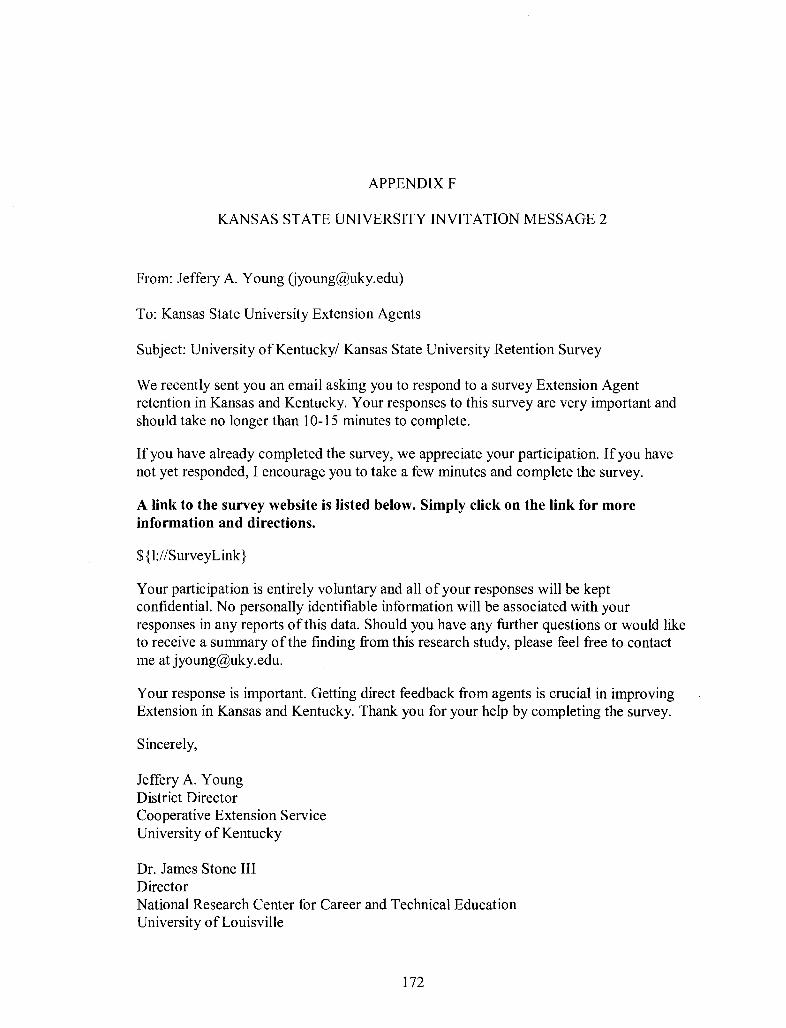
APPENDIX F
KANSAS STATE UNIVERSITY INVITATION MESSAGE 2
From: Jeffery A. Young [email protected])
To: Kansas State University Extension Agents
Subject: University of Kentuckyl Kansas State University Retention Survey
We recently sent you an email asking you to respond to a survey Extension Agent retention in Kansas and Kentucky. Your responses to this survey are very important and should take no longer than 10-15 minutes to complete.
If you have already completed the survey, we appreciate your participation. If you have not yet responded, I encourage you to take a few minutes and complete the survey.
A link to the survey website is listed below. Simply click on the link for more information and directions.
$ {1:IISurveyLink}
Your participation is entirely voluntary and all of your responses will be kept confidential. No personally identifiable information will be associated with your responses in any reports ofthis data. Should you have any further questions or would like to receive a summary of the fmding from this research study, please feel free to contact me at [email protected].
Your response is important. Getting direct feedback from agents is crucial in improving Extension in Kansas and Kentucky. Thank you for your help by completing the survey.
Sincerely,
Jeffery A. Young District Director Cooperative Extension Service University of Kentucky
Dr. James Stone III Director National Research Center for Career and Technical Education University of Louisville
172
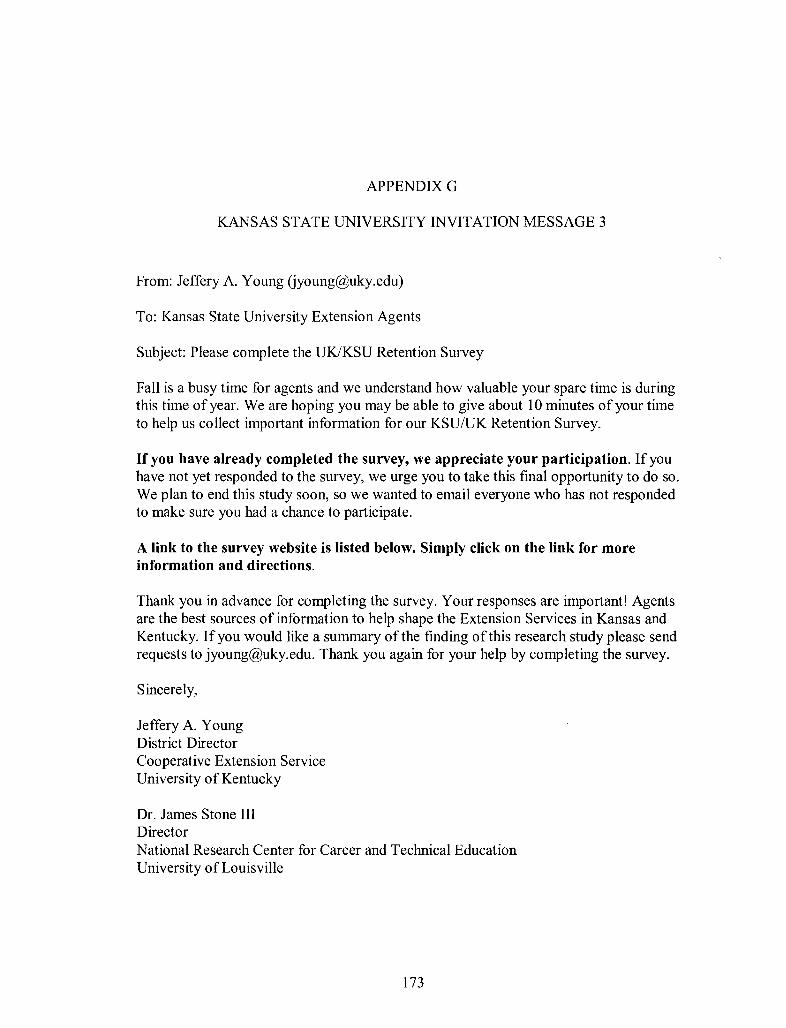
APPENDIXG
KANSAS STATE UNIVERSITY INVITATION MESSAGE 3
From: Jeffery A. Young [email protected])
To: Kansas State University Extension Agents
Subject: Please complete the UKlKSU Retention Survey
Fall is a busy time for agents and we understand how valuable your spare time is during this time of year. We are hoping you may be able to give about 10 minutes of your time to help us collect important information for our KSU/UK Retention Survey.
If you have already completed the survey, we appreciate your participation. If you have not yet responded to the survey, we urge you to take this [mal opportunity to do so. We plan to end this study soon, so we wanted to email everyone who has not responded to make sure you had a chance to participate.
A link to the survey website is listed below. Simply click on the link for more information and directions.
Thank you in advance for completing the survey. Your responses are important! Agents are the best sources of information to help shape the Extension Services in Kansas and Kentucky. If you would like a summary of the finding of this research study please send requests to [email protected]. Thank you again for your help by completing the survey.
Sincerely,
Jeffery A. Young District Director Cooperative Extension Service University of Kentucky
Dr. James Stone III Director National Research Center for Career and Technical Education University of Louisville
173

APPENDIXH
KANSAS STATE UNIVERSITY INVITATION MESSAGE 4
From: Jeffery A. Young ([email protected])
To: Kansas State University Extension Agents
Subject: Please complete the UKlKSU Retention Survey
Fall is a busy time for agents and we understand how valuable your spare time is during this time of year. We are hoping you may be able to give about 10 minutes of your time to help us collect important information for our KSU/UK Retention Survey.
If you have already completed the survey, we appreciate your participation. If you have not yet responded to the survey, we urge you to take this [mal opportunity to do so. We plan to end this study soon, so we wanted to email everyone who has not responded to make sure you had a chance to participate.
A link to the survey website is listed below. Simply click on the link for more information and directions.
Thank you in advance for completing the survey. Your responses are important! Agents are the best sources of information to help shape the Extension Services in Kansas and Kentucky. If you would like a summary of the finding of this research study please send requests to [email protected]. Thank you again for your help by completing the survey.
Sincerely,
Jeffery A. Young District Director Cooperative Extension Service University of Kentucky
Dr. James Stone III Director National Research Center for Career and Technical Education University of Louisville
174
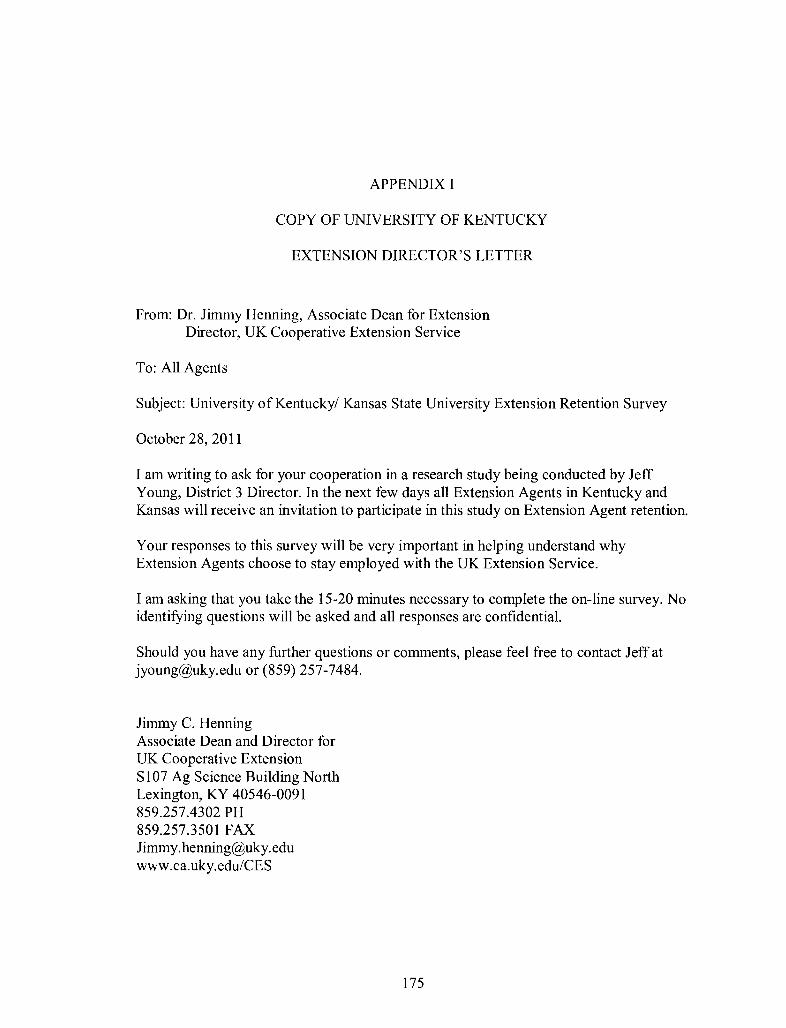
APPENDIX I
COPY OF UNIVERSITY OF KENTUCKY
EXTENSION DIRECTOR'S LETTER
From: Dr. Jimmy Henning, Associate Dean for Extension Director, UK Cooperative Extension Service
To: All Agents
Subject: University of Kentucky/ Kansas State University Extension Retention Survey
October 28,2011
I am writing to ask for your cooperation in a research study being conducted by Jeff Young, District 3 Director. In the next few days all Extension Agents in Kentucky and Kansas will receive an invitation to participate in this study on Extension Agent retention.
Your responses to this survey will be very important in helping understand why Extension Agents choose to stay employed with the UK Extension Service.
I am asking that you take the 15-20 minutes necessary to complete the on-line survey. No identifying questions will be asked and all responses are confidential.
Should you have any further questions or comments, please feel free to contact Jeff at [email protected] or (859) 257-7484.
Jimmy C. Henning Associate Dean and Director for UK Cooperative Extension S107 Ag Science Building North Lexington, KY 40546-0091 859.257.4302 PH 859.257.3501 FAX [email protected] www.ca.uky.edu/CES
175
APPENDIXJ
UNIVERSITY OF KENTUCKY INVITATION MESSAGE 1
Good Day!
Last week you received an email from Dr. Jimmy Henning asking for your cooperation in a research study involving retention of Extension Agents at Kansas State University and the University of Kentucky.
The fmding of this survey will help answer many important questions and potentially save thousands of dollars in recruiting and retraining costs and only takes 15 minutes to complete.
A link to the survey website is listed below. Simply click on the link for more information and directions. ${I:1 IS urvey Link}
A summary of the fmding from this research study will be made available upon request. If you have any requests, questions, concerns, or complaints about the research study, please contact me at 502-492-0985 or [email protected].
Sincerely
Jeffery A. Young University of Kentucky Cooperative Extension Service District 3 Director N-106, Ag. Science North Lexington, KY 40546
176
APPENDIXK
UNIVERSITY OF KENTUCKY INVITATION MESSAGE 2
From: Jeffery A. Young ([email protected])
To: University of Kentucky Extension Agents
Subject: University of Kentuckyl Kansas State University Retention Survey
We recently sent you an email asking you to respond to a survey Extension Agent retention in Kansas and Kentucky. Previous responses show that this survey takes no longer than 10-15 minutes to complete.
If you have already completed the survey, we appreciate your participation. If you have not yet responded to the survey, we encourage you to take a few minutes and complete the survey.
A link to the survey website is listed below. Simply click on the link for more information and directions.
Your participation in the survey is entirely voluntary and all of your responses will be kept confidential. No personally identifiable information will be associated with your responses in any reports of this data. Should you have any further questions or would like to receive a summary of the finding from this research study, please feel free to contact me [email protected].
Your response is important. Getting direct feedback from agents is crucial in improving Extension in Kansas and Kentucky. Thank you for your help by completing the survey
Sincerely,
Jeffery A. Young District Director Cooperative Extension Service University of Kentucky
Dr. James Stone III Director National Research Center for Career and Technical Education University of Louisville
177

APPENDIX L
UNIVERSITY OF KENTUCKY INVITATION MESSAGE 3
From: Jeffery A. Young ([email protected])
To: University of Kentucky Extension Agents
Subject: Please complete the UKlKSU Retention Survey
Fall is a busy time for agents and we understand how valuable your spare time is during this time of year. We are hoping you may be able to give about 15-20 minutes of your time to help us collect important information for our KSU/UK Retention Survey.
If you have already completed the survey, we appreciate your participation. If you have not yet responded to the survey, we urge you to take a few minutes and complete the survey. We plan to end this study soon, so we wanted to email everyone who has not responded to make sure you had a chance to participate.
A link to the survey website is listed below. Simply click on the link for more information and directions.
Thank you in advance for completing the survey. Your responses are important! Agents are the best sources of information to help shape the Extension Services in Kansas and Kentucky. If you would like a summary of the finding ofthis research study please send requests to [email protected]. Thank you again for your help by completing the survey.
Sincerely,
Jeffery A. Young District Director Cooperative Extension Service University of Kentucky
Dr. James Stone III Director National Research Center for Career and Technical Education University of Louisville
178

APPENDIXM
UNIVERSITY OF KENTUCKY INVITATION MESSAGE 4
From: Jeffery A. Young [email protected])
To: University of Kentucky Extension Agents
Subject: Please complete the UKJKSU Retention Survey
Fall is a busy time for agents and we understand how valuable your spare time is during this time of year. We are hoping you may be able to give about 10 minutes of your time to help us collect important information for our KSU/UK Retention Survey.
If you have already completed the survey, we appreciate your participation. If you have not yet responded to the survey, we urge you to take this [mal opportunity to do so. We plan to end this study soon, so we wanted to email everyone who has not responded to make sure you had a chance to participate.
A link to the survey website is listed below. Simply click on the link for more information and directions.
Thank you in advance for completing the survey. Your responses are important! Agents are the best sources of information to help shape the Extension Services in Kansas and Kentucky. If you would like a summary of the finding of this research study please send requests to [email protected]. Thank you again for your help by completing the survey.
Sincerely,
Jeffery A. Young District Director Cooperative Extension Service University of Kentucky
Dr. James Stone III Director National Research Center for Career and Technical Education University of Louisville
179

APPENDIXN
NIF A LAND-GRANT COLLEGES AND UNIVERSITIES MAP
180
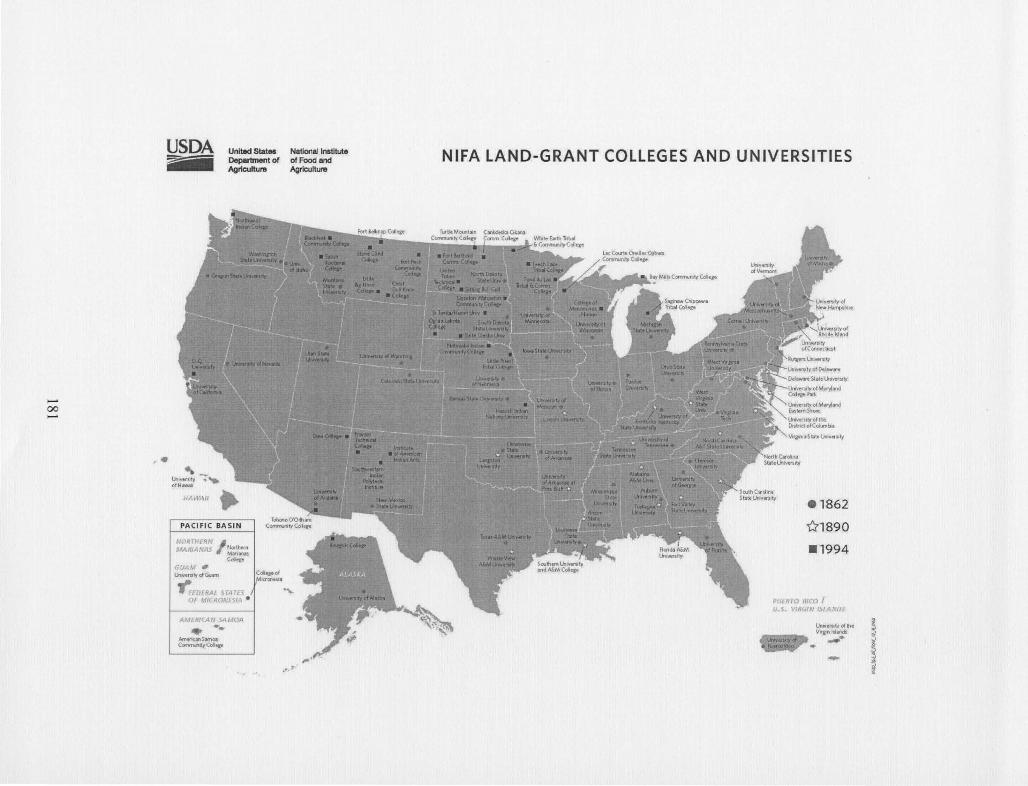
...... 00 ......
!LSDA United States Department of Agriculture
,. HAI-'t&,\"
PACIFIC BASIN
NORTHERN MARIANAS
(iUAM .. lXIivfflItyotGuam
Northern MarIanas College
~FfJERAI fTATES Of MJCI{ONfSIA •
AMI:.RtCAN SAMOA . ... Am!ri(;m Samoa ComrtU'lilyColI~
Colie-geof Mlaa'l6.S1a
National Insmul8 of Food and Agrlcu~ure
.,.~
NIFA LAND-GRANT COLLEGES AND UNIVERSITIES
. 1862
tr1890
.1994
PUi:Rro RICO I 1../.5. V:R<JIN I.SLANOS
Um"er:sltvof Ihe VU'i\nISlands _. -
~ .'
i i
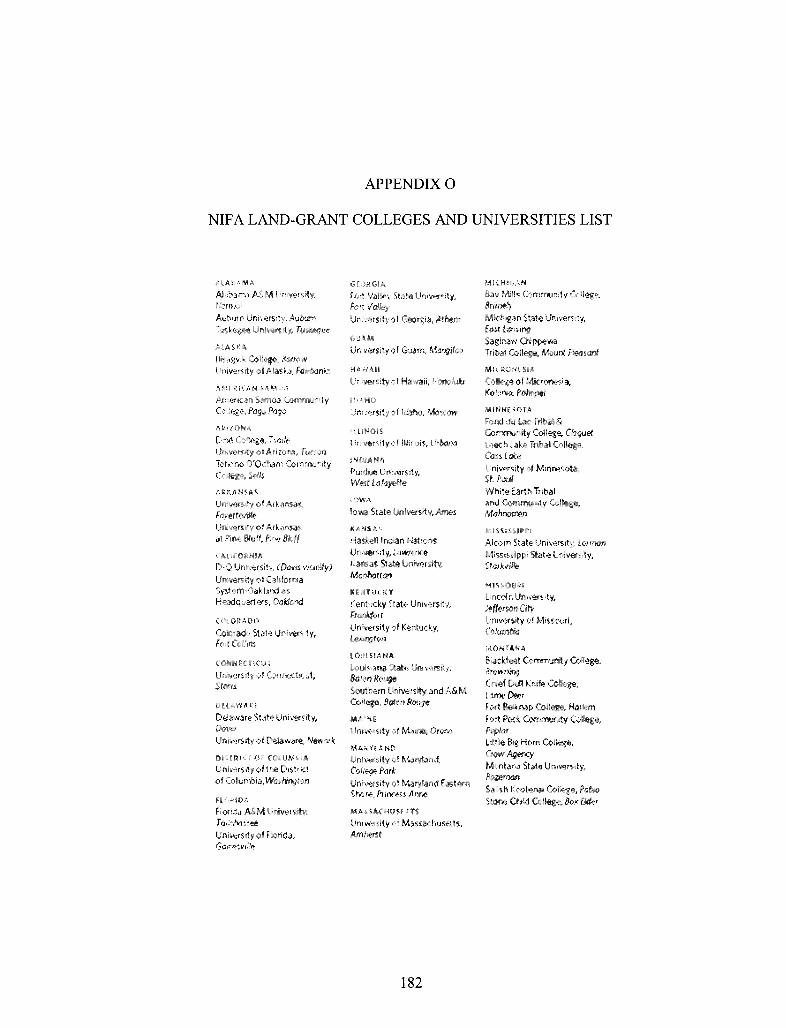
APPENDIX 0
NIF A LAND-GRANT COLLEGES AND UNIVERSITIES LIST
Uni'/8f5 fty 'et Ark""s;)'!" F(l't'I!Jftf"ld'e
i
Uni"",srty 01 C)n1'fl8{tlC1<i,
[).;,1"W~'13 $~,lt'" Uni,.~l,ity, 07:tV€>:f
lfrdwlrs,1y <II [}'sbWij'oa, N'lw*"k
l;r,,,,,rs ,I Y 1~1! t hi'! DIS! ",1
"j Coi.umbia, WQ:r"I>:/ton
fk,nda MM Uri,versrty, Tallar.:n,.ee Vf,i''''Srly "I 'lQnd,), Gorrw:!,vrt~
IJni~"~'H'-Sity.
.'Ve:t Lafayette
ti!lr~rtity, [<lwr~rk:!l'
l:am.s:<l5 S1~I;t Uni,"lIr5ity, I\'l.(l~tf,;;"
1::entlJd" Stilt" Ij nll';f$lt)', Ff6ot:(orr Un'~r$itl'of leXington
louiSta~ Stat" U", YBrslty, I14ton f/:1)i,K}1'I
>'''<Jthem Uni~lt)' and A.'1M Colieg<:, 8atM Rooge
Lln;v",r~lty of Maryl"n,;!, Ccdl~Park
University cf Massachusell$, ,4mllilr~t
182
Sagmaw Chl~wa Tribal Glllleg<:, Mowt PI>!l'31<W
Fq.rd du lac Tno,,; &. C.ommun,ity C,41.;,ge. Cloquet: l~~h l~b; Tno"IGllII.;,ge, ellS tate Unive,~ity 01 M,n"'!!sold, Sf PooI While tdrtl't ToM! ~I'ld M<rhnome:n
Alcorn State tini\'ersrty, [orman MiSSfs"ppi ~at" lIfllV€l'S,ly, Sfa.rkville:
Linc01 n Univer-s:ily, jYpftl!r'A~" City Unt\l\lf$ity 01 M,,$ourl, CO,~i111/li<1
BJ".:kloot C"''''''''''ccrtty GIIlleg'!l, S'rowrn"9 (tlei Dd! Kmfe (,:ll~'" L1roo~1 fe.rl £I"";I:ndP GlllI~. Hllrfem Fort ~~ Ulmf!'iil.'fllfty Coir.;,g'l, Popll.lf Utile Big Hom C"jf~;;(I, em"" AgffiL" Montana StaiB Univer'>ity. 80l~n
Sah~h Koo\;!nar C(.II.;,ge, Pate,l, StON! Ctrlid GllII~, l!1;\< [Ide!
S.:nj1h'i\r€tEt~m
kr::titute.
lj,C"'"8rs4y, (;!~$ooro Car(,!iffaSlate
Rak?lgfl
Tcrtt'))
N<>rth tta>:>:!! a S.tate FO!go Sittmg Butl C"I'~e, Tur\l~ M<",!(,tain Commuo.ty
N.)rth"m Marlana5 C(,I[~~. eM
()Uarmrli! S'ate Uni\~,t"., S~i:IJ~'l:1~¢J
PenrJS)+¥Jfba Stat"? Un,'\!~N:!ty, Vnl~'!flity p'lr~
tJnPM''!>lty 01 Rhode 1~J,3nd,
i:~']llorl
I/IA
i)ni',>?,I$ity, Clermon 5<;.I.,t h CarolIna Stat<:l \Jnlveor' ~it'(, C'(l"!l¢t\1rg
Efl.;1~!,,,rrt>
5",t" G ieska Uni\,<:lf$ ,tV. !?¢~d
G"mrrul,nrr', C,(.I~"" SGI>!'lv1f 5<;.~h Dal1)1a State 1j,,,,,,,,,,,1y. BroohfY,/5
UnI\4:rslty Qj r"'fl"",s~ee, rro,I'I·,fl"
P,,a,ri<i V¥iI;w A.&M l;f\;"<il$,ty, V.'ew A&M l!ni .. "r5i!y,
Co.'!e9,,5!attoJl
183
lffli'IB,~,lty .:,t V<lrmoht. a-tJf~n;I()')
IJllf,tute W""slVirgmia M.;>rgatlt" .. m
l,.c COurl,. Or""!;",, Ojibwa, C)rrmunity College, Hayward
WI£C¢r{5!h"
APPENDIXP
NIF A Salary Analysis of Cooperative Extension Service Positions
~ aa.&..DJ'a c. ~ ~...-xm. ~ 'bbl.. 2
_u ---~ ----...--......... -aa:uuu ....... aT EtcIIIIl&y .... r.-.. ~ ...... '!:UH QiII' .....-:1131 -2010
...,..... - - CJ!ID&LS, ._
.. _ .. __ .---.......... __ ... ..---------------_ .. _- .. _-.. _ ... _ .. __ .... - ---_ .. _ .. _--...... ... ... .. ,.. nt ... .... &lIII .. - ...,. """ 'PI -- -.. Ill. - :n.001> *l.U'! U.'21 U ".U:II 1<I.M2 W.2M H <12.23 ".Hl H.1M! 1'1: fU.'IU 11 Dl ........ <I2.MS "'.'21 , •• US n y.t~ UO.,", ".222 a n.," U'.:~U lU.tI&7 1't ".U<I 1. 20
JIIU'- «.000 ".0. ".Ut u 52.000 101.7&0 ft._ H &7.!. t<l.771 71.UO a "'.Nli u SI _ .... sa.ooo n._ ".1I~ 11 St.l:K ".'" !iolN H Mt.US 11 ., - 100.001> 110._ 1OS. '00 2t "0.00 11'.700 1' 0S» U ..100 UI.700 n.m 11 .. ,.- a lil -- ".100 '71._ ".'toot no H.lOO 10't._ SI._ 11 54. coo '4.700 ,..- U tH._ l' us
~lc.vt y ••• U._ 51.'" 14 U.I" U<I • .,J ".17& lG H.aU1U._ fIt._ a .... - 20 ~ - ".lU 75.0I2JII H.1" l' y.tH 1!I.Hl 71.sn 11 !II.'. 101 •• ' 77 .... H .... ut U U Dl:RII%C."Sl a»" cm.v SII ..... n .•• " •• toot 1<1 11.S7$ .2.,.. :M.1In U
U au. »<I u 10 -- n . .ol> .,.w. «.U1 n ".US 14' •• " ... ttl U !II.2!111 11&._ 'tS 01H 112._ l' -- st.OOO ".- U.UIt l' ,..0. '2._1 H._ t? H.'M ".'M! a o'" U .... 'tU " 25. _ .
... au n. _ ... tto U h.O" 100._ 'tS.Uf U tH.U.ll 10$ •• ' tn._ 11 a" •. _ u u - ".UI st._ ... OU 1S SII.Oi12: I ..... w._ 11 Sf. 5<12 . .. ..., -.* U -.- 11 ,t .......... ".n' 1"._ st.SH U ".000 UO.f4! _ou.s 1't ".1t!! ".- a._ 11 ••. ut 11 D' - SI.US 5'1.tt., 0.'" 1. 25.'1H 'O.lIS !t.2U 11 U,l" H._ P.- tt tH.M.!I til -~ 11.1211> 1't._ 56.1S11 U H.OOO 10 •••• "otH 20 ll'._ ,..- ... U7 11 -.- ,.1 14) - !!.ooo. .S.Sh ".020 U SII._l0 •• ttl W._ U H.ua 1&.- H._ 11 fU._ 20 :I,U - 11.001> *1._ u.no 11 :$2.'00 at,"''' 56._ 11 t,.t!II .. ,ttS M.!t1 U .... 'tS'7 11 ~. -...- !I. 000 '1,221 ",S57 U :12 .... I",ns !iolSfl IS ".1.., u .•• ".1!1! ,. fU •• ' 25 2n - ... au sa,_ 52.2f1 1* 21.112 IS."" a._ it H.n. 1 .... 1 71._ :12 au._ tt ~ .......- 56 .... ".- 56.501 it H.U! u.a .. ...... 11 n._ n .• 71._ U -.- tt 2' •· .. "_u. tt.toll> 10._ ".Ito HI !I4!.SOO lOS •• •• 121 20 -.'" 10.721 •• 72' U '''''.472 it • ... ~ !!.'" M._ S1.1U 1& M.OOO 10 •• _ !i.'" 17 &l.'N ,t •• ' 12._ 11 ,U._ l' --- SI.UII "'. 'tS'7 Y.'IO it ".000 ..... , p.lIn 11 •• Ut u .... a.IU 11 ..., .... n 151
KlMl:UQIlrI% !I.OO,", A.OH H •• f! 1. _.000 n.,., !t.102 it H.''/!! n .•• a .... H .... is' 11 U4 ... -. D . ." n._ ".U! u S't. ,. ... -lito_ 11 ".212 7S •• ' W oSS1i 11 fU.t1t is :I2lI - n.oo • • 1.- l2.ua 11 6.'25 ... ., ... '12' U .... - .. '" - SII.n:lt .'.- n.lu it M.200 lU •• U "oSU 20 4.1.'21 'D.:Ii., M.'lIS t't au.2U 20 1JII - n,51S 51._ &1.IH n H.ID UII._ a ..... H ..... .:1 .... ".- it fIt._ 11 U -- U.lOCI ».- ... su 11 Y.I., t&.no ".- 11 71.!!O u._ n._ n _.IM tt ., -- 17.1. U •• n1 ",1'12 20 11. ISO ... -"'.122 11 au.n • n liS _ 1IIIIaCD n.n' n. _
!I.1D t' H.ln ".- "'.111 20 11.'. U._ ct._ it au .... l' 1& -- :ltt.ooo N._ H.,.S 1& 2I.S". 2Ot.tU Sf. au D !II.GOO :to •• " K.K' 11 tH.U' l' stt -- n.Mt .,.,- ...... n S't,t"10~.'" M.IN 11' ".U' ".- _.ft. l' fU." t, .1
-"""""'" ».100 ".- ta •• t! to M._ 'S,M' H._ 11 .7. I,/!! n.PI ftoS'S 17 .".- 20 D4 ""0 :n.2" a,_ D.OO1 110 D.OOO ' •• '720 -.U2 D n.2" ...... ".11' 20 -.- 11 :12' - :n .... &l._ tt.'" 11 H.'OI t7.U2 u.n. 11' &!I.GOO n.su •• au 15 .".- tt UI ..-. st .... CO.U2 ta.no 1a H.OIO 11&._ a o!" 11 S7.t. U2.D' .,..2SfI 11 -.- 11 10 -.-.a. 2&.021 '1'1.- " .... n "'.15& 110._ a._ H D._ ".K • •• tu 17 '!'7.02:'7 1t -_.- 'It.t. u.at "'.Ist S! 11'!I.1st S5 t -- U.211> ".- O.MII 17 M.'ao 10."" u.1N 11 ",ut U.lIO ... tIS it au.", 1* 12
-"""""'" D .... I •• ,... U.SH 1lI S!,012 1Il._ ... 2ft 1lI IS._ 'l •• ' ft.<IU 17 _.2ft 11 D1 -- U.IIU U.<IU 1S.!I2't 17 11.1411 n.2n M.1U u ".101 ' •• 10' SlotH D .... 001 11 2U ...... 12.500 n._ ".»1 l' !!.OOO ,:S._ st.to: 1'1 ".Jllt01.D' a
o_
1a , •• ut n U3 ..... _.000 n.H:I IS.'. 20 SII.OOO '11._ H.,," 11 H."O IO.DI !it .... 11 t:sa._ n cs -- H.OOO ".tn .... U l' :$2.000 n._ ... US 11 ",500 to._ Ho'tY a t4't.tn 11 lit - :$'1'.',,* S'._ ~.'Sf 17 U._ 50. _ _ .'t» lG t, .... u.,., ... -a fit.'" u II -- 0.1!I2 so._ ".1" is n.,ltO 10 ••• !it._ 21 IS.GOO " •• S !t._ U ".02' n Dl
ott_a D.'" "'.111 56.31t 17 21.'21 'I.NS ft. on 11 ... SIt n.l1o !t.2U U -.- I' 2U ...... sa.,., n._ ".'A 11 » .... ts.SI' $1.- H 11.'511 U.K' ct._ U -.- tt 52 -- :n.OJ' !t.124 D.2U 1* H.O" II.ft. Sf.U' 21 ".1'12 t!.ftlt •• 4't2 11 au._ a u. .- 22.HI ~.- :so. au 11 <IS.'" II.Ht 15.711:11 U 56.000 10._ Mo_ n 0"'._ u 10
... - 21.410 2'._ 21 .... 20 21.'U t2._ .. -11 "t._ U ,
......... 1 ....... 2i1.1111 "',- n.210 u ie,IU 3O.M1 •• 111 H D.1f' 1 •••• -.- H ,:!d.,," U t
v .• ~ ..... 2O,.lD 11O .. M1:I .. ,US 11> 21.1«2 H<I.tU ft._ tlt ".101 :to& ••• ...S'tS 11 ,!I.- tt _1
184

APPENDIXQ
CORRELATIONS ALL VARIABLES
185
...... 00 0'1
EmbTot IntStay DES Black Indian Masters Doctoral PAFCS PA4H PAhort PAced PAother Age 28-32 Age 33-38 Age 39-43 Age 44-49 Age 50-55 Age 56-61 Age 62+ Yrs Ext 6-10 YrsExtll-15 Yrs Ext 16-20 Yrs Ext 21-25 Y rs Ext 26-30 Yrs Ext 31-35 Yrs Ext 36+ Y rssother 6-10 Y rssother I 1+ YrsPrivate Yrsnonprof CoPop 10-3 0 CoPop30-60 CoPop60-100 CoPop100+ Female
EmbTot IntStay DES
.217" .334" -.005
'Cannot be computed because at least one of the variables is constant.
Correlations: Part 1
Black Indian Masters
-.047 -.199" .012 -.046 -.038 -.038 -.064 -.068 .212"
-.010 -.027 -.080
* Correlation is significant at the 0.05 level (2-tailed). *. Correlation is significant at the 0.0 I level (2-tailed).
Doctoral
-.010 .28* .03* .080
-.99* .210
PAFCS PA4H PAhort PAced PAother
-.025 .000 -.008 .054 .054 .107' .002 -.020 .084 .084 .045 .062 -.034 -.021 -.021 .Q78 .068 -.041 -.010 -.010 .035 -.043 -.018 -.004 -.004
-.019 .079 -.076 .056 .056 .02" -.070 .060 -.050 .020
-.391" -.164" -.040 -.040 -.175" -.043 -.043
-.018 -.018 1.000"
Correlations: Part 2
Age Age Age Age Age Age Age Yrs ext Yrs ext Yrs ext Yrs ext Yrs ext 28-32 33-38 39-43 44-49 50-55 56-61 62+ 6-10 11-15 16-20 21-25 26-30
EmbTot -.019 -.002 -.044 -.027 .045 .058 -.027 .004 .016 -.035 .020 -.016 IntStay -.039 -.054 -.033 -.017 .129" .040 -.017 -.018 -.087 -.001 .006 -.009 DES -.048 -.026 .022 .036 .046 .026 .036 .005 .010 -.003 -.031 .066 Black -.002 -.061 -.005 .019 -.067 -.022 .019 .036 .007 .046 -.053 -.045 Indian -.023 .068 -.023 -.028 -.030 .064 -.028 -.034 -.031 -.023 -.024 .102' Masters .005 -.042 .079 .121 .015 -.003 .121 -.020 .140" .025 .028 .052 Doctoral .010 .050 -.070 -.11 * -.02* -.010 .220 .010 -.130 -.020 -.040 -.05* PAFCS -.042 -.049 -.070 .003 .022 .127" .003 -.024 -.029 -.014 .021 .001 PA4H .098' .026 .004 .032 -.044 -.115' .032 .055 .044 -.002 -.077 -.016 PAhort -.006 .039 .017 .006 -.028 .006 .006 .036 .030 -.064 -.013 -.017 PAced -.023 -.027 .189" -.028 -.030 -.028 -.028 -.034 -.031 .193" -.024 -.020 PAother -.023 -.027 .189" -.028 -.030 -.028 -.028 -.034 -.031 .193" -.024 -.020 Age 28-32 -.139" -.119' -.145" -.152" -.145" -.145" .383" -.160" -.117' -.121' -.10]' Age 33-38 -.143" -.174" -.183" -.174" -.174" .120' .295" -.140" -.145" -.121" Age 39-43 -.150" -.157" -.150" -.150" -.021 .162" .291" -.103' -.105' Age 44-49 -.191" -.182" 1.000" .010 .019 .072 .312" -.038
....... Age 50-55 -.191" -.191" -.139" -.089 .000 .102' .212" 00 Age 56-61 -.182" -.156" -.028 .012 .022 .141" -...I Age 62+ .010 .019 .072 .312" -.038
Yrs Ext 6-10 -.239" -.174" -.180" -.151" Yrs Ext 11-15 -.162" -.168" -.141" Yrs Ext 16-20 -.122" -.102' Yrs Ext 21-25 -.106' Yrs Ext 26-30 YrsExt31-35 Yrs Ext 36+ Yrssother 6-10 Y rssother 11 + YrsPrivate Yrsnonprof CoPopl0-30 CoPop30-60 CoPop60-100 CoPop100+ Female
* Correlation is significant at the 0.05 level (2-tai1ed). ** Correlation is significant at the 0.01 level (2-tailed).
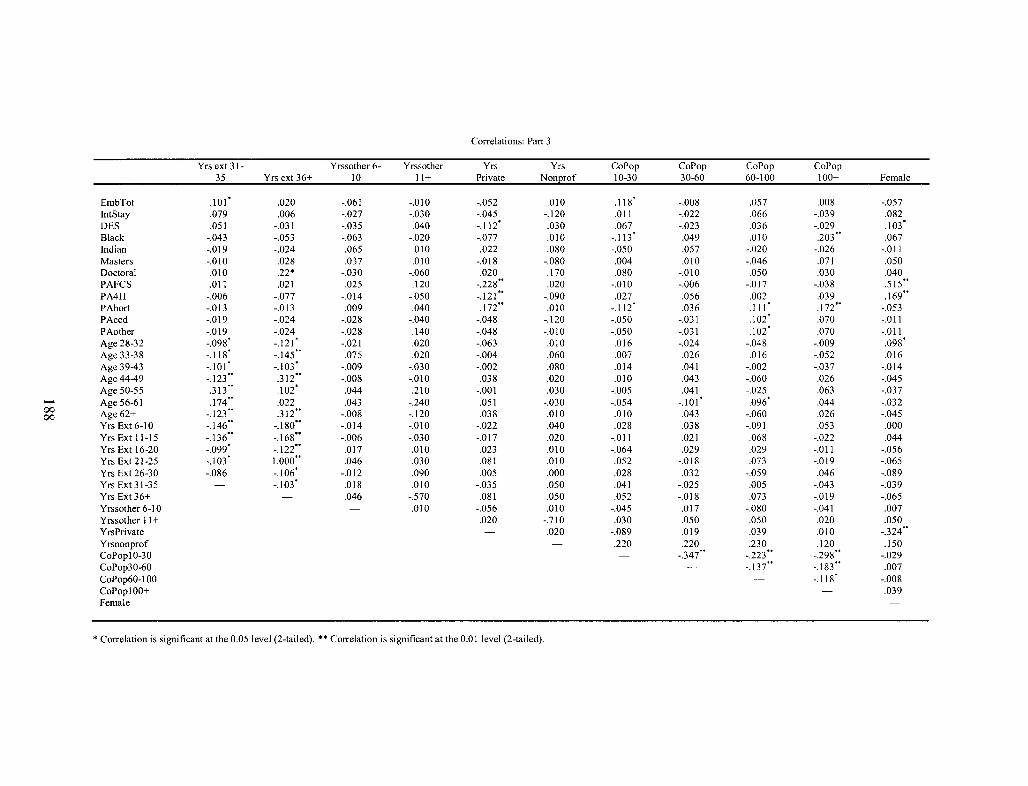
Correlations: Part 3
Yrs ext 31- Y rssother 6- Yrssother Yrs Yrs CoPop CoPop CoPop CoPop 35 Yrs ext 36+ 10 11+ Private NonJ2rof 10-30 30-60 60-100 100+ Female
EmbTot .101" .020 -.061 -.010 -.052 .010 .118' -.008 .057 .008 -.057 IntStay .079 .006 -.027 -.030 -.045 -.120 .011 -.022 .066 -.039 .082 DES .051 -.031 -.035 .040 -.112' .030 .067 -.023 .036 -.029 .103' Black -.043 -.053 -.063 -.020 -.077 .010 -.113' .049 .010 .203" .067 Indian -.019 -.024 .065 .010 .022 .080 -.050 .057 -.020 -.026 -.011 Masters -.010 .028 .037 .010 -.018 -.080 .004 .010 -.046 .071 .050 Doctoral .010 .22" -.030 -.060 .020 .170 .080 -.010 .050 .030 .040 PAFCS .011 .021 .025 .120 -.228" .020 -.010 -.006 -.017 -.038 .515" PA4H -.006 -.077 -.014 -.050 -.121" -.090 .027 .056 .002 .039 .169" PAhort -.013 -.013 .009 .040 .172" .010 -.ll2' .036 .11 I" .172" -.053 PAced -.019 -.024 -.028 -.040 -.048 -.120 -.050 -.031 .102' .070 -.011 PAother -.019 -.024 -.028 .140 -.048 -.010 -.050 -.031 .102' .070 -.011 Age 28-32 -.098' -.121' -.021 .020 -.063 .010 .016 -.024 -.048 -.009 .098' Age 33-38 -.ll8' -.145" .075 .020 -.004 .060 .007 .026 .016 -.052 .016 Age 39-43 -.101" -.103' -.009 -.030 -.002 .080 .014 .041 -.002 -.037 -.014 Age 44-49 -.123" .312" -.008 -.010 .038 .020 .010 .043 -.060 .026 -.045 Age 50-55 .313" .102' .044 .210 -.001 .030 -.005 .041 -.025 .063 -.037
...... Age 56-61 .174" .022 .043 -.240 .051 -.030 -.054 -.1 0 I" .096" .044 -.032 00 Age 62+ -.123" .312" -.008 -.120 .038 .010 .010 .043 -.060 .026 -.045 00
YrsExt6-10 -.146" -.180" -.014 -.010 -.022 .040 .028 .038 -.091 .053 .000 Yrs Ext 11-15 -.136" -.168" -.006 -.030 -.017 .020 -.011 .021 .068 -.022 .044 Yrs Ext 16-20 -.099' -.122" .017 .010 .023 .010 -.064 .029 .029 -.011 -.056 Yrs Ext 21-25 -.103" 1.000" .046 .030 .081 .010 .052 -.018 .073 -.019 -.065 Yrs Ext 26-30 -.086 -.106' -.012 .090 .005 .000 .028 .032 -.059 .046 -.089 Yrs Ext 31-35 -.1 03" .018 .010 -.035 .050 .041 -.025 .005 -.043 -.039 Yrs Ext 36+ .046 -.570 .081 .050 .052 -.018 .073 -.019 -.065 Y rssother 6-1 0 .010 -.056 .010 -.045 .017 -.080 -.041 .007 Y rssother I I + .020 -.710 .030 .050 .050 .020 .050 YrsPrivate .020 -.089 .019 .039 .010 -.324" Yrsnonprof .220 .220 .230 .120 .150 CoPoplO-30 -.347" -.223" -.298" -.029 CoPop30-60 -.137" -.183" .007 CoPop60-100 -.118" -.008 CoPopIOO+ .039 Female
"Correlation is significant at the 0.05 level (2-tailed) .• * Correlation is significant at the 0.01 level (2-tailed).
CURRICULUM VITAE
JEFFERY ALLEN YOUNG 132 MILLWOOD DRIVE
SHEPHERDSVILLE, KY 40165
ACADEMIC BACKGROUND
Graduate • Doctor of Philosophy
Dissertation Title: Job Embeddedness Theory: Can it Help Explain Employee Retention?
Major: Education Leadership and Organizational Development UNIVERSITY OF LOUISVILLE, LOUISVILLE, KENTUCKY 2012
• Master of Public Administration Major: Public Policy and Administration UNIVERSITY OF LOUISVILLE, LOUISVILLE, KENTUCKY 1995
Undergraduate • Bachelor of Science
Major: Agricultural Economics UNIVERSITY OF KENTUCKY, LEXINGTON, KENTUCKY 1985
WORK EXPERIENCE • District 3 Director, University of Kentucky, Cooperative Extension Service
2007 -Present
• County Extension Agent for 4-H Youth Development, University of Kentucky Cooperative Extension Service 1990-2007
• Location Manager, Goodyear Tire and Rubber Co., Richmond, Virginia 1987-1990
• Assistant Location Manager, Southern States Cooperative, Goochland, Virginia 1985-1987
189
EXPERIENCES AND TRAINING
• Multi-Area/Regional Extension Conference Planning Committees • Southern Region Volunteer Forum, Planning Committee and Presenter • Kentucky Volunteer Leader Forum, Planning Committee and Presenter • Youth Protection Risk Management, trainer, writer and planning committee member • County Review Team member (multiple) • Regional Issues and Program Committee • Turning Lemons, Into Lemonade, Dr. Ron Hustedde, University of Kentucky • Extension Mentor Training • Managerial Assessment of Proficiency (MAP), UK April, 2004 • Managing to EXCEL - UK November, 2004 • Equipping Emerging Leaders - Situational Leadership Program • "How to Handle Difficult People," Rockhurst College • Human Resources and the Law - Rockhurst College • Managing Multiple Projects, Rockhurst College • Communicating with Confidence, Clarity and Credibility, Rockhurst College • Managing Emotions in the Workplace, Rockhurst College • Conflict Resolution Training, Just Solutions of Louisville • National Issues Forum, University of Miami-Ohio • Myers-Briggs Type Indicator - Qualified Presenter • Common-health Citizens Forums Facilitator • Living Leadership, Maximum Impact Group • Management Training Program, Southern States Cooperative • Management Training and Continuing Education, Goodyear Tire and Rubber Co. • Managed retail sales operation with annual sales of over $1 million and 8 employees
190