updated opacities from the opacity project
TRANSCRIPT
arX
iv:a
stro
-ph/
0410
744v
2 1
8 D
ec 2
004
Mon. Not. R. Astron. Soc. 000, 1–12 (2004) Printed 2 February 2008 (MN LATEX style file v2.2)
Up-dated opacities from the Opacity Project
N. R. Badnell1, M. A. Bautista2, K. Butler3, F. Delahaye4,5, C. Mendoza2,
P. Palmeri6⋆, C. J. Zeippen5 and M. J. Seaton71Department of Physics, University of Strathclyde, Glasgow, G4 0NG2Centro de Fısica, IVIC, PO Box 21827, Caracas 1020A, Venezuela3Universitatssternwarte Munchen, Scheinerstraße 1, D-81679, Munchen, Germany4Department of Astronomy, Ohio State University, Ohio, 43210-1173, USA5LUTH, Observatoire de Paris, F-92195, Meudon, France6NASA Goddard Space Flight Center, Code 662, Greenbelt, Maryland, 20771, USA7Department of Physics and Astronomy, University College London, London, WC1E 6BT
Accepted XXX. Received XXX; in original form XXX
ABSTRACT
Using the code autostructure, extensive calculations of inner-shell atomic datahave been made for the chemical elements He, C, N, O, Ne, Na, Mg, Al, Si, S, Ar,Ca, Cr, Mn, Fe and Ni. The results are used to obtain up-dated opacities from theOpacity Project, OP. A number of other improvements on earlier work have also beenincluded.
Rosseland-mean opacities from OP are compared with those from OPAL. Differ-ences of 5 to 10% occur. OP gives the ‘Z-bump’, at log(T ) ≃ 5.2, to be shifted toslightly higher temperatures. The opacities from OP, as functions of temperature anddensity, are smoother than those from OPAL.
The accuracy of the integrations used to obtain mean opacities can depend onthe frequency-mesh used. Tests involving variation of the numbers of frequency pointsshow that for typical chemical mixtures the OP integrations are numerically correctto within 0.1%.
The accuracy of the interpolations used to obtain mean opacities for any requiredvalues of temperature and density depend on the temperature–density meshes used.Extensive tests show that, for all cases of practical interest, the OP interpolations giveresults correct to better than 1%.
Prior to a number of recent investigations which have indicated a need for down-ward revisions in the solar abundances of oxygen and other elements, there was goodagreement between properties of the sun deduced from helioseismology and from stellarevolution models calculated using OPAL opacities. The revisions destroy that agree-ment. In a recent paper Bahcall et al. argue that the agreement would be restored ifopacities for the regions of the sun with 2 × 10⁶ . T . 5 × 10⁶ K (0.7 to 0.4R⊙) werelarger than those given by OPAL by about 10%. In the region concerned, the presentresults from OP do not differ from those of OPAL by more than 2.5%.
Key words: atomic process – radiative transfer – stars: interiors.
1 INTRODUCTION
First results for opacities from the Opacity Project (OP)were published by Seaton et al. (1994, to be referred to asPaper I) and were in good general agreement with those fromthe OPAL project (Rogers and Iglesias, 1992) except for re-gions of high densities and temperatures. In a more recentpaper, Badnell and Seaton (2003, Paper II) confirmed a sug-
⋆ Present address: Astrophysique et Spectroscopie, Universite deMons-Hainaut, 20 Place du Parc, B-7000 Mons, Belgium
gestion made by Iglesias and Rogers (1995) that the discrep-ancies in those regions were due to the omission of importantinner-shell processes in the OP work. Further comparisonsbetween OPAL results and those from OP with inclusionof all important inner-shell processes are given by Seatonand Badnell (2004, Paper III) for the case of the 6-elementmix (H, He, C, O, S and Fe) of Iglesias and Rogers (1995).In Papers II and III, the required inner-shell atomic datawere computed using the code autostructure (Badnell,1986, 1997). Similar computations of the required inner-shellatomic data for all cosmically-abundant elements (He, C, N,
2 N. R. Badnell et al.
O, Ne, Na, Mg, Al, Si, S, Ar, Ca, Cr, Mn, Fe and Ni) havenow been made. Some further improvements and up-datesof the OP work are also considered in the present paper.
2 OUTER-SHELL ATOMIC DATA
Most of the original OP outer-shell atomic data were com-puted using sophisticated R-matrix methods (see The Opac-ity Project Team, 1995, 1997). Ions are specified by nuclearcharge Z and number of ‘target’ electrons NE: the total num-ber of electrons in an ion is equal to (NE+1). For iron ionswith NE= 13 to 18, the R-matrix data were supplemented byextensive data calculated by Lynas-Gray et al. (1995) usingthe code superstructure (Eissner et al. , 1974). Data forthe less-abundant iron group elements, Cr, Mn and Ni, wereobtained from iron data using interpolation techniques de-scribed in Paper I.
All original outer-shell atomic data were computed inLS coupling and allowance for fine-structure was includedusing methods described in Paper I.
In Paper III the experiment was made of replacing all ofthe original iron data for NE = 13 to 18 by data computed inintermediate coupling using autostructure. Use of thosenew data did not make any major changes, which provideda good check on the earlier work, but there were some im-provements due to the inclusion of intercombination linesand some improvements in photoionization cross-sections.The new intermediate-coupling iron data for iron (NE = 13to 18) are used in the present work.
As in Paper I, we use data from Kurucz (1988) for thefirst few ionization stages of iron-group elements.
3 INNER-SHELL ATOMIC DATA
All inner-shell atomic data were calculated using au-
tostructure employing both Russell–Saunders coupling(LS) and intermediate coupling (IC). In Paper II it was re-ported that, for the inner-shell work, the use of LS data andallowance for fine-structure using methods described in Pa-per I, did not give opacities differing significantly from thoseobtained using the IC atomic data. The LS inner-shell datawere used in the present opacity work.
New inner-shell data have been calculated for the ele-ments N, Ne, Na, Mg, Al, Si, Ar, Ca, Cr, Mn and Ni for NE
= 1 − 12. The present data were generated by working iso-electronically. Data for He, C, O, S and Fe were reported-onin Paper II and were generated by working iso-nuclearly. ForC, O and S, this has led to the calculation of some additionalinner-shell data (see below).
The K-shell processes that were included are of theform:
1sq2lpn′l′ + hν → 1sq−12lpn′l′ + e− (1)
for photoionization and
1sq2lpn′l′ + hν → 1sq−12lpn′l′n′′l′′ → X(NE) + e− (2)
for photoexcitation (–autoionization), where 2lp stands for2ss2pt with p = s + t. Calculations were made for q = 1 forp = 0 and q = 2 for p = 0 − 7. We used n′, n′′ = 2 to 5,
for all allowed l′, l′′. The contributions from higher-n in (2)were obtained by matching onto the results of (1).
The L-shell processes that were included are
2lq3l′pn′′l′′ + hν → 2lq−13l′pn′′l′′ + e− (3)
and
2lq3l′pn′′l′′ + hν → 2lq−13l′pn′′l′′n′′′l′′′ → X(NE) + e−, (4)
where 3l′p stands for for 3ss3pt3du with p = s + t + u.Calculations were made for q = 1−7 for p = 0 and q = 8 forp = 0 − 2. We used n′, n′′, n′′′ = 3 to 6 for photoexcitationand = 3 to 5 for photoionization, for all allowed l′, l′′, l′′′.
The M-shell processes that were included are
3lqn′l′ + hν → 3lq−1n′l′ + e− (5)
and
3lqn′l′ + hν → 3lq−1n′l′n′′l′′ → X(NE) + e−. (6)
Calculations were made for q = 1 and 2 and n′, n′′ = 3 to 6.Calculations for q = 3 (NE=13) for Fe were made previously,and reported-on in Paper II.
The range of p and q used in equations (1) – (6) arethe same as were used in Paper II for Fe, while those usedpreviously for C, O and S were more restrictive (but suf-ficient for the 6-element mix). The same range of p and qhas now been used for all elements. Further details of thecalculations with autostructure may be found in PaperII.
The calculation using autostructure provided totalsof 11 523 624 spectrum lines and 815 989 photo-ionizationcross-sections for use in the opacity work.
4 THE FREQUENCY MESH
Let u = hν/(kT ) and let σ(u) be the monochromatic opacitycross-section per atom. The Rosseland-mean cross-section isσR where
1
σR
=
∫∞
0
1
σ(u)F (u) du (7)
and
F (u) = [15/(4π4)]u4 exp(−u)/[1 − exp(−u)]2. (8)
The Rosseland-mean opacity per unit mass is κR = σR/µwhere µ is the mean atomic weight.
The function F (u) has a maximum value for u =3.8300 . . . and is small for u small and u large. It is not prac-ticable to use a mesh in u such as to resolve all spectral-lineprofiles, the number of points would be much too large. Wetherefore seek a mesh such that trapezoidal-rule integrationsgive results of acceptable accuracy. In Paper I a mesh wasused with 104 points in the range 0.001 6 u 6 20.
Equation (7) may be replaced by
1
σR
=
∫vmax
v=0
1
σ(u)dv (9)
where
v(u) =
∫v
0
F (u) du (10)
Up-dated opacities from the Opacity Project 3
Table 1. Element abundances, A(n) = log(N(n)), relative toA(H) = 12.
Elem. BP04 A04 Elem. BP04 A04
H 12.00 12.00 Si 7.56 7.51He 10.92 10.925 S 7.20 7.14C 8.52 8.41 Ar 6.40 6.18N 7.92 7.80 Ca 6.35 6.31O 8.83 8.66 Cr 5.69 5.62Ne 8.08 7.84 Mn 5.53 5.46Na 6.32 6.17 Fe 7.50 7.44Mg 7.58 7.55 Ni 6.25 6.18Al 6.49 6.37
and vmax = v(u → ∞). From numerical integration, vmax =1.0553 . . .. With a given total number of integration points,NTOT, and constant intervals in u or v, use of (9) in place of(7) gives more points in regions giving large contributions tothe integrals. It was found that the use of (9) gave a signif-icant improvement in the accuracy of calculated Rosseland-means.
5 ELEMENT ABUNDANCES
Results of Paper I were for a solar mix referred to as S92,based on work of Anders and Grevesse (1989) together withsome later revisions. Abundances used by Bahcall and Pin-sonneault (2004) in constructing a solar model, which wewill refer to as BP04, are not very different from those ofS92 or of GN93 (Grevesse and Noels 1993) used in much ofthe OPAL work. However, recent work (Asplund et al. 2004,and references cited therein) has suggested a need for sub-stantial revisions in solar abundances for oxygen and otherelements. Dr N. Grevesse has kindly provided us with anupdated table of recommended abundances, which we willrefer to as A04, taking account of recent work by Asplundand others. Table 1 gives, for the 17 elements considered inthe present work, the abundances from BP04 and A04: BP04gives X = 0.7394, Z = 0.0170 while A04 gives X = 0.7403,Z = 0.0123.
A detailed discussion of recent work on the solar chem-ical composition is given by Asplund, Grevesse and Sauval(2005).
6 CONTRIBUTIONS OF INNER-SHELL
TRANSITIONS TO ROSSELAND-MEANS
We use the variable
R = ρ/T 36 (11)
introduced in the OPAL work, where ρ is mass–density andT6 = 10−6
× T with T in K. The behaviour of R in somestellar models is shown on Figs. 1 and 2 of Paper I.
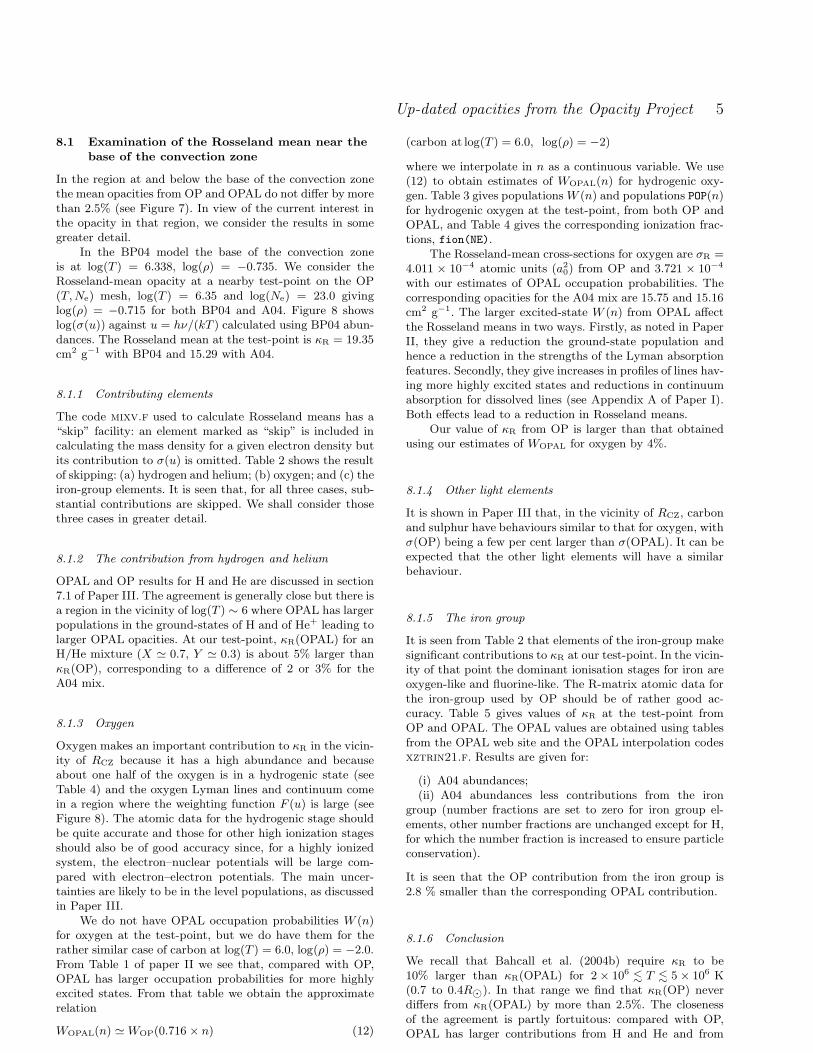
Fig. 1 shows, for the S92 solar mix, log(κR) againstlog(T ) for log(R) = −1,−2,−3,−4,−5 and −6, both withand without inclusion of inner-shell transitions. It is seenthat the inner-shell transitions contribute very little to themeans at the lower densities, say log(R) . −4. The reason isthat, at a lower density, ions in a given ionization stage will
have maximum abundance only at a lower temperature: andat the lower temperatures features in the monochromaticopacities due to inner-shell transitions will appear at largervalues of the frequency-variable u corresponding to regionswhere the weighting function F (u) in equation (7) is small.
7 COMPARISONS WITH OPAL
OPAL data can be obtained from the OPAL web site1 forany required composition. The basic data are given as tablesof log(κR) as functions of log(T ) and log(R). Codes are givenfor interpolations to any required values of log(T ) and log(ρ)and further interpolations in X and Z.
The OP calculations of monochromatic opacities foreach chemical element are made on a mesh of valuesof log(T ) and log(Ne) where Ne is electron density (themeshes used will be discussed further in Section 9). A codemixv.f reads the monochromatic opacities and calculatesRosseland-means on the OP (T, Ne) mesh. A further code,opfit.f, provides interpolations to any required values ofT and ρ. It includes a facility to produce tables in OPALformat. Such tables will be used in comparing results fromOPAL and OP.
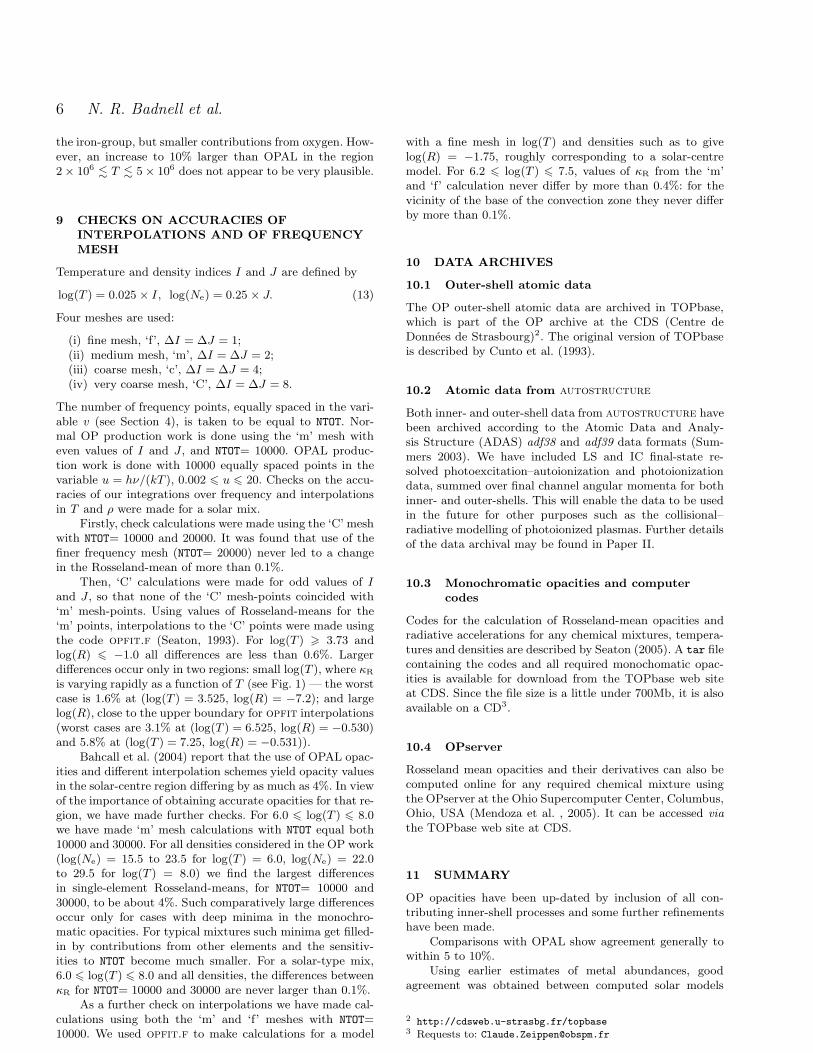
Fig. 2 shows log(κR) against log(T ) for log(R) =−1,−2,−3,−4 and −6, from both OP and OPAL. The over-all agreement is seen to be good. The feature at log(T ) ≃ 5.2,usually known as the ‘Z-bump’, is mainly due to transitionsin iron ions with NE= 13 to 18. It is seen that, compared toOPAL, the OP feature is shifted to slightly higher temper-atures.
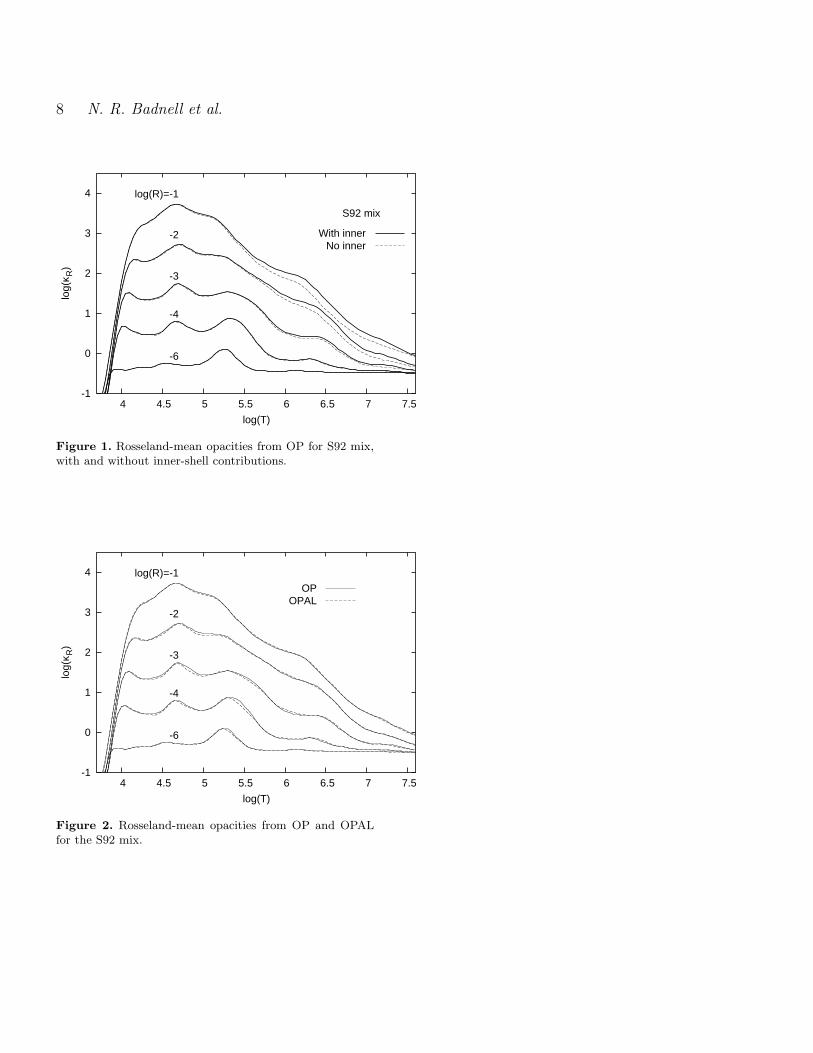
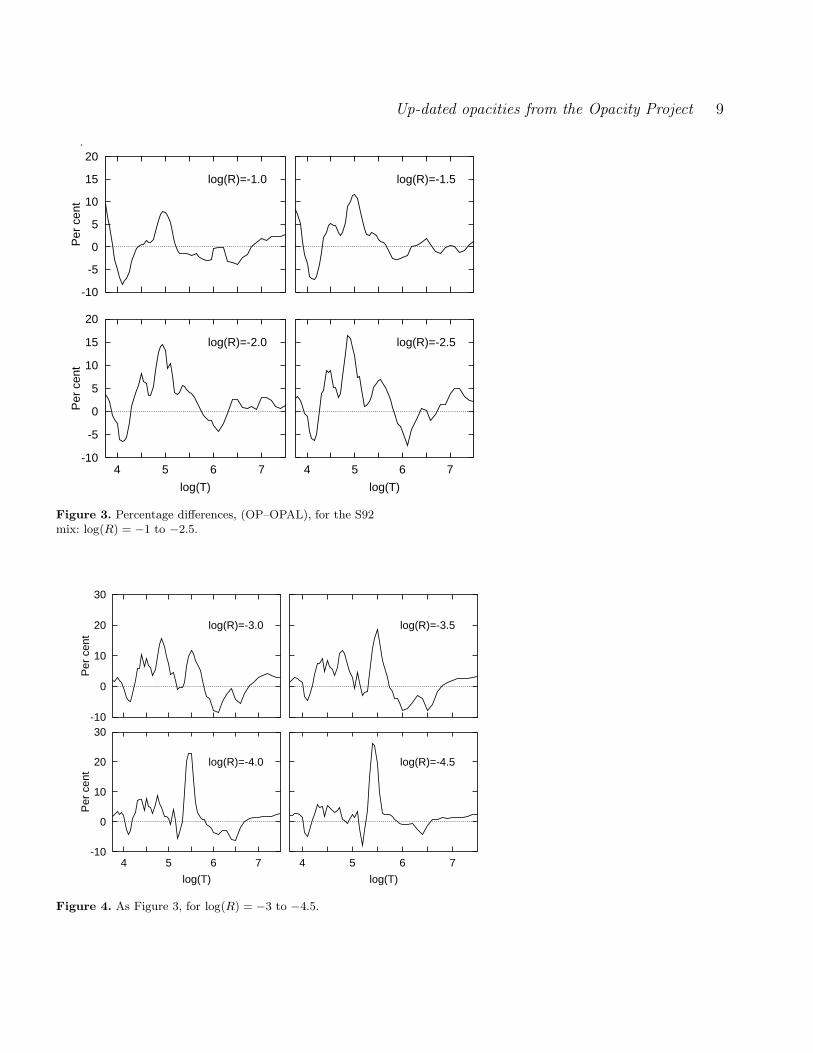
Use of the logarithmic scale for log(κR), as in Fig. 2,does not allow one to see the finer details of the level ofagreement between the two calculations. Percentage differ-ences, (OP–OPAL), are shown on Fig. 3 for log(R) = −1.0to −2.5, and on Fig. 4 for log(R) = −3.0 to −4.5. It is seenthat the general level of agreement is in the region of 5 to10%. An excursion to larger differences at log(T ) ≃ 5.5, ap-proaching 30% at log(R) = −4.5, is due to the differencesin the high-temperature wing of the Z-bump, as shown onFig. 2.
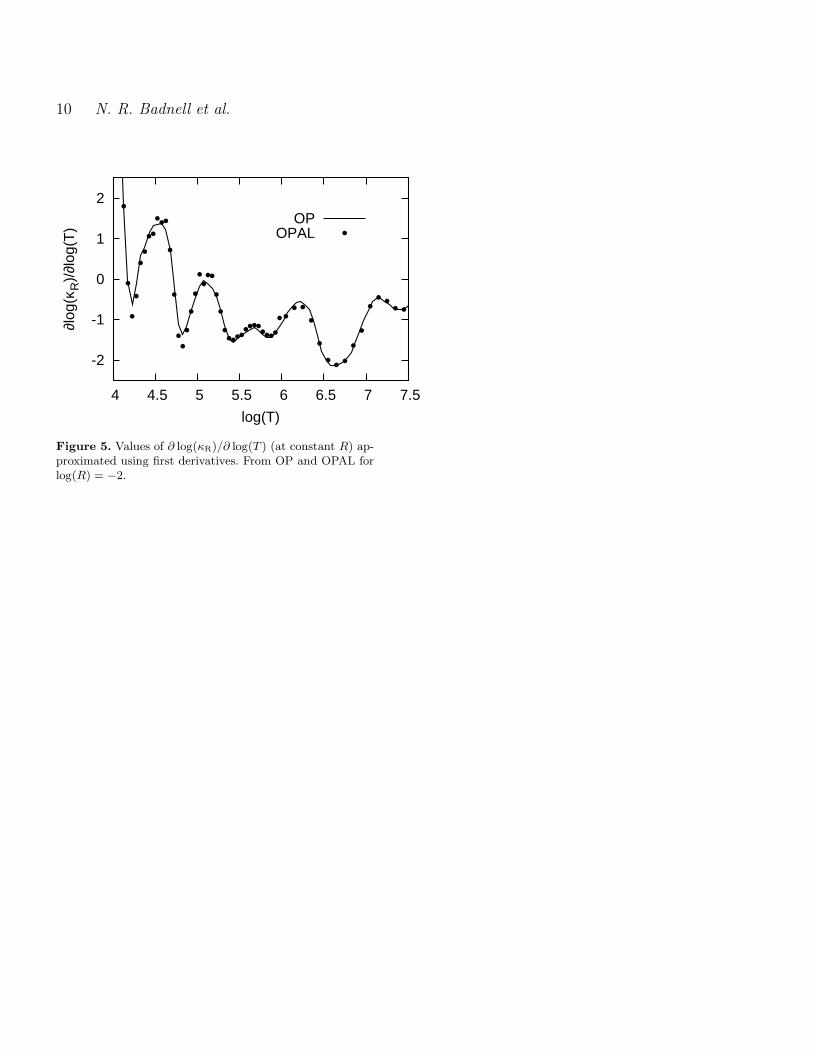
The differences of Figs. 3 and 4 have a somewhat raggedappearance which results from some lack of smoothness inthe values of κR at the level of 1 or 2%. Fig. 5 shows∂ log(κR)/∂ log(T ) at constant log(R), calculated using firstdifferences, for log(R) = −2. The data from OP are seen tobe smoother than those from OPAL. Use of the v-mesh inthe OP work (see Section 4) gives an improvement in thesmoothness.
8 THE SOLAR RADIATIVE INTERIOR
Helioseismology provides remarkably accurate values for thedepth, RCZ, of the solar convection zone (CZ). With theearlier estimates of solar element abundances, such as S92or GN93 (see section 6), values of RCZ and other data fromhelioseismology were found to be in good agreement withresults from solar models computed using OPAL opacities.However, with the new abundances it is found in two recent
1 www-phys.llnl.gov/Research/OPAL/
4 N. R. Badnell et al.
Table 2. Contributions to κR at the test-point, log(T ) = 6.35,log(Ne) = 23.0. A04 abundances.
Skip κR
None 15.29H, He 10.51O 10.52Fe group 11.03
Table 3. Occupation probabilities and level populations for hy-drogenic oxygen at the test-point.
OP OPALn W (n) POP(n) W (n) POP(n)
1 1.000 0.361 1.000 0.3252 0.987 0.048 0.993 0.0443 0.813 0.048 0.954 0.0504 0.151 0.013 0.830 0.0635 0.009 0.001 0.289 0.0316 0.000 0.000 0.062 0.0097 0.009 0.0028 0.000 0.000
papers to be necessary to increase opacities in the vicinityof RCZ: by 19% according to Basu and Antia (2004); and by21% according to Bahcall et al. (2004a). In a further detailedstudy of the problem, Bahcall et al. (2004b) show that thereare also discrepancies for the solar profiles of sound speedand density and of helium abundance. They argue that allsuch discrepancies would be removed if the opacities werelarger than those from OPAL by about 10% in the region of2 × 106K . T . 5 × 10⁶K (0.7 to 0.4R⊙).
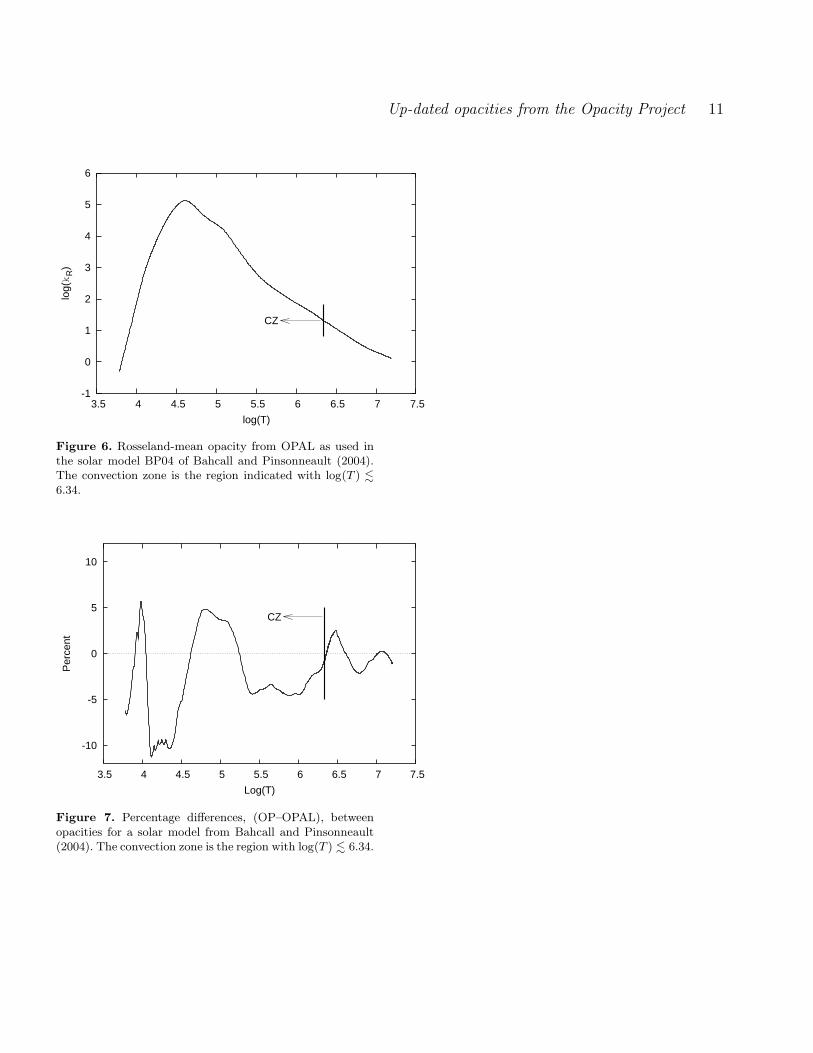
In the solar model of Bahcall and Pinsonneault (2004),referred to as BP04, the base of the convection zone is atlog(T ) ≃ 6.34 (r ≃ 0.715R⊙). In the CZ the abundancesare independent of depth and the values used for the modelwere similar to those of the S92 mix (i.e. not taking ac-count of recently proposed revisions). Below the convectionzone, log(T ) & 6.34 (r . 0.715R⊙), abundances depend onthe nuclear reactions which have taken place and vary withdepth. Fig. 6 shows the Rosseland-mean opacities adoptedby BP04, using OPAL data. In the CZ the exact values ofopacity are not of great importance for the calculation of amodel, since in that region the temperature gradient is nolonger controlled by the opacity, but comparisons of differentopacity calculations is still of interest.
Fig. 7 shows percentage differences, (OP–OPAL), be-tween opacities from OP and those used for BP04. In theregion below RCZ the relative abundances of metals are as-sumed to be independent of depth but the mass-fractionsX, Y and Z are variable. We use a code mixz.f to obtainmonochromatic opacities for the specified mixture of metals,and a code mxz.f for variable X and Z (with Y = 1−X−Z).At the lowest temperatures (say log(T ) 6 4.5) κR is varyingvery rapidly as a function of T (see Fig. 6) and the differ-ences (OP–OPAL) are as large as 10%. Throughout the restof the CZ the differences are never larger than about 5%.
Table 4. Ionization fractions for oxygen at the test-point (NE=−1 for fully-ionized, NE= 0 for hydrogenic).
NE OP OPAL
−1 0.415 0.3740 0.471 0.5241 0.109 0.0982 0.005 0.0053 0.001 0.0004 0.000
Table 5. Rosseland-means at the test point.
Mixture OP OPAL % difference
A04 15.29 14.99 +2.0A04 less iron-group 11.03 10.63 +3.7
Difference 4.26 4.38 −2.8
Up-dated opacities from the Opacity Project 5
8.1 Examination of the Rosseland mean near the
base of the convection zone
In the region at and below the base of the convection zonethe mean opacities from OP and OPAL do not differ by morethan 2.5% (see Figure 7). In view of the current interest inthe opacity in that region, we consider the results in somegreater detail.
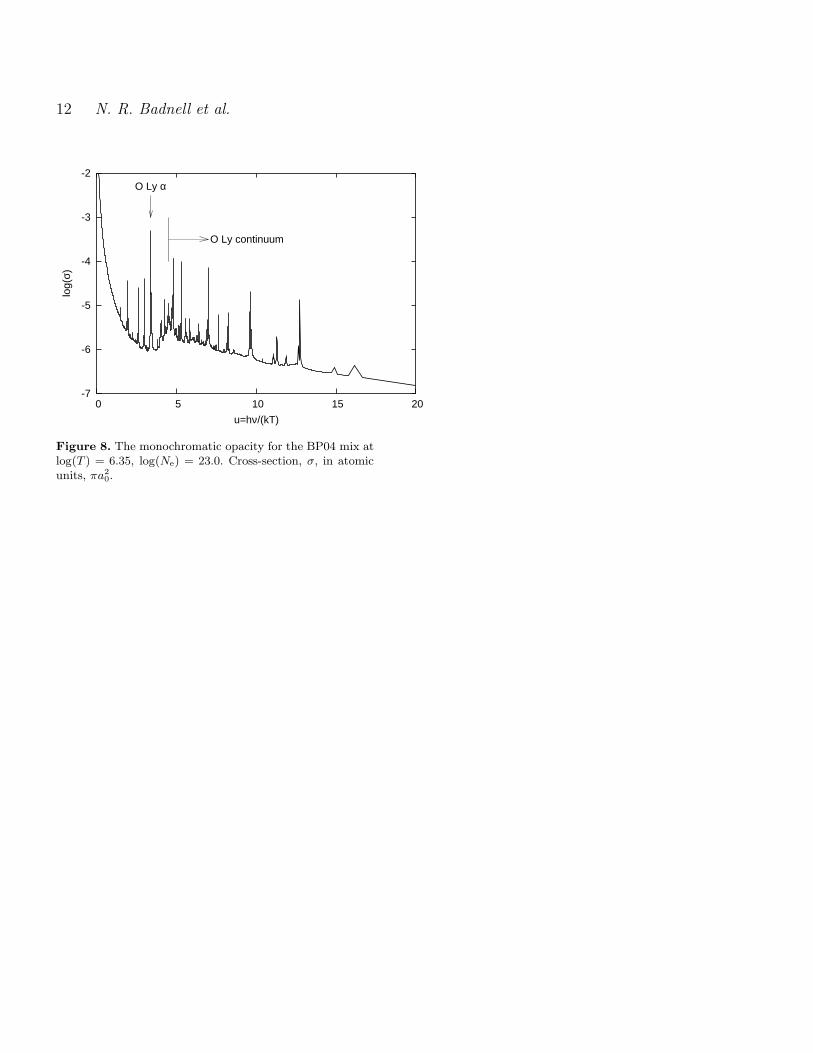
In the BP04 model the base of the convection zoneis at log(T ) = 6.338, log(ρ) = −0.735. We consider theRosseland-mean opacity at a nearby test-point on the OP(T, Ne) mesh, log(T ) = 6.35 and log(Ne) = 23.0 givinglog(ρ) = −0.715 for both BP04 and A04. Figure 8 showslog(σ(u)) against u = hν/(kT ) calculated using BP04 abun-dances. The Rosseland mean at the test-point is κR = 19.35cm2 g−1 with BP04 and 15.29 with A04.
8.1.1 Contributing elements
The code mixv.f used to calculate Rosseland means has a“skip” facility: an element marked as “skip” is included incalculating the mass density for a given electron density butits contribution to σ(u) is omitted. Table 2 shows the resultof skipping: (a) hydrogen and helium; (b) oxygen; and (c) theiron-group elements. It is seen that, for all three cases, sub-stantial contributions are skipped. We shall consider thosethree cases in greater detail.
8.1.2 The contribution from hydrogen and helium
OPAL and OP results for H and He are discussed in section7.1 of Paper III. The agreement is generally close but there isa region in the vicinity of log(T ) ∼ 6 where OPAL has largerpopulations in the ground-states of H and of He+ leading tolarger OPAL opacities. At our test-point, κR(OPAL) for anH/He mixture (X ≃ 0.7, Y ≃ 0.3) is about 5% larger thanκR(OP), corresponding to a difference of 2 or 3% for theA04 mix.
8.1.3 Oxygen
Oxygen makes an important contribution to κR in the vicin-ity of RCZ because it has a high abundance and becauseabout one half of the oxygen is in a hydrogenic state (seeTable 4) and the oxygen Lyman lines and continuum comein a region where the weighting function F (u) is large (seeFigure 8). The atomic data for the hydrogenic stage shouldbe quite accurate and those for other high ionization stagesshould also be of good accuracy since, for a highly ionizedsystem, the electron–nuclear potentials will be large com-pared with electron–electron potentials. The main uncer-tainties are likely to be in the level populations, as discussedin Paper III.
We do not have OPAL occupation probabilities W (n)for oxygen at the test-point, but we do have them for therather similar case of carbon at log(T ) = 6.0, log(ρ) = −2.0.From Table 1 of paper II we see that, compared with OP,OPAL has larger occupation probabilities for more highlyexcited states. From that table we obtain the approximaterelation
WOPAL(n) ≃ WOP(0.716 × n) (12)
(carbon at log(T ) = 6.0, log(ρ) = −2)
where we interpolate in n as a continuous variable. We use(12) to obtain estimates of WOPAL(n) for hydrogenic oxy-gen. Table 3 gives populations W (n) and populations POP(n)for hydrogenic oxygen at the test-point, from both OP andOPAL, and Table 4 gives the corresponding ionization frac-tions, fion(NE).
The Rosseland-mean cross-sections for oxygen are σR =4.011 × 10⁻⁴ atomic units (a2
0) from OP and 3.721 × 10⁻⁴
with our estimates of OPAL occupation probabilities. Thecorresponding opacities for the A04 mix are 15.75 and 15.16cm2 g−1. The larger excited-state W (n) from OPAL affectthe Rosseland means in two ways. Firstly, as noted in PaperII, they give a reduction the ground-state population andhence a reduction in the strengths of the Lyman absorptionfeatures. Secondly, they give increases in profiles of lines hav-ing more highly excited states and reductions in continuumabsorption for dissolved lines (see Appendix A of Paper I).Both effects lead to a reduction in Rosseland means.
Our value of κR from OP is larger than that obtainedusing our estimates of WOPAL for oxygen by 4%.
8.1.4 Other light elements
It is shown in Paper III that, in the vicinity of RCZ, carbonand sulphur have behaviours similar to that for oxygen, withσ(OP) being a few per cent larger than σ(OPAL). It can beexpected that the other light elements will have a similarbehaviour.
8.1.5 The iron group
It is seen from Table 2 that elements of the iron-group makesignificant contributions to κR at our test-point. In the vicin-ity of that point the dominant ionisation stages for iron areoxygen-like and fluorine-like. The R-matrix atomic data forthe iron-group used by OP should be of rather good ac-curacy. Table 5 gives values of κR at the test-point fromOP and OPAL. The OPAL values are obtained using tablesfrom the OPAL web site and the OPAL interpolation codesxztrin21.f. Results are given for:
(i) A04 abundances;(ii) A04 abundances less contributions from the iron
group (number fractions are set to zero for iron group el-ements, other number fractions are unchanged except for H,for which the number fraction is increased to ensure particleconservation).
It is seen that the OP contribution from the iron group is2.8 % smaller than the corresponding OPAL contribution.
8.1.6 Conclusion
We recall that Bahcall et al. (2004b) require κR to be10% larger than κR(OPAL) for 2 × 10⁶ . T . 5 × 10⁶ K(0.7 to 0.4R⊙). In that range we find that κR(OP) neverdiffers from κR(OPAL) by more than 2.5%. The closenessof the agreement is partly fortuitous: compared with OP,OPAL has larger contributions from H and He and from
6 N. R. Badnell et al.
the iron-group, but smaller contributions from oxygen. How-ever, an increase to 10% larger than OPAL in the region2 × 106 . T . 5 × 10⁶ does not appear to be very plausible.
9 CHECKS ON ACCURACIES OF
INTERPOLATIONS AND OF FREQUENCY
MESH
Temperature and density indices I and J are defined by
log(T ) = 0.025 × I, log(Ne) = 0.25 × J. (13)
Four meshes are used:
(i) fine mesh, ‘f’, ∆I = ∆J = 1;(ii) medium mesh, ‘m’, ∆I = ∆J = 2;(iii) coarse mesh, ‘c’, ∆I = ∆J = 4;(iv) very coarse mesh, ‘C’, ∆I = ∆J = 8.
The number of frequency points, equally spaced in the vari-able v (see Section 4), is taken to be equal to NTOT. Nor-mal OP production work is done using the ‘m’ mesh witheven values of I and J , and NTOT= 10000. OPAL produc-tion work is done with 10000 equally spaced points in thevariable u = hν/(kT ), 0.002 6 u 6 20. Checks on the accu-racies of our integrations over frequency and interpolationsin T and ρ were made for a solar mix.
Firstly, check calculations were made using the ‘C’ meshwith NTOT= 10000 and 20000. It was found that use of thefiner frequency mesh (NTOT= 20000) never led to a changein the Rosseland-mean of more than 0.1%.
Then, ‘C’ calculations were made for odd values of Iand J , so that none of the ‘C’ mesh-points coincided with‘m’ mesh-points. Using values of Rosseland-means for the‘m’ points, interpolations to the ‘C’ points were made usingthe code opfit.f (Seaton, 1993). For log(T ) > 3.73 andlog(R) 6 −1.0 all differences are less than 0.6%. Largerdifferences occur only in two regions: small log(T ), where κR
is varying rapidly as a function of T (see Fig. 1) — the worstcase is 1.6% at (log(T ) = 3.525, log(R) = −7.2); and largelog(R), close to the upper boundary for opfit interpolations(worst cases are 3.1% at (log(T ) = 6.525, log(R) = −0.530)and 5.8% at (log(T ) = 7.25, log(R) = −0.531)).
Bahcall et al. (2004) report that the use of OPAL opac-ities and different interpolation schemes yield opacity valuesin the solar-centre region differing by as much as 4%. In viewof the importance of obtaining accurate opacities for that re-gion, we have made further checks. For 6.0 6 log(T ) 6 8.0we have made ‘m’ mesh calculations with NTOT equal both10000 and 30000. For all densities considered in the OP work(log(Ne) = 15.5 to 23.5 for log(T ) = 6.0, log(Ne) = 22.0to 29.5 for log(T ) = 8.0) we find the largest differencesin single-element Rosseland-means, for NTOT= 10000 and30000, to be about 4%. Such comparatively large differencesoccur only for cases with deep minima in the monochro-matic opacities. For typical mixtures such minima get filled-in by contributions from other elements and the sensitiv-ities to NTOT become much smaller. For a solar-type mix,6.0 6 log(T ) 6 8.0 and all densities, the differences betweenκR for NTOT= 10000 and 30000 are never larger than 0.1%.
As a further check on interpolations we have made cal-culations using both the ‘m’ and ‘f’ meshes with NTOT=10000. We used opfit.f to make calculations for a model
with a fine mesh in log(T ) and densities such as to givelog(R) = −1.75, roughly corresponding to a solar-centremodel. For 6.2 6 log(T ) 6 7.5, values of κR from the ‘m’and ‘f’ calculation never differ by more than 0.4%: for thevicinity of the base of the convection zone they never differby more than 0.1%.
10 DATA ARCHIVES
10.1 Outer-shell atomic data
The OP outer-shell atomic data are archived in TOPbase,which is part of the OP archive at the CDS (Centre deDonnees de Strasbourg)2. The original version of TOPbaseis described by Cunto et al. (1993).
10.2 Atomic data from autostructure
Both inner- and outer-shell data from autostructure havebeen archived according to the Atomic Data and Analy-sis Structure (ADAS) adf38 and adf39 data formats (Sum-mers 2003). We have included LS and IC final-state re-solved photoexcitation–autoionization and photoionizationdata, summed over final channel angular momenta for bothinner- and outer-shells. This will enable the data to be usedin the future for other purposes such as the collisional–radiative modelling of photoionized plasmas. Further detailsof the data archival may be found in Paper II.
10.3 Monochromatic opacities and computer
codes
Codes for the calculation of Rosseland-mean opacities andradiative accelerations for any chemical mixtures, tempera-tures and densities are described by Seaton (2005). A tar filecontaining the codes and all required monochomatic opac-ities is available for download from the TOPbase web siteat CDS. Since the file size is a little under 700Mb, it is alsoavailable on a CD3.
10.4 OPserver
Rosseland mean opacities and their derivatives can also becomputed online for any required chemical mixture usingthe OPserver at the Ohio Supercomputer Center, Columbus,Ohio, USA (Mendoza et al. , 2005). It can be accessed via
the TOPbase web site at CDS.
11 SUMMARY
OP opacities have been up-dated by inclusion of all con-tributing inner-shell processes and some further refinementshave been made.
Comparisons with OPAL show agreement generally towithin 5 to 10%.
Using earlier estimates of metal abundances, goodagreement was obtained between computed solar models
2 http://cdsweb.u-strasbg.fr/topbase3 Requests to: [email protected]

Up-dated opacities from the Opacity Project 7
and results obtained from helioseismology for RCZ and otherdata. With recent downward revisions in metal abundancesthat agreement is destroyed. It is shown by Bahcall etal. (2004b) that agreement would be restored if opacitiesin the region just below the base of the convection zone,2 × 106 . T . 5 × 10⁶ K (0.7 to 0.4R⊙), were 10% largerthan those from OPAL . In that region we find κR(OP) neverto be larger than κR(OPAL) by more than 2.5%. Results foropacities in the region near the base of the convection zonehave been discussed in some detail.
Studies have been made of the accuracies of the OP in-tegrations over frequency, used to obtain Rosseland means,and of the OP procedures used for interpolations in temper-ature and density. It is concluded that the OP Rosseland-means should be numerically correct to within 1% or better.
ACKNOWLEDGEMENTS
We thank Dr N. Grevesse for providing the table of abun-dances which we refer to as A04, and Dr A. M. Serenelli forproviding the table of abundances for BP04. We thank Dr J.N. Bahcall for advice and comments. FD is grateful to theINSU/CNRS for support during visits to Meudon.
REFERENCES
Anders E., Grevesse N., 1989, Geochim. Cosmochim. Acta., 53,197
Asplund M., Grevesse N., Sauval A. J., Allende Prieto C., Kisel-man D., 2004, A&A, 417, 751
Asplund M., Grevesse N., Sauval A. J., 2005, in Bash F. N.,Barnes T. G., eds. Cosmic Abundances as Records of Stel-lar Evolution and Nucleosynthesis, ASP Conf. Series, to bepublished (astro-ph/0410214)
Badnell N. R., 1986, J. Phys. B, 19, 3827Badnell N. R., 1997, J. Phys. B, 30, 1Badnell N. R., Seaton M. J., 2003, J. Phys. B, 36, 4367 (Paper
II)Bahcall J. N., Pinsonneault M. H., 2004, Phys. Rev. Lett., 92,
121301
Bahcall J. N., Serenelli A. M., Pinsonneault M., 2004a, ApJ, 614,464
Bahcall J. N., Basu S., Pinsonneault M., Serenelli A. M., 2004b,ApJ, submitted (astro-ph/0407060)
Basu S., Antia H. M., 2004, ApJ, 606, L85Cunto W., Mendoza C., Ochsenbein F., Zeippen C. J., 1993,
A&A, 275, L5Eissner W., Jones M., Nussbaumer H., 1974, Comp. Phys.
Comm., 8, 270Grevesse N., Noels A., 1993, in Pratzo M., Vangioni-Flam E.,
Casse M. eds., Origin and Evolution of the Elements. CUP,p. 15
Iglesias C. A., Rogers F. J., 1995, ApJ 443, 460Kurucz R. L., 1988, in McNally D., ed., Trans. IAU, XXB, Kluwer,
Dordrecht, p. 168Lynas-Gray A. E., Seaton M. J., Storey P. J., 1995, J. Phys. B,
28, 2817Mendoza C., et al. , 2005, MNRAS, to be submitted
The Opacity Project Team, 1995, The Opacity Project Vol. 1.IOP Publishing, Bristol
The Opacity Project Team, 1997, The Opacity Project Vol. 2.IOP Publishing, Bristol
Rogers F. J., Iglesias C. A., 1992, ApJS, 79, 507Seaton M. J., 2005, Submitted to MNRAS (astro-ph/0411010)
Seaton M. J., 1993, MNRAS, 265, L25
Seaton M. J., Badnell N. R., 2004, MNRAS, 354, 457 (Paper III)Seaton M. J., Yu Yan, Mihalas D., Pradhan A. K., 1994, MNRAS,
266, 805 (Paper I)Summers H. P., 2003, ADAS User Manuel (Version 2.6)
http://adas.phys.strath.ac.uk
This paper has been typeset from a TEX/ LATEX file preparedby the author.
8 N. R. Badnell et al.
-1
0
1
2
3
4
4 4.5 5 5.5 6 6.5 7 7.5
log(
κ R)
log(T)
log(R)=-1
-2
-3
-4
-6
S92 mix
With inner No inner
Figure 1. Rosseland-mean opacities from OP for S92 mix,with and without inner-shell contributions.
-1
0
1
2
3
4
4 4.5 5 5.5 6 6.5 7 7.5
log(
κ R)
log(T)
log(R)=-1
-2
-3
-4
-6
OP OPAL
Figure 2. Rosseland-mean opacities from OP and OPALfor the S92 mix.
Up-dated opacities from the Opacity Project 9
.
-10
-5
0
5
10
15
20
Per
cen
t
log(R)=-1.0 log(R)=-1.5
-10
-5
0
5
10
15
20
4 5 6 7
Per
cen
t
log(T)
log(R)=-2.0
4 5 6 7
log(T)
log(R)=-2.5
Figure 3. Percentage differences, (OP–OPAL), for the S92mix: log(R) = −1 to −2.5.
-10
0
10
20
30
Per
cen
t
log(R)=-3.0 log(R)=-3.5
-10
0
10
20
30
4 5 6 7
Per
cen
t
log(T)
log(R)=-4.0
4 5 6 7
log(T)
log(R)=-4.5
Figure 4. As Figure 3, for log(R) = −3 to −4.5.
10 N. R. Badnell et al.
-2
-1
0
1
2
4 4.5 5 5.5 6 6.5 7 7.5
∂log
(κR
)/∂l
og(T
)
log(T)
OPOPAL
Figure 5. Values of ∂ log(κR)/∂ log(T ) (at constant R) ap-proximated using first derivatives. From OP and OPAL forlog(R) = −2.
Up-dated opacities from the Opacity Project 11
-1
0
1
2
3
4
5
6
3.5 4 4.5 5 5.5 6 6.5 7 7.5
log(k
R)
log(T)
CZ
Figure 6. Rosseland-mean opacity from OPAL as used inthe solar model BP04 of Bahcall and Pinsonneault (2004).The convection zone is the region indicated with log(T ) .
6.34.
-10
-5
0
5
10
3.5 4 4.5 5 5.5 6 6.5 7 7.5
Per
cent
Log(T)
CZ
Figure 7. Percentage differences, (OP–OPAL), betweenopacities for a solar model from Bahcall and Pinsonneault(2004). The convection zone is the region with log(T ) . 6.34.
12 N. R. Badnell et al.
-7
-6
-5
-4
-3
-2
0 5 10 15 20
log(
σ)
u=hν/(kT)
O Ly α
O Ly continuum
Figure 8. The monochromatic opacity for the BP04 mix atlog(T ) = 6.35, log(Ne) = 23.0. Cross-section, σ, in atomicunits, πa2
0.