low z opacities at high densities
TRANSCRIPT
Journal of Quantitative Spectroscopy &Radiative Transfer 81 (2003) 441–450
www.elsevier.com/locate/jqsrt
Low Z opacities at high densities
R. Schotta, F. Philippea, P. Angeloa, E. Dufoura, A. Poqu0erussea,E. Dalimiera ;∗, P. Sauvanb, E. Minguezb, J.M. Gilc, J.G. Rubianoc,
R. Rodriguezc, P. Martelc, R. MancinidaPhysique Atomique dans les Plasmas Denses, Laboratoire pour l’Utilisation des Lasers Intenses (LULI),
Unit�e Mixte No 7605, CNRS-CEA- �Ecole Polytechnique-Universit�e Paris VI, 75252 Paris c�edex 05,France and 91128 Palaiseau c�edex, France
bInstituto de Fusi�on Nuclear, E.T.S. de Ingenieros Industriales U.P.M.,Jos�e Guti�errez Abascal, 2 - 28006 Madrid, Spain
cDepartamento de Fisica, Universidad de Las Palmas de Gran Canaria, SpaindPhysics Department University of Nevada, Reno, NV 89557, USA
Accepted 23 February 2003
Abstract
We present an experimental study devoted to measuring the opacity of bound–bound transitions in ultra-dense,hot, low Z plasmas, which are at the extreme limit for conditions of both emission spectroscopy and absorptionspectroscopy. In this work, we develop an absorption spectroscopy experiment specially adapted to high-densitydiagnostics, using newly designed structured targets and an ultra-high resolution spectrograph. An aluminumplasma is chosen as the :rst candidate and the opacity of the He-like 1s2–1s2p (He�) and 1s2–1s3p (He�)transitions are measured.? 2003 Elsevier Science Ltd. All rights reserved.
PACS: 52.70.La; 52.25.Wr; 52.50.Jm; 32.70.−n.
1. Introduction
The present work is aimed at measuring bound–bound opacities of laser-shocked dense aluminumplasmas using absorption spectroscopy. This study is of importance for several reasons: :rst, thereinterest in :lling a glaring lack of experimental data and calculations for these extreme conditions thatare encountered in astrophysical plasmas, e.g., white dwarfs and center of the sun, and in laboratoryplasmas, e.g., inertial fusion or Z pinch plasmas. Second, the diagnostics of the density-temperaturedomain (200–400 eV)–(5× 10²²–1024 cm−3) requires spectroscopic modeling that depends strongly
∗ Corresponding author. Fax: +33-144277537.E-mail address: [email protected] (E. Dalimier).
0022-4073/03/$ - see front matter ? 2003 Elsevier Science Ltd. All rights reserved.doi:10.1016/S0022-4073(03)00094-3
442 R. Schott et al. / Journal of Quantitative Spectroscopy & Radiative Transfer 81 (2003) 441–450
on radiative transfer. Third, for low Z dense plasmas spectral line shapes appear to be crucial forthe determination of the absorption coeFcient [1–3], which in turn provide information on atomicproperties and ionic correlations. Further, we emphasize that previous attempts have never quitereached the plasma conditions we study here, they have dealt with emission or absorption, direct orindirect measurements [4–7].
Obviously ultra-dense hot plasmas are diFcult to characterize either by emission spectroscopyor by absorption spectroscopy. As these plasmas are weakly emissive for temperatures Te ∼= 200–300 eV we :nd that for low Z (Z6 15) and high densities the hydrogen- and helium-like opacitiesare signi:cant only for geometric depths such that the self-emission cannot be ignored. In previouswork, a :rst attempt was made to measure the hydrogen-like opacities of aluminum by emissionspectroscopy [8]. There the diagnostic required the comparison between diKerent absorption spectrafrom plasmas resulting from diKerent laser shots. The spectrally resolved absorption coeFcient wasmeasured for the aluminum Lyman � line at 300 eV and 1023 cm−3.Here we have chosen to reproduce the same measurements by absorption spectroscopy. The success
of the experiment relies on the abundance of the ionic populations of the lower levels involved forthe aluminum transitions considered. Consequently it turns out to be easier to get absorption inhelium-like lines than hydrogen-like lines. So we have concentrated our eKorts on aluminum He�and He�. Moreover, we have modi:ed the targets and the laser conditions to emphasize the lowertemperatures and, consequently, helium-like absorption.
This work has been performed in parallel with theoretical investigations on opacities for the sameconditions [3]. After a detailed description of the experimental set up, we present experimentalabsorption spectra showing in one spectrum the absorption for aluminum He� and He�. From theseresults we provide a :rst estimate of the opacities.
2. The experimental set up
In the following, we give the conditions for the laser and the improvements made to the targetsand the spectrograph for an absorption spectroscopy diagnostic of the laser-shocked plasma.
The experiments have been carried out at LULI-Ecole Polytechnique on the nanosecond laserfacility. The neodymium laser chain provides a 600 ps Gaussian pulse with a maximum energy 80 Jand a wavelength of 1:053 �m. A 4! beam, i.e., at 263 nm, of up to 25 J, delivered in 500 ps, isfocused onto a structured target, the 100 �m focal spot yields intensities as high as 2×10¹⁴ W cm−2.As we will see, this intensity was intentionally reduced for some shots to enhance the helium-likeemission. A second beam at 2! irradiates a samarium X-source used as a back-lighter.
2.1. The targets
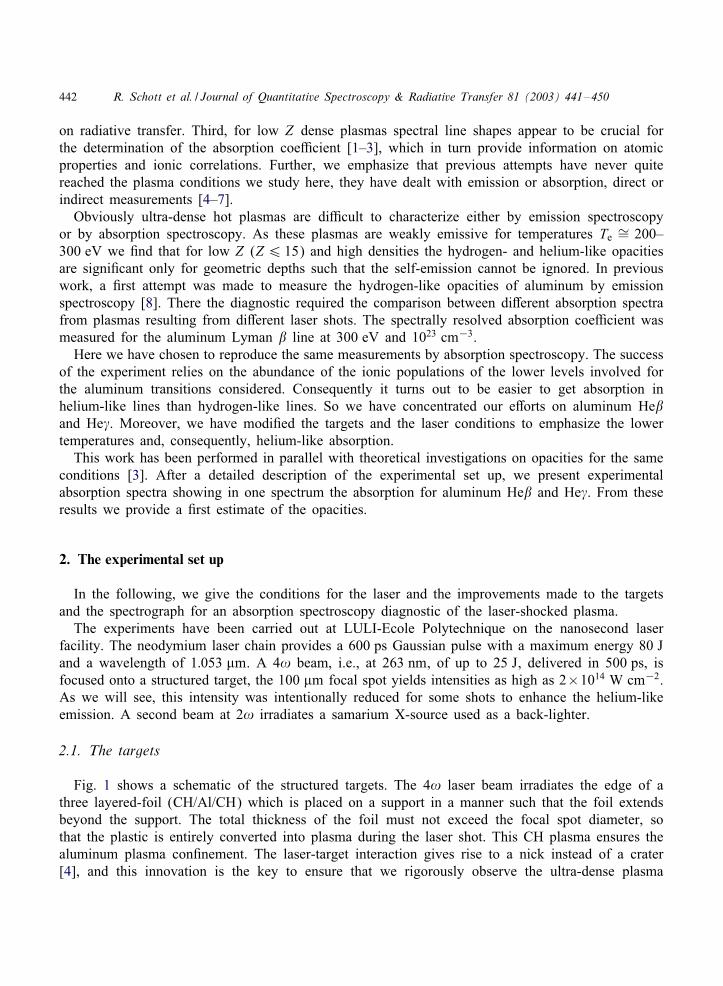
Fig. 1 shows a schematic of the structured targets. The 4! laser beam irradiates the edge of athree layered-foil (CH/Al/CH) which is placed on a support in a manner such that the foil extendsbeyond the support. The total thickness of the foil must not exceed the focal spot diameter, sothat the plastic is entirely converted into plasma during the laser shot. This CH plasma ensures thealuminum plasma con:nement. The laser-target interaction gives rise to a nick instead of a crater[4], and this innovation is the key to ensure that we rigorously observe the ultra-dense plasma
R. Schott et al. / Journal of Quantitative Spectroscopy & Radiative Transfer 81 (2003) 441–450 443
Fig. 1. New target design. A 100 �m three-layered foil (glue included) sticks out from a 2 mm high support, allowingdirect observation of ultra-dense plasma region from the slit.
transversely. This implementation allows a space resolution of a large part of the ultra-dense plasmawithout involving simultaneous integration over less dense regions. In this way the newly designedtarget is particularly suitable for absorption spectroscopy. In fact, it is possible for the back-lighteremission to go through the densest part of the aluminum plasma.
2.2. The absorption experiment set up
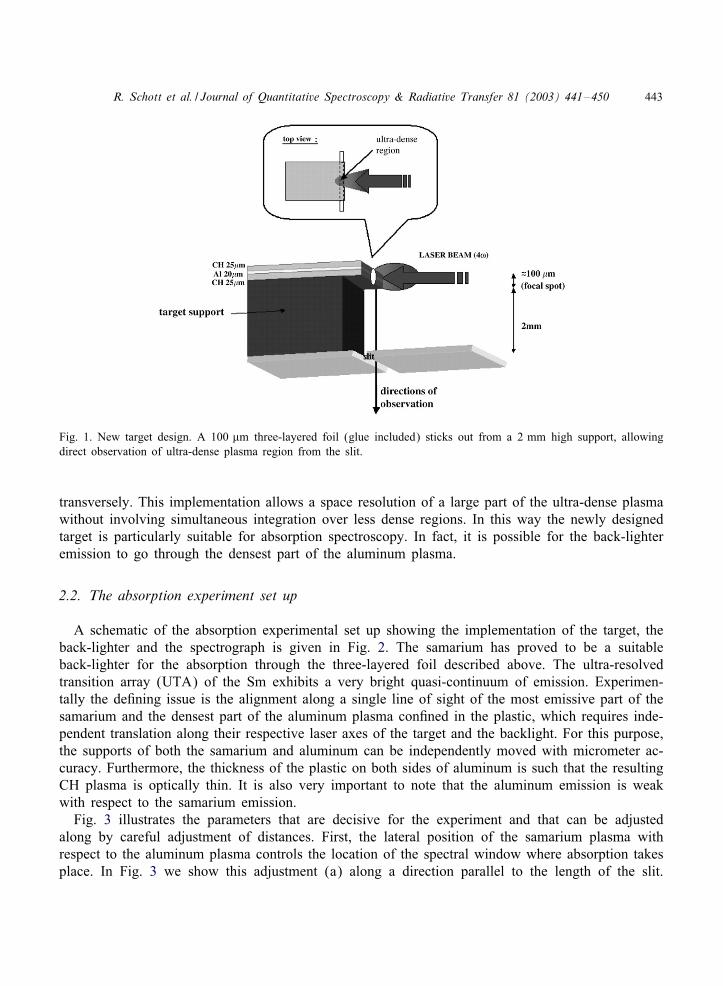
A schematic of the absorption experimental set up showing the implementation of the target, theback-lighter and the spectrograph is given in Fig. 2. The samarium has proved to be a suitableback-lighter for the absorption through the three-layered foil described above. The ultra-resolvedtransition array (UTA) of the Sm exhibits a very bright quasi-continuum of emission. Experimen-tally the de:ning issue is the alignment along a single line of sight of the most emissive part of thesamarium and the densest part of the aluminum plasma con:ned in the plastic, which requires inde-pendent translation along their respective laser axes of the target and the backlight. For this purpose,the supports of both the samarium and aluminum can be independently moved with micrometer ac-curacy. Furthermore, the thickness of the plastic on both sides of aluminum is such that the resultingCH plasma is optically thin. It is also very important to note that the aluminum emission is weakwith respect to the samarium emission.
Fig. 3 illustrates the parameters that are decisive for the experiment and that can be adjustedalong by careful adjustment of distances. First, the lateral position of the samarium plasma withrespect to the aluminum plasma controls the location of the spectral window where absorption takesplace. In Fig. 3 we show this adjustment (a) along a direction parallel to the length of the slit.
444 R. Schott et al. / Journal of Quantitative Spectroscopy & Radiative Transfer 81 (2003) 441–450
Fig. 2. Experimental setup for the absorption experiment: a 4! beam and a 2! beam facing each other irradiate thethree-layered foil and the samarium, respectively. The foil and samarium mounts are allowed to move in all directionsfor an accurate alignment of the two plasmas.
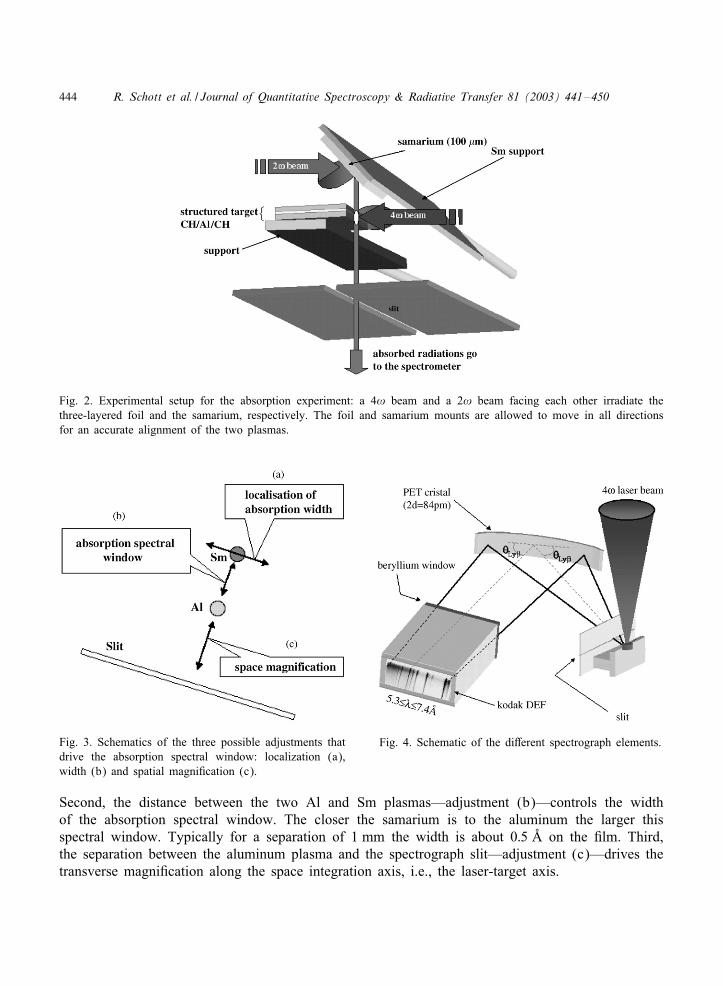
Fig. 3. Schematics of the three possible adjustments thatdrive the absorption spectral window: localization (a),width (b) and spatial magni:cation (c).
Fig. 4. Schematic of the diKerent spectrograph elements.
Second, the distance between the two Al and Sm plasmas—adjustment (b)—controls the widthof the absorption spectral window. The closer the samarium is to the aluminum the larger thisspectral window. Typically for a separation of 1 mm the width is about 0:5 PA on the :lm. Third,the separation between the aluminum plasma and the spectrograph slit—adjustment (c)—drives thetransverse magni:cation along the space integration axis, i.e., the laser-target axis.
R. Schott et al. / Journal of Quantitative Spectroscopy & Radiative Transfer 81 (2003) 441–450 445
2.3. The spectrograph
The samarium backlight emission absorbed by the aluminum plasma is dispersed with an ultra-highresolution (�=Q�=6000) spectrograph (see Fig. 4). A PET crystal, curved to :t a circle whose radiusis twice the Rowland circle radius, is used in Johann geometry. The spectral window includes thealuminum hydrogen- and helium-like lines from 5.3 to 7:4 PA. A beryllium window protects the DEF:lm from the visible light.
The aluminum plasma is very close to the slit, i.e., 2 mm, allowing the very high transversemagni:cation of 100. In Fig. 4 the upper edge of the slit acts as a knife-edge and the :lm detectsthe emission with progressive spatial integration along the laser-target axis. For instance, the emissionon the :lm 0:2 mm from the bottom of the lines corresponds to the emissive volume of the densestpart of the plasma extending to about 2 �m. This volume corresponds to the plasma to be probedin this work by absorption spectroscopy.
3. Results
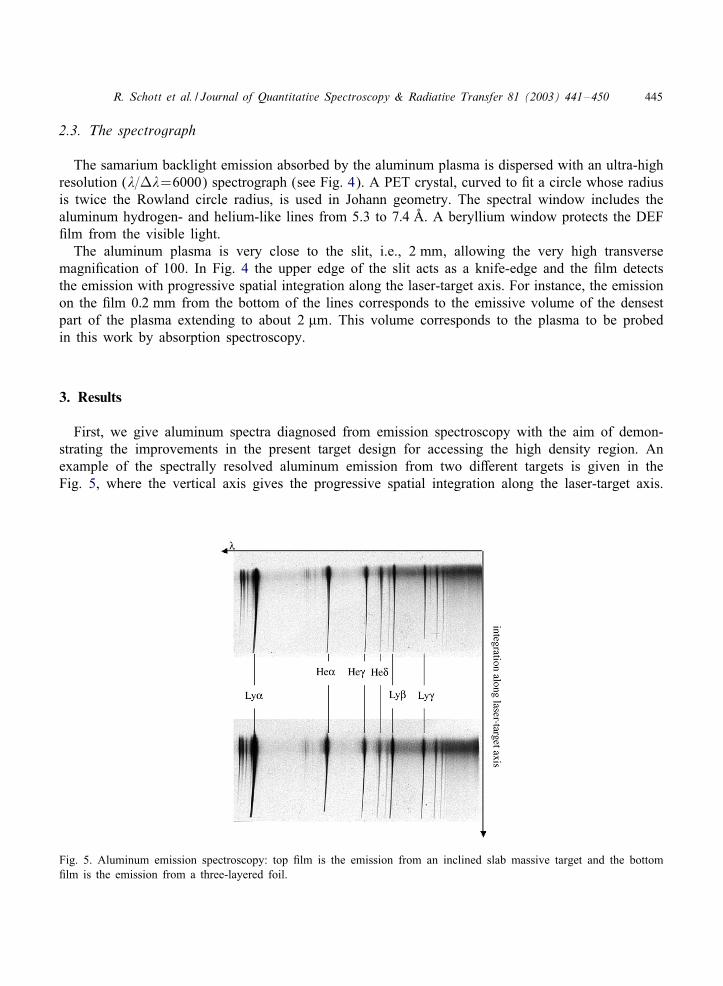
First, we give aluminum spectra diagnosed from emission spectroscopy with the aim of demon-strating the improvements in the present target design for accessing the high density region. Anexample of the spectrally resolved aluminum emission from two diKerent targets is given in theFig. 5, where the vertical axis gives the progressive spatial integration along the laser-target axis.
Fig. 5. Aluminum emission spectroscopy: top :lm is the emission from an inclined slab massive target and the bottom:lm is the emission from a three-layered foil.
446 R. Schott et al. / Journal of Quantitative Spectroscopy & Radiative Transfer 81 (2003) 441–450
The upper :lm is related to the previous target design [5] while the lower :lm corresponds to a newthree-layered foil target described above. The spectral windows, dispersions, and laser conditions arethe same for both :lms. A comparison between the two :lms reveals that the maximum broadeningof the lines is more dominant with the newly designed target than with the previous one. This broad-ening is the signature of the Stark eKect, i.e., the density eKect; thus denser plasma is accessed withthe new design. The distance on :lm over which this consequent Stark broadening is observedgives an indication of the extent of the dense plasma region. This distance is increased withthe three-layered target because the observation takes place in the nick where most of the denseplasma is located while the previous, inclined, target only allowed the probing of a small part of thecrater [5].
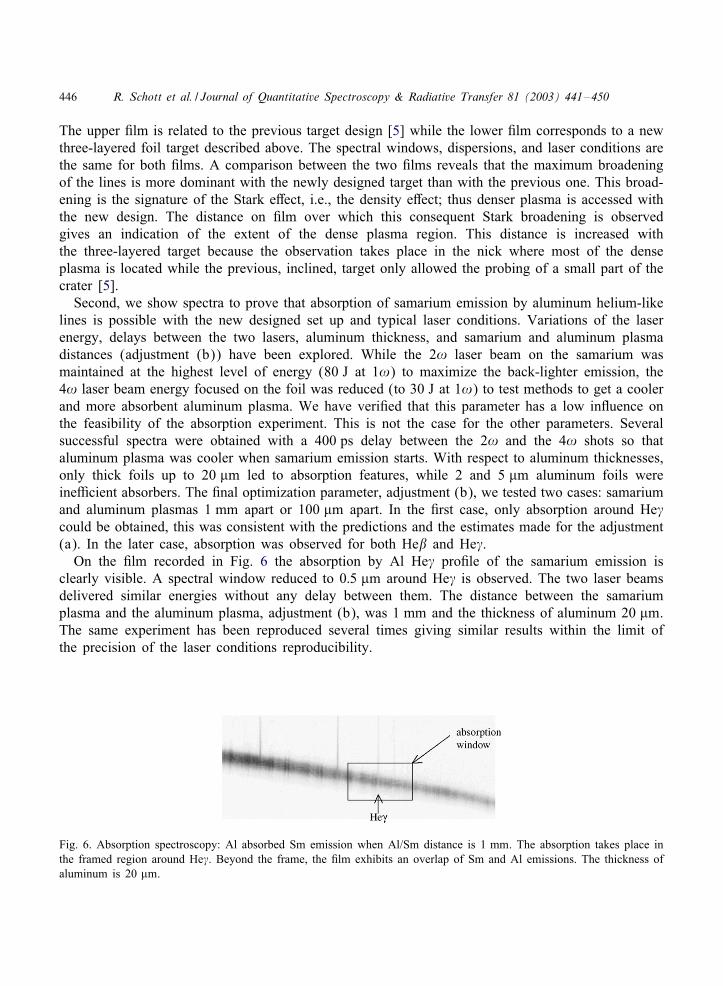
Second, we show spectra to prove that absorption of samarium emission by aluminum helium-likelines is possible with the new designed set up and typical laser conditions. Variations of the laserenergy, delays between the two lasers, aluminum thickness, and samarium and aluminum plasmadistances (adjustment (b)) have been explored. While the 2! laser beam on the samarium wasmaintained at the highest level of energy (80 J at 1!) to maximize the back-lighter emission, the4! laser beam energy focused on the foil was reduced (to 30 J at 1!) to test methods to get a coolerand more absorbent aluminum plasma. We have veri:ed that this parameter has a low inRuence onthe feasibility of the absorption experiment. This is not the case for the other parameters. Severalsuccessful spectra were obtained with a 400 ps delay between the 2! and the 4! shots so thataluminum plasma was cooler when samarium emission starts. With respect to aluminum thicknesses,only thick foils up to 20 �m led to absorption features, while 2 and 5 �m aluminum foils wereineFcient absorbers. The :nal optimization parameter, adjustment (b), we tested two cases: samariumand aluminum plasmas 1 mm apart or 100 �m apart. In the :rst case, only absorption around He�could be obtained, this was consistent with the predictions and the estimates made for the adjustment(a). In the later case, absorption was observed for both He� and He�.On the :lm recorded in Fig. 6 the absorption by Al He� pro:le of the samarium emission is
clearly visible. A spectral window reduced to 0:5 �m around He� is observed. The two laser beamsdelivered similar energies without any delay between them. The distance between the samariumplasma and the aluminum plasma, adjustment (b), was 1 mm and the thickness of aluminum 20 �m.The same experiment has been reproduced several times giving similar results within the limit ofthe precision of the laser conditions reproducibility.
Fig. 6. Absorption spectroscopy: Al absorbed Sm emission when Al/Sm distance is 1 mm. The absorption takes place inthe framed region around He�. Beyond the frame, the :lm exhibits an overlap of Sm and Al emissions. The thickness ofaluminum is 20 �m.
R. Schott et al. / Journal of Quantitative Spectroscopy & Radiative Transfer 81 (2003) 441–450 447
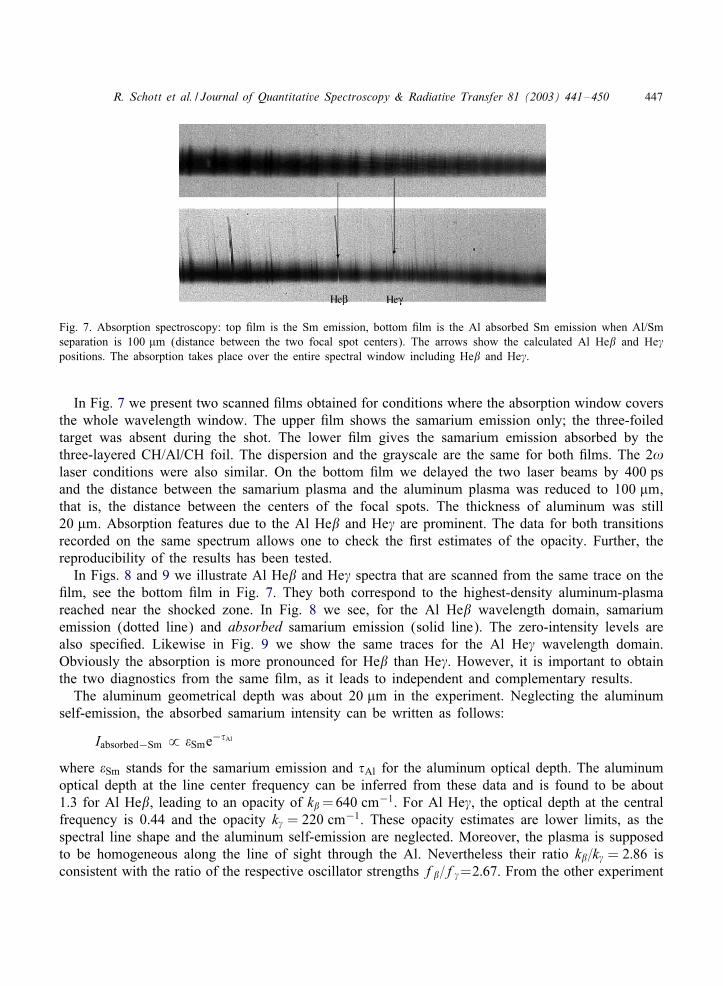
Fig. 7. Absorption spectroscopy: top :lm is the Sm emission, bottom :lm is the Al absorbed Sm emission when Al/Smseparation is 100 �m (distance between the two focal spot centers). The arrows show the calculated Al He� and He�positions. The absorption takes place over the entire spectral window including He� and He�.
In Fig. 7 we present two scanned :lms obtained for conditions where the absorption window coversthe whole wavelength window. The upper :lm shows the samarium emission only; the three-foiledtarget was absent during the shot. The lower :lm gives the samarium emission absorbed by thethree-layered CH/Al/CH foil. The dispersion and the grayscale are the same for both :lms. The 2!laser conditions were also similar. On the bottom :lm we delayed the two laser beams by 400 psand the distance between the samarium plasma and the aluminum plasma was reduced to 100 �m,that is, the distance between the centers of the focal spots. The thickness of aluminum was still20 �m. Absorption features due to the Al He� and He� are prominent. The data for both transitionsrecorded on the same spectrum allows one to check the :rst estimates of the opacity. Further, thereproducibility of the results has been tested.
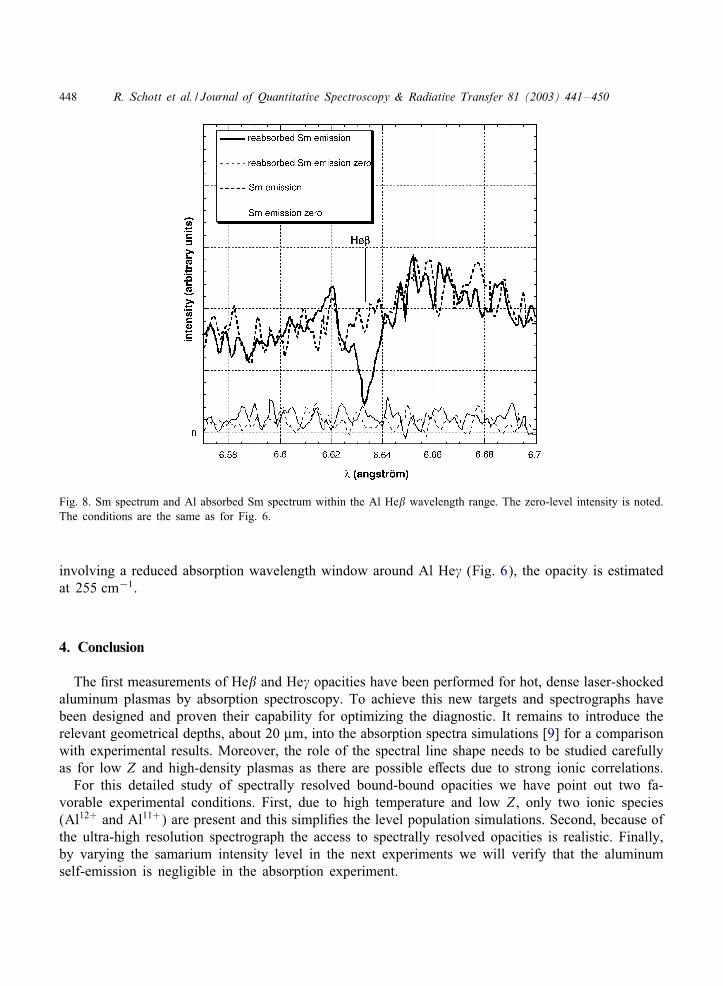
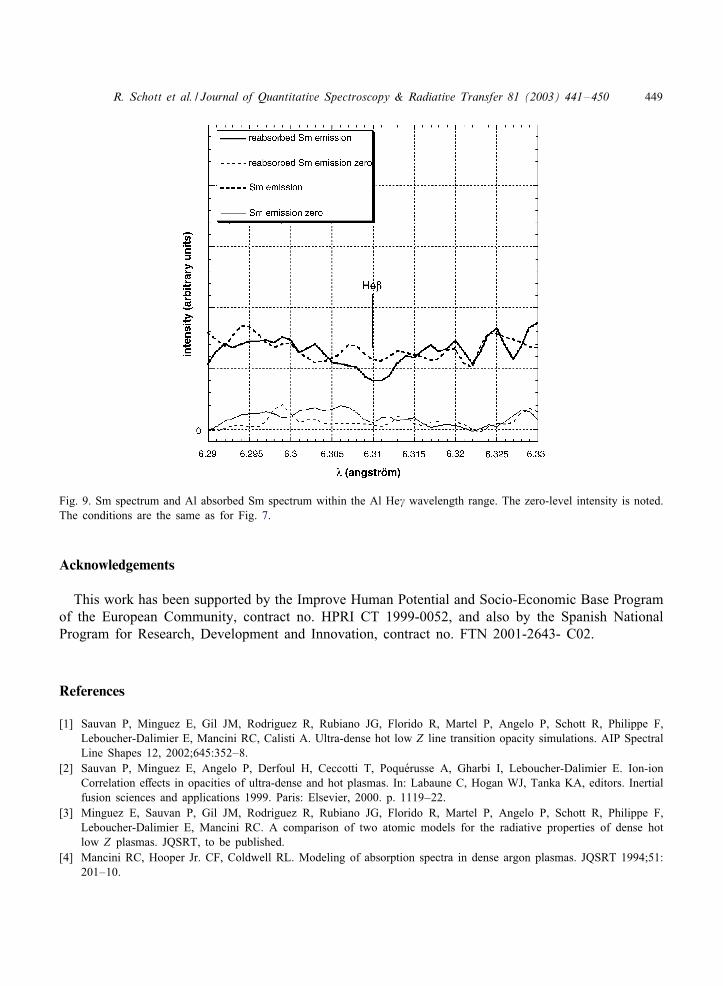
In Figs. 8 and 9 we illustrate Al He� and He� spectra that are scanned from the same trace on the:lm, see the bottom :lm in Fig. 7. They both correspond to the highest-density aluminum-plasmareached near the shocked zone. In Fig. 8 we see, for the Al He� wavelength domain, samariumemission (dotted line) and absorbed samarium emission (solid line). The zero-intensity levels arealso speci:ed. Likewise in Fig. 9 we show the same traces for the Al He� wavelength domain.Obviously the absorption is more pronounced for He� than He�. However, it is important to obtainthe two diagnostics from the same :lm, as it leads to independent and complementary results.
The aluminum geometrical depth was about 20 �m in the experiment. Neglecting the aluminumself-emission, the absorbed samarium intensity can be written as follows:
Iabsorbed−Sm ˙ �Sme−�Al
where �Sm stands for the samarium emission and �Al for the aluminum optical depth. The aluminumoptical depth at the line center frequency can be inferred from these data and is found to be about1.3 for Al He�, leading to an opacity of k�=640 cm−1. For Al He�, the optical depth at the centralfrequency is 0.44 and the opacity k� = 220 cm−1. These opacity estimates are lower limits, as thespectral line shape and the aluminum self-emission are neglected. Moreover, the plasma is supposedto be homogeneous along the line of sight through the Al. Nevertheless their ratio k�=k� = 2:86 isconsistent with the ratio of the respective oscillator strengths f�=f�=2:67. From the other experiment
448 R. Schott et al. / Journal of Quantitative Spectroscopy & Radiative Transfer 81 (2003) 441–450
Fig. 8. Sm spectrum and Al absorbed Sm spectrum within the Al He� wavelength range. The zero-level intensity is noted.The conditions are the same as for Fig. 6.
involving a reduced absorption wavelength window around Al He� (Fig. 6), the opacity is estimatedat 255 cm−1.
4. Conclusion
The :rst measurements of He� and He� opacities have been performed for hot, dense laser-shockedaluminum plasmas by absorption spectroscopy. To achieve this new targets and spectrographs havebeen designed and proven their capability for optimizing the diagnostic. It remains to introduce therelevant geometrical depths, about 20 �m, into the absorption spectra simulations [9] for a comparisonwith experimental results. Moreover, the role of the spectral line shape needs to be studied carefullyas for low Z and high-density plasmas as there are possible eKects due to strong ionic correlations.For this detailed study of spectrally resolved bound-bound opacities we have point out two fa-
vorable experimental conditions. First, due to high temperature and low Z , only two ionic species(Al12+ and Al11+) are present and this simpli:es the level population simulations. Second, because ofthe ultra-high resolution spectrograph the access to spectrally resolved opacities is realistic. Finally,by varying the samarium intensity level in the next experiments we will verify that the aluminumself-emission is negligible in the absorption experiment.
R. Schott et al. / Journal of Quantitative Spectroscopy & Radiative Transfer 81 (2003) 441–450 449
Fig. 9. Sm spectrum and Al absorbed Sm spectrum within the Al He� wavelength range. The zero-level intensity is noted.The conditions are the same as for Fig. 7.
Acknowledgements
This work has been supported by the Improve Human Potential and Socio-Economic Base Programof the European Community, contract no. HPRI CT 1999-0052, and also by the Spanish NationalProgram for Research, Development and Innovation, contract no. FTN 2001-2643- C02.
References
[1] Sauvan P, Minguez E, Gil JM, Rodriguez R, Rubiano JG, Florido R, Martel P, Angelo P, Schott R, Philippe F,Leboucher-Dalimier E, Mancini RC, Calisti A. Ultra-dense hot low Z line transition opacity simulations. AIP SpectralLine Shapes 12, 2002;645:352–8.
[2] Sauvan P, Minguez E, Angelo P, Derfoul H, Ceccotti T, Poqu0erusse A, Gharbi I, Leboucher-Dalimier E. Ion-ionCorrelation eKects in opacities of ultra-dense and hot plasmas. In: Labaune C, Hogan WJ, Tanka KA, editors. Inertialfusion sciences and applications 1999. Paris: Elsevier, 2000. p. 1119–22.
[3] Minguez E, Sauvan P, Gil JM, Rodriguez R, Rubiano JG, Florido R, Martel P, Angelo P, Schott R, Philippe F,Leboucher-Dalimier E, Mancini RC. A comparison of two atomic models for the radiative properties of dense hotlow Z plasmas. JQSRT, to be published.
[4] Mancini RC, Hooper Jr. CF, Coldwell RL. Modeling of absorption spectra in dense argon plasmas. JQSRT 1994;51:201–10.
450 R. Schott et al. / Journal of Quantitative Spectroscopy & Radiative Transfer 81 (2003) 441–450
[5] Golovkin IE, Mancini RC, Woolsey NC, Back CA, Lee RW, Klein L. Opacity analysis of the He§ line in Ar-dopedindirect drive implosion at NOVA. In: Labaune C, Hogan WJ, Tanka KA, editors. Inertial fusion sciences andapplications 1999. Paris: Elsevier, 2000. p. 1123–6.
[6] Seely JF, Feldman U, Brown CM, Hammel BA, Back CA, Hsieh E, Lee RW. Absorption spectroscopy ofradiatively-heated low Z foils. JQSRT 1994;51:349–55.
[7] Erskine D, Rosnyai B, Ross M. Measuring opacity of shock generated argon plasmas. JQSRT 1994;51:97–100.[8] Schott R, Philippe F, Angelo P, Dufour E, Poqu0erusse A, Leboucher-Dalimier E, Sauvan P, Velarde P, Ogando F,
Minguez E, Gil JM, Rubiano JG, Rodriguez R, Martel P, Mancini RC. Access to spectrally resolved ultra-dense hotlow Z emissivities and opacities. AIP Spectral Line Shapes 12 2002;645:340–51.
[9] Hakel P, Shlyaptseva A, Mancini RC, Bastiani S, Audebert P, Geindre JP, Gauthier JC, Grillon G, Mysyrowicz A,Antonetti A. High order K� emission from plasmas driven by ultrashort laser pulses. AIP Conf Proc 1 1997;406:427–34.