a tool for analyzing synaptic densities in neurons - scitepress
TRANSCRIPT
SynapCountJ: A Tool for Analyzing Synaptic Densities in Neurons
Gadea Mata1, Jonathan Heras1, Miguel Morales2, Ana Romero1 and Julio Rubio1
1Departamento de Matematicas y Computacion, Universidad de La Rioja, Logrono, La Rioja, Spain2Institut de Neurocincies, Universitat Autonoma de Barcelona, Barcelona, Spain
Keywords: Synapses, Synaptic Density, Image Processing, ImageJ.
Abstract: The quantification of synapses is instrumental to measure the evolution of synaptic densities of neurons underthe effect of some physiological conditions, neuronal diseases or even drug treatments. However, the manualquantification of synapses is a tedious, error-prone, time-consuming and subjective task; therefore, tools thatmight automate this process are desirable. In this paper, we present SynapCountJ, an ImageJ plugin, thatcan measure synaptic density of individual neurons obtained by immunofluorescence techniques, and alsocan be applied for batch processing of neurons that have been obtained in the same experiment or using thesame setting. The procedure to quantify synapses implemented in SynapCountJ is based on the colocalizationof three images of the same neuron (the neuron marked with two antibody markers and the structure of theneuron) and is inspired by methods coming from Computational Algebraic Topology. SynapCountJ providesa procedure to semi-automatically quantify the number of synapses of neuron cultures; as a result, the timerequired for such an analysis is greatly reduced.
1 INTRODUCTION
Synapses are the points of connection between neu-rons, and they are dynamic structures subject toa continuous process of formation and elimination.Pathological conditions, such as the Alzheimer dis-ease, have been related to synapse loss associatedwith memory impairments. Hence, the possibilityof changing the number of synapses may be an im-portant asset to treat neurological diseases (Selkoe,2002). To this aim, it is necessary to determine theevolution of synaptic densities of neurons under theeffect of some physiological conditions, neuronal dis-eases or even drug treatments.
The procedure to quantify synaptic density of aneuron is usually based on the colocalization be-tween the signals generated by two antibodies (Cuestoet al., 2011). Namely, neuron cultures are permeabi-lized and treated with two different primary markers(for instance, bassoon and synapsin). These antibod-ies recognize specifically two presynaptic structures.Then, it is necessary a secondary antibody couple at-tached to different fluorochromes (for instance redand green; note, that several other combinations ofcolor are possible) making these two synaptic proteinsvisible under the fluorescence microscope. The twomarkers are photographed in two gray-scale images;
that, in turn, are overlapped using respectively the redand green channels. In the resultant image, the yel-low points (colocalization of the code channels) arethe candidates to be the synapses.
The final step in the above procedure is the selec-tion of the yellow points that are localized either onthe dendrites of the neuron or adjacent to them. Toolslike MetaMorph (Devices, 2015) or ImageJ (Schnei-der et al., 2012) — a Java platform for image pro-cessing that can be easily extended by means of plu-gins — can be used to manually count the number ofsynapses; however, such a manual quantification is atedious, time-consuming, error-prone, and subjectivetask; hence, tools that might automate this processare desirable. In this paper, we present SynapCountJ,an ImageJ plugin, that semi-automatically quantifiessynapses and synaptic densities in neuron cultures.
2 METHODOLOGY
SynapCountJ supports two execution modes: individ-ual treatment of a neuron and batch processing — theworkflow of both modes is provided in Figure 1
Mata, G., Heras, J., Morales, M., Romero, A. and Rubio, J.SynapCountJ: A Tool for Analyzing Synaptic Densities in Neurons.DOI: 10.5220/0005637700250031In Proceedings of the 9th International Joint Conference on Biomedical Engineering Systems and Technologies (BIOSTEC 2016) - Volume 2: BIOIMAGING, pages 25-31ISBN: 978-989-758-170-0Copyright c© 2016 by SCITEPRESS – Science and Technology Publications, Lda. All rights reserved
25

Sta
rtB
atch
p
roce
ssin
g?
NO
Con
figu
re s
etti
ng
Cha
nn
el
Gre
en Im
age
Cha
nn
el R
ed
Imag
eSt
ruct
ure
(t
xt-f
ile)
Kno
wn
th
resh
old
?Se
lect
th
resh
old
NO
Wri
te t
hres
ho
ld
YES
Save
th
e se
ttin
gs?
Imag
e w
ith
anal
yze
d re
gio
n
Imag
e w
ith
ind
icat
ed
syn
apse
s
Xm
l-fi
le w
ith
the
sett
ings
YES
Show
the
res
ult
s
Tab
le w
ith
anal
ysis
YES
Pat
h o
f d
irec
tory
wit
h
imag
es
NO
Lif-
file
s?
Xm
l-fi
le w
ith
sett
ings
YES
Lif-
file
End
Cal
cula
te n
umb
er
of s
ynap
ses
and
den
sity
Show
tab
leSa
ve r
esu
lts
imag
esTa
ble
wit
h an
alys
isIm
age
wit
h an
alyz
ed
regi
on
Imag
e w
ith
ind
icat
ed
syn
apse
s
NO
Save
set
ting
s
Cal
cula
te n
umb
er o
f sy
nap
ses
and
d
ensi
ty
Cho
ose
inp
ut
file
s
Inp
ut p
ath
of
file
s
Cho
ose
d
irec
tori
es
Figure 1: Workflow of SynapCountJ.
BIOIMAGING 2016 - 3rd International Conference on Bioimaging
26
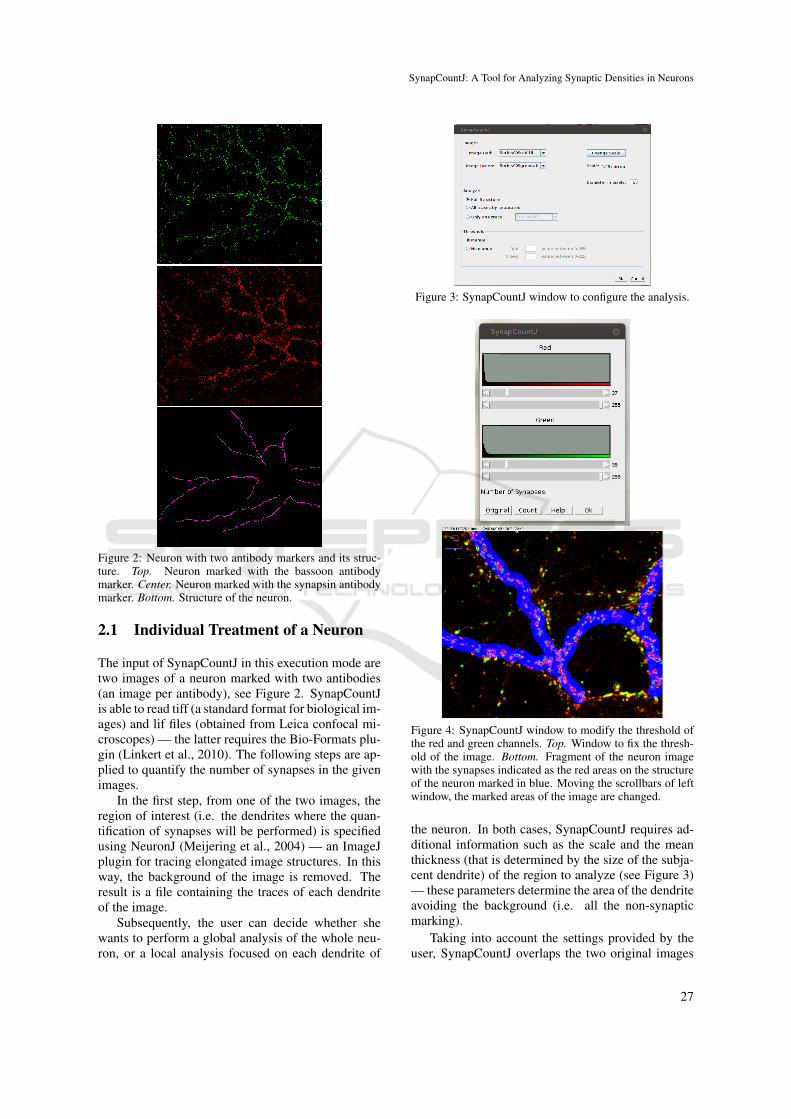
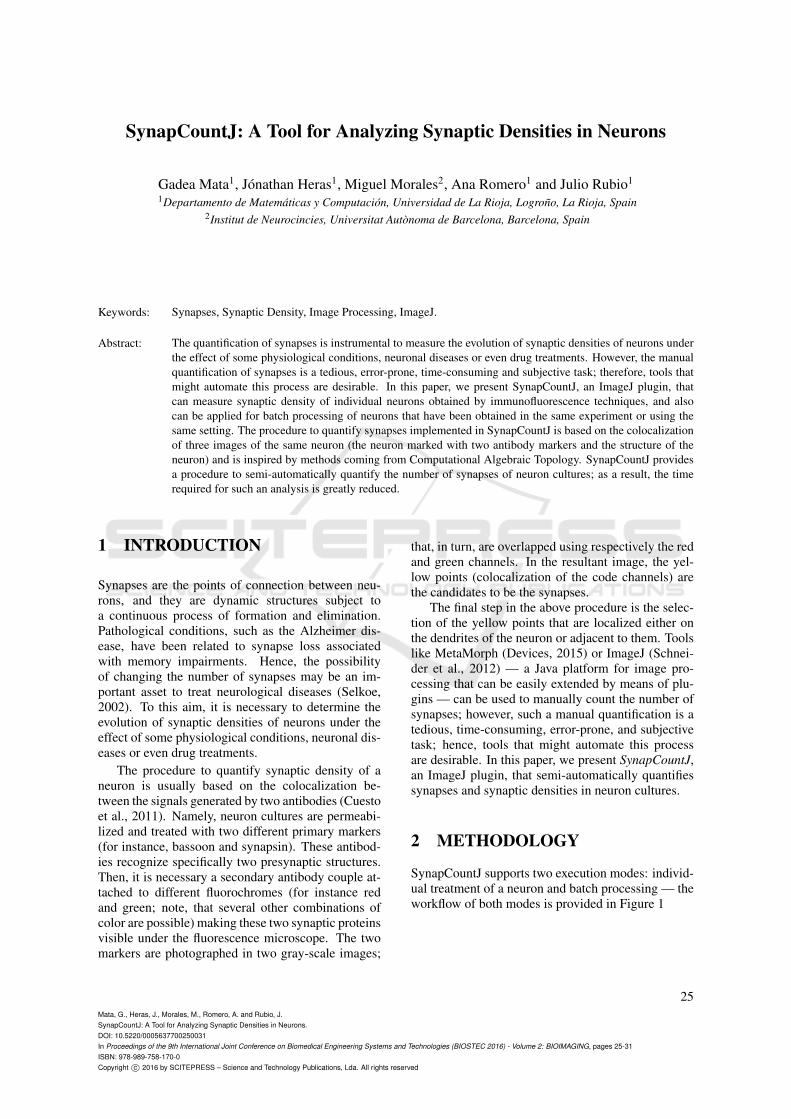
Figure 2: Neuron with two antibody markers and its struc-ture. Top. Neuron marked with the bassoon antibodymarker. Center. Neuron marked with the synapsin antibodymarker. Bottom. Structure of the neuron.
2.1 Individual Treatment of a Neuron
The input of SynapCountJ in this execution mode aretwo images of a neuron marked with two antibodies(an image per antibody), see Figure 2. SynapCountJis able to read tiff (a standard format for biological im-ages) and lif files (obtained from Leica confocal mi-croscopes) — the latter requires the Bio-Formats plu-gin (Linkert et al., 2010). The following steps are ap-plied to quantify the number of synapses in the givenimages.
In the first step, from one of the two images, theregion of interest (i.e. the dendrites where the quan-tification of synapses will be performed) is specifiedusing NeuronJ (Meijering et al., 2004) — an ImageJplugin for tracing elongated image structures. In thisway, the background of the image is removed. Theresult is a file containing the traces of each dendriteof the image.
Subsequently, the user can decide whether shewants to perform a global analysis of the whole neu-ron, or a local analysis focused on each dendrite of
Figure 3: SynapCountJ window to configure the analysis.
Figure 4: SynapCountJ window to modify the threshold ofthe red and green channels. Top. Window to fix the thresh-old of the image. Bottom. Fragment of the neuron imagewith the synapses indicated as the red areas on the structureof the neuron marked in blue. Moving the scrollbars of leftwindow, the marked areas of the image are changed.
the neuron. In both cases, SynapCountJ requires ad-ditional information such as the scale and the meanthickness (that is determined by the size of the subja-cent dendrite) of the region to analyze (see Figure 3)— these parameters determine the area of the dendriteavoiding the background (i.e. all the non-synapticmarking).
Taking into account the settings provided by theuser, SynapCountJ overlaps the two original images
SynapCountJ: A Tool for Analyzing Synaptic Densities in Neurons
27
of the neuron and the structure of the neuron pre-viously defined. From the resultant image, Synap-CountJ identifies the almost white points (the resultof green, red, and blue combination) as synaptic can-didates, and it allows the user to modify the valuesof the red and green channels in order to modify thedetection threshold (see Figure 4).
Once that the detection threshold has been fixed,the counting process is started. Such a process isinspired by techniques coming Computational Alge-braic Topology. In spite of being an abstract math-ematical subject, Algebraic Topology has been suc-cessfully applied in digital image analysis (Segonneet al., 2003; Gonzalez-Dıaz and Real, 2005) In ourparticular case, the white areas are segmented fromthe overlapped image, and the colors of the resultantimage are inverted — obtaining as a result a black-and-white image where the synapses are the black ar-eas. From such an image, the problem of quantifyingthe number of synapses is reduced to compute the ho-mology group in dimension 0 of the image; this corre-sponds to the computation of the number of connectedcomponents of the image.
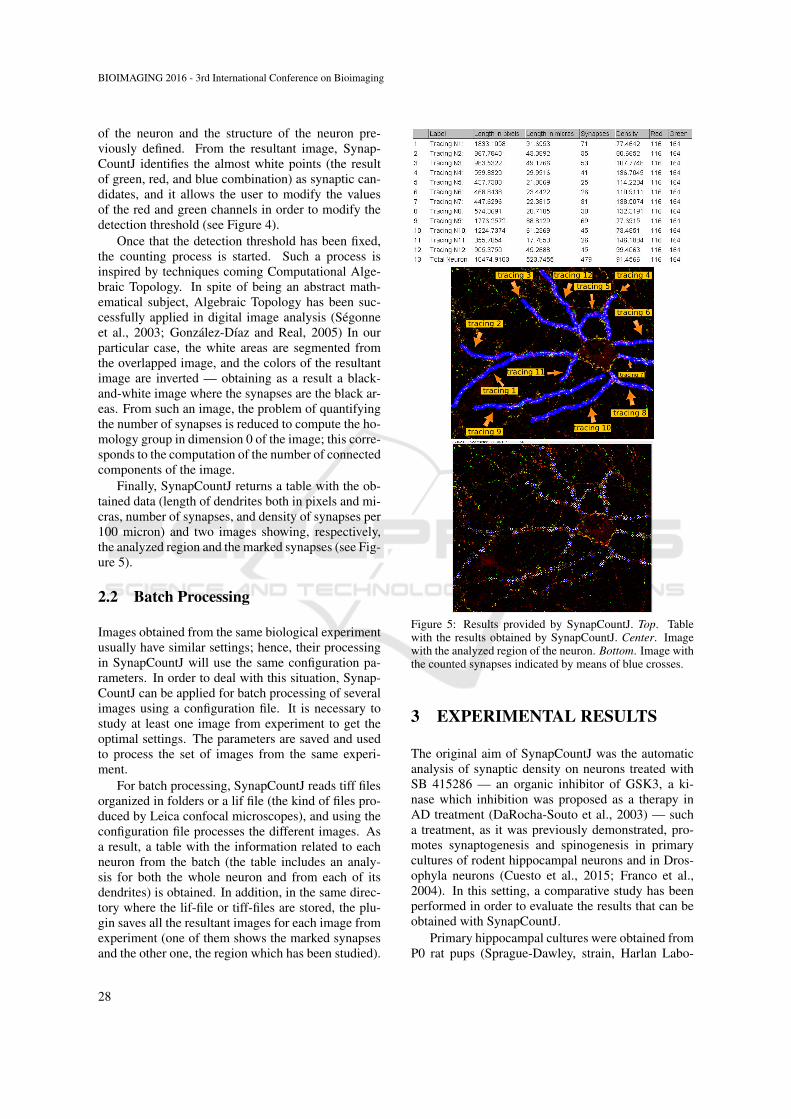
Finally, SynapCountJ returns a table with the ob-tained data (length of dendrites both in pixels and mi-cras, number of synapses, and density of synapses per100 micron) and two images showing, respectively,the analyzed region and the marked synapses (see Fig-ure 5).
2.2 Batch Processing
Images obtained from the same biological experimentusually have similar settings; hence, their processingin SynapCountJ will use the same configuration pa-rameters. In order to deal with this situation, Synap-CountJ can be applied for batch processing of severalimages using a configuration file. It is necessary tostudy at least one image from experiment to get theoptimal settings. The parameters are saved and usedto process the set of images from the same experi-ment.
For batch processing, SynapCountJ reads tiff filesorganized in folders or a lif file (the kind of files pro-duced by Leica confocal microscopes), and using theconfiguration file processes the different images. Asa result, a table with the information related to eachneuron from the batch (the table includes an analy-sis for both the whole neuron and from each of itsdendrites) is obtained. In addition, in the same direc-tory where the lif-file or tiff-files are stored, the plu-gin saves all the resultant images for each image fromexperiment (one of them shows the marked synapsesand the other one, the region which has been studied).
Figure 5: Results provided by SynapCountJ. Top. Tablewith the results obtained by SynapCountJ. Center. Imagewith the analyzed region of the neuron. Bottom. Image withthe counted synapses indicated by means of blue crosses.
3 EXPERIMENTAL RESULTS
The original aim of SynapCountJ was the automaticanalysis of synaptic density on neurons treated withSB 415286 — an organic inhibitor of GSK3, a ki-nase which inhibition was proposed as a therapy inAD treatment (DaRocha-Souto et al., 2003) — sucha treatment, as it was previously demonstrated, pro-motes synaptogenesis and spinogenesis in primarycultures of rodent hippocampal neurons and in Dros-ophyla neurons (Cuesto et al., 2015; Franco et al.,2004). In this setting, a comparative study has beenperformed in order to evaluate the results that can beobtained with SynapCountJ.
Primary hippocampal cultures were obtained fromP0 rat pups (Sprague-Dawley, strain, Harlan Labo-
BIOIMAGING 2016 - 3rd International Conference on Bioimaging
28
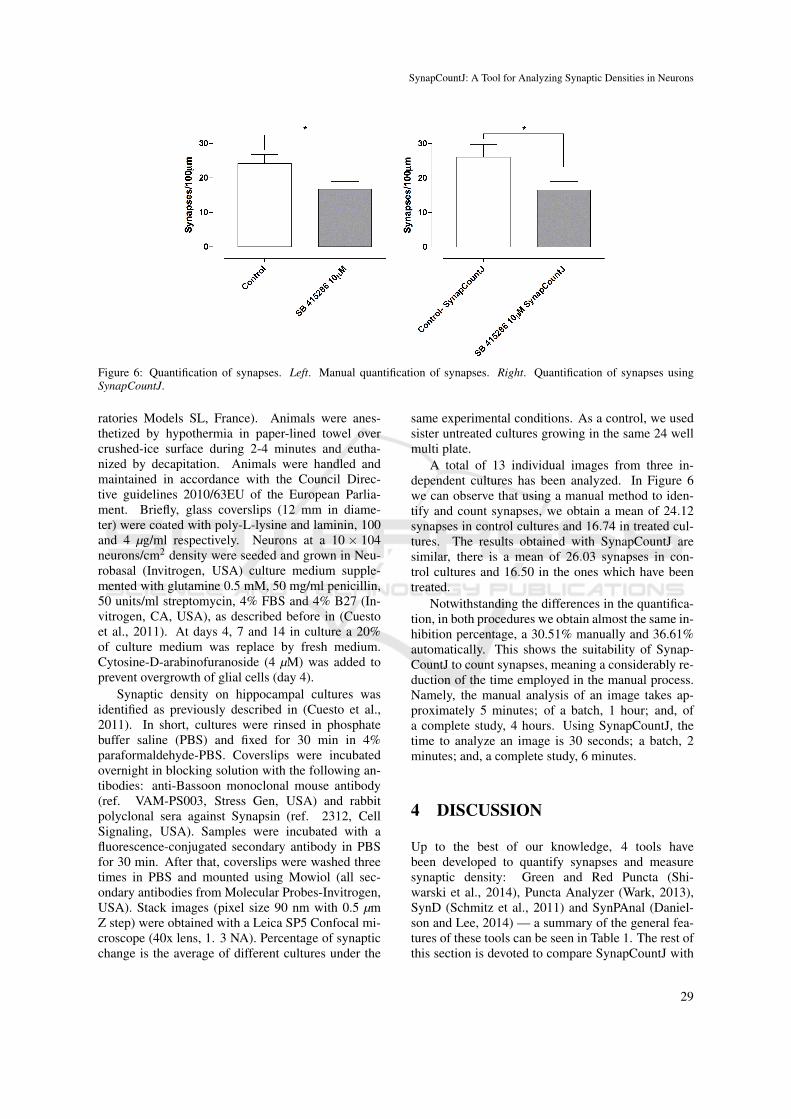
Figure 6: Quantification of synapses. Left. Manual quantification of synapses. Right. Quantification of synapses usingSynapCountJ.
ratories Models SL, France). Animals were anes-thetized by hypothermia in paper-lined towel overcrushed-ice surface during 2-4 minutes and eutha-nized by decapitation. Animals were handled andmaintained in accordance with the Council Direc-tive guidelines 2010/63EU of the European Parlia-ment. Briefly, glass coverslips (12 mm in diame-ter) were coated with poly-L-lysine and laminin, 100and 4 µg/ml respectively. Neurons at a 10× 104neurons/cm2 density were seeded and grown in Neu-robasal (Invitrogen, USA) culture medium supple-mented with glutamine 0.5 mM, 50 mg/ml penicillin,50 units/ml streptomycin, 4% FBS and 4% B27 (In-vitrogen, CA, USA), as described before in (Cuestoet al., 2011). At days 4, 7 and 14 in culture a 20%of culture medium was replace by fresh medium.Cytosine-D-arabinofuranoside (4 µM) was added toprevent overgrowth of glial cells (day 4).
Synaptic density on hippocampal cultures wasidentified as previously described in (Cuesto et al.,2011). In short, cultures were rinsed in phosphatebuffer saline (PBS) and fixed for 30 min in 4%paraformaldehyde-PBS. Coverslips were incubatedovernight in blocking solution with the following an-tibodies: anti-Bassoon monoclonal mouse antibody(ref. VAM-PS003, Stress Gen, USA) and rabbitpolyclonal sera against Synapsin (ref. 2312, CellSignaling, USA). Samples were incubated with afluorescence-conjugated secondary antibody in PBSfor 30 min. After that, coverslips were washed threetimes in PBS and mounted using Mowiol (all sec-ondary antibodies from Molecular Probes-Invitrogen,USA). Stack images (pixel size 90 nm with 0.5 µmZ step) were obtained with a Leica SP5 Confocal mi-croscope (40x lens, 1. 3 NA). Percentage of synapticchange is the average of different cultures under the
same experimental conditions. As a control, we usedsister untreated cultures growing in the same 24 wellmulti plate.
A total of 13 individual images from three in-dependent cultures has been analyzed. In Figure 6we can observe that using a manual method to iden-tify and count synapses, we obtain a mean of 24.12synapses in control cultures and 16.74 in treated cul-tures. The results obtained with SynapCountJ aresimilar, there is a mean of 26.03 synapses in con-trol cultures and 16.50 in the ones which have beentreated.
Notwithstanding the differences in the quantifica-tion, in both procedures we obtain almost the same in-hibition percentage, a 30.51% manually and 36.61%automatically. This shows the suitability of Synap-CountJ to count synapses, meaning a considerably re-duction of the time employed in the manual process.Namely, the manual analysis of an image takes ap-proximately 5 minutes; of a batch, 1 hour; and, ofa complete study, 4 hours. Using SynapCountJ, thetime to analyze an image is 30 seconds; a batch, 2minutes; and, a complete study, 6 minutes.
4 DISCUSSION
Up to the best of our knowledge, 4 tools havebeen developed to quantify synapses and measuresynaptic density: Green and Red Puncta (Shi-warski et al., 2014), Puncta Analyzer (Wark, 2013),SynD (Schmitz et al., 2011) and SynPAnal (Daniel-son and Lee, 2014) — a summary of the general fea-tures of these tools can be seen in Table 1. The rest ofthis section is devoted to compare SynapCountJ with
SynapCountJ: A Tool for Analyzing Synaptic Densities in Neurons
29
Table 1: General features of the analyzed software.
Software Language Underlying Tech-nology
Types of Im-ages
Technique for de-tection
Green and Red Puncta Java ImageJ tiff ColocalizationPuncta Analyzer Java ImageJ2 tiff Colocalization
SynapCountJ Java ImageJ tiff and lif ColocalizationSynD Matlab Matlab tiff and lsm Brightness
SynPAnal Java tiff Brightness
Table 2: Features to quantify synapses and synaptic density of the analyzed software.
Software Detection of den-drites
Threshold BatchProcessing
Dendriteslength
Density Export Save
Green and RedPuncta
Not used X
Puncta Analyzer Manual ROI X XSynapCountJ Manual X X X X X XSynD Automatic X X X X XSynPAnal Manual X X X X
these tools — such a comparison is summarized inTable 2.
There are two approaches to locate synapses in anRGB image either based on colocalization or bright-ness. In the former, synapses are identified as thecolocalization of bright points in the red and greenchannels — this is the approach followed by Greenand Red Puncta, Puncta Analyzer and SynapCountJ— in the latter, synapses are the bright points of a re-gion of an image — the approach employed in SynDand SynPAnal. In both approaches, it is necessary athreshold that can be manually adjusted to increase(or decrease) the number of detected synapses; such afunctionality is supported by all the tools.
In the quantification of synapses from RGB im-ages, it is instrumental to determine the region of in-terest (i.e. the dendrites of the neurons where thesynapses are located); otherwise, the analysis will notbe precise due to noise coming from irrelevant regionsor the background of the image — this happens inthe Green and Red Puncta tool since it considers thewhole image for the analysis. Puncta Analyzer al-lows the user to fix a rectangle containing the den-drites of the neuron, but this is not completely pre-cise since some regions of the rectangle might con-tain points considered as synapses that do not belongto the structure of the neuron. SynD is the only soft-ware that automatically detects the dendrites of a neu-ron; however, it can only be applied to neurons witha cell-fill marker, and does not support the analysisfrom specific regions, such as soma or distal den-drites. SynapCountJ and SynPAnal provide the func-tionality to manually draw the dendrites of the image;allowing the user to designate the specific areas where
quantification is restricted.The main output produced by all the available
tools is the number of synapses of a given image;additionally, SynapCountJ, SynD and SynPAnal pro-vides the length of the dendrites; and, SynapCountJis the only tool that outputs the synaptic density permicron. All the tools but Green and Red Punctua canexport the results to an external file for storage andfurther processing.
Finally, as we have explained in Subsection 2.2,images obtained from the same biological experimentusually have similar settings; hence, batch process-ing might be useful. This functionality is featured bySynapCountJ and SynD, and requires a previous stepof saving the configuration of an individual analysis.SynPAnal does not support batch processing, but theconfiguration of an individual analysis can be savedto be later applied in other individual analysis.
As a summary, SynapCountJ is more completethan the rest of available programs. It can use differ-ent types of synaptic markers and can process batchimages. Furthermore, a differential feature of Synap-CountJ is that it is based on a topological algorithm(namely, computing the number of connected com-ponents in a combinatorial structure), allowing us tovalidate the correctness of our approach by means offormal methods in software engineering.
5 CONCLUSIONS AND FURTHERWORK
SynapCountJ is an ImageJ plugin that provides asemi-automatic procedure to quantify synapses and
BIOIMAGING 2016 - 3rd International Conference on Bioimaging
30
measure synaptic density from immunofluorescenceimages obtained from neuron cultures. This pluginhas been tested not only with neurons in development,but also with the neuromuscular union of Drosophila;therefore, it can be applied to the study of images thatcontain two synaptic markers and a determined struc-ture. The results obtained with SynapCountJ are con-sistent with the results obtained manually; and Synap-CountJ dramatically reduces the time required for thequantification of synapses.
As further work, it remains the tasks of improv-ing the usability of the plugin and including post-processing tools to manually edit the obtained results.Additionally, and since the final aim of our projectis the complete automation of the whole process, itis necessary a procedure to automatically detect theneuron morphology.
6 AVAILABILITY ANDSOFTWARE REQUIREMENTS
SynapCountJ is an ImageJ plugin that can bedownloaded, together with its documentation, fromhttp://imagejdocu.tudor.lu/doku.php?id=plugin:utilities:synapsescountj:start. SynapCountJ is open sourceand available for use under the GNU General PublicLicense. This plugin runs within both ImageJ andFiji (Schindelin et al., 2012) and has been tested onWindows, Macintosh and Linux machines.
REFERENCES
Cuesto, G., Enriquez-Barreto, L., Carames, C., et al. (2011).Phosphoinositide-3-kinase activation controls synap-togenesis and spinogenesis in hippocampal neurons.Journal of Neuroscience, 31(8):2721–2733.
Cuesto, G., Jordan-Alvarez, S., Enriquez-Barreto, L., et al.(2015). GSK3β inhibition Promotes Synaptogenesisin Drosophila and Mammalian Neurons. PlosOne,10(3). doi=10.1371/journal.pone.0118475.
Danielson, E. and Lee, S. H. (2014). SynPAnal: Soft-ware for Rapid Quantification of the Density andIntensity of Protein Puncta from Fluorescence Mi-croscopy Images of Neurons. PLoS ONE, 9(12).doi=10.1371/journal.pone.0115298.
DaRocha-Souto, B., Scotton, T. C., Coma, M., et al. (2003).Brain oligomeric β-amyloid but not total amyloidplaque burden correlates with neuronal loss and astro-cyte inflammatory response in amyloid precursor pro-tein/tau transgenic mice. Journal of Neuropathology& Experimental Neurology, 70(5):360–376.
Devices, M. (2015). Metamorph research imag-ing. http://www.moleculardevices.com/systems/metamorph-research-imaging.
Franco, B., Bogdanik, L., Bobinnec, Y., et al. (2004).Shaggy, the homolog of glycogen synthase ki-nase 3, controls neuromuscular junction growth inDrosophila. Journal of Neuroscience, 24(29):6573–6577.
Gonzalez-Dıaz, R. and Real, P. (2005). On the Cohomologyof 3D Digital Images. Discrete Applied Mathematics,147(2–3):245–263.
Linkert, M., Rueden, C. T., Allan, C., et al. (2010). Meta-data matters: access to image data in the real world.The Journal of Cell Biology, 189(5):777–782.
Meijering, E., Jacob, M., Sarria, J. C. F., et al. (2004). De-sign and Validation of a Tool for Neurite Tracing andAnalysis in Fluorescence Microscopy Images. Cytom-etry Part A, 58(2):167–176.
Schindelin, J., Argand-Carreras, I., Frise, E., et al. (2012).Fiji: an open-source platform for biological-imageanalysis. Nature methods, 9(7):676–682.
Schmitz, S. K., Hjorth, J. J. J., Joemail, R. M. S., et al.(2011). Automated analysis of neuronal morphology,synapse number and synaptic recruitment. Journal ofNeuroscience Methods, 195(2):185–193.
Schneider, C., Rasband, W., and Eliceiri, K. (2012). NIHImage to ImageJ. Nature Methods, 9:671–675.
Segonne, F., Grimson, E., and Fischl, B. (2003). Topolog-ical Correction of Subcortical Segmentation. In Pro-ceedings of the 6th International conference on Med-ical Image Computing and Computer Assisted Inter-vention (MICCAI’03), volume 2879 of Lecture Notesin Computer Science, pages 695–702.
Selkoe, D. J. (2002). Alzheimer’s diseases is a synapticfailure. Science, 298(5594):789–791.
Shiwarski, D. J., Dagda, R. D., and Chu, C. T.(2014). Green and red puncta colocalization.http://imagejdocu.tudor.lu/doku.php?id=plugin:analysis:colocalization analysis macro for red and greenpuncta:start.
Wark, B. (2013). Puncta analyzer v2.0. https://github.com/physion/puncta-analyzer.
SynapCountJ: A Tool for Analyzing Synaptic Densities in Neurons
31