treatment of oil sands process-affected water with ceramic ultrafiltration membrane: effects of...
TRANSCRIPT

Separation and Purification Technology 122 (2014) 170–182
Contents lists available at ScienceDirect
Separation and Purification Technology
journal homepage: www.elsevier .com/locate /seppur
Treatment of oil sands process-affected water with ceramicultrafiltration membrane: Effects of operating conditionson membrane performance
1383-5866/$ - see front matter � 2013 Elsevier B.V. All rights reserved.http://dx.doi.org/10.1016/j.seppur.2013.11.005
⇑ Corresponding author. Address: NSERC Senior Industrial Research Chair in OilSands Tailings Water Treatment, Helmholtz – Alberta Initiative Lead (Theme 5),3-093 Markin/CNRL Natural Resources Engineering Facility, Department of Civil andEnvironmental Engineering, University of Alberta, Edmonton, Alberta T6G 2W2,Canada. Tel.: +1 780 492 5124; fax: +1 780 492 0249.
E-mail address: [email protected] (M. Gamal El-Din).
Alla Alpatova a, Eun-Sik Kim a,b, Shimiao Dong a, Nian Sun a, Pamela Chelme-Ayala a,Mohamed Gamal El-Din a,⇑a Department of Civil and Environmental Engineering, University of Alberta, Edmonton, Alberta T6G 2W2, Canadab Department of Environmental System Engineering, Chonnam National University, 50 Daehak-ro, Yeosu, Jeonnam, 550-749, South Korea
a r t i c l e i n f o a b s t r a c t
Article history:Received 4 June 2013Received in revised form 4 November 2013Accepted 5 November 2013Available online 12 November 2013
Keywords:UltrafiltrationCeramic membraneOil sandsCoagulationFouling mechanism
This study investigated the performance of 1 kDa ceramic ultrafiltration membrane for the removal ofinorganic and organic compounds from oil sands process-affected water (OSPW) generated after thermaloperations of heavy oil recovery in Alberta, Canada. The OSPW was pretreated with alum coagulant, andthe effect of operating conditions on subsequent membrane filtration was studied. While permeate fluxincreased with increasing trans-membrane pressure (TMP) from 1.4 bar to 3.5 bar, greater permeate fluxdecline was observed at TMP of 3.5 bar due to increased accumulation of foulants at the membrane sur-face. The membrane filtration performed at cross-flow velocity (CFV) of 0.2 L/min was characterized bythe lowest initial and steady-state permeate fluxes and by the highest normalized flux decline comparedto higher CFVs. This effect was attributed to lower turbulence at the membrane surface which might havepromoted the buildup of contaminants. According to the resistance-in-series model, no irreversible mem-brane fouling was observed when OSPW was pretreated with coagulation–flocculation–sedimentation.The pore blocking and cake layer formation dominated at the beginning of filtration, whereas cake layerformation was the primary fouling mechanism at later stages. The final membrane permeates met therequirements for the high pressure-driven membrane processes (i.e., nanofiltration and reverse osmosis)with respect to turbidity and silt density index (SDI15) values. Up to 38.6 ± 2.7% (depending on TMP andCFV values) of chemical oxygen demand (COD) was removed, and the removal percentages of the acidextractable fraction (AEF) and naphthenic acids (NAs) were less because of the small sizes of NAs andother organic compounds contributing to the AEF as compared to the membrane pore sizes.
� 2013 Elsevier B.V. All rights reserved.
1. Introduction
During thermal operations of heavy oil recovery in Northern Al-berta, Canada, the caustic soda is used to extract bitumen from theoil sands, and four cubic meters of the oil sands process-affectedwater (OSPW) are produced per one cubic meter of oil sands [1].The water demand for this process is met by OSPW recycling andby the fresh water uptake from the Athabasca River [2]. As a result,the quality of OSPW which is a complex mixture of solids, dis-solved organic and inorganic species as well as metals [3], deterio-rates due to concentrating of organic and inorganic constituents
during OSPW recycle. Under no-release policy, operating compa-nies store OSPW in tailing ponds in order to avoid its release intothe receiving environment [2,4]. To achieve the sustainability ofthe oil sands operations, OSPW needs to be treated to decreaseits toxicity and to facilitate its reclamation for safe release intothe receiving environment and/or for treated-OSPW recycle for re-use to minimize the volume of the fresh water uptake. Variouschemical, physical, physicochemical and biological treatmentshave been evaluated in order to develop a performance-efficientand cost-effective strategy for OSPW remediation [5–10].
The use of membrane filtration for water treatment has in-creased worldwide because of the advances in treatment efficiencyand reduction in operational costs [11,12]. Low pressure-drivenmembrane processes such as microfiltration and ultrafiltration(UF) are being considered as attractive alternatives for municipaland industrial water treatment [13–15]. The use of ceramic mem-branes due to their excellent chemical resistance to inorganicacids, bases, oxidants, the tolerance to high temperatures and long-
A. Alpatova et al. / Separation and Purification Technology 122 (2014) 170–182 171
er life-span [16–19] has increased over the last decade [13,20–22].Recently, they have been applied for the treatment of petrochem-ical wastewaters [15,23,24]. For example, Deriszadeh et al. [15] re-ported the application of 50 kDa TiO2 ceramic membrane for theremoval of organic contaminants from the oil-field processedwaters in Alberta and California.
Due to the high concentration of solids, organic compounds andionic species, OSPW can cause severe fouling of polymeric mem-branes and rapid decrease in permeate flux [7,25,26]. Thus, itwas shown that chemical cleaning of polymeric nanofiltration(NF) and reverse osmosis (RO) was not capable of restoring the ini-tial permeate flux [26]. As such, in a new approach to the treat-ment of OSPW we employed ceramic 1 kDa UF membrane for theremoval of organic and inorganic compounds from OSPW. Wehypothesized that the application of ceramic membrane filtrationto the treatment of OSPW will allow to achieve high removal ratiosof organic and inorganic contaminants and to maintain high per-meate flux due to the better ability of ceramic membranes to sus-tain cleaning procedures as compared to their polymericcounterparts. The objectives of this study were as follows: (1) toinvestigate the effect of coagulant addition on the treatment effi-ciency in terms of permeate flux and membrane selectivity; (2)to evaluate the effect of hydrodynamic conditions such as trans-membrane pressure (TMP) and cross-flow velocity (CFV) on themembrane filtration performance; and (3) to evaluate the mem-brane fouling caused by OSPW and to elucidate the fouling mech-anisms. Our previous studies have shown that OSPWpretreatments such as coagulation/flocculation/sedimentation(CFS) or filtration with the direct coagulant addition reduced mem-brane fouling of NF and RO polymeric membranes [25,26]. Thecoagulation of OSPW destabilized suspended solids and colloidalmatter by reducing their surface charge and promoting their coa-lescence leading to flocs formation during the flocculation process[6,26]. The flocs were further removed by a sedimentation (i.e., set-tling) process or on membranes’ surfaces during direct filtration[25,26]. Although CFS followed by ceramic membrane filtrationhas been recently applied for the treatment of surface waters(membranes with the nominal pore sizes of 0.01 lm [13,14] and0.1 lm [13,14]) and for secondary effluent from wastewater treat-ment plant (membranes with the nominal pore sizes of 0.1 lm,0.5 lm and 1.0 lm) [21] in order to enhance the removal of partic-ulate material and dissolved organics, this process has never beeninvestigated with respect to the treatment of OSPW.
The TMP and CFV are factors that significantly influence theseparation properties and permeate quality [27–29]. Therefore,it is important to evaluate the operating parameters of ceramicmembrane filtration in order to achieve maximum removals oforganic and inorganic compounds from OSPW while keepinghigh permeate flux. A resistance-in-series model [27,30] wasused in this study to analyze different types of fouling and fou-lant/membrane interactions caused by the complex nature ofOSPW matrix. The fouling mechanisms were elucidated basedon four classical models (cake filtration, complete, standard orintermediate pore blockings) which are commonly applied to de-scribe the fouling behavior of both natural waters and solutionsof model compounds [31–33]. The three-mechanism model re-cently developed by Duclos-Orcello et al. [34] was also used toevaluate the internal and external membrane fouling. Thus, un-like previously published studies on membrane filtration ofOSPW, this is the first study which comprehensively examinesall aspects of membrane filtration including removal of contam-inants, effect of hydrodynamic conditions on process efficiencyas well as evaluation of OSPW fouling behavior. Consideringmembrane’s performance, this may decrease operational exp-ences as well as membranes’ cleaning and maintenance costsin a long-term prospective.
2. Materials and methods
2.1. OSPW and chemicals
OSPW was collected from an active OSPW recycling pond inFort McMurray, Alberta, Canada. OSPW was stored in polyvinylchloride containers at 4 �C and was warmed up to the room tem-perature (21 ± 1 �C) before conducting the experiments. Due toits high turbidity, raw OSPW was stirred with a mechanical mixer(Model L, Mixing Equipment Co., Inc., Rochester, NY, USA) for 1 minto ensure sample homogeneity. The OSPW characteristics areshown in Table 1. All solutions used in this experimental studywere prepared with Milli-Q water (Millipore Corp., Bedford, MA,USA). Solutions used in NAs analysis by ultra performance liquidchromatography were prepared with Optima-grade water (FisherScientific, Fair Lawn, NJ, USA). The details of the chemicals can befound in Supplementary Information (SI).
2.2. Jar tests
The optimum coagulant dose was determined in a six-paddlejar-test apparatus (PB-700 Jar Tester, Phipps & Bird, Richmond,VA, USA) by using the procedure developed in previous studies[6,25]. Aluminum sulfate octadecahydrate (Al2(SO4)3�18H2O) inthe range of 20–145 mg/L (as alum) was added to raw OSPW andthe water was rapidly mixed at 120 rpm for 30 s, followed by slowmixing at 30 rpm for 10 min. As the flocs were formed, the sampleswere allowed to settle for 1.5 h [6,25]. Each alum dose was testedin triplicate.
2.3. Membrane filtration system
Fig. 1 shows a schematic of the membrane filtration system. Thesystem consisted of a membrane module, recirculation pumps, afeed tank and a data acquisition system. The membrane housingand fittings were purchased from TAMI Industries (Nyons, France).The volume of the feed OSPW tank was 3 L. The system was oper-ated in a total recycling mode in which permeate was recycled,using a Master Flex L/S peristaltic pump (ColeParmer, Chicago, IL,USA), into a feed tank once the permeate volume reached200 mL. The TMP and CFV were set up using a mechanical pump(Model 75211-10, ColeParmer, Montreal, QC, Canada) and a back-pressure valve (Swagelok, Solon, OH, USA). The mass of permeatewas measured by an electronic balance (Scout Pro, Ohaus Corp.,Parsippany, NJ, USA). CFS-pretreated OSPW (using the optimumcoagulant dose) served as a feed water to the membrane filtrationsystem (i.e., CFS treatment followed by membrane filtration (de-noted as ‘‘CFS-filtration’’)). To evaluate the effect of sedimentationalone on membrane filtration, OSPW treated by coagulation/floc-culation without sedimentation step was tested in a separateexperiment, denoted as ‘‘direct filtration’’.
2.4. Ceramic membranes
Two tubular 1 kDa membranes with seven channels (innerdiameter: 0.1 cm; hydraulic diameter of each channel: 0.02 cm;membrane length: 25 cm) (Inside CéRAM™, TAMI Industries,Nyons, France) were used for CFS-filtration and direct filtration,respectively. The total effective filtering area of each membranewas 132 cm2. The membranes’ selective and support layers wereTiO2/ZrO2 and TiO2, respectively [16]. Upon receiving the mem-branes were cleaned with 0.4 M sodium hydroxide (NaOH) andphosphoric acid (H3PO4) according to the manufacturer’s technicaldirections [16]. The membranes’ flux and removal were measuredaccording to Eqs. S1 and S2, respectively (see SI). After each exper-

Table 1Characteristics of oil sands process-affected water.
Parameter Raw oil sands process-affected water After coagulation/flocculation/sedimentation process with 30 mg/L of alum
pH 8.3 ± 0.2 8.1 ± 0.2Chemical oxygen demand (COD), mg/L 302.2 ± 10.2 266.7 ± 17.7Acid extractable fraction (AEF), mg/L 48.5 ± 0.2 48.7 ± 1.2Total organic carbon (TOC), mg/L 65.1 ± 6.2 56.1 ± 1.3Naphthenic acids (NAs)*, mg/L 8.92 8.95UV254, a.u. n/a** 0.655 ± 0.040Conductivity, mS/cm 4.5 ± 0.1 4.3 ± 0.3Turbidity, NTU 213.3 ± 2.6 6.3 ± 0.7Total suspended solids (TSS), mg/L 221.0 ± 4.5 5.3 ± 3.4Total dissolved solids (TDS), mg/L 2859.0 ± 14.8 2425.7 ± 11.0Total alkalinity, mg/L as CaCO3 609.3 ± 1.2 599.3 ± 1.2
* Was not replicated.** Was not measured due to high turbidity of raw oil sands process-affected water.
Fig. 1. Schematic of membrane filtration system.
172 A. Alpatova et al. / Separation and Purification Technology 122 (2014) 170–182
iment, the membranes were cleaned by backwashing with 3 L ofMilli-Q water followed by recirculation of 0.1 M NaOH for60 min. Due to severe fouling observed during the direct filtrationopeartions, additional cleaning with 0.4 M NaOH at 85 �C for30 min followed by rinsing with 0.01 M H3PO4 at 50 �C for15 min was applied [16]. The membranes were rinsed with theMilli-Q water after each cleaning until pH of permeate reached7.0 ± 0.5.
2.5. Resistance-in-series analysis of membrane fouling
The resistance of foulants which built up during the filtration ofOSPW was determined by Darcy’s law (Eq. (1)):
J ¼ TMPlRT
ð1Þ
where J is the permeate flux (L/m2 h), TMP is the differential pres-sure across the membrane (2.8 bar), l is the dynamic viscosity(0.001 kg/m s at 20 �C), and RT is the total resistance (1/m). The RT
was determined based on the resistance-in-series model [27,30].The RT was subdivided into three resistance components
according to Eq. (2):
RT ¼ RM þ RCP þ RF ð2Þ
where RM is the intrinsic membrane resistance (1/m), RCP is theresistance caused by the concentration polarization (1/m), and RF
is the resistance caused by the fouling (1/m). The RF comprised ofRR and RIR, which corresponded to the reversible and irreversible
components of the fouling resistance, respectively, as shown inEq. (3):
RF ¼ RR þ RIR ð3Þ
The reversible resistance RR was further split into the followingcomponents according to Eq. (4):
RR ¼ RCL þ RPB þ RCC ð4Þ
where RCL is the resistance caused by the loosely attached foulantson the membrane surface. These foulants were removed by mem-brane flushing with Milli-Q water at higher CFV value becausestronger shear forces caused the dislodging of foulants from themembrane surface. The RPB corresponded to a fraction of foulingwhich was caused by pore blocking. This resistance was removedby backwashing with Milli-Q water. The RCC accounted for the foul-ing due to the adsorption of contaminants onto the membrane ma-trix. The contaminants which caused RCC were dissolved duringchemical cleaning. The measuring protocol for each resistance isshown in Table 2.
2.6. Filtration mechanisms
The membrane filtration experiments were performed in thedead-end configuration of the membrane filtration system atTMP of 2.8 bar. The models used in this study and theircorresponding equations used to model the membranes’ foulingmechanisms (Eqs. (12)–(16)) are briefly described in Table 3. Eqs.(12)–(16) conform to the cake filtration, complete pore blocking,standard blocking, intermediate blocking, and three mechanism

Table 2Measuring protocol for the resistance-in-series model.
Resistance Measuring protocol Equation
Intrinsic membraneresistance RM
The permeate flux J0 with Milli-Q water was measured before the fouling experiment attrans-membrane pressure (TMP) of 2.8 bar and cross-flow velocity (CFV) of 0.6 L/min
RM ¼ TMPlJ0
(5)
Total resistance RT The permeate flux J was measured during last 10 min of OSPW filtration at TMP of 2.8 barand CFV of 0.6 L/min
RM ¼ TMPlJ
(6)
Resistance due toconcentration polarizationRCP
The Milli-Q water permeate flux JCP was measured at TMP of 2.8 bar and CFV of 0.6 L/min RCP ¼ RT � TMPlJCP� RM (7)
Resistance due to looselyattached foulants RCL
The membrane was flushed with the Milli-Q water for 30 min at CFV of 1 L/min. Thepermeate flux JCl was measured at TMP of 2.8 bar and CFV of 0.6 L/min
RCL ¼ RF � TMPlJCL� RM (8)
Resistance due to poreblocking RPB
The membrane was backwashed with 3L of Milli-Q water at TMP = 3.5 bar. The permeateflux JPB was measured at TMP of 2.8 bar and CFV of 0.6 L/min
RPB ¼ RCL � TMPlJPB� RM (9)
Resistance due to foulantsadsorption ontomembrane RCC
The membrane was cleaned by recirculation of 0.1 M NaOH for 60 min in the sameconditions as during OSPW filtration. The membrane was further cleaned with Milli-Qwater until pH = 7. The permeate flux JCC was measured at TMP of 2.8 bar and CFV of0.6 L/min
RCC ¼ RPB � TMPlJCC� RM (10)
Irreversible resistance RIR Irreversible resistance RIR ¼ RT � ðRCP þ RCLRPB þ RCC þ RMÞ (11)
A. Alpatova et al. / Separation and Purification Technology 122 (2014) 170–182 173
model, respectively. For the three mechanism model (Eq. (16)), theexperimental data was fitted to the general differential equation(Eq. (17)):
d2tdt¼ k
dtdV
� �n
ð17Þ
In Eqs. (12)–(17), J0 is the initial permeate flux (L/m2 h), J is the per-meate flux at any given time t (L/m2 h), V is the cumulative perme-ate volume (m3), A is the membrane area (m2), n is the poreblocking index, and kb, ks, ki, kc are the coefficients of the corre-sponding models. The experimental data were plotted accordingto the models’ linearized forms and their linearity was examinedby the best fit method [31].
2.7. Water quality analyses
The sample pH and conductivity were measured using an Acc-umet Research AR20 pH/conductivity Meter (Fisher Scientific, Ot-tawa, ON, Canada). The turbidity was measured by an Orbeco-Hellige 965 Digital Nephelometric Turbidimeter (Orbeco AnalyticalSystems Inc., Sarasota, FL, USA). The total suspended solids (TSS)and the total dissolved solids (TDS) were measured following theStandard Method 2540-Solids [35]. The alkalinity was evaluatedaccording to the Standard Method 2320-B [35]. Chemical oxygendemand (COD) was measured following the Standard ColorimetricMethod 5220-D [35]. The concentration of UV254-absorbing com-pounds was evaluated with a UV/visible spectrophotometer atk = 254 nm (Varian Inc., Santa Clara, CA, USA). An Apollo 9000 TotalOrganic Carbon (TOC) Combustion Analyzer (FOLIO InstrumentsInc., Kitchener, ON, Canada) was used to measure TOC. The acidextractable fraction (AEF) in OSPW was measured using PerkinEl-mer Spectrum 100 Fourier transform infrared spectroscopy (FT-IR) Spectrometer (Woodbridge, ON, Canada) according to themethod described elsewhere [6]. A Fluka napthenic acids (NAs)solution (i.e., a commercial mixture of NAs) in dichloromethane(0–100 mg/L) was used to prepare the calibration curve. TheSDI15 of OSPW samples was determined using a 0.45 lm mem-brane (Millipore Corp., Bedford, MA, USA) at a TMP of 2.1 bar anda total elapsed test time of 15 min according to the procedure de-scribed elsewhere [36]. Each water quality parameter was mea-sured in triplicate and the value is given as an average ± standarddeviation. The data were analyzed by the one-way analysis of var-iance (ANOVA) using Microsoft Excel� at a 95% confidence interval.Synchronous fluorescent spectra (SFS) were taken using AgilentCary Eclipse Fluorescence Spectrophotometer (Markham, ON,Canada).
An ultra performance liquid chromatograph (Waters Corp., Mil-ford, MA, USA) equipped with a Phenyl BEH column (150 � 1 mm,
1.7 lm) (Waters Corp., Milford, MA, USA) was used for the chro-matographic separation of NAs. The detection was performed witha high resolution Synapt G2 HDMS Mass Spectrometer (WatersCorp., Milford, MA, USA) equipped with an electrospray ionizationsource (Waters Corp., Milford, MA, USA) operating in negative ionmode. More details on water quality analyses can be found in theSI.
3. Results and discussion
3.1. Determination of the optimal coagulant dose
Pretreatment of OSPW with alum was necessary due to the highTSS (221.0 ± 4.5 mg/L) and turbidity (213.3 ± 2.6 NTU) contents ofraw OSPW (Table 1). Our previous studies showed that raw OSPWcaused severe permeate flux decline due to the deposition of par-ticulate materials on the surface of polymeric membranes[25,26]. The flux declines were diminished when OSPW was trea-ted with alum [25]. Moreover, due to various chemical composi-tions of different OSPW matrices, depending on the source ofOSPW and the operating conditions during bitumen extraction,the optimal coagulant dose has to be determined for any specificOSPW stream (i.e., matrix) in order to minimize the membranefouling [6,25]. Different concentrations of alum were added toOSPW, and the change in turbidity as a function of alum concentra-tion is shown in Fig. S1 (SI). Significant turbidity reduction was ob-served after CFS pretreatment, with over 97% of turbidity beingremoved at alum doses P30 mg/L. A previous study showed thatf-potential of raw OSPW was �40.0 ± 3.0 mV [6]. The CFS treat-ment with alum steadily increased f-potential of OSPW; however,it remained negative even after addition of 800 mg/L of alum(�6.0 ± 1 mV) [6]. Given that zero point charge pH of TiO2 whichcomprises the membranes’ selective layer is in the range of 4.1–7.2 [37], the membrane surface is expected to be charged nega-tively because the pH of OSPW after coagulation was in the weakalkaline range (Table 1). As such, it can be concluded that the addi-tion of alum will not change the membrane’s surface charge. Giventhat the addition of alum beyond 30 mg/L did not improve turbid-ity removal, 30 mg/L of alum was chosen as an optimum dose forfurther membrane filtration experiments.
3.2. Effect of hydrodynamic conditions on the permeate flux andmembrane’s selectivity
3.2.1. Effect of TMPThe transient permeate flux (J) and the normalized permeate
flux (J/Jo) as functions of TMP are shown in Fig. 2. Jo is permeateflux measured at the beginning of experiment, and J is permeate

Table 3Membrane fouling mechanisms applied in this study.
Type of model Equation Plottype
Cake filtration: particles with the sizes bigger than the membrane pores accumulate on the membrane surface resulting in theformation of permeable cake layer
dVdt ¼ J0 � kbV (12) t
V � V
Complete pore blocking: each particle blocs the entrance to the membrane pore. The particle does not sit on another particle. Themembrane pores are not blocked
tV ¼ 1
J0þ ks
2 t (13) dVdt � V
Standard pore blocking: blocking occurs inside the pores because the particle size is smaller than the pore size. The pore volumedecreases proportionally to the permeate volume. The membrane pores have equal diameter and length
dtdV ¼
1J0þ kit (14) t=V � t
Intermediate pore blocking: extension of the complete blocking model. The difference is that some particles may settle on the previouslydeposited ones. Not all particles on the membrane surface seal pores
tV ¼ 1
J0
kc2 V (15) dt
dV � t
Three-mechanism: accounts for external fouling (cake filtration and pore blockage) and internal fouling (pore constriction) d2 tdt2 ¼ � 1
J3 A2dJdt
(16) d2tdV2 � dt
dV
174 A. Alpatova et al. / Separation and Purification Technology 122 (2014) 170–182
flux at a time t. As seen in Fig. 2a, for the OSPW treated by CFS andthen followed by filtration, the increase in TMP from 1.4 bar to3.5 bar caused the increase in the initial permeate flux from36.5 L/m2 h to 79.4 L/m2 h. As the filtration proceeded, the perme-ate flux decreased for all applied TMPs due to membrane fouling.The rate of permeate flux decrease was higher in the initial 40–50 min of filtration followed by a stable decrease during theremaining filtration time (Fig. 2b). A larger decrease in the normal-ized permeate flux was observed at 3.5 bar as compared to lowerTMPs. After 240 min of filtration, the normalized permeate fluxat 3.5 bar was 28% lower than that at 1.4 bar. The increase in per-meate flux with increasing TMP promoted foulants’ accumulationon the membrane surface, and subsequent cake layer formation.This process is also accompanied by foulants’ compaction [22].As a result, greater fouling resistance caused higher decrease inpermeate flux over the course of filtration. Similar trend has beenobserved during ceramic membrane filtrations of reactive dyesolution [28] and oily wastewater [29].
The direct filtration of untreated OSPW performed at TMP of2.1 bar was characterized by a continuous decrease in transientand normalized permeate fluxes, resulting in the highest permeateflux decline after 240 min of operation (Fig. 2). In this filtrationmode, the flocs were removed directly on the membrane surface.This caused severe membrane fouling as compared to CFS-pre-treated OSPW, with the clean water flux recovery of only 75%.Due to this reason, the direct filtration was not pursued in any fur-ther experiments.
The effect of TMP on the permeate quality was investigated interms of turbidity and UV254 removals is shown in Fig. 3. SinceOSPW is a complex mixture of solids, organic and inorganic speciesin both ionic and non-ionic form, different removal mechanismsare expected to govern the removal of solids, inorganic and organicconstituents in OSPW. The majority of turbidity-causing com-pounds were removed during CFS pretreatment, reducing the tur-bidity from 213.3 ± 2.6 NTU to 6.3 ± 0.7 NTU. The remainingparticulates were removed by membrane and formed cake layeron the membrane surface. As a result, the turbidity removal didnot significantly change over the filtration time regardless of theapplied TMP (p > 0.05) for any applied pretreatment (Fig. 3a). Theconcentration of UV254-absorbing compounds in permeates de-creased in the initial filtration stage, and did not change signifi-cantly during the remaining filtration time (Fig. 3b). Previousstudies showed that the rejection of organic compounds by ultra-filtration and nanofiltration membranes decreased with the in-crease in the filtration time due to concentration polarization[38–40]. In this study, the highest permeate flux decline was ob-served at the beginning of filtration and then decreased due tomembrane fouling (Fig. 2). A fouling layer formed on the mem-brane surface during filtration of OSPW could hamper the back-dif-fusion of organic molecules to the feed thus increasing theirconcentration at the membrane surface [38]. Consequently, more
organic molecules would pass to the permeate side due to higherconcentration gradient, and UV254 removal decreased. As filtrationprogressed, permeate flux tended to reach steady state, so the con-centration of UV254-absorbing compounds did not decrease fur-ther. After 240 min of filtration, the concentration of UV254-absorbing compounds in permeate increased with TMP increasefrom 1.4 bar to 3.5 bar. This was caused by enhanced concentrationpolarization due to higher load of contaminants at the membranesurface at higher TMP [22].
3.2.2. Effect of CFVBased on the effect of TMP on membrane performance, TMP of
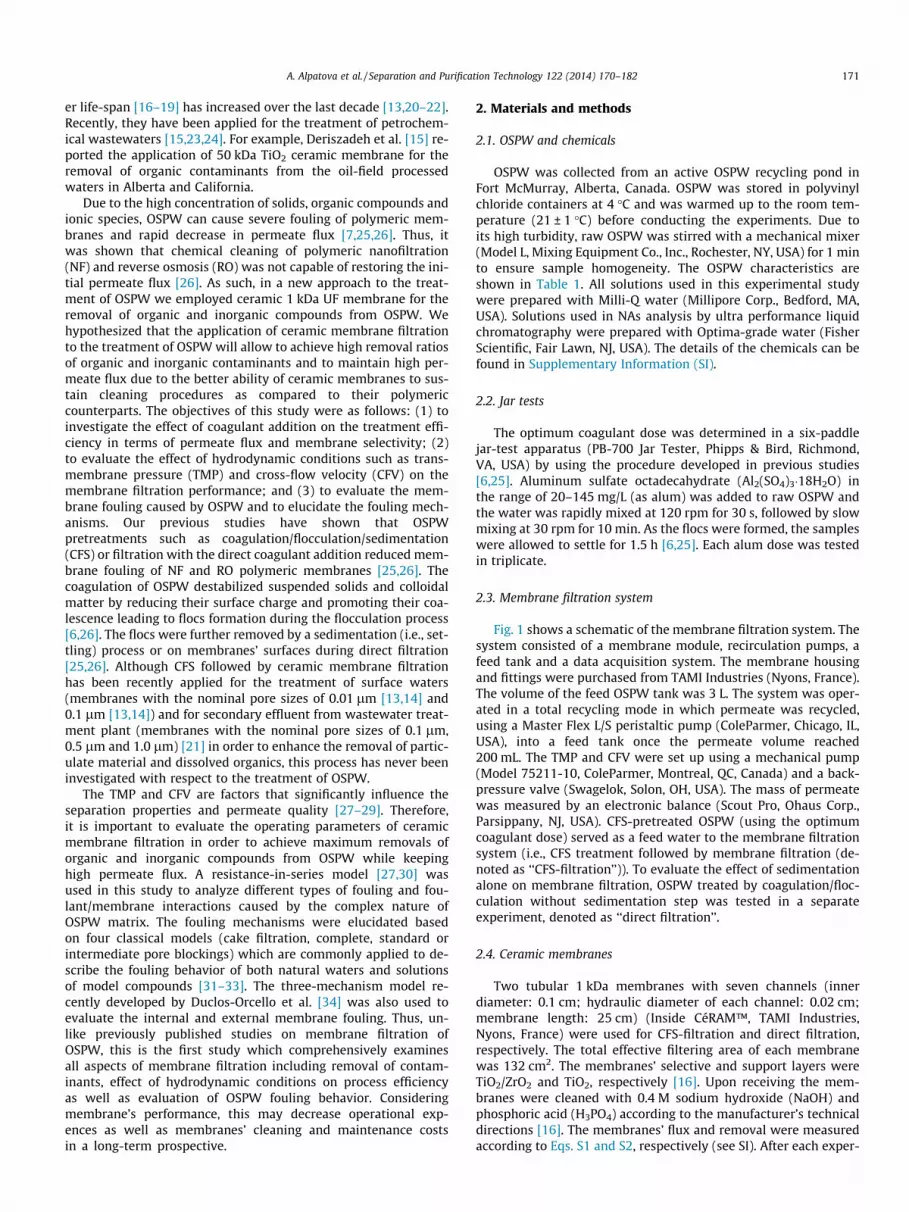
2.8 bar was selected to conduct further CFS-filtration experiments.The J and J/Jo changes as a function of CFV are shown in Fig. 4. Asseen in Fig. 4a, the effect of CFV on permeate flux was more pro-nounced at the lowest CFV of 0.2 L/min compared to higher CFVsof 0.4 L/min and 0.6 L/min. The membrane filtration performed atCFV of 0.2 L/min was characterized by the lowest initial and stea-dy-state permeate fluxes and by the highest decline in the normal-ized flux. The larger hydrodynamic shear at higher CFV probablydisturbed the foulants on the membrane surface. As a result, thefouling layer became thinner and the filtration efficiency improved.Similar results were reported by other researches who attributedthe decrease in membrane fouling with CFV increase to higher lev-els of turbulence which prevented particulate transport to themembrane surface, and washed away the accumulated foulants[28,41].
The effect of CFV on the permeate quality over the course of fil-tration was evaluated by measuring turbidity and concentration ofUV254-absorbing compounds, and the results are presented inFig. 5. As shown in Fig. 5a, the turbidity values decreased to below1 NTU at any applied CFV, and the turbidity changes with CFV fol-lowed a similar trend to that of TMP. The concentration of UV254-absorbing compounds in permeates was the lowest in the initial20 min of filtration; however, when filtration time reached40 min, the concentration of UV254-absorbing compounds in thepermeate increased at all CFVs. After 240 min of filtration, the con-centration of UV254-absorbing compounds at CFV of 0.2 L/min washigher compared to those measured at higher CFVs. Probably, aninsufficient turbulence level at the membrane surface caused bythe feed flow at low CFV, promoted concentration polarization nearthe membrane surface, resulting in decreasing removal efficiencyof UV254-absorbing compounds when filtration progressed [22].
3.3. Membrane fouling analysis by resistance-in-series model
The membrane fouling caused by OSPW constituents was eval-uated by the resistance-in-series model. The resistance-in-seriesmodel is widely used to describe the fouling behavior of contami-nants during membrane filtration of various liquids [22,30,42].This model determines the dominant components and factors that

Fig. 2. Effect of trans-membrane pressure (TMP) on (a) transient and (b) normalized permeate fluxes during filtration of oil sands process-affected water. The crossflowvelocity was set at 0.6 L/min. – coagulation/flocculation/sedimentation (CFS) followed by membrane filtration at TMP of 3.5 bar; – CFS followed by membrane filtrationat TMP of 2.8 bar; h – CFS followed by membrane filtration at TMP of 2.1 bar; – coagulation/flocculation–membrane filtration (‘‘direct filtration’’) at TMP of 2.1 bar; – CFSfollowed by membrane filtration at TMP of 1.4 bar. The applied alum dose was 30 mg/L.
A. Alpatova et al. / Separation and Purification Technology 122 (2014) 170–182 175
govern membrane fouling and lead to permeate flux decline. Fig. 6shows the evolution of the total resistance RT measured after mem-brane filtration and different cleaning protocols. Comparing theintrinsic membrane resistance RM and the total resistance RT atthe end of filtration, it is apparent that the filtration of OSPWcaused significant membrane fouling. As shown in Fig. 6, the totalresistance RT after filtration was almost twice higher than theintrinsic membrane resistance RM. It can be noted that the cleaningprotocol applied in this study was effective in eliminating bothexternal and internal membrane fouling. The RT gradually de-creased as the cleaning proceeded, and RM reached its original va-lue after chemical cleaning (p > 0.05). In order to evaluate the inputof each type of fouling, RCP, RCL, RPB, RCC and RIR were calculated andtheir values are summarized in Table 4. No irreversible fouling oc-curred with the CFS-pretreated OSPW (RCC = 0). Among the revers-ible fouling, the resistance caused by cake layer formation (RCL)was higher than the resistance caused by pore blocking (RPB) (i.e.the external membrane fouling caused by RCL resulted in largerpermeate flux decline comparing to the internal membrane foulingRPB). The contribution of fouling resistance removed by physicalcleaning was almost twice higher than that removed by chemicalcleaning. The results of this study showed that the total internalmembrane fouling caused by pore blocking and contaminantsadsorption onto membrane matrix (RPB + RCC) played significantrole in fouling of the low molecular weight cut-off 1 kDa mem-brane. Muthukumaran et al. [42] also observed strong internalmembrane fouling during filtration of the synthetic secondary
sewage effluent with the same membrane type in similar condi-tions (cross-flow filtration at TMP of 2.8 bar).
3.4. Filtration mechanisms
Five different fouling models were employed in this study toevaluate OSPW fouling mechanisms. By fitting experimental datainto these models, fouling mechanisms as well as their evolutionover filtration time were elucidated. Fig. S2 (SI) represents charac-teristic curves with respect to each classical model. The curvesshowed similar patterns with the initial concave up or down fol-lowed by a straight line when filtration time increased. The lackof data linearity was caused by the complexity of OSPW matrix.Both organic and inorganic constituents in OSPW affected mem-brane fouling, but the fouling mechanisms could vary dependingon the fouling type. In addition, the fouling mechanisms can evolveover the course of filtration. Therefore, different mechanismswould dominate at different time points [43,44]. These facts com-plicated the interpretation of the curves in Fig. S2. To resolve theconstrictions of the classical models, Duclos-Orsello et al. [34] sug-gested the three-mechanism model which accounts for the inter-nal and the external membrane fouling and the transition offouling mechanisms with the filtration time. This model incorpo-rates fouling caused by pore blockage, pore constriction and cakefiltration. As shown in Fig. 7, in the initial �10–12 min of filtration,the decreasing trend with a negative slope dominated, followed bya period when the experimental data tended to yield a zero slope.

Fig. 3. Effect of trans-membrane pressure (TMP) on (a) turbidity and (b) UV254-absorbing compounds during filtration of oil sands process-affected water. The cross-flowvelocity was set at 0.6 L/min. – coagulation/flocculation/sedimentation (CFS) followed by membrane filtration at TMP of 3.5 bar; – CFS followed by membrane filtrationat TMP of 2.8 bar; h – CFS followed by membrane filtration at TMP of 2.1 bar; – coagulation/flocculation – membrane filtration (‘‘direct filtration’’) at TMP of 2.1 bar; – CFSfollowed by membrane filtration at TMP of 1.4 bar. The applied alum dose was 30 mg/L.
176 A. Alpatova et al. / Separation and Purification Technology 122 (2014) 170–182
This trend correlated with the transient permeate flux decline pat-tern (Fig. S3, SI). Similar fouling pattern was observed during thefiltration of a 0.25 lm polystyrene microspheres through the0.2 lm polycarbonate microfiltration membrane [34]. In thatstudy, the external fouling predominated and cake filtration devel-oped when the slope of d2t/dV2 versus dt/dV approached zero.Based on the shape of the plot in Fig. 7, it can be presumed thatthere was a transition in the filtration mechanisms over the timeof filtration due to the complexity of OSPW matrix. To describethe early stage of membrane filtration and how its impacts mem-brane fouling, the initial 12 min of filtration data were re-plottedby using classical membrane fouling models (Fig. 8). Better fitswere observed in this case as compared to Fig. S2, with the highestR2 corresponding to cake filtration and standard pore blockingmechanisms (0.98 and 0.97, respectively). The assumption of thestandard pore blocking is that fouling occurs inside the pores be-cause the foulants are smaller than the pore sizes [31,32]. Some or-ganic contaminants in OSPW are smaller than the pore sizes of1 kDa ceramic UF membrane. For example, the reported molecularsize range of NAs is 140–500 Da [1]. Based on SDI15 index of per-meate (0.3 ± 0.003), particulate material with the particle sizes be-low 1 kDa is also present in OSPW. As such, OSPW constituents canenter membrane pores and deposit on the pore walls causing inter-nal fouling. As it is shown in Figs. 3 and 5, the ceramic membranefiltration effectively removed the turbidity-causing compounds inOSPW, which accumulate on the membrane surface. With the in-crease in the filtration time, a cake layer will be developed andcake formation will became the dominant fouling mechanism.The experimental data showed the contribution of both cake layer
and pore blocking to the membrane fouling, and the greater impactof the cake layer on membrane fouling as compared to pore block-ing (Table 4).
3.5. Removal of organic fraction from OSPW
The organic content in OSPW is diverse and includes a range ofdifferent compounds such as bitumen, NAs, humic and fulvic acids,phenols, phthalates, polycyclic aromatic hydrocarbons and toluene[3]. Due to differences in molecular weights and structure, the or-ganic compounds in OSPW are expected to be removed with differ-ent efficiencies.
3.5.1. Removal of COD and AEFThe removal of COD and AEF compounds was measured at the
end of filtration experiments as a function of the applied TMPand CFV, and the results are shown in Figs. 9 and 10, respectively.Depending on TMP and CFV, the removal efficiency of COD rangedfrom 24.8 ± 2.7% to 38.6 ± 2.7% (which corresponded to the de-crease in COD concentrations from 302.2 ± 10.2 mg/L to227.2 ± 2.7 mg/L and 185.5 ± 8.1 mg/L, respectively); the removalefficiency of AEF was lower, varying from 1.1 ± 0.7% to13.0 ± 0.9% (which corresponded to the decrease in AEF concentra-tions from 48.6 ± 0.2 mg/L to 47.9 ± 0.3 mg/L and 42.2 ± 0.4 mg/L,respectively). The lower AEF removal efficiency could be explainedby the fact that COD accounts for the entire organic fraction inOSPW, whereas AEF includes a significant portion of compoundswith the molecular weights smaller than the membrane pore sizes(e.g., NAs) [1,45,46]. As such, COD compounds which molecular
Fig. 4. Effect of cross-flow velocity (CFV) on (a) transient and (b) normalized permeate fluxes during filtration of oil sands process-affected water. The trans-membranepressure was set at 2.8 bar. – coagulation/flocculation/sedimentation (CFS) followed by membrane filtration at CFV of 0.6 L/min; – CFS followed by membrane filtration atCFV of 0.4 L/min; – CFS followed by membrane filtration at CFV of 0.2 L/min. The applied alum dose was 30 mg/L.
A. Alpatova et al. / Separation and Purification Technology 122 (2014) 170–182 177
sizes P1 kDa will be removed by membrane, while the removal ofAEF is not dominated by the size exclusion. TOC concentrationmeasurements in OSPW before and after membrane filtration atTMP of 2.8 bar and CFV of 0.6 L/min (65.1 ± 6.2 mg C/L and45.4 ± 1.6 mg C/L, respectively) resulted in the removal of30.2 ± 2.4%. This is in good correlation with COD removal(28.5 ± 2.4%) achieved at the same operating conditions. SinceTOC is also a representative of the entire organic fraction in OSPW,this suggests that the some of the organic compounds in OSPW canbe removed due to size exclusion. The charge repulsion due todeprotonation of carboxylic groups at alkaline pH [47] could alsocontribute to the removal of organic compounds on negativelycharged ceramic membranes’ surfaces.
COD removal decreased with TMP increase from 1.4 bar to3.5 bar due to the development of concentration polarization andfouling layer formation at higher TMPs (Fig. 9a). A similar effectwas observed by Xu et al. [22] during ceramic membrane filtrationof seawater. The removal of AEF-causing compounds did notchange with TMP increase from 1.4 bar to 3.5 bar (Fig. 9). The dif-ferences in COD and AEF removals could arise from the differenttransport mechanisms of AEF and COD. Due to their smaller sizes,the molecules of the AEF-causing compounds would pass throughthe membrane pores to more extent. As such, they would be lesssusceptible to concentration polarization.
The increase in CFV from 0.2 L/min to 0.6 L/min resulted in dif-ferent trends for COD and EOF removals (Fig. 10). While the re-moval of AEF-causing compounds gradually increased with CFV
increase, no difference in COD removal was observed as a resultof CFV increase. It is known that the turbulence near membranesurface is increased with CFV increase [28]. In this study, whenCFV is increased from 0.2 L/min to 0.6 L/min, AEF compounds arelikely to be washed away more effectively as compared to CODcompounds due to their smaller sizes. Subsequently, less AEF mol-ecules would pass to the permeate side and their rejection wouldincrease. Similarly, in a study on membrane filtration of cork pro-cessing wastewater, Benitez et al. [41] observed that the removalof some of the accumulated components increased to more extentwith CFV increase as compared to others.
3.5.2. Removal of NAsNAs is a group of alkyl-substituted acyclic and cycloaliphatic
carboxylic acids described by the formula CnH2n+zO2, where n iscarbon number and –z is a negative even integer, representingthe number of rings [1]. The removal of NAs from OSPW was mea-sured for two types of treatment: CFS only and CFS followed bymembrane filtration at TMP of 2.8 bar and CFV of 0.6 L/min.Fig. 11 shows the total concentrations of NAs in raw and treatedOSPWs as well as the distribution of individual NAs species withrespect to their n and �z numbers. No removal of NAs was ob-served after CFS treatment with 30 mg/L of alum (concentrationsof NAs before and after treatment were 8.92 mg/L and 8.95 mg/L,respectively). However, previous study showed that when the ap-plied alum dose was increased to 250 mg/L, the removal of NAsreached 37% [6]. The concentration of NAs further decreased to

Fig. 5. Effect of CFV on (a) turbidity and (b) UV254-absorbing compounds during filtration of OSPW. The TMP was set at 2.8 bar. – coagulation/flocculation/sedimentation(CFS) followed by membrane filtration at CFV of 0.6 L/min; – CFS followed by membrane filtration at CFV of 0.4 L/min; – CFS followed by membrane filtration at CFV of0.2 L/min. The applied alum dose was 30 mg/L.
Fig. 6. Evolution of the total resistance RT according to the resistance-in-series model.
178 A. Alpatova et al. / Separation and Purification Technology 122 (2014) 170–182
7.81 mg/L after membrane filtration (12.4% removal). As it isshown in Fig. 11, concentrations of individual NAs species de-creased for all n and�z numbers, and no particular trends were ob-served with respect to the removal of NAs species with the same nor �z numbers.
3.5.3. Synchronous fluorescent spectra (SFS) of OSPWThe fluorescent spectroscopy was used by several researchers in
order to qualitatively characterize the aromatic organic fraction inOSPW [48,49]. In this study, SFS spectra were taken for raw OSPWand two types of treatment: CFS only and CFS followed by mem-
brane filtration at TMP of 2.8 bar and CFV of 0.6 L/min. As shownin Fig. 12, SFS spectra of raw and treated OSPWs produced singlepeak centered at around 270 nm and two double peaks, centredat 306 and 325 nm, and 405 and 413 nm, respectively. These peakswere attributed to one, two–three, and Pfour rings aromatic acids[48] and named peak I, II and III, respectively (Fig. 12). The rawOSPW was characterized by a high intensity peak III, while peaksI and II were less intense (Fig. 12). However, the intensity of peakIII significantly decreased after CFS treatment followed by its com-plete disappearance after membrane filtration. As opposite, theintensities of the peaks I and II considerably increased after CFS

Table 4Fouling resistances determined based on the resistance-in-series model.
Type ofresistance
Resistance due to concentrationpolarization
Resistance due to looselyattached foul ants
Resistance due to poreblocking
Resistance due to foulants adsorptiononto membrane
Irreversibleresistance
RCP RCL RPB RCC RIR
R (�l0�12,m�1)
0.3 ± 0.1 6.1 ± 0.1 4.4 ± 1.4 6.4 ± 0.3 0
A. Alpatova et al. / Separation and Purification Technology 122 (2014) 170–182 179
treatment with the intensity of peak I further increasing aftermembrane filtration. It has been reported that water matrix effectwhich is referred to the combined action of the components in asample other than the analyte, could considerably influence thefluorescence patterns of the compounds present in a sample[50,51]. While studying the fluorescence of organic matter fromsix different freshwaters, Baker et al. [51] found that the signalintensity of the tryptophan compounds gradually decreased after
Fig. 7. Three-mechanism membrane fouling model plotted based on entirefiltration time.
Fig. 8. Classic membrane fouling models pl
the samples were sequentially filtered through 1.2 lm and0.2 lm polycarbonate membranes, while the fluorescent intensityof the humic compounds showed little change with filtration. Theauthors attributed this effect to different affinity of organic com-pounds to solids and colloidal material present in studied freshwa-ters. As such, a fraction of tryptophan compounds which wasassociated with the solids and colloidal material was filtered outand its fluorescence intensity decreased in the filtered samples.The treatments applied in this study removed particulate materialfrom OSPW, resulting in turbidity decrease from 213.3 ± 2.6 to be-low 1 NTU (Table 1 and Figs. 3 and 5). It is known that hydropho-bicity of organic molecules increases with the increase in thenumber of carbon rings [52]. As such, peak III compounds whichare more hydrophobic as compared to peak I and II compounds,could be associated with the solid material in OSPW and be furtherremoved from OSPW during CFS alone and CFS-filtration treat-ments. In a recent study, Pourrezzaei et al. [6] showed that NAswith higher number of rings were preferentially removed fromOSPW during CFS treatment comparing to the compounds withthe lower number of rings. The removal of particulates and associ-ated peak III compounds is expected to change the OSPW matrix byredistributing the signal intensity in the treated OSPWs [50].Hence, CFS signals corresponding to peak I and II compoundswould increase. Since the decrease in turbidity after membrane fil-tration was smaller comparing to CFS alone treatment, the changes
otted within initial 12 min of filtration.

Coagulation/flocculation/sedimentationalone
Coagulation/flocculation - membranefiltration (“direct filtration”) at trans-membranepressure of 2.1 bar
1.4 bar 2.1 bar 2.8 bar 3.1 bar
Coagulation/flocculation/sedimentation followed by membrane filtration at different trans-membrane pressures
Fig. 9. Effect of trans-membrane pressure on the removal of chemical oxygen demand ( ) and acid extractable fraction (AEF) ( ) from oil sands process-affected water. Thecross-flow velocity (CFV) was set at 0.6 L/min. No removal of AEF was observed during coagulation/flocculation/sedimentation alone treatment.
Fig. 10. Effect of cross-flow velocity on the removal of chemical oxygen demand( ) and acid extractable fraction ( ) from oil sands process-affected water. Thetransmembrane pressure was set at 2.8 bar.
180 A. Alpatova et al. / Separation and Purification Technology 122 (2014) 170–182
in SFS spectra between these two treatments were not as pro-nounced as compared to raw OSPW. Given strong OSPW matrix ef-fect on SFS signal, the removal of I and II peak compounds cannotbe concluded with any degree of certainty for any of the appliedtreatments by using SFS analysis.
Fig. 11. Concentration of naphthenic acids (NAs) species in (a) raw oil sands-process affected water, (b) after coagulation/flocculation/sedimentation (CFS)treatment, and (c) after CFS followed by membrane filtration at trans-membranepressure of 2.8 bar and cross-flow velocity of 0.6 L/min.
3.6. Sustainability of OSPW permeate for high pressure membraneprocesses
Turbidity and SDI15 values are two important indicators whichhave to be considered in order to evaluate if the water meets thedemands of NF or RO processes in terms of the feed water quality.As seen in Figs. 3 and 5a, the turbidity of OSPW permeate de-creased to the acceptable values of less than 1 NTU [53] at any ap-plied treatment. The SDI15 of OSPW measured before and afterfiltration at TMP = 2.8 bar and CFV = 0.6 L/min were 6.0 ± 0.1 and0.3 ± 0.003, respectively. As such, CFS followed by ceramic mem-brane filtration produced sustainable permeate, which can be fur-ther treated by RO or NF to remove the low molecular weightorganic compounds and dissolved ions.

Fig. 12. Synchronous fluorescent spectra of raw and treated oil sands process-affected waters.
A. Alpatova et al. / Separation and Purification Technology 122 (2014) 170–182 181
4. Conclusions
This study investigated the application of 1 kDa ceramic ultra-filtration membrane for the removal of inorganic and organiccompounds from OSPW generated after thermal operations ofheavy oil recovery in Alberta, Canada. The oil sands process-af-fected water (OSPW) was pretreated with alum as a coagulant,and the effect of operating conditions on membrane filtrationwas studied. It was found that while direct filtration of OSPWcaused irreversible membrane fouling, the membrane’s perme-ability after coagulation/flocculation/sedimentation followed bymembrane filtration of OSPW was fully restored (p > 0.05) afterbackwashing with 3 L of Milli-Q water followed by recirculationof 0.1 M sodium hydroxide for 60 min. Although the permeateflux increased with initial trans-membrane pressure (TMP) in-crease, higher flux decline was observed at the highest appliedTMP of 3.5 bar. It was also observed that cross-flow velocity(CFV) of 0.2 L/min resulted in the lowest permeate flux due tohigher membrane fouling as compared to higher CFVs of 0.4 L/min and 0.6 L/min. The results of this study showed that variousfouling components such as concentration polarization, cake layerformation, pore blocking and adsorption contributed to the mem-brane fouling. Among reversible membrane foulings, the externalfouling caused by cake layer formation resulted in larger perme-ate flux decline comparing to the internal membrane foulingcaused by pore blocking; also, the total internal membrane foul-ing caused by pore blocking and contaminants adsorption ontomembrane matrix plays significant role in fouling of the studiedmembrane. The analysis of fouling mechanisms suggested thatcake layer formation and pore blocking dominated at the initialstage of filtration whereas cake layer formation was the majorfouling mechanism during the remaining filtration time. The re-sults also demonstrated that due to their low turbidity and siltdensity index (SDI15), permeates produced in this study are suit-able for further treatment by high pressure membrane processessuch as NF and RO in order to enhance the removal of low molec-ular weight compounds and dissolved ions. Besides the high re-moval efficiencies of particulates, the applied treatmentsremoved up to 38.6 ± 2.7% of COD. However, the removal ofAEF-causing compounds and NAs was less efficient because oftheir smaller molecular sizes compared to membrane pores.
Acknowledgements
The authors acknowledge financial supports provided by theHelmholtz-Alberta Initiative (Theme 5) and NSERC Industrial Re-search Chair Program in Oil Sands Tailings Water Treatmentthrough the support by: Syncrude Canada Ltd., Suncor EnergyInc., Shell Canada, Canadian Natural Resources Ltd., Total E&P Can-ada Ltd., EPCOR Water Services, IOWC Technologies Inc. (BioLargoInc.), Alberta Innovates – Energy and Environment Solution, andAlberta Environment and Sustainable Resource Development. Theauthors would like to thank Drs. Nikolaus Klamerth and YanyanZhang for their valuable comments and proof reading of this paper.
Appendix A. Supplementary material
Supplementary data associated with this article can be found, inthe online version, at http://dx.doi.org/10.1016/j.seppur.2013.11.005.
References
[1] F.M. Holowenko, M.D. MacKinnon, P.M. Fedorak, Characterization ofnaphthenic acids in oil sands wastewaters by gas chromatography-massspectrometry, Water Res. 36 (2002) 2843–2855.
[2] J.P. Giesy, J.C. Anderson, S.B. Wiseman, Alberta oil sands development, PNAS107 (2010) 951–952.
[3] E.W. Allen, Process water treatment in Canada’s oil sands industry: I. Targetpollutants and treatment objectives, J. Environ. Eng. Sci. 7 (2008) 123–138.
[4] M.D. MacKinnon, Development of the tailings pond at Syncrude’s oil sands plat1978–1987, AOSTRA J. Res. 5 (1989) 109–133.
[5] P. Drzewicz, L. Perez-Estrada, A. Alpatova, J.W. Martin, M. Gamal, El-Din,Impact of peroxydisulfate in the presence of zero valent iron on the oxidationof cyclohexanoic acid and naphthenic acids from oil sands process-affectedwater, Environ. Sci. Technol. 46 (2012) 8984–8991.
[6] P. Pourrezaei, P. Drzewicz, Y.N. Wang, M. Gamal El-Din, L.A. Perez-Estrada, J.W.Martin, J. Anderson, S. Wiseman, K. Liber, J.P. Giesy, The impact of metalliccoagulants on the removal of organic compounds from oil sands process-affected water, Environ. Sci. Technol. 45 (2011) 8452–8459.
[7] H. Peng, K. Volchek, M. MacKinnon, W.P. Wong, C.E. Brown, Application ofnanofiltration to water management options for oil sands operation,Desalination 170 (2004) 137–150.
[8] W. Zubot, M.D. MacKinnon, P. Chelme-Ayala, D.W. Smith, M. Gamal El-Din,Petroleum coke adsorption as a water management option for oil sandsprocess-affected water, Sci. Total Environ. 427 (2012) 364–372.
[9] Y.H. He, S.B. Wiseman, X.W. Zhang, M. Hecker, P.D. Jones, M. Gamal El-Din, J.W.Martin, J.P. Giesy, Ozonation attenuates the steroidogenic disruptive effects of

182 A. Alpatova et al. / Separation and Purification Technology 122 (2014) 170–182
sediment free oil sands process water in the H295R cell line, Chemosphere 80(2010) 578–584.
[10] M. Gamal El-Din, H.J. Fu, N. Wang, P. Chelme-Ayala, L. Perez-Estrada, P.Drzewicz, J.W. Martin, W. Zubot, D.W. Smith, Naphthenic acids speciation andremoval during petroleum-coke adsorption and ozonation of oil sandsprocess-affected water, Sci. Total Environ. 409 (2011) 5119–5125.
[11] J.M. Laine, D. Vial, P. Moulart, Status after 10 years of operation – overview ofUF technology today, Desalination 131 (2000) 17–25.
[12] T. Leiknes, The effect of coupling coagulation and flocculation with membranefiltration in water treatment: a review, J. Environ. Sci. 21 (2009) 8–12.
[13] K. Guerra, J. Pellegrino, J.E. Drewes, Impact of operating conditions onpermeate flux and process economics for cross flow ceramic membraneultrafiltration of surface water, Sep. Purif. Technol. 87 (2012) 47–53.
[14] T. Meyn, J. Altmann, T. Leiknes, In-line coagulation prior to ceramicmicrofiltration for surface water treatment – minimisation of flocculationpre-treatment, Desalin. Water Treat. 42 (2012) 163–176.
[15] A. Deriszadeh, M.M. Husein, T.G. Harding, Produced water treatment bymicellar-enhanced ultrafiltration, Environ. Sci. Technol. 44 (2010)1767–1772.
[16] TAMI Industries. Technical Directions. 25-60-120 Housing. Document B.BL.NOCELGB7, 2006, 13/18.
[17] S. Byun, S.H. Davies, A.L. Alpatova, L.M. Corneal, M.J. Baumann, V.V. Tarabara,S.J. Masten, Mn oxide coated catalytic membranes for a hybrid ozonation–membrane filtration: comparison of Ti, Fe and Mn oxide coated membranes forwater quality, Water Res. 45 (2011) 163–170.
[18] B.S. Karnik, S.H.B.M.J.M.S.J. Davies, The effects of combined ozonation andfiltration on disinfection by-product formation, Water Res. 39 (2005) 2839–2850.
[19] AWWA, Water Treatment: Membrane Processes, McGraw Hill, 1996.[20] Z. Cui, W. Xing, Y. Fan, N. Xu, Pilot study on the ceramic membrane pre-
treatment for seawater desalination with reverse osmosis in Tianjin Bohai Bay,Desalination 279 (2011) 190–194.
[21] H. Zhu, X. Wen, X. Huang, Characterization of membrane fouling in amicrofiltration ceramic membrane system treating secondary effluent,Desalination 284 (2012) 324–331.
[22] J. Xu, C.-Y. Chang, C. Gao, Performance of a ceramic ultrafiltration membranesystem in pretreatment to seawater desalination, Sep. Purif. Technol. (2010)165–173.
[23] Z. Sadeghian, F. Zamani, S.N. Ashrafizadeh, Removal of oily hydrocarboncontaminants from wastewater by c-alumina nanofiltration membranes,Desalin. Water Treat. 20 (2010) 80–85.
[24] S.R.H. Abadi, M.R. Sebzari, M. Hemati, F. Rekabdar, T. Mohammadi, Ceramicmembrane performance in microfiltration of oily wastewater, Desalination265 (2011) 222–228.
[25] E.-S. Kim, Y. Liu, M. Gamal El-Din, The effects of pretreatment on nanofiltrationand reverse osmosis membrane filtration for desalination of oil sands process-affected water, Sep. Purif. Technol. 81 (2011) 418–428.
[26] E.-S. Kim, Y. Liu, M. Gamal El-Din, Evaluation of membrane fouling for in-linefiltration of oil sands process-affected water: the effects of pretreatmentconditions, Environ. Sci. Technol. 46 (2012) 2877–2884.
[27] J. Xu, C.-Y. Chang, C. Gao, Performance of a ceramic ultrafiltration membranesystem in pretreatment to seawater desalination, Sep. Purif. Technol. 75(2010) 165–173.
[28] E. Alventosa-deLara, S. Barredo-Damas, M.I. Alcaina-Miranda, M.I. Iborra-Clar,Ultrafiltration technology with a ceramic membrane for reactive dye removal:optimization of membrane performance, J. Hazard. Mater. 209–210 (2012)492–500.
[29] F.L. Hua, Y.F. Tsang, Y.J. Wang, S.Y. Chan, H. Chua, S.N. Sin, Performance studyof ceramic microfiltration membrane for oily wastewater treatment, Chem.Eng. J. 128 (2007) 169–175.
[30] K.-H. Choo, C.-H. Lee, Membrane fouling mechanisms in the membrane-coupled anaerobic bioreactor, Water Res. 30 (1996) 1771–1780.
[31] C.-H. Wei, S. Laborie, R. Ben Aim, G. Amy, Full utilization of silt density index(SDI) measurements for seawater pre-treatment, J. Membr. Sci. 405–406(2012) 212–218.
[32] C. Wang, Q. Li, H. Tang, D. Yan, W. Zhou, J. Xing, Y. Wan, Membrane foulingmechanism in ultrafiltration of succinic acid fermentation broth, Bioresour.Technol. 116 (2012) 366–371.
[33] J. Hermia, Constant pressure blocking filtration laws - application to power-law non-Newtonian fluids, Chem. Eng. Res. Des. 60 (1982) 183–187.
[34] C. Duclos-Orsello, W. Li, C.-C. Ho, A three mechanism model to describe foulingof microfiltration membranes, J. Membr. Sci. 280 (2006) 856–866.
[35] L.S. Clesceri, A.E. Greenberg, A.D. Eaton, Standard Methods for examinations ofWater and Wastewater, 20th ed., American Public Health Association,Washington, DC, 1998.
[36] Standard Test Method for Silt Density Index (SDI) of Water. ASTM D4189-07,American Society for Testing and Materials, Philadelphia, PA, 2007.
[37] M. Kosmulski, Compilation of PZC and IEP of sparingly soluble metal oxidesand hydroxides from literature, Adv. Colloid Interface 152 (2009) 14–25.
[38] D. Jermann, W. Pronk, M. Boller, A.I. Schäfer, The role of NOM fouling for theretention of estradiol and ibuprofen during ultrafiltration, J. Membr. Sci. 329(2009) 75–84.
[39] L.D. Nghiem, S. Hawkes, Effects of membrane fouling on the nanofiltration ofpharmaceutically active compounds (PhACs): Mechanisms and role ofmembrane pore size, Sep. Purif. Technol. 57 (2007) 176–184.
[40] L.D. Nghiem, D. Vogel, S. Khan, Characterising humic acid fouling ofnanofiltration membranes using bisphenol A as a molecular indicator, WaterRes. 42 (2008) 4049–4058.
[41] F.J. Benítez, J.L. Acero, A.I. Leal, M. González, The use of ultrafiltration andnanofiltration membranes for the purification of cork processing wastewater,J. Hazard. Mater. 162 (2009) 1438–1445.
[42] S. Muthukumaran, D.A. Nguyen, K. Baskaran, Performance evaluation ofdifferent ultrafiltration membranes for the reclamation and reuse ofsecondary effluent, Desalination 279 (2011) 383–389.
[43] J.X. Li, R.D. Sanderson, G.Y. Chai, D.K. Hallbauer, Development of an ultrasonictechnique for in situ investigating the properties of deposited protein duringcrossflow ultrafiltration, J. Colloids. Interface Sci. 284 (2005) 228–238.
[44] E.M. Tracey, R.H. Davis, BSA fouling of track-etched polycarbonatemicrofiltration membranes, J. Colloid. Interf. Sci. 167 (1994) 104–116.
[45] J.V. Headley, D.W. McMartin, A review of the occurrence and fate ofnaphthenic acids, J. Environ. Sci. Health. Part A A39 (2004) 1989–2010.
[46] D.M. Grewer, R.F. Young, R.M. Whittal, P.M. Fedorak, Naphthenic acids andother acid-extractables in water samples from Alberta: What is beingmeasured?, Sci Total Environ. 408 (2010) 5997–6010.
[47] S.A. Armstrong, J.V. Headley, K.M. Peru, J.J. Germida, Phytotoxicity of oil sandsnaphthenic acids and dissipation from systems planted with emergent aquaticmacrophytes, J. Environ. Sci. Health A 43 (2008) 36–42.
[48] R.J. Kavanagh, B.K. Burnison, R.A. Frank, K.R. Solomon, G. Van Der Kraak,Detecting oil sands process-affected waters in the Alberta oil sands regionusing synchronous fluorescence spectroscopy, Chemosphere (2009) 120–126.
[49] U.K. Ahmad, Z. Ujang, Z. Yusop, T.L. Fong, Fluorescence technique for thecharacterization of natural organic matter in river water, Water Sci. Technol. 9(2002) 117–125.
[50] R.K. Henderson, A. Baker, K.R. Murphy, A. Hambly, R.M. Stuetz, S.J. Khan,Fluorescence as a potential monitoring tool for recycled water systems: areview, Water Res. 43 (2009) 863–881.
[51] A. Baker, S. Elliott, J.R. Lead, Effects of filtration and pH perturbation onfreshwater organic matter fluorescence, Chemosphere 67 (2007) 2035–2043.
[52] K. Skupinska, I. Misiewicz, T. Kasprzycka-Guttman, Polycyclic aromatichydrocarbons: Physicochemical properties, environmental appearance andimpact on living organisms, Acta Pol. Pharm. 61 (2004) 233–240.
[53] FILMTEC membranes, <http://msdssearch.dow.com/PublishedLiteratureDOWCOM/dh_003c/0901b8038003c02f.pdf?filepath=/609-02024.pdf&fromPage=GetDoc>.As of 10/17/2013.