trawl gear performance trials
TRANSCRIPT

TORRES STRAIT PRAWN PROJECT: A review of research 1986-88
Fisheries Branch
,.. Queensland Department of Primary Industries

TORRES STRAIT PRAWN PROJECT: a review of research 1986-88
Edited by J.E. Mellors Fisheries Branch
Queensland Department of Primary Industries Brisbane 1990

ISSN 0727-6273 AGDEX 489110
O Queensland Government 1990
Queensland Department of Primarj Industries GPO Box 46 Brisbane Q 4001

CONTENTS
LlST OF ILLUSTRATIONS
LlST OF TABLES
Section Title
INTRODUCTION
1. General introduction R.A. Watson and J.E. Mellors
TORRES STRAIT PRAWN FISHERY
2. Commercial prawn catches in Torres Strait. R.A. Watson, P. Channells and P.f Blyth
3. Fishing patterns of the Torres Strait prawn fleet. R.A. Watson, P.J. Blyth and P. Channells
BIOLOGY
4. Settlement of juvenile Penaeus esculentus (Haswell, 1879) on nursery grounds in Torres Strait. C.T. Turnbull and J.E. Mellors
5. Spawning, recruitment and life history studies of Penaeus esculentus (Haswell, 1879) in Torres Strait. P.J. Blyth, R.A. Watson and D.I. Sterling
6. Reproductive biology of Penaeus esculentus (Haswell, 1879) and Metapenaeus endeavouri (Schmin, 1926) in Torres Strait. J.A. Keating, R.A. Watson and D.J. Sterling
7. Movement and growth of Penaeus esculentus (Haswell, 1879) estimated from tagging in
5 Torres Strait. K.J. Derbyshire, D.J. Sterling, R.A. Watson and A. Lisle
8. Velvet prawns (Metapenaeopsis spp) of Torres Strait. R.A. Watson and J.A. Keating
9. Seagrass fish fauna and predation on juvenile prawns. K.J. Derbyshire and D.M. Dennis
GEAR
10. Experimental beam trawls for sampling juvenile prawns. C.T. Turnbull and R.A. Watson
11. Trawl gear performance trials. D.J. Sterling J.E. Mellors and R.A. Watson
POPULATION DYNAMICS
12. Prawn fishery simulation yield model. R.A. Watson and D.J. Sterling
DISCUSSION
13. General Discussion. R.A. Watson
page
iii
vlii
page iii

LIST OF ILLUSTRATIONS
SECTION 1
Figure 1. Torres Strait Protected Zone and Fisheries Jurisdiction Line.
SECTION 2
Figure 1. Commercial prawn unloadings in Torres Strait, 1978-88 showing: (a) total catch (t), (b) effort (vessel month-'), (c) CPUE (t vessel month-') and the per cent of the total catch formed of P. esculentus, brown tiger prawns, by weight.
Figure 2. Records from NPF endorsed vessels in Torres Strait, 1978-88 showing: (a) total catch (t), (b) effort (vessel month-'), (c) effort (hours) and (d) CPUE (t vessel month-').
Figure 3. Annual species composition (%) of commercial prawn catches in Torres Strait (by weight), 1978-88.
Figure 4. Unloadings (t) of P. esculentus (brown tiger), M. endeavour; (endeavour) and P, longistylus (red spot king) prawns in the commercial prawn catch of Torres Strait, 1978-88.
SECTION 3
Figure 1. Location of Torres Strait showing trawling grounds, seabed jurisdiction lines, and area in Australian waters closed to trawling.
Figure 2. Map of the Torres Strait fishing grounds showing the five defined areas used in the analysis of effort distribution.
Figure 3. Percentage composition of P. esculentus from the total catch (1980-86) over five defined areas.
Figure 4. Torres Strait prawn fleet movement patterns for 1983. Total effort (hours trawled) for each two-month period is shown in the bottom right corner. Circle size represents percentages of maximum effort in each two month period.
Figure 5. Yearly effort in five defined fishing areas as a percentage of the total yearly effort (1 980-1 986).
SECTION 4
Figure 1. Location of juvenile sampling stations within Torres Strait.
Figure 2, Seagrass nursery areas and juvenile sampling stations on Warrior Reef and the Yorke Islands.
Figure 3. Densities of P. esculentus at each station from january 1986 to April 1988.
Figure 4. Size frequency distributions of P, esculentus for Warrior Reef and Yorke Islands from January 1986 to April 1988.
Figure 5. Monthly size frequency distribution of P. esculentusaveraged over 28 months for the Warrior Reef stations 101,102 and 103.
Figure 6. Monthly size frequency distribution of P. esculentusaveraged over 28 months for the Yorke Islands stations 1 11 and 11 2.

SECTION 5
Figure 1. Map of Torres Strait showing sampling stations and the seabed jurisdiction line.
Figure 2. Sampling schedule from January 1986 to April 1988.
Figure 3. (a)Population Fecundity lndex (PFI) of P. esculentus. (b) Abundance of females. (c) Monthly mean surface sea water temperature PC) and long term average
maximum and minimum air temperature PC) for Torres Strait. (d) The percentage of ripe females (stages Ill and IV). (e) The monthly mean carapace length (mm) of ripe females (stages Ill and IV). (0 The monthly modal carapace length (mm) of ripe females (stages Ill and IV).
Figure 4. Population Fecundity lndex (PFI) of P. esculentus for 28 sampling stations, scaled from the maximum for: (a) January-March 1986, (b) August-September 1986 and (c) October-November 1986.
Figure 5. A comparison between the Yorke islands area and other areas in Torres Strait for mean carapace length (mm) of ripe females (stages Ill and IV).
Figure 6. (a) Monthly abundances of ail P. esculentus < 26 mm carapace length. (b) Monthly abundances of all P, esculentus. (c) Monthly mean carapace length of all P. esculentus.
Figure 7. Length frequency distribution of P, esculentus from January 1986 to April 1988 for: (a) West and (b) East.
4 Figure 8. Location of small (< 26 mm CL) P. esculentus, scaled from the maximum for
January 1988.
Figure 9. Areas of spawning and subsequent movement of P. esculentus for: n (a) January-March, (b) August-September and (c) October-November.
SECTION 6
Figure 1. Logistic relationship between probability of ripe females (ovary stages Ill and IV) and carapace length in the East and the West for female P. esculentus, indicating size at maturity.
Figure 2. Relationship between numbers of; females, ripe females (ovary stages Ill and IV), inseminated ripe females, eggs produced by inseminated ripe females and carapace length for P. esculentus from January 1986 to December 1987.
Figure 3. Population Fecundity lndex (PFI) of P. esculentus in the (a) West and (b) East from January 1986 to December 1987.
Figure 4. Logistic relationship between probability of ripe females (ovary stages Ill and IV) and carapace length in the East and the West for female M, endeavouri, indicating size at maturity.
Figure 5. Logistic relationship between probability of mature males and carapace length in the East and the West for male M. endeavouri, indicating size at maturity.

SECTION 7
Figure 1. Length frequency distribution of males and females, and return rates for prawns tagged and released to the (a) West and (b) East during January 1987.
Figure 2. Length frequency distribution of males and females, and return rates for prawns tagged and released to the (a) West and (b) East during February 1987.
Figure 3. Release areas and recapture positions for prawns tagged and released to the West.
Figure 4. Release areas and recapture positions for prawns tagged and released to the East.
Figure 5. Component distribution for short-term growth of (a) females and (b) males.
Figure 6. Joint 95% confidence regions for L_ and K for females tagged and released to the West and the East, and for males (West and East combined).
SECTION 8
Figure 1. Map of Torres Strait showing the proporiion of catches formed by M. rosea and M. palmensis on a number basis at five areas representing pooled trawling station data.
Figure 2. Monthly size distribution of M. rosea and M. palmensis. Length class abundances are expressed as a percentage on a monthly basis.
Figure 3. Monthly abundance of M, rosea and M. palmensis from the East and the West.
Figure 4. Power curve regression line showing the relationship between weight vs carapace length for male and female M. rosea and M, palmensis.
Figure 5. Linear regression lines showing the relationship between In weight vs in carapace length for male and female M, rosea and M. palrnensis.
Figure 6. Monthly changes in the abundance of ovary stages (after Tuma 1967) of M. rosea and M. palmensis(I=quiescent, ll=developing, ill=early maturity, iV=ripe, and V=spent).
Figure 7. Relationship between the percentage of females with early mature-ripe ovaries (stages Ill-IV) and carapace length for M. rosea and M. palmensis.
SECTION 9
Figure 1. Areas sampled by QDPl for seagrass fish fauna in tropical Queensland waters for which data was analysed.
Figure 2. Die1 activity patterns of some common fish species captured on Torres Strait seagrass beds.
SECTION 10
Figure 1. Design of beam trawl frame, net and water jet beam.
Figure 2. Comparison of catches of P. esculentus, M. endeavouri and M. bennettae for Experiment 1 from the nighttime conventional beam trawl, daytime water jet beam trawl and daytime electric beam trawl.
Figure 3. Comparison of catches of (a) P. esculentus, (b) M. endeavouri and (c) M. bennettae for Experiment 2 from the nighttime conventional beam trawl, daytime water jet beam trawl and daytime electric beam trawl.

SECTION 11
Figure 1. Netting plan and drop gear arrangement of the 48 mm mesh 3-fathom sampling net.
Figure 2. Netting plan and ground line arrangement of the 29 mm mesh ?.-fathom trawl designed for low catch bias.
Figure 3. General arrangement of the dual-net sampling rig designed for trawl comparison.
Figure 4. Netting plan and drop gear arrangement of the 32 mm mesh 3-fathom sampling net.
Figure 5. Length-frequency distribution caught by the non-standard net in Experiment 1, showing the contributions made by the six most abundant species.
Figure 6. Size-specific gear efficiencies measured for al l species pooled measured for the standard 48 mm mesh trawl with the fitted logistic curve.
Figure 7. Prawn length-frequency distribution caught by the starboard net in Experiment 2, showing the contributions made by the four commercial species processed.
Figure 8. Selectivity data and fined logistic curve, based on pooled species catches obtained from port and starboard nets in Experiment 2.
Figure 9. Selectivity data for P, esculentus and M. endeavouri prawns based on catches obtained from port and starboard nets in Experiment 2.
SECTION 12
Figure 7 . Schematic representation of the simulation model.
Figure 2. Annual catch values of all commercial prawns predicted by model and coeffecients of fishing mortality for different closure periods.
0
Figure 3. Recruitment peaks of P. esculentus produced by the simulation model from survey data.

LIST OF TABLES
SECTION 2
Table 1. Annual summaries for the Torres Strait prawn fishery on catch, effort and CPUE for (a) unloadings data, (b) NPF logbook data and (c) TSPZ catch report data.
SECTION 3
Table 1. Breakdown of Effort into grids for Torres Strait based on NPF logbook records for 1980 to 1986.
SECTION 4
Table 1. Description of each juvenile sampling station.
SECT ION 6
Table 1. Estimated parameters for logistic equation 1 obtained by using nonlinear regression for size at maturity of female P. esculentus.
Table 2. Estimated parameters for logistic equation 1 obtained by using nonlinear regression for size at maturity of female M, endeavouri.
SECTION 7
Table 1. Summaw of releases of tagged prawns.
Table 2. Return rates CO/o) for female and male prawns released east and west of Warrior Reefs.
Table 3. Means (mm) and their standard errors estimated by the MIX computer program for peaks of short term growth.
Table 4. Goodness of fit statistics computed by MIX for the analysis of short term growth.
Table 5. Estimates of growth parameters for females and males tagged and released in the East and West.
SECTION 8
Table 1. The regression parameters for the weight-length relationships of M. rosea and M. palmensis.
Table 2. ANCOVA table for In carapace length (CL) vs In total weight (W) for species and sex interactions.
SECTION 9
Table 1. Dominant fish families occurring in seagrass beds of Torres Strait. All stations sampled, total area sampled 2.45 ha.
Table 2, Dominant fish families recorded from beam trawl catches on seagrass beds in tropical Queensland waters.
Table 3. Comparison of the fish communities at 7 stations on Warrior Reef (stn 101-104, 107) and Yorke Is. (stn 1 1 1 ,I 12).

Table 4. Comparison of fish communities caught by night and by day at 2 stations on Warrior Reef. All shots 1 40ma
Table 5. Comparison of seagrass survey sites in Torres Strait.
Table 6. Fish identified as predators of the commercially important prawns of Torres ~irai t .
SECTION 10
Table 1. Catch rates of P, esculentus, M, endeavouri, and M, bennettae from the preliminary beam trawl gear experiment. The electric beam trawl was not tested during the day.
Table 2. Mean catch rates (no. of prawns trawl') from beam trawl Experiment 1. Significance levels from ANOVA are listed and indicated by * p<.05 or *' p<.01. Standard errors are indicated in parenthesis.
Table 3. Mean ca t~h rates (no, of prawns trawl1) from beam trawl Experiment 2. Significance levels from ANOVA indicated by p<.05 or ** p<.01. Standard errors are indicated in parenthesis. For the orthogonal components analysis the 5% significance level (') is indicated by an F > 5.99 and the 1% level (**) by F > 13.74
Table 4. Catches of P. esculentus, M. endeavouri and P. longistylus from tests of different jet heights on the daytime water jet beam trawl. bo, = 2.78 and to,,, = 4.60
SECTION 11
Table 1. Aspects of otter trawl equipment used commercially and for survey work in the Australian prawn industry that influence gear efficiency.
Table 2. Parameters for the relationship between efficiency and prawn carapace length.
Table 3. Parameters for the relationship between the selectivity of all species pooled and their carapace length.
Table 4. Parameters for the relationship between the selectivity of M. endeavouri and their carapace length.
Table 5. Parameters for the relationship between the selectivityof P. esculentus and their carapace length.
SECTION 12
Table 1. Coefficient values for the weight-length relationship used for commercial prawn species from Torres Strait.
Table 2. Coefficient values for the von Bertalanffy growth model used for commercial prawn species from Torres Strait.
Table 3. Values for the annual coefficient of natural mortality used for all commercial prawn species from Torres Strait.
Table 4. Proportion of annual fishing each month for different closure period in Torres Strait.
Table 5. Prawn prices used for commercial prawn species from Torres Strait.
Table 6. An example of text output for P. esculentus from the simulation model.
Table 7. An example of text output for all species from the simulation model.
page ix


INTRODUCTION


1. GENERAL INTRODUCTION R.A. Watson and J.E. Mellors
1.1 Torres Strait
1 .I .1 Geography
Torres Strait is a tropical body of water lying between the tip of the Cape York peninsula and the south coast of Papua New Guinea and bordered on the east and west by the Coral Sea and Arafura Sea respectively (Figure 1). The strait is shallow, usually less than 15 m deep. it extends 100 km north-south and 20 to 60 km east-west (Wolanski 1986). This region has extensive coral reefs, numerous coral cays and some conti- nental islands. There are more than 70 islands throughout the Straits' 8 000 km2 sea area. Seventeen of these are inhabited by Islander communities (Bain 1986). The largest reefs in Torres Strait are the Warrior Reefs which extend for 65 km roughly north-south, bisecting the region and separating the Coral Sea to the east from the Arafura Sea to the west. Torres Strait is separated from the deeper waters of the Coral Sea by a ribbon of reefs which are a continuation of the outer Great Barrier Reef, Immediately to the east of the Warrior Reefs is the Great North East Channel. This channel is 20-40 m deep and continues as far as Papua New Guinea making it important as an international shipping route. It i s this region where most of the Torres Strait fisheries are located (Anon. 1987a).
....... --- Protected Zone
Australia / PNG Fisheries Jurisdiction Line
11.~-
Figure 1. Torres Strait Protected Zone and Fisheries Jurisdiction Line.
1.1.2 Winds
The seasonal fluctuations of the winds in Torres Strait are comprised of the south-east trade winds from April to November and the northerly monsoon from December through to March (Wolanski 1986). For the eight .. months between April and November the wind is predominately (about 90% of the time) from the east- south-east. For 66% of this time the wind is greater than 20 knots (Anon. 1987a). During the other four months of the year, December-March, the monsoonal winds have a north-westerly component and are generally (about 70% of the time) less than 20 knots.

1 .1 .3 Rainfall
The two patterns of wind circulation are correlated with well defined wet and dry seasons in this region. The wet season corresponds to the Northwest Monsoon period and the dry season corresponds to the period when the Southeast Trade winds influence the entire Queensland coast (Brandon 1970). As a consequence Torres Strait receives 70% of its rainfall between January and March and is comparatively dry for the rest of the year (Brandon 1970).
1 .1 .4 Sediments and currents
Sediments and currents were reported extensively by Harris, Schneider and Baker (1 988). In general, sediments of Torres Strait are in the category of very muddy sands, that is, they have a relatively low content of mud (< 40%, Harris 1988). There i s no reported net current through Torres Strait. The currents that are present are swift (up to 1.0 m.9 and strongly tidal (Wolanski 1986). These currents alternate eastward then westward and bear some correlation with sea level differences between the Arafura Sea and the Coral Sea, as well as with the east-west wind component (Anon. 1987a).
1 .1 .5 Temperature and salinity
Shallow depths, strong winds and currents ensure that the waters of Torres Strait are well mixed with respect to temperatures and salinities. Salinities in the Great North East Channel range from 31.5 to 36.0 g1.I (Somers eta/. 1987) depending on the degree of freshwater intrusion from the considerable river discharge into the Gulf of Papua from the Fly River, Papua New Guinea. Surface sea temperatures range from about 25°C to 300C.
1.1.6 Seagrass meadows
Seagrass beds act as nursery grounds for juvenile prawns (Coles and Lee Long 1985; Staples eta/, 1985 and Coles et a/. 1987). Extensive seagrass beds occur throughout Torres Strait around the coasts of the conti- nental islands; on reef flats; and lagoons of the atolls and reefs and; in the shallow open ocean ofthe north- western Torres Strait. It i s believed that only a small proportion of these beds formeffective prawn nursery grounds, therefore it is essential for the long-term survival of the prawn stocks and fishery that these areas are not damaged.
1.1.7 Relationship between physical and environmental parameters and prawn stocks
information on the physical and environmental parameters (temperature, sediment, salinity, currents and seagrass beds) of Torres Strait allow a better understanding of prawn behaviour with regard to distribution, spawning and recruitment patterns. Knowledge of these parameters is essential to the implementation of useful management strategies for the fishery. Awareness of seagrass nursery areas is an important aspect in the management of commercial prawn fisheries. Samples of prawn populations in nursery areas can provide a measure of the success of spawning females, as well as the timing of juvenile prawns moving to the fishing grounds.
1.2 History of Commercial Fishing in Torres Strait
Prior to European colonization of Torres Strait in 1800, the indigenous Torres Strait island people were already dependent on its marine resources such as marine turtles, dugong, reef fisheq molluscs and other invertebrates as a protein source. Trading in bechede-mer fishing commenced in the late 1700's in this region (Shelley 1986). Wide commercial interest in the marine riches of Torres Strait first occurred with the discovery of substantial quantities of mother-of-pearl shell in 1868 (Colgan 1988). Trochus shell harvests began in 1912 (Nash 1986). Prior to the Second World War, an Australian troll fishery for mackerel existed in Torres Strait waters (McPherson 1986). During the war an Australian Army fishing unit was established at Thursday Island to supply mackerel, Scomberomorus commerson, to troops stationed in the area.
It was this unit that first assessed the rock lobster Panulirus ornatus resources of the Torres Strait. Many attempts to establish a commercial rock lobster fishery were unsuccessful during the 1950's and 1960's. in 1969, the first seafood processing factory, Norshrimp Pty Ltd, opened and this provided the much

needed facilities for this fishery to succeed (Channells 1986). With the establishment of Norshrimp Pty Ltd commercial prawn trawling also commenced in Torres Straits (Channells et al. 1988) and this has become one of the major fisheries f;rr the area, with an average annual catch of 1 000 t, worth $l4M(based on the 1988 average price for all species of prawns, P. Channels, Australian Fisheries Service pers. comm.).
1.3 History of the Torres Strait Prawn Fishery
There have been vast improvements in the operational efficiency of vessels in this fishery and an explosion in the number of vessels participating since 1974, when five prawn trawlers were based at Thursday Island. By the 19801s, fuel barges were moored for at least part of the year at the Yorke Islands allowing refuelling on the trawling grounds. Regularly scheduled small aircraft and even helicopter services to many Torres Strait communities allows easy access to supplies, spare parts, replacement crew and mail. Improvements in radio telephone services and the placement of telephones at many communities allows vessels to arrange supplies and repairs, and to sell their catches without delays. Mothership operators now buy prawns on the fishing grounds removing the necessity for trawlers to unload at Thursday Island or at any other port.
The Torres Strait Prawn Fishery has experienced an increase in technical innovations as have other fishing ventures in Australia. Greatly improved radar, depth sounders and sonar have enhanced the safety and the effectiveness of operations. Vessel construction and engine horse-power improvements have also occurred combining to increase the overall efficiency and endurance of fishing operations.
There were about 604 vessel masters and 453 vessels licensed to operate in Torres Strait by 1986 (Anon. 1987b). Many of these operators did not use their option to fish in Torres Strait and in 1986 only about two dozen vessels operated in Torres Strait throughout the fishing season, though in some months, nearly 70 individual vessels were recorded as fishing in this region.
The fishery is a mixed penaeid prawn trawl fishery, with Penaeus esculentus, brown tiger prawn, and Metapenaeus endeavouri, endeavour prawn, comprising about 90% of the catch. Penaeus longistylus, red spot king prawn, makes up the balance of the commercial catch.
1.4 Management of the Torres Strait Prawn Fishery
The Torres Strait Treaty, delimits the fisheries and seabed jurisdicitions of Australia and papua New Guinea. Following ratification of the Torres Strait Treaty in 1985, the Torres Strait Protected Zone was declared (Figure 1). This zone consists of areas in which Australia and Papua New Guinea have jurisdiction over 'swimming' fish and sedentary species. The purpose of this zone was to recognize and protect the life and livelihood of the traditional human inhabitants, including their traditional fishing (Haines 1986). The Treaty facilitated the joint management of commercial fisheries within this zone by Australia and Papua New Guinea. The prawn fishery was amongst six fisheries initially nominated under Article 22 of this Treaty for co-operative management. Annual quotas or total allowable catches (TACs) were established for each 'Article 22' fishery to faciliate catch sharing between Australia and Papua New Guinea.
Management of the Torres Strait Prawn Fishery as a separate and distinct fishery from the Northern Prawn Fishery and the Queensland East Coast Fishery is only a recent development. Prior to the Torres Strait Treaty between Australia and Papua New Guinea, this fishery had been treated as a part of the Queensland East Coast Fishery.
Initially the fishery was small in scale and the few management measures employed were not deter- mined by state or federal government but by the majority of the operators involved in the fishery. These measures included resting some trawling grounds until catches improved (spatial closures) and to stop trawling at certain times of the year to protect the small prawns entering the fishery (seasonal closures). At present both spatial and seasonal closures are used as management tools in Torres Strait.

1.4.1 Spatial closures
The permanent closure of an area which serves as a nursery to juvenile prawns and contains few individuals of preferred harvest size has been effectively employed in other fisheries throughout the world (Gulland and Rothschild 1984).
In October 1981, the fishing grounds to the west of the Warrior Reefs were closed to trawling under Commonwealth legislation at industry request. Industry participants believed that large catches of small, non-commercial-sized P. esculentus, (the most important species in the fishery) were being taken in this area.
In July 1987, an area immediately to the east of southern Warrior Reef, in the Basilisk Passage area (Figure I), was also closed to prawn trawling all year round. Industry participants sought this closure be- cause they believed that prawns taken in this area were generally less than optimum-sized and often 'soft and broken' (poor quality).
Another area closure implemented in Torres Strait was the absolute closure of western Torres Strait to fishing in 1988, to allow for the potential redevelopment of the pearling industry. This ban was put in place to prospective pearl shell beds from substrate disturbance (~non . 1989);
1.4.2 Seasonal closures
Seasonal closures have been used effectively to select the size at first harvest in prawn stocks where there is a seasonality of recruitment into the fishery (Gulland and Rothschild 1984). Based on scientific studies by CSlRO and industry support, seasonal prawn closures that had become routine in the Gulf of Carpentaria were introduced to the north-east coast of Queensland. Although the Torres Strait Prawn Fishery is legally distinct from the two adjacent fisheries, management of this fishery has been run in parallel with the Queensland East Coast Prawn Fishery. Consequently the Torres Strait Prawn Fishery closures mirrored those of the East Coast Prawn Fishery.
The first seasonal closure to prawn trawling in the Torres Strait and East Coast Fisheries extended from January 1 to February 28, 1985, coinciding with the time when fishermen thought that small, less valuable prawns recruited into the fishery. The timing of this closure was based on information from two sources. Firstly, experienced commercial operators, indicated times of the year when trawl catchescontained a large proportion of juvenile prawns and, secondly, data had been collected by QDPI Fisheries Research Branch on the timing of prawn life cycles (Coles eta/. 1985). As a management measure, the closure was markedly successful. In the absence of trawling, there was an increase in the total number and weight of commer- cially important prawns (Coles eta/. 1985).
A similar rationale was used to establish a prawn closure the next year from 13 December, 1985 to 28 February, 1986. At the start of the 1986-87 season, however, there was no prawn closure on the east coast of Queensland, and consequently in Torres Strait. This was at the request of some sections of the industry, particulary northern-based operators. They believed that the previous year's closure had aggre- gated effort into the first months of fishing causing a 'pulse fishing' effect (Queensland Commercial Fisher- men's Organisation consultations). Some northern operators affected by the closure believed that southern operators, whose home grounds were not part of the closure, should not participate on an equal basis when the season opened following the closure (Beurteaux 1987). Though agreement was not reached on a license scheme to address this concern, urgings from research scientists from QDPI, and an underlying belief as to the value of closures by commercial operators, allowed a closure to be reintroduced the following year from 15 December, 1 987 to 1 March, 1988.
In 1989, the Torres Strait closure period was from December 23 to April 15, north of 10" 13's and from December 23 to March 7, south of this line. The lengthened closure period in most of Torres Strait reflected the general view of operators and researchers, that a longer closure further optimized prawn catch values whilst somewhat reducing fishing effort. The area to the south of 10" 13's supports a P. longistylus, red spot king prawn fishery, of which the life cycle timing requires an earlier opening date.

1.4.3 Other management measures
Other management measures enforced on the Torres Strait Prawn Fishery include gear restrictions and closures to protect other fisheries such as the rock lobster and pearl fisheries. *
In September and October of 1981, a ban was placed on daylight trawling of prawn trawlers for rock lobsters in Torres Strait. This restriction was designed to stop the targeting of migrating lobstersduring the
0 day. This was expected to provide some relief to migrating aggregations, as trawlers would find relocating the aggregations difficult the following night (Williams 1986). This ban was later extended year-round and by 1988, no trawled rock lobsters could be kept by trawlers at any time. This ensured that the rock lobster fishery remained as a diver fishery, in an effort to allow the maximum opportunity for economic develop- ment of Torres Strait and adjacent areas of both Australia and Papua New Guinea (Anon. 1987b).
In July 1985, vessel size and gear limits were introduced to the Torres Strait Prawn Fishery, in line with similar restrictions already introduced on the Queensland east coast. Vessels had to be under 20 m in length and the total combined length of net headline and footrope could not exceed 88 m. This restricted both the size and the number of nets that could be used. These management measures successfully re- stricted the entry into the fishery of the larger boats that fished the Gulf of Carpentaria.
In 1988, vessels which had failed to prove a recent history of trawling in Torres Strait had their endorsements cancelled in an attempt to reduce 'latent' effort -the number of vessels that could potentially fish in Torres Strait in the future. Managers wanted to circumvent the possibility of over-fishing as the fishery was already considered to be over-capitalized (Anon. 1989). This action reduced the number of endorsed vessels from 421 to about 140. Further attempts to reduce the numbers of vessels have been unsuccessful to date. Other catch restrictive measures now in place are mesh-size restrictions and a total ban on daylight trawling.
As an Article 22 fishery under the Treaty, the prawn fishery of Torres Strait is required to determine a total allowable catch (TAC). The TAC is set annually and is currently set at 1 500 t (Anon. 1989). The TAC is a requirement of the Treaty, to be used as a basis of catch-sharing, and is not necessarily a measure aimed at biological conservation (Haines 1986). From 1990, Australia and Papua New Guinea are required to - begin to progressivley implement the detailed catch-sharing provisions of the Treaty, with a view to full implementation from 1995. Enforcement of the catch-sharing arrangement has still to be effected.
C TACs have been.unsuccessful for prawn fisheries elsewhere in the world (Pope 1983). Prawns are short lived with a single cohort alive at one time. This, combined with high year-to-year recruitmentvari- ability, makes it imposible for managers to respond quickly enough to set new catch quotas. As an alterna- tive management measure to TACs the use of effort quotas is currently being considered.
1.5 History of the QDPl Torres Strait Prawn Project
In July 1985, a Queensland state government-funded project was initiated to determine the recruitment patterns, movement and distribution of the commercial prawns comprising the Torres Strait Prawn Fishery. Industry required information on prawn growth and movement so as to increase the effectiveness of spatial and seasonal closures as management strategies. This was achieved by establishing the optimum times and areas for closures. Details on the numbers and distribution of juvenile prawns were also required to assist in the formulation of annual quotas or TACs required under the Torres Strait Treaty.
Staff were appointed in 1985, and general surveys of areas of seagrass in the region were completed. In September 1985, a commercial prawn trawler was chartered to establish initial sites for sampling. Gen- eral sampling commenced in late January 1986.
The project's objectives are to: 1) determine the distribution and abundance of juvenile prawns in seagrass areas. (Section 4), 2) establish the timing and pathways of recruitment and migration of the prawns. (Section 5), 3) collate historical catch data and monitor commercial catchfeffort. (Sections 2 and 3), 4) determine spawning periods. (Sections 5 and 61,

5) establish growth and mortality rates. (Section 7), 6) assist management in the rationalization of spatial and temporal closures, and 7) assist management in the formulation of optimum effort levels and of a TAC.
lnformation obtained from the study is also being used to develop computer models tosimulate the effects of different management regimes (Section 12). Such developments have application to prawn fisher- ies outside Torres Strait and have already been applied to management of the Torres Strait Prawn Fishery Oohn Stewart, Torres Strait manager, Australian Fisheries Service pers. comm.).
1.6 Conclusion
This report represents a portion of three years research. Each objective has been addressed (as listed above) and has been presented in relevant subject categories. The sections fall into broad categories of Torres Strait Prawn Fishery, Sampling, Biology, Gear and Population Dynamics. As an interim report some subject matters have only been presented in part (Sections 4 - 7 and 12) while other sections have been presented in full (Sections 2 and 3 and 8 - 10 and parts of 11 1.
The information presented is specifically pertinent to P. esculentus, brown tiger prawn, as it is the most valuable component of the fishery, Information relevant to the other commercial species that comprise this mixed fishery will be documented in subsequent reports.
1.7 References
Anon. (1 987a). Synopsis of the major Torres Strait fisheries. (Ed. M.J. Storrs, Resource Management Section, Aust. Fisheries Service). Mimmeo. 108pp. (Dept. Primary Industry: Canberra).
Anon. (1 987b). Torres Strait Protected Zone Joint Authority annual report 1986. (Aust. Gov. Pub. Ser.: Canberra).
Anon. (1 989). Torres Strait Protected Zone Joint Authority annual report 1988. (Aust. Gov. Pub. Ser.: Canberra).
Bain, R. (1 986). Foreword. In Torres Strait Fisheries Seminar, Port Moresby, 11 -1 4 February' (Eds A.K. Haines, G.C. Williams, and D. Coates). pp. (iii). (Aust. Gov. Pub. Ser.: Canberra).
Beurteaux, Y.F. (1 987). A shot at prawns; an examination of effort, mobility and management within the East Coast Prawn Trawl Fishery with reference to the North East Coast. Hons thesis. (James Cook University of North Queensland: Townsville).
Brandon, D.E. (1970). Oceanography of the Great Barrier Reef and the Queensland continental shelf. Ph.D. Thesis (The University of Michigan: Michigan, U.S.A.).
Channels, P. (1 986). History and development of the Australian rock lobster fishery for Panulirus ornatus. In 'Torres Strait Fisheries Seminar, Port Moresby, 11-14 February' (Eds A.K. Haines, G.C. Williams, and D. Coates). pp. 184-1 89. (Aust. Gov. Pub. Ser.: Canberra).
Channels, P., Watson, R., and Blyth, P. (1 988). Commercial prawn catches in Torres Strait. Aust. Fish. 47, 23-26.
Coles, R.G., and Lee Long, W.J. (1 985). Juvenile prawn biology and the distribution of seagrass prawn nursery grounds in the southeastern Gulf of Carpentaria. In 'Second Australian Prawn Seminar'. (Eds P.C. Rothlisberg, 0.1. Hill and D.J. Staples), pp. 55-60. (NPS2: Cleveland, Australia).
Coles, R.G., Lee Long, W.J., Mellors, J.E., and Coedon, G.B. (1985). An assessment of the 1985 Queensland east coast prawn trawling closure. Queensl. Dep. Primary Ind. lnformation Series Q185023.

Coles, R.C., Lee Long, W.I., Squire, B.A., Squire, L.C., and Bibby, J.M. (19871. Distribution of seagrasses and associated juvenile commercial penaeid prawns in north-eastern Queensland waters. Aust. j. Mar. Freshw. Res. 38, 103-1 19.
Colgan, K. (1988). What does the future hold for pearling in Torres Strait! Aust. Fish. 47, 1'2-16.
Culland, J.A., and Rothschild, 8.1. Eds. (1984). Penaeid shrimps - their biology and management. (Fishing News Books Ltd: Surrey, England).
Haines, A.K. (1 986). Background to management. In 'Torres Strait Fisheries Seminar, Port Moresby, 11 -1 4 February' (Eds A.K. Haines, G.C. Williams, and D. Coates). pp. 2-1 7. (Aust. Cov. Pub. Ser.: Canberra).
Harris, P.T. (1988). Sediments, bedforms and bedload transport pathways on the continental shelf adjacent to Torres Strait Australia - Papua New Guinea. Cont. Shelf Res. 8, 979-1003.
Harris, P.T., ~chneider, P.M., and Baker, E.K. (1988). Currents, sedimentation and sandwave migration in the Great North East Channel and Adolphus Channel areas of Torres Strait: report on measurements taken during H.M.A.S. "Cook" cruises, 1988. Ocean Science Institute, Report No. 28 (The University of Sydney: Sydney).
McPherson, G. (1 986). The Torres Strait spanish mackerel fishery: a review of Australian development, production and research. In 'Torres Strait Fisheries Seminar, Port Moresby, 11 -1 4 February' (Eds A.K. Haines, C.C. Williams, and D. Coates). pp. 151 -1 63. (Aust. Gov. Pub. Ser.: Canberra).
Nash, W. (1 986). Commercial culture of the marine gastropod, Trochus niloticus in Torres Strait: its feasibility and prospects. In 'Torres Strait Fisheries Seminar, Port Moresby, 11 -14 February' (Eds A.K. Haines, G.C. Williams, and D. Coates), pp, 133-1 39. (Aust. Cov. Pub. Ser.: Canberra).
Pope, J.C. (1 983). Notes on the scientific problems of TAC management. In 'Report of the expert consultation on the regulation of fishing effort (fishing mortality) Rome, 17-26 January'. pp. 129-1 47. (FAO: Rome).
Shelley, C.C., (1986). The potential for re-introduction of a bechede-mer fishery in Torres Strait. In Torres Strait Fisheries Seminar, Port Moresby, 11 -1 4 February' (Eds A.K. Haines, G.C. Williams, and D. Coates). pp. 140-1 50. (Aust. Cov. Pub. Service: Canberra).
Somers. I.F., Poiner, I.R., and Harris, A.N. (1987). A study of the species composition and distribution of commercial penaeid prawns of Torres Strait. Aust. 1. Mar. Freshw. Res. 38,47-61.
Staples, D.J., Vance, D.J., and Heales, D.S. (1985). Habitat requirements of juvenile penaeid prawns and their relationship to offshore fisheries. In 'Second Australian Prawn Seminar'. (Eds P.C. Rothlisberg, 8.1. Hill and 0.1. Staples.) pp. 47-54 (NPS2: Cleveland, Australia).
Williams, C.C. (1 986). The Torres Strait prawn fishery. In Torres Strait Fisheries Seminar, Port Moresby, 11 14 February' (Eds A.K. Haines, C.C. Williams, and D. Coates). pp. 233-237. (Aust. Cov. Pub. Ser.: Canberra).
Wolanski, E.J. (1 986). The physical oceanography of Torres Strait. In 'Torres Strait Fisheries Semina,, Port Moresby, 11 -1 4 February' (Eds A.K. Haines, C.C. Williams, and D. Coates). pp. 275-291. (Aust. Cov. Pub. Ser.: Canberra).


TORRES STRAIT PRAWN FISHERY
page 11


2. COMMERCIAL PRAWN CATCHES IN TORRES STRAIT '
R.A. Watson, P. Channells, and P.J. Blyth
2.1 Introduction
Records of prawn catches in Torres Strait were poorly recorded during the developmental years of the prawning industry. Information collected by officers of the Northern Fisheries Unit in Cairns shows that in 1973-74 about ten prawn trawlers regularly fished Torres Strait, producing an annual catch of between 100 and 120 t. Catches consisted of mainly Penaeus esculentus, brown tiger prawns, and also Metapenaeus endeavouri, endeavour prawns. Prices at this time averaged $1.20 kg' for tiger prawns and $1.00 kgf for endeavour prawns. These vessels fished mainly from June to December in Torres Strait, after the end of the P. merguiensis, banana prawn, season in the Gulf of Carpentaria.
Following ratification of the Torres Strait Treaty between Australia and Papua New Guinea in 1985 a management area, the Torres Strait Protected Zone (TSPZ), was defined under the jurisdiction of the Pro- tected Zone Joint Authority (Section 1 - Figure 1). Although legally distinct from the two adjacent prawn fisheries, the Northern Prawn Fishery (NPF) and the Queensland East Coast Prawn Fishery, management of the Torres Strait Prawn Fishery has been run as part of the East Coast Prawn Fishery.
With the introduction of joint management of Torres Strait fisheries with Papua New Guinea it be- came important to examine existing catch data for historical trends. The introduction of prawn catch quotas required by the Torres Strait Treaty relied on past catch records. This section collates historical catch data and examines trends in catch and effort.
2.2 Materials and Methods
Records of commercial catch unloadings, from export inspection records obtained from the Australian Quarantine Inspection Service, were used to provide details of the catch of each species (kg) and thenum- bers of vessels fishing. Other records were obtained from TSPZ compulsory monthly catch reports (total weight of catch), and the NPF compulsory logbook (catch of each species (kg) and effort (hr)) provided by the Australian Fisheries Service. Statistical results reported are the outcomes of one-way analysis of variance tests.
2.3 Results and Discussion
2.3.1 Data sources
Statistics on the Torres Strait Prawn Fishery are available since 1978 from three main sources.
Unloading data. These are vessel unloading records, compulsory catch reports and logbook returns (Table 1). Each time a prawn trawler unloads product, whether at sea or at a shore-based facility, details of the quantity of produd unloaded are recorded. In Torres Strait these records provide a continuous measure of the total catch of the fishery, by each month and by each species as well as a crude measure of effort (Table 1 (a), Figure 1 ).
NPF logbook data. Many of the prawn trawlers that fish in Torres Strait also have an endorsement to fish in the NPF. The degree of participation of NPF endorsed vessels in the Torres Strait Prawn Fishery can be determined by the proportion of the total catch from unloadings data which is reported in NPF logbooks (Table l(b)). From 1982 to 1985 inclusive, trawlers with NPF endorsements landed an average of 53% of the total Torres Strait prawn catch. This proportion has been decreasing since 1984, and by 1987 was only 32%.
Masters of prawn trawlers with NPF endorsements are required to keep a fishing logbook, even when fishing in areas outside the NPF area. These logbooks are a major source of information on the Torres Strait Prawn Fishery. The logbooks also provide detailed data on areas fished, effort, species composition and catch per unit effort (CPUE) for the area since 1980 (Table l(b)).
page 13

Table 1. Annual summaries for the Torres Strait prawn fishery on catch, effort and CPUE for (a) unioadings data, (b) NPF logbook data and (c) TSPZ catch report data
(a) Unloadings data Catch Effort
( t ) (boat (esf Year months)hr 10') 1978 337.6 156 -- 1979 729.5 262 -- 1980 715.6 400 31.8 1981 469.1 174 27.8 1982 797.9 256 41.1 1983 858.2 273 59.7 1984 732.6 233 43.7 1985 1 100.3 322 58.4 1986 930.2 278 52.9 1987 1 164.0 341 56.8 1988 1 020.5 298 54.9
(b) NPF logbook data % NPF Catch Effort CPUE catch of (0 (boat hr kg
Unloadings months) 1 O3 hrl -- *- -- -- -- -- -- -- -- -- .- 13 90.1 39 4.0 22.5 15 68.3 34 4.1 16.7 46 368.2 143 19.0 19.4 47 401.7 197 27.9 14.4 69 508.1 198 30.3 16.8 52 571 .O 181 30.3 18.8 40 367.3 151 21.4 17.1 32 372.7 153 18.2 20.5 13" 128.4" 8@ 6.9" 18.6"
-
(c) TSPZ catch report data Catch Effort
(t) (boat (est' months) hr lo3)
-- --- --
Estimated by dividing mean annual CPUE from logbook data into the respective total catches A Complete records for this year were not available
1978 1979 1980 1981 1982 1983 1984 1985 1986 1987 1988
Year
Figure 1.Commercial prawn unloadings in Torres Strait, 1978-88 showing: (a) total catch (t), (b) effort (vessel month1), (c) CPUE (t vessel month1) and the per cent of the total
catch formed of P, esculentus, brown tiger prawns, by weight.

Catch form data. Compulsory catch reporting was established for the TSPZ prawn fishe~y in 1985 with the ratification of the Torres Strait Treaty. The system requires the master of any licensed fishingvessel catching prawns in Torres Strait to furnish total monthly catch figures to the Commonwealth Department of Primary Industries and Energy. These records give a measure of the total prawn catch, by month, since 1985 (Table 1 (c))
2.3.2 Catch and effort data
Analysis of all the available data revealed several trends. Total annual landings or unloadings have signifi- cantly increased (p < 0.05) at an average rate of 63 t yr ' since 1978 (when 338 t were landed) (Table l(a)). Unloadings vary considerably behveen months from less than one t to about 300 t (Figure 1 a), with an average over the past 11 years of 67 t.
The number of individual fishing vessels recorded each month is only a crude indication of fishing effort and varied considerably from zero to 70 (Figures 1 a and 2b). It is not discernable how many hours a vessel fished during the month. No significant trend could be observed in boat months since 1980 for either unloadings or NPF logbook data (Table l(a) and (b)). Effort, measured in vessel hours from unloading records, increased significantly (p < 0.01) at an average rate of 3 360 hr yr l from 1980 until 1988 (Table l(a)). This trend, based on catch ratios was not reflected in NPF effort figures after 1985 as the proportion of the total effort in Torres Strait expended by NPF endorsed vessels began to decrease at that time (Table 1). Effort has also increased due to improvements in gear and improved knowledge of vessel operators.
200
-G 5 0- ozijt: 100 + 0
0 40
w 5-; zmmz 20 z o o W L E
0 8.000
4- L-
O 2 4,000 5 5 0
40
W7L = 20 82 -
0 1980 1981 1982 1983 1984 1985 1986 1987 1988
Year
Figure 2.Records from NPF endorsed vessels in Torres Strait, 1978-88 showing: (a) total catch (t), (b) effort (vessel month'), (c) effort (hours) and (d) CPUE (t vessel month').
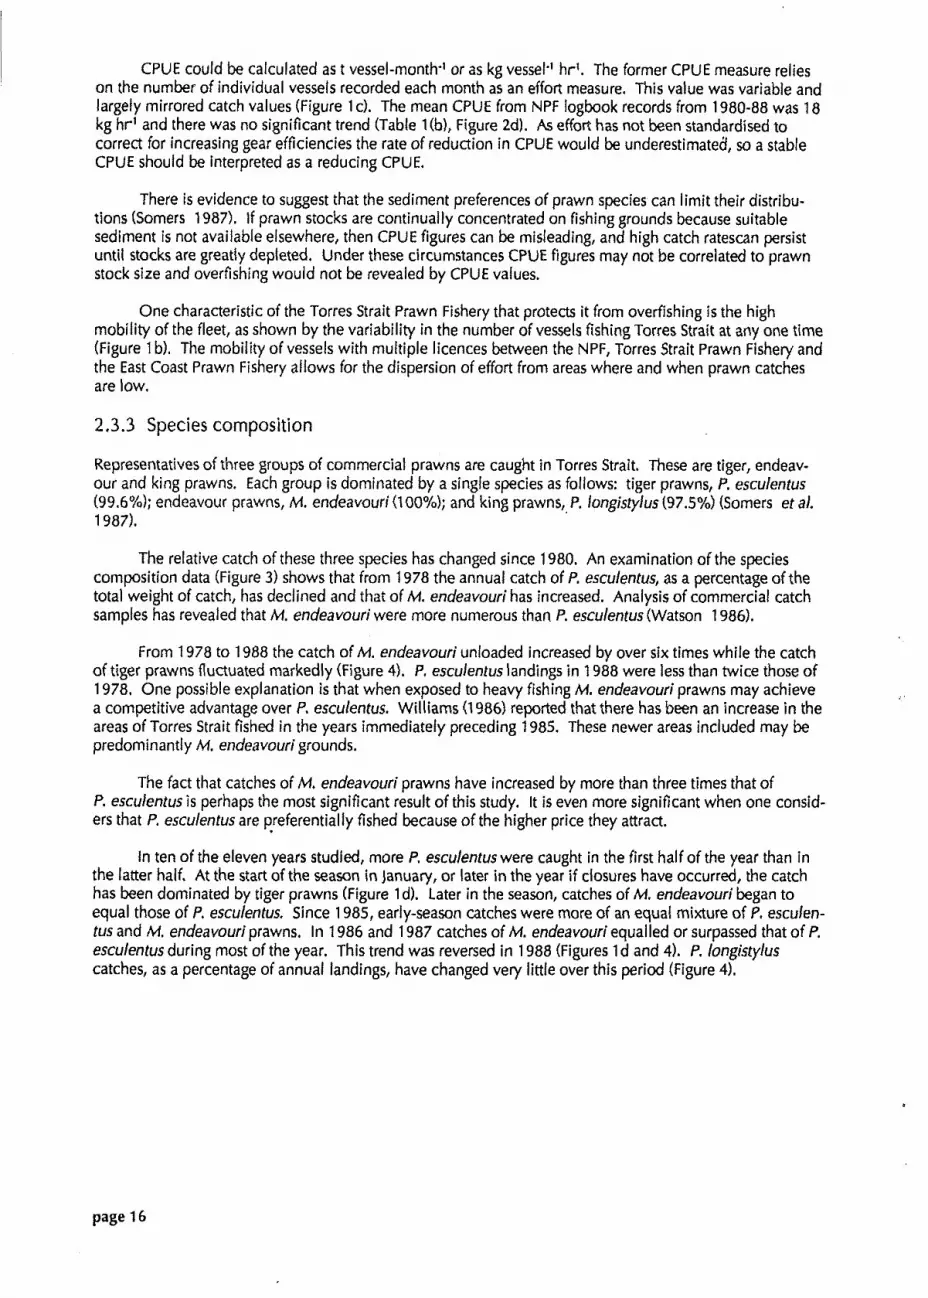
CPUE could be calculated as t vessel-month-' or as kg vessel.' hrl. The former CPUE measure relies on the number of individual vessels recorded each month as an effort measure. This value was variable and largely mirrored catch values (Figure 1 c). The mean CPUE from NPF logbook records from 1980-88 was 18 kg hrl and there was no significant trend (Table l(b), Figure 2d). As effort has not been standardised to correct for increasing gear efficiencies the rate of reduction in CPUE would be underestimated, so a stable CPUE should be interpreted as a reducing CPUE.
There is evidence to suggest that the sediment preferences of prawn species can limit their distribu- tions (Somers 1987). If prawn stocks are continually concentrated on fishing grounds because suitable sediment i s not available elsewhere, then CPUE figures can be misleading, and high catch ratescan persist until stocks are greatly depleted. Under these circumstances CPUE figures may not be correlated to prawn stock size and overfishing would not be revealed by CPUE values.
One characteristic of the Torres Strait Prawn Fishery that protects it from overfishing is the high mobility of the fleet, as shown by the variability in the number of vessels fishing Torres Strait at any one time (Figure 1 b). The mobility of vessels with multiple licences between the NPF, Torres Strait Prawn Fishery and the East Coast Prawn Fishery allows for the dispersion of effort from areas where and when prawn catches are low.
2.3.3 Species composition
Representatives of three groups of commercial prawns are caught in Torres Strait. These are tiger, endeav- our and king prawns. Each group is dominated by a single species as follows: tiger prawns, P. esculentus (99.6%); endeavour prawns, M. endeavouri (100%); and king prawns, P, longistylus (97.5% (Somers et al. 1987).
The relative catch of these three species has changed since 1980. An examination of the species composition data (Figure 3) shows that from 1978 the annual catch of P. esculentus, as a percentage ofthe total weight of catch, has declined and that of M. endeavouri has increased. Analysis of commercial catch samples has revealed that M. endeavouri were more numerous than P. esculentus(Watson 1986).
From 1978 to 1988 the catch of M. endeavouri unloaded increased by over six times while the catch of tiger prawns fluctuated markedly (Figure 4). P, esculentus landings in 1988 were less than twice those of 1978. One possible explanation is that when exposed to heavy fishing M. endeavouri prawns may achieve a competitive advantage over P. esculentus. Williams (1986) reported that there has been an increase in the areas of Torres Strait fished in the years immediately preceding 1985. These newer areas included may be predominantly M, endeavouri grounds.
The fact that catches of M. endeavouri prawns have increased by more than three times that of P. esculentusis perhaps the most significant result of this study. It is even more significant when one consid- ers that P. esculentus are preferentially fished because of the higher price they attract.
In ten of the eleven years studied, more P. esculentuswere caught in the first half of the year than in the latter half. At the start of the season in January, or later in the year if closures have occurred, the catch has been dominated by tiger prawns (Figure 1 d). Later in the season, catches of M. endeavouri began to equal those of P, esculentus. Since 1985, early-season catches were more of an equal mixture of P, esculen- tus and M. endeavouri prawns. In 1986 and 1987 catches of M. endeavouri equalled or surpassed that of P. esculentus during most of the year. This trend was reversed in 1988 (Figures 1 d and 4). P. longistylus catches, as a percentage of annual landings, have changed very little over this period (Figure 4).
page 16

P. esculentus lwl M. endeavouri P, Iongistylus Brown t i g e r E n d e a v o u r R e d spo t k ing
Flgure 3. Annual species composition (%I of commercial prawn catches in Torres Strait (by weight), 1978-88.

/ .............. ..... e m . . , ....................... ..... .... ...... I I I I 1 I I 8 I I I I
1978 1979 1980 1981 1982 1983 1984 1985 1986 1987 1988
Year
- P esculentus , , M endeavouri ....... P Iongistylus Brown tiger Endeavour Red spot king
Figure 4. Unloadings (t) of P, esculentus (brown tiger), M. endeavouri (endeavour) and P. longis~lus (red spot king) prawns in the commercial prawn catch of Torres Strait, 1978-88.
The major commercially valuable by-catch component of the Torres Strait Prawn Fishery is Thenus orien- talis, the Moreton Bay bug. Annual catches of bugs have varied considerably over the period between 1980 to 1986 from 14 to 16 t whole weight, with an average of 30 t. This represents an average annual catch value for bugs from this area of $200 000.
Panulirus ornatus, tropical rock lobsters, have formed a significant part of the trawler by-catch in the past when trawler trawlers targeted on the annual migration of lobsters through Torres Strait. Catches between 1980 and 1983 inclusive ranged from eight to 75 t tail weight, valued at between $120 000 and $1.1 million. In 1986 catches amounted to about 10 t yr', worth about $250 000, however current legisla. tion prevents trawlers targeting on this emigration, as rock lobsters are not allowed to be kept on board.
Other less economically important by-catch products taken by prawn trawlers include coral prawns (Watson and Keating, in press), squid, octopus, and crabs. It is now common for these products to be retained for sale.
2.3.5 General discussion
There is clear evidence that catch and effort have increased since 1980. There is no evidence to date of a decrease in CPUE. A reduction in the proportion of the catch comprised of P, esculentus has been coinci- dent with a rapid increase in the catch of M. endeavouri. These changes can only be interpreted if we have an understanding of the biology of the species involved and knowledge of fishing effort patterns and fleet dynamics.

It i s mandatory for all vessels fishing in Torres Strait to record catches in the NPF logbook. This will assure the continuation of this valuable data series which began in 1980. It will greatly reduce the reliance of managers and scientists on unloading records as the primary historical data series, a purpose for which it was neither designed, nor well suited. Unloading data lacks specific records of where and when vessels fish, as well as how much effort they expend. This data source will, however, continue to be useful for comparison with the NPF logbook data.
2.4 Acknowledgements
The authors are grateful to Greg Burnage for the data from 1978-80; the staff of the Export Inspection Sew- ice, Cairns; A. Caton, Kathy Colgan, Geoff Williams and Meryl Williams of the Bureau of Rural Science; and J. Wylie of the Northern Prawn Group, Department of Primary Industries and Energy, Canberra.
2.5 References
Somers, I.F. (1 987). Sediment types as a factor in the distribution of ~ o r n ~ e r c i a l prawn species in the Western Gulf of Carpentaria, Australia. Aust. I. Mar. Freshw. Res. 38, 133-49.
Somers, I.F., Poiner, I., and Harris, A. (1987). A study of the species composition and distribution of commercial penaeid prawns of Torres Strait. Aust. I. Mar. Freshw. Res. 38,47-61.
Watson, R.A. (1 986). New prawn research in Torres Strait. Aust. Fish. 45,s-6.
Watson, R.A., and Keating, J.A. (In Press). Velvet shrimps (Metapenaeopsis spp.) of Torres Strait, Queensland, Australia. Asian Fish. Sci.
Williams, G. C. (1986). The Torres Strait prawn fishery. In 'Torres Strait Fisheries Seminar'. (Eds A. K. Haines, G. C. Williams and D. Coates.) pp.233-8. (Aust. Gov. Pub. Ser.: Canberra).
page 19

3. FISHING PATTERNS OF THE TORRES STRAIT PRAWN FLEET R. A, Watson, P. ). Blyth, and P. Channells
3.1 Introduction
Commercial prawn trawling has occurred in Torres Strait since 1974 and now produces 1000 tonnes annu- ally (Section l ) . Three main species of penaeid prawns are taken commercially: Penaeus esculentus, the brown tiger prawn, Metapenaeus endeavouri, the endeavour prawn and P. longistylus, the red spot king prawn. P. esculentus and M, endeavouri together make up 90% of prawn landings for Torres Strait. P. esculentus dominates prawn catches and are the most sought after because the highest export prices are paid for this species.
Fishing effort in the Torres Strait Prawn Fishery is concentrated in the early months of the year. This coincides with a peak in recruitment of small P. esculentus (Section 5). Prior to implementation of seasonal closures to fishing, fishing effort was more evenly applied throughout the year.
The Torres Strait Prawn Fishery is subject to an international treaty which calls for joint catch-sharing and management arrangements between Austtalia and Papua New Guinea. Total allowable catch quotas, closed fishing seasons, vessel and gear restrictions and closed areas are employed in its management. The geographical extent of the fishery, the location of those areas currently closed and the areas of national jurisdiction are shown in Figure 1.
Figure 1. Location of Torres Strait showing trawling grounds, seabed jurisdiction lines, and area in Australian waters closed to trawling.
Fisheries management requires detailed catch and effort data over a long time so that trends can be observed and possible population changes can be predicted, and the disaster of a failed fishery hopefully avoided. The Northern Prawn Fishery (NPF) logbook data is the only source of information which permits analysis of spatial and temporal trends of catch and effort in the Torres Strait Prawn Fishery (Section 2).
page 20

Logbook records provide total effort (hours trawled) and catch (kg) data for P. esculentus, M. endeavouri, P. longisrylus, and other unidentified species of prawns at a spatial resolution of about 11 km2. Records are available from 1980 to the present.
This study examines the spatial and temporal fishing patterns of the Torres Strait prawn fleet from 1980-86 based on NPF logbook records and relates these fishing patterns to P. esculentus recruitment - patterns (Section 5).
3.2 Materials and Methods
Information on fishing effort and catch was extracted from NPF logbooks and unloading (export inspection service) records. To facilitate larger scale spatial comparisons of fishing effort the 11 km2 girds were com- bined into five larger areas (Figure 2).
B r i s t o w I s . .... . . .- .
3 . r e a r
. : . . L
. . S t e p h e n s I s . 2::::
6.1:
Figure 2. Map of the Torres Strait fishing grounds showing the five defined areas used in the analysis of effort distribution.
3.3 Results and Discussion
3.3.1 Catch composition
The percentage that P. esculentus catches comprised of the total catch varied markedly from year to year for most of the defined areas (Figure 3). P. esculentus usually accounted for more than 50% of the catch from areas 1 and 4, conversely, other prawn species, principally M. endeavouri, often dominated in areas 3 and 5. In area 2, catches were comprised of about equal quantities of P, esculentus and M, endeavouri.

A r e a 1 "I"
Figure 3. Percentage composition of P. esculentus from the total catch (1 980-86) over five defined areas.
Based on unloading records, the annual catch of P. esculentus, as a percentage of the total weight of the catch, has declined since 1978 (Section 2). P. esculentus, as shown by both unloading records and by NPF logbook data, fluctuated annually between 41% and 61% by weight of the total prawn catch (Figure 3). The remainder of the catch was comprised mostly of M. endeavouri. Catches of P. longistylus prawns have remained relatively small and stable.
The fluctuation in the contribution made by P. esculentus to the total annual prawn catch may be related to either closures to fishing, which alter the spatial and temporal distribution of fishing effort, or to environmental factors which can affect the abundance or catchability of this species.
Environmental factors such as currents and weather could possibly regulate the number of prawn recruits entering the fishery during any one year. Different species may be affected to varying degrees which could alter the catch composition. Little information i s available on this topic and is beyond the scope of this report.
We do know that seasonal closures can affect effort patterns, which may in turn alter catch composi- tion. Seasonal closures were in place at the beginning of 1985 and 1986. Area closures have prohibited fishing west of Warrior Reef since 1982 (Figure 1 ). These closures were designed to allow P. esculentus recruiting to the fishery more time to grow and move into the deeper south-eastern areas of Torres Strait (Seaion 5). At the start of each season, most fishing effort has been directed to the areas containing the highest level of recruiting tiger prawns in the catch (Figure 4 and Section S). Closures, introduced to in- crease catch values, have forced fishing effort away from the Warrior Reef complex, the site of major P. esculenfus nursery grounds (Section 4, as by the time the fishing season begins many prawns have already migrated further east (Sections 5 and 7). These changes in the spatial distribution of prawns may favour fishing in other areas as commercial operators attempt to optimize the value oftheir catch.
page 22

9 I el. o o i o I
P e r c e n t of
, max. e f f o r t
Figure 4. Torres Strait prawn fleet movement patterns for 1983. Total effort (hours trawled) for each two- month period is shown in the bottom right corner. Circle size represents percentages of maximum effort in
each two month period.
3.3.2 Seasonal fishing patterns
The distribution of fishing effort in Torres Strait was examined on a bimonthly basis for the period from 1980 * to 1986. During January and February in 1980 and 1981, most effort was applied to the south of the War- rior Reef complex (area 3, Figure 2). Later in the season, the fleet concentrated on the area around Stephens Island (area 2, Figure 2).
Fishing patterns changed in 1982 when, at the fishing industry's request, the area west of the Warrior Reef complex was closed to trawling for the protection of smaller-sized prawns (Section 1). Since then the pattern of the fleet's movements was similar from year to year until the introduction of seasonal closures at the end of 1984. During January to March of these pre-closure years, fishing effort was concentrated in areas close to the eastern side of the Warrior Reef complex, and extended south from Pearce Cay to Coconut Island (Figure 2). From March until September effort rapidly shifted eastwardand centred around the Yorke Islands. Some effort returned to the southern-most grounds and the Pearce Cay area from September until December when the fishing season traditionally ended.
With the introduction of seasonal closures at the end of 1984 the fleet was denied access to the newly recruited prawns in the vicinity of the Warrior Reefs until March or April. Over this interval, these prawns grew and dispersed generally eastward (Section 7). This meant that when the fishing season began in March or April the fleet was more dispersed and generally further east.
3.3.3 Spatial effort distribution
Table 1 shows the geographical distribution of annual fishing effort according to the NPF logbook grids. In + the 1982 season, the total area fished almost doubled. Following this the number of grids fished has re-
mained fairly constant. Effort concentration has, however, varied widely from year to year. In 1982 effort was distributed over 70 different grids and only one locality (in area 3) received more than 8% of the total
page 23

annual effort (Table 1 ). Effort was more concentrated in 1984 and 1986, with two grids (in areas 3 and 4 respectively) exceeding this 8% value. Effort was more uniformly dispersed during 1983 and 1985, with most grids recording less than 4% of the total yearly trawling hours.
Table 1. Breakdown of Effort into grids for Torres Strait based on NPF logbook records for 1980 to 1986.
No, of No, of No. of Grids Grids Grids
Total 0-4 %of 4-8 %of 8-1 2 % of Year grids totaleffort totaleffort total effort
Changes in the distribution of effort can be related broadly to changes in the proportion of P. esculen- tus in the total catch. In a year with a high catch, such as 1985 (Section 2), when the proportion of P. esculentus in the catch was greater than 50% in all areas (Figure 3), effort was well dispersed. In a year with reduced catches such as 1984 when only areas 1 and 4 yielded catches comprising more than 50% of P. esculentus, the effort was concentrated in area 4 (53% of total yearly effort, Figure 5). This circumstance may be explained by a poor P. esculentus recruitment for that year into area 3. This proposition is sup- ported by the lower proportion of P. esculentus in the catch (Figure 3) than in other areas.
A r e a
Figure 5. . Yearl) Y e a r
r effort in five defined fishing areas as a percentage of the total yearly effort (1 980-1 986).

Fishing takes place where commercial operators can maximise their profit, convenience and safety. The distribution of the trawling fleet is controlled by these parameters, particularly the profit margin: the value of the catch versus the cost to land it. Catch per unit of effort (CPUE) primarily determines the spatial distribution of the trawl fleet through time. Records from NPF logbooks, show that the spatialdistribution of annual average CPUE values has varied only slightly from 1980 to 1986. Short term changes in CPUE may occur very quickly and could be related to prawn behaviour. The catch rate for prawns may alter from hour to hour throughout the evening as prawn activity patterns change. Prawn species in Torres Strait are not catchable during daylight hours because they are dormant until evening. Consequently the parameter mostly likely to determine fishing patterns (CPUE) is not simply related to prawn density but also to prawn behaviour as it affects their catchability. The ability of managers and scientists to model this fishery and others requires not only a representative series of historical data but also an understanding of prawn behav- iour, and its affects on catchability and CPUE.
3.4 Acknowledgements
We would like to thank D. Andrews, J. Wylie and Butch van Montfrans of the Commonwealth Department of Primary Industry and Energy, as well as Yvette Beurteaux of the Queensland Department of Primary Industries.
3.5 References
Channells, P., Watson, R., and Blyth, P. (1988). Commercial prawn catches in Torres Strait. Aust. Fish. 47, 23-6.
Somers, I. F., Poiner, I., and Harris A. (1987). A study of the species composition and distribution of commercial Penaeid prawns of Torres Strait. Aust. 1. Mar. Freshw. Res. 38,47-61.
Watson, R. (1986). New prawn research in Torres Strait, Aust. Fish. 45, 5-6.
Williams, C. C. (1986). The Torres Strait prawn fishery. In 'Torres Strait Fisheries Seminar'. (Eds A. K. Haines, C. C. Williams and D. Coates.) pp. 233-8. (Aust. Cov. Pub. Ser.: Canberra).
page 25

page 26

BIOLOGY


4. SETTLEMENT OF JUVENILE PENAEUS ESCULENTUS HASWELL, 1879 O N T O NURSERY GROUNDS IN TORRES STRAIT
C.T. Turnbull and J.E. Mellors
4.1 Introduction
Nearshore, intertidal and estuarine seagrass-vegetated areas are important habitats for the juveniles of commercially important penaeid prawn species in tropical Australia (Coles etal. 1987). In the Torres Strait region the only large estuarine environment lies to the north along the coast of Papua New Guinea, and is 60 km from the trawl grounds of the commercial prawn fishery. For juvenile prawns to reach the fishery from these estuaries they would have to undertake a migration of 60 to 80 km across the east-west tidal flow. Although, migration distances of 70 to 100 km have been reported for the Gulf of Carpentaria (Roth- lisberg 1982), the prawn larvae, in that area, utilize tidal flow from the offshore spawning grounds to the coastal nurseries. It is unlikely that the larval prawns of Papua New Guinea contribute to the Torres Strait Prawn Fishery. It is more likely that the nurseries are located within Torres Strait in a non-estuarine environ- ment, much nearer to the fishery grounds, in seagrass beds on coral reef-platforms.
A major objective of the Torres Strait Prawn Project was to locate the nursery areas for Penaeus esculentus, brown tiger prawn in Torres Strait and to establish the timing of post-larval settlement onto and emigration from the nursery areas. These times were determined and correlated with the timing of spawning and recruitment into the fisheryof P. esculentus(Section 5). An understanding of the entire life cycle of P. esculentus in Torres Strait is required to manage the fishery in an effective manner.
4.2 Materials and Methods
4.2.1 Initial surveys
An initial aerial survey of Torres Strait in August 1985 identified seagrass beds on many reef-platforms and around islands. Further surveys with conventional nighttime beam trawls established which of these seagrass areas harboured post-larval commercial prawns. Our efforts were focused on the Warrior Reefs (Figure I), the dominant marine topographic feature of the northern half of Torres Strait.
4.2.2 Beam trawl sampling
The timing of post-larval settlement onto and emigration from Warrior Reef and the reef around the Yorke Islands was established by sampling juvenile prawn populations with a beam trawl at the time of the new moon each month, over the 28 month period, January 1986 to April 1988.
Juvenile sampling stations (Figure 2 and Table 1) in areas of seagrass habitat were situated on the southern half of Warrior Reef and the reef-platform around the Yorke Islands. These two reefs were chosen as they harboured post-larval commercial prawn species, have a variety of seagrass habitats, and could easily be sampled on a monthly basis in conjunction with adult prawn sampling from the R.V. "Lumaigul" (Section 5).
Polystyrene floats 100 m apart were used to identify the stations and mark the beam trawl sampling path. During 1986, only one 100 m trawl was made at each station. From January 1987 monthly sampling included up to four 100 m replicate trawls at each station. Replicate trawls increased the numbers of prawns sampled and provided a measure of the variability of the sampling procedure.

Figure 1. Location of juvenile sampling stations within Torres Strait.
Figure 2. Seagrass nursery areas and juvenile sampling stations on Warrior Reef and the Yorke Islands.
page 30

Table 1. Description of each juvenile sampling station.
Station Habitat and location
101 Station had a very soft, silty substrate with 70 to 80% seagrass cover, mainly Thalassia hemprichii. Enhalus acoroides was the second most dominant species. Cymodocea rotundata and Halophila ovalis were also present.
102 Station was located about 1.5 kilometres south-west of station 101, on a less silty substrate. The seagrass here was less dense with 50 to 60% cover, and had a higher proportion of E. acoroides than station 101.
103 Station was located on the western side of the reef on a coarse coralline substrate and exhibited a low density (1 0 to 20%) cover of seagrass, which consisted mainly of T. hemprichii with some E. acoroides and H. ovalis. This station was at a lower (1 -2 m) level on the reef than the other stations.
104 The seagrass here was very dense (80 - 90% cover), and consisted mainly of T. hemprichii. The substrate was firmer than at 101 and contained less silt.
107 This station was established in November 1987 to sewe as a replicate for station 101 and was located about 500 m away from station 101 on the same bed of seagrass.
111 This station was located on the northern side of Yorke island on sparse seagrass. This station is typical of the patchy sparse cover found on most of the reefs in the area. The substrate consisted mostly of coarse coralline sand with some fine sand. The seagrass cover was about 20% and consisted mainly of C. rotundata and T. hemprichii with some H. ovalis.
112 This station was located on the southern side of the Yorke Islands on a small (1 20 m x 30 m) n atypical patch of quite dense seagrass (80% cover). The substrate consisted of a mixture of
medium to very fine coralline sand. The main seagrass species were T. hemprichii, C. rotundata and Halodule uninentis.
0
4.2.3 Vessel and trawl gear
Samples of juvenile prawns were collected with a 1.4 m wide, water-jet beam trawl fitted with a 2 mm mesh-net and trawled behind an outboard powered 4.4 m aluminium dinghy, motored at a speed of25 rn minute" over the seagrass. Due to tidal constraints (insufficient water depth over the reef flat during the night to operate the dinghy and trawl) for most of the year (September-May) samples were collected during daylight hours. Sampling with a water-jet beam trawl allowed daytime sampling of the nocturnally active penaeid prawns (Section 10). In mid-winter, however, the tidal patterns are reversed and there is insufficient water depth over the reef flat during the day for trawling. This necessitated nighttime sampling at some of the stations (Figure 3) during those months. The water jets of the beam trawl were not used and the trawl functioned as a conventional nighttime beam trawl on those occasions (Section 10).

D a y samples
Night samples
D a y & night samples
Not sampled
Month
Figure 3. Densities of P. esculentus at each station from January 1986 to April 1988.
4.2.4 Sample processing
The samples were washed in the net to remove as much fine silt as possible, then bagged and frozen for transport to the laboratory. Occasionally, if the sample was considered too bulky for the limited on-board freezer storage, then sand, silt and algae were removed through a decantingsieving process in the field. juvenile prawns were separated from other material collected in the beam trawl samples in the laboratory.
Laboratory processing of juvenile prawns followed the same procedure as that for adult prawns (Section 5). Prawns were sorted to species and carapace length (CL) measured. Moult stage, sex and sexual development, i f discernible, were also recorded for each prawn.
4.2.5 Mapping of seagrass habitat
Three remote sensing techniques were used, in conjunction with diving surveys, to locate and map the extent of potential seagrass nursery areas in Torres Strait.
Aerial photographs. At the time of the study the only aerial photography available for Torres Strait were on black and white images taken by the Division of National Mapping in 1973. From these a compos- ite photograph of Warrior Reef was produced.
Landsat imagery. An enhanced Landsat image of the Warrior Reefs was produced for the project by the Queensland Department of Mapping and Surveying.
Sled-mounted undenvater television camera. A towed underwater television camera system was successfully used to search for seagrass beds in the relatively shallow (5-1 5 m) and uncharted waters west of the Warrior Reefs during an extensive juvenile prawn and seagrass survey that was conducted during late
page 32

February and early March 1988. The area encompassed by this survey extended from Darnley lsland to Orman Reefs (just west of Gabba Island) and from Kumusi Reef to Sassie Island (Figure 1). The survey was conducted jointly with the seagrass research team from the Northern Fisheries Research Centre.
Although the detailed results of the combined juvenile prawn and seagrass survey will be presented in a separate report, to be.produced jointly by the Torres Strait project and the Seagrass project, some of the general findings are referred to in this report.
4.3 Results and discussion
4.3.1 Initial surveys
These surveys showed that Warrior Reef was the most likely major nursery area for the commercial prawn fishery in Torres Strait. This reef i s ideally located adjacent to the fishery and has suitable juvenile prawn nursery habitat present.
Unlike many of the reefs of the Great Barrier Reef, the Warrior Reefs has extensive dense seagrass beds on very silty substrates, similar to seagrass communities found in the tropical Caribbean (Poiner et al. 1989). The east-west tidal flow between the two sides of the Warrior Reefs is restricted by the relatively narrow channels through the reef complex. The waters to the west of the reef are very shallow and silty in contrast to the east where the water is much deeper and less turbid. 4.3.2 Warrior Reef stations (1 01 -4 and 107)
All four stations on Warrior Reef (1 01 to 104) showed similar seasonal patterns of variation in juvenile prawn density (Figure 3). Stations 101 and 107 both had very high densities of juvenile P, esculentus relative to the other stations in this study (Figure 1) and studies elsewhere (Coles et a/. 1987). Conse- quently, the habitat at these two stations (Table 1) appears to be ideal for the settlement and growth of juvenile P, esculentus.
The lower densities of juvenile P. esculentus prawns found at station 102, compared to 101 and 107, 'I suggest that the habitat at this station is less than optimum for settlement and growth of juvenile
P. esculentus. From observation, this station differs physically from stations 101 and 107. Firstly, there appears to be less silt present in the substrate and secondly percent seagrass cover is lower (Table 1). Either
a one or both of these factors in combination, may determine the optimum habitat for juvenile P. esculentus.
The low density of juvenile P, esculentus at station 103 could be related also to the sparsity of sea- grass and the lower silt content of the substrate (Table l). Station 103 failed to show any January-March settlement peaks and this may be related to turbulence as the site is exposed to strong north-west winds that prevail during those months. At station 103, the largest peak in numbers of juvenile P. esculentusoccurred during November-December (Figure 3).
Due to tidal constraints it was difficult to sample station 104 regularly, particularly during May- October. However, a January-February peak in numbers is evident in the samples that were taken (Figure 3). Although the percent seagrass cover is very high at station 104 (Table I), it did not support high densities of juvenile P. esculentus (Figure 3). This could be an artifact caused by the inability of the beam trawl,s water jets to penetrate effectively the high percent cover of seagrass found there. Alternatively, juvenile P. esculentus may seek a slightly lower, optimum density in above-ground cover of seagrass, such as that found at stations 101 and 107. Station 104 also appears to have less fine silt (Table 1) thanstation 101 which may indicate that silt content of the substrate is an important component of the juvenile's preferred habitat. An alternative explanation could be that tidal currents do not carry high densities of prawn larvae into this area, however, this seems unlikely as station 101, located only 6 km to the south (Figure 2), gener- ally had very high densities of juvenile P, esculentus (Figure 3).
4.3.3 Yorke Islands stations (1 11 and 11 2)
At Yorke Islands, stations 11 1 (Figure I), typical of the seagrass beds on reefs to the east of the Warrior Reefs, had very low densities of P. esculentus in comparison with stations 11 2,101 and 107 (Figure 3). Consequently it appears unlikely that the eastern reefs that surround the commercial prawn fishery would
page 33

provide any significant recruitment to the fishery. The small isolated patches of seagrasses represented by station 112 could, however, serve as "collectors" indicating the presence of P. escu/entus larvae in the waters surrounding these reefs.
4.3.4 Juvenile P. esculentus size frequency distribution
There is a marked decrease in the numbers of juvenile P. esculentus found on Warrior Reef in the 10 to 15 mm carapace length (CL) size class, indicating that prawns at this size move out of the seagrass beds and off the reef (Figures 4 and 5). A few individuals remain in the seagrass habitat and grow to about 20 mm CL before they either emigrate or are presumably removed by predators.
320
240
160 & a 80 E
140 - a 105 .I- ' 70
35
0 5 10 15 20 2 5 Carapace length (mm)
Figure 4. Size frequency distributions of P. esculentus for Warrior Reef and Yorke lslands from January 1986 to April 1988.
Juvenile P. esculentus present in the seagrass habitat on Warrior Reef sites were larger (mean C t of 8.4 mm) than those present at Yorke Islands sites (mean CL of 5.7 mm). At the stations around the Yorke Islands most P. esculentus(the bulk of which occurred at station 112) had either emigrated or been removed by predaiion before reaching 8-9 mm CL and the largest P. esculentus caught was only 12 mm CL. The disappearance of juvenile P, esculentus from the seagrass at station 112 at a smaller size and earlier than those on Warrior Reef, could be due to the small area (120 m x 30 m) of seagrass habitat available, resulting in less protection from predation.

Jan
Feb .c I
Mar (d c
E + c Jun 0 0 c
JuI a, n-
Nov 2 1
Dec 0 5 10 15 20 25
Carapace length (mm)
Oct
Figure 5. Monthly size frequency distribution of P, esculentus averaged over 28 months for the Warrior Reef stations 101,102 and 103.
1 s
4.3.5 Seasonality of juvenile prawn settlement
Although juvenite P, esculentus inhabited the reef-top seagrasses of Warrior Reef throughout the year there were clear seasonal peaks of settlement that corresponded with peaks of spawning activity (Sections 5 and 6). The largest peak of post-larval settlement occurred during January-April (Figsure. 3 and 5). This timing corresponds to the settlement period for P. esculentuson the north-eastern Queensland coast (Coies et al. 1987) and in Moreton Bay (Young 1978) but differs from the settlement pattern established for P. esculentus in the western Gulf of Carpentaria (Coles and Lee Long 1985). The multi-modal.nature of the length frequency distribution suggests that the seagrass population consists of multiple waves of settlement.
A smaller peak in abundance consisting of slightly larger P. esculentusoccurred during July, 1987 (Figure 3). Although sampling problems associated with tides necessitated a change to nighttime sampling at stations 101 and 102 during July and August, 1987, the settlement peak does not appear to be related to the change in sampling gear (Section 10). Station 103, sampled in July 1987 using the standard water jet trawl, also showed an increase in the number of prawns settling onto the seagrass nursery areas. The size of the July 1987 settlement (Figures 3 and 5) could have been larger as no corrections were made for the differ- ent gear types. There i s some evidence that a conventional beam trawl samples more efficiently than the water jet beam trawl when the tidal range is small and the weather calm. On a large tide with rough weather the conventional beam trawl i s less efficient than the water jet beam trawl (Seaion 10).
Post larval P. esculentusshowed a slightly different pattern of settlement at the Yorke Islands (Figures 3 and 6) to that displayed on Warrior Reef. Relatively large densities occurred at station 112 from January- June with smaller settlement peaks in October. There is no evidence of a July settlement peak.

Jan
Feb F .
I
Mar a c
(U
A P ~ 0 7
May x c c. c Jun > 0
0 K
Jul a, 3 0-
A u g a, L Y-
S ~ P C a Oct r"
Dec 0 5 10 15 20 25
Carapace length (mm)
Figure 6. Monthly size frequency distribution of P. esculentusaveraged over 28 months for the Yorke Islands stations 11 1 and 11 2.
4.3.6 Mapping of seagrass on Warrior Reef
A band that corresponded to the densest seagrass beds could easily be distinguished in both the photo- graphic and Landsat imagery of Warrior Reef. Using photography, dense seagrass appeared as a dark band while the Landsat imagery clearly showed a red zone of vegetation. Although algae also shows up as red, further analysis of the image data using a Microbrian system may enable the two types of cover to be sepa- rated. Ground truthing confirmed the location of areas with a high percent cover of seagrass. Water depth limits the use of Landsat imagery, as areas of dense seagrass, located by diving on deeper sections of the reef, failed to show up in the image. This problem can be overcome by selecting an image recorded during a very low tide.
The combined results of these mapping techniques established that a band (2 km wide and 25 km long) of dense seagrass extends almost the entire length of Warrior Reef (Figure 2), while the remainder of the reef-platform has a covering of sparse seagrass. The silty seagrass habitat represented by stations 101 and 107 extends for 2 km across the reef and at least 4 km along the reef and similar habitat exists in several places on the northern section of this reef.
4.3.7 1988 survey
The survey supported the hypothesis that Warrior Reef is a major nursery area for the commercial prawn fishery, as none of the other areas of seagrass surveyed produced high densities of juveniles. The northern most reef of the Warrior Reef complex (known locally as Kumusi Reefl has very extensive beds of dense seagrass on a very silty substrate (similar to stations 101 and 107 ). At the time of the survey, Kumusi Reef contained very low densities of juvenile P, esculentus, while Warrior Reef had very high densities of juvenile P, esculentus. To confirm that Kumusi Reef i s not a nursery area, sampling throughout the year is required as senlement on this reef could be out of phase with settlement on Warrior Reef. To determine if this is the situation, new stations were established in June 1988 on the northern section of Warrior Reef and on Kumusi

Reef (Figure 1). Analysis of data collected from these new stations is ongoing and will be the subject of sub- sequent reports.
Diving and use of a sled-mounted television camera during the 1988 survey confirmed that there were no seagrass nursery areas in the silty shallow waters to the west of the Warrior Reefs (Figure 1 ). Al- though beds of the seagrass Halophila spinulosa were found in deeper (15 m) water 30 km to the west of the Warrior Reefs, catches from nighttime beam trawls revealed that these seagrass areas were not inhabited by juvenile P. esculentus although large adults of this species were found in these seagrass beds.
4.4 Conclusions
The results indicate that the extensive and dense seagrass on Warrior Reef is one of the major reef-top seagrass nursery areas for the Torres Strait Prawn Fishery. Larvae could be easily carried the short (2-40 km) distances from the spawning grounds to the east and west of Warrior Reef by the strong east-west tidal flow that i s the major current regime in Torres Strait (Wolanski 1986).
High densities of juvenile P. esculentus inhabit the seagrass on Warrior Reef, with the main settlement occurring in January-April. A second settlement peak, possibly larger than indicated by the data, occurs in July. These settlement peaks are in synchrony with the peaks of spawning activity (Section 5).
A comparison of the densities of juvenile P, esculentus sampled in various habitats indicates that the optimum habitat for settlement and growth of P. esculentus in Torres Strait is a Thalassia hemprichii seagrass community on a soft silty substrate.
4.5 Acknowledgements
The authors would like to thank Julie Keating for identifying and measuring the juvenile prawns from the samples, Dot Caesar and Rick Vogt for sorting samples and entering the data and Rob Coles and Rod Garrett for reviewing the manuscript. The assistance of Marcus Oke, Master of the R.V. "Lumaigul", and crew, Darren Dennis are gratefully acknowledged. Rob Coles and Warren Lee Long assisted on the 1988 Seagrass Survey and with identification of seagrass species.
4.6 References
Coles, R.C.. and Lee Lona W.1. (1985). luvenile orawn bioloev and the distribution of seaerass orawn ., - nursery grounds in tne southeastern Gulf 61 ~ar~entar r i . In *'Second Abstralian ~azonal'prawn Seminar." (Eds. P.C. Rothlisoerg, 8.). Hill, and D.J. Staples.) pp. 55-60. (NPS2: Cleveland, Australia.)
Coles, R.C., Lee Long, W.J., Squire, B.A., Squire, L.C., and Bibby, J.M. (1987). Distribution of seagrasses and associated juvenile commercial penaeid prawns in north-eastern Queensland waters. Aust. I. Mar. Freshw. Res. 38, 103-1 21.
Poiner, I.R., Walker, D.I., and Coles, R.C. (1 989). ~ e ~ i o ' a ~ studies - seagrasses of tropical Australia. In "Biology of Seagrasses- An Australian Perspective". (Eds A.W.D. Larkum, A.J. McComb and S.A. Shepherd). pp. 279-296. (Elsevier Science Publishing Company Inc.: New York).
Rothlisberg, P.C. (1982). Vertical migration and its effect on dispersal of penaeid shrimp larvae in the Gulf of Carpentaria, Australia. Fish. Bull. 80, 541 -554.
Wolanski, E.J. (1986). The physical oceanography of Torres Strait. In Torres Strait Fisheries Seminar, Port Moresby, PNC. February, 1985'. (Eds A.K. Haines, G.C. Williams and D. Coats.) 275-291. (Aust. Cov. Pub. Ser.: Canberra.)
Young, P.C. (1978). Moreton Bay, Queensiand: a nursery area for juvenile penaeid prawns. Aust. 1. Mar. Freshw. Res. 29,55-75.
page 37

5. S P A W N I N G , R E C R U I T M E N T A N D LIFE H I S T O R Y STUDIES O F PENAEUS ESCULENTUS HASWELL, 1879 IN TORRES STRAIT.
P.J. Blyth, R.A. Watson and D.J. Sterling.
5.1 Introduction
Penaeus esculentus, the brown tiger prawn, is endemic to Australian waters (Grey et a/. 1983). it i s found northward from southern New South Wales, through the Gulf of Carpentaria and around to Shark Bay in Western Australia (Grey et al. 1983). Torres Strait is the most northerly extent of its distribution. Catches of P. esculentusform the main component of catches from the Torres Strait Prawn Fishery (Section 21.
Except for the habitat utilized by the juvenile stage, in Torres Strait P. esculentus conforms to the penaeid life cycle as outlined by Garcia and Le Reste (1 981 ), Juvenile P. esculentus in this region, use seagrass beds on reef-platforms as nursery areas (Section 4), and not estuaries as in other brown tiger prawn fisheries.
information on spawning and recruitment patterns of P. esculentus is essential to the implementation of management strategies such as temporal and spatial closures and effort limitation. However, there is little life history information available for this species in Torres Strait. Studies on the reproductive activity of P. esculentus in the Gulf of Carpentaria (Crocos 1987; Buckworth 1985; Robertson et a/. 1985) found major spawning periods from July-November. Other studies on P. esculentus in Torres Strait (Somers etal. 1987) and the Low islet region of the East Coast Prawn Fishery (Ofconnor 1979) found a major spawning period occurred in March.
Information on P. esculentus recruitment patterns i s confusing. Recruitment to the fishery of sub- adults ( < 26 mm carapace length) occurred from March-May in the Exmouth Gulf (Penn and Caputi 1986) and November-March in the Gulf of Carpentaria (Somerset a/. 1987b). in Torres Strait, Somers et al. (1987a) found continuous recruitment to the fishery of P. esculentusfrom March-September followed by a decrease in December.
The differences in spawning and recruitment periods between the Torres Strait, Queensland East Coast and the Northern Prawn Fisheries, poses a problem for fisheries managers with regard to blanket management policies for P, esculentus. This study provides biological information on spawning and recruit- ment timing of P. esculentus in Torres Strait. This information can be used to formulate management strate- gies designed to maintain high yields in the short term, and long term productivity of the Torres Strait Prawn Fishery.
5.2 Materials and Methods
5.2.1 Selection of sampling stations
A range of sampling stations were selected which differed in distances from reefs (sources of recruitmeno and seagrass areas (settlement areas), and traversed environmental gradients such as depth and sediment type (Figure 1). At each station, depth profiles and monthly sea surface temperatures were recorded. The temperatures were averaged for Torres Strait. Maximum and minimum monthly air temperatures for Torres Strait were based on the average of 34 years obtained from the Bureau of Meteorology, Brisbane. Sediment samples were taken from the northern and southern extremes of each station. Particle size and organic content of these samples were analysed by the Ocean Science Institute of the University of Sydney.
page 38

June '88 - present
T o r r e s
S t r a i t
Figure 1. Map of Torres Strait showing sampling stations and the seabed jurisdiction line.
5.2.2 Sampling schedule
Sampling commenced in January 1986 using the fisheries research trawler R.V. 'Lumaigul', a 14 m, planing- hull vessel of Stebercraft design. Data was collected from trawl sites at the time of the new moon each month from January 1986 to April 1988 (Figure 2).
5.2.3 Trawl gear
The R.V. 'Lumaigul' was set up as a stern trawler. Initially, a single three-fathom wide 48 mm-mesh net was used (Section 11 ). In November 1987 a second smaller (32 mm) mesh net was added and the pair operated as twin gear separated by a sled.
Trawl starting points were fixed by radar distances from two nearby islands. Trawl paths using a single net, would follow an arc around one of these islands for 30 minutes in one direction and then turn 180" returning along the arc for another 30 minutes. Swept area or the area of the sea floor covered by the trawl gear was calculated using vessel speed, duration of the trawl and the spread or width of the trawl net. When twin nets were used the trawl duration was reduced to 30 minutes, following the arc in one direction, to maintain the same total swept area as the single net.
5.2.4 Sample processing
Samples from port and starboard nets were kept separate to provide data for selectivity trials (Section 11). if for any reason, trawl efficiency was considered impaired (such as the mouth of the net was blocked by a large animal), the sample collected was used only for qualitative purposes (Figure 2). Samples were labelled and frozen for later examination in the laboratory.
page 39

- - - ~~
Quanitat ive Qual i tat ive
J F M A M J J A S O N D J F M A M J J A S O N D J F M A
1986 1987 1 1988 1 Month
Figure 2. Sampling schedule from January 1986 to April 1988.
In the laboratory all prawn species (commercial and non-commercial) were identified and measured. Prawn size was determined by measuring carapace length (CL) to the nearest 0.1 mm. Sex, ovary develop- '. ment and moult stage were recorded for each prawn. Ovary stages (after Tuma 1967) were referred to as quiescent (stage I), developing (stage II), early maturity (stage Ill), ripe (stage IV) and spent (stage V). As stages I and V could not be differentiated, they were combined. Moult staging was a visual method involv- ing three stages of shell softness which covered the range from immediate post-moult to normal inter-moult hardness.
5.2.5 Defini t ion of areas w i th in fishery
Sampling commenced in January 1986 and analysis included a total of 28 monthly samples to April 1988 (Figure 2). The fishery was divided into two areas: (1) west of Warrior Reef (West) an area not fished for prawns since 1981, and (2) east of Warrior Reef (East) the current fishing grounds (Figure 1). The name, Torres Strait, is used when the two areas are considered together.
5.2.6 Spawning areas
Ripe females are those with visual ovary stages Ill and IV. A population fecundity index (PFI), measured in number of eggs ha1 (Section 6), was used to represent spawning activity. The major spawning areas were deduced from a spatial analysis of the highest PFI values obtained over the time series. This method is similar to that used by Crocos and Kerr (1983) and Crocos (1 987) using egg production indices.

5.3 Results and Discussion
5.3.1 Spawning
Seasonality. Analysis of PFI data averaged from all stations for each month showed two major spawn- ings occurred each year in the East (Figure 3a). The peaks were January-March and August-September in 1986, January-February and May-June in 1987, and January-March in 1988 (Figure 3 and Section 6-Figure 2). PFI values for the West showed the major spawning to occur in July-August, October-November, 1986 and January, July and October, 1987 (Figure 3a and Section 6-Figure 2). In the West, minor spawnings mir- rored major spawnings in the East. We can conclude that throughout Torres Strait, the intensity and dura- tion of spawning showed a considerable degree of annual variation.
The abundance of females in the East reached an annual maximum between January-March 1986, May 1987 and February 1988 (Figure 3b). Abundance of female P, esculentus in the East, declined sharply in March 1986 and 1988 (Figure 3b). This decline coincided with the opening of the fishing season and is probably due to fishing mortality. This pattern is not evident in 1987 and is a consequence of noclosure being implemented. Low abundances of female P. esculentus in the East after May in each of the years (Figure 3b), could have been caused by reduced catchability induced by falling water temperatures (Figure 3c). In the West the abundance of females reached a maximum in February 1986, April 1987 and April 1988. The abundance of females in the West was generally higher throughout the 28 months than in the East (Figure 3b).
The proportion of ripe females in the East reached maximum values in July-August 1986, and January and December 1987, although a high proportion were caught throughout the year (Figure 3d). An increase in the proportion of ripe females in the East and in the West (Figure 3d) is associated with a change in abso- lute water temperature which is believed to trigger ovary maturation (Penn 1980) (Section 6). This increase in numbers could also have been attributed to the high catchability of ripe females during periods of low water temperatures (Figure 3c and Section 6). In the West, the pattern was similar for 1986 but a decline in the proportion of ripe females from October-November is evident (Figure 3d). The propor- tion fell as the abundance of smaller prawns recruiting into the area increased (Figure 6a), and older prawns either migrated through to the East (Section 7) or died.
The mean carapace length of ripe females in the West showed a slight decrease after November (Figure 3e), probably due to the migration of smaller ripe females into the area (Figure 6a). The mean cara- pace length of ripe females in the East remained relatively stable over the three years.

P L * ! 4 I,
.19. . m .->.I: ...... .\. .......... "> - " ;, :;/ ..........
........
............ 3;-
........ . "
............ r
: < n ....... a -, Y -
0 0 0 0 n o w ,- ,-
Figure 3. (a) Population Fecundity Index (PFI) of P. esculentus. (b) Abundance of females. (c) Monthly mean surface sea water temperature PC) and long term average maximum and minimum air temperature
PC) for Torres Strait. (d) The percentage of ripe females (stages iil and IV). (el The monthly mean carapace length (mm) of ripe females (stages Ill and IV). (0 The monthly modal carapace length (mm) of ripe females

A small number of large (33 - 38 mm CL) ripe females (Figure 30 produced the 1986 August-Septem- ber spawning in Torres Strait (Figures 3a and 4b). This peak was not as pronounced in 1987. The October- November spawning, in Torres Strait (Figures 3a and 4c), comprised of two size groups of female prawns: the more abundant, recruiting females of 28 - 34 mm CL; and a group of less abundant, but older ripe females of 38 - 40 mm CL. By comparison, a single group of female prawns, comprising df few ripe fe- males, of 30 - 34 mm CL (Figure 30 produced the 1986 January-March spawning in Torres Strait (Figures 3a and 4a).
Somers eta!. (1987a) used the percentage of mature females with visible ovaries and the abundance of ripe females as indicators of spawning activity in Torres Strait. They found maximum spawning periods in March with some spawning occurring throughout the year. The timing of their quarterly sampling and the degree of interannual variation in the timing of spawning seasons could have caused them to miss a poten- tial spawning peak during the colder months of 1985.
Spatial. As there was only small annual spatial variation, our 1986 results were presented as repre- sentative. The optimum recruitment areas were nominated in a similar manner. PFI values were calculated for each station.
Areas located just east of Warrior Reef had high PFI values (1 05 - 140) in January-March (Figure 4a). Further east, the PFI values decreased before increasing again near the Yorke Islands (Figure 4a). In the West, the only significant spawning in January-March occurred in close proximity to south-west of Warrior Reef where PFI values ranged from 70 - 105 (Figure 4a).
High PFI values (70 - 140) were found in the Yorke Islands area and just east of the Warrior Reefs from August-September (Figure 4b). Elsewhere there was a relatively low level of spawning (Figure 4b).
The October-November spawning was most notable in the West with PFI values ranging from 60 - 240 (Figure 43. East of Warrior Reef, a low level of spawning occurred from October-November but the major spawning area was again concentrated around the Yorke Islands (Figure 4c and Section 6-Figure 2).
Spawning was protracted (Figures. 4a, 4b and 4c) in the deeper waters around the Yorke Islands, an area which lies to the east of the fishery. This area in the East, yields larger ripe female prawns and hence higher PFI values throughout the year compared with other areas in Torres Strait (Figure 5). The West pre- dominated in the October-November spawning (Figure 3a and 4c) as smaller, developing females, joined older ripe females (Figure 30. These older females may have failed to migrate to the East (Section 7) during the previous January-June recruitment period.

Torres
Strait to Trawllng
d
................
.' Yorke
Torres
Strait
to Trawling
Torres
Strait
Figure 4. Population Fecundity Index (PFl) of P. esculentusfor 28 sampling stations, scaled from the maximum for: (a) January-March 1986, (b) August-September 1986 and (c) October-November 1986.

- Yorke Is. area
..... Other areas
~ O / ~ ~ I I I I I I ~ I I I I I I I I I I I ~ ~ ~ ~ ~ ~ ~ ~ ~ J A J 0 J A J 0 J A
Month
Figure 5. A comparison between the Yorke Islands area and other areas in Torres Strait for mean carapace length (mm) of ripe females (stages Ill and iv).
5.3.2 Recruitment
Seasonality. Recruitment of small P. esculentus (< 26 mm CL) into the fishery in the East was at a continuously low level in 1986 and 1987, although a small peak was observed in April 1987 (Figure 6a). By comparison, movement into our western sampling sites commenced in October 1986, peaked in February 1987, and then declined rapidly to a minimum in July-August 1987, before rising again in November 1987 (Figure 6a). The greater number of small prawns in the West suggests that this area is more important as a pre-recruitment habitat for small prawns than the East. The total abundance of all prawns is greater in the West than in the East for the 28 months sampled (Figure 6b). This can be attributed to the abundance of small prawns in the West. Movement of smaller prawns from the Warrior Reefs to the West decreased by May (Figure 6a) as did the emigration to the East (Section 7) of resident larger prawns. This resulted in an increase through grow*, of the mean carapace length of prawns in the West from May to September (Figure 6c). Prawns in the East were smaller than those in the West from May-September (Figure 6c) probably due to size-selective fishing mortality.
P. esculentus length frequency data for the West and East confirmed recruitment timing (Figure 7). This data, combined with growth rate data (Section 7), established that the small prawns (< 26 mm CL) in the West from April-July 1986 (Figure 6a and Figure 7a) were spawned from the previous January-March spawning (Figure 3a). As only small numbers of these prawns can be seen (Figures 6a and 7a), it is assumed thatthese prawns overwintered in an area just behind the reef before migrating in August-October into our sampling stations in the West as large prawns (Figsure 6c and 7a). These prawns recruited to the fishing grounds in the East (Section 7), in the following January-February (Figure 7). Similarly, small prawns in the West in November 1986 (Figure 7a), were spawned in the previous August-September spawning (Figure 3a). These prawns migrated to the East and recruited in January-February of 1987 (Figures 6c and 7). Small prawns in the West in February-1 987 and January 1988 (Figure 7a) were spawned in the previous October. These prawns recruited into the fishery in the East in the following April-May (Figures 6c and 7).

West . . . . .
..,
0 E 0 C (D
0 a
0 J A J O J A J O J A J A J O J A J O J A I 1 8 8 6 I 1 8 8 7 t i 8 8 4 I 1 8 8 5 I 1 8 8 7 t i 8 8 4
Month Month
Month
Figure 6. (a) Monthly abundances of all P. esculentus< 26 mm carapace length. (b) Monthly abundances of all P. esculentus. (c) Monthly mean carapace length of all P. esculentus.
Carapace length (rnrn)
(a) West
Figure 7. Length frequency distribution of P, esculentus from January 1986 to April 1988 for: (a) West and (b) East.
page 46
max. - Month (b) East
12 5 4 4 4 2 - 2
7
1 2 a 2
c 4 4
0 5 :
6
a 4 3 2 u 2 a L
LL 4 5 5 2
8
Jan Feb
max. -
: - 4 h + i - i .-dl l l I .A - .: .d$lLa...L.
: . - : -i-
_ L , * L U .- i+., lB,~ -- -
j . - L l l l l l l l ~ :- -
s . . .
-
j - :
- dhb
I . L . J l ~ l ~ l ~ ~ ; -dllb,.,4 . I - ."-+I- .. . 1 . i JJ . i
i , & L- +,I"".+ ; 4 f l . - + - - Cdd.2.- -
. ---
Jun JuI g
AUQ r SBP oct Nov oec - Jan Feb Mar A P ~ May Jun 1C JuI g
AUQ , Sep oct Ncv Dec Jan a Feb a Mar ffl Apr '
4 4 5 4 4 2 4 2 - 2 - 2 'm 2 2 .
0 10 20 30 40 50
- ~ - - I l $ l l l l ~ . - : - d R I l , ~
2
. - -.
. --
a 2 2 LL
2
. 4
A- ' 4
0 10 20 30 40 50

Annual variation in the timing of spawning influenced the pattern of recruitment. Spawning in the East, occurred in August-September of 1986 compared with May-June in 1987 (Figure 3a). Cold watertem- peratures would have slowed the growth rate of the May-June 1987 spawning. As a result, the migration of prawns from the pre-recruitment habitat in the West to our sampling areas in the West occurred one month earlier in January 1988 compared with February 1987 (Figures 6a and 7). These prawns formed the peak of the distribution of February 1987 and probably the right peak of January 1988 (Figure 6c and 7a). A strong association or correlation between environmental factors such as rainfall, water currents or water tempera- ture and timing of spawning and of subsequent recruitment may explain annual changes. This has not been fully investigated in this report.
The relatively low recruitment rate of small prawns (< 26 mm CL) into the East found by this study was also reported by Somers et a/. (1 987a). These authors did not detect spawning or recruitment in the West because of their sampling design.
Spatial. In January 1988, small (<26 mm CL) recruiting prawns were found in the West (Figure a), close to the northern seabed jurisdiction line that divides Papua New Guinea and Australia (Figure I) . Monthly analysis for the 28 months, found that this is the only area where recruiting small prawns are numerous.
0 - 2 6
d
......................... ...
, Yorke 6 a * & :
: Islands ........... P n .. loosi -
* * a,' +3
P
to Trawling
T o r r e s
S t r a i t
Figure 8.Location of small (< 26 mm CL) P. esculentus, scaled from the maximum for January 1988.
page 47

5.4 General Discussion
This discussion is based on 1986 data only and describes a hypothetical life cycle for P, esculentusin Torres Strait. P. esculentus had three major spawning periods in Torres Strait: January-March and August-Septem- ber in the East, and October-November in the West. These periods of spawning activity preceded peaks of larval settlement on Warrior Reef which forms the major juvenile nursery ground in Torres Strait (Section 4).
J Some juvenile prawns may recruit directly from the nursery areas on Warrior Reef into the fishery to
the East while the remainder migrate to the West (Figures 6a and 7). The latter remain in the West for nine months or more before they emigrate to the deeper waters east of Warrior Reef (Section 7) and recruit to the fishery. Prawns recruit into the fishery in the East at a range of ages and sizes.
From October, the abundance of small prawns began to increase in the West (Figure 6a) as prawns from the previous January-March spawning (Figure 3a) began to migrate into our sampling stations (Figure 9a). From December 1986 to April 1987 there is a further influx of small prawns into the West (Figures 6a and 7a) as prawns from the August-September and October-November spawnings migrate from the nursery areas (Figures 9b and 9c). Abundance of all prawns in the West reached a maximum in March-April 1987 (Figure 6b). Prawns from the 1986 January-March spawning then migrated to the East in January-February 1987 and recruited into the fishery (Figure 9a). Prawns from the previous August-September and October- November spawnings (Figures 9b and 9c) emmigrated into our western sampling stations in February and April. These prawns then migrated east and recruited into the fishery in March-April and May-June respec- tively (Figures 9b and 9c).
Prawns from the August-September and October-November spawning periods moved through the early phases of this migration-recruitment cycle more quickly than did prawns from the January-March spawning. Prawns from the January-March spawning experienced cooler water temperatures thereby reducing metabolism and slowing growth rate. Compared with those from the winter spawnings, these prawns could have lingered up to two months or longer in this shallow water area (6-1 Om) and fine silty mud close to the west of Warrior Reef. This area was unsampled by this study until September 1988. Observations so far have shown this area to nurture small prawns and further investigation will determine if small prawns use this area to ovenvinter in.
page 48
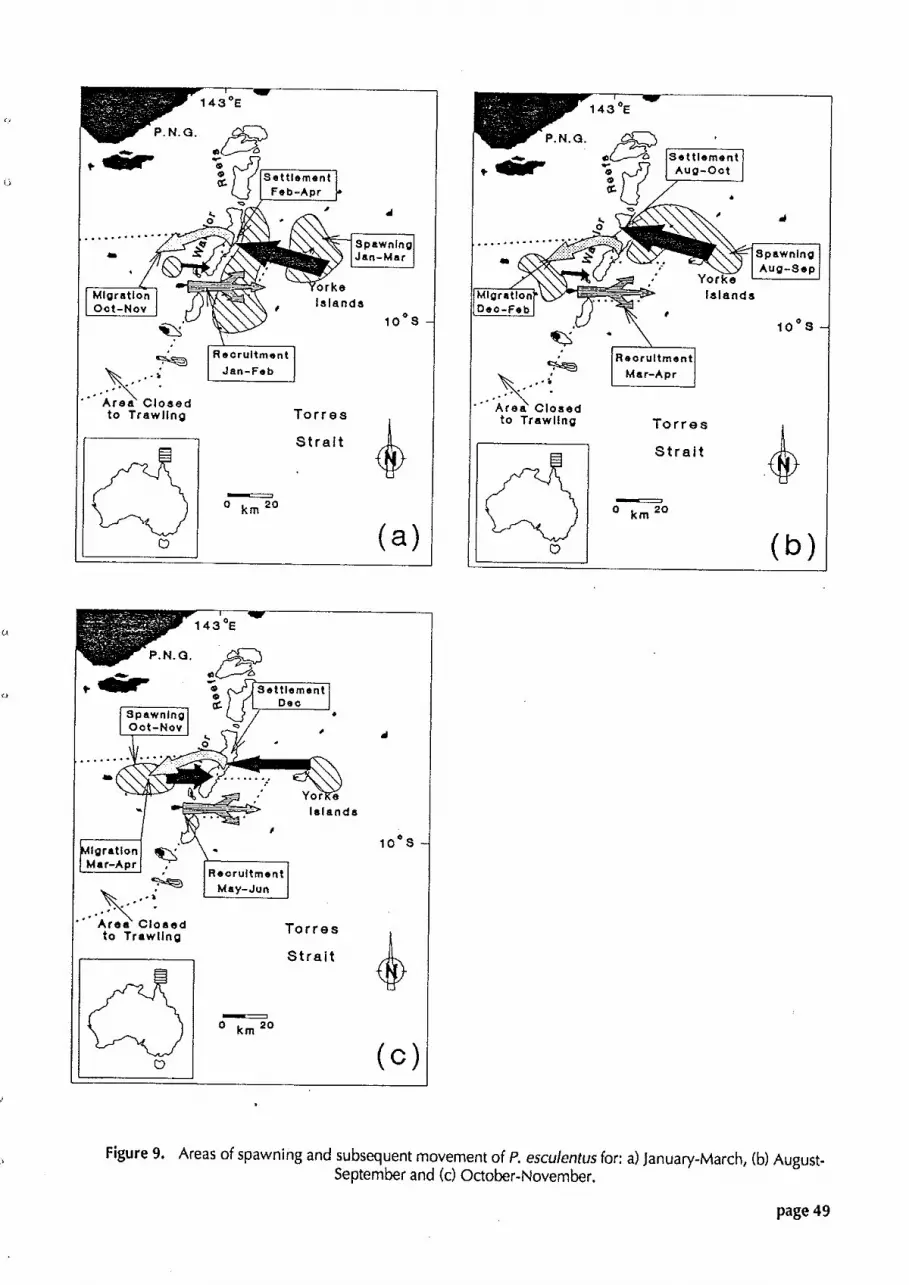
..... \ Area Closed to Trawling Torres , l
S t ra i t
P
km 20
r a t ?'- Mar-Apr
Ma. \ C l o e e d to Trawllng Torres
St ra i t
- k m Z 0
..... \ Area Closed to Trawling Torres
S t r a i t
- k m Z 0
Figure 9. Areas of spawning and subsequent movement of P. esculentus for: a) January-March, (b) August- September and (c) October-November.
page 49

5.5 Acknowledgements
The authors wish to thank Julie Keating for PFI calculations and Rob Garren and Rob Coles for reviewing the manuscript. Dot Ceaser, Rick Vogt and the crew of the R.V. 'Lumaigul' are duly acknowledged for their participation in the logistics of this study. We would also like to thank Jane Mellors for writing part of the material and methods section.
5.6 References
Buckworth, R.C. (1985). Preliminary results of a study of commercial catches, spawning and recruitment of Penaeus esculentus and Penaeus semisulcatus in the western Gulf of Carpentaria. In 'Second Australian NationalPrawn Seminar'. (Eds P.C. Rothlisberg, 8.1. Hill and D.J. Stapled pp. 213-220. (NPS2, Cleveland, Australia.)
Crocos, P.J. (1 987). Reproductive dynamics of the tiger prawn Penaeus esculentus, and a comparison with Penaeus semisulcatus, in the North-western Gulf of Carpentaria, Australia. Aust. I. Mar. Freshw. Res. 38, 79-90.
Garcia, S, and Le Reste, L. (1981). Life cycles, dynamics, exploitation and management of coastal penaeid shrimp stocks. FA0 Fish. Tech. Paper 203,215pp.
Grey, D.L., Dall, W., and Baker, A. (1983). "A Guide to the Australian'Penaeid Prawns". (Northern Territory Department of Primary Production: Darwin).
O'Connor, C.Y. (1 979). Reproductive periodicity of a Penaeus esculentus population near Low Islets, Queensland, Australia. Aquaculture 16, 153-62.
Penn, J.W. (1980). Spawning and fecundity of the western king prawn, Penaeus latisulcatus Kishinouye, in Western Australian waters. Aust. I. Mar. Freshw. Res. 31, 21 -35.
J Penn, J.W., and Caputi, N. (1986). Spawning stock relationships and environmental influences on the tiger
prawn Penaeus esculentus fishery in Exmouth Gulf, Western Australia. Aust. I. Mar. Freshw. Res. 37, 491-505.
Robertson, J.W.A., Coles, R.G., and Goeden, G.B. (1 985). Distribution patterns of commercial prawns and reproduction of Penaeus esculentus around the Wellesley Islands in the southeastern Gulf of Carpentaria. in 'Second Australian National Prawn Seminar'. (Eds P.C. Rothlisberg, 8.1. Hill and D.J.Staples.) pp. 71-75. (NPS2, Cleveland, Australia.)
Somers, I.F., Poiner, I.R., and Harris, A.N. (1987a). A study of the composition and distribution of commercial Penaeid prawns of Torres Strait. Aust. I. Mar. Freshw. Res. 38,47-61.
Somers, I.F., Crocos, P.I., and Hill, 5.1. (1987b). Distribution and abundance of the tiger prawns Penaeus esculentus and Penaeus semisulcatus in the North-western Gulf of Carpentaria, Australia. Aust. I. Mar. Freshw. Res. 38,63-78.
Tuma, D.J. (1 967). A description of the development of primary and secondary sexual characters in the banana prawn, Penaeus rnerguiensis de Man (Crustacea: Decapoda: Penaeinae). Aust. I. Mar. Freshw. Res, 18. 73-88.

6. REPRODUCTIVE BIOLOGY OF PENAEUS ESCULENTUS HASWELL, 1879 AND METAPENAEUS ENDEAVOUR1 (SCHMITT, 1926) IN TORRES
STRAIT J.A. Keating, R.A. Watson and D.J. Sterling
6.1 Introduction
In the past, management of the Torres Strait Prawn Fishery has relied on the reproductive biology and larval and juvenile abundance information on Penaeus esculentus, brown tiger prawn, from the Northern Prawn Fishery and the Queensland East Coast Prawn Fishery. Seasonal trawling closures in Torres Strait are ad- justed to coincide with the main seasonal closure in these areas (Section 1). Metapenaeus endeavouri, endeavour prawn is often taken in association with P, esculentus (Grey et a/. 1983). Although M. endeavouri is a major contributor to the commercial prawn landings of Torres Strait, very little information on its reproductive biology is available compared with P. esculentus. As the commercial catch of the Torres Strait Prawn Fishery increases (Section 2), knowledge of the reproductive biology of the penaeid prawns present in Torres Strait i s required for management purposes.
The reproductive biology of P. esculentus has been investigated in the Gulf of Carpentaria (Northern Prawn Fishery) (Buckworth 1985; Robertson et a/. 1985; Crocos 1987b), Exmouth Gulf (Western Australia) (Penn and Caputi 1986) and the Low Isles (Queensland East Coast Fishery) (O'Connor 1979). Somers et a/. (1 987), investigated the reproductive activity of P. esculentus and M. endeavouri in Torres Strait. Interpreta- tion of this study was restricted due to the three-monthly interval between sampling periods (Courtney and Dredge 1988).
To enable documentation of the reproductive patterns and spawning seasons for the commercial prawn species in Torres Strait, an egg production index or a PFI (Population Fecundity Index) has been estimated. Population fecundity is the sum of the fecundities of all the females in a population (Bagenal 1973) and can be expressed in terms of an index of population fecundity (PFI) which i s the number of eggs produced or potentially produced by a population. This measure has been used in combination with estimates of spawning frequency to document spawning seasons (Penn 1980). Past calculationsof a PFI for perlaeid species (Penn 1980; Crocos and Kerr 1983; Crocos 1987a and 1987b; Courtney and Dredge 1988) have incorporated the proportion of female spawners in the population, their length distribution and the relationship between an individual female's fecundity with its carapace length.
The PFI calculated in this study does not incorporate the proportion of female spawners in the population but uses the number of female prawns with mature ovaries per square metre of seabed swept by trawl nets as estimated from our surveys. This method is equivalent to the methods used in other reproduc- tion studies on P. esculentus (O'Connor 1979; Buckworth 1985; Robertson et a/. 1989, except these studies identified spawning peaks from the proportion of females with mature ovaries in a population (Crocos 1987a).
To assess the true reproductive potential of a female prawn, the probability that it will be inseminated and therefore have fertile eggs must be determined. Crocos and Kerr (1 983), Crocos (1 987a and 1987b) and Courtney and Dredge (1 988) studied the proportion of inseminated female penaeids but did not, however, incorporate this informition into their egg production index or PFI. In this study, probability of insemination of ripe females has been incorporated into the PFI calculations.
The aim of this report is to investigate the reproduction dynamics of both species to facilitate study of spawning seasonality and spawning areas for future management of the Torres Strait Fishery.
page 51

6.2 Materials and Methods
6.2.1 Sampling methods
The Torres Strait Prawn Fishery was divided into two areas for analysis: (1) west of Warrior ~ & f (Wed, an area not fished for prawns since 1981, and (2) east of Warrior Reef (East), the current fishing grounds (Sec- tion S - Figure 1). .-
Monthly sampling of sites and processing and examination of samples were completed as described in Section 5. For the purpose of this study, the insemination status of female M. endeavouri and maturity of male P. esculentus and M. endeavouri were recorded. Insemination of female M. endeavouri was deter- mined by the presence of a spermatophore attached to the theiycum. Male P, esculentus and M. endeavouri are considered mature when the first pair of pleonic endopodites fuse to form a petasma, the organ used to transfer spermatophores to the female during copulation (Tuma 1967). Ovary stages Ill and IV (Tuma 1967) were used to designate female prawns with mature ovaries.
Lengths of prawns referred to are carapace lengths (CL), and were measured in millimetres (mm).
6.2.2 Size at maturity
Size at maturity curves for P. esculentusand M. endeavouri were obtained from 24 monthly surveys from January 1986 to December 1987. As spawning is assumed to be asynchronous (Crocos 1989, the probabil- ity that all females in a particular length class are ripe is quite low, except in the larger length classes where fewer prawns are present. Therefore, we defined size at maturity as the carapace length that has a probabil- ity of maturity equal to 0.5 of the probability curve's upper asymptote.
Analysis of variance (ANOVA) was used to test differences between years with relation to the propor- tion of ripe females. As the difference between the two years was not significant for P, esculentus(p > 0.1) and M, endeavouri (p > 0.1), the 24 months of data were combined for each species, and the proportion of ripe females for each carapace length from each area was calculated.
The relationship between female carapace length and the probability of the prawn being a ripe female from the East or being a ripe female from the West for both species was modelled using the logistic equa- tion:
y = x, / ( l t e(x, (CL - x,)) (equation 1)
where: y is the proportion of ripe females x, is the upper asymptote x, is the gradient of the slope CL is the carapace length in mm x, is the value of CL where the curve reaches 0.5 of the upper asymptote (size at maturity)
The three parameters for the model were obtained by nonlinear regression and were estimated with standard errors and regression coefficents. Length classes represented by only five or fewer prawns were not included in the model as samples of this size were not considered representative of the length class.
This model was also used to determine size at maturity for male M. endeavouri. It i s assumed that when maturity is reached, all males will remain mature. For this reason parameter x, was fixed at 1.0 which i s the expected upper asymptote for this case and parameter y is the proportion of mature males.
6.2.3 Penaeus esculentus
Calculation of PFI. The PFI was determined as:
I PFl= T, n * E * i (equation 2)
r
page 52

where: r is the carapace length of the smallest recruit I is the greatest carapace length
for: n the number of females with mature ovaries per metre of swept area, E the number of eggs per ripe female i the proportion of inseminated females at that carapace length Information from previous published studies on egg production indices for P. esculentuswas required
to enable calculation of several parameters before a true PFI could be determined. It was assumed that these derived parameters would be identical for all populations of P, esculentus.
The number of ripe eggs per female (E) was calculated using Crocos's (1987b) linear relationship between carapace length and total ovary egg count for P, esculentus in the Gulf of Carpentaria.
E = 22 573 * CL - 529 29 (equation 3)
where: E i s the number of eggs in the ovary CL is the carapace length (mm)
Further, a logistic relationship between female carapace length and the proportion of females insemi- nated was derived from information on P. esculentus in Crocos (1 987b).
i = 0.7701 / (1 + e(4.6'(CL"9.56") (equation 4)
where: i is the proportion of females inseminated CL is the carapace length (mm)
This gave an asymptote of 0.77 at a carapace length of 37 mm.
6.2.4 Metapenaeus endeavouri
Calculation of PFI. Parameter values for equation 2 are obtained from the examination of field collected material.
To determine egg numbers, females at ovary stage IV were dissected and the ovary weighed and preserved in 10% buffered formalin. The ovary was represented by two subsamples, sectioned from the first abdominal segment of each prawn, as development i s considered constant in all sections of the ovary (Penn 1980; Crocos and Kerr 1 983).
The first sample was dehydrated, embedded in paraffin, sectioned at 4 pm, and stained with Haema- toxylin and Eosin. Microscopic staging was used to differentiate between the third and fourth stages of ovarian development (Tuma 1967). The presence of cortical specialization In the ripe oocyte of stage IV ovaries indicated spawning would occur within 7 to 9 days (Anderson eta/. 1985). If the first subsample indicated an ovary at stage IV, then a second ovarian subsample was weighed and carefully teased apart in water which allowed the eggs to be easily counted. The number of eggs per ovary was then calculated using simple proportions. Only stage IV ovaries were used for calculations Involving egg number (E) (equa- tions 2 and 3), as they most reliably indicate individual spawning activity (Crocos and Kerr 1983).
6.2.5 Assurnptions.in calculating PFI.
The methods used to calculate a PFi assume that the duration of ripe ovary stages Ill and IV is shorter than one month (the period of sampling frequency), the duration of development of ovary stages Ill and iV remains constant for the population, spawning is asynchronous, and catchability i s constant (Penn 1980).
page 53

1 I Inseminated ripe females I\ - -- Ripe females ::J \
Carapace length (mm) Figure 2,Relationship between numbers of; females, ripe females (ovary stages Ill and IV), inseminated ripe
females, eggs produced by inseminated ripe females and carapace length for P, esculentusfrom January 1986 to December 1987.
In order to study the relationship between spawning time, spawning areas and PFI, a monthly PFI was calculated for the East and West (Fig. 3). Monthly estimates of a PFI for P, esculentus for Torres Strait ranged from 5-1 03 in the East and from 2-90 in the West (Figure 3). These monthly values were used to identify peaks of spawning (Section 5).
Crocos (1 985) found no evidence for lunar synchrony of spawning for P. esculentus in Moreton Bay, Other cues, external or environmental, may cause seasonal spawning peaks at particular times of the year (Figure 3). Water temperature change has been correlated with peaks in PFI for P, esculentus in Torres Strait (Section 5). This change in absolute water temperature may result in decreasing or increasing intermoult periods, catchability and egg production.
Insemination. insemination of female Penaeusspecies reportedly occurs at the timk of moulting. A spermatophore is deposited on the thelycum and enclosed by the hardening shell (Penn 1976 and 1980). ~ e n n (1 976 and 198'0) observed that it was necessary for spawning and insimination to occur within the same intermoult period because the spermatophore was lost during the moult. Crocos (1 987b) found that 60 to 80% of female P. esculenrus in the Gulf of Carpentaria > 32 mm CL were inseminated while only 22% at 28 mm CL were inseminated.. If insemination rates are not incorporated into PFI calculations, and all ripe females are assumed to be inseminated, the number of fertilized eggs will be overestimated, particularly for females under 32 mm CL with developing ovaries. There were many ripe female prawns > 25 mm CL and < 32 mm CL (Figure 2). Insemination of these prawns commenced at approximately 27 mm CL and the in- semination rate at this size was quite low. The low insemination and egg production rates of smaller prawns meant that they contributed relatively little to PFI values. The model in this study takes these parameters into account for calculation of a PFI.
The probable cause of low insemination rates of ripe female P. esculentus < 32 mm CL was undevel- oped thelyca. Although we observed all females to have an externally developed thelycum, it is probably not functional until the thelycal plates reach a particular size (Tuma 1967). Tuma (1967) found that al- though female P. merguiensis have a structurally complete thelycum at 24 mm CL, insemination rates were low at carapace lengths < 30 mm. He assumed that insemination was dependant on the size of the the- lycum.
page 56

* Missing samples
- J A J O J A J O J A J O J A J O
M o n t h 1
Figure 3.Population Fecundity Index (PFI) of P. esculentus in the (a) West and (b) East from January 1986 to December 1987.
Spawning seasonality. Monthly PFI values indicated that spawning occurred throughout the year in Torres Strait (Figure 3). Periods of spawning activity were observed in July-August and October-November, 1986 and January, July and October in 1987 in the West. In the East, spawning activity was observed from
Q January-March and August-September in 1986 and January-February and May-June, 1987. The October- November spawning period contributed the most eggs in the West and the January-March spawning period contributed the most eggs in the East in 1986.
These results extend the findings of Somers et ai.(1987). They found that although the abundance of ripe females was highest in March, abundance was relatively low in other cruises in Torres Strait. Catch rates of small prawns however were consistent over their three-monthly sampling schedule, indicating the inherent potential for year round reproduction. This limited sampling regime of Somers et a/. (1987) could have missed other spawning periods, identified by our monthly sampling.
Other studies on P. esculentus (reviewed in Crocos 1987b), have reported a constant and protracted period of egg production for the species with moderate peaks occurring in spring and autumn, with a July- October spawning contributing most to recruitment in the Gulf of Carpentaria. These studies considered only the proportion of ripe females present and egg production level was based on the success of subse- quent recruits. The proportion of ripe females does not necessarily indicate egg production correctly unless parameters of abundance and size are incorporated (Crocos 1987b). Based on seasonal PFI (Figure 31, egg production during January-March would appear to contribute equally or greater to the population of P. esculentus in Torres Strait than does any of the other spawning periods. As peaks of PFI can precede recruit- ment, this index has great potential for management.
Physiological changes as a result of varying environmental factors may account for the protracted level of ripe females and the seasonal variations in egg production. The physical oceanography of Torres Strait (Section 1) may also account for the differences of these parameters in Torres Strait compared with the studies from the Gulf of Carpentaria and east coast of Queensland. A decrease in water temperature can cause a physiological effect such as a reduction in metabolic rate and therefore catchability (Fuss and Ogren
1 1966 ; Penn 1976 and 1980): Hill (1 985) also found emergence andtherefore catchability to be a function
page 57

of water temperature for P. esculentus. During colder months, catch rates of P. esculentus are reduced due to low water temperatures (White 1973). During the periods of low water temperatures, the metabolic rate of ripe females does not reduce because of egg production, and the catchability of these prawns may be increased as they forage for additional food (Penn 1976 and 1980). This increased catchability promotes unexpectedly high levels of ripe females in catches, and gives rise to inflated levels of egg production that are not indicative of the total female population (Penn 1980). Fuss and Ogren (1 966) investigated prawn behaviour of P. duofarum and correlated cold water temperatures with extended activity and a decrease in the number of active prawns, while more prawns were active in warm water temperatures over a shorter period of time. Thus the proportion of ripe females may be overestimated from June-August, a time of low water temperatures (Section 5 - Fig. 3c), when activity is increased causing increased catchability and distorting estimations of peak spawning periods. The use of both ripe and early ripe stages may also overes- timate spawning activity if large sized ripe females are present and their intermoult period exceeds the monthly sampling frequency (Crocos 1985). Food foraging may account for the continuing catch of ripe females during colder months but further studies on P. esculentus behaviour are required to establish this fact.
6.3.2 Metapenaeus endeavouri
Size at maturity. As with P. esculentusdifferences in the size at maturity for M. endeavouri between the unfished West and theiished East were unexpected. The estimated parameters (Table 2) resulted in logistic curves for M, endeavouri in both areas (Figure 4), were similar to those derived for P. esculentus (Figure 1). The smallest ripe females were found at 13 mm CL in the East and 16 mm CL in the West. The size at maturity was 27 mm CL for the East and 31 mm CL for the West (Figure 4).
Table 2. Estimated parameters for logistic equation 1 obtained by using nonlinear regression for size at maturity of female M. endeavouri.
West East
Estimate SE ? Estimate SE ?
The proportion of ripe females c 32 mm CL between the East and the West was significantly different (t = 1.748, d.f. = 29, p < 0.10) (Student t-test). Above 32 mm CL the difference was not significant (t = 0.149, d.f. = 15, p > 0.10) (Student t-test). Below 32 mm CL, there was a higher probability of ripe females occurring in the East than in the West whereas above 32 mm CL, the probability was similar. This indicated a seasonal or environmental factor affecting the probability of a female being ripe. Investigations into sea- sonal effects are still continuing, although considerable seasonal variation does exist.
Somers et al. (1 987) found the smallest mature female M, endeavouri in Torres Strait were 20 mm CL and the size at maturity was 27 mm CL. The results from the present study showed much smaller mature prawns in both the East and West, a similar size at maturity in the East, but a much greater size at maturity in the West.
Size at maturity of male M. endeavouri in Torres Strait was 18 mm CL in the West and 17 mm CL in the East. The smallest carapace length with a joined petasma was 11 mm CL in the West and 8 mm CL in the East (Figure 51. Most male M. endeavouri were mature by 23 mm CL. The majority of M. endeavouri, unlike P. esculentus, appear to leave the nursery grounds and move into the fishery before maturation. The minimum carapace lentgth at which a male M. endeavouri is able to inseminate is unknown.
page 58

East
0 * - - - - - - West
Size at maturity
Carapace length (mm)
Figure 4.Logistic relationship between probability of ripe females (ovary stages Ill and iV) and carapace length in the East and the West for female M. endeavouri, indicating size at maturity.
.--..- West
Size at maturity
10 15 20 25 30 35 40 45 50
Carapace length (mm)
Figure 5.Logistic relationship between probability of mature males and carapace length in the East and the West for male M. endeavouri, indicating size at maturity.
page 59


Crocos, P.J. (1 985). Appraisal of some factors relevant to the development of penaeid prawn population reproductive models. In "Second Australian National Prawn Seminar". (Eds P.C. Rothlisberg, 0.1. Hill and D.J. Staples). pp. 159-164. (NPS2, Cleveland, Australia).
Crocos, P.J. (1 987a). Reproductive dynamics of the grooved tiger prawn, Penaeus semisulcatus in the north western Gulf of Carpentaria, Australia. Aust. I. Mar. Freshw. Res. 38, 79-90.
Crocos, P.J. (1 987b). Reproductive dynamics of the tiger prawn P. esculentus and a comparisonwith P, semisulcatus, in the north-western Gulf of Carpentaria, Australia. Aust 1. Mar. Freshw. Res. 38, 91 -1 02.
Crocos, P.J., and Kerr, J.D. (1 983). Maturation and spawning of the banana prawn Penaeus merguiensis de Man (Crustacea: Penaeidae) in the Gulf of Carpentaria, Australia. Aust. I. Mar. Freshw. Res. 69, 37-59.
Fuss, C.M., and Ogren, L.H. (1966). Factors affecting activity and burrowing of the pink shrimp, Penaeus duorarum Burkenroad. Biol. Bull. (Wwds Hole) 130,170-91.
Grey, D.L., Dall, W., and Baker, A. (1983). 'A Guide to the Australian Penaeid Prawns". (Northern Territory Department of Primary Production: Darwin).
Hill, 8.1. (1985). Effect of temperature on duration of emergence, speed of movement, and catchability of the prawn Penaeus esculentus. In "Second Australian National Prawn Seminar" (Eds P.C. Rothlisberg, B.J. Hill and D.J. Staples). pp. 77-83. (NPS2, Cleveland, Australia).
O'Connor, C.Y. (1 979). Reproductive periodicity of a Penaeus esculentus population near Low Islets, Queensland, Australia. Aquaculture 16,153-62.
Penn, J.W. (1 976). Tagging experiments with western king prawn Penaeus latisulcatus Kishinouye II. Estimation of population parameters. Aust. 1. Mar. Freshw. Res. 27,239-50.
Penn, J.W. (1 980). Spawning and fecundity of the western king prawn, Penaeus latisulcatus Kishinouye, in Western Australian waters. Aust. I. Mar. Freshw. Res. 31,21-35.
Penn, J.W., and Caputi, N. (1 986). Spawning stock recruitment relationships and environmental Influences 0
on the tiger prawn Penaeus esculentusfishery in Exmouth Gulf, Western Australia. Aust. I. Mar. Freshw. Res. 37,491 -505.
Poner, LC., Penn, J.W., and Brwker, K.5. (1986). Life cycle of the western school prawn, Metapenaeus dalli Racek, in a Western Australian estuary. Aust. I. Mar. Freshw. Res. 37, 95-103.
Reinhard, E.G. (1 956). Parasitic castration of Crustacea. Parasitology V, 79-1 07.
Robertson, J.W.A., Coles, R.G., and Goeden, G.B. (1 985). Distribution patterns of commercial prawns and reproduction of Penaeus esculentus around the Weliesley Islands in the southeastern Gulf of Carpentaria. In "Second Australian National Prawn Seminar". (Eds P.C. Rothlisberg, 6.1. Hill and D.J. Staples). pp. 71 -75. (NPS2, Cleveland, Australia).
Somers, I.F., Poiner, I.R., and Harris, A.N. (1987). A study of the species composition and distribution of commercial Penaeid prawns of Torres Strait. Aust. 1. Mar. Freshw. Res. 38,4761.
Tuma, D.J. (1 967). A description of the development of primary and secondary sexual characters in the banana Drawn, Penaeus merguinensis de Man (Crustacea: Decapoda: Penaeinae). Aust. I. Mar.
White, T. (1 973). Factors affecting the catchability of a penaeid shrimp, Penaeus esculentus Haswell 1879. a In "First Australian National Prawn Seminar". (Ed. P.C. Young), pp. 11 5-1 37. (NPS1, Maroochydore,
Queensland).

7. MOVEMENT AND GROWTH OF PENAEUS ESCULENTUS HASWELL, 1879 ESTIMATED FROM TAGGING IN TORRES STRAIT.
K.J. Derbyshire, D.J. Sterling, R.A. Watson and A. Lisle
7.1 Introduction
Some of the most important factors in managing a fishery are: an estimate of the relative abundance of the population, the agdsize composition of the population, growth rates, age at maturity, and mortality rates from fishing and natural causes (Rounsefell 1975). As juvenile prawns are found in a separate habitat from that of adults, prawn movements are also important to management. Tagging of animals for later recovery is an excellent method for estimating growth rates and migration, and for separating fishing and natural mortal- ity rates (Gulland 1983). In some instances tagging can also be used to estimate population size Oones 1977).
Several assumptions are made concerning tagged individuals. Firstly, that the tagged individuals disperse randomly through the population to be studied before recapture, secondly that the tagged individu- als are subject to the same mortality rates as untagged individuals, and thirdly that tags are not lost or overlooked when recovered (Krebs 1978). In some circumstances it is impossible not to violate one of these assumptions. Tags are known to affect speed of movement, susceptibility to predation, feeding ability and mortality (Rounsefell 1975). Despite these violations, tagging is the most reliable method for estimating growth in ~enaeidae (Garcia and Le Reae 1981). Another rdiabk application of tagging experiments is to quantify the movement of tagged animals. A knowledge of migration patterns is an essential component in the identification of stock boundaries (Somers and Kirkwood 19841, an issue of importance for the Torres Strait Prawn Fishery which has catch sharing arrangements between two countries, Australia and Papua New Guinea.
The initial objectives of this tagging programme were to describe the movements and growth of Penaeus esculentus, the brown tiger prawn.
7.2 Materials and Methods
7.2.1 Study area
Two areas were used for the capture of prawns and their subsequent release after tagging: (1) west of War- rior Reef (hereafter referred to as West'), an area not fished for prawns since 1981, and (2) east of Warrior Reefs (hereafier referred to as 'East'), the current fishing grounds (Section 1 - Figure 1). Previous surveys had indicated that through January and February these areas would yield sufficient numbers of smaller P. esculentus (less than 30 mm carapace length) for tagging. Prawns were tagged at both areas during two periods: 19 January to 25 January 1987, and 18 February to 23 February 1987. The numbers of prawns tagged on each date are indicated in Table 1.

Table 1. Summary of releases of tagged prawns.
January February
Date Number Date Number Tagged Tagged
TOTAL 9667 9489
7.2.2 Prawn capture
Prawns were captured using 30 min shots of twin 6-fathom wide, 48 mm mesh otter trawl gear hauled by the 18 m R.V. 'Gwendoline May'. Undamaged P, esculentuswere quickly removed from the sorting tray and placed in buckets of fresh seawater. These were emptied within minutes into holding tanks with a
* continuous seawater supply. These tanks had removable plastic mesh liners to facilitate moving prawns and retrieving prawns from the bottom. The first prawns were tagged within 15 min of their removal from the trawl net.
Sites used for tagged prawn release were not fished by the 'Gwendoline May' during the month when prawns were released there.
7.2.3 Description of tags
Blue-coloured polyethylene streamer tags (Hallprint Pty Ltd, South Australia) were used. These were about 5.7 cm in length (detached from needles), 3 mm wide at their printed ends and 1.5 mm wide inthe centre (manufacture's size 7s). Each piastic tag was bonded to a sewing needle. Tags were printed with consecu- tive identification numbers and an abbreviated name for our organisation. Several hours before use, the base of each tag was coated with a broad spectrum antibiotic cream, Auromyecin, in an attempt to reduce the subsequent risk of infection at the site of tag penetration.
7.2.4 Tagging and prawn release
Only vigorous prawns were selected from the holding tank for tagging. The tag was passed laterally through the first abdominal segment, midway between the segmental joints below the midline so as to avoid vital organs and nerve ganglia. The tag was visible to fishermen as it protruded about 2 cm from both sides of the prawn.
Prawns were returned to another holding tank following tagging. Within one to two hours, vigorous prawns were removed from this tank for identification and measurement. Each prawn had its tag number,
page 63

carapace length (CL, to nearest 0.1 mm), sex and moult stage recorded. The ovary condition and maturity of female prawns was designated to stages as described by Tuma (1 967). The presence of parasites such as bopyrids, or injuries to the prawn were noted. These prawns were then returned to a holding tank.
Prawns were usually released in groups of approximately 600 to 800 individuals. Prawns were transferred to a release cage which was quickly lowered to the bottom where an attached rope allowed the lid to be removed and the cage inverted, This operation was always completed before day break to assure that predation by fish was minimized. On the occasions when dolphins were in the vicinity of the vessel, by-catch (primarily crabs and fish) was retained on board and jettisoned rapidly as the release cage was lowered. This sewed to confuse and distract the dolphin pod by presenting an excess of food and sonar contacts.
7.2.5 Tag recovery system
The fishing industry was informed of the tagging programme through leaflets, newspaper and radio articles, and directly by fisheries staff prior to tagging. Plastic resealable containers were supplied to alltrawling operators, which included resealable bags, labels and instructions. A $2 reward was paid for the retum of each tagged prawn with supporting documentation.
Labels supplied with tagged prawns required the trawling operator to identify the approximate recap- ture position on a map andlor by nominating distances and bearings measured by radar from landmarks. The date of recapture, the vessel, and the operators name were also required. Recaptured prawns were kept frozen until returned to the laboratory.
Most tags were collected from fishing vessels on the grounds by fisheries research or fisheries enforce- ment staff. On several occasions tagged prawns were returned directly to the laboratory. It was rare for tags to be returned without prawns or supporting documentation. A common problem was insufficient informa- tion to uniquely identify the recapture position, and frequently two recapture locations were possible. When this was observed, and when it was possible, the fishermen were asked to nominate the most likely recapture position.
7.2.6 Analysis
Information from tagged and recaptured prawns was maintained in a computer database. An index for the assessed accuracy of the recapture position was created, and prawns recaptured from uncertain locations were not included in analyses of prawn migration.
Short term growth. Frequency distributions for the observed growth of each sex were ploned, and the MIX comouter orowam (P.D.M. Macdonald. lchthus Data Svstems) was used to determine comoonent distributions ;hat bkst {ned the histograms. hi; program i s baskd on the method outlined by ~acdonald and Pitcher (1 979) for analysing distribution mixtures. The means of these distributions represented mean moult increments and analisisbas restricted to the first three means. This technique was considered particularly applicable bec'ause the size range of the tagged population was relatively small, which indicated that prawns were from a single cohort and were expected to have similar growth rates. This type of analysis i s rarely possible from taggingdata, as short term return rates are usually low.
Long term growth. Prawns at liberty for less than 40 days and which had grown less than 1 mm were not included in the analysis of long term growth, as the type of model used was not suitable for predicting growth increments for prawns with short periods at liberty relative to the intermoult period (Kirkwood and Somers 1984). Residuals from nonlinear regressions were examined to identify extreme outliers, and these were subsequently omitted from the data.
Individual growth increments of prawns were used to assign growth parameters to the von Bertalanffy growth model. The form of the model used was:
y i s the growth increment x, i s the initial size x, is the time at liberty
page 64
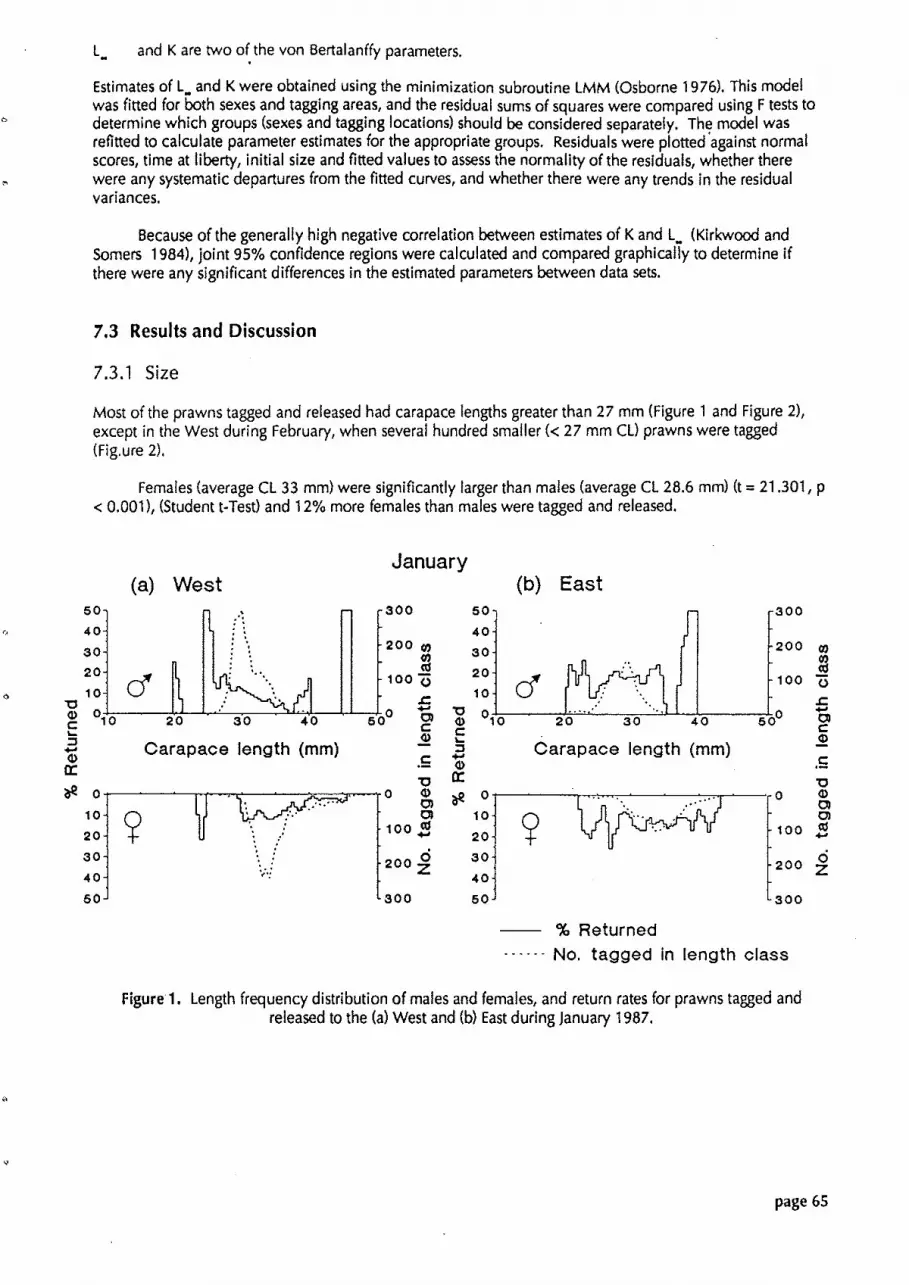
L_ and K are two of the von Bertalanffy parameters.
Estimates of L- and K were obtained using the minimization subroutine LMM (Osborne 1976). This model was fined for both sexes and tagging areas, and the residual sums of squares were compared using F tests to
6 determine which groups (sexes and tagging locations) should be considered separately. The model was refined to calculate parameter estimates for the appropriate groups. Residuals were ploned'against normal scores, time at liberty, initial size and fitted values to assess the normality of the residuals, whether there
m were any systematic departures from the fined curves, and whether there were any trends in the residual variances.
Because of the generally high negative correlation between estimates of K and L_ (Kirkwood and Somers 19841, joint 95% confidence regions were calculated and compared graphically to determine if there were any significant differences in the estimated parameters between data sets.
7.3 Results and Discussion
7.3.1 Size
Most of the prawns tagged and released had carapace lengths greater than 27 mm (Figure 1 and Figure 2), except in the West during February, when several hundred smaller (< 27 mm CL) prawns were tagged (Figure 2).
Females (average CL 33 mm) were significantly larger than males (average CL 28.6 mm) (t = 21.301, p < 0.001), (Student t-Test) and 12% more females than males were tagged and released.
(a) West January
(b) East
a Carapace length (mm) -
C .-
, 30- -200 0)
. . . . 3 . . -100
10 'O: i pf'-q _.._: ... 5 $ "TO 2 0 30 4 0 571° z c L a 3 C a r a p a c e length (mm) - C b) .- C
- % Returned ...... No, tagged in length class
Figure 1. Length frequency distribution of males and females, and return rates for prawns tagged and released to the (a) West and (b) East during January 1987.
page 65

(a) West February
(b) East
Carapace length (mm) I L 3 CI
Carapace length (rnm) 0
---- % Returned ...... No. tagged in length c lass
Figure 2. Length frequency distribution of males and females, and return rates for prawns tagged and released to the (a) West and (b) East during February 1987,
7.3.2 Return rates
Of the 19 156 tagged prawns released, 2085 were returned. The return rate for prawns released in the East (20%) was higher than for prawns released in the West (6.8%), due to differences in the level of fishing effort between the two areas. There was no fishing effort in the West, so prawns released there could not be recaptured by the fleet unless they migrated to the East. Most recaptures of prawns released in the East were made within 20 days after release, as there was a pulse of fishing effort at the beginning of the fishing e
season, which opened soon after tagging in February.
Return rates for males and females were similar, except for those prawns released in the East during January, of which 11.8% and 15.4% respectively were returned (Table 2). Prawns released in the East had relatively constant return rates across the range of carapace lengths tagged (Figure 1 and Figure 2). Return rates for prawns released in the West during January declined with increasing carapace length, especially for males (Figure 1).
Table 2. Return rates (%) for female and male prawns released east and west of Warrior Reefs.
Females Males
West January 8.3 9.0
West February 4.5 5.4
East January 11.8 15.4
East February 27.0 26.6
page 66

Return rates for small (< 27 mm CL) prawns released in the West during February were lower than for larger prawns (Figure 2). This may have been caused by greater tag induced mortality for these smaller- prawns. Hill and Wassenberg (1 985) demonstrated in laboratory studies that tag induced mortality was greater in P. esculentus smaller than 19 mm CL. The prawns tagged in the present study were larger than this (Figure 1 and Figure 2). Return rates may also be influenced by size dependent natural mortality, as marine invertebrates typically have higher natural mortality earlier in life (Krebs 1978).
7.3.3 Movement
Wet. Apart from six prawns recaptured in the West by the 'Gwendoline May', all of the returns from prawns released in the West were recaptured in the East (Figure 3). Even though prawns could not be recap- tured by the fleet in the West as the area is closed to commercial fishing, it is evident that there was a major movement of prawns to the East. Recaptures were concentrated south of Warrior Reef and around Yorke Islands and probably reflect the distribution of effort of the fishing fleet (Section 3).
Figure 3. Release areas and recapture positions for prawns tagged and released to the West.
The average distance moved by males (24.9 n mile) was significantly less than that moved by females (27.5 n mile) (t = 3.448, p < O.OOl)(Student t-Test). The greatest distance travelled was 69 n mile by a female released during'february.
The average time at liberty was 72.7 days (s.d. = 44.8) and the greatest time at liberty recorded was 297 days for a male released during January. There was no significant difference in time at liberty between sexes (t = 1.304, p > 0.05)(Student t-Test) which, as males travelled smaller distances than females, indicates that males generally moved more slowly than females. There was no evidence of different migration routes for males and females (Figure 3).
page 67

Analysis of variance revealed that the distance moved significantly increased with time at liberty (F = 193, p < 0.001)(F Test), which was probably a result of the shift in effort of the fishing fleet from the Warrior Reef area towards Yorke Islands (Section 3). If the assumption that the fleet follows prawn movement is made, then the trend shown by the ANOVA can be attributed to prawn movement.
East. Most of the returns from prawns released in the East were recaptured close to the release areas (Figure 4). other recaptures were scattered throughout the East (Figure 4). Concentrations of recaptures south of Warrior Reefs and around Yorke Islands such as occurred for prawns from the West(Figure 3) were not evident. The average time at liberty for prawns from the East was significantly less than that for prawns from the West (t = 20.907, p < O.OOl)(Student t-Test), which indicates that the high fishing effort in the release areas of the East arpund the time of release may have prevented large numbers of prawns from migrating from these areas.
Figure 4. Release areas and recapture positions for prawns tagged and released to the East.
The average distance travelled by females (4.3 n mile) was not significantly different to that moved by males (4.8 n mile) (t = 1.229, p > 0,05)(Student t-Test). The average distance travelled by prawns from the East was significantly less than for prawns from the West (t = 55.01 4, p < 0.001 )(Student t-Test), which is at least partially attributable to the unequal distribution of fishing effort. The greatest distance travelled was 58 n mile by a male released during January.
The average time at liberty was 27.9 days (s.d. = 34.5) and the greatest time at liberty recorded was 243 days for a male released during January. There was no significant difference in time at liberty between sexes (t = 1.401, p > O.OS)(Student t-Test).
As for the West, there was a significant positive relationship between the distance moved and time at liberty (F = 629, p < O.OOl)(F Test).
page 68

7.3.4 Growth
Short term. Data on short term growth was restricted to prawns released in the East because of insufficient returns of prawns released in the West with small (< 20 days) periods at liberty.
The first three peaks of growth increments, identified for both sexes using the MIX program, were interpreted as representing prawns prior to ecdysis, those which had moulted once, and those which had moulted twice following tagging (Figure 5). The estimated means for these peaks and their standard errors are given in Table 3, and the computed chi-squared statistics indicate a good fit for both sexes (Table 4).
(a) Females (b) Males U26J
Growth increment (mm) Growth increment (mm)
Figure 5. Component distribution for short-term growth of (a) females and (b) males.
Table 3, Means (mm) and their standard errors estimated by the MIX computer program for peaks of short term growth.
Means he.) Moult Females Males
page 69

Table 4. Goodness of fit statistics computed by MIX for the analysis of short term growth.
Sex df X2 P
Females 24 16.128 0.883
Males 19 10.347 0.944
There was no significant difference between the means of females and males which had not moulted between release and recapture (t = 0.496, p > o.oS)(Student &Test). The mean growthincrement of females which had moulted once since release was significantly larger than that for males of the same moult (t = 2.81 2, p < 0.05)(Student t-Test), as was the increment for females which had moulted twice (t = 3.364, p < 0.05). This indicates that females grew more than males during the period of the first two moults after release.
Subtracting the mean growth increment for one ecdysis from the following increment reveals that carapace lengths increased by between 0.6 rnm and 0.9 mm with each moult. This i s similar to the size increments found by Hill and Wassenberg (1985) for tagged Pa esculentus in the laboratory.
The mean of the peak representing no ecdysis for both sexes was about -0.3 mm, which may indicate that shrinkage of the carapace occurred since release. This value is approximately 1% of the average carapace length, an insignificant amount when measuring longer term growth, but important when measur- ing a moult increment of between 0.6 mm and 0.9 mm. Since the prawns were returned to the laboratory frozen and measured at a lower temperature than when they were tagged (around 25°C difference), it is possible that thermal contraction caused the apparent negative growth. Measurement of carapace lengths in the laboratory over temperatures which ranged from WC to 2S°C produced no obvious trend, so if freezing caused contraction it appears to be non-reversible.
Long term. Comparison of the residual sums of squares for females indicated that prawns from the East and West were significantly different (F = 20.94, p < 0.001)(F Test), hence growth parameters and joint 95% confidence regions for these prawns were estimated separately. Males from the East and West were not significantly different (F = 0.23, p > 0.05)(F Test), and were combined for estimation of growth parame- ters and joint 95% confidence regions. Estimates of growth parameters are given in Table 5, and joint 95% confidence regions corresponding to these estimates are shown in Figure 6. Residual diagnostic plots did not indicate any unusual departures from the fined model.
Table 5. Estimates of growth parameters for females and males tagged and released in the East and West.
Area Sex No. of L_ (s.e.) K (s.e.) Prawns (mm) (day')
East Female 112 42.4 (0.9) 0.0091 (0.001 3)
Male 104 37.2 (1.2) 0.0057 (0.001)
West Female 281 52.6 (2.1) 0.0035 (0.0005)
Male 237 36.6 (0.6) 0.0063 (0.0007)
page 70

Females (East) \
Figure 6. Joint 95% confidence regions for L- and K for females tagged and released to the West and the East, and for males (West and East combined).nt 95% confidence regions for L
There were highly significant differences in both K and La between females from each area (Figure 6). There i s some overlap of K between females from the East and males, otherwise the estimated parameters for males were significantly different from those for females from both areas.
q The greater L_ estimated for females from the West compared to those from the East may be related to differences in the timing of spawning events for the two groups. Prawns from the different areas originate from different spawning periods (Section 5). Those from the West, which mature at a larger size, may be older when external cues stimulate biological changes such as ovary development (Section 6).
Using a similar analysis of P, esculentusfor the Gulf of Carpentaria, Kirkwwd and Somers (1984) obtained estimates of LI = 42.4 mm he. = 0.9) and K = 0.0066 dayf (s.e. = 0.0007) for females, and L_ = 37.5 mm (s.e. = 0.5) and K = 0.0049 day1 fs.e. = 0.0004) for males. The joint 95% confidence regions corresponding to these estimates generally overlap with those shown in Figure 6, except for females from the West. Kirkwood and Somers found no significant difference in K between sexes for P. esculentus, unlike the difference found between females from the West and males in Torres Strait (Figure 6). The differences in growth parameters for P. esculentus between the Gulf of Carpentaria and Torres Strait may be due to differ- ences in the timing of life history events such as spawning and maturation.
7.4 Acknowledgments
The authors wish to thank Dot Caesar, Rick Vogt and Roslyn Warren for sample sorting and data processing, Peter Blyth, Marc Smarle, Ursula Kolkolo (Papua New Guinea Department Of Primary Industry, Fisheries Division) and Julie Keating (who also assisted with the preparation of figures) for assistance with field work, Jane Mellors for writing the introduction, and Rob Coles for reviewing the manuscript.
7.5 References
" Garcia, S., and Le Reste, L. (1 987). Life cycles, dynamics, exploitations and management of coastal penaeid
page 71

shrimp stocks. FA0 Fish. Tech. Paper No. 203.
Gulland, J.A. (1983). Fish stock assessment: A manual of basic methods (FAO/LViley series on food and agriculture, volume 1). (John Wiley & Sons: Chichester).
Hill, B.W., and Wassenberg, T.J. (1 985). A laboratory study of the effect of streamer tags on mortality, growth, moulting and duration of nocturnal emergence of the tiger prawn Penaeus esculentus (Haswell). Fish Res 3,223-235.
Jones, R. (1 977). Tagging: Theoretical methods and practical difficulties. In "Fish population dynamics" (Ed J.A. Gulland). pp. 46-66. (John Wiley & Sons: Chichester).
Kirkwood, G.P., and Somers, I.F. (1 984). Growth of two species of tiger prawn, Penaeus esculentus and P. semisulcatus, in the western Gulf of Carpentaria. Aust. j. Mar. Freshw. Res. 35, 703-12.
Krebs, C.1. (1 978). Ecology: The experimental analysis of distribution and abundance (2nd Edition). (Harper & Row: New York).
Macdonald, P.D.M., and Pitcher, T.J. (1 979). Age-groups from size-frequency data: A versatile and efficient method of analysing distribution mixtures. J. Fish. Res. Board Can. 36,987-1001.
Osborne, M.R. (1 976). Nonlinear least squares - the Levenberg algorithm revisited. j. Aust Math. Soc. Ser. Bull. 19,343-57.
Rounsefell, G.A. (1975). Ecology, utilization, and management of marine fisheries. (The C.V. Mosby Company: St. Louis).
Somers, I.F., and Kirkwood, G.P. (1 984). Movements of tagged tiger prawns, Penaeus spp., in the Western Gulf of Carpentaria. Aust. I. Mar. Freshw. Res. 35, 713-23.
Tuma, D.J. (1 967). A description of the development of primay and secondary sexual characters in the banana prawn, Penaeus merguiensisde Man (Crustacea: Decapoda: Penaeinae). Aust. J. Mar. Freshw. Res. 18, 73-88.

8. VELVET PRAWNS (METAPENAEOPSIS SPP.) OF TORRES STRAIT R.A. Watson and ].A. Keating
8.1 Introduction
Velvet prawn is the FA0 common name (Holthius 1980) given to a group of small penaeid species caught in tropical-temperate waters. Metapenaeopsis rosea Racek and Dall, 1965 (pink velvet prawn or rosy prawn) and M. palmensis (Haswell, 1879) (southern velvet prawn) are the two most abundant of five Met- apenaeopsis species taken by trawlers operating in Torres Strait.
M, rosea is an indo-Pacific prawn of minor commercial importance. Distribution of M, rosea is restricted to northern Australia (particularly in the vicinity of the Great Barrier ReeO (Racek and Dall 1969, from Mackay (Queensland) through the Gulf of Carpentaria to Darwin (Northern Territory), and the northeastern Arafura Sea (near lrian Jaya) (Grey et al. 1983).
The distribution of M. palmensis is more extensive and they are of commercial importance in some areas. They form over 15% of the prawn catch in small trawl operations in some areas of central Japan (Hayashi and Sakamoto 1978). This species is found in waters of eastern Borneo, Indonesia and Papua New Guinea (Racek and Dall 1965) and is the most dominant species of Metapenaeopsis in the Batan Bay and Tigbauan-Gimbal waters in the Philippines (Motoh etal. 1977). in the Gulf of Thailand, small M. palmensis are taken as bycatch and are sold as a dried product (Yoo-Sook-Swat and Thubthimsang 1988). Within Australia, M. palmensis is found in warm temperate and tropical northern Australian waters from Shark Bay (Western Australia), through to Sydney (New South Wales) in the east, but i s much more common in waters along the northeastern coast (Racek and Dall 1965).
Over twenty Metapenaeopsis species are distributed widely throughout the world. Approximately nine species are found in Australian waters (Racek and Dall 1965). Other species of Metapenaeopsis caught in trawls in Torres Strait are M. novaguineae (Haswell, 1879), M. lamellata (de Haan, 1850) and M, mogiensis (Rathbun, 1902). Metapenaeopsis species are found in waters of South East Africa (Racek and Dall 1965; Racek and Yaldwyn 1970; Champion 1973), North and South America (Huff and Cobb 1979; Bauer 1989, Malaysia and Indonesia (Racek and Dall 1965; Racek and Yaldwyn 1970; Hall 1962; Johnson 1976; Kubo 1949; Tseng and Cheng 1980), India (Suseelan et a/. 1982; Dutt and Ramaseshaiah 19861, South China Sea (Kubo 1949; Hall 1962; Tham 1968b; Tseng and Cheng 1980; Johnson 19761, Melanesia (Hall 1962; Racek and Dall 1965; Racek and Yaldwyn 1970; Johnson 19761, Arabian-Persian Gulf and Red Sea (Miquel 1984).
Despite their wide occurrence, few details are known of the biology of the Metapenaeopsis species in Australia, perhaps because M. rosea and M. palmensis are not specific targets of trawl fisheries in Austra- lia. They are taken as by-products in fisheries for other penaeid species (Grey et al. 1983). Catches of these species are not usually recorded by fishermen and are discarded. In recent years it has become common for larger sizes to be retained and marketed. Information on distribution, abundance, and maturation is neces- sary as their exploitation increases, if management of the fishery is to succeed. This study addresses these needs and represents the first detailed life history study of these species from Australia.
8.2 Methods and ater rials
8.2.1 Sampling methods
The fishery was divided into two areas for analysis: (1) west of Warrior Reef (West) an area not fished for prawns since 1981, and (2) east of Warrior Reef (East) the current fishing grounds (Section 5 -Figure 1).
Monthly sampling of sites and processing and examination of samples was completed as described in
* Section 5. For the purpose of this study, males were considered mature when the first pair of pleonic endopodites had fused to form the petasma. Ovary stages Ill and IV (Tuma 1967) were used to designate female prawns with mature ovaries.

Lengths of prawns referred to are carapace lengths (CL), and were measured in millimetres (mm). The number of prawns per hectare of bottom swept by trawl nets is referred to as abundance.
8.2.2 Weight-length relationship
Parameters for the weight-length relationship were obtained by simple regression analysis (Table I), and fitted to a power function (equation 1) and a linear function (equation 2). Linear regression analysis and analysis of covariance (ANCOVA) were calculated on weight and carapace length data, transformed to the natural log, to determine the significance of difference in the weight-length relationship between species and sex.
Table 1. The regression parameters for the weight-length relationships of M, rosea and M. palmensis.
Species Sex N Regression parameters P
W=abCLAb In(W)=a+bbln(CL)
a b a b . .
M. rosea F 498 1.4E-03 2.79 -6.56 2.79 90.9 M 501 7.7E-04 3.05 -7.1 7 3.05 91.8
M. palmensis F 31 5 8.9E-04 2.94 -7.02 2.94 94.8 M 148 5.1E-04 3.17 -7.58 3.17 89.4
W = a * CLb (equation 1) In(W) = a t b * In(CL) (equation 2)
where: W represents the weight (g) CL represents the carapace length (mm) a i s the intercept b is the slope
8.3 Results
8.3.1 Spatial distribution
By number, M, rosea and M, palmensis formed a large part of the penaeid prawn catch from all areas surveyed in Torres Strait (Figure 1). Of the two velvet prawns, M. rosea was usually the more numerous except in the northeastern sector between Warrior Reefs and the Yorke Islands where numbers of M, rosea and M. palmensis were similar.
8.3.2 Size distribution
For each year studied, the size of both species ranged from 5 to 30 mm CL (Figure 2). Juvenile prawns of both species recruited into the fishery each year, at around 5 mm CL, in January-March of both years s tudied.
page 74

M. rosea
M. palmensis Other Penaeids
I r - Yorke Is.
O- krn 20 -= -- - . .~. . - - - . - - - -~ ~
~ -- -
Figure 1. Map of Torres Strait showing the proportion of catches formed by M. rosea and M, palmensis on a number basis at five areas representing pooled trawling station data.
(a) M rosea n=
1 264 j --.?III#UI~..----, 1 . 1 . . . 1 m . j 369
i ---- ~ - - . I t I l l I ~ ---- j 51 1 i --,i ,,.. Illm1.,-,, & 822 j ---- i---.il .a .--- 1273 1 : --- - ; ---;,..Ill lI.m,--,28_82
- -j ---m~111m.,---i3432 : I lt&----~?Et!l : ------ -,-
i --.. hI li.---i2_6_s_Z '1 :3276 -i --,, ill I1 m--- &---- : 1863 j --,..lllll~li.---+----
; ---,.. llll1i .--- L1_426 i i i 3 5 4 ~ --L ,... llll 111,- -------- i 1265 1 .1III1I .----: , -----
i ---- i,. .lllIl~,----i L38_7
, ------ I 0
(b) M palmensis n=
Carapace length (mm) Figure 2. Monthly size distribution of M. rosea and M. palmensis. Length class abundances
are expressed as a percentage on a monthly basis. page 75

8.3.3 Seasonal abundance
Abundance of M, rosea was variable and area dependent but generally peaked between May-October (Figure 3). Although this species was twice as numerous in the West as it was in the East, the seasonal pattern of abundance in both areas was similar. Abundance was higher in 1986 than in 1987'for both areas.
(a) M rosea (b) M palmensis
- East ..... West
* Missing sample 11
J A J O J A J O
1986 1987
150-
100-
Month
I 8 . ' * . 1 .
I . I , 11 I , *. I , . . I , . I . , . .' . I . I , 8 *I , . I' , I * , I . . % . . I '1
I '1
Figure 3. Monthly abundance of M. rosea and M. palmensis from the East and the West.
. .' . ., ' . ' #
0 - , , , , , , , , , , , , , , , , , , , , , , I ,
J A J O J A J O
A seasonal panern of abundance for M. palmensis caught in the East was found to be similar to that of M, rosea caught in the East (Figure 3). Those caught to the East displayed a major peak in abundance from September-January whilst those caught in the West displayed a peak in abundance from May-October. M. palmensis numbers recorded from the East and West was 25% that of M. rosea.
8.3.4 Weight-length relationship
Power curves and linear regression lines for a weight-length model were ploned for both sexes of M. rosea and M, palmensis (Figs 4 and 5).
Analysis of covariance on the weight-length relationships showed a significant difference between M. rosea males and females (p < 0.001 1, although no difference was found between sexes of M. palmensis (p > 0.2). A significant difference was found between female M, rosea and M. palmensis (p < 0.001) and be- tween males of the two species tp < 0.001) (Table 2).
page 76

30 i M. rosea Females ---.
Males
M palmensis Females - ' / I
~.
Carapace length (mm)
Figure 4. Power curve regression line showing the relationship between weight vs carapace length for male and female M, rosea and M. palmensis.
M rosea Females --- Males - - - - -
M palmensis Females - Males - -
- 8 1 1 1 1 1 1 1 1 1 1 1 1 1 1 ~ ~ ~ ~ ~ ~ ~ l l ~ ~ 1 1 ~ ~ 1 1 i
1.6 2.3 2.71 2.99 3.22 3.4
In Carapace !ength (mm)
Figure 5.Linear regression lines showing the relationship between In weigbt vs In carapace length for male and female M. rosea and M. palmensis.
page 77

Table 2. ANCOVA table for In carapace length (CL) vs In total weight (W) for species and sex interactions.
Source of Variation Sig. level
Between species M. rosea female vs M. palmensis female 0.0006 M, rosea male vs M. palmensis male 0.0000 *
Between sex M, rosea female vs M, rosea male 0.0000 * M, pa/mensis female vs M, palmensis male 0.2045 ns
8.3.5 Seasonal ovary development
The proportion of M, rosea or M. palmensis females with developing-ripe ovaries (stages II to IV) was usually less than 20% of those sampled, except when peaks of up to 50% of females with developing-ripe ovaries were present, indicating major breeding periods (Figure 6).
Spawning periods (stages Ill to IV) for M. rosea, occurred in April and July in 1986, and in April, July and October in 1987. Peak spawning periods for M. palmensisoccurred in April, July and October in 1986 and 1987 (Figure 6). The October spawning peak for both species, appears to correspond to the January- March recruitment periods (Figure 2).
(a) M rosea (b) M palmensis
100 Ovary Stage
1+v II 80
111 I IV * Missing sample 60
J A J O J A J O
1987 1986 Month
Figure 6.Monthly changes in the abundance of ovary stages (after Tuma 1967) of M. rosea and M. palmensis (!=quiescent, il=developing, ill=early maturity, IV=ripe, and V=spent).

8.3.6 Maturation
Gravid females of both species first appeared at 12 mm CL (Figure 71. Regardless of carapace length, the percentage of ripe females (stages I l l and IV) never exceeded 20% (Figure 7).
Fusion of the petasma of male M. rosea and M. palmensis was evident in some individuals as small as 5 mm CL. All males were mature by 9 mm CL.
20 M rosea - M palmensis .=...
5 10 15 20 2 5 30 Carapace length (mm)
Figure 7,Relationship between the percentage of females with early mature-ripe ovaries (stages Ill-IV) and carapace length for M, rosea and M. palmensis.
8.4 Discussion
The distribution of velvet prawns in Torres Strait is likely to be related to sediment types or water depth. M, rosea are found southwest of the Warrior Reef complex. This region has fine sediments (Harris 1988) and shallower waters (10 to 14 m). M. palmensis is mainly found in the section north of the Yorke Islands. This region has coarser sediments (Harris 1988) and deeper waters (24 to 40 m). Other studies report that sediment preferences for M. rosea range from mud to mud-sand at 30 m depth (Racek and Dall 1965; Grey et a/. 1983), while M. palmensis occurs over mud or sand bottoms at 5 to 30 m depth (Grey et al. 1983). Another species, M. gow'ei found in waters off Florida is commonly found on coarse sand and shell sub- strates in 37 m of depth (Huff and Cobb 1979).
Recruitment of velvet prawns in Torres Strait occurs during the months oflanuary-March. Some northern hemisphere Metapenaeopsis species also recruit during the summer. Small M. palmensis enter the central Japanese fishery from July-November (Hayashi and Sakamoto 1978), and M. barbata from August- October (Sakamoto and Hayashi 1977). However, settlement of juvenile Metapenaeopsis species onto seagrass beds showed ipcreases in numbers from August and September or October in Dorado on the north coast of Puerto Rico (Bauer 1985), inferring a possible winter recruitment into the fishery.
page 79

Velvet prawn abundance in Torres Strait was greatest during May to October and less so from Decem- ber to March. Huff and Cobb (1979) reported peaks of abundance of M. goodei during summer and autumn in the Caribbean. This increased abundance is associated with spawning aggregations (Huff and Cobb 1979). The number of individuals of M. barbata was highest during autumn in Japan (Sakamoto and Hayashi 1977). 8auer (1 985) reported little seasonal variation in Metapenaeopsis adult numbers on the north coast of Puerto Rico. Abundance is related to recruitment but also to survival. In Torres Strait, fishing effort is most intense in the East during the period of March to April, which reduces the numbers of all species substantially (Channells et al. 1988).
In Torres Strait, the peak periods of female velvet prawn breeding, based on ovary condition, is April, July and October. M. palmensis spawn from June-September in central Japan (Hayashi and Sakamoto 1978). These authors believed that each individual female spawned only once but there is no evidence for this for M, palmensis from Torres Strait. Hall (1 962) reported that M. barbata bred twice yearly in Singapore waters.
The smallest Torres Strait velvet prawns found with developed ovaries were 12 mm CL. No literature could be found relating prawn age or size with ovary development. Huff and Cobb (1 979) found impreg- nated females of M, goodei were from 8 to 16 mm CL in size but did not report on ovary development.
Maturation of male velvet prawns occurred at between 5 mm and 9 mm CL. This is similar to M, goodei which begin to mature at 4 mm CL and are completely mature by 6 mm CL (Huff and Cobb 1979).
A knowledge of weight-length relationships is important in relating prawn carapace length to com- mercial gradings. Analysis of the weight-length relationship for M, rosea showed that males of any given carapace length were significantly heavier than their female counterparts, though males do not reach the same maximum size as females. This difference has also been reported for larger penaeid species such as Penaeus longistylus (Penn 1980), P. latisulcatus and P. esculentus (Penn and Hall 1974). Male and female M. palmensis were of similar weight and carapace length although males did not attain the same maximum carapace length as females. Yoo-Smk-Swat and Thubthimsang (1 988) found female M. palmensis slightly heavier than males in the Gulf of Thailand. For a given carapace length, M. rosea of either sex are heavier than their M, palmensis counterpart. Hall (1 9621 published weight-length relationships for M. stridulans and M, barbata. He reported that although the weight-length relationship between congeneric species appears similar, the relationship does differ significantly.
Acceptance in the market place for velvet prawns will increase, as they have a reputation for flavour that exceeds that of the larger commercial penaeid species (Pmle 1987). When demand increases a knowledge of velvet shrimp biology will be essential for the effective management of these species as a fisheries resource.
8.5 Acknowledgements
We thank Dr. Bill Dall and Ms Bev Squire for their valuable assistance with specimen identification. We are grateful to the sample sorters and boat crews at the Northern Fisheries Research Centre for their efforts in obtaining and processing samples. We gratefully acknowledge the assistance provided by the staff of the Queensland Department of Primary Industries Fisheries Library for a literature review; and to Rob Coles, Rod Garrett and Clive Jones for reviewing this manuscript.
8.6 References
Bauer, R.T. (1 985). Penaeqid shrimp fauna from tropical seagrass meadows: species composition, diurnal, and seasonal variation in abundance. Proc. Biol. Soc. Washington 98(1), 177-1 90.
Champion, H.F.8. (1 973). New records of Penaeid prawns from the east coast of Southern Africa with notes on Penaeus marginatus Randall and a new species of Metapenaeopsis. Crustaceana 25(2), 181 -203.
Channells, P., Watson, R., and Blyth, P. (1988). Commercial prawn catches in Torres Strait. Aust Fish. 47, 23-6.

Dub, S., and Ramaseshaiah, M. (1986). Species composition and size distribution of small penaeid prawns in trawl catches from Visakhapatnam, lndia waters during 1980-1981. In "Biology of Benthic Marine Organisms: techniques and methods". (Ed. M.F. Thompson.) pp. 351-354.
Grey, D.L., Dall, W., and Baker, A. (1 983). "A Guide to the Australian Penaeid Prawns". (tdorthern Territory Department of Primary Production: Darwin).
Hall, D.N.F. (19621, Observations on the taxonomy and biology of some lndo-West Pacific Penaeidae (Crustacea, Decapoda), Fish. Bull. Vol. 17. (Colonial Office: London).
Harris, P.T. (1 988). Sediments, bedforms and bedload transport pathways on the continental shelf adjacent to Torres Strait, Australia-Papua New Guinea. Cont. Shelf Res. 8, 979-1 003.
Hayashi, K., and Sakamoto, T. (1978). Taxonomy and biology of Metapenaeopsispalrnensis (Haswell) (Crustacea, Decapoda, Penaeidae) collected from the Kii Strait, Central Japan. Bull, of the japan. Soc. Sci. Fish. 44, 709-1 4.
Holthius, L.B. (1980). FA0 species catalogue. Vol. 1. Shrimps and prawns of the world. An annotated catalogue of species of interest to fisheries. FA0 Fish. Synop. 125(1), 261 pp.
Huff, J.A., and Cobb, S.P. (1979). penaeoid and Sergestoid shrimps (Crustacea Decapoda). "Memoirs of the Hourglass Cruises". Vol 5(4).
Johnson, D.S. (1 976). Prawns of the Malacca Straits and Singapore waters. I. Mar. Biol. Assoc, India 18(1), 1-54.
Kubo, i. (1 949). Studies on penaeids of Japanese and its adjacent waters. I. Tokyo Coll. Fish. 36, 1-467.
Miquel, J.C. (1 984). Range extension of species of Acetes, Metapenaeopsis and Parapenaeus (Decapoda, Penaeidea). Crustaceana 46(2), 21 1-21 6.
a Motoh, H., Solis, N., and Caligdong, E. (1977). Ecology and life history of penaeid shrimps. Quart. Res. Rep. 2nd quarter. (Aquaculture Department, SEAFDEC: Iloilo, Philippines).
Penn, J. W. (1 980). Observations on length-weight relationships and distribution of red spot king prawns, Penaeus longist~lus Kubo, in Western Australian waters. Aust. J. Mar. Freshw. Res. 31,547-52.
Penn, J.W., and Hall, N.G. (1974). Morphometric data relating to the western king prawn Penaeus latisulcatus and the brown tiger prawn Penaeus esculentus from Shark Bay Western Australia. West. Aust Mar. Res. Lab., Fish. Res. Bull. 15.
Poole, S. (1 987). Storage trials on coral prawn. Qld. Fish. October, 21 -2.
Racek, A.A., and Dall, W. (1965). Littoral Penaeinae (Crustacea Decapoda) from Northern Australia, New Guinea, and adjacent waters. Verh. K. Ned. Akad. Wet. 56, 1-1 16.
Racek, A.A., and Yaldwyn, J.C. (1970). Notes on the littoral Penaeinae (Crustacea: Decapoda) from the New Guinea area. Proc. Linn. Soc. New South Wales 95(3), 209-214.
Sakamoto, T., and Hayashi, K. (1 977). Prawns and shrimps collected from the Kii Strait by small type trawlers. Bull. lap. Soc. Sci. Fish. 43, 1259-1 268.
Suseelan, C., Thomas, M.M., Kurup, N.S., and Gopalakrishnan, K.N. (1 982). A potential new resource of prawns from Neendakara area in Kerala Coast. Marine Fisheries Information Service. Technical Extension Service 35,15-17.
Tham, A.K. (1968). Unit stocks of shrimps and prawns in the IPFC region and unit fisheries exploiting them. FA0 Fish. Rep. 57(2), 85-93.
Tseng, W.Y., and Cheng, W.W. (1980). The economic shrimps of Hong Kong. In "Proceedings of the First International Marine Biological Workshop: The Marine Flora and Fauna of Hong Kong". (Eds B.S. Morton and C.K. Tseng), pp. 285-313.
page 81

Tuma, D.I. (1 967). A description of the development of primary and secondary sexual characters in the banana prawn, Penaeus merguiensisde Man (Crustacea: Decapoda: Penaeidae). Aust. I. Mar. Freshw. Res. 18, 73-88.
Yoo-Sook-Swat, S., and Thubthimsang, W. (1988). An assessment of the Southern Velvet shrimp (Metapenaeopsis palmensis) (Penaeidae) off the coast of Rayong Province, Gulf of Thailand. In 'Con tributions to tropical fisheries biology'. Papers prepared by the participants at the FAOIDANIDA follow-up training course. (Eds S. Venema, J. Moller-Christensen and D. Pauly). FA0 Fisheries Report 389. Rome 1988.

9. SEAGRASS FISH FAUNA AND PREDATION ON JUVENILE PRAWNS K.J. Derbyshire and D.M. Dennis
9.1 Introduction
Diverse assemblages of tropical seagrasses are associated with scattered coral reefs in Torres Strait and represent unique fish habitats. In addition to the resident species inhabiting the seagrass meadows, many transient species occupy these habitats for varying amounts of time. Robblee and Zieman (1984) noted the importance of a Thalassia-dominated meadow as a feeding ground for a number of coral reef fishes. They reported the migration of ten primary coral reef fishes onto seagrass beds to feed at night. Coral reef species are also an important subset of the fish population inhabiting seagrasses on Green Island in northern Queensland (QDPI unpubl. data). It i s clear that the diversity and abundance of fish associated with sea- grass is affected by the proximity of such adjacent habitats.
Comparisons of fish assemblages inhabiting seagrass meadows have been documented. A review by Pollard (1 984) revealed several general patterns common to different geographical areas. Differences in the faunal composition of ieagrass beds have also been recognised, and anributed to a variety of interacting factors (Kikuchi and Peres 1977). Bell and Harmelin-Vivien (1 982) noted significant differences in seagrass fish fauna due to die1 changes in community structure. Differences in fish assembiages have also been recorded from adjacent seagrass beds with different floral composition (Middleton et a/. 1984; Young 1981 1.
The mechanisms governing habitat selection by seagrass fish are not fully understood, although many workers have made this the subject of their studies. Fish assemblages in seagrass meadows are almost invariably more diverse than those of adjacent bare substrates (Bell and Pollard 1989). Seagrasses act as nursery areas for juvenile fish (Bell and Pollard 1989), and support many smaller fish species with cryptic habits. Seagrass meadows also support greater epifaunal invertebrate populations than bare substrates (Orth et al. 1984). Amongst these invertebrates, crustaceans are an important foodsource for the majority of fish inhabiting seagrass beds (Bell and Pollard 1989). Fish abundances have been shown to decrease when seagrass density is reduced (Bell and Westoby 1986a). Two main hypotheses are postulated to explain this: (i) Predators are more successful in seagrasses of lower density, thus reducing density of more common prey species (Heck and Orth 1980), or (ii) distributions are determined merely by habitat selection. Bell and Westoby (1986b), using four macrofaunal crustacean and one fish species, reduced seagrass density in the presence and absence of predators to test these hypotheses. They found that habitat selection seems to determine faunal distributions on seagrass beds.
Seagrass meadows in Torres Strait support the juvenile stages (1-1 5 mm carapace length) of the three major commercially exploited prawn species of this region: Penaeus esculentus, P, longistylus and Metape- naeusendeavouri. Several workers have identified fish as penaeid predators (Bell eta/. 1978, Blaber eta/. 1988; Carr and Adams 1973; Fuss and Ogren 1966; Huh and Kitting 1985). While it i s difficult to quantify the effects of fish predation on a prawn population, a bener understanding of these effects may provide more accurate information about life history events of juvenile prawns, and of prawn recruitment to the fishery.
This study was part of the ongoing juvenile penaeid research programme conducted by the Fisheries Research Branch of the Queensland Department of Primary Industries (QDPI) in Torres Strait. This paper provides details of the fish fauna captured on Torres Strait seagrass beds, and includes comparisons with similar studies elsewhere. Site differences are assessed, a comparative analysis of day and night assembiages i s made, and predation by fish on penaeid prawns is documented.
9.2 Study Area
Apart from deep water Halophila spinulosa beds, seagrass meadows in Torres Strait are found exclusively on coral reef platforms. Height of water above these meadows ranges from 0 m at low tide to 3.5 m at high tide. Unlike southern temperate regions (e.g. Botany Bay) where seagrass meadows tend to bedominated by a single species, Torres Strait meadows are often comprised of several species. Seagrass species occurring in the Torres Strait include Halophila ovalis, H, ovata, Cymodocea rotundata, C, serrulata, Enhalus acoroides, Halodule uninervis, Thalassia hemprichii, Syringodium isoetifolium and Thalassodendron ciliaturn.
page 83

Stations 101 - 104, 107 and stations 1 11 and 11 2 sampled in this study were located on the Warrior Reef complex and the Yorke islands respectively (Section 4 - Figure 1). Seagrass and substrate composition of these sites are outlined in Section 4. Tidal currents, turbidity and temperature ranges are exfreme in these environments.
Sites near Darnley Island, Stephens lsland and Sassie Island, and on northern Warrior Reef, Kumusi Reef and Kokope Reef, and deep water sites (>tom depth) near Gabba lsland were also sampled during this study (Section 4 - Figure 1).
9.3 Materials and Methods
The sampling regime was the same as that employed for sampling juvenile penaeids (Section 4). Fish were collected monthly at stations 101, 102, 103, 104,107, 11 1 and 11 2 between August 1987 and April 1988. Sites near Darnley Island, Sassie lsland and Stephens Island, and on northern Warrior Reef, Kokope Reef and Kumusi Reef, and in deep water near Gabba lsland were sampled during a seagrass survey in February1 March 1988.
A 1.4 rn wide beam trawl (Section 4) was towed by a 4.4 m dinghy (at 1-2 knots) for a distance of either 100 m or 200 m. Appendix 2 shows the total area sampled at each station. By-catch fish were frozen aboard the R.V. 'Lumaigul' and later shipped to the Northern Fisheries Research Centre in Cairns, where they were identified. Standard length (tip of snout to last vertebra) to the nearest millimetre and weight to the nearest 0.1 g was recorded for all specimens. Where practical, guts were removed and stored in 70% alcohol for later identification of contents.
9.4 Results and Discussion
From August 1987 to April 1988,102 species of fish from 40 families were recorded from the study sites in Torres Strait (Appendix 1 ). Five species appeared to be ubiquitous, having wide-ranging distributions. These were Cymbacephalus nematophthalmus (Fringe-eyed flathead), Centrogenys vaigiensis (False scorpionfish), c.f. Dasson variabilis (Sabre-toothed blenny), Arothron immaculatus (Narrow-lined toadfish) and Monacan- thus chinensis (Leatherjacket). Biomass, number of species and number of individuals for dominant fish families are listed in Table 1.
Table 1. Dominant fish families occurring in seagrass beds of Torres Strait. All stations sampled, total area sampled 2.45 ha.
Family Number of Number of Total Soecies Individuals Biomass (e)
Apogonidae Gobiidae Labridae Lethrinidae Lutjanidae Serranidae Syngnathidae Teraponidae Tetraodontidae
The QDPI has conducted similar studies of the fish fauna inhabiting seagrass beds in tropical Queens- land waters, using passive beam trawls at night. Broad comparisons can be made between Cairns Harbour (Coles et al. 1989), Mornington lsland (QDPI, unpubl. data), Bowen to Water Park Point (Coles et a/. 1987) and Torres Strait (Table 2 and Figure 1). Differences between these areas and Torres Strait, seem related to the proximity of coral reef to Torres Strait seagrass beds, in contrast to the estuarine/coastal location of the

other beds. For example, while the Labridae was the most speciose family, and serranids contributed significantly to numerical abundance and biomass in Torres Strait, neither family was prominent at the other locations. Leiognathids were a major family in Cairns Harbour, and the Platycephalidae contributed the highest biomass between Bowen and Water Park Point, but neither family dominated in Torres Strait. While not dominant at every site, the Teraponidae and Gobiidae were common throughout all areas. Work is con- tinuing in Cairns Harbour and at Mornington Island, and further analysis i s necessary to compare locations in greater detail.
Table 2. Dominant fish families recorded from beam trawl catches on seagrass beds in tropical Queensland waters.
Torres Strait Cairns Harbour Mornington Is Bowen to Water park Point
Highest number of species
Labridae Engraulidae no dominant Apoginidae Syngnathidae Cobiidae family Gobiidae
Leiognathidae Leiognathidae
Highest number of individuals
Torres Strait
Teraponidae Cobiidae Teraponidae Cerreidae Tetraodontidae Leiognathidae Cobiidae Monacanthidae Serranidae Teraponidae Clupeidae Apogonidae
Highest biomass
sampled
Tetraodontidae Leiognathidae Teraponidae Platycephalidae Serranidae Ephippidae Platycephalidae Monacanthidae Teraponidae Teraponidae Monacanthidae Apogonidae
Figure 1 .Areas sampled by QDPl for seagrass fish fauna in tropical Queensland waters for which data was analysed.
page 85

Comparison of fish assemblages in Torres Strait to those of southeastern Australia revealed some similarities at the familial level (see Burchmore et al. 1984 and Middleton et a/. 1984). As inmost studies of seagrass fish assemblages, the families Syngnathidae and Gobiidae were represented by relatively high numbers of species (Table 1). Diversity in Torres Strait is enhanced by the addition of several reef-dwelling species (e.g. labrids). The close proximity of living reef to the seagrass beds enables reef fish to venture onto the meadows to forage. Comparisons of assemblages are unfortunately restricted due to differences in sampling techniques (e.g, beam trawling versus rotenone poisonin$.
Temporal residence patterns were divided into various categories by assigning each species a resi- dence status. Based on the classification of Burchmore et a/. (1984), the Warrior Reef and Yorke Island assemblages were divided into regular resident (26%), temporary resident (26%) and transient (48%) species (Appendix 1). The term 'regular resident' was used (rather than 'permanent resident') as Warrior Reef is usually exposed at low tide, so few fish could survive there permanently. The proportion of regular residenrs found during this study is low compared to the results of some other workers. Bell and Harmelin-Vivien (1 982) reported 61 -2% resident species in French Posidonia oceanica meadows. Fifty percent of the fish species sampled in a Posidonia australis habitat in Port Hacking, New South Wales, were classified as permanent residents (Burchmore et a/. 1984).
It i s evident that many fish species associated with seagrass beds in Torres Strait utilize alternate habitats, such as adjacent coral reef areas, on a die1 basis. Robblee and Zieman (1984) found that 87% of nocturnal visitors to a tropical Caribbean Thalassia-dominated meadow were coral reef fishes.
9.4.1 Warrior Reef and Yorke Islands sites
The Warrior Reef and Yorke Islands fish assemblages were dominated by five species: Cymbacephalus nematophthalmus, Arothron immaculatus, Gerrespoeiti (Silver biddy), Centrogenys vaigiensis and Amnia- taba caudavittatus (Yellow-tailed perch). These species represented 66% of the total number of fish and 81 % of the total biomass of fish caught.
A comparison of stations sampled on Warrior Reef and Yorke Islands using number of species, num- ber of individuals and biomass of fish collected (Table 3) shows that stations 101, 102 and 107 supported the most abundant and diverse communities. These stations, which had similar fish assemblages, were in close proximity and situated on similar seagrass habitats. It should also be noted that they were sampled more frequently than other stations (Appendix 2).
Table 3. Comparison of the fish communities at 7 stations on Warrior Reef (stn 101 -1 04, 107) and Yorke Is. (stn 11 1,112).
Station Number of Number of Biomass (gPna) S~ecies Individualha
page 86

The relatively depauperate fish fauna captured at station 104 may have been due to the particularly dense seagrass bed present. Seagrass density may reach a threshold at which the canopy becomesinacces- sible to the fish, or inhibits foraging (Heck and Orth 1980). The dense seagrass may also have inhibited the efficiency of the sampling gear. Additionally, the area sampled at station 104 was smaller than at any other station.
Station 11 2 was located on a relatively small seagrass bed surrounded by a large sand bank, and supported a relatively high biomass of fish. The greater diversity and abundance of fish associated with seagrass beds compared to adjacent bare substrata is well documented (Bell and Pollard 1989 and refer- ences therein), and this bed may act as a 'refuge' in this area.
Station 11 1 supported a relatively low number and low biomass of fish, This station was situated on a bed which also included much coral rubble and algae, and only a small total area (1 540 m2) was sampled here.
Numbers of individuals at station 103 were inflated due to the presence of large numbers of juvenile Arothron irnmaculalus in the October 1987 samples.
Fish assemblages captured at night at stations 101 and 107 were more diverse, and individuals more abundant than during the day (Table 4). Similarly, Bell and Harmelin-Vivien (1982) found that species richness and density of fish were higher at night in Mediterranean Posidonia oceanica meadows. Night- active prey items (e.g. decripods) may be more susceptible to predation by fish at night, hence more fish are present and actively foraging at this time. The activity panerns of some common fish species (Figure 2) sup- port this hypothesis. Heck (1977) noted that in Caribbean seagrass meadows, invertebrates were more abundant at night, and that fish predators fed on these invertebrates, especially the crustaceans. The sam- pling technique for the present study was different for night and day trawls: during the day the beam trawl was operated in 'active' mode (Section lo), whereas 'passive' trawls were made at night. The active beam trawl was more noisy and more visible (during day light hours) than the nighttime passive trawl, perhaps allowing fish to easily evade capture during the day.
Table 4. Comparison of fish communities caught by night and by day at 2 stations on Warrior Reef. All shots 1 40m2
Station Sample Shot Number of Number of Biomass(g) Species Individuals
101 Night . I 2 3
107 Night 1 2
page 87

X CAUOrT BY NIGHT X CAU;HT BY DAY
100 0 100
C. nematopthalrms - A. caudavittatus - S. vaiqiensis
M_. chinensis
G. a - A, imrawlatus - Y. - P. guadrflineatus -
Figure 2.Diel activity panerns of some common fish species captured on Torres Strait seagrass beds..
9.4.2 Seagrass survey sites
Of the sites sampled during the February-March seagrass survey, Stephens lsland supported the greatest diversity of fish (Table 5). Only 36% of the species found there also occurred at sites on southern Warrior Reef. Fourteen of the 25 species collected from the Stephens lsland seagrass bed were primary coral reef fish and this bed also supported nine of the 14 labrids identified from all sites. The abundance of such fish was undoubtedly due to the presence of isolated coral outcrops within the seagrass meadow, the surround- ing fringing coral reef, and a sufficient depth of water to allow fish to forage during the entire tidal cycle. Robblee and Zieman (1984) also noted a relatively large proportion of coral reef fish in a Thalassia-domi- nated meadow adjacent to areas of living coral reef. Sites near Darniey Island also supported a high propor- tion of coral reef fish and the fish assemblage there was again dissimilar to that of southern Warrior Reef (53% of species in common). The deep water Halophila spinulosa beds near Gabba Island also supported a fish assemblage dissimilar to that of southern Warrior Reef, with only 35% of species in common. The average size of fish captured on the H spinulosa beds was larger than at other sites and the species present were more typical of those species found on fishing grounds. Nemipterus furcosus and Parapercis nebulosa, two species which Jones and Derbyshire (1988) found to be abundant in their survey of a central Queens- land trawl fishery, were found only at this site.
Table 5. Comparison of seagrass survey sites in Torres Strait.
Survey Site Number of Number of Diversity Indices % Species Common toDominant Species Species Individualsha Simpson Shannon Warrior Rf group
Darnley Is. 17 1750 0.75 1.97 53(9/17) Apogon sp.2 P. cylindrica
Stephens Is, 25 1060 0.88 2.61 36(9/25) c.f. D.variabilis P. cylindrica
Cabba Is. (deep) 17 1540 0.82 2.1 1 35(6/17) M. chinensis C.puncticeps
Sassie Is. 10 1430 0.76 1.73 100(10/10) A.caudavinatus Y. criniger
N. Warrior Reef 10 480 0.83 1.99 80(8/10) M.chinensis C. vaigiensis
Kokope/Kumusi 16 1190 0.73 1.69 75(12/16) C, vaigiensis Reefs M.chinensis
page 88

The fish assemblages of the remaining seagrass survey sites were similar to those of the southern Warrior Reef stations. All of the species found near Sassie Island, 80% of those on northern Warrior Reef, and 75% of those on Kokope-Kumusi Reef were also found on southern Warrior Reef. The conformity of these assemblages is due to the relative paucity of strict coral reef fish at these sites and the shared habitat preference of the species present. These stations, unlike those near Darnley and Stephens Islands, are bounded by dead coral clumps with some interspersed living reef. The reefs around Darnley and Stephens islands are mainly comprised of living corals with less algae, which almost certainly accounts for the greater abundance of reef fish species in the adjacent seagrass meadows.
9.4.3 Predation on penaeids
Of those fish from whiqh gut contents were examined, the major contributors to juvenile mortality of com- mercially targeted prawns were Cyrnbacephalus nematophthalrnus, a flathead, and Centrogenys vaigiensis, a serranid (Table 6). Both of these species had wide-ranging distributions and occurred in relatively high numbers. Several other species had a high proportion of individuals with gut contents containing penaeids, however, the abundances of these species were low. Klumpp and Nichols (1 983) found that the carid prawn Pontophilus interrnedius was eaten by small (25-33 cm SL) flathead, Platycephalus laevigatus, inhab- iting a Victorian Posidonia bed, though its contribution to the fish's nutrition was considered insignificant. Bell eral. (1978) found penaeids were important in the diet of a scorpaenid, Centropogon australis, in a N.S.W. Posidonia bed. In the present study, 40% of individuals examined of the scorpaenid Paracentropo- gon longispinis were found to contain penaeids. Carr and Adams (1973), in their study of juvenile estuarine seagrass fish in Florida, identified several shrimp predators, many of which showed ontogenetic changes in dietary habits. As a planktivore (< 26 mm SL), the haemulid Orthopristis chrysoptera consumed mainly copepods, mysids and small postlarval shrimp, whilst the importance of carids and penaeids increased in the diet of larger, carnivorous specimens. There was little overlap at the family level between the shrimp predators identified by Carr and Adams (1 973), and those sampled in Torres Strait seagrass beds.
Table 6. Fish identified as predators of the commercially important prawns of Torres Strait.
" Species Number % containing At station 101
Sampled penaeids Numberha Biornassha
C,nernatopthalrnus Lethrinus spp. E. tauvina P. waigiensis Lutjanus spp. Y. criniger C, vaigiensis P. longispinus Csubducens c.f. D.variabilis C.cephalotes Gpoeiti S,gracilis P.quadrilineatus A.caudavittatus
Totals 188 1214 6230
Most of the species implicated in penaeid prawn mortality in Torres Strait were macrophagic carni- vores, which fed principally on crabs and small fish, a diet similar to that identified by Bell and Harmelin- Vivien (1 983) for piscine macrophagic carnivores on Mediterranean Posidonia beds. Shifts in the feeding habits of seagrass fish corresponding with changes in prey availability have been documented (Huh and Kitting 1985). The importance of commercially targeted prawns in the diet of Torres Strait seagrass fish may increase during periods of maximum settlement of prawns onto the seagrass beds (January-April, and to a
u lesser extent August-September - Section 4).
page 89

Fish such as sharks (Carcharhinus spp.) and queenfish (Scomberoides cornmersonianusl have been identified as important predators of juvenile penaeids (Blaber et al. 19881, and it was recognised that our sampling technique was selective and particularly inadequate for capturing such large, motilespecies. Accordingly, a gill nening exercise was undertaken to capture these transitory predators. Unfortunately large numbers of sharks anacked the fish caught in the net, resulting in loss of the catch and damage to the net. The exercise was not repeated.
9.5 Conclusions
The relatively large proportion of coral reef fish found in this study confirms that the nature of adjacent habitats can affect the faunal composition of seagrass beds. The presence of several piscine penaeid preda- tors signifies the importance of predator-prey relationships in seagrass beds. It is possible that fish predation can significantly reduce the number of prawns available to recruit into the fishery, though further work is necessary to determine its effects in Torres Strait.
9.6 Acknowledgments
The authors would like to thank Reg Watson, Jane Mellors and Rob Coles for their constructive criticism and advice with the preparation of this manuscript.
9.6 References
Bell, J.D., Burchmore, J.J., and Pollard, D.A. (1 978). Feeding ecology of a scorpaenid fish the fortescue Centropogon australis, from a Posidonia seagrass habitat in New South Wales. Aust. 1. Mar. Freshw. Res. 29,175-85.
Bell, J.D., and Harmelin-Vivien, M.L. (1982). Fish fauna of French Mediterranean Posidonia oceanica seagrass meadows. I. Community structure. Tethys 10 (4), 337-47.
Bell, J.D., and Harmelin-Vivien, M.L. (1 983). Fish fauna of French Mediterranean Posidonia oceanica seagrass meadows. 2. Feeding habits. Tethys 11 (I), 1-1 4.
Bell, J.D., and Westoby, M. (1986a). Importance of local changes in leaf height and density to fish and decapods associated with seagrasses. 1. Exp. Mar. Biol. Ecol. 104,249-74.
Bell, J.D., and Pollard, D.A. (1 989). Ecology of fish assemblages and fisheries associated with seagrasses. In 'Biology of Seagrasses: A treatise on the biology of seagrasses with special reference to the Australian region'. ( Eds A.W. McComb, A.J. Larkum and S.A. Shepherd). pp. 565-609. (Elsevier: Amsterdam).
Bell, J.D., and Westoby, M. (198613). Abundance of macrofauna in dense seagrass is due to habitat preference, not predation. Oecologia (Berlin) 68,205-9.
Blaber, S.J.M., Salini, J. and Brewer, D.T. (1988). Fish predation on penaeid prawns in the Gulf of Carpentaria. Australian Society For Fish Biology Newsletter 18, 30.
Burchmore, I.]., Pollard, D.A., and Bell, J.D. (1984). Community structure and trophic relationships of the fish fauna of an estuarine Posidonia australisseagrass habitat in Port Hacking, New South Wales. Aquat Bot. 18,71-87.
Carr, W.E., and Adams, C.A. (1973). Food habits of juvenile marine fishes occupying seagrass beds in the estuarine zone near Crystal River, Florida. Trans. Am. Fish Soc. 102, 51 1-540.
Coles, R.G., Mellors, J.E., Bibby, J.M., Derbyshire, K., Squire, B.A., Squire, L.C., and Lee Long, W.]. (1987). Distribution of seagrasses and associated juvenile commercial penaeid prawns and fish between
page 90

Bowen and Water Park Point. A report to the Great Barrier Reef Marine Park Authority. Queensland Department of Primary Industries December 1987.
Coles, R.G., Goeden, G.B., and Greenway, M. (1989). An assessment of the likely effects of the proposed Trinity Point project on the marine ecology of the Cairns Harbour and foreshore. Q'ueensland Department of Primary Industries January 1989. Internal Report.
Fuss, C.M. Jr., and Ogren, L.H. (1966). Factors affecting activity and burrowing habits of the pink shrimp, Penaeus duoarum Burkenroad. Biol. Bull. 130, 170-91.
Heck, K.L. Jr. (1 977). Cpmparative species richness, composition, and abundance of invertebrates in Caribbean seagrass (Thalassia testudinum) meadows (Panama). Mar. Biol. 41, 335-48.
Heck. K.L. Ir, and Orth. R.I. (1 980). Seanrass habitats: The roles of habitat com~lexitv. comoetition and ., , . predation in structu;ing associated fish and motile macroinvenebrate assemblages. 1; 'Estuarine perspectives'. (Ed. V. S. Kennedy.) pp. 449-64. (Academic Press: New York.)
Huh, S-H, and Kitting, C.L. (1985). Trophic relationships among concentrated populations of small fishes in seagrass meadows. I. Exp. Mar. 6/01. Ecol. 92, 29-43.
Jones, C.M., and Derbyshire, K. (1988). Sampling the demersal fauna from a commercial penaeid prawn fishery off the central Queensland coast. Mem. Qld. Mus. 25 (2), 403-15.
Kikuchi, T., and Peres, J.M. (1 977). Consumer ecology of seagrass beds. In 'Seagrass Ecosystems: A Scientific Perspective'. (Eds C.P. McRoy and C. Heifferich.) pp. 147-93. (Marcel Dekker, Inc: New York.)
Klumpp, P.W., and Nichols, P.D. (1 983). A study of food chains in seagrass communities. li. Food of the rock flathead, Platycephalus laevigatus Cuvier, a major predator in a Posidonia australis seagrass bed. Aust.1. Mar. Freshw. Res. 34, 745-54.
" Middleton, M.J., Bell, J.D., Burchmore, J.J., Pollard, D.A., and Pease, B.C. (1984). Structural differences in the fish communities of Zostera capricorni and Posidonia australis seagrass meadows in Botany Bay, New South Wales. Aquat. Bot. 18,89-109.
Orth, R.J., Heck, K.L. Jr., and van Montfrans, J. (1 984). Faunal communities in seagrass beds: A review of the influence of plant structure and prey characteristics on predator-prey relationships. Estuaries 7 (4A), 339-50.
Pollard, D.A. (1 984). A review of ecological studies on seagrass-fish communities, with particular reference to recent studies in Australia. Aquat. Bot 18, 3-42.
Robblee, M.B., and Zieman, J.C. (1984). Die1 variation in the fish fauna of a tropical seagrass feeding ground. Bull. Mar. Sci. 34 (3), 335-45.
Young, P.C. (1981). Temporal changes in the vagile epibenthic fauna of two seagrass meadows (Zostera capricorni and Posidonia australis). Mar. Ecol. Prog. Ser. 5, 91 -1 02.
page 91

Appendix 1. Systematic list of fish species recorded from Torres Strait seagrass beds. species are classified as regular resident (R), temporary resident (Te) or transient (TO inhabitants. Thirty species collected during the seagrass survey remained unclassifed due to the resricted sampling period, Station codes: 1= Oarnley Is,z=Stephens Is, 3= Sassie Is, 4= Gabba deep water, 5=N. Warrior Reef, 6= Kokope Reef and Kumusi Reef.
Taxa Number of Residence Stations Mean Mean Individuals Status Length (mm) Weight (g)
F.Ophichthyidae Opichthyidae sp.1
F.Muraenidae Gymnothorax sp.1
F.Leptocephalidae Leptocephalidae sp.1
F.Plotosidae Euristhmus nudiceps
F.Synodontidae Saurida gracilis
F.Antennariidae Tathicarpus butleri
F.Tetrabrachiidae Tetrabrachium ocellatus
F.Hemirhamphidae Hyporhampus balinensis
F.Syngnathidae Bombonia djarong
Corythoichthys haemopterus
Corythoichthys shultzi
Hippocampus sp. 1
Hippocampus kuda
Stigmatophora argus
Syngnathidae sp.1
Syngnathoides biaculeatus
F.Atherinidae Hypoatherina lacunosa

Taxa Number of Residence Stations Mean Mean individuals Status Length (mm) Weight (g)
F.Scorpaeinidae Paracentropogon longispinus 41
Parascorpaena picta 2
Richardsonichthys leucogaster 1
Synanceia verrucossa 4
F.Platycephalidae Cymbacephalus nematophthalmus 209
lnegocia japonicus
F.Pegasidae Pegasus volitans
F.Centropomidae Psammoperca waigiensis 18
F.Serranidae Centrogenys vaigiensis 354
Epinephelus megachir 1 "
Epinephelus tauvina
F.Tera~onidae ~mnjataba caudavittatus
Pelates quadrilineatus
Pelates sexlineatus
Terapon puta
F.Apogonidae Apogon robustus
Apogon sp. 1
Apogon sp.2
Apogon sp.3
Apogonichthys marmoratus
F.Carangidae Carangidae sp.1
F.Cerreidae Cerres poeiti

Taxa Number of Residence Stations Mean Mean individuals Status Length (mm) Weight (g)
F.Lutjanidae Lutjanus carponotatus 2 Te 101,102 50 12.9
Lutjanus decuratus
Lutjanus fulviflammus
Lutjanus russelli
Lutjanus vitta
F-Nemipteridae Nemipterus furcosus
F.Haemulidae Plectorhynchus sp. 1
F.Lethrinidae Lethrinus fletus
Lethrinus harak
Lethrinus ramak
Lethrinus semicinctus
Lethrinus sp. 1
F.Mullidae Parupeneus indicus
Upeneus bensasi
Upeneus tragula
Upeneus sp. 1
F.Chaetodontidae Chaetodon sp.1
Parachaetodon ocellatus
F.Pomacentridae Paraglyphidodon melas
F.Sphyraenidae Sphyraena sp.1
F.Labridae Cheilinus oxycephalus
Cheilinus sp.1
Labridae sp.1

Taxa Number of ~esidence Stations Mean Mean individuals Status Length (mm) Weight (g)
Labridae sp.2
Labridae sp.3
Choerodon cephalotes
Coris pallida
Coris variegata
Halichoeres margariticoeus
Halichoeres sp.1
Stethojulis strigiventer
Stethojulis trilineatus
Stethojulis sp.1
Stethojulis sp.2
Wetmorella sp. 1
FScaridae Scarus sp. I
F.Mugiloididae Parapercis cylindrica
Parapercis nebulosa
F.Congrogadidae Congrogadus subducens
F.Blennidae Blennidae sp.1
c.f. Dasson variabilis
lstiblennius edentulus
Petroscirtes sp. 1
F.Callionymidae Callionymus wilburi
F.Cobiidae Acentrogobius fulvulus
Amblygobius bynoensis

Taxa Number of Residence Stations Mean Mean Individuals Status Length (mm) Weight (g)
Cobiidae sp.1 10 1,107
Yongeichthys criniger 125 R 101,102,104,107,3, 5
F-Siganidae Siganus canaliculatus 5 Tr 101,111
Siganus guttatus 10 Tr 102,3,107
Siganus spinus 78 Te 101,102,103,107, 111,112
F.Bothidae Crossorhombus azureus 1 4
Pseudorhombus jenynsii 3 Tr 103,4
Pseudorhombus quinquocellatus 1 Tr 103
F.Cynoglossidae Cynoglossus puncticeps 24
F.Tetraodontidae Arothron hispidus 15 R 102,112
Arothron imrnaculatus 552 R 101,102,103,104, 107,111,112,2,6
F.Monacanthidae Acreichthys hajarn
Anacanthus barbatus 1 4,6
Monacanthus chinensis 188 R 101,102,103,104, 107,l ll,l12,2,3,4,5,
6
page 96

Appendix 2. Areas sampled at all study sites.
Station Area (m2) Station Area (m2)
Darnley Is (1) 980
Stephens Is (2) 840
Sassie Is (3) 560
Gabba Is (4) 840
N. Warrior Reef (5) 560
Kokope/Kumusi Reef (6) 1260
page 97


GEAR


10. EXPERIMENTAL BEAM TRAWLS FOR SAMPLING JUVENILE PRAWNS C. T. Turnbull and R. A. Watson
10.1 Introduction
Small fine-meshed bearn trawls have been used for conventional sampling of juvenile penaeids in seagrass areas (Coles and Lee Long 1985). As juvenile penaeids are nocturnally active, beam trawl sam- pling for them occurs at night for a set time or on a trawl track generally marked by lighted buoys. Many factors can affect the efficiency of beam trawls such as water depth, lunar intensity and the type of substrate or sediment being trawled over.
Sediments associated with seagrass nursery habitat sampled by Coles and Lee Long (1 985) in the Gulf of Carpentaria were usually fine and silty. Sediments of Torres Strait nursery areas (Section 4) are coralline and punctuated by pieces of dead corals weighing several kilograms. This rough substrate interferes with the efficiency of a conventional beam trawl. Low tides at night on the reef-platform nursery areas of Torres Strait made daytime time sampling of juvenile penaeids in this region necessary (Section 4). Alternative sampling gear was designed for daylight sampling, which incorporated a higher clearance from the bottom to minimise the effect df rough terrain on the trawl gear.
A varietv of gear has been used to samole orawns. Allen and Hudson (1 970) described a sled- mounted suctibn device which they employed tdquantitatively sample young pink shrimp, Penaeus duor- arum duorarum. They found that samples from their suction device compared favourably with those from a more conventional, hand-pulled frame trawl.
Penn and Stalker (1 975) described and tested an "active" beam trawl which operated by pumping jets of water into the substrate. This action washed inactive buried prawns into the path of the net. Their design allowed quantitative daylight samples of nocturnally active juvenile prawns. Their beam trawl used a large collecting bottle on the cod end of their net which proved ineffective in substrates with a high volume of organic material such as dead seagrass.
Electricity has been used to improve catches of fish (McRae and French, 1965), prawns (Pease and Seidel, 1967), and lobsters (Saila and Williams, 1972). It is used routinely in the mariculture harvest of prawns such as Penaeus japonicus in Japan (Lewis and Carrick, 1987). It also can be used for daytime harvest of nocturnally active animals. Electric sampling gear has an added advantage. It can be designed to limit the retention of vegetation and sediment in the collecting bag by relying on the involuntary movement of prawns influenced by pulsed current rather than through the mechanical disturbance of the bottom.
In the present study three alterative beam trawls were tested to compare their efficiency. A conven- tional beam trawl designed for nighttime use was compared with a water jet beam trawl, and an electric beam trawl both designed for daytime use.
10.2 Materials and Methods
10.2.1 Frame and net
The same frame and net were used for the three bearn trawl types. The frame was constructed of aluminium and its design i s shown in Figure 1. The net had a mesh size of 2 mm and was of a similar design to that used by Coles and Lee Long (1 985). Netting was added to the front of the net to cover the top and sides of the frame. The net mouth measured 0.5 m high and 1.4 m wide. A 100 mm high rubber flap beneath the net mouth allowed the trawl to pass over lumps of coral, and prevented undue loss of suspended material under the net. The trawl was towed at approximately '5 m min-l,20 m behind a 4.44 m aluminium dinghy powered by an outboard motor.
page 101

Figure 1. Design of beam trawl frame, net and water jet beam.
10.2.2 Trawl gear types
Conventional beam trawl. This beam trawl samples passively, that is prawns are not stimulated by an active tickler chain, water jets or electric current. A light tickler chain was used by Coles and Lee Long (19851. This was not used with our trawl, as it caught on lumps of coral. Only active prawns, those swim- ming in the water column or positioned up high on seagrass blades, could be caught by this design.
Water jet beam trawl. To operate the gear as a water jet beam trawl, a centrifugal pump (500 Ilmin) 4
was used to force jets of sea water into the seagrass ahead of the net. A pump in the dinghy supplied water to the beam trawl through a 20 m length of 25 mm diameter reinforced plastic tubing. The water jet nozzles were incorporated on a beam constructed of 38 mm galvanized water pipe (Figure I), placed 700 mm in front of the net. The water jet noules consisted of 20 x 5 mm diameter plastic tail pieces screwed into the pipe at 60 mm intervals. The ends of the water jet nozzles were 100 mm above the substrate.
The water jets were aimed to disturb the substrate, lifting loose material into suspension ahead of the net. The spacing between the water jet beam and the net, in combination with the speed of the trawl, allowed most of the disturbed sand to settle out in front of net, allowing fine silt, seagrass fragments, and prawns to pass into the net.
Electric beam trawl. To operate the gear as an electric beam trawl, an electrode array was positioned beneath the water jet beam and dragged across the bottom by the trawl. Rapid, direct 20 volt current pulses of a 2 milli-second duration, were supplied to the electrode array, from two, 12 volt batteries. The electrode array consisted of parallel positively charged plates (500 mm long and 50 mm high), with a 200 mm separa- tion. Negatively charged rods, 500 mm long were positioned parallel to and midway between the lower edges of the plates so that they were in contact with the substrate.
10.2.3 Preliminary experiment
During March 1987, a preliminary experiment was conducted using the three beam trawl types at station 101 (Section 4 - Figure 2). The water jet and conventional beam trawls were tested during the daytime and nighttime. Due to the short duration of daytime tides the electric trawl was tested only at night. To test i f the electrode array was acting as a tickler, the electric trawl was tested a second time during the nighttime with the current turned off. The short duration of the high tide permitted only one shot with each trawl type.

10.2.4 Experiment 1
During September 1987, sample replicates from beam trawl trials were collected at high tide from adjacent 100 m transects at station 101 on Warrior Reef. Four replicates were made with each beam trawl type at each sampling time. There were two sampling periods for the water jet and the electric beam trawls and one for the conventional beam trawl. On the first day of the experiment, the water jet day trawl tests were quickly followed by those of the electric beam trawl, and the conventional beam trawl was used that eve- ning. On the second day, the order was reversed and the electric beam trawl was used first, to ensure that the order of the trials was not affecting the results. Time did not permit us to retest the conventional beam trawl the second evening.
Analysis of variance was used for the different beam trawls using the numbers of: Penaeus esculentus, the brown tiger prawn, Metapenaeus endeavouri, the endeavour prawn and all other decapods (mostly carids) as the response variables.
10.2.5 Experiment 2
During March 1988, beam trawl tests were conducted at two stations (101 and 107) on Warrior Reef (Sec- tion 4). These stations were approximately 500 m apart. Three replicates were made at each station using the nighttime conventional beam trawl, daytime water jet beam trawl and daytime electric beam trawl. The experiment was completed within a 24-hour period. At station 107 the daytime water jet beam trawl was tested before the daytime electric beam trawl. The order was reversed at station 101.
Counts and carapace length measurements were taken of all penaeid prawns caught in shots in this experiment. Carid prawns were numerous but were not retained.
Analysis of variance was used for the different beam trawl types using as the response variables, the numbers of: P. esculentus, M. endeavouri, and M. bennettae, a non-commercial species.
Individual gear types were compared by ~artitioning the total sum of squares into two orthogonal components. A Kolmogorov-Smirnov two-sample test was used to check for differences in the size frequency distributions of the catches (Sokal and Rohlf 1969).
10.2.6 Effect of altering height of water jet nozzles above the substrate
During Februar) 1988, trials were conducted at a regular sampling site (n 112) on the reef surrounding the Yorke Islands in Torres Strait (Section 4, to determine the effect of lowering the height of the water jet nozzles on the daytime water jet trawl. Three replicate 100 m trawls were made. The lower (40 mm) noeight was used first, followed by our standard (1 00 mm) nozzle height.
Counts and carapace measurements were made of all penaeid prawns taken from trials in this experiment.
The difference in mean catch rates with the jets at normal height (1 00 mm) and lowered height (40 mm) was analyzed by a Student t-Test.
10.3 Results and Discussion
10.3.1 Preliminary experiment
The conventional and water jet beam trawls conducted at night had the highest catch of P, esculentus (Table 1). Beam trawl catches.from these gear types taken during the night were approximately twice that of the catches from the daytime water jet beam trawl. Generally, daytime catch rates for all species (P, esculentus, M. endeavouri and M, bennettae) were very low when the conventional beam trawl was used (Table 1). This is probably due to the nocturnal behaviour of these species (Penn 1984). Catch rates of water jet and electric beam trawls conducted at night were two to four times greater than the nighttime conventional and daytime water jet beam trawls for both M. endeavouri and M, bennettae (Table 1).
page 103

Table 1. Catch rates of P. esculentus, M. endeavouri, and M. bennettae from the preliminary beam trawl gear experiment. The electric beam trawl was not tested during the day.
I Species Time Beam trawl type
Conventional Water iet Electric on Electric off
P, esculentus Day 7 59 Night 104 84 9 2 61
M, endeavouri Day 10 133 Night 144 450 495 163
M, bennettae Day 1 191 1 Night 158 246 360 179
Differences in catch rates between day and night trawls for P. esculentusfor all gear types were small compared to the large differences between day and night catches with "active" gear for M. endeavouri and M, bennettae (Table 1). Stimulation (by water\s or electric pulses) at night caused an increase in the number of M, endeavouri and M, bennettae caught, but appeared to slightly reduce catches of P. esculentus. This species is nocturnal and continuously active at night. They are buried during the day with a tendency to occasionally emerge (Penn 1984). Stimulation would be expected to have no effect or a negative effect on the catchability of P. esculentus. The dramatic increase in catchability of M. endeavouri and M, bennettae through stimulation at night suggests that they are strongly nocturnal but often inactive or buried at night. These differences in catchability between species indicates species-specific behaviour in response to the different beam trawl types.
Nighttime water jet beam trawl catches of all three species (P. esculentus, M. endeavouri and M, bennettae) were higher than daytime water jet beam trawl catches (Table 1). There are two possible explanations, either prawns move into the area at night, or they are deeply buried and/or harder to stimulate during the daytime than at night.
The nighttime electric beam trawl even with the current turned off, increased nighttime catch rates because of a tickler chain effect. While numbers of M. endeavouri and M. benneffae were greater with the inactive array attached, catches of P. esculentus were smaller than the catches taken by the nighttime conventional beam trawl (Table 1). The electrode array of the inactivated electric beam trawl appears to act as a mechanical tickler disturbing the substrate ahead of the net increasing catches of M, endeavouri andM. bennettae but decreasing in catches of P, esculentus. The disturbance caused by the electrode array may allow sufficient warning for the very active P, esculentus to escape the trawl.
10.3.2 Experiment 1
Counts and carapace length measurements were made of all Penaeidae (including carids) taken from trials in this experiment (Table 2). There were no significant differences between replicate shots for each trawl type or between days in the experiment.
Table 2. Mean catch rates from beam trawl Experiment 1. Significance levels from ANOVA are listed and indicated by * p<.05 or " p<.01. Standard errors are indicated in parenthesis.
Beam Trawl Type Nighttime Daytime Daytime Significance level
Conventional Water Jet Electric
P. esculentus 3.8 ( 3.1) 13.1 ( 2.2) 5.8 ( 2.5) 0.0407 *
M, endeavouri 9.2 ( 4.4) 35.6 ( 3.1) 3.0 ( 3.6) 0.0000 *$
page 104

For ail Penaeidae species considered, there were significant differences in catch rates between all beam trawl types (Table 2 and Figure 2). The daytime electric and conventional nighttime beam trawl catch rates were not different and were approximately one third those of the water jet daytime beam trawl for P, esculentus and M, endeavouri (Figure 2). The catch rates of non-commercial species, mainly carids, in the daytime water jet and nighttime conventional beam trawls were similar and four times'greater than those for the daytime electric trawl (Figure 2).
M endeavouri 240
Non commercial 220 200
180
160 140
120 100
80
60
40
20
0 Nighttime Daytime Day time
conventional water jet electric beam trawl beam trawl beam trawl
Figure 2. Comparison of catches of P. esculentus, M, endeavouri and M, bennettae for Experiment 1 from the nighttime conventional beam trawl, daytime water jet beam trawl and daytime electric beam trawl.
The difference in catch rates between commercial and non-commercial species, indicates different behaviour and responses to the different trawl types. The low catch rates of the daytime electric beam trawl for non-commercial species may have been a result of their small size relative to the commercial species. A smaller body width results in a decreased electric potential difference (generated by the electric field be- tween the electrodes) across the animal's body and less stimulus to jump. The jumping height of the small non-commercial prawns may be less, and insufficient to place them in the path of the net.
10.3.3 Experiment 2
There were significant differences between the catch rates in the different beam trawl types for P. esculentus, M. endeavouri and M. bennettae (Figure 3 and Table 3). The catch rates for P, esculentusin the nighttime conventional beam trawl were significantly greater than the daytime water jet beam trawl, which in turn was significantly greater than the daytime electric beam trawl (Figure 3 and Table 3). M, endeavouri and M. bennettae catches taken by the nighttime conventional beam trawl were much greater than the catches from the other beam trawl types (Figure 3 and Table 3). Catches in the "active" gear types did not differ signifi- cantly (Figure 3 and Table 3).

Figure 3. Comparison of catches of (a) P. esculentus, (b) M. endeavouri and (c) M. bennettae for Experiment 2 from the nighttime conventional beam trawl, daytime water jet beam trawl and daytime
electric beam trawl.
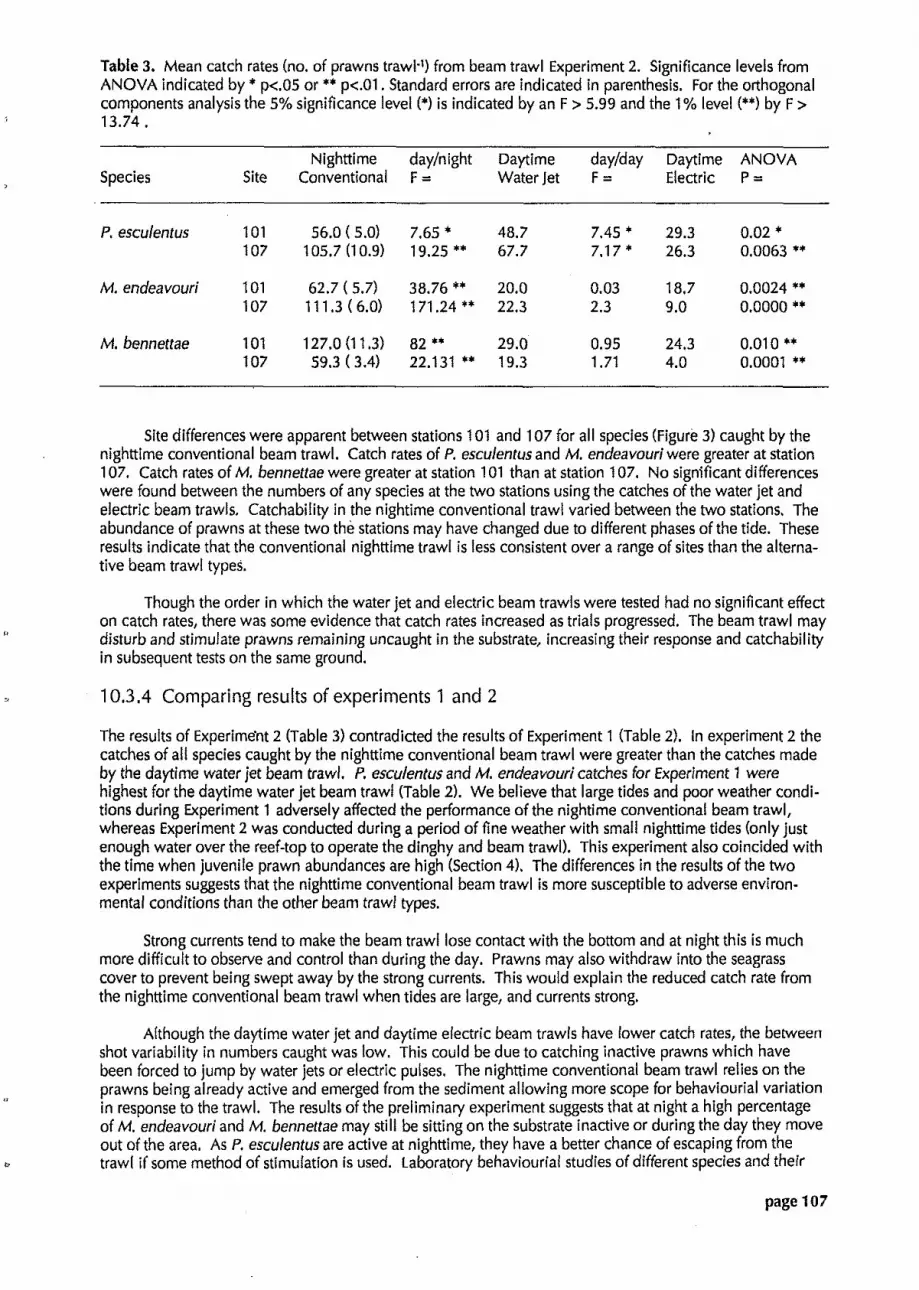
Table 3. Mean catch rates (no, of prawns trawl') from beam trawl Experiment 2. Significance levels from ANOVA indicated by * p<.05 or ** p<.01. Standard errors are indicated in parenthesis. For the orthogonal components analysis the 5% significance level (*) is indicated by an F > 5.99 and the 1 % level (**) by F > 13.74.
Nighttime daylnight Daytime daylday Daytime ANOVA Species Site Conventional F = Water Jet F = Electric P =
P. esculentus 101 56.0 ( 5.0) 7.65 * 48.7 7.45 * 29.3 0.02 * 107 105.7 (1 0.9) 19.25 ** 67.7 7.1 7 * 26.3 0.0063 **
M. endeavour! 101 62.7 ( 5.7) 38.76 ** 20.0 0.03 18.7 0.0024 ** 107 11 1.3 ( 6.0) 171.24 ** 22.3 2.3 9.0 0.0000 **
M, bennettae 101 127.0 (1 1.3) 82 ** 29.0 0.95 24.3 0.010 ** 107 59.3 ( 3.4) 22.131 ** 19.3 1.71 4.0 0.0001 **
Site differences were apparent between stations 101 and 107 for all species (Figure 3) caught by the nighttime conventional beam trawl. Catch rates of P. esculentus and M. endeavour! were greater at station 107. Catch rates of M, bennettae were greater at station 101 than at station 107. No significant differences were found between the numbers of any species at the two stations using the catches of the water jet and electric beam trawls. Catchability in the nightime conventional trawl varied between the two stations. The abundance of prawns at these two the stations may have changed due to different phases of the tide. These results indicate that the conventional nighttime trawl is less consistent over a range of sites than the alterna- tive beam trawl types.
Though the order in which the water jet and electric beam trawls were tested had no significant effect on catch rates, there was some evidence that catch rates increased as trials progressed. The beam trawl may disturb and stimulate prawns remaining uncaught in the substrate, increasing their response and catchability in subsequent tests on the same ground.
10.3.4 Comparing results of experiments 1 and 2
The results of Experiment 2 (Table 3) contradicted the results of Experiment 1 (Table 2). In experiment 2 the catches of all species caught by the nighttime conventional beam trawl were greater than the catches made by the daytime water jet beam trawl. P, esculentusand M. endeavouricatches for Experiment 1 were highest for the daytime water jet beam trawl (Table 2). We believe that large tides and poor weather condi- tions during Experiment 1 adversely affected the performance of the nightime conventional beam trawl, whereas Experiment 2 was conducted during a period of fine weather with small nighttime tides (only just enough water over the reef-top to operate the dinghy and beam trawl). This experiment also coincided with the time when juvenile prawn abundances are high (Section 4). The differences in the results of the two experiments suggests that the nighttime conventional beam trawl is more susceptible to adverse environ- mental conditions than the other beam trawl types.
Strong currents tend to make the beam trawl lose contact with the bottom and at night this i s much more difficult to observe and control than during the day. Prawns may also withdraw into the seagrass cover to prevent being swept away by the strong currents. This would explain the reduced catch rate from the nighttime conventional beam trawl when tides are large, and currents strong.
Although the daytime water jet and daytime electric beam trawls have lower catch rates, the between shot variability in numbers caught was low. This could be due to catching inactive prawns which have been forced to jump by water jets or electric pulses. The nighttime conventional beam trawl relies on the prawns being already active and emerged from the sediment allowing more scope for behaviourial variation in response to the trawl. The results of the preliminary experiment suggests that at night a high percentage of M. endeavouri and M. bennettae may still be sitting on the substrate inactive or during the day they move out of the area. As P. esculentus are active at nighttime, they have a better chance of escaping from the trawl if some method of stimulation is used. Laboratory behaviourial studies of different species and their
page 107

escape response to the three different beam trawl types would be required to answer these questions.
10.3.5 Size frequency distribution
There was a significant difference (p < 0.05 D = .2059 > DO5 = .I833 )(Kolmgorov-Smironov two-sample tesO in the size frequency distribution of P. esculentus at station 101, between catches from the daytime water jet and daytime electric beam trawls. There were less prawns in the smaller carapace length class sizes (4-8 mm) for catches of the electric beam trawl than the catches from the water jet beam trawl. At station 107, the size frequency distributions of P. esculentus from catches of the water jet and electric beam trawls were not significantly different (p > 0.05 D,o, = .I221 < D = .0771)(Kolmgorov-Smirnov two-sample test), though the trend of less prawns in the smaller size classes was also apparent at this site. All other combinations of trawl types at each station, for each species, were not significantly different.
10.3.6 Effect of lowering jets
There was no significant increase in catch rates of P, esculentus, M. endeavourior P. longistylus caused by lowering the height of the water jet nozzles (Table 4). it appears that variations in the height of the water jet nozzles above the substrate has little impact on the catch rate as long as the nozzles are low enough to effectively disturb the substrate. Direct observation of the water jet beam trawl suggested 100 mm is the greatest effective jet height. Any further elevation reduced the water jets penetration of the bottom.
Table 4. Catches of P. esculentus, M, endeavouri and P, longistylus from tests of different jet heights on the daytime water jet beam trawl. 6.05 = 2.78 and t.01 = 4.60
Species jet height mean number 'T' value per trawl
P. esculentus normal 46.3 0.5658 lowered 36.3
M. endeavouri normal 18.3 0.0063 lowered 20.3
P. longistylus normal 13.3 0.01 58 lowered 24.3
10.4 Conclusions
Catch rates for all species examined were highest in the nighttime conventional beam trawl when tides and weather conditions allowed the trawl to operate at maximum efficiency. When strong tides, currents, and winds prevail then the catch rates of the nighttime conventional beam trawl are significantly more variable than the catch rates of the daytime water jet and daytime electric beam trawls.
The daytime water jet beam trawl provided a reliable alternative to the nighttime conventional beam trawl when problems with navigation or tidal range made trawling difficult at night. Although daytime water jet beam trawl catches were generally lower than catches made by the nighttime conventional beam trawl, daytime water jet beam trawls were more reliable over a wider range of tidal and weather conditions. If species specific correction factors are applied to the data to make comparisons with nighttime conventional beam trawl data, then the catch rates of the daytime water jet beam trawl compared to the nighttime con- ventional beam trawl would be approximately 75% for P, esculentus, and 25% for M, endeavouri and M. bennettae.
The daytime electric beam trawl was not an effective alternative to a nighttime conventional beam trawl because catch rates of all species were lower than the catches for the daytime water jet beam trawl, and the electrode array readily caught on small humps of coral protruding from the substrate.
page 108

10.5 Acknowledgements
The authors would like to thank Julie Keating for identifying and measuring the juvenile prawns from the i
samples, David Sterling for designing and constructing the electronics for the electric trawl, and Allan Lisle, QDPl Biometry Branch, for assisting with the orthogonal components analysis of the results. The assistance of Dot Caesar and Rick Vogt who sorted samples and entered data, and Marcus Oke, Master of the R.V. "Lumaigul", and crew, Darren Dennis are gratefully acknowledged.
10.6 References
Allen, D.M., and Hudson, J.H. (1 970). A sled-mounted suction sampler for benthic organisms. U.S. Fish Wildl. Ser. Spec. Sci. Rep. Fish. No. 614. 5pp.
Coles, R.G., and Lee Long, W.J. (1 985). Juvenile prawn biology and the distribution of seagrass nursery grounds in the southeastern Gulf of Carpentaria. In 'Second Australian National Prawn Seminar'. (Eds P. C. Rothiisberg, 8. J. Hill, and D. J. Staples.) pp. 55-60. (NPSZ, Cleveland, Australia.)
Lewis, R.K., and Carrick, N.A. (1 987). Overview of prawn aquaculture in the Peoples Republic of China and Japan. SAFISH 11 (21, 10-1 5.
McRae, E.D., and French Jr, L.E. (1 965). An experiment in electrical fishing with an electric field used as an adjunct to an otter-trawl net. Comm. Fish. Rev. 27, 1-1 1.
Pease, N.L., and Seidel, W.R. (1967). Development of the electro-shrimp trawl system. Comm. Fish. Rev. 29, 58-63.
Penn, J.W. (1 984). The behaviour and catchability of some commercially exploited penaeids and their relationship to stock and recruitment. In 'Penaeid shrimps - their biology and management! (Eds. J.A.Gulland and B.J.Rothschild) pp. 173-186 (Fishing News Books Limited: Farnham Surrey England).
Penn, J.W., and Stalker, R.W. (1975). A daylight sampling net for juvenile penaeid prawns. Aust. I. Mar. Freshw. Res. 26, 287-91.
Saila, S.B., and Williams, C.E. (1972). An electric trawl system for lobsters. Mar. Tech. Soc. 1. 6, 25-31.
Sokal, R.R. and Rohlf, F.1. (1981). Biometry. (second edition) p. 859 (W.H. Freeman and Company: New York).
Staples, D.J. (1984). Habitat requirements of juvenile prawns. In 'The Potential of Aquaculture in Queensland'. (Eds B.R. Pollock and R.H. Quinn.) pp.87-102, Qld. Dept. Primary Ind. Conf. Workshop Ser. QC83012.

11. TRAWL GEAR PERFORMANCE TRIALS D.J. Sterling, J.E. Mellors and R.A. Watson
11.1 Introduction
An accurate estimate of abundance is essential for fisheries management. Abundance estimates are often limited, due to insufficient information regarding the catch efficiency of the sampling gear. A measure of sampling gear efficiency will enable a realistic estimation of abundance. Trawl sampling gear efficiency, is the proportion of animals retained in the net relative to the total number in the path of the trawl (Kjelsohn and Johnson 1978).
Estimating the efficiency of the sampling gear often causes serious problems for the analysis of trawl survey data. Gear efficiency involves many complex variables that are often insufficiently understood to predict their cumulative effects. The efficiency of trawl sampling gear varies not only for each species but also for different size classes and with varying environmental conditions (Kjelsohn and Johnson 1978). This unmeasured variability in trawl sampling gear efficiency, results in an error in estimating population size. Measuring this error remains a major and largely unresolved challenge in fishery science.
Selectivity is closely related to gear efficiency and includes components of net mesh Selectivity and fish or prawn behaviour. Mesh selectivity is the variation in fishing mortality with age, which is the differen- tial escape of certain sizes of fish or prawns after they enter the mouth of the net (Gulland 1983). Both efficiency and selectivity describe in some way the performance of gear. The distinction made is that efficiency is a measure of the gear's catch relative to the total population present in the area swept by the net. Mesh selectivity i s a measure of the gear's catch relative to the number of prawns that entered the mouth of the net. Gear efficiency includes the effects of mesh selectivity and any other processes of selectivity that occur when fish or prawns are initially stimulated from the sea bed into the mouth of the trawl.
Errors that occur in these calculations affect the estimates of absolute abundance and the shape of length-frequency distributions. Errors in length-frequency distributions are due to the size-specific nature of sampling trawl gear efficiency. Errors in estimates of absolute abundance are due both to the size-specific nature of the trawl, and to species-specific factors such as diurnal and seasonal variations in behaviour.
Other factors that affect trawl efficiency are associated with the physical aspects of the fishing gear itself (Table 1). These factors have an importance that i s often not fully appreciated in fisheries research. It is imperative that these factors are closely monitored during survey work to ensure that inter-sample vari- ation of trawl efficiency is minimized.
Table 1. Aspects ofotter trawl equipment used commercially and for survey work in the Australian prawn industry that influence gear efficiency.
Primary Factors Secondary Factors
mesh size fishing line height drop chain length and weight
tickler weight warp length to depth ratio otterboard settings headline length to spread ratio
tickler chain lead headline lead headline height trawl speed
page 11 0

Commercial trawl gear designs compromise gear efficiency to achieve a practical and safe operation. The designs are selective for commercial species and sizes. They may be strongly biased against catching trash species and collecting debris even to the extent of having a negative effect on their commercial catch. If using commercial gear in fisheries research it may be necessary to be aware and correct for any bias that may exist.
We conducted two separate experiments for efficiency and selectivity in order to investigate sample bias. Experiment 1 was designed to measure the size-specific trawl efficiency. Experiment 2 investigated mesh selectivity in greater detail. Experiment 1 is reported in full. The results presented for Experiment 2 incorporate data from only the first two monthly surveys and provides a preliminary examination of the selectivity performance of a standard port net relative to a small mesh starboard net.
11.2 Materials and Methods
Our trawling surveys utilized three-fathom wide prawn nets of a design commonly used by commercial operators. All net mesh sizes quoted were measured from centre of knot to the centre of the adjacent knot. The standard net for both experiments was always on the port side and the modified nets on the starboard side of the boat.
11 -2.1 Experiment 1 - Gear Efficiency
The experimental design consisted of a comparison of catch of all prawn species from our standard 48 mm mesh sampling trawl (Figure 1) with that of a trawl designed to be as efficient as possible (Figure 2). To pro- duce these qualities three design features were implemented on the non-standard trawl: 29 mm mesh size, zero fishing line height, and a tickler chain well forward of the fishing line (Figure 2). Other aspects of the non-standard net design were unchanged from the standard port net. The nighttime catch of this non- standard net was assumed to measure approximately the total trawl path biomass in the area swept by the net. By comparing the catches of both nets we determined the efficiency of the Torres Strait Prawn Project's standard oner trawl.
The two nets were towed from our 14 m research vessel R.V. 'Lumaigul' in a dual net system (Fig- ure 3). This system ensured that similar grounds were covered by both nets and that bottom times were identical. The spread of each trawlwas continuously recorded with side-scan sonar and the results used to
e correct for differences in swept area trawled.
Comparing the catches of the two nets, when appropriately corrected for differences in swept area, theoretically yields size-specific trawl efficiencies for any species.
The data analyzed was taken from a 30 minute trawl made at station 21, west of Warrior Reef (Sec- tion 5 - Figure 1) in November 1987. At this time of year this station typically returns a sample containing a high abundance of medium-sized commercial prawns (Section 5 - Figure 6). All prawns were frozen and returned to the laboratory where they were identified, measured and sexed.
There were insufficient numbers of any single commercial species common to both nets to provide species-specific results. Analysis of the sample was made with all species pooled. The frequency distribu- tion of prawns for each net was determined for 1 mm carapace length (CL) classes. For each carapace length class the proportion caught in the standard net relative to the non-standard net was calculated and corrected for swept area differences giving the efficiency of the sampling trawl gear for that particular prawn carapace length class. Nonlinear regression analysis was used to fit a logistic model to the variation of gear efficiency with carapace length. The equation of the model is of the form:
Where: y is the proportion captured by the standard net relative to the non-standard net x, is the upper asymptote x, determines the slope of the curve CL is the carapace length of prawns in mm x, is the value of CL where the curve reaches half of the upper asymptote
page 111

The three parameters (x,, x, and x,) were estimated with their standard errors and regression coefficient. Length classes represented by ten or fewer prawns caught in the non-standard net were not included as observations in the regression as it was thought that they were non-representative of the size class.
Figure 1. Netting plan and drop gear arrangement of the 48 mm mesh 3-fathom sampling net.
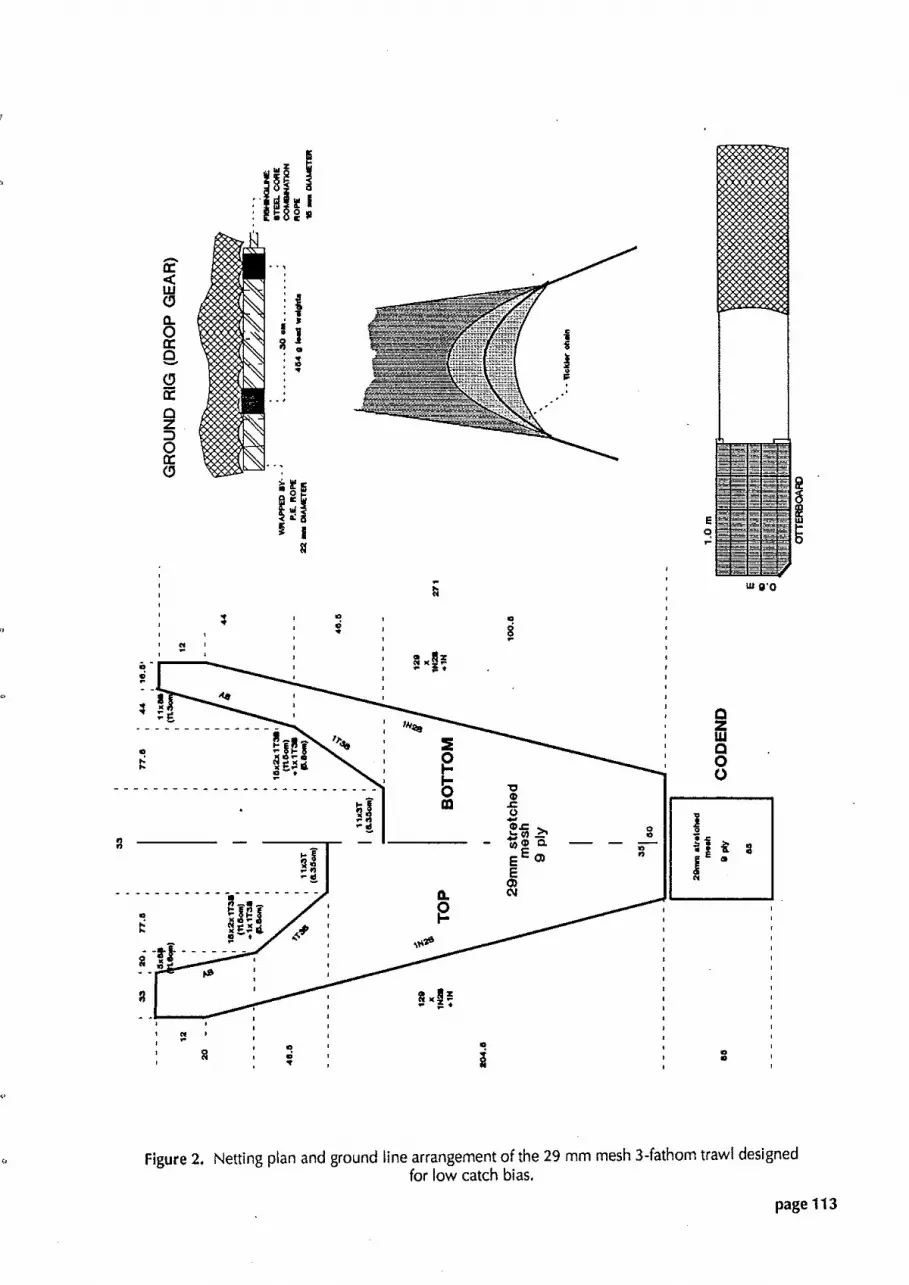
Figure 2. Netting plan and ground line arrangement of the 29 mm mesh 3-fathom trawl designed for low catch bias.
page 11 3

32 MM MESH NET
STANDARD 48 MM MESH NET
Figure 3. General arrangement of the dual-net sampling rig designed for trawl comparison.
11.2.2 Experiment 2 - Gear Selectivity
The traditional method of determining selectivity of a trawl is by using a small mesh cover over the cod-end of a net (Kina in oress). This method for calculatine seiectivitv assumes that orawns escaw exclusivelv through the rod dnd. Selectivity of nets can also bidetermined by comparative lishing ekperiments (doyce 1972). In these type of experiments, nets of different construction are Fished side by side. This method is more exacting as it assumes that prawns can escape through the mesh at any point'along the net.
Whatever method is used, the results can be expressed as the proportion of prawns at each length class entering the net which are retained in the cod-end (Culldnd 1984). When these proportions are ploned against length, the selection curve for the species is obtained.
In September 1988, the RV 'Lumaigul' was fitted with a dual-net system incorporating the standard 48 mm mesh net on the port side and a exact 1:l scale copy using 32 mm mesh (Figure 4) on the starboard side. This gear was primarily designed to enhance the proje&s data for growth and recruitment analysis from the monthly survey work, by improving the performance of the overall gear for smaller-sized (< 20 mrn CL) prawns.
Prawn samples were treated identically to those in Experiment 1, although only commercial species (Penaeus and Metapenaeus spp) were processed. Selectivity analysis was for three groups: (1 ) all species pooled, (2) Metapenaeus endeavouri, endeavour prawns and (3) Penaeus esculentus, brown tiger prawns.
The analysis for the three groups was identical to Experiment 1, although this experiment measured the selectivity of the standard trawl and not its efficiency. No spread difference correction was applied. The spread difference used in Experiment 1 would not be appropriate because of the difference in netting mate- rial and ground chain arrangement used in Experiment 2.
It was assumed that a catch of at least 10 prawns by the starboard net was necessary to represent a particular length class accurately.
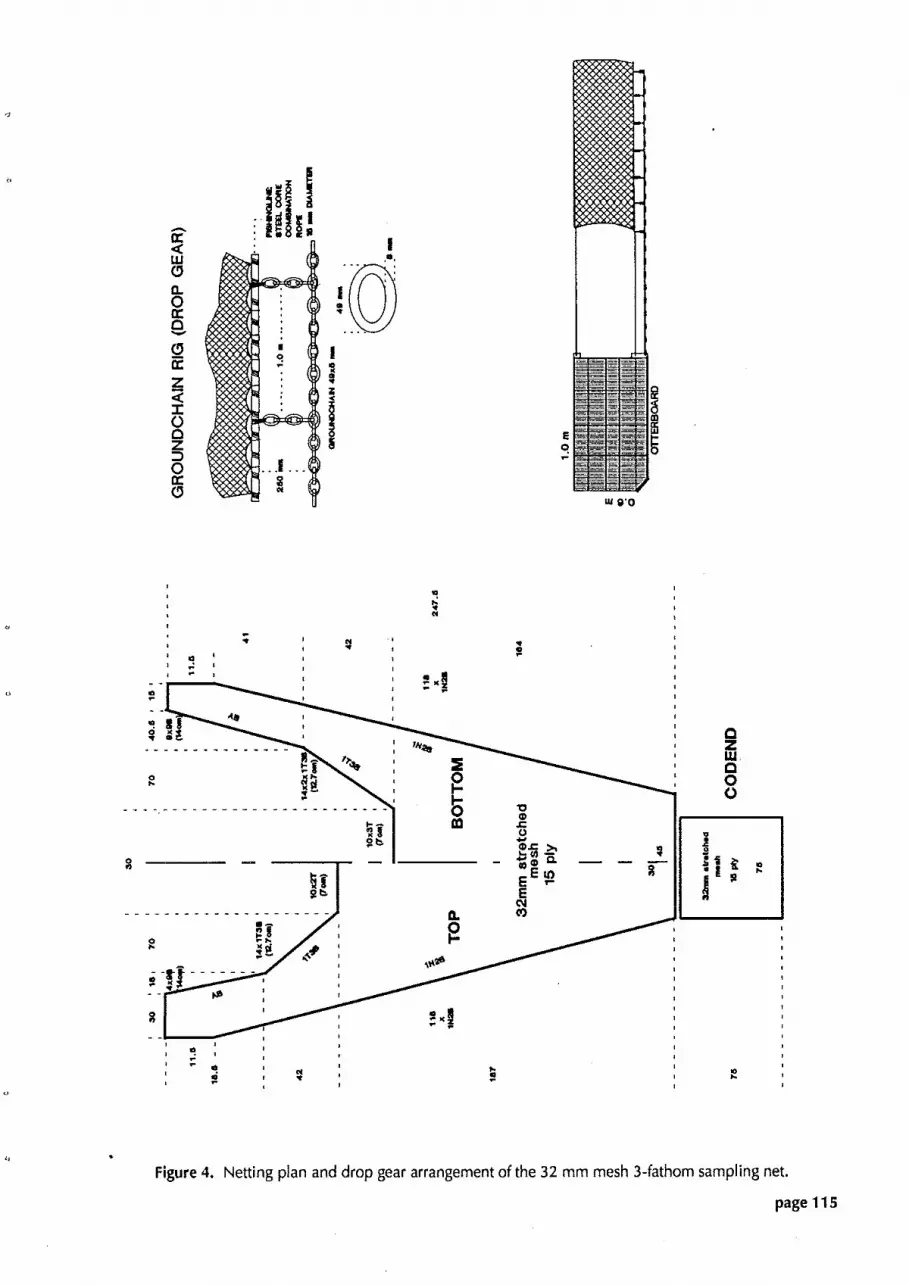
Figure 4. Netting plan and drop gear arrangement of the 32 mrn mesh 3-fathom sampling net.
page 11 5

11.3 Results and Discussion
11.3.1 Experiment 1 - Gear Efficiency
An estimate of the average spread ratio of the standard net relative to the non-standard net was calculated as 1.1 3 based on sonar measurements taken during earlier trials. The accuracy of this ratio was confirmed by repeated trials.
Eleven species of prawns were collected including several non-commercial species. The prawns caught in the non-standard trawl ranged in size from 5 to 45 mm CL (Figure 5). Sizes of the commercial species: P. esculentus, M. endeavouri and P. longistylus only overlapped slightly with the smaller non- commercial species.
P. esculentus
El M, endeavouri
P. longistylus
0 Mp. r o s e a
Q Mp. palmensis
U l T granulosus
C a r a p a c e l e n g t h ( m m )
Figure 5. Length-frequency distribution caught by the non-standard net in Experiment 1, showing the contributions made by the six most abundant species.
There was a positive correlation between efficiency and carapace length (Figure 6). A logistic curve fitted by nonlinear regression adequately represented the trend in the data (Table 2). The parameter x, (0.81 2, Table 2) was significantly less than 1, where 1 would be the asymptote of a curve of a net 100% efficient (p < 0.05, Student t-Test)). This shows that the standard net never attained 100% efficiency relative to the non-standard net, even at the largest prawn sizes. This result probably refleas the percentage of large prawns (> 27 mm CL) that can escape through the dropgear (Figure 1) of the standard trawl (QDPI unpubl. data).

Carapace l eng th (mm)
Figure 6. Size-specific gear efficiencies for all species pwled measured for the standard 48 mm mesh trawl with the fitted logistic curve.
Table 2. Parameters for the relationship between efficiency and prawn carapace length.
Estimate Standard Error
11.3.2 Experiment 2 - Gear Selectivity
All Species Pooled. The commercial prawn species caught did not have the same size ranges (mm CL). Individuals of P. esculentus were on average larger than M. endeavouri(Figure 7).
The relationship'between selectivity of all species p l e d and carapace length was well represented by a logistic curve (Figure 8). The upper asymptote, x, of 1 .I 05 (Table 3) was statistically larger than 1 (p < 0.1, Student t-Test). This shows that it is likely that the small mesh net is catching fewer large prawns than the standard net, (1 0% fewer), through comparison of the upper asymptotes of 1.1 05 to 1. Theoretically calculations of selectivities can yield values that range from zero to 100%. In practice when selectivity is greater than 100% the value is set at 100% (Kjelsohn and Johnson 1978). However it was felt that i f this conditional 100% was applied to our data it would mask the actual performance of the trawl sampling gear. One reason for a 10% difference could be an average spread difference of the otter boards of around 10%. If so, this reduction would have occurred over all the length classes and species. This was not the case.

Another reason could be that the performance of the smaii mesh net allows larger prawns to either escape from the net or avoid the net, as there is evidence that jumping height and consequently the ability to escape a net i s size dependent (QDPI unpubl. data).
5 l o o
Carapace length (mm)
Figure 7. Prawn length-frequency distribution caught by the starboard net in Experiment 2, showing the contributions made by the four commercial species processed.
Table 3. Parameters for the relationship between the selectivity of all species pooled and their carapace length.
Estimate Standard Error
King (1979) measured the proportion of western king prawns, P. latisulcatus, retained in the codend of a 50 mm mesh trawl by using a fine mesh cover which caught all prawns escaping the codend. .ur CL,O% value of 19.9 mm (Table 3) was considerably less than 29.88 mm as determined by King (1 979). Several factors may account for the different CL,, between these two studies. One explanation may be that as King (1 979) used a larger mesh net than that used in this study, his CL,,,was greater. The use of a codend cover by King (1 979) may have changed his net's performance allowing more escapement through the net and into the cover. Greater escapement from the cod-end is possible if the fine-mesh cover reduced codend water flow. Reduced codend water flow may allow prawns to move more freely inside the net and escape. It may also cause an increase in the effective size of codend mesh openings permitting prawns to pass through the mesh into the codend cover. It should also be remembered that the CL,, for this study

was determined for all species p l e d and not one species as in King's study. The smaller CL,,,of our study may have been influenced by the high propoflion of small M. endeavouri prawns in the catch (Figure 7). It could also be attributed to different net avoidance behaviour of different species.
C a r a p a c e l e n g t h (mm)
Figure 8. Selectivity data and fitted logistic curve, based on pooled species catches obtained from port and starboard nets in Experiment 2.
Metapenaeus endeavour;. A logistic relationship behveen trawl selectivity and carapace length for M. endeavouri prawns was determined (Fig. 9). and the logistic parameters estimated (Table 4).
Estimated parameters for the fitted logistic curve were not statistically different (p > 0.05, Student t- Test) from those parameters estimated for the pooled species (Table 3 and Table 4). This was expected as the majority of prawns in the p l e d analysis wereM, endeavouri (Figure 7). Parameter x, (1.203, Table 4) was significantly greater than 1 (p<0.05, Student t-Test).
page 11 9

+ *. 120- Q) C
lz 02 100- + * + Q) .t.............-............-
-0 E + 9, I C = 80- .- a (d - E t 9, U) h
+. 60- c 7 0 -
+ 0 L
+ ..... P. esculenfus
m - M. endea vouri
1 1 1 1 1 1 1 1 1 1 1 1 1 1 1 1 1 1
C a r a p a c e l e n g t h (mm)
Figure 9. Selectivity data and fitted logistic curve for P, esculentus and M. endeavour;, based on catches obtained from port and starboard nets in Experiment 2.
Table 4. Parameters for the relationship between the selectivity of M. endeavouri and their carapace length.
Estimate Standard Error
X1 1.203 0.061 6 Xa -0.353 0.0596 x3 20.8 0.562
Penaeus esculentus. A logistic curve was fitted to the P. esculentus selectivity data (Figure 9). The numbers caught were low and the majority of prawns caught were in size classes above the 50% selectivity level.
The asymptote of the selectivity curve was lower for P. esculentus than it was for M. endeavouri (Figure 9). The asymptote x, (0.945, Table 5) for P. esculentuswas not significantly different from 1 (p > 0.05, Student t-Test). This suggests that there was no difference in the spread of the two nets, which is contrary to our explanation for mesh selectivity curve asymptotes being greater than 1 for M, endeavouri. The average number of M. endeavouri > 26 mm CL retained was compared with the average number of similar-sized P, esculentus retained (Figure 7) and was found to be significantly different (p < 0.1, Student t- Test).
page 120

Table 5. Parameters for the relationship between the selectivity of P, esculentus and their carapace length.
Estimate Standard Error
1 1.3.3 General Discussion
The parameters calculated in Experiment 1 can be used to correct the bias associated with the use of com- mercial trawls as sampling devices for all species of prawns. This correction may have to be species-specific as indicated by the different selectivity results for M, endeavouri and P. esculentus.
Results from Experiment 1 on gear efficiency showed that up to 20% of large-sized prawns (> 26 mm CL; comparison of catches from both nets) are lost through the ground chain rig. It would be possible to isolate the size-specific effects of drop gear by comparing the results of Experiment 2 with those of Experi- ment 1. This has not yet been possible due to the small sample size in Experiment 1. Further trials of Experiment 1 would be required to achieve an adequate sample size for this comparison.
The results from Experiment 2 showed that the proportion of P. esculentus retained in the standard net for a given carapace length class was consistently lower than that for M, endeavouri. Differences in the CL,,, between these two species would suggest differences in mesh selectivity. The fact that a common upper asymptote was not shared by these species would suggest that the set of the trawl sampling gear selects differently for individual species. If this does cause the different asymptote values for the different species, it may also explain the differences in the other estimated selectivity parameters of x,, x, and CL,, The behaviour of prawns when approached by trawl gear is likely to differ between species. This behaviour in turn may be affected differently by such factors as ground chain lead ahead of the net, a factor which is " affected by net spread, Investigations into details of net settings and animal behaviour was beyond the scope of this study, however there i s a definite need for further investigation before species-specific mesh selectivity effects can be determined.
*
11.4 Acknowledgements
The authors thank Mike King, and Mike Dredge for their comments on the experimental design of this study. We would also like to thank Rob Coles for his constructive comments on the manuscript and acknowledge the invaluable assistance of the crew of the R.V. 'Lumaigul' and 'Cwendoline May'.
11.5 References
Gulland, J. A. (1 9831, Fish Stock Assessment. FAOhVhiley series on food and agriculture; vol. 1.
King, M. (1 979), The biology of the Western King prawn Penaeus latisulcatus Kishinouye and aspects of the fishery in South Australia. MSc. Thesis, University of Adelaide.
King, M. (in press). 'Australian Marine Biology'. (Longman & Cheshire).
Kjelsohn, M.A., and Johnson, G.N. (1 979). Catch efficiencies of a 6.1 meter otter trawl for estuarine fish o populations. Trans. Am. Fish Soc. 107, 246-254.
Royce, W.F. (1 972). 'Introduction to the fishery sciences'. (Academic Press: London) 351pp.
m
QDPI, Rural Credits Project on the net avoidance behaviour of prawns. (unpublished data)
page 121

page 122

POPULATION DYNAMICS


12. PRAWN FISHERY SIMULATION YIELD MODEL R.A. Watson
12.1 Introduction
Managers of fisheries have always sought to predict the consequences of any management measure before it is introduced. Even broad predictions have proven extremely difficult to make and, mistakes in predictions can be costly to the industry and possibly the long term durability of the fishery. The industry expects management measures to be precise. For example the optimum dates for seasonal closures are expected to have an accuracy measured in weeks, if not days.
Many of the management measures being employed on prawn fisheries in Northern Australia are novel in their application, for example, seasonal closures to protect small prawns have been in use for less than ten years in northern Australia. Few if any experimental controls have been used to establish the effec- tiveness of these measures. Large inter-year variations in prawn numbers occur naturally and can compli- cate long-term assessments. In response to industry concern, several different management regimes have been used in successive years, making the explanation of results extremely difficult because of their possible interactions.
To assess the response and elasticity of a fisheries' potential to withstand fishing pressure it is usually necessary to employ widely varying levels of exploitation and then observe the response. This means some degree of calculated under fishing exploitation and over fishing exploitation within the fishery. To be successful these 'experiments' have to be large in scale and extend for several years. The very idea of costly manipulation of a viable important fishery is, at least for the present, politically unacceptable. This means that researchers are asked to help managers decide on strategies without the benefit of the type of data from the system which would allow statistical predictions to be made. They must therefore employ data from other fisheries. Fisheries from which data is available are often from temperate regions, and all too often are failed fisheries and not ideal for comparison with a tropical prawn fishery.
e There is one other tool researchers and managers can employ. This tool is simulation modelling. A fisheries biologist can estimate a number of important biological and population parameters from direct measurement, experimentation, or from the scientific literature. These can be combined with information
c, gathered from economists, commercial processors and fishermen to produce a series of rules and relation- ships. Such controls often govern the fishery through various limiting factors such as the number of vessels, the available searching time, the biology of the key species, or the economics of the products. One or more of these aspects can be combined using the computational powers of computers in a simulation of the fishery. These computer simulations often allow for graphical or tabular display of the results so that all potential users can visualise the results and gain some understanding of the interplay between the many complex relationships underlying the model.
Several types of computer simulation models exist. As the name implies they are meant to simulate the fishery. Given suitable input such as the numbers and sizes of animals recruiting into the fishery, models can produce estimates of potential outcomes. These may be landings, numbers of animals the following year, or even net profits. Most of these simulation programs are based on dynamic models. Dynamic models attempt to model the passage of time in the life of the fishery. Some programs model time on a continuous basis, while most models use discrete time units. Units of years are applicable only to compari- tively long-lived animals. For prawns, units of months or even weeks are more appropriate. The time scale most appropriate is dependent on the generation time of the key species as well as the detail available in the input data, and the precision required of the predictions.
Many models use fixed rules to relate the input data to outcomes and do not allow for chance circum- stances, these are deterministic models. Others attempt to simulate the natural uncertainty in the reaction of one factor in the fishery to others, or the certainty or potential error in the input data. These models allow for random or pseudo-random processes to occur. These stochastic models produce different results every time they are used even if the same input data is used. While this produces a more realistic approximation of the natural situation, it requires additional information on the rules which regulate how this variation or randomness occurs. When stochastic modeis are used, it i s common to reuse the computer model a number

of times, through the process of Monte Carlo simulations, in order to extract the average result, In addition to the average outcome, stochastic models also allow the range of expected results to be determined.
Models can be either extremely complex or 'reductionist' in nature and attempt to describe all know- able aspects of the animals' biology and the fishery in fine detail, or they can be general or 'holistic' in approach and deal with only the generalised net or overall affects. They can attempt to explain the relation- ship between all parameters that can be measured and attempt to predict all aspects of the fishery, or they can use only some of the available data to predict only one result such as the net profit.
Modelling has been employed to great effect by Somers (1 985) to predict the optimum opening date for the Penaeus merguiensis, banana prawn fishery in the Gulf of Carpentaria. Somers (1 985) used informa- tion on prawn prices and prawn growth rates, together with weekly size surveys, to predict when harvest would maximise the gross profits of prawn fishermen. Sluczanowski (1 984) used historical catch data and existing fisheries models to optimise (through modelling) population parameters for the Spencer Gulf prawn fishery of P, latisulcatus, the western king prawn. These parameters were then used in a subsequent model, which had an economic framework, to find management measures which would optimise total industry profits.
The deterministic model that will be described below is not as complex as that used by Sluczanowski (1 984) in the Spencer Gulf, and as yet has not been elaborated to produce economic parameters other than gross catch values. This model was originally developed to simulate the growth, immigration, emigration and mortality processes of juvenile P. esculentus, brown tiger prawns, in nursery areas of Torres Strait. It was then extended to include the adult or commercial phase of the life cycle, and to include the other two commercial species in Torres Strait, Metapenaeus endeavouri, endeavour prawn, and P. longistylus, redspot king prawn. It has already been employed to make crude predictions of the effects of differing seasonal closure periods on prawn catch values. With modification and further sophistication this model can be used to meet many of the prawn fishery managers future needs.
12.2 Materials and Methods
12.2.1 General model description
The initial input data used in this deterministic simulation model are the numbers of prawns km-2 at 1 mm size classes (length density values). These prawns are subjected to size-specific natural mortality (Figure I), then they are fished according to schedules of fishing effort. In the simulation, prawns are caught at varying rates in accordance with experimentally-established size-selectivity relationships (Section 11). Some prawns are harvested and their abundance, sex and carapace lengths are recorded. The weight and value of this catch is then calculated using sex and species-specific weight-length relationships, as well as size-specific price schedules.
Prawns remaining at the end of a one monthly cycle are joined by new recruits, whose numbers are calculated by changes in the length frequency data, before the process is repeated. The model was usually used to simulate twelve months in the fishery and can be used, in the absence of recruitment data, to follow a group of prawns until extinction. The three prawn species were modelled separately before their results were combined.

Figure 1. Schematic representation of the simulation model, 0
12.2.2 Description of sub-models
Weight-length. Parameters were fitted to the relationship:
where W is a total wet weight of a prawn (g) and L is its carapace length (mm)
Parameter values varied for different prawn species and sex (Table 1). The values used were derived from laboratory measurements.
Table 1. Coefficient values for the weight-length relationship used for commercial prawn species from Torres Strait.
Species a b Male Female Male Female
Penaeus esculentus 0.0024 0.0026 2.72 2.67 Metapenaeus endeavouri 0.001 7 0.001 5 2.79 2.81 Penaeus /ongisty/us 0,001 7 0,001 5 2.79 2.81

Growih. Parameters were fitted to the von Bertalanffy growth curve from tagging experiments or derived from the literature (Table 2). This curve has the form:
Table 2. Coefficient values for the von Bertalanffy growth model used for commercial prawn species from Torres Strait.
- -
Species k L- Male Female Male Female
Penaeus esculentus 0.22 0.22 35 43 MetapenaeuS endeavouri 0.14 0.1 6 37 45 Penaeus longistylus 0.1 0 0.1 7 43 48
Natural mortality. A size-specific mortality schedule was created for each species (Table 3) based on extrapolations of average literature values for Australian prawn species (Garcia 1985). The assumption was made that at smaller, non-commercial sizes and at sizes approaching L, natural mortality values exceed that for the mean size.
Table 3. Values for the annual coefficient of natural mortality used for all commercial prawn species from Torres Strait.
Carapace length range Value
Gear selectivity. Based on trawl gear experiments (Section 11) an asymptotic relationship was used to describe the vulnerability of prawns to trawling in each 1 mm length class. Insufficient information i s available at this time to assign separate selection curves to different species of prawn. The relationship used was:
where Y is the proportion of prawns vulnerable to capture at any length L (mm), x, is the upper asymptote of the curve, x, is the slope of the ascending limb of the curve, and x3 is the carapace limb (mm) at which 50% of prawns would be caught.
Parameters used for.all species were: x, = 0.81 2, x, = -0.452 and x3 = 20.0 mm (Section 11 1.
Seasonal exploitation. The annual fishing mortality was set equal to the annual natural mortality. This assumption has been used before with Australian prawn fisheries (Haynes and Pascoe 1988). A per- centage of this annual fishing mortality was apportioned to each month based on the Northern Prawn Fishery logbook records from Torres Strait vessels (Section 2). The distribution of fishing effort throughout the year differed depending on the presence and timing of seasonal closures (Table 4). The simulation program allowed different seasonal closure scenarios to be chosen, with each scenario using different seasonal fishing effort schedules.

Table 4. Proportion of annual fishing each month for different closure period in Torres Strait.
1 No D e c l 5 D e c l 5 D e c l S D e c l S D e c l 5 D e c l S
Month Closure Feb 1 Feb 15 Mar 1 Mar 15 Apr 1 Apr 15
January 0.08 Febrary 0.13 March 0.1 7 April 0.07 May 0.13 June 0.07 July 0.05 August 0.1 2 September 0.09 October 0.05 November 0.04 December 0.01
Prawn prices. The wholesale purchase prices of the three commercial species were obtained from Cairns buyers at the time the analysis was performed. Buyers informed us at the time that prices did not exhibit a predictable seasonal pattern. We therefore, did not attempt to make seasonal adjustments to the price structure in Table 5. Larger sized prawns were higher priced and smaller sizes which are not exported, are much less valuable. Consequently the price schedule used had a stepped format. Price is not directly related to prawn carapace length but rather to prawn weight or count (number per unit of weight). Counts are often given in units of the number of prawns which weigh one kilogram. Prices were supplied as $AUS kg1 for different ranges of prawn counts. These ranges of prawn counts by weight were calculated for ranges of prawn carapace lengths using species and sex-dependent weight-length relationships (Table I).
Table 5. Prawn prices used for commercial prawn species from Torres Strait.
Species Range of carapace c, lengths (mm) Price ($ kg l )
Penaeus esculentus 0 - 20 21 - 24 25 - 29 30 - 38 39 and above
Metapenaeus endeavour; 0 - 19 20 - 24 25 - 29 30 and above
Penaeus longistylus 0 - 1 9 20 - 28 29 - 33 34 and above
12.2.3 Input data
Trawl stations in Torres Strait were surveyed monthly from January 1986 to January 1988. The catch of prawns caught from each hectare of the bonom swept by the survey trawl gear was recorded in 1 mm " carapace length class intervals. The January 1986 survey results were used as the initial estimates of prawn
page 129

numbers for the model. All sizes of prawns from this initial month were introduced into the model as new recruits. In subsequent months, the length frequency data was examined, but only those prawns which could not already have been included from the previous months surveys were added as new recruits. A conservative approach was adopted when new recruits were calculated. To determine which prawns could not have been included previously, a maximum size limit or cut-off size was calculated. An increase in length equivalent to one month of growth was added to the smallest Sized prawns surviving from the previ- ous months survey results. Prawns equal to or greater than this projected size were not included as they could already have been included as new recruits into the model from the previous month.
12.2.4 Output data
There are two types of output: graphical and text. Text output can be directed to a printer as well as to the computer screen. Graphical and text output i s produced for each species of prawn separately. These out- puts are followed by a text summary which combines all commercial species. It is possible to combine text and graphical output in several formats.
Text output. For each species the text format produces a table, each row representing the results from one month of simulation (Table 6). The columns in Table 6 represent: the month, the proportion of total annual fishing effort for a non-closure year, the number of prawns ha-' remaining alive and free, the ratio of deaths from fishing to those from natural mortality, the number of new recruits ha-', the number of deaths from natural causes ha.', the number of deaths from fishing or the number caught ha.', the cumulative value of the catch, the monthly or incremental value of the catch, the weight (kg) of the catch, the average weight of a prawn (g) for the month, the average value per prawn for the month, and the ratio of fishlng to natural mortality rates. Below the rows representing monthly results are the averages and totals for the species over the total simulation period which is usually one year. These include: the total catch in weight (kg) and value, the average price kg-' and per prawn, the total number of deaths by natural causes and through fishing, the average prawn weight (g) and carapace length (mm), and the yield per recruit by weight (g) and by dollar value. These statistics are also repeated for all species combined over the simulation period (Table 7).
Table 6. An example of text output for P, esculentusfrom the simulation model.
.............................................................................
* * * STATION: 9 P. ESCVLENTUS STARTING MONTH: JANUARY, 1986 %
********U********U******tt*******************=**w*********************m***
MONTHLY PRAWNS RATIO NEW EFFORT LEFT F/M REC
J A N I L 7229 0.64 7229 FE N I L 5927 0.64 231 MA 0.39 5044 0.63 0 AP 0.07 1736 0.61 599 MA 0.10 1643 0.77 226 JUO.05 1227 1.03 1168 JU 0.07 1758 0.71 0 AU 0.14 1229 0.71 260 SE 0.06 B89 0.72 0 IX 0.07 635 0.72 0 NO 0.05 444 0.72 379 DE 0.01 602 0.66 113
DEATHS CATCH VALUE ($) CATCH W(G)/ $/ W R T R NAT FISH CUMOLAT INCREM (KG) PRAWN PRAWN F/N
1310 0 0.00 ***** No Catch ***** 1114 0 0.00 ***** No Catch ***** 618 2691 1051.201051.20 75.02 27.89 0.40 4.36 392 3 0 1172.59 121.38 8.39 27.99 0.41 0.77 303 3391315.62143.03 9.79 28.89 0.43 1.12 410 227 1396.10 80.48 6.00 26.44 0.36 0.56 293 236 1499.13 103.03 6.93 29.39 0.44 0.81 231 3691668.45169.32 11.11 30.12 0.46 1.60 149 104 1722.08 53.63 3.41 32.69 0.52 0.70 105 86 1770.78 48.70 3.01 34.85 0.57 0.83 140 81 1809.02 38.24 2.52 31.12 0.48 0.58 127 14 1816.08 7.05 0.45 31.35 0.50 0.12
CATCH TOTAL: (KG) 126.7 PRICE AVERAGE ($): (KG) 14.35 ($) 1816.08 (EACH) 0.41
DEATHS NATURAL: 5192 AVG PRAWN KT (G): 28.48 FISHING: 4447 LT ((24): 31.74

Table 7. An example of text output for all species from the simuiation model.
...............................................................................
* * STATION: 9 ALL SPECIES STARTING M: JANUARY, 1987 *
***tt,**************~f**********f****************************a**********
U T a l TOTAL: (KG) 269.3 PRICE AVERAGE ($): (KG) 10.92
$ 2939.10 (EACH) 0.25
DEATHS NATURAL: 16024 AVG PRAW W (G): 22.78 FISHING: 11822 LT (CH): 29.48
YIELD/RECRUIT: (g) 8.04
($1 0.09
Graphical output. Graphical output takes up only one half of the computer screen. The graphical output is currently designed for use with computers with Extended Graphics (EGA) or Video Graphics Adaptor capabilities. Text output can be used with or without graphical output as it does not require graph- ics capabilities. By itself, text display will use the entire computer screen. When used with a graphics display the text utilises only the lower half of the screen but scrolls as this area is filled.
There are two graphical displays possible and each i s designed to use half of the computer's display area. These displays can be used together or singly with the text display. The first graphics display is basically a length-frequency histogram for each month of the simulation. These histograms show the num- ber of prawns ha.1 at I mm carapace length classes. The histograms are colour coded to indicate the number of male prawns surviving, female prawns surviving, prawns caught, prawns dead from natural causes and new recruits. The second graphical display shows an entire year of data. For each month the weight of prawns caught is colour coded to show the proportion under and over the minimum export size. The cumulative value of the catch is also shown in the background.
12.2.5 Program options
Through a series of questions at the beginning of the program, the user can choose between many different options. In each case there is a default choice displayed in parenthesis.
Output format. The first series of questions establishes what type of output display is desired. At this point there is an opportunity to have the text output sent to a printer and a general title can be entered.
Input data. Users can choose the first calendar month of the simulation as well as which trawl stations to include.
Fishing pattern. The annual level of fishing mortality is selected. If the level of fishing mortality is set to zero then no fishing will occur but the standing value of the prawn stocks will still be reported monthly. If fishing effort is applied, different seasonal effort patterns are available for a variety of seasonal closure periods.
Recursive option. It is possible to save the length frequency information for prawns still surviving after one year of the simulation -these are termed 'the leftovers'. It is also possible to begin a simulation by adding the leftovers from a previous simulation to the new recruits. This allows a more realistic simuiation, especially if the total value of the fishery for a single year is the most important output parameter.

12.3 Results and Discussion
12.3.1 Potential catch value vs seasonal closures
It is possible to model the prawn fishery under different seasonal closure regimes and make eitimates of the gross annual value of the prawn catch per area of the bottom trawled. This gross value is related to the level of fishing activity or fishing mortality coefficient, F. In our simulation we used a value for F equal to the literature value of natural mortality, M, of 2.4. We also used values of F equal to 1.2 and 3.6 to represent units of instantaneous fishing mortality that has been halved and increased by half respectively.
The simulation was based on a station just east of Warrior Reef (station 9 - Section 5) and used survey data from 1986 when there was a seasonal closure in effect (Section 1). The model predicts an increase to the annual gross value of the fishery if a seasonal closure is enforced, unless the closure period extends beyond April 15 (Figure 2). Seasonal closures longer than this period have little positive effect. Closures cause a comparative increase to the value of the fishery at higher levels of exploitation (the curve is more arched). At low levels of fishing effort the model predicts that closures have little effect. At high levels, closure timing is critical i f maximum catch values are to be attained.
2,000 1 I I I I I I I I
No 15Dec 15Dec 15Dec l5Dec 15Dec 15Dec Closure Febl Febl5 Marl Marl5 Aprl Aprl5
Closure period
Figure 2. Annual catch values of all commercial prawns predicted by model and coeffecients of fiahing mortality for different closure periods.
In the future we can model other stations in Torres Strait and years, however, indications are that the results will be similar. it is difficult to use survey data from years when seasonal closures did not occur, as the effect of commercial fishing alters our survey data and makes predictions of unfished recruitment nearly impossible.
12.3.2 Stochastic recruitment processes
Recruitment into a prawn fishery varies widely from year to year. The number of recruiting prawns in any r 3
one year i s extremely difficult to predict. A deterministic model does not allow for this interannual variation
page 132

and relies directly on survey data to establish recruitment levels. A more realistic approach would be to examine several years of recruitment data in order to establish the timing and magnitude of recruitment peaks and, more importantly, their variance. The recruitment peaks established using the criteria described , for the model occur twice a year (Figure 3). These recruitment peaks vary in their timing and magnitude. If we assume that the peaks are similar to the normal gaussian curve in shape then we can estimate the means and variance of these recruitment peaks.
J F M A M J J A S O N D J F M A M J J A S O N D J F M A
Figure 3. Recruitment peaks of P. esculentus produced by the simulation model from survey data.
1986
In the future we plan to use these means and variance to establish recruitment peaks that vary ran- domly around these values for the simulation. Recruitment will vary about the means as predicted by the variance and as a resuli each simulation run will produce different results. The mean of a series of Monte Carlo trials will establish long term average estimates. This process is more realistic than simple determinis- tic models as it includes a range of natural variation, it also allows some idea of the range of results that a management measure may have, and allow experimentation with the variability of recruitment itself.
1 2.3.4 Future model uses
Month
1987
In the future the model will be extended to include fleet dynamics - the interaction between the rate of fishing and such factors as prawn prices, prawn catches, interest rates etc. If fisheries managers want to predict the effects of these factors on prawn catches then a submodel of fleet dynamics must be included. This submodel would also allow managers to study the possible effects of changing the fleet size or altering Its catching power.
1988
The model will also be elaborated into a spatial model which will directly incorporate survey data from prawn tagging experiments and juvenile prawn studies. If managers were to consider additional or altered spatial closures then the model must have a spatial component.
page 133

The model can be elaborated or simplified in many ways. The model already allows for prawns to grow at random rates relative to the overall mean predicted by the von Bertalanffy growth curve. This random growth is more realistic, however, this effect increases the computer time necessary to make predic- tions without greatly modifying the predictions. The computer code which simulates random growth has been disabled in our simulation. This in an example of how different processes or submodelscan be added or abandoned as needed to maintain the simplest model consistent with our needs and understanding.
12.4 Acknowledgments
The author wishes to thank David Sterling for his helpful discussion and input into the model and Rob Coles for reviewing the manuscript and Julie Keating for preparing the figures.
12.5 References
Garcia, S. (1 985). Reproduction, stock assessment models and population parameters in exploited penaeid shrimp populations. In 'Second National Prawn Seminar'. (Eds P.C. Rothlisberg, B.J. Hill and D.J. Staples). pp. 139-58. (NPS2: Cleveland, Australia).
Haynes, J. and Pascoe, S. (1988). A policy model of the Northern Prawn Fishery. Aust. Bur. Agric.and Res. Econ. Aust. Govt Pub. Serv.: Canberra. 49pp.
Somers, I.F. (1985). Maximising value per recruit in the fishery for banana prawns, Penaeus merguiensis, in the Gulf of Carpentaria. In 'Second National Prawn Seminar'. (Eds P.C. Rothllsberg, B.J. Hill and D.J. Staples). pp. 185-91. (NPS2: Cleveland, Australia).
Sluuanowski, P.R. (1984). Modelling and optimal control: a case study based on the Spencer Gulf prawn fishery for Penaeus longistylus Kishinouye. I. Cons. Int. Explor. Mer, 41: 21 1-25.

DISCUSSION

page 1 36

13. GENERAL DISCUSSION R.A. Watson
13.1 Issues Addressed
This repoft presents some of the results from three years of research in Torres Strait. Some of the sections cover research which is presently ongoing andtherefore are truly provisional in nature, while other sections have been reported in full as those phases of our research are completed. All sections presented in this interim report are esserltial to meeting our project's objectives (Section I), as we could not restrict our research to surveys of adult commercial catches and historical studies of the fishery. It was necessary to study aspects of adult reproduction and juvenile development and to initiate tagging studies to understand and elucidate the life-cycle of the commercial prawn species Tagged prawns also allowed migration and growth rates to be monitored.
It was necessary to investigate the use and performance of various survey gear to quantify estimates of juvenile and adult prawn numbers. Though this work was not an end in itself, it increased our understand- ing of prawn behaviour and revealed the potential sources of error in our survey estimates.
Velvet prawns are not fished commercially in Torres Strait as they are in other north Queensland fisheries. We included them in our study for a two-year period because they were numerous, they are important to many other fisheries in the lndo-Pacific region, and they are of potential commercial value in Torres Strait. This work is now complete and it greatly increased our understanding of these species.
Our surveys for juvenile prawns in seagrass areas often captured large numbers of other species, most notibly smaller Ash species. Some of these are known to be major predators of juvenile commercial prawns. By retaining these fish specimens from beam trawl samples we were able to greatly expand our knowledge of potential prawn predators and of the community structure of seagrass habitats.
Gathering information on the basic biological parameters of the commercial prawn species is time consuming. Often there is no completely satisfactory way of assessing the precision of our estimates of important things such as growth rates. A few years study of such a complex system as the Torres Strait Prawn Fisherydoes not allow much insight into the variability of these parameters between areas, years, and sometimes species. Though there is a strong desire for us to continue to improve our estimates and our understanding of the processes involved, this refinement would ultimately occur at the expense of our commitment to fisheries managers who require information on the relative merits of management options in real time.
Key biological or population parameters can be combined with historical data in new or existing models of the fishery. The creation of these models test our understanding of the system. Our models can be refined as our understanding develops and through this process we can redirect our existing research to gather further information on key parameters or processes, or initiate research on important components that have been overlooked. We can use our models to test the possible impacts of different management scenar- ios once our models adaquately represent our understanding of the system and produce predictions which can be verified. Though the model predictions can often not be tested directly, they nevertheless represent our best estimate of the possible outcome of a management measure given our understanding of the fishery. in this way we can provide fisheries managers with the best information possible on which to base manage- ment decisions.
1 3.2 Present Research
We have addressed many aspects of the Torres Strait Prawn Fishery concentrating on Penaeus esculentus, the brown tiger prawn, its most valuable and unarguablely its most exploited species. This report does not present much information on the biology of Metapenaeus endeavouri, the endeavour prawn, which is nearly as valuable and certainly more numerous, nor does it report on the red-spot king prawn, P. longistylus, which consistently forms 10% of the commercial catch. We have three and a half years survey data on the adults and juvenile of both these species being analysed.

This report only briefly reports on the results of our initial P. esculentus tagging programme. Further analysis of this data is already underway. We have also completed the field component of a second tagging study of both P. esculentus and M. endeavouri.
We have modified our sampling programme since our initial three years of surveys which form the basis of this report. Survey stations which were unproductive or which no longer contibuted much to our understanding of the fishery or its species composition were abandoned and replaced with others better situated to allow us to test our hypotheses on such concerns as prawn migration routes. New stations have 0
also been added within the jurisdiction area of Papua New Guinea, which will yield critical information on the relationships between the two fisheries and on the best approach for joint management practices.
13.3 Plans for the Future
An additional prawn tagging study is planned for early 1990 which will help distinguish prawn stocks in the far north and in the south of the Australian Torres Strait Protected Zone. This study will also trace the migra- tion of prawns in central Torres Strait beyond the geographical limits previously possible. We plan to tag all three commercial species at these sites.
Further computer modelling is planned. We will collaborate with American researchers to investigate the most modern techniques in fisheries computer simulation. The addition of overseas expertise will ensure that the best of existing approaches are used when our survey data is Interpreted for management purposes. Through collaboration we will develop new techniques specifically designed for fisheries such as the Torres Strait Prawn Fishery.
Our second report will address the other two major commercial species, M, endeavouri and P. longistylus. This second report and subsequent reports will also describe advances made in our under- standing of P, esculentus. We will document the findings from our two tagging programmes and plan to publish sections of our reports in professional fishing magazines and in the scientific literature.
Responsible fisheries research must provide accurate information on the biology of exploited stocks, and assess the effects of fishing and other factors on these stocks. This can only occur if research pro- '>
grammes are developed through liaison with industry representatives and fisheries managers. This report documents some aspects of our research in Torres Strait and provides a sound scientific basis for the im- proved management of the Torres Strait Prawn Fishery.
page 138