tide-surge interaction intensified by the taiwan strait
TRANSCRIPT

ClickHere
for
FullArticle
Tide‐surge Interaction Intensified by the Taiwan Strait
Wen‐Zhou Zhang,1,2,3 Fengyan Shi,3 Hua‐Sheng Hong,1 Shao‐Ping Shang,2
and James T. Kirby3
Received 27 August 2009; revised 4 January 2010; accepted 7 January 2010; published 19 June 2010.
[1] The Taiwan Strait is a long and wide shelf‐channel where the hydrodynamics isextremely complex, being characterized by strong tides, and where storm surges frequentlyoccur during the typhoon season. Obvious oscillations due to tide‐surge interaction wereobserved by tide gauges along the northern Fujian coast, the west bank of the Taiwan Strait,during Typhoon Dan (1999). Numerical experiments indicate that nonlinear bottom friction(described by the quadratic formula) is a major factor to predict these oscillations whilethe nonlinear advective terms and the shallowwater effect have little contribution. It is foundthat the tide‐surge interaction in the northern portion of the Taiwan Strait is intensified bythe strait. Simulations based on simplified topographies with and without the island ofTaiwan show that, in the presence of the island, the channel effect strengthens tidal currentsand tends to align the major axes of tidal ellipses along the channel direction. Storm‐inducedcurrents are also strengthened by the channel. The pattern of strong tidal currents and storm‐induced currents along the channel direction enhances tide‐surge interaction via thenonlinear bottom friction, resulting in the obvious oscillations along the northern Fujiancoast.
Citation: Zhang, W.‐Z., F. Shi, H.‐S. Hong, S.‐P. Shang, and J. T. Kirby (2010), Tide‐surge Interaction Intensifiedby the Taiwan Strait, J. Geophys. Res., 115, C06012, doi:10.1029/2009JC005762.
1. Introduction
[2] The Taiwan Strait is located on the wide continentalshelf of the China Seas, bounded by the island of Taiwan tothe east and the Chinese mainland to the west. It is a long andwide channel connecting the East China Sea and the SouthChina Sea. The average depth of the strait is nearly 60 m.[3] Tidal range in the Taiwan Strait has a large spatial
variation. The mean tidal range in its northwest end is largerthan 4 m while that in the southeast end is smaller than 1 m.The remarkable spatial difference in tidal range results inextremely strong currents [Fang et al., 1985]. The semidi-urnal tide is dominant in the Taiwan Strait. Both observationsand numerical model results have shown that the major axesof ellipses of M2 and K1 tidal constituents are in the directionalong the strait [Jan et al., 2002; Lin et al., 2005].[4] The Taiwan Strait is on the west edge of the western
North Pacific (WNP) where tropical cyclones form frequently.Tropical cyclones formed in the WNP account for over 30%
of events occurring worldwide [Gray, 1968; Lander andGuard, 1998]. There are about 6–8 typhoons, or strongtropical cyclones, affecting the strait every year. Typhoonsoften induce storm surge and coastal inundation, causingheavy damage to property and loss of life. Based on the datagiven by Yang et al. [1993], there were 69 typhoons inducinghigh storm surges over 1 m at the Fujian coast, the westernbank of the Taiwan Strait, from 1949 to 1990, four of whichcaused a storm surge elevation over 2 m. Among them,Typhoon Elsie (1961) induced a fatal storm surge over 2 mand inundation at the northwest coastal area of the TaiwanStrait and 7770 people were killed. Since 1990, there wereseveral strong typhoons affecting the Taiwan Strait andaccompanying with them, devastating storm surges appearedalong the Fujian coast. They destroyed coastal infrastruc-ture and caused severe disasters. For example, TyphoonDan (1999) caused a damage of four billion Chinese yuanand a loss of 72 people. Frequent occurrence and high riskattracted much attention to the storm surge and its predictiontechnique.[5] Tide‐surge interaction is one of the most important
problems in the study and the prediction of storm surges[Proudman, 1955a; Doodson, 1956;Wolf, 1981; Bernier andThompson, 2007]. In early pioneering work, Proudman[1955a, 1955b, 1957] conducted theoretical investigationson the effect of tide‐surge interaction on storm surges in anestuary and showed that tide‐surge interaction makes theheight of a storm surge whose peak occurs near to tidal highwater less than that of a surge whose peak occurs near to tidal
1State Key Laboratory of Marine Environmental Science, XiamenUniversity, Xiamen, China.
2Key Laboratory of Underwater Acoustic Communication and MarineInformation Technology of the Minister of Education, Xiamen University,Xiamen, China.
3Center for Applied Coastal Research, Department of Civil andEnvironmental Engineering, University of Delaware, Newark, Delaware,USA.
Copyright 2010 by the American Geophysical Union.0148‐0227/10/2009JC005762
JOURNAL OF GEOPHYSICAL RESEARCH, VOL. 115, C06012, doi:10.1029/2009JC005762, 2010
C06012 1 of 17

low water for a progressive wave, while the effect is reversedfor a standing oscillation. Doodson [1956] studied the tide‐surge interaction in a long uniform gulf and showed that theinteraction between tide and surge affects the shapes andheights of the storm surges. According to studies sincemid‐1950s, tide‐surge interaction cannot be neglected inpredictions of storm surges in shallow water. The tide‐surgeinteraction in the North Sea and River Thames was exten-sively investigated in several studies by Rossiter [1961],Banks [1974], Prandle and Wolf [1978], and Wolf [1981].The main contributions of their work to the literature havebeen described amply in Bernier and Thompson [2007] andHorsburgh and Wilson [2007]. Recently, Horsburgh andWilson [2007] confirmed the reported tendency for peakresiduals to occur most frequently on the rising tide based on1993–2005 data from the five sites on the east coast of theUnited Kingdom. Attention has been paid to the importanceof tide‐surge interaction in some other regions. Johns et al.[1985] showed that tide‐surge interaction produces a sub-stantial effect off the Orissa coast of India and causes the seasurface elevation either to increase above or to decreasebelow its pure surge value. As‐Salek and Yasuda [2001]found that the tide‐surge interaction in the Meghna estuaryof Bangladesh displays the progressive wave nature of localtide. Wang and Chai [1989] indicated that the periodic re-siduals during storm periods at Wusong on the coast of theEast China Sea are mainly caused by the interaction betweentide and storm surge. Bernier and Thompson [2007] showedthat the nonlinear parameterization of bottom stress is theprincipal contributor to their modeled tide‐surge interactionoff the east coast of Canada and northeastern United States.[6] Although both large tidal ranges and frequent storm
surges are observed in the Taiwan Strait, little attention hasbeen paid to tide‐surge interaction. Observations of stormsurges often show oscillations with near‐tidal period at thenorthern Fujian coast [Wang and Liu, 1986; Zhang et al.,2004]. The purpose of this work was to investigate the os-cillations due to tide‐surge interaction and to explain theenhancing effect of the Taiwan Strait on the tide‐surgeinteraction at the northern Fujian coast.[7] The paper is organized as follows. The tide‐surge
model used in this work is briefly described in section 2.Section 3 describes the observations of oscillations with near‐tidal period in the storm surge data during Typhoon Dan(1999) and the decisive factor of tide‐surge interaction for theoscillations. In section 4, a series of numerical experiments isconducted to examine dynamic factors related to tide‐surgeinteraction. Section 5 discusses the intensification caused bythe Taiwan Strait on tide‐surge interaction and its mechanismrelated to the nonlinear bottom friction. Results are summa-rized and concluded in section 6.
2. Tide‐Surge Model
2.1. Numerical Model
[8] The numerical model (the two‐way Nested CoupledTide‐Surge Model, NCTSM) is described in detail by Zhanget al. [2007] and is used to forecast typhoon surges by threeoperational forecast agencies (Oceanic and Fishery Bureauof Fujian Province, Fujian Marine Forecast Center, andNingde Marine Forecast Center) in Fujian Province since
2007. It is a 2‐D barotropic model based on depth‐averagedmomentum and continuity equations in the spherical co-ordinates as follows:
@u
@tþ u
R cos’
@u
@�þ v
R
@u
@’� uv tan’
R� fv
¼ � g
R cos’
@�
@�� 1
�R cos’
@pa@�
þ 1
�HFs � Fbð Þ ð1Þ
@v
@tþ u
R cos’
@v
@�þ v
R
@v
@’þ u2 tan’
Rþ fu
¼ � g
R
@�
@’� 1
�R
@pa@’
þ 1
�HGs � Gbð Þ ð2Þ
@�
@tþ 1
R cos’
@ Huð Þ@�
þ @ Hv cos’ð Þ@’
� �¼ 0; ð3Þ
where the notations are the same as those given by Zhanget al. [2007]. t represents the time; (l,’) represent the eastlongitude and north latitude; (u,v) represent the east and northcomponents of the depth‐averaged velocity q; z representsthe sea surface elevation above the undisturbed sea level; Hrepresents the total water depth, H = h + z; h represents thedepth of undisturbed water; pa represents the atmosphericpressure on the sea surface; tb = (Fb, Gb) represents thebottom friction; and ts = (Fs, Gs) represents the wind stress.Two‐dimensional models are widely adopted in the studieson tide‐surge interaction and in the operational forecast ofstorm surge [e.g., Banks, 1974;Wolf, 1981; Tang et al., 1996;Flather, 2000; As‐Salek and Yasuda, 2001; Shen et al., 2006;Bernier and Thompson, 2007;Horsburgh andWilson, 2007].Although recent results [Weisberg and Zheng, 2008] indicatethat 3‐D models can give significantly different results forpredicted surges owing to differences in the orientation andmagnitude of the bottom stress vector, the 2‐D model isapplied in this work.[9] For analysis of tide‐surge interaction, z is usually
considered to be the algebraic sum of tide level (zT), purestorm surge elevation (zS, sea level change produced byatmospheric forcing only), and residual elevation due to tide‐surge interaction (zI) [Banks, 1974], namely, z = zT + zS + zI.Practical storm surge (zSI) is the sum of the latter two parts(zSI = zS + zI = z − zT). z, zT, and zS can be obtained by threecontrol model runs, respectively, one with full forcingincluding atmospheric forcing and tidal forcing (full run), onewith tidal forcing only (tide‐only run), and one with atmo-spheric forcing only (storm‐only run). Then, zSI and zI canbe calculated from the results of above three model runs: zSI =z − zT and zI = zSI − zS. Since zI is the result of tide‐surgeinteraction, it can be taken as a direct measure of the inter-action [Bernier and Thompson, 2007]. The root‐mean‐square(RMS) value of zI can be used to determine the magnitude orthe intensity of the oscillations due to tide‐surge interactionduring an entire storm event [Bernier and Thompson, 2007].The ratio (referred to as Ir) of RMS(zI) to RMS(zS) can reflecttotal relative intensity of tide‐surge interaction and pure stormsurge.
ZHANG ET AL.: TIDE‐SURGE INTERACTION C06012C06012
2 of 17

[10] The quadratic law is applied in the parameterization ofbottom stress (tb) and wind stress (ts) as follows:
tb ¼ �Cb qj jq; ð4Þ
ts ¼ �aCd Wj jW ð5Þ
where Cb is the bottom friction coefficient which can bea constant or calculated using Chezy formula, i.e., Cb = gc−2,c = H1/6/n in which n is Manning coefficient. Chezy formulawith n = 0.0295 was used in this study.W is the wind velocityvector at a height of 10 m above sea surface; ra is the densityof air; and Cd is the wind stress coefficient and
Cd � 103 ¼
1:052; Wj j � 6 m s�1
0:638þ 0:069 Wj j; 6 < Wj j < 30 m s�1
2:708; Wj j � 30 m s�1
;
8>>>><>>>>:
ð6Þ
which has been used by Zhang et al. [2007] and Zhang et al.[2009].[11] The model domain is shown in Figure 1. The hori-
zontal resolution is 1/10° (about 11.1 km) both in latitude andin longitude for the coarse structured mesh (110°E∼130°E,18°N∼30°N) and 1/30° (about 3.7 km) for the fine mesh(113.3°E∼121.5°E, 22.0°N∼28.4°N). The coarse mesh man-tles the whole fine mesh. Only the coarse mesh was usedin this study to keep domain boundaries consistent in allnumerical experiments. No water is allowed to flow throughthe coastal boundaries by making the normal component ofcurrent vanish. On the open boundaries, a radiation conditionis used as follows [Zhang et al., 2007; Zhang et al., 2009]:
qn ¼ q̂n �C
H� � �̂
� �; C ¼
ffiffiffiffiffiffiffigH
pð7Þ
where the subscript n stands for the component normal tothe open boundary; �̂ is the water level input on the openboundary which is prescribed beforehand; and q̂n is the cur-rent input determined by local solution.More details about theNCTSM are given by Zhang et al. [2007].
2.2. Tropical Cyclone Model
[12] A tropical cyclone (typhoon or hurricane) is a strongtropical weather system with cyclonic wind field and lowcentral air pressure. In this work, an analytic axisymmetricmodel, which is presented by Holland [1980] and is widelyused in the operational forecasting of storm surges producedby a tropical cyclone, is applied to describe the wind field andair pressure field associated with a static cyclone. Holland[1980] demonstrated that this model is better than the modi-fied Rankine vortex since the latter is too sensitive to theestimation of the radius to maximum wind. It includes twoequations of the radial profiles of sea level pressure andwindsin a cyclone and makes the air in cyclostrophic balance. Theair pressure profile is given by the following equation:
pa ¼ pc þ�p exp � r
rm
� ��B" #
; �p ¼ pe � pc; r > 0; ð8Þ
where pc (Pa) is the central pressure of the cyclone, pe (Pa)the ambient pressure or environmental pressure, and Dp thepressure drop or the pressure deficit; B is the shape parameter;r is the distance from the center, and rm is the radius to max-imum wind speed Wm. The wind profile is as follows:
Wc ¼ Wm �B exp 1� �B � �1=2
; � ¼ rmr: ð9Þ
where Wc is the wind speed at the distance r from the center.In equations (8) and (9), the shape parameter B can be cal-culated by the following formula developed from the studies
Figure 1. The geographic map and model domain. Water depth contours are in meters. SS: Sansha; PT:Pingtan; XM: Xiamen; DS: Dongshan.
ZHANG ET AL.: TIDE‐SURGE INTERACTION C06012C06012
3 of 17

of Atkinson and Holliday [1977], Jakobsen and Madsen[2004], and Zhang et al. [2007]:
B ¼ � Pe � Pcð Þ�þ"; ð10Þ
where a, b, and e are empirical coefficients and are given by0.095, 0.288, and 0.1, respectively, in this study.[13] Since the wind field of a tropical cyclone circumrotates
around its center, the wind direction is ideally tangent to theconcentric circles. Because of friction effects, the actual winddirection deflects to the center an angle (inflow angle) fromthe tangential direction.[14] The above wind profile is for the static cyclone. An
additional wind field due to the motion of the cyclone[Jelesnianski, 1965] is added to the above static cyclonemodel. This tropical cyclone model is used in Zhang et al.[2009].
3. Oscillation due to Tide‐Surge Interaction
3.1. Observations
[15] Typhoon Dan formed in the WNP on 4 October 1999.It moved west to the northeast area of the South China Sea,then turned north late on 6 October, and finally made landfallnear Xiamen. Its moving path is plotted in Figure 2 basedon the path data published by the China MeteorologicalAdministration.[16] Typhoon Dan is a good case to study the oscillations
due to tide‐surge interaction at the northern Fujian coast. Onereason is that tide gauges at Sansha and Pingtan at thenorthern coast of Fujian recorded significant residual signalswhich were not submerged in storm surge peaks since thegauges were far from the storm path. The other reason is that
the wind field was scarcely affected by the high terrain ofthe island of Taiwan since the storm center stayed more than200 km away from the island, and its 7 Beaufort scale radiuswas too small to reach the island. Previous studies showedthat the high terrain of the island has a significant influenceon the low wind field and pressure field of a typhoon passingby it [Chang et al., 1993], which results in some unexpectedvariations in storm surges and contaminates the oscillationswith near‐tidal period. In this case, the uncertainty of atmo-spheric forcing due to the terrain of the island was avoided tothe utmost because of the unique storm path.[17] The water level observations used in this study were
obtained with float‐type tide gauges at four tide gauge sta-tions along Fujian coast (Figure 1), managed by the StateOceanic Administration of China. Time series of measuredstorm surge at Sansha, Pingtan, Xiamen, and Dongshan arecalculated by subtracting predicted astronomical tide with170 tidal constituents from the observed water level data andare shown by black solid lines in Figure 3. Dashed and dottedlines in Figure 3 represent numerical results and will bedescribed in section 3.2. The measured data show that thepeak of surge reached 121 cm at Xiamen where Dan passed.Surges at Sansha and Pingtan stations were small but indi-cated obvious oscillations with the semidiurnal tidal period.
3.2. Simulations
[18] Typhoon Dan was simulated using the NCTSMmodeldescribed in section 2. To quantify the effect of tide‐surgeinteraction, we carried out three runs: tide‐only run, storm‐only run, and full run. Eight tidal constituents, including M2,S2, N2, K2, K1, O1, P1, and Q1, were taken into account in tidesimulations. The three runs were fully spun‐up prior to ex-tracting results in the storm period. We used pure storm surgezS, practical storm surge zSI, and residual zI to represent,
Figure 2. The best track of Typhoon Dan (1999) during the period from 3–10 October. Black dots denotethe positions of the typhoon at 0800 local standard time (LST) on the dates labeled by numbers; circlesdenote the positions at 0200, 1400, or 2000 LST.
ZHANG ET AL.: TIDE‐SURGE INTERACTION C06012C06012
4 of 17

respectively, predicted surge without tide‐surge interaction,surge with tide‐surge interaction, and residual due to tide‐surge interaction. They were obtained using the algebra definedin section 2.1.[19] Figure 3 shows the time series of measured storm
surge, model‐predicted pure storm surge, and practical stormsurge, respectively, at Sansha, Pingtan,Xiamen, andDongshan.The full run predicted the oscillation patterns whichmatch themeasured surges in both magnitude and phase. Especially atSansha and Pingtan, located at the northern Fujian coast, themagnitudes of the oscillations are more than 40 cm in both themeasured data and the full run results, while the pure surgescalculated from the storm‐only run are less than 27 cm atthe two gauges. The values of Ir are 0.649, 0.557, 0.244, and0.334 at Sansha, Pingtan, Xiamen, and Dongshan, respec-tively, indicating that the tidal modulation at former twostations is more important than at the latter two. The intensity
of tide‐surge interaction is demonstrated by plots of resid-ual shown in Figure 4. The magnitudes of the residuals areslightly larger than the storm‐only induced surges, suggestingthat tide‐surge interaction is important in this region.[20] It was noted that although wetting and drying schemes
were not considered in the model [Zhang et al., 2007], bothtide simulations (refer to Zhang et al. [2007]) and storm surgesimulations during Typhoon Dan were still in good agree-ment with measurements, indicating that the inundationprocess had little impact on tide‐surge interaction in this areaand the model was appropriate to this study.
4. Dynamic Factors for the Oscillation
[21] In studies of tide‐surge interaction, mechanisms of theinteraction are usually examined using a numerical modelingtechnique which separates the contribution to the interaction
Figure 4. Time series of simulated residuals due to tide‐surge interaction.
Figure 3. Time series of measured and predicted storm surges during the period from 0000 LST 8Octoberto 2300 LST 9 October 1999.
ZHANG ET AL.: TIDE‐SURGE INTERACTION C06012C06012
5 of 17

[e.g.,Prandle andWolf, 1978;Bernier and Thompson, 2007].Tide‐surge interaction is a nonlinear phenomenon and ismathematically attributed to nonlinear terms in the equationsof motion. The governing equations (1) to (3) contain severalnonlinear terms which can be classified into three nonlineareffects: (a) advective effect arising from the advective termsas shown in the momentum equations (1) and (2); (b) non-linear effect of bottom friction terms with quadratic param-eterization in (4); and (c) shallow water effect which arisesfrom nonlinear terms related to (h + z) in mass conservationequation (3) and in momentum equations (1) and (2). Theterminology “shallow water effect” was used by many authorswho did not refer to the same terms in the nonlinear shallowwater equations [e.g., Proudman, 1955a; Prandle and Wolf,1978; Horsburgh and Wilson, 2007]. Here, in this paper,we refer shallow water effect to the effect from the termsrelated to (h + z). Details will be described in section 4.3.[22] Previous studies showed that the significance of three
effects may be case dependent and more related to specificregions associated with topography, tidal range, and strengthof storm [Proudman, 1957; Prandle and Wolf, 1978; Bernierand Thompson, 2007; Horsburgh and Wilson, 2007]. Toexamine the three nonlinear effects in prediction of residualsin the Taiwan Strait, we carried out numerical experimentsusing reduced models by eliminating or linearizing nonlinearterms associated with each nonlinear effect. The results cal-culated from the model including all three effects (standardmodel/case) will be used as a reference, namely, standardresults (see section 3.2), for comparisons with results from thereduced models.
4.1. Nonlinear Advective Effect
[23] After removing advective terms in momentum equa-tions, we followed the same procedures as in the standard caseand performed three model runs, i.e., tide‐only run, storm‐only run, and full run. Surges with and without tide‐surgeinteraction (zSI and zS) and residuals (zI) were obtained in thesame way as in the standard case. Comparisons of residualsbetween the standard case and the case without advectiveterms (the figure omitted) show that the results of the twocases are very close, indicating that removing advective termshas little effect. Since the RMS value of residual zI is used toquantify the intensity of tide‐surge interaction, the reductionratio of RMS(zI) between the reduced model and the standardmodel can be calculated via the following formula:
%Ip ¼ RMS �ISCð Þ � RMS �Ið ÞRMS �ISCð Þ � 100 ð11Þ
where Ip represents the reduction ratio and zISC and zI areresiduals from the standard model and the reduced model,respectively. The reduction ratios are 4.7% at Sansha and6.2% at Pingtan calculated from the hourly data during thestorm period from 00:00 local standard time (LST) 8 Octoberto 23:00 LST 9 October 1999. Based on the scaling analysisof momentum equations controlling tide and storm surgemotions, the nonlinear advective term is an order of magni-tude smaller than the quadratic bottom friction term (dis-cussed in the following section) in the Taiwan Strait,indicating that the advective effect is insignificant for thetide‐surge interaction in this area, compared with the bottomfriction effect.
4.2. Nonlinear Bottom Friction
[24] To examine the influence of nonlinear bottom frictionon tide‐surge interaction, we set up a reduced model in whichthe quadratic form of bottom friction was replaced with alinear form,
tb ¼ �Cblq; ð12Þ
where Cbl is the coefficient of the linear bottom friction. Thevalue of Cbl in the linear form of bottom friction may beinconsistent with that of Cb in the quadratic form. Heaps[1969] used a value Cbl = 0.0024 m s−1 in the linear bottomfriction formulation for the North Sea. Here, we used a valueCbl = 0.0020 m s−1 which produced surges with peaks atSansha and Pingtan comparable to those predicted by thenonlinear friction model.[25] Three runs were conducted as in section 4.1. The same
comparisons were made at Sansha and Pingtan as shown inFigure 5. Figures 5a and 5b show the time series of stormsurges predicted by the reduced model with and without tide‐surge interaction, with comparison to the measured data. Thetwo results are almost identical and both of them disagreewith measured data. Tidal modulations as shown in bothmeasured data and the standard results were not predicted bythe reduced model with linear bottom friction. Figures 5c and5d show comparisons of residuals between the standard caseand the case with linear bottom friction. The residuals pre-dicted by the reduced model were very small, compared withthe standard results. The discrepancy resulting from the linearbottom friction indicated that the nonlinear form of bottomfriction is important in predicting tide‐surge interaction. Thereduction ratios Ip between the current case and the standardcase are 83.6% at Sansha and 77.4% at Pingtan during thestorm period. The high reduction ratios also implied that thenonlinear bottom friction is a major contributor to predictionof tide‐surge interaction, which is consistent with the resultsin some other regions [e.g., Tang et al., 1996; Bernier andThompson, 2007].[26] One concern about the residual oscillations almost
disappearing in the reduced model is that the linear parame-terization of friction is allowing much larger currents so thatthe surface stresses become negligible. From the comparisonbetween the linear bottom friction and the quadratic bottomfriction, the difference in using the different formulas can bemeasured by Cr = Cb∣q∣/Cbl with Cr ∼ 1 representing that thesame magnitude of bottom stresses can be obtained by bothformulas. For general parameters in tide and storm surgesimulations in the Taiwan Strait domain, the average depthof 60 m and current of ∼ 1 m s−1 result in Cr ∼ 1, indicatingthat the linear bottom friction formula may produce bottomstresses comparable to those from the quadratic formula.Figure 6 shows the comparisons of simulated currents andbottom stresses between the reduced model and the standardmodel. Surface stresses are also plotted in the figure forcomparison. It can be seen from panels (a) and (b) that thecurrents simulated with linear bottom friction are comparableto those with quadratic one. Figure 6d shows that the non-linear and linear bottom stresses calculated at Pingtan havesimilar amplitudes as in the comparison of currents shownin Figure 6b. However, the nonlinear bottom stress calculatedat Sansha is obviously smaller than the linear one as shownin Figure 6c although the currents separately simulated with
ZHANG ET AL.: TIDE‐SURGE INTERACTION C06012C06012
6 of 17

Figure 6. Time series of (a and b) current and (c and d) wind stress and bottom stress. Solid lines denoteeast components and dotted ones denote north components. Red solid and dotted lines are results (currentand bottom stress) with nonlinear bottom friction; blue ones are results with linear bottom friction; blackones are wind stresses.
Figure 5. Time series of storm surges, (a and b) measured and simulated with a linear bottom friction formand (c and d) simulated residuals due to tide‐surge interaction.
ZHANG ET AL.: TIDE‐SURGE INTERACTION C06012C06012
7 of 17

nonlinear and linear bottom friction formulas are almost thesame in Figure 6a. These could be expected because, for thetwo specific stations, Cr is about 1 (H∼10 m, ∣q∣ ∼ 0.5 m s−1)at Pingran while Cr is quite smaller than 1 (H∼10 m, ∣q∣ ∼0.2 m s−1) at Sansha. It is clear that the surface stress is notnegligible in these two cases (Figures 6c and 6d), indicatingthat the wind stress is not swamped by the bottom stress.[27] Another concern is that the coefficient of the nonlinear
friction from equation (4) with the Chezy formula is depen-dent on the total water depth (H = h + z) which should rep-resent a nonlinear effect. In order to examine its influence ontide‐surge interaction, we used a constant friction coefficientCb = 0.0025 and repeated all simulations. Figures 7a and 7bshow results from the model with constant friction coeffi-cient, which are in good agreement with the measurements atSansha and Pingtan like standard results. The comparisons ofresiduals in Figures 7c and 7d demonstrate that the differ-ences caused by the two different types of coefficients aresmall. Thus, the oscillations due to tide‐surge interaction werebasically induced by the quadratic form of bottom frictionrather than the depth‐dependent coefficient.
4.3. Shallow Water Effect
[28] The effect of shallow water terms was initially namedby Proudman [1957], who called the product term of surfaceelevation z and velocity u in the mass conservation equa-tion and the advective term in the momentum equation the“shallow water terms.” Later, Prandle and Wolf [1978]referred to the nonlinear terms containing (h + z) as shal-low water terms. In this paper, we investigated the shallowwater effects from the product terms in the mass conserva-tion equation (3) and the terms which contain (h + z) in thedenominator, in the momentum equations (1) and (2).
[29] We set up a reduced model by replacing occurrencesof H ( = h + z) with h in the governing equations. Followingthe same procedures as in sections 4.1 and 4.2, we obtainedsurges with and without tide‐surge interaction. Results ofthese simulations (not shown here) indicated that replacingHwith h has little effect. The reduction ratios calculated wereless than 20% at both Sansha and Pingtan, which was ex-pected considering the small ratio of surface elevation towater depth. According to the result presented byWolf [1981]and cited byHorsburgh andWilson [2007], the shallowwatereffect may become dominant over quadratic friction only fortidal amplitudes in excess of 3 m and water depths of 10 m orless. In the Taiwan Strait, both the tidal amplitudes and surgesin this case are less than 3 m [Zhang et al., 2007], and thedepths in most area are more than 10 m. Since the amplitudesof tides and surges are usually significantly smaller thanwaterdepths in the strait, water level variation contributes little tototal water depth. In other words, the shallow water effect isnot important in the strait. The results from the previoussection and this section demonstrate that tidal modulation ofstorm surges arise dominantly through tidal current changesrather than tidal level variations in the northern part of theTaiwan Strait during Typhoon Dan.
5. Intensification of the Tide‐Surge Interaction
[30] Based on scaling analysis [Welander, 1961; Feng,1977], the significance of nonlinear effects can be measuredby the ratio of surface elevation to water depth, e.g., � = z/h.Tide‐surge interaction was believed to be a higher‐ordereffect in estuaries or open coastal oceans [Proudman, 1957;Liu and Wang, 1989] if � � 1 is satisfied. Residuals dueto the nonlinear tide‐surge interaction should be smaller in
Figure 7. Time series of storm surges, (a and b) measured and simulated with a constant coefficient qua-dratic bottom friction form and (c and d) simulated residuals due to tide‐surge interaction.
ZHANG ET AL.: TIDE‐SURGE INTERACTION C06012C06012
8 of 17

magnitude than pure surges based on the weakly nonlinearassumption. However, in this study, numerical results atSansha and Pingtan showed that the magnitude of oscillationscaused by tide‐surge interaction were even larger than puresurges driven by atmospheric forcing. That motivated us toinvestigate causes beyond the standard analysis. Our hypoth-esis was that the unique geological features of the TaiwanStrait may play an important role in tide‐surge interaction.[31] In this section, we conducted two sets of numerical
experiments: one is with the real bathymetry but with theisland of Taiwan removed from the computation domain; theother is with idealized coast and bathymetry with and withoutan island. The first experiment was used to reveal the roleof the Taiwan Strait in tide‐surge interaction. The secondexperiment was to examine hydrodynamic response to large‐scale geological features without influences from small localbathymetric characteristics.
5.1. Experiment Without the Island
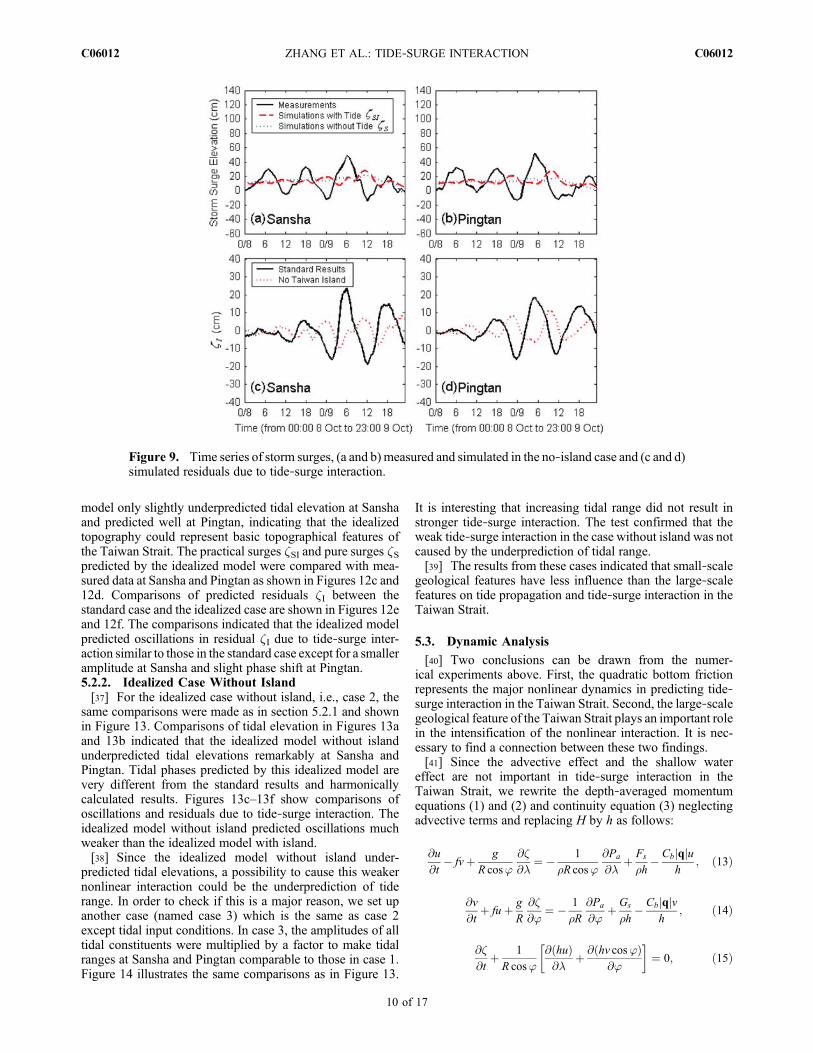
[32] The island of Taiwanwas replaced by an artificial shelfregion the bathymetry of which was obtained by linearinterpolation using water depths around the island. Figure 8shows the constructed bathymetry without the island.[33] Simulations were carried out in the domain without the
island following the same procedures and applying the samedynamic forcing (tidal forcing and atmospheric forcing) asin the standard case. Figures 9a and 9b show results from thesimulations compared with measurements at Sansha andPingtan. Although oscillations in the predicted practicalsurges zSI are recognized, the magnitude of the oscillations ismuch smaller in this case than in the standard case (Figure 3).Figures 9c and 9d show comparisons of residuals due to tide‐surge interaction zI between the standard case and the casewithout island. The intensities of the oscillations measured by1 − Ip are reduced to 44.9% and 53.9% at Sansha and Pingtan,respectively, relative to the standard case, suggesting that theisland has a significant influence on tide‐surge interaction inthe Taiwan Strait.
5.2. Experiments With Idealized Coastand Bathymetry
[34] Although the above test case indicated that the islandof Taiwan plays an important role in intensifying tide‐surgeinteraction in the Taiwan Strait, some uncertainties in con-structing the bathymetry without the island and the influenceof small‐scale geological features on tide‐surge interac-tion are concerns. In order to confirm if the intensificationof tide‐surge interaction is mainly caused by the large‐scalegeological feature of the Taiwan Strait, we constructed anidealized topography including a curved coast line, an island,and shelf bathymetry according to basic geometric char-acteristics of the Taiwan Strait as shown in Figure 10a. Thesimplified coastline follows the sketch of the mainland coast.The island of Taiwan was simplified as a rectangle with sizecomparable to the island. The bathymetry contours follow thecurve of the coastline, with water depth increasing linearlyfrom 5m at the coastline to 115 m at a distance comparable tothe width of the Taiwan Strait, resulting in an average depth ofabout 60 m (the average depth in the Taiwan Strait). The restof the seaward bathymetry was constructed using two slopes,one from 115m to 200 mwith a mild slope and the other from200m to 4000mwith a steep slope, and a submarine plain witha constant depth of 4000 m, as shown in Figures 10b and 11.[35] Two idealized cases, one with the island (case 1 as
shown in Figure 10b) and the other without island (case 2,Figure 10c), were examined with the same tidal forcing andatmospheric forcing as in the standard case. For comparisonsbetween the standard case and the idealized cases, the modeloutput was made at Point A and B marked in Figures 10band 10c, corresponding to Pingtan and Sansha (also calledPingtan and Sansha for idealized cases).5.2.1. Idealized Case With Island[36] With the tidal boundary conditions as the same as in
the standard case, the idealized model with island predictedtidal elevations comparable to the standard case at Sansha andPingtan as shown in Figures 12a and 12b. The idealized
Figure 8. The bathymetry with the island of Taiwan replaced by artificial shelf bathymetry. Water depthcontours are in meters.
ZHANG ET AL.: TIDE‐SURGE INTERACTION C06012C06012
9 of 17
model only slightly underpredicted tidal elevation at Sanshaand predicted well at Pingtan, indicating that the idealizedtopography could represent basic topographical features ofthe Taiwan Strait. The practical surges zSI and pure surges zSpredicted by the idealized model were compared with mea-sured data at Sansha and Pingtan as shown in Figures 12c and12d. Comparisons of predicted residuals zI between thestandard case and the idealized case are shown in Figures 12eand 12f. The comparisons indicated that the idealized modelpredicted oscillations in residual zI due to tide‐surge inter-action similar to those in the standard case except for a smalleramplitude at Sansha and slight phase shift at Pingtan.5.2.2. Idealized Case Without Island[37] For the idealized case without island, i.e., case 2, the
same comparisons were made as in section 5.2.1 and shownin Figure 13. Comparisons of tidal elevation in Figures 13aand 13b indicated that the idealized model without islandunderpredicted tidal elevations remarkably at Sansha andPingtan. Tidal phases predicted by this idealized model arevery different from the standard results and harmonicallycalculated results. Figures 13c–13f show comparisons ofoscillations and residuals due to tide‐surge interaction. Theidealized model without island predicted oscillations muchweaker than the idealized model with island.[38] Since the idealized model without island under-
predicted tidal elevations, a possibility to cause this weakernonlinear interaction could be the underprediction of tiderange. In order to check if this is a major reason, we set upanother case (named case 3) which is the same as case 2except tidal input conditions. In case 3, the amplitudes of alltidal constituents were multiplied by a factor to make tidalranges at Sansha and Pingtan comparable to those in case 1.Figure 14 illustrates the same comparisons as in Figure 13.
It is interesting that increasing tidal range did not result instronger tide‐surge interaction. The test confirmed that theweak tide‐surge interaction in the case without island was notcaused by the underprediction of tidal range.[39] The results from these cases indicated that small‐scale
geological features have less influence than the large‐scalefeatures on tide propagation and tide‐surge interaction in theTaiwan Strait.
5.3. Dynamic Analysis
[40] Two conclusions can be drawn from the numer-ical experiments above. First, the quadratic bottom frictionrepresents the major nonlinear dynamics in predicting tide‐surge interaction in the Taiwan Strait. Second, the large‐scalegeological feature of the Taiwan Strait plays an important rolein the intensification of the nonlinear interaction. It is nec-essary to find a connection between these two findings.[41] Since the advective effect and the shallow water
effect are not important in tide‐surge interaction in theTaiwan Strait, we rewrite the depth‐averaged momentumequations (1) and (2) and continuity equation (3) neglectingadvective terms and replacing H by h as follows:
@u
@t� fvþ g
R cos’
@�
@�¼ � 1
�R cos’
@Pa
@�þ Fs
�h� Cb qj ju
h; ð13Þ
@v
@tþ fuþ g
R
@�
@’¼ � 1
�R
@Pa
@’þ Gs
�h� Cb qj jv
h; ð14Þ
@�
@tþ 1
R cos’
@ huð Þ@�
þ @ hv cos’ð Þ@’
� �¼ 0; ð15Þ
Figure 9. Time series of storm surges, (a and b) measured and simulated in the no‐island case and (c and d)simulated residuals due to tide‐surge interaction.
ZHANG ET AL.: TIDE‐SURGE INTERACTION C06012C06012
10 of 17

Figure 10. (a) Sketch map of the Taiwan Strait and idealized coastal boundaries, (b) the idealized coastlineand bathymetry contours (meters) in the idealized case 1, and (c) the idealized coastline and bathymetrycontours (meters) in the idealized cases 2 and 3. Points A and B are locations corresponding to Sanshaand Pingtan, respectively.
ZHANG ET AL.: TIDE‐SURGE INTERACTION C06012C06012
11 of 17

[42] The variables associated with pure tidal motion (uT,vT, zT) satisfy equations (13) to (15) with zero‐atmosphereforcing, and pure atmosphere‐driving motion (uS, vS, zS) alsosatisfy the equations without tidal forcing at open boundaries.
Equations for residuals due to tide‐surge interaction thenfollow
@uI@t
� fvI þ g
R cos’
@�I@�
¼ � Cb qj ju� qTj juT � qSj juSð Þh
� �; ð16Þ
@vI@t
þ fuI þ g
R
@�I@8
¼ � Cb qj jv� qTj jvT � qTj jvSð Þh
� �; ð17Þ
@�I@t
þ 1
R cos’
@ huIð Þ@�
þ @ hvI cos’ð Þ@’
� �¼ 0; ð18Þ
where uI = u − uT − uS, vI = v − vT − vS and zI = z − zT − zS.Equations (16) and (17) show that the motion associated withthe residual is driven by the quadratic friction term. Thevector form of the forcing may be written as follows:
t I ¼ �Cb
hjqjq� jqT jqT � jqS jqSð Þ: ð19Þ
Figure 11. Vertical profile of the idealized bathymetry.
Figure 12. (a and b) Time series of tidal elevations, (c and d) storm surges measured and simulated in theidealized case 1, and (e and f) simulated residuals due to tide‐surge interaction.
ZHANG ET AL.: TIDE‐SURGE INTERACTION C06012C06012
12 of 17

Replacing q with qT + qS + qI yields
t I ¼ �Cb
hjqT þ qS þ qI j qT þ qS þ qIð Þ � jqT jqT � jqS jqS½ �:
ð20Þ
[43] To simplify the discussion, we disregard qI inequation (20). The magnitude of the forcing tI can beevaluated using the norm of tI which is bounded by (seeAppendix A)
2Cb
hjqT j jqS j �Min jqT j2; jqS j2
� �h i� jt I j � 2Cb
hjqT j jqS j
ð21Þ
[44] The inequality expressed in equation (21) indicatesthat the magnitude of the forcing tI is dependent on theproduct of ∣qT∣ and ∣qS∣. Increasing qT and qS may result inincreases of the nonlinear interaction. The forcing becomesa maximum when qT and qS are in the same direction asdescribed in Appendix A.
[45] In the Taiwan Strait, M2 and K1 are the major semi-diurnal and diurnal tidal constituents, respectively. Both ob-servations and numerical model results have shown that themajor axes of their ellipses are in the direction along the strait[Jan et al., 2002; Lin et al., 2005]. Figure 15 shows simulatedtidal current ellipses of M2 and K1 in the idealized case withisland (case 1, top panels) compared with simulations in thecase without island (case 2, bottom panels). In the northernportion of the strait, the major axes of both M2 and K1 tidalellipses are basically parallel with the two side banks of thestrait in the case with island. In the case without island, themajor axes of M2 are almost normal to the coast. The majoraxes of K1 are still parallel with the coast, but magnitudes ofits tidal ellipses are rather small compared with those in thecase with island. Figure 16 shows snapshots of simulatedstorm‐induced currents during Typhoon Dan in the idealizedcases with island (top panels) and without island (bottompanels). In the case with island, storm‐induced currents in thenorthern portion of the strait basically were aligned along thechannel direction. In the case without island, storm‐inducedcurrents were generally small compared with those in the casewith island.
Figure 13. (a and b) Time series of tidal elevations, (c and d) storm surges measured and simulated in theidealized case 2, and (e and f) simulated residuals due to tide‐surge interaction.
ZHANG ET AL.: TIDE‐SURGE INTERACTION C06012C06012
13 of 17

[46] The simulations above indicate that, with the presenceof the island, the channel effect of the strait strengthens bothtidal current and storm‐induced current and tends to alignthem along the channel direction in the northern portion ofthe strait. The force driving tide‐surge interaction is thusincreased according to the dynamic analysis above. Based onthe momentum balance, the increased force of bottom stressis balanced by the pressure gradient force (surface slope) andthen the surge residual which indicates the intensity of tide‐surge interaction. Therefore, the tide‐surge interaction is inten-sified by the channel effect of the strait. Since the tidal motionis periodic, this process is also periodic and results in thesignificant oscillations with a tidal period.
6. Conclusion
[47] This study was motivated by obvious oscillations ofstorm surge elevation with near‐tidal period observed alongthe northern Fujian coast during Typhoon Dan (1999). Theresults demonstrated that the oscillations were caused by thetide‐surge interaction and intensified by the channel effect
of the Taiwan Strait. Numerical experiments using reducedmodels indicated that the nonlinear bottom friction (describedby the quadratic bottom friction formula) is themajor factor topredict the oscillations due to the tide‐surge interaction whilethe nonlinear advective effect and the shallow water effecthave little contribution. Simulations based on simplifiedtopographies with and without the island of Taiwan showthat the large‐scale geological feature of the strait plays animportant role in the intensification of tide‐surge interaction.In the presence of the island, the channel effect strengthensboth tidal currents and storm‐induced currents and trends toalign the currents along the channel direction in the northernportion of the Taiwan Strait. Strong tidal currents and storm‐induced currents along the channel direction enhance thetide‐surge interaction via the nonlinear bottom friction, whichresults in the obvious oscillations along the northern Fujiancoast.[48] Our model was based on 2‐D formulations, and depth‐
averaged current velocity was used in the bottom stress for-mulas. Three‐dimensional effects on bottom stress, aspointed by Weisberg and Zheng [2008], were not taken into
Figure 14. (a and b) Time series of tidal elevations, (c and d) storm surges measured and simulated in theidealized case 3, and (e and f) simulated residuals due to tide‐surge interaction.
ZHANG ET AL.: TIDE‐SURGE INTERACTION C06012C06012
14 of 17

account in the present study but may be addressed in thefurther investigation of tide‐surge interaction in the TaiwanStrait.
Appendix A: Derivation of Inequalityin Equation (21)
[49] Set
qT ¼ jqT j cos T iþ sin T jð Þ ðA1Þ
qS ¼ jqS j cos S iþ sin Sjð Þ ðA2Þ
where T and S represent velocity angles. Disregarding qI inequation (20) we obtained
jt I j ¼ Cb
hj qT þ qS jj Þ qT þ qSð Þ � jqT jqT � jqS jqSð j ðA3Þ
jqT þ qS j ¼ jqT j2 þ jqS j2 þ 2jqT j jqS j cos T � Sð Þh i1=2
: ðA4Þ
The upper bound value can be obtained when the two velocityvectors are in the same direction, i.e., T = S:
jt I j ¼ 2Cb
hjqT j jqS j ðA5Þ
Figure 15. Tidal current ellipses ofM2 and K1 constituents (top) in the idealized case 1 and (bottom) in theidealized case 2.
ZHANG ET AL.: TIDE‐SURGE INTERACTION C06012C06012
15 of 17

and the lower bound values can be obtained when the twovelocity vectors are in the opposite direction, i.e., T = S + p,
jt I j ¼ 2Cb
hjqT j jqS j �Min jqT j2; jqS j2
� �h iðA6Þ
[50] Acknowledgments. This work was jointly supported by theScience Foundation of Fujian Province (2009J01223) and a project of theNational High‐tech R&D Program (2006AA09A302–6). The first author,W.‐Z. Zhang, would like to thank the Center for Applied Coastal Researchof University of Delaware for providing research facilities during his postdoctoral study. F. Shi and J. T. Kirby would like to acknowledge the supportof the National Oceanographic Partnership Program, Project N00014‐06‐1‐0945. Comments from anonymous reviewers were helpful for improving themanuscript.
ReferencesAs‐Salek, J. A., and T. Yasuda (2001), Tide‐surge interaction in the MeghnaEstuary: Most severe conditions, J. Phys. Oceanogr., 31, 3059–3072,doi:10.1175/1520-0485(2001)031<3059:TSIITM>2.0.CO;2.
Atkinson, G. D., and C. R. Holliday (1977), Tropical cyclone minimum sealevel pressure/maximum sustained wind relationship for the westernNorth Pacific, Mon. Weather Rev., 105, 421–427, doi:10.1175/1520-0493(1977)105<0421:TCMSLP>2.0.CO;2.
Banks, J. E. (1974), A mathematical model of a river‐shallow sea systemused to investigate tide, surge and their interaction in Thames‐SouthernNorth Sea region, Philos. Trans. R. Soc. A, 275, 567–609, doi:10.1098/rsta.1974.0002.
Bernier, N. B., and K. R. Thompson (2007), Tide‐surge interaction off theeast coast of Canada and northeastern United States, J. Geophys. Res.,112, C06008, doi:10.1029/2006JC003793.
Chang, C. P., T. C. Yeh, and J. M. Chen (1993), Effects of terrain on thesurface structure of typhoons over Taiwan, Mon. Weather Rev., 121,734–752, doi:10.1175/1520-0493(1993)121<0734:EOTOTS>2.0.CO;2.
Doodson, A. T. (1956), Tides and storm surges in a long uniform gulf,Proc. R. Soc. Lond. A, 237, 325–343, doi:10.1098/rspa.1956.0180.
Fang, G., J. Yang, and X. Zhao (1985), A numerical model for the tides andtidal currents in the Taiwan Strait, Acta Oceanol. Sin., 4, 189–200.
Feng, S. (1977), A three‐dimensional nonlinear model of tides, Sci. Sin., 4,436–446.
Flather, R. A. (2000), Existing operational oceanography, Coastal Eng., 41,13–40, doi:10.1016/S0378-3839(00)00025-9.
Gray, W. M. (1968), A global view of the origin of tropical disturbancesand storms, Mon. Weather Rev., 96, 669–700, doi:10.1175/1520-0493(1968)096<0669:GVOTOO>2.0.CO;2.
Heaps, N. S. (1969), A two‐dimensional numerical sea model, Philos.Trans. R. Soc. A, 265, 93–137, doi:10.1098/rsta.1969.0041.
Holland, G. J. (1980), An analytic model of the wind and pressure profilesin hurricanes, Mon. Weather Rev., 108, 1212–1218, doi:10.1175/1520-0493(1980)108<1212:AAMOTW>2.0.CO;2.
Horsburgh, K. J., and C. Wilson (2007), Tide‐surge interaction and its rolein the distribution of surge residuals in the North Sea, J. Geophys. Res.,112, C08003, doi:10.1029/2006JC004033.
Jakobsen, F., and H. Madsen (2004), Comparison and further developmentof parametric tropical cyclone models for storm surge modeling, J. WindEng. Ind. Aerodyn., 92, 375–391, doi:10.1016/j.jweia.2004.01.003.
Jan, S., C.‐S. Chern, and J. Wang (2002), Transition of tidal waves fromthe East to South China Seas over the Taiwan Strait: Influence of theabrupt step in the topography, J. Oceanogr., 58, 837–850, doi:10.1023/A:1022827330693.
Jelesnianski, C. P. (1965), A numerical calculation of storm tides inducedby a tropical storm impinging on a continental shelf, Mon. Weather Rev.,93, 343–358, doi:10.1175/1520-0493(1993)093<0343:ANCOS>2.3.CO;2.
Johns, B., A. D. Rao, S. K. Dube, and P. C. Sinha (1985), Numerical mod-elling of tide‐surge interaction in the bay of Bengal, Philos. Trans. R.Soc. London, Ser. A, 313, 507–535, doi:10.1098/rsta.1985.0002.
Lander, M. A., and C. P. Guard (1998), A look at global tropical cycloneactivity during 1995: Contrasting high Atlantic activity with low activityin other basins, Mon. Weather Rev., 126, 1163–1173, doi:10.1175/1520-0493(1998)126<1163:ALAGTC>2.0.CO;2.
Lin, S. F., T. Y. Tang, S. Jan, and C.‐J. Chen (2005), Taiwan strait currentin winter,Cont. Shelf Res., 25, 1023–1042, doi:10.1016/j.csr.2004.12.008.
Figure 16. Storm‐induced currents caused by Typhoon Dan (1999) (top) in the idealized case 1 and (bot-tom) in the idealized case 2.
ZHANG ET AL.: TIDE‐SURGE INTERACTION C06012C06012
16 of 17

Liu, F., and X. Wang (1989), A review of storm surge research in China,Nat. Hazards, 2(1), 17–29, doi:10.1007/BF00124755.
Murty, T. S. (1984), Storm surges—meteorological ocean tides, in Cana-dian Bulletin of Fisheries and Aquatic Sciences, 212, 897 pp., ScientificInformation and Publications Branch, Ottawa, Canada.
Prandle, D., and J. Wolf (1978), Surge‐tide interaction in the South NorthSea, in Nihoul, Hydrodynamics of Estuaries and Fjords (Proceedingsof the 9th International Liege Colloquium on Ocean Hydrodynamics),edited by J. C. J., pp. 161–185, Amsterdam, Elsevier.
Proudman, J. (1955a), The propagation of tide and surge in an estuary,Proc. R. Soc. Lond. A, 231, 8–24, doi:10.1098/rspa.1955.0153.
Proudman, J. (1955b), The effect of friction on a progressive wave of tideand surge in an estuary, Proc. R. Soc. Lond. A, 233, 407–418,doi:10.1098/rspa.1955.0276.
Proudman, J. (1957), Oscillation of tide and surge in an estuary of finitelength, J. Fluid Mech., 2, 371–382, doi:10.1017/S002211205700018X.
Rossiter, J. R. (1961), Interaction between tide and surge in the Thames,Geophys. J., 6, 29–53, doi:10.1111/j.1365-246X.1961.tb02960.x.
Shen, J., W. Gong, and H. V. Wang (2006), Water level response to 1999Hurricane Floyd in the Chesapeake Bay, Cont. Shelf Res., 26, 2484–2502, doi:10.1016/j.csr.2006.07.021.
Tang, Y. M., R. Grimshaw, B. Sanderson, and G. Holland (1996), Anumerical study of storm surges and tides, with application to the NorthQueensland coast, J. Phys. Oceanogr., 26, 2700–2711, doi:10.1175/1520-0485(1996)026<2700:ANSOSS>2.0.CO;2.
Wang, J., and F. Chai (1989), Nonlinear interaction between astronomicaltides and storm surges at Wusong tidal station, Chin. J. OceanologyLimnol., 7, 135–142, doi:10.1007/BF02842749.
Wang, X., and F. Liu (1986), The primary study of typhoon surges alongFujian and Guangdong coasts, Stud. Mar. Sin., 27, 33–43.
Weisberg, R. H., and L. Zheng (2008), Hurricane storm surge simulationscomparing three‐dimensional with two‐dimensional formulations basedon an Ivan‐like storm over the Tampa Bay, Florida region, J. Geophys.Res., 113, C12001, doi:10.1029/2008JC005115.
Welander, P. (1961), Numerical prediction of storm surges, Adv. Geophys.,8, 315–379.
Wolf, J. (1981), Surge‐tide interaction in the North Sea and River Thames,in Floods due to high winds and tides, edited by D. H. Peregrine,pp. 75–94, Academic, London.
Yang, H., S. Tian, L. Ye, and F. Xu (1993), Catalog of Marine and CoastalDisasters in China (1949–1990), China Ocean Press, Beijing, China.
Zhang, W.‐Z., J. Y. Hu, S. P. Shang, M. N. Chen, and W. M. She (2004),On the characteristics of storm surges along Fujian coast, Mar. Sci. Bull.,23, 12–19.
Zhang, W.‐Z., H.‐S. Hong, S.‐P. Shang, D.‐W. Chen, and F. Chai (2007),A two‐way nested coupled tide‐surge model for the Taiwan Strait, Cont.Shelf Res., 27, 1548–1567, doi:10.1016/j.csr.2007.01.018.
Zhang, W.‐Z., H.‐S. Hong, S.‐P. Shang, X.‐H. Yan, and F. Chai (2009),Strong southward transport events due to typhoons in the Taiwan Strait,J. Geophys. Res., 114, C11013, doi:10.1029/2009JC005372.
H.‐S. Hong and W.‐Z. Zhang, State Key Laboratory of MarineEnvironmental Science, Xiamen University, 422 Siming South Road,Xiamen, Fujian 361005, China. ([email protected])J. T. Kirby and F. Shi, Center for Applied Coastal Research, Department
of Civil and Environmental Engineering, University of Delaware, Newark,DE, USA.S.‐P. Shang, Key Laboratory of Underwater Acoustic Communication
and Marine Information Technology of the Minister of Education,Xiamen University, Xiamen, China.
ZHANG ET AL.: TIDE‐SURGE INTERACTION C06012C06012
17 of 17