the role of ecologic diversification in sibling speciation of empidonax flycatchers (tyrannidae):...
TRANSCRIPT
Molecular Ecology (2002)
11
, 2065–2081
© 2002 Blackwell Science Ltd
Blackwell Science, Ltd
The role of ecologic diversification in sibling speciation of
Empidonax
flycatchers (Tyrannidae): multigene evidence from mtDNA
N . K . JOHNSON
*†
and C. CICERO
*
*
Museum of Vertebrate Zoology,
†
Department of Integrative Biology, University of California, Berkeley, CA 94720–3160, USA
Abstract
Avian genera characterized by sibling species with distinctive habitat preferences presentan evolutionary enigma in view of the more commonplace occurrence of syntopic congenersthat differ strikingly in colour and pattern. No existing theory has explained the evolutionarybackground that led to these differences. Here we propose that great phenotypic similarityamong some groups of sibling species limits their coexistence and that clues to their radi-ation can be seen in patterns of geographical occurrence. To illustrate our thesis we focusedon the New World flycatcher genus
Empidonax
, a group of 15 species notorious for theirgreat phenotypic similarity. Using 3069 base pairs of mitochondrial DNA from four genes,we produced a complete molecular phylogeny that identified four clades, three of whichrepresent close relatives. The fourth clade includes only
E. virescens
, which apparently hasno close living relatives. The majority of species, including many distant relatives, are com-pletely (58.1%) or essentially (6.7%) allopatric in breeding distribution and exhibit strikingecological segregation into distinctive climate–vegetation zones. Even where ranges over-lap, occupancy of the same habitat by different species is rare. Phylogenetic and distribu-tional patterns in
Empidonax
suggest a peripatric model of stepwise colonization and thenrange expansion of small groups of pioneers during glacial periods into initially enlarging,distinctive habitats destined to be widespread during interglacials. Vicariance is not indi-cated in the absence of barriers of appropriate age and geographical position. Rapoport’srule that northern species have larger ranges than southern species is strongly supported.
Keywords
: allopatric divergence,
Empidonax
, habitat shift, mitochondrial DNA, molecular phylo-geny, sibling species
Received 6 February 2002; revision received 22 May 2002; accepted 25 June 2002
Introduction
Radiations of sibling species, i.e. biological species that arealmost indistinguishable phenotypically from their closestrelatives, are poorly represented in the world’s avifaunacompared with their occurrence in other major animalgroups (Mayr & Short 1970). However, exceptions arefound in several avian families, most notably Apodidae(
Apus
,
Collocalia
), Strigidae (
Otus
,
Glaucidium
), Tyrannidae(
Elaenia
,
Myiarchis
,
Empidonax
), Corvidae (
Corvus
), andSylviidae (
Phylloscopus
). These scattered genera of uniform
species contrast strikingly with the vast majority of aviancongeners that display distinctive plumage patterns andcolours which were important in their speciation, e.g. NewWorld warblers (
Dendroica
; Lovette & Bermingham 1999),orioles (
Icterus
; Omland
et al
. 1999), and tanagers (
Euphonia
,
Tangara
,
Piranga
; Isler & Isler 1987). Thus, radiations ofavian sibling species illustrate an evolutionary enigma thathas not been explained.
Three general features common to sibling species ofbirds shed light on their evolution. First, sibling speciescan be distinguished readily by voice, which by inferenceserves to isolate them reproductively in the absence ofspecies-specific plumage signals. This implies that thenature of their vocal evolution was intimately involved intheir speciation. Moreover, sibling species typically occur
Correspondence: N. K. Johnson. Fax: + 01 510643 8238; E-mail:[email protected]
MEC_1588.fm Page 2065 Thursday, September 12, 2002 1:14 PM
2066
N . K . J O H N S O N and C . C I C E R O
© 2002 Blackwell Science Ltd,
Molecular Ecology
, 11, 2065–2081
in distinctive habitats, and choice of nest sites in species-specific ecological settings can offer a secondary means offield identification. Finally, an under-appreciated aspect ofmany avian sibling species is that their breeding distri-butions often occupy broadly distributed ecogeographicregions that are allopatric with the nesting associations oftheir presumed closest relatives.
We propose that differences in habitat preference inbroad allopatry reflect a critical but heretofore overlookedaspect of sibling speciation in birds. Testing this supposi-tion requires a robust molecular phylogeny of a genuscharacterized by a radiation of sibling species, i.e. a phylo-geny that reveals the most closely related clusters offorms at early stages of the allopatric speciation process.Here we present a complete molecular phylogeny of thegenus
Empidonax
, a group of North and Middle Americantyrannid flycatchers notorious for interspecies similarity insize and plumage and, hence, difficulty of identification. Amajor impediment to understanding speciation and radi-ation of this genus has been the lack of a dependable mole-cular phylogeny, exacerbated until recently by concernsabout misidentification of specimens and unavailabilityof specific tissues. We are unaware of any other completemolecular phylogeny of an avian genus dominated bysibling species.
In a previous attempt to understand genetic relation-ships among sibling species of tyrannid flycatchers, Zink &Johnson (1984) examined 38 allozyme loci for 11 of the 15currently recognized species of
Empidonax
plus three of 14species in the related genus
Contopus
. An additional taxonanalysed in that study, ‘
Empidonax
’
euleri
, has subsequentlybeen placed in the genus
Lathrotriccus
based on morpho-logic and molecular differences (Zink & Johnson 1984;Lanyon & Lanyon 1986; Cicero & Johnson 2002). These pro-tein data produced a poorly resolved, bushy phylogeny, withthe topology varying depending upon the tree-buildingalgorithm (Distance Wagner, Fitch–Margoliash,
upgma
).Only the alliances of
Empidonax alnorum
–
E. traillii
and
Contopus sordidulus
–
C. virens
were consistently producedby the three different methods. Moreover, due to lack oftissues, the allozyme work excluded three species (
E.albigularis
,
E. affinis
,
E. fulvifrons
) that in retrospect werecrucial to unravelling close interspecific relationshipswithin the genus. Also, a fourth taxon (
E. occidentalis
) wasnot analysed because it was lumped until recently with
E.difficilis
( Johnson & Marten 1988; American Ornithologists’Union 1989; Johnson 1994a).
Because mitochondrial DNA (mtDNA) has proveduseful in resolving intrageneric relationships in birdsand other vertebrates (e.g. Avise 1994; Mindell 1997), wecreated an independent mtDNA assessment of relation-ships within the challenging genus
Empidonax
. This ana-lysis included all the described species as well as twowell-marked subspecies. The resulting phylogeny defined
distinctive clades and allowed a detailed examination ofgeographical patterns and the role of habitat selection inallopatric sibling speciation within this genus.
Materials and methods
Specimens examined
We sequenced two to four individuals of all currentlyrecognized species of
Empidonax
except
E. affinis
, which isrelatively rare in tissue collections and was represented byonly a single specimen (Appendix I). Although samplingof geographical variation was not a primary objective ofthis study, two taxa (
E. difficilis
and
E. flavescens
) withespecially well-marked subspecies were represented bysamples of the nominate as well as distinctive form (
E. d.difficilis/E. d. insulicola
and
E. f. flavescens/E. f. salvinii
,respectively). Other species represented by geographicallyseparate samples included
E. oberholseri
,
E. hammondii
,
E.wrightii
and
E. alnorum
. We also obtained tissue from anunidentified
Empidonax
from Mexico (originally thought tobe
E. albigularis
) which turned out to have a sequencealmost identical to
E. minimus
. Although we were unable toborrow the voucher specimen to verify its identity, thepotential for misidentification of genetic samples (seeCicero & Johnson 2002) underscores the importance ofcollecting vouchers for molecular studies (Remsen 1995;Winker
et al
. 1996; Ruedas
et al
. 2000).Selection of an appropriate outgroup was based on pre-
vious hypotheses of the relationship between
Empidonax
and other tyrannid genera. Because
Contopus
has tradition-ally been treated as a close relative of
Empidonax
(Traylor1977), Zink & Johnson (1984) compared protein variationin three species of
Contopus
to samples of
Empidonax
tojudge the proposed close relationship of these genera.Lanyon (1986), using morphologic and behavioural data,placed
Empidonax
and
Contopus
within one of two cladesthat defined a broader
Empidonax
group of flycatchers, butallied
Contopus
with the genus
Mitrephanes
on the basis ofsimilar foraging techniques (specialized aerial hawking).Subsequent molecular studies of the
Empidonax
group,however, confirmed the alliance between
Empidonax
and
Contopus
(allozymes, Lanyon & Lanyon 1986; mtDNA,Cicero & Johnson 2002). Consequently, we sequenced twosamples of each of three species of
Contopus
as outgroups.To enable direct comparison, we analysed the same speciesas in the previous allozyme study of
Empidonax
(Zink &Johnson 1984).
DNA techniques and genes sequenced
Whole genomic DNA was extracted from frozen or buffer-preserved tissues with a DNeasy extraction kit (Qiagen).Using different combinations of primers (Cicero & Johnson
MEC_1588.fm Page 2066 Thursday, September 12, 2002 1:14 PM
S I B L I N G S P E C I A T I O N O F
E M P I D O N A X
F L Y C A T C H E R S
2067
© 2002 Blackwell Science Ltd,
Molecular Ecology
, 11, 2065–2081
2001), double-stranded fragments from four mtDNA genes[cytochrome
b
(cyt
b
), NADH2 (ND2), NADH3 (ND3) andcytochrome oxidase I (COI)] were amplified via poly-merase chain reaction (PCR) in a PTC-100 (MJ Research)programmable thermocycler. The entire genes were ampli-fied and sequenced for cyt
b
(1143 bp), ND2 (1041 bp), andND3 (351 bp), while only a portion of COI (534 bp) wastargeted. These same markers were used in a higher-level phylogenetic study of the
Empidonax
group (Cicero& Johnson 2002), and protocols for PCR reactions,thermal cycling and automated sequencing (ABI Prism™377) were the same in both studies. To verify sequencesand guard against co-amplification of nuclear copiesof mtDNA (Collura & Stewart 1995; Sorenson & Quinn1998), overlapping fragments from each individual weresequenced in both directions, electropherograms wereexamined closely for co-amplified peaks, and sequenceswere translated to code unambiguously for functionalproteins. Sequences are deposited in GenBank, where theyare referenced to voucher specimens and locality data(Accessions AF447597–AF447602, AF447605–AF447610,AF447624–AF447629, AF447632–AF447637, AF447651–AF447656, AF447659–AF447664, AF447678–AF447683,AF447685–AF447688, AY030103–AY030104, AY030124–AY030125, AY030150–AY030151, AY030170–AY030171,AY143182–AY143289).
Phylogenetic analyses
Sequences for each fragment were aligned (clustal method)and checked against electropherograms using
Sequencenavigator
version 1.0.1 (Applied Biosystems, Perkin Elmer),then joined and translated with
macdnasysis
Pro version1.0 (Hitachi Software Engineering America Ltd 1991).Complete sequences were analysed with
paup
* (Swofford2001) using the
β
-test version 4.0b6 for Power Macintoshand Windows operating systems. A partition-homogeneitytest (Farris
et al
. 1995) was used to assess whether thefour genes showed significant heterogeneity. In addition,uncorrected pairwise divergence (
p
) was plotted againstthe proportion of transition and transversion substitutionsat each codon position to test for evidence of saturation(Swofford
et al
. 1996) in the four genes.Tree topologies were generated using maximum parsi-
mony and maximum likelihood. Parsimony analyses wererun on each gene and on combined sequences using twodata partitions: all characters unweighted, and third-position transitions excluded (weight = 0). Weighting ofcharacters was based on the results of saturation plots.Parsimony trees included all sequenced taxa as well as asubset of taxa that excluded the four species (
E. albigularis
,
E. affinis
,
E. fulvifrons
,
E. occidentalis
) and two subspecies (
E.d. insulicola
,
E. f. salvinii
) not analysed allozymically byZink & Johnson (1984). Analyses involved 1000 bootstrap
replications with full heuristic searches, using the TBRbranch-swapping algorithm and random addition of taxa(10 replicates per iteration). Bremer (1988) decay indiceswere calculated with
Autodecay
version 4.0 (Eriksson1998; 20 random-addition replicates per tree), then dis-played using
treeview
version 1.5.3 (Page 1996).Because all parsimony trees had the same topology,
maximum likelihood analysis was performed on the com-plete data set of all taxa, genes and characters. Likelihoodtrees were generated with and without the constraint ofa molecular clock. In both analyses, we used an iterativeapproach in which a starting tree was obtained by parsi-mony (same criteria as above), and the data and tree topo-logy were subjected to several rounds of likelihood analysisuntil a stable tree and log likelihood value was obtained(see Huelsenbeck & Crandall 1997; Huelsenbeck 1998). TheHKY85 model (Hasegawa
et al
. 1985; Swofford
et al
. 1996)with two substitution types and unequal, empirical basefrequencies was used, with three parameters estimatedfrom the data set: transition/transversion ratio, proportionof invariant sites, and shape of the gamma distribution ofrate change at different sites. We used the likelihood ratiotest (Felsenstein 1981; Groth & Barrowclough 1999: 122) toexamine the significance of the clock constraint, i.e. the nullhypothesis that the combined mtDNA genes are evolvingin a clock-like manner (significant
P
value means rejectionof null hypothesis).
Re-analysis of allozyme data
Allelic frequencies for 26 polymorphic loci [Zink &Johnson 1984; ‘
Empidonax
’ (=
Lathrotriccus
)
euleri
excluded]were re-analysed using Cavalli-Sforza & Edward’s (1967)arc distances (Swofford
et al
. 1996) to assess further therobustness of trees based on allozyme data.
Distances were calculated using
biosys
-1 version 1.7 forDOS (Swofford & Selander 1989), and used to constructneighbour-joining and minimum evolution trees (Saitou &Nei 1987; Swofford
et al
. 1996; Nei & Kumar 2000) with
mega
version 2.1 (Kumar
et al
. 2001). In addition, Nei’s
D
(Zink & Johnson 1984) was regressed against Tamura &Nei (1993) mtDNA distances (this study) to compare rel-ative rates of evolution in nuclear vs. mtDNA markers.
Quantitative assessment of geographical range
Using the species-level phylogeny of
Empidonax
, weassessed patterns of geographical distribution of sisterclades following the general approach presented byChesser & Zink (1994), Barraclough & Vogler (2000), andWebb & Gaston (2000). The breeding range of each specieswas outlined on a map of North and Middle America,ranges were overlayed on graph paper, and values wereconverted to square kilometres using area data for the
MEC_1588.fm Page 2067 Thursday, September 12, 2002 1:14 PM
2068
N . K . J O H N S O N and C . C I C E R O
© 2002 Blackwell Science Ltd,
Molecular Ecology
, 11, 2065–2081
United States (http://www.netstate.com\states\tables\st_size.htm). To test Rapoport’s rule, i.e. to see whethergeographical range increases with latitude (Rapoport 1982;Price
et al
. 1997), we regressed the estimated range size ofeach species against the midpoint latitude of the range.Using the same estimates of range size, we determined thedegree of sympatry between pairs of species andsuccessively inclusive sister clades by dividing the area ofoverlap by the range size of the more restricted species orclade (Chesser & Zink 1994; Barraclough and Vogler 2000);the resulting values vary from 0 (parapatry or disjunctallopatry) to 1 (total sympatry). A matrix of range overlapbetween pairs of species was compared with a matrix ofuncorrected mtDNA
p
-distances using Mantel’s (1967)test (
ntsys
-pc, version 1.50; Rohlf 1988). Because Mantel’stest assesses the correlation between two dissimilaritymatrices, percentage range overlap was converted tononoverlap (1
−
overlap) and the resulting values were arc-transformed prior to analysis (Sokal 1979; Sokal & Rohlf1981). Estimates of range overlap for sister clades wereplotted against two measures taken from the mtDNAphylogeny (Barraclough and Vogler 2000): the level of eachnode above the tips of the phylogeny, with level 1representing sister taxa and successively larger numbersindicating deeper nodes in the tree; and branch length(substitutions/site), measured from the tip of the longestbranch for each clade being compared. In this analysis,values for percentage range overlap also were arcsine-transformed before fitting intercepts to plots by linearregression (Sokal & Rohlf 1981; Barraclough and Vogler2000). Finally, Spearman’s rank test was used to obtain acorrelation coefficient (
r
s
) between degree of sympatry andnode level or branch length.
Results
Properties of mtDNA sequence variation in
Empidonax
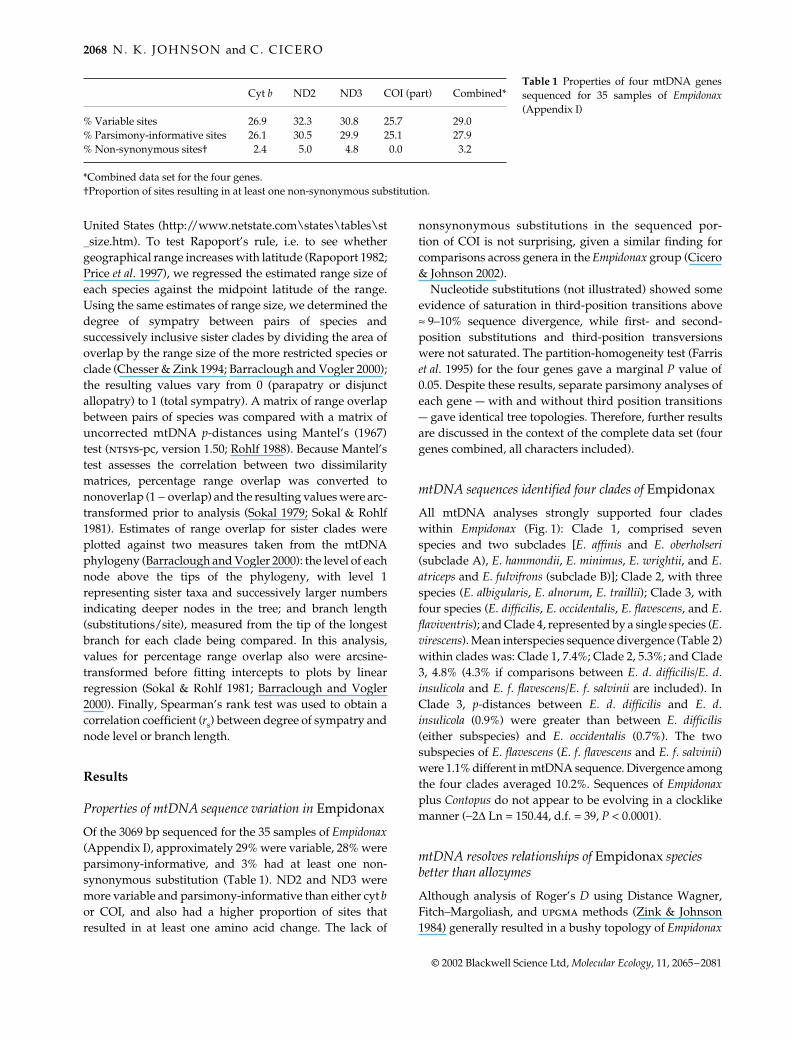
Of the 3069 bp sequenced for the 35 samples of
Empidonax
(Appendix I), approximately 29% were variable, 28% wereparsimony-informative, and 3% had at least one non-synonymous substitution (Table 1). ND2 and ND3 weremore variable and parsimony-informative than either cyt
b
or COI, and also had a higher proportion of sites thatresulted in at least one amino acid change. The lack of
nonsynonymous substitutions in the sequenced por-tion of COI is not surprising, given a similar finding forcomparisons across genera in the
Empidonax
group (Cicero& Johnson 2002).
Nucleotide substitutions (not illustrated) showed someevidence of saturation in third-position transitions above
≈
9–10% sequence divergence, while first- and second-position substitutions and third-position transversionswere not saturated. The partition-homogeneity test (Farris
et al
. 1995) for the four genes gave a marginal
P
value of0.05. Despite these results, separate parsimony analyses ofeach gene — with and without third position transitions— gave identical tree topologies. Therefore, further resultsare discussed in the context of the complete data set (fourgenes combined, all characters included).
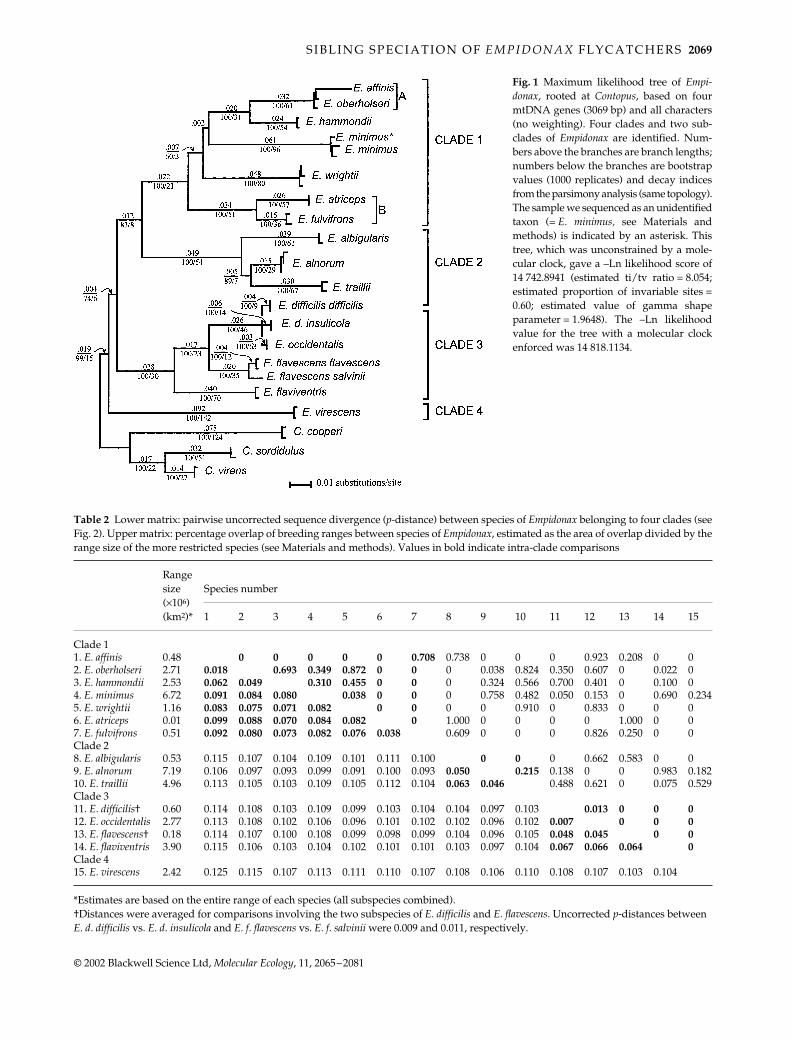
mtDNA sequences identified four clades of
Empidonax
All mtDNA analyses strongly supported four cladeswithin
Empidonax
(Fig. 1): Clade 1, comprised sevenspecies and two subclades [
E. affinis
and
E. oberholseri
(subclade A),
E. hammondii
,
E. minimus
,
E. wrightii
, and
E.atriceps
and
E. fulvifrons
(subclade B)]; Clade 2, with threespecies (
E. albigularis
,
E. alnorum
,
E. traillii
); Clade 3, withfour species (
E. difficilis
,
E. occidentalis
,
E. flavescens
, and
E.flaviventris
); and Clade 4, represented by a single species (
E.virescens
). Mean interspecies sequence divergence (Table 2)within clades was: Clade 1, 7.4%; Clade 2, 5.3%; and Clade3, 4.8% (4.3% if comparisons between
E. d. difficilis/E. d.insulicola
and
E. f. flavescens/E. f. salvinii
are included). InClade 3,
p-
distances between
E. d. difficilis
and
E. d.insulicola (0.9%) were greater than between E. difficilis(either subspecies) and E. occidentalis (0.7%). The twosubspecies of E. flavescens (E. f. flavescens and E. f. salvinii)were 1.1% different in mtDNA sequence. Divergence amongthe four clades averaged 10.2%. Sequences of Empidonaxplus Contopus do not appear to be evolving in a clocklikemanner (−2∆ Ln = 150.44, d.f. = 39, P < 0.0001).
mtDNA resolves relationships of Empidonax species better than allozymes
Although analysis of Roger’s D using Distance Wagner,Fitch–Margoliash, and upgma methods (Zink & Johnson1984) generally resulted in a bushy topology of Empidonax
Cyt b ND2 ND3 COI (part) Combined*
% Variable sites 26.9 32.3 30.8 25.7 29.0% Parsimony-informative sites 26.1 30.5 29.9 25.1 27.9% Non-synonymous sites† 2.4 5.0 4.8 0.0 3.2
*Combined data set for the four genes.†Proportion of sites resulting in at least one non-synonymous substitution.
Table 1 Properties of four mtDNA genessequenced for 35 samples of Empidonax(Appendix I)
MEC_1588.fm Page 2068 Thursday, September 12, 2002 1:14 PM
S I B L I N G S P E C I A T I O N O F E M P I D O N A X F L Y C A T C H E R S 2069
© 2002 Blackwell Science Ltd, Molecular Ecology, 11, 2065–2081
Fig. 1 Maximum likelihood tree of Empi-donax, rooted at Contopus, based on fourmtDNA genes (3069 bp) and all characters(no weighting). Four clades and two sub-clades of Empidonax are identified. Num-bers above the branches are branch lengths;numbers below the branches are bootstrapvalues (1000 replicates) and decay indicesfrom the parsimony analysis (same topology).The sample we sequenced as an unidentifiedtaxon (= E. minimus, see Materials andmethods) is indicated by an asterisk. Thistree, which was unconstrained by a mole-cular clock, gave a –Ln likelihood score of14 742.8941 (estimated ti/tv ratio = 8.054;estimated proportion of invariable sites =0.60; estimated value of gamma shapeparameter = 1.9648). The –Ln likelihoodvalue for the tree with a molecular clockenforced was 14 818.1134.
Table 2 Lower matrix: pairwise uncorrected sequence divergence (p-distance) between species of Empidonax belonging to four clades (seeFig. 2). Upper matrix: percentage overlap of breeding ranges between species of Empidonax, estimated as the area of overlap divided by therange size of the more restricted species (see Materials and methods). Values in bold indicate intra-clade comparisons
Rangesize (×106)(km2)*
Species number
1 2 3 4 5 6 7 8 9 10 11 12 13 14 15
Clade 11. E. affinis 0.48 0 0 0 0 0 0.708 0.738 0 0 0 0.923 0.208 0 02. E. oberholseri 2.71 0.018 0.693 0.349 0.872 0 0 0 0.038 0.824 0.350 0.607 0 0.022 03. E. hammondii 2.53 0.062 0.049 0.310 0.455 0 0 0 0.324 0.566 0.700 0.401 0 0.100 04. E. minimus 6.72 0.091 0.084 0.080 0.038 0 0 0 0.758 0.482 0.050 0.153 0 0.690 0.2345. E. wrightii 1.16 0.083 0.075 0.071 0.082 0 0 0 0 0.910 0 0.833 0 0 06. E. atriceps 0.01 0.099 0.088 0.070 0.084 0.082 0 1.000 0 0 0 0 1.000 0 07. E. fulvifrons 0.51 0.092 0.080 0.073 0.082 0.076 0.038 0.609 0 0 0 0.826 0.250 0 0Clade 28. E. albigularis 0.53 0.115 0.107 0.104 0.109 0.101 0.111 0.100 0 0 0 0.662 0.583 0 09. E. alnorum 7.19 0.106 0.097 0.093 0.099 0.091 0.100 0.093 0.050 0.215 0.138 0 0 0.983 0.18210. E. traillii 4.96 0.113 0.105 0.103 0.109 0.105 0.112 0.104 0.063 0.046 0.488 0.621 0 0.075 0.529Clade 311. E. difficilis† 0.60 0.114 0.108 0.103 0.109 0.099 0.103 0.104 0.104 0.097 0.103 0.013 0 0 012. E. occidentalis 2.77 0.113 0.108 0.102 0.106 0.096 0.101 0.102 0.102 0.096 0.102 0.007 0 0 013. E. flavescens† 0.18 0.114 0.107 0.100 0.108 0.099 0.098 0.099 0.104 0.096 0.105 0.048 0.045 0 014. E. flaviventris 3.90 0.115 0.106 0.103 0.104 0.102 0.101 0.101 0.103 0.097 0.104 0.067 0.066 0.064 0Clade 415. E. virescens 2.42 0.125 0.115 0.107 0.113 0.111 0.110 0.107 0.108 0.106 0.110 0.108 0.107 0.103 0.104
*Estimates are based on the entire range of each species (all subspecies combined).†Distances were averaged for comparisons involving the two subspecies of E. difficilis and E. flavescens. Uncorrected p-distances between E. d. difficilis vs. E. d. insulicola and E. f. flavescens vs. E. f. salvinii were 0.009 and 0.011, respectively.
MEC_1588.fm Page 2069 Thursday, September 12, 2002 1:14 PM
2070 N . K . J O H N S O N and C . C I C E R O
© 2002 Blackwell Science Ltd, Molecular Ecology, 11, 2065–2081
species, several patterns emerged that agree with themtDNA data: (i) E. alnorum and E. traillii were united assister taxa; (ii) nominate subspecies of E. difficilis and E.flavescens clustered together in two of three analyses; in theDistance Wagner tree, E. difficilis and E. flaviventris groupedtogether; and (iii) E. virescens was highly divergent fromother species in the genus. In contrast to the mtDNA data,however, Zink & Johnson’s (1984) allozyme analyses (i)never placed E. difficilis, E. flavescens and E. flaviventris inthe same clade; (ii) suggested a close affinity betweenE. hammondii and E. atriceps; and (iii) indicated that E.minimus, like E. virescens, was strongly differentiatedwithin the genus. Their results were not affected by theexclusion of ‘E. (= Lathrotriccus) euleri’ from the allozymeanalyses (this study, data not shown).
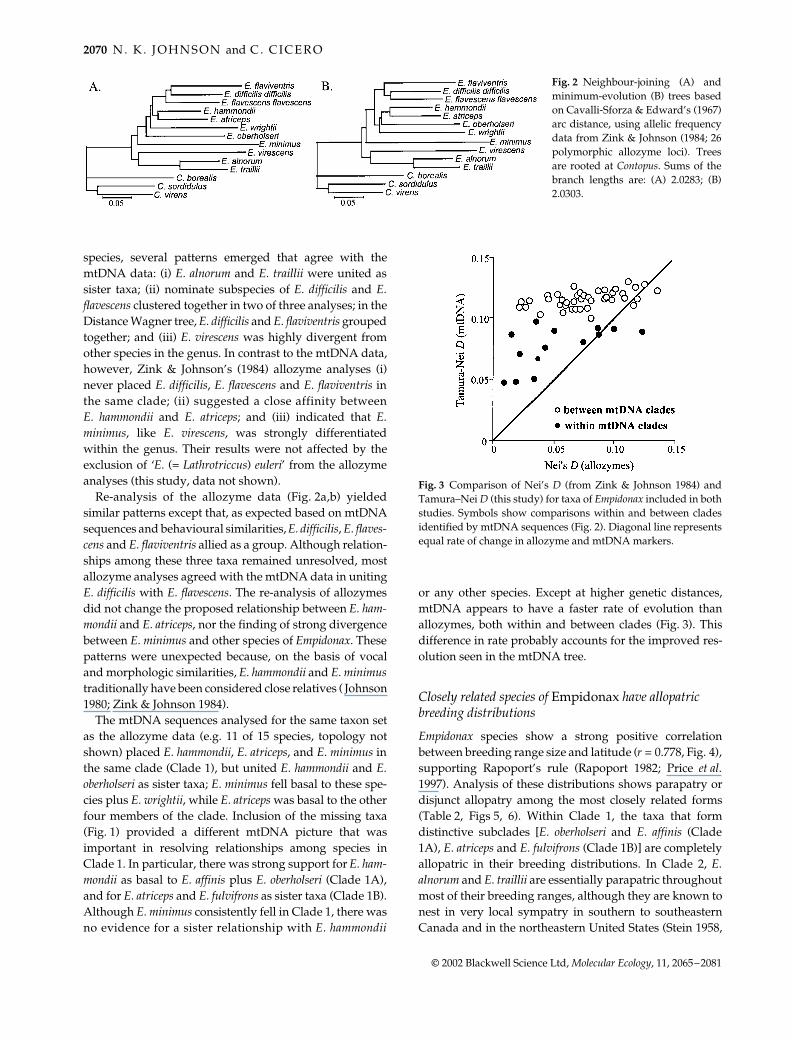
Re-analysis of the allozyme data (Fig. 2a,b) yieldedsimilar patterns except that, as expected based on mtDNAsequences and behavioural similarities, E. difficilis, E. flaves-cens and E. flaviventris allied as a group. Although relation-ships among these three taxa remained unresolved, mostallozyme analyses agreed with the mtDNA data in unitingE. difficilis with E. flavescens. The re-analysis of allozymesdid not change the proposed relationship between E. ham-mondii and E. atriceps, nor the finding of strong divergencebetween E. minimus and other species of Empidonax. Thesepatterns were unexpected because, on the basis of vocaland morphologic similarities, E. hammondii and E. minimustraditionally have been considered close relatives ( Johnson1980; Zink & Johnson 1984).
The mtDNA sequences analysed for the same taxon setas the allozyme data (e.g. 11 of 15 species, topology notshown) placed E. hammondii, E. atriceps, and E. minimus inthe same clade (Clade 1), but united E. hammondii and E.oberholseri as sister taxa; E. minimus fell basal to these spe-cies plus E. wrightii, while E. atriceps was basal to the otherfour members of the clade. Inclusion of the missing taxa(Fig. 1) provided a different mtDNA picture that wasimportant in resolving relationships among species inClade 1. In particular, there was strong support for E. ham-mondii as basal to E. affinis plus E. oberholseri (Clade 1A),and for E. atriceps and E. fulvifrons as sister taxa (Clade 1B).Although E. minimus consistently fell in Clade 1, there wasno evidence for a sister relationship with E. hammondii
or any other species. Except at higher genetic distances,mtDNA appears to have a faster rate of evolution thanallozymes, both within and between clades (Fig. 3). Thisdifference in rate probably accounts for the improved res-olution seen in the mtDNA tree.
Closely related species of Empidonax have allopatric breeding distributions
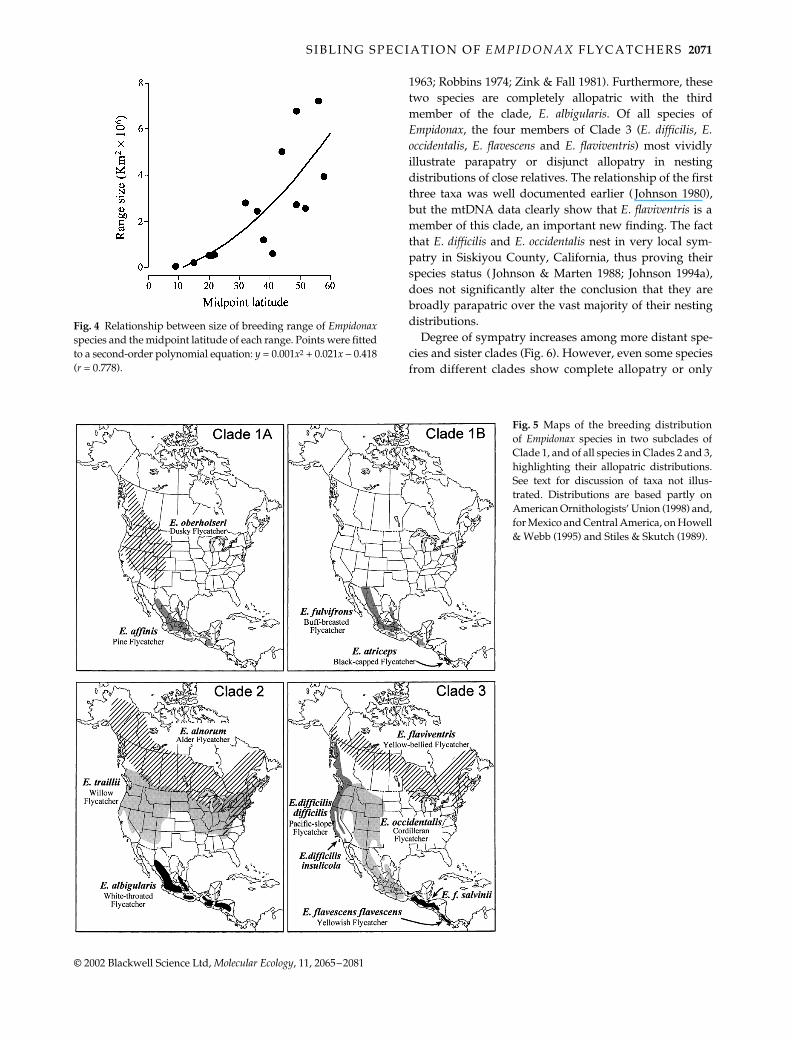
Empidonax species show a strong positive correlationbetween breeding range size and latitude (r = 0.778, Fig. 4),supporting Rapoport’s rule (Rapoport 1982; Price et al.1997). Analysis of these distributions shows parapatry ordisjunct allopatry among the most closely related forms(Table 2, Figs 5, 6). Within Clade 1, the taxa that formdistinctive subclades [E. oberholseri and E. affinis (Clade1A), E. atriceps and E. fulvifrons (Clade 1B)] are completelyallopatric in their breeding distributions. In Clade 2, E.alnorum and E. traillii are essentially parapatric throughoutmost of their breeding ranges, although they are known tonest in very local sympatry in southern to southeasternCanada and in the northeastern United States (Stein 1958,
Fig. 2 Neighbour-joining (A) andminimum-evolution (B) trees basedon Cavalli-Sforza & Edward’s (1967)arc distance, using allelic frequencydata from Zink & Johnson (1984; 26polymorphic allozyme loci). Treesare rooted at Contopus. Sums of thebranch lengths are: (A) 2.0283; (B)2.0303.
Fig. 3 Comparison of Nei’s D (from Zink & Johnson 1984) andTamura–Nei D (this study) for taxa of Empidonax included in bothstudies. Symbols show comparisons within and between cladesidentified by mtDNA sequences (Fig. 2). Diagonal line representsequal rate of change in allozyme and mtDNA markers.
MEC_1588.fm Page 2070 Thursday, September 12, 2002 1:14 PM
S I B L I N G S P E C I A T I O N O F E M P I D O N A X F L Y C A T C H E R S 2071
© 2002 Blackwell Science Ltd, Molecular Ecology, 11, 2065–2081
1963; Robbins 1974; Zink & Fall 1981). Furthermore, thesetwo species are completely allopatric with the thirdmember of the clade, E. albigularis. Of all species ofEmpidonax, the four members of Clade 3 (E. difficilis, E.occidentalis, E. flavescens and E. flaviventris) most vividlyillustrate parapatry or disjunct allopatry in nestingdistributions of close relatives. The relationship of the firstthree taxa was well documented earlier ( Johnson 1980),but the mtDNA data clearly show that E. flaviventris is amember of this clade, an important new finding. The factthat E. difficilis and E. occidentalis nest in very local sym-patry in Siskiyou County, California, thus proving theirspecies status ( Johnson & Marten 1988; Johnson 1994a),does not significantly alter the conclusion that they arebroadly parapatric over the vast majority of their nestingdistributions.
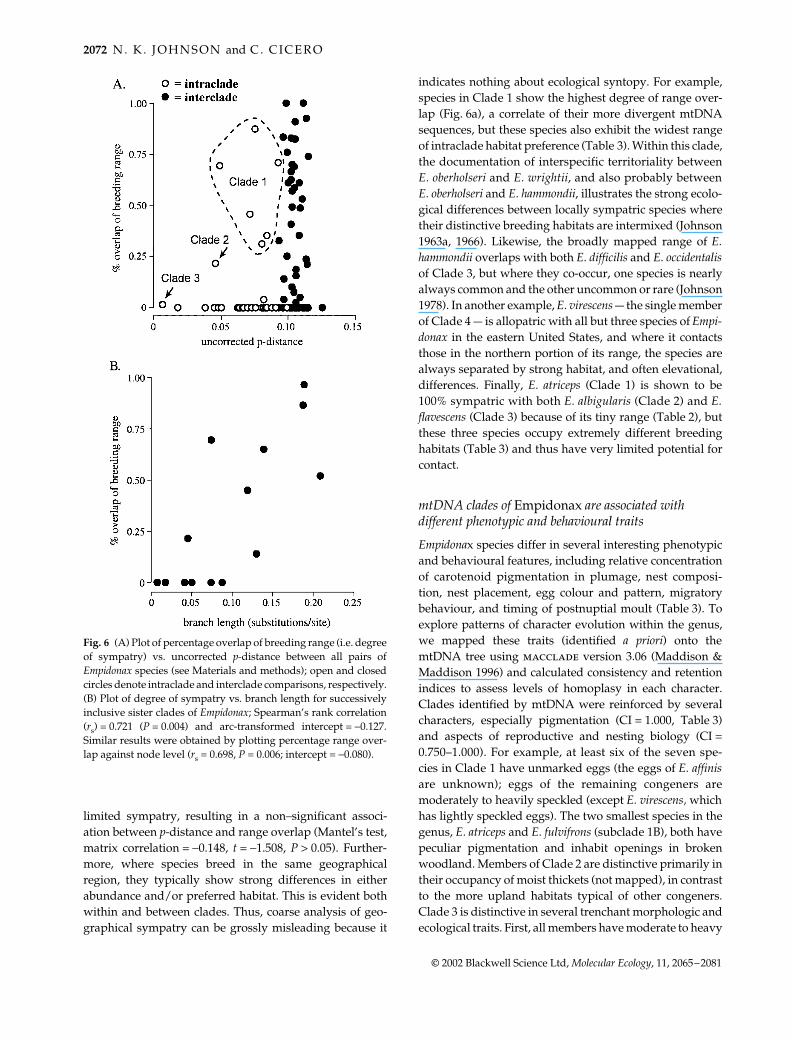
Degree of sympatry increases among more distant spe-cies and sister clades (Fig. 6). However, even some speciesfrom different clades show complete allopatry or only
Fig. 5 Maps of the breeding distributionof Empidonax species in two subclades ofClade 1, and of all species in Clades 2 and 3,highlighting their allopatric distributions.See text for discussion of taxa not illus-trated. Distributions are based partly onAmerican Ornithologists’ Union (1998) and,for Mexico and Central America, on Howell& Webb (1995) and Stiles & Skutch (1989).
Fig. 4 Relationship between size of breeding range of Empidonaxspecies and the midpoint latitude of each range. Points were fittedto a second-order polynomial equation: y = 0.001x2 + 0.021x − 0.418(r = 0.778).
MEC_1588.fm Page 2071 Thursday, September 12, 2002 1:14 PM
2072 N . K . J O H N S O N and C . C I C E R O
© 2002 Blackwell Science Ltd, Molecular Ecology, 11, 2065–2081
limited sympatry, resulting in a non–significant associ-ation between p-distance and range overlap (Mantel’s test,matrix correlation = −0.148, t = −1.508, P > 0.05). Further-more, where species breed in the same geographicalregion, they typically show strong differences in eitherabundance and/or preferred habitat. This is evident bothwithin and between clades. Thus, coarse analysis of geo-graphical sympatry can be grossly misleading because it
indicates nothing about ecological syntopy. For example,species in Clade 1 show the highest degree of range over-lap (Fig. 6a), a correlate of their more divergent mtDNAsequences, but these species also exhibit the widest rangeof intraclade habitat preference (Table 3). Within this clade,the documentation of interspecific territoriality betweenE. oberholseri and E. wrightii, and also probably betweenE. oberholseri and E. hammondii, illustrates the strong ecolo-gical differences between locally sympatric species wheretheir distinctive breeding habitats are intermixed (Johnson1963a, 1966). Likewise, the broadly mapped range of E.hammondii overlaps with both E. difficilis and E. occidentalisof Clade 3, but where they co-occur, one species is nearlyalways common and the other uncommon or rare (Johnson1978). In another example, E. virescens — the single memberof Clade 4 — is allopatric with all but three species of Empi-donax in the eastern United States, and where it contactsthose in the northern portion of its range, the species arealways separated by strong habitat, and often elevational,differences. Finally, E. atriceps (Clade 1) is shown to be100% sympatric with both E. albigularis (Clade 2) and E.flavescens (Clade 3) because of its tiny range (Table 2), butthese three species occupy extremely different breedinghabitats (Table 3) and thus have very limited potential forcontact.
mtDNA clades of Empidonax are associated with different phenotypic and behavioural traits
Empidonax species differ in several interesting phenotypicand behavioural features, including relative concentrationof carotenoid pigmentation in plumage, nest composi-tion, nest placement, egg colour and pattern, migratorybehaviour, and timing of postnuptial moult (Table 3). Toexplore patterns of character evolution within the genus,we mapped these traits (identified a priori) onto themtDNA tree using macclade version 3.06 (Maddison &Maddison 1996) and calculated consistency and retentionindices to assess levels of homoplasy in each character.Clades identified by mtDNA were reinforced by severalcharacters, especially pigmentation (CI = 1.000, Table 3)and aspects of reproductive and nesting biology (CI =0.750–1.000). For example, at least six of the seven spe-cies in Clade 1 have unmarked eggs (the eggs of E. affinisare unknown); eggs of the remaining congeners aremoderately to heavily speckled (except E. virescens, whichhas lightly speckled eggs). The two smallest species in thegenus, E. atriceps and E. fulvifrons (subclade 1B), both havepeculiar pigmentation and inhabit openings in brokenwoodland. Members of Clade 2 are distinctive primarily intheir occupancy of moist thickets (not mapped), in contrastto the more upland habitats typical of other congeners.Clade 3 is distinctive in several trenchant morphologic andecological traits. First, all members have moderate to heavy
Fig. 6 (A) Plot of percentage overlap of breeding range (i.e. degreeof sympatry) vs. uncorrected p-distance between all pairs ofEmpidonax species (see Materials and methods); open and closedcircles denote intraclade and interclade comparisons, respectively.(B) Plot of degree of sympatry vs. branch length for successivelyinclusive sister clades of Empidonax; Spearman’s rank correlation(rs) = 0.721 (P = 0.004) and arc-transformed intercept = −0.127.Similar results were obtained by plotting percentage range over-lap against node level (rs = 0.698, P = 0.006; intercept = −0.080).
MEC_1588.fm Page 2072 Thursday, September 12, 2002 1:14 PM
SIB
LIN
G S
PE
CIA
TIO
N O
F E
MP
IDO
NA
X F
LY
CA
TC
HE
RS
2073
© 2002 B
lackwell Science L
td, M
olecular Ecology, 11, 2065–2081
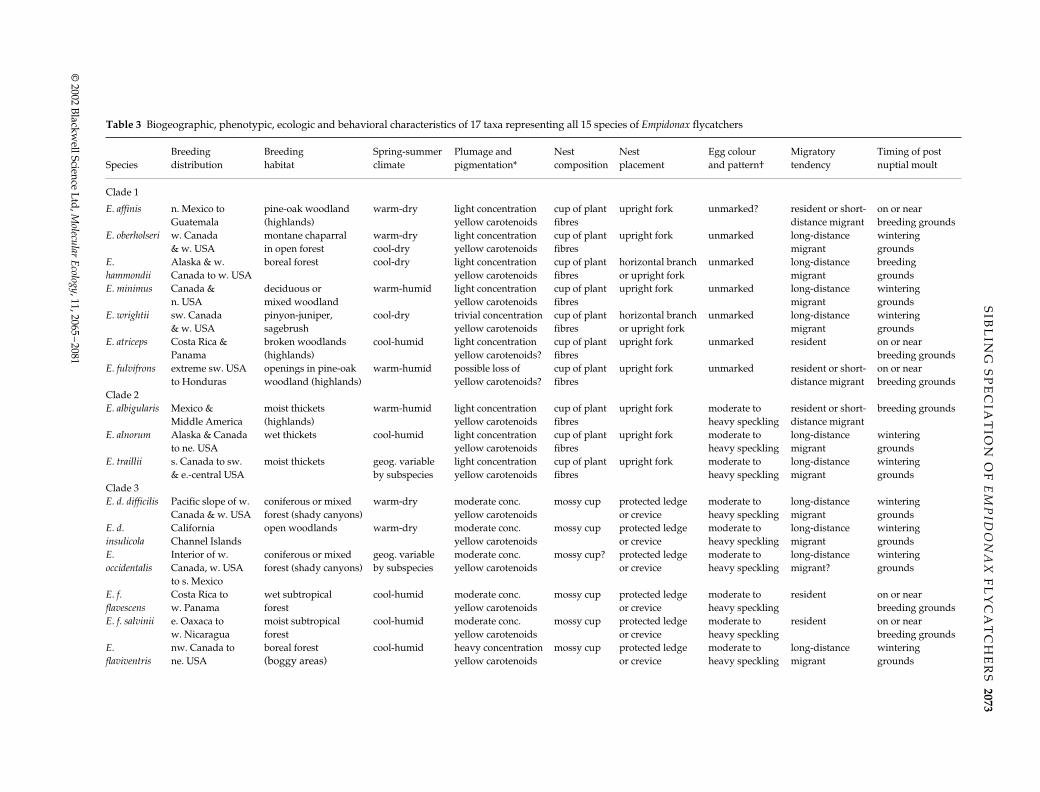
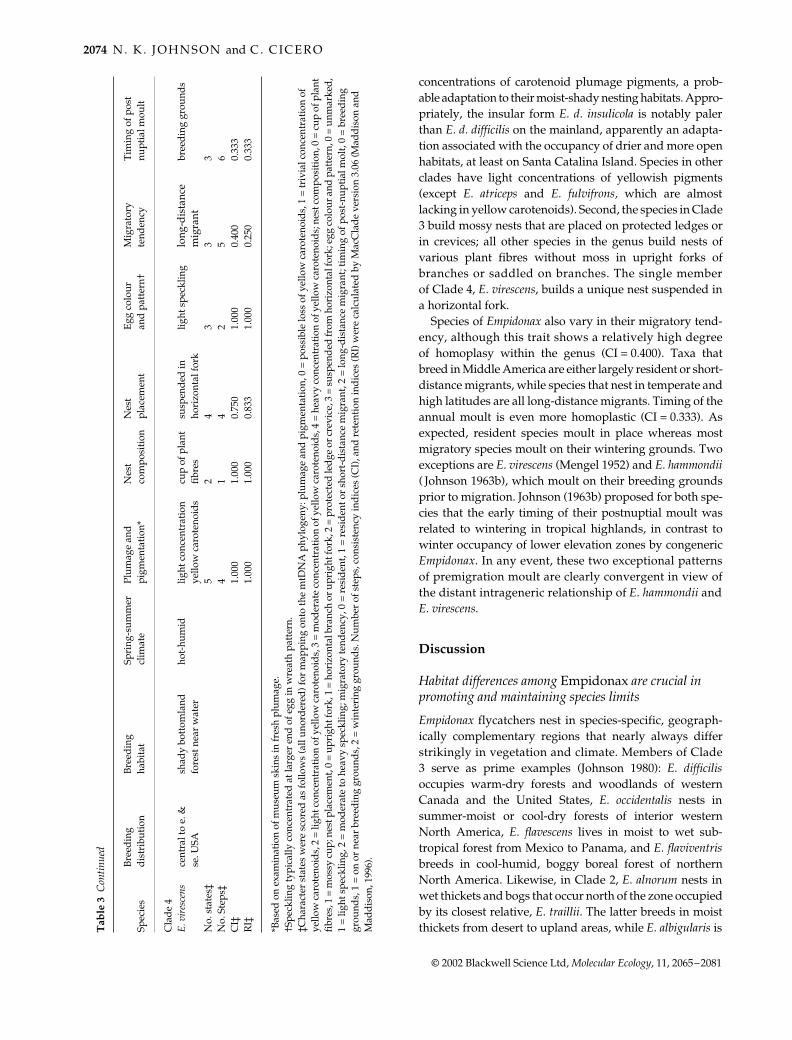
Table 3 Biogeographic, phenotypic, ecologic and behavioral characteristics of 17 taxa representing all 15 species of Empidonax flycatchers
SpeciesBreedingdistribution
Breedinghabitat
Spring-summerclimate
Plumage andpigmentation*
Nestcomposition
Nestplacement
Egg colourand pattern†
Migratorytendency
Timing of post nuptial moult
Clade 1
E. affinis n. Mexico to pine-oak woodland warm-dry light concentration cup of plant upright fork unmarked? resident or short- on or near Guatemala (highlands) yellow carotenoids fibres distance migrant breeding grounds
E. oberholseri w. Canada montane chaparral warm-dry light concentration cup of plant upright fork unmarked long-distance wintering& w. USA in open forest cool-dry yellow carotenoids fibres migrant grounds
E. hammondii
Alaska & w. boreal forest cool-dry light concentration cup of plant horizontal branch unmarked long-distance breedingCanada to w. USA yellow carotenoids fibres or upright fork migrant grounds
E. minimus Canada & deciduous or warm-humid light concentration cup of plant upright fork unmarked long-distance winteringn. USA mixed woodland yellow carotenoids fibres migrant grounds
E. wrightii sw. Canada pinyon-juniper, cool-dry trivial concentration cup of plant horizontal branch unmarked long-distance wintering& w. USA sagebrush yellow carotenoids fibres or upright fork migrant grounds
E. atriceps Costa Rica & broken woodlands cool-humid light concentration cup of plant upright fork unmarked resident on or nearPanama (highlands) yellow carotenoids? fibres breeding grounds
E. fulvifrons extreme sw. USA openings in pine-oak warm-humid possible loss of cup of plant upright fork unmarked resident or short- on or nearto Honduras woodland (highlands) yellow carotenoids? fibres distance migrant breeding grounds
Clade 2E. albigularis Mexico & moist thickets warm-humid light concentration cup of plant upright fork moderate to resident or short- breeding grounds
Middle America (highlands) yellow carotenoids fibres heavy speckling distance migrantE. alnorum Alaska & Canada wet thickets cool-humid light concentration cup of plant upright fork moderate to long-distance wintering
to ne. USA yellow carotenoids fibres heavy speckling migrant groundsE. traillii s. Canada to sw. moist thickets geog. variable light concentration cup of plant upright fork moderate to long-distance wintering
& e.-central USA by subspecies yellow carotenoids fibres heavy speckling migrant groundsClade 3E. d. difficilis Pacific slope of w. coniferous or mixed warm-dry moderate conc. mossy cup protected ledge moderate to long-distance wintering
Canada & w. USA forest (shady canyons) yellow carotenoids or crevice heavy speckling migrant groundsE. d. insulicola
California open woodlands warm-dry moderate conc. mossy cup protected ledge moderate to long-distance winteringChannel Islands yellow carotenoids or crevice heavy speckling migrant grounds
E. occidentalis
Interior of w. coniferous or mixed geog. variable moderate conc. mossy cup? protected ledge moderate to long-distance winteringCanada, w. USA forest (shady canyons) by subspecies yellow carotenoids or crevice heavy speckling migrant? groundsto s. Mexico
E. f. flavescens
Costa Rica to wet subtropical cool-humid moderate conc. mossy cup protected ledge moderate to resident on or nearw. Panama forest yellow carotenoids or crevice heavy speckling breeding grounds
E. f. salvinii e. Oaxaca to moist subtropical cool-humid moderate conc. mossy cup protected ledge moderate to resident on or nearw. Nicaragua forest yellow carotenoids or crevice heavy speckling breeding grounds
E. flaviventris
nw. Canada to boreal forest cool-humid heavy concentration mossy cup protected ledge moderate to long-distance winteringne. USA (boggy areas) yellow carotenoids or crevice heavy speckling migrant grounds
ME
C_1588.fm
Page 2073 Thursday, Septem
ber 12, 2002 1:14 PM
2074 N . K . J O H N S O N and C . C I C E R O
© 2002 Blackwell Science Ltd, Molecular Ecology, 11, 2065–2081
concentrations of carotenoid plumage pigments, a prob-able adaptation to their moist-shady nesting habitats. Appro-priately, the insular form E. d. insulicola is notably palerthan E. d. difficilis on the mainland, apparently an adapta-tion associated with the occupancy of drier and more openhabitats, at least on Santa Catalina Island. Species in otherclades have light concentrations of yellowish pigments(except E. atriceps and E. fulvifrons, which are almostlacking in yellow carotenoids). Second, the species in Clade3 build mossy nests that are placed on protected ledges orin crevices; all other species in the genus build nests ofvarious plant fibres without moss in upright forks ofbranches or saddled on branches. The single memberof Clade 4, E. virescens, builds a unique nest suspended ina horizontal fork.
Species of Empidonax also vary in their migratory tend-ency, although this trait shows a relatively high degreeof homoplasy within the genus (CI = 0.400). Taxa thatbreed in Middle America are either largely resident or short-distance migrants, while species that nest in temperate andhigh latitudes are all long-distance migrants. Timing of theannual moult is even more homoplastic (CI = 0.333). Asexpected, resident species moult in place whereas mostmigratory species moult on their wintering grounds. Twoexceptions are E. virescens (Mengel 1952) and E. hammondii( Johnson 1963b), which moult on their breeding groundsprior to migration. Johnson (1963b) proposed for both spe-cies that the early timing of their postnuptial moult wasrelated to wintering in tropical highlands, in contrast towinter occupancy of lower elevation zones by congenericEmpidonax. In any event, these two exceptional patternsof premigration moult are clearly convergent in view ofthe distant intrageneric relationship of E. hammondii andE. virescens.
Discussion
Habitat differences among Empidonax are crucial in promoting and maintaining species limits
Empidonax flycatchers nest in species-specific, geograph-ically complementary regions that nearly always differstrikingly in vegetation and climate. Members of Clade3 serve as prime examples (Johnson 1980): E. difficilisoccupies warm-dry forests and woodlands of westernCanada and the United States, E. occidentalis nests insummer-moist or cool-dry forests of interior westernNorth America, E. flavescens lives in moist to wet sub-tropical forest from Mexico to Panama, and E. flaviventrisbreeds in cool-humid, boggy boreal forest of northernNorth America. Likewise, in Clade 2, E. alnorum nests inwet thickets and bogs that occur north of the zone occupiedby its closest relative, E. traillii. The latter breeds in moistthickets from desert to upland areas, while E. albigularis is C
lad
e 4
E. v
ires
cens
cent
ral t
o e.
&
shad
y bo
ttom
land
hot-
hum
idlig
ht c
once
ntra
tion
cup
of p
lant
susp
end
ed in
light
spe
cklin
glo
ng-d
ista
nce
bree
din
g gr
ound
sse
. USA
fore
st n
ear
wat
erye
llow
car
oten
oid
sfi
bres
hori
zont
al fo
rkm
igra
ntN
o. s
tate
s‡5
24
33
3N
o. S
teps
‡4
14
25
6C
I‡1.
000
1.00
00.
750
1.00
00.
400
0.33
3R
I‡1.
000
1.00
00.
833
1.00
00.
250
0.33
3
*Bas
ed o
n ex
amin
atio
n of
mus
eum
ski
ns in
fres
h pl
umag
e.†S
peck
ling
typi
cally
con
cent
rate
d a
t lar
ger
end
of e
gg in
wre
ath
patt
ern.
‡Cha
ract
er s
tate
s w
ere
scor
ed a
s fo
llow
s (a
ll un
ord
ered
) for
map
ping
ont
o th
e m
tDN
A p
hylo
geny
: plu
mag
e an
d p
igm
enta
tion
, 0 =
pos
sibl
e lo
ss o
f yel
low
car
oten
oid
s, 1
= tr
ivia
l con
cent
rati
on o
f ye
llow
car
oten
oid
s, 2
= li
ght c
once
ntra
tion
of y
ello
w c
arot
enoi
ds,
3 =
mod
erat
e co
ncen
trat
ion
of y
ello
w c
arot
enoi
ds,
4 =
hea
vy c
once
ntra
tion
of y
ello
w c
arot
enoi
ds;
nes
t com
posi
tion
, 0 =
cup
of p
lant
fi
bres
, 1 =
mos
sy c
up; n
est p
lace
men
t, 0
= up
righ
t for
k, 1
= h
oriz
onta
l bra
nch
or u
prig
ht fo
rk, 2
= p
rote
cted
led
ge o
r cre
vice
, 3 =
sus
pend
ed fr
om h
oriz
onta
l for
k; e
gg c
olou
r and
pat
tern
, 0 =
unm
arke
d,
1 =
light
spe
cklin
g, 2
= m
oder
ate
to h
eavy
spe
cklin
g; m
igra
tory
tend
ency
, 0 =
res
iden
t, 1
= re
sid
ent o
r sh
ort-
dis
tanc
e m
igra
nt, 2
= lo
ng-d
ista
nce
mig
rant
; tim
ing
of p
ost-
nupt
ial m
olt,
0 =
bree
din
g gr
ound
s, 1
= o
n or
nea
r br
eed
ing
grou
nds,
2 =
win
teri
ng g
roun
ds.
Num
ber
of s
teps
, con
sist
ency
ind
ices
(CI)
, and
ret
enti
on in
dic
es (R
I) w
ere
calc
ulat
ed b
y M
acC
lad
e ve
rsio
n 3.
06 (M
add
ison
and
M
add
ison
, 199
6).
Spec
ies
Bre
edin
gd
istr
ibut
ion
Bre
edin
gha
bita
tSp
ring
-sum
mer
clim
ate
Plum
age
and
pigm
enta
tion
*N
est
com
posi
tion
Nes
tpl
acem
ent
Egg
col
our
and
pat
tern
†M
igra
tory
tend
ency
Tim
ing
of p
ost
nupt
ial m
oult
Tab
le 3
Con
tinue
d
MEC_1588.fm Page 2074 Thursday, September 12, 2002 1:14 PM
S I B L I N G S P E C I A T I O N O F E M P I D O N A X F L Y C A T C H E R S 2075
© 2002 Blackwell Science Ltd, Molecular Ecology, 11, 2065–2081
found in similar but more highland habitats in Mexico andMiddle America. Even species without close relatives inthe genus demonstrate a strong affinity for maintainingdistinctive habitats in different climate–vegetation zones.Thus, E. hammondii occupies cool-dry boreal forest inwestern North America, E. wrightii breeds in pinyon-juniper and old-growth sagebrush in the interior of thewestern United States and southwestern Canada, E. minimusnests in the vast deciduous forest of northeastern NorthAmerica, and E. virescens concentrates in the bottomlandforests of the eastern United States.
Habitat divergence in Empidonax clearly starts at thesubspecies stage. For example, E. difficilis insulicola of theCalifornia Channel Islands nests in drier and more openhabitats than the shady, mesic sites occupied by its main-land counterpart, E. d. difficilis. Likewise, E. occidentalis hell-mayri of interior western North America and northernMexico breeds in high elevation, summer-dry conifers,whereas E. o. occidentalis prefers mid-elevation oak wood-lands in summer-wet regions of central and southernMexico. In the same clade, E. flavescens salvinii of southernMexico and northern Central America inhabits distinctlydrier (albeit still moist) forests than the mesic cloud forestsof Costa Rica and Panama in which E. flavescens flavescensoccurs ( Johnson 1980). A similar situation is found in twosubspecies of E. traillii, whereby E. t. extimus occupieswarm desert riparian corridors of tamarisk and willow,and E. t. adastus breeds in cooler upland willows to thenorth (Sedgwick 2000, 2001).
The obvious habitat specificity of Empidonax species isclosely correlated with the fact that they all share the sameforaging mode (categorized as ‘perch-hawk generalists’,Fitzpatrick 1981, 1985; Cicero & Johnson 2002). Johnson(1980) noted that, because of similarities in morphologyand foraging behaviour, significant ecological overlapamong species is usually constrained (as in E. hammondiiand E. occidentalis where they co-occur, Johnson 1978).Where species are syntopic, interspecific territories aredefended (e.g. E. traillii and E. alnorum, Stein 1958, 1963; E.oberholseri and E. wrightii, Johnson 1963a; E. hammondii andE. difficilis, Johnson 1978). This pattern contrasts sharplywith many avian congeners that share broad-scale plantformations but closely subdivide foraging places. Forexample, species of Dendroica wood-warblers that co-inhabit spruce-fir forests of northeastern North Americawere highlighted in the classic foraging niche studiesof Macarthur (1958). A clear example of ecological specifi-city in Empidonax is provided by the gray flycatcher (E.wrightii), which breeds in identical pinyon-juniper-sagebrush woodland from the southern extremity of itsrange in the southwestern United States to the north-eastern periphery of its distribution in southern Wyoming(Pavlacky & Anderson 2001), a habitat it shares with noother congeners.
Allopatric distributions persist long after sibling speciation in Empidonax
Johnson (1980) proposed that at least nine species ofEmpidonax form sets of superspecies that diverged allo-patrically and have maintained their allopatric distribu-tions long after the completion of speciation. He alsosuspected that E. virescens, E. flaviventris and E. affinis aremembers of superspecies combinations, but did notspeculate on their intrageneric relationships. Our mtDNAphylogeny resolved relationships of these three speciesand confirmed the alliances of seven taxa grouped on thebasis of similarities in morphology, voice, behaviour, orecology, i.e. E. fulvifrons–E. atriceps, E. difficilis (includingE. occidentalis)–E. flavescens, and the position of E. albigularisrelative to E. alnorum–E. traillii. The remaining two species(E. hammondii–E. minimus) paired by Johnson (1980),however, have proved not to be close relatives based onallozymes (Johnson & Marten 1988), karyotypes (Shieldset al. 1987), and mtDNA sequences (this study).
Two of the four clearly demarked clades — Clade 2 (E.alnorum–E. traillii–E. albigularis) and Clade 3 (E. difficilis–E.occidentalis–E. flavescens–E. flaviventris) — identify certainsister or near-sister taxa that breed mostly allopatricallyand therefore are poised at medium stages in their evolu-tionary history. In contrast, species in Clade 1 representmore divergent lineages that have progressed beyondintermediate levels of speciation but have maintainedessential allopatry with each other (14 of 21 interspeciescombinations show complete allopatry). The two sub-clades containing E. oberholseri–E. affinis and E. atriceps–E. fulvifrons, although closest living relatives also probablyreflect later stages of speciation in view of their disjunctlyallopatric breeding distributions. Even members ofstrongly divergent lineages maintain essential allopatryover broad continental regions, e.g. E. virescens, E. trailliiand E. minimus in the eastern United States, and E. ham-mondii, E. difficilis and E. occidentalis in the westernUnited States. Over all 105 combinations of species pairs ofEmpidonax, 61 (58.1%) are completely allopatric and anadditional seven species (6.7%) overlap ranges at 10% orless (Table 2). Thus, almost two-thirds of all species pairsare allopatric or nearly so, even long after speciation.
The relationship of current geographical range to sibling speciation in Empidonax
The distribution of closely related species of birds hasprovided cornerstone data for biogeographic-evolutionarytheory, including speciation, for well over a century. Thisemphasis continues to the present. In contrast to earlierwork, recent studies have stressed objective quantifica-tion of present range patterns in attempts to illuminatespeciation processes, particularly in congeners (Lynch
MEC_1588.fm Page 2075 Thursday, September 12, 2002 1:14 PM
2076 N . K . J O H N S O N and C . C I C E R O
© 2002 Blackwell Science Ltd, Molecular Ecology, 11, 2065–2081
1989; Chesser & Zink 1994; Barraclough & Vogler 2000;Webb & Gaston 2000). This effort has again exposed thelack of evidence for avian sympatric speciation, leavingallopatric speciation, either through vicariance or colon-ization, as the only realistic model. Here we weigh thepossibility that present distributions hold clues to theprocess of sibling speciation in Empidonax flycatchers.
The use of current ranges to clarify ancient processesis not without pitfalls. This is especially true for highlymobile birds that over a few decades can expand, contract,or shift nesting ranges across hundreds of kilometres evenin undisturbed habitats (Johnson 1994b). Chesser & Zink(1994) also invoked high rates of postspeciation dispersalin many avian species when refuting Lynch’s (1989) claim(for birds) that extensive or complete overlap of congenericranges indicated sympatric speciation. Within Empidonaxseveral species comparisons (E. atriceps–E. albigularis, E.atriceps–E. flavescens, E. alnorum–E. flaviventris) illustratedistributional patterns suggestive of sympatric speciationunder Lynch’s criteria because the range of one speciesenvelops that of the other. However, the fact that the twospecies in each pair belong to a different genetic cladeexcludes the possibility that one was derived from theother.
Our ability to infer historical speciation processes frompresent distributions depends critically upon two majorissues: environmental stability and age of species. Evid-ence from fossils unequivocally indicates that the Pleis-tocene was a major period of both extinction and speciationof a large component of the earth’s biota, including birds(Brodkorb 1960; Selander 1965). The most extreme influ-ences were felt in temperate and higher latitude NorthAmerica which was greatly effected by glaciation (Martin& Klein 1984; Pielou 1991). Over an estimated 20 cycles(Porter 1989), glacial conditions prevailed in NorthAmerica for approximately 80% of the past 2 million years(Myr; Willis & Whittaker 2000). Vast fields of Laurentideand Cordilleran ice eliminated or telescoped pre-existinghabitats over broad regions, dislocating and shrinkingbreeding ranges.
Total land area habitable by birds was significantlyreduced. Species’ populations were diminished or locallyextirpated. No-analogue biotic communities, i.e. thosewithout present-day counterparts, were commonplace(FAUNMAP Working Group 1996), throwing species intonew competitive combinations. Major latitudinal and alti-tudinal climatic shifts coincident with habitat changefurther reconfigured biotic communities. Geographicallyfragmented populations were repeatedly isolated in refu-gia (Congdon et al. 2000) in unique biotic settings con-ducive to strong directional selection and genomicreorganization (Hewitt 1996). Even in benign environ-ments, small populations could have diverged via drift.Interglacial conditions would have been ideal for peripatric
speciation after colonization of regions recently freed ofice, although this process may have been modest becauseinterglacial conditions comprised only approximately20% of the ice ages. It is clear that, on a millennial scale, theenvironment was unstable during the entire Pleistocene.Therefore, modern ranges of Empidonax tell us much aboutHolocene interglacial conditions but rather little about eitherthe locations of species in refuges during glacial episodesor the status of their ranges during previous interglacials.
In the absence of fossils, which are nearly impossibleto identify to species in passerine birds (e.g. Steadman &Martin 1984), and which certainly would be unidentifiablein Empidonax, the age of species can be inferred from cali-brated molecular distance values. Although our mtDNAanalysis rejected a molecular clock for Empidonax, Webb &Gaston (2000) noted that degrees of divergence should atleast correlate with divergence times even when molecularevolution is not strictly clock-like. These authors alsoreviewed the various papers that led to the ‘consensus rate’of 2% divergence of mtDNA per Myr, an indirect phylo-genetic estimate. Recently, however, Lambert et al. (2002)provided direct estimates of mtDNA evolution for theAdelie penguin (Pygoscelis adeliae) that were two to seventimes higher than previous indirect estimates. Their datawere based on calibrations applied to subfossil bones andliving birds sequenced for the hypervariable mtDNA con-trol region I (HVRI). While we recognize the problemsassociated with calibrations of molecular data, includinginferring rates for other regions of mtDNA based on HVRIand applying rates for penguins to species such as Empi-donax with very different life histories, the penguin studyillustrates the potential for much faster rates of mtDNAevolution than previously proposed. Thus, we apply thisrange in rate to the mtDNA data for Empidonax, usingdivergence values from 2% to 14% per Myr. These varyingrates result in crude estimates of speciation times: Clade 1,mean divergence of 7.4% = an age of 0.5–3.7 Myr; Clade 2,5.3% = 0.4–2.7 Myr; Clade 3, 4.8% = 0.3–2.4 Myr; inter-clade, 10.2% = 0.7–5.1 Myr. On the basis of these explora-tory estimates, species of Empidonax plausibly range fromapproximately 300 000 to 5 Myr in age, inevitably exposingmodern forms to at least several glacial–interglacial cyclesduring and after their speciation.
This background on Pleistocene instability and age ofspecies reveals an obvious enigma: if habitat use is crucialto their speciation, how did new species of Empidonax copewith cycles of small ranges in telescoped habitat duringglacial periods that alternated with large ranges in broadlydistributed habitat during interglacials? We propose thatthe geography of current habitat use provides the answer.Although close relatives show essential or complete allo-patry, where they do overlap with congeners the differentspecies are typically not syntopic, i.e. they still select theirdistinctive habitats. Therefore it is plausible that during
MEC_1588.fm Page 2076 Thursday, September 12, 2002 1:14 PM
S I B L I N G S P E C I A T I O N O F E M P I D O N A X F L Y C A T C H E R S 2077
© 2002 Blackwell Science Ltd, Molecular Ecology, 11, 2065–2081
Pleistocene glacial periods, when habitats and ranges weretelescoped into unusual configurations, species werepacked tightly in geographically limited communities thatstill allowed distinctive habitat use by each form. We pro-pose that speciation occurred through the export of poten-tial colonists from those small refuges with distinctive,albeit mixed, habitats, across barriers and into other smallrefugia that then expanded into regions recently freed ofice. Rapid population and range expansion ensued, result-ing in currently broad ranges that correlate with inter-glacial regionalization of climate–plant associations. Inessence, this is the peripatric speciation model of Mayr(1954, 1963). This scenario is similar to a model of siblingspeciation in Empidonax proposed by Johnson (1980), andto an hypothesis of speciation in another sibling speciesclade of New World passerines, the genus Vireo (Cicero &Johnson 1998). Support for this explanation is also pro-vided by Webb & Gaston (2000), who showed that rangesizes appear to expand most rapidly postspeciation. Inaccordance with Rapoport’s (1982) rule, northern speciesof Empidonax have larger ranges than southern species,probably as a result of the increasing availability of bothlandmass and broadly distributed habitats at higher lati-tudes in temperate North America. At least nine species ofEmpidonax currently breed in broad northern regions thatwere unsuitable for occupancy during Pleistocene glacials.Thus, during glacial periods these species must have hadsmaller ranges further south and/or down-mountain fromthe glacial ice, ranges that expanded northward during eachinterglacial to occupy distributions similar to those seentoday. Current ranges therefore do not provide evidencefor vicariance because barriers of appropriate age and geo-graphical position are lacking. However, the possibility ofvicariance during glacial epochs cannot be discounted.
In addition to strict habitat selection, vocal isolating mechanisms predominated in sibling speciation of Empidonax
The key to speciation is the evolution of reproductiveisolating mechanisms that allow genetic independenceamong populations. This can be accomplished throughpre-mating reproductive isolating mechanisms (PRIMs)that prevent or discourage copulations between indi-viduals in sympatry or geographical proximity. In birds,PRIMs typically consist of distinctive plumage colours andpatterns emphasized in species-specific displays (Sibley1957) that are used in combination with divergent vocalfeatures (Kroodsma & Miller 1996). An excellent exampleis provided by the 27 extant species of Dendroica, a well-studied group (Shutler & Weatherhead 1990; Lovette &Bermingham 1999) characterized by modest morpho-logic variation but brilliant differences in plumage colora-tion. As shown by Shutler & Weatherhead (1990), sexual
selection on song and plumage characters played afundamental role in the speciation of this genus.
In Empidonax and other genera of avian sibling species,restricted plumage differences among taxa limit PRIMs tounique characteristics of voice. Therefore, the evolution ofvocal differences is of unusual importance in their speci-ation ( Johnson 1980). Several cases in Empidonax vividlydemonstrate that advertising songs and other vocaliza-tions differentiate in allopatry. In an unusually detailedanalysis, Sedgwick (2001) documented the allopatric vocaldivergence of otherwise weakly differentiated E. trailliiextimus and E. t. adastus. Empidonax difficilis insulicola alsoshows vocal divergence from E. d. difficilis, although thesedifferences are weak relative to the moderate differences inmorphology, plumage colour, and habitat ( Johnson 1980).At a higher level, the E. difficilis–E. occidentalis–E. flavescenscomplex has differentiated allopatrically on a continent-wide scale in both male advertising song and male positionnotes ( Johnson 1980). The evolution of such vocal differ-ences in allopatry could well have been associated withselection for acoustic traits adaptive in different habitats(Morton 1975).
General patterns of sibling speciation in birds: comparisons with other taxa
We note the obvious need to test ideas presented herewith other radiations of avian sibling species. The genusPhylloscopus, with an estimated 46 (Monroe & Sibley 1993)to 49 (Baker 1997) species, many of which qualify as‘sibling species’, seems an obvious target for such acomparison. First, Phylloscopus has been the subject ofrecent ecological (Richman & Price 1992; Richman 1996),distributional (Price et al. 1997), and speciation (Price et al.1998; Irwin et al. 2001a) research, much of it with anmtDNA phylogenetic perspective. Furthermore, at leasttwo important parallels with Empidonax have emerged: thesignificant role of dispersal rather than vicariance in thespeciation of Phylloscopus, and the fact that closely relatedmembers of at least some superspecies groups exist largelyin allopatry (Price et al. 1997). A major point of contrast alsois evident: up to nine species of Phylloscopus may breed ata single locality in the Himalayas (Richman 1996), thusshowing an extreme degree of niche partitioning unseen inEmpidonax. Beyond these few observations, we proposethat extensive additional comparisons of Empidonax withPhylloscopus would be premature. First, species limits arenot well-resolved for all taxa of Phylloscopus, although thework of Irwin et al. (2001a,b) has made a step in thatdirection. Second, radiations of at least some lineages ofPhylloscopus appear to be surprisingly old (Price et al. 1998),and recent speciation events may be scarce in this genus(except perhaps in the P. trochiloides ring species, Irwin2000; Irwin et al. 2001b). Finally, a complete molecular
MEC_1588.fm Page 2077 Thursday, September 12, 2002 1:14 PM
2078 N . K . J O H N S O N and C . C I C E R O
© 2002 Blackwell Science Ltd, Molecular Ecology, 11, 2065–2081
phylogeny that includes all species of Phylloscopus is notyet available. When complete phylogenies of Phylloscopusor other genera replete with sibling species are at hand, weanticipate great strides in understanding patterns andprocesses of sibling speciation in birds.
Acknowledgements
George F. Barrowclough, Adolfo Navarro, Duke Rogers, F. GaryStiles, Phil Wright and Robert M. Zink assisted in obtaining andtransporting tissue samples. Harold Fong performed most of theDNA laboratory work. Alison Chubb assisted with some analyses.Karen Klitz prepared the final versions of the figures. Craig Moritzoffered useful comments after a seminar in which this work wasdiscussed. Two anonymous reviewers improved an earlier draftof this manuscript. Laboratory expenses were met with a grantfrom the Lulu Von Hagen Foundation. Field expenses were par-tially covered by a research grant from the University of CaliforniaCommittee on Research. We express our sincere gratitude to all ofthe above individuals and organizations.
References
American Ornithologists’ Union (1989) Thirty-seventh (Suppl.)to the American Ornithologists’ Union Check-list of NorthAmerican Birds. Auk, 106, 532–538.
American Ornithologists’ Union (1998) Check-List of North Amer-ican Birds, 7th edn. Allen Press, Lawrence, KS.
Avise JC (1994) Molecular Markers, Natural History and Evolution.Chapman & Hall, New York.
Baker K (1997) Warblers of Europe, Asia, and North Africa. PrincetonUniversity Press, Princeton, NJ.
Barraclough TG, Vogler AP (2000) Detecting the geographicalpattern of speciation from species-level phylogenies. AmericanNaturalist, 155, 419–434.
Bremer K (1988) The limits of amino acid sequence data inangiosperm phylogenetic reconstruction. Evolution, 42, 795–803.
Brodkorb P (1960) How many species of birds have existed? Bulle-tin of the Florida State Museum, 5, 41–53.
Cavalli-Sforza LL, Edwards AWF (1967) Phylogenetic analysis:models and estimation procedures. Evolution, 21, 550–570.
Chesser RT, Zink RM (1994) Modes of speciation in birds: a test ofLynch’s method. Evolution, 48, 490–497.
Cicero C, Johnson NK (1998) Molecular phylogeny and ecologicaldiversification in a clade of New World songbirds (genus Vireo).Molecular Ecology, 7, 1359–1370.
Cicero C, Johnson NK (2001) Higher-level phylogeny of NewWorld vireos (Aves: Vireonidae) based on sequences of mul-tiple mitochondrial DNA genes. Molecular Phylogenetics and Evo-lution, 20, 27–40.
Cicero C, Johnson NK (2002) Phylogeny and character evolutionin the Empidonax group of tyrant flycatchers (Aves: Tyrannidae):a test of W. E. Lanyon’s hypothesis using mtDNA sequences.Molecular Phylogenetics and Evolution, 22, 289–302.
Collura RV, Stewart CB (1995) Insertions and duplications ofmtDNA in the nuclear genomes of Old World monkeys andhominoids. Nature, 378, 485–489.
Congdon BC, Piatt JF, Martin K, Friesen VL (2000) Mechanismsof population differentiation in Marbled Murrelets: historicalversus contemporary processes. Evolution, 54, 974–986.
Eriksson T (1998) Autodecay, Version 4.0. Stockholm University,Stockholm.
Farris JS, Källersjö M, Kluge AG, Bult C (1995) Testing significanceof incongruence. Cladistics, 10, 315–319.
FAUNMAP Working Group: Graham RW, Lundelius EL Jr,Graham MA et al. (1996) Spatial response of mammals to LateQuaternary environmental fluctuations. Science, 272, 1601–1606.
Felsenstein J (1981) Evolutionary trees from DNA sequences: amaximum likelihood approach. Journal of Molecular Evolution,17, 368–376.
Fitzpatrick JW (1981) Search strategies of tyrant flycatchers.Animal Behavior, 29, 810–821.
Fitzpatrick JW (1985) Form, foraging behavior, and adaptiveradiation in the Tyrannidae. In: Neotropical Ornithology (edsBuckley PA, Foster MS, Morton ES, Ridgely RS, Buckley FG),pp. 447–470. American Ornithologists’ Union, Washington, D.C.
Groth JG, Barrowclough GF (1999) Basal divergences in birds andthe phylogenetic utility of the nuclear RAG-1 gene. MolecularPhylogenetics and Evolution, 12, 115–123.
Hasegawa M, Kishino H, Yano T (1985) Dating the human-apesplit by a molecular clock of mitochondrial DNA. Journal ofMolecular Evolution, 22, 160–174.
Hewitt GM (1996) Some genetic consequences of ice ages, andtheir role in divergence and speciation. Biological Journal of theLinnean Society, 58, 247–276.
Hitachi Software Engineering America Ltd. (1991) Macintosh DNAand Protein Sequence Input and Analysis System, Version 1.0.Hitachi, San Bruno, CA.
Howell SNG, Webb S (1995) A Guide to the Birds of Mexico andNorthern Central America. Oxford University Press, Oxford, UK.
Huelsenbeck JP (1998) Systematic bias in phylogenetic analysis:is the Stripsiptera problem solved? Systematic Biology, 47,519–537.
Huelsenbeck JP, Crandall KA (1997) Phylogeny estimation andhypothesis testing using maximum likelihood. Annual Review ofEcology and Systematics, 28, 437–466.
Irwin DE (2000) Song variation in an avian ring species. Evolution,54, 998–1010.
Irwin DE, Alström P, Olsson U, Benowitz-Fredericks ZM (2001a)Cryptic species in the genus Phylloscopus (Old World leafwarblers). Ibis, 143, 233–247.
Irwin DE, Bensch S, Price TD (2001b) Speciation in a ring. Nature,409, 333–337.
Isler ML, Isler PR (1987) The Tanagers: Natural History, Distribution,and Identification. Smithsonian Institution Press, Washington, D.C.
Johnson NK (1963a) Biosystematics of sibling species in theEmpidonax hammondii–oberholseri–wrightii complex. University ofCalifornia Publications in Zoology, 66, 79–238.
Johnson NK (1963b) Comparative molt cycles in the tyrannidgenus Empidonax. Proceedings of the International OrnithologicalCongress, 13, 870–883.
Johnson NK (1966) Bill size and the question of competitionin allopatric and sympatric populations of Dusky and Gray fly-catchers. Systematic Zoology, 15, 70–87.
Johnson NK (1978) Patterns of avian geography and speciation inthe Intermountain Region. In: Intermountain Biogeography: aSymposium. Great Basin Naturalist Memoirs no. 2 (eds Harper KT,Reveal JL), pp. 137–159. Brigham Young University, Provo, UT.
Johnson NK (1980) Character variation and evolution of siblingspecies in the Empidonax difficilis–flavescens complex (Aves:Tyrannidae). University of California Publications in Zoology, 112,1–151.
MEC_1588.fm Page 2078 Thursday, September 12, 2002 1:14 PM
S I B L I N G S P E C I A T I O N O F E M P I D O N A X F L Y C A T C H E R S 2079
© 2002 Blackwell Science Ltd, Molecular Ecology, 11, 2065–2081
Johnson NK (1994a) Old-school taxonomy versus modern bio-systematics: species-level decisions in Stelgidopteryx andEmpidonax. Auk, 111, 773–780.
Johnson NK (1994b) Pioneering and natural expansion ofbreeding distributions in western North American birds. In:A Century of Avifaunal Change in Western North America. Studiesin Avian Biology no. 15 (eds Jehl JR Jr, Johnson NK), pp. 27–44.Allen Press Inc., Lawrence, KA, USA.
Johnson NK, Marten JA (1988) Evolutionary genetics of flycatch-ers. II. Differentiation in the Empidonax difficilis complex. Auk,105, 177–191.
Kroodsma DE, Miller EH, eds (1996) Ecology and Evolution ofAcoustic Communication in Birds. Cornell University Press,Ithaca, NY.
Kumar S, Tamura K, Jakobsen IB, Nei M (2001) MEGA2: MolecularEvolutionary Genetics Analysis software. Arizona State University,Tempe, AZ.
Lambert DM, Ritchie PA, Millar CD, Holland B, Drummond AJ,Baroni C (2002) Rates of evolution in ancient DNA from AdeliePenguins. Science, 295, 2270–2273.
Lanyon WE (1986) A phylogeny of the thirty-three genera in theEmpidonax assemblage of tyrant flycatchers. American MuseumNovitates, 2846, 1–64.
Lanyon WE, Lanyon SM (1986) Generic status of Euler’sflycatcher: a morphological and biochemical study. Auk, 103,341–350.
Lovette IJ, Bermingham E (1999) Explosive speciation in the NewWorld Dendroica warblers. Proceedings of the Royal Society ofLondon B, 266, 1629–1636.
Lynch JD (1989) The gauge of speciation: on the frequency ofmodes of speciation. In: Speciation and its Consequences (eds OtteD, Endler JA), pp. 527–553. Sinauer, Sunderland, MA.
Maddison WP, Maddison DR (1996) MacClade, Version 3.06: Ana-lysis of Phylogeny and Character Evolution. Sinauer, Sunderland,MA.
Mantel N (1967) The detection of disease clustering and a generalregression approach. Cancer Research, 27, 209–220.
Martin PS, Klein RG (1984) Quaternary Extinctions: a PrehistoricRevolution. University of Arizona Press, Tucson, AZ.
Mayr E (1954) Change of genetic environment and evolution.In: Evolution as a Process (eds Huxley J, Hardy AC, Ford EB),pp. 157–180. Allen and Unwin, London.
Mayr E (1963) Animal Species and Evolution. Harvard UniversityPress, Cambridge, MA.
Mayr E, Short LL (1970) Species taxa of North American birds.Publications of the Nuttall Ornithological Club, 9, 1–127.
MacArthur RH (1958) Population ecology of some warblers ofnortheastern coniferous forests. Ecology, 39, 599–619.
Mengel RM (1952) Certain molts and plumages of Acadian andYellow-bellied flycatchers. Auk, 69, 273–283.
Mindell DP, ed. (1997) Avian Molecular Evolution and Systematics.Academic Press, San Diego, CA.
Monroe BL, Sibley CG (1993) A World Checklist of Birds. Yale Uni-versity Press, New Haven, CT.
Morton ES (1975) Ecological sources of selection on avian sounds.American Naturalist, 108, 17–34.
Nei M, Kumar S (2000) Molecular Evolution and Phylogenetics.Oxford University Press, New York.
Omland KE, Lanyon SM, Fritz SJ (1999) A molecular phylogeny ofthe New World orioles (Icterus): the importance of dense taxonsampling. Molecular Phylogenetics and Evolution, 12, 224–239.
Page RDM (1996) treeview: an application to display phylo-
genetic trees on personal computers. Computer Applications in theBiosciences, 12, 357–358.
Pavlacky DC Jr, Anderson SH (2001) Habitat preferences ofpinyon-juniper specialists near the limit of their geographicrange. Condor, 103, 322–331.
Pielou EC (1991) After the Ice Age, the Return of Life to Glaciated NorthAmerica. University of Chicago Press, Chicago, IL.
Porter SC (1989) Some geological implications of average Quater-nary glacial conditions. Quaternary Research, 32, 245–261.
Price TD, Helbig AJ, Richman AD (1997) Evolution of breedingdistributions in the Old World leaf warblers (genus Phyllosco-pus). Evolution, 51, 552–561.
Price TD, Gibbs HL, de Sousa L, Richman AD (1998) Differenttiming of the adaptive radiations of North American and Asianwarblers. Proceedings of the Royal Society of London B, 265, 1969–1975.
Rapoport E (1982) Areography: Geographic Strategies of Species.Pergamon Press, Oxford.
Remsen JV Jr (1995) The importance of continued collecting of birdspecimens in ornithology and bird conservation. Bird Conserva-tion International, 5, 177–212.
Richman AD (1996) Ecological diversification and communitystructure in the Old World leaf warblers (genus Phylloscopus): aphylogenetic perspective. Evolution, 50, 2461–2470.
Richman AD, Price TD (1992) Evolution of ecologic differences inthe Old World leaf warblers. Nature, 355, 817–821.
Robbins S (1974) The willow and alder flycatchers in Wisconsin: apreliminary description of summer range. Passenger Pigeon, 36,147–152.
Rohlf FJ (1988) NTSYS-pc: Numerical Taxonomy and Multivariate Ana-lysis System, Version 1.50. Applied Biostatistics, Setauket, NY.
Ruedas LA, Salazar-Bravo J, Dragoo JW, Yates TL (2000) The impor-tance of being earnest: What, if anything, constitutes a ‘specimenexamined?’. Molecular Phylogenetics and Evolution, 17, 129–132.
Saitou N, Nei M (1987) The neighbor-joining method: a newmethod for reconstructing phylogenetic trees. Molecular Biologyand Evolution, 4, 406–425.
Sedgwick JA (2000) Willow Flycatcher (Empidonax traillii). In: TheBirds of North America No. 533 (eds Poole A, Gill FB). The Birdsof North America, Inc., Philadelphia, PA.
Sedgwick JA (2001) Geographic variation in the song of willowflycatchers: differentiation between Empidonax traillii adastusand E. t. extimus. Auk, 118, 366–379.
Selander RK (1965) Avian speciation in the Quaternary. In: TheQuaternary of the United States (eds Wright HE Jr, Frey DG),pp. 527–542. Princeton University Press, Princeton, NJ.
Shields GF, Barlow JC, James RD (1987) Karyotypes of five speciesof Empidonax flycatchers. Wilson Bulletin, 99, 169–174.
Shutler D, Weatherhead PJ (1990) Targets of sexual selection: songand plumage of wood warblers. Evolution, 44, 1967–1977.
Sibley CG (1957) The evolutionary and taxonomic significance ofsexual dimorphism and hybridization in birds. Condor, 59, 166–191.
Sokal RR (1979) Testing statistical significance of geographicvariation patterns. Systematic Zoology, 28, 227–232.
Sokal RR, Rohlf FJ (1981) Biometry: the Principles and Practice ofStatistics in Biological Research, 2nd edn. WH Freeman and Co.,New York, NY.
Sorenson MD, Quinn TW (1998) Numts: a challenge for avian sys-tematics and population biology. Auk, 115, 214–221.
Steadman DW, Martin PS (1984) Extinction of birds in the LatePleistocene of North America. In: Quaternary Extinctions: aPrehistoric Revolution (eds Hillis DM, Klein RG), pp. 466–477.University of Arizona Press, Tucson, AZ.
MEC_1588.fm Page 2079 Thursday, September 12, 2002 1:14 PM
2080 N . K . J O H N S O N and C . C I C E R O
© 2002 Blackwell Science Ltd, Molecular Ecology, 11, 2065–2081
Stein RC (1958) The behavioral, ecological and morpholo-gical characteristics of two populations of the alder flycatcher,Empidonax traillii (Audubon). New York State Museum andScience Service Bulletin, 371, 1–63.
Stein RC (1963) Isolating mehanisms between populations ofTraill’s flycatcher. Proceedings of the American PhilosophicalSociety, 107, 21–50.
Stiles FG, Skutch AF (1989) A Guide to the Birds of Costa Rica.Cornell University Press. Ithaca, NY.
Swofford DL (2001) PAUP*. Phylogenetic Analysis using Parsimony(*And Other Methods), Version 4. Sinauer Associates, Sunder-land, MA.
Swofford DL, Olsen GJ, Waddell PJ, Hillis DM (1996) Phylogeneticinference. In: Molecular Systematics, 2nd edn (eds Hillis DM,Moritz C, Mable BK), pp. 407–514. Sinauer Associates, Inc., Sun-derland, MA.
Swofford DL, Selander RB (1989) BIOSYS-1: A Computer Programfor the Analysis of Allelic Variation in Population Genetics andBiochemical Systematics, Version 1.7. Illinois Natural HistorySurvey, Champaign, IL.
Tamura K, Nei M (1993) Estimation of the number of nucleotidesubstitutions in the control region of mitochondrial DNA inhumans and chimpanzees. Molecular Biology and Evolution, 10,512–526.
Traylor MA Jr (1977) A classification of the tyrant flycatchers(Tyrannidae). Bulletin of the Museum of Comparative Zoology, 148,129–184.
Webb TJ, Gaston KJ (2000) Geographic range size and evolution-ary age in birds. Proceedings of the Royal Society of London B, 267,1843–1855.
Willis KJ, Whittaker RJ (2000) The refugial debate. Science, 287,1406–1407.
Winker K, Braun MJ, Graves GR (1996) Voucher specimens andquality control in avian molecular studies. Ibis, 138, 345–346.
Zink RM, Fall BA (1981) Breeding distribution, song, and habitatof the alder flycatcher and willow flycatcher in Minnesota. Loon,53, 208–214.
Zink RM, Johnson NK (1984) Evolutionary genetics of flycatchers.I. Sibling species in the genera Empidonax and Contopus. System-atic Zoology, 33, 205–216.
This paper is a contribution from the Laboratory of EvolutionaryGenetics of the Museum of Vertebrate Zoology, where NedJohnson is Curator of Ornithology and Professor of IntegrativeBiology and Carla Cicero is Curatorial and Research Associate.Both authors have been investigating genetic population structureand distribution of birds in western North America for over adecade. Current, shared research topics include biosystematicwork with the Steller’s Jay, Spotted Towhee, and the Sage Sparrowcomplex, using comparative analyses of genetic, vocal, morpho-logic, and colorimetric traits at the boundaries of subspecies andnear-species.
MEC_1588.fm Page 2080 Thursday, September 12, 2002 1:14 PM
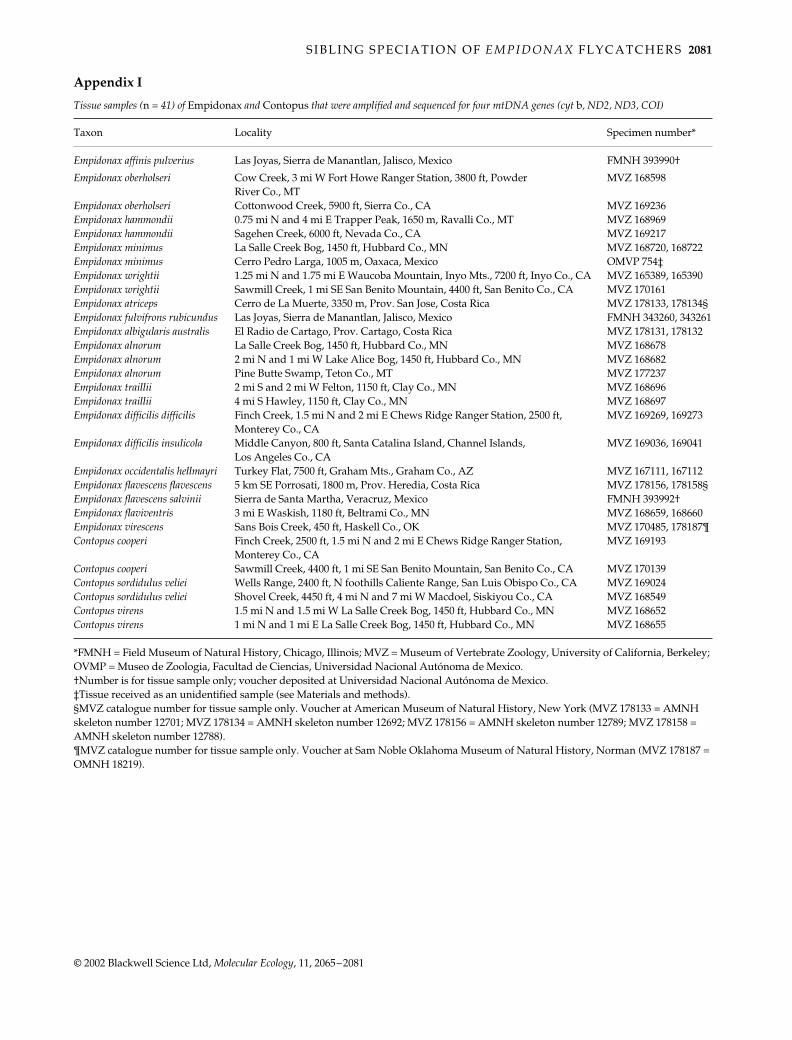
S I B L I N G S P E C I A T I O N O F E M P I D O N A X F L Y C A T C H E R S 2081
© 2002 Blackwell Science Ltd, Molecular Ecology, 11, 2065–2081
Appendix I
Tissue samples (n = 41) of Empidonax and Contopus that were amplified and sequenced for four mtDNA genes (cyt b, ND2, ND3, COI)
Taxon Locality Specimen number*
Empidonax affinis pulverius Las Joyas, Sierra de Manantlan, Jalisco, Mexico FMNH 393990†
Empidonax oberholseri Cow Creek, 3 mi W Fort Howe Ranger Station, 3800 ft, Powder MVZ 168598River Co., MT
Empidonax oberholseri Cottonwood Creek, 5900 ft, Sierra Co., CA MVZ 169236Empidonax hammondii 0.75 mi N and 4 mi E Trapper Peak, 1650 m, Ravalli Co., MT MVZ 168969Empidonax hammondii Sagehen Creek, 6000 ft, Nevada Co., CA MVZ 169217Empidonax minimus La Salle Creek Bog, 1450 ft, Hubbard Co., MN MVZ 168720, 168722Empidonax minimus Cerro Pedro Larga, 1005 m, Oaxaca, Mexico OMVP 754‡Empidonax wrightii 1.25 mi N and 1.75 mi E Waucoba Mountain, Inyo Mts., 7200 ft, Inyo Co., CA MVZ 165389, 165390Empidonax wrightii Sawmill Creek, 1 mi SE San Benito Mountain, 4400 ft, San Benito Co., CA MVZ 170161Empidonax atriceps Cerro de La Muerte, 3350 m, Prov. San Jose, Costa Rica MVZ 178133, 178134§Empidonax fulvifrons rubicundus Las Joyas, Sierra de Manantlan, Jalisco, Mexico FMNH 343260, 343261Empidonax albigularis australis El Radio de Cartago, Prov. Cartago, Costa Rica MVZ 178131, 178132Empidonax alnorum La Salle Creek Bog, 1450 ft, Hubbard Co., MN MVZ 168678Empidonax alnorum 2 mi N and 1 mi W Lake Alice Bog, 1450 ft, Hubbard Co., MN MVZ 168682Empidonax alnorum Pine Butte Swamp, Teton Co., MT MVZ 177237Empidonax traillii 2 mi S and 2 mi W Felton, 1150 ft, Clay Co., MN MVZ 168696Empidonax traillii 4 mi S Hawley, 1150 ft, Clay Co., MN MVZ 168697Empidonax difficilis difficilis Finch Creek, 1.5 mi N and 2 mi E Chews Ridge Ranger Station, 2500 ft, MVZ 169269, 169273
Monterey Co., CAEmpidonax difficilis insulicola Middle Canyon, 800 ft, Santa Catalina Island, Channel Islands, MVZ 169036, 169041
Los Angeles Co., CAEmpidonax occidentalis hellmayri Turkey Flat, 7500 ft, Graham Mts., Graham Co., AZ MVZ 167111, 167112Empidonax flavescens flavescens 5 km SE Porrosati, 1800 m, Prov. Heredia, Costa Rica MVZ 178156, 178158§Empidonax flavescens salvinii Sierra de Santa Martha, Veracruz, Mexico FMNH 393992†Empidonax flaviventris 3 mi E Waskish, 1180 ft, Beltrami Co., MN MVZ 168659, 168660Empidonax virescens Sans Bois Creek, 450 ft, Haskell Co., OK MVZ 170485, 178187¶Contopus cooperi Finch Creek, 2500 ft, 1.5 mi N and 2 mi E Chews Ridge Ranger Station, MVZ 169193
Monterey Co., CAContopus cooperi Sawmill Creek, 4400 ft, 1 mi SE San Benito Mountain, San Benito Co., CA MVZ 170139Contopus sordidulus veliei Wells Range, 2400 ft, N foothills Caliente Range, San Luis Obispo Co., CA MVZ 169024Contopus sordidulus veliei Shovel Creek, 4450 ft, 4 mi N and 7 mi W Macdoel, Siskiyou Co., CA MVZ 168549Contopus virens 1.5 mi N and 1.5 mi W La Salle Creek Bog, 1450 ft, Hubbard Co., MN MVZ 168652Contopus virens 1 mi N and 1 mi E La Salle Creek Bog, 1450 ft, Hubbard Co., MN MVZ 168655
*FMNH = Field Museum of Natural History, Chicago, Illinois; MVZ = Museum of Vertebrate Zoology, University of California, Berkeley; OVMP = Museo de Zoologia, Facultad de Ciencias, Universidad Nacional Autónoma de Mexico.†Number is for tissue sample only; voucher deposited at Universidad Nacional Autónoma de Mexico.‡Tissue received as an unidentified sample (see Materials and methods).§MVZ catalogue number for tissue sample only. Voucher at American Museum of Natural History, New York (MVZ 178133 = AMNH skeleton number 12701; MVZ 178134 = AMNH skeleton number 12692; MVZ 178156 = AMNH skeleton number 12789; MVZ 178158 = AMNH skeleton number 12788).¶MVZ catalogue number for tissue sample only. Voucher at Sam Noble Oklahoma Museum of Natural History, Norman (MVZ 178187 = OMNH 18219).
MEC_1588.fm Page 2081 Thursday, September 12, 2002 1:14 PM