a multigene genetic programming model for thyroid disorder detection
TRANSCRIPT
Applied Mathematical Sciences, Vol. 9, 2015, no. 135, 6707 - 6722HIKARI Ltd, www.m-hikari.com
http://dx.doi.org/10.12988/ams.2015.59563
A Multigene Genetic Programming Model
for Thyroid Disorder Detection
Joseph Ackora-Prah
Department of MathematicsKwame Nkrumah University of Science and Technology
Kumasi, Ghana
Fidelis Nyame Oheneba-Osei
Department of MathematicsKwame Nkrumah University of Science and Technology
Kumasi, Ghana
Perpetual Saah Andam
Department of MathematicsKwame Nkrumah University of Science and Technology
Kumasi, Ghana
Daniel Gyamfi
Department of MathematicsKwame Nkrumah University of Science and Technology
Kumasi, Ghana
Samuel Asante Gyamerah
Department of MathematicsKwame Nkrumah University of Science and Technology
Kumasi, Ghana
Copyright c© 2015 Joseph Ackora-Prah et al. This article is distributed under the
Creative Commons Attribution License, which permits unrestricted use, distribution, and
reproduction in any medium, provided the original work is properly cited.

6708 Joseph Ackora-Prah et al.
Abstract
Two common diseases of the thyroid gland, which releases thyroidhormones for regulating the rate of the body’s metabolism, are hyper-thyroidism and hypothyroidism. Before a patient is classified as beingnormal or suffering from hyperthyroidism or hypothyroidism, there are alot of information and tests conducted on the patient by existing modelsand these are costly in terms of time and money. We present the detec-tion of thyroid disorder based on attributes collected from patients. Amathematical model is developed using Multigene Symbolic RegressionGenetic Programming technique. The results show that the model isgood and is even able to reduce the number of attributes used to classifya patient as Normal, Hyperthyroidism and Hypothyroidism.
Keywords: Hyperthyroidism, Hypothyroidism, Multigene Symbolic Re-gression Genetic Programming technique
1 Introduction
The human being’s neck has a thyroid gland which contains endrocrine. Thisendrocrine gland is responsible for the secretion of hormones that control thebody’s metabolism and growth. A well functioning thyroid produces the rightamount of hormones needed to keep the body’s metabolism working at a nor-mal rate (not too fast or too slow). Thyroid disorders can range from a small,harmless goiter (enlarged gland) that needs no treatment to life-threateningcancer. The most common thyroid problems involve abnormal production ofthyroid hormones. Over-production of thyroid hormone results in a conditionknown as hyperthyroidism. Insufficient hormone production leads to hypothy-roidism. The ability to classify such an abnormality for proper diagnoses andtreatment is crucial.
Hypothyroidism (under-active thyroid), has many causes. Some of thecauses are prior thyroid surgery, exposure to ionizing radiation, chronic in-flammation of the thyroid (autoimmune thyroiditis), iodine deficiency, lack ofenzymes to make thyroid hormone, and various kinds of medication,[6]. Hyper-thyroidism, may also be caused by inflammation of the thyroid, various kindsof medications, and lack of control of thyroid hormone production. The se-riousness of thyroid disorders should not be underestimated as thyroid storm(an episode of severe hyperthyroidism) and myxedema coma (the end stageof untreated hypothyroidism) may lead to death in a significant number ofcases,[6]. Recent studies have shown that evolutionary algorithms (EAs), suchas genetic Programming (GP), can successfully be used as a model for thyroiddisorder,[8].
Zhang [2] applied genetic programming to solve a symbolic regression. Hisobjective was to find a function fitting the given input-output data as close as
A MGGP model for thyroid disorder detection 6709
possible. In his experiment, he first observes that the function and terminalsets had a powerful impact on the performance of the GP. Too many functionsand terminals increased the search space exponentially, resulting in long train-ing times and more local minimums, so the algorithm was more likely to betrapped by some suboptimal solutions. On the other hand, too few functionsfailed in finding a fitting function. He concluded that the size of population,the selection method and selection percentage are main factors that affect thevariety of generations.
Muhammed et al.[7], used genetic programming (GP) and a variation ofgenetic programming called GP with Comparative Partner Selection (CPS)for diabetes detection. They used GP to produce an individual from trainingdata and converted the available features to a single feature that has differentvalues for healthy and patient (diabetes) data.They claim that their proposedsystem was able to achieve 78.5+
−2.2% accuracy. Their results showed that GPbased classifier can assist in the diagnosis of diabetes disease.
Again Ahlam et al. [1] used a multigene genetic programming techniqueto detect diabetes based on set of attributes collected from patients. Theirtechnique showed significant advantages of an evolving nonlinear model whichcan be used for prediction. Their developed GP model was evaluated usingPima Indian data set and showed higher capability and accuracy in detectionand diagnosis of Diabetes.In this work, we develop a mathematical model using MGGP for the detectionof thyroid disorder based on attributes collected from patients. Section 2 dealswith the preliminary concepts of GP, where the concept of GP and henceMultigene symbolic regression GP is introduced. We present the MultigeneGenetic Programming algorithm to the Thyroid problem in section 3. Section 4also deals with how the Multigene Genetic Programming model was developedand finally the analysis of the developed model is presented in section 5.
2 Preliminary concepts
2.1 Genetic Programming(GP)
GP is basically a new area of artificial intelligence research. It is an algorithminspired by biological evolution to find computer programs that perform a userdefined task. It is a machine learning technique used to optimize a populationof computer programs according to a fitness landscape determined by a pro-grams ability to perform a given computational task.In GP, solutions are expressed as syntax trees rather than as lines of codes.In order to solve a problem, it is important to specify the steps such as Ter-minal set, Function set, Fitness measure, parameters like population sizes,genetic operators etc. and termination criterion.
6710 Joseph Ackora-Prah et al.
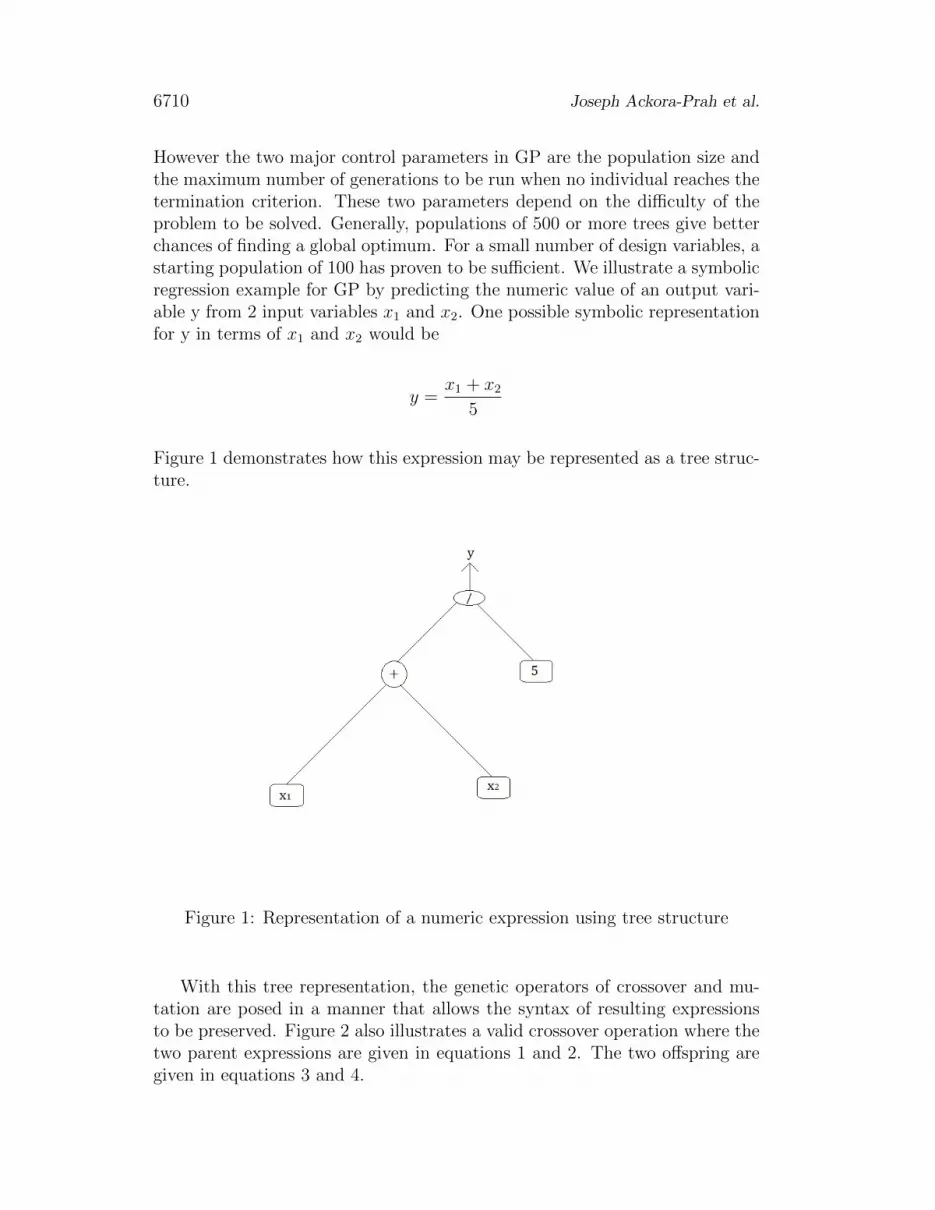
However the two major control parameters in GP are the population size andthe maximum number of generations to be run when no individual reaches thetermination criterion. These two parameters depend on the difficulty of theproblem to be solved. Generally, populations of 500 or more trees give betterchances of finding a global optimum. For a small number of design variables, astarting population of 100 has proven to be sufficient. We illustrate a symbolicregression example for GP by predicting the numeric value of an output vari-able y from 2 input variables x1 and x2. One possible symbolic representationfor y in terms of x1 and x2 would be
y =x1 + x2
5
Figure 1 demonstrates how this expression may be represented as a tree struc-ture.
Figure 1: Representation of a numeric expression using tree structure
With this tree representation, the genetic operators of crossover and mu-tation are posed in a manner that allows the syntax of resulting expressionsto be preserved. Figure 2 also illustrates a valid crossover operation where thetwo parent expressions are given in equations 1 and 2. The two offspring aregiven in equations 3 and 4.

A MGGP model for thyroid disorder detection 6711
y1 =x1 + x2
5(1)
y2 = (x3 − x2) ∗ (x1 + x3) (2)
y3 =x1 + x2
x3 − x2
(3)
y4 = 5 ∗ (x1 + x3) (4)
Figure 2: Valid crossover representation
2.2 The Multigene symbolic regression GP
A multigene individual consists of one or more genes, each of which is a tra-ditional GP tree. The overall model is a weighted linear combination of eachgene. The optimal weights for the genes are obtained using ordinary leastsquare method to regress the genes against the output data. Mathematically,a multigene regression model can be written as:
y = bo + b1 ∗ tree + b2 ∗ tree + · · ·+ bm ∗ treeM
where bo is bias (offset) term, b1, . . . , bm are gene weights and M is the numberof genes (trees).

6712 Joseph Ackora-Prah et al.
2.2.1 Least Square Estimates
The prediction of the y training data is estimated by:
y = b0 + b1t1 + b2t2 + · · ·+ bgtG (5)
where ti is the (N × 1) vector of outputs from the ith tree(gene) comprising amultigene individual.Next, define G as a (N × (G + 1)) gene response matrix as follows in G =[1 t1, . . . , tG] where the 1 refers to a (N×1) column of ones used as a bias(offset)input. Now (5) can be rewritten as:
y = Gb
The least squares estimate of the coefficients b0, b1, b2, . . . , bg formulated as a((G + 1)× 1) vector can again be computed from the training data as
b = (GTG)−1GT (6)
We note that the optimality of the estimates of b is only true if a number ofassumptions are met such as independence of the columns of G and normallydistributed errors. In practice the assumptions are rarely strictly met, and thecolumns of the gene response matrix G may be collinear (e.g. due to duplicategenes in an individual). Besides our matrix is too large which could end up tobe singular and so therefore the Moore-Penrose pseudo-inverse through singu-lar value decomposition (SVD) is used in (6) instead of the standard matrixinverse.
2.2.2 Singular value decomposition (SVD)
Generally, the SVD finds application in problems involving large matrices, withdimensions that can reach into the thousands as it can turn a singular probleminto a non-singular one. SVD is based on a theorem from linear algebra whichsays that a rectangular matrix A can be broken down into the products of threematrices- an orthogonal matrix U, a diagonal matrix S, and the transpose ofan orthogonal matrix V.[10]
2.2.3 Theorem SVD:
Theorem 1 Let A be a real valued m x n matrix, where m ≥ n. Then A can bedecomposed as follows: A = USV T , where UTU = I, V TV = I. The columnsof U are orthonormal eigenvectors of AAT , the columns of V are orthonormaleigenvectors of ATA and S is diagonal matrix containing the square roots ofeigenvalues from U or V in descending order. [11]

A MGGP model for thyroid disorder detection 6713
Hence (6) becomesb = US−1V T (7)
3 The Multigene Genetic programming Algo-
rithm to the Thyroid Problem
The data used was retrieved from the UCI Machine learning Repository [12].The data has 7200 instances and consists of twenty one (21) input variablesand one (1) output variable which has a value ‘1’, ‘2’ or ‘3’, where ‘1’ meansthe person is normal, ‘2’ implies the person is suffering from hyperthyroidismand ‘3’ means the person is suffering from hypothyroidism. The input vari-ables (terminal set) consist of information and tests conducted on the patientas shown in Table 1.
Table 1: GP terminal setX1 AgeX2 SexX3 On thyroxineX4 Query on thyroxineX5 On antithyroid medicationX6 SickX7 PregnantX8 Thyroid surgeryX9 I131 treatmentX10 Query on hypothyroidX11 Query on hyperthyroidX12 LithiumX13 GoiterX14 TumorX15 HypopituitaryX16 PsychX17 TSHX18 T3X19 TT4X20 T4UX21 FTI
1. We input a data file containing m x n matrix of input (predictor) vari-ables, and m x 1 matrix of output (response) variables.

6714 Joseph Ackora-Prah et al.
2. An initial population of candidate solutions are generated randomlybased on step one by using Ramped-half-and -half method (e.g. If max-imum tree depth is 5 and population is 100 then, on average, 20 will begenerated at each depth (1/2 using grow and 1/2 using full ) after wehad chosen our function and terminal sets. The maximum depth of eachgene is then set to 5 to control the complexity of the model.
3. The number of genes(Gmax) is set to 8 as a high Gmax may capture morenon-linear behavior but there is the risk of over-fitting the training dataand creating models that contain complex terms that contribute littleor nothing to the model’s predictive performance. Conversely, settingGmax to 1 is equivalent to performing the scaled symbolic regression(where we have only the bias term b0 and a scaling term b1)
4. Our fitness measure is to minimize the error between the predicted valuesand the actual observed values , hence we then evaluated the fitness ofeach individual solutions in the population (p) by using:
RMSE =
√∑pp=1(Fp − Fp)2
p
where,Fp = actual values observed and Fp = predicted values.
5. We create a new population by repeating the following steps until thenew population is complete.
(a) We set a tournament size of 7 and apply Lexicographic Tournamentpressure as our selection method to select the more fitter solutionsinto the next generation, i.e
Lexicographic Tournament selection = pickmax{F (G1), F (G2), . . . , F (G7)}
ifF (G1) = F (G2) = · · · = F (G7)
pickmin{S(G1), S(G2), . . . , S(G7)}
Where,
F (Gn) = Fitness level of gene n
S(Gn) = Size of gene n
(b) We apply two point high level crossover with a probability of 0.85to the selected individual solutions.
(c) A subtree mutation is applied with the probability of 0.1
A MGGP model for thyroid disorder detection 6715
(d) Also we apply the direct reproduction operator (elitism) with aprobability of 0.05. i.e. the entire individual is simply copied to thenext generation without modification.
(e) We then place new offspring in the new population.
6. The new generated population is used to generate subsequent generationsper the continuation of the algorithm.
7. If the end condition is satisfied, stop and return the best solution incurrent population.
8. Otherwise go to step 4 for fitness evaluation (loop).
The maximum number of generation we used is 250 and an initial populationof size 1500.
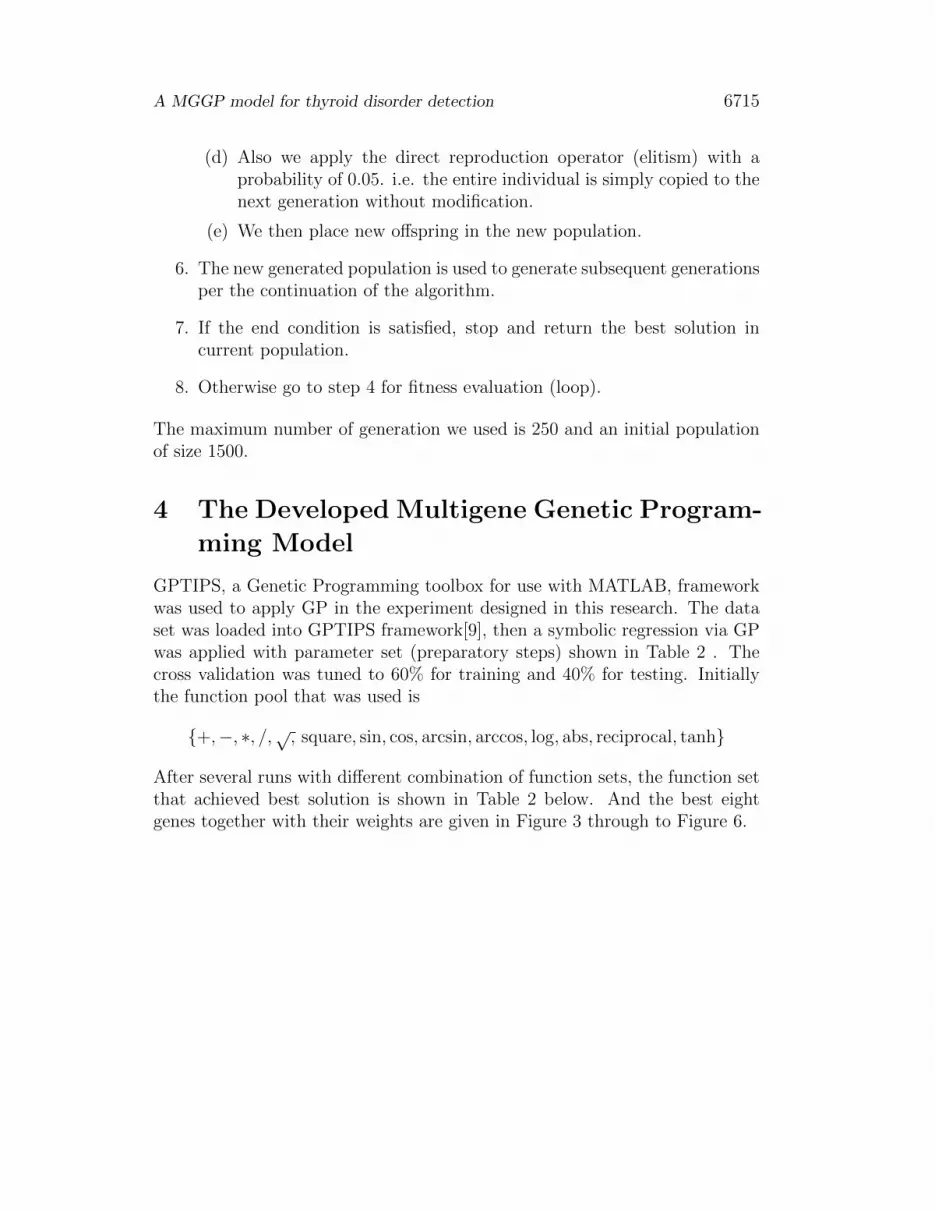
4 The Developed Multigene Genetic Program-
ming Model
GPTIPS, a Genetic Programming toolbox for use with MATLAB, frameworkwas used to apply GP in the experiment designed in this research. The dataset was loaded into GPTIPS framework[9], then a symbolic regression via GPwas applied with parameter set (preparatory steps) shown in Table 2 . Thecross validation was tuned to 60% for training and 40% for testing. Initiallythe function pool that was used is
{+,−, ∗, /,√, square, sin, cos, arcsin, arccos, log, abs, reciprocal, tanh}
After several runs with different combination of function sets, the function setthat achieved best solution is shown in Table 2 below. And the best eightgenes together with their weights are given in Figure 3 through to Figure 6.

6716 Joseph Ackora-Prah et al.
Table 2: GP Preparatory stepsPopulation size 1500Number of generation 250Selection Method Lexicographic tournament selectionTournament size 7Termination criteria 0Maximum depth of each tree 7Maximum Number of Genes 8Function set {+,-,*,tanh,cos,}Crossover probability 0.85Mutation probability 0.1Elite probability 0.05
Figure 3: Gene 1 & 2

A MGGP model for thyroid disorder detection 6717
Figure 4: Gene 3 & 4
Figure 5: Gene 5 & 6
4.1 The Complete Model
After linear combination of all the eight (8) genes together with their weights,the over all simplified multigene symbolic regression model was harvested as

6718 Joseph Ackora-Prah et al.
Figure 6: Gene 7 & 8
below.
y = 0.1835x19 − 1.607 tanh(27.14x17 − tanh(x3 + 2.359))
+ 1.209 tanh(tanh(x17x18 tanh(x17))) + 0.6011 tanh(39.4x17 − x3)
+ 0.5486 tanh(tanh(x21 + 1.846))(x3 + tanh(x21 + 7.51))
+ 0.2079 tanh(17.22x17)(2x3 + x19)
+ 0.3851 tanh(1.965x9 − 2x17)(tanh(x17) + x1x8 cos(x17))
+ 0.3399x18 tanh(cos(1.965x9)) tanh(x17)− 1.131
5 Analysis of Results
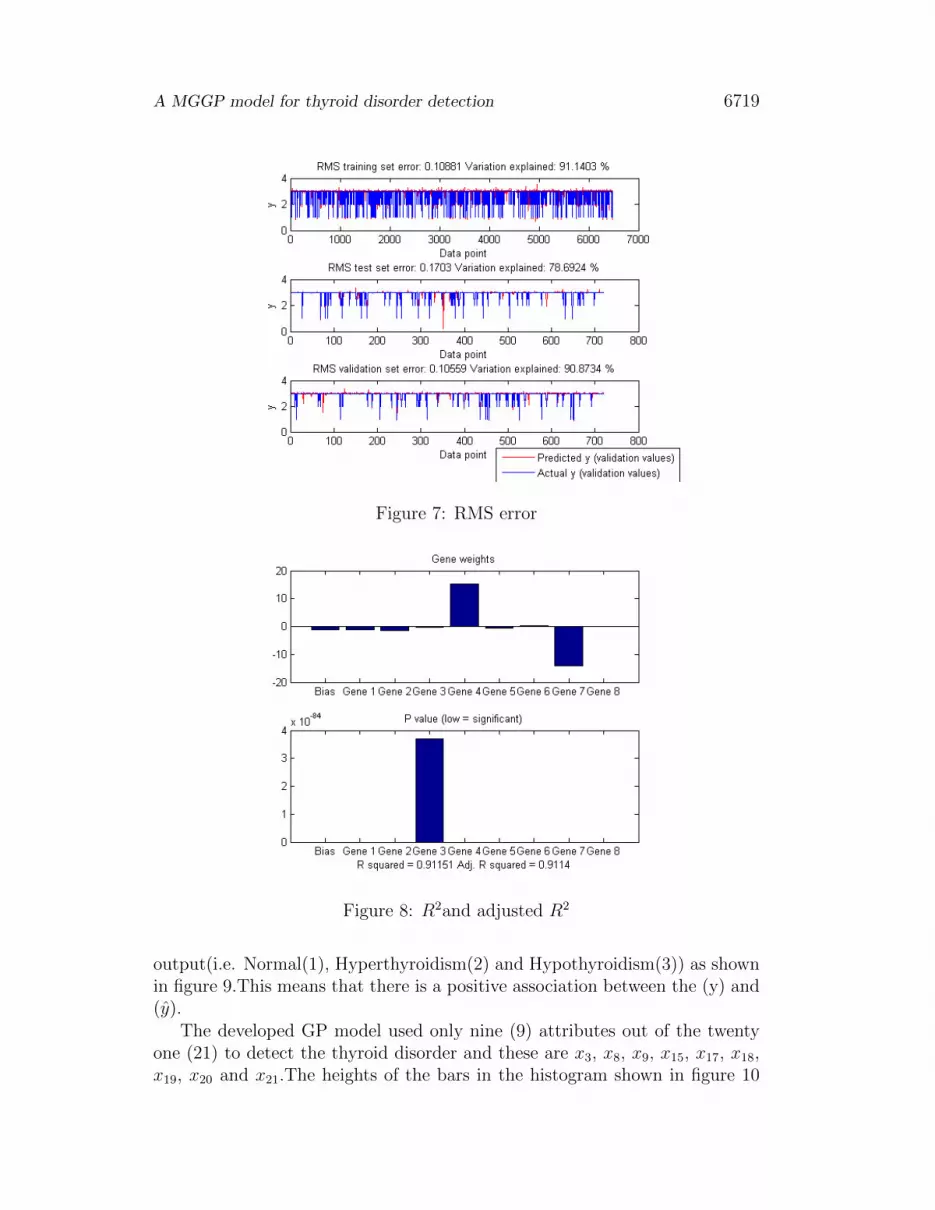
We did statistical analysis of the developed GP model to test the goodness of fitof our model. From Figure 7, the RMSE for the training data set was 0.10881and had 91.1403% variation explained. The RMSE for the test data set was0.1703 and had 78.6924% variation explained. The model gave the coefficientof determination (R2) = 0.91151 and the Adjusted R2 = 0.9114.This showsthat there is a good correlation between the variable of interest (y) and theindependent variables (xi). The regression coefficients were estimated by themethod of least squares and are shown in Figure 8 as Gene weights.
We also plotted a scatter diagram to have a visual indication of the degreeof the association between the response variables, that is the predicted (y)and the actual (y). The line drawn passed through the points plotted for the
A MGGP model for thyroid disorder detection 6719
Figure 7: RMS error
Figure 8: R2and adjusted R2
output(i.e. Normal(1), Hyperthyroidism(2) and Hypothyroidism(3)) as shownin figure 9.This means that there is a positive association between the (y) and(y).
The developed GP model used only nine (9) attributes out of the twentyone (21) to detect the thyroid disorder and these are x3, x8, x9, x15, x17, x18,x19, x20 and x21.The heights of the bars in the histogram shown in figure 10

6720 Joseph Ackora-Prah et al.
Figure 9: scatter diagram
corresponds to the degree or how much the predictor variables (xi) influencethe response variables (y). The longer the height of a predictor variable, thegreater the influence (i.e. most important variable). Out of the nine (9)nine attributes that GP used, TSH(x17) was the most influential factor on theresponse variable followed by x3(On thyroxine), x21(FTI), x18(T3), x19(TT4),x8(Thyroid surgery), x20(T4U),x9(I131 treatment) and x15(Hypopituitary) inthat order. These are shown in figure 10 as histogram.
Figure 10: Best nine inputs

A MGGP model for thyroid disorder detection 6721
6 Conclusion
In this work, a MGGP mathematical model was developed to provide a so-lution to the thyroid problem,that is the ability to diagnose a patient of thethyroid disorder(Hyperthyroidism and Hypothyroidism). Root mean squareerror (RMSE), R2 and Adjusted R2, scatter diagram and histogram were usedto ascertain the goodness of the Model. Based on the statistical analysis, themodel is found to be good for the thyroid disorder detection and is able toclassify patient as normal (1), suffering from Hyperthyroidism (2) or Hypothy-roidism (3). The developed MGGP model was able to reduce the attributesused in the classification and hence the model is cost effective compare to thetraditional approach of using all the twenty one (21) attributes for diagnosingthyroid disorder. That’s the MGGP used 9 most important attributes insteadof the whole 21 for the thyroid disorder detection.
Acknowledgements. We express our gratitude to the the Departmentof Mathematics, Kwame Nkrumah University of Science and Technology forproviding us resources to help complete this research successfully.
References
[1] Ahlam A. Sharief, A. Sheta, Developing a mathematical model to de-tect diabetes using multigene genetic programming, International Jour-nal of Advanced Research in Artificial Intelligence, 3 (2014), 54-59.http://dx.doi.org/10.14569/ijarai.2014.031007
[2] C. Zhang, Genetic programming for symbolic regression, University ofTennesse, Knoxville, TN 37996, USA, (2012).
[3] D. P. Searson, D. E. Leahy, M. J. Willis, GPTIPS: An open source geneticprogramming toolbox for multigene symbolic regression, In Proceedings ofthe International Multi-conference of Engineers and Computer Scientists,1 (2010), 77 - 80.
[4] H. Faris, A symbolic regression approach for modeling the temperatureof metal cutting tool, International Journal of Control and Automation,6 (2013), 431-440.
[5] J. R. Koza, Genetic Programming: On the Programming of Computers byMeans of Natural Selection, MIT Press, Cambridge, USA, 1992.
[6] S. N. Kulkarni and A. R. Karwankar, Thyroid Disease Detection usingModified Fuzzy Hyper-line Segment Clustering Neural Network, Interna-tional Journal of Computers, 3 (2012).

6722 Joseph Ackora-Prah et al.
[7] Muhammed A. Pradhan, P. R. Abdul Rahman, Design of classifier fordetection of diabetes using genetic programming, European Signal Pro-cessing Conference, (2010).
[8] L. Ozyimalz, T. Yildirim, Diagnosis of thyroid disease using artifi-cial neural network methods, In Proceedings of International Confer-ence on Neural Information Processing, Singapore, (2002), 2033-2036.http://dx.doi.org/10.1109/iconip.2002.1199031
[9] D. Searson, Genetic Programming and Symbolic Regression for Matlab,School of Computing Science, Newcastle University, UK, 2009.
[10] Emmett J. Jentilucci, Using the singular value decomposition, Chester F.Carlson Center For Imaging Science, Rochester Institute of Technology,(2003).
[11] Kirk Baker, Singular value decomposition tutorial, (2013).
[12] UCI, Thyroid disease data set, 1987, Retrieved fromhttps://archive.ics.uci.edu/ml/datasets/Thyroid+Disease
Received: September 17, 2015; Published: November 10, 2015