inheritance of size and shape in a natural population of collared flycatchers, ficedula albicollis
TRANSCRIPT
J. evol. Biol. 6: 375-395 (1993) 1010-061X/93/030375-21 $ 1.50+0.20/O (7 1993 Birkhauser Verlag, Base1
Inheritance of size and shape in a natural population of collared flycatchers, Ficedzh albicollis
Juha Merila* and Lars Gustafsson
Depurtment of Zoology, Section of Animul Ecology, Uppsalu Univeristy, Box 561, S-751 22 Uppsulu, Sweden
Key words: Ficedulu alhicollis; body size; genetic covariance genetic correlation; heritability; metric traits.
Abstract
Four external skeletal and three feather dimensions were measured on adult collared flycatchers (Ficedulu ulbicollis) and their adult offspring. By using mid- offspring-midparent regressions, all traits were found to be heritable with an arithmetic mean heritability of 0.46. Heritability estimates from full-sib analyses were about 1.5 times higher (mean 0.67) indicating that variation in traits was affected by shared nest environment among full-sibs. The overall body size as measured by principal component one (PCl) was found to be heritable (h2 = 0.40). However, this multivariate measure of heritability was not significant in offspring- father comparison, while highly so in offspring-mother comparison (h2 = 0.60). Low offspring-father resemblance was evident also in univariate estimates of heritability. Possible causes of this (extra-pair copulations, maternal effects, sex- linked variance) are discussed.
Genetic correlations among seven traits were estimated to be low (mean 0.22) and of similar magnitude or higher than phenotypic correlations (mean 0.18). All genetic correlations were positive. Genetic and phenotypic correlations as well as covariances were fairly similar to each other (Y = 0.85 and Y = 0.87, respectively). Environmental correlations did not follow the pattern of genetic correlations (v = 0.1 l), but were more similar to phenotypic correlations (r = 0.60). Given the low genetic correlations and moderate heritabilities, the overall conclusion is that the external morphology of collared flycatchers is largely under additive genetic control and that there is a strong potential for evolutionary change in morphology even under complex multivariate selection.
* Author for correspondence
375
376 Meriki and Gustafsson
The evolution of morphometric differences among members of a taxon is a function of their evolutionary history (genes inherited from a common ancestor) and the selective regime they currently encounter (e.g. Schluter, 1989). If we consider two closely related species hardly differing in their morphology, such as the two old world Aycatchers Ficedula hypoleuca and Ficrdula albicollis, two different explanations for their low degree of divergence can be offered (Merila et al., subm.). First, the low divergence could be explained by the hypothesis that these two species are ecologically very similar and share a common selective regime so that no selection for divergence has occurred. Second, low divergence may be explained by the shared developmental (genetic/epigenetic) constraints inherited from a common ancestor (Alberch, 1980; Arnold, 1981; Maynard Smith et al., 1985).
The role of constraints in evolutionary diversification has been clarified by Lande ( 1986) who argued that for developmental constraints to explain low divergence between related species, there must be no heritability in the traits, or genetic covariances among traits must be so strong that they cannot be independently altered (e.g. Arnold, 1981; Lofsvold, 1986). Thus, estimation of additive genetic variances and covariances provides a means of determining the magnitude of genetic constraints imposed by inheritance and pleiotropy (Arnold 1981; Clark, 1987; Leamy and Atchley, 1984; Lofsvold, 1988; Kingsolver and Wiernasz, 1991; Schluter, 1984).
There is a growing amount of evidence from natural populations of birds that most morphological traits have large heritabilities (Boag and Grant, 1978; Smith and Zach, 1979; Boag and Grant, 1981; Dhondt, 1982; Boag, 1983; Grant, 1983; Smith and Dhondt, 1980; Alatalo and Lundberg, 1986; Schluter and Smith, 1986; Wiggins, 1989; Larsson and Forslund, 1992). However, many of these studies considered only one or a few characters, and consequently, few reliable estimates of genetic covariances and correlations are available. This is unfortunate, since the role of genetic constraints in evolution of metric traits still remains unclear partly because of the lack of empirical data from natural populations (Grant, 1983; Leamy and Atchley, 1984; Lofsvold, 1986; Turelli, 1988). To fully understand the role of genetic constraints in the evolution of metric traits, as well as other important empirical questions of quantitative genetics, such as maintenance of additive genetic variation in traits closely related to fitness, we need more estimates of genetic correlations for a whole range of species from natural populations (Turelli, 1988; Barton and Turelli, 1989; Stearns et al., 1991).
The present study was designed to provide heritability estimates for seven morphometric traits in a natural population of collared flycatchers, to see whether the population would respond genetically to current selection, or whether past episodes of selection had eliminated genetic variability. Genetic correlations and covariances between traits were estimated in order to evaluate possible constraints for further differentiation imposed by pleiotropy (Clark, 1987). Estimation of genetic correlations can also give insight into the action of selection in the past: traits which make an important joint contribution to fitness are predicted to be more tightly genetically correlated than functionally independent traits (Cheverud,
Inheritance of size and shape 377
1984). Finally, by comparing phenotypic and genetic correlations, we will also address the recent suggestion that when estimation of genetic correlations is not possible, phenotypic correlations can be used to replace them (Cheverud, 1988).
Material and methods
Relewnt naturul history
The collared flycatcher is a small (approx 13 g), hole-nesting migratory passerine breeding mainly in eastern and central Europe. Two isolated populations, however, inhabit the Baltic islands of eland and Gotland off the Swedish east coast. The data for this study derive from the population on Gotland (57’ IO’ N, 18’ 20’ E) where the number of breeding pairs has been recently estimated to be approx. 4000 (Gustafsson and Hogstrom, 1981). This population has been intensively studied since 1980 (e.g. Gustafsson, 1989a, 1989b), and the material analyzed here was collected during the nine breeding seasons from 1980 to 1988. A detailed description of the study area and breeding ecology of the species can be found in Gustafsson (op. cit.) and Part (1991).
The dutu
Family relationships were determined by capturing parents from nest-boxes while they were feeding the young (mainly males) or incubating the eggs (females). All fledglings were marked with aluminium rings at the age of 6 to 13 days, permitting individual recognition of birds recruiting to the population in subsequent years. Heritability estimates were thus based on measurements made upon fully grown offspring recruiting to the population as adults.
Since female flycatchers lay eggs only in their own nests, the mothers of young were always known with certainty. However, because extrapair copulations occur in this species (Alatalo et al., 1984, 1989; Gelter et al., 1992), some inaccuracy may affect father-offspring relationships. Using indirect reasoning, Alatalo et al. (op. pict.) estimated the cuckoldry frequency in this population to be about 21%.
A total of 774 families were included in the present analyses. Most of the families (71.3%) were represented by single offspring; there were 193 2-offspring families (24.9%) 24 3-offspring families (3.1%) and 5 4-offspring families (0.6%). In many tests, sample sizes varied considerably due to missing values, or due to the fact that only one parent of the offspring was known. Lower sample sizes of beak width and depth were due to the fact that measurement of these traits only began in 1985. For this reason, phenotypic correlations among the seven variables were calculated by using the subset of individuals (n = 1275, parents and offspring combined) mea- sured for all traits.
The seven morphometric traits considered here include: length of folded right wing (WI) held flat and straight on a ruler; tail length (TL), measured from cloaca1
378 Merill and Gustafsson
notch to tip of the longest rectrices; length of first primary (PR) measured from metacarpal joint to tip of feather; tarsus length (TS), as described in Alatalo et al. ( 1984); beak length (BL) from angle of the skull to tip of upper mandible; beak width (BW), at the anterior edge of nostrils; and beak depth (BD), in a vertical plane at the anterior end of nostrils over both mandibles (all in mm). Feather lengths were measured with a ruler to an accuracy of 0.5 mm and skeletal dimensions with slide calibers to an accuracy of 0.1 mm. (The term skeletal will be used throughout this paper as a shortening to mean the skeletal structures covered with modified integument known as rhamphotheca; Stettenheim, 1972.) Although all traits were approximately normally distributed, they were In-transformed for calculations of phenotypic and genotypic correlations to improve linearity between measures. Since In-transformation did not affect heritability estimates, we present only estimates based on untransformed data. The majority of the measurements were taken by L. Gustafsson; special care was taken to reduce any inter-observed bias in measurements (repeated comparisons between measures).
Since some of the characters (WI, TL, PR) exhibited a considerable age-depen- dent variation (Merila et al., manus.), they were age-corrected before analysis. This was done by adding the average difference between 1 and 2 2 year old birds to the measurements of birds measured at the age of 1 year.
Repeatabilities
In order to assess measurement error for each trait (Boag and Noordwijk, 1987) we estimated repeatabilities for all traits by using variance components from single classification ANOVA (see Bailey and Byrnes, 1990; Lessels and Boag, 1987). Because of a slight size difference among sexes, separate repeatability analyses were made for females and males. For both sexes, we carried out an ANOVA which comprised all available repeated measures for all individuals measured for all traits. This estimate thus includes errors stemming from all possible sources, such as variation due to changes in measurement technique with time, growth and abrasion. A second type of repeatability estimate was obtained for males which were measured within the same breeding season (usually within a time interval of only few days). This analysis was performed in order to exclude the among year component of variation from measures and thus to obtain estimates of “pure” measurement error. This analysis was not made for females since too few repeated measures were available (the male data set consisted of polygamous males captured from different nest-boxes within a given breeding season).
Hrritddity estimutes
Heritability estimates were calculated by separately regressing mean values of offspring (i.e. mid-offspring values) on female and male parents (h2 = twice the
Inheritance of size and shape 379
slope) and on mean values of both parents (i.e. mid-parent values (h’ = slope)). In addition, we performed a full-sib analysis by using single classification ANOVA (Sokal and Rohlf, 1981; 216) that partitioned the variance for within and among full-sib (litters) components. The heritability estimates thus obtained corresponded to twice the intra-class correlation coefficient among two or more sibs (Falconer, 1989). However, the estimates obtained from full-sib analyses are known to overestimate parametric heritabilities because twice the component of variance among full-sib families estimates the additive genetic variance plus half of the dominance variance (Falconer, 1989).
No family size weighting procedure was employed in any of the analyses since this would have had only a marginal effect on estimates (Falconer, 1989). By contrast, we performed a correction for a slight sexual dimorphism present in some of the characters by adjusting male values to female equivalents. This was done because failure to correct for sex differences can produce inflated estimates of phenotypic variance and correlation since the variance and correlation between male and female means are included (Falconer, 1989; Schluter and Smith, 1986). This correction was made by multiplying male values with a constant (BW 1.0083, BL 1.0026, TS 1.0035, WI 0.9814, TL 0.9813, PR 0.9947) reflecting female/male ratios in the sample used to calculate heritabilities. After these corrections, no sexual dimorphism was present in any character.
Significance tests and standard errors of heritability estimates were based on values uncorrected for measurement error. All regressions were inspected for outliers, but estimates did not change when single observations were excluded. Therefore, no outliers were deleted. Descriptive statistics for the samples used to calculate heritabilities are given in Appendix 1.
Confounding ,fac.tors
Several pitfalls have to be avoided when estimating heritabilities and genetic correlations. Inflated heritability estimates may arise for example as a result of assortative mating, unequal parental variances, and environmental correlations among offspring and parents (Falconer, 1989).
Assortative mating between parents may inflate heritabilities deduced from offspring on single parent regressions, but will not affect the estimates derived from offspring-midparent regressions (Falconer, 1989; 176). To check whether our h ‘-estimates could be inflated by assortative mating, we calculated Pearson product- moment correlations for each trait between mates involved in the midoffspring-mid- parent analysis. Significance levels for correlation coefficients were determined after Sokal and Rohlf (1981; 584).
The equality of parental phenotypic variances for each trait was tested by using F-statistics. Among parents included in midoffspring-midparent comparison un- equal parental variances were only detected for break depth [J;c,,298) = 1.44, p = 0.002; all others F < 1.20, p > 0.05). This difference remains significant after sequential Bonferroni correction. In the case of midoffspring-single parent regres-
380 Merili and Gustaf’sson
sions, none of parental variances was found to be unequal (in all F < 1.19). Thus, the difference in beak depth variances may be due to sampling error, since it was not found in the latter comparison. Moreover, since the F-ratio was fairly low, this difference is not likely to impose any strong bias upon heritability estimates.
If genotypes are not randomly distributed among environments, resemblance between offspring and parents may be inflated due to shared environment, i.e. resemblance between parents and offspring may be mainly environmental (Feldman and Lewontin, 1975; van Noordwijk, 1984; Larsson and Forslund, 1992). One way to test the importance of this cause of parent-offspring resemblance is to exchange young among broods and then compare resulting offspring values with both true and foster parent values (e.g. Smith and Dhondt, 1980; Alatalo and Lundberg, 1986; Alatalo and Gustafsson, 1988; Wiggins, 1989). If environmental causes of resemblance are strong, young should resemble their foster parents as much as, or more than, their true parents; if they are weak, young should resemble only their true parents. However, previously collected data from cross-fostering experiments with the collared flycatcher showed no such effects on tarsus length (Alatalo et al., 1990). For the other six traits, we found no indication that environmental correla- tions confound heritability estimates (Gustafsson and Merilh, subm.).
Phmot~~pic and gemtypic cnrrclutions
Genetic correlations were computed from midparent-midoffspring covariances (Falconer, 1989). Two estimates of genetic correlations were obtained for each pair of traits X and Y from the following equations:
r(;(,) = cov(X’, Y)/J{cov(X’, X)cov( Y’, Y)}, and
r(;(2) = cov(X, Y’>/J{cov(xr, X)cov( Y’, Y)},
where ’ refers to the mid-parent value. Since the two estimates should be the same, their similarity can be used to assess their robustness (van Noordwijk, 1984; Schluter and Smith, 1986). The arithmetic mean of these two estimates is the final estimate for the genetic correlations rC;, which was used to calculate environmental correlations:
r t = (r,, - rc;hxhy )/JC 1 - hZ, )( 1 - h’Y h
where r). is the phenotypic correlation between X and Y, and h is the square root of the heritability (Falconer, 1989). Approximate standard errors for genetic correlations were calculated from Reeve’s (1955) formula:
SE,, = (1 - r~;/J2)(SEh$SEh$/h$h$)
where SE is standard error. Phenotypic correlations were calculated using standard procedures (Sokal and
Rohlf, 1981) with individual data. Principal components were extracted from an r’p matrix (unrotated eigenvalue solution) to summarize linear trends in the correlated
Inheritance of size and shape 381
data set. Component selection was carried out using the method described by Muirhead (1982: 406-420). In short, the t - 1, t - 2, . , f - n, eigenvalues were tested sequentially until we found the number, (I = t -k, of eigenvalues that were equal. The k eigenvalues are thus distinct. By these means we found four distinct eigenvalues. By using midoffspring-midparent regressions, component scores for parents and offspring were used to suggest which overall phenotypic qualities were most strongly inherited.
To compare similarity between genetic, phenotypic and environmental correla- tions, we applied Mantel tests, a randomization test free from distributional assumptions. 1000 randomly selected permutations were used to assess the validity of the null hypothesis of no matrix correlation. The P value reported is the proportion of the randomizations with correlation coefficients as high or higher than the observed value (Cheverud et al., 1989).
To analyze the proportionality of correlation or variance-covariance matrices, we first calculated eigenvectors and then used pairwise vector correlations (rV) to measure degree of orthogonality among vectors (Lofsvold, 1986). A correlation coefficient of I.0 corresponds to total collinearity, whereas a correlation coefficient of 0.0 corresponds to total orthogonality (Morrison, 1976).
Phenotypic and genetic rlclriLln~e-~or~arian~e rnutrices
Genetic correlations cannot be directly incorporated into evolutionary models which make use of variance-covariance matrices. For each particular correlation matrix there may exist an infinite number of covariance matrices, and different covariance matrices with identical correlation structures under identical selective regime may yield evolutionary trajectories that arc qualitatively different (Kohn and Atchley, 1988; Cheverud et al., 1989). For this reason we also calculated phenotypic (P) and genetic (C) variance-covariance matrices from the data used to estimate corresponding correlations (In-transformed; see above). Genetic variances were calculated as twice the covariance among the same trait in offspring and parent, given that the pure covariance term estimates only half of the trait additive genetic variance (Falconer, 1989). Genetic covariance among traits was calculated as the sum of two reciprocal covariances COVE; = cov(X”, Y’) + cov(Y”, X’), where ” denotes the trait value of mid-parents and ’ that of mid-offspring.
Results
Repeutuhilities
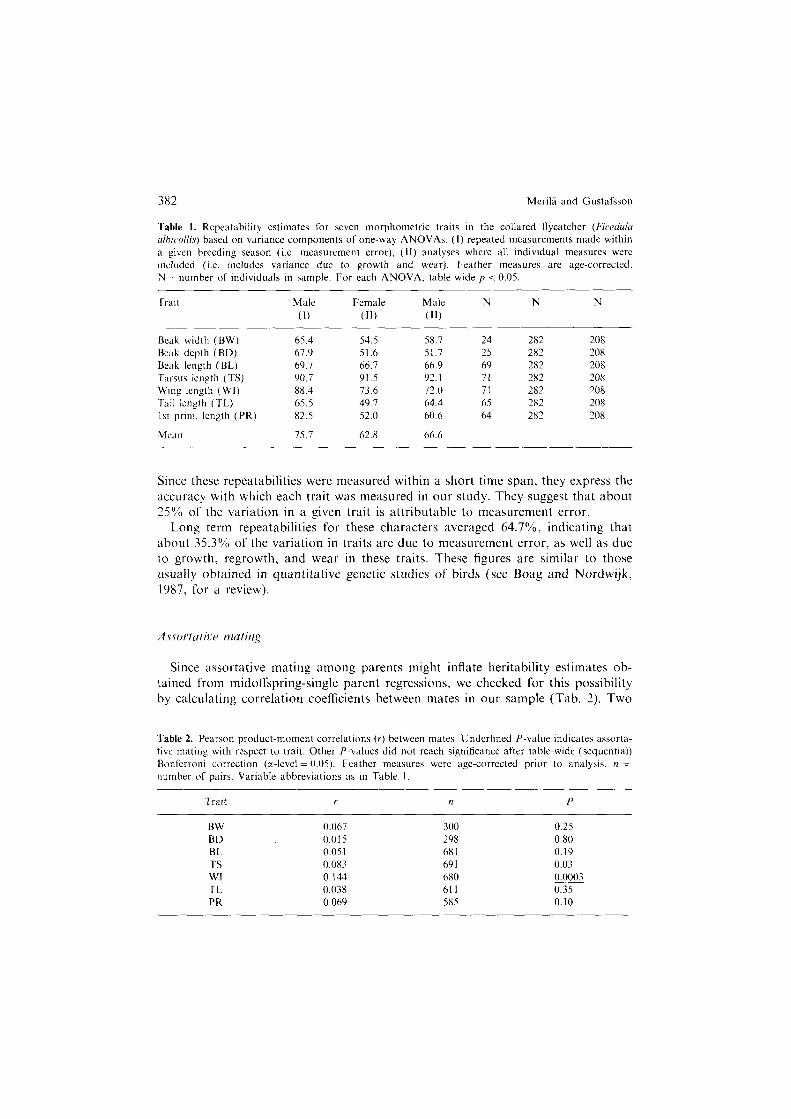
Repeatabilities of seven metric traits are given in Table 1. Short term repeatabil- ities, made for same individuals within a given breeding season, were about 12.5% higher than long-term repeatabilities (Wilcoxon signed-rank; z = - 2.20, p < 0.05).
382 Merila and Gustafsson
Table I. Repeatability estimates for seven morphometric traits in the collared hycatcher (Ficedulu ulhic~ollis) based on variance components of one-way ANOVAs. (I) repeated measurements made within a given breeding season (i.e. measurement error), (II) analyses where all individual measures were included (i.e. includes variance due to growth and wear). Feather measures are age-corrected. N = number of individuals in sample. For each ANOVA. table-wide p < 0.05.
Trait Male
(1)
Female Male N N N
(11) (11)
Beak width (BW) 65.4 54.5 Beak depth (BD) 67.9 51.6 Beak length (BL) 69.7 66.7 Tarsus length (TS) 90.7 91.5 Wing length (WI) 88.4 73.6 Tail length (TL) 65.5 49.1 I st prim. length (PR) 82.5 52.0
Mean 75.7 62.8
58.7 24 282 208 51.7 25 282 208 66.9 69 282 208 92. I 71 282 208 72.0 71 282 208 64.4 65 282 208 60.6 64 282 208
66.6
Since these repeatabilities were measured within a short time span, they express the accuracy with which each trait was measured in our study. They suggest that about 25% of the variation in a given trait is attributable to measurement error.
Long term repeatabilities for these characters averaged 64.7%, indicating that about 35.3% of the variation in traits are due to measurement error, as well as due to growth, regrowth, and wear in these traits. These figures are similar to those usually obtained in quantitative genetic studies of birds (see Boag and Nordwijk, 1987, for a review).
Since assortative mating among parents might inflate heritability estimates ob- tained from midoffspring-single parent regressions, we checked for this possibility by calculating correlation coefficients between mates in our sample (Tab. 2). Two
Table 2. Pearson product-moment correlations (T) between mates. Underlined P-value indicates assorta- tivc mating with respect to trait. Other P-values did not reach significance after table-wide (sequential) Bonferroni correction (a-level = 0.05). Feather measures were age-corrected prior to analysis. n = number of pairs. Variable abbreviations as in Table I.
Trait I n P
BW 0.067 300 0.25 BD 0.015 298 0.x0 BL 0.051 681 0.19 TS 0.083 691 0.03 WI 0.144 680 m TL 0.038 61 I 0.35 PR 0.069 5x5 0.10
Inheritance of size and shape 383
of the seven correlations were significant, indicating assortative mating by wing and tarsus length. However, after a sequential Bonferonni correction (Rice, 1989) only the correlation of wing length among mates remained significant. Since this correlation was fairly low (v = 0.114; r* = 0.021) and corrections made for herita- bility estimates (Falconer, 1989; 404) did not differ qualitatively from uncorrected values, we conclude that assortative mating has very little influence upon the single-parent heritability estimates.
Heritabilitirs
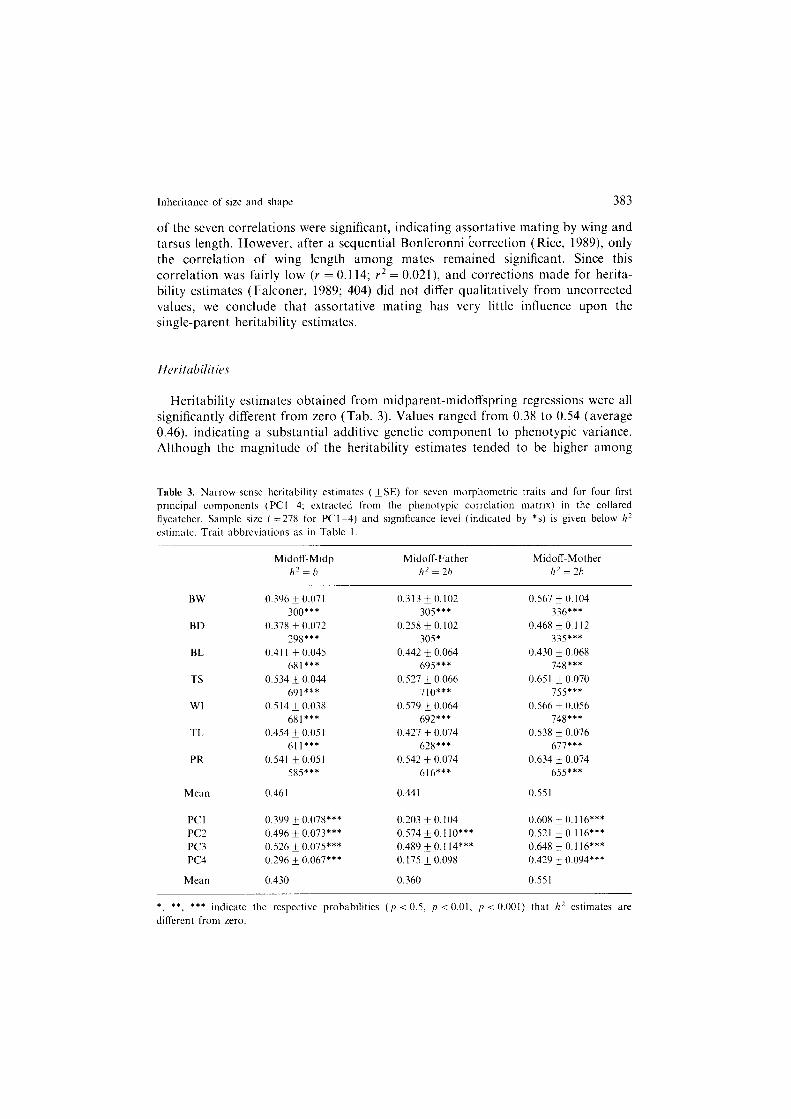
Heritability estimates obtained from midparent-midoffspring regressions were all significantly different from zero (Tab. 3). Values ranged from 0.38 to 0.54 (average 0.46) indicating a substantial additive genetic component to phenotypic variance. Although the magnitude of the heritability estimates tended to be higher among
Table 3. Narrow-sense heritability estimates (*SE) for seven morphometric traits and for four first principal components (PCI 4: extracted from the phenotypic correlation matrix) in the collared
flycatcher. Sample size (=27X for PCI -4) and significance level (indicated by *s) is given below h2
cstimatc. Trait abbreviations as in Table I.
Midoff-Midp h2z/,
Midoff-Father h'=2h
Midoff-Mother h2=2h
BW
BD
BL
TS
WI
TL
PR
Mean
PCI PC2
PC3 PC4
0.399 & 0.07x***
0.496 i 0.073*** 0.526 i 0.075*** 0.296 f 0.067***
Mean 0.430
0.396 + 0.071 300***
0.378 + 0.072
298*** 0.41 I + 0.045
681*** 0.534 * 0.044
691***
0.514 f 0.038 681***
0.454 * 0.05 I 6ll***
0.541 * 0.051 585***
0.461
0.313 * 0.102 305***
0.258 k 0. I02
305* 0.442 i 0.064
695*** 0.527 i 0.066
710***
0.579 i 0.064 692***
0.427 f 0.074 628***
0.542 f 0.074 616***
0.441
0.203 f 0.104
0.574 f 0.1 lo*** 0.489 + 0.114*** 0.175 f 0.098
0.360
0.567 & 0.104 336***
0.468+0.112 335***
0.430 + 0.068 748***
0.65 I If- 0.070 755***
0.566 & 0.056
74x*** 0.538 f 0.076
677+**
0.634 & 0.074 655***
0.551
0.608 k 0.1 l6***
0.521 i 0.1 l6*** 0.648 F 0.1 l6*** 0.429 & 0.094***
0.551
* , **, *** indicate the respective probabilities (p < 0.5, p <O.OI, p < 0.001) that h2 estimates are different from zero.
384 Merila and Gustafsson
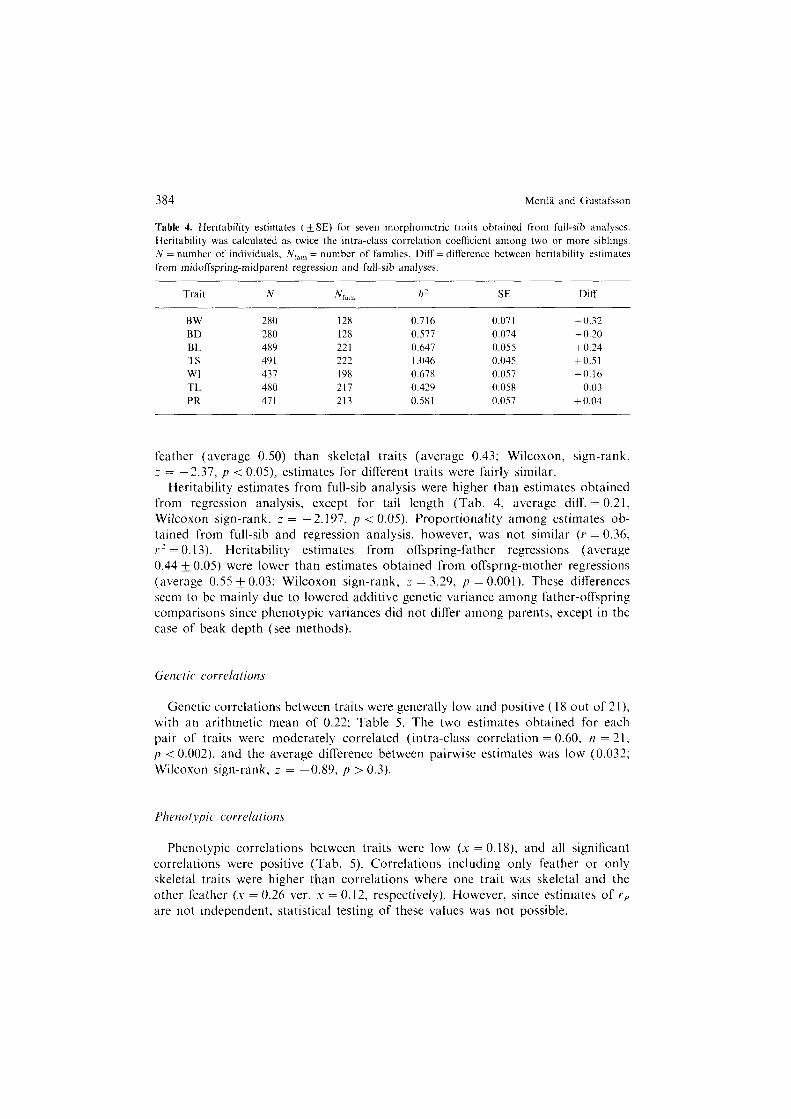
Table 4. Heritability estimates (&SE) for seven morphometric traits obtained from full-sib analyses. Heritability was calculated as twice the intra-class correlation coefficient among two or more siblmgs. N = number of individuals, A’,,, = number of families. Diff = difference between heritability estimates
from midoffspring-midparent regression and full-sib analyses.
Trait N N,,, h2 SE Diff
BW 2x0 128 0.716 0.07 I +0.32
BD 280 128 0.577 0.074 +0.20 BL 489 221 0.647 0.055 +0.24 TS 491 222 1.046 0.045 f0.51
WI 437 I98 0.678 0.057 +0.16 TL 480 217 0.429 0.058 -0.03
PR 471 213 0.581 0.057 +0.04
feather (average 0.50) than skeletal traits (average 0.43; Wilcoxon, sign-rank, ;= -2.37, p < 0.05) estimates for different traits were fairly similar.
Heritability estimates from full-sib analysis were higher than estimates obtained from regression analysis, except for tail length (Tab. 4, average diff. = 0.21, wilcoxon sign-rank, z = -2.197, p < 0.05). Proportionality among estimates ob- tained from full-sib and regression analysis, however, was not similar (Y = 0.36, r’ = 0.13). Heritability estimates from offspring-father regressions (average 0.44 i: 0.05) were lower than estimates obtained from offsprng-mother regressions (average 0.55 + 0.03; Wilcoxon sign-rank, z = 3.29, p = 0.001). These differences seem to be mainly due to lowered additive genetic variance among father-offspring comparisons since phenotypic variances did not differ among parents, except in the case of beak depth (see methods).
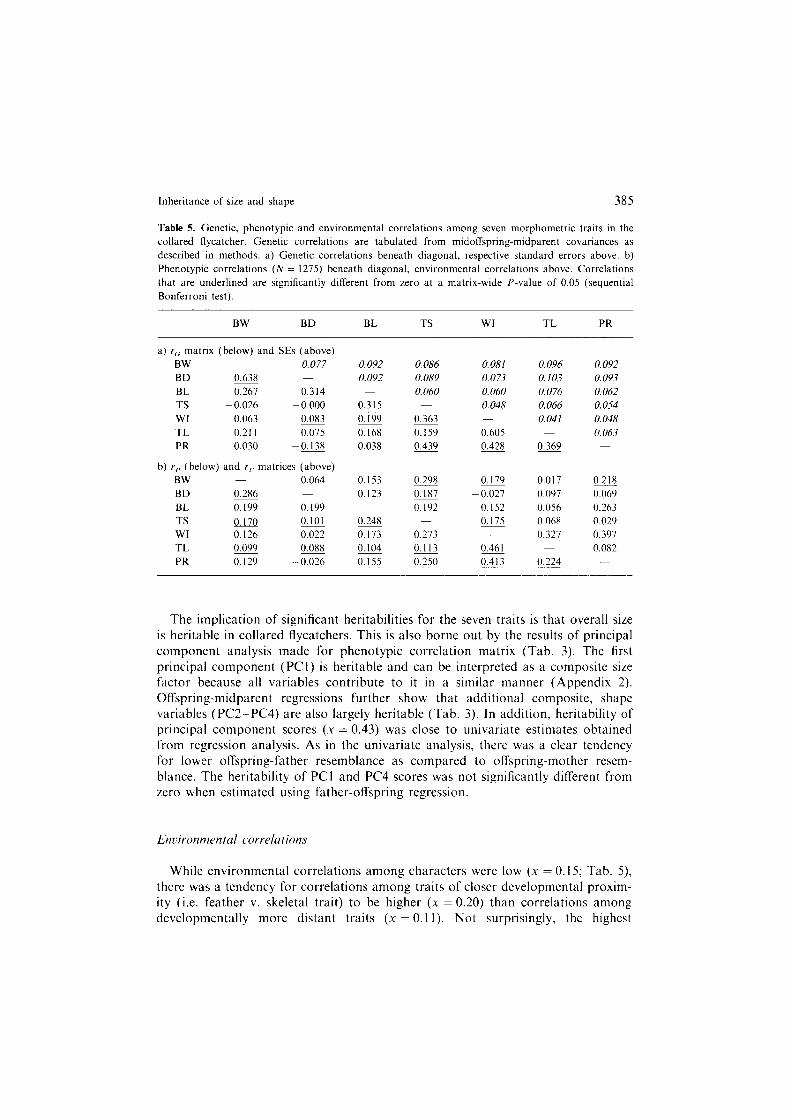
Genetic correlations between traits were generally low and positive ( I8 out of 2 I), with an arithmetic mean of 0.22; Table 5. The two estimates obtained for each pair of traits were moderately correlated (intra-class correlation = 0.60, n = 21, 17 < 0.002) and the average difference between pairwise estimates was low (0.032; Wilcoxon sign-rank, z = -0.89, p > 0.3).
Phenotypic correlations
Phenotypic correlations between traits were low (X = 0.18) and all significant correlations were positive (Tab. 5). Correlations including only feather or only skeletal traits were higher than correlations where one trait was skeletal and the other feather (.u = 0.26 ver. x = 0.12, respectively). However, since estimates of rp are not independent, statistical testing of these values was not possible.
Inheritance of size and shape 385
Table 5. Genetic, phenotypic and environmental correlations among seven morphometric traits in the
collared flycatcher. Genetic correlations are tabulated from midoffspring-midparent covariances as described in methods. a) Genetic correlations beneath diagonal, respective standard errors above. b)
Phenotypic correlations (N = 1275) beneath diagonal, environmental correlations above. Correlations that are underlined are significantly different from zero at a matrix-wide P-value of 0.05 (sequential
Bonferroni test).
BW BD BL TS WI TL PR
a) rcI matrix (below) and SEs (above)
BW 0.077 0.092 0.086 0.081 0.096 0.092 BD 0.638 0.092 0.089 0.073 0.103 0.093 BL 0.267 0.314 0.060 0.060 0.076 0.062
TS -0.026 -0.000 0.315 0.048 0.066 0.054
WI 0.063 0.083 0.199 0.363 0.041 0.048
TL 0.211 0.075 0.168 0.159 0.605 0.063
PR 0.030 -0.138 0.038 0.439 0.428 0.369
b) I,, (below) and rt. matrices (above) BW 0.064 0.153 0.298 0.179 0.017 0.218
BD 0.286 0.123 0.187 -0.027 0.097 0.069 BL g.l.l 0. I99 0.192 0.152 0.056 0.263
TS 0.170 0.101 0.248 0. I75 0.068 0.029 WI 0.126 0.022 0.173 0.273 0.327 0.397 TL 0.099 0.088 0.104 0.113 0.461 0.082
PR 0.129 -0.026 0.155 0.250 0.413 0.224
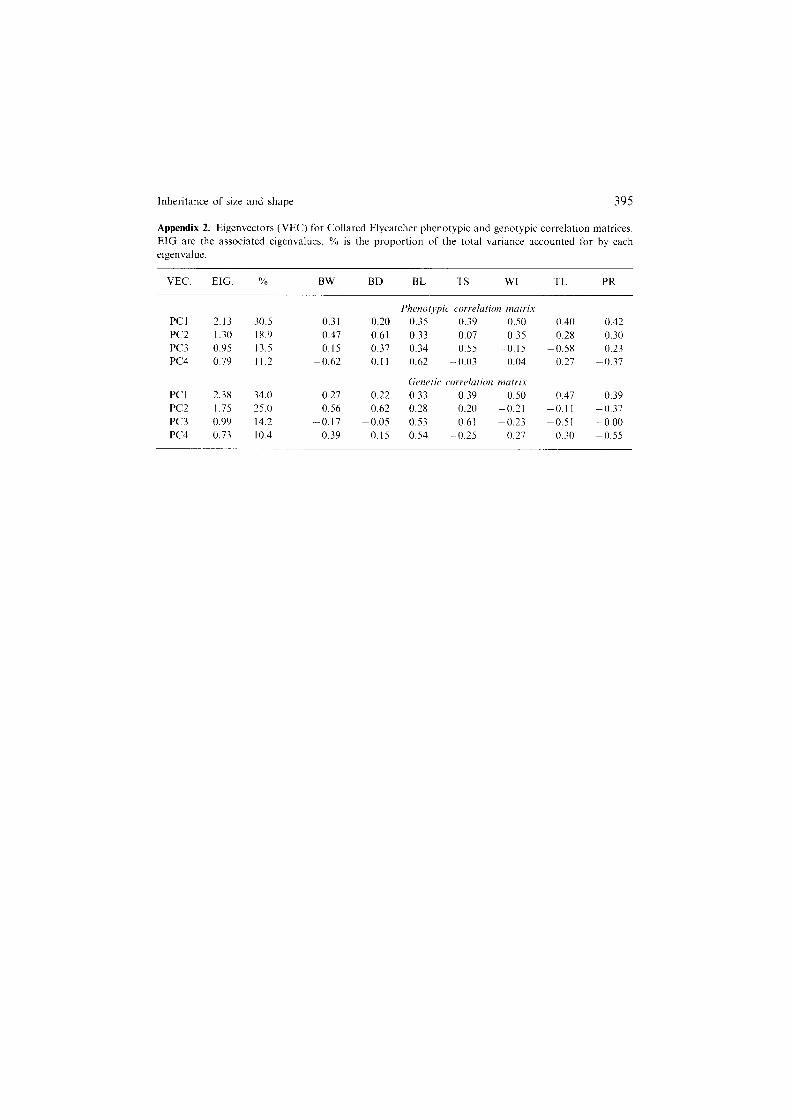
The implication of significant heritabilities for the seven traits is that overall size is heritable in collared flycatchers. This is also borne out by the results of principal component analysis made for phenotypic correlation matrix (Tab. 3). The first principal component (PCl) is heritable and can be interpreted as a composite size factor because all variables contribute to it in a similar manner (Appendix 2). Offspring-midparent regressions further show that additional composite, shape variables (PC22PC4) are also largely heritable (Tab. 3). In addition, heritability of principal component scores (X = 0.43) was close to univariate estimates obtained from regression analysis. As in the univariate analysis, there was a clear tendency for lower offspring-father resemblance as compared to offspring-mother resem- blance. The heritability of PCI and PC4 scores was not significantly different from zero when estimated using father-offspring regression.
lk~ironmental correlations
While environmental correlations among characters were low (X = 0.15; Tab. 5) there was a tendency for correlations among traits of closer developmental proxim- ity (i.e. feather v. skeletal trait) to be higher (x = 0.20) than correlations among developmentally more distant traits (X = 0.1 1). Not surprisingly, the highest
386 Merila and Gustafsson
environmental correlations occurred among feather traits which simultaneously achieve their dimensions during moult.
Similarity of genetic, phenotypic and environmental correlations
The similarity between genetic and phenotypic correlations, as measured by matrix correlation, was high (r = 0.85, n = 21, p < 0.001). On the other hand, while there was no similarity between genetic and environmental correlations (r = 0.11, n = 21, p = 0.33) the fit between phenotypic and environmental correlations was moderate (r = 0.60, y1 = 21, p < 0.006). However, as pointed out by Willis et al. ( 1991) this kind of comparison does not directly test for disparities between correlations. Large positive matrix correlations merely indicate that correlations vary in similar directions, but not necessarily that the actual values are identical. In order to acquire a more precise picture of the similarity between correlations, we calculated the absolute difference between all comparable matrix elements.
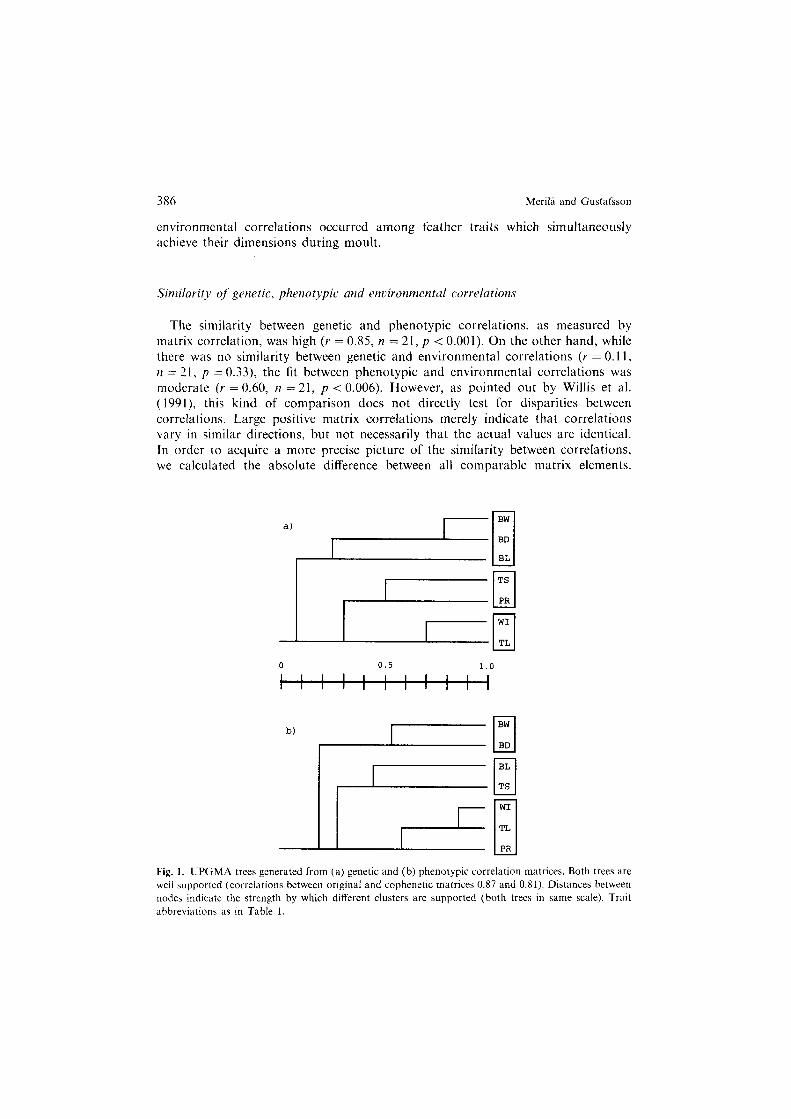
Fig. 1. UPGMA trees generated from (a) genetic and (b) phenotypic correlation matrices. Both trees are well supported (correlations between original and cophenetic matrices 0.87 and 0.81). Distances between nodes indicate the strength by which different clusters are supported (both trees in same scale). Trait abbreviations as in Table 1.
Inheritance of size and shape 387
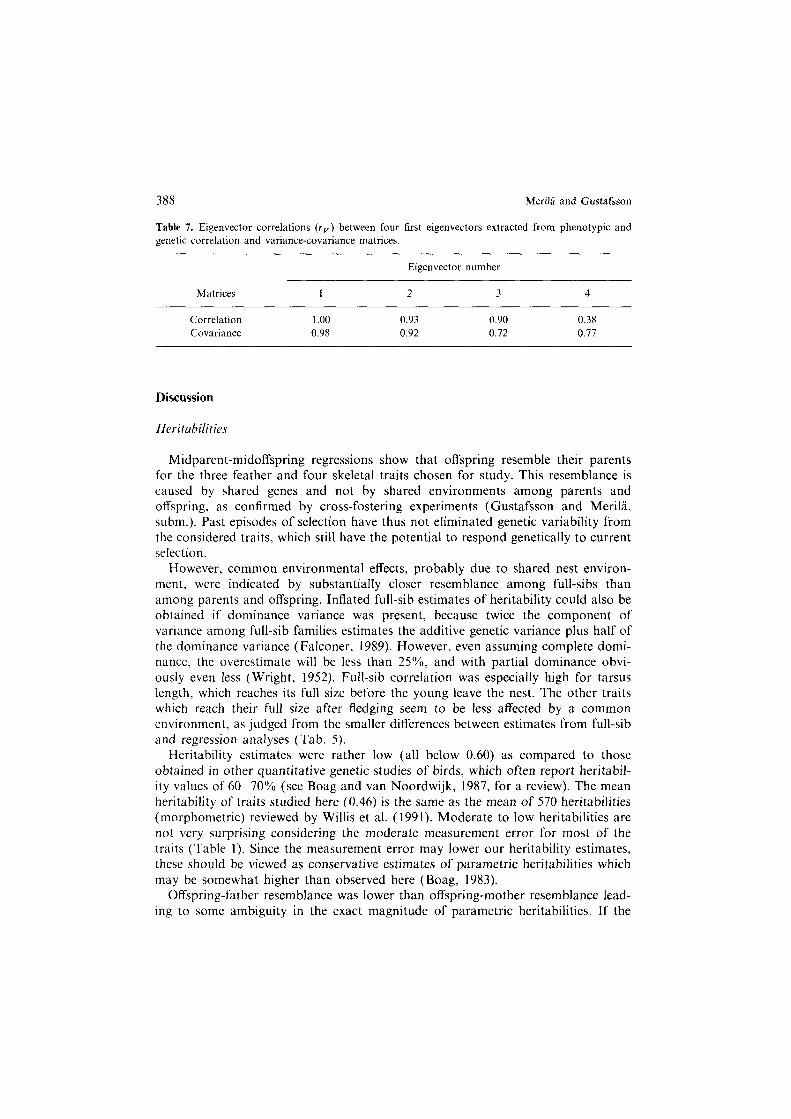
However, none of the three matrix comparisons revealed significant differences (Wilcoxon sign-rank, z = - 1.33, p > 0.15; z = - 1.29, p > 0.15; z = - 1.19, p > 0.20; for rg -r,,, raPr, and rP- r,, comparisons respectively). The similarity between genetic and phenotypic correlation matrices was also borne out from eigenvector correlations (see Lofsvold, 1986). Three first eigenvectors were closely correlated (rv:s 1.0-0.94) but the similarity between the last significant eigenvectors was low (rv = 0.38; Table 7). Thus, although these tests indi- cate some similarity between genetic and phenotypic correlation structures, there are, nevertheless, certain differences which are not obvious from previous comparisons.
UPGMA trees generated from these two matrices show that the correlation structure of these two matrices is dissimilar in certain respects (Fig. 1). The tree for genetic matrix places three bill dimensions in their own cluster and splits the first primary from other feather measures, placing it in the same branch as tarsus length. The phenotypic tree, on the other hand, places three feather mea- sures together and puts beak length on the same branch as tarsus length. While beak dimensions are more closely related in genotype as compared to feather measures, the opposite is indicated at the level of phenotype.
Genetic and phenot.vpipic comriunces
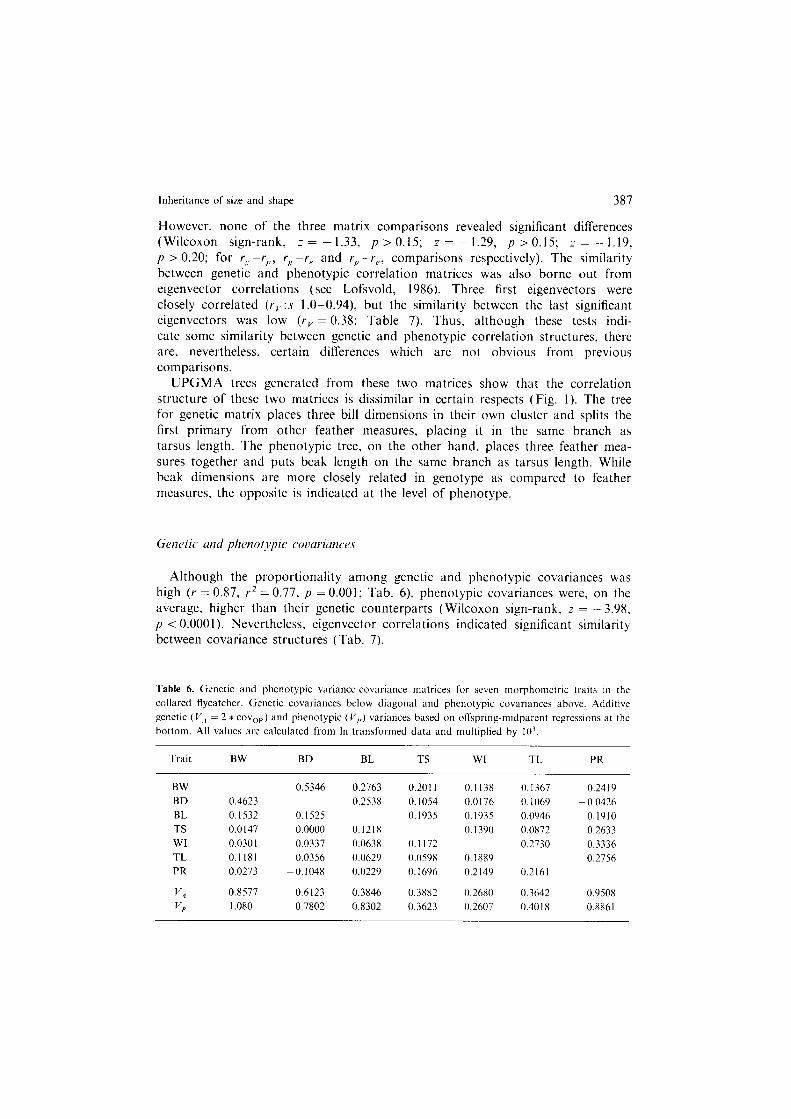
Although the proportionality among genetic and phenotypic covariances was high (r = 0.87, r2 = 0.77, p = 0.001; Tab. 6) phenotypic covariances were, on the average, higher than their genetic counterparts (Wilcoxon sign-rank, z = - 3.98, p < O.OOOl). Nevertheless, eigenvector correlations indicated significant similarity between covariance structures (Tab. 7).
Table 6. Genetic and phenotypic variance-covariance matrices for scvcn morphometric traits in the
collared flycatcher. Genetic covariances below diagonal and phenotypic covariances above. Additive
genetic (VA = 2 * covop) and phenotypic (V,,) variances based on offspring-midparent regressions at the
bottom. All values are calculated from In-transformed data and multiplied by IO’.
Trait BW BD BL TS WI TL PR
BW
BD
BL
TS WI
TL
PR
0.5346
0.4623
0.1532
-0.0147
0.0301
0.1 I81 0.0273
0.2763
0.2538
0. IS25
~ 0.0000
0.0337
0.0356
-0.1048
0.201 I
0.1054
0.1935
0.1218 0.0638
0.0629 0.0229
0.1138
0.0176
0.1935
0. I390
0.1172
0.0598
0.1696
0.1889
0.2149
VA 0.8577 0.6123 0.3846 0.3882 0.2680
VP I.080 0.7802 0.8302 0.3623 0.2607
0.1367
0.1069
0.0946
0.0872
0.2730
0.2161
0.3642
0.4018
0.2419
0.0426
0.1910
0.2633
0.3336
0.2756
0.9508
0.8861
388 Me& and Gustafsson
Table 7. Eigenvector correlations (ry) between four first eigenvectors extracted from phenotypic and genetic correlation and variance-covariance matrices.
Matrices
Correlation
Covariance
I
1.00
0.98
Eigenvector number
2 3
0.93 0.90
0.92 0.72
4
0.38
0.77
Discussion
Herituhilities
Midparent-midoffspring regressions show that offspring resemble their parents for the three feather and four skeletal traits chosen for study. This resemblance is caused by shared genes and not by shared environments among parents and offspring, as confirmed by cross-fostering experiments (Gustafsson and Merila, subm.). Past episodes of selection have thus not eliminated genetic variability from the considered traits, which still have the potential to respond genetically to current selection.
However, common environmental effects, probably due to shared nest environ- ment, were indicated by substantially closer resemblance among full-sibs than among parents and offspring. Inflated full-sib estimates of heritability could also be obtained if dominance variance was present, because twice the component of variance among full-sib families estimates the additive genetic variance plus half of the dominance variance (Falconer, 1989). However, even assuming complete domi- nance, the overestimate will be less than 25%, and with partial dominance obvi- ously even less (Wright, 1952). Full-sib correlation was especially high for tarsus length, which reaches its full size before the young leave the nest. The other traits which reach their full size after fledging seem to be less affected by a common environment, as judged from the smaller differences between estimates from full-sib and regression analyses (Tab. 5).
Heritability estimates were rather low (all below 0.60) as compared to those obtained in other quantitative genetic studies of birds, which often report heritabil- ity values of 60-70% (see Boag and van Noordwijk, 1987, for a review). The mean heritability of traits studied here (0.46) is the same as the mean of 570 heritabilities (morphometric) reviewed by Willis et al. (1991). Moderate to low heritabilities are not very surprising considering the moderate measurement error for most of the traits (Table 1). Since the measurement error may lower our heritability estimates, these should be viewed as conservative estimates of parametric heritabilities which may be somewhat higher than observed here (Boag, 1983).
Offspring-father resemblance was lower than offspring-mother resemblance lead- ing to some ambiguity in the exact magnitude of parametric heritabilities. If the
Inheritance of size and shape 389
primary cause of low offspring-father resemblance is extra-pair copulations (EPC), observed heritabilities will underestimate parametric heritabilities (Alatalo et al., 1984, 1989). On the other hand, if the cause is maternal effects, parametric heritabilities may be lower than observed. We can think of three different explana- tions for this difference in paternal and matermal heritability estimates, namely EPC, maternal effects and sex-linked variance. Alatalo et al. ( 1984, 1989) proposed that low offspring-father resemblance in tarsus length could be ascribed to EPC, known to occur in this species (Gelter et al., 1992). However, when offspring-parent relationships were partitioned to father-son, father-daughter, mother-son and mother-daughter comparisons, it became obvious that the direct cause of low father-offspring heritabilities was low father-son heritabilities, while the father- daughter heritabilities were of the same magnitude as offspring-mother heritabilities (unpublished). This finding suggests that EPC are far from the only cause of low father-offspring resemblance, and indicates that sex-linked variance could explain differences in offspring-father and offspring-mother regressions (Mather and Jinks, 1971; Cha IO). This is because EPC should affect both father-daughter and -son regressions in a similar manner. It is also difficult to imagine some maternal effects that would contribute to differential resemblance among parents and male and female offspring, because the rearing environment and time are similar for both sexes. The question of possible sex-linked variance will be discussed elsewhere (in
prep.).
Genetic correlations
Genetic correlations among traits were low to moderate as were their phenotypic and environmental counterparts. In general, the strongest genetic correlations occurred between three feather measures (0.37-0.61) as well as between three beak dimensions (0.27-0.64). Moderate correlations among these traits could be a result of selection for the integration of characters that make an important joint contribu- tion to individual fitness (Olson and Miller, 1968). For example, Kurten (1953) observed that functionally related teeth in certain mammals tend to be more highly correlated with each other than with vestigial teeth. However, an alternative explanation for high correlations among beak and feather dimensions could be their developmental proximity. As pointed out by Atchley (1987) traits may become genetically correlated irrespective of whether they are functionally related. For example, Cowley and Atchley (1990) observed that in Drosophila melanogaster traits that share the same developmental origin and undergo simultaneous develop- ment were tied together by stronger genetic correlations as compared to develop- mentally unrelated traits. We have no way of deciding between these two hypotheses, but the strongest correlations in this study were found among traits which are, at least functionally, and probably also developmentally coupled.
It is interesting that beak dimensions appeared to be more closely related at the genotype than at the phenotype, while the opposite was true for feather dimensions (Fig. 1). This difference in genetic and phenotypic integration between these two
390 MeriG and Gustafsson
trait sets can be understood in terms of environmental correlations. Environmental correlations between feather traits are higher than those among beak traits. This means that in the presence of environmentally induced variation, part of the phenotypic correlations among feather traits are made up of environmental correla- tions, while environmental variation in beak traits acts as a random deviate. Phenotypic correlations among beak traits will therefore be lower than those among feather traits.
Given the relatively large samples used to calculate these estimates, our results suggest that genetic correlations are not likely to impose any profound constraints on the evolution of the traits considered here. That is, the weak correlations suggest that there is ample variation in proportionality among traits (“shape”) in this population. This should permit the population to evolve in many directions, even under complex multivariate selection. Possible exceptions to this general pattern might be the correlations between beak width and height, as well as between wing and tail length (rG > 0.6).
An eigenanalysis of the additive genetic correlation matrix gave a genetic size function (PC]) as the largest component of genetic covariation (Appendix 2). This conclusion was supported by the finding that PC1 of the phenotypic correlation matrix can be interpreted as a heritable composite size function. These findings suggest that as the underlying genetic expression in one trait changes, there is a corresponding change in almost all other traits, i.e. Wright’s (1968) universal pleiotropy. Morphological shape appears to be under additive genetic control, as shown by the large heritabilities of composite shape functions, PC224 (Tab. 3). Similar findings for morphometric traits have been reported by Atchley (1983, and refs there in), Boag ( 1983) and Grant ( 1983).
Sirnilurity between genetic, phenotypic and endronmental correlations
The interest in comparing genetic and phenotypic correlations has been encour- aged by the difficulty in estimating genetic correlations, which are required in evolutionary models to predict responses to natural selection or genetic drift (Lande, 1979). If the phenotypic correlations were generally similar to their genetic counterparts, this might encourage their use as a substitute when estimation of genetic correlations is not possible (Cheverud, 1988). Although the comparison of these two types of correlations (the same applies to comparison of phenotypic and environmental correlations) is not strictly acceptable from the statistical point of view (see below), such comparisons have been frequently reported, and similarity is often found (e.g. Cheverud, 1982, 1988; Grant, 1983; Schluter and Smith, 1986; but see Willis et al., 1991). A close resemblance between these two correlations can arise if heritabilities are uniformly high, since the correlations between environmental effects will then exert little influence on the phenotype. Since the observed heritabil- ities were relatively low and of varying magnitude, it is surprising that genetic and phenotypic correlations were found to be quite similar (r = O.SS), as were the corresponding covariances (r = 0.87). Another situation where genetic and pheno-
Inheritance of size and shape 391
typic correlations are expected to be similar is when genetic and environmental correlations are similar, since phenotypic correlations are the weighted sums of genetic and environmental correlations (Cheverud, 1984, 1988). This occurs regard- less of the level of heritability (ibid). Such parallel genetic and environmental associations commonly occur in morphological studies (Atchley, 1983 and refs. therein). In this study, however, similarity between genetic and environmental correlations was weak (u = 0.1 I), indicating that environmental variation did not follow the pattern of genetic correlations. Since the environmental correlations express the degree to which two traits respond to variations in environmental conditions, this result clearly suggests that genetical and environmental factors do not reinforce each other during the ontogeny of traits. Cheverud (1982) and Grant ( 1983) found that the genetic and environmental correlations in rhesus macaque and a Darwin’s finch were negatively correlated. Nevertheless, given moderate to low heritabilities and a poor fit between environmental and genetic correlations we find it hard to understand how the observed similarity between phenotypic and environmental correlations can be accounted for. One possible explanation is that environmental correlations, which were very low, exerted only a weak influence on phenotype as compared to the genetic correlations. Or alternatively, because all the estimates of correlations (especially genetic) were made with some degree of error (Falconer, 1989) the sampling error in both phenotypic and genetic correlations could account for the discrepancy.
In conclusion, the findings of this study show that the external morphology of the collared flycatcher is largely under additive genetic control, and that genetic correlations among traits are low to moderate. This indicates that genetic variances and covariances are not likely to exert any profound constraints on the further evolution of morphology in this species.
Acknowledgements
We thank Mats Bjiirklund, Kjell Larsson, Dolph Schluter, and Staffan Ulfstrand for helpful and critical remarks on this manuscript. Special thanks are given to MB for his generous help with matrix statistics. Many people helped with field work, in particular Giiran Carlen, Ryszard Corona, Tomas Part and Dag Nordling. Study was supported by grants from the C. F. and Maria von Wahlberg’s
Foundation (JM), the Swedish Natural Science Research Council (LG), and Magnus Bergwall Founda- tion (LG).
References
Alatalo, R., D. Erikson, L. Gustafsson and A. Lundberg. 1990. Hybridization between pied and collared flycatchers sexual selection and speciation theory. J. evol. Biol. 3: 375 389.
Alatalo, R., L. Gustafsson and A. Lundberg. 19X4. High frequency of cuckoldry in pied and collared flycatchers. Oikos 42: 41 47.
Alatalo, R., L. Gustafsson and A. Lundberg. 1989. Extra-pair paternity and heritability esttmates of
tarsus length in pied and collared flycatchers. Oikos 56: 54458. Alatalo, R. and L. Gustafsson. 1988. Genetic component of morphological differentiation in coal tits
under competitive release. Evolution 42: 200-203.
392 Merila and Gustafsson
Alatalo, R. and A. Lundberg. 1986. Heritability and selection on tarsus length in the pied flycatcher (Ficrdula hypoluuca). Evolution 45: 5744583.
Alberch, P. 1980. Ontogenesis and morphological diversification. Am. Zool. 20: 653-667. Arnold, S. J. 1981. Behavioural variation in natural populations. I. Phenotypic, genetic, and environ-
mental correlations between chemoreceptive responses to prey in the garter snake, Thamnophsi.~ elegan.s. Evolution 35: 1037- 1055.
Atchley, W. R. 1983. Some aspects of morphometric variation, pp. 346- 363. In J. Felsenstein (Ed.), Numerical Taxonomy. NATO ASI Series, Vol. Gi. Springer-Verlag, Berlin & Heidelberg.
Atchley, W. R. 1987. Development quantitative genetics and evolution of ontogenies. Evolution 41: 316 330.
Bailey, R. C. and J. Byrnes. 1990. A new. old method for assessing measurement error in both univariate and multivariate morphometric studies. Syst. Zool. 39: 124 130.
Barton, N. H. and M. Turelli. 1989. Evolutionary quantitative genetics: how little do we know? Annu. Rev. Genet. 23: 337-370.
Boag, P. T. 1983. The heritability of external morphology in Darwin’s ground finches (Geospiza) of Isla Daphne Minor, Galapagos. Evolution 37: 877 894.
Boag, P. T. and P. R. Grant. 1978. Heritability of external morphology in Darwin’s finches. Nature 274: 793-794.
Boag, P. T. and P. R. Grant, 1981. Intense natural selection in a population of Darwin’s Finches (Gro.vpizinue) in the Galapagos, Science 214: 82- 84.
Boag, P. T. and A. J. van Noordwijk. 1987. Quantitative Genetics, pp. 45 77. In: F. Cooke and P. A. Buckley (Eds.), Avian Genetics. Academic Press, London, U.K.
Cheverud. J. M. 1982. Phenotypic, genetic, and environmental morphological integration m the cranium. Evolution 36: 4999516.
Cheverud, J. M. 1984. Quantitative genetics and developmental constraints on evolution by selection. J. Theor. Biol. 110: 1555171.
Chcvcrud, J. M. 1988. A comparison of genetic and phenotypic correlations. Evolution 42: 9588968. Cheverud, J. M., G. P. Wagner and M. Dow. 1989. Methods for the comparative analysis of variation
patterns. Syst. Zool. 38: 201-213. Clark, A. G. 1987. Genetic correlations of the genetics of evolutionary constraints, pp. 25 45. In: V.
Loeschcke (Ed.), Genetic Constraints on Adaptive Evolution. Springer-Verlag. Berlin. Cowley, D. E. and W. R. Atchley. 1990. Developmental and quantitative genetics of correlation
structure among body parts of Drosophila melunogaskr. Am. Nat. 135: 242~-268. Dhondt, A. A. 1982. Heritability of blue tit tarsus length from normal and cross-fostered broods.
Evolution 36: 418 419. Falconer, D. S. 1989. Introduction to quantitative genetics. 3rd. ed. Longman Scientific & Technical,
London, U.K. Feldman, M. W. and R. C. Lewontin. 1975. The heritability hang-up. Science 190: 1163 1168. Gelter, H., L. Gustafsson and H. Tegelstriim. 1992. Hybrid fertility according to Haldane’s rule
confirmed by hatching success and DNA fingerprinting between Ficrdula hypoleucu and F. a/hkollis. Ibis 134: 62-68.
Grant, P. R. 1983. Inheritance of size and shape in a population of Darwin’s finches. Proc. R. Sot. Lond. B. 220: 219-236.
Gustafsson, L. 1989a. Collared flycatcher, pp. 75 -88. In: I. Newton (Ed.), Lifetime Reproduction in Birds. Academic Press Ltd, London.
Gustafsson, L. 1989b. Life-history trade-offs and optimal clutch size in relation to age in the Collared Flycatcher, pp. 2355246. In: J. Blonde], A. Goslcr, J.-D. Lebreton and R. McClecry (Eds.), Population Biology of Passerine Birds. An integrated approach. NATO AS1 Series G: Ecological Sciences, Vol 24. Springer-Verlag, Berlin.
Gustafsson, L. and S. Hogstrom. 1981. Hur manga Wglar hackar det pa Gotland? Blicku 7: 81 138. Gustafsson. L. and J. Merila. Foster parent experiment reveals no genotype-environment correlation in
external morphology of the collared flycatcher. Subm. Kingsolvcr, R. J. G. and D. C. Wiernasz. 1991. Development, function, and the quantitative genetics of
wing melanin pattern in Pieris buttcrilies. Evolution 45: 1480 1492.
Inheritance of size and shape 393
Kohn, L. A. and W. R. Atchley. 1988. How similar are genetic correlation structures? Data from mice and rats. Evolution 42: 4677481.
Kurt&r, B. 1953. On the variation and population dynamics of fossil and recent mammal species. Ann. Zool. Fennica 76: I 122.
Lande, R. 1979. Quantitative genetic analysis of multivariate evolution applied to brain-body size allometry. Evolution 33: 402 -416.
Lande, R. 1986. The dynamics of peak shifts and the pattern of morphological evolution. Paleobiology
12: 343-354. Larsson, K. and P. Forslund. 1992. Genetic and social inheritance of body and egg size in the barnacle
goose (Brantu Irucopis). Evolution 46: 2355244.
Leamy, L. and W. Atchley. 19X4. Static and evolutionary allometry of osteometric traits in selected lines of rats. Evolution 38: 47 54.
Lessels, C. M. and P. T. Boag. 1987. Unrepeatable repeatabilities a common mistake. Auk 104: 116- 121.
Lofsvold, D. 1986. Quantitative genetics of morphological differentiation in Prromrscus. I. Tests of the homogeneity of genetic covariance structure among species and subspecies. Evolution 40: 559
573. Lofsvold, D. 1988. Quantitative genetics of morphological differentiation in Peromyscus. II. Analysis of
selection and drift. Evolution 42: 54 67.
Mather, K. and J. L. Jinks. 1981. Biometrical genetics. Chapman and Hall, London. Maynard Smith, J., R. Burian, S. Kauffman, P. Alberch, J. Campbell, B. Goodwin, R. Lande, D. Raup
and L. Wolpert. 1985. Developmental constraints and evolution. Quart. Rev. Biol. 60: 2655287.
Merila, J., L. Gustafsson and T. Part. Do collared flycatchers grow or shrink in older ages? Manus. Merila. J., M. Bjiirklund and L. Gustafsson. Evolution of morphological differences with moderate
genetic correlations among traits as exemplified by flycatchers (Muscicapidae). Subm.
Morrison, D. F. 1976. Multivariate statistical methods. 2nd. McGraw-Hill, N.Y. Mousseau, T. A. and D. A. Roff. 1987. Natural selection and the heritability of fitness components.
Heredity 59: 181~ 197. Muirhead, R. J. 1982. Aspects of Multivariate Statistical Theory. Wiley, N.Y.
Olson, E. C. and R. L. Miller. 1958. Morphological Integration. Univ. of Chicago Press, Chicago. Part, T. 1991. Philopatry and age as factors influencing reproductive success in the collared flycatcher
(Ficedulu ulhicol/i.s). Ph.D. Thesis, Uppsala University. Reeve 1955. The variance of the genetic correlation coefficient. Biometrics 11: 357 374. Rice, W. R. 1989. Analyzing tables of statistical tests. Evolution 43: 223- 225.
Schluter, D. 1984. Morphological and phylogenetic relations among the Darwin’s Iinches. Evolution 38: 921 930.
Schluter, D. 1989. Bridging population and phylogenetic approaches to the evolution of complex traits, pp. 79995. In: D. B. Wake and G. Roth (Eds.), Complex Organismal Functions Integration and Evolution in Vertebrates. John Wiley Sons, N.Y.
Schluter, D. and J. N. M. Smith. 1986. Genetic and phenotypic correlations in a natural population of song sparrows. Biol. J. Linn. Sot. 29: 23 -36.
Smith, J. N. M. and R. Zach. 1979. Heritability of some morphological characters in the song sparrow. Evolution 33: 460~-467.
Smith, J. N. M. and A. A. Dhondt. 1980. Experimental confirmation of heritable morphological
variation in a natural population of song sparrows. Evolution 34: I155 1158.
Sokal. R. R. and F. J. Rohlf. 1981. Biometry. 2nd ed. Freeman, San Francisco. Turelli, M. 1988. Phenotypic evolution. constant covariances, and the maintenance of additive variance.
Evolution 42: 1342 1347.
Stearns, S., G. de Jong and B. Newman. 1991. The effects of phenotypic plasticity on genetic correlations. TREE 6: 122 125.
Stcttenheim, P. 1972. The integument of birds, pp. I 63. In: D. Farner. J. King and K. Parkes. Avian Biology. Vol 2. Academic Press, NY.
394 Merila and Gustafsson
van Noordwijk. A. J. 1984. Quantitative genetics in natural populations of birds illustrated with
examples from the great tit, Pwu.r m&r, pp. 67 79. In: K. Wiihrmann and V. Loeschckc (Eds.), Population Biology and Evolution. Springer-Verlag, Berlin & Heidelberg.
Wiggins, D. A. 1989. Heritability of body size in cross-fostered tree swallow broods. Evolution 43:
1808 1811. Willis, J. H., J. A. Coyne and M. Kirkpatrik. 1991. Can one predict the evolution of quantitative traits
wtthout genetics? Evolution 45: 441-443. Wright, S. 1952. The genetics of quantitative variability, pp. 541. In: E. C. R. Reeve and H.
Waddington (Eds.), Quantitative Inheritance. Agricul. Res. Council. Her Majesty’s Stationery Ofice, London.
Wright, S. 1968. Evolution and Genetics of Populations. Vol. I. Univ. of Chicago press, Chicago.
Recctved 7 September 1992;
accepted 10 November 1992. Corresponding Editor: G. Miiller
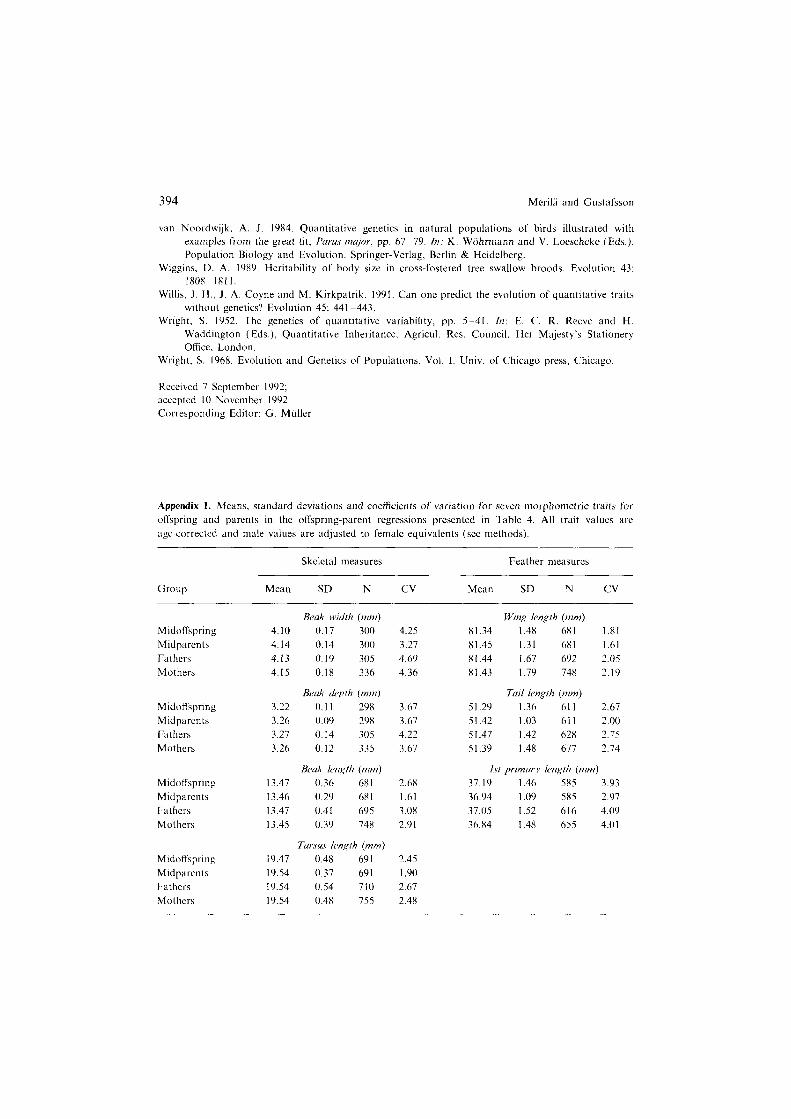
Appendix I. Means, standard deviations and coefficients of variation for seven morphomctric traits for
offspring and parents in the offspring-parent regressions presented in Table 4. All trait values are age-corrected and male values are adjusted to female equivalents (see methods).
Skeletal measures Feather measures
Group Mean SD N CV Mean SD N CV
Midoflspring
Midparents
Fathers
Mothers
Midoffspring
Midparents
Fathers
Mothers
Midoffspring
Midparcnts
Fathers
Mothers
Mrdoffspring
Midparents
I-athers
Mothers
Beok width (mm) JVin,q Iqqh (mm)
4.10 0.17 300 4.25 81.34 1.48 681 1.81
4.14 0.14 300 3.27 81.45 1.31 681 1.61
4.13 0.19 305 4.69 81.44 1.67 692 2.05
4.15 0.18 336 4.36 81.43 1.79 748 2.19
Beak depth (mm) Tail length (mm)
3.22 0.1 I 29X 3.61 51.29 1.36 611 2.67
3.26 0.09 298 3.67 51.42 1.03 611 2.00
3.27 0.14 305 4.22 51.47 1.42 628 2.75
3.26 0.12 335 3.67 51.39 1.48 617 2.74
Bruk kqqih (mm) 1.~1 primq lengfh (mm)
13.47 0.36 681 2.68 37.19 1.46 585 3.93
13.46 0.29 681 1.61 36.94 1.09 585 2.91
13.47 0.41 695 3.08 37.05 1.52 616 4.09
13.45 0.39 748 2.91 36.84 1.48 655 4.01
Tarsus l~wgth (mm)
19.47 0.48 691 2.45
19.54 0.37 691 1.90
19.54 0.54 710 2.67
19.54 0.48 755 2.48
Inheritance of size and shape 395
Appendix 2. Eigenvectors (VEC) for Collared Flycatcher phenotypic and genotypic correlation matrices. EIG are the associated elgenvalucs, % is the proportion of the total variance accounted for by each elgenvaluc.
VEC. EIG. % BW BD BL TS WI TL PR
PCI PC2 PC3 PC4
PC1 PC2 PC3 PC4
2.13 30.5 1.30 18.9 0.95 13.5 0.79 Il.2
2.38 34.0 0.27 0.22 I .75 25.0 0.56 0.62 0.99 14.2 -0.17 -0.05 0.73 10.4 -0.39 -0.15
0.31 0.20 0.47 0.61
-0.15 -0.37 -0.62 0.1 I
Phcnotypic correlrrion nru,rix 0.35 0.39 0.50 0.33 0.07 m-o.35
0.34 0.55 -0.15
0.62 -0.03 0.04
Genefic~ corrrlation mutria
0.33 0.39 0.50 0.28 - 0.20 -0.21
0.53 0.61 -0.23
0.54 -0.25 0.27
0.40 0.42 -0.28 -0.30
-0.58 0.23 0.27 -0.37
0.47 0.39 -0.1 I -0.37
-0.51 -0.00 0.30 -0.55