the impact of on-wafer calibration method on the measured results of coplanar waveguide circuits
TRANSCRIPT
IEEE TRANSACTIONS ON ADVANCED PACKAGING, VOL. 33, NO. 1, FEBRUARY 2010 285
The Impact of On-Wafer Calibration Method on theMeasured Results of Coplanar Waveguide Circuits
Qian Li and Kathleen L. Melde, Senior Member, IEEE
Abstract—This paper compares four commonly used on-wafercalibration methods including multiline thru-reflect-line (TRL),line-reflect-reflect-match, line-reflect-match, and short-open-load-thru, for three diverse coplanar waveguide (CPW) circuits. Themagnitudes and phases of �� and �� of the CPW circuitsare compared to quantify how the specific calibration methodinfluences measured scattering parameters. Special care is takento ensure that the measured scattering parameters are normalizedto the same reference impedance and reference plane for accuratecomparison. The measured results are compared with full-wavesimulations to provide additional assessment of accuracy. Amethod to de-embed the discontinuity of the CPW at the probetip and the CPW of the test structures is presented. The effectof probe-to-device-under-test discontinuity is effectively modeledby one- or two- section of shunt capacitor and series inductor.The results show that the multiline TRL calibration methodprovides the highest transmission coefficient repeatability on notwell-matched circuits and highest accuracy on the three circuitsin this paper up to 40 GHz.
Index Terms—Coplanar waveguide (CPW), high-frequencypackaging, on-wafer measurements.
I. INTRODUCTION
T HE high-frequency performance of high-speed digitaland wireless circuits has attracted increased attention.
High-frequency modeling and simulation tools can be used torapidly develop new circuit structures, yet the models mustoften be verified by comparison to broadband measurements.On-wafer measurements of coplanar waveguide (CPW) struc-tures are widely used since they can easily interface withprobe stations. This eliminates the need for connectorized teststructures. The important factors to consider include whichcalibration method to use, how to fabricate the necessarycalibration artifacts, and the impact that the calibration methodmay have on the measurement results. The increase in clockspeeds and the push to higher frequencies of operation meanthat many of the calibration approaches typically used at lowerfrequencies must be reevaluated. The verification of accuratehigh-frequency design and analysis tools mean that the mea-sured results on the test structures must also be very accurate
Manuscript received September 26, 2008; revised May 13, 2009. First pub-lished October 02, 2009; current version published February 26, 2010. Thiswork was supported by the Semiconductor Research Corporation (SRC) underTask ID 1292.063. This work was recommended for publication by AssociateEditor J. Tan upon evaluation of the reviewers comments.
The authors are with the Department of Electrical and Computer Engineering,University of Arizona, Tucson, AZ 85721 USA (e-mail: [email protected]).
Color versions of one or more of the figures in this paper are available onlineat http://ieeexplore.ieee.org.
Digital Object Identifier 10.1109/TADVP.2009.2025365
at increasingly higher frequencies. In this paper, we comparethe differences in the results and the implementation of somecommonly-used calibration methods. We assess the repeata-bility and compare the results of the measurements of severaldifferent types of CPW circuits to full-wave simulations.
The calibrations are based on different error models andmay have significant effects on the measurement accuracyand repeatability. Multiline thru-reflect-line TRL (ML-TRL),line-reflect-reflect-match (LRRM), line-reflect-match (LRM),and short-open-load-thru (SOLT) are popular on-wafer calibra-tion methods and are available in [1]. The ML-TRL calibrationartifacts and the device-under-test (DUT) typically reside onthe same substrate. This dramatically reduces errors due todifferences of the substrate materials or CPW dimensionsbetween the calibration standards and DUT. The standardsused for LRRM, LRM, and SOLT are realized on a commer-cially-available impedance standard substrate (ISS). There maybe differences between the CPW dimensions and materials ofthe ISS (for calibration) and the DUT (for measurement) thataffect the measurement results at high frequency [2].
Previously reported calibration comparison techniques pri-marily focus on the error bound of the worst-case measure-ments [2], [3]. Some other comparison techniques [4] are basedon measurements of different verification standards, such asopen-stubs and a straight line standard. This paper presents anew approach that provides guidance and insight into the im-pact of calibrations on measured results. The impact of the cal-ibration method is applied to specific CPW circuit structuresused by design engineers. The investigation includes a diverseset of CPW structures that include a straight transmission line,a stepped impedance line, and a bandpass filter. These struc-tures exhibit diverse responses, such as low reflection (for theline), and a narrow filter response. In this paper, the average andstandard deviation of the measured -parameters are compared.This paper compares the impact of the measured results ob-tained from the different calibrations to full-wave simulations.The simulations are used to provide another assessment of mea-surement accuracy. The discussion is intended to be broad andto relate to engineers who must compare measured results withsimulations. Some of the previous work on this subject have fo-cused primarily on the measurements and relate to those gen-erally familiar with the techniques and terminology. Before thecomparisons are conducted, all of the scattering parameters arenormalized so that the measured results are referenced to thesame port impedance and reference plane. This is an importantpoint to consider, since some calibrations approaches are refer-enced to a 50 termination and some are not. An accurate com-parison of accuracy and to simulated results requires that they allbe normalized to the same reference impedance and plane. The
1521-3323/$26.00 © 2010 IEEE
286 IEEE TRANSACTIONS ON ADVANCED PACKAGING, VOL. 33, NO. 1, FEBRUARY 2010
current paper is inspired by the interest in the work discussedin [5]. The work in [5] compared ML-TRL, SOLT, and LRMcalibrations up to 20 GHz. The comparison was done with theML-TRL results normalized to the characteristic impedance ofthe DUT, while all of the LRM and SOLT results are normal-ized to 50 . In this paper, the calibration comparisons are re-visited with some significant changes. LRRM is now included,full-wave simulations are included, the results are compared upto 40 GHz, and all of the results are normalized to the same refer-ence plane and impedance. Our previous work [6] discussed thecomparisons based on reflection coefficients only. In this paper,the magnitude and phase for both reflection and transmissioncoefficients are compared.
Section II provides a brief review of the different calibrationmethods used in this paper. Section III describes the variousCPW test structures, the fabrication of these structures, and theassociated calibration standards. Section IV discusses the ap-proach used to compare the impact of the choice of calibrationon the measured CPW test structures. The results are presentedin Section V. Section VI models the effect of the probe-to-DUTtransition discontinuity. Section VII provides some conclusions.
II. OVERVIEW OF ON-WAFER CPW CALIBRATION METHODS
This section provides a brief overview of the typical on-wafercalibration methods. It also provides some guidelines on the fab-rication of the calibration artifacts. Note that the designator, ,in the different abbreviated names for the calibration methodshas different meanings. The designator, , means “load” as in50 , for SOLT, yet means “line” as in a straight section oftransmission line for most of the other calibration methods tobe addressed. It is also important to note that the typical refer-ence impedance for which the measured results are normalizedis 50 . This is not mandatory, but if the reference impedance ofthe DUT is not the same as the reference impedance of the cali-bration standards, then normalized -parameters are measured.In many methods, the calibration artifacts and the DUT can befabricated on the same test coupon. This is the most desirablecase, since small fabrication process variations may result in lineover or under etching. This may result in line impedance valuesthat vary slightly from a nominal 50 value. One challengein making accurate and repeatable calibrations over a large fre-quency range is the availability of a broadband 50 impedanceload standard. Instead, there is wide availability of calibrationsubstrates such as the impedance standard substrate (ISS). TheISS contains many of the calibration standards needed for thecalibration methods discussed here. One challenge in using theISS to perform the calibrations is that the cross section (in termsof both material thickness and CPW conductor trace widths)for the ISS may be different for the fabricated DUT. This cre-ates a small probe-pitch discontinuity that is not accounted forwhen the calibration and the calibration check is done entirelyon the ISS.
SOLT [7] uses four CPW line standards: an open circuitedline, a short circuited line, a load with characteristic impedance
, and a straight through 50 CPW line. SOLT hasbeen the most widely used calibration standard for coaxial basedmeasurements up to 26 GHz. It is not suggested for use withCPW structures for frequencies above 1 GHz since it is quite
difficult to fabricate ideal open and short circuited line standardsin CPW above 1 GHz.
TRL [8] uses three distinct calibration artifacts. These includea thru standard; a nonideal reflect standard that has a large reflec-tion coefficient (that may be slightly less than one); and an idealor known line standard. In this paper, a short circuited CPWline is used as the reflect standard. The characteristic impedanceof the line and thru standards must be identical to one anotherand the insertion phases of these two standards must be dif-ferent from one another. TRL is popular for use at frequenciesabove 1 GHz since only the line standard must be well character-ized. At low frequencies, the calibration line standard becomesincreasing longer. CPW transmission lines are dispersive andhave a frequency-dependent characteristic impedance. It is im-portant to determine the port impedance of the CPW lines whende-embedding measured -parameters. The reflect standard canbe used on both ports. The insertion phase of the line standardand the thru standards must be different from one another. Theyshould ideally differ by 90 at the center frequency of interest.This occurs at only one frequency, so to extend the usable fre-quency range of measurements acquired using this calibrationmethod, the phase difference is relaxed. The frequency rangeof applicability for TRL is when insertion phase of the line andthru standards is between 20 and 160 . This range of phasesensures that the difference in the lengths of the two standards isnot a multiple of . An additional line standard can be used,yet there will be a discontinuity in the calibration. This occurswhen the calibration switches from using one line/thru pair tothe second line/thru air. This must be avoided at specific mea-surement frequencies of interest for the DUT.
ML-TRL is an extension to TRL. ML-TRL uses multipleline standards. ML-TRL is ideal for measurements over a verylarge frequency band. In TRL, the user must divide the mea-surement frequency range into smaller frequency bands in orderto avoid inaccuracies (indeterminacy) when the length differ-ence of the line/thru pairs is multiples of . ML-TRL usesmultiple thru/line pairs throughout the entire measurement fre-quency range and avoids the discontinuities observed in TRL. Inthis way, ML-TRL extends the measurement bandwidth obtain-able with a single calibration procedure. The measurement ofmultiple lines also allows ML-TRL to solve for the propagationconstant. This allows convenient shifting of the measurementreference planes. Several line standards are needed for wide-band measurements [2].
Multiline TRL is generally known to have improved accuracycompared to LRM and SOLT, improved bandwidth (using onecalibration) over TRL, and allows the reference planes of themeasured results to be conveniently shifted. ML-TRL requiresseveral different line standards to be fabricated. This may in-clude long line standards if very low frequencies (below 1 GHz)are to be considered. All of the ML-TRL calibrations line stan-dards should be fabricated on the same substrate as the DUTstructures. This may impose certain layout limitations in thecase where long calibration lines must be accommodated. It isimportant to note that the measured scattering parameters ob-tained after either a TRL or ML-TRL calibration are normal-ized to the characteristic impedance of the CPW lines used forthe thru and line standards. This may or may not be precisely

LI AND MELDE: IMPACT OF ON-WAFER CALIBRATION METHOD 287
50 . Experience shows that although one may layout the linesfor fabrication in order to yield 50 lines, fabrication varia-tions may actually result in CPW lines with slightly lower orslightly higher characteristic impedance than 50 . This doesnot necessarily pose a problem when all the calibration artifactsare fabricated on the same test coupon. It does require renormal-ization when the desired reference impedance for comparison is50 .
LRM [9], [10] calibration uses a line standard, a reflectstandard, and a match standard. The original version of LRMrequired the match standard to be 50 , or the same as the portimpedance. The method now allows match standards to have afrequency-dependent impedance. This allows a much broaderband calibration when the load is well-characterized a priori.LRM is most typically employed with the 50 match standardbecause of the extra processing complexity needed to reliablyfabricate a prescribed frequency-dependent match standard.LRM is a modification of TRL where the TRL line standardis replaced by a known match standard. The impedance of thematch standard is the only artifact that needs to be completelycharacterized with this approach. The reference plane after anLRM calibration is always set at the center of the line standard.LRM does not allow for convenient re-shifting of the referenceplane since the propagation constant is not determined in thismethod. LRM is a good approach for measurements at low fre-quencies, since long line standards do not need to be fabricated.LRM uses the same set of standards as SOLT, yet only onereflect (typically the open) is used in LRM. LRM only requiresthat the match standard be well characterized. The bandwidthobtained by LRM is greater than that of TRL.
LRRM [11] calibration uses a line standard, two reflect stan-dards, and a match standard. It is a variation of LRM, but in thiscase, two reflect standards (an open circuited CPW line and ashort circuited CPW line) are used. Compared with LRM, thereare several advantages of LRRM. First, since LRRM only mea-sures one match standard at one port, the inconsistencies in theLRM calibration due to the small discrepancies in resistance ofthe two match standards or the misalignment of the two portswill be avoided. Secondly, both the open and short are used asreflect standards in LRRM, since they are the most widely sep-arated on the Smith chart. In some commercial measurementsoftware, the inductance of the load in LRRM can be automati-cally calculated and corrected during the calibration, which re-sults in more accurate results.
One important factor to consider when comparing differentcalibration methods is the definition of the reference impedanceand the reference planes. The reference impedance in ML-TRLis the characteristic impedance of the line standards , whichmay not be 50 and the reference plane, is at the center of thethru standard on the DUT. The reference impedance for LRRM,LRM, and SOLT is set by impedance of the match standard,which typically equals 50 , while the reference plane is set atthe probe tips. In this paper, the results obtained by ML-TRLare also renormalized to a 50 reference impedance and thereference planes are shifted so that they are at the same loca-tion as the LRRM, LRM, and SOLT results. Once this is done,then the accuracy and repeatability of the different methods arecompared.
Fig. 1. DUT board and ISS.
TABLE ILENGTHS OF ML-TRL CALIBRATION STANDARDS
Fig. 2. Cross section of CPW standards on DUT board.
III. BENCHMARK STRUCTURES
Fig. 1 shows the fabricated DUT board and ISS from Cas-cade Microtech [12]. LRRM, LRM, and SOLT use the sameset of standards on the 625- -thick ISS. The DUT board onalumina substrate ( ) consists of calibration standardsfor ML-TRL and DUTs. Scattering parameter results obtainedfrom network analyzer measurements assume that only a singlemode propagates on the transmission line. To ensure this is thecase, the propagating modes on the CPW lines were analyzedusing full-wave simulations on HFSS [13]. The results demon-strate that only one mode propagates on the CPW line at allfrequencies below 40 GHz. In addition to this, HFSS was alsoused to help place the standards on the ML-TRL test couponshown in Fig. 1. HFSS was used to confirm that there is nocoupling between adjacent standards. The calibration standardsfor ML-TRL include: one thru, two shorts and seven lines, thelengths of which are summarized in Table I. The cross section ofthe standards is shown in Fig. 2, with , ,and . The three different DUTs are a line, a step anda filter, as shown in Fig. 3. These three structures each have aunique characteristic; the line has a low overall and nearzero dB , the step is matched at some frequencies and mis-matched at others, and the filter has a bandpass response. Both
and were used to evaluate the calibration response.

288 IEEE TRANSACTIONS ON ADVANCED PACKAGING, VOL. 33, NO. 1, FEBRUARY 2010
Fig. 3. DUTs.
Fig. 4. Data process flow chart.
IV. COMPARISON APPROACH
The calibrations are compared in two different ways. First, astatistical analysis of measurement repeatability of andfor each circuit and each calibration was performed. Second, theaverage values of and (both magnitude and phase) foreach circuit are compared with full-wave simulation results. Thefull-wave simulations were done using Ansoft’s high-frequencystructure simulator (HFSS) [13]. In the simulation, the thicknessof conductor, frequency-dependent loss of the substrate, and thefabricated dimensions are taken into account. In all cases, theML-TRL data is processed, as shown in Fig. 4, so that the re-sulting reference impedance and reference plane is coincidentwith those for the LRRM, LRM, and SOLT measurement re-sults. For each calibration case, one calibration was performedand then 20 different measurements of the DUT of interest wereperformed in order to obtain the mean value and the standard de-viation from 1 GHz to 40 GHz.
Since the parameters represent both the magnitude andphase relations between the incident and reflected travelingwaves for a microwave network, it is very important andmeaningful to set all of the parameters that are used forcalibration comparison to the same reference plane. However,in the measurement of ML-TRL, the reference planes are setby the calibration algorithm to be the center of thru (plane inFig. 5), which is one of ML-TRL calibration standards. While,the reference planes of the other calibrations are at probe tips(plane in Fig. 5). The reference plane of the ML-TRLresults can be shifted to the probe tips by using the propagationconstant, shown in
(1)
where represents the parameters after shifting,is the measured parameters using ML-TRL calibra-
tion, is half the length of the thru standard used in ML-TRL.
Fig. 5. Shift of reference plane.
The propagation constant can be solved from the parame-ters of two transmission lines with different lengths by usingequation
(2)
where and are the measured forward trans-mission parameter for CPW line 1 and 2 standards, respec-tively. They are defined by which can beobtained by the measurements of ML-TRL. and are thelengths of the two CPW lines.
The circuit ABCD matrix was used to renormalize theML-TRL -parameters to 50 , (the reference impedance usedfor the other calibrations.) The elements of ABCD matrix canbe described as [14]
(3)
For a given two-port network, the ABCD matrix is determinedby the network itself. When the ports are terminated withdifferent impedance , the corresponding parameters arechanged. The ABCD matrix, however, does not change. Thus,the parameters can be renormalized to a specific referenceimpedance through the ABCD matrix. This strategy is shownin equations
(4)
LI AND MELDE: IMPACT OF ON-WAFER CALIBRATION METHOD 289
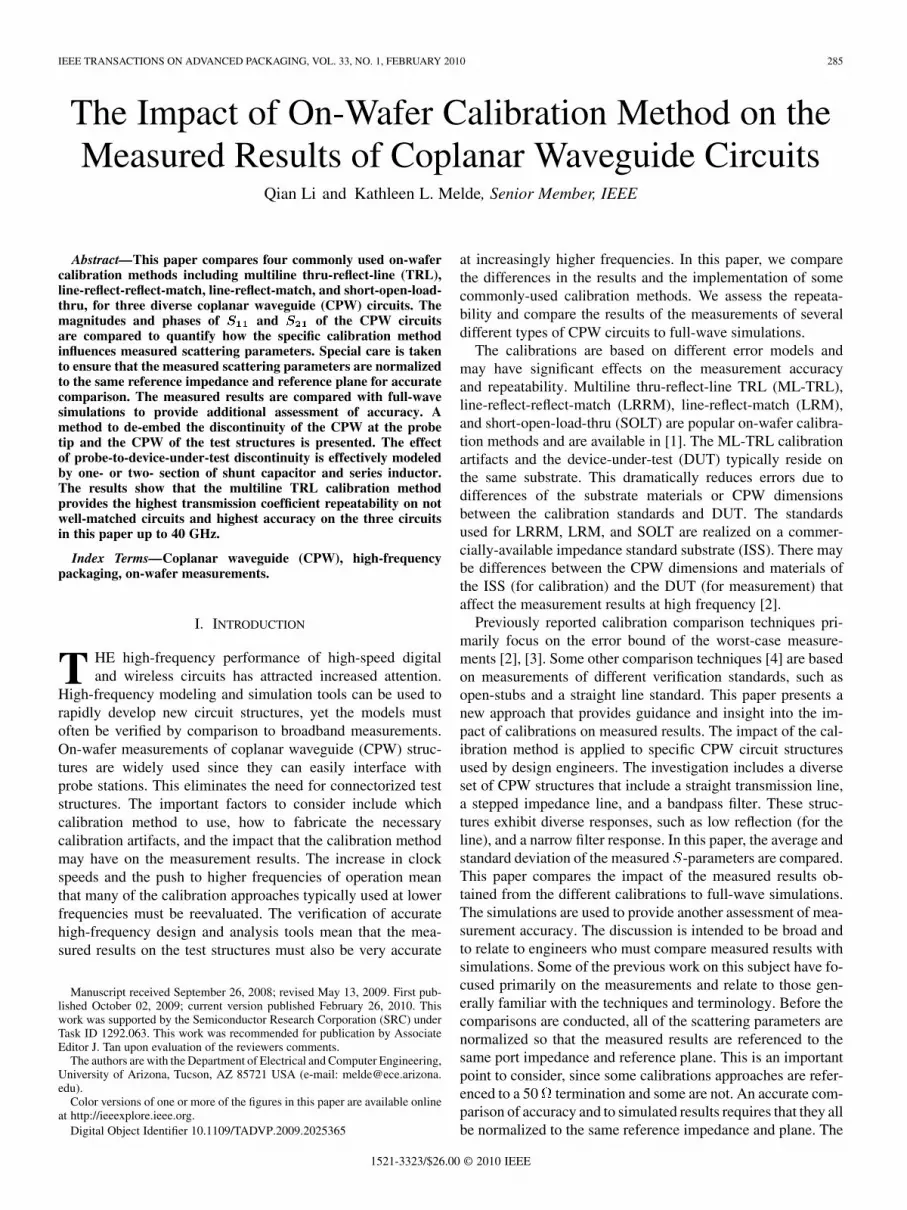
Fig. 6. Enlarged view of the GSG probe tips [16].
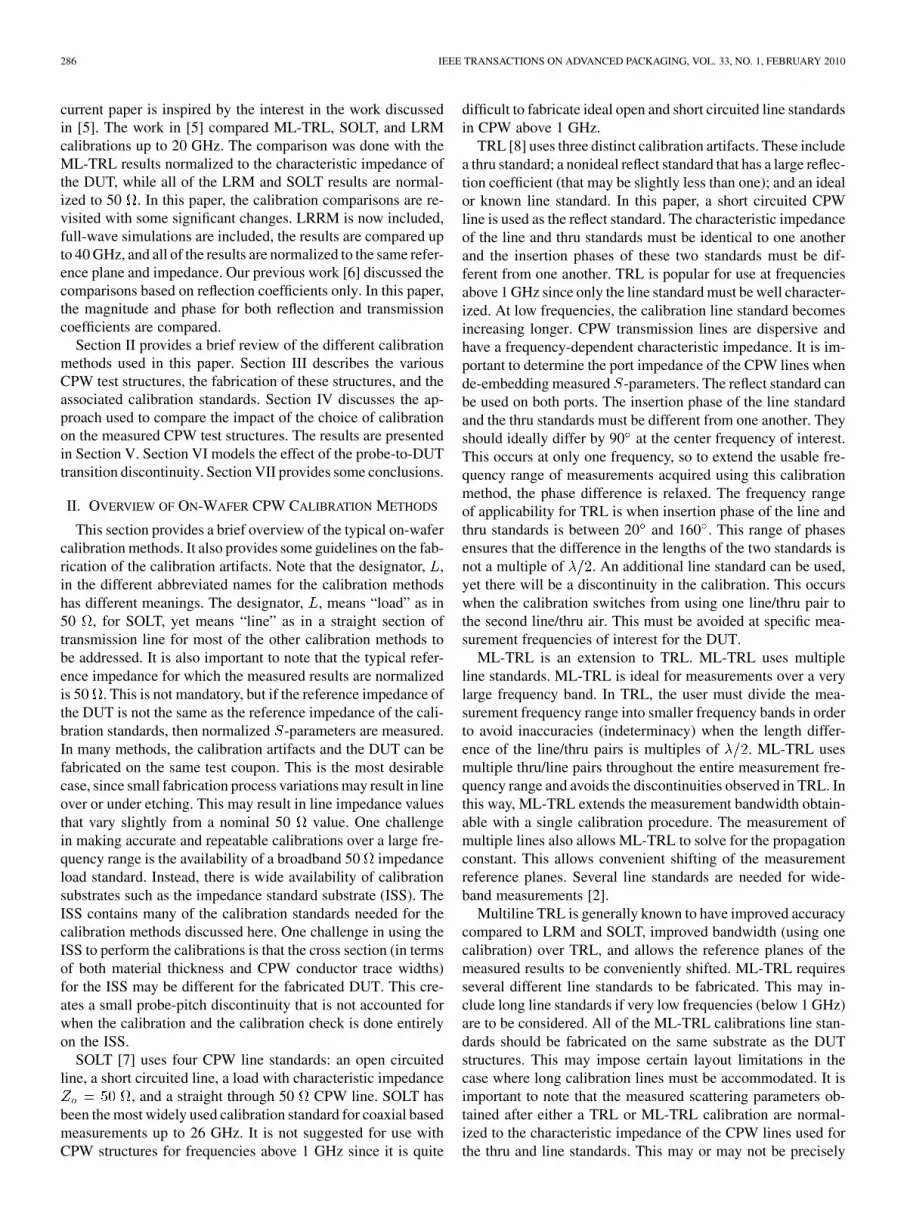
Fig. 7. � Standard deviation of line.
where the superscripts “ ” and “50” represent ML-TRL and50 , respectively; , , and are the measured -pa-rameters directly obtained from ML-TRL; , , and arethe ML-TRL -parameters renormalized to 50 ; is thereference impedance used by ML-TRL [15] and is 50 .Since all the test circuits are reciprocal, . Three un-knowns , , and are numerically solved from the (4).In this way, direct comparison of the calibrations is realized.
V. MEASUREMENT SETUP AND EXPERIMENTAL RESULT
The calibrations and -parameter measurements are per-formed on the HP8510C network analyzer for a frequencyrange of . The line and step are probed by usingCascade ACP50-GSG-250 probes ( ) [16], whichhave 250 probe tip center to center spacing, as shownin Fig. 6. These results are plotted to 40 GHz. Because offabrication processing limits and small dimensions, the filteris fabricated with the interface for ACP50-GSG-500 probes( ), which leaves more design tolerance for CPWdimensions. These results are plotted to 22 GHz. The ML-TRL,LRRM, LRM, and SOLT calibrations are implemented inCascade WinCal XE software [1]. After each calibration,verification is employed to confirm the calibration accuracy.The repeatability study consists of test set and measurementaspects. We evaluated test set repeatability by performing aML-TRL at the beginning and at the end of the measurement[17]. The results show that the maximal -parameter errorbound in worst-case is 0.012 within . Therefore,we consider that the test set yields repeatable measurements.
The measurement repeatability is quantified by the standarddeviations of and among 20 measurements for each cal-ibration [5], which are illustrated in Figs. 7–12. From these fig-ures, we noticed that the standard deviation for both andvaries with frequency. They tend to increase when frequencygoes to higher. In the measurement repeatability compar-ison, we observed that ML-TRL has lowest standard deviationon the filter (lower than 0.0025 for 1–40 GHz), but the highest
Fig. 8. � Standard deviation of step.
Fig. 9. � Standard deviation of filter.
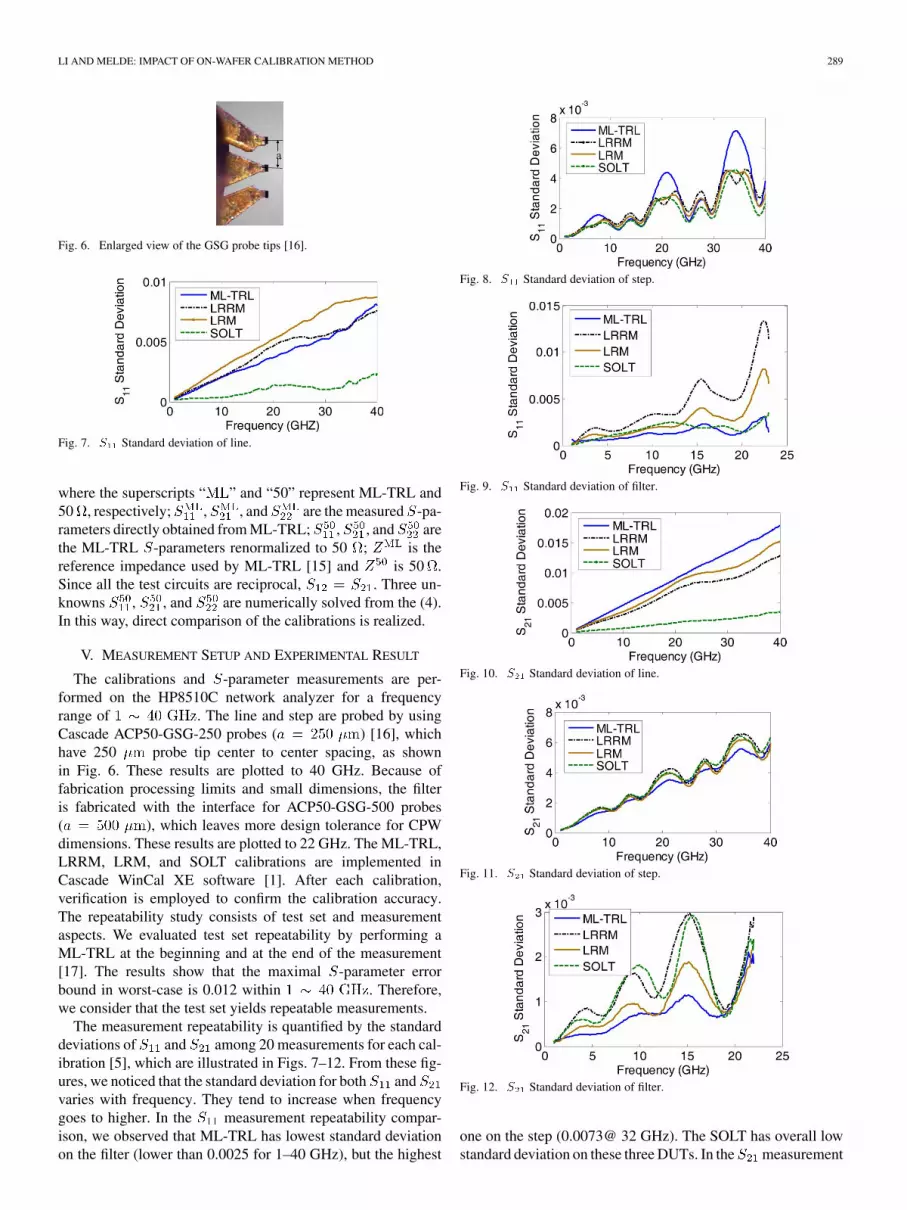
Fig. 10. � Standard deviation of line.
Fig. 11. � Standard deviation of step.
Fig. 12. � Standard deviation of filter.
one on the step (0.0073@ 32 GHz). The SOLT has overall lowstandard deviation on these three DUTs. In the measurement
290 IEEE TRANSACTIONS ON ADVANCED PACKAGING, VOL. 33, NO. 1, FEBRUARY 2010
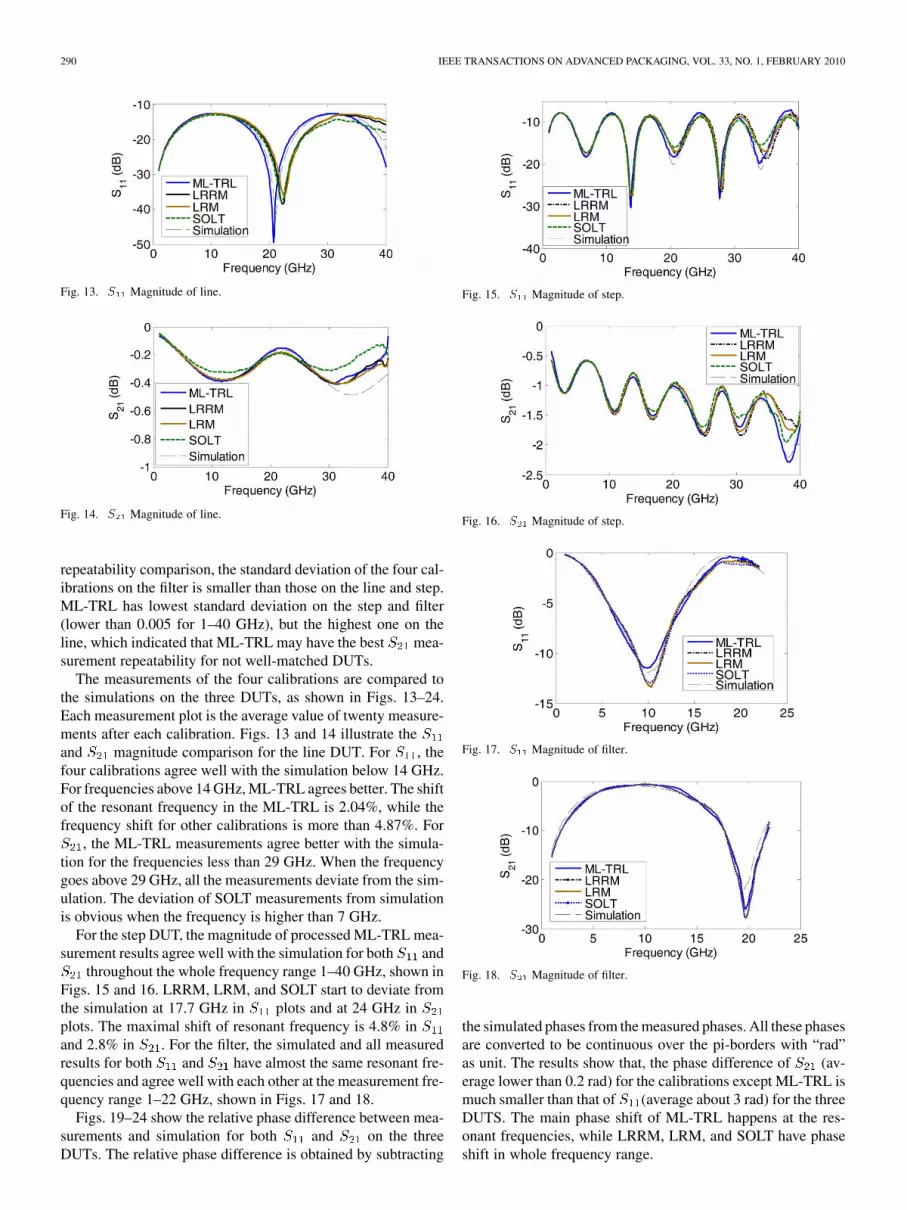
Fig. 13. � Magnitude of line.
Fig. 14. � Magnitude of line.
repeatability comparison, the standard deviation of the four cal-ibrations on the filter is smaller than those on the line and step.ML-TRL has lowest standard deviation on the step and filter(lower than 0.005 for 1–40 GHz), but the highest one on theline, which indicated that ML-TRL may have the best mea-surement repeatability for not well-matched DUTs.
The measurements of the four calibrations are compared tothe simulations on the three DUTs, as shown in Figs. 13–24.Each measurement plot is the average value of twenty measure-ments after each calibration. Figs. 13 and 14 illustrate theand magnitude comparison for the line DUT. For , thefour calibrations agree well with the simulation below 14 GHz.For frequencies above 14 GHz, ML-TRL agrees better. The shiftof the resonant frequency in the ML-TRL is 2.04%, while thefrequency shift for other calibrations is more than 4.87%. For
, the ML-TRL measurements agree better with the simula-tion for the frequencies less than 29 GHz. When the frequencygoes above 29 GHz, all the measurements deviate from the sim-ulation. The deviation of SOLT measurements from simulationis obvious when the frequency is higher than 7 GHz.
For the step DUT, the magnitude of processed ML-TRL mea-surement results agree well with the simulation for both and
throughout the whole frequency range 1–40 GHz, shown inFigs. 15 and 16. LRRM, LRM, and SOLT start to deviate fromthe simulation at 17.7 GHz in plots and at 24 GHz inplots. The maximal shift of resonant frequency is 4.8% inand 2.8% in . For the filter, the simulated and all measuredresults for both and have almost the same resonant fre-quencies and agree well with each other at the measurement fre-quency range 1–22 GHz, shown in Figs. 17 and 18.
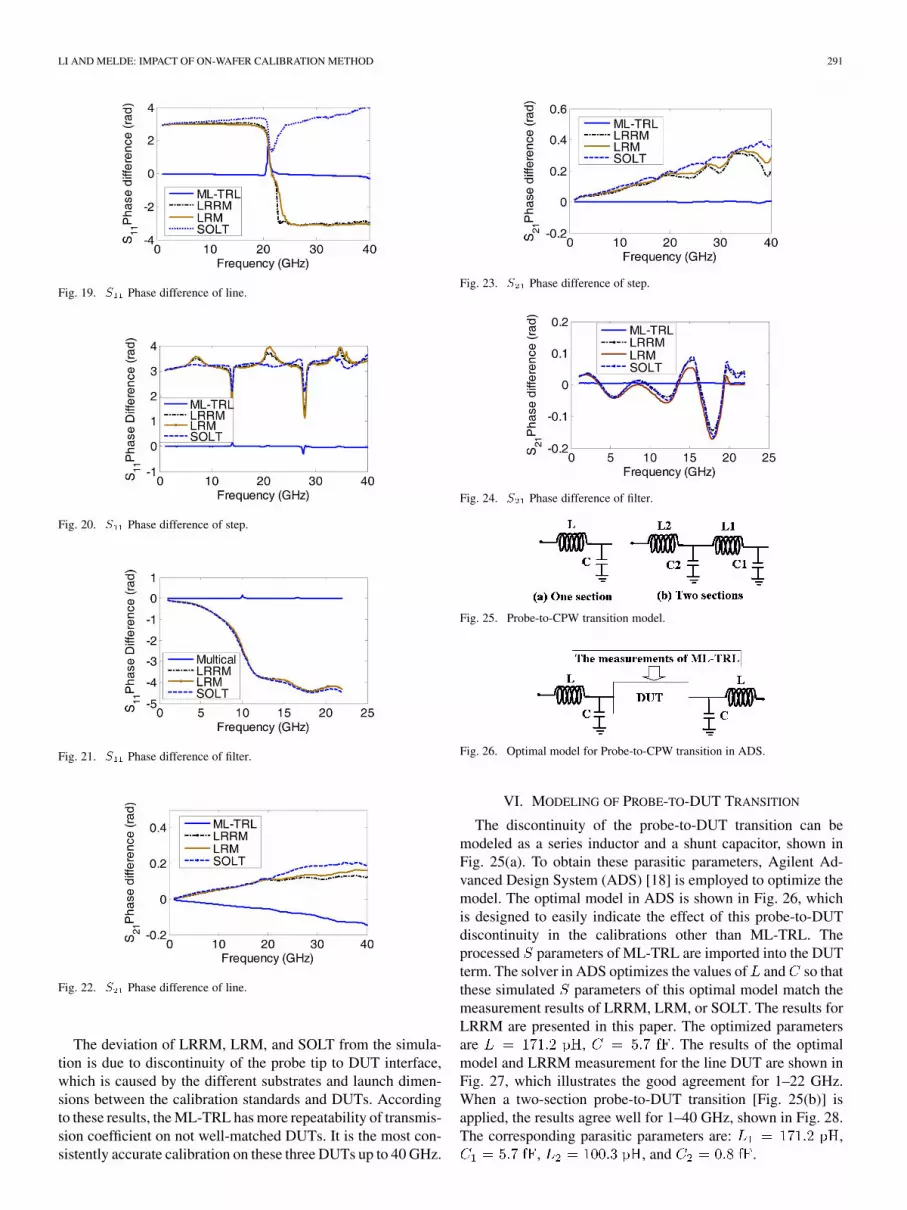
Figs. 19–24 show the relative phase difference between mea-surements and simulation for both and on the threeDUTs. The relative phase difference is obtained by subtracting
Fig. 15. � Magnitude of step.
Fig. 16. � Magnitude of step.
Fig. 17. � Magnitude of filter.
Fig. 18. � Magnitude of filter.
the simulated phases from the measured phases. All these phasesare converted to be continuous over the pi-borders with “rad”as unit. The results show that, the phase difference of (av-erage lower than 0.2 rad) for the calibrations except ML-TRL ismuch smaller than that of (average about 3 rad) for the threeDUTS. The main phase shift of ML-TRL happens at the res-onant frequencies, while LRRM, LRM, and SOLT have phaseshift in whole frequency range.
LI AND MELDE: IMPACT OF ON-WAFER CALIBRATION METHOD 291
Fig. 19. � Phase difference of line.
Fig. 20. � Phase difference of step.
Fig. 21. � Phase difference of filter.
Fig. 22. � Phase difference of line.
The deviation of LRRM, LRM, and SOLT from the simula-tion is due to discontinuity of the probe tip to DUT interface,which is caused by the different substrates and launch dimen-sions between the calibration standards and DUTs. Accordingto these results, the ML-TRL has more repeatability of transmis-sion coefficient on not well-matched DUTs. It is the most con-sistently accurate calibration on these three DUTs up to 40 GHz.
Fig. 23. � Phase difference of step.
Fig. 24. � Phase difference of filter.
Fig. 25. Probe-to-CPW transition model.
Fig. 26. Optimal model for Probe-to-CPW transition in ADS.
VI. MODELING OF PROBE-TO-DUT TRANSITION
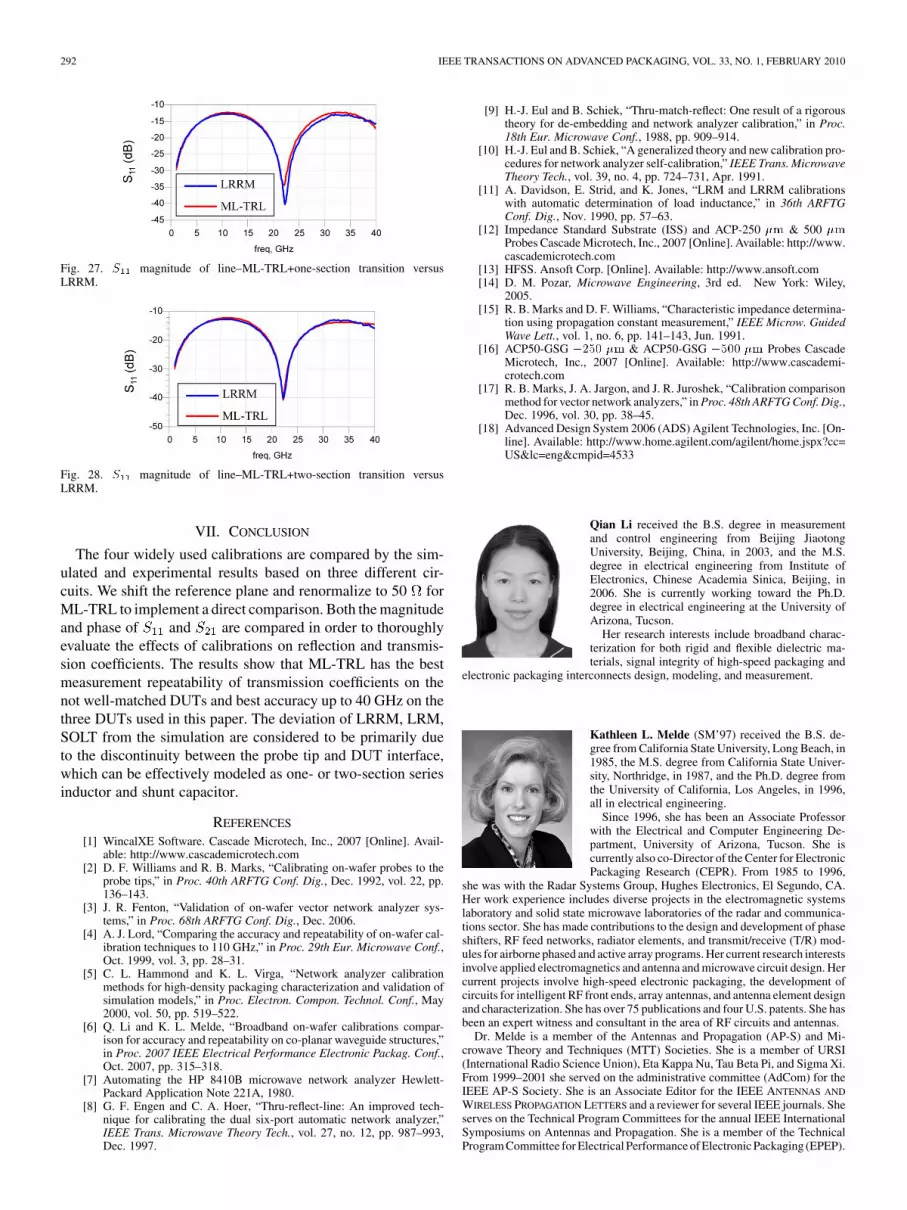
The discontinuity of the probe-to-DUT transition can bemodeled as a series inductor and a shunt capacitor, shown inFig. 25(a). To obtain these parasitic parameters, Agilent Ad-vanced Design System (ADS) [18] is employed to optimize themodel. The optimal model in ADS is shown in Fig. 26, whichis designed to easily indicate the effect of this probe-to-DUTdiscontinuity in the calibrations other than ML-TRL. Theprocessed parameters of ML-TRL are imported into the DUTterm. The solver in ADS optimizes the values of and so thatthese simulated parameters of this optimal model match themeasurement results of LRRM, LRM, or SOLT. The results forLRRM are presented in this paper. The optimized parametersare , . The results of the optimalmodel and LRRM measurement for the line DUT are shown inFig. 27, which illustrates the good agreement for 1–22 GHz.When a two-section probe-to-DUT transition [Fig. 25(b)] isapplied, the results agree well for 1–40 GHz, shown in Fig. 28.The corresponding parasitic parameters are: ,
, , and .
292 IEEE TRANSACTIONS ON ADVANCED PACKAGING, VOL. 33, NO. 1, FEBRUARY 2010
Fig. 27. � magnitude of line–ML-TRL+one-section transition versusLRRM.
Fig. 28. � magnitude of line–ML-TRL+two-section transition versusLRRM.
VII. CONCLUSION
The four widely used calibrations are compared by the sim-ulated and experimental results based on three different cir-cuits. We shift the reference plane and renormalize to 50 forML-TRL to implement a direct comparison. Both the magnitudeand phase of and are compared in order to thoroughlyevaluate the effects of calibrations on reflection and transmis-sion coefficients. The results show that ML-TRL has the bestmeasurement repeatability of transmission coefficients on thenot well-matched DUTs and best accuracy up to 40 GHz on thethree DUTs used in this paper. The deviation of LRRM, LRM,SOLT from the simulation are considered to be primarily dueto the discontinuity between the probe tip and DUT interface,which can be effectively modeled as one- or two-section seriesinductor and shunt capacitor.
REFERENCES
[1] WincalXE Software. Cascade Microtech, Inc., 2007 [Online]. Avail-able: http://www.cascademicrotech.com
[2] D. F. Williams and R. B. Marks, “Calibrating on-wafer probes to theprobe tips,” in Proc. 40th ARFTG Conf. Dig., Dec. 1992, vol. 22, pp.136–143.
[3] J. R. Fenton, “Validation of on-wafer vector network analyzer sys-tems,” in Proc. 68th ARFTG Conf. Dig., Dec. 2006.
[4] A. J. Lord, “Comparing the accuracy and repeatability of on-wafer cal-ibration techniques to 110 GHz,” in Proc. 29th Eur. Microwave Conf.,Oct. 1999, vol. 3, pp. 28–31.
[5] C. L. Hammond and K. L. Virga, “Network analyzer calibrationmethods for high-density packaging characterization and validation ofsimulation models,” in Proc. Electron. Compon. Technol. Conf., May2000, vol. 50, pp. 519–522.
[6] Q. Li and K. L. Melde, “Broadband on-wafer calibrations compar-ison for accuracy and repeatability on co-planar waveguide structures,”in Proc. 2007 IEEE Electrical Performance Electronic Packag. Conf.,Oct. 2007, pp. 315–318.
[7] Automating the HP 8410B microwave network analyzer Hewlett-Packard Application Note 221A, 1980.
[8] G. F. Engen and C. A. Hoer, “Thru-reflect-line: An improved tech-nique for calibrating the dual six-port automatic network analyzer,”IEEE Trans. Microwave Theory Tech., vol. 27, no. 12, pp. 987–993,Dec. 1997.
[9] H.-J. Eul and B. Schiek, “Thru-match-reflect: One result of a rigoroustheory for de-embedding and network analyzer calibration,” in Proc.18th Eur. Microwave Conf., 1988, pp. 909–914.
[10] H.-J. Eul and B. Schiek, “A generalized theory and new calibration pro-cedures for network analyzer self-calibration,” IEEE Trans. MicrowaveTheory Tech., vol. 39, no. 4, pp. 724–731, Apr. 1991.
[11] A. Davidson, E. Strid, and K. Jones, “LRM and LRRM calibrationswith automatic determination of load inductance,” in 36th ARFTGConf. Dig., Nov. 1990, pp. 57–63.
[12] Impedance Standard Substrate (ISS) and ACP-250 �� & 500 ��Probes Cascade Microtech, Inc., 2007 [Online]. Available: http://www.cascademicrotech.com
[13] HFSS. Ansoft Corp. [Online]. Available: http://www.ansoft.com[14] D. M. Pozar, Microwave Engineering, 3rd ed. New York: Wiley,
2005.[15] R. B. Marks and D. F. Williams, “Characteristic impedance determina-
tion using propagation constant measurement,” IEEE Microw. GuidedWave Lett., vol. 1, no. 6, pp. 141–143, Jun. 1991.
[16] ACP50-GSG ���� �� & ACP50-GSG ���� �� Probes CascadeMicrotech, Inc., 2007 [Online]. Available: http://www.cascademi-crotech.com
[17] R. B. Marks, J. A. Jargon, and J. R. Juroshek, “Calibration comparisonmethod for vector network analyzers,” in Proc. 48th ARFTG Conf. Dig.,Dec. 1996, vol. 30, pp. 38–45.
[18] Advanced Design System 2006 (ADS) Agilent Technologies, Inc. [On-line]. Available: http://www.home.agilent.com/agilent/home.jspx?cc=US&lc=eng&cmpid=4533
Qian Li received the B.S. degree in measurementand control engineering from Beijing JiaotongUniversity, Beijing, China, in 2003, and the M.S.degree in electrical engineering from Institute ofElectronics, Chinese Academia Sinica, Beijing, in2006. She is currently working toward the Ph.D.degree in electrical engineering at the University ofArizona, Tucson.
Her research interests include broadband charac-terization for both rigid and flexible dielectric ma-terials, signal integrity of high-speed packaging and
electronic packaging interconnects design, modeling, and measurement.
Kathleen L. Melde (SM’97) received the B.S. de-gree from California State University, Long Beach, in1985, the M.S. degree from California State Univer-sity, Northridge, in 1987, and the Ph.D. degree fromthe University of California, Los Angeles, in 1996,all in electrical engineering.
Since 1996, she has been an Associate Professorwith the Electrical and Computer Engineering De-partment, University of Arizona, Tucson. She iscurrently also co-Director of the Center for ElectronicPackaging Research (CEPR). From 1985 to 1996,
she was with the Radar Systems Group, Hughes Electronics, El Segundo, CA.Her work experience includes diverse projects in the electromagnetic systemslaboratory and solid state microwave laboratories of the radar and communica-tions sector. She has made contributions to the design and development of phaseshifters, RF feed networks, radiator elements, and transmit/receive (T/R) mod-ules for airborne phased and active array programs. Her current research interestsinvolve applied electromagnetics and antenna and microwave circuit design. Hercurrent projects involve high-speed electronic packaging, the development ofcircuits for intelligent RF front ends, array antennas, and antenna element designand characterization. She has over 75 publications and four U.S. patents. She hasbeen an expert witness and consultant in the area of RF circuits and antennas.
Dr. Melde is a member of the Antennas and Propagation (AP-S) and Mi-crowave Theory and Techniques (MTT) Societies. She is a member of URSI(International Radio Science Union), Eta Kappa Nu, Tau Beta Pi, and Sigma Xi.From 1999–2001 she served on the administrative committee (AdCom) for theIEEE AP-S Society. She is an Associate Editor for the IEEE ANTENNAS AND
WIRELESS PROPAGATION LETTERS and a reviewer for several IEEE journals. Sheserves on the Technical Program Committees for the annual IEEE InternationalSymposiums on Antennas and Propagation. She is a member of the TechnicalProgram Committee for Electrical Performance of Electronic Packaging (EPEP).