the effect of earnings management on the asymmetric timeliness of earnings
TRANSCRIPT

The Effect of EarningsManagement on the Asymmetric
Timeliness of Earnings
JUAN MANUEL GARCIA LARA, BEATRIZ GARCIA OSMA AND
ARACELI MORA*
Abstract: Is earnings management affecting (driving) the measures of earn-ings conservatism? Ball et al. (2000) point out that the asymmetry in the recogni-tion of good and bad news in earnings (faster recognition of bad news: earningsconservatism) is more pronounced in common-law than in code-law basedaccounting regimes. However, comparative studies on earnings conservatismin Europe have failed to identify significant differences between common-lawand code-law based countries. We argue that in code-law based countriesmanagers have incentives to reduce earnings consistently. This enhances theassociation between earnings and returns in bad news periods. We find that aftercontrolling for discretionary accruals, the differential earnings response to badnews in Germany and France decreases significantly.
Keywords: conservatism, earnings management, Europe, comparability
* The first and second authors are from Lancaster University. The third author is fromUniversidad de Valencia, Spain. They gratefully acknowledge the helpful comments andsuggestions of an anonymous referee, Steve Young and Ken Peasnell. They acknowledgefinancial contribution from the Valencian Institute of Economic Research (IVIE), theSpanish Ministry of Science and Technology (SEC2002-04608-C02-01/2) and from theEuropean Commission (HPRN CT 2000-00062). The paper has benefited frompresentations at the 2003 AECA meeting; the accounting research workshop at theAmsterdam Graduate Business School; the workshop on empirical research on financialaccounting at the University of Alicante, the EIASM workshop on capital market research inaccounting at Goethe Universitat Frankfurt am Main, the 2004 EAA Conference, the 2004BAA Conference, a seminar at the University Carlos III Madrid, the 2004 JBFA annualConference on capital markets and the 2004 AAA annual meeting. Juan Manuel GarcıaLara acknowledges the financial contribution of Lancaster University Management SchoolPump Priming Research Grants, Lancaster University Small Grants Scheme (AFA7620),and the Nuffield Foundation, through their Small Grant Scheme (SGS/00963/G).
Address for correspondence: Juan Manuel Garcıa Lara, Lancaster University ManagementSchool, Department of Accounting and Finance, Bailrigg, Lancaster LA1 4YX, UK.e-mail: [email protected]
Journal of Business Finance & Accounting, 32(3) & (4), April/May 2005, 0306-686X
# Blackwell Publishing Ltd. 2005, 9600 Garsington Road, Oxford OX4 2DQ, UKand 350 Main Street, Malden, MA 02148, USA. 691

1. INTRODUCTION
The seminal paper by Basu (1997) on income statement (earnings)conservatism is the starting point of a flourishing stream ofaccounting research on conservatism and other properties of earn-ings. However, a certain amount of concern has been expressedabout how to empirically disentangle earnings conservatism fromearnings management or earnings smoothing. The measures ofearnings conservatism derived from Basu’s model are affected bythe extent and pervasiveness of earnings management.
Ball et al. (2000) explain that due to the different economicrole of financial statements in common-law and code-law basedaccounting regimes, earnings conservatism is expected to bemore pronounced in common-law based countries. Althoughthey test this hypothesis successfully, comparing the US tocode-law based countries, comparative studies on a Europeancontext, such as Giner and Rees (2001), Garcıa Lara and Mora(2004) or Raonic et al. (2004), fail to find significant differencesbetween common-law and code-law based countries in Europe.Although the demand for conservative measures is embeddedin all conceptual frameworks of accounting, the incentives man-agers have to engage in conservative practices will be directlylinked to the litigation threats, which are expected to differbetween common-law and code-law based countries.
We argue that these surprising results (similar level of earningsconservatism in the UK and in continental European countries) areattributable to differences in earnings management practices acrossEuropean countries. In line with this argument, a recent study byLeuz et al. (2003) shows that there are significant differences inearnings management (very broadly defined to encompass severalearnings management practices) between countries.
In our study, we analyse in a first step the existence of earn-ings conservatism, that is, whether bad news is captured fasterthan good news in financial statements in France, Germany andthe UK. Consistent with prior studies, we do not find significantdifferences in the level of conservatism between the three coun-tries. In a second step, we control for the existence of earningsmanagement, and re-examine earnings conservatism in thethree countries under study, as we think that continentalEuropean managers have incentives to manage earnings
692 GARCIA LARA, GARCIA OSMA AND MORA
# Blackwell Publishing Ltd 2005

downwards consistently. We find that the differential recogni-tion speed of bad news decreases significantly in France andGermany when we use a measure of unmanaged earnings(earnings minus discretionary accruals) instead of observedearnings. Once we correct for discretionary accruals, the differ-ences in earnings conservatism between the UK (common-law)and France and Germany (code-law) become significant.
Our paper contributes to the growing body of literature onaccounting conservatism. We attempt to shed additional light onthe differences in the properties of earnings across Europeancountries. We think that this is an issue of especial interest in thisparticular moment given that a key objective of the EuropeanCommission is to ensure the comparability of accounting num-bers of EU firms. Analysing the differences in earnings proper-ties before the implementation of the International FinancialReporting Standards (IFRSs) establishes a benchmark forassessing the effects of EU-wide IFRS implementation.
The remainder of the paper is as follows. In Section 2 we discussprevious evidence on earnings conservatism and describe theeffect that earnings management has on the measures of earningsconservatism. In Section 3 we analyse the prior literature onearnings management, focusing on income-decreasing motiva-tions. Section 4 contains the research design. In Section 5 wepresent our results, and finally, in Section 6 we show theconclusions and offer some directions for further research.
2. CONSERVATISM AND EARNINGS MANAGEMENT
Conservatism is described in most regulatory accounting frame-works as a ‘prudent reaction to uncertainty’ (FASB 1980,SFAC 2). In the IASB framework (IASC, 1989), it is stated thatprudence (conservatism) implies that:
[. . .] assets or income are not overstated and liabilities or expenses are notunderstated.
However, it also points out that prudence does not allow:
the deliberate understatement of assets or income, or the deliberate over-statement of liabilities or expenses, because the financial statements wouldnot be neutral and, therefore, not have the quality of reliability.
EFFECT OF EARNINGS MANAGEMENT 693
# Blackwell Publishing Ltd 2005

Consequently, the deliberate and consistent understatementof income or overstatement of expenses should not be describedas conservatism, or interpreted as desirable properties ofaccounting numbers, as they would lead to the contraventionof qualitative characteristics such as neutrality or representa-tional faithfulness. The practices that through the under-statement of income or overstatement of expenses go aboveand beyond the conservatism principle and undermine thereliability of accounting information should be considered asearnings management practices, as their objectives deviatefrom the protection of investors and respond to managers’own incentives.
Looking at conservatism from a timing perspective, Basu(1997) interprets conservatism as capturing accountants’ ten-dency to require a higher degree of verification for recognizinggood rather than bad news in earnings. Bad news is reflected inthe profit and loss account faster than good news. In contrast totraditional definitions of conservatism based on the understate-ment of shareholders’ equity (Feltham and Ohlson, 1995), earn-ings conservatism is a question of the timing and sequencing ofgains and losses with respect to their associated cash flows(Givoly and Hayn, 2000). Using this interpretation of conserva-tism, Basu (1997) finds evidence consistent with the existence ofearnings conservatism in the US, using the rate of return as aproxy for news in the following regression:
E=Pt�1 ¼ �0 þ �1Dþ �2Rþ �3RD ð1Þwhere E is earnings per share; P is share price; D is a dummyvariable that equals 1 when the rate of return is negative, 0otherwise; and R is the rate of return. In this regression, �3
captures the differential recognition speed of bad news in earn-ings, with respect to good news (captured by �2). However, �3
will be influenced not only by the investor-protective conserva-tive practices described in the conceptual frameworks, but alsoby the unwanted deliberate conservatism that we argue shouldbe classified as earnings management. When managers haveincentives to reduce or delay the recognition of earnings, theytake additional income-decreasing measures that go beyond theinvestor protection objectives as defined in the conceptualframeworks, thereby increasing the �3 coefficient in a Basu
694 GARCIA LARA, GARCIA OSMA AND MORA
# Blackwell Publishing Ltd 2005
(1997) type regression. However, this increase in �3 responds toearnings management practices, and not to conservatism.
As cash flows capture news symmetrically, accruals will be usedto achieve conservatism as defined in the conceptual frameworks. If we decompose accruals into their non-discretionary(normal) and discretionary (abnormal) components, conserva-tism should be reflected in the non-discretionary component,while undesirable conservatism, that is, unnecessary overstate-ment of expenses or understatement of gains, would bereflected in discretionary accruals, leading to a loss in reliabilityof accounting information.1 Therefore, discretionary accrualswill contribute to increase �3 in the Basu model, inflatingBasu’s conservatism measure. That is, discretionary accrualswill be used to ‘abuse’ the conservatism principle.
Nevertheless, Guay et al. (1996) argue, in a US context, thatmanagers use discretionary accruals to produce a more reliablemeasure of firm performance, that is, they make earnings time-lier. However, it could be argued that the threat of litigation willresult in managers having incentives to use their discretion overaccruals to align earnings and returns only in bad news periods.Consequently, discretionary accruals would capture news asym-metrically, and will contribute to increase Basu’s �3 coefficient.In other institutional contexts (continental Europe) where man-agers have incentives to decrease earnings for tax, dividend orother purposes, discretionary accruals will also be contributingto align earnings and returns in bad news periods, but not ingood news periods. That is, if given a predefined set of accrualchoices, managers choose those that will lead to more reducedearnings numbers, we will observe a more pronounced associa-tion between earnings and returns in bad news periods. Againin this case, discretionary accruals will capture news asymmet-rically.
Previous research on earnings conservatism in an inter-national context shows that common-law accounting regimes
1 Managers could also be using real operating instruments to manipulate earnings,affecting cash flows in such a way that they would not capture news symmetrically.However, real operating decisions to manage earnings can reduce shareholder valueand are considered more costly and visible than pure financial decisions. Therefore,managers are expected to prefer accounting manipulation to real manipulation thataffects cash flows (Peasnell et al., 2000b).
EFFECT OF EARNINGS MANAGEMENT 695
# Blackwell Publishing Ltd 2005

(the UK being the clearest example in Europe) are more earn-ings conservative than code-law based accounting regimes (allEuropean continental countries, except The Netherlands).According to Ball et al. (2000), this difference is explained bythe different economic role of financial statements in the twotypes of countries. In common-law countries, the ownership ofthe company is spread over a wide number of shareholders,who are willing and able to sue managers or auditors if they donot disclose bad news in a timely way through financial state-ments. As a response to this external demand for conservativemeasures, managers increase the asymmetry in the recognitionof good and bad news in earnings. Thus, litigation risk is themain trigger of earnings conservatism in common-law basedcountries. In contrast, in code-law based countries, the mainproviders of capital funds are financial institutions, fundamen-tally banks. In these countries, demand for timely informationin the annual accounts is less important, since these financialinstitutions already know about the financial affairs of the com-pany through other timelier sources.
The fact that banks are the main providers of finance in code-law based countries leads to greater balance sheet conservatism.Banks demand reduced values of shareholders’ equity to assessthe borrowing capacity of the firm from a prudent perspective.Their objective is to be sure that if the firm faces some kind offinancial distress, they will be able to recover the investmentthrough the liquidation of assets. Consequently, greater balancesheet conservatism is observed in code-law based countries (Joosand Lang, 1994; Joos, 1997; and Garcıa Lara and Mora, 2004).The existence of balance sheet conservatism also reduces thepossibility of engaging in earnings conservatism practices incode-law based countries. Pope and Walker (2003) show thatearnings conservatism decreases with balance sheet conserva-tism. If a particular asset is not recognised in the balance sheet,news about that particular asset will not be captured in earnings,and will not lead to any asymmetry in news recognition inearnings. Balance sheet conservatism should consequently becontributing to smaller earnings conservatism in code-law basedcountries, consistent with Ball et al.’s (2000) hypothesis.
However, the studies that analyse earnings conservatismfocusing on European countries, e.g. Giner and Rees (2001),
696 GARCIA LARA, GARCIA OSMA AND MORA
# Blackwell Publishing Ltd 2005

Garcıa Lara and Mora (2004) and Raonic et al. (2004), find thatthe differences between the UK and continental Europeancountries are not as pronounced as one might expect.2 Theirresults suggest that the differences (if any) are not significant.No satisfactory explanations for these conflicting results haveappeared in the literature. The reduced litigation risk faced bymanagers and auditors and the greater balance sheet conserva-tism in code-law based countries should lead to differences inearnings conservatism between the UK and continentalEuropean countries. We test the hypothesis that earnings man-agement practices differ substantially between countries andaffect directly the measure of earnings conservatism, increasing�3 in continental European countries. In our empirical study,we find that discretionary accruals in Continental Europeancountries show a larger contemporary association with returnsin bad news periods, biasing upwards the Basu (1997) �3 coeffi-cient, which in the absence of discretionary accruals would givean unbiased measure of conservatism.
3. EARNINGS MANAGEMENT AS A DRIVER FOR EARNINGSCONSERVATISM
Jensen and Meckling (1976) point out that the lack of align-ment between managers and shareholders’ interests createsincentives for managers to use the firm’s resources in a self-beneficial way. In line with this general idea, earnings man-agement can be defined as a purposeful alteration of thefinancial reports to either ‘mislead some stakeholders aboutthe underlying performance of the company or to influencecontractual outcomes’ (Healy and Wahlen, 1999, p. 368). Thisbroad definition encompasses a number of practices carriedout by managers, generally leading to a reduced variability ofreported income (earnings smoothing) or to covering deterior-ating firm performance. Recent studies examine how wide-spread and pervasive these practices are, seeming to affectmost publicly traded companies and being common to firms
2 In the case of Raonic et al. (2004) they use only cross-listed firms, leading to a greaterhomogeneity between firms in their sample. Consequently, their results showing nodifferences between countries are not surprising.
EFFECT OF EARNINGS MANAGEMENT 697
# Blackwell Publishing Ltd 2005

all over the world (see Healy and Wahlen, 1999; or Dechowand Skinner, 2000; for reviews of the earnings managementliterature). However, the objective and direction of these earn-ings management practices vary depending on the incentivesthat managers face.
Different institutional environments lead to differences inmanagers’ incentives to manipulate earnings. In code-lawbased countries accounting income is strongly linked to currentpayouts to employees, managers, shareholders and the govern-ment. If this link contributes to managerial incentives to man-age earnings downwards, it enhances the association betweenearnings and returns in bad news periods. Also, the associationbetween earnings and returns in good news periods decreases(one could think that the incentives to manage earnings down-wards are more pronounced in good news periods), with whichthe apparent bad news effect is therefore greater. If this hypo-thesis holds, when analysing earnings conservatism using a Basu(1997) type regression, the differential bad news coefficient withrespect to good news is artificially inflated. We provide thefollowing arguments to explain why continental European man-agers engage in persistent income decreasing strategies: (i) thelink between dividends and earnings, (ii) the pecking ordertheory, (iii) the link between earnings and taxation, (iv) thereduced incentives to manage earnings upwards, and (v) theexistence of strong labour unions.
(i) The Link Between Dividends and Earnings
The relationship between accounting numbers and payments toshareholders is much stronger in countries where investorprotection is weak. La Porta et al. (2000) argue that firms incountries where investor protection is low (and they give theexample of French type civil (code) law countries) try to estab-lish a good reputation for ‘moderation in expropriating share-holders’ to be able to raise funds in capital markets. Accordingto La Porta et al. (2000), a reputation for good treatment ofshareholders is crucial in countries with weak investor protec-tion, that is, where shareholders are not able to sue managerssuccessfully. Firms in these countries use dividends as asubstitute for legal protection, and they are keen to show
698 GARCIA LARA, GARCIA OSMA AND MORA
# Blackwell Publishing Ltd 2005

shareholders high dividend payout ratios. However, these highpayout ratios can be achieved also by managing earnings down-wards. La Porta et al. (2000) explicitly argue that in code-lawbased countries reported earnings could be lower than whatthey call ‘true earnings’ (p. 11). This is why they calculate pay-out ratios not only as Dividends/Earnings, which can bemanipulated, but also as Dividends/Sales.
In a similar way, Harris et al. (1994) argue that commercialregulation in Germany is strengthening the link betweenearnings and dividends, giving German managers the incen-tive to manage earnings downwards so that they can moreeasily shape their dividend policies. The German Stock Cor-poration Law only allows managers to retain half of the netincome of the year. The rest, including certain retained earn-ings, are left to the discretion of shareholders at the annualmeeting. According to Harris et al. (1994), this establishes astrong link between earnings and dividends, creating incen-tives to manage reported earnings to attain a desired divi-dend policy, because higher reported earnings createshareholder pressure for higher dividends. In their studythey find that earnings payout ratios are greater in Germanythan in the US and link this result to incentives for lowerreported earnings. There is also evidence of dividend-drivenearnings management in a code-law based country (Finland)in the study by Kasanen et al. (1996), where the authorsargue that the firm’s motivations to pay dividends in code-law based countries (apart from Finland, their country understudy, they put the examples of France, Germany and Swe-den) are demand driven because of the dominant role ofinstitutional ownership.3
(ii) The Pecking Order Theory
The pecking order theory (Myers, 1984; and Myers and Majluf,1984) offers a theoretical framework where managers have
3 In the extreme case of countries with illiquid markets and high transaction costs (e.g.Finland, which is the case of Kasanen et al., 1996) one could expect income-increasingdividends driven earnings management, to achieve a predetermined level of dividends.This, however, does not apply to France and Germany, as financial markets in thesecountries are liquid and transactions costs are more reduced.
EFFECT OF EARNINGS MANAGEMENT 699
# Blackwell Publishing Ltd 2005

incentives to decrease earnings. The pecking order theoryargues that managers prefer internal funds to finance theirinvestment strategies. This, according to Fama and French(2002), has important implications for the dividend policy ofthe company. If the pecking order theory holds, then managerswill retain as much earnings as they can, which in the Germancase cannot be more than 50%, as established by the StockCorporation Law. Ehrhardt and Schmidt (2003) test whetherGerman managers behave according to the pecking ordertheory and argue (p. 3) that:
part of net earnings disposable for dividend payments and retention,respectively, is reduced through accruals management. While the retain-able amount of (explicit) net earnings is limited by German payout rules,the amount of net earnings reduced through accruals management is‘retained’ completely. That is, the internal funds disposable via open reten-tion policy might be extended through hidden action via discretionaryvariations of accruals.
Their empirical results show that German managers behave inaccordance with the pecking order theory and that they avoidearnings increases through earnings management given that itis the only way to fully retain income increases in order toenhance internal funds (p. 21).
(iii) The Link Between Earnings and Taxation
In code-law based countries taxes are closely tied to reportedearnings. For individual accounts (also for consolidatedaccounts in Germany) there are no differences between taxableincome and profit before tax. That is, the flow-through methodis used. Looking at the German case, Seckler (1998, p. 361)points out:
commercial accounts in Germany are linked directly with tax accounts. [. . .]the accounting treatment in the commercial financial statements in generaldirectly affects the tax position of the company.
This link between accounting and taxation gives Germanmanagers the incentive to manage earnings downwards todelay (or even avoid) tax payments. The situation in France,regarding the linkage between accounting and taxation is
700 GARCIA LARA, GARCIA OSMA AND MORA
# Blackwell Publishing Ltd 2005

similar.4 Lamb et al. (1998) analyse the linkage betweenaccounting and taxation in the US, the UK, France and Ger-many, and they reach the conclusion that the linkage is muchmore pronounced in France and Germany than in the US andthe UK, although differences also exist between France andGermany. Harris et al. (1994) stress the link between taxationand accounting, pointing out that one of the main objectives offinancial statements in Germany is to compute taxable income.Finally, Kasanen et al. (1996) argue that when taxes are closelytied to reported earnings there is a strong incentive to reportlow earnings in general. Although they analyse the Finnishstock market, they state that the situation is similar in, at least,France, Germany and the Scandinavian countries.
(iv) Reduced Incentives to Manage Earnings Upwards
Aside from the previously discussed incentives for incomedecreasing earnings management, the more concentrated own-ership and the lesser importance of capital markets as financingmechanisms in continental European countries is expected toreduce the incentives to engage in income increasing strategies.As earnings are not such an important signalling device, incen-tives for example, to meet or beat analysts’ forecasts will not be
4 In our empirical study we use data from DataStream, which means that we work withconsolidated financial statements. In France, a new law was approved in 1998 allowing(though not obliging) French listed firms to prepare their consolidated accountsfollowing US-GAAP or IASB standards, even if they use the French GAAP to preparetheir individual accounts. This means that from 1999, our argument of the link betweenaccounting and taxation to explain managers’ incentives to manage earnings downwardswould not hold for those firms using US or international standards. However, this onlyaffects a very reduced number of observations and only from 1999 onwards (our samplecovers 1990–2001). In any case, and as Richard (2001, p. 1135) points out, ‘this changecannot be done at once and [. . .] is only an expectation of change’. The situation is alsosimilar in Germany, where a new law was approved in 1998 similar to the one alreadyexplained for the French case, allowing German firms to prepare group accountsaccording to internationally accepted accounting principles (i.e. FASB or IASB)instead of the German group accounting law. Again, the impact in our sample isreduced given that it could only be affecting a reduced number of observations from1999 onwards. In any case, and to avoid the impact that these observations could haveon the results, we replicate the analysis restricting our sample to the time period1990–1998. We find that our results are not sensitive to this change in the sample.
EFFECT OF EARNINGS MANAGEMENT 701
# Blackwell Publishing Ltd 2005

as important as in countries where ownership is widespread andcapital market pressures are more pronounced.5
(v) The Existence of Strong Labour Unions
Another important institutional feature in continental countriesthat could be leading firms to manage earnings downwards isthe existence of strong labour unions, which have substantialrepresentation in the boards of directors. Although there is noempirical evidence, Harris et al. (1994) support the hypothesisthat German firms are hesitant to report high earnings for fearof strengthening the position of labour unions in their negotia-tions with the firm. This argument, however, should be takencautiously, as there is somewhat mixed evidence of incomedecreasing earnings management driven by the presence ofstrong labour unions (Liberty and Zimmerman, 1986; andDeAngelo and DeAngelo, 1991).
Supporting our arguments of differences in earnings man-agement across countries, a recent study conducted by Leuzet al. (2003) builds an aggregate earnings management meas-ure, and compares it across a comprehensive sample of coun-tries, including the UK, France and Germany. They find thatearnings management practices differ significantly across coun-tries, and that the divergences are linked to the different insti-tutional environments in each country. Their evidence suggeststhat countries with less dispersed ownership structure and weakinvestor rights (e.g. Germany) engage more in earnings man-agement, even if there is strong legal enforcement. They argueexplicitly that:
earnings management is more pervasive in countries where the legal pro-tection of outside investors is weak, because in these countries insidersenjoy greater private control benefits and hence have stronger incentivesto obfuscate firm performance (Leuz et al., 2003, p. 507).
5 There could be incentives to engage in income increasing strategies, especially in theUK, around corporate events such as mergers, IPOs or SEOs (Friedlan, 1994; Teohet al., 1998; and Rangan, 1998). However, these strategies are probably transitory, andthe analysis of the effect that they could have on earnings conservatism is beyond thescope of this study. One could think however, that these strategies would increase thecoefficient on good news around the corporate event, and the coefficient on bad news insubsequent years.
702 GARCIA LARA, GARCIA OSMA AND MORA
# Blackwell Publishing Ltd 2005

Consequently, litigation risk plays an important role in miti-gating earnings management practices. In those countrieswhere shareholders do not have the opportunity to sue man-agers (continental Europe), managers will have more room tomanage earnings. Consistent with this idea, they find thatFrench and German managers are more likely to engage inearnings management practices than their counterparts in theUS and the UK.
Their results are consistent with our hypothesis about theunequal effect that earnings management can have on themeasure of earnings conservatism in the sense that they findGerman and French managers more likely to engage in earn-ings management practices than those in the UK. In their study,Leuz et al. (2003) work with a very broad definition of earningsmanagement, including measures of earnings smoothing usingaccruals and measures of discretion in reported earnings, focus-ing not only on accruals but also on small loss avoidance. In ourpaper, we identify earnings management by measuring discre-tionary accruals. To calculate discretionary accruals we use themodels proposed by Jones (1991), Dechow et al. (1995) andPeasnell et al. (2000a).
In our empirical study we show that earnings management isa key factor enhancing the measures of earnings conservatismin European continental countries. However, and in spite of thefact that it increases the asymmetry, we should not refer to thisphenomenon as earnings conservatism, since it is only attribut-able to earnings management techniques implemented bymanagers to accomplish certain objectives regarding tax pay-ments, the dividend policy of the firm and/or the relation withother third parties like labour unions. These objectives aredifferent from complying with the prudence or conservatismprinciple as stated in the conceptual frameworks (FASB, IASBor ASB), and enhanced (enforced) by a greater development offinancial markets and a more litigious environment.
4. RESEARCH DESIGN
Our empirical tests compare the results of analysing the exist-ence of earnings conservatism in European countries (UK,
EFFECT OF EARNINGS MANAGEMENT 703
# Blackwell Publishing Ltd 2005

France and Germany), before and after taking into account theeffect of earnings management.
For our tests, we use the model proposed by Basu:
Xt ¼ �0 þ �1Dt þ �2Rt þ �3RtDt þ ut ð2Þwhere Xt is earnings before extraordinary items per share(DataStream item 254) deflated by share price at the begin-ning of the period. Rt is the rate of return of the firm,calculated as (Pt�Pt�1)/Pt�1.6 Share prices have beenadjusted for stock splits, new equity issues, etc., Dt is adummy variable that takes the value 1 in the case of badnews (negative or zero rate of return) and 0 in the case ofgood news (positive rate of return). This definition of earn-ings (Xt) is the one used in previous studies and we use it forour first set of tests. Next, and to disentangle the effect ofearnings management from earnings conservatism we build ameasure of ‘unmanaged earnings’. In this specification withunmanaged earnings, X�
t equals earnings before extra-ordinary items per share minus discretionary accruals pershare, deflated by share price at the beginning of the period.In mathematical notation:
X�t ¼ EPSt � DACCPS�
tð Þ=Pt�1 ð3Þwhere DACCPS* is discretionary accruals per share multipliedby lagged total assets.
We define discretionary accruals (DACC) as the predictionerror of the Jones (1991) accruals model. We calculate discre-tionary accruals using a two-stage approach. Firstly, we use thestandard Jones (1991) model as applied cross-sectionally to totalaccruals (TACC). We measure total accruals (TACC) as thechange in non-cash working capital plus depreciation andamortisation.7 We then regress total accruals on the change in
6 In our initial tests we do not include dividends so that our results are consistent withprior European research (Pope and Walker, 1999; Giner and Rees, 2001; Garcıa Laraand Mora, 2004; and Raonic et al., 2004). We replicate all the analyses includingdividends to calculate the rate or return, but our results are not sensitive to this change.7 Thus, TACC¼D(CA�CASH)�D(CL�CBORR)� (DEPþ INT), where CA is totalcurrent assets (DataStream item 376), CASH is total cash and equivalents (DS375), CLis total current liabilities (DS389), CBORR is borrowings repayable within 1 year(DS309), DEP is depreciation (DS402) and INT is amounts written off intangibles(DS562).
704 GARCIA LARA, GARCIA OSMA AND MORA
# Blackwell Publishing Ltd 2005

sales and property, plant and equipment for each DataStreamlevel-3 industry-year, using all available data, but imposing therestriction of at least six observations per industry-year combina-tion. The model is as follows:
TACCt=TAt�1 ¼ �0ð1=TAt�1Þ þ �1ð�REVt=TAt�1Þþ �2ðPPEt=TAt�1Þ þ "t
ð4Þ
where TA is total assets (DataStream item 392), DREV is changein total sales (DataStream item 104) and PPE is gross propertyplant and equipment (DataStream item 330). The DREV andPPE terms control for the non-discretionary component oftotal accruals associated with changes in operating activity andlevel of depreciation. In the second stage, we use these industry-year ordinary least square parameter estimates from equation(4) to partition the TACC into discretionary accruals (DACC)and non-discretionary accruals (NDACC). NDACC are the pre-dicted part of TACC, while DACC are the residual resultingfrom this regression. Therefore:
DACCt ¼ TACCt=TAt�1 � NDACCt
¼ TACCt=TAt�1 � ½�0ð1=TAt�1Þ þ �1ð�REVt=TAt�1Þþ �2ðPPEt=TAt�1Þ�
ð5Þ
where �0, �1 and �2 are the industry-year parameters estimatedin regression (4).8
We perform several robustness checks using alternativeearnings management proxies and model specifications.First, we estimate DACC using the modified Jones model(Dechow et al., 1995), calculating �0, �1 and �2 as in equation(4), but subtracting the change in debtors (DREC)9 fromDREV at the second stage. Second, we use discretionaryworking capital accruals as our earnings management proxy, asprevious research has argued that long-term accruals such asdepreciation are unlikely to be manipulated, and the manipulation
8 We run equation (4) both scaling the intercept and without scaling it. Our results arenot sensitive to these alternative specifications, which is in line with the findings of verylittle differences in the distribution of DACC calculated with or without scaling theintercept reported by Gill de Albornoz and Illueca (2004).9 Change in debtors is calculated DREC¼D(DEB�CDEB), where DEB is trade debtors(DataStream item 287), and CDEB is trade debtors due in more than 1 year (DS288).
EFFECT OF EARNINGS MANAGEMENT 705
# Blackwell Publishing Ltd 2005

of working capital accruals (WCA) is less visible (Beneish, 1998;and Young, 1999). WCA are defined as the change in non-cashworking capital,10 and they are regressed on the change insales for each Datastream level-3 industry-year. As with TACC,we calculate DACC using both the standard Jones (1991) andthe modified Jones (Dechow et al., 1995) models, thereforeobtaining two additional measures of DACC. Third, wecalculate DACC using the cross-sectional ‘margin model’ designedby Peasnell et al. (2000a) as applied to WCA. We regress WCA onCR and REV, where CR is total sales minus the change in totaldebtors (DataStream items 104–D370).11 DACC are calculated asthe residual resulting from this regression following the sameprocedure as before.
We include in our sample all observations available in theDataStream ‘Live’ and ‘Dead’ files for the UK, France andGermany. We exclude financial firms and firms with account-ing periods of more than 380 or less than 350 days. Weexclude firms with missing industry information and industry-year combinations with fewer than 6 observations at each of theDataStream level-3 industrial classification groups. Previous tothe elimination of extreme values, we estimate discretionaryaccruals. For the conservatism models we exclude the twoextreme percentiles of each variable (observed earnings,unmanaged earnings, rate of return, price and lagged price)per country. The final sample that we use to estimate earningsconservatism consists of 10,131 firm-year observations for theUK, 1,367 for France and 3,245 for Germany, for the period1990–2001. This sample size, and descriptive statistics inTable 1 correspond to the conservatism model estimatedusing discretionary accruals obtained from the total accrualsversion of the Jones (1991) model. The sample size variesslightly with the accruals model used.
10 WCA¼D(Total Current Assets�Cash and Cash equivalents)�D(Currentliabilities�Borrowings repayable in one year) [DataStream itemsD(376�375)�D(389�309)].11 Refer to Peasnell et al. (2000a) for a more detailed explanation of the ‘marginmodel’.
706 GARCIA LARA, GARCIA OSMA AND MORA
# Blackwell Publishing Ltd 2005

Table 1 contains sample descriptive statistics.12 Consistentwith the prior literature on earnings management, discretion-ary accruals are on average close to zero. Both the mean and
Table 1
Descriptive Statistics
Country N. Obs Variable Mean Median Std. Dev Min. Max.
UK 10,131 X 0.038 0.066 0.139 �0.968 0.365X* 0.041 0.050 0.200 �1.271 1.173
return 0.055 0.000 0.448 �0.815 2.386dacc 0.001 0.003 0.129 �2.561 2.309ndacc �0.041 �0.043 0.686 �53.480 42.225
France 1,367 X 0.041 0.053 0.095 �0.954 0.363X* 0.036 0.039 0.177 �1.228 1.143
return 0.076 0.025 0.426 �0.803 2.379dacc 0.005 0.005 0.076 �0.526 0.662ndacc �0.051 �0.051 0.046 �0.576 0.241
Germany 3,245 X 0.017 0.035 0.121 �0.934 0.354X* 0.022 0.030 0.289 �1.286 1.190
return 0.021 �0.013 0.348 �0.814 2.362dacc �0.002 �0.002 0.211 �1.649 5.429ndacc �0.050 �0.056 0.169 �1.411 2.791
Notes:X is earnings before extraordinary items per share (DataStream item 254), deflated
by beginning of period share price.X* is earnings before extraordinary items per share (DataStream item 254) minus
discretionary accruals per share; deflated by beginning of period share price.Discretionary accruals is defined as dacc times total assets in t� 1.
return is the rate of return of the firm.dacc is discretionary accruals, calculated as the residual of the standard Jones (1991)
accruals model, as applied to total accruals.ndacc is non discretionary accruals, estimated as the predicted part of the working
capital accruals.
12 From Table 1 we can see that there is at least one extreme value in the UK. Wereplicate our analyses excluding also the 2 (5) top and bottom percentiles, and extremevalues of additional variables not included directly in the Basu (1997) regression, such asdiscretionary and non-discretionary accruals. Results are not sensitive to the exclusion ofthese observations, but we only remove extreme observations for discretionary and non-discretionary accruals when we trim outliers directly from these variables. From thissensitivity test we think it is interesting to point out that there is a number of firms withextreme observations of accruals and discretionary accruals. When we eliminate the topand bottom percentile (of discretionary and non-discretionary accruals) we observe thatthe median discretionary accruals per share multiplied by lagged total assets reducesearnings in France by 17%, in Germany by 7%, and increases earnings in the UK by4%.
EFFECT OF EARNINGS MANAGEMENT 707
# Blackwell Publishing Ltd 2005

median for the three countries under study are close to zero.Consistent with the existence of earnings conservatism, earnings(‘managed’ or ‘unmanaged’) are negatively skewed.13 If wefocus on returns, exactly the opposite occurs. The standarddeviation of earnings (again, ‘managed’ or ‘unmanaged’) issmaller than the standard deviation of returns, consistent withBall et al.’s (2000) argument that net income is a function of pastand present returns.
Figure 1 provides graphical evidence of our empirical expect-ation that the distribution of observed (managed) earningsdiffers severely across the three countries. As predicted, thedistribution of earnings scaled by beginning of period totalassets for Germany and France, shown in Figure 1, Panels Band C reveals a distinct accumulation of observations just abovethe zero earnings reference point (i.e. there is an unusually highnumber of firms reporting ‘small profits’). The impression con-veyed by Figure 1 is that the discontinuity in the earningsdistribution around small earnings is much stronger for Ger-many and France than for the UK, as is the occurrence ofobservations in the region that includes the six intervals imme-diately above zero, showing an accumulation in the area of smallprofits that would be consistent with a certain aversion to bigprofits, as firms reporting big profits seem fairly common in theUK but very rare both in France and Germany.14 This graphicalevidence is consistent with our expectation that the strong linkbetween accounting income to current payouts to employees,managers, shareholders and the government in code-law basedcountries creates additional managerial incentives to manageearnings downwards. Consistent with this idea, the distributionof earnings is less normal in France and Germany, being moreconcentrated in the six intervals just to the right of zero. Figure 2
13 From Table 1 we see that in all 3 countries the median is greater than the mean formanaged and unmanaged earnings. Additionally, we have also calculated a skewnesscoefficient for every country, being negative both for managed and unmanagedearnings in all three countries.14 To a certain degree this evidence could also be consistent with a small loss avoidanceexplanation, that is, with firms using income-increasing measures to move from smalllosses to small profits. However, small loss avoidance does not explain why big profitsare so rare in France and Germany, and recent research by Dechow et al. (2003) andBeaver et al. (2003) questions the extent to which income-increasing accrualmanagement causes this discontinuity in the distribution of earnings just at zeroearnings.
708 GARCIA LARA, GARCIA OSMA AND MORA
# Blackwell Publishing Ltd 2005

Panel A: UK Earnings (scaled by beginning of year total assets) N = 10,131 Class width 0.01
Panel B: Germany Earnings (scaled by beginning of year total assets) N = 3,245 Class width 0.01
Panel C: France Earnings (scaled by beginning of year total assets) N = 1,367 Class width 0.01
0
100
200
300
400
500
600
700
800
900
–0.25 –0.20 –0.15 –0.10 –0.05 0.00 0.05 0.10 0.15 0.20 0.25
–0.25 –0.20 –0.15 –0.10 –0.05 0.00 0.05 0.10 0.15 0.20 0.25
–0.25 –0.20 –0.15 –0.10 –0.05 0.00 0.05 0.10 0.15 0.20 0.25
0
50
100
150
200
250
300
350
400
450
500
0
20
40
60
80
100
120
140
160
180
Figure 1
Histogram of Observed Earnings Levels
EFFECT OF EARNINGS MANAGEMENT 709
# Blackwell Publishing Ltd 2005

Panel A: UK Unmanaged Earnings [(DS625/lagDS392) – dacc] N = 10,131 Class width 0.01
Panel B: Germany Unmanaged Earnings [(DS625/lagDS392) – dacc] N = 3,245 Class width 0.010
Panel C: France Unmanaged Earnings [(DS625/lagDS392) – dacc] N = 1,367 Class width 0.01
0
100
200
300
400
500
600
700
800
900
0
50
100
150
200
250
300
350
400
450
500
0
20
40
60
80
100
120
140
160
180
–0.25 –0.20 –0.15 –0.10 –0.05 0.00 0.05 0.10 0.15 0.20 0.25
–0.25 –0.20 –0.15 –0.10 –0.05 0.00 0.05 0.10 0.15 0.20 0.25
–0.25 –0.20 –0.15 –0.10 –0.05 0.00 0.05 0.10 0.15 0.20 0.25
Figure 2
Histogram of Unmanaged Earnings Levels
710 GARCIA LARA, GARCIA OSMA AND MORA
# Blackwell Publishing Ltd 2005

represents the distribution of unmanaged earnings. It can beclearly observed that the histograms are more similar acrossthe three countries, being in all three cases closer to a normaldistribution.15 This graphical evidence is consistent with differ-ences in discretionary accruals across countries.
5. RESULTS
We first analyse the existence of earnings conservatism in eachcountry using the model proposed by Basu (1997). In Basu’smodel, �3 shows the differential effect of bad news in earningsrelative to good news. In Table 2, Panel A, we see that for allcountries �3 is significantly positive. That is, earnings conserva-tism exists in all countries. Specifically, �3 is 0.24 in the UK, 0.22in Germany, and 0.16 in France. This is consistent with priorliterature. Also, the intercept is significantly positive, showingthe incorporation of prior period good news into contemporaryearnings. The effect of good news in this period (�2) is, asexpected, very small in all cases. The adjusted R2s are consistentalso with those in previous studies, and around 0.12. These lowvalues of the R2s are attributable to the asynchrony betweenaccounting information and share prices (the prices leadingearnings hypothesis; see for example Easton et al., 1992).
Secondly, we re-run the Basu (1997) model, but recalculatingthe dependent variable to disentangle the effect of earningsmanagement. We work with a measure of ‘unmanaged’ earn-ings that we define as observed earnings per share minusdiscretionary accruals times lagged total assets per share,discretionary accruals having been previously calculated as theestimation error of the total accruals variant of the standardJones (1991) accruals model.
In this case, as shown in Panel B in Table 2, the bad newsdifferential coefficient (�3) for the UK remains approximatelythe same. It is 0.21, when it was 0.24 when using observed(managed) earnings. However, in the case of France andGermany, where we expected it to be much smaller, it is nowdown to 0.05 and 0.08 respectively. That is, there is a reduction
15 This evidence is consistent with the graphical evidence reported by Gore et al. (2002)for the UK.
EFFECT OF EARNINGS MANAGEMENT 711
# Blackwell Publishing Ltd 2005

Table 2
Earnings Conservatism by Country (Individual Regressions)
Pooled Regressions Fama and MacBeth (1973) Regressions
�0 �1 �2 �3 �0 �1 �2 �3
t-stat t-stat t-stat t-stat Adj. R2 t-stat t-stat t-stat t-stat Adj. R2
Panel A: Observed EarningsUK 0.07 0.01 0.02 0.24
0.140.07 0.01 0.03 0.24
0.1730.26 1.37 3.65 18.79 15.37 1.12 3.49 8.02
France 0.06 0.00 0.02 0.160.12
0.05 0.01 0.04 0.220.15
15.82 �0.34 2.23 6.52 7.37 0.81 3.14 4.73
Germany 0.04 0.01 0.02 0.220.09
0.04 0.00 0.04 0.200.12
9.98 1.82 1.50 9.21 6.20 0.74 1.95 4.96
Panel B: Unmanaged EarningsUK 0.07 �0.01 0.02 0.21
0.060.07 0.00 0.01 0.21
0.0717.43 0.02 1.78 12.28 9.74 �1.61 0.39 6.50
France 0.05 �0.02 0.03 0.050.02
0.04 0.00 0.05 0.150.05
5.65 �1.64 1.32 1.25 3.06 0.10 1.02 2.27
Germany 0.03 0.00 0.01 0.080.00
0.04 0.00 0.02 0.100.02
3.25 �0.25 0.30 1.60 2.81 �0.47 0.69 2.58
71
2G
AR
CIA
LA
RA
,G
AR
CIA
OS
MA
AN
DM
OR
A
#B
lackw
ellP
ub
lishin
gL
td2
00
5
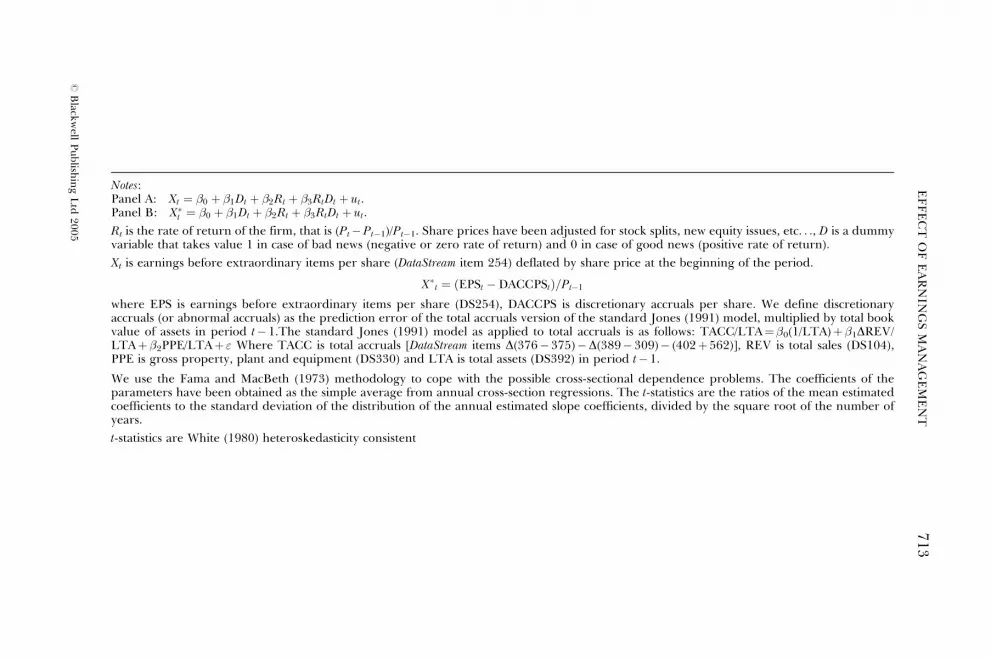
Notes:Panel A: Xt ¼ �0 þ �1Dt þ �2Rt þ �3RtDt þ ut.Panel B: X�
t ¼ �0 þ �1Dt þ �2Rt þ �3RtDt þ ut.
Rt is the rate of return of the firm, that is (Pt�Pt�1)/Pt�1. Share prices have been adjusted for stock splits, new equity issues, etc. . ., D is a dummyvariable that takes value 1 in case of bad news (negative or zero rate of return) and 0 in case of good news (positive rate of return).
Xt is earnings before extraordinary items per share (DataStream item 254) deflated by share price at the beginning of the period.
X�t ¼ ðEPSt � DACCPStÞ=Pt�1
where EPS is earnings before extraordinary items per share (DS254), DACCPS is discretionary accruals per share. We define discretionaryaccruals (or abnormal accruals) as the prediction error of the total accruals version of the standard Jones (1991) model, multiplied by total bookvalue of assets in period t� 1.The standard Jones (1991) model as applied to total accruals is as follows: TACC/LTA¼�0(1/LTA)þ �1DREV/LTAþ �2PPE/LTAþ " Where TACC is total accruals [DataStream items D(376�375)�D(389� 309)� (402þ562)], REV is total sales (DS104),PPE is gross property, plant and equipment (DS330) and LTA is total assets (DS392) in period t� 1.
We use the Fama and MacBeth (1973) methodology to cope with the possible cross-sectional dependence problems. The coefficients of theparameters have been obtained as the simple average from annual cross-section regressions. The t-statistics are the ratios of the mean estimatedcoefficients to the standard deviation of the distribution of the annual estimated slope coefficients, divided by the square root of the number ofyears.
t-statistics are White (1980) heteroskedasticity consistent
EF
FE
CT
OF
EA
RN
ING
SM
AN
AG
EM
EN
T7
13
#B
lackw
ellP
ub
lishin
gL
td2
00
5

in the coefficient of approximately 69% for France and 64% forGermany. The decrease in the �3 coefficient is statistically sig-nificant at a 5% level in the cases of Germany and France, whileit is not significant in the case of the UK.16 The coefficient onthe intercepts remains approximately equal to the original Basumodel estimates in all countries. It is also interesting to note thatthe good news coefficient (�2) becomes not significant aftercontrolling for discretionary accruals. This is not consistentwith a decrease in the association between earnings and returnsin good news periods due to the usage of income decreasingearnings management. This result could be attributable to man-agers using positive discretionary accruals to align earnings andreturns in good news periods (Guay et al., 1996), which couldbe partially offsetting the effect of the negative discretionaryaccruals used for the income decreasing strategies. However,good news captured in earnings through discretionary accrualsis not significant, as we can see in Table 3.
We also use Fama and MacBeth (1973) mean annual regres-sions to discard the possibility of our results being influenced bycross-sectional dependence problems. The results using themean annual regressions are very similar to the ones obtainedwith the pooled regressions.17
It is also interesting to point out the decrease in the R2s in allcountries. This is not surprising, given that we are now using asthe dependent variable a measure of the performance of thecompany closer to cash flows. As previous studies point outaccruals are value relevant (Dechow, 1994; and Ball et al.,2000). When we remove from earnings one part of the accrualsthe reduction on the association is straightforward. Ball et al.(2000, p. 36) when measuring the association between cash flowfrom operations and returns obtain R2s of between 1 and 4 percent, depending on the country. An alternative explanation(see Guay et al., 1996) is that firms manage earnings to improve
16 We estimate the statistical significance of the differences between coefficients in
regressions using observed and unmanaged earnings as �1� �2 divided byffiffiffiffiffiffiffiffiffiffiffiffiffiffiffiffi�2
1 þ �22
q
where �i is the estimated coefficient and �i the standard error for variable i.17 Fama and MacBeth (1973) regressions should be interpreted with caution. Basu(1999) gives a number of reasons against the use of mean annual regressions, relatedmainly to the parameters not being stationary.
714 GARCIA LARA, GARCIA OSMA AND MORA
# Blackwell Publishing Ltd 2005

the relation between earnings and changes in value, andconsequently, that discretionary accruals are relevant. Guayet al. (1996, p. 98) examine also the association between earn-ings (managed and unmanaged) and returns in the US and findthat the R2 decreases from 9 per cent to between 7 and 1 percent, depending on the model used to estimate discretionaryaccruals. Our results are consistent with those in both Guayet al. (1996) and Ball et al. (2000).
As expected, and consistent with our results in Table 2, wefind that discretionary accruals exhibit an asymmetric associ-ation with returns. In Table 3 we show the results of a regressionof discretionary accruals on returns. The �3 coefficient, whichshows the differential recognition speed of bad news throughdiscretionary accruals, is in all three countries significantlypositive. However, the recognition of good news through dis-cretionary accruals, captured by �2, is not significant.
Table 3
Individual Regressions of Discretionary Accruals on Returns by Country
Pooled Regressions
�0 �1 �2 �3
Discretionary Accruals t-stat t-stat t-stat t-stat Adj. R2
UK �0.01 0.01 �0.00 0.040.001�1.40 1.83 �0.08 2.63
France 0.00 0.02 �0.01 0.110.006
0.37 1.52 �0.28 3.02
Germany �0.01 0.01 0.01 0.110.004�1.04 0.48 0.50 2.42
Notes:
DACCPSt ¼ �0 þ �1Dt þ �2Rt þ �3RtDt þ utRt is the rate of return of the firm, that is (Pt�Pt�1)/Pt�1. Share prices have been adjustedfor stock splits, new equity issues, etc. . ., D is a dummy variable that takes value 1 in case ofbad news (negative or zero rate of return) and 0 in case of good news (positive rate ofreturn).
DACCPSt is discretionary accruals per share. We define discretionary accruals (or abnor-mal accruals) as the prediction error of the total accruals version of the standard Jones(1991) model, multiplied by total book value of assets in period t�1.The standard Jones(1991) model as applied to total accruals is as follows: TACC/LTA¼�0(1/LTA)þ �1DREV/LTAþ �2PPE/LTAþ " Where TACC is total accruals [DataStream itemsD(376�375)�D(389�309)� (402þ 562)], REV is total sales (DS104), PPE is gross prop-erty, plant and equipment (DS330) and LTA is total assets (DS392) in period t�1.
t-statistics are White (1980) heteroskedasticity consistent.
EFFECT OF EARNINGS MANAGEMENT 715
# Blackwell Publishing Ltd 2005

Finally, we analyse whether the differences that arise betweencountries once we incorporate discretionary accruals are signifi-cant. To do that we run the previous regressions, but instead ofrunning one regression per country, we use just one model forall countries, incorporating the differential effect of each coun-try using dummy variables. We use the UK as a referencecountry given that it is a priori, and also consistent with resultsin Table 2 Panel B, the most different of the three countriesunder study.
If we focus on Table 4, Panel A, we see that differences existonly between the UK and France when using observed (‘man-aged’) earnings. However, when we remove discretionaryaccruals from earnings, the differences between countries aremuch more noticeable (Table 4, Panel B). The incremental badnews coefficient in France (Germany) with respect to the UK is�0.15 (�0.13), significant at 5%. With respect to good news,there are no differences in the coefficient between countriesregardless of whether we use observed or unmanaged earnings.
The results of this pooled country model could be biased aswe make the strong assumption that the variance of the disturb-ance term in all 3 countries is equal. To avoid this problem andcompare the three countries without making this assumption wetest the differences in the coefficients across countries in thesame way as we test the significance of the decrease in the badnews coefficient from managed to unmanaged earnings (seefootnote 16). This analysis confirms the results obtained withthe pooled country and dummy variables regression.
To test whether our results are sensitive to the model used tocalculate discretionary accruals we replicate the analysis usingthe following additional accruals models: the Jones (1991) work-ing capital accruals model, the Modified Jones (Dechow et al.1995) working capital accruals and total accruals models, andthe margin model proposed by Peasnell et al. (2000a). Resultsare similar to those obtained with the Jones (1991) total accrualsmodel, although the decreases in the �3 (conservatism coeffi-cient) are more pronounced when we use total accruals models.
Figure 3 compares the decrease in the earnings conservatismmeasure (percentage change in �3 coefficient from usingobserved earnings to using unmanaged earnings) in all 3 coun-tries and across all accruals models. It can be observed that the
716 GARCIA LARA, GARCIA OSMA AND MORA
# Blackwell Publishing Ltd 2005
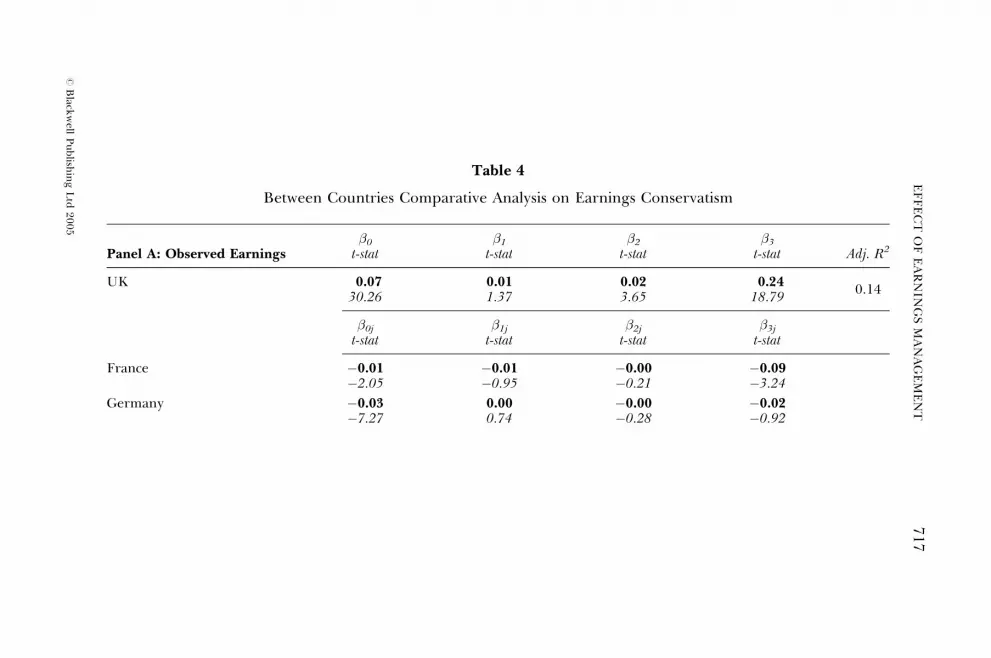
Table 4
Between Countries Comparative Analysis on Earnings Conservatism
�0 �1 �2 �3
Panel A: Observed Earnings t-stat t-stat t-stat t-stat Adj. R2
UK 0.07 0.01 0.02 0.240.14
30.26 1.37 3.65 18.79
�0j �1j �2j �3j
t-stat t-stat t-stat t-stat
France �0.01 �0.01 �0.00 �0.09�2.05 �0.95 �0.21 �3.24
Germany �0.03 0.00 �0.00 �0.02�7.27 0.74 �0.28 �0.92
EF
FE
CT
OF
EA
RN
ING
SM
AN
AG
EM
EN
T7
17
#B
lackw
ellP
ub
lishin
gL
td2
00
5

Table 4 (Continued)
�0 �1 �2 �3
Panel B:UnmanagedEarnings t-stat t-stat t-stat t-stat Adj. R2
UK 0.07 �0.01 0.02 0.210.04
17.43 0.02 1.78 12.28
�0j �1j �2j �3j
t-stat t-stat t-stat t-stat
France �0.02 �0.02 0.01 �0.15�1.96 �1.20 0.37 �3.43
Germany �0.04 0.00 �0.01 �0.13
�3.62 0.11 �0.32 �2.57
Notes:Panel A: Xt ¼ �0 þ �j �0jCDj þ �1RDt þ �j �1jCDjRDt þ �2Rt þ �j �2jCDjRt þ �3RtRDt þ �j �3jRtCDjRDt þ ut
Panel B: X�t ¼ �0 þ �j �0jCDj þ �1RDt þ �j �1jCDjRDt þ �2Rt þ �j �2jCDjRt þ �3RtRDt þ �j �3jRtCDjRDt þ ut
Rt is the rate of return of the firm, that is (Pt�Pt�1)/Pt�1. Share prices have been adjusted for stock splits, new equity issues,etc. . ., D is a dummy variable that takes value 1 in case of bad news (negative or zero rate of return) and 0 in case of good news(positive rate of return). CD is a country dummy that takes value 1 in the case of France and Germany, and value 0 otherwise.Xt is earnings before extraordinary items per share (DataStream item 254) deflated by share price at the beginning of theperiod. X�
t ¼ ðEPSt � DACCPStÞ=Pt�1 where EPS is earnings before extraordinary items per share (DS254) DACCPS isdiscretionary accruals per share. We define discretionary accruals (or abnormal accruals) as the prediction error of the totalaccruals version of the standard Jones (1991) model, multiplied by total book value of assets in period t�1. The standardJones (1991) model as applied to total accruals is as follows: TACC/LTA¼�0(1/LTA)þ �1DREV/LTAþ�2PPE/LTAþ ". WhereTACC is total accruals [DataStream items D(376� 375)�D(389�309)� (402þ 562)], REV is total sales (DS104), PPE is grossproperty, plant and equipment (DS330) and LTA is total assets (DS392) in period t�1.t-statistics are White (1980) heteroskedasticity consistent.
71
8G
AR
CIA
LA
RA
,G
AR
CIA
OS
MA
AN
DM
OR
A
#B
lackw
ellP
ub
lishin
gL
td2
00
5

consistent decrease in the coefficient in France and Germany(which is significant at a 5% level in all models with the except-ion of the margin model proposed by Peasnell et al., 2000a),while in the UK, although the decrease exists, it is not so notice-able (it is only statistically significant at a 10% level when usingthe modified Jones total accruals model).
Pope and Walker (1999) analyse differences in earningsconservatism between the US and the UK. They show thatwhen using earnings before extraordinary items, the US showsa much more pronounced conservatism bias than the UK. How-ever, when they use bottom line earnings, that is, earnings afterextraordinary items, they find that the level of earnings conser-vatism in both countries is very similar. This result suggests thatwhen analysing earnings conservatism between countries,researchers should also consider the treatment given to extra-ordinary items. To avoid the distorting effect of a different
90%
80%
70%
60%
50%
40%
30%
20%
10%
0%Jwca Jta MJwca MJta PPY
Accrual Model
France
Germany
Uk
Figure 3
Decrease in Differential Bad News Effect from Observed (Managed) toUnmanaged Earnings
Notes:Percentage change in �3 from Panel A (with observed earnings) to Panel B (withunmanaged earnings), from Table 2, using the following models to calculate DACC:Jwca: Jones (1991) model, working capital accruals.Jta: Jones (1991) model, total accruals.MJwca: Modified Jones (Dechow et al. 1995), working capital accruals.MJta: Modified Jones (Dechow et al. 1995), total accruals.PPY: Peasnell, Pope and Young (2000a). (Margin model.)
EFFECT OF EARNINGS MANAGEMENT 719
# Blackwell Publishing Ltd 2005

classification of good and bad news within financial statementsacross countries (the possibility of news, especially bad news,being classified as extraordinary or exceptional items) we repli-cate all our analyses using earnings after extraordinary items.18
These results (see summary in Figure 4) are very similar tothose obtained using earnings before extraordinary items.
Finally, and to control for within country factors (a differentsample composition in each country, and whether this could affectthe results), we split the sample into 3 sub-samples according tosize (total assets) and another 3 according to growth (percentagechange in sales: [salest� salest�1]/salest�1). We find similar
90%
80%
70%
60%
50%
40%
30%
20%
10%
0%
–10% Jwca Jta MJwca MJta PPY
Accrual Model
France
Germany
Uk
Figure 4
Decrease in Differential Bad News Effect from Observed (Managed) toUnmanaged Earnings (Using Earnings After Extraordinary Items)
Notes:Percentage change in �3 from Panel A (with observed earnings) to Panel B (withunmanaged earnings), from regressions in Table 2, but using earnings afterextraordinary items (DataStream item 254þ [DataStream item 193/number of shares]).Number of shares is DS625/DS254. Using the following models to calculate the DACC:Jwca: Jones (1991) model, working capital accruals.Jta: Jones (1991) model, total accruals.MJwca: Modified Jones (Dechow et al. 1995), working capital accruals.MJta: Modified Jones (Dechow et al. 1995), total accruals.PPY: Peasnell, Pope and Young (2000a). (Margin model.)
18 We also control for the differences in the definitions of extraordinary/exceptionalitems introduced by FRS3 in the United Kingdom.
720 GARCIA LARA, GARCIA OSMA AND MORA
# Blackwell Publishing Ltd 2005

decreases in the conservatism coefficient after controlling for dis-cretionary accruals in the three size sub-samples (see Table 5). Inaddition, we find that, consistent with prior literature, earningsconservatism for continental countries is more pronounced forsmall firms when using observed earnings. However, when wecontrol for discretionary accruals these a priori surprising resultsare not clear, and it appears that large firms are more conserva-tive, as one should expect given that they should be more similarto common-law type firms. With respect to growth, results acrossthe different growth sub-samples are consistent with our overallresults.19
Our overall results indicate a decrease in the differentialearnings response to bad news with respect to good newswhen using earnings minus discretionary accruals. Thisdecrease is more pronounced in France and Germany than inthe UK, and differences between the UK with respect to Franceand Germany in earnings conservatism become significant aftercontrolling for discretionary accruals.
6. SUMMARY AND CONCLUSIONS
We show that in certain institutional contexts (weaker investorprotection and less dispersed ownership structure), earningsmanagement drives significantly the measures of earnings con-servatism. Our results show that while earnings conservatismdoes not change significantly in the UK after removing theeffect of discretionary accruals, in the cases of France and Ger-many the typical measure of earnings conservatism (the incre-mental bad news effect, in a regression of earnings on returns)suffers a significant reduction.
Our findings explain why in previous studies the measures ofearnings conservatism in European continental countries weretoo large and too similar to those in the UK. We argue thatmanagers in European continental countries have incentives tomanage earnings downwards, and that this behaviour is likely toaffect seriously the results of accounting research in Europe.The effects we document on earnings conservatism are just an
19 These results are not disclosed, but are available from the authors on request.
EFFECT OF EARNINGS MANAGEMENT 721
# Blackwell Publishing Ltd 2005

Table 5
Earnings Conservatism by Country (Sensitivity Analysis by Size)
Small Firms Medium Firms Large Firms
�0 �1 �2 �3 �0 �1 �2 �3 �0 �1 �2 �3t-stat t-stat t-stat t-stat Adj. R2 t-stat t-stat t-stat t-stat Adj. R2 t-stat t-stat t-stat t-stat Adj. R2
Panel A: Observed EarningsUK 0.06 �0.01 0.01 0.24
0.130.07 0.01 0.03 0.22
0.150.07 0.01 0.02 0.23
0.1510.64 �1.21 1.38 10.67 19.14 2.22 4.45 10.69 28.30 2.38 2.48 9.49
France 0.05 0.01 0.03 0.160.17
0.06 �0.01 0.01 0.150.10
0.06 �0.02 �0.00 0.140.08
7.17 0.94 2.75 4.46 10.56 �0.79 0.49 3.54 11.74 �1.18 �0.36 3.15
Germany 0.03 0.00 0.00 0.250.11
0.04 0.01 0.02 0.200.08
0.04 0.02 0.02 0.190.08
5.13 0.09 0.22 6.40 4.37 0.80 0.89 4.94 8.30 2.42 1.58 3.75
Panel B: Unmanaged EarningsUK 0.06 �0.02 0.02 0.18
0.060.07 �0.00 0.02 0.19
0.050.08 0.01 0.03 0.22
0.066.95 �1.91 1.03 6.62 9.52 �0.40 0.99 6.58 14.22 1.51 1.97 6.39
France 0.04 �0.01 0.07 0.020.06
0.07 �0.02 0.04 0.050.02
0.06 �0.05 �0.06 0.120.01
2.88 �0.25 3.17 0.32 3.60 �0.82 0.89 0.50 3.67 �1.93 �1.91 1.57
Germany 0.01 0.02 0.01 0.06 �0.000.04 �0.03 �0.02 0.08
0.000.04 0.00 0.03 0.13
0.010.75 0.88 0.31 0.80 2.29 �0.96 �0.42 0.84 2.37 0.11 0.71 1.43
72
2G
AR
CIA
LA
RA
,G
AR
CIA
OS
MA
AN
DM
OR
A
#B
lackw
ellP
ub
lishin
gL
td2
00
5

Notes:Panel A: Xt ¼ �0 þ �1Dt þ �2Rt þ �3RtDt þ utPanel B: X�
t ¼ �0 þ �1Dt þ �2Rt þ �3RtDt þ ut
Rt is the rate of return of the firm, that is (Pt�Pt�1)/Pt�1. Share prices have been adjusted for stock splits, new equity issues, etc . . . , D is a dummyvariable that takes value 1 in case of bad news (negative or zero rate of return) and 0 in case of good news (positive rate of return).Xt is earnings before extraordinary items per share (DataStream item 254) deflated by share price at the beginning of the period.
X�t ¼ ðEPSt � DACCPStÞ=Pt�1
where EPS is earnings before extraordinary items per share (DS254) DACCPS is discretionary accruals per share. We define discretionary accruals(or abnormal accruals) as the prediction error of the total accruals version of the standard Jones (1991) model, multiplied by total book value of assetsin period t�1.The standard Jones (1991) model as applied to total accruals is as follows: TACC/LTA¼ �0(1/LTA)þ�1DREV/LTAþ�2PPE/LTAþ "Where TACC is total accruals [DataStream items D(376�375)�D(389�309)� (402þ562)], REV is total sales (DS104), PPE is gross property, plantand equipment (DS330) and LTA is total assets (DS392) in period t� 1.
t-statistics are White (1980) heteroskedasticity consistent.
Number of observations per size group: Small: UK (3,377), France (455); Germany (1,081)Medium and Large: UK (3,377), France (456), Germany (1,082).
EF
FE
CT
OF
EA
RN
ING
SM
AN
AG
EM
EN
T7
23
#B
lackw
ellP
ub
lishin
gL
td2
00
5

example (the understatement of earnings could be affectingvaluation models using earnings numbers, valuation using mul-tiples, the earnings response coefficient in association models,etc. . .), and further investigation in this area should be pursued,especially at a time when the European Commission has set upcomparability in accounting information as one of the mainobjectives regulators should seek in Europe. These differencesalso raise questions as to whether standardisation is enough toachieve comparability without harmonisation of incentives.
REFERENCES
Ball, R., S.P. Kothari and A. Robin (2000), ‘The Effect of InternationalInstitutional Factors on Properties of Accounting Earnings’, Journal ofAccounting and Economics, Vol. 29 (February), pp. 1–51.
Basu, S. (1997), ‘The Conservatism Principle and the Asymmetric Timelinessof Earnings’, Journal of Accounting and Economics, Vol. 24 (December),pp. 3–37.
——— (1999), ‘Discussion of International Differences in the Timeliness,Conservatism and Classification of Earnings’, Journal of AccountingResearch, Vol. 37 (Supplement), pp. 89–99.
Beaver, W.H., M.F. McNichols and K.K. Nelson (2003), ‘An AlternativeInterpretation of the Discontinuity in Earnings Distributions’, WorkingPaper (Stanford University).
Beneish, M.D. (1998), ‘Discussion of ‘Are Accruals During Initial PublicOffering Opportunistic?’’, Review of Accounting Studies, Vol. 3, No. 1,pp. 209–21.
DeAngelo, H. and L. DeAngelo (1991), ‘Union Negotiations and CorporatePolicy: A Study of Labor Concessions in the Domestic Steel IndustryDuring the 1980s’, Journal of Financial Economics, Vol. 30 (November),pp. 3–43.
Dechow, P.M. (1994), ‘Accounting Earnings and Cash Flows as Measuresof Firm Performance: The Role of Accounting Accruals’, Journal ofAccounting and Economics, Vol. 18 (July), pp. 3–42.
——— S.A. Richardson and I. Tuna (2003), ‘Why are Earnings Kinky? AnExamination of the Earnings Management Explanation’, Review ofAccounting Studies, Vol. 8 (June/September), pp. 355–84.
——— and D.J. Skinner (2000), ‘Earnings Management: Reconciling theViews of Accounting Academics, Practitioners and Regulators’, AccountingHorizons, Vol. 14 (June), pp. 235–50.
——— R.G. Sloan and A.P. Sweeney (1995), ‘Detecting EarningsManagement’, The Accounting Review, Vol. 70 (April), pp. 193–225.
Easton, P.D., T.S Harris and J.A. Ohlson (1992), ‘Aggregate AccountingEarnings Can Explain Most of Security Returns’, Journal of Accountingand Economics, Vol. 15 (June/September), pp. 119–42.
724 GARCIA LARA, GARCIA OSMA AND MORA
# Blackwell Publishing Ltd 2005

Ehrhardt, O. and M. Schmidt (2003), ‘Managerial Discretion in Internal Finance: ATest of Pecking Order and Accruals Management Under German Corporateand Accounting Regulation’, Working Paper (Humboldt-University Berlin).
Fama, E. and K. French (2002), ‘Testing Tradeoff and Pecking OrderPredictions About Dividends and Debt’, Review of Financial Studies, Vol.15 (Spring), pp. 1–33.
——— and J. MacBeth (1973), ‘Risk, Return, and Equilibrium: EmpiricalTests’, Journal of Political Economy, Vol. 81 (May/June), pp. 607–36.
Feltham, G. and J.A. Ohlson (1995), ‘Valuation and Clean Surplus Accountingfor Operating and Financial Activities’, Contemporary Accounting Research,Vol. 11 (Spring), pp. 689–732.
Financial Accounting Standards Board (1980), Statement of Financial AccountingConcepts No. 2, Qualitative Characteristics of Accounting Information (Norwalk,Connecticut).
Friedlan, J.M. (1994), ‘Accounting Choices of Issuers of Initial PublicOfferings’, Contemporary Accounting Research, Vol. 11 (Summer), pp. 1–34.
Garcıa Lara, J.M. and A. Mora (2004), ‘Balance Sheet versus EarningsConservatism in Europe’,TheEuropeanAccountingReview, Vol. 13, pp. 261–92.
Gill de Albornoz Noguer, B. and M. Illueca Munoz (2004), ‘ComparingAbnormal Accruals Models: A Non-parametric Approach’, AppliedEconomics, Vol. 36, No. 13, pp. 1455–60.
Giner, B. and W. Rees (2001), ‘On the Asymmetric Recognition of Good and BadNews in France, Germany and the United Kingdom’, Journal of Business,Finance & Accounting, Vol. 28 (November/December), pp. 1285–331.
Givoly, D. and C. Hayn (2000), ‘The Changing Time-series Properties of Earnings,Cash Flows and Accruals: Has Financial Reporting Become More Conser-vative?’, Journal of Accounting and Economics, Vol. 29 (June), pp. 287–320.
Gore, P., P.F. Pope and A.K. Singh (2002), ‘Earnings Management and theDistribution of Earnings Relative to Targets: U.K. Evidence’, WorkingPaper (Lancaster University).
Guay, W.R., S.P. Kothari and R.L. Watts (1996), ‘A Market Based Evaluationof Discretionary Accruals Models’, Journal of Accounting Research, Vol. 34(Supplement), pp. 83–105.
Harris, T.S., M. Lang and P. Moller (1994), ‘The Value Relevance of GermanAccounting Measures: An Empirical Analysis’, Journal of AccountingResearch, Vol. 32 (Autumn), pp. 187–209.
Healy, P.M. and J.M. Wahlen (1999), ‘A Review of the Earnings ManagementLiterature and its Implications for Standard Setters’, Accounting Horizons,Vol. 13 (December), pp. 365–83.
International Accounting Standards Committee (1989), Framework for thePreparation and Presentation of Financial Statements (London).
Jensen, M. and W. Meckling (1976), ‘Theory of the Firm: ManagerialBehaviour, Agency Costs and Ownership Structure’, Journal of FinancialEconomics, Vol. 3 (October), pp. 305–60.
Jones, J.J. (1991), ‘Earnings Management During Import Relief Invest-igations’, Journal of Accounting Research, Vol. 29 (Autumn), pp. 193–228.
Joos, P. (1997), ‘The Stock Market Valuation of Earnings and Book ValueAcross International Accounting Systems,’ Doctoral Thesis (UMI).
——— and M. Lang (1994), ‘The Effects of Accounting Diversity: Evidencefrom the European Union’, Journal of Accounting Research, Vol. 32(Supplement), pp. 141–\68.
EFFECT OF EARNINGS MANAGEMENT 725
# Blackwell Publishing Ltd 2005
Kasanen, E., J. Kinnunen and J. Niskanen (1996), ‘Dividend-based EarningsManagement: Empirical Evidence from Finland’, Journal of Accounting andEconomics, Vol. 22 (August-December), pp. 283–312.
La Porta, R., F. Lopez-de-Silanes, A. Shleifer and R.W. Vishny (2000), ‘AgencyProblems and Dividend Policies Around the World’, The Journal ofFinance, Vol. 55 (February), pp. 1–33.
Lamb, M., C.W. Nobes and A. Roberts (1998), ‘International Variations in theConnections Between Tax and Financial Reporting’, Accounting andBusiness Research, Vol. 28 (Summer), pp. 173–88.
Leuz, C., D. Nanda and P.D. Wysocki (2003), ‘Earnings Management andInvestor Protection: An International Comparison’, Journal of FinancialEconomics, Vol. 69 (September), pp. 505–27.
Liberty, S.E. and J.L. Zimmerman (1986), ‘Labor Union Contract Negotia-tions and Accounting Choices’, The Accounting Review, Vol. 61 (October),pp. 692–712.
Myers, S.C. (1984), ‘The Capital Structure Puzzle’, The Journal of Finance, Vol. 39(July), pp. 575–92.
——— and N. Majluf (1984), ‘Corporate Financing and Investment DecisionsWhen Firms Have Information Investors Do Not Have’, Journal ofFinancial Economics, Vol. 13 (June), pp. 187–221.
Peasnell, K.V., P.F. Pope and S. Young (2000a), ‘Detecting Earnings Manage-ment Using Cross-sectional Abnormal Accruals Models’, Accounting andBusiness Research, Vol. 30 (Autumn), pp. 313–26.
——— ——— ——— (2000b), ‘Accrual Management to Meet Earnings Tar-gets: UK Evidence Pre- and Post- Cadbury’, British Accounting Review, Vol.32 (December), pp. 415–45.
Pope, P.F. and M. Walker (1999), ‘International Differences in the Timeliness,Conservatism and Classification of Earnings’, Journal of AccountingResearch, Vol. 37 (Supplement), pp. 53–87.
——— ——— (2003), ‘Ex-ante and Ex-post Accounting Conservatism, AssetRecognition and Asymmetric Earnings Timeliness’, Working Paper (Lan-caster University and University of Manchester).
Rangan, S. (1998), ‘Earnings Management and the Performance of SeasonedEquity Offerings’, Journal of FinancialEconomics, Vol. 50 (October), pp. 101–22.
Raonic, I., S.J. Mcleay and I. Asimakopoulos (2004), ‘The Timeliness ofIncome Recognition by European Companies: An Analysis of Institu-tional and Market Complexity’, Journal of Business Finance & Accounting,Vol. 31 (January), pp. 115–48.
Richard, J. (2001), ‘France. Group Accounts’, in D. Ordelheide (ed.),Transnational Accounting (2nd ed., Palgrave Publishers).
Seckler, G. (1998), ‘Germany’, in A. Alexander and S. Archer (eds.), EuropeanAccounting Guide (3rd ed., Harcourt Brace).
Teoh, S.H., I. Welch and T.J. Wong (1998), ‘Earnings Management and theUnderperformance of Seasoned Equity Offerings’, Journal of FinancialEconomics, Vol. 50 (October), pp. 63–99.
White, H. (1980), ‘A Heteroskedasticity-consistent Covariance MatrixEstimator and a Direct Test for Heteroskedasticity’, Econometrica, Vol. 48(May), pp. 817–38.
Young, S. (1999), ‘Systematic Measurement Error in the Estimation of DiscretionaryAccruals: An Evaluation of Alternative Modelling Procedures’, Journal ofBusiness Finance & Accounting, Vol. 26 (September/October), pp. 833–62.
726 GARCIA LARA, GARCIA OSMA AND MORA
# Blackwell Publishing Ltd 2005