2021-q4 earnings presentation
TRANSCRIPT

February 16, 2022
INVESTOR PRESENTATION
This document includes estimates, projections, and statements relating to our plans, commitments, objectives, andexpectations that are "forward-looking statements" within the meaning of the Private Securities Litigation Reform Act of 1995,Section 27A of the Securities Act of 1933, and Section 21E of the Securities Exchange Act of 1934.
These statements include, but are not limited to, statements regarding the anticipated consummation of the acquisition ofHEYDUDE and the timing and benefits thereof, Crocs' strategy, plans, objectives, expectations (financial or otherwise) andintentions, future financial results and growth potential, statements regarding full year and first quarter 2022 financial outlookand future profitability, cash flows, and brand strength, anticipated product portfolio and our ability to create and delivershareholder value. These statements involve known and unknown risks, uncertainties and other factors, which may cause ouractual results, performance or achievements to be materially different from any future results, performances, or achievementsexpressed or implied by the forward-looking statements. These risks and uncertainties include, but are not limited to, thefollowing: risks related to Crocs' ability to complete the HEYDUDE transaction on the proposed terms and schedule or at all;risks associated with acquisitions, such as the risk that the business will not be integrated successfully, that such integrationmay be more difficult, time-consuming, or costly than expected or that the expected benefits of the transaction will not occur;risks related to future opportunities and plans for HEYDUDE and its products, including uncertainty of the expected financialperformance of HEYDUDE and its products; the COVID-19 pandemic and related government, private sector, and individualconsumer responsive actions; current global financial conditions, including economic impacts resulting from the COVID-19pandemic; the effect of competition in our industry; our ability to effectively manage our future growth or declines in revenues;changing consumer preferences; our ability to maintain and expand revenues and gross margin; our ability to accuratelyforecast consumer demand for our products; our ability to successfully implement our strategic plans; our ability to develop andsell new products; our ability to obtain and protect intellectual property rights; the effect of potential adverse currency exchangerate fluctuations and other international operating risks and other factors described in our most recent Annual Report on Form10-K under the heading "Risk Factors" and our subsequent filings with the Securities and Exchange Commission. Readers areencouraged to review that section and all other disclosures appearing in our filings with the Securities and ExchangeCommission.
All information in this document speaks as of February 16, 2022. We do not undertake any obligation to update publicly anyforward-looking statements, whether as a result of the receipt of new information, future events, or otherwise, except asrequired by applicable law.
2
FOR
WA
RD
-LO
OK
ING
S
TAT
EM
EN
T
CO
NT
EN
T
• Our Vision & Values
• 2021 Update
• Crocs Growth Framework
• HEYDUDE Acquisition Update
• Financial Results & Outlook
• Appendix3
4
OUR VISION
Everyone comfortable in their own shoes
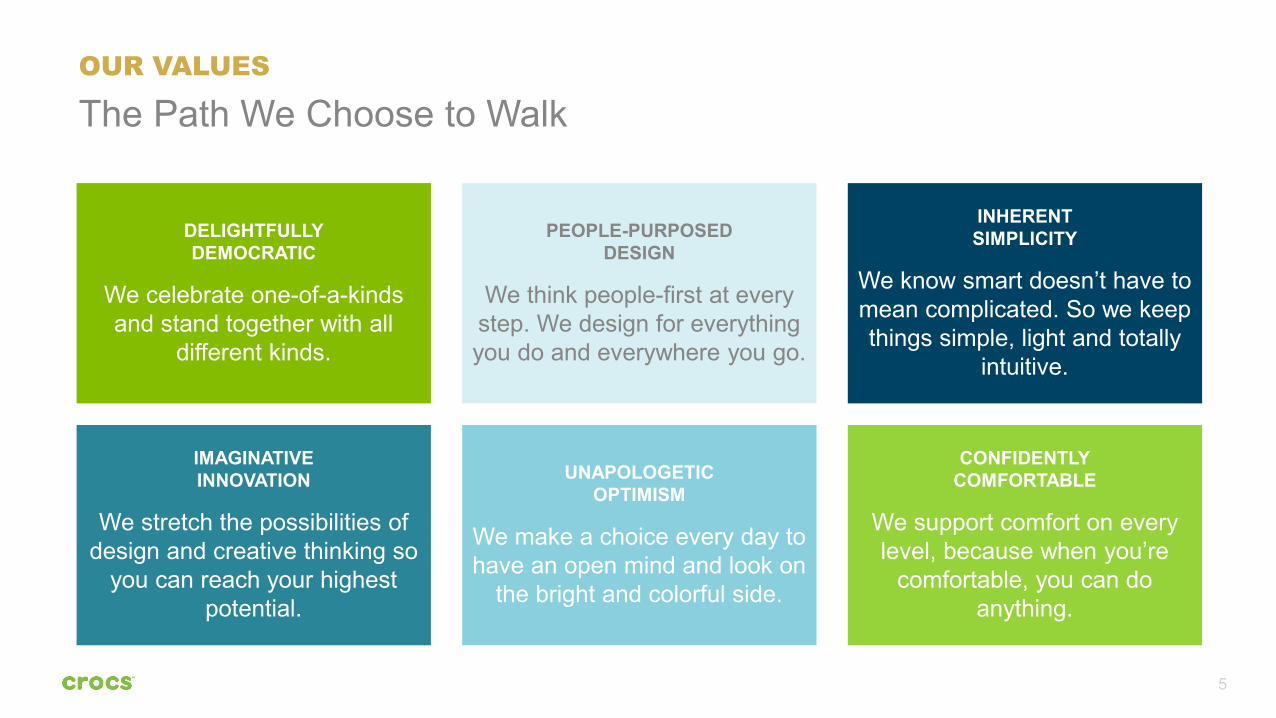
DELIGHTFULLYDEMOCRATIC
We celebrate one-of-a-kinds and stand together with all
different kinds.
PEOPLE-PURPOSEDDESIGN
We think people-first at every step. We design for everything you do and everywhere you go.
INHERENTSIMPLICITY
We know smart doesn’t have to mean complicated. So we keep things simple, light and totally
intuitive.
IMAGINATIVEINNOVATION
We stretch the possibilities of design and creative thinking so
you can reach your highest potential.
UNAPOLOGETICOPTIMISM
We make a choice every day to have an open mind and look on
the bright and colorful side.
CONFIDENTLYCOMFORTABLE
We support comfort on every level, because when you’re
comfortable, you can do anything.
5
OUR VALUES
The Path We Choose to Walk
A strong 2021 holiday season completed a very successful
year for our brand. We achieved incredible results with
record revenues of $2.3 billion, 67% revenue growth and
industry-leading 30% operating margin. Our fourth straight
year of revenue growth was fueled by continued strong
consumer demand for the Crocs brand globally. We are
excited about our sustainable growth trajectory for both the
Crocs and HEYDUDE brands and are confident in our plan
to grow to $6 billion in revenues by 2026.”
– Andrew Rees, CEO
“
6
QU
AR
TE
RLY
HIG
HLI
GH
TS
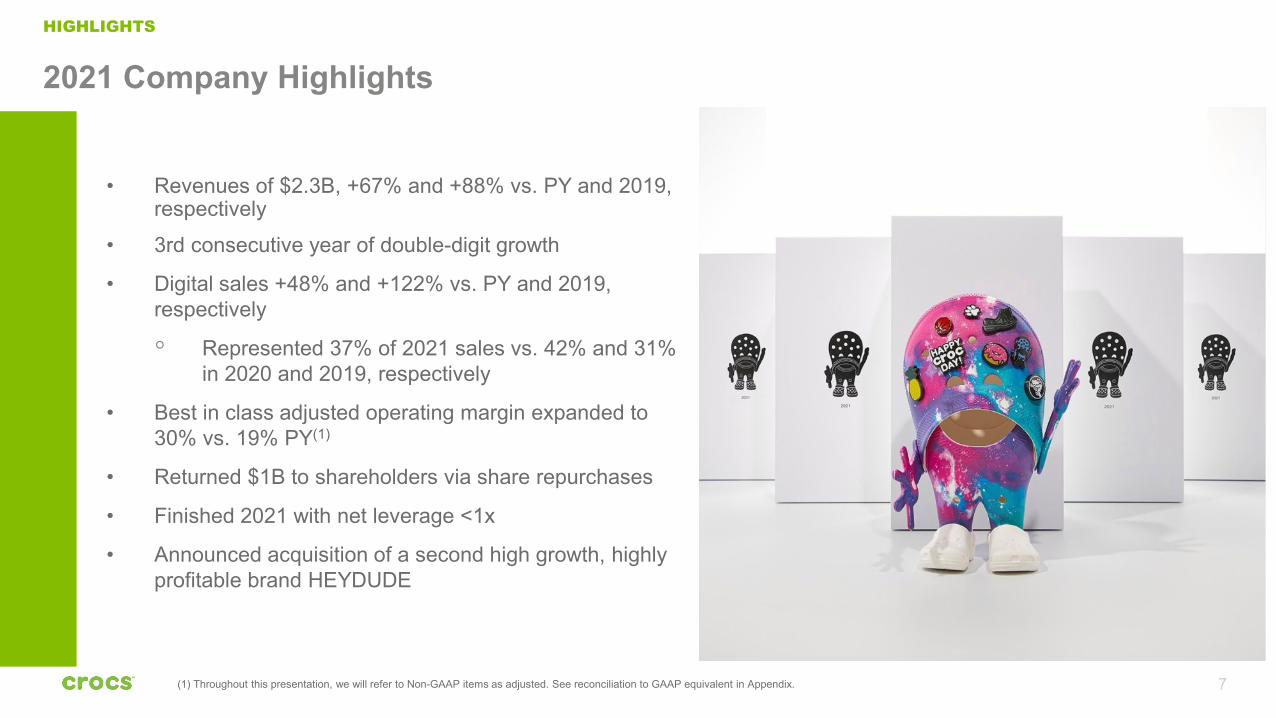
2021 Company Highlights
7
HIGHLIGHTS
• Revenues of $2.3B, +67% and +88% vs. PY and 2019, respectively
• 3rd consecutive year of double-digit growth
• Digital sales +48% and +122% vs. PY and 2019, respectively
◦ Represented 37% of 2021 sales vs. 42% and 31% in 2020 and 2019, respectively
• Best in class adjusted operating margin expanded to 30% vs. 19% PY(1)
• Returned $1B to shareholders via share repurchases
• Finished 2021 with net leverage <1x
• Announced acquisition of a second high growth, highly profitable brand HEYDUDE
(1) Throughout this presentation, we will refer to Non-GAAP items as adjusted. See reconciliation to GAAP equivalent in Appendix.

2021 Update
8
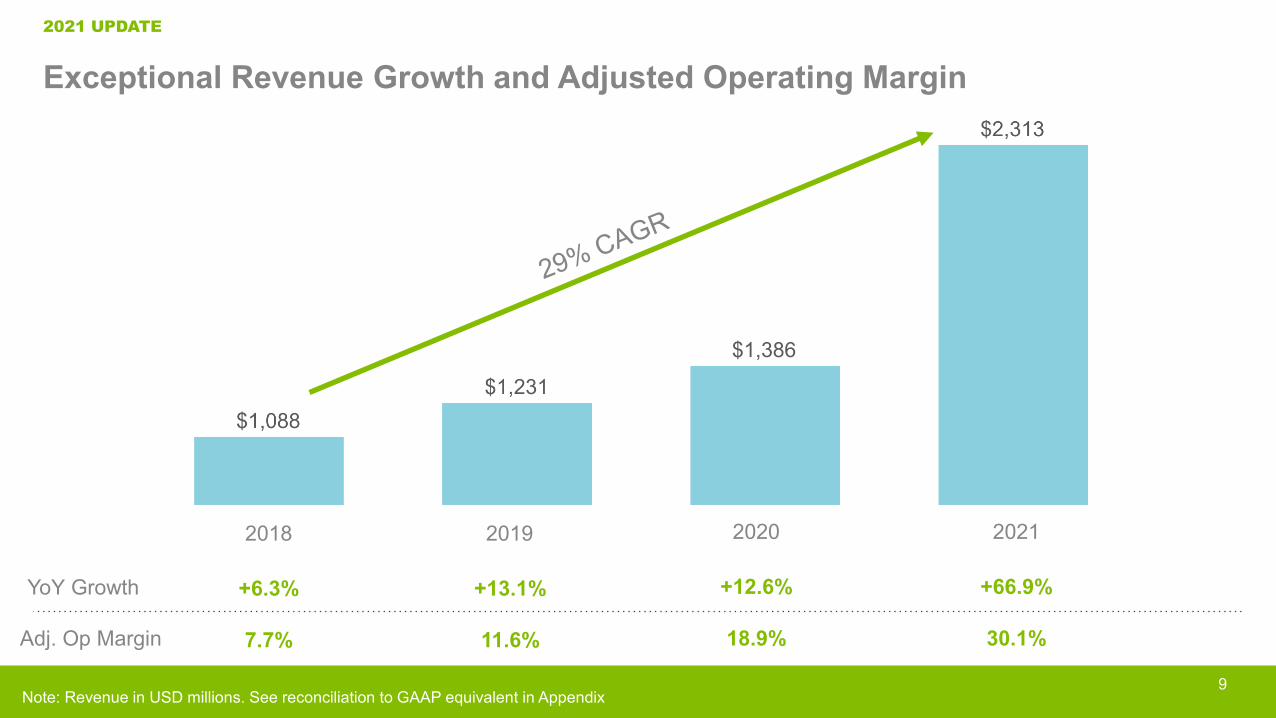
Exceptional Revenue Growth and Adjusted Operating Margin2021 UPDATE
2020 202120192018
YoY Growth +12.6% +66.9%+13.1%+6.3%
Adj. Op Margin 18.9% 30.1%11.6%7.7%
Note: Revenue in USD millions. See reconciliation to GAAP equivalent in Appendix9
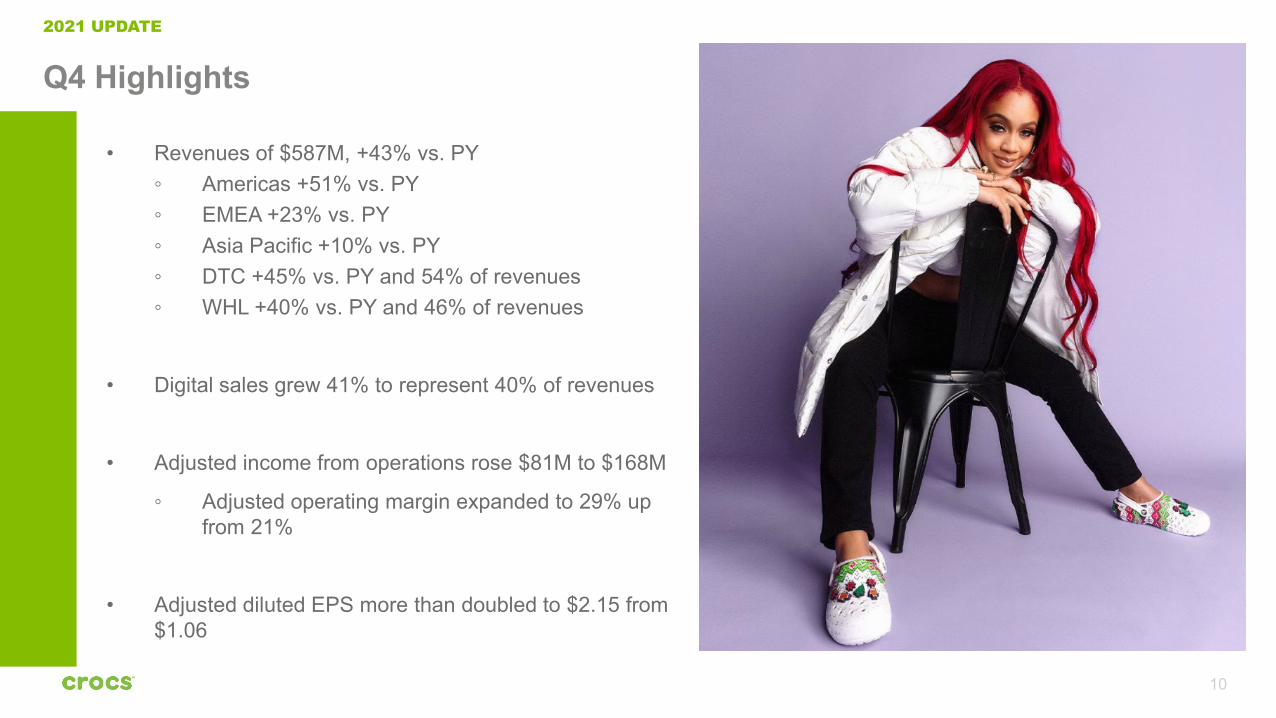
Q4 Highlights
• Revenues of $587M, +43% vs. PY◦ Americas +51% vs. PY◦ EMEA +23% vs. PY◦ Asia Pacific +10% vs. PY◦ DTC +45% vs. PY and 54% of revenues◦ WHL +40% vs. PY and 46% of revenues
• Digital sales grew 41% to represent 40% of revenues
• Adjusted income from operations rose $81M to $168M
◦ Adjusted operating margin expanded to 29% up from 21%
• Adjusted diluted EPS more than doubled to $2.15 from $1.06
2021 UPDATE
10
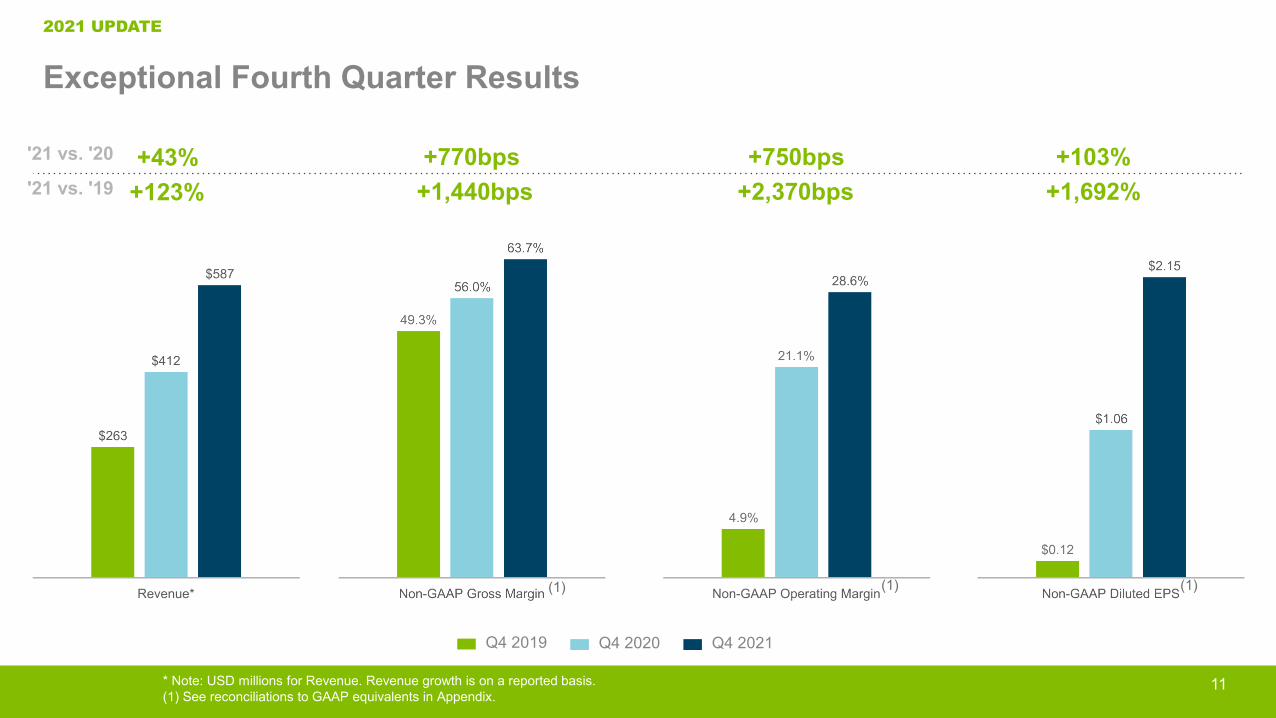
Exceptional Fourth Quarter Results2021 UPDATE
+43% +770bps +750bps +103%
Q4 2020 Q4 2021
* Note: USD millions for Revenue. Revenue growth is on a reported basis.(1) See reconciliations to GAAP equivalents in Appendix.
11
Q4 2019
'21 vs. '20
+123% +1,440bps +2,370bps +1,692%'21 vs. '19
(1) (1) (1)
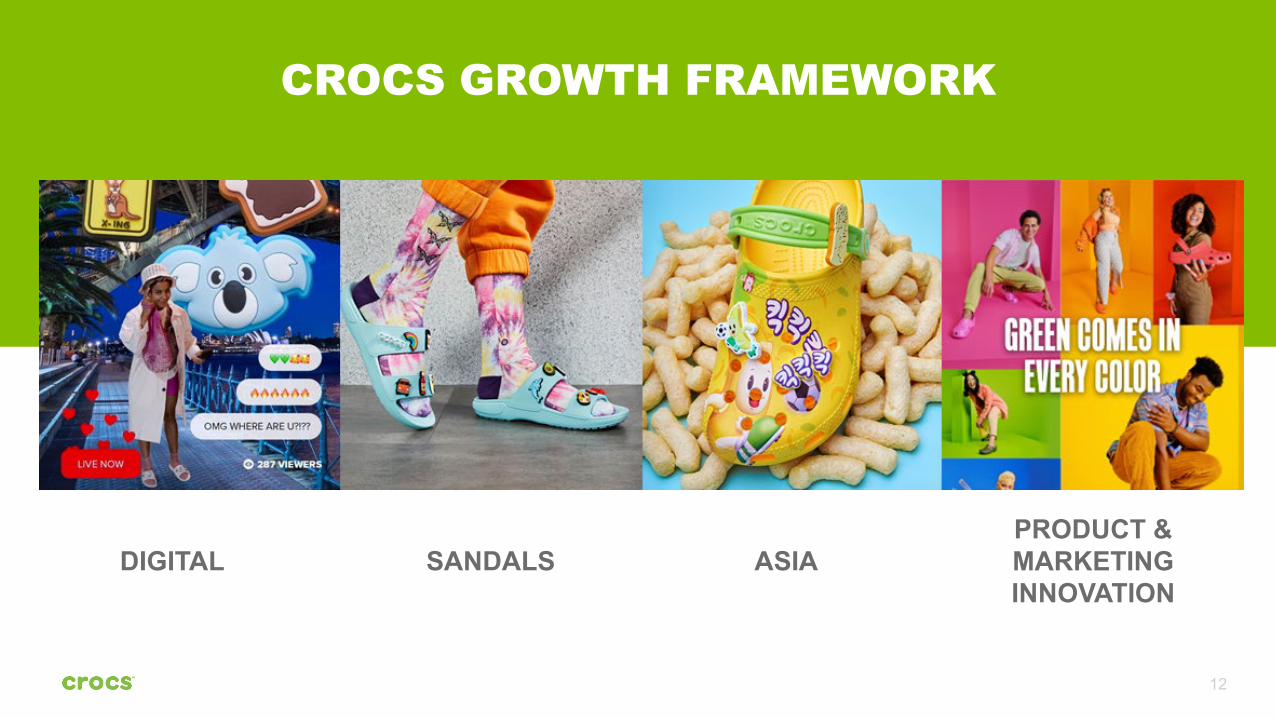
CROCS GROWTH FRAMEWORK
12
DIGITAL SANDALS ASIAPRODUCT & MARKETING INNOVATION
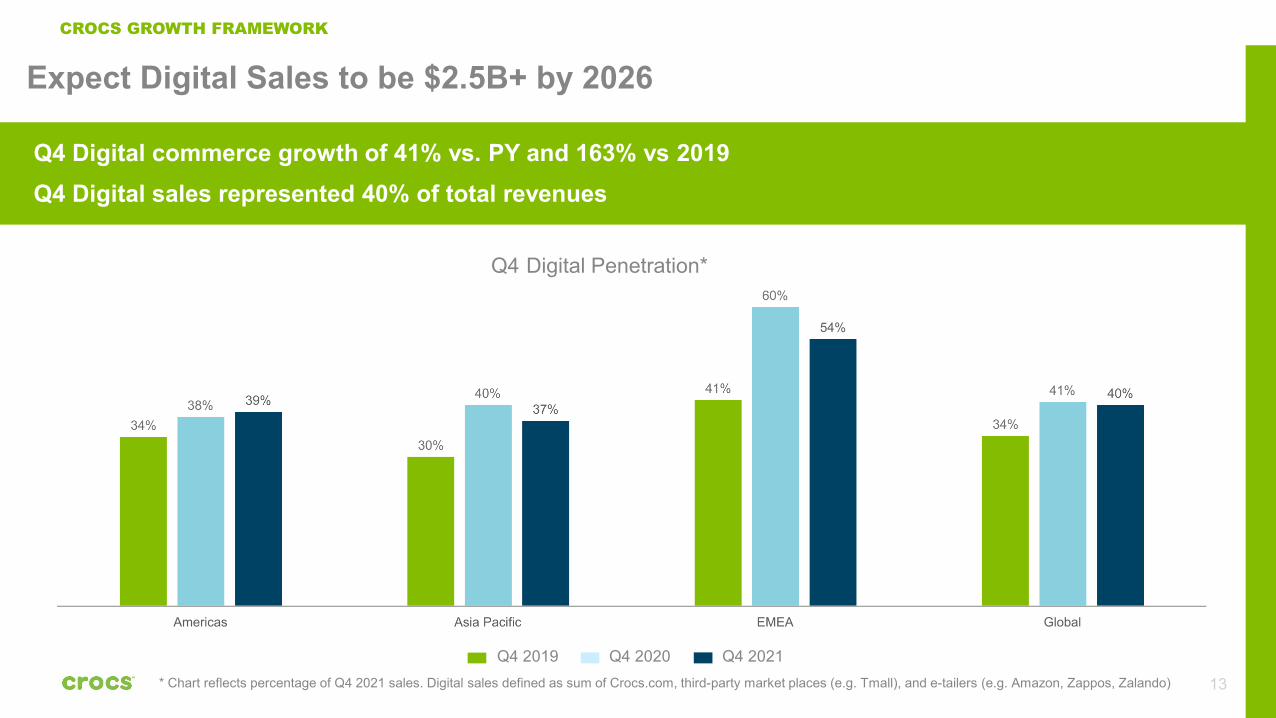
* Chart reflects percentage of Q4 2021 sales. Digital sales defined as sum of Crocs.com, third-party market places (e.g. Tmall), and e-tailers (e.g. Amazon, Zappos, Zalando) 13
CROCS GROWTH FRAMEWORK
Expect Digital Sales to be $2.5B+ by 2026
Q4 Digital commerce growth of 41% vs. PY and 163% vs 2019Q4 Digital sales represented 40% of total revenues
Q4 Digital Penetration*
Q4 2020 Q4 2021Q4 2019
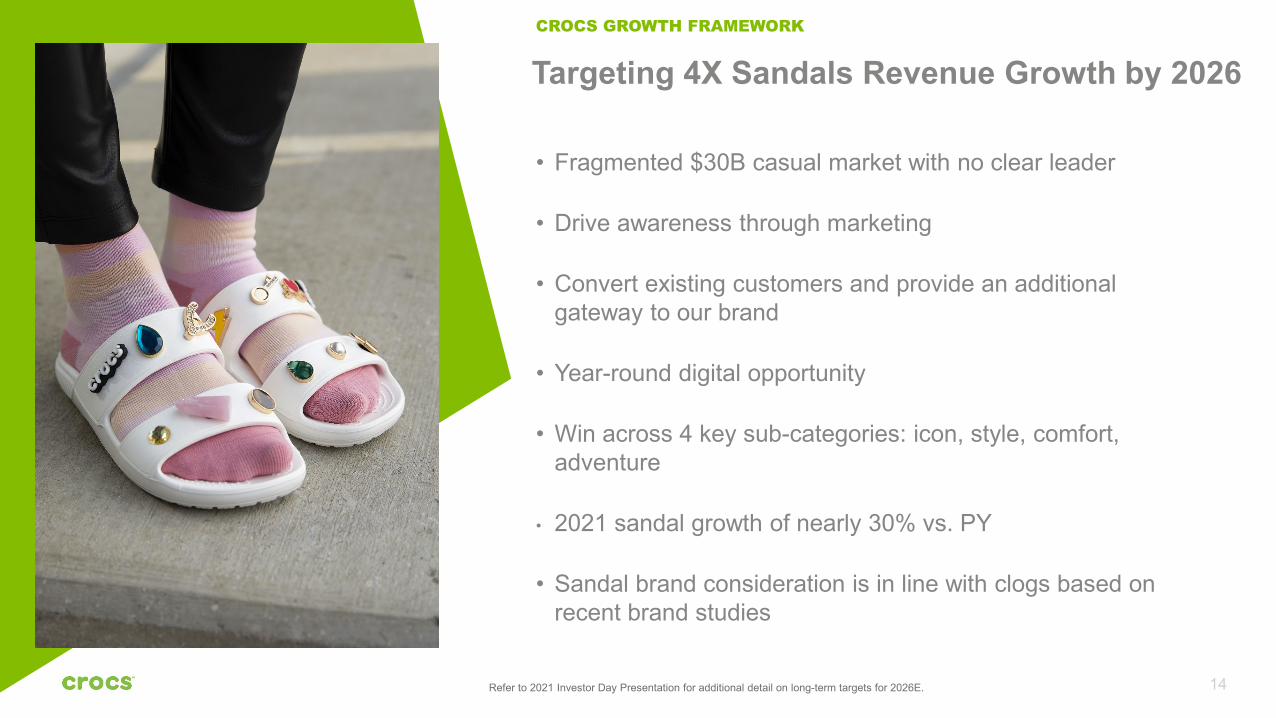
• Fragmented $30B casual market with no clear leader
• Drive awareness through marketing
• Convert existing customers and provide an additional gateway to our brand
• Year-round digital opportunity
• Win across 4 key sub-categories: icon, style, comfort, adventure
• 2021 sandal growth of nearly 30% vs. PY
• Sandal brand consideration is in line with clogs based on recent brand studies
CROCS GROWTH FRAMEWORK
14
Targeting 4X Sandals Revenue Growth by 2026
Refer to 2021 Investor Day Presentation for additional detail on long-term targets for 2026E.
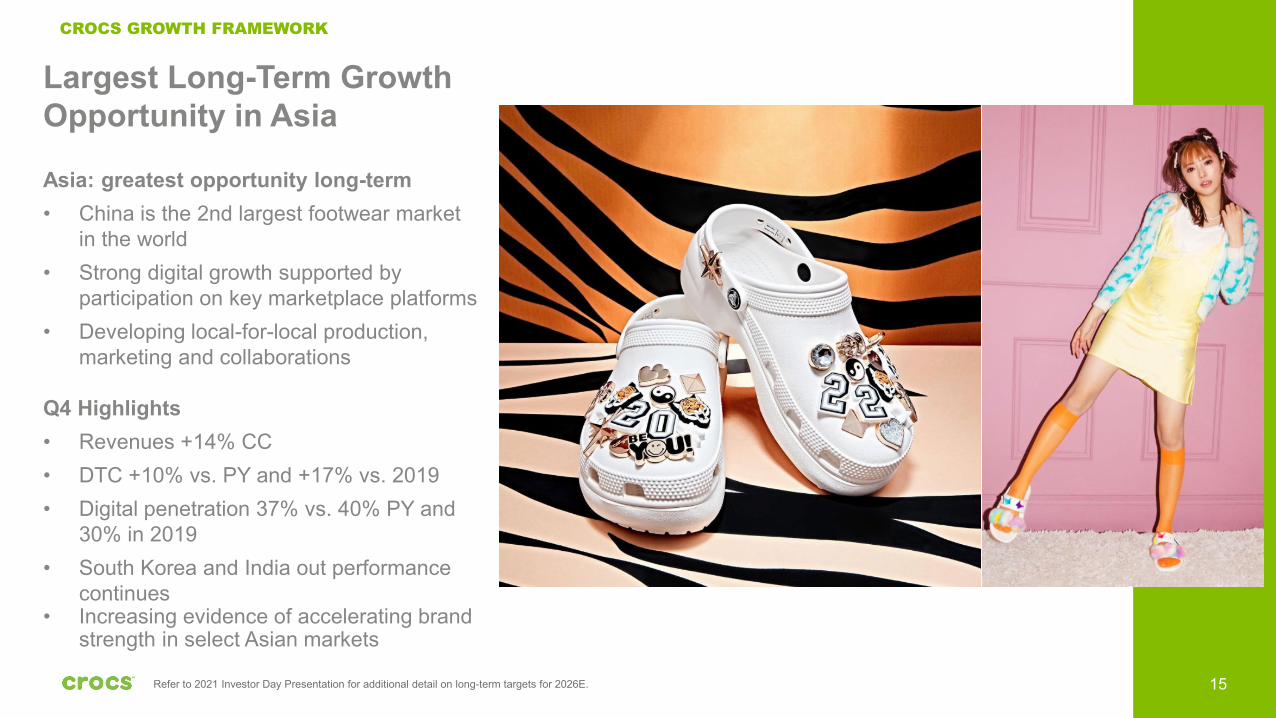
Largest Long-Term Growth Opportunity in Asia
Asia: greatest opportunity long-term• China is the 2nd largest footwear market
in the world• Strong digital growth supported by
participation on key marketplace platforms• Developing local-for-local production,
marketing and collaborations
Q4 Highlights• Revenues +14% CC• DTC +10% vs. PY and +17% vs. 2019• Digital penetration 37% vs. 40% PY and
30% in 2019• South Korea and India out performance
continues• Increasing evidence of accelerating brand
strength in select Asian markets
Refer to 2021 Investor Day Presentation for additional detail on long-term targets for 2026E.
CROCS GROWTH FRAMEWORK
15
16
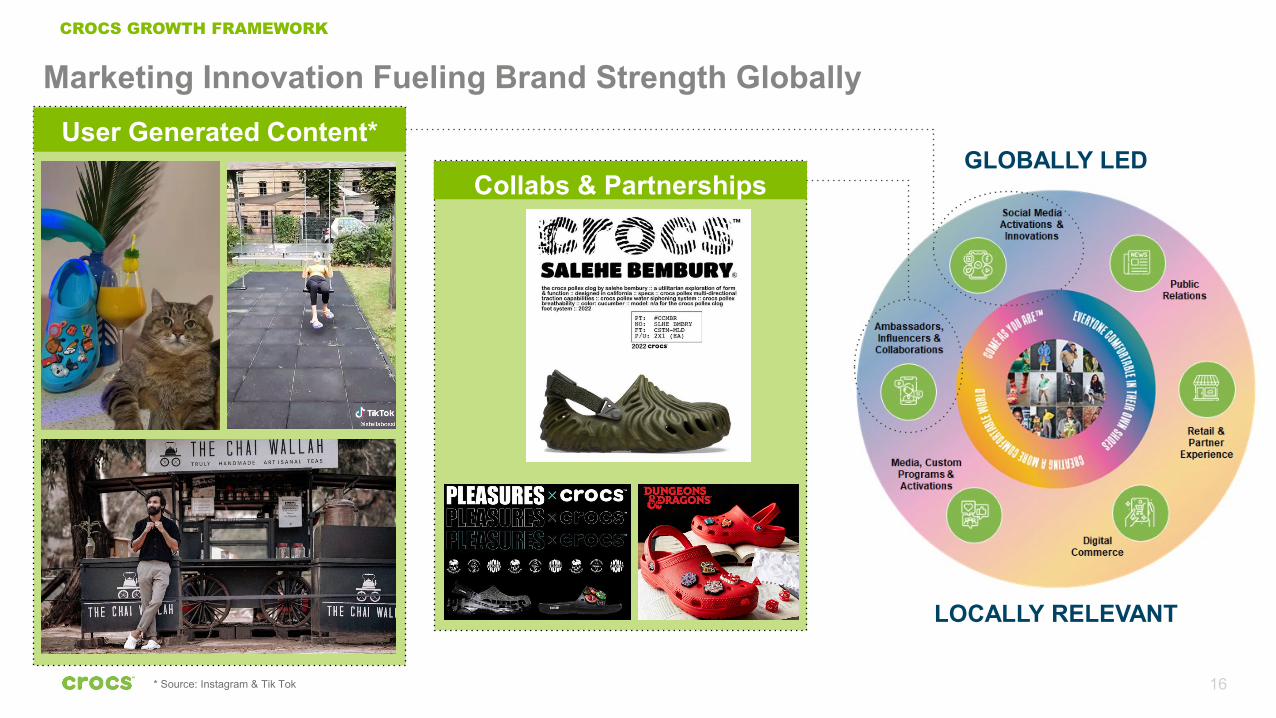
Marketing Innovation Fueling Brand Strength Globally
GLOBALLY LED
LOCALLY RELEVANT
User Generated Content*
Collabs & Partnerships
* Source: Instagram & Tik Tok
CROCS GROWTH FRAMEWORK
16
Acquisition Update
17
18
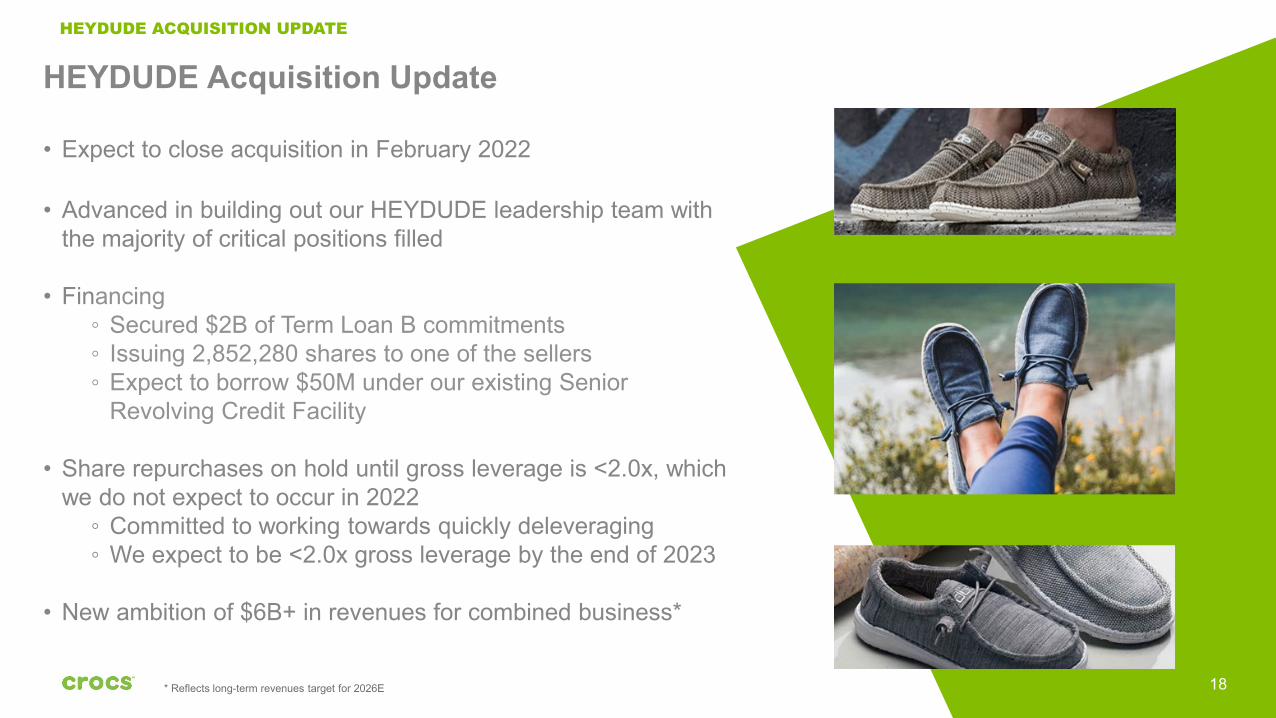
HEYDUDE Acquisition Update
• Expect to close acquisition in February 2022
• Advanced in building out our HEYDUDE leadership team with the majority of critical positions filled
• Financing◦ Secured $2B of Term Loan B commitments◦ Issuing 2,852,280 shares to one of the sellers◦ Expect to borrow $50M under our existing Senior
Revolving Credit Facility
• Share repurchases on hold until gross leverage is <2.0x, which we do not expect to occur in 2022
◦ Committed to working towards quickly deleveraging◦ We expect to be <2.0x gross leverage by the end of 2023
• New ambition of $6B+ in revenues for combined business*
* Reflects long-term revenues target for 2026E
HEYDUDE ACQUISITION UPDATE
19
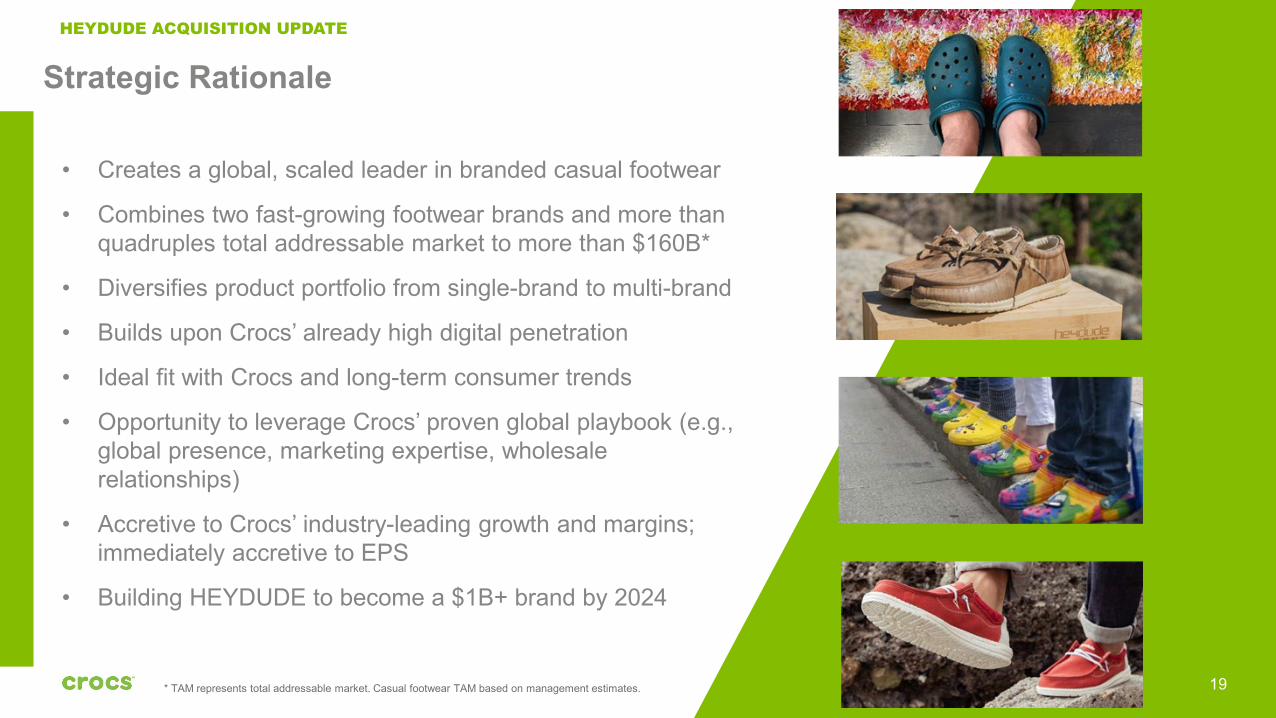
Strategic Rationale
• Creates a global, scaled leader in branded casual footwear
• Combines two fast-growing footwear brands and more than quadruples total addressable market to more than $160B*
• Diversifies product portfolio from single-brand to multi-brand
• Builds upon Crocs’ already high digital penetration
• Ideal fit with Crocs and long-term consumer trends
• Opportunity to leverage Crocs’ proven global playbook (e.g., global presence, marketing expertise, wholesale relationships)
• Accretive to Crocs’ industry-leading growth and margins; immediately accretive to EPS
• Building HEYDUDE to become a $1B+ brand by 2024
HEYDUDE ACQUISITION UPDATE
* TAM represents total addressable market. Casual footwear TAM based on management estimates.
20
Building HEYDUDE to $1B+ by 2024
• Invest in industry-leading marketing to build brand awareness
• Enhance digital capabilities to further accelerate digital
• Leverage Crocs strong wholesale relationships to enhance distribution
• Leverage Crocs distribution for global growth
• Invest to scale supply chain and gain efficiencies
• Test selective retail footprint for enhanced brand awareness
HEYDUDE ACQUISITION UPDATE
21
Significant Value Creation From Both Brands
High Revenue Growth
Industry Leading Profitability
Exceptional Cash Flow Generation
HEYDUDE ACQUISITION UPDATE

Financial Results
22
23
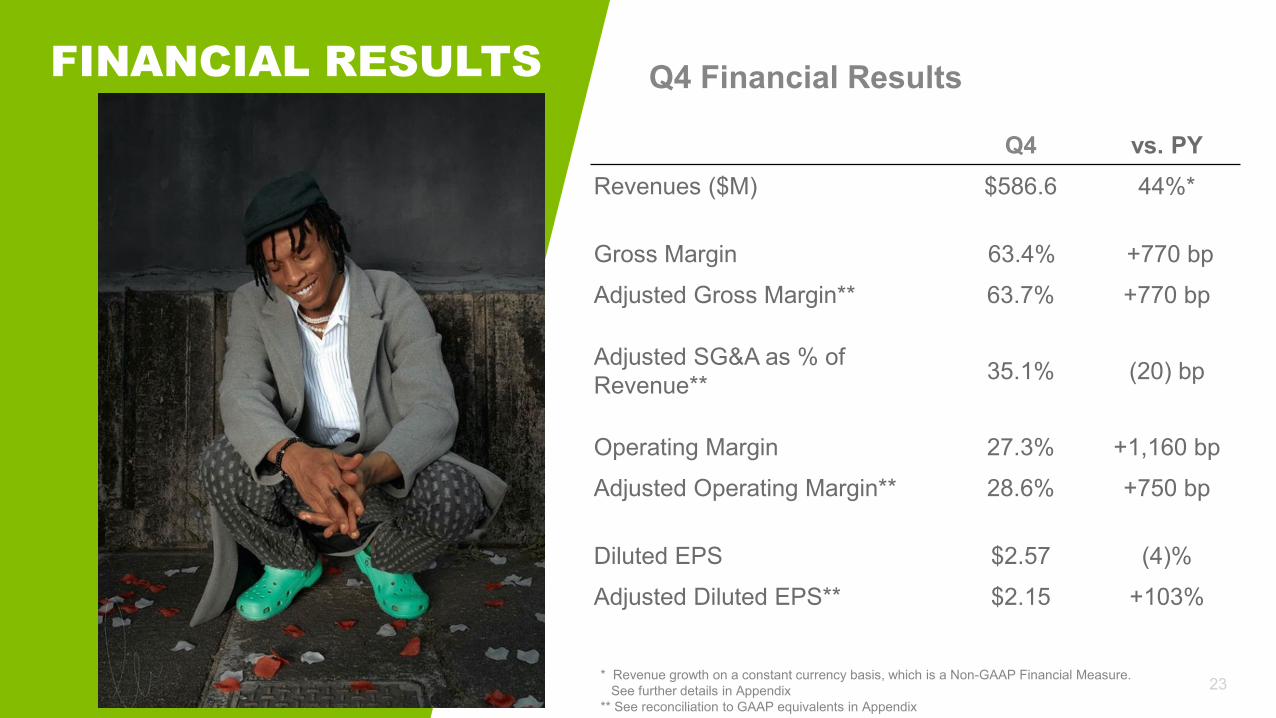
Q4 vs. PYRevenues ($M) $586.6 44%*
Gross Margin 63.4% +770 bp
Adjusted Gross Margin** 63.7% +770 bp
Adjusted SG&A as % of Revenue** 35.1% (20) bp
Operating Margin 27.3% +1,160 bp
Adjusted Operating Margin** 28.6% +750 bp
Diluted EPS $2.57 (4)%
Adjusted Diluted EPS** $2.15 +103%
FINANCIAL RESULTS Q4 Financial Results
* Revenue growth on a constant currency basis, which is a Non-GAAP Financial Measure. See further details in Appendix
** See reconciliation to GAAP equivalents in Appendix23
24
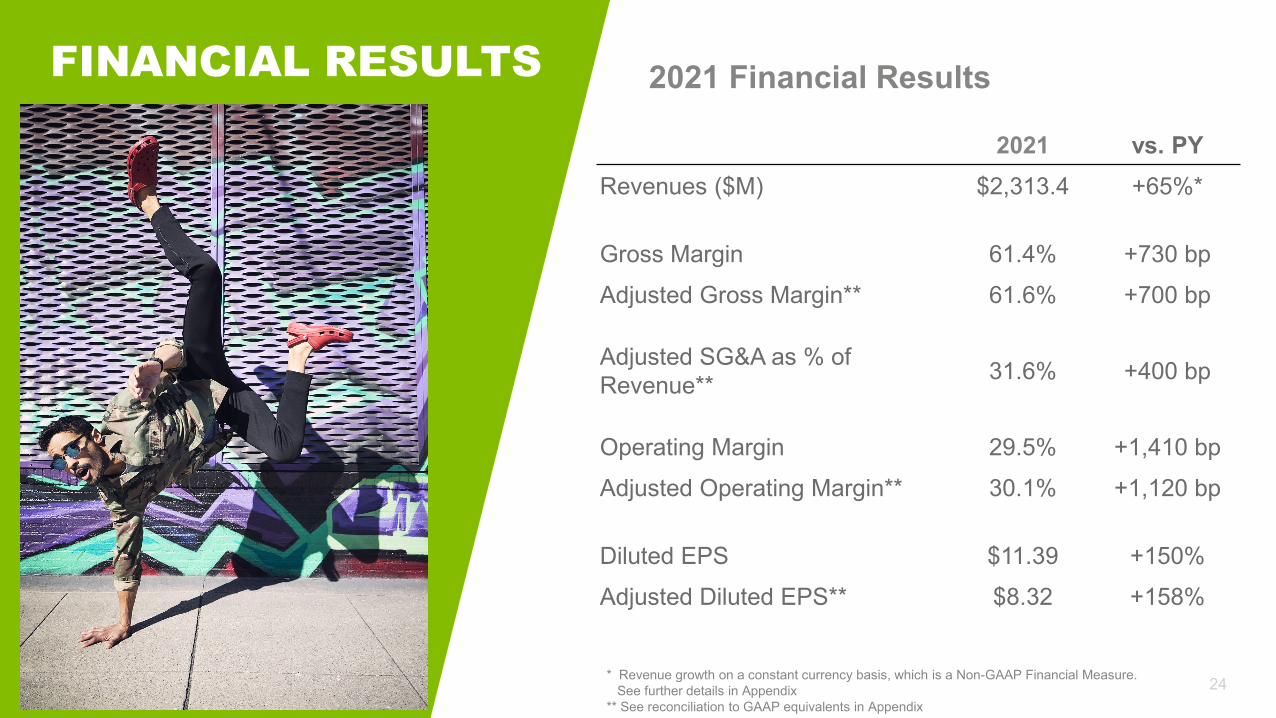
2021 Financial Results
24* Revenue growth on a constant currency basis, which is a Non-GAAP Financial Measure. See further details in Appendix
** See reconciliation to GAAP equivalents in Appendix
2021 vs. PYRevenues ($M) $2,313.4 +65%*
Gross Margin 61.4% +730 bp
Adjusted Gross Margin** 61.6% +700 bp
Adjusted SG&A as % of Revenue** 31.6% +400 bp
Operating Margin 29.5% +1,410 bp
Adjusted Operating Margin** 30.1% +1,120 bp
Diluted EPS $11.39 +150%
Adjusted Diluted EPS** $8.32 +158%
FINANCIAL RESULTS
2022E Outlook
25
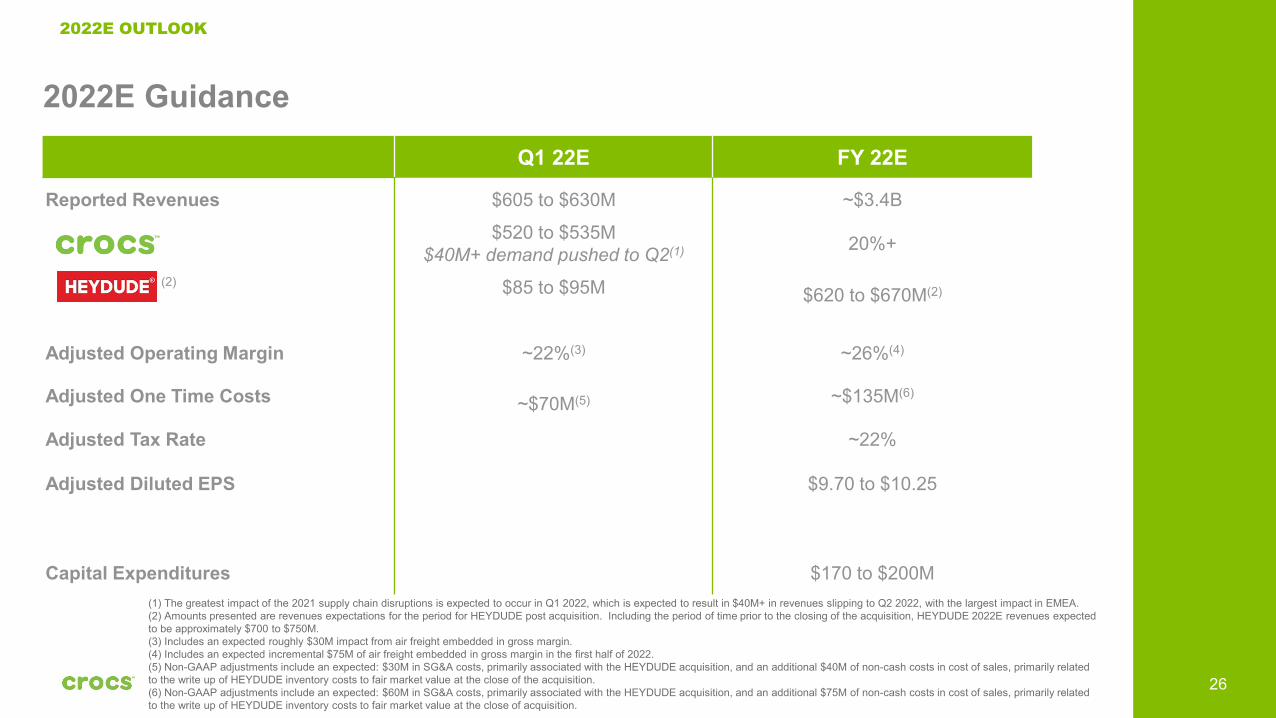
Q1 22E FY 22E
Reported Revenues $605 to $630M ~$3.4B
$520 to $535M$40M+ demand pushed to Q2(1) 20%+
. (2) $85 to $95M $620 to $670M(2)
Adjusted Operating Margin ~22%(3) ~26%(4)
Adjusted One Time Costs ~$70M(5) ~$135M(6)
Adjusted Tax Rate ~22%
Adjusted Diluted EPS $9.70 to $10.25
Capital Expenditures $170 to $200M
26
2022E Guidance
(1) The greatest impact of the 2021 supply chain disruptions is expected to occur in Q1 2022, which is expected to result in $40M+ in revenues slipping to Q2 2022, with the largest impact in EMEA.(2) Amounts presented are revenues expectations for the period for HEYDUDE post acquisition. Including the period of time prior to the closing of the acquisition, HEYDUDE 2022E revenues expected to be approximately $700 to $750M.(3) Includes an expected roughly $30M impact from air freight embedded in gross margin.(4) Includes an expected incremental $75M of air freight embedded in gross margin in the first half of 2022.(5) Non-GAAP adjustments include an expected: $30M in SG&A costs, primarily associated with the HEYDUDE acquisition, and an additional $40M of non-cash costs in cost of sales, primarily related to the write up of HEYDUDE inventory costs to fair market value at the close of the acquisition.(6) Non-GAAP adjustments include an expected: $60M in SG&A costs, primarily associated with the HEYDUDE acquisition, and an additional $75M of non-cash costs in cost of sales, primarily related to the write up of HEYDUDE inventory costs to fair market value at the close of acquisition.
2022E OUTLOOK
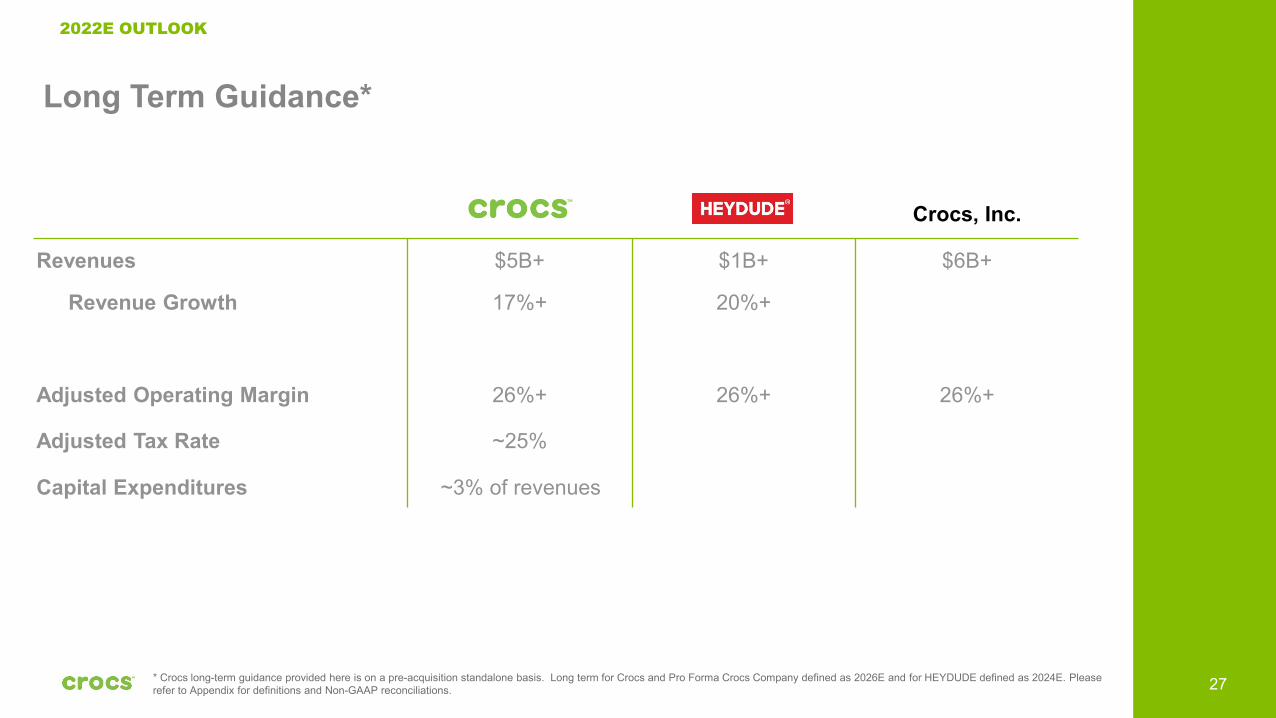
Crocs, Inc.
Revenues $5B+ $1B+ $6B+
Revenue Growth 17%+ 20%+
Adjusted Operating Margin 26%+ 26%+ 26%+
Adjusted Tax Rate ~25%
Capital Expenditures ~3% of revenues
27
Long Term Guidance*
* Crocs long-term guidance provided here is on a pre-acquisition standalone basis. Long term for Crocs and Pro Forma Crocs Company defined as 2026E and for HEYDUDE defined as 2024E. Please refer to Appendix for definitions and Non-GAAP reconciliations.
2022E OUTLOOK
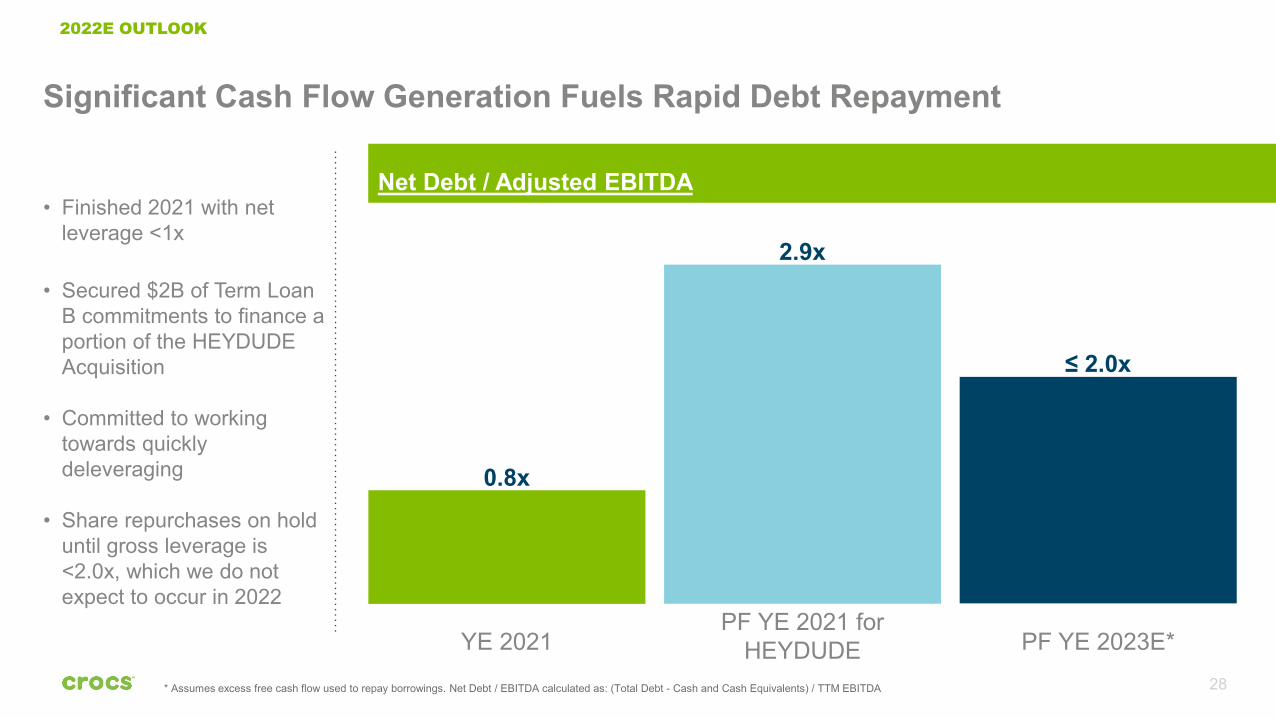
Net Debt / Adjusted EBITDA
28
0.8x
2.9x
YE 2021
≤ 2.0x
PF YE 2021 for HEYDUDE PF YE 2023E*
* Assumes excess free cash flow used to repay borrowings. Net Debt / EBITDA calculated as: (Total Debt - Cash and Cash Equivalents) / TTM EBITDA
• Finished 2021 with net leverage <1x
• Secured $2B of Term Loan B commitments to finance a portion of the HEYDUDE Acquisition
• Committed to working towards quickly deleveraging
• Share repurchases on hold until gross leverage is <2.0x, which we do not expect to occur in 2022
2022E OUTLOOK
Significant Cash Flow Generation Fuels Rapid Debt Repayment
Appendix
29
NON-GAAP RECONCILIATION
30
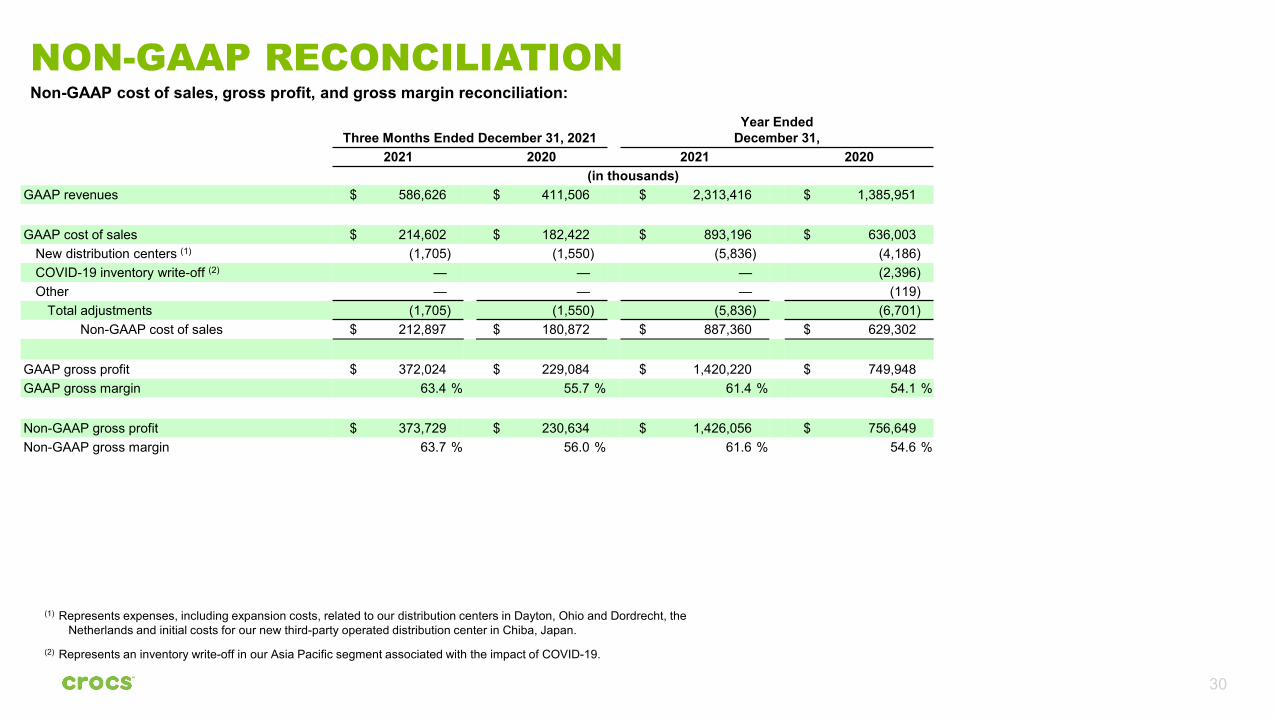
Non-GAAP cost of sales, gross profit, and gross margin reconciliation:
Three Months Ended December 31, 2021Year Ended
December 31,2021 2020 2021 2020
(in thousands)GAAP revenues $ 586,626 $ 411,506 $ 2,313,416 $ 1,385,951
GAAP cost of sales $ 214,602 $ 182,422 $ 893,196 $ 636,003New distribution centers (1) (1,705) (1,550) (5,836) (4,186)COVID-19 inventory write-off (2) — — — (2,396)Other — — — (119)
Total adjustments (1,705) (1,550) (5,836) (6,701)Non-GAAP cost of sales $ 212,897 $ 180,872 $ 887,360 $ 629,302
GAAP gross profit $ 372,024 $ 229,084 $ 1,420,220 $ 749,948GAAP gross margin 63.4 % 55.7 % 61.4 % 54.1 %
Non-GAAP gross profit $ 373,729 $ 230,634 $ 1,426,056 $ 756,649Non-GAAP gross margin 63.7 % 56.0 % 61.6 % 54.6 %
(1) Represents expenses, including expansion costs, related to our distribution centers in Dayton, Ohio and Dordrecht, the Netherlands and initial costs for our new third-party operated distribution center in Chiba, Japan.
(2) Represents an inventory write-off in our Asia Pacific segment associated with the impact of COVID-19.
NON-GAAP RECONCILIATION (cont’d)
31
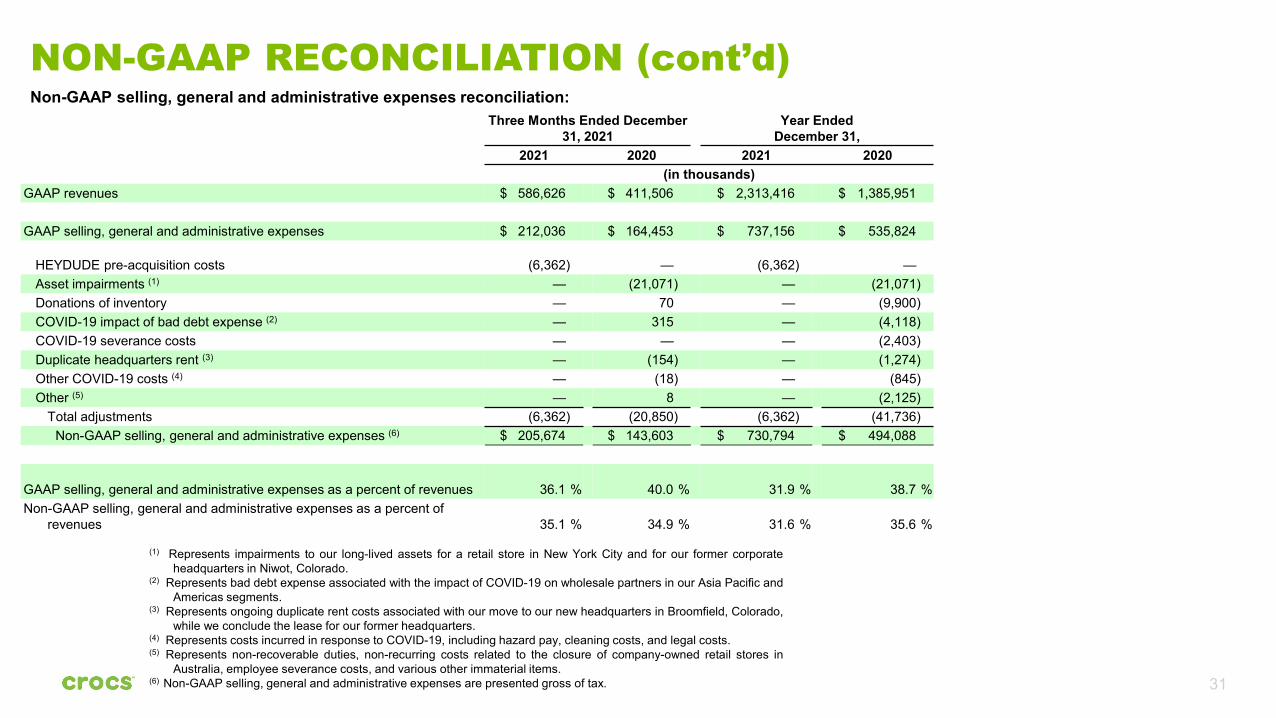
Non-GAAP selling, general and administrative expenses reconciliation:Three Months Ended December
31, 2021Year Ended
December 31,2021 2020 2021 2020
(in thousands)GAAP revenues $ 586,626 $ 411,506 $ 2,313,416 $ 1,385,951
GAAP selling, general and administrative expenses $ 212,036 $ 164,453 $ 737,156 $ 535,824
HEYDUDE pre-acquisition costs (6,362) — (6,362) —Asset impairments (1) — (21,071) — (21,071)Donations of inventory — 70 — (9,900)COVID-19 impact of bad debt expense (2) — 315 — (4,118)COVID-19 severance costs — — — (2,403)Duplicate headquarters rent (3) — (154) — (1,274)Other COVID-19 costs (4) — (18) — (845)Other (5) — 8 — (2,125)
Total adjustments (6,362) (20,850) (6,362) (41,736)Non-GAAP selling, general and administrative expenses (6) $ 205,674 $ 143,603 $ 730,794 $ 494,088
GAAP selling, general and administrative expenses as a percent of revenues 36.1 % 40.0 % 31.9 % 38.7 %Non-GAAP selling, general and administrative expenses as a percent of
revenues 35.1 % 34.9 % 31.6 % 35.6 %
(1) Represents impairments to our long-lived assets for a retail store in New York City and for our former corporateheadquarters in Niwot, Colorado.
(2) Represents bad debt expense associated with the impact of COVID-19 on wholesale partners in our Asia Pacific andAmericas segments.
(3) Represents ongoing duplicate rent costs associated with our move to our new headquarters in Broomfield, Colorado,while we conclude the lease for our former headquarters.
(4) Represents costs incurred in response to COVID-19, including hazard pay, cleaning costs, and legal costs.(5) Represents non-recoverable duties, non-recurring costs related to the closure of company-owned retail stores in
Australia, employee severance costs, and various other immaterial items.(6) Non-GAAP selling, general and administrative expenses are presented gross of tax.
NON-GAAP RECONCILIATION (cont’d)
32
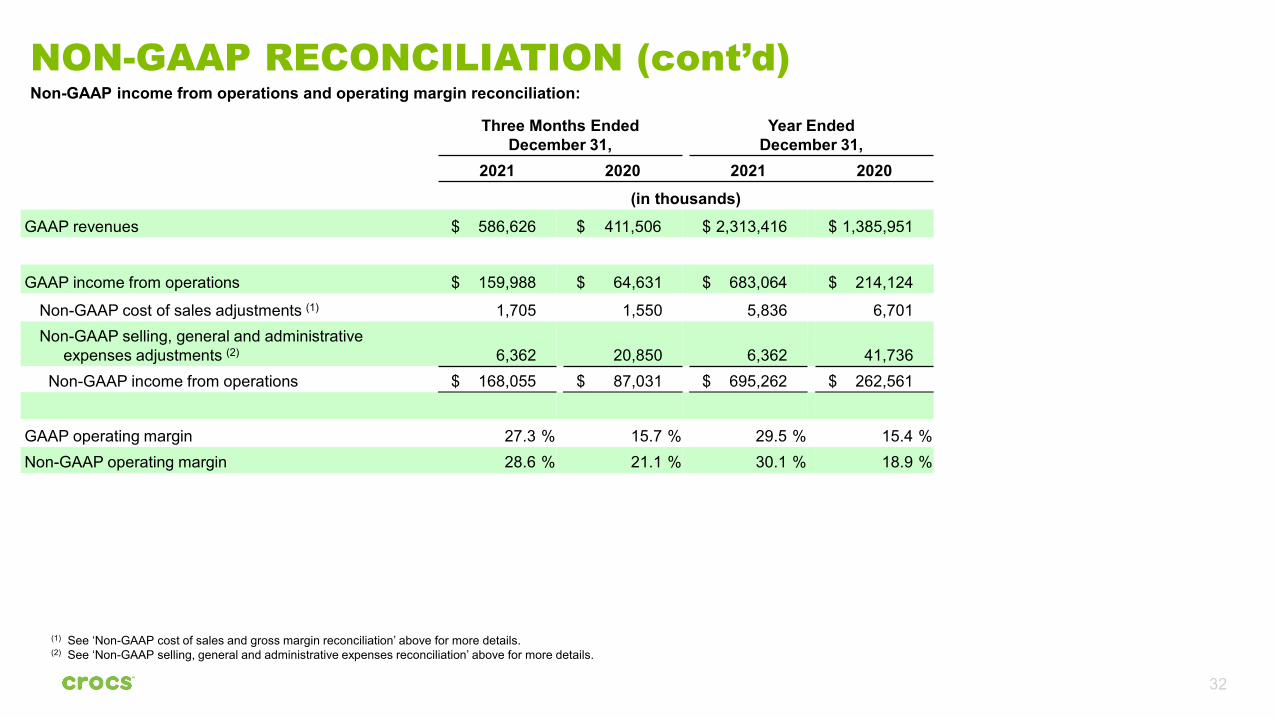
Non-GAAP income from operations and operating margin reconciliation:
Three Months Ended December 31,
Year EndedDecember 31,
2021 2020 2021 2020(in thousands)
GAAP revenues $ 586,626 $ 411,506 $ 2,313,416 $ 1,385,951
GAAP income from operations $ 159,988 $ 64,631 $ 683,064 $ 214,124
Non-GAAP cost of sales adjustments (1) 1,705 1,550 5,836 6,701Non-GAAP selling, general and administrative
expenses adjustments (2) 6,362 20,850 6,362 41,736Non-GAAP income from operations $ 168,055 $ 87,031 $ 695,262 $ 262,561
GAAP operating margin 27.3 % 15.7 % 29.5 % 15.4 %Non-GAAP operating margin 28.6 % 21.1 % 30.1 % 18.9 %
(1) See ‘Non-GAAP cost of sales and gross margin reconciliation’ above for more details.(2) See ‘Non-GAAP selling, general and administrative expenses reconciliation’ above for more details.
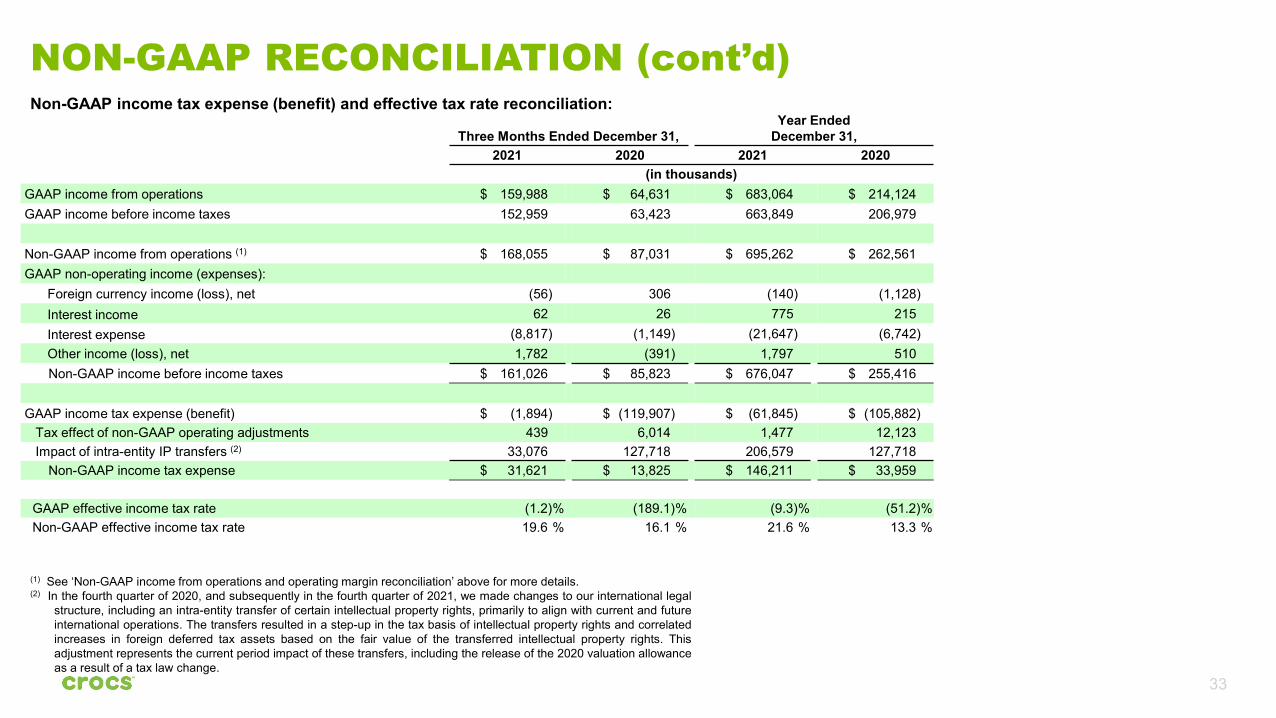
Non-GAAP income tax expense (benefit) and effective tax rate reconciliation:
33
Three Months Ended December 31,Year Ended
December 31,2021 2020 2021 2020
(in thousands)GAAP income from operations $ 159,988 $ 64,631 $ 683,064 $ 214,124GAAP income before income taxes 152,959 63,423 663,849 206,979
Non-GAAP income from operations (1) $ 168,055 $ 87,031 $ 695,262 $ 262,561GAAP non-operating income (expenses):
Foreign currency income (loss), net (56) 306 (140) (1,128)Interest income 62 26 775 215Interest expense (8,817) (1,149) (21,647) (6,742)Other income (loss), net 1,782 (391) 1,797 510Non-GAAP income before income taxes $ 161,026 $ 85,823 $ 676,047 $ 255,416
GAAP income tax expense (benefit) $ (1,894) $ (119,907) $ (61,845) $ (105,882)Tax effect of non-GAAP operating adjustments 439 6,014 1,477 12,123Impact of intra-entity IP transfers (2) 33,076 127,718 206,579 127,718
Non-GAAP income tax expense $ 31,621 $ 13,825 $ 146,211 $ 33,959
GAAP effective income tax rate (1.2)% (189.1)% (9.3)% (51.2)%Non-GAAP effective income tax rate 19.6 % 16.1 % 21.6 % 13.3 %
(1) See ‘Non-GAAP income from operations and operating margin reconciliation’ above for more details.(2) In the fourth quarter of 2020, and subsequently in the fourth quarter of 2021, we made changes to our international legal
structure, including an intra-entity transfer of certain intellectual property rights, primarily to align with current and futureinternational operations. The transfers resulted in a step-up in the tax basis of intellectual property rights and correlatedincreases in foreign deferred tax assets based on the fair value of the transferred intellectual property rights. Thisadjustment represents the current period impact of these transfers, including the release of the 2020 valuation allowanceas a result of a tax law change.
NON-GAAP RECONCILIATION (cont’d)
34
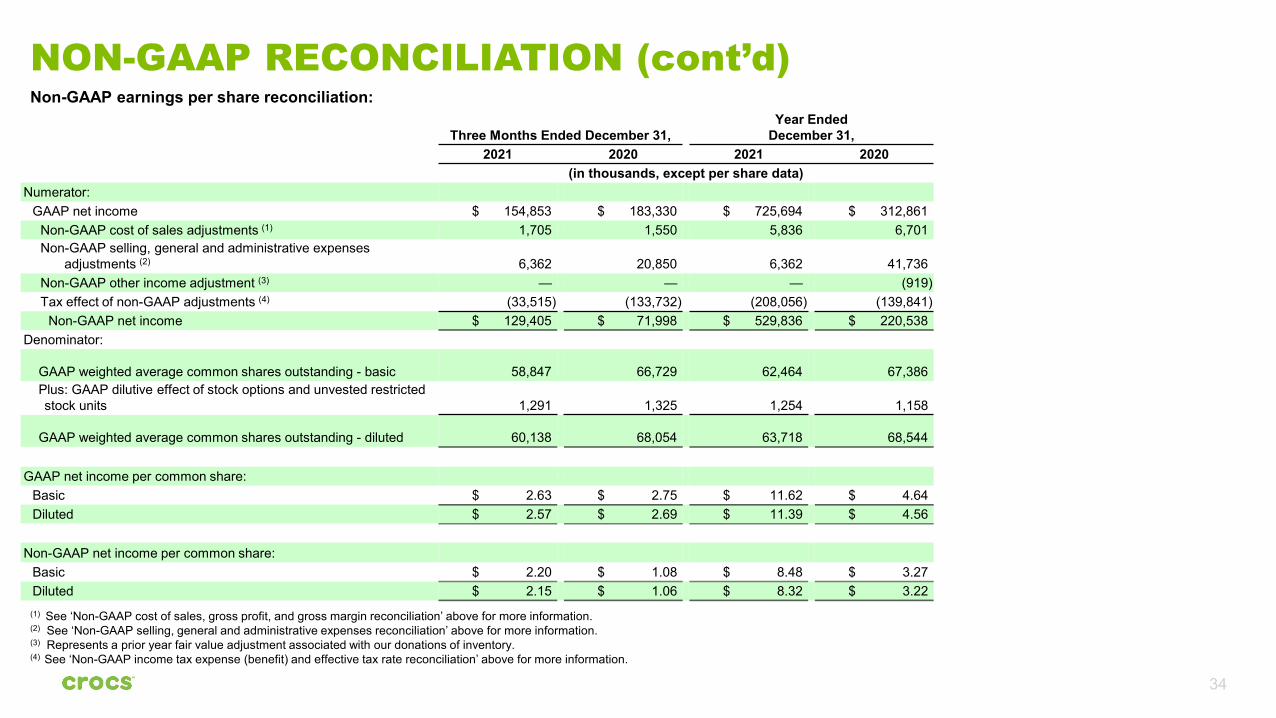
Non-GAAP earnings per share reconciliation:
Three Months Ended December 31,Year Ended
December 31,2021 2020 2021 2020
(in thousands, except per share data)Numerator:
GAAP net income $ 154,853 $ 183,330 $ 725,694 $ 312,861Non-GAAP cost of sales adjustments (1) 1,705 1,550 5,836 6,701Non-GAAP selling, general and administrative expenses
adjustments (2) 6,362 20,850 6,362 41,736Non-GAAP other income adjustment (3) — — — (919)Tax effect of non-GAAP adjustments (4) (33,515) (133,732) (208,056) (139,841)
Non-GAAP net income $ 129,405 $ 71,998 $ 529,836 $ 220,538Denominator:
GAAP weighted average common shares outstanding - basic 58,847 66,729 62,464 67,386Plus: GAAP dilutive effect of stock options and unvested restricted stock units 1,291 1,325 1,254 1,158
GAAP weighted average common shares outstanding - diluted 60,138 68,054 63,718 68,544
GAAP net income per common share:Basic $ 2.63 $ 2.75 $ 11.62 $ 4.64Diluted $ 2.57 $ 2.69 $ 11.39 $ 4.56
Non-GAAP net income per common share:Basic $ 2.20 $ 1.08 $ 8.48 $ 3.27Diluted $ 2.15 $ 1.06 $ 8.32 $ 3.22
(1) See ‘Non-GAAP cost of sales, gross profit, and gross margin reconciliation’ above for more information.(2) See ‘Non-GAAP selling, general and administrative expenses reconciliation’ above for more information.(3) Represents a prior year fair value adjustment associated with our donations of inventory.(4) See ‘Non-GAAP income tax expense (benefit) and effective tax rate reconciliation’ above for more information.
NON-GAAP RECONCILIATION (cont’d)
35
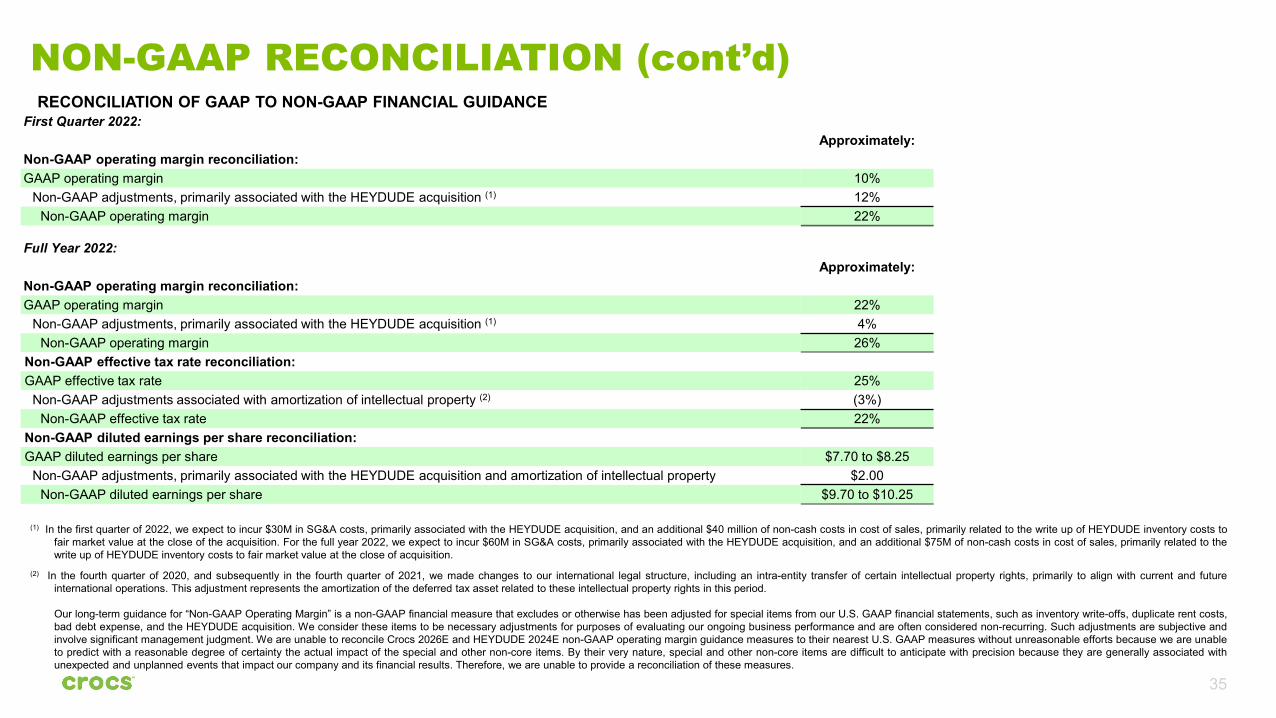
RECONCILIATION OF GAAP TO NON-GAAP FINANCIAL GUIDANCE
(1) In the first quarter of 2022, we expect to incur $30M in SG&A costs, primarily associated with the HEYDUDE acquisition, and an additional $40 million of non-cash costs in cost of sales, primarily related to the write up of HEYDUDE inventory costs tofair market value at the close of the acquisition. For the full year 2022, we expect to incur $60M in SG&A costs, primarily associated with the HEYDUDE acquisition, and an additional $75M of non-cash costs in cost of sales, primarily related to thewrite up of HEYDUDE inventory costs to fair market value at the close of acquisition.
(2) In the fourth quarter of 2020, and subsequently in the fourth quarter of 2021, we made changes to our international legal structure, including an intra-entity transfer of certain intellectual property rights, primarily to align with current and futureinternational operations. This adjustment represents the amortization of the deferred tax asset related to these intellectual property rights in this period.
Our long-term guidance for “Non-GAAP Operating Margin” is a non-GAAP financial measure that excludes or otherwise has been adjusted for special items from our U.S. GAAP financial statements, such as inventory write-offs, duplicate rent costs,bad debt expense, and the HEYDUDE acquisition. We consider these items to be necessary adjustments for purposes of evaluating our ongoing business performance and are often considered non-recurring. Such adjustments are subjective andinvolve significant management judgment. We are unable to reconcile Crocs 2026E and HEYDUDE 2024E non-GAAP operating margin guidance measures to their nearest U.S. GAAP measures without unreasonable efforts because we are unableto predict with a reasonable degree of certainty the actual impact of the special and other non-core items. By their very nature, special and other non-core items are difficult to anticipate with precision because they are generally associated withunexpected and unplanned events that impact our company and its financial results. Therefore, we are unable to provide a reconciliation of these measures.
First Quarter 2022:Approximately:
Non-GAAP operating margin reconciliation:GAAP operating margin 10%
Non-GAAP adjustments, primarily associated with the HEYDUDE acquisition (1) 12%Non-GAAP operating margin 22%
Full Year 2022:Approximately:
Non-GAAP operating margin reconciliation:GAAP operating margin 22%
Non-GAAP adjustments, primarily associated with the HEYDUDE acquisition (1) 4%Non-GAAP operating margin 26%
Non-GAAP effective tax rate reconciliation:GAAP effective tax rate 25%
Non-GAAP adjustments associated with amortization of intellectual property (2) (3%)Non-GAAP effective tax rate 22%
Non-GAAP diluted earnings per share reconciliation:GAAP diluted earnings per share $7.70 to $8.25
Non-GAAP adjustments, primarily associated with the HEYDUDE acquisition and amortization of intellectual property $2.00Non-GAAP diluted earnings per share $9.70 to $10.25
NON-GAAP RECONCILIATION (cont’d)

36