earnings presentation (fy23 q1)
TRANSCRIPT

Q1FY2023
Financialpresentationtoaccompanymanagementcommentary

ThispresentationcontainsstatementsormayincludeormayincorporatebyreferenceWalmartmanagement’sguidanceregardingearningspersharegrowth,consolidatednetsales,consolidatedoperatingincome,capitalexpenditures,sharerepurchases,Walmart’seffectivetaxrateforthefiscalyearendingJanuary31,2023,andcomparablesalesgrowth.Walmartbelievessuchstatementsmaybedeemedtobe"forward-lookingstatements"withinthemeaningofSection21EoftheSecuritiesExchangeActof1934,asamended(the"Act")andareintendedtoenjoytheprotectionofthesafeharborforforward-lookingstatementsprovidedbytheActaswellasprotectionsaffordedbyotherfederalsecuritieslaws.Assumptionsonwhichsuchforward-lookingstatementsarebasedarealsoforward-lookingstatements.Suchforward-lookingstatementsarenotstatementsofhistoricalfacts,butinsteadexpressourestimatesorexpectationsforourconsolidated,oroneofoursegment'sorbusiness’,economicperformanceorresultsofoperationsforfutureperiodsorasoffuturedatesoreventsordevelopmentsthatmayoccurinthefutureordiscussourplans,objectivesorgoals.Ouractualresultsmaydiffermateriallyfromthoseexpressedinorimpliedbyanyoftheseforward-lookingstatementsasaresultofchangesincircumstances,assumptionsnotbeingrealizedorotherrisks,uncertaintiesandfactorsincluding:theimpactoftheCOVID-19pandemiconourbusinessandtheglobaleconomy;economic,capitalmarketsandbusinessconditions;trendsandeventsaroundtheworldandinthemarketsinwhichweoperate;currencyexchangeratefluctuations,changesinmarketinterestratesandmarketlevelsofwages;changesinthesizeofvariousmarkets,includingeCommercemarkets;unemploymentlevels;inflationordeflation,generallyandinparticularproductcategories;consumerconfidence,disposableincome,creditavailability,spendinglevels,shoppingpatterns,debtlevelsanddemandforcertainmerchandise;theeffectivenessoftheimplementationandoperationofourstrategies,plans,programsandinitiatives;unexpectedchangesinourobjectivesandplans;theimpactofacquisitions,investments,divestitures,andotherstrategicdecisions;ourabilitytosuccessfullyintegrateacquiredbusinesses;changesinthetradingpricesofcertainequityinvestmentswehold;initiativesofcompetitors,competitors'entryintoandexpansioninourmarkets,andcompetitivepressures;customertrafficandaveragetransactionsinourstoresandclubsandonoureCommercewebsites;themixofmerchandisewesell,thecostofgoodswesellandtheshrinkageweexperience;ourgrossprofitmargins;thefinancialperformanceofWalmartandeachofitssegments,includingtheamountsofourcashflowduringvariousperiods;theamountofournetsalesandoperatingexpensesdenominatedintheU.S.dollarandvariousforeigncurrencies;commoditypricesandthepriceofgasolineanddieselfuel;supplychaindisruptionsanddisruptionsinseasonalbuyingpatterns;theavailabilityofgoodsfromsuppliersandthecostofgoodsacquiredfromsuppliers;ourabilitytorespondtochangingtrendsinconsumershoppinghabits;consumeracceptanceofandresponsetoourstores,clubs,eCommerceplatforms,programs,merchandiseofferingsanddeliverymethods;cybersecurityeventsaffectingusandrelatedcostsandimpacttothebusiness;developmentsin,outcomesof,andcostsincurredinlegalorregulatoryproceedingstowhichweareapartyoraresubject,andtheliabilities,obligationsandexpenses,ifany,thatwemayincurinconnectiontherewith;casualtyandaccident-relatedcostsandinsurancecosts;theturnoverinourworkforceandlaborcosts,includinghealthcareandotherbenefitcosts;oureffectivetaxrateandthefactorsaffectingoureffectivetaxrate,includingassessmentsofcertaintaxcontingencies,valuationallowances,changesinlaw,administrativeauditoutcomes,impactofdiscreteitemsandthemixofearningsbetweentheU.S.andWalmart'sinternationaloperations;changesinexistingtax,laborandotherlawsandregulationsandchangesintaxratesincludingtheenactmentoflawsandtheadoptionandinterpretationofadministrativerulesandregulations;theimpositionofnewtaxesonimports,newtariffsandchangesinexistingtariffrates;theimpositionofnewtraderestrictionsandchangesinexistingtraderestrictions;adoptionorcreationofnew,andmodificationofexisting,governmentalpolicies,programs,initiativesandactionsinthemarketsinwhichWalmartoperatesandelsewhereandactionswithrespecttosuchpolicies,programsandinitiatives;changesinaccountingestimatesorjudgments;thelevelofpublicassistancepayments;naturaldisasters,changesinclimate,geopoliticalevents,globalhealthepidemicsorpandemicsandcatastrophicevents;andchangesingenerallyacceptedaccountingprinciplesintheUnitedStates.
OurmostrecentannualreportonForm10-KfiledwiththeSECdiscussesotherrisksandfactorsthatcouldcauseactualresultstodiffermateriallyfromthoseexpressedorimpliedbyanyforward-lookingstatementinthepresentation.Weurgeyoutoconsideralloftherisks,uncertaintiesandfactorsidentifiedaboveordiscussedinsuchreportscarefullyinevaluatingtheforward-lookingstatementsinthispresentation.Walmartcannotassureyouthattheresultsreflectedinorimpliedbyanyforward-lookingstatementwillberealizedor,evenifsubstantiallyrealized,thatthoseresultswillhavetheforecastedorexpectedconsequencesandeffectsfororonouroperationsorfinancialperformance.Theforward-lookingstatementsmadetodayareasofthedateofthispresentation.Walmartundertakesnoobligationtoupdatetheseforward-lookingstatementstoreflectsubsequenteventsorcircumstances.
Thispresentationincludescertainnon-GAAPmeasuresasdefinedunderSECrules,includingnetsales,revenue,andoperatingincomeonaconstantcurrencybasis,adjustedoperatingincome,adjustedoperatingincomeonaconstantcurrencybasis,adjustedEPS,freecashflowandreturnoninvestment.Refertoinformationaboutthenon-GAAPmeasurescontainedinthispresentation.AdditionalinformationasrequiredbyRegulationGandItem10(e)ofRegulationS-Kregardingnon-GAAPmeasurescanbefoundinourmostrecentForm10-KandourForm8-KfurnishedasofthedateofthispresentationwiththeSEC,whichareavailableatwww.stock.walmart.com.
2
Safeharborandnon-GAAPmeasures

3
Fiscal2023Q2andfull-yearguidanceThefollowingguidancereflectstheCompany’supdatedexpectationsforQ2andfiscalyear2023andisprovidedonanon-GAAPbasisastheCompanycannotpredictcertainelementswhichareincludedinreportedGAAPresults,includingtheeffectsofforeignexchangetranslationandthechangesinfairvalueoftheCompany’sequityinvestments.Growthratesreflectanadjustedbasisforprioryearresults.Thecompany’sguidanceassumesagenerallystableconsumerintheU.S.,highersupplychaincosts,continuedpressurefrominflation,andmixofproductsandformatsglobally.
1WecompletedthesaleofouroperationsintheU.K.andJapaninthefirstquarteroffiscal2022.
Metric FullYearGuidance:Feb17,2022 FullYearGuidance:May17,2022Consolidatednetsales Increaseabout3%inconstantcurrency
• Excludingdivestitures1,increaseabout4%Increaseabout4%inconstantcurrency
• Excludingdivestitures1,increase4.5%to5%
Compsalesgrowth • WalmartU.S.,slightlyabove3%,ex.fuel • WalmartU.S.,about3.5%,ex.fuel
Consolidatedoperatingincome Increaseabout3%inconstantcurrency• Excludingdivestitures1,increaseataratehigherthan
netsales
Decreaseabout1%inconstantcurrency• Excludingdivestitures1,flatversuslastyear
Effectivetaxrate 25%to26% Nochange
EPS Increasemidsingle-digits• Excludingdivestitures1,increase5%to6%
Decreaseabout1%• Excludingdivestitures1,flatversuslastyear
Capitalexpenditures Upperendof2.5%to3%ofnetsaleswithafocusonsupplychain,automation,customer-facinginitiativesandtechnology Nochange
Metric Q2Guidance:Feb17,2022 Q2Guidance:May17,2022Consolidatednetsales Notprovided Increaseover5%
Compsalesgrowth Notprovided WalmartU.S.,increase4%to5%,ex.fuel
Consolidatedoperatingincome Increaselowtomidsingle-digits Flattoupslightly
EPS Increaselowtomidsingle-digits Flattoupslightly

4
Totalrevenue
$141.6+2.4%
Totalrevenue,constantcurrency1,2
$141.9+2.6%
MembershipandOtherIncome
$1.3+11.3%
Netsales2
$140.3+2.3%
Netsales,constantcurrency1
$140.7+2.6%
Grossprofitrate2
23.8%-87bps
Operatingexpenseasapercentageofnetsales2
21.0%+45bps
Operatingincome2
$5.3-23.0%
Operatingincome,constantcurrency1
$5.3-22.7%
Effectivetaxrate
27.5%AdjustedEffectivetaxrate1
24.9%EPS
$0.74-23.7%
AdjustedEPS1,2
$1.30-23.1%
WalmartInc.-Q1FY23Dollarsinbillions,exceptpershare.Changeiscalculatedasthechangeversustheprioryearcomparableperiod
1Seepressreleaselocatedatwww.stock.walmart.comandreconciliationsattheendofpresentationregardingnon-GAAPfinancialmeasures.2WhenremovingthedivestituresofU.K.andJapan:
• Totalrevenueinconstantcurrencywouldhaveincreased6.5%,excluding$5.0billioninQ1fiscal2022.• Grossprofitratewouldhavedecreased89bps,excludinga2bpsimpactinQ1fiscal2022.• Operatingexpenseasapercentageofnetsaleswouldhaveincreased39bps,excludinga6bpsimpactinQ1fiscal2022.• Operatingincomewouldhavedecreased19.7%,excluding$289millioninQ1fiscal2022.• AdjustedEPSwouldhavedecreased19.8%,excludinga$0.07impactinQ1fiscal2022.
Adj.operatingincome,constantcurrency1,2
$5.4-23.1%

1DebttototalcapitalizationcalculatedasofApril30,2022.Debtincludesshort-termborrowings,long-termdebtduewithinoneyear,financeleaseobligationsduewithinoneyear,long-termdebtandlong-termfinanceleaseobligations.TotalcapitalizationincludesdebtandtotalWalmartshareholders'equity.
2Calculatedforthetrailing12monthsendedApril30,2022.ForROI,seereconciliationsattheendofpresentationregardingnon-GAAPfinancialmeasures.5
Receivables,net Debttocapitalization1
$7.7 40.4%+32.4% +220bps
Inventories Returnonassets2
$61.2 5.5%+32.0% +20bps
Accountspayable Returnoninvestment2
$52.9 13.9%+9.9% -50bps
WalmartInc.-Q1FY23Dollarsinbillions.Changeiscalculatedasthechangeversustheprioryearcomparableperiod

1Seepressreleaselocatedatwww.stock.walmart.comandreconciliationsattheendofthispresentationregardingnon-GAAPfinancialmeasures.2$8.3billionremainingof$20billionauthorizationapprovedinFebruary2021.Thecompanyrepurchasedapproximately17millionsharesinQ1fiscal2023. 6
Operatingcashflow Dividends
-$3.8 $1.5-$6.6
Capitalexpenditures Sharerepurchases2
$3.5 $2.4+$1.3
Freecashflow1 Totalshareholderreturns
-$7.3 $4.0-$7.9
WalmartInc.-Q1FY23Dollarsinbillions.Dollarchangesmaynotrecalculateduetorounding.Changeiscalculatedasthechangeversustheprioryearcomparableperiod

7
NetSales
$96.9+4.0%
eCommercenetsalesgrowth
+1%eCommercecontributiontocomp1
-30bps
Inventory
Total:+33.4%
Comparablesales1
3.0%Comparabletransactions
flatComparableaverageticket
3.0%
• Continuedstronggrocerymarketsharegains
• eCommercesalesincreased38%onatwo-yearstack
• Compsalesincreased,ledbystrengthinfoodcategories,despitelappinglastyear'sstimulus-relatedsales
• Compsalesup9.0%ontwo-yearstack
• Onatwo-yearstack,compticketincreased12.5%
Remodels:>75stores
Pickup:~4,600locations
Same-daydelivery:>3,600stores
• Increasereflectshighercostofgoodsduetoinflationandaggressiveinventorybuysoverthepastfewquarters
1Compsalesforthe13-weekperiodendedApril29,2022comparedtothe13-weekperiodendedApril30,2021,andexcludesfuel.
WalmartU.S.-Q1FY23Dollarsinbillions.Changeiscalculatedasthechangeversustheprioryearcomparableperiod

8
Grossprofitrate
-38bpsOperatingincome
$4.5-18.2%
Operatingexpenserate
+95bps
• Three-quartersofthedeclinerelatedtohigher-than-expectedsupplychaincosts,includingfuelandeCommercefulfillment
• CategorymixshiftstowardgrocerypressuredtheGPratedueinparttolappingstimulusspendinglastyear
• Generalmerchandisemarkdownswere$100Mmorethanexpected
• Managingpricesduetohighercostinflation
• Expensesdeleverageddueprimarilytoincreasedwagecostsrelatedtolastyear'shourlywageinvestmentsandassociatesreturningfromCovidleavemorerapidlythananticipated
• TotalCOVIDcostswerelowerby~$0.2billion
Adj.operatingincome1
$4.5-18.2%
WalmartU.S.-Q1FY23Dollarsinbillions.Changeiscalculatedasthechangeversustheprioryearcomparableperiod
1Seepressreleaselocatedatwww.stock.walmart.comandreconciliationsattheendofpresentationregardingnon-GAAPfinancialmeasures.
• Grossmarginandexpensepressurewerepartlyoffsetbysolidgrowthinmembershipandotherincome

WalmartU.S.-quarterlymerchandisehighlights
9
Category Compsales Details
Grocery +lowdouble-digits
• Salesgrowthledbystrengthinfood(+lowdouble-digits);reflectedcontinuedmarketsharegains(accordingtoNielsen);onatwo-yearstack,salesincreasedbyhighsingle-digits
• Foodcategoriesincreasedbymid-20%onathree-yearstack
• Consumablesledbystrengthinpetcategoriesdueinparttoinflation
Health&wellness +highsingle-digits • Strongpharmacysalesprimarilyreflectedfavorablemixandbrandeddruginflation;saleswereuphigh-teensonatwo-yearstack
Generalmerchandise -lowdouble-digits
• Softnessindiscretionarycategoriesaswelappedstrongsaleslastyearduetostimulusspending
• Unseasonablycoolweatherpressuredsalesinapparel,patiofurnitureandlandscapingsupplies
• Generalmerchandisesalesincreasedhighsingle-digitsonatwo-yearstack

• Divestituresaccountedfordeleverage;retainedmarketleveragewasflat
• Increasereflectshighercostsofgoodsduetoinflationandincreasedinventorybuysoverthepastfewquarterstoaddressglobalsupplychainconstraints
10
1Seepressreleaselocatedatwww.stock.walmart.comandreconciliationsattheendofpresentationregardingnon-GAAPfinancialmeasures.2WhenremovingthedivestituresofU.K.,JapanandArgentina
• WalmartInternationalnetsalesandnetsalesinconstantcurrencywouldhaveincreased6.3%and8.0%,respectively,excluding5.0billioninQ1fiscal2022.• WalmartInternationaleCommercenetsalesinconstantcurrencywouldhaveincreased22%,excluding$0.7billioninQ1fiscal2022,andonatwo-yearstackbasiswouldhaveincreased86%,excluding$0.7billioninQ1fiscal2021• WalmartInternationaloperatingincomeinconstantcurrencywouldhavedecreased12.5%,excluding$289millioninQ1fiscal2022.
Inventory
$11.1+20.5%
Grossprofitrate
-108bpsOperatingincome
$0.8-35.3%
Netsales,constantcurrency1,2
$24.1-11.6%
Operatingexpenserate
+12bps
Operatingincome,constantcurrency1,2
$0.8-33.7%
• Negativelyaffectedby36bpsfromdivestitures
• Retainedmarketgrossprofitratedecreaseof72bps
◦ Duetomarkdownsfromslowersalesgrowth,aswellasongoinggrowthinSam'sClubandeCommercesalesinChina
Netsales2
$23.8-13.0%
WalmartInternational-Q1FY23Dollarsinbillions.Dollarchangesmaynotrecalculateduetorounding.Changeiscalculatedasthechangeversustheprioryearcomparableperiod
• Divestituresaccountedforareductionof$289million
• Retainedmarketdeclineof14.7%,12.5%inconstantcurrency,
◦ DecreaseduetolowergrossprofitinChinaandplannedinvestmentsineCommerce
Adj.operatingincome1
$0.9-26.3%
• Divestituresaccountedforareductionof$5.0billion
• Retainedmarketgrowthof6.3%,and8.0%inconstantcurrency◦ StrongsalesgrowthinMexico,Canada,andChile;slowerthanexpectedgrowthinChina
◦ StronggrowthineCommerce,contributing18.2%oftotalnetsales
◦ Growthinfoodandconsumablesoutpacedgeneralmerchandise
Adj.operatingincome,constantcurrency1,2
$0.9-24.5%
• Retainedmarketgrowthof2.7%
• Retainedmarketgrowthof0.8%

• Salesgrowthacceleratedthroughoutthequarter
• StrengthinGroceryandFreshcategories
• eCommercenetsales-4%
◦ Two-yearstack+112%
1WalmexincludestheconsolidatedresultsofMexicoandCentralAmerica.
11
Walmex1 China Canada
Netsalesgrowth +10.4% +7.2% +6.9%
Comparablesales +9.2% +4.4% +7.7%
Comparabletransactions +6.2% +0.2% +10.6%
Comparableticket +2.8% +4.2% -2.5%
• DoubledigitgrowthwithstrengthinfoodcategoriesandtheBodegaformatinMexicoandCentralAmerica
• Increasedpricegapvscompetitorsby160bps
• InMexico,compsalesincreased+9.0%
• MexicoeCommercenetsales+19%◦ Two-yearstack+185%
• Strengthinconsumablescategorydrivingsalesgrowth
• Covidrestrictionsanddeliveryconstraintsledtoslowerthanexpectedgrowth
• eCommercenetsales+89%
◦ Two-yearstack+149%
WalmartInternational-Q1FY23Resultsarepresentedonaconstantcurrencybasis.Netsalesandcompsalesarepresentedonanominal,calendarbasisandincludeeCommerceresults.Changeiscalculatedasthechangeversustheprioryearcomparableperiod.
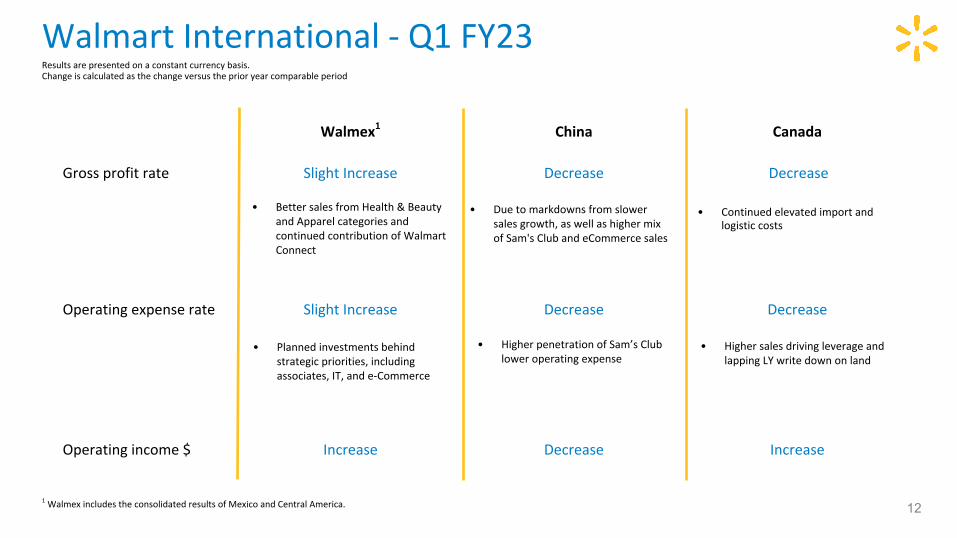
• HighersalesdrivingleverageandlappingLYwritedownonland
• HigherpenetrationofSam’sClubloweroperatingexpense
• Continuedelevatedimportandlogisticcosts
1WalmexincludestheconsolidatedresultsofMexicoandCentralAmerica.
12
Walmex1 China Canada
Grossprofitrate SlightIncrease Decrease Decreasex
• BettersalesfromHealth&BeautyandApparelcategoriesandcontinuedcontributionofWalmartConnect
• Duetomarkdownsfromslowersalesgrowth,aswellashighermixofSam'sClubandeCommercesales
Operatingexpenserate SlightIncrease Decrease Decrease
Operatingincome$ Increase Decrease Increase
WalmartInternational-Q1FY23Resultsarepresentedonaconstantcurrencybasis.Changeiscalculatedasthechangeversustheprioryearcomparableperiod
• Plannedinvestmentsbehindstrategicpriorities,includingassociates,IT,ande-Commerce

13
+10.2%Comparablesales
+10.0%Comparabletransactions
+0.2%Averagecomparableticket
~150bpseCommercecontribution
$16,532+11%
Netsales
+10.5%Membershipincome
-219bpsGrossprofitrate
-63bpsOperatingexpenserate
$335-36.8%
Operatingincome
WithFuel WithoutFuel
Comparablesales1
+17.0%
Netsales
$19.6+17.5%
eCommercenetsalesgrowth
+22%
Comparablesales
+17%
Membershipincome
+10.5%
Grossprofitrate
-216bps
Operatingexpenserate
-117bps
Inventory
$7.1+44.6%
Operatingincome
$0.5(20.0)%
• Solidmembershiptrendswithrecordtotalmembercount
• Pluspenetrationincreased~290bps,reachinganotherall-timehigh
• Highersalespositivelyaffectedoperatingexpenseleverage
• COVID-relatedcostswerelowerby~$33mil.andbenefitedexpenseleverageby~20bps
• Highersupplychaincosts,elevatedinflation,andmarkdownscausedbyinventorydelays
• Strongcontributionfrombothdirect-to-homeandcurbside
• Strongcompsalesgrowthdrivenbylowdouble-digitincreaseintransactionsaswellasinflation
• Compsalesincreased28.1%onatwo-yearstackbasis
• Strengthacrossmostcategories,ledbyfood
• Tobacconegativelyaffectedcompsales
1Compsalesforthe13-weekperiodendedApril29,2022comparedtothe13-weekperiodendedApril30,2021.
• Increasereflectsinventorybuildtosupporthighersalestrendsandinflation
Sam'sClub-Q1FY23Dollarsinbillions.Changeiscalculatedasthechangeversustheprioryearcomparableperiod

14
$19,621+17.5%NetSales
+33%eCommercenetsalesgrowth
+17%Comparablesales
-216bpsGrossprofitrate
-117bpsOperatingexpenserate
$460(20)%
Operatingincome
WithoutFuel
Netsales
$16.5+10.7%
Operatingexpenserate
-63bps
Grossprofitrate
-219bps
Operatingincome
$0.3-36.8%
Comparabletransactions
+10.0%
Comparablesales1,2
+10.2%
eCommercecontribution
~150bps
Averagecomparableticket
+0.2%
1Compsalesforthe13-weekperiodendedApril29,2022comparedtothe13-weekperiodendedApril30,2021,andexcludesfuel.2Tobacconegativelyaffectedcompsalesforthe13-weekperiodendedApril29,2022by40basispoints.Onatwo-yearstack,tobacconegativelyaffectedcompsalesby380basispoints.
Sam'sClub-Q1FY23Dollarsinbillions.Changeiscalculatedasthechangeversustheprioryearcomparableperiod
• Onatwo-yearstack,averagecompticketincreased5.1%
• Onatwo-yearstack,compsalesincreased17.4%
• Onatwo-yearstack,comptransactionsincreased12.2%

15
Category Compsales Details
Fresh/Freezer/Cooler +mid-teens • Freshmeat,produce&floral,cooler,anddeliperformedwell
Groceryandbeverage +high-teens • Drygrocery,drinksandchipsshowedstrength
Consumables +mid-teens • Petsupplies,laundry&homecare,andbabycareperformedwell
Homeandapparel -lowsingle-digit • Homewassoftduetolappingstimuluslastyearandcontinuedsupplychainconstraints,partiallyoffsetbyapparel,outdoorliving,andtiresstrength
Technology,officeandentertainment -highsingle-digit • Consumerelectronicsweresoftduetolappingstimuluslastyear,partiallyoffsetbygift
cardsstrength
Healthandwellness +midsingle-digit • Healthcareandoverthecounterwerestrong
Sam'sClub-quarterlyfinancialhighlights
WeincludeReturnonAssets("ROA"),whichiscalculatedinaccordancewithU.S.generallyacceptedaccountingprinciples("GAAP")aswellasReturnonInvestment("ROI")asmeasurestoassessreturnsonassets.ManagementbelievesROIisameaningfulmeasuretosharewithinvestorsbecauseithelpsinvestorsassesshoweffectivelyWalmartisdeployingitsassets.TrendsinROIcanfluctuateovertimeasmanagementbalanceslong-termstrategicinitiativeswithpossibleshort-termimpacts.WeconsiderROAtobethefinancialmeasurecomputedinaccordancewithGAAPthatisthemostdirectlycomparablefinancialmeasuretoourcalculationofROI.
ROAwas5.5percentand5.3percentforthetrailing12monthsendedApril30,2022and2021,respectively.TheincreaseinROAwasprimarilyduetotheincreaseinnetincome.ROIwas13.9percentand14.4percentforthetrailing12monthsendedApril30,2022and2021,respectively.ThedecreaseinROIwasprimarilyduetotheincreaseinaveragetotalassetsdrivenbyhigherinventories.
WedefineROIasadjustedoperatingincome(operatingincomeplusinterestincome,depreciationandamortization,andrentexpense)forthetrailingtwelvemonthsdividedbyaverageinvestedcapitalduringthatperiod.Weconsideraverageinvestedcapitaltobetheaverageofourbeginningandendingtotalassets,plusaverageaccumulateddepreciationandaverageamortization,lessaverageaccountspayableandaverageaccruedliabilitiesforthatperiod.
OurcalculationofROIisconsideredanon-GAAPfinancialmeasurebecausewecalculateROIusingfinancialmeasuresthatexcludeandincludeamountsthatareincludedandexcludedinthemostdirectlycomparableGAAPfinancialmeasure.Forexample,weexcludetheimpactofdepreciationandamortizationfromourreportedoperatingincomeincalculatingthenumeratorofourcalculationofROI.Asmentionedabove,weconsiderROAtobethefinancialmeasurecomputedinaccordancewithGAAPmostdirectlycomparabletoourcalculationofROI.ROIdiffersfromROA(whichisconsolidatednetincomefortheperioddividedbyaveragetotalassetsfortheperiod)becauseROI:adjustsoperatingincometoexcludecertainexpenseitemsandaddsinterestincome;andadjuststotalassetsfortheimpactofaccumulateddepreciationandamortization,accountspayableandaccruedliabilitiestoarriveattotalinvestedcapital.Becauseoftheadjustmentsmentionedabove,webelieveROImoreaccuratelymeasureshowwearedeployingourkeyassetsandismoremeaningfultoinvestorsthanROA.AlthoughROIisastandardfinancialmeasure,numerousmethodsexistforcalculatingacompany'sROI.Asaresult,themethodusedbymanagementtocalculateourROImaydifferfromthemethodsusedbyothercompaniestocalculatetheirROI.
16
Non-GAAPmeasures-ROI

ThecalculationofROAandROI,alongwithareconciliationofROItothecalculationofROA,isasfollows:
17
3 Upon adoption of ASU 2016-02, Leases, a factor of eight times rent is no longer included in the calculation of ROI on a prospective basis as operating lease assets are now recorded on the Consolidated Balance Sheet.
1 The average is based on the addition of the account balance at the end of the current period to the account balance at the end of the prior period and dividing by 2.
2 The average is based on the addition of 'total assets without leased assets, net' at the end of the current period to 'total assets without leased assets, net' at the end of the prior period and dividing by 2, plus 'leased assets, net' at the end of the current period.
3 The average is based on the addition of 'accumulated depreciation and amortization, without leased assets' at the end of the current period to 'accumulated depreciation and amortization, without leased assets' at the end of the prior period and dividing by 2, plus 'accumulated amortization on leased assets' at the end of the current period.
NP = not provided
CALCULATIONOFRETURNONASSETS CALCULATIONOFRETURNONINVESTMENT
TrailingTwelveMonths TrailingTwelveMonths
Ended April30, Ended April30,(Dollarsinmillions) 2022 2021 (Dollarsinmillions) 2022 2021Numerator NumeratorConsolidatednetincome $ 13,232 $ 12,443 Operatingincome $ 24,351 $ 24,233Denominator +Interestincome 163 108Averagetotalassets1 $ 241,362 $ 234,737 +Depreciationandamortization 10,679 11,022Returnonassets(ROA) 5.5% 5.3% +Rent 2,270 2,534
ROIoperatingincome $ 37,463 $ 37,897
April30, DenominatorCertainBalanceSheetData 2022 2021 2020 Averagetotalassets1 $ 241,362 $ 234,737
Totalassets $ 246,142 $ 236,581 $ 232,892'+Averageaccumulateddepreciationandamortization1 100,315 95,424
Accumulateddepreciationandamortization 104,295 96,334 94,514 '-Averageaccountspayable1 50,539 46,124Accountspayable 52,926 48,151 44,096 '-Averageaccruedliabilities1 21,216 20,874
Accruedliabilities 21,061 21,371 20,377 Averageinvestedcapital $ 269,922 $ 263,163
Returnoninvestment(ROI) 13.9% 14.4%
1Theaverageisbasedontheadditionoftheaccountbalanceattheendofthecurrentperiodtotheaccountbalanceattheendofthepriorperiodanddividingby2.
Non-GAAPmeasures-ROI(cont.)
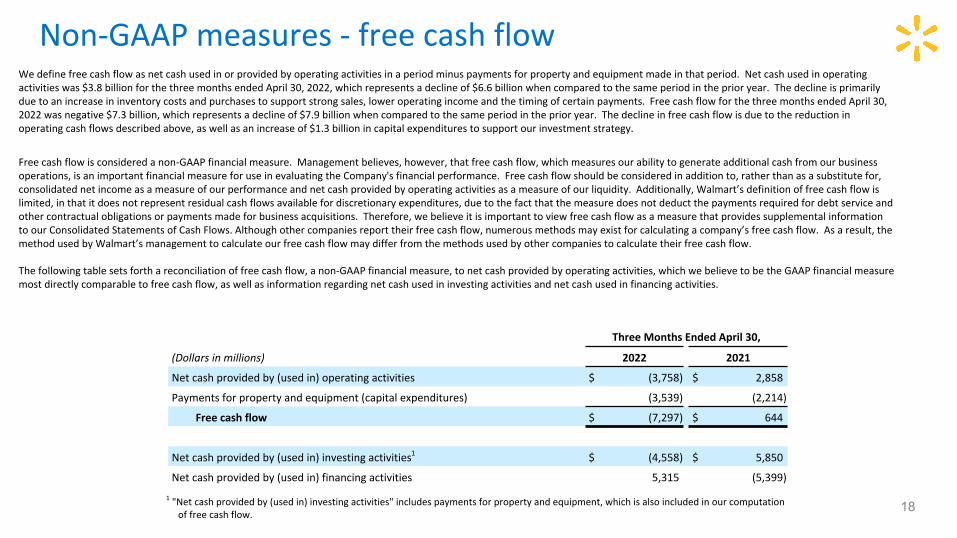
1"Netcashprovidedby(usedin)investingactivities"includespaymentsforpropertyandequipment,whichisalsoincludedinourcomputationoffreecashflow.
18
Wedefinefreecashflowasnetcashusedinorprovidedbyoperatingactivitiesinaperiodminuspaymentsforpropertyandequipmentmadeinthatperiod.Netcashusedinoperatingactivitieswas$3.8billionforthethreemonthsendedApril30,2022,whichrepresentsadeclineof$6.6billionwhencomparedtothesameperiodintheprioryear.Thedeclineisprimarilyduetoanincreaseininventorycostsandpurchasestosupportstrongsales,loweroperatingincomeandthetimingofcertainpayments.FreecashflowforthethreemonthsendedApril30,2022wasnegative$7.3billion,whichrepresentsadeclineof$7.9billionwhencomparedtothesameperiodintheprioryear.Thedeclineinfreecashflowisduetothereductioninoperatingcashflowsdescribedabove,aswellasanincreaseof$1.3billionincapitalexpenditurestosupportourinvestmentstrategy.
Freecashflowisconsideredanon-GAAPfinancialmeasure.Managementbelieves,however,thatfreecashflow,whichmeasuresourabilitytogenerateadditionalcashfromourbusinessoperations,isanimportantfinancialmeasureforuseinevaluatingtheCompany'sfinancialperformance.Freecashflowshouldbeconsideredinadditionto,ratherthanasasubstitutefor,consolidatednetincomeasameasureofourperformanceandnetcashprovidedbyoperatingactivitiesasameasureofourliquidity.Additionally,Walmart’sdefinitionoffreecashflowislimited,inthatitdoesnotrepresentresidualcashflowsavailablefordiscretionaryexpenditures,duetothefactthatthemeasuredoesnotdeductthepaymentsrequiredfordebtserviceandothercontractualobligationsorpaymentsmadeforbusinessacquisitions.Therefore,webelieveitisimportanttoviewfreecashflowasameasurethatprovidessupplementalinformationtoourConsolidatedStatementsofCashFlows.Althoughothercompaniesreporttheirfreecashflow,numerousmethodsmayexistforcalculatingacompany’sfreecashflow.Asaresult,themethodusedbyWalmart’smanagementtocalculateourfreecashflowmaydifferfromthemethodsusedbyothercompaniestocalculatetheirfreecashflow.
Thefollowingtablesetsforthareconciliationoffreecashflow,anon-GAAPfinancialmeasure,tonetcashprovidedbyoperatingactivities,whichwebelievetobetheGAAPfinancialmeasuremostdirectlycomparabletofreecashflow,aswellasinformationregardingnetcashusedininvestingactivitiesandnetcashusedinfinancingactivities.
ThreeMonthsEndedApril30,
(Dollarsinmillions) 2022 2021
Netcashprovidedby(usedin)operatingactivities $ (3,758) $ 2,858
Paymentsforpropertyandequipment(capitalexpenditures) (3,539) (2,214)
Freecashflow $ (7,297) $ 644
Netcashprovidedby(usedin)investingactivities1 $ (4,558) $ 5,850
Netcashprovidedby(usedin)financingactivities 5,315 (5,399)
Non-GAAPmeasures-freecashflow

1Changeversusprioryearcomparableperiod.2WalmartInternationaleCommercenetsaleswere$4.3billionforthethreemonthsendedApril30,2022,whichwasnegativelyimpactedby$54millionofcurrencyexchangeratefluctuations.3WalmartInternationaleCommercenetsaleswereflatonareportedbasisandincreased1%inconstantcurrencyforthethreemonthsendedApril30,2022.
19
Indiscussingouroperatingresults,thetermcurrencyexchangeratesreferstothecurrencyexchangeratesweusetoconverttheoperatingresultsforcountrieswherethefunctionalcurrencyisnottheU.S.dollarintoU.S.dollars.Wecalculatetheeffectofchangesincurrencyexchangeratesasthedifferencebetweencurrentperiodactivitytranslatedusingthecurrentperiod'scurrencyexchangeratesandthecomparableprioryearperiod'scurrencyexchangerates.Additionally,nocurrencyexchangeratefluctuationsarecalculatedfornon-USDacquisitionsuntilownedfor12months.Throughoutourdiscussion,werefertotheresultsofthiscalculationastheimpactofcurrencyexchangeratefluctuations.Whenwerefertoconstantcurrencyoperatingresults,thismeansoperatingresultswithouttheimpactofthecurrencyexchangeratefluctuations.ThedisclosureofconstantcurrencyamountsorresultspermitsinvestorstobetterunderstandWalmart’sunderlyingperformancewithouttheeffectsofcurrencyexchangeratefluctuations.Thetablebelowreflectsthecalculationofconstantcurrencyfortotalrevenues,netsalesandoperatingincomeforthethreemonthsendedApril30,2022.
ThreeMonthsEndedApril30,2022
2022PercentChange1 2022
PercentChange1
(Dollarsinmillions) WalmartInternational ConsolidatedTotalrevenues:Asreported $ 24,101 -12.9% $ 141,569 2.4%Currencyexchangeratefluctuations 377 N/A 377 N/AConstantcurrencytotalrevenues $ 24,478 -11.5% $ 141,946 2.6%
Netsales2,3:Asreported $ 23,763 -13.0% $ 140,288 2.3%Currencyexchangeratefluctuations 376 N/A 376 N/AConstantcurrencynetsales $ 24,139 -11.6% $ 140,664 2.6%
Operatingincome:Asreported $ 772 -35.3% $ 5,318 -23.0%Currencyexchangeratefluctuations 20 N/A 20 N/AConstantcurrencyoperatingincome $ 792 -33.7% $ 5,338 -22.7%
Non-GAAPmeasures-constantcurrency
1Changeversusprioryearcomparableperiod.2ConsolidatedeCommercenetsaleswere$21.9billionand$13.3billionforthethreemonthsendedJanuary31,2022and2020,respectively.3WalmartInternationaleCommercenetsaleswere$5.8billionand$18.5billionforthethreemonthsandfiscalyearendedJanuary31,2022,andwerenegativelyimpactedby$30millionand
positivelyimpactedby$471millionofcurrencyexchangeratefluctuations,respectively.4WalmartInternationaleCommercenetsalesdecreased5%onareportedbasisand5%inconstantcurrencyandincreased11%onareportedbasisand8.7%inconstantcurrencyforthethree
andfiscalyearendedJanuary31,2022,respectively.
20
AdjusteddilutedearningspershareattributabletoWalmart(AdjustedEPS)isconsideredanon-GAAPfinancialmeasureundertheSEC’srulesbecauseitexcludescertainamountsincludedinthedilutedearningspershareattributabletoWalmartcalculatedinaccordancewithGAAP(EPS),themostdirectlycomparablefinancialmeasurecalculatedinaccordancewithGAAP.ManagementbelievesthatAdjustedEPSisameaningfulmeasuretosharewithinvestorsbecauseitbestallowscomparisonoftheperformancewiththatofthecomparableperiod.Inaddition,AdjustedEPSaffordsinvestorsaviewofwhatmanagementconsidersWalmart’scoreearningsperformanceandtheabilitytomakeamoreinformedassessmentofsuchcoreearningsperformancewiththatoftheprioryear.
Weadjustfortheunrealizedandrealizedgainsandlossesonourequityinvestmentseachquarterbecausealthoughtheinvestmentsarestrategicdecisionsforthecompany’sretailoperations,management’smeasurementofeachstrategyisprimarilyfocusedontheoperationalresultsratherthanthefairvalueofsuchinvestments.Additionally,managementdoesnotforecastchangesinthefairvalueofitsequityinvestments.Accordingly,managementadjustsEPSeachquarterfortherealizedandunrealizedgainsandlossesrelatedtothoseequityinvestments.
WehavecalculatedAdjustedEPSforthethreemonthsendedApril30,2022byadjustingEPSforunrealizedandrealizedgainsandlossesonthecompany’sequityinvestments.
Non-GAAPmeasures-adjustedEPS

21
1Changeversusprioryearcomparableperiod.2Calculatedbasedonnatureofitem,includinganyrealizabledeductions,andstatutoryrateineffectforrelevantjurisdictions.3Thereportedeffectivetaxratewas27.5%forthethreemonthsendedApril30,2022.Adjustedfortheaboveitem,theeffectivetaxratewas24.9%forthethreemonthsendedApril30,2022.
ThreeMonthsEndedApril30,2022
PercentChange1
Dilutedearningspershare:
ReportedEPS $ 0.74 (23.7%)
Adjustments:Pre-TaxImpact
TaxImpact2,3
NetImpact
Unrealizedandrealized(gains)andlossesonequityinvestments $ 0.71 $ (0.15) $ 0.56
Netadjustments $ 0.56
AdjustedEPS $ 1.30 (23.1%)
Non-GAAPmeasures-adjustedEPS(cont.)

22
AspreviouslydisclosedinourfirstquarterendedApril30,2021pressrelease,wehavecalculatedAdjustedEPSforthethreemonthsendedApril30,2021byadjustingEPSforthefollowing:(1)theincrementallossonsaleofouroperationsintheU.K.andJapanduringthefirstquarteroffiscal2022;and(2)unrealizedandrealizedgainsandlossesonthecompany’sequityinvestments.
ThreeMonthsEndedApril30,2021
Dilutedearningspershare:
ReportedEPS $ 0.97
Adjustments:Pre-TaxImpact
TaxImpact1,2 NetImpact
Unrealizedandrealized(gains)andlossesonequityinvestments 0.74 (0.17) 0.57
IncrementallossonsaleofouroperationsintheU.K.andJapan 0.15 — 0.15
Netadjustments $ 0.72
AdjustedEPS $ 1.69
Non-GAAPmeasures-adjustedEPS(cont.)
1Calculatedbasedonnatureofitem,includinganyrealizabledeductions,andstatutoryrateineffectforrelevantjurisdictions.Minimalrealizabletaxbenefitwasprovidedinconnectionwiththeincrementallossonsale.
2Thereportedeffectivetaxratewas26.9%forthethreemonthsendedApril30,2021.Adjustedfortheaboveitems,theeffectivetaxratewas23.3%forthethreemonthsendedApril30,2021.

• Unitcounts&squarefootage• Comparablestoresales,includingandexcludingfuel• Terminology
23
Additionalresourcesatstock.walmart.com