rautaruukki corporation interim report 2013 q1 - ssab
TRANSCRIPT
www.ruukki.com
INTERIM REPORT1 Jan-31 Mar 2013RTRKS
25 April 2013 RAUTARUUKKI CORPORATION
Q1
Rautaruukki Corporation Interim report Q1/2013 1
Rautaruukki Corporation Stock exchange release 25 April 2013 at 9am EEST
RAUTARUUKKI CORPORATION INTERIM REPORT Q1/2013:
EFFICIENCY PROGRAMMES IMPROVED PROFITABILITY January-March 2013 (Q1/2012) - Net cash from operating activities was EUR 22 million (54). - Order intake was down 7% at EUR 590 million (634). - Comparable net sales were down 16% at EUR 590 million (699). This decrease was mostly due to divestment of the Engineering business at the end of 2012. - Comparable operating profit was EUR 5 million (-15). - Comparable result before taxes was -EUR 3 million (-25).
Guidance for 2013 remains unchanged Comparable net sales in 2013 are estimated to be at the same level as in 2012. Comparable operating profit is estimated to improve compared to 2012 and to be positive.
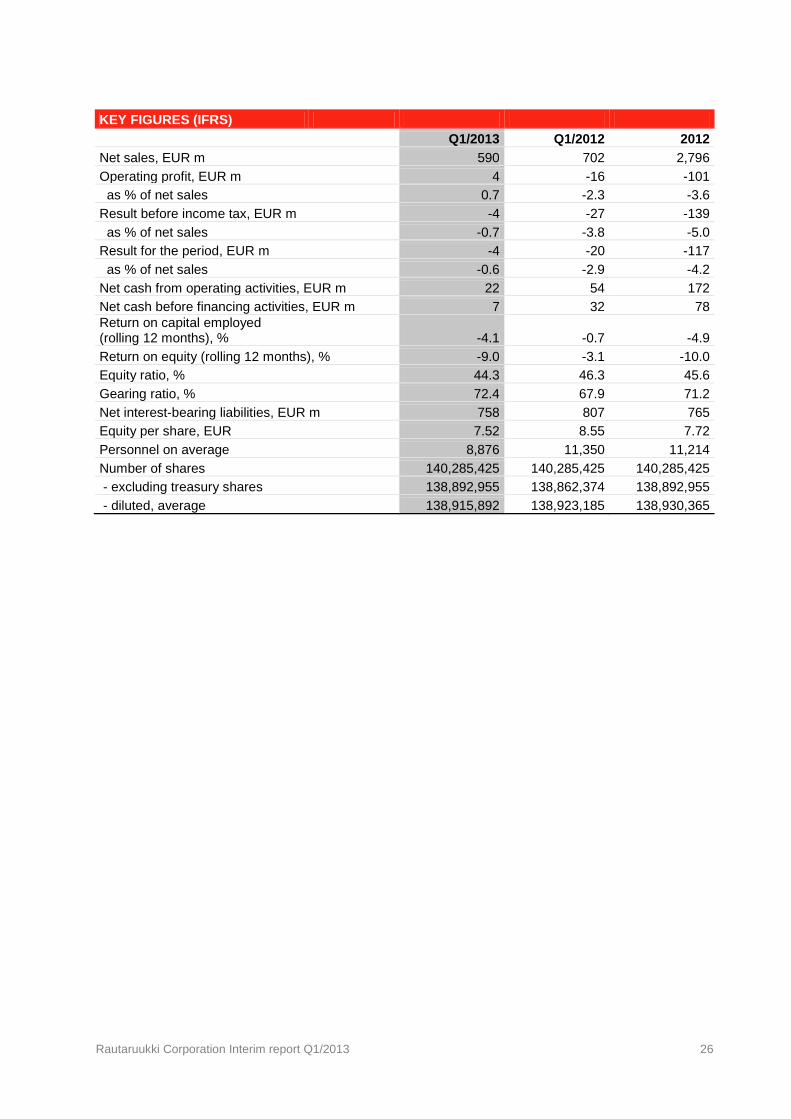
KEY FIGURES Q1/13 Q1/12 2012 Comparable figures Comparable net sales, EUR m 590 699 2,789 Comparable operating profit, EUR m 5 -15 -65 Comparable operating profit as % of net sales 0.8 -2.2 -2.3 Comparable result before income tax, EUR m -3 -25 -103 Reported figures Reported net sales, EUR m 590 702 2,796 Reported operating profit, EUR m 4 -16 -101 Reported result before income tax, EUR m -4 -27 -139 Net cash from operating activities, EUR m 22 54 172 Net cash before financing activities, EUR m 7 32 78 Earnings per share, EUR -0.03 -0.15 -0.85 Return on capital employed (rolling 12 months), % -4.1 -0.7 -4.9 Return on capital employed (annualised), % 0.8 -2.9 -4.9 Gearing ratio, % 72.4 67.9 71.2 Equity ratio, % 44.3 46.3 45.6 Personnel on average 8,876 11,350 11,214
Rautaruukki Corporation Interim report Q1/2013 2
President & CEO Sakari Tamminen
Uncertainty in the eurozone continued and the area was in recession during the first quarter of 2013. Economic development continued also to show regional differences. Market sentiment was and is wait-and-see. The emerging markets and the United States are forecast to maintain global growth. As regards Ruukki’s most important markets, Sweden upgraded its growth forecast, whereas forecasts in Russia were downgraded due to weakened domestic demand and fewer investments. Many forecasts do not expect the eurozone economy, underpinned by export-driven demand, to return to growth until the second half of 2013 or in early 2014.
Improved earnings performance was mainly attributable to efficiency improvement projects we initiated about a year ago across our businesses and to favourable price development of raw material costs. These efficiency projects have progressed to plan and during the first quarter this year generated cost benefits totalling around EUR 18 million in addition to around EUR 20 million in earnings improvement achieved last year. The annualised cost impact of ongoing projects was around EUR 70 million at the end of March. It is now estimated that the savings of around EUR 100 million sought will be achieved and that the improvement in earnings performance will be visible in full from the third quarter of this year onwards.
Significantly improved earnings performance in our steel business, both year on year and quarter on quarter, turned comparable consolidated operating profit back into the black. Compared to the previous quarter, improved earnings performance was also visible as positive cash flow of EUR 22 million from operating activities. Net working capital to sales was unchanged quarter on quarter at 18%. Order intake in the construction business was up 4% year on year, whereas order intake in the steel business was down 10%. Ruukki’s net sales were clearly at a lower level compared to a year earlier. This was largely due to withdrawal from the engineering business at the end of last year.
Operating profit in our construction business improved year on year as a result of the efficiency programme, but was down quarter on quarter due to normal seasonality. Order intake for residential roofing products was at the same level as a year earlier, which is in line with market growth expectations. Ruukki’s focus on its own distribution in roofing products was visible as higher than market growth last year and it is my view that this performance can be repeated also during the current year. Our order intake for commercial and industrial construction was up clearly compared to a year earlier. Russia and Sweden accounted for most of the growth, whereas activity in Finland was more modest. Order intake included new project orders in Sweden and in Russia order intake was up both for concept buildings and steel structure projects.
The clear improvement in profitability compared to the previous quarter in our steel business was attributable to higher delivery volumes, better product mix, lower costs and optimum use of raw materials, together with cost savings achieved. The comparable share of special steel products reported for previous years rose year on year to account for 32% (30) of net sales in our steel business.
Overcapacity in the steel industry in Europe means that price development depends not just on demand, but also greatly on the price development of main raw materials. It is estimated that steel wholesalers have now restocked and this might weaken demand during the second quarter. There are good prospects for Ruukki to grow its share of special steels because our product portfolio and quality, together with our sales and distribution network, provide a strong platform for growth.
My expectations for 2013 are mildly optimistic thanks to our actions to improve efficiency and the business choices we have made, even though we cannot expect any significant help from a pick-up in the market. Comparable net sales in 2013 are estimated to be at the same level as in 2012. Comparable operating profit is estimated to improve compared to 2012 and to be positive.
Rautaruukki Corporation’s full interim report for January-March 2013 is attached to this release.
Rautaruukki Corporation Interim report Q1/2013 3
For further information, please contact Sakari Tamminen, President & CEO, tel. +358 20 592 9075 Markku Honkasalo, CFO, tel. +358 20 592 8840
News conference for analysts and the media A joint news conference in English both for analysts and the media will be hosted on Thursday 25 April at 10.30am at Ruukki, Suolakivenkatu 1, 00810 Helsinki.
A live webcast of the event and the presentation by the company's President & CEO Sakari Tamminen may be followed online on the company website at www.ruukki.com/Investors starting at 10.30am EEST. This event can also be attended through a conference call by dialling the number below 5-10 minutes before the scheduled time: +44 207 1620 177 (calls outside Finland) +358 9 2313 9202 (calls inside Finland) Access code: 930974
A replay of the webcast can be viewed on the company’s website from no later than 4pm EEST onwards. A recording of the conference call will be available until 3 May 2013 at: +44 20 7031 4064 (calls outside Finland) +358 9 2314 4681 (calls inside Finland) Access code: 930974
Rautaruukki Corporation Taina Kyllönen SVP, Marketing and Communications
Ruukki specialises in steel and steel construction. We provide customers with energy-efficient steel solutions for better living, working and moving. We have around 9,000 employees and an extensive distribution and dealer network across some 30 countries including the Nordic countries, Russia and elsewhere in Europe and the emerging markets, such as India, China and South America. Net sales in 2012 totalled EUR 2.8 billion. The company's share is quoted on NASDAQ OMX Helsinki (Rautaruukki Oyj: RTRKS). www.ruukki.com
DISTRIBUTION: NASDAQ OMX Helsinki Main media www.ruukki.com
Rautaruukki Corporation Interim report Q1/2013 4
RAUTARUUKKI CORPORATION’S INTERIM REPORT FOR JANUARY-MARCH 2013 Business environment European economic development continued to be weak and regionally uneven during the first quarter of the year. Growth expectations remained low key in most countries. Recession and the wait-and-see sentiment of the markets resulted in uncertainty in customer demand. In economies outside Europe, some signs of recovery were visible especially in the United States and China. As regards Ruukki’s most important economies, growth forecasts were upgraded in Sweden, whereas forecasts in Russia were downgraded due to weakened domestic demand and fewer investments. Construction in Europe was at a low level because of weak economic conditions and seasonality in the construction industry. In Finland, overall construction activity was modest and the number of building permits granted in the early part of the year was at a lower level also compared to a year earlier. On a positive note, in the other Nordic countries growth in commercial and industrial construction, as well as in residential construction, was somewhat more favourable. Besides Sweden and Norway, growth in commercial and industrial construction was also seen in Russia. In Poland, construction activity began to weaken in the second half of 2012 and this spilled over into the first quarter of the current year. Apparent steel demand in the EU-27 region during the first quarter of 2013 was at a clearly lower level year on year, but was up quarter on quarter. Steel wholesalers restocked during the early part of the year and, since the end of 2012, inventories levels in Europe had risen to a normal level compared to sales by the end of the report period. Average market prices for steel products in Europe rose during January-February, but the rise levelled off during March because of growing market uncertainty and the completion of restocking. The market prices of iron ore and coking coal, the main raw materials in steel production, continued to rise during January-February, but started to fall in March. At the end of the first quarter, prices were again at the same level as at the end of 2012. Growth in demand in Ruukki Metals was reflected in higher prices in order intake during the first quarter. There was good development in demand for special steels in most market areas. Average capacity utilisation rate in steel production was at the same level as for the previous quarter at about 80%.
Rautaruukki Corporation Interim report Q1/2013 5
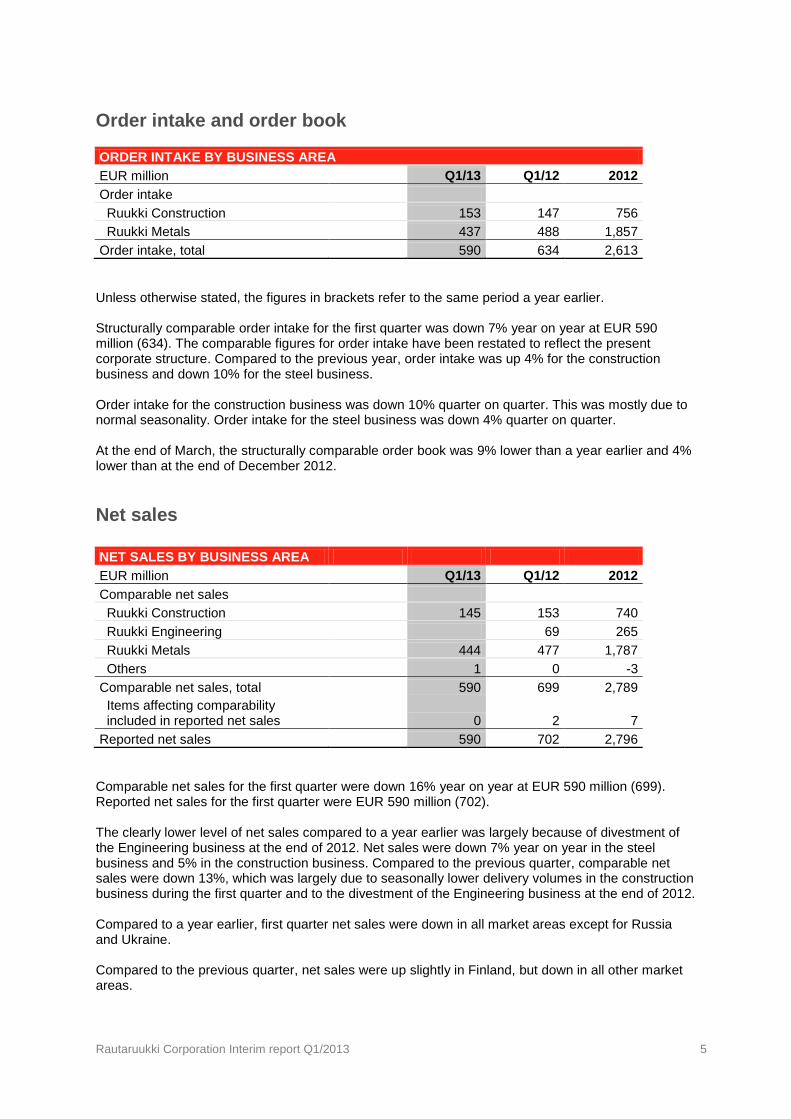
Order intake and order book ORDER INTAKE BY BUSINESS AREA EUR million Q1/13 Q1/12 2012 Order intake Ruukki Construction 153 147 756 Ruukki Metals 437 488 1,857 Order intake, total 590 634 2,613 Unless otherwise stated, the figures in brackets refer to the same period a year earlier. Structurally comparable order intake for the first quarter was down 7% year on year at EUR 590 million (634). The comparable figures for order intake have been restated to reflect the present corporate structure. Compared to the previous year, order intake was up 4% for the construction business and down 10% for the steel business. Order intake for the construction business was down 10% quarter on quarter. This was mostly due to normal seasonality. Order intake for the steel business was down 4% quarter on quarter. At the end of March, the structurally comparable order book was 9% lower than a year earlier and 4% lower than at the end of December 2012. Net sales NET SALES BY BUSINESS AREA EUR million Q1/13 Q1/12 2012 Comparable net sales
Ruukki Construction 145 153 740 Ruukki Engineering 69 265 Ruukki Metals 444 477 1,787 Others 1 0 -3 Comparable net sales, total
590 699 2,789
Items affecting comparability included in reported net sales 0 2 7 Reported net sales 590 702 2,796 Comparable net sales for the first quarter were down 16% year on year at EUR 590 million (699). Reported net sales for the first quarter were EUR 590 million (702). The clearly lower level of net sales compared to a year earlier was largely because of divestment of the Engineering business at the end of 2012. Net sales were down 7% year on year in the steel business and 5% in the construction business. Compared to the previous quarter, comparable net sales were down 13%, which was largely due to seasonally lower delivery volumes in the construction business during the first quarter and to the divestment of the Engineering business at the end of 2012. Compared to a year earlier, first quarter net sales were down in all market areas except for Russia and Ukraine. Compared to the previous quarter, net sales were up slightly in Finland, but down in all other market areas.
Rautaruukki Corporation Interim report Q1/2013 6
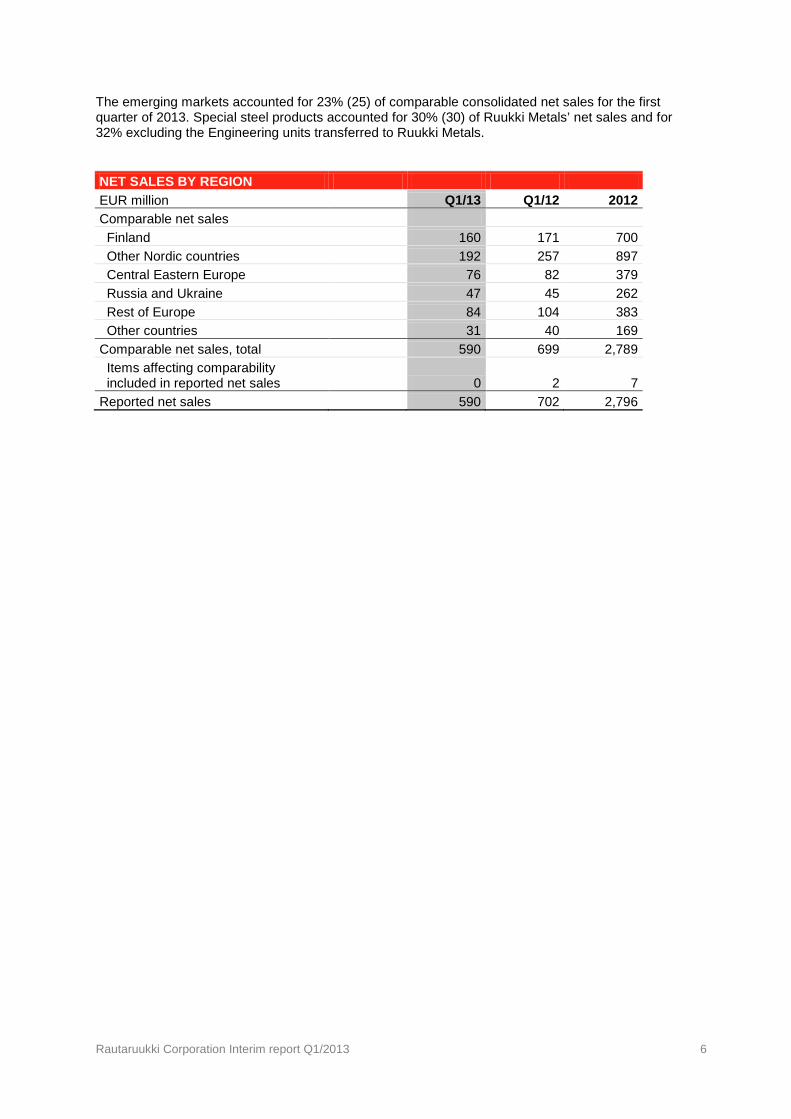
The emerging markets accounted for 23% (25) of comparable consolidated net sales for the first quarter of 2013. Special steel products accounted for 30% (30) of Ruukki Metals’ net sales and for 32% excluding the Engineering units transferred to Ruukki Metals. NET SALES BY REGION EUR million Q1/13 Q1/12 2012 Comparable net sales Finland 160 171 700 Other Nordic countries 192 257 897 Central Eastern Europe 76 82 379 Russia and Ukraine 47 45 262 Rest of Europe 84 104 383 Other countries 31 40 169 Comparable net sales, total 590 699 2,789 Items affecting comparability included in reported net sales 0 2 7 Reported net sales 590 702 2,796
Rautaruukki Corporation Interim report Q1/2013 7
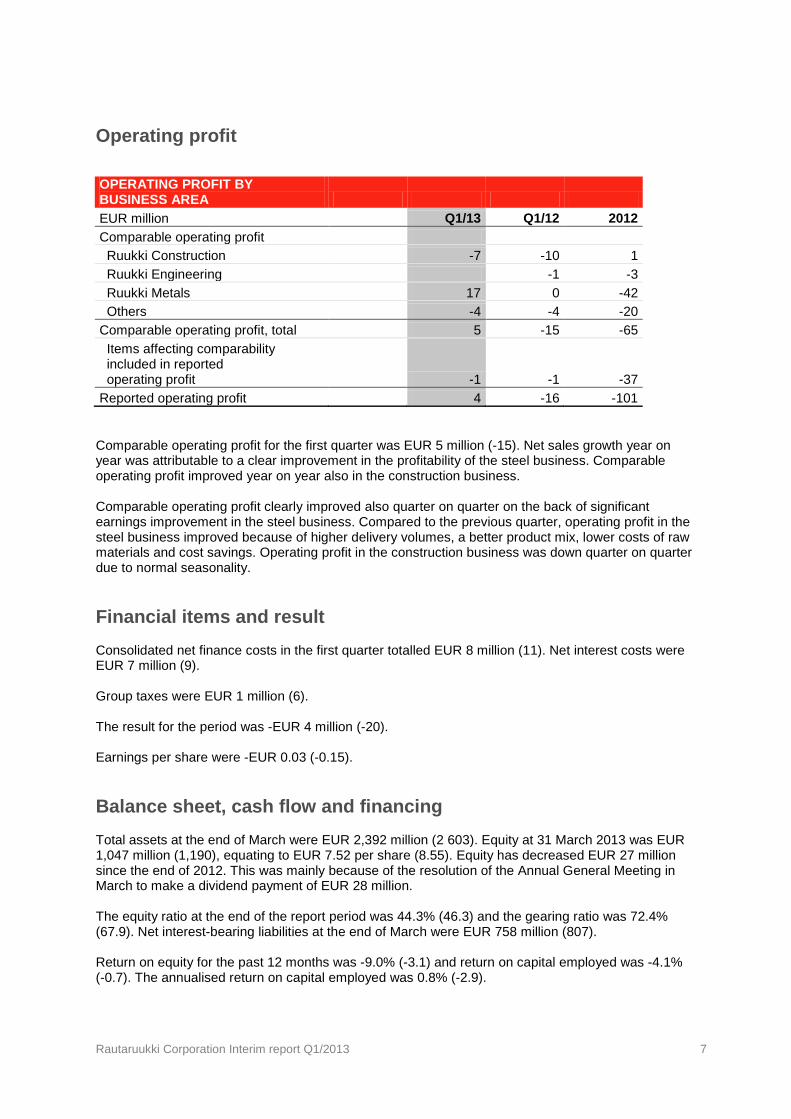
Operating profit OPERATING PROFIT BY BUSINESS AREA EUR million Q1/13 Q1/12 2012 Comparable operating profit
Ruukki Construction -7 -10 1 Ruukki Engineering -1 -3 Ruukki Metals 17 0 -42 Others -4 -4 -20 Comparable operating profit, total 5 -15 -65 Items affecting comparability included in reported operating profit -1 -1 -37 Reported operating profit 4 -16 -101 Comparable operating profit for the first quarter was EUR 5 million (-15). Net sales growth year on year was attributable to a clear improvement in the profitability of the steel business. Comparable operating profit improved year on year also in the construction business. Comparable operating profit clearly improved also quarter on quarter on the back of significant earnings improvement in the steel business. Compared to the previous quarter, operating profit in the steel business improved because of higher delivery volumes, a better product mix, lower costs of raw materials and cost savings. Operating profit in the construction business was down quarter on quarter due to normal seasonality. Financial items and result Consolidated net finance costs in the first quarter totalled EUR 8 million (11). Net interest costs were EUR 7 million (9). Group taxes were EUR 1 million (6). The result for the period was -EUR 4 million (-20). Earnings per share were -EUR 0.03 (-0.15). Balance sheet, cash flow and financing Total assets at the end of March were EUR 2,392 million (2 603). Equity at 31 March 2013 was EUR 1,047 million (1,190), equating to EUR 7.52 per share (8.55). Equity has decreased EUR 27 million since the end of 2012. This was mainly because of the resolution of the Annual General Meeting in March to make a dividend payment of EUR 28 million. The equity ratio at the end of the report period was 44.3% (46.3) and the gearing ratio was 72.4% (67.9). Net interest-bearing liabilities at the end of March were EUR 758 million (807). Return on equity for the past 12 months was -9.0% (-3.1) and return on capital employed was -4.1% (-0.7). The annualised return on capital employed was 0.8% (-2.9).

Rautaruukki Corporation Interim report Q1/2013 8
Net cash from operating activities in the first quarter was EUR 22 million (54) and net cash before financing activities was EUR 7 million (32). EUR 15 million was tied up in working capital (freed up EUR 51 million). At the end of March, the group had liquid assets of EUR 46 million (46) and undrawn committed credit facilities of EUR 475 million (445), EUR 425 million of which were long-term. Capital expenditure Net cash used in investing activities during the first quarter was -EUR 15 million (-22). Investments in tangible and intangible assets totalled EUR 17 million (23), of which maintenance investments accounted for EUR 12 million (15) and development investments EUR 5 million (8). Cash inflow from other investing activities was EUR 2 million (1). Depreciation and impairments amounted to EUR 34 million (36). Investments in tangible and intangible assets during 2013 are expected to be in the region of EUR 90 million. Personnel PERSONNEL BY REGION
31 Mar
2013 31 Mar
2012 31 Dec
2012 Finland 5,404 6,345 5,547 Other Nordic countries 576 648 580 Central Eastern Europe 1,105 2,068 1,106 Russia and Ukraine 1,646 1,886 1,686 Rest of Europe 52 69 63 Other countries 35 275 52 Total 8,818 11,291 9,034 The group employed an average of 8,876 persons (11,350) during the first quarter and at the end of March, the headcount was 8,818 (11,291). The Fortaco deal completed at the end of 2012 resulted in a decrease of 1,334 in Ruukki’s personnel numbers. At the end of the report period, 61% (56) of Ruukki’s personnel worked in Finland. In 2013, Ruukki will hire more than 800 summer workers. Most of the summer jobs provided by Ruukki are intended for university and vocational college students of technology and commerce. The majority of the summer workers are hired by Ruukki’s largest production sites in Raahe and Hämeenlinna. Safety measured in terms of accidents per million working hours was 9 (7).

Rautaruukki Corporation Interim report Q1/2013 9
BUSINESS AREAS RUUKKI CONSTRUCTION
• Order intake was up 4% year on year, order book up 24% year on year and 5% quarter on quarter
• Operating improved year on year mainly because of the efficiency programme initiated in 2012
• EUR 8 million of the total cost savings programme target of EUR 20 million was achieved in 2012 and EUR 5 million during the first quarter of 2013
RUUKKI CONSTRUCTION EUR million Q1/13 Q1/12 2012 Order intake 153 147 756 Net sales 145 153 740 Comparable operating profit -7 -10 1 Comparable operating profit as % of net sales
-5.1 -6.8 0.1
Items affecting comparability included in reported operating profit -11 Reported operating profit -7 -10 -10 Reported operating profit as % of net sales -5.1 -6.8 -1.3 Personnel at end of period 3,196 3,548 3,266 Order intake and order book Order intake in the first quarter was up 4% year on year at EUR 153 million (147). Order intake for commercial and industrial construction was up 11%. Compared to a year earlier, order intake showed clear growth in Russia and Sweden. New project orders were received in Sweden and also demand for components was up year on year. Order intake grew in Russia both for concept buildings and for steel structure projects. In Finland and Poland, order intake both for projects and components was down compared to a year earlier. Order intake for residential roofing products was at the same level as a year earlier. As regards Ruukki’s main markets, order intake was up in Finland and Sweden, but down in Poland. Order intake for infrastructure construction was down 4% year on year. Orders showed clear growth in Sweden, where orders for pile products, among others, were up. As regards Ruukki’s main markets, orders were down in Finland and Norway. Compared to the previous quarter, Ruukki Construction’s order intake was down 10%. Order intake for infrastructure construction was up 28% quarter on quarter driven by project orders received from Sweden and also because of a number of major sales of piles. These also included significant orders for a new product developed by Ruukki, an RD pile wall. Order intake for residential construction was down 44% quarter on quarter due to seasonality. Order intake for commercial and industrial construction was down 3% quarter on quarter.
Rautaruukki Corporation Interim report Q1/2013 10
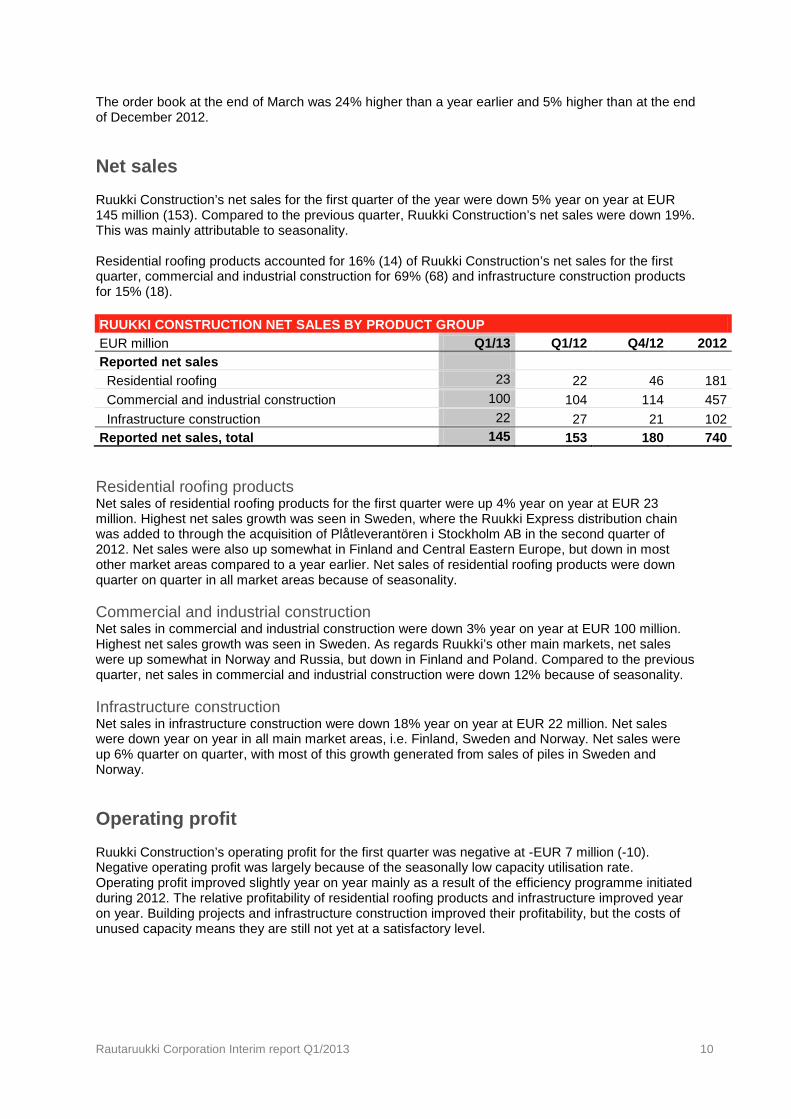
The order book at the end of March was 24% higher than a year earlier and 5% higher than at the end of December 2012. Net sales Ruukki Construction’s net sales for the first quarter of the year were down 5% year on year at EUR 145 million (153). Compared to the previous quarter, Ruukki Construction’s net sales were down 19%. This was mainly attributable to seasonality. Residential roofing products accounted for 16% (14) of Ruukki Construction’s net sales for the first quarter, commercial and industrial construction for 69% (68) and infrastructure construction products for 15% (18). RUUKKI CONSTRUCTION NET SALES BY PRODUCT GROUP EUR million Q1/13 Q1/12 Q4/12 2012 Reported net sales Residential roofing 23 22 46 181 Commercial and industrial construction 100 104 114 457 Infrastructure construction 22 27 21 102 Reported net sales, total 145 153 180 740 Residential roofing products Net sales of residential roofing products for the first quarter were up 4% year on year at EUR 23 million. Highest net sales growth was seen in Sweden, where the Ruukki Express distribution chain was added to through the acquisition of Plåtleverantören i Stockholm AB in the second quarter of 2012. Net sales were also up somewhat in Finland and Central Eastern Europe, but down in most other market areas compared to a year earlier. Net sales of residential roofing products were down quarter on quarter in all market areas because of seasonality. Commercial and industrial construction Net sales in commercial and industrial construction were down 3% year on year at EUR 100 million. Highest net sales growth was seen in Sweden. As regards Ruukki’s other main markets, net sales were up somewhat in Norway and Russia, but down in Finland and Poland. Compared to the previous quarter, net sales in commercial and industrial construction were down 12% because of seasonality. Infrastructure construction Net sales in infrastructure construction were down 18% year on year at EUR 22 million. Net sales were down year on year in all main market areas, i.e. Finland, Sweden and Norway. Net sales were up 6% quarter on quarter, with most of this growth generated from sales of piles in Sweden and Norway. Operating profit Ruukki Construction’s operating profit for the first quarter was negative at -EUR 7 million (-10). Negative operating profit was largely because of the seasonally low capacity utilisation rate. Operating profit improved slightly year on year mainly as a result of the efficiency programme initiated during 2012. The relative profitability of residential roofing products and infrastructure improved year on year. Building projects and infrastructure construction improved their profitability, but the costs of unused capacity means they are still not yet at a satisfactory level.

Rautaruukki Corporation Interim report Q1/2013 11
Actions to improve profitability During the second quarter of 2012, Ruukki Construction initiated a project across the division to improve profitability and aimed at a permanent improvement of EUR 20 million in earnings performance. Within the limits of this programme, the production-distribution process and material flows were optimised, the efficiency of sales, marketing and support functions was improved and the business model in the project business was developed. Around EUR 8 million of the earnings improvement target in the construction business was achieved during 2012 and around EUR 5 million in the first quarter of 2013. Earnings improvement relating to efficiency projects is expected to be seen in full by the third quarter of the current year onwards. Product development and major delivery contracts Ruukki launches the world’s first roof for installation on single-family homes to harness solar thermal energy Ruukki was the first company in the world to launch a flexibly designed roof for an ordinary single-family home to harness solar thermal energy. The Ruukki Classic Solar Thermal Roof generates energy both for domestic hot water and for heating. The integrated heat collector blends in virtually invisibly with Ruukki's Classic roof without the need to mount separate thermal heat collectors.
Steel structure contract for Ruukki for Mälarenergi’s combined heat and power plant Ruukki is to deliver the steel frame and envelope structures for Mälarenergi's new combined heat and power plant to be built at Västerås in Sweden. Ruukki's customer is Metso Corporation, which is responsible for supplying the world's largest recoverable fuel fired boiler for the project. The total value of Ruukki's deliveries for the project is around EUR 12 million. Ruukki is responsible for delivery and installation of the steel frame, wall and roof structures, and hollow core slabs for the new building. Ruukki's deliveries are scheduled from the beginning of 2013 until the fourth quarter.
Large order for Ruukki’s complete buildings solutions in Russia After the report period, Ruukki announced a major order received from the agricultural sector in Russia. Ruukki is to deliver buildings totalling 60,000 square metres for Poultry Akashevskaya's new facility in the Mari El Republic in Russia. The buildings are based on Ruukki's cold-formed galvanised profiles, which are market leader in Russia. The new facility is being built from distinct, lightweight structural components that can be modified for various applications. Thanks to their simple structure, the buildings can be quickly tailored to meet specific customer needs. Highly prefabricated elements and structures enable quick installation and thus reduce building costs. Thanks to the rapid modernisation of Russian agriculture, Ruukki's complete buildings solutions are now in demand, especially in the agricultural sector. The order is included in received orders for the reporting period.
Rautaruukki Corporation Interim report Q1/2013 12
RUUKKI METALS
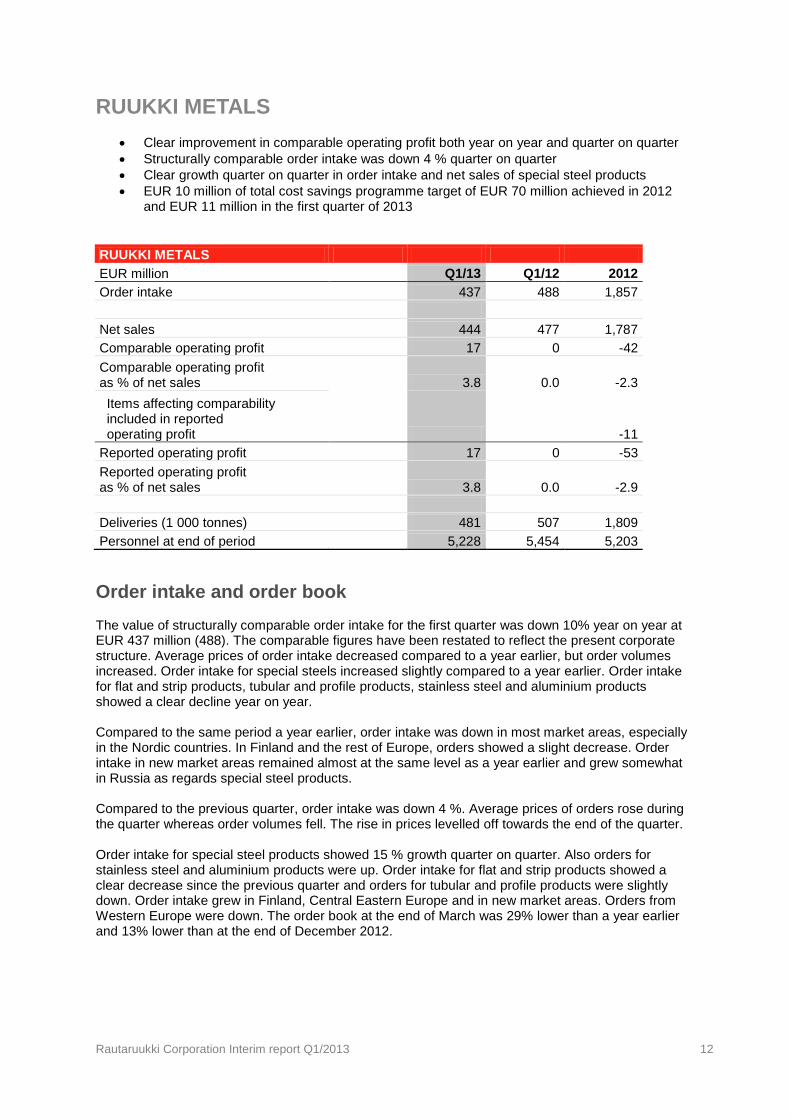
• Clear improvement in comparable operating profit both year on year and quarter on quarter • Structurally comparable order intake was down 4 % quarter on quarter • Clear growth quarter on quarter in order intake and net sales of special steel products • EUR 10 million of total cost savings programme target of EUR 70 million achieved in 2012
and EUR 11 million in the first quarter of 2013
RUUKKI METALS EUR million Q1/13 Q1/12 2012 Order intake 437 488 1,857 Net sales 444 477 1,787 Comparable operating profit 17 0 -42 Comparable operating profit as % of net sales
3.8 0.0 -2.3
Items affecting comparability included in reported operating profit -11 Reported operating profit 17 0 -53 Reported operating profit as % of net sales 3.8 0.0 -2.9 Deliveries (1 000 tonnes) 481 507 1,809 Personnel at end of period 5,228 5,454 5,203 Order intake and order book The value of structurally comparable order intake for the first quarter was down 10% year on year at EUR 437 million (488). The comparable figures have been restated to reflect the present corporate structure. Average prices of order intake decreased compared to a year earlier, but order volumes increased. Order intake for special steels increased slightly compared to a year earlier. Order intake for flat and strip products, tubular and profile products, stainless steel and aluminium products showed a clear decline year on year. Compared to the same period a year earlier, order intake was down in most market areas, especially in the Nordic countries. In Finland and the rest of Europe, orders showed a slight decrease. Order intake in new market areas remained almost at the same level as a year earlier and grew somewhat in Russia as regards special steel products. Compared to the previous quarter, order intake was down 4 %. Average prices of orders rose during the quarter whereas order volumes fell. The rise in prices levelled off towards the end of the quarter. Order intake for special steel products showed 15 % growth quarter on quarter. Also orders for stainless steel and aluminium products were up. Order intake for flat and strip products showed a clear decrease since the previous quarter and orders for tubular and profile products were slightly down. Order intake grew in Finland, Central Eastern Europe and in new market areas. Orders from Western Europe were down. The order book at the end of March was 29% lower than a year earlier and 13% lower than at the end of December 2012.
Rautaruukki Corporation Interim report Q1/2013 13
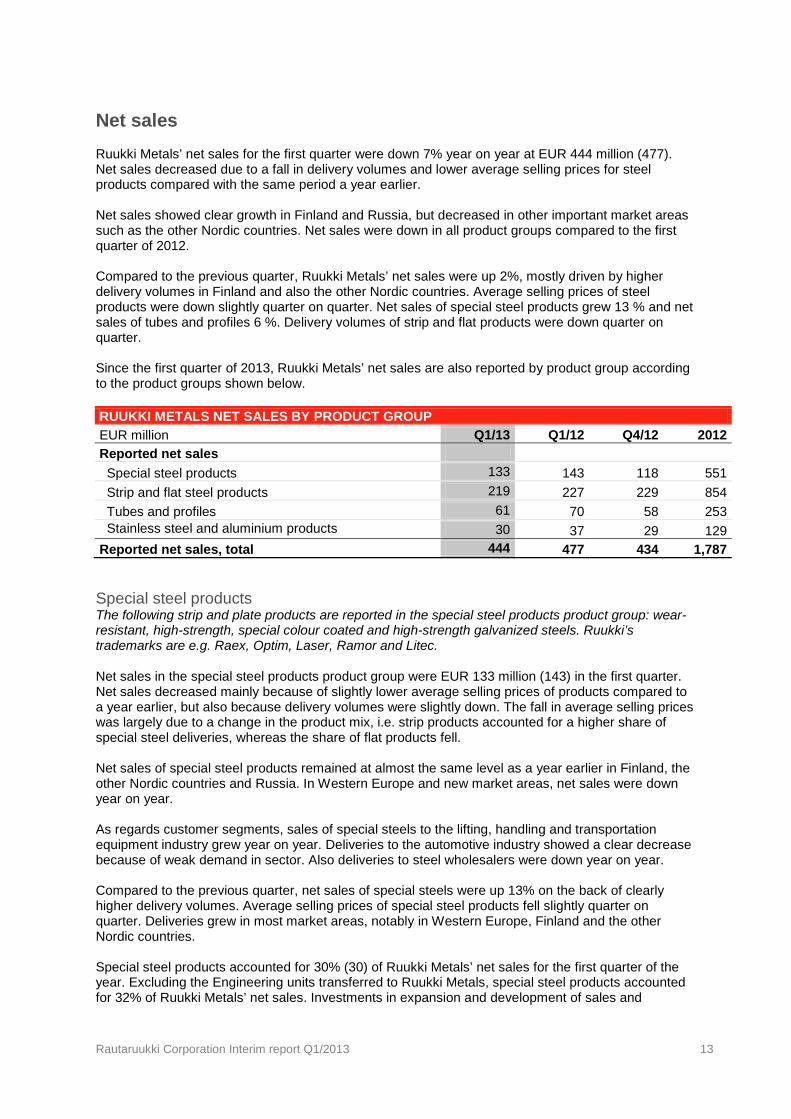
Net sales Ruukki Metals’ net sales for the first quarter were down 7% year on year at EUR 444 million (477). Net sales decreased due to a fall in delivery volumes and lower average selling prices for steel products compared with the same period a year earlier. Net sales showed clear growth in Finland and Russia, but decreased in other important market areas such as the other Nordic countries. Net sales were down in all product groups compared to the first quarter of 2012. Compared to the previous quarter, Ruukki Metals’ net sales were up 2%, mostly driven by higher delivery volumes in Finland and also the other Nordic countries. Average selling prices of steel products were down slightly quarter on quarter. Net sales of special steel products grew 13 % and net sales of tubes and profiles 6 %. Delivery volumes of strip and flat products were down quarter on quarter. Since the first quarter of 2013, Ruukki Metals’ net sales are also reported by product group according to the product groups shown below. RUUKKI METALS NET SALES BY PRODUCT GROUP EUR million Q1/13 Q1/12 Q4/12 2012 Reported net sales Special steel products 133 143 118 551 Strip and flat steel products 219 227 229 854 Tubes and profiles 61 70 58 253 Stainless steel and aluminium products 30 37 29 129 Reported net sales, total 444 477 434 1,787 Special steel products The following strip and plate products are reported in the special steel products product group: wear-resistant, high-strength, special colour coated and high-strength galvanized steels. Ruukki’s trademarks are e.g. Raex, Optim, Laser, Ramor and Litec. Net sales in the special steel products product group were EUR 133 million (143) in the first quarter. Net sales decreased mainly because of slightly lower average selling prices of products compared to a year earlier, but also because delivery volumes were slightly down. The fall in average selling prices was largely due to a change in the product mix, i.e. strip products accounted for a higher share of special steel deliveries, whereas the share of flat products fell. Net sales of special steel products remained at almost the same level as a year earlier in Finland, the other Nordic countries and Russia. In Western Europe and new market areas, net sales were down year on year. As regards customer segments, sales of special steels to the lifting, handling and transportation equipment industry grew year on year. Deliveries to the automotive industry showed a clear decrease because of weak demand in sector. Also deliveries to steel wholesalers were down year on year. Compared to the previous quarter, net sales of special steels were up 13% on the back of clearly higher delivery volumes. Average selling prices of special steel products fell slightly quarter on quarter. Deliveries grew in most market areas, notably in Western Europe, Finland and the other Nordic countries. Special steel products accounted for 30% (30) of Ruukki Metals’ net sales for the first quarter of the year. Excluding the Engineering units transferred to Ruukki Metals, special steel products accounted for 32% of Ruukki Metals’ net sales. Investments in expansion and development of sales and

Rautaruukki Corporation Interim report Q1/2013 14
distribution network for special steel products were reflected positively in sales of certain special steel products. Strip and flat products The following are reported in the strip and flat products product group: hot- and cold-rolled steels and coated standard steel products. Sales of the Engineering units remaining with Ruukki and of by-products and mineral products are also reported in this group. Net sales in the strip and flat products product group were EUR 219 million (227) in the first quarter. Both delivery volumes and average selling prices were down slightly year on year. Net sales of strip and flat products showed clear growth year on year in Finland, but decreased in the other Nordic countries. Net sales in Western Europe and Russia were up slightly year on year. As regards customer segments, sales to the shipbuilding industry showed clear growth year on year. Compared to the previous quarter, net sales of products in the strip and flat products product group were down 4% because of lower delivery volumes. Average selling prices of strip and flat products rose slightly quarter on quarter. Tubes and profiles The following are reported in the tubes and profiles product group: structural hollow sections, precision tubes, profiles and line pipes. Net sales in the tubes and profiles product group were EUR 61 million (70) in the first quarter. Net sales decreased mainly because of lower delivery volumes year on year and also because of slightly lower average selling prices. Net sales were down in all market areas. Deliveries to the most important customer segment, the building products industry, were down slightly year on year. Compared to the previous quarter, net sales of tubes and profiles were up 6% driven by higher delivery volumes. Average selling prices, on the other hand, were down slightly quarter on quarter. Stainless steels and aluminium products The following are reported in the stainless steels and aluminium products group: stainless steel and aluminium sold as trading products, coils, sheets, bars, profiles and tubes made of aluminium and delivered to customers in standard dimensions, prefabricated or as components. Net sales of trading products sold in the stainless steel and aluminium products product group were EUR 30 million (37) in the first quarter. Net sales decreased mainly because of lower delivery volumes year on year and also because of lower average selling prices. Net sales were down in all market areas. As regards main customer segments, net sales were down in the manufacture of structural hollow sections, infrastructure construction and in the building product industry compared to a year earlier. Compared to the previous quarter, net sales of stainless steels and aluminium products were up 5%. Delivery volumes rose, but average selling prices fell quarter on quarter.
Rautaruukki Corporation Interim report Q1/2013 15
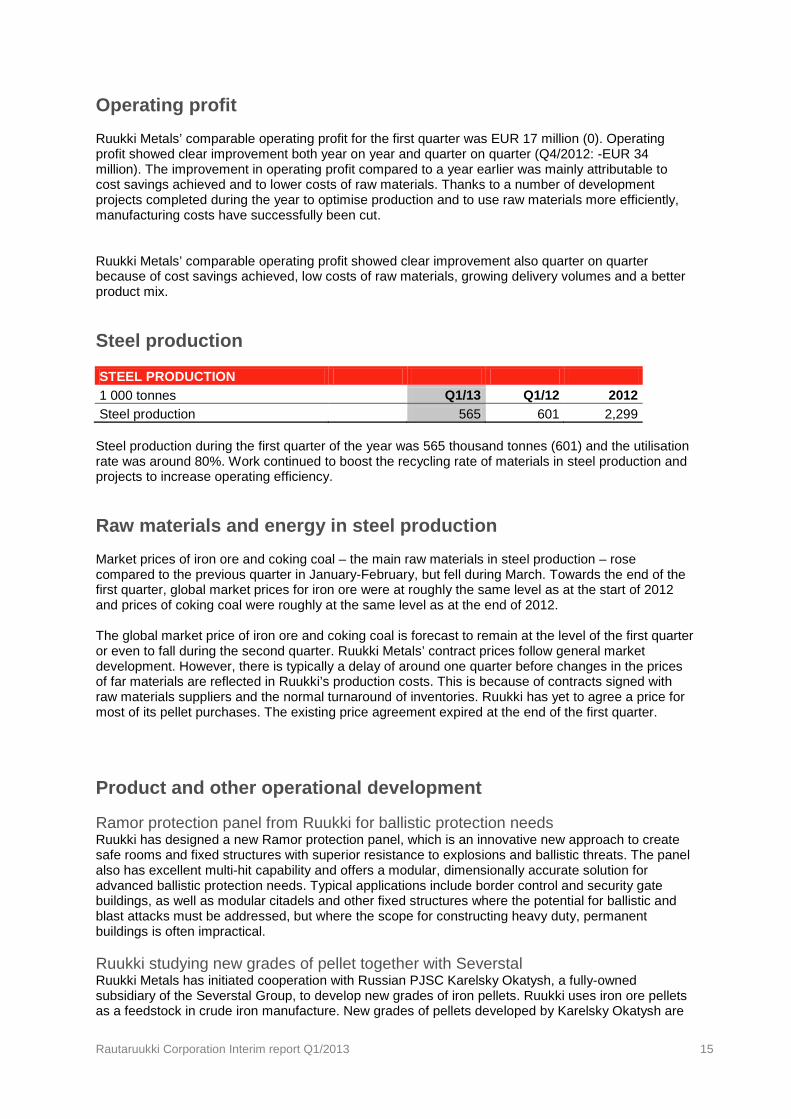
Operating profit Ruukki Metals’ comparable operating profit for the first quarter was EUR 17 million (0). Operating profit showed clear improvement both year on year and quarter on quarter (Q4/2012: -EUR 34 million). The improvement in operating profit compared to a year earlier was mainly attributable to cost savings achieved and to lower costs of raw materials. Thanks to a number of development projects completed during the year to optimise production and to use raw materials more efficiently, manufacturing costs have successfully been cut. Ruukki Metals’ comparable operating profit showed clear improvement also quarter on quarter because of cost savings achieved, low costs of raw materials, growing delivery volumes and a better product mix. Steel production STEEL PRODUCTION 1 000 tonnes Q1/13 Q1/12 2012 Steel production 565 601 2,299 Steel production during the first quarter of the year was 565 thousand tonnes (601) and the utilisation rate was around 80%. Work continued to boost the recycling rate of materials in steel production and projects to increase operating efficiency. Raw materials and energy in steel production Market prices of iron ore and coking coal – the main raw materials in steel production – rose compared to the previous quarter in January-February, but fell during March. Towards the end of the first quarter, global market prices for iron ore were at roughly the same level as at the start of 2012 and prices of coking coal were roughly at the same level as at the end of 2012. The global market price of iron ore and coking coal is forecast to remain at the level of the first quarter or even to fall during the second quarter. Ruukki Metals’ contract prices follow general market development. However, there is typically a delay of around one quarter before changes in the prices of far materials are reflected in Ruukki’s production costs. This is because of contracts signed with raw materials suppliers and the normal turnaround of inventories. Ruukki has yet to agree a price for most of its pellet purchases. The existing price agreement expired at the end of the first quarter.
Product and other operational development Ramor protection panel from Ruukki for ballistic protection needs Ruukki has designed a new Ramor protection panel, which is an innovative new approach to create safe rooms and fixed structures with superior resistance to explosions and ballistic threats. The panel also has excellent multi-hit capability and offers a modular, dimensionally accurate solution for advanced ballistic protection needs. Typical applications include border control and security gate buildings, as well as modular citadels and other fixed structures where the potential for ballistic and blast attacks must be addressed, but where the scope for constructing heavy duty, permanent buildings is often impractical. Ruukki studying new grades of pellet together with Severstal Ruukki Metals has initiated cooperation with Russian PJSC Karelsky Okatysh, a fully-owned subsidiary of the Severstal Group, to develop new grades of iron pellets. Ruukki uses iron ore pellets as a feedstock in crude iron manufacture. New grades of pellets developed by Karelsky Okatysh are
Rautaruukki Corporation Interim report Q1/2013 16
to be tested in the laboratory at Ruukki's Raahe Works in Finland. Tests will also be conducted at the University of Oulu in the Laboratory of Process Metallurgy, which can simulate blast furnace conditions. Ruukki sources most of the pellets its needs from Sweden. In spring last year, Ruukki signed a three-year contract for supplies of coking coal and iron pellets with Severstal Resources, a division of the Severstal Group. The goal is to spread purchases of raw materials and to improve the overall efficiency of the steel-making process, where development of the blast furnace charge material is an important factor. Ruukki has developed a new product for earthworks and road construction Ruukki has developed a new LD blast furnace (BF) sand for use in earthworks and road construction. The new product is a mixture of BF sand and steel slag and can be made in different mixture ratios. Manufacturing and selling this sand enables Ruukki to utilise the steel slag and BF sand created as by-products in the steel making process. Steel slag is also used as a raw material in Ruukki’s own production process. BF sand is also sold for agricultural liming and as a raw material in the cement industry. Significant decrease in emissions at Ruukki’s Raahe Works Ruukki has been actively working to reduce emissions at the Raahe steel mill by investing in environmental technology and by improving production processes. Process changes and replacement of dust removal devices reduced particulate emissions significantly last year in line with targets to result in an emissions reduction of up to over 80 per cent compared to 2011. The decrease in emissions was especially attributable to the changeover to pellets as feedstock, the related closure of the sinter plant and replacement of the dust removal devices in the blast furnaces at the steel mill. In addition, the closed cooling water circulation system in blast furnace slag granulation has considerably reduced the discharge of suspended solids into the sea. Emissions of sulphur dioxide into the air were just a quarter of what they were in 2011 and carbon dioxide emissions have decreased by around a further 10%. Ruukki's steel production already ranked better than the European average in terms of carbon dioxide efficiency. Both blast furnaces at the works have for years ranked among the most energy efficient in Europe. Ruukki invests in new slitting line Ruukki is developing and improving the efficiency of production operations at its steel service centre in Naantali, Finland by investing in a new slitting line. The investment is worth around EUR 2 million and is aimed at improving customer service, delivery reliability and cost efficiency by automating steel cutting operations. The new line will be operative starting in July-August 2013. Ruukki Metals’ project to improve profitability During the first quarter of 2012, an efficiency improvement programme was initiated with the aim of achieving a permanent annual improvement of EUR 70 million in earnings performance. A number of development projects to improve competitiveness and achieve savings have been completed, especially at various production sites. Some of the cost savings have been generated by efficiency actions already completed in operations and workforce reductions in production, sales, marketing and business support functions. During 2012, the programme delivered around EUR 10 million in earnings improvement and a further EUR 11 million in the first quarter of 2013. It is estimated that earnings improvement as a result of efficiency projects will be visible in full from the third quarter of the current year onwards.
Rautaruukki Corporation Interim report Q1/2013 17
Environmental matters Ruukki’s Corporate Responsibility Report for 2012 was published in February. The report widely describes Ruukki’s work to promote sustainability and environmental matters as one of the key areas in this. The Corporate Responsibility Report may be viewed on the company’s website at www.ruukki.com/Corporate-responsibility. More information about environmental matters can also be found in product declarations, English summaries of the annual environmental reviews of our works in Raahe and Hämeenlinna and on the company’s website at www.ruukki.com. Ruukki’s share is included in many sustainability share indexes. Resolutions of the Annual General Meeting Rautaruukki Corporation’s Annual General Meeting was held in Helsinki on 21 March 2013. A total of 483 shareholders were represented at the meeting. The Annual General Meeting approved the payment of a dividend for 2012 of EUR 0.20 per share. The dividend payout totalled EUR 28 million and was paid on 4 April 2013. In addition, the Annual General Meeting adopted the financial statements and consolidated financial statements and discharged the members of the Board of Directors and the President & CEO from liability for 2012. It was confirmed that the number of members of the Board of Directors is seven (7). President & CEO Kim Gran, CEO Liisa Leino, President & CEO Matti Lievonen, CFO and deputy CEO Saila Miettinen-Lähde and CEO Jaana Tuominen were re-elected to the Board. Executive Advisor Timo U. Korhonen and CEO Matti Kähkönen were elected as new members of the Board of Directors. KHT audit firm KPMG Oy Ab was re-appointed as the company's auditor, who appointed Petri Kettunen APA as the principal auditor. Authority to acquire and transfer the company’s own shares In accordance with the Board of Directors' proposal, the Annual General Meeting granted the Board of Directors the authority to acquire a maximum of 12,000,000 of the company's own shares. The authority is valid until the following Annual General Meeting. This authority supersedes the earlier authority granted by the 2012 Annual General Meeting to purchase 12,000,000 shares and which was valid until the 2013 Annual General Meeting. In accordance with the Board of Directors' proposal, the Annual General Meeting granted the Board of Directors the authority to decide on a share issue, which includes the right to issue new shares and/or to transfer treasury shares held by the company. The authority applies to a maximum of 14,000,000 shares. The Board of Directors has the right to disapply the pre-emption rights of existing shareholders in a directed issue. The authority also includes the right to decide on a bonus issue. The authority is valid for a period of one year following the date of decision of the Annual General Meeting. Board of Directors’ organisation meeting Kim Gran was re-elected as chairman of the Board of Directors and Matti Lievonen was elected as deputy chairman. In its organisation meeting held on 21 March 2013, the Board of Directors elected committee members from among themselves. Matti Lievonen was appointed as chairman and Timo U. Korhonen, Liisa Leino and Saila Miettinen-Lähde as members of the Audit Committee. Kim Gran was appointed as chairman and Matti Kähkönen and Jaana Tuominen as members of the Remuneration and HR Committee. All members of the Board of Directors are independent of both the company and the company’s largest shareholders.
Rautaruukki Corporation Interim report Q1/2013 18
Shares and share capital SHARES LISTED ON NASNAQ OMX HELSINKI STOCK EXCHANGE 31 March 2013 No. of
shares No.
of votes Number of
shares traded
Q1/2013
Value of shares traded
Q1/2013, MEUR
RTRKS
140,285,425 140,285,425 27,387,004 148
1.1.-31.3.2013 Highest Lowest VWAP* Closed Share price
6.32 4.95 5.4 4.95
* Trade volume-weighted average price
31 Mar 2013
31 Mar 2012
Market capitalisation, MEUR 694 1,104 Foreign ownership, % 13.9 16.0 During the first quarter of 2013, a total of 27 million (48) Rautaruukki shares (RTRKS) were traded on NASDAQ OMX Helsinki for a total of EUR 148 million (411). The highest price quoted was EUR 6.32 in March and the lowest was EUR 4.95 in January. The volume-weighted average price was EUR 5.4. The share closed at EUR 4.95 (7.87) at the end of the report period and the company had a market capitalisation of EUR 694 million (1,104). Rautaruukki’s share is also traded, in addition to NASDAQ OMX Helsinki, on multilateral trading facilities (MTF). According to information received by the company, a total of 9 million (11) Rautaruukki shares were traded on MTFs for a total of EUR 51 million (98) during the first quarter of 2013. The company’s registered share capital at 31 March 2013 was EUR 238.5 million (238.5) and there were 140,285,425 shares outstanding. At the end of the report period, the company held a total of 1,392,470 treasury shares (1,423,051), which had a market value of EUR 6.9 million (11.2) and an accounting par value of EUR 2.4 million (2.4). Treasury shares accounted for 0.99% (1.01) of the total shares and votes The valid authorities to acquire and transfer the company’s own shares are detailed above under Authority to acquire and transfer the company’s own shares. As at 31 March 2013, the Board of Directors had not exercised its authority to issue shares or to purchase the company’s own shares. Information about the company’s shareholder structure by sector and size of holding, the largest shareholders and Board of Director and Corporate Executive Board interests can be found on the company’s website at www.ruukki.com. Structure and management changes Sami Ärilä, LLM, was appointed Senior Vice President, Human Resources and a member of the Corporate Executive Board of Rautaruukki Corporation as of 1 March 2013. He reports to the President & CEO Sakari Tamminen. Sami Ärilä has been working for Ruukki for approximately five years, most recently as Vice President, Human Resources Management.

Rautaruukki Corporation Interim report Q1/2013 19
Near-term business risks The company’s risks and risk management are detailed in the Annual Report for 2012. The company does not consider there to have been any material changes during the report period in the risks and factors of uncertainty presented in the Annual Report. Near-term outlook Many economic forecasts still expect global economic growth to be only around 3% in 2013. This rate is below the historical growth trend. The economy in Europe is generally not expected to return, underpinned by export-driven demand, to the growth track until the second half of 2013 or in early 2014. As regards Ruukki’s main markets, the German, Swedish and Norwegian economies are expected to show moderate growth in 2013. Economic activity in Finland is forecast to remain at the level of 2012. As a result of the latest weakening of business trends in Russia, economic growth in Russia in 2013 is now anticipated to be at more or less the same level as global economic growth. In construction, the growth outlook in most main market areas weakened in late 2012, since when there have been no significant changes during the seasonally quiet first quarter. Construction activity is expected either to remain at the same level as in 2012 or to decline slightly in all Ruukki’s main market areas, including Poland. On the other hand, in Russia and Sweden, commercial and industrial construction is expected to grow compared to the previous year. Ruukki’s focus on its own distribution channel for roofing products was reflected in these products outperforming market growth in 2012. It is thought there is good potential for this to continue also during 2013. Whereas infrastructure construction activity in Finland is expected to remain weak, the outlook for 2013 is more positive in the other Nordic countries. Because of the overcapacity prevailing in the European steel industry, the price development of steel products for the whole year greatly depends on demand and on the price development of raw materials. The market prices of iron ore and coking coal are forecast to remain at the level of the first quarter or even to fall during the second quarter. In Ruukki’s steel business, service centre sales are expected to continue at a good level. However, the downturn in Europe gives rise to much uncertainty as regards demand from mill customers. After moderate restocking during the first quarter, inventories of steel products in Europe had returned to a normal level compared to sales at the end of the report period. There are good prospects for Ruukki to grow its share of special steels because our product portfolio and quality, together with our sales and distribution network, provide a platform for strong growth. Efficiency projects initiated across Ruukki in 2012 delivered cost benefits of EUR 20 million last year and a further EUR 18 million during the first quarter of 2013. The annualised cost impact of ongoing projects was around EUR 70 million at the end of March. The projects have progressed to plan and it is now estimated that the savings of around EUR 100 million sought from efficiency actions will be achieved. The ensuing improvement in earnings performance is estimated to be visible in full by no later than the third quarter of 2013 onwards. Comparable net sales in 2013 are estimated to be at the same level as in 2012. Comparable operating profit is estimated to improve compared to 2012 and to be positive.
Rautaruukki Corporation Interim report Q1/2013 20
INTERIM REPORT AND NOTES This interim report has been prepared in accordance with IAS 34 and, with the exception of the changes arising from amendments to IFRS standards that entered into force on 1 January 2013 and referred to below, is in conformity with the accounting policies published in the 2012 financial statements. Starting on 1 January 2013, the operations of the remaining Ruukki Engineering units subsequent to completion of the Fortaco deal in December 2012 are reported as part of Ruukki Metals’ business. IAS 1 Presentation of Financial Statements: amendment to Presentation of Items of Other Comprehensive Income The amendment requires items of other comprehensive income to be grouped into items that can be reclassified subsequently to profit and loss and those that will not be reclassified to profit and loss. Also deferred taxes associated with these items are similarly presented.
• Items that can be reclassified subsequently to profit and loss are translation differences (reclassified to profit and loss when disposing of a foreign unit) and gains and losses realised on available-for-sale financial assets or cash flow hedges.
• Items that will not be reclassified subsequently to profit and loss are items arising from the remeasurement of defined benefit plans (IAS 19) and revaluation fund items (IAS 16 and IAS 38).
This interim report has also restated reference periods in accordance with the amended form of presentation. IFRS 13 Fair Value Measurement The standard sets a single definition of fair value applicable to all IFRS standards and a single approach to measuring fair value. It does not amend regulation with regard to when a reporting entity should measure an asset or liability at fair value. The standard increases the information to be disclosed on the use of fair values and requires interim reports to also disclose information about financial assets and liabilities measured at fair value. This interim report includes a table of the hierarchy used in measuring the fair value of financial assets and liabilities. The measurement and valuation principles used are consistent with those presented in the financial statements for 2012. Amended IAS 19 Employee benefits Most significant amendments:
• The so-called corridor method has been eliminated so that all actuarial gains and losses are recognised as they occur in items of other comprehensive income and the full net liability or asset arising from employee benefits is entered in the statement of financial position.
• Finance costs are determined on a net funding basis and the expected yield from funds is calculated by using the same discount rate as used to calculate the current value of the obligation.
Elimination of the corridor method does not result in any changes for Ruukki because Ruukki ceased using the corridor method as long ago as in 2008. Calculation of the yield of funds and present value of the obligation increased salaries and other employee benefits by EUR 2.4 million in 2012. The comparable figures and indicators have been restated accordingly.
Rautaruukki Corporation Interim report Q1/2013 21
Impacts of the amended standard on the consolidated statement of financial position and income statement in the reference period were as follows:
STATEMENT OF FINANCIAL POSITION
EUR million 1 Jan 2012 31 Dec
2012 Deferred tax assets -1,0 -0,8 Retained earnings 3,1 3,1 Total comprehensive income
-0,8
Pension loans -4,1 -3,1
INCOME STATEMENT EUR million 2012 Employee benefits
-2,4
Change in deferred taxes 0,6 Result for the period
-1,8
Actuarial gains and losses
1,3 Tax on actuarial gains and losses -0,3 Total comprehensive income
-0,8
Use of estimates The preparation of an interim report in conformity with IFRS requires management to make estimates and assumptions that affect the reported amounts of assets and liabilities, the reporting of contingent assets and liabilities and the reported amounts of income and expense. Even though these estimates are based on management’s best judgment at the time, actual results may ultimately differ from these estimates. Individual figures and totals appearing in the tables have been rounded to the nearest whole million of euros. This interim report is unaudited.
Rautaruukki Corporation Interim report Q1/2013 22
CONSOLIDATED INCOME STATEMENT (IFRS) EUR million Q1/13 Q1/12 2012 Net sales 590 702 2,796 Cost of sales -533 -660 -2,656 Gross profit 57 42 140 Other operating income 3 3 13 Selling and marketing expenses -25 -27 -115 Administrative expenses -30 -34 -138 Other operating expenses -1 0 0 Operating profit
4 -16 -101
Finance income 14 12 45 Finance costs -22 -23 -85 Net finance costs -8 -11 -40 Share of profit of equity- accounted investees -1 1 2 Result before income tax -4 -27 -139 Income tax expense 1 6 22 Result for the period -4 -20 -117 Attributable to:
Owners of the company -4 -20 -118 Non-controlling interest 0 0 0 Earnings per share, diluted, EUR -0.03 -0.15 -0.85 Earnings per share, basic, EUR -0.03 -0.15 -0.85 Operating profit as % of net sales 0.7 -2.3 -3.6
Rautaruukki Corporation Interim report Q1/2013 23
CONSOLIDATED STATEMENT OF COMPREHENSIVE INCOME (IFRS) EUR million Q1/13 Q1/12 2012 Result for the period -4 -20 -117 Other comprehensive income:
Items that will not be reclassified to profit or loss:
Defined benefit plan actuarial gains and losses -11
Tax on items that will not be reclassified to profit or loss 2
Total items that will not be reclassified to profit or loss -9 Items that may be reclassified subsequently to profit or loss:
Effective portion of changes in fair value of cash flow hedges
7 -11 -11
Cash flow hedges reclassified to profit and loss during the period
0 -4 -8
Translation differences -3 11 9 Translation differences reclassified
to profit and loss during the period -5 Tax on items that may be
reclassified subsequently to profit or loss -2 4 5 Total items that may be reclassified subsequently to profit or loss 3 0 -10 Total comprehensive income for the period
-1 -21 -136
Attributable to:
Owners of the company
-1 -21 -137
Non-controlling interest 0 0 0
Rautaruukki Corporation Interim report Q1/2013 24
SUMMARY CONSOLIDATED STATEMENT OF FINANCIAL POSITION (IFRS)
EUR million 31 Mar
2013 31 Mar
2012 31 Dec
2012 ASSETS
Non-current assets 1,354 1,412 1,371 Deferred tax assets 48 41 46 Current assets Inventories 583 688 590 Trade and other receivables 361 415 353 Cash and cash equivalents 46 46 21 Total assets 2,392 2,603 2,380 EQUITY AND LIABILITIES Equity Equity attributable to owners of the company 1,044 1,187 1,072 Non-controlling interest 3 2 3 Non-current liabilities Loans and borrowings 556 539 533 Other non-current liabilities 67 53 70 Deferred tax liabilities 4 15 1 Current liabilities Loans and borrowings 248 315 253 Trade payables and other current liabilities 470 492 449 Total equity and liabilities 2,392 2,603 2,380
Rautaruukki Corporation Interim report Q1/2013 25
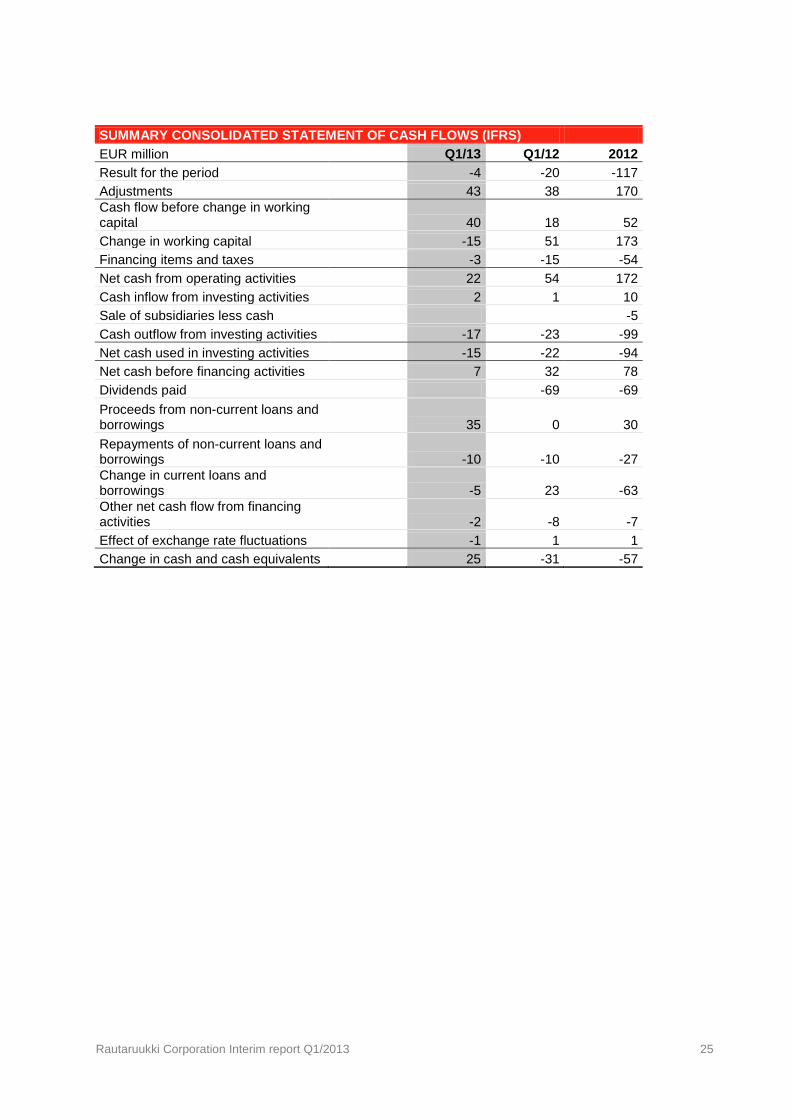
SUMMARY CONSOLIDATED STATEMENT OF CASH FLOWS (IFRS) EUR million Q1/13 Q1/12 2012 Result for the period -4 -20 -117 Adjustments 43 38 170 Cash flow before change in working capital 40 18 52 Change in working capital -15 51 173 Financing items and taxes -3 -15 -54 Net cash from operating activities 22 54 172 Cash inflow from investing activities 2 1 10 Sale of subsidiaries less cash -5 Cash outflow from investing activities -17 -23 -99 Net cash used in investing activities -15 -22 -94 Net cash before financing activities 7 32 78 Dividends paid -69 -69 Proceeds from non-current loans and borrowings 35 0 30 Repayments of non-current loans and borrowings -10 -10 -27 Change in current loans and borrowings -5 23 -63 Other net cash flow from financing activities -2 -8 -7 Effect of exchange rate fluctuations -1 1 1 Change in cash and cash equivalents 25 -31 -57
Rautaruukki Corporation Interim report Q1/2013 26
KEY FIGURES (IFRS)
Q1/2013 Q1/2012 2012
Net sales, EUR m 590 702 2,796 Operating profit, EUR m 4 -16 -101 as % of net sales 0.7 -2.3 -3.6 Result before income tax, EUR m -4 -27 -139 as % of net sales -0.7 -3.8 -5.0 Result for the period, EUR m -4 -20 -117 as % of net sales -0.6 -2.9 -4.2 Net cash from operating activities, EUR m 22 54 172 Net cash before financing activities, EUR m 7 32 78 Return on capital employed (rolling 12 months), % -4.1 -0.7 -4.9 Return on equity (rolling 12 months), % -9.0 -3.1 -10.0 Equity ratio, % 44.3 46.3 45.6 Gearing ratio, % 72.4 67.9 71.2 Net interest-bearing liabilities, EUR m 758 807 765 Equity per share, EUR 7.52 8.55 7.72 Personnel on average 8,876 11,350 11,214 Number of shares 140,285,425 140,285,425 140,285,425 - excluding treasury shares 138,892,955 138,862,374 138,892,955 - diluted, average 138,915,892 138,923,185 138,930,365
Rautaruukki Corporation Interim report Q1/2013 27
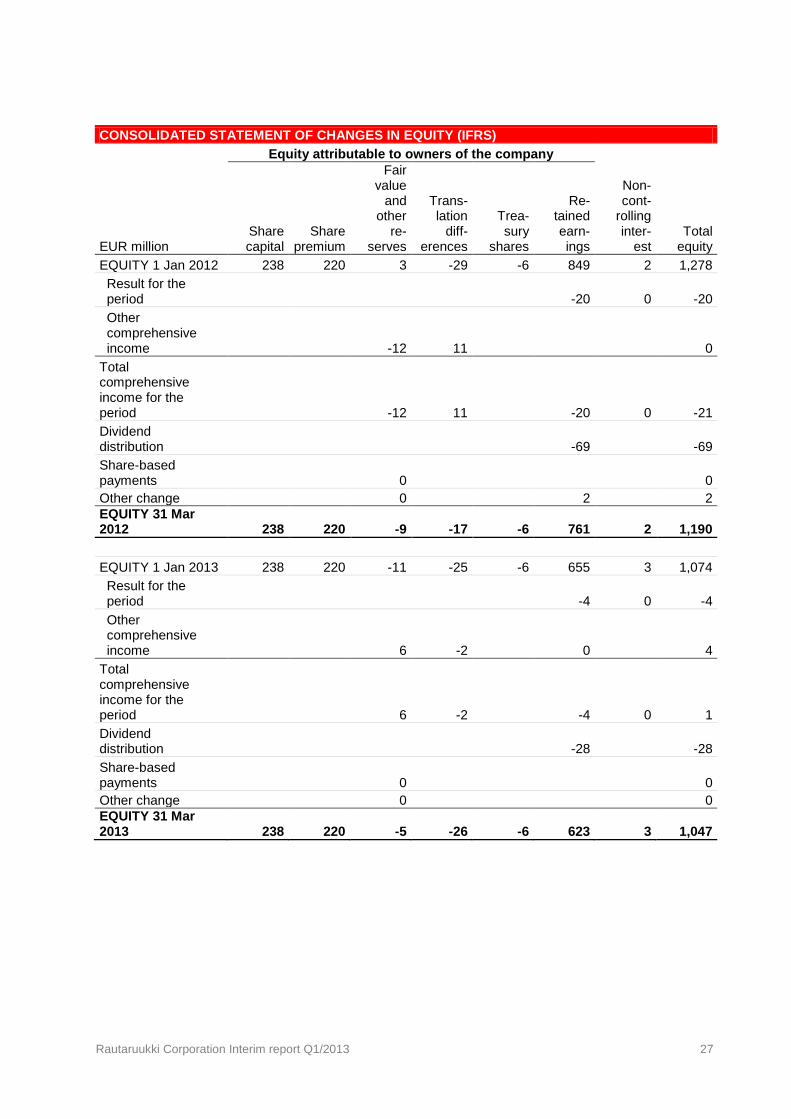
CONSOLIDATED STATEMENT OF CHANGES IN EQUITY (IFRS)
Equity attributable to owners of the company
EUR million Share capital
Share premium
Fair value
and other
re- serves
Trans- lation
diff- erences
Trea- sury
shares
Re- tained earn- ings
Non- cont-
rolling inter-
est Total
equity EQUITY 1 Jan 2012 238 220 3 -29 -6 849 2 1,278 Result for the period -20 0 -20 Other comprehensive income -12 11 0 Total comprehensive income for the period
-12 11
-20 0 -21
Dividend distribution -69 -69 Share-based payments 0 0 Other change 0 2 2 EQUITY 31 Mar 2012 238 220 -9 -17 -6 761 2 1,190
EQUITY 1 Jan 2013 238 220 -11 -25 -6 655 3 1,074 Result for the period -4 0 -4 Other comprehensive income 6 -2 0 4 Total comprehensive income for the period
6 -2
-4 0 1
Dividend distribution -28 -28 Share-based payments 0 0 Other change 0 0 EQUITY 31 Mar 2013 238 220 -5 -26 -6 623 3 1,047
Rautaruukki Corporation Interim report Q1/2013 28
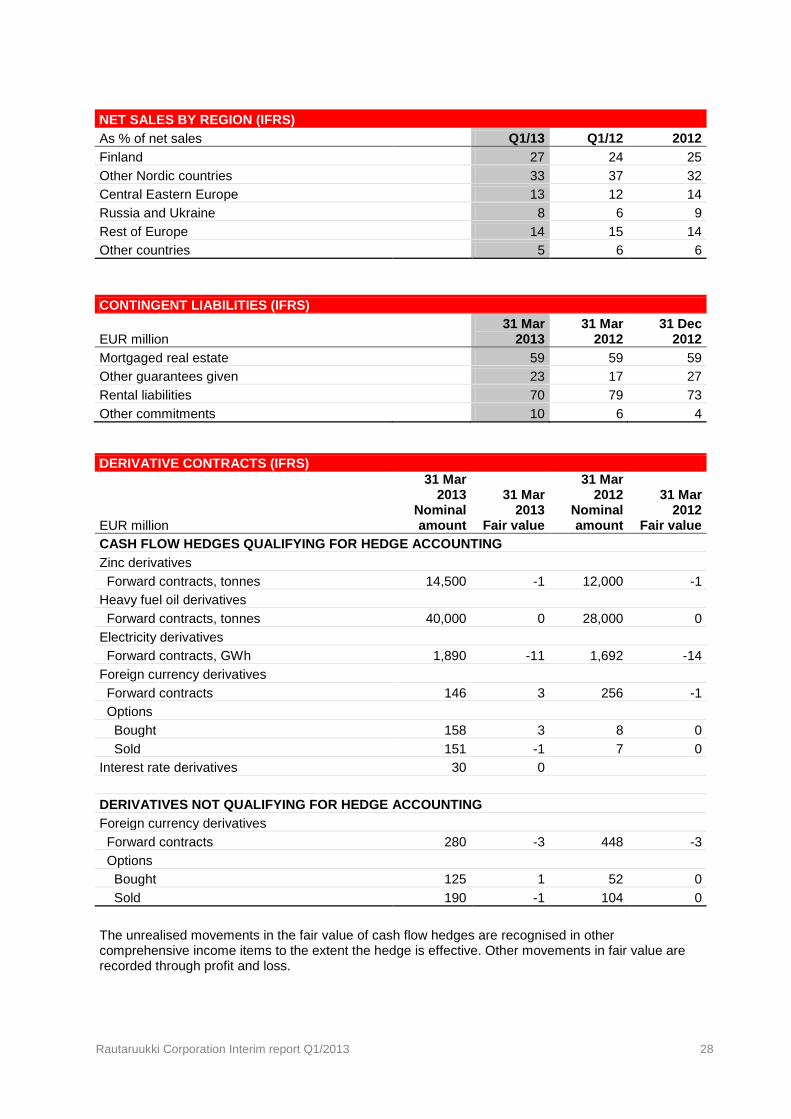
NET SALES BY REGION (IFRS) As % of net sales Q1/13 Q1/12 2012 Finland 27 24 25 Other Nordic countries 33 37 32 Central Eastern Europe 13 12 14 Russia and Ukraine 8 6 9 Rest of Europe 14 15 14 Other countries 5 6 6
CONTINGENT LIABILITIES (IFRS)
EUR million 31 Mar
2013 31 Mar
2012 31 Dec
2012 Mortgaged real estate 59 59 59 Other guarantees given 23 17 27 Rental liabilities 70 79 73 Other commitments 10 6 4 DERIVATIVE CONTRACTS (IFRS)
EUR million
31 Mar 2013
Nominal amount
31 Mar 2013
Fair value
31 Mar 2012
Nominal amount
31 Mar 2012
Fair value CASH FLOW HEDGES QUALIFYING FOR HEDGE ACCOUNTING Zinc derivatives Forward contracts, tonnes 14,500 -1 12,000 -1 Heavy fuel oil derivatives Forward contracts, tonnes 40,000 0 28,000 0 Electricity derivatives Forward contracts, GWh 1,890 -11 1,692 -14 Foreign currency derivatives Forward contracts 146 3 256 -1 Options Bought 158 3 8 0 Sold 151 -1 7 0 Interest rate derivatives 30 0 DERIVATIVES NOT QUALIFYING FOR HEDGE ACCOUNTING Foreign currency derivatives Forward contracts 280 -3 448 -3 Options Bought 125 1 52 0 Sold 190 -1 104 0
The unrealised movements in the fair value of cash flow hedges are recognised in other comprehensive income items to the extent the hedge is effective. Other movements in fair value are recorded through profit and loss.
Rautaruukki Corporation Interim report Q1/2013 29
HIERARCHY USED IN MEASURING THE FAIR VALUE OF FINANCIAL ASSETS AND LIABILITIES
Total
EUR million Level 1
Level 2
Level 3
31 Mar 2013
Assets measured at fair value
Foreign currency derivatives
2
2
Foreign currency derivatives (cash flow hedges)
7
7 Commodity derivatives (cash flow hedges)
Electricity
1
1 Heavy fuel oil derivatives
0
0
Zinc
0
0 Investments recognised at fair value through profit and loss
Loan receivables from equity-accounted investees
73 73 Available-for-sale financial assets 14 14 Assets total
9 87 96
Liabilities measured at fair value
Foreign currency derivatives
-5
-5
Foreign currency derivatives (cash flow hedges)
-1
-1 Interest rate derivatives (cash flow hedges)
0
0
Commodity derivatives (cash flow hedges)
Electricity
-12
-12
Heavy fuel oil derivatives
0
0 Zinc -1 -1
Liabilities total -20 -20
Total
EUR million Level 1
Level 2
Level 3
31 Dec 2012
Assets measured at fair value
Foreign currency derivatives
4
4
Foreign currency derivatives (cash flow hedges)
0
0 Commodity derivatives (cash flow hedges)
Electricity
0
0 Heavy fuel oil derivatives
0
0
Zinc
1
1 Investments recognised at fair value through profit and loss
Loan receivables from equity-accounted investees
72 72 Available-for-sale financial assets 14 14 Assets total
5 86 91
Liabilities measured at fair value
Foreign currency derivatives
-6
-6
Foreign currency derivatives (cash flow hedges)
-7
-7 Commodity derivatives (cash flow hedges)
Electricity
-13
-13 Heavy fuel oil derivatives
0
0
Zinc 0 0 Liabilities total -26 -26
Rautaruukki Corporation Interim report Q1/2013 30
CHANGES IN PROPERTY, PLANT AND EQUIPMENT (IFRS) EUR million Q1/13 Q1/12 2012 Carrying amount at the beginning of period 1,122 1,214 1,214 Additions 15 20 92 Additions through acquisitions 0 Disposals -1 0 -8 Disposals through divestments -50 Depreciation -30 -30 -125 Impairment 0 -1 -8 Translation differences 1 8 7 Carrying amount at the end of period 1,107 1,211 1,122
TRANSACTIONS WITH RELATED PARTIES (IFRS) EUR million Q1/13 Q1/12 2012 Sales to equity-accounted investees 6 6 21 Purchases from equity-accounted investees 2 2 7 Loan receivables from equity-accounted investees 73 72 Transactions with Rautaruukki Pension Foundation 0 0 0
31 Mar
2013 31 Mar
2012 31 Dec
2012 Trade and other receivables from related parties 7 5 4 Trade and other payables to related parties 0 1 0 INVESTMENT COMMITMENTS (IFRS)
EUR million After 31
Mar 2013 After 31
Mar 2012 After 31
Dec 2012 Maintenance investments 78 80 61 Development investments and investments in special steel products 14 16 13 Total 92 96 74
Rautaruukki Corporation Interim report Q1/2013 31
SEGMENT INFORMATION EUR million Q1/13 Q1/12 2012 Order intake
Ruukki Construction 153 147 756 Ruukki Metals 437 488 1,857 Order intake, total 590 634 2,613 Comparable net sales Ruukki Construction 145 153 740 Ruukki Engineering 69 265 Ruukki Metals 444 477 1,787 Others 1 0 -3 Comparable net sales, total 590 699 2,789 Items affecting comparability included in reported net sales 0 2 7 Reported net sales 590 702 2,796 Comparable operating profit Ruukki Construction -7 -10 1 Ruukki Engineering -1 -3 Ruukki Metals 17 0 -42 Others -4 -4 -20 Comparable operating profit, total 5 -15 -65 Items affecting comparability included in reported operating profit -1 -1 -37 Reported operating profit 4 -16 -101 Net finance costs -8 -11 -40 Share of profit of equity-accounted investees -1 1 2 Result before income tax -4 -27 -139 Income tax expense 1 6 22 Result for the period -4 -20 -117
EUR million
31 Mar 2013
31 Mar 2012
31 Dec 2012
Operative capital employed Ruukki Construction 385 437 386
Ruukki Engineering 154 36 Ruukki Metals 1,421 1,513 1,409 Others 25 31 22 Operative capital employed, total 1,831 2,136 1,853

Rautaruukki Corporation Interim report Q1/2013 32
QUARTERLY SEGMENT INFORMATION EUR million Q1/12 Q2/12 Q3/12 Q4/12 Q1/13 Order intake
Ruukki Construction 147 246 193 170 153 Ruukki Metals 488 468 448 454 437 Order intake, total 634 714 640 624 590 Comparable net sales Ruukki Construction 153 199 208 180 145 Ruukki Engineering 69 72 63 60 Ruukki Metals 477 470 406 434 444 Others 0 -2 -3 2 1 Comparable net sales, total 699 740 674 676 590 Items affecting comparability included in reported net sales 2 2 1 1 0 Reported net sales 702 742 675 677 590
Comparable operating profit Ruukki Construction -10 4 8 -1 -7 Ruukki Engineering -1 1 0 -3 Ruukki Metals 0 10 -18 -34 17 Others -4 -7 -7 -2 -4 Comparable operating profit, total -15 8 -18 -39 5 Items affecting comparability included in reported net sales -1 -13 -3 -20 -1 Reported operating profit -16 -6 -21 -59 4 Net finance costs -11 -9 -11 -9 -8 Share of profit of equity- accounted investees 1 1 0 0 -1 Result before income tax -27 -14 -32 -67 -4 Income tax expense 6 3 2 11 1 Result for the period -20 -11 -30 -57 -4
Rautaruukki Corporation Interim report Q1/2013 33
ITEMS AFFECTING COMPARABILITY OF REPORTED NET SALES EUR million Q1/12 Q2/12 Q3/12 Q4/12 Q1/13 Others
Net sales of Mo i Rana unit 2 2 1 1 0
ITEMS AFFECTING COMPARABILITY OF REPORTED OPERATING PROFIT EUR million Q1/12 Q2/12 Q3/12 Q4/12 Q1/13 Ruukki Construction
Expenses related to restructuring -2 -9 Effect of change in discount rate on long service benefit costs 0 Ruukki Engineering
Expenses related to restructuring 0 -6 -2 Impact from Fortaco deal 0 Effect of change in discount rate on long service benefit costs 0 Ruukki Metals
Cost of fire at Raahe steel works -3 Expenses related to restructuring -6 Effect of change in discount rate on long service benefit costs -2 Others
Operating profit of Mo i Rana unit 0 -3 0 0 0 Impact from Fortaco deal 2 -1 Expenses related to restructuring -2 Restatement due to change of IAS19 -1 -1 -1 -1 Effect of change in discount rate on long service benefit costs
0
Items affecting comparability of reported operating profit, total -1 -13 -3 -20 -1 DELIVERIES, RUUKKI METALS 1 000 tonnes Q1/12 Q2/12 Q3/12 Q4/12 Q1/13 Deliveries 507 448 389 466 481
Rautaruukki Corporation Interim report Q1/2013 34
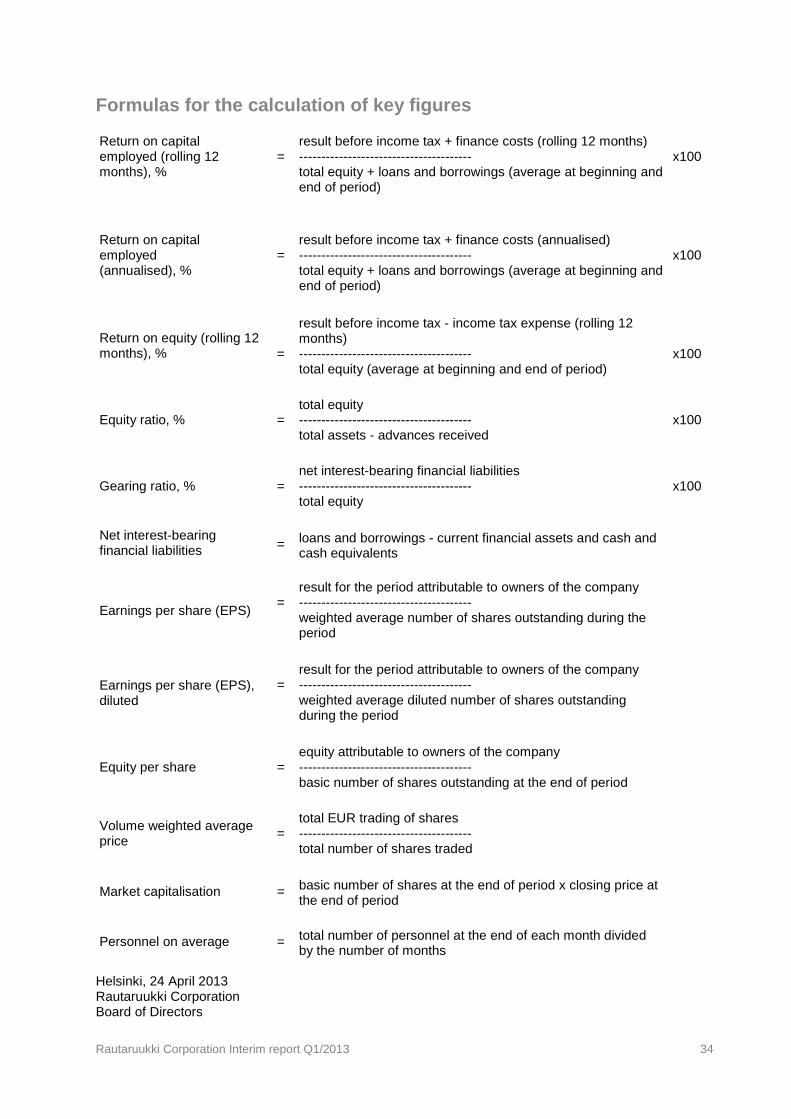
Formulas for the calculation of key figures
Return on capital employed (rolling 12 months), %
result before income tax + finance costs (rolling 12 months)
x100 = ---------------------------------------
total equity + loans and borrowings (average at beginning and end of period)
Return on capital employed (annualised), %
result before income tax + finance costs (annualised)
x100 = ---------------------------------------
total equity + loans and borrowings (average at beginning and end of period)
Return on equity (rolling 12 months), %
result before income tax - income tax expense (rolling 12 months)
x100 = --------------------------------------- total equity (average at beginning and end of period)
Equity ratio, % total equity
x100 = --------------------------------------- total assets - advances received
Gearing ratio, % net interest-bearing financial liabilities
x100 = --------------------------------------- total equity
Net interest-bearing financial liabilities = loans and borrowings - current financial assets and cash and
cash equivalents
Earnings per share (EPS)
result for the period attributable to owners of the company = ---------------------------------------
weighted average number of shares outstanding during the period
Earnings per share (EPS), diluted
result for the period attributable to owners of the company = --------------------------------------- weighted average diluted number of shares outstanding
during the period
Equity per share equity attributable to owners of the company
= --------------------------------------- basic number of shares outstanding at the end of period
Volume weighted average price
total EUR trading of shares = --------------------------------------- total number of shares traded
Market capitalisation = basic number of shares at the end of period x closing price at the end of period
Personnel on average = total number of personnel at the end of each month divided by the number of months
Helsinki, 24 April 2013 Rautaruukki Corporation Board of Directors
Ruukki provides its customers with energy-efficient steel solutions for better living, working and moving.
CFI.00
1EN/0
4.2013/RU
UKKI
Rautaruukki Corporation, Suolakivenkatu 1, FI-00810 Helsinki, Finland, +358 20 5911, www.ruukki.com Business ID 0113276–9, VAT No. FI 01132769, Registered Office Helsinki
Copyright© 2013 Rautaruukki Corporation. All rights reserved. Ruukki, Rautaruukki, Living. Working. Moving. and Ruukki’s product names are trademarks or registered trademarks of Rautaruukki Corporation.
The interim report for the period January-June 2013 will be published on 8 August 2013.