q1-2021 quarterly perspectives - tavistock wealth
TRANSCRIPT
Q1-2021 QUARTERLY PERSPECTIVES
Welcome to the Q1-2021 ‘Quarterly Perspectives’ publication
Tavistock Wealth - Investment OutlookJohn Leiper, Andrew Pottie, Sekar Indran, Alex Livingstone, Jonah Levy and James Peel
Page 1 of 16
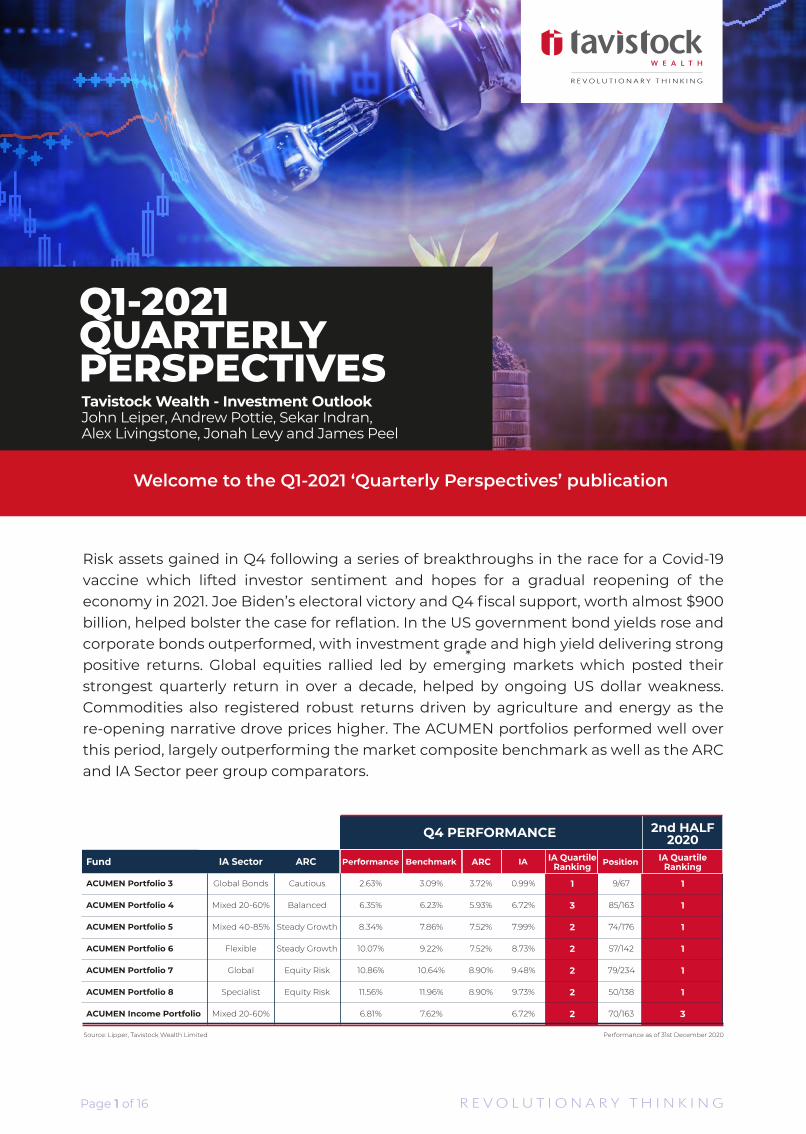
Risk assets gained in Q4 following a series of breakthroughs in the race for a Covid-19 vaccine which lifted investor sentiment and hopes for a gradual reopening of the economy in 2021. Joe Biden’s electoral victory and Q4 fiscal support, worth almost $900 billion, helped bolster the case for reflation. In the US government bond yields rose and corporate bonds outperformed, with investment grade and high yield delivering strong positive returns. Global equities rallied led by emerging markets which posted their strongest quarterly return in over a decade, helped by ongoing US dollar weakness. Commodities also registered robust returns driven by agriculture and energy as the re-opening narrative drove prices higher. The ACUMEN portfolios performed well over this period, largely outperforming the market composite benchmark as well as the ARC and IA Sector peer group comparators.
*
Page 2 of 16
Key Themes
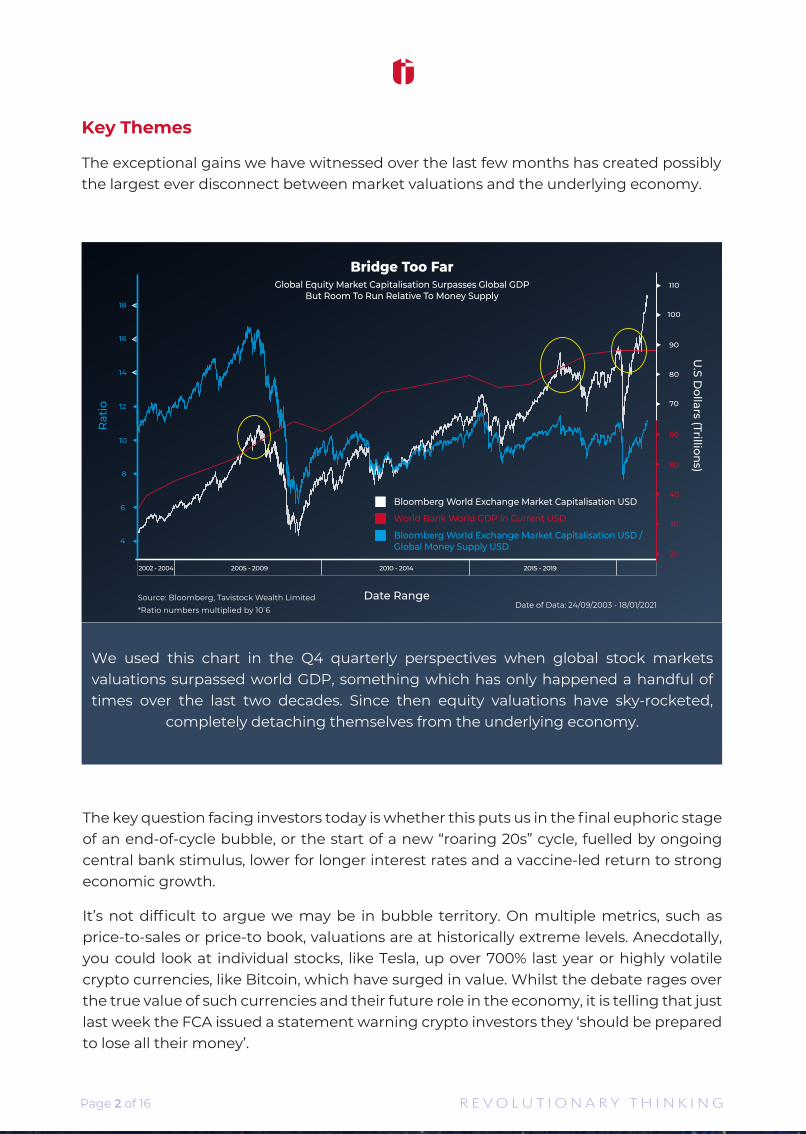
The exceptional gains we have witnessed over the last few months has created possibly the largest ever disconnect between market valuations and the underlying economy.
We used this chart in the Q4 quarterly perspectives when global stock markets valuations surpassed world GDP, something which has only happened a handful of times over the last two decades. Since then equity valuations have sky-rocketed,
completely detaching themselves from the underlying economy.
The key question facing investors today is whether this puts us in the final euphoric stage of an end-of-cycle bubble, or the start of a new “roaring 20s” cycle, fuelled by ongoing central bank stimulus, lower for longer interest rates and a vaccine-led return to strong economic growth.
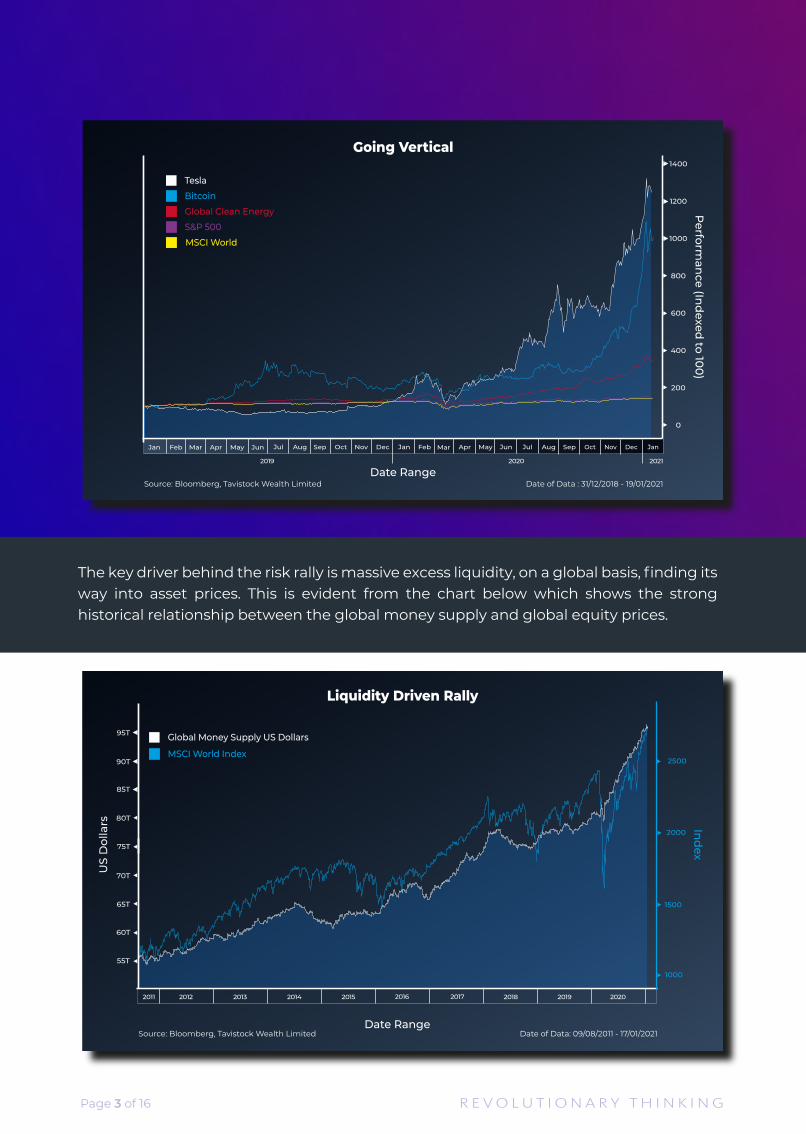
It’s not difficult to argue we may be in bubble territory. On multiple metrics, such as price-to-sales or price-to book, valuations are at historically extreme levels. Anecdotally, you could look at individual stocks, like Tesla, up over 700% last year or highly volatile crypto currencies, like Bitcoin, which have surged in value. Whilst the debate rages over the true value of such currencies and their future role in the economy, it is telling that just last week the FCA issued a statement warning crypto investors they ‘should be prepared to lose all their money’.
Page 3 of 16
The key driver behind the risk rally is massive excess liquidity, on a global basis, finding its way into asset prices. This is evident from the chart below which shows the strong historical relationship between the global money supply and global equity prices.
Page 4 of 16
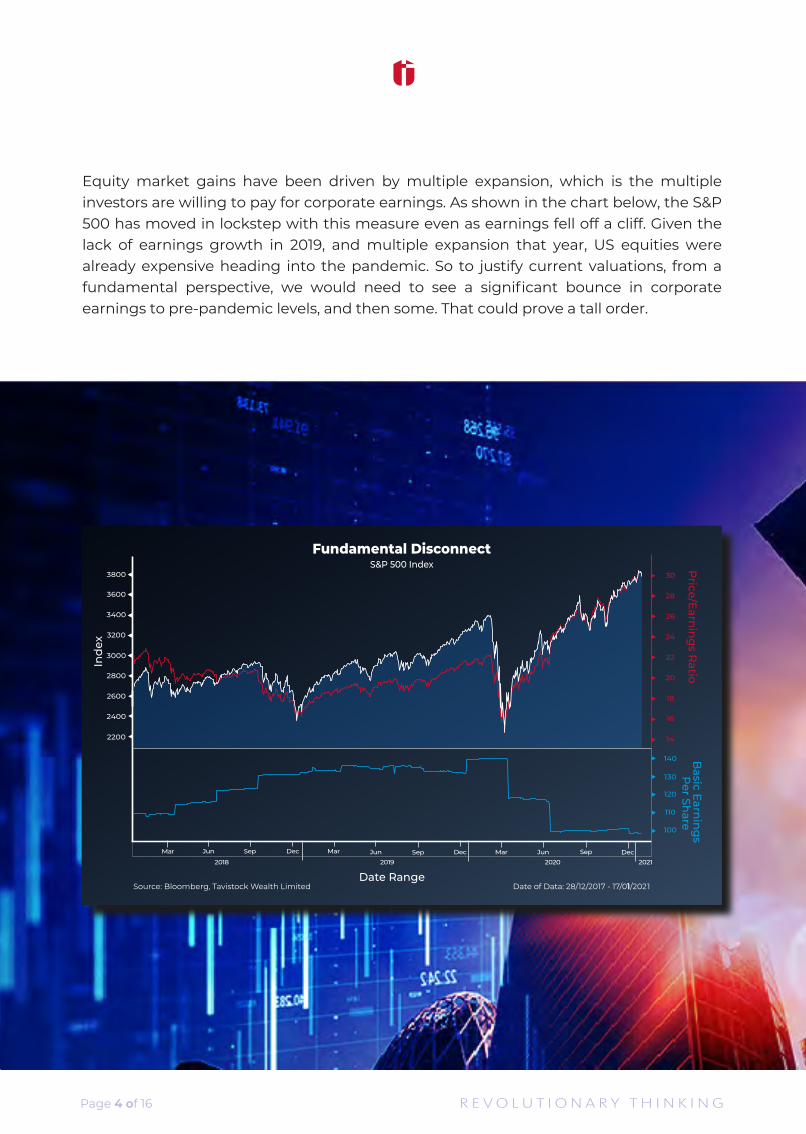
Equity market gains have been driven by multiple expansion, which is the multiple investors are willing to pay for corporate earnings. As shown in the chart below, the S&P 500 has moved in lockstep with this measure even as earnings fell off a cliff. Given the lack of earnings growth in 2019, and multiple expansion that year, US equities were already expensive heading into the pandemic. So to justify current valuations, from a fundamental perspective, we would need to see a significant bounce in corporate earnings to pre-pandemic levels, and then some. That could prove a tall order.
Page 5 of 16
It is not just valuations that are at extreme levels. Investor sentiment is also running wild. This is evident from a range of indicators including the Citi Panic/Euphoria index, the CNN Fear/Greed index and AAII Investor Sentiment survey, conducted by the American Association of Individual Investors. It’s also clear from the December Bank of America global fund manager report, which was the most bullish of 2020, pricing in a 20-year high in GDP expectations and the lowest fund manager cash levels since before the crisis, close to the contrarian “sell signal” indicator. Market positioning is overwhelmingly long and at the time of writing over 90% of S&P 500 constituents are trading above their 200-day moving average. Further, there seems to be little demand for downside protection as evidenced by the put-call ratio, which is at levels last seen in 2000, before the tech bubble popped.
Bullish investor sentiment and positioning seldom cause a reversal by themselves. But when they reach extreme levels, like we see today, they increase the risk that an external catalyst could cause one. This brings us to the ongoing threat from Covid-19. If the virus were to mutate or the vaccine were to prove ineffectual it could thrust us into a fresh recession this year, an outcome not yet priced into markets.
Setting aside the ongoing Covid-19 risks, as investors the question we need to ask ourselves is whether the potential rebound in earnings, on a reopening economy, justifies current valuations or whether markets are already too stretched to bridge the expectations gap. One potential answer is to look at the bond market where valuations dwarf those on stocks. Relative to bonds, equity prices seem reasonable. This is the view of Professor Robert Shiller, Yale economist and winner of the Nobel prize who successfully identified the bubbles in 2000 and 2008. In a recent interview on CNBC he said, “the market is highly priced, but it’s not so high that I wouldn’t consider an investment” and that he expected stocks to outperform bonds for the foreseeable future.
Equities are valued by discounting future cash flows by interest rates which, as shown in the chart below, are at all-time lows. Whilst there are growing signs that yields could drift higher over time it is reassuring to see that Jay Powell is very attuned to investor concerns. In a virtual event hosted by Princeton University last week he stated the Fed had to be “very careful” because of “real sensitivity” among investors and that the central bank was far from considering an “exit” from its ultra-loose monetary policies. So assuming corporate earnings are strong, and interest rates remain low relative to their own history, could equities have further upside?
Page 6 of 16
Chart of the Quarter
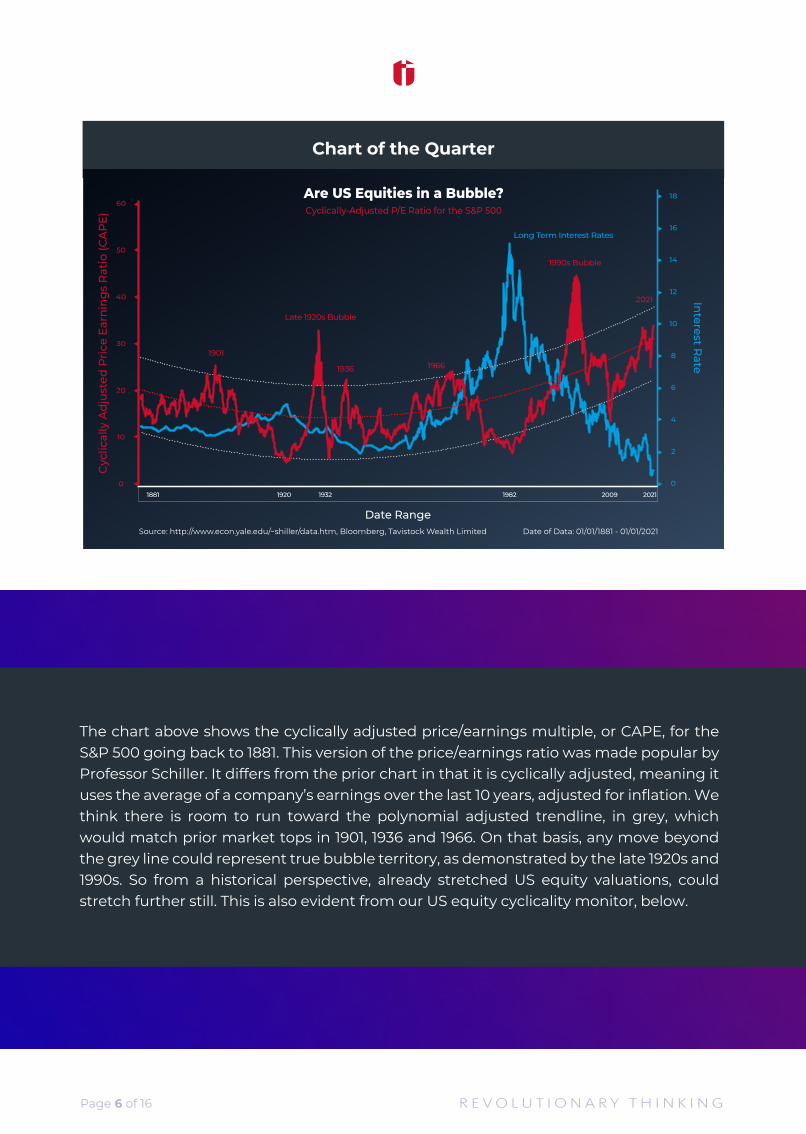
The chart above shows the cyclically adjusted price/earnings multiple, or CAPE, for the S&P 500 going back to 1881. This version of the price/earnings ratio was made popular by Professor Schiller. It differs from the prior chart in that it is cyclically adjusted, meaning it uses the average of a company’s earnings over the last 10 years, adjusted for inflation. We think there is room to run toward the polynomial adjusted trendline, in grey, which would match prior market tops in 1901, 1936 and 1966. On that basis, any move beyond the grey line could represent true bubble territory, as demonstrated by the late 1920s and 1990s. So from a historical perspective, already stretched US equity valuations, could stretch further still. This is also evident from our US equity cyclicality monitor, below.
Page 7 of 16
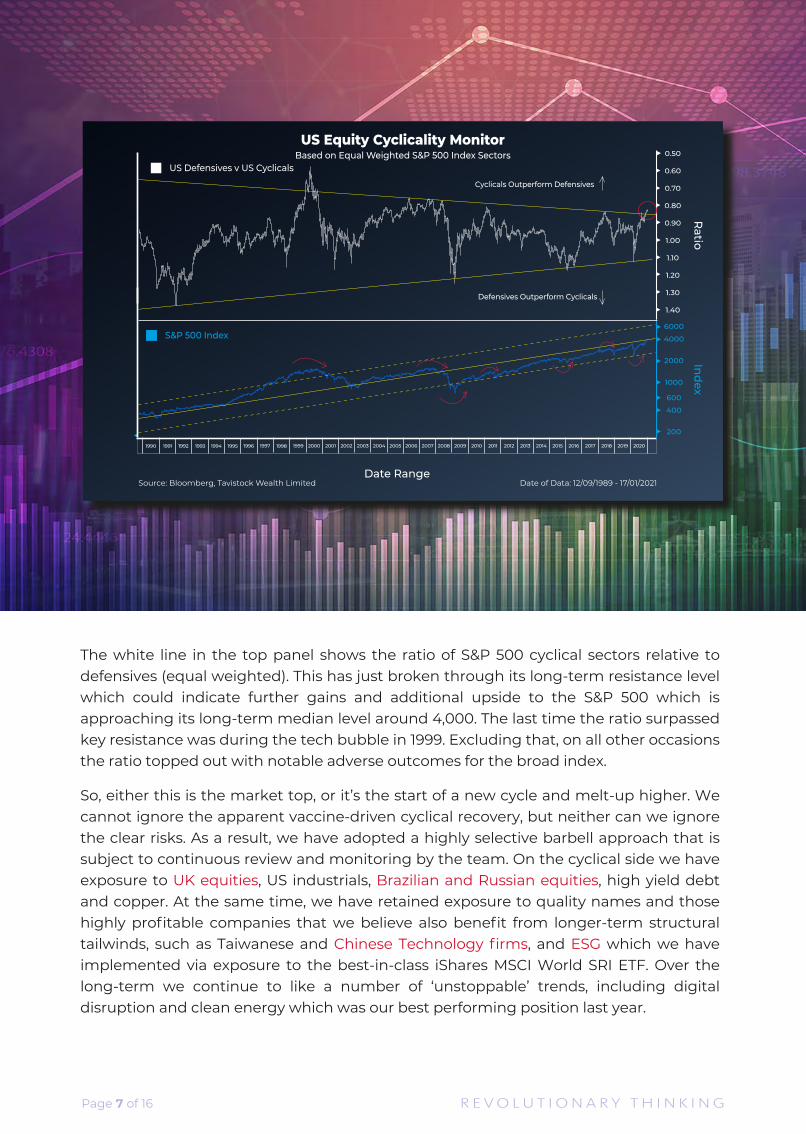
The white line in the top panel shows the ratio of S&P 500 cyclical sectors relative to defensives (equal weighted). This has just broken through its long-term resistance level which could indicate further gains and additional upside to the S&P 500 which is approaching its long-term median level around 4,000. The last time the ratio surpassed key resistance was during the tech bubble in 1999. Excluding that, on all other occasions the ratio topped out with notable adverse outcomes for the broad index.
So, either this is the market top, or it’s the start of a new cycle and melt-up higher. We cannot ignore the apparent vaccine-driven cyclical recovery, but neither can we ignore the clear risks. As a result, we have adopted a highly selective barbell approach that is subject to continuous review and monitoring by the team. On the cyclical side we have exposure to UK equities, US industrials, Brazilian and Russian equities, high yield debt and copper. At the same time, we have retained exposure to quality names and those highly profitable companies that we believe also benefit from longer-term structural tailwinds, such as Taiwanese and Chinese Technology firms, and ESG which we have implemented via exposure to the best-in-class iShares MSCI World SRI ETF. Over the long-term we continue to like a number of ‘unstoppable’ trends, including digital disruption and clean energy which was our best performing position last year.
Page 8 of 16
Fixed Income
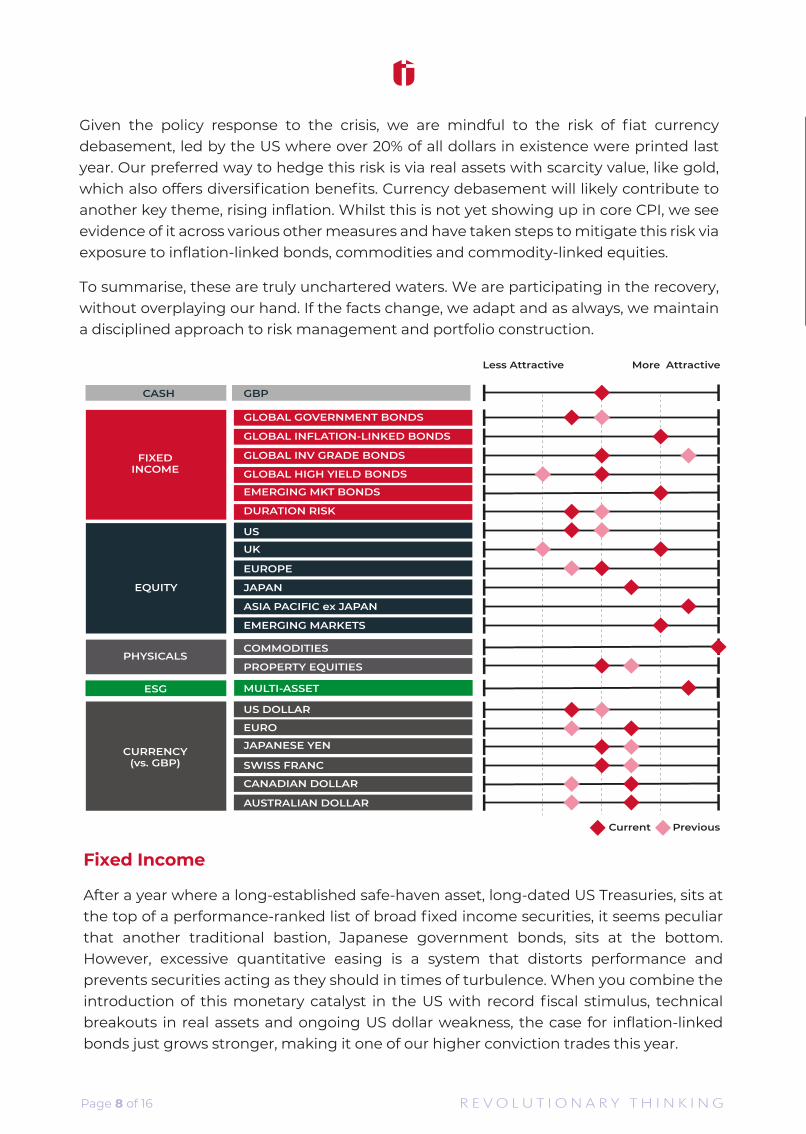
After a year where a long-established safe-haven asset, long-dated US Treasuries, sits at the top of a performance-ranked list of broad fixed income securities, it seems peculiar that another traditional bastion, Japanese government bonds, sits at the bottom. However, excessive quantitative easing is a system that distorts performance and prevents securities acting as they should in times of turbulence. When you combine the introduction of this monetary catalyst in the US with record fiscal stimulus, technical breakouts in real assets and ongoing US dollar weakness, the case for inflation-linked bonds just grows stronger, making it one of our higher conviction trades this year.
Given the policy response to the crisis, we are mindful to the risk of fiat currency debasement, led by the US where over 20% of all dollars in existence were printed last year. Our preferred way to hedge this risk is via real assets with scarcity value, like gold, which also offers diversification benefits. Currency debasement will likely contribute to another key theme, rising inflation. Whilst this is not yet showing up in core CPI, we see evidence of it across various other measures and have taken steps to mitigate this risk via exposure to inflation-linked bonds, commodities and commodity-linked equities.
To summarise, these are truly unchartered waters. We are participating in the recovery, without overplaying our hand. If the facts change, we adapt and as always, we maintain a disciplined approach to risk management and portfolio construction.
Page 9 of 16
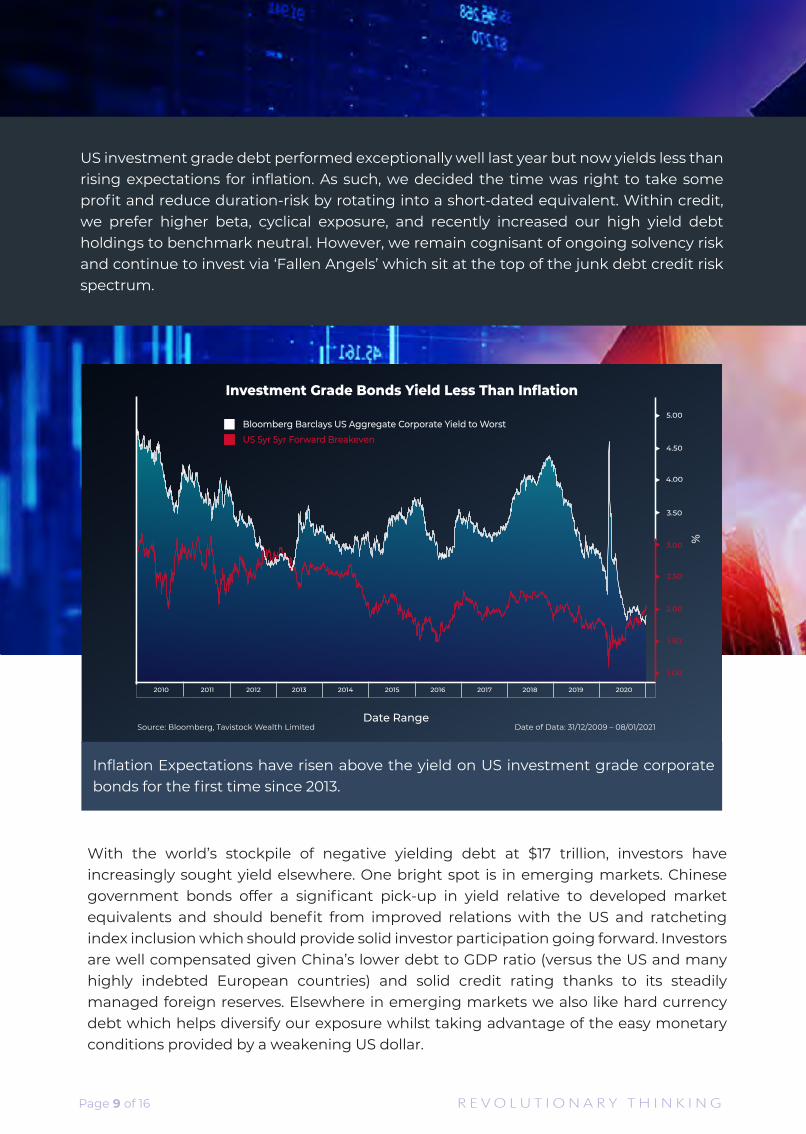
Inflation Expectations have risen above the yield on US investment grade corporate bonds for the first time since 2013.
With the world’s stockpile of negative yielding debt at $17 trillion, investors have increasingly sought yield elsewhere. One bright spot is in emerging markets. Chinese government bonds offer a significant pick-up in yield relative to developed market equivalents and should benefit from improved relations with the US and ratcheting index inclusion which should provide solid investor participation going forward. Investors are well compensated given China’s lower debt to GDP ratio (versus the US and many highly indebted European countries) and solid credit rating thanks to its steadily managed foreign reserves. Elsewhere in emerging markets we also like hard currency debt which helps diversify our exposure whilst taking advantage of the easy monetary conditions provided by a weakening US dollar.
US investment grade debt performed exceptionally well last year but now yields less than rising expectations for inflation. As such, we decided the time was right to take some profit and reduce duration-risk by rotating into a short-dated equivalent. Within credit, we prefer higher beta, cyclical exposure, and recently increased our high yield debt holdings to benchmark neutral. However, we remain cognisant of ongoing solvency risk and continue to invest via ‘Fallen Angels’ which sit at the top of the junk debt credit risk spectrum.
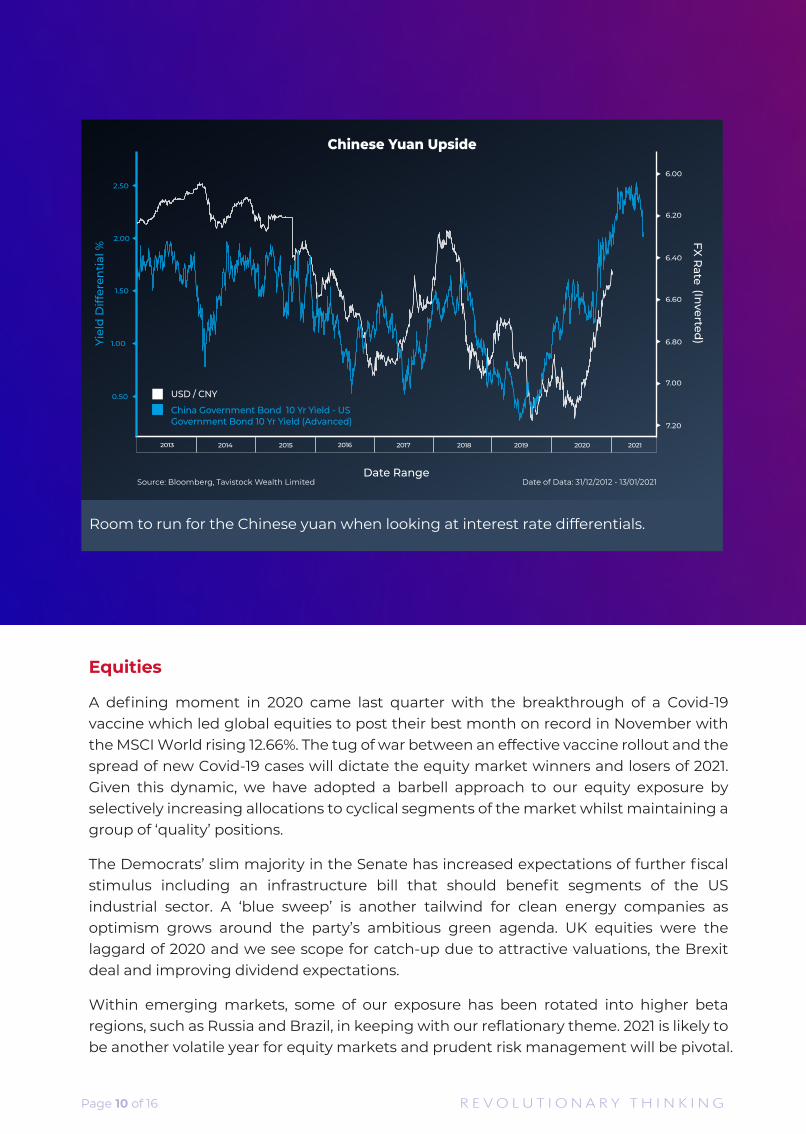
Room to run for the Chinese yuan when looking at interest rate differentials.
Page 10 of 16
Equities
A defining moment in 2020 came last quarter with the breakthrough of a Covid-19 vaccine which led global equities to post their best month on record in November with the MSCI World rising 12.66%. The tug of war between an effective vaccine rollout and the spread of new Covid-19 cases will dictate the equity market winners and losers of 2021. Given this dynamic, we have adopted a barbell approach to our equity exposure by selectively increasing allocations to cyclical segments of the market whilst maintaining a group of ‘quality’ positions.
The Democrats’ slim majority in the Senate has increased expectations of further fiscal stimulus including an infrastructure bill that should benefit segments of the US industrial sector. A ‘blue sweep’ is another tailwind for clean energy companies as optimism grows around the party’s ambitious green agenda. UK equities were the laggard of 2020 and we see scope for catch-up due to attractive valuations, the Brexit deal and improving dividend expectations.
Within emerging markets, some of our exposure has been rotated into higher beta regions, such as Russia and Brazil, in keeping with our reflationary theme. 2021 is likely to be another volatile year for equity markets and prudent risk management will be pivotal.
Page 11 of 16
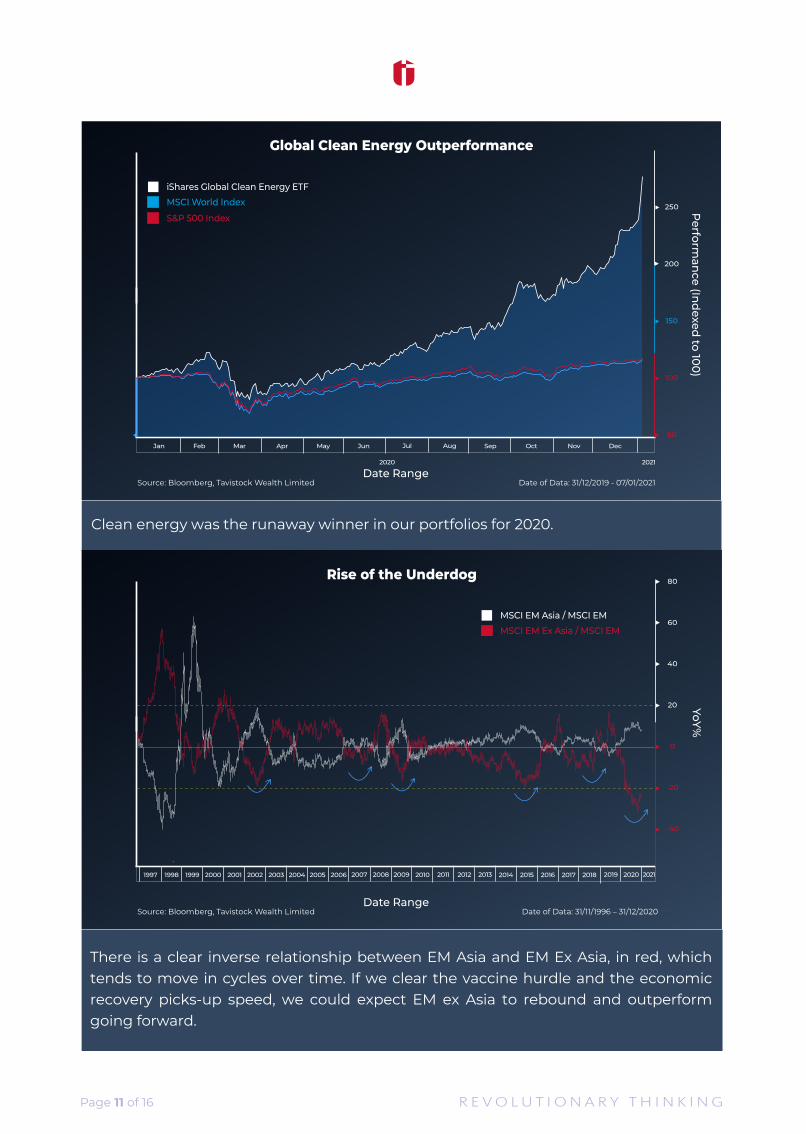
Clean energy was the runaway winner in our portfolios for 2020.
There is a clear inverse relationship between EM Asia and EM Ex Asia, in red, which tends to move in cycles over time. If we clear the vaccine hurdle and the economic recovery picks-up speed, we could expect EM ex Asia to rebound and outperform going forward.
Physicals
Sustained economic recovery, driven by China, and a successful vaccine roll-out program should continue to support strong positive momentum across commodity prices in 2021.
Cyclical sectors will benefit most from the recovery, and we are already seeing signs of this in industrial metals and oil. WTI oil prices are above $50 for the first time since February, rising from a technical low when prices briefly went negative due to an extreme case of super contango. Recent and unexpected production cuts by Saudi Arabia signify OPECs desire to stabilise the oil price, and with falling inventory levels and rising demand, further appreciation is likely through 2021. Our call for ongoing US dollar weakness should also support both oil and the broader commodity complex.
Our position in copper as well as Brazilian and Russian equities should also benefit from the above narrative. Further support for copper prices comes from robust Chinese economic growth, where GDP expanded 6.5% in Q4 (one of the few countries to grow last year), and swathes of “green investment” projects, promised by heads of state globally. This psychological shift towards cleaner living demands a focus on electric vehicle indices and battery makers, and their constituent commodities, through 2021. Having taken tactical profit on our silver position late last year, we continue to monitor for an attractive re-entry point, whilst we maintain our strategic allocation to physical gold.
Property continues to harbour signs of exhaustion following a meek recovery in the second half of 2020. Persisting Covid-19 concerns continue to shutter offices, with residential sectors facing many of the same concerns. In both the UK and the US, new home starts, pending applications and mortgage applications have all been on a downward trajectory in Q4 2020 and as such we remain cautious on real estate.
Page 12 of 16
Foreign Exchange
2020 was a tale of US dollar weakness versus wider G10 and EM currency appreciation. This resonated with our year-end projection for GBP/USD which closed the year at 1.36, just above our 1.35 target.
Looking ahead, we believe long-term real growth differentials will narrow as global economies recover from the economic disruption last year; interest rate differentials will remain capped, until consistent inflation returns; and the market will remain flooded with US dollars from ongoing stimulus measures, all of which points to ongoing currency weakness. The key risk to this theme, in the short-term, is that market positioning is already extreme, with the highest level of net-short futures positions since 2006. The next leg down for the US dollar will not be linear.
In the cyclical environment ahead the UK pound looks set to appreciate. With the notable exception of Israel, the UK is leading the race to roll-out the Covid-19 vaccine and with a Brexit deal now under the belt, funds have already started flowing back to the UK. The euro also looks attractive on its pro-cyclical aspects but may be tethered by ECB rhetoric keen to keep the currency below 1.20 against the US dollar. Over the long-term we also like cheap emerging market commodity currencies with strong potential for catch-up growth, like the Russian rouble and Brazilian real although it will be important to manage exposure on a tactical basis given ongoing risks to these regions.
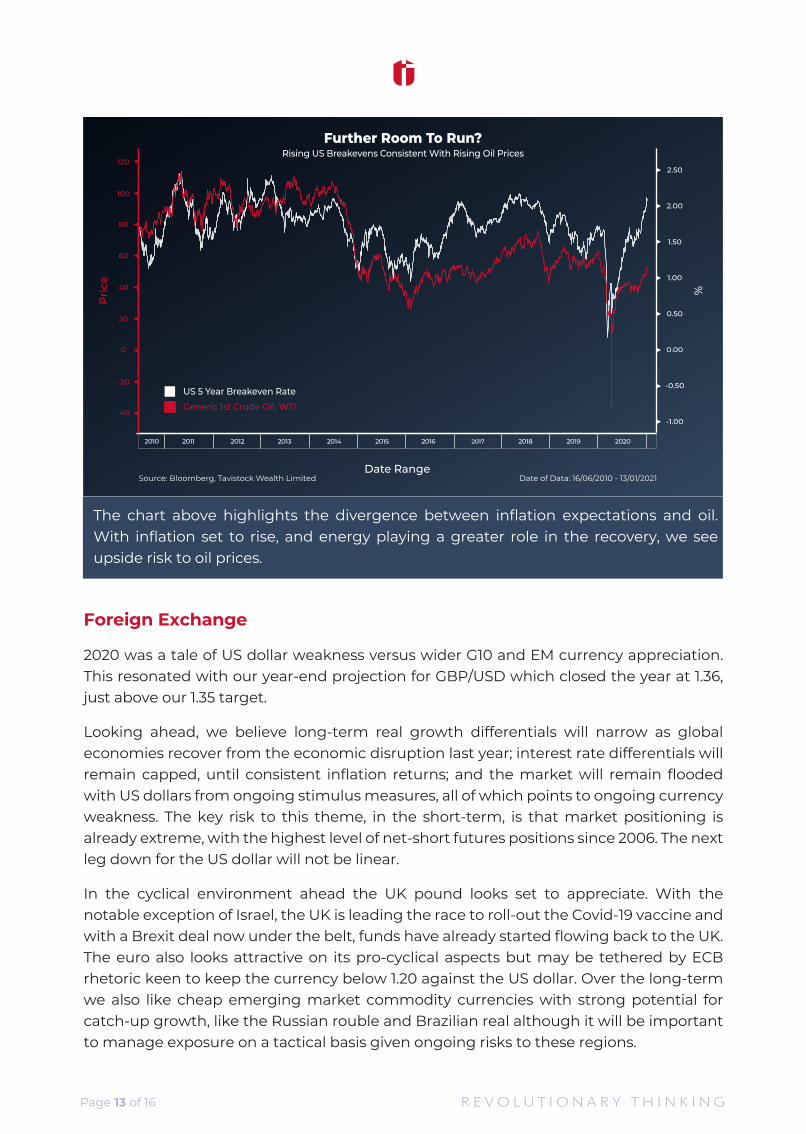
The chart above highlights the divergence between inflation expectations and oil. With inflation set to rise, and energy playing a greater role in the recovery, we see upside risk to oil prices.
Page 13 of 16
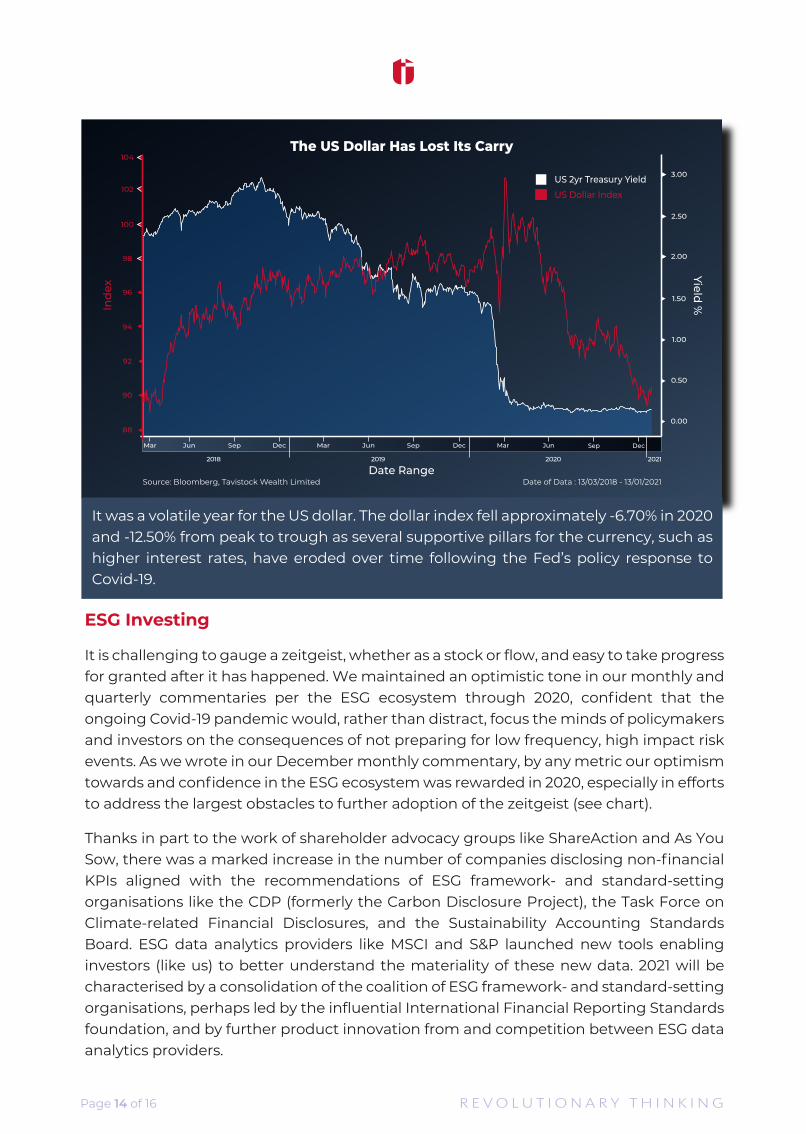
It was a volatile year for the US dollar. The dollar index fell approximately -6.70% in 2020 and -12.50% from peak to trough as several supportive pillars for the currency, such as higher interest rates, have eroded over time following the Fed’s policy response to Covid-19.
ESG Investing
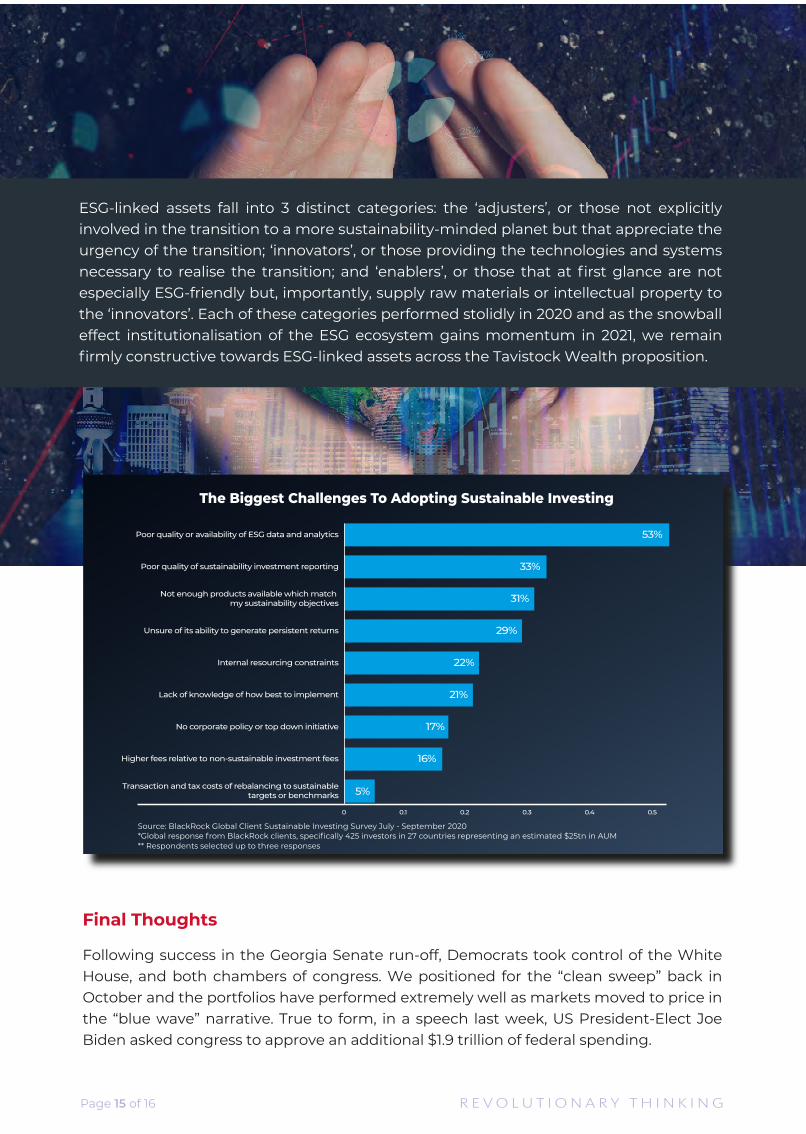
It is challenging to gauge a zeitgeist, whether as a stock or flow, and easy to take progress for granted after it has happened. We maintained an optimistic tone in our monthly and quarterly commentaries per the ESG ecosystem through 2020, confident that the ongoing Covid-19 pandemic would, rather than distract, focus the minds of policymakers and investors on the consequences of not preparing for low frequency, high impact risk events. As we wrote in our December monthly commentary, by any metric our optimism towards and confidence in the ESG ecosystem was rewarded in 2020, especially in efforts to address the largest obstacles to further adoption of the zeitgeist (see chart).
Thanks in part to the work of shareholder advocacy groups like ShareAction and As You Sow, there was a marked increase in the number of companies disclosing non-financial KPIs aligned with the recommendations of ESG framework- and standard-setting organisations like the CDP (formerly the Carbon Disclosure Project), the Task Force on Climate-related Financial Disclosures, and the Sustainability Accounting Standards Board. ESG data analytics providers like MSCI and S&P launched new tools enabling investors (like us) to better understand the materiality of these new data. 2021 will be characterised by a consolidation of the coalition of ESG framework- and standard-setting organisations, perhaps led by the influential International Financial Reporting Standards foundation, and by further product innovation from and competition between ESG data analytics providers.
Page 14 of 16
Page 15 of 16
ESG-linked assets fall into 3 distinct categories: the ‘adjusters’, or those not explicitly involved in the transition to a more sustainability-minded planet but that appreciate the urgency of the transition; ‘innovators’, or those providing the technologies and systems necessary to realise the transition; and ‘enablers’, or those that at first glance are not especially ESG-friendly but, importantly, supply raw materials or intellectual property to the ‘innovators’. Each of these categories performed stolidly in 2020 and as the snowball effect institutionalisation of the ESG ecosystem gains momentum in 2021, we remain firmly constructive towards ESG-linked assets across the Tavistock Wealth proposition.
Final Thoughts
Following success in the Georgia Senate run-off, Democrats took control of the White House, and both chambers of congress. We positioned for the “clean sweep” back in October and the portfolios have performed extremely well as markets moved to price in the “blue wave” narrative. True to form, in a speech last week, US President-Elect Joe Biden asked congress to approve an additional $1.9 trillion of federal spending.
Page 16 of 16Tavistock Wealth Limited, 35 Heddon Street, Mayfair, London, W1B 4BN
https://ifa.tavistockwealth.com T: 01753 867000 e: [email protected]
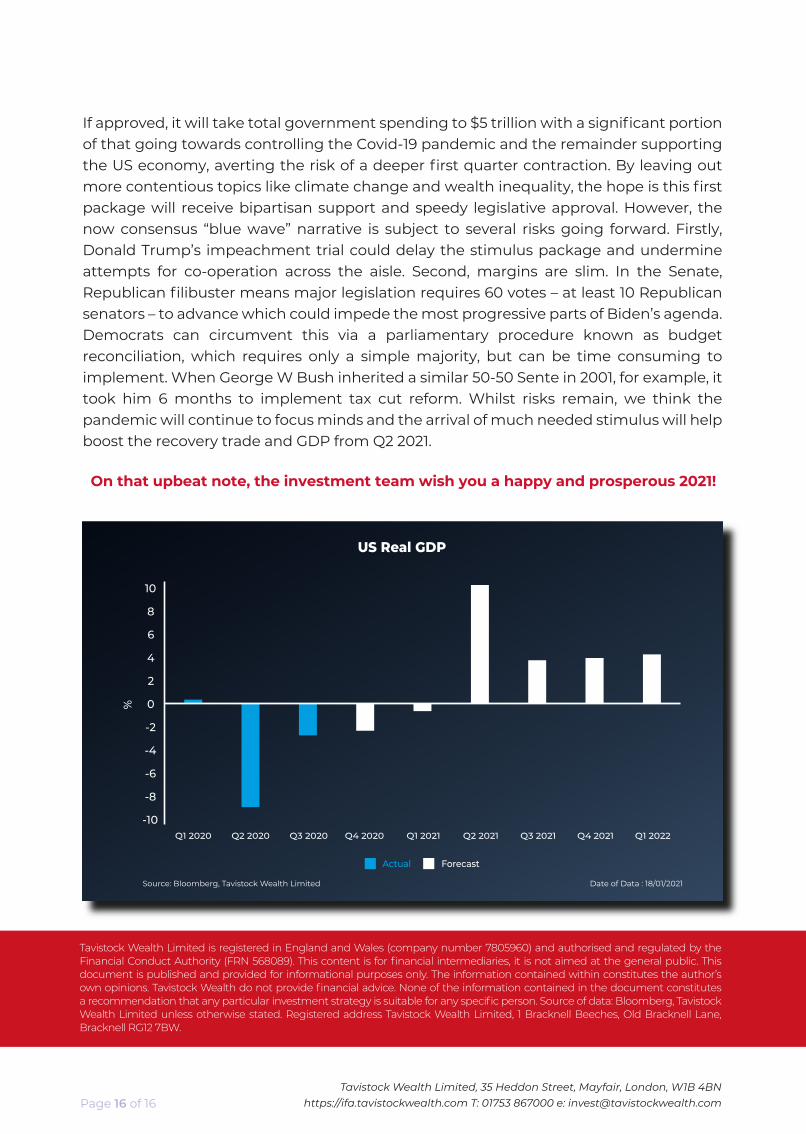
If approved, it will take total government spending to $5 trillion with a significant portion of that going towards controlling the Covid-19 pandemic and the remainder supporting the US economy, averting the risk of a deeper first quarter contraction. By leaving out more contentious topics like climate change and wealth inequality, the hope is this first package will receive bipartisan support and speedy legislative approval. However, the now consensus “blue wave” narrative is subject to several risks going forward. Firstly, Donald Trump’s impeachment trial could delay the stimulus package and undermine attempts for co-operation across the aisle. Second, margins are slim. In the Senate, Republican filibuster means major legislation requires 60 votes – at least 10 Republican senators – to advance which could impede the most progressive parts of Biden’s agenda. Democrats can circumvent this via a parliamentary procedure known as budget reconciliation, which requires only a simple majority, but can be time consuming to implement. When George W Bush inherited a similar 50-50 Sente in 2001, for example, it took him 6 months to implement tax cut reform. Whilst risks remain, we think the pandemic will continue to focus minds and the arrival of much needed stimulus will help boost the recovery trade and GDP from Q2 2021.
Tavistock Wealth Limited is registered in England and Wales (company number 7805960) and authorised and regulated by theFinancial Conduct Authority (FRN 568089). This content is for financial intermediaries, it is not aimed at the general public. Thisdocument is published and provided for informational purposes only. The information contained within constitutes the author’sown opinions. Tavistock Wealth do not provide financial advice. None of the information contained in the document constitutes a recommendation that any particular investment strategy is suitable for any specific person. Source of data: Bloomberg, TavistockWealth Limited unless otherwise stated. Registered address Tavistock Wealth Limited, 1 Bracknell Beeches, Old Bracknell Lane,Bracknell RG12 7BW.
On that upbeat note, the investment team wish you a happy and prosperous 2021!