fresenius quarterly financial report q1/2022
TRANSCRIPT
QUARTERLY FINANCIAL REPORT
Q1 2022
At a Glance Shareholder Information Interim Group Management Report Financial Statements Financial Calendar/Contact Table of contents
1st Q
uart
er 2
022
Qua
rter
ly F
inan
cial
Rep
ort
Fre
sen
ius
2
TABLE OF CONTENTS
13 Business segments
3 Fresenius Group figures at a glance 13 Fresenius Medical Care 28 Consolidated financial statements
15 Fresenius Kabi 28 Consolidated statement of income
17 Fresenius Helios 29 Consolidated statement of comprehensive income
4 Shareholder information 19 Fresenius Vamed 30 Consolidated statement of financial position
20 Employees 31 Consolidated statement of cash flows
20 Changes to the Management Board 33 Consolidated statement of changes in equity
5 Management Report 20 Research and development 35 Consolidated segment reporting first quarter of 2022
5 Strategy and goals 20 Rating
7 Healthcare industry 21 Oppotunities and risk report
8 Results of operations, financial position, assets and liabilities 21 Subsequent events 36 Notes
8 Sales 22 Outlook 2022
9 Earnings 25 Reconciliation tables
10 Reconciliation 27 Estimated COVID-19 effects 56 Financial Calendar
11 Investments
11 Cash flow
12 Asset and liability structure
At a Glance Shareholder Information Interim Group Management Report Financial Statements Financial Calendar/Contact Table of contents
3
1st Q
uart
er 2
022
Qua
rter
ly F
inan
cial
Rep
ort
Fre
sen
ius
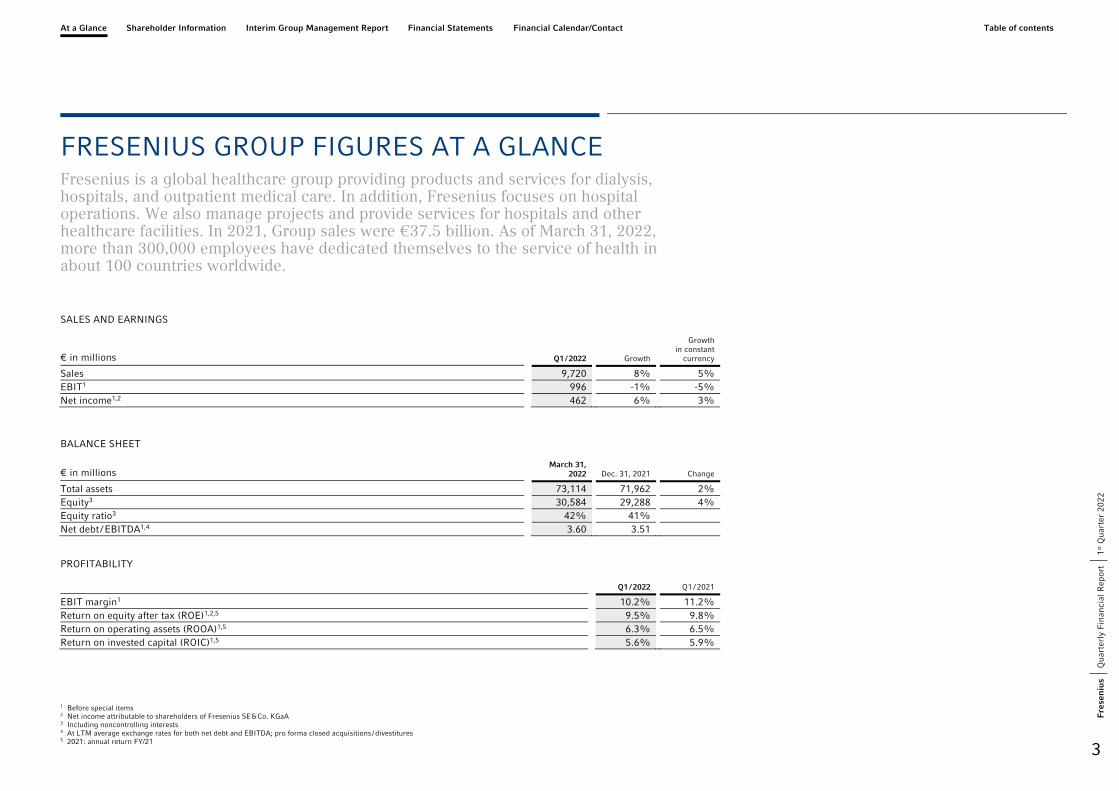
FRESENIUS GROUP FIGURES AT A GLANCE Fresenius is a global healthcare group providing products and services for dialysis, hospitals, and outpatient medical care. In addition, Fresenius focuses on hospital operations. We also manage projects and provide services for hospitals and other healthcare facilities. In 2021, Group sales were €37.5 billion. As of March 31, 2022, more than 300,000 employees have dedicated themselves to the service of health in about 100 countries worldwide.
SALES AND EARNINGS
€ in millions Q1 / 2022 Growth
Growth in constant
currency
Sales 9,720 8% 5% EBIT1 996 -1% -5% Net income1,2 462 6% 3%
BALANCE SHEET
€ in millions March 31,
2022 Dec. 31, 2021 Change
Total assets 73,114 71,962 2% Equity3 30,584 29,288 4% Equity ratio3 42% 41% Net debt / EBITDA1,4 3.60 3.51
PROFITABILITY
Q1 / 2022 Q1 / 2021
EBIT margin1 10.2% 11.2% Return on equity after tax (ROE)1,2,5 9.5% 9.8% Return on operating assets (ROOA)1,5 6.3% 6.5% Return on invested capital (ROIC)1,5 5.6% 5.9%
1 Before special items
2 Net income attributable to shareholders of Fresenius SE & Co. KGaA 3 Including noncontrolling interests 4 At LTM average exchange rates for both net debt and EBITDA; pro forma closed acquisitions / divestitures 5 2021: annual return FY/21
At a Glance Shareholder Information Interim Group Management Report Financial Statements Financial Calendar/Contact Table of contents
4
1st Q
uart
er 2
022
Qua
rter
ly F
inan
cial
Rep
ort
Fre
sen
ius
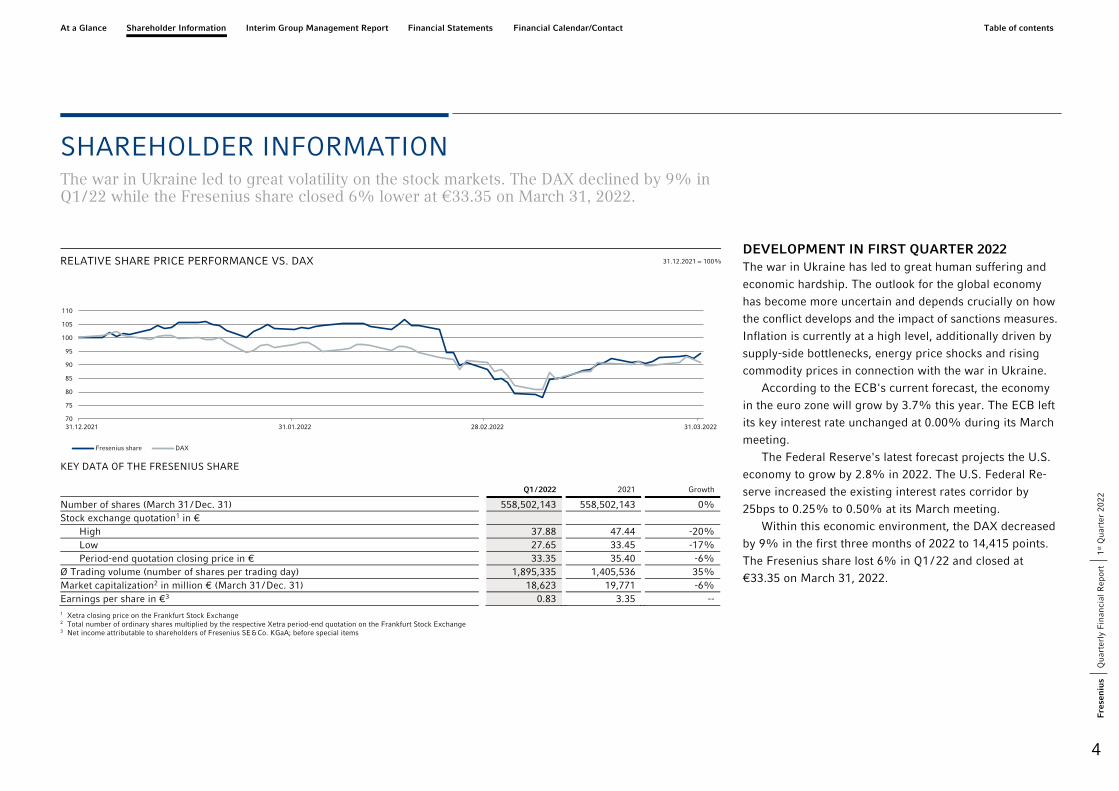
SHAREHOLDER INFORMATION The war in Ukraine led to great volatility on the stock markets. The DAX declined by 9% in Q1 / 22 while the Fresenius share closed 6% lower at €33.35 on March 31, 2022.
KEY DATA OF THE FRESENIUS SHARE
Q1 / 2022 2021 Growth
Number of shares (March 31 / Dec. 31) 558,502,143 558,502,143 0% Stock exchange quotation1 in €
High 37.88 47.44 -20% Low 27.65 33.45 -17% Period-end quotation closing price in € 33.35 35.40 -6%
Ø Trading volume (number of shares per trading day) 1,895,335 1,405,536 35% Market capitalization2 in million € (March 31 / Dec. 31) 18,623 19,771 -6% Earnings per share in €3 0.83 3.35 -- 1 Xetra closing price on the Frankfurt Stock Exchange 2 Total number of ordinary shares multiplied by the respective Xetra period-end quotation on the Frankfurt Stock Exchange 3 Net income attributable to shareholders of Fresenius SE & Co. KGaA; before special items
DEVELOPMENT IN FIRST QUARTER 2022 The war in Ukraine has led to great human suffering and
economic hardship. The outlook for the global economy
has become more uncertain and depends crucially on how
the conflict develops and the impact of sanctions measures.
Inflation is currently at a high level, additionally driven by
supply-side bottlenecks, energy price shocks and rising
commodity prices in connection with the war in Ukraine.
According to the ECB's current forecast, the economy
in the euro zone will grow by 3.7% this year. The ECB left
its key interest rate unchanged at 0.00% during its March
meeting.
The Federal Reserve's latest forecast projects the U.S.
economy to grow by 2.8% in 2022. The U.S. Federal Re-
serve increased the existing interest rates corridor by
25bps to 0.25% to 0.50% at its March meeting.
Within this economic environment, the DAX decreased
by 9% in the first three months of 2022 to 14,415 points.
The Fresenius share lost 6% in Q1 / 22 and closed at
€33.35 on March 31, 2022.
70
75
80
85
90
95
100
105
110
31.12.2021 31.01.2022 28.02.2022 31.03.2022
Fresenius share DAX
RELATIVE SHARE PRICE PERFORMANCE VS. DAX 31.12.2021 = 100%
At a Glance Shareholder Information Interim Group Management Report Financial Statements Financial Calendar/Contact Table of contents
1st Q
uart
er 2
022
Qua
rter
ly F
inan
cial
Rep
ort
Fre
sen
ius
5
INTERIM GROUP MANAGEMENT REPORT Fresenius with solid start to 2022 despite macroeconomic challenges
► Fresenius Medical Care in line with its expectations countering significant headwinds► Fresenius Kabi’s solid financial performance based on strong Emerging Markets growth► Fresenius Helios’ strong performance driven by growing admissions in Germany and Spain► Fresenius Vamed with continued progress towards normal operations, very good performance in the service business► Ongoing headwinds from cost inflation and supply chain challenges, with uncertainty and volatility fueled by the
Ukraine war► Guidance for 2022 confirmed► Fresenius appoints Sara Hennicken as Chief Financial Officer --- Rachel Empey to leave company at own request► Dr. Carla Kriwet to succeed Rice Powell on January 1, 2023, as Chief Executive Officer of Fresenius Medical Care
and member of the Fresenius Management Board
STRATEGY AND GOALS
Our goal is to expand Fresenius' position as a leading
global provider of products, services, and therapies for crit-
ically and chronically ill people.
Our purpose is to offer ‘‘Ever better medicine for ever
more people’’. In line with this purpose, Fresenius devel-
ops innovative, affordable, and profitable medical solutions
for the megatrends of health and demographics. What
drives us to achieve top performance every day is our mis-
sion: we improve people’s lives by providing high-quality
and affordable healthcare. Consequently, Fresenius’ busi-
ness decisions are guided by this mission. Our goal is to
expand Fresenius’ position as a leading global provider of
products, services, and therapies for critically and chroni-
cally ill people. At the same time, we want to grow profita-
bly and use our capital efficiently. We have lived up to our
special responsibility as part of the healthcare system, even
under the difficult circumstances of the current COVID-19
pandemic. With our products, services, and therapies, we
have made many important contributions worldwide.
In our view, a significant adjustment of our strategy due
to the COVID-19 pandemic is not necessary.
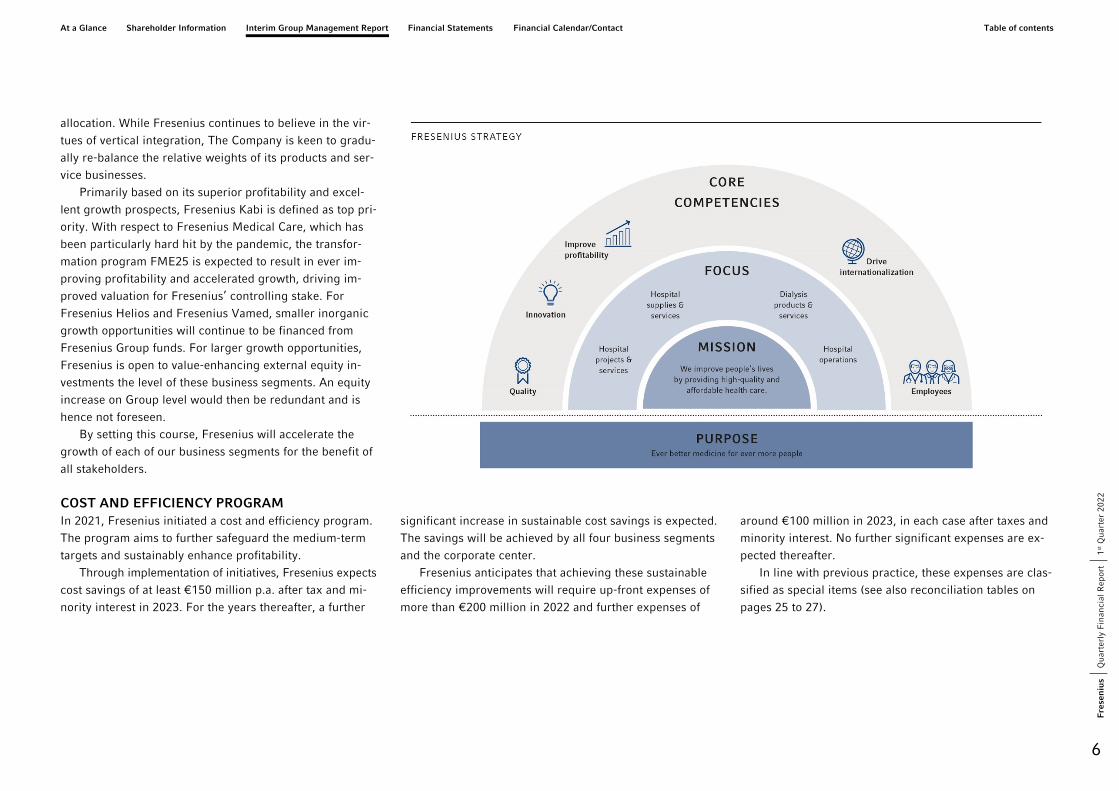
PATH TO ACCELERATED GROWTH Fresenius has defined a strategic path to pursue accelerated
profitable growth and hence to strengthen the Group and
each of its business segments by tapping new sources of
capital and prioritizing segment capital allocation. All our
stakeholders continue to benefit from the advantages of the
Group’s current structure, which offers stability through
diversification as well as efficiency through economies of
scale, access to attractive debt financing and tax savings.
All of Fresenius’ business segments have excellent market
positions and ample meaningful growth opportunities.
Properly balancing the objectives of all our stakeholder
groups requires an even more targeted approach to capital
At a Glance Shareholder Information Interim Group Management Report Financial Statements Financial Calendar/Contact Table of contents
1st Q
uart
er 2
022
Qua
rter
ly F
inan
cial
Rep
ort
Fre
sen
ius
6
allocation. While Fresenius continues to believe in the vir-
tues of vertical integration, The Company is keen to gradu-
ally re-balance the relative weights of its products and ser-
vice businesses.
Primarily based on its superior profitability and excel-
lent growth prospects, Fresenius Kabi is defined as top pri-
ority. With respect to Fresenius Medical Care, which has
been particularly hard hit by the pandemic, the transfor-
mation program FME25 is expected to result in ever im-
proving profitability and accelerated growth, driving im-
proved valuation for Fresenius’ controlling stake. For
Fresenius Helios and Fresenius Vamed, smaller inorganic
growth opportunities will continue to be financed from
Fresenius Group funds. For larger growth opportunities,
Fresenius is open to value-enhancing external equity in-
vestments the level of these business segments. An equity
increase on Group level would then be redundant and is
hence not foreseen.
By setting this course, Fresenius will accelerate the
growth of each of our business segments for the benefit of
all stakeholders.
COST AND EFFICIENCY PROGRAM In 2021, Fresenius initiated a cost and efficiency program.
The program aims to further safeguard the medium-term
targets and sustainably enhance profitability.
Through implementation of initiatives, Fresenius expects
cost savings of at least €150 million p.a. after tax and mi-
nority interest in 2023. For the years thereafter, a further
significant increase in sustainable cost savings is expected.
The savings will be achieved by all four business segments
and the corporate center.
Fresenius anticipates that achieving these sustainable
efficiency improvements will require up-front expenses of
more than €200 million in 2022 and further expenses of
around €100 million in 2023, in each case after taxes and
minority interest. No further significant expenses are ex-
pected thereafter.
In line with previous practice, these expenses are clas-
sified as special items (see also reconciliation tables on
pages 25 to 27).

At a Glance Shareholder Information Interim Group Management Report Financial Statements Financial Calendar/Contact Table of contents
1st Q
uart
er 2
022
Qua
rter
ly F
inan
cial
Rep
ort
Fre
sen
ius
7
HEALTHCARE INDUSTRY
The healthcare sector is one of the world’s largest indus-
tries and we are convinced that it shows excellent growth
opportunities.
The main growth factors are:
► rising medical needs deriving from aging populations,► the growing number of chronically ill and multimorbid
patients,► stronger demand for innovative products and therapies,► advances in medical technology,► the growing health consciousness, which increases the
demand for healthcare services and facilities, and► the increasing demand for digital health services for
patients.
In the emerging countries, additional drivers are:
► expanding availability and correspondingly greater
demand for basic healthcare, and► increasing national incomes and hence higher spend-
ing on healthcare.
Healthcare structures are being reviewed and cost-cutting
potential identified in order to contain the steadily rising
healthcare expenditures. However, such measures cannot
compensate for the cost pressure. Market-based elements
are increasingly being introduced into the healthcare sys-
tem to create incentives for cost- and quality-conscious be-
havior. Overall treatment costs will be reduced through im-
proved quality standards.
In addition, ever-greater importance is being placed on
disease prevention and innovative reimbursement models
linked to treatment quality standards.
The industry-specific framework for the operating busi-
ness of the Fresenius Group remained essentially unchanged
in the first Quarter of 2022.
External factors The COVID-19 pandemic has a significant impact on the
economic environment of the Fresenius Group. We demon-
strated our special responsibility as part of the healthcare
system even under the difficult circumstances of the
COVID-19 pandemic.
With our products, services, and therapies, we have
made many important contributions worldwide.
The war between Russia and Ukraine, could have a signifi-
cant negative impact on our net assets, financial position
and results of operations. While the direct and indirect im-
pact of the war is difficult to predict at the present time,
price increases including gas and oil prices, could lead to,
amongst others, higher costs for energy, manufacturing of
supplies and transportation of goods.Further explanations
can be found in the opportunity and risk report.
The legal framework for the operating business of the
Fresenius Group remained essentially unchanged.
We carefully monitor and evaluate country-specific,
political, legal, and financial conditions.
At a Glance Shareholder Information Interim Group Management Report Financial Statements Financial Calendar/Contact Table of contents
1st Q
uart
er 2
022
Qua
rter
ly F
inan
cial
Rep
ort
Fre
sen
ius
8
RESULTS OF OPERATIONS, FINANCIAL POSITION, ASSETS AND LIABILITIES
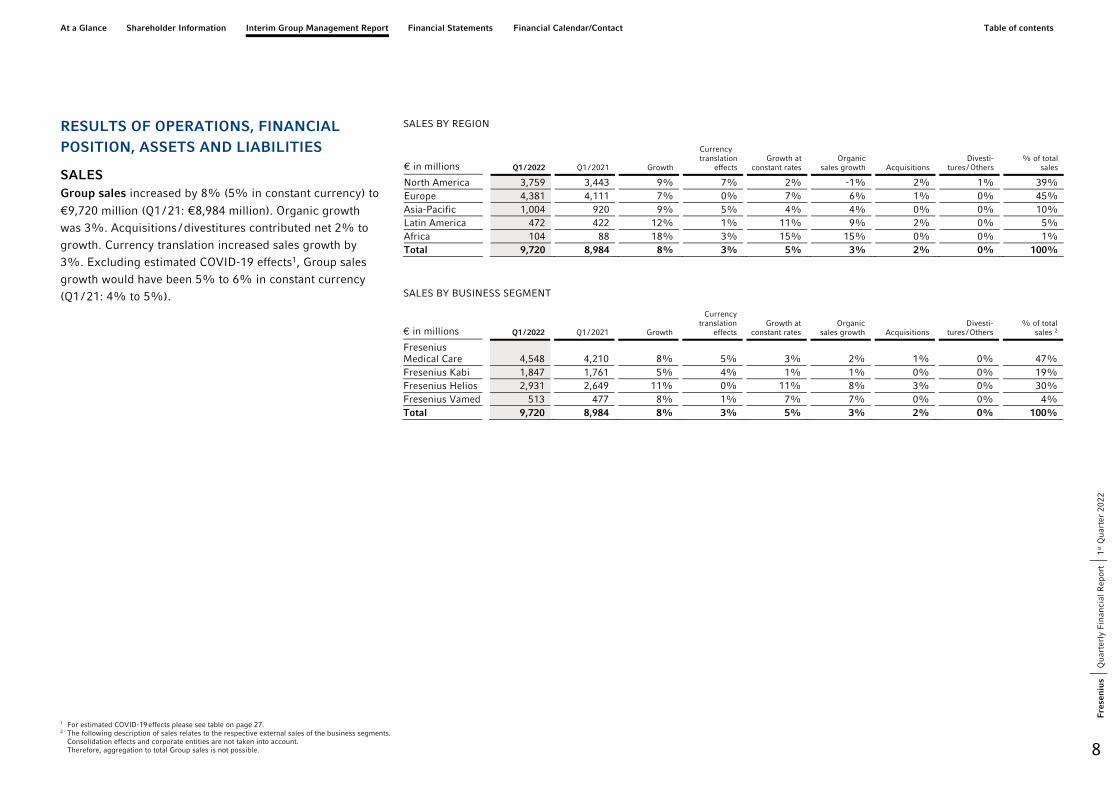
SALES Group sales increased by 8% (5% in constant currency) to
€9,720 million (Q1 / 21: €8,984 million). Organic growth was 3%. Acquisitions / divestitures contributed net 2% to growth. Currency translation increased sales growth by 3%. Excluding estimated COVID-19 effects1, Group sales growth would have been 5% to 6% in constant currency (Q1 / 21: 4% to 5%).
SALES BY REGION
SALES BY BUSINESS SEGMENT
€ in millions Q1 / 2022 Q1 / 2021 Growth
Currency translation
effects Growth at
constant rates Organic
sales growth Acquisitions Divesti-
tures / Others % of total
sales 2
Fresenius Medical Care 4,548 4,210 8% 5% 3% 2% 1% 0% 47% Fresenius Kabi 1,847 1,761 5% 4% 1% 1% 0% 0% 19% Fresenius Helios 2,931 2,649 11% 0% 11% 8% 3% 0% 30% Fresenius Vamed 513 477 8% 1% 7% 7% 0% 0% 4% Total 9,720 8,984 8% 3% 5% 3% 2% 0% 100%
€ in millions Q1 / 2022 Q1 / 2021 Growth
Currency translation
effects Growth at
constant rates Organic
sales growth Acquisitions Divesti-
tures / Others % of total
sales
North America 3,759 3,443 9% 7% 2% -1% 2% 1% 39% Europe 4,381 4,111 7% 0% 7% 6% 1% 0% 45% Asia-Pacific 1,004 920 9% 5% 4% 4% 0% 0% 10% Latin America 472 422 12% 1% 11% 9% 2% 0% 5% Africa 104 88 18% 3% 15% 15% 0% 0% 1% Total 9,720 8,984 8% 3% 5% 3% 2% 0% 100%
1 For estimated COVID-19 effects please see table on page 27. 2 The following description of sales relates to the respective external sales of the business segments.
Consolidation effects and corporate entities are not taken into account. Therefore, aggregation to total Group sales is not possible.
At a Glance Shareholder Information Interim Group Management Report Financial Statements Financial Calendar/Contact Table of contents
1st Q
uart
er 2
022
Qua
rter
ly F
inan
cial
Rep
ort
Fre
sen
ius
9
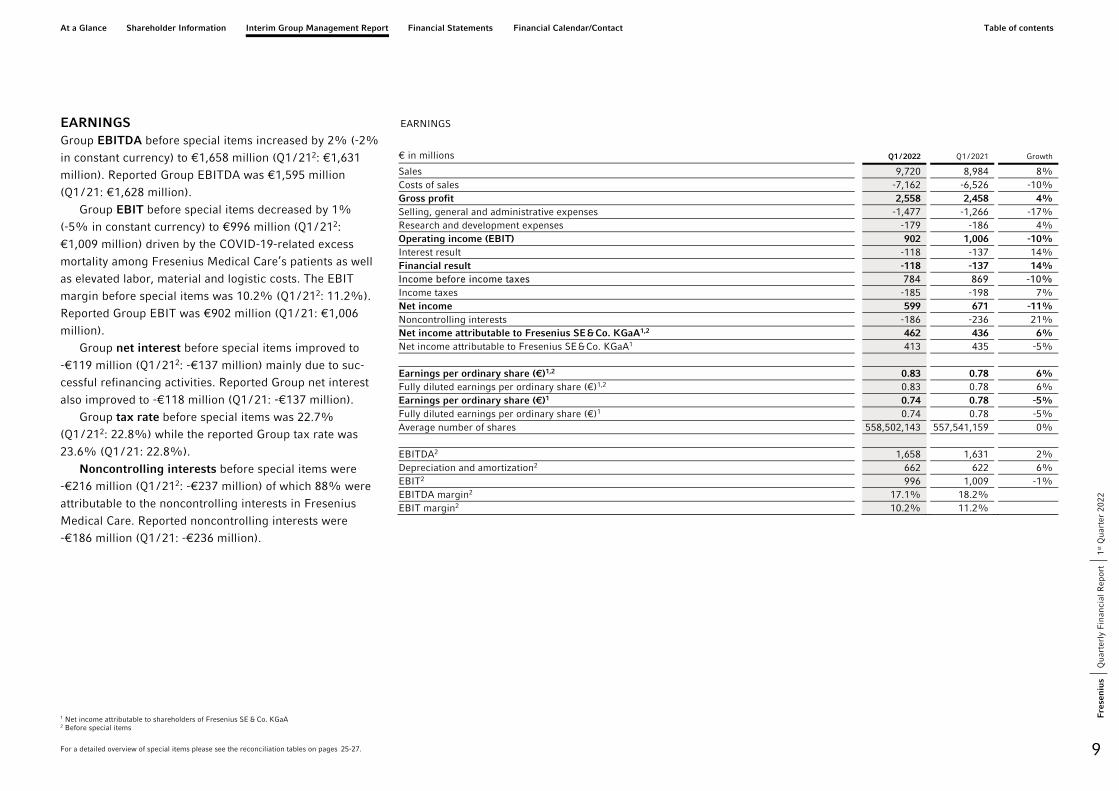
EARNINGS Group EBITDA before special items increased by 2% (-2%
in constant currency) to €1,658 million (Q1 / 212: €1,631
million). Reported Group EBITDA was €1,595 million
(Q1 / 21: €1,628 million).
Group EBIT before special items decreased by 1%
(-5% in constant currency) to €996 million (Q1 / 212:
€1,009 million) driven by the COVID-19-related excess
mortality among Fresenius Medical Care’s patients as well
as elevated labor, material and logistic costs. The EBIT
margin before special items was 10.2% (Q1 / 212: 11.2%).
Reported Group EBIT was €902 million (Q1 / 21: €1,006
million).
Group net interest before special items improved to
-€119 million (Q1 / 212: -€137 million) mainly due to suc-
cessful refinancing activities. Reported Group net interest
also improved to -€118 million (Q1 / 21: -€137 million).
Group tax rate before special items was 22.7%
(Q1 / 212: 22.8%) while the reported Group tax rate was
23.6% (Q1 / 21: 22.8%).
Noncontrolling interests before special items were
-€216 million (Q1 / 212: -€237 million) of which 88% were
attributable to the noncontrolling interests in Fresenius
Medical Care. Reported noncontrolling interests were
-€186 million (Q1 / 21: -€236 million).
EARNINGS
1 Net income attributable to shareholders of Fresenius SE & Co. KGaA 2 Before special items
For a detailed overview of special items please see the reconciliation tables on pages 25-27.
€ in millions Q1 / 2022 Q1 / 2021 Growth
Sales 9,720 8,984 8% Costs of sales -7,162 -6,526 -10%Gross profit 2,558 2,458 4% Selling, general and administrative expenses -1,477 -1,266 -17%Research and development expenses -179 -186 4% Operating income (EBIT) 902 1,006 -10%Interest result -118 -137 14% Financial result -118 -137 14% Income before income taxes 784 869 -10%Income taxes -185 -198 7% Net income 599 671 -11%Noncontrolling interests -186 -236 21% Net income attributable to Fresenius SE & Co. KGaA1,2 462 436 6% Net income attributable to Fresenius SE & Co. KGaA1 413 435 -5%
Earnings per ordinary share (€)1,2 0.83 0.78 6% Fully diluted earnings per ordinary share (€)1,2 0.83 0.78 6% Earnings per ordinary share (€)1 0.74 0.78 -5%Fully diluted earnings per ordinary share (€)1 0.74 0.78 -5%Average number of shares 558,502,143 557,541,159 0%
EBITDA2 1,658 1,631 2% Depreciation and amortization2 662 622 6% EBIT2 996 1,009 -1%EBITDA margin2 17.1% 18.2% EBIT margin2 10.2% 11.2%
At a Glance Shareholder Information Interim Group Management Report Financial Statements Financial Calendar/Contact Table of contents
1st Q
uart
er 2
022
Qua
rter
ly F
inan
cial
Rep
ort
Fre
sen
ius
10
Group net income1 before special items increased by 6%
(3% in constant currency) to €462 million (Q1 / 212: €436
million). Excluding estimated COVID-19 effects3, Group net
income1 before special items would have been broadly sta-
ble (-2% to 2% in constant currency (Q1 / 21: 0% to 4%).
Reported Group net income1 decreased to €413 million
(Q1 / 21: €435 million).
Earnings per share1 before special items increased by
6% (3% in constant currency) to €0.83 (Q1 / 212: €0.78).
Reported earnings per share1 were €0.74 (Q1 / 21: €0.78).
RECONCILIATION Consolidated results for Q1 / 2022 and Q1 / 2021 include
special items.
These concern:
► revaluations of biosimilars contingent purchase price
liabilities► expenses associated with the Fresenius cost and
efficiency program (including costs related to FME25
program),► impacts related to the war in Ukraine as well as► transaction costs mAbxience, Ivenix.
The special items shown within the reconciliation tables
are reported in the ‘‘Corporate’’ segment. For a detailed
overview of special items please see the reconciliation ta-
bles from page 25 onwards.
1 Net income attributable to shareholders of Fresenius SE & Co. KGaA 2 Before special items 3 For estimated COVID-19 effects in Q1 / 22 and Q1 / 21 please see table on page 27.
For a detailed overview of special items please see the reconciliation tables on pages 25-27.

At a Glance Shareholder Information Interim Group Management Report Financial Statements Financial Calendar/Contact Table of contents
1st Q
uart
er 2
022
Qua
rter
ly F
inan
cial
Rep
ort
Fre
sen
ius
11
INVESTMENTS Spending on property, plant and equipment was €338
million corresponding to 3% of sales (Q1 / 21: €384 mil-lion; 4% of sales). These investments served primarily for the modernization and expansion of dialysis clinics, pro-duction facilities as well as hospitals and day clinics.
Total acquisition spending was €162 million (Q1 / 21:
€149 million), mainly for the acquisition of dialysis clinics by Fresenius Medical Care and hospitals by Helios Spain.
CASH FLOW Group operating cash flow decreased to €101 million
(Q1 / 21: €652 million) with a margin of 1.0% (Q1 / 21: 7.3%),
mainly driven by working capital build-up from higher raw
material inventories and receivables, among others, as well as phasing effects. Free cash flow before acquisitions and dividends decreased to -€255 million (Q1 / 21: €241 million).
Free cash flow after acquisitions and dividends decreased
to -€403 million (Q1 / 21: €117 million).
INVESTMENTS / ACQUISITIONS BY BUSINESS SEGMENT
€ in millions Q1 / 2022 Q1 / 2021
Thereof property, plant and
equipment Thereof
acquisitions Growth % of total
Fresenius Medical Care 245 315 162 83 -22% 49% Fresenius Kabi 86 100 84 2 -14% 17% Fresenius Helios 151 93 79 72 62% 30% Fresenius Vamed 18 22 12 6 -18% 4% Corporate 0 3 1 -1 -100% 0% Total 500 533 338 162 -6% 100%
CASH FLOW STATEMENT (SUMMARY)
€ in millions Q1 / 2022 Q1 / 2021 Growth
Net income 599 671 -11%Depreciation and amortization 693 622 11% Change working capital and others -1,191 -641 -86%Operating Cash flow 101 652 -85%Capital expenditure, net -356 -411 13% Cash flow before acquisitions and dividends -255 241 -- Cash used for acquisitions / proceeds from divestitures -92 -63 -46%Dividends paid -56 -61 8% Free cash flow after acquisitions and dividends -403 117 -- Cash provided by / used for financing activities -319 -123 -159%Effect of exchange rates on change in cash and cash equivalents 35 46 -24%Net change in cash and cash equivalents -687 40 --

At a Glance Shareholder Information Interim Group Management Report Financial Statements Financial Calendar/Contact Table of contents
1st Q
uart
er 2
022
Qua
rter
ly F
inan
cial
Rep
ort
Fre
sen
ius
12
ASSET AND LIABILITY STRUCTURE Group total assets increased by 2% (0% in constant cur-
rency) to €73,114 million (Dec. 31, 2021: €71,962 million) given currency translation effects and the expansion of business activities. Current assets increased by 3% (2% in constant currency) to €18,002 million (Dec. 31, 2021: €17,461 million), mainly driven by the increase of trade accounts receivables. Non-current assets increased by 1% (0% in constant currency) to €55,112 million (Dec. 31, 2021: €54,501 million).
Total shareholders’ equity increased by 4% (3% in
constant currency) to €30,584 million (Dec. 31, 2021: €29,288 million). The equity ratio was 41.8% (Dec. 31, 2021: 40.7%).
Group debt remained stable (0% in constant currency)
at €27,211 million (Dec. 31, 2021: € 27,155 million). Group net debt increased by 3% (2% in constant currency) to € 25,134 million (Dec. 31, 2021: € 24,391 million).
As of March 31, 2022, the net debt / EBITDA ratio in-
creased to 3.60x1,2 (Dec. 31, 2021: 3.51x1,2) mainly driven by COVID-19 effects weighing on operating cash flow.
BALANCE SHEET
€ in millions March 31,
2022 Dec. 31,
2021 Change
Assets Current assets 18,002 17,461 3% thereof trade accounts receivables 7,794 7,045 11% thereof inventories 4,423 4,218 5% thereof cash and cash equivalents 2,077 2,764 -25%Non-current assets 55,112 54,501 1% thereof property, plant and equipment 12,649 12,569 1% thereof goodwill and other intangible assets 33,209 32,774 1% thereof right-of-use-assets 5,994 6,014 0% Total assets 73,114 71,962 2%
Liabilities and shareholders' equity Liabilities 42,530 42,674 0% thereof trade accounts payable 1,897 2,039 -7%thereof accruals and other short-term liabilities 10,435 10,594 -2%thereof debt 27,211 27,155 0% thereof lease liabilities 6,584 6,590 0% Noncontrolling interests 10,714 10,290 4% Total Fresenius SE & Co. KGaA shareholders' equity 19,870 18,998 5% Total shareholders' equity 30,584 29,288 4% Total liabilities and shareholders' equity 73,114 71,962 2%
1 At LTM average exchange rates for both net debt and EBITDA; pro forma closed acquisitions / divestitures 2 Before special items
For a detailed overview of special items please see the reconciliation tables on page 25-27.
At a Glance Shareholder Information Interim Group Management Report Financial Statements Financial Calendar/Contact Table of contents
1st Q
uart
er 2
022
Qua
rter
ly F
inan
cial
Rep
ort
Fre
sen
ius
13
BUSINESS SEGMENTS
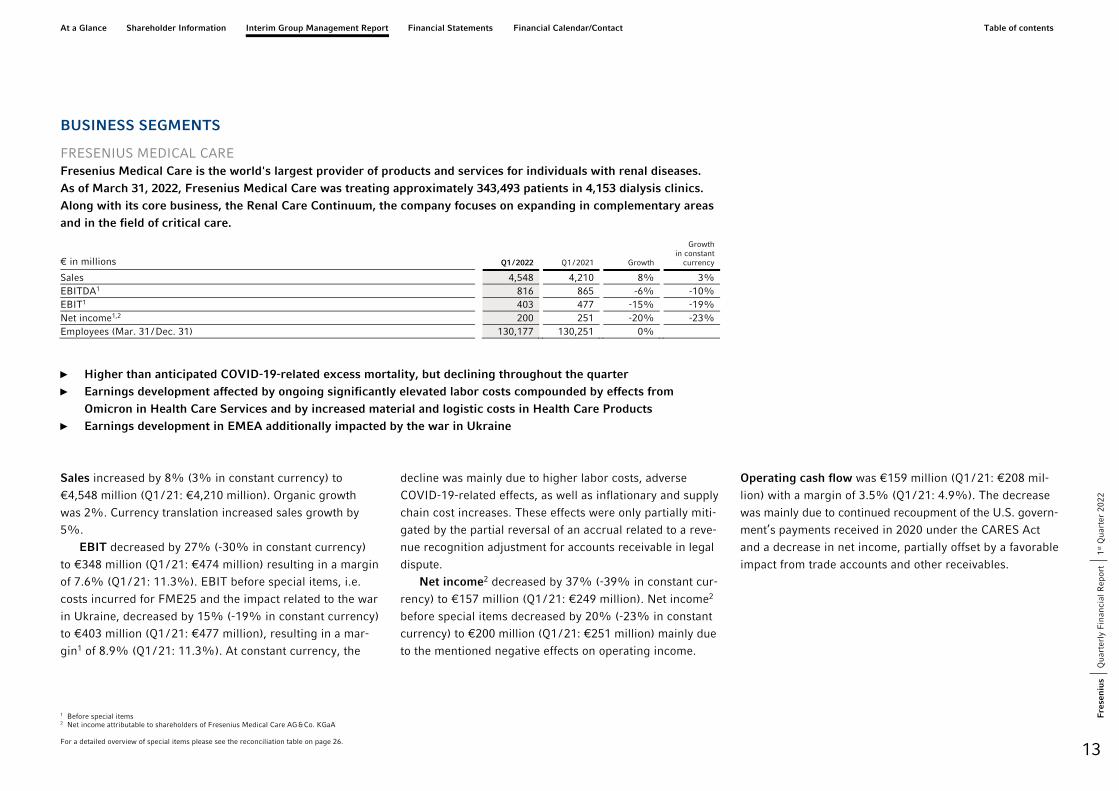
FRESENIUS MEDICAL CARE Fresenius Medical Care is the world's largest provider of products and services for individuals with renal diseases. As of March 31, 2022, Fresenius Medical Care was treating approximately 343,493 patients in 4,153 dialysis clinics. Along with its core business, the Renal Care Continuum, the company focuses on expanding in complementary areas and in the field of critical care.
€ in millions Q1 / 2022 Q1 / 2021 Growth
Growth in constant
currency
Sales 4,548 4,210 8% 3% EBITDA1 816 865 -6% -10%EBIT1 403 477 -15% -19%Net income1,2 200 251 -20% -23%Employees (Mar. 31 / Dec. 31) 130,177 130,251 0%
► Higher than anticipated COVID-19-related excess mortality, but declining throughout the quarter► Earnings development affected by ongoing significantly elevated labor costs compounded by effects from
Omicron in Health Care Services and by increased material and logistic costs in Health Care Products► Earnings development in EMEA additionally impacted by the war in Ukraine
Sales increased by 8% (3% in constant currency) to
€4,548 million (Q1 / 21: €4,210 million). Organic growth
was 2%. Currency translation increased sales growth by
5%.
EBIT decreased by 27% (-30% in constant currency)
to €348 million (Q1 / 21: €474 million) resulting in a margin
of 7.6% (Q1 / 21: 11.3%). EBIT before special items, i.e.
costs incurred for FME25 and the impact related to the war
in Ukraine, decreased by 15% (-19% in constant currency)
to €403 million (Q1 / 21: €477 million), resulting in a mar-
gin1 of 8.9% (Q1 / 21: 11.3%). At constant currency, the
decline was mainly due to higher labor costs, adverse
COVID-19-related effects, as well as inflationary and supply
chain cost increases. These effects were only partially miti-
gated by the partial reversal of an accrual related to a reve-
nue recognition adjustment for accounts receivable in legal
dispute.
Net income2 decreased by 37% (-39% in constant cur-
rency) to €157 million (Q1 / 21: €249 million). Net income2
before special items decreased by 20% (-23% in constant
currency) to €200 million (Q1 / 21: €251 million) mainly due
to the mentioned negative effects on operating income.
Operating cash flow was €159 million (Q1 / 21: €208 mil-
lion) with a margin of 3.5% (Q1 / 21: 4.9%). The decrease
was mainly due to continued recoupment of the U.S. govern-
ment’s payments received in 2020 under the CARES Act
and a decrease in net income, partially offset by a favorable
impact from trade accounts and other receivables.
1 Before special items 2 Net income attributable to shareholders of Fresenius Medical Care AG & Co. KGaA
For a detailed overview of special items please see the reconciliation table on page 26.
At a Glance Shareholder Information Interim Group Management Report Financial Statements Financial Calendar/Contact Table of contents
1st Q
uart
er 2
022
Qua
rter
ly F
inan
cial
Rep
ort
Fre
sen
ius
14
For FY / 22, Fresenius Medical Care confirms its outlook
and expects revenue1 and net income2,3 to grow at low- to
mid-single-digit percentage rates in constant currency4.
For further information, please see Fresenius Medical
Care’s press release at www.freseniusmedicalcare.com.
1 FY / 21 base: €17,619 million 2 Net income attributable to shareholders of Fresenius Medical Care AG & Co. KGaA 3 FY / 21 base: €1,018 million, before special items; FY / 22 before special items 4 These targets are based on the 2021 results excluding the costs related to FME25 of €49 million (for net income). They are based on the assumptions outlined in the press release on the Q4 and FY
2021 results (Feb.22, 2022), in constant currency and exclude special items. Special items include further costs related to FME25, the impacts related to the war in Ukraine, and other effects that are unusual in nature and have not been foreseeable or not foreseeable in size or impact at the time of giving guidance.
For a detailed overview of special items please see the reconciliation table on page 26.
At a Glance Shareholder Information Interim Group Management Report Financial Statements Financial Calendar/Contact Table of contents
1st Q
uart
er 2
022
Qua
rter
ly F
inan
cial
Rep
ort
Fre
sen
ius
15
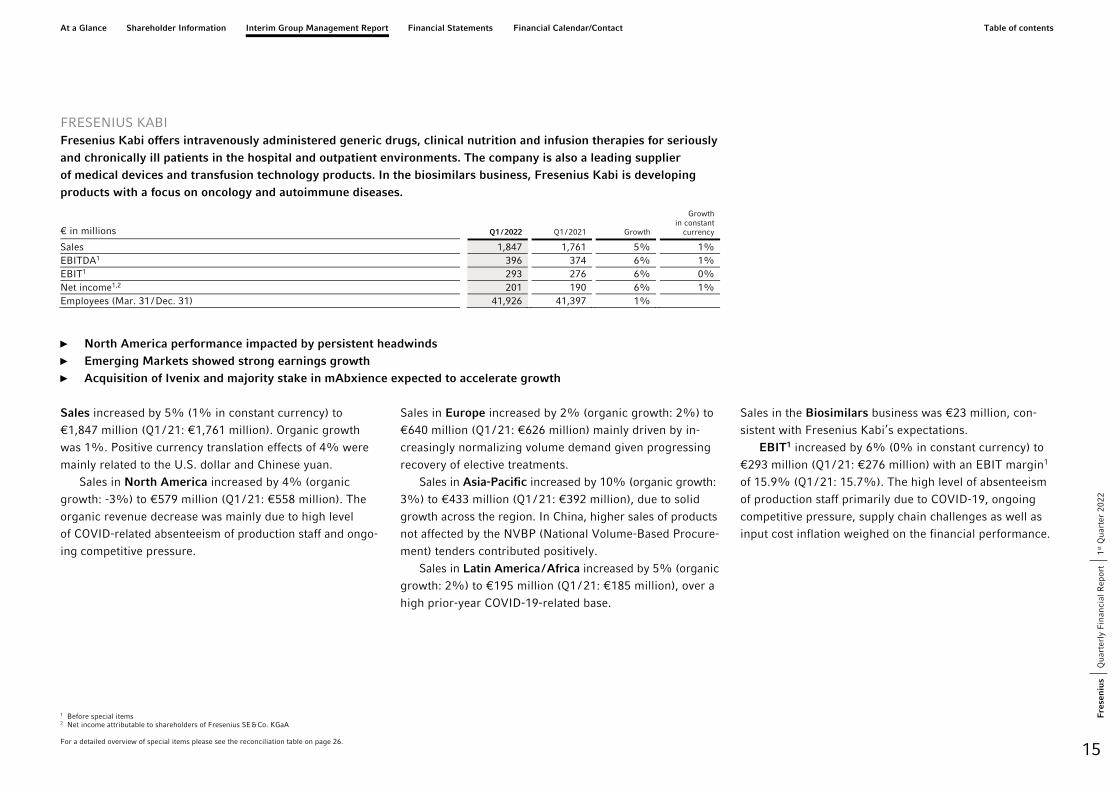
FRESENIUS KABI Fresenius Kabi offers intravenously administered generic drugs, clinical nutrition and infusion therapies for seriously and chronically ill patients in the hospital and outpatient environments. The company is also a leading supplier of medical devices and transfusion technology products. In the biosimilars business, Fresenius Kabi is developing products with a focus on oncology and autoimmune diseases.
€ in millions Q1 / 2022 Q1 / 2021 Growth
Growth in constant
currency
Sales 1,847 1,761 5% 1% EBITDA1 396 374 6% 1% EBIT1 293 276 6% 0% Net income1,2 201 190 6% 1% Employees (Mar. 31 / Dec. 31) 41,926 41,397 1%
► North America performance impacted by persistent headwinds ► Emerging Markets showed strong earnings growth ► Acquisition of Ivenix and majority stake in mAbxience expected to accelerate growth
Sales increased by 5% (1% in constant currency) to
€1,847 million (Q1 / 21: €1,761 million). Organic growth
was 1%. Positive currency translation effects of 4% were
mainly related to the U.S. dollar and Chinese yuan.
Sales in North America increased by 4% (organic
growth: -3%) to €579 million (Q1 / 21: €558 million). The
organic revenue decrease was mainly due to high level
of COVID-related absenteeism of production staff and ongo-
ing competitive pressure.
Sales in Europe increased by 2% (organic growth: 2%) to
€640 million (Q1 / 21: €626 million) mainly driven by in-
creasingly normalizing volume demand given progressing
recovery of elective treatments.
Sales in Asia-Pacific increased by 10% (organic growth:
3%) to €433 million (Q1 / 21: €392 million), due to solid
growth across the region. In China, higher sales of products
not affected by the NVBP (National Volume-Based Procure-
ment) tenders contributed positively.
Sales in Latin America / Africa increased by 5% (organic
growth: 2%) to €195 million (Q1 / 21: €185 million), over a
high prior-year COVID-19-related base.
Sales in the Biosimilars business was €23 million, con-
sistent with Fresenius Kabi’s expectations.
EBIT1 increased by 6% (0% in constant currency) to
€293 million (Q1 / 21: €276 million) with an EBIT margin1
of 15.9% (Q1 / 21: 15.7%). The high level of absenteeism
of production staff primarily due to COVID-19, ongoing
competitive pressure, supply chain challenges as well as
input cost inflation weighed on the financial performance.
1 Before special items 2 Net income attributable to shareholders of Fresenius SE & Co. KGaA For a detailed overview of special items please see the reconciliation table on page 26.

At a Glance Shareholder Information Interim Group Management Report Financial Statements Financial Calendar/Contact Table of contents
1st Q
uart
er 2
022
Qua
rter
ly F
inan
cial
Rep
ort
Fre
sen
ius
16
Net income1,2 increased by 6% (increased by 1% in con-
stant currency) to €201 million (Q1 / 21: €190 million).
Operating cash flow decreased to €133 million
(Q1 / 21: €278 million) with a margin of 7.2% (Q1 / 21:
15.8%) mainly driven by a working capital build-up from
e.g. higher raw material inventories.
For FY / 22, Fresenius Kabi confirms its outlook and ex-
pects organic sales3 growth in a low-single-digit percent-
age range. Constant currency EBIT4 is expected to decline
in a high-single- to low-double-digit percentage range.
Both sales and EBIT outlook include expected COVID-19
effects.
In March, the acquisitions of Ivenix and a majority
stake in mAbxience were announced. mAbxience signifi-
cantly enhances Fresenius Kabi’s presence in the high-
growth biopharmaceuticals market. The acquisition of
Ivenix, closed at the beginning of May, strengthens the
company’s MedTech business. The financial effects from
both acquisitions are excluded from guidance.
1 Before special items 2 Net income attributable to shareholders of Fresenius SE & Co. KGaA 3 FY / 21 base: €7,193 million 4 FY / 21 base: €1,153 million, before special items, FY / 22 before special items For a detailed overview of special items please see the reconciliation table on page 26.

At a Glance Shareholder Information Interim Group Management Report Financial Statements Financial Calendar/Contact Table of contents
1st Q
uart
er 2
022
Qua
rter
ly F
inan
cial
Rep
ort
Fre
sen
ius
17
FRESENIUS HELIOS Fresenius Helios is Europe's leading private hospital operator. The company comprises Helios Germany, Helios Spain and Helios Fertility. Helios Germany operates 88 hospitals, ~130 outpatient centers and 6 prevention centers. Helios Spain operates 50 hospitals, 97 outpatient centers and around 300 occupational risk prevention centers. In addition, the company is active in Latin America with 8 hospitals and as a provider of medical diagnostics. Helios Fertility offers a wide spectrum of state-of-the-art services in the field of fertility treatments.
€ in millions Q1 / 2022 Q1 / 2021 Growth
Growth in constant
currency
Sales 2,931 2,649 11% 11% EBITDA1 428 380 13% 13% EBIT1 306 268 14% 15% Net income1,2 195 173 13% 13% Employees (Mar. 31 / Dec. 31) 124,430 123,484 1%
► Helios Germany with solid organic growth based on increased number of admissions ► Helios Spain delivered excellent organic sales and earnings growth given continued strong activity levels ► Helios Fertility with solid financial performance
Sales increased by 11% (11% in constant currency) to
€2,931 million (Q1 / 21: €2,649 million). Organic growth was
8%. Acquisitions, mainly at Helios Fertility, contributed
3% to sales growth.
Sales of Helios Germany increased by 7% (organic
growth: 5%) to €1,783 million (Q1 / 21: €1,673 million),
mainly driven by increasing admissions, which are however
still below pre-pandemic levels. Hence growth was sup-
ported by COVID-19-related reimbursement schemes. Acqui-
sitions contributed 1% to sales growth.
Sales of Helios Spain increased by 12% (12% in constant
currency) to €1,089 million (Q1 / 21: €976 million). Organic
growth of 11% was driven by consistently high activity lev-
els. The hospitals in Latin America also contributed to sales
growth. Acquisitions contributed 1% to sales growth.
Sales of the Helios Fertility were €57 million.
EBIT1 increased by 14% (15% in constant currency) to
€306 million (Q1 / 21: €268 million) with an EBIT margin1
of 10.4% (Q1 / 21: 10.1%).
EBIT1 of Helios Germany increased by 3% to €154
million (Q1 / 21: €150 million) with an EBIT margin1 of 8.6%
(Q1 / 21: 9.0%). COVID-related elevated staff absenteeism
at the beginning of the quarter weighed on profitability. Infla-
tionary effects had only a small negative impact.
EBIT1 of Helios Spain increased by 21% (22% in constant
currency) to €153 million (Q1 / 21: €126 million) due to the
consistently high level of treatments. The Latin American
business also showed a good performance. The EBIT margin1
was 14.0% (Q1 / 21: 12.9%).
EBIT1 of Helios Fertility was €4 million with an EBIT1
margin of 7.0%.
1 Before special items 2 Net income attributable to shareholders of Fresenius SE & Co. KGaA For a detailed overview of special items please see the reconciliation table on page 27.
At a Glance Shareholder Information Interim Group Management Report Financial Statements Financial Calendar/Contact Table of contents
1st Q
uart
er 2
022
Qua
rter
ly F
inan
cial
Rep
ort
Fre
sen
ius
18
Net income1,2 increased by 13% (13% in constant currency)
to €195 million (Q1 / 21: €173 million).
Operating cash flow decreased to -€136 million (Q1 / 21:
€215 million) with a margin of -4.6% (Q1 / 21: 8.1%) fol-
lowing a strong Q4 / 21 and COVID-19-related delays in
budget negotiations in Germany.
For FY / 22, Fresenius Helios confirms its outlook and
expects organic sales3 growth in a low- to mid-single-digit
percentage range and constant currency EBIT4 growth in a
mid-single-digit percentage range. Both sales and EBIT
outlook include expected COVID-19 effects.
1 Before special items 2 Net income attributable to shareholders of Fresenius SE & Co. KGaA 3 FY / 21 base: €10,891 million 4 FY / 21 base: €1,127 million, before special items, FY / 22 before special items For a detailed overview of special items please see the reconciliation table on page 27.
At a Glance Shareholder Information Interim Group Management Report Financial Statements Financial Calendar/Contact Table of contents
1st Q
uart
er 2
022
Qua
rter
ly F
inan
cial
Rep
ort
Fre
sen
ius
19
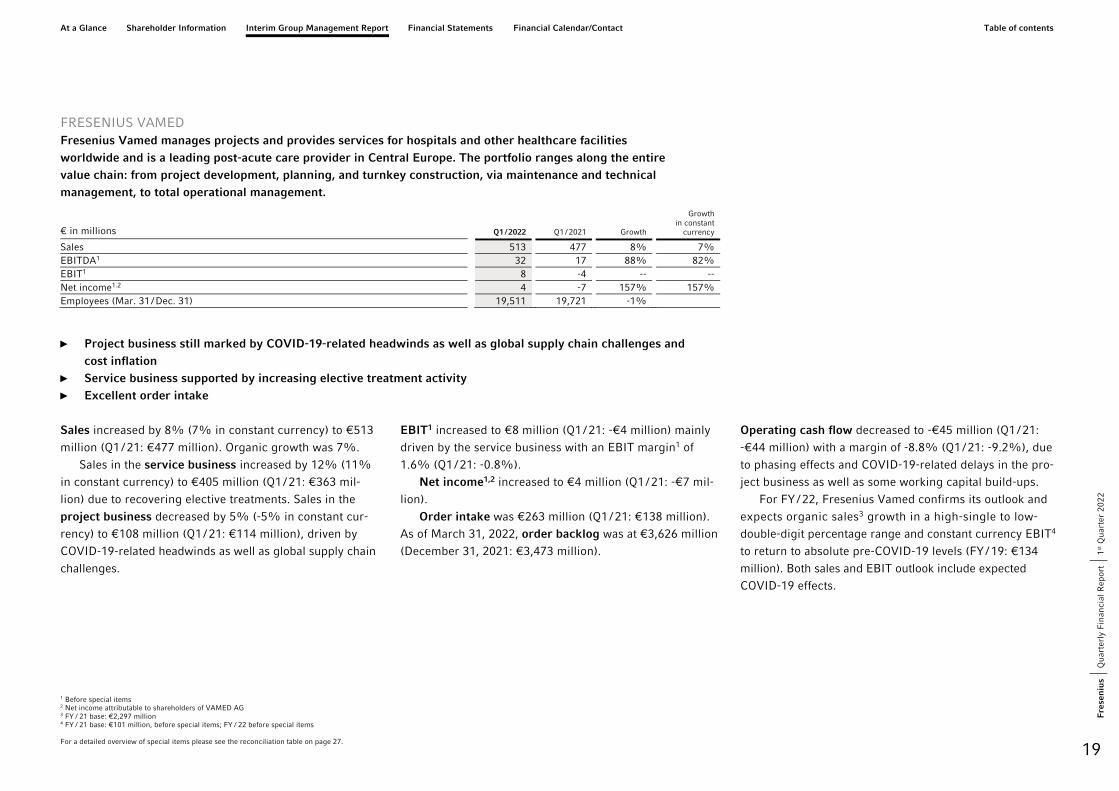
FRESENIUS VAMED Fresenius Vamed manages projects and provides services for hospitals and other healthcare facilities worldwide and is a leading post-acute care provider in Central Europe. The portfolio ranges along the entire value chain: from project development, planning, and turnkey construction, via maintenance and technical management, to total operational management.
€ in millions Q1 / 2022 Q1 / 2021 Growth
Growth in constant
currency
Sales 513 477 8% 7% EBITDA1 32 17 88% 82% EBIT1 8 -4 -- -- Net income1.2 4 -7 157% 157% Employees (Mar. 31 / Dec. 31) 19,511 19,721 -1%
► Project business still marked by COVID-19-related headwinds as well as global supply chain challenges and cost inflation
► Service business supported by increasing elective treatment activity ► Excellent order intake
Sales increased by 8% (7% in constant currency) to €513
million (Q1 / 21: €477 million). Organic growth was 7%.
Sales in the service business increased by 12% (11%
in constant currency) to €405 million (Q1 / 21: €363 mil-
lion) due to recovering elective treatments. Sales in the
project business decreased by 5% (-5% in constant cur-
rency) to €108 million (Q1 / 21: €114 million), driven by
COVID-19-related headwinds as well as global supply chain
challenges.
EBIT1 increased to €8 million (Q1 / 21: -€4 million) mainly
driven by the service business with an EBIT margin1 of
1.6% (Q1 / 21: -0.8%).
Net income1,2 increased to €4 million (Q1 / 21: -€7 mil-
lion).
Order intake was €263 million (Q1 / 21: €138 million).
As of March 31, 2022, order backlog was at €3,626 million
(December 31, 2021: €3,473 million).
Operating cash flow decreased to -€45 million (Q1 / 21:
-€44 million) with a margin of -8.8% (Q1 / 21: -9.2%), due
to phasing effects and COVID-19-related delays in the pro-
ject business as well as some working capital build-ups.
For FY / 22, Fresenius Vamed confirms its outlook and
expects organic sales3 growth in a high-single to low-
double-digit percentage range and constant currency EBIT4
to return to absolute pre-COVID-19 levels (FY / 19: €134
million). Both sales and EBIT outlook include expected
COVID-19 effects.
1 Before special items 2 Net income attributable to shareholders of VAMED AG 3 FY / 21 base: €2,297 million 4 FY / 21 base: €101 million, before special items; FY / 22 before special items For a detailed overview of special items please see the reconciliation table on page 27.

At a Glance Shareholder Information Interim Group Management Report Financial Statements Financial Calendar/Contact Table of contents
1st Q
uart
er 2
022
Qua
rter
ly F
inan
cial
Rep
ort
Fre
sen
ius
20
EMPLOYEES As of March 31, 2022, the number of employees was 317,242
(Dec. 31, 2021: 316,078).
NUMBER OF EMPLOYEES
Number of employees March 31,
2022 Dec. 31,
2021 Growth
Fresenius Medical Care 130,177 130,251 0% Fresenius Kabi 41,926 41,397 1% Fresenius Helios 124,430 123,484 1% Fresenius Vamed 19,511 19,721 -1% Corporate 1,198 1,225 -2% Total 317,242 316,078 0%
CHANGES TO THE MANAGEMENT BOARD The Fresenius Management SE Supervisory Board has unan-
imously appointed Sara Hennicken (41), currently Senior
Vice President Global Treasury & Corporate Finance at
Fresenius, to become the company’s new Chief Financial
Officer as of September 1, 2022. She will succeed Rachel
Empey (45), who joined the Management Board of Fresenius
as CFO on August 1, 2017 and will leave the company at
her own request at the end of August.
Dr. Carla Kriwet (51) will become the new CEO of
Fresenius Medical Care, the world's leading provider of
products and services for individuals with renal diseases,
on January 1, 2023. The Supervisory Board of Fresenius
Medical Care Management AG unanimously appointed her
to succeed Rice Powell (66), who in accordance with the
company’s age limit for Management Board members is
stepping down when his contract ends on December 31,
after 10 years heading the company. Like Rice Powell,
Dr. Carla Kriwet will also be a member of the Management
Board of Fresenius Management SE. Helen Giza, Chief Finan-
cial Officer of Fresenius Medical Care, will enter a new five-
year contract, and in addition to her current positions as
CFO and CTO will assume the position of Deputy CEO.
RESEARCH AND DEVELOPMENT Product and process development as well as the improve-
ment of therapies are at the core of our growth strategy.
Fresenius focuses its R & D efforts on its core competencies
in the following areas:
► Dialysis ► Generic IV drugs ► Biosimilars ► Infusion and nutrition therapies ► Medical devices
Apart from new products, we are concentrating on devel-
oping optimized or completely new therapies, treatment
methods, and services.
RESEARCH AND DEVELOPMENT EXPENSES
BY BUSINESS SEGMENT
€ in millions Q1 / 2022 Q1 / 2021 Growth
Fresenius Medical Care 50 49 2% Fresenius Kabi1 128 137 -7% Fresenius Helios 0 1 -100% Fresenius Vamed - - -- Corporate 0 -1 100% Total1 178 186 -4%
1 Before special items
RATING Fresenius is covered by the rating agencies Moody’s,
Standard & Poor’s and Fitch.
The following table shows the company rating of Fresenius
SE & Co. KGaA:
Standard &
Poor’s Moody’s Fitch
Company rating BBB Baa3 BBB - Outlook stable stable stable
At a Glance Shareholder Information Interim Group Management Report Financial Statements Financial Calendar/Contact Table of contents
1st Q
uart
er 2
022
Qua
rter
ly F
inan
cial
Rep
ort
Fre
sen
ius
21
OPPORTUNITIES AND RISK REPORT Compared to the presentation in the consolidated financial
statements and the management report as of December 31,
2021 applying Section 315e HGB in accordance with IFRS,
there has been the following important developments in
Fresenius’ overall opportunities and risk situation until
March 31, 2022.
Russia’s war against the Ukraine, could have a signifi-
cant negative impact on our net assets, financial position,
and results of operations.
As a provider of life-sustaining medical products and
healthcare services, we are continuing our activities in
both, Russia, and Ukraine to the best of our ability despite
the war and the restrictions resulting from the extensive
economic sanctions imposed on Russia and Belarus by
numerous governments. However, we cannot exclude that
operations in Ukraine, Russia and Belarus are impacted by
the destruction of assets, expropriation or other regulatory
actions. In addition to such risks, considerable uncertain-
ties are related to a possible deterioration of the global
macroeconomic outlook. While the direct and indirect im-
pact of the war is difficult to predict at the present time,
price increases including gas and oil prices, could lead to,
amongst others, higher costs for energy, manufacturing of
supplies and transportation of goods. A potential disruption
in energy supplies from Russia may have additional ad-
verse effects on our business, as well as an expansion of
the war beyond the borders of Ukraine with significant
consequences for Europe as a whole. Furthermore, our
ability to access capital could be impacted by increases in
interest rates. Overall, the abovementioned factors could
have a negative impact on our net assets, financial position,
and results of operations.
The global COVID-19 pandemic, continued to adversely affect
our business in the first months of 2022. We expect further
negative effects on our business and result of operations
for the second quarter of 2022. The further development of
the worldwide situation in 2022 remains uncertain and de-
pends on the progress of the vaccination campaigns world-
wide as well as the extent to which further virus variants
spread and whether governmental responses in the regions
we operate or source from. An unfavorable development may
result in additional adverse effects on our financial results
and our ability to achieve our Guidance.
In the ordinary course of Fresenius Group’s operations,
the Fresenius Group is subject to litigation, arbitration as
well as external and internal investigations relating to vari-
ous aspects of its business.
The Fresenius Group regularly analyzes current infor-
mation about such matters for probable losses and provides
accruals for such matters, including estimated expenses for
legal services, as appropriate.
We report on legal proceedings on pages 49 to 50 in
the Notes of this report.
SUBSEQUENT EVENTS April 2022 was characterized worldwide by a regionally
varying development of the COVID-19 pandemic with con-
tinuing high infection numbers. Large-scale constraints of
public and private life are still enacted in various countries
in order to curtail the spread of COVID-19. The vaccination
programs were continued worldwide and the development
in each country differs. The further development of the global
situation and its impact on Fresenius remain uncertain. Cost
inflation and supply chain disruption continues to be a
theme on a global level.
The ongoing war from Russia against the Ukraine may
have direct and indirect negative effects on the Fresenius
Group's business activities, which, however, cannot be es-
timated at present.
Information on changes to the Management Board are
provided on page 20.
Beyond that, there have been no significant changes in
the industry environment. Also otherwise there have been
no further events with a significant impact on the net as-
sets, financial position and results of operations since the
end of the first quarter of 2022.
At a Glance Shareholder Information Interim Group Management Report Financial Statements Financial Calendar/Contact Table of contents
1st Q
uart
er 2
022
Qua
rter
ly F
inan
cial
Rep
ort
Fre
sen
ius
22
OUTLOOK 2022
ASSUMPTIONS FOR GUIDANCE FY / 22 COVID-19 will continue to impact Fresenius’ operations in
2022. Fresenius expects COVID-19 case numbers to decline
going forward and consequently the number of elective
treatments and staff availability to improve. An unlikely but
possible significant deterioration of the situation triggering
containment measures that could have a significant and
direct impact on the healthcare sector without any appro-
priate compensation is not reflected in the Group’s FY / 22
guidance.
The war in Ukraine is affecting Fresenius Group’s oper-
ations. The adverse effect of the war amounted to €14 mil-
lion at net income level of Fresenius Group in the first quarter
and is treated as a special item. Fresenius will continue to
monitor closely the potential effects of the war.
With the increased uncertainty and volatility related to
the Ukraine war, Fresenius now expects more pronounced
cost inflationary effects and supply chain disruptions in
2022.
The Management Board assumes an unchanged corporate
tax rate in the United States.
Furthermore, the assumptions for Fresenius Medical
Care's FY / 22 guidance are also fully applicable to Fresenius
Group's FY / 22 guidance.
All of these assumptions are subject to considerable un-
certainty.
The recently announced acquisitions of Ivenix and the
majority stake in mAbxience as well as any further poten-
tial acquisitions are excluded from guidance.
FRESENIUS GROUP For FY / 22, Fresenius confirms its guidance and projects
sales growth1 in a mid-single-digit percentage range in
constant currency. Net income2,3 is expected to grow in a
low-single-digit percentage range in constant currency. Im-
plicitly, net income2 for the Group excluding Fresenius
Medical Care is also expected to grow in a low-single-digit
percentage range in constant currency.
Without further acquisitions4, Fresenius projects an im-
provement of the net debt / EBITDA5 ratio (December 31,
2021: 3.51x6) into the self-imposed target corridor of 3.0x
to 3.5x by the end of 2022. Fresenius expects the net
debt / EBITDA ratio to slightly increase once the acquisi-
tions of Ivenix and the majority stake in mAbxience are
closed.
SALES AND EARNINGS BY BUSINESS SEGMENT In 2022, we expect sales and earnings development in our
business segments as shown in the table on page 23.
PROGRESS ON EFFICIENCY MEASURES TO SUSTAINABLY IMPROVE PROFITABILITY The Group’s cost and efficiency program is evolving accord-
ing to plan and Fresenius confirms its increased savings
targets provided in February 2022 of at least €150 million
p.a. after tax and minority interest in 2023. For the years
thereafter, a further significant increase in sustainable cost
savings is expected.
EXPENSES For 2022, we do not expect selling, general, and administra-
tive expenses (before special items) as a percentage of con-
solidated net sales to change significantly compared to 2021
(2021: 14.1%).
1 FY / 21 base: €37,520 million 2 Net income attributable to shareholders of Fresenius SE & Co. KGaA 3 FY / 21 base: €1,867 million; before special items; FY / 22: before special items 4 Cut-off date 22 February 2022 5 At LTM average exchange rates for both net debt and EBITDA; pro forma closed acquisitions / divestitures; excluding further potential acquisitions; before special items; including lease liabilities 6 At LTM average exchange rates for both net debt and EBITDA; pro forma closed acquisitions / divestitures; before special items; including lease liabilities For a detailed overview of special items please see the reconciliation tables on pages 25-27.

At a Glance Shareholder Information Interim Group Management Report Financial Statements Financial Calendar/Contact Table of contents
1st Q
uart
er 2
022
Qua
rter
ly F
inan
cial
Rep
ort
Fre
sen
ius
23
LIQUIDITY AND CAPITAL MANAGEMENT For 2022, we expect an operating cash flow margin in the
range of 10% to 12%.
In addition, undrawn credit lines under syndicated or
bilateral credit facilities from banks provide us with a suffi-
cient financial headroom.
Financing activities in 2022 are largely geared to refi-
nancing existing financial liabilities maturing in 2022 and
2023.
Without further acquisitions1, Fresenius projects an im-
provement of the net debt / EBITDA2 ratio (December 31,
2021: 3,51×3) into the self-imposed target corridor of 3.0×
to 3.5× by the end of 2022. Fresenius expects the net
debt/EBITDA ratio to slightly increase once the acquisi-
tions of Ivenix and the majority stake in mAbxience are
closed.
There are no significant changes in the financing strat-
egy planned for 2022.
INVESTMENTS In 2022, we expect to invest about 6% of sales in property,
plant and equipment. About 45% of the capital expendi-
ture planned will be invested at Fresenius Medical Care,
about 23% at Fresenius Kabi, and around 27% at Fresenius
Helios.
At Fresenius Medical Care, investments will primarily
be used for the expansion of production capacity, optimiz-
ing production costs, and the establishment of new dialysis
clinics.
Fresenius Kabi will primarily invest in expanding and
maintaining production facilities, as well as in introducing
new manufacturing technologies.
At Fresenius Helios, we will primarily invest in the new
buildings, and in the modernizing and equipping of existing
hospitals, newly acquired hospitals, and outpatient centers.
Fresenius Vamed primarily invests in modernization as
well as equipment for existing post-acute care facilities.
With a share of around 60%, Europe is the regional
focus of investment in the planning period. Around 30% of
the investments are planned for North America and around
10% for Asia-Pacific, Latin America, and Africa. About
30% of total funds will be invested in Germany.
For 2022, we assume that the return on operating assets
(ROOA 2021: 6.5%) and the return on invested capital (ROIC
2021: 5.9%) will remain on prior year level.
CAPITAL STRUCTURE For 2022, we do not expect the equity ratio to change sig-
nificantly compared to 2021 (2021: 41%). Furthermore, we
expect debt in relation to total assets to remain around the
prior year’s level (2021: 38%).
DIVIDEND The dividend increases provided by Fresenius in the last
28 years show impressive continuity. Our dividend policy
aims to align dividends with earnings-per-share growth
(before special items). The payout ratio is expected to be in
the range of approximately 20% to 25%. Fresenius intends
to increase the dividend for 2022.
1 Cut-off date 22 February 2022 2 At LTM average exchange rates for both net debt and EBITDA; pro forma closed acquisitions / divestitures; excluding further potential acquisitions; before special items; including lease liabilities 3 At LTM average exchange rates for both net debt and EBITDA; pro forma closed acquisitions/divestitures; before special items; including lease liabilities For a detailed overview of special items please see the reconciliation tables on pages 25-27.
At a Glance Shareholder Information Interim Group Management Report Financial Statements Financial Calendar/Contact Table of contents
1st Q
uart
er 2
022
Qua
rter
ly F
inan
cial
Rep
ort
Fre
sen
ius
24
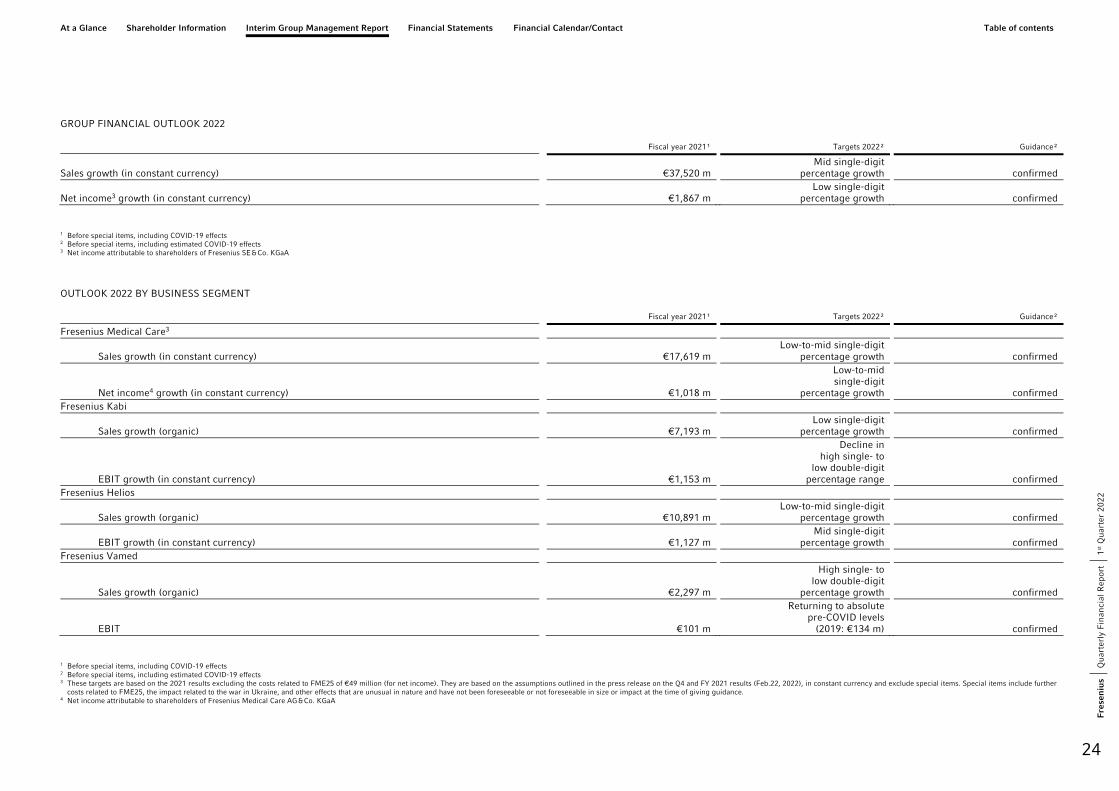
GROUP FINANCIAL OUTLOOK 2022
Fiscal year 2021¹ Targets 2022² Guidance²
Sales growth (in constant currency) €37,520 m Mid single-digit
percentage growth
confirmed
Net income3 growth (in constant currency) €1,867 m Low single-digit
percentage growth
confirmed
1 Before special items, including COVID-19 effects 2 Before special items, including estimated COVID-19 effects 3 Net income attributable to shareholders of Fresenius SE & Co. KGaA
OUTLOOK 2022 BY BUSINESS SEGMENT
Fiscal year 2021¹ Targets 2022² Guidance²
Fresenius Medical Care3
Sales growth (in constant currency) €17,619 m Low-to-mid single-digit
percentage growth confirmed
Net income4 growth (in constant currency) €1,018 m
Low-to-mid single-digit
percentage growth confirmed Fresenius Kabi
Sales growth (organic) €7,193 m Low single-digit
percentage growth
confirmed
EBIT growth (in constant currency) €1,153 m
Decline in high single- to
low double-digit percentage range confirmed
Fresenius Helios
Sales growth (organic) €10,891 m Low-to-mid single-digit
percentage growth
confirmed
EBIT growth (in constant currency) €1,127 m Mid single-digit
percentage growth confirmed Fresenius Vamed
Sales growth (organic) €2,297 m
High single- to low double-digit
percentage growth
confirmed
EBIT €101 m
Returning to absolute pre-COVID levels
(2019: €134 m) confirmed
1 Before special items, including COVID-19 effects 2 Before special items, including estimated COVID-19 effects 3 These targets are based on the 2021 results excluding the costs related to FME25 of €49 million (for net income). They are based on the assumptions outlined in the press release on the Q4 and FY 2021 results (Feb.22, 2022), in constant currency and exclude special items. Special items include further
costs related to FME25, the impact related to the war in Ukraine, and other effects that are unusual in nature and have not been foreseeable or not foreseeable in size or impact at the time of giving guidance. 4 Net income attributable to shareholders of Fresenius Medical Care AG & Co. KGaA

At a Glance Shareholder Information Interim Group Management Report Financial Statements Financial Calendar/Contact Table of contents
1st Q
uart
er 2
022
Qua
rter
ly F
inan
cial
Rep
ort
Fre
sen
ius
25
RECONCILIATION TABLES
RECONCILIATION FRESENIUS GROUP Q1
€ in millions Q1 / 2022 Q1 / 2021 Growth rate
Growth rate in constant
currency
Sales reported 9,720 8,984 8% 5% EBIT reported (after special items) 902 1,006 -10% -14% Revaluations of biosimilars contingent purchase price liabilities -2 - Expenses associated with the Fresenius cost and efficiency program 64 3 Impacts related to the war in Ukraine 30 - Transaction costs mAbxience, Ivenix 2 - EBIT (before special items) 996 1,009 -1% -5% Net interest reported (after special items) -118 -137 14% 17% Revaluations of biosimilars contingent purchase price liabilities -1 - Net interest (before special items) -119 -137 13% 16% Income taxes reported (after special items) -185 -198 7% 10% Revaluations of biosimilars contingent purchase price liabilities 1 - Expenses associated with the Fresenius cost and efficiency program -12 -1 Impacts related to the war in Ukraine -3 - Transaction costs mAbxience, Ivenix 0 - Income taxes (before special items) -199 -199 0% 4% Noncontrolling interests reported (after special items) -186 -236 21% 25% Expenses associated with the Fresenius cost and efficiency program -17 -1 Impacts related to the war in Ukraine -13 - Noncontrolling interests (before special items) -216 -237 9% 13% Net income reported (after special items)1 413 435 -5% -8% Revaluations of biosimilars contingent purchase price liabilities -2 - Expenses associated with the Fresenius cost and efficiency program 35 1 Impacts related to the war in Ukraine 14 - Transaction costs mAbxience, Ivenix 2 - Net income (before special items)1 462 436 6% 3%
The special items shown within the reconciliation tables are reported in the Corporate segment.
1 Net income attributable to shareholders of Fresenius SE & Co. KGaA
At a Glance Shareholder Information Interim Group Management Report Financial Statements Financial Calendar/Contact Table of contents
1st Q
uart
er 2
022
Qua
rter
ly F
inan
cial
Rep
ort
Fre
sen
ius
26
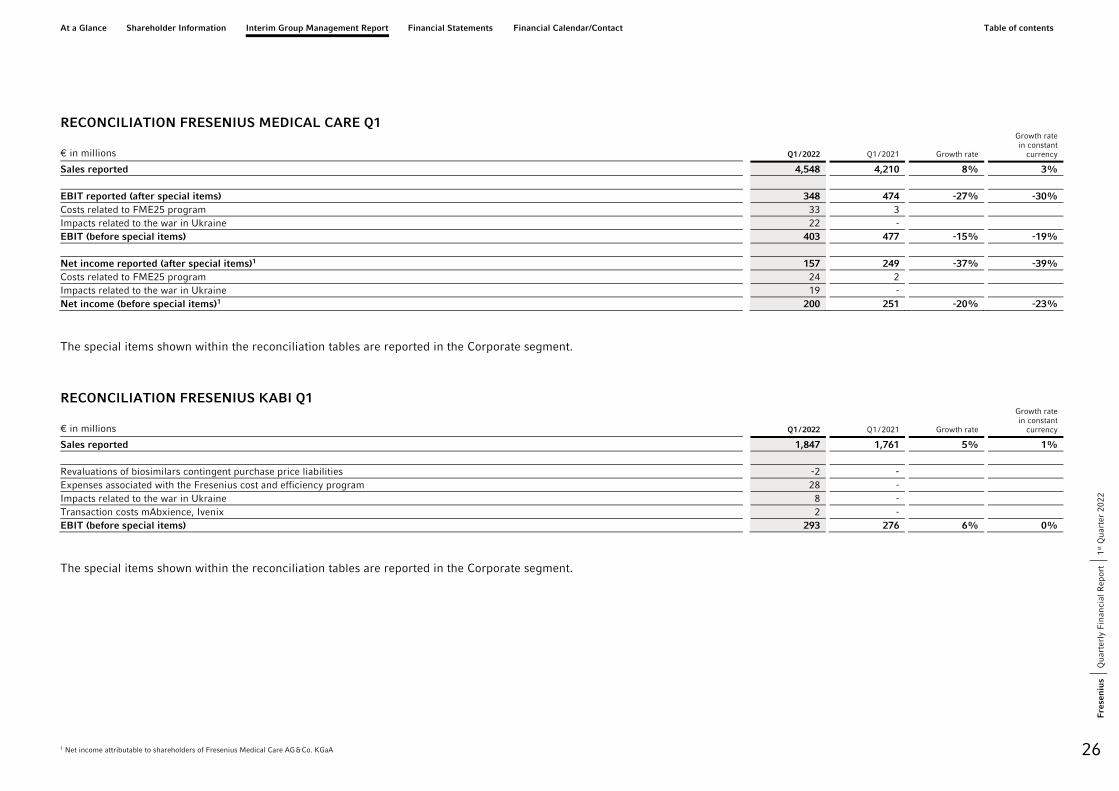
RECONCILIATION FRESENIUS MEDICAL CARE Q1
€ in millions Q1 / 2022 Q1 / 2021 Growth rate
Growth rate in constant
currency
Sales reported 4,548 4,210 8% 3% EBIT reported (after special items) 348 474 -27% -30% Costs related to FME25 program 33 3 Impacts related to the war in Ukraine 22 - EBIT (before special items) 403 477 -15% -19% Net income reported (after special items)1 157 249 -37% -39% Costs related to FME25 program 24 2 Impacts related to the war in Ukraine 19 - Net income (before special items)1 200 251 -20% -23%
The special items shown within the reconciliation tables are reported in the Corporate segment.
RECONCILIATION FRESENIUS KABI Q1
€ in millions Q1 / 2022 Q1 / 2021 Growth rate
Growth rate in constant
currency
Sales reported 1,847 1,761 5% 1% Revaluations of biosimilars contingent purchase price liabilities -2 - Expenses associated with the Fresenius cost and efficiency program 28 - Impacts related to the war in Ukraine 8 - Transaction costs mAbxience, Ivenix 2 - EBIT (before special items) 293 276 6% 0%
The special items shown within the reconciliation tables are reported in the Corporate segment.
1 Net income attributable to shareholders of Fresenius Medical Care AG & Co. KGaA

At a Glance Shareholder Information Interim Group Management Report Financial Statements Financial Calendar/Contact Table of contents
1st Q
uart
er 2
022
Qua
rter
ly F
inan
cial
Rep
ort
Fre
sen
ius
27
RECONCILIATION FRESENIUS HELIOS Q1
€ in millions Q1 / 2022 Q1 / 2021 Growth rate
Growth rate in constant
currency
Sales reported 2,931 2,649 11% 11% Expenses associated with the Fresenius cost and efficiency program 0 - EBIT (before special items) 306 268 14% 15%
The special items shown within the reconciliation tables are reported in the Corporate segment.
RECONCILIATION FRESENIUS VAMED Q1
€ in millions Q1 / 2022 Q1 / 2021 Growth rate
Growth rate in constant
currency
Sales reported 513 477 8% 7% Expenses associated with the Fresenius cost and efficiency program 1 - EBIT (before special items) 8 -4 -- --
The special items shown within the reconciliation tables are reported in the Corporate segment.
ESTIMATED COVID-19 EFFECTS Q1
Reported growth rate in constant currency
including COVID-19-effects
Estimated COVID-19 impact
in constant currency
Estimated growth rate in constant currency
excluding COVID-19-effects € in millions Q1 / 2022 Q1 / 2021 Q1 / 2022 Q1 / 2021 Q1 / 2022 Q1 / 2021
Sales 5% 3% 0 to -1% -1 to -2% 5 to 6% 4 to 5% Net income (before special items)1 3% -2% 5 to 1% -2 to -6% -2 to 2% 0 to 4%
1 Net income attributable to shareholders of Fresenius SE & Co. KGaA

At a Glance Shareholder Information Interim Group Management Report Financial Statements Financial Calendar/Contact Table of contents
1st Q
uart
er 2
022
Qua
rter
ly F
inan
cial
Rep
ort
Fre
sen
ius
28
FRESENIUS SE & CO. KGAA CONSOLIDATED STATEMENT OF INCOME (UNAUDITED)
€ in millions Q1 / 2022 Q1 / 2021
Sales 9,720 8,984 Cost of sales -7,162 -6,526 Gross profit 2,558 2,458 Selling, general and administrative expenses -1,477 -1,266 Research and development expenses -179 -186 Operating income (EBIT) 902 1,006 Net interest -118 -137 Income before income taxes 784 869 Income taxes -185 -198 Net income 599 671 Noncontrolling interests 186 236 Net income attributable to shareholders of Fresenius SE & Co. KGaA 413 435 Earnings per share in € 0.74 0.78 Fully diluted earnings per share in € 0.74 0.78
The following notes are an integral part of the unaudited condensed interim financial statements.
At a Glance Shareholder Information Interim Group Management Report Financial Statements Financial Calendar/Contact Table of contents
1st Q
uart
er 2
022
Qua
rter
ly F
inan
cial
Rep
ort
Fre
sen
ius
29
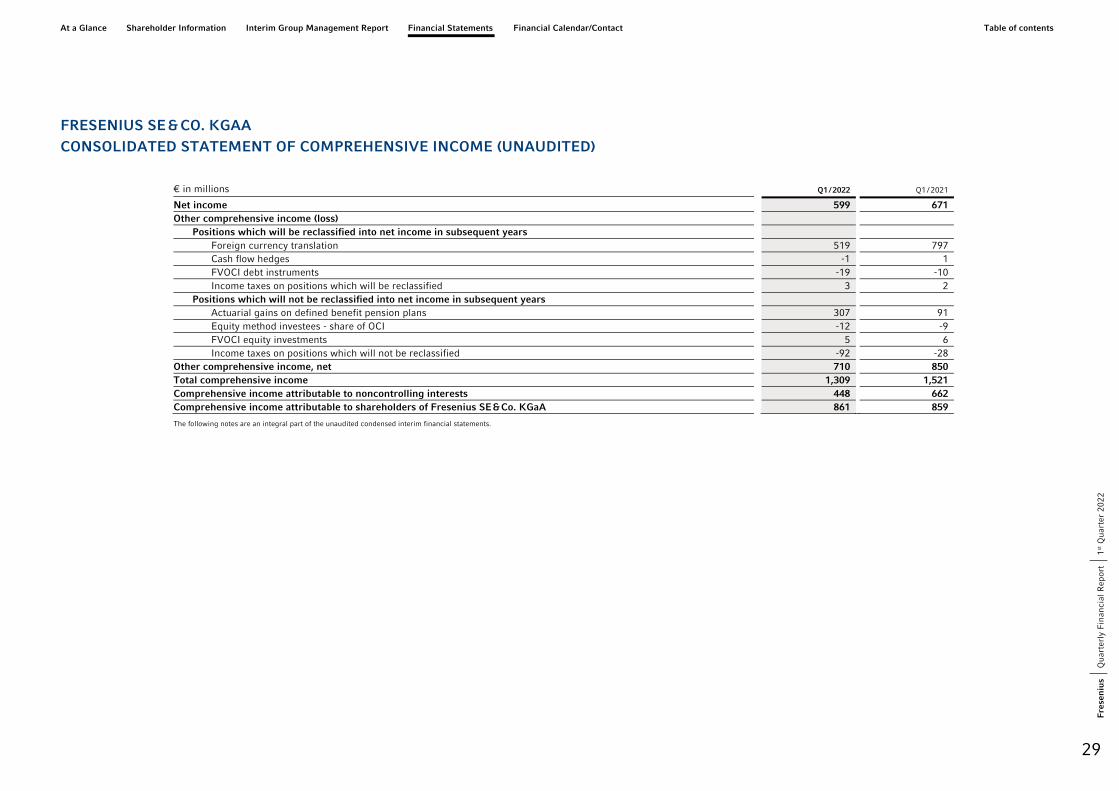
FRESENIUS SE & CO. KGAA CONSOLIDATED STATEMENT OF COMPREHENSIVE INCOME (UNAUDITED)
€ in millions Q1 / 2022 Q1 / 2021
Net income 599 671 Other comprehensive income (loss)
Positions which will be reclassified into net income in subsequent years Foreign currency translation 519 797 Cash flow hedges -1 1 FVOCI debt instruments -19 -10 Income taxes on positions which will be reclassified 3 2
Positions which will not be reclassified into net income in subsequent years Actuarial gains on defined benefit pension plans 307 91 Equity method investees - share of OCI -12 -9 FVOCI equity investments 5 6 Income taxes on positions which will not be reclassified -92 -28
Other comprehensive income, net 710 850 Total comprehensive income 1,309 1,521 Comprehensive income attributable to noncontrolling interests 448 662 Comprehensive income attributable to shareholders of Fresenius SE & Co. KGaA 861 859
The following notes are an integral part of the unaudited condensed interim financial statements.
At a Glance Shareholder Information Interim Group Management Report Financial Statements Financial Calendar/Contact Table of contents
1st Q
uart
er 2
022
Qua
rter
ly F
inan
cial
Rep
ort
Fre
sen
ius
30
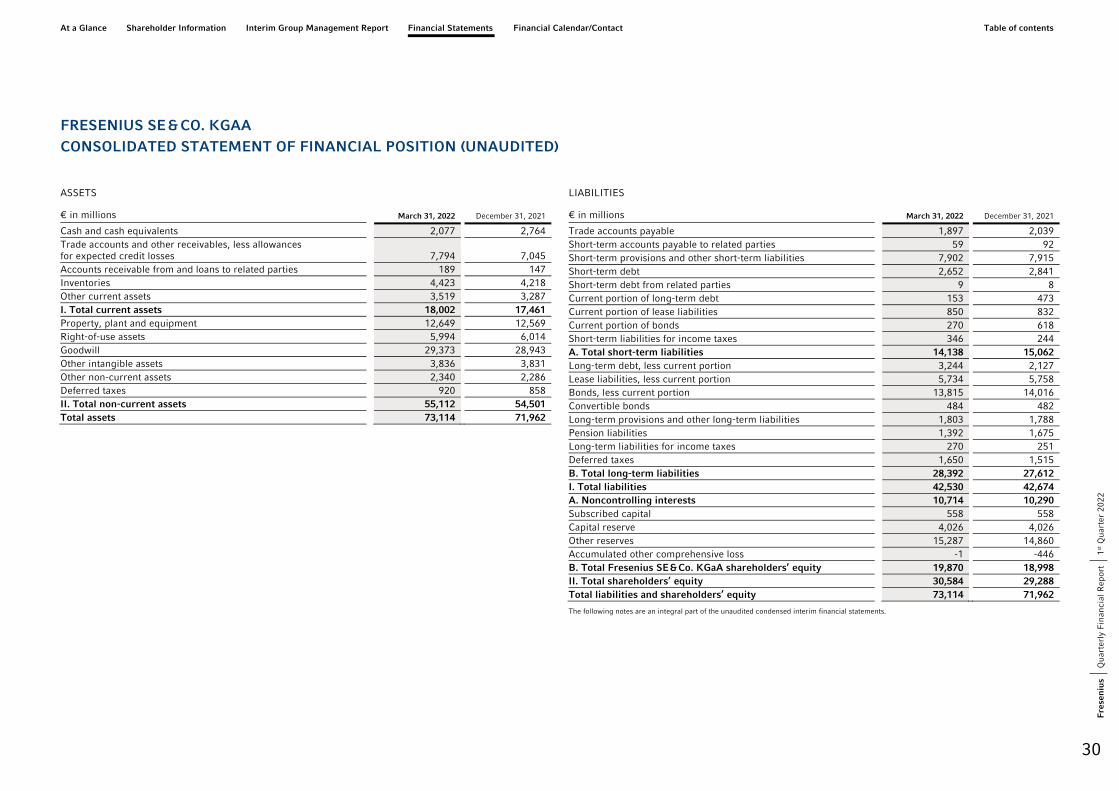
FRESENIUS SE & CO. KGAA CONSOLIDATED STATEMENT OF FINANCIAL POSITION (UNAUDITED)
ASSETS
€ in millions March 31, 2022 December 31, 2021
Cash and cash equivalents 2,077 2,764 Trade accounts and other receivables, less allowances for expected credit losses 7,794 7,045 Accounts receivable from and loans to related parties 189 147 Inventories 4,423 4,218 Other current assets 3,519 3,287 I. Total current assets 18,002 17,461 Property, plant and equipment 12,649 12,569 Right-of-use assets 5,994 6,014 Goodwill 29,373 28,943 Other intangible assets 3,836 3,831 Other non-current assets 2,340 2,286 Deferred taxes 920 858 II. Total non-current assets 55,112 54,501 Total assets 73,114 71,962
LIABILITIES
€ in millions March 31, 2022 December 31, 2021
Trade accounts payable 1,897 2,039 Short-term accounts payable to related parties 59 92 Short-term provisions and other short-term liabilities 7,902 7,915 Short-term debt 2,652 2,841 Short-term debt from related parties 9 8 Current portion of long-term debt 153 473 Current portion of lease liabilities 850 832 Current portion of bonds 270 618 Short-term liabilities for income taxes 346 244 A. Total short-term liabilities 14,138 15,062 Long-term debt, less current portion 3,244 2,127 Lease liabilities, less current portion 5,734 5,758 Bonds, less current portion 13,815 14,016 Convertible bonds 484 482 Long-term provisions and other long-term liabilities 1,803 1,788 Pension liabilities 1,392 1,675 Long-term liabilities for income taxes 270 251 Deferred taxes 1,650 1,515 B. Total long-term liabilities 28,392 27,612 I. Total liabilities 42,530 42,674 A. Noncontrolling interests 10,714 10,290 Subscribed capital 558 558 Capital reserve 4,026 4,026 Other reserves 15,287 14,860 Accumulated other comprehensive loss -1 -446 B. Total Fresenius SE & Co. KGaA shareholders’ equity 19,870 18,998 II. Total shareholders’ equity 30,584 29,288 Total liabilities and shareholders’ equity 73,114 71,962
The following notes are an integral part of the unaudited condensed interim financial statements.
At a Glance Shareholder Information Interim Group Management Report Financial Statements Financial Calendar/Contact Table of contents
1st Q
uart
er 2
022
Qua
rter
ly F
inan
cial
Rep
ort
Fre
sen
ius
31
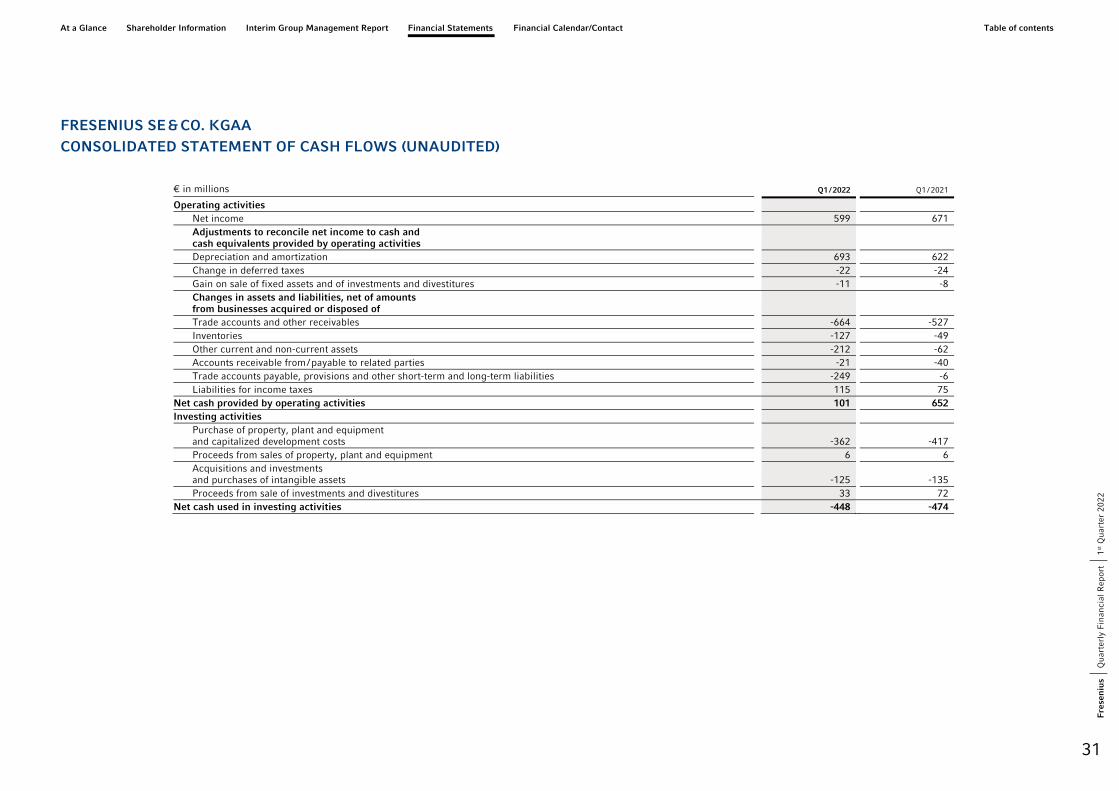
FRESENIUS SE & CO. KGAA CONSOLIDATED STATEMENT OF CASH FLOWS (UNAUDITED)
€ in millions Q1 / 2022 Q1 / 2021
Operating activities Net income 599 671 Adjustments to reconcile net income to cash and cash equivalents provided by operating activities Depreciation and amortization 693 622 Change in deferred taxes -22 -24 Gain on sale of fixed assets and of investments and divestitures -11 -8 Changes in assets and liabilities, net of amounts from businesses acquired or disposed of Trade accounts and other receivables -664 -527 Inventories -127 -49 Other current and non-current assets -212 -62 Accounts receivable from / payable to related parties -21 -40 Trade accounts payable, provisions and other short-term and long-term liabilities -249 -6 Liabilities for income taxes 115 75
Net cash provided by operating activities 101 652 Investing activities
Purchase of property, plant and equipment and capitalized development costs -362 -417 Proceeds from sales of property, plant and equipment 6 6 Acquisitions and investments and purchases of intangible assets -125 -135 Proceeds from sale of investments and divestitures 33 72
Net cash used in investing activities -448 -474
At a Glance Shareholder Information Interim Group Management Report Financial Statements Financial Calendar/Contact Table of contents
1st Q
uart
er 2
022
Qua
rter
ly F
inan
cial
Rep
ort
Fre
sen
ius
32
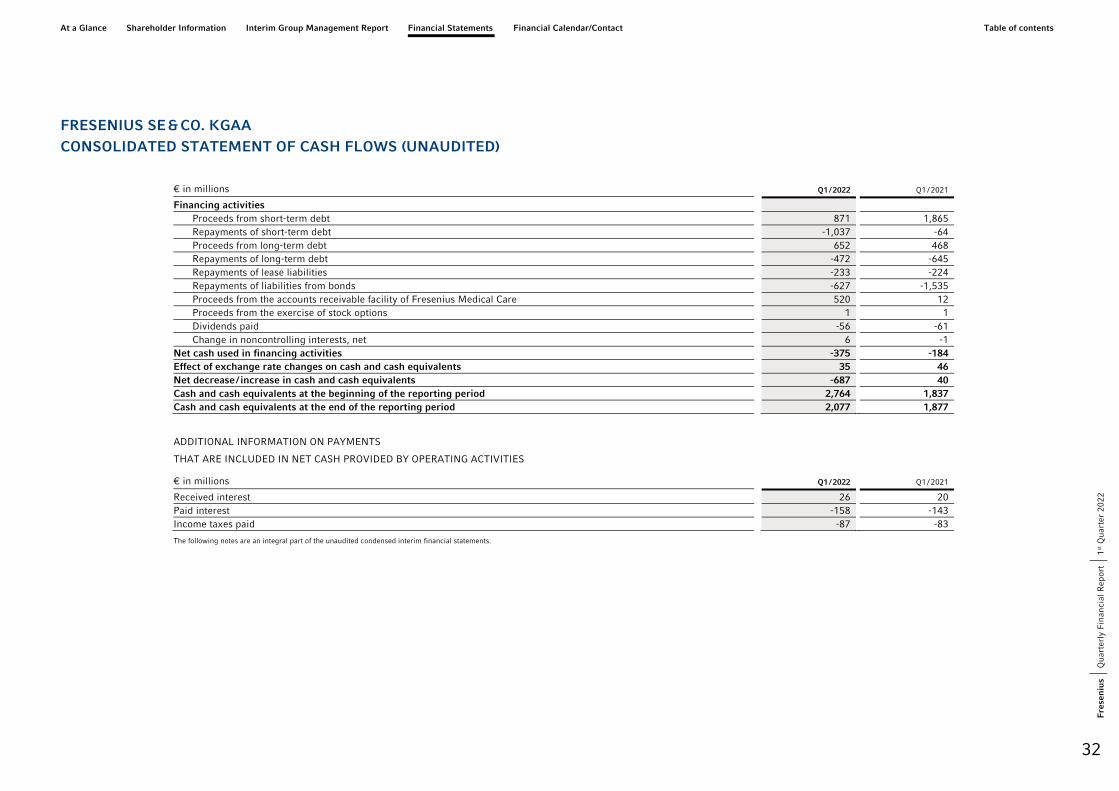
FRESENIUS SE & CO. KGAA CONSOLIDATED STATEMENT OF CASH FLOWS (UNAUDITED)
€ in millions Q1 / 2022 Q1 / 2021
Financing activities Proceeds from short-term debt 871 1,865 Repayments of short-term debt -1,037 -64 Proceeds from long-term debt 652 468 Repayments of long-term debt -472 -645 Repayments of lease liabilities -233 -224 Repayments of liabilities from bonds -627 -1,535 Proceeds from the accounts receivable facility of Fresenius Medical Care 520 12 Proceeds from the exercise of stock options 1 1 Dividends paid -56 -61 Change in noncontrolling interests, net 6 -1
Net cash used in financing activities -375 -184 Effect of exchange rate changes on cash and cash equivalents 35 46 Net decrease / increase in cash and cash equivalents -687 40 Cash and cash equivalents at the beginning of the reporting period 2,764 1,837 Cash and cash equivalents at the end of the reporting period 2,077 1,877
ADDITIONAL INFORMATION ON PAYMENTS
THAT ARE INCLUDED IN NET CASH PROVIDED BY OPERATING ACTIVITIES
€ in millions Q1 / 2022 Q1 / 2021
Received interest 26 20 Paid interest -158 -143 Income taxes paid -87 -83
The following notes are an integral part of the unaudited condensed interim financial statements.
At a Glance Shareholder Information Interim Group Management Report Financial Statements Financial Calendar/Contact Table of contents
1st Q
uart
er 2
022
Qua
rter
ly F
inan
cial
Rep
ort
Fre
sen
ius
33
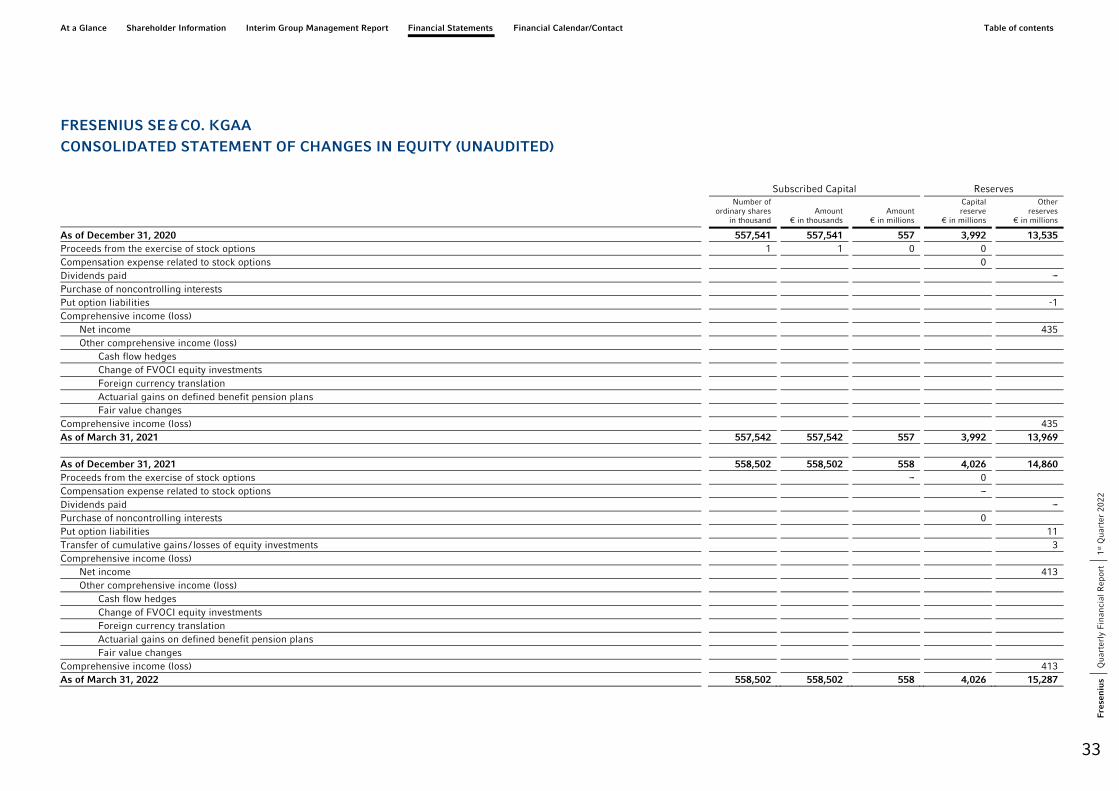
FRESENIUS SE & CO. KGAA CONSOLIDATED STATEMENT OF CHANGES IN EQUITY (UNAUDITED)
Subscribed Capital Reserves
Number of ordinary shares
in thousand Amount
€ in thousands Amount
€ in millions
Capital reserve
€ in millions
Other reserves
€ in millions
As of December 31, 2020 557,541 557,541 557 3,992 13,535 Proceeds from the exercise of stock options 1 1 0 0 Compensation expense related to stock options 0 Dividends paid --- Purchase of noncontrolling interests Put option liabilities -1 Comprehensive income (loss)
Net income 435 Other comprehensive income (loss)
Cash flow hedges Change of FVOCI equity investments Foreign currency translation Actuarial gains on defined benefit pension plans Fair value changes
Comprehensive income (loss) 435 As of March 31, 2021 557,542 557,542 557 3,992 13,969 As of December 31, 2021 558,502 558,502 558 4,026 14,860 Proceeds from the exercise of stock options --- 0 Compensation expense related to stock options --- Dividends paid --- Purchase of noncontrolling interests 0 Put option liabilities 11 Transfer of cumulative gains / losses of equity investments 3 Comprehensive income (loss)
Net income 413 Other comprehensive income (loss)
Cash flow hedges Change of FVOCI equity investments Foreign currency translation Actuarial gains on defined benefit pension plans Fair value changes
Comprehensive income (loss) 413 As of March 31, 2022 558,502 558,502 558 4,026 15,287

At a Glance Shareholder Information Interim Group Management Report Financial Statements Financial Calendar/Contact Table of contents
1st Q
uart
er 2
022
Qua
rter
ly F
inan
cial
Rep
ort
Fre
sen
ius
34
FRESENIUS SE & CO. KGAA CONSOLIDATED STATEMENT OF CHANGES IN EQUITY (UNAUDITED)
Accumulated other comprehensive income (loss)
Foreign currency
translation € in millions
Cash flow hedges
€ in millions Pensions
€ in millions
Equity investments € in millions
Fair value changes
€ in millions
Total Fresenius
SE & Co. KGaA
shareholders’ equity
€ in millions
Non- controlling
interests € in millions
Total shareholders’
equity € in millions
As of December 31, 2020 -704 -62 -405 9 27 16,949 9,074 26,023 Proceeds from the exercise of stock options 0 0 0 Compensation expense related to stock options 0 0 0 Dividends paid --- -61 -61 Purchase of noncontrolling interests --- 35 35 Put option liabilities -1 -3 -4 Comprehensive income (loss)
Net income 435 236 671 Other comprehensive income (loss)
Cash flow hedges 1 1 -2 -1 Change of FVOCI equity investments 1 1 3 4 Foreign currency translation 391 0 -2 0 389 410 799 Actuarial gains on defined benefit pension plans 38 38 27 65 Fair value changes -5 -5 -12 -17
Comprehensive income (loss) 391 1 36 1 -5 859 662 1,521 As of March 31, 2021 -313 -61 -369 10 22 17,807 9,707 27,514 As of December 31, 2021 54 -66 -411 -42 19 18,998 10,290 29,288 Proceeds from the exercise of stock options 0 1 1 Dividends paid 0 -56 -56 Purchase of noncontrolling interests 0 7 7 Put option liabilities 11 24 35 Transfer of cumulative gains / losses of equity investments -3 --- --- Comprehensive income (loss) ---
Net income 413 186 599 Other comprehensive income (loss) ---
Cash flow hedges -2 -2 1 -1 Change of FVOCI equity investments 5 5 0 5 Foreign currency translation 309 -1 -1 0 0 307 221 528 Actuarial gains on defined benefit pension plans 147 147 68 215 Fair value changes -9 -9 -28 -37
Comprehensive income (loss) 309 -3 146 5 -9 861 448 1,309 As of March 31, 2022 363 -69 -265 -40 10 19,870 10,714 30,584
The following notes are an integral part of the unaudited condensed interim financial statements.
At a Glance Shareholder Information Interim Group Management Report Financial Statements Financial Calendar/Contact Table of contents
1st Q
uart
er 2
022
Qua
rter
ly F
inan
cial
Rep
ort
Fre
sen
ius
35
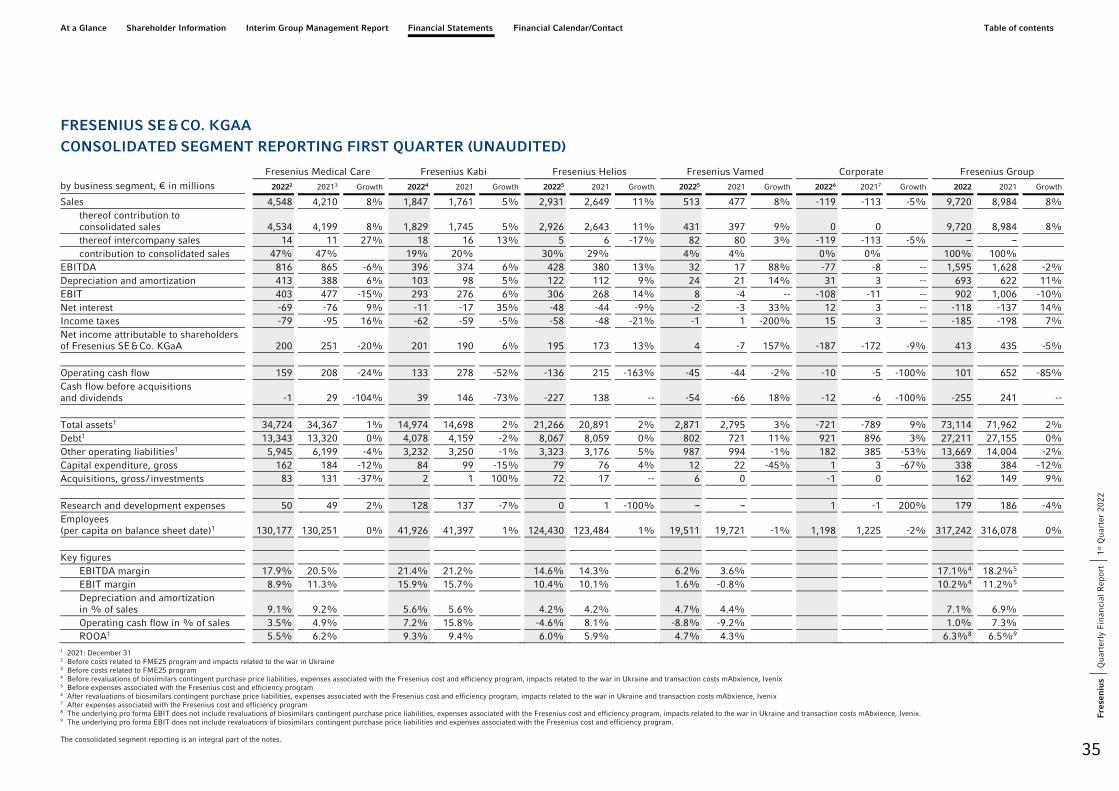
FRESENIUS SE & CO. KGAA CONSOLIDATED SEGMENT REPORTING FIRST QUARTER (UNAUDITED)
Fresenius Medical Care Fresenius Kabi Fresenius Helios Fresenius Vamed Corporate Fresenius Group by business segment, € in millions 20222 20213 Growth 20224 2021 Growth 20225 2021 Growth 20225 2021 Growth 20226 20217 Growth 2022 2021 Growth
Sales 4,548 4,210 8% 1,847 1,761 5% 2,931 2,649 11% 513 477 8% -119 -113 -5% 9,720 8,984 8% thereof contribution to consolidated sales 4,534 4,199 8% 1,829 1,745 5% 2,926 2,643 11% 431 397 9% 0 0 9,720 8,984 8% thereof intercompany sales 14 11 27% 18 16 13% 5 6 -17% 82 80 3% -119 -113 -5% --- --- contribution to consolidated sales 47% 47% 19% 20% 30% 29% 4% 4% 0% 0% 100% 100%
EBITDA 816 865 -6% 396 374 6% 428 380 13% 32 17 88% -77 -8 -- 1,595 1,628 -2% Depreciation and amortization 413 388 6% 103 98 5% 122 112 9% 24 21 14% 31 3 -- 693 622 11% EBIT 403 477 -15% 293 276 6% 306 268 14% 8 -4 -- -108 -11 -- 902 1,006 -10% Net interest -69 -76 9% -11 -17 35% -48 -44 -9% -2 -3 33% 12 3 -- -118 -137 14% Income taxes -79 -95 16% -62 -59 -5% -58 -48 -21% -1 1 -200% 15 3 -- -185 -198 7% Net income attributable to shareholders of Fresenius SE & Co. KGaA 200 251 -20% 201 190 6% 195 173 13% 4 -7 157% -187 -172 -9% 413 435 -5% Operating cash flow 159 208 -24% 133 278 -52% -136 215 -163% -45 -44 -2% -10 -5 -100% 101 652 -85% Cash flow before acquisitions and dividends -1 29 -104% 39 146 -73% -227 138 -- -54 -66 18% -12 -6 -100% -255 241 -- Total assets1 34,724 34,367 1% 14,974 14,698 2% 21,266 20,891 2% 2,871 2,795 3% -721 -789 9% 73,114 71,962 2% Debt1 13,343 13,320 0% 4,078 4,159 -2% 8,067 8,059 0% 802 721 11% 921 896 3% 27,211 27,155 0% Other operating liabilities1 5,945 6,199 -4% 3,232 3,250 -1% 3,323 3,176 5% 987 994 -1% 182 385 -53% 13,669 14,004 -2% Capital expenditure, gross 162 184 -12% 84 99 -15% 79 76 4% 12 22 -45% 1 3 -67% 338 384 -12% Acquisitions, gross / investments 83 131 -37% 2 1 100% 72 17 -- 6 0 -1 0 162 149 9% Research and development expenses 50 49 2% 128 137 -7% 0 1 -100% --- --- 1 -1 200% 179 186 -4% Employees (per capita on balance sheet date)1 130,177 130,251 0% 41,926 41,397 1% 124,430 123,484 1% 19,511 19,721 -1% 1,198 1,225 -2% 317,242 316,078 0% Key figures
EBITDA margin 17.9% 20.5% 21.4% 21.2% 14.6% 14.3% 6.2% 3.6% 17.1%4 18.2%5 EBIT margin 8.9% 11.3% 15.9% 15.7% 10.4% 10.1% 1.6% -0.8% 10.2%4 11.2%5 Depreciation and amortization in % of sales 9.1% 9.2% 5.6% 5.6% 4.2%
4.2%
4.7%
4.4%
7.1%
6.9%
Operating cash flow in % of sales 3.5% 4.9% 7.2% 15.8% -4.6% 8.1% -8.8% -9.2% 1.0% 7.3% ROOA1 5.5% 6.2% 9.3% 9.4% 6.0% 5.9% 4.7% 4.3% 6.3%8 6.5%9
1 2021: December 31 2 Before costs related to FME25 program and impacts related to the war in Ukraine 3 Before costs related to FME25 program 4 Before revaluations of biosimilars contingent purchase price liabilities, expenses associated with the Fresenius cost and efficiency program, impacts related to the war in Ukraine and transaction costs mAbxience, Ivenix 5 Before expenses associated with the Fresenius cost and efficiency program 6 After revaluations of biosimilars contingent purchase price liabilities, expenses associated with the Fresenius cost and efficiency program, impacts related to the war in Ukraine and transaction costs mAbxience, Ivenix 7 After expenses associated with the Fresenius cost and efficiency program 8 The underlying pro forma EBIT does not include revaluations of biosimilars contingent purchase price liabilities, expenses associated with the Fresenius cost and efficiency program, impacts related to the war in Ukraine and transaction costs mAbxience, Ivenix. 9 The underlying pro forma EBIT does not include revaluations of biosimilars contingent purchase price liabilities and expenses associated with the Fresenius cost and efficiency program. The consolidated segment reporting is an integral part of the notes.
At a Glance Shareholder Information Interim Group Management Report Financial Statements Financial Calendar/Contact Table of contents
36
1st Q
uart
er 2
022
Qua
rter
ly F
inan
cial
Rep
ort
Fre
sen
ius
TABLE OF CONTENTS NOTES
37 General Notes 43 Notes on the consolidated statement of financial position 49 Other notes
37 1. Principles 43 8. Trade accounts and other receivables 49 17. Legal and regulatory matters
37 I. Group structure 43 9. Inventories 50 18. Financial instruments
37 II. Basis of presentation 43 10. Other current and non-current assets 53 19. Information on capital management
37 III. Summary of significant accounting policies 44 11. Goodwill 53 20. Notes on the consolidated segment reporting
38 IV. Recent pronouncements, applied 44 12. Debt 54 21. Share-based compensation plans
38 V. Recent pronouncements, not yet applied 46 13. Bonds 55 22. Subsequent events 39 2. Acquisitions, divestitures and investments 47 14. Convertible bonds 55 23. Corporate Governance
47 15. Noncontrolling interests
48 16. Fresenius SE & Co. KGaA shareholders‘ equity
41 Notes on the consolidated statement of income
41 3. Special items
41 4. Sales
42 5. Research and development expenses
42 6. Taxes
42 7. Earnings per share
At a Glance Shareholder Information Interim Group Management Report Financial Statements Financial Calendar/Contact Table of contents
37
1st Q
uart
er 2
022
Qua
rter
ly F
inan
cial
Rep
ort
Fre
sen
ius
GENERAL NOTES
1. PRINCIPLES
I. GROUP STRUCTURE Fresenius is a global health care group with products and
services for dialysis, hospitals and outpatient medical care.
In addition, the Fresenius Group focuses on hospital opera-
tions and also manages projects and provides services for
hospitals and other health care facilities worldwide. Besides
the activities of the parent company Fresenius SE & Co.
KGaA, Bad Homburg v. d. H., Germany, the operating
activities are organized amongst the following legally
independent business segments as of March 31, 2022:
► Fresenius Medical Care ► Fresenius Kabi ► Fresenius Helios ► Fresenius Vamed
The reporting and functional currency of the Fresenius
Group is the euro. In order to improve the clarity of presen-
tation, amounts are generally presented in million euros.
Amounts less than €1 million, after rounding, are marked
with ‘‘0’’.
II. BASIS OF PRESENTATION Fresenius SE & Co. KGaA, as a stock exchange listed com-
pany with a domicile in a member state of the European
Union (EU), fulfills its obligation to prepare and publish
the consolidated financial statements in accordance with
the International Financial Reporting Standards (IFRS) as
adopted by the EU and applying Section 315e of the Ger-
man Commercial Code (HGB).
The consolidated interim financial statements and ac-
companying condensed notes are prepared in accordance
with the International Accounting Standard (IAS) 34. The
primary financial statements are presented in the format
consistent with the consolidated financial statements as
of December 31, 2021. The consolidated interim financial
statements have been prepared in accordance with the
Standards and interpretations in effect on the reporting
date, and endorsed in the EU, as issued by the International
Accounting Standards Board (IASB) and the IFRS Interpre-
tations Committee (IFRS IC).
The interim financial statements have been prepared
in accordance with the same general accounting policies
applied in the preparation of the consolidated financial
statements as of December 31, 2021.
III. SUMMARY OF SIGNIFICANT ACCOUNTING POLICIES Principles of consolidation The condensed consolidated financial statements and
interim management report for the first quarter ended
March 31, 2022 have not been audited nor reviewed and
should be read in conjunction with the notes included and
published in the consolidated financial statements as of
December 31, 2021 applying Section 315e HGB in accord-
ance with IFRS as adopted by the EU.
Except for the reported acquisitions (see note 2, Acqui-
sitions, divestitures and investments), there have been no
other material changes in the Fresenius Group’s consolida-
tion structure.
The consolidated financial statements for the first quar-
ter ended March 31, 2022 include all adjustments that, in
the opinion of the Management Board, are of a normal and
recurring nature and are necessary to provide a fair presen-
tation of the assets and liabilities, financial position and
results of operations of the Fresenius Group.
The results of operations for the first quarter ended
March 31, 2022 are not necessarily indicative of the results
of operations for the fiscal year 2022.
Classifications Comparative information for certain items have been
reclassified to conform with current year’s presentation.
At a Glance Shareholder Information Interim Group Management Report Financial Statements Financial Calendar/Contact Table of contents
38
1st Q
uart
er 2
022
Qua
rter
ly F
inan
cial
Rep
ort
Fre
sen
ius
Government grants and impacts of COVID-19 pandemic In the first quarter of 2022, the Fresenius Group received
reimbursement payments and funding from various govern-
ments due to the COVID-19 pandemic. They have been
accounted for in accordance with terms and regulations
set forth in by the local laws and regulations.
In Germany, the hospitals of the Fresenius Group have
received reimbursements and grants in the first quarter of
2022 to compensate for COVID-19 related financial charges.
In the first quarter of 2022, the German hospitals of the
Fresenius Group received total reimbursements and grants
of €166 million (Q1 / 2021: €216 million), of which €158 mil-
lion (Q1 / 2021: €207 million) were recorded in sales and
€8 million (Q1 / 2021: €9 million) as grants in other operat-
ing income.
In the United States, Fresenius Medical Care North
America received government grants from the U.S. govern-
ment in the amount of €16 million (Q1 / 2021: €7 million).
The remaining amount of government grants received rec-
orded in deferred income was US$46 million (€41 million)
at March 31, 2022 and US$62 million (€55 million) at
December 31, 2021. The Fresenius Group also recorded a
contract liability for advance payments received under the
Center for Medicare and Medicaid (CMS) Accelerated and
Advance Payment program which is currently recorded
within short-term provisions and other short-term liabilities.
Contract liabilities related to the CMS Accelerated and
Advance Payment program were US$252 million (€227 mil-
lion) and US$443 million (€391 million) as of March 31,
2022 and December 31, 2021, respectively.
In addition to the programs above, the Fresenius Group
also received grants and other reimbursements in the first
quarter of 2022 under various other programs from mul-
tiple governments around the world in the amount of €10
million (Q1 / 2021: €6 million).
Use of estimates The preparation of consolidated financial statements in
conformity with IFRS requires management to make esti-
mates and assumptions that affect the reported amounts of
assets and liabilities, the disclosure of contingent assets
and liabilities at the date of the consolidated financial state-
ments and the reported amounts of income and expenses
during the reporting period. Actual results could differ
from those estimates.
IV. RECENT PRONOUNCEMENTS, APPLIED The Fresenius Group has prepared its consolidated financial
statements at and for the three months ended March 31,
2022 in conformity with IFRS, as adopted by the EU, that
must be applied for the interim periods starting on or after
January 1, 2022.
For the first quarter of 2022, there were no recently
implemented accounting pronouncements that had a
material effect on the Fresenius Group’s consolidated
financial statements.
V. RECENT PRONOUNCEMENTS, NOT YET APPLIED The IASB issued the following new standards relevant for
the Fresenius Group’s business:
In January 2020, the IASB issued Amendments to IAS 1, Classification of Liabilities as Current and Non-current. The amendments clarify under which circum-
stances debt and other liabilities with an uncertain settle-
ment date should be classified as current or non-current.
Among others, the amendments state that liabilities shall
be classified depending on rights that exist at the end of
the reporting period and define under which conditions lia-
bilities might be settled by cash, other economic resources
or equity. On July 15, 2020, the IASB deferred the effective
date by one year to provide companies with more time to
implement any classification changes resulting from the
amendments. The amendments to IAS 1 are now effective
for fiscal years beginning on or after January 1, 2023. Ear-
lier adoption is permitted. The Fresenius Group is currently
evaluating the impact of the amendments to IAS 1 on the
consolidated financial statements.
In May 2017, the IASB issued IFRS 17, Insurance Contracts. In June 2020 and December 2021, further
amendments were published. IFRS 17 establishes princi-
ples for the recognition, measurement, presentation and
disclosure related to the issuance of insurance contracts.
IFRS 17 replaces IFRS 4, Insurance Contracts, which was
brought in as an interim standard in 2004. IFRS 4 permit-
ted the use of national accounting standards for the ac-
counting of insurance contracts under IFRS. As a result of

At a Glance Shareholder Information Interim Group Management Report Financial Statements Financial Calendar/Contact Table of contents
39
1st Q
uart
er 2
022
Qua
rter
ly F
inan
cial
Rep
ort
Fre
sen
ius
the varied application for insurance contracts, there was a
lack of comparability among peer groups. IFRS 17 elimi-
nates this diversity in practice by requiring all insurance
contracts to be accounted for using current values. The
frequent updates to the insurance values are expected to
provide more useful information to users of financial state-
ments. On June 25, 2020, the IASB issued amendments to
IFRS 17, which among others, defer the effective date to
fiscal years beginning on or after January 1, 2023. Earlier
adoption is permitted for entities that have also adopted
IFRS 9, Financial Instruments, and IFRS 15, Revenue from
Contracts with Customers. The Fresenius Group is cur-
rently evaluating the impact of IFRS 17 on the consoli-
dated financial statements.
The EU Commission’s endorsement of the amendments
to IAS 1 is still outstanding.
In the Fresenius Group’s view, there are no other IFRS
standards or interpretations not yet effective that would
be expected to have a material impact on the consolidated
financial statements.
2. ACQUISITIONS, DIVESTITURES AND INVESTMENTS The Fresenius Group made acquisitions, investments and
purchases of intangible assets of €162 million and €149
million in the first quarter of 2022 and 2021, respectively.
Of this amount, €125 million was paid in cash and €37 mil-
lion was assumed obligations in the first quarter of 2022.
FRESENIUS MEDICAL CARE In the first quarter of 2022, Fresenius Medical Care spent
€83 million (Q1 / 2021: €131 million) on acquisitions, mainly
on the purchase of dialysis clinics.
On March 21, Fresenius Medical Care announced that it
had entered into an agreement to create a company that
combines Fresenius Health Partners, Inc., the value-based
care division of Fresenius Medical Care North America,
with InterWell Health LLC, a physician organization driving
innovation in the kidney care space in the U.S., and Cricket
Health, Inc., a U.S. provider of value-based kidney care
with a patient engagement and data platform. The business
combination brings together Fresenius Health Partners’
expertise in kidney care value-based contracting and per-
formance, InterWell Health’s clinical care models and net-
work of 1,600 nephrologists and Cricket Health’s tech-
enabled care model that utilizes its proprietary informatics,
StageSmart™ and patient engagement platforms to create
an entity targeting the management of care for more than
270,000 people with kidney disease by 2025 and to manage
around US$11 billion (€10 billion) in medical costs in the
same year. The closing of the transaction is subject to regu-
latory review and, if successful, the new entity will be con-
solidated into Fresenius Medical Care’s operating results.
FRESENIUS KABI In the first quarter of 2022, Fresenius Kabi spent €2 million
(Q1 / 2021: €1 million) on acquisitions, for subsequent pur-
chase price payments for acquisitions from previous years.
On March 31, 2022, Fresenius Kabi announced that it has
agreed to acquire a stake of 55% of mAbxience Holding S.L.
(mAbxience). The purchase price will be a combination of
€495 million upfront payment and milestone payments,
strictly tied to the achievement of commercial and develop-
ment targets. The contractual provisions also include a

At a Glance Shareholder Information Interim Group Management Report Financial Statements Financial Calendar/Contact Table of contents
40
1st Q
uart
er 2
022
Qua
rter
ly F
inan
cial
Rep
ort
Fre
sen
ius
put / call option scheme regarding the current owners’
remaining shares in mAbxience (45%). mAbxience is a
leading international biopharmaceutical company, focused
on the rapidly developing market for the development and
manufacturing of biological drugs (biosimilars). The com-
pany currently employs approximately 600 staff and gen-
erated sales of approximately €255 million in 2021. The
transaction remains subject to regulatory approvals and
other customary closing conditions and is expected to
close by mid-2022.
Also on March 31, 2022, Fresenius Kabi announced that
it has agreed to acquire Ivenix, Inc. (Ivenix), a specialized
infusion therapy company. The purchase price will be a
combination of US$240 million upfront payment and mile-
stone payments, strictly linked to the achievement of com-
mercial and operating targets. The acquisition of Ivenix
was closed at the beginning of May 2022.
FRESENIUS HELIOS In the first quarter of 2022, Fresenius Helios spent €72 mil-
lion (Q1 / 2021: €17 million) on acquisitions, mainly for the
purchase of an oncology clinic and an ophthalmology care
center in Colombia as well as the acquisition of a clinic in
Spain.
Acquisition of the Eugin Group On April 14, 2021, Fresenius Helios has finalized the com-
plete acquisition of Luarmia S.L., Spain, holding company
of all worldwide activities of the Eugin group, and of NMC
Eugin US Corporation from NMC Health (together the Eugin
Group), one of the leading international fertility groups. The
purchase price is based on a valuation of €430 million. It
includes acquired noncontrolling interests and debt of
approximately €80 million. The noncontrolling interests are
held by the respective senior doctors. The Eugin Group has
been consolidated as of April 1, 2021.
Eugin Group’s network comprised at the time of the
acquisition 31 clinics and additional 34 sites across 9 coun-
tries on 3 continents. With about 1,300 employees, the com-
pany offers a wide spectrum of state-of-the-art services in
the field of fertility treatments. With the acquisition of the
Eugin Group, Fresenius Helios becomes a leading player
in the dynamically growing market for fertility services and
establishes a strong basis for further expansion.
The acquisition was financed through available cash
and credit facilities. The purchase price was paid in cash.
The transaction was accounted for as a business combina-
tion whereby assets and liabilities and noncontrolling inter-
ests are recognized at their fair values.
Based on the purchase price allocation, intangible assets
in the amount of €41 million and a goodwill of €348 million
which is not deductible for tax purposes were recorded for
the initial statement of financial position of the Eugin Group.
Goodwill mainly represents the market position of the
acquired fertility hospitals and employee know-how.
Since January 1, 2022, the Eugin Group forms a new
and separate Fresenius Helios business and reporting unit,
Helios Fertility, alongside Helios Germany and Helios Spain.
In the first quarter of 2022, the Eugin Group has con-
tributed €57 million to sales and €4 million to the operat-
ing income (EBIT) of the Fresenius Group.
FRESENIUS VAMED In the first quarter of 2022, Fresenius Vamed spent €6 mil-
lion (Q1 / 2021: €0 million) on acquisitions, mainly for the
purchase of one rehabilitation clinic each in the United
Kingdom and Germany.
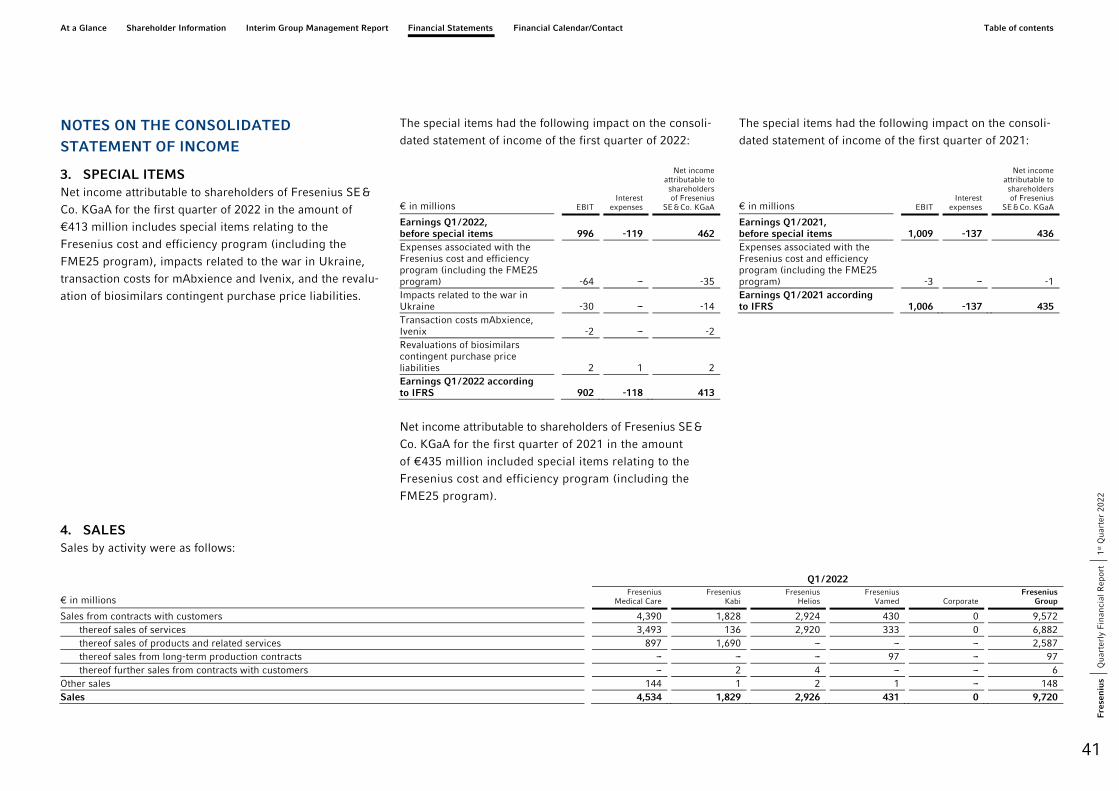
At a Glance Shareholder Information Interim Group Management Report Financial Statements Financial Calendar/Contact Table of contents
41
1st Q
uart
er 2
022
Qua
rter
ly F
inan
cial
Rep
ort
Fre
sen
ius
NOTES ON THE CONSOLIDATED STATEMENT OF INCOME
3. SPECIAL ITEMS Net income attributable to shareholders of Fresenius SE &
Co. KGaA for the first quarter of 2022 in the amount of
€413 million includes special items relating to the
Fresenius cost and efficiency program (including the
FME25 program), impacts related to the war in Ukraine,
transaction costs for mAbxience and Ivenix, and the revalu-
ation of biosimilars contingent purchase price liabilities.
The special items had the following impact on the consoli-
dated statement of income of the first quarter of 2022:
€ in millions EBIT Interest
expenses
Net income attributable to shareholders of Fresenius
SE & Co. KGaA
Earnings Q1 / 2022, before special items 996 -119 462 Expenses associated with the Fresenius cost and efficiency program (including the FME25 program) -64 --- -35 Impacts related to the war in Ukraine -30 --- -14 Transaction costs mAbxience, Ivenix -2 --- -2 Revaluations of biosimilars contingent purchase price liabilities 2 1 2 Earnings Q1 / 2022 according to IFRS 902 -118 413
Net income attributable to shareholders of Fresenius SE &
Co. KGaA for the first quarter of 2021 in the amount
of €435 million included special items relating to the
Fresenius cost and efficiency program (including the
FME25 program).
The special items had the following impact on the consoli-
dated statement of income of the first quarter of 2021:
€ in millions EBIT Interest
expenses
Net income attributable to shareholders of Fresenius
SE & Co. KGaA
Earnings Q1 / 2021, before special items 1,009 -137 436 Expenses associated with the Fresenius cost and efficiency program (including the FME25 program) -3 --- -1 Earnings Q1 / 2021 according to IFRS 1,006 -137 435
4. SALES Sales by activity were as follows:
Q1 / 2022
€ in millions Fresenius
Medical Care Fresenius
Kabi Fresenius
Helios Fresenius
Vamed Corporate Fresenius
Group
Sales from contracts with customers 4,390 1,828 2,924 430 0 9,572 thereof sales of services 3,493 136 2,920 333 0 6,882 thereof sales of products and related services 897 1,690 --- --- --- 2,587 thereof sales from longterm production contracts --- --- --- 97 --- 97 thereof further sales from contracts with customers --- 2 4 --- --- 6
Other sales 144 1 2 1 --- 148 Sales 4,534 1,829 2,926 431 0 9,720

At a Glance Shareholder Information Interim Group Management Report Financial Statements Financial Calendar/Contact Table of contents
42
1st Q
uart
er 2
022
Qua
rter
ly F
inan
cial
Rep
ort
Fre
sen
ius
Q1 / 2021
€ in millions Fresenius
Medical Care Fresenius
Kabi Fresenius
Helios Fresenius
Vamed Corporate Fresenius
Group
Sales from contracts with customers 4,072 1,744 2,640 396 0 8,852 thereof sales of services 3,233 20 2,639 294 0 6,186 thereof sales of products and related services 839 1,721 --- --- --- 2,560 thereof sales from longterm production contracts --- --- --- 102 --- 102 thereof further sales from contracts with customers --- 3 1 --- --- 4
Other sales 127 1 3 1 --- 132 Sales 4,199 1,745 2,643 397 0 8,984
Other sales include sales from insurance and lease contracts.
5. RESEARCH AND DEVELOPMENT EXPENSES Research and development expenses of €179 million
(Q1 / 2021: €186 million) included expenditures for re-
search and non-capitalizable development costs as well as
regular depreciation and amortization expenses relating
to capitalized development costs of €5 million (Q1 / 2021:
€5 million). The expenses for the further development of the
biosimilars business included in the research and develop-
ment expenses amounted to €34 million in the first quarter
of 2022 (Q1 / 2021: €34 million).
6. TAXES During the first quarter of 2022, there were no material
changes relating to accruals for income taxes as well as
recognized and accrued payments for interest and penal-
ties. Further information can be found in the consolidated
financial statements as of December 31, 2021 applying
Section 315e HGB in accordance with IFRS.
7. EARNINGS PER SHARE The following table shows the earnings per share including
and excluding the dilutive effect from stock options issued:
Q1 / 2022 Q1 / 2021
Numerators, € in millions Net income attributable to shareholders of Fresenius SE & Co. KGaA 413 435 less effect from dilution due to Fresenius Medical Care shares 0 0 Income available to all ordinary shares 413 435 Denominators in number of shares Weighted average number of ordinary shares outstanding 558,502,143 557,541,159 Potentially dilutive ordinary shares --- 107,835 Weighted average number of ordinary shares outstanding assuming dilution 558,502,143 557,648,994 Basic earnings per share in € 0.74 0.78 Fully diluted earnings per share in € 0.74 0.78

At a Glance Shareholder Information Interim Group Management Report Financial Statements Financial Calendar/Contact Table of contents
43
1st Q
uart
er 2
022
Qua
rter
ly F
inan
cial
Rep
ort
Fre
sen
ius
NOTES ON THE CONSOLIDATED STATEMENT OF FINANCIAL POSITION
8. TRADE ACCOUNTS AND OTHER RECEIVABLES As of March 31, 2022 and December 31, 2021, trade accounts and other receivables were as follows:
March 31, 2022 December 31, 2021
€ in millions thereof credit
impaired thereof credit
impaired
Trade accounts and other receivables 8,302 738 7,494 691 less allowances for expected credit losses 508 385 449 340 Trade accounts and other receivables, net 7,794 353 7,045 351
Within trade accounts and other receivables (before allow-
ances) as of March 31, 2022, €8,180 million (December 31,
2021: €7,378 million) relate to revenue from contracts with
customers as defined by IFRS 15. This amount includes
€506 million (December 31, 2021: €448 million) of allow-
ances for expected credit losses. Further trade accounts
and other receivables, net, relate to other sales.
9. INVENTORIES As of March 31, 2022 and December 31, 2021, inventories
consisted of the following:
€ in millions Mar. 31, 2022 Dec. 31, 2021
Raw materials and purchased components 1,055 971 Work in process 464 440 Finished goods 3,060 2,961 less reserves 156 154 Inventories, net 4,423 4,218
10. OTHER CURRENT AND NON-CURRENT ASSETS At equity investments as of March 31, 2022 in the amount
of €817 million (December 31, 2021: €804 million) mainly
related to the equity method investee of Fresenius Medical
Care named Vifor Fresenius Medical Care Renal Pharma Ltd.
In the first quarter of 2022, income of €11 million (Q1 / 2021:
€28 million) resulting from this equity investment was
included in selling, general and administrative expenses
in the consolidated statement of income.

At a Glance Shareholder Information Interim Group Management Report Financial Statements Financial Calendar/Contact Table of contents
44
1st Q
uart
er 2
022
Qua
rter
ly F
inan
cial
Rep
ort
Fre
sen
ius
11. GOODWILL The carrying amount of goodwill has developed as follows:
€ in millions Fresenius
Medical Care Fresenius
Kabi Fresenius
Helios Fresenius
Vamed Corporate Fresenius
Group
Carrying amount as of January 1, 2021 12,959 5,058 8,278 298 6 26,599 Additions 444 --- 621 0 --- 1,065 Disposals --- -1 0 --- --- -1 Foreign currency translation 958 316 4 2 --- 1,280 Carrying amount as of December 31, 2021 14,361 5,373 8,903 300 6 28,943 Additions 14 --- 61 6 --- 81 Disposals --- --- -2 --- --- -2 Foreign currency translation 254 93 4 0 --- 351 Carrying amount as of March 31, 2022 14,629 5,466 8,966 306 6 29,373
The increase of goodwill mainly relates to foreign currency translation.
12. DEBT
SHORT-TERM DEBT As of March 31, 2022 and December 31, 2021, short-term debt consisted of the following:
Book value € in millions March 31, 2022 December 31, 2021
Fresenius SE & Co. KGaA Commercial Paper 880 1,056 Fresenius Medical Care AG & Co. KGaA Commercial Paper 556 715 Other shortterm debt 1,216 1,070 Short-term debt 2,652 2,841
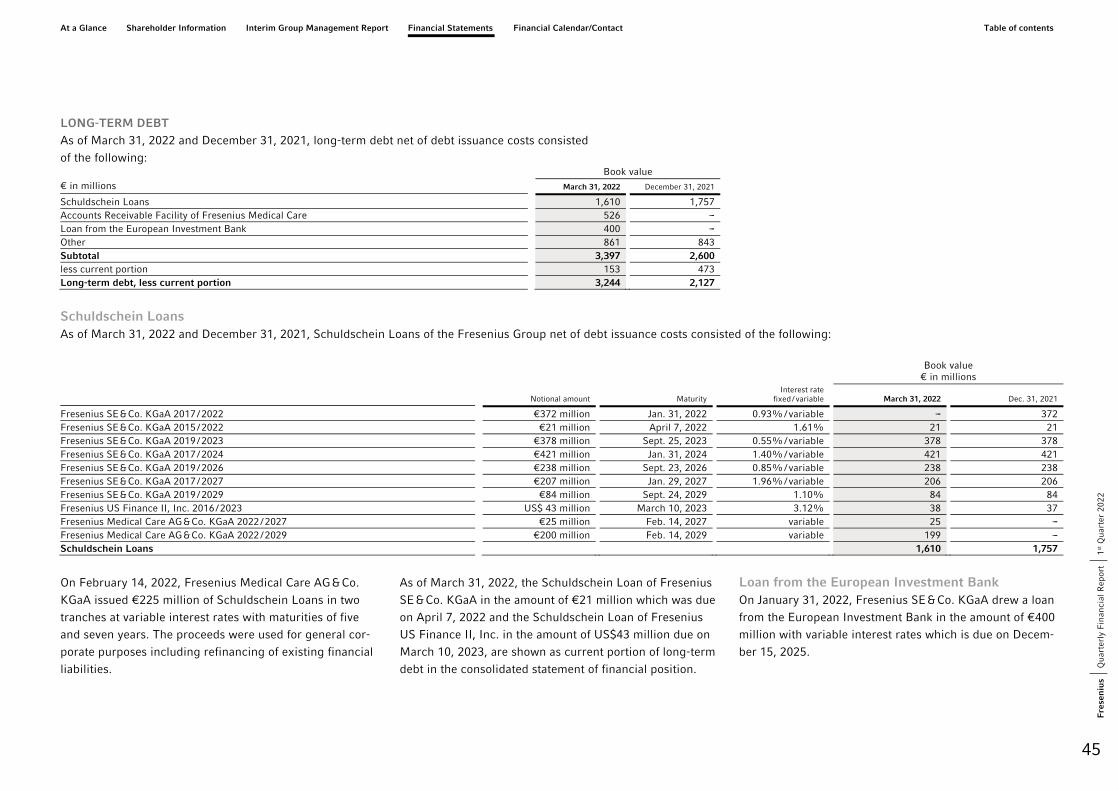
At a Glance Shareholder Information Interim Group Management Report Financial Statements Financial Calendar/Contact Table of contents
45
1st Q
uart
er 2
022
Qua
rter
ly F
inan
cial
Rep
ort
Fre
sen
ius
LONG-TERM DEBT As of March 31, 2022 and December 31, 2021, long-term debt net of debt issuance costs consisted
of the following: Book value € in millions March 31, 2022 December 31, 2021
Schuldschein Loans 1,610 1,757 Accounts Receivable Facility of Fresenius Medical Care 526 --- Loan from the European Investment Bank 400 --- Other 861 843 Subtotal 3,397 2,600 less current portion 153 473 Long-term debt, less current portion 3,244 2,127
Schuldschein Loans As of March 31, 2022 and December 31, 2021, Schuldschein Loans of the Fresenius Group net of debt issuance costs consisted of the following:
Book value
€ in millions
Notional amount Maturity Interest rate
fixed / variable March 31, 2022 Dec. 31, 2021
Fresenius SE & Co. KGaA 2017 / 2022 €372 million Jan. 31, 2022 0.93% / variable --- 372 Fresenius SE & Co. KGaA 2015 / 2022 €21 million April 7, 2022 1.61% 21 21 Fresenius SE & Co. KGaA 2019 / 2023 €378 million Sept. 25, 2023 0.55% / variable 378 378 Fresenius SE & Co. KGaA 2017 / 2024 €421 million Jan. 31, 2024 1.40% / variable 421 421 Fresenius SE & Co. KGaA 2019 / 2026 €238 million Sept. 23, 2026 0.85% / variable 238 238 Fresenius SE & Co. KGaA 2017 / 2027 €207 million Jan. 29, 2027 1.96% / variable 206 206 Fresenius SE & Co. KGaA 2019 / 2029 €84 million Sept. 24, 2029 1.10% 84 84 Fresenius US Finance II, Inc. 2016 / 2023 US$ 43 million March 10, 2023 3.12% 38 37 Fresenius Medical Care AG & Co. KGaA 2022 / 2027 €25 million Feb. 14, 2027 variable 25 --- Fresenius Medical Care AG & Co. KGaA 2022 / 2029 €200 million Feb. 14, 2029 variable 199 --- Schuldschein Loans 1,610 1,757
On February 14, 2022, Fresenius Medical Care AG & Co.
KGaA issued €225 million of Schuldschein Loans in two
tranches at variable interest rates with maturities of five
and seven years. The proceeds were used for general cor-
porate purposes including refinancing of existing financial
liabilities.
As of March 31, 2022, the Schuldschein Loan of Fresenius
SE & Co. KGaA in the amount of €21 million which was due
on April 7, 2022 and the Schuldschein Loan of Fresenius
US Finance II, Inc. in the amount of US$43 million due on
March 10, 2023, are shown as current portion of long-term
debt in the consolidated statement of financial position.
Loan from the European Investment Bank On January 31, 2022, Fresenius SE & Co. KGaA drew a loan
from the European Investment Bank in the amount of €400
million with variable interest rates which is due on Decem-
ber 15, 2025.

At a Glance Shareholder Information Interim Group Management Report Financial Statements Financial Calendar/Contact Table of contents
46
1st Q
uart
er 2
022
Qua
rter
ly F
inan
cial
Rep
ort
Fre
sen
ius
CREDIT LINES AND OTHER SOURCES OF LIQUIDITY The syndicated credit facilities of Fresenius SE & Co. KGaA
and Fresenius Medical Care AG & Co. KGaA in the amount
of €2.0 billion each which were entered into in July 2021
serve as backup line. They were undrawn as of March 31,
2022. In addition, further bilateral facilities are available to
the Fresenius Group which have not been utilized, or have
only been utilized in part, as of the reporting date.
At March 31, 2022, the total financial headroom result-
ing from unutilized credit facilities was approximately
€4.7 billion. Thereof, €4.0 billion accounted for syndicated
credit facilities and approximately €0.7 billion for bilateral
facilities with commercial banks.
13. BONDS As of March 31, 2022 and December 31, 2021, bonds of the Fresenius Group net of debt issuance costs consisted of the following:
Book value
€ in millions Notional amount Maturity Interest rate March 31, 2022 December 31, 2021
Fresenius Finance Ireland PLC 2017 / 2024 €700 million Jan. 30, 2024 1.50% 699 699 Fresenius Finance Ireland PLC 2021 / 2025 €500 million Oct. 1, 2025 0.00% 497 497 Fresenius Finance Ireland PLC 2017 / 2027 €700 million Feb. 1, 2027 2.125% 695 695 Fresenius Finance Ireland PLC 2021 / 2028 €500 million Oct. 1, 2028 0.50% 497 497 Fresenius Finance Ireland PLC 2021 / 2031 €500 million Oct. 1, 2031 0.875% 494 494 Fresenius Finance Ireland PLC 2017 / 2032 €500 million Jan. 30, 2032 3.00% 496 496 Fresenius SE & Co. KGaA 2014 / 2024 €450 million Feb. 1, 2024 4.00% 449 449 Fresenius SE & Co. KGaA 2019 / 2025 €500 million Feb. 15, 2025 1.875% 497 497 Fresenius SE & Co. KGaA 2020 / 2026 €500 million Sep. 28, 2026 0.375% 496 495 Fresenius SE & Co. KGaA 2020 / 2027 €750 million Oct. 8, 2027 1.625% 743 742 Fresenius SE & Co. KGaA 2020 / 2028 €750 million Jan. 15, 2028 0.75% 745 745 Fresenius SE & Co. KGaA 2019 / 2029 €500 million Feb. 15, 2029 2.875% 495 495 Fresenius SE & Co. KGaA 2020 / 2033 €500 million Jan. 28, 2033 1.125% 497 497 Fresenius US Finance II, Inc. 2015 / 2023 US$ 300 million Jan. 15, 2023 4.50% 270 265 Fresenius Medical Care AG & Co. KGaA 2019 / 2023 €650 million Nov. 29, 2023 0.25% 649 649 Fresenius Medical Care AG & Co. KGaA 2018 / 2025 €500 million July 11, 2025 1.50% 498 498 Fresenius Medical Care AG & Co. KGaA 2020 / 2026 €500 million May 29, 2026 1.00% 497 496 Fresenius Medical Care AG & Co. KGaA 2019 / 2026 €600 million Nov. 30, 2026 0.625% 595 595 Fresenius Medical Care AG & Co. KGaA 2019 / 2029 €500 million Nov. 29, 2029 1.25% 497 497 Fresenius Medical Care AG & Co. KGaA 2020 / 2030 €750 million May 29, 2030 1.50% 746 746 Fresenius Medical Care US Finance II, Inc. 2012 / 2022 US$ 700 million Jan. 31, 2022 5.875% --- 618 Fresenius Medical Care US Finance II, Inc. 2014 / 2024 US$ 400 million Oct. 15, 2024 4.75% 359 352 Fresenius Medical Care US Finance III, Inc. 2019 / 2029 US$ 500 million June 15, 2029 3.75% 443 434 Fresenius Medical Care US Finance III, Inc. 2020 / 2031 US$ 1,000 million Feb. 16, 2031 2.375% 894 875 Fresenius Medical Care US Finance III, Inc. 2021 / 2026 US$ 850 million Dec. 1, 2026 1.875% 759 744 Fresenius Medical Care US Finance III, Inc. 2021 / 2031 US$ 650 million Dec. 1, 2031 3.00% 578 567 Bonds 14,085 14,634
As of March 31, 2022, the bonds issued by Fresenius US
Finance II, Inc. in the amount of US$300 million, which are
due on January 15, 2023, are shown as current portion of
bonds in the consolidated statement of financial position.

At a Glance Shareholder Information Interim Group Management Report Financial Statements Financial Calendar/Contact Table of contents
47
1st Q
uart
er 2
022
Qua
rter
ly F
inan
cial
Rep
ort
Fre
sen
ius
14. CONVERTIBLE BONDS As of March 31, 2022 and December 31, 2021, the convertible bonds of the Fresenius Group net of debt issuance costs consisted of the following:
Book value
€ in millions
Notional amount Maturity Coupon Current
conversion price March 31, 2022 December 31, 2021
Fresenius SE & Co. KGaA 2017 / 2024 €500 million Jan. 31, 2024 0.000% €105.2603 484 482 Convertible bonds 484 482
The fair value of the derivative embedded in the convertible
bonds of Fresenius SE & Co. KGaA was €318 thousand and
€70 thousand at March 31, 2022 and December 31, 2021,
respectively. Fresenius SE & Co. KGaA purchased stock
options (call options) with a corresponding fair value to
hedge future fair value fluctuations of this derivative.
Potential conversions are always cash-settled. Any in-
crease of Fresenius’ share price above the conversion price
would be offset by a corresponding value increase of the
call options.
15. NONCONTROLLING INTERESTS As of March 31, 2022 and December 31, 2021, noncontrol-
ling interests in the Fresenius Group were as follows:
€ in millions Mar. 31, 2022 Dec. 31, 2021
Noncontrolling interests in Fresenius Medical Care AG & Co. KGaA 8,972 8,609 Noncontrolling interests in VAMED Aktiengesellschaft 88 88 Noncontrolling interests in the business segments
Fresenius Medical Care 1,305 1,280 Fresenius Kabi 183 161 Fresenius Helios 148 134 Fresenius Vamed 18 18
Total noncontrolling interests 10,714 10,290
Noncontrolling interests changed as follows:
€ in millions Q1 / 2022
Noncontrolling interests as of December 31, 2021 10,290 Noncontrolling interests in profit 186 Purchase of noncontrolling interests 7 Stock options 1 Dividend payments -56 Currency effects and other changes 286 Noncontrolling interests as of March 31, 2022 10,714

At a Glance Shareholder Information Interim Group Management Report Financial Statements Financial Calendar/Contact Table of contents
48
1st Q
uart
er 2
022
Qua
rter
ly F
inan
cial
Rep
ort
Fre
sen
ius
16. FRESENIUS SE & CO. KGAA SHAREHOLDERS’ EQUITY
SUBSCRIBED CAPITAL As of January 1, 2022, the subscribed capital of Fresenius
SE & Co. KGaA consisted of 558,502,143 bearer ordinary
shares.
During the first quarter of 2022, no stock options were
exercised. Consequently, as of March 31, 2022, the sub-
scribed capital of Fresenius SE & Co. KGaA still consisted of
558,502,143 bearer ordinary shares. The shares are issued
as non-par value shares. The proportionate amount of the
subscribed capital is €1.00 per share.
CONDITIONAL CAPITAL In order to fulfill the subscription rights under the current
stock option plan 2013 of Fresenius SE & Co. KGaA, Condi-
tional Capital IV exists (see note 21, Share-based compen-
sation plans). Another Conditional Capital III exists for
the authorization to issue option bearer bonds and / or
convertible bonds.
The Conditional Capital did not change in the first quarter
of 2022. It was composed as follows as of March 31, 2022:
in € Ordinary
shares
Conditional Capital I Fresenius AG Stock Option Plan 2003 (expired) 4,735,083 Conditional Capital II Fresenius SE Stock Option Plan 2008 (expired) 3,452,937 Conditional Capital III option bearer bonds and / or convertible bonds 48,971,202 Conditional Capital IV Fresenius SE & Co. KGaA Stock Option Plan 2013 22,824,857 Total Conditional Capital as of March 31, 2022 79,984,079
DIVIDENDS Under the German Stock Corporation Act (AktG), the
amount of dividends available for distribution to share-
holders is based upon the unconsolidated retained earn-
ings of Fresenius SE & Co. KGaA as reported in its state-
ment of financial position determined in accordance with
the German Commercial Code (HGB).
The general partner and the Supervisory Board of
Fresenius SE & Co. KGaA will propose a dividend of €0.92
per bearer ordinary share to the virtual Annual General
Meeting taking place on May 13, 2022, i.e. a total dividend
payment of €514 million. Fresenius wants to give its share-
holders the opportunity to opt to receive a portion of the
dividend (Dividend Option Portion) in Fresenius SE & Co.
KGaA shares. The remaining portion of the dividend (Divi-
dend Base Portion) will always be paid in cash.
At a Glance Shareholder Information Interim Group Management Report Financial Statements Financial Calendar/Contact Table of contents
49
1st Q
uart
er 2
022
Qua
rter
ly F
inan
cial
Rep
ort
Fre
sen
ius
OTHER NOTES
17. LEGAL AND REGULATORY MATTERS The Fresenius Group is routinely involved in claims, law-
suits, regulatory and tax audits, investigations and other
legal matters arising, for the most part, in the ordinary
course of its business of providing health care services and
products. Legal matters that the Fresenius Group currently
deems to be material or noteworthy are described below.
The Fresenius Group records its litigation reserves for cer-
tain legal proceedings and regulatory matters to the extent
that the Fresenius Group determines an unfavorable out-
come is probable and the amount of loss can be reasona-
bly estimated. For the other matters described below, the
Fresenius Group believes that the loss is not probable
and / or the loss or range of possible losses cannot be rea-
sonably estimated at this time. The outcome of litigation
and other legal matters is always difficult to predict accu-
rately and outcomes that are not consistent with Fresenius
Group’s view of the merits can occur. The Fresenius Group
believes that it has valid defenses to the legal matters pend-
ing against it and is defending itself vigorously. Neverthe-
less, it is possible that the resolution of one or more of the
legal matters currently pending or threatened could have a
material adverse effect on its business, results of operations
and financial condition.
Further information regarding legal disputes, court pro-
ceedings and investigations can be found in detail in the
consolidated financial statements as of December 31, 2021
applying Section 315e HGB in accordance with IFRS. In the
following, only changes as far as content or wording are
concerned during the first quarter ended March 31, 2022
compared to the information provided in the consolidated
financial statements are described. These changes should
be read in conjunction with the overall information in the
consolidated financial statements as of December 31, 2021
applying Section 315e HGB in accordance with IFRS; defined
terms or abbreviations having the same meaning as in the
consolidated financial statements as of December 31, 2021
applying Section 315e HGB in accordance with IFRS.
HBDI REQUEST In February 2022, Fresenius Medical Care AG & Co. KGaA
(FMC-AG & Co. KGaA) received a formal request for
information from the Hessen Data Protection Authority
(Hessischer Beauftragter für Datenschutz und Informations-
freiheit or HBDI). The information request relates to specific
data processing functions of a few of FMC-AG & Co. KGaA’s
peritoneal dialysis devices. FMC-AG & Co. KGaA is commit-
ted to comply with the HBDI’s request and cooperate with
them, and it is working to provide the relevant information.
OSHA COMPLAINT On March 20 and April 12, 2022, respectively, an attorney
employed as general counsel for FMC-AG & Co. KGaA’s
North American division from 2013 to 2016 filed a com-
plaint with the Occupational Safety and Health Administra-
tion (OSHA) under the Sarbanes-Oxley Act of 2002 and
other anti-retaliation statutes, and a civil lawsuit in Suffolk
County, Massachusetts seeking compensation for person-
nel management decisions allegedly adverse to him. OSHA
Case No. 1-076-22-049; Kott v. National Medical Care, Inc.,
Case No. 22-802 (Superior Court, Suffolk County, Mass.)
The plaintiff alleges in support of his demands for com-
pensation that he was transferred to a subordinate position
in the global legal department, and subsequently terminated
from employment as part of the FME 25 reorganization, in
retaliation for legal advice he provided with respect to a
licensing agreement with DaVita relating to pharmaceuti-
cal operations and products. The DaVita licensing agree-
ment expired by its terms in 2017.
As previously disclosed in FMC-AG & Co. KGaA’s finan-
cial statements, the United States Department of Justice
has reviewed multiple aspects of the DaVita contract in
question, including those relevant to the plaintiff’s alle-
gations. No enforcement action has resulted against
FMC-AG & Co. KGaA.
Other bases of retaliation alleged by the plaintiff impli-
cate internal personnel and privacy protection concerns
that do not impact ongoing operations, and on which
FMC-AG & Co. KGaA does not comment.
GENERAL RISKS On April 21, 2022, the U.S. FDA recommended that
Fresenius Medical Care Holdings, Inc. (FMCH) temporarily
pause shipping of new dialysis machines in the United
States. FMCH has accepted the recommendation and will
not resume shipping before notifying the FDA. The tem-
porary pause implicates a machine component that was
already scheduled to be replaced later in 2022.
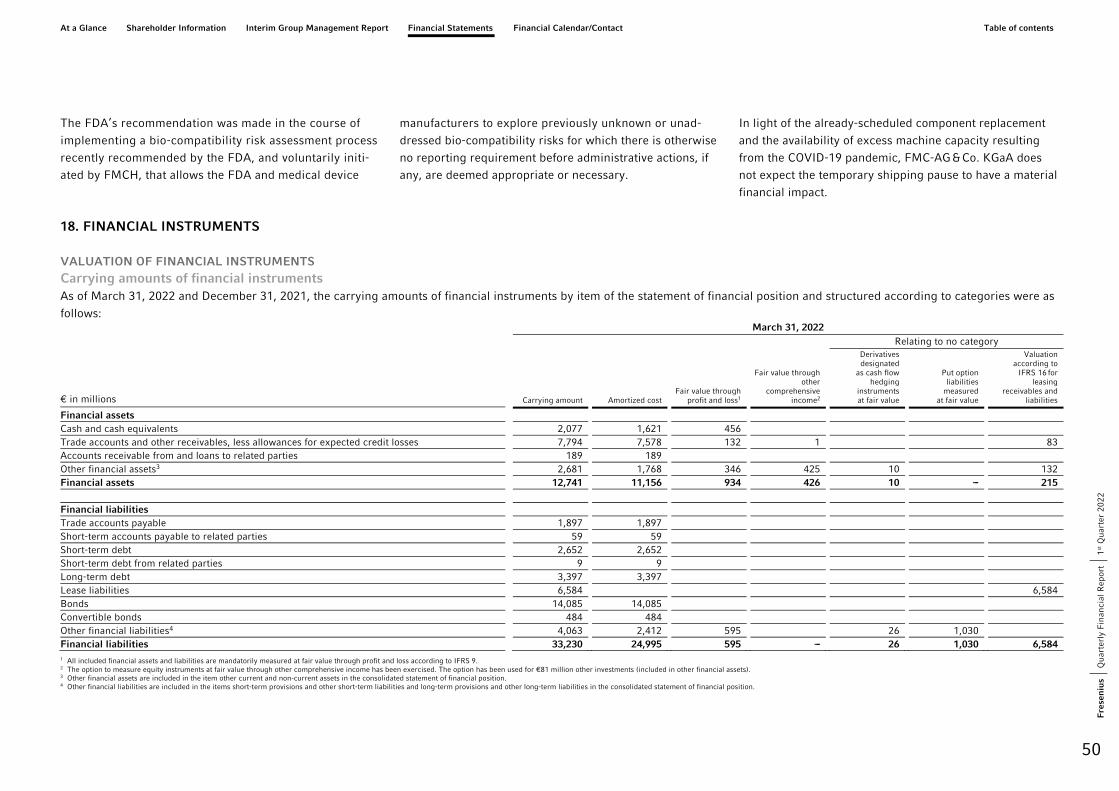
At a Glance Shareholder Information Interim Group Management Report Financial Statements Financial Calendar/Contact Table of contents
50
1st Q
uart
er 2
022
Qua
rter
ly F
inan
cial
Rep
ort
Fre
sen
ius
The FDA’s recommendation was made in the course of
implementing a bio-compatibility risk assessment process
recently recommended by the FDA, and voluntarily initi-
ated by FMCH, that allows the FDA and medical device
manufacturers to explore previously unknown or unad-
dressed bio-compatibility risks for which there is otherwise
no reporting requirement before administrative actions, if
any, are deemed appropriate or necessary.
In light of the already-scheduled component replacement
and the availability of excess machine capacity resulting
from the COVID-19 pandemic, FMC-AG & Co. KGaA does
not expect the temporary shipping pause to have a material
financial impact.
18. FINANCIAL INSTRUMENTS
VALUATION OF FINANCIAL INSTRUMENTS Carrying amounts of financial instruments As of March 31, 2022 and December 31, 2021, the carrying amounts of financial instruments by item of the statement of financial position and structured according to categories were as
follows: March 31, 2022 Relating to no category
€ in millions Carrying amount Amortized cost Fair value through
profit and loss1
Fair value through other
comprehensive income2
Derivatives designated
as cash flow hedging
instruments at fair value
Put option liabilities
measured at fair value
Valuation according to
IFRS 16 for leasing
receivables and liabilities
Financial assets Cash and cash equivalents 2,077 1,621 456 Trade accounts and other receivables, less allowances for expected credit losses 7,794 7,578 132 1 83 Accounts receivable from and loans to related parties 189 189 Other financial assets3 2,681 1,768 346 425 10 132 Financial assets 12,741 11,156 934 426 10 --- 215 Financial liabilities Trade accounts payable 1,897 1,897 Short-term accounts payable to related parties 59 59 Short-term debt 2,652 2,652 Short-term debt from related parties 9 9 Long-term debt 3,397 3,397 Lease liabilities 6,584 6,584 Bonds 14,085 14,085 Convertible bonds 484 484 Other financial liabilities4 4,063 2,412 595 26 1,030 Financial liabilities 33,230 24,995 595 --- 26 1,030 6,584 1 All included financial assets and liabilities are mandatorily measured at fair value through profit and loss according to IFRS 9. 2 The option to measure equity instruments at fair value through other comprehensive income has been exercised. The option has been used for €81 million other investments (included in other financial assets). 3 Other financial assets are included in the item other current and non-current assets in the consolidated statement of financial position. 4 Other financial liabilities are included in the items short-term provisions and other short-term liabilities and long-term provisions and other long-term liabilities in the consolidated statement of financial position.
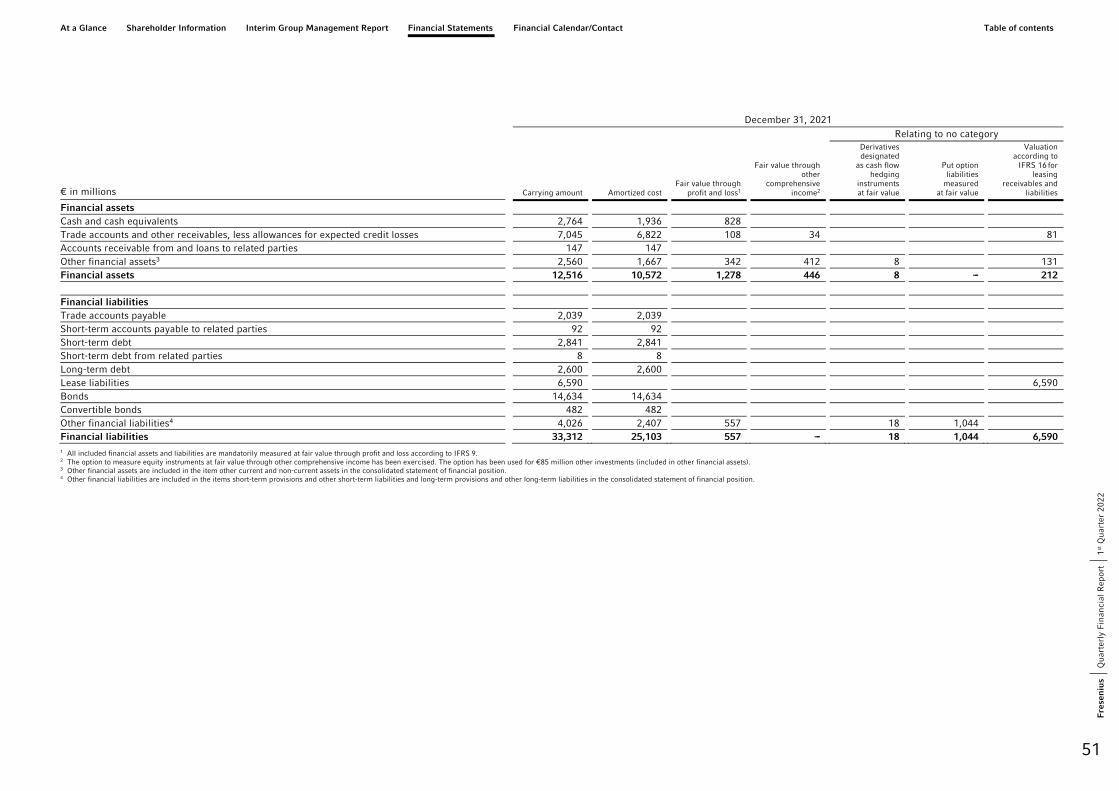
At a Glance Shareholder Information Interim Group Management Report Financial Statements Financial Calendar/Contact Table of contents
51
1st Q
uart
er 2
022
Qua
rter
ly F
inan
cial
Rep
ort
Fre
sen
ius
December 31, 2021
Relating to no category
€ in millions Carrying amount Amortized cost Fair value through
profit and loss1
Fair value through other
comprehensive income2
Derivatives designated
as cash flow hedging
instruments at fair value
Put option liabilities
measured at fair value
Valuation according to
IFRS 16 for leasing
receivables and liabilities
Financial assets Cash and cash equivalents 2,764 1,936 828 Trade accounts and other receivables, less allowances for expected credit losses 7,045 6,822 108 34 81 Accounts receivable from and loans to related parties 147 147 Other financial assets3 2,560 1,667 342 412 8 131 Financial assets 12,516 10,572 1,278 446 8 --- 212 Financial liabilities Trade accounts payable 2,039 2,039 Short-term accounts payable to related parties 92 92 Short-term debt 2,841 2,841 Short-term debt from related parties 8 8 Long-term debt 2,600 2,600 Lease liabilities 6,590 6,590 Bonds 14,634 14,634 Convertible bonds 482 482 Other financial liabilities4 4,026 2,407 557 18 1,044 Financial liabilities 33,312 25,103 557 --- 18 1,044 6,590 1 All included financial assets and liabilities are mandatorily measured at fair value through profit and loss according to IFRS 9. 2 The option to measure equity instruments at fair value through other comprehensive income has been exercised. The option has been used for €85 million other investments (included in other financial assets). 3 Other financial assets are included in the item other current and non-current assets in the consolidated statement of financial position. 4 Other financial liabilities are included in the items short-term provisions and other short-term liabilities and long-term provisions and other long-term liabilities in the consolidated statement of financial position.
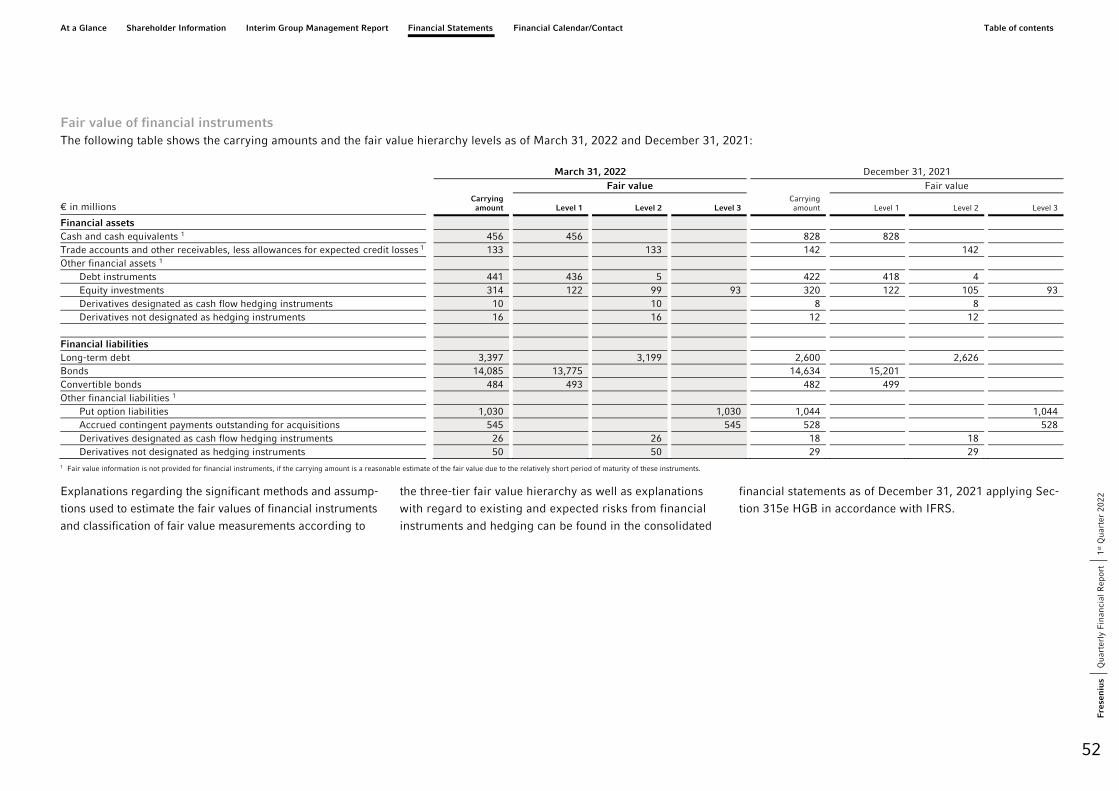
At a Glance Shareholder Information Interim Group Management Report Financial Statements Financial Calendar/Contact Table of contents
52
1st Q
uart
er 2
022
Qua
rter
ly F
inan
cial
Rep
ort
Fre
sen
ius
Fair value of financial instruments The following table shows the carrying amounts and the fair value hierarchy levels as of March 31, 2022 and December 31, 2021:
March 31, 2022 December 31, 2021
Fair value Fair value
€ in millions Carrying amount Level 1 Level 2 Level 3
Carrying amount Level 1 Level 2 Level 3
Financial assets Cash and cash equivalents 1 456 456 828 828 Trade accounts and other receivables, less allowances for expected credit losses 1 133 133 142 142 Other financial assets 1
Debt instruments 441 436 5 422 418 4 Equity investments 314 122 99 93 320 122 105 93 Derivatives designated as cash flow hedging instruments 10 10 8 8 Derivatives not designated as hedging instruments 16 16 12 12
Financial liabilities Long-term debt 3,397 3,199 2,600 2,626 Bonds 14,085 13,775 14,634 15,201 Convertible bonds 484 493 482 499 Other financial liabilities 1
Put option liabilities 1,030 1,030 1,044 1,044 Accrued contingent payments outstanding for acquisitions 545 545 528 528 Derivatives designated as cash flow hedging instruments 26 26 18 18 Derivatives not designated as hedging instruments 50 50 29 29
1 Fair value information is not provided for financial instruments, if the carrying amount is a reasonable estimate of the fair value due to the relatively short period of maturity of these instruments.
Explanations regarding the significant methods and assump-
tions used to estimate the fair values of financial instruments
and classification of fair value measurements according to
the three-tier fair value hierarchy as well as explanations
with regard to existing and expected risks from financial
instruments and hedging can be found in the consolidated
financial statements as of December 31, 2021 applying Sec-
tion 315e HGB in accordance with IFRS.
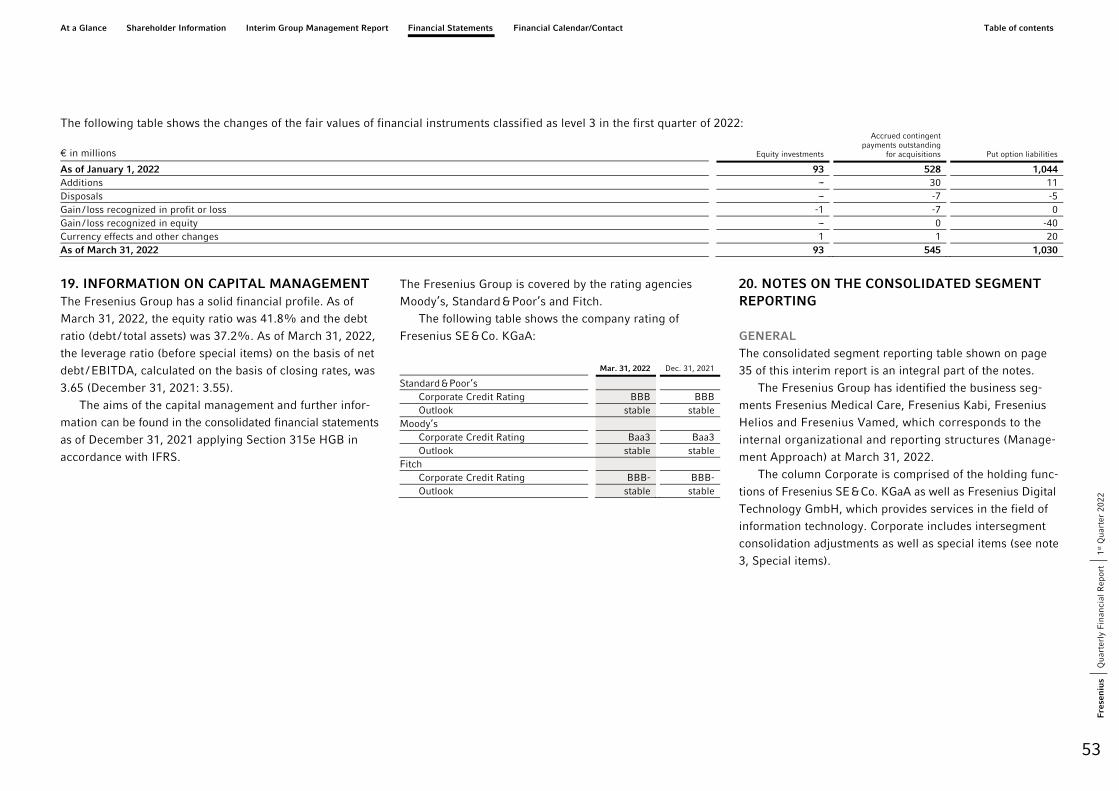
At a Glance Shareholder Information Interim Group Management Report Financial Statements Financial Calendar/Contact Table of contents
53
1st Q
uart
er 2
022
Qua
rter
ly F
inan
cial
Rep
ort
Fre
sen
ius
The following table shows the changes of the fair values of financial instruments classified as level 3 in the first quarter of 2022:
€ in millions Equity investments
Accrued contingent payments outstanding
for acquisitions Put option liabilities
As of January 1, 2022 93 528 1,044 Additions --- 30 11 Disposals --- -7 -5 Gain / loss recognized in profit or loss -1 -7 0 Gain / loss recognized in equity --- 0 -40 Currency effects and other changes 1 1 20 As of March 31, 2022 93 545 1,030
19. INFORMATION ON CAPITAL MANAGEMENT The Fresenius Group has a solid financial profile. As of
March 31, 2022, the equity ratio was 41.8% and the debt
ratio (debt / total assets) was 37.2%. As of March 31, 2022,
the leverage ratio (before special items) on the basis of net
debt / EBITDA, calculated on the basis of closing rates, was
3.65 (December 31, 2021: 3.55).
The aims of the capital management and further infor-
mation can be found in the consolidated financial statements
as of December 31, 2021 applying Section 315e HGB in
accordance with IFRS.
The Fresenius Group is covered by the rating agencies
Moody’s, Standard & Poor’s and Fitch.
The following table shows the company rating of
Fresenius SE & Co. KGaA:
Mar. 31, 2022 Dec. 31, 2021
Standard & Poor’s Corporate Credit Rating BBB BBB Outlook stable stable
Moody’s Corporate Credit Rating Baa3 Baa3 Outlook stable stable
Fitch Corporate Credit Rating BBB- BBB- Outlook stable stable
20. NOTES ON THE CONSOLIDATED SEGMENT REPORTING
GENERAL The consolidated segment reporting table shown on page
35 of this interim report is an integral part of the notes.
The Fresenius Group has identified the business seg-
ments Fresenius Medical Care, Fresenius Kabi, Fresenius
Helios and Fresenius Vamed, which corresponds to the
internal organizational and reporting structures (Manage-
ment Approach) at March 31, 2022.
The column Corporate is comprised of the holding func-
tions of Fresenius SE & Co. KGaA as well as Fresenius Digital
Technology GmbH, which provides services in the field of
information technology. Corporate includes intersegment
consolidation adjustments as well as special items (see note
3, Special items).

At a Glance Shareholder Information Interim Group Management Report Financial Statements Financial Calendar/Contact Table of contents
54
1st Q
uart
er 2
022
Qua
rter
ly F
inan
cial
Rep
ort
Fre
sen
ius
The business segments were identified in accordance with
IFRS 8, Operating Segments, which defines the segment
reporting requirements in the annual financial statements
and interim reports with regard to the operating business,
product and service businesses and regions. Further expla-
nations with regard to the business segments can be found
in the consolidated financial statements as of December 31,
2021 applying Section 315e HGB in accordance with IFRS.
NOTES ON THE BUSINESS SEGMENTS Explanations regarding the notes on the business segments
can be found in the consolidated financial statements as of
December 31, 2021 applying Section 315e HGB in accord-
ance with IFRS.
RECONCILIATION OF KEY FIGURES TO
CONSOLIDATED EARNINGS
€ in millions Q1 / 2022 Q1 / 2021
Total EBIT of reporting segments 1,010 1,017 Special items -94 -3 General corporate expenses Corporate (EBIT) -14 -8 Group EBIT 902 1,006 Net interest -118 -137 Income before income taxes 784 869
RECONCILIATION OF NET DEBT WITH THE CONSOLIDATED
STATEMENT OF FINANCIAL POSITION
€ in millions Mar. 31, 2022 Dec. 31, 2021
Short-term debt 2,652 2,841 Short-term debt from related parties 9 8 Current portion of long-term debt 153 473 Current portion of lease liabilities 850 832 Current portion of bonds 270 618 Long-term debt, less current portion 3,244 2,127 Lease liabilities, less current portion 5,734 5,758 Bonds, less current portion 13,815 14,016 Convertible bonds 484 482 Debt 27,211 27,155 less cash and cash equivalents 2,077 2,764 Net debt 25,134 24,391
21. SHARE-BASED COMPENSATION PLANS
SHARE-BASED COMPENSATION PLANS OF FRESENIUS SE & CO. KGAA As of March 31, 2022, Fresenius SE & Co. KGaA had two
share-based compensation plans in place: the Fresenius SE &
Co. KGaA Long Term Incentive Program 2013 (2013 LTIP)
which is based on stock options and phantom stocks and
the Long Term Incentive Plan 2018 (LTIP 2018) which is
solely based on performance shares. Currently, solely
LTIP 2018 can be used to grant performance shares.
Transactions during the first quarter of 2022 During the first quarter of 2022, no stock options were
exercised.
At March 31, 2022, 4,961,507 stock options issued
under the 2013 LTIP were outstanding and exercisable.
The members of the Fresenius Management SE Manage-
ment Board held 603,281 stock options. At March 31, 2022,
the Management Board members of Fresenius Manage-
ment SE held 582,234 performance shares and employees
of Fresenius SE & Co. KGaA held 2,335,676 performance
shares under the LTIP 2018.
At a Glance Shareholder Information Interim Group Management Report Financial Statements Financial Calendar/Contact Table of contents
55
1st Q
uart
er 2
022
Qua
rter
ly F
inan
cial
Rep
ort
Fre
sen
ius
SHARE-BASED COMPENSATION PLANS OF FRESENIUS MEDICAL CARE AG & CO. KGAA On March 1, 2022, 212,715 performance shares with a total
fair value of €11 million were allocated under the Manage-
ment Board Long Term Incentive Plan 2020 to the mem-
bers of the Management Board and to senior members of
Fresenius Medical Care AG & Co. KGaA's managerial staff
who serve on Fresenius Medical Care AG & Co. KGaA's
Executive Committee (Executive Committee). Of this num-
ber, 153,072 performance shares with a total fair value of
€8 million relate to members of the Management Board
and 59,643 performance shares with a total fair value of
€3 million relate to members of the Executive Committee.
These amounts will be amortized over the three-year vest-
ing period. The weighted average fair value per perfor-
mance share at the allocation date was €52.57.
During the first quarter of 2022, 15,940 stock options
were exercised. Fresenius Medical Care AG & Co. KGaA
received cash of €0.8 million upon exercise of these stock
options.
22. SUBSEQUENT EVENTS April was characterized worldwide by a regionally varying
development of the COVID-19 pandemic with continuing
high infection numbers. Large-scale constraints of public
and private life are still enacted in various countries in order
to curtail the spread of COVID-19. The vaccination programs
were continued worldwide and the development in each
country differs. The further development of the global situ-
ation and its impact on Fresenius remain uncertain. Cost
inflation and supply chain disruption continues to be a
theme on a global level.
The ongoing war between Russia and Ukraine may have
direct and indirect negative effects on the Fresenius Group's
business activities, which, however, cannot be estimated at
present.
Beyond that, there have been no significant changes in
the Fresenius Group’s operating environment following the
end of the first quarter of 2022. No other events of material
importance on the assets and liabilities, financial position,
and results of operations of the Group have occurred follow-
ing the end of the first quarter of 2022.
On May 4, 2022, Fresenius announced, that the
Fresenius Management SE Supervisory Board has unani-
mously appointed Sara Hennicken (41), currently Senior
Vice President Global Treasury & Corporate Finance at
Fresenius, to become the company’s new Chief Financial
Officer as of September 1, 2022. She will succeed Rachel
Empey (45), who joined the Management Board of Fresenius
as CFO on August 1, 2017 and will leave the company at
her own request at the end of August.
On May 4, 2022, Fresenius Medical Care announced, that
Dr. Carla Kriwet (51) will become the new CEO of Fresenius
Medical Care, the world's leading provider of products and
services for individuals with renal diseases, on January 1,
2023. The Supervisory Board of Fresenius Medical Care
Management AG unanimously appointed her to succeed
Rice Powell (66), who in accordance with the company’s
age limit for Management Board members is stepping down
when his contract ends on December 31, 2022, after
10 years heading the company. Like Rice Powell, Dr. Carla
Kriwet will also be a member of the Management Board of
Fresenius Management SE. Helen Giza, Chief Financial
Officer of Fresenius Medical Care, will enter a new five-
year contract, and in addition to her current positions as
CFO and CTO will assume the position of Deputy CEO.
23. CORPORATE GOVERNANCE For each consolidated stock exchange listed entity, the
declaration pursuant to Section 161 of the German Stock
Corporation Act (Aktiengesetz) has been issued and made
available to shareholders on the website of Fresenius SE &
Co. KGaA (www.fresenius.com/corporate-governance),
and of Fresenius Medical Care AG & Co. KGaA
(www.freseniusmedicalcare.com).

At a Glance Shareholder Information Interim Group Management Report Financial Statements Financial Calendar/Contact Table of contents
1st Q
uart
er 2
022
Qua
rter
ly F
inan
cial
Rep
ort
Fre
sen
ius
56
FINANCIAL CALENDAR Annual General Meeting May 13, 2022 Report on 1st half 2022 Conference call, Live webcast August 2, 2022 Report on 1st --- 3rd quarter 2022 Conference call, Live webcast November 1, 2022
Subject to change
FRESENIUS SHARE/ADR Ordinary share ADR Securities identification no. 578 560 CUSIP 35804M105 Ticker symbol FRE Ticker symbol FSNUY ISIN DE0005785604 ISIN US35804M1053 Bloomberg symbol FRE GR Structure Sponsored Level 1 ADR Reuters symbol FREG.de Ratio 4 ADR = 1 share Main trading location Frankfurt / Xetra Trading platform OTC
CONTACTCorporate Headquarters Else-Kröner-Straße 1 Bad Homburg v. d. H. Germany
Postal address Fresenius SE & Co. KGaA 61346 Bad Homburg v. d. H. Germany
Contact for shareholders Investor Relations & Sustainability Telephone: ++ 49 61 72 6 08-24 87 Telefax: ++ 49 61 72 6 08-24 88 E-Mail: [email protected]
Contact for journalists Corporate Communications Telephone: ++ 49 61 72 6 08-23 02 Telefax: ++ 49 61 72 6 08-22 94 E-mail: [email protected]

Commercial Register: Bad Homburg v. d. H.; HRB 11852 Chairman of the Supervisory Board: Wolfgang Kirsch
General Partner: Fresenius Management SE
Registered Office and Commercial Register: Bad Homburg v. d. H.; HRB 11673Management Board: Stephan Sturm (President and CEO), Dr. Sebastian Biedenkopf, Dr. Francesco De Meo, Rachel Empey, Rice Powell, Michael Sen, Dr. Ernst WastlerChairman of the Supervisory Board: Wolfgang Kirsch
For additional information on the performance indicators used please refer to our website https://www.fresenius.com/alternative-performance-measures.
Forward-looking statements:This Quarterly Financial Report contains forward-looking statements. These statements represent assessments which we have made on the basis of the information available to us at the time. Should the assumptions on which the statements are based on not occur, or if risks should arise – as mentioned in the consolidated financial statements and the management report as of December 31, 2021 applying Section 315e HBG in accordance with IFRS and the SEC filings of Fresenius Medical Care AG & Co. KGaA – the actual results could differ mate-rially from the results currently expected.