analyst conference call q1 2022 - basf
TRANSCRIPT
Analyst Conference Call Q1 2022April 29, 2022

April 29, 20222 | BASF Analyst Conference Call Q1 2022
Cautionary note regarding forward-looking statements
This presentation contains forward-looking statements. These statements are based on currentestimates and projections of the Board of Executive Directors and currently available information.Forward-looking statements are not guarantees of the future developments and results outlinedtherein. These are dependent on a number of factors; they involve various risks and uncertainties; andthey are based on assumptions that may not prove to be accurate. Such risk factors include thosediscussed in Opportunities and Risks on pages 151 to 160 of the BASF Report 2021. BASF does notassume any obligation to update the forward-looking statements contained in this presentation aboveand beyond the legal requirements.

April 29, 20223 | BASF Analyst Conference Call Q1 2022
Snapshot of the current market environment
Macroeconomic environment is characterized by a high degree of uncertainty
Industries, customers and consumers are facing an increasingly inflationary environment:
− Drastically higher energy, industrial raw materials and logistics costs
− Food prices are increasing globally due to loss of agricultural exports and fertilizers from Ukraine and Russia
China’s economic growth is softening, especially due to the zero-COVID strategy
Semiconductor shortages and now, additionally, the shortage of wire harnesseslimit automotive production
April 29, 20224 | BASF Analyst Conference Call Q1 2022
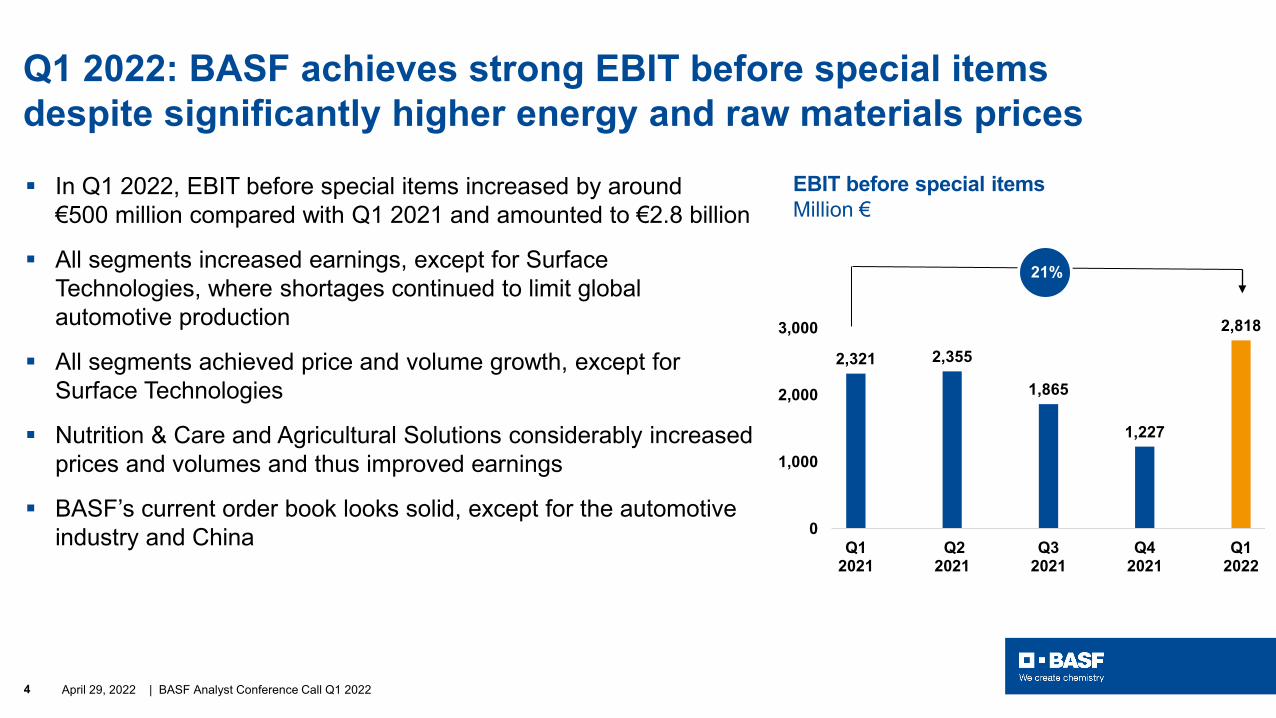
In Q1 2022, EBIT before special items increased by around€500 million compared with Q1 2021 and amounted to €2.8 billion
All segments increased earnings, except for Surface Technologies, where shortages continued to limit global automotive production
All segments achieved price and volume growth, except for Surface Technologies
Nutrition & Care and Agricultural Solutions considerably increased prices and volumes and thus improved earnings
BASF’s current order book looks solid, except for the automotive industry and China
2,321 2,355
1,865
1,227
2,818
0
1,000
2,000
3,000
Q12021
Q22021
Q32021
Q42021
Q12022
EBIT before special itemsMillion €
21%
Q1 2022: BASF achieves strong EBIT before special items despite significantly higher energy and raw materials prices
April 29, 20225 | BASF Analyst Conference Call Q1 2022
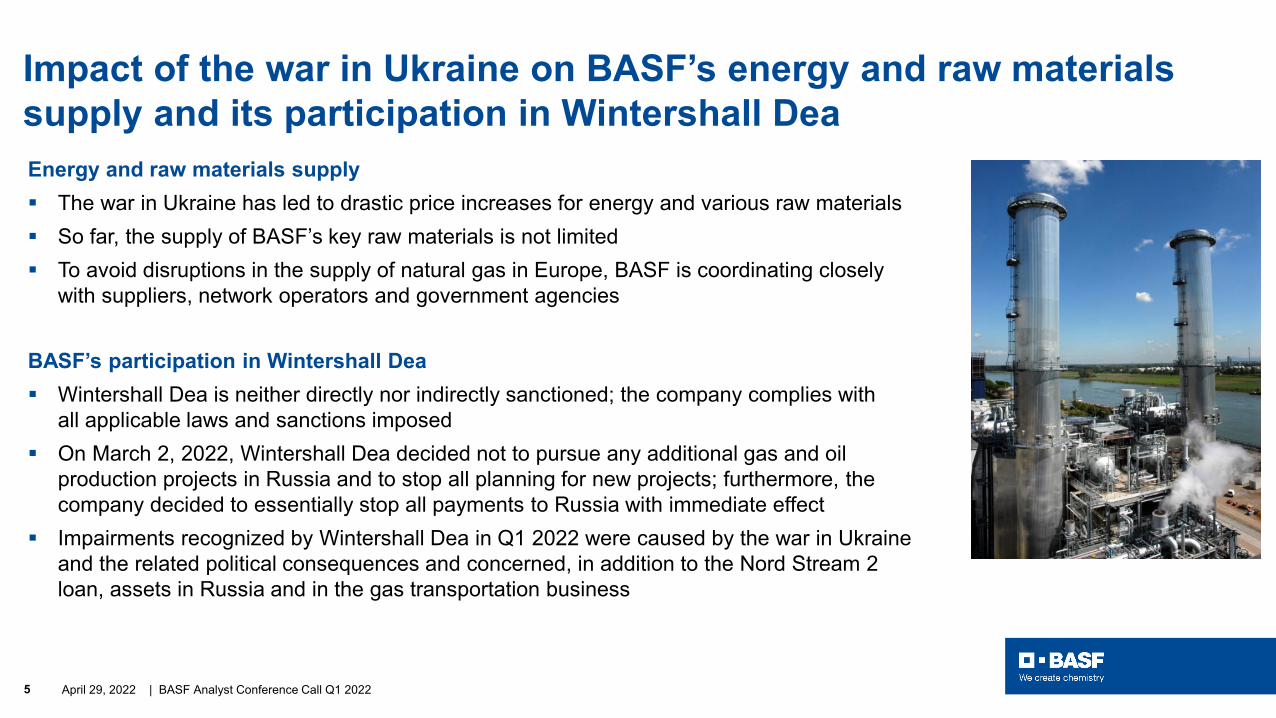
Impact of the war in Ukraine on BASF’s energy and raw materials supply and its participation in Wintershall DeaEnergy and raw materials supply The war in Ukraine has led to drastic price increases for energy and various raw materials So far, the supply of BASF’s key raw materials is not limited To avoid disruptions in the supply of natural gas in Europe, BASF is coordinating closely
with suppliers, network operators and government agencies
BASF’s participation in Wintershall Dea Wintershall Dea is neither directly nor indirectly sanctioned; the company complies with
all applicable laws and sanctions imposed On March 2, 2022, Wintershall Dea decided not to pursue any additional gas and oil
production projects in Russia and to stop all planning for new projects; furthermore, the company decided to essentially stop all payments to Russia with immediate effect
Impairments recognized by Wintershall Dea in Q1 2022 were caused by the war in Ukraine and the related political consequences and concerned, in addition to the Nord Stream 2 loan, assets in Russia and in the gas transportation business
April 29, 20226 | BASF Analyst Conference Call Q1 2022
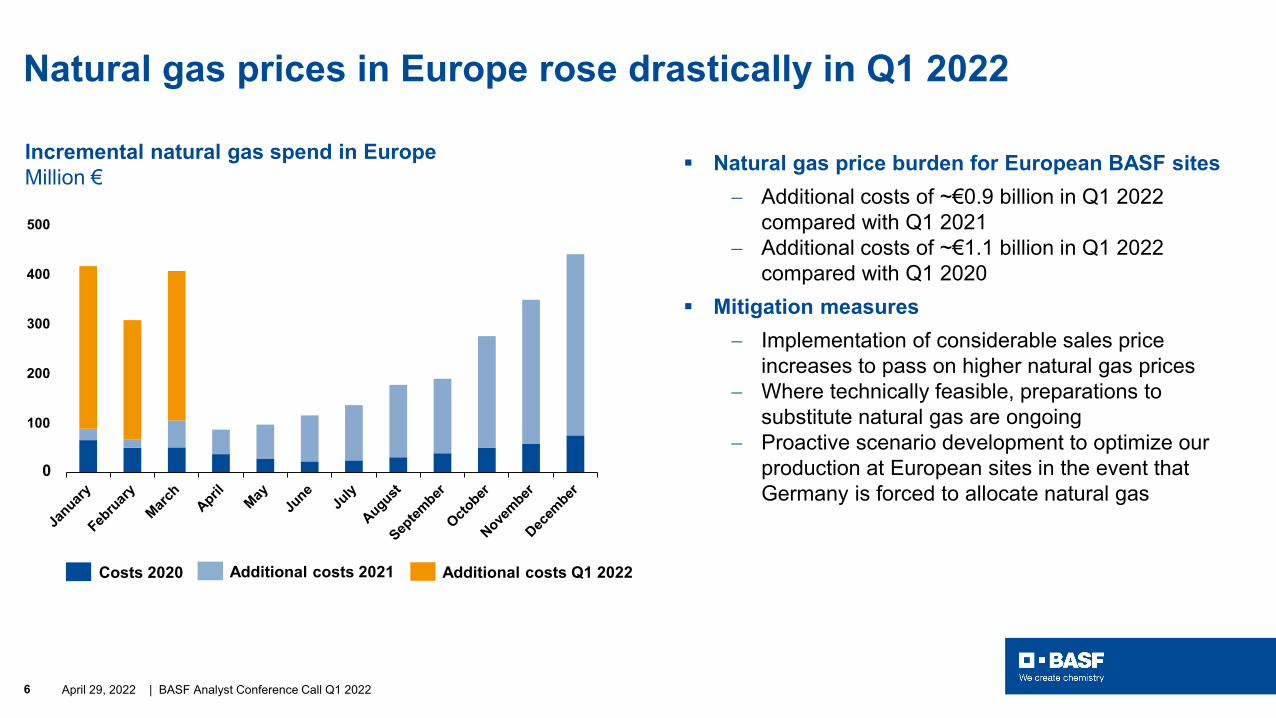
Natural gas prices in Europe rose drastically in Q1 2022
Incremental natural gas spend in Europe Million € Natural gas price burden for European BASF sites
− Additional costs of ~€0.9 billion in Q1 2022 compared with Q1 2021
− Additional costs of ~€1.1 billion in Q1 2022 compared with Q1 2020
Mitigation measures− Implementation of considerable sales price
increases to pass on higher natural gas prices− Where technically feasible, preparations to
substitute natural gas are ongoing− Proactive scenario development to optimize our
production at European sites in the event that Germany is forced to allocate natural gas
-
100
200
300
400
500
Costs 2020 Additional costs 2021
0
Additional costs Q1 2022
April 29, 20227 | BASF Analyst Conference Call Q1 2022
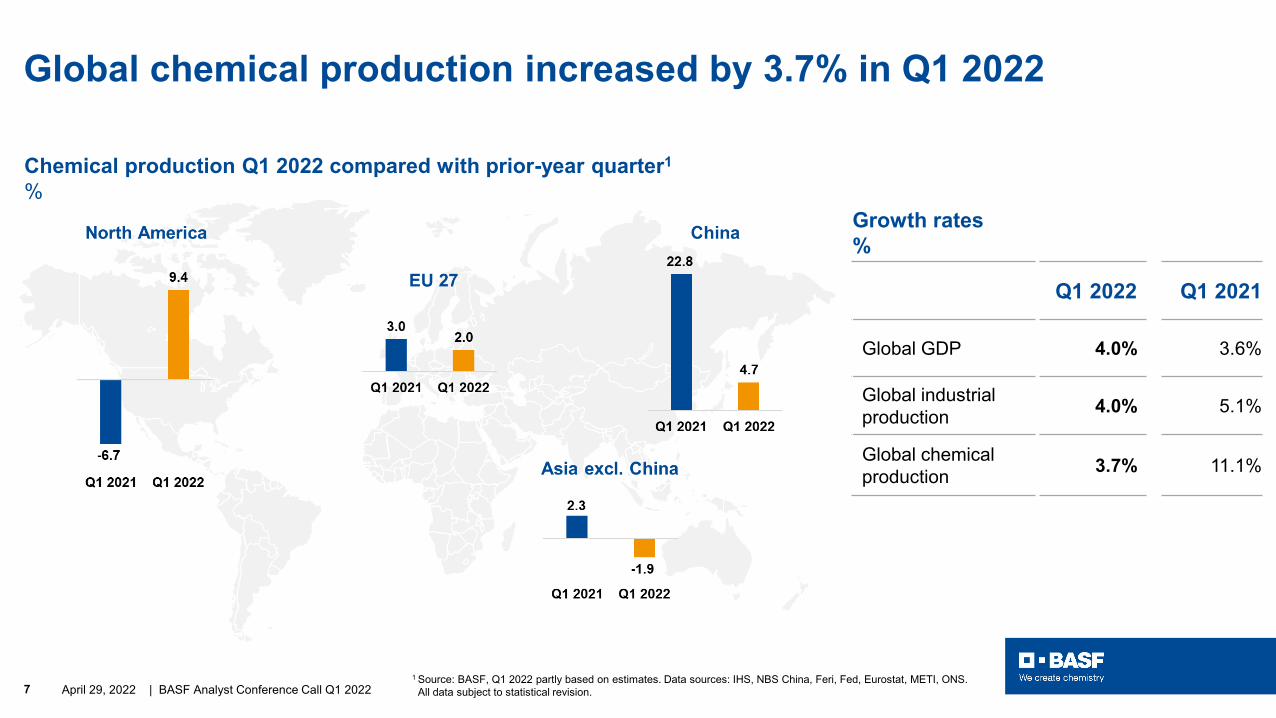
Chemical production Q1 2022 compared with prior-year quarter1
%
Global chemical production increased by 3.7% in Q1 2022
Q1 2022 Q1 2021
Global GDP 4.0% 3.6%
Global industrial production 4.0% 5.1%
Global chemical production 3.7% 11.1%
Growth rates%
1 Source: BASF, Q1 2022 partly based on estimates. Data sources: IHS, NBS China, Feri, Fed, Eurostat, METI, ONS. All data subject to statistical revision.
April 29, 20228 | BASF Analyst Conference Call Q1 2022
Chemicals MaterialsIndustrial Solutions
SurfaceTechnologies
Nutrition & Care
Agricultural Solutions Other
Overall volume
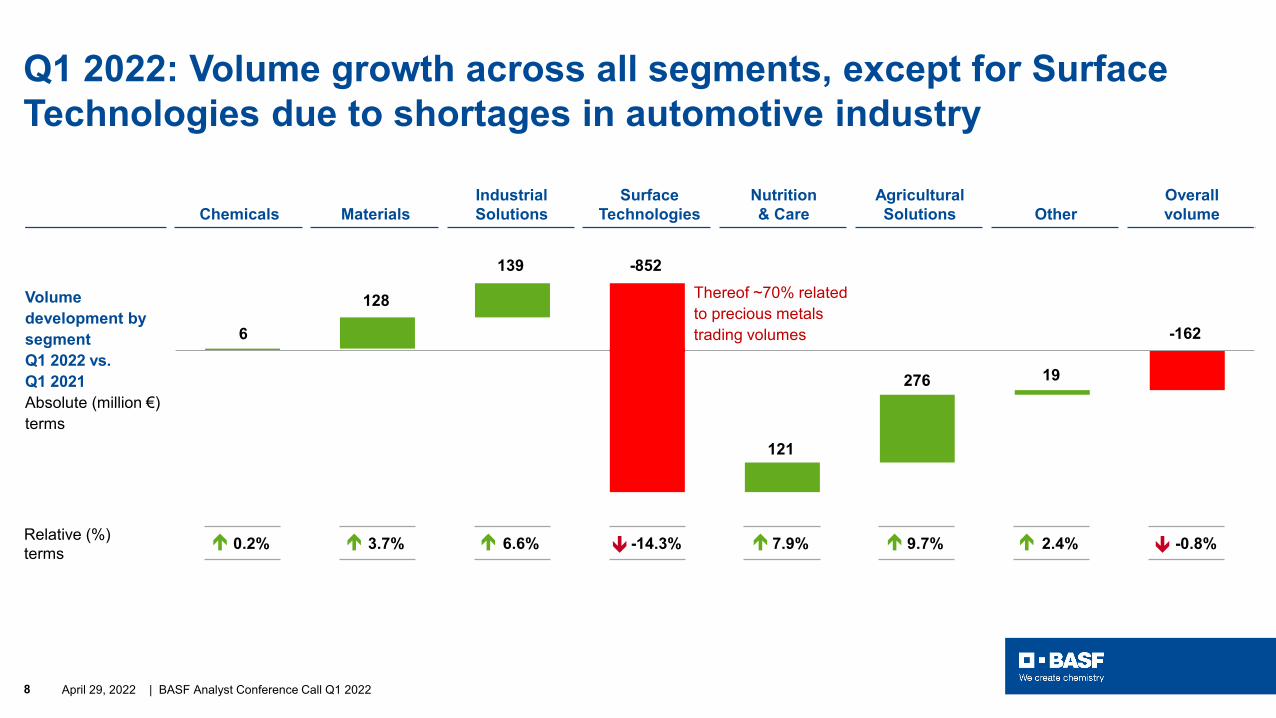
Volume development by segment Q1 2022 vs. Q1 2021Absolute (million €) terms
Q1 2022: Volume growth across all segments, except for Surface Technologies due to shortages in automotive industry
Relative (%) terms 0.2% 3.7% 6.6% -14.3% 7.9% 9.7% 2.4% -0.8%
-1626
128
139 -852
121
276 19
Thereof ~70% related to precious metals trading volumes

April 29, 20229 | BASF Analyst Conference Call Q1 2022
BASF Group Chemicals Materials
Industrial Solutions
SurfaceTechnologies
Nutrition & Care
Agricultural Solutions Other
BASFGroup
SalesQ1 2022 vs. Q1 2021Million €
EBIT before special itemsQ1 2022 vs. Q1 2021Million €
Q1 2022: Sales and EBIT before special items increased considerably
858 751 348 267 244 868 -518
4,004 4,821 2,493 5,457 1,971 3,397 940Sales by segment Million €
EBIT before special items by segment Million €
April 29, 202210 | BASF Analyst Conference Call Q1 2022
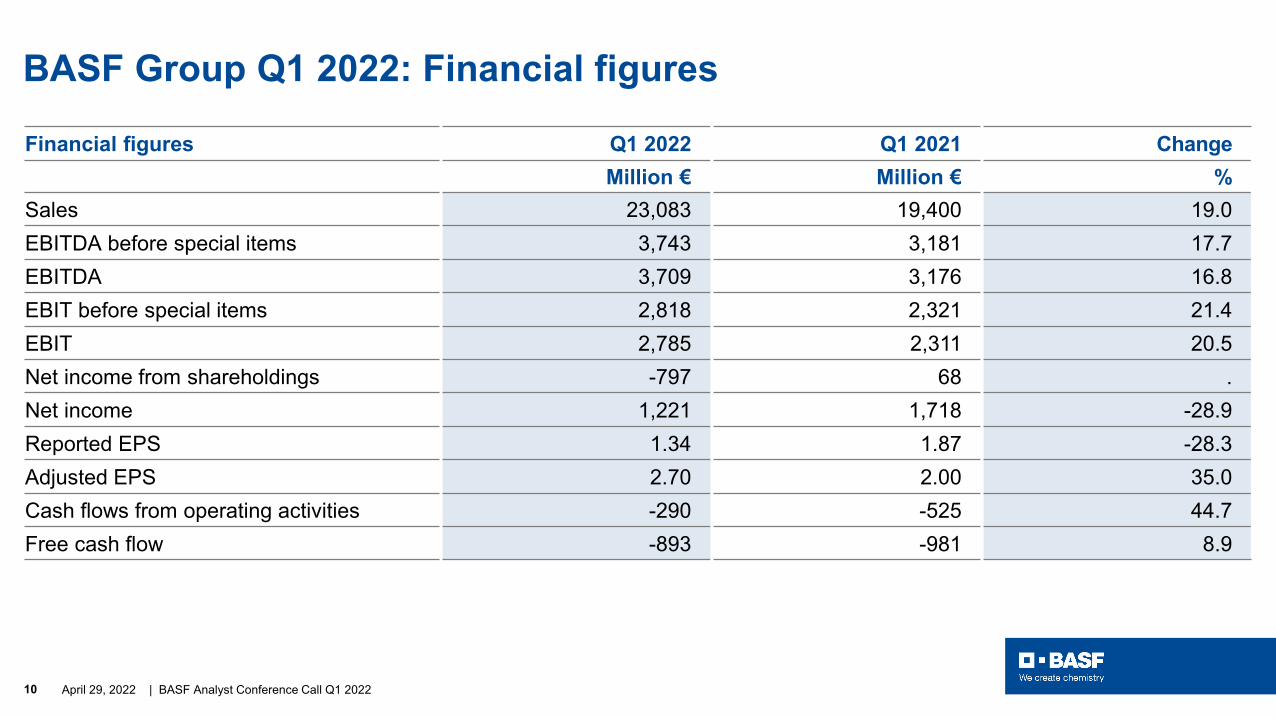
BASF Group Q1 2022: Financial figures
Financial figures Q1 2022 Q1 2021 ChangeMillion € Million € %
Sales 23,083 19,400 19.0EBITDA before special items 3,743 3,181 17.7EBITDA 3,709 3,176 16.8EBIT before special items 2,818 2,321 21.4EBIT 2,785 2,311 20.5Net income from shareholdings -797 68 .Net income 1,221 1,718 -28.9Reported EPS 1.34 1.87 -28.3Adjusted EPS 2.70 2.00 35.0Cash flows from operating activities -290 -525 44.7Free cash flow -893 -981 8.9

April 29, 202211 | BASF Analyst Conference Call Q1 2022
Cash flow development in Q1 2022
Q1 2022 Q1 2021
Million € Million €
Cash flows from operating activities -290 -525
Thereof Changes in net working capital1 -3,182 -2,773
Miscellaneous items 746 -335
Cash flows from investing activities -579 -435
Thereof Payments made for property, plant and equipmentand intangible assets -603 -456
Acquisitions / divestitures 10 -7
Cash flows from financing activities 2,685 710
Thereof Changes in financial and similar liabilities 3,504 717
Dividends - -7
Free cash flow -893 -9811 In order to optimize precious metal stocks, BASF sells precious metals and concurrently enters into agreements to repurchase them at a set price. The cash flows resulting from the sale and repurchase are reported in cash flows from operating activities. Liabilities to repurchase precious metals amounted to €780 million as of March 31, 2022.
April 29, 202212 | BASF Analyst Conference Call Q1 2022
Strong balance sheet
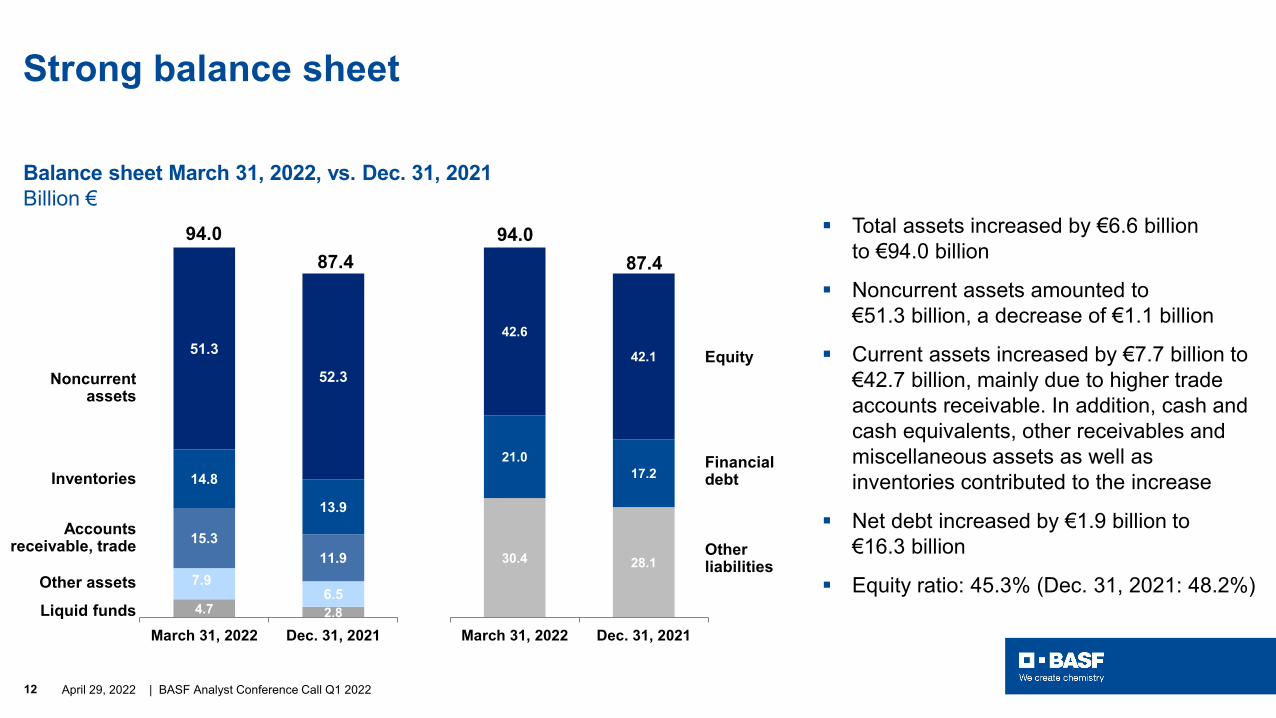
Balance sheet March 31, 2022, vs. Dec. 31, 2021Billion €
Liquid funds
Accountsreceivable, trade
Noncurrentassets
Inventories
Other assets4.7 2.8
7.96.5
15.311.9
14.8
13.9
51.3
52.3
March 31, 2022 Dec. 31, 2021
87.494.0
Otherliabilities
Financialdebt
Equity
30.4 28.1
21.017.2
42.6
42.1
March 31, 2022 Dec. 31, 2021
87.494.0 Total assets increased by €6.6 billion
to €94.0 billion
Noncurrent assets amounted to€51.3 billion, a decrease of €1.1 billion
Current assets increased by €7.7 billion to €42.7 billion, mainly due to higher trade accounts receivable. In addition, cash and cash equivalents, other receivables and miscellaneous assets as well as inventories contributed to the increase
Net debt increased by €1.9 billion to€16.3 billion
Equity ratio: 45.3% (Dec. 31, 2021: 48.2%)

April 29, 202213 | BASF Analyst Conference Call Q1 2022
Outlook 2022 for BASF Group
Outlook 2022Sales €74 billion – €77 billionEBIT before special items €6.6 billion – €7.2 billionROCE 11.4% – 12.6%CO2 emissions 19.6 – 20.6 million metric tons
Underlying assumptions Growth in gross domestic product: 3.8% Growth in industrial production: 3.8% Growth in chemical production: 3.5% Average euro/dollar exchange rate: $1.15 per euro Average annual oil price (Brent crude): $75 per barrel