the analyst
TRANSCRIPT


The Analytical Journal of The Royal Society of Chemistry
K. D. Bartle (Leeds, UK)D. Betteridge (Sunbury·on- Thames, UK)N. T. Crosby (Teddington, UK)L. Ebdon (Plymouth, UK)J. Egan (Cambridge, UK)
Advertisements: Advertisement Department, The Royal Society of Chemistry, BurlingtonHouse, Piccadilly, London, W1V OBN. Telephone 071-437 8656. Telex No. 268001.
Fax 071·437 8883.
The Analyst
Fifty reprints are supplied free of charge.
Full details of how to submit material torpublication in The Analyst are given in theInstructions to Authors in the January issue.Separate copies are available on request.The Analyst publishes papers on all aspects ofthe theory and practice of analytical chemistry.fundamental and applied, inorganic andorganic, including chemical, physical. biochemical, clinical, pharmaceutical, biological,environmental, automatic and computer-basedmethods. Papers on new approaches to existingmethods, new techniques and instrumentation,detectors and sensors, and new areas of application with due attention to overcoming limitations and to underlying principles are all equallywelcome. There is no page charge.
The following types of papers will be considered:
Full papers, describing original work.Shan papers: the criteria for originality are
the same as for full papers, but shon papersgenerally repon less extensive investigations orare of limited breadth of subject matter.
Communicarions. which must be on anurgent matler and be of obvious scientificimponance. Rapidity of publication is enhancedif diagrams are omitted. but tables and formulaecan be included. Communications receive priority and are usually published within 5-8weeks of receipt. They are intended for briefdescriptions of work that has progressed to astage at which it is likely to be valuable toworkers faced with similar problems. A fullerpaper may be offered subsequently, 'if justifiedby later work.
Reviews, which must be a critical evaluationof the existing state of knowledge on a particular facet of analytical chemtstry.
Every paper (except Communications) will besubmitted to at least two referees, by whoseadvice the Editorial Board of The Analystwill beguided as to its acceptance or rejection. Papersthat are accepted must not be published elsewhere except by permission. Submission of amanuscript will be regarded as an undenakingthat the same material is not being consideredfor publication by another journal.
Regional Advisory Editors. For the benefit ofpotential contributors outside the United Kingdom, a Panel of Regional Advisory Editorsexists. Requests for help or advice on anymatter related to the preparation of papers andtheir submission for publication in The Analystcan be sent to the nearest member of the Panel.Currently serving Regional Advisory Editors arelisted in each issue of The Analyst.
Manuscripts (four copies typed in double spacing) should be addressed to:
Harpal S. Minhas, Editor, The Analyst,Royal Society of Chemistry,Thomas Graham House,Science Park. Milton Road,CAM8RIDGE C84 4WF, UK or:Dr. J. F. TysonUS Associate Editor. The AnalystDepartment of ChemistryUniversity of MassachusettsAmherst MA 01003. USA
Panicular attention should be paid to the use ofstandard methods of literature citation, includingthe journal abbreviations defined in ChemicalAbstracts Service Source Index. Wherever possible. the nomenclature employed should follow IUPAC recommendations, and units andsymbols should be those associated with SI.All queries relating to the presentation andsubmission of papers, and any correspondenceregarding accepted papers and proofs. shouldbe directed to the Editor. The Analyst (addressas above). Members of the Analytical EditorialBoard (who may be contacted directly or via theEditorial Office) would welcome comments,suggestions and advice on general policy matters concerning The Analyst.
© Th. Royal Society of Chemistry. 1990. Allrights reserved. No pan of this publication maybe reproduced, stored in a retrieval system, ortransmitted in any form, or by any means,electronic. mechanical, photographic, recording, or otherwise, without the prior permissionof the publishers.
Information for Authors
Assistant EditorsBrenda Holliday, Paula O'Riordan, Sheryl Whitewood
Advisory Board
E. Pungor (Hungary)J. R~zicka (USA)W. I. Stephen (Aberdeen, UK)M. Stoeppler (Federal Republic of Germany)J. M. Thompson (Birmingham, UK)K. C. Thompson (Sheffield, UK)J. F. Tyson (USA)P. C. Uden (USA)A. M. Ure (Aberdeen, UK)A. Walsh, K.B. (Australia)J. Wang (USA)G. Werner (German Democratic Republic)T. S. West (Aberdeen, UK)
Editorial Secretary: Claire Harris
Analytical Editorial Board
Chairman: A. G. Fogg (Loughborough, UK)
H. M. Frey (Reading, UK)D. E. Games (Swansea, UK)D. L. Miles (Wallingford, UK)J. N. Miller (Loughborough, UK)
Senior Assistant EditorPaul Delaney
J. F. Alder (Manchester, UK)E. Bishop (Exeter, UK)A. M. Bond (Australia)R. F. Browner (USA)D. T. Burns (Belfast, UK)G. D. Christian (USA)L. de Galan (The Netherlands)T. P. Hadjiioannou (Greece)W. R. Heineman (USA)A. Hulanicki (Poland)I. Karube (Japan)E. J. Newman (Poole, UK)T. B. Pierce (Harwe'" UK)
(he Analyst (ISSN 0003-2654) is published monthly by The Royal Society of Chemistry,Thomas Graham House, Science Park, Milton Road, Cambridge CB4 4WF, UK. All ordersaccompanied with payment should be sent directly to The Royal Society of Chemistry, TheDistribution Centre, Biackhorse Road. Letchworth, Herts. SG6 1HN, England. 1390 Annualsubscription rate UK £220.00, EEC £233.00, Rest of World £253.00, USA $493.00. Purchaoedwith Analytical Abstracts UK £476.00, EEC £520.00, Rest of World £547.00, USA 5995.00.Purchased with Analytical Abstracts plus Ana/l'tical Proceedings UK £561.00, EEC £611.00,Rest of World £645.00, USA $1187.00. Purchased with Analytical Proceedings UK £279.00,EEC £296.50, Rest of Wotld £321.00, USA $626.00 Air freignt and moiling in the USA byPublications Expediting Inc., 200 Meacham Avenue. Eimont, NY 11003.USA Postmaster: Send address changes to: The .4naiysr. Publications Expediting Inc., 200Meacham Avenue, Elmont, NY 11003. Second class postage paid at Jamaice, NY 11431. Allother despatches outside the UK by Bulk Airmail within Europe, Accelerated Surface Postoutside Europe. PRINTED IN THE UK.
Editorial Manager, Analytical Journals: Judith Egan
Editor, The Analyst US Associate Editor, The AnalystHarpal S. Minhas Dr J. F. TysonThe Royal Society of Chemistry, Department of Chemistry,Thomas Graham House, Science Park, University of Massachusetts.Milton Road, Cambridge CB4 4WF, UK Amherst MA 01 003, USATelephone 0223 420066. Telephone 413 545 0195Fax 0223423623. Telex No. 818293 ROYAL. Fax413 545 4490
Regional Advisory Editors
For advice and help to authors outside the UK
Professor Dr. U. A. Th. Brinkman, Free University of Amsterdam, 1083 de Boelelaan, 1081 HVAmsterdam, THE NETHERLANDS.
Professor Dr. sc. K. Dittrich, Analytisches Zentrum, Sektion Chemie, Karl+Marx+Universit8t,Talstr. 35, DDR·7010 Leipzig, GERMANY.
Dr. O. Osibanio, Department of Chemistry, University of Ibadan, Ibadan. NIGERIA.Dr. G. Rossi, Chemistry Division, Spectroscopy Sector, CEe Joint Research Centre.
EURATOM, Ispra Establishment, 21020 Ispra (VareseI.ITALY.Professor K. Saito, Coordination Chemistry Laboratories. Institute for Molecular Science.
Myodaiji, Okazaki 444, JAPAN.Professor M. Thompson, Department of Chemistry, University of Toronto, 80 St. George
Street, Toronto, Ontario M5S lAl, CANADA.Professor Dr. M. Valcarcel. Departamento de Quimica Analitiea. Facultad de Ciencias.
Universidad de Cordoba. 14005 Cordoba, SPAIN.Professor Yu Ru·Oin, Department of Chemistry and Chemical Engineering, Hunan University,
Changsha, PEOPLES REPUBLIC OF CHINA.Professor Yu. A. Zolotov, Kurnakov Institute of General and Inorganic Chemistry, 31 Lenin
Avenue, 117907, Moscow V·71, USSR.
Circle 003 for further information
LOW ALLOY STEELSBCS/SS-CRMs 40612-410/2
announce the availability ofa series of replacement
WILEYFROM
Practical Surface Analysis2nd EditionVolume 1: Auger and X.Ray PhotoelectronSpectroscopyEdited by D. BRIGGS, ICI pic, Wilton Materials Research Centre, UKCompletely rewritten and updated, this practical manual coversthe theory and practice of X-ray photoelectron spectroscopy (XPS)and Auger electron spectroscopy (AES) techniques for surfaceanalysis. Also taken into account are improvements in equipment,experimental procedures and data interpretation over the lastseven years.
Co-publication with Salle & Sauerlinder. not available fromWiley in German speaking countries0471920819 Volume 1 680pp 1990 £85.00/$195.500471920827 Volume 2: 10n and Neutral Spectroscopydue June 1991 approx £85.00/$195.50
BOOKS
W iley books are available through your bookseller.Alternatively arder direct from Wiley (paymem to John
Wiley & Sons Ud). Credit card arders accepted by telephone (0243) 829121 or FREEFONE 3477. Plea.se note lhut. pricesquoted here apply to UK and Europe only.
JOHN WILEY & SONS LTD @WILEYBAFFINS LANE . CHICHESTERWEST SUSSEX P019 IUD PulWhtzsSinaI807
Infrared Spectroscopy of AdsorbedSpecies on the Surface ofTransition Metal OxidesA.A. DAVYDOV, USSR Academy of Science, RussiaPrimarily summarized in this work are the IR investigations of thesurface chemistry of simple and complex oxide catalysts. Specialemphasis is placed on spectral characteristics of active sites onoxide surfaces. A detailed account is presented of the methods usedfor characterising the oxidation state and co-ordination of cationson oxide surfaces by the adsorption of the probe molecule.047191813X 258pp 1990 £65.001$134.55
Continuous·Flow Fast AtomBombardment Mass SpectrometryEdited by R.M. CAPRIOLl, University of Texas Medical School atHouston, USAThis book is based on the presentations made at a workshop onContinuous-Flow FAB held in Annapolis, Maryland in November1989. The papers presented have been expanded and edited toform a small volume detailing recent advances in a number of keyareas of continuous-flow fast atom bombardment massspectrometry. The book is written at the practical 'hands-on' level- intended to give readers insight into the day-to-day operationof the technique so that the subtleties may be quickly mastered.0471928631 208pp 1990 £27.50/$63.25
Spectral and ChemicalCharacterization of OrganicCompounds3rd EditionW.J. CRIDDLE and G.P. ELLIS both at University of Wales Collegeof Cardiff, UKThis book brings together information the student is likely to needin the laboratory for characterization of organic compounds - theirprincipal chemical reactions and their spectral properties. For thethird edition of this popular laboratory student text the authorshave included the theoretical basis of the chemical tests which aredescribed and have also expanded the sections on spectroscopy."This book is strongly recommended to all teachers of practicalorganic chemistry." ANALYST"The authors' vast experience in the research and teaching oforganic chemistry, together with the ability of lucid and concisewriting is reflected in the excellence of this small volume."
RESEARCH INST F'OR ORGANIC CHEMICAL INDUSTRY, BUDAPEST0471927155 (paper only) 132pp 1990 £22.50/$45.30
RUGGED
*INEXPENSIVE
*REPRODUCIBLE
COUNTRATES
Glass Expansion Ply Ltd.PO 80x 411, Camberwell,3124, Victoria, AustraliaTel: 613-882-9320 Fax: 613-882-9319
@JBUREAU OF ANALYSED
SAMPLES LTD.
Telex: 587765 BASRIDTelephone: (0642) 300500
Fax: (0642) 315209
CONCENTRIC NEBULIZERS
BAS Ltd., Newham Hall, Newby,Middlesbrough, Cleveland, TS8 9EA
Available as A-C-K or T, made andmatched to your requirements at aprice that will delight you.
Handles slurries. Two weeks delivery.
For further information on these and otherCertified Reference Materials
please contact:
in both finely divided (chip) form and in theform of solid (disc) samples for opticalemission and XRF analysis.
Circle 001 forfurther information Circle 002 for further information

ii
An internationallJ' respectedAna~icalJournal has animportant opportunityfor an .
AnalyticalScientistNegotiable SalaryRhine Valley, Germany
A position has been created within the journal'sscienrific editorial swft'. In addition to the publishingactivities, you will form the key link with the analyticalscience community worldwide. This will requireattendance at conferences, developing conwcts. anddiscussing original analytical scientific papers andreview articles.
You tire probably a PhD, a respected professionalscienrist of some standing in analysis. able to fostercontacts with authors, and are conversant with thewhole range of the science in both ~lcademia and indust~·.
It is imporwnt that you have complete mastery ot'the English langmlge in both written ~lnd spoken form.together with a very good knowledge of German. \oumust be able to work independently and contribute to
a small team.
Ci rcle 004 forfu rther information
The company is siwated in all attractive area in theRhine Yalley. The environment offers a high quality oflife, bur within reach of major cities andcommunication networ);;:s.
Sala~' is negotiahle with modern companybenefits. A full reloc::Hion paclwge is aV:lilable.Initial interviews will take place in the UK.
If ~'ou are seeking a new. intellectual ch::lllenge ::l11dhave the maturity and breaddl of experience to
contrihute to this established business. then pleasetelephone, post or fax your c.v. to Dr. Ian Collins at thefollowing address, quoting ref A/575/IC.
Exc(.'ut;'Oc Selcct;OJl Associates t;mitcd.1.,-17 TIle Broadwa)'. Old Ha(l'ielcl. Herts .lL9 .5HZ.Telep/lOl/e: (0707) 2M.Jll. Fa." (0707) 27.5-102.
£'SAEXECUTIVESELECTIONASSOCIATES
~1~'~,1~1~11•••·.~l!rg~Nf~.~~,t'f
KEY PUBLICATIONAnalysis - What Analytical Chemists Doby Julian TysonLoughborough University
Analysis: What Analytical Chemists Do provides an invaluable insight into the philosophy and methodology of analytical chemistry, illustratingthe relevance of the subject to many areas of science. The book explains the chemical and physical principles involved in analytical chemistryand covers several widely used instrumental techniques. Included are atomic and molecular spectroscopies and the separation sciences. andexamples of their application to such areas as medical. agriCUltural and forensic sciences. environmental monitoring and various manufacturingindustries are provided.
Analysis: What Analytical Chemists Do provides a discussion of the relevant aspects of reaction chemistry. explains how the reliability ofquantitative measurements may be assessed and describes the financial constraints governing the choice of analytical method. This book willprove invaluable to sixth formers. undergraduates and teachers. as well as those who wish to be belter informed about the scope and limitationsof analytical chemistry.
RSC PaperbackSoftcover199ppISBN 0 85186 463 5 (1988)Price £9.95
Customers who wish to obtain an inspection copy of this book forrecommended reading for students. should contact the Sales andPromotion Manager at our Cambridge address.
ROYALSOCIETY OFCHEMISTRY
InformationServices
To Order, Please write to the: Royal Society of Chemistry. Distribution Centre. Blackhorse Road. letchwonh. Herts SG6 1HN.LJK.or telephone (0462)672555 quoting your credit card details. We can now accept AccessNisaiMasterCardiEurocard.
For further information. please write to the:Royal Society of Chemistry. Sales and Promotion Department. Thomas Graham House. Science Park. Milton RoadCambridge CB4 4WF. UK.
RSC Members should obtain members prices and order Irom:The Membership Affairs Department at the Cambridge address above.
Circle 005 for further information
ANALYST. NOVEMBER 1990. VOL. 115 1397
Use of X-ray Fluorescence Spectrometry for the Direct Multi-elementAnalysis of Coal Powders
Bill C. Pearce, John W. F. Hill and Ian KerryBritish Coal Corporation, Scientific Services Laboratory Technical Department, Ashby Road, StanhopeBretby, Burton on Trent, Staffordshire DE15 000, UK
The evaluation of automated X-ray fluorescence (XRFj spectrometry for the elemental analysis of UK coals isdescribed. The XRF determination of chlorine is now used for coal pricing purposes and phosphorus levelsare reported routinely in order to monitor the quality of coal. The data on elemental composition which can begenerated rapidly by direct XRF analysis of pressed coal powders enable values of slagging and foulingindices to be determined with acceptable accuracy. Such factors have wide application in industry forpredicting the combustion characteristics of coal, including slagging and fouling propensities. The relativestandard deviations for the elements chlorine, sulphur and phosphorus and the calculated slagging index andfouling factor are less than 7%. The accuracy of the method when compared to standard reference coals isacceptable with detection limits which range from 0.04 and 0.05% m/m for the major elements AI and Si,respectively, 0.01 % m/m for minor elements and 0.002% m/m for the trace element phosphorus.
Keywords: Coal analysis; automated X-ray fluorescence analysis; slagging and fouling indices; chlorine andphosphorus determination
The use of X-ray f1uorcscence (XRF) spectrometry for theanalysis of coal powdcrs is extremcly atlractive for thcfollowing rcasons. (i) It is a muhi-elemcnt technique; (ii) itprovides good sensitivity down to trace concentrations in coal;(iii) only minimal and non-destructive sample preparation isrequired; (iv) absorption is low because the matrix is basicallycarbon; and (v) the technique is highly suitable for automationand provides a high throughput of samples.
The increasing demands for improved efficiency for coalanalysis without loss of precision and accuracy have resulted ininvestigations into instrumental methods as alternatives toBritish Standard (BS) procedures. I The BS tests requirelengthy digestion procedures. for example the determinationof sulphur involves fusion of the coal with Na2C03 - MgO toconvert all of the sulphur into sulphate followed by gravimetric determination of the precipitated barium sulphate.Such procedures take several hours per sample and arc verylabour intensive. Elemental composition is normally determined by first ashing the coal at 815°C and digesting the asheither in hydrofluoric acid or sodium hydroxide. The solutionsarc then analysed by classical methods or by atomic absorptionand colorimetric techniques. (For a more detailed appraisalsec reference I.)
The usc of XRF for coal analysis is not new and has beenutilised by British Coal for many years to determine ashcontent.2.3 The methods. however. were only applicable to asingle source of coal and required frequent updating as thecoal matrix changed. The technique has been assessed by Kiss4for the determination of sulphur, chlorine and other clementsin American brown coal. However. the concentrations reported for sulphur and chlorine were very much lower thanthose typically found in ~oal< mined in the UK. Kuhn andHenderson' have reported a ,;uecessful wavelength dispersiveXRF system to determine some 21 minor and trace elementsin coal. Pearce" and Thorne et af.7 have described muhielement XRF analysis using muhi-variable regression procedures for the automated analysis of coal. The use of XRF forproduction and quality control monitoring in other fields isalready well established~·9 and its suitability for automationaceepted W X-ray fluorescence analysis in metallurgical andmineral analysis has been shown to be both precise andaccurate. I I
A problem with accurate quantitative XRF analysis is thatobserved X-ray emission intensities must be corrected formatrix effects that cause absorption or enhancement of the
X-ray signal. 12-14 Synthetic matrix-matched standards for coalarc extremely difficult to produce. IS This is primarily due tothe great variation in the forms of bonding of the elementsfound in coal. For example, sulphur can exist as pyrites,organic sulphur bound to the coal substance and sulphates allof which produce widely different X-ray emissions for thesame mass concentration. The proportions in coal of the threeforms are also extremely variable, hence, a calibration setwould require a wide range to cover all of the sulphurcompounds. The particle sizes of the mineral species presentare also variable and affect the intensity values obtained.
The use of a "fundamental parameters" approach tocalculate theoretical correction constants '6 is complex andwould require extensive chemical analysis and computation ofdata. Therefore, in order to establish accurate XRF analysis ofpowders, particle size effects 17- 19 and mineralogicaleffects '2.2f1 need to be considered. Alternatively, someworkers,21.22' have suggested the use of thin films for coalanalysis using XRF techniques in order to avoid complicationswith matrix effects. The current daily determinations requiredon coal samples supplied to the National Laboratory of theBritish Cmil Corporation at Bretby are in excess of 5000. Theuse of automated XRF spectrometry for the accurate determination of chlorine, phosphorus and elements used tocalculate coal combustion parameters23 .24 is described in thispaper. The results have been validated using certified reference materials and comparison with coals analysed by BritishStandard methods l and currently accepted standard methods.
Experimental
Apparatus
The following apparatus was used: an Applied ResearchLaboratories (ARL) Model 72000S simultaneous, vacuumX-ray fluorescence spectrometer fitted with a 3-kW rhodiumanode end-window tube, controlled by a DEC PDP 11-03computer; a microprocessor-controlled scanner covering thewavelength range 0.085-D.72 nm; and monochromators forthe elements carbon, sodium, magnesium, aluminium, silicon,phosphorus. sulphur, chlorine, pota~sium, calcium, titanium,manganese, iron and rhodium. The detector flow gases usedwere: 90% argon· 10% methane for sodium and 21% carbondioxide - 79% helium for carbon, other detectors sealed. A 36-
1398
sample autochanger with a sample rotation facility to takesteel sample rings with a 4O-mmi%uide diameter, 35-mminternal diameter and 14-mm de h [Fisons Instruments,Applied Research Laboratories ARL), Crawley, Sussex,UK]; mains voltage stabiliser, 220 V, 42 A (Watford ControlInstruments, Watford, UK); a recirculating water cooler,Model IC20 (Floweool Systems, Somereotes, Derbyshire,UK); a pclletising press and tool for the abovc steel rings,Model HTP-40 (Herzog, OsnabrOck, FRG); a planetary ballmill (Christison, Team Valley, Gateshead, UK); a Malvernlaser particle sizing instrument (Malvern Instruments, Malvern Link, Malvern, Worcestershire, UK); and a top-panbalance to weigh up to 20 ± 0.05 g were also used. The roomwas air conditioned to 21 ± 2 0c.
Reagents
Lithium tetraborate flux (Spectroflux 1(0). (JohnsonMatthcy, Royston, Hertfordshirc, UK.)
AnalaR grade chemicals. (BDH, Poole, Dorset, UK.)
Sample SelectionThere arc very few coals with certified elcmental concentrations which can be used for calibration of the XRF spcctrometer. It was therefore necessary to select and analyse acalibration set of coals. The ARL software used can accommodate up to 99 samples to produce calibration equations andinterference corrections. It was decided that a maximumnumber of standards should be used where possible to coverthe wide range of elemental concentrations found in cleancoals of less than 5% mlm ash and coal blends used forelectricity generation which have up to 25% mlm ash content.
For the calibration of chlorine, 99 coals covering thecommercial outputs of the Nottinghamshire and Derbyshirecoalfields were initially chosen. A wider selection of 88 coalsfrom the Southern, Northern and Midland coalfields in the.UK were selected for the remaining elements to give a broadercoal sample selection and wider rank range. The resultingcalibration algorithms were evaluated by analysing a further99 coals of the Southern coalfields, National Institute ofStandards and Technology Standard Reference Material(NIST SRM) 1632a Trace Elements in Coal (Bituminous) andthree Alpha Resources certified coals.
Sample Preparation
The coal samples were air-dried and ground to less than 212I-'m. Air-dried coal is necessary as the inherent moistureappears to act as a binding agent. In addition chlorine in coal isvolatile and thus could be lost in any forced drying process. Aportion of this air-dried coal (8 ± 0.05 g) was wcighed on thetop-pan balance. This was transferred into the steel sample
Table L Make up of beads for drift correction
Botlom standard
ANALYST, NOVEMBER 1990, VOL. 115
ring and placed on the pressing tool of thc Herzog pelletisingpress. The clean tool head was placcd in position and the coalpowder pclletised under a load of 16 tonnes for 25 s. The toolhead was polished to better than a 1 I-'m finish and re-polishedafter every thousand pressings to maintain the smooth surfaceof the pressed coal pellet.
Lithium tetraborate beads were prepared by fusion in theaccepted way using various additions of AnalaR gradereagents to produce eight beads containing a low and a highX-ray intensity for cach c1cment. These bcads were used toadjust day to day spectromcter drift utilising a two-pointcorrcction. Carbon was drift-correctcd using a perspex bottomstandard and a polythene top standard. The elcmentalconstituents in each of the beads are given in Table I.
Instrument Conditions
The rhodium X-ray tube was operated at 50 kV, 40 rnA withre-circulating water cooling to stabilise the X-ray output. Thecounting time was regulated by an internal titanium target for12 X 106 counts which gives approximately 35 s per analysis.The spectrometer was thermostatically stabilised at 30.5 ±0.5 °C and the instrument sited in an air conditioned room at21 ± 2 0c. The above criteria arc necessary to maintainaccurate calibrations for long periods. i.e., to give maximumroutine analysis throughputs. The vacuum in the spcctrometerwas maintained at <100 I-'m of Hg with a sample pre-vacuumof up to 100 I-'m of Hg.
The details of thc monochromator used for each c1emcntare given in Table 2. Two unusual monochromators arerequired for sulphur and chlorine which usc an NaCi crystal inprefcrence to the gcneral LiF crystal because it has bctterreflectivity for sulphur and chlorine X-rays, particularly inlight element matrices. However, the chlorine background ispoorer duc to secondary emission from the crystal.
The carbon total reflection monochromator overcomes theproblem of detecting low energy X-rays by using a crystal thatallows some higher energy X-rays to be reflected which arceliminated using magnets. X-rays of lower energy than carbonarc also reflected but these arc absorbed prior to the crystal bya polypropylene film in the primary slit. Two further featuresof this monochromator are the use of activated alumina toimprove the local vacuum. and He - CO2 flow gas rather thanthe normal Ar - CH".
CalibrationThe set of calibration coals were thoroughly analysed chemically by the following methods. Chlorine determination usingBS 1016' Esehka mixture fusion: sulphur determination withthe Leco SC132 sulphur analyser. The ash elements weredetermined after hydrofluoric acid digestion of the coal ashusing inductively coupled plasma optical emission spec-
Top standard
Bead
ABC
DEFG
H
Monochromators
CNa,KMg. AI. P.Ca.Ti.Fe
Si.S.C1Rh
Compounds added
PerspexNa,CO,. K,CO,MgO.AI20,.Ca3(PO"h. TiO, .Fe,03SiO, . K2SO".LiCi
Monochromators
RhSi
Na,MgP,SCAI. K. Ca. Ti. Fe
CI
Compounds added
Na,CO". K,CO"SiO,
Na,CO." MgOCa,(PO"h- K,SO,PolythencAl,O,. K,SO"Ca3(PO"h- TiO,.FC20J
LiCI
ANALYST. NOVEMBER 1990. VOL. 115 1399
trometry (ICP-OES).25 The ash content was determined usingthe incineration method of BS 1016.' The elemental composition of the coal can be calculated from the determined ashanalysis using the equation:
Element (%m1m) air-dried coal basis =elemental oxide in the ash (%m1m) x
ash (%m1m) air-dried basis
100 x factor converting elemental oxide into element
Previous work" has shown that the amount of coal used topress the pellet affected the X-ray intensity. For the range ofelements determined there was an increase of between0.4 and 3% and for rhodium backscatter an increase of 30% inthe mass range 4-12 g. This increase was greatest up to 8 g witha linear increase up to 12 g. This is because the lower X-rayenergies of the elements determined up to iron have aneffective layer thickness of < 1 mm. Hence an increase inover-all thickness has a negligible effect on the intensities otthese elements from 4 g upwards. However, rhodium Kbackscatter radiation would be expected to increase up to itseffective layer thickness of approximately 10 mm in acarbon-based matrix. This is greater than the typical depth of3 mm of an 8-g pellet.
As rhodium backscatter is used in the elemental correctionprocedure, a constant mass for the coal pellet is essential. Amass of 8 g was selected because at this mass the backscatterchange becomes linear and in practice 8 g of coal are as muchas can be transferred accurately into the steel ring. The samplerotation facility was used for the bead standard analysis toovercome inhomogeneity problems produced by the fusionprocedure. However, it was found unnecessary for this to beused for coal samples because they gave virtually identicalintensities irrespective of whether they were rotated. Thecoals were therefore analysed without rotation.
The sets of calibration coals were pelletised and thespectrometer was drift-corrected using the bead standards.The coals were then analysed twice consecutively and theaverage intensities for each element stored in a regression file.Nominal concentrations for the above coals were thenmatched with the stored intensities. From these data thecalibration was performed using the Multi-Variable Regression (MVR) program provided by the manufacturer whichallows for various mathematical correction models andpolynomials to be assessed. The model used was the LucasTooth - Pyne intensity mode126 illustrated simply below.
Ca = (Ao + A,Ia + A 2Ia2)(1 + K;li + L;li2)
where Ca = the concentration of the element affected; I a =intensity of the element affected; A o, A" A 2 = the coefficients
Table 2. Monochromator details
SEE,% m/m0.0120.0160.1090.1330.0030.072Om80.0240.0220.0060.0560.61
Interfering element
SiSiFe. Rh backscatterAI,CaSiMg, Ca, Fe. Rh backscatterSiAI. Rh backscatterMg. Rh backscatterSiRh backscatterC. K, Ca, Fe. Rh backscatter
NaMg ..AISiPSCIKCaTiFe(Ash)
Element
of the polynomial calibration graph; Ii = intensity of interfering elements; and K" L, = the coefficients of the polynomialfor interfering elements. The effect of interfering elementswas calculated from the MVR software using a selection ofelements which included silicon or rhodium backscatterintensity. These elements generally give good absorptioncorrections as they reflect the ash content of the coal.Mineralogical effects in coal were also corrected, e.g., ironand sulphur in pyrites, and calcium and sulphur in gypsum.
The cal ibn lion was initially assessed using a calculatedstandard error of the estimate (SEE) of the differencesbetween nominal and calculated values using the equation:
SEE = j(cN - cc)
"V n-2where CN = the nominal concentration of the element; Cc = thecalculated concentration of the element; and n = the numberof samples. The interfering elements used are listed in Table 3.The calibration and correction equations were stored in thecoal analysis program file together with the necessary data fordrift corrections. Several other coal combustion parameterscan be derived from the XRF ,,:~. ~iental analysis such asslagging and fouling propensities.23 'j ,'ese are discussed inmore detail below.
Ash content is broadly proportional to silicon concentrationand a regression of silicon counts versus nominal ash contentwas evaluated. The base: acid ratio is the ratio of basic toacidic oxides in the ash.
. . Fez03 + CaO + Na20 + MgO + K20Base: aCid ralio = '0 I 0 T'O
51 Z + A 2 3 + I z
This gives an indication of the potential melting-point of coalash on combustion particularly in the secondary superheaterand economiser tubes. Such fouling deposits impede gas flowsand dramatically reduce efficiency and are related accordingto the equation:
Fouling factor = base: acid ratio x NazO (% m1m) in the ash.
The base: acid ratio is also useful for determining the slaggingcharacteristics of ash material. Such material is difficult toremove from the combustion zone of the boiler and its
Table 3. Calibration graphs listing interfering elements (SEEstandard error of the estimate)
Table 4. Mean size of coal during grinding in a planetary ball mill
Mean particle size/j.lm
Grinding Coal Coal Coal Coal Coaltime/min GI G2 G3 G4 G5
0 38 57 59 62 555 26 36 32 31 33
10 22 27 24 28 2915 19 24 22 24 2820 19 22 20 22 2830 18 20 18 21 2860 20 20 18 23 28
0.08~.350
0.18().4).720
Wavclcngth/nm4.41.19090.98890.83390.71260.61550.53730.47290.37420.33600.27500.1937
X-ray lineKKKKKKKKKKKK
Compton K
CrystalElement
C -'Na.. TIAPtMg.. ADPtAI PET§Si PETP PETS NaCICI NaCiK LiF20flCa LiF200
Ti .. LiF200Fe .. LiF200Rh . LiFz(J()Scanner LiF200Scanner PET
* Total reflection monochromator.t Thallium hydrogen phthalate.t Ammonium dihydrogen phosphate.§ Pentacrythritol.
1400 ANALYST, NOVEMBER 1990. VOL. 115
10 LL.._"'----'-_.l----'_-'-------'_--'-_.L----'--_.l----'_....LJ
0.8 LL..-'--'----'-----'-----'-----'---'------'------'------'------'_'--w
10 15 20 25 30 35 40 45 50 55 60Grinding time/min
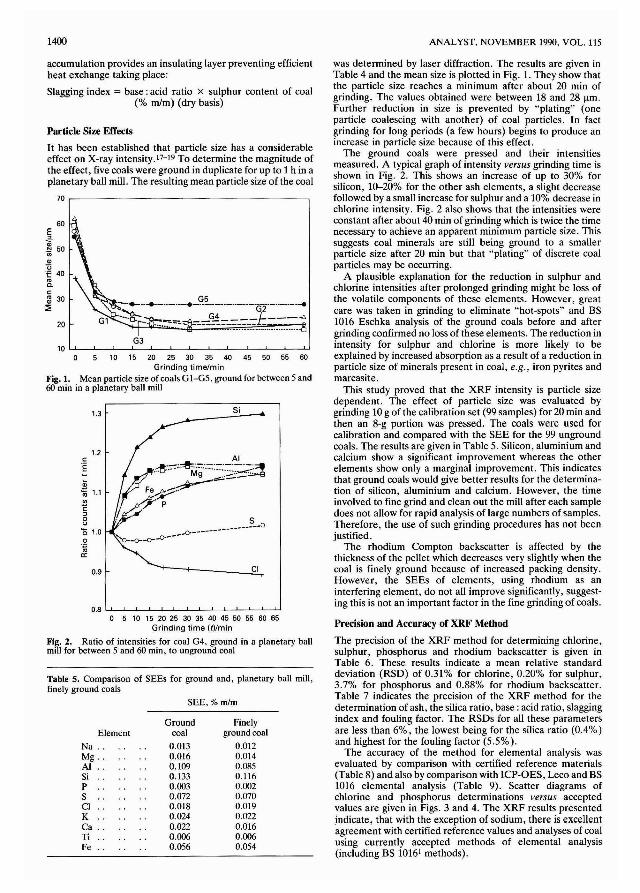
Fig. 1. Mean particle size of coals GI-G5, ground for between 5 and60 min in a planetary ball mill
was determined by laser diffraction. The results are given inTable 4 and the mean size is plotted in Fig. 1. They show thatthe particle size reaches a minimum after about 20 min ofgrinding. The values obtained were between 18 and 28 ftm.Further reduction in size is prevented by "plating" (oneparticle coalescing with another) of coal particles. In factgrinding for long periods (a few hours) begins to produce anincrease in particle size because of this effect.
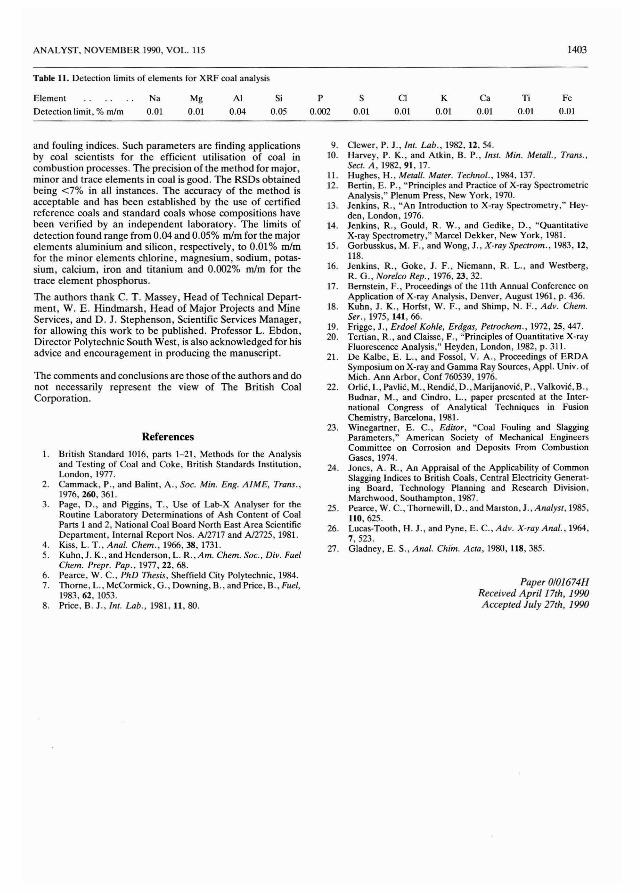
The ground coals were pressed and their intensitiesmeasured. A typical graph of intensity versus grinding time isshown in Fig. 2. This shows an increase of up to 30% forsilicon, 10-20% for the other ash elements, a slight decreasefollowed by a small increase for sulphur and a 10% decrease inchlorine intensity. Fig. 2 also shows that the intensities wereconstant after about 40 min of grinding which is twice the timenecessary to achieve an apparent minimum particle size. Thissuggests coal minerals are still being ground to a smallerparticle size after 20 min but that "plating" of discrete coalparticles may be occurring.
A plausible explanation for the reduction in sulphur andchlorine intensities after prolonged grinding might be loss ofthe volatile components of these elements. However, greatcare was taken in grinding to eliminate "hot-spots" and BS1016 Eschka analysis of the ground coals before and aftergrinding confirmed no loss of these elements. The reduction inintensity for sulphur and chlorine is more likely to beexplained by increased absorption as a result of a reduction inparticle size of minerals present in coal, e.g., iron pyrites andmarcasite.
This study proved that the XRF intensity is particle sizedependent. The effect of particle size was evaluated bygrinding 10 g of the calibration set (99 samples) for 20 min andthen an 8-g portion was pressed. The coals were used forcalibration and compared with the SEE for the 99 ungroundcoals. The results are given in Table 5. Silicon, aluminium andcalcium show a significant improvement whereas the otherelements show only a marginal improvement. This indicatesthat ground coals would give better results for the determination of silicon, aluminium and calcium. However, the timeinvolved to fine grind and clean out the mill after each sampledoes not allow for rapid analysis of large numbers of samples.Therefore, the use of such grinding procedures has not beenjustified.
The rhodium Compton backscatter is affected by thethickness of the pellet which decreases very slightly when thecoal is finely ground because of increased packing density.However, the SEEs of elements, using rhodium as aninterfering element, do not all improve significantly, suggesting this is not an important factor in the fine grinding of coals.
CI
Si
0.9
1,2
1.3
Q;~ 1.1<Il
E:J
8'01.0o.~
a:
cE
G3
\ G'<~;.-._--..--_._._-.-.__.__.__._-_._..__._.__.._,..... ''''0- G2
G1 -~'o. " ...:~"'-=_ ==GA-=-_-:=_-:l:---":'
60
Particle Size Effects
It has been established that particle size has a considerableeffect on X-ray intensity. 17-19 To determine the magnitude ofthe effect, five coals were ground in duplicate for up to 1 h in aplanetary ball mill. The resulting mean particle size of the coal
70,-----------------------,
20
accumulation provides an insulating layer preventing efficientheat exchange taking place:
Slagging index = base: acid ratio x sulphur content of coal(% mlm) (dry basis)
E"-
Q;.~ 50<Il
Q)
U'f 40
'"c.c:ll 30~
o 5 10 15 2025 30 35 40 45 50 55 60 65Grinding time (tl/min
Fig. 2. Ratio of intensities for coal G4, ground in a planetary ballmill for between 5 and 60 min, to unground coal
Table 5. Comparison of SEEs for ground and, planetary ball mill,finely ground coals
SEE, -Yo mlm
Ground FinelyElement coal ground coal
Na .. 0.013 0.012Mg .. 0.016 0.014AI 0.109 0.085Si 0.133 0.116P 0.003 0.002S 0.072 0.070Cl 0.018 0.019K 0.024 0.022Ca .. 0.022 0.016Ti 0.006 0.006Fe .. 0.056 0.054
Precision and Accuracy of XRF Method
The precision of the XRF method for determining chlorine,sulphur, phosphorus and rhodium backscatter is given inTable 6. These results indicate a mean relative standarddeviation (RSD) of 0.31 % for chlorine, 0.20% for sulphur,3.7% for phosphorus and 0.88% for rhodium backscatter.Table 7 indicates the precision of the XRF method for thedetermination of ash, the silica ratio, base: acid ratio, slaggingindex and fouling factor. The RSDs for all these parametersare less than 6%, the lowest being for the silica ratio (0.4%)and highest for the fouling factor (5.5%).
The accuracy of the method for elemental analysis wasevaluated by comparison with certified reference materials(Table 8) and also by comparison with lCP-OES, Leco and BS1016 elemental analysis (Table 9). Scatter diagrams ofchlorine and phosphorus determinations versus acceptedvalues are given in Figs. 3 and 4. The XRF results presentedindicate, that with the exception of sodium, there is excellentagreement with certified reference values and analyses of coalusing currently accepted methods of elemental analysis(including BS 10161 methods).

ANALYST, NOVEMBER 1990, VOL. 115 1401
Table 6. Reproducibility of analysing ten different pellets for two selected coals X and Y
Silicon-based ash,Chlorine, % mlm Sulphur, % mlm Phosphorus, % mlm %mlm
Pellet No. X Y X Y X Y X Y
1 0.193 0.302 2.110 1.464 0.0601 0.0041 18.272 2.8672 0.193 0.301 2.115 1.460 6.0598 0.0042 18.209 2.9163 0.193 0.300 2.109 1.458 0.0602 0.0039 18.123 2.8674 0.193 0.299 2.116 1.457 0.0594 0.0038 18.155 2.8225 0.192 0.299 2.110 1.455 0.0591 0.0035 18.172 2.8526 0.192 0.300 2.121 1.457 0.0592 0.0044 18.139 2.8267 0.193 0.300 2.109 1.454 0.0603 0.0040 18.398 2.8778 0.193 0.299 2.109 1.456 0.0597 0.0042 18.170 2.8209 0.192 0.298 2.112 1.458 0.0601 0.0037 18.316 2.844
10 0.193 0.300 2.113 1.460 0.0594 0.0040 18.445 2.810
Mean 0.1927 0.2998 2.1124 1.4579 0.05973 0.00398 18.240 2.850SD 0.000483 0.00113 0.00395 0.00288 0.000437 0.000266 0.000483 0.0326RSD,% .. 0.25 0.38 0.19 0.20 0.73 6.67 0.62 1.14Chemical value- 0.18 0.29 2.41 1.52 0.060 0.003 19.13 2.86
- See reference I.
Table 7. Analysis of a typical coal sample to evaluate the precision of the method
Coal Ash, Silica Base: acid Siagging Foulingpressing %mlm ratio ratio index factor
1 15.18 77.46 0.264 0.484 0.6212 15.86 77.07 0.267 0.500 0.6013 15.77 76.93 0.269 0.508 0.6004 16.32 76.69 0.270 0.521 0.5465 15.75 76.93 0.269 0.506 0.5946 15.75 76.84 0.268 0.501 0.5827 15.80 76.77 0.270 0.509 0.6088 15.21 77.09 0.268 0.494 0.6519 16.36 76.39 0.273 0.525 0.564
10 15.87 77.11 0.266 0.505 0.575
Mean 15.79 76.93 0.268 0.505 0.594Range 15.18-16.36 76.39-77.46 0.264-0.273 0.484-0.525 0.546--{).651SD 0.38 0.29 0.002 0.012 0.03095% Confidence limit' .. 15.79 ± 0.76 76.93 ± 0.58 0.268 ± 0.004 0.505 ± 0.024 0.594 ± 0.060RSD.% 2.4 0.4 0.7 2.4 5.5
Table 8. Comparison of XRF values with certified or reference values
Value,Sample %mlm Na Mg AI Si P S CI K Ca Ti Fe (Ash)
NISTSRM 1632a Certified 0.08 0.10- 2.97- 5.9- 0.028- 1.62 0.08- 0.42 0.23 0.16- 1.11 NDt(1.45)-
XRF 0.09 0.12 2.61 5.59 0.025 1.42 0.09 0.40 0.27 0.15 1.07 ND0.09 0.12 2.61 5.61 0.025 1.42 0.09 0.41 0.27 0.15 1.08 ND0.10 0.12 2.61 5.60 0.025 1.41 0.09 0.41 0.27 0.15 1.08 ND
MeanXRF 0.09 0.12 2.61 5.60 0.025 1.42 0.09 0.41 0.27 0.15 1.08 ND
Alpha 2753* .. Certified 0.01 0.04 1.07 1.96 0.014 ND ND 0.15 0.04 0.06 0.36 7.3XRF 0.05 0.04 0.94 2.00 0.018 0.82 0.05 0.15 0.D7 0.06 0.34 6.7
0.05 0.04 0.94 2.00 0.018 0.82 0.05 0.15 0.07 0.06 0.34 6.60.04 0.04 0.94 2.01 0.D18 0.82 0.05 0.15 0.D7 0.06 0.34 6.6
MeanXRF 0.05 0.04 0.94 2.00 0.018 0.82 0.05 0.15 0.07 0.06 0.34 6.6
Alpha2757t .. Certified 0.05 0.08 1.34 3.14 0.004 ND ND 0.31 0.12 0.08 1.46 12.5XRF 0.D7 0.11 1.42 3.12 0.010 2.79 0.04 0.32 0.16 0.07 .47 12.1
0.08 0.11 1.42 3.10 0.010 2.79 0.04 0.31 0.16 0.07 1.47 12.20.07 0.11 1.42 3.11 0.010. 2.79 0.04 0.32 0.16 0.07 1.48 12.3
MeanXRF 0.D7 0.11 1.42 3.11 0.010 2.79 0.04 0.32 0.16 0.07 1.47 12.2
Alpha275lt Certified 0.31 0.10 0.52 0.77 0.010 ND ND 0.03 0.60 0.03 0.30 5.2XRF 0.20 0.13 0.43 0.49 0.012 0.51 0.03 0.01 0.70 0.03 0.31 4.1
0.20 0.13 0.43 0.49 0.012 0.49 0.03 0.01 0.67 0.03 0.29 4.00.20 0.13 0.43 0.49 0.012 0.49 0.03 0.01 0.66 0.03 0.29 3.9
MeanXRF 0.20 0.13 0.43 0.49 0.012 0.50 0.03 0.01 0.68 0.03 0.30 4.0
- Values determined by Gladney, see reference 27.t ND = Not determined.* Alpha Resources Inc., Stevensville, MI, USA.

1402 ANALYST, NOVEMBER 1990, VOL. 115
Table 9. Statistical summary of comparison of XRF coal analysis and ICP ash analysis, Leco sulphur elemental analysis and BS 1016 elementalanalysis
0.060.01 0.02 0.03 0.04 0.05XRF value Dhosphorus, % m/m
Fig. 4. Scatter diagram for XRF determined phosphorus against ICPvalues for 99 test coals
0.2 0.4 0.6 0.8XRF value chlorine, % mlm
Fig. 3. Scatter diagram for XRF determined chlorine against BSchlorine determination for 99 test coals .
Concentration (air·dried coal basis), % mlm
Na Mg AI Si P S CI' K Ca Ti FeRange. 0.03- <0.01- 0.52- 0.30- 0.002- 0.95- 0.08- 0.01- 0.07- 0.02- 0.26-
0.31 0.45 4.34 7.75 0.053 2.87 0.79 1.05 1.00 0.17 2.09MeanXRF 0.128 0.134 1.648 2.813 0.Q18 1.617 0.332 0.317 0.329 0.066 1.064Mean ICPand BS 1016 0.110 0.136 1.666 2.819 0.Q18 1.575 0.337 0.333 0.317 0.066 1.095Average difference,
XRF-ICP;n =99 0.018 -0.002 -0.017 0.004 0.0005 0.041 -0.006 -0.016 0.011 <0.001 -0.032Standard deviation of
difference 0.014 0.029 0.124 0.273 0.0046 0.118 0.Q18 0.029 0.028 0.013 0.09295% Confidence limit .. ±0.028 ±0.058 ±0.248 ±0.546 ±0.0092 ±0.236 ±0.036 ±0.058 ±0.056 ±0.026 ±0.184
• BS 1016 Esehka determination on the coal.
0.06
.€ 0.8E 0.05 •
E .. E • • •.... .... •
Vi 0.04 •.,; • •:> •.~ 0.6 is • •is .. .J::. ."': • •:<: .. g. 0.03u 0 • .-'" .J::. •~ 0.4 0. ••..
~ 0.02 • ••>Vl OilD >
0.2 "-~O.o1
Table 10. Comparison of XRF coal analysis with BS ash content and derived ash parameters
Ash (air-dried basis), Silica Base: acid Slagging Fouling%mJm ratio ratio index factor
Range 3.3-31.9 48.5-84.0 0.2()...().61 0.18-1.12 0.11-3.14MeanXRF 12.540 70.770 0.334 0.538 0.681Mean ICP and BSI016 12.299 70.474 0.334 0.558 0.647Average difference,
XRF - ICP,n = 99 0.16 0.27 0.004 -0.015 0.039Standard deviation of
difference 0.64 1.87 0.031 0.084 0.16495% Confidence limit ±1.28 ±3.74 ±0.062 ±0.168 ±0.328
0.7 r---------------------,ro
Conclusions
X-ray fluorescence spectrometry has been applied successfullyto rapid elemental determinations of pressed coal powders. Inaddition, XRF elemental analyses have been utilised successfully to calculate coal combustion parameters such as slagging
Table 10 shows the results for XRF determinations of ash,silica ratio, base: acid ratio, slagging index and fouling factor.The scatter diagram for base: acid ratio versus rep values isgiven in Fig. 5. The values presented for 99 coal samples showgood agreement for all of the parameters with the exception ofthe fouling factor. This can be largely attributed to theinaccuracies in the XRF determination of sodium. Thedetection limits for the elemental analysis of coal by XRF aregiven in Table 11. This shows detection limits range from'0.04 and 0.05% mlm for the major elements aluminium andsilicon, respectively, to 0.01% mlm for the minor elementsand 0.002% mlm for the trace element phosphorus.
0,70.6
x •x
xx
0.2
O. 1 LL~_ __'______'_ .1._____'_______'__--'
0.1
0.2
0.6
o.~ 0.5
'0'v~ 0.4
~,g~ 0.3
0.3 0,4 0.5XRF base: acid ratio
Fig. S. Scatter diagram for XRF determined base: acid ratio againstICP values for 99 test coals
ANALYST, NOVEMBER 1990. VOL. 115
Table II. Detection limits of elements for XRF coal analysis
1403
Element
Detection limit, % mlm
Na
0.01
Mg
omAI
0.04
Si
0.05
P
0.002S
0.01
CJ0.01
K
0.01
Ca
omTi
0.01
Fe
0.01
and fouling indices. Such parameters are finding applicationsby coal scientists for the efficient utilisation of coal incombustion processes. The precision of the method for major,minor and trace elements in coal is good. The RSDs obtainedbeing <7% in all instances. The accuracy of the method isacceptable and has been established by the use of certifiedreference coals and standard coals whose compositions havebeen verified by an independent laboratory. The limits ofdetection found range from 0.04 and 0.05% m1m for the majorelements aluminium and silicon, respectively, to 0.01% mlmfor the minor elements chlorine, magnesium, sodium, potassium, calcium, iron and titanium and 0.002% m1m for thetrace element phosphorus.
The authors thank C. T. Massey, Head of Technical Department, W. E. Hindmarsh, Head of Major Projects and MineServices, and D. J. Stephenson, Scientific Services Manager,for allowing this work to be published. Professor L. Ebdon,Director Polytechnic South West, is also acknowledged for hisadvice and encouragement in producing the manuscript.
The comments and conclusions are those of the authors and donot necessarily represent the view of The British CoalCorporation.
References
1. British Standard 1016, parts 1-21, Methods for the Analysisand Testing of Coal and Coke, British Standards Institution,London, 1977.
2. Cammack, P., and Balint, A., Soc. Min. Eng. AIME, Trans.,1976, 260, 361.
3. Page, D., and Piggins, T., Use of Lab-X Analyser for theRoutine Laboratory Determinations of Ash Content of CoalParts 1 and 2, National Coal Board North East Area ScientificDepartment, Internal Report Nos. A12717 and A12725, 1981.
4. Kiss, L. T., Anal. Chem., 1966, 38, 1731.5. Kuhn, J. K.. and Henderson, L. R., Am. Chem. Soc., Div. Fuel
Chem. Prepr. Pap., 1977, 22, 68.6. Pearce. W. c.. PhD Thesis, Sheffield City Polytechnic, 1984.7. Thorne, L., McCormick, G., Downing, B., and Price, B., Fuel,
1983,62. 1053.8. Price, B. J., Int. Lab., 1981,11,80.
9. Clewer, P. J., Int. Lab., 1982, 12,54.10. Harvey, P. K., and Atkin, B. P., Inst. Min. Metall., Trans.,
Sect. A, 1982,91,17.11. Hughes, H., Metall. Mater. Technol., 1984, 137.12. Bertin, E. P., "Principles and Practice of X-ray Spectrometric
Analysis," Plenum Press, New York, 1970.13. Jenkins, R., "An Introduction to X-ray Spectrometry," Hey
den, London, 1976.14. Jenkins, R., Gould, R. W., and Gedike, D., "Quantitative
X-ray Spectrometry," Marcel Dekker, New York, 1981.15. Gorbusskus, M. F., and Wong, J., X-ray Spectrom., 1983, 12,
118.16. Jenkins, R., Goke, J. F., Niemann, R. L., and Westberg,
R. G., Norelco Rep., 1976,23,32.17. Bernstein, F., Proceedings of the 11th Annual Conference on
Application of X-ray Analysis, Denver, August 1961, p. 436.18. Kuhn, J. K., Hortst, W. F., and Shimp, N. F., Adv. Chem.
Ser., 1975, 141,66.19. Frigge, J., Erdoel Kahle, Erdgas, Petrochem., 1972,25,447.20. Tertian, R., and Claisse, F., "Principles of Quantitative X-ray
Fluorescence Analysis," Heyden, London, 1982, p. 311.21. De Kalbe, E. L., and Fossol, V. A., Proceedings of ERDA
Symposium on X-ray and Gamma Ray Sources, Appl. Univ. ofMich. Ann Arbor, Conf 760539, 1976.
22. arlie, I., Pavlic, M., Rendie, D., Marijanovic, P., Valkovic. B.,Budnar, M., and Cindro, L., paper presented at the International Congress of Analytical Techniques in FusionChemistry, Barcelona, 1981.
23. Winegartner, E. C., Editor, "Coal Fouling and SlaggingParameters," American Society of Mechanical EngineersCommittee on Corrosion and Deposits From CombustionGases, 1974.
24. Jones, A. R., An Appraisal of the Applicability of CommonSiagging Indices to British Coals, Central Electricity Generating Board, Technology Planning and Research Division,Marchwood, Southampton, 1987.
25. Pearce, W. c., Thornewill, D., and Marston, J., Analyst, 1985,110,625.
26. Lucas-Tooth, H. J., and Pyne, E. C., Adv. X-ray Anal., 1964,7,523.
27. Gladney, E. S., Anal. Chim. Acta, 1980, 118, 385.
Paper 0/01674HReceived April 17th, 1990Accepted July 27th, 1990

ANALYST. NOVEMBER 1990, VOL. 115
Rapid Acid Extraction of Bituminous Coal for the Determination ofPhosphorus
Kenneth W. Riley, Harry N. S. Schafer and Helen OrbanCSIRO Division of Coal and Energy Technology, P.O. Box 136, North Ryde, NSW 2113, Australia
1405
A rapid acid extraction method for the determination of phosphorus in coal is described. Coal is weighed intopolypropylene bottles, hydrofluoric and hydrochloric acids are added and the resulting mixture is heated in amicrowave oven. Boric acid is then added to complex the fluoride. Phosphorus is determined byspectrophotometry, as the molybdovanadate complex, in an aliquot ofthe acid extract. This method is a rapidalternative to the commonly used methods, which require the prior oxidation of coal. A comparison of resultsfor the analysis of 22 coals by this method and a standard method indicate that the proposed method isaccurate.
Keywords: Coal analysis; phosphorus determination; microwave oven digestion
A number of standard methods l - 3 are available for thedetermination of phosphorus in coal. These methods requirethe oxidation of coal, either in a furnace or with nitric andsulphuric acids, before spectrophotometric measurement ofphosphorus as the reduced molybdophosphate complex.Standard methods are also available for the determination ofphosphorus in coal ash. The ash is fused with lithiumtetraborate,4 digested with sulphuric, hydrofluoric and nitricacids5 or decomposed with hydrochloric and hydrofluoricacids in a bomb or sealed bottle;6 the phosphorus is thendetermined as the molybdovanadate complex. The timerequired for the determination of phosphorus in coal could besignificantly shortened if the lime consuming oxidation stepwere to be avoided.
A rapid, alternative method, involving the use of a mixtureof hydrochloric and hydrofluoric acids to dissolve most of themineral matter in coal without oxidising the carbonaceousmatter, has been devised. The coal is heated with the acids in asealed polypropylene bottle in a microwave oven. Extractionof phosphorus is complete in a matter of minutes. Thephosphorus in solution is subsequently determined by spectrophotometry as the yellow phosphomolybdovanadate.
Experimental
The method used to determine the phosphorus in bituminouscoal samples is described below.
Acid Extraction
Sub-samples (1 g) of coal (crushed to ==212 J!m) were weighedinto autoclavable polypropylene bottles (Nalgene, 125 mlcapacity, Cat. No. 2006-0004). The total mass of each coalsample plus bottle was noted. Concentrated hydrochloric acid(1 ml) and hydrofluoric acid (40%, mlm) (4 ml) were addedand the bottles were sealed and shaken to wet the coal. Sixbottles at a time were placed in a sealed plastic container andheated for 45 s at 500 W in a microwave oven, equipped with aturn-table. This digestion time was established by trial anderror. Care must be taken to balance the loading of the ovenwith the heating time and energy output to avoid overheatingand overpressurising the polypropylene bottles. The use ofmicrowave ovens for acid digestion, and the precautions to betaken, have been discussed in the literature.7-9
The bottles were cooled, opened in a fume cupboard, and40 ml of 4% (m/v) boric acid solution were added. The bottleswere again sealed, placed in the plastic container and heatedfor a further 60 s. On cooling, the mass of solution wasadjusted to 100.0 g with distilled water. An aliquot of each
solution, free from suspended coal, was obtained by centrifuging or by filtration through a dry filter-paper (Whatman No.40). A reagent blank was submitted to the same procedure.
Calibration
A standard phosphorus solution (1 ml ,,0.1 mg of P) wasprepared by dissolving 0.2197 g of dried (at 110°C) potassiumdihydrogen phosphate in distilled water and adjusting thevolume to 500 ml. Calibration solutions were prepared bytransferring aliquots (2, 4 and 6 ml) of this standard solutioninto polypropylene bottles, together with the amounts ofhydrochloric, hydrofluoric and boric acids used to extract thecoal. The mass of each calibration solution was adjusted to100.0 g. A blank reference solution containing the acids wasprepared similarly.
Determination of Phosphorus
Aliquots (10 ml) of each of the reference, calibration, sampleand blank solutions were transferred into 25-ml calibratedflasks. To each was added 5 ml of molybdovanadate solution6[1 I of this solution was prepared by dissolving 1.25 g ofNH4V03 in 400 ml of dilute (1 + 1) nitric acid, then adding,with stirring, 400 ml of a solution containing 50 g of(N~)t;M07024.4H20 and diluting to volume). The complexed solutions were diluted to 25 ml, and the molybdovanadate complex was allowed to form for 10 min before theabsorbance of each was measured at 430 nm, in 40 mm cells,against the complexed reference solution (blank). A UnicamSP 500 Series 2 spectrophotometer was used. A calibrationgraph was prepared by plotting absorbance versus thephosphorus content of the calibration solutions, the concentrations of phosphorus in the sample solutions were read fromthe graph, and the concentrations in the coal samples werecalculated.
Of the 22 co~s analysed by this method, only one produceda yellow extrac~ before complexation. This is caused either byFe3+ or soluble organic matter and can, of course, cause anerror in the spectrophotometric measurement. This wascompensated for by taking a second aliquot of the uncomplexed acid extract, diluting to 25 ml and reading theabsorbance. This reading was used to correct for the apparentconcentration of phosphorus in that sample.
If the amount of phosphorus in a sample aliquot was greaterthan that of the highest calibration solution, a smaller aliquotwas taken and the volume of this was adjusted to 10 ml withthe blank solution, before the addition of the molybdovanadate.

1406
Table 1. Comparison of acid-extraction procedure with standardmethod (results are expressed as percentage of P, dry basis)
Coal Acid extraction Standard methodA 0.002,0.001 0.002,0.002B 0.005,0.005 0.004,0.004C 0.076,0.079 0.078,0.079D 0.151,0.158 0.155,0.152E 0.584,0.611 0.587,0.574ASCRM 009* 0.031,0.032 0.033,0.033
* Australian Standard Coal Reference Material 009, 0.032% Pcertified.
Comparison With Standard Method
The same coals were analysed using the Australian standardmethod! (dry oxidation procedure), which is similar to theBritish2 and IS03 standard methods. The coals were ashedand the ash was dissolved in sulphuric and hydrofluoric acids.Aliquots of the resulting digests were taken, and the reducedmolybdophosphate complex was formed by the addition ofammonium molybdate, antimony tartrate and ascorbic acidsolutions. The absorbance of each solution, together with astandard solution, was measured at 710 nm and the concentrations of phosphorus present in the coals were calculated.
Results and DiscussionTypical results obtained on a number of the coals, anaiysed bythe direct acid-extraction method and the standard method,are listed in Table 1. The individual results for each of thesecoals, analysed in duplicate, are given to indicate therepeatability of the method. The results obtained are inexcellent agreement with those obtained by use of thestandard method. The least-squares regression of the two setsof analyses of 22 coals with phosphorus contents between0.002 and 0.6% is
y = 1.029x - 0.003 (R2 = 0.999)
where y = result (mean) using proposed method and x =result (mean) using standard method.
However, if the result for coal E, which is unusually high inphosphorus, is removed from the data set, the regression is
y = 1.oo2x - 0.001 (R2 = 0.998)
This is the regression of21 results ranging from 0.002 to 0.16%of phosphorus; eight results of <0.05%, six between 0.05 and0.10%, and seven >0.1%.
The use of the microwave oven allows the very rapid acidextraction of the coal. However, concerns have beenexpressed on the safety? of using microwave ovens notdesigned for laboratory use for this purpose. As an alternativeto heating in a microwave oven, the coals can be extracted byusing a heated water-bath or ultrasonic bath10 although theextraction time is lengthened. \
A number of samples were extracted in a water-bath at90°C for 2 h and then heated further for 1 h after the additionof boric acid. These times are recommended for the digestionof coal ash6 and it is probable that these could be reduced. The
ANALYST, NOVEMBER 1990, VOL. 115
Table 2. Comparison of different acid extractions and standardmethod (results are expressed as percentage of P, dry basis)
Microwave StandardCoal oven Water-bath method
A 0.002 0.002 0.002B 0.005 0.004 0.004F 0.028 0.030 0.033I 0.064 0.066 0.068
results for the analysis of four coals using the microwave ovenand water-bath digestions and of the standard method aregiven in Table 2. The agreement between the methods is good.
Conclusion
Phosphorus can be determined by spectrophotometry afterthe direct acid extraction of bituminous coal. This is a rapidalternative to the commonly used methods, which require thecoal to be ashed in a furnace or oxidised with acids beforedetermination of the phosphorus. The time of acid extractioncan also be significantly shortened if the coal - acid mixture isheated in a microwave oven.
The accuracy of the method is excellent, as indicated by thevery good agreement between the results obtained with thismethod and those of the Australian standard method.
References
1. "Phosphorus in Coal and Coke," Australian Standard 1038,Part 9, 1977, Standards Association of Australia, NorthSydney, 1977.
2. "Phosphorus in Coal and Coke," BS 1016: 1977: Part 9, BritishStandards Institution, London, 1977.
3. "Solid Mineral Fuels-Determination of Phosphorus Content-Reduced Molybdophosphate Photometric Method," International Standard 622, 1981, International Organization forStandardization, 1981.
4. American Society for Testing and Materials, "Major and MinorElements in Coal and Coke Ash by Atomic Absorption,"ASTM D 3682-78, Annual Book of ASTM Standards, Volume05.05, American Society for Testing and Materials, Philadelphia, PA, 1987.
5. American Society for Testing and Materials, "Analysis of Coaland Coke Ash," ASTM, D 2795-84, Annual Book of ASTMStandards, Volume 05.0.5, American Society for Testing andMaterials, Philadelphia, PA, 1987.
6. "Analysis of Higher Rank Coal Ash and Coke Ash," Australian Standard 1038, Part 14.2, 1985, Standards Association ofAustralia, North Sydney, 1985.
7. Kingston, H. M., and lassie, L. B., in Kingston, H. M., andlassie, L. B., Editors, "Introduction to Microwave SamplePreparation: Theory and Practice," American ChemicalSociety, Washington, DC, 1988, pp. 231-243.
8. Gilman, L., and Grooms, W., Anal. Chern., 1988,60, 1624.9. Aysola, P., Anderson, P. W., and Langford. C. H., Anal.
Chern., 1988,60, 1625.10. Riley. K. W., and Godbeer, W. c., Analyst, 1990, 115. 865.
Paper 0/02624GReceived June 12th, 1990
Accepted July 4th, 1990
ANALYST, NOVEMBER 1990, VOL. 115
Automated Flow Injection Measurement of Photographic Dyes inGelatin at Elevated Temperatures
Richard H. Taylor, Gregory D. Clark," Jaromir Rliiicka and Gary D. ChristianCenter for Process Analytical Chemistry, Department of Chemistry, 8G-10, University of Washington,Seattle, WA 98195, USA.
1407
A method of measuring spectrophotometrically the concentrations of photographic dyes is described. Theproblems of analysing the highly concentrated, non-aqueous dyes when dispersed in a highly viscous gelatinmatrix were solved by the use of a flow injection analysis system which performed automated dissolution anddilution using the split zone - gradient chamber method at elevated temperatures with dimethyl sulphoxide asthe system carrier stream. The requirement of maintaining the matrix in which the dyes are located at anelevated temperature was met by housing the fluid bearing portion of the system within an incubator oven,with remote computer control and remote detection via optical fibres. The precision of the dilutions gave arelative standard deviation of 2% or better for dilutions up to 2000-fold of the injected sample. Whencompared with manual dilution and measurement, agreement was within 5% for all samples.
Keywords: Visible spectrophotometry; flow injection; automated dilution; photographic dyes
In the analysis of many process streams the necessity of samplepre-treatment makes the use of on-line analysis impractical.The sample handling required fO£ pre-treatment also introduces possible sources of error and presents a problem whenthe sample is toxic, radioactive or requires a specific physicalenvironment.
The use of flow injection analysis (FIA) is a way to addressthese problems. The FlA method has been shown to performeffectively with non-aqueous systems as with aqueoussystems. l -4 It allows for remote control and, by the use ofoptical fibres, remote spectrophotometric detection. Thisenables the solution bearing portion of the FlA apparatus tobe isolated and maintained in a specific environment or to beat a distant location.
One example of the types of samples encountered in processstreams is that of photographic dyes, which are dispersedat very high concentrations in gelatin media and which must bemaintained at elevated temperatures in order to avoidgelation. It is necessary to dilute the process stream samples ofthese dyes up to several thousand times prior to spectrophotometric analysis. Several automatic dilution systems, such aszone sampling, gradient chamber dilution, dual-stage gradientchamber dilution and the cascade dilution system have beendeveloped.5-ll
In this study, photographic dyes in gelatin matrices weremeasured spectrophotometrically after using an FIA automated dilution system at elevated temperatures. The splitzone - gradient chamber technique was selected for this studybecause large dilutions could be reproduced accurately andthe degree of dilution could be changed without physicallyaltering the system.9 This technique, due to the mechanicalstirring in the gradient chamber, is independent of the sampleviscosity up to fairly high viscosity levels. The dye samplesmust be maintained at an elevated temperature for the gelatinmedia in which they are dispersed to remain in the liquid state.This requirement is met by enclosing the solution bearingsections of the FlA system within an incubator oven where aconstant elevated temperature can be maintained.
Principle
The split zone - gradient chamber technique for automateddilution9 is based on the reproducible dispersion that occurswhen a sample is injected into an FIA system, i.e., each
• Present address: Department of Laboratory Medicine, SB-10,University of Washington, Seattle, WA 98195, USA.
IDJection of a similar analyte will disperse in an identicalmanner. 1O A portion of the trailing edge of the sample zone,can be re-directed, or split off, to obtain a dilution of theinjected sample. This re-direction, or zone splitting, can beaccomplished with a pump and a T-piece and is madereproducible through appropriate control of the pump. Thetrailing zone is the portion of the sample that is detected. Theheight and area of the detected peak can be measured andeach parameter can be related to the sample concentration.
The dilution that occurs in the system can be defined interms of the inverse mole ratio, introduced by Whitman andChristian.8 The ratio of the number of moles injected, nO, tothe number of moles detected, nde" is the inverse molefraction, x-I, such that:
X-I = nOlnde.
As the area of the detected peak is proportional to the numberof moles then x- I can be written as:
X-I = kAolAde•
where AO is the area of the k-fold manually diluted calibrationstandard and A de• is the area of the peak of the same standardsolution after dilution by zone splitting.
The gradient chamber is the primary dispersing componentin the system and causes the system to perform in a way similarto a single mixing chamber system, which changes the shape ofthe peak to be skewed and hence produces a more pronouncedtrailing edge. This increases the amount of control over theextent of the dilution and enhances the precision.6
Experimental
Reagents
The carrier used in all experiments was ACS spectroscopicgrade dimethyl sulphoxide (DMSO) (J. T. Baker). Twodifferent photographic dyes, magenta and yellow, in gelatinmedia were provided by the Polaroid Corporation. All manualdilutions of the dyes provided were performed with the samegradeDMSO.
Apparatus
A split zone dilution system with an in-line gradient chamberwas used (Fig. 1). The pumps were Alitea Cf-4 peristalticpumps with remote Alitea Model SC controllers. A RheodyneType 5701 pneumatic actuator was used with a RheodyneType 50 4-way injection valve employing a 25-ILI sample loop.
1408
To waste 12
Pump 1
Carrierstream
11 -t---;--i
Merging Injectionstream valve
11' -il--+--="'------......J
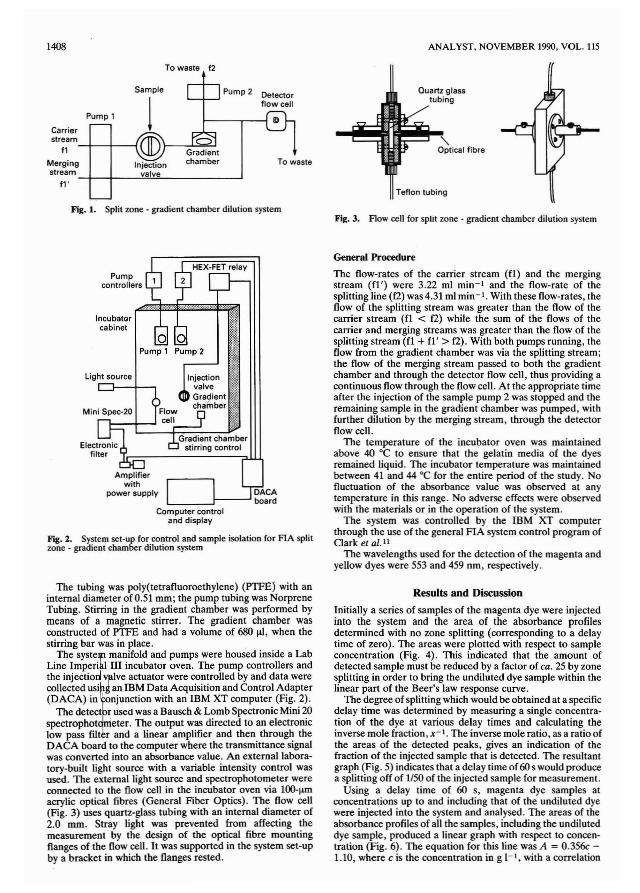
Fig. 1. Split zone - gradient chamber dilution system
ANALYST, NOVEMBER 1990, VOL. 115
Quartz glasstubing
"Optical fibre
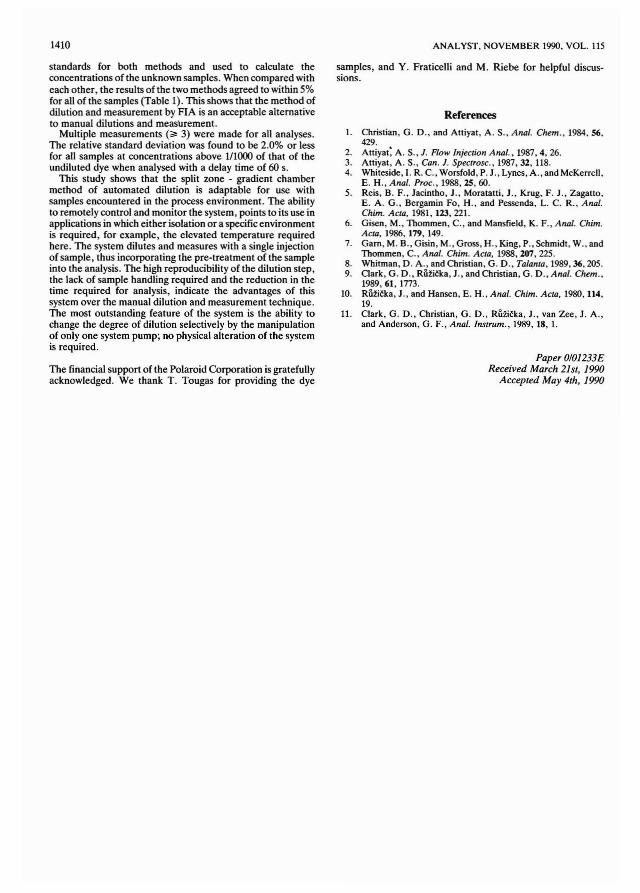
Fig. 3. Flow cell for split wne - gradient chamber dilution system
Computer controland display
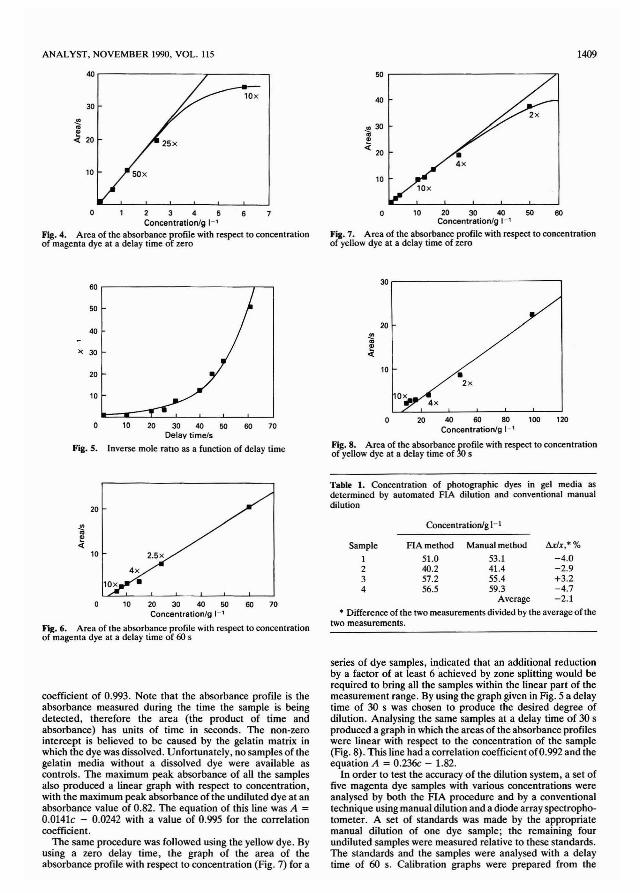
Fig. 2. System set-up for control and sample isolation for FIA splitwne - gradient chamber dilution system
Pumpcontrollers
Incubatorcabinet
Light source
General Procedure
The flow-rates of the carrier stream (fl) and the mergingstream (fl') were 3.22 ml min-I and the flow-rate of thesplitting line (f2) was 4.31 ml min-I. With these flow-rates, theflow of the splitting stream was greater than the flow of thecarrier stream (fl < f2) while the sum of the flows of thecarrier and merging streams was greater than the flow of thesplitting stream (fl + fl' > f2). With both pumps running, theflow from the gradient chamber was via the splitting stream;the flow of the merging stream passed to both the gradientchamber and through the detector flow cell, thus providing acontinuous flow through the flow cell. At the appropriate timeafter the injection of the sample pump 2 was stopped and theremaining sample in the gradient chamber was pumped, withfurther dilution by the merging stream, through the detectorflow cell.
The temperature of the incubator oven was maintainedabove 40 °C to ensure that the gelatin media of the dyesremained liquid. The incubator temperature was maintainedbetween 41 and 44 °C for the entire period of the study. Nofluctuation of the absorbance value was observed at anytemperature in this range. No adverse effects were observedwith the materials or in the operation of the system.
The system was controlled by the mM XT computerthrough the use of the general FIA system control program ofClark et al. tl
The wavelengths used for the detection of the magenta andyellow dyes were 553 and 459 nm, respectively.
The tubing was poty(tetrafluoroethylene) (PTFE) with aninternal diameter of 0.51 mm; the pump tubing was NorpreneTubing. Stirring in the gradient chamber was performed bymeans of a magnetic stirrer, The gradient chamber wasconstructed of PTFE and had a volume of 680 IJ.I, when thestirring bar was in place.
The systeIjll manifold and pumps were housed inside a LabLine Imperial III incubator oven. The pump controllers andthe injectiod v~lve actuator were controlled by and data werecollected usi~g an IBM Data Acquisition and Control Adapter(DACA) in~'onjunction with an ffiM XT computer (Fig. 2).
The detect r used was a Bausch & Lomb Spectronic Mini 20spectrophot 'eter. The output was directed to an electroniclow pass filt r and a linear amplifier and then through theDACA board to the computer where the transmittance signalwas converted into an absorbance value. An externallaboratory-built light source with a variable intensity control wasused. The external light source and spectrophotometer wereconnected to the flow cell in the incubator oven via 100-lJ.macrylic optical fibres (General Fiber Optics). The flow cell(Fig. 3) uses quartz-glass tubing with an internal diameter of2.0 nun. Stray light was prevented from affecting themeasurement by the design of the optical fibre mountingflanges of the flow cell. It was supported in the system set-upby a bracket in which the flanges rested.
Results and Discussion
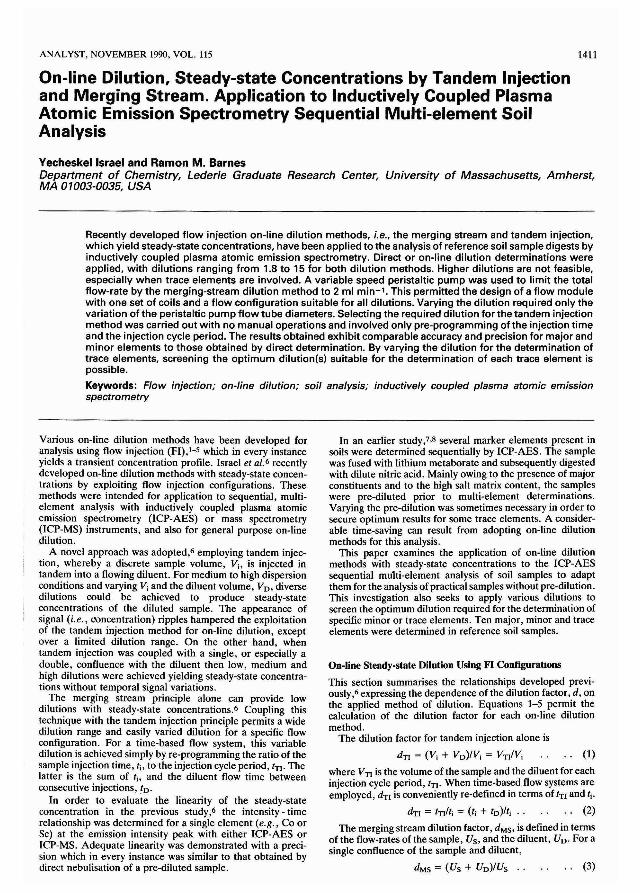
Initially a series of samples of the magenta dye were injectedinto the system and the area of the absorbance profilesdetermined with no zone splitting (corresponding to a delaytime of zero). The areas were plotted with respect to sampleconcentration (Fig. 4). This indicated that the amount ofdetected sample must be reduced by a factor of ca. 25 by zonesplitting in order to bring the undiluted dye sample within thelinear part of the Beer's law response curve.
The degree of splitting which would be obtained at a specificdelay time was determined by measuring a single concentration of the dye at various delay times and calculating theinverse mole fraction, X-I. The inverse mole ratio, as a ratio ofthe areas of the detected peaks, gives an indication of thefraction of the injected sample that is detected. The resultantgraph (Fig. 5) indicates that a delay time of 60 s would producea splitting off of 1/50 of the injected sample for measurement.
Using a delay time of 60 s, magenta dye samples atconcentrations up to and including that of the undiluted dyewere injected into the system and analysed. The areas of theabsorbance profiles of all the samples, including the undiluteddye sample, produced a linear graph with respect to concentration (Fig. 6). The equation for this line was A = 0.356c 1.10, where c is the concentration in g I-t, with a correlation
ANALYST, NOVEMBER 1990, VOL. 115 1409
.!!!~« 20
10
o 2 3 4 6Concentrationig 1-1
Fig. 4. Area of the absorbance profile with respect to concentrationof magenta dye at a delay time of zero
50 r-------------""""71
40
.. 30"iiiCD
< 20
4x
10lOx
o 10 20 30 40 50 60Concentrationig 1-1
Fig. 7. Area of the absorbance profile with respect to concentrationof yellow dye at a delay time of zero
60
50
40
'i
'" 30
20
10
0
Fig. 5.
10 20 30 40 50 60 70Delay time/s
Inverse mole ratio as a function of delay time
30,------------------,
20
..!!?to~«
10 •2x
lOx4x
0 20 40 60 eo 100 120Concentrationlg 1- 1
Fig. 8. Area of the absorbance profile with respect to concentrationof yellow dye at a delay time of 30 s
Concentrationlg 1-1
Table 1. Concentration of photographic dyes in gel media asdetermined by automated FIA dilution and conventional manualdilution
lulx,*%Manual methodFIAmethod
51.040.257.256.5
Sample
1234
53.1 -4.041.4 -2.955.4 +3.259.3 -4.7
Average -2.1
• Difference of the two measurements divided by the average of thetwo measurements.
10x
20
10 20 30 40 50 60 70Concentrationlg 1-1
Fig. 6. Area of the absorbance profile with respect to concentrationof magenta dye at a delay time of 60 s
10
coefficient of 0.993. Note that the absorbance profile is theabsorbance measured during the time the sample is beingdetected, therefore the area (the product of time andabsorbance) has units of time in seconds. The non-zerointercept is believed to be caused by the gelatin matrix inwhich the dye was dissolved. Unfortunately, no samples of thegelatin media without a dissolved dye were available ascontrols. The maximum peak absorbance of all the samplesalso produced a linear graph with respect to concentration,with the maximum peak absorbance of the undiluted dye at anabsorbance value of 0.82. The equation of this line was A =0.0141c - 0.0242 with a value of 0.995 for the correlationcoefficient.
The same procedure was followed using the yellow dye. Byusing a zero delay time, the graph of the area of theabsorbance profile with respect to concentration (Fig. 7) for a
series of dye samples, indicated that an additional reductionby a factor of at least 6 achieved by zone splitting would berequired to bring all the samples within the linear part of themeasurement range. By using the graph given in Fig. 5 a delaytime of 30 s was chosen to produce the desired degree ofdilution. Analysing the same samples at a delay time of 30 sproduced a graph in which the areas of the absorbance profileswere linear with respect to the concentration of the sample(Fig. 8). This line had a correlation coefficient of0.992 and theequation A = 0.236c - 1.82.
In order to test the accuracy of the dilution system, a set offive magenta dye samples with various concentrations wereanalysed by both the FIA procedure and by a conventionaltechnique using manual dilution and a diode array spectrophotometer. A set of standards was made by the appropriatemanual dilution of one dye sample; the remaining fourundiluted samples were measured relative to these standards.The standards and the samples were analysed with a delaytime of 60 s. Calibration graphs were prepared from the
1410
standards for both methods and used to calculate theconcentrations of the unknown samples. When compared witheach other, the results of the two methods agreed to within 5%for all of the samples (Table 1). This shows that the method ofdilution and measurement by FIA is an acceptable alternativeto manual dilutions and measurement.
Multiple measurements (~ 3) were made for all analyses.The relative standard deviation was found to be 2.0% or lessfor all samples at concentrations above 111000 of that of theundiluted dye when analysed with a delay time of 60 s.
This study shows that the split zone - gradient chambermethod of automated dilution is adaptable for use withsamples encountered in the process environment. The abilityto remotely control and monitor the system, points to its use inapplications in which either isolation or a specific environmentis required, for example, the elevated temperature requiredhere. The system dilutes and measures with a single injectionof sample, thus incorporating the pre-treatment of the sampleinto the analysis. The high reproducibility ofthe dilution step,the lack of sample handling required and the reduction in thetime required for analysis, indicate the advantages of thissystem over the manual dilution and measurement technique.The most outstanding feature of the system is the ability tochange the degree of dilution selectively by the manipulationof only one system pump; no physical alteration of the systemis required.
The financial support of the Polaroid Corporation is gratefullyacknowledged. We thank T. Tougas for providing the dye
ANALYST, NOVEMBER 1990. VOL. 115
samples, and Y. Fraticelli and M. Riebe for helpful discussions.
References
1. Christian, G. D., and Attiyat, A. S.. Anal. Chem .• 1984. Sfi.429.
2. Attiyat; A. S., J. Flow Injection Anal., 1987,4, 26.3. Attiyat, A. S., Can. J. Spectrosc., 1987, 32, 118.4. Whiteside, I. R. C., Worsfold, P. J., Lynes, A., and McKerrell,
E. H., Anal. Proc., 1988, 25, 60.5. Reis, B. F., Jacintho, J., Moratatti, J., Krug, F. J., zagatto,
E. A. G., Bergamin Fo, H., and Pessenda, L. C. R. o Anal.Chim. Acta, 1981, 123,221.
6. Gisen, M., Thommen, c., and Mansfield, K. F., Anal. Chim.Acta, 1986, 179, 149.
7. Gam, M. B., Gisin, M., Gross, H., King, P., Schmidt, W.. andThommen, C., Anal. Chim. Acta, 1988,207,225.
8. Whitman, D. A., and Christian, G. D., Talama, 1989,36,205.9. Clark, G. D., RlI!icka, J., and Christian, G. D., Anal. Chem.,
1989,61, 1773.10. R1I!icka, J., and Hansen, E. H., Anal. Chim. Acta, 1980,114,
19.11. Clark, G. D., Christian, G. D., RlI!icka, J., van Zee, J. A.,
and Anderson, G. F., Anal. Instrum., 1989, 18, 1.
Paper 0/01233£Received March 21st, 1990
Accepted May 4th, 1990
ANALYST, NOVEMBER 1990, VOL. 115
On-line Dilution, Steady-state Concentrations by Tandem Injectionand Merging Stream. Application to Inductively Coupled PlasmaAtomic Emission Spectrometry Sequential Multi-element SoilAnalysis
1411
Yecheskellsrael and Ramon M. BarnesDepartment of Chemistry, Lederle Graduate Research Center, University of Massachusetts, Amherst,MA 01003-0035, USA
Recently developed flow injection on-line dilution methods, i.e., the merging stream and tandem injection,which yield steady-state concentrations, have been applied to the analysis of reference soil sample digests byinductively coupled plasma atomic emission spectrometry. Direct or on-line dilution determinations wereapplied, with dilutions ranging from 1.8 to 15 for both dilution methods. Higher dilutions are not feasible,especially when trace elements are involved. A variable speed peristaltic pump was used to limit the totalflow-rate by the merging-stream dilution method to 2 ml min-l, This permitted the design of a flow modulewith one set of coils and a flow configuration suitable for all dilutions. Varying the dilution required only thevariation ofthe peristaltic pump flow tube diameters. Selecting the required dilution for the tandem injectionmethod was carried out with no manual operations and involved only pre-programming of the injection timeand the injection cycle period. The results obtained exhibit comparable accuracy and precision for major andminor elements to those obtained by direct determination. By varying the dilution for the determination oftrace elements, screening the optimum dilution(s) suitable for the determination of each trace element ispossible.
Keywords: Flow injection; on-line dilution; soil analysis; inductively coupled plasma atomic emissionspectrometry
Various on-line dilution methods have been developed foranalysis using flow injection (FI),1-5 which in every instanceyields a transient concentration profile. Israel el af. 6 recentlydeveloped on-line dilution methods with steady-state concentrations by exploiting flow injection configurations. Thesemethods were intended for application to sequential, multielement analysis with inductively coupled plasma atomicemission spectrometry (ICP-AES) or mass spectrometry(ICP-MS) instruments, and also for general purpose on-linedilution.
A novel approach was adopted,6 employing tandem injection, whereby a discrete sample volume, Vj, is injected intandem into a flowing diluent. For medium to high dispersionconditions and varying V; and the diluent volume, V D , diversedilutions could be achieved to produce steady-stateconcentrations of the diluted sample. The appearance ofsignal (i.e., c.,'Oncentration) ripples hampered the exploitationof the tandem injection method for on-line dilution, exceptover a limited dilution range. On the other hand, whentandem injection was coupled with a single, or especially adouble, confluence with the diluent then low, medium andhigh dilutions were achieved yielding steady-state concentrations without temporal signal variations.
The merging stream principle alone can provide lowdilutions with steady-state concentrations.6 Coupling thistechnique with the tandem injection principle permits a widedilution range and easily varied dilution for a specific flowconfiguration. For a time-based flow system, this variabledilution is achieved simply by re-programming the ratio of thesample injection time, Ij, to the injection cycle period, ITI' Thelatter is the sum of Ii, and the diluent flow time betweenconsecutive injections, ID'
In order to evaluate the linearity of the steady-stateconcentration in the previous study,6 the intensity - timerelationship was determined for a single element (e.g., Co orSc) at the emission intensity peak with either ICP-AES orICP-MS. Adequate linearity was demonstrated with a precision which in every instance was similar to that obtained bydirect nebulisation of a pre-diluted sample.
In an earlier study,7,8 several marker elements present insoils were determined sequentially by ICP-AES. The samplewas fused with lithium metaborate and subsequently digestedwith dilute nitric acid. Mainly owing to the presence of majorconstituents and to the high salt matrix content, the sampleswere pre-diluted prior to multi-element determinations.Varying the pre-dilution was sometimes necessary in order tosecure optimum results for some trace elements. A considerable time-saving can result from adopting on-line dilutionmethods for this analysis.
This paper examines the application of on-line dilutionmethods with steady-state concentrations to the ICP-AESsequential mu1ti-element analysis of soil samples to adaptthem for the analysis of practical samples without pre-dilution.This investigation also seeks to apply various dilutions toscreen the optimum dilution required for the determination ofspecific minor or trace elements. Ten major, minor and traceelements were determined in reference soil samples.
On-line Steady-state Dilution Using FI Configurations
This section summarises the relationships developed previously,6 expressing the dependence of the dilution factor, d, onthe applied method of dilution. Equations 1-5 permit thecalculation of the dilution factor for each on-line dilutionmethod.
The dilution factor for tandem injection alone is
dTl = (Vi + VD)IV; = VTllVi •• (1)
where VTI is the volume of the sample and the diluent for eachinjection cycle period, ITI' When time-based flow systems areemployed, dTl is conveniently re-defined in terms of ITI and Ii'
dTl = ITI/I; = (I; + ID)/I; .. (2)
The merging stream dilution factor, dMS, is defined in termsof the flow-rates of the sample, Us, and the diluent, UD· For asingle confluence of the sample and diluent,
dMS = (Us + UD)lUs .. (3)
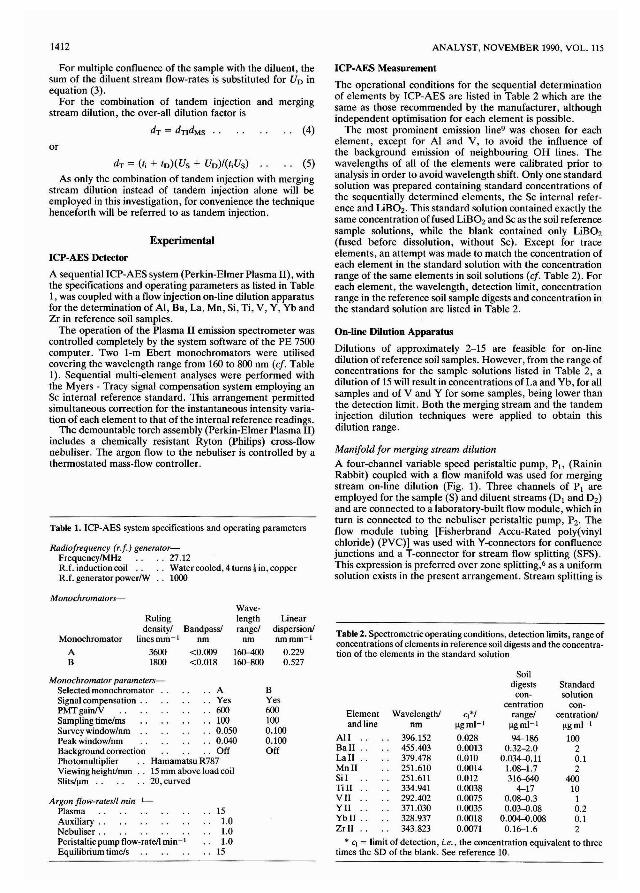
1412 ANALYST, NOVEMBER 1990, VOL. 115
For multiple confluence of the sample with the diluent, thesum of the diluent stream flow-rates is substituted for Uo inequation (3).
For the combination of tandem injection and mergingstream dilution, the over-all dilution factor is
.. (4)
or
dT = (Ii + to)( Us + UO)/(tiUS) (5)
As only the combination of tandem injection with mergingstream dilution instead of tandem injection alone will beemployed in this investigation, for convenience the techniquehenceforth will be referred to as tandem injection.
Experimental
ICP·AES Detector
A sequential ICP-AES system (Perkin-Elmer Plasma II), withthe specifications and operating parameters as listed in Table1, was coupled with a flow injection on-line dilution apparatusfor the determination of AI, Ba, La, Mn, Si, Ti, V, Y, Yb andZr in reference soil samples.
The operation of the Plasma II emission spectrometer wascontrolled completely by the system software of the PE 7500computer. Two I-m Ebert monochromators were utilisedcovering the wavelength range from 160 to 800 nm (cf. Table1). Sequential multi-element analyses were performed withthe Myers· Tracy signal compensation system employing anSc internal reference standard. This arrangement permittedsimultaneous correction for the instantaneous intensity variation of each element to that of the internal reference readings.
The demountable torch assembly (Perkin-Elmer Plasma II)includes a chemically resistant Ryton (Philips) cross-flownebuliser. The argon flow to the nebuliser is controlled by athermostated mass-flow controller.
Table 1. ICP-AES system specifications and operating parameters
Radiofrequency (r.f) generator-Frequency/MHz 27.12R.t. induction coil .. Water cooled, 4 turns! in, copperR.t. generator powerlW .. 1000
ICP-AES Measurement
The operational conditions for the sequential determinationof elements by ICP-AES are listed in Table 2 which are thesame as those recommended by the manufacturer, althoughindependent optimisation for each element is possible.
The most prominent emission line9 was chosen for eachelement, except for Al and V, to avoid the influence ofthe background emission of neighbouring OH lines. Thewavelengths of all of the elements were calibrated prior toanalysis in order to avoid wavelength shift. Only one standardsolution was prepared containing standard concentrations ofthe sequentially determined elements, the Sc internal reference and LiBOz. This standard solution contained exactly thesame concentration of fused LiBOzand Sc as the soil referencesample solutions, while the blank contained only LiBOz(fused before dissolution, without Sc). Except for traceelements, an attempt was made to match the concentration ofeach element in the standard solution with the concentrationrange of the same elements in soil solutions (cf. Table 2). Foreach element, the wavelength, detection limit, concentrationrange in the reference soil sample digests and concentration inthe standard solution are listed in Table 2.
On-line Dilution Apparatus
Dilutions of approximately 2-15 are feasible for on-linedilution of reference soil samples. However, from the range ofconcentrations for the sample solutions listed in Table 2, adilution of 15 will result in concentrations of La and Yb, for allsamples and of V and Y for some samples, being lower thanthe detection limit. Both the merging stream and the tandeminjection dilution techniques were applied to obtain thisdilution range.
Manifold for merging stream dilution
A four-channel variable speed peristaltic pump, PJ, (RaininRabbit) coupled with a flow manifold was used for mergingstream on-line dilution (Fig. 1). Three channels of PI areemployed for the sample (S) and diluent streams (DI and Dz)and are connected to a laboratory-built flow module, which inturn is connected to the nebuliser peristaltic pump, Pz' Theflow module tubing [Fisherbrand Accu-Rated poly(vinylchloride) (PVC») was used with V-connectors for confluencejunctions and a T-connector for stream flow splitting (SFS).This expression is preferred over zone splitting,6 as a uniformsolution exists in the present arrangement. Stream splitting is
Monochromators-Wave-
Ruling length Lineardensityl Bandpassf rangel dispersion!
Monochromator linesmm- 1 nm nm nmmm- 1
A 3600 <0.009 160-400 0.229B 1800 <0.018 160-800 0.527
Table 2. Spectrometricoperating conditions, detection limits, range ofconcentrations of elements in reference soil digests and the concentration of the elements in the standard solution
Standardsolution
concentration/
I!gml- I
10020.12
4001010.20.12
Soildigests
con-centration
rangelI!gml- 1
94-1860.32-2.0
0.034-0.111.08-1.7316-640
4-170.08-0.30.03-4).08
0.004-0.0080.16-1.6
c,*1I!gml-'O.oz80.00130.0100.00140.0120.00380.00750.00350.00180.0071
Wavelengthlnrn
396.152455.403379.478251.610251.611334.941292.402371.030328.937343.823
Elementand line
AllBall ..La IIMnllSilTillVIIYIIYbll ..Zrll ..
* c, = limit of detection, i.e.• the concentration equivalent to threetimes the SD of the blank. See reference 10.
BYes6001000.1000.100Off
AYes6001000.0500.040Off
Hamamatsu R78715 mm above load coil20,curved
Monochromator paramelersSelected monochromatorSignal compensation ..PMTgainIVSampling time/msSurvey window/nmPeak window/nmBackground correctionPhotomultiplierViewing height/mm ..Slitsfl!m ..
Argon flow-ratesll min- I -
Plasma 15Auxiliary . . 1.0Nebuliser . . 1.0Peristaltic pump flow-raten min- 1 1.0Equilibrium time/s 15
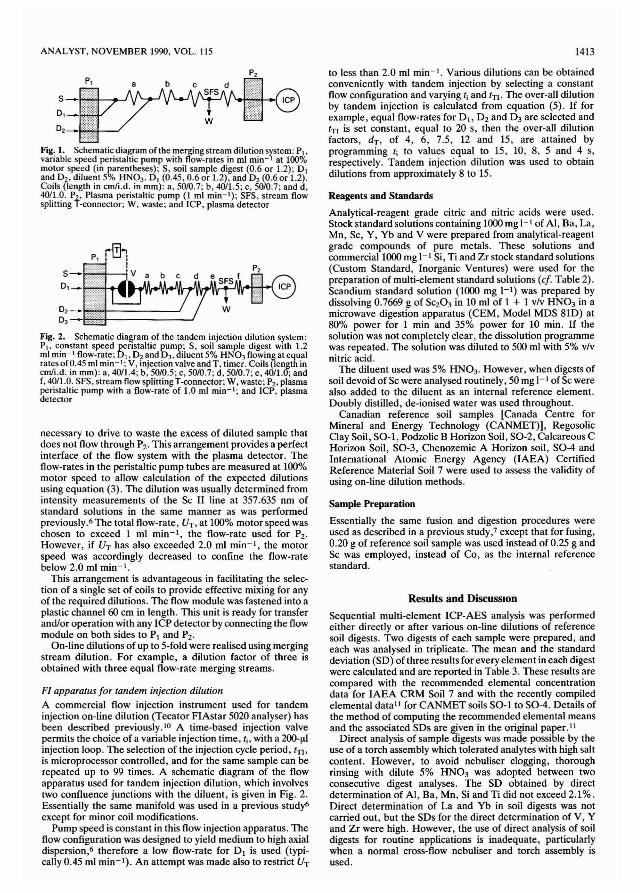
P,
s0,_
ANALYST, NOVEMBER 1990. VOL. U5
Fig. 1. Schematic diagram of the merging stream dilution system: PI.variable speed peristaltic pump with flow-rates in ml min- I at 100%motor speed (in parentheses); S. soil sample digest (0.6 or 1.2); 0 1and O2 • diluent 5% HN03 . 0 1 (0.45,0.6 or 1.2), and O2 (0.6 or 1.2).Coils (length in cm/i.d. in mm): a, 50/0.7; b, 40/1.5; c, 50/0.7; and d,40/1.0. P2 , Plasma peristaltic pump (1 mt min-I); SFS, stream flowsplitting T-connector; W, waste; and ICP, plasma detector
Fig. 2. Schematic diagram of the tandem injection dilution system:PI. constant speed peristaltic pump.; S, soil sample dige.st with 1.2ml mIn- 1 flow-rate; 0" O2 and 0 3 , dIluent 5% HN03 flOWIng at equalrates of 0.45 ml min-I; Y, injection valve and T, timer. Coils (length incm/i.d. in mm): a, 40/1.4; b, 50/0.5; c, 50/0.7; d, 50/0.7; e, 40/1.0; andf. 40/1.0. SFS, stream flow splitting T-connector; W, waste; P2, plasmaperistaltic pump with a flow-rate of 1.0 mt min-I; and ICP, plasmadetector
necessary to drive to waste the excess of diluted sample thatdoes not flow through P2 • This arrangement provides a perfectinterface of the flow system with the plasma detector. Theflow-rates in the peristaltic pump tubes are measured at 100%motor speed to allow calculation of the expected dilutionsusing equation (3). The dilution was usually determined fromintensity measurements of the Sc II line at 357.635 nm ofstandard solutions in the same manner as was performedpreviously.6 The total flow-rate, UT , at 100% motor speed waschosen to exceed 1 ml min-I, the flow-rate used for P2 •
However, if UT has also exceeded 2.0 ml min-I, the motorspeed was accordingly decreased to confine the flow-ratebelow 2.0 ml min-I.
This arrangement is advantageous in facilitating the selection of a single set of coils to provide effective mixing for anyof the required dilutions. The flow module was fastened into aplastic channel 60 cm in length. This unit is ready for transferand/or operation with any 1CP detector by connecting the flowmodule on both sides to PI and P2 •
On-line dilutions of up to 5-fold were realised using mergingstream dilution. For example, a dilution factor of three isobtained with three equal flow-rate merging streams.
FI apparatus for tandem injection dilution
A commercial flow injection instrument used for tandeminjection on-line dilution (Tecator FIAstar 5020 analyser) hasbeen described previously. 10 A time-based injection valvepermits the choice of a variable injection time, t;, with a 200-111injection loop. The selection of the injection cycle period, tTl>
is microprocessor controlled, and for the same sample can berepeated up to 99 times. A schematic diagram of the flowapparatus used for tandem injection dilution, which involvestwo confluence junctions with the diluent, is given in Fig. 2.Essentially the same manifold was used in a previous study6except for minor coil modifications.
Pump speed is constant in this flow injection apparatus. Theflow configuration was designed to yield medium to high axialdispersion,6 therefore a low flow-rate for DI is used (typically 0.45 ml min-I). An attempt was made also to restrict UT
1413
to less than 2.0 ml min-I. Various dilutions can be obtainedconveniently with tandem injection by selecting a constantflow configuration and varying t; and tTl' The over-all dilutionby tandem injection is calculated from equation (5). If forexample, equal flow-rates for D" D2 and D3 are selected andtTl is set constant, equal to 20 s, then the over-all dilutionfactors, dT , of 4, 6, 7.5, 12 and 15, are attained byprogramming t; to values equal to 15, 10, 8, 5 and 4 s,respectively. Tandem injection dilution was used to obtaindilutions from approximately 8 to 15.
Reagents and Standards
Analytical-reagent grade citric and nitric acids were used.Stock standard solutions containing 1000 mg I-I of AI, Ba, La,Mn, Sc, Y, Yb and V were prepared from analytical-reagentgrade compounds of pure metals. These solutions andcommercial 1000 mg I-I Si, Ti and Zrstock standard solutions(Custom Standard, Inorganic Ventures) were used for thepreparation of multi-element standard solutions (cf. Table 2).Scandium standard solution (1000 mg I-I) was prepared bydissolving 0.7669 g of SC203 in 10 ml of 1 + 1 v/v HN03 in amicrowave digestion apparatus (CEM, Model MDS 81D) at80% power for 1 min and 35% power for 10 min. If thesolution was not completely clear, the dissolution programmewas repeated. The solution was diluted to 500 ml with 5% v/vnitric acid.
The diluent used was 5% HN03 . However, when digests ofsoil devoid of Sc were analysed routinely, 50 mg I-I of Sc werealso added to the diluent as an internal reference element.Doubly distilled, de-ionised water was used throughout.
Canadian reference soil samples [Canada Centre forMineral and Energy Technology (CANMET)), RegosolicClay Soil, SO-I, Podzolic B Horizon Soil, SO-2, Calcareous CHorizon Soil, SO-3, Chenozemic A Horizon soil, SO-4 andInternational Atomic Energy Agency (IAEA) CertifiedReference Material Soil 7 were used to assess the validity ofusing on-line dilution methods.
Sample Preparation
Essentially the same fusion and digestion procedures wereused as described in a previous study,7 except that for fusing,0.20 g of reference soil sample was used instead of 0.25 g andSc was employed, instead of Co, as the internal referencestandard.
Results and DiscUSSIon
Sequential multi-element ICP-AES analysis was performedeither directly or after various on-line dilutions of referencesoil digests. Two digests of each sample were prepared, andeach was analysed in triplicate. The mean and the standarddeviation (SD) of three results for every element in each digestwere calculated and are reported in Table 3. These results arecompared with the recommended elemental concentrationdata for IAEA CRM Soil 7 and with the recently compiledelemental data11 for CANMET soils SO-l to SO-4. Details ofthe method of computing the recommended elemental meansand the associated SDs are &ven in the original paper."
Direct analysis of sample digests was made possible by theuse of a torch assembly which tolerated analytes with high saltcontent. However, to avoid nebuliser clogging, thoroughrinsing with dilute 5% HN03 was adopted between twoconsecutive digest analyses. The SD obtained by directdetermination of AI, Ba, Mn, Si and Ti did not exceed 2.1%.Direct determination of La and Yb in soil digests was notcarried out, but the SDs for the direct determination of V, Yand Zr were high. However, the use of direct analysis of soildigests for routine applications is inadequate, particularlywhen a normal cross-flow nebuliser and torch assembly isused.
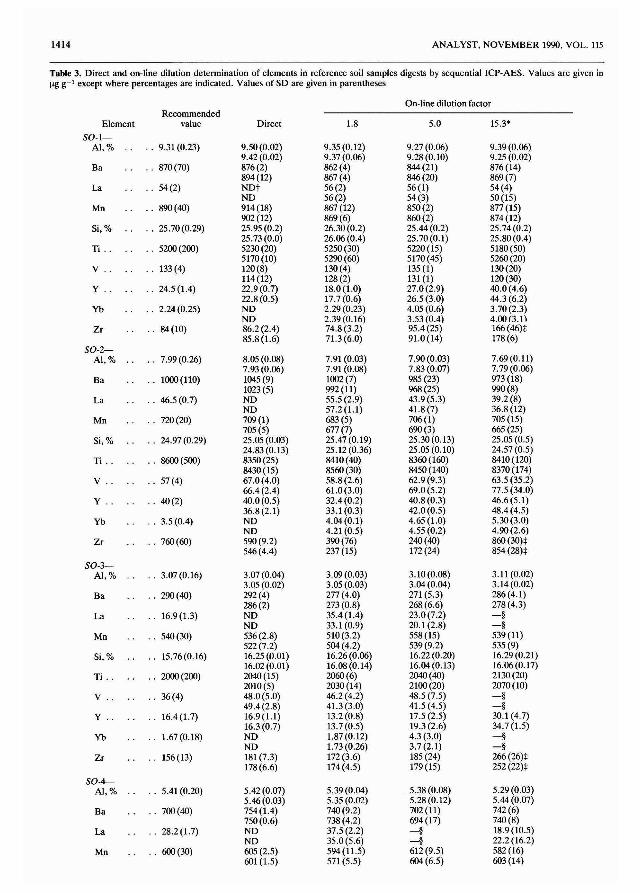
1414 ANALYST, NOVEMBER 1990, VOL. 115
Table 3. Direct and on-line dilution determination of elements in reference soil samples digests by sequential ICP-AES. Values are given in!!g g-l except where percentages are indicated. Values of SD are given in parentheses
On-line dilution factorRecommended
Element value Direct 1.8 5.0 15.3'
SO-l-AI,% · . .. 9.31 (0.23) 9.50(0.02) 9.35 (0.12) 9.27 (0.06) 9.39 (0.06)
9.42(0.02) 9.37 (0.06) 9.28 (0.10) 9.25 (0.02)Ba .. 870 (70) 876(2) 862 (4) 844 (21) 876 (14)
894 (12) 867 (4) 846 (20) 869 (7)La .. 54 (2) NDt 56(2) 56(1) 54 (4)
ND 56(2) 54(3) 50 (15)Mn .. 890 (40) 914 (18) 867 (12) 850(2) 877 (15)
902 (12) 869 (6) 860(2) 874 (12)Si,% · . .. 25.70(0.29) 25.95 (0.2) 26.30 (0.2) 25.44 (0.2) 25.74 (0.2)
25.73 (0.0) 26.06 (0.4) 25.70 (0.1) 25.80 (0.4)Ti .. .. 5200(200) 5230 (20) 5250(30) 5220(15) 5180 (50)
5170 (10) 5290 (60) 5170(45) 5260 (20)V .. .. 133 (4) 120(8) 130 (4) 135 (1) 130(20)
114(12) 128 (2) 131 (1) 120(30)Y .. .. 24.5 (1.4) 22.9(0.7) 18.0 (1.0) 27.0(2.9) 40.0 (4.6)
22.8(0.5) 17.7 (0.6) 26.5 (3.0) 44.3 (6.2)Yb .. 2.24 (0.25) ND 2.29(0.23) 4.05(0.6) 3.70 (2.3)
ND 2.39 (0.16) 3.53 (0.4) 4.00 13.1\Zr .. 84 (10) 86.2 (2.4) 74.8 (3.2) 95.4 (25) 166 (46):j:
85.8 (1.6) 71.3 (6.0) 91.0 (14) 178 (6)SO-2-
AI,% · . .. 7.99 (0.26) 8.05(0.08) 7.91 (0.03) 7.90 (0.03) 7.69(0.11)7.93 (0.06) 7.91 (0.08) 7.83 (0.07) 7.79 (0.06)
Ba .. 1000(110) 1045 (9) 1002 (7) 985 (23) 973 (18)1023 (5) 992(11) 968 (25) 990(8)
La .. 46.5 (0.7) ND 55.5 (2.9) 43.9 (5.3) 39.2 (8)ND 57.2(1.1) 41.8 (7) 36.8 (12)
Mn · . 720(20) 709 (1) 683 (5) 706 (1) 705 (15)705 (5) 677 (7) 690 (3) 665 (25)
Si,% · . .. 24.97 (0.29) 25.05 (0.03) 25.47 (0.19) 25.30 (0.13) 25.05 (0.5)24.83 (0.13) 25.12 (0.36) 25.05 (0.10) 24.57 (0.5)
Ti .. .. 8600 (500) 8350(25) 8410(40) 8360 (160) 8410(120)8430(15) 8560 (30) 8450 (140) 8370(174)
V .. .. 57 (4) 67.0(4.0) 58.8 (2.6) 62.9 (9.3) 63.5 (35.2)66.4 (2.4) 61.0(3.0) 69.0(5.2) 77.5 (34.0)
Y .. .. 40(2) 40.0(0.5) 32.4(0.2) 40.8(0.3) 46.6(5.1)36.8 (2.1) 33.1 (0.3) 42.0(0.5) 48.4 (4.5)
Yb · . 3.5 (0.4) ND 4.04(0.1) 4.65 (1.0) 5.30(3.0)ND 4.21 (0.5) 4.55 (0.2) 4.90(2.6)
Zr · . 760(60) 590 (9.2) 390(76) 240(40) 860 (30):j:546 (4.4) 237 (15) 172 (24) 854 (28):j:
SO-3-AI,% · . · . 3.07 (0.16) 3.07(0.04) 3.09(0.03) 3.10(0.08) 3.11 (0.02)
3.05(0.02) 3.05 (0.03) 3.04(0.04) 3.14 (0.02)Ba .. 290(40) 292 (4) 277 (4.0) 271 (5.3) 286 (4.1)
286 (2) 273 (0.8) 268 (6.6) 278 (4.3)La .. 16.9 (1.3) ND 35.4(1.4) 23.0(7.2) -§
ND 33.1 (0.9) 20.1 (2.8) -§Mn .. 540(30) 536 (2.8) 510 (3.2) 558 (15) 539 (11)
522 (7.2) 504 (4.2) 539 (9.2) 535 (9)Si,% .. 15.76 (0.16) 16.25 (0.01) 16.26 (0.06) 16.22 (0.20) 16.29 (0.21)
16.02 (0.01) 16.08 (0.14) 16.04(0.13) 16.06 (0.17)Ti .. .. 2000(200) 2040 (15) 2060(6) 2040(40) 2130 (20)
2010 (5) 2030(14) 2100(20) 2070(10)V .. .. 36 (4) 48.0(5.0) 46.2 (4.2) 48.5 (7.5) -§
49.4 (2.8) 41.3 (3.0) 41.5 (4.5) -§Y .. .. 16.4 (1.7) 16.9 (1.1) 13.2 (0.8) 17.5 (2.5) 30.1 (4.7)
16.3 (0.7) 13.7 (0.5) 19.3 (2.6) 34.7 (1.5)Yb .. 1.67 (0.18) ND 1.87 (0.12) 4.3 (3.0) -§
ND 1.73 (0.26) 3.7(2.1) -§Zr .. 156 (13) 181 (7.3) 172 (3.6) 185 (24) 266 (26):j:
178(6.6) 174 (4.5) 179 (15) 252 (22):j:
SO-4-AI,% · . .. 5.41 (0.20) 5.42 (0.07) 5.39 (0.04) 5.38 (0.08) 5.29 (0.03)
5.46(0.03) 5.35 (0.02) 5.28 (0.12) 5.44(0.07)Ba .. 700(40) 754(1.4) 740 (9.2) 702 (11) 742 (6)
750(0.6) 738 (4.2) 694 (17) 740 (8)La · . 28.2 (1.7) ND 37.5 (2.2) -§ 18.9 (10.5)
ND 35.0 (5.6) -§ 22.2 (16.2)Mn .. 600 (30) 605 (2.5) 594(11.5) 612 (9.5) 582 (16)
601 (1.5) 571 (5.5) 604 (6.5) 603 (14)
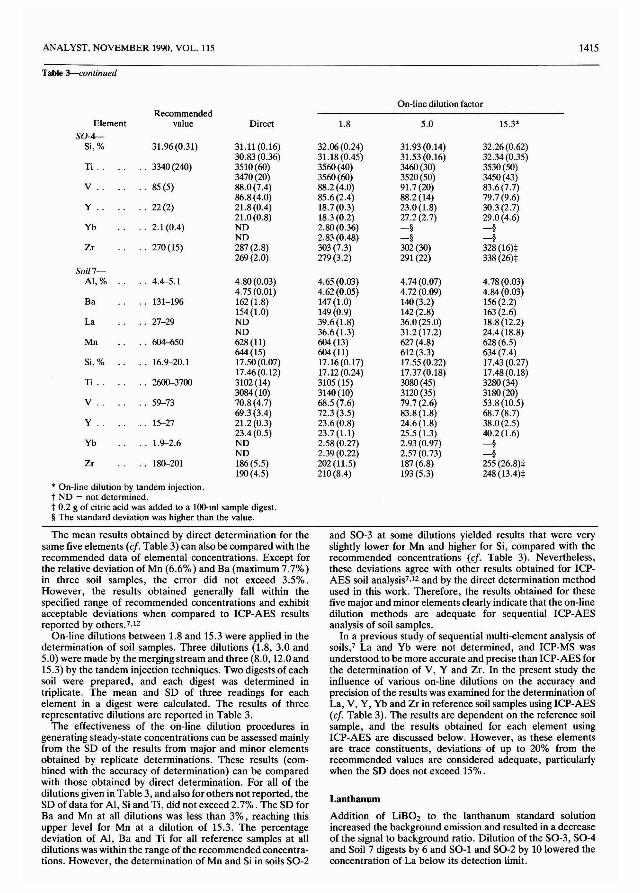
ANALYST, NOVEMBER 1990, VOL. 115 1415
Table 3---<:ontinued
On-line dilution factorRecommended
Element value Direct 1.8 5.0 15.3'SO-4--
Si,% 31.96 (0.31) 31.11 (0.16) 32.06 (0.24) 31.93 (0.14) 32.26 (0.62)30.83 (0.36) 31.18 (0.45) 31.53 (0.16) 32.34 (0.35)
Ti .. 3340(240) 3510 (60) 3560(40) 3460(30) 3530(50)3470 (20) 3560(60) 3520(50) 3450(43)
V .. 85 (5) 88.0(7.4) 88.2(4.0) 91.7 (20) 83.6 (7.7)86.8(4.0) 85.6 (2.4) 88.2 (14) 79.7 (9.6)
Y .. 22(2) 21.8 (0.4) 18.7 (0.3) 23.0 (1.8) 30.3 (2.7)21.0(0.8) 18.3 (0.2) 27.2 (2.7) 29.0 (4.6)
Yb 2.1 (0.4) NO 2.80(0.36) -§ -§NO 2.83(0.48) -§ -§
Zr 270 (15) 287 (2.8) 303 (7.3) 302 (30) 328 (16):1:269 (2.0) 279 (3.2) 291 (22) 338 (26):1:
Soi/7-Al,% 4.4-5.1 4.80 (0.03) 4.65 (0.03) 4.74 (0.07) 4.78 (0.03)
4.75 (0.01) 4.62(0.05) 4.72 (0.09) 4.84(0.03)Ba 131-196 162 (1.8) 147 (1.0) 140(3.2) 156 (2.2)
154 (1.0) 149 (0.9) 142 (2.8) 163 (2.6)La 27-29 NO 39.6 (1.8) 36.0 (25.0) 18.8 (12.2)
ND 36.6(1.3) 31.2 (17.2) 24.4 (18.8)Mn 604-650 628 (11) 604 (13) 627 (4.8) 628 (6.5)
644 (15) 604(11) 612 (3.3) 634 (7.4)Si,% 16.9-20.1 17.50 (0.07) 17.16(0.17) 17.55 (0.22) 17.43 (0.27)
17.46 (0.12) 17.12(0.24) 17.37 (0.18) 17.48 (0.18)Ti .. 2600-3700 3102 (14) 3105 (15) 3080 (45) 3280(34)
3084 (10) 3140 (10) 3120 (35) 3180(20)V .. 59-73 70.8(4.7) 68.5 (7.6) 79.7 (2.6) 53.8 (10.5)
69.3 (3.4) 72.3 (3.5) 83.8 (1.8) 68.7 (8.7)Y .. 15-27 21.2 (0.3) 23.6 (0.8) 24.6 (1.8) 38.0 (2.5)
23.4 (0.5) 23.7 (1.1) 25.5 (1.3) 40.2 (1.6)Yb 1.9-2.6 ND 2.58 (0.27) 2.93 (0.97) -§
ND 2.39 (0.22) 2.57 (0.73) -§Zr 180-201 186 (5.5) 202 (11.5) 187 (6.8) 255 (26.8)+
190 (4.5) 210 (8.4) 193 (5.3) 248 (13.4):1:, On-line dilution by tandem injection.t ND = not determined.:I: 0.2 g of citric acid was added to a 100-ml sample digest.§ The standard deviation was higher than the value.
The mean results obtained by direct determination for thesame five elements (c/. Table 3) can also be compared with therecommended data of elemental concentrations. Except forthe relative deviation ofMn (6.6%) and Ba (maximum 7.7%)in three soil samples, the error did not exceed 3.5%.However, the results obtained generally fall within thespecified range of recommended concentrations and exhibitacceptable deviations when compared to ICP-AES resultsreported by others,?,12
On-line dilutions between 1.8 and 15.3 were applied in thedetermination of soil samples. Three dilutions (1.8, 3.0 and5.0) were made by the merging stream and three (8.0, 12.0and15.3) by the tandem injection techniques. Two digests of eachsoil were prepared, and each digest was determined intriplicate. The mean and SD of three readings for eachelement in a digest were calculated. The results of threerepresentative dilutions are reported in Table 3.
The effectiveness of the on-line dilution procedures ingenerating steady-state concentrations can be assessed mainlyfrom the SD of the results from major and minor elementsobtained by replicate determinations. These results (combined with the accuracy of determination) can be comparedwith those obtained by direct determination. For all of thedilutions given in Table 3, and also for others not reported, theSD of data for AI, Si and Ti, did not exceed 2.7%. The SD forBa and Mn at all dilutions was less than 3%, reaching thisupper level for Mn at a dilution of 15.3. The percentagedeviation of AI, Ba and Ti for all reference samples at alldilutions was within the range of the recommended concentrations. However, the determination of Mn and Si in soils SO-2
and SO-3 at some dilutions yielded results that were veryslightly lower for Mn and higher for Si, compared with therecommended concentrations (cf. Table 3). Nevertheless,these deviations agree with other results obtained for ICPAES soil analysis7.12 and by the direct determination methodused in this work. Therefore, the results obtained for thesefive major and minor elements clearly indicate that the on-linedilution methods are adequate for sequential ICP-AESanalysis of soil samples.
In a previous study of sequential multi-element analysis ofsoils,7 La and Yb were not determined, and ICP-MS wasunderstood to be more accurate and precise than ICP-AES forthe determination of V, Y and Zr. In the present study theinfluence of various on-line dilutions on the accuracy andprecision of the results was examined for the determination ofLa, V, Y, Yb and Zr in reference soil samples using ICP-AES(cf. Table 3). The results are dependent on the reference soilsample, and the results obtained for each element usingICP-AES are discussed below. However, as these elementsare trace constituents, deviations of up to 20% from therecommended values are considered adequate, particularlywhen the SD does not exceed 15%.
Lanthanum
Addition of LiB02 to the lanthanum standard solutionincreased the background emission and resulted in a decreaseof the signal to background ratio. Dilution of the SO-3, SO-4and Soil 7 digests by 6 and SO-1 and SO-2 by 10 lowered theconcentration of La below its detection limit.
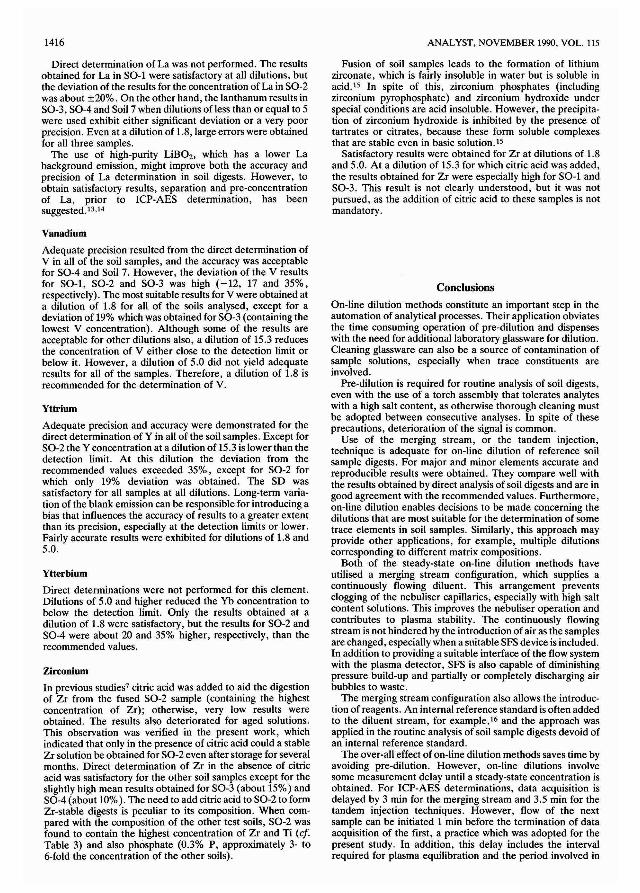
1416
Direct determination of La was not performed. The resultsobtained for La in SO-1 were satisfactory at all dilutions, butthe deviation of the results for the concentration of La in SO-2was about ±20%. On the other hand, the lanthanum results inSO-3, SO-4 and Soil 7 when dilutions of less than or equal to 5were used exhibit either significant deviation or a very poorprecision. Even at a dilution of 1.8, large errors were obtainedfor all three samples.
The use of high-purity LiBOz, which has a lower Labackground emission, might improve both the accuracy andprecision of La determination in soil digests. However, toobtain satisfactory results, separation and pre-concentrationof La, prior to ICP-AES determination, has beensuggested. 13 .14
Vanadium
Adequate precision resulted from the direct determination ofV in all of the soil samples, and the accuracy was acceptablefor SO-4 and Soil 7. However, the deviation of the V resultsfor SO-I, SO-2 and SO-3 was high (-12, 17 and 35%,respectively). The most suitable results for V were obtained ata dilution of 1.8 for all of the soils analysed, except for adeviation of 19% which was obtained for SO-3 (containing thelowest V concentration). Although some of the results areacceptable for other dilutions also, a dilution of 15.3 reducesthe concentration of V either close to the detection limit orbelow it. However, a dilution of 5.0 did not yield adequateresults for all of the samples. Therefore, a dilution of 1.8 isrecommended for the determination of V.
Yttrium
Adequate precision and accuracy were demonstrated for thedirect determination of Y in all of the soil samples. Except forSO-2 the Y concentration at a dilution of 15.3 is lower than thedetection limit. At this dilution the deviation from therecommended values exceeded 35%, except for SO-2 forwhich only 19% deviation was obtained. The SD wassatisfactory for all samples at all dilutions. Long-term variation of the blank emission can be responsible for introducing abias that influences the accuracy of results to a greater extentthan its precision, especially at the detection limits or lower.Fairly accurate results were exhibited for dilutions of 1.8 and5.0.
Ytterbium
Direct determinations were not performed for this element.Dilutions of 5.0 and higher reduced the Yb concentration tobelow the detection limit. Only the results obtained at adilution of 1.8 were satisfactory, but the results for SO-2 andSO-4 were about 20 and 35% higher, respectively, than therecommended values.
Zirconium
In previous studies? citric acid was added to aid the digestionof Zr from the fused SO-2 sample (containing the highestconcentration of Zr); otherwise, very low results wereobtained. The results also deteriorated for aged solutions.This observation was verified in the present work, whichindicated that only in the presence of citric acid could a stableZr solution be obtained for SO-2 even after storage for severalmonths. Direct determination of Zr in the absence of citricacid was satisfactory for the other soil samples except for theslightly high mean results obtained for SO-3 (about 15%) andSO-4 (about 10%). The need to add citric acid to SO-2 to formZr-stable digests is peculiar to its composition. When compared with the composition of the other test soils, SO-2 wasfound to contain the highest concentration of Zr and Ti (cf.Table 3) and also phosphate (0.3% P, approximately 3- to6-fold the concentration of the other soils).
ANALYST, NOVEMBER 1990, VOL. 115
Fusion of soil samples leads to the formation of lithiumzirconate, which is fairly insoluble in water but is soluble inacid. IS In spite of this, zirconium phosphates (includingzirconium pyrophosphate) and zirconium hydroxide underspecial conditions are acid insoluble. However, the precipitation of zirconium hydroxide is inhibited by the presence oftartrates or citrates, because these form soluble complexesthat are stable even in basic solution. IS
Satisfactory results were obtained for Zr at dilutions of 1.8and 5.0. At a dilution of 15.3 for which citric acid was added,the results obtained for Zr were especially high for SO-1 andSO-3. This result is not clearly understood, but it was notpursued, as the addition of citric acid to these samples is notmandatory.
Conclusions
On-line dilution methods constitute an important step in theautomation of analytical processes. Their application obviatesthe time consuming operation of pre-dilution and dispenseswith the need for additional laboratory glassware for dilution.Cleaning glassware can also be a source of contamination ofsample solutions, especially when trace constituents areinvolved.
Pre-dilution is required for routine analysis of soil digests,even with the use of a torch assembly that tolerates analyteswith a high salt content, as otherwise thorough cleaning mustbe adopted between consecutive analyses. In spite of theseprecautions, deterioration of the signal is common.
Use of the merging stream, or the tandem injection,technique is adequate for on-line dilution of reference soilsample digests. For major and minor elements accurate andreproducible results were obtained. They compare well withthe results obtained by direct analysis of soil digests and are ingood agreement with the recommended values. Furthermore,on-line dilution enables decisions to be made concerning thedilutions that are most suitable for the determination of sometrace elements in soil samples. Similarly, this approach mayprovide other applications, for example, multiple dilutionscorresponding to different matrix compositions.
Both of the steady-state on-line dilution methods haveutilised a merging stream configuration, which supplies acontinuously flowing diluent. This arrangement preventsclogging of the nebuliser capillaries, especially with high saltcontent solutions. This improves the nebuliser operation andcontributes to plasma stability. The continuously flowingstream is not hindered by the introduction of air as the samplesare changed, especially when a suitable SFS device is included.In addition to providing a suitable interface of the flow systemwith the plasma detector, SFS is also capable of diminishingpressure build-up and partially or completely discharging airbubbles to waste.
The merging stream configuration also allows the introduction of reagents. An internal reference standard is often addedto the diluent stream, for example,16 and the approach wasapplied in the routine analysis of soil sample digests devoid ofan internal reference standard.
The over-all effect of on-line dilution methods saves time byavoiding pre-dilution. However, on-line dilutions involvesome measurement delay until a steady-state concentration isobtained. For ICP-AES determinations, data acquisition isdelayed by 3 min for the merging stream and 3.5 min for thetandem injection techniques. However, flow of the nextsample can be initiated 1 min before the termination of dataacquisition of the first, a practice which was adopted for thepresent study. In addition, this delay includes the intervalrequired for plasma equilibration and the period involved in
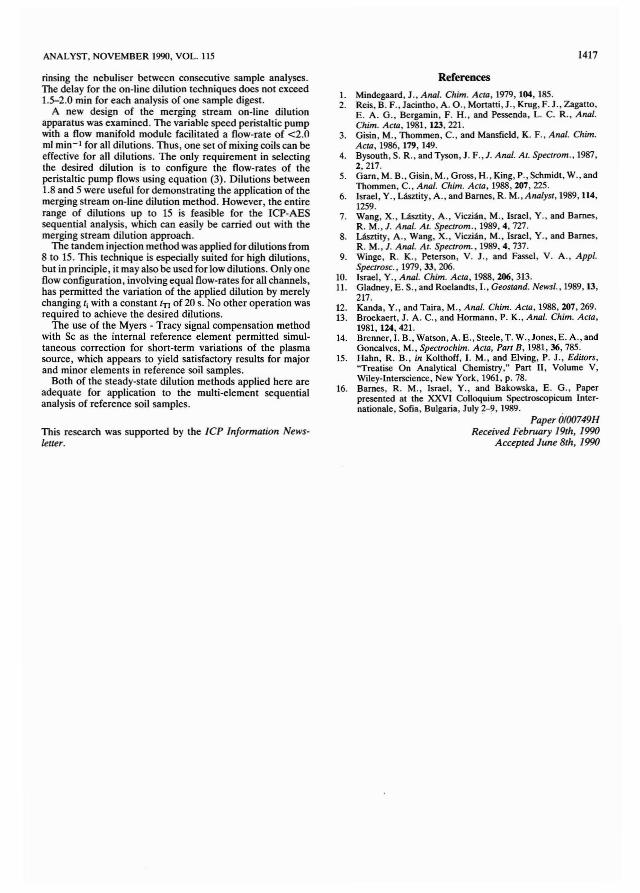
ANALYST, NOVEMBER 1990, VOL. 115
rinsing the nebuliser between consecutive sample analyses.The delay for the on-line dilution techniques does not exceed1.5--2.0 min for each analysis of one sample digest.
A new design of the merging stream on-line dilutionapparatus was examined. The variable speed peristaltic pumpwith a flow manifold module facilitated a flow-rate of <2.0011 min- 1 for all dilutions. Thus, one set of mixing coils can beeffective for all dilutions. The only requirement in selectingthe desired dilution is to configure the flow-rates of theperistaltic pump flows using equation (3). Dilutions between1.8 and 5 were useful for demonstrating the application of themerging stream on-line dilution method. However, the entirerange of dilutions up to 15 is feasible for the ICP-AESsequential analysis, which can easily be carried out with themerging stream dilution approach.
The tandem injection method was applied for dilutions from8 to 15. This technique is especially suited for high dilutions,but in principle, it may also be used for low dilutions. Only oneflow configuration, involving equal flow-rates for all channels,has permitted the variation of the applied dilution by merelychanging ti with a constant tTl of 20 s. No other operation wasrequired to achieve the desired dilutions.
The use of the Myers - Tracy signal compensation methodwith Sc as the internal reference element permitted simultaneous correction for short-term variations of the plasmasource, which appears to yield satisfactory results for majorand minor elements in reference soil samples.
Both of the steady-state dilution methods applied here areadequate for application to the multi-element sequentialanalysis of reference soil samples.
This research was supported by the ICP Information Newsletter.
1417
References
1. Mindegaard, J., AfUll. Chim. Acta, 1979, 104, 185.2. Reis, B. F., Jacintho, A. 0., Mortatti, J., Krug, F. J., Zagatlo,
E. A. G., Bergamin, F. H., and Pessenda, L. C. R., AfUll.Chim. Acta, 1981, 123,221.
3. Gisin, M., Thommen, c., and Mansfield, K. F., Anal. Chim.Acta, 1986, 179, 149.
4. Bysouth, S. R., and Tyson, J. F., J. AfUll. At. Spectrom., 1987,2,217.
5. Gam, M. B., Gisin, M., Gross, H., King, P., Schmidt, W., andThommen, c., AfUll. Chim. Acta, 1988,207,225.
6. Israel, Y., Lasztity, A., and Barnes, R. M., AfUllyst, 1989, 114,1259.
7. Wang, X., Lasztity, A., Viczian, M., Israel, Y., and Barnes,R. M., J. AfUll. At. Spectrom., 1989,4,727.
8. Lasztity, A., Wang, X., Viczian, M., Israel, Y., and Barnes,R. M., J. Anal. At. Spectrom., 1989,4,737.
9. Winge, R. K., Peterson, V. J., and Fassel, V. A., Appl.Spectrose., 1979, 33, 206.
10. Israel, Y., Anal. Chim. Acta, 1988,206,313.11. Gladney, E. S., and Roelandts, I., Geostand. Newsl., 1989, 13,
217.12. Kanda, Y., and Taira, M., Anal. Chim. Acta, 1988, 207, 269.13. Broekaert, J. A. C., and Hormann, P. K., Anal. Chim. Acta,
1981, 124, 421.14. Brenner, I. B., Watson, A. E., Steele, T. W.,Jones, E. A., and
Goncalves, M., Spectrochim. Acta, Pan B, 1981,36,785.15. Hahn, R. B., in Kolthoff, I. M., and Elving, P. J., Editors,
"Treatise On Analytical Chemistry," Part II, Volume V,Wiley-Interscienee, New York, 1961, p. 78.
16. Barnes, R. M., Israel, Y., and Bakowska, E. G., Paperpresented at the XXVI Colloquium Spectroscopicum Internationale, Sofia, Bulgaria, July 2-9, 1989.
Paper OlOO749HReceived February 19th, 1990
Accepted June 8th, 1990

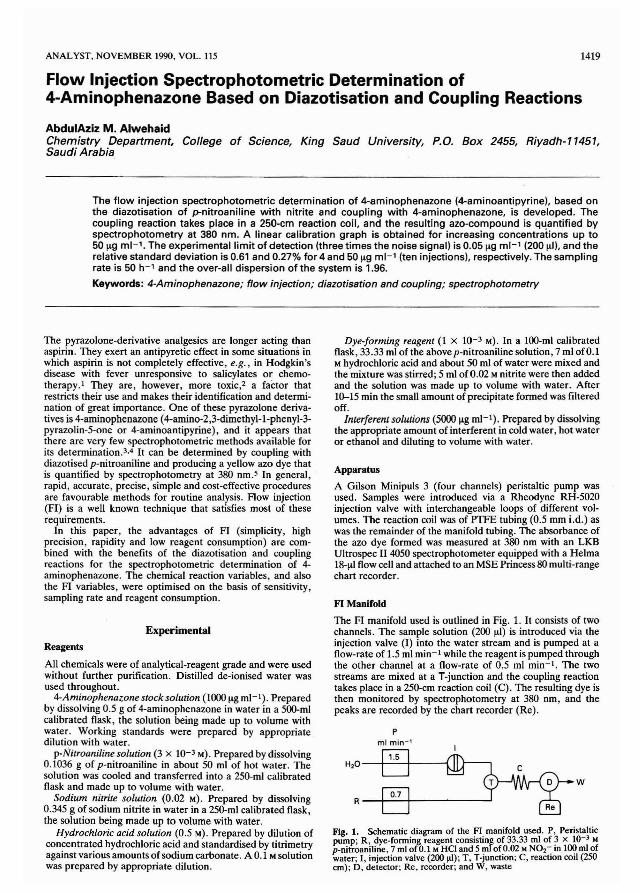
ANALYST, NOVEMBER 1990, VOL. 1I5 1419
Flow Injection Spectrophotometric Determination of4-Aminophenazone Based on Diazotisation and Coupling Reactions
AbdulAziz M. AlwehaidChemistry Department, College of Science, King Saud University, P.O. Box 2455, Riyadh-11451,Saudi Arabia
The flow injection spectrophotometric determination of 4-aminophenazone (4-aminoantipyrine), based onthe diazotisation of p-nitroaniline with nitrite and coupling with 4-aminophenazone, is developed. Thecoupling reaction takes place in a 250-cm reaction coil, and the resulting azo-compound is quantified byspectrophotometry at 380 nm. A linear calibration graph is obtained for increasing concentrations up to50 Ilg ml- 1• The experimental limit of detection (three times the noise signal) is 0.051lg ml- 1 (200 Ill). and therelative standard deviation is 0.61 and 0.27% for 4 and 50 Ilg ml- 1 (ten injections). respectively. The samplingrate is 50 h- 1 and the over-all dispersion of the system is 1.96.
Keywords: 4-Aminophenazone; flow injection; diazotisation and coupling; spectrophotometry
The pyrazolone-derivative analgesics are longer acting thanaspirin. They exert an antipyretic effect in some situations inwhich aspirin is not completely effective, e.g., in Hodgkin'sdisease with fever unresponsive to salicylates or chemotherapy.l They are, however, more toxic,2 a factor thatrestricts their use and makes their identification and determination of great importance. One of these pyrazolone derivatives is 4-aminophenazone (4-amino-2,3-dimethyl-l-phenyl-3pyrazolin-S-one or 4-aminoantipyrine), and it appears thatthere are very few spectrophotometric methods available forits determination.3•4 It can be determined by coupling withdiazotised p-nitroaniline and producing a yellow azo dye thatis quantified by spectrophotometry at 380 nm.S In general,rapid, accurate, precise, simple and cost-effective proceduresare favourable methods for routine analysis. How injection(FI) is a well known technique that satisfies most of theserequirements.
In this paper, the advantages of FI (simplicity, highprecision, rapidity and low reagent consumption) are combined with the benefits of the diazotisation and couplingreactions for the spectrophotometric determination of 4aminophenazone. The chemical reaction variables, and alsothe FI variables, were optimised on the basis of sensitivity,sampling rate and reagent consumption.
Experimental
Reagents
All chemicals were of analytical-reagent grade and were usedwithout further purification. Distilled de-ionised water wasused throughout.
4-Aminophenazone stock solution (1000 Ilg ml- 1). Preparedby dissolving O.S g of 4-aminophenazone in water in a SOO-mlcalibrated flask, the solution being made up to volume withwater. Working standards were prepared by appropriatedilution with water.
p-Nitroaniline solution (3 x 10⁻³M). Prepared by dissolving0.1036 g of p-nitroaniline in about 50 ml of hot water. Thesolution was cooled and transferred into a 2SO-ml calibratedflask and made up to volume with water.
Sodium nitrite solution (0.02 M). Prepared by dissolving0.34S g of sodium nitrite in water in a 2SO-ml calibrated flask,the solution being made up to volume with water.
Hydrochloric acid solution (O.S M). Prepared by dilution ofconcentrated hydrochloric acid and standardised by titrimetryagainst various amounts of sodium carbonate. A 0.1 M solutionwas prepared by appropriate dilution.
Dye-forming reagent (1 X 10⁻³ M). In a loo-ml calibratedflask, 33.33 ml of the abovep-nitroaniline solution, 7 ml of 0.1M hydrochloric acid and about SO ml of water were mixed andthe mixture was stirred; S ml of 0.02 M nitrite were then addedand the solution was made up to volume with water. After1001S min the small amount of precipitate formed was filteredoff.
lnterferent solutions (SOOO Ilg ml- l). Prepared by dissolvingthe appropriate amount of interferent in cold water, hot wateror ethanol and diluting to volume with water.
Apparatus
A Gilson Minipuls 3 (four channels) peristaltic pump wasused. Samples were introduced via a Rheodyne RH-S020injection valve with interchangeable loops of different volumes. The reaction coil was of PTFE tubing (O.S mm i.d.) aswas the remainder of the manifold tubing. The absorbance ofthe azo dye formed was measured at 380 nm with an LKBUltrospec II 4OS0 spectrophotometer equipped with a Helma18-1l1 flow cell and attached to an MSE Princess 80 multi-rangechart recorder.
FI Manifold
The FI manifold used is outlined in Fig. 1. It consists of twochannels. The sample solution (200 Ill) is introduced via theinjection valve (I) into the water stream and is pumped at aflow-rate of 1.S ml min- l while the reagent is pumped throughthe other channel at a flow-rate of O.S ml min-I. The twostreams are mixed at a T-junction and the coupling reactiontakes place in a 2SO-cm reaction coil (C). The resulting dye isthen monitored by spectrophotometry at 380 nm, and thepeaks are recorded by the chart recorder (Re).
p
ml min- 1
H20 --+-'-'-'-t----{
w
R-4-.::.;;.-+-------1
Fig. 1. Schematic diagram of the FI manifold used. P, Peristalticpump; R, dye-forming reagent consisting of 33.33 ml of ~ x 10-3 M
p-nitroaniline, 7 ml of 0.1 M HCl and 5 ml of 0.02 M NOz- In 100ml ofwater; I, injection valve (200 111); T, T-junClion; C, reaction coil (250cm); D, detector; Re, recorder; and W, waste
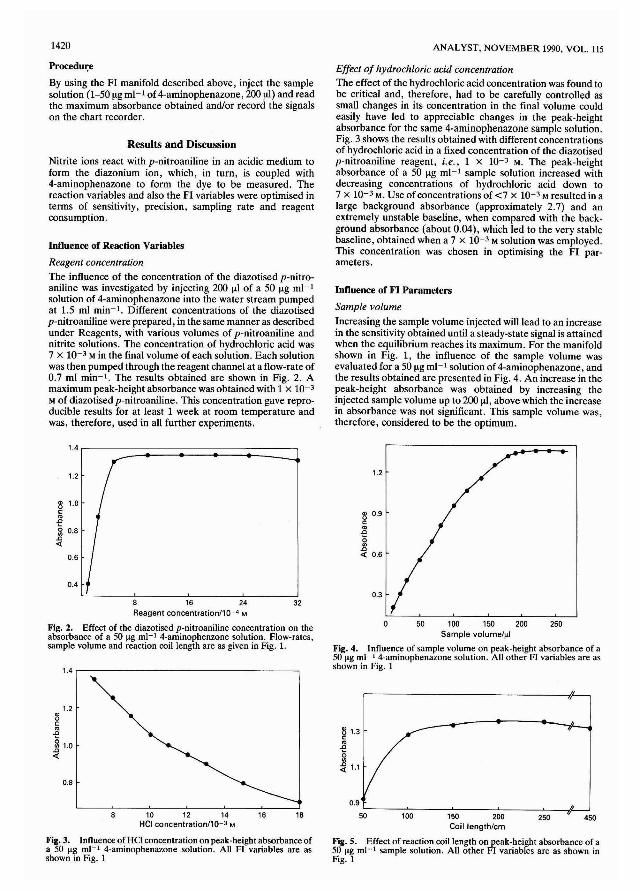
1420 ANALYST, NOVEMBER 1990, VOL. 115
ProcedUl:e
By using the FI manifold described above, inject the samplesolution (1-50 f!g ml- I of 4-aminophenazone, 200 fll) and readthe maximum absorbance obtained and/or record the signalson the chart recorder.
Results and Discussion
Nitrite ions react with p-nitroaniline in an acidic medium toform the diazonium ion, which, in turn, is coupled with4-aminophenazone to form the dye to be measured. Thereaction variables and also the FI variables were optimised interms of sensitivity, precision, sampling rate and reagentconsumption.
Influence of Reaction Variables
Reagentconcenuation
The influence of the concentration of the diazotised p-nitroaniline was investigated by injecting 200 f!l of a 50 f!g ml- Isolution of 4-aminophenazone into the water stream pumpedat 1.5 ml min-I. Different concentrations of the diazotisedp-nitroaniline were prepared, in the same manner as describedunder Reagents, with various volumes of p-nitroaniline andnitrite solutions. The concentration of hydrochloric acid was7 x 10-3 M in the final volume of each solution. Each solutionwas then pumped through the reagent channel at a flow-rate of0.7 ml min-I. The results obtained are shown in Fig. 2. Amaximum peak-height absorbance was obtained with 1 x 10⁻³
M of diazotised p-nitroaniline. This concentration gave reproducible results for at least 1 week at room temperature andwas, therefore, used in all further experiments.
Effect of hydrochloric acid concentrationThe effect of the hydrochloric acid concentration was found tobe critical and, therefore, had to be carefully controlled assmall changes in its concentration in the final volume couldeasily have led to appreciable changes in the peak-heightabsorbance for the same 4-aminophenazone sample solution.Fig. 3 shows the results obtained with different concentrationsof hydrochloric acid in a fixed concentration of the diazotisedp-nitroaniline reagent, i.e., 1 x 10⁻³ M. The peak-heightabsorbance of a 50 f!g ml- 1 sample solution increased withdecreasing concentrations of hydrochloric acid down to7 x 10-3 M. Use of concentrations of <7 x 10⁻³ M resulted in alarge background absorbance (approximately 2.7) and anextremely unstable baseline, when compared with the background absorbance (about 0.04), which led to the very stablebaseline, obtained when a 7 x 10⁻³ M solution was employed.This concentration was chosen in optimising the PI parameters.
Influence of FI Parameters
Sample volume
Increasing the sample volume injected will lead to an increasein the sensitivity obtained until a steady-state signal is attainedwhen the equilibrium reaches its maximum. For the manifoldshown in Fig. 1, the influence of the sample volume wasevaluated for a 50 f!g ml- I solution of 4-aminophenazone, andthe results obtained are presented in Fig. 4. An increase in thepeak-height absorbance was obtained by increasing theinjected sample volume up to 200 f!l, above which the increasein absorbance was not significant. This sample volume was,therefore, considered to be the optimum.
50 100 150 200 250Sample volume/iii
Fig. 4. Influence of sample volume on peak-height absorbance of a50 Jig ml- 1 4-aminophenazone solution. All other PI variables are asshown in Fig. 1
32
1.2
"uc:" 0.9
'" u-e c:
'"0 .a<J>(;.a« <J>.a«
1.4 ~-------------------~
8 16 24Reagent concentration/l 0~4 M
Fig. 2. Effect of the diazotised p-nitroaniline concentration on theabsorbance of a 50 Jig ml- 1 4-aminophenzone solution. Flow-rates,sample volume and reaction coil length are as given in Fig. 1.
Fig. 3. Influence ofHeIconcentration on peak-height absorbance ofa 50 Jig ml- 1 4-aminophenazone solution. All PI variables are asshown in Fig. I
~ 1.3c:
'".a(;<J>
~ 1.1
4502500.9 :----:-"':'---~---'----~-If_---.J
50 100 150 200Coil length/em
Fig. 5. Effect of reaction coil length on peak-height absorbance of a50 Jig ml-1 sample solution. All other PI variables are as shown inFig. 1
181610 12 14HCI concentration/l0~3 M
0.8
~c:
'".a(;~ 1.0«
1.2

ANALYST, NOVEMBER 1990, VOL. 115 1421
Table 1. Effect of some possible interfering species on FI determination of 10 I'g ml- l of 4-aminophenzone.
1.4 r-"""""----------------,
1.2
'"uc:...Q
~.Q«
1.0
B0.8 L-_~ ~ ~ __...J
0.5 1.5 2.~ 3.5Flow-ratelml min-'
Fig. 6. Effect of flow-rate on absorbance of a 50 I'g m1- l samplesolution; A, total flow-rate; B, sample stream; and C, reagent stream
InterferentAlanineAntipyrineAmidopyrineAminobenzoic acidAminobenzoic acidAminoacetophenone ..Arginine ..Benzoic acidIndoleIndole2-Aminonaphthalene-4-sulphonic
acid2-Aminonaphthalene-4-sulphonic
acida-NaphthOla-Naphthol1-AminonapthaleneSalicyclic acidUracil
Concentration!I-lgml- l
10010010010050
10010010010050
100
5010050
100100100
Error,%327
301015
Io
18798
164
89213160
ooo
3 3
Time-
Fig. 7. Typical calibration peaks for the determination of 4-aminophenazone. The concentrations are shown on the peaks in I'g ml-'
Sample and reagent flow-ratesThe effect of sample flow-rate was evaluated over the range0.45-3.0 mt min- 1 at a reagent flow-rate of 0.7 ml min-I. It
was found that increasing the sample flow-rate from 0.45 to1.0 ml min-I resulted in an increase in sensitivity (Fig. 6, curveB) and sample throughput. The sensitivity at higher flow-ratesremained constant, up to 1.5 ml min-I, above which itdecreased. The reason for this effect was explained previously6 by using a similar FI manifold to that shown in Fig. 1and injecting a dye. It was shown that when the flow-rates inboth channels are similar, reproducible and fast mixing isachieved in the T-junction. As the sample flow-rate decreases,however, its flow into the exit stream is restricted, leading todrawn-out peaks; this explains the decrease in curve B (Fig. 6)as the flow-rate decreases. Therefore, increasing the flow-rateimproves the sensitivity. This effect, however, is in conflictwith the dispersion effect as the flow-rate increases, leading toa constant sensitivity over the range 1.0-1.5 ml min-I. Higherflow-rates resulted in poorer sensitivity, owing to dispersionand the decrease in the time allowed for dye formation.
The reagent flow-rate was investigated at a sample flow-rateof 1.5 ml min-I. The results obtained (Fig. 6, curve C) showthat maximum sensitivity was obtained at a reagent flow-rateof 0.7 ml min-I. Lower flow-rates resulted in poorersensitivity, owing to insufficient reagent being delivered,while higher flow-rates merely increased the dispersion. Thetotal flow-rate under the optimised conditions was 2.2mlmin- I.
Determination of 4-Aminophenazone
Calibration graphs for the determination of 4-aminophenazone were established under the optimised experimentalconditions shown in Fig. 1. The calibration graph was linearfor up to 50 I-lg ml- I with a correlation coefficient (9 points) of0.9997. Typical recorded calibration peaks, covering the range1-5 I-Ig mJ-1 are shown in Fig. 7. The least-squares equationfor this graph is peak-height absorbance = 0.02& -1 x 10⁻³ ,
where c is the concentration of 4-aminophenazone in I-lg ml- I.The experimental limit of detection was obtained by comparing the magnitude of the signal of the injected sample witha signal equal to three times the noise signal caused by thepulsation of the peristaltic pump. It was found to be 0.05I-lg ml- I. The calculated limit of detection,7 using the statisticalinformation obtained from the graph shown in Fig. 7, wasfound to be O.ll-1g ml- I (twice the noise signal). The relativestandard deviation was 0.61% for a 41-lg ml- I sample solutionand 0.27% for a 50 I-lg ml- I solution (ten injections of each).The sampling rate was 50 h-I and the over-all dispersion of thesystem was 1.96.
Total flow-rate
The influence of total flow-rate was evaluated, at a flow-rateratio (sample to reagent) of 1: 1, by increasing the pump speedand injecting a 50 I-lg ml- I sample solution at different totalflow-rates. The results shown in Fig. 6 (curve A) indicate thatmaximum absorbance was obtained at the lowest possibleflow-rate. However, the peaks were broadened and samplethroughput was very low, hence it was decided to evaluatesample and reagent flow-rates individually.
~c:...Q(;
'".Q«
Reaction coil length
By using the FI parameters shown in Fig. 1, the effect ofreaction coil length on the peak-height absorbance of a 50I-lg ml- I sample solution was evaluated. Various coils withincreasing lengths were placed between the T-junction and thedetector. The results obtained (Fig. 5) show that maximumdye production was achieved with coil lengths of 200-300 cm.This can be explained as follows: as the reaction coil lengthincreases more dye is produced, up to 200 cm, above which aconstant absorbance is obtained, owing to the balancebetween the increase in the dye production and the dispersioneffect up to 300 cm. At longer coil lengths, dispersiondecreases the absorbance. A 200-cm coil length was, therefore, chosen as the optimum.
1422
Interference
Table 1 summarises the effects of some possible interferingspecies and shows that indole, 2-aminonaphthalene-4-sulphonic acid and ~-naphthol interfere in the determination of10 !!g ml- 1 of 4-aminophenazone.
Conclusion
The FI method described above for the determination of4-aminophenazone in aqueous solution, based on diazotisation and coupling reactions, provides a precise, simple andrapid technique that satisfies most of the requirements inroutine analysis.
The author thanks M. Demashki for assistance, and theResearch Centre of the College of Science for financialsupport (Project No. Chem/l408/05).
ANALYST, NOVEMBER 1990, VOL. 115
References
1. Meyers, F. H., Jawetz, E., and Goldfien, A., "Review ofMedical Pharmacology," Sixth Edition, Lange Medical Publications, Los Altos, CA, 1976, p. 290.
2. Reynolds, J. E. F., and Prasad, A. B., "Martindale, The ExtraPharmacopoeia," Twenty-eighth Edition, The PharmaceuticalPress, London, 1982, p. 272.
3. Zanin, V. V., Musael'yants, V. Ya., Savel'eva, T. A., andPonomarev, V. D., Farmatsiya (Moscow), 1982,31,77; Anal.Abstr., 1982,43, 5E38.
4. Zanin, V. V., Smirnov, E. V., Papikyan, N. N., andPonomarev, V. D., Farmatsiya (Moscow), 1979,28,33; Anal.Abstr., 1980, 38, 4E45.
5. AI-Abachi, M. Q., AI-Delami, A. M. S., and AI-Najafi, S..Analyst, 1988, 113, 1661.
6. Al-Wehaid, A., and Townshend, A., Anal. Chim. Acta, 1987.198,45.
7. Miller, J. c., and Miller, J. N., "Statistics for AnalyticalChemistry," Ellis Horwood, Chichester, 1986, p. 96.
Paper 0/001891Received January 12th, 1990
Accepted June 26th, 1990
ANALYST, NOVEMBER 1990, VOL. 115 1423
Determination of Light Hydrocarbon Gases in Sea Water Using ThreeVariants of Static IIEquilibrium" Headspace Analysis
Alexander P. BianchiEnvironmental Laboratory, Exxon Chemical Company, Cadland Road, Hythe, Southampton, HampshireS046NP, UK
Three methods for the determination of the light hydrocarbon gases methane, ethane, ethene, propane,propene, butane, 2-methylpropane and butenes in coastal sea water are described. The first two methods arebased on manual equilibration of the headspace vapours in glass vessels, followed by injection into the gaschromatograph. The third method uses a commercial semi-automatic, pneumatically controlled headspacedevice interfaced to the gas chromatograph. Analysis is then performed using both packed and capillarycolumn chromatography, followed by flame-ionisation detection. The limit of detection is below 2 x 10⁻⁵
mil-I vlv for method variant I and below 5 x 10⁻⁶ mil-I vlv for method variants II and III.
Keywords: Light hydrocarbon gas; surface water; coastal sea water; static headspace; gas chromatographywith flame-ionisation detection
Reports of oil pollution in the marine environment havereceived considerable attention recently. Spills of oil andvolatile chemicals into coastal sea water represent potentiallysignificant environmental and ecological threats to marineecosystems. However, the more visible effects of oil in seawater have masked interest in the disposition and behaviour ofthe more soluble components of petroleum, particularly thedissolved gaseous hydrocarbons. Marine chemists have longrecognised that these compounds do not all evaporatefollowing spillage, and may be transported down into thewater column via turbulent mixing of water masses andlaterally via currents. I
Equally, little attention has been devoted to assessing theoccurrence and importance of low-level inputs of biogenicallyderived hydrocarbon gases within productive coastal estuaries.2 Taken individually, or together, these hitherto unexplored processes lead to various concentrations of dissolvedgases in water which in turn provide information aboutpolluting or biological activities. For example, in a recentstudy of marine pollution caused by shoreside marina developments in the UK, exceptionally high levels of light hydrocarbons were found in nearby waters.3
There have been few reports of low relative molecular masshydrocarbons in open-ocean waters or in rivers and estuaries.Swinnerton and Linnenbom4 reported the first in situmeasurements of the CI-C4 hydrocarbon content of sea waterfrom the Atlantic and the Gulf of Mexico. This was shortlyfollowed by a study of the distribution of methane and carbonmonoxide between the atmosphere and the sea water surface.sThere are no published references to similar studies of lighthydrocarbons in any UK rivers, estuaries or coastal waters.Therefore, it is impossible to assess the likelihood of theiroccurrence or potential contribution to levels of dissolvedorganic carbon in natural waters. A common theme in thistype of work is that the relevant data are not available becausesuitable methods and equipment have not been developed forthe study of these compounds. The absence of data, in turn,forestalls judgement and leads to the exclusion of thesecompounds from scientific assessments of estuarine quality.
Until comparatively recently, very few simple analyticalmethods have been available for the determination of tracelevels of dissolved light hydrocarbons in water. Early techniques developed in the USAI involved continuous strippingof large volumes of sea water (i.e., 6 I min-I) followed byvacuum collection of the stripped gas inside glass funnels. Thestripped gas was then injected into a gas chromatograph via a1.76-ml sample loop at 5-min intervals. Limits of detection forthe CI-C4 hydrocarbon gases down to 1 x 10⁻⁷ mll-I werereported for the method.
Two simpler methods for detecting C,-C4 hydrocarbons inwater have been developed by UK water authority laboratories.6 These variants include direct aqueous injection andvacuum de-gassing of water samples in a glass vessel, followedby displacement of the gas into a gas-sampling loop. Bothmethods utilise packed column chromatography and f1ameionisation detection. Direct aqueous injection was found to beunsatisfactory in the laboratory for routine analysis ofmoderately contaminated sea water samples. High levels ofsuspended matter and salt deposits were observed to collect inthe chromatograph injection liner causing contamination and"memory" effects. The vacuum de-gassing method overcamethese difficulties but provided unreliable repeatability inregular use. This was because many water samples frequentlycontained varying levels of viscous oils, acids and suspendedsolids (i.e., >100 mg I-I) which rapidly abrade glass joints andprecipitate leakages.
Equilibrium headspace methods overcome these problemsand have been used successfully for the determination ofvolatile compounds in both surface water and "hostile" samplematrices. Manual "static" headspace techniques have beenreported by Croll et aU for trihalomethanes in surface watersand by Bianchi and Varney8 for volatile aromatics in estuarinesediments Both methods provide low limits of detection (i.e.,<1.0 flg I-I) and have relative standard deviations (RSDs) ofless than 2%.
Experimental
Apparatus and Instrumentation
Three different static headspace methods were investigatedfor the determination of light hydrocarbons in surface waters.The basic approaches are summarised below.
Variant I. Indirect gas-syringe sampling
Equilibration and sampling were carried out using a simplesyringe-pump arrangement. The apparatus is illustrated inFig. 1. In this arrangement, a 500-ml syringe was interfaced toa stainless-steel tube (3 mm o.d.) connected to the inlet of asix-port gas sampling valve (2-ml sampling loop capacity). Thesampling bottle was connected by a glass stopcock - metalconnection to the outlet tubing of the gas sampling valve. Thesample vessel (containing 800 ml of sample and 200 ml ofpurified helium head-gas) was immersed in a 5-1 water-bath.The sample bottle was agitated every 10 min. Gaschromatographic analysis. was carried out using a packedcolumn.

1424 ANALYST, NOVEMBER 1990, VOL. 115
sampling instrument (Perkin-Elmer HS-6) permanentlyattached to the gas chromatograph. Water samples wereequilibrated and injected in situ. The HS-6 unit consists of arotating temperature-controlled magazine with six recesses for6-ml glass vials and a control unit for programming the timeand temperature of the sampling. The magazine is mounted onthe injector panel of the chromatograph. The operatingprinciple involves controlled heating of the sample vials withinthe magazine [see Fig. 3(a)]. After the heating and equilibration period, the magazine is pushed upwards on a spigot. Thisstep causes a fixed sampling needle to penetrate the septum ofthe headspace vial [see Fig. 3(b)]. The penetration of theneedle is followed by pneumatic introduction of a predetermined aliquot of equilibration gas. The gas develops apressure inside the headspace of the vial greater than that atthe inlet of the chromatographic column. After a programmedtime interval, the pressurised sample vapour is flushed fromthe sampling needle into the capillary column. The threestages of equilibration, pressurisation and sampling are shownschematically in Fig. 4.
The operating conditions for each of the three variants arepresented in Table 1.
Standard Preparation
Gas and aqueous standards were prepared according toprotocols described by Brooks and Sackett,! Thain9 and Groband Kaiser. 10 Briefly, this involves the dilution of gas mixturesin water using 1- and 2-1 calibrated flasks (at room temperature and pressure) containing blank sea water. Injections wereconducted according to the protocols described by Kolbetal. lI
Reagents and Glassware
"Blank" sea water was prepared by solvent extraction of seawater taken from an unpolluted coastal site. After theextraction of solvent extractable organics into re-distilleddichloromethane, the sea water was purged in a stream ofultrapure nitrogen. Secondary blank sea water was preparedby spiking AnalaR-grade distilled water with a heat-treated,dehydrated sea-salt mixture (Instant-ocean, AquariumSystems, OR, USA) to simulate natural sea water [salinity =30 ± 3 p.p.t. (parts per thousand)] and brackish estuarinewater (salinity = 15 ± 3 p.p.t.).
Calibrated flasks fitted with modified stoppers for theinsertion of hypodermic syringe needles were washed anddried before use. Glass tubing and glass - metal fixtures werecleaned before use. Glass gas-bulbs for gas standard preparation were stored under nitrogen.
ToGC
L-&u~To=yyr-GC
Thermostatedwaterjacket
VFlow meter
Fig. 2. Analytical system for injection of the equilibration gas from avariable-volume sampling device onto a PLOT fused-silica capillarycolumn
Glass - metalunion
Fig. 1. Analytical system for injection of equilibration gas using asimple syringe-pump principle onto a stainless-steel packed column
Variant Ill. Pneumatic, semi-automatic injectionThe manual injection techniques descibed in variants I and IIwere substituted by a commercial semi-automated headspace
Variant II. Direct gas-syringe sampling
Equilibration and sampling were carried out using a similartechnique to that described for variant I. This variant is shownin Fig. 2. The syringe has a fabricated water sheath lining,permitting water at the same temperature as the equilibrationtemperature to be passed through the sheath. A 20-mlhead-gas sample was drawn from the equilibration bottle intothe syringe and injected into the gas chromatograph via agas-sampling valve. A PLOT fused-silica capillary column wasused for the chromatographic separation.
6
(b)
Fig. 3. Schematic illustration of the HS-6 automatic headspace accessory fitted to a Sigma-3B Model gas chromatograph. (a) Positioning ofthe sample vial and (b) sampling position. 1, Control unit of the headspace sampling accessory; 2, tem)'t'rature-controlled magazine to hold thevials; 3, gas chromatograph tnjector; 4, pre-column (optional); 5, chromatographic column; 6, detector (flame ionisation for hydrocarbons); 7and8, electronically controlled gas-control valves. Reproduced with permission from Perkin-Elmer

ANALYST, NOVEMBER 1990, VOL. 115
Results and DiscussionEvaluation of the Analytical Variants
The chromatographic separation of standard componentpeaks on the packed column (variant I) is shown in Fig. 5(a).A corresponding analysis of an actual sample taken from the
Pressurisation
1425
river Itchen is shown in Fig. 5(b). Although individual peaksare discernible, the separation is poor and the analysis timefairly long. The improved chromatography obtained using thecapillary columns in variants II and III are shown forcomparison in Fig. 6(a) and (b).
Simple experiments were conducted in order to determinethe effect of temperature and ionic strength on the recoverability of light hydrocarbons from spiked standard mixtures.Using variants I and II, experiments to determine an optimumsample volume were carried out. By comparison, the semiautomated headspace equipment (HS-6) is designed such thatthe upper limit is approximately 6 ml. Further work wasattempted to define the lower limits of detection and the RSDsof the analytical techniques.
Effect of temperature
Raising the temperature of the sample matrix decreases thesolubility of many organic compounds in water, andproportionally enriches the gas phase. TheClausius - Clapeyron equation demonstrates how the partialpressure of components is increased by an increase in
(a)
7
..r::~ r:(7
b:-)----;--------------,
Time/minFig. s. (a) Standard chromatogram of a light hydrocarbon mixture inwater run on a Porapak-Q packed column: range x 1 and attenuationx 1. (b) Sample chromatogram showing light hydrocarbons in asurface w~ter sample from the River Itchen on a Poropak-Q column:range x 1 and attentuation x 1. Components: 1, methane; 2, ethene;3, ethane; 4, propene; 5, propane; 6, 2-methylpropane; 7, butene; 8,butane; 9, cis-but-2-eneiand 10, trallS-but-2-ene
Sampling
Fig. 4. Schematic diagram of the three principal stages of the HS-6headspace analyser system. Reproduced with permission fromPerkin-Elmer
Table 1. Operating conditions for variants I, " and III
Variant 1
o
Variant 11
10
Variant III
Sample equilibration:Equilibration lemperaturef'CEquilibration time/min
Gas chromatography:GCcolumn
Carrier gasColumn Ilow/ml min-'Initialtemperaturef'CInitialtime/minRamp ratef'C min- 1
Finaltemperaturef'CInjector temperaturef'CDetector temperaturef'C
5045
2m x 3mmo.d.stainless steelpacked with80-100 meshPorapak-Q
Helium3550 (isothermal)
75175
5045
50 m x 0.32 mm i.d.A120,IKCI PLOT
Helium170o416070200
704
50m x 0.32i.d.AI20,IKCI PLOT
Helium17057.516070200

1426 ANALYST, NOVEMBER 1990, VOL. 115
751.96 ± 0.551.99 ± 0.432.01 ± 0.652.10 ± 0.632.01 ± 0.642.44 ± 0.542.57 ± 0.73
702.43 ± 0.052.02 ± 0.062.30 ± 0.032.03 ± 0.032.05 ± 0.032.38 ± 0.042.47 ± 0.04
66
1.02 ± 0.401.03 ± 0.431.02 ± 0.321.02 ± 0.301.03 ± 0.241.07 ± 0.471.09 ± 0.35
501.59 ± 0.031.33 ± 0.021.45 ± 0.041.34 ± 0.041.44 ± 0.051.40± 0.051.75 ± 0.05
501.89 ± 0.031.58 ± 0.021.69 ± 0.031.45 ± 0.041.64 ± 0.031.57 ± 0.031.74 ± 0.04
30
1.00 ± 0.011.oo± 0.011.00 ± 0.021.00 ± 0.021.00 ± 0.021.00 ± 0.011.00 ± 0.01
Salinity, p.p.1.
Equilibration temperaturefOC
Equilibration temperaturefOC
301.00 ± 0.011.00 ± 0.021.00 ± 0.021.00 ± 0.021.00 ± 0.031.00 ± 0.021.00 ± 0.01
301.00 ± 0.011.00 ± 0.011.00 ± 0.021.00 ± 0.021.00 ± 0.031.00 ± 0.031.00 ± 0.04
101.00 ± 0.010.99 ± 0.010.99 ± 0.010.99 ± 0.011.00 ± 0.021.00 ± 0.031.00 ± 0.03
MethaneEthaneEthenePropanePropene2-Methylpropane ..1,3-Butadiene
A key observation arising from the HS-6 data is the muchsmaller increase in standard deviation with temperaturecompared with variants I and II. This is further evidence thatthe larger amounts of water vapour, and hence the greaterpotential for condensation, are the main cause of the increasein standard deviation. However, as the HS-6 is an automaticdevice, whereas variants I and II are manually controlled,some element of operator error may also be a contributingfactor. Variant II utilises a capillary column, which suggeststhat the use of a packed column rather than thehigh-performance fused-silica capillary column is not a majorsource of variation in this particular application. The use ofthe higher equilibration temperature (i. e., 70°C) is thereforea worthwhile strategy considering the increase in peak arearecovery it affords.
Effect of salinity
Increasing the ionic strength of the sample matrix will enhancethe concentration of organic compounds found in the gasphase. As the blank matrix was sea water (rather than distilledwater), no correction for the increased solubility exhibited byorganic compounds in distilled water was necessary.
However, as the salinity of estuarine waters can range fromvirtually zero to that of sea water (about 33 p.p.t.) someassessment of the influence of varying salinity was required. Astandard sea water matrix spiked with equal volumes ofmethane, ethane, ethene, propane, propene, 2-methylpropane and 1,3-butadiene was used. Their concentrations wereapproximately 1 x 10⁻⁴ mll- 1 each. Standards were prepared
Table 2. Effects of equilibration temperature on relative recovery forboth variants I and II ± one standard deviation
Table 3. Effects of equilibration temperature on relative recoveryusing the HS-6 headspace device ± one standard deviation
MethaneEthaneEthenePropanePropene2-Methylpropane ..1,3-Butadiene
MethaneEthaneEthenePropanePropene2-methylpropane1,3-Butadiene
Table 4. Effect of ionic strength on the relative recovery of lighthydrocarbons from water using variants I and II ± one standarddeviation
20
1210
15
84 6Time/min
o
(b) 17
4
11
58 12 13 15
162 9 1014.. 1 3
U>'C
"l:l~
1 6 7
(a) 5
1
4
3
2
Gas valve
7 irurn into loop.6
iijc:Oliii
iijc:OlUi
temperature: dlnpt/dT = LlRT2, where Tis the temperature,L the latent heat of vaporisation of component i, and R the gasconstant.
Standards containing approximately equal volumes ofmethane, ethane, ethene, propane, propene, butane and1,3-butadiene (about 1 x 10⁻⁴ mll- t) were equilibrated at 25,50 and 75°C, using variants I and II. The results, normalisedto the values obtained at 25 °C and quoted as ± one standarddeviation, are presented in Table 2. They represent therecovery dependence of both variants, because,experimentally, there was found to be <5% differencebetween them. This suggests that temperature variations havean almost identical effect on recovery. However, inspection ofthe data shows that at temperatures above 50°C the standarddeviation of the means increases .significantly. Despite thevirtual doubling in response, this disproportionate effect isprobably due to condensation effects inside the samplingsystem and the gas sample valve pipework. Although the useof heated tape minimises this effect, the collection of largeamounts of water vapour inside the sampling system isundesirable.
A similar experiment was performed on variant III (theHS-6 system). As the sample volume is considerably less, theproblem of water vapour condensation is expected to be lesspronounced. The experimental data are shown in Table 3. Asbefore, the values are normalised to those obtained at 30°C,and tabulated as ± one standard deviation.
10Time/min
Fig. 6. Standard chromatograms of two light hydrocarbon mixturesin water run on PLOT fused-silica capillary columns. (a) Standard(approximately 2 x 10⁻³ mll- 1 for comp'0nents 1-5) using the directgas-syringe technique, i.e., variant II. (b) Standard (approximately1 x 10-3 mll- 1 per component) using the HS-6headspace device, i.e.,variant III (see text for details). Components: 1, methane; 2, ethane;3, ethene; 4, propane; 5, propene; 6, ethyne; 7, alkyne (propadiene?);8, 2-methylpropane; 9, butane; 10, trans-but-2-ene; 11, but-1-ene; 12,2-methylpropene; 13, cil'-but-2-ene; 14, 2-methylbutane; 15, propyne;16, pentane; and 17, 1,3-butadiene
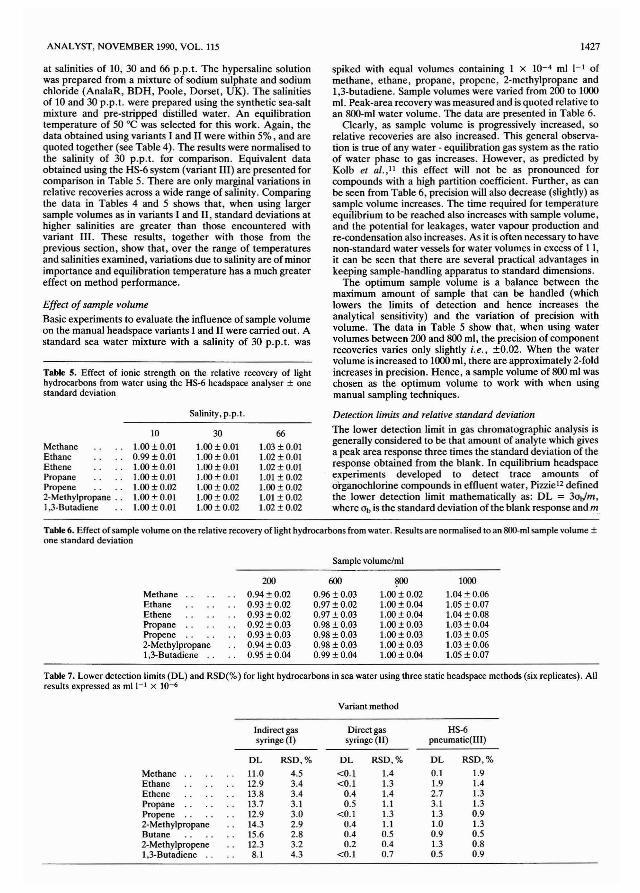
ANALYST, NOVEMBER 1990, VOL. 115 1427
Table S. Effect of ionic strength on the relative recovery of lighthydrocarbons from water using the HS-6 headspace analyser ± onestandard deviation
Effect of sample volume
Basic experiments to evaluate the influence of sample volumeon the manual headspace variants] and II were carried out. Astandard sea water mixture with a salinity of 30 p. p. t. was
at salinities of 10, 30 and 66 p.p.t. The hypersaline solutionwas prepared from a mixture of sodium sulphate and sodiumchloride (AnalaR, BDH, Poole, Dorset, UK). The salinitiesof 10 and 30 p.p.t. were prepared using the synthetic sea-saltmixture and pre-stripped distilled water. An equilibrationtemperature of 50°C was selected for this work. Again, thedata obtained using variants] and II were within 5%, and arequoted together (see Table 4). The results were normalised tothe salinity of 30 p.p.t. for comparison. Equivalent dataobtained using the HS-6 system (variant II]) are presented forcomparison in Table 5. There are only marginal variations inrelative recoveries across a wide range of salinity. Comparingthe data in Tables 4 and 5 shows that, when using largersample volumes as in variants] and II, standard deviations athigher salinities are greater than those encountered withvariant III. These results, together with those from theprevious section, show that, over the range of temperaturesand salinities examined, variations due to salinity are of minorimportance and equilibration temperature has a much greatereffect on method performance.
MethaneEthaneEthenePropanePropene2-Methylpropane ..1,3-Butadiene
10l.(lO ± 0.010.99 ± 0.011.00 ± 0.011.00 ± 0.011.00 ± 0.021.00 ± 0.011.00 ± 0.01
Salinity, p.p.l.
301.00± 0.011.00± 0.011.00 ± 0.011.00 ± 0.011.00 ± 0.021.00 ± 0.021.00 ± 0.02
661.03 ± 0.011.02 ± 0.011.02 ± 0.011.01 ± 0.021.00 ± 0.021.01 ± 0.021.02 ± 0.02
spiked with equal volumes containing 1 X 10⁻⁴ ml 1-1 ofmethane, ethane, propane, propene, 2-methylpropane and1,3-butadiene. Sample volumes were varied from 200 to 1000m\. Peak-area recovery was measured and is quoted relative toan BOO-ml water volume. The data are presented in Table 6.
Clearly, as sample volume is progressively increased, sorelative recoveries are also increased. This general observation is true of any water - equilibration gas system as the ratioof water phase to gas increases. However, as predicted byKolb et aI., 11 this effect will not be as pronounced forcompounds with a high partition coefficient. Further, as canbe seen from Table 6, precision will also decrease (slightly) assample volume increases. The time required for temperatureequilibrium to be reached also increases with sample volume,and the potential for leakages, water vapour production andre-condensation also increases. As it is often necessary to havenon-standard water vessels for water volumes in excess of 11,it can be seen that there are several practical advantages inkeeping sample-handling apparatus to standard dimensions.
The optimum sample volume is a balance between themaximum amount of sample that can be handled (whichlowers the limits of detection and hence increases theanalytical sensitivity) and the variation of precision withvolume. The data in Table 5 show that, when using watervolumes between 200 and 800 ml, the precision of componentrecoveries varies only slightly i.e., ±O.02. When the watervolume is increased to 1000 ml, there are approximately 2-foldincreases in precision. Hence, a sample volume of 800 ml waschosen as the optimum volume to work with when usingmanual sampling techniques.
Detection limits and relative standard deviation
The lower detection limit in gas chromatographic analysis isgenerally considered to be that amount of analyte which givesa peak area response three times the standard deviation of theresponse obtained from the blank. ]n equilibrium headspaceexperiments developed to detect trace amounts oforganochlorine compounds in effluent water, Pizzie lZ definedthe lower detection limit mathematically as: DL = 3o.,lm,where 0b is the standard deviation of the blank response and m
Table 6. Effect of sample volume on the relative recovery of light hydrocarbons from water. Results are normalised to an BOO-ml sample volume ±one standard deviation
Sample volumelml
MethaneEthaneEthenePropanePropene2-Methylpropane1,3-Butadiene ..
2000.94±0.020.93 ± 0.020.93 ± 0.020.92 ± 0.030.93 ± 0.030.94 ± 0.030.95 ± 0.04
600
0.96 ± 0.030.97 ±0.020.97 ± 0.030.98 ± 0.030.98 ± 0.030.98 ± 0.030.99 ±0.04
?GO1.00 ± 0.021.00 ± 0.041.00 ± 0.041.00 ± 0.031.00 ± 0.031.00 ± 0.031.00 ± 0.04
1000
1.04 ± 0.061.05 ± 0.071.04 ± 0.081.03 ± 0.041.03 ± 0.051.03 ± 0.061.05 ± 0.07
Table 7. Lower detection limits (DL) and RSD(%) for light hydrocarbons in sea water using three static headspace methods (six replicates). Allresults expressed as mil-I x 10-6
Variant method
Indirect gas Direct gas HS-6syringe (I) syringe (II) pneumatic(lII)
DL RSD,% DL RSD,% DL RSD,%
Methane 11.0 4.5 <0.1 1.4 0.1 1.9Ethane 12.9 3.4 <0.1 1.3 1.9 1.4Ethene 13.8 3.4 0.4 1.4 2.7 1.3Propane 13.7 3.1 0.5 1.1 3.1 1.3Propene 12.9 3.0 <0.1 1.3 1.3 0.92-Methylpropane 14.3 2.9 0.4 1.1 1.0 1.3Butane 15.6 2.8 0.4 0.5 0.9 0.52-Methylpropene 12.3 3.2 0.2 0.4 1.3 0.81,3·Butadiene .. 8.1 4.3 <0.1 0.7 0.5 0.9

1428
Table 8. Typical dissolved light hydrocarbon concentrations in watersamples from the estuaries of Southampton and the Beaulieu river.Results expressed as mll- 1 x 10⁻⁶
ANALYST, NOVEMBER 1990, VOL. 115
ingly growing source of these hydrocarbons relative to many ofthe "traditional" inputs associated with local chemical-processing industries.
is the slope (or sensitivity) of the calibration graph for theanalyte in question.
The lower limits of detection and the RSD(%) for CI-C4
light hydrocarbons using variants I, II and III are shown inTable 7. These detection limits reflect, in part, the lowersensitivity obtained using packed column chromatography(variant I) compared with the high-performance fused-silicacapillary PLOT columns (used in variants II and III). Manualsystems of equilibration and injection can be considered muchless efficient than the semi-automatic, pneumatic system(variant III). Even though variant II is capable of lower limitsof detection, variant III, combined with capillary columnchromatography, offers a limit of detection comparable tovariant II, but uses much less sample. Variants II and IIIgenerate repeatable data to within an RSD of2%. Variant I,however, exhibited higher RSD values between 2.8 and 4.5%,largely due to the use of a packed column. It ought to berecognised that this performance will be satisfactory for manylaboratories that wish to carry out less precise determinationsof light hydrocarbons in water.
Sample Data-A Case Study
The methods described were used to study the variation inlevels of light hydrocarbons with time in Southampton water.The existence of the estuary has led to the intense commercialand residential development of its shores where it supports anumber of industries varying from oil refining and merchantshipping to boat building and fishing. Large tracts of shorelinehave also been converted to marina complexes over the last 5years. The Beaulieu river, a smaller estuary, is located afurther 15 miles to the west along the Solent coastline. Thisrural waterway remains largely undeveloped and is thereforeconsiderably less subject to inputs of anthropogenic volatilecarbon compounds. Typical sample data from surface water inboth estuaries are shown in Table 8 for comparison.
The data suggest that, although methane is largely ofbiogenic origin, the industrialised Southampton estuary contains up to ten times higher concentrations of Cz-C4 hydrocarbons than the rural Beaulieu estuary. Previous research3•13•14•
has suggested that spillages of marine fuels, atmosphericfallout and untreated sewage wastes are a major and increas-
MethaneEthaneEthenePropanePropene2-MethylpropaneButane2-MethylpropeneButene1,3-Butadiene
Southamptonwater (Hythe) Beaulieu river
1040 179075 2595 15
120 1045 15
255 40300 20175 10125 <540 <5
Conclusion
As a major reason for studying light hydrocarbons was toexamine anthropogenic inputs to surface water, these limitswere compared with the concentrations found in uncontaminated open-ocean water by Brooks and Sackett. l Theseworkers quoted levels of approximately 5 x 10⁻⁵ mIl-I formethane, 3 x 10⁻⁶ mIl-I for ethane plus ethene, 1 x 10⁻⁶
ml I-I for propane and about 1 x 10⁻¹ ml I-I for C4hydrocarbons in open-ocean surface waters. Table 7 showsthat only variants II and III are suitable for monitoring lighthydrocarbons in the estuary by this criterion.
However, all three methods offer a significant degree offlexibility to the analytical chemist working in this field. Allthree techniques can be used with relatively clean waters orwith contaminated wastewaters. They do not involve the useof cumbersome or highly expensive and complex apparatus.Further, these methods have facilitated the monitoring of lighthydrocarbon gases in estuarine and coastal waters andprovided exclusive quantitative data on the occurrence andbehaviour of these compounds as water pollutants.
The author thanks M. S. Varney (Oceanography Department,University of Southampton) and A. J. Phillips (EarthSciences, Open University) for their valuable comments madeduring the preparation of the manuscript.
References
1. Brooks, J. M., and Sackett, W. M., J. Geophys. Res., 1973, 78,5248.
2. Knap, A. H., PhD Thesis, University of Southampton, 1984.3. Bianchi, A. P., Bianchi, C. A., and Varney, M. S., Oil Chem.
Pol/ut., 1989, S, 477.4. Swinnerton,J. W., and Linnenbom, V. J.,J. Gas Chromatogr.,
1967, S, 570.5. Swinnerton, J. W., and Linnenbom, V. J., Environ. Sci.
Technol., 1969, 3, 838.6. "The Determination of Methane and Other Hydrocarbon
Gases in Water, 1988," HM Stationery Office, London, 1988.7. Croll, B. T., Sumner, M. E., and Leathard, D. A., Analyst,
1986, 111, 73.8. Bianchi, A., and Varney, M. S., Analyst, 1989, 114,47.9. Thain, W., "Monitoring Toxic Gases in the Atmosphere for
Hygiene and Pollution Control," Pergamon Press, New York,1980.
10. Grob, R. L., and Kaiser, M. A., "Environmental ProblemSolving Using Gas - Liquid Chromatography," Journal ofChromatography Library Volume 21, Elsevier, Amsterdam,1982.
11. Kolb, B., Kraub, H., and Auer, M., "Perkin-Elmer Applications Paper 2111978/HSA-21," Perkin-Elmer, Buckinghamshire, 1978.
12. Pizzie, R, PhD Thesis, University of Southampton, 1984.13. Bianchi, A., and Varney, M. S., Water Waste Treat., 1988,31,
14.14. Bianchi, A., Varney, M. S., and Phillips, A. J., J. Chromat
ogr., 1989,467,111.
Paper 0101352HReceived March 28th, 1990
Accepted July 25th, 1990

ANALYST. NOVEMBER 1990, VOL. 115
Application of High-performance Size-exclusion LiquidChromatography to the Study of Copper Speciation in WatersExtracted From Sewage Sludge Treated Soils
Andrew R. Morrisson and John S. ParkSchool of Applied Sciences, RGIT, S1. Andrews Street, Aberdeen, UKBarry L. SharpAnalytical Division, Macaulay Land Use Research Institute, Craigiebuckler, Aberdeen, UK
1429
A simple linear relationship has been established between the ionic strength and electrical conductivity of soilsolutions. This relationship allows the preparation of an eluent for high-performance liquid chromatographywhich resembles the soil solution in terms of pH and ionic strength without requiring a complete ionicanalysis of the sample. High-performance size-exclusion chromatography has been used in conjunction withultraviolet detection for the molecular species and graphite furnace atomic absorption spectrometry forcopper. A TSK G3000 SW column was used with an eluent consisting of Na2HPO. - NaH2PO•. The analysis ofsoil solutions extracted by centrifugation using this system enabled the separation of the soluble organicmatter into fractions of high and low relative molecular mass. The determination of copper in these fractionsrevealed that 60-80% ofthe copper is bound to humic and fulvic acids and is unavailable for plant uptake. Theproportion of copper complexed with organic matter of high relative molecular mass was found to be affectedby the drainage status of the soil.
Keywords: Chemical speciation; graphite furnace atomic absorption spectrometry; high-performancesize-exclusion chromatography; soil solution; sewage sludge treated soil
In recent years there has been considerable concern regardingthe disposal of sewage sludges on agricultural land. Thisconcern is related to the high concentrations of potentiallytoxic heavy metals that may be present in such effluents.! Thetoxicity of these heavy metals is governed by their physicochemical form or speciation.2 However, because there is a lackof analytical methods capable of providing a convenientassessment of this speciation, regulatory agencies havedefined upper limits for the loading of soils in terms of theextractable contents using the classical diagnostic reagentsemployed to determine plant "availability." A recent Councilfor European Communities (CEC) directive laid down upperlimits for heavy metal concentrations in sewage sludge used inagriculture. 3
For copper, the apparently high level permitted in the soilarises because a large proportion of the metal is organicallybound in forms that are not available to the plant. This isthought to be the result of complexation with the higherrelative molecular mass humic substances. 4 Humic substanceshave been defined as a "general category of naturallyoccurring, biogenic, heterogeneous organic substances thatcan generally be characterised as being yellow to black incolour, of high molecular weight and refractory."5 Humicsubstances can be split into two main classes, i. e., humic andfulvic acids, with fulvic acid generally being of lower relativemolecular mass. The addition of such ligands to a polluted soilhas been shown to cause a decrease in the plant-availablecopper.6
Copper is also known to form complexes with lower relativemolecular mass ligands, e.g., citric acid.7 The lower relativemolecular mass copper complexes are potentially available toa greater extent to plants and it is already known that, forexample, copper - citrate complexes are highly toxic to thealga Selenastrum capricomutum.8 For inorganic copper thereis considerable evidence that the free Cu2+ ion is the mosttoxic form, but that simple inorganic species, e.g., CuCIz arealso extremely toxic.2
Heavy metals in soil solutions undergo complex equilibriawhich are very easily disturbed. Conventional methods usedfor assessing plant availability involve the use of chemicalextractants.l·9 However, the addition of any extractant to asoil will have a disruptive effect on the soil equilibria and it has
been shown that the correlation between extractable copperand plant-available copper is very 10w. 1O The diversity andpoorly defined properties of naturally occurring aqueousorganic material still constitutes a major drawback for copperspeciation studies. A division between defined low relativemolecular mass organic substances and diversified highrelative molecular mass humic substances is perhaps theclearest distinction that can be made.s A much lowerproportion of the copper is present as Cu2+ or simpleinorganic complexes, e.g., CuCIz.
The criteria for an analytical method to investigate thepartitioning between the plant-available and non-availableforms are that it should provide a separation based primarilyon molecular size/mass, such that the natural speciationshould not be significantly altered by the preparationchemistry or interactions with the column packing and that itshould be convenient to run on a routine basis. Theserequirements suggested the use of size-exclusion chromatography (SEC). It was then necessary to establish that asatisfactory separation could be achieved at a pH and totalionic strength (I) equivalent to that of the extracted solutionsin order that the original speciation was preserved.
The total ionic strength of a solution can be determined by acomplete analysis of the component ionic species. This isappropriate for the initial investigation of an analyticalmethod, but would be too time consuming. to carry out onevery sample. For this reason, the relationship between totalionic strength and electrical conductivity (EC) of the extractedsolutions was investigated and a model was established, whichagrees well with that previously proposed by Griffin andJurinak. ll Hence simple measurements of the solution conductivity and pH indicate directly an appropriate compositionfor the eluent. The resulting model was also applied to real soilsolutions in order that an estimate of the degree of complexation of the major ionic species could be obtained.
Experimental
Apparatus
Soils were centrifuged using an MSE Mistral 3000 centrifuge(Fisons Scientific Equipment, Loughborough, Leicestershire,

1430 ANALYST, NOVEMBER 1990, VOL. 115
Table 2. Laverock Brae Soil, map reference NJ 921111
Table 1. Furnace conditions for the Pye Unicam SP9 atomicabsorption spectrometer at A= 324.8 run
Reagents
Model soil solutions were prepared from AnalaR-gradechemicals (BDH, Poole, Dorset, UK). In order that coppercontamination could be minimised, the HPLC eluent wasprepared from high-purity Aristar-grade chemicals (BDH).
A humic acid standard (50 mg dm-3) was made by dilutionof a 200 mg dm-3 stock solution prepared by dissolving 0.2 gof humic acid powder in 1 cm3 of 0.2 mol dm-3 NaOH anddiluting with water. A fulvic acid standard (SO mg dm- 3) wasprepared by dissolving fulvic acid powder in distilled water.This solution was then filtered to remove any particulatematter. The humic and fulvic acids were extracted from soil of
UK). 'The resultant solutions were analysed for cationiccontent by flame emission spectrometry (Na and K) on aComing 400 photometer (Coming, Halstead, Essex, UK) andby atomic absorption spectrometry (AAS) (Ca, Mg and Cu)on either a Varian 1275 (Varian Associates, Walton onThames, Surrey, UK) or a Perkin-Elmer 560 (Perkin-Elmer,Beaconsfield, Buckinghamshire, UK) instrument. Anionswere determined by high-performance ion chromatography(CI- and S042-) on a Dionex 4000 chromatograph (DionexUK, Camberley, Surrey, UK) and by flow injection colorimetry (HC03-, N03- and P043-) on a Tecator FIAstar510 instrument (Perstorp Analytical, Bristol, UK).
The high-performance liquid chromatography (HPLC)separation was carried out with a TSK (Toyo Soda, Tokyo,Japan) G3000 SW SEC column (8 x 300 mm) fitted with aTSK GSW (8 x 40 mm) guard column. All HPLC apparatusused was manufactured by LKB (Bromma, Sweden) andconsisted of: a 2152 HPLC controller, a 2158 UV cord SD, (A= 284 nm) 2150 HPLC pump and a 11300 Ultrograd mixerdriver. Samples were injected via a Valco C6W injection valvefitted with a 200-111 injection loop. Fractions of the eluate (0.25ml) were collected and an aliquot (5 Ill) was analysed bygraphite furnace AAS (GFAAS) using a Pye Unicam SP9atomic absorption spectrometer fitted with a PU 9090 datagraphics system, a PU 9095 video furnace programmer and anSP 9 furnace power supply. The furnace conditions employedwere as given in Table 1.
HPLC analysis of soil solutions
The soils were sampled and centrifuged as before, except thatthe soil solutions were filtered using a Gelman LC3A OA5-l1mfilter to remove any particulate matter before analysis. Thesoil solutions were injected on to the HPLC column with acarrier flow-rate of 0.75 ml min-I. The mobile phase usedconsisted of Na2HP04 and NaH2P04. A computer programBUFFER was written which enabled the correct concentration of each of the two components to be calculated so that theresulting buffer had the same ionic strength and pH as the soilsolution under investigation.
the Insch Association sampled at Greenhall Farm, Insch.Unless stated otherwise, all other reagents were preparedfrom AnalaR-grade chemicals.
All glassware was soaked overnight in 2% Decon, rinsed,washed three times with 1 + 4 vlv HN03 and finally rinsedthree times with water. All water used was purified byde-ionisation and distillation.
Results and Discussion
The data obtained from the total ionic analysis of the soilsolution are shown in Table 3.
Procedure
Preparation ofmodel soil solutions
Eighteen model soil solutions were prepared with similar ionicconcentrations to the soil extracts studied by Griffin andJurinak. tt The use of model solutions ensured that their ioniccontent was known accurately. It was decided that the use ofdata obtained from the analysis of soil extracts wouldintroduce errors into the derivation of a conductivity - ionicstrength relationship for the following reasons: experimentalerrors would be introduced during the extraction and subsequent analysis; the experimental methods used by Griffin andJurinak measured total concentrations and not the free ionicfraction which contributes to the ionic strength. This wouldlead to an overestimation of the ionic strength of the soilextract.
Additionally, five model solutions were prepared withsimilar ionic concentrations to the field of interest (LaverockBrae Farm, Aberdeen, UK). This field has a history of sewagesludge application and its characteristics are shown in Table 2.Soil samples were taken from the Ap horizon (the 0-20 cmploughed surface layer of the soil) of the field. The soilsolutions were extracted by centrifugation of the wet soil (2 x25G-g samples) at 2000 g for 1 h. The centrifuge tubes werespecially constructed and were similar to those used byElkhatib et al. 12
The conductivities of the 23 model solutions were measuredat 25 0c. The calculated total ionic strength was then correctedfor ion-pair formation. 13 A linear regression analysis was thencarried out on the EC versus I data.
1800 26505 5
70025
35025
10025
7520
1
Till derived from mixed acid.. Glacial till igneous, acid metamorphic and
basic igneous rocks. . Ta~es . Brown forest soil.. Thlstlyhdl., Imperfect.. Rotational by pasture based on rye grass
Parent material
Soil associationSoil seriesDrainageVegetation
Temperaturef'CTimels
Table 3. Soil solution concenlrations. In each instance the first value in the pair of values is concentration in p.p.m. and the second isconcentration in mmol dm-3
SampleMn2+site CI- HC03- N03- P043- SO.,- Ca2+ Cu2+ K+ Mg2+ Na+
38.132 39.101 16.713 0.205 8.073 1.1948 0.313 2.253 0.16 0.0041 24.261.074 0.641 0.269 0.00216 0.0841 0.0298 0.000489 0.0577 0.0067 OO75סס.0 1.0547
2 27.538 34.9 26.733 0.198 11.97 2.093 0.0178 1.994 0.17 0.0067 16.290.776 0.57 0.431 0.0021 0.124 0.0523 0.000278 0.0511 0.00709 0.000122 0.708
3 35.465 12.86 28.429 0.155 7.31 2.330 0.02 2.399 0.10 0.0184 10.670.999 0.211 0.458 0.00163 0.076 0.0583 0.000313 0.0615 0.00417 0.000335 0.464
4 29.77 24.91 15.215 0.104 10.35 1.506 0.0179 2.54 0.06 0.0087 13.980.839 0.408 0.245 0.00109 0.108 0.0377 0.000279 0.0651 0.0025 0.000158 0.608
5 23.31 49.77 8.574 0.0073 4.510 0.96 0.0157 1.15 0.06 0.023 16.040.657 0.816 0.141 0.00076 0.047 0.024 0.000245 0.0295 0.0025 0.000418 0.697
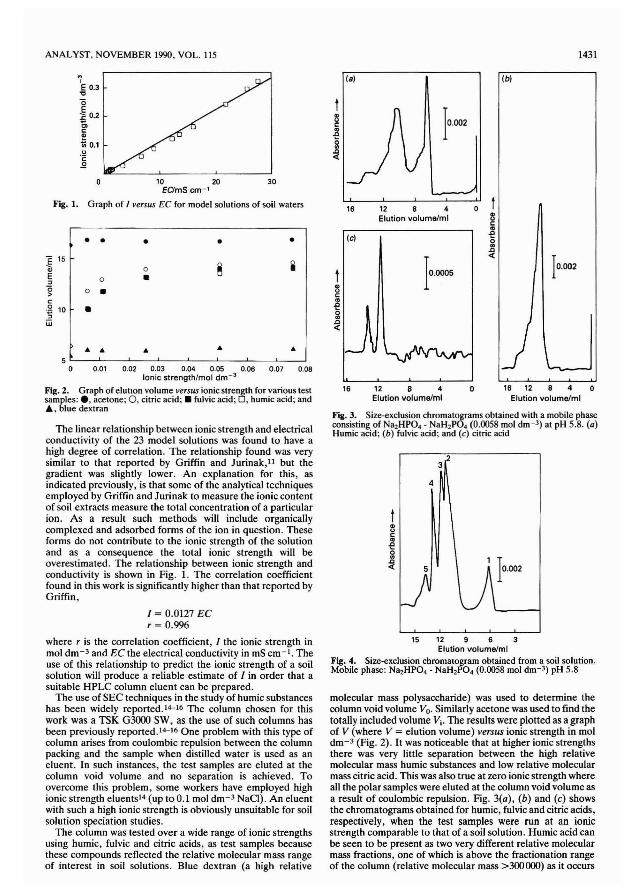
ANALYST. NOVEMBER 1990. VOL. 115 1431
1= 0.0127 ECr = 0.996
'-16 12 8 4 0
Elution volumelml
(b)
)
1 10.002
o
10.002
4
5
t.,uc:co-eg.0<l:
12 8 4Elution volumelml
16 12 8 4Elution volumelml
.,uc:co
(e) -e0...0
10.0005
<l: 10.002
(a)
16
Fig. 3. Size-exclusion chromatograms obtained with a mobile phaseconsisting of Na2HPO. - NaH2PO. (0.0058 mol dm-3) at pH 5.8. (a)Humic acid; (b) fulvic acid; and (e) citric acid
23
•
..
•
..
•o•
..
• •E 15Q;E 0:>(; 0 •>c:0 10 •'5u;
... ...
10 20 30EOmScm- 1
Fig. 1. Graph of I versus EC for model solutions of soil waters
...I
E 0.3..,(;E~ 0.2CDc:~t:i 0.1u
'".2
The linear relationship between ionic strength and electricalconductivity of the 23 model solutions was found to have ahigh degree of correlation. The relationship found was verysimilar to that reported by Griffin and Jurinak,l1 but thegradient was slightly lower. An explanation for this, asindicated previously, is that some of the analytical techniquesemployed by Griffin and Jurinak to measure the ionic contentof soil extracts measure the total concentration of a particularion. As a result such methods will include organicallycomplexed and adsorbed forms of the ion in question. Theseforms do not contribute to the ionic strength of the solutionand as a consequence the total ionic strength will beoverestimated. The relationship between ionic strength andconductivity is shown in Fig. 1. The correlation coefficientfound in this work is significantly higher than that reported byGriffin,
5 "-_--'--_----'-__L-_--'--_-'-_-"'L-_-'-_-'o 0.01 0.02 0.03 0.04 0.05 0.06 0.07 0.08
Ionic strength/mol dm-3
Fig. 2. Graph of elution volume versus ionic strength for various testsamples: •. acetone; O. citric acid; • fulvic acid; 0, humic acid; and., blue dextran
where r is the correlation coefficient, I the ionic strength inmol dm-3 and EC the electrical conductivity in mS cm- I • Theuse of this relationship to predict the ionic strength of a soilsolution will produce a reliable estimate of I in order that asuitable HPLC column eluent can be prepared.
The use of SEC techniques in the study of humic substanceshas been widely reported. 14-16 The column chosen for thiswork was a TSK G3000 SW, as the use of such columns hasbeen previously reported. 14-16 One problem with this type ofcolumn arises from coulombic repulsion between the columnpacking and the sample when distilled water is used as aneluent. In such instances, the test samples are eluted at thecolumn void volume and no separation is achieved. Toovercome this problem, some workers have employed highionic strength eluents14 (up to 0.1 mol dm- 3 NaCI). An eluentwith such a high ionic strength is obviously unsuitable for soilsolution speciation studies.
The column was tested over a wide range of ionic strengthsusing humic, fulvic and citric acids, as test samples becausethese compounds reflected the relative molecular mass rangeof interest in soil solutions. Blue dextran (a high relative
15 12 9 6 3Elution volume/ml
Fig. 4. Size-exclusion chromatogram obtained from a soil solution.Mobile phase: Na2HPO. - NaH2PO. (0.0058 mol dm-3) pH 5.8
molecular mass polysaccharide) was used to determine thecolumn void volume Vo. Similarly acetone was used to find thetotally included volume VI' The results were plotted as a graphof V (where V = elution volume) versus ionic strength in moldm-3 (Fig. 2). It was noticeable that at higher ionic strengthsthere was very little separation between the high relativemolecular mass humic substances and low relative molecularmass citric acid. This was also true at zero ionic strength whereall the polar samples were eluted at the column void volume asa result of coulombic repulsion. Fig. 3(a), (b) and (c) showsthe chromatograms obtained for humic, fulvic and citric acids,respectively, when the test samples were run at an ionicstrength comparable to that of a soil solution. Humic acid canbe seen to be present as two very different relative molecularmass fractions, one of which is above the fractionation rangeof the column (relative molecular mass >300()()() as it occurs

1432
0.14
0.12
0.10.,uc:..-e 0.08
]« 0.06
0.04
0.02
15 12 9 6 3 0Elution volumelml
Fig. S. Size-exclusion chromatogram obtained for sample site LabI-A. Mobile phase: NazHP04 - NaHzP04 (0.0058 mol dm-3) pH 5.8
Table 4. Results obtained for the determination of total soil solutioncopper by ICP-OES
Low relative molecularHumic materials mass ligands
Amount of total Cu Amount of total Cu
Soil sampling site % p.p.m. % p.p.m.Lab I-A 67.0 0.106 33.0 0.052Lab I-B 63.2 0.099 26.8 0.041Lab1-C 83.0 0.094 16.6 0.019
at the void volume and one of much lower relative molecularmass. Fulvic acid occurs as just one fraction with an elutionvolume almost identical with the lower relative molecularmass humic acid fraction. Similar splitting of humic acid peakswas found by Vaughan and Ord1? when they attempted toseparate humic and fulvic acids by gel filtration on SephadexG-75. They also encountered a second humic acid peak whichco-eluted with fulvic acid. Although humic acid is generallyclassed as being soluble in alkali it usually contains a~ater-.soluble ~raction which has very similar properties,mcludmg relaltve molecular mass, to fulvic acid. It is thisfraction which co-elutes with fulvic acid. Citric acid also occursas two peaks, the reason for this is unclear. It is unlikely that itis due to impurities as the citric acid was of AnalaR-grade andshould, therefore, contain no noticeable impurities. Indeedthe same sample has been tested on a reversed-phase columnand was found to contain no impurities. One possibleexplanation for the second peak is that some of the citric acidmay have interacted with the sodium ions in the eluent,resulting in the formation of the sodium salt of citric acid.
It was noted that at low ionic strengths the degree ofseparation between citric acid and the humic substances wasmuch greater than at either zero ionic strength or high ionicstrengths. It may be that the column was not separating thecompounds on relative molecular mass alone, and somecoulombic repulsion was occurring. This coulombic repulsionseemed to affect the humic substances to a much greaterextent than citric acid and hence permitted a clear separationbetween the low relative molecular mass organic ligands andthe humic and fulvic fractions.
ANALYST. NOVEMBER 1990, VOL. 115
A soil solution was analysed under the same conditions andthe resulting chromatogram is shown in Fig. 4. The chromatogram can be seen to consist of five distinct peaks. Peak 1 is dueto the high relative molecular mass humic acid fractionnormally present in soils. Peak 2 is thought to be due to thelow relative molecular mass humic acid fraction and also fulvicacid, as the elution volume was identical with that of the testsamples. Similarly, peak 4 has an elution volume similar tothat of citric acid and was, therefore, due to the low relativemolecular mass organic ligands in the soil solution. Peak 3 liesin between those due to citric acid and the lower relativemolecular mass humic substances and it is most likely that thispeak is due to a splitting of the latter peak. Peak 5 may be dueto splitting of the low relative molecular mass organic acidpeak. Again this may be due to interactions with the sodiumions in the elue~J.t, or ultraviolet absorbing inorganic ligands,e.g., N03 -, whtch also elute at this volume.
Duplicate soil samples were taken from each sampling siteand the soil solutions were extracted as before. The sampleswere run using HPLC and O.25-ml fractions were collected andanalysed for copper by GFAAS. The resulting absorbanceswere superimposed on the chromatogram (Fig. 5). It is evidentthat the majority of the copper (67%) is complexed with thehumic substances which is, as expected, due to the abundanceof humic materials in soils. A significant amount of copper iscomplexed with low relative molecular mass ligands (33%).
Another two samples were taken from different locations~nd the total soil solution copper was determined by inducltvely coupled plasma optical emission spectrometry (ICPOES). The results are presented in Table 4.
It is apparent that in this soil the majority of the copper ispresent as complexes with humic substances but that asignificant amount is present as complexes with low relativemolecular mass ligands, e.g., citric, malic and lactic acids. Thespecific ~atur~ of the.se low relative molecular mass ligandswIll be mvesltgated m future work. From the results it isevident that samples taken from sites Lab I-A and Lab l-Bwere similar in the amounts of copper bound by humicmaterials. Sampling site Lab l-C, however, showed a muchgreater proportion of the copper bound to humic material.This site was different from the previous two in that the soilhad a much higher moisture content. In fact this part of thefield tend~d to collect water and was often waterlogged. Incontrast sItes I-A and l-B were on a much greater gradientand subsequently water tended to drain off rapidly. Fromthese results it seems evident that if soil water is allowed timeto equilibrate with the soil particles then the soil solutioncopper will be predominantly in the form of copper - humic orcopper - fulvic acid complexes.
We are grateful to the Science and Engineering ResearchCouncil for their financial support. We thank M. L. Berrow~or his a.ssistance with sampling and providing backgroundmformalton on the Laverock Brae soil. We also thank A.Hepbum(Soils Division, Macaulay Land Use ResearchInstitute, Aberdeen, UK) for providing the humic and fulvicacid samples.
References1. Burridge, J. c., and Berrow, M. L., in "Proceedings of the
International Conference on Environmental Contamination,"London, July 1984. CEP Consultants Ltd., Edinburgh, 1984,pp. 215-224.
2. Florence, T. M., Trends Anal. Chern., 1983,2, 162.3. Council of European Communities, 1986, "Council Directive
on the Protection of the Environment, and in Particular of theSoil when Sewage Sludge is used in Agriculture." CEC8612781EEC.
4. Saunders, J. R., and Bloomfield, c., J. Soil Sci., 1980, 31, 53.5. Ohman, L. 0., and Sjoberg, S., in Kramer, J. R., and Allen,
H. E., Edllors, "Metal Speciation: Theory, Analysis andPractice," Lewis 1988, pp. 1-33.

ANALYST, NOVEMBER 1990, VOL. 115
6. Piccolo, A., Sci. Total Environ., 1989,81,607.7. Brown, L., Haswell, S. J., Rhead, M. M., O'Neill, P., and
Bancroft, K. C. C., Analyst, 1983, lOS, 1511.8. Florence, T. M., Analyst, 1986, 111,489.9. Mclaren, R. G., and Crawford, D. V., J. Soil Sci., 1973, 24,
171.10. Gunn, A. M., Winnard, D. A. and Hunt, D. T. E., in Kramer,
J. R., and Allen, H. E., Editor, "Metal Speciation: Theory,Analysis and Practice," Lewis, 1988, p. 261.
11. Griffin, R. A., and Jurinak, J. J., Soil Sci., 1973, 116,26.12. Elkhatib, E. A., Hem, J. L., and Staley, T. E., Soil Sci. Am. J.,
1987, 51, 578.
1433
13. Adams, F., Soil Sci. Soc. Am. Proc., 1971,35,420.14. Baham, J., Ball, N. B., and Sposito, G., J. Environ. Qual.,
1978, 7, 181.15. Saito, Y., and Hayano, S., J. Chromatogr., 1979, 177,390.16. Adamic, M. L., and Bartak, D. E., Anal. Chern., 1984,57,279.17. Vaughan, D., and Ord, B. G., J. Exp. Bot., 1981,32,679.
Paper 01010181Received March 6th, 1990Accepted July 27th, 1990


ANALYST, NOVEMBER 1990, VOL. 115
Analytical Methodology for the Determination of Aflatoxins inPeanut Butter: Comparison of High-performance Thin-layerChromatographic, Enzyme-linked Immunosorbent Assay andHigh-performance Liquid Chromatographic Methods*
1435
M. P. K. Dell and S. J. HaswelltSchool of Chemistry, Thames Polytechnic, Wellington Street, London SE18 6PF, UKO. G. RochSchool of Pharmacy and Biomedical Sciences, Portsmouth Polytechnic, King Henry I Street, PortsmouthP012DZ, UKR. D. Coker, V. F. P. Medlock and K. TomlinsMycotoxin Section, Natural Resources Institute, Chatham Maritime, Chatham, Kent ME64TB, UK
High-performance thin-layer chromatography (HPTLC) was applied to the separation and quantification ofaflatoxin in 300 jars of "crunchy" peanut butter. A critical evaluation ofthe proposed HPTLC method has beencarried out by statistical comparisons with a commercially available enzyme-linked immunosorbent assay(ELISA) kit and a high-performance liquid chromatographic (HPLC) method. The statistical tests indicated thatwhilst the distributions of the data sets obtained with each method were similar, the HPLC method was foundto be biased. Over-all results indicated that the HPTLC method gave more consistent data, relatively lowerstandard deviations and lower coefficients of variation. The ELISA kit was found to be less precise than theHPTLC and HPLC methods and prone to some loss of sensitivity caused by matrix interference.
Keywords: Aflatoxin determination; peanut butter; high-performance thin-layer chromatography;enzyme-linked immunosorbent assay; high-performance liquid chromatography
Aflatoxin B1 is a highly toxic carcinogenic fungal metabolitethat may playa key role in the epidemiology of human livercancer and other diseases. I Aflatoxins are produced infoodstuffs and feedstuffs by the fungi Aspergillus flavus andAspergillus parasilieus, at higher temperatures and relativehumidities than those normally found in the UK.2 However,there is considerable evidence showing the presence ofaflatoxins in commodities imported into the UK, includingconfectionery nuts and nut-based food products such· aspeanut butter.3 Owing to the inevitable health risks to manand livestock from this mycotoxin, many countries haveintroduced regulations and legislation which stipulate themaximum levels of aflatoxin permitted in foods and feeds.4Anupper legal limit of 10 fLg kg-1is proposed for the UK, for thetotal level of aflatoxin permitted in individual retail packs offinished nuts and nut products.3
Simple, sensitive and rapid methods of analysis are requiredif such regulations are to be efficiently implemented and theexposure of the UK population to aflatoxin properly investigated. Currently, thin-layer chromatography (TLC)5-7 andhigh-performance liquid chromatography (HPLC) are widelyused for the quantification of aflatoxins and several HPLCmethods for peanut butter analysis have been published.8-15Recently a number of enzyme-linked immunosorbent assays(ELISA) for peanut butter have been described, demonstrating the many advantages they have over conventional analytical procedures. 16-23 Some of these studies have been devotedto optimising and improving the ELISA protocol by decreasing the analytical time involvedl7·20.21 and by increasing thespecificity and sensitivity using monoclonal antibodies. 16 Animproved ELISA test has also been used as a routinetechnique in the assay of aflatoxin BI in peanut butter.21Peanut butter is marketed as "smooth" and "crunchy" forms,with the crunchy peanut butter containing particles up toapproximately 1 mm in diameter. A study carried out in 1986
• Presented at SAC 89. the 8th SAC International Conference onAnalytical Chemistry. Cambridge, UK, 30 July-5 August. 1989.
t To whom correspondence should be addressed.
on aflatoxin levels in peanut butter showed that out of the 129jars examined, 6% exceeded a concentration of 10 fLg kg-I,8% contained <10 fLg kg- I and 86% of the samples werebelow the limit of detection.21 Studies in 1982,1983 and 198410
indicated that the aflatoxins were particularly associated withsamples of peanut butter in the crunchy form.
In the present study 300 jars of crunchy peanut butter havebeen analysed by high-performance thin-layer chromatography (HPTLC)24.25 and the results recorded have beenstatistically compared to those obtained using both a commercial ELISA kit and an HPLC method.
Experimental
Apparatus
The Bond-Elut clean-up equipment supplied by Jones Chromatography consisted of a vacuum manifold (Vacelut),disposable 5OO-mg phenyl bonded phase cartridges (PH),solvent reservoirs (4, 25 and 75 ml), polyethylene porous frits(20 fLm), adapters and luer stopcocks. The HPTLC aluminium-backed plates, 20 x 20 cm (Merck 5547), were cut to a 10x 20-cm size, pre-conditioned by immersion in methanol for60 min and oven-dried for 2-3 min at 100 °C; the preconditioned plates were then stored in a desiccator. TheHPTLC experiments were performed using a f1uorodensitometer (TLC scannerII: Camag 76610), an electronic integrator (TLC integrator SP 4270: Camag 76650) and an ApricotPC operating with Link-up software (Quadrant Scientific). Anautomated TLC sampler (Camag 27200) was also used.
Absorbance measurements of the ELISA kits wererecorded on a Dynatech MR600 microplate reader. A Gilson222-401 autosampler was used for the automatic dilution andtransfer of the crude sample extracts on to the micro-titrationplates.
The HPLC equipment consisted of a Waters 6000A pumpfitted with a Rheodyne 7125 injection valve (2oo-fLlloop). Theanalytical column used was a reversed-phase Spherisorb 5ODS, 25 x 4.6 cm (Technicol), with a mobile phase ofwater - acetonitrile - methanol (60 + 30 + 10) pumped at a
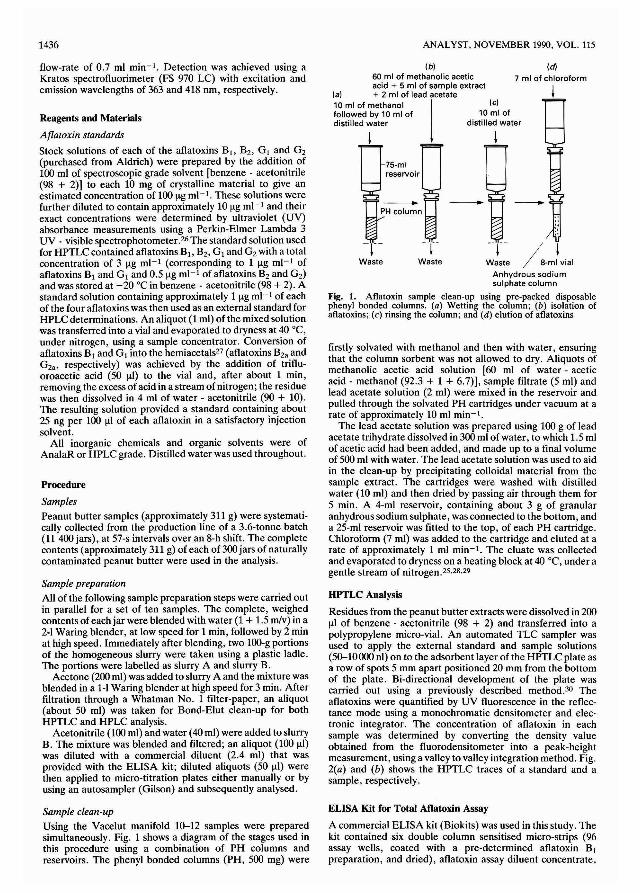
1436 ANALYST, NOVEMBER 1990, VOL. 115
(eI)
7 ml of chloroform
Ie)10 ml of
distilled water
Waste
(b)
60 ml of methanolic aceticacid + 5 ml of sample extract
(al + 2 ml of lead acetate
10 ml of methanol Ifollowed by 10 ml ofdistilled water
Waste ~-m~vial
Anhydrous sodiumsulphate column
Fig. 1. Aflatoxin sample clean-up using pre-packed disposablephenyl bonded columns. (a) Wetting the column; (b) isolation ofaflatoxins; (c) rinsing the column; and (d) elution of aflatoxins
HPTLC Analysis
Residues from the peanut butter extracts were dissolved in 200III of benzene - acetonitrile (98 + 2) and transferred into apolypropylene micro-vial. An automated TLC sampler wasused to apply the external standard and sample solutions(50-10000 nl) on to the adsorbent layer of the HPTLC plate asa row of spots 5 mm apart positioned 20 mm from the bottomof the plate. Bi-directional development of the plate wascarried out using a previously described method.30 Theaflatoxins were quantified by UV fluorescence in the reflectance mode using a monochromatic densitometer and electronic integrator. The concentration of aflatoxin in eachsample was determined by converting the density valueobtained from the fluorodensitometer into a peak-heightmeasurement, using a valley to valley integration method. Fig.2(a) and (b) shows the HPTLC traces of a standard and asample, respectively.
firstly solvated with methanol and then with water, ensuringthat the column sorbent was not allowed to dry. Aliquots ofmethanolic acetic acid solution [60 ml of water - aceticacid - methanol (92.3 + 1 + 6.7)], sample filtrate (5 ml) andlead acetate solution (2 ml) were mixed in the reservoir andpulled through the solvated PH cartridges under vacuum at arate of approximately 10 ml min-I.
The lead acetate solution was prepared using 100 g of leadacetate trihydrate dissolved in 300 ml of water, to which 1.5 mlof acetic acid had been added, and made up to a final volumeof 500 ml with water. The lead acetate solution was used to aidin the clean-up by precipitating colloidal material from thesample extract. The cartridges were washed with distilledwater (10 mJ) and then dried by passing air through them for5 min. A 4-ml reservoir, containing about 3 g of granularanhydrous sodium sulphate, was connected to the boltom, anda 25-ml reservoir was filted to the top, of each PH cartridge.Chloroform (7 ml) was added to the cartridge and eluted at arate of approximately 1 ml min-I. The eluate was collectedand evaporated to dryness on a heating block at 40°C, under agentle stream of nitrogen.25.28.29
Procedure
Samples
Peanut butter samples (approximately 311 g) were systematically collected from the production line of a 3.6-tonne batch(11 400 jars), at 57-s intervals over an 8-h shift. The completecontents (approximately 311 g) of each of 300 jars of naturallycontaminated peanut butter were used in the analysis.
flow-rate of 0.7 ml min-I. Detection was achieved using aKratos spectrofluorimeter (FS 970 LC) with excitation andemission wavelengths of 363 and 418 nm, respectively.
Sample preparation
All of the following sample preparation steps were carried outin parallel for a set of ten samples. The complete, weighedcontents of each jar were blended with water (1 + 1.5 m1v) in a2-1 Waring blender, at low speed for 1 min, followed by 2 minat high speed. Immediately after blending, two 100-g portionsof the homogeneous slurry were taken using a plastic ladle.The portions were labelled as slurry A and slurry B.
Acetone (200 ml) was added to slurry A and the mixture wasblended in a 1-1 Waring blender at high speed for 3 min. Afterfiltration through a Whatman No.1 filter-paper, an aliquot(about 50 ml) was taken for Bond-Elut clean-up for bothHPTLC and HPLC analysis.
Acetonitrile (100 ml) and water (40 ml) were added to slurryB. The mixture was blended and filtered; an aliquot (100 Ill)was diluted with a commercial diluent (2.4 ml) that wasprovided with the ELISA kit; diluted aliquots (50 Ill) werethen applied to micro-titration plates either manually or byusing an autosampler (Gilson) and subsequently analysed.
Reagents and Materials
Aflatoxin standards
Stock solutions of each of the aflatoxins BI> B2, G 1 and G2(purchased from Aldrich) were prepared by the addition of100 ml of spectroscopic grade solvent [benzene - acetonitrile(98 + 2)] to each 10 mg of crystalline material to give anestimated concentration of 100 Ilg ml-1 . These solutions werefurther diluted to contain approximately 10 Ilg ml- I and theirexact concentrations were determined by ultraviolet (UV)absorbance measurements using a Perkin-Elmer Lambda 3UV - visible spectrophotometer.26 The standard solution usedfor HPTLC contained aflatoxins BI, B2, G 1 and G2with a totalconcentration of 3 Ilg ml- 1 (corresponding to 1 Ilg ml- 1 ofaflatoxins B1 and GI and 0.5 Ilg ml- I of aflatoxins B2and G2)and was stored at -20°C in benzene - acetonitrile (98 + 2). Astandard solution containing approximately 1 Ilg ml- I of eachof the four aflatoxins was then used as an external standard forHPLC detenninations. An aliquot (1 ml) of the mixed solutionwas transferred into a vial and evaporated to dryness at 40 °C,under nitrogen, using a sample concentrator. Conversion ofaflatoxins B1 and G1 into the hemiacetals27 (aflatoxins B2a andG2a, respectively) was achieved by the addition of trifluoroacetic acid (50 Ill) to the vial and, after about 1 min,removing the excess of acid in a stream of nitrogen; the residuewas then dissolved in 4 ml of water - acetonitrile (90 + 10).The resulting solution provided a standard containing about25 ng per 100 III of each aflatoxin in a satisfactory injectionsolvent.
All inorganic chemicals and organic solvents were ofAnalaR or HPLC grade. Distilled water was used throughout.
Sample clean-up
Using the Vacelut manifold 10-12 samples were preparedsimultaneously. Fig. 1 shows a diagram of the stages used inthis procedure using a combination of PH columns andreservoirs. The phenyl bonded columns (PH, 500 mg) were
ELISA Kit for Total Anatoxin Assay
A commercial ELISA kit (Biokits) was used in this study. Thekit contained six double column sensitised micro-strips (96assay wells, coated with a pre-detennined aflatoxin BIpreparation, and dried), aflatoxin assay diluent concentrate,
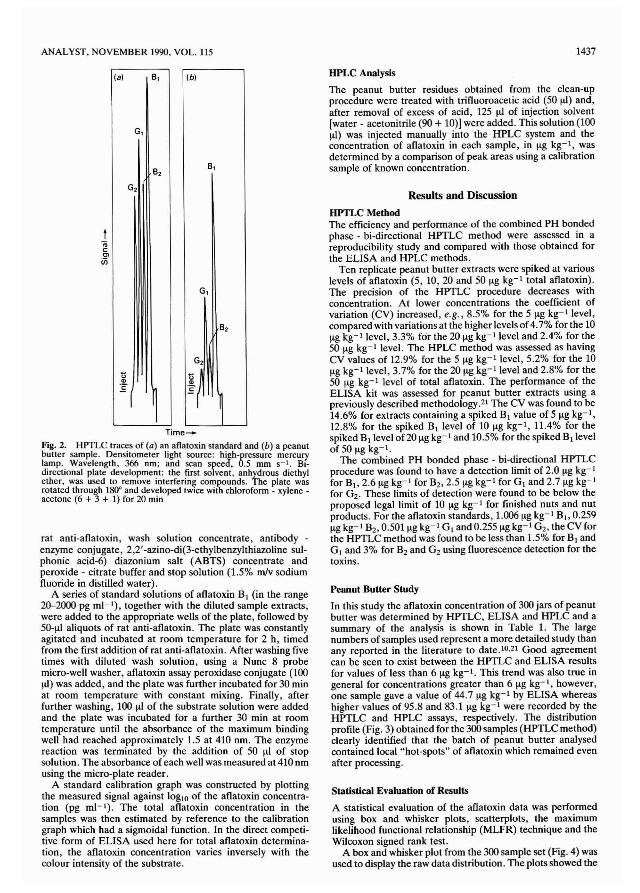
ANALYST, NOVEMBER 1990, VOL. 115 1437
(al B,
G,
(b)
B,
HPLC Analysis
The peanut butter residues obtained from the clean-upprocedure were treated with trifluoroacetic acid (50 Ill) and,after removal of excess of acid, 125 III of injection solvent[water - acetonitrile (90 + 10») were added. This solution (100Ill) was injected manually into the HPLC system and theconcentration of aflatoxin in each sample, in Ilg kg-I, wasdetermined by a comparison of peak areas using a calibrationsample of known concentration.
Results and Discussion
G,
Tlme
Fig, 2. HPTLC traces of (a) an aflatoxin standard and (b) a peanutbutter sample. Densitometer light source: high-8ressure mercurylamp. Wavelength, 366 nm; and scan speed, .5 mm S-I. Bidirectional plate development: the first solvent, anhydrous diethylether, was used to remove interfering compounds. The plate wasrotated through 180" and developed twice with chloroform - xylene acetone (6 + 3 + 1) for 20 min
rat anti-aflatoxin, wash solution concentrate, antibody enzyme conjugate, 2,2'-azino-di(3-ethylbenzylthiazoline sulphonic acid-6) diazonium salt (ABTS) concentrate andperoxide - citrate buffer and stop solution (1.5% rnlv sodiumfluoride in distilled water).
A series of standard solutions of aflatoxin B I (in the range20-2000 pg ml- I), together with the diluted sample extracts,were added to the appropriate wells of the plate, followed by50-Ill aliquots of rat anti-aflatoxin. The plate was constantlyagitated and incubated at room temperature for 2 h, timedfrom the first addition of rat anti-aflatoxin. After washing fivetimes with diluted wash solution, using a Nunc 8 probemicro-well washer, aflatoxin assay peroxidase conjugate (100Ill) was added, and the plate was further incubated for 30 minat room temperature with constant mixing. Finally, afterfurther washing, 100 III of the substrate solution were addedand the plate was incubated for a further 30 min at roomtemperature until the absorbance of the maximum bindingwell had reached approximately 1.5 at 410 nm. The enzymereaction was terminated by the addition of 50 III of stopsolution. The absorbance of each well was measured at 410 nmusing the micro-plate reader.
A standard calibration graph was constructed by plottingthe measured signal against 10glO of the aflatoxin concentration (pg ml- I). The total aflatoxin concentration in thesamples was then estimated by reference to the calibrationgraph which had a sigmoidal function. In the direct competitive form of ELISA used here for total aflatoxin determination, the aflatoxin concentration varies inversely with thecolour intensity of the substrate.
HPTLC MethodThe efficiency and performance of the combined PH bondedphase - bi-directional HPTLC method were assessed in areproducibility study and compared with those obtained forthe ELISA and HPLC methods.
Ten replicate peanut butter extracts were spiked at variouslevels of aflatoxin (5, 10,20 and 50 Ilg kg- I total aflatoxin).The precision of the HPTLC procedure decreases withconcentration. At lower concentrations the coefficient ofvariation (CV) increased, e.g., 8.5% for the 5 Ilg kg- I level,compared with variations at the higher levels of 4.7% for the 10Ilg kg- I level, 3.3% feir the 20 Ilg kg- I level and 2.4% for the50 Ilg kg- I level. The HPLC method was assessed as havingCV values of 12.9% for the 5 Ilg kg- I level, 5.2% for the 10Ilg kg- I level, 3.7% for the 20 Ilg kg- I level and 2.8% for the50 Ilg kg-1 level of total aflatoxin. The performance of theELISA kit was assessed for peanut butter extracts using apreviously described methodology.21 The CV was found to be14.6% for extracts containing a spiked B I value of 5 Ilg kg-I,12.8% for the spiked BI level of 10 Ilg kg-I, 11.4% for thespiked BI level of 20 Ilg kg-I and 10.5% for the spiked BI levelof 50 Ilg kg-I.
The combined PH bonded phase - bi-directional HPTLCprocedure was found to have a detection limit of 2.0 Ilg kg-1for B1> 2.61lg kg- I for B2, 2.5 Ilg kg-I for G1 and 2.71lg kg-Ifor G2. These limits of detection were found to be below theproposed legal limit of 10 Ilg kg- I for finished nuts and nutproducts. For the aflatoxin standards, 1.006 Ilg kg- I B1> 0.259Ilg kg-I B2, 0.5011lg kg- I GI and 0.2551lg kg- IG2, the CVforthe HPTLC method was found to be less than 1.5% for B I and0 1and 3% for B2and O2using fluorescence detection for thetoxins.
Peanut Butter Study
In this study the aflatoxin concentration of 300 jars of peanutbutter was determined by HPTLC, ELISA and HPLC and asummary of the analysis is shown in Table 1. The largenumbers of samples used represent a more detailed study thanany reported in the literature to date. IO,21 Oood agreementcan be seen to exist between the HPTLC and ELISA resultsfor values of less than 6 Ilg kg-I. This trend was also true ingeneral for concentrations greater than 6 Ilg kg-I, however,one sample gave a value of 44.7 Ilg kg- I by ELISA whereashigher values of 95.8 and 83.1 Ilg kg-1 were recorded by theHPTLC and HPLC assays, respectively. The distributionprofile (Fig. 3) obtained for the 300 samples (HPTLC method)clearly identified that the batch of peanut butter analysedcontained local "hot-spots" of aflatoxin which remained evenafter processing.
Statistical Evaluation of Results
A statistical evaluation of the aflatoxin data was performedusing box and whisker plots, scatterplots, the maximumlikelihood functional relationship (MLFR) technique and theWilcoxon signed rank test.
A box and whisker plot from the 300 sample set (Fig. 4) wasused to display the raw data distribution. The plots showed the

1438 ANALYST. NOVEMBER 1990. VOL. 115
Table I. Analysis of 300 crunchy peanut butter samples
Number ofsamples in the totalaflatoxin concentration range (Ilg kg-I)
MethodHPTLCELISAHPLC
Clean-upPH Bond-ElutNo clean-upPH Bond-Elut
Type of aflatoxin
B.. 8,. G.. G2Total aflatoxinB.. 8" G.. G2
<213
45
2-5
107104123
6-10
12512777
11-30
504943
31-1001616II
>100111
Maximum
170.8165.2117.4
Average10.310.27.9
/
A /./
//
// B/
//
/
"//
.//.. /
./.f,
%/~-A..:30
60
120
150
180 ..--------------~(a)
«~ 90w
120
>- 90
"c":JC"~"- 60
30
150r-rr--------------,
oL.L--r-....."'""....-..J""'"~....r::::l'---r---.J-10 30 70 110 150 190
HPTLC
Fig. 3. Skewed distribution of aflatoxin concentrations in 300 jars ofpeanut butter
HPTLC ~f-----------------t
ELISA 1]-----------------1HPLC ~f------------I
Fig. 4. Box and whisker plots for 300 samples of peanut butter usingthe Tukey five number summary
minimum value, the lower quartile (25th percentile), themedian, the upper quartile (75th percentile), and the maximum value, and indicate that all three methods had a similarasymmetric distribution with little apparent differencebetween the sets of raw data.
Pairwise scatterplots were used to examine the relationshipbetween the methods. On inspection of these scatterplots oneobserves that there is a rotational bias between all the methods[Fig. 5(a) and (b)], however, the HPTLC - ELISA scatterplotshowed less bias than the HPTLC - HPLC scatterplot. Hence,these plots suggest that the HPTLC - ELISA methods give abetter agreement than the HPTLC - HPLC methods. It is alsoclear that the ELISA data have more experimental variationor scatter than the HPTLC or HPLC data.
It is evident from Fig. 3 that the distribution ofthe aflatoxinsin the 300 peanut butter samples is skewed. Conventionalregression methods assume a normally distributed y-variableand no random variations in the x-variable. Hence linearregression does not offer a valid approach for the comparison
25th 75thMinimum Percentile Median Percentile Maximum
HPTLC - HPLC
300240156.68157
101.21111.0424
HPTLC - ELISA
300144142.608150144.15
0.785846
/
A //
//
// B
//
//
//
//.
//
/./.
./,....30
60
120
180r-------------....,(b)
150
u~ 90::t:
Test parameterNumber of samplesNo. of positive differencesAverage rankNo. of negative differencesAverage rankSample test statistic l ..
30 60 90 120 150 180HPTLC
of these methods, although such techniques are still widelyused. To overcome these problems the transformation of the xand y variables (i.e., use of a log scale) or the use of analternative regression method such as the MLFR techniquecan be used)l
The MLFR technique assumes that there is variance on bothaxes and it provides unbiased estimates of the intercept (a)
o 30 60 90 120 150 180HPTLC
Fig. 5. Scallerplots for 300 samples of peanut butter. (a) HPTLC ELISA scatterplot; and (b) HPTLC - HPLC scatterplot. A, Line ofperfect agreement; and B, regression line
Table 2. Wilcoxon signed rank test
4.304.402.60
1.701.300.30
6.20 9.50 170.806.00 9.80 165.204.30 8.30 117.40
0.30 85.55 170.81-1--------II----------li
HPTLCELISAHPLC
ANALYST, NOVEMBER 1990, VOL. 115
and the slope coefficient (b) with their respective standarderrors [se(a) and se(b)], A FORTRAN program for the MLFRtechnique was used to determine the functional relationshipbetween the methods (the program was obtained fromProfessor B. D. Ripley). The results for the HPTLC - ELISAmethods were: intercept = -0.1894 with a standard error of0.2241, slope =0.9969 with a standard error of 0.02607, whilstthe results for the HPTLC - HPLC methods were: intercept =0.2724 with a standard error of 0.08488, slope = 0.7828 with astandard error of 0.0665. These results indicate that there is ameasurable bias between the HPTLC - HPLC methods whichis not apparent between the HPTLC - ELISA methods.
The Wilcoxon signed rank test was also used on the data setsof the three methods to confirm the trends identified by theMLFR technique. This test indicated that the data from theHPTLC - ELISA methods were in good agreement (Table 2)giving 144 positive differences with an average rank of 142.61,whilst the 150 negative differences showed an average rank of144.15. The calculated test statistic (z = 0.79) was notconsidered significant, leading to the conclusion that the twosample sets, from the HPTLC - ELISA methods, may havemedians that are not significantly different. However, thecalculated test statistic for the HPTLC - HPLC set was 11.04,hence at the 1% level of significance the null hypothesis wasrejected as the test statistic was greater than 2.58.
Conclusions
The results showed that many advantages are gained by usingHPTLC as a routine method for the analysis of peanut butter.The HPTLC method is robust and can handle a high samplethroughput; 36 samples may be separated simultaneously andscanned at a rate of at least one sample per minute.
"Poisoning" of the adsorbent layer of the disposableHPTLC plate with residual contaminants does not represent aproblem. However, some manual skill is required for developing plates if reproducible densitometer readings are to beobtained. The aflatoxins are naturally fluorescent and, therefore, can be detected easily by HPTLC in the low picogramrange. The choice of detector is not restricted because allsamples are detected in situ, in the absence of the developingsolvent. Furthermore, the amount of solvent used [20 ml ofchloroform· xylene - acetone (6 + 3 + 1)] is much less thanthat required for the analysis of a comparable number ofsamples by HPLC. The PH Bond-Elut column clean-up wasfound to be simple to use and gave satisfactory results in allrespects.
The ELISA kits offer a rapid, cheap and potentiallysensitive method of detecting aflatoxins; however, the assay isstill prone to some loss of sensitivity caused by matrixinterferences at lower toxin levels and a loss of precision.However, it is worth noting that the extraction procedure forthe kit was very simple and no clean-up was found to benecessary.
The HPLC method used in this study (manual injection andpre-column derivatisation) was found to be precise but biased.The pre-column derivatisation step was thought to be apossible source of this apparent systematic bias.
The statistical tests also indicated that whilst the distributions of the data sets obtained by each method were similar,the HPLC method was found to be biased. However, over-allresults showed that the HPTLC method gave more consistentdata, relatively lower standard deviations and lower coefficients of variation for a range of aflatoxin concentrations.
This research project was funded by SERC and NRl. P.Goodwin of Cortecs Diagnostics is thanked for providing theELISA kits and the technical assistance that went with it.
1439
Professor B. D. Ripley, Department of Mathematics, University of Strathclyde, Glasgow Gl lXH, UK, is thanked forsharing his MLFR program. The authors also thank Dr. C.Gay of NRI for his helpful advice on the statistical interpretation of results.
References
1. Peers, F. G., Gilman, G. A., and Linsell, C. A., Int. J. Cancer,1976,17,167.
2. Diener, U. L., and Davis, N. D.,]. Stored Prod. Res., 1969,5,251.
3. Ministry of Agriculture, Fisheries and Food, Survey of Mycotoxins in the United Kingdom: Fourth Report of the SteeringGroup on Food Surveillance, Working Party on Mycotoxins.Food Surveillance Paper No.4, HM Stationery Office,London, 1980, p. 5.
4. Van Egmond, H. P., Food Addit. Contam., 1989,6,139.5. Altenkirk, B., J. Chromatogr., 1972, 65, 456.6. Beljaars, P. R., Verhulsdonk, C A. H., Paulsch, W. E., and
Liem, D. H., J. Assoc. Off Anal. Chem., 1973,56,1444.7. Trucksess, M. W., Brumley, W. C, and Nesheim, S.,J. Assoc.
Off. Anal. Chem., 1984,67,973.8. Campbell, A. D., Francis, O. J., Beebe, R. A., and Stoloff, L.,
J. Assoc. Off Anal. Chem., 1984,67,312.9. Francis, O. J., Lipinski, L. L., Gaul, J. A., and Campbell,
A. D., J. Assoc. Off Anal. Chem., 1982, 65, 672.10. Gilbert, J., and Shepherd, M. J., Food Addit. Contam., 1985,
2, 171.11. Hurst, W. J., and Toomey, P. B., J. Chromatogr. Sci., 1978,
16,372.12. Jansen, H., Jansen, R., Brinkman, U. A. Th., and Frei, R. W.,
Chromatographia, 1987,24,555.13. Pons, W. A., and Franz, A. 0., J. Assoc. Off. Anal. Chem.,
1978, 61, 793.14. Tarter, E. J., Hanchay, J.-P., and Scott, P. M., J. Assoc. Off
Anal. Chem., 1984,67,597.15. Thiel, P. G., Stockenstrom. S., and Gathercole, P. S., J. Uq.
Chromatogr., 1986, 9, 103.16. Candlish, A. A. G., Stimson, W. H., and Smith, J. E., Food
Microbiol., 1987,4,147.17. Chu, F. S., Fan, T. S., Zhang, G.-S., Xu, Y.·C., Faust, S., and
McMahon, P. L., J. Assoc. Off Anal. Chem., 1987,70,854.18. EI-Nakib, 0., Pestka, J. J., and Chu, F. S., J. Assoc. Off. Anal.
Chem., 1981,64,1077.19. Fan, T. S. L.. and Chu, F. S., J. Food Prot., 1984,47,263.20. Morgan, M. R. A., Kang, A. S., and Chan, H. S. W., J. Sci.
Food Agric., 1986,37,908.21. Mortimer, D. N., Shepherd, M. J., Gilbert, J., and Morgan,
M. R. A., Food Addit. Contam., 1987, S, 127.22. Ram, B. P., Hart, P., Cole, R. J., and Pestka, J. J., J. Food
Prot .. 1986,49,792.23. Mortimer, D. N., Shepherd, M. J., Gilbert, J., and Clarke, C,
Food Addit. Contam., 1988,5,601.24. Tosch, D., Waltking, A. E., and Schlesier, J. F.,J. Assoc. Off
Anal. Chem., 1984,67,337.25. Dell, M. P. K., Haswell, S. J., and Coker, R. D. (in
preparation).26. Coker, R. D., Jones, B. D., Nagler, M. J., Gilman, G. A.,
Wallbridge, A. J., and Panigrahi, S., "Mycotoxin TrainingManual," National Resources Institute, London, 1984, SectionB:2.
27. Takahashi, D. Moo J. Chromatogr., 1977, 131, 147.28. Hurst, W. J., Snyder, K. P., and Martin, R. A., J. Chro
matogr., 1987,409,413.29. Tomlins, K. I., Jewers, K., and Coker, R. D., Chromato
graphia, 1989, 27, 67.30. Coker, R. D., Jewers, K., Tomlins, K. I., and B1unden, G.,
Chromatographia, 1989, 27, 49.31. Thompson, M., Anal. Chem., 1989, 61, 1942.
Paper 9/02102GReceived May 18th, 1989Accepted July 13th, 1990


ANALYST. NOVEMBER 1990. VOL. 115 1441
Determination of Selenium by Gas Chromatography and ComparisonWith Graphite Furnace Atomic Absorption Spectrometry*
A. F. AI-Attart and G. NicklessDepartment of Inorganic Chemistry, School of Chemistry, The University, Bristol BSB 1TS, UK
Selenium(lV) reacts with 3-bromo-5-trifluoromethyl-1,2-diaminobenzene to form' 4-bromo-6trifluoromethylpiazselenol, which is detected by means of a gas chromatograph equipped with an electroncapture detector. A rapid and sensitive method for the determination of total selenium in plant samples thusdeveloped, is described. A comparison of gas - liquid chromatography with electron-capture detection andgraphite furnace atomic absorption spectrometry for the determination of selenium in plant samples, showedno difference between the two methods at the 99% level of confidence. The synthesis and characterisation ofsubstituted 1,2-diaminobenzenes used as reagents for selenium determination is also reported. Thesereagents, namely 3-chloro-5-trifluoromethyl-1,2-diaminobenzene and 4-chloro-5-f1uoro-1,2-diaminobenzene,are very sensitive and have short retention times. Their applicability to the determination oftotal selenium inNational Institute of Standards and Technology Standard Reference Materials was therefore evaluated. Thedetection limit was 2.2 ng ml-1 and the minimum detectable amount was about 5 pg of selenium. Thedetection limits were evaluated using statistical methods.
Keywords: Selenium determination; method comparison; gas - liquid chromatography; graphite furnaceatomic absorption spectrometry
The discovery of selenium as an essential trace element foranimals and humans1 has resulted in an increased interest inthis element. Initial attention lay in its potential toxicity, butsubsequent studies have shifted because of its importance inbiochemistry.2
Selenium is an important element in relation to humanhealth and disease because the safety margins betweendeficiency, nutrition and toxic doses are very narrow.3
Selenium is widely distributed in the Earth's crust, butoccurs at low concentrations (0.05 p.p.m.); the primarysources are volcanic. emanations and metallic sulphidesassociated with igneous activity. Secondary sources arebiological sinks in which the element has accumulated.4
The determination of selenium is still a major challenge.Many problems that complicate its determination have beenreported,S i.e., severe matrix effects, digestion or extractiondifficulties and the volatility of the element.
A number of analytical methods are now available for thedetermination of selenium at trace levels (ng g-l) using thedifferent detection techniques that have been developed.5-12Generally, gas -liquid chromatography with electron- capturedetection (GLC-ECD) and atomic absorption [hydride generation and graphite furnace atomic absorption spectrometry(GFAAS)] are the most popular methods for the determination of selenium in biological and environmental samples.
1,2-Diaminobenzene (a-phenylenediamine) and its derivatives react selectively and quantitatively with selenium(IV) toform piazselenols that are volatile and stable. Trace levels ofselenium in materials as diverse as biological tissues, highpurity metals and natural waters have been determinedsuccessfully as piazselenols by means of gas chromatographywith ECD.3.11.13.14
The use of AAS has increased during the last two decadesand now covers a large proportion of the total number ofselenium determinations in various materials.6.8.9.1O.1S
* Presented at SAC 86. the 7th SAC International Conference onAnalytical Chemistry. Bristol. UK. 20--26 July. 1986.
t Present address: Petroleum and Petrochemicals Research Institute. King AbdulAziz City for Science and Technology, P.O. Box6086. Riyadh-11442. Saudi Arabia.
Graphite furnace atomic absorption spectrometry is especially suitable for direct analysis because of its highsensitivity (detection limit 90 pg of selenium), but it is neithersimple, nor free from interferences or losses through volatilisation. lO
Nakashima and Toei l6 first used the GLC-ECD method forthe determination of selenium using 4-chloro-l,2-diaminobenzene and reported a minimum detectable amount of40 ng of selenium. Shimoishi l4 studied 13 derivatives of1,2-diaminobenzene, and found the sensitivity of the derivatives varied with the nature of the substituents in the orderH < CI < Br < N02. 4,6-Dibromopiazselenol had the highestsensitivity and could be used to detect 1 ng of selenium.
Dilli and Sutiknol7 prepared and investigated Iwo fluorinated reagents, namely the 4-f1uoro- and 4-trifluoromethyl1,2-diaminobenzenes. AI-Attar and Nickless3investigated theproperties of 3-bromo-5-f1uoro-1,2-diaminobenzene and3-bromo-5-trifluoromethyl-1,2-diaminobenzene as reagentsfor the determination of selenium using GLC-ECD. Theyproved to be superior to previously reported systems.
The purpose of the present work has been to investigate thepossibility of finding more sensitive reagents for the determination of selenium by GLC-ECD. This paper also comparesthe results of two different methods for the determination ofselenium in a series of plant samples by GLC-ECD using3-bromo-5-trifluoromethyl-1,2-diaminobenzene and byGFAAS.
Experimental
Reagents and Materials
AU glassware was washed with detergent solution, rinsed withtap water followed by distilled water, and placed in 40% v/vnitric acid (concentrated) (analytical-reagent grade) for atleast 48 h before use. The glassware was then rinsed withdistilled water and doubly diStilled water and oven-dried at60 °C.
AnalaR hydrochloric, nitric, perchloric and sulphuric acids,AnalaR magnesium nitrate hexahydrate and selenious acidstandard solution (SpectrosoL; for atomic spectrometry) andanalytical-reagent grade selenium dioxide were obtained fromBDH (Poole, Dorset, UK). 4-F\uoro-5-chloro-l,2-diaminobenzene, 3-chloro-5-trifluoromethyl-1 ,2-diaminoben-

1442 ANALYST, NOVEMBER 1990, VOL. 115
Table 1. Atomic absorption furnace operating parameterszene and 1,2-dinitro-3,4,5,6-tetrachlorobenzene wereobtained from Maybridge Chemicals (Trevillet, Tintagel,Cornwall, UK).
The following reagents were prepared:1,2-Diamino-3,4,5,6-tetrachlorobenzene hydrochloride.
This was synthesised from 1,2-dinitro-3,4,5,6-tetrachlorobenzene (10.71 g, 0.035 M) by reduction with iron (metal) powderin the presence of hydrogen (BDH) in ethanol containingammonium chloride. The resultant crude precipitate wasdissolved in diethyl ether and hydrogen chloride gas waspassed through the solution to obtain the hydrochloride salt.The yield was 7.1 g (63.6%) as a white crystalline solid withm.p. 212-214 °C (decomposed).
3,5-Dinitro-l,2-diaminobenzene This reagent was synthesised as described in the following scheme:
StepNo.I23456789
Temperature!°C
90120300500500500
270027002700
Time!s5
6010552l.l22
N2 flow!Imin- I
33333ooo3
Readcommand
Fig. 1. Electron-capture detector responses showing peaks inchromatograms of 5-chloro-6-fluoropiazselenol extracts and effects ofclean-up. (a) 0.2 ng of selenium(IV) + 1,2-diamino-4-chloro-5fluorobenzene without clean-up: (b) 0.2 ng of selenium(IV) +1,2-diamino-4-cbloro-5-fluorobenzene + washing three times with 6 MHCl04; (e) 0.2 ng of selenium(IV) + 1,2-diamino-4-chloro-5-fluorobenzene + washing three times with 9 M HCI; and (d) 0.2 ng ofselenium as standard 5-chloro-6-fluoropiazselenol (weighed)
with the N2stopped-flow method. A hollow-cathode lamp wasemployed for selenium at a current of 5 rnA. All analyses wereperformed at 196.0 nm using a 1.0-nm bandpass (slit-width).Pyrolytic graphite coated graphite tubes· (Varian) wereemployed. The deuterium lamp background corrector wasemployed to correct for non-specific absorption observedduring atomisation. The furnace operating parameters areshown in Table 1. The instrument was calibrated with standardsolutions using the concentration mode.
Procedure
An experiment to provide suitable biological material for totalselenium determination was carried out using Lolium perenneseedlings. Selenium(VI) as sodium selenate was added tonutrient solutions in which the seedlings were grown hydroponically. The seedlings were germinated, allowed to establish themselves on exposure of 1 week to pure nutrientsolution, followed by immersion in contaminated solutions for3 weeks. The procedure has been discussed in detail elsewhere. 18.20
Plant material was wet-digested in concentrated AnalaRnitric acid and an aliquot of the digest heated in an oven at150°C for 60-75 min in a PTFE vessel before the determination of selenium. Nickel nitrate was used as a matrix modifierin the GFAAS technique.2o
15
20
840o4 0 8 4Time/min
o
(d) (c) (b) (a)
SeSe
Se
Se
1---' ~ ---" j.J4
UN JxNO'N
7" '- Concentrated HN03 7" "-Se . .. Se
~ / Concentrated H,S04 ~ /O,N N 0, N
~entrated HINO,
h NH'
O'N"~~~NH'
Instrumentation
Gas -liquid chromatography{GLC) was carried out with a PyeUnicam Series 104 chromatograph equipped with a 63Nielectron-capture detector in the pulse mode (150 !-Is), adetector oven controller and a column oven controller.Extracts were separated on a 150 x 0.3 cm i.d., 0.6 cm o.d.,Pyrex glass column.··The column was packed with 5% QV-17on Chromosorb W-AW-DMCS (80-100 mesh). The columnand detector temperatures were maintained at 200 and 300 °C,respectively, and the nitrogen flow-rate was 30 ml min-I.
A Varian AA 775 atomic absorption spectrometer fittedwith a Model GTA 95 graphite tube atomiser was used for allabsorption measurements. Absorption signals were obtained
5-Nitropiazselenol (20 g, 0.088 M) was dissolved in concentrated sulphuric acid (160 ml) and fuming nitric acid (sp. gr.1.5; 120 ml) was added. The solution was heated slowly to90 °C and, after 15 min, cooled and poured on to crushed ice.The precipitate was filtered off, dried and recrystallised fromacetic acid to yield pale yellow needles of 4,6-dinitropiazselenol (17.3 g, 72%), m.p. 210-212 °C. 18.19
4,6-Dinitropiazselenol (4.1 g, 0.015 M) was mixed with 55%hydriodic acid (sp. gr. 1.7; 35 ml) and heated at 50°C for 2 hunder refluxing conditions. The cooled mixture was treatedwith sodium hydrogen sulphite to remove iodine, and madealkaline with 30% rnlv sodium hydroxide solution andextracted with diethyl ether. The crude product was recrystallised from acetic acid l9 to give brick-red needles of 3,5-dinitro1,2-diaminobenzene (1.8 g, 60%) with m.p. 216-218 0c.
Purification of 1,2-diamines and the preparation of theirsolutions were carried out following previously reportedprocedures.3
Piazselenols For the synthesis of piazselenol standards,equimolar amounts of 0.04 M diamine hydrochloride salt andselenium(IV) (as selenium dioxide or selenious acid) weremixed in 0.2 M HCI (the corresponding piazselenol wasimmediately precipitated). The mixture was allowed to standat room temperature for at least 2 h. The solid piazselenolswere filtered off through a glass-fibre paper and the dampsolids recrystallised from ethanol - acetone (95 + 5).3.14
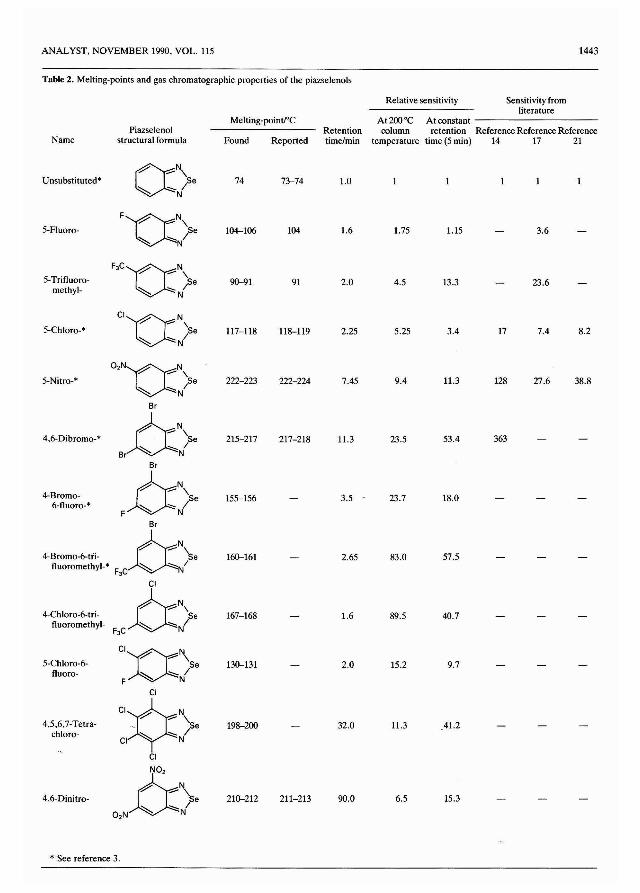
ANALYST, NOVEMBER 1990, VOL. 115 1443
Table 2, Melting-points and gas chromatographic properties of the piazselenols
Relative sensitivity Sensitivity fromliterature
Melting-pointf'C At 200°C At constantPiazselenol Retention column retention Reference Reference Reference
Name structural formula Found Reported time/min temperature time (5 min) 14 17 21
O:N\Unsubstituted* Se 74 73--74 1.0~ ::-./
N
5-Fluoro- FV:N
\ 1.75 1.15 3.6~ ~lse 104-106 104 1.6
5-Trifluoro-F3C
U
N\
~ "'-N~e 90--91 91 2.0 4.5 13.3 23.6methyl-
5-Chloro-*CIUN\
7.4 8.2Se 117-118 118-119 2.25 5.25 3.4 17~ .... l
02N
U
N\
222-223 7.45 9.4 11.3 128 27.6 38.85-Nitro-* Se 222-224~ ~NI
Br
4,6-Dibromo-* b:N, 215-217 217-218 11.3 23.5 53.4 363Se~ ~I
B NBr
4-Bromo- LeN,155-156 3.5 23.7 18.0le6-fluoro-* F ~ >--N
Br
4-Bromo-6-tri- tr:N, 160-161 2.65 83.0 57.5Sefluoromethyl-* F3C ~ ""'N
1
CI
4-Chloro-6-tri- tr:N\Se 167-168 1.6 89.5 40.7fluoromethyl- F3C ~ ....N
1
5-Chloro-6-CIDN\
130-131 2.0 15.2 9.7Sefluoro- ~ ~/
F NCI
4,5,6,7-Tetra- ,,¢~ 198-200 32.0 11.3 41.2chloro- ~ "'-/
CI N
CI
N02
4,6-Dinitro- C\ 210-212 211-213 90.0 6.5 15.3Se02 N ~ ~NI
* See reference 3.
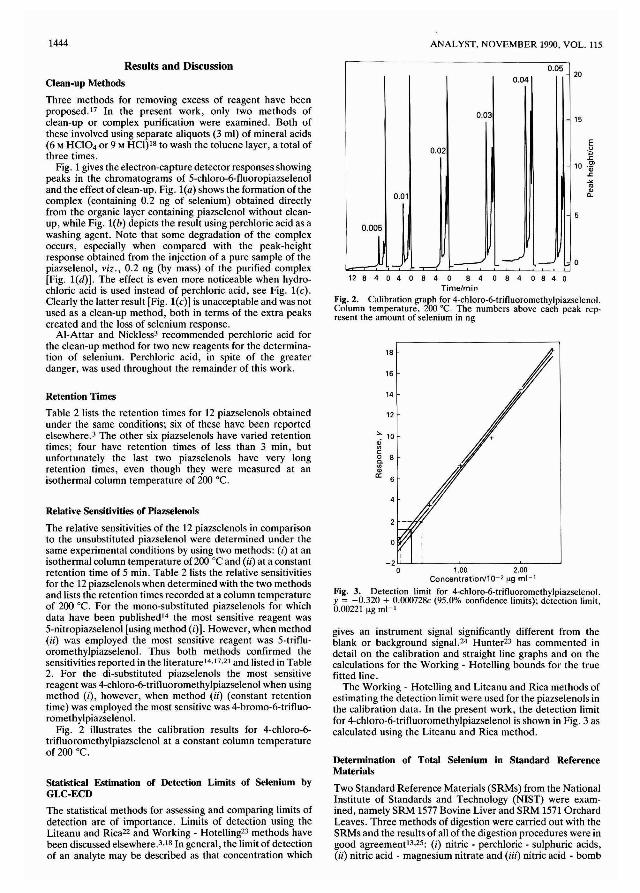
1444 ANALYST. NOVEMBER 1990. VOL. 115
12 8 4 0 4 0 8 4 0 8 4 0 8 4 0 8 4 0Time/min
Fig. 2. Calibration graph for 4-chloro-6-trifluoromethylpiazselenol.Column temperature. 200 0c. The numbers above each peak represent the amount of selenium in ng
-2 LL..--L.J...-__-'- ----L__-----'
o , .00 2.00Concentration/10-' ~g ml-'
Fig. 3. Detection limit for 4-chloro-6-trifluoromethylpiazselenol.y = -0.320 + 0.000728c (95.0% confidence limits); detection limit,0.00221 IJ.g ml- l
Determination of Total Selenium in Standard ReferenceMaterials
Two Standard Reference Materials (SRMs) from the NationalInstitute of Standards and Technology (NIST) were examined, namely SRM 1577 Bovine Liver and SRM 1571 OrchardLeaves. Three methods of digestion were carried out with theSRMs and the results of all of the digestion procedures were ingood agreement13•25: (i) nitric - perchloric - sulphuric acids,(ii) nitric acid - magnesium nitrate and (iii) nitric acid - bomb
20
15
18
I16
14
/12
>: 10Q)
'"<:
8. 8
'"Q)a:
6
0.050.04
0.03
0.02
0.01
0.005
J :-;' ~ -~ ,--'
gives an instrument signal significantly different from theblank or background signal. 24 Hunter23 has commented indetail on the calibration and straight line graphs and on thecalculations for the Working - Hotelling bounds for the truefitted line.
The Working - Hotelling and Liteanu and Rica methods ofestimating the detection limit were used for the piazselenols inthe calibration data. In the present work, the detection limitfor 4-chloro-6-trifluoromethylpiazselenol is shown in Fig. 3 ascalculated using the Liteanu and Rica method.
Statistical Estimation of Detection Limits of Selenium byGLC-ECD
The statistical methods for assessing and comparing limits ofdetection are of importance. Limits of detection using theLiteanu and Rica22 and Working - Hotelling23 methods havebeen discussed elsewhere.3.18 In general, the limit of detectionof an analyte may be described as that concentration which
Results and Discussion
Clean-up Methods
Three methods for removing excess of reagent have beenproposed.I7 In the present work, only two methods ofclean-up or complex purification were examined. Both ofthese involved using separate aliquots (3 ml) of mineral acids(6 M HCl04or 9 M HCl)18 to wash the toluene layer, a total ofthree times.
Fig. 1gives the electron-capture detector responses showingpeaks in the chromatograms of 5-chloro-6-fluoropiazselenoland the effect of clean-up. Fig. l(a) shows the formation of thecomplex (containing 0.2 ng of selenium) obtained directlyfrom the organic layer containing piazselenol without cleanup, while Fig. l(b) depicts the result using perchloric acid as awashing agent. Note that some degradation of the complexoccurs, especially when compared with the peak-heightresponse obtained from the injection of a pure sample of thepiazselenol, viz., 0.2 ng (by mass) of the purified complex[Fig. l(d)). The effect is even more noticeable when hydrochloric acid is used instead of perchloric acid, see Fig. l(c).Clearly the latter result [Fig. l(c)) is unacceptable and was notused as a clean-up method, both in terms of the extra peakscreated and the loss of selenium response.
AI-Attar and Nickless3 recommended perchloric acid forthe clean-up method for two new reagents for the determination of selenium. Perchloric acid, in spite of the greaterdanger, was used throughout the remainder of this work.
Relative Sensitivities of Piazselenols
The relative sensitivities of the 12 piazselenols in comparisonto the unsubstituted piazselenol were determined under thesame experimental conditions by using two methods: (i) at anisothermal column temperature of200 °C and (ii) at a constantretention time of 5 min. Table 2 lists the relative sensitivitiesfor the 12 piazselenols when determined with the two methodsand lists the retention times recorded at a column temperatureof 200 0c. For the mono-substituted piazselenols for whichdata have been publishedl4 the most sensitive reagent was5-nitropiazselenol [using method (i)). However, when method(ii) was employed the most sensitive reagent was 5-trifluoromethylpiazselenol. Thus both methods confirmed thesensitivities reported in the literature14.17.21 and listed in Table2. For the di-substituted piazselenols the most sensitivereagent was 4-chloro-6-trifluoromethylpiazselenol when usingmethod (i), however, when method (ii) (constant retentiontime) was employed the most sensitive was 4-bromo-6-trifluoromethylpiazselenol.
Fig. 2 illustrates the calibration results for 4-chloro-6trifluoromethylpiazselenol at a constant column temperatureof 200 0c.
Retention Times
Table 2 lists the retention times for 12 piazselenols obtainedunder the same conditions; six of these have been reportedelsewhere.3 The other six piazselenols have varied retentiontimes; four have retention times of less than 3 min, butunfortunately the last two piazselenols have very longretention times, even though they were measured at anisothermal column temperature of 200 0c.
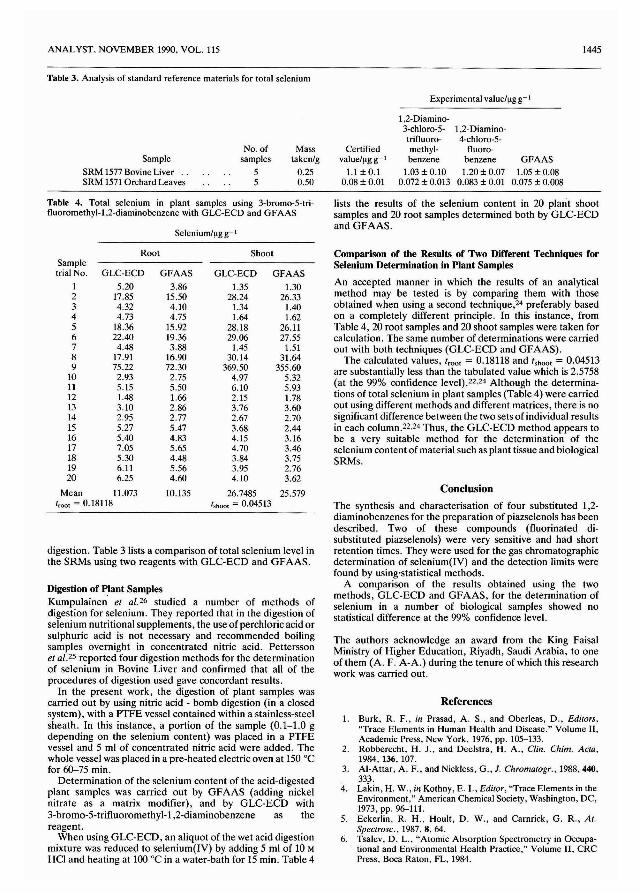
ANALYST, NOVEMBER 1990. VOL. 115
Table 3. Analysis of standard reference materials for total selenium
1445
Experimental value!l!g g-I
SampleSRM 1577 Bovine LiverSRM 1571 Orchard Leaves
No. ofsamples
55
Masstaken/g
0.250.50
Certifiedvalue/!!g g-I
1.1±0.10.08 ± om
1,2-Diamino-3-chloro-5- 1,2-Diamino-trifluoro- 4-chloro-5-methyl- f1uoro-benzene benzene GFAAS
1.03 ± 0.10 1.20 ± 0.07 1.05 ± 0.080.072 ± 0.013 0.083 ± 0.01 0.075 ± 0.008
Table 4. Total selenium in plant samples using 3-bromo-5-trifluoromethyl-1,2-diaminobenzene with GLC-ECD and GFAAS
Selenium/!!g g-I
Root ShootSampletrial No. GLC-ECD GFAAS GLC-ECD GFAAS
1 5.20 3.86 1.35 1.302 17.85 15.50 28.24 26.333 4.32 4.10 1.34 1.404 4.73 4.75 1.64 1.625 18.36 15.92 28.18 26.116 22.40 19.36 29.06 27.557 4.48 3.88 1.45 1.518 17.91 16.90 30.14 31.649 75.22 72.30 369.50 355.60
10 2.93 2.75 4.97 5.3211 5.15 5.50 6.10 5.9312 1.48 1.66 2.15 1.7813 3.10 2.86 3.76 3.6014 2.95 2.77 2.67 2.7015 5.27 5.47 3.68 2.4416 5.40 4.83 4.15 3.1617 7.05 5.65 4.70 3.4618 5.30 4.48 3.84 3.7519 6.11 5.56 3.95 2.7620 6.25 4.60 4.10 3.62
Mean 11.073 10.135 26.7485 25.579/mol = 0.18118 /,hoo' = 0.04513
digestion. Table 3 lists a comparison of total selenium level inthe SRMs using two reagents with OLC-ECD and OFAAS.
Digestion of Plant SamplesKumpulainen' et a/. 26 studied a number of methods ofdigestion for selenium. They reported that in the digestion ofselenium nutritional supplements, the use of perchloric acid orsulphuric acid is not necessary and recommended boilingsamples overnight in concentrated nitric acid. Petterssonet a/.2S reported four digestion methods for the determinationof selenium in Bovine Liver and confirmed that all of theprocedures of digestion used gave concordant results.
In the present work, the digestion of plant samples wascarried out by using nitric acid - bomb digestion (in a closedsystem), with a PTFE vessel contained within a stainless-steelsheath. In this instance, a portion of the sample (0.1-1.0 gdepending on the selenium content) was placed in a PTFEvessel and 5 ml of concentrated nitric acid were added. Thewhole vessel was placed in a pre-heated electric oven at 150°Cfor 60-75 min.
Determination of the selenium content of the acid-digestedplant samples was carried out by OFAAS (adding nickelnitrate as a matrix modifier), and by OLC-ECD with3-bromo-5-trifluoromethyl-1,2-diaminobenzene as thereagent.
When using OLC-ECD, an aliquot of the wet acid digestionmixture was reduced to selenium(IV) by adding 5 ml of 10 M
HCI and heating at 100 °c in a water-bath for 15 min. Table 4
lists the results of the selenium content in 20 plant shootsamples and 20 root samples determined both by OLe-ECDand OFAAS.
Comparison of the Results of Two DitTerent Techniques forSelenium Determination in Plant Samples
An accepted manner in which the results of an analyticalmethod may be tested is by comparing them with thoseobtained when using a second technique,24 preferably basedon a completely different principle. In this instance, fromTable 4, 20 root samples and 20 shoot samples were taken forcalculation. The same number of determinations were carriedout with both techniques (OLC-ECD and OFAAS).
The calculated values, trool = 0.18118 and tshool = 0.04513are substantially less than the tabulated value which is 2.5758(at the 99% confidence level).22.24 Although the determinations of total selenium in plant samples (Table 4) were carriedout using different methods and different matrices, there is nosignificant difference between the two sets of individual resultsin each column.22 ,24 Thus, the OLC-ECD method appears tobe a very suitable method for the determination of theselenium content of material such as plant tissue and biologicalSRMs,
Conclusion
The synthesis and characterisation of four substituted 1,2diaminobenzenes for the preparation of piazselenols has beendescribed. Two of these compounds (fluorinated disubstituted piazselenols) were very sensitive and had shortretention times. They were used for the gas chromatographicdetermination of selenium(IV) and the detection limits werefound by using'statistical methods,
A comparison of the results obtained using the twomethods, OLC-ECD and OFAAS, for the determination ofselenium in a number of biological samples showed nostatistical difference at the 99% confidence level.
The authors acknowledge an award from the King FaisalMinistry of Higher Education, Riyadh, Saudi Arabia, to oneof them (A. F, A-A,) during the tenure of which this researchwork was carried out.
References
I. Burk, R. F" in Prasad, A, S., and Oberleas, D" Editors,"Trace Elements in Human Health and Disease," Volume II,Academic Press, New York. 1976, pp, 105-133.
2. Robberecht, H. J., and Deelstra, H, A" Clin. Chim. Ac/a,1984. 136, 107.
3. AI-Attar, A, F" and Nickless, G" J. Chroma/ogr" 1988,440,333.
4, Lakin, H, W.. in Kothny, E. I., Editor, "Trace Elements in theEnvironment," American Chemical Society, Washington, DC,1973, pp. 96-111.
5, Eckerlin. R, H" Hoult, D. W., and Carnrick, G, R., A/.Spec/rosc., 1987.8.64.
6. Tsalev, D. L., "Atomic Absorption Spectrometry in Occupational and Environmental Health Practice," Volume II, CRCPress. Boca Raton, FL, 1984.

1446
7. Bern, E. M., Environ. Hea/th Perspect., 1981,37,183.8. Shamberger, R. J., "Biochemistry of Selenium," Plenum Press,
New York, 1983.9. Robberecht, H. J., and Van Grieken, R., T%nto, 1982, 29,
823.10. Robberecht, H. J., and Deelstra, H. A., T%nto, 1984,31,497.11. DiIli, S., and Sutikno, I., J. Chromatogr., 1984,300,265.12. Adeloju, S. B., Bond, A. M., Briggs, M. H., and Hughes,
H. c., Anal. Chern., 1983,55,2076.13. Siu, K. W. M., and Berman, S. S., T%nto, 1984,31,1010.14. Shimoishi, Y., J. Chromatogr., 1977, 136,85.15. Verlinden, M., Deelstra, H., and Adriaenssens, E., T%nto,
1981,28,637.16. Nakashima, S., and Toei, K., T%nto, 1968, 15, 1475.17. DiIli, S., and Sutikno, I., J. Chromatogr., 1984,298,21.18. AI-Attar, A. F., PhD Thesis, University of Bristol, 1987.19. Elvidge, J. A., Newbold, G. T., Percival, A., and Senciall,
I. R., J. Chern. Soc., 1965,5119.
ANALYST, NOVEMBER 1990. VOL. 115
20. AI-Attar, A. F., Martin, M. H., and Nickless, G., Chernosphere, 1988, 17, 845.
21. Bycroft, B. M., and Clegg, D. E., J. Assoc. Off Ana/. Chern.,1978,61,923.
22. Liteanu, c., and Rica, I., "Statistical Theory and Methodologyof Trace Analysis," Halsted Press, Wiley, Chichester, 1980.
23. Hunter, J. S., J. Assoc. Off Anal. Chern., 1981,64,574.24. Miller, J. c., and Miller, J. N., "Statistics for Analytical
Chemistry," Halsted Press, Wiley, Chichester, 1984.25. Pettersson, J., Hansson, L., and Olin, A., T%nto, 1986, 33,
249.26. Kumpulainen, J., Raittila, A., Lehto, J., and Koivistoinen, P.,
J. Assoc. Off Anal. Chern., 1983,66,1129.
Paper 9105229AReceived December 8th, 1989
Accepted July 9th, 1990
ANALYST, NOVEMBER 1990, VOL. 115 1447
Electrocatalytic Detection of Streptomycin and Related Antibiotics atRuthenium Dioxide Modified Graphite - Epoxy Composite Electrodes
Donal Leech* and Joseph WangtDepartment of Chemistry, New Mexico State University, Las Cruces, NM 88003, USA
Malcolm R. SmythSchool of Chemical Science, Dublin City University, Dublin 9, Ireland
The application of ruthenium dioxide (RuOz) modified electrodes to the electrocatalytic detection of thesaccharide-related antibiotics streptomycin, novobiocin and neomycin, at low fixed potentials, wasinvestigated, The RuOz-modified graphite - epoxy composite electrodes give extremely stable andreproducible catalytic oxidation currents for these antibiotics at potentials as low as +0,2 V (versus Ag - Agel),Rapid quantification at the micromolar level is therefore possible. Standard calibration graphs forstreptomycin and neomycin yielded slopes of 4.43 and 0,08 nA f.lM-1 overthe linear ranges of 1.5 x 10⁻⁶-2.5 x10⁻⁴ and 1 x 10⁻⁵-2 X 10⁻³ M, respectively, Owing to its catalytic oxidation by the RUlli - Ru lV couple, ratherthan the Ru lV - RuVI transition (which catalyses the oxidation of streptomycin and neomycin), novobiocincould be detected at a lower (+0.2 V) potential, with a sensitivity of 1.31 nA f.lM-1. Detection limits of 1.5, 6.0and 10 f.lM were obtained for streptomycin, novobiocin and neomycin, respectively. These catalytic surfacescan be renewed (by polishing), with a surface-to-surface reproducibility of 6.5% forthe detection of 5 x 10⁻⁵ Mstreptomycin. The analytical application of RuOz-modified carbon paste electrodes to the analysis of theseantibiotics by flow injection was investigated, with a view to liquid chromatographic separation withelectrochemical detection applications.
Keywords: Ruthenium dioxide modified electrode; graphite - epoxy composite electrode; streptomycin;neomycin; novobiocin
Streptomycin is a trisaccharide derivative that is important intuberculosis therapy and the treatment of other infectionssuch as tularemia and plague. The electrochemical reductionof streptomycin, involving the aliphatic aldehyde group, hasbeen exploited for polarographic measurements of the drugusing various mercury electrodes. 1-4 With d.c. polarography,millimolar concentrations of streptomycin can be quantified. J.2 Differential-pulse polarography permits detection ofmicromolar levels,3 whereas adsorptive stripping voltammetryof the drug offers detection limits in the nanomolar range. 4
The related saccharide antibiotics neomycin and novobiocinhave also been determined using polarographic techniques.4 .5
Methods based on solid electrodes may be more desirable forsensing and flow [flow injection (FI)] applications. In particular, constant-potential amperometric monitoring of theseantibiotics offers a more attractive and simpler approach tovarious flow or batch quantifications. Unfortunately, theanodic oxidation of saccharide antibiotics suffers from highovervoltages and poor reproducibility.
Recently, carbon paste electrodes modified with a rutheniumdioxide (RuOz) catalyst have been shown to be effective forthe electrocatalytic oxidation of hydroxylated compoundssuch as alcohols6 and carbohydrates,? allowing their quantification via fixed-potential amperometry. Other recent studiesin this and other laboratories have demonstrated the improvedstability and reproducibility that composite graphite - epoxyelectrodes containing electrocatalysts can offer over theircarbon paste counterparts. Graphite - epoxy electrodesmodified with RuOz have been utilised as glucose sensors.8
These electrodes showed similar analytical attributes for thedetection of glucose as their carbon paste counterparts, whileoffering benefits of increased mechanical stability, versatilityand renewability. Polishable graphite - epoxy electrodes
* Permanent address: School of Chemical Science, Dublin CityUniversity, Dublin 9. Ireland.
t To whom correspondence should bc addressed.
modified with other metal-containing catalysts9-11 and biological entities1z have been used successfully.
The purpose of this work was to iilVestigate the applicationof RuOz-modified electrodes to electrocatalytic detection ofvarious saccharide antibiotics. The surface modifier greatlylowers the overvoltage for the oxidation of these antibiotics,hence allowing their quantification at low, fixed potentials. Ahighly stable and renewable electrocatalytic response isobserved by incorporating the RuOz within the graphite epoxy matrix. Preliminary FI experiments utilising RuOzmodified carbon paste electrodes (RuOz-CPEs) were alsoconducted in order to investigate the possible amperometricflow detection of saccharide antibiotics.
Experimental
Apparatus
Cyclic voltammetric and batch amperometric experimentswere performed with an EG & G Princeton Applied ResearchModel 264A voltammetric analyser in conjunction with aHouston x - y recorder or a Recorder Company 4500Microscribe strip-chart recorder, respectively. A BioanaIytical Systems (BAS) Model VC-2 electrochemical cell (10ml) was employed in these experiments with the workingelectrode, reference electrode (Ag . AgCl, Model RE-l,BAS) and platinum wire auxiliary electrode inserted into thecell through holes in its Teflon cover. Mass transport in thebatch system was achieved with an IKAMAG RE-G magneticstirrer and a 1 cm long magnetic flea. A stirring rate of 400rev min- t was used in all studies.
The FI system consisted of a carrier reservoir, a RaininModel504l sample injection valve (20-f.llloop), interconnect- .ing Teflon tubing, a thin-layer electrochemical detector(Model TL-4, BAS), an Ag - AgCl reference electrode (ModelRE-l) and a stainless-steel auxiliary electrode. A gravity feedof the carrier with a flow-rate of 1 ml min-1 was usedthroughout this study.
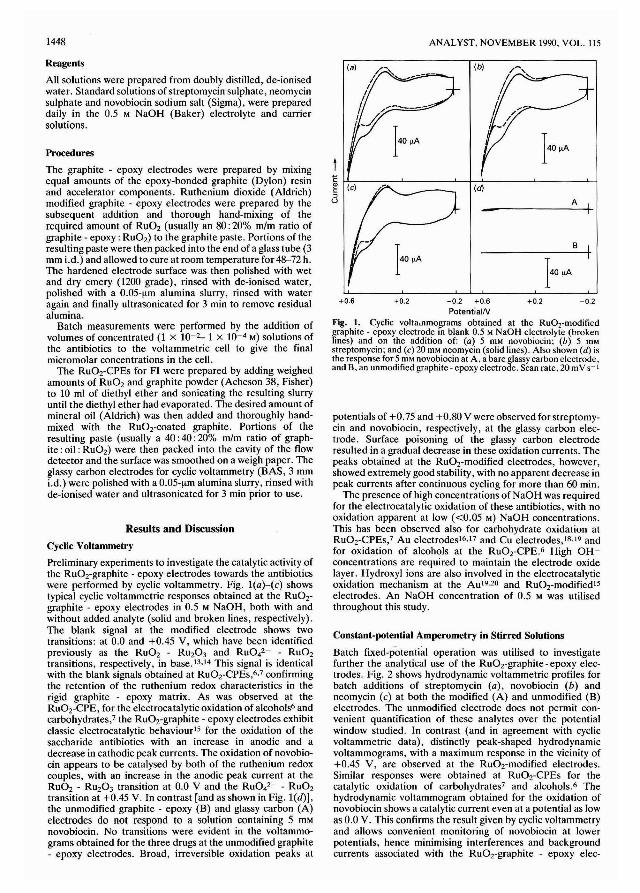
1448
Reagents
All solutions were prepared from doubly distilled, de-ionisedwater. Standard solutions of streptomycin sulphate, neomycinsulphate and novobiocin sodium salt (Sigma), were prepareddaily in the 0.5 M NaOH (Baker) electrolyte and carriersolutions.
Procedures
The graphite - epoxy electrodes were prepared by mixingequal amounts of the epoxy-bonded graphite (Dylon) resinand accelerator components. Ruthenium dioxide (Aldrich)modified graphite - epoxy electrodes were prepared by thesubsequent addition and thorough hand-mixing of therequired amount of RU02 (usually an 80 :20% m/m ratio ofgraphite - epoxy: RU02) to the graphite paste. Portions of theresulting paste were then packed into the end of a glass tube (3mm i.d.) and allowed to cure at room temperature for 48-72 h.The hardened electrode surface was then polished with wetand dry emery (1200 grade), rinsed with de-ionised water,polished with a 0.05-!J.m alumina slurry, rinsed with wateragain and finally ultrasonicated for 3 min to remove residualalumina.
Batch measurements were performed by the addition ofvolumes of concentrated (I x 10-2- 1 X 10-' M) solutions ofthe antibiotics to the voltammetric cell to give the finalmicromolar concentrations in the cell.
The RU02-CPEs for FI were prepared by adding weighedamounts of RU02 and graphite powder (Acheson 38, Fisher)to 10 ml of diethyl ether and sonicating the resulting slurryuntil the diethyl ether had evaporated. The desired amount ofmineral oil (Aldrich) was then added and thoroughly handmixed with the RuOrcoated graphite. Portions of theresulting paste (usually a 40: 40: 20% mlm ratio of graphite :oil : RU02) were then packed into the cavity of the flowdetector and the surface was smoothed on a weigh paper. Theglassy carbon electrodes for cyclic voltammetry (BAS, 3 mmi.d.) were polished with a 0.05-!J.m alumina slurry, rinsed withde-ionised water and ultrasonicated for 3 min prior to use.
Results and Discussion
Cyclic Voltammetry
Preliminary experiments to investigate the catalytic activity ofthe RuOrgraphite - epoxy electrodes towards the antibioticswere performed by cyclic voltammetry. Fig. l(a)-(c) showstypical cyclic voltammetric responses obtained at the RU02graphite - epoxy electrodes in 0.5 M NaOH, both with andwithout added analyte (solid and broken lines, respectively).The blank signal at the modified electrode shows twotransitions: at 0.0 and +0.45 V, which have been identifiedpreviously as the RuOz - RU203 and RuOi- - RU02transitions, respectively, in base. n .l ' This signal is identicalwith the blank signals obtained at RU02,CPEs,6.7 confirmingthe retention of the ruthenium redox characteristics in therigid graphite - epoxy matrix. As was observed at theRuOrCPE, for the electrocatalytic oxidation of alcohols6andcarbohydrates,7 the RuOrgraphite - epoxy electrodes exhibitclassic electrocatalytic behaviour IS for the oxidation of thesaccharide antibiotics with an increase in anodic and adecrease in cathodic peak currents. The oxidation of novobiocin appears to be catalysed by both of the ruthenium redoxcouples, with an increase in the anodic peak current at theRU02 - RU203 transition at 0.0 V and the RuO.2- - RU02transition at +0.45 V. In contrast [and as shown in Fig. l(d)],the unmodified graphite - epoxy (B) and glassy carbon (A)electrodes do not respond to a solution containing 5 mMnovobiocin. No transitions were evident in the voltammograms obtained for the three drugs at the unmodified graphite- epoxy electrodes. Broad, irreversible oxidation peaks at
ANALYST, NOVEMBER 1990, VOL. 115
Ee:;u
+0.6 +0.2 -0.2 +0.6 +0.2 -0.2Potentia IN
Fig. I. Cyclic volta.nmograms obtained at the RuOTmodificdgraphite - epoxy electrode in blank 0.5 MNaOH electrolyte (brokenlines) and on the addition of: (a) 5 mM novobiocin; (b) 5 mMstreptomycin; and (c) 20 mM neomycin (solid lines). Also shown (d) isthe response for 5 mM novobiocin at A. a bare glassy carbon electrode.and B, an unmodified graphite - epoxy electrode. Scan rate. 20 mV S-I
potentials of +0.75 and +0.80 V were observed for streptomycin and novobiocin, respectively, at the glassy carbon electrode. Surface poisoning of the glassy carbon electroderesulted in a gradual decrease in these oxidation currents. Thepeaks obtained at the Ru02-modified electrodes, however,showed extremely good stability, with no apparent decrease inpeak currents after continuous cycling for more than 60 min.
The presence of high concentrations of NaOH was requiredfor the electrocatalytic oxidation of these antibiotics, with nooxidation apparent at low «0.05 M) NaOH concentrations.This has been observed also for carbohydrate oxidation atRuOrCPEs,7 Au electrodes l6,17 and Cu electrodes,18.19 andfor oxidation of alcohols at the RuOrCPE.6 High OHconcentrations are required to maintain the electrode oxidelayer. Hydroxyl ions are also involved in the electrocatalyticoxidation mechanism at the AU I9.20 and RuOrmodifiedl5electrodes. An NaOH concentration of 0.5 M was utilisedthroughout this study.
Constant-potential Amperometry in Stirred Solutions
Batch fixed-potentiil\ operation was utilised to investigatefurther the analytical use of the RuOz-graphite - epoxy electrodes. Fig. 2 shows hydrodynamic voltammetric profiles forbatch additions of streptomycin (a), novobiocin (b) andneomycin (c) at both the modified (A) and unmodified (B)electrodes. The unmodified electrode does not permit convenient quantification of these analytes over the potentialwindow studied. In contrast (and in agreement with cyclicvoltammetric data), distinctly peak-shaped hydrodynamicvoltammograms, with a maximum response in the vicinity of+0.45 V, are observed at the RuOrmodified electrodes.Similar responses were obtained at RuOrCPEs for thecatalytic oxidation of carbohydrates7 and alcohols.6 Thehydrodynamic voltammogram obtained for the oxidation ofnovobiocin shows a catalytic current even at a potential as lowas 0.0 V. This confirms the result given by cyclic voltammetryand allows convenient monitoring of novobiocin at lowerpotentials, hence minimising interferences and backgroundcurrents associated with the RuOrgraphite - epoxy e1ec-
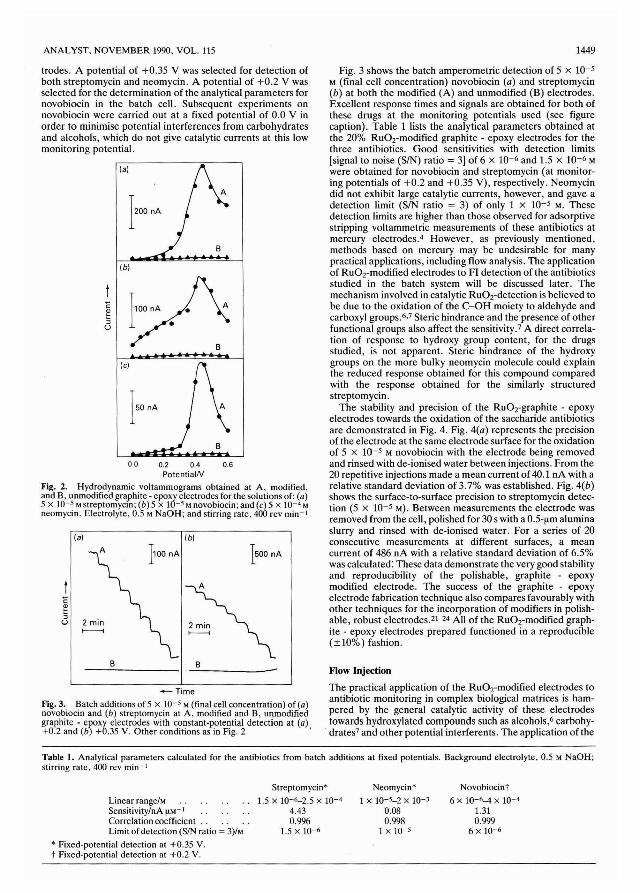
ANALYST. NOVEMBER 1990. VOL. 115 1449
B
Flow Injection
The practical application of the RuOrmodified electrodes toantibiotic monitoring in complex biological matrices is hampered by the general catalytic activity of these electrodestowards hydroxylated compounds such as alcohols,6 carbohydrates7 and other potential interferents. The application of the
Fig. 3 shows the batch amperometric detection of 5 x 10⁻⁵
M (final cell concentration) novobiocin (a) and streptomycin(b) at both the modified (A) and unmodified (B) electrodes.Excellent response times and signals are obtained for both ofthese drugs at the monitoring potentials used (see figurecaption). Table 1 lists the analytical parameters obtained atthe 20% RuOrmodified graphite - epoxy electrodes for thethree antibiotics. Good sensitivities with detection limits[signal to noise (SIN) ratio = 3] of 6 x 10⁻⁶ and 1.5 x 10⁻⁶ M
were obtained for novobiocin and streptomycin (at monitoring potentials of +0.2 and +0.35 V), respectively. Neomycindid not exhibit large catalytic currents, however, and gave adetection limit (SIN ratio = 3) of only 1 x 10⁻⁵ M. Thesedetection limits are higher than those observed for adsorptivestripping voltammetric measurements of these antibiotics atmercury electrodes.4 However, as previously mentioned,methods based on mercury may be undesirable for manypractical applications, including flow analysis. The applicationof Ru02-modified electrodes to FI detection of the antibioticsstudied in the batch system will be discussed later. Themechanism involved in catalytic RuOrdetection is believed tobe due to the oxidation of the C-OH moiety to aldehyde andcarboxyl groups.6.7 Steric hindrance and the presence of otherfunctional groups also affect the sensitivity.7 A direct correlation of response to hydroxy group content, for the drugsstudied, is not apparent. Steric hindrance of the hydroxygroups on the more bulky neomycin molecule could explainthe reduced response obtained for this compound comparedwith the response obtained for the similarly structuredstreptomycin.
The stability and precision of the RuOrgraphite - epoxyelectrodes towards the oxidation of the saccharide antibioticsare demonstrated in Fig. 4. Fig. 4(0) represents the precisionof the electrode at the same electrode surface for the oxidationof 5 x 10⁻⁵ M novobiocin with the electrode being removedand rinsed with de-ionised water between injections. From the20 repetitive injections made a mean current of 40.1 nA with arelative standard deviation of 3.7% was established. Fig. 4(b)shows the surface-to-surface precision to streptomycin detection (5 x 10⁻⁵ M). Between measurements the electrode wasremoved from the cell, polished for 30 s with a O.5-flm aluminaslurry and rinsed with de-ionised water. For a series of 20consecutive measurements at different surfaces, a meancurrent of 486 nA with a relative standard deviation of 6.5%was calculated: These data demonstrate the very good stabilityand reproducibility of the polishable, graphite - epoxymodified electrode. The success of the graphite - epoxyelectrode fabrication technique also compares favourably withother techniques for the incorporation of modifiers in polishable, robust electrodes.21-24 All of the RuOrmodified graphite - epoxy electrodes prepared functioned in a reproducible(±10%) fashion.
BB
E~:;u 2 min
>-------i
(al (bl
1100 nA 1500 nA
-Time
Fig. 3. Batch additions of 5 x 10⁻⁵ M(final cell concentration) of (0)novobiocin and (b) streptomycin at A, modified and B, unmodifiedgraphite - epoxy electrodes with constant-potential detection at (0)+0.2 and (b) +0.35 V. Other conditions as in Fig. 2 .
(c)
E I] 100 nA •
(bl
(a)
trodes. A potential of +0.35 V was selected for detection ofboth streptomycin and neomycin. A potential of +0.2 V wasselected for the determination of the analytical parameters fornovobiocin in the batch cell. Subsequent experiments onnovobiocin were carried out at a fixed potential of 0.0 V inorder to minimise potential interferences from carbohydratesand alcohols, which do not give catalytic currents at this lowmonitoring potential.
0.0 0.2 0.4 0.6PotentialN
Fig. 2. Hydrodynamic voltammograms obtained at A. modified,and B, unmodified graphite - epoxy electrodes for the solutions of: (0)5 x 10⁻⁵ Mstreptomycin; (b) 5 x 10⁻⁵ Mnovobiocin; and (c) 5 x 10⁻⁴ Mneomycin. Electrolyte. 0.5 MNaOH; and stirring rate, 400 rev min-'
Table 1. Analytical parameters calculated for the antibiotics from batch additions at fixed potentials. Background electrolyte, 0.5 MNaOH;stirring rate. 400 rev min~ 1
Linear range/MSensitivity/nA I-lM- 1
Correlation coefficient ..Limit of detection (SIN ratio = 3)/M
, Fixed-potential detection at +0.35 V.t Fixed-potential detection at +0.2 V.
Streptomycin'1.5 x 10-"-2.5 x 10⁻⁴
4.430.996
1.5 x 10⁻⁶
Neomycin'1 X 10-5.2 X 10-3
0.080.998
1 x 10⁻⁵
Novobiocint6 x 10-6-4 X 10⁻⁴
1.310.999
6 X 10⁻⁶
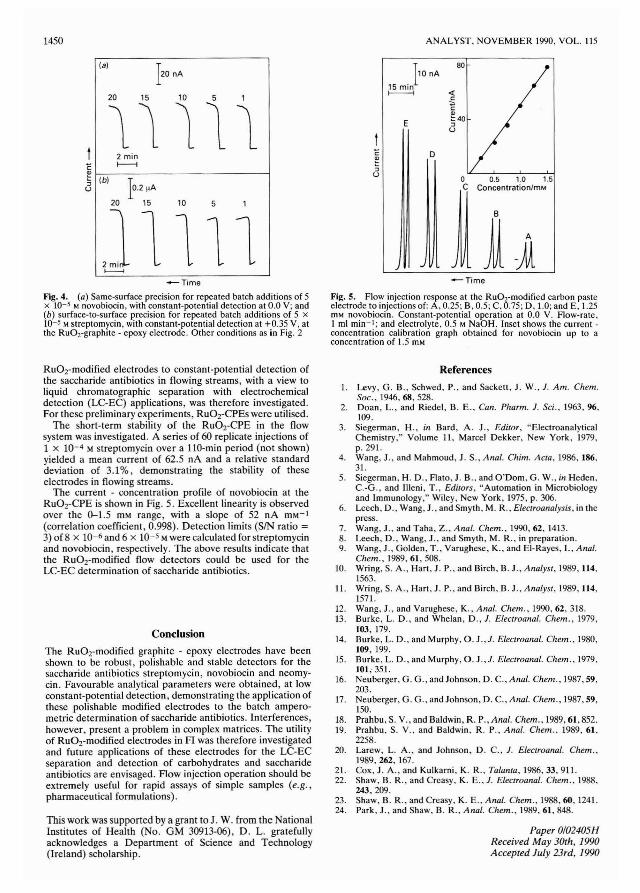
1450 ANALYST. NOVEMBER 1990. VOL. 115
o 0.5 1.0 1.5j~i,,·~m"
80
E
110 nA15 min~
E D~:JU
120 nA
2 minf----i
(a)
E~ 1-('"'b7) --T,--------------IU t2~A
20 15 10 5 1
]1111I------<
-Time
Fig. 4. (a) Same-surface precision for repeated batch additions of 5x 10⁻⁵ Mnovobiocin, with constant-potential detection at 0.0 V; and(b) surface-to-surface precision for repeated batch additions of 5 x10⁻⁵ Mstreptomycin, with constant-potential detection at +0.35 Y, atthe RuOrgraphite - epoxy electrode. Other conditions as in Fig. 2
Fig. 5. Flow injection response at the RuOrmodified carbon pasteelectrode to injections of: A. 0.25; B, 0.5; C. 0.75; D. 1.0; and E. 1.25mM novobiocin. Constant-potential operation at 0.0 Y. Flow-rate.1 ml min-I; and electrolyte. 0.5 MNaOH. Inset shows the currentconcentration calibration graph obtained for novobiocin up to aconcentration of 1.5 mM
RuOz-modified electrodes to constant-potential detection ofthe saccharide antibiotics in flowing streams, with a view toliquid chromatographic separation with electrochemicaldetection (LC-EC) applications, was therefore investigated.For these preliminary experiments, RuOz-CPEs were utilised.
The short-term stability of the RuOz-CPE in the flowsystem was investigated. A series of 60 replicate injections of1 x 10-4 Mstreptomycin over a nO-min period (not shown)yielded a mean current of 62.5 nA and a relative standarddeviation of 3.1%, demonstrating the stability of theseelectrodes in flowing streams.
The current - concentration profile of novobiocin at theRuOz-CPE is shown in Fig. 5. Excellent linearity is observedover the 0--1.5 mM range, with a slope of 52 nA mM-\(correlation coefficient, 0.998). Detection limits (SIN ratio =3) of 8 x 10⁻⁶ and 6 x 10⁻⁵ Mwere calculated for streptomycinand novobiocin, respectively. The above results indicate thatthe RuOz-modified flow detectors could be used for theLC-EC determination of saccharide antibiotics.
Conclusion
The RuOz-modified graphite - epoxy electrodes have beenshown to be robust, polishable and stable detectors for thesaccharide antibiotics streptomycin, novobiocin and neomycin. Favourable analytical parameters were obtained, at lowconstant-potential detection, demonstrating the application ofthese polishable modified electrodes to the batch amperometric determination of saccharide antibiotics. Interferences,however, present a problem in complex matrices. The utilityof RuOz-modified electrodes in FI was therefore investigatedand future applications of these electrodes for the LC-ECseparation and detection of carbohydrates and saccharideantibiotics are envisaged. Flow injection operation should beextremely useful for rapid assays of simple samples (e.g.,pharmaceutical formulations).
This work was supported by a grant to J. W. from the NationalInstitutes of Health (No. GM 30913-06), D. L. gratefullyacknowledges a Department of Science and Technology(Ireland) scholarship.
References
1. Levy, G. B., Schwed. P.. and Sackett. J. W.. 1. Arn. Chern.Soc., 1946.68,528.
2. Doan, L., and Riedel, B. E.. Can. Pharrn. J. Sci .. 1963.96.109.
3. Siegerman, H., in Bard, A. J., Editor, "ElectroanalyticalChemistry," Volume I 1, Marcel Dekker, New York, 1979.p. 291.
4. Wang, J., and Mahmoud, J. S., Anal. Chirn. Acta. 1986, 186.31.
5. Siegerman, H. D., Flato. J. B.. and O'Dom, G. W.. in Heden.c.-G., and Illeni. T.. Editors. "Automation in Microbiologyand Immunology," Wiley, New York, 1975, p. 306.
6. Leuh. D.. Wang, J.. and Smyth. M. R.. Electroanalysis. in thepress.
7. Wang, J.. and Taha. Z .• Anal. Chern .. 1990,62. 1413.8. Leech, D., Wang, 1.. and Smyth, M. R.. in preparation.9. Wang, J., Golden, T., Varughese, K.. and EI-Rayes, I., Anal.
Chern., 1989,61,508.10. Wring, S. A., Hart, J. P.. and Birch. B. J., Analyst, 1989, 114,
1563.11. Wring. S. A.. Hart. J. P.. and Birch, B. J.. Analyst, 1989, 114,
1571.12. Wang, J .• and Varughese. K., Anal. Chern., 1990,62.318.13. Burke. L. D., and Whelan, D., J. Electroanal. Chern., 1979.
103, 179.14. Burke, L. D.. and Murphy. O. J.,1. Eleclroanal. Chern., 1980.
109, 199.15. Burke. L. D., and Murphy, O. J.,J. Eleclroanal. Chern .• 1979.
101; 351.16. Neuberger, G. G.. and Johnson. D. c., Anal. Chern., 1987,59,
203.17. Neuberger, G. G.. and Johnson, D. c., Anal. Chern., 1987,59,
150.18. Prahbu, S. Y., and Baldwin, R. P., Anal. Chern .. 1989, 61,852.19. Prahbu, S. V.. and Baldwin, R. P., Anal. Chern .. 1989,61,
2258.20. Larew. L. A.. and Johnson. D. C., J. Electroanal. Chern ..
1989,262. 167.21. Cox, J. A., and Kulkarni. K. R.. Talanla, 1986, 33, 91 I.22. Shaw, B. R., and Creasy. K. E., J. Eleclroanal. Chern., 1988.
243.209.23. Shaw, B. R.. and Creasy. K. E.. Anal. Chern., 1988,60.1241.24. Park, J.. and Shaw. B. R.. Anal. Chern., 1989.61, 848.
Paper 0/02405HReceived May 30th, 1990Accepted July 23rd, 1990
ANALYST, NOVEMBER 1990, VOL 115
Mercurated Polystyrene as a Sensor for Anionic Surfactants inlon-selective Polymeric Membrane Electrodes
Walenty SzczepaniakFaculty of Chemistry, A. Mickiewicz University, 60-780 Poznan, ul.Grunwaldzka 6, Poland
1451
Mercurated polystyrene (R-Hg-Ac) was employed as a sensor in a membrane electrode sensitive to anionicsurfactants. A Nernstian dependence over the concentration range of sodium dodecyl sulphate of from 1 x10⁻³ to 1 X 10⁻⁷ M and a high selectivity for anionic surfactants relative to inorganic anions were found fortheelectrode. Moreover, the electrode shows interesting properties towards hydroxyl ions. The electrode mayfind application in the analysis of surfactants, as an indicator electrode in the potentiometric titration of bothcationic and anionic surfactants and in the physico-chemical studies of surfactant solutions.
Keywords: Anionic surfactant; ion-selective electrode; mercurated polystyrene
Synthetic surface-active agents (surfactants) are produced inlarge amounts and are used extensively in industry andhousehold cleaning products, and also in chemistry andbiochemistry research laboratories. Such wide application ofsurfactants may result in the pollution of surface waters.Hence, industry, environmental protection services andresearch laboratories have shown considerable interest indeveloping rapid methods for the determination of traceamounts of surfactants.
Anionic surfactants comprise about 70% of all the surfactants manufactured, hence they are often the subject ofenvironmental monitoring. Many methods for the determination of anionic surfactants have been reported, of which themost important are titrimetric,l-s spectrophotometric,6-10spectrofluorimetric,'1.12 chromatographic13- 17 and electrochemical methods incorporating ion-selective electrodes sensitive to this group of compounds. 18-36
In ion-selective electrodes sensitive to ionic surfactants, anion associate of the type B+A-is used as the electroactivesubstance in which the anion A-is an anionic surfactant andthe cation B+ is usually a cationic surfactant. Hence, suchelectrodes are sensitive to both cationic and anionic surfactants.
This paper describes the application of mercurated polystyrene as a sensor in an ion-selective polymeric membraneelectrode sensitive to anionic surfactants. The mercuratedpolystyrene has the following formula:
(
-CH-CH,- "\
~"o-o-~,",)
In previous papers,37-39 the application of a mercuratedstyrene - divinylbenzene copolymer as an anion exchanger wasproposed. In addition, the synthesis and extraction propertiesof mercurated polystyrene were studied. A solution ofmercurated polystyrene [(R-Hg-Ac); mean relative molecular mass, 10(00) in nitrobenzene exhibits anion-exchangeproperties in accordance with the reaction
In this way CI-, Br-, 1-, SCN-, CN- and anionic surfactantswere extracted.
In the present paper mercurated polystyrene was employedas a liquid polymeric anion exchanger and used as the activesubstance in a membrane electrode sensitive to anionicsurfactants.
Experimental
ReagentsSurfactant solutions
Two anionic surfactants were used for testing the electrodes;sodium dodecyl sulphate (SDS) (Fluka, Buchs, Switzerland)and sodium p-dodecylbenzenesulphonate (SOBS) (Fluka).The surfactants were dried at 50°C under reduced pressure toa constant mass. Weighed portions of SDS and SOBS weredissolved' in distilled water to obtain basic solutions ofconcentrations of I x 10-3 M. The working solutions wereprepared prior to use by dilution of the basic solutions.
Other reagents
The reagents used in this work were obtained from thefollowing suppliers: 2-nitrophenyl octyl ether (NPOE)(Fluka), didecyl phthalate (DDP) (Fluka), dibutyl phthalate(DBP) (Fluka), tributyl phosphate (TBP) (Fluka), tri(2-ethylhexyl) phosphate (TEHP) (Koch-Light, Colnbrook, Buckinghamshire, UK), poly(vinyl chJoride) (PVC) of high relativemolecular mass (M,) (Aldrich, Beerse, Belgium) and threepolystyrene (PS) standards (Technical University, Szczecin,Poland) (M, =2800, M,IMn = 1.20; M, =5800, M,IMn = 1.06;M, = 9800, M,IMn = 1.08). Analytical-reagent grade chemicals were used in all other instances and re-distilled water wasused for preparing all aqueous solutions.
Electrode Preparation
An electrode with a polymeric membrane and a metalliccontact of the coated-wire type was used. The active membrane component was mercurated polystyrene.
Three polystyrenes of different relative molecular masses,viz., 2800, 5800 and 9800 g mol-I, were employed. Mercuration was performed as described previously.37.38 The contentof Hg in the mercurated polystyrenes, as determined byatomic absorption spectrometry, was 0.3840, 0.3814 and0.3832 g per gram of polymer, respectively. This implies thatas a result of mercuration, half of the benzene rings inpolystyrene contained the -Hg-Q-CO--CH3 substituent.
The coating mixture was prepared as a ternary cocktailconsisting of matrix, sensor and plasticiser. Poly(vinylchloride) or PS was used as the matrix support, R-Hg-Ac asthe sensor and DDP, DBP, TBP, TEHP or NPOE as thesolvent mediator.
The membrane coating solution was prepared as follows: to2 ml of a 1% solution of R-Hg-Ac in dioxane, 0.5 ml ofplasticiser and 2 ml of 10% PVC in tetrahydrofuran or 2 ml of10% PS in dioxane were added. Prior to coating, the platinumwire was washed with concentrated H2S04 and water and

1452 ANALYST, NOVEMBER 1990, VOL. 115
Table I. Composition of the different membranes and some electrode characteristics measured as a response to SDS
Composition of the membraneSlope
Solvent at 25 0c/No. Matrix Sensor mediator mVdecade- 1 Linear range/M
I PVC R-Hg-Ac (M, 2800) NPOE 58 I x 10-3-5 X 10⁻⁷
II PVC R-Hg-Ac (M, 5800) NPOE 58 I x 10-3-5 X 10⁻⁷
III PVC R-Hg-Ac (M, 9800) NPOE 58 1 x 10⁻³-5 X 10⁻⁷
IV PVC R-Hg-Ac (M, 2800) DBP 59 I x 10-3-1 X 10⁻⁷
V PVC R-Hg-Ac (M, 5800) DBP 59 I x 10-3-1 X 10⁻⁷
VI PVC R-Hg-Ac (M, 9800) DBP 59 I x 10-3-1 X 10⁻⁷
VII PVC R-Hg-Ac (M, 9800) TBP 7VIII PVC R-Hg-Ac (M, 9800) TEHP 21 1 x 10⁻³-1 X 10⁻⁵
IX PVC R-Hg-Ac (M, 9800) DDP 46 I x 10-3-1 X 10⁻⁶
X PVC R-Hg-Ac (M, 9800) DDP-NPOE(I + I) 58 I x 10-3-1 X 10⁻⁶
XI PS R-Hg-Ac (M, 9800) NPOE 41 I x 10-3-1 X 10⁻⁵
XII PS R-Hg-Ac (M, 9800) DBP 36 I x 10-3-1 X 10⁻⁵
dried with acetone. It was then rinsed with chloroform andallowed to dry. A piece of the platinum wire, 2 mm indiameter, was coated to a height of 0.5 cm by three successiveimmersions in the membrane solution. The electrode was leftfor 24 h in ambient air so that the solvents would evaporate.The surface of the coated part of the wire was further coatedwith unmodified PVC and shielded with a glass tube. Prior touse, the electrode was conditioned for 24 h in I x 10-4 M SDSor SDBS solution.
Apparatus
The measuring cell was
Pt IMembrane I Test II I Mil M IAgCl- Agsolution NR,N03 \ KCl
The e.mJ. was measured (±0.1 mV) with an N-512 pH meter(ELPO, Wroclaw, Poland) connected to a V-544 digitalvoltmeter (Meratronik, Wroclaw, Poland) and a GIB l
recorder (Carl Zeiss, Jena, GDR). Measurements were madein a 5O-ml water-jacketed vessel at 25 ± 0.1 0c. The solutionunder study was stirred with a magnetic stirrer.
Results and Discussion
A membrane electrode sensitive to anions has been described.The electroactive substance of the electrode is a metalloorganic polymer. To date, this type of compound has not beenused either in electrodes sensitive to anionic surfactants or inelectrodes sensitive to other anions. Only dialkyltin chlorides(R2SnCIz) and their complexes have been employed inanion-selective electrodes.40.41
Electrodes with membranes of different composition (seeTable I) were tested. Both the sensor and the matrix and alsothe solvent mediator were changed. No significant differencesbetween the three mercurated polystyrenes of various relativemolecular masses were found. Both PVC and PS were testedas the matrix membrane, and PVC was found to be superior.In addition, it was shown that the matrix membranes based onPS were mechanically unstable. The best properties werefound for electrodes with NPOE, DBP or a I + I mixture ofNPOE - DDP as plasticiser. Hence, of the 12 electrodes shownin Table 1, the electrode with a membrane made of PVC NPOE - R-Hg-Ac (M, = 9800) (electrode PtlIII) , theelectrode with a membrane containing PVC - DBP - R-Hg-Ac(Mr = 9800) (electrode PtlVI) and the PVC - NPOE - DDPR-Hg-Ac (M, = 9800) membrane-based electrode (electrodePtIX) were used for further studies.
230
200
>!: 150""'Ew
100
50
4 5 6pSos-
Fig. I. Calibration of the anionic surfactant-selective electrode PtiXin aqueous solutions of SDS
Calibration of the Electrode
Standard solutions of SDS were used for electrode calibrations. A typical calibration graph for SDS using the PtlXelectrode is presented in Fig. 1.
Studies on the calibration of electrodes gave the followingresults: (1) below the critical micellar concentration (CMC)the electrode system exhibited a Nernstian or near-Nernstianresponse giving a slope of 58 mV for the Pt/III and Pt/Xelectrodes and 59 mV for the PtNI electrode per decadechange in DS- activity (aos-); (2) at a point corresponding tothe CMC the calibration graph deviates from linearity, and atgreater activities the potential increases; (3) the values of theCMC for SDS and SDBS, determined from the calibrationgraphs, are 8.2 x 10⁻³ and 1.2 x 10⁻³, respectively. Theformer is fairly close to the literature value,42 whereas thelatter agrees well with the literature value;42 (4) a broad rangeof linear Nernstian dependence was observed for the electrodes: for the PtlIII electrode, the range is from I x 10-3 to 5X 10⁻⁷ M, for the PtlVl electrode from I x 10-3 to I X 10-7 M
and for the Pt/X electrode from I x 10-3 to 1 X 10⁻⁶ M. Thelower limit for the PtlIII and PtlVI electrodes is much lowerthan that reported for electrodes sensitive to SDS and basedon ion pairs; (5) the time required for the potential to reach astable value ranges from 30 s for a I x 10-3 M SDS solution to3 min for a I x 10-7 M SDS solution.
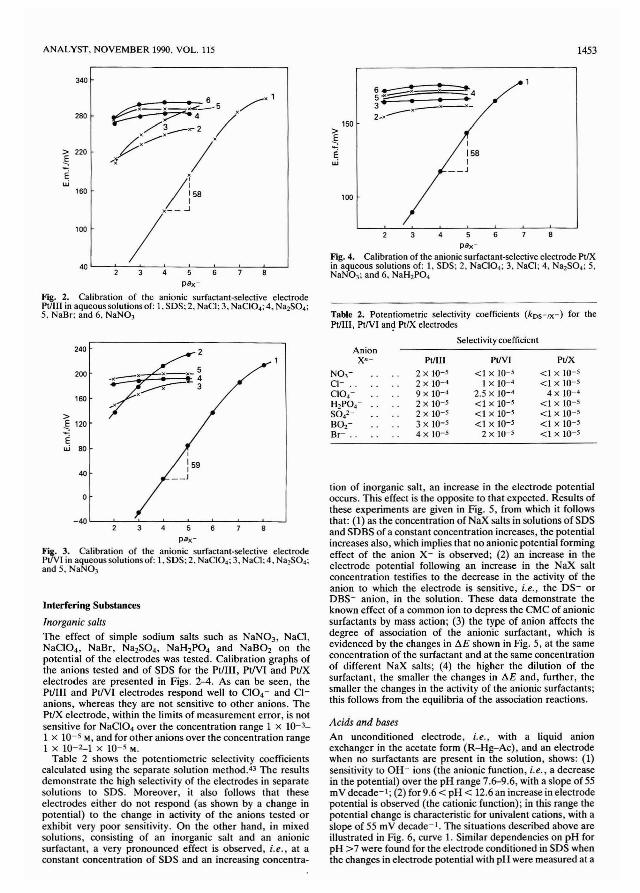
ANALYST. NOVEMBER 1990. VOL. 115 1453
340
3 4 5
pax'
Fig. 3. Calibration of the anionic surfactant-selective electrodePtIVl in aqueous solutions of: 1. SDS; 2. NaCl04; 3. NaCl; 4. Na2S04;and 5. NaN03
40 L--"':---':3----'4,---5~--':--~-~---l
pax'
Fig. 2. Calibration of the anionic surfactant-selective electrodePtlIII in aqueous solutions of: 1. SDS; 2. NaCI; 3. NaCI04;4, Na2S04;5. NaBr; and 6. NaN03
I
158I
__ J
6~ : -"45;---. • ..3 __x-J(-
2..)(---)(
100
150>~...;EW
Anionx·- PtlIII PtlVI PtlX
NO,- 2 X \0-5 <1 X \0-5 <1 X \0-5CI- .. 2 X \0-4 1 X \0-4 <1 X \0-5Cl04- 9 X \0-4 2.5 X \0-4 4 X 10⁻⁴H2P04- 2 X \0-5 <1 X 10⁻⁵ <1 X 10⁻⁵SOi- 2 x \0-5 <1 X \0-5 <1 X 10⁻⁵B02- 3 X \0-5 <1 X 10⁻⁵ <! X 10-5Br- .. 4 X \0-5 2 X \0-5 <1 X 10⁻⁵
Table 2. Potentiometric selectivity coefficients (kDS - IX-) for thePtlIII, PtN! an~ PtlX electrodes
Selectivity coefficient
3 4 5 6 8
pax'
Fig. 4. Calibration of the anionic surfactant-selective electrode PtlXin aqueous solutions of: I, SDS; 2. NaCI04; 3, NaCI; 4, Na2S04; 5,NaNO,; and 6. NaH2P04
Acids and basesAn unconditioned electrode, i.e., with a liquid anionexchanger in the acetate form (R-Hg-Ac), and an electrodewhen no surfactants are present in the solution, shows: (1)sensitivity to OH- ions (the anionic function, i.e., a decreasein the potential) over the pH range 7.6-9.6, with a slope of 55mV decade- l ; (2) for 9.6 < pH < 12.6 an increase in electrodepotential is observed (the cationic function); in this range thepotential change is characteristic for univalent cations, with aslope of 55 mV decade-I. The situations described above areillustrated in Fig. 6, curve I. Similar dependencies on pH forpH >7 were found for the electrode conditioned in SOS whenthe changes in electrode potential with pH were measured at a
tion of inorganic salt, an increase in the electrode potentialoccurs. This effect is the opposite to that expected. Results ofthese experiments are given in Fig. 5, from which it followsthat; (1) as the concentration of NaX salts in solutions of SOSand SOBS of a constant concentration increases, the potentialincreases also, which implies that no anionic potential formingeffect of the anion X- is observed; (2) an increase in theelectrode potential following an increase in the NaX saltconcentration testifies to the decrease in the activity of theanion to which the electrode is sensitive, i.e., the OS- orOBS- anion, in the solution. These data demonstrate theknown effect of a common ion to depress the CMC of anionicsurfactants by mass action; (3) the type of anion affects thedegree of association of the anionic surfactant, which isevidenced by the changes in t.E shown in Fig. 5, at the sameconcentration of the surfactant and at the same concentrationof different NaX salts; (4) the higher the dilution of thesurfactant, the smaller the changes in t.E and, further, thesmaller the changes in the activity of the anionic surfactants;this follows from the equilibria of the association reactions.
240
200
160
>E 120:;::Ew 80
40
0
-40
280
> 220~~
Ew
100
160
Interfering Substances
Inorganic saltsThe effect of simple sodium salts such as NaN03 , NaCl,NaCI04, NaBr, Na2S04, NaH2P04 and NaB02 on thepotential of the electrodes was tested. Calibration graphs ofthe anions tested and of SOS for the PtlIII, PtNI and PtlXelectrodes are presented in Figs. 2--4. As can be seen, thePtlIII and PtlVI electrodes respond well to Cl04- and CIanions, whereas they are not sensitive to other anions. ThePtlX electrode, within the limits of measurement error, is notsensitive for NaCl04 over the concentration range 1 x 10-3I X 10-5 M, and for other anions over the concentration range1 x 10-2.-1 X 10⁻⁵ M.
Table 2 shows the potentiometric selectivity coefficientscalculated using the separate solution method. 43 The resultsdemonstrate the high selectivity of the electrodes in separatesolutions to SOS. Moreover, it also follows that theseelectrodes either do not respond (as shown by a change inpotential) to the change in activity of the anions tested orexhibit very poor sensitivity. On the other hand, in mixedsolutions, consisting of an inorganic salt and an anionicsurfactant, a very pronounced effect is observed, i.e., at aconstant concentration of SOS and an increasing concentra·
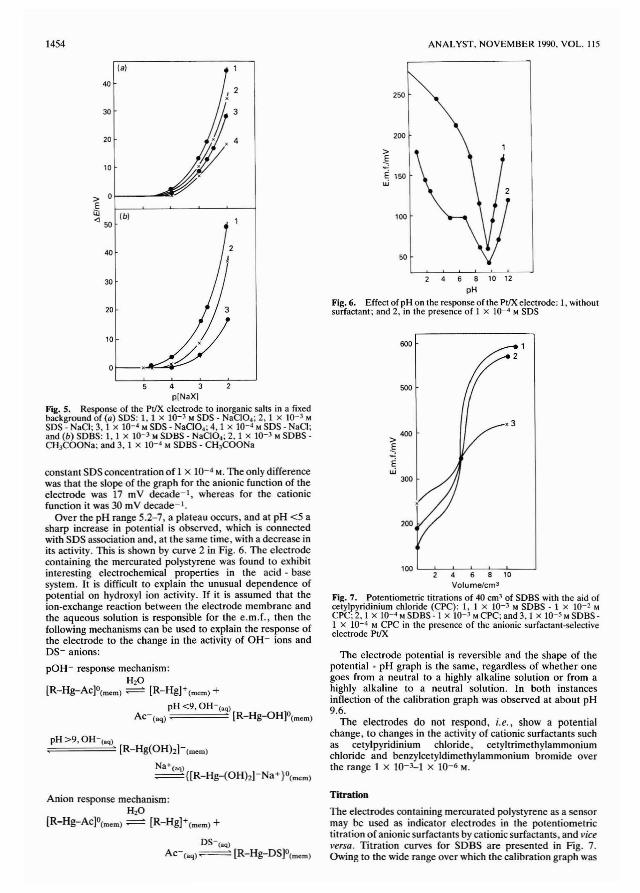
4 3plNaXI
Fig. S. Response of the PtIX electrode to inorganic salts in a fixedbackground of (a) SOS: I, I X 10-3 M SOS - NaCl04 ; 2, 1 x 10⁻³ M
SOS - NaCI; 3, 1 x 10⁻⁴ M SOS - NaCI04; 4, 1 x 10⁻⁴ M SOS - NaCI;and (b) SOBS: I, 1 x WOo3 M SOBS - NaCl04; 2, 1 x 10--3 M SOBS CH3COONa; and 3, 1 x 10⁻⁴ M SOBS - CH3COONa
12
600
500
400>~Ew
100 '----:--4'--6':--,8':--:''::-0-----1
Volume/cm3
Fig. 7. Potentiometric titrations of 40 cm3 of SOBS with the aid ofcetylpyridinium chloride (CPC): I. 1 x 10⁻³ M SOBS - 1 x 10⁻² M
CPC; 2, 1 X 10⁻⁴ M SOBS - 1 x 10⁻³ M CPC; and 3. I x IO-s M SOBS1 x 10-4 M CPC in the presence of the anionic surfactant-selectiveelectrode PtlX
4 6 8 10 12
pHFig. 6. Effect of pH on the response of the PtlX electrode: I, withoutsurfactant; and 2, in the presence of 1 x 10⁻⁴ M SOS
ANALYST. NOVEMBER 1990. VOL. 115
The electrode potential is reversible and the shape of thepotential -- pH graph is the same, regardless of whether onegoes from a neutral to a highly alkaline solution or from ahighly alkaline to a neutral solution. In both instancesinflection of the calibration graph was observed at about pH9.6.
The electrodes do not respond, i.e., show a potentialchange, to changes in the activity of cationic surfactants suchas cetylpyridinium chloride, cetyltrimethylammoniumchloride and benzylcetyldimethylammonium bromide overthe range 1 x 1O-L 1 X 10⁻⁶ M.
[R-Hg(OHhhmem)
Na+(aq)==([R-Hg-(OHh]-Na+}o(mem)
pH >9, OH-(.q)
1454
(a)
40
30
20
1O
> °Ei:iJ (b)<l 50
40 2
30
~20
1O
~
constant SOS concentration of 1 x 10⁻⁴ M. The only differencewas that the slope of the graph for the anionic function of theelectrode was 17 mV decade--!, whereas for the cationicfunction it was 30 mV decade-I.
Over the pH range 5.2-7, a plateau occurs, and at pH <5 asharp increase in potential is observed, which is connectedwith SOS association and, at the same time, with a decrease inits activity. This is shown by curve 2 in Fig. 6. The electrodecontaining the mercurated polystyrene was found to exhibitinteresting electrochemical properties in the acid - basesystem. It is difficult to explain the unusual dependence ofpotential on hydroxyl ion activity. If it is assumed that theion-exchange reaction between the electrode membrane andthe aqueous solution is responsible for the e.m.f., then thefollowing mechanisms can be used to explain the response ofthe electrode to the change in the activity of OH- ions andOS- anions:
pOH- response mechanism:H20
[R-Hg-Ac]O(mem) === [R-Hg]+(mem) +pH <9. OH-(aq)
AC-(aq) [R-Hg-OH]O(mem)
Anion response mechanism:H20
[R-Hg-Ac]O(mem) === [R-Hg]+(mem) +
OS-(.q)Ac-(aq)~ [R-Hg-OS]O(mem)
Titration
The electrodes containing mercurated polystyrene as a sensormay be used as indicator electrodes in the potentiometrictitration of anionic surfactants by cationic surfactants, and viceversa. Titration curves for SOBS are presented in Fig. 7.Owing to the wide range over which the calibration graph was
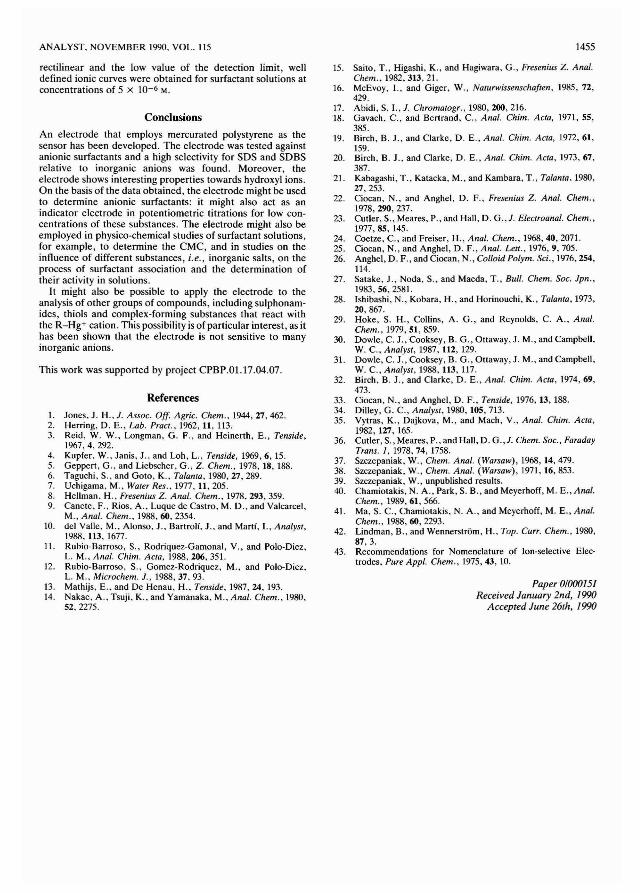
ANALYST. NOVEMBER 1990. VOL. 115
rectilinear and the low value of the detection limit, welldefined ionic curves were obtained for surfactant solutions atconcentrations of 5 x 10⁻⁶ M.
Conclusions
An electrode that employs mercurated polystyrene as thesensor has been developed. The electrode was tested againstanionic surfactants and a high selectivity for SDS and SDBSrelative to inorganic anions was found. Moreover, theelectrode shows interesting properties towards hydroxyl ions.On the basis of the data obtained, the electrode might be usedto determine anionic surfactants: it might also act as anindicator electrode in potentiometric titrations for low concentrations of these substances. The electrode might also beemployed in physico-chemical studies of surfactant solutions,for example, to determine the CMC, and in studies on theinOuence of different substances, i.e., inorganic salts, on theprocess of surfactant association and the determination oftheir activity in solutions.
It might also be possible to apply the electrode to theanalysis of other groups of compounds, including suiphonamides, thiols and complex-forming substances that react withthe R-Hg+ cation. This possibility is of particular interest, as ithas been shown that the electrode is not sensitive to manyinorganic anions.
This work was supported by project CPBP.Ol.17.04.07.
References
I. Jones. J. H.• J. Assoc. Off. Agric. Chern .• 1944,27,462.2. Herring. D. E.• Lab. Pract.• 1962, II. 113.3. Reid. W. W.• Longman, G. F., and Heinerth, E., Tenside,
1967,4,292.4. Kupfer. W., Janis. J .. and Loh, L.. Tenside, 1969,6,15.5. Geppert, G .. and Liebscher. G .. Z. Chern., 1978, 18, 188.6. Taguchi. S., and Goto, K.• Talanta. 1980,27,289.7. Uchigama. M.. Water Res.. 1977. 11.205.8. Hellman. H.. Fresenius Z. Anal. Chern .• 1978,293,359.9. Canetc, F.. Rios. A., Luque de Castro, M. D., and Valcarcel,
M .• Anal. Chern., 1988,60.2354.10. del Valle. M.. Alonso. J., Bartrolf, J .. and Marti. I., Analyst,
1988. 113. 1677.II. Rubio-Barroso, S., Rodriquez·Gamonal, V., and Polo-Diez,
L. M .. Anal. Chirn. Acta, 1988,206,351.12. Rubio-Barroso, S.• Gomez-Rodriquez, M.. and Polo-Diez.
L. M .• Microchern. J., 1988,37.93.13. Mathijs. E .. and De Henau, H .. Tenside. 1987,24.193.14. Nakae, A .. Tsuji. K.. and Yamanaka. M., Anal. Chern .. 1980,
52.2275.
1455
15. Saito, T., Higashi, K., and Hagiwara, G., Fresenius Z. Anal.Chern .. 1982,313.21.
16. McEvoy. I., and Giger, W., Naturwissenschaften, 1985, 72,429.
17. Abidi, S. I., J. Chrornatogr .. 1980, ZOO, 216.18. Gavach. C, and Bertrand. C.. Anal. Chirn. Acta, 1971, 55,
385.19. Birch, B. J., and Clarke, D. E.. Anal. Chirn. Acta, 1972,61,
159.20. Birch. B. J., and Clarke, D. E., Anal. Chim. Acta, 1973, 67,
387.21. Kabagashi, T .. Katacka, M., and Kambara, T., Talanta, 1980,
27,253.22. Ciocan. N., and Anghel, D. F.. Fresenius Z. Anal. Chern.,
1978,290,237.23. Cutler, S., Meares, P., and Hall, D. G.,J. Electroanal. Chern.,
1977,85,145.24. Coetze, C. and Freiser, H., Anal. Chern., 1968,40,2071.25. Ciocan, N., and Anghel, D. F., Anal. Lell., 1976,9,705.26. Anghel, D. F., and Ciocan, N., Colloid Polyrn. Sci., 1976, 254,
114.27. Satake, J., Noda, S., and Maeda, T., Bull. Chern. Soc. Jpn.,
1983, 56, 2581.28. Ishibashi, N., Kobara, H., and Horinouchi, K., Talanta, 1973,
20,867.29. Hoke. S. H., Collins, A. G., and Reynolds, C. A., Anal.
Chern., 1979.51,859.30. Dowie, C. J .. Cooksey, B. G., Ottaway, J. M., and Campbell,
W. C., Analyst, 1987, 112, 129.31. Dowie, C J., Cooksey, B. G., Ottaway, J. M., and Campbell,
W. C., Analyst, 1988, 113, 117.32. Birch. B. J., and Clarke, D. E., Anal. Chirn. Acta, 1974,69,
473.33. Ciocan, N., and Anghel, D. F., Tenside, 1976,13,188.34. Dilley, G. C., Analyst, 1980, 105,713.35. Vytras. K., Dajkova, M., and Mach, V., Anal. Chirn. Acta,
1982,127,165.36. Cutler, S., Meares. P., and Hall, D. G.,J. Chern. Soc., Faraday
Trans. I, 1978,74,1758.37. Szczepaniak, W.. Chern. Anal. (Warsaw), 1968, 14, 479.38. Szczepaniak, W., Chern. Anal. (Warsaw), 1971, 16, 853.39. Szczepaniak, W., unpublished results.40. Chamiotakis, N. A., Park, S. B., and Meyerhoff, M. E., Anal.
Chern., 1989,61,566.41. Ma, S. C, Chamiotakis, N. A., and Meyerhoff, M. E., Anal.
Chern., 1988,60,2293.42. Lindman, B.. and Wennerstrom, H., Top. Curro Chern., 1980,
87,3.43. Recommendations for Nomenclature of Ion-selective Elec
trodes, Pure Appl. Chern., 1975,43, 10.
Paper 0/00015/Received January 2nd, /990
Accepted June 26th, /990


ANALYST. NOVEMBER 1990. VOL. 115
Study of Protolytic Equilibria of Flurazepam
Lidija B. Pfendt and Tomislav J. JanjicFaculty of Chemistry, University of Belgrade, P.O. Box 550, 11001 Belgrade, Yugoslavia
Gordana V. PopovicFaculty of Pharmacy, University of Belgrade, 11001 Belgrade, Yugoslavia
1457
Protolytic equilibria of flurazepam, a diprotic base which is sparingly soluble in water, were investigated. Theinvestigations were carried out in the pH range 0-12, at constant ionic strength (0.1 M NaCI) and 25 ± 0.1 °C, bythe application of spectrophotometric, pH-metric and solubility methods. The acidity, hydrolysis andequilibrium constants in the heterogeneous system were determined. In addition, a method, based on theapplication of a formation function to the hydrolytic process, is proposed. Finally, buffer characteristics offlurazepam in the homogeneous and heterogeneous systems were studied.
Keywords: Flurazepam; protolytic equilibria; hydrolysis; heterogeneous equilibria; two-phase buffer
Flurazepam (7-chloro-l-(2-diethylaminoethyl)-5-(2'-fluorophenyl)-1,3-dihydro-2H-l ,4-benzodiazepin-2-one) belongs tothe class of benzodiazepine derivatives. In addition to thepharmacological activity characteristic of this class of drugs,flurazepam shows a unique hypnotic action.
Chemically flurazepam behaves as a diprotic basel and issparingly soluble in water. In acidic solution it undergoesreversible hydrolysis, the mechanism of which has beenstudied in detail. 2.3 However, no data are reported in theliterature on the investigation of the equilibria of flurazepamin heterogeneous systems, and the data on acidity constants,particularly for pKa2 , are not consistent. On the basis ofpolarographic investigations only the approximate values forthe acidity constants of flurazepam have been determined,pKal values ranging between 1 and 2 and pKa2 values between8 and 10.4 Rudy and Senkowski l reported the unpublisheddata obtained by Toome and Raymond for the pKa values offlurazepam (1.90 and 8.16), determined spectrophotometrically, whereas the value for pKa2 , determined by titration, in apropan-2-01- water mixture (1 + 1), after suitable correctionswas found to be 7.9. However, in the opinion of Groves andSmyth5 the pKa2 value for flurazepam cannot be preciselydetermined spectrophotometrically because of the slightdifference in the spectra of the non-protonated and monoprotonated base. Therefore, these workers have only determinedspectrophotometrically, by the application of the acidityfunction, Ho , the value of pKal (1.42).
The aforementioned data show that the acidity constants forflurazepam, determined by different workers, differ fromone another both in value and precision, and also indicate thatthe heterogeneous equilibria of flurazepam have not beeninvestigated to date. As shown in a previous paper,6 theinvestigation of heterogeneous equilibria can afford usefulinformation on acid - base equilibria in homogeneous systems.Hence, the aim of the present work is to extend theinvestigation to flurazepam and also to perform a quantitativestudy of other protolytic equilibria to which flurazepam issubjected. These investigations include the determination ofits acidity, hydrolysis and equilibrium constants in heterogeneous systems and also the buffer characteristics of monophase and two-phase buffer systems consisting of the solidflurazepam, which is sparingly soluble, and its saturatedsolution. As has been reported previously6 these investigations are of wide-ranging interest.
Experimental
Apparatus
Measurements and the interpretation of the pH valuesmeasured were carried out as described in a previous paper,6
where the following relationships are valid: [H30+) = 10-PCH= lO-(pHoE - 0.04) and pK(i, = 13.81 ± 0.01 for ionic strength, I= 0.1 M (NaC!) at 25 ± 0.1 °C; pHoE is the pH as determinedwith a pH meter, pk(i, = PCh + PCOH, PCH = -log[H30+) andPCOH = - 10g[OH-J. Spectrophotometric measurements wereperformed on a Beckman DU-50 spectrophotometer in l-cmsilica cells.
Reagents
All investigations were carried out with flurazepam monohydrochloride (Fz.HCI) produced by Hoffmann La Roche(Basle, Switzerland). A stock solution of the drug wasprepared by weighing accurately the dry substance anddissolving it in water or 0.1 M NaCI. A freshly preparedsolution was always used and all operations with the drug werecarried out in the absence of light. Other reagents were ofanalytical-reagent grade. Standardisation of HCI and NaOHsolutions was performed potentiometrically.
Methods
Determination of acidity constants
Optimum wavelengths for the determination of Kal wereselected on the basis of the spectra of flurazepam solutions inthe PCH range 1~, recorded in the 2Q0-400 nm range, at fastscan (scan speed 750 nm min-I). The solutions used for therecording of spectra and absorbance measurements at selectedwavelengths were prepared immediately before measuring inorder to prevent possible hydrolysis. For the determination ofKal , stock solutions of Fz.HCI (3.24 x 10⁻⁴ M) and HCI (8.42x 1O-L 8.42 x 10⁻² M) were prepared with the addition ofNaCI to give I = 0.1 M. Aliquots of 0.2 and 0.5 ml of Fz.HCIsolution were then rapidly mixed and shaken in cells with 3 mlof HCI, and the absorbances of these solutions were measuredat 230 and 282 nm, respectively, against a correspondingblank.
The acid constant, Ka2 was determined from the dataobtained by pH-metric titration. Aliquots of 20 and 2S ml ofFz.HCI solution (8.0 x 10⁻⁴ M in 0.1 M NaCI) were titratedwith O.OI-ml increments of NaOH solution (0.079 M). Fromthese data the formation function, "H, namely the meannumber of protons bound to the base (Fz) was calculated bymeans of the following equation:
_ CFz.HCI- [H30+) + [OH-)- CNaOH (1)nH =
CFz.HCI
In equation (1) and in all other instances C denotes thestoicheiometric concentrations, whereas square bracketsdenote equilibrium concentrations.

1458 ANALYST. NOVEMBER 1990. VOL. 115
(4)
(5)
The acidity constants of these processes are defined as:
K _ [BH+J[H30+]al - [BH22+]
K = [B][H30+)"2 [BH+]
0.2 0'--:~-4'----_L6--L.8--1~0--1-'-2--1-'-4-.J
IABH + - AI/[H30+)
•2
IABH+ - AI/[H30+]2 3 4 5
Because the corresponding protolytic processes are "separ~ted" (pK. values of flurazepam differ by more than 4 pKumts), both constants can be determined independently, as formonoprotic bases.
For the determination of pKa, the spectrophotometricmethod? was employed, according to which, from the absorbances of a flurazepam solution measured at different PCH
values, the following linear dependence was calculated:
A =A 2+ + K IA BH+ -AI (6)BH2 - al [H
30+]
where ABHl+, A BH + and A are the absorbances of solutionscontaining BH22+, BH+ and their mixtures, respectively, atgiven wavelengths. Equation (6) shows that for the determination of pKa) it is not necessary to know the absorbance of thepure BH22+ species, and that the determination of pKa ispossible under the conditions applied (I = 0.1 M). The Iin~ardependence expressed by equation (6) obtained on the basis ofexperimental data for two optimum wavelengths, is shown inFig. 1. The slope of the straight lines obtained corresponds tothe acidity constant +Kal for (A BH+ - A) > 0, and to -Ka )
for (ABH+ - A) < 0, respectively, whereas the intercept onthe ordinate corresponds to the absorbance of the pure BH22+species. Both magnitudes were calculated by regressionanalysis. The mean va}ue obtained for pKal is 1.53. Fig. 2shows absorption spectra of the acidic flurazepam solutionsrecorded at fast scan, on the basis of which optimumwavelengths for the determination of Ka , were selected. Ascan be seen in Fig. 2, the spectra of pure BH+ and BH22+species and of their mixtures intersect at three isosbestic pointsat the wavelengths 238, 248 and 262 nm, respectively. The
(2)
Fig. 1. Spectrophotometric determination of Ka according toequation (6): 1, A= 230 nm. c,o. = 2.025 X 10⁻⁵ M; '2. A= 282 nm.CIO. = 4.63 X 10⁻⁵ M
+ .......C,HsCH,-CH,-N,
~)O HC,Hs
,,~,
Determination of the pK. Values of Flurazepam
In the pH range 0--14 flurazepam undergoes a "simple" acid base equilibrium as shown in Scheme 1.
+ .......C,Hs
In direct titration CNaOH = O.
DetermiTUltion of the hydrolysis constant
The hydrolysis constant, K hl , was determined from the data of"slow" pH-metric titrations. These were carried out in twoways. For direct titration, to a series of solutions (V = 20 ml)of the same stoicheiometric Fz.HCI concentration (5.0 x10⁻³ M in 0.1 M NaCI) various volumes (0.15--{).70 ml) of0.2105 M HCI were added. For back-titration a solution ofFz.HCl (5.0 x 10⁻³ M) in 8.42 x 10⁻³ M HCI with the additionof NaCI to give I = 0.1 M, was prepared. This solution was leftto stand for 6 h. Then to a series of this solution (V = 20 ml)various volumes (0.15--{).65 ml) of 0.1895 M NaOH wereadded. Both series of solutions were thermostated for 4 h. Theequilibration was followed pH-metrically. From the pHOEvalues measured at the equilibrium state, the formationfunction, ii' , in this instance was calculated according to theequation:
ii' = CFz.HCI + CHCI + [OH-]- [H30+]- CNaOH
CFz.HCI
Results and Discussion
All equilibrium constants determined in this paper relate toan ionic strength of 0.1 M and accordingly are defined asconcentration, i.e., stoicheiometric constants.
Heterogeneous system
Saturated solutions for the determination of equilibriumconstants in the heterogeneous system were obtained bypartial precipitation of the free base from 20 ml of Fz.HCIsolution (1.0 x 10⁻² M in 0.1 M NaCI) by the addition ofdifferent aliquots of 0.3979 M NaOH. The samples were thenthermostated for 4 h with occasional shaking until theequilibrium was established. From the pHOE values measuredat the equilibrium state, the concentration of protons bound tothe base in the solution was calculated:
[H+lb = CFz.HCI - CNaOH - [H30+1+ [OH-] .. (3)
For the determination of the solubility of flurazepam theprecipitate was separated by centrifugation. The aliquots ofthe solutions were then diluted, made alkaline (pH = 11) andthe actual concentration of the base was determined spectrophotometrically at 230 nm, the validity of Beer's Law havingbeen verified previously.
The buffer curve of a two-phase buffer was determined bytitrating an Fz.HCI solution (20 ml; 1.0 x 10⁻² M in 0.1 M
NaCl) with a standard NaOH solution (0.3979 M) withvigorous stirring.
In the processing of experimental data, corrections weremade for volume changes; the data were processed by meansof suitable programs with a Texas Instrument TI-66 programmable calculator.
BH+
Scheme t
B

ANALYST, NOVEMBER 1990, VOL 115 1459
(8)
appearance of these isosbestic points shows that the "simple"protolytic reactions, under working conditions, are notcomplicated by secondary processes, In addition, the absorption spectrum of the pure molecular base is also shown in Fig,2, The slight difference observed in the spectra of pure BH+and B species indicates that spectrophotometry is not applicable to a reliable determination of K.2 .
For the determination of pKa2 the pH-metric titrationmethod was employed; it is based on the determination of fiHwhich, in the situation concerned, i.e., in the pH range inwhich BH+ and B species are in equilibrium, can be given bythe equation:
_ [BH+)nH = [BH+) + [B) (7)
From the linear dependence which relates fiH [equation (7»)with Ka2 [equation (5») i.e"
1-fiH_~
fiH - [H30+)
Ka2 was calculated by regression analysis. Fig. 3 shows thecorresponding linear dependence calculated as describedunder Experimental.
Determination of Hydrolysis Constants
On the basis of the kinetic studies of the hydrolysis off1urazepam2•3 it was assumed that in acidic solution f1urazepam undergoes a reversible ring-opening reaction at itsazomethine group, One of the main objectives of the presentpaper is the quantitative study of the corresponding equilibriaat various pH values, therefore, a method based on theapplication of a formation function to the hydrolytic process isproposed.
Taking into account "simple" protolytic and hydrolyticreactions occurring simultaneously in an acidic f1urazepamsolution the processes shown in Scheme 2 are possible whenthe equilibration is completed.The equilibrium constants for the corresponding hydrolyticprocesses are given by the expressions:
(9)
(10)
K _ ----'['-B_'H_2:-2_+)'-
hI - [BH+] [H30+)
[B'H22+]
Kh2 = [BH22+)
,~
"",~I I
2 345(H30+)-'/10" M
Fig. 3, pH-metric determination of K'2 according to equation (8)
+/CzHsCHz-CHz-N"
~~\:Z-NH~ CzHs
CI "",,0 H
Fo
360
/"'.----4Ir~--3
215
a L- .J.--__--:~_..L-_ _=::o..J
200
0.2
0.6
280Wavelength/nm
Fig, 2, Absorption spectra of f1urazepam in solutions of different{'CH' Scan speed, 750 nm min-I; {'ath lengtli, 1 cm; PCH: I, 5.81(BH+); 2, 1.80; 3, 1.10; 4, 1 M Hel (BH22+); and 5, 0.1 M NaOH (B);C,ot = 2,025 X 10-5 M
BH+
CI
+HzO
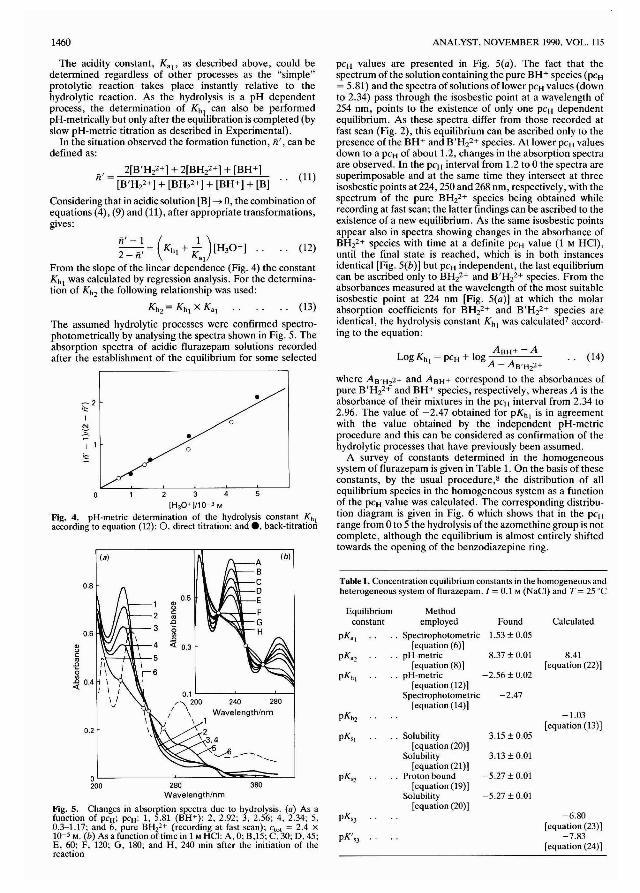
1460 ANALYST, NOVEMBER 1990, VOL. 115
Z 3 4
(H30+I/10-3 M
Fig. 4. pH-metric determination of the hydrolysis constant K h )
according to equation (12): 0, direct titration; and ., back-titration
_, 2[B'Hzz+] + 2[BHl+] + [BH+]n = [B'Hzz+] + [BHzz+] + [BH+] + [B] (11)
Considering that in acidic solution [B] -> 0, the combination ofequations (4), (9) and (11), after appropriate transformations,gives:
oL-_~~~:-.J200 280 360
Wavelength/nm
Fig. 5. Changes in absorption spectra due to hydrolysis. (a) As afunction of pCH; PCH: 1, 5.81 (BH+); 2, 2.92; 3, 2.56; 4, 2.34; 5,0.3-1.17; and 6, pure BHzz+ (recording at fast scan); Ctot = 2.4 X10⁻⁵ M. (b) As a function of time in 1 M HCI: A, 0; B,15; C, 30; D, 45;E, 60; F, 120; G, 180; and H, 240 min after the initiation of thereaction
Calculated
-1.03[equation (13)]
-6.80[equation (23)]
-7.83[equation (24)]
8.41[equation (22»)
Solubility 3.15 ± 0.05[equation (20)]
Solubility 3.13 ± om[equation (21)]
Proton bound -5.27 ± 0.01[equation (19)]
Solubility -5.27 ± om[equation (20)]
pK,z
Table 1. Concentration equilibrium constants in the homogeneous andheterogeneous system of flurazepam. 1= 0.1 M (NaCl) and T = 25 °C
PCH values are presented in Fig, 5(a), The fact that thespectrum ofthe solution containing the pure BH+ species (pCH= 5.81) and the spectra of solutions of lower PCH values (downto 2.34) pass through the isosbestic point at a wavelength of254 nm, points to the existence of only one pCH dependentequilibrium, As these spectra differ from those recorded atfast scan (Fig. 2), this equilibrium can be ascribed only to thepresence of the BH+ and B'Hz2+ species. At lower PCH valuesdown to a PCH of about 1.2, changes in the absorption spectraare observed, In the PCH interval from 1,2 to 0 the spectra aresuperimposable and at the same time they intersect at threeisosbestic points at 224,250 and 268 nm, respectively, with thespectrum of the pure BH2Z+ species being obtained whilerecording at fast scan; the latter findings can be ascribed to theexistence of a new equilibrium, As the same isosbestic pointsappear also in spectra showing changes in the absorbance ofBHzz+ species with time at a definite PCH value (1 M HCl),until the final state is reached, which is in both instancesidentical [Fig. 5(b)] but PCH independent, the last equilibriumcan be ascribed only to BHzZ+ and B'Hl+ species, From theabsorbances measured at the wavelength of the most suitableisosbestic point at 224 nm [Fig. 5(a)] at which the molarabsorption coefficients for BHz2+ and B'Hzz+ species areidentical, the hydrolysis constant Kh1 was calculated7 according to the equation:
ABH+ -ALog Kht = PCH + log (14)
A - A B 'HZ2+
where A B'HZ2+ and A BH + correspond to the absorbances ofpure B'Hl+ and BH+ species, respectively, whereas A is theabsorbance of their mixtures in the PCH interval from 2.34 to2.96. The value of -2.47 obtained for pKht is in agreementwith the value obtained by the independent pH-metricprocedure and this can be considered as confirmation of thehydrolytic processes that have previously been assumed.
A survey of constants determined in the homogeneoussystem of flurazepam is given in Table 1. On the basis of theseconstants, by the usual procedure,S the distribution of allequilibrium species in the homogeneous system as a functionof the pCH value was calculated, The corresponding distribution diagram is given in Fig. 6 which shows that in the pCHrange from 0 to 5 the hydrolysis of the azomethine group is notcomplete, although the equilibrium is almost entirely shiftedtowards the opening of the benzodiazepine ring.
(12)
(b)
Equilibrium Methodconstant employed Found
pKa ) Spectrophotometric 1.53 ± 0.05[equation (6)]
pKaz pH-metric 8.37 ± om[equation (8)]
pKh ) pH-metric -2.56 ± 0.02[equation (12)]
Spectrophotometric -2.47240 280 [equation (14)]
Wavelength/nm pKhZ
0.5Q)
"c:
'".Q<;'".Q
<t 0.3
12
3
•:;--z'C:
I0
N;:;: •
I 10
~
0.6
la)
0.2
0.8
""c:
'".Q<; ,\~ 0.4
I
ii' -1 ( 1 )--_-, = Kh [ + - [H30+] ..2 - n Ka[
From the slope of the linear dependence (Fig. 4) the constantKht was calculated by regression analysis. For the determination of KhZ the following relationship was used:
KhZ = K ht X Kat (13)
The assumed hydrolytic processes were confirmed spectrophotometrically by analysing the spectra shown in Fig. 5. Theabsorption spectra of acidic flurazepam solutions recordedafter the establishment of the equilibrium for some selected
The acidity constant, Kal' as described above, could bedetermined regardless of other processes as the "simple"protolytic reaction takes place instantly relative to thehydrolytic reaction. As the hydrolysis is a pH dependentprocess, the determination of Kh [ can also be performedpH-metrically but only after the equilibration is completed (byslow pH-metric titration as described in Experimental).
In the situation observed the formation function, ii', can bedefined as:
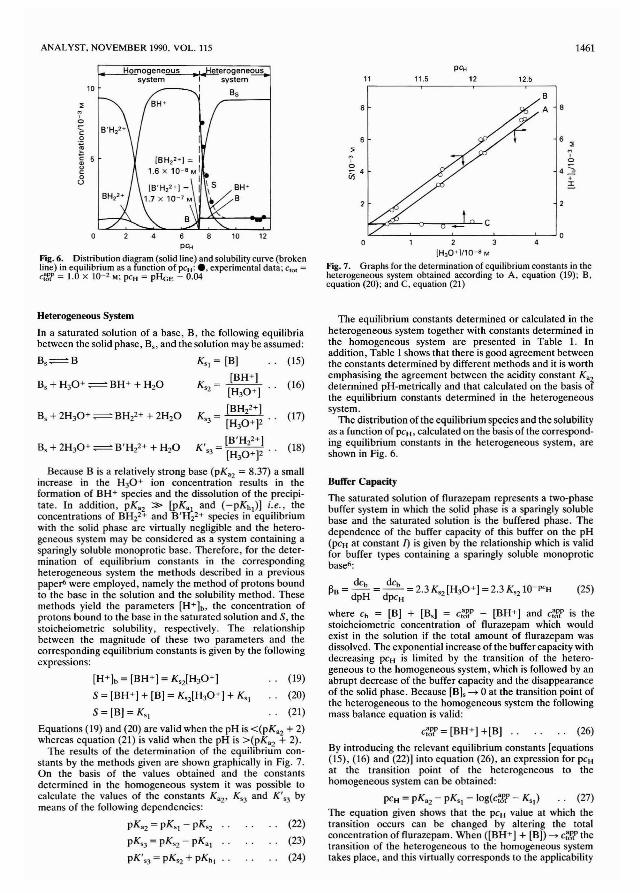
ANALYST. NOVEMBER 1990. VOL. 115 1461
o 6 8 10 12PCH
Fig. 6. Distribution diagram (solid line) and solubility curve (brokenli,?e)~n equilibri~m as a function of PCH: ., experimental data; c'o< =c,K.P - 1.0 x 10 2 M. PCH = pHGE - 0.04
B
A
12.511.511
8
~
M,oiii 4
2 3IH30+l!10-8 M
Fig. 7. Graphs for the determination of equilibrium constants in theheterogeneous system obtained according to A, equation (19); B,equation (20); and C, equation (21)
BH+
B
I+_-,Hceo",mogeneous • I "Heterogeneoussystem I system
I Bs10
Ioco.~
~ 5<>c:oU
Heterogeneous System
In a saturated solution of a base, B, the following equilibriabetween the solid phase, Bs , and the solution may be assumed:
Bs ;:::= B Ks ] = [B] (15)
Bs + H30+;:::= BH+ + H20 K = [BH+] (16)S2 [H30+]
[BH22+]Bs + 2H30+ ;:::= BH22+ + 2H20 KS3 = [H
30+ J2 .. (17)
, [B'H22+]Bs + 2H30+;:::= B'H22+ + H20 K S3 = [H
30+ J2 .. (18)
Because B is a relatively strong base (pK'2 = 8.37) a smallincrease in the H30+ ion concentration results in theformation of BH+ species and the dissolution of the precipitate. 10 addition, pK'2 » [pK.[ and (-pKh\)] i.e., theconcentrations of BH22+ and B'H22+ species in equilibriumwith the solid phase are virtually negligible and the heterogeneous system may be considered as a system containing asparingly soluble monoprotic base. Therefore, for the determination of equilibrium constants in the correspondingheterogeneous system the methods described in a previouspaper6 were employed, namely the method of protons boundto the base in the solution and the solubility method. Thesemethods yield the parameters [H+]b, the concentration ofprotons bound to the base in the saturated solution and S, thestoicheiometric solubility, respectively. The relationshipbetween the magnitude of these two parameters and thecorresponding equilibrium constants is given by the followingexpressions:
[H+]b= [BH+] = KszlH30+] (19)
S = [BH+] + [B] = K szlH30+] + Ks [ (20)
S = [B] = KS1 (21)
Equations (19) and (20) are valid when the pH is «pK'2 + 2)whereas equation (21) is valid when the pH is >(pK.z + 2).
The results of the determination of the equilibrium constants by the methods given are shown graphically in Fig. 7.On the basis of the values obtained and the constantsdetermined in the homogeneous system it was possible tocalculate the values of the constants K.2, KS3 and K'S3 bymeans of the following dependencies:
pK'2 = pKs\ - pKS2 (22)
pKS3 = pKS2 - pKa [ (23)
pK'S3 = pKS2 + pKh [ (24)
The equilibrium constants determined or calculated in theheterogeneous system together with constants determined inthe homogeneous system are presented in Table 1. Inaddition, Table 1 shows that there is good agreement betweenthe constants determined by different methods and it is worthemphasising the agreement between the acidity constant K.determined pH-metrically and that calculated on the basis otthe equilibrium constants determined in the heterogeneoussystem.
The distribution of the equilibrium species and the solubilityas a function of PCH, calculated on the basis of the corresponding equilibrium constants in the heterogeneous system, areshown in Fig. 6.
Buffer Capacity
The saturated solution of nurazepam represents a two-phasebuffer system in which the solid phase is a sparingly solublebase and the saturated solution is the buffered phase. Thedependence of the buffer capacity of this buffer on the pH(pCH at constant f) is given by the relationship which is validfor buffer types containing a sparingly soluble monoproticbase6 :
dCb dCbfiB = dpH = dpcH = 2.3 KS2 [H30+] = 2.3 K S2 lO-PCH (25)
where Cb = [B] + [Bs] = c:t.P - [BH+) and c~J'f is thestoicheiometric concentration of nurazepam which wouldexist in the solution if the total amount of nurazepam wasdissolved. The exponential increase of the buffer capacity withdecreasing PCH is limited by the transition of the heterogeneous to the homogeneous system, which is followed by anabrupt decrease of the buffer capacity and the disappearanceof the solid phase. Because [B]s -> 0 at the transition point ofthe heterogeneous to the homogeneous system the followingmass balance equation is valid:
c~J:P = [BH+] +[B] .. (26)
By introducing the relevant equilibrium constants [equations(15), (16) and (22)] into equation (26), an expression for PCHat the transition point of the heterogeneous to thehomogeneous system can be obtained:
PCH = pK'2 - pKs\ -log(c~J:P - K s\) (27)
The equation given shows that the PCH value at which thetransition occurs can be changed by altering the totalconcentration of nurazepam. When ([BH+] + [B)) -> c~J:P thetransition of the heterogeneous to the homogeneous systemtakes place, and this virtually corresponds to the applicability
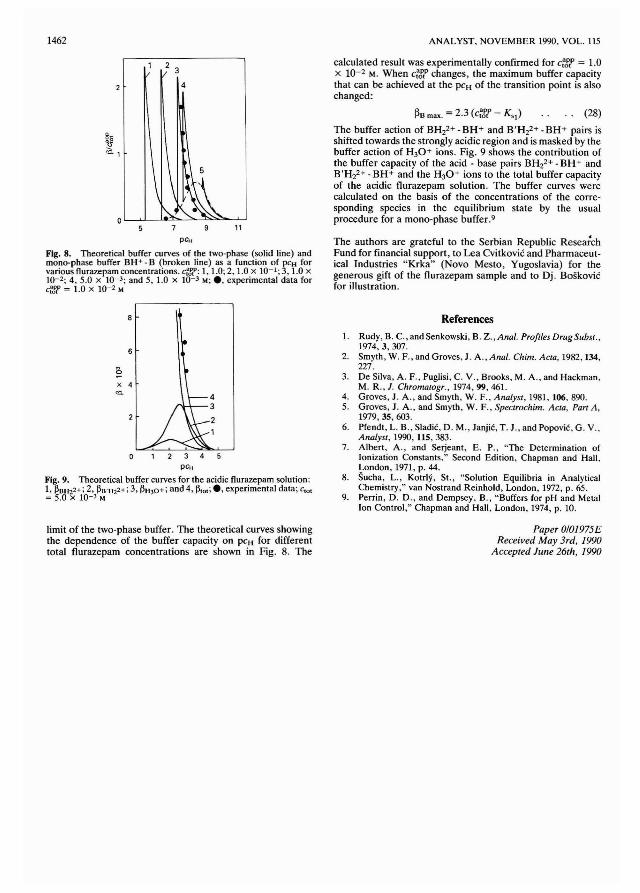
1462 ANALYST. NOVEMBER 1990. VOL. 115
2 3
4
calculated result was experimentally confirmed for c~g.p = 1.0X 10⁻² M. When c~g.p changes, the maximum buffer capacitythat can be achieved at the pCH of the transition point is alsochanged:
PCH
Fig. 8. Theoretical buffer curves of the two-phase (solid line) andmono-phase buffer BH+ -B (broken line) as a function of PCH forvarious fJurazepam concentrations. c:.f,P: 1, 1.0; 2,1.0 x 10-1 ; 3, 1.0 x10⁻²; 4, 5.0 x 10⁻³; and 5, 1.0 x 10⁻³ M; •• experimental data forc:.ff = 1.0 x 10⁻² M
~B max. = 2.3 (c~J'tP - K'l) (28)
The buffer action of BH22+ - BH+ and B'H22L BH+ pairs isshifted towards the strongly acidic region and is masked by thebuffer action of H30+ ions. Fig. 9 shows the contribution ofthe buffer capacity of the acid - base pairs BHi+· BH+ andB'H22+ - BH+ and the H30+ ions to the total buffer capacityof the acidic f1urazepam solution. The buffer curves werecalculated on the basis of the concentrations of the corresponding species in the equilibrium state by the usualprocedure for a mono-phase buffer. 9
The authors are grateful to the Serbian Republic ResearchFund for financial support, to Lea Cvitkovic and Pharmaceutical Industries "Krka" (Novo Mesto, Yugoslavia) for thegenerous gift of the f1urazepam sample and to Dj. Boskovicfor illustration.
References1. Rudy, B. c., and Senkowski, B. Z., Anal. Profiles DrugSubst.,
1974, 3, 307.2. Smyth, W. F., and Groves, J. A., Anal. Chim. Acta, 1982,134,
227.3. De Silva, A. F., Puglisi, C. V., Brooks, M. A., and Hackman.
M. R.. J. Chromatogr., 1974,99,461.4. Groves, J. A., and Smyth. W. F., Analyst, 1981, 106. 890.5. Groves, J. A., and Smyth, W. F., Spectrochim. Acta, Part A,
1979, 35, 603.6. Pfendt, L. B., Sladic, D. M., Janjic, T. J., and Popovic, G. V..
Analyst, 1990, 115,383.7. Albert, A., and Serjeant, E. P., "The Determination of
Ionization Constants:' Second Edition, Chapman and Hall.London,I971,p.44.
8. Sucha, L., Kotrlji, St., "Solution Equilibria in AnalyticalChemistry," van Nostrand Reinhold, London, 1972, p. 65.
9. Perrin, D. D., and Dempsey. B.. "Buffers for pH and MetalIon Control," Chapman and Hall, London, 1974, p. 10.
43
21
4
X<C.
3
PCH
Fig. 9. Theoretical buffer curves for the acidic flurazepam solution:1, IIOH22+; 2, 1I0'H22+; 3, IIH30 +; and 4, lito,;., experimental data; Cto,
= 5.0 X 10⁻³ M
limit of the two-phase buffer. The theoretical curves showingthe dependence of the buffer capacity on PCH for differenttotal f1urazepam concentrations are shown in Fig. 8. The
Paper 0101975£Received May 3rd, 1990
Accepted June 26th, 1990
ANALYST. NOVEMBER 1990, VOL. 115 1463
Determination of Low Chemical Oxygen Demand Values in Water bythe Dichromate Semi-micro Method
Josef Hejzlar and Jiri KopacekSection ofHydrobiology, Institute ofLandscape Ecology, CzechoslovakAcademyofSciences, Na sadkach 7,37005 Ceske Budejovice, Czechoslovakia
A semi-micro modification of the dichromate method for the determination of low concentrations (1-35mg 1-1 ) of the chemical oxygen demand is described. It is based on the experimentally establisheddependencies of the oxidation efficiency on the concentrations of H2S04, K2Cr207 and Ag2S04, and on thetemperature and time of heating. The procedure involves increasing the concentration of H2S04 and heatingin closed test-tubes in a heating block at 170°C for 40 min and the spectrophotometric determination ofdichromate at 455 nm. The interfering effect of chloride, up to a concentration of 100 mg 1-\ is masked byusing a combination of HgS04 and KCr(S04h. The modification has been tested on 30 samples of ground, tap,precipitation and surface waters and on 16 chemical compounds, and gives results comparable to those froma standard reflux method.
Keywords: Chemical oxygen demand; sealed test-tube digestion; chloride suppression; chromium(JIl)addition
For nearly 40 years, 1,2 the dichromate open reflux method forthe determination of the chemical oxygen demand (COD) hasbeen and is still used in water analysis3although it has severalshortcomings: it requires large amounts of reagents andsample, it is space demanding, tedious, time consuming, and,in particular, its sensitivity (about 5 mg 1-1 when using 0.0417M K2Cr207),3 is too low for application to waters with loworganic matter contents such as drinking, ground and nonpolluted surface waters.
To reduce the consumption of chemicals and save space,alternative methods of COD determination on a semi-microscale, with a comparable sensitivity, have been introducedwithin the past 20 years.4-9 The digestion conditions arelargely identical with those used in the original method; i.e.,50% vlv (63.6% mlm) H2S04 in the digestion mixture andheating at 150°C for 2 h. The boiling under a reflux condenser,however, is usually replaced by heating in thermostatedblocks, and the quantification is often based on the spectrophotometric determination of Cr3+ ions4.5.7 or on the amperometric titration of the unconsumed dichromate.s
Efforts have been made to reduce the time of the originalprocedurellH2; however, for many compounds (e.g., aliphaticacids) 12 shortening the digestion period leads to a decrease inoxidation efficiency, unless the concentration of H2S04 andthe temperature are increased. A solution to this problem, inmany respects successful, has been offered by Wagner andRuck,13 who devised a rapid method applicable to thedetermination of COD at levels encountered in drinkingwaters, i.e" in the range of about 1-10 mg I-I. By increasingthe concentration of H2S04 to 83% mlm and the temperatureto 170°C, they were able to reduce the time of digestion to 45min. Using perfectly purified reagents, they attained detectionlimits below 1 mg I-I. The increased digestion temperature,however, brought about problems associated with the masking of chloride because at temperatures above 150°C, HgS04alone failed to mask chloride effectively. This problem wascircumvented by removing chloride as HCI in vapour formprior to the digestion,13.14 a procedure that is, however,tedious and time consuming.
This paper describes an approach to the determination oflow COD values on a semi-micro scale, with digestionconditions optimised to attain comparable efficiency to that ofthe standard method,3 and with a considerably reduceddigestion time. The interfering effect of chloride is limited bythe combined masking effects of HgS04and Cr3+ ions. IS Thissemi-micro method is compared with the open reflux methodusing samples of various waters and chemical compounds. In
the open reflux method, which is used as a reference method,the digestion conditions of the standard method3 weremaintained, however, the manner in which the sample andreagent were dispensed, was modified, in order to achieveimproved accuracy and ensure comparable precision, so thatboth methods could be compared.
Experimental
ChemicalsAll chemicals used were of analytical-reagent grade, suppliedby Lachema (Brno, Czechoslovakia). The digestion solutionsand sulphuric acid reagents were prepared from 96 or 92%mlm sulphuric acid pre-treated by filtration and heated toboiling-point in an all-glass apparatus equipped with an aircooler. Sulphuric acid, 98.3% mlm, was obtained by distillation of the 96% mlm acid in an all-glass apparatus. Allfiltrations were carried out through a sintered glass funnel[type Sl, 0.09--D.15-mm porosity (Jena Glass, Jena, GDR)].Water for sample dilution and for the preparation of standardand reagent solutions was obtained from distilled water byre-distilling with the addition of KMn04 and H2S04,
Reagents for the Semi-micro Method
Digestion solution (900 mg I-I K2Cr207, 7.2 g 1-1KCr(S04h.12H20 and 46 g I-I HgS04in 37.3% m1v H2S04),Dissolve 0.900 ± 0.005 mg of K2Cr207, 7.20 ± 0.01 g ofKCr(S04h.12H20, 50 ± 1 ml of 96% mlm sulphuric acid and46 ± 1 g of HgS04 in about 500 ml of water. After completedissolution of all components, add 162 ± 1 ml of 96% mlmsulphuric acid, dilute with water to I I and filter.
Sulphuric acid reagent (10 g 1-1 Ag2S04in H2S04), Dissolve10 ± 0.1 g of Ag2S04 in 1 I of 96% mlm sulphuric acid; afterdissolution, filter and heat to boiling-point in an all-glassapparatus.
Standard potassium hydrogen phthalate (KHP) solution(100 mg I-I COD). Dissolve 85.1 ± 0.1 mg of KHP(previously dried at 120°C for 2 h) in water and dilute withwater to 11.
Calibration KHP solutions (5, 10, 15, 20, 25, 30 and 35mg I-I COD). DiluteS, 10, 15,20,25, 30and35 ml of standardKHP solution to 100 ml with water.
KHP solution (4 g I-I). Dissolve 200 ± 1 mg of KHP and0.5 ± 0.05 ml of 96% mlm sulphuric acid (as a preservative) in50 ml of water.
1464 ANALYST. NOVEMBER 1990, VOL. 115
60
o
ZO0
2
l..15
'"3
E I:>00u
o 0.5 1 1.5IK2Cr207)/g 1-'
Fig. 2. Oxidation efficiency (E) for nicotinic acid as a function ofK,Cr207 concentration in the digestion mixture
Results and Discussion
Efficiency of Oxidation
Published data , ·z •lz ,16 indicate that the efficiency of oxidationdepends appreciably on the concentrations of sulphuric acid,KZCrZ07 and AgzS04 in the digestion mixture and on thetemperature and time of heating. The dependence of theefficiency of oxidation on these parameters was studied on thesemi-micro scale; one parameter was varied at a time whilekeeping the others constant. Oxidation of nicotinic acid,which in the standard method using 0.0417 M KZCrZ07proceeds only to 24.3% of the theoretical oxygen demand(TOD),16 was chosen as the main criterion for the evaluationof the oxidation efficiency.
The influence of the concentration of AgzS04 in thereaction mixture is shown in Fig. 1 for nicotinic and aceticacids and for a sample of river water. While the organic
o 4 6 B 10IAg2SO.)/g 1-'
Fig. 1. Chemical oxygen demand as a function of Ag2SO. concentration in the digestion mixture, \, Acetic acid (TOO = 20,0 mg I-I);2, nicotinic acid (TOO = 71.6 mg I-I); and 3. river water
Open Reflux Method
Follow the standard method,3 but use 25 ml of sample, 5 ml ofthe digestion solution and 35 ml of the sulphuric acid reagent.This gives the same composition of the digestion mixture asthe standard method3 using 0.00833 M KZCrZ07.
Reagents for the Open Reflux Method
Digestion solution (5.465 g 1-1 KZCrZ07 and 89.1 g I-IHgS04 in 33.2% m/v HzS04 ). Add 5.465 ± 0.001 g ofKZCrZ07, 50 ± I ml of 92% mlm sulphuric acid and 89.1 ± 0.1g of HgS04 to about 500 ml of water. After dissolution of thecomponents, add 148 ± I ml of92% mlm sulphuric acid, dilutewith water to 1 I and filter.
Sulphuric acid reagent (12.7 g I-I AgZS04 in 92% m/mHzS04 ). Dissolve 12.7 ± 0.1 g of AgzS04 in I I of 92% m/msulphuric acid and filter.
Semi-micro Method
Mix 2 ml of sample and 1 ml of digestion solution in a 20 x 180mm test-tube fitted with a ground-glass stopper (Sklo Union,Labora, Czechoslovakia), add carefully 5 ml of sulphuric acidreagent to form a layer on the bottom,4 close the tube tightlywith the stopper and mix the contents thoroughly but preventtheir penetration to the ground glass joint. Immediately aftermixing, place the tube in a thermostated block pre-heated to170 ± 0.5 0c. (CAUTION: bumping may occur if mixing prior tothe heating is omitted). After 40 ± I min remove the tubefrom the heating block, allow it to cool to 20-25 °C then add 7ml of water and mix thoroughly. After cooling, read theabsorbance at 455 nm in a 5-cm cell. At the same timedetermine at least two blanks by replacing the sample withre-distilled water. Calculate the COD value from the difference between the absorbances of the sample and the averagevalue of the blanks according to the calibration graphprepared using the calibration KHP solutions.
For natural waters with suspended inorganic particlescorrection should be made to eliminate the error caused by theturbidity of the digestion mixture: follow the proceduredescribed above for the sample and the blank but add 1 drop(0.05 ± 0.01 ml) of KHP solution (4 g I-I) to the tubes beforedigestion in each instance, to reduce the dichromate in thedigestion mixture. Measure the absorbances and subtract thedifference between them from the absorbance of the sampleobtained without dichromate reduction. Calculate the CODvalue using the corrected absorbance value.
Table 1. Comparison of the semi-micro (S) and open reflux (R) methods for various compounds (n = 2)
Sample
Glucose ..StarchGlycine ..Aspartic acidTryptophanCysteineBovine serum albuminAcetic acidSodium dodecyl sulphate ..Humic acid (Fluka) ..Humic acid (Roth)Humic acid (peat-bog)Pyridine ..Nicotinic acid ..MethylamineEthylamine
• c = mass concentration.
c'lmgl- I
18.616.031.528.611.616.714.418.86.16
14.915.315.0
20250.175.817.4
TODImgl- I
19.819.020.120.620.919.9
20.012.3
45071.6
12236,9
c(S)1mgl- I
19.218.615.220.321.916.317.919.511.419.316.714.85.7
15.712.216.7
c(R)1mgl- I
18.817.919.320.321.114.116.619,810.619.516.715.03.8
10.416.014.9
SIR x 100, %
10210479
10010411610898
10899
10099
15015176
112

ANALYST, NOVEMBER 1990, VOL. 115 1465
90 L-_-'-__~_-'-__.L...J
o 60 120 180 240Time/min
-----Fig. 5. Effect of temperature on the decomposition of K2Crz07 inthe digestion mixture in the absence of oxidisable organic matter. • ,150; and 0,170·C
Interferences
Similarly as with the open reflux method, all inorganicsubstances capable of oxidation, such as Fe2+, S2- or nitrite,interfere with the semi-micro method. Correction is performed in the same manner as for the standard method. 3
Turbidity of the reaction mixture, caused by inorganicparticulate substances present in some surface water samples,increases the absorbance, causing a negative error in thedetermination. The method for the elimination of this error is
Cl.;§. 110
()<5':?100
The efficiency of oxidation is also affected by the concentration of sulphuric acid in the digestion mixture. Fig. 3 shows theresults of experiments with sulphuric acid reagents preparedfrom H2S04 at concentrations in the range 88-98.3% mlm,which corresponds to H2S04 concentrations in the digestionmixture in the range 67.9-75.9% mlm. As the concentration ofH2S04 is lowered, the efficiency of nicotinic acid oxidationdecreases from 27% for 98.3% mlm H2S04 to approximately5% for 88% mlm H2S04 , The oxidation of acetic acid, on theother hand, is complete using any of the H2S04 concentrationsindicated.
Fig, 4 shows the rate of oxidation of nicotinic and aceticacids and of organic substances in river water at 150 and170°C. Increasing the temperature from 150 to 170°C causesa higher efficiency of oxidation, particularly for nicotinic acid.To attain the same degree of oxidation as is achieved onheating at 170°C for 30 min, heating at 150 °C requires aperiod of more than 2 h. Acetic acid and organic substances inriver water were completely oxidised within 15 min at both 150and 170°C.
The increased oxidising ability of the reaction mixture at170°C is, of course, accompanied by a faster spontaneousdecomposition of dichromate. Fig. 5 shows that the amount ofdichromate decomposed in 40 min of heating at 170°C isabout 10 mg 1-1, which is approximately the same as thatdecomposed at 150°C after 3 h of heating.
1001 0 10
01-0 0 0
95
cfl. 20
/ui 15
10
oL-...-'--~-----I.-L--'----,L--'
86 88 90 92 94 96 98
IH2S041, % m/m._. --
Fig. 3. Oxidation efficiency (E) as a function of H2S04 concentration in the digestion mixture. 1, Acetic acid (TOO = 20.0mg I-I); and2, nicotinic acid (TOO = 71.6 mg I-I)
20(a)
substances in the water were oxidised almost quantitativelyeven in the absence of Ag2S04 , its presence was requisite forthe complete oxidation of acetic and nicotinic acids inconcentrations of 1.3 and 6.5 g I-I, respectively. Based on thisresult, an Ag2S04 concentration of 6.77 g 1-1 in the digestionmixture, i.e., 10 g 1-1 in the sulphuric acid reagent, waschosen.
The effect of the concentration of K2Cr207 on the efficiencyof nicotinic acid oxidation is shown in Fig. 2. The efficiencydrops rapidly if the concentration of K2Cr207 in the digestionmixture is reduced below 500 mg 1-1. On the other hand, theconcentration of K2Cr207 must not be too high if a reasonablesensitivity is to be achieved. In the method devised, a K2Cr207concentration of 120 mg 1-1, corresponding to COD values ofup to approximately 70 mg I-I, was chosen; the efficiency ofoxidation of nicotinic acid is then about 22%. On depletion ofK2Cr207 to 60 mg I-I the efficiency decreases by approximately one-third, i.e., to 15%, which is comparable to theefficiency of oxidation of nicotinic acid in the standard methodusing 0.00833 M K2Cr207 (see Table 1). Although thecalibration graph for KHP is linear up to a COD of at least 60mg I-I, the efficiency for substances that are difficult to oxidiseis poorer, restricting the upper limit of the method to a CODof35 mg I-I. This corresponds to a depletion of approximatelyhalf of the dichromate in the reaction mixture. Therefore, thesemi-micro method could be modified for a COD of up to 100mg I-I by merely increasing the concentration of K2Cr207 inthe digestion solution approximately 2.5-fold while reducingthe optical path length in the spectrophotometric determination of the remaining dichromate from 5 to 2 cm. In thismodification the efficiency of oxidation would be improved(about 40% of nicotinic acid could be oxidised), the sensitivity, however, would apparently decrease.
10
a 0.5 1 1.5 2.5Time/h
Fig. 4. Kinetics of oxidation using different temperatures ofdigestion for: (a) acetic acid (TOD = 20.0 mg I-I); (b) nicotinic acid(TOD = 50.1 mg I-I); and (c) river water.., 150; and 0,170·C
50 100 150 200
Turbidity, NTU
Fig. 6. Relationship between the turbidity of the original sample andthe error of COD determination (~ COD) caused by the turbidity ofthe digestion mixture (NTU = nephelometric turbidity unit). Linearregression: COD = 0.065 x turbidity -0.083 (n = 30, r = 0.95).Broken lines represent 99% confidence limits
:!:.Cl 20
~8 10
(b)
•
15
I- 10Cl
~ou 5<]
//.
// ,/
/ ,/
/ ,// ,/
/ /,/ ,/,/
./.-;''''''e. /.,/. ,/,..,/ /,/ /
1466
described under Semi-micro Method. As an example, Fig. 6shows the relationship between turbidity in the original waterand the COD corresponding to the absorbance increment dueto the presence of dispersions in samples taken from rivers inSouth Bohemia, Czechoslovakia.
Particular attention was given to the masking of chloridebecause this anion is common in both surface and groundwaters and can cause considerable error, especially if theconcentration of organic mailer is low. In the proposedsemi-micro method proposed, HgS04 and Cr3+ ions [asKCr(S04h.12H20) at respective concentrations of 6.22 and0.1 g 1-1 in the reaction mixture were used to mask chloride.This concentration of HgS04 allows for up to 600 mg I-I ofchloride in the sample. At higher concentrations, a turbiditycaused by silver chloride appears in the system on dilution andcooling. If HgS04 is added in lower concentrations, the
3
10 20 30 40COD/mg 1-'
Fig. 7. Efficiency of chloride oxidation as a function of COD fordifferent starting concentrations of Cr3 + ions in the digestion mixture:1,0; 2, 50; 3, 100; and 4, 250 mg I-I. Determined for 600 mg I-I ofchloride and different concentrations of KHP
ANALYST. NOVEMBER 1990, VOL. 115
turbidity appears at lower chloride concentrations and themasking efficiency is poorer. Experiments in which theoxidation of chloride was examined at different concentrations of sulphuric acid and dichromate and at differenttemperatures and times of heating revealed that the dependencies of the oxidation of chloride on these parameters arebasically the same as those for the oxidation of organic matter,i.e., the oxidation efficiency improves if any of these parameters is increased. Fig. 7 shows the efficiency of oxidation ofchloride as a function of COD at various concentrations ofCrH ions. Based on the relationship between the percentageof chloride oxidation and COD of the sample (Fig. 7), anequation can be derived to calculate the COD value caused byoxidation of chloride for the reaction conditions of thesemi-micro method: COD of chloride = 0.23 x CCI- x (0.022- 0.00033 x COD) (n = 5, r = 0.99), where CCl- and CODare, respectively the concentration of chloride and the COD inthe sample, in mg I-I. The effect of the oxidation of chloridecan be disregarded in the semi-micro method up to a chlorideconcentration of about 100 mg 1-1, corresponding to a CODvalue not exceeding a maximum of 0.5 mg 1-1 (about half ofthe detection limit). At higher chloride concentrations, theexperimental COD value should be corrected.
Comparison of the Semi-micro and Open Reflux Methods
The comparison was performed on two sets of safTIples: (i) 30samples of water of various types (Table 2), 'and (ii) 16chemical compounds (Table 1). The tables demonstrate thatthe results of the semi-micro and the open reflux methods arecomparable. For sample set (i), the ratio of the meansobtained ~he two methods was 101%, with a ~~~ndard
Table 2. Comparison of the semi-micro (S) and open reflux (R) methods for waters (n = 5)
COD/mgl- 1
S R
Sample Mean SD Mean SD SIR X 100, %
Ground water .. I" 0.74 0.36 1.16 0.61 642' 2.68 0.33 2.66 0.71 1013" 5.38 0.45 5.30 0.22 1024' 6.02 0.18 6.24 0.00 965' 6.90 0.30 6.84 0.36 101
Tap water I" 6.94 0.22 7.30 0.26 952' 7.70 0.38 7.42 0.18 1043" 7.84 0.26 7.45 0.30 1054' 8.18 0.25 8.20 0.34 1005' 9.76 0.23 10.38 0.88 94
Precipitation .. I' 3.26 0.48 2.72 0.36 1202" 3.44 0.17 3.10 0.42 1113' 4.24 0.38 3.06 0.71 1394' 5.18 0.31 5.20 0.34 1005" 10.20 0.54 10.16 0.41 100
River water I' 14.14 0.49 14.22 0.30 992" 14.28 0.30 14.40 0.35 993' 18.10 0.26 18.08 0.39 1004" 19.36 0.26 19.40 0.81 1005' 33.60 0.29 34.02 0.18 99
Reservoir I" 10.76 0.25 10.72 0.30 1002' 14.70 0.44 14.98 0.30 983" 18.06 0.55 18.30 0.37 994' 18.82 0.46 18.02 0.33 1045 24.76 0.26 23.84 0.22 104
Fish-pond I" 11.54 0.36 11.24 0.17 1032' 16.78 0.29 16.42 0.30 1023' 20.64 0.26 22.30 0.63 934 24.38 0.04 25.10 0.21 975' 30.72 0.42 30.82 0.27 100
Mean 12.64 0.33 12.64 0.37 101
, Paired I-test showed no statistically significant difference at the 5% level.

ANALYST. NOVEMBER 1990. VOL. 115 1467
Table 3. Recoveries of KHP added to samples with the semi-micro method (n = 5)
COD/mgl- 1
S!,mpleSample +KHP
KHP Recovery,Sample Mean SD added Mean SD %
Ground water .. 1 5.38 0.45 5.80 11.48 0.20 1052 6.90 0.30 5.80 12.56 0.41 98
Tap water 1 6.94 0.22 5.80 12.64 0.30 982 8.18 0.25 5.80 14.02 0.35 101
River water 1 14.14 0.49 5.90 20.31 0.26 1052 26.46 0.35 5.80 31.98 0.18 95
Reservoir 1 14.70 0.25 5.90 20.61 0.05 1002 24.76 0.26 5.90 30.47 0.30 97
Fish-pond 1 11.54 0.35 5.90 17.51 0.36 1012 24.38 0.04 5.90 30.27 0.14 100
Mean 100
deviation (SD) of 5.7%. The agreement for the majority ofchemical compounds was also good. A rather poorer efficiency of oxidation by the semi-micro method was observedonly for glycine, for which the degrees of oxidation with thesemi-micro method and the open reflux method were 76 and96%, respectively, and for methylamine, for which thedegrees of oxidation were 10 and 13%, respectively. Higheroxidation yields, on the other hand, were obtained with these,mi-micro method for cysteine, pyridine, nicotinic acid andfor volatile substances such as acetone or benzene. Theirvapours in the open reflux method apparently leave the systemvia the reflux condenser. However, the oxidation was notcomplete in the semi-micro method either, probably becausesome of the vapours of the volatile substances pass into the gasphase and, perhaps, even leak through the ground glass joint.
Detection Limit, Precision and Accuracy
The detection limit of the semi-micro method was calculatedas the mean bias of the blank plus twice the average SD usingvalues obtained for sample set (i) (Table 2). The mean bias ofthe blank determination in the semi-micro method generallydid not exceed 0.5 mg 1-1, the average SD was 0.33 mg 1-1 andthe COD detection limit was 1.16 mg I-I. The modified openreflux method gave an average SD of 0.37 mg 1-1 for the sameset of samples, which leads to approximately the samedetection limit.
The precision of the semi-micro method depends on theprecision with which the sample and the reagents aredispensed, on the precision of the spectrophotometricmeasurement of dichromate and also on how strictly the timeand temperature of heating are adhered to. For waters withsuspended matter, the use of a representative sample must beensured; if a coarse suspension is present, an appropriatehomogenisation procedure9 is necessary. Temperature variations within the heating block should not exceed ±0.5 ·C andtemperature gradients between different sites of the heatingblock must be eliminated to prevent dichromate from decomposing at different rates.
The accuracy of the semi-micro method for the determination of COD was tested by spiking ten samples of differenttypes of water with KHP. The results are presented in Table 3.The yield with respect to KHP added was from 95 to 105%,with an average of 100%, which compares well with thestandard method.3
References
1. Moore, W. A., Kroner, R. c., and Ruchhoft, C. C., Anal.Chern., 1949,21,953.
2. Moore, W. A., Ludzack, F. J., and Ruchhoft, C. c., Anal.Chern., 1951,23,1297.
3. American Public Health Association, American Water WorksAssociation and Water Pollution Control Federation,"Standard Methods for the Examination of Water and Wastewater," Sixteenth Edition, American Public Health Association, Washington, DC, 1985, p. 532.
4. Jirka, A. M., and Carter, M. J., Anal. Chern., 1975,47,1397.5. Himebaugh, R. R., and Smith, M. J., Anal. Chern., 1979,51,
108.6. De Casseres, K. E., Water Pollut. Control, Maidstone, Engl.,
1980, 79, 143.7. Messenger, A. L., J. Water Pollut. Control Fed., 1981, 53, 232.8. Edwards, S. J., and Allen, M., Analyst, 1984, 109,671.9. "Chemical Oxygen Demand (Dichromate Value) of Polluted
and Waste Waters 1986," Second Edition, HM StationeryOffice, London, 1986.
10. Jeris, J. S., Water Wastes Eng., 1967, 4, 89.11. Leithe, W., Yarn Wasser, 1970,37, 106.12. Leithe, W., Yarn Wasser, 1971,38, 119.13. Wagner, R., and Ruck, W., Z. Wasser Abwasser Forsch., 1984,
17,268.14. Wagner, R., and Ruck, W., Z. Wasser Abwasser Forsch., 1981,
14,145.15. DeCasseres, K. E., Best, D. G., and May, B. D., Water Pollut.
Control, Maidstone, Engl., 1984, 83, 416.16. Chudoba, J., and Zeis, K., Acta Hydrochirn. Hydrobiol., 1975,
3,275.
Paper 9104306CReceived October 9th, 1989
Accepted July 2nd, 1990

ANALYST, NOVEMBER 1990, VOL. 115 1469
Enrichment of Trace Metals in Water on Activated Carbon
P. Rama Devi and G. Rama Krishna Naidu*Department of Chemistry, S. V. University College, Tirupati 517 502, India
Trace metals in water were pre-concentrated on activated carbon after chelation with potassium ethylxanthate. Optimum conditions for the maximum recovery of metal ions were developed. The recoveries ofCd, Co, Cu, Hg and Zn, at concentrations ranging from 10 to 500 ng ml- 1, were >92, =85, >92, >93 and >92%,respectively. The method was used to determine these metals in water samples by instrumental neutronactivation analysis and atomic absorption spectrometry.
Keywords: Trace metal; pre-concentration; quantitative recovery; activated carbon; potassium ethylxanthate
Knowledge of the detrimental effects of trace and ultra-traceamounts of metals in the environment has greatly increased.In order to understand the impact of metals in the environment, accurate and reliable methods must be developed fortheir determination. Because of the extremely low concentrations of metals in water, a preliminary concentration step isusually necessary before the determination can be carried out.A survey of the literature on water analysis shows thatenrichment of heavy metals on activated carbon offers goodpossibilities. A number of elements can be pre-concentratedby this technique, which is simple, fast and inexpensive. Vander Sioot I used activated carbon as a collector for colloidaltrace elements in water, biological material and in rocks incombination with neutron activation analysis (NAA), atomicabsorption spectrometry (AAS) and X-ray fluorescence.Matsueda and Morimot02explained the adsorption behaviourof some metal ions on activated carbon treated with8-hydroxyquinoline. An activated-carbon enrichment andAAS determination of trace amounts of metals has beenreported by Liu. 3 Varderborght and Van Grieken4 used acombination of multi-element chelation by 8-hydroxyquinoline with subsequent adsorption on activated carbon for thepre-concentration of trace metals from water samples.
In the present investigation, Cd, Co, Cu, Hg and Zn inwater were enriched on activated carbon, after complexationwith potassium ethyl xanthate, and determined by instrumental NAA (INAA) and flame AAS (FAAS). The preconcentration procedure is simple, fast, sensitive, multielemental and inexpensive.
acid per litre of sample. The samples were filtered through0.45-l-lm filter-discs and then analysed. The pre-concentrationwas carried out within 24 h of collection.
Neutron activation was carried out in the Apsara reactor atthe Bhabha Atomic Research Centre, Bombay, in a neutronflux of 1 x 10¹² n cm-2 S-1 for 6 h.
Analysis, in the example of the tracer method and NAA,was carried out by v-ray spectrometry, with a Ge(Li) detectorlinked to a 4096-channel analyser. The FAAS studies werecarried out with the use of a double-beam atomic absorptionspectrometer (Perkin-Elmer, Model 2380). In the FAASmethod, the carbon, containing the adsorbed metals, wastreated with 1.5 ml of hot 16 M nitric acid (this ensuresquantitative desorption of the metals) and the solution wasevaporated to dryness under an infrared lamp. The metalswere leached into 10 ml of 1.5 M nitric acid and then the samplewas analysed for Co, Cu, Cd and Zn under the conditions citedin Table 1.
Procedure
To a 100-ml water sample, an aliquot of the tracer mixture,containing 10 I-lg each of Cd, Co, Cu, Hg and Zn, was added,and the pH was adjusted to 5 with 1 M nitric acid and 7 M
ammonia solution, and 5 ml of 0.4% potassium ethyl xanthatesolution were' added. The mixture was stirred with 100 mg ofactivated carbon for 10 min by use of a mechanical stirrer. Thesuspension was filtered off, and the carbon was sealed intopolyethylene strips and mounted for counting.
Preparation of standards
Standards were prepared by drying an aliquot of the tracermixture, absorbed on a filter-paper, over calcium chloride in adesiccator, to prevent any loss of Hg by evaporation.
Results and Discussion
Optimum conditions for the quantitative recovery of metalions were determined by studying the effect of pH, stirringtime, concentration of potassium ethyl xanthate, concentration of metal ion, mass of activated carbon and samplevolume.
Table 1. Conditions used for FAAS
Lamp Wavelength!Element current/rnA nm
Flamegases
A - Ac*A- AcA- AcA- Ac
Slit/nm0.70.20.70.2
228.8240.7324.8213.8
4303015
CdCoCuZn
SampleNo.
I234
Experimental
Materials and Methods
All the chemicals used were of analytical-reagent grade.Potassium ethyl xanthate was synthesiseds and purified.6
Activated carbon powder (analytical-reagent grade) wastreated with 11 M hydrochloric acid and washed with doublydistilled water to remove any trace elements present.
Stock solutions of Cd, Co, Cu, Hg and Zn (1 mg ml- I ) wereprepared by dissolving each metal in the minimum amount of1 + 1 nitric acid separately and diluting the solution to 11 with1% v/v nitric acid. Multi-element standard solutions of Cd,Co, Cu, Hg and Zn (10 to 100 I-lg ml- 1) were prepared fromthe stock solutions.
A 0.4% solution of potassium ethyl xanthate was preparedin doubly distilled water.
Tracers used in the present study were IlSCd, 6OCO, 6SZn,197Hg and 64CU.
Water samples from different locations were collected inpolyethylene bottles and acidified with 1.5 ml of 16 M nitric
* To whom correspondence should be addressed.* A - Ac = air - acetylene.

400
1470
100
80?1'-
~Q)>0
" 60Q)a:
40
6 lQ
oHFig. l. Influence of pH on the adsorption of D. Co; f::" Cu; X. Zn;O. Cd; and •• Hg on activated carbon
pH
Zinc, Cd, Hg and Cu were recovered at levels >90% in the pHrange 4-7, whereas the recovery of Co was =85%. The resultsare presented graphically in Fig. 1. The experiment was alsocarried out in the absence of potassium ethyl xanthate.Recovery of Cd, Co and Zn increases as the pH is raised, andreaches a maximum at pH 8 for Cu and Hg, where therecoveries are 90-100% in the pH range 4-8. The recovery ofmetal ions is not reproducible in the absence of xanthate; theadsorption could be due to their hydrolysed products.
Stirring Time
The recovery of Cd, Co, Cu, Hg and Zn is not quantitativewhen the metal ion solution with potassium ethyl xanthate ispassed through a carbon-coated filter-disc. Hence, therecovery studies were carried out by stirring the solution withcarbon. The recovery is quantitative for stirring times >5 min(up to 30 min).
Xanthate and Activated Carbon
Quantitative recovery of Cd, Co, Cu, Hg and Zn is observedfor amounts ofxanthate >10 mg (up to 40 mg). The recoveryof Cu, Zn and Hg is >90% with 50 mg of carbon, whereas Coand Cd need a larger amount (70 mg).
Effect of Metal Ion
This study shows that metal ion concentrations of 10-500ng ml- t can give quantitative recovery values.
Sample Volume
The amount of metal studied, when present in volumes up to500 ml, still gives a quantitative recovery, indicating that therecovery is independent of the mass; volume ratio.
Effect of Blank
Purified activated carbon was irradiated for 6 h in the Apsarareactor and then analysed for Cu, Cd, Co, Zn and Hg after adelay of 15 h. The blank contribution was negligible.
Conclusion
The pre-concentration method has been used for the analysisof "spiked" tap water samples by INAA and FAAS. ForINAA, standards and samples, triply sealed in polyethylenestrips, and then placed in a polyethylene bottle, were
ANALYST. NOVEMBER 1990. VOL. 1I5
Table 2. Recovery of Co. Cu. Zn. Cd and Hg from tap water
Amount ofmetal ion Metal ion found. %'
Sample taken!No. Element ngml- 1 INAA FAAS
Co 100 85.65 85.5885.60 85.5285.62 85.54(0.03) (0.036)
2 Cu 100 95.54 95.5695.52 95.5895.50 95.54
(0.021) (0.021)3 Zn 100 92.84 92.80
92.78 92.8392.82 92.79
(0.033) (0.023)4 Cd 100 94.50 94.52
94.46 94.5494.48 94.47
(0.021) (0.038)5 Hg 100 96.25
96.7296.26
(0.279)
• Coefficients of variation are given in parentheses.
::JU:z
100 200 300Channel number
Fig. 2. Gamma-ray spectrum of trace elements pre-concentrated onactivated carbon from a water sample measured after a delay of 15 h.Irradiation time, 6 h. Calibration: slope = 0.4946 keV per channel;intercept = 1.64 IceV
simultaneously subjected to irradiation in the Apsara reactorfor 6 h. and the analysis was carried out after a delay of 15 h.The activity of the nuclides produced was measured by y-rayspectrometry. For FAAS, the metals enriched on activatedcarbon were leached into 1.5 M nitric acid and then determined. The determination of Hg was not carried out owing tothe non-availability of a COld-vapour atomisation system. Theresults presented in Table 2 show that the data obtained byINAA are comparable to those given by FAAS. The datapertaining to the analyses of authentic water samples arepresented in Table 3. The y-ray spectrum of a water sampleenriched on activated carbon is presented in Fig. 2.
The advantage of INAA over FAAS is that the technique isnon-destructive and multi-elemental. In FAAS, the metalsmust be leached into acid; this procedure results in a reductionin the enrichment factor. Analysis by FAAS is rapid and theequipment required is widely available.

ANALYST. NOVEMBER 1990. VOL. 115
Table 3. Oetermination of Co. Cu. Zn. Cd and Hg in water (concentrations in ng ml-')*
1471
Co Cu Zn Cd HgName of the
Sample No. sample lNAA FAAS lNAA FAAS INAA FAAS INAA FAAS INAA FAAS
1 Renigunta 0.90 NOt 20.26 20.39 28.83 28.68 4.60 4.59 1.52 NA:j:1.00 NO 20.35 20.27 28.75 28.81 4.62 4.71 1.45 NA0.89 NO 20.31 20.29 28.79 28.72 4.73 4.68 1.48 NA
(6.54) (0.223) (0.317) (0.138) (0.232) (1.505) (1.340) (2.388)2 KalyaniOam NO NO 9.58 9.53 18.35 18.31 NO NO NO NA
NO NO 9.59 9.61 18.38 18.32 NO NO NO NANO NO 9.45 9.55 18.33 18.39 NO NO NO NA
(0.819) (0.437) (0.139) (0.238)3 Papavinasam NO NO 16.45 16.54 32.76 32.79 NO NO NO NA
NO NO 16.48 16.51 32.80 32.76 NO NO NO NANO NO 16.52 16.46 32.78 32.71 NO NO NO NA
(0.215) (0.246) (0.061) (0.124)Blank NO NO 0.35 NO 0.53 NO NO NO NO NA
NO NO 0.29 NO 0.55 NO NO NO NO NAND NO 0.32 NO 0.58 NO NO NO NO NA
(9.375) (4.635)
* Coefficients of variation are given in parentheses.t NO: Not detected.:j: NA: Not analysed.
The pre-concentration method developed is, therefore,simple and rapid compared with the method developed byVanderborght and Van Grieken.4 The concentration rangecovered in the present work can be enhanced by increasing theamount of activated carbon and the reagent concentration.
Hence, the proposed pre-concentration method can be usedsuccessfully for the determination of Cd, Hg, Co, Cu and Znin water by INAA and also by FAAS.
The financial assistance rendered by the CSIR is gratefullyacknowledged. Thanks are due also to the Analytical Chemistry Division, BARC, Bombay, for providing the facilities tocarry out the research.
References
1. Van der Sioot, H. A., Chern. Weekbl. Mag., 1979,297,299.2. Matsueda, T., and Morimoto, M., Bunseki Kagaku, 1978, 27,
312.3. Liu, X., Huanjing Huaxue, 1986, S, 53.4. Vanderborght, B. M., and Van Grieken, R. E., Anal. Chern.,
1977.49,311.5. Vogel, A. 1., "A Text-book of Practical Organic Chemistry
Including Qualitative Organic Analysis," Third Edition, Longman, London, 1957, p. 499.
6. Ramachandra Rao, S., "Xanthates and Related Compounds,"Marcel Oekker, New York, 1971, p. 15.
Paper O/01292KReceived March 26th, 1990
Accepted July 9th, 1990

ANALYST. NOVEMBER 1990, VOL. 115 1473
Extraction of Cobalt and Nickel Salicylates: Application to Steel andIndustrial Wastewater Samples
Purnima L. Malvankar and Vijay M, Shinde*Analytical Laboratory, Institute of Science, 15 Madam Cama Road, Bombay 400032, India
Aliquat 336 was used as an extractant for cobalt and nickel salicylates. The proposed method was applied tothe determination of cobalt and nickel in alloys and industrial wastewater. The results obtained with theproposed method agree well with certified values and are comparable to those given by atomic absorptionspectrometry. The method has a high degree of accuracy and precision.
Keywords: Solvent extraction; liquid ion exchanger; salicylate solution
Cobalt and nickel are useful elements because of their strengthand high resistance to corrosion in many media. Cobalt iswidely used in high-speed tool steels, magnets and hightemperature alloys. Nickel is used in nickel-plating articles,nickel coating, etc. It is also used in pharmaceutical processing. Both cobalt and nickel are also used as catalysts inindustrial processes.
In previous papers, high relative molecular mass aminessuch as trioctylamine,1.2 tribenzylamine,3 methyltrioctylammonium chloride (Aliquat 336),4-{; di- and triethylamine7
and di- and tributylamine7 were used for extraction studies ofcobalt and nickel. However, these methods have drawbackssuch as a long shaking period,I-3 prolonged time for phaseseparation4 and multiple extractionS; moreover, the extraction is not quantitative.3.6•7
The present paper describes a method for the extraction ofcobalt and nickel salicylates using Aliquat 336 as the extractant. The metal ions were stripped with ammonia solution anddetermined volumetrically8 or spectrophotometrically.9Atomic absorption spectrometry (AAS) could also be used forthe determination of the metal ions. The proposed method isfast, providing extraction in a single step, and has been appliedto the determination of cobalt and nickel in alloys and nickel inindustrial wastewater samples.
Experimental
Apparatus
A Bausch and Lomb Spectronic 20 spectrophotometer, aControl Dynamics digital pH meter with a combined glasselectrode, a wrist-action flask shaker and a Varian TechtronAA6 atomic absorption spectrometer were used.
Chemicals and Reagents
Stock solutions of cobalt and nickel were prepared bydissolving 1.23 g of cobalt nitrate and 1.19 g of nickel sulphatein 250 ml of distilled water containing 1 ml of concentratedHN03 and 1 ml of concentrated H2S04, respectively. Thesolutions were standardised by known methods8 and testsolutions of lower concentrations were prepared by suitabledilution.
A buffer solution of pH 4.7 was prepared using 0.01 M aceticacid and 0.01 M sodium acetate solution.
A 5% mlv solution of Aliquat 336 (Fluka, Buchs, Switzerland) in toluene was shaken with an equal volume of 2 M
sodium salicylate solution for 45 min and used as theextractant.
• To whom correspondence should be addressed.
General Extraction Procedure for Nickel(ll) and Cobalt(ll)
To 500 !!g of nickel or cobalt in solution, sodium salicylate wasadded to give the desired concentration in a final volume of 25ml. After adding 10 ml of buffer solution of pH 4.7 the solutionwas extracted with 10 ml of 5% Aliquat 336 dissolved intoluene. After phase separation the metal ions were strippedfrom the organic phase with two 5-ml portions of 1 M ammoniasolution. The combined aqueous phase was shaken with 5 mlof toluene to remove any traces of dissolved Aliquat 336 andfinally the metal ions were determined either volumetrically,8spectrophotometrically9 or by AAS.
Results and Discussion
Extraction Conditions
The optimum extraction conditions for cobalt and nickel wereestablished by varying the pH, sodium salicylate concentration, Aliquat 336 concentration and shaking time. Theoptimum extraction conditions are reported in Table 1.Milligram amounts of cobalt and nickel were determinedvolumetrically8 whereas microgram amounts were determinedeither spectrophotometrically9 or by AAS.
Effect of Various Diluents
Several solvents such as xylene, benzene, hexane, carbontetrachloride, chloroform and toluene were tested. The resultsgiven in Table 2 show that quantitative extraction was feasibleonly with toluene and xylene. For further studies, toluene wasused as the diluent.
Period of Extraction
The minimum shaking time was determined by varying theshaking time from 30 to 180 s. The optimum shaking time was60 s. However, prolonged shaking had no adverse effect onthe extraction of metal ions.
Effect of Stripping Agents
Various stripping agents (Table 3) at different concentrationswere studied for the back-extraction of metal ions from theorganic phase. Quantitative stripping of cobalt from theorganic phase was possible with two 5-ml portions of HCl (1-4M), H2S04 (1-4 M), HN03 (1-4 M), water, NaOH (1-4 M) orammonia solution (1-2 M), whereas the stripping of nickelfrom the organic phase was possible with two 5-ml portions ofHCI (1-3 M), H2S04 (1-3 M), HN03 (1-2 M), water orammonia solution (1-2 M). Nickel was not back-extracted withNaOH (1-4 M).
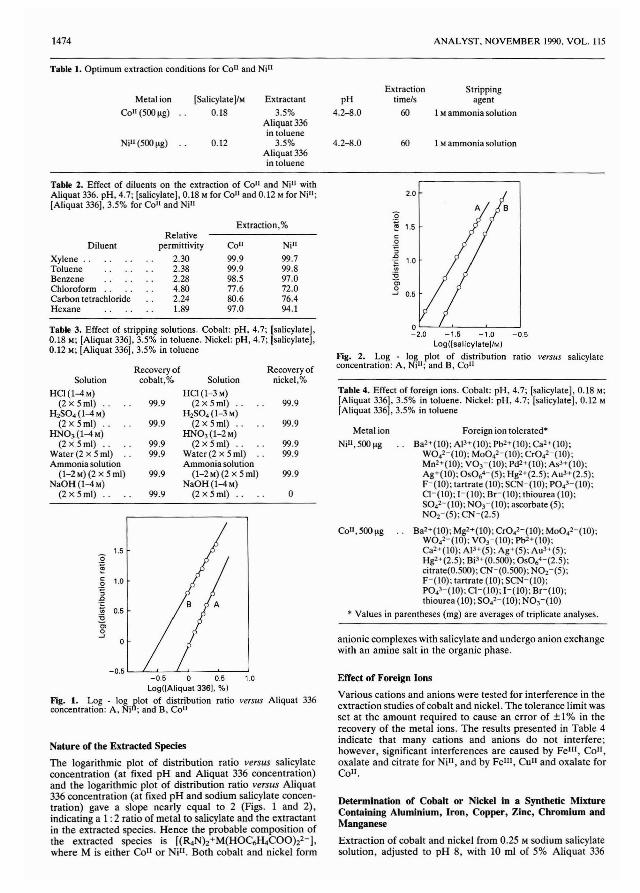
1474 ANALYST. NOVEMBER 1990. VOL. 11S
Table 1. Optimum extraction conditions for Co" and Ni II
Metal ion
Co" (SOOllg)
Ni" (SOOllg)
[Salicylate)/M
0.18
0.12
Extractant
3.5%Aliquat336in toluene
3.S%Aliquat336in toluene
pH
4.2--s.0
4.2--s.0
Extraction Strippingtime/s agent
60 I Mammonia solution
60 I Mammonia solution
anionic complexes with salicylate and undergo anion exchangewith an amine salt in the organic phase.
"0.~
~ 1.5c:.2:;D.~
15c;o
...J 0.5
Foreign ion tolerated"Ba2+(IO); AP+(IO); Pb2+(IO); Ca2+(10);
WO.z-(IO); MOO.2-(10); Cr042-(10);Mn2+(IO); VO,-(IO); Pd2+(IO); As'+(IO);Ag+(IO); OS06"(S); Hg2+(2.S); Au3+(2.S);F'(10); tartrate (10); SCN-(10); PO.3-(10);CI-(10); 1-(10); Br'(IO); thiourea (10);SO.2'(IO); NO,-(lO); ascorbate (S);N02'(S); CN'(2.S)
Ba2+(IO); Mg2+(IO); CrO.2-(10); MoO.2'(l0);WO."(IO); VO,'(IO); Pb2+(IO);Ca'+(IO); AJ3+(S); Ag+(S); Au3+(S);Hg'+(2.S); Bi'+(O.SOO); OS064'(2.S);citrate(O.SOO); CN'(O.SOO); NO,'(S);F'(IO); tartrate (10); SCN-(IO);PO."(IO); CI'(10); 1-(10); Br'(IO);thiourea (10); SO.2'(10); NO,-(IO)
• Values in parentheses (mg) are averages of triplicate analyses.
Metal ion
Ni",SOOllg
Table 4. Effect of foreign ions. Cobalt: pH, 4.7; [salicylate], 0.18 M;[Aliquat 336), 3.S% in toluene. Nickel: pH, 4.7; [salicylate], 0.12 M[Aliquat 336), 3.S% in toluene
-1.5 -1.0 -0.5Log([salicylate!/M)
Fig. 2. Log - lo~ plot of distribution ratio versus salicylateconcentration: A, NI"; and B, Co"
1.5:2~c: 1.0.2:;:gu; 0.515Ci0
...J0
RelativeDiluent permittivity Co" Ni"
Xylene 2.30 99.9 99.7Toluene 2.38 99.9 99.8Benzene 2.28 98.S 97.0Chloroform 4.80 77.6 72.0Carbon tetrachloride 2.24 80.6 76.4Hexane 1.89 97.0 94.1
Table 2. Effect of diluents on the extraction of Co" and NiH withAliquat336. pH, 4.7; [salicylate], 0.18 Mfor Co" and 0.12 Mfor Ni lI ;
[Aliquat 336), 3.S% for Co" and Ni"
Extraction,%
Table 3. Effect of stripping solutions. Cobalt: pH, 4.7; [salicylate],0.18 M; [Aliquat336], 3.S% in toluene. Nickel: pH, 4.7; [salicylate),0.12 M; [Aliquat 336], 3.S% in toluene
Recovery of Recovery ofSolution cobalt,% Solution nickel,%
HCI(I-4M) HCI (1-3 M)(2xSml) .. 99.9 (2xSml) .. 99.9
H2SO. (1-4 M) H2S04(1-3 M)(2xSml) 99.9 (2xSml) .. 99.9
HN03(1-4 M) HNO, (1-2 M)(2 x Sml) .. 99.9 (2xSml) . . 99.9
Water (2 x S ml) 99.9 Water (2 x S ml) 99.9Ammonia solution Ammonia solution
(1-2 M) (2 x S ml) 99.9 (1-2 M) (2 x S ml) 99.9NaOH(I-4M) NaOH (1-4 M)
(2 x S ml) .. 99.9 (2 x Sml) .. 0
-0.5 '--....L..-'-_--"--~__~_ _'-0.5 0 0.5 1.0
Log(iAliquat336J. %1Fig. I. Log. log plot of distribution ratio versus Aliquat 336concentration: A, Nit\; and B. Co"
Nature of the Extracted Species
The logarithmic plot of distribution ratio versus salicylateconcentration (at fixed pH and Aliquat 336 concentration)and the logarithmic plot of distribution ratio versus AJiquat336 concentration (at fixed pH and sodium salicylate concentration) gave a slope nearly equal to 2 (Figs. 1 and 2),indicating a 1: 2 ratio of metal to salicylate and the extractantin the extracted species. Hence the probable composition ofthe extracted species is [(R.Nh+M(HOCJI4COOh2-j,where M is either Coli or Ni ll . Both cobalt and nickel form
Effect of Foreign Ions
Various cations and anions were tested for interference in theextraction studies of cobalt and nickel. The tolerance limit wasset at the amount required to cause an error of ±1% in therecovery of the metal ions. The results presented in Table 4indicate that many cations and anions do not interfere;however, significant interferences are caused by Felli, COli,oxalate and citrate for Ni", and by Felli, Cull and oxalate forCOIl.
Determination of Cobalt or Nickel in a Synthetic MixtureContaining Aluminium, Iron, Copper, Zinc, Chromium andManganese
Extraction of cobalt and nickel from 0.25 M sodium salicylatesolution, adjusted to pH 8, with 10 ml of 5% Aliquat 336
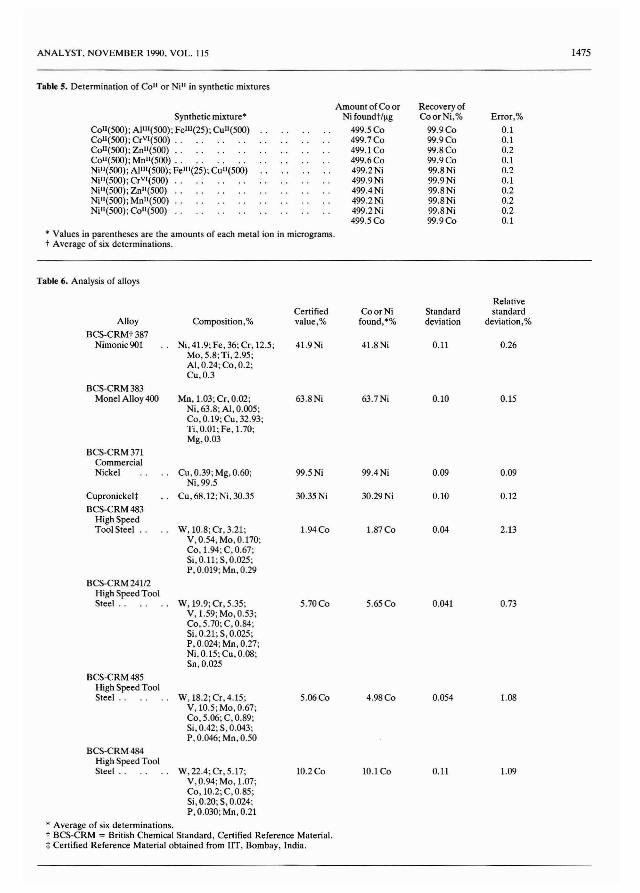
ANALYST. NOVEMBER 1990. VOL. 115 1475
Table 5. Determination of COli or Ni ll in synthetic mixtures
Amount of Co or Recovery ofSynthetic mixture' Ni foundt/l!g CoorNi,% Error,%
ColI(500); AIIII(500); Felll(25); Cu ll(500) 499.5 Co 99.9 Co 0.1ColI(500); CrV1 (500) .. 499.7 Co 99.9 Co 0.1ColI(500); Znll (500) .. 499.1 Co 99.8 Co 0.2Coll(500); Mnll(5OO) .. 499.6 Co 99.9 Co 0.1Nill(500); AllII(500); Fe lll(25); Cu ll(500) 499.2Ni 99.8Ni 0.2Nill(5OO); CrV1 (5OO) 499.9Ni 99.9Ni 0.1Njll(500); Zn ll (5OO) 499.4Ni 99.8Ni 0.2Ni ll(5OO); Mn ll(5OO) 499.2Ni 99.8Ni 0.2Nill(5OO); ColI(500) 499.2Ni 99.8Ni 0.2
499.5 Co 99.9 Co 0.1
, Values in parentheses are the amounts of each metal ion in micrograms.t Average of six determinations.
Table 6. Analysis of alloys
RelativeCertified CoorNi Standard standard
Alloy Composition,% value,ok found,'% deviation deviation,%
BCS-CRMt 387Nimonic901 Ni, 41.9; Fe, 36; Cr,12.5; 41.9 Ni 41.8Ni 0.11 0.26
Mo, 5.8; Ti, 2.95;AI, 0.24; Co, 0.2;CU,O.3
BCS-CRM383Monel Alloy 400 Mn, 1.03; Cr, 0.02; 63.8Ni 63.7Ni 0.10 0.15
Ni, 63.8; AI, 0.005;Co, 0.19; Cu, 32.93;Ti, 0.01; Fe, 1.70;Mg,O.03
BCS-CRM371CommercialNickel Cu, 0.39; Mg, 0.60; 99.5Ni 99.4Ni 0.09 0.09
Ni,99.5
Cupronickel* Cu, 68.12; Ni, 30.35 30.35Ni 30.29Ni 0.10 0.12
BCS-CRM483High SpeedToolSteel .. W,lO.8;Cr,3.21; 1.94 Co 1.87 Co 0.04 2.13
V, 0.54, Mo, 0.170;Co, 1.94; C, 0.67;Si, 0.11; S, 0.025;P, 0.019; Mn, 0.29
BCS-CRM 241/2High Speed ToolSteel .. W, 19.9; Cr, 5.35; 5.70 Co 5.65 Co 0.041 0.73
V, 1.59; Mo, 0.53;Co, 5.70; C, 0.84;Si, 0.21; S, 0.025;P, 0.024; Mn, 0.27;Ni, 0.15; Cu, 0.08;Sn,O.025
BCS-CRM485High Speed ToolSteel .. W,18.2; Cr,4.15; 5.06 Co 4.98 Co 0.054 1.08
V, 10.5; Mo, 0.67;Co, 5.06; C, 0.89;Si, 0.42; S, 0.043;P, 0.046; Mn, 0.50
BCS-CRM484High Speed ToolSteel .. W,22.4;Cr,5.17; 10.2 Co 10.1 Co 0.11 1.09
V, 0.94; MO,1.07;Co, 10.2; C, 0.85;Si, 0.20; S, 0.024;P, 0.030; Mn, 0.21
, Average of six determinations.t BCS-CRM = British Chemical Standard, Certified Reference Material.* Certified Reference Material obtained from lIT, Bombay, India.
1476 ANALYST, NOVEMBER 1990, VOL. 115
Table 7. Analysis of industrial wastewater samples
" Average of three determinations.t Determined directly, before extraction, by AAS.
Sample No.
I2
Ni found" byproposed method,
p.p.m.
0.230.18
NifoundtbyAAS,p.p.m.
0.270.18
Applications
Analysis of alloys
High Speed Tool Steel (2.0 g dissolved in 15 ml of 1 + 2 HN03and 4 ml of 4 M HCI, finally diluted to 250 ml with distilledwater), Cupronickel (0.05 g dissolved in 5 ml of concentratedHCI and diluted to 250 ml with distilled water), Nimonic 901,Monel Alloy 400 and Commercial Nickel (62, 33 and 20 mg,respectively, dissolved in concentrated HCI and diluted to250 m1 with distilled water) were analysed by using therecommended procedure. The recoveries of cobalt and nickelwere ;;'99.0%. The results are reported in Table 6.
dissolved in toluene, facilitates their separation and determination in synthetic mixtures containing aluminium, iron andcopper. Nickel and cobalt were stripped from the organicphase with 2 x 5 ml of 1 M ammonia solution and determinedas described in the general extraction procedure. Results arereported in Table 5.
Cobalt and nickel were determined in the presence of zincand manganese by extraction from 0.25 M sodium salicylatesolution of pH 4.7. Zinc and manganese were co-extracted;however, cobalt and nickel were stripped selectively withwater and determined as described above. The results arereported in Table 5.
Cobalt and nickel could be determined in the presence ofchromium using the recommended procedure because chromium was not extracted into the Aliquat 336 solution.
Mutual Separation of Nickel and Cobalt
Results in Table 3 show that quantitative separation of cobaltand nickel is feasible. Cobalt and nickel were extracted from0.25 M sodium salicylate solution, adjusted to pH 4.7, with 10ml of 5% Aliquat 336 in toluene. Cobalt was strippedselectively from the organic phase with 1 M NaOH anddetermined volumetrically.8 Finally, nickel was stripped fromthe Aliquat 336 solution with 1 M ammonia solution anddetermined volumetrically.8 The results of this separation aregiven in Table 5.
Analysis of environmental samples
By use of the proposed method nickel was determined inindustrial wastewater samples collected from the MaharashtraPollution Control Board, Central Laboratory, New Bombay.The recovery of nickel was reproducible and accurate (Table7).
References
1. McClellan, B. E., and Benson, V. M., Anal. Chern., 1964,36,1985.
2. Sato, T .• J. Inorg. Nuc/. Chern., 1967,29,547.3. Mahlmann, H. A., Leddicolt, G. W., and Moore, F. L., Anal.
Chern., 1954,26, 1939.4. Goto, T., and Ozaki, T., Mizu Shori Gijutsu, 1979,20,1139.5. deJong, G. J., and Brinkman, U. A. Th.,J. Radioanal. Chern.,
1977, 35, 223.6. Sato, T., J. Chern. Technol. Biotechnol., 1979,29,39.7. Gorlach, V. F., Ukr.Khirn.Zh., 1974,40,760.8. Vogel, A. I., "A Text-book of Quantitative Inorganic Analy
sis," Longman Green, London, 1961, pp. 358, 433, 435, 436and 443.
9. Marczenko, Z., "Spectrophotometric Determination of Elements," Ellis Horwood, Chichester, 1976, pp. 216, 227, 311,345 and 372.
Paper 0/01l37AReceived March 14th, 1990
Accepted July 10th, 1990
ANALYST, NOVEMBER 1990, VOL. 115
Fluorogenic Reagents: 4-Aminosulphonyl-7-hydrazino2,1,3-benzoxadiazole, 4-(N,N-Dimethylaminosulphonyl)7-hydrazino-2,1,3-benzoxadiazole and 4-Hydrazino-7-nitro-2,1 ,3benzoxadiazole Hydrazine for Aldehydes and Ketones
Sonoko Uzu, Susumu Kanda and Kazuhiro Imai*Branch Hospital Pharmacy, University of Tokyo, 3-28-6 Mejirodai, Bunkyo-ku, Tokyo 112, Japan
Kenichiro Nakashima and Shuzo AkiyamaFaculty of Pharmaceutical Sciences, Nagasaki University, 1-14 Bunkyo-Machi, Nagasaki 852, Japan
1477
Fluorogenic reagents for aldehydes and ketones, viz., 4-aminosulphonyl-7-hydrazino-2,1,3-benzoxadiazole(ABO-H) and 4-(N,N-dimethylaminosulphonyl)-7-hydrazino-2,1,3-benzoxadiazole (DBD-H) and also purified4-hydrazino-7-nitro-2,1,3-benzoxadiazole hydrazine (NBD-H.NH2 NHz) were synthesised. These reagents arenot fluorescent; however, their reaction products with aldehydes and ketones fluoresce at wavelengths from548 to 580 nm with excitation from 450 to 470 nm. Both ABD-H and DBD-H exhibited similar reactivity andwere more reactive than NBD-H.NH2NH2• The respective pseudo-first-order reaction rate constants for theproduction ofthe hydrazone of propionaldehyde with ABD-H, DBD-H and NBD-H.NH 2NH 2 were 8.9 x 10-2,7.2X 10-2 and 4.2 x 10⁻² min- 1 (the reaction was carried out in 0.0025% trifluoroacetic acid in acetonitrile atroom temperature, 22 ec). The detection limits using the manual method (i.e., measurement offluorescenceintensity) forthe hydrazones of aldehydes and ketones with ABD-H, DBD-H and NBD-H.NH2NH2 were in the ~Mrange. The substrate blank fluorescence with ABD-H was half of that with DBD-H and NBD-H.NH2 NHz. Thereaction products were separated and analysed by reversed-phase high-performance liquid chromatography(HPLC) with spectrofluorimetric detection. The detection limits for propionaldehyde were 1040, 120 and 35.0fmol with ABD-H, DBD-H and NBD-H.NH2 NH2, respectively, and those for heptan-4-one were 2690, 560 and673 fmol, respectively. Of the three reagents, DBD-H is recommended for the sensitive detection of ketonesand NBD-H.NHzNH2 for the detection of aldehydes. The detection limits for aldehydes and ketones by HPLCwere in the sub-pmol to pmol range.
Keywords: Fluorogenic reagents for aldehydes and ketones; 4-aminosulphonyl-7-hydrazino2, 1,3-benzoxadiazole; 4-(N,N-dimethylaminosulphonyJ}-7-hydrazino-2, 1,3-benzoxadiazole;4-hydrazino-7-nitro-2,1,3-benzoxadiazole hydrazine; high-performance liquid chromatography
There are many biologically important compounds in naturethat have a carbonyl moiety in their skeleton, such as sugarsand oxo-steroids. The sensitive determination of these compounds has been performed usually by derivatisation withfluorogenic reagents such as dansylhydrazine (5-hydrazino-lnaphthalene-N,N-dimethylsulphonamide, DNS-H)I.Z and4-hydrazino-7-nitro-2,l,3-benzoxadiazole (NBD-H)3 followed by the separation and detection of sugars,4,S oxosteroids'Ho and various aldehydes and ketones3 by highperformance liquid chromatography (HPLC). The reagentDNS-H has been reported to afford a high fluorescentbackground, produced by the reagent itself. To remove theexcess of reagent, high-performance gel-permeation chromatography has been adopted.9 .10 Recently anthracence-1- and2-carboxylic acid hydrazides and 0-(1-, 2- and 9-anthrylmethyl)hydroxylamines have been used as fluorogenic labelling reagents for carbonyl compounds. I I However, thesereagents also fluoresce themselves. The physico-chemicalproperties of NBD-H, including melting-point and elementalanalysis, have not been described owing to the difficulty inobtaining the pure compound.3
In order to study the feasibility of using aryl hydrazineshaving a 2,1,3-benzoxadiazole skeleton, such as NBD-H, forthe sensitive detection of aldehydes and ketones, two hydrazino-benzoxadiazoles namely, 4-aminosulphonyl-7-hydrazino-2,1,3-benzoxadiazole (ABD-H) and 4-(N,N-dimethylaminosulphonyl)-7-hydrazino-2,1,3-benzoxadiazole (DBDH) and also purified 4-hydrazino-7-nitro-2,1,3-benzoxadiazole hydrazine (NBD-H.NH2NH2) have been synthesisedand their reactivities towards aldehydes and ketones, physico-
• To whom correspondence should be addressed.
chemical properties, fluorescence characteristics and theliquid chromatographic detection of their hydrazones havebeen investigated.
Experimental
Materials
Acetonitrile, methanol and water of HPLC grade, andacetone, trifluoroacetic acid (TFA) and p-hydroxybenzaldehyde were purchased from Wako Pure Chemicals (Tokyo,Japan). Propionaldehyde, butyraldehyde, heptan-4-one and4'-ethylacetophenone and all of the other chemicals used wereof analytical-reagent grade obtained from Tokyo Kasei Kogyo(Tokyo, Japan). The 4-(aminosulphonyl)-7-fluoro-2,1,3benzoxadiazole (ABD-FI2) and 4-fluoro-7-nitro-2,1,3benzoxadiazole (NBD-F13) were from Wako Pure Chemicals,and 4-(N, N-dimethylaminosulphonyl)-7-fluoro-2,1,3-benzoxadiazole (DBD-FI4) was from Tokyo Kasei Kogyo.
Apparatus
Proton nuclear magnetic resonance spectra were recorded ona JEOL Model JNM-FX-9OQ spectrometer at 90 MHz usingtetramethylsilane as an internal standard. Infrared (IR)spectra were obtained with a JASCO Model IRA 810spectrophotometer using potassium bromide discs. Electronimpact mass spectrometry (EI-MS) was performed with aJEOL JMS-DX-303 instrument. For manual measurements aHitachi 650-60 fluorescence spectrophotometer with a 1-cmquartz cell was used. Ultraviolet (UV), visible and fluorescence wavelengths were obtained without spectral correction.Reaction temperatures were controlled by a Mini ThermoUnit L-l (Taiyo Bussan, Tokyo, Japan) .

1478
NHNH2
blYN\OaylR
ABD-H; R = S02NH2DBD-H; R = SO,N(CH3 ),
NBD-H.NH,NH2 ; R = N02.NH2NH,
Fig. 1. Structures of ABD-H, DBD-H and NBD-H.NH2NHz
High-performance Liquid Chromatography
An L-6200 Intelligent Pump (Hitachi Seisakusho, Tokyo,Japan) equipped with a Rheodyne injector (Model 7125,Cotati, CA, USA) was used. The data were processed by aC-RIA Chromatopac (Shimadzu Seisakusho, Kyoto, Japan).A TSK-LS 80Tm (ODS) column [150 x 4.6 mm i.d., 5 !-lm(Tosoh, Tokyo, Japan)] was used at ambient temperatu.re. AHitachi F-1000 fluorescence spectrophotometer eqUIppedwith a 12-!-l1 flow cell was used to monitor elu~tes .from thecolumn. All mobile phases were de-gassed by aspiration undersonication on a Bransonic 42 before use. The eluent flow-ratewas 1.0 ml min-I.
Synthesis of ABD-H, DBD-H and NBD-H.NH,NH, (Fig. 1)
4-Aminosulphonyl-7-fluoro-2,l,3-benzoxadiazole. ~ABD-F)
(24 mg, 0.11 mmol) was dissolved in ~ ml of acetomtnle..Afterthe addition of 10 !-ll of 98% hydrazme hydrate, the mixturewas heated at 50-55°C for 20 min in the dark. Afterevaporation, the residue was recrystallised from methanol togive ABD-H [yellow - orange needles, yield 18 mg (71%)]:m.p. 184-185 °c (decomp.); /)H[(CD3hSO], 6.54 (1 H, d, Jab= 8.1 Hz, Ha or Hb), 7.83 (1 H, d, Jab = 8.1 Hz, Ha or Hb); IR(KBr), 1640, 1560,3370 em-I; UVAmax. (in CH3CN), 258 nm(E = 4100 I mol-I em-I); EI-MS, mlz 229 (M+); calculated forC6H7Ns0 3S, C 31.44, H 3.08, N 30.55, S 13.99%; found, C30.94, H 2.99, N 29.89, S 13.82%.
4-(N, N-Dimethylaminosulphonyl)-7-f1uoro-2,l,3:benzoxadiazole (DBD-F) (80 mg, 0.33 mmol) was dissolved 10 12. mlofacetonitrile. The same treatment (50-55°C for 20 mm) asdescribed above for ABD-F with 40 !-ll of 98% hydrazinehydrate was performed and the crude ~roduct obtained v:asthen recrystallised from methanol to give DBD-H [reddishbrown crystals, yield 60 mg (71%)]: m.p. 138-139°C(decomp.); /)H (CDCi), 2.87 (6 H, s, Me), 6.67 (1 H, d, Jab =7.9 Hz, Ha or Hb), 7.93 (1 H, d, Jab = 7.9 Hz, Ha or Hb); IR(KBr), 1575, 3330 em-I; UV Amax. (in CH3CN), 246 nm (E =4300 I mol- 1 em-I); EI-MS, mlz 257 (M+); calculated forCgH llNs0 3S, C 37.35, H 4.31, N 27.23, S 12.47%; found, C37.15, H 4.23, N 27.11, S 12.55%. .
To the NBD-F solution (50 mg, 0.27 mmol) 10 10 ml ofmethanol were added 100 !-ll of 98% hydrazine hydrate. i~ thedark. After heating at 50-53°C for 20 min, the preclpll~te
obtained was filtered and recrystallised from methanol to giveNBD-H.NH2NH2 [yellow- brown crystals, yield 45 mg(73% )]: m.p. >300 °C; /)H [(CD3)2S0], 5.79 (1 H, d, Jab =10.3 Hz, Ha or Hb), 7.01 (1 H, d, Jab = 10.3 Hz, Ha or Hb); IR(KBr), 1610,3370 em-I; UV Amax. (in CH3CN), 225 nm (E =5200 I mol- 1 em-I); EI-MS, mlz 195 (M+); calculated for~HsNs03.N2~, C 31.72, H 3.99, N 43.16%; found, C 31.66,H 3.85, N 42.71%.
Synthesis of the Hydrazones of Propionaldehyde and AcetoneWith ABD-H, DBD-" and NBD-H.NH,NHz
The ABD-H (17 mg, 0.074 mmol) in 10 ml of methanol wasadded to propionaldehyde (43 mg, 0.74 mmol) 10 5 ml ofmethanol. The mixture was refluxed for 30 mm. After
ANALYST, NOVEMBER 1990, VOL. 115
evaporation of the reaction solvent, the residue o~tained
was recrystallised from diethyl ether- benzene to gIVe thehydrazone of propionaldehyde with ABD-H [yellowishorange powder, yield 9 mg (45%»): m.p. 178--180 °C; /)H(CD03), 6.98 (1 H, d, Jab = 8.0 Hz, Ha or Hb), 8.00 (1 H, d,Jab = 8.0 Hz, Ha or Hb), 7.35 (lH, t, =CH-), 2.4-2.6 (2 H, m,-eHz-), 1.20 (3H, t,J = 7.1 Hz, Me), 5.12 (2H, S, -NH2), 8.56(1 H, s, NH); IR (KBr), 1580, 1615,3250 em-I; fluorescencein CH3CN - H20 (1 + I, v/v), Amax.(excitation), 450 nm;Amax.(emission), 570 nm; EI-MS, mlz 269 (M+); calculated for~HllNs03S, C 40.14, H 4.12, N 26.01, S 11.91%; found,C 40.53, H 4.13, N 25.91, S 11.75%.
The ABD-H (20 mg, 0.087 mmol) in 10 ml of acetone wasrefluxed for 30 min. After cooling to room temperature, themixture was evaporated. The residue obtained was recrystallised from acetone - benzene to give the hydrazone of acetonewith ABD-H [yellowish orange powder, yield 8 mg (34%)]:m.p. 183-185°C; I)H (CDC)3), 7.00 (1 H, d,Jab =7.9 Hz, Ha orHb), 7.99 (1 H, d, Jab = 7.9 Hz, Ha or Hb), 2.16 (3 H, s, Me),2.07 (3 H, s, Me), 5.14 (2 H, S, NH2), 8.23 (1 H, s, NH); IR(KBr), 1412, 1580,3300 em-I, fluorescence in CH3CN - H20(1 + I, v/v), Amax . (excitation), 450 nm; Amax. (emission), 570nm; EI-MS, mlz 269 (M+); calculated for ~HllNs03S,
C 40.15, H 4.12, N 26.02, S 11.92%; found, C 40.49, H 4.09,N 25.97, S 11.86%.
The hydrazones of propionaldehyde and acetone withDBD-H and NBD-H.NH2NH2were also obtained in the samemanner as mentioned above (refluxed for 30 min) with thefollowing amount of each substance: DBD-H, 0.078 mmol;propionaldehyde, 0.78 mmol; DBD-H, 0.078 mmol; acetone,10 ml; NBD-H.NH2NH2, 0.15 mmol; propionaldehyde, 1.5mmol; NBD-H.NH2NH2, 0.25 mmol; and acetone, 20 ml. Thephysico-chemical properties of each hydrazone were asfollows.
Hydrazone of propionaldehyde with DBD-H: the residueobtained was recrystallised from benzene - hexane (orangepowder, yield 38%): m.p. 167-168°C (decomp.); I)H (CDCI3),7.01 (1 H, d, Jab = 7.9 Hz, Ha or Hb), 7.95 (1 H, d,Jab = 7.9Hz, Ha or Hb), 2.88 (6 H, s, NMe2), 8.56 (1 H, s, NH), 1.20 (3H, t, J = 7.2 Hz, Me), 2.3-2.6 (2 H, m, CH2), 7.46 (1 H, t, J =4.6 Hz, CH); IR (KBr), 1580, 1610,3310 em-I; fluorescencein CH3CN - H20 (1 + 1, v/v), Amax. (excitation), 450 nm; Amax.(emission), 565 nm; EI-MS, mlz 297 (M+); calculated forCIIHISNs03S, C 44.44, H 5.09, N 23.56, S 10.79%; found,C44.70, H 4.98, N 23.49, S 10.91%.
Hydrazone of acetone with DBD-H: the residue obtainedwas recrystallised from benzene - hexane (yellowish brownpowder, yield 38%): m.p. 140-143°C (decomp.); I)H(CDCI3), 7.03 (1 H, d, Jab = 8.1 Hz, Ha or Hb), 7.95 (1 H, d,Jab = 8.1 Hz, Ha or Hb), 2.88 (6 H, s, NMe2), 2.16 (3 H, s,CH3), 2.06 (3 H, s, CH3), 8.21 (1 H, s, NH); IR (KBr), 1570,1615,3300 em-I; fluorescence in CH3CN - H20 (1 + I, v/v),Amax.(excitation), 450 nm; Amax.(emission), 570 nm; EI-MS,mlz 297 (M+); calculated for CLIHlSNs03S, C 44.44, H 5.09,N 23.56, S 10.79%; found, C 44.12, H 4.93, N 23.07,S 10.83%.
Hydrazone of propionaldehyde with NBD-H.NH2NH2: theresidue obtained was recrystallised from benzene - hexane(reddish powder, yield 43%): m.p. 123-125 °C (decomp.); I)H(CDCl3), 7.05 (1 H, d, Jab = 8.6 Hz, Ha or Hb), 8.53 (1 H, d,Jab = 8.6 Hz, Ha or Hb), 1.23 (3 H, t, J = 7.5 Hz, Me), 2.3-2.7(2 H, m, CH2), 7.59 (1 H, t, J = 4.8 Hz, CH), 9.02 (1 H, s,NH); IR (KBr), 1590, 1620, 3380 em-I; fluorescence inCH3CN - H20 (1 + I, v/v) , Amax.(excitation), 468 nm;Amax.(emission), 548 nm; EI-MS, mlz 235 (M+); calculated for~H9Ns03, C 45.96, H 3.86, N 29.78%; found, C 45.91,H 3.89, N 29.24%.
Hydrazone of acetone with NBD-H.NH2NH2: the residueobtained was recrystallised from methanol (reddish powder,yield 66%): m.p. 181-182 °C (decomp.); I)H (CDCh), 7.06 (IH, d, Jab =8.6 Hz, Ha or Hb), 8.53 (1 H, d, Jab =8.6 Hz, Ha or

ANALYST. NOVEMBER 1990. VOL. 115
Hb), 2.20 (3 H, s, Me), 2.11 (3 H, s, Me), 8.64 (1 H, s, NH); IR(KBr), 1580, 1620,3330 em-I; fluorescence in CH3CN - H20(1 + 1, v/v), Am••. (excitation), 468 nm; Am••. (emission), 550nm; EI-MS, mlz 235 (M+); calculated for4H9Ns03, C45.96,H 3.84, N 29.78%; found, C 46.14, H 3.90, N 29.45%.
Fluorescence Intensities and Wavelength Maxima of Hydrazones in the Buffer at Various pH Values and in Acetonitrile Water Solution
The relative fluorescence intensities of 2.5 flM of the standardhydrazones of propionaldehyde and acetone with ABO-H,DBO-H and NBO-H.NH2NH2, dissolved in CH3CN Theorell - Stenhagen buffer (1 + 1, v/v) (for a solution pH inthe range 2-12 and 0.1 MHCI for a solution with a pH of 1),were measured at the optimum wavelengths for each hydrazone at 540-570 nm (excitation at 450-470 nm). Theorell Stenhagen buffer was prepared as follows: orthophosphoricacid (3%) was neutralised with 1 MNaOH (solution A). Citricacid (70 g 1-') was also neutralised with 1 MNaOH (solutionB). Solutions A and B (100 ml of each), 3.54 g of boric acidand 343 ml of 1 M NaOH were mixed and diluted to 1 I(solution C). The pH of solution C (100 ml) was adjusted topH 12 with 0.1 MHCl and the solution diluted to 500 ml. Theother buffer solutions (pH 2-11) were prepared in the samemanner.
To examine the effect of organic solvent on the fluorescenceintensity, an aqueous solution (5 flM) of each hydrazonecontaining CH3CN in various ratios was measured at 540-570nm (excitation at 450-470 nm).
Time Course of the Reaction of Aldehydes and Ketones WithABD-H, DBD-H and NBD-H.NH2NH2
A 20-fll volume of 500 flM ABD-H, OBD-H or NBO-H.NH2NH2, 101-11 of 13.9 flM propionaldehyde or acetone and10 fll of 0.01% (or 0.02,0.05 and 0.1%) TFA in acetonitrilewere mixed in a 1.5-ml brown Eppendorf tube. The tube wascapped and allowed to stand at room temperature. At fixedreaction time intervals, a portion of the reaction mixture wastaken and subjected to HPLC analysis as described below.The reagent blank without propionaldehyde or acetone wastreated similarly.
Measurement of Pseudo-first-order Reaction Rate Constants
The pseudo-first-order reaction rate constants were obtainedunder the following conditions: propionaldehyde, 3.48 flM;hydrazine, 250 flM; and 0.0025% TFA in acetonitrile at roomtemperature (22°C). The calculation made was based on thepeak heights of the standard hydrazones of propionaldehydewith ABD-H, OBD-H or NBD-H.NH2NH2.
Detection Limits of the Hydrazones in the Manual Method
Aldehydes or ketones (75 fl\) (15-70 flM) in CH3CN, 75 fll of0.1 % TFA (for aldehydes) or 1% TFA (for ketones), and 150fll of 500 flM ABD-H, DBD-H or NBD-H.NH2NH2 weremixed and allowed to stand for 1 h (aldehydes) or 5 h(ketones). The fluorescence intensity was measured at eachmaximum wavelength. The reagent blank without carbonylwas treated in the same manner as the carbonyl samples. Thedetection limit was calculated as that concentration at whichthe fluorescence intensity of the sample was equal to threetimes the fluorescence intensity of the reagent blank.
High-performance Liquid Chromatography of Hydrazones
Aldehydes or ketones (10 fl\) (2-3 flM), 20 fll of 500 flM,ABD-H, DBD-H orNBD-H.NH2NH2 and 10fllofO.l% TFA(for aldehydes) or 1% TFA (for ketones) were reacted inCH3CN for 1 h (for aldehydes) or for 5 h (for ketones) at room
1479
temperature. The reaction mixture was then subjected toHPLC. lsocratic elution with CH3CN - H20 containing0.05% TFA was adopted. The column eluate was monitoredwith fluorescence at the optimum wavelength for each·hydrazone as indicated in Table 2.
Results and Discussion
According to the method used by Gubitz et al.,3 NBD-H wassynthesised from hydrazine with 4-chloro-7-nitro-2,1,3-benzoxadiazole (NBO-CI), at room temperature in the dark for1 h under a nitrogen atmosphere. The precipitate thusproduced, presumably NBD-H, was washed with benzene anddried at room temperature but failed to recrystallise.However, pure NBO-H.NH2NH2, the hydrazine adduct, canbe obtained by use of NBD-F which is about ten times morereactive than NBO-CI.I3 The solid NBD-H.NH2NH2 shouldbe kept in the dark as it turns brown when exposed to light. Onthe other hand, pure ABD-H and DBD-H, without theaddition of hydrazine, were obtained with ABD-F12 andDBD-F14 as starting materials as described under Experimental. Both the reagents were light stable. The ABD-H andDBD-H were soluble in methanol and acetonitrile at aconcentration of more than 5 mM, but NBD-H.NH2NH2 wassoluble in methanol only at concentrations of less than 1 mM.Thus, for NBD-H.NH2NH2 at a concentration of 2.5 mM,0.025% TFA was added to the reaction medium to achievecomplete dissolution.
Effect of pH and Organic Solvent Concentration on theFluorescence Intensities of Hydrazones of Propionaldehydeand Acetone With ABD-H, DBD-H and NBD-H.NH2NH2
The standard samples of each hydrazone of propionaldehydeand acetone with ABD-H, DBD-H and NBD-H.NH2NH2were dissolved in CH3CN - Theorell - Stenhagen buffers (pH2-12) or 0.1 Mhydrochloric acid (pH 1) and the fluorescenceintensities were measured at the appropriate maximumwavelengths (548--570 nm) for each hydrazone with excitationat 450-470 nm. As shown in Fig. 2(a) and (b), almost constantfluorescence intensities were obtained for the hydrazone withABD-H and DBD-H in the pH range 2-9. The intensities withDBD-H were about three times those found with ABD-H andgradually decreased outside this pH range. The intensities ofthe hydrazones with NBD-H.NH2NH2 , however, were different from those of ABD-H and DBD-H. The maximumintensities were obtained at pH 2-3 and the lowest from pH 6to 12. At pH 2, the intensities of the hydrazones with NBD-H.NH2NH2 were about seven times higher than those withDBD-H and about 12 times those observed with ABD-H,while at pH 7-12, the intensities were less than those withABD-H and DBD-H. The greater electronegativity (discussed below) at the para position to the hydrazine moietywould enhance the fluorescence intensity of the hydrazonebelow pH 6. The same trend in fluorescence intensity wasobserved for the NBD-amines (the reaction products ofamines with NBD-F), DBD-amines (the reaction products ofamines with DBD-F) and ABD-amines (the reaction productsof amines with ABD-F) (data not shown). Considering theseresults, the fluorescence intensity of the hydrazone with7-hydrazino-2,1,3-benzoxadiazole-4-sulphonate (SBD-H)would be lower than that of the hydrazone with ABD-H.Thus, the preparation of SBD-H from ammonium 7-f1uoro2,1 ,3-benzoxadiazole-4-sulphonate (SBD-F)lS was not carriedout.
As to the effect of organic solvent composition on thefluorescence intensities, the larger ratio of organic solvent(acetonitrile) to water gave the higher intensities for the sixhydrazones as shown in Fig. 3(a) and (b). This trend was alsomentioned, but without data, for the hydrazone with NBD-Hby Gubitz et aJ.3
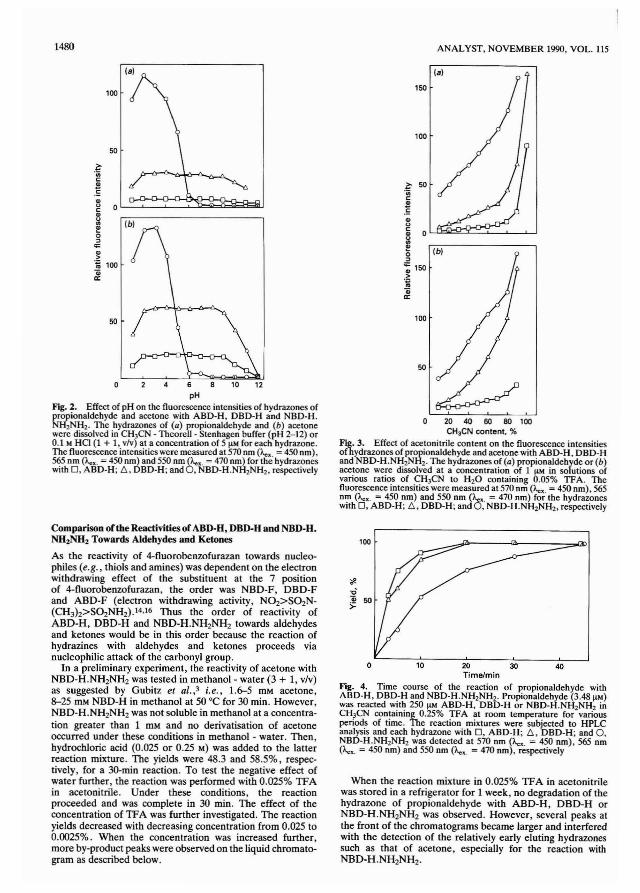
1480
100
50
50
4 6
pH
Fig. 2. Effect of pH on the fluorescence intensities of hydrazones ofpropionaldehyde and acetone with ABD·H, DBD·H and NBD-H.NH2NH2 • The hydrazones of (a) propionaldehyde and (b) acetonewere dissolved in CH3CN - TheorelJ - Stenhagen buffer (pH 2-12) or0.1 M HO (1 + 1, v/v) at a concentration of 5 J.lM for each hydrazooe.The fluorescence iotensities were measured at 570 nm (A.x. = 450 nm),565 nm (A.x. = 450 nm) and 550 nm (A.x. = 470 nm) for the hydrazoneswith 0, ABD-H; 6, DBD-H; and 0, NBD-H.NH2NH2 , respectively
Comparison of the Reactivities of ABD-H, DBD-H and NBD-H.NH,NH2 Towards Aldehydes and Ketones
As the reactivity of 4-f1uorobenzofurazan towards nucleophiles (e.g., thiols and amines) was dependent on the electronwithdrawing effect of the substituent at the 7 positionof 4-f1uorobenzofurazan, the order was NBD-F, DBD-Fand ABD-F (electron withdrawing activity, NOz>SOzN(CH3h>SOzNHz).14.16 Thus the order of reactivity ofABO-H, DBD-H and NBO-H.NHzNHz towards aldehydesand ketones would be in this order because the reaction ofhydrazines with aldehydes and ketones proceeds vianucleophilic attack of the carbonyl group.
In a preliminary experiment, the reactivity of acetone withNBO-H.NHzNHz was tested in methanol - water (3 + I, v/v)as suggested by Gubitz et ai.,3 i.e., 1.6-5 mM acetone,8--25 mM NBO-H in methanol at 50 °C for 30 min. However,NBO-H.NHzNHz was not soluble in methanol at a concentration greater than 1 mM and no derivatisation of acetoneoccurred under these conditions in methanol - water. Then,hydrochloric acid (0.025 or 0.25 M) was added to the latterreaction mixture. The yields were 48.3 and 58.5%, respectively, for a 3Q-min reaction. To test the negative effect ofwater further, the reaction was performed with 0.025% TFAin acetonitrile. Under these conditions, the reactionproceeded and was complete in 30 min. The effect of theconcentration of TFA was further investigated. The reactionyields decreased with decreasing concentration from 0.025 to0.0025%. When the concentration was increased further,more by-product peaks were observed on the liquid chromatogram as described below.
ANALYST, NOVEMBER 1990, VOL. 115
150
100
&: 50...c:l!!.:..uc:§ 0~ r(c-
b)-,----------,
:>
';150>.~
Q;a:
100
o 20 40 60 80 100CH3CN content. %
Fig. 3. Effect of acetonitrile content on the fluorescence intensitiesofhydrazones of propionaldehyde and acetone with ABD-H. DBD-Haod NBD-H.NH2NHz. The hydrazones of (a) propionaldehyde or (b)acetone were dissolved at a concentration of 1 J.lM in solutions ofvarious ratios of CH3CN to H20 containing 0.05% TFA. Thefluorescence intensities were measured at 570 nm (A.x. = 450 nm), 565nm (A.x. = 450 nm) and 550 nm (A.x. = 470 nm) for the hydrazoneswith 0, ABD-H; 6, DBD-H; and 0, NBD-H.NH2NH2, respectively
o 10 ZO 30 40Time/min
Fig. 4. Time course of the reaction of propionaldehyde withABD-H, DBD-H and NBD-H.NH2NH2• Propionaldehyde (3.48 11M)was reacted with 250 11M ABD-H. DBD-H or NBD-H.NH2NH2 inCH3CN containing 0.25% TFA at room temperature for variousperiods of time. The reaction mixtures were subjected to HPLCanalysis and each hydrazone with 0, ABD-H; 6, DBD-H; and 0,NBD-H.NH2NHZ was detected at 570 nm (A.x. = 450 nm), 565 nm(A... = 450 nm) and 550 nm (A"x. = 470 nm), respectively
When the reaction mixture in 0.025% TFA in acetonitrilewas stored in a refrigerator for 1 week, no degradation of thehydrazone of propionaldehyde with ABO-H, OBO-H orNBD-H.NHzNHz was observed. However, several peaks atthe front of the chromatograms became larger and interferedwith the detection of the relatively early eluting hydrazonessuch as that of acetone, especially for the reaction withNBO-H.NHzNHz·
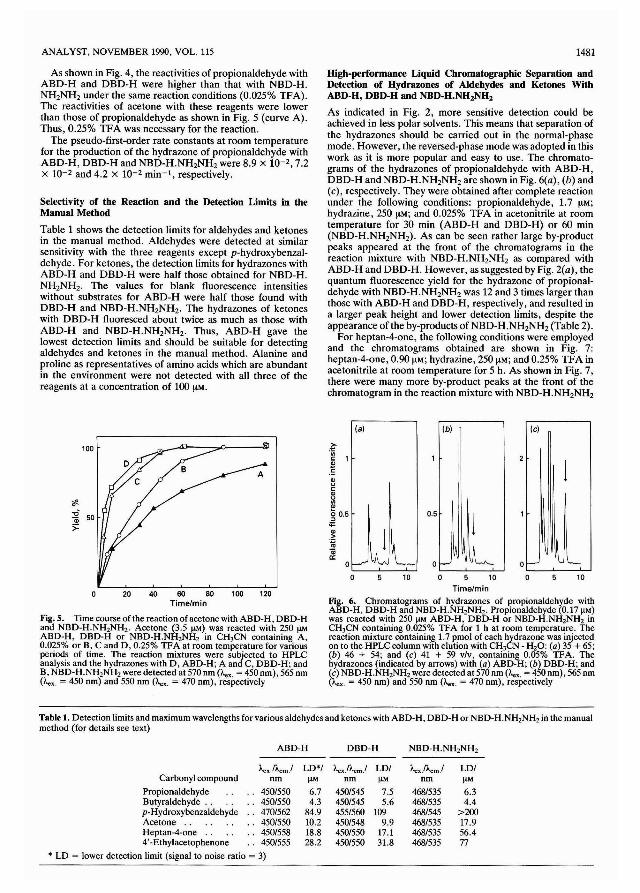
ANALYST, NOVEMBER 1990, VOL. U5 1481
As shown in Fig. 4, the reactivities of propionaldehyde withABD-H and DBD-H were higher than that with NBD-H.NHzNHz under the same reaction conditions (0.025% TFA).The reactivities of acetone with these reagents were lowerthan those of propionaldehyde as shown in Fig. 5 (curve A).Thus, 0.25% TFA was necessary for the reaction.
The pseudo-first-order rate constants at room temperaturefor the production of the hydrazone of propionaldehyde withABD-H, DBD-H and NBD-H.NHzNHz were 8.9 x 1O-z,7.2X lO-z and 4.2 x lO-z min-I, respectively.
Selectivity of the Reaction and the Detection Limits in theManual Method
Table 1 shows the detection limits for aldehydes and ketonesin the manual method. Aldehydes were detected at similarsensitivity with the three reagents except p-hydroxybenzaldehyde. For ketones, the detection limits for hydrazones withABD-H and DBD-H were half those obtained for NBD-H.NHzNHz. The values for blank fluorescence intensitieswithout substrates for ABD-H were half those found withDBD-H and NBD-H.NHzNHz. The hydrazones of ketoneswith DBD-H fluoresced about twice as much as those withABD-H and NBD-H.NHzNHz. Thus, ABD-H gave thelowest detection limits and should be suitable for detectingaldehydes and ketones in the manual method. Alanine andproline as representatives of amino acids which are abundantin the environment were not detected with all three of thereagents at a concentration of 100 ILM.
High-performance Liquid Chromatographic Separation andDetection of Hydrazones of Aldehydes and Ketones WithABD-H, DBD-H and NBD-H.NHzNH2
As indicated in Fig. 2, more sensitive detection could beachieved in less polar solvents. This means that separation ofthe hydrazones should be carried out in the normal-phasemode. However, the reversed-phase mode was adopted in thiswork as it is more popular and easy to use. The chromatograms of the hydrazones of propionaldehyde with ABD-H,DBD-H and NBD-H.NHzNHz are shown in Fig. 6(a), (b) and(c), respectively. They were obtained after complete reactionunder the following conditions: propionaldehyde, 1.7 ILM;hydrazine, 250 ILM; and 0.025% TFA in acetonitrile at roomtemperature for 30 min (ABD-H and DBD-H) or 60 min(NBD-H.NHzNHz). As can be seen rather large by-productpeaks appeared at the front of the chromatograms in thereaction mixture with NBD-H.NHzNHz as compared withABD-H and DBD-H. However, as suggested by Fig. 2(a), thequantum fluorescence yield for the hydrazone of propionaldehyde with NBD-H.NHzNHz was 12 and 3 times larger thanthose with ABD-H and DBD-H, respectively, and resulted ina larger peak height and lower detection limits, despite theappearance of the by-products of NBD-H.NH2NH2 (Table 2).
For heptan-4-one, the following conditions were employedand the chromatograms obtained are shown in Fig. 7:heptan-4-one, 0.90 ILM; hydrazine, 250 ILM; and 0.25% TFA inacetonitrile at room temperature for 5 h. As shown in Fig. 7,there were many more by-product peaks at the front of thechromatogram in the reaction mixture with NBD-H.NH2NHz
10
Ic)
o~
1L
(b)
o f-'
o
0.5
10
(a)
o 5 10
Time/min
Fig. 6. Chromatograms of hydrazones of propionaldehyde withABD-H, DBD-H and NBD-H.NHzNHz. Propionaldehyde (0.17 f.lM)was reacted with 250 f.lM ABD-H, DBD-H or NBD-H.NHzNHz inCH3CN containing 0.025% lFA for 1 h at room temperature. Thereaction mixture containing 1.7 pmol of each hydrazone was injectedon to the HPLC column with elution with CH3CN - HzO: (a) 35 + 65;(b) 46 + 54; and (c) 41 + 59 v/v, containing 0.05% lFA. Thehydrazones (indicated by arrows) with (a) ABD-H; (b) DBD-H; and(c) NBD-H.NHzNHzwere detected at 570 nm (Aex. = 450nm), 565 nm(Aex. = 450 nm) and 550 nm (Aex. = 470 nm), respectively
?:'iiic: 1
.~l'lc:
""'"~00.5::>
'"
100 12020
100
40 60 80Time/min
Fig. S. Time course oflhe reaclion of acetone with ABD-H, DBD-Hand NBD-H.NHzNHz. Acetone (3.5 f.lM) was reacted with 250 f.lMABD-H, DBD-H or NBD-H.NHzNHz in CH3CN containing A,0.025% or B, C and D, 0.25% lFA at room temperature for variousperiods of time. The reaction mixtures were subjected to HPLCanalysis and the hydrazones with D, ABD-H; A and C, DBD-H; andB, NBD-H.NHzNHz were detected at 570 nm (Aex. = 450 nm), 565 nm(Aex = 450 nm) and 550 nm (Aex. = 470 nm), respectively
Table 1. Detection limits and maximum wavelengths for various aldehydes and ketones with ABD-H, DBD-H or NBD-H.NHzNHzin the manualmethod (for details see text)
ABD-H DBD-H NBD-H.NHzNHz
AexlA.m.! LD*/ Aex.lA.m.! LD/ AexAm.! LD/Carbonyl compound nm f.lM nm f.lM nm f.lM
Propionaldehyde 450/550 6.7 450/545 7.5 468/535 6.3Butyraldehyde .. 450/550 4.3 450/545 5.6 468/535 4.4p-Hydroxybenzaldehyde 470/562 84.9 455/560 109 468/545 >200Acetone .. 450/550 10.2 450/548 9.9 468/535 17.9Heptan-4-one .. 450/558 18.8 450/550 17.1 468/535 56.44'-Ethylacetophenone 450/555 28.2 450/550 31.8 468/535 77
* LD = lower detection limit (signal to noise ratio = 3)
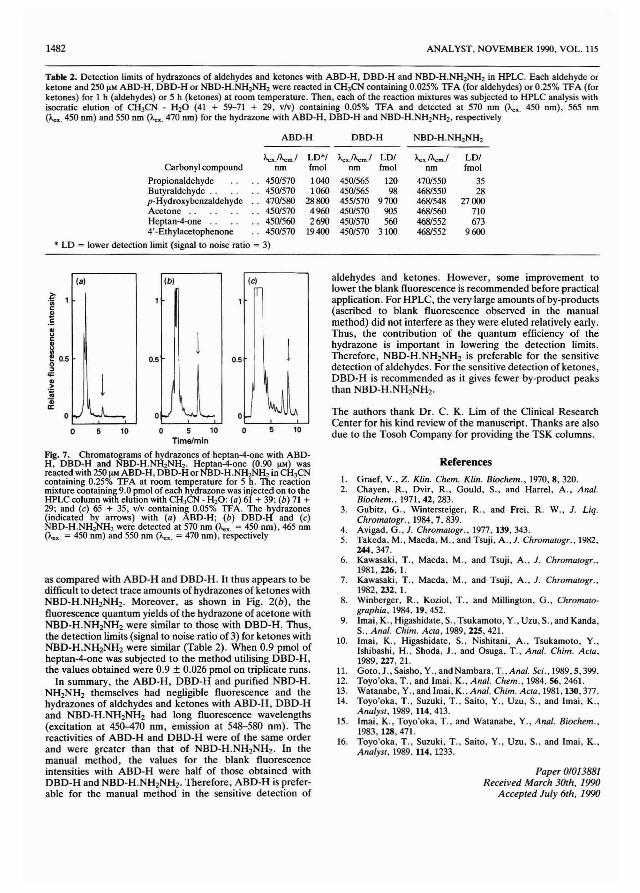
1482 ANALYST, NOVEMBER 1990, VOL. 115
Table 2. Detection limits of hydrazones of aldehydes and ketones with ABD-H, DBD-H and NBD-H.NH2NH2 in HPLC. Each aldehyde orketone and 250 J!M ABD-H, DBD-H or NBD-H.NH2NH2 were reacted in CH3CN containing 0.025% TFA (for aldehydes) or 0.25% TFA (forketones) for 1 h (aldehydes) or 5 h (ketones) at room temperature. Then, each of the reaction mixtures was subjected to HPLC analysis withisocratic elution of CH3CN - H20 (41 + 59-71 + 29, vlv) containing 0.05% TFA and detected at 570 nm ('-ex. 450 nm), 565 nm('-ex. 450 nm) and 550 nm (1-«. 470 nm) for the hydrazone with ABD-H, DBD-H and NBD-H.NHzNHz, respectively
ABD-H DBD-H NBD-H.NHzNHz
'-e•.fA.m.l LD*I I-.,.I'-eml LDI A.•.I'-em.l LDICarbonyl compound nm fmol nm fmol nm fmol
Propionaldehyde 450/570 1040 450/565 120 470/550 35Butyraldehyde .. 450/570 1060 450/565 98 4681550 28p-Hydroxybenzaldehyde 470/580 28800 4551570 9700 4681548 27000Acetone .. 450/570 4960 450/570 905 4681560 710Heptan-4-0ne .. 450/560 2690 450/570 560 4681552 6734'-Ethylacetophenone 4501570 19400 450/570 3100 4681552 9600
* LD = lower detection limit (signal to noise ratio = 3)
l:'wc:$.!:8c:
i_ 0.5o::l
;
(a)
1
(b) (e)
0.5 0.5
aldehydes and ketones. However, some improvement tolower the blank fluorescence is recommended before practicalapplication. For HPLC, the very large amounts of by-products(ascribed to blank fluorescence observed in the manualmethod) did not interfere as they were eluted relatively early.Thus, the contribution of the quantum efficiency of thehydrazone is important in lowering the detection limits.Therefore, NBD-H.NHzNHz is preferable for the sensitivedetection of aldehydes. For the sensitive detection of ketones,DBD-H is recommended as it gives fewer by-product peaksthan NBD-H.NHzNHz.
The authors thank Dr. C. K. Lim of the Clinical ResearchCenter for his kind review of the manuscript. Thanks are alsodue to the Tosoh Company for providing the TSK columns.
References
as compared with ABD-H and DBD-H. It thus appears to bedifficult to detect trace amounts of hydrazones of ketones withNBD-H.NHzNHz. Moreover, as shown in Fig. 2(b), thefluorescence quantum yields of the hydrazone of acetone withNBD-H.NHzNHz were similar to those with DBD-H. Thus,the detection limits (signal to noise ratio of 3) for ketones withNBD·H.NHzNHz were similar (Table 2). When 0.9 pmol ofheptan-4-one was subjected to the method utilising DBD-H,the values obtained were 0.9 ± 0.026 pmol on triplicate runs.
In summary, the ABD-H, DBD-H and purified NBD-H.NHzNHz themselves had negligible fluorescence and thehydrazones of aldehydes and ketones with ABD-H, DBD-Hand NBD-H.NHzNHz had long fluorescence wavelengths(excitation at 450-470 nm, emission at 548-580 nm). Thereactivities of ABD-H and DBD-H were of the same orderand were greater than that of NBD-H.NHzNHz. In themanual method, the values for the blank fluorescenceintensities with ABD-H were half of those obtained withDBD-H and NBD-H.NHzNHz. Therefore, ABD-H is preferable for the manual method in the sensitive detection of
1. Graef, V., Z. Klin. Chem. Klin. Biochem., 1970, 8, 320.2. Chayen, R., Dvir. R., Gould, S., and Harrel, A., Anal.
Biochem., 1971,42,283.3. Gubitz, G., Wintersteiger, R., and Frei, R. W., J. Liq.
Chromatogr., 1984,7,839.4. Avigad, G., J. Chromatogr .. 1977, 139,343.5. Takeda, M., Maeda, M.. and Tsuji, A., J. Chromatogr., 1982.
244,347.6. Kawasaki, T., Maeda, M.. and Tsuji, A.. J. Chromatogr..
1981,226, 1.7. Kawasaki, T., Maeda, M., and Tsuji. A.. J. Chromatogr.,
1982, 232, 1.8. Winberger, R., Koziol, T., and Millington. G., Chromato
graphia, 1984, 19, 452.9. Imai, K.. Higashidate, S., Tsukamoto, Y., Uzu,S., and Kanda,
S., Anal. Chim. Acta, 1989, 225, 421.10. Imai, K., Higashidate, S., Nishitani, A., Tsukamoto, Y.,
Ishibashi, H.. Shoda, J., and Osuga, T., Anal. Chim. Acta,1989, 227, 21.
11. Goto, J., Saisho, Y., and Nambara, T., Anal. Sci., 1989,5,399.12. Toyo'oka, T., and Imai, K.. Anal. Chem., 1984,56,2461.13. Watanabe, Y., and Imai, K.. Anal. Chim. Acta, 1981, 130, 377.14. Toyo'oka, T.. Suzuki, T.. Saito, Y., Uzu, S., and Imai, K.,
Analyst, 1989, 114,413.15. Imai, K., Toyo'oka. T., and Watanabe, Y., Anal. Biochem.,
1983, 128, 471.16. Toyo'oka, T., Suzuki, T., Saito. Y., Uzu. S.. and Imai, K.,
Analyst, 1989, 114, 1233.
Paper 0101388/Received March 30th, /990
Accepted JuLy 6th, /990
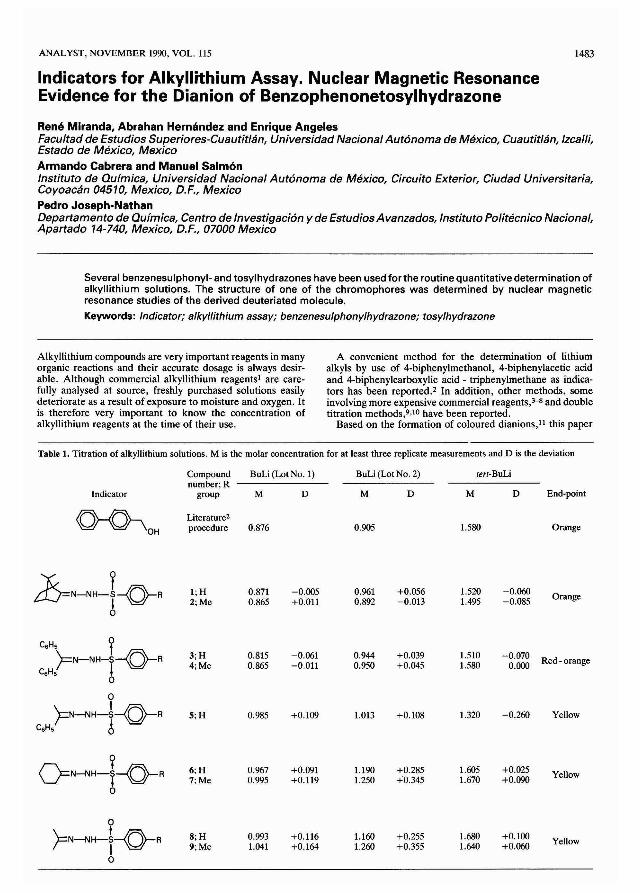
ANALYST, NOVEMBER 1990, VOL. 115
Indicators for Alkyllithium Assay. Nuclear Magnetic ResonanceEvidence for the Dianion of Benzophenonetosylhydrazone
1483
Rene Miranda, Abrahan Hernandez and Enrique AngelesFacultad de Estudios Superiores-Cuautitlan, Universidad Nacional Aut6noma de Mexico, Cuautitlan, Izcalli,Estado de Mexico, MexicoArmando Cabrera and Manuel Salm6nInstituto de Quimica, Universidad Nacional Aut6noma de Mexico, Circuito Exterior, Ciudad Universitaria,Coyoacan 04510, Mexico, D.F., MexicoPedro Joseph-NathanDepartamento de Quimica, Centro de Investigaci6n y de Estudios Avanzados, Instituto Politecnico Nacional,Apartado 14-740, Mexico, D.F., 07000 Mexico
Several benzenesulphonyl- and tosylhydrazones have been used forthe routine quantitative determination ofalkyllithium solutions. The structure of one of the chromophores was determined by nuclear magneticresonance studies of the derived deuteriated molecule.
Keywords: Indicator; alkyllithium assay; benzenesulphonylhydrazone; tosylhydrazone
Alkyllithium compounds are very important reagents in many A convenient method for the determination of lithiumorganic reactions and their accurate dosage is always desir- alkyls by use of 4-biphenylmethanol, 4-biphenylacetic acidable. Although commercial alkyllithium reagents l are care- and 4-biphenylcarboxylic acid - triphenylmethane as indica-fully analysed at source, freshly purchased solutions easily tors has been reported. 2 In addition, other methods, somedeteriorate as a result of exposure to moisture and oxygen. It involving more expensive commercial reagents,3-8 and doubleis therefore very important to know the concentration of titration methods,9,10 have been reported.alkyllithium reagents at the time of their use, Based on the formation of coloured dianions,l1 this paper
Table 1. Titration of alkyllithium solutions. M is the molar concentration for at least three replicate measurements and 0 is the deviation
Compound BuLi (Lot No.1) BuLi (Lot No.2) tert-BuLinumber;R
Indicator group M 0 M 0 M D End-point
~ Literature2
OH procedure 0.876 0.905 1.580 Orange
JS=N-NH-t-o-R I;H 0.871 -0.005 0.961 +0.056 1.520 -0.060 Orange2;Me 0.865 +0.011 0,892 -0.013 1.495 -0.0850
C.Hs Y+0.039 1.510)=N-NH-S-Q-R 3;H 0.815 -0.061 0.944 -0.070 Red-orange
C.Hs b 4; Me 0.865 -0.011 0.950 +0.045 1.580 0.000
0
)=~H-!-Q-R S;H 0.985 +0.109 1.013 +0.108 1.320 -0.260 YellowC.H5 ~
?ON-NH-f-Q-R 6;H 0.967 +0.091 1.190 +0.285 1.605 +0.025 Yellow7;Me 0.995 +0.119 1.250 +0.345 1.670 +0.0900
0
)=N-NH-t-Q-R 8;H 0.993 +0.116 1.160 +0.255 1.680 +0.100 Yellow9;Me 1.041 +0.164 1.260 +0.355 1.640 +0.0600
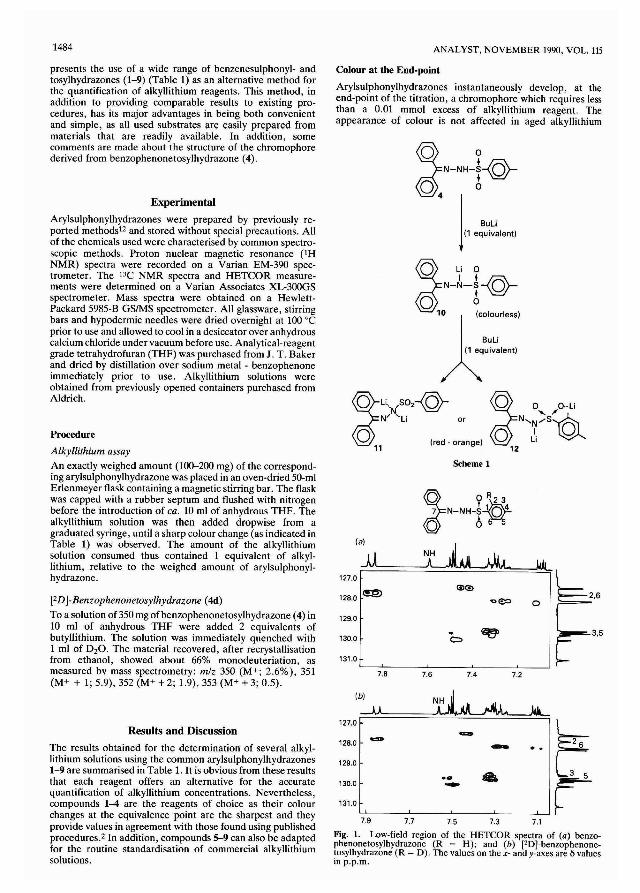
1484 ANALYST, NOVEMBER 1990, VOL. 115
""eo 0
7.6 7.4 7.2
~o
N-NH-~-@-
0 4 j ~BuLi
(1 equivalent)
Scheme 1
~Li °
N-~-~-@-
° 61~O(colourless)
BuLi(1 equivalent)
\Q(U.}/02-@-@N/ 'Li or°11 (red - orange)
(a)
..1\127.0
128.0 ~
129.0
130.0
131.0
7.8
(b)
127.0
128.0 ..:D
129.0
130.0
131.0
Colour at the End-point
Arylsulphonylhydrazones instantaneously develop, at theend-point of the titration, a chromophore which requires lessthan a 0.01 mmol excess of alkyllithium reagent. Theappearance of colour is not affected in aged alkyllithium
7.9 7.7 7.5 7.3 7.1
Fig. 1. Low-field region of the HETCOR spectra of (0) benzophenonetosylhydrazone (R = H); and (b) FD)-benzophenonetosylhydrazone (R = D). The values on the x- and y-axes are I) valuesinp.p.m.
Procedure
Alkyllithium assay
An exactly weighed amount (100-200 mg) of the corresponding arylsulphonylhydrazone was placed in an oven-dried 50-mlErlenmeyer flask containing a magnetic stirring bar. The flaskwas capped with a rubber septum and flushed with nitrogenbefore the introduction of ca. 10 ml of anhydrous THF. Thealkyllithium solution was then added dropwise from agraduated syringe, until a sharp colour change (as indicated inTable 1) was observed. The amount of the alkyllithiumsolution consumed thus contained 1 equivalent of alkyllithium, relative to the weighed amount of arylsulphonylhydrazone.
presents the use of a wide range of benzenesulphonyl- andtosylhydrazones (1-9) (Table 1) as an alternative method forthe quantification of alkyllithium reagents. This method, inaddition to providing comparable results to existing procedures, has its major advantages in being both convenientand simple, as all used substrates are easily prepared frommaterials that are readily available. In addition, somecomments are made about the structure of the chromophorederived from benzophenonetosylhydrazone (4).
Experimental
Arylsulphonylhydrazones were prepared by previously reported methods12 and stored without special precautions. Allof the chemicals used were characterised by common spectroscopic methods. Proton nuclear magnetic resonance (1HNMR) spectra were recorded on a Varian EM-390 spectrometer. The 13C NMR spectra and HETCOR measurements were determined on a Varian Associates XL-3OOGSspectrometer. Mass spectra were obtained on a HewlettPackard 5985-B GSIMS spectrometer. All glassware, stirringbars and hypodermic needles were dried overnight at 100 °Cprior to use and allowed to cool in a desiccator over anhydrouscalcium chloride under vacuum before use. Analytical-reagentgrade tetrahydrofuran (THF) was purchased from J. T. Bakerand dried by distillation over sodium metal - benzophenoneimmediately prior to use. Alkyllithium solutions wereobtained from previously opened containers purchased fromAldrich.
[2D)-Benzophenonetosylhydrazone (4d)
To a solution of 350 mg ofbenzophenonetosylhydrazone (4) in10 ml of anhydrous THF were added 2 equivalents ofbutyllithium. The solution was immediately quenched with1 ml of 0 20. The material recovered, after recrystallisationfrom ethanol, showed about 66% monodeuteriation, asmeasured bv mass spectrometry: mlz 350 (M+; 2.6%), 351(M+ + 1; 5.9), 352 (M+ + 2; 1.9),353 (M+ + 3; 0.5).
Results and Discussion
The results obtained for the determination of several alkyllithium solutions using the common arylsulphonylhydrazones1-9 are summarised in Table 1. It is obvious from these resultsthat each reagent offers an alternative for the accuratequantification of alkyllithium concentrations. Nevertheless,compounds 1-4 are the reagents of choice as their colourchanges at the equivalence point are the sharpest and theyprovide values in agreement with those found using publishedprocedures.2 In addition, compounds 5-9 can also be adaptedfor the routine standardisation of commercial alkyllithiumsolutions.
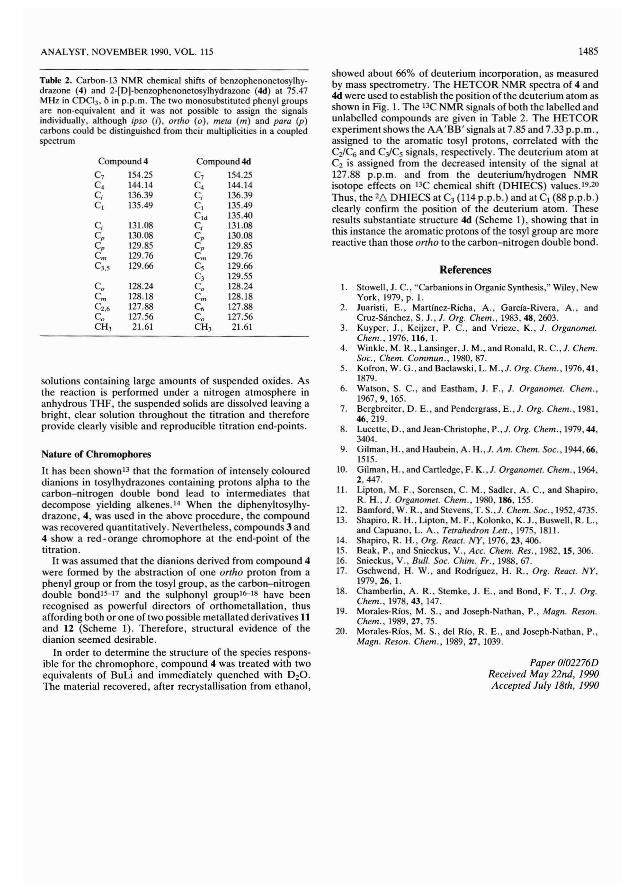
ANALYST, NOVEMBER 1990, VOL. 115
Table 2, Carbon-13 NMR chemical shifts of benzophenonetosylhydrazone (4) and 2-[D]-benzophenonetosylhydrazone (4d) at 75.47MHz in CDCI3• Ii in p.p.m. The two monosubstituted phenyl groupsare non-equivalent and it was not possible to assign the signalsindividually, although ipso (i), ortho (0), rnera (rn) and para (P)carbons could be distinguished from their multiplicities in a coupledspectrum
Compound 4 Compound4dC7 154.25 C7 154.25C. 144.14 C. 144.14Ci 136.39 Ci 136.39C, 135.49 C, 135.49
C'd 135.40Ci 131.08 Ci 131.08Cp 130.08 Cp 130.08Cp 129.85 Cp 129.85Cm 129.76 Cm 129.76C3.5 129.66 Cs 129.66
C3 129.55Co 128.24 Co 128.24Cm 128.18 Cm 128.18CZ•6 127.88 C6 127.88Co 127.56 Co 127.56CH3 21.61 CH3 21.61
solutions containing large amounts of suspended oxides. Asthe reaction is performed under a nitrogen atmosphere inanhydrous THF, the suspended solids are dissolved leaving abright, clear solution throughout the titration and thereforeprovide clearly visible and reproducible titration end-points.
Nature of Chromophores
It has been shown 13 that the formation of intensely coloureddianions in tosylhydrazones containing protons alpha to thecarbon-nitrogen double bond lead to intermediates thatdecompose yielding alkenes. 14 When the diphenyltosylhydrazone, 4, was used in the above procedure, the compoundwas recovered quantitatively. Nevertheless, compounds 3 and4 show a red - orange chromophore at the end-point of thetitration.
It was assumed that the dianions derived from compound 4were formed by the abstraction of one ortho proton from aphenyl group or from the tosyl group, as the carbon-nitrogendouble bond 1S- 17 and the suJphonyl groupl6-18 have beenrecognised as powerful directors of orthometallation, thusaffording both or one of two possible metallated derivatives 11and 12 (Scheme 1). Therefore, structural evidence of thedianion seemed desirable.
In order to determine the structure of the species responsible for the chromophore, compound 4 was treated with twoequivalents of BuLi and immediately quenched with DzO.The material recovered, after recrystallisation from ethanol,
1485
showed about 66% of deuterium incorporation, as measuredby mass spectrometry. The HETCOR NMR spectra of 4 and4d were used to establish the position of the deuterium atom asshown in Fig. 1. The 13C NMR signals of both the labelled andunlabelled compounds are given in Table 2. The HETCORexperiment shows the AA'BB' signals at 7.85 and 7.33 p.p.m.,assigned to the aromatic tosyl protons, correlated with theCz/C6 and CyCSsignals, respectively. The deuterium atom atCz is assigned from the decreased intensity of the signal at127.88 p.p.m. and from the deuterium/hydrogen NMRisotope effects on I3C chemical shift (DHIECS) values. 19.Z0
Thus, the zf:::, DHIECS at C3 (114 p.p.b.) and at C1(88 p.p.b.)clearly confirm the position of the deuterium atom. Theseresults substantiate structure 4d (Scheme 1), showing that inthis instance the aromatic protons of the tosyl group are morereactive than those ortho to the carbon-nitrogen double bond.
References
1. Stowell, J. c., "Carbanions in Organic Synthesis," Wiley, NewYork, 1979, p. I.
2. Juaristi, E., Martfnez-Richa, A., Garcia-Rivera, A., andCruz-Sanchez, S. J., J. Org. Chern., 1983,48,2603.
3. Kuyper. J" Keijzer, P. C., and Vrieze, K., J. Organornet.Chern., 1976, 116, I.
4, Winkle, M. R., Lansinger, J. M., and Ronald, R. c.,J, Chern,Soc., Chern. Comrnun., 1980,87.
5. Kofron, W. G., and Baclawski, L. M., J. Org. Chern., t976, 41,1879.
6. Watson, S. c., and Eastham, J. F., J. Organornet. Chern.,1967, 9, 165.
7. Bergbreiter, D. E., and Pendergrass, E., J. Org. Chern., 1981,46,219.
8. Lucette, D., and Jean-Christophe, P., J, Org. Chern., 1979,44,3404.
9. Gilman, H., and Haubein, A. H.,J. Arn. Chern. Soc" 1944,66,1515.
10. Gilman, H., and Cartledge, F. K.,J. Organomet. Chern., 1964,2,447.
11. Lipton, M. F., Sorensen, C. M., Sadler, A. C., and Shapiro,R. H., J. Organornet. Chern., 1980, 186, 155.
12. Bamford, W. R., and Stevens, T. S.,J. Chern. Soc., 1952,4735.13. Shapiro, R. H., Lipton, M. F., Kolonko, K. J., Buswell, R. L.,
and Capuano, L. A., Tetrahedron Lett., 1975, 1811.14. Shapiro, R. H., Org. Reacl. NY, 1976, 23,406.15. Beak, P., and Snieckus, Y" Acc. Chern. Res., 1982, IS, 306.16. Snieckus, V., Bull. Soc. Chirn. Fr., 1988, 67.17. Gschwend, H. W., and Rodriguez, H. R., Org. Reacl. NY,
1979,26, 1.18. Chamberlin, A. R., Stemke, J. E., and Bond, F. T., 1. Org.
Chem., 1978,43,147.19. Morales-Rios, M. S., and Joseph-Nathan, P" Magn. Resoll.
Chern., 1989,27,75.20. Morales-Rios, M. S., del Rio, R. E., and Joseph-Nathan, P.,
Magll. Reson. Chern., 1989,27,1039.
Paper 0/02276DReceived May 22nd, 1990Accepted July 18th, 1990


ANALYST, NOVEMBER 1990. VOL. 115
Transmittance Ratio Spectrometry as a Stray Radiant Energy TestMethod for Optical-null Spectrophotometers
Paddy FlemingSligo Regional Technical College, Sligo, Ireland
1487
A stray radiant energy (SREj test method for optical-null double-beam spectrophotometers is describedbased on transmittance ratio measurements made on an absorbing species placed in a pair of matchedcuvettes whose path-length ratio is maintained constant while the said path-length is gradually increased. Atheoretical expression is derived which relates the coordinates of the minimum ofthe resulting characteristictransmittance ratio versus reference transmittance plot, to the relative SRE level, and to the sample cell toreference cell path-length ratio employed. The effect of sample absorption of the SRE on transmittance ratiomeasurements is also explored. The result obtained with a Perkin-Elmer 297 spectrophotometer is comparedwith that obtained by applying the SRE test method of Mielenz et al. to the same instrument.
Keywords: Infrared spectrometry; optical-null spectrophotometer; stray radiant energy; path-length ratio;transmittance ratio
.. (2)
Stray radiant energy (SRE), a universal problem inspectrometry, is radiation scattered by imperfections on thesurface of the diffraction grating and then sensed by thedetector to give spurious transmittance readings. An opticalnull double-beam spectrophotometer uses a nulling comb inthe reference beam to balance sample absorption automatically, and because of its poor linearity and zero transmittance(0% 1) drift, due to electrical pick-up, :t makes unreliabletransmittance readings below 10% T. [American Society forTesting and Materials (ASTM) E 387-84.]1 Therefore, anSRE test procedure must be designed to give transmittancereadings greater than 10% T. The ASTM Test Method E387-84, which measures the apparent transmittance of a sharpcut-off ftlter while keeping the transmittance reading greaterthan 10% T by the stepwise attenuation of the reference beamusing screens of varying mesh size, is currently recommended.The nulling comb attenuates the SRE in the reference beamrelative to the SRE in the sample beam and therefore theanalysis proposed by the author2 for a ratio-recordinginstrument must be revised. Most optical-null spectrophotometers now in use deal with the mid-infrared region.Transmittance ratio spectrometry in the infrared (IR) regionuses matched cells to measure the transmittance of a samplebeam solution relative to that of an identical reference-beamsolution, the sample cell being a constant factor thicker thanthe reference cell.
Theoretical expressions are derived in this paper showinghow the relative SRE level in an optical-null double-beamspectrophotometer is related to the observable coordinates ofthe minimum of the transmittance ratio versus the truereference transmittance plot, and to the relevant sample cell toreference cell thickness ratio. The proposed analysis is appliedto transmittance ratio measurements made on a Perkin-ElmerModel 297 optical-null spectrophotometer. The ensuingexperimental SRE value is compared with the correspondingexperimental SRE value determined using the test method ofMielenz et af.3 as modified by the author4 to suit optical-nullinstruments. The leading and trailing edges of a CC4band-stop absorption peak were used in this latter method.The method of Mielenz et af.3 gradually increases differentialabsorbance by wavelength scanning through the leading andtrailing absorbance edges of a cut-off solution which has beenplaced in both the sample and reference beams, whereas themethod proposed herein is to be carried out at a fixedwavelength while differential absorbance is increased bygradually increasing the path lengths of the solution held in thesample and reference beams. The recorded differentialabsorbance for both methods will not increase indefinitely but
will peak at a value determined by the SRE level present in theinstrument and by the path-length ratio in use. The termstransmittance ratio and differential absorbance are usedinterchangeably in the text.
The presence of test materials which may not be transparentto SRE in a spectrophotometer means that the relative SRElevels may be underestimated. This effect can be minimised byusing materials having simple absorption spectra.
Formulation of Experimental Quantities
If similar solutions are placed in the cells, the sample cell being<X-times thicker than the reference cell, then the transmittanceratio of the sample solution relative to the reference solution(Ra ), as per the Beer-Lambert law, is given by;
Ra =TglTa =Tg-t (1)
where To is the absolute transmittance of the reference sampleto radiation of wavenumber a.
However, equation (1) ignores the inevitable presence ofSRE which may be absorbed by a sample. The observedtransmittance ratio R~ is given in terms of the ratio of thetransmittances of the sample and the reference beams asfollows
R' = Tg + smaAaa To +R~mAo
where 0 < s « 1 is the relative SRE level and 0 < m '" 1 is theSRE transmittance of the reference sample whose monochromatic absorbance, A a (= 10glOTa), is unity.
In equation (2) it is assumed that the SRE levels in thebeams of an optical-null spectrophotometer are equal when atransparent substance is present in both beams and the beamsare balanced at 100% T. However, the SRE in the referencebeam is attenuated (relative to the SRE in the sample beam)by the nulling comb as it moves to balance the beams opticallywhenever the sample beam becomes more monochromaticallyabsorbing than the reference beam, hence the presence of R~in the denominator of equation (2). A typical optical nullingarrangement in a double-beam optical-null spectrophotometer is shown in Fig. 1.
Equation (2) is formulated so as to accommodate theprogressive attenuation of the SRE in both beams as thethickness of the cells is increased. If m is the SRE transmittance of the reference beam when its monochromaticabsorbance is unity, then mAo is its SRE transmission when its
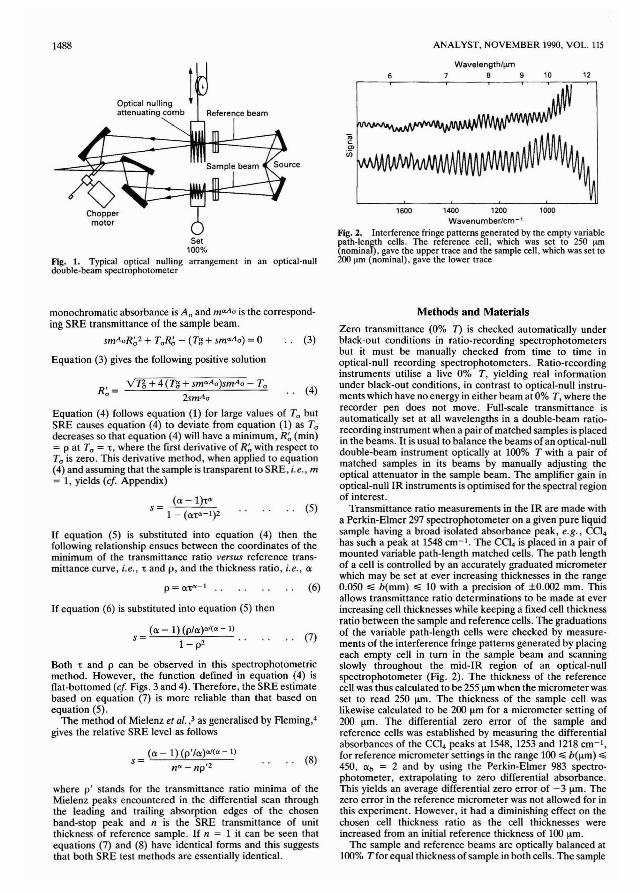
1488 ANALYST, NOVEMBER 1990, VOL. 115
1600 1400 1200 1000Wavenumber/cm- 1
Fig. 2. Interference fringe patterns generated by the empty variablepath-length cells. The reference cell, which was set to 250 ~m
(nominal), gave the upper trace and the sample cell, which was set to200 ~m (nominal), gave the lower trace
1210Wavelength/~m
86
..<::Ol
(j) WM.fWV'J1~IMI\MIMIVVVVVVV'VV'
Set100%
Fig. 1. Typical optical nulling arrangement in an optical-nulldouble-beam spectrophotometer
vn + 4 (Th + smaAo)smAo - TR' - a a a (4)0- 2smA o
monochromatic absorbance is A o and m~Ao is the corresponding SRE transmittance of the sample beam.
smAoR~2 + ToR;, - (Tg + smaAo) = 0 (3)
Equation (3) gives the following positive solution
where p' stands for the transmittance ratio minima of theMielenz peaks encountered in the differential scan throughthe leading and trailing absorption edges of the chosenband-stop peak and n is the SRE transmittance of unitthickness of reference sample. If n = 1 it can be seen thatequations (7) and (8) have identical forms and this suggeststhat both SRE test methods are essentially identical.
Methods and Materials
Zero transmittance (0% 7) is checked automatically underblack-out conditions in ratio-recording spectrophotometersbut it must be manually checked from time to time inoptical-null recording spectrophotometers. Ratio-recordinginstruments utilise a live 0% T, yielding real informationunder black-out conditions, in contrast to optical-null instruments which have no energy in either beam at 0% T, where therecorder pen does not move. Full-scale transmittance isautomatically set at all wavelengths in a double-beam ratiorecording instrument when a pair of matched samples is placedin the beams. It is usual to balance the beams of an optical-nulldouble-beam instrument optically at 100% T with a pair ofmatched samples in its beams by manually adjusting theoptical attenuator in the sample beam. The amplifier gain inoptical-null IR instruments is optimised for the spectral regionof interest.
Transmittance ratio measurements in the IR are made witha Perkin-Elmer 297 spectrophotometer on a given pure liquidsample having a broad isolated absorbance peak, e.g.• Cel.has such a peak at 1548 em-I. The Cel. is placed in a pair ofmounted variable path-length matched cells. The path lengthof a cell is controlled by an accurately graduated micrometerwhich may be set at ever increasing thicknesses in the range0.050 ,.; b(mm) ,.; 10 with a precision of ±0.002 mm. Thisallows transmittance ratio determinations to be made at everincreasing cell thicknesses while keeping a fixed cell thicknessratio between the sample and reference cells. The graduationsof the variable path-length cells were checked by measurements of the interference fringe patterns generated by placingeach empty cell in turn in the sample beam and scanningslowly throughout the mid-IR region of an optical-nullspectrophotometer (Fig. 2). The thickness of the referencecell was thus calculated to be 255 ~m when the micrometer wasset to read 250 J.lm. The thickness of the sample cell waslikewise calculated to be 200 J.lm for a micrometer setting of200 J.lm. The differential zero error of the sample andreference cells was established by measuring the differentialabsorbances of the Cel. peaks at 1548, 1253 and 1218 em-I,for reference micrometer settings in the range 100,.; b(~m) ,.;450, exb = 2 and by using the Perkin-Elmer 983 spectrophotometer, extrapolating to zero differential absorbance.This yields an average differential zero error of -3 /-lm. Thezero error in the reference micrometer was not allowed for inthis experiment. However, it had a diminishing effect on thechosen cell thickness ratio as the cell thicknesses wereincreased from an initial reference thickness of 100 flm.
The sample and reference beams are optically balanced at100% Tfor equal thickness of sample in both cells. The sample
(6)
(5)
(7)
(8)
p= CX't~-1 .•
(ex-l)(p'lex)cxI(~-I)
s=n~- np'2
Equation (4) follows equation (1) for large values of To butSRE causes equation (4) to deviate from equation (1) as Todecreases so that equation (4) will have a minimum, R~ (min)= p at To = " where the first derivative of R~ with respect toTo is zero. This derivative method, when applied to equation(4) and assuming that the sample is transparent toSRE, i.e., m= 1, yields (ef Appendix)
(ex-l).as=
1 - (CX'ta - l )2
If equation (5) is substituted into equation (4) then thefollowing relationship ensues between the coordinates of theminimum of the transmittance ratio versus reference transmittance curve, i.e., • and p, and the thickness ratio, i.e.• ex
If equation (6) is substituted into equation (5) then
(ex - 1) (p/ex)cxI(a - I)s= 1- p2
Both • and p can be observed in this spectrophotometricmethod. However, the function defined in equation (4) isflat-bottomed (ef Figs. 3 and 4). Therefore, the SRE estimatebased on equation (7) is more reliable than that based onequation (5).
The method of Mielenz et al.,3 as generalised by Fleming,'gives the relative SRE level as follows

ANALYST, NOVEMBER 1990, VOL. 115 1489
1.00---------------------, 1.0 r-------------------,
Table 1. Measurements and ensuing calculations on Fig. 3 togetherwith the corresponding measurements and calculations arising fromapplying the generalised SRE test method of Mielenz et aJ.
13501650 1550 1450Wavenumber/cm- 1
Fig. S. Experimental Mielenz transmittance ratio spectrum of CO.in a 3-mm sample cell versus CO. in a 1.5-mm reference cell in thespectral range 1750;;" 0 (em-I);;" 1350
Conclusion
Optical-null spectrophotometry is now a curiousity in ultraviolet - visible spectrometry and is being displaced in themid-IR by ratio-recording and Fourier transform instruments.However, there are many optical-null IR spectrophotometersin use 'and SRE affects quantitative measurements made by
1.01"""'==----------------==='"
0.4
.g~., 0.8ul:..::'E~ 0.6~I-
.g 0.8~
8l:..:: 0.6.~
l:...= 0.4
0.2 L- ~ "'_ '______.J
o 0.5 1.0 1.5 2.0Reference absorbance
Fig. 4. Simulated transmittance ratio versus reference absorbance atthe CO. 1548 em-I peak for SRE transmittances, m, of 1.0 and 0.85, arelative SRE level, s, of 0.02 and a thickness ratio, ceb, of 2
the sample shifts the coordinates of the transmittance ratiominimum towards lower values and makes the transmittanceratio curve more flat-bottomed. lfFig. 3 is compared with Fig.4 then the premise that the sample is transparent to SRE, i.e.,m = 1, must be false. Therefore, calculations based onapplying equation (7) underestimate the relative SRE levelinvolved. However, the SRE transmittance of the sample is anelusive quantity and a remedy for this may lie in fittingequation (4) to the curve in Fig. 3 using realistic trial values forsand m, i.e., by incrementally increasing the value for s fromthat calculated by applying equation (7) to Fig. 3 andsimultaneously gradually decreasing m from unity until areasonable agreement is achieved between the experimentalcurve and equation (4).
The differential absorbance spectrum of CCI. in a 3-mmsample cell plotted against CCI. in a 1.5-mm reference cell, inthe spectral range 1750 '" a(cm- 1) '" 1350, is shown in Fig. 5.
If the absolute absorbance of 0.1 mm CCI. at 1548 em-I is0.266 then the peak differential absorbance in the absence ofSRE for the above Mielenz scan should have been 4.However, Mielenz SRE peaks are observed on the leadingand trailing edges of the band-stop peak at 1590 and 1490cm- I, respectively. The transmittance ratio minima (p') ofthese peaks together with an estimate of SRE based onequation (8) for n = 1 are recorded in Table 1.
1490 em-I
0.33
0.38
0.005 (0.5%)
0.04(4%)
Perkin-Elmer Model 2972Transmittance ratio
spectrometry1548 em-ISlit programme 30.28
0.02(2%)Mielenz
1590cm-1
cell thickness is then increased by the chosen cell thicknessratio, and its transmittance ratio relative to the reference cellcan be determined. This process is repeated for increasing cellthicknesses until it is no longer possible to balance both beamsoptically at 100% Tat 1548 cm- I.
If the variable path-length cells are set wide enough then the1548 cm- I CCI. peak becomes a band-stop absorption peakwith leading and trailing edges. The method of Mielenz et a/.3is applied to this band-stop peak by scanning the differentialspectrum of b (mm) CCI. in the reference beam and rxb (mm)CCI. in the sample beam between 1750 and 1350 em-I, where1 .. b (mm) .. 1.5 and rxb = 2.
.g 0.8~.,Ul:
~ 0.6'E'"l:...= 0.4
0.21.----------'----------:-':.,------'o 1.00 2.00
Reference absorbanceFig. 3. Experimental transmittance ratio versus reference absorbance at the CO. 1548 cm- I peak for a thickness ratio, ceb, of 2. Thethickness range of the reference cell is 0.1 ,,;; b, (mm) ,,;; 0.8
Experimental
The experimental transmittance ratio measurements made onthe Perkin-Elmer 297 spectrophotometer are plotted in Fig. 3.The transmittance ratio minimum (p) is well established in thefigure but the corresponding reference absorbance coordinate, -log 1:, is uncertain because of the flat-bottomed shapeof the experimental curve and, therefore, equation (7) is usedinstead of equation (5) for calculating the relative SRE level.Measurements and ensuing calculations on Fig. 3 togetherwith the corresponding measurements and calculations arisingfrom applying the generalised SRE test method of Mielenzet al. 3 are presented in Table 1.
Equation (4) is plotted in Fig. 4 for s = 0.02 (2%) and m = 1and m = 0.85. Fig. 4 indicates that the absorption of SRE by
CCI. peak wavenumberSlit-widthTransmittance ratio minimum, PRelative SRE level based on equation
(7) for m = I, s ..SRE test method ..CCI. leading-edge Mielenz
peak wavenumberCo. trailing-edge Mielenz
peak wavenumberLeading-edge Mielenz peak
average transmittance, p' ..Trailing-edge Mielenz peak
average transmittance, p' ..Relative SRE level based on
equation (8) and n = I, s ..Relative SRE level based on
specification, s ..
Instrument type ..Cell path-length ratio, cebSRE test method ..
1490
such instruments. The transmittance ratio test method may bemore useful for quantifying the relative SRE level in suchinstruments than the cut-off fLlter test method in use heretofore as it employs materials that are readily available and itgives transmittance scale readings greater than 10% T.
The experimental SRE levels reported in Table 1 are in therange 2 "" SRE(%) "" 4. The generalised test method ofMielenz et aJ.3 yields a 4% relative SRE level while thetransmittance ratio method yields a level of 2%. These valuesare larger than the 0.5% specified by Perkin-Elmer but theinstrument in question has been in use for nearly 20 years.
The proposed SRE test method has been refined to allowfor the absorption of SRE. However, this refinement is notpursued here because the SRE transmittance of a givensample is unknown' and it may vary from instrument toinstrument.
ANALYST, NOVEMBER 1990, VOL. 115
Substituting y = ," -I and using equation (A4) gives
1- (exy)2 1 - (exy)2TIs =---and ,"Is =---
(ex-l)y ex-I
If equation (A4) is substituted into equation (AI) at To = ,where R~(min) = p then equation (6) can be obtained asfollows
~[1- (exy)2)2 1- (exy)2 1- (exy)2
p= +---+1- ---[2(ex - l)y)2 ex - 1 2(ex -l)y
= V[l- (exy)2)2+4(ex-l)(y2- ex2.Y") +4(ex-l)2y2-1+ (exy)2
2(ex-l)y
= V (1 - 2exy2+ ex2y2)2 - 1 + (exy)2
2(ex - l)y
.. (A4)Paper 0/00137F
Received January 9th, 1990Accepted July 3rd, 1990
1. ASTM Committee E-l3, "Manual on Recommended PracticalSpectrophotometry," ASTM E 387-84, American Society forTesting and Materials, Philadelphia, 1984, pp. 136-145.
2. Fleming, P., Analyst, 1990, 115,375.3. Mielen2, K. D., Weidner, V. R., and Burke, R. W., Appl.
Opt., 1982,21,3354.4. Fleming, P., Appl. Spectrosc., 1990,44,522.
Appendix
Equation (4) for m = 1 and s > 0 may be rewritten as
R~ = VeTJ2s)2 + Tgls + 1 - TJ2s (AI)
The first derivative of equation Al with respect to To is givenby
, = Tol152 + exTg - lIs _ 1 (A2)dRo/dTo 2V(ToI15)2 + Tgls + 1 115 ..
But dRddTo = 0 at To = ,where R~ (min) = p and therefore
('t!2s)2 + ,"Is + 1= (TI2s + exT,,-I)2 .. (A3)
Solving equation (A3) for s yields equation (5) in the main text
(ex-I},"s= 1- (exT,,-I)2 ..
= o:ta - 1
References
(AS)

ANALYST, NOVEMBER 1990, VOL. 115 1491
Determination of Carbendazim in Benomyl Using InfraredSpectrophotometry
Gabor Meszlenyi, Judit Kortvelyessy, Eva Juhasz and Maria LelkesResearch Institute for Organic Chemical Industry, P.O. Box 41, H-1428 Budapest, Hungary
Benomyl is a well known fungicide that will undergo decomposition to carbendazim in both aqueous andnon-aqueous solutions. Infrared spectrophotometry was found to be the most suitable method for thedetermination of carbendazim in benomyl, as it avoids the need to use a solvent. The limit of detection ofthemethod (for carbendazim in benomyl) is 2.0-2.5%, with a precision of 5-6% relative, at the 95% probabilitylevel.
Keywords: Benomyl; carbendazim; fungicide; infrared spectrophotometry; ultraviolet spectrophotometry
Benomyl [methyl 1-(butylcarbamoyl)-2-benzimidazolylcarbamate] (Fundazol 50 WP in Hungary) is a well knownfungicide. The determination of residual amounts of benomylin soil and plant material by ultraviolet (UV) spectrophotometry has been reported. 1.2 High-performance liquid chromatography (HPLC) methods have been described for thedetermination of benomyl in the form of its principaldegradation product, carbendazim (methyl 2-benzimidazolecarbamate).3-5
The decomposition of benomyl, shown in Fig. I, is thereverse of the last step of its synthesis; the compound iscleaved to give butyl isocyanate and carbendazim.
Chiba and Veres6 developed an HPLC method to determine benomyl and carbendazim separately; the latter compound was detected in the form of its propyl isocyanateadduct.
The aim of the present work was to re-examine thedecomposition of benomyF and to develop an infrared (IR)spectrophotometric method for the determination of thecarbendazim content in benomyl.
Experimental
Apparatus
A Perkin-Elmer 783 IR spectrophotometer was used.
Procedure
Benomyl (5 mg) or carbendazim (5 mg) and potassiumbromide (300 mg) were ground together (the accuracy of theweighing was 0.1 mg) and pressed into pellets. The IR spectrawere recorded and then a series of carbendazim - benomylmixtures containing different carbendazim concentrations(2-50%) were prepared (Fig. 5). Samples (5 mg) of themixtures were used to obtain the calibration graph. Thesamples with an unknown carbendazim content were thenanalysed under the same conditions (see Table 1).
(8) B (b) B (c) (d) (8)B
BB
c: A0.~
A" III'c
IIu L1 L '-
Benomyl
Fig. 1. Decomposition of benomyl
/'\I \BI \
1.2 I \
\I,I
1.4
"uc:~ 0.8(;V>
~ 0.6
0.2
0.4
OL-_"--_"-_,-":-:-_='--'210 230 250 270
Wavelength/nmFig. 3. UV spectra of A, benomyl; and B, carbendazim
Fig. 2. Monitorinll the decomposition of benomyl by chromatograms recorded at given periods of time: (a) 3; (b) 10; (c) 17; (d) 24;and (e) 67 min. Stationary phase, Alltech RP-18; mobile phase,acetonitrile - water (8 + 2); and wavelength of detection, 280 nm. A,Carbendazim; and B, benomyl
Butyl isocyanateCarbendazim
orArrN
IIVN}-NH-C-OCH3
IH
Reagents
The samples of benomyl and carbendazim were of technicalgrade and were obtained from Chinoin Works, Budapest,Hungary. The potassium bromide used for the preparation ofthe KBr disc and for IR spectrophotometry was from FlukaChemie, Buchs, Switzerland.
orA1IN
IIVN~NH-C-OCH3
IO=C-NH-C.H.
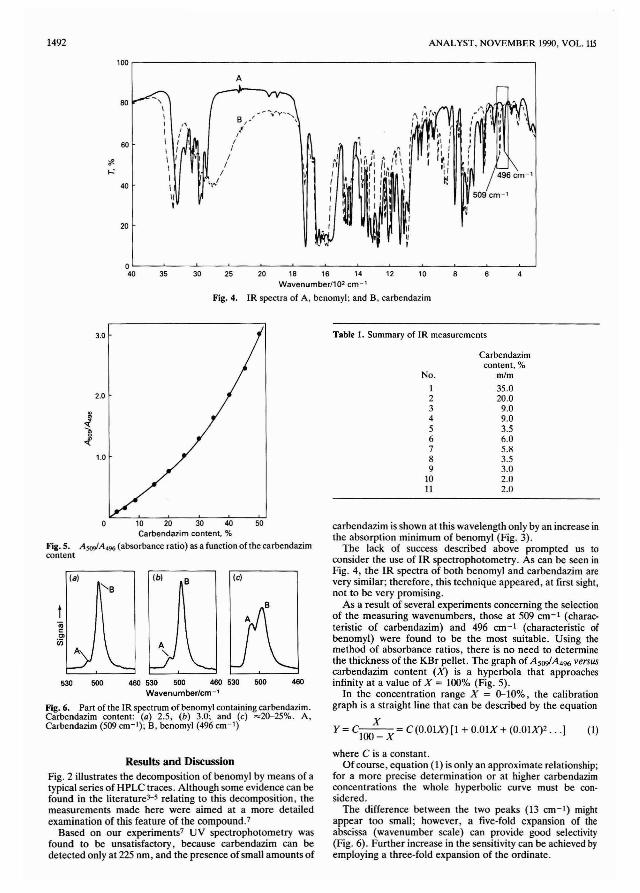
1492
100
A
80 -,\I
B ",
I ", I l, I
60 I , I I\ I I
*- \ I " II
1--' \I
1~\,,"I40 \
",20
I
"IfIIIIII,
,I
I f ~ .. f."i'" rl 11.:
1\
1,1,111r II I1'1I"I' ,
IIuI
ANALYST, NOVEMBER 1990, VOL. 115
509 cm-'
46830 25 20 18 16 14 12 10
Wavenumberl102 cm- 1
Fig. 4. IR spectra of A, benomyl; and B, carbendazim
35O~-~----'---~--~--'---~----'---~--""""'--~-~--~--'40
Carbendazimcontent, %
m1m
35.020.0
9.09.03.56.05.83.53.02.02.0
No.
123456789
1011
Table 1. Summary of IR measurements
carbendazim is shown at this wavelength only by an increase inthe absorption minimum of benomyl (Fig. 3).
The lack of success described above prompted us toconsider the use of IR spectrophotometry. As can be seen inFig. 4, the IR spectra of both benomyl and carbendazim arevery similar; therefore, this technique appeared, at first sight,not to be very promising.
As a result of several experiments concerning the selectionof the measuring wavenumbers, those at 509 cm- I (charac·teristic of carbendazim) and 496 cm-I (characteristic ofbenomyl) were found to be the most suitable. Using themethod of absorbance ratios, there is no need to determinethe thickness of the KBr pellet. The graph of AsWA496 versuscarbendazim content (X) is a hyperbola that approachesinfinity at a value of X = 100% (Fig. 5).
In the concentration range X = 0-10%, the calibrationgraph is a straight line that can be described by the equation
Xy = C100 _ X = C (0.01X) [1 + O.OlX + (0.01X)2 ... ] (1)
460
(e)B(b)
1.0
3.0
2.0
500
(a)
530
10 20 30 40 50Carbendazim content, %
Fig. S. AsooIA496 (absorbance ratio) as a function ofthe carbendazimcontent
460 530 500 460 530 500
Wavenumber/cm-'
Fig. 6. Part of the IR spectrum of benomyl containing carbendazim.Carbendazim content: (0) 2.5, (b) 3.0; and (e) ",,20-25%. A,Carbendazim (509 cm- I ); B, benomyl (496 cm- I )
Results and DiscussionFig. 2 illustrates the decomposition of benomyl by means of atypical series of HPLC traces. Although some evidence can befound in the literature3-S relating to this decomposition, themeasurements made here were aimed at a more detailedexamination of this feature of the compound.7
Based on our experiments7 UV spectrophotometry wasfound to be unsatisfactory, because carbendazim can bedetected only at 225 nm, and the presence of small amounts of
where C is a constant.Of course, equation (1) is only an approximate relationship;
for a more precise determination or at higher carbendazimconcentrations the whole hyperbolic curve must be con·sidered.
The difference between the two peaks (13 cm- I ) mightappear too small; however, a five·fold expansion of theabscissa (wavenumber scale) can provide good selectivity(Fig. 6). Further increase in the sensitivity can be achieved byemploying a three·fold expansion of the ordinate.
ANALYST, NOVEMBER 1990, VOL. 115
The calibration graph was constructed using more than tensamples of benomyl - carbendazim mixtures. Experimentsshowed that the lowest measuring limit is for a carbendazimcontent of 2.0-2.5%. The accuracy of the method is ±~%,at a probability level of 95%. In view of the accuracy ofquantitative IR measurements, this result appears to be good.
In our institute both the quality and amount of solvent usedin the last step of the synthesis (Fig. 1) was modified foreconomic reasons. Incorrect choice of the solvent resulted inhigh carbendazim contents (Table 1, entries I and 2). The useof IR spectrophotometry to monitor the carbendazim contentin the benomyl thus produced (Table 1) enabled the correctsolvents for obtaining a pure product to be found (see entries8-11 in Table 1).
Conclusion
The determination of the carbendazim content of benomylcannot be effected satisfactorily by HPLC or UV spectrophotometry because of the occurrence of decomposition. Nodecomposition takes place in a KBr pellet, hence IR spectro-
1493
photometry is suitable for determining or checking thecarbendazim content in benomyl. The proposed method issimple and does not require tedious sample preparation.
References
1. Pavoni, G., Boll. Cltim. Unione Ital. Lab. Provo Parte Sci.,1979, S, 601.
2. EI-Zeftawi, B. M. J., Sci. Hortic. Amsterdnm, 1982, 17,241.3. Kirkland. J., Holt, R., and Pease, H., J. Agric. Food Cltem.,
1973,21,368.4. Mayer, W. J., and Greenberg, M. S., J. Cltromatogr., 1981,
208,295.5. Burzi, F. F., Berri, A., and Zacchetti, M., Riv. Soc. Ital. Sci.
Aliment., 1981, 10, 19.6. Chiba, M., and Veres, D. F., J. Assoc. Off Anal. Cltem., 1980,
63, 1291.7. Meszlenyi, G.. and Ktirtvelyessy, J., unpublished results.
Paper 0/01497DReceived April 4th, 1990Accepted July 9th, 1990

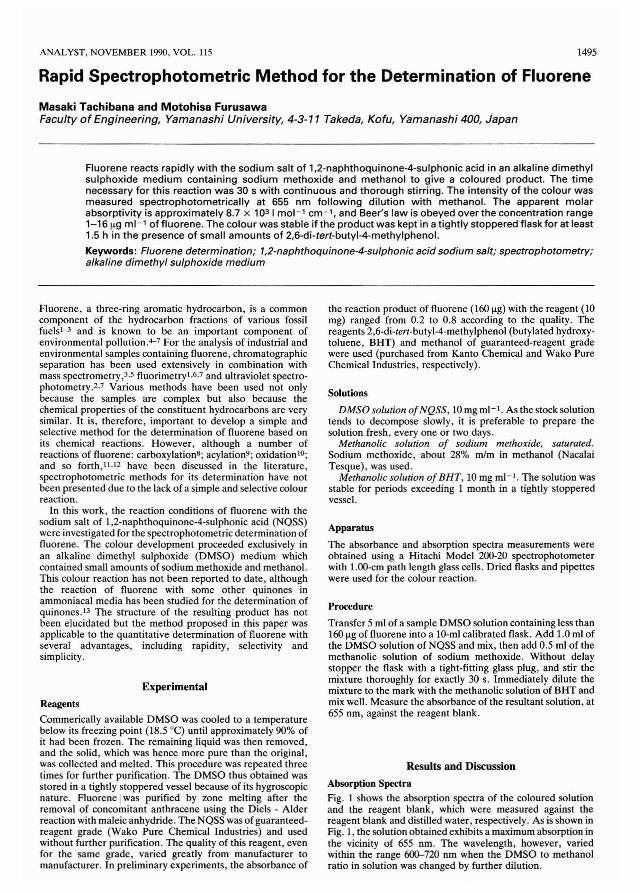
ANALYST. NOVEMBER 1990. VOL. 115 1495
Rapid Spectrophotometric Method for the Determination of Fluorene
Masaki Tachibana and Motohisa FurusawaFaculty of Engineering, Yamanashi University, 4-3-11 Takeda, Kofu, Yamanashi 400, Japan
Fluorene reacts rapidly with the sodium salt of 1,2-naphthoquinone-4-sulphonic acid in an alkaline dimethylsulphoxide medium containing sodium methoxide and methanol to give a coloured product. The timenecessary for this reaction was 30 s with continuous and thorough stirring. The intensity of the colour wasmeasured spectrophotometrically at 655 nm following dilution with methanol. The apparent molarabsorptivity is approximately 8.7 x 10³ I mol-1 cm- 1, and Beer's law is obeyed over the concentration range1-16 Ilg ml- 1 of fluorene. The colour was stable if the product was kept in a tightly stoppered'flask for at least1.5 h in the presence of small amounts of 2,6-di-tert-butyl-4-methylphenol.
Keywords: Fluorene determination; 1,2-naphthoquinone-4-sulphonic acid sodium salt; spectrophotometry;alkaline dimethyl sulphoxide medium
Fluorene, a three-ring aromatic hydrocarbon, is a commoncomponent of the hydrocarbon fractions of various fossilfuels l-3 and is known to be an important component ofenvironmental pollution.4-7 For the analysis of industrial andenvironmental samples containing fluorene, chromatographicseparation has been used extensively in combination withmass spectrometry,3.5 fluorimetryl.6.7 and ultraviolet spectrophotometry.2.7 Various methods have been used not onlybecause the samples are complex but also because thechemical properties of the constituent hydrocarbons are verysimilar. It is, therefore, important to develop a simple andselective method for the determination of fluorene based onits chemical reactions. However, although a number ofreactions of fluorene: carboxylation8; acylation9 ; oxidation10;
and so forth, 1l.12 have been discussed in the literature,spectrophotometric methods for its determination have notbeen presented due to the lack of a simple and selective colourreaction.
In this work, the reaction conditions of fluorene with thesodium salt of 1,2-naphthoquinone-4-sulphonic acid (NQSS)were investigated for the spectrophotometric determination offluorene. The colour development proceeded exclusively inan alkaline dimethyl sulphoxide (DMSO) medium whichcontained small amounts of sodium methoxide and methanol.This colour reaction has not been reported to date, althoughthe reaction of fluorene with some other quinones inammoniacal media has been studied for the determination ofquinones. 13 The structure of the resulting product has notbeen elucidated but the method proposed in this paper wasapplicable to the quantitative determination of fluorene withseveral advantages, including rapidity, selectivity andsimplicity.
Experimental
Reagents
Commerically available DMSO was cooled to a temperaturebelow its freezing point (18.5 0c) until approximately 90% ofit had been frozen. The remaining liquid was then removed,and the solid, which was hence more pure than the original,was collected and melted. This procedure was repeated threetimes for further purification. The DMSO thus obtained wasstored in a tightly stoppered vessel because of its hygroscopicnature. Fluorene Iwas purified by zone melting after theremoval of concomitant anthracene using the Diels - Alderreaction with maleic anhydride. The NQSS was of guaranteedreagent grade (Wako Pure Chemical Industries) and usedwithout further purification. The quality of this reagent, evenfor the same grade, varied greatly from manufacturer tomanufacturer. In preliminary experiments, the absorbance of
the reaction product of fluorene (160 Ilg) with the reagent (10mg) ranged from 0.2 to 0.8 according to the quality. Thereagents 2,6-di-tert-butyl-4-methylphenol (butylated hydroxytoluene, BHT) and methanol of guaranteed-reagent gradewere used (purchased from Kanto Chemical and Wako PureChemical Industries, respectively).
Solutions
DMSOsolution ofNQSS, 10 mg ml- I . As the stock solutiontends to decompose slowly, it is preferable to prepare thesolution fresh, everyone or two days.
Methanolic solution of sodium methoxide, saturated.Sodium methoxide, about 28% m1m in methanol (NacalaiTesque), was used.
Methanolic solution of BHT, 10 mg ml- I . The solution wasstable for periods exceeding 1 month in a tightly stopperedvessel.
Apparatus
The absorbance and absorption spectra measurements wereobtained using a Hitachi Model 200-20 spectrophotometerwith I.oo-cm path length glass cells. Dried flasks and pipetteswere used for the colour reaction.
Procedure
Transfer 5 ml of a sample DMSO solution containing less than160 Ilg of fluorene into a 10-ml calibrated flask. Add 1.0 ml ofthe DMSO solution of NQSS and mix, then add 0.5 mt of themethanolic solution of sodium methoxide. Without delaystopper the flask with a tight-fitting glass plug, and stir themixture thoroughly for exactly 30 s. Immediately dilute themixture to the mark with the methanolic solution of BHT andmix well. Measure the absorbance of the resultant solution, at655 nm, against the reagent blank.
Results and Discussion
Absorption Spectra
Fig. 1 shows the absorption spectra of the coloured solutionand the reagent blank, which were measured against thereagent blank and distilled water, respectively. As is shown inFig. 1, the solution obtained exhibits a maximum absorption inthe vicinity of 655 nm. The wavelength, however, variedwithin the range 600-720 nm when the DMSO to methanolratio in solution was changed by further dilution.
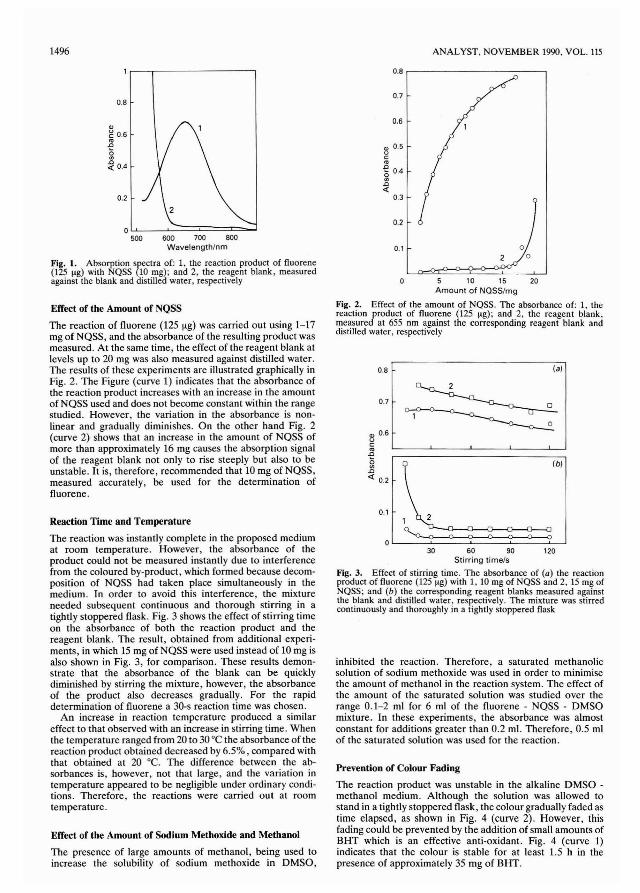
1496 ANALYST, NOVEMBER 1990, VOL. 115
0.8,---------------,
0.7
0.1
(a)
~(b)
, 2
~30 60 90 120
Stirring time/s
Fig. 3. Effect of stirring time. The absorbance of (a) the reactionproduct of fluorene (125 ",g) with 1, 10 mg of NQSS and 2, 15 mg ofNQSS; and (b) the corresponding reagent blanks measured againstthe blank and distilled water, respectively. The mixture was stirredcontinuously and thoroughly in a tightly stoppered flask
0.6
0.1
CD 0.6uc:...0
~.0
« 0.2
0.7
0.2
0.8
~ 0.5c:<0
~ 0.4
'".0«0.3
inhibited the reaction. Therefore, a saturated methanolicsolution of sodium methoxide was used in order to minimisethe amount of methanol in the reaction system. The effect ofthe amount of the saturated solution was studied over therange 0.1-2 ml for 6 ml of the fluorene - NQSS - DMSOmixture. In these experiments, the absorbance was almostconstant for additions greater than 0.2 m\. Therefore, 0.5 mIof the saturated solution was used for the reaction.
5 10 15 20Amount of NOSS/mg
Fig. 2. Effect of the amount of NQSS. The absorbance of: 1, thereaction product of fluorene (125 ",g); and 2, the reagent blank,measured at 655 nm against the corresponding reagent blank anddistilled water, respectively
Prevention of Colour Fading
The reaction product was unstable in the alkaline DMSO methanol medium. Although the solution was allowed tostand in a tightly stoppered flask, the colour gradually faded astime elapsed, as shown in Fig. 4 (curve 2). However, thisfading could be prevented by the addition of small amounts ofBHT which is an effective anti-oxidant. Fig. 4 (curve 1)indicates that the colour is stable for at least 1.5 h in thepresence of approximately 35 mg of BHT.
oL....-_""":::====..::J500 600 700 800
Wavelength/nm
Fig. l. Absorption spectra of: 1, the reaction product of fluorene(125 I'g) with NQSS (10 mg); and 2, the reagent blank, measuredagainst the blank and distilled water, respectively
0.8
Reaction Time and Temperature
The reaction was instantly complete in the proposed mediumat room temperature. However, the absorbance of theproduct could not be measured instantly due to interferencefrom the coloured by-product, which formed because decomposition of NQSS had taken place simultaneously in themedium. In order to avoid this interference, the mixtureneeded subsequent continuous and thorough stirring in atightly stoppered flask. Fig. 3 shows the effect of stirring timeon the absorbance of both the reaction product and thereagent blank. The result, obtained from additional experiments, in which 15 mg of NQSS were used instead of 10 mg isalso shown in Fig. 3, for comparison. These results demonstrate that the absorbance of the blank can be quicklydiminished by stirring the mixture, however, the absorbanceof the product also decreases gradually. For the rapiddetermination of fluorene a 30-s reaction time was chosen.
An increase in reaction temperature produced a similareffect to that observed with an increase in stirring time. Whenthe temperature ranged from 20 to 30°C the absorbance of thereaction product obtained decreased by 6.5%, compared withthat obtained at 20°C. The difference between the absorbances is, however, not that large, and the variation intemperature appeared to be negligible under ordinary conditions. Therefore, the reactions were carried out at roomtemperature.
Effect of the Amount of Sodium Methoxide and Methanol
The presence of large amounts of methanol, being used toincrease the solubility of sodium methoxide in DMSO,
0.2
Effect of the Amount of NQSS
The reaction of fluorene (125 f.lg) was carried out using 1-17mg of NQSS, and the absorbance of the resulting product wasmeasured. At the same time, the effect of the reagent blank atlevels up to 20 mg was also measured against distilled water.The results of these experiments are illustrated graphically inFig. 2. The Figure (curve 1) indicates that the absorbance ofthe reaction product increases with an increase in the amountof NQSS used and does not become constant within the rangestudied. However, the variation in the absorbance is nonlinear and gradually diminishes. On the other hand Fig. 2(curve 2) shows that an increase in the amount of NQSS ofmore than approximately 16 mg causes the absorption signalof the reagent blank not only to rise steeply but also to beunstable. It is, therefore, recommended that 10 mg of NQSS,measured accurately, be used for the determination offluorene.

ANALYST, NOVEMBER 1990, VOL. 115 1497
Table 1. Effect of a variety of aromatic compounds0,7
3
• According to the procedure, 100 J!g of fluorene were allowed toreact.
Amount ofadded
compound! Absorbancemg at 655 nm Difference
0.520102 0.526 +0.006102 0.524 +0.004102 0.520 0.000105 0.521 +0.00110.7 0.511 -0.00920.8 0.500 -0.0200.12 0.508 -0.0120.35 0.500 -0.0201.2 0.494 -0.026
101 0.515 -0.005101 0.514 -0.006102 0.516 -0.00423.0 0.516 -0.0040.33 0.513 -0.0071.1 0,493 -0.0272.0 0.521 +0.0015.0 0.503 -0.017
10.8 0,494 -0.0260.34 0.515 -0.0051.1 0,490 -0.0300.12 0.509 -0.0110.36 0,473 -0.0471.2 0,412 -0.1080.31 0.509 -0.0111.0 0.501 -0.0190.010 0.509 -0.0110.031 0,491 -0.0290.10 0.469 -0.0510.31 0.410 -0.1101.0 0.400 -0.1201.1 0.514 -0.0062.2 0.504 -0.0160.011 0.513 -0.0070.032 0.484 -0.0360.11 0,430 -0.0900.32 0.340 -0.1801.1 0.215 -0.3050.52 0.528 +0.0081.0 0.530 +0.0102.1 0.499 -0.021
1,4-Naphthoquinone
'"uc:~ 0.4
~.c<l:
0.2
Anthrone
0.6
9,10-Phenanthrenequinone
Anthraquinone
Acenaphthenequinone
9-Fluorenone
FluoranthenePyrene ..DibenzofuranDibenzothiopheneCarbazole
Compound addedNone*BiphenylNaphthaleneAcenaphthenePhenanthrene ..Anthracene
Xanthene
Acridine ..
9,IO-Dihydroanthracene
600 700 BOOWavelength/nm
Fig. 5. Absorption spectra obtained from commercially availablephenanthrene and pyrene. According to the determination procedure: 1,52 mg of the phenanthrene; 2, 105 mg of the pyrene; and 3,fluorene standard solutIOn (120 J!g) were allowed to react
The concentrations of fluorene in commercial phenanthreneand pyrene samples were 0.21 and 0.086% m1m, respectively,according to calculation from the calibration graph. The nettime required to determine fluorene in each sample was lessthan 5 min. In comparison with the chromatographic separa-
Application to Practical Samples
The proposed method was applied directly to the determination of fluorene in commercially available phenanthrene andpyrene without pre-treatment. As the purification of suchpolycyclic aromatic hydrocarbons, mostly obtained from coaltar, is relatively difficult, the commercial chemicals usuallycontain a variety of small amounts of the analogues asimpurities. Therefore, it is useful to determine fluorene as oneof the impurities in these samples because the results mayprovide valuable information on the purity and the source.Fig. 5 shows the resulting absorption spectra obtained fromphenanthrene (52 mg) and pyrene (105 mg) samples, whichwere of guaranteed-reagent grade, and the spectrum from afluorene standard solution (120 f!g). These three spectra arevirtually identical over the wide wavelength range 550--850nm, as shown in Fig. 5. Therefore, Fig. 5 indicates that theproposed spectrophotometric method is selective for thedetermination of fluorene in these analogous hydrocarbons.
l'l; 0.6.c(;<II.c<l: 0,5
0,4
0.5 1 1.5Standing time/h
Fig. 4. Effect of standing time. The reaction mixture consisting offluorene (125 J!g), NQSS (10 mg), sodium methoxide. methanol andDMSO solution was diluted to the mark with 1, a 10 mg ml- 1
methanolic solution of BHT or 2, methanol only
Effect of Foreign Compounds
The effect of 19 different aromatic compounds on thedetermination of fluorene (100 f!g) was studied and the resultsare summarised in Table 1. Some aromatic carbonyl compounds and quinones have an appreciable effect on the colourdevelopment, but even in the presence of 10-fold amounts ofthese compounds the colour reaction of fluorene proceeds,albeit with a decrease in absorbance. Unlike such interferingcompounds, analogous polycyclic aromatic hydrocarbons(except anthracene and 9,10-dihydroanthracene) and dibenzofuran do not interfere even in amounts 1000-fold greater thanfluorene. Judging from the influence of anthraquinone givenin Table 1, it can be presumed that the adverse effects ofanthracene and 9,10-dihydroanthracene are attributable tothat of anthraquinone produced by the oxidation of bothhydrocarbons in the reaction mixture. Therefore, Table 1indicates that the colour reaction is easily applicable to theselective determination of fluorene in the presence of otherhydrocarbons.
Calibration Graph
Beer's law was obeyed up to a concentration of 16 f!g ml- 1 offluorene. The relative standard deviation was 1.3% on tenmeasurements carried out using 125 f!g of fluorene. Thereaction product possesses an apparent molar absorptivity of8.7 x 103 1mol- 1 cm- I which was calculated on the basis of theresulting absorbance (0.657) at 655 nm in the final dilutesolution (10 mt) obtained from 125 f!g of fluorene and 10 mg ofNQSS, even if further additions of NQSS result in an increasein the absorbance (see Fig. 2).

1498
tion, the proposed determination procedure is selective, rapidand simple.
References
1. Bagheri, H., and Creaser, C. S., Analyst, 1988, 113, 1175.2. Davies, I. L., Bartle, K. D., Williams, P. T., and Andrews,
G. E., Anal. Chem., 1988,60,204.3. Wozniak, T. J., and Hites, R. A.,Anal. Chem., 1983, 55,1791.4. Morselli, L., and Zappoli, S., Sci. Total Environ., 1988, 73,
257.5. Bedding, N. D., Mcintyre, A. E., Lester, J. N., and Perry, R.,
l. Chromatogr. Sci., 1988, 26, 597.6. Draisci, R., Cecinato, A., Brancaleoni, E., and Ciccioli, P.,
Chromatographia, 1987,23,803.
ANALYST, NOVEMBER 1990, VOL. 115
7. Lebo, J. A., and Smith, L. M., l. Assoc. Off. Anal. Chem.,1986, 69, 944.
8. Minabe, M., Isozumi, K., Kawai, K., and Yoshida, M., Bul/.Chem. Soc. lpn., 1988,61,2063.
9. Bokova, A. I., and Badiu, M., Sint. Reakts. Sposobn. Org.,Soedin., 1983,38; Chem. Abstr.. 1984, 101, 72396k.
10. Bhattacharjee, A. K., and Mahanti, M. K., Oxid. Commun.,1984,7,145.
11. Hashimoto, S., Chem. Express, 1988,3,479.12. Kajigaeshi, S., Kadowaki, T., Nishida, A., and Fujisaki, S.,
Bull. Chem. Soc. lpn., 1986, 59, 97.13. Zaki, M., Tarek, M., Fawzy, M. H., and Assey, M. M.,
Mikrochim. Acta, 1987,3,321.
Paper O/01383HReceived March 30th, 1990
Accepted July 24th, 1990
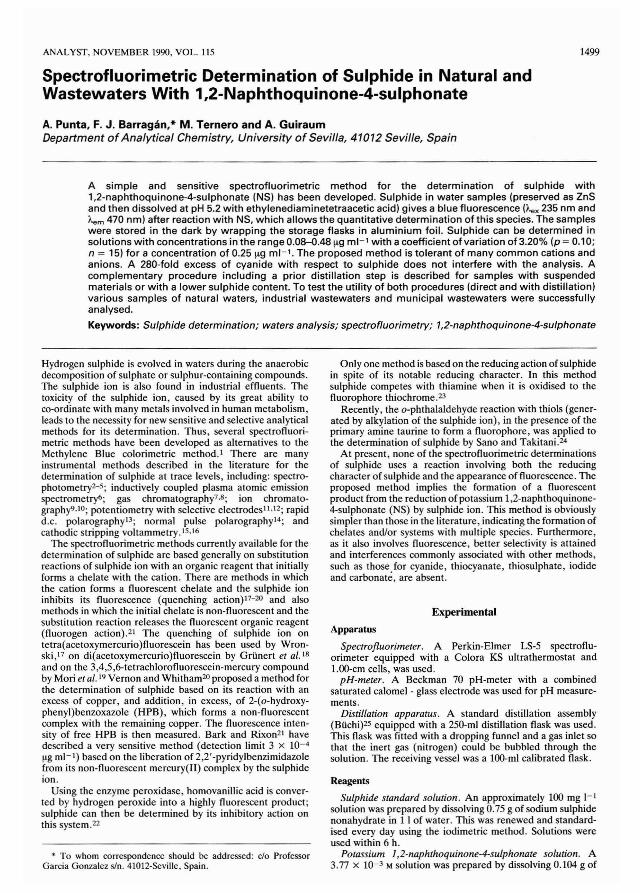
ANALYST, NOVEMBER 1990. VOL. liS
Spectrofluorimetric Determination of Sulphide in Natural andWastewaters With 1,2-Naphthoquinone-4-sulphonate
A. Punta, F. J. Barragan,* M. Ternero and A. GuiraumDepartment ofAnalytical Chemistry, University of Sevilla, 41012 Seville, Spain
1499
A simple and sensitive spectrofluorimetric method for the determination of sulphide with1,2-naphthoquinone-4-sulphonate (NS) has been developed. Sulphide in water samples (preserved as ZnSand then dissolved at pH 5.2 with ethylenediaminetetraacetic acid) gives a blue fluorescence O'ex 235 nm and"-em 470 nm) after reaction with NS, which allows the quantitative determination of this species. The sampleswere stored in the dark by wrapping the storage flasks in aluminium foil. Sulphide can be determined insolutions with concentrations in the range O.08-0.48l!g ml- 1 with a coefficient of variation of 3.20% (p = 0.10;n = 15) for a concentration of 0.25 I!g ml-'. The proposed method is tolerant of many common cations andanions. A 2aO-fold excess of cyanide with respect to sulphide does not interfere with the analysis. Acomplementary procedure including a prior distillation step is described for samples with suspendedmaterials or with a lower sulphide content. To test the utility of both procedures (direct and with distillation)various samples of natural waters, industrial wastewaters and municipal wastewaters were successfullyanalysed.
Keywords: Sulphide determination; waters analysis; spectrofluorimetry; 1,2-naphthoquinone-4-sulphonate
Hydrogen sulphide is evolved in waters during the anaerobicdecomposition of sulphate or sulphur-containing compounds.The sulphide ion is also found in industrial effluents. Thetoxicity of the sulphide ion, caused by its great ability toco-ordinate with many metals involved in human metabolism,leads to the necessity for new sensitive and selective analyticalmethods for its determination. Thus, several spectrofluorimetric methods have been developed as alternatives to theMethylene Blue colorimetric method. I There are manyinstrumental methods described in the literature for thedetermination of sulphide at trace levels, including: spectrophotometry2-5; inductively coupled plasma atomic emissionspectrometry6; gas chromatography7.S; ion chromatography9.1O; potentiometry with selective electrodes I1.12; rapidd.c. polarographyl3; normal pulse polarographyl4; andcathodic stripping voltammetry.15.16
The spectrofluorimetric methods currently available for thedetermination of sulphide are based generally on substitutionreactions of sulphide ion with an organic reagent that initiallyforms a chelate with the cation. There are methods in whichthe cation forms a fluorescent chelate and the sulphide ioninhibits its fluorescence (quenching action)17-20 and alsomethods in which the initial chelate is non-fluorescent and thesubstitution reaction releases the fluorescent organic reagent(fluorogen action).21 The quenching of sulphide ion ontetra(acetoxymercurio)fluorescein has been used by Wronski,I7 on di(acetoxymercurio)fluorescein by Griinert et al. lsand on the 3,4,5,6-tetrachlorofluorescein-mercury compoundby Mori et al. 19 Vernon and Whitham20 proposed a method forthe determination of sulphide based on its reaction with anexcess of copper, and addition, in excess, of 2-(o-hydroxyphenyl)benzoxazole (HPB), which forms a non-fluorescentcomplex with the remaining copper. The fluorescence intensity of free HPB is then measured. Bark and Rixon21 havedescribed a very sensitive method (detection limit 3 x 10⁻⁴I!g ml- I) based on the liberation of2,2'-pyridylbenzimidazolefrom its non-fluorescent mercury(U) complex by the sulphideion.
Using the enzyme peroxidase, homovanillic acid is converted by hydrogen peroxide into a highly fluorescent product;sulphide can then be determined by its inhibitory action onthis system.22
• To whom correspondence should be addressed; do ProfessorGarcia Gonzalez sin. 41012-Seville, Spain.
Only one method is based on the reducing action of sulphidein spite of its notable reducing character. In this methodsulphide competes with thiamine when it is oxidised to thefluorophore thiochrome. 23
Recently, the o-phthalaldehyae reaction with thiols (generated by alkylation of the sulphide ion), in the presence of theprimary amine taurine to form a fluorophore, was applied tothe determination of sulphide by Sano and Takitani,24
At present, none of the spectrofluorimetric determinationsof sulphide uses a reaction involving both the reducingcharacter of sulphide and the appearance of fluorescence. Theproposed method implies the formation of a fluorescentproduct from the reduction of potassium 1,2-naphthoquinone4-sulphonate (NS) by sulphide ion. This method is obviouslysimpler than those in the literature, indicating the formation ofchelates andlor systems with multiple species. Furthermore,as it also involves fluorescence, better selectivity is attainedand interferences commonly associated with other methods,such as those for cyanide, thiocyanate, thiosulphate, iodideand carbonate, are absent.
Experimental
Apparatus
Spectrojluorimeter. A Perkin-Elmer LS-5 spectrofluorimeter equipped with a Colora KS ultrathermostat andl.00-cm cells, was used.
pH-meter. A Beckman 70 pH-meter with a combinedsaturated calomel - glass electrode was used for pH measurements.
Distillation apparatus. A standard distillation assembly(Biichi)25 equipped with a 250-ml distillation flask was used.This flask was fitted with a dropping funnel and a gas inlet sothat the inert gas (nitrogen) could be bubbled through thesolution. The receiving vessel was a l00-ml calibrated flask.
Reagents
Sulphide standard solution. An approximately 100 mg I-Isolution was prepared by dissolving 0.75 g of sodium sulphidenonahydrate in 1 I of water. This was renewed and standardised every day using the iodimetric method. Solutions wereused within 6 h.
Potassium 1,2-naphthoquinone-4-sulphonate solution. A3.77 X 10-3 M solution was prepared by dissolving 0.104 g of

1500
the potassium salt in 100 ml of water and stored in anamber-coloured bottle. This NS solution must be prepareddaily.
Acetic acid - potassium acetate buffer solution. AD. 1 M (totalconcentration) pH 5.2 solution was prepared by dissolving 6ml of glacial acetic acid and 3.5 g of potassium hydroxide in 11of water.
Zinc acetate solution. An approximately 0.1 M solution wasprepared by dissolving 22 g of zinc acetate dihydrate in 1 I ofwater. Dilute this stock solution as appropriate to produce a0.01 M working solution.
Ethylenediaminetetraacetic acid solution (EDTA). Anapproximately 0.1 M solution was prepared by dissolving 40 gof the disodium dihydrate salt in 1 I of water.
Potassium chlorate solution. An approximately 0.1 M
solution was prepared by dissolving 12.2 g of the salt in 1 I ofwater.
Phosphoric acid solution. Concentrated phosphoric acidsolution (85%) (sp.gr. 1.71) was used.
Nitrogen-purifying solution. Mercury(II) chloride (5 g) wasdissolved in 100 ml of 2% mJv potassium permanganatesolution.
The reagents for the Methylene Blue reference methodused for evaluating the performance of the proposed methodwere prepared as described in reference 1.
All reagents and solvents were of analytical-reagent grade.Distilled, de-ionised water was used throughout.
Procedure
Spectrofluorimetric determination of sulphide
To the sample solution, containing 2-12 ~g of sulphide, in a25-ml calibrated flask wrapped with aluminium foil to secure aconvenient darkness, add 5 ml of pH 5.2 buffer solution and0.8 ml of 3.77 x 10⁻³ M NS solution and dilute to the mark withwater. After mixing, allow to stand for 30 min, prepare a blanksolution without sulphide and measure the fluorescenceintensities (25 ± 1°C) of both solutions at 470 nm, using anexcitation wavelength of 235 nm. Then calculate the difference in fluorescence intensities and plot a calibration graph.
Determination of sulphide in watersPreserve the sample by placing 2 ml of 0.1 M zinc acetatesolution into a 1000-ml flask, filling completely with thesample and stoppering. Total sulphide was determinedspectrofluorimetrically either by a direct method, or bydistilling as hydrogen sulphide from acidic media if the sampleis not entirely free from suspended solids, or to concentratethe sulphide content into a smaller volume for greateranalytical sensitivity.
(a) Direct determination without distillation. Depending onthe sulphide ion content, transfer an accurate volume ofsample (up to 15 ml), containing 2-12 ~g of sulphide into a25-ml calibrated flask wrapped in aluminium foil and then add2.5 ml of 0.1 M chlorate solution. After mixing, add 5 ml of pH5.2 buffer solution, 0.8 ml of3.77 x 10-3 M NS solution and 0.5ml of 0.1 M EDTA solution, and dilute to the mark with water.Similarly, prepare a blank solution without sulphide. Allow itto stand for 30 min and measure the fluorescence intensities(25 ± 1°C) at 470 nm, using an excitation wavelength of 235nm. Calculate the difference in fluorescence values anddetermine the concentration of sulphide in the sample fromthe calibration graph prepared using data obtained underidentical conditions.
(b) Determination with distillation. Depending on thesulphide ion content, place up to 200 ml of the samplecontaining 8-48 ~g of sulphide into a 250-ml distillation flask(for samples with sulphide concentrations lower than 0.04~g ml- t , place up to 400 ml into a 500-ml distillation flask).Introduce 1 ml of 0.01 M zinc acetate solution and 20 ml ofdistilled water into a 100-ml calibrated flask. Heat until boiling
ANALYST, NOVEMBER 1990, VOL. 115
under a moderate flow of nitrogen (2 ml min-I) which haspassed through a wash bottle containing the nitrogen-purifying solution to remove sulphide and other reducing impurities.When the water begins to distil over into the receiver, add 5 mlof phosphoric acid solution to the distillation flask through thedropping funnel. After 15 min, when approximately 70 mlhave distilled over, cease distillation. Remove the calibratedflask and inlet tube from the apparatus, wrap in aluminium foiland add 10 ml of 0.1 M chlorate solution. After mixing, add 10ml of pH 5.2 buffer solution, 3.2 ml of 3.77 x 10⁻³ M NSsolution and 2 ml of 0.1 M EDTA solution, dilute to the markwith water and proceed as described under (a) Directdetermination without distillation. Prepare the calibrationgraph by using standard solutions of sulphide treated in thesame manner.
Results and Discussion
Study of the NS - Sulphide System
When a solution of NS, which is yellow, is treated with aweakly acidic solution of sulphide, a colourless product isformed. The colour reaction has already been used for theindirect determination of sulphide in the spectrophotometricdetermination of unreacted NS with sulphanilic acid. 26
The product ofthis reaction has fluorescence properties andthe maximum wavelengths of the excitation and emissionspectra at pH 5.2 are 235 and 475 nm, respectively. Ascorbicacid also produces a similar fluorescent product with NS, butits fluorescence intensity is about lO-fold lower, under similarconditions. On the other hand, NS itself shows some fluorescence when boiled for 30 min in aqueous solutions27 (Fig. 1).
The addition of sulphide ion to a solution of the NS reagentinduces fluorescence, which increases slightly over 25 min andthen reaches a constant value at room temperature; thefluorescence remains constant for a further 120 min afterwhich a decrease in the fluorescence is observed.
The measured fluorescence intensity diminished undernormal light, as NS is susceptible to photochemical decomposition which increases the fluorescence of the blank. Hence, adecrease of the measured fluorescence of 5% from the initialvalue was observed for samples under ultraviolet or visiblelight. Throughout this work the samples were protectedagainst light decomposition by wrapping them in aluminiumfoil to ensure good reproducibility and a consistent magnitudeof measurements.
The effect of temperature was tested in the range 20-70 ce,under the conditions given in the procedure for the spectrofluorimetric determination of sulphide (see Table 1). Thefluorescence intensity remained stable for measurementsmade at temperatures of up to 50°C. At higher temperatures,
100,..-------------------,
..!!- 50
400 500 600Wavelength/nm
Fig. 1. Fluorescence emission spectra of 1.03 x 10⁻⁴ M NS solution.1, Without sulphide at 25°C; 2, without sulphide and boiling for 30min; 3, with sulphide (1.07 x 10⁻⁵ M), at 25°C; and 4, with ascorbicacid (1.07 x 10⁻⁵ M), at 25°C

ANALYST, NOVEMBER 1990. VOL. 115 1501
Table 1. Effect of temperature on the relative fluorescence intensity ofthe NS - sulphide system (amount of sulphide taken = O.409l'g ml-')
Table 2. Effect of foreign ions on the spectrofluorimetric determination of sulphide (amount of sulphide taken = 0.35 I'g ml-')
Calions-Nal,K' 2000NH.' 100Call,MglI.. 50Cd" . . 0.2 (30)'Cull, Mn" 0.1 (10)'Znll , Felli. . 0.1 (2)'
'With addition of EDTA to the sample, fixed with zinc acetate.t With addition of chlorate to the sample, fixed with zinc acetate.
RelativeTfC fluorescence intensity20 57.125 55.530 55.535 55.240 54.945 56.250 54.555 53.060 52.065 52.370 52.5
60
40
Ion addedAnions
AcetateChloride, bromide, sulphateCarbonateTetraborate, arsenate, orthophosphate,
tartrate ..Nitrate, oxalateCitrateCyanideThiosulphateIodide, thiocyanateNitriteIodate, chlorateSulphite ..Periodate ..
ToleranceIimitlJlgml- 1
20001000500
2001005050(100)'20520.50.4 (2)t0.3
20 Table 3. Recovery of sulphide in the presence of zinc acetate andlorEDTA
Substance added(I'ffiol per 25 ml of sample)
268.8107.553.853.853.853.8
EDTA
3.822.291.15
1.530.190.03
Zinc(I1)
Sulphide recovered-------------- (I'mol per25ml
of sample)0.32
<0.010.270.320.180.270.330.180.320.32
greater amounts, which is of analytical interest. The relativeamounts of thiosulphate, cyanide and iodide that can betolerated are greater than those in the Methylene Blue methodand most of the spectrofluorimetric methods (Table 5).
Other anions such as chlorate, iodate and periodate, thatcause oxidation of sulphide also interfere. Therefore, if theseoxidants are present in a sample it is unlikely that any sulphidewill be present, hence, examination ofthese incompatible ionsas interferents in these methods becomes unnecessary.
Next, the effect of foreign cations was studied. Cationswhich react with sulphide to form precipitates showedinterferences. Other cations (calcium, magnesium, sodium,potassium and ammonium) which do not form insolublesulphides can be tolerated to a greater excess.
Zinc acetate is normally used to preserve sulphide in watersamples9•28 and as a reagent to collect hydrogen sulphide indistillation procedures. A preliminary interference study wascarried out in the presence of zinc acetate in order to establishits suitability for these purposes. The interfering effect ofEDTA was also investigated, and utilised in order to enablethe total dissolution of zinc sulphide at the working pH of 5.2.The EDTA also acts as a masking reagent for other cationswhich form insoluble sulphides. The results of these investigations appear in Table 3.
the relative decrease in fluorescence is due to the increase offluorescence in the blank. Subsequent measurements werecarried out at 25 ± 1°C.
4 6 10pH
Fig. 2. Fluorescence intensity versus pH. The cross-hatched zonerepresents precipitation of NS in the sample
Spectrofluofimetric Determination of Sulphide
The optimisation of every variable influencing the reactionbetween sulphide and NS has been studied.
The reaction is dependent On pH. The fluorescenceintensity versus pH graph (Fig. 2) shows a useful working pHrange between 5.00 and 5.70. Acetate buffer (pH 5.2) wasused in all subsequent fluorescence work.
The effect of the NS concentration on the intensity of thefluorescence was tested. A 5-fold molar excess of the reagentis necessary for maximum fluorescence.
The ionic strength of the solution does not affect thefluorescence of the NS - sulphide system.
The order of addition of the reagents was found not to beimportant. The sequence: sulphide; buffer solution; NS wasadhered to during the preparation of all measured solutions.
A linear calibration graph was obtained over the COncentration range 0.0!Hl.48 Jlg ml- 1 of sulphide. The coefficient ofvariation (p = 0.10, n = 15) of the method is 3.02% for 0.25Jlg ml- 1 of sulphide and 3.53% for 0.12 Jlg ml- 1 of sulphide.
In order to assess the possible analytical applications of thespectrofluorimetric method, the influence of some of theaniOns that often accompany sulphide was examined byadding different amounts of these aniOns to a 0.35 Jlg ml- I
sulphide ion solution. An error of 2% in the fluorescencereadings was considered tolerable. The results obtained areshown in Table 2. The major interferences were caused byanions such as sulphite and nitrite. Other sulphur anions suchas thiocyanate, thiosulphate and sulphate can be tolerated in
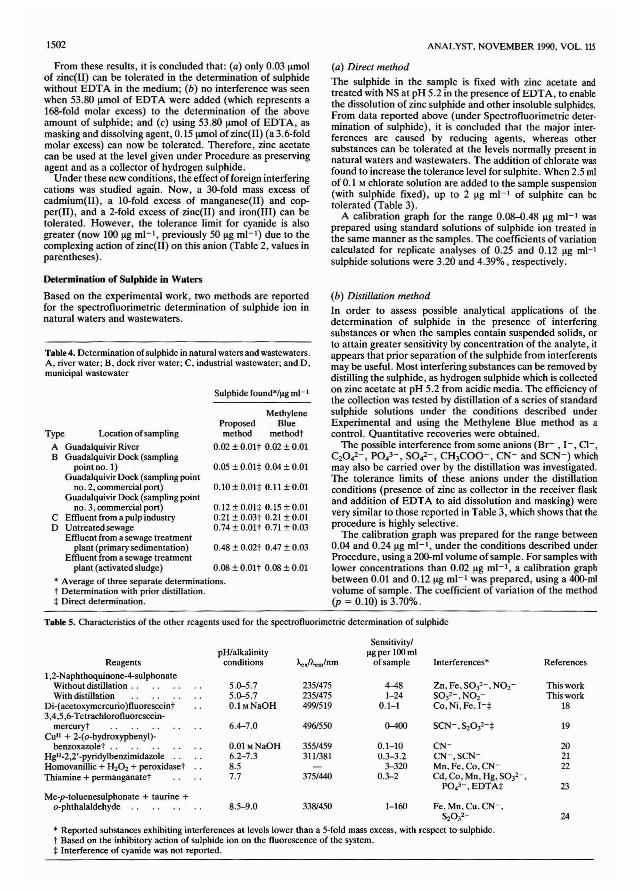
1502 ANALYST. NOVEMBER 1990. VOL. 115
From these results, it is concluded that: (a) only 0.03 J.lmolof zinc(lI) can be tolerated in the determination of sulphidewithout EDTA in the medium; (b) no interference was seenwhen 53.80 J.lmol of EDTA were added (which represents a168-fold molar excess) to the determination of the aboveamount of sulphide; and (c) using 53.80 J.lmol of EDTA, asmasking and dissolving agent, 0.15 J.lmol ofzinc(lI) (a 3.6-foldmolar excess) can now be tolerated. Therefore, zinc acetatecan be used at the level given under Procedure as preservingagent and as a collector of hydrogen sulphide.
Under these new conditions, the effect of foreign interferingcations was studied again. Now, a 3D-fold mass excess ofcadmium(Il), a lO-fold excess of manganese(Il) and copper(Il), and a 2-fold excess of zinc(Il) and iron(III) can betolerated. However, the tolerance limit for cyanide is alsogreater (now 100 J.lg ml- I , previously 50 J.lg ml- I ) due to thecomplexing action of zinc(Il) on this anion (Table 2, values inparentheses).
(a) Direct method
The sulphide in the sample is fixed with zinc acetate andtreated with NS at pH 5.2 in the presence of EDTA, to enablethe dissolution of zinc sulphide and other insoluble sulphides.From data reported above (under Spectrofluorimetric determination of sulphide), it is concluded that the major interferences are caused by reducing agents, whereas othersubstances can be tolerated at the levels normally present innatural waters and wastewaters. The addition of chlorate wasfound to increase the tolerance level for sulphite. When 2.5 mlof 0.1 M chlorate solution are added to the sample suspension(with sulphide fixed), up to 2 J.lg ml- 1 of sulphite can betolerated (Table 3).
A calibration graph for the range 0.lJ8-{).48 J.lg ml- I wasprepared using standard solutions of sulphide ion treated inthe same manner as the samples. The coefficients of variationcalculated for replicate analyses of 0.25 and 0.12 J.lg ml- I
sulphide solutions were 3.20 and 4.39%, respectively.
0.48 ± O.02t 0.47 ± 0.03
0.05 ± O.OH 0.04 ± 0.Ql
0.12 ± O.OH 0.15 ± 0.010.21 ± 0.03t 0.21 ± 0.010.74 ± O.Olt 0.71 ± 0.03
Sulphide found"/Ilg ml- I
(b) Distillation method
In order to assess possible analytical applications of thedetermination of sulphide in the presence of interferingsubstances or when the samples contain suspended solids, orto attain greater sensitivity by concentration of the analyte, itappears that prior separation of the sulphide from interferentsmay be useful. Most interfering substances can be removed bydistilling the sulphide, as hydrogen sulphide which is collectedon zinc acetate at pH 5.2 from acidic media. The efficiency ofthe collection was tested by distillation of a series of standardsulphide solutions under the conditions described underExperimental and using the Methylene Blue method as acontrol. Quantitative recoveries were obtained.
The possible interference from some anions (Br- , 1- , CI- ,C20 42-, P043-, S042-, CH3COO-, CN- and SCN-) whichmay also be carried over by the distillation was investigated.The tolerance limits of these anions under the distillationconditions (presence of zinc as collector in the receiver flaskand addition of EDTA to aid dissolution and masking) werevery similar to those reported in Table 3, which shows that theprocedure is highly selective.
The calibration graph was prepared for the range between0.04 and 0.24 J.lg ml- I , under the conditions described underProcedure, using a 2OD-ml volume of sample. For samples withlower concentrations than 0.02 J.lg ml- 1, a calibration graphbetween 0.01 and 0.12 J.lg ml- 1 was prepared, using a 4OD-mlvolume of sample. The coefficient of variation of the method(p = 0.10) is 3.70%.
MethyleneProposed Bluemethod methodt
0.02 ± O.Olt 0.02 ± 0.01Type Location ofsampling
A Guadalquivir RiverB Guadalquivir Dock (sampling
point no. 1)Guadalquivir Dock (sampling point
no. 2, commercial port) 0.10 ± O.OH 0.11 ± 0.01Guadalquivir Dock (sampling point
no. 3, commercial port)C Effluent from a pulp industryD Untreated sewage
Effluent from a sewage treatmentplant (primary sedimentation)
Effluent from a sewage treatmentplant (activated sludge) 0.08 ± O.Olt 0.08 ± 0.01
" Average of three separate determinations.t Determination with prior distillation.i Direct determination.
Table 4. Determination of sulphide in natural waters and wastewaters.A, river water; B, dock river water; C, industrial wastewater; and D,municipal wastewater
Determination of Sulphide in Waters
Based on the experimental work, two methods are reportedfor the spectrofluorimetric determination of sulphide ion innatural waters and wastewaters.
Table S. Characteristics of the other reagents used for the spectrofluorimetric determination of sulphide
Sensitivity/pH/alkalinity Ilg per 100 ml
Reagents conditions Aexfl....m/nm of sample Interferences" References1,2-Naphthoquinone-4-sulphonate
5.0-5.7 235/475 4-48 Zn, Fe. S032-. N02- This workWithout distillation ..With distillation 5.0-5.7 235/475 1-24 S032-.N02- This work
Di-(acetoxymercurio)f1uoresceint O.lMNaOH 499/519 0.1-1 Co, Ni, Fe. I-i 183,4,5,6-Tetrachlorofluorescein-
4961550 0-400 SCN-. ~032-i 19mercuryt 6.4-7.0CUll + 2-(o-hydroxyphenyl)-
O.QlMNaOH 355/459 0.1-10 CN- 20bemoxazolet ..Hgll_2,2'-pyridylbemimidazole 6.2-7.3 311/381 0.3-3.2 CN-,SCN- 21Homovanillic + H20 2+ peroxidaset 8.5 3-320 Mn, Fe, Co. CN- 22Thiamine + permanganatet 7.7 375/440 0.3-2 Cd, Co, Mn, Hg, SOl-,
P043- , EDTAi 23
241-16033814508.5-9.0 Fe. Mn.Cu.CN-,
~Oi-
" Reported substances exhibiting interferences at levels lower than a 5-fold mass excess, with respect to sulphide.t Based on the inhibitory action of sulphide ion on the fluorescence of the system.i Interference of cyanide was not reported.
Me-p-toluenesulphonate + taurine +o-phthalaldehyde ..

ANALYST, NOVEMBER 1990, VOL. 115
Analysis of natural water and wastewaters
The proposed methods were applied successfully to thedetermination of trace amounts of sulphide in natural watersand wastewaters.
The results are given in Table 4 together with thoseobtained using the Methylene Blue method as reference.However the Methylene Blue method could not be applieddirectly, but only after distillation under the same conditionsas for the proposed procedure, because the presence ofinterfering substances always prevented formation of thecharacteristic blue colour.
The proposed method was applied directly, and also bydistillation of H2S (depending on sulphide content andlor theinterfering substances and suspended solids, present in thesamples). Thus, the direct method was applied for thedetermination of three samples taken from GuadalquivirDock at Seville, and the distillation method for samples fromthe Guadalquivir River and from municipal and industrialeffluents. The results showed that the accuracy for thedetermination of sulphide was satisfactory.
Conclusions
Two sensitive and selective procedures for the determinationof sulphide ion in waters have been established, based on thefluorescent reaction of this ion with the NS reagent at pH 5.2.The first procedure relies directly on the reaction betweensulphide and NS and the second involves prior distillation asH2S. Hence, the over-all determination time is longer,however, the method has lower determination limits andturbid waters can also be processed.
The proposed method is highly selective. The main interferents are sulphite and nitrite ions, which may also be carriedover by the distillation procedure. The elimination of theseinterferents, if necessary (for a ratio of interferentto sulphidegreater than 5 to 1), is very simple. Co-distilled S02 can beremoved using a filter impregnated with KHC0323 and N02can be removed by adding several drops of urea solution25 intothe receiver flask.
Many other reagents have been proposed for the spectrofluorimetric determination of sulphide (Table 5). Most of thesemethods are based on the inhibitory action of sulphide on afluorescent system,I8-23 which represents a severe disadvantage in relation to their reliability. It is noticeable that theirdirect applicability to water samples is often limited by theinterference of trace amounts of metals precipitating with thesulphide or as hydroxide due to the high alkalinity employedin the procedures. In contrast, the direct procedure [procedure (a)Idoes not suffer from the above limitations (as it is notbased on fluorescence quenching) and EDTA addition andpH of the medium minimise the interference from metal ions.Many of the other methods in Table 518-21 are based onsubstitution reactions (reactions between sulphide ion and acation that initially forms a chelate with an organic reagent)which have high sensitivities, but are less selective over-allwith respect to other competitive complexing anions. Forexample, CN- seems to be a strong interferent for thesubstitution and other methods but the proposed methodtolerates a concentration of CN- that is 286-fold in excess ofthat of the sulphide ion.
The proposed method is not as sensitive as some othermethods, even when the distillation technique is considered.Nevertheless, the applicability of other methods to realsamples has not been substantiated, and has only been testedwith SUlphide standards. The method of Bark and Rixon21always involves distillation. The method of Grunert et al. IS ishighly sensitive, but also involves a complicated procedureand is particularly recommended for the determination oftrace amounts of sulphur in organic substances afterhydrogenation.
1503
Sano and Takitani24 applied the f1uorogenic reaction ofalkylated sulphide ion with taurine and o-phthalaldehyde tothe determination of sulphide in natural spiked waters. Atpresent it is the only method for the determination of sulphidebased on the appearance of fluorescence, but it also has theinconvenience of having to heat the solutions to 60 °C for 30min and the method suffers interference from cyanide andsome cations.
The standard Methylene Blue method for the determination of sulphide in waters I is less selective and 3-10 times lesssensitive than the proposed method and it suffers from thepractical disadvantage, that the rate of colour formation isdependent on the concentration of sulphide.
The proposed method, according to the above considerations and the satisfactory results obtained for various realsamples, provides a useful tool for the determination ofsulphide ion in natural waters and in both municipal andindustrial wastewaters. The method shows excellent selectivity, sensitivity, reproducibility and versatility and may be useddirectly, or with prior distillation of H2S.
References
1. "Standard Methods for Examination of Water and Wastewater," Fifteenth Edition, American Public Health Association, American Water Works Association, Water PollutionControl Federation, Washington, DC, 1980, pp. 1132-1151.
2. Smirnov, E. V., Morsk. Girdofyz. Issled, 1971, 195. Chem.Abstr., 1972, 77, 38951p.
3. Kloster, M. B., and King, M. P., J. Am. Water Works Assoc.,1977, 69, 544.
4. Wood, C. F., and Marr, I. L., Analyst, 1988, 113, 1635.5. Bahat, S. R., Eckert, J. H., Gibson, R., and Goyer, J. M.,
Anal. Chim. Acta, 1979, 108,293.6. Lewin, K., Walsh, J. N., and Miles, D. L., J. Anal. At.
Spectrom., 1987,2,249.7. Hawke, D. J., Lloyd, A., Martinson, D. M., Slater, P. G., and
Excell, c., Analyst, 1985, 110, 269.8. Caron, F., and Kramer, J. R., Anal. Chem., 1989,61,114.9. Goodwin, L. R., Francom, D., Urso, A., and Dieken, F. P.,
Anal. Chem., 1988, 60, 216.10. Haddad, P. R., and Hockenberg, A. L., J. Chromatogr., 1988,
447,415.11. Glaister, M. G., Moody, G. J., and Thomas, J. D. R., Analyst,
1985, 110, 113.12. Clysters, H., Adams, F., and Verbeck, F., Anal. Chim. Acta.
1976, 83, 27.13. Luther,.G. W., Giblin, A. E., and Varsolona, R., Limnol.
Oceanogr., 1975,30,727.14. Leung, L. K., and Bartak, D. E., Anal. Chim. Acta, 1981, 131,
167.15. Shimizu, K., and Osteryoung, R. A., Anal. Chem., 1981,53,
584.16. Jaya, S., Rao, T. P., and Rao, G. P., Analyst, 1986, 111, 717.17. Wronski, M., Fresenius Z. Anal. Chem., 1961, 180, 185.18. Griinert, A., Ballschmiter, K., and Tiilg, G., Talanta, 1968, 15,
451.19. Mori, I., Fujita, Y., Goto, M., Furuya, S., and Enoki, T.,
Bunseki Kagaku, 1980,29,145.20. Vernon, F., and Whitham, P.,Anal. Chim. Acta, 1972,59, 155.21. Bark, L. S., and Rixon, A., Analyst, 1970, 95, 786.22. Guilbault, G. G., Brignac, P., and Zimmer, M., Anal. Chem.,
1968,40, 190.23. Holzbecher, J., and Ryan, D. E., Anal. Chim. Acta, 174,68,
454.24. Sano, A., and Takitani, S., Anal. Sci., 1986, 2, 357.25. "The Testing of Water," Merck, Darmstadt (R.F.A.), 1974,
pp. 193 and 194.26. Punta, A., Barragan, F. J., Ternero, M., and Guiraum, A., Int.
J. Environ. Anal. Chem., in the press.27. De Moerloose, P., and Baeyens, W., Ver. Koninkl. Gen. Belg.,
1976, 38, 252.28. Pomeroy, R., Anal. Chem., 1954, 26, 571.
Paper 9/04965GReceived November 20th, 1989
Accepted May 30th, 1990

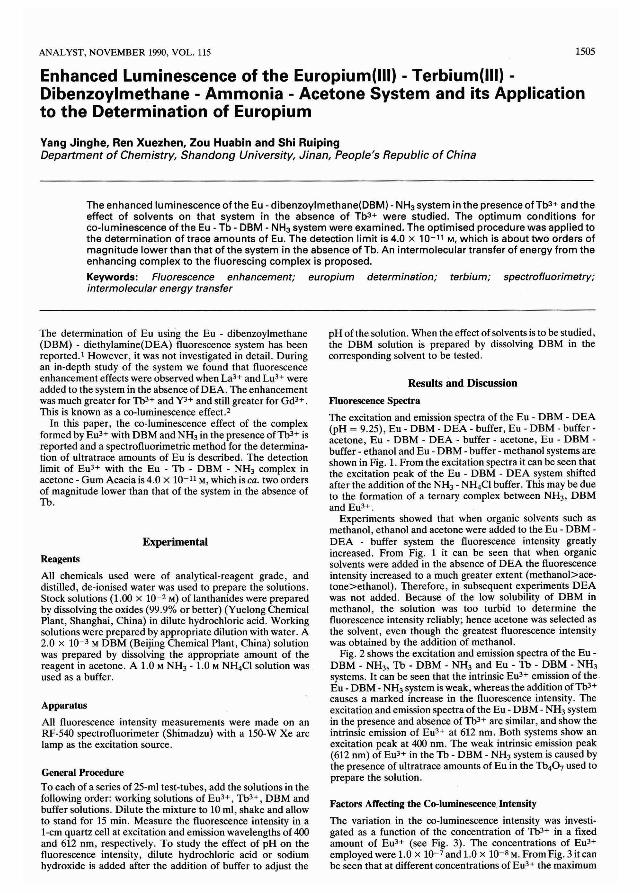
ANALYST, NOVEMBER 1990, VOL. 115 1505
Enhanced Luminescence of the Europium(lII) - Terbium(lII) Dibenzoylmethane - Ammonia - Acetone System and its Applicationto the Determination of Europium
Yang Jinghe, Ren Xuezhen, Zou Huabin and Shi RuipingDepartment of Chemistry, Shandong University, Jinan, People's Republic of China
The enhanced luminescence ofthe Eu - dibenzoylmethane(DBMj - NH3 system in the presence ofTb3 + and theeffect of solvents on that system in the absence of Tb3 + were studied. The optimum conditions forco-luminescence of the Eu - Tb - DBM - NH3 system were examined. The optimised procedure was applied tothe determination of trace amounts of Eu. The detection limit is 4.0 x 10⁻¹¹ M, which is about two orders ofmagnitude lower than that of the system in the absence of Tb. An intermolecular transfer of energy from theenhancing complex to the fluorescing complex is proposed.
Keywords: Fluorescence enhancement; europium determination; terbium; spectrofluorimetry;intermolecular energy transfer
The determination of Eu using the Eu - dibenzoylmethane(DBM) - diethylamine(DEA) fluorescence system has beenreported. l However, it was not investigated in detail. Duringan in-depth study of the system we found that fluorescenceenhancement effects were observed when La3+ and Lu3+ wereadded to the system in the absence of DEA. The enhancementwas much greater for 'fb3+ and Y3+ and still greater for Gd3+.This is known as a co-luminescence effect.2
In this paper, the co-luminescence effect of the complexformed by Eu3+ with DBM and NH3 in the presence ofTb3+ isreported and a spectrofluorimetric method for the determination of ultratrace amounts of Eu is described. The detectionlimit of Eu3+ with the Eu - Tb - DBM - NH3 complex inacetone - Gum Acacia is 4.0 x 10⁻¹¹ M, which is ca. two ordersof magnitude lower than that of the system in the absence ofTb.
Experimental
Reagents
All chemicals used were of analytical-reagent grade, anddistilled, de-ionised water was used to prepare the solutions.Stock solutions (1.00 x 10⁻² M) of lanthanides were preparedby dissolving the oxides (99.9% or better) (Yuelong ChemicalPlant, Shanghai, China) in dilute hydrochloric acid. Workingsolutions were prepared by appropriate dilution with water. A2.0 x 10-3 M DBM (Beijing Chemical Plant, China) solutionwas prepared by dissolving the appropriate amount of thereagent in acetone. A 1.0 M NH3 - 1.0 M NH4Cl solution wasused as a buffer.
Apparatus
All fluorescence intensity measurements were made on anRF-540 spectrofluorimeter (Shimadzu) with a 150-W Xe arclamp as the excitation source.
General Procedure
To each of a series of 25-ml test-tubes, add the solutions in thefollowing order: working solutions of Eu3+, Tb3+, DBM andbuffer solutions. Dilute the mixture to 10 ml, shake and allowto stand for 15 min. Measure the fluorescence intensity in al-cm quartz cell at excitation and emission wavelengths of 400and 612 nm, respectively. To study the effect of pH on thefluorescence intensity, dilute hydrochloric acid or sodiumhydroxide is added after the addition of buffer to adjust the
pH of the solution. When the effect of solvents is to be studied,the DBM solution is prepared by dissolving DBM in thecorresponding solvent to be tested.
Results and Discussion
Fluorescence Spectra
The excitation and emission spectra of the Eu - DBM - DEA(pH = 9.25), Eu - DBM - DEA - buffer, Eu - DBM - bufferacetone, Eu - DBM - DEA - buffer - acetone, Eu - DBM buffer - ethanol and Eu - DBM - buffer - methanol systems areshown in Fig. 1. From the excitation spectra it can be seen thatthe excitation peak of the Eu - DBM - DEA system shiftedafter the addition of the NH3- NH4Cl buffer. This may be dueto the formation of a ternary complex between NH3, DBMand Eu3+.
Experiments showed that when organic solvents such asmethanol, ethanol and acetone were added to the Eu - DBM DEA - buffer system the fluorescence intensity greatlyincreased. From Fig. 1 it can be seen that when organicsolvents were added in the absence of DEA the fluorescenceintensity increased to a much greater extent (methanol>acetone>ethanol). Therefore, in subsequent experiments DEAwas not added. Because of the low solubility of DBM inmethanol, the solution was too turbid to determine thefluorescence intensity reliably; hence acetone was selected asthe solvent, even though the greatest fluorescence intensitywas obtained by the addition' of methanol.
Fig. 2 shows the excitation and emission spectra of the Eu DBM - NH3, Tb - DBM - NH3 and Eu - Tb - DBM - NH3systems. It can be seen that the intrinsic Eu3+ emission of the,Eu - DBM - NH3system is weak, whereas the addition of'fb3+causes a marked increase in the fluorescence intensity. Theexcitation and emission spectra of the Eu - DBM - NH3 systemin the presence and absence of Tb3+ are similar, and show theintrinsic emission of Eu3+ at 612 nm. Both systems show anexcitation peak at 400 nm. The weak intrinsic emission peak(612 nm) of Eu3+ in the Tb - DBM - NH3system is caused bythe presence of ultratrace amounts of Eu in the Tb40 7 used toprepare the solution.
Factors Affecting the Co-luminescence Intensity
The variation in the co-luminescence intensity was investigated as a function of the concentration of Tb3+ in a fixedamount of Eu3+ (see Fig. 3). The concentrations of Eu3+employed were 1.0 x 10⁻⁷ and 1.0 x 10⁻⁸ M. From Fig. 3 it canbe seen that at different concentrations of Eu3+ the maximum
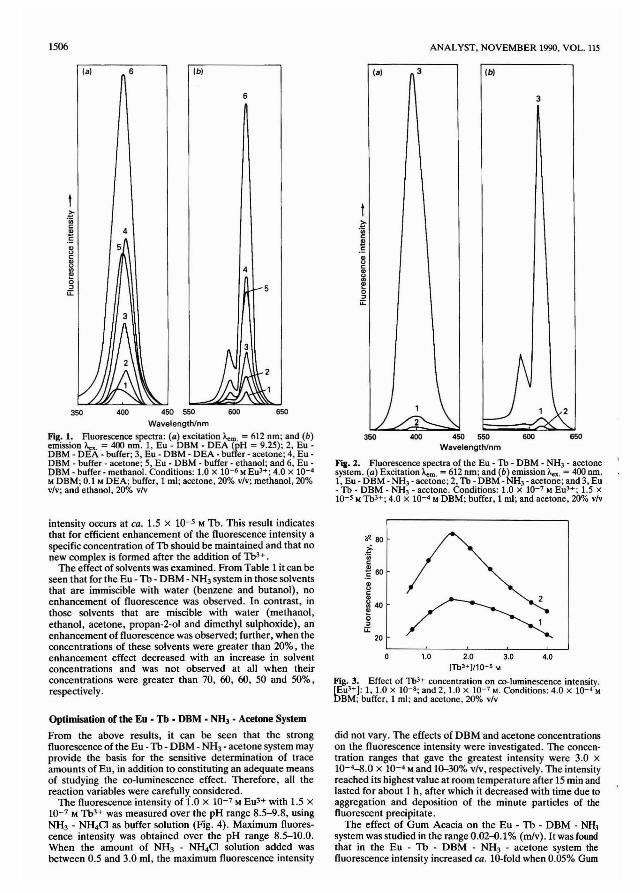
1506 ANALYST, NOVEMBER 1990, VOL. 115
18) 6 Ib) (a) (b)
6 3
t t.~en
.~c4
.~enc.. 5 .~u
C ..., uu 4 c.. ..~ u0 en:> --5 ~u: 0
:>ii:
3
650600400350 450 550Wavelength/nm
FIg. 2. Fluorescence spectra of the Eu - Tb - DBM - NH3 • acetonesystem. (a) Excitation ).em. = 612 nm; and (b) emission A.x. = 400 nm.I, Eu - DBM-NH3 - acetone; 2, Tb -DBM -NH3 -acetone; and3, Eu- Tb - DBM - NH3- acetone. Conditions: 1.0 x 10⁻⁷ M Eu3+; 1.5 x10⁻⁵ M Tb3+; 4.0 X 10-' M DBM; buffer, 1 ml; and acetone, 20% v/v
350 400 450 550 600 650
Wavelength/nmFIg. 1. Fluorescence spectra: (a) excitation A.m. = 612 nm; and (b)emission A.x. = 400 nm. 1, Eu - DBM - DEA (pH = 9.25); 2, Eu DBM - DEA - buffer; 3, Eu - DBM - DEA . buffer - acetone; 4, Eu DBM - buffer - acetone; 5, Eu . DBM - buffer - ethanol; and 6, Eu .DBM - buffer - methanol. Conditions: 1.0 X 10⁻⁶ M Eu3+; 4.0 X 10-'M DBM; 0.1 M DEA; buffer, 1 ml; acetone, 20% v/v; methanol, 20%v/v; and ethanol, 20% v/v
1.0 2.0 3.0 4.0[Tb3+ ]/1 0-5 M
Fig. 3. Effect of Tb3+ concentration on co-luminescence intensity.[Eu3+): 1, 1.0 x 10⁻⁸; and 2, 1.0 x 10⁻⁷ M. Conditions: 4.0 x 10⁻⁴ M
OBM; buffer, I ml; and acetone, 20% v/v
intensity occurs at ca. 1.5 x 10⁻⁵ M Th. This result indicatesthat for efficient enhancement of the fluorescence intensity aspecific concentration of Th should be maintained and that nonew complex is formed after the addition of Th3+.
The effect of solvents was examined. From Table 1 it can beseen that for the Eu - Th - DBM - NH3system in those solventsthat are immiscible with water (benzene and butanol), noenhancement of fluorescence was observed. In contrast, inthose solvents that are miscible with water (methanol,ethanol, acetone, propan-2-01 and dimethyl sulphoxide), anenhancement of fluorescence was observed; further, when theconcentrations of these solvents were greater than 20%, theenhancement effect decreased with an increase in solventconcentrations and was not observed at all when theirconcentrations were greater than 70, 60, 60, 50 and 50%,respectively.
20
Optinmation of the Eu • Tb • DBM • NH3 • Acetone System
From the above results, it can be seen that the strongfluorescence of the Eu - Th - DBM - NH3- acetone system mayprovide the basis for the sensitive determination of traceamounts of Eu, in addition to constituting an adequate meansof studying the co-luminescence effect. Therefore, all thereaction variables were carefully considered.
The fluorescence intensity of 1'.0 x 10-7 M Eu3+ with 1.5 x10⁻⁷ M Th3+ was measured over the pH range 8.5-9.8, usingNH3 - NH.CI as buffer solution (Fig. 4). Maximum fluorescence intensity was obtained over the pH range 8.5-10.0.When the amount of NH3 - NH.Cl solution added wasbetween 0.5 and 3.0 ml, the maximum fluorescence intensity
did not vary. The effects of DBM and acetone concentrationson the fluorescence intensity were investigated. The concentration ranges that gave the greatest intensity were 3.0 x10⁻⁴-8.0 X 10-' M and 10-30% v/v, respectively. The intensityreached its highest value at room temperature after 15 min andlasted for about 1 h, after which it decreased with time due toaggregation and deposition of the minute particles of thefluorescent precipitate.
The effect of Gum Acacia on the Eu - Tb - DBM - NH3system was studied in the range 0.02--0.1% (rnIv). It was foundthat in the Eu - Th - DBM - NH3 - acetone system thefluorescence intensity increased ca. lO-fold when 0.05% Gum

ANALYST, NOVEMBER 1990, VOL. 115 1507
Table 1. Effect of solvents on fluorescence intensity. The reference intensity (100%) is that of the Eu - DBM - NH3 system in thecorresponding solvent. [Eu3+1= 1.0 X 10⁻⁷ M
[Methanol], [Ethanol), [Acetone), [Propan-2-01), [DMSO*],%v/v %v/v % v/v %v/v % v/v
20 50 70 20 50 60 20 50 60 20 50 60 20 50 Benzene Butanol
Eu - DBM - NH3 -solvent 100 100 100 100 100 100 100 100 100 100 100 100 100 100 100 100
Eu-Th- DBM-NH3- solvent .. 7500 300 99 4000 320 60 8000 500 80 1000 100 100 150 100 85 100
* DMSO = Dimethyl sulphoxide.
80
20 l------''-- -'- --' '----'
Table 2. Determination of Eu by the standard additions method
than that of the Eu - OBM - NH3 - acetone system. In thepresence of Gum Acacia the detection limit (SIN = 3) is 4 X
10-11 M.
The effect of other lanthanide ions was studied for 1.0 x10⁻⁷ M Eu3+. The highest molar excesses that caused avariation of ±5% in the fluorescence intensity were as follows:)'3+ and Gd3+, 4Q-fold; La3+ and Lu3+, 2Q-fold; Sm3+,lQ-fold; Oy3+ and Yb3+, 5-fold; and other ions, an equivalentmolar excess. Higher concentrations decreased the intensity.Therefore, the standard additions method was employed forthe determination of Eu. The results obtained (Table 2) forsynthetic mixtures, which were prepared on the basis of theamount of each rare earth element in the Earth's crust,3indicate that the procedure is suitable for the determination oftrace amounts of Eu.
Enhancement Mechanism
Fig. 2 shows that the excitation spectrum of the Eu - Th - OBM- NH3system is similar to that of the system without Th. Fig. 3shows that there is no constant molar ratio of Eu3+ to Th3+.These results indicate that Th does not form a new complexwith the Eu - OBM - NH3system. Assuming the formation ofthe ternary Eu(OBM),.OEA complex l in the Eu - OBM OEA system, we believe that the ternary Eu(OBM),.NH3andTh(OBMh.NH3 complexes are both formed in the Eu - Th OBM - NH3system, and that they exist in water in the form ofa solid-solution because of the similarity of their chemicalproperties and their low solubilities.
The OBM molecules in the ternary complexes are excited toan excited singlet state after they have absorbed light energy,after which they go to the triplet state through a radiationlesstransition. Because the luminescence level (504) ofTh3+(20430 em-I, reference 4) is higher than that of theexcited triplet state of OBM (20300 cm- I , reference 5), itappears that the excited OBM molecules cannot transfer theirenergy to Th3+ through an intramolecular transfer of energy,but can transfer their energy to Eu3+ in the Eu(OBM),.NH3complex, which is very similar to the Th(OBMh-NH3complex, through an intermolecular transfer of energy. Theconcentration of the Th complex is much greater than that ofthe Eu complex and each Eu(OBM),.NH3 molecule issurrounded by many Th(OBMh.NH3 molecules. Therefore,the fluorescence intensity of Eu3 + is considerably enhanced.With the instrumentation available it was not possible toinvestigate the mechanism further, by the use of tluorescencelifetime measurements.
The proposed intermolecular energy transfer mechanism iswell supported by the effect of solvents on the system. Inorganic solvents that are immiscible with water and in mixedsolvents containing an organic solvent and water (in which thevolume ratios are large), Eu(OBMh.NH3 andTh(OBMh.NH3 exist as single molecules. The distancebetween Eu(OBMh.NH3 and Th(OBM),.NH3 would belarge and it would be difficult for the intermolecular transferof energy to occur; hence enhancement of the fluorescence isnot observed.
11.0
0.22 ±0.02
Mean ± standarddeviation/ng
20.7 ± 1.4
Mean ± standarddeviation,%
10.09.0
Europium founding
19.1,22.1,22.2,19.6,20.4
8.0
Europium added/ng
20
Acacia was added, whereas in the Eu - Th - OBM - NH3 methanol (or ethanol) system the fluorescence intensitydecreased when Gum Acacia was added. The stability of theEu - Th - OBM - NH3 - acetone system was greatly improvedafter the addition of Gum Acacia. The system reachedmaximum fluorescence intensity in 15 min at room temperature after the solutions were mixed, and lasted for at least 3 h.
pH
Fig. 4. Effect of pH on fluorescence intensity. Conditions: 1.0 x10-' M Eu3+; 1.5 X 10⁻⁵ M Th3+; 4.0 X 10⁻⁴ M DBM; buffer, I ml; andacetone, 20% v/v
Analytical Characteristics
The fluorescence intensity of the Eu - Th - OBM - NH3 acetone system is a linear function of the Eu3+ concentrationin the range 5.0 x 10-'·1.0 X 10⁻⁹ M under the optimisedconditions. The detection limit [signal to noise (SIN) ratio =3) is 1.5 X 10⁻¹⁰ M, which is ca. two orders of magnitude less
*i-'iiic:~60£~c:~<II
~ 40o::lu::
Synthetic sample*-
Determined value ofEU203,%
0.22,0.24,0.24,0.21,0.21,0.20
* The amount of each lanthanide ion (!!g) per 100 ml of thesynthetic sample was as follows: La(I90), Ce(440), Pr(56), Nd(240),Sm(105), Eu(lO), Gd(63). Th(IO) , Dy(43). Ho(12). Er(24), Tm(2.1),Yb(26), Lu(7) and Y(310).
t The standard sample was obtained from the Baotou Institute ofRare Earths, Baotou, China. Its composition (%) is as follows:La20 3(27.1I), C~03(49.21), Pr601l(5.18). Nd20 3(16.75),Sm203(1.29), EU203(0.23), Gd20 3(0.40), Th40,(0.03), DY203(0.09)and Y20 3(0.27).
Standard samplet
Standard value ofEU203,%
0.23

1508
References
1. Tishchenko, M. A., Zheltvai, I. L., Poluektov, N. S., andBakshun, I. V., Zavod. Lab., 1973,39,671.
2. Yang, J.-H., and Zhu, G.-Y., J. Shandong Univ. (Nat. Sci.Ed.), 1986,21, 133.
3. Huang, H.-G., Liou, E.-B., and Duan, W.-Z., Fenxi Shiyanshi, 1985, 4, 1.
ANALYST, NOVEMBER 1990, VOL. 115
4. Crosby, G. A., Whan, R. E., and Alire, R. A.,J. Chern. Phys.,1961,34,743.
5. Sager, W. F., Filipeseu, N., and Serafin, F. A.,J. Phys. Chern.,1965,69, 1092.
Paper 0101145BReceived March 15th, 1990
Accepted June 26th, 1990
ANALYST, NOVEMBER 1990, VOL. 115
BOOK REVIEWS
Spectroscopic Properties of Inorganic and Organometallic Compounds. Volume 22. Specialist Periodical Reports.G. Davidson and E. A. Ebsworth. Pp. xiv + 480. RoyalSociety of Chemistry. 1989. Price £130; $253.00. ISBN0851862039.
This review of the recent literature up to late 1988 follows thesame pattern as previous volumes. Individual chapters coverNMR (193 pp.), NQR (28 pp.) and rotational spectroscopies(21 pp.), 3 chapters deal with the IR spectra of main groupcompounds, transition element compounds and co-<>rdinatedligands (120 pp.), and there are two chapters of Mossbauerspectroscopy (99 pp.) and gas-phase electron diffraction (19pp.). As usual, the information is comprehensive, withextensive references (6074 in all), and the series continues tobe an invaluable reference work for inorganic chemists.
Alan Townshend
Heavy Metals in SollsEdited by B. J. Alloway. Pp. xiii + 339. Blackie. 1990. Price£59.00. ISBN 0 216 92698 X; 0 470 21598 4 (USA andCanada).
The problem with many multi-authored books on topics suchas heavy metals in soils is that they rapidly become merecatalogues of references to the ageing primary literature, withlittle attempt to place the subject in overall context andperspective, both scientific and historical. This book,however, edited by B. J. Alloway, takes steps to at leastpartially avoid this problem.
It is organised into three main sections. The first, GeneralPrinciples, 80 pages long, contain four chapters: Introduction;Soil processes and the behaviour of metals; The origins ofheavy metals in soils (all by Alloway); and an especiallyauthoritative, readable and comprehensive 312-referenceMethods of analysis for heavy metals in soils (by Ure). Theseneatly and concisely lay down the general foundations offundamental soil chemistry, heavy metal sources and analysiswhich enables more effective use of the detailed informationin the ten review chapters of the succeeding section onIndividual Elements.
The chapters of the second section, each about 20 pageslong, focus on Arsenic (O'Neill), Cadmium (Alloway),Chromium and nickel (McGrath and S. Smith), Copper(Baker), Lead (Davies), Manganese and cobalt (K. A.Smith), Mercury (Steinnes), Selenium (Neal), Zinc (Kiekens)and Other metals and metalloids (antimony, gold, molybdenum, silver, thallium, uranium and vanadium) (Jones, Leppand Obbard). I particularly liked the sub-sectional structurecommon to most of the first nine of these chapters, usuallyintroduction, geochemical occurrence, origin (soil parent,agricultural, atmospheric deposition, sewage sludges andother sources), chemical behaviour in the soil, soil - plantrelationships, polluted soils and concluding comments,although Davies and K. A. Smith were clearly permitted somelatitude in deviating slightly from this format. The individualauthors have shown a critical discrimination in the selection ofreferences, which range from 47 on arsenic to 151 onchromium and nickel. The amount of post-1985 materialvaries from 5 per cent. of the 340 references on themulti-element chapter. Other metals and metalloids, to 43 percent. for arsenic.
The book is nicely rounded off by a useful final section ofseven appendices containing summary tables of metal concentration data and regulatory limits for soils, plants and sewage
1509
sludges as well as analytical data for Certified ReferenceMaterials.
The many sources, wide environmental distribution,diverse beneficial and harmful roles and complex behaviour ofheavy metals have made them the subject of intensiveinvestigation by research chemists, geochemists, soilscientists, agricultural chemists and environmental scientists,for whom this volume is intended. I feel that postgraduatestudents will find it a useful source of reference but its valuefor advanced undergraduates may be restricted to theoverview of Section 1. At £59 it represents a good investmentfor the library and the committed researcher but not for thegeneral environmental reader or typically impoverishedstudent.
John G. Farmer
Chromatography/Fourier Transform Infrared Spectroscopy and Its ApplicationsRobert White, Practical Spectroscopy Series. Volume 10.Pp. vi + 328. Marcel Dekker. Price $99.75 (USA andCanada); $119.50 (Export). ISBN 0 8247 8191 O.
Interfacing chromatography with Fourier transform infraredspectroscopy (FTIR) has received a large amount of researchattention in the past few years. The development of thesehyphenated techniques has proved to be a powerful analyticaltool and has significantly increased the applicability of IRspectroscopy to the analysis of complex mixtures. A bookwhich deals with this topical issue in such a detailed andcomprehensive manner, therefore, is to be welcomed.
The introductory chapter serves to summarise the basictheories and advantages of the various chromatographictechniques coupled with IR spectroscopy and discusses howchromatographic efficiency and IR spectroscopy are affectedby the methods of connecting the two. There then follow threechapters, each dealing with the theory and instrumentation ofa particular hyphenated technique: GC - FfIR, LC - FTIRand TLC - FfIR. Of the three techniques, only GC - FTIR hasattained commercial maturity and this is reflected in the depthof coverage in this central section of the book and in the lastsection, dealing with industrial applications.
In Chapter 2, a full account of the instrumentation is givenand a comparison of interface characteristics is made for threeGC - FfIR methodologies: light-pipe, matrix isolation (MI)and sub-ambient. The trade-offs between sensitivity andexpense are discussed in each instance. The less common LC FTIR technique is dealt with in Chapter 3. Methods of dealingwith the lack of IR-transparent solvents and their effects onresolution degradation are discussed. Some space is alsodevoted in this chapter to SFC - FfIR and its limitations.Chapter 4 deals with TLC - and HPTLC - FfIR. The twosampling techniques used, DRIFf and PAS, are discussed inrelation to their lack of sensitivity and susceptibility to spectraldistortion.
In the remaining two chapters, the author looks at theproblems of computer-aided structure elucidation in chromatography - FfIR. Various methods are described, with mostemphasis on library searching programs but with somemention of expert systems. Industrial applications of chromatography - FfIR interfaces are also discussed, although asmentioned earlier, most are in the better known GC - FTIRarea.
The author's intention is to produce an up-to-date referencesource for those familiar with chromatography- FTIRmethods, and an introduction to the techniques and applications for those interested in future uses for chromatography FfIR. He has largely succeeded in these aims, so that thebook is a useful addition to the literature in this area.
O. M. Lacy
1510
Trace Element Analytical Chemistry in Medicine andBiology. Volume 5. Proceedings of the Fifth InternationalWorkshop Neuherberg. Federal Republic of Germany,April1988Edited by Peter Bratter and Peter Schramel. Pp. xvii + 666.de Gruyter. 1988. Price DM330. ISBN 3 110113406.
The fifth volume in this series of international workshopproceedings is arranged in 8 sections and reports 12 plenarypapers (up to 3 per section) plus 62 presented papers. Thesections are newer analytical techniques, pre-analytical treatment of samples, speciation, physiological levels and reference data, aluminium and platinum (as two elements of specialinterest), nutrition, pathology and metabolic processes.
The section on newer analytical methods is introduced byTolg whose review encompasses a wide range of analyticaltechniques but which concentrates mainly on atomic/massspectrometric methods. These methods dominate this sectionwith papers on HGAAS and ETAAS, LEI spectroscopy,XRF and NAA. The last two of these papers seem to offerlittle which is new. It was also disappointing to find nodiscussion of recent advances in electrochemical techniquesalthough this was probably due to the omission of Stoeppler'spaper.
Sample preparation procedures are excellently reviewed byKnapp, who with others in this section provides much usefuldata on sample collection and preparation for analysis.
The section on specification is (for me) the most interestingand stimulating part of the book. A superb, comprehensivereview of Duneman and Bratter ranges from speciation innatural waters to bioavailability of metals from soils to plants,to detailed studies of Ni and Zn in soya bean flour. Proceduresare outlined for sample preparation, separation and elementaland protein analysis. There follows some excellent applications in which AAS, ICP-AES, ICP-MS and NAA analysesare combined with separation techniques such as HPLC,FPLC, polyacrylamide gel electrophoresis, gel filtration andanion-exchange chromatography. These studies provide datafor ten elements, Ca, Cd, Cr, Cu, Fe, Mg, Mn, Ni, Se and Znand metal-binding species including citrate, metallothieneinsand proteins of high relative molecular mass.
The clinical importance of Pt and Al justifies their specialattention. All's paper reviews the methods currently availablefor measuring PI. This is followed by using an RNAA methodfor measuring down to 8 ng I-I in urine and 5 ng kg- t in liverspecimens. Caroli et al., combined HPLC with lCP-AES forthe separation and measurement of cisplatin and carboplatinin pharmacokinetic studies. The papers on AI are concernedmainly with the application of ETAAS to the analysis of urine,serum, tissue specimens and ultrafilterable fractions fromserum and with the use of 67Ga as a model for Al inbioavailability studies.
The analysis and classification of dietary fibre reported byvan Soest and Jones is excellent being both concise andinformative. They explain the absence of effect of dietary fibreon bioavailablity of trace elements in terms of initial impairment of Gl absorption by complexation followed by a latercolonic fermentation yielding short chain fatty acids whichtransport metal ions across the colon. The remainder of thissection on food/nutrition contains much valuable informationon total elemental concentrations as well as speciation. Thesections on pathological states and diagnosis, and on physiological levels and reference values contain little of analyticalinterest but have a wealth of data on trace element concentrations in healthy and diseased states.
Aggett's plenary paper gives an excellent review of thechanges in pregnancy of the metabolic processes associatedwith trace element species, with emphasis on Cu, Zn, Se andCr. The remainder of this section also contains good data ontotal trace elements and trace element speciation.
ANALYST. NOVEMBER 1990. VOL. 115
The editors claim that the workshop was "more orientatedtowards the state-of-the-art of trace element analytical techniques." However, the emphasis of the book is more towardsthe acquisition and presentation of biochemical data ratherthan towards new analytical procedures. The book willtherefore appeal more to the biochemist/clinical scientist thanit will to those concerned more with analytical developments.
There are a few typographical errors and pages 44 and 42are interchanged. Even so this does not detract from the valueof this book.
H. T. Delve.!
Mass Spectrometry of Biological MaterialsEdited by Charles N. McEwen and Barbara S. Larsen.Practical Spectroscopy Series. Volume 8. Pp. xiii + 515.Marcel Dekker. 1990. Price $125.00 (USA and Canada);$150.00 (Export). ISBN 0824781821.
1 opened the package that contained this book and my heartsank. Yet another collection of standard reviews, by yetanother set of internationally respected authors, I thought.But it would be unfair and unkind to view the book in thislight, even though the list of contents would give thisimpression. There are 15 contributions, by 38 authors, withthe emphasis on the isolation and mass spectrometric analysisof peptides (6 chapters). Other topics covered are glycoproteins, biogenic amines, lipids, steroids and bile acids (2chapters), pesticide metabolites, porphyrin photosensitisers,isotope dilution methods, GC - MS, and LC - MS. The bookends with a subject index. So, what sets this book apart fromother collections of reports? As a volume of the PracticalSpectroscopy Series, the book often uses a didactic approachand gives many practical hints.
Biemann's considered overview of the applications of massspectrometry to peptides carefully avoids exaggerated claimsfor the technique. 1particularly enjoyed the lively chapter (62pages) on strategies for the isolation and structural analysis ofpeptides by Shively and Paxton. Replete with many practicalinsights into the topic, it succeeds in alerting the proteinchemist to the needs of the mass spectrometrist and vice versa.Given that mass spectrometry plays a major role when theEdman method fails, reviews on post-translationally modifiedpeptides and glycoproteins are valuable inclusions.
The non-peptidic part of the text is inevitably limited inscope but the areas chosen for discussion are sensible andworthwhile. The articles vary from conventional reviews tovirtual instruction manuals. Most contributions, however, hitthe happy medium. At 9 pages, the primer on sterols is toobrief but it is followed by a more substantial chapter onhormonal steroids and bile acids (81 pages). Weintraubadmirably squeezes a representative examination of lipids into30 pages. The last three technique-led chapters on isotopedilution, GC - MS and LC - MS are necessarily very selective.Wisely, the authors concentrate on their own expertise andexperience. Henion and Lee steer the reader carefully throughthe myriad approaches to LC - MS, stressing the undoubtedversatility of atmospheric pressure ionisation mass spectrometry in coupling with both HPLC and SFC.
Multi-author books are prone to problems such as duplicatiori, missing topics, variable quality, inconsistent jargon andso on. This volume avoids most of the pitfalls but 1still had afew grumbles. For instance, the important topics of continuous-flow FAB mass spectrometry, capillary electrophoresisand electrospray mass spectrometry are either hardly coveredor not at all. In the peptide section of the book, fragmentationnomenclature is defined in three separate chapters and severalother unfortunate overlaps also occur. I found it difficult tofathom the reason for the order of some ofthe chapters. There

ANALYST, NOVEMBER 1990, VOL. 115
is some loose language: abundant ions are often referred to as"strong" or "intense" (conjuring up images of muscular,emotionally charged entities!), and in one chapter theamounts given as "sensitivity" are presumably limits ofdetection. Potential purchasers of the book should also notethat its price will make a sizeable hole in their budgets.
Life sciences is one of the areas that has benefited by recentinnovations in mass spectrometry, especially in ionisationmethods and extended mass ranges. Such developmentsensure increasing applications of the technique to biologicalmaterials and make it worthwile for the mass spectrometrist toreserve a place on hislher shelf for this well balanced, amplyillustrated and acid-free book.
M. E. Rose
Chemical Analysis of Polycyclic Aromatic CompoundsEdited by Tuan Vo-Dinh. Volume 101 in Chemical Analysis: A Series ofMonographs on Analytical Chemistry andIts Applications. Pp. xxiv + 494. Wiley-Interscience. 1990.Price £70.00. ISBN 0 471 628891.
This is an important book as polycyclic aromatic compounds(PAC) are ubiquitous pollutants and represent the largestclass of known chemical carcinogens; it follows that anup-to-date account of current developments in the analysis ofPAC is required reading for all chemists engaged in environmental analysis.
The book consists of 15 chapters by a total of 27 authors, allbut three with US addresses and includes many of theacknowledged leaders in the field. After an introductorychapter by the Editor, there are chapters on chromatography(gas and liquid by J. C. Fetzer; supercritical fluid chromatography by B. W. Wright and R. D. Smith) and immunologicalmethods (by R. M. Santella and M. Stefanidis), and thenchapters describing a variety of spectroscopic procedures.Interesting chapters on the novel techniques of micellemediated methodologies, multi-dimensional resonance massspectrometry, and photothermal spectroscopy are contributed, respectively, by W. L. Hinze and co-workers, S. J.Weeks and colleagues and M. D. Morris.
1511
It has to be said that this is very much a book for thespecialist, with the emphasis clearly on techniques. Analystswishing to find established and reliable procedures fordetermining PAC in, say, food, dust or engine exhausts willfind it more useful to consult earlier texts (see, for examplereferences I and 2). However, those looking for a survey ofmodem directions in PAC analysis, with the emphasis onspectroscopic methods, will find much of interest.
Within this framework, the coverage is a little uneven, withfew clues as to the relative values of different approaches;thus, over 60 pages are devoted to laser multiphotonionisation spectroscopy (K. Siomos) whereas, gas and liquidchromatography, surely the methods most often applied,merit fewer pages, a consequence perhaps, of the maturity ofthe latter techniques. On the other hand, the thought-provoking chapter by D. A. Lane on the fate of PAC in theatmosphere and during sampling, and the thorough coverageof mass spectrometric analysis of PAC by R. A. Hites, areboth model reviews. Similarly, the two chapters on electronicspectroscopy (by M. Zander, and L. B. McGown and K.Nithipatikom) and those on infrared and Raman spectroscopy(by P. Stout and G. Mamantov, D. L. Gerrard and H. J.Bowley, and T. Vo-Dinh) together provide the most complete~overage yet attempted of the spectroscopic analysis of PAC.
Overall, the style and presentation of the book are pleasingwith only occasional inconsistencies in PA.C nomenclature;the principles behind the more innovative methods are clearlyexplained, and most chapters emphasise their relevance to thespecial problems of PAC analysis.
Highly recommended!
References1. Bj~rseth, A., and Randal, T., Editors, "Handbook of Poly
cyclic Aromatic Hydrocarbons," Volume I, Marcel Dekker,New York, 1983.
2. Bj~rseth, A., and Randal, T., Editors, "Handbook of Polycyclic Aromatic Hydrocarbons," Volume 2, Marcel Dekker,New York, 1985.
3. Bj~rseth, A., and Becher, G., "PAC in Workplace Atmospheres: Occurrence and Determination," CRC Press, BocaRaton, 1986.
K. D. Bartle

ANALYST, NOVEMBER 1990, VOL. 115
CUMULATIVE AUTHOR INDEX
JANUARY-NOVEMBER 1990
1513
Abad, Encarna Lorenzo, 617Abbas, Nureddin M., 1375Abdallah, Amin Mohamed A.,
221Abelian, Concepci6n, 217Abousahl, Said, 731Abramovie, Biljana F., 79, 705,
715Af~ar, Hiiseyin, 99Ahmad, Shakeel, 287Ahmed, Md. Jamal Uddin, 439Akagi, Tasuku, 1329Akama , Yoshifumi, 947Akella, S. R. K. M.. 455Akiyama, Shuzo, 1477Alan6n, Aurelia, 1117AI-Attar, A. F., 1441Albero, Maria Isabel, 989, 1257AI-Daher, Ismail M.. 645Aleixo, Luiz M.. 761Alfassi, Zeev B., 29, 817Allain, Pierre, 813Alonso, J., 315Altinoz, Sacide, 873Alvarez, Jose M. Fernandez,
617Alwehaid, AbdulAziz M., 1419Amlathe, Sulbha, 1385Analytical Methods Committee,
459Andres Garcia, Elena, 89Angeles, Enrique, 1483Anzano, Jesus M., 955Aoki, Koichi, 413Aoki, Nobumi, 435Apak, Re~at, 99Arent, Lori J., 899Arima, Shoichi, 1191Armanino, Carla, 907Arpadjan, S. , 399Arruda, Marco Aurelio Zezzi,
779Ausili, Antonella, 1167Avramides, E. J., 1037Baeyens, Willy, 359Baeza, J. J. Baeza, 721Bahari, M. Shahru, 417Baha-Uddin, Sulafa S., 1059Balasubramanian, N., 859Barba, Flora, 1335Barbooti, Mahmood M., 1059Barnes, Ramon M.. 1411Barragan, F. J .. 1499Bartle, Keith D., 125Bartroli, J., 315Baty, J. D., 517, 521Beary, Ellyn S., 911Beaugrand, Claude, 813Beceiro-Gonzalez, Elisa, 545Bedair, Mona M.. 449Beksac, Sinan, 873Belarra, Miguel A., 955Belfiore, A.. 649Berg-Nielsen, Karen, 1265Bermejo-Barrera, Adela, 545Bermejo-Barrera, Pilar, 545,
549Bermejo-Martinez, Francisco,
545,549Berthod, A.. 933Bhatia, Virendra K., 253Bianchi, Alexander P., 1423Birch, Brian J., 1277Biziuk, Marek, 393Blanchflower, W. John, 1323Blanco Gomis, Domingo, 89Blanco, Paulino Tun6n, 209,
1215Bonilla, Milagros, 563Bonilla Simon, Ma M., 337Bosch Reig, F., 111
Bovara, Roberto, 889Brainina, Khiena Z., 1301Bralie, Marija, 737Bramwell, Helena, 185Braven, Jim, 189Brennan, John D., 147Bresadola, Silvano, 1041Brienza, Sandra Maria Boscolo,
779Brinkman, Jan-Henk W., 1033Brinkman, Udo A. Th., 1033Brooksbank, P., 507Brossa, F., 1025Brown, Craig J., 1197Brown, R. Stephen, 147Brush, Pamela J., 1389Buldini, Pier Luigi, 1073Burse, Virlyn W., 243Buttery, Peter J., 1309Bysouth, Stephen R., 571Bystryak, I1'ya M., 839Caballero, Manuel, 1201Cabrera, Armando, 1483Cacho, Juan, 657Cadogan, Aodhmar, 1207takar, Mira, 787Calokerinos, Antony C, 613,
1229Calu~aru, A., 1223Calvo, Consuelo Pita, 549Camara, Carmen, 553, 563Camoni, Ivano, 1167Campanella, Luigi, 827Campins Fa1e6, P., 111Canale-Gutierrez, Lucia, 1243Cannavan, Andrew, 1323Capitan, Fermin, 849Capitan-Vallvey, Luis Fermin,
849Cardone, M. J., 111Cardwell, Terence J., 878, 1235Carlomagno, Doralysa N., 1093Camero Ruiz, C, 1121Caro, Arturo, 753Carrascal, Isabel, 345Carraz6n, Jose M. Pingarr6n,
869Carrea, Giacomo, 889Carty, Patricia, 617Cass, Anthony E. G., 185Castegnaro, Marcel, 129Castillo, Juan R., 539, 955Castino, Mario, 907Catterick, Timothy, 919Cattrall, Robert W., 878, 1235Cela, Rafael, 1201Cella, Norberto, 341Cerda, Victor, 749, 753Chai, Fong, 143Chakrabarti, Anil Kumar, 439Chalk, Phillip M., 365Chamberlain, Stephen J., 1161Chan, Lai Kwan, 201Chan, Wing Hong, 201, 205Chan, Wing-Fat, 567Chandra, Satya V., 287Changui, Cherkaoui, 1177Chen, Deli, 365Chen, Le-Tian, 1019Chen, P. Y., 29Chen, Qing, 109Cheung, Yiu-Ming, 1349Chiu, Teresa P. Y., 653Chopra, Sneh J., 253Chrastil, Joseph, 1383Christian, Gary D., 475, 1407Chu, C C, 29Chung, Koo-soon, 965Cipko, Edward, 593Clark, Georgina B., 1Clark, Gregory D., 1407
Clifford, Anthony A., 125Cody, Maria K., 1Coker, R. D., 1435Coleman, Catherine S., 517Conway, Brian O. B., 1Corbisier, Veronique, 359Cortes, Gabriel, 753Cretella, Ruben F., 915Criddle, W. J., 417Crosby, Neil T., 1Cross, Graeme J., 1235Cudby, Michael E. A., 1313da Silva, William Jose, 341Dadgar, Darioush, 275Dafoe, T., 507Dakashev, Anastas Dimitrou,
1247Dams, Richard, 17Dart, Peter J., 13Davidson, Alexander G., 997Davies, Cledwyn L., 379Dawson, George A., 1153De Elvira C6zar, A., 337de Gracia, Juan Pedro, 849de Oliveira Neto, Graciliano,
761de Ruiter, Cor, 1033Delaporte, Thierry, 813Dell, M. P. K., 1435Di Noto, Vito, 1041Diamond, Dermot, 1207, 1215Diaz Garcia, Marta Elena, 575Dfaz, Jose Manuel, 1201Diaz, Victor Cabal, 209Dommarco, Roberto, 1167Douge, Christophe, 813DowIe, Chris J., 105Duncan, Gregory, 109Duran-Meras, Isabel, 1007Durrani, Tariq M., 531Ebdel-Hay, Mohamed A., 449Ebdon, Les, 189Economou, E. D., 765Edmonds, Tony E., 599, 1277Efstathiou, Constantinos E.,
291EI-Gany, Nadya EI-Sayed Abd,
221Emons, Hendrik, 405, 895Estela, J. M., 749Evershed, Richard P., 1339Evmiridis, Nicholaos P., 765,
771, 1103Fadiran, Emmanuel 0., 997Fagioli, Francesco, 173Faizullah, Azad T., 69Farabella, Luciano, 593Farroha, Sabri M., 57Faruffini, G., 1025Fattah, Fattah A., 645Fedoroff, Michel, 731, 981Fernandez-Alba, A. R., 329Ferreira, Jose Roberto, 779Ferreira, Vicente, 657Ferri, Elida, 889Fierro, Jose L. G., 345Fleming, Paddy, 375, 1487Flint, F. Olga, 61Flores, Juana Rodriguez, 617Fogg, Arnold G., 41, 305,593,
599,1277Forina, Michele, 907Forteza, R., 749Frampton, Nicholas C, 189Franco, Douglas Wagner, 795Frank, Steven, 1327Frazier, Donald 0., 229Frei, Roland W., 1033Freney, John R., 365Friel, James K., 269Fudagawa, Noriko, 1185
Fumagalli, E. M., 1025Fung, Ying-sing, 1219Furusawa, Motohisa, 1495Fux, Pierre, 179Gaal, Ferenc F., 79, 715Gaind, Virindar S., 143, 801,
925,1359Galeeran, Ma. Teresa, 959Galindo Riano, M. D., 973Gallego, Mercedes, 943Gallorini, M., 1025Gambetti, Luisa, 1167Gani, David, 1313Gao, Zhiqiang, 951Garcia, Agustin Costa, 209,
1215Garcia Alvarez-Coque, M.
Celia, 1125Garcia, Angel J. Reviejo, 869Garcia, Maria C, 345Garcia, Maria Soledad, 989,
1257Garcia Sanchez, F., 1003, 1121Garcia-Vargas, M., 973Gardner, M. J., 371Garrels, Rick L., 155Gaskin, James E., 507Gazy, Azza A., 449Georgiou, Constantinos A., 309Ghini, Severino, 889Ghosh, Alpana, 969Gibbs, Phillip N. B., 185Gill, R., 371Girotti, Stefano, 889Glennon, Jeremy D., 627Goad, L. John, 1339Godbeer, William C., 865Godinho, Oswaldo E. S., 761G6mez, M., 553G6mez-Hens, A., 1377Gong, Cheng, 49Gonzalo, Pedro, 345Gramlich, John W., 1019Grassi, Marco T., 761Green, Monika J., 185Greenfield, Stanley, 531Greenway, Gillian M., 1297Grekas, Nikos, 613Grey, Peter, 159Grigolo, Brunella, 889Groce, Donald F., 243Grzeskowiak, Roman, 1063Guarneri, Mario, 929Guiraum, A., 1499Gunasingham, Hari, 35Gupta, Anita, 421Gupta, V. K., 1385Gutierrez, M. C, 1377Habboush, Albertine E., 57Hafez, Medhat Abd
EI-Hamied,221Halvatzis, Stergios A., 1229Hamada, Marawan A., 623Hamano, Takashi, 435Hamid, Junainah Abdul, 1289Hanna, George M., 1157Hara, Hirokazu, 1077Hara, Shuuji, 1363Harris, Stephen J., 1207Hart, Barry T., 878Hasdemir, Erdogan, 297Hase, Tapio A., 263Hasebe, Kiyoshi, 413Hassan, Eman B., 1059Hassan, Saad S. M., 623Haswell, Stephen J., 1063,
1435Haustein, Catherine Hinga, 155Head, Susan L., 243Heberger, Karoly, 725Hehn, Karen E., 1019
1514 ANALYST, NOVEMBER 1990, VOL. 115
Heineman, William R., 405,895
Hejzlar, Josef, 1463Henderson, Gillian E., 1063Hendra, Patrick J., 1313Heredia Bayona, A., 1121Hernandez, Abrahan, 1483Hernandez Cordoba, Manuel,
757Hernandez L6pez, M., 1003,
1121Heron, Carl, 1339Hikima, Satoshi, 413Hill, John W. F., 1397Hirata, Takafumi, 1329Holten, C. L. M., 1211Hon, Ping-Kay, 567Hosein, Sherina, 147Hoshika, Takeshi, 535Hoshino, Hitoshi, 133Hou, Weiying, 139Hougham, Bruce D., 147Huabin, Zou, 1505Huang, Lolita, 925Idei, Masae, 1109Iketani, Shin-ichi, 1251Ilcheva, Liliana Ilieva, 319,
1247Imai, Kazuhiro, 1477Imakita, Tsuyoshi, 1185Imasaka, Totaro, 73Inoue, Kouji, 1363lob, Asfaha, 1375Ishibashi, Nobuhiko, 73Ishida, Ryoei, 23Ishikawa, Keiko, 425Israel, Yecheskel, 1411Ito, Yoshio, 435Iwashimizu, Tsuyoushi, 413Iwata, Tetsuharu, 1363Jackson, Simon E., 269Jadage, Chandrakant D.,
1367Janardanan, c., 85Janjic, Tomislav J., 383, 1457Jaunault, Laurent, 813Jedrzejczak, Kazik, 925, 1359Jeng, Ingming, 109Jiang, Mian, 49Jinghe, Yang, 1505Jinno, Tsunenobu, 535Johnson, Brian J., 1153Jones, Sheila J .• 501Joseph-!'jathan, Pedro, 1483Juhasz, Eva, 1491Jun, Zou, 389Kakizaki, Teiji, 413Kanada, Susumu, 1477Kanai, Yutaka, 809Kapoor, Vidya B., 253Karayannis, Miltiades I., 741,
977, 1103Katayama, Masatoki, 9Kateman, Gerrit, 487Kaya, Satilmis, 531Kelly, W. Robert, 1019Kemp, Anthony J., 1197Kennedy, Colin D., 1067Kennedy, D. Glen, 1323Kerry, Ian, 1397Khanina, Rosa M., 1301Khier, A. Aboul, 1181Kimura, Keiichi, 1251Kintz, Pascal, 1269Kithinji, Jacob P., 125Klemm, Nancy, 109Koch, Klaus R., 823Koh, TomolO, 1133Komers, Karel, 467Kopacek, JiTi, 1463Korany, Mohamed A., 449Kiirtvelyessy, Judit, 1491Korver, Margaret P., 243Kotel'nikov, Aleksander I., 839Koupparis, Michael A., 309Kozuka, Shoji, 431Krivokapic, Jasmina, 745Krull, Ulrich J., 147,883Kubota, Hiroki, 1109
Kubota, Masaaki, 283, 939,1185
Kuldvere, Arnold, 559Kumar, B. S. M., 859Kumar, T., 1319Kura, Genichiro, 843Kuroda, R9kuro, 431Kurunczi, Eva K., 715Lahsen, Joaquin, 409Lamant, Jean-Michel, 1269Landi, Silvio, 173Lapeze, Jr., Chester R., 243Lau, Oi-Wah, 653, 1349Lau-Cam, Cesar A., 1157Lavi, N., 817Lee, Albert Wai Ming, 201, 205Lee, Geum-hee, 965Leech, Donal, 1447Lelkes, Maria, 1491Lemus, Jose M., 1117Lentza-RilOs, Ch., 1037Leon-Gonzalez, M. Eugenia,
609Lewis, Daniel M., 1029Likhtenshtein, Gerts I., 839Lima, Carlos A. S., 341Lin, Betty, 359Lingeman, Henk, 1033Liu, Hai-Ian, 835Liu, Jianhua, 1089Liu, Keshun, 1143Liu, Kuai-zhi, 835Locatelli, Clinio, 173Longerich, Henry P., 269Loos-Neskovic, Christiane, 731,
981Lovric, Milivoj, 45Lowes, Stephen, 511Luk, Shiu-fai, 653, 1219Lukaszew, Rosa A., 915Luque de Castro, M. D., 699Maccil, Carlo, 631McCalley, David V., 13, 1355McClure, Patricia C., 243Machado, Adelio A. S. C., 195McKelvie, Ian D., 878McKervey, M. Anthony, 1207McLaughlin, Kieran, 275McMaster, Dorothy, 275Maddams, William F., 1313Madrid, Yolanda, 563Maeno, Isao, 73Makkar, Harinder Paul S., 1309Malcolme-Lawes, David J., 65Malinowska, Eltbieta, 1085Malvankar, Purnima L.. 1473Malyan, Andrew P., 105Mangin, Patrice, 1269Manzoori, Jamshid L., 1055Maquieira, Angel, 1243Marinkovic, Mitar M., 79Mark, Jr., Harry B., 667Markakis, Pericles, 1143Marques, Edmar Pereira, 795Marquez Gomez, J. c., 1003,
1121Marquezini, Maria Valeria, 341Marrero, Julieta G., 915Martinez Calatayud, J., 855Martrnez-Lebrusant, Charo,
1335Martinez-Lozano, M. Carmen,
217,783Martinez-Vidal, J. L., 329Maru, Girish, 129Maru, Vibuthi, 129Marwah, Ashok K., 445Marwah, Padma, 445Masuda, Akimasa, 1329Masuda, Yoshitaka , 1089Matheson, Alasdair M., 105Matuska, Radek, 1271Mauras, Yves, 813Mecherri, Mohamed 0., 981Medina Hernandez, Maria Jose,
1125Medlock, V. F. P., 1435Meenakumari, K., 465Mendez, Rita, 213
Menegatti, Enea, 929Meng, Fanchang, 49Mestres, Joan S., 1097Meszlenyi, Gabor, 1491Metcalf, Richard C., 899Midgley, Derek, 1283Milovanovic, Gordana A., 787,
791Minobe, Masao, 535Minorikawa, Masea, 23Miranda, Rene, 1483Mishra, R. K., 969Mitsuhashi, Yukimasa, 435Miura, Jun'ichiro, 1191Miura, Yasuyuki, 1133Miyazaki, Akira, 1055Mizuno, Takayuki, 279Mlakar, Marina, 45Mohite, Barburao S., 1367Molina, R. Valero, 721Monfort Cuenca, Enrique, 1125Monreal, Francisco, 539Montero, Rosa, 943Moody, G. J., 1289Morales, Alfonso, 409Moreira, Josino c., 41Mori, Shigetsugu, 1077Moro, Antonino Lo, 641, 649Morrison, Gregory M., 1371Morrisson, Andrew R., 1429Motomizu, Shoji, 389, 1109Motta, Roberto, 889Mottola, Horacio A., 679Mrzljak, Robert I., 1235Muccio, Alfonso Di, 1167Muk, Aurora, 745Mukai, Yoshio, 9Mukunda Rao, S. R., 1129Munoz de la Pena. Arsenio,
1007Munoz Leyva, J. A., 973Munoz, M., 315Murillo, Jose A., 1117Murthy, Ramesh c., 287Nagy, Vitalii Yu., 839Nair, S. Madhavankutty, 85Najm, Kassim A., 645Nakamuara, Masaru, 1363Nakamura, Susumu, 283, 939Nakano, Kouji, 133Nakashima, Kenichiro, 1477Nakata, Ryuji, 425Navalon, Alberto, 849Nawata, Sawako, 843Needham, Larry L., 243Ng, Alice Chui Wah, 205Nickless, G., 1441Nikolelis, Dimitrios P., 291, 883Nitta, Akihiko, 425Noutary, Clemente J., 915Nukatsuka, Isoshi. 23Oguma, Koichi, 431Ohta, Kiyohisa, 279Ohzeki, Kunio, 23Ojanper., Ilkka, 263Oji, Yoshikiyo, 435O'Kennedy, Richard J., 617,
1145Olenchock, Stephen A., 1029Ongomo, Peter, 1297Orban, Helen, 1405Ordieres, Arturo J. Miranda,
1215Oshima, Mitsuko, 389Otto, Matthias, 685Ozawa, Hideaki, 1343Ozsoz, Mehmet, 831Pal, Bijoli Kanti, 439Palacios, M. A., 553Pambid, Ernesto R., 301Panciatici, G., 649Papadopoulos, Constantine G.,
323Parida, F. C., 1129Park, John S., 1429Parthasarathy, T. N., 455Passingham, Catherine, 1313Patel. Bharti, 1063Patel. K. S., 969
Patterson, Ronald L. S., 501Pazouki, Sima, 517Pearce, Bill c., 1397Peck, David V., 899Pereiro Garcia, Maria Rosario,
575Perez-Bendito, Dolores, 689,
1261, 1377Perez-Bustamante, Juan
Antonio, 1201Perez-Ruiz, Tomas, 217, 783Petersen, Martin, 1029Petilino, Roberto, 889Petrukhin, Oleg M., 839Pfendt, Lidija B., 383, 1457Pietra. R., 1025PilIai, Vadasseril N.
Sivasankara, 213Piracci, Antonio, 907Pia. F. Perez, 721Polizello, Ana Cristina M., 1093Polkowska, Zaneta, 393Polo Diez, Luis Maria, 337,
609.869Popovic, Gordana V., 383,1457Pratap, Shridhar R., 1367Preisler, Ladislav. 1271Prioli, Alberto Jose, 341Puchades, Rosa, 1243Punta, A., 1499Quintero, Maria del Carmen,
1261Radk, Njegomir, 737Raimundo, Jr., Ivo M., 761Rajadel, Pilar, 1097Raju, K. Ramakrishnam, 455Rakanovic, Mila, 801Rama Devi, P.. 1469Rama Krishna Naidu, G., 1469Raman, B., 93Ramos, G. Ramis, 721Randles, Mark A., 379Rao, Ganti Shankar, 445Rapaumbya, Guy-Roland, 637Raspi, Giorgio, 641, 649Rauret, Gemma, 959, 1097Ravenscroft, J. E., 371Rawle, N. W., 521Raynor, Mark W., 125Reading, Christopher L., 1145Ribera, Merce, 1097Richards, Michael E., 797Richter, Pablo, 409Riise, Edel, 1265Riley, Kenneth W., 865,1405Roch, O. G., 1435Roda, Aldo, 889Rodriguez, I., 553Rodriguez, Jose R. Barreira,
209Rodriguez, Juana, 1117Roe, J. N., 353Rose, Malcolm E., 511Royaud, Isabelle A. M., 1313Rubio, Roser, 959Rubio, S., 1377Riicker, G., 1181Ruiping, Shi, 1505Ruiz-Lopez, Maria-Dolores,
129Ruzicka, Jaromir, 475, 1407Sabbioni, E., 1025Sabharwal, Sunil, 1305Saccon, Mauro, 1041Sadek, M. EI, 1181Sadiris, Nicholaos c., 1103Saez, Andres, 1257Sahoo , P., 1129Saito, Kenichi, 431Sakamoto, Hidefumi, 1251Salinas, Francisco, 329, 1007Salmon, Manuel, 1483Sammartino, Maria Pia, 827Sampedro, A. Sanchez, 855Sanchez-Pedreno, Concepcion,
757, 989, 1257Sanghi, Sunil K., 333Santha, Kolla, 465Santilio, Angela, 1167

ANALYST, NOVEMBER 1990, VOL. 115 1515
Santos-Delgado, M. Jesus, 609Sanz-Medel, Alfredo, 575Sarantonis, E. G., 977Saraswathi, Kanneganti, 465Sarrion, S. Navasquillo, 855Satake, Masatada, 1191Sauvage, Jean-Paul, 637Saxena, Praveen, 1073Saxena, Vibha, 1073Scalia, Santo, 929Schafer, Harry N. S., 1405Scollary, Geoffrey R., 1235Scullion, S. Paul. 599, 1277Sekido, Eiichi, 1089Seligman, Peter F., 1327Serra, Dinah B., 341Seward, Eileen M., 1207Shakir, Issam M. A., 69Shanawany, A. EI, 1181Sharp, Barry L., 1429Shaw, Ian C., 1389Sheng, Liangquan, 951Shinde, V. M., 93Shinde, Vijay M., 1473Shono, Toshiyuki, 1251Si, Zhi-Kun, 1139Siegel, Paul D., 1029Silva, Edson c., 341Silva, Manuel, 993, 1261Singh, Raj P., 301Singh, Sunil Kumar, 421Sithole, B. Bruce, 237Sivasubramanian, K., 1129Skinner, Craig S., 269Siadic, Du~an M., 383Smrek, Ann L., 243Smyth, Malcolm R., 275, 617,
1207, 1215, 1447Soledad Dunln, Maria, 1007Somer, GUIer, 297Spadaro, Augusto Cesar c.,
1093Spinetti, Maria, 641Srijaranai, Supalax, 627
Srivastava, Ashutosh, 421Stallard, Martha 0., 1327Stang, Peter M., 1327Stein, H. N., 1211Stockwell, Peter B., 571Stone, William E. E., 1177Stoyanoff, Robert E., 801Sugiyama, Takehiko, 279Suzuki, Harumi, 167Svehla, Gyula, 1207Szczepaniak, Walenty, 1451Szklar, Roman S., 801Szoka, F. c., 353Szpunar-I:.obinska, Joanna, 319Tachibana, Masaki, 1495Tadros, Shawky H., 229Takaki, Toshihiro. 1133Takeda, Kikuo, 535Tan, Chin-Huat, 35Tanaka. S., 947Taniguchi, Hirokazu, 9Tao, Hiroaki, 1055Taylor, Richard H., 1407Taylor, Robert B.• 797Teien, Gerd, 259Telting-Diaz, Martin. 1215Temizer. Aytekin. 873Terashita. Minoru, 425Teresa, M., 195Ternero. M.• 1499Thomas, J. D. R., 417, 1289Timotheou-Potamia, Meropi
M.,1229Tipton. Keith, 617Toda, Shozo, 167Tomas, Virginia, 217. 783Tomassetti, Mauro, 827Tomlins, K., 1435Tong, A., 947Toponi, Alessandro, 1073Tor, Isset, 99Torres, A., 1377Townshend, Alan. 495Trojanowicz, Marek, 319
Tsuji, Sumiko, 435Tsukioka, Tadashi, 1343Tyson, Julian F., 305, 531, 571,
587,593Ubigli, Mario, 907Uchida, H.• 933Uden, Peter c., 525Uisaker, Gunnar A., 259Utley, David, 1239Uzu, Sonoko, 1477Valcarcel, Miguel, 699, 943, 993Valente, Antonio Luiz Pires,
525Valiente, M., 315Valkirs, Aldis 0., 1327van Rensburg, Ancel, 605. 1049van Staden, Jacobus F., 581,
605,1049van Zonnen, Piet, 1033Vandecasteele, Carlo, 17Vandenberg, Elaine T., 147Vargas, Helion, 341Vasconcelos, S. D., 195Vasi", Vesna, 745Vassileva, E., 399Vecchietti, Roberto, 173Velasco, Antonio, 993Veltsistas, Panayotis G .• 741Verchere, Jean-Fran~ois,637Vergori, Fabio, 1167Vergori, Luciano, 1167Verkman, A. S., 353Verma, Archana, 333Verma, Krishna K., 333Vermeiren, Koen, 17Vidal, Juan c., 539Vielvoye, Leon, 1177Vilchez, Jose Luis, 849Vilchinskaya, Elena A., 1301Villanueva Camaiias. Rosa M.,
1125Vinas, Pilar, 757V1essidis, Athanasios G., 771Vohra, Kay. 925
Volodarskii, Leonid B., 839Vuac, Nevenka, 791W~h~Hi, Kristiina, 263Wallace, Heather M., 517Wang, Erkang, 139Wang, Jirong, 53Wang, Joseph, 831, 1447Wang, Xiang-wen, 305Werner, Gerhard, 405White, Peter C., 919Willis, Harry A., 1313Willis, R. G., 521Winefordner. J. D., 933Wong, Koon Hung, 65Wood, John P. M., 1389Wu, Qing-guo, 835Wu, Weh S., 801Xing, D. Kai-Io, 797Xuezhen, Ren, 1505YagUe, Encarna, 783Yako, Tadaaki, 535Yamaguchi, Masatoshi, 1363Yamamoto, Susumu, 435Yamamuro, Norihito, 1133Yamazaki, Sunao, 167Yang, Mo H., 29Yee, K. F., 225Ying-Kai, Xiao, 911Yokota, Fumihiko, 23Yoshimura, Etsuro, 167Yoshimura, Kazuhisa, 843Yotsuyanagi, Takao, 133Zagatto, Elias Ayres Guidetti,
779Zaki, Nabila S., 1059Zannetti, Roberto, 1041Zhao, Zaofan, 49, 951Zhu, Gui-Yun, 1139Zhu, Wen-Jing, 1139Zichy, Veronica, 1313Zolotov, Yurii A., 839Zotou, Anastasia Ch., 323Zoulis, Nikolaos E., 291Zurmiihl, Torsten, 1171

iii
IUPAC•will be held in
Grieg Hall, Bergen, NorwayJune 9-14 1991
The XXVII Colloquium Spectroscopicum InternationaleXXVII CSI,.-.mUL
1991NORWAY
This traditional biennial conference in analytical spectroscopy will once again provide a forwn for atomic, nuclear andmolecular spectroscopists worldwide to encourage personal contacl and the exchange of experience.
Parlicipants are invited to submit papers for presentation at the XXVII CSI, dealing with the following topics:Basic theory and instrunllmJotion of-
Atomic spectroscopy (emission. absorption. fluorescence)Molecular spectroscopy (UV. VIS and IR)X-ray spectroscopyGanuna spectroscopyMass spectrometry (inorganic and organic)Electron spectroscopyRaman spectroscopyMossbauer spectroscopyNuclear magnetic resonance spectrometryMethods of surface analysis and depth profilingPhotoacoustic spectroscopy
Application of spectroscopy in the analysis ofMetals and alloysGeological materialsIndustrial productsBiological samplesFood and agricultural products
Special emphasis will be given to trace analysis. environmental pollutants and slandard reference materials.The scientific progranune will consist of both plenary lectures and parallel sessions of oral presentation. Specific limes will bereserved for posler sessions.
PRE· AND POST-SYMPOSIAIn connection with the XXVII CSI the following symposia will be organised:
Pre-symposia--I. GRAPHITE ATOMISER TECHNIQUES IN ANALYTICAL SPECTROSCOPYJune 6-8.1991. Hotel Ullensvang. Lofthus. Norway.
II. CHARACTERISATION OF Oil COMPONENTS USING SPECTROSCOPIC METHODSJune 6-8.1991. Hotel Hardangerfjord. 0yslese. Norway.
III. MEASUREMENT OF RADIO-NUCLIDES AFTER THE CHERNOBYl ACCIDENTJune 6-8.1991. Hotel Solstrand. Bergen. Norway.
Post-symposium-IV. SPECIATION OF ELEMENTS IN ENVIRONMENTAL AND BIOLOGICAL SCIENCESJune 17-19, 1991. Hotel Alexandra. Loen, Norway.
For further informalion contact:
THE SECRETARIATXXVII CSIHSD Congress-ConferenceP.O. Box 1721 NordnesN-5024 Bergen, Norway.Tel. 47-5-318414, Telex 42607 hsd n, Telefax 47-5-324555
Circle 006 for further information
.".
'ii
'",...."
~oIm:IIm
FOLD HERE
For further information about any ofthe products featured in the advertisements in this issue. please writethe appropriate number in one of the boxes below.Postage paid if posted in the British Isles but overseas readers must affix a stamD.
3 STREET[ I I I I I I I
II TOWN I I I I I I I I ! I5 COUNTY ITI I I I i I LPOST CODE
6 COUNTRY I I I I I I I I I I7 DEPARTMENTI III I I I [ I I I I I I IDIVISION
8 YOUR JOB TITLEI I I I I I I I [ [ I I I [ IPOSITION
9 TELEPHONE NO I I I OF F ICE USE ONl y HEC'U I I I I PAoe I) I I I I IFOLD HERE
NOV'90 .
Valid 72 monrhs
Do not affix Postage Stamps if posted in Gt. Britain,Channel Islands, N. Ireland or the Isle of Man
[ I I I I I I I I I I I I I I i I I I I I I I [ II I I I I I I I I I II [ I I I I I I I I I I I I
Postagewill bepaid byLicensee
2 COMPANY
PLEASE GIVE YOUR BUSINESS ADDRESS IF POSSIBLE. IF NOT, PLEASE TICK HERE 0
1 NAME
PLEASE USE BLOCK CAPITALS LEAVING A SPACE BETWEEN WORDS
THE ANALYST READER ENQUIRY SERVICE
BUSINESS REPLY SERVICELicence No, WD 106
Reader Enquiry ServiceThe AnalystThe Royal Society of ChemistryBurlington House, PiccadillyLONDONW1E 6WFEngland

JAAS provides a unique publication service in support of growing research effortsin, and application of, atomic spectrometric techiques.
Don't be without a subscription to JAAS
Order today from the address below •••
Editor: Judith Egan, Royal Society ofChemistry, Thomas Graham House, Science Park, Milton Road,Cambridge CB4 4WF, UKUS Associate Editor: J.M. Hamly, Department ofAgriculture, Beltsville Human Nutrition ResearchCenter, BLDG 161, BARC-EAST, Beltsville, MD20705, USA
An international journalon the development and
application of atomicspectrometric techniques
leading analytical
The Journal ofAnalytical Atomic Spectrometry (JAAS) is an international journalfor the publication of original research papers, short papers, communications andletters concerned with the development and analytical application of atomicspectrometric techniques. It also includes comprehensive reviews on specifictopics of interest to practising atomic spectroscopists.
Subscription details 1990:ISSN 0267·9477
6 issues per annum plus two special issuesUK £276.00 Other EC £276.00 USA $618.00 Rest of World £317.00
The journal is published eight times per year, including two special issues, andcontains papers on all aspects of the subject. It features information on forthcoming conferences and meetings, recent awards, items of historical interest, bookreviews, conference reports and papers to be included in future issues.
A special feature of JAAS. which makes it significantly different from all others inthe field, is the inclusion of Atomic Spectrometry Updates. The six regular issueseach contain a major review covering a period of one year. Successive issues ofJAAS review the whole range of topics previously covered by ARAAS (AnnualReports on Analytical Atomic Spectroscopy) and provide a unique appreciation ofdevelopments in analytical atomic spectrometry. Also included with each Update isa cumulative list of references to primary research papers and conferenceproceedings on which the reviews are based - an extremely useful starting pointfor further reading.
One of the world'schemistry journals
Journal ofAnalyticalAtomicSpectrometry
InformationServices
The Royal Society of Chemistry, Distribution Centre, Blackhorse Road,Letchworth, Herts SG6 1HN, United Kingdom.
Tel: + 44 (0) 462672555 Fax: +44(0) 462 480947 Telex: 825372
Circle 007 for further information

ANALAO 115(11) 1397-1516 (1990)
The Analyst
November 1990'
The Analytical Journal of The Royal Society of Chemistry
CONTENTS
1397 Use of X-ray Fluorescence Spectrometry for the Direct Multi-element Analysis of Coal Powders-Bill C. Pearce, JohnW. F. Hill, Ian Kerry
1405 Rapid Acid Extraction of Bituminous Coal for the Determination of Phosphorus- Kenneth W. Riley, Harry N. S. Schafer,Helen Orban
1407 Automated Flow Injection Measurement of Photographic Dyes in Gelatin at Elevated Temperatures-Richard H.Taylor, Gregory D. Clark, Jaromir Ruzicka, Gary D. Christian
1411 On-line Dilution, Steady-state-Concentrations by Tandem Injection and Merging Stream. Application to InductivelyCoupled Plasma Atomic Emission Spectrometry Sequential Multi-element Soil Analysis- Yecheskellsrael, RamonM. Barnes
1419 Flow Injection Spectrophotometric Determination of 4-Aminophenazone Based on Diazotisation and CO(lplingReactions-AbdulAziz M. Alwehaid .
1423 Determination of Light Hydrocarbon Gases in Sea Water Using Three Variants of Static "Equilibrium" HeadspaceAnalysis-Alexander P. Bianchi
1429 Application of High-performance Size-exclusion Liquid Chromatography to the Study of Copper Speciation in WatersExtracted From Sewage Sludge Treated Soils-Andrew R. Morrisson, John S. Park, Barry L. Sharp
1435 Analytical Methodology for the Determination of Aflatoxins in Peanut Butter: Comparison of High-performanceThin-layer Chromatographic, Enzyme-linked Immunosorbent Assay and High-performance Liquid Chromatographic Methods-M. P. K. Dell, S. J. Haswell, O. G. Roch, R. D. Coker, V. F. P. Medlock, K. Tomlins
1441 Determination of Selenium by Gas Chromatography and Comparison With Graphite Furnace Atomic AbsorptionSpectrometry-A. F. AI-Attar, G. Nickless
1447 Electrocatalytic Detection of Streptomycin and Related Antibiotics at Ruthenium Dioxide Modified Graphite - EpoxyComposite Electrodes-Donal Leech, Joseph Wang, Malcolm R. Smyth
1451 Mercurated Polystyrene as a Sensor for Anionic Surfactants in lon-selective Polymeric Membrane ElectrodesWalenty Szczepaniak
1457 Study of Proto lytic Equilibria of Flurazepam-Lidija B. Pfendt, Tomislav J. Janjic, Gordana V. Popovic
1463 Determination of Low Chemical Oxygen Demand Values in Water by the Dichromate Semi-micro Method-JosefHejzlar, Jifi Kopacek
1469 Enrichment of Trace Metals in W~ter on Activated Carbon-Po Rama Devi, G. Rama Krishna Naidu
1473 Extraction of Cobalt and Nickel Salicylates: Application to Steel and Industrial Wastewater Samples- Purnima L.Malvankar, Vijay M. Shinde
1477 Fluorogenic Reagents: 4-Aminosulphonyl-7-hydrazino-2,1,3-benzoxadiazole, 4-(N,N-Dimethylaminosulphonyl)-7hydrazino-2,1,3-benzoxadiazole and 4-Hydrazino-7-nitro-2,1,3-benzoxadiazole Hydrazine for Aldehydes andKetones-Sonoko Uzu, Susumu Kanada, Kazuhiro Imai, Kenichiro Nakashima, Shuzo Akiyama
1483 Indicators for Alkyllithium Assay. Nuclear Magnetic Resonance Evidence for the Dianion of Benzophenonetosylhydrazone-Rene Miranda, Abrahan Hernandez, Enrique Angeles, Armando Cabrera, Manuel Salmon, Pedro JosephNathan
1487 Transmittance Ratio Spectrometry as a Stray Radiant Energy Test Method for Optical-null SpectrophotometersPaddy Fleming
1491 Determination of Carbendazim in Benomyl Using Infrared Spectrophotometry-Gabor Meszlenyi, Judit K6rtvelyessy,Eva Juhasz, Maria Lelkes
1495 Rapid Spectrophotometric Method for the Determination of Fluorene-Masaki Tachibana, Motohisa Furusawa
1499 Spectrofluorimetric Determination of Sulphide in Natural and Wastewaters With 1,2-Naphthoquinone-4-sulphonateA. Punta, F. J. Barrpgan, M. Ternero, A: Guiraum
1505 Enhanced Lumi'nescence of the Europium(lII) - Terbium(lII) - Dibenzoylmethane - Ammonia - Acetone System and itsApplication to the Determination of Europium-Yang Jinghe, Ren Xuezhen, Zou Huabin, Shi Ruiping
1509 BOOK REVIEWS
1513 CUMULATIVE AUTHOR INDEX
Typeset and printed by Black Bear Press limited. Cambridge. England