additional analyst information for 30 june 2021 - sasol
TRANSCRIPT

Contents
Financial overviewSalient features 3
Financial results, ratios and statistics 4
Financial ratios - calculations 6
Half year financial results, ratios and statistics 8
Key sensitivities 9
Latest hedging overview 10
Income statement overview 11
Mining – earnings performance 16
Gas feeds – earnings performance 17
Fuels – earnings performance 18
Chemicals Africa – earnings performance 20
Chemicals America – earnings performance 21
Chemicals Eurasia – earnings performance 22
Financial position overview – assets 23
Asset Divestments 25
Financial position overview – equity and liabilities 26
Abbreviated cash flow statement overview 28
Eleven year financial performance
Eleven year financial performance 34
Segment information
Segmental analysis 29
Other disclosureComprehensive response plan 32
Sasol 2.0 transformation programme 32
Sasol South Africa 33
Sasol Limited Group
2 Sasol Additional Information for Analysts 30 June 2021
Sasol Additional Information for Analysts 30 June 2021 3
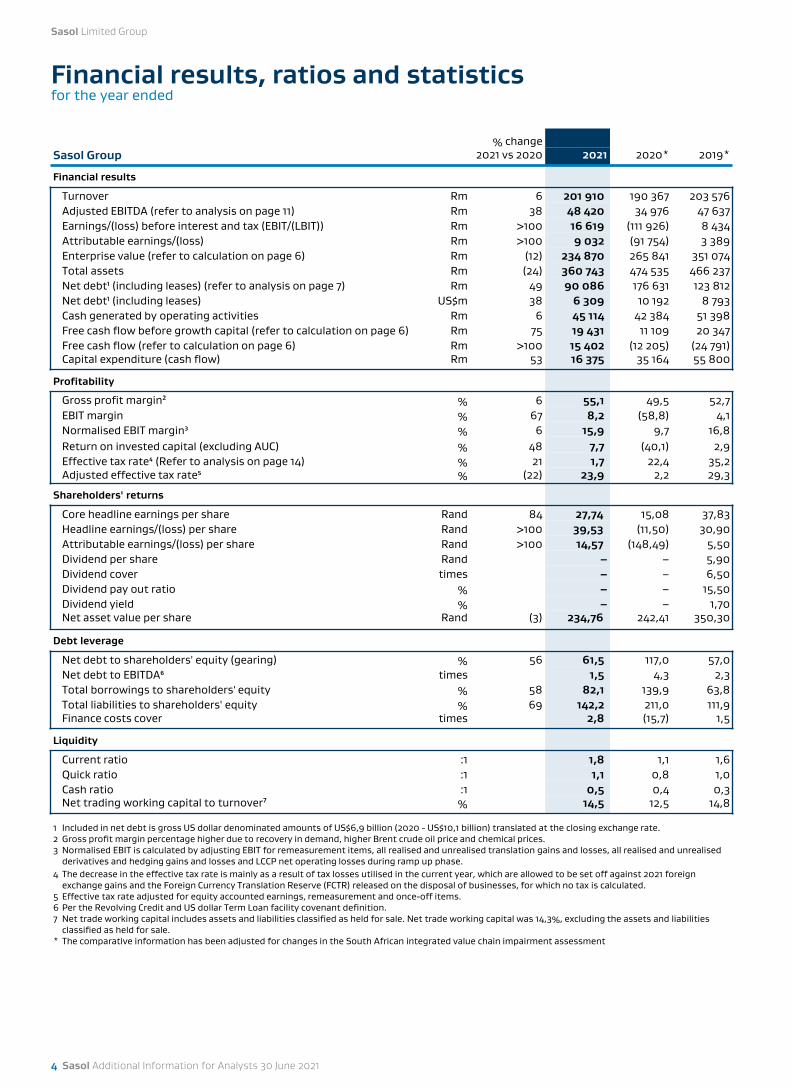
% changeSasol Group 2021 vs 2020 2021 2020* 2019*
Financial results
Turnover Rm 6 201 910 190 367 203 576Adjusted EBITDA (refer to analysis on page 11) Rm 38 48 420 34 976 47 637Earnings/(loss) before interest and tax (EBIT/(LBIT)) Rm >100 16 619 (111 926) 8 434Attributable earnings/(loss) Rm >100 9 032 (91 754) 3 389Enterprise value (refer to calculation on page 6) Rm (12) 234 870 265 841 351 074Total assets Rm (24) 360 743 474 535 466 237Net debt¹ (including leases) (refer to analysis on page 7) Rm 49 90 086 176 631 123 812Net debt¹ (including leases) US$m 38 6 309 10 192 8 793Cash generated by operating activities Rm 6 45 114 42 384 51 398Free cash flow before growth capital (refer to calculation on page 6) Rm 75 19 431 11 109 20 347Free cash flow (refer to calculation on page 6) Rm >100 15 402 (12 205) (24 791)Capital expenditure (cash flow) Rm 53 16 375 35 164 55 800
Profitability
Gross profit margin² % 6 55,1 49,5 52,7EBIT margin % 67 8,2 (58,8) 4,1Normalised EBIT margin³ % 6 15,9 9,7 16,8Return on invested capital (excluding AUC) % 48 7,7 (40,1) 2,9Effective tax rate⁴ (Refer to analysis on page 14) % 21 1,7 22,4 35,2Adjusted effective tax rate⁵ % (22) 23,9 2,2 29,3
Shareholders' returns
Core headline earnings per share Rand 84 27,74 15,08 37,83Headline earnings/(loss) per share Rand >100 39,53 (11,50) 30,90Attributable earnings/(loss) per share Rand >100 14,57 (148,49) 5,50
X Dividend per share Rand 1 000 – – 5,90Dividend cover times – – 6,50Dividend pay out ratio % – – 15,50Dividend yield % – – 1,70Net asset value per share Rand (3) 234,76 242,41 350,30
Debt leverage
Net debt to shareholders' equity (gearing) % 56 61,5 117,0 57,0Net debt to EBITDA⁶ times 1,5 4,3 2,3Total borrowings to shareholders' equity % 58 82,1 139,9 63,8Total liabilities to shareholders' equity % 69 142,2 211,0 111,9Finance costs cover times 2,8 (15,7) 1,5
Liquidity
Current ratio :1 1,8 1,1 1,6Quick ratio :1 1,1 0,8 1,0Cash ratio :1 0,5 0,4 0,3Net trading working capital to turnover⁷ % 14,5 12,5 14,8
1
1 Included in net debt is gross US dollar denominated amounts of US$6,9 billion (2020 - US$10,1 billion) translated at the closing exchange rate.2 Gross profit margin percentage higher due to recovery in demand, higher Brent crude oil price and chemical prices.3 Normalised EBIT is calculated by adjusting EBIT for remeasurement items, all realised and unrealised translation gains and losses, all realised and unrealised
derivatives and hedging gains and losses and LCCP net operating losses during ramp up phase.4 The decrease in the effective tax rate is mainly as a result of tax losses utilised in the current year, which are allowed to be set off against 2021 foreign
exchange gains and the Foreign Currency Translation Reserve (FCTR) released on the disposal of businesses, for which no tax is calculated.5 Effective tax rate adjusted for equity accounted earnings, remeasurement and once-off items.6 Per the Revolving Credit and US dollar Term Loan facility covenant definition.7 Net trade working capital includes assets and liabilities classified as held for sale. Net trade working capital was 14,3%, excluding the assets and liabilities
classified as held for sale.* The comparative information has been adjusted for changes in the South African integrated value chain impairment assessment
Sasol Limited Group
4 Sasol Additional Information for Analysts 30 June 2021
Financial results, ratios and statisticsfor the year ended

Sasol Group 2021 2020* 2019*
Stock exchange performance
Market capitalisationSasol ordinary shares Rm 136 888 82 757 218 776Sasol BEE ordinary shares¹ Rm 725 603 1 758
(Discount to) / premium over shareholders funds Rm (8 876) (67 616) 3 310Price to book :1 0,94 0,55 1,02
Share performance
Total shares in issue million 634,2 632,3 631,0
Sasol ordinary shares in issue million 627,9 626,0 624,7Sasol BEE ordinary shares in issue¹ million 6,3 6,3 6,3
Sasol Foundation² million 10,2 9,5 9,5Weighted average shares in issue³ million 619,9 617,9 616,6
Total shares in issue million 634,2 632,3 631,0Sasol Foundation million (9,5) (9,5) (9,5)Weighting of shares issued with Sasol Khanyisa transaction million (4,1) (4,5) (4,5)Weighting of long-term incentive scheme shares vested during the year million (0,7) (0,4) (0,4)
Weighted average number of shares for DEPS million 627,8 622,3 620,3Weighted average shares in issue million 619,9 617,9 616,6Potential dilutive effect of long-term incentive scheme million 3,8 2,6 2,9Potential dilutive effect of Sasol Khanyisa Tier 1 million 4,1 1,8 0,8
Economic indicators⁴
Average crude oil price (Brent) US$/bbl 54,20 51,22 68,63Average Rand per barrel R/bbl 834,68 803,64 974,55Average ethane price (US - Mont Belvieu) US$c/gal 23,15 17,23 31,92
Rand/US dollar exchange rate - closing US$1 = R 14,28 17,33 14,08Rand/US dollar exchange rate - average US$1 = R 15,40 15,69 14,20
Rand/Euro exchange rate - closing €1 = R 16,93 19,46 16,01Rand/Euro exchange rate - average €1 = R 18,38 17,34 16,19
1
1 Sasol BEE ordinary shares have been listed on the JSE Limited's BEE segment of the main board since 7 February 2011. 2 The Sasol Foundation approached the Sasol Khanyisa Employee Share Ownership Plan Trust to acquire Sasol BEE Ordinary Shares becoming available as a
result of the Khanyisa Tier 1 shares vesting in exchange for SOL shares. The deal was done at off-market prices.3 Including Sasol BEE ordinary shares after the share repurchase programme.4 Exchange rates are determined as the mid-closing interbank rate of South African banks daily as published by Thomson Reuters. The average rate for the
period is determined as an arithmetic average of the mid-closing interbank rates for each of the South African business days for the financial period under review. Brent crude oil prices are determined from the quoted market prices of Brent North Sea crude oil as published by Platts-Global Alert. The average price is calculated as an arithmetic average of the daily published prices.
* The comparative information has been adjusted for changes in the South African integrated value chain impairment assessment
Sasol Additional Information for Analysts 30 June 2021 5
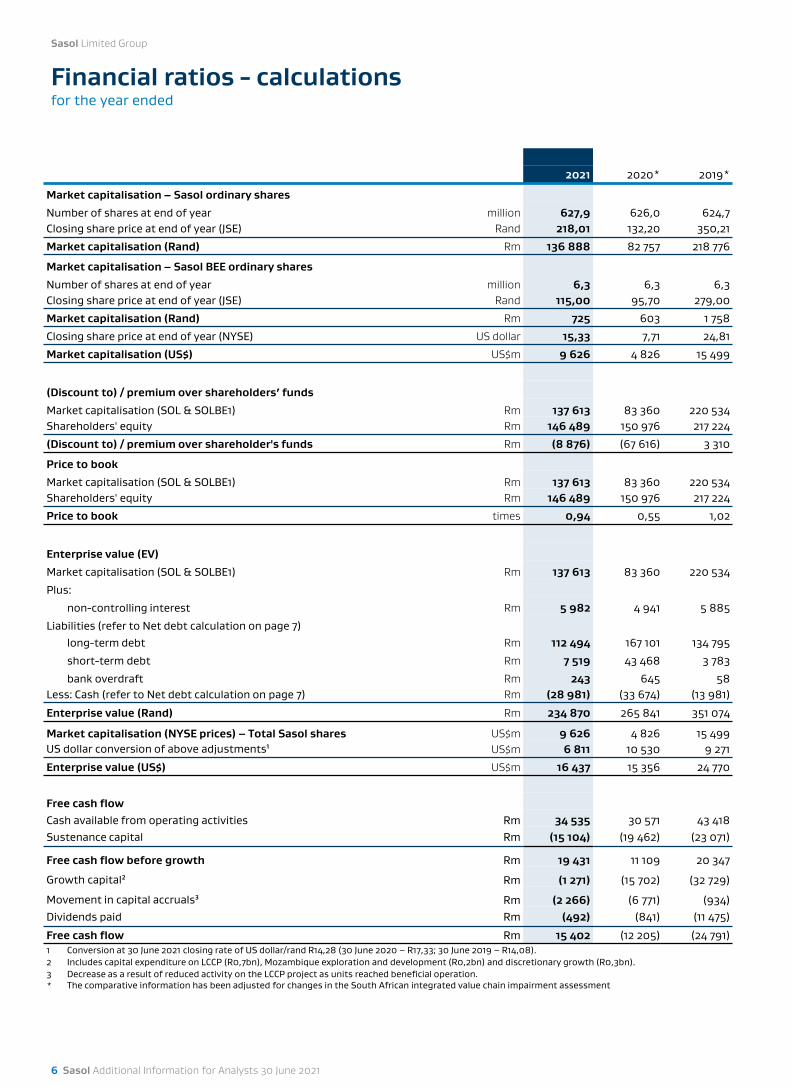
Financial ratios - calculationsfor the year ended
2021 2020* 2019*
Market capitalisation – Sasol ordinary sharesNumber of shares at end of year million 627,9 626,0 624,7Closing share price at end of year (JSE) Rand 218,01 132,20 350,21
Market capitalisation (Rand) Rm 136 888 82 757 218 776
Market capitalisation – Sasol BEE ordinary sharesNumber of shares at end of year million 6,3 6,3 6,3Closing share price at end of year (JSE) Rand 115,00 95,70 279,00
Market capitalisation (Rand) Rm 725 603 1 758
Closing share price at end of year (NYSE) US dollar 15,33 7,71 24,81
Market capitalisation (US$) US$m 9 626 4 826 15 499
(Discount to) / premium over shareholders’ fundsMarket capitalisation (SOL & SOLBE1) Rm 137 613 83 360 220 534Shareholders' equity Rm 146 489 150 976 217 224
(Discount to) / premium over shareholder's funds Rm (8 876) (67 616) 3 310
Price to bookMarket capitalisation (SOL & SOLBE1) Rm 137 613 83 360 220 534Shareholders' equity Rm 146 489 150 976 217 224
Price to book times 0,94 0,55 1,02
Enterprise value (EV)Market capitalisation (SOL & SOLBE1) Rm 137 613 83 360 220 534
Plus:
non-controlling interest Rm 5 982 4 941 5 885
Liabilities (refer to Net debt calculation on page 7)long-term debt Rm 112 494 167 101 134 795
short-term debt Rm 7 519 43 468 3 783
bank overdraft Rm 243 645 58Less: Cash (refer to Net debt calculation on page 7) Rm (28 981) (33 674) (13 981)
Enterprise value (Rand) Rm 234 870 265 841 351 074
Market capitalisation (NYSE prices) – Total Sasol shares US$m 9 626 4 826 15 499US dollar conversion of above adjustments¹ US$m 6 811 10 530 9 271
Enterprise value (US$) US$m 16 437 15 356 24 770
Free cash flowCash available from operating activities Rm 34 535 30 571 43 418Sustenance capital Rm (15 104) (19 462) (23 071)
Free cash flow before growth Rm 19 431 11 109 20 347
Growth capital² Rm (1 271) (15 702) (32 729)
Movement in capital accruals³ Rm (2 266) (6 771) (934)Dividends paid Rm (492) (841) (11 475)
Free cash flow Rm 15 402 (12 205) (24 791)1 Conversion at 30 June 2021 closing rate of US dollar/rand R14,28 (30 June 2020 – R17,33; 30 June 2019 – R14,08).2 Includes capital expenditure on LCCP (R0,7bn), Mozambique exploration and development (R0,2bn) and discretionary growth (R0,3bn).3 Decrease as a result of reduced activity on the LCCP project as units reached beneficial operation.* The comparative information has been adjusted for changes in the South African integrated value chain impairment assessment
Sasol Limited Group
6 Sasol Additional Information for Analysts 30 June 2021
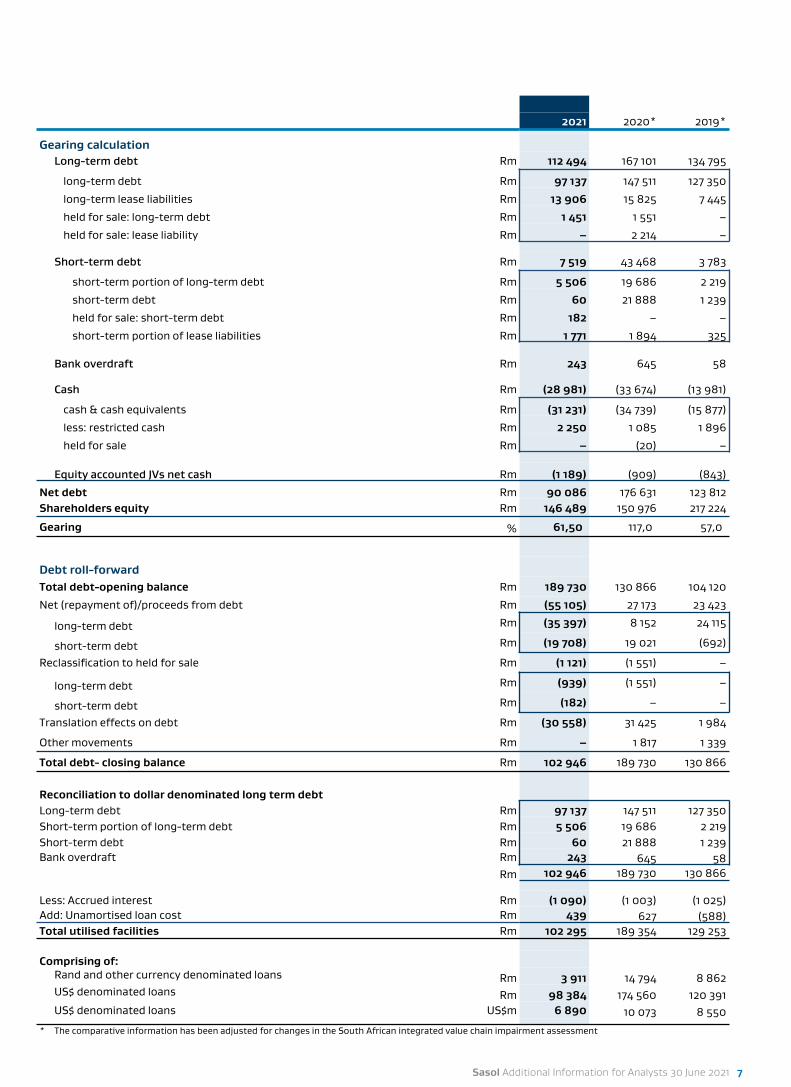
2021 2020* 2019*
Gearing calculationLong-term debt Rm 112 494 167 101 134 795
long-term debt Rm 97 137 147 511 127 350
long-term lease liabilities Rm 13 906 15 825 7 445
held for sale: long-term debt Rm 1 451 1 551 –
held for sale: lease liability Rm – 2 214 –
Short-term debt Rm 7 519 43 468 3 783
short-term portion of long-term debt Rm 5 506 19 686 2 219
short-term debt Rm 60 21 888 1 239
held for sale: short-term debt Rm 182 – –
short-term portion of lease liabilities Rm 1 771 1 894 325
Bank overdraft Rm 243 645 58
Cash Rm (28 981) (33 674) (13 981)
cash & cash equivalents Rm (31 231) (34 739) (15 877)
less: restricted cash Rm 2 250 1 085 1 896
held for sale Rm – (20) –
Equity accounted JVs net cash Rm (1 189) (909) (843)
Net debt Rm 90 086 176 631 123 812Shareholders equity Rm 146 489 150 976 217 224
Gearing % 61,50 117,0 57,0
Debt roll-forwardTotal debt-opening balance Rm 189 730 130 866 104 120
Net (repayment of)/proceeds from debt Rm (55 105) 27 173 23 423
long-term debt Rm (35 397) 8 152 24 115
short-term debt Rm (19 708) 19 021 (692)
Reclassification to held for sale Rm (1 121) (1 551) –
long-term debt Rm (939) (1 551) –
short-term debt Rm (182) – –
Translation effects on debt Rm (30 558) 31 425 1 984
Other movements Rm – 1 817 1 339
Total debt- closing balance Rm 102 946 189 730 130 866
Reconciliation to dollar denominated long term debtLong-term debt Rm 97 137 147 511 127 350Short-term portion of long-term debt Rm 5 506 19 686 2 219Short-term debt Rm 60 21 888 1 239Bank overdraft Rm 243 645 58
Rm 102 946 189 730 130 8661
Less: Accrued interest Rm (1 090) (1 003) (1 025)Add: Unamortised loan cost Rm 439 627 (588)Total utilised facilities Rm 102 295 189 354 129 253
Comprising of: Rand and other currency denominated loans Rm 3 911 14 794 8 862US$ denominated loans Rm 98 384 174 560 120 391US$ denominated loans US$m 6 890 10 073 8 550
11
* The comparative information has been adjusted for changes in the South African integrated value chain impairment assessment
Sasol Additional Information for Analysts 30 June 2021 7
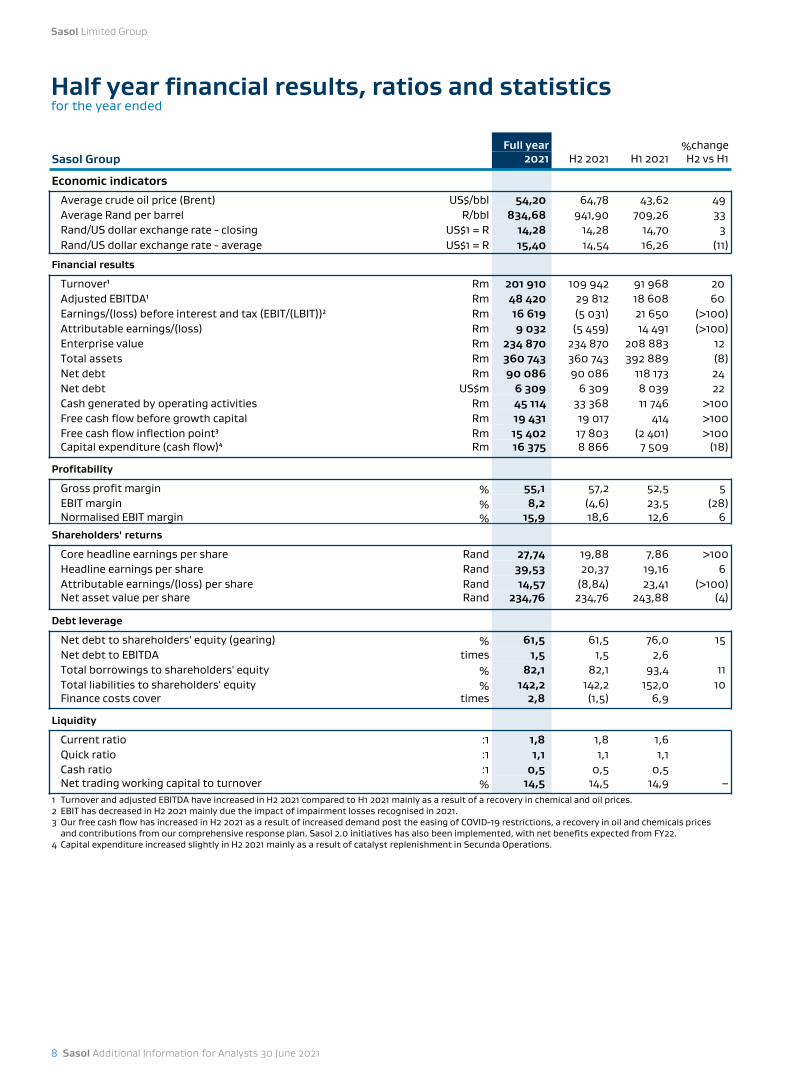
Full year %changeSasol Group 2021 H2 2021 H1 2021 H2 vs H1
Economic indicatorsAverage crude oil price (Brent) US$/bbl 54,20 64,78 43,62 49Average Rand per barrel R/bbl 834,68 941,90 709,26 33Rand/US dollar exchange rate - closing US$1 = R 14,28 14,28 14,70 3Rand/US dollar exchange rate - average US$1 = R 15,40 14,54 16,26 (11)
Financial results
Turnover¹ Rm 201 910 109 942 91 968 20Adjusted EBITDA¹ Rm 48 420 29 812 18 608 60Earnings/(loss) before interest and tax (EBIT/(LBIT))² Rm 16 619 (5 031) 21 650 (>100)Attributable earnings/(loss) Rm 9 032 (5 459) 14 491 (>100)Enterprise value Rm 234 870 234 870 208 883 12Total assets Rm 360 743 360 743 392 889 (8)Net debt Rm 90 086 90 086 118 173 24Net debt US$m 6 309 6 309 8 039 22Cash generated by operating activities Rm 45 114 33 368 11 746 >100Free cash flow before growth capital Rm 19 431 19 017 414 >100Free cash flow inflection point³ Rm 15 402 17 803 (2 401) >100Capital expenditure (cash flow)⁴ Rm 16 375 8 866 7 509 (18)
Profitability
Gross profit margin % 55,1 57,2 52,5 5EBIT margin % 8,2 (4,6) 23,5 (28)Normalised EBIT margin % 15,9 18,6 12,6 6
Shareholders' returns
Core headline earnings per share Rand 27,74 19,88 7,86 >100Headline earnings per share Rand 39,53 20,37 19,16 6Attributable earnings/(loss) per share Rand 14,57 (8,84) 23,41 (>100)Net asset value per share Rand 234,76 234,76 243,88 (4)
Debt leverage
Net debt to shareholders' equity (gearing) % 61,5 61,5 76,0 15Net debt to EBITDA times 1,5 1,5 2,6Total borrowings to shareholders' equity % 82,1 82,1 93,4 11Total liabilities to shareholders' equity % 142,2 142,2 152,0 10Finance costs cover times 2,8 (1,5) 6,9
Liquidity
Current ratio :1 1,8 1,8 1,6Quick ratio :1 1,1 1,1 1,1Cash ratio :1 0,5 0,5 0,5Net trading working capital to turnover % 14,5 14,5 14,9 –
1 Turnover and adjusted EBITDA have increased in H2 2021 compared to H1 2021 mainly as a result of a recovery in chemical and oil prices. 2 EBIT has decreased in H2 2021 mainly due the impact of impairment losses recognised in 2021. 3 Our free cash flow has increased in H2 2021 as a result of increased demand post the easing of COVID-19 restrictions, a recovery in oil and chemicals prices
and contributions from our comprehensive response plan. Sasol 2.0 initiatives has also been implemented, with net benefits expected from FY22.4 Capital expenditure increased slightly in H2 2021 mainly as a result of catalyst replenishment in Secunda Operations.
Half year financial results, ratios and statisticsfor the year ended
Sasol Limited Group
8 Sasol Additional Information for Analysts 30 June 2021
Key sensitivities*Exchange rates The majority of our turnover is denominated in US dollars or significantly influenced by the rand/US dollar exchange rate. This turnover
is derived either from exports from South Africa, businesses outside of South Africa or sales in South Africa, which comprise mainly petroleum and chemical products that are based on global commodity and benchmark prices quoted in US dollars. Therefore, the average exchange rate for the year has a significant impact on our turnover and earnings before interest and tax (EBIT).
For forecasting purposes, we estimate that a 10c change in the annual average rand/US dollar exchange rate will impact EBIT by approximately R690 million (US$49 million) in 2022. This excludes the effect of our hedging programme and is based on an average Brent crude oil price assumption of US$70/barrel.
During 2022, we expect the average rand/US dollar exchange rate to range between R13,50 and R15,00. Risks remain and are expected to result in ongoing currency and financial market volatility. These risks include COVID-19 developments such as the pace and efficacy of vaccine roll-outs, severely strained government finances, high probabilities of policy mistakes, US inflation and interest rate expectations, and geo-politics.
Sasol has entered into hedges against the rand strengthening against major currencies to increase the stability and predictability of our cash flows. In respect of 2022, Sasol executed ~89% of the hedging programme which equates to ~US$3,9 billion.
Crude oil and fuel product prices Market prices for Brent crude oil fluctuate because they are subject to international supply, demand and political factors. Our exposure
to the crude oil price relates mainly to crude oil related raw materials used in our Natref refinery and certain offshore operations, as well as on the selling price of fuel marketed by our Energy business which is governed by the Basic Fuel Price (BFP) formula.
For forecasting purposes, a US$1/barrel change in the average annual crude oil price will impact EBIT by approximately R685 million (US$48 million) in 2022. This is based on an average rand/US dollar exchange rate assumption of R14,20.
Following the recent rise in the oil price, Sasol has been able to restructure 24 million barrels of put options to zero cost collars thereby increasing the gross average floor level. The crude oil hedge cover ratio for financial year 2022 has also been increased by hedging an additional 18 million barrels using swaps. For 2022, Sasol executed 100% of the hedging programme, which equates to 42 million barrels per annum (90% of total Synfuels synthetic crude oil production, 90% of Sasol’s share of ORYX production and equivalent commodity chemicals volumes where there is a strong correlation to oil price using a combination of zero cost collars and swaps.
We expect the average Brent crude oil price to range between US$55/bbl and US$75/bbl for 2022. Global oil demand is recovering from the impact of COVID-19 amidst economic stimulus and the steady rollout of vaccinations in major demand hubs. Downside price risk is driven by the spread of COVID-19 variants and the possibility of weakened vaccine efficacy to these variants. The rate of returning oil production by OPEC+ and the timing of the lifting of Iranian sanctions add to the price uncertainty. Total liquids inventory levels remain high and will require continued OPEC+ supply management to reduce stocks.
Fuel margins Key drivers in the BFP are the Mediterranean and Singapore or Mediterranean and Arab Gulf product prices for petrol and diesel (fuel
price crack spreads), respectively. For forecasting purposes, a US$1/bbl change in the average annual fuel price differential of the Sasol group will impact EBIT by
approximately R597 million (US$42 million) in 2022. This is based on an average rand/US dollar exchange rate of R14,20. Transport fuel demand is improving globally, and gasoline stocks are returning to the five year range, however, demand remains below
pre-COVID-19 levels and excess refining capacity weighs on market prices. New refining capacity additions are greater than the expected capacity losses during 2022 with two large refineries ramping up in the Middle East. Some recovery in domestic flight activity in the US, China and across Europe does offer some support to jet fuel prices in 2022, although global demand is still well below pre-COVID-19 levels. Crack spreads are expected to fluctuate within the following ranges:- Petrol: US$3/bbl to US$10/bbl- Diesel: US$3/bbl to US$10/bbl- Fuel Oil: (US$10/bbl) to (US$5/bbl)
Ethane gas US Ethane prices are impacted by supply and demand as well as US tight oil dynamics. Recovery in US tight oil production post the 2020
oil price crash has been slow, and this has resulted in lower ethane availability. Ethane prices initially moved higher during H2 2021 as supply began to tighten. However, the US Arctic storm in February 2021 resulted in a shutdown in production and lower operating rates, leading to lower ethane prices in a US$20-23c/gal range. Increasing demand in April 2021 and cracker start-ups supported the ethane price pushing it up towards US$28c/gal.
Sasol executed ~20% of the 2022 hedging programme which equates to ~4 million barrels. For forecasting purposes, it is estimated that a US$5c/gal change in the ethane price will have an impact of approximately US$22 million
on North American Operations, post the sale of 50% of the LCCP Base Chemicals business to LyondellBasell. During 2022, we expect the average ethane gas price to range between US$25c/gal and US$32c/gal as ethane availability remains tight
and demand continues to grow.
Chemical price outlook Commodity chemical prices reached unprecedented highs in Q4 2021 due to a combination of strong demand amid reduced market
supply resulting from the February 2021 US Arctic storm and global supply chain challenges due to the ongoing COVID-19 pandemic. In 2022, we expect prices to moderate as supply normalises and the market rebalances. In the short term, chemical prices are expected to be pressured as abundant new capacity comes online, especially in China. Movements in the cost of petrochemical feedstocks (crude oil/naphtha, natural gas and natural gas liquids) and supply/demand changes related to the COVID-19 pandemic could influence prices in the short term. Sasol is not a price-setter for most of its chemicals product portfolio, however, we continue to focus on ensuring the optimum placement of our product across global markets.
*The sensitivity calculations are done at a point in time and are based on a 12-month average exchange rates/prices. It may be used as a general rule but the sensitivities are not linear over large absolute changes in the assumptions or volumes and hence applying it to these scenarios may lead to an incorrect reflection of the change in earnings before interest and tax.
Sasol Additional Information for Analysts 30 June 2021 9
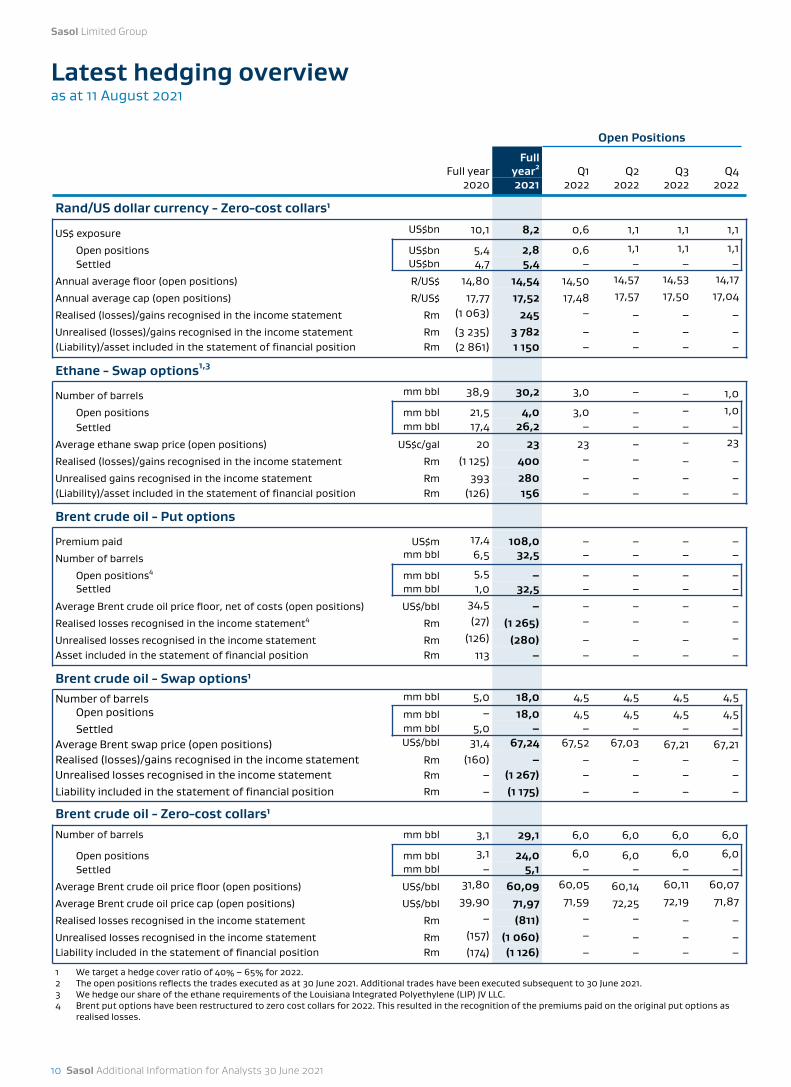
Latest hedging overview as at 11 August 2021
Open Positions
Full yearFull
year2 Q1 Q2 Q3 Q42020 2021 2022 2022 2022 2022
Rand/US dollar currency - Zero-cost collars¹
US$ exposure US$bn 10,1 8,2 0,6 1,1 1,1 1,1
Open positions US$bn 5,4 2,8 0,6 1,1 1,1 1,1Settled US$bn 4,7 5,4 – – – –
Annual average floor (open positions) R/US$ 14,80 14,54 14,50 14,57 14,53 14,17
Annual average cap (open positions) R/US$ 17,77 17,52 17,48 17,57 17,50 17,04
Realised (losses)/gains recognised in the income statement Rm (1 063) 245 – – – –Unrealised (losses)/gains recognised in the income statement Rm (3 235) 3 782 – – – –(Liability)/asset included in the statement of financial position Rm (2 861) 1 150 – – – –
Ethane - Swap options1,3
Number of barrels mm bbl 38,9 30,2 3,0 – – 1,0
Open positions mm bbl 21,5 4,0 3,0 – – 1,0Settled mm bbl 17,4 26,2 – – – –
Average ethane swap price (open positions) US$c/gal 20 23 23 – – 23
Realised (losses)/gains recognised in the income statement Rm (1 125) 400 – – – –Unrealised gains recognised in the income statement Rm 393 280 – – – –(Liability)/asset included in the statement of financial position Rm (126) 156 – – – –
Brent crude oil - Put options
Premium paid US$m 17,4 108,0 – – – –Number of barrels mm bbl 6,5 32,5 – – – –
Open positions4 mm bbl 5,5 – – – – –Settled mm bbl 1,0 32,5 – – – –
Average Brent crude oil price floor, net of costs (open positions) US$/bbl 34,5 – – – – –Realised losses recognised in the income statement4 Rm (27) (1 265) – – – –
Unrealised losses recognised in the income statement Rm (126) (280) – – – –Asset included in the statement of financial position Rm 113 – – – – –
Brent crude oil - Swap options¹Number of barrels mm bbl 5,0 18,0 4,5 4,5 4,5 4,5
Open positions mm bbl – 18,0 4,5 4,5 4,5 4,5Settled mm bbl 5,0 – – – – –
Average Brent swap price (open positions) US$/bbl 31,4 67,24 67,52 67,03 67,21 67,21Realised (losses)/gains recognised in the income statement Rm (160) – – – – –Unrealised losses recognised in the income statement Rm – (1 267) – – – –Liability included in the statement of financial position Rm – (1 175) – – – –
Brent crude oil - Zero-cost collars¹Number of barrels mm bbl 3,1 29,1 6,0 6,0 6,0 6,0
Open positions mm bbl 3,1 24,0 6,0 6,0 6,0 6,0Settled mm bbl – 5,1 – – – –
Average Brent crude oil price floor (open positions) US$/bbl 31,80 60,09 60,05 60,14 60,11 60,07
Average Brent crude oil price cap (open positions) US$/bbl 39,90 71,97 71,59 72,25 72,19 71,87
Realised losses recognised in the income statement Rm – (811) – – – –Unrealised losses recognised in the income statement Rm (157) (1 060) – – – –Liability included in the statement of financial position Rm (174) (1 126) – – – –
1 We target a hedge cover ratio of 40% – 65% for 2022.2 The open positions reflects the trades executed as at 30 June 2021. Additional trades have been executed subsequent to 30 June 2021.3 We hedge our share of the ethane requirements of the Louisiana Integrated Polyethylene (LIP) JV LLC.4 Brent put options have been restructured to zero cost collars for 2022. This resulted in the recognition of the premiums paid on the original put options as
realised losses.
Sasol Limited Group
10 Sasol Additional Information for Analysts 30 June 2021
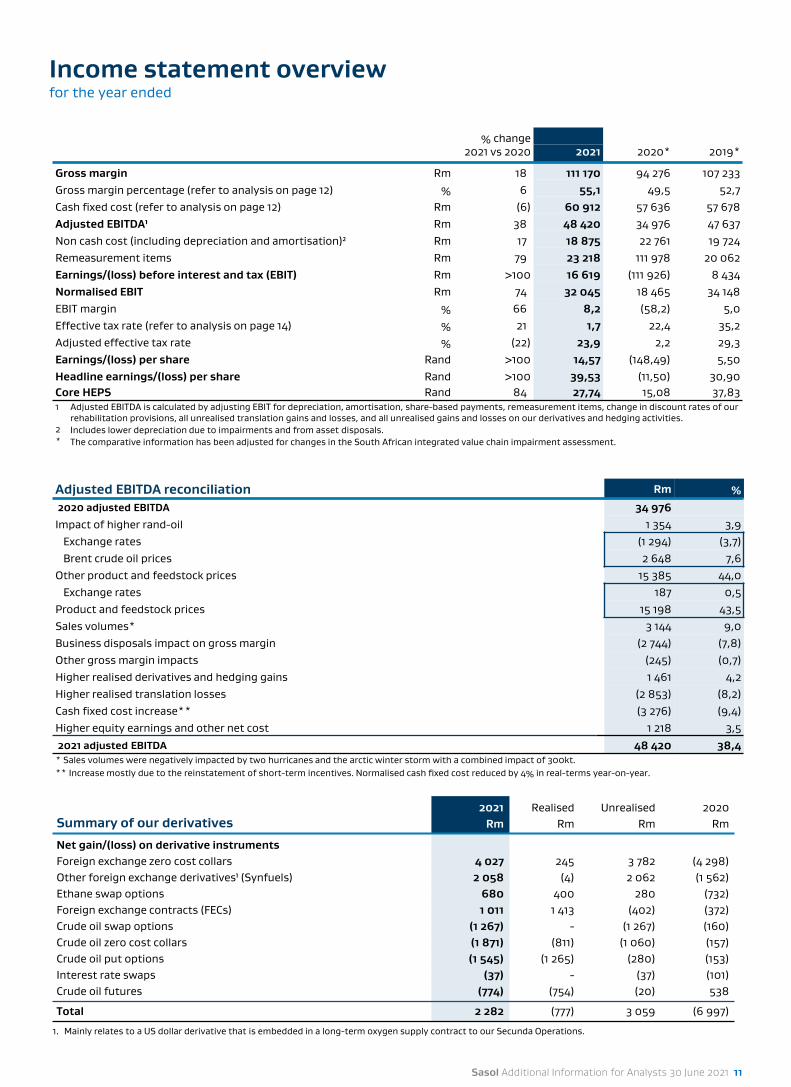
Income statement overviewfor the year ended
% change2021 vs 2020 2021 2020* 2019*
Gross margin Rm 18 111 170 94 276 107 233Gross margin percentage (refer to analysis on page 12) % 6 55,1 49,5 52,7Cash fixed cost (refer to analysis on page 12) Rm (6) 60 912 57 636 57 678Adjusted EBITDA¹ Rm 38 48 420 34 976 47 637Non cash cost (including depreciation and amortisation)² Rm 17 18 875 22 761 19 724Remeasurement items Rm 79 23 218 111 978 20 062Earnings/(loss) before interest and tax (EBIT) Rm >100 16 619 (111 926) 8 434Normalised EBIT Rm 74 32 045 18 465 34 148EBIT margin % 66 8,2 (58,2) 5,0Effective tax rate (refer to analysis on page 14) % 21 1,7 22,4 35,2Adjusted effective tax rate % (22) 23,9 2,2 29,3Earnings/(loss) per share Rand >100 14,57 (148,49) 5,50Headline earnings/(loss) per share Rand >100 39,53 (11,50) 30,90Core HEPS Rand 84 27,74 15,08 37,831 Adjusted EBITDA is calculated by adjusting EBIT for depreciation, amortisation, share-based payments, remeasurement items, change in discount rates of our
rehabilitation provisions, all unrealised translation gains and losses, and all unrealised gains and losses on our derivatives and hedging activities. 2 Includes lower depreciation due to impairments and from asset disposals.* The comparative information has been adjusted for changes in the South African integrated value chain impairment assessment.
Adjusted EBITDA reconciliation Rm %
2020 adjusted EBITDA 34 976Impact of higher rand-oil 1 354 3,9
Exchange rates (1 294) (3,7)Brent crude oil prices 2 648 7,6
Other product and feedstock prices 15 385 44,0Exchange rates 187 0,5
Product and feedstock prices 15 198 43,5Sales volumes* 3 144 9,0Business disposals impact on gross margin (2 744) (7,8)Other gross margin impacts (245) (0,7)Higher realised derivatives and hedging gains 1 461 4,2Higher realised translation losses (2 853) (8,2)Cash fixed cost increase** (3 276) (9,4)Higher equity earnings and other net cost 1 218 3,52021 adjusted EBITDA 48 420 38,4
* Sales volumes were negatively impacted by two hurricanes and the arctic winter storm with a combined impact of 300kt.** Increase mostly due to the reinstatement of short-term incentives. Normalised cash fixed cost reduced by 4% in real-terms year-on-year.
Summary of our derivatives2021
RmRealised
RmUnrealised
Rm2020
Rm
Net gain/(loss) on derivative instrumentsForeign exchange zero cost collars 4 027 245 3 782 (4 298)Other foreign exchange derivatives¹ (Synfuels) 2 058 (4) 2 062 (1 562)Ethane swap options 680 400 280 (732)Foreign exchange contracts (FECs) 1 011 1 413 (402) (372)Crude oil swap options (1 267) - (1 267) (160)Crude oil zero cost collars (1 871) (811) (1 060) (157)Crude oil put options (1 545) (1 265) (280) (153)Interest rate swaps (37) - (37) (101)Crude oil futures (774) (754) (20) 538
Total 2 282 (777) 3 059 (6 997)
1. Mainly relates to a US dollar derivative that is embedded in a long-term oxygen supply contract to our Secunda Operations.
Sasol Additional Information for Analysts 30 June 2021 11
94 2
76 111 1
70
17 8
46
3 14
4
1 10
7
2 74
4
245
2020
Bren
t cr
ude
oil a
ndPr
oduc
t pr
ices
Exch
ange
rate
Sale
s vo
lum
es
Busi
ness
disp
osal
s
Oth
er
2021
Rm
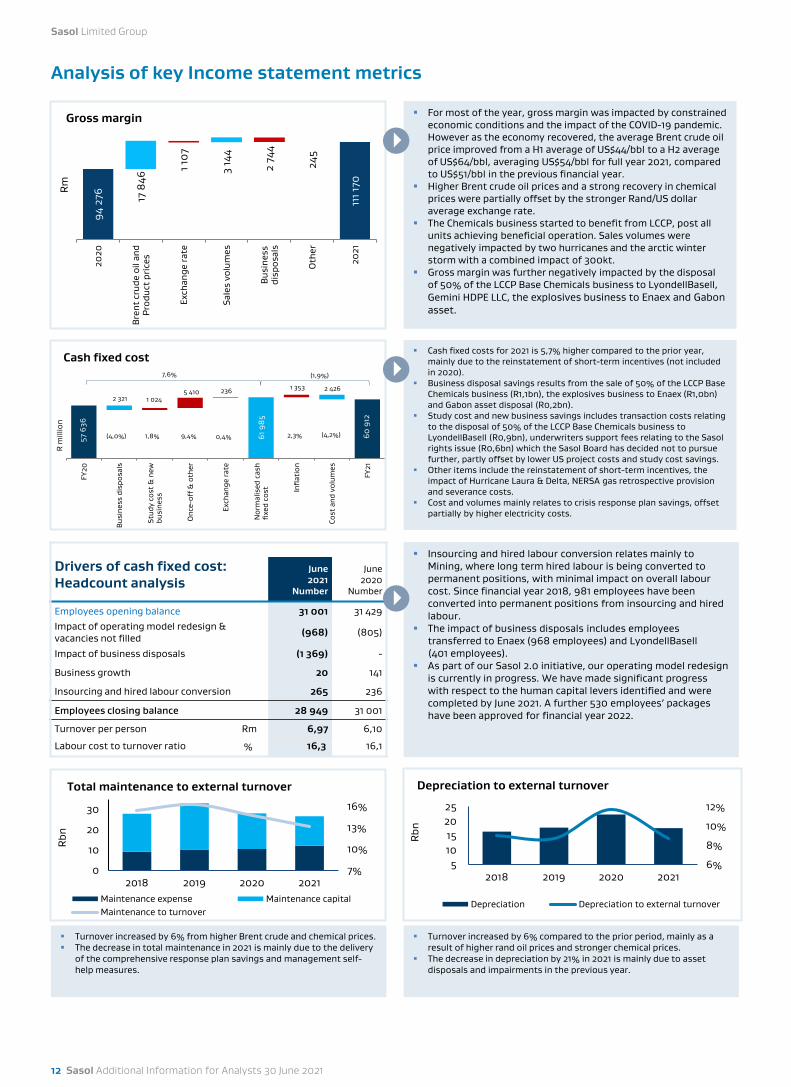
Gross margin For most of the year, gross margin was impacted by constrained economic conditions and the impact of the COVID-19 pandemic. However as the economy recovered, the average Brent crude oil price improved from a H1 average of US$44/bbl to a H2 average of US$64/bbl, averaging US$54/bbl for full year 2021, compared to US$51/bbl in the previous financial year.
Higher Brent crude oil prices and a strong recovery in chemical prices were partially offset by the stronger Rand/US dollar average exchange rate.
The Chemicals business started to benefit from LCCP, post all units achieving beneficial operation. Sales volumes were negatively impacted by two hurricanes and the arctic winter storm with a combined impact of 300kt.
Gross margin was further negatively impacted by the disposal of 50% of the LCCP Base Chemicals business to LyondellBasell, Gemini HDPE LLC, the explosives business to Enaex and Gabon asset.
Cash fixed costs for 2021 is 5,7% higher compared to the prior year, mainly due to the reinstatement of short-term incentives (not included in 2020).
Business disposal savings results from the sale of 50% of the LCCP Base Chemicals business (R1,1bn), the explosives business to Enaex (R1,0bn) and Gabon asset disposal (R0,2bn).
Study cost and new business savings includes transaction costs relating to the disposal of 50% of the LCCP Base Chemicals business to LyondellBasell (R0,9bn), underwriters support fees relating to the Sasol rights issue (R0,6bn) which the Sasol Board has decided not to pursue further, partly offset by lower US project costs and study cost savings.
Other items include the reinstatement of short-term incentives, the impact of Hurricane Laura & Delta, NERSA gas retrospective provision and severance costs.
Cost and volumes mainly relates to crisis response plan savings, offset partially by higher electricity costs.
Drivers of cash fixed cost: Headcount analysis
June2021
Number
June2020
Number
Employees opening balance 31 001 31 429Impact of operating model redesign & vacancies not filled (968) (805)
Impact of business disposals (1 369) -
Business growth 20 141
Insourcing and hired labour conversion 265 236
Employees closing balance 28 949 31 001
Turnover per person Rm 6,97 6,10
Labour cost to turnover ratio % 16,3 16,1
Insourcing and hired labour conversion relates mainly to Mining, where long term hired labour is being converted to permanent positions, with minimal impact on overall labour cost. Since financial year 2018, 981 employees have been converted into permanent positions from insourcing and hired labour.
The impact of business disposals includes employees transferred to Enaex (968 employees) and LyondellBasell (401 employees).
As part of our Sasol 2.0 initiative, our operating model redesign is currently in progress. We have made significant progress with respect to the human capital levers identified and were completed by June 2021. A further 530 employees’ packages have been approved for financial year 2022.
Analysis of key Income statement metrics
6%
8%
10%
12%
5 10 15
20 25
2018 2019 2020 2021
Rbn
Depreciation to external turnover
Depreciation Depreciation to external turnover
7%
10%
13%
16%
0
10
20
30
2018 2019 2020 2021
Rbn
Total maintenance to external turnover
Maintenance expense Maintenance capitalMaintenance to turnover
Turnover increased by 6% from higher Brent crude and chemical prices. The decrease in total maintenance in 2021 is mainly due to the delivery
of the comprehensive response plan savings and management self-help measures.
Turnover increased by 6% compared to the prior period, mainly as a result of higher rand oil prices and stronger chemical prices.
The decrease in depreciation by 21% in 2021 is mainly due to asset disposals and impairments in the previous year.
Sasol Limited Group
12 Sasol Additional Information for Analysts 30 June 2021
57 6
36
61 9
85
60 9
12
1 0245 410 236 1 353
2 3212 426
FY20
Bus
ines
s di
spos
als
Stud
y co
st &
new
busi
ness
Onc
e-of
f & o
ther
Exch
ange
rate
Nor
mal
ised
cas
hfi
xed
cost In
flat
ion
Cost
and
vol
umes
FY21
R m
illio
n
Cash fixed cost7,6% (1,9%)
(4,0%) 1,8% 9,4% 2,3% (4,2%)0,4%
Income statement overview (continued)
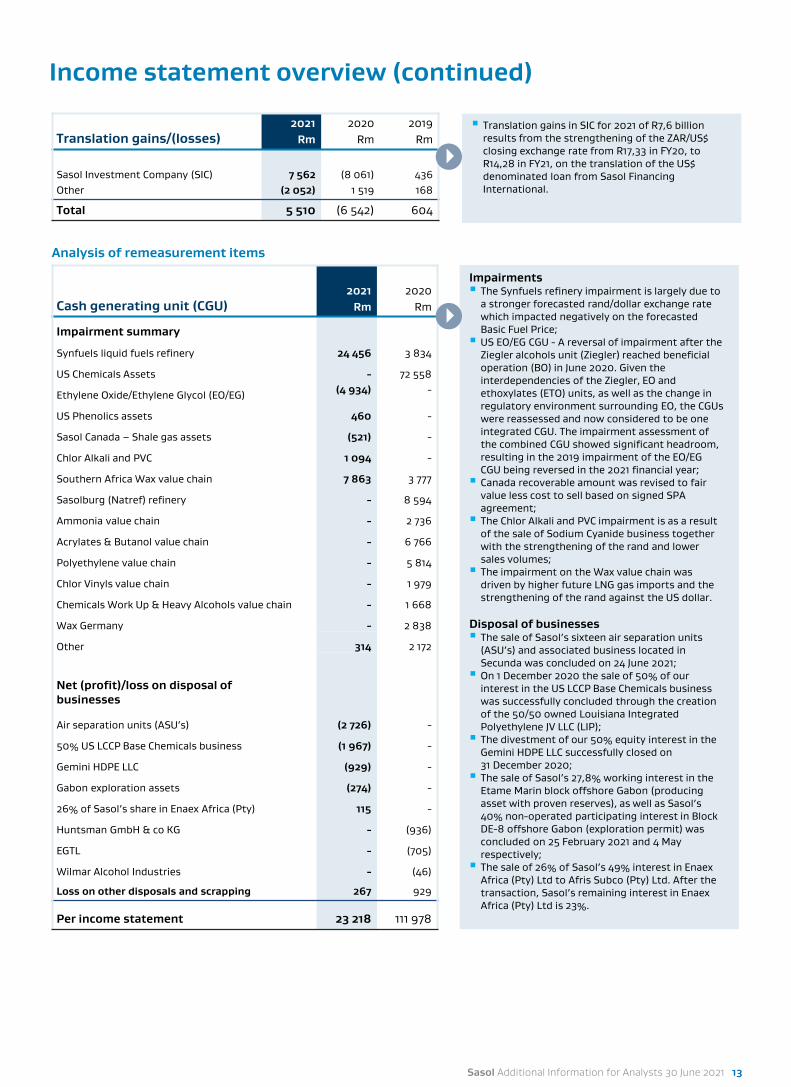
Cash generating unit (CGU)2021
Rm2020
Rm
Impairment summary
Synfuels liquid fuels refinery 24 456 3 834
US Chemicals Assets - 72 558
Ethylene Oxide/Ethylene Glycol (EO/EG) (4 934) -
US Phenolics assets 460 -
Sasol Canada – Shale gas assets (521) -
Chlor Alkali and PVC 1 094 -
Southern Africa Wax value chain 7 863 3 777
Sasolburg (Natref) refinery - 8 594
Ammonia value chain - 2 736
Acrylates & Butanol value chain - 6 766
Polyethylene value chain - 5 814
Chlor Vinyls value chain - 1 979
Chemicals Work Up & Heavy Alcohols value chain - 1 668
Wax Germany - 2 838
Other 314 2 172
Net (profit)/loss on disposal of businesses
Air separation units (ASU’s) (2 726) -
50% US LCCP Base Chemicals business (1 967) -
Gemini HDPE LLC (929) -
Gabon exploration assets (274) -
26% of Sasol’s share in Enaex Africa (Pty) 115 -
Huntsman GmbH & co KG - (936)
EGTL - (705)
Wilmar Alcohol Industries - (46)
Loss on other disposals and scrapping 267 929
Per income statement 23 218 111 978
Impairments The Synfuels refinery impairment is largely due to
a stronger forecasted rand/dollar exchange rate which impacted negatively on the forecasted Basic Fuel Price; US EO/EG CGU - A reversal of impairment after the
Ziegler alcohols unit (Ziegler) reached beneficial operation (BO) in June 2020. Given the interdependencies of the Ziegler, EO and ethoxylates (ETO) units, as well as the change in regulatory environment surrounding EO, the CGUs were reassessed and now considered to be one integrated CGU. The impairment assessment of the combined CGU showed significant headroom, resulting in the 2019 impairment of the EO/EG CGU being reversed in the 2021 financial year; Canada recoverable amount was revised to fair
value less cost to sell based on signed SPA agreement; The Chlor Alkali and PVC impairment is as a result
of the sale of Sodium Cyanide business together with the strengthening of the rand and lower sales volumes; The impairment on the Wax value chain was
driven by higher future LNG gas imports and the strengthening of the rand against the US dollar.
Disposal of businesses The sale of Sasol’s sixteen air separation units
(ASU’s) and associated business located in Secunda was concluded on 24 June 2021; On 1 December 2020 the sale of 50% of our
interest in the US LCCP Base Chemicals business was successfully concluded through the creation of the 50/50 owned Louisiana Integrated Polyethylene JV LLC (LIP); The divestment of our 50% equity interest in the
Gemini HDPE LLC successfully closed on 31 December 2020; The sale of Sasol’s 27,8% working interest in the
Etame Marin block offshore Gabon (producing asset with proven reserves), as well as Sasol’s 40% non-operated participating interest in Block DE-8 offshore Gabon (exploration permit) was concluded on 25 February 2021 and 4 May respectively; The sale of 26% of Sasol’s 49% interest in Enaex
Africa (Pty) Ltd to Afris Subco (Pty) Ltd. After the transaction, Sasol’s remaining interest in Enaex Africa (Pty) Ltd is 23%.
Analysis of remeasurement items
Translation gains/(losses)2021
Rm2020
Rm2019
Rm
Sasol Investment Company (SIC) 7 562 (8 061) 436Other (2 052) 1 519 168
Total 5 510 (6 542) 604
Translation gains in SIC for 2021 of R7,6 billion results from the strengthening of the ZAR/US$ closing exchange rate from R17,33 in FY20, to R14,28 in FY21, on the translation of the US$ denominated loan from Sasol Financing International.
Sasol Additional Information for Analysts 30 June 2021 13
Income statement overview (continued)
Notes on year 2021 items: Disallowed expenses includes non-deductible expenses
incurred not deemed to be in the production of taxable income mainly relating to non-productive interest in our treasury function and project costs.
Disallowed share-based payments relates to the Sasol Khanyisa transaction.
Exempt income mainly relates to the Foreign Currency Translation Reserve (FCTR) reclassified on the disposal of business.
Assessed losses relate to tax losses utilised in the current year which are allowed to be set off against 2021 foreign exchange gains.
Capital gains and losses relates mainly to the disposal of the Air Separation Units.
The adjusted effective tax rate is adjusted for equity accounted investments, remeasurement items and once-off items.
Finance cost reconciliation2021
Rm2020
Rm2019
Rm
Total finance cost 7 638 10 823 8 195
Amounts capitalised to AUC (880) (3 520) (6 942)
Per income statement 6 758 7 303 1 253
Total finance cost 7 638 10 823 8 195
Amortisation of loan cost (160) (135) (725)
Notional interest (668) (945) (857)
Modification (loss)/gain - (1 193) 109
Modification adjustments 785 - -
Interest accrued (1 422) (1 412) (1 025)Interest reversed on tax payable - 16 525
Per the statement of cash flows 6 173 7 154 6 222
Taxation rate reconciliation2021
%
Restated 2020
%
South Africantaxrate 28,0 28,0Disallowed expenses 11,4 (1,0)Different tax rates 0,5 (3,6)Tax losses not recognized - (2,0)Disallowed share-based payments 2,3 (0,3)Share ofprofits of equity accountedinvestments (2,1) (0,1)Investment incentive allowances (0,4) -Exempt income (10,0) 0,7Prior year adjustments (2,2) 0,9Assessed losses utilised (20,9) -Translation differences (1,9) -Capital gains and losses (1,8) -Other (1,2) (0,2)
Effective tax rate 1,7 22,4
Adjusted effective tax rate 23,9 2,2
Decrease in finance costs due to: Lower interest expense as we repaid debt from asset
divestment proceeds and lower interest rates in 2021.
A decrease in the interest capitalisation of R2,6 billion mainly as a result of all LCCP units having reached beneficial operation in 2020.
Modification adjustments relates to amortisation of 2020 modification loss and an extinguishment gain of R435 million (US$28,2 million) relating to repayments of the RCF.
Outlook for 2022: We expect the amount to be expensed in the income
statement in 2022 to range between R5 billion and R7 billion. This could be impacted by the progress made and timing on the asset disposal programme.
2021 2020 2019
Rand per share
Rand per share
Rand per share
Earnings/(loss) per share 14,57 (148,49) 5,50Net remeasurement items 24,96 136,99 25,40
Headline earnings/(loss) per share 39,53 (11,50) 30,90Translation impact of closing exchange rate (10,15) 11,34 (0,79)Realised and unrealised (gains)/losses on derivative and hedging activities (2,81) 7,87 3,06Implementation of Khanyisa B-BBEE transaction 1,17 1,30 1,26LCCP operating losses during ramp-up – 6,07 4,73Core headline earnings per share 27,74 15,08 37,83
Sasol Limited Group
14 Sasol Additional Information for Analysts 30 June 2021
Income statement overview (continued)
Earnings per share is higher due to higher gross margin, lower impairments, lower depreciation and FCTR gains mainly on the disposal of 50% of the LCCP Base Chemicals business to LyondellBasell and Gemini HDPE LLC.
Headline earnings per share (HEPS) is up by more than 100% mainly due to higher gross margin, translation gains and gains on derivatives and hedging activities resulting from the stronger R/$ closing rate.
Core headline earnings per share (CHEPS) increased by 84% mainly due to a stronger macroeconomic environment, higher oil and chemicals prices, which offset the impact of COVID-19 and weather related events on our operations.
5,50
30,9
0 37,8
3
(148
,49)
(11,
50)
15,0
8
14,5
7
39,5
3
27,7
4
-30
-15
0
15
30
EPS HEPS Core HEPS
Ran
d pe
r sh
are
(not
to s
cale
)
Earnings performance
2019 Restated 2020 Restated 2021
(150)
Sasol Additional Information for Analysts 30 June 2021 15
Mining – earnings performancefor the year ended 30 June 2021Maintaining steady safe production
EBIT increased by 17% for the year to R3,2 billion compared to the prior year, mainly due to higher sales volumes, higher export sales prices and lower external coal purchases, offset by higher depreciation and an unfavourable stock movement.
Our normalised mining unit cost increased by 8% to R376/ton due to higher labour, maintenance and depreciation costs, partially negated by cash conservation measures.
Our productivity of 1 131 tons per continuous miner per shift (t/cm/s) was lower than expected, which necessitated more externalcoal purchases to meet demand from Secunda Operations (SO). To improve productivity sustainably going forward, we have implemented the Fulco integrated shift system across all Secunda mines, with the last mine rollout completed in June 2021, two months earlier than planned. We expect our productivity to increase and external purchases to decrease as we fully ramp up the Fulco integrated shift system.
Our commitment to safety and continued reinforcement of our High Severity Injury (HSI) programme aimed at preventing fatalities,HSIs and process safety incidents have resulted in zero work-related fatalities. In addition, our COVID-19 response plans and mitigating protocols have enabled us to manage the risks of the third wave as the virus continues to spread within our communities. We continue to monitor the situation closely to ensure employee wellbeing as well as safe operations.
In financial year 2022, we expect mining productivity of 1 200 – 1 300 t/cm/s, supported by the ramp-up of the full calendar operations (Fulco) integrated shift system across all Secunda mines.
% change2021 vs 2020 2021 2020 2019
Gross margin Rm 5 13 424 12 829 13 993
Gross margin % % (2) 62 64 67
Cash fixed costs Rm - 7 500 7 501 6 984
Adjusted EBITDA Rm 10 5 793 5 269 6 869
Earnings before interest and tax (EBIT) Rm 17 3 227 2 756 4 701
Normalised EBIT Rm 15 3 307 2 879 4 765Normalised EBIT margin % % - 15 15 23
Effective tax rate % 1 29 30 29
313 34
7
376
370
385
423
436
430
0
100
200
300
400
2019 2020 2021 2022 Outlook
R/t
on
Mining unit cost per production ton
Normalised Mining unit cost per production tonTotal cost per sales tonNormalised cost at PPI increase from 2019
1 191
1 148
1 131
1 20
0 –
1 30
0
2019 2020 2021 2022 Outlook
t/cm
/s
Tons per continuous miner per shift (t/cm/s)
Sasol Limited Group
16 Sasol Additional Information for Analysts 30 June 2021
% change2021 vs 2020 2021 2020 2019
ProductionSaleable production¹ mm tons (2) 35,4 36,1 36,1Mining productivity² t/cm/s (1) 1 131 1 148 1 191
External purchases mm tons (6) 6,1 6,5 5,2Internal sales
Fuels mm tons (3) 22,7 23,5 22,6Chemicals mm tons 11 17,4 15,7 16,5
External sales
International and other domestic mm tons 37 2,6 1,9 3,21 Saleable production represents total production adjusted for discard arising from the coal beneficiation process at our export operations. The discard reduces saleable
production volumes. Due to higher export volumes in the period, we are seeing a higher discard resulting in a 2% decrease in saleable production.2 Our production was supplemented with external coal purchases to meet demand from SO. We expect our productivity to increase and external purchases to decrease in
2022 as we fully ramp up the Fulco integrated shift system.

Gas – earnings performancefor the year ended 30 June 2021
Consistent operational performance with higher external sales volumes
EBIT increased by 20% to R6,7 billion compared to the prior year. The gas value chain benefited from higher external gas sales in South Africa, the stronger closing rand/US dollar exchange rate on translation of our Mozambique foreign operations and lower depreciation on various assets classified as held for sale. This was partially offset by a provision of R1,4 billion for the potential retrospective application of the final determination by NERSA of the maximum gas price.
Natural gas sales volumes in South Africa were 16% higher than the prior year due to higher demand from resellers and customers asCOVID-19 restrictions were eased. Methane rich gas (MRG) sales volumes however were 5% lower compared to the prior year due tooperational issues experienced by key customers.
In Mozambique, our gas operations were stable despite several operational challenges due to COVID-19. Production volumes of 114,5 bscf were 2% higher than the prior year. Our drilling campaign was suspended due to COVID-19 restrictions and started up on 7 August 2021.
In line with our strategic objectives, we divested of our interest in the Gabon oil producing asset during February 2021 and successfullycompleted the divestment of our interest in the Canadian shale gas assets on 29 July 2021.
We expect our gas production volumes from the Petroleum Production Agreement license area in Mozambique to be between106 to 110 bscf in financial year 2022.
% change2021 vs 2020 2021 2020 2019
Gross margin¹ Rm (7) 9 732 10 426 10 968Cash fixed costs² Rm (17) 2 982 2 547 2 517Adjusted EBITDA Rm (18) 6 728 8 214 8 113Remeasurement items³ Rm (>100) (655) (30) 1 977Earnings before interest and tax (EBIT) Rm 20 6 656 5 527 3 948Normalised EBIT Rm (16) 5 112 6 056 6 000Effective tax rate⁴ % 16 23 39 591 Lower gas selling prices in South Africa from the retrospective application of the final ruling on the NERSA maximum gas pricing matter resulted in 7% lower gross margin2 Excluding the impact of the once-off provision of R0,4 billion relating to the retrospective application of the NERSA ruling, cash fixed costs increased by 2,7%.3 Remeasurement items includes gain on disposal of our Gabon assets and the partial reversal of previous impairments on our Canadian shale gas assets4 Full year 2021 lower as a result of gains on disposal of Gabon assets which are exempt from tax
Sasol Additional Information for Analysts 30 June 2021 17
% change2021 vs 2020 2021 2020 2019
ProductionNatural gas – South Africa bscf 2 114,5 112,4 114,0
External salesNatural gas – South Africa¹ bscf 16 37,5 32,3 35,2Methane rich gas – South Africa bscf (5) 20,8 21,8 21,8Natural gas – Mozambique² bscf 2 15,5 15,2 15,3Condensate – Mozambique m bbl (5) 197 208 247Crude oil – Gabon m bbl (38) 783 1267 1042Natural gas – Canada bscf (17) 12,4 15,0 16,3Condensate – Canada m bbl (37) 124 197 63
Internal sales – Natural gas²Mozambique to Fuels bscf (3) 29,2 30,2 32,4Mozambique to Chemicals bscf (2) 43,5 44,4 41,6
1 Includes volumes relating to the 30% shareholding of our Mozambique assets, held by third parties.2 Volumes shown reflect Sasol's share after royalties.
114,
0
112,
4
114,
5
0
30
60
90
120
2019 2020 2021 2022 outlook
bscf
Mozambique Natural Gas Production
2019 2020 2021 2022 outlook
106
-11
0
5 52
7 6 65
6
744 23
7 625
1 262
62 189
2020
Crud
e oi
l and
pro
duct
pric
es
Exch
ange
rate
s
Infla
tion
Sale
s vo
lum
es
Tota
l cos
t
Rem
easu
rem
ent
item
s
2021
Rm
22,8%(13,5%) (1,1%) 4,3% 11,3%(3,4%)
EBIT variance analysis
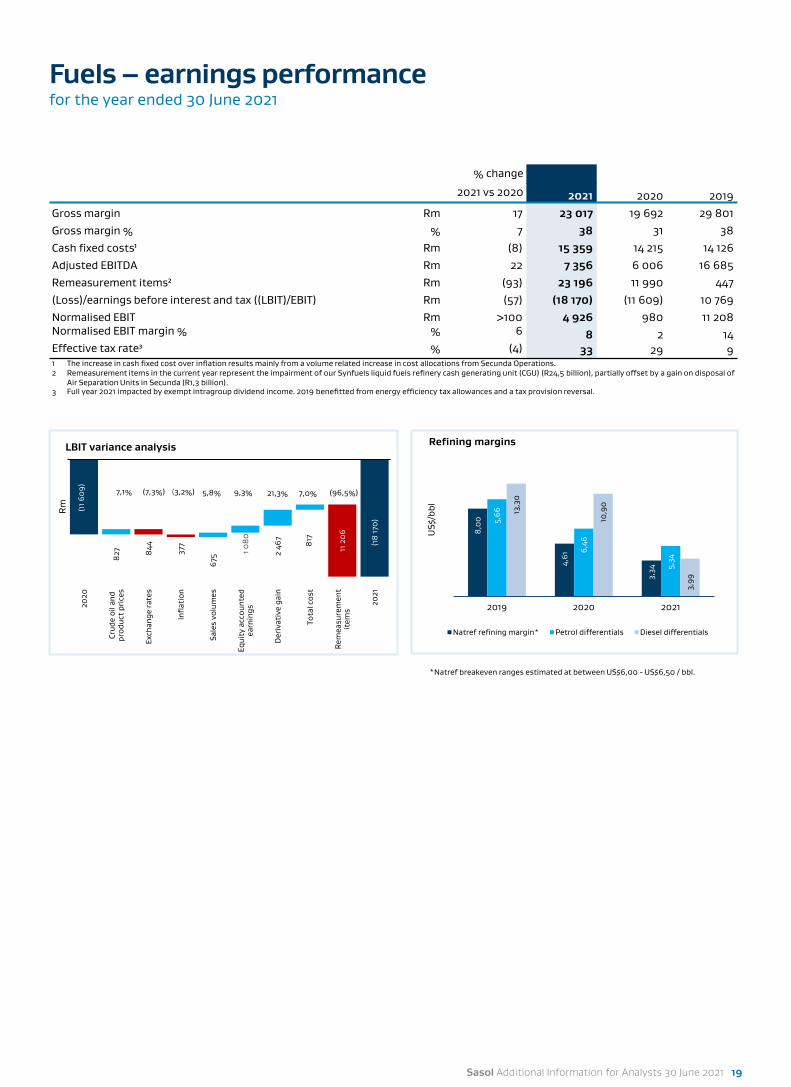
Fuels – earnings performancefor the year ended 30 June 2021
Recovery in liquid fuels volumes, benefitting from easing of lockdown restrictions
The Fuels segment benefited from stronger demand as COVID-19 restrictions were eased. Demand for diesel has recovered toabove pre-COVID 19 levels, while petrol demand remains between 90 - 95% of pre-COVID-19 levels. Jet fuel demand continues to remain constrained. Liquid fuel sales volumes of 54,2 million barrels were 3% higher than the prior year.
We recorded a LBIT of R18,2 billion compared to the prior year LBIT of R11,6 billion. The LBIT for the financial year includes an impairment of R24,5 billion relating to our Secunda liquid fuels refinery cash generating unit, resulting mainly from a stronger rand/US dollar exchange rate outlook and higher cost to produce gas in the longer term.
Excluding remeasurement items, our profitability increased more than 100% and gross margin increased from 31% to 38% compared to the prior year, mainly due to higher production at SO and the benefit of Natref procuring crude oil at much lower prices at the start of the year.
SO volumes of 7,6mt for 2021 were 3% higher than the prior year with the benefit of the September 2020 phase shutdown which was replaced by a ‘pitstop’ shutdown in May 2020. However, the increase in volumes was partly offset by some operational challenges. At Natref, together with our partner, we reduced our run rates to respond to lower market demand.
ORYX GTL contributed R719 million to EBIT, increasing by more than 100% compared the prior year due to a solid operational performance post the extended shutdown during the first half of the financial year.
In financial year 2022, we expect SO volumes of 7,4 to 7,5 million tons attributed to lower gas supply due to the drilling campaign in Mozambique and coal quality. The Natref run rate is expected to be between 560 and 590 m³/h.
Additionally, we expect liquid fuels sales of approximately 57 to 58 million barrels in financial year 2022, dependent on further waves of COVID-19 and the pace of the COVID- 19 vaccine roll-out.
Sasol Limited Group
18 Sasol Additional Information for Analysts 30 June 2021
% change
2021 vs 2020 2021 2020 2019
Synfuels production* kt 3 7 610 7 373 7 619Refined product kt 3 3 630 3 541 3 699Heating Fuels kt (2) 635 651 665Alcohols/ketones kt 4 622 597 623Other chemicals kt 7 2 014 1 887 1 910Gasification kt - 572 571 590Other kt 9 137 126 132
Synfuels total refined product mm bbl 3 32,1 31,2 32,6Electricity production
Total SA operations average annual requirement MW 1 597 1 539 1 564
Own capacity % 69 72 71Own production** % 49 52 53
NatrefCrude oil (processed) mm bbl 5 18,1 17,2 22,2White product yield % 88,5 89,4 89,4Total yield % 97,6 97,4 97,3Production mm bbl 5 17,7 16,8 21,6
Oryx Production mm bbl 41 4,67 3,31 4,67Utilisation rate of nameplate capacity % 81 57 81
External purchases (white product) mm bbl 15 3,8 3,3 5,6Sales
Liquid fuels - white product mm bbl 3 52,0 50,4 57,5Liquid fuels - black product mm bbl (4) 2,2 2,3 2,5
*Synfuels production volumes shown includes chemical products which are further beneficiated and marketed under the Chemicals business.**The decrease is a result of boiler availability challenges in Secunda.
Fuels – earnings performancefor the year ended 30 June 2021
% change
2021 vs 2020 2021 2020 2019Gross margin Rm 17 23 017 19 692 29 801Gross margin % % 7 38 31 38Cash fixed costs¹ Rm (8) 15 359 14 215 14 126Adjusted EBITDA Rm 22 7 356 6 006 16 685Remeasurement items² Rm (93) 23 196 11 990 447(Loss)/earnings before interest and tax ((LBIT)/EBIT) Rm (57) (18 170) (11 609) 10 769Normalised EBIT Rm >100 4 926 980 11 208Normalised EBIT margin % % 6 8 2 14Effective tax rate³ % (4) 33 29 91 The increase in cash fixed cost over inflation results mainly from a volume related increase in cost allocations from Secunda Operations.2 Remeasurement items in the current year represent the impairment of our Synfuels liquid fuels refinery cash generating unit (CGU) (R24,5 billion), partially offset by a gain on disposal of
Air Separation Units in Secunda (R1,3 billion).3 Full year 2021 impacted by exempt intragroup dividend income. 2019 benefitted from energy efficiency tax allowances and a tax provision reversal.
(11 6
09)
(18
170
)
827
675 1 0
80
2 46
7
817
844 377 11 2
06
2020
Crud
e oi
l and
prod
uct
pric
es
Exch
ange
rate
s
Infla
tion
Sale
s vo
lum
es
Equi
ty a
ccou
nted
earn
ings
Der
ivat
ive
gain
Tota
l cos
t
Rem
easu
rem
ent
item
s
2021
Rm
LBIT variance analysis
8,0
0
4,61
3,34
5,66
6,46
5,34
13,3
0
10,9
0
3,99
0
2
4
6
8
10
12
14
2019 2020 2021
US$
/bbl
Refining margins
Natref refining margin* Petrol differentials Diesel differentials
(7,3%)7,1% (3,2%) 5,8% 9,3% (96,5%)21,3% 7,0%
*Natref breakeven ranges estimated at between US$6,00 - US$6,50 / bbl.
Sasol Additional Information for Analysts 30 June 2021 19
(17
035
)
6 95
7
2 71
5
445
1 668
2 34
5
16 2
33
6 0
95
2020
Crud
e oi
l and
prod
uct
pric
es
Exch
ange
rate
s
Infl
atio
n
Sale
s vo
lum
es
Tota
l cos
t
Rem
easu
rem
ent
item
s
2021
Rm
EBIT variance analysis
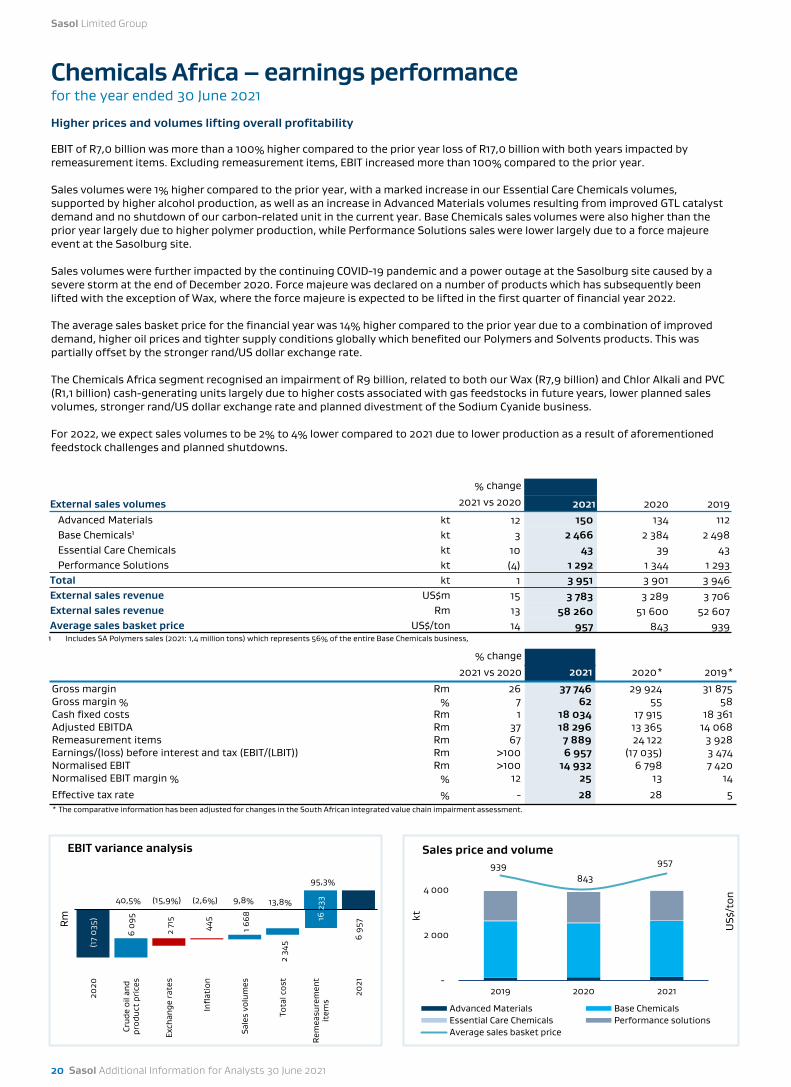
Chemicals Africa – earnings performancefor the year ended 30 June 2021
Higher prices and volumes lifting overall profitability
EBIT of R7,0 billion was more than a 100% higher compared to the prior year loss of R17,0 billion with both years impacted byremeasurement items. Excluding remeasurement items, EBIT increased more than 100% compared to the prior year.
Sales volumes were 1% higher compared to the prior year, with a marked increase in our Essential Care Chemicals volumes, supported by higher alcohol production, as well as an increase in Advanced Materials volumes resulting from improved GTL catalyst demand and no shutdown of our carbon-related unit in the current year. Base Chemicals sales volumes were also higher than the prior year largely due to higher polymer production, while Performance Solutions sales were lower largely due to a force majeure event at the Sasolburg site.
Sales volumes were further impacted by the continuing COVID-19 pandemic and a power outage at the Sasolburg site caused by a severe storm at the end of December 2020. Force majeure was declared on a number of products which has subsequently been lifted with the exception of Wax, where the force majeure is expected to be lifted in the first quarter of financial year 2022.
The average sales basket price for the financial year was 14% higher compared to the prior year due to a combination of improved demand, higher oil prices and tighter supply conditions globally which benefited our Polymers and Solvents products. This was partially offset by the stronger rand/US dollar exchange rate.
The Chemicals Africa segment recognised an impairment of R9 billion, related to both our Wax (R7,9 billion) and Chlor Alkali and PVC(R1,1 billion) cash-generating units largely due to higher costs associated with gas feedstocks in future years, lower planned sales volumes, stronger rand/US dollar exchange rate and planned divestment of the Sodium Cyanide business.
For 2022, we expect sales volumes to be 2% to 4% lower compared to 2021 due to lower production as a result of aforementioned feedstock challenges and planned shutdowns.
% change
2021 vs 2020 2021 2020* 2019*
Gross margin Rm 26 37 746 29 924 31 875Gross margin % % 7 62 55 58Cash fixed costs Rm 1 18 034 17 915 18 361Adjusted EBITDA Rm 37 18 296 13 365 14 068Remeasurement items Rm 67 7 889 24 122 3 928Earnings/(loss) before interest and tax (EBIT/(LBIT)) Rm >100 6 957 (17 035) 3 474Normalised EBIT Rm >100 14 932 6 798 7 420Normalised EBIT margin % % 12 25 13 14
Effective tax rate % - 28 28 5* The comparative information has been adjusted for changes in the South African integrated value chain impairment assessment.
Sasol Limited Group
20 Sasol Additional Information for Analysts 30 June 2021
% change
External sales volumes 2021 vs 2020 2021 2020 2019Advanced Materials kt 12 150 134 112Base Chemicals¹ kt 3 2 466 2 384 2 498Essential Care Chemicals kt 10 43 39 43Performance Solutions kt (4) 1 292 1 344 1 293
Total kt 1 3 951 3 901 3 946External sales revenue US$m 15 3 783 3 289 3 706External sales revenue Rm 13 58 260 51 600 52 607Average sales basket price US$/ton 14 957 843 939¹ Includes SA Polymers sales (2021: 1,4 million tons) which represents 56% of the entire Base Chemicals business,
939 843
957
200
400
600
800
1000
-
2 000
4 000
2019 2020 2021
US$
/ton
kt
Sales price and volume
Advanced Materials Base ChemicalsEssential Care Chemicals Performance solutionsAverage sales basket price
(15,9%)40,5% (2,6%) 9,8%
95,3%
13,8%
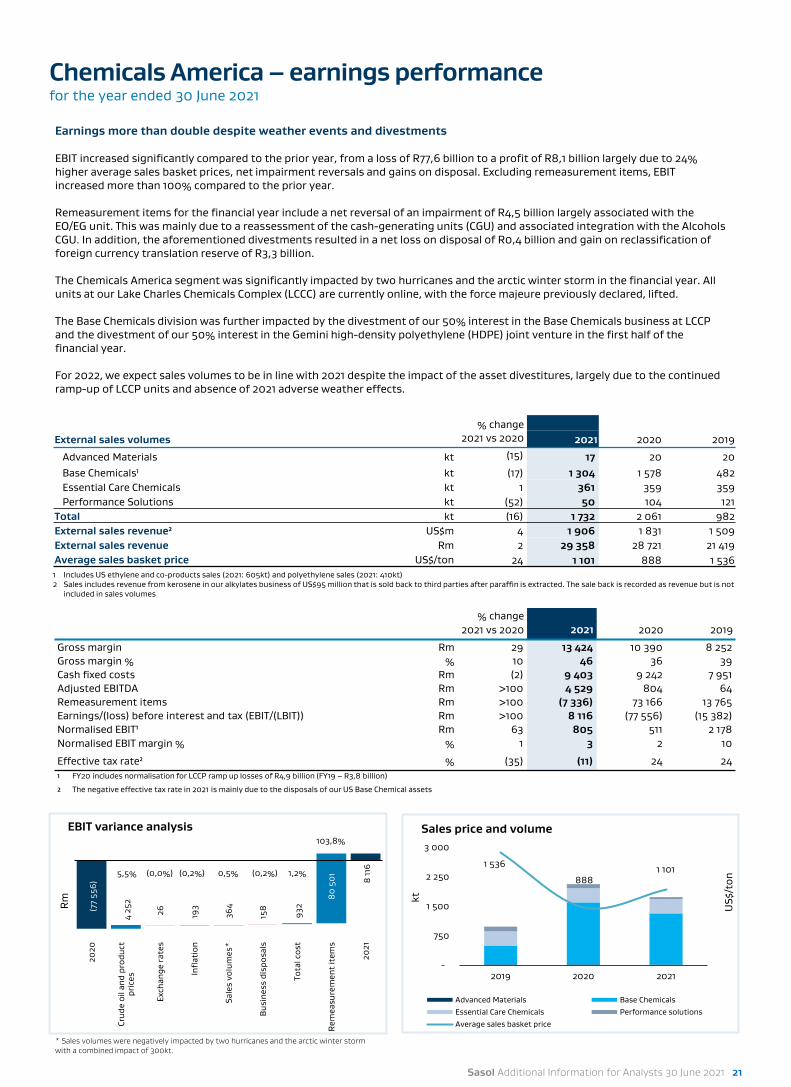
Chemicals America – earnings performancefor the year ended 30 June 2021
% change2021 vs 2020 2021 2020 2019
Gross margin Rm 29 13 424 10 390 8 252Gross margin % % 10 46 36 39Cash fixed costs Rm (2) 9 403 9 242 7 951Adjusted EBITDA Rm >100 4 529 804 64Remeasurement items Rm >100 (7 336) 73 166 13 765Earnings/(loss) before interest and tax (EBIT/(LBIT)) Rm >100 8 116 (77 556) (15 382)Normalised EBIT¹ Rm 63 805 511 2 178Normalised EBIT margin % % 1 3 2 10
Effective tax rate² % (35) (11) 24 24
¹ FY20 includes normalisation for LCCP ramp up losses of R4,9 billion (FY19 – R3,8 billion)
² The negative effective tax rate in 2021 is mainly due to the disposals of our US Base Chemical assets
Earnings more than double despite weather events and divestments
EBIT increased significantly compared to the prior year, from a loss of R77,6 billion to a profit of R8,1 billion largely due to 24% higher average sales basket prices, net impairment reversals and gains on disposal. Excluding remeasurement items, EBIT increased more than 100% compared to the prior year.
Remeasurement items for the financial year include a net reversal of an impairment of R4,5 billion largely associated with the EO/EG unit. This was mainly due to a reassessment of the cash-generating units (CGU) and associated integration with the Alcohols CGU. In addition, the aforementioned divestments resulted in a net loss on disposal of R0,4 billion and gain on reclassification of foreign currency translation reserve of R3,3 billion.
The Chemicals America segment was significantly impacted by two hurricanes and the arctic winter storm in the financial year. Allunits at our Lake Charles Chemicals Complex (LCCC) are currently online, with the force majeure previously declared, lifted.
The Base Chemicals division was further impacted by the divestment of our 50% interest in the Base Chemicals business at LCCP and the divestment of our 50% interest in the Gemini high-density polyethylene (HDPE) joint venture in the first half of the financial year.
For 2022, we expect sales volumes to be in line with 2021 despite the impact of the asset divestitures, largely due to the continued ramp-up of LCCP units and absence of 2021 adverse weather effects.
Sasol Additional Information for Analysts 30 June 2021 21
% changeExternal sales volumes 2021 vs 2020 2021 2020 2019
Advanced Materials kt (15) 17 20 20Base Chemicals¹ kt (17) 1 304 1 578 482Essential Care Chemicals kt 1 361 359 359Performance Solutions kt (52) 50 104 121
Total kt (16) 1 732 2 061 982External sales revenue² US$m 4 1 906 1 831 1 509External sales revenue Rm 2 29 358 28 721 21 419Average sales basket price US$/ton 24 1 101 888 1 5361 Includes US ethylene and co-products sales (2021: 605kt) and polyethylene sales (2021: 410kt)2 Sales includes revenue from kerosene in our alkylates business of US$95 million that is sold back to third parties after paraffin is extracted. The sale back is recorded as revenue but is not
included in sales volumes
1 536
888 1 101
200
700
1200
-
750
1 500
2 250
3 000
2019 2020 2021
US$
/ton
kt
Sales price and volume
Advanced Materials Base ChemicalsEssential Care Chemicals Performance solutionsAverage sales basket price
(77
556)
8 11
6
4 25
2
364
932
80
50
1
26 193
158
2020
Crud
e oi
l and
pro
duct
pric
es
Exch
ange
rate
s
Infl
atio
n
Sale
s vo
lum
es*
Busi
ness
dis
posa
ls
Tota
l cos
t
Rem
easu
rem
ent
item
s
2021
Rm
EBIT variance analysis
5,5% (0,0%) 0,5% (0,2%)
103,8%
(0,2%) 1,2%
* Sales volumes were negatively impacted by two hurricanes and the arctic winter storm with a combined impact of 300kt.
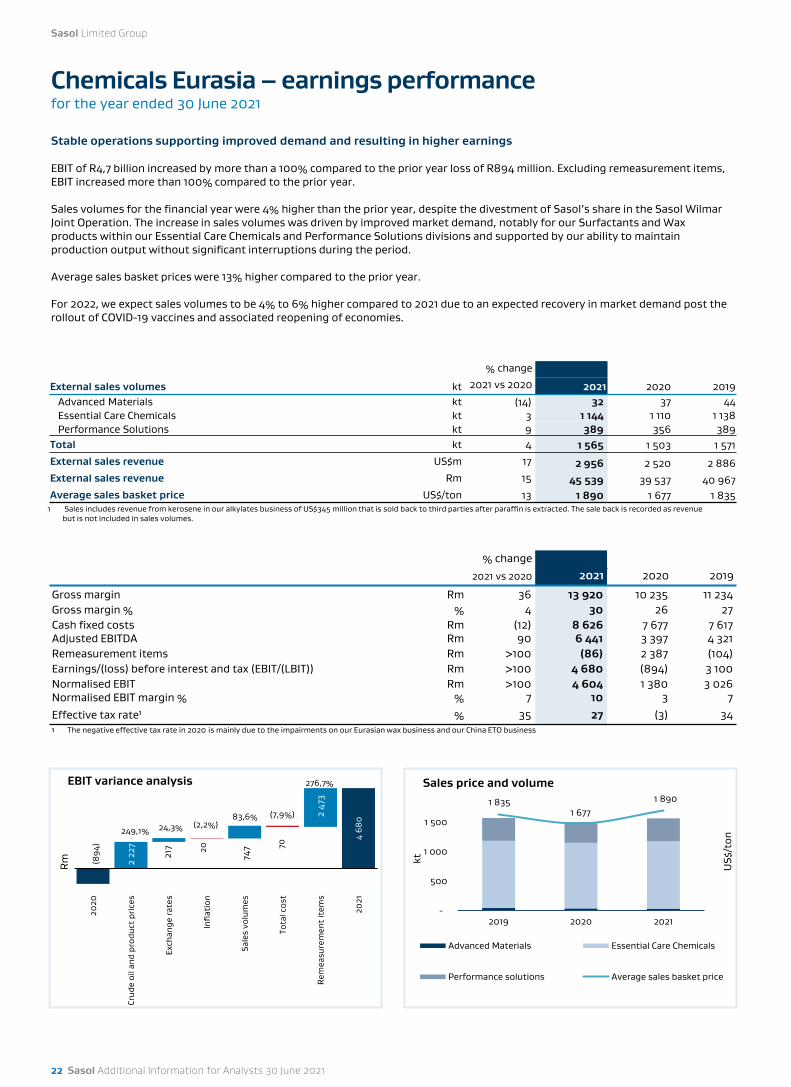
Chemicals Eurasia – earnings performancefor the year ended 30 June 2021
Stable operations supporting improved demand and resulting in higher earnings
EBIT of R4,7 billion increased by more than a 100% compared to the prior year loss of R894 million. Excluding remeasurement items,EBIT increased more than 100% compared to the prior year.
Sales volumes for the financial year were 4% higher than the prior year, despite the divestment of Sasol’s share in the Sasol WilmarJoint Operation. The increase in sales volumes was driven by improved market demand, notably for our Surfactants and Wax products within our Essential Care Chemicals and Performance Solutions divisions and supported by our ability to maintain production output without significant interruptions during the period.
Average sales basket prices were 13% higher compared to the prior year.
For 2022, we expect sales volumes to be 4% to 6% higher compared to 2021 due to an expected recovery in market demand post the rollout of COVID-19 vaccines and associated reopening of economies.
% change2021 vs 2020 2021 2020 2019
Gross margin Rm 36 13 920 10 235 11 234Gross margin % % 4 30 26 27Cash fixed costs Rm (12) 8 626 7 677 7 617Adjusted EBITDA Rm 90 6 441 3 397 4 321Remeasurement items Rm >100 (86) 2 387 (104)Earnings/(loss) before interest and tax (EBIT/(LBIT)) Rm >100 4 680 (894) 3 100Normalised EBIT Rm >100 4 604 1 380 3 026Normalised EBIT margin % % 7 10 3 7Effective tax rate¹ % 35 27 (3) 34¹ The negative effective tax rate in 2020 is mainly due to the impairments on our Eurasian wax business and our China ETO business
Sasol Limited Group
22 Sasol Additional Information for Analysts 30 June 2021
% change
External sales volumes kt 2021 vs 2020 2021 2020 2019Advanced Materials kt (14) 32 37 44Essential Care Chemicals kt 3 1 144 1 110 1 138Performance Solutions kt 9 389 356 389
Total kt 4 1 565 1 503 1 571External sales revenue US$m 17 2 956 2 520 2 886External sales revenue Rm 15 45 539 39 537 40 967Average sales basket price US$/ton 13 1 890 1 677 1 835
1 Sales includes revenue from kerosene in our alkylates business of US$345 million that is sold back to third parties after paraffin is extracted. The sale back is recorded as revenuebut is not included in sales volumes.
1 835 1 677
1 890
200400600800100012001400160018002000
-
500
1 000
1 500
2019 2020 2021
US$
/ton
kt
Sales price and volume
Advanced Materials Essential Care Chemicals
Performance solutions Average sales basket price
(894
)
4 68
0
2 22
7
217
747
2 47
3
20 70
2020
Crud
e oi
l and
pro
duct
pri
ces
Exch
ange
rate
s
Infl
atio
n
Sale
s vo
lum
es
Tota
l cos
t
Rem
easu
rem
ent
item
s
2021
Rm
EBIT variance analysis
249,1% 24,3% (2,2%)83,6%
276,7%
(7,9%)

Financial position overview - assetsat 30 June
2021 2020*Rm Rm
AssetsProperty, plant and equipment 198 021 227 645Right of use assets 12 903 13 816Goodwill and other intangible assets 2 482 2 800Equity accounted investments 10 142 11 812Post-retirement benefit assets 591 467Deferred tax assets 24 511 31 665
Other long-term assets 6 929 8 361
Non-current assets 255 579 296 566
Inventories 29 742 27 801Trade and other receivables 32 046 30 516Short-term financial assets 1 514 645Cash and cash equivalents 31 231 34 739
Current assets 94 533 93 701
Assets in disposal groups held for sale 10 631 84 268Total assets 360 743 474 535* The comparative information has been adjusted for changes in the South African integrated value chain impairment assessment.
Sasol Additional Information for Analysts 30 June 2021 23
Analysis of key statement of financial position metrics
Sasol Limited Group
24 Sasol Additional Information for Analysts 30 June 2021
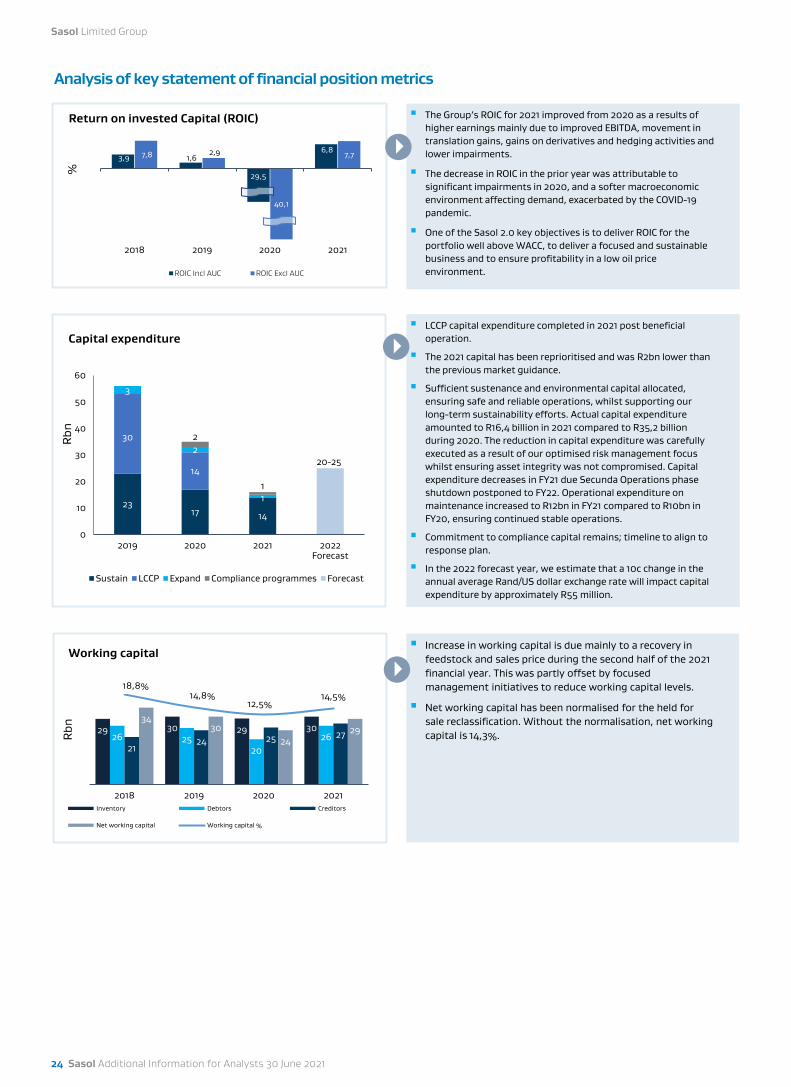
2317 14
30
14
3
2
1
2
1
20-25
0
10
20
30
40
50
60
2019 2020 2021 2022Forecast
Rbn
Capital expenditure
Sustain LCCP Expand Compliance programmes Forecast
LCCP capital expenditure completed in 2021 post beneficial operation.
The 2021 capital has been reprioritised and was R2bn lower than the previous market guidance.
Sufficient sustenance and environmental capital allocated, ensuring safe and reliable operations, whilst supporting our long-term sustainability efforts. Actual capital expenditure amounted to R16,4 billion in 2021 compared to R35,2 billion during 2020. The reduction in capital expenditure was carefully executed as a result of our optimised risk management focus whilst ensuring asset integrity was not compromised. Capital expenditure decreases in FY21 due Secunda Operations phase shutdown postponed to FY22. Operational expenditure on maintenance increased to R12bn in FY21 compared to R10bn in FY20, ensuring continued stable operations.
Commitment to compliance capital remains; timeline to align to response plan.
In the 2022 forecast year, we estimate that a 10c change in the annual average Rand/US dollar exchange rate will impact capital expenditure by approximately R55 million.
29 30 29 3026 25
2026
2124 25 27
3430
2429
18,8%14,8%
12,5%14,5%
-10,0%
-5,0%
0,0%
5,0%
10,0%
15,0%
0
10
20
30
40
2018 2019 2020 2021
Rbn
Working capital
Inventory Debtors Creditors
Net working capital Working capital %
Increase in working capital is due mainly to a recovery in feedstock and sales price during the second half of the 2021 financial year. This was partly offset by focused management initiatives to reduce working capital levels.
Net working capital has been normalised for the held for sale reclassification. Without the normalisation, net working capital is 14,3%.
3,9 1,6
29,5
6,8 7,8 2,9
40,1
7,7
2018 2019 2020 2021
%
Return on invested Capital (ROIC)
ROIC Incl AUC ROIC Excl AUC
The Group’s ROIC for 2021 improved from 2020 as a results of higher earnings mainly due to improved EBITDA, movement in translation gains, gains on derivatives and hedging activities and lower impairments.
The decrease in ROIC in the prior year was attributable to significant impairments in 2020, and a softer macroeconomic environment affecting demand, exacerbated by the COVID-19 pandemic.
One of the Sasol 2.0 key objectives is to deliver ROIC for the portfolio well above WACC, to deliver a focused and sustainable business and to ensure profitability in a low oil price environment.

▪ The group has commenced a process to divest from some or all of its shareholding in ROMPCO. The transaction is expected to close before financial year end.
▪ Sasol entered into a Sale Securities Purchase Agreement for the divestment of our full shareholding in CTRG, the gas-to-power plant located in Ressano Garcia, Mozambique. The transaction is subject to a number of conditions precedent. The assets and liabilities of CTRG were classified as held for sale at 30 June 2021. The divestment is expected to be concluded in the next 12 months.
▪ Sasol signed an agreement to divest of all our interests in Canada to a Canadian oil and natural gas company. The transaction closed on 29 July 2021. R521 million, (CAD45 million) of the previous impairments was reversed at 30 June 2021 to measure the carrying value of the disposal group at its fair value less cost to sell.
Assets held for sale at 30 June 2021Assets
RmLiabilities
RmNetRm
Investment in Republic of Mozambique Pipeline Investment Company (Pty) Ltd (ROMPCO) 6 085 (1 771) 4 314
Investment in Central Termica De Ressane Garcia S.A. (CTRG) 3 034 (1 109) 1 925
Canadian Montney assets 1 181 (824) 357
Other 331 (2) 329
Total held for sale 10 631 (3 706) 6 925
Asset Divestments concluded in FY21
Asset divestments are a key pillar of our comprehensive response plan, as well as our longer term strategy to streamline our asset portfolio. Significant progress on divestments was realised, with announced asset divestments to the value of US$3,8 billion to date, of which US3,2 billion has been realised in proceeds. These divestments strengthened our balance sheet, and we were able to successfully mitigate a rights issue.
Balance sheet deleveraging will continue to be prioritised, with further updates on other divestments provided as and when appropriate. The following key transactions were completed in financial year 2021:
Asset Business impact
Air Separation Units (Secunda)
Proceeds: R8,1billion (R5,525 billion plus EUR148,75 million)▪ The sale of Sasol’s 16 Air Separation Units (ASU’s) in Secunda to Air Liquide.
▪ A long term gas supply agreement (15 years) will ensure the continuous supply of oxygen and other gases to Sasol’s fuels and chemicals production units.
▪ Air Liquide takes full operational control of the assets, effective from 24 June 2021.
▪ In FY21, a profit on sale of R2,7 billion was recognised.
▪ The transaction is anticipated to result in a negative impact to EBITDA of approximately R2 billion per annum (in FY21 terms). However, it should be noted that all capital expenditure, including sustenance capital (~R500 million –R600million per annum) and the significant capital associated with the restoration of the ageing units (approximately R200 – R250 million per train) will no longer be borne by Sasol.
▪ Further benefits of Air Liquide’s ownership of the ASU’s includes energy efficiency gains and contribution to decarbonisation of the site, supporting the development of the overall sustainability roadmap for Secunda.
Lake Charles Base Chemicals (North America)
Proceeds: US$2 billion▪ Divestment of Sasol’s 50% equity interest in Lake Charles Chemicals Project (LCCP) Base Chemicals business and
creation of a joint venture (JV) with LyondellBasell, significantly reducing net debt and accelerating the shift towards a specialty chemicals portfolio.
▪ The impact on EBITDA in FY21 is not material, based on the negative effect of the Hurricanes in the first half, impacting production volumes, and units which were still ramping up.
Gemini HDPE (North America)
Proceeds: US$404 million▪ Divestment of Sasol’s 50% equity interest in the High Density Polyethylene Joint Venture to Ineos, supporting
strategic ambition to accelerate the shift to a specialty chemicals portfolio.
▪ Part of the proceeds were utilised to settle debt of US$181 million.
▪ An EBITDA of US$18 million was realised for FY21, based on the transaction closing date of 31 December 2020.
Gabon (West Africa)
Proceeds: US$44 million, adjusted for JV cash movements▪ Sasol has divested our 27,8% working interest in the producing Etame Marine block offshore Gabon (Etame) and
our 40% non-operated participating interest in exploration Block DE-8 offshore Gabon.
▪ An EBITDA of US$17,8 million was realised for FY21, with further benefits relating to avoidance of capital for offshore oil production infrastructure maintenance and further exploration capital commitments.
Sasol Additional Information for Analysts 30 June 2021 25
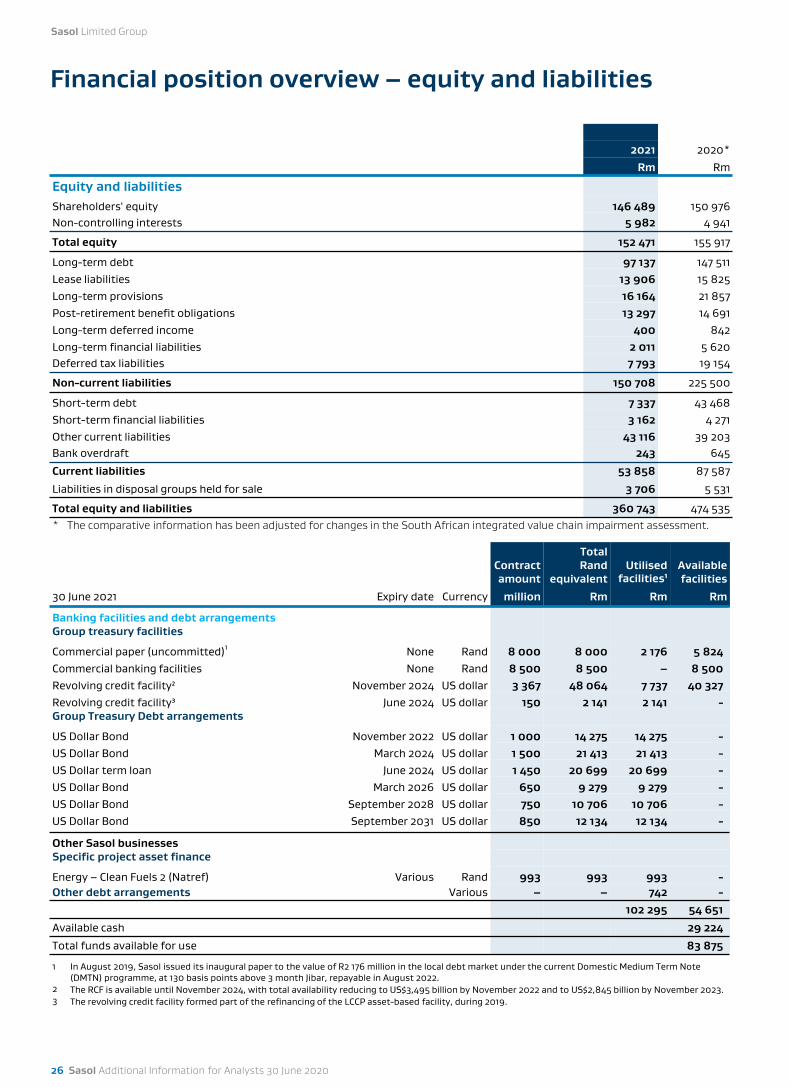
Financial position overview – equity and liabilities
Contract amount
Total Rand
equivalentUtilised
facilities¹Availablefacilities
30 June 2021 Expiry date Currency million Rm Rm Rm
Banking facilities and debt arrangementsGroup treasury facilities
Commercial paper (uncommitted)1 None Rand 8 000 8 000 2 176 5 824Commercial banking facilities None Rand 8 500 8 500 – 8 500Revolving credit facility² November 2024 US dollar 3 367 48 064 7 737 40 327Revolving credit facility³ June 2024 US dollar 150 2 141 2 141 -Group Treasury Debt arrangements
US Dollar Bond November 2022 US dollar 1 000 14 275 14 275 -US Dollar Bond March 2024 US dollar 1 500 21 413 21 413 -US Dollar term loan June 2024 US dollar 1 450 20 699 20 699 -US Dollar Bond March 2026 US dollar 650 9 279 9 279 -US Dollar Bond September 2028 US dollar 750 10 706 10 706 -US Dollar Bond September 2031 US dollar 850 12 134 12 134 -
Other Sasol businessesSpecific project asset finance
Energy – Clean Fuels 2 (Natref) Various Rand 993 993 993 -Other debt arrangements Various – – 742 -
102 295 54 651Available cash 29 224Total funds available for use 83 8751
1 In August 2019, Sasol issued its inaugural paper to the value of R2 176 million in the local debt market under the current Domestic Medium Term Note (DMTN) programme, at 130 basis points above 3 month Jibar, repayable in August 2022.
2 The RCF is available until November 2024, with total availability reducing to US$3,495 billion by November 2022 and to US$2,845 billion by November 2023.3 The revolving credit facility formed part of the refinancing of the LCCP asset-based facility, during 2019.
2021 2020*Rm Rm
Equity and liabilitiesShareholders' equity 146 489 150 976Non-controlling interests 5 982 4 941
Total equity 152 471 155 917
Long-term debt 97 137 147 511Lease liabilities 13 906 15 825Long-term provisions 16 164 21 857Post-retirement benefit obligations 13 297 14 691Long-term deferred income 400 842Long-term financial liabilities 2 011 5 620Deferred tax liabilities 7 793 19 154
Non-current liabilities 150 708 225 500
Short-term debt 7 337 43 468Short-term financial liabilities 3 162 4 271Other current liabilities 43 116 39 203Bank overdraft 243 645
Current liabilities 53 858 87 587
Liabilities in disposal groups held for sale 3 706 5 531
Total equity and liabilities 360 743 474 535* The comparative information has been adjusted for changes in the South African integrated value chain impairment assessment.
Sasol Limited Group
26 Sasol Additional Information for Analysts 30 June 2020
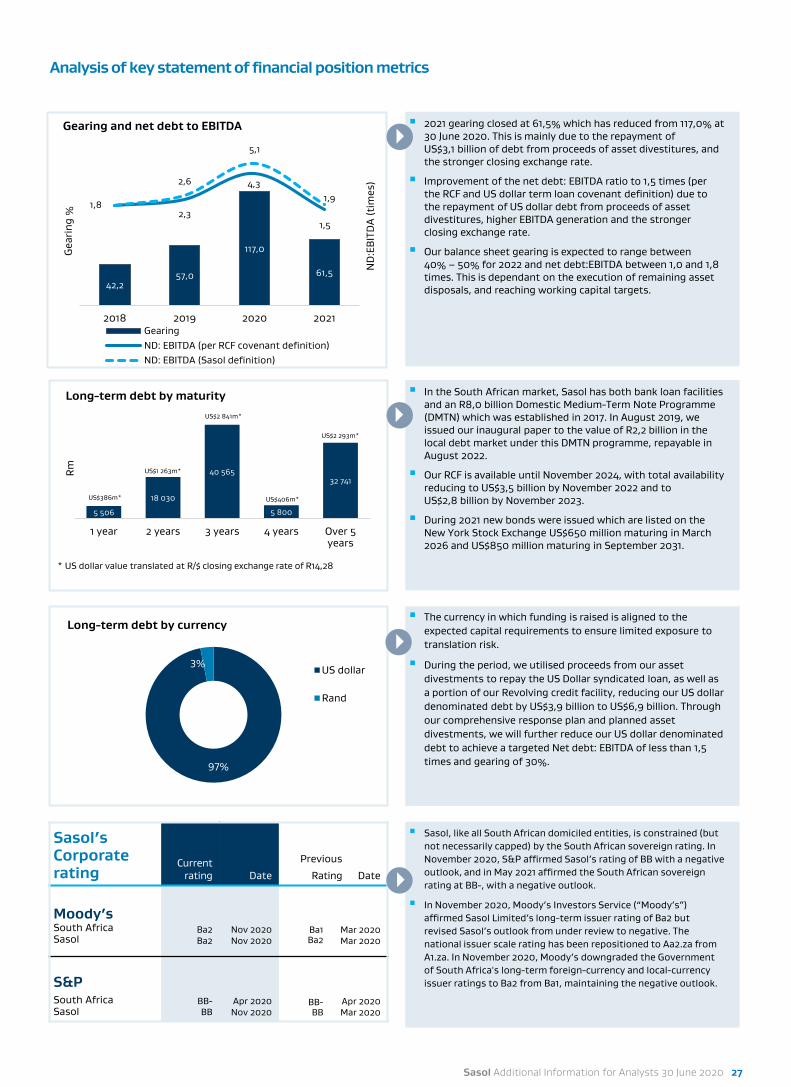
5 506
18 030
40 565
5 800
32 741
US$386m*
US$1 263m*
US$2 841m*
US$406m*
US$2 293m*
1 year 2 years 3 years 4 years Over 5years
Rm
Long-term debt by maturity
Analysis of key statement of financial position metrics
42,257,0
117,0
61,5
2,3
4,3
1,5
1,8
2,6
5,1
1,9
-6-5-4-3-2-10123456
10
50
90
130
2018 2019 2020 2021
ND
:EBI
TDA
(tim
es)
Gea
ring
%
Gearing and net debt to EBITDA
GearingND: EBITDA (per RCF covenant definition)ND: EBITDA (Sasol definition)
2021 gearing closed at 61,5% which has reduced from 117,0% at 30 June 2020. This is mainly due to the repayment of US$3,1 billion of debt from proceeds of asset divestitures, and the stronger closing exchange rate.
Improvement of the net debt: EBITDA ratio to 1,5 times (per the RCF and US dollar term loan covenant definition) due to the repayment of US dollar debt from proceeds of asset divestitures, higher EBITDA generation and the stronger closing exchange rate.
Our balance sheet gearing is expected to range between 40% – 50% for 2022 and net debt:EBITDA between 1,0 and 1,8 times. This is dependant on the execution of remaining asset disposals, and reaching working capital targets.
In the South African market, Sasol has both bank loan facilities and an R8,0 billion Domestic Medium-Term Note Programme (DMTN) which was established in 2017. In August 2019, we issued our inaugural paper to the value of R2,2 billion in the local debt market under this DMTN programme, repayable in August 2022.
Our RCF is available until November 2024, with total availability reducing to US$3,5 billion by November 2022 and to US$2,8 billion by November 2023.
During 2021 new bonds were issued which are listed on the New York Stock Exchange US$650 million maturing in March 2026 and US$850 million maturing in September 2031.
97%
3%
Long-term debt by currency
US dollar
Rand
The currency in which funding is raised is aligned to the expected capital requirements to ensure limited exposure to translation risk.
During the period, we utilised proceeds from our asset divestments to repay the US Dollar syndicated loan, as well as a portion of our Revolving credit facility, reducing our US dollar denominated debt by US$3,9 billion to US$6,9 billion. Through our comprehensive response plan and planned asset divestments, we will further reduce our US dollar denominated debt to achieve a targeted Net debt: EBITDA of less than 1,5times and gearing of 30%.
Sasol’s Corporate rating
Currentrating Date
Previous
Rating Date
Moody’sSouth AfricaSasol
Ba2Ba2
Nov 2020Nov 2020
Ba1Ba2
Mar 2020Mar 2020
S&PSouth AfricaSasol
BB-BB
Apr 2020Nov 2020
BB-BB
Apr 2020Mar 2020
Sasol, like all South African domiciled entities, is constrained (but not necessarily capped) by the South African sovereign rating. In November 2020, S&P affirmed Sasol’s rating of BB with a negative outlook, and in May 2021 affirmed the South African sovereign rating at BB-, with a negative outlook.
In November 2020, Moody’s Investors Service (“Moody’s”) affirmed Sasol Limited’s long-term issuer rating of Ba2 but revised Sasol’s outlook from under review to negative. The national issuer scale rating has been repositioned to Aa2.za from A1.za. In November 2020, Moody’s downgraded the Government of South Africa's long-term foreign-currency and local-currency issuer ratings to Ba2 from Ba1, maintaining the negative outlook.
* US dollar value translated at R/$ closing exchange rate of R14,28
Sasol Additional Information for Analysts 30 June 2020 27
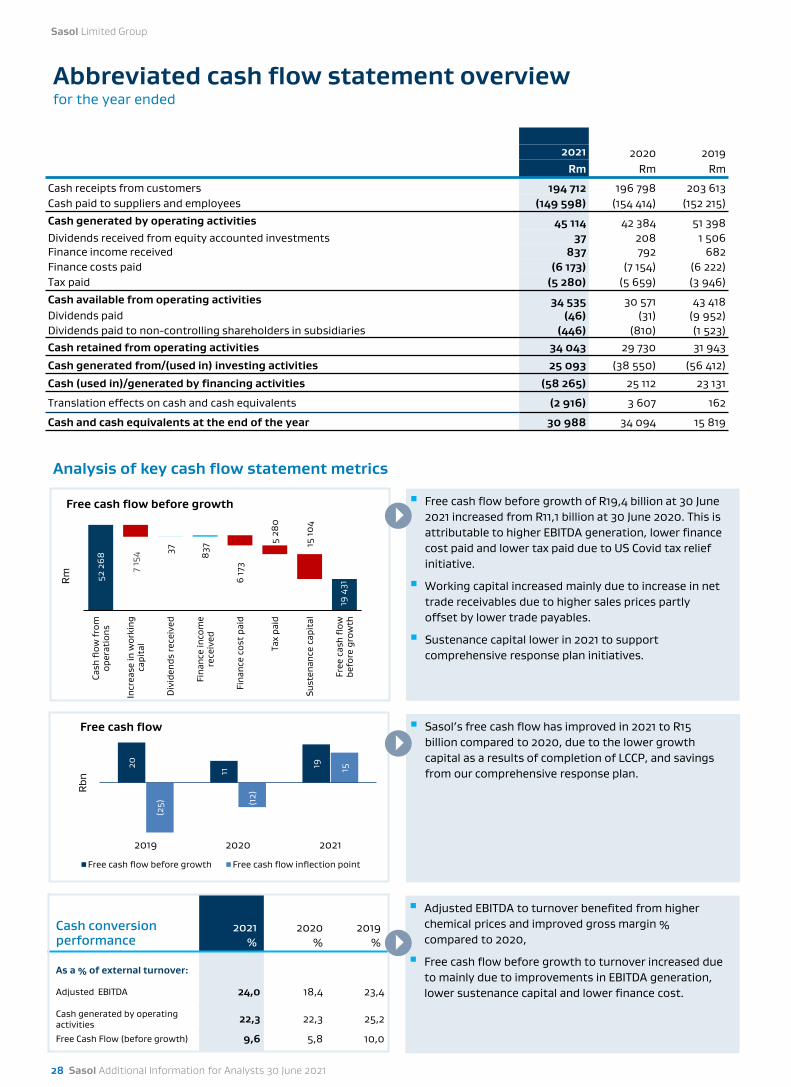
Abbreviated cash flow statement overviewfor the year ended
2021 2020 2019Rm Rm Rm
Cash receipts from customers 194 712 196 798 203 613Cash paid to suppliers and employees (149 598) (154 414) (152 215)Cash generated by operating activities 45 114 42 384 51 398Dividends received from equity accounted investments 37 208 1 506Finance income received 837 792 682Finance costs paid (6 173) (7 154) (6 222)Tax paid (5 280) (5 659) (3 946)Cash available from operating activities 34 535 30 571 43 418Dividends paid (46) (31) (9 952)Dividends paid to non-controlling shareholders in subsidiaries (446) (810) (1 523)Cash retained from operating activities 34 043 29 730 31 943
Cash generated from/(used in) investing activities 25 093 (38 550) (56 412)
Cash (used in)/generated by financing activities (58 265) 25 112 23 131
Translation effects on cash and cash equivalents (2 916) 3 607 162
Cash and cash equivalents at the end of the year 30 988 34 094 15 819
52 2
68
19 4
31
37
837
7 15
4
6 17
3
5 28
0
15 10
4
Cash
flow
from
oper
atio
ns
Incr
ease
in w
orki
ngca
pita
l
Div
iden
ds re
ceiv
ed
Fina
nce
inco
me
rece
ived
Fina
nce
cost
pai
d
Tax
paid
Sust
enan
ce c
apit
al
Free
cas
h fl
owbe
fore
gro
wth
Rm
Free cash flow before growth Free cash flow before growth of R19,4 billion at 30 June 2021 increased from R11,1 billion at 30 June 2020. This is attributable to higher EBITDA generation, lower finance cost paid and lower tax paid due to US Covid tax relief initiative.
Working capital increased mainly due to increase in net trade receivables due to higher sales prices partly offset by lower trade payables.
Sustenance capital lower in 2021 to support comprehensive response plan initiatives.
Sasol’s free cash flow has improved in 2021 to R15 billion compared to 2020, due to the lower growth capital as a results of completion of LCCP, and savings from our comprehensive response plan.
Cash conversion performance
2021 %
2020 %
2019 %
As a % of external turnover:
Adjusted EBITDA 24,0 18,4 23,4
Cash generated by operatingactivities 22,3 22,3 25,2
Free Cash Flow (before growth) 9,6 5,8 10,0
Adjusted EBITDA to turnover benefited from higher chemical prices and improved gross margin % compared to 2020,
Free cash flow before growth to turnover increased due to mainly due to improvements in EBITDA generation, lower sustenance capital and lower finance cost.
Analysis of key cash flow statement metrics
20
11
19
(25) (1
2)
15
2019 2020 2021
Rbn
Free cash flow
Free cash flow before growth Free cash flow inflection point
Sasol Limited Group
28 Sasol Additional Information for Analysts 30 June 2021
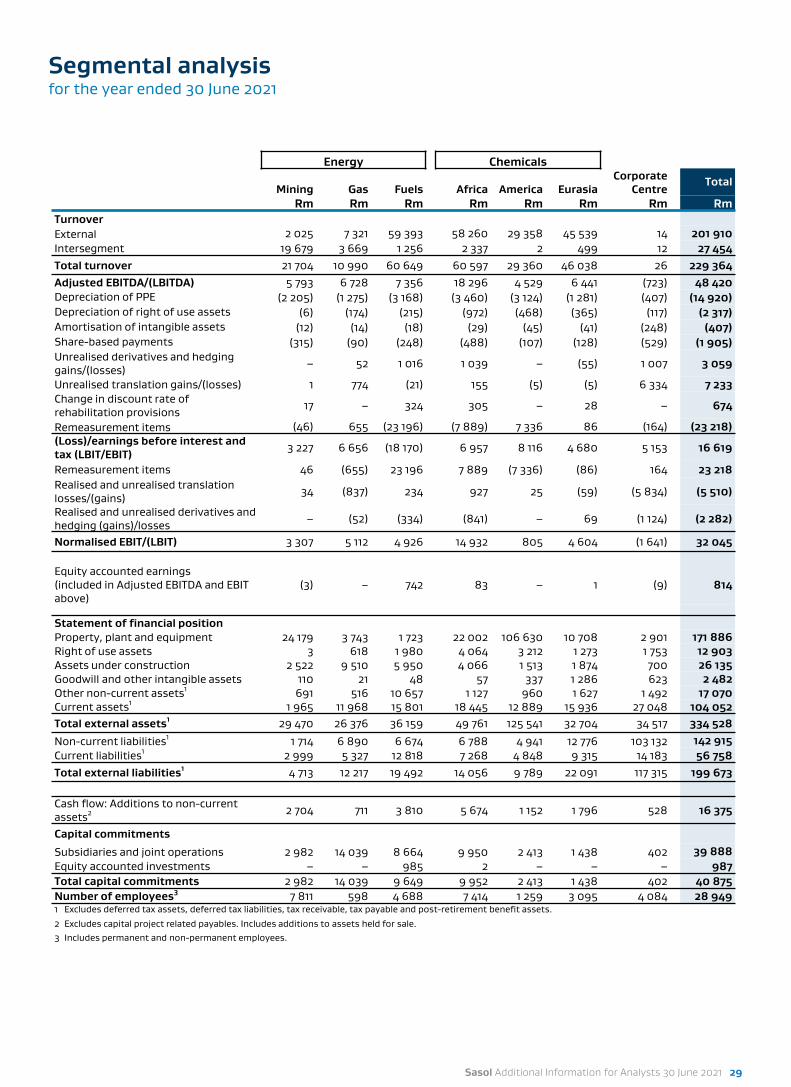
Segmental analysisfor the year ended 30 June 2021
Energy Chemicals
Mining Gas Fuels Africa America EurasiaCorporate
CentreTotal
Rm Rm Rm Rm Rm Rm Rm RmTurnover External 2 025 7 321 59 393 58 260 29 358 45 539 14 201 910Intersegment 19 679 3 669 1 256 2 337 2 499 12 27 454Total turnover 21 704 10 990 60 649 60 597 29 360 46 038 26 229 364Adjusted EBITDA/(LBITDA) 5 793 6 728 7 356 18 296 4 529 6 441 (723) 48 420Depreciation of PPE (2 205) (1 275) (3 168) (3 460) (3 124) (1 281) (407) (14 920)Depreciation of right of use assets (6) (174) (215) (972) (468) (365) (117) (2 317)Amortisation of intangible assets (12) (14) (18) (29) (45) (41) (248) (407)Share-based payments (315) (90) (248) (488) (107) (128) (529) (1 905)Unrealised derivatives and hedging gains/(losses) – 52 1 016 1 039 – (55) 1 007 3 059
Unrealised translation gains/(losses) 1 774 (21) 155 (5) (5) 6 334 7 233Change in discount rate of rehabilitation provisions 17 – 324 305 – 28 – 674
Remeasurement items (46) 655 (23 196) (7 889) 7 336 86 (164) (23 218)(Loss)/earnings before interest and tax (LBIT/EBIT) 3 227 6 656 (18 170) 6 957 8 116 4 680 5 153 16 619
Remeasurement items 46 (655) 23 196 7 889 (7 336) (86) 164 23 218Realised and unrealised translation losses/(gains) 34 (837) 234 927 25 (59) (5 834) (5 510)
Realised and unrealised derivatives and hedging (gains)/losses – (52) (334) (841) – 69 (1 124) (2 282)
Normalised EBIT/(LBIT) 3 307 5 112 4 926 14 932 805 4 604 (1 641) 32 045
Equity accounted earnings (included in Adjusted EBITDA and EBIT above)
(3) – 742 83 – 1 (9) 814
Statement of financial position Property, plant and equipment 24 179 3 743 1 723 22 002 106 630 10 708 2 901 171 886Right of use assets 3 618 1 980 4 064 3 212 1 273 1 753 12 903Assets under construction 2 522 9 510 5 950 4 066 1 513 1 874 700 26 135Goodwill and other intangible assets 110 21 48 57 337 1 286 623 2 482Other non-current assets1 691 516 10 657 1 127 960 1 627 1 492 17 070Current assets1 1 965 11 968 15 801 18 445 12 889 15 936 27 048 104 052Total external assets1 29 470 26 376 36 159 49 761 125 541 32 704 34 517 334 528Non-current liabilities1 1 714 6 890 6 674 6 788 4 941 12 776 103 132 142 915Current liabilities1 2 999 5 327 12 818 7 268 4 848 9 315 14 183 56 758Total external liabilities1 4 713 12 217 19 492 14 056 9 789 22 091 117 315 199 673
Cash flow: Additions to non-current assets2 2 704 711 3 810 5 674 1 152 1 796 528 16 375
Capital commitments
Subsidiaries and joint operations 2 982 14 039 8 664 9 950 2 413 1 438 402 39 888Equity accounted investments – – 985 2 – – – 987Total capital commitments 2 982 14 039 9 649 9 952 2 413 1 438 402 40 875Number of employees3 7 811 598 4 688 7 414 1 259 3 095 4 084 28 9491 Excludes deferred tax assets, deferred tax liabilities, tax receivable, tax payable and post-retirement benefit assets.
2 Excludes capital project related payables. Includes additions to assets held for sale.3 Includes permanent and non-permanent employees.
Sasol Additional Information for Analysts 30 June 2021 29
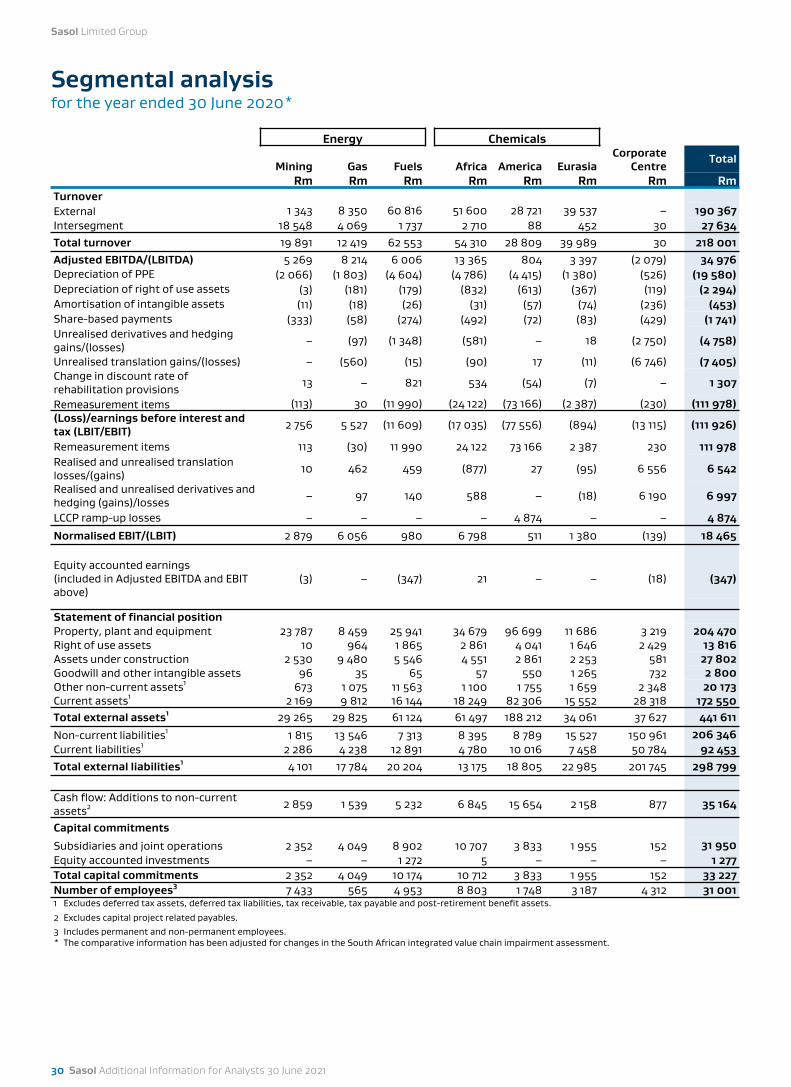
Segmental analysisfor the year ended 30 June 2020*
Energy Chemicals
Mining Gas Fuels Africa America EurasiaCorporate
CentreTotal
Rm Rm Rm Rm Rm Rm Rm RmTurnover External 1 343 8 350 60 816 51 600 28 721 39 537 – 190 367Intersegment 18 548 4 069 1 737 2 710 88 452 30 27 634Total turnover 19 891 12 419 62 553 54 310 28 809 39 989 30 218 001Adjusted EBITDA/(LBITDA) 5 269 8 214 6 006 13 365 804 3 397 (2 079) 34 976Depreciation of PPE (2 066) (1 803) (4 604) (4 786) (4 415) (1 380) (526) (19 580)Depreciation of right of use assets (3) (181) (179) (832) (613) (367) (119) (2 294)Amortisation of intangible assets (11) (18) (26) (31) (57) (74) (236) (453)Share-based payments (333) (58) (274) (492) (72) (83) (429) (1 741)Unrealised derivatives and hedging gains/(losses) – (97) (1 348) (581) – 18 (2 750) (4 758)
Unrealised translation gains/(losses) – (560) (15) (90) 17 (11) (6 746) (7 405)Change in discount rate of rehabilitation provisions 13 – 821 534 (54) (7) – 1 307
Remeasurement items (113) 30 (11 990) (24 122) (73 166) (2 387) (230) (111 978)(Loss)/earnings before interest and tax (LBIT/EBIT) 2 756 5 527 (11 609) (17 035) (77 556) (894) (13 115) (111 926)
Remeasurement items 113 (30) 11 990 24 122 73 166 2 387 230 111 978Realised and unrealised translation losses/(gains) 10 462 459 (877) 27 (95) 6 556 6 542
Realised and unrealised derivatives and hedging (gains)/losses – 97 140 588 – (18) 6 190 6 997
LCCP ramp-up losses – – – – 4 874 – – 4 874Normalised EBIT/(LBIT) 2 879 6 056 980 6 798 511 1 380 (139) 18 465
Equity accounted earnings (included in Adjusted EBITDA and EBIT above)
(3) – (347) 21 – – (18) (347)
Statement of financial position Property, plant and equipment 23 787 8 459 25 941 34 679 96 699 11 686 3 219 204 470Right of use assets 10 964 1 865 2 861 4 041 1 646 2 429 13 816Assets under construction 2 530 9 480 5 546 4 551 2 861 2 253 581 27 802Goodwill and other intangible assets 96 35 65 57 550 1 265 732 2 800Other non-current assets1 673 1 075 11 563 1 100 1 755 1 659 2 348 20 173Current assets1 2 169 9 812 16 144 18 249 82 306 15 552 28 318 172 550Total external assets1 29 265 29 825 61 124 61 497 188 212 34 061 37 627 441 611Non-current liabilities1 1 815 13 546 7 313 8 395 8 789 15 527 150 961 206 346Current liabilities1 2 286 4 238 12 891 4 780 10 016 7 458 50 784 92 453Total external liabilities1 4 101 17 784 20 204 13 175 18 805 22 985 201 745 298 799
Cash flow: Additions to non-current assets2 2 859 1 539 5 232 6 845 15 654 2 158 877 35 164
Capital commitments
Subsidiaries and joint operations 2 352 4 049 8 902 10 707 3 833 1 955 152 31 950Equity accounted investments – – 1 272 5 – – – 1 277Total capital commitments 2 352 4 049 10 174 10 712 3 833 1 955 152 33 227Number of employees3 7 433 565 4 953 8 803 1 748 3 187 4 312 31 0011 Excludes deferred tax assets, deferred tax liabilities, tax receivable, tax payable and post-retirement benefit assets.
2 Excludes capital project related payables. 3 Includes permanent and non-permanent employees.* The comparative information has been adjusted for changes in the South African integrated value chain impairment assessment.
Sasol Limited Group
30 Sasol Additional Information for Analysts 30 June 2021
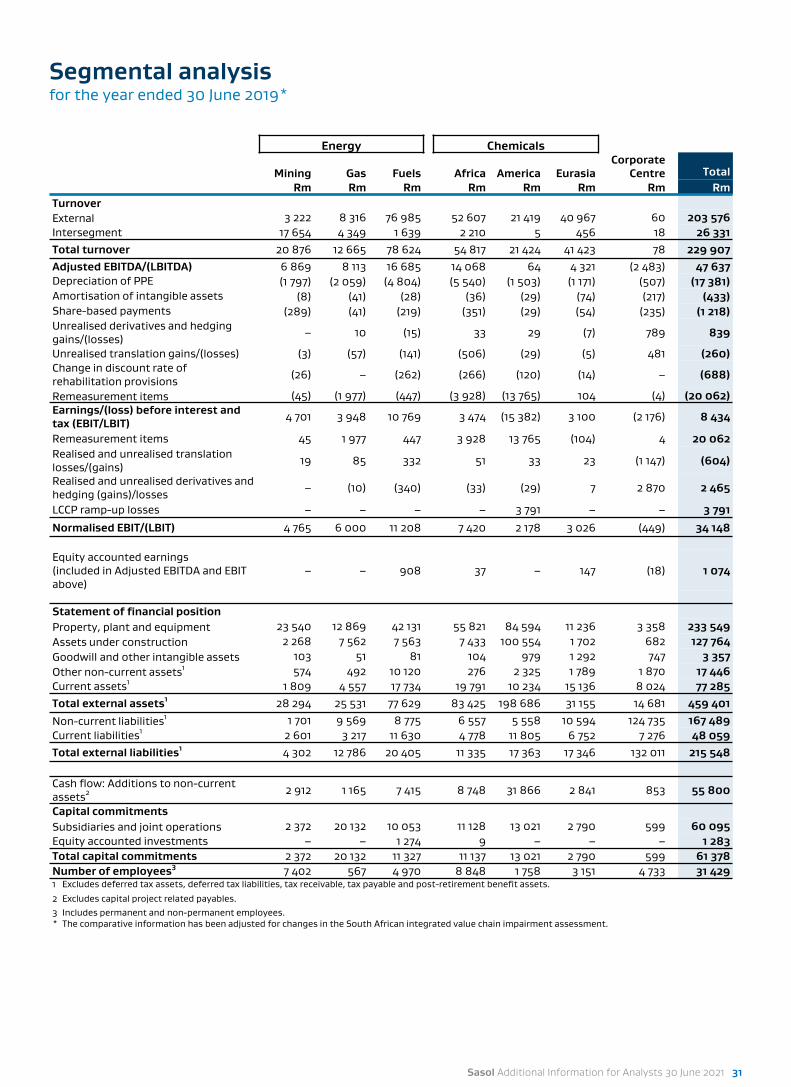
Segmental analysisfor the year ended 30 June 2019*
Energy Chemicals
Mining Gas Fuels Africa America EurasiaCorporate
Centre Total Rm Rm Rm Rm Rm Rm Rm Rm
Turnover External 3 222 8 316 76 985 52 607 21 419 40 967 60 203 576Intersegment 17 654 4 349 1 639 2 210 5 456 18 26 331Total turnover 20 876 12 665 78 624 54 817 21 424 41 423 78 229 907Adjusted EBITDA/(LBITDA) 6 869 8 113 16 685 14 068 64 4 321 (2 483) 47 637Depreciation of PPE (1 797) (2 059) (4 804) (5 540) (1 503) (1 171) (507) (17 381)Amortisation of intangible assets (8) (41) (28) (36) (29) (74) (217) (433)Share-based payments (289) (41) (219) (351) (29) (54) (235) (1 218)Unrealised derivatives and hedging gains/(losses) – 10 (15) 33 29 (7) 789 839
Unrealised translation gains/(losses) (3) (57) (141) (506) (29) (5) 481 (260)Change in discount rate of rehabilitation provisions (26) – (262) (266) (120) (14) – (688)
Remeasurement items (45) (1 977) (447) (3 928) (13 765) 104 (4) (20 062)Earnings/(loss) before interest and tax (EBIT/LBIT) 4 701 3 948 10 769 3 474 (15 382) 3 100 (2 176) 8 434
Remeasurement items 45 1 977 447 3 928 13 765 (104) 4 20 062Realised and unrealised translation losses/(gains) 19 85 332 51 33 23 (1 147) (604)
Realised and unrealised derivatives and hedging (gains)/losses – (10) (340) (33) (29) 7 2 870 2 465
LCCP ramp-up losses – – – – 3 791 – – 3 791Normalised EBIT/(LBIT) 4 765 6 000 11 208 7 420 2 178 3 026 (449) 34 148
Equity accounted earnings (included in Adjusted EBITDA and EBIT above)
– – 908 37 – 147 (18) 1 074
Statement of financial position Property, plant and equipment 23 540 12 869 42 131 55 821 84 594 11 236 3 358 233 549Assets under construction 2 268 7 562 7 563 7 433 100 554 1 702 682 127 764Goodwill and other intangible assets 103 51 81 104 979 1 292 747 3 357Other non-current assets1 574 492 10 120 276 2 325 1 789 1 870 17 446Current assets1 1 809 4 557 17 734 19 791 10 234 15 136 8 024 77 285Total external assets1 28 294 25 531 77 629 83 425 198 686 31 155 14 681 459 401Non-current liabilities1 1 701 9 569 8 775 6 557 5 558 10 594 124 735 167 489Current liabilities1 2 601 3 217 11 630 4 778 11 805 6 752 7 276 48 059Total external liabilities1 4 302 12 786 20 405 11 335 17 363 17 346 132 011 215 548
Cash flow: Additions to non-current assets2 2 912 1 165 7 415 8 748 31 866 2 841 853 55 800
Capital commitments Subsidiaries and joint operations 2 372 20 132 10 053 11 128 13 021 2 790 599 60 095Equity accounted investments – – 1 274 9 – – – 1 283Total capital commitments 2 372 20 132 11 327 11 137 13 021 2 790 599 61 378Number of employees3 7 402 567 4 970 8 848 1 758 3 151 4 733 31 4291 Excludes deferred tax assets, deferred tax liabilities, tax receivable, tax payable and post-retirement benefit assets.
2 Excludes capital project related payables. 3 Includes permanent and non-permanent employees.* The comparative information has been adjusted for changes in the South African integrated value chain impairment assessment.
Sasol Additional Information for Analysts 30 June 2021 31
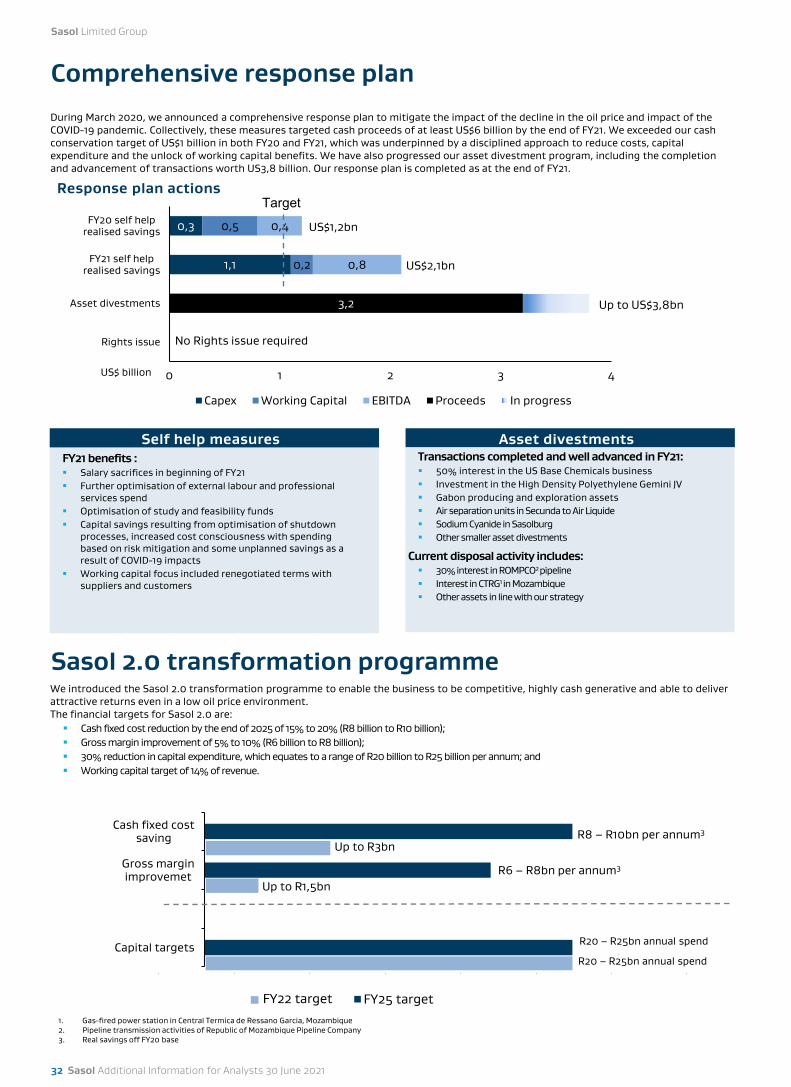
Comprehensive response plan During March 2020, we announced a comprehensive response plan to mitigate the impact of the decline in the oil price and impact of the COVID-19 pandemic. Collectively, these measures targeted cash proceeds of at least US$6 billion by the end of FY21. We exceeded our cash conservation target of US$1 billion in both FY20 and FY21, which was underpinned by a disciplined approach to reduce costs, capital expenditure and the unlock of working capital benefits. We have also progressed our asset divestment program, including the completion and advancement of transactions worth US3,8 billion. Our response plan is completed as at the end of FY21.
Response plan actions
FY21 benefits : Salary sacrifices in beginning of FY21 Further optimisation of external labour and professional
services spend Optimisation of study and feasibility funds Capital savings resulting from optimisation of shutdown
processes, increased cost consciousness with spending based on risk mitigation and some unplanned savings as a result of COVID-19 impacts
Working capital focus included renegotiated terms with suppliers and customers
Asset divestments Transactions completed and well advanced in FY21: 50% interest in the US Base Chemicals business Investment in the High Density Polyethylene Gemini JV Gabon producing and exploration assets Air separation units in Secunda to Air Liquide Sodium Cyanide in Sasolburg Other smaller asset divestments
Current disposal activity includes: 30% interest in ROMPCO2 pipeline Interest in CTRG1 in Mozambique Other assets in line with our strategy
Self help measures
1. Gas-fired power station in Central Termica de Ressano Garcia, Mozambique2. Pipeline transmission activities of Republic of Mozambique Pipeline Company3. Real savings off FY20 base
1,1
0,3
0,2
0,5
0,8
0,4
3,2 Up to US$3,8bn
0 1 2 3 4
Rights issue
Asset divestments
FY21 self helprealised savings
FY20 self helprealised savings
US$ billion
Capex Working Capital EBITDA Proceeds In progress
No Rights issue required
Target
Sasol 2.0 transformation programme
US$1,2bn
We introduced the Sasol 2.0 transformation programme to enable the business to be competitive, highly cash generative and able to deliver attractive returns even in a low oil price environment. The financial targets for Sasol 2.0 are: Cash fixed cost reduction by the end of 2025 of 15% to 20% (R8 billion to R10 billion); Gross margin improvement of 5% to 10% (R6 billion to R8 billion); 30% reduction in capital expenditure, which equates to a range of R20 billion to R25 billion per annum; and Working capital target of 14% of revenue.
US$2,1bn
Capital targets
Gross marginimprovemet
Cash fixed costsaving
FY25 target
1
R8 – R10bn per annum3
R6 – R8bn per annum3
R20 – R25bn annual spend
FY22 target
Up to R3bn
Up to R1,5bn
R20 – R25bn annual spend
Sasol Limited Group
32 Sasol Additional Information for Analysts 30 June 2021
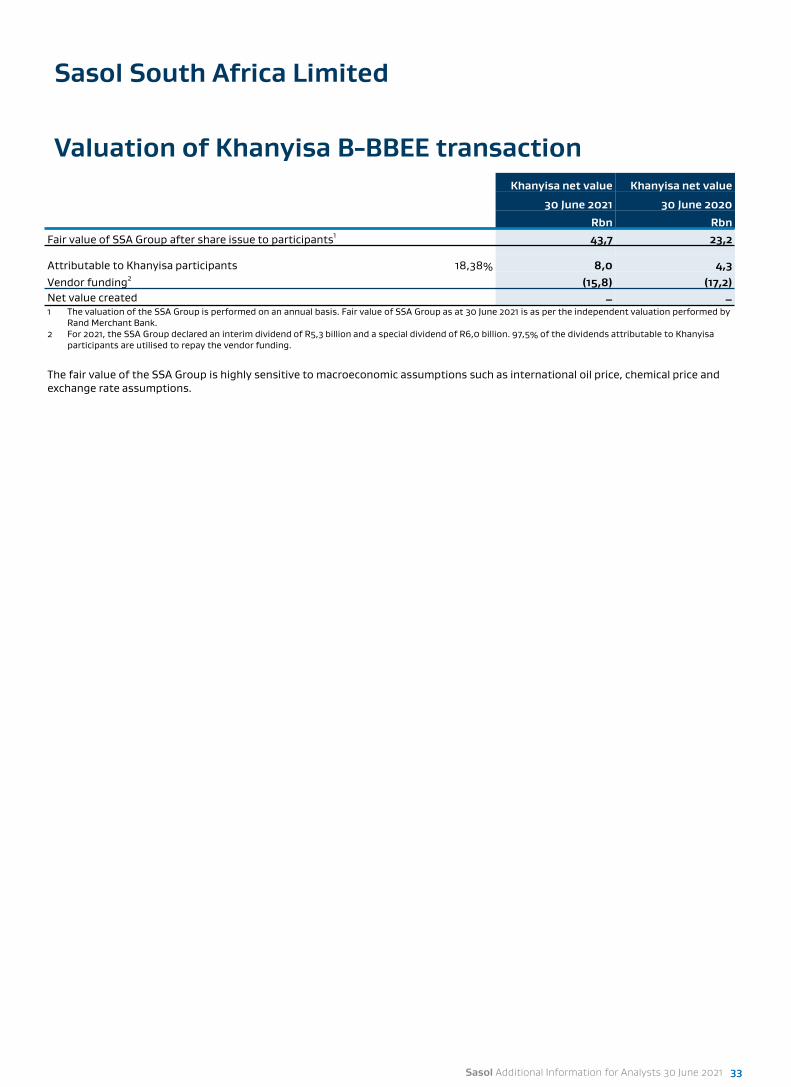
Sasol South Africa Limited
Khanyisa net value Khanyisa net value
30 June 2021 30 June 2020Rbn Rbn
Fair value of SSA Group after share issue to participants1 43,7 23,2
Attributable to Khanyisa participants 18,38% 8,0 4,3Vendor funding2 (15,8) (17,2)Net value created 111 – –1 The valuation of the SSA Group is performed on an annual basis. Fair value of SSA Group as at 30 June 2021 is as per the independent valuation performed by
Rand Merchant Bank.2 For 2021, the SSA Group declared an interim dividend of R5,3 billion and a special dividend of R6,0 billion. 97,5% of the dividends attributable to Khanyisa
participants are utilised to repay the vendor funding.
The fair value of the SSA Group is highly sensitive to macroeconomic assumptions such as international oil price, chemical price and exchange rate assumptions.
Valuation of Khanyisa B-BBEE transaction
Sasol Additional Information for Analysts 30 June 2021 33
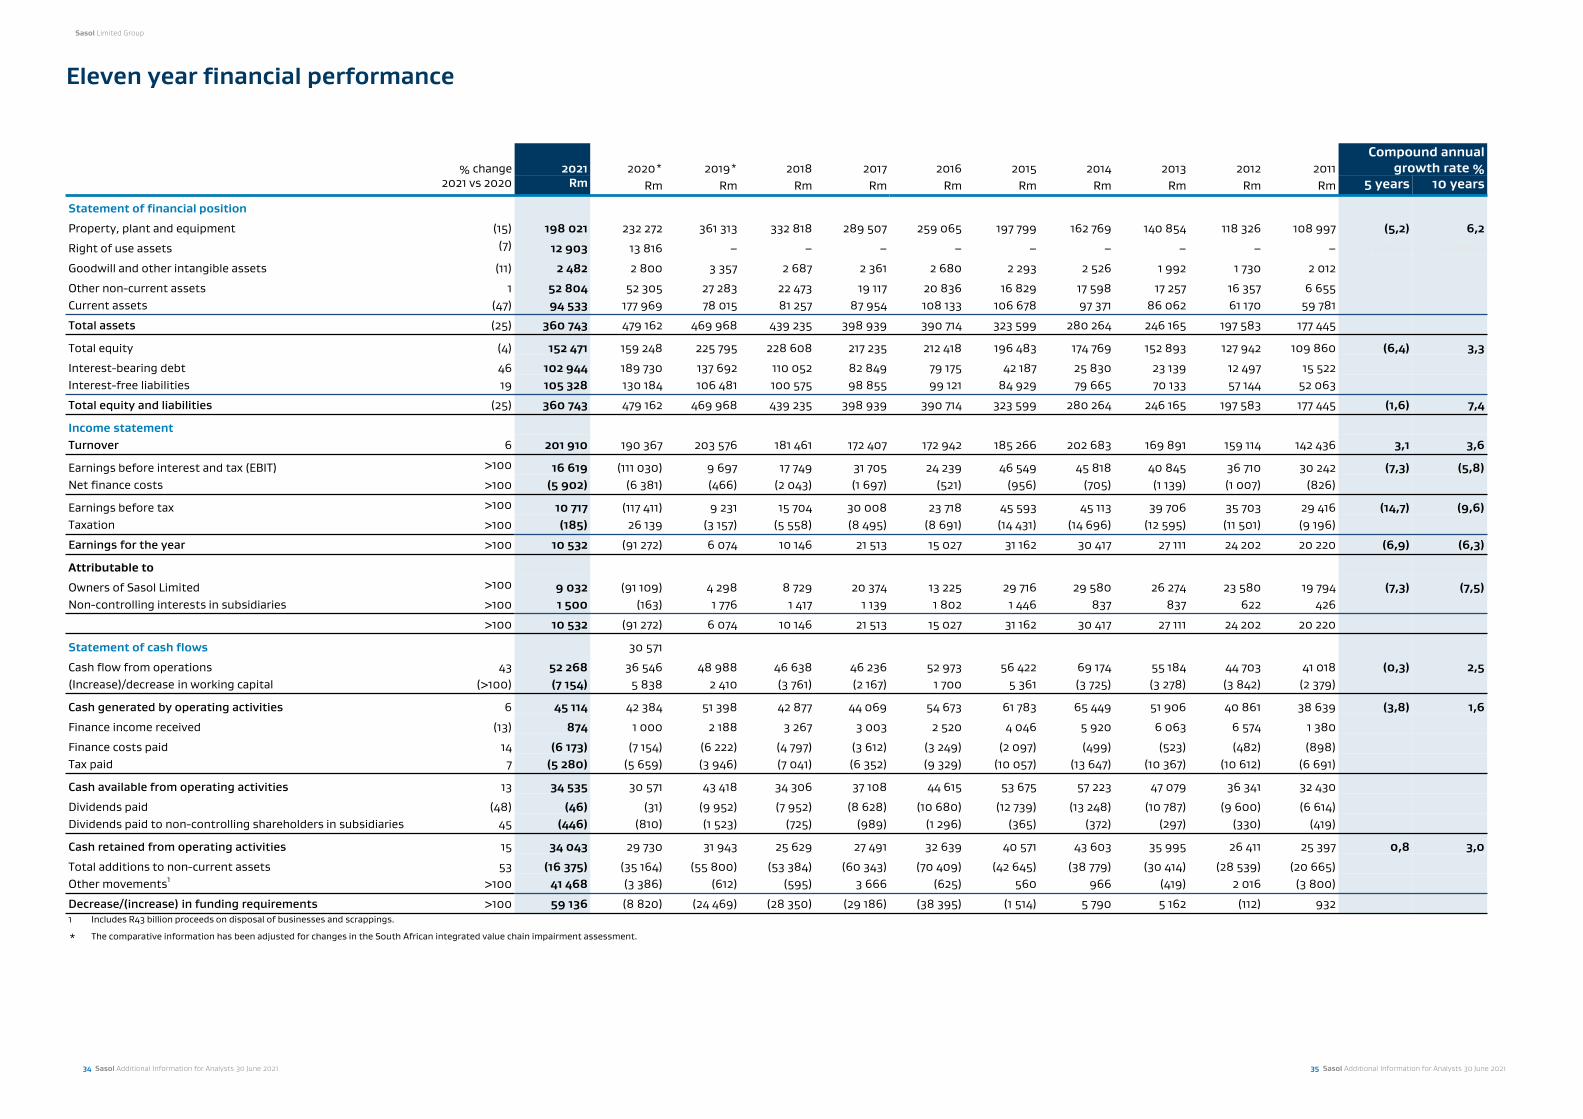
Eleven year financial performance
% change 2021 2020* 2019* 2018 2017 2016 2015 2014 2013 2012 2011Compound annual
growth rate %2021 vs 2020 Rm Rm Rm Rm Rm Rm Rm Rm Rm Rm Rm 5 years 10 years
Statement of financial position
Property, plant and equipment (15) 198 021 232 272 361 313 332 818 289 507 259 065 197 799 162 769 140 854 118 326 108 997 (5,2) 6,2
Right of use assets (7) 12 903 13 816 – – – – – – – – – 1 000,0 1 000,0
Goodwill and other intangible assets (11) 2 482 2 800 3 357 2 687 2 361 2 680 2 293 2 526 1 992 1 730 2 012
Other non-current assets 1 52 804 52 305 27 283 22 473 19 117 20 836 16 829 17 598 17 257 16 357 6 655Current assets (47) 94 533 177 969 78 015 81 257 87 954 108 133 106 678 97 371 86 062 61 170 59 781
Total assets (25) 360 743 479 162 469 968 439 235 398 939 390 714 323 599 280 264 246 165 197 583 177 445
Total equity (4) 152 471 159 248 225 795 228 608 217 235 212 418 196 483 174 769 152 893 127 942 109 860 (6,4) 3,3
Interest-bearing debt 46 102 944 189 730 137 692 110 052 82 849 79 175 42 187 25 830 23 139 12 497 15 522Interest-free liabilities 19 105 328 130 184 106 481 100 575 98 855 99 121 84 929 79 665 70 133 57 144 52 063
Total equity and liabilities (25) 360 743 479 162 469 968 439 235 398 939 390 714 323 599 280 264 246 165 197 583 177 445 (1,6) 7,4
Income statementTurnover 6 201 910 190 367 203 576 181 461 172 407 172 942 185 266 202 683 169 891 159 114 142 436 3,1 3,6
Earnings before interest and tax (EBIT) >100 16 619 (111 030) 9 697 17 749 31 705 24 239 46 549 45 818 40 845 36 710 30 242 (7,3) (5,8)Net finance costs >100 (5 902) (6 381) (466) (2 043) (1 697) (521) (956) (705) (1 139) (1 007) (826)
Earnings before tax >100 10 717 (117 411) 9 231 15 704 30 008 23 718 45 593 45 113 39 706 35 703 29 416 (14,7) (9,6)Taxation >100 (185) 26 139 (3 157) (5 558) (8 495) (8 691) (14 431) (14 696) (12 595) (11 501) (9 196)
Earnings for the year >100 10 532 (91 272) 6 074 10 146 21 513 15 027 31 162 30 417 27 111 24 202 20 220 (6,9) (6,3)
Attributable to
Owners of Sasol Limited >100 9 032 (91 109) 4 298 8 729 20 374 13 225 29 716 29 580 26 274 23 580 19 794 (7,3) (7,5)Non-controlling interests in subsidiaries >100 1 500 (163) 1 776 1 417 1 139 1 802 1 446 837 837 622 426
>100 10 532 (91 272) 6 074 10 146 21 513 15 027 31 162 30 417 27 111 24 202 20 220
Statement of cash flows 30 571
Cash flow from operations 43 52 268 36 546 48 988 46 638 46 236 52 973 56 422 69 174 55 184 44 703 41 018 (0,3) 2,5(Increase)/decrease in working capital (>100) (7 154) 5 838 2 410 (3 761) (2 167) 1 700 5 361 (3 725) (3 278) (3 842) (2 379)
Cash generated by operating activities 6 45 114 42 384 51 398 42 877 44 069 54 673 61 783 65 449 51 906 40 861 38 639 (3,8) 1,6
Finance income received (13) 874 1 000 2 188 3 267 3 003 2 520 4 046 5 920 6 063 6 574 1 380
Finance costs paid 14 (6 173) (7 154) (6 222) (4 797) (3 612) (3 249) (2 097) (499) (523) (482) (898)Tax paid 7 (5 280) (5 659) (3 946) (7 041) (6 352) (9 329) (10 057) (13 647) (10 367) (10 612) (6 691)
Cash available from operating activities 13 34 535 30 571 43 418 34 306 37 108 44 615 53 675 57 223 47 079 36 341 32 430
Dividends paid (48) (46) (31) (9 952) (7 952) (8 628) (10 680) (12 739) (13 248) (10 787) (9 600) (6 614)Dividends paid to non-controlling shareholders in subsidiaries 45 (446) (810) (1 523) (725) (989) (1 296) (365) (372) (297) (330) (419)
Cash retained from operating activities 15 34 043 29 730 31 943 25 629 27 491 32 639 40 571 43 603 35 995 26 411 25 397 0,8 3,0
Total additions to non-current assets 53 (16 375) (35 164) (55 800) (53 384) (60 343) (70 409) (42 645) (38 779) (30 414) (28 539) (20 665)Other movements1 >100 41 468 (3 386) (612) (595) 3 666 (625) 560 966 (419) 2 016 (3 800)
Decrease/(increase) in funding requirements >100 59 136 (8 820) (24 469) (28 350) (29 186) (38 395) (1 514) 5 790 5 162 (112) 9321 Includes R43 billion proceeds on disposal of businesses and scrappings.
* The comparative information has been adjusted for changes in the South African integrated value chain impairment assessment.
Sasol Limited Group
34 Sasol Additional Information for Analysts 30 June 2021 35 Sasol Additional Information for Analysts 30 June 2021
Abbreviations
m bbl - thousand barrels Rbn - Rand billions
mm bbl - million barrels Rm - Rand millions
mm tons - million tons R/ton - rand per ton
bscf - billion standard cubic feet R/US$ - Rand/US dollar currency
EUR/ton - Euro per ton US$bn - US dollar billions
US$/bbl - US dollar per barrel US$m - US dollar millions
US$/ton - US dollar per ton m³/h - cubic meter per hour
US$ c/gal - US dollar cent per gallon MW - Megawatt
t/cm/s - tons per continuous miner per shift BOE - barrels of oil equivalent
kt - thousand tons BPD - barrels per day
Definitions1111
Adjusted EBITDA - Adjusted EBITDA is calculated by adjusting EBIT for depreciation, amortisation, share-based payments, remeasurement items, change in discount rates of our rehabilitation provisions, all unrealised translation gains and losses and all unrealised gains and losses on our derivatives and hedging activities.1111
Normalised EBIT - Normalised EBIT represents reported EBIT adjusted for remeasurement items, earnings/losses of significant capital projects (exceeding R4 billion) which have reached beneficial operation and are still ramping up, all translation gains and losses, and all gains and losses on our derivatives and hedging activities (realised and unrealised).1111
Core HEPS - Core HEPS is calculated by adjusting headline earnings with non-recurring items, earnings losses of significant capital projects (exceeding R4 billion) which have reached beneficial operation and are still ramping up, all translation gains and losses (realised and unrealised), all gains and losses on our derivatives and hedging activities (realised and unrealised), and share-based payments on implementation of Broad-Based Black Economic Empowerment (BBBEE) transactions
Sasol Limited Group
36 Sasol Additional Information for Analysts 30 June 2021
Disclaimer - Forward-looking statements
Sasol may, in this document, make certain statements that are not historical facts and relate to analyses and other information which are based on forecasts of future results and estimates of amounts not yet determinable. These statements may also relate to our future prospects, expectations, developments and business strategies. Examples of such forward-looking statements include, but are not limited to, the impact of the novel coronavirus (COVID-19) pandemic on Sasol’s business, results of operations, financial condition and liquidity and statements regarding the effectiveness of any actions taken by Sasol to address or limit any impact of COVID-19 on its business; statements regarding exchange rate fluctuations, changing crude oil prices, volume growth, changes in demand for Sasol’s products, increases in market share, total shareholder return, executing our growth projects, oil and gas reserves, cost reductions, legislative, regulatory and fiscal development, our climate change strategy and business performance outlook. Words such as “believe”, “anticipate”, “expect”, “intend", “seek”, “will”, “plan”, “could”, “may”, “endeavour”, “target”, “forecast” and “project” and similar expressions are intended to identify such forward-looking statements, but are not the exclusive means of identifying such statements. By their very nature, forward-looking statements involve inherent risks and uncertainties, both general and specific, and there are risks that the predictions, forecasts, projections and other forward-looking statements will not be achieved. If one or more of these risks materialise, or should underlying assumptions prove incorrect, our actual results may differ materially from those anticipated. You should understand that a number of important factors could cause actual results to differ materially from the plans, objectives, expectations, estimates and intentions expressed in such forward-looking statements. These factors and others are discussed more fully in our most recent annual report on Form 20-F filed on 24 August 2020 and in other filings with the United States Securities and Exchange Commission. The list of factors discussed therein is not exhaustive; when relying on forward-looking statements to make investment decisions, you should carefully consider both these factors and other uncertainties and events. Forward-looking statements apply only as of the date on which they are made, and we do not undertake any obligation to update or revise any of them, whether as a result of new information, future events or otherwise.
Disclaimer – photographyPhotographs used in this report have been sourced from our photographic library and were taken before the COVID-19 outbreak. Some of these photographs do not reflect the social distancing and protocols approved by the World Health Organisation (WHO) such as wearing of masks in public places. All initiatives and related photographs done during the pandemic were carried out in line with country-specific requirements.
Comprehensive additional information is available on our website: www.sasol.com
Sasol Additional Information for Analysts 30 June 2021 37