information content of equity analyst reports
TRANSCRIPT

ARTICLE IN PRESS
Journal of Financial Economics 75 (2005) 245–282
0304-405X/$
doi:10.1016/j
$We than
Beverly Walt
State, The Co
comments an
Rossana Ivan�CorrespoE-mail ad
www.elsevier.com/locate/econbase
Information content of equity analyst reports$
Paul Asquitha, Michael B. Mikhailb,�, Andrea S. Auc
aSloan School of Management, Massachusetts Institute of Technology, Cambridge, MA, 02142, USAbFuqua School of Business, Duke University, Durham, NC, 27708, USA
cState Street Global Advisors, Boston, MA, 02111, USA
Received 13 September 2002; accepted 14 January 2004
Available online 25 August 2004
Abstract
We catalog the complete contents of Institutional Investor All-American analyst reports and
examine the market reaction to their release. Including the justifications supporting an
analyst’s opinion reduces, and in some models eliminates, the significance of earnings forecasts
and recommendation revisions. Analysts both provide new information and interpret
previously released information. The information in a report is most important for
downgrades; target prices and the analyst’s justifications are the only significant elements
for reiterations. No correlation exists between valuation methodology and either analyst
accuracy or the market’s reaction to a report. Our adjusted R2s are much larger than those of
studies using only summary measures.
r 2004 Elsevier B.V. All rights reserved.
JEL classification: G11; G14; G24; M41
Keywords: Stock recommendations; Price targets; Earnings forecasts; Security analysts
- see front matter r 2004 Elsevier B.V. All rights reserved.
.jfineco.2004.01.002
k Jennifer Francis, S.P. Kothari, Grace Pownall, Jay Ritter, Philip Stocken, Wanda Wallace,
her, Richard Willis, the referee for this journal, and workshop participants at MIT, Penn
llege of William and Mary, Wharton, SESARC, and the AAA Annual Meeting for helpful
d suggestions. We also acknowledge the research assistance of Jeff Braun, Kevin Kadakia,
ova, and Xin Wang.
nding author. Tel.: +1-919-660-2900; fax: +1-919-660-8038.
dress: [email protected] (M.B. Mikhail).

ARTICLE IN PRESS
P. Asquith et al. / Journal of Financial Economics 75 (2005) 245–282246
1. Introduction
This paper investigates the association between market returns and the content ofsecurity analyst reports. It also provides the first detailed catalog of the elements in atypical analyst report. An analyst report is the culmination of a process that includesthe collection, evaluation, and dissemination of information related to a firm’s futureperformance. The majority of these reports include three key summary measures: anearnings forecast, a stock recommendation—such as buy, sell, or hold—and a pricetarget. In addition, these reports frequently present extensive quantitative andqualitative analysis supporting the summary measures.Most previous research on analyst reports examines revisions in only two of the
summary elements: stock recommendations and earnings forecasts. We extend thisresearch by incorporating the contents of analyst reports in their entirety rather thanjust the individual summary elements such as the stock recommendation. Oneproblem in evaluating stock recommendations in isolation is that there are a limitednumber of recommendation levels. More specifically, although analysts have fivedistinct recommendations—strong buy, buy, hold, sell, and strong sell—at theirdisposal, they are generally reluctant to use the two negative ratings (see, e.g., Barberet al., 2001; Mikhail et al., 2004).1 By incorporating gradations in the analysts’ pricetargets and the reports’ contents, we overcome many of the disadvantages of limited,discrete recommendation categories. Our approach to this analysis is captured by thefollowing observation: ‘‘In the end, stock ratings and target prices are just the skinand bones of analysts’ research. The meat of such reports is in the analysis, detail,and tone’’ (‘‘When a stock’s rating and target collide’’, Business Week Online, April25, 2002). This is especially true for recommendation reiterations, which representalmost two-thirds of the analyst reports in our sample.Using a database constructed from analyst reports issued by Institutional Investor
All-American team members during 1997–1999, we find that changes in summaryearnings forecasts, stock recommendations, and price targets all provide independentinformation to the capital markets. In particular, incorporating changes in analystprice targets dramatically increases the fit of our regression results over that obtainedfrom earnings forecast revisions and discrete recommendations alone. We then showthat other information in a report, such as the strength of the written argumentsmade to support an analyst’s opinion, is also significant. The stronger thejustifications provided in the report, the stronger the market’s reaction to thereport. This holds for aggregate strength-of-argument measures and for severalalternatives, including independent measures of positive and negative arguments aswell as many disaggregated justifications. When analyst justifications are included,the market still reacts strongly to changes in price targets, but the significance of
1An often-cited rationale for the lack of negative ratings is that an analyst’s salary and bonus are linked
to quantifiable measures such as underwriting fees or commissions generated by his or her
recommendations, outcomes that might be facilitated by the issuance of favorable reports. In addition,
analysts rely on company management for information and thus have a reason to maintain good
relationships with them. SEC Regulation FD, which requires firms to publicly disseminate all material
information, presumably reduces this incentive.
ARTICLE IN PRESS
P. Asquith et al. / Journal of Financial Economics 75 (2005) 245–282 247
earnings forecast and recommendation revisions is reduced and, in some models,eliminated.After analyzing all the elements of an analyst report (i.e., earnings forecast, analyst
recommendation, price target, and the justifications given), we examine whether themarket’s reaction is affected by variations in firm-specific characteristics, the releaseof contemporaneous information, or recommendation type (e.g., upgrade, reitera-tion, or downgrade). Consistent with other studies, the market’s reaction to earningsrevisions and recommendation downgrades, when considered separately, issignificantly greater for small firms and for firms with a smaller analyst following.We find a similar result for price target revisions. However, when all three summarymeasures and a proxy for the strength of an analyst’s justifications are includedsimultaneously, only the reaction to price target revisions is significantly affected bythese factors.To examine if an analyst report provides new information to the market or
whether it merely reiterates or interprets information previously released, we identifyany contemporaneous release of information concerning earnings, dividend changes,stock splits, changes in business expectations, equity issues, debt issues, mergers anddivestitures, major management changes, credit rating changes, lawsuits, andsignificant new contracts and/or product introductions. Approximately half of theanalyst reports in our sample occur simultaneously with these other informationreleases. When we reestimate our regressions on the subsample of observations thatare free of confounding events, all our results are qualitatively similar. When we runthe regressions on the subsample of firms with contemporaneous informationreleases, the only significant coefficients are the proxy for the strength of an analyst’sarguments and the price target revisions. This suggests that for these reports, theanalyst’s role is to provide an interpretation of information releases to the market.Our analysis also shows that the market treats an analyst report differently based
on whether a report reiterates an old recommendation or represents an upgrade ordowngrade. We find that the contents of an analyst report receive the most scrutinyin the case of downgrades. Both the changes in a firm’s price target and the strengthof a report’s arguments are significant and positively correlated with the market’sresponse. Conversely, the proxy for a relationship between a brokerage and the firmis significantly negative. This last result suggests that the market amplifies bad newswhen the brokerage is not independent of the firm. In the case of reiterations, theonly significant coefficients are the strength of an analyst’s arguments and the pricetarget changes. None of the examined factors are significant in the directionpredicted for upgrades.Finally, we examine the accuracy of price targets and the effects of the valuation
methodology employed by an analyst. We consider a price target prediction to beaccurate if the analyzed firm’s stock price equals the 12-month projected price at anytime during the year following the release of a report. Using this definition ofaccuracy, approximately 54% of analysts’ price targets are achieved or exceeded.The remaining 46% of firms achieve an average of 84% of the price target within 12months. The level of optimism exhibited by an analyst, as measured by the projectedchange in a firm’s stock price, appears to be inversely related to the probability of

ARTICLE IN PRESS
P. Asquith et al. / Journal of Financial Economics 75 (2005) 245–282248
achieving a particular target. We find no correlation between the valuationmethodology used by analysts and either the market’s reaction to a report’s releaseor to their accuracy in predicting price targets. In fact, most analysts use a simpleearnings multiple valuation model. Only a minority use net present value or any ofthe other discounted cash flow approaches favored by finance textbooks and MBAcurriculums.In Section 2 we summarize prior research. Section 3 describes the data and sample
selection criteria as well as a typical analyst report. We discuss our empirical resultsin Section 4. Sections 5 and 6 provide results on price target accuracy and valuationmethodologies. Section 7 concludes.
2. Prior research
Over the past two decades, security analyst reports have been the subject ofextensive empirical and experimental work. Early investigations are primarily relatedto the market’s reaction to revisions in either analysts’ earnings forecasts orrecommendations. Most of this work shows positive (negative) abnormal returns forupward (downward) earnings forecast revisions or new buy (sell) recommendations.For example, Abdel-khalik and Ajinkya (1982) find significant abnormal returnsduring the publication week of forecast revisions by Merrill Lynch analysts.Similarly, Lys and Sohn (1990) present evidence consistent with forecast revisionshaving information content (see also Stickel, 1991).Research on revisions in analyst recommendations has also found a positive
association between abnormal returns and the direction of a recommendationchange. Lloyd-Davies and Canes (1978) indirectly examine the market reaction tosecurity analyst recommendations by studying stock suggestions appearing in theWall Street Journal’s ‘‘Heard on the Street’’ column. They find an event-day returnof 0.93% (�2.37%) for new buy (sell) recommendations (see also Bjerring et al.,1983; Elton et al., 1986; Liu et al., 1990; Beneish, 1991; Stickel, 1995). More recently,Womack (1996) uses First Call data to directly examine price reactions for stockrecommendation changes to and from the most extreme buy and sell categories. Hefinds that stocks added to (removed from) strong buy lists earned size-adjustedreturns of 2.98% (�1.94%) while stocks added to (removed from) strong sell listsearned size-adjusted returns of �4.69% (0.32%) in the three-day event periodsurrounding the release of the recommendation revision. In most of these studies,reiterations of a previous forecast or recommendation are ignored. In our paper, byexamining the content of an analyst report beyond the summary recommendation,we are able to draw conclusions about reiterations as well as revisions.Our work is also related to more recent research investigating security returns
conditional on examining both earnings forecast and recommendation revisionssimultaneously. For example, Francis and Soffer (1997) find that neither earningsforecast revisions nor stock recommendations completely incorporate theinformation in the other signal. They also show that when a report is summarizedby a favorable stock recommendation, investors rely on earnings forecast revisions

ARTICLE IN PRESS
P. Asquith et al. / Journal of Financial Economics 75 (2005) 245–282 249
to a greater extent. Stickel (1995), in addition to the summary recommendation andearnings forecast revisions, includes proxies for the magnitude of the recommenda-tion revision, the analyst’s reputation, the size of the analyst’s brokerage house, andthe analyzed firm’s information environment. His results are consistent with those ofFrancis and Soffer indicating that earnings forecast revisions are informative even inthe presence of a summary recommendation. He also finds that company size andanalyst reputation affect returns for buy recommendations, while the magnitude ofthe recommendation revision and brokerage size affect returns for sell recommenda-tions. Although the Francis and Soffer and Stickel studies include a broad cross-section of potential factors that contribute to the market’s reaction to a newrecommendation, they do not consider price targets or the content of the reports,and the adjusted R
2
s for their models are low. The adjusted R2
for Stickel’s study is1% for his buy regression and 2% for his sell regression, suggesting that importantpieces of the puzzle are missing. Francis and Soffer get an adjusted R
2
of 5% for theircross-sectional model.Our research on analyst reports is contemporaneous with recent research
incorporating price targets as a source of information. Bradshaw (2002) documents,using a sample of 103 analyst reports, that target prices are reported more frequentlyin favorable reports. Bradshaw and Brown (2002), using a large sample of firms, findthat price targets are realized a majority of the time and that individual analystsdiffer in their accuracy. Brav and Lehavy (2003) reexamine Francis and Soffer’squestion of simultaneous information by adding price targets to earnings forecastsand recommendation levels. Using a large database of price targets, they find asignificant market reaction to price targets both unconditionally and conditional onsimultaneous recommendation and earnings forecast revisions. They then regress thethree variables on the market’s reaction and find adjusted R
2
s of almost 8%, wellabove the 5% found by Francis and Soffer.Finally, our work is related to Previts et al. (1994) and Hirst et al. (1995), who
consider the written content of a report. Previts et al. use word recognition softwareto examine the terminology used in analyst reports, but do not perform anystatistical analysis on either the content of the reports or the market’s reaction to thereports. Hirst et al. use an experimental setting to investigate how potential investorsassess the information contained in security analyst reports. They assume two levelsof strength of argument (strong or weak), two levels of recommendation (favorableor unfavorable), and two sources of the report (independent brokerage oranalyzed firm’s investment bank). They find that when a report is unfavorable, thestrength of the arguments contained in an analyst report affects investors’judgments. This result conflicts with Francis and Soffer (1997) who find thatinvestors are more likely to rely on other information in cases of good news reports.Furthermore, Hirst et al. report that experimental investors react more strongly tonegative reports from analysts who lack independence. The effects associated with alack of independence are similar to those found by Michaely and Womack (1999),who document that the mean excess returns around a buy recommendation revisionare lower when the recommendation is made by an underwriter rather than by anunaffiliated brokerage.
ARTICLE IN PRESS
P. Asquith et al. / Journal of Financial Economics 75 (2005) 245–282250
This paper differs from other recent work, such as Brav and Lehavy (2003) andBradshaw (2002), in that we examine the complete text of a large sample of actualanalyst reports and our analysis provides information beyond earnings forecasts,recommendations, and price targets. We demonstrate that other information, suchas the strength of the analyst’s justifications, is also important and whenincorporated in our analysis reduces, and in some models eliminates, the significanceof the information available in earnings forecasts and recommendation revisions. Bycontrolling for the simultaneous release of other information, we show that analystreports do not merely repeat other corporate releases of information, but alsoprovide new and independent analysis to the market. By examining whether themarket’s reaction differs by report type (i.e., upgrade, reiteration, or downgrade), wedemonstrate that information in a report is more important for downgrades than forupgrades. Furthermore, the only elements that matter for reiterations are targetprices and the strength of the accompanying arguments. Finally, our R2 of nearly26% is three or four times larger than that of other studies that use only partialcontent from analyst reports.
3. Sample selection and data description
3.1. Sample selection
Our analysis uses a total of 1,126 complete analyst reports written by 56 differentsell-side analysts from 11 different investment banks covering 46 industries asprovided by the Investext database. Investext features current research reports frommore than 630 investment banks, brokerage houses, and research firms worldwide,including, but not limited to, Credit Suisse First Boston, Lehman Brothers, MerrillLynch, Morgan Stanley Dean Witter, and Salomon Smith Barney. Each report wasread in its entirety and coded by hand for 30 separate data fields.There are a number of financial databases that catalog and summarize earnings
forecasts and analyst recommendations (e.g., Zacks Investment Research and I/B/E/S). To the best of our knowledge, however, there are currently no databases thatprovide similarly compiled information that includes analyst price targets and otherinformation typically found in an analyst report, such as valuation methodologies orjustifications for recommendations. The only way to collect this information is toread individual analyst reports and hand code the contents. To generate our sample,we select equity analyst reports that were written in 1997, 1998, or 1999 by a memberof Institutional Investor’s All-American Research Team. To qualify for inclusion inthe sample, an analyst must have achieved at least one ‘‘First Team’’ ranking. Wechoose these analysts because they have been independently recognized as topanalysts in their given industries. Furthermore, prior research finds thatAll-American Research Team members supply more accurate earnings forecaststhan other analysts (e.g., Stickel, 1992) and their recommendation revisionsresult in a stronger stock market reaction than that observed for a typical analyst(see Stickel, 1995).

ARTICLE IN PRESS
P. Asquith et al. / Journal of Financial Economics 75 (2005) 245–282 251
During our sample period, the number of analysts receiving top honors in theInstitutional Investor survey each year ranges from 76 to 84. However, since manyanalysts are multiple-year winners, only 153 unique analysts are represented in oursample. In addition to being written by a recent All-American Research Teammember, the report must also be available through both the Zacks InvestmentResearch (Zacks) and Investext Databases. When we began our initial analysis,Investext did not allow users to search reports by analyst. As a result, we used Zacksto generate a list of reports written by our sample of analysts. (Investext has sincereleased a newer version that provides more search options including a category forreport author.) Zacks identifies approximately 7,100 reports that meet our year andanalyst criteria. These analyst reports consist of both company and industry reports.All of these analyst reports are then cross-referenced in the Investext database usingcompany and brokerage identifiers as well as report dates obtained from Zacks. Weomit industry reports from our sample since they do not usually contain newcompany-specific information but rather serve as a summary across firms. Ananalyst who reports new information about a company and/or changes recommen-dations in an industry report usually issues a concurrent company report as well.In our matching, 21 analysts could not be included in our sample because the
investment firms that employ them do not provide reports to Investext (e.g.,Goldman Sachs). We realize that this introduces a potential bias into our sample, asonly firms willing to make their reports publicly available are included within oursample. Moreover, five of the 99 industries for which Institutional Investor issues aranking (Accounting and Tax Policy, Convertibles, Equity Derivatives, Multi-Industry, and Quantitative Research) do not require that analysts follow anyspecifically identified firms. We exclude these categories, which represent sevenadditional analysts, from our sample. In total, we omit 28 analysts from our All-American Research Team sample, leaving 125 different analysts.Unfortunately, the Investext database is less complete than Zacks and we are only
able to find a subset of the Zacks reports.2 More specifically, Investext contains feweranalysts and does not contain as many reports by the analysts it lists. Of the analystreports listed in Zacks, the percentages found in Investext are less than 13.1%,12.4%, and 50.3% in 1997, 1998, and 1999, respectively. Our final sample includes1,126 reports consisting of 262 upgrades, 739 reiterations, and 125 downgrades,written by 56 analysts.Having identified our sample, the next challenge is to determine the correct
announcement date for each report. Firms often release key information containedin the analyst report before the actual report is dated and made available. As aconsequence, the announcement dates given by many analyst databases, includingZacks, often differ from the date given on the report. In our sample, 58.6% of allreport dates matched the announcement date exactly, leaving 41.4% of the analyst
2Zacks also appears to be incomplete. Investext contains some reports by particular analysts that were
not identified in our search of Zacks. In both Investext and Zacks, coverage significantly improves in the
latter part of our sample period.
ARTIC
LEIN
PRES
S
Table 1
Strong buy Buy Hold Sell S_Sell All Total
Up Reit Up Reit Down Up Reit Down Reit Down Down Up Reit Down Sample
Panel A: Security analyst report descriptive statisticsNumber of reports 149 198 111 296 43 2 244 77 1 3 2 262 739 125 1126% of sample 13.2 17.6 9.9 26.3 3.8 0.2 21.7 6.8 0.0 0.3 0.2 23.3 65.5 11.1 100.0Earnings forecast1 year 97.3 100.0 99.1 99.0 97.7 100.0 99.6 98.7 100.0 100.0 100.0 98.1 99.5 98.4 99.1Multiple years 95.3 96.5 95.5 95.6 93.0 100.0 95.9 89.6 100.0 100.0 100.0 95.4 95.9 91.2 95.3Price targetsTarget reported 94.0 94.4 98.2 91.2 95.3 100.0 11.1 50.6 100.0 0.0 100.0 95.8 65.5 65.6 72.6Point estimate provided 88.6 95.7 90.7 97.4 80.5 100.0 96.3 92.3 100.0 NA 50.0 89.2 96.9 85.4 93.8Projected increase 34.6 44.0 22.6 34.3 21.0 –17.5 8.6 5.5 –9.6 NA –19.0 28.9 36.6 19.1 32.9ForecastsIncome statement 55.6 24.7 35.1 13.5 39.5 0.0 24.6 39.0 0.0 33.3 100.0 46.6 20.1 40.0 28.5Balance sheet 12.1 3.5 9.0 2.7 2.3 0.0 2.0 10.3 0.0 33.3 0.0 10.7 2.7 8.0 5.1Cash flow statement 30.9 14.6 27.9 9.8 20.9 0.0 8.6 33.8 0.0 0.0 100.0 29.4 10.7 29.6 17.1Segment dataGeographic 4.7 3.5 3.6 6.1 0.0 0.0 1.2 2.6 0.0 0.0 0.0 4.2 3.8 1.6 3.6Product 4.0 2.0 6.6 4.7 4.7 0.0 4.5 3.9 0.0 0.0 0.0 5.0 3.9 4.0 4.2Division 9.4 13.6 12.6 9.5 14.0 0.0 7.8 6.5 0.0 0.0 0.0 10.7 10.0 8.8 10.0AffiliationUnderwriter 60.8 64.6 44.1 53.7 60.5 0.0 43.4 39.0 100.0 66.7 0.0 53.3 53.4 46.4 52.6Holdings 63.5 88.4 74.8 91.9 81.4 50.0 99.6 51.9 0.0 66.7 100.0 68.2 93.4 63.2 84.2Valuation modelsEarnings multiples 99.3 99.5 99.1 98.0 100.0 100.0 100.0 100.0 0.0 100.0 100.0 99.2 98.9 100.0 99.1DCF variations 16.8 13.1 9.9 9.5 14.0 0.0 11.5 26.0 0.0 0.0 0.0 13.7 11.1 20.8 12.8Asset multiples 23.5 22.7 22.5 26.3 14.0 0.0 32.8 14.3 0.0 33.3 50.0 22.9 27.6 15.2 25.1Other 3.4 6.6 2.7 3.7 2.3 0.0 1.2 5.2 0.0 0.0 0.0 3.1 3.6 4.0 3.5Average number pages 9.5 5.7 9.0 5.3 5.9 2.0 4.5 7.5 1.0 6.7 11.5 9.3 5.1 7.0 6.3
Panel B: Security analyst report descriptive statisticsa
Recommendation basisRevenues (Inc) 39.6 46.0 36.9 64.5 11.6 0.0 6.6 13.0 100.0 0.0 0.0 38.2 40.4 12.0 36.7Revenues (Dec) 0.0 1.5 3.6 1.4 9.3 0.0 4.5 40.3 0.0 0.0 0.0 1.5 2.4 28.0 5.0Earnings (Inc) 62.4 42.9 54.1 24.3 23.3 0.0 5.3 9.1 0.0 0.0 0.0 58.4 23.0 13.6 30.2Earnings (Dec) 0.0 0.0 3.6 5.1 23.3 0.0 6.6 19.5 0.0 100.0 0.0 1.5 4.2 22.4 5.6Product intro (Pos) 26.2 17.2 18.0 20.9 7.0 0.0 8.6 3.9 0.0 0.0 0.0 22.5 15.8 4.8 16.1Product intro (Neg) 0.0 0.5 0.9 1.4 2.3 0.0 0.0 3.9 0.0 0.0 0.0 0.4 0.7 3.2 0.9
P.
Asq
uith
eta
l./
Jo
urn
al
of
Fin
an
cial
Eco
no
mics
75
(2
00
5)
24
5–
28
2252

ARTIC
LEIN
PRES
S
New projects (Pos) 13.4 9.6 8.1 12.8 7.0 0.0 10.7 10.4 0.0 0.0 0.0 11.1 11.4 8.8 11.0New projects (Neg) 0.0 0.0 0.9 1.0 2.3 0.0 1.2 2.6 0.0 0.0 0.0 0.4 0.8 2.4 0.9Cost efficiencies 39.6 21.2 24.3 15.2 11.6 50.0 19.7 13.0 0.0 0.0 50.0 33.2 18.5 12.8 21.3Cost inefficiencies 2.0 7.6 10.8 18.9 11.6 0.0 12.7 19.5 0.0 33.3 0.0 5.7 13.8 16.8 12.2Expectations met 37.6 29.3 10.8 33.1 30.2 0.0 37.3 31.2 0.0 0.0 100.0 26.0 33.5 31.2 31.5Expectations not met 9.4 7.1 29.7 7.8 18.6 0.0 11.9 19.5 0.0 66.7 0.0 17.9 8.9 20.0 12.2M&A activity (Pos) 28.9 10.6 21.6 13.5 18.6 0.0 6.6 9.1 0.0 0.0 0.0 25.6 10.4 12.0 14.1M&A activity (Neg) 0.0 0.5 1.8 0.3 2.3 0.0 2.5 7.8 0.0 0.0 0.0 0.8 1.1 5.6 1.5Repurchases (Pos) 17.4 7.1 14.4 9.1 7.0 50.0 17.6 14.3 0.0 0.0 0.0 16.4 11.4 11.2 12.5Repurchases (Neg) 0.0 0.0 0.9 0.3 0.0 0.0 0.0 3.9 0.0 0.0 0.0 0.4 0.1 2.4 0.4Industry climate (Pos) 24.2 12.1 18.9 11.1 9.3 50.0 4.5 3.9 0.0 0.0 0.0 22.1 9.2 5.6 11.8Industry climate (Neg) 3.4 7.1 8.1 5.1 7.0 0.0 7.4 15.6 0.0 66.7 50.0 5.3 6.5 14.4 7.1Management (Pos) 37.6 15.7 25.2 27.4 7.0 50.0 4.1 22.1 0.0 0.0 50.0 32.4 16.6 16.8 20.3Management (Neg) 0.0 1.0 0.0 0.7 7.0 0.0 1.6 7.8 0.0 66.7 50.0 0.0 1.1 9.6 1.8International ops (Pos) 19.5 9.6 11.7 32.1 4.7 0.0 5.3 0.0 0.0 0.0 0.0 16.0 17.2 1.6 15.2International ops (Neg) 2.7 1.0 2.7 2.0 9.3 0.0 7.0 15.6 0.0 33.3 0.0 2.7 3.4 13.6 4.4Leverage (Pos) 11.4 4.0 4.5 7.4 7.0 0.0 2.5 3.9 0.0 0.0 0.0 8.4 4.9 4.8 5.7Leverage (Neg) 4.7 2.5 0.9 3.7 2.3 0.0 7.4 10.4 0.0 33.3 0.0 3.1 4.7 8.0 4.7Competition (Pos) 15.4 6.6 3.6 17.9 4.7 0.0 2.5 7.8 0.0 0.0 0.0 10.3 9.9 6.4 9.6Competition (Neg) 4.0 4.0 3.6 2.4 7.0 50.0 9.4 10.4 0.0 33.3 0.0 4.2 5.1 9.6 5.4Risk (Pos) 17.4 8.6 2.7 6.8 11.6 0.0 0.8 6.5 0.0 0.0 0.0 11.1 5.3 8.0 6.9Risk (Neg) 7.4 4.0 2.7 5.7 7.0 0.0 4.9 20.8 0.0 66.7 50.0 5.3 5.0 17.6 6.5
Panel C: Security analyst report descriptive statisticsModel variablesEARN_REV 4.1 –4.4 4.0 2.4 –7.3 0.0 –5.9 –4.5 2.5 –12.1 118.8 4.1 –2.1 –3.6 –1.0TGT_REV 13.8 1.0 5.5 2.7 –7.0 0.0 1.0 –7.5 0.0 NA –14.7 11.7 1.9 –7.3 2.8STR_ARG 3.6 2.1 1.8 2.4 0.5 1.5 0.5 –0.5 0.0 –5.0 0.5 2.8 1.7 –0.2 1.7UND_HLD 1.2 1.5 1.2 1.5 1.4 0.5 1.4 0.9 1.4 0.9 1.0 1.2 1.5 1.1 1.4CAR (%) 4.7 0.3 4.1 0.8 –7.0 10.0 –1.1 –6.4 2.2 –8.7 2.1 4.5 0.0 –6.6 0.3Firm–specific variablesSIZE 12.60 14.13 11.99 30.88 7.10 16.03 8.11 12.64 0.14 2.03 15.68 12.37 18.82 10.53 16.39ANALYSTS 9.81 12.78 9.61 11.75 9.58 7.50 9.22 10.34 2.00 5.67 12.50 9.71 11.18 10.00 10.71MKT_BK 2.44 2.56 2.38 3.03 1.67 2.13 1.72 1.75 1.15 0.79 1.54 2.44 2.33 1.67 2.27Information announcements (%)Earnings announcements 18.12 33.67 27.03 38.85 23.26 0.00 34.43 24.68 100.00 0.00 50.00 21.76 36.08 24.00 31.41Dividend changes 0.67 2.01 2.70 1.35 0.00 0.00 2.46 0.00 0.00 0.00 50.00 1.53 1.89 0.80 1.69Stock splits 0.00 1.01 0.00 0.68 0.00 0.00 0.00 0.00 0.00 0.00 50.00 0.00 0.54 0.80 0.44Changes in expectations 3.36 10.05 11.71 11.15 23.26 50.00 14.34 12.99 0.00 33.33 0.00 7.25 11.89 16.80 11.35Mergers & divestitures 10.74 11.06 8.11 10.81 6.98 50.00 8.20 11.69 0.00 0.00 0.00 9.92 10.00 9.60 9.94Lawsuits 2.68 3.02 0.90 5.74 2.33 0.00 1.23 0.00 0.00 33.33 0.00 1.91 3.51 1.60 2.92Debt rating changes 0.67 2.51 3.60 1.01 2.33 0.00 2.46 10.39 0.00 33.33 0.00 1.91 1.89 8.00 2.57Debt financing 3.36 2.51 0.90 1.35 0.00 0.00 1.64 0.00 0.00 33.33 0.00 2.29 1.76 0.80 1.77
P.
Asq
uith
eta
l./
Jo
urn
al
of
Fin
an
cial
Eco
no
mics
75
(2
00
5)
24
5–
28
2253
ARTIC
LEIN
PRES
S
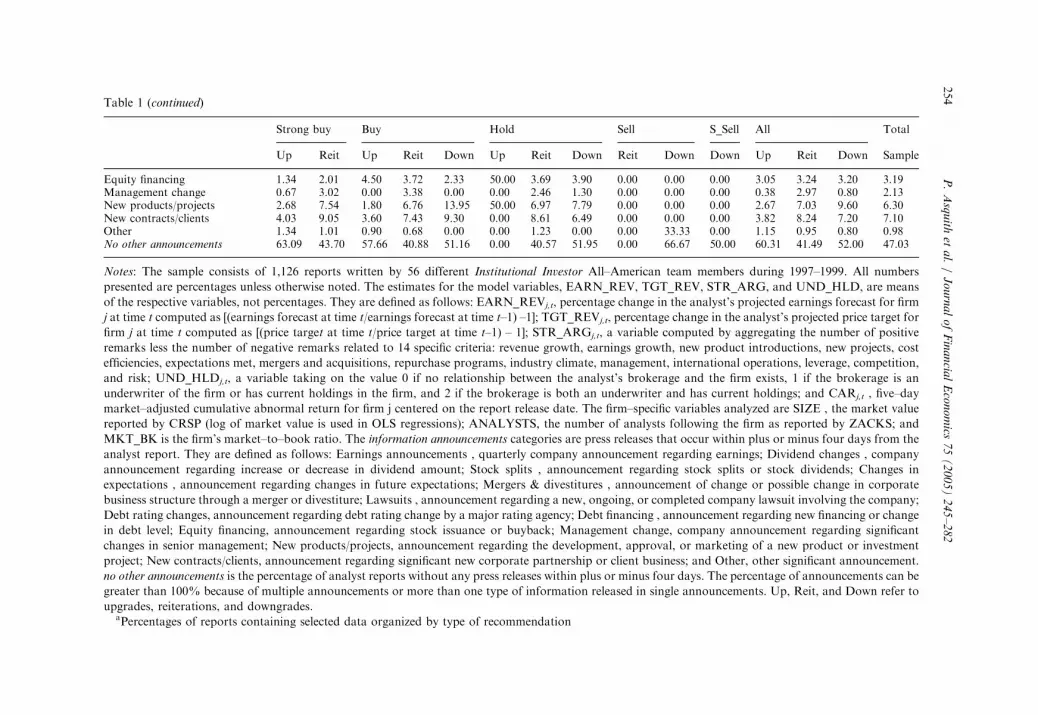
Equity financing 1.34 2.01 4.50 3.72 2.33 50.00 3.69 3.90 0.00 0.00 0.00 3.05 3.24 3.20 3.19Management change 0.67 3.02 0.00 3.38 0.00 0.00 2.46 1.30 0.00 0.00 0.00 0.38 2.97 0.80 2.13New products/projects 2.68 7.54 1.80 6.76 13.95 50.00 6.97 7.79 0.00 0.00 0.00 2.67 7.03 9.60 6.30New contracts/clients 4.03 9.05 3.60 7.43 9.30 0.00 8.61 6.49 0.00 0.00 0.00 3.82 8.24 7.20 7.10Other 1.34 1.01 0.90 0.68 0.00 0.00 1.23 0.00 0.00 33.33 0.00 1.15 0.95 0.80 0.98No other announcements 63.09 43.70 57.66 40.88 51.16 0.00 40.57 51.95 0.00 66.67 50.00 60.31 41.49 52.00 47.03
Notes: The sample consists of 1,126 reports written by 56 different Institutional Investor All–American team members during 1997–1999. All numbers
presented are percentages unless otherwise noted. The estimates for the model variables, EARN_REV, TGT_REV, STR_ARG, and UND_HLD, are means
of the respective variables, not percentages. They are defined as follows: EARN_REVj,t, percentage change in the analyst’s projected earnings forecast for firm
j at time t computed as [(earnings forecast at time t/earnings forecast at time t–1) –1]; TGT_REVj,t, percentage change in the analyst’s projected price target for
firm j at time t computed as [(price target at time t/price target at time t–1) – 1]; STR_ARGj,t, a variable computed by aggregating the number of positive
remarks less the number of negative remarks related to 14 specific criteria: revenue growth, earnings growth, new product introductions, new projects, cost
efficiencies, expectations met, mergers and acquisitions, repurchase programs, industry climate, management, international operations, leverage, competition,
and risk; UND_HLDj,t, a variable taking on the value 0 if no relationship between the analyst’s brokerage and the firm exists, 1 if the brokerage is an
underwriter of the firm or has current holdings in the firm, and 2 if the brokerage is both an underwriter and has current holdings; and CARj,t , five–day
market–adjusted cumulative abnormal return for firm j centered on the report release date. The firm–specific variables analyzed are SIZE , the market value
reported by CRSP (log of market value is used in OLS regressions); ANALYSTS, the number of analysts following the firm as reported by ZACKS; and
MKT_BK is the firm’s market–to–book ratio. The information announcements categories are press releases that occur within plus or minus four days from the
analyst report. They are defined as follows: Earnings announcements , quarterly company announcement regarding earnings; Dividend changes , company
announcement regarding increase or decrease in dividend amount; Stock splits , announcement regarding stock splits or stock dividends; Changes in
expectations , announcement regarding changes in future expectations; Mergers & divestitures , announcement of change or possible change in corporate
business structure through a merger or divestiture; Lawsuits , announcement regarding a new, ongoing, or completed company lawsuit involving the company;
Debt rating changes, announcement regarding debt rating change by a major rating agency; Debt financing , announcement regarding new financing or change
in debt level; Equity financing, announcement regarding stock issuance or buyback; Management change, company announcement regarding significant
changes in senior management; New products/projects, announcement regarding the development, approval, or marketing of a new product or investment
project; New contracts/clients, announcement regarding significant new corporate partnership or client business; and Other, other significant announcement.
no other announcements is the percentage of analyst reports without any press releases within plus or minus four days. The percentage of announcements can be
greater than 100% because of multiple announcements or more than one type of information released in single announcements. Up, Reit, and Down refer to
upgrades, reiterations, and downgrades.aPercentages of reports containing selected data organized by type of recommendation
Table 1 (continued)
Strong buy Buy Hold Sell S_Sell All Total
Up Reit Up Reit Down Up Reit Down Reit Down Down Up Reit Down Sample
P.
Asq
uith
eta
l./
Jo
urn
al
of
Fin
an
cial
Eco
no
mics
75
(2
00
5)
24
5–
28
2254

ARTICLE IN PRESS
P. Asquith et al. / Journal of Financial Economics 75 (2005) 245–282 255
reports dated differently from the Zacks dates. Of the reports with differing dates,92% of the report dates fall after the corresponding Zacks date.Obtaining the correct date is clearly important, given that our analysis involves
examining the market reaction to information releases from the reports. We explorevarious sources of news releases including Dow Jones and Lexis-Nexus, as well asfinance websites such as Yahoo, to determine the correct information announcementdate for a random sample of 50 reports. We find that Zacks is particularly accuratein reporting recommendation release dates and thus we use its dates as ourannouncement dates whenever possible.
3.2. Typical analyst report
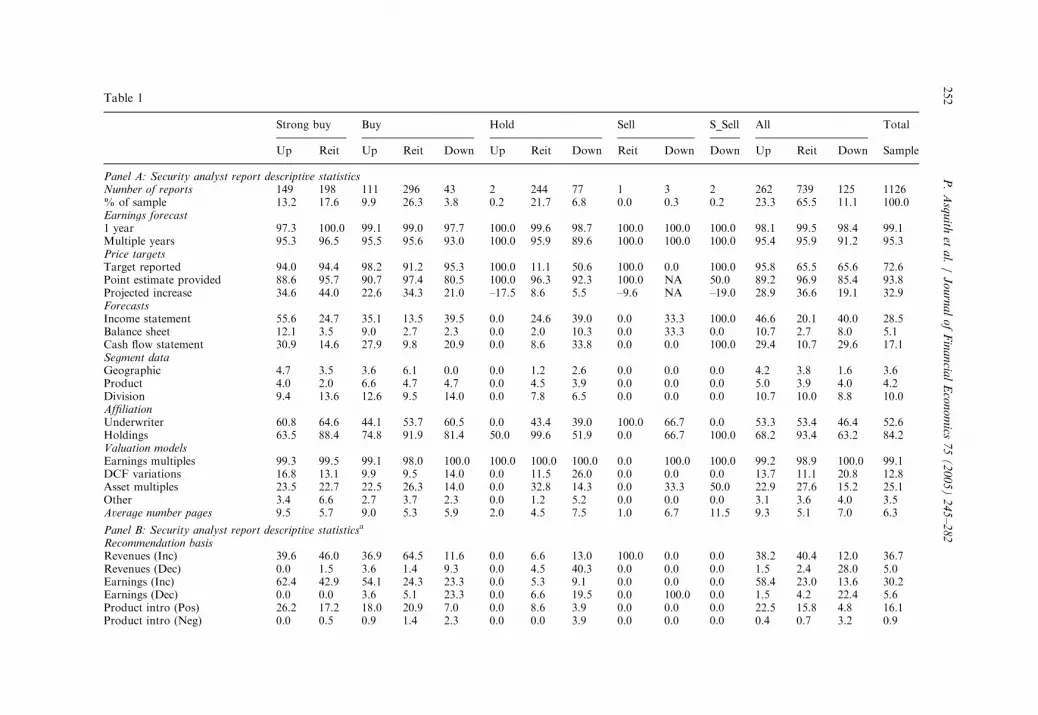
Table 1, Panels A and B, presents summary statistics on average values andfrequency of reporting for several of the data fields that we collect from each analystreport. All reports contain a summary stock recommendation and our table isorganized by recommendation category, such as upgrade to strong buy ordowngrade to hold, as well as by the combined categories of all upgrades, allreiterations, or all downgrades, and a total sample column. (An analyst reportgenerally indicates whether its recommendation is an upgrade, downgrade, orreiteration; when the previous recommendation is indeterminate, we use the previousrecommendation as conveyed by Zacks to classify the report.) The majority of thereports also include summary earnings forecasts and price targets. Additional dataincluded in each report in support of the authoring analyst’s forecasts and opinionsare also presented in Table 1. These include the prevalence of accounting statementforecasts and segment data analyses, data regarding relationships between theanalyst’s brokerage and the firm, data regarding the valuation methods employed,and the analyst’s qualitative justifications of his or her recommendation.Consistent with other studies and recent press reports, we find that analysts rarely
issue sell or strong sell recommendations. Line 2 of Table 1, Panel A, shows that only0.5% of the recommendations in our sample fall into these two categories. Incontrast, 30.8% of the recommendations are classified as strong buy, 40.0% as buy,and 28.7% as hold. We also find that the majority of reports issued across allrecommendations are reiterations. The last three columns before the Total column inTable 1, Panel A, show that upgrades, downgrades, and reiterations represent23.3%, 11.1%, and 65.5% of our sample, respectively.All of our reports contain a summary stock recommendation and almost all
reports also provide EPS forecasts—99.1% for the current fiscal year and 95.3% forat least one subsequent year. Only 22.7% of our analyst reports contain forecastsbeyond one year. There is no notable difference in the percentage of reports thatcontain one-year earnings forecasts across recommendation types. At 89.6%, thedowngrade to hold recommendations are the only category of subsequent yearforecasts to fall below 90%.Price targets, which are the analyst’s price forecasts, are only present in 72.6% of
analyst reports. They are given as either a point estimate or a range that the stockprice is expected to achieve within the next 12 months. Price targets, while not as

ARTICLE IN PRESS
P. Asquith et al. / Journal of Financial Economics 75 (2005) 245–282256
common as recommendations or earnings forecasts in the total sample, are even lessfrequent for unfavorable reports. In our sample, while over 90% of all strong buy orbuy recommendations include price targets, only 11.1% of hold reiterationsand 50.6% of hold downgrades include these projections. Overall, 95.8% ofupgrades, 65.5% of reiterations, and 65.6% of downgrades include price forecasts. Itappears that analysts’ reluctance to issue negative information via downgradesextends to price targets as well, although not as strongly. In fact, 62.8% ofdowngrades that do not include a price target in the current report had one in theprior report. In light of recent events, some investment banks are specificallyrequiring their analyst to disclose price targets in reports with a positiverecommendation (e.g., Merrill Lynch). In addition, these banks are including astock chart indicating the points at which they changed their recommendations orprice targets.The projected stock price increase, i.e., the percentage by which the price target is
above the current price, varies systematically across recommendation categories. Forexample, the third line under the category Price targets in Table 1, Panel A, showsthat the average projected increase over the current stock price for an upgrade tostrong buy or buy are 34.6% and 22.6%, respectively. Interestingly, reiterations haveeven higher stock price increases than upgrades for each recommendation category.For the entire sample, reiterations project an average 36.6% increase while upgradesproject a 28.9% average increase. Price targets below current market price are fairlyuncommon. Even in unfavorable reports such as a downgrade to hold, the averageprojected increase is a positive 5.5%.In addition to price targets and earnings forecasts, we compile information on
income statements, balance sheets, statements of cash flow, and segment forecasts.Based on our sample, financial statement forecasts are not disclosed as frequently asearnings or price forecasts. Of the reports in our sample, 28.5% contain incomestatement forecasts, 5.1% contain balance sheet forecasts, and 17.1% containstatement of cash flow forecasts. Although the percentages of upgrade anddowngrade reports that contain income statement forecasts are similar (46.6% and40.0%, respectively), these percentages are much higher than those of reiteratedreports, which contain these forecasts only 20.1% of the time. Similar patterns existfor balance sheet and cash flow forecasts. Very few analyst reports containgeographic (3.6%), product (4.2%), or segment information (10.0%).We also collect information on existing relationships between the company and
the investment bank writing the report. Analysts are required to provide thisinformation as a disclaimer in their report. Of the firms examined, 52.6% havean underwriting relationship with the analyst’s brokerage. The underwritingrelationship is similar across both upgrades and reiterations at 53%. Downgradesare only slightly less frequent with an underwriting relationship in 46.4% of thecases examined. Differences in current holdings are more varied. Investmentbanks have holdings in 84.2% of the firms analyzed. Holdings of company stockexist in 68.2%, 63.2%, and 93.4% of upgrades, downgrades, and reiterations,respectively.

ARTICLE IN PRESS
P. Asquith et al. / Journal of Financial Economics 75 (2005) 245–282 257
Next, we document the valuation methods used by the analysts in Table 1, PanelA, under the category Valuation models. We find that 99.1% of analysts mentionthat they use some sort of earnings multiple (e.g., a price-to-earnings ratio, EBITDAmultiple, or a relative price-to-earnings ratio). Only 12.8% of analysts report usingany variation of discounted cash flow in computing their price targets. Notably, thediscounted cash flow method is much more prevalent in downgrade reports, 20.8%,compared to 13.7% and 11.1% in upgrades and reiterations, respectively. Valuationmodels based on asset multiples are used in 25.1% of all reports and 22.9%, 27.6%,and 15.2% of upgrades, reiterations, and downgrades, respectively. Very fewanalysts use alternative valuation methodologies. Other valuation methods notfalling into one of the three categories discussed above are observed in less than3.5% of our sample. We include PEG (PE to growth) under alternative valuationmethodologies since only seven of the 1,126 analyst reports in our sample use them.All analysts who mention a valuation method use an earnings multiple. That is, the0.9% that do not mention an earnings multiple do not mention any valuationmethod.Finally, Table 1, Panel B, catalogs the analyst’s qualitative justifications of his or
her recommendation. Positive and negative remarks are recorded for 14 specificcriteria: revenue growth, earnings growth, new product introductions, new projects,cost efficiencies, expectations met, mergers and acquisitions, repurchase programs,industry climate, management, international operations, leverage, competition, andrisk. Only 3% (i.e., 34) of our sample reports contain no justification of therecommendations.
3.3. Model variables
Our empirical analyses require us to calculate several variables not directlyprovided in the analyst reports we examine (see Table 1, Panel C). The first modelvariable we compute is the percentage change in an analyst’s earnings forecast for afirm (EARN_REV). This is the new earnings forecast divided by the old earningsforecast minus 1. Since the current report does not usually contain the previousearnings forecast, we collect previous earnings forecasts from Investext, using thereport immediately preceding the one in our sample. We obtain previous earningsforecasts for 1,029 reports, 91.4% of our sample. We find average earnings forecastchanges of 4.1% and 4.0% for strong buy and buy upgrades, respectively. Incontrast, unfavorable reports such as a downgrade to buy or hold generallyexperience reductions in forecasted earnings. Downgrades to buy result in an averagereduction in earnings forecasts of 7.3%, while downgrades to hold experience areduction of 4.5%. Overall, upgrades, downgrades, and reiterations experienceearnings forecast changes of 4.1%, �3.6%, and �2.1%, respectively.The second model variable we compute is the percentage change in an analyst’s
price target forecast for a firm (TGT_REV). This is the new price target dividedby the old price target minus 1. Since the current report rarely contains theprevious price target, we collect previous price target information from Investext asdescribed above. We obtain previous price targets for 664 reports or 59.0% of our

ARTICLE IN PRESS
P. Asquith et al. / Journal of Financial Economics 75 (2005) 245–282258
sample.3 We find an average price target change of 2.8% for the total sample. Theaverage price target changes are 13.8% and 5.5% for strong buy and buy upgrades,respectively. In contrast, we find price target changes of only 1.0% and 2.7% forstrong buy and buy reiterations. Downgrades to buy result in an average reductionin price targets of 7.0%, while downgrades to hold experience an average reductionof 7.5%. Overall, upgrades, downgrades, and reiterations experience average pricetarget changes of 11.4%, �7.3%, and 1.9%, respectively. Except for sell reiterationsand downgrades to hold and strong sell, the average price target revisions are morepositive than the average earnings forecast revisions. Earnings forecast revisions andprice target changes are the only model variables not computed for every report inour sample.To measure the relationship between the firm analyzed and the analyst’s employer,
we construct another model variable, a proxy for underwriter affiliation and stockholdings (UND_HLD). This indicator variable takes on a value of 0 if there is norelationship between the analyst’s brokerage and the firm, 1 if the brokerage is anunderwriter of the firm or has current holdings in the firm, and 2 if the brokerage isboth an underwriter and has current holdings. The average UND_HLD is similar forupgrades and downgrades with a value of 1.2 and 1.1, respectively. Reiterations areslightly higher with an average value of 1.5.We model the analyst’s qualitative justifications for his or her opinion by
constructing a ‘‘strength-of-arguments’’ variable (STR_ARG). This variable iscomputed by aggregating the number of positive remarks less the number of negativeremarks from Table 1, Panel B. The analyst reports were read for any mention of the28 recommendation categories in Table 1, Panel B. Positive comments about acategory are given a value of +1 and negative comments are given a value of �1.For example, if a report mentions that revenues are expected to increase, thecategory for increasing revenues is given a value of +1; if a report mentions thatrevenues are expected to decrease, the category for decreasing revenues is given avalue of �1. The percentage of reports with comments in each category is given inTable 1, Panel B. Upgrades have an average strength value of 2.8 compared to 1.7for reiterations and �0.2 for downgrades. It is notable that downgrades still result inan average score close to zero. This is consistent with the desire to minimizemanagement retaliation since company management is a key source of informationand future underwriting business.This process differs from that employed by Hirst et al. (1995) who had subjects
rate the strength of the report’s comments on a scale from 1 to 15. We consideredtrying to code intensity but found it to be less objective than merely tabulatingpositive or negative remarks. That is, an analyst might remark that he or she expectsa ‘‘large’’ or a ‘‘very large’’ improvement in revenue growth. Different observers willcode these as different intensities, and indeed different analysts can have differentmeanings for ‘‘large’’ and ‘‘very large’’. Our approach removes subjective differences
3We cannot be certain that the price target or earnings forecast (above) is from the report immediately
prior to our sample report due to reports missing on Investext. Errors from obtaining earlier targets or
earnings forecasts should weaken our results. This is discussed further in Section 4.
ARTICLE IN PRESS
P. Asquith et al. / Journal of Financial Economics 75 (2005) 245–282 259
between both analysts and readers.4 While not perfect, we believe our method isunbiased and reasonably objective. Importantly, our measure yields statisticallysignificant empirical results.Next, we measure the market’s reaction to the release of analyst reports with the
five-day market-adjusted cumulative abnormal return (CAR) centered on the reportrelease date. The average mean CAR for all firms in our sample is a negligible 0.3%.Consistent with our expectations and prior research, we find statistically significantmean returns of 4.5% for upgrades and �6.6% for downgrades, and an insignificantmean reaction of 0.0% for reiterations. Breaking up report types into specificsummary categories yields similar results. Upgrades to strong buy and buy result insignificant mean returns of 4.7% and 4.1%, respectively. Downgrades to buy andhold result in significant mean returns of �7.0% and �6.4%, respectively. The meanCARs for upgrades and downgrades are all statistically different from zero with atwo-tailed probability of less than 0.01. Reiterations are generally small andinsignificant with one exception: reiterations of hold recommendations have anaverage mean return of �1.1%. Reports representing hold upgrades, sell and strongsell downgrades, or reiterations have too few observations to draw any reliableconclusions as to average market reactions. We find that a particular report’sdirection (e.g., upgrade, downgrade, or reiteration) tends to dominate the specificrecommendation level. The differences in the observed market reaction betweenstrong buy upgrades and buy upgrades, buy downgrades and hold downgrades, orstrong buy reiterations versus buy reiterations are all insignificant. As such, althoughwe provide descriptive statistics for reports categorized by both report type andsummary recommendation, our primary empirical tests are performed on reportscategorized by direction only.Table 2 presents the Spearman and Pearson correlations for the model variables
and the recommendation revisions in our sample. As expected from the last fourcolumns in Table 1, Panel C, both the Spearman and Pearson correlations betweenCAR and upgrades are positive and highly significant, while the correlations betweenCAR and downgrades are negative and highly significant. The Pearson correlation isnot significant between CAR and reiterations although the Spearman correlation issignificantly negative.More interesting, our model variables EARN_REV and STR_ARG are highly
and positively correlated (Spearman=0.40, Pearson=0.17). This relation suggeststhat positive (negative) earnings forecast revisions are generally supported by moreoptimistic (pessimistic) analyst statements. A similar result is observed betweenTGT_REV and STR_ARG. The Spearman and Pearson correlations between CARand STR_ARG are 0.30 and 0.33 whereas between CAR and EARN_REV they areonly 0.18 and 0.11, respectively. These results suggest that the market uncondition-ally reacts more to the analyst’s qualitative arguments than to the actual earnings
4The list of factors was initially compiled by all the authors independently and cross-checked with each
other. Once the standard coding was agreed upon, the authors and research assistants (RAs) read all
reports again. Over 75% of the reports were read by at least one author. There is no significant difference
in the coding patterns between authors and RAs.

ARTIC
LEIN
PRES
S
Table 2
Pearson/Spearman correlation coefficients
UP_GR DOWN_GR REIT CAR EARN_REV TGT_REV STR_ARG UND_HLD
UP_GR 0.2721*** 0.0980** 0.2062*** 0.2685*** –0.1570***
o.0001 0.0152 o.0001 o.0001 o.0001
DOWN_GR �0.2994*** –0.0560 –0.2777*** –0.2784*** –0.1160***
o.0001 0.1663 o.0001 o.0001 0.0023
REIT �0.0572 –0.0464 0.0163 –0.0671* 0.2121***
0.1329 0.2516 0.7470 0.0780 o.0001
CAR 0.3068*** �0.2514*** –0.1180*** 0.1130*** 0.4266*** 0.3343*** –0.0330
o.0001 o.0001 0.0019 0.0051 o.0001 o.0001 0.3872
EARN_REV 0.1285*** �0.1459*** –0.0129 0.1883*** 0.2312*** 0.1728*** –0.0288
0.0014 0.0003 0.7492 o.0001 o.0001 o.0001 0.4769
TGT_REV 0.2594*** �0.2635*** –0.0376 0.2945*** 0.2966*** 0.3720*** –0.0331
o.0001 o.0001 0.4573 o.0001 o.0001 o.0001 0.5127
STR_ARG 0.2466*** �0.2507*** –0.0646* 0.3002*** 0.4006*** 0.3619*** 0.0304
o.0001 o.0001 0.0894 o.0001 o.0001 o.0001 0.4252
UND_HLD �0.1260*** –0.1031*** 0.1765*** –0.0425 0.0116 –0.0235 0.0450
0.0009 0.0067 o.0001 0.2643 0.7745 0.6413 0.2371
Notes: This table presents the Pearson (upper triangle) and Spearman (lower triangle) correlations for the following variables: UP_GRj,t, a variable taking on
the value 1 for reports issued for firm j at time t that indicate the analyst’s recommendation has been upgraded, 0 otherwise; DOWN_GRj,t, a variable taking
on the value 1 for reports issued for firm j at time t that indicate the analyst’s recommendation has been downgraded, 0 otherwise; REITj,t, a variable taking on
the value 1 for reports issued for firm j at time t that indicate the analyst’s recommendation has been reiterated, 0 otherwise; CARj,t, five–day market–adjusted
cumulative abnormal return for firm j centered on the report release date t; EARN_REVj,t, percentage change in the analyst’s projected earnings forecast for
firm j at time t computed as [(earnings forecast at time t/earnings forecast at time t–1) – 1]; TGT_REVj,t, percentage change in the analyst’s projected price
target for firm j at time t computed as [(price target at time t/price target at time t–1) – 1]; STR_ARGj,t, a variable computed aggregating the number of
positive remarks less the number of negative remarks related to 14 specific criteria: revenue growth, earnings growth, new product introductions, new projects,
cost efficiencies, expectations met, mergers and acquisitions, repurchase programs, industry climate, management, international operations, leverage,
competition, and risk; UND_HLDj,t, a variable taking on the value 0 if no relationship between the analyst’s brokerage and the firm exists, 1 if the brokerage is
an underwriter of the firm or has current holdings in the firm, and 2 if the brokerage is both an underwriter and has current holdings; P–values are listed below
the correlation numbers. * one–tailed probability o0.10; ** one–tailed probability o0.05; *** one–tailed probability o0.01.
P.
Asq
uith
eta
l./
Jo
urn
al
of
Fin
an
cial
Eco
no
mics
75
(2
00
5)
24
5–
28
2260

ARTICLE IN PRESS
P. Asquith et al. / Journal of Financial Economics 75 (2005) 245–282 261
revisions that the analyst makes. The correlations between CAR and downgradesand CAR and upgrades are about the same as between CAR and STR_ARG,suggesting a role for the strength of an analyst’s arguments at least as strong asthat of a recommendation revision. Only the Pearson correlation for TGT_REVand CAR is higher than that of the strength of arguments variable. Theseunconditional correlations support the view that investors use the qualitativeinformation in an analyst’s report. This conclusion is further supported by theregression results below.
3.4. Firm-specific variables
For each firm in our sample of analyst reports, we collect proxies for size (SIZE),growth versus value (MKT_BK), and analyst coverage (ANALYSTS). SIZE ismeasured as the log of market value of equity from the Center for Research inSecurity Prices (CRSP), MKT_BK is the ratio of the firm’s market value of equity tothe firm’s book value from COMPUSTAT, and ANALYSTS is the total number ofanalysts following the firm (not just All-American analysts) from Zacks. Descriptivestatistics for these variables are given in the second section of Table 1, Panel C. Thereappear to be a few systematic differences between the various categories of reports.For example, market-to-book ratios tend to be lower for downgrades (1.67) than foreither reiterations or upgrades (2.33 and 2.44). These variables allow us to determineif the market’s reaction to analyst reports differs for large versus small firms, growthversus value firms, or firms that are heavily followed.
3.5. Other information releases
To investigate the confounding effects of other information that is releasedsimultaneously with the analyst report, we collect all announcements of thefollowing events: earnings, dividend changes, stock splits, changes in businessexpectations, new equity and debt financing, mergers and divestitures, credit ratingchanges, lawsuits, new product introductions, new contracts, and managementchanges. This information is from multiple sources: earnings announcements arefrom Zacks; dividend changes and stock splits are from CRSP; and all otherinformation is from the Dow Jones Newswire. We define information to besimultaneous if it occurs within a nine-day window centered on the analyst report’srelease date.The third section of Table 1, Panel C catalogs the number of analyst reports that
occur with and without other information. As seen in the last line, 47% of all reportsdo not occur contemporaneously with the above-mentioned announcements. Thepercentage is highest for upgrades (60.3%) and lowest for reiterations (41.5%). Theprimary source of other information is earnings announcements, with 31.4% of allreports having an earnings announcement within plus or minus four days of theanalyst report. The next largest source of other information is announcements aboutchanges in expectations (11.35%).

ARTICLE IN PRESS
P. Asquith et al. / Journal of Financial Economics 75 (2005) 245–282262
4. Empirical results
4.1. Report content: earnings, recommendations, price target revisions, and
justifications
We first document that the market reacts to earnings forecasts, recommendationrevisions, and price targets contained in a security analyst report at the time of itsrelease. Market reaction is measured by five-day market-adjusted returns centeredon the report’s release date. This allows for possible delays by a brokerage indelivering its forecasts to Zacks or for leaks of information prior to its public release.Next, we show that the strength of the arguments in a report is a significant factor inexplaining the market’s reaction. We also investigate the presence of an underwritingrelationship between or current stock holdings by the analyst’s brokerage house andthe firm.Table 3 provides the results of the following regression estimation using ordinary
least squares:
CARj;t ¼ a0 þ a1 EARN REVj;t þ a2 UP GRj;t þ a3 DOWN GRj;t þ a4 TGT REVj;t
þ a5 STR ARGj;t þ a6 UND HLDj;t þ �j;t ð1Þ
where the variables are defined as follows:
CARj,t
five-day market-adjusted cumulative abnormal return for firm jcentered on the report release date t;
EARN_REVj,t percentage change in the analyst’s earnings forecast for firm j attime t computed as [(earnings forecast at time t/earningsforecast at time t-1) –1];
UP_GRj,t
a variable taking on the value 1 for reports issued for firm j attime t that indicate the analyst’s recommendation has beenupgraded, 0 otherwise;DOWN_GRj,t
a variable taking on the value 1 for reports issued for firm jat time t that indicate the analyst’s recommendation has beendowngraded, 0 otherwise;
TGT_REVj,t
percentage change in the analyst’s projected price target forfirm j at time t computed as [(price target at time t/price targetat time t-1) – 1];STR_ARGj,t
a variable computed by aggregating the number of positiveremarks less the number of negative remarks related to 14specific criteria: revenue growth, earnings growth, new productintroductions, new projects, cost efficiencies, expectations met,mergers and acquisitions, repurchase programs, industryclimate, management, international operations, leverage,competition, and risk;UND_HLDj,t
a variable taking on the value 0 if there is no relationshipbetween the analyst’s brokerage and the firm, 1 if the brokerageis an underwriter of the firm or has current holdings in the firm,
ARTICLE IN PRESS
P. Asquith et al. / Journal of Financial Economics 75 (2005) 245–282 263
and 2 if the brokerage is both an underwriter and has currentholdings;
ej,t
assumed normally distributed error term with zero mean andconstant variance.The coefficients EARN_REVj,t and TGT_REVj,t are computed using earnings andprice target forecasts from the current report and the most recent prior report ifreleased within 60 days of our report. As described previously, we collect priorearnings and price targets from the same analyst’s Investext report immediatelypreceding ours. Since Investext does not contain all reports, there is a chance thatanother report was released after the prior report we collect. If so, this will make ourregression results weaker. Since analysts usually write a minimum of six reports ayear on the companies they follow, we do not include revisions from prior reportsissued more than 60 days before our report. This restriction minimizes the effect ofmissing reports. Regressions using longer time periods, e.g., 60–90 days or all reportsover 90 days, provide qualitatively similar results, although the significance levels ofthe variables are reduced.Columns 1, 2, and 3 of Table 3 present the results from estimating regressions for
earnings forecast revisions, recommendation revisions, and changes in pricetargets individually (i.e., only including those proxy variables in the OLSregressions). If, as documented in prior research, the market reacts to changes inearnings forecasts and the stock recommendation contained in the typical securityanalyst report, the coefficients EARN_REV in column 1 and UP_GR in column 2will be positive while DOWN_GR in column 2 will be negative. If, as predicted,analyst price target revisions have information, TGT_REV in column 3 will bepositive.Consistent with prior research, we find that the coefficient on EARN_REV is
positive and statistically significant (0.0545, t=2.81, one-tailed po0.01), suggestingthat increases (decreases) in earnings forecasts are associated with positive (negative)abnormal returns. Also in agreement with existing work, we find that reiterations,upgrades, and downgrades are associated with insignificant, positive, and negativeabnormal returns, respectively. The intercept in column 2 is the mean abnormalreturn associated with a reiteration (�0.0044, t=�1.12, two-tailed p40.10). Column2A calculates the mean returns associated with an upgrade (0.0473, F=44.84, one-tailed po0.01) or downgrade (�0.0894, F=66.77, one-tailed po0.01) by summing(a0+a2) and (a0+a3), respectively.The results for price target revisions are reported in column 3. As predicted,
TGT_REV is positive and statistically significant, consistent with an associationbetween positive (negative) abnormal returns and increasing (decreasing) pricetargets (0.3191, t=9.34, one-tailed po0.01). This shows that price target revisionscontain new information that is quickly impounded by the market. In fact, themarket reaction for a given change in a price target forecast is stronger than that foran equal percentage change in an earnings forecast, i.e., it has a higher coefficient,t-value, and adjusted R2.

ARTIC
LEIN
PRES
S
Table 3
The market’s reaction to the release of a security analyst report: regression results on earnings forecast revisions, recommendations, price target revisions,
argument strength, and affiliation
Variable Predicted sign (1) (2) (2A) (3) (4) (4A) (5) (5A)
INTERCEPT ? –0.0029 –0.0044 –0.0018 –0.0009 –0.0211*(–0.78) (–1.12) (–0.40) (–0.18) (–1.70)
EARN_REV + 0.0545*** 0.0804** 0.0618*(2.81) (2.27) (1.77)
UP_GR + 0.0517*** 0.0283 0.0222(6.40) (2.24) (1.76)
DOWN_GR – –0.0850*** –0.0494*** –0.0340**(–7.31) (–3.09) (–2.10)
Upgrade (a0+a2) + 0.0473*** 0.0274** 0.0011(44.84) (5.52) (0.00)
Downgrade (a0+a3) – –0.0894*** –0.0503*** –0.0551***(66.77) (11.09) (10.69)
TGT_REV + 0.3191*** 0.2552*** 0.2116***(9.34) (7.06) (5.76)
STR_ARG + 0.0104***(4.40)
UND_HLD – –0.0011(–0.16)
Adjusted R2 0.0112*** 0.1382*** 0.1799*** 0.2193*** 0.2529***(7.91) (56.40) (87.21) (28.38) (23.00)
N 612 691 393 390 390
Notes: This table presents the results of estimating the following regression using ordinary least squares: CARj,t=a0+a1 EARN_REVj,t+a2UP_GRj,t+a3 -DOWN_GRj,t+a4 TGT_REVj,t+a5 STR_ARGj,t+a6UND_HLDj,t+ej,t, where the variables are defined as follows: CARj,t, five–day market–adjusted
cumulative abnormal return for firm j centered on the report release date t; EARN_REVj,t, percentage change in the analyst’s projected earnings forecast for
firm j at time t computed as [(earnings forecast at time t/earnings forecast at time t–1) – 1]; UP_GRj,t, a variable taking on the value 1 for reports issued for firm
j at time t that indicate the analyst’s recommendation has been upgraded, 0 otherwise; DOWN_GRj,t, a variable taking on the value 1 for reports issued for
firm j at time t that indicate the analyst’s recommendation has been downgraded, 0 otherwise; TGT_REVj,t, percentage change in the analyst’s projected price
target for firm j at time t computed as [(price target at time t/price target at time t–1) – 1]; STR_ARGj,t, a variable computed aggregating the number of
positive remarks less the number of negative remarks related to 14 specific criteria: revenue growth, earnings growth, new product introductions, new projects,
cost efficiencies, expectations met, mergers and acquisitions, repurchase programs, industry climate, management, international operations, leverage,
competition, and risk; UND_HLDj,t, a variable taking on the value 0 if no relationship between the analyst’s brokerage and the firm exists, 1 if the brokerage is
an underwriter of the firm or has current holdings in the firm, and 2 if the brokerage is both an underwriter and has current holdings; and ej,t, assumed
normally distributed error term with zero mean and constant variance. t–statistics are below the estimated coefficients. F–statistics are below the adjusted R2
and the aggregated coefficient estimates in columns 2A, 4A, and 5A. * one–tailed probability o0.10; ** one–tailed probability o0.05; *** one–tailed
probability o0.01.
P.
Asq
uith
eta
l./
Jo
urn
al
of
Fin
an
cial
Eco
no
mics
75
(2
00
5)
24
5–
28
2264
ARTICLE IN PRESS
P. Asquith et al. / Journal of Financial Economics 75 (2005) 245–282 265
In column 4, we examine whether each of the three summary components of ananalyst report—forecast revisions, recommendations, and price target changes—contribute information beyond what’s contained in the others. When all three areincluded in our regression, we find that earnings forecast revisions, price targetrevisions, and the mean return for an upgrade remain positive and statisticallysignificant while the mean return for a downgrade remains statistically negative. Theresults for price target revisions remain stronger than those of earnings forecastrevisions. Including the three primary components of an analyst report simulta-neously in our regression increases the adjusted R2 to 22%. Our results extendFrancis and Soffer (1997), who only look at earnings forecast revisions andrecommendations, and support Brav and Lehavy (2003), who show that theinformation in each of the three components of an analyst report is not subsumed bythe other two. Column 4A calculates, as column 2A did, the mean returns and Fvalues for upgrades and downgrades by summing (a0+a2) and (a0+a3),respectively.Regression results reported in column 5 examine the effects of affiliations between
the firm covered and the brokerage employing the analyst issuing the report, as wellas the strength of an analyst’s arguments, by adding UND_HLD and STR_ARG.When a brokerage has served as an underwriter for or has current holdings in areviewed firm, we expect investors to exhibit skepticism in responding to good newsand a more pronounced reaction to bad news resulting in a6 being negative. We findthat the coefficient for existing relationships between the analyst and a company isstatistically insignificant, contradicting prior work (�0.0011, t=�0.16, one-tailedp40.10). We calculate our underwriting holdings variable several ways. In Eq. (1),reported in Table 3, the variable takes a value of 0 if there is no relationship, 1 if thebrokerage is an underwriter or has holdings, and 2 if it is both an underwriter andhas holdings. We also examine holdings and underwriting relationship as separatevariables. There are no significant results, regardless of how the variable is specified.We predict that the strength of arguments contained in the report is likely to
amplify investor reaction to both good and bad news, suggesting that a5 will bepositive. The coefficient on STR_ARG is positive and statistically significant(0.0104, t=4.40, one-tailed po0.01) indicating that investors react to a report’scontents even in the presence of the three primary components previously discussed.However, once information regarding the strength of an analyst’s arguments (ascontained in a report’s text) is considered, investors appear to rely less on earningsforecast revisions and upgrade labels. Earnings forecast revisions are now lesssignificant (0.0618, t=1.77, one-tailed po0.10) and the mean return for upgrades,given in Column 5A, is now 0.0011 with an insignificant F value. Price targets andthe mean return for downgrades remain highly significant (0.2116, t=5.76, one-tailed po0.01 and �0.0551, t=10.69, one-tailed po0.01, respectively). We examinethe effects of report type on the market’s reaction to the release of an analyst’s reportin more detail in Section 4.4.The importance of the analyst’s arguments in explaining the market’s reaction to
the release of a report also holds if we split the strength-of-arguments variable intoits positive and negative components. That is, we tally separately the positive and

ARTICLE IN PRESS
P. Asquith et al. / Journal of Financial Economics 75 (2005) 245–282266
negative justifications and include them in our regression as two variables. Thepositive argument coefficient is 0.0071 with a t-statistic of 2.41 and the negativeargument coefficient is �0.0205 with a t-statistic of �3.53. This suggests thatnegative comments have a larger impact on the market than do positive ones, butthat both are important. Although not reported here, when the strength-of-arguments variable is split into positive and negative components, the coefficients onearnings forecast revisions, price target revisions, and upgrades and downgrades aresimilar to those reported in Table 3, Column 5.In addition to disaggregating our strength-of-arguments variable into its positive
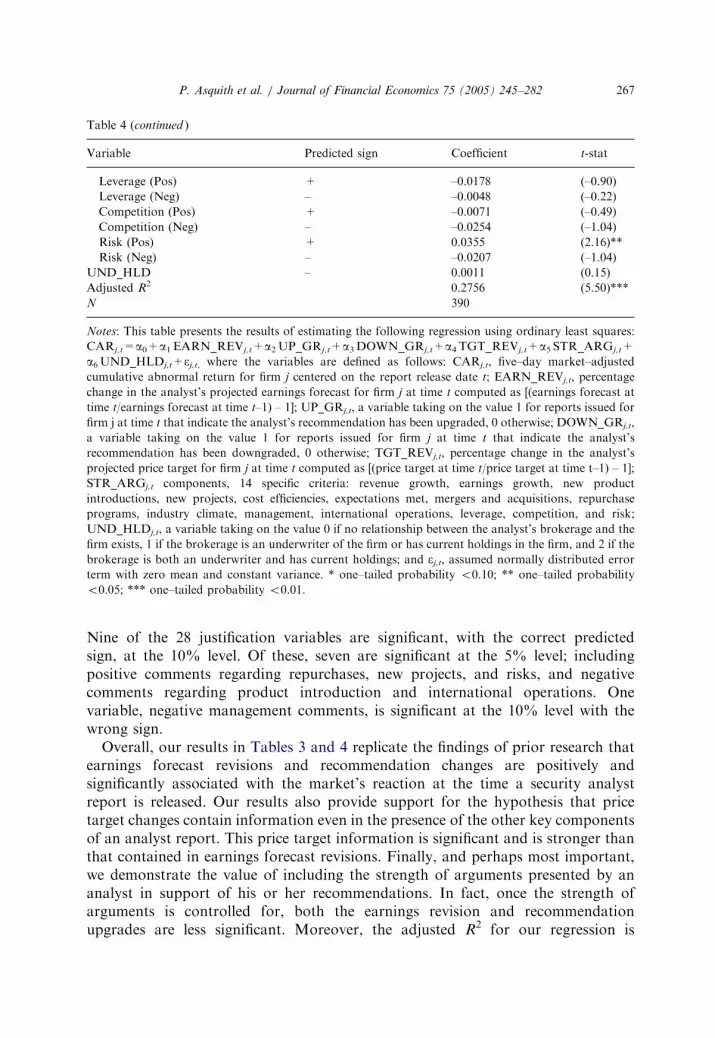
and negative components, we consider each of our 28 justification variablesindependently. That is, we add 28 dummy variables to the regression, such aspositive revenue growth, negative revenue growth, positive cost savings, negativecost savings, etc. The regression results using these 28 variables are reported inTable 4. The coefficients and significance levels on earnings revisions, target pricechanges, and upgrades and downgrades are similar to those in Table 3, Column 5.
Table 4
The market’s reaction to the release of a security analyst report: regression results on earnings forecast
revisions, recommendations, price target revisions, argument strength by justification category, and
affiliation
Variable Predicted sign Coefficient t-stat
INTERCEPT ? –0.0072 (–0.49)
EARN_REV + 0.0655 (1.77)**
UP_GR + 0.0294 (2.18)**
DOWN_GR – –0.0368 (–2.04)**
TGT_REV + 0.1884 (4.83)***
STR_ARG
Revenues (Inc) + 0.0011 (0.11)
Revenues (Dec) – –0.0686 (–2.31)**
Earnings (Inc) + –0.0057 (–0.58)
Earnings (Dec) – –0.0418 (–1.92)**
Product intro (Pos) + 0.0050 (0.45)
Product intro (Neg) – –0.0727 (–1.47)*
New projects (Pos) + 0.0288 (1.97)**
New projects (Neg) – 0.0030 (0.07)
Cost efficiencies + 0.0026 (0.23)
Cost inefficiencies – –0.0009 (–0.06)
Expectations met + 0.0156 (1.51)*
Expectations not met – –0.0463 (–2.79)***
M&A activity (Pos) + –0.0093 (–0.67)
M&A activity (Neg) – 0.0250 (0.41)
Repurchases (Pos) + 0.0270 (1.85)**
Repurchases (Neg) – 0.0048 (0.07)
Industry climate (Pos) + 0.0153 (1.17)
Industry climate (Neg) – –0.0223 (–1.11)
Management (Pos) + 0.0074 (0.69)
Management (Neg) – 0.0689 (1.85)**
International ops (Pos) + 0.0103 (0.91)
International ops (Neg) – –0.0417 (–1.45)*
ARTICLE IN PRESS
Table 4 (continued )
Variable Predicted sign Coefficient t-stat
Leverage (Pos) + –0.0178 (–0.90)
Leverage (Neg) – –0.0048 (–0.22)
Competition (Pos) + –0.0071 (–0.49)
Competition (Neg) – –0.0254 (–1.04)
Risk (Pos) + 0.0355 (2.16)**
Risk (Neg) – –0.0207 (–1.04)
UND_HLD – 0.0011 (0.15)
Adjusted R2 0.2756 (5.50)***
N 390
Notes: This table presents the results of estimating the following regression using ordinary least squares:
CARj,t=a0+a1 EARN_REVj,t+a2 UP_GRj,t+a3 DOWN_GRj,t+a4 TGT_REVj,t+a5 STR_ARGj,t+
a6UND_HLDj,t+ej,t, where the variables are defined as follows: CARj,t, five–day market–adjusted
cumulative abnormal return for firm j centered on the report release date t; EARN_REVj,t, percentage
change in the analyst’s projected earnings forecast for firm j at time t computed as [(earnings forecast at
time t/earnings forecast at time t–1) – 1]; UP_GRj,t, a variable taking on the value 1 for reports issued for
firm j at time t that indicate the analyst’s recommendation has been upgraded, 0 otherwise; DOWN_GRj,t,
a variable taking on the value 1 for reports issued for firm j at time t that indicate the analyst’s
recommendation has been downgraded, 0 otherwise; TGT_REVj,t, percentage change in the analyst’s
projected price target for firm j at time t computed as [(price target at time t/price target at time t–1) – 1];
STR_ARGj,t components, 14 specific criteria: revenue growth, earnings growth, new product
introductions, new projects, cost efficiencies, expectations met, mergers and acquisitions, repurchase
programs, industry climate, management, international operations, leverage, competition, and risk;
UND_HLDj,t, a variable taking on the value 0 if no relationship between the analyst’s brokerage and the
firm exists, 1 if the brokerage is an underwriter of the firm or has current holdings in the firm, and 2 if the
brokerage is both an underwriter and has current holdings; and ej,t, assumed normally distributed error
term with zero mean and constant variance. * one–tailed probability o0.10; ** one–tailed probability
o0.05; *** one–tailed probability o0.01.
P. Asquith et al. / Journal of Financial Economics 75 (2005) 245–282 267
Nine of the 28 justification variables are significant, with the correct predictedsign, at the 10% level. Of these, seven are significant at the 5% level; includingpositive comments regarding repurchases, new projects, and risks, and negativecomments regarding product introduction and international operations. Onevariable, negative management comments, is significant at the 10% level with thewrong sign.Overall, our results in Tables 3 and 4 replicate the findings of prior research that
earnings forecast revisions and recommendation changes are positively andsignificantly associated with the market’s reaction at the time a security analystreport is released. Our results also provide support for the hypothesis that pricetarget changes contain information even in the presence of the other key componentsof an analyst report. This price target information is significant and is stronger thanthat contained in earnings forecast revisions. Finally, and perhaps most important,we demonstrate the value of including the strength of arguments presented by ananalyst in support of his or her recommendations. In fact, once the strength ofarguments is controlled for, both the earnings revision and recommendationupgrades are less significant. Moreover, the adjusted R2 for our regression is

ARTICLE IN PRESS
P. Asquith et al. / Journal of Financial Economics 75 (2005) 245–282268
significantly larger than that found in previous work for either individual variablesor less complete multivariate specifications.
4.2. Firm-specific variables
It is a well-known result that the market reaction to analysts’ earnings forecastrevisions and recommendation changes varies by the firm’s information environment(e.g., Lys and Sohn, 1990; Stickel, 1995). Common proxies for the prevalence ofinformation about a firm are its size and analyst following. The reasons commonlygiven for these results is that individual analysts play a more important function forsmaller firms that have less institutional ownership, less press coverage, and lessanalyst following. Whether a firm is a growth or value firm (as measured by itsmarket-to-book ratio) is another factor that could influence the impact ofinformation releases.Table 5 presents the results from estimating a version of Eq. (1) modified to
include firm-size cross products in addition to our report variables (i.e., earningsforecast revisions, recommendation changes, price target revisions, strength of
Table 5
The market’s reaction to the release of a security analyst report: regression results on earnings forecast
revisions, recommendations, price target revisions, argument strength, affiliation, and firm size
Variable Predicted sign (1) (2) (3) (4) (5)
INTERCEPT ? –0.0028 –0.0044 0.0015 0.0024 –0.0214*
(–0.74) (–1.14) (0.35) (0.49) (–1.77)
EARN_REV + 0.2770*** 0.1194 0.1582
(3.52) (0.71) (0.96)
EARN_REV SIZE + –0.0280*** –0.0120 –0.0205
(–2.92) (–0.49) (–0.85)
UP_GR + 0.0680* –0.0606 –0.0863
(1.85) (–1.00) (–1.35)
UP_GR SIZE + –0.0020 0.0110 0.0133*
(–0.45) (1.52) (1.76)
DOWN_GR – –0.2947*** –0.1401* –0.1124
(–5.80) (–1.90) (–1.50)
DOWN_GR SIZE – 0.0260*** 0.011 0.0092
(4.24) (1.20) (1.03)
TGT_REV + 1.0787*** 0.9431*** 0.8402***
(8.32) (6.17) (5.27)
TGT_REV SIZE + –0.1008*** –0.0912*** –0.0834***
(–6.05) (–4.70) (–4.16)
STR_ARG + 0.0175*
(1.78)
STR_ARG SIZE + –0.0009
(–0.74)
UND_HLD – 0.0030
(0.16)

ARTICLE IN PRESS
Table 5 (continued )
Variable Predicted sign (1) (2) (3) (4) (5)
UND_HLD SIZE – –0.0001
(–0.05)
Adjusted R2 0.0232*** 0.1580*** 0.2484*** 0.2875*** 0.3184***
(8.25) (33.36) (65.78) (20.62) (16.14)
N 611 690 392 389 389
Notes: This table presents the results of estimating the following regression using ordinary least squares
and SIZE cross products: CARj,t=a0+a1 EARN_REVj,t+a2UP_GRj,t+a3DOWN_GRj,t+a4 TG-T_REVj,t+a5 STR_ARGj,t+a6UND_HLDj,t+ej,t, where the variables are defined as follows: CARj,t,
five–day market–adjusted cumulative abnormal return for firm j centered on the report release date t;
EARN_REVj,t, percentage change in the analyst’s projected earnings forecast for firm j at time t computed
as [(earnings forecast at time t/earnings forecast at time t–1) – 1]; UP_GRj,t, a variable taking on the value
1 for reports issued for firm j at time t that indicate the analyst’s recommendation has been upgraded, 0
otherwise; DOWN_GRj,t, a variable taking on the value 1 for reports issued for firm j at time t that
indicate the analyst’s recommendation has been downgraded, 0 otherwise; TGT_REVj,t, percentage
change in the analyst’s projected price target for firm j at time t computed as [(price target at time t/price
target at time t–1) – 1]; STR_ARGj,t, a variable computed aggregating the number of positive remarks less
the number of negative remarks related to 14 specific criteria: revenue growth, earnings growth, new
product introductions, new projects, cost efficiencies, expectations met, mergers and acquisitions,
repurchase programs, industry climate, management, international operations, leverage, competition, and
risk; UND_HLDj,t, a variable taking on the value 0 if no relationship between the analyst’s brokerage and
the firm exists, 1 if the brokerage is an underwriter of the firm or has current holdings in the firm, and 2 if
the brokerage is both an underwriter and has current holdings; SIZE, the log of market value as reported
by CRSP; and ej,t, assumed normally distributed error term with zero mean and constant variance.
t–statistics are below the estimated coefficients. * one–tailed probability o0.10; ** one–tailed probability
o0.05; *** one–tailed probability o0.01.
P. Asquith et al. / Journal of Financial Economics 75 (2005) 245–282 269
arguments, and affiliation). Column 1 shows that the cross product of earningsforecast revision with size is significantly negative (�0.0280, t=�2.92, po0.001).This suggests, consistent with prior literature, that the market reaction to earningsrevisions is smaller for large firms when EARN_REV is the only factor considered.In Column 2 the cross product of firm size with downgrades shows that the market’sreaction is less negative for larger firms in the case of downgrades. Similarly, Column3 demonstrates that the market reaction to price target revisions is significantlyweaker for larger firms. When all factors are considered simultaneously in Column 5,however, just as in Table 3, the importance of earnings forecast revisions andrecommendation changes is now reduced. The earnings coefficient is still positive butno longer significant. Price targets and the strength-of-arguments variable remainsignificant in the direction predicted and the effect of size on price targets remains.Also, as in Table 3, the adjusted R2s for the regressions are much larger whenTGT_REV and STR_ARG are included.Table 6 duplicates Column 5 from Table 5 for all three firm-specific factors, i.e.,
firm size, number of analysts, and market-to-book. Column 1 duplicates Column 5from Table 5, which reports the firm-size cross product terms. Columns 2 and 3substitute number of analysts and market-to-book value as the cross product factorsin the regression. Although there are some small differences depending on which

ARTICLE IN PRESS
Table 6
The market’s reaction to the release of a security analyst report: regression results on earnings forecast
revisions, recommendations, price target revisions, argument strength, affiliation, and firm specific
variables
Predicted sign Size Number of analysts Market–to–book(1) (2) (3)
INTERCEPT ? –0.0214* –0.0226* –0.0198(–1.77) (–1.80) (–1.58)
EARN_REV + 0.1582 0.0878** 0.0387(0.96) (1.83) (1.06)
EARN_REV* FACTORa + –0.0205 –0.0030 0.0113*(–0.85) (–0.66) (1.66)
UP_GR + –0.0863 –0.0016 0.0117(–1.35) (–0.08) (0.65)
UP_GR* FACTORa + 0.0133* 0.0022 0.0024(1.76) (1.44) (0.95)
DOWN_GR – –0.1124 –0.0219 0.0017(–1.50) (–0.79) (0.08)
DOWN_GR* FACTORa – 0.0092 –0.0013 –0.0092***(1.03) (–0.69) (–2.65)
TGT_REV + 0.8402*** 0.3650*** 0.2992***(5.27) (6.26) (5.53)
TGT_REV* FACTORa + –0.0834*** –0.0138*** –0.0130**(–4.16) (–3.24) (–2.34)
STR_ARG + 0.0175* 0.0103*** 0.0115***(1.78) (2.77) (3.66)
STR_ARG* FACTORa + –0.0009 0.0000 –0.0004(–0.74) (0.08) (–1.04)
UND_HLD – 0.0030 0.0047 –0.0048(0.16) (0.51) (–0.60)
UND_HLD* FACTORa – –0.0001 –0.0003 0.0011(–0.05) (–0.63) (1.41)
Adjusted R2 0.3184*** 0.2723*** 0.2618***(16.14) (13.16) (12.50)
N 389 390 389
Notes: This table presents the results of estimating the following regression using ordinary least squares and
SIZE, ANALYSTS, or MKT_BK cross products: CARj,t=a0+a1 EARN_REVj,t+a2UP_GRj,t+a3 -DOWN_GRj,t+a4 TGT_REVj,t+a5 STR_ARGj,t+a6UND_HLDj,t+ej,t, where the variables are defined
as follows: CARj,t, five–day market–adjusted cumulative abnormal return for firm j centered on the report
release date t; EARN_REVj,t, percentage change in the analyst’s projected earnings forecast for firm j at
time t computed as [(earnings forecast at time t/earnings forecast at time t–1) – 1]; UP_GRj,t, a variable
taking on the value 1 for reports issued for firm j at time t that indicate the analyst’s recommendation has
been upgraded, 0 otherwise; DOWN_GRj,t, a variable taking on the value 1 for reports issued for firm j at
time t that indicate the analyst’s recommendation has been downgraded, 0 otherwise; TGT_REVj,t,
percentage change in the analyst’s projected price target for firm j at time t computed as [(price target at
time t/price target at time t–1) – 1]; STR_ARGj,t, a variable computed aggregating the number of positive
remarks less the number of negative remarks related to 14 specific criteria: revenue growth, earnings
growth, new product introductions, new projects, cost efficiencies, expectations met, mergers and
acquisitions, repurchase programs, industry climate, management, international operations, leverage,
competition, and risk; UND_HLDj,t, a variable taking on the value 0 if no relationship between the
analyst’s brokerage and the firm exists, 1 if the brokerage is an underwriter of the firm or has current
holdings in the firm, and 2 if the brokerage is both an underwriter and has current holdings; SIZE, the log
of market value as reported by CRSP; ANALYSTS, the number of analysts following the firm as reported
by Zacks; MKT_BK is the firm’s market–to–book ratio; and ej,t, assumed normally distributed error term
with zero mean and constant variance. # Factor is SIZE in Column 1, Factor is ANALYSTS in Column 2,
and Factor is MKT_BK in Column 3. t–statistics are below the estimated coefficients. * one–tailed
probability o0.10; ** one–tailed probability o0.05; *** one–tailed probability o0.01.
P. Asquith et al. / Journal of Financial Economics 75 (2005) 245–282270
ARTICLE IN PRESS
P. Asquith et al. / Journal of Financial Economics 75 (2005) 245–282 271
firm-specific variable is used in Table 6 (i.e., EARN_REV times MKT_BK issignificant in Column 3 but not Columns 1 and 2) the noteworthy results fromTable 5 hold. TGT_REV and STR_ARG are positive, large, and statisticallysignificant in all three columns. Furthermore, the coefficients for all three factorsinteracted with TGT_REV are negative and statistically significant.
4.3. Other information releases
The analyst literature usually measures the market’s reaction to the release of newinformation by focusing on a short event window centered on a report’s release date.As such, it implicitly assumes that a report provides new and unique information tothe market and is not contemporaneous with other releases. This is not necessarilythe case, however. Analyst reports can simply publicize or reiterate informationalready public (e.g., firms release their own earnings reports, 10-Qs, press releases,etc.). This possibility is not currently considered in the literature.To analyze the question of whether analysts provide new information for our
sample (and by extension for much of the analyst literature), we collect simultaneousinformation events as detailed in Section 3.5. To be conservative, we use a nine-daywindow equal to plus or minus two days around our five-day return window (i.e.,plus or minus four days centered on the report date). We find that otherannouncements take place approximately 53% of the time. After excluding all ofthese possible contemporaneous events, we rerun our analysis on the sample ofanalyst reports that occur independently. (We do not collect information onconference calls that do not result in a press release to the news media.) Table 7(which duplicates Table 3 on this more restrictive sample) reports the results. Theresults are qualitatively similar to those reported in Table 3, and the adjusted R2 forcolumn 5 changes from 0.2529 to 0.2591 despite the large decrease in sample size.That is, removing other simultaneous announcements reinforces our previousconclusions. This result supports the view that many analyst reports provide newinformation or analysis. We also run the regression on the sample of analyst reportsthat has other information releases within the nine-day window. The results, notreported in a table, show that when the complete model is run on this subsample onlythe coefficients TGT_REV and STR_ARG remain significant (0.2217, t=3.31,po0.001 and 0.0130, t=3.17, po0.001) although the adjusted R2 remains at 0.2479.These results highlight that analysts also have a role in interpreting informationreleased from alternative sources.
4.4. The effects of report type
Prior research, along with the CARs in Table 1, Panel C, and columns 2 and 2A ofTables 3 and 7, indicate that the market reacts as predicted to changes inrecommendations, that is, positively to upgrades and negatively to downgrades. Thisholds even when earnings forecast revisions and price target revisions are added asshown in columns 4 and 4A of Tables 3 and 7. However, columns 5 and 5A indicatethat additional information, such as the strength of accompanying arguments,

ARTIC
LEIN
PRES
S
Table 7
The market’s reaction to the release of a security analyst report on the sample with no simultaneous announcements: regression results on earnings forecast
revisions, recommendations, price target revisions, argument strength, and affiliation
Variable Predicted sign (1) (2) (2A) (3) (4) (4A) (5) (5A)
INTERCEPT ? –0.0048 –0.0071 –0.0062 –0.0058 –0.0211(–0.93) (–1.24) (–1.04) (–0.85) (–1.30)
EARN_REV + 0.0310* 0.0507 0.0471*(1.47) (1.41) (1.95)
UP_GR + 0.0497*** 0.0316** 0.0259*(6.19) (2.28) (1.32)
DOWN_GR – –0.0939*** –0.0724*** –0.0589***(–7.33) (–3.33) (–2.62)
Upgrade (a0+a2) + 0.0426*** 0.0258** 0.0048(24.64) (4.40) (0.07)
Downgrade (a0+a3) – –0.1010*** –0.0782*** –0.0800***(43.71) (14.67) (10.72)
TGT_REV + 0.2756*** 0.2123*** 0.1962***(6.43) (4.93) (4.49)
STR_ARG + 0.0067**(2.19)
UND_HLD – 0.0011(0.12)
Adjusted R2 0.0040 0.1717*** 0.1731*** 0.2477*** 0.2591***(2.15) (34.89) (41.41) (16.89) (12.25)
N 285 327 193 193 193
Notes: This table presents the results of estimating the following regression using ordinary least squares: CARj,t=a0+a1 EARN_REVj,t+a2UP_GRj,t+a3 -DOWN_GRj,t+a4 TGT_REVj,t+a5 STR_ARGj,t+a6UND_HLDj,t+ej,t, where the variables are defined as follows: CARj,t, five–day market–adjusted
cumulative abnormal return for firm j centered on the report release date t; EARN_REVj,t, percentage change in the analyst’s projected earnings forecast for
firm j at time t computed as [(earnings forecast at time t/earnings forecast at time t–1) – 1]; UP_GRj,t, a variable taking on the value 1 for reports issued for firm
j at time t that indicate the analyst’s recommendation has been upgraded, 0 otherwise; DOWN_GRj,t, a variable taking on the value 1 for reports issued for
firm j at time t that indicate the analyst’s recommendation has been downgraded, 0 otherwise; TGT_REVj,t, percentage change in the analyst’s projected price
target for firm j at time t computed as [(price target at time t/price target at time t–1) – 1]; STR_ARGj,t, a variable computed aggregating the number of
positive remarks less the number of negative remarks related to 14 specific criteria: revenue growth, earnings growth, new product introductions, new projects,
cost efficiencies, expectations met, mergers and acquisitions, repurchase programs, industry climate, management, international operations, leverage,
competition, and risk; UND_HLDj,t, a variable taking on the value 0 if no relationship between the analyst’s brokerage and the firm exists, 1 if the brokerage is
an underwriter of the firm or has current holdings in the firm, and 2 if the brokerage is both an underwriter and has current holdings; and ej,t, assumed
normally distributed error term with zero mean and constant variance. t–statistics are below the estimated coefficients. F–statistics are below the adjusted R2
and the aggregated coefficient estimates in columns 2A, 4A, and 5A. * one–tailed probability o0.10; ** one–tailed probability o0.05; *** one–tailed
probability o0.01.
P.
Asq
uith
eta
l./
Jo
urn
al
of
Fin
an
cial
Eco
no
mics
75
(2
00
5)
24
5–
28
2272

ARTICLE IN PRESS
P. Asquith et al. / Journal of Financial Economics 75 (2005) 245–282 273
affects upgrades differently from downgrades. In this section, we further investigatethe effects of the information released in an analyst report by conditioning on thedirection of the recommendation revision.Current evidence on whether or not investors tend to place greater reliance on
specific information in an analyst’s report conditional on report type (e.g., upgrade,downgrade, or reiteration) is inconclusive. As stated earlier, Francis and Soffer(1997) find that investors place greater weight on earnings forecast revisions forfavorable reports while Hirst et al. (1995) find that investors are more likely toanalyze other information when reports are unfavorable. Our database allows usto examine this question with a broader set of information than that available toFrancis and Soffer and overcomes the shortcomings associated with an experimentalsetting such as the one employed by Hirst et al. To investigate whether potentialinvestors assess the information contained in security analyst reports conditional onwhether the report is an upgrade, a reiteration, or a downgrade, we estimate thefollowing regression using ordinary least squares:
CARj;t ¼ g0 þ g1 EARN REVj;t þ g2 UP GRj;t þ g3 DOWN GRj;t þ g4 TGT REVj;t
þ g5 STR ARGj;t þ g6 UND HLDj;t þ g7 EARN REVn
j;t UP GRj;t
þ g8 EARN REVn
j;t DOWN GRj;t þ g9 TGT REVn
j;t UP GRj;t
þ g10 TGT REVn
j;t DOWN GRj;t þ g11 STR ARGn
j;t UP GRj;t
þ g12 STR ARGn
j;t DOWN GRj;t þ g13 UND HLDn
j;t UP GRj;t
þ g14 UND HLDn
j;t DOWN GRj;t þ �j;t ð2Þ
Eq. (2) is simply Eq. (1) modified by the addition of eight interaction variablescomputed as EARN_REV* UP_GR, EARN_REV* DOWN_GR, TGT_REV*UP_GR, TGT_REV* DOWN_GR, STR_ARG* UP_GR, STR_ARG*DOWN_GR, UND_HLD* UP_GR, and UND_HLD* DOWN_GR.The intercept, g0, represents an investor’s reaction to a reiteration of a prior
recommendation, controlling for all other information found in the analystreport. Likewise, the coefficient values on EARN_REV (g1), TGT_REV (g4),STR_ARG (g5), and UND_HLD (g6) represent the degree to which an investorreacts to earnings forecast revisions, target revisions, the strength of a report’sarguments, and the affiliation of the brokerage issuing the recommendation for areiteration.Tests of hypotheses about how a report’s type affects investor reaction are based
on the upgrade (UP_GR) and downgrade (DOWN_GR) shift and differentialvariables. For example, a significant negative coefficient on TGT_REV* UP_GRwould indicate that investors place less weight on target revisions for upgrades asrelated to reiterations. The mean coefficients and F-statistics for upgrades as theyrelate to earnings forecast revisions, target revisions, the strength of a report’sarguments, and the affiliation characteristics of the brokerage issuing therecommendation are captured by (g1+g7, EARN_REV+EARN_REV* UP_GR),(g4+g9, TGT_REV+TGT_REV* UP_GR), (g5+g11, STR_ARG+STR_ARG*

ARTICLE IN PRESS
P. Asquith et al. / Journal of Financial Economics 75 (2005) 245–282274
UP_GR), and (g6+g13, UND_HLD+UND_HLD* UP_GR). Similarly, the meancoefficients and F-statistics for downgrades are given by (g1+g8, EARN_-REV+EARN_REV* DOWN_GR), (g4+g10, TGT_REV+TGT_REV*DOWN_GR), (g5+g12, STR_ARG+STR_ARG* DOWN_GR), and (g6+g14,UND_HLD+UND_HLD* DOWN_GR).Table 8 reports the results from estimating Eq. (2) organized by recommendation
revision type. Our sample is now restricted to only analyst reports without othersimultaneous information releases. Results for the entire sample generally showsimilar R2, coefficient size, and significance levels for our variables. Any differenceswill be pointed out in the discussion of results. We find evidence that investors assessthe information contained in security analysts’ reports conditional on whether thereport is an upgrade, a reiteration, or a downgrade. Investors appear most interestedin an analyst’s supporting documentation and affiliation in the case of a downgrade.As expected, both TGT_REV (g4+g10=0.5074, F=19.98, one-tailed po0.01)and STR_ARG (g5+g12=0.0255, F=5.50, one-tailed po0.05) are significantlypositive while UND_HLD is significantly negative (g6+g14=�0.0529, F=2.77, one-tailed po0.05). In the case of reiterations, only TGT_REV (g4=0.1198, t=2.34,one-tailed po0.05) and STR_ARG (g5=0.0081, t=2.40, one-tailed po0.05)are statistically significant. Unlike downgrades, investors do not appear to adjusttheir reaction in response to UND_HLD for reiterations (g6=0.0022, t=0.19,one-tailed p40.10).In contrast to the results observed for downgrades and reiterations, but consistent
with Hirst et al. (1995), investors do not appear to investigate beyond report type inthe case of upgrades. The mean return for upgrades is large, positive, and statisticallysignificant (g0+g2=0.0712, F=6.86, one-tailed po0.01). However, the coefficientestimates for both TGT_REV (g4+g9=�0.0257, F=0.08, one-tailed p40.10) andUND_HLD (g6+g13=�0.0013, F=0.01, one-tailed p40.10) are insignificant. Theonly anomaly in our results is the significantly negative coefficient on STR_ARG forupgrades (g5+g11=�0.0094, F=2.35, one-tailed po0.10), which is the opposite ofour predicted sign. The coefficient for EARN_REV is insignificant for allrecommendation revision types. This is consistent with Tables 3 and 7, which showthat EARN_REV is less significant when a more complete regression, one thatincludes TGT_REV and STR_AGR, is used. When the entire sample is used toestimate the regressions, the coefficient for EARN_REV is positive and statisticallysignificant for downgrades, as predicted.These results lead to the conclusion that investors pay closer attention to the total
content of analyst reports in the case of downgrades and reiterations. This isnot surprising in the case of reiterations since the recommendation level does notcontain much new information. However, investors seem to read downgrade reportsclosely, utilizing more supporting information than in the case of upgrades. Eventhough other information contained in an analyst report beyond the summaryrecommendation is not significant in the case of recommendation upgrades, thecontents of a report are still important for reiterations and downgrades. As shown inTable 1, these two categories constitute 76.6% of all reports issued during oursample period.

ARTIC
LEIN
PRES
S
TABLE 8
The market reaction to the release of a security analyst report:the effects of recommendation revision type on the sample with no simultaneous announcements
Reiterations Upgrades Downgrades
Variable Predicted sign Coefficient t–stat Predicted sign Coefficient F–stat Predicted sign Coefficient F–stat
Intercept ? g0 �0.0235 (–1.20)
Upgrade + g0+g2 0.0712*** (6.86)
Downgrade – g0+g3 0.0454 (0.71)
EARN_REV + g1 0.0199 (0.55) + g1+g7 0.0949 (0.36) + g1+g8 0.0684 (0.47)
TGT_REV + g4 0.1198** (2.34) + g4+g9 –0.0257 (0.08) + g4+g10 0.5074*** (19.98)
STR_ARG + g5 0.0081** (2.40) + g5+g11 –0.0094* (2.35) + g5+g12 0.0255** (5.50)
UND_HLD – g6 0.0022 (0.19) – g6+g13 –0.0013 (0.01) – g6+g14 –0.0529** (2.77)
Adjusted R2 0.3822 ***
F–stat (9.53)
N 193
Notes: This table presents the results of estimating the following regression using ordinary least squares: CARj,t=g0+g1 EARN_REVj,t+g2UP_GRj,t+g3 -DOWN_GRj,t+g4 TGT_REVj,t+g5 STR_ARGj,t+g6UND_HLDj,t+g7 EARN_REVj,t* UP_GRj,t+g8 EARN_REVj,t* DOWN_GRj,t+g9 TGT_REVj,t*
UP_GRj,t+g10TGT_REVj,t* DOWN_GRj,t+g11 STR_ARGj,t* UP_GRj,t+g12 STR_ARGj,t* DOWN_GRj,t+g13UND_HLDj,t* UP_GRj,t+
g14UND_HLDj,t* DOWN_GRj,t+xj,t, where the variables are defined as follows: CARj,t, five–day market–adjusted cumulative abnormal return for firm j
centered on the report release date t; EARN_REVj,t, percentage change in the analyst’s projected earnings forecast for firm j at time t computed as [(earnings
forecast at time t/earnings forecast at time t–1) – 1]; UP_GRj,t, a variable taking on the value 1 for reports issued for firm j at time t that indicate the analyst’s
recommendation has been upgraded, 0 otherwise; DOWN_GRj,t, a variable taking on the value 1 for reports issued for firm j at time t that indicate the
analyst’s recommendation has been downgraded, 0 otherwise; TGT_REVj,t, percentage change in the analyst’s projected price target for firm j at time t
computed as [(price target at time t/price target at time t–1) – 1]; STR_ARGj,t, a variable computed aggregating the number of positive remarks less the
number of negative remarks related to 14 specific criteria: revenue growth, earnings growth, new product introductions, new projects, cost efficiencies,
expectations met, mergers and acquisitions, repurchase programs, industry climate, management, international operations, leverage, competition, and risk;
UND_HLDj,t, a variable taking on the value 0 if no relationship between the analyst’s brokerage and the firm exists, 1 if the brokerage is an underwriter of the
firm or has current holdings in the firm, and 2 if the brokerage is both an underwriter and has current holdings; and ej,t, assumed normally distributed error
term with zero mean and constant variance. t–statistics are to the right of the estimated reiteration coefficients. F–statistics are to the right of the aggregated
coefficient estimates for upgrades and downgrades. The adjusted R2 and associated F–statistic is for the entire regression in Eq. (2). * one–tailed probability
o0.10; ** one–tailed probability o0.05; *** one–tailed probability o0.01.
P.
Asq
uith
eta
l./
Jo
urn
al
of
Fin
an
cial
Eco
no
mics
75
(2
00
5)
24
5–
28
2275

ARTICLE IN PRESS
P. Asquith et al. / Journal of Financial Economics 75 (2005) 245–282276
5. Price target accuracy
Price targets received most of the analyst media coverage prior to the recentemphasis on recommendation levels. Headlines such as ‘‘Price Targets areHazardous to Investors’ Wealth’’ or ‘‘Forget Analysts’ Price Targets. They’reReally Just for Show’’ represent the content of these articles (see the New York
Times, August 5, 2001, p. C1; Forbes, December 11, 2000, p. 288). Skepticism aboutanalysts’ research and the projections they produce has also captured the attentionof members of Congress and the SEC (see ‘‘Is Wall Street Serious AboutReform?’’ Fortune, July 9, 2001, p. 90). As discussed earlier, analysts might bemore likely to issue highly favorable recommendations due to concerns overpersonal compensation, relationships with the analyzed firms’ management, ortheir own firm’s underwriting business. Price targets can be either a way foranalysts to ameliorate the effects of overly optimistic reports or a part of the saleshype used to peddle stocks. In Sections 4.1–4.4, we provide evidence consistent withprice target changes containing important additional information used by investors.This result is especially true for reiterations and downgrades and is proof that themarket reacts to price targets. The question now becomes whether the market should
react to price targets. In this section, we provide some results on price targetaccuracy.A price target is really a combination of several forecasts. First, an analyst must
evaluate the firm’s specific cash flows and risk level. Second, an evaluation of theindustry’s prospects must be completed. Finally, an assessment of the macro-economic factors that affect the overall market must be undertaken. We do notattempt to separate or model these forecasts but examine whether price targets areachieved.Our analysis uses 818 price targets issued over the period 1997–1999. Of this
sample, 796 forecasts are for a price target above the current price. For thissubsample, we consider a price target prediction to be accurate if the analyzed firm’sstock price equals or exceeds the projected price at any time during the 12-monthperiod following the release of a report. Most (but not all) analysts list a 12-monthtime horizon for their price targets. For the remaining 22 targets that forecast pricedecreases, we consider an analyst to be accurate and the target achieved if the stockprice falls below the price target. Table 9, Panel A, presents price target accuracy andthe time necessary to achieve the target categorized by the type of recommendation.For the overall sample, price forecasts are achieved in 54.3% of all cases. Althoughnot broken out in Table 9, price targets below the current price are achieved in 20 ofthe 22 instances.Table 9, Panel B, Column 1 (Target Missed) presents the average percentage of the
price target achieved by the 45.7% of the firms that do not reach the analysts’ pricetarget. The ratio is the maximum price achieved within 12 months divided by theprice target if the price target is set above the current price; it equals the price targetdivided by the minimum price achieved within 12 months if the price target is setbelow the current price. Column 3 (Target Achieved) shows that firms that achievethe price target usually overshoot it by an average of 37% during the 12 months. We

ARTICLE IN PRESS
Table 9
Target achieved in:
Target achieved 1–3 months 4–6 months 7–9 months 10–12 months N
Panel A: Percentage of reports achieving 12–month price targets by recommendation typea
All 54.28 30.81 13.21 5.62 4.64 818Upgrades 57.37 25.50 17.13 7.17 7.57 251Reiterations 50.72 30.93 11.55 5.15 3.09 485Downgrades 65.85 46.34 10.98 3.66 4.88 82
Strong buy 45.12 17.99 17.07 4.57 5.49 328Upgrades 50.00 16.43 20.00 7.14 6.43 140Reiterations 41.49 19.15 14.89 2.66 4.79 188
Buy 57.14 35.48 11.67 7.38 2.62 420Upgrades 66.97 36.70 13.76 11.93 4.59 109Reiterations 54.81 36.67 10.00 6.30 1.85 270Downgrades 46.34 24.39 17.07 2.44 2.44 41
Hold 77.61 61.2 4.48 7.46 4.48 67Upgrades 50.00 50.00 0.00 0.00 0.00 2Reiterations 73.08 53.85 3.85 11.54 3.85 26Downgrades 84.62 69.23 5.13 5.13 5.13 39
Sell 100.00 100.00 0.00 0.00 0.00 1Reiterations 100.00 100.00 0.00 0.00 0.00 1
Strong sell 100.00 50.00 0.00 0.00 50.00 2Downgrades 100.00 50.00 0.00 0.00 50.00 2
Panel B: 12–month price maximums/minimums and predicted price targets (%)b
Target missed N Target achieved N Full Sample N
All 84.38 374 137.27 444 113.09 818Upgrades 88.05 107 130.86 144 112.61 251Reiterations 82.50 239 140.07 246 111.70 485Downgrades 86.37 28 141.59 54 122.74 82
Strong buy 83.20 181 129.30 147 103.86 328Upgrades 87.20 71 127.53 69 107.08 140Reiterations 80.61 110 130.86 78 101.46 188
Buy 85.21 179 141.43 241 117.47 420Upgrades 90.39 35 133.34 74 119.55 109Reiterations 83.61 122 146.48 148 118.07 270Downgrades 85.83 22 133.54 19 107.94 41
Hold 89.00 14 141.76 53 130.74 67Upgrades 66.51 1 176.95 1 121.73 2Reiterations 92.75 7 128.37 19 118.78 26Downgrades 88.34 6 148.41 33 139.17 39
Sell NA NA 131.63 1 131.63 1Reiterations NA NA 131.63 1 131.63 1
Strong sell NA NA 105.64 2 105.64 2Downgrades NA NA 105.64 2 105.64 2
aThis table presents the percentage of reports achieving 12–month price targets. The data are
summarized by recommendation type: strong buy, buy, hold, sell, or strong sell, and by change in
recommendation type: upgrade, reiteration, or downgrade.bThis table presents the average percentage maximum and minimum stock price, as compared to the
stock price on the date of the analyst report, within 12 months. Maximums are calculated if the target price
exceeds the current price and minimums are calculated if the target price is below the current price. The
data are broken up into target missed and target achieved categories.
P. Asquith et al. / Journal of Financial Economics 75 (2005) 245–282 277

ARTICLE IN PRESS
P. Asquith et al. / Journal of Financial Economics 75 (2005) 245–282278
do not consider subsequent price target revisions that could reduce this overshootingpercentage.Although not shown, the probability of achieving a particular target is highly
dependent on the level of optimism exhibited by the analyst. Price targets thatproject a change of 0-10% and 10-20% are achieved 74.4% and 59.6% of the time,respectively. In contrast, price targets that project a change in price of 70% or moreare realized in fewer than 25% of the cases observed.Taken together, Panels A and B of Table 9 show that slightly more than 50% of
the price targets are achieved. When price forecasts are missed, the averagemaximum (minimum) price observed for projected increases (decreases) is 84% ofthe price target. Whether this is a good record of accuracy in a rising market is aconclusion we leave to the reader.
6. Valuation methodology
Most methodologies used in valuing stocks fall into one of three major categories:earnings or cash flow multiples, discounted cash flow (DCF) models, and assetmultiples. Earnings or cash flow multiples used by analysts include price-to-earnings(PE) ratios, relative price-to-earnings (Relative PE) ratios, earnings before interest,tax, depreciation, and amortization (EBITDA) multiples, and revenue multiples.DCF models use estimated discount rates and projected cash flows, and include freecash flow to the firm, free cash flow to equity, and enterprise or economic valueadded (EVA). Analysts use market-to-book value as their asset multiple. We groupall other valuation methodologies under other models. These are usually unique tothe individual analyst and are not recognizable to the readers of modern financetextbooks.The first question we ask in this section is whether the market reacts differently
depending on the valuation methodology employed. We add valuation dummies toEq. (1) and find that these valuation methodologies are insignificant in all ourregressions.5 That is, the market does not react differently depending on thevaluation methodology used by the analyst or whether the analyst uses one or manymethods.6
Next, in Table 10, we examine whether the valuation methodology employedby an analyst affects the probability of achieving a particular target. Thevarious iterations of earnings multiples—PE, relative PE, EBITDA, and revenue
5We run the valuation methodologies as individual dummies, i.e., PE, relative PE, etc., and as major
categories, i.e., earnings multiples, DCF, asset multiples, and other. We do not report these results but they
are available upon request.6As business school professors who teach DCF as the superior valuation method, we find this result
disappointing. The methodology is either being misapplied or it is not significant. It is possible that a
number of analysts use a DCF model to predict prices but translate this into earnings multiples for the text
of their report. However, Black (1999) surveys analysts and finds that only 15.2% report using present
value methods. This is in line with the 12.8% reported in Table 1, Panel A.

ARTICLE IN PRESS
Table 10
Percentage of reports achieving 12–month price targets by valuation methodology
Target achieved in
Target achieved 1–3 months 4–6 months 7–9 months 10–12 months N
All
Price–to–earnings 54.36 31.10 13.02 6.70 3.54 791
Relative price–to–earnings 53.03 27.58 14.84 6.07 4.54 330
EBITDA 48.39 25.35 11.06 6.91 5.07 245
Revenue multiples 55.05 24.77 17.44 8.25 4.59 109
Discounted cash flow 52.34 24.30 16.83 6.54 4.67 107
EVA 35.00 25.00 5.00 5.00 0.00 20
Price–to–book 45.45 22.72 10.10 8.08 4.55 198
Other models 37.21 18.61 9.30 6.97 2.33 43
Upgrades
Price–to–earnings 57.61 25.92 17.70 10.29 3.70 243
Relative price–to–earnings 53.03 21.97 16.67 9.84 4.55 132
EBITDA 53.93 21.35 15.73 11.23 5.62 89
Revenue multiples 50.00 14.29 28.57 7.14 0.00 14
Discounted cash flow 52.78 11.11 25.00 13.89 2.78 36
EVA 33.33 0.00 0.00 33.33 0.00 3
Price–to–book 59.32 22.03 22.04 8.47 6.78 59
Other models 63.64 18.19 18.18 27.27 0.00 11
Reiterations
Price–to–earnings 51.07 31.63 10.89 5.34 3.21 468
Relative price–to–earnings 48.82 27.06 14.11 3.53 4.12 170
EBITDA 36.27 18.62 8.83 3.92 4.90 102
Revenue multiples 59.77 27.59 17.24 9.19 5.75 87
Discounted cash flow 46.43 21.43 14.29 3.57 7.14 56
EVA 28.57 21.43 7.14 0.00 0.00 14
Price–to–book 37.80 21.26 4.73 8.66 3.15 127
Other models 17.86 10.72 3.57 0.00 3.57 28
Downgrades
Price–to–earnings 63.75 43.75 11.25 3.75 5.00 80
Relative price–to–earnings 78.57 57.14 10.72 3.57 7.14 28
EBITDA 76.92 65.38 3.85 3.84 3.85 26
Revenue multiples 12.50 12.50 0.00 0.00 0.00 8
Discounted cash flow 73.32 66.66 6.66 0.00 0.00 15
EVA 66.67 66.67 0.00 0.00 0.00 3
Price–to–book 58.33 41.66 8.34 0.00 8.33 12
Other models 75.00 50.00 25.00 0.00 0.00 4
Notes: This table presents the percentage of reports achieving 12-month price targets and a break down of
how quickly the price target is achieved. The data are summarized by valuation methodology; Price-to-
earnings, ratio of current stock price divided by current EPS; Relative price-to-earnings, Price-to-earnings
multiple relative to a stock or industry index; EBITDA, multiple of earnings before interest, taxes,
depreciation, and amortization; Revenue multiples, multiples of company revenue; Discounted cash flow,
model calculating the present value of predicted future cash flow; EVA, enterprise value added model
discounting predicted future cash flow; Price-to-book, current stock price divided by stock book value;
and Other models, other models not mentioned above, i.e., those specific to investment bank, industry
analysis, or analyst.
P. Asquith et al. / Journal of Financial Economics 75 (2005) 245–282 279

ARTICLE IN PRESS
P. Asquith et al. / Journal of Financial Economics 75 (2005) 245–282280
multiples—are fairly consistent in accuracy. The percentage of target prices achievedranges from 48.4% for EBITDA multiples to 55.1% for revenue multiples. Note that99% of analyst reports in our sample use PE multiples. The accuracy of DCF modelsfalls within this range, with 52.3% of target prices achieved. Price-to-book modelsare slightly less accurate at 45.5%. Analysts are least successful in predicting targetprices when they use EVA or other models, that is, when the analyst employs a‘‘unique’’ method that is not used by other analysts or covered in most valuationtextbooks. The number of analysts that use these other models, however, is muchlower than for any other category.
7. Conclusion
This paper first describes the content of security analyst reports and then examinesthe reaction of the market to all the elements of those reports. Using a databaseconstructed from security analyst reports issued over the period 1997–1999, wereplicate prior research that earnings forecast revisions and recommendationrevisions are significantly and positively associated with the market’s reaction atthe time a security analyst report is released. Next, we examine price targets and findthat the market reaction to price target revisions is stronger than that of an equalpercentage change in earnings forecasts. Price target revisions also contain newinformation even in the presence of earnings revisions and stock recommendations.In addition, the adjusted R2 on our models increases measurably when price targetchanges are added.We then investigate the strength of an analyst’s argument by examining the
justifications provided in an analyst report. These justifications provide significantinformation to the market both individually and in aggregate. Furthermore, thesignificance of the market’s reaction associated with changes in earnings forecasts isreduced (in some models below standard statistical cutoffs) when proxies for thestrength of an analyst’s arguments and the price target revisions are included in theregression models.By examining information releases that occur contemporaneously with the analyst
report, we find that approximately half of our reports contain new information notpreviously released. The market reacts to all of the elements of these reports asdescribed above. For those reports that occur with other information releases, themarket reacts to the analyst price targets and to the justifications provided. Thissuggests that analyst reports have a role in interpreting information from othersources. Future studies of analyst reports should consider whether they contain newor merely interpretive information.We also examine how investors assess the information contained in security
analyst reports conditional on whether the report is an upgrade, a reiteration, or adowngrade. We find that investors place the greatest reliance on the content of asecurity analyst report when it is a downgrade. For reiterations, the only elementsthat matter are target prices and the justifications given. For upgrades, none of theelements are important statistically.

ARTICLE IN PRESS
P. Asquith et al. / Journal of Financial Economics 75 (2005) 245–282 281
Finally, we provide an examination of the accuracy of price targets and theimportance of valuation methodology. We find that approximately 54% of analysts’price targets are achieved within 12 months. When the target is missed, the averagemaximum (minimum) price observed for projected increases (decreases) is 84% ofthe price target. We fail to observe any systematic association between the valuationmethod employed by an analyst and either the market’s reaction or the probabilityof achieving a price target.In summary, the addition of both target prices and analyst justifications are
important in explaining the market’s reaction to analyst reports. The market reactspositively and significantly to these two sources of information regardless of whatother report elements are considered and regardless of whether other information isannounced contemporaneously. Their inclusion significantly increases the adjustedR2 of all of the models employed.
References
Abdel-khalik, A., Ajinkya, B., 1982. Returns to informational advantages: the case of analysts’ forecast
revisions. The Accounting Review 57, 661–680.
Barber, B., Lehavy, R., McNichols, M., Trueman, B., 2001. Can investors profit from the prophets?
Security analyst recommendations and stock returns. The Journal of Finance 56, 531–563.
Beneish, M., 1991. Stock prices and the dissemination of analysts’ recommendations. Journal of Business
64, 393–416.
Bjerring, J., Lakonishok, J., Vermaelen, T., 1983. Stock prices and financial analysts’ recommendations.
Journal of Finance 38, 187–204.
Black, S., 1999. A study of financial analysts: practice and theory. Financial Analysts Journal 55, 86–95.
Bradshaw, M., 2002. The use of target prices to justify sell-side analysts’ stock recommendations.
Accounting Horizons 16 (1), 27–41.
Bradshaw, M., Brown, L., 2002. An examination of sell-side analysts’ abilities to predict target prices.
Unpublished working paper, Harvard University.
Brav, A., Lehavy, R., 2003. An empirical analysis of analysts’ target prices: short-term informativeness
and long-term dynamics. Journal of Finance 58, 1933–1967.
Elton, E., Gruber, M., Grossman, S., 1986. Discrete expectational data and portfolio performance.
Journal of Finance 41, 699–713.
Francis, J., Soffer, L., 1997. The relative informativeness of analysts’ stock recommendations and earnings
forecast revisions. Journal of Accounting Research 35 (No. 2), 193–211.
Hirst, E., Koonce, L., Simko, P., 1995. Investor reactions to financial analysts’ research reports. Journal of
Accounting Research 33 (No. 2), 335–351.
Liu, P., Smith, S., Syed, A., 1990. Stock price reactions to the Wall Street Journal’s securities
recommendations. Journal of Financial and Quantitative Analysis 25, 399–410.
Lloyd-Davies, P., Canes, M., 1978. Stock prices and the publication of second-hand information. Journal
of Business 51, 43–56.
Lys, T., Sohn, S., 1990. The association between revisions of financial analysts’ earnings forecasts and
security price changes. Journal of Accounting and Economics 13, 341–363.
Michaely, R., Womack, K., 1999. Conflict of interest and the credibility of underwriter analyst
recommendations. The Review of Financial Studies 12, 653–686.
Mikhail, M., Walther, B., Willis, R., 2004. Do security analysts exhibit persistent differences in stock
picking ability? Journal of Financial Economics, Article in press.
Previts, G., Bricker, R., Robinson, T., Young, J., 1994. A content analysis of sell-side financial analyst
company reports. Accounting Horizons 8 (No. 2), 55–70.

ARTICLE IN PRESS
P. Asquith et al. / Journal of Financial Economics 75 (2005) 245–282282
Stickel, S., 1991. Common stock returns surrounding earnings forecast revisions: more puzzling evidence.
The Accounting Review 66, 402–416.
Stickel, S., 1992. Reputation and performance among security analysts. The Journal of Finance 47,
1811–1836.
Stickel, S., 1995. The anatomy of the performance of buy and sell recommendations. Financial Analysts
Journal 51, 25–39.
Womack, K., 1996. Do brokerage analysts’ recommendations have investment value? The Journal of
Finance 51, 137–168.