ziff davis analyst day 2021 presentation
TRANSCRIPT

www.ziffdavis.com©2021 Ziff Davis. All right reserved. 1
ANALYST DAY
September 9, 2021
www.ziffdavis.com©2021 Ziff Davis. All right reserved.

www.ziffdavis.com©2021 Ziff Davis. All right reserved.
Safe Harbor for Forward-looking Statements
2
Certain statements in this presentation are “forward-looking statements” within the meaning of the Private
Securities Litigation Reform Act of 1995, particularly those regarding our 2021 Financial Guidance. Such
forward-looking statements are subject to numerous assumptions, risks and uncertainties that could
cause actual results to differ materially from those described in those statements. Readers should
carefully review the Risk Factors slide of this presentation. These forward-looking statements are based
on management’s expectations or beliefs as of September 9, 2021 as well as those set forth in our
Annual Report on Form 10-K filed by us on March 1, 2021 with the Securities and Exchange Commission
(“SEC”) and the other reports we file from time to time with the SEC. We undertake no obligation to
revise or publicly release any updates to such statements based on future information or actual results.
Such forward-looking statements address the following subjects, among others:
• Future operating results
• Ability to acquire businesses on acceptable terms and integrate and recognize synergies from
acquired businesses
• Deployment of cash and investment balances to grow the company
• Subscriber growth, retention, usage levels and average revenue per account
• Cloud service and digital media growth
• International growth
• New products, services, features and technologies
• The form, terms, timing and ability to complete the proposed spin-off transaction or the sale of the
B2B Backup business.
• Corporate spending including stock repurchases
• Intellectual property and related licensing revenues
• Liquidity and ability to repay or refinance indebtedness
• Systems capacity, coverage, reliability and security
• Regulatory developments and taxes
All information in this presentation speaks as of September 9, 2021 and any redistribution or rebroadcast
of this presentation after that date is not intended and will not be construed as updating or confirming
such information.
Industry, Market and Other Data
Certain information contained in this presentation concerning our industry and the markets in
which we operate, including our general expectations and market position, market opportunity and market
size, is based on reports from various sources. Because this information involves a number of
assumptions and limitations, you are cautioned not to give undue weight to such information. We have not
independently verified market data and industry forecasts provided by any of these or any other third-party
sources referred to in this presentation. In addition, projections, assumptions and estimates of our future
performance and the future performance of the industry in which we operate are necessarily subject to a
high degree of uncertainty and risk due to a variety of factors. These and other factors could cause results
to differ materially from those expressed in the estimates made by third parties and by us.
Pro Forma Financial Information
Unless otherwise specified, all financial data and operating metrics presented herein for Ziff Davis
are presented on a pro forma (“PF”) basis giving effect to the reorganization and the separation of
Consensus Cloud Solutions, Inc. as described in the Form 10 filed by Consensus with the Securities and
Exchange Commission.
Non-GAAP Financial information
Included in this presentation are certain financial measures that are not calculated in accordance
with U.S. generally accepted accounting principles ("GAAP") designed to supplement, and not substitute,
Ziff Davis’s financial information presented in accordance with GAAP. The non-GAAP measures as
defined by Ziff Davis may not be comparable to similar non-GAAP measures presented by other
companies. The presentation of such measures, which may include adjustments to exclude unusual or
non-recurring items, should not be construed as an inference that Ziff Davis’s future results or leverage will
be unaffected by other unusual or non-recurring items. Please see the appendix to this presentation for
how we define these non-GAAP measures, a discussion of why we believe they are useful to investors
and certain limitations thereof, and reconciliations thereof to the most directly comparable GAAP
measures.
Third Party Information
All third-party trademarks, including names, logos and brands, referenced by the Company in this
presentation are property of their respective owners. All references to third-party trademarks are for
identification purposes only and shall be considered nominative fair use under trademark law.

www.ziffdavis.com©2021 Ziff Davis. All right reserved.
Risk FactorsThe following factors, among others, could cause our business, prospects, financial condition, operating results and cash flows to be
materially adversely affected:
• Competition from others with regard to price, service, content and functionality
• Inadequate intellectual property (IP) protection, expiration, invalidity or loss of
key patents, violations of 3rd party IP rights or inability or significant delay in
monetizing IP
• Inability to continue to expand our business and operations internationally
• Inability to maintain required services on acceptable terms with financially stable
telecom, co-location and other critical vendors; and inability to obtain telephone
numbers in sufficient quantities on acceptable terms and in desired locations
• Level of debt limiting availability of cash flow to reinvest in the business; inability
to repay or refinance debt when due; and restrictive covenants relating to debt
imposing operating and financial restrictions on business activities or plans
• Inability to maintain and increase our customer base or average revenue per
user
• Inability to achieve business or financial results in light of burdensome
telecommunications, internet, advertising, health care, consumer, privacy or
other regulations, or being subject to existing regulations
• Inability to adapt to technological change and diversify services and related
revenues at acceptable levels of financial return
• Loss of services of executive officers and other key employees
• Other factors set forth in our Annual Report on Form 10-K filed by us on March
1, 2021 with the SEC and the other reports we file from time to time with the
SEC
• Our plan to separate into two independent publicly traded companies is subject
to various risks and uncertainties. It may not achieve some or all of the
anticipated benefits. It may not be completed in accordance with the expected
plans or anticipated timeline, or at all, and will involve significant time and
expense, which could disrupt or adversely affect our business.
• Inability to sustain growth or profitability, and any related impact of U.S. or
worldwide economic issues on customer acquisition, retention and usage levels,
advertising spend and credit and debit card payment declines
• Inability to acquire businesses on acceptable terms or successfully integrate and
realize anticipated synergies
• Failure to offer compelling digital media content causing reduced traffic and
advertising levels; loss of advertisers or reduction in advertising spend;
increased prevalence or effectiveness of advertising blocking technologies;
inability to monetize handheld devices and handheld traffic supplanting
monetized traffic; and changes by our vendors or partners that impact our traffic
or publisher audience acquisition and/or monetization
• New or unanticipated costs and/or fees or tax liabilities, including those relating
to federal and state income tax and indirect taxes, such as sales, value-added
and telecommunications taxes
• Inability to manage certain risks inherent to our business, such as fraudulent
activity, system failure or a security breach; inability to manage reputational risks
associated with our businesses
3

www.ziffdavis.com©2021 Ziff Davis. All right reserved.
Agenda
4
Company Overview | Vivek Shah, Chief Executive Officer
Acquisition System | Sean Alford, Senior Vice President
Technology, Shopping & Entertainment | Steve Horowitz, Division President
Health & Wellness | Dan Stone, Division President
Cybersecurity & Martech | Nate Simmons, Division President
Sustainability & Responsibility | Darrah Feldman, Vice President
Live Q&A

www.ziffdavis.com©2021 Ziff Davis. All right reserved. 5
Ziff Davis

www.ziffdavis.com©2021 Ziff Davis. All right reserved.
Experts in Digital Transformation & Creators of Premium Content & Tools
Highly Recurring Revenues Across Advertising & Subscription Businesses
Disciplined Capital Allocators with a Proven Track Record
Systematic & Repeatable Acquisition System Supporting Long-Term Growth
Portfolio of Digital Media & Internet Brands in High-Value Verticals
Strong Growth, Profitability & Free Cash Flow Fundamentals
Investment Highlights
6

www.ziffdavis.com©2021 Ziff Davis. All right reserved.
’17-’21 CAGR
17%Shopping $35
17% Health &
Wellness$11
24%Technology $32
14%Entertainment $16
Participants in the Highest-Value, Fastest-Growing Verticals on the Internet
• Leadership positions in categories that collectively
represent 50%+ of U.S. digital ad spending
7
• 55% of business leaders plan to increase their
security budgets in the next year2
• 69% of marketers expect marketing technology
investments to increase next year3
Source: eMarketer, internal estimates. Note: Metrics are for the U.S. Digital Media market.
1. ’18-21 CAGR.
2. PwC.
3. CMO Council.
12%Martech $21
14%Cybersecurity $33
’21 Digital
Ad Spend ($B)
’17-’21 CAGR’21 TAM ($B)
1

www.ziffdavis.com©2021 Ziff Davis. All right reserved.
Experts in Digital TransformationZiff Davis has an established platform and playbook that takes advantage of the secular shift from analog to digital
8
Ziff Davis Advantage
Deep bench
of digital
executives
Superior
monetization
of audiences
Proprietary
tech platforms
for scale
& efficiency
Returns-based
resource
allocation
Secular Shifts

www.ziffdavis.com©2021 Ziff Davis. All right reserved.
Shopping MartechEntertainment
• Editorial content that informs important decisions
• Actionable reviews, recommendations and “how to” articles
• Service journalism that shapes purchase intent
Content
Tools
Brands
Select Examples
Monthly U.S.
Unique Visitors
Total Social
Followers
Annual
Video Views
Annual
GMV
Annual
Page Views
Annual
Emails Sent
Total App
Installs
Subscribers
100MM1
135MM
1B $4.8B+27B
73B
664MM2.4MM
Key Metrics
• Apps to measure and improve broadband
• End-to-end protection against cybersecurity threats
• Full marketing technology suite to acquire and engage customers
Tech CybersecurityHealth &
Wellness
High-Quality Content and Widely-Adopted Tools
91. Comscore June 2021.

www.ziffdavis.com©2021 Ziff Davis. All right reserved.
$473MM
Subscription Revenue(Q2’21 TTM)
$758MM
Advertising Revenue(Q2’21 TTM)
BUSINESS
MODELS
Robust and Balanced Monetization Formula
10

www.ziffdavis.com©2021 Ziff Davis. All right reserved.
Intent-Driven
Advertising
2.1K+Advertisers1
(Q2’21 TTM)
$345KRevenue per Advertiser
(Q2’21 TTM)
$4.8B+Annual GMV
Participants in the most valuable categories where intent volume and yield are highest
Actionable reviews, recommendations, how to’s, rankings, etc.
Direct advertising and merchant relationships that drive the best price, deal and offer for
the user
Future-proofed from third-party cookie phaseout in 2023+ as nearly all of Ziff Davis’s
customer insights are first-party sourced
Authoritative editorial content and tools that instills confidence for important decisions
Advertising: An Intent-Driven Model
111. This excludes advertisers that generated less than $10,000 of revenue on a Q2’21 TTM basis.

www.ziffdavis.com©2021 Ziff Davis. All right reserved.
$482$529
$623
$758
2018 2019 2020 Q2'21 TTM
Advertising Revenue($ in MM)
Advertising: High Growth and SaaS-Like Revenue RetentionOur advertising model is recurring in nature
1. Net Advertising Revenue Retention = (Amount Spent by Prior Year Advertisers in Current Year Period (exclude revenue from acquisitions during the stub period)) / (Amount Spent by Prior Year
Advertisers in Prior Year Period (exclude revenue from acquisitions during the stub period)). Excludes advertisers that generated less than $10,000 of revenue on a Q2’21 TTM basis.
106%
Net Advertising
Revenue Retention1
20%
2018 – 2021 TTM
Revenue CAGR
12

www.ziffdavis.com©2021 Ziff Davis. All right reserved.
Cybersecurity Indie Gaming Connectivity Retail Martech
Technology Entertainment Technology Shopping
Strong Track Record of Expanding into Subscription AdjacenciesWe leverage audience reach, traffic insights and domain expertise in existing verticals to actively pursue subscription adjacencies
Select ExamplesExisting Verticals
Subscription Adjacency
13

www.ziffdavis.com©2021 Ziff Davis. All right reserved.
38% Subscription Revenue
as % of Total Revenue
• Consumer/SOHO subscriptions to access content
& services
• Customer acquisition predominantly via online
sales
• Recurring and ongoing data-as-a-service and IP
licensing
• Customer acquisition predominantly via channel
and direct sales
• SMB and Enterprise subscriptions to access
and use content, tools and services
• Customer acquisition via online, channel and
direct sales
B2B Subscriptions B2C Subscriptions
$16Monthly
ARPS
2.4MMTotal
Subscribers
Other Recurring Licensing
Subscriptions: A Proven and Durable Model
2.3MMConsumer Subscribers
46%of Total Subscription Revenue
18KCustomers
23%of Total Subscription Revenue
101KBusiness Subscribers
31%of Total Subscription Revenue
14
1 1 1
1
2 2 2
2 3
1. TTM Monthly Average as of June 30, 2021.
2. Percentage for the TTM ended June 30, 2021. 3. Monthly ARPS = TTM Subscription Revenue / TTM Average Monthly Subscribers / 12.

www.ziffdavis.com©2021 Ziff Davis. All right reserved.
Subscription Revenue($ in MM)
1. “Churn Rate” = A / B. A = (average revenue per subscription in the prior month) x (number of cancels in current month), calculated at each business and aggregated*. B = subscription revenue in the
current month, calculated at each business and aggregated. Churn rate is presented for the period Q2’21. *For Ookla, this is calculated by taking the sum of the monthly revenue from the specific
cancelled agreements.
Subscription: A Consistent Growth EngineOur subscription model supports strong customer retention
21%
2018 – 2021 TTM
Revenue CAGR
2.5%
Churn Rate1
15
$294
$418$445
$473
2018 2019 2020 Q2'21 TTM

www.ziffdavis.com©2021 Ziff Davis. All right reserved. 16
Capital
Expenditures
Mergers &
Acquisitions
Share
Repurchases
Capital Allocation
➢20% IRR Hurdle
➢Investments
Ranked by Risk
and Return
Capital Allocation Framework Maximizes Shareholder Value
$300MM
Cumulative
Capital Expenditures
(2013 – 2021 YTD)
1. This assumes that $49MM of the 1H JCOM CapEx is attributed to Ziff Davis.
2. Includes Acquisitions from 2013 through June 2021, plus the Ziff Davis acquisition from 2012. This reflects only the businesses that will comprise the Ziff Davis portfolio following the spin of
Consensus and excludes divested businesses, assets held for sale, and assets that will travel with the spin of Consensus.
1
$2.7B
Cumulative
M&A Spend
(2013 – 2021 YTD)
2
$320MM
Cumulative
Share Repurchases
(2013 – 2021 YTD)
$73 / Share
VWAP of
Share Repurchases
(2013 – 2021 YTD)

www.ziffdavis.com©2021 Ziff Davis. All right reserved.
An M&A System Driven by Core Principles
Digital
Transformation
Large and
Growing Verticals
Platform-Based
Value Creation
Focus on
Free Cash Flow
Lower Middle
Market
Patience and
Discipline
17

www.ziffdavis.com©2021 Ziff Davis. All right reserved.
Historical PF Revenue & PF Adj. EBITDA
18
Ziff Davis’s historical PF revenue and PF Adj. EBITDA reflects its pro forma position following the separation of Consensus
($ in MM) 2018 2019 2020 2021
’18-’21
CAGR
Revenues $785 $965 $1,090 $1,382 21%
PF Adj. EBITDA $251 $318 $387 $488 25%
PF Adj. EBITDA Margin 32% 33% 35% 35%
Note: See Appendix for reconciliation of non-GAAP financial information.
1. Based on midpoint of guidance.
1

www.ziffdavis.com©2021 Ziff Davis. All right reserved.
($ in MM) 2020 2021 Growth 2020 2021 Growth 2020 2021 Growth
Organic Revenue $232 $253 9% $232 $279 20% $464 $533 15%
Acquired Revenue -- $46 -- $51 -- $97
Total Revenue $232 $299 29% $232 $330 42% $464 $629 36%
PF Adj. EBITDA $62 $98 59% $77 $114 49% $138 $212 53%
PF Adj. EBITDA Margin 27% 33% 33% 35% 30% 34%
YTD Financials
19
1. Defined as any revenue in the respective periods derived from businesses acquired in the last 12 months. Revenue from an acquired business becomes organic revenue in the first month in which
we can compare a full month in the current year against a full month under our ownership in a prior year (i.e., the 12 months measurement period for acquired revenue starts with the first full month
under our ownership).
1
Q1 Q2 1H

www.ziffdavis.com©2021 Ziff Davis. All right reserved.
($ in MM) Low Midpoint High Low Midpoint High Low Midpoint High
Revenues $1,375 $1,382 $1,389 $347 $350 $353 $1,722 $1,732 $1,742
EBITDA $475 $479 $483 $220 $221 $222 $695 $700 $705
(+/-) Shared Overhead Savings $9 $9 $9 ($9) ($9) ($9)
(-) Full Year Dissynergy Costs ($10) ($10) ($10)
PF Adj. EBITDA $484 $488 $492 $201 $202 $203
2021 Guidance (Forward-Looking Statements)Ziff Davis’s 2021 guidance reflects its pro forma position following the separation of Consensus
1. Figures are adjusted non-GAAP, and exclude our Consensus, B2B Backup and UK Voice businesses. The Company has not reconciled the non-GAAP Adjusted EBITDA to the most directly
comparable GAAP measure because this cannot be done without unreasonable effort due to the variability with respect to forecasted revenues and costs primarily related to acquisitions and taxation.
2. Annual pro forma savings of previously shared corporate overhead and operating expenses that will be eliminated in connection with the separation.
20
2
1

www.ziffdavis.com©2021 Ziff Davis. All right reserved.
2.0xGross Leverage
1.3xNet Leverage
(Cash Only)
0.6xNet Leverage
(Including all Cash & Investments)
$360MMCash
$340MMInvestments
Ziff Davis Estimated Capitalization Post Spin
Cash & Investments
at Close1
Debt at Close
Credit Statistics2
$1BGross Debt
1. Includes expected balance sheet cash in addition to expected proceeds from the sale of B2B backup, investment in Welltok, investment in OCV and the expected value of the Consensus retained stake. Estimated as of the end of Q3’21.
2. Ratios calculated based off of the midpoint of 2021 PF Adj. EBITDA guidance.
21
$300MMNet Debt
(Including all Cash & Investments)
$640MMNet Debt(Cash Only)

www.ziffdavis.com©2021 Ziff Davis. All right reserved. 22
Acquisition System

www.ziffdavis.com©2021 Ziff Davis. All right reserved.
1. Includes acquisitions from 2013 through June 2021, plus the Ziff Davis acquisition from 2012. This reflects only the businesses that will comprise the Ziff Davis portfolio following the spin of
Consensus and excludes divested businesses, assets held for sale, and assets that will travel with the spin of Consensus.
Acquisition System
23
Sean Alford
SVP, Corporate Development
Background
• Proskauer Rose
• Comcast / NBCUniversal
A structured and repeatable system designed for speed,
efficiency, conviction and consistency in results
72Acquisitions1
Recent Transactions
By the Numbers
~$2.7BCapital Deployed1
500+Deals Assessed
Annually
10Deal Professionals

www.ziffdavis.com©2021 Ziff Davis. All right reserved.
Transaction Types
Acquisitions are Our Strategic Advantage
24
Obsess over free cash flow
Lean in where we uniquely create value
Embrace the debate
Exercise discipline
Support backable executives
Prioritize by expected risk and return
M&A Philosophy
Act quickly when conviction is high
Public Companies
Growth Distressed
TUCK-IN ACQUISITIONS
DomesticNorth
AmericaROW
Cash Flywheel
PLATFORM ACQUISITIONS
Corporate Carveouts
Closely Held
Sponsor-Backed
DIVESTITURES
STRATEGIC TRANSACTIONS

www.ziffdavis.com©2021 Ziff Davis. All right reserved.
Flywheel Advantage
Access to capital, operating talent, sector expertise and transaction expertise
creates a virtuous cycle
Sourcing Network
Culture of M&A and competition for resources results in a high volume of
prospective targets from across the organization
Programmatic Review Process
Systematic gates and checkpoints ensure that only the best opportunities make it
to close
Disciplined Deal-Making
Adherence to valuation discipline and a focus on free cash flow results in outsized
internal rates of return on investments
Operational Enhancements
Operational infrastructure and sector expertise unlock synergy advantages that
differentiate us from other buyers
Efficiency in Execution
Volume and repetition has allowed us to calibrate our process to reduce friction
and increase conviction
Efficiency
In Execution
Flywheel
Advantage
Sourcing
Network
Programmatic
Review
Process
Disciplined
Deal-Making
Operational
Enhancements
M&A Toolkit Designed for Speed, Efficiency and ConvictionUnique combination of a systematized process, transaction expertise, operator know-how and access to capital drives a high-velocity
program that yields attractive returns
25

www.ziffdavis.com©2021 Ziff Davis. All right reserved.
Year of Acquisition:
Purchase Price / Synergized EBITDA:
2017
3.2x
Year of Acquisition:
Purchase Price / Synergized EBITDA:
2016
4.6x
Year of Acquisition:
Purchase Price / Synergized EBITDA:
2014
3.6x
Year of Acquisition:
Purchase Price / Synergized EBITDA:
2015
3.0x
Year of Acquisition:
Purchase Price / Synergized EBITDA:
2019
4.6x
Year of Acquisition:
Purchase Price / Synergized EBITDA:
2018
4.0x
A Track Record of Unlocking Synergies
26
Note: Purchase Price / Synergized EBITDA ratios are based on full acquisition price (including earnouts) and the EBITDA contribution of the applicable business as of 12/31/2020.
1. Reflects original EHG asset acquired in 2016 (which excludes PRIME Education, Health eCareers, BabyCenter, and others).
1

www.ziffdavis.com©2021 Ziff Davis. All right reserved.
$276 $170
$399
$210
$339
$426
$481
$94
$311
$587$757
$1,156$1,366
$1,704
$2,130
$2,611 $2,705
2013 2014 2015 2016 2017 2018 2019 2020 2021 (1H)
M&A Spend Over Time($ in MM)
In-Period M&A Spend1
Cumulative M&A Spend1
1. Includes Acquisitions from 2013 through June 2021, plus the Ziff Davis acquisition from late 2012, which is included in the 2013 column. This reflects only the businesses that will comprise the Ziff
Davis portfolio following the spin of Consensus and excludes divested businesses, assets held for sale, and assets that will travel with the spin of Consensus.
2. Based on midpoint guidance.
3. Based on Q2’21 TTM revenue.
A Steady & Repeatable System that Drives Consistent GrowthZiff Davis today represents a collection of businesses that have been acquired and enhanced since 2013
27
~$2.7BCumulative M&A Spend
~35%2021E EBITDA Margin
~$1.4B2021E Revenue
11
$188 $256 $354
$449
$656 $785
$965 $1,090
$1,382
2013 2014 2015 2016 2017 2018 2019 2020 2021
2
CAGR
+28%
PF Revenue($ in MM)
6 6 7 11 11 10 3810 1.7x 2.1x 2.6x 2.1x 2.2x 2.2x 2.2x32.4x2.3x
No. of Acquisitions
Cumulative M&A Spend / Revenue Ratio

www.ziffdavis.com©2021 Ziff Davis. All right reserved. 28
Technology, Shopping & Entertainment

www.ziffdavis.com©2021 Ziff Davis. All right reserved.
Steve Horowitz
Division President
Background
• Bankrate
• AOL
• Yahoo
Key Verticals & Brands
By the Numbers
Trusted content and tools that help customers research, decide and
act on important decisions in the largest categories in digital media
25% Revenue CAGR
since 2013
$681MMQ2’21 TTM
Revenue
$283MMQ2’21 TTM
EBITDA1
520MM+Average O&O
Monthly Visits
Technology EntertainmentShopping
• GeoCities
• Bertelsmann
• Turner Broadcasting
Technology, Shopping & Entertainment
29
1. The Company has not reconciled the non-GAAP Adjusted EBITDA for the divisional EBITDAs in this presentation to the most directly comparable GAAP measure because this cannot be done without unreasonable effort due to
the pro forma nature of the historical presentations and the fact that these divisions have historically had commingled operating costs, both across divisions and between divisions and business that have been excluded from the
historical presentation due to divestitures and the separation. The Company expects to provide such reconciliations when presenting non-GAAP Adjusted EBITDA for its divisions following the completion of the separation.

www.ziffdavis.com©2021 Ziff Davis. All right reserved.
1. eMarketer.
2. IJSCSEIT.
3. U.S. Department of Commerce.
4. WSJ.
30
$12 $14 $13 $16
$24 $27 $28
$35
$18
$22 $26
$32
$54
$63 $67
$83
2018 2019 2020 2021
Digital Ad Spending in the U.S.1
($ in B)Our $83B Market Opportunity
$32B
$35B
$16B
U.S. Digital Ad Spend in Telecom & Electronics
● #4 and #5 overall U.S. digital ad categories
● 75B Connected IoT devices expected by 2025,
+25% CAGR from 20202
U.S. Digital Ad Spend in Retail
● #1 overall U.S. digital ad category
● eCommerce accounted for 14% of all U.S.
transactions in Q4’20, up 32% YoY3
U.S. Digital Ad Spend in Entertainment & Media
● #8 and #9 overall U.S. digital ad categories
● 1B+ Streaming subscriptions globally4
Entertainment
Shopping
Tech & Telecom
Largest Ad Categories in Digital Media, Accounting for 50%+ of Total U.S. Digital Media Ad Spending1

www.ziffdavis.com©2021 Ziff Davis. All right reserved.
$124, 96%
$479, 72%
$5, 4%
$180, 26%
$22, 2%
$129
$681
2013 Q2'21 TTM
Revenue Composition Over Time($ in MM, % of revenue)
Other
Subscription
Advertising
Attack Key Verticals Through a Mix of Advertising and Subscription Adjacencies
31
CAGR
+25%

www.ziffdavis.com©2021 Ziff Davis. All right reserved.
Engagement1 18B+Views / Year
$4.8BIn GMV2
5.7BMinutes of Watch Time
1.5K# of Advertisers
101%Net Advertising
Revenue Retention
$310KARPA
ProductsDisplay Advertising Video Advertising
Performance Marketing Sponsorships
Audience1 520MM+ 100MM+Social Followers
44MM+Verified ContactsAverage O&O
Visits / mo.
The Formula that Drives our Advertising Revenue Philosophy
32
Yield2
1. All monthly or yearly metrics are FY20 unless indicated otherwise.
2. Q2’21 TTM.
Advertising Revenue($ in MM)
$312 $323
$369
$479
2018 2019 2020 Q2'21 TTM
CAGR
+19%

www.ziffdavis.com©2021 Ziff Davis. All right reserved.
Engagement2 ~6.5B 11B+
Yield3 580K $26# of
Subscribers4
Monthly
ARPS5
ProductsConsumer
Digital GoodsData Licensing
Enterprise
Audience1 520MM+ 550MM+
The Formula that Drives our Subscription Revenue Philosophy
33
Marketing / Brand
Licensing
1. All monthly or yearly metrics are FY20 unless indicated otherwise.
2. As of Q2’21.
3. Q2’21 TTM.
4. Reflects change in methodology from J2 Analyst Day 2020. Prior methodology would yield
600k+ subscribers.
5. Monthly ARPS = TTM Subscription Revenue / TTM Average Monthly Subscribers / 12.
Monthly Buyer
Signals
Tests and Reports
/ Year
Total App
Installs2
Average O&O
Visits / mo.
Subscription Revenue($ in MM)
$112
$158 $163
$180
2018 2019 2020 Q2'21 TTM
CAGR
+21%

www.ziffdavis.com©2021 Ziff Davis. All right reserved.
PublishingSubscriptions eCommerce
Fuels the Content
Flywheel
Design/PlanningMeasurement Troubleshooting
Unique Vantage Point that Spawns Subscription AdjacenciesRelationships with vertical audiences and editorial perspective give us unique visibility into sector trends and opportunities that have
evolved into investible subscription platforms
34

www.ziffdavis.com©2021 Ziff Davis. All right reserved.
Engine, Chassis
or both
Lean into performance
based, “always on” budgets
All shapes/sizes: micro/large,
renovation/growth
Decision-based,
high intent audiences:
consumer, enterprise, SMB
Direct ownership
of audiences and advertisers
(supply and demand)
Proactively seek
adjacencies: subscriptions,
sub-verticals
Proper timing and
laddering of deal types
Active M&A Platform: Closed 24 transactions since 2013
35

www.ziffdavis.com©2021 Ziff Davis. All right reserved. 36
1. The Company has not reconciled the non-GAAP Adjusted EBITDA for the divisional EBITDAs in this presentation to the most directly comparable GAAP measure because this cannot be done without unreasonable effort due to
the pro forma nature of the historical presentations and the fact that these divisions have historically had commingled operating costs, both across divisions and between divisions and business that have been excluded from the
historical presentation due to divestitures and the separation. The Company expects to provide such reconciliations when presenting non-GAAP Adjusted EBITDA for its divisions following the completion of the separation. For
2018-2020, previously unallocated media segment overhead is burdened by the divisions on a pro-forma basis tied to revenue.
EBITDA1
($ in MM)
Revenue($ in MM)
Consistent Growth and Profitability55%+ Total Revenue and 90%+ EBITDA dollar growth since 2018
2018 2019 2020 Q2'21 TTM
$434
$499$554
$681
EBITDA
Margin34% 37% 39% 42%
$146
$185
$218
$283
2018 2019 2020 Q2'21 TTM
CAGR
+30%
CAGR
+20%

www.ziffdavis.com©2021 Ziff Davis. All right reserved. 37
Health & Wellness

www.ziffdavis.com©2021 Ziff Davis. All right reserved.
Health & Wellness
38
Dan Stone
President, Everyday Health Group
• AccentHealth
• Scient; Imaginova
• CNN.com; iab
• Turner Broadcasting; TBS International
• Amsterdam Pacific; Kidder, Peabody
• Booz, Allen & Hamilton
Key Verticals & Brands
By the Numbers
Healthcare Consumers Healthcare Providers
890KPhysician
Audience
59MMConsumer
Audience
76%U.S.
Pregnancies
$285MMQ2’21
TTM Revenue
Powerful advertising platforms for pharma and health & wellness markets
Driving better clinical and health outcomes through decision-making informed
by highly relevant information, data, and analytics
21%’18-Q2’21 TTM
Revenue CAGR
Moms & Parents

www.ziffdavis.com©2021 Ziff Davis. All right reserved.
`
Large and Growing Health & Wellness Markets
39
1. CMS; 2. Represents invoice level spending, IQVIA; 3. IMARC; 4. eMarketer; 5. Internal estimate, U.S. Census, Stanford Medicine, Rock Health; 6. AAMC; 7. ZS Associates; 8. Internal estimate, CDC; 9. Health Affairs; 10. Internal estimate,
Statista, Comserve; 11. U.S. Census; 12. Internal estimate, CDC, Guttmacher Institute.
$4T Annual U.S. Spend on Healthcare1
$560B Annual U.S. Pharma Revenue2
Projected +3% CAGR ’21-’25
$11B Annual U.S. Healthcare & Pharma
Industry Digital Ad Spend4
+17% ’17-’21 CAGR
• Audience of >930K physicians in U.S.6
• In-Person access to physicians by pharma sales
reps has declined to <50%7
• Each physician drives $4.5MM in annual
healthcare spend (Medical + Pharma)1,6
• Audience of >165MM U.S. adults who search for
health information online5
• Shift to digital away from TV and magazine is
accelerating
• Audience of 63MM parents with children living at
home in U.S.11
• ~5MM pregnancies in the U.S. each year12
• Evergreen audience
$120B Annual U.S. Spend on Pregnancy & Newborn Care8
Healthcare Consumers Healthcare Providers Moms & Parents
$4.5K Average Out-of-Pocket Healthcare Spend
on Maternity Care per Pregnancy9
+49% from ’08-’15
$12B Annual U.S. Maternity &
Baby Product Revenue10
$18B Annual U.S. Healthcare Ad Spend3
Projected +6% CAGR ’21-’26
1

www.ziffdavis.com©2021 Ziff Davis. All right reserved.
Powerful Audience Platforms Reaching ValuableConsumer and HCP Sub-Segments
40
Moms & ParentsHealthcare Consumers Healthcare Providers
Endemic Advertising
Condition-Specific Campaigns
Extensive Data / Analytics Platforms
Flexible Ad Formats / Metrics
Cookie-less Targeting
Consumer Tools Provider Tools
Trusted, Authoritative Content
Diet & Pregnancy Apps and Trackers
“A to Z” Condition / Drug Library
Online Learning
Trusted Medical News
Reputation Management
Continuing Medical Education (CME)
Job Listings
• #1 and #2 Pregnancy Apps
• 91% Reach Among First-Time Moms
• 76% of U.S. Pregnancies
• 52MM Monthly Unique Visitors
• 59MM Monthly Unique Visitors
• 45MM Monthly Social Reach
• 46 Engaged Condition Audiences
• #1 Destination for Migraine Sufferers
• 890K U.S. Physician Digital Reach
• 80% Reach in over 30 MD Specialties
• 4.8MM Monthly Active Users
• 1.2MM Job Seeking HCPs
• 60K Castle Connolly Top Doctors

www.ziffdavis.com©2021 Ziff Davis. All right reserved.
Strong and Recurring Endemic Advertising Base with Compelling Adjacencies
41
Consumer Health Content
Healthcare Professional Content
Online Learning / Self-Help Tools
Online Job Boards for Healthcare
Professionals
Continuing Medical Education
✓ >100% Net Advertising Revenue Retention1
✓ Highly targeted, contextual audiences
✓ Creative advertising solutions
✓ Patent protected pharma brands
✓ Superior operational execution
✓ Superior ROI performance
drives renewals
Tenure +5 Years
Tenure +3 Years
Select Examples of Compelling Adjacencies
1. Net Advertising Revenue Retention = (Amount Spent by Prior Year Advertisers in Current Year Period (exclude revenue from acquisitions during the stub period)) / (Amount Spent by Prior Year Advertisers in Prior Year Period (exclude
revenue from acquisitions during the stub period).

www.ziffdavis.com©2021 Ziff Davis. All right reserved.
Dynamic Health & Wellness Growth Strategy
42
Addressable
Market
Expansion
Compelling
Adjacencies
Audience
Monetization
Narrow Audience
Populations
www.ziffdavis.com©2021 Ziff Davis. All right reserved.
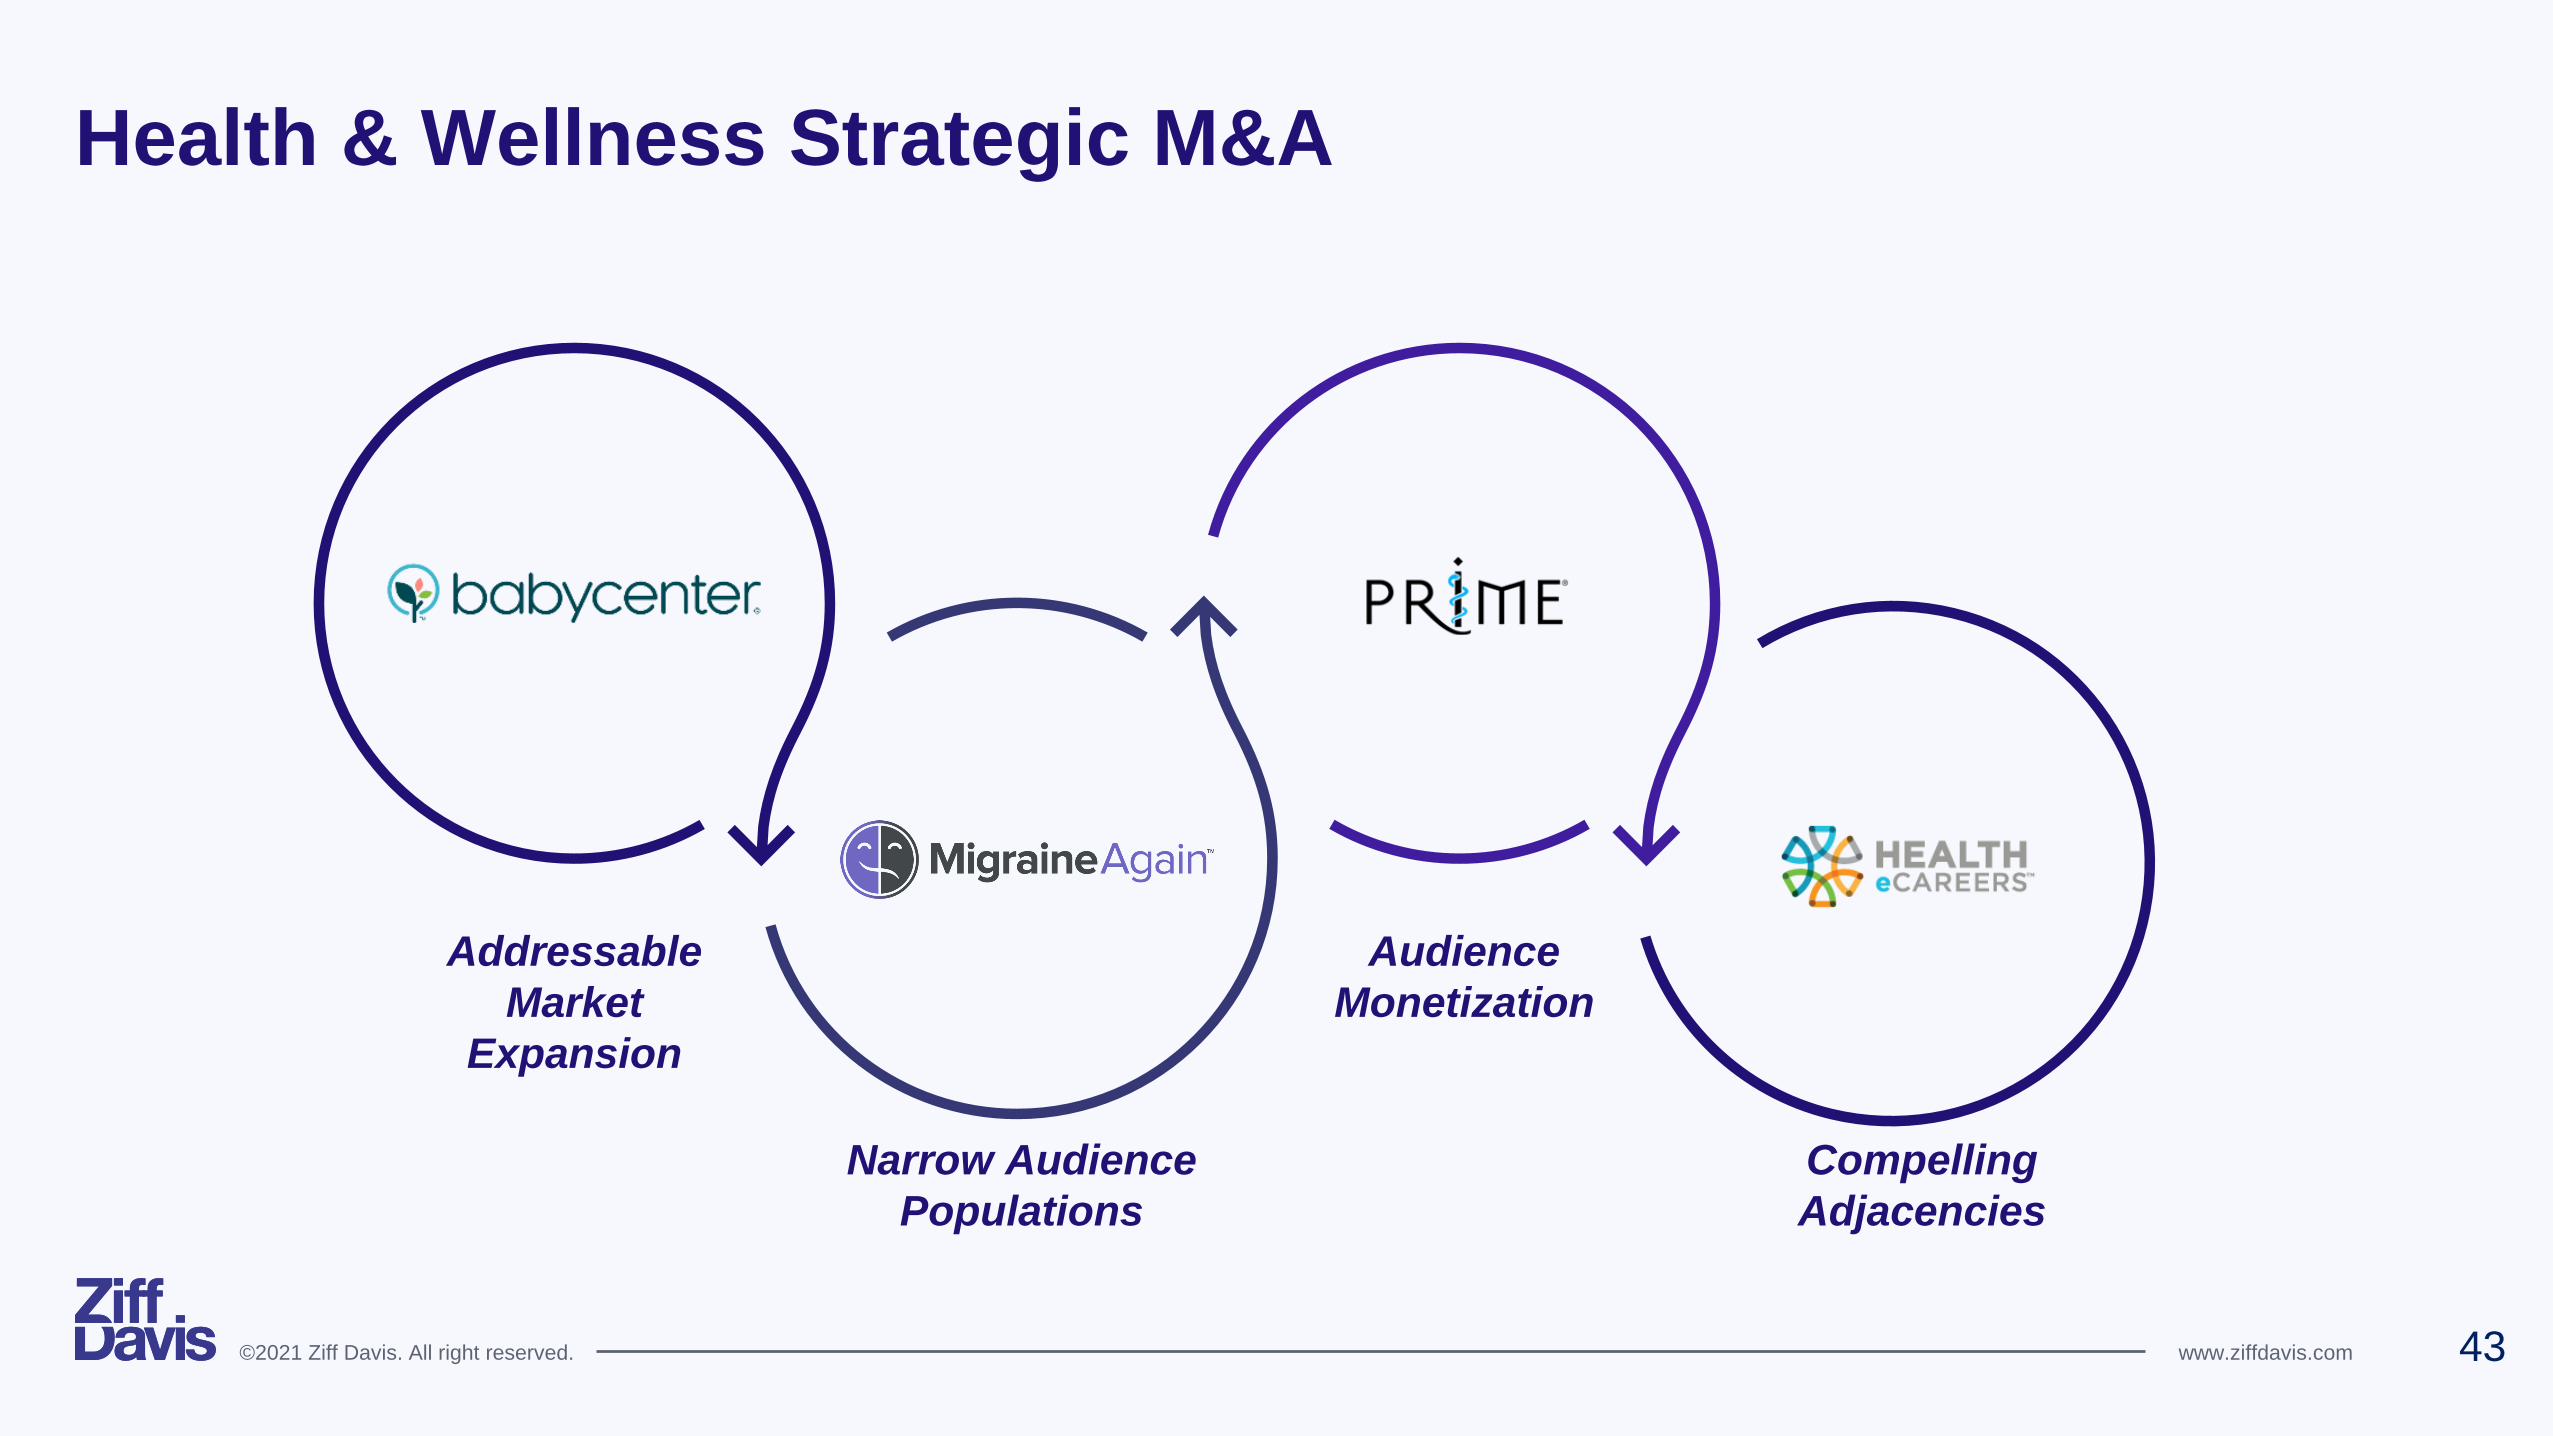
Health & Wellness Strategic M&A
43
Addressable
Market
Expansion
Audience
Monetization
Compelling
Adjacencies
Narrow Audience
Populations

www.ziffdavis.com©2021 Ziff Davis. All right reserved.
Product and Business Innovation Drives Organic Growth
44
Healthcare Consumers Moms & Parents Healthcare Providers
the Well
• Brand studio
• First-of-their-kind programs
& campaigns
Tippi
• Community of patients,
caretakers & HCPs
• Curated tips / advice
Baby Registry Builder
• Across retail brands
• Product reviews &
recommendations
Clinical Trial Recruiting
• Moms, babies, kids
• Multiple COVID studies in process
Expert Content Aggregator
• AI-based content
recommendation engine
Right Patients / Right Doctors
• “Care Connect”
• “Ask a Castle Connolly
Top Doctor”
• “Check in & Check up”

www.ziffdavis.com©2021 Ziff Davis. All right reserved.
Rapidly Growing Revenues and Margins Demonstrate Significant Operating Leverage
45
1. The Company has not reconciled the non-GAAP Adjusted EBITDA for the divisional EBITDAs in this presentation to the most directly comparable GAAP measure because this cannot be done without unreasonable effort due to
the pro forma nature of the historical presentations and the fact that these divisions have historically had commingled operating costs, both across divisions and between divisions and business that have been excluded from the
historical presentation due to divestitures and the separation. The Company expects to provide such reconciliations when presenting non-GAAP Adjusted EBITDA for its divisions following the completion of the separation. For
2018-2020, previously unallocated media segment overhead is burdened by the divisions on a pro-forma basis tied to revenue.
EBITDA1
($ in MM)
Revenue($ in MM)
$57 $61
$99
$119
2018 2019 2020 Q2'21 TTM
$176
$211
$258
$285
2018 2019 2020 Q2'21 TTM
EBITDA
Margin32% 29% 39% 42%
CAGR
+34%
CAGR
+21%

www.ziffdavis.com©2021 Ziff Davis. All right reserved.
Health & Wellness Vertical Summary
46
Large and growing addressable market with favorable secular trends
Recurring relationships with global pharma and health & wellness advertisers
Compelling adjacencies to core advertising categories
Proven growth platform for innovation and accretive M&A
Attractive financial profile with significant operating leverage
Leading editorial brands that deliver authoritative and trustworthy content
✓
✓
✓
✓
✓
✓

www.ziffdavis.com©2021 Ziff Davis. All right reserved. 47
Cybersecurity & Martech

www.ziffdavis.com©2021 Ziff Davis. All right reserved.
Cybersecurity & Martech
48
Nate Simmons
Division President
Background
• NortonLifeLock
• Warner Media
Key Verticals & Brands
By the Numbers
Cybersecurity Martech
$290MMRevenue
(Q2’21 TTM)
$101MMEBITDA1
(Q2’21 TTM)
1.8MMPaid accounts
Subscription-based digital solutions that help
businesses and consumers thrive on the Internet
• Time Inc.
• McKinsey & Company 22%Revenue CAGR
(‘18 – Q2’21 TTM)
1. The Company has not reconciled the non-GAAP Adjusted EBITDA for the divisional EBITDAs in this presentation to the most directly comparable GAAP measure because this cannot be done without unreasonable effort due to
the pro forma nature of the historical presentations and the fact that these divisions have historically had commingled operating costs, both across divisions and between divisions and business that have been excluded from the
historical presentation due to divestitures and the separation. The Company expects to provide such reconciliations when presenting non-GAAP Adjusted EBITDA for its divisions following the completion of the separation.

www.ziffdavis.com©2021 Ziff Davis. All right reserved.
Leveraging Vertical Expertise to Build Adjacent Subscription Businesses
49
Enabling businesses to
engage digitally and grow
their revenue
Technology
expertise, buyer
insights, internet
traffic data
Audience-based,
data-driven view into
online security and
privacy market
opportunities
Protecting millions of
consumers and businesses
against threats to their data
and privacy on the Internet
Performance
marketing expertise
and retail client
relationships
Deep insights into
the evolving needs
and preferred tools
of digital marketers

www.ziffdavis.com©2021 Ziff Davis. All right reserved.
1. Internal estimates; 2. Hootsuite; 3. Harris Poll/NortonLifeLock; 4. PwC; 5. Mimecast; 6. Verizon; 7. Internal estimates; 8. Adobe; 9. Search Engine Land; 10. Radicati; 11. Gartner, “The State of Marketing Budgets 2021”; 12. CMO
Council; 13. Campaign Monitor
Large and Growing Markets Fueled by the Shift to Digital
50
4.7Bactive Internet users
worldwide2
65% of people are spending more
time online than ever3
$33BTotal Addressable Market1
14%’17 – ’21 CAGR1
69%of marketers expect
to increase their Martech
spend12
27%Gartner CMO Spend Survey
indicates that Martech spend
makes up 26.6% of marketing
budgets in 202111
72%of small businesses use email
to communicate with their
customers13
Cybersecurity
Accelerating migration of shopping,
entertainment, health, and other
activities to the Internet increases the
need for protection against proliferating
cyber vulnerabilities
84%of organizational data
breaches involve a human
element6
64%rise in email-based threats5
Martech
Surge in e-commerce and online
shopping makes it more essential than
ever that businesses directly engage,
convert, and retain their customers
online
$4.2Tin global e-commerce sales
projected8
2T+Google searches annually9
4BActive daily email users10
88%of people in the US have
actively taken steps to hide
their online footprint3
55%of business leaders plan to
increase their security
budgets in next year4
$21BTotal Addressable Market7
12%’18 – ’21 CAGR7

www.ziffdavis.com©2021 Ziff Davis. All right reserved.
The VIPRE Group: Security, Privacy, Data Protection
Train employee to
avoid cyber threats
Secure over 1MM endpoints
from malware, ransomware,
and cyber threats
Scan over 14B emails
annually for phishing,
malware, and other threats.
Over 2MM end-user devices
connected to our encrypted
virtual private network
Securely backup over 50
petabytes of data
Endpoint
SecurityEmail
Security
Data
Protection
Internet
Privacy
Protecting Consumers and Small and
Mid-Sized Businesses
• Demographically diverse
• Worried about personal information
• Want virus protection and privacy
• Limited IT-savvy
• Worried about down-time
• Want basic malware and network
protection
• IT buyer/small IT team
• Worried about down-time and data theft
• Want more advanced malware and
email threat protection; training
Small
Businesses1-100 Employees
Mid-Sized
Businesses100-1,000 Employees
Consumer
Security awareness training provisioned to
over 6MM employees
51

www.ziffdavis.com©2021 Ziff Davis. All right reserved.
The Moz Group: Comprehensive Marketing Technology
52
2MM total users of
SEO tools and content
60B emails sent
annually
265MM calls and
texts annually
Serving SOHO, SMB, and Agencies
• Need 1:1 communications (voice, text),
limited email marketing
• Healthcare, real estate, financial
services professionals
• Email, social, search are top channels
for reaching new customers
• Email is top channel for communicating
with existing customers
• Resell our tools as part of professional
services contracts
• Serve SMBs and enterprise
SMB
SOHO
Agencies
4.5B emails
verified
SEO Visibility
Email and SMS
Campaigns
Conversion and
Optimization
1:1 Communications
Lifecycle
Communications

www.ziffdavis.com©2021 Ziff Davis. All right reserved.
Growth and M&A Strategy
53
Robust
bundling and
product
integration
opportunities
Recurring
Revenue Model
TAM
expansion in
adjacent, high-
growth market
segments
Focus on
Consumer,
SOHO, and
SMB

www.ziffdavis.com©2021 Ziff Davis. All right reserved.
Strong Growth and Predictable Recurring Revenue
54
1. The Company has not reconciled the non-GAAP Adjusted EBITDA for the divisional EBITDAs in this presentation to the most directly comparable GAAP measure because this cannot be done without unreasonable effort due to
the pro forma nature of the historical presentations and the fact that these divisions have historically had commingled operating costs, both across divisions and between divisions and business that have been excluded from the
historical presentation due to divestitures and the separation. The Company expects to provide such reconciliations when presenting non-GAAP Adjusted EBITDA for its divisions following the completion of the separation.
Includes the annual pro forma savings of previously shared Cloud Services corporate overhead and operating expenses that will be eliminated in connection with the separation.
EBITDA1
($ in MM)
Revenue($ in MM)
$67
$101 $106
$101
2018 2019 2020 Q2'21 TTM
$176
$255$279 $290
2018 2019 2020 Q2'21 TTM
EBITDA
Margin38% 40% 38% 35%
CAGR
+18%
CAGR
+22%

www.ziffdavis.com©2021 Ziff Davis. All right reserved.
Cybersecurity and Martech Verticals Summary
55
Leveraging vertical expertise across Ziff Davis to build subscription businesses
Established strategy for growth and M&A
Strong growth and predictable recurring revenue
The VIPRE Group protects consumers and businesses from threats to their data and privacy
The Moz Group empowers businesses to engage customers digitally and grow revenue
Large and growing addressable markets fueled by the growth of Internet usage
✓
✓
✓
✓
✓
✓
Cybersecurity
&
Martech

www.ziffdavis.com©2021 Ziff Davis. All right reserved. 56
Sustainability & Responsibility

www.ziffdavis.com©2021 Ziff Davis. All right reserved.
Sustainability & Responsibility
57
Darrah Feldman
Vice President, Sustainability & Responsibility
Background
• CIT
• JPMorgan Chase
• Merrill Lynch
• Smith Barney

www.ziffdavis.com©2021 Ziff Davis. All right reserved.
Our Purpose-Driven Agenda: Five Pillars
58
Ziff Davis is committed to being best in class in each of these areas and has made important headway over the last year
Diversity
Reinforce our diverse
workforce, reflect our
diverse audiences, and
extend upon our
inclusive culture
Sustainability
Reduce our environmental
footprint and continue
helping customers reduce
their footprint
Community
Extend our influence into
the physical and digital
communities we serve
Data
Protect our data and our
clients’ data, ensure our
product security, and
broadly respect data
privacy rights
Governance
Rigorous corporate
governance structure,
committed to representing
shareholders’ best interests

www.ziffdavis.com©2021 Ziff Davis. All right reserved.
Recent Highlights
59
Diversity
∙ 2nd annual publication of
Diversity Report with
workforce representation,
hiring, senior leadership, and
board data
∙ Employee guided Diversity
Council
∙ Five Employee Resource
Groups now offered
∙ Expanded mandatory
DEI training
∙ $6MM media partnership
with NAACP to date;
committing another $5MM to
an array of nonprofits
supporting DEI
Sustainability
∙ Efforts to reduce
environmental footprint by
encouraging employees to
work remotely (including
25% permanently post-
pandemic) and limit
business travel (targeting
a 50% reduction post-
pandemic)
∙ Reduce the environmental
footprint of our customers
by switching them from
analog to digital and away
from associated paper,
energy, and water waste
∙ Will be embarking upon
a Greenhouse Gas audit
next month
Community
∙ Launched Benevity
platform, where employees
can sign up for volunteer
opportunities and - coming
soon - make charitable
donations to the nonprofits of
their choice
∙ Employees are given
16 hours of Volunteer
Time Off annually
∙ Will be rolling out new
programs this fall including
an Employee Match
Program and Dollars for
Doers Program
Data
∙ Comprehensive privacy
policies and internal
processes for every brand,
encompassing rights
provided to individuals
regarding the control of
their data
∙ Ensure user consent
relating to all tracking from
advertising
∙ Annual cybersecurity
training for all full-time
employees
∙ Internal and external audit
of information security
policies and systems
at least annually
Governance
∙ Approximately 30% of Ziff
Davis’s Global Board
members are female and
30% are People of Color
∙ Last five additions to the
Board were all women
and/or People of Color,
and as of Feb ‘21 our
Lead Independent
Director is female
∙ Updated and enhanced
dozens of policies and
procedures, and will review
them annually to ensure we
are on the frontlines of
compliance

www.ziffdavis.com©2021 Ziff Davis. All right reserved.
ESG Ratings Agencies Are Taking Note
60
Sustainalytics: Significantly improved overall ESG Risk Rating
• Improved from 26.4 to 16.6 YOY (lower is better)
• Went from “medium risk” to “low risk”
ISS: Improved in all areas of Environment, Social, and Governance YOY (lower is better)
• Environment: Went from 7 to 4
• Social: Went from 9 to 1
• Governance: Went from 3 to 2
We are confident we will continue to see additional gains as we pursue our efforts
ESG ratings agencies are already rewarding our efforts
Sources: Sustainalytics ESG Risk Rating Report, May 7, 2020, and June 25, 2021; ISS Proxy Research Report, March 16, 2020, and March 16, 2021.

www.ziffdavis.com©2021 Ziff Davis. All right reserved.
Where We Are Headed
61
We will be conducting a 2019, 2020 and 2021 Greenhouse Gas (GHG) audit
• Measuring GHG emissions is the critical starting point for several sustainability activities including reporting, target setting, and
achieving reductions
• The GHG audit will calculate our Scope 1 and 2 emissions, and assess the materiality of our Scope 3 emissions
• Once the audit is completed at year end, we will assess whether we want to go further and set science-based targets and carbon
neutral goals, which we could likely achieve in ~5 years
We will be releasing the company’s first Environmental, Social & Governance (ESG) Report in Q1’22
• The report will align us with GRI, SASB, and TCFD reporting standards
• The findings from the GHG audit will also be incorporated into the report

www.ziffdavis.com©2021 Ziff Davis. All right reserved. 62
Q&A

www.ziffdavis.com©2021 Ziff Davis. All right reserved. 63
Appendix

www.ziffdavis.com©2021 Ziff Davis. All right reserved.
GAAP Reconciliations: Revenue
64
($ in MM) 2013 2014 2015 2016 2017 2018 2019 2020
Revenue $237 $327 $470 $568 $805 $893 $1,061 $1,172
Reconciliation of GAAP to Adjusted non-GAAP measures:
Acquisition-related integration costs (2) 2 -- -- -- -- -- --
Pro Forma Adjustments:
Operational adjustments2 (21) (26) (56) (7) (11) (13) (12) (13)
Excluded assets3 (27) (46) (60) (111) (138) (95) (85) (68)
Pro Forma Revenue $188 $256 $354 $449 $656 $785 $965 $1,090
1 1 1 1 1 1 1 1
1. Adjusted to exclude patent BU related revenue recorded within J2 Cloud Services.
2. Operational adjustments exclude intercompany revenues.
3. Excluded assets represent the pro forma impact of businesses sold and certain assets within the Backup business unit which are expected to be sold.

www.ziffdavis.com©2021 Ziff Davis. All right reserved.
($ in MM) 2018 2019 2020
Net Income $19 $38 $37
Plus:
Interest expense, net 26 27 56
Other expense (income), net 4 7 12
Income tax expense 7 17 25
Depreciation and Amortization 172 222 217
(Earnings)/Losses from equity investments, net of tax 4 0 11
Reconciliation of GAAP to Adjusted non-GAAP measures:
Share-based Compensation 26 23 23
Acquisition-related integration costs 29 17 13
Indirect tax expense (benefit) from prior years
Restructuring costs 0 -- --
Lease asset impairments and other charges -- -- 15
Pro Forma Adjustments:
Operational adjustments1 (1) (1) (6)
Excluded assets2 (44) (39) (26)
Shared overhead reallocation3 9 9 9
Pro Forma EBITDA $251 $318 $387
GAAP Reconciliations: Adjusted EBITDA
65
1. Operational adjustments exclude intercompany revenues, cost of revenues and allocated costs between business units.
2. Excluded assets represent the pro forma impact of businesses sold and certain assets within the Backup business unit which are expected to be sold.
3. Annual pro forma savings of previously shared Cloud Services and Inc. corporate overhead and operating expenses that will be eliminated in connection with the separation