no load fund analyst - morningstar
TRANSCRIPT
No Load Fund Analyst
“Model Portfolio Commentary” continued p2
A L I T M A N / G R E G O R Y P U B L I C A T I O N v . 2 3 . n . 4
I N - D E P T H A N A L Y S I S O F F I N A N C I A L M A R K E T S A N D M U T U A L F U N D S
Model Portfolio Commentary
Stocks continued their upward march in the first quarter, with large-caps gaining almost 6%, while mid- and small-cap stocks
posted gains approaching 8% (see table on back cover for index returns). Overseas, returns were not as strong, though still good. Developed-market foreign stocks were up more than 3%, while emerging-market equities gained just under 2% for the quarter. Domestic high-quality, intermediate-term bonds didn’t fare as well, barely gaining ground in the first quarter, while foreign bonds did a bit better, with developed-market government bonds gaining 0.7% and emerging-market bonds climbing by almost 3%. As a result of our conservative bias, the reasons for which we explain in our commentary below, our model portfolios generally trailed in the quarter. We are willing to accept underperformance in a strong up market because we don’t believe current valuations provide adequate return to compensate us for the risks we see, and so this is not unex-pected or concerning to us. Our track record is very strong over the long term; this success stems from our willingness to invest based on our longer-term convictions.
We Are Not Perma-Bears, But We Are Cautious NowFor much of the last 13 years we have been cautious towards the stock
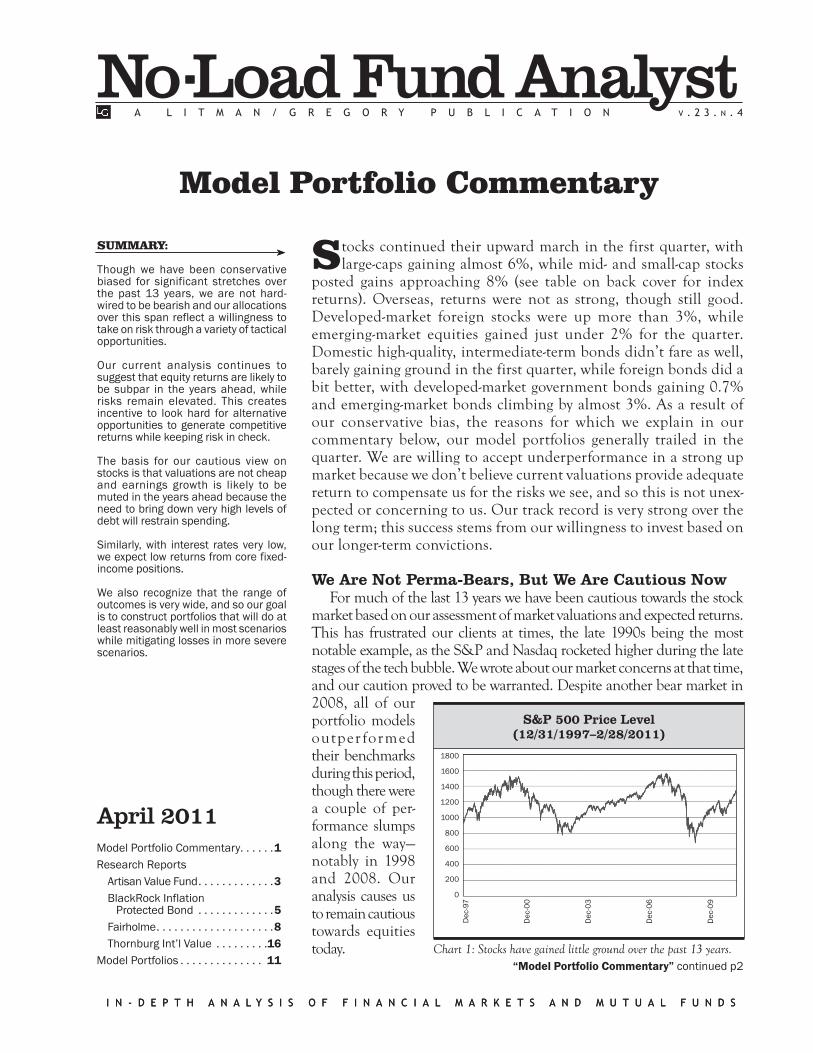
market based on our assessment of market valuations and expected returns. This has frustrated our clients at times, the late 1990s being the most notable example, as the S&P and Nasdaq rocketed higher during the late stages of the tech bubble. We wrote about our market concerns at that time, and our caution proved to be warranted. Despite another bear market in 2008, all of our portfolio models outper formed their benchmarks during this period, though there were a couple of per-formance slumps along the way—notably in 1998 and 2008. Our analysis causes us to remain cautious towards equities today.
Model Portfolio Commentary. . . . . .1Research Reports Artisan Value Fund . . . . . . . . . . . . .3 BlackRock Inflation Protected Bond . . . . . . . . . . . . .5 Fairholme . . . . . . . . . . . . . . . . . . . .8 Thornburg Int’l Value . . . . . . . . .16Model Portfolios . . . . . . . . . . . . . . 11
SUMMARY:
Though we have been conservative biased for significant stretches over the past 13 years, we are not hard-wired to be bearish and our allocations over this span reflect a willingness to take on risk through a variety of tactical opportunities.
Our current analysis continues to suggest that equity returns are likely to be subpar in the years ahead, while risks remain elevated. This creates incentive to look hard for alternative opportunities to generate competitive returns while keeping risk in check.
The basis for our cautious view on stocks is that valuations are not cheap and earnings growth is likely to be muted in the years ahead because the need to bring down very high levels of debt will restrain spending.
Similarly, with interest rates very low, we expect low returns from core fixed-income positions.
We also recognize that the range of outcomes is very wide, and so our goal is to construct portfolios that will do at least reasonably well in most scenarios while mitigating losses in more severe scenarios.
I N - D E P T H A N A L Y S I S O F F I N A N C I A L M A R K E T S A N D M U T U A L F U N D S
April 2011
S&P 500 Price Level(12/31/1997–2/28/2011)
1800
1600
1400
1200
1000
800
600
400
200
0
Dec
-97
Dec
-00
Dec
-03
Dec
-06
Dec
-09
Chart 1: Stocks have gained little ground over the past 13 years.
2 No-Load Fund Analyst • April 2011
As we reflect back and look forward, there are several points worth emphasizing.
1. Our long-term, valuation-driven and scenario-based approach has served us very well over lengthy time periods. Occasionally, over shorter time periods we can be wrong, too early, or blindsided by unexpected events (such as 9/11, natural disasters, geopolitics).
2. Even in the midst of multiyear periods where returns are low there are opportuni-ties to add incremental value. In fact, these low-return periods are often characterized by heightened volatility that can offer occa-sional fat pitches in “risky” asset classes like equities, REITs, and high-yield bonds. We have been able to take advantage of a number of fat pitches in each of the last two cycles and they have contributed signifi-cantly to our return premium over the benchmark during this period.
3. We are not perma-bears. There have been extended periods over the past decade where our equity exposure was at a neutral level and/or our actual “equity like” expo-sure was at or above neutral (taking into account exposure to asset classes that have some equity-like risk such as high-yield bonds and REITs).
4. As we look ahead, we continue to see an unusually wide range of possible outcomes for the economy and stock market. The weight of the evidence continues to suggest mediocre to low returns for the financial markets over our five-year time horizon. We remain cautious and somewhat defensive.
Stock Returns— Why We Remain Cautious
Stocks are the primary asset class for taking on risk. So when expected returns from stocks are not attractive to us, our positioning is likely to be cautious—as it is today. To understand the poten-tial upside for stocks it’s important to evaluate each of the factors that drives returns and how they might behave over our investment horizon. There are three key variables we assess: dividends, earnings growth, and changes in the price/earn-
ings ratio. Our scenario analysis focuses on assessing each.
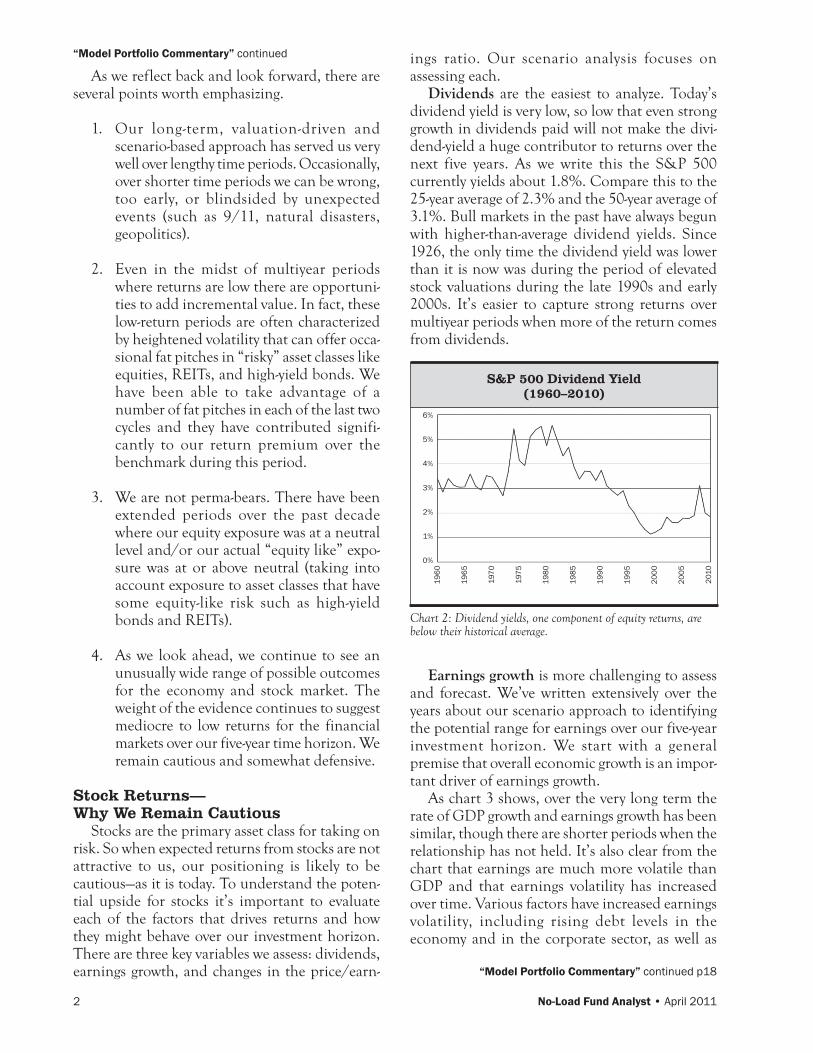
Dividends are the easiest to analyze. Today’s dividend yield is very low, so low that even strong growth in dividends paid will not make the divi-dend-yield a huge contributor to returns over the next five years. As we write this the S&P 500 currently yields about 1.8%. Compare this to the 25-year average of 2.3% and the 50-year average of 3.1%. Bull markets in the past have always begun with higher-than-average dividend yields. Since 1926, the only time the dividend yield was lower than it is now was during the period of elevated stock valuations during the late 1990s and early 2000s. It’s easier to capture strong returns over multiyear periods when more of the return comes from dividends.
S&P 500 Dividend Yield(1960–2010)
6%
5%
4%
3%
2%
1%
0%
1960
1965
1970
1975
1980
1985
1990
1995
2000
2005
2010
Chart 2: Dividend yields, one component of equity returns, are below their historical average.
Earnings growth is more challenging to assess and forecast. We’ve written extensively over the years about our scenario approach to identifying the potential range for earnings over our five-year investment horizon. We start with a general premise that overall economic growth is an impor-tant driver of earnings growth.
As chart 3 shows, over the very long term the rate of GDP growth and earnings growth has been similar, though there are shorter periods when the relationship has not held. It’s also clear from the chart that earnings are much more volatile than GDP and that earnings volatility has increased over time. Various factors have increased earnings volatility, including rising debt levels in the economy and in the corporate sector, as well as
“Model Portfolio Commentary” continued
“Model Portfolio Commentary” continued p18
No-Load Fund Analyst • April 2011 3
research updateArtisan Value Fund (ARTLX)category: Larger-Cap Valuemanagers: George Sertl, Scott Satterwhite,
and Jim Kiefferdate of interview: 3/16/11with: George Sertl
George Sertl, who co-manages the Artisan Small Cap Value, Artisan Mid Cap Value,
and Artisan Value funds (all of which are on our Recommended list), shared his investment views at an Artisan event last month. Following the event, we met with Sertl to get an update on the all-cap value fund. Our conversation was oriented towards getting a general update on the portfolio, as opposed to conducting a formal fund update where our objective is to challenge the managers and revisit our investment thesis. Below are the highlights of our conversation.
Sertl says that since the stock market bottomed in early 2009, large-cap stocks have nearly doubled, which he says seemed to be driven largely by short-term macro expectations along with earnings and price momentum. He says that this environment has created a headwind for the team’s investment process, which is designed to outperform its benchmark over a full market cycle by partici-pating in up markets and holding up better in down markets. At current levels, Sertl believes that large-caps are the most attractively priced market-cap segment, and he explains that the team is having a tough time finding attractively priced small-caps and, to a lesser extent, mid-cap stocks.
Sertl’s concerns about corporate profit margins are also making it difficult to identify compelling ideas. He explains that corporate margins are currently high because companies cut costs and got lean during the downtown. Sertl and the team use normalized margins in their analysis, and he says that almost all of the margins they are using in their estimates are below current corporate margin levels. He says that some companies’ gross
margins are under pressure because of rising commodity costs, though he believes some compa-nies will be able to pass those costs on to consumers. Sertl can’t say for sure if margins will remain at the current elevated levels, but there’s a chance that margins could remain above average for a while for a number of reasons. One is that he does not expect an increase in wage inflation anytime soon, which is a big operating cost for companies. Sertl also says that a number of industries are a lot more consolidated than they were 10 years ago, and have become a lot more efficient in some cases. Additionally, the economic slowdown has resulted in less competition in some areas of the market, which could help margins remain elevated. Other reasons include leverage that companies are getting from information technology and continued merger and acquisition activity, which reduces the number of competitors.
From a performance attribution standpoint, energy has been a strong contributor to recent performance, and the team has been cutting their energy positions as their holdings have appreci-ated. One winner has been Exxon Mobil, the world’s largest international integrated oil & gas company as well as the world’s largest refiner and marketer of petroleum products. At year end, the stock was a top holding in portfolio (a 5% weighting) because the team felt that the company solidly met all three of their investment criterion—attractive valuation, sound financial condition,
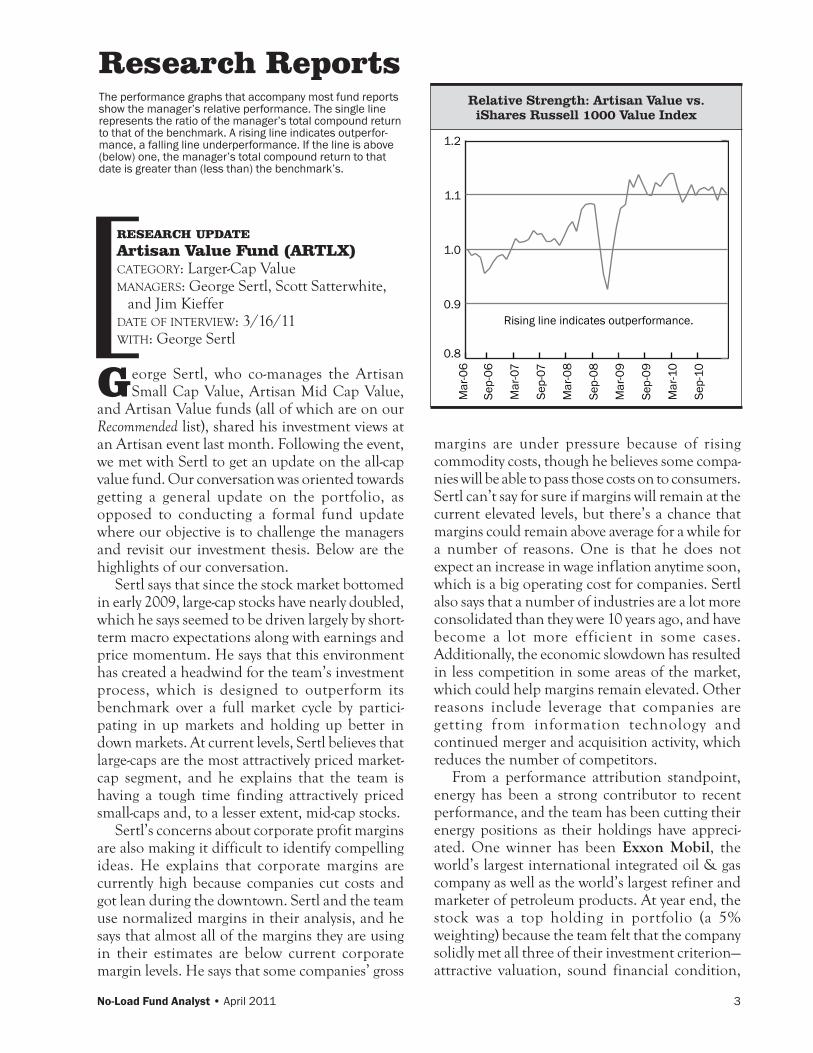
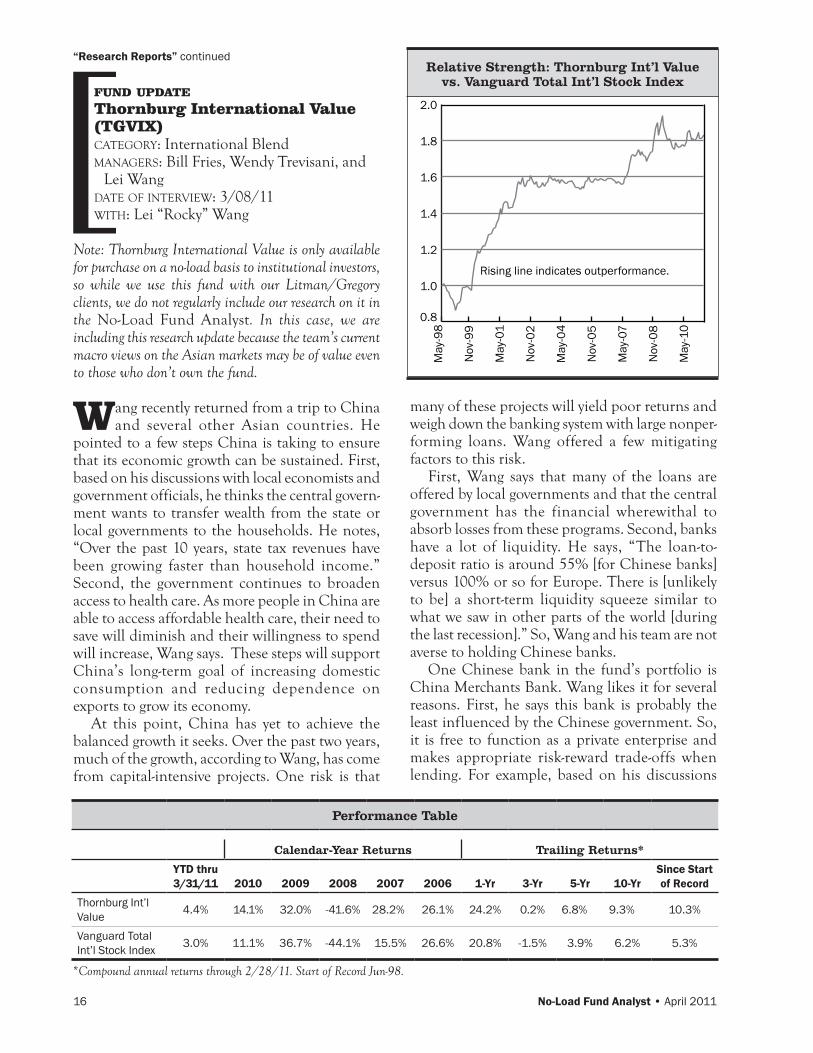
Research ReportsThe performance graphs that accompany most fund reports show the manager’s relative performance. The single line represents the ratio of the manager’s total compound return to that of the benchmark. A rising line indicates outperfor-mance, a falling line underperformance. If the line is above (below) one, the manager’s total compound return to that date is greater than (less than) the benchmark’s.
[Relative Strength: Artisan Value vs. iShares Russell 1000 Value Index
0.8
0.9
1.0
1.1
1.2
Sep-
10
Mar
-10
Sep-
09
Mar
-09
Sep-
08
Mar
-08
Sep-
07
Mar
-07
Sep-
06
Mar
-06
Rising line indicates outperformance.
4 No-Load Fund Analyst • April 2011
and attractive business economics. Sertl says the company’s stock price continued to rise steadily this year along with the price of oil, which recently exceeded $100 per barrel, which led the team to reduce the stock’s position size.
Despite Exxon’s stock price appreciation, Sertl says the stock was trading at a low double-digit multiple (12x–13x) to the team’s normalized earn-ings estimate, which is in the $6 range. He adds that the team’s normalized earnings estimate is below Exxon’s current earnings as well as next year’s consensus earnings, largely because the team’s earnings estimates assume a lower oil price. They believe $65–$80 per barrel oil is a reasonable range for oil, not current price levels of over $100. Sertl believes a mid-teens multiple is justified given the company’s high-quality assets (which provides advantages of scale, geographic diversity, and busi-ness mix), above average returns on capital (the result of excellent management, and low cost of capital), financial strength (AAA credit rating), and its lengthy history of adding shareholder value through stock buybacks and dividends. Despite these positives, the stock has appreciated from the team’s cost of roughly $60 when they initiated a position last year to the upper-$80 range, and they trimmed the position to 2% based on their view of the current risk reward. Another energy holding that was trimmed is Apache, one the largest explo-ration and production companies in the United States, as its stock price rose along with rising oil prices and an announced increase in production. At the end of February 2011, this stock remained a top holding at a 3% weighting.
Many of the proceeds from trimming energy holdings have gone into consumer stocks, mainly consumer staples companies such as Unilever and discount retailers such as Wal-Mart. Unilever is a stock the team has (successfully) owned previously and is currently back among the portfolio’s top 10 holdings with a 3.3% weighting. Sertl says that since selling the stock the valuation has come
down, as earn-ings have grown much faster than the stock price. Some of this growth has come from the emerging mar-kets, which Sertl says accounts for roughly 50% of the compa-ny’s business. He adds that over the past 15 or 20 years, the compa-ny’s emerging-markets busi-nesses have grown revenues at nearly 10%, compared to 0%–2% growth in developed markets. Though he expects the emerging-markets growth to be bumpy, he believes the company is well-positioned in these countries and should continue to do well as these countries become wealthier. Additionally, the company has divested many businesses over the last 5–10 years and, currently, 70%-plus of their business comes from brands ranked 1 or 2, so they have good market positions, and they continue to gain market share. While not a high-growth busi-ness, Sertl believes the company can grow revenues at roughly 5% over time and, combined with margin improvement and stock buybacks, he esti-mates that high single-digit earnings growth is possible. Add a 4% dividend yield, and Sertl thinks a 10%–15% return is possible, without earnings multiple expansion. The company has no debt and generates high return on capital.
As for the discount retailers, Wal-Mart and Tesco are top-five holdings and total just over 7% of the portfolio. Sertl believes there will be head-
“Research Reports” continued
Performance Table
Calendar-Year Returns Trailing Returns*
YTD thru 3/31/11 2010 2009 2008 2007 1-Yr 3-Yr
Since Start of Record
Artisan Value 7.2% 11.3% 35.5% -37.5% 2.3% 18.1% 2.0% 3.2%iShares Russell 1000 Value 6.4% 15.3% 19.6% -36.8% -0.3% 21.9% 0.1% 1.2%
*Compound annual returns throurgh 2/28/11, start of record Apr-06.
Microsoft 5.0%Wal-Mart Stores 4.5%Baxter International 4.0%Cisco Systems 3.9%Tesco 3.6%Ingram Micro 3.5%Unilever 3.3%Texas Instruments 3.2%Apache 3.0%Chubb 3.0%Total 37.0%
Artisan ValueTop 10 Holdings
2/28/11
Information Technology 30.3%Financials 20.1%Consumer Staples 14.6%Health Care 12.7%Energy 9.9%Total 87.6%
Artisan ValueTop Five Sectors
2/28/11

No-Load Fund Analyst • April 2011 5
winds for the consumer going forward, which will be a positive for discount retailers in the long term. Additionally, these companies are generating tons of cash and have bought back 5%–6% of their stock last year, and are paying a 3% dividend. He believes high single-digit or low double-digit growth is possible for these companies.
Another relatively new holding in the Value portfolio is networking giant Cisco Systems, a position the team initiated in the fourth quarter when the stock sold off sharply due to concerns about a slowdown in government spending and increased competition. Sertl says the company is a market leader and has a strong balance sheet with more than $4 per share of cash. He thinks the company is well-positioned to benefit from a pickup in enterprise spending as well as some of today’s technology trends, including cloud computing and video. From an investment perspective, he particularly likes that the company is increasingly dedicated to creating shareholder value through dividends and share buybacks. Sertl believes Cisco is trading at a substantial discount to their estimate of intrinsic value despite the company’s leading market share, scale advantages, and strong financials. The stock is a material holding in the portfolio at 3.9%.
—Jack Chee
fund updateBlackRock Inflation Protected Bond (BPRIX)category: Inflation-Protected Bondmanagers: Brian Weinstein and Martin
Hegartydate of interview: 3/15/11with: Martin Hegarty
Towards the end of last year, the fund reduced its TIPS exposure to roughly 90% as Hegarty
anticipated signs of economic improvement,
which typically is accompanied by a rise in real yields (e.g., yields on TIPS as opposed to nominal yields on U.S. Treasuries) and a corresponding decline in TIPS prices. Hegarty explains that, as expected, economic data continued to show signs of firming, but the Fed’s quantitative easing program (a.k.a. QE2) counteracted normal market movements and real yields remained low. As a result of this atypical environment, the fund’s underweighting in TIPS detracted from perfor-mance. In response, the team quickly raised the TIPS position back to 96%, limiting underperfor-mance. The fund’s initial underweight was reduced through additions in the five-year sector of the curve and, to a lesser extent, in the 30-year sector as, in Hegarty’s view, these were the areas of the curve that were pricing in the proper levels of future inflation expectations. A key contributor to performance late in the year was the portfolio’s yield-curve positioning. The team had positioned the portfolio for a flattening of the real-yield curve, where the yield difference between the shortest and longest maturity narrows.
Throughout most of the first quarter, Hegarty was comfortable taking on some interest-rate risk, which was reflected in a portfolio duration that was roughly a half year to three-quarters of a year longer than the benchmark. Hegarty says this positioning was based on the team’s view that prices on TIPS at the longer end of the yield curve were more attractive. To lengthen duration, the team predominantly bought 30-year TIPS during February’s TIPS auction, while still maintaining a
Contact & Purchase Information
Phone: (800) 344-1770Web Address: http://www.artisanfunds.com
Fund Min. initiAl AvAilAbility† exPensesInvestor (ARTLX) $1,000 SIO, SO, AN, FN 1.18%
†Certain restrictions may apply. Please check with your broker/dealer for details.
[Relative Strength: BlackRock Inflation
Protected Bond vs. iShares Barclays TIPS ETF
Rising line indicates outperformance.
0.6
0.8
1.0
1.2
1.4
Nov
-10
Nov
-07
Nov
-04
Nov
-01
Nov
-98
0.8
0.9
1.0
1.1
1.2D
ec-1
0
Dec
-09
Dec
-08
Dec
-07
Dec
-06
Dec
-05
Dec
-04
Rising line indicates outperformance.
6 No-Load Fund Analyst • April 2011
curve-flattening bias. He recent-ly had about 21% of the fund positioned in TIPS securities matur ing in 18–30 years, com-pared to 12% for the benchmark. Another reason for being slight-
ly long duration was that Hegarty believed that the Fed would maintain its accommodative stance, and that the risk of imminently higher rates was low. But, midway through March, the team reduced their duration to be more in line with the benchmark because of the uncertainty in the Middle East and the impact on energy prices, which is a key component of headline inflation (i.e., core inflation plus the volatile energy and food sectors.)
Demand for TIPS has remained fairly constant from Hegarty’s point of view, and he has not seen a lot of selling, as investors continue to seek to hedge inflation risk in their portfolios. Looking ahead, Hegarty thinks rapidly rising inflation is unlikely. In his view, he does see some infla-tionary pressures, and he estimates that near-term inflation could reach 2%, but for a number of reasons he does not subscribe to the view some hold that 4% headline inflation will occur a year from now. Hegarty says that 4% headline infla-tion would represent a nearly 250% increase over current levels, and that while 4% inflation has occurred 13% of the time since 1990, he doesn’t believe the drivers of inflation are currently strong enough to push inflation to that level. By his estimate, all of the following would have to occur to hit 4% inflation number: year-over-year
shelter inflation would have to increase 10 times from the current rate of 0.2%, food and energy inflation rates would have to triple, and inflation in the core (ex-shelter) categories would have to double. Hegarty also believes that the currently below-average money multiplier will limit how quickly inflation can increase from current levels.
Specific to shelter inflation, Hegarty says that he has seen a bottoming as the rental market has picked up since the middle of 2009. While he expects this upward trend in rents will contribute to inf lation, he believes a sharp increase is unlikely as existing home supply is at elevated levels, while rental vacancy rates are at near-record levels. Regarding the recent rise in head-line inflation, i.e., the more volatile food and energy categories, Hegarty says it is coming from the cost side, particularly commodities, as opposed to demand, which should remain muted. With higher cost pressures coming from the energy sector, Hegarty says this will be an additional tax on the consumer that limits consumption. Within the core (ex-shelter) catego-ries, Hegarty believes consumption is likely to remain subdued given today’s elevated unemploy-ment rate. He cites a recent University of Michigan survey on expected changes in family income over the next year. Hegarty says that in 2008, expectations for family income declined dramatically and have not improved since, and very recently trended lower, reaching 25-year lows. If he were to suddenly see improvement in the employment data or average hourly earnings, he suspects this would send strong signals to the Fed, which could cause them to raise rates more quickly, likely putting downward pressure on TIPS prices.
As for the inflation risk associated with the stimulus actions the government and the Federal Reserve took to stabilize the economy and finan-cial markets, Hegarty believes they have been
“Research Reports” continued
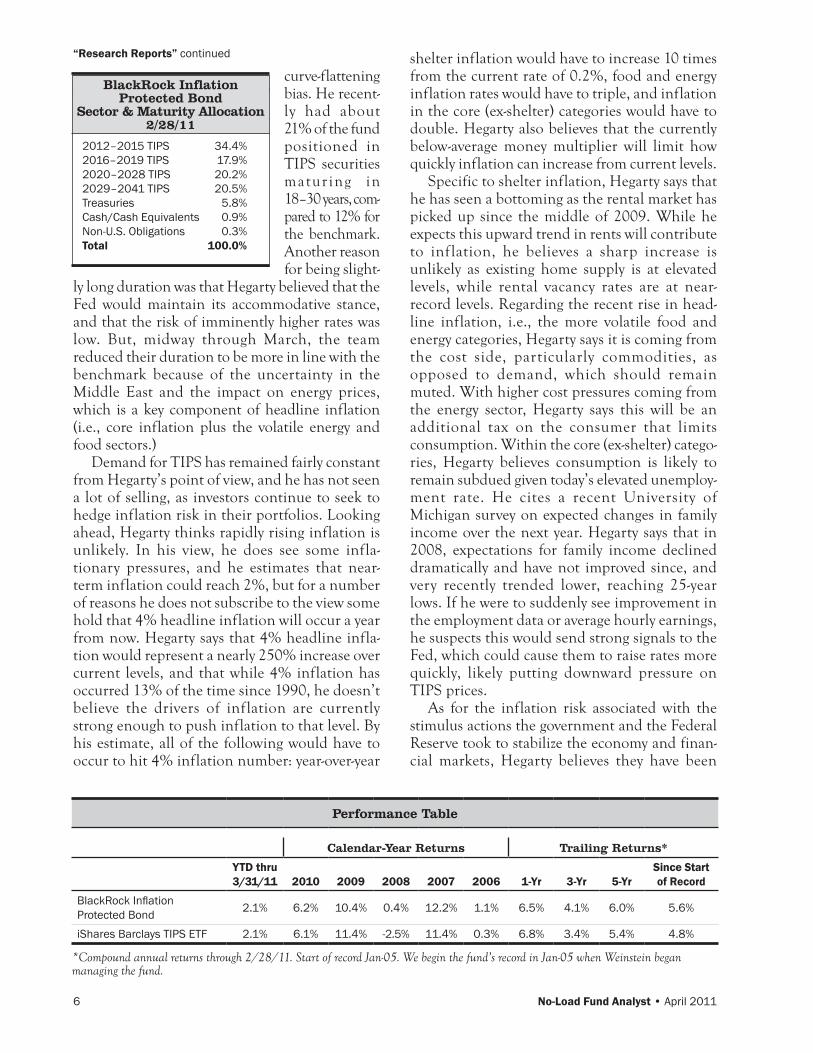
2012–2015 TIPS 34.4%2016–2019 TIPS 17.9%2020–2028 TIPS 20.2%2029–2041 TIPS 20.5%Treasuries 5.8%Cash/Cash Equivalents 0.9%Non-U.S. Obligations 0.3%Total 100.0%
BlackRock Inflation Protected Bond
Sector & Maturity Allocation2/28/11
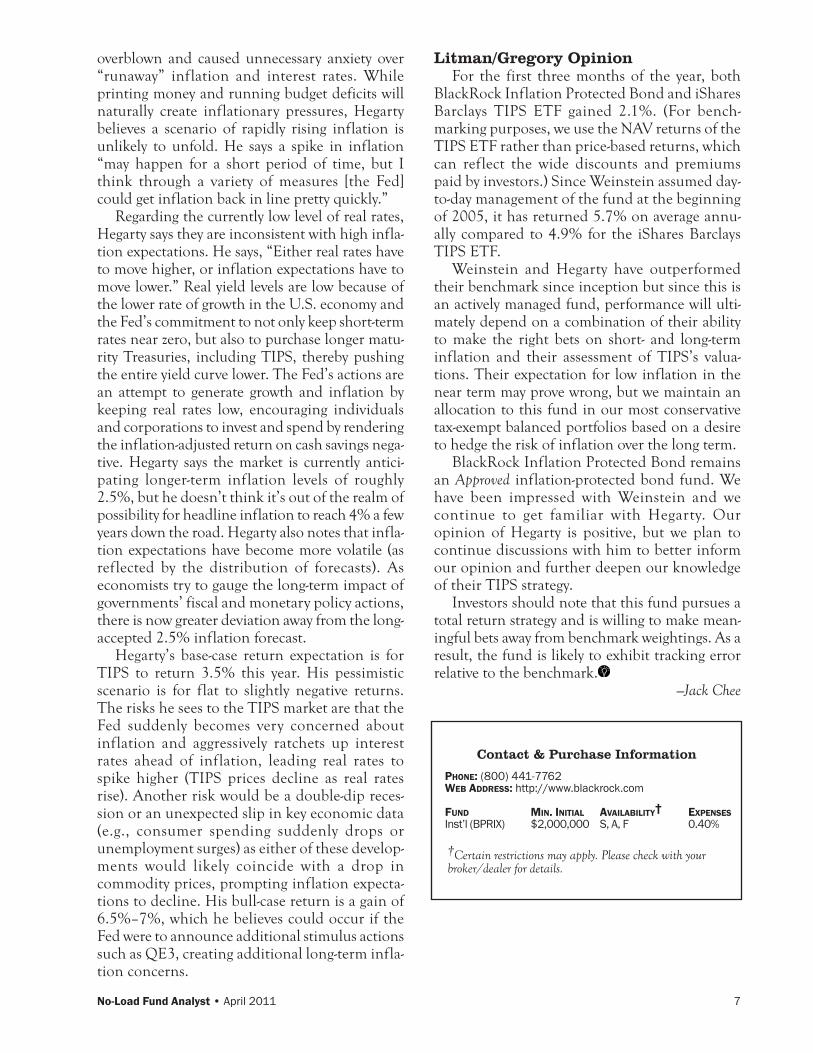
Performance Table
Calendar-Year Returns Trailing Returns*
YTD thru 3/31/11 2010 2009 2008 2007 2006 1-Yr 3-Yr 5-Yr
Since Start of Record
BlackRock Inflation Protected Bond 2.1% 6.2% 10.4% 0.4% 12.2% 1.1% 6.5% 4.1% 6.0% 5.6%
iShares Barclays TIPS ETF 2.1% 6.1% 11.4% -2.5% 11.4% 0.3% 6.8% 3.4% 5.4% 4.8%
*Compound annual returns through 2/28/11. Start of record Jan-05. We begin the fund’s record in Jan-05 when Weinstein began managing the fund.
No-Load Fund Analyst • April 2011 7
overblown and caused unnecessary anxiety over “runaway” inflation and interest rates. While printing money and running budget deficits will naturally create inflationary pressures, Hegarty believes a scenario of rapidly rising inflation is unlikely to unfold. He says a spike in inflation “may happen for a short period of time, but I think through a variety of measures [the Fed] could get inflation back in line pretty quickly.”
Regarding the currently low level of real rates, Hegarty says they are inconsistent with high infla-tion expectations. He says, “Either real rates have to move higher, or inflation expectations have to move lower.” Real yield levels are low because of the lower rate of growth in the U.S. economy and the Fed’s commitment to not only keep short-term rates near zero, but also to purchase longer matu-rity Treasuries, including TIPS, thereby pushing the entire yield curve lower. The Fed’s actions are an attempt to generate growth and inflation by keeping real rates low, encouraging individuals and corporations to invest and spend by rendering the inflation-adjusted return on cash savings nega-tive. Hegarty says the market is currently antici-pating longer-term inflation levels of roughly 2.5%, but he doesn’t think it’s out of the realm of possibility for headline inflation to reach 4% a few years down the road. Hegarty also notes that infla-tion expectations have become more volatile (as reflected by the distribution of forecasts). As economists try to gauge the long-term impact of governments’ fiscal and monetary policy actions, there is now greater deviation away from the long-accepted 2.5% inflation forecast.
Hegarty’s base-case return expectation is for TIPS to return 3.5% this year. His pessimistic scenario is for flat to slightly negative returns. The risks he sees to the TIPS market are that the Fed suddenly becomes very concerned about inflation and aggressively ratchets up interest rates ahead of inflation, leading real rates to spike higher (TIPS prices decline as real rates rise). Another risk would be a double-dip reces-sion or an unexpected slip in key economic data (e.g., consumer spending suddenly drops or unemployment surges) as either of these develop-ments would likely coincide with a drop in commodity prices, prompting inflation expecta-tions to decline. His bull-case return is a gain of 6.5%–7%, which he believes could occur if the Fed were to announce additional stimulus actions such as QE3, creating additional long-term infla-tion concerns.
Litman/Gregory OpinionFor the first three months of the year, both
BlackRock Inflation Protected Bond and iShares Barclays TIPS ETF gained 2.1%. (For bench-marking purposes, we use the NAV returns of the TIPS ETF rather than price-based returns, which can reflect the wide discounts and premiums paid by investors.) Since Weinstein assumed day-to-day management of the fund at the beginning of 2005, it has returned 5.7% on average annu-ally compared to 4.9% for the iShares Barclays TIPS ETF.
Weinstein and Hegarty have outperformed their benchmark since inception but since this is an actively managed fund, performance will ulti-mately depend on a combination of their ability to make the right bets on short- and long-term inflation and their assessment of TIPS’s valua-tions. Their expectation for low inflation in the near term may prove wrong, but we maintain an allocation to this fund in our most conservative tax-exempt balanced portfolios based on a desire to hedge the risk of inflation over the long term.
BlackRock Inflation Protected Bond remains an Approved inflation-protected bond fund. We have been impressed with Weinstein and we continue to get familiar with Hegarty. Our opinion of Hegarty is positive, but we plan to continue discussions with him to better inform our opinion and further deepen our knowledge of their TIPS strategy.
Investors should note that this fund pursues a total return strategy and is willing to make mean-ingful bets away from benchmark weightings. As a result, the fund is likely to exhibit tracking error relative to the benchmark.
—Jack Chee
Contact & Purchase Information
Phone: (800) 441-7762Web Address: http://www.blackrock.com
Fund Min. initiAl AvAilAbility† exPensesInst’l (BPRIX) $2,000,000 S, A, F 0.40%
†Certain restrictions may apply. Please check with your broker/dealer for details.

8 No-Load Fund Analyst • April 2011
fund updateFairholme (FAIRX)category: Larger-Cap Blend managers: Bruce Berkowitz and Charlie
Fernandezdate of interview: 3/3/11with: Charlie Fernandez, co-portfolio
manager
In our recent discussion, Charlie Fernandez provided an update on the fund’s sizable
continued investment in financial companies. As of the last shareholder report (11/30/10), the fund was nearly three-quarters invested in equities and more than 60% of the fund (most of the equity exposure) was invested in various financial compa-nies. Needless to say, Fernandez tells us that he and Berkowitz monitor these holdings very closely, given the enormity of the bet they have made in the fund. “This isn’t only about money for us,” Fernandez explains, referring to the fact that he and Berkowitz have essentially their entire liquid net worth invested in the fund, “this is the value of our franchise.”
Fernandez tells us that their process for moni-toring these companies and the associated issues includes employing consultants—from former regulators and examiners, to former CFOs of banks and litigation attorneys—to help them assess the related regulatory and business risks for each company. He and Berkowitz also focus on chal-lenging company management about things like the impact of various legislative scenarios that could play out and the potential impact on the company in each scenario.
Ultimately, the two managers believe that there will not be a double-dip recession in the United States, which bodes well for their investments in financial companies. However, Fernandez concedes, “There might be a slower-than-expected recovery,” but that it’s a matter of when—not if—the recovery takes hold and what the velocity of that recovery will be. Digging into the details more, Fernandez explains that most commercial loans are about five years in length and consumer loans are typically two to three years in length. “During the worst time [the banks] put on their best loans, because they don’t do many of these high-risk loans. They demand more credit [quality] and monitoring.” As a result of the bad loans “burning off” and the newer, higher quality loans maturing,
Fernandez believes that banks are four to six quar-ters away, at most, from returning to “normalized earnings,” although this will require the banks to weaken their balance sheets a bit and start making new loans on a regular basis. While Fernandez says that earnings of financial companies in general probably won’t return to pre-recession levels, he expects earnings to reach a level similar to what they were coming out of the last recession.
Applying this to specific companies in the port-folio, Fernandez says he does not expect a company like AIG to trade for 5x tangible book value, like it did at its peak. (For a more detailed discussion of the fund’s investment in AIG, see our July 2010 update.) However, he believes that in a “normal-ized world” the company should trade for about 2x tangible book value or somewhere above $90 per share (the stock traded around $37 at the time of our conversation). Similarly, Fernandez thinks that Bank of America should trade at 2x tangible book value (or at about $24 per share). Another valuation metric he uses supports a similar price. Fernandez says Bank of America should trade for at least 10x normalized earnings, which he esti-mates at more than $2 per share, or more than $20. Right now, he says those companies are trading far below those values for two reasons. The first reason has to do with resolving the mortgage litigation issues and how much the companies will be liable for. The second reason has to do with the bad loans made years ago being worked completely off the books, which he believes will happen within four to six quarters. By that time, he also expects
“Research Reports” continuedRelative Strength: Fairholme vs.
Vanguard 500 Index Fund
0
1
2
3
4
5
Dec
-09
Dec
-07
Dec
-05
Dec
-03
Dec
-01
Dec
-99
Rising line indicates outperformance.
[
No-Load Fund Analyst • April 2011 9
the economic recovery will have had a mean ing fu l , positive impact on earnings.
I n 2 010 , Fernandez and Berkowitz added to their stable of financial com-pany holdings w h e n t h e y bought MBIA, a bond reinsur-ance company, which Fernandez tells us they remain ver y excited about. While a small holding in the
fund (1.2% of net assets as of 11/30/10), Fernandez explains that they currently own 19.9% of the company’s outstanding shares and just days before our conversation, Fairholme filed paperwork with the Department of Insurance for the right to purchase up to 24.9% of MBIA. “We’re doing that because we really do believe their stock is quite cheap at these prices,” he says. “There is price volatility in the short term and we’re going to continue to see that, but at the right price, we’re obviously buyers and not sellers of anything that we particularly believe is too cheap.”
Fernandez and Berkowitz believe that the CEO, Jay Brown, is making good progress and will ulti-mately deliver on the plan he has laid out to share-holders to restore the company to health. Specifically, the goals are to stabilize the company financially, to get the company to a position where it can start writing new business again, and to resolve the outstanding litigation issues. (Fernandez tells us that Fairholme has essentially employed a full-time lawyer as a consultant who is keeping on top of the mortgage litigation situation and reporting to them weekly.)
With regard to writing new business, Fernandez says, “No doubt in the past they were picking up quarters in front of a steamroller. That said, premiums now are going to be much higher and the margins are going to be better.” He adds, “They’ve learned a lot of their lessons,” and Fernandez says the level of scrutiny being applied
to credit analysis is tenfold what it was just a couple of years ago. Even if the company doesn’t write any new business at all, Fernandez explains that he and Berkowitz believe the run-off value of the company (the value if the company were no longer a going concern) is somewhere between $34 and $40 per share, which is more than 3x the stock’s current trading value.
While he and Berkowitz remain convinced of the investment merits of their positions in finan-cial companies, he reiterates that they have always been cautious and continue to be so. With nearly 17% of the fund in cash and equivalents as of the last reporting period (11/30/10), Fernandez says that they are well-positioned to take advantage of new opportunities as they appear.
One additional source of liquidity that will be accounted for in the next shareholder report is the fund’s sale of General Growth Properties, which had been the fund’s single largest equity position as of November 30, 2010. General Growth Properties is a mall REIT (real estate investment trust) that Fairholme recapitalized and brought out of bank-ruptcy with the help of Pershing Square Capital Management and Brookfield Asset Management. Fernandez says they had no interest in selling their position until Brookfield approached them in early 2011 and made an offer for a cash and stock deal worth about $1.7 billion. Fernandez says they sold the Brookfield stock, but kept the warrants, which he says are attractive because, in addition to providing a call option on any upside on Brookfield’s portfolio (including its 38% stake in General Growth Properties), the warrants have substantial ratchet-down features, meaning that every time Brookfield pays a dividend, the price of the warrant decreases. Fernandez adds, “We also have some more protection on the upside, because there are a lot of other things that they have bought at good prices during a distressed time.”
We also discussed Fairholme’s activist invest-ment in the St. Joe Company (a Florida-based property developer), which has become a very public battle that has played out in the press. Fairholme has owned a position in the company for several years, but filed as an activist investor in 2010 after disagreeing with management over compensa-tion issues and management’s failure to slash over-head costs in a terrible real estate environment. Fernandez says, “We basically disagreed with management and the board on executive compensa-tion, which was not tied to the performance of the company in our opinion.” He adds, “We don’t
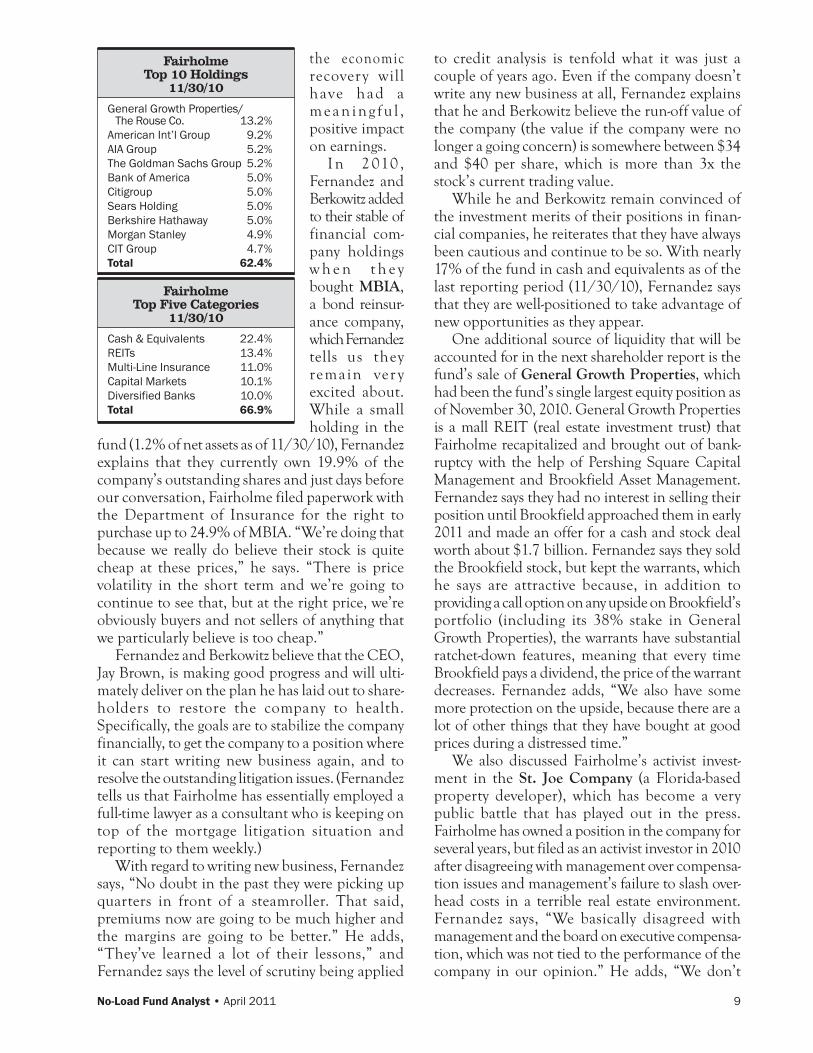
General Growth Properties/ The Rouse Co. 13.2%American Int’l Group 9.2%AIA Group 5.2%The Goldman Sachs Group 5.2%Bank of America 5.0%Citigroup 5.0%Sears Holding 5.0%Berkshire Hathaway 5.0%Morgan Stanley 4.9%CIT Group 4.7%Total 62.4%
FairholmeTop 10 Holdings
11/30/10
Cash & Equivalents 22.4%REITs 13.4%Multi-Line Insurance 11.0%Capital Markets 10.1%Diversified Banks 10.0%Total 66.9%
FairholmeTop Five Categories
11/30/10
10 No-Load Fund Analyst • April 2011
suffer much from denial. We made a mistake. We thought the management was really trying to hunker down and just wait out the recession because they had no debt.” But as management failed to cut overhead as he and Berkowitz believed was necessary, their opinion changed. “If there were not changes in both corporate governance and the day-to-day management of the company, we believed in the short term . . . they were ultimately going to have to sell assets to pay operating expenses.”
At that point, owning nearly 30% of the company (although that accounted for only 2.4% of the Fairholme fund as of 11/30/10), Fernandez and Berkowitz negotiated to get themselves on the board of directors. After serving for just a couple of months, Fernandez and Berkowitz resigned from the board, convinced they would not be able to effect enough change to help the company realize the value of its assets. However, just hours before our conversation with Fernandez, he and Berkowitz were renamed to the St. Joe board of directors as vice chairman and chairman, respec-tively, and the CEO and several board members resigned. Because they were once again privy to insider information, our conversation about this company was kept to a discussion of overall company strategy rather than specifics.
Fernandez explains that while they made a mistake believing in former management, they do not believe they have made a mistake in the valu-ation of the company’s assets (including a $300 million tax loss carry-forward); he and Berkowitz believe the company has “tremendous upside.” He says that overhead can be cut by 50% and there are many opportunities to grow the company. “The company lost $1.42 per share in 2009,” Fernandez explains. “In 2010, even with what we believe to be extremely wasteful spending, they lost $0.39 per share, so we do believe breakeven is something that is not unrealistic pretty quickly.” Despite their
belief that the value of the company’s underlying assets will recover, Fernandez acknowledges that it is totally tied to the U.S. economy and housing markets, both of which he and Berkowitz believe will recover. Looking prospectively, Fernandez says, “We will not take on debt. We will not sell property at cheap prices to cover operating expenses. We will shrink to the size that allows the company, at a minimum, to be breakeven and at a positive, to be profitable.”
Litman/Gregory OpinionIn the first quarter of 2011, the fund lost 2.3%
compared to a 5.9% gain for the Vanguard 500 benchmark. However, we remain impressed with the consistency of Berkowitz’s outperformance relative to the benchmark and with his ability to protect shareholders on the downside. The fund has outperformed the Vanguard 500 benchmark in 89% of all rolling 12-month periods. Over rolling one-year periods when the benchmark experienced a loss, the fund outperformed 98% of the time and over rolling one-year periods when the benchmark had a gain, the fund outperformed 82% of the time. The fund has also outperformed the benchmark over all rolling three-year periods since the fund’s January 2000 inception. Over the same period, the fund has outperformed its bench-mark by nearly 13 percentage points annualized. The fund has trailed the benchmark by nearly 700 basis points over the last 12 months, despite its 8.6% absolute gain.
Since concluding our initial due diligence on the fund back in November 2008, there have been multiple developments within the Fairholme team that we have reported on in our ongoing fund updates. Berkowitz emphasizes that all of the changes discussed below have enabled him to focus a large percentage of his time on investing (rather than
“Research Reports” continued
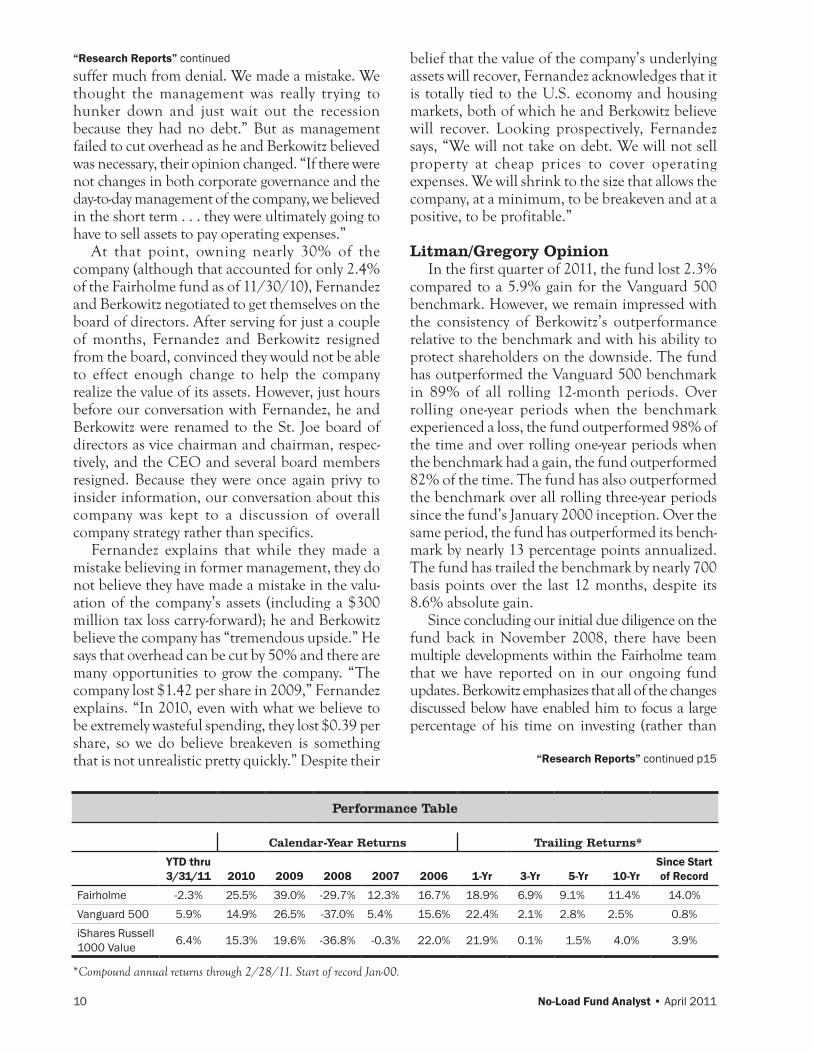
Performance Table
Calendar-Year Returns Trailing Returns*
YTD thru 3/31/11 2010 2009 2008 2007 2006 1-Yr 3-Yr 5-Yr 10-Yr
Since Start of Record
Fairholme -2.3% 25.5% 39.0% -29.7% 12.3% 16.7% 18.9% 6.9% 9.1% 11.4% 14.0%Vanguard 500 5.9% 14.9% 26.5% -37.0% 5.4% 15.6% 22.4% 2.1% 2.8% 2.5% 0.8%iShares Russell 1000 Value 6.4% 15.3% 19.6% -36.8% -0.3% 22.0% 21.9% 0.1% 1.5% 4.0% 3.9%
*Compound annual returns through 2/28/11. Start of record Jan-00.
“Research Reports” continued p15
No-Load Fund Analyst • April 2011 11
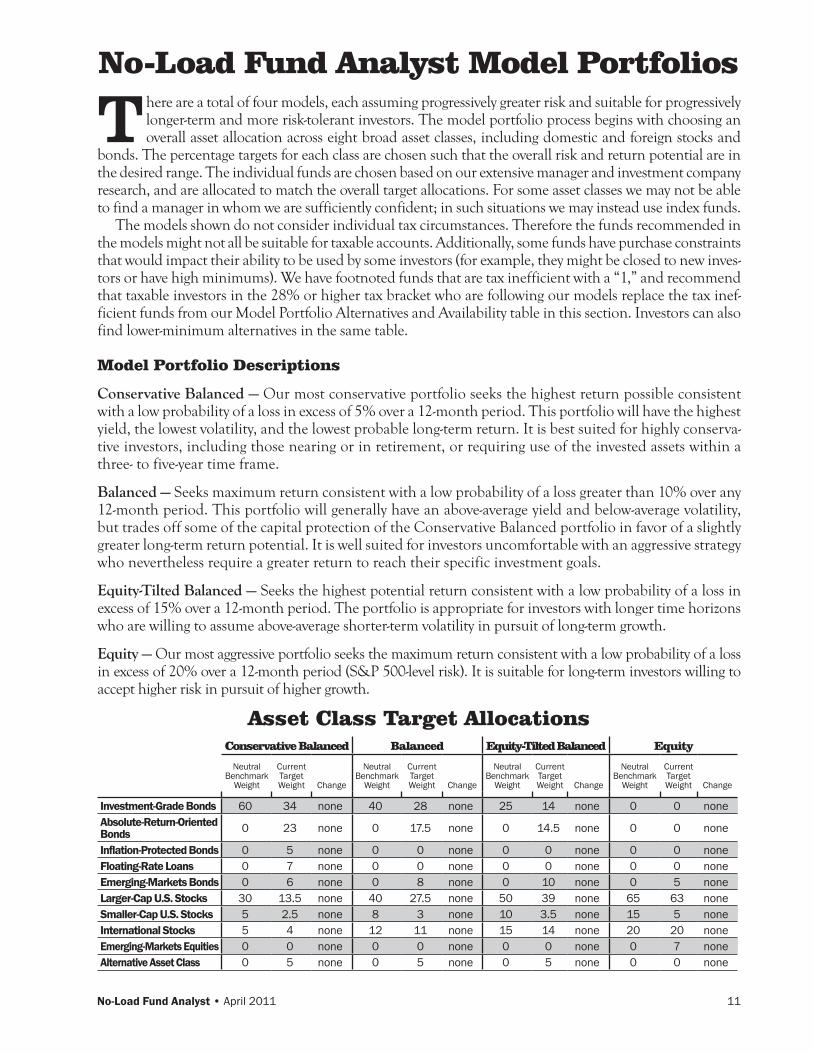
There are a total of four models, each assuming progressively greater risk and suitable for progressively longer-term and more risk-tolerant investors. The model portfolio process begins with choosing an overall asset allocation across eight broad asset classes, including domestic and foreign stocks and
bonds. The percentage targets for each class are chosen such that the overall risk and return potential are in the desired range. The individual funds are chosen based on our extensive manager and investment company research, and are allocated to match the overall target allocations. For some asset classes we may not be able to find a manager in whom we are sufficiently confident; in such situations we may instead use index funds.
The models shown do not consider individual tax circumstances. Therefore the funds recommended in the models might not all be suitable for taxable accounts. Additionally, some funds have purchase constraints that would impact their ability to be used by some investors (for example, they might be closed to new inves-tors or have high minimums). We have footnoted funds that are tax inefficient with a “1,” and recommend that taxable investors in the 28% or higher tax bracket who are following our models replace the tax inef-ficient funds from our Model Portfolio Alternatives and Availability table in this section. Investors can also find lower-minimum alternatives in the same table.
Model Portfolio Descriptions
Conservative Balanced — Our most conservative portfolio seeks the highest return possible consistent with a low probability of a loss in excess of 5% over a 12-month period. This portfolio will have the highest yield, the lowest volatility, and the lowest probable long-term return. It is best suited for highly conserva-tive investors, including those nearing or in retirement, or requiring use of the invested assets within a three- to five-year time frame.
Balanced — Seeks maximum return consistent with a low probability of a loss greater than 10% over any 12-month period. This portfolio will generally have an above-average yield and below-average volatility, but trades off some of the capital protection of the Conservative Balanced portfolio in favor of a slightly greater long-term return potential. It is well suited for investors uncomfortable with an aggressive strategy who nevertheless require a greater return to reach their specific investment goals.
Equity-Tilted Balanced — Seeks the highest potential return consistent with a low probability of a loss in excess of 15% over a 12-month period. The portfolio is appropriate for investors with longer time horizons who are willing to assume above-average shorter-term volatility in pursuit of long-term growth.
Equity — Our most aggressive portfolio seeks the maximum return consistent with a low probability of a loss in excess of 20% over a 12-month period (S&P 500-level risk). It is suitable for long-term investors willing to accept higher risk in pursuit of higher growth.
No-Load Fund Analyst Model Portfolios
Asset Class Target AllocationsConservative Balanced Balanced Equity-Tilted Balanced Equity
Neutral Benchmark
Weight
Current Target Weight Change
Neutral Benchmark
Weight
Current Target Weight Change
Neutral Benchmark
Weight
Current Target Weight Change
Neutral Benchmark
Weight
Current Target Weight Change
Investment-Grade Bonds 60 34 none 40 28 none 25 14 none 0 0 noneAbsolute-Return-Oriented Bonds 0 23 none 0 17.5 none 0 14.5 none 0 0 none
Inflation-Protected Bonds 0 5 none 0 0 none 0 0 none 0 0 noneFloating-Rate Loans 0 7 none 0 0 none 0 0 none 0 0 noneEmerging-Markets Bonds 0 6 none 0 8 none 0 10 none 0 5 noneLarger-Cap U.S. Stocks 30 13.5 none 40 27.5 none 50 39 none 65 63 noneSmaller-Cap U.S. Stocks 5 2.5 none 8 3 none 10 3.5 none 15 5 noneInternational Stocks 5 4 none 12 11 none 15 14 none 20 20 noneEmerging-Markets Equities 0 0 none 0 0 none 0 0 none 0 7 noneAlternative Asset Class 0 5 none 0 5 none 0 5 none 0 0 none
12 No-Load Fund Analyst • April 2011
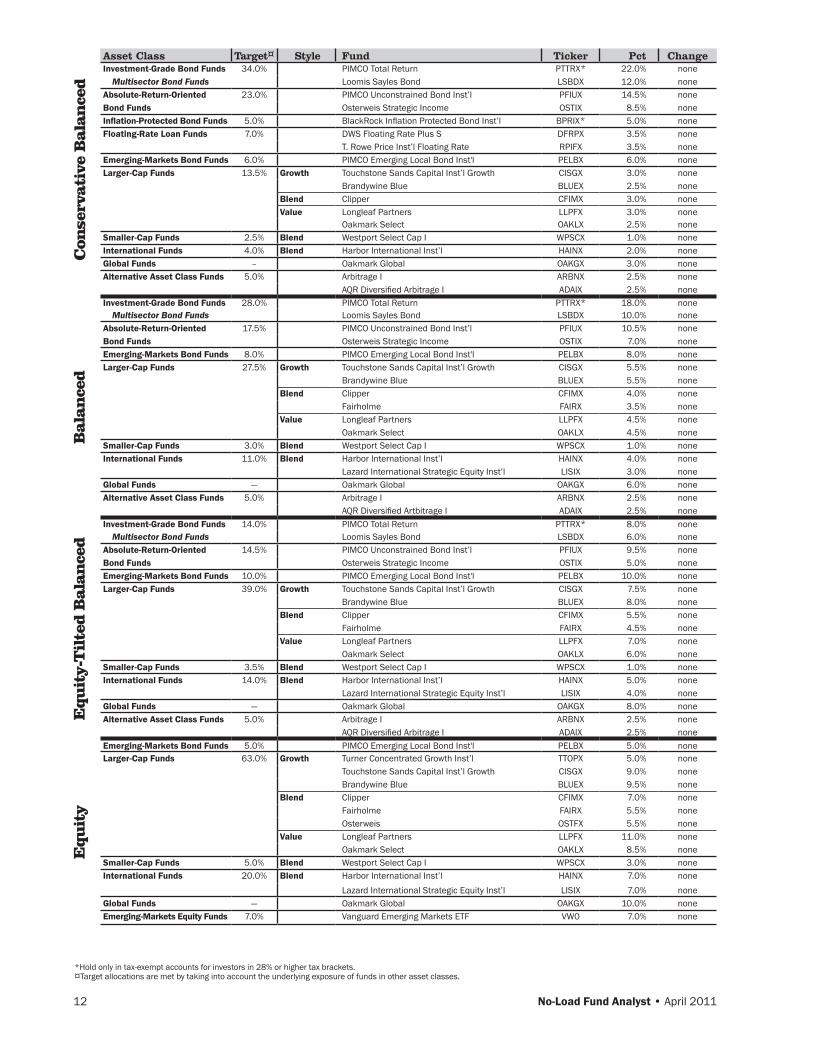
Asset Class Target¤ Style Fund Ticker Pct ChangeInvestment-Grade Bond Funds 34.0% PIMCO Total Return PTTRX* 22.0% none
Multisector Bond Funds Loomis Sayles Bond LSBDX 12.0% noneAbsolute-Return-Oriented 23.0% PIMCO Unconstrained Bond Inst’l PFIUX 14.5% noneBond Funds Osterweis Strategic Income OSTIX 8.5% noneInflation-Protected Bond Funds 5.0% BlackRock Inflation Protected Bond Inst’l BPRIX* 5.0% noneFloating-Rate Loan Funds 7.0% DWS Floating Rate Plus S DFRPX 3.5% none
T. Rowe Price Inst’l Floating Rate RPIFX 3.5% noneEmerging-Markets Bond Funds 6.0% PIMCO Emerging Local Bond Inst'l PELBX 6.0% noneLarger-Cap Funds 13.5% Growth Touchstone Sands Capital Inst’l Growth CISGX 3.0% none
Brandywine Blue BLUEX 2.5% noneBlend Clipper CFIMX 3.0% noneValue Longleaf Partners LLPFX 3.0% none
Oakmark Select OAKLX 2.5% noneSmaller-Cap Funds 2.5% Blend Westport Select Cap I WPSCX 1.0% noneInternational Funds 4.0% Blend Harbor International Inst’l HAINX 2.0% noneGlobal Funds – Oakmark Global OAKGX 3.0% noneAlternative Asset Class Funds 5.0% Arbitrage I ARBNX 2.5% none
AQR Diversified Arbitrage I ADAIX 2.5% noneInvestment-Grade Bond Funds 28.0% PIMCO Total Return PTTRX* 18.0% none
Multisector Bond Funds Loomis Sayles Bond LSBDX 10.0% noneAbsolute-Return-Oriented 17.5% PIMCO Unconstrained Bond Inst’l PFIUX 10.5% noneBond Funds Osterweis Strategic Income OSTIX 7.0% noneEmerging-Markets Bond Funds 8.0% PIMCO Emerging Local Bond Inst'l PELBX 8.0% noneLarger-Cap Funds 27.5% Growth Touchstone Sands Capital Inst’l Growth CISGX 5.5% none
Brandywine Blue BLUEX 5.5% noneBlend Clipper CFIMX 4.0% none
Fairholme FAIRX 3.5% noneValue Longleaf Partners LLPFX 4.5% none
Oakmark Select OAKLX 4.5% noneSmaller-Cap Funds 3.0% Blend Westport Select Cap I WPSCX 1.0% noneInternational Funds 11.0% Blend Harbor International Inst’l HAINX 4.0% none
Lazard International Strategic Equity Inst’l LISIX 3.0% noneGlobal Funds — Oakmark Global OAKGX 6.0% noneAlternative Asset Class Funds 5.0% Arbitrage I ARBNX 2.5% none
AQR Diversified Artbitrage I ADAIX 2.5% noneInvestment-Grade Bond Funds 14.0% PIMCO Total Return PTTRX* 8.0% none
Multisector Bond Funds Loomis Sayles Bond LSBDX 6.0% noneAbsolute-Return-Oriented 14.5% PIMCO Unconstrained Bond Inst’l PFIUX 9.5% noneBond Funds Osterweis Strategic Income OSTIX 5.0% noneEmerging-Markets Bond Funds 10.0% PIMCO Emerging Local Bond Inst'l PELBX 10.0% noneLarger-Cap Funds 39.0% Growth Touchstone Sands Capital Inst’l Growth CISGX 7.5% none
Brandywine Blue BLUEX 8.0% noneBlend Clipper CFIMX 5.5% none
Fairholme FAIRX 4.5% noneValue Longleaf Partners LLPFX 7.0% none
Oakmark Select OAKLX 6.0% noneSmaller-Cap Funds 3.5% Blend Westport Select Cap I WPSCX 1.0% noneInternational Funds 14.0% Blend Harbor International Inst’l HAINX 5.0% none
Lazard International Strategic Equity Inst’l LISIX 4.0% noneGlobal Funds — Oakmark Global OAKGX 8.0% noneAlternative Asset Class Funds 5.0% Arbitrage I ARBNX 2.5% none
AQR Diversified Arbitrage I ADAIX 2.5% noneEmerging-Markets Bond Funds 5.0% PIMCO Emerging Local Bond Inst'l PELBX 5.0% noneLarger-Cap Funds 63.0% Growth Turner Concentrated Growth Inst’l TTOPX 5.0% none
Touchstone Sands Capital Inst’l Growth CISGX 9.0% noneBrandywine Blue BLUEX 9.5% none
Blend Clipper CFIMX 7.0% noneFairholme FAIRX 5.5% noneOsterweis OSTFX 5.5% none
Value Longleaf Partners LLPFX 11.0% noneOakmark Select OAKLX 8.5% none
Smaller-Cap Funds 5.0% Blend Westport Select Cap I WPSCX 3.0% noneInternational Funds 20.0% Blend Harbor International Inst’l HAINX 7.0% none
Lazard International Strategic Equity Inst’l LISIX 7.0% noneGlobal Funds — Oakmark Global OAKGX 10.0% noneEmerging-Markets Equity Funds 7.0% Vanguard Emerging Markets ETF VW0 7.0% none
Con
serv
ati
ve B
ala
nce
d B
ala
nce
dE
qu
ity-
Til
ted B
ala
nce
dE
qu
ity
*Hold only in tax-exempt accounts for investors in 28% or higher tax brackets. ¤Target allocations are met by taking into account the underlying exposure of funds in other asset classes.
No-Load Fund Analyst • April 2011 13
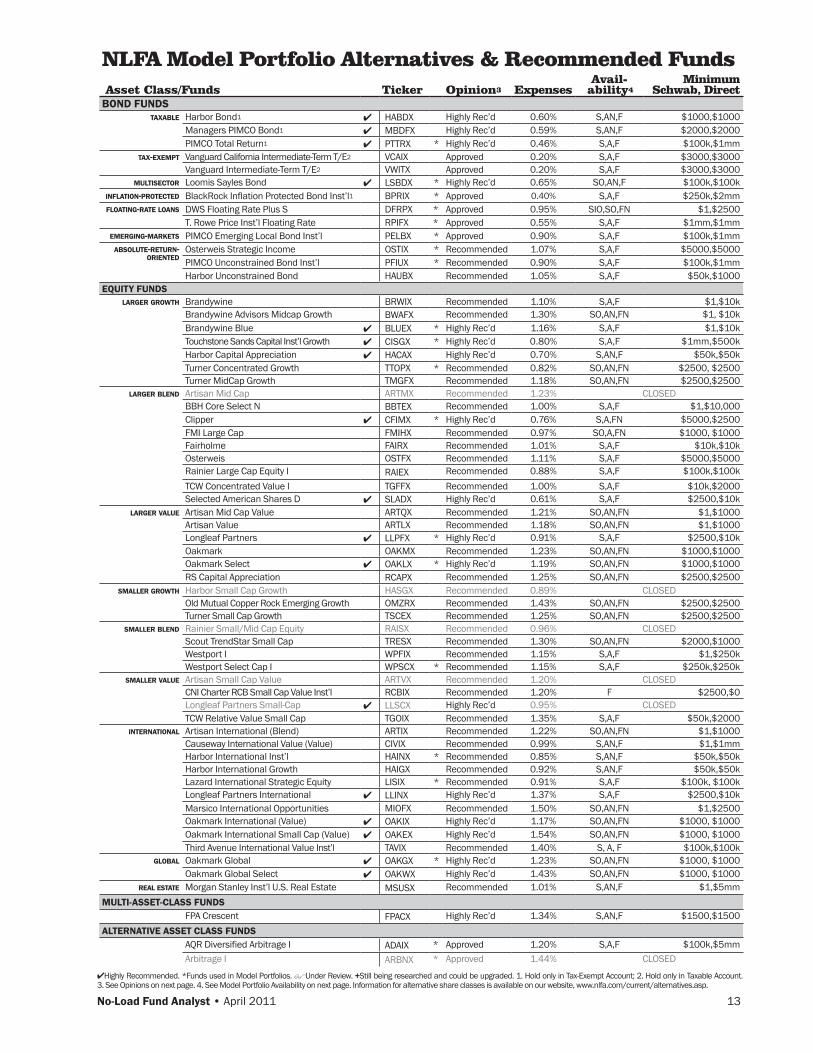
Asset Class/Funds Ticker Opinion3 ExpensesAvail-
ability4Minimum
Schwab, DirectBOND FUNDS
tAxAble Harbor Bond1 ✔ HABDX Highly Rec’d 0.60% S,AN,F $1000,$1000Managers PIMCO Bond1 ✔ MBDFX Highly Rec’d 0.59% S,AN,F $2000,$2000PIMCO Total Return1 ✔ PTTRX * Highly Rec’d 0.46% S,A,F $100k,$1mm
tAx-exeMPt Vanguard California Intermediate-Term T/E2 VCAIX Approved 0.20% S,A,F $3000,$3000Vanguard Intermediate-Term T/E2 VWITX Approved 0.20% S,A,F $3000,$3000
Multisector Loomis Sayles Bond ✔ LSBDX * Highly Rec’d 0.65% SO,AN,F $100k,$100kinFlAtion-Protected BlackRock Inflation Protected Bond Inst’l1 BPRIX * Approved 0.40% S,A,F $250k,$2mmFloAting-rAte loAns DWS Floating Rate Plus S DFRPX * Approved 0.95% SIO,SO,FN $1,$2500
T. Rowe Price Inst’l Floating Rate RPIFX * Approved 0.55% S,A,F $1mm,$1mmeMerging-MArkets PIMCO Emerging Local Bond Inst’l PELBX * Approved 0.90% S,A,F $100k,$1mm
Absolute-return-oriented
Osterweis Strategic Income OSTIX * Recommended 1.07% S,A,F $5000,$5000PIMCO Unconstrained Bond Inst’l PFIUX * Recommended 0.90% S,A,F $100k,$1mmHarbor Unconstrained Bond HAUBX Recommended 1.05% S,A,F $50k,$1000
EQUITY FUNDSlArger groWth Brandywine BRWIX Recommended 1.10% S,A,F $1,$10k
Brandywine Advisors Midcap Growth BWAFX Recommended 1.30% SO,AN,FN $1, $10kBrandywine Blue ✔ BLUEX * Highly Rec’d 1.16% S,A,F $1,$10kTouchstone Sands Capital Inst’l Growth ✔ CISGX * Highly Rec’d 0.80% S,A,F $1mm,$500kHarbor Capital Appreciation ✔ HACAX Highly Rec’d 0.70% S,AN,F $50k,$50kTurner Concentrated Growth TTOPX * Recommended 0.82% SO,AN,FN $2500, $2500Turner MidCap Growth TMGFX Recommended 1.18% SO,AN,FN $2500,$2500
lArger blend Artisan Mid Cap ARTMX Recommended 1.23% CLOSEDBBH Core Select N BBTEX Recommended 1.00% S,A,F $1,$10,000Clipper ✔ CFIMX * Highly Rec’d 0.76% S,A,FN $5000,$2500FMI Large Cap FMIHX Recommended 0.97% SO,A,FN $1000, $1000Fairholme FAIRX Recommended 1.01% S,A,F $10k,$10kOsterweis OSTFX Recommended 1.11% S,A,F $5000,$5000Rainier Large Cap Equity I RAIEX Recommended 0.88% S,A,F $100k,$100kTCW Concentrated Value I TGFFX Recommended 1.00% S,A,F $10k,$2000Selected American Shares D ✔ SLADX Highly Rec’d 0.61% S,A,F $2500,$10k
lArger vAlue Artisan Mid Cap Value ARTQX Recommended 1.21% SO,AN,FN $1,$1000Artisan Value ARTLX Recommended 1.18% SO,AN,FN $1,$1000Longleaf Partners ✔ LLPFX * Highly Rec’d 0.91% S,A,F $2500,$10kOakmark OAKMX Recommended 1.23% SO,AN,FN $1000,$1000Oakmark Select ✔ OAKLX * Highly Rec’d 1.19% SO,AN,FN $1000,$1000RS Capital Appreciation RCAPX Recommended 1.25% SO,AN,FN $2500,$2500
sMAller groWth Harbor Small Cap Growth HASGX Recommended 0.89% CLOSEDOld Mutual Copper Rock Emerging Growth OMZRX Recommended 1.43% SO,AN,FN $2500,$2500Turner Small Cap Growth TSCEX Recommended 1.25% SO,AN,FN $2500,$2500
sMAller blend Rainier Small/Mid Cap Equity RAISX Recommended 0.96% CLOSEDScout TrendStar Small Cap TRESX Recommended 1.30% SO,AN,FN $2000,$1000Westport I WPFIX Recommended 1.15% S,A,F $1,$250kWestport Select Cap I WPSCX * Recommended 1.15% S,A,F $250k,$250k
sMAller vAlue Artisan Small Cap Value ARTVX Recommended 1.20% CLOSEDCNI Charter RCB Small Cap Value Inst’l RCBIX Recommended 1.20% F $2500,$0Longleaf Partners Small-Cap ✔ LLSCX Highly Rec’d 0.95% CLOSEDTCW Relative Value Small Cap TGOIX Recommended 1.35% S,A,F $50k,$2000
internAtionAl Artisan International (Blend) ARTIX Recommended 1.22% SO,AN,FN $1,$1000Causeway International Value (Value) CIVIX Recommended 0.99% S,AN,F $1,$1mmHarbor International Inst’l HAINX * Recommended 0.85% S,AN,F $50k,$50kHarbor International Growth HAIGX Recommended 0.92% S,AN,F $50k,$50kLazard International Strategic Equity LISIX * Recommended 0.91% S,A,F $100k, $100kLongleaf Partners International ✔ LLINX Highly Rec’d 1.37% S,A,F $2500,$10kMarsico International Opportunities MIOFX Recommended 1.50% SO,AN,FN $1,$2500Oakmark International (Value) ✔ OAKIX Highly Rec’d 1.17% SO,AN,FN $1000, $1000Oakmark International Small Cap (Value) ✔ OAKEX Highly Rec’d 1.54% SO,AN,FN $1000, $1000Third Avenue International Value Inst’l TAVIX Recommended 1.40% S, A, F $100k,$100k
globAl Oakmark Global ✔ OAKGX * Highly Rec’d 1.23% SO,AN,FN $1000, $1000Oakmark Global Select ✔ OAKWX Highly Rec’d 1.43% SO,AN,FN $1000, $1000
reAl estAte Morgan Stanley Inst’l U.S. Real Estate MSUSX Recommended 1.01% S,AN,F $1,$5mmMULTI-ASSET-CLASS FUNDS
FPA Crescent FPACX Highly Rec’d 1.34% S,AN,F $1500,$1500ALTERNATIVE ASSET CLASS FUNDS
AQR Diversified Arbitrage I ADAIX * Approved 1.20% S,A,F $100k,$5mmArbitrage I ARBNX * Approved 1.44% CLOSED
NLFA Model Portfolio Alternatives & Recommended Funds
✔Highly Recommended. *Funds used in Model Portfolios. Under Review. +Still being researched and could be upgraded. 1. Hold only in Tax-Exempt Account; 2. Hold only in Taxable Account. 3. See Opinions on next page. 4. See Model Portfolio Availability on next page. Information for alternative share classes is available on our website, www.nlfa.com/current/alternatives.asp.
14 No-Load Fund Analyst • April 2011
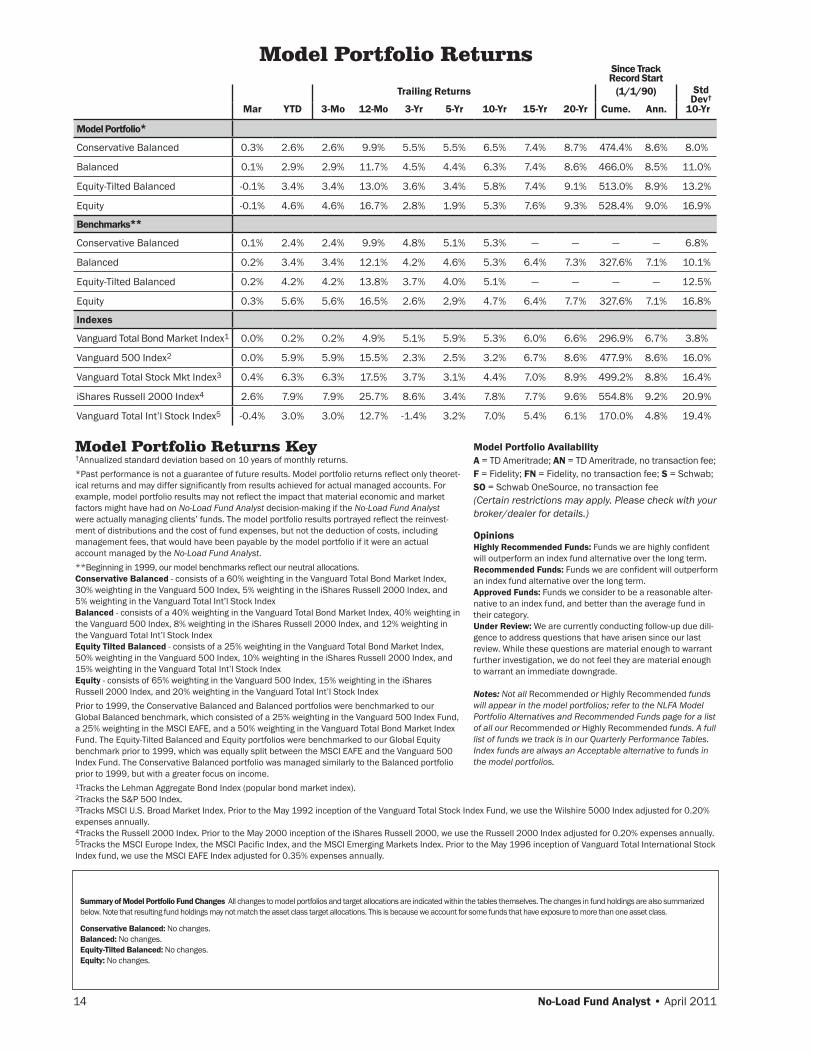
Model Portfolio Returns
Summary of Model Portfolio Fund Changes All changes to model portfolios and target allocations are indicated within the tables themselves. The changes in fund holdings are also summarized below. Note that resulting fund holdings may not match the asset class target allocations. This is because we account for some funds that have exposure to more than one asset class.
Conservative Balanced: No changes.Balanced: No changes.Equity-Tilted Balanced: No changes.Equity: No changes.
Since Track Record Start
Trailing Returns (1/1/90)
Mar YTD 3-Mo 12-Mo 3-Yr 5-Yr 10-Yr 15-Yr 20-Yr Cume. Ann. 10-Yr
Model Portfolio*
Conservative Balanced 0.3% 2.6% 2.6% 9.9% 5.5% 5.5% 6.5% 7.4% 8.7% 474.4% 8.6% 8.0%
Balanced 0.1% 2.9% 2.9% 11.7% 4.5% 4.4% 6.3% 7.4% 8.6% 466.0% 8.5% 11.0%
Equity-Tilted Balanced -0.1% 3.4% 3.4% 13.0% 3.6% 3.4% 5.8% 7.4% 9.1% 513.0% 8.9% 13.2%
Equity -0.1% 4.6% 4.6% 16.7% 2.8% 1.9% 5.3% 7.6% 9.3% 528.4% 9.0% 16.9%
Benchmarks**
Conservative Balanced 0.1% 2.4% 2.4% 9.9% 4.8% 5.1% 5.3% — — — — 6.8%
Balanced 0.2% 3.4% 3.4% 12.1% 4.2% 4.6% 5.3% 6.4% 7.3% 327.6% 7.1% 10.1%
Equity-Tilted Balanced 0.2% 4.2% 4.2% 13.8% 3.7% 4.0% 5.1% — — — — 12.5%
Equity 0.3% 5.6% 5.6% 16.5% 2.6% 2.9% 4.7% 6.4% 7.7% 327.6% 7.1% 16.8%
Indexes
Vanguard Total Bond Market Index1 0.0% 0.2% 0.2% 4.9% 5.1% 5.9% 5.3% 6.0% 6.6% 296.9% 6.7% 3.8%
Vanguard 500 Index2 0.0% 5.9% 5.9% 15.5% 2.3% 2.5% 3.2% 6.7% 8.6% 477.9% 8.6% 16.0%
Vanguard Total Stock Mkt Index3 0.4% 6.3% 6.3% 17.5% 3.7% 3.1% 4.4% 7.0% 8.9% 499.2% 8.8% 16.4%
iShares Russell 2000 Index4 2.6% 7.9% 7.9% 25.7% 8.6% 3.4% 7.8% 7.7% 9.6% 554.8% 9.2% 20.9%
Vanguard Total Int’l Stock Index5 -0.4% 3.0% 3.0% 12.7% -1.4% 3.2% 7.0% 5.4% 6.1% 170.0% 4.8% 19.4%
Model Portfolio Returns Key†Annualized standard deviation based on 10 years of monthly returns.*Past performance is not a guarantee of future results. Model portfolio returns reflect only theoret-ical returns and may differ significantly from results achieved for actual managed accounts. For example, model portfolio results may not reflect the impact that material economic and market factors might have had on No-Load Fund Analyst decision-making if the No-Load Fund Analyst were actually managing clients’ funds. The model portfolio results portrayed reflect the reinvest-ment of distributions and the cost of fund expenses, but not the deduction of costs, including management fees, that would have been payable by the model portfolio if it were an actual account managed by the No-Load Fund Analyst.** Beginning in 1999, our model benchmarks reflect our neutral allocations. Conservative Balanced - consists of a 60% weighting in the Vanguard Total Bond Market Index, 30% weighting in the Vanguard 500 Index, 5% weighting in the iShares Russell 2000 Index, and 5% weighting in the Vanguard Total Int’l Stock Index Balanced - consists of a 40% weighting in the Vanguard Total Bond Market Index, 40% weighting in the Vanguard 500 Index, 8% weighting in the iShares Russell 2000 Index, and 12% weighting in the Vanguard Total Int’l Stock Index Equity Tilted Balanced - consists of a 25% weighting in the Vanguard Total Bond Market Index, 50% weighting in the Vanguard 500 Index, 10% weighting in the iShares Russell 2000 Index, and 15% weighting in the Vanguard Total Int’l Stock Index Equity - consists of 65% weighting in the Vanguard 500 Index, 15% weighting in the iShares Russell 2000 Index, and 20% weighting in the Vanguard Total Int’l Stock IndexPrior to 1999, the Conservative Balanced and Balanced portfolios were benchmarked to our Global Balanced benchmark, which consisted of a 25% weighting in the Vanguard 500 Index Fund, a 25% weighting in the MSCI EAFE, and a 50% weighting in the Vanguard Total Bond Market Index Fund. The Equity-Tilted Balanced and Equity portfolios were benchmarked to our Global Equity benchmark prior to 1999, which was equally split between the MSCI EAFE and the Vanguard 500 Index Fund. The Conservative Balanced portfolio was managed similarly to the Balanced portfolio prior to 1999, but with a greater focus on income.1Tracks the Lehman Aggregate Bond Index (popular bond market index). 2Tracks the S&P 500 Index. 3Tracks MSCI U.S. Broad Market Index. Prior to the May 1992 inception of the Vanguard Total Stock Index Fund, we use the Wilshire 5000 Index adjusted for 0.20% expenses annually. 4Tracks the Russell 2000 Index. Prior to the May 2000 inception of the iShares Russell 2000, we use the Russell 2000 Index adjusted for 0.20% expenses annually. 5Tracks the MSCI Europe Index, the MSCI Pacific Index, and the MSCI Emerging Markets Index. Prior to the May 1996 inception of Vanguard Total International Stock Index fund, we use the MSCI EAFE Index adjusted for 0.35% expenses annually.
Model Portfolio AvailabilityA = TD Ameritrade; AN = TD Ameritrade, no transaction fee; F = Fidelity; FN = Fidelity, no transaction fee; S = Schwab; SO = Schwab OneSource, no transaction fee(Certain restrictions may apply. Please check with your broker/dealer for details.)
OpinionsHighly Recommended Funds: Funds we are highly confident will outperform an index fund alternative over the long term.Recommended Funds: Funds we are confident will outperform an index fund alternative over the long term.Approved Funds: Funds we consider to be a reasonable alter-native to an index fund, and better than the average fund in their category.Under Review: We are currently conducting follow-up due dili-gence to address questions that have arisen since our last review. While these questions are material enough to warrant further investigation, we do not feel they are material enough to warrant an immediate downgrade.
Notes: Not all Recommended or Highly Recommended funds will appear in the model portfolios; refer to the NLFA Model Portfolio Alternatives and Recommended Funds page for a list of all our Recommended or Highly Recommended funds. A full list of funds we track is in our Quarterly Performance Tables. Index funds are always an Acceptable alternative to funds in the model portfolios.
Std Dev†
No-Load Fund Analyst • April 2011 15
managing a team or running a business), which we view as a positive. But analysts Keith Trauner, Larry Pitkowski, and David Ahl, with whom we were very impressed during our initial discussions, are no longer with the firm. Fernandez now serves as the chief research officer and a co-manager on the fund. He conducts company analysis, is involved in discus-sions with company management, and is Berkowitz’s second-in-command when it comes to allocating assets in the portfolio. Fernandez tells us that he has two other people reporting to him internally that serve as research associates.
It is also clear, based on our conversations with Berkowitz and Fernandez over the last several years, that they are increasingly relying on the input of outside consultants that are highly specialized in the specific industries Berkowitz is interested and/or invested in. He relies on their experience and knowledge as he attempts to build (and tear down) the investment case for a particular company. This is a different model from many, if not all, of the funds we recommend, which typically have teams of full-time internal research analysts. Berkowitz’ approach is more similar to a hedge fund model—which does not make it inherently better or worse—where the services of consultants with highly specialized expertise in a particular area are employed only as long the investment in that industry is maintained. When new investment ideas are unearthed, he establishes consultant rela-tionships in the new industry of focus. One benefit to this model, as Berkowitz points out, is that he can avoid paying a team of “armchair” analysts who may or may not have any companies in the portfolio. It also reduces the distraction of having a team of internal people to manage. On the other hand, we realize that working with the same team of analysts over time has its advantages. It allows the portfolio manager to gain a deeper understanding of an indi-vidual analyst’s strengths and weaknesses, which can be factored into the manager’s decision of how much weight to put on the analysis. Working with new people requires a greater level of initial vetting. While this is not a material concern for us at this point, we continue to evaluate the managers’ use of consultants in an effort to better understand the pros and cons of this approach.
We continue to think very highly of Berkowitz as an investor. He is passionate about investing and knows his companies extremely well. He is an inde-pendent thinker whose conviction in his holdings is reflected in his portfolio. We believe he learns from
his mistakes, which will make him a better investor over time. Importantly, he has maintained his focus on investing over the years. He has grown his team in a measured way and hired experienced people to help him run the day-to-day business. Berkowitz’s investment approach is understandable and we are impressed with the intensity of his research process. Furthermore, Berkowitz has invested nearly his entire liquid net worth in the fund. We believe this is very compelling and demonstrates his level of commit-ment and belief in the fund’s strategy, and that aligns his interests with his shareholders’.
With a much larger asset base at his disposal than in the past (he currently runs approximately $20 billion), Berkowitz is now willing to take bigger stakes in companies. Taking on a larger stake in a company may very well make it harder and more costly for him to exit. However, Berkowitz has also demonstrated his ability and willingness to use his large asset base to take an activist investor role. Fernandez has also told us that running such a large asset base has given them the financial resources to afford to hire specialized consultants, who they believe add value, but who are not cheap. However, it seems that the fund’s enormous size has restricted the managers’ opportunity set. Positions in small- and mid-cap companies are infeasible and would have little to no impact on performance. We believe this is one of the reasons Berkowitz launched the Fairholme Allocation fund on December 31, 2010. This new fund will also be concentrated and can invest in many of the same asset classes and securi-ties as Fairholme fund can, but, with the smaller asset base, Berkowitz has said publicly that the new fund will allow him to invest in smaller-cap compa-nies that would not have much impact on the Fairholme fund’s performance. We remain confi-dent in the investment merits of the Fairholme fund and as such the fund is Recommended. However, we plan to address broader firm issues with Berkowitz within the next month.
—Melissa Wedel, CFA
Contact & Purchase Information
Phone: (866) 202-2263Web Address: http://www.fairholmefunds.com
Fund Min. initiAl AvAilAbility† exPensesRetail (FAIRX) $10,000 S, A, F 1.01%
†Certain restrictions may apply. Please check with your broker/dealer for details.*A 2% redemption fee is assessed on shares held 60 days or less.
“Research Reports” continued from p10
16 No-Load Fund Analyst • April 2011
fund updateThornburg International Value (TGVIX)category: International Blendmanagers: Bill Fries, Wendy Trevisani, and
Lei Wangdate of interview: 3/08/11with: Lei “Rocky” Wang
Note: Thornburg International Value is only available for purchase on a no-load basis to institutional investors, so while we use this fund with our Litman/Gregory clients, we do not regularly include our research on it in the No-Load Fund Analyst. In this case, we are including this research update because the team’s current macro views on the Asian markets may be of value even to those who don’t own the fund.
Wang recently returned from a trip to China and several other Asian countries. He
pointed to a few steps China is taking to ensure that its economic growth can be sustained. First, based on his discussions with local economists and government officials, he thinks the central govern-ment wants to transfer wealth from the state or local governments to the households. He notes, “Over the past 10 years, state tax revenues have been growing faster than household income.” Second, the government continues to broaden access to health care. As more people in China are able to access affordable health care, their need to save will diminish and their willingness to spend will increase, Wang says. These steps will support China’s long-term goal of increasing domestic consumption and reducing dependence on exports to grow its economy.
At this point, China has yet to achieve the balanced growth it seeks. Over the past two years, much of the growth, according to Wang, has come from capital-intensive projects. One risk is that
many of these projects will yield poor returns and weigh down the banking system with large nonper-forming loans. Wang offered a few mitigating factors to this risk.
First, Wang says that many of the loans are offered by local governments and that the central government has the financial wherewithal to absorb losses from these programs. Second, banks have a lot of liquidity. He says, “The loan-to-deposit ratio is around 55% [for Chinese banks] versus 100% or so for Europe. There is [unlikely to be] a short-term liquidity squeeze similar to what we saw in other parts of the world [during the last recession].” So, Wang and his team are not averse to holding Chinese banks.
One Chinese bank in the fund’s portfolio is China Merchants Bank. Wang likes it for several reasons. First, he says this bank is probably the least influenced by the Chinese government. So, it is free to function as a private enterprise and makes appropriate risk-reward trade-offs when lending. For example, based on his discussions
“Research Reports” continued
[Relative Strength: Thornburg Int’l Value
vs. Vanguard Total Int’l Stock Index
Rising line indicates outperformance.
0.6
0.8
1.0
1.2
1.4
Nov
-10
Nov
-07
Nov
-04
Nov
-01
Nov
-98
0.8
1.0
1.2
1.4
1.6
1.8
2.0
May
-10
Nov
-08
May
-07
Nov
-05
May
-04
Nov
-02
May
-01
Nov
-99
May
-98
Rising line indicates outperformance.
Performance Table
Calendar-Year Returns Trailing Returns*
YTD thru 3/31/11 2010 2009 2008 2007 2006 1-Yr 3-Yr 5-Yr 10-Yr
Since Start of Record
Thornburg Int’l Value 4.4% 14.1% 32.0% -41.6% 28.2% 26.1% 24.2% 0.2% 6.8% 9.3% 10.3%
Vanguard Total Int’l Stock Index 3.0% 11.1% 36.7% -44.1% 15.5% 26.6% 20.8% -1.5% 3.9% 6.2% 5.3%
*Compound annual returns through 2/28/11. Start of Record Jun-98.
No-Load Fund Analyst • April 2011 17
with current and ex-employees of China Merchants, Wang has found that the bank is very quick to call in loans when it sees there is a risk that they may turn bad. So, the quality of its loan book and, as a result, its earnings are high (as earnings are unlikely to be hit with huge loan losses). Second, relative to many of its peers, the bank’s funding costs are low. China Merchants is able to attract a strong share of high-end customers be- cause of its stellar reputation of
superior customer service and technology. Wang says a lot of high-end customers keep a pretty high balance in their checking accounts, which have low interest rates and, therefore, represent low funding costs for the bank. Finally, Wang thinks the bank is reasonably valued. At around 10x next year’s earnings, it does not look cheap relative to other Chinese banks. But, Wang expects it to grow earnings at a faster rate, close to 20% on an annual basis versus around mid-teens for its peers, in part because of its relatively greater exposure to higher-margin, fee-generating businesses, such as credit cards.
Turning back to big-picture issues, one outcome of China’s focus on growth has been high infla-tion over the past year. Wang says, “The most powerful tool they have [to fight inflation] is [to let] their currency appreciate.” An appreciating renminbi, all else equal, would make China’s products more expensive to foreign customers whose currency has declined versus the renminbi. Wang believes China will be less worried that a higher renminbi would negatively impact its
export growth for a few reasons. One, he says China already has a dominant market share in “low-end” products, so it can pass on the implicit price increases that result from an appreciating renminbi. Second, Wang thinks there is little risk that China’s competitive advantage—an educated and trained labor force and well-developed infra-structure—can be replicated by its competitors in the near future. Wang says, “This time I went to Indonesia. We visited the ministry of finance there and they told us they want to shift to [China’s] model. But they have two big problems. One, their labor is unskilled. Two, they need [investment in] infrastructure.”
Litman/Gregory OpinionThornburg International Value was up 14.1%
in 2010, beating the Vanguard Total International Stock Index fund by 300 basis points. Year to date through March 2011, the fund has returned 4.4% while its benchmark was up 3%. The fund’s long-term performance is excellent. Over the five years ending March 2010, the fund has outperformed its benchmark by nearly 300 basis points, annual-ized. Over the trailing 10 years the fund’s margin of outperformance is similar. Since its inception in June 1998, the fund is ahead of its index by about five percentage points, annualized, while generating slightly lower volatility than the index (as measured by standard deviation of monthly returns). This performance has also come with good consistency, with the fund beating the index in 75% and 89% of the possible rolling 12- and 36-month time periods, respectively.
Thornburg is now managing over $30 billion in international assets. This limits the team’s opportu-nity set, i.e., going forward we believe the fund will have fewer smaller-cap names than in the past or an individual small-cap name is unlikely to be purchased at a weighting that will make a material
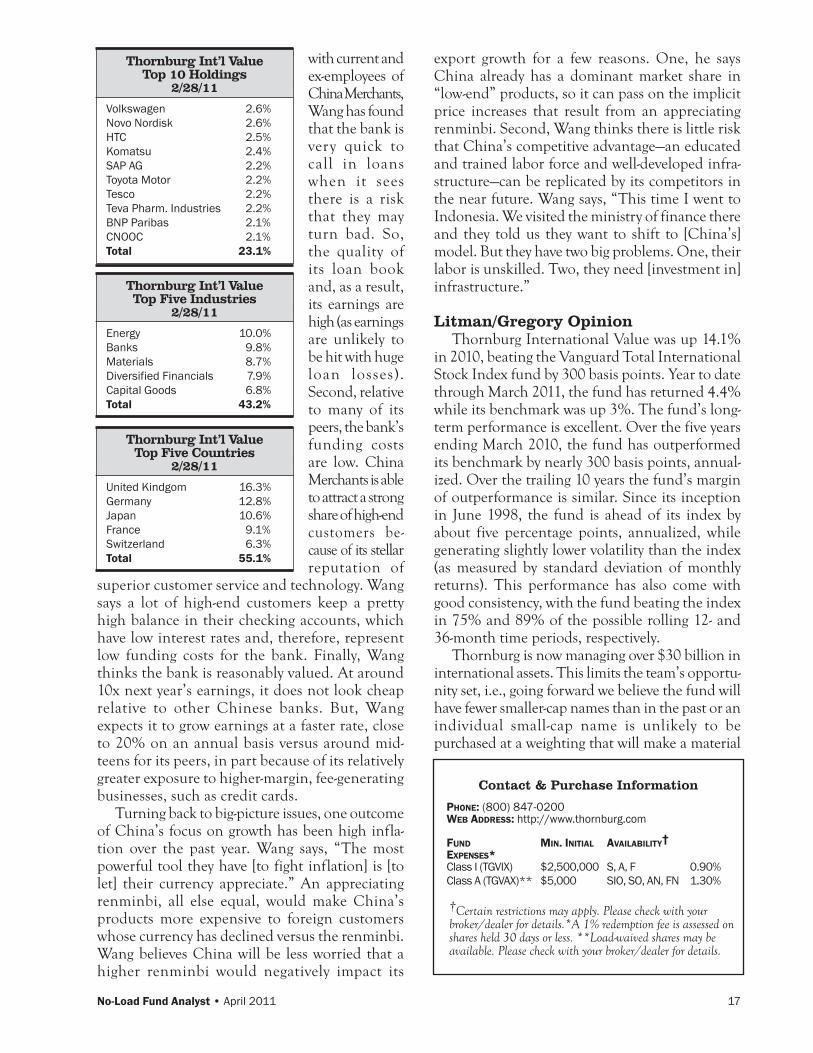
Volkswagen 2.6%Novo Nordisk 2.6%HTC 2.5%Komatsu 2.4%SAP AG 2.2%Toyota Motor 2.2%Tesco 2.2%Teva Pharm. Industries 2.2%BNP Paribas 2.1%CNOOC 2.1%Total 23.1%
Thornburg Int’l ValueTop 10 Holdings
2/28/11
Energy 10.0%Banks 9.8%Materials 8.7%Diversified Financials 7.9%Capital Goods 6.8%Total 43.2%
Thornburg Int’l ValueTop Five Industries
2/28/11
United Kindgom 16.3%Germany 12.8%Japan 10.6%France 9.1%Switzerland 6.3%Total 55.1%
Thornburg Int’l ValueTop Five Countries
2/28/11
Contact & Purchase Information
Phone: (800) 847-0200Web Address: http://www.thornburg.com
Fund Min. initiAl AvAilAbility† exPenses*Class I (TGVIX) $2,500,000 S, A, F 0.90%Class A (TGVAX)** $5,000 SIO, SO, AN, FN 1.30%
†Certain restrictions may apply. Please check with your broker/dealer for details.*A 1% redemption fee is assessed on shares held 30 days or less. **Load-waived shares may be available. Please check with your broker/dealer for details.
18 No-Load Fund Analyst • April 2011
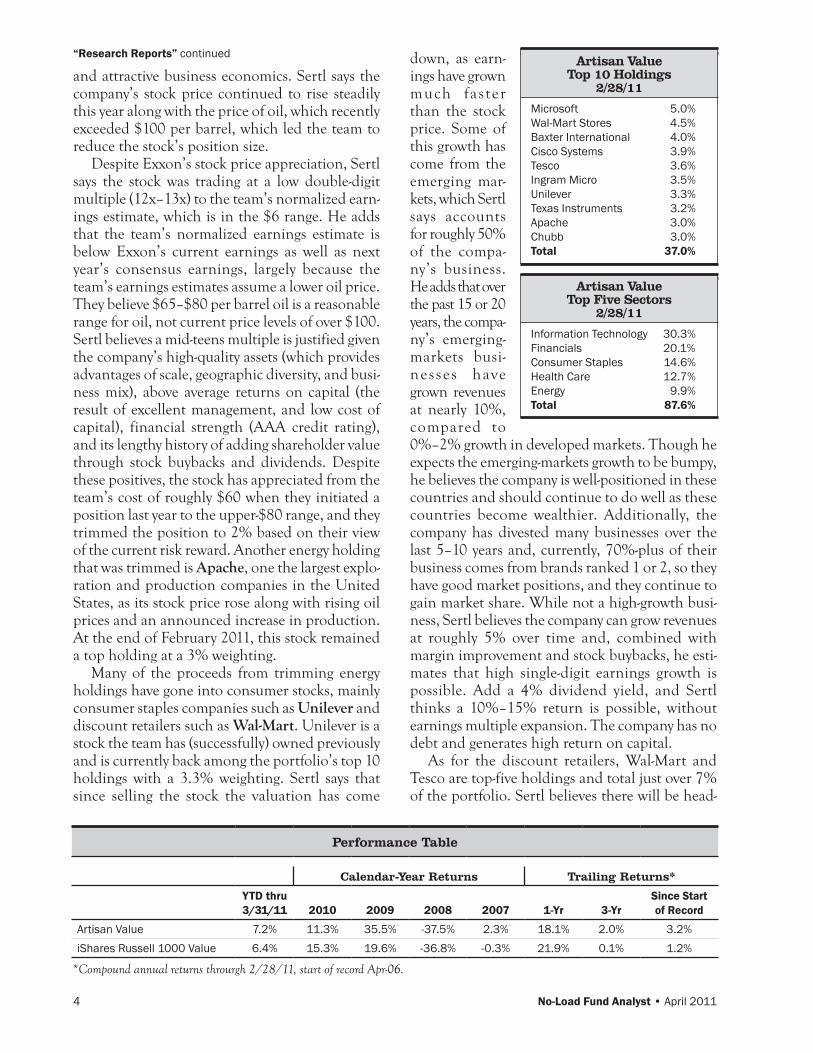
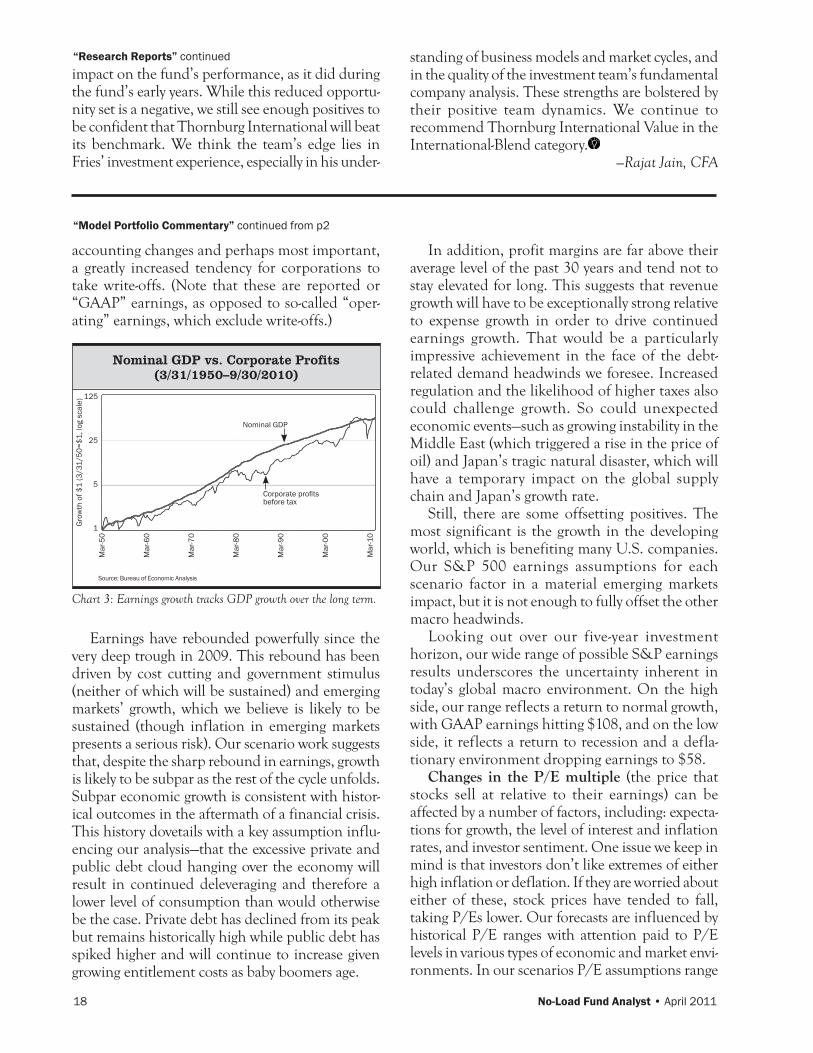
accounting changes and perhaps most important, a greatly increased tendency for corporations to take write-offs. (Note that these are reported or “GAAP” earnings, as opposed to so-called “oper-ating” earnings, which exclude write-offs.)
Nominal GDP vs. Corporate Profits(3/31/1950–9/30/2010)
125
25
5
1
Mar
-50
Mar
-60
Mar
-70
Mar
-80
Mar
-90
Mar
-00
Mar
-10
Source: Bureau of Economic Analysis
Gro
wth
of $
1 (3
/31/
50=$
1, lo
g sc
ale)
Nominal GDP
Corporate profits before tax
Chart 3: Earnings growth tracks GDP growth over the long term.
Earnings have rebounded powerfully since the very deep trough in 2009. This rebound has been driven by cost cutting and government stimulus (neither of which will be sustained) and emerging markets’ growth, which we believe is likely to be sustained (though inflation in emerging markets presents a serious risk). Our scenario work suggests that, despite the sharp rebound in earnings, growth is likely to be subpar as the rest of the cycle unfolds. Subpar economic growth is consistent with histor-ical outcomes in the aftermath of a financial crisis. This history dovetails with a key assumption influ-encing our analysis—that the excessive private and public debt cloud hanging over the economy will result in continued deleveraging and therefore a lower level of consumption than would otherwise be the case. Private debt has declined from its peak but remains historically high while public debt has spiked higher and will continue to increase given growing entitlement costs as baby boomers age.
In addition, profit margins are far above their average level of the past 30 years and tend not to stay elevated for long. This suggests that revenue growth will have to be exceptionally strong relative to expense growth in order to drive continued earnings growth. That would be a particularly impressive achievement in the face of the debt-related demand headwinds we foresee. Increased regulation and the likelihood of higher taxes also could challenge growth. So could unexpected economic events—such as growing instability in the Middle East (which triggered a rise in the price of oil) and Japan’s tragic natural disaster, which will have a temporary impact on the global supply chain and Japan’s growth rate.
Still, there are some offsetting positives. The most significant is the growth in the developing world, which is benefiting many U.S. companies. Our S&P 500 earnings assumptions for each scenario factor in a material emerging markets impact, but it is not enough to fully offset the other macro headwinds.
Looking out over our five-year investment horizon, our wide range of possible S&P earnings results underscores the uncertainty inherent in today’s global macro environment. On the high side, our range reflects a return to normal growth, with GAAP earnings hitting $108, and on the low side, it reflects a return to recession and a defla-tionary environment dropping earnings to $58.
Changes in the P/E multiple (the price that stocks sell at relative to their earnings) can be affected by a number of factors, including: expecta-tions for growth, the level of interest and inflation rates, and investor sentiment. One issue we keep in mind is that investors don’t like extremes of either high inflation or deflation. If they are worried about either of these, stock prices have tended to fall, taking P/Es lower. Our forecasts are influenced by historical P/E ranges with attention paid to P/E levels in various types of economic and market envi-ronments. In our scenarios P/E assumptions range
“Model Portfolio Commentary” continued from p2
impact on the fund’s performance, as it did during the fund’s early years. While this reduced opportu-nity set is a negative, we still see enough positives to be confident that Thornburg International will beat its benchmark. We think the team’s edge lies in Fries’ investment experience, especially in his under-
standing of business models and market cycles, and in the quality of the investment team’s fundamental company analysis. These strengths are bolstered by their positive team dynamics. We continue to recommend Thornburg International Value in the International-Blend category.
—Rajat Jain, CFA
“Research Reports” continued

No-Load Fund Analyst • April 2011 19
from 12x earnings to 18x earnings (P/Es based on 12-month trailing GAAP earnings have averaged about 16.5x since the end of WWII).
This all nets out to a wide annualized return range for stocks of -8% (deflation) to 11% (return to normal) from a starting S&P level of just below 1300. While this is the broad range, we believe the evidence suggests stock market returns are likely to come in around the midpoint of this range—in other words, low single digits.
At the low end, we believe the deflationary scenario is not likely. The economy has been improving and the developing world is growing at a healthy clip and is now big enough to have a mate-rial impact on global growth. However, the defla-tionary scenario is not so improbable to justify dismissing it. At the other end, we also don’t view a return to normal as highly probable given the continued stress points in the economy including high public and private debt levels throughout most of the developed world, weakness in the labor market, and the threat of further declines in housing prices. Additionally there are the global risks of spiking oil prices, food and commodity-driven inflation in emerging markets, and now supply chain disruptions from Japan. It is true that the U.S. economy has clearly improved. This contributes to our view that continued subpar growth, not imminent recession, is the most likely scenario. However this recovery is unusually weak despite the fact that the downturn was so sharp (which normally results in an equally sharp rebound) and the fact that there has been massive fiscal and monetary stimulus. (See chart 4).
Shiller Normalized Price Earnings Ratio
50
45
40
35
30
25
20
15
10
5
0
1926
1936
1946
1956
1966
1976
1986
1996
2006
Chart 4: Except for the periods encompassing the tech and real estate/debt bubbles, the only other times the P/E has been this high was in the late 1920s and mid-1960s. Both periods preceded long and deep bear markets.
Pric
e-Ea
rnin
gs R
atio
(Cyc
lical
ly A
djus
ted)
Price Earnings Ratio
Average
The stimulus and quantitative easing are sched-uled to wind down in coming months; it is not clear that the private sector is ready to take the baton and accelerate into a normal recovery mode. Consumer confidence is improved from its lowest levels but remains weak overall. Business confi-dence is back to normal levels, however, CEOs remain concerned about consumer demand. The labor market looks set to improve, but the improve-ment so far is at a rate that is not contributing enough to job growth (all measures of unemploy-ment are historically quite bad—for example the U6 rate which measures the unemployed, under-employed, and “discouraged” workers is at an extremely high 16%).
Chart 5 shows how this recession was abnor-mally deep relative to the average (over 65 years), and how the first six quarters of the recovery have also been below average.
GDP (Annualized Qtly Change) Now vs. the Avg. Post-WWII Recession and Recovery:Worse on the Downside and the Upside
10%
8%
6%
4%
2%
0%
-2%
-4%
-6%
-8%
-4Q
-3Q
-2Q
-1Q
+1Q
+2Q
+3Q
+4Q
+5Q
+6Q
Average recession/recovery
Recent recession/recovery
Rece
ssio
n en
d
Chart 5: The last recession was unusually deep and the recovery has been below average as well.
In our view, the European equity markets remain similar to those in the United States with respect to overall fundamentals and return poten-tial. Europe continues to struggle with its own debt crisis and economic challenges. The single currency greatly complicates policy management for a group of countries with entirely different economic fundamentals—a powerful Germany at one extreme and debt-plagued Greece, Ireland, and Portugal at the other.
Our modeling work suggests emerging-market equities will generate higher returns than devel-oped markets over our investment horizon but with potentially higher short-term volatility. They
20 No-Load Fund Analyst • April 2011
are not currently attractive enough on a risk-adjusted basis to qualify as a tactical opportunity. The growing inflation risk in emerging markets has led them to underperform since late last year and is a near-term concern that we are monitoring.
There are risks to our view on equities and they mostly relate to “tail” risks—the risk that one of the more extreme outcomes plays out.
On the downside, we could be underestimating the odds of a deflationary scenario. If heavily indebted households and governments retrench, the resulting drop in aggregate demand for goods and services could send prices dramatically lower. Such bouts of deflation can be self reinforcing.
Policy risk in the United States and around the world is a major concern. How high might interest rates rise and what will happen to finan-cial markets when the Fed stops buying U.S. Treasuries at the end of QE2 in June? It has purchased 70% of the new Treasury supply since last summer and PIMCO estimates that rates would be 1.5 percentage points higher without Fed buying. How will politicians address the deficit? The issue must be dealt with, but it is highly politicized and must be handled with intel-ligent policies and at the right pace. What is “right” is debatable but the increasing willingness of some politicians to consider tax and entitle-ment reform offers a little hope, though it’s difficult for us to have much confidence in the outcome of political debates these days. Despite these very real concerns we continue to believe that the strength and growing influence of the developing world and the resiliency and resources of the United States make the def lationary outcome a relatively low probability.
At the other extreme we could be underesti-mating the risk that inflation might spike consid-erably higher, driven by rising commodity prices due to emerging-market demand, further disrup-tions of oil supply, and by government policy that is left with no choice but to inflate away the debt problem (the alternative is politically unpopular tax increases and spending cuts). Somewhat higher inflation in the near term is quite possible due to rising commodity-driven import prices and we believe higher inflation is probable over our five-year investment horizon. But with sizable slack in the economy and no sign of upward pressure on wages (which would seem critical in order to generate a 1970s-style wage-price inflationary spiral), sharply higher prices don’t seem to be in
the cards any time soon. (Aside from the inflation worry, rising commodity prices, if not passed through to the end consumer, imply a profit-margin squeeze to corporate earnings.) Never before in our investment careers (some going back more than three decades) have we felt the need to consider the possibilities of both deflation and inflation—this underscores the unusually high macro uncertainty.On the upside, we may be overestimating the magnitude of the deleveraging to come, or under-estimating the potential for households to leverage up one more time. Moreover, emerging markets might have even more global macro influence than we give them credit for, and may themselves leverage up more than we expect. We could also be underes-timating the willingness of the financial markets to allow the United States to inflate away its debt problem. But overall, we believe the “return to normal and perhaps beyond” outcome is also unlikely, particularly the willingness and ability of U.S. households to support consumption by taking on more leverage in an environment where lending standards have tightened considerably.
Alternatively, we may be underestimating the possibility of another low-interest-rate-triggered bubble, where investors are tempted to take more and more risk because of the skimpy yields avail-able in the bond and money markets. Money market fund yields border on zero. The longer the economy can muddle through in a low-rate envi-ronment, perhaps the greater the potential for temporarily higher equity returns. This is by no means a far-fetched possibility—in our view it is already happening, with the stock market up over 20% since the Fed’s announced the second round of quantitative easing last summer. (In fact, an explicit goal of QE2 was to cause equity prices to rise with the aim of generating a positive wealth effect that would stimulate real economy.) However, if this happens in a big way and without strong business fundamentals supporting the higher stock prices, we expect it to end badly as bubbles always do. Ultimately interest rates will rise, removing the justification for holding riskier assets at high prices. If rates don’t rise it will mean that the deflation scenario is playing out, which obviously would be bad for stocks as well. In the meantime, the pain of foregone opportunity, given our underweight to equities, might sting for a while.
One last possibility is that well-run actively managed funds could enter a period in which a healthy return premium can be achieved relative
“Model Portfolio Commentary” continued
No-Load Fund Analyst • April 2011 21
to the overall market. We saw this briefly in 2009, but for much of the post-crisis period stock prices have been highly correlated, suggesting that inves-tors were focused on asset-class-level macro factors rather than individual company funda-mentals and valuations. Recently, correlations have been declining, which should be a good thing for stock picking. We’re not hugely confi-dent in making this call and we don’t factor it heavily into our decision making, but it would not surprise us to see the equity funds we own significantly outperform their benchmarks over the next few years.
Building Intelligent Portfolios in a Highly Uncertain World
Given the level of macro risks facing a highly indebted developed world, our goal is to build portfolios that can perform reasonably well in most scenarios, and mitigate losses in more severe scenarios. Historically, heightened exposure to investment-grade bonds would be a natural option. However, current yields are extremely and artificially low (because of Fed policy) and we expect them to be higher over our investment horizon. If we are right, fixed-income returns will be in the low single digits. For this reason, our portfolios currently have historically low exposure to traditional investment-grade bond funds, and what we do hold is there solely to provide a hedge against recession and deflation risk. So it is a chal-lenge to build a “safe” portfolio in this environ-ment because not only are stocks and investment-grade bonds unattractive, there are no other asset classes or investment categories that are hugely compelling. However there are asset classes, strat-egies, and niche areas that offer at least somewhat attractive fundamentals and high potential for acceptable if unexciting returns for balanced port-folios. These include:
• Short-term high-yield bonds—This is a niche area that we invest in through Osterweis Strategic Income. We have a high degree of confidence in the credit research conducted by the team at Osterweis, and believe we are very likely to capture the yield on the portfolio, i.e., that the bonds will mature without defaulting. Annualized returns in the 5%–6% range are likely over a two-year period though there is the poten-tial for temporary losses over a year in a severe market decline.
• Flexible, absolute-return-oriented bond funds—Generally these types of funds are not tied to an investment-grade bond benchmark. Instead, they focus on generating return in any environment so they can adjust (reduce) their sensitivity to rising interest rates and inflation, invest outside the U.S. dollar with a portion of their portfolio, and focus heavily, if warranted, on bond market sectors such as corporate bonds or the mortgage sector. PIMCO Unconstrained is our primary holding in this area. It currently has minimal exposure to rising interest rates and a sizable position (about 20%) in Asian currencies that the manager believes will appreciate against the dollar over a period of months and years. We expect mid-single-digit returns from these funds with low volatility over our five-year investment horizon.
• Floating-rate loan funds—We recently added two floating-rate loan funds to our conserva-tive balanced portfolio because this portfolio was more exposed to risk from a sharp rise in interest rates. As we mentioned earlier, we don’t expect a sharp rise in rates in the near term, but it is a stress scenario we consider plausible. As we assessed the potential 12-month downside risk in this scenario rela-tive to other potential stress scenarios, we felt it made sense to reduce the duration (interest rate sensitivity) somewhat. These funds invest in bank loans and have adjustable interest rates. Effectively this means that they should experience minimal price risk due to changes in interest rates. However, they do have more credit risk than a typical invest-ment-grade bond fund and for that reason we made adjustments in these portfolios to reduce risk (slight reductions to equities and emerging-market local-currency bonds). We have applied our detailed, scenario-based modeling approach to this asset class and based on that analysis we believe returns in the 5%–6% range are likely, but similar to short-term high-yield bonds, this asset class has the potential to temporarily generate a single-digit loss in a sharp market decline.
• Arbitrage strategies—We added exposure to two arbitrage funds last May 2010. These funds aim to generate long-term returns in at least the mid-single digits, with a low corre-
22 No-Load Fund Analyst • April 2011
lation to the equity and bond markets, by following a merger-arbitrage strategy. To briefly describe what this strategy entails, when a merger or acquisition deal is announced, the target’s stock price appreci-ates because the acquirer typically pays a premium. But, until the deal closes, the target’s stock price generally trades at a small discount to the deal price. This discount is called “the spread.” The spread exists because investors demand compensation for the risk that the deal may fail (though most tend to consummate successfully) and for the time value of money for the time it takes for the deal to close. There are other factors that influence spreads, but the two we mention are the primary ones. An arbitrage strategy typically requires owning the target’s shares and shorting the acquirer’s stock (to hedge the market risk). One of the two funds we own also focuses on other types of arbitrage strategies such as convertible arbitrage and event-driven arbitrage.
Other fixed-income strategies offer higher return potential but at a cost of more short-term volatility and downside risk:
• Emerging-markets local-currency bonds—Despite the recent trimming, emerging-markets local-currency bonds are a mean-ingful position in our portfolios, and have been for quite some time (5%–10% alloca-tions depending on the model). We use a PIMCO fund to gain exposure to this asset class because of its yield (currently around 7%) and our expectation that the dollar is likely to gradually weaken relative to the currencies owned in the fund. Based on our modeling we expect emerging-markets local-currency bonds to return in the high single digits over our five-year investment horizon. If our currency appreciation assumptions turn out to be conservative and/or the active management component adds a lot of value, returns could be higher. However, while the expected returns from this asset class are higher than others we’re discussing here, it is also a more volatile asset class that has the potential for greater short-term declines and a lower long-term return in our most pessi-mistic scenario. We believe the downside
over 12 months in a severe bear market could be in the mid-teens. This loss would be driven by a safety-seeking flight to the dollar that would result in currency losses. We should note that inflation fears in many emerging markets have not been a surprise to us. In fact, before we invested in the asset class, we modeled two different rising-infla-tion scenarios to assess the impact on the asset class. We recently revisited this analysis and concluded that the impact on our five-year return expectations, while negative, doesn’t undermine our thesis. Rising yields over time would deliver incremental return to recoup part of the short-term price decline. It is also possible that currency appreciation could surprise us on the upside. Bottom line, we view this asset class as likely to offer some of the best returns out there over our investment horizon but with possible volatility along the way.
• Multi-sector bond fund—We’ve owned Loomis Sayles Bond for almost 20 years and the fund has delivered very high returns for a fixed-income fund (more than four percentage points per year above the bond index return over the last 10 years). The fund has captured these returns via excellent bond picking, flex-ibility, and a willingness to pursue good value at the expense of short-term volatility. The fund typically owns a meaningful slug of corporate bonds and high-yield bonds. Recently, a third of the fund was invested in mostly better-quality high-yield bonds. It is also willing to own non-dollar-denominated bonds. Currently, about a third of the port-folio is invested in these, mostly from commodity producing countries.
Our investment-grade bond exposure is achieved mostly via PIMCO Total Return and municipal bond funds for taxable portfolios. We believe they will deliver better returns over our investment horizon than the investment-grade bond index.
• PIMCO Total Return—This is not a typical investment-grade bond fund in that it invests across the entire fixed-income opportunity set to capture total return. Though it is more benchmark sensitive than other fixed-income funds we own, relative to typical investment-grade funds it is much more willing to invest
“Model Portfolio Commentary” continued
No-Load Fund Analyst • April 2011 23
away from its benchmark including some opportunities in non-dollar currencies. It also is somewhat more flexible in making adjustments to its duration based on PIMCO’s interest-rate forecast. For example, the fund was recently in the headlines for eliminating all of its U.S. Treasury exposure, something a more benchmark-oriented manager would never do.
• Municipal bonds—In taxable balanced port-folios we continue to hold municipal bond funds. This sector of the bond market has been in the headlines for months with some commentators making doomsday forecasts of massive defaults. Moreover, the asset class can be hard to evaluate on an aggregate basis because of the lack of underlying fundamental data and the fact that there are about 60,000 different bond issuers. We’ve approached our analysis by relying on conversations with a variety of people in our network, reviews of research and data, and a close study of struc-tural factors that affect the finances of different types of issuers. We believe the massive default forecasts are greatly exaggerated. While defaults are almost certain to increase among smaller local issuers and will likely be higher than in past cycles, we believe there are plenty of solid muni credits available to bond managers. At a state level, overall debt is gener-ally not excessive. Maturities are long, so there is not huge rollover risk in the near term, and rates are very low, making debt service afford-able relative to state revenues. Pension under-funding is a headline issue and a real problem for many states but it is long-term and not an imminent source of default risk. At a local level, cities and counties remain highly stressed but most will cut expenses and or raise taxes because they have to. While some will default, we have become more confident that the magnitude of defaults will not be so great that direct default-related losses in most municipal
bond fund portfolios will result in material damage. However, scattered high profile defaults are entirely possible and these could spook investors and trigger more temporary nasty sell-offs for the broader municipal bond market. Over our five-year investment horizon, municipal bonds could be more volatile than taxable investment-grade bonds. But the overall market is currently pricing in a default level that we believe is much too pessimistic—many muni bonds are offering yields that are higher than U.S. Treasury yields. If municipal yields relative to taxable bond yields normalize over five years (the muni yields normally are lower since they are exempt from tax), inves-tors may be able to capture returns that are nearly as high as the current yields, even in light of the rise we expect in the general level of interest rates. This should equate to pre-tax equivalent returns of around 5%, much better than the returns we expect from taxable investment-grade bonds. This makes munic-ipal bond funds a decent asset class to own for the conservative portion of our portfolios though the short-term risk in the event of a downturn is higher given the general percep-tion with respect to default risk. It is possible that headline risk-related price declines could trigger a compelling opportunity to increase exposure to muni bond funds at some point over the next year.
Collectively these investments make up a mate-rial portion of our balanced portfolios. Overall, our expectations from these investments are returns that are not exciting, but are acceptable given the current environment. While they would not be immune to a market sell-off, they would hold up better than the investments we would own if we were more neutrally allocated. So in a market decline we would be in a position to redeploy this capital into stocks or other “risky” asset classes that would then be priced at levels more likely to reward us well for the risk we take. Our scenario work is
Editor’s Note: For investors who cannot access the floating-rate loan funds recommended in our portfolios, we have conducted initial research on Fidelity Floating Rate High Income (ticker: FFRHX). This is a transaction–fee fund with a $2,500 minimum. Though we have not done enough research on the Fidelity fund to add it to our Approved list, we did come away with a sufficiently favorable impression to consider it suitable for gaining exposure to the asset class.
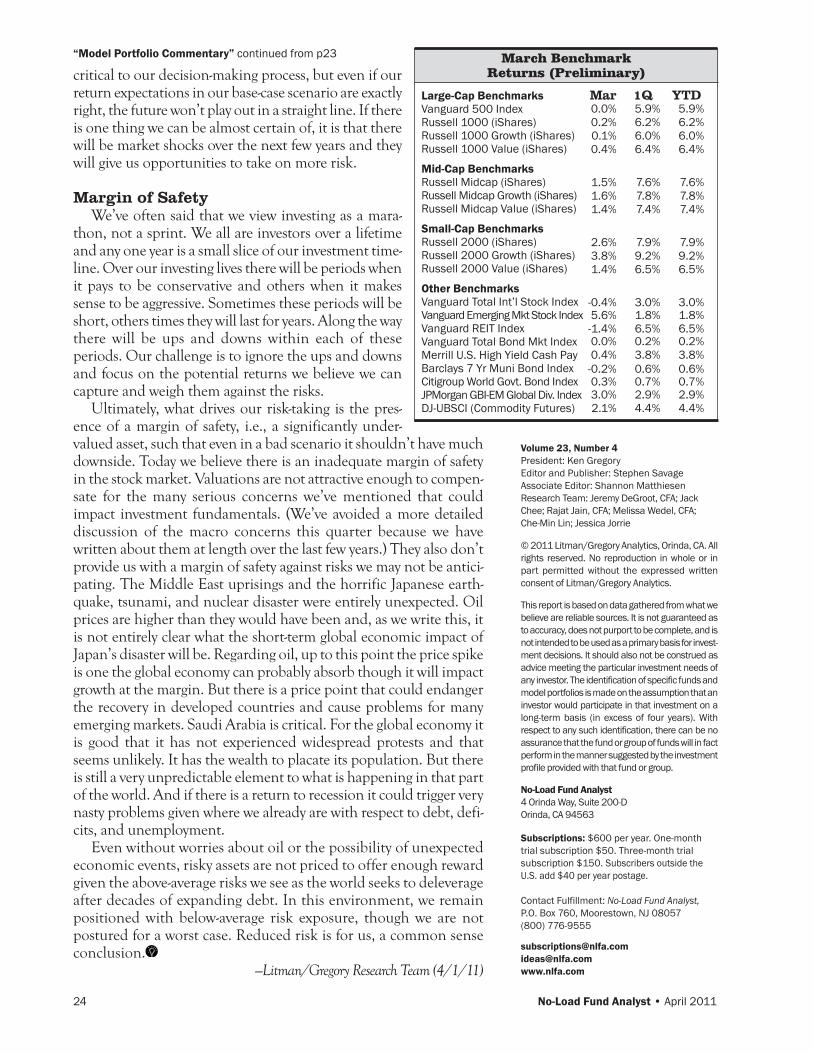
24 No-Load Fund Analyst • April 2011
“Model Portfolio Commentary” continued from p23
critical to our decision-making process, but even if our return expectations in our base-case scenario are exactly right, the future won’t play out in a straight line. If there is one thing we can be almost certain of, it is that there will be market shocks over the next few years and they will give us opportunities to take on more risk.
Margin of SafetyWe’ve often said that we view investing as a mara-
thon, not a sprint. We all are investors over a lifetime and any one year is a small slice of our investment time-line. Over our investing lives there will be periods when it pays to be conservative and others when it makes sense to be aggressive. Sometimes these periods will be short, others times they will last for years. Along the way there will be ups and downs within each of these periods. Our challenge is to ignore the ups and downs and focus on the potential returns we believe we can capture and weigh them against the risks.
Ultimately, what drives our risk-taking is the pres-ence of a margin of safety, i.e., a significantly under-valued asset, such that even in a bad scenario it shouldn’t have much downside. Today we believe there is an inadequate margin of safety in the stock market. Valuations are not attractive enough to compen-sate for the many serious concerns we’ve mentioned that could impact investment fundamentals. (We’ve avoided a more detailed discussion of the macro concerns this quarter because we have written about them at length over the last few years.) They also don’t provide us with a margin of safety against risks we may not be antici-pating. The Middle East uprisings and the horrific Japanese earth-quake, tsunami, and nuclear disaster were entirely unexpected. Oil prices are higher than they would have been and, as we write this, it is not entirely clear what the short-term global economic impact of Japan’s disaster will be. Regarding oil, up to this point the price spike is one the global economy can probably absorb though it will impact growth at the margin. But there is a price point that could endanger the recovery in developed countries and cause problems for many emerging markets. Saudi Arabia is critical. For the global economy it is good that it has not experienced widespread protests and that seems unlikely. It has the wealth to placate its population. But there is still a very unpredictable element to what is happening in that part of the world. And if there is a return to recession it could trigger very nasty problems given where we already are with respect to debt, defi-cits, and unemployment.
Even without worries about oil or the possibility of unexpected economic events, risky assets are not priced to offer enough reward given the above-average risks we see as the world seeks to deleverage after decades of expanding debt. In this environment, we remain positioned with below-average risk exposure, though we are not postured for a worst case. Reduced risk is for us, a common sense conclusion.
—Litman/Gregory Research Team (4/1/11)
Volume 23, Number 4President: Ken GregoryEditor and Publisher: Stephen SavageAssociate Editor: Shannon MatthiesenResearch Team: Jeremy DeGroot, CFA; Jack Chee; Rajat Jain, CFA; Melissa Wedel, CFA; Che-Min Lin; Jessica Jorrie
© 2011 Litman/Gregory Analytics, Orinda, CA. All rights reserved. No reproduction in whole or in part permitted without the expressed written consent of Litman/Gregory Analytics.
This report is based on data gathered from what we believe are reliable sources. It is not guaranteed as to accuracy, does not purport to be complete, and is not intended to be used as a primary basis for invest-ment decisions. It should also not be construed as advice meeting the particular investment needs of any investor. The identification of specific funds and model portfolios is made on the assumption that an investor would participate in that investment on a long-term basis (in excess of four years). With respect to any such identification, there can be no assurance that the fund or group of funds will in fact perform in the manner suggested by the investment profile provided with that fund or group.
No-Load Fund Analyst4 Orinda Way, Suite 200-DOrinda, CA 94563
Subscriptions: $600 per year. One-month trial subscription $50. Three-month trial subscription $150. Subscribers outside the U.S. add $40 per year postage.
Contact Fulfillment: No-Load Fund Analyst, P.O. Box 760, Moorestown, NJ 08057 (800) 776-9555
[email protected]@nlfa.comwww.nlfa.com
March Benchmark Returns (Preliminary)
Large-Cap Benchmarks Mar 1Q YTDVanguard 500 IndexRussell 1000 (iShares)Russell 1000 Growth (iShares)Russell 1000 Value (iShares)
Mid-Cap Benchmarks Russell Midcap (iShares)Russell Midcap Growth (iShares)Russell Midcap Value (iShares)
Small-Cap Benchmarks Russell 2000 (iShares)Russell 2000 Growth (iShares)Russell 2000 Value (iShares)
Other Benchmarks Vanguard Total Int’l Stock IndexVanguard Emerging Mkt Stock IndexVanguard REIT IndexVanguard Total Bond Mkt IndexMerrill U.S. High Yield Cash PayBarclays 7 Yr Muni Bond IndexCitigroup World Govt. Bond IndexJPMorgan GBI-EM Global Div. IndexDJ-UBSCI (Commodity Futures)
0.0% 5.9% 5.9%0.2% 6.2% 6.2%0.1% 6.0% 6.0%0.4% 6.4% 6.4%
1.5% 7.6% 7.6%1.6% 7.8% 7.8%1.4% 7.4% 7.4%
2.6% 7.9% 7.9%3.8% 9.2% 9.2%1.4% 6.5% 6.5%
-0.4% 3.0% 3.0%5.6% 1.8% 1.8%-1.4% 6.5% 6.5%0.0% 0.2% 0.2%0.4% 3.8% 3.8%-0.2% 0.6% 0.6%0.3% 0.7% 0.7%3.0% 2.9% 2.9%2.1% 4.4% 4.4%