comgest growth plc - morningstar document library
TRANSCRIPT
COMGEST GROWTH PLC (an open ended investment company with variable capital structured as an umbrella fund with segregated liability between Funds) Registered offices: 2 Grand Canal Square, Dublin 2, Ireland Company Registration No: 323577
ANNUAL REPORT AND AUDITEDFINANCIAL STATEMENTS FORTHE FINANCIAL YEAR ENDED31 DECEMBER 2020
COMGEST GROWTH plc
(An open ended investment company with variable capital structured as an umbrella fund with segregated liability between Fundsincorporated with limited liability in Ireland)
(Registration Number 323577)
Annual Report and Audited
Financial Statements
for the financial year ended
31 December 2020
General Information 4
Directors’ Report 6
Report of the Depositary to the Shareholders 17
Investment Manager’s Report
COMGEST GROWTH WORLD 18COMGEST GROWTH WORLD PLUS1 20COMGEST GROWTH GLOBAL FLEX 22COMGEST GROWTH EAFE 24COMGEST GROWTH AMERICA 26COMGEST GROWTH JAPAN 28COMGEST GROWTH JAPAN COMPOUNDERS 31COMGEST GROWTH EMERGING MARKETS 33COMGEST GROWTH EMERGING MARKETS EX CHINA 36COMGEST GROWTH EMERGING MARKETS FLEX 38COMGEST GROWTH EMERGING MARKETS PLUS2 40COMGEST GROWTH GEM PROMISING COMPANIES 42COMGEST GROWTH EUROPE 44COMGEST GROWTH EUROPE COMPOUNDERS 46COMGEST GROWTH EUROPE PLUS 48COMGEST GROWTH EUROPE S 50COMGEST GROWTH EUROPE OPPORTUNITIES 52COMGEST GROWTH EUROPE SMALLER COMPANIES 54COMGEST GROWTH EUROPE EX SWITZERLAND 56COMGEST GROWTH EUROPE EX UK 58COMGEST GROWTH ASIA 60COMGEST GROWTH ASIA EX JAPAN 62COMGEST GROWTH ASIA PAC EX JAPAN 64COMGEST GROWTH CHINA 66COMGEST GROWTH INDIA 68COMGEST GROWTH LATIN AMERICA 70
Independent Auditor’s Report 72
Statement of Financial Position 75
Statement of Comprehensive Income 104
Statement of Changes in Net Assets Attributable to Holders of Redeemable Participating Shares 132
Statement of Cash Flows 173
Notes to the Financial Statements 201
Schedule of Investments
COMGEST GROWTH WORLD 306COMGEST GROWTH WORLD PLUS1 312COMGEST GROWTH GLOBAL FLEX 318COMGEST GROWTH EAFE 323COMGEST GROWTH AMERICA 328COMGEST GROWTH JAPAN 331COMGEST GROWTH JAPAN COMPOUNDERS 334COMGEST GROWTH EMERGING MARKETS 337COMGEST GROWTH EMERGING MARKETS EX CHINA 344COMGEST GROWTH EMERGING MARKETS FLEX 349COMGEST GROWTH EMERGING MARKETS PLUS2 355COMGEST GROWTH GEM PROMISING COMPANIES 361
COMGEST GROWTH plc
CONTENTS
2
Schedule of Investments (continued)
COMGEST GROWTH EUROPE 368COMGEST GROWTH EUROPE COMPOUNDERS 373COMGEST GROWTH EUROPE PLUS 377COMGEST GROWTH EUROPE S 382COMGEST GROWTH EUROPE OPPORTUNITIES 387COMGEST GROWTH EUROPE SMALLER COMPANIES 393COMGEST GROWTH EUROPE EX SWITZERLAND 399COMGEST GROWTH EUROPE EX UK 404COMGEST GROWTH ASIA 409COMGEST GROWTH ASIA EX JAPAN 413COMGEST GROWTH ASIA PAC EX JAPAN 418COMGEST GROWTH CHINA 423COMGEST GROWTH INDIA 427COMGEST GROWTH LATIN AMERICA 431
Significant Portfolio Changes
COMGEST GROWTH WORLD 436COMGEST GROWTH WORLD PLUS1 438COMGEST GROWTH GLOBAL FLEX 439COMGEST GROWTH EAFE 441COMGEST GROWTH AMERICA 443COMGEST GROWTH JAPAN 445COMGEST GROWTH JAPAN COMPOUNDERS 447COMGEST GROWTH EMERGING MARKETS 449COMGEST GROWTH EMERGING MARKETS EX CHINA 451COMGEST GROWTH EMERGING MARKETS FLEX 452COMGEST GROWTH EMERGING MARKETS PLUS2 454COMGEST GROWTH GEM PROMISING COMPANIES 456COMGEST GROWTH EUROPE 458COMGEST GROWTH EUROPE COMPOUNDERS 460COMGEST GROWTH EUROPE PLUS 461COMGEST GROWTH EUROPE S 463COMGEST GROWTH EUROPE OPPORTUNITIES 465COMGEST GROWTH EUROPE SMALLER COMPANIES 467COMGEST GROWTH EUROPE EX SWITZERLAND 469COMGEST GROWTH EUROPE EX UK 471COMGEST GROWTH ASIA 473COMGEST GROWTH ASIA EX JAPAN 475COMGEST GROWTH ASIA PAC EX JAPAN 477COMGEST GROWTH CHINA 479COMGEST GROWTH INDIA 481COMGEST GROWTH LATIN AMERICA 482
Appendix I Additional Provisions for Investors in Switzerland (unaudited) 484
Appendix II Total Expense Ratios (unaudited) 485
Appendix II Turnover Ratios (unaudited) 489
Appendix II Fund Performance Data (unaudited) 490
Appendix III Cybersecurity Risk (unaudited) 495
Appendix IV UCITS V Remuneration Disclosure (unaudited) 496
Securities Financing Transactions Regulation (unaudited) 497
1 Comgest Growth World Plus was launched on 27 November 2020.2 Comgest Growth Emerging Markets Plus was launched on 29 January 2020.
COMGEST GROWTH plc
CONTENTS (continued)
3
Registered Office
6th Floor2 Grand Canal SquareDublin 2, D02 A342Ireland
Investment Manager
Comgest Asset Management InternationalLimited6th Floor2 Grand Canal SquareDublin 2, D02 A342Ireland
Sub Investment Managers
Comgest SA17 Square Edouard VIIParis 75009, France
Comgest Far East LimitedLevel 1028 Hennessy RoadHong Kong
Comgest Singapore Pte. Ltd.8 Temasek Boulevard#20-01A Suntec Tower ThreeSingapore 038988
Administrator, Registrar and Transfer Agent
RBC Investor Services Ireland Limited4th FloorOne George’s Quay PlazaGeorge’s QuayDublin 2, D02 E440Ireland
Legal Advisors
William Fry2 Grand Canal SquareDublin 2, D02 A342Ireland
Secretary
Wilton Secretarial Limited6th Floor2 Grand Canal SquareDublin 2, D02 A342Ireland
Depositary
RBC Investor Services Bank S.A. DublinBranch4th FloorOne George’s Quay PlazaGeorge’s QuayDublin 2, D02 E440Ireland
Independent Auditors
Deloitte Ireland LLPDeloitte and Touche HouseChartered Accountants and Statutory Audit FirmEarlsfort TerraceDublin 2, D02 AY28Ireland
Directors
Daniel Morrissey (Irish)Philippe Lebeau (French)Jan-Peter Dolff (German)David Raper (New Zealander)(Resigned 4 February 2021)Bronwyn Wright (Irish)*Gaurish Pinge (Australian)(appointed as of 4 February 2021)
* Independent Director
All Directors are non-executive(Please see the Directors’ Report)
Bankers
RBC Investor Services Bank S.A. DublinBranch4th FloorOne George’s Quay PlazaGeorge’s QuayDublin 2, D02 E440Ireland
KBC Bank N.V., Dublin BranchKBC House4 George’s DockDublin 1, D01 E4W9Ireland
KBC Bank IrelandSandwith StreetDublin 2, D02 X489Ireland
BNP Paribas Dublin Branch5 George’s DockIFSCDublin 1, D01 X8N7Ireland
COMGEST GROWTH plc
GENERAL INFORMATION
4
Broker(for Comgest Growth Emerging Markets Flex and Comgest Growth Global Flex)
Société Générale International Limited10 Bishops SquareLondon, E1 6EGUnited Kingdom
Representative in Switzerland
BNP Paribas Securities Services, ParisSuccursale de ZurichSelnaustrasse 168002 ZurichSwitzerland
Paying Agent in Switzerland
BNP Paribas Securities Services, ParisSuccursale de ZurichSelnaustrasse 168002 ZurichSwitzerland
Shariah Supervisory Board
Amanie Advisors Sdn. Bhd.Level 13A-2Menara Tokio Marine Life189, Jalan Tun Razak50400 Kuala LumpurMalaysia
COMGEST GROWTH plc
GENERAL INFORMATION (continued)
5
The Directors present their report for the financial year ended 31 December 2020.
Statement of Directors’ Responsibilities in respect of the Financial Statements
The Directors are responsible for preparing the Directors’ report and the financial statements in accordance with theCompanies Act 2014 (the “Act”), as amended and the applicable regulations.
Irish company law requires the Directors to prepare financial statements for each financial year. Under the law, the Directorshave elected to prepare the financial statements in accordance with International Financial Reporting Standards (IFRS) asadopted by the European Union (“relevant financial reporting framework”).
Under company law, the Directors must not approve the financial statements unless they are satisfied that they give a trueand fair view of the assets, liabilities and financial position of the Company as at the financial year end date and of the profitor loss of the Company for the financial year and otherwise comply with the Act.
In preparing those financial statements, the Directors are required to:
• select suitable accounting policies and then apply them consistently;
• make judgements and estimates that are reasonable and prudent;
• state whether the financial statements have been prepared in accordance with the applicable accounting standards,identify those standards, and note the effect and the reasons for any material departure from those standards; and
• prepare the financial statements on the going concern basis unless it is inappropriate to presume that the Companywill continue in business.
The Directors are responsible for ensuring that the Company keeps or causes to be kept adequate accounting records whichcorrectly explain and record the transactions of the Company, enable at any time the assets, liabilities, financial position andprofit or loss of the Company to be determined with reasonable accuracy and that the financial statements and Directors’report comply with the Act, as amended and with the European Communities (Undertakings for Collective Investment inTransferable Securities) Regulations, 2011, SI No. 352 of 2011) as amended by the European Union (Undertakings forCollective Investment in Transferable Securities) (Amendment) Regulations 2019, (SI No. 143 of 2016) (the “Central BankUCITS Regulations”) and enable the financial statements to be audited. They are also responsible for safeguarding theassets of the Company and hence for taking reasonable steps for the prevention and detection of fraud and otherirregularities.
The financial statements are prepared on a going concern basis.
Date of Incorporation
The Company was incorporated on 23 March 2000 and was authorised by the Central Bank of Ireland, and commencedbusiness, on 2 May 2000. The Company is organised as an investment company with variable capital and segregated liabilitybetween Funds pursuant to the UCITS Regulations.
Principal Activities
The Company’s principal activity is the collective investment of capital raised from the public in transferable securities. TheCompany is an umbrella type collective investment vehicle.
COMGEST GROWTH plc
DIRECTORS’ REPORT
For the financial year ended 31 December 2020
6
Principal Activities (continued)
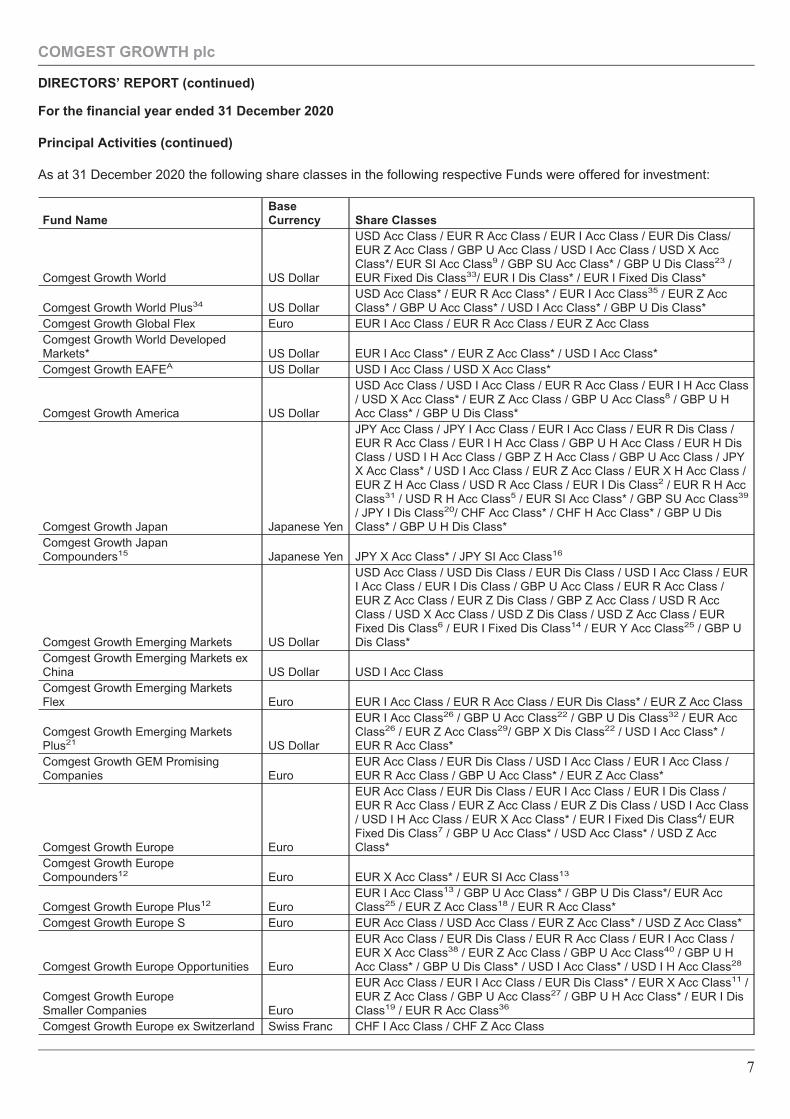
As at 31 December 2020 the following share classes in the following respective Funds were offered for investment:
Fund NameBaseCurrency Share Classes
Comgest Growth World US Dollar
USD Acc Class / EUR R Acc Class / EUR I Acc Class / EUR Dis Class/EUR Z Acc Class / GBP U Acc Class / USD I Acc Class / USD X AccClass*/ EUR SI Acc Class9 / GBP SU Acc Class* / GBP U Dis Class23 /EUR Fixed Dis Class33/ EUR I Dis Class* / EUR I Fixed Dis Class*
Comgest Growth World Plus34 US DollarUSD Acc Class* / EUR R Acc Class* / EUR I Acc Class35 / EUR Z AccClass* / GBP U Acc Class* / USD I Acc Class* / GBP U Dis Class*
Comgest Growth Global Flex Euro EUR I Acc Class / EUR R Acc Class / EUR Z Acc ClassComgest Growth World DevelopedMarkets* US Dollar EUR I Acc Class* / EUR Z Acc Class* / USD I Acc Class*Comgest Growth EAFEA US Dollar USD I Acc Class / USD X Acc Class*
Comgest Growth America US Dollar
USD Acc Class / USD I Acc Class / EUR R Acc Class / EUR I H Acc Class/ USD X Acc Class* / EUR Z Acc Class / GBP U Acc Class8 / GBP U HAcc Class* / GBP U Dis Class*
Comgest Growth Japan Japanese Yen
JPY Acc Class / JPY I Acc Class / EUR I Acc Class / EUR R Dis Class /EUR R Acc Class / EUR I H Acc Class / GBP U H Acc Class / EUR H DisClass / USD I H Acc Class / GBP Z H Acc Class / GBP U Acc Class / JPYX Acc Class* / USD I Acc Class / EUR Z Acc Class / EUR X H Acc Class /EUR Z H Acc Class / USD R Acc Class / EUR I Dis Class2 / EUR R H AccClass31 / USD R H Acc Class5 / EUR SI Acc Class* / GBP SU Acc Class39
/ JPY I Dis Class20/ CHF Acc Class* / CHF H Acc Class* / GBP U DisClass* / GBP U H Dis Class*
Comgest Growth JapanCompounders15 Japanese Yen JPY X Acc Class* / JPY SI Acc Class16
Comgest Growth Emerging Markets US Dollar
USD Acc Class / USD Dis Class / EUR Dis Class / USD I Acc Class / EURI Acc Class / EUR I Dis Class / GBP U Acc Class / EUR R Acc Class /EUR Z Acc Class / EUR Z Dis Class / GBP Z Acc Class / USD R AccClass / USD X Acc Class / USD Z Dis Class / USD Z Acc Class / EURFixed Dis Class6 / EUR I Fixed Dis Class14 / EUR Y Acc Class25 / GBP UDis Class*
Comgest Growth Emerging Markets exChina US Dollar USD I Acc ClassComgest Growth Emerging MarketsFlex Euro EUR I Acc Class / EUR R Acc Class / EUR Dis Class* / EUR Z Acc Class
Comgest Growth Emerging MarketsPlus21 US Dollar
EUR I Acc Class26 / GBP U Acc Class22 / GBP U Dis Class32 / EUR AccClass26 / EUR Z Acc Class29/ GBP X Dis Class22 / USD I Acc Class* /EUR R Acc Class*
Comgest Growth GEM PromisingCompanies Euro
EUR Acc Class / EUR Dis Class / USD I Acc Class / EUR I Acc Class /EUR R Acc Class / GBP U Acc Class* / EUR Z Acc Class*
Comgest Growth Europe Euro
EUR Acc Class / EUR Dis Class / EUR I Acc Class / EUR I Dis Class /EUR R Acc Class / EUR Z Acc Class / EUR Z Dis Class / USD I Acc Class/ USD I H Acc Class / EUR X Acc Class* / EUR I Fixed Dis Class4/ EURFixed Dis Class7 / GBP U Acc Class* / USD Acc Class* / USD Z AccClass*
Comgest Growth EuropeCompounders12 Euro EUR X Acc Class* / EUR SI Acc Class13
Comgest Growth Europe Plus12 EuroEUR I Acc Class13 / GBP U Acc Class* / GBP U Dis Class*/ EUR AccClass25 / EUR Z Acc Class18 / EUR R Acc Class*
Comgest Growth Europe S Euro EUR Acc Class / USD Acc Class / EUR Z Acc Class* / USD Z Acc Class*
Comgest Growth Europe Opportunities Euro
EUR Acc Class / EUR Dis Class / EUR R Acc Class / EUR I Acc Class /EUR X Acc Class38 / EUR Z Acc Class / GBP U Acc Class40 / GBP U HAcc Class* / GBP U Dis Class* / USD I Acc Class* / USD I H Acc Class28
Comgest Growth EuropeSmaller Companies Euro
EUR Acc Class / EUR I Acc Class / EUR Dis Class* / EUR X Acc Class11 /EUR Z Acc Class / GBP U Acc Class27 / GBP U H Acc Class* / EUR I DisClass19 / EUR R Acc Class36
Comgest Growth Europe ex Switzerland Swiss Franc CHF I Acc Class / CHF Z Acc Class
COMGEST GROWTH plc
DIRECTORS’ REPORT (continued)
For the financial year ended 31 December 2020
7
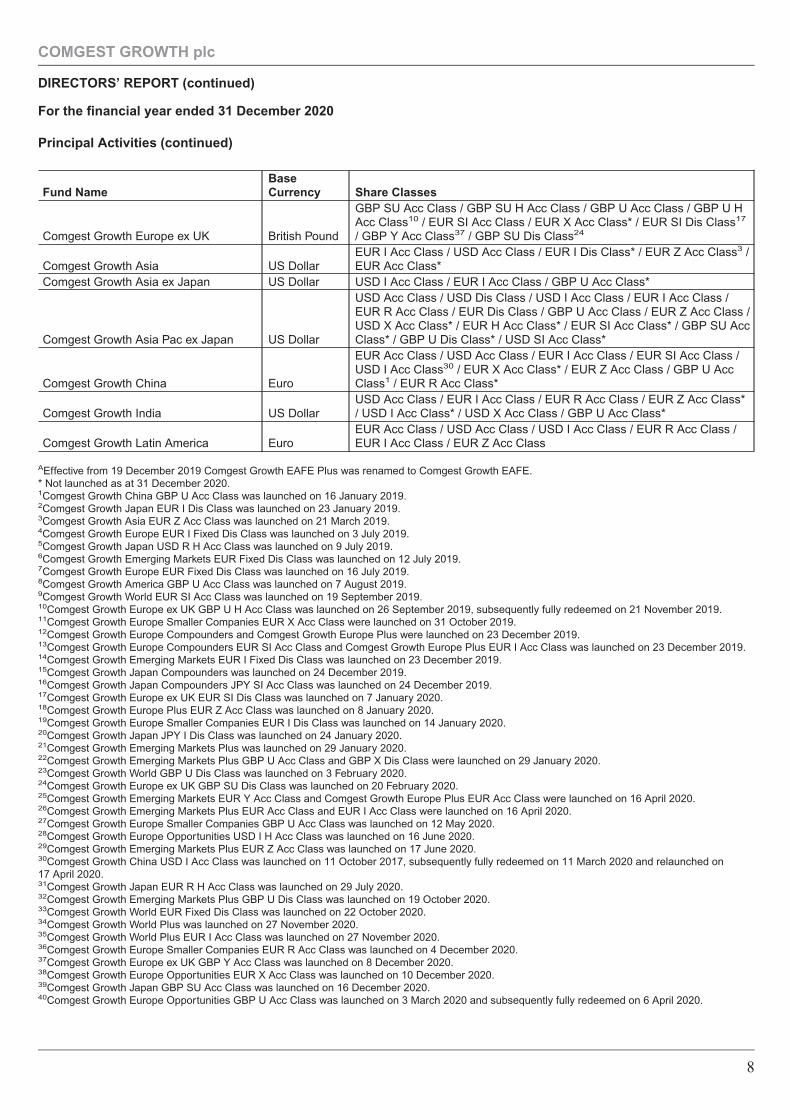
Principal Activities (continued)
Fund NameBaseCurrency Share Classes
Comgest Growth Europe ex UK British Pound
GBP SU Acc Class / GBP SU H Acc Class / GBP U Acc Class / GBP U HAcc Class10 / EUR SI Acc Class / EUR X Acc Class* / EUR SI Dis Class17
/ GBP Y Acc Class37 / GBP SU Dis Class24
Comgest Growth Asia US DollarEUR I Acc Class / USD Acc Class / EUR I Dis Class* / EUR Z Acc Class3 /EUR Acc Class*
Comgest Growth Asia ex Japan US Dollar USD I Acc Class / EUR I Acc Class / GBP U Acc Class*
Comgest Growth Asia Pac ex Japan US Dollar
USD Acc Class / USD Dis Class / USD I Acc Class / EUR I Acc Class /EUR R Acc Class / EUR Dis Class / GBP U Acc Class / EUR Z Acc Class /USD X Acc Class* / EUR H Acc Class* / EUR SI Acc Class* / GBP SU AccClass* / GBP U Dis Class* / USD SI Acc Class*
Comgest Growth China Euro
EUR Acc Class / USD Acc Class / EUR I Acc Class / EUR SI Acc Class /USD I Acc Class30 / EUR X Acc Class* / EUR Z Acc Class / GBP U AccClass1 / EUR R Acc Class*
Comgest Growth India US DollarUSD Acc Class / EUR I Acc Class / EUR R Acc Class / EUR Z Acc Class*/ USD I Acc Class* / USD X Acc Class / GBP U Acc Class*
Comgest Growth Latin America EuroEUR Acc Class / USD Acc Class / USD I Acc Class / EUR R Acc Class /EUR I Acc Class / EUR Z Acc Class
AEffective from 19 December 2019 Comgest Growth EAFE Plus was renamed to Comgest Growth EAFE.* Not launched as at 31 December 2020.1Comgest Growth China GBP U Acc Class was launched on 16 January 2019.2Comgest Growth Japan EUR I Dis Class was launched on 23 January 2019.3Comgest Growth Asia EUR Z Acc Class was launched on 21 March 2019.4Comgest Growth Europe EUR I Fixed Dis Class was launched on 3 July 2019.5Comgest Growth Japan USD R H Acc Class was launched on 9 July 2019.6Comgest Growth Emerging Markets EUR Fixed Dis Class was launched on 12 July 2019.7Comgest Growth Europe EUR Fixed Dis Class was launched on 16 July 2019.8Comgest Growth America GBP U Acc Class was launched on 7 August 2019.9Comgest Growth World EUR SI Acc Class was launched on 19 September 2019.10Comgest Growth Europe ex UK GBP U H Acc Class was launched on 26 September 2019, subsequently fully redeemed on 21 November 2019.11Comgest Growth Europe Smaller Companies EUR X Acc Class were launched on 31 October 2019.12Comgest Growth Europe Compounders and Comgest Growth Europe Plus were launched on 23 December 2019.13Comgest Growth Europe Compounders EUR SI Acc Class and Comgest Growth Europe Plus EUR I Acc Class was launched on 23 December 2019.14Comgest Growth Emerging Markets EUR I Fixed Dis Class was launched on 23 December 2019.15Comgest Growth Japan Compounders was launched on 24 December 2019.16Comgest Growth Japan Compounders JPY SI Acc Class was launched on 24 December 2019.17Comgest Growth Europe ex UK EUR SI Dis Class was launched on 7 January 2020.18Comgest Growth Europe Plus EUR Z Acc Class was launched on 8 January 2020.19Comgest Growth Europe Smaller Companies EUR I Dis Class was launched on 14 January 2020.20Comgest Growth Japan JPY I Dis Class was launched on 24 January 2020.21Comgest Growth Emerging Markets Plus was launched on 29 January 2020.22Comgest Growth Emerging Markets Plus GBP U Acc Class and GBP X Dis Class were launched on 29 January 2020.23Comgest Growth World GBP U Dis Class was launched on 3 February 2020.24Comgest Growth Europe ex UK GBP SU Dis Class was launched on 20 February 2020.25Comgest Growth Emerging Markets EUR Y Acc Class and Comgest Growth Europe Plus EUR Acc Class were launched on 16 April 2020.26Comgest Growth Emerging Markets Plus EUR Acc Class and EUR I Acc Class were launched on 16 April 2020.27Comgest Growth Europe Smaller Companies GBP U Acc Class was launched on 12 May 2020.28Comgest Growth Europe Opportunities USD I H Acc Class was launched on 16 June 2020.29Comgest Growth Emerging Markets Plus EUR Z Acc Class was launched on 17 June 2020.30Comgest Growth China USD I Acc Class was launched on 11 October 2017, subsequently fully redeemed on 11 March 2020 and relaunched on17 April 2020.31Comgest Growth Japan EUR R H Acc Class was launched on 29 July 2020.32Comgest Growth Emerging Markets Plus GBP U Dis Class was launched on 19 October 2020.33Comgest Growth World EUR Fixed Dis Class was launched on 22 October 2020.34Comgest Growth World Plus was launched on 27 November 2020.35Comgest Growth World Plus EUR I Acc Class was launched on 27 November 2020.36Comgest Growth Europe Smaller Companies EUR R Acc Class was launched on 4 December 2020.37Comgest Growth Europe ex UK GBP Y Acc Class was launched on 8 December 2020.38Comgest Growth Europe Opportunities EUR X Acc Class was launched on 10 December 2020.39Comgest Growth Japan GBP SU Acc Class was launched on 16 December 2020.40Comgest Growth Europe Opportunities GBP U Acc Class was launched on 3 March 2020 and subsequently fully redeemed on 6 April 2020.
COMGEST GROWTH plc
DIRECTORS’ REPORT (continued)
For the financial year ended 31 December 2020
8
Political donations
During the financial year there were no political donations made by the Company or the Investment Manager.
Statement of Relevant Audit Information
In the case of each person who was a Director of the Company at the time the report is approved:
1. so far as the Directors are aware, there is no relevant audit information of which the Company’s statutory auditors areunaware; and
2. the Directors have taken all the steps that they ought to have taken as Directors in order to make themselves aware of anyrelevant audit information and to establish that the Company’s statutory auditors are aware of that information.
Results
The outbreak of COVID 19 worldwide has triggered drastic measures by governments in an attempt to contain the pandemicand its impact. The Board of Directors continue to monitor the evolution of the situation closely. The Company hasprocedures in place to actively monitor its delegates and service providers to ensure its continued operational effectiveness.In addition, the Company is closely monitoring a number of key areas including the investment policies, strategies,investment flows, performance and liquidity of the Funds during this period.
The companies in our portfolios were not immune to share price volatility. However our portfolios have proven their relativeresilience with the strategies generally outperforming their comparative indices.
Up to date performance reports can be found on our website www.comgest.com and a further commentary on COVID-19 iscontained in note 17, Significant Events during the period, to these financial statements.
The financial position and results for the financial year are set out on page 75 to 131. Dividends for Fiscal Year 2019 werepaid in April 2020 in respect of Comgest Growth Emerging Markets (USD Dis Class, USD Z Dis Class, EUR Dis Class, EURI Dis Class and EUR Z Dis Class), Comgest Growth Japan (EUR I Dis Class), Comgest Growth Europe (EUR I Dis Class),and Comgest Growth Asia Pac ex Japan (USD Dis Class and EUR Dis Class). Dividends were paid in July 2020 and October2020 in respect of Comgest Growth Europe (EUR I Fixed Dis Class and EUR Fixed Dis Class) and Comgest GrowthEmerging Markets (EUR Fixed Dis Class) (see note 13).
Key Performance Indicators
The total Net Asset Value of the Company increased from €14,226,664,201 to €18,388,670,987 during the financial year. Adetailed review of business and future developments is in the Investment Manager’s Reports from page 18 to page 71.
Directors
The names of the persons who were Directors at any time during the financial year are set out on page 4.
Secretary
Wilton Secretarial Limited served as secretary throughout the financial year.
COMGEST GROWTH plc
DIRECTORS’ REPORT (continued)
For the financial year ended 31 December 2020
9
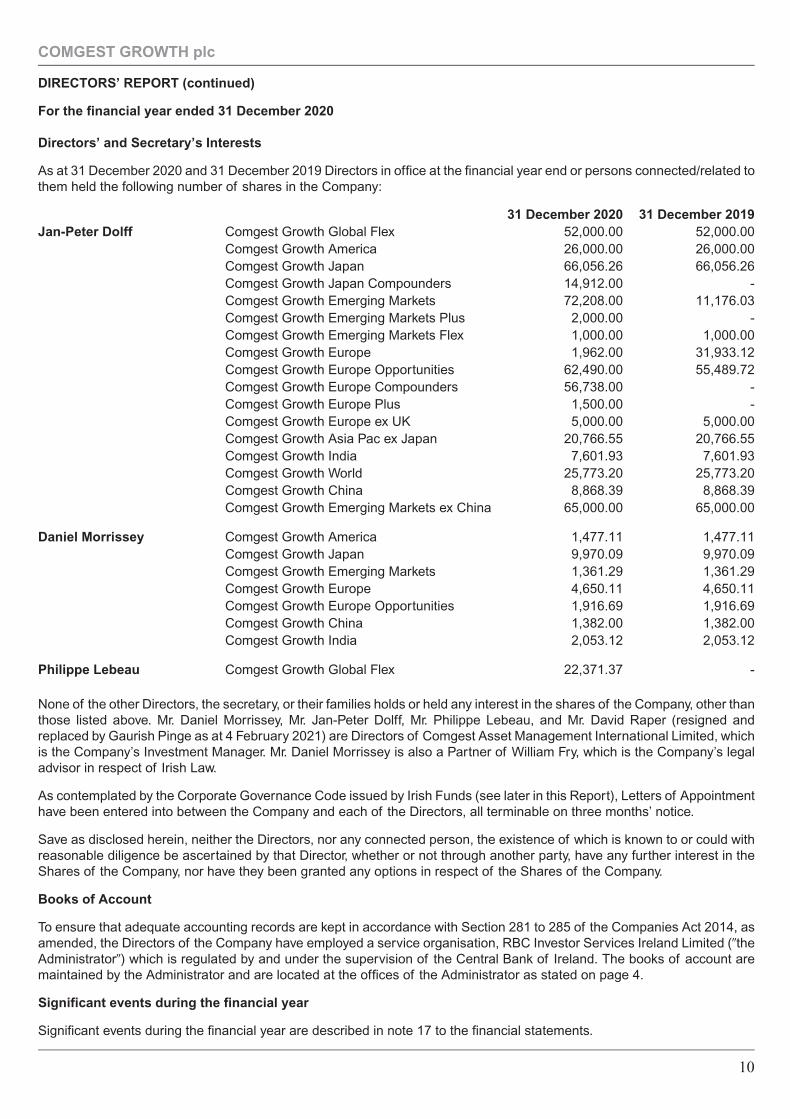
Directors’ and Secretary’s Interests
As at 31 December 2020 and 31 December 2019 Directors in office at the financial year end or persons connected/related tothem held the following number of shares in the Company:
31 December 2020 31 December 2019Jan-Peter Dolff Comgest Growth Global Flex 52,000.00 52,000.00
Comgest Growth America 26,000.00 26,000.00Comgest Growth Japan 66,056.26 66,056.26Comgest Growth Japan Compounders 14,912.00 -Comgest Growth Emerging Markets 72,208.00 11,176.03Comgest Growth Emerging Markets Plus 2,000.00 -Comgest Growth Emerging Markets Flex 1,000.00 1,000.00Comgest Growth Europe 1,962.00 31,933.12Comgest Growth Europe Opportunities 62,490.00 55,489.72Comgest Growth Europe Compounders 56,738.00 -Comgest Growth Europe Plus 1,500.00 -Comgest Growth Europe ex UK 5,000.00 5,000.00Comgest Growth Asia Pac ex Japan 20,766.55 20,766.55Comgest Growth India 7,601.93 7,601.93Comgest Growth World 25,773.20 25,773.20Comgest Growth China 8,868.39 8,868.39Comgest Growth Emerging Markets ex China 65,000.00 65,000.00
Daniel Morrissey Comgest Growth America 1,477.11 1,477.11Comgest Growth Japan 9,970.09 9,970.09Comgest Growth Emerging Markets 1,361.29 1,361.29Comgest Growth Europe 4,650.11 4,650.11Comgest Growth Europe Opportunities 1,916.69 1,916.69Comgest Growth China 1,382.00 1,382.00Comgest Growth India 2,053.12 2,053.12
Philippe Lebeau Comgest Growth Global Flex 22,371.37 -
None of the other Directors, the secretary, or their families holds or held any interest in the shares of the Company, other thanthose listed above. Mr. Daniel Morrissey, Mr. Jan-Peter Dolff, Mr. Philippe Lebeau, and Mr. David Raper (resigned andreplaced by Gaurish Pinge as at 4 February 2021) are Directors of Comgest Asset Management International Limited, whichis the Company’s Investment Manager. Mr. Daniel Morrissey is also a Partner of William Fry, which is the Company’s legaladvisor in respect of Irish Law.
As contemplated by the Corporate Governance Code issued by Irish Funds (see later in this Report), Letters of Appointmenthave been entered into between the Company and each of the Directors, all terminable on three months’ notice.
Save as disclosed herein, neither the Directors, nor any connected person, the existence of which is known to or could withreasonable diligence be ascertained by that Director, whether or not through another party, have any further interest in theShares of the Company, nor have they been granted any options in respect of the Shares of the Company.
Books of Account
To ensure that adequate accounting records are kept in accordance with Section 281 to 285 of the Companies Act 2014, asamended, the Directors of the Company have employed a service organisation, RBC Investor Services Ireland Limited (�theAdministrator�) which is regulated by and under the supervision of the Central Bank of Ireland. The books of account aremaintained by the Administrator and are located at the offices of the Administrator as stated on page 4.
Significant events during the financial year
Significant events during the financial year are described in note 17 to the financial statements.
COMGEST GROWTH plc
DIRECTORS’ REPORT (continued)
For the financial year ended 31 December 2020
10
Subsequent events after the financial year end
Significant events after the financial year end are described in note 18 to the financial statements.
Review of Development of the Business and Future Developments
A detailed review of the business and potential future development is included in the Investment Manager’s Reports, frompage 18 to page 71.
Risk Management Objectives and Policies
The Company seeks to provide investors with capital appreciation by investing in high quality long term growth companies.Investment in the Company carries with it a degree of risk including, but not limited to, the risks referred to in note 7 andappendix III of these financial statements. Shareholders should also refer to the Company’s Prospectus.
Independent Auditors
The auditors, Deloitte Ireland LLP, Chartered Accountants and Statutory Audit Firm have signified their willingness tocontinue in office in accordance with Section 383(2) of the Companies Act 2014, as amended.
Accountability
The Directors acknowledge that they are required, under Section 167 of the Companies Act 2014, as amended, to considerthe establishment of an audit committee. An audit committee’s responsibilities under Section 167 must comprise at least thefollowing:
a) monitoring the financial reporting process;b) monitoring the effectiveness of the systems of internal control, internal audit and risk management;c) monitoring the statutory audits of the statutory financial statements; andd) monitoring and reviewing the independence of the statutory auditors, in particular the provision of additional services to
the Company.
The Directors have decided not to establish an audit committee at this time. In the Directors’ opinion, the responsibilities ofan audit committee under Section 167 are already being fulfilled by virtue of the Board of Directors (“the Board”) corporategovernance regime and the existing arrangements and structures in place designed to monitor compliance with theextensive legal and regulatory obligations of the Company including the Company’s financial reporting process. In arriving attheir decision, the Board have considered the nature, scale and complexity of the Company’s business activities inconjunction with the legal and regulatory obligations.
Additionally, each of the Directors is subject to the statutory Fitness and Probity regime as established by the Central BankReform Act, 2010 whereby the Company may not permit a person to perform the role of Director unless the Company issatisfied on reasonable grounds that the person complies with the standards of fitness and probity issued under thatlegislation and the person agrees to comply with those standards which are continuing obligations.
As at 31 December 2020, the Board is formed of five non-executive Directors. One of these is a fully independent Director,Ms Bronwyn Wright, and one is independent of the executive management of Comgest but is also a non-executive Directorof the Investment Manager, Mr Daniel Morrissey. Furthermore, there are three Directors who are full time executives ofComgest. All Directors are fully independent of the financial statement preparation and production process and Ms BronwynWright and Mr Daniel Morrissey are fully independent of decisions related to the valuation of assets held by the Company.The Company complies with the provisions of the Corporate Governance Code. Whilst continuing to retain the overallresponsibilities as required by Section 167, the Directors have delegated the day-to-day investment management andadministration of the Company to Comgest Asset Management International Limited and RBC Investor Services IrelandLimited respectively and has appointed RBC Investors Services Bank S.A., Dublin Branch as depositary of the assets of theCompany. The Board regularly receives reporting from these delegates (which include experienced financial, risk andcompliance professionals) and auditors detailing reviews performed during the year. The Board continues to monitor therelationship with the Company’s statutory auditors with regard to independence and objectivity and to make appropriatedecisions with regard to performance, remuneration, selection and retention of statutory auditors.
COMGEST GROWTH plc
DIRECTORS’ REPORT (continued)
For the financial year ended 31 December 2020
11
Directors Compliance Statement
The Directors acknowledge that they are responsible for securing the Company’s compliance with the relevant obligations asset out in section 225 of the Companies Act 2014, as amended.
The Directors confirm that:
1. a compliance policy statement has been drawn up that sets out policies, which in the Directors opinion are appropriate tothe Company, respecting compliance by the Company with its relevant obligations;
2. appropriate arrangements or structures are in place that are, in the Directors’ opinion, designed to secure materialcompliance with the Company’s relevant obligations; and
3. during the financial year, the arrangements or structures referred to in (2) have been reviewed.
In designing and putting in place those arrangements and structures designed to provide the Directors with reasonableassurance of material compliance with those relevant obligations, the Directors have relied upon advice, guidance andassistance of employees and advisers who the Directors believe have the requisite knowledge and experience for the designand putting in place of those arrangements and structures.
These relevant obligations as set out in section 225 of the Companies Act 2014, as amended are separate from andadditional to the legal and regulatory requirements to which the Company is subject by virtue of its regulation by the CentralBank of Ireland.
Corporate Governance Statement
Although there is no specific statutory corporate governance code applicable to Irish collective investment schemes, theCompany is subject to corporate governance practices imposed by:
• The Irish Companies Act 2014, as amended which is available for inspection at the registered office of the Companyand may also be obtained at www.irishstatutebook.ie.
• The Articles of Association of the Company which are available for inspection at the registered office of theCompany at 2 Grand Canal Square, Dublin 2, Ireland and at the Companies Registration Office in Ireland.
• The Central Bank of Ireland in the Central Bank UCITS Regulations which can be obtained from the Central Bank ofIreland’s website at http://www.centralbank.ie/regulation/industry-sectors/funds/ucits/Pages/default.aspx
• A corporate governance code (the Corporate Governance Code) was issued by Irish Funds (formerly known as theIrish Funds Industry Association) in December 2011 that may be adopted on a voluntary basis by Irish authorisedcollective investment schemes effective 1 January 2012 with a twelve month transitional period. The CorporateGovernance Code may be inspected on/obtained from www.irishfunds.ie. In December 2012, the Board adopted theCorporate Governance Code having regard for certain other key pillars of governance within the collectiveinvestment fund governance structure, including:
• the unique role of the Promoter of the collective investment fund (which is, or a related company of which is,normally the investment manager of the collective investment fund), as recognised by the Central Bank ofIreland, in supporting the corporate governance culture of the Company. Comgest Asset ManagementInternational Limited acts as promoter for the Company and will continue to do so;
• the uniqueness of the independent segregation of duties as between the Investment Manager, the Administrator(with responsibility for the calculation of the net asset value, amongst other duties) and the independentDepositary (with responsibility for safeguarding the assets of the Company and overseeing how the Company ismanaged), such segregation of duties/functions being achieved through delegation of respectiveresponsibilities to and appointment of suitably qualified and also regulated third party entities who are subject toregulatory supervision; and
• the role of the Company’s investors/Shareholders in electing to have their money managed in accordance withthe investment objectives and policies of the Funds of the Company as set out in the relevant Funds Details ofthe Prospectus of the Company.
COMGEST GROWTH plc
DIRECTORS’ REPORT (continued)
For the financial year ended 31 December 2020
12
Corporate Governance Statement (continued)
The Company has no employees and the Directors are all non-executive. Consistent with the regulatory frameworkapplicable to self-managed investment fund companies, the Company operates under the delegated model whereby it hasdelegated investment management, administration and distribution functions to third parties without abrogating the Board’soverall responsibility. The Board has in place mechanisms for monitoring the exercise of such delegated functions which arealways subject to the supervision and direction of the Board.
These delegations of functions and the appointment of regulated third party entities are detailed in the Company’sProspectus. In summary, they are:
1. the Company has delegated the performance of the investment management functions in respect of the Company and ofits Funds to the Investment Manager as detailed in the Prospectus and listed in the directory to these financial statements.The Investment Manager has direct responsibility for the decisions relating to the day to day running of the Funds and it isaccountable to the Board of the Company for the investment performance of the Funds. The Investment Manager hasinternal controls and risk management processes in place aimed at ensuring that applicable risks pertaining to itsmanagement of the Funds are identified, monitored and managed and appropriate reporting is made to the Board on aregular basis. The Investment Manager is regulated by and under the supervision of the Central Bank of Ireland;
2. the Company has delegated its responsibility as Administrator, Registrar and Transfer Agent to RBC Investor ServicesIreland Limited (the “Administrator”) which entity has responsibility for the day to day administration of the Company and theFunds including the calculation of the net asset values. The Administrator is regulated by and under the supervision of theCentral Bank of Ireland;
3. the Company has delegated the distribution of the Funds of the Company to the Investment Manager.
The Company also has appointed RBC Investor Services Bank S.A. Dublin Branch (the “Depositary”) as independentDepositary of its assets which entity has responsibility for the safekeeping of such assets in accordance with the UCITSRegulations and exercising independent oversight over how the Company is managed (amongst other duties). TheDepositary is regulated by and under the supervision of the Central Bank of Ireland.
The Board receives reports on a regular (and at least quarterly) basis from each of its delegate service providers and theDepositary which enables it to assess the performance of the delegate service providers and the Depositary (as the casemay be).
Diversity in operations
The Board acknowledges the importance of diversity to enhance its operation. During the selection process the Board iscommitted to selecting those with diversity of business skills, experience and gender and candidates for appointment areconsidered based on these attributes. The Board’s principle is that each member of the Board must have the skills,experience, knowledge and overall suitability that will enable each director to contribute individually, and as part of the boardteam, to the effectiveness of the Board. Subject to that overriding principle, the Board believe that diversity of experience andapproach, including educational and professional background, gender, age and geographical provenance, amongst boardmembers is of great value when considering overall board balance in making new appointments to the Board. The Boards’priority is to ensure that it continues to have strong leadership and the relevant skills to deliver the business strategy. TheBoard reviews the balance of skills, knowledge, experience and diversity on the Board and leads succession planning forappointments to the Board. The Board will ensure that all selection decisions are based on merit and that recruitment is fairand non-discriminatory. The current Board composition reflects diverse age, gender, educational and professionalbackgrounds.
COMGEST GROWTH plc
DIRECTORS’ REPORT (continued)
For the financial year ended 31 December 2020
13
Corporate Governance Statement (continued)
Financial Reporting Process - description of main features
The Board has ultimate responsibility for overseeing the establishment and maintenance of adequate internal control andrisk management systems of the Company in relation to the financial reporting process. The Board has appointed theAdministrator, RBC Investor Services Ireland Limited, to maintain the accounting records of the Company independent ofthe Investment Manager and the Depositary. The Administrator is contractually obliged to maintain proper books and recordsin compliance with local laws. To that end the Administrator performs regular reconciliations of its records to those of theDepositary. The Administrator is also contractually obliged to design and maintain control structures to manage the risks forinternal control over financial reporting. These control structures include appropriate division of responsibilities and specificcontrol activities aimed at detecting or preventing the risk of significant deficiencies in financial reporting for every significantaccount in the financial statements and the related notes in the Company’s annual report.
The Board is responsible for assessing the risk of irregularities whether caused by fraud or error in financial reporting andensuring the processes are in place for the timely identification of internal and external matters with a potential effect onfinancial reporting. The Board’s appointment of the Administrator is intended to manage rather than eliminate the risk offailure to achieve the Company’s financial reporting objectives and can only provide reasonable and not absolute assuranceagainst material misstatement or loss.
The Administrator is also contractually obliged to prepare, for review and approval by the Board, the annual and half yearlyfinancial statements. The annual financial statements are required to be audited by independent auditors who reportannually to the Board their findings. As part of its review procedures, the Board receives presentations from relevant partiesincluding consideration of International Financial Reporting Standards (IFRSs) and changes in accounting rules to ensurethat these changes are accurately reflected in the Company’s financial statements. The Board also receives presentationsand reports on the audit process.
The Board evaluates and discusses significant accounting and reporting issues as the need arises. The Board alsoassesses and evaluates the Administrator’s financial accounting and reporting routines and further assesses and evaluatesthe external auditors’ performance, qualifications and independence.
The annual financial statements of the Company are required to be filed with the Central Bank of Ireland.
Composition of the Board of Directors
With regard to the appointment and replacement of Directors, the Company is governed by its Articles of Association (the“Articles”) and the Irish Statute comprising the Companies Act 2014, as amended as applicable to investment funds. TheArticles themselves may be amended by special resolution of the Shareholders. The Articles do not provide for retirement ofDirectors by rotation. However, the Directors may be removed by the Shareholders by ordinary resolution in accordance theprocedures established under the Irish Companies Act 2014, as amended. A Director may also be removed upon notice fromthe Company in accordance with the Letter of Appointment between him/her and the Company.
The Board is responsible for managing the business affairs of the Company in accordance with the Articles. There arecurrently five Directors (refer to page 4 for details), all of whom are non-executive. Jan-Peter Dolff, Philippe Lebeau andDavid Raper are full time executives of the Comgest Group. Simon Champetier de Ribes resigned from the Board on30 September 2019. Jan-Peter Dolff, Philippe Lebeau and David Raper (resigned and replaced by Gaurish Pinge as at4 February 2021) together with Daniel Morrissey, are Directors of the Investment Manager. Bronwyn Wright is anindependent director. All related party transactions during the financial year are detailed in the notes to these financialstatements.
The Board meets at least quarterly. There are no permanent sub-committees of the Board.
Capital structure
No person has any special rights of control over the Company’s share capital. There are no restrictions on voting rights onany of the existing share classes.
COMGEST GROWTH plc
DIRECTORS’ REPORT (continued)
For the financial year ended 31 December 2020
14
Corporate Governance Statement (continued)
Capital structure (continued)
Under the Articles, the Directors are given authority to effect the issue of Participating Shares and have absolute discretionto accept or reject in whole or in part any application for Participating Shares without providing a reason for their decision.The Directors have power to impose such restrictions as they think necessary to ensure that no Participating Shares areacquired by any person which might result in the legal and beneficial ownership of Participating Shares by persons who arenot qualified holders or expose the Company to adverse tax or regulatory consequences.
Participating Shares are (save as hereinafter specified) freely transferable and may be transferred provided always that thetransferee completes a notice in a form approved by the Directors and the Administrator and furnishes the Administrator withany documents required by the Administrator. In addition, the Directors may decline to register any transfer of a share wherethey are aware or believe that such transfer would or might result in the beneficial ownership of such share by a person whois not a qualified holder or expose the Company or the Shareholders as a whole to adverse tax or regulatory consequences.
Shareholder meetings
The Annual General Meeting of the Company will usually be held in Ireland, normally during the month of June or such otherdate as the Directors may determine. Notice convening the Annual General Meeting in each year at which the auditedfinancial statements of the Company will be presented (together with the Directors’ and Auditors’ Reports of the Company)will be sent to Shareholders at their registered addresses not less than 21 clear days before the date fixed for the meeting.Other extraordinary general meetings may be convened from time to time by the Directors in such manner as provided byIrish law. All business shall be deemed special that is transacted at an extraordinary general meeting as also will all businessthat is transacted at an Annual General Meeting with the exception of the consideration of the accounts and the Statementof Financial Position and the reports of the Directors and Auditors, the election of Directors and Auditors in the place ofthose retiring and the appointment and the fixing of the remuneration of the Auditors.
At any general meeting, a resolution put to vote of the meeting shall be decided on a show of hands unless before, or on thedeclaration of the result of the show of hands, a poll is duly demanded. A poll may be demanded by (a) the Chairman of themeeting (b) by at least five Members present having the right to vote at the meeting or (c) by any Member or Memberspresent representing not less than one-tenth of the total voting rights of all the Members having the right to vote at themeeting. Unless a poll is so demanded, a declaration by the Chairman that a resolution has been carried, or carriedunanimously, or by a particular majority, or lost, or not carried by a particular majority and an entry to that effect in the minutesof the meeting shall be conclusive evidence of the fact without proof of the number or proportion of the votes recorded infavour of or against such resolution.
Votes of Members may be given either personally or by proxy. Every Member entitled to attend and vote at a general meetingmay appoint a proxy to attend, speak and vote on their behalf. Where there is an equality of votes the Chairman of themeeting at which the vote takes place shall be entitled to a casting vote in addition to any other vote he/she may have.
Connected Persons
In accordance with the Central Bank’s UCITS Regulations, any transaction carried out with the Company by its manager,depositary, investment adviser, sub-investment manager and/or associated or group companies of theseentities (“connected persons”) must be carried out as if negotiated at arm’s length. Such transactions must be in the bestinterests of the Shareholders. In addition to those transactions, there are also transactions carried out by connected personson behalf of the Company to which the Directors have no direct access and in respect of which the Directors must rely uponassurances from its delegates that the connected persons carrying out those transactions do carry them out on a similarbasis.
Shareholders should have regard to the governance structure of the Company as more particularly described in theCorporate Governance Statement section of the Directors’ Report included in these financial statements and the roles andresponsibilities of the Company’s respective delegates subject to the overall supervision of the Board.
Shareholders should also refer to the provisions of the Prospectus dealing with conflicts of interest.
COMGEST GROWTH plc
DIRECTORS’ REPORT (continued)
For the financial year ended 31 December 2020
15
SOMGE$T ffiRSWTH ptc
DIRECTORS' REPORT (continued)
For the financial year ended 31 December 2020
Connected Persons (continued)
Therefore, having regard to confirmations from the Company's management and its relevant delegates, the Board ofDirectors of the Company is satisfied that (i) there are arrangements (as evidenced by written procedures documented bythe lnvestment Manager) in place to ensure that the obligations described above are applied to all transactions withconnected persons; and (ii) transactions with connected persons entered into during the financial year complied with theseobligations, as attested by the lnvestment lvlanager through regular updates to the Directors. The Board of Directors is notaware of any transactions with connected persons during the financial year ended 31 December 2A20, other than thosedisclosed inlthough these financial statements.
Note 9 details related party transactions in the financial year as required by applicable financial reporting standards.Howeve[ Shareholders should understand that not all "connected persons" are related parties as such latter expression isdefined by those financial reporting standards- Details of fees paid to related parties and certain connected persons are setout in note 9.
MIFID II
The lnvestment Manager, up to 31 December 2019, operated a research payment account for the discharge of researchexpenses in accordance with the European Union (Markets in Financial lnstruments) Regulation 2017 at an agreed annualbudget for this expense with the Board. There will be no such research expenses or costs incurred by the Company as from1 January 2020 onwards.
On behalf of the Board
Director:Daniel Morrissey
Director:Bronwyn Wright
31 March 2021
*--a
t6
&-J"#
RBC Investor Services Bank S.A., Dublin Branch4th Floor, One George's Quay PlazaGeorge's QuayDublin 2, Ireland
T +353 1 613 0400F +353 1 613 1198
RBC Investor Services Bank S.A., Dublin Branch
is a branch of RBC Investor Services Bank S.A.
Registered office: 14, Porte de France, L-4360 Esch-sur-Alzette, Luxembourg
Registered in Ireland 905449
Incorporated in Luxembourg with Limited Liability
Registered in Luxembourg B 47 192
Report of the Depositary to the Shareholders For the year ended 31 December 2020
As required by the European Communities (Undertakings for Collective Investment in Transferable Securities) Regulations 2011 (as amended) (“the Regulations”) and solely within the context of our oversight duties as depositary, we are pleased to present our report as follows.
In our opinion, Comgest Growth plc (the “Company”) has been managed for the year ended 31 December 2020
(i) In accordance with the limitations imposed on the investment and borrowing powers of the Company by the Memorandum & Articles of Association and the Regulations; and
(ii) Otherwise in accordance with the provisions of the Memorandum & Articles of Association and the Regulations.
RBC INVESTOR SERVICES BANK S.A. Date: 12 March 2021DUBLIN BRANCH
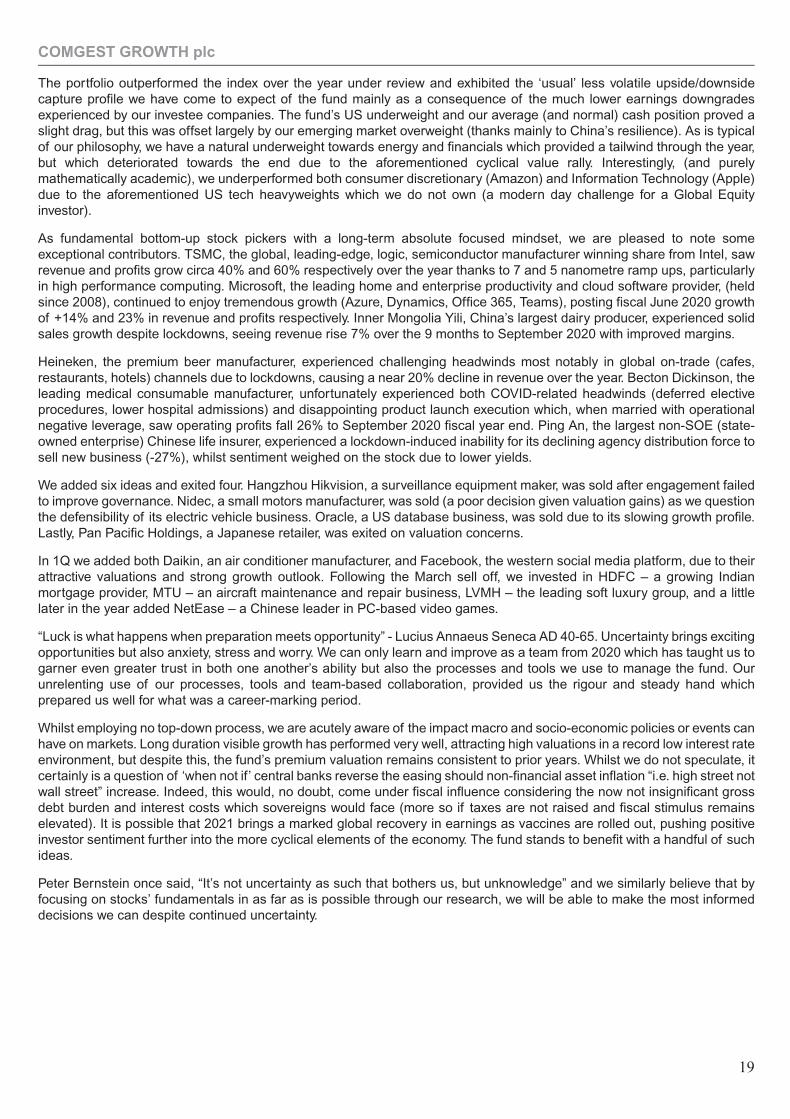
Performance Summary
Sub-fund share class Currency Performance 2020
COMGEST GROWTH WORLD USD ACC USD 21.78COMGEST GROWTH WORLD USD I ACC USD 22.57MSCI AC World - Net Return* USD 16.25
COMGEST GROWTH WORLD EUR I ACC EUR 12.43COMGEST GROWTH WORLD EUR R ACC EUR 11.18COMGEST GROWTH WORLD EUR Z ACC EUR 12.38COMGEST GROWTH WORLD EUR DIS EUR 11.40COMGEST GROWTH WORLD EUR SI ACC EUR 12.56MSCI AC World - Net Return* EUR 6.65
COMGEST GROWTH WORLD EUR FIXED DIS1 EUR 5.10MSCI AC World - Net Return* EUR 7.98
COMGEST GROWTH WORLD GBP U ACC GBP 18.79MSCI AC World - Net Return* GBP 12.67
COMGEST GROWTH WORLD GBP U DIS2 GBP 16.18MSCI AC World - Net Return* GBP 11.56
1inception date 22/10/20202inception date 03/02/2020*used for comparative purposes only
Commentary
No crystal ball offering 20-20 vision would have predicted that global equity markets would have hit record levels. It was ayear of surprises – the pandemic, the sheer size of fiscal and monetary responses, the US election, Suganomics, a last-minute Brexit deal, lightning speed efficacious vaccines – and most of us, if not all, are hoping for 2021 to be less full ofsurprises.
Thanks to the unprecedented economic responses, most major economies have largely escaped long-term lockdown-induced damage (thus far), excluding unprecedent gross government debt levels and particularly damaged sectors withhospitality, tourism, transport and retail the hardest hit. The responses were most felt in the equity market which, havingcorrected during the steep March sell off, gradually recovered to near breakeven levels by November, after which positivevaccine developments stimulated a sharp rally. This rally was driven by a style rotation towards cyclical value – energy,materials, financials, industrials – at the expense of growth (especially for stocks which benefitted from both the lockdownsand the economic responses and those which are ‘long duration’ growth) – technology, staples, utilities and discretionary.
The MSCI AC World index (+16.3% in USD, +6.7% in EUR) was led, once again, by US equites, with the top ten positivecontributing stocks (all tech and representing approximately 25% of the US market/ 15% of the global market) accounting fortwo thirds of this gain (a portfolio management performance consideration and a risk in itself). Emerging markets followedthanks to resilient Hong Kong and Chinese equities, with Japan not far behind as the country continues to attract investorinterest where growth stocks are debunking a ‘low inflationary” paradigm. Europe was the weakest, undoubtedly as itgrappled until the last minute with Brexit.
COMGEST GROWTH plc
COMGEST GROWTH WORLDa fund of Comgest Growth plc
INVESTMENT MANAGER’S REPORTFOR THE FINANCIAL YEAR ENDED 31 DECEMBER 2020
18
The portfolio outperformed the index over the year under review and exhibited the ‘usual’ less volatile upside/downsidecapture profile we have come to expect of the fund mainly as a consequence of the much lower earnings downgradesexperienced by our investee companies. The fund’s US underweight and our average (and normal) cash position proved aslight drag, but this was offset largely by our emerging market overweight (thanks mainly to China’s resilience). As is typicalof our philosophy, we have a natural underweight towards energy and financials which provided a tailwind through the year,but which deteriorated towards the end due to the aforementioned cyclical value rally. Interestingly, (and purelymathematically academic), we underperformed both consumer discretionary (Amazon) and Information Technology (Apple)due to the aforementioned US tech heavyweights which we do not own (a modern day challenge for a Global Equityinvestor).
As fundamental bottom-up stock pickers with a long-term absolute focused mindset, we are pleased to note someexceptional contributors. TSMC, the global, leading-edge, logic, semiconductor manufacturer winning share from Intel, sawrevenue and profits grow circa 40% and 60% respectively over the year thanks to 7 and 5 nanometre ramp ups, particularlyin high performance computing. Microsoft, the leading home and enterprise productivity and cloud software provider, (heldsince 2008), continued to enjoy tremendous growth (Azure, Dynamics, Office 365, Teams), posting fiscal June 2020 growthof +14% and 23% in revenue and profits respectively. Inner Mongolia Yili, China’s largest dairy producer, experienced solidsales growth despite lockdowns, seeing revenue rise 7% over the 9 months to September 2020 with improved margins.
Heineken, the premium beer manufacturer, experienced challenging headwinds most notably in global on-trade (cafes,restaurants, hotels) channels due to lockdowns, causing a near 20% decline in revenue over the year. Becton Dickinson, theleading medical consumable manufacturer, unfortunately experienced both COVID-related headwinds (deferred electiveprocedures, lower hospital admissions) and disappointing product launch execution which, when married with operationalnegative leverage, saw operating profits fall 26% to September 2020 fiscal year end. Ping An, the largest non-SOE (state-owned enterprise) Chinese life insurer, experienced a lockdown-induced inability for its declining agency distribution force tosell new business (-27%), whilst sentiment weighed on the stock due to lower yields.
We added six ideas and exited four. Hangzhou Hikvision, a surveillance equipment maker, was sold after engagement failedto improve governance. Nidec, a small motors manufacturer, was sold (a poor decision given valuation gains) as we questionthe defensibility of its electric vehicle business. Oracle, a US database business, was sold due to its slowing growth profile.Lastly, Pan Pacific Holdings, a Japanese retailer, was exited on valuation concerns.
In 1Q we added both Daikin, an air conditioner manufacturer, and Facebook, the western social media platform, due to theirattractive valuations and strong growth outlook. Following the March sell off, we invested in HDFC – a growing Indianmortgage provider, MTU – an aircraft maintenance and repair business, LVMH – the leading soft luxury group, and a littlelater in the year added NetEase – a Chinese leader in PC-based video games.
“Luck is what happens when preparation meets opportunity” - Lucius Annaeus Seneca AD 40-65. Uncertainty brings excitingopportunities but also anxiety, stress and worry. We can only learn and improve as a team from 2020 which has taught us togarner even greater trust in both one another’s ability but also the processes and tools we use to manage the fund. Ourunrelenting use of our processes, tools and team-based collaboration, provided us the rigour and steady hand whichprepared us well for what was a career-marking period.
Whilst employing no top-down process, we are acutely aware of the impact macro and socio-economic policies or events canhave on markets. Long duration visible growth has performed very well, attracting high valuations in a record low interest rateenvironment, but despite this, the fund’s premium valuation remains consistent to prior years. Whilst we do not speculate, itcertainly is a question of ‘when not if’ central banks reverse the easing should non-financial asset inflation “i.e. high street notwall street” increase. Indeed, this would, no doubt, come under fiscal influence considering the now not insignificant grossdebt burden and interest costs which sovereigns would face (more so if taxes are not raised and fiscal stimulus remainselevated). It is possible that 2021 brings a marked global recovery in earnings as vaccines are rolled out, pushing positiveinvestor sentiment further into the more cyclical elements of the economy. The fund stands to benefit with a handful of suchideas.
Peter Bernstein once said, “It’s not uncertainty as such that bothers us, but unknowledge” and we similarly believe that byfocusing on stocks’ fundamentals in as far as is possible through our research, we will be able to make the most informeddecisions we can despite continued uncertainty.
COMGEST GROWTH plc
19
Performance Summary
Sub-fund share class Currency Performance 2020
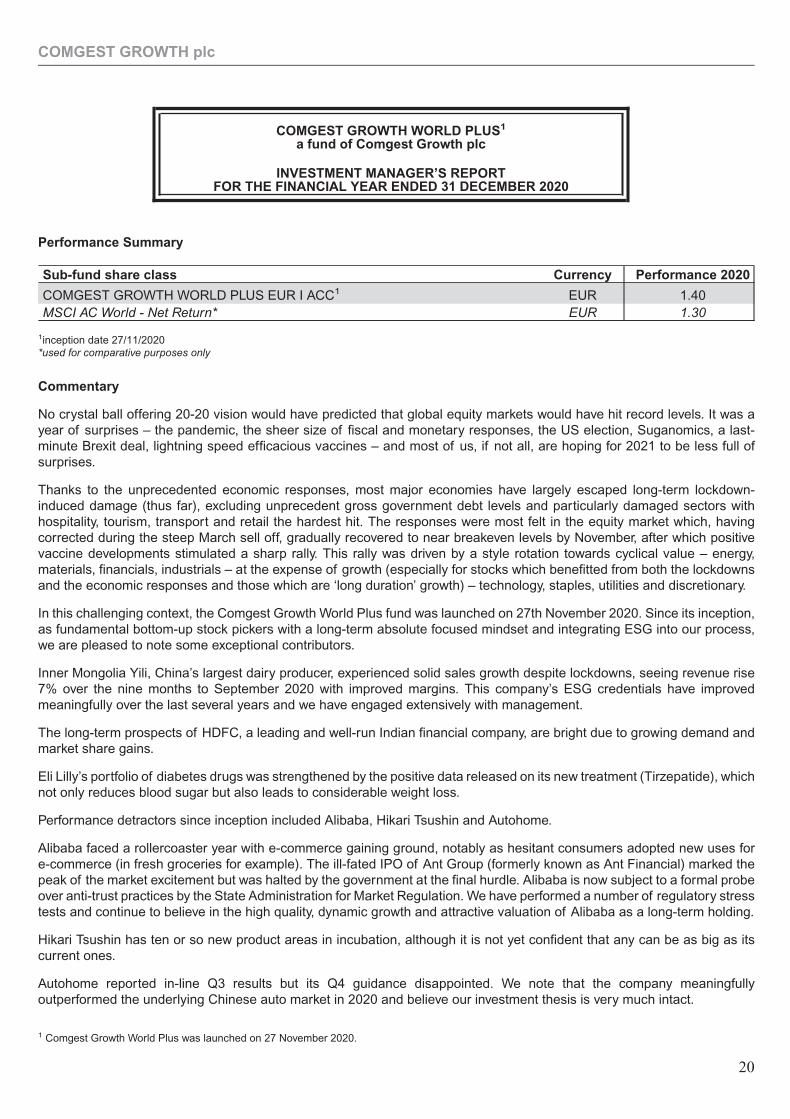
COMGEST GROWTH WORLD PLUS EUR I ACC1 EUR 1.40MSCI AC World - Net Return* EUR 1.30
1inception date 27/11/2020*used for comparative purposes only
Commentary
No crystal ball offering 20-20 vision would have predicted that global equity markets would have hit record levels. It was ayear of surprises – the pandemic, the sheer size of fiscal and monetary responses, the US election, Suganomics, a last-minute Brexit deal, lightning speed efficacious vaccines – and most of us, if not all, are hoping for 2021 to be less full ofsurprises.
Thanks to the unprecedented economic responses, most major economies have largely escaped long-term lockdown-induced damage (thus far), excluding unprecedent gross government debt levels and particularly damaged sectors withhospitality, tourism, transport and retail the hardest hit. The responses were most felt in the equity market which, havingcorrected during the steep March sell off, gradually recovered to near breakeven levels by November, after which positivevaccine developments stimulated a sharp rally. This rally was driven by a style rotation towards cyclical value – energy,materials, financials, industrials – at the expense of growth (especially for stocks which benefitted from both the lockdownsand the economic responses and those which are ‘long duration’ growth) – technology, staples, utilities and discretionary.
In this challenging context, the Comgest Growth World Plus fund was launched on 27th November 2020. Since its inception,as fundamental bottom-up stock pickers with a long-term absolute focused mindset and integrating ESG into our process,we are pleased to note some exceptional contributors.
Inner Mongolia Yili, China’s largest dairy producer, experienced solid sales growth despite lockdowns, seeing revenue rise7% over the nine months to September 2020 with improved margins. This company’s ESG credentials have improvedmeaningfully over the last several years and we have engaged extensively with management.
The long-term prospects of HDFC, a leading and well-run Indian financial company, are bright due to growing demand andmarket share gains.
Eli Lilly’s portfolio of diabetes drugs was strengthened by the positive data released on its new treatment (Tirzepatide), whichnot only reduces blood sugar but also leads to considerable weight loss.
Performance detractors since inception included Alibaba, Hikari Tsushin and Autohome.
Alibaba faced a rollercoaster year with e-commerce gaining ground, notably as hesitant consumers adopted new uses fore-commerce (in fresh groceries for example). The ill-fated IPO of Ant Group (formerly known as Ant Financial) marked thepeak of the market excitement but was halted by the government at the final hurdle. Alibaba is now subject to a formal probeover anti-trust practices by the State Administration for Market Regulation. We have performed a number of regulatory stresstests and continue to believe in the high quality, dynamic growth and attractive valuation of Alibaba as a long-term holding.
Hikari Tsushin has ten or so new product areas in incubation, although it is not yet confident that any can be as big as itscurrent ones.
Autohome reported in-line Q3 results but its Q4 guidance disappointed. We note that the company meaningfullyoutperformed the underlying Chinese auto market in 2020 and believe our investment thesis is very much intact.
1 Comgest Growth World Plus was launched on 27 November 2020.
COMGEST GROWTH plc
COMGEST GROWTH WORLD PLUS1
a fund of Comgest Growth plc
INVESTMENT MANAGER’S REPORTFOR THE FINANCIAL YEAR ENDED 31 DECEMBER 2020
20
“Luck is what happens when preparation meets opportunity” - Lucius Annaeus Seneca AD 40-65. Uncertainty brings excitingopportunities but also anxiety, stress and worry. We can only learn and improve as a team from 2020 which has taught us togarner even greater trust in both one another’s ability but also the processes and tools we use to manage the fund. Ourunrelenting use of our processes, tools and team-based collaboration, provided us the rigour and steady hand whichprepared us well for what was a career-marking period.
Whilst employing no top-down process, we are acutely aware of the impact macro and socio-economic policies or events canhave on markets. Long duration visible growth has performed very well, attracting high valuations in a record low interest rateenvironment. Whilst we do not speculate, it certainly is a question of ‘when not if’ central banks reverse the easing shouldnon-financial asset inflation “i.e. high street not wall street” increase. Indeed, this would, no doubt, come under fiscalinfluence considering the now not insignificant gross debt burden and interest costs which sovereigns would face (more so iftaxes are not raised and fiscal stimulus remains elevated). It is possible that 2021 brings a marked global recovery inearnings as vaccines are rolled out, pushing positive investor sentiment further into the more cyclical elements of theeconomy. The fund stands to benefit with a handful of such ideas.
Peter Bernstein once said, “It’s not uncertainty as such that bothers us, but unknowledge” and we similarly believe that byfocusing on stocks’ fundamentals in as far as is possible through our research, we will be able to make the most informeddecisions we can despite continued uncertainty.
COMGEST GROWTH plc
21
Performance Summary
Sub-fund share class Currency Performance 2020
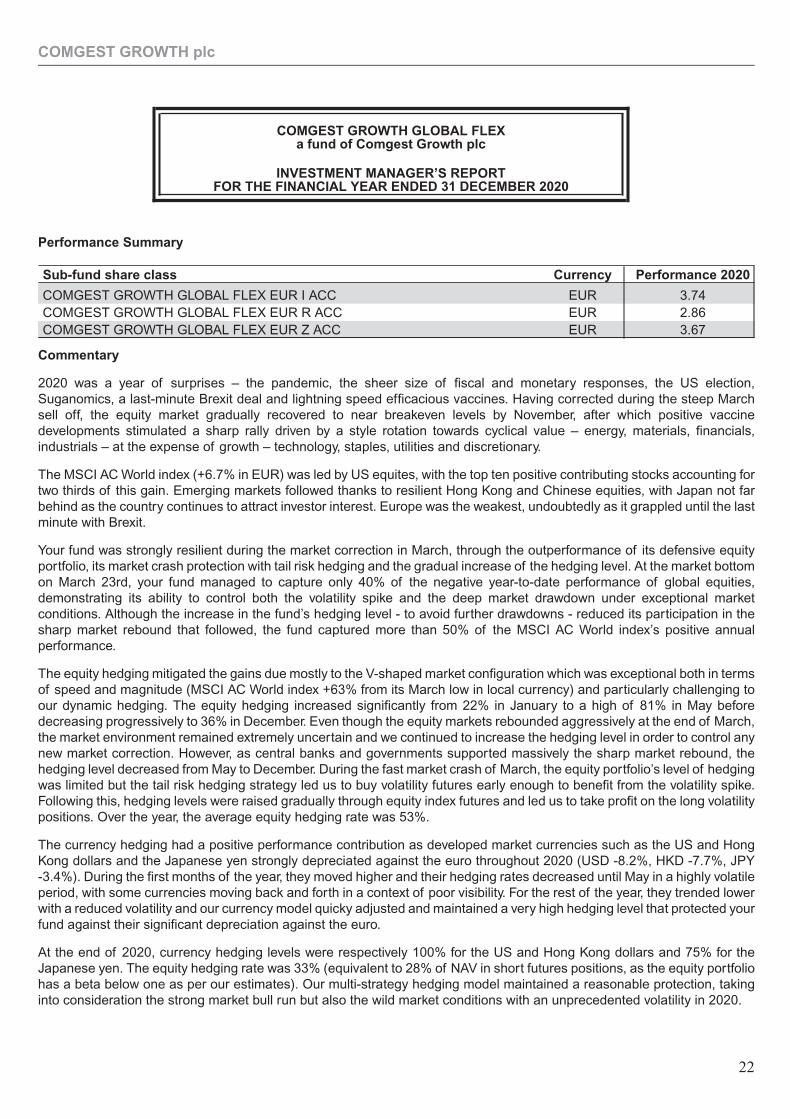
COMGEST GROWTH GLOBAL FLEX EUR I ACC EUR 3.74COMGEST GROWTH GLOBAL FLEX EUR R ACC EUR 2.86COMGEST GROWTH GLOBAL FLEX EUR Z ACC EUR 3.67
Commentary
2020 was a year of surprises – the pandemic, the sheer size of fiscal and monetary responses, the US election,Suganomics, a last-minute Brexit deal and lightning speed efficacious vaccines. Having corrected during the steep Marchsell off, the equity market gradually recovered to near breakeven levels by November, after which positive vaccinedevelopments stimulated a sharp rally driven by a style rotation towards cyclical value – energy, materials, financials,industrials – at the expense of growth – technology, staples, utilities and discretionary.
The MSCI AC World index (+6.7% in EUR) was led by US equites, with the top ten positive contributing stocks accounting fortwo thirds of this gain. Emerging markets followed thanks to resilient Hong Kong and Chinese equities, with Japan not farbehind as the country continues to attract investor interest. Europe was the weakest, undoubtedly as it grappled until the lastminute with Brexit.
Your fund was strongly resilient during the market correction in March, through the outperformance of its defensive equityportfolio, its market crash protection with tail risk hedging and the gradual increase of the hedging level. At the market bottomon March 23rd, your fund managed to capture only 40% of the negative year-to-date performance of global equities,demonstrating its ability to control both the volatility spike and the deep market drawdown under exceptional marketconditions. Although the increase in the fund’s hedging level - to avoid further drawdowns - reduced its participation in thesharp market rebound that followed, the fund captured more than 50% of the MSCI AC World index’s positive annualperformance.
The equity hedging mitigated the gains due mostly to the V-shaped market configuration which was exceptional both in termsof speed and magnitude (MSCI AC World index +63% from its March low in local currency) and particularly challenging toour dynamic hedging. The equity hedging increased significantly from 22% in January to a high of 81% in May beforedecreasing progressively to 36% in December. Even though the equity markets rebounded aggressively at the end of March,the market environment remained extremely uncertain and we continued to increase the hedging level in order to control anynew market correction. However, as central banks and governments supported massively the sharp market rebound, thehedging level decreased from May to December. During the fast market crash of March, the equity portfolio’s level of hedgingwas limited but the tail risk hedging strategy led us to buy volatility futures early enough to benefit from the volatility spike.Following this, hedging levels were raised gradually through equity index futures and led us to take profit on the long volatilitypositions. Over the year, the average equity hedging rate was 53%.
The currency hedging had a positive performance contribution as developed market currencies such as the US and HongKong dollars and the Japanese yen strongly depreciated against the euro throughout 2020 (USD -8.2%, HKD -7.7%, JPY-3.4%). During the first months of the year, they moved higher and their hedging rates decreased until May in a highly volatileperiod, with some currencies moving back and forth in a context of poor visibility. For the rest of the year, they trended lowerwith a reduced volatility and our currency model quicky adjusted and maintained a very high hedging level that protected yourfund against their significant depreciation against the euro.
At the end of 2020, currency hedging levels were respectively 100% for the US and Hong Kong dollars and 75% for theJapanese yen. The equity hedging rate was 33% (equivalent to 28% of NAV in short futures positions, as the equity portfoliohas a beta below one as per our estimates). Our multi-strategy hedging model maintained a reasonable protection, takinginto consideration the strong market bull run but also the wild market conditions with an unprecedented volatility in 2020.
COMGEST GROWTH plc
COMGEST GROWTH GLOBAL FLEXa fund of Comgest Growth plc
INVESTMENT MANAGER’S REPORTFOR THE FINANCIAL YEAR ENDED 31 DECEMBER 2020
22
Switching to the equity portfolio, our investee companies experienced much lower earnings downgrades. Our USunderweight and average cash position proved a slight drag, but this was offset largely by our emerging market overweight(thanks mainly to China’s resilience). We also have a natural underweight towards energy and financials which provided atailwind through the year, but which deteriorated towards the end due to the cyclical value rally.
TSMC, the global, leading-edge, logic, semiconductor manufacturer winning share from Intel, saw revenue and profits growcirca 40% and 60% respectively over the year. Microsoft, the leading home and enterprise productivity and cloud softwareprovider continued to enjoy tremendous growth posting fiscal June 2020 growth of +14% and 23% in revenue and profitsrespectively. Inner Mongolia Yili, China’s largest dairy producer, experienced solid sales growth despite lockdowns, seeingrevenue rise 7% over the nine months to September 2020 with improved margins.
Heineken, the premium beer manufacturer, experienced challenging headwinds due to lockdowns, causing a near 20%decline in revenue over the year. Becton Dickinson, the leading medical consumable manufacturer, unfortunatelyexperienced both COVID-related headwinds and disappointing product launch execution which saw operating profits fall26% to September 2020 fiscal year end. Ping An, the largest non-SOE (state-owned enterprise) Chinese life insurer,experienced a lockdown-induced inability for its declining agency distribution force to sell new business (-27%), whilstsentiment weighed on the stock due to lower yields.
We added six ideas and exited four. Hangzhou Hikvision, a surveillance equipment maker, was sold after engagement failedto improve governance. Nidec, a small motors manufacturer, was sold as we question the defensibility of its electric vehiclebusiness. Oracle, a US database business, was liquidated due to its slowing growth profile. Lastly, Pan Pacific Holdings, aJapanese retailer, was exited on valuation concerns.
In 1Q we added both Daikin, an air conditioner manufacturer, and Facebook, the western social media platform, due to theirattractive valuations and strong growth outlook. Following the March sell off, we invested in HDFC – a growing Indianmortgage provider, MTU – an aircraft maintenance and repair business, LVMH – the leading soft luxury group, and a littlelater in the year added NetEase – a Chinese leader in PC-based video games.
Long duration visible growth has performed very well, attracting high valuations in a record low interest rate environment, butdespite this, the fund’s premium valuation remains consistent to prior years. It is possible that 2021 brings a marked globalrecovery in earnings as vaccines are rolled out, pushing positive investor sentiment further into the more cyclical elements ofthe economy. The equity portfolio stands to benefit with a handful of such ideas.
COMGEST GROWTH plc
23
Performance Summary
Sub-fund share class Currency Performance 2020
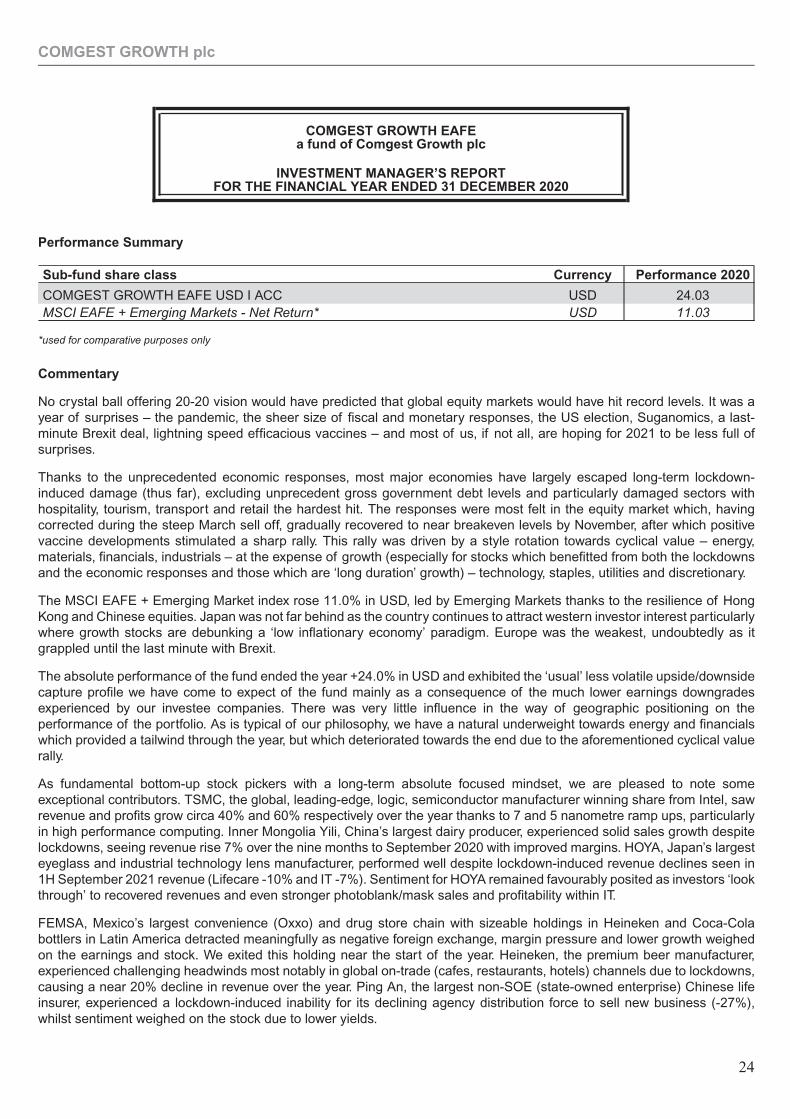
COMGEST GROWTH EAFE USD I ACC USD 24.03MSCI EAFE + Emerging Markets - Net Return* USD 11.03
*used for comparative purposes only
Commentary
No crystal ball offering 20-20 vision would have predicted that global equity markets would have hit record levels. It was ayear of surprises – the pandemic, the sheer size of fiscal and monetary responses, the US election, Suganomics, a last-minute Brexit deal, lightning speed efficacious vaccines – and most of us, if not all, are hoping for 2021 to be less full ofsurprises.
Thanks to the unprecedented economic responses, most major economies have largely escaped long-term lockdown-induced damage (thus far), excluding unprecedent gross government debt levels and particularly damaged sectors withhospitality, tourism, transport and retail the hardest hit. The responses were most felt in the equity market which, havingcorrected during the steep March sell off, gradually recovered to near breakeven levels by November, after which positivevaccine developments stimulated a sharp rally. This rally was driven by a style rotation towards cyclical value – energy,materials, financials, industrials – at the expense of growth (especially for stocks which benefitted from both the lockdownsand the economic responses and those which are ‘long duration’ growth) – technology, staples, utilities and discretionary.
The MSCI EAFE + Emerging Market index rose 11.0% in USD, led by Emerging Markets thanks to the resilience of HongKong and Chinese equities. Japan was not far behind as the country continues to attract western investor interest particularlywhere growth stocks are debunking a ‘low inflationary economy’ paradigm. Europe was the weakest, undoubtedly as itgrappled until the last minute with Brexit.
The absolute performance of the fund ended the year +24.0% in USD and exhibited the ‘usual’ less volatile upside/downsidecapture profile we have come to expect of the fund mainly as a consequence of the much lower earnings downgradesexperienced by our investee companies. There was very little influence in the way of geographic positioning on theperformance of the portfolio. As is typical of our philosophy, we have a natural underweight towards energy and financialswhich provided a tailwind through the year, but which deteriorated towards the end due to the aforementioned cyclical valuerally.
As fundamental bottom-up stock pickers with a long-term absolute focused mindset, we are pleased to note someexceptional contributors. TSMC, the global, leading-edge, logic, semiconductor manufacturer winning share from Intel, sawrevenue and profits grow circa 40% and 60% respectively over the year thanks to 7 and 5 nanometre ramp ups, particularlyin high performance computing. Inner Mongolia Yili, China’s largest dairy producer, experienced solid sales growth despitelockdowns, seeing revenue rise 7% over the nine months to September 2020 with improved margins. HOYA, Japan’s largesteyeglass and industrial technology lens manufacturer, performed well despite lockdown-induced revenue declines seen in1H September 2021 revenue (Lifecare -10% and IT -7%). Sentiment for HOYA remained favourably posited as investors ‘lookthrough’ to recovered revenues and even stronger photoblank/mask sales and profitability within IT.
FEMSA, Mexico’s largest convenience (Oxxo) and drug store chain with sizeable holdings in Heineken and Coca-Colabottlers in Latin America detracted meaningfully as negative foreign exchange, margin pressure and lower growth weighedon the earnings and stock. We exited this holding near the start of the year. Heineken, the premium beer manufacturer,experienced challenging headwinds most notably in global on-trade (cafes, restaurants, hotels) channels due to lockdowns,causing a near 20% decline in revenue over the year. Ping An, the largest non-SOE (state-owned enterprise) Chinese lifeinsurer, experienced a lockdown-induced inability for its declining agency distribution force to sell new business (-27%),whilst sentiment weighed on the stock due to lower yields.
COMGEST GROWTH plc
COMGEST GROWTH EAFEa fund of Comgest Growth plc
INVESTMENT MANAGER’S REPORTFOR THE FINANCIAL YEAR ENDED 31 DECEMBER 2020
24
We added six new ideas to the fund and exited five (including the aforementioned FEMSA). Hangzhou Hikvision, asurveillance equipment maker, was sold after engagement failed to improve governance. Nidec, a small motorsmanufacturer, was sold (a poor decision given valuation gains) as we question the defensibility of its electric vehiclebusiness. Kose, a Japanese beauty products business, was exited due to slowing growth whilst Coloplast, medicalconsumables business, was exited on valuation considerations.
At the start of the year we added both Pernod Ricard, a spirits manufacturer, and Novo Nordisk, a leading diabetes focusedpharmaceutical, due to their attractive valuations and strong growth outlook. Pernod Ricard is expected to see long-termvisible growth particularly in India and China whilst Novo Nordisk should see continued growth in its Diabetes Type-2 treatments. We invested in HDFC – a growing Indian mortgage provider, MTU – an aircraft maintenance and repairbusiness, LVMH – the leading soft luxury group, and NetEase – a Chinese leader in PC-based video games.
“Luck is what happens when preparation meets opportunity” - Lucius Annaeus Seneca AD 40-65. Uncertainty brings excitingopportunities but also anxiety, stress and worry. We can only learn and improve as a team from 2020 which has taught us togarner even greater trust in both one another’s ability but also the processes and tools we use to manage the fund. Ourunrelenting use of our processes, tools and team-based collaboration, provided us the rigour and steady hand whichprepared us well for what was a career-marking period.
Whilst employing no top-down process, we are acutely aware of the impact macro and socio-economic policies or events canhave on markets. Long duration visible growth has performed very well, attracting high valuations in a record low interest rateenvironment, but despite this, the fund’s premium valuation remains consistent to prior years. Whilst we do not speculate, itcertainly is a question of ‘when not if’ central banks reverse the easing should non-financial asset inflation “i.e. high street notwall street” increase. Indeed, this would, no doubt, come under fiscal influence considering the now not insignificant grossdebt burden and interest costs which sovereigns would face (more so if taxes are not raised and fiscal stimulus remainselevated). It is possible that 2021 brings a marked global recovery in earnings as vaccines are rolled out, pushing positiveinvestor sentiment further into the more cyclical elements of the economy. The fund stands to benefit with a handful of suchideas.
Peter Bernstein once said, “It’s not uncertainty as such that bothers us, but unknowledge” and we similarly believe that byfocusing on stocks’ fundamentals in as far as is possible through our research, we will be able to make the most informeddecisions we can despite continued uncertainty.
COMGEST GROWTH plc
25
Performance Summary
Sub-fund share class Currency Performance 2020
COMGEST GROWTH AMERICA USD ACC USD 24.34COMGEST GROWTH AMERICA USD I ACC USD 25.30S&P 500 - Net Return* USD 17.75
COMGEST GROWTH AMERICA EUR R ACC EUR 13.52COMGEST GROWTH AMERICA EUR Z ACC EUR 14.88S&P 500 - Net Return* EUR 8.03
COMGEST GROWTH AMERICA GBP U ACC GBP 21.48S&P 500 - Net Return* GBP 14.12
COMGEST GROWTH AMERICA EUR I H ACC1 EUR 25.61S&P 500 Hedged to EUR - Net Return* EUR 29.80
1inception date 17/04/2020*used for comparative purposes only
Commentary
Commenting on the year 2020 is a delicate matter, so harsh is the contrast between the stock market’s performance -American in particular - and the misfortunes, both human and economic, that have befallen so many families. Monetary andfiscal support measures were implemented swiftly and effectively and should preserve the US economy’s potential torebound in 2021.
The year ended with a flow of encouraging news. The vaccination campaign is in full swing in the United States, even thoughthe desired herd immunity cannot be achieved until after the second quarter of 2021. Unlike Europeans, Americans arereceptive to the argument that the benefits of a vaccine outweigh the risks, which augurs well.
Despite some last-minute procrastination, it seems certain that an aid package for households and small and medium-sizedenterprises will be put in place in January, thereby enabling stabilizing activity in the short term.
The valuation of the US market rose during the year, supported by lower long-term interest rates, and despite heightenedvolatility. This coming year is expected to feature a marked rebound in corporate earnings (+20% for the S&P500 accordingto the Bloomberg consensus) with a significant catch up of investment and consumption.
The dilemma now facing investors is whether to prefer the “victims” of the health crisis (commodities, consumerdiscretionary, etc.), in hopes of a speedy return to normal, or whether to prefer the companies that have gained from the newconsumer and work habits. We continue to favor the second: more than 80% of your portfolio consists of companies thatprovide essential services and which have shown their resilience during the crisis and whose growth prospects for2021 remain intact.
Most of the portfolio companies have strengthened their competitive positions, either by winning market share or by offeringinnovative products and services that are in demand. Below are some examples:
Eli Lilly’s portfolio of diabetes drugs was strengthened by the positive data released on its new treatment (Tirzepatide), whichnot only reduces blood sugar but also leads to considerable weight loss.
Apple made a considerable technological breakthrough with the in-house development for its MacBook range of a processorwhose performance is twice that of Intel’s equivalent processors. The company now wishes to carry out similardevelopments for the components used in its iPhones. This points to improved margins and market share in coming years.
COMGEST GROWTH plc
COMGEST GROWTH AMERICAa fund of Comgest Growth plc
INVESTMENT MANAGER’S REPORTFOR THE FINANCIAL YEAR ENDED 31 DECEMBER 2020
26

Activision, a leader in video games, saw in-game purchases surge as they released free-to-play and mobile versions of keyfranchises, benefitting from stay-at-home entertainment. In-game payments accounted for nearly two thirds of its sales,eclipsing the more volatile annual game release sales, and emboldened the company to systematically release its otherIntellectual Properties across devices and free version models.
Avery Dennison is the world leader in adhesive labels and tags used in everyday consumer products and industrialapplications. The company is ideally positioned to benefit from accelerated adoption of radio frequency identification (RFID)in inventory management in the clothing sector, which we expect to spread to additional applications.
Microsoft, our largest position, is one of the companies whose services proved essential during the lockdown. Itscollaboration tools (collaboration tool, Teams with 115 million users each day), cloud computing (on-demand delivery of ITresources) and its installed base of more than one billion Windows 10 users enabled its customers to operate on ateleworking basis. Its sales have grown by more than 10% last year, including during the last quarter after the lockdowns.
Facebook, Google and Amazon face lawsuits for their past competitive practices. These lawsuits are in some cases attemptsto rewrite history - the regulators approved the acquisitions and had all the information at the time - and often reflect practicesthat are no longer in use. We are nonetheless playing close attention to these companies’ legal risks and practices.
In addition to the four stocks mentioned above, we have introduced and strengthened several others. These include Oracle,where we do not share the market’s skepticism, reflected by a price-to-earnings multiple of only 14x with profit growth of 12%in the last quarter. Its latest results show the strong momentum of its software-as-a-service applications and the resilience ofits database revenues.
We re-introduced Equifax and Estée Lauder to your portfolio during the year (consumer credit bureau, and prestige beautyleader respectively), and increased your positions in Intuit (accounting and tax preparation software), CMS Energy(regulated electric and gas utility), Facebook and Alphabet. We initiated a handful of new investments, includingsemiconductor designer Analog Devices and funeral service provider Service Corporation.
The largest reductions to your holding were in Becton Dickinson, Tyler Technologies, and Church & Dwight. We fully soldyour position in Aramark.
Given recent US presidential elections and global government coordination, we believe we’re entering a year ofincrementally better visibility. January will see the end of the US election cycle with the two Senate runoff elections inGeorgia.
The other element to be monitored closely in 2021 will be the upturn in inflation, which is expected to approach 3% in themiddle of the year due to a significant base effect in 2020. Will the equity market interpret this as simply a statisticalphenomenon or will it see it as a change of paradigm? It is still too soon to say, particularly as these figures will probablycoincide with very robust purchases of goods and services (travel, transport, etc.).
Note that whether a stock is cyclical or not is not one of our selection criteria; we seek stocks with visible growth, which doesnot preclude participation in economic cycles. In other words, a vigorous recovery in the US economy this year will benefit themajority of our portfolio stocks, in the form of raised earnings forecasts.
COMGEST GROWTH plc
27
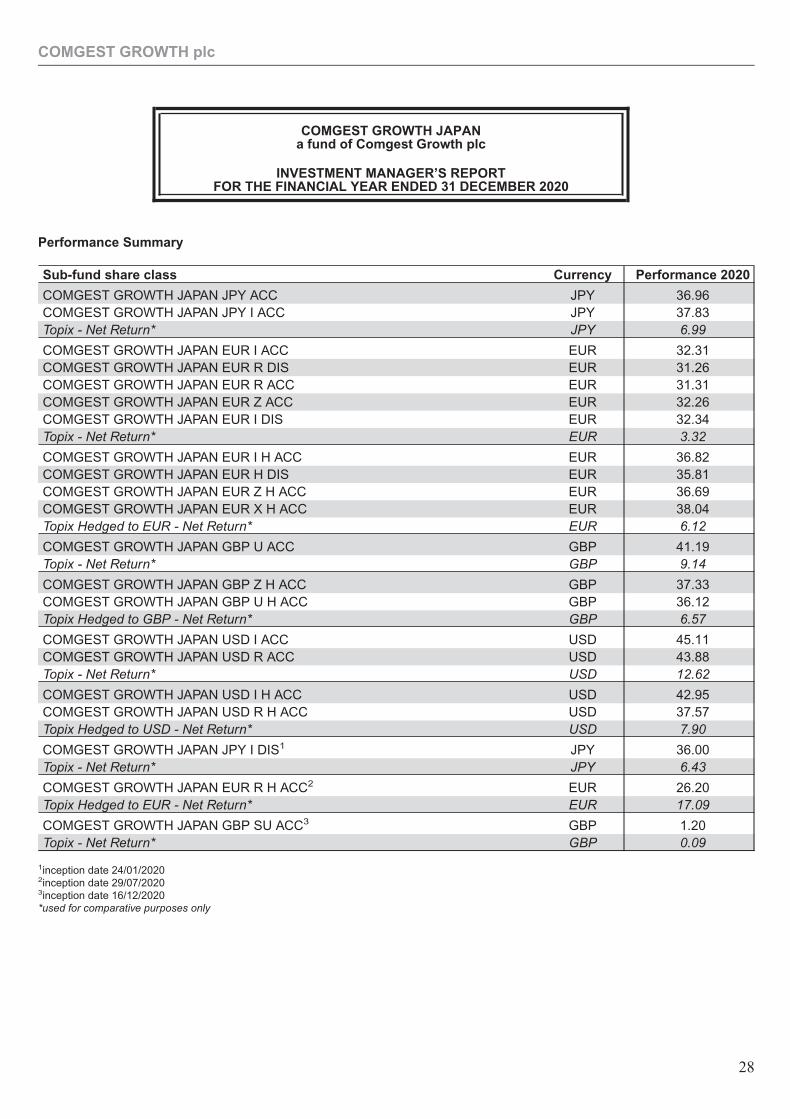
Performance Summary
Sub-fund share class Currency Performance 2020
COMGEST GROWTH JAPAN JPY ACC JPY 36.96COMGEST GROWTH JAPAN JPY I ACC JPY 37.83Topix - Net Return* JPY 6.99
COMGEST GROWTH JAPAN EUR I ACC EUR 32.31COMGEST GROWTH JAPAN EUR R DIS EUR 31.26COMGEST GROWTH JAPAN EUR R ACC EUR 31.31COMGEST GROWTH JAPAN EUR Z ACC EUR 32.26COMGEST GROWTH JAPAN EUR I DIS EUR 32.34Topix - Net Return* EUR 3.32
COMGEST GROWTH JAPAN EUR I H ACC EUR 36.82COMGEST GROWTH JAPAN EUR H DIS EUR 35.81COMGEST GROWTH JAPAN EUR Z H ACC EUR 36.69COMGEST GROWTH JAPAN EUR X H ACC EUR 38.04Topix Hedged to EUR - Net Return* EUR 6.12
COMGEST GROWTH JAPAN GBP U ACC GBP 41.19Topix - Net Return* GBP 9.14
COMGEST GROWTH JAPAN GBP Z H ACC GBP 37.33COMGEST GROWTH JAPAN GBP U H ACC GBP 36.12Topix Hedged to GBP - Net Return* GBP 6.57
COMGEST GROWTH JAPAN USD I ACC USD 45.11COMGEST GROWTH JAPAN USD R ACC USD 43.88Topix - Net Return* USD 12.62
COMGEST GROWTH JAPAN USD I H ACC USD 42.95COMGEST GROWTH JAPAN USD R H ACC USD 37.57Topix Hedged to USD - Net Return* USD 7.90
COMGEST GROWTH JAPAN JPY I DIS1 JPY 36.00Topix - Net Return* JPY 6.43
COMGEST GROWTH JAPAN EUR R H ACC2 EUR 26.20Topix Hedged to EUR - Net Return* EUR 17.09
COMGEST GROWTH JAPAN GBP SU ACC3 GBP 1.20Topix - Net Return* GBP 0.09
1inception date 24/01/20202inception date 29/07/20203inception date 16/12/2020*used for comparative purposes only
COMGEST GROWTH plc
COMGEST GROWTH JAPANa fund of Comgest Growth plc
INVESTMENT MANAGER’S REPORTFOR THE FINANCIAL YEAR ENDED 31 DECEMBER 2020
28
Commentary
2020 concentrated several years’ worth of change into a few months, as remote working, online shopping and medicinebecame the norm under COVID-19. Several of our companies, which had already been benefitting from these trends, grewat ‘warp speed’. This was the case for M3 (online medical services), MonotaRO (disintermediation of distribution), GMOPayment Gateway (online transactions), OBIC (small company workflow software) and Nihon M&A Center (small companysuccession planning), among others.
From roughly the summer, as Asia and Japan normalised, China-rebound beneficiaries such as Daikin, Pigeon, Sysmex,Fanuc, Keyence and Hamamatsu Photonics were the strongest growers. Daifuku (warehouse logistics and Asiasemiconductor and flat panel exposure) benefitted from both COVID-19 trends and the Asia rebound.
Later in the year, Japan normalisation beneficiaries such as Kose (cosmetics beneficiary of department store and officetraffic), Fast Retailing, Sushiro (a sushi restaurant chain) and Oriental Land (Tokyo Disneyland) took the lead in earnings. InDecember alone, the picture was more confused, with a resurgence in COVID-19 cases challenging some normalisationstories, and year-end profit-taking distorting some share price behaviour.
Alpha leadership roughly followed the above three stages. The Japanese market is sufficiently deep and broad, as well asrelatively under-researched, that unique and growing companies can be found which benefit from each of theseenvironments. We keep a close ear to the ground with 400 or so meetings each year and adjust portfolio positions to reflectlong-term growth as well as our companies’ indications of short-term momentum.
Below is a sample of those unique growth dynamics from recent meetings with our portfolio companies.
Workman’s CEO told us that November’s 0.8% same-store growth versus one year previously was smaller than in previousmonths mainly because of warmer weather. Inventory restocking and new formats augur well for 2021.
Pigeon informed us that its China organic sales growth this year has been 7% to date and that its Lansinoh US business isgrowing thanks to online demand.
Expert calls with a former GSK official and a University of Colorado professor on PeptiDream confirmed the uniqueness ofits peptide discovery technology and big pharmaceutical companies’ enthusiasm to use this in their pipeline development.
Disco told us that November semiconductor wafer dicer orders are accelerating, to about 20% versus the previous month,driven by assembly company demand for handset assembly.
MonotaRO stated that its 23% growth versus one year earlier (adjusting for business days) in November sales exceeded itsinternal plan, as the disintermediation of the supply chain continues.
Daifuku’s US business is benefitting from Amazon and DIY tool demand, its Japan business from e-commerce logistics andits airport baggage handling business from a new order at a US West Coast airport.
Suzuki mentioned that Maruti sales data point to a significant shoot versus its full-year guidance.
Hikari Tsushin has ten or so new product areas in incubation, although it is not yet confident that any can be as big as itscurrent ones.
We sold Relo, PERSOL, Makita, AMADA and ZOZO early in the year, to concentrate on the best combination of growth andvaluation. We bought CyberAgent, Japan’s leading agency for online advertising which is also developing a ‘Netflix’-typeonline television channel called Abema. We also acquired Shimano, a former holding, following our conviction that itsprincipal market of European sports bicycles has returned to growth. The fund purchased Japan Airport Terminal, for itsHaneda and Narita Airport operating franchises and the expectation that domestic, and then international travel will return tothe multi-year growth trajectory which has buoyed this company’s earnings over several years. ORIX was also acquired, forits franchise among Japan’s small companies and mitigation of COVID-19 risks.
Commentators talk about deglobalisation, but Japan has just signed the Regional Comprehensive Economic Partnershipwith its Asian neighbours, a wide-ranging pact with the UK, and in 2019 a similarly broad agreement with the EU. Japan’sability to export its technology and brands especially along the ‘Silk Road’, its historical and natural conduit to Asia, seemssecure; and Japanese equities are rightly becoming understood as a platform to invest in Asian growth.
COMGEST GROWTH plc
29

At the same time, Japan’s changes of regulation, governance and society itself continue under their own momentum,catalysed by the returning domestic investor and encouraged by a government which changed leadership in 2020 soseamlessly that the market barely noticed. They offer another rich hunting ground for investment candidates which benefitfrom these changes, as providers of transforming services, as consolidators, as shareholder-oriented managements often –paradoxical as it may sound - because of family ownership.
Berkshire Hathaway’s arrival in Japan symbolises the foreign investor’s growing awareness of these opportunities. ActiveJapan funds have now beaten the S&P 500 index over five years or more, even though the Nikkei index is the only majorindex still below its all-time high (although it is heading steadily towards it). The impact of COVID-19 and fatality rate in Japanhave been among the most meagre in the world, as its relative economic performance attests, and if the Olympics happen asscheduled next year, the world’s major reopening will start in Japan.
Our decade-plus office presence in Japan, our work with Japanese investors in Japanese equities, our multi-decadeexperience in Japan, and our template for finding unique and inherently growing companies, support our search for the bestcompanies.
COMGEST GROWTH plc
30
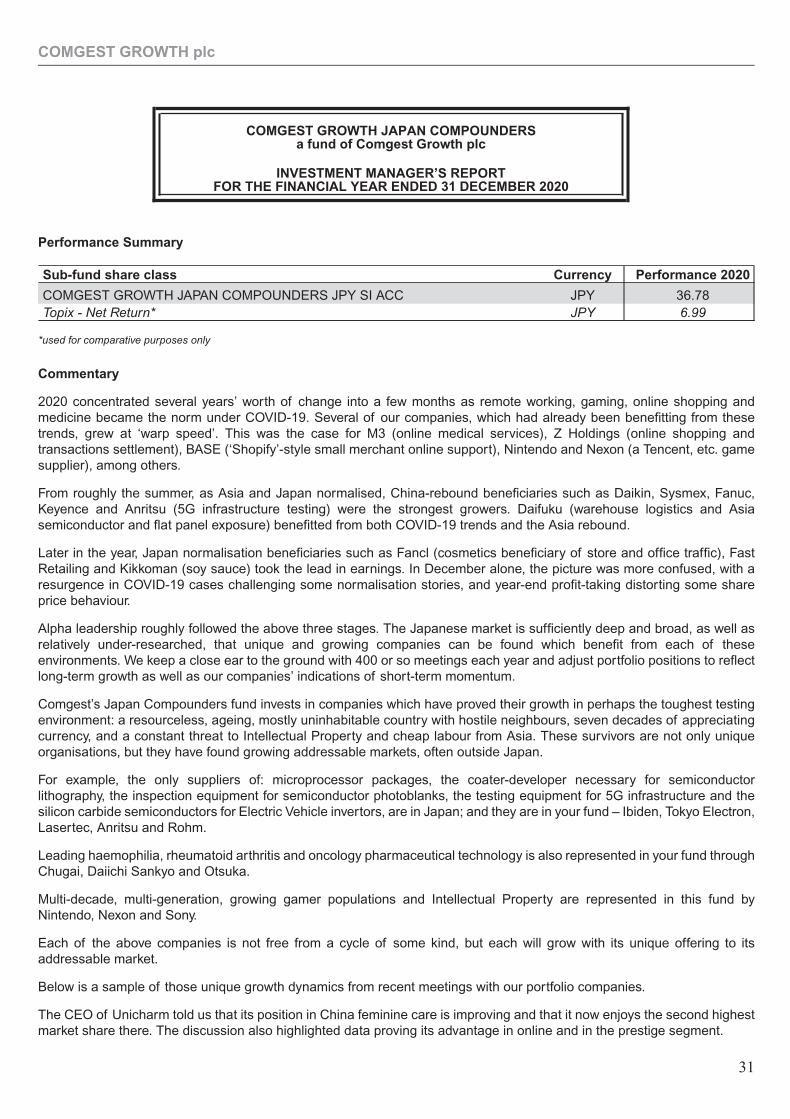
Performance Summary
Sub-fund share class Currency Performance 2020
COMGEST GROWTH JAPAN COMPOUNDERS JPY SI ACC JPY 36.78Topix - Net Return* JPY 6.99
*used for comparative purposes only
Commentary
2020 concentrated several years’ worth of change into a few months as remote working, gaming, online shopping andmedicine became the norm under COVID-19. Several of our companies, which had already been benefitting from thesetrends, grew at ‘warp speed’. This was the case for M3 (online medical services), Z Holdings (online shopping andtransactions settlement), BASE (‘Shopify’-style small merchant online support), Nintendo and Nexon (a Tencent, etc. gamesupplier), among others.
From roughly the summer, as Asia and Japan normalised, China-rebound beneficiaries such as Daikin, Sysmex, Fanuc,Keyence and Anritsu (5G infrastructure testing) were the strongest growers. Daifuku (warehouse logistics and Asiasemiconductor and flat panel exposure) benefitted from both COVID-19 trends and the Asia rebound.
Later in the year, Japan normalisation beneficiaries such as Fancl (cosmetics beneficiary of store and office traffic), FastRetailing and Kikkoman (soy sauce) took the lead in earnings. In December alone, the picture was more confused, with aresurgence in COVID-19 cases challenging some normalisation stories, and year-end profit-taking distorting some shareprice behaviour.
Alpha leadership roughly followed the above three stages. The Japanese market is sufficiently deep and broad, as well asrelatively under-researched, that unique and growing companies can be found which benefit from each of theseenvironments. We keep a close ear to the ground with 400 or so meetings each year and adjust portfolio positions to reflectlong-term growth as well as our companies’ indications of short-term momentum.
Comgest’s Japan Compounders fund invests in companies which have proved their growth in perhaps the toughest testingenvironment: a resourceless, ageing, mostly uninhabitable country with hostile neighbours, seven decades of appreciatingcurrency, and a constant threat to Intellectual Property and cheap labour from Asia. These survivors are not only uniqueorganisations, but they have found growing addressable markets, often outside Japan.
For example, the only suppliers of: microprocessor packages, the coater-developer necessary for semiconductorlithography, the inspection equipment for semiconductor photoblanks, the testing equipment for 5G infrastructure and thesilicon carbide semiconductors for Electric Vehicle invertors, are in Japan; and they are in your fund – Ibiden, Tokyo Electron,Lasertec, Anritsu and Rohm.
Leading haemophilia, rheumatoid arthritis and oncology pharmaceutical technology is also represented in your fund throughChugai, Daiichi Sankyo and Otsuka.
Multi-decade, multi-generation, growing gamer populations and Intellectual Property are represented in this fund byNintendo, Nexon and Sony.
Each of the above companies is not free from a cycle of some kind, but each will grow with its unique offering to itsaddressable market.
Below is a sample of those unique growth dynamics from recent meetings with our portfolio companies.
The CEO of Unicharm told us that its position in China feminine care is improving and that it now enjoys the second highestmarket share there. The discussion also highlighted data proving its advantage in online and in the prestige segment.
COMGEST GROWTH plc
COMGEST GROWTH JAPAN COMPOUNDERSa fund of Comgest Growth plc
INVESTMENT MANAGER’S REPORTFOR THE FINANCIAL YEAR ENDED 31 DECEMBER 2020
31
Nintendo’s CEO informed us that the success of Animal Crossing and its digital collaborations, including with Tencent,suggest a longer cycle for Switch than for previous consoles. The company is also levering Intellectual Property, for exampleby working with the Universal Studios Park in Osaka.
Daiichi Sankyo explained to us the efficacy of its Enhertu drug against interstitial lung disease and the success of itsNon-Small Cell Lung Cancer product DS-1062.
Daifuku’s US business is benefitting from Amazon and DIY tool demand, its Japan business from e-commerce logistics andits airport baggage handling business from a new order at a US West Coast airport.
Suzuki mentioned that Maruti sales data point to a significant shoot versus its full-year guidance.
Purchases during the year included Lasertec (semiconductor photoblank inspection), Ibiden (microprocessor packages) andBASE (small company online store support). We recently bought Makita following a clearer demand outlook in its Europeanbusiness and continued share gain in Japan, its capacity and technology advantages versus peers, and the opportunity ingardening equipment. We sold Fujitsu, on concerns about its businesses outside its core Systems Integration strength.
Commentators talk about deglobalisation, but Japan has just signed the Regional Comprehensive Economic Partnershipwith its Asian neighbours, a wide-ranging pact with the UK, and in 2019 a similarly broad agreement with the EU. Japan’sability to export its technology and brands especially along the ‘Silk Road’, its historical and natural conduit to Asia, seemssecure; and Japanese equities are rightly becoming understood as a platform to invest in Asian growth.
At the same time, Japan’s changes of regulation, governance and society itself continue under their own momentum,catalysed by the returning domestic investor and encouraged by a government which changed leadership in 2020 soseamlessly that the market barely noticed. They offer another rich hunting ground for investment candidates which benefitfrom these changes, as providers of transforming services, as consolidators, as shareholder-oriented managements often –paradoxical as it may sound - because of family ownership.
Berkshire Hathaway’s arrival in Japan symbolises the foreign investor’s growing awareness of these opportunities. ActiveJapan funds have now beaten the S&P 500 index over five years or more, even though the Nikkei index is the only majorindex still below its all-time high (although it is heading steadily towards it). The impact of COVID-19 and fatality rate in Japanhave been among the most meagre in the world, as its relative economic performance attests, and if the Olympics happen asscheduled next year, the world’s major reopening will start in Japan.
Our decade-plus office presence in Japan, our work with Japanese investors in Japanese equities, our multi-decadeexperience in Japan, and our template for finding unique and inherently growing companies, support our search for the bestcompanies.
COMGEST GROWTH plc
32
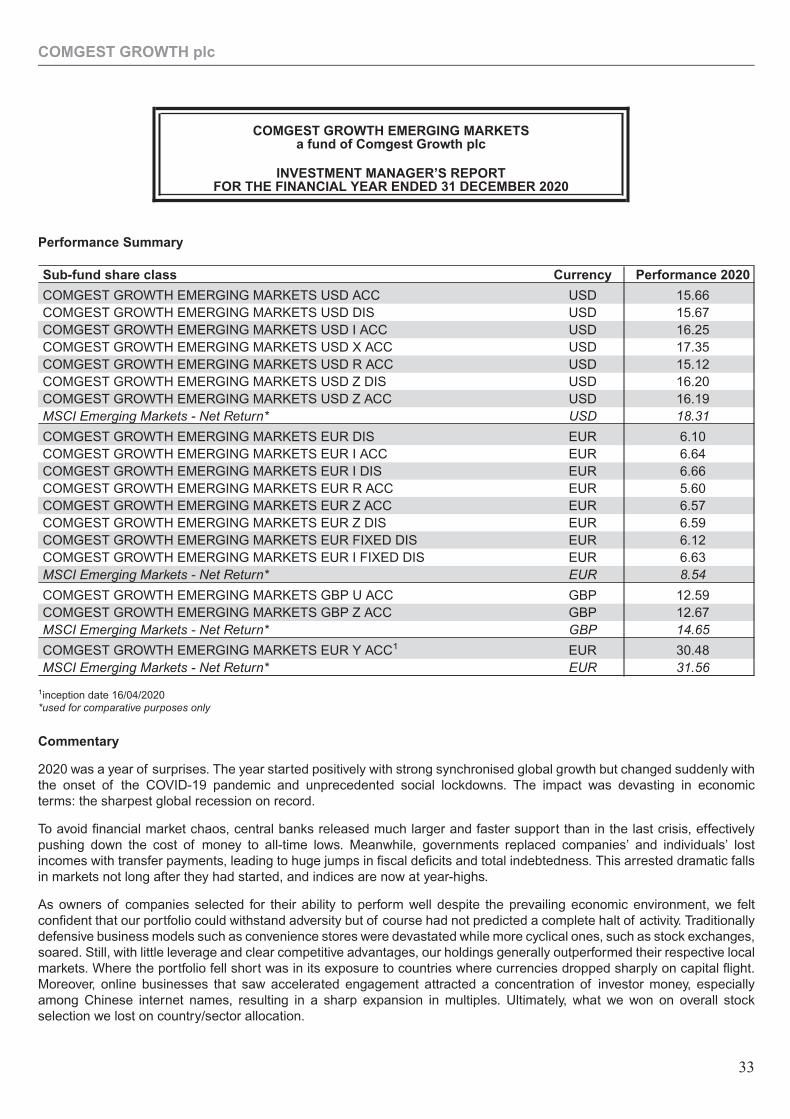
Performance Summary
Sub-fund share class Currency Performance 2020
COMGEST GROWTH EMERGING MARKETS USD ACC USD 15.66COMGEST GROWTH EMERGING MARKETS USD DIS USD 15.67COMGEST GROWTH EMERGING MARKETS USD I ACC USD 16.25COMGEST GROWTH EMERGING MARKETS USD X ACC USD 17.35COMGEST GROWTH EMERGING MARKETS USD R ACC USD 15.12COMGEST GROWTH EMERGING MARKETS USD Z DIS USD 16.20COMGEST GROWTH EMERGING MARKETS USD Z ACC USD 16.19MSCI Emerging Markets - Net Return* USD 18.31
COMGEST GROWTH EMERGING MARKETS EUR DIS EUR 6.10COMGEST GROWTH EMERGING MARKETS EUR I ACC EUR 6.64COMGEST GROWTH EMERGING MARKETS EUR I DIS EUR 6.66COMGEST GROWTH EMERGING MARKETS EUR R ACC EUR 5.60COMGEST GROWTH EMERGING MARKETS EUR Z ACC EUR 6.57COMGEST GROWTH EMERGING MARKETS EUR Z DIS EUR 6.59COMGEST GROWTH EMERGING MARKETS EUR FIXED DIS EUR 6.12COMGEST GROWTH EMERGING MARKETS EUR I FIXED DIS EUR 6.63MSCI Emerging Markets - Net Return* EUR 8.54
COMGEST GROWTH EMERGING MARKETS GBP U ACC GBP 12.59COMGEST GROWTH EMERGING MARKETS GBP Z ACC GBP 12.67MSCI Emerging Markets - Net Return* GBP 14.65
COMGEST GROWTH EMERGING MARKETS EUR Y ACC1 EUR 30.48MSCI Emerging Markets - Net Return* EUR 31.56
1inception date 16/04/2020*used for comparative purposes only
Commentary
2020 was a year of surprises. The year started positively with strong synchronised global growth but changed suddenly withthe onset of the COVID-19 pandemic and unprecedented social lockdowns. The impact was devasting in economicterms: the sharpest global recession on record.
To avoid financial market chaos, central banks released much larger and faster support than in the last crisis, effectivelypushing down the cost of money to all-time lows. Meanwhile, governments replaced companies’ and individuals’ lostincomes with transfer payments, leading to huge jumps in fiscal deficits and total indebtedness. This arrested dramatic fallsin markets not long after they had started, and indices are now at year-highs.
As owners of companies selected for their ability to perform well despite the prevailing economic environment, we feltconfident that our portfolio could withstand adversity but of course had not predicted a complete halt of activity. Traditionallydefensive business models such as convenience stores were devastated while more cyclical ones, such as stock exchanges,soared. Still, with little leverage and clear competitive advantages, our holdings generally outperformed their respective localmarkets. Where the portfolio fell short was in its exposure to countries where currencies dropped sharply on capital flight.Moreover, online businesses that saw accelerated engagement attracted a concentration of investor money, especiallyamong Chinese internet names, resulting in a sharp expansion in multiples. Ultimately, what we won on overall stockselection we lost on country/sector allocation.
COMGEST GROWTH plc
COMGEST GROWTH EMERGING MARKETSa fund of Comgest Growth plc
INVESTMENT MANAGER’S REPORTFOR THE FINANCIAL YEAR ENDED 31 DECEMBER 2020
33
Some clear trends are discernible for the year, although more recently some of these trends have been reversing as cyclicalsand value stocks recover. All top ten contributors were Asian, with eight of them “new economy” stocks. This highlights theongoing fast tracking of digitalisation across an expanding number of sectors, yet probably also illustrates somewhat of anovershoot due to the exceptional pandemic conditions. Our holdings in NetEase and NCsoft benefitted from this dynamic.Both companies, along with Tencent/Naspers, enjoyed an expanded addressable market and continued to grow theirpipelines with globally competitive games driving consistently strong results.
China is likely to be the only major economy globally to grow in 2020, which, along with specific company execution andconsistently good company results, has enabled the positions in Inner Mongolia Yili, Midea and Autohome to produce strongpositive contributions throughout 2020.
The strength of the semiconductor industry enabled Korea and Taiwan to perform well. The fund’s largest contributor to fundperformance was TSMC. Results for the company throughout the year were strong, with full-year 2020 revenue guidanceraised to over 20% despite the backdrop of COVID-19 and the loss of Huawei as a customer due to US regulations. Likewise,Samsung Electronics performed well due to better product pricing supported by supply constraints and ongoingimprovements in governance.
Of the stocks that detracted from performance, five of the top ten were in South Africa and Brazil, suffering among otherreasons from currency weakness. The decline in Brazilian Real was to the detriment of companies like CCR which derives100% of its income domestically.
Cogna, the education company in Brazil, was one of the largest detractors and was sold from the portfolio. Burdened by itsbalance sheet following recent acquisitions, the negative impact of the recent recession, with a high number of dropouts andan elevated offline fixed cost base, was severe.
Although outperforming the financial sector, our Insurance companies in aggregate detracted from absolute performance.AIA, Discovery and Ping An were up but BB Seguridade, China Life, Sanlam and Samsung Life sold off sharply. Much of thedamage was done earlier in the year; performance has improved recently as concerns of provisioning, weaker premiumsales and the impact of low interest rates on investment portfolios abated. The 2021 outlook for the insurance sector isstrong.
The portfolio quality was progressively upgraded, particularly during the market lows as we capitalised on valuations unseenin years. HDFC, a well-run Indian financial company, was our largest purchase. The long-term prospects are bright due togrowing demand and market share gains while valuations hit a decade low. LG Household & Health Care re-entered thefund, while China Resources Gas and Shandong Weigao were also added. Autohome was increased in anticipation ofimproving sales and we added to our holding in Discovery which should benefit from new banking operations. Given the40%+ discount of Naspers to Tencent, we increased the former at the expense of the latter.
We reduced Inner Mongolia Yili, Mail.ru, NetEase and TSMC as valuations became less attractive. Finally, we sold FocusMedia, MTN, Ultrapar and BIM on operational uncertainty.
Investing responsibly is a considerable challenge globally today. With the environment so framed by monetary excesses,economic extremes, financial distortions, accelerating ecologic trends and blatant shortcomings in governance, it can behard to tell dream from reality. Yet, we are positive on Emerging Markets (EM), an asset class which has done little for adecade. While the pandemic has hit some parts hard, the aggregate fiscal reaction has been more constrained than inDeveloped Markets (DM). This will likely turn out to be a blessing over time: no country grows rich on debt or the printing ofmoney.
EM companies, thanks to much healthier balance sheets, withstood the extreme challenges well. Earnings Per Share (EPS)fell less than in past recessions and are now better placed to grow long term. Despite such positive fundamentals, EM assetshave been shunned by investors and trade on sizable discounts. That began to adjust itself in the fourth quarter but has along way to go given faster prospective growth, improving returns and lower debt.
Of course, the fund’s concentrated portfolio of carefully selected quality growth companies represents just a small part ofthe broader market. With hindsight, we capped our exposure prematurely - but consistent with time-tested risk managementprinciples - in several increasingly fully-valued companies, while acquiring future upside from other strong franchises in lessfashionable but steadily growing areas of our universe. The result was a de-rating of the fund vs a market where returns werehighly concentrated, even within our specific style.
COMGEST GROWTH plc
34
As illustrated by ours, it is possible to build an EM portfolio with robust EPS growth prospects from quality companies withabove-average ESG credentials (and thus lower risk) at multiples that are attractive both vs history and the broader market.We expect the de-rating to reverse as investor interest broadens thanks to an economic normalisation, allowing for the fund’sstronger fundamentals to visibly play out in 2021 and beyond.
We would like to thank our investors for their ongoing support and wish everyone a happy and healthy 2021.
COMGEST GROWTH plc
35
Performance Summary
Sub-fund share class Currency Performance 2020
COMGEST GROWTH EMERGING MARKETS EX CHINA USD I ACC USD 12.30MSCI Emerging Markets ex China - Net Return* USD 12.55
*used for comparative purposes only
Commentary
2020 was a year of surprises. The year started positively with strong synchronised global growth but changed suddenly withthe onset of the COVID-19 pandemic and unprecedented social lockdowns. The impact was devasting in economicterms: the sharpest global recession on record.
To avoid financial market chaos, central banks released much larger and faster support than in the last crisis, effectivelypushing down the cost of money to all-time lows. Meanwhile, governments replaced companies’ and individuals’ lostincomes with transfer payments, leading to huge jumps in fiscal deficits and total indebtedness.
As owners of companies selected for their ability to perform well despite the prevailing economic environment, we feltconfident that our portfolio could withstand adversity but of course had not predicted a complete halt of activity. Traditionallydefensive business models such as convenience stores were devastated while more cyclical ones, such as stock exchanges,soared. Still, with little leverage and clear competitive advantages, our holdings generally outperformed their respective localmarkets. Where the portfolio fell short was in its exposure to countries where currencies dropped sharply on capital flight andits relative underweight exposure to cyclicals towards the end of the year. While the portfolio was running ahead of the indexthroughout most of the year, we lost some ground in December. As a result, the fund slightly underperformed the MSCIEmerging Markets ex China index which was up 12.6% year-to-date in USD.
Some clear trends are discernible for the year, although more recently some of these trends have been reversing as cyclicalsand value stocks recover. The top four contributors were Asian, with most of them “new economy” stocks. This highlights theongoing fast tracking of digitalisation across an expanding number of sectors, yet probably also illustrates somewhat of anovershoot due to the exceptional pandemic conditions. Our holdings in Naver and NCsoft benefitted from this dynamic. Bothcompanies, along with Naspers, enjoyed an expanded addressable market and continued to grow their pipelines withglobally competitive games driving consistently strong results.
The strength of the semiconductor industry enabled Korea and Taiwan to perform well. The fund’s largest contributor to fundperformance was TSMC. Results for the company throughout the year were strong, with full-year 2020 revenue guidanceraised to over 20% despite the backdrop of COVID-19 and the loss of Huawei as a customer due to US regulations. Likewise,Samsung Electronics performed well due to better product pricing supported by supply constraints and ongoingimprovements in governance.
Infosys, the Indian IT services provider, was also a strong contributor. While the COVID-19 outburst put its clients’ plans onhold, this was temporary. Companies soon realised that they had to double down on their IT infrastructures and thistranslated into multitude new mega-deals for Infosys.
Of the stocks that detracted from performance, eight of the top ten were in South Africa and Brazil, suffering among otherreasons from currency weakness. The decline in Brazilian Real was to the detriment of companies like CCR which derives100% of its income domestically.
Cogna Educacao, the education company in Brazil, was the fund’s largest detractor year-to-date. Burdened by its balancesheet following recent acquisitions, the negative impact of the recent recession, with a high number of dropouts and anelevated offline fixed cost base, was severe. A strong recovery with positive operational leverage is expected.
COMGEST GROWTH plc
COMGEST GROWTH EMERGING MARKETS EX CHINAa fund of Comgest Growth plc
INVESTMENT MANAGER’S REPORTFOR THE FINANCIAL YEAR ENDED 31 DECEMBER 2020
36
Although outperforming the financial sector, our Insurance companies in aggregate detracted from absolute performance.Discovery, Moscow Exchange and B3 were up but BB Seguridade and Sanlam sold off sharply. Much of the damage wasdone earlier in the year; performance has improved recently as concerns of provisioning, weaker premium sales and theimpact of low interest rates on investment portfolios abated. The 2021 outlook for the insurance sector is strong.
The portfolio quality was progressively upgraded, particularly during the market lows as we capitalised on valuations unseenin years. We bought Vinamilk, the dominant dairy player in Vietnam, and purchased Localiza, the leading car rental companyin Brazil as valuations hit multi-year lows. New purchases also included Cheil Worldwide, a Korean advertising agency, on asolid and stable growth outlook with a high dividend payout.
We sold our Turkish holdings in BIM and Coca-Cola Icecek on poor country fundamentals as well as Remgro and Multichoicewhose proceeds were reallocated to higher conviction names in South Africa. We reduced TSMC, Cognizant and Infosys asvaluations were less compelling. Suzuki Motor and Sanlam, among others, were increased.
Investing responsibly is a considerable challenge globally today. With the environment so framed by monetary excesses,economic extremes, financial distortions, accelerating ecologic trends and blatant shortcomings in governance, it can behard to tell dream from reality. Yet, we are positive on Emerging Markets ex China, an asset class which has done little for adecade. While the pandemic has hit some parts hard, the aggregate fiscal reaction has been more constrained than inDeveloped Markets. This will likely turn out to be a blessing over time: no country grows rich on debt or the printing of money.
Emerging Markets ex China companies, thanks to much healthier balance sheets, withstood the extreme challenges well.Earnings Per Share (EPS) fell less than in past recessions and are now better placed to grow long term. Despite suchpositive fundamentals, Emerging Markets ex China assets have been shunned by investors and trade on sizable discounts.That began to adjust itself in the fourth quarter but has a long way to go given faster prospective growth, improving returnsand lower debt.
Of course, the fund’s concentrated portfolio of carefully selected quality growth companies represents just a small part ofthe broader market. With hindsight, we capped our exposure prematurely - but consistent with time-tested risk managementprinciples - in several increasingly fully-valued companies, while acquiring future upside from other strong franchises in lessfashionable but steadily growing areas of our universe. The result was a de-rating of the fund vs a market where returns werehighly concentrated, even within our specific style.
As illustrated by ours, it is possible to build an Emerging Markets ex China portfolio with robust EPS growth prospects fromquality companies with above-average ESG credentials (and thus lower risk) at multiples that are attractive both vs historyand the broader market. We expect the de-rating to reverse as investor interest broadens thanks to an economicnormalisation, allowing for the fund’s stronger fundamentals to visibly play out in 2021 and beyond.
We would like to thank our investors for their ongoing support and wish everyone a happy and healthy 2021.
COMGEST GROWTH plc
37
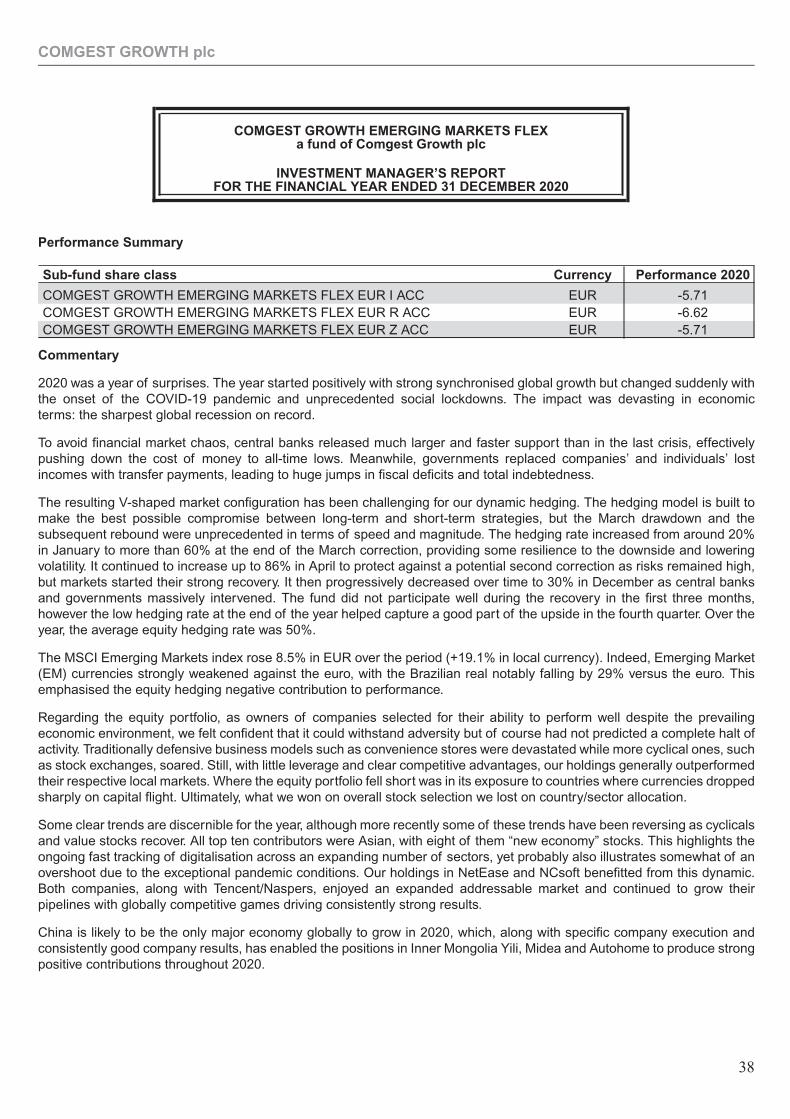
Performance Summary
Sub-fund share class Currency Performance 2020
COMGEST GROWTH EMERGING MARKETS FLEX EUR I ACC EUR -5.71COMGEST GROWTH EMERGING MARKETS FLEX EUR R ACC EUR -6.62COMGEST GROWTH EMERGING MARKETS FLEX EUR Z ACC EUR -5.71
Commentary
2020 was a year of surprises. The year started positively with strong synchronised global growth but changed suddenly withthe onset of the COVID-19 pandemic and unprecedented social lockdowns. The impact was devasting in economicterms: the sharpest global recession on record.
To avoid financial market chaos, central banks released much larger and faster support than in the last crisis, effectivelypushing down the cost of money to all-time lows. Meanwhile, governments replaced companies’ and individuals’ lostincomes with transfer payments, leading to huge jumps in fiscal deficits and total indebtedness.
The resulting V-shaped market configuration has been challenging for our dynamic hedging. The hedging model is built tomake the best possible compromise between long-term and short-term strategies, but the March drawdown and thesubsequent rebound were unprecedented in terms of speed and magnitude. The hedging rate increased from around 20%in January to more than 60% at the end of the March correction, providing some resilience to the downside and loweringvolatility. It continued to increase up to 86% in April to protect against a potential second correction as risks remained high,but markets started their strong recovery. It then progressively decreased over time to 30% in December as central banksand governments massively intervened. The fund did not participate well during the recovery in the first three months,however the low hedging rate at the end of the year helped capture a good part of the upside in the fourth quarter. Over theyear, the average equity hedging rate was 50%.
The MSCI Emerging Markets index rose 8.5% in EUR over the period (+19.1% in local currency). Indeed, Emerging Market(EM) currencies strongly weakened against the euro, with the Brazilian real notably falling by 29% versus the euro. Thisemphasised the equity hedging negative contribution to performance.
Regarding the equity portfolio, as owners of companies selected for their ability to perform well despite the prevailingeconomic environment, we felt confident that it could withstand adversity but of course had not predicted a complete halt ofactivity. Traditionally defensive business models such as convenience stores were devastated while more cyclical ones, suchas stock exchanges, soared. Still, with little leverage and clear competitive advantages, our holdings generally outperformedtheir respective local markets. Where the equity portfolio fell short was in its exposure to countries where currencies droppedsharply on capital flight. Ultimately, what we won on overall stock selection we lost on country/sector allocation.
Some clear trends are discernible for the year, although more recently some of these trends have been reversing as cyclicalsand value stocks recover. All top ten contributors were Asian, with eight of them “new economy” stocks. This highlights theongoing fast tracking of digitalisation across an expanding number of sectors, yet probably also illustrates somewhat of anovershoot due to the exceptional pandemic conditions. Our holdings in NetEase and NCsoft benefitted from this dynamic.Both companies, along with Tencent/Naspers, enjoyed an expanded addressable market and continued to grow theirpipelines with globally competitive games driving consistently strong results.
China is likely to be the only major economy globally to grow in 2020, which, along with specific company execution andconsistently good company results, has enabled the positions in Inner Mongolia Yili, Midea and Autohome to produce strongpositive contributions throughout 2020.
COMGEST GROWTH plc
COMGEST GROWTH EMERGING MARKETS FLEXa fund of Comgest Growth plc
INVESTMENT MANAGER’S REPORTFOR THE FINANCIAL YEAR ENDED 31 DECEMBER 2020
38
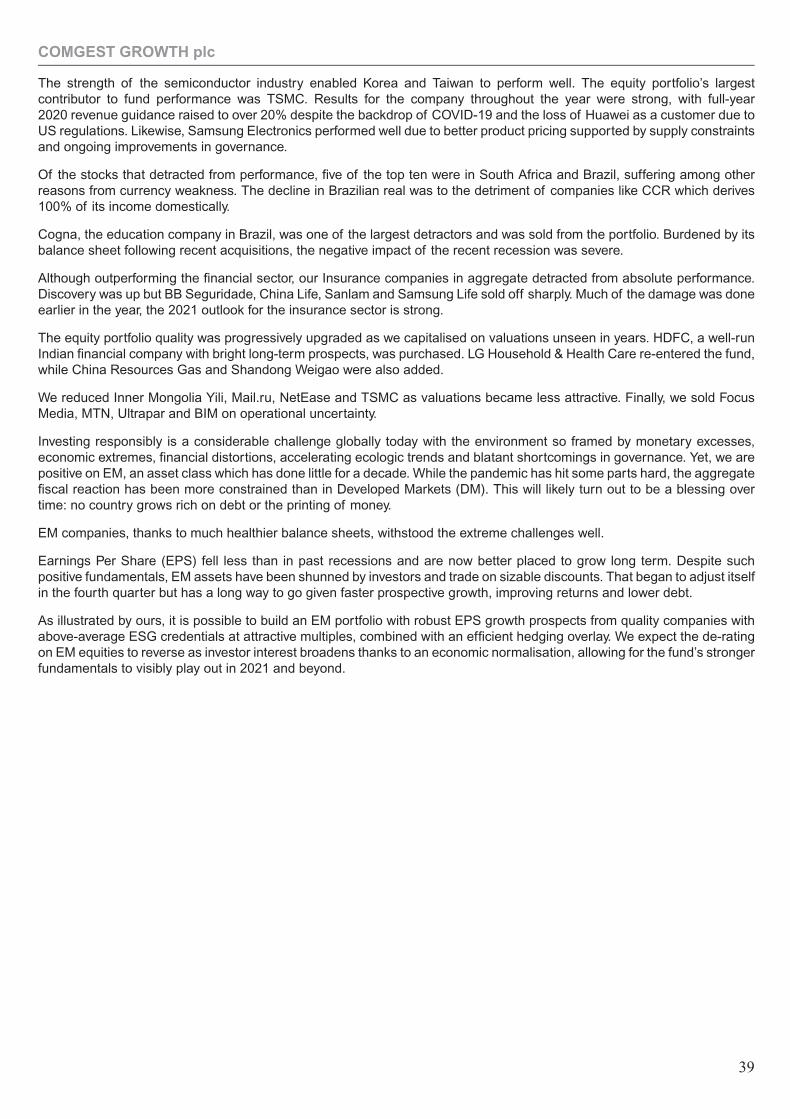
The strength of the semiconductor industry enabled Korea and Taiwan to perform well. The equity portfolio’s largestcontributor to fund performance was TSMC. Results for the company throughout the year were strong, with full-year2020 revenue guidance raised to over 20% despite the backdrop of COVID-19 and the loss of Huawei as a customer due toUS regulations. Likewise, Samsung Electronics performed well due to better product pricing supported by supply constraintsand ongoing improvements in governance.
Of the stocks that detracted from performance, five of the top ten were in South Africa and Brazil, suffering among otherreasons from currency weakness. The decline in Brazilian real was to the detriment of companies like CCR which derives100% of its income domestically.
Cogna, the education company in Brazil, was one of the largest detractors and was sold from the portfolio. Burdened by itsbalance sheet following recent acquisitions, the negative impact of the recent recession was severe.
Although outperforming the financial sector, our Insurance companies in aggregate detracted from absolute performance.Discovery was up but BB Seguridade, China Life, Sanlam and Samsung Life sold off sharply. Much of the damage was doneearlier in the year, the 2021 outlook for the insurance sector is strong.
The equity portfolio quality was progressively upgraded as we capitalised on valuations unseen in years. HDFC, a well-runIndian financial company with bright long-term prospects, was purchased. LG Household & Health Care re-entered the fund,while China Resources Gas and Shandong Weigao were also added.
We reduced Inner Mongolia Yili, Mail.ru, NetEase and TSMC as valuations became less attractive. Finally, we sold FocusMedia, MTN, Ultrapar and BIM on operational uncertainty.
Investing responsibly is a considerable challenge globally today with the environment so framed by monetary excesses,economic extremes, financial distortions, accelerating ecologic trends and blatant shortcomings in governance. Yet, we arepositive on EM, an asset class which has done little for a decade. While the pandemic has hit some parts hard, the aggregatefiscal reaction has been more constrained than in Developed Markets (DM). This will likely turn out to be a blessing overtime: no country grows rich on debt or the printing of money.
EM companies, thanks to much healthier balance sheets, withstood the extreme challenges well.
Earnings Per Share (EPS) fell less than in past recessions and are now better placed to grow long term. Despite suchpositive fundamentals, EM assets have been shunned by investors and trade on sizable discounts. That began to adjust itselfin the fourth quarter but has a long way to go given faster prospective growth, improving returns and lower debt.
As illustrated by ours, it is possible to build an EM portfolio with robust EPS growth prospects from quality companies withabove-average ESG credentials at attractive multiples, combined with an efficient hedging overlay. We expect the de-ratingon EM equities to reverse as investor interest broadens thanks to an economic normalisation, allowing for the fund’s strongerfundamentals to visibly play out in 2021 and beyond.
COMGEST GROWTH plc
39
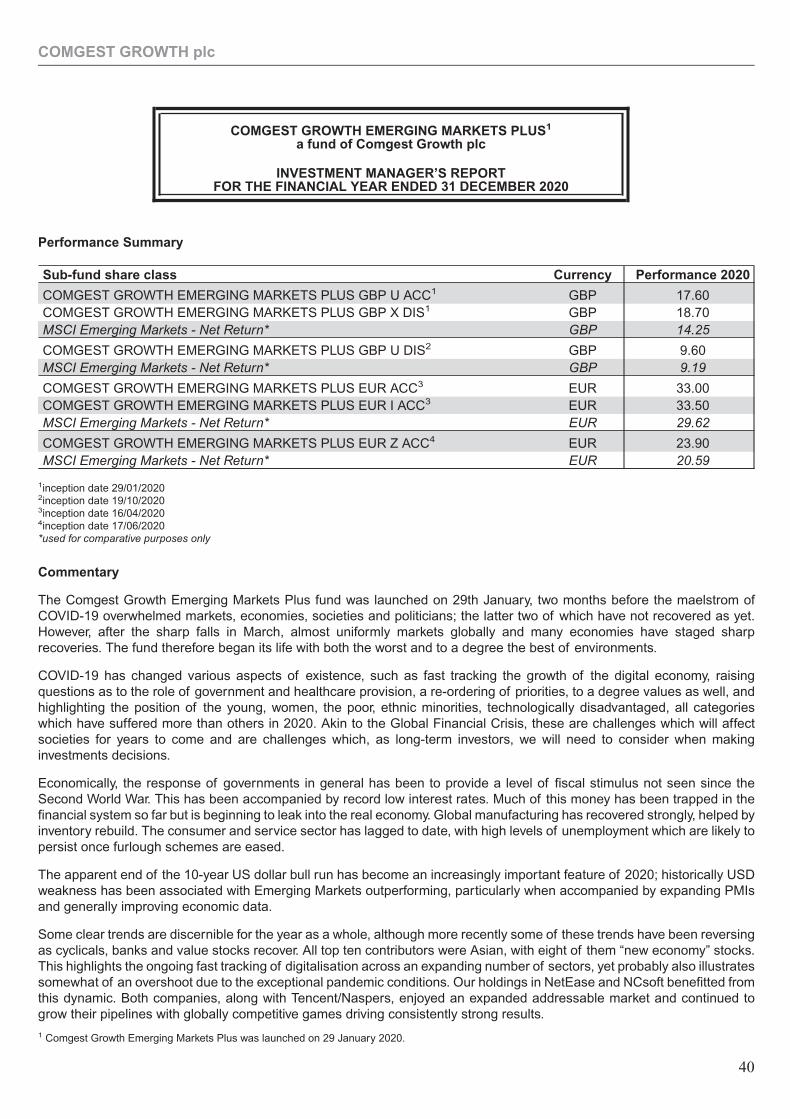
Performance Summary
Sub-fund share class Currency Performance 2020
COMGEST GROWTH EMERGING MARKETS PLUS GBP U ACC1 GBP 17.60COMGEST GROWTH EMERGING MARKETS PLUS GBP X DIS1 GBP 18.70MSCI Emerging Markets - Net Return* GBP 14.25
COMGEST GROWTH EMERGING MARKETS PLUS GBP U DIS2 GBP 9.60MSCI Emerging Markets - Net Return* GBP 9.19
COMGEST GROWTH EMERGING MARKETS PLUS EUR ACC3 EUR 33.00COMGEST GROWTH EMERGING MARKETS PLUS EUR I ACC3 EUR 33.50MSCI Emerging Markets - Net Return* EUR 29.62
COMGEST GROWTH EMERGING MARKETS PLUS EUR Z ACC4 EUR 23.90MSCI Emerging Markets - Net Return* EUR 20.59
1inception date 29/01/20202inception date 19/10/20203inception date 16/04/20204inception date 17/06/2020*used for comparative purposes only
Commentary
The Comgest Growth Emerging Markets Plus fund was launched on 29th January, two months before the maelstrom ofCOVID-19 overwhelmed markets, economies, societies and politicians; the latter two of which have not recovered as yet.However, after the sharp falls in March, almost uniformly markets globally and many economies have staged sharprecoveries. The fund therefore began its life with both the worst and to a degree the best of environments.
COVID-19 has changed various aspects of existence, such as fast tracking the growth of the digital economy, raisingquestions as to the role of government and healthcare provision, a re-ordering of priorities, to a degree values as well, andhighlighting the position of the young, women, the poor, ethnic minorities, technologically disadvantaged, all categorieswhich have suffered more than others in 2020. Akin to the Global Financial Crisis, these are challenges which will affectsocieties for years to come and are challenges which, as long-term investors, we will need to consider when makinginvestments decisions.
Economically, the response of governments in general has been to provide a level of fiscal stimulus not seen since theSecond World War. This has been accompanied by record low interest rates. Much of this money has been trapped in thefinancial system so far but is beginning to leak into the real economy. Global manufacturing has recovered strongly, helped byinventory rebuild. The consumer and service sector has lagged to date, with high levels of unemployment which are likely topersist once furlough schemes are eased.
The apparent end of the 10-year US dollar bull run has become an increasingly important feature of 2020; historically USDweakness has been associated with Emerging Markets outperforming, particularly when accompanied by expanding PMIsand generally improving economic data.
Some clear trends are discernible for the year as a whole, although more recently some of these trends have been reversingas cyclicals, banks and value stocks recover. All top ten contributors were Asian, with eight of them “new economy” stocks.This highlights the ongoing fast tracking of digitalisation across an expanding number of sectors, yet probably also illustratessomewhat of an overshoot due to the exceptional pandemic conditions. Our holdings in NetEase and NCsoft benefitted fromthis dynamic. Both companies, along with Tencent/Naspers, enjoyed an expanded addressable market and continued togrow their pipelines with globally competitive games driving consistently strong results.
1 Comgest Growth Emerging Markets Plus was launched on 29 January 2020.
COMGEST GROWTH plc
COMGEST GROWTH EMERGING MARKETS PLUS1
a fund of Comgest Growth plc
INVESTMENT MANAGER’S REPORTFOR THE FINANCIAL YEAR ENDED 31 DECEMBER 2020
40
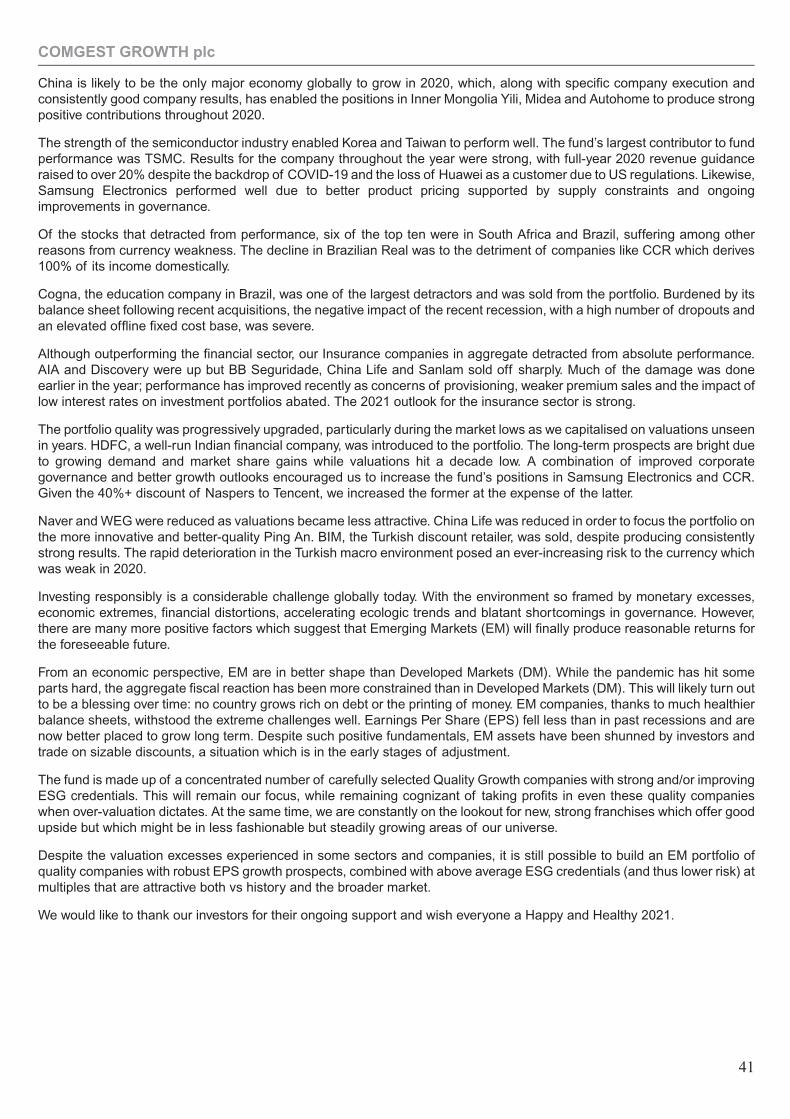
China is likely to be the only major economy globally to grow in 2020, which, along with specific company execution andconsistently good company results, has enabled the positions in Inner Mongolia Yili, Midea and Autohome to produce strongpositive contributions throughout 2020.
The strength of the semiconductor industry enabled Korea and Taiwan to perform well. The fund’s largest contributor to fundperformance was TSMC. Results for the company throughout the year were strong, with full-year 2020 revenue guidanceraised to over 20% despite the backdrop of COVID-19 and the loss of Huawei as a customer due to US regulations. Likewise,Samsung Electronics performed well due to better product pricing supported by supply constraints and ongoingimprovements in governance.
Of the stocks that detracted from performance, six of the top ten were in South Africa and Brazil, suffering among otherreasons from currency weakness. The decline in Brazilian Real was to the detriment of companies like CCR which derives100% of its income domestically.
Cogna, the education company in Brazil, was one of the largest detractors and was sold from the portfolio. Burdened by itsbalance sheet following recent acquisitions, the negative impact of the recent recession, with a high number of dropouts andan elevated offline fixed cost base, was severe.
Although outperforming the financial sector, our Insurance companies in aggregate detracted from absolute performance.AIA and Discovery were up but BB Seguridade, China Life and Sanlam sold off sharply. Much of the damage was doneearlier in the year; performance has improved recently as concerns of provisioning, weaker premium sales and the impact oflow interest rates on investment portfolios abated. The 2021 outlook for the insurance sector is strong.
The portfolio quality was progressively upgraded, particularly during the market lows as we capitalised on valuations unseenin years. HDFC, a well-run Indian financial company, was introduced to the portfolio. The long-term prospects are bright dueto growing demand and market share gains while valuations hit a decade low. A combination of improved corporategovernance and better growth outlooks encouraged us to increase the fund’s positions in Samsung Electronics and CCR.Given the 40%+ discount of Naspers to Tencent, we increased the former at the expense of the latter.
Naver and WEG were reduced as valuations became less attractive. China Life was reduced in order to focus the portfolio onthe more innovative and better-quality Ping An. BIM, the Turkish discount retailer, was sold, despite producing consistentlystrong results. The rapid deterioration in the Turkish macro environment posed an ever-increasing risk to the currency whichwas weak in 2020.
Investing responsibly is a considerable challenge globally today. With the environment so framed by monetary excesses,economic extremes, financial distortions, accelerating ecologic trends and blatant shortcomings in governance. However,there are many more positive factors which suggest that Emerging Markets (EM) will finally produce reasonable returns forthe foreseeable future.
From an economic perspective, EM are in better shape than Developed Markets (DM). While the pandemic has hit someparts hard, the aggregate fiscal reaction has been more constrained than in Developed Markets (DM). This will likely turn outto be a blessing over time: no country grows rich on debt or the printing of money. EM companies, thanks to much healthierbalance sheets, withstood the extreme challenges well. Earnings Per Share (EPS) fell less than in past recessions and arenow better placed to grow long term. Despite such positive fundamentals, EM assets have been shunned by investors andtrade on sizable discounts, a situation which is in the early stages of adjustment.
The fund is made up of a concentrated number of carefully selected Quality Growth companies with strong and/or improvingESG credentials. This will remain our focus, while remaining cognizant of taking profits in even these quality companieswhen over-valuation dictates. At the same time, we are constantly on the lookout for new, strong franchises which offer goodupside but which might be in less fashionable but steadily growing areas of our universe.
Despite the valuation excesses experienced in some sectors and companies, it is still possible to build an EM portfolio ofquality companies with robust EPS growth prospects, combined with above average ESG credentials (and thus lower risk) atmultiples that are attractive both vs history and the broader market.
We would like to thank our investors for their ongoing support and wish everyone a Happy and Healthy 2021.
COMGEST GROWTH plc
41
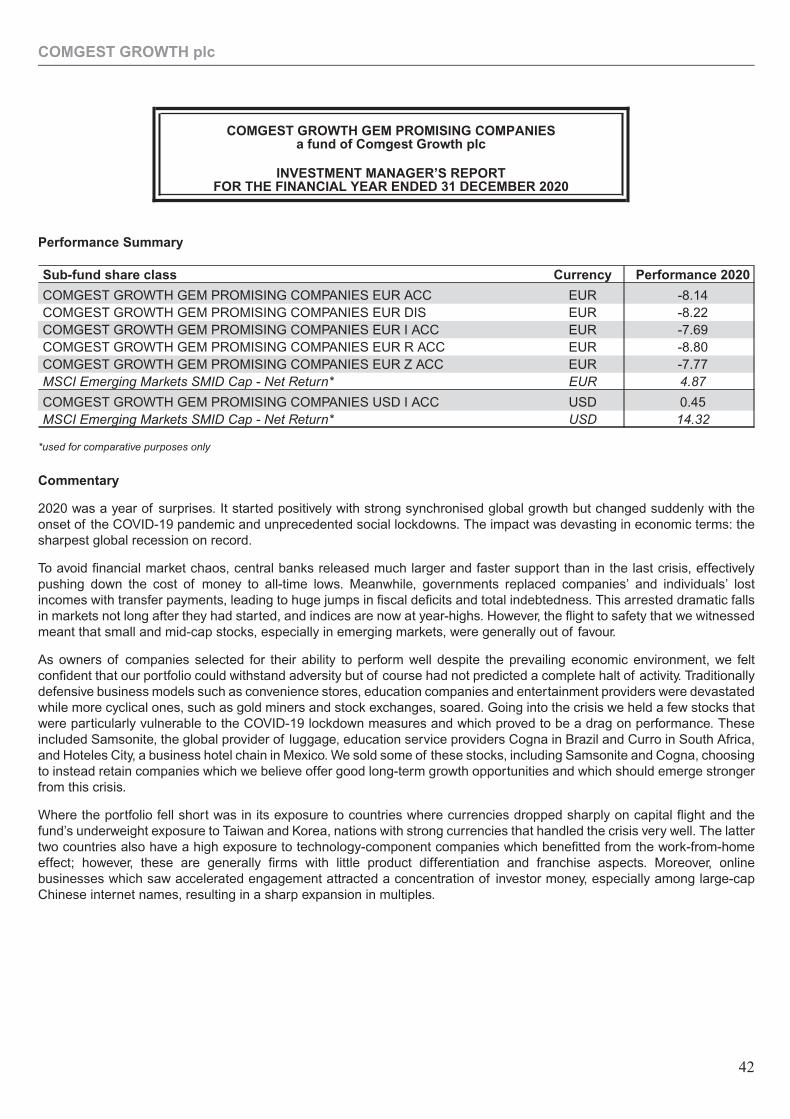
Performance Summary
Sub-fund share class Currency Performance 2020
COMGEST GROWTH GEM PROMISING COMPANIES EUR ACC EUR -8.14COMGEST GROWTH GEM PROMISING COMPANIES EUR DIS EUR -8.22COMGEST GROWTH GEM PROMISING COMPANIES EUR I ACC EUR -7.69COMGEST GROWTH GEM PROMISING COMPANIES EUR R ACC EUR -8.80COMGEST GROWTH GEM PROMISING COMPANIES EUR Z ACC EUR -7.77MSCI Emerging Markets SMID Cap - Net Return* EUR 4.87
COMGEST GROWTH GEM PROMISING COMPANIES USD I ACC USD 0.45MSCI Emerging Markets SMID Cap - Net Return* USD 14.32
*used for comparative purposes only
Commentary
2020 was a year of surprises. It started positively with strong synchronised global growth but changed suddenly with theonset of the COVID-19 pandemic and unprecedented social lockdowns. The impact was devasting in economic terms: thesharpest global recession on record.
To avoid financial market chaos, central banks released much larger and faster support than in the last crisis, effectivelypushing down the cost of money to all-time lows. Meanwhile, governments replaced companies’ and individuals’ lostincomes with transfer payments, leading to huge jumps in fiscal deficits and total indebtedness. This arrested dramatic fallsin markets not long after they had started, and indices are now at year-highs. However, the flight to safety that we witnessedmeant that small and mid-cap stocks, especially in emerging markets, were generally out of favour.
As owners of companies selected for their ability to perform well despite the prevailing economic environment, we feltconfident that our portfolio could withstand adversity but of course had not predicted a complete halt of activity. Traditionallydefensive business models such as convenience stores, education companies and entertainment providers were devastatedwhile more cyclical ones, such as gold miners and stock exchanges, soared. Going into the crisis we held a few stocks thatwere particularly vulnerable to the COVID-19 lockdown measures and which proved to be a drag on performance. Theseincluded Samsonite, the global provider of luggage, education service providers Cogna in Brazil and Curro in South Africa,and Hoteles City, a business hotel chain in Mexico. We sold some of these stocks, including Samsonite and Cogna, choosingto instead retain companies which we believe offer good long-term growth opportunities and which should emerge strongerfrom this crisis.
Where the portfolio fell short was in its exposure to countries where currencies dropped sharply on capital flight and thefund’s underweight exposure to Taiwan and Korea, nations with strong currencies that handled the crisis very well. The lattertwo countries also have a high exposure to technology-component companies which benefitted from the work-from-homeeffect; however, these are generally firms with little product differentiation and franchise aspects. Moreover, onlinebusinesses which saw accelerated engagement attracted a concentration of investor money, especially among large-capChinese internet names, resulting in a sharp expansion in multiples.
COMGEST GROWTH plc
COMGEST GROWTH GEM PROMISING COMPANIESa fund of Comgest Growth plc
INVESTMENT MANAGER’S REPORTFOR THE FINANCIAL YEAR ENDED 31 DECEMBER 2020
42
We did not waste the crisis, using it to buy strong franchises at reasonable valuations. We purchased MercadoLibre, ownerof the largest e-commerce platform in Latin America. The COVID-19 crisis led to a significant boost in online shopping whichsaw the company’s gross merchandise value more than double in 2020. Additionally, its MercadoPago payments ecosystemfor merchants and customers has become a business as important as e-commerce. The fund bought Headhunter, theleading Russian online job board in the white and blue-collar segments and the world’s third largest job platform in terms oftraffic (behind Indeed and Jooble). In November the group announced the acquisition of Zarplata, a job classified platform,with a strong footprint in central/northern Russia. We also acquired Eicher Motors, owner of India’s beloved Royal Enfieldmotorcycle brand and Endurance, India’s largest two-wheeler automobile component company. Both companies arebenefitting from a pick-up in sales post COVID-19 following a weak Indian macro environment over the past two years and ascommuters look to avoid public transportation. Lepu Medical Technology was also added to the portfolio. The companyfocuses on medical devices and drugs for cardiovascular disease (CVD), which is the leading disease in terms of the numberof deaths in China. We expect Lepu to generate more than 15% top line growth as it gains market share based on its: 1)technology leadership in high-end coronary stents where it has 20% market share; 2) rich product coverage and pipeline inboth medical devices and drugs; and 3) proven M&A capabilities to expand vertically.
The fund initiated a position in Suofeiya, the largest Chinese wardrobe and second largest custom-made furniture company.The company operates in a very fragmented industry dominated by mom & pops. Suofeiya has more than 3,300 outletsacross China which stand out for their reliable product and service quality as well as quick responses to customisationrequests.
The portfolio quality was progressively upgraded particularly during the market lows as we capitalised on valuations unseenin years. We increased our holding in PagSeguro, Brazil’s payments and fintech business focusing on underbanked micro-merchants. We exited the Turkish retailer BIM on macro concerns despite a solid performance and sold Linx and 58.comafter they received take-over offers. IEnova and Mediclinic were liquidated on mediocre growth outlooks.
Investing responsibly is a considerable challenge globally today. With the environment so framed by monetary excesses,economic extremes, financial distortions, accelerating ecologic trends and blatant shortcomings in governance, it can behard to tell dream from reality. Yet, we are positive on Emerging Markets (EM), an asset class which has done little for adecade. While the pandemic has hit some parts hard, the aggregate fiscal reaction has been more constrained than inDeveloped Markets (DM). This will likely turn out to be a blessing over time: no country grows rich on debt or the printing ofmoney.
EM companies, thanks to much healthier balance sheets, withstood the extreme challenges well. Earnings Per Share (EPS)fell less than in past recessions and are now better placed to grow long term.
Despite such positive fundamentals, EM assets, especially smaller and less liquid stocks, have been shunned by investorsand trade on sizable discounts. That began to adjust itself in the fourth quarter but has a long way to go given fasterprospective growth, improving returns and lower debt.
The companies in the fund are highly exposed to domestic economies. As the COVID-19 situation normalises in 2021, thesecompanies should also recover the most after their very sharp underperformance in 2020.
We believe it is possible to build an EM portfolio with robust EPS growth prospects from quality companies with above-average ESG credentials (and thus lower risk) at multiples that are attractive both vs history and the broader market. Weexpect the de-rating to reverse as investor interest broadens thanks to an economic normalisation, allowing for the fund’sstronger fundamentals to visibly play out in 2021 and beyond.
COMGEST GROWTH plc
43
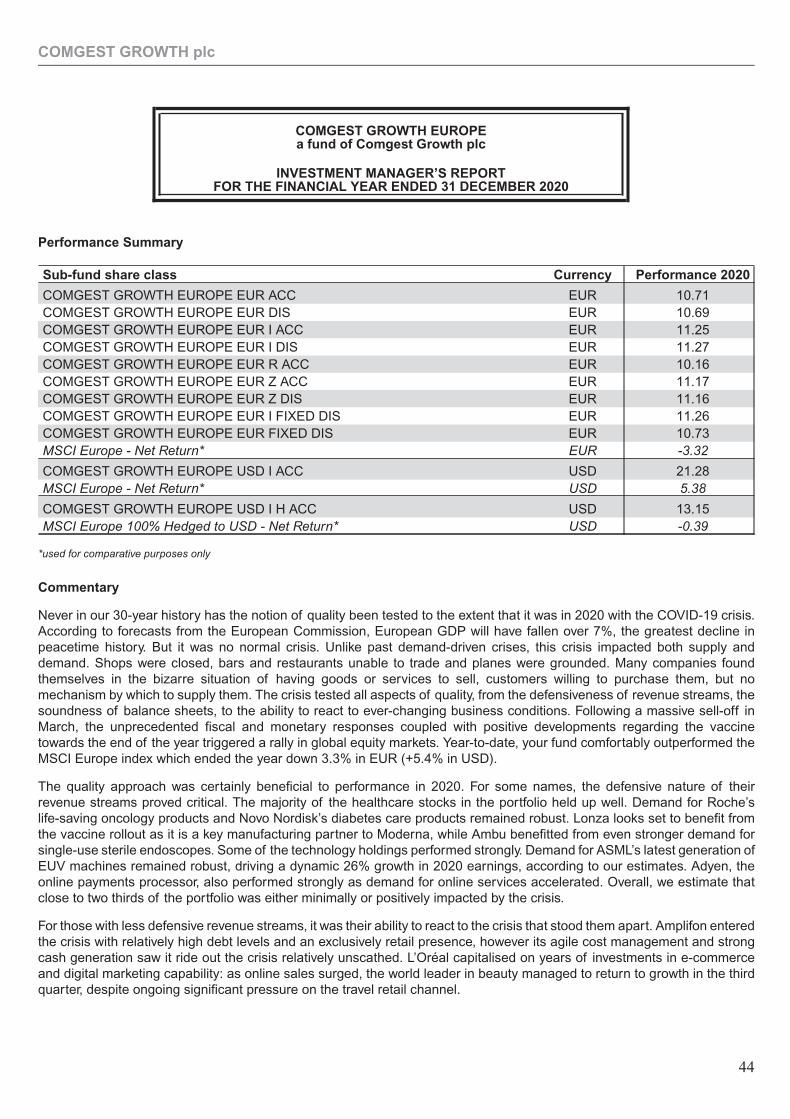
Performance Summary
Sub-fund share class Currency Performance 2020
COMGEST GROWTH EUROPE EUR ACC EUR 10.71COMGEST GROWTH EUROPE EUR DIS EUR 10.69COMGEST GROWTH EUROPE EUR I ACC EUR 11.25COMGEST GROWTH EUROPE EUR I DIS EUR 11.27COMGEST GROWTH EUROPE EUR R ACC EUR 10.16COMGEST GROWTH EUROPE EUR Z ACC EUR 11.17COMGEST GROWTH EUROPE EUR Z DIS EUR 11.16COMGEST GROWTH EUROPE EUR I FIXED DIS EUR 11.26COMGEST GROWTH EUROPE EUR FIXED DIS EUR 10.73MSCI Europe - Net Return* EUR -3.32
COMGEST GROWTH EUROPE USD I ACC USD 21.28MSCI Europe - Net Return* USD 5.38
COMGEST GROWTH EUROPE USD I H ACC USD 13.15MSCI Europe 100% Hedged to USD - Net Return* USD -0.39
*used for comparative purposes only
Commentary
Never in our 30-year history has the notion of quality been tested to the extent that it was in 2020 with the COVID-19 crisis.According to forecasts from the European Commission, European GDP will have fallen over 7%, the greatest decline inpeacetime history. But it was no normal crisis. Unlike past demand-driven crises, this crisis impacted both supply anddemand. Shops were closed, bars and restaurants unable to trade and planes were grounded. Many companies foundthemselves in the bizarre situation of having goods or services to sell, customers willing to purchase them, but nomechanism by which to supply them. The crisis tested all aspects of quality, from the defensiveness of revenue streams, thesoundness of balance sheets, to the ability to react to ever-changing business conditions. Following a massive sell-off inMarch, the unprecedented fiscal and monetary responses coupled with positive developments regarding the vaccinetowards the end of the year triggered a rally in global equity markets. Year-to-date, your fund comfortably outperformed theMSCI Europe index which ended the year down 3.3% in EUR (+5.4% in USD).
The quality approach was certainly beneficial to performance in 2020. For some names, the defensive nature of theirrevenue streams proved critical. The majority of the healthcare stocks in the portfolio held up well. Demand for Roche’slife-saving oncology products and Novo Nordisk’s diabetes care products remained robust. Lonza looks set to benefit fromthe vaccine rollout as it is a key manufacturing partner to Moderna, while Ambu benefitted from even stronger demand forsingle-use sterile endoscopes. Some of the technology holdings performed strongly. Demand for ASML’s latest generation ofEUV machines remained robust, driving a dynamic 26% growth in 2020 earnings, according to our estimates. Adyen, theonline payments processor, also performed strongly as demand for online services accelerated. Overall, we estimate thatclose to two thirds of the portfolio was either minimally or positively impacted by the crisis.
For those with less defensive revenue streams, it was their ability to react to the crisis that stood them apart. Amplifon enteredthe crisis with relatively high debt levels and an exclusively retail presence, however its agile cost management and strongcash generation saw it ride out the crisis relatively unscathed. L’Oréal capitalised on years of investments in e-commerceand digital marketing capability: as online sales surged, the world leader in beauty managed to return to growth in the thirdquarter, despite ongoing significant pressure on the travel retail channel.
COMGEST GROWTH plc
COMGEST GROWTH EUROPEa fund of Comgest Growth plc
INVESTMENT MANAGER’S REPORTFOR THE FINANCIAL YEAR ENDED 31 DECEMBER 2020
44
Finally, for some, the crisis created a once-in-a-lifetime opportunity to cement their leadership. Ryanair took advantage ofcompetitor retrenchments to reduce its cost base further while signing a new long-term contract with Boeing to securegrowth in the years to come. We believe Ryanair will emerge from the crisis stronger and better able to capitalise on theplentiful growth opportunities ahead.
The crisis was also an opportunity to test the ESG credentials of your holdings. Ferrari, like many portfolio holdings,continued to pay its staff in full even when production was suspended. Furthermore, the company provided testing facilitiesto employees, their families and suppliers while providing special assistance to any employee who tested positive. But itwasn’t just employees who were cared for: L’Oréal froze receivable payments for over 100,000 clients – such as independenthair salons – while shortening the payment terms for close to 9,000 suppliers. LVMH dedicated factories to produce handsanitiser, which it then donated to health workers and associations. The crisis tested not only the financial strength of yourholdings, but also their duty of care, whether it be to their employees, customers, suppliers or society at large.
In 2020, we added four names to the portfolio and exited three. The spring correction gave us the opportunity to buildpositions in SimCorp, a software vendor, and in Teleperformance, the global leader in customer relations outsourcing. Laterin the year we initiated a position in the recently listed technology company Prosus, which owns a sizable stake in theChinese internet company Tencent. We also initiated a position in Linde plc, the leading global industrial gases company onthe back of a resilient business model with high barriers to entry, a performance culture inherited from Praxair and a mediumto long-term optionality, notably with regards to hydrogen. We sold out of Fresenius, Associated British Foods and Genmab.
A volatile year and highly heterogenous returns in the portfolio gave us the opportunity to adjust position sizes on valuationgrounds: we notably took profits on names such as Lonza, Coloplast and Ambu. Conversely, early in the year we added topositions such as Ferrari, Campari and Amplifon.
At the time of writing, many countries across Europe have begun vaccinating their populations. The crisis is far from over, butthere is light at the end of the tunnel. Accordingly, attention is turning to the shape of the recovery with economistsforecasting a wide range of scenarios. Our conviction is that, as in past crises, it is the strong that will emerge stronger, thusfavouring a “K-shape recovery” scenario. Not only within sectors, but also across sectors, in a context of accelerated digitaland environmental transitions. Strong franchises in the hands of long-term managers see crises as long-term opportunitiesas much as they do short-term threats.
Your portfolio suffered its first earnings decline since its launch (albeit less than the market), and we expect a strong reboundin 2021 despite a currency headwind coming from a weaker US Dollar. Beyond that, we continue to see plentiful growthopportunities for the portfolio’s holdings. More than ever, we will continue to focus our attention on finding high quality,long-term winners able to flourish in the post COVID-19 world.
COMGEST GROWTH plc
45
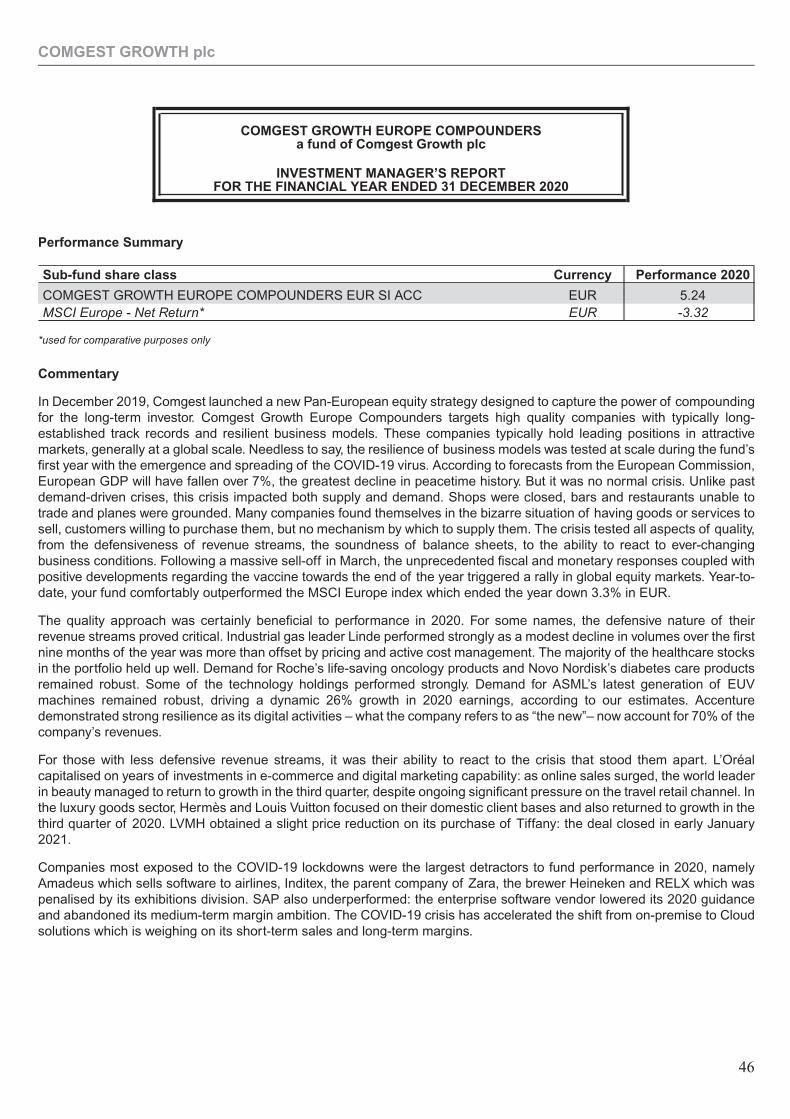
Performance Summary
Sub-fund share class Currency Performance 2020
COMGEST GROWTH EUROPE COMPOUNDERS EUR SI ACC EUR 5.24MSCI Europe - Net Return* EUR -3.32
*used for comparative purposes only
Commentary
In December 2019, Comgest launched a new Pan-European equity strategy designed to capture the power of compoundingfor the long-term investor. Comgest Growth Europe Compounders targets high quality companies with typically long-established track records and resilient business models. These companies typically hold leading positions in attractivemarkets, generally at a global scale. Needless to say, the resilience of business models was tested at scale during the fund’sfirst year with the emergence and spreading of the COVID-19 virus. According to forecasts from the European Commission,European GDP will have fallen over 7%, the greatest decline in peacetime history. But it was no normal crisis. Unlike pastdemand-driven crises, this crisis impacted both supply and demand. Shops were closed, bars and restaurants unable totrade and planes were grounded. Many companies found themselves in the bizarre situation of having goods or services tosell, customers willing to purchase them, but no mechanism by which to supply them. The crisis tested all aspects of quality,from the defensiveness of revenue streams, the soundness of balance sheets, to the ability to react to ever-changingbusiness conditions. Following a massive sell-off in March, the unprecedented fiscal and monetary responses coupled withpositive developments regarding the vaccine towards the end of the year triggered a rally in global equity markets. Year-to-date, your fund comfortably outperformed the MSCI Europe index which ended the year down 3.3% in EUR.
The quality approach was certainly beneficial to performance in 2020. For some names, the defensive nature of theirrevenue streams proved critical. Industrial gas leader Linde performed strongly as a modest decline in volumes over the firstnine months of the year was more than offset by pricing and active cost management. The majority of the healthcare stocksin the portfolio held up well. Demand for Roche’s life-saving oncology products and Novo Nordisk’s diabetes care productsremained robust. Some of the technology holdings performed strongly. Demand for ASML’s latest generation of EUVmachines remained robust, driving a dynamic 26% growth in 2020 earnings, according to our estimates. Accenturedemonstrated strong resilience as its digital activities – what the company refers to as “the new”– now account for 70% of thecompany’s revenues.
For those with less defensive revenue streams, it was their ability to react to the crisis that stood them apart. L’Oréalcapitalised on years of investments in e-commerce and digital marketing capability: as online sales surged, the world leaderin beauty managed to return to growth in the third quarter, despite ongoing significant pressure on the travel retail channel. Inthe luxury goods sector, Hermès and Louis Vuitton focused on their domestic client bases and also returned to growth in thethird quarter of 2020. LVMH obtained a slight price reduction on its purchase of Tiffany: the deal closed in early January2021.
Companies most exposed to the COVID-19 lockdowns were the largest detractors to fund performance in 2020, namelyAmadeus which sells software to airlines, Inditex, the parent company of Zara, the brewer Heineken and RELX which waspenalised by its exhibitions division. SAP also underperformed: the enterprise software vendor lowered its 2020 guidanceand abandoned its medium-term margin ambition. The COVID-19 crisis has accelerated the shift from on-premise to Cloudsolutions which is weighing on its short-term sales and long-term margins.
COMGEST GROWTH plc
COMGEST GROWTH EUROPE COMPOUNDERSa fund of Comgest Growth plc
INVESTMENT MANAGER’S REPORTFOR THE FINANCIAL YEAR ENDED 31 DECEMBER 2020
46
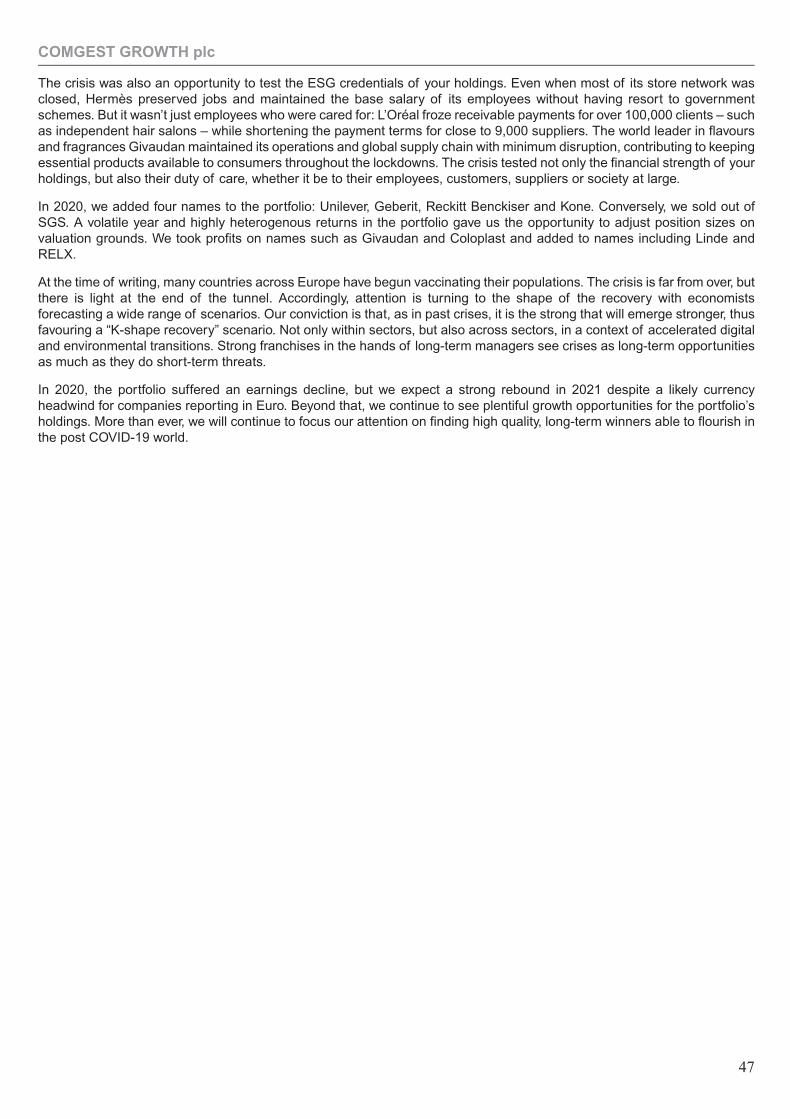
The crisis was also an opportunity to test the ESG credentials of your holdings. Even when most of its store network wasclosed, Hermès preserved jobs and maintained the base salary of its employees without having resort to governmentschemes. But it wasn’t just employees who were cared for: L’Oréal froze receivable payments for over 100,000 clients – suchas independent hair salons – while shortening the payment terms for close to 9,000 suppliers. The world leader in flavoursand fragrances Givaudan maintained its operations and global supply chain with minimum disruption, contributing to keepingessential products available to consumers throughout the lockdowns. The crisis tested not only the financial strength of yourholdings, but also their duty of care, whether it be to their employees, customers, suppliers or society at large.
In 2020, we added four names to the portfolio: Unilever, Geberit, Reckitt Benckiser and Kone. Conversely, we sold out ofSGS. A volatile year and highly heterogenous returns in the portfolio gave us the opportunity to adjust position sizes onvaluation grounds. We took profits on names such as Givaudan and Coloplast and added to names including Linde andRELX.
At the time of writing, many countries across Europe have begun vaccinating their populations. The crisis is far from over, butthere is light at the end of the tunnel. Accordingly, attention is turning to the shape of the recovery with economistsforecasting a wide range of scenarios. Our conviction is that, as in past crises, it is the strong that will emerge stronger, thusfavouring a “K-shape recovery” scenario. Not only within sectors, but also across sectors, in a context of accelerated digitaland environmental transitions. Strong franchises in the hands of long-term managers see crises as long-term opportunitiesas much as they do short-term threats.
In 2020, the portfolio suffered an earnings decline, but we expect a strong rebound in 2021 despite a likely currencyheadwind for companies reporting in Euro. Beyond that, we continue to see plentiful growth opportunities for the portfolio’sholdings. More than ever, we will continue to focus our attention on finding high quality, long-term winners able to flourish inthe post COVID-19 world.
COMGEST GROWTH plc
47
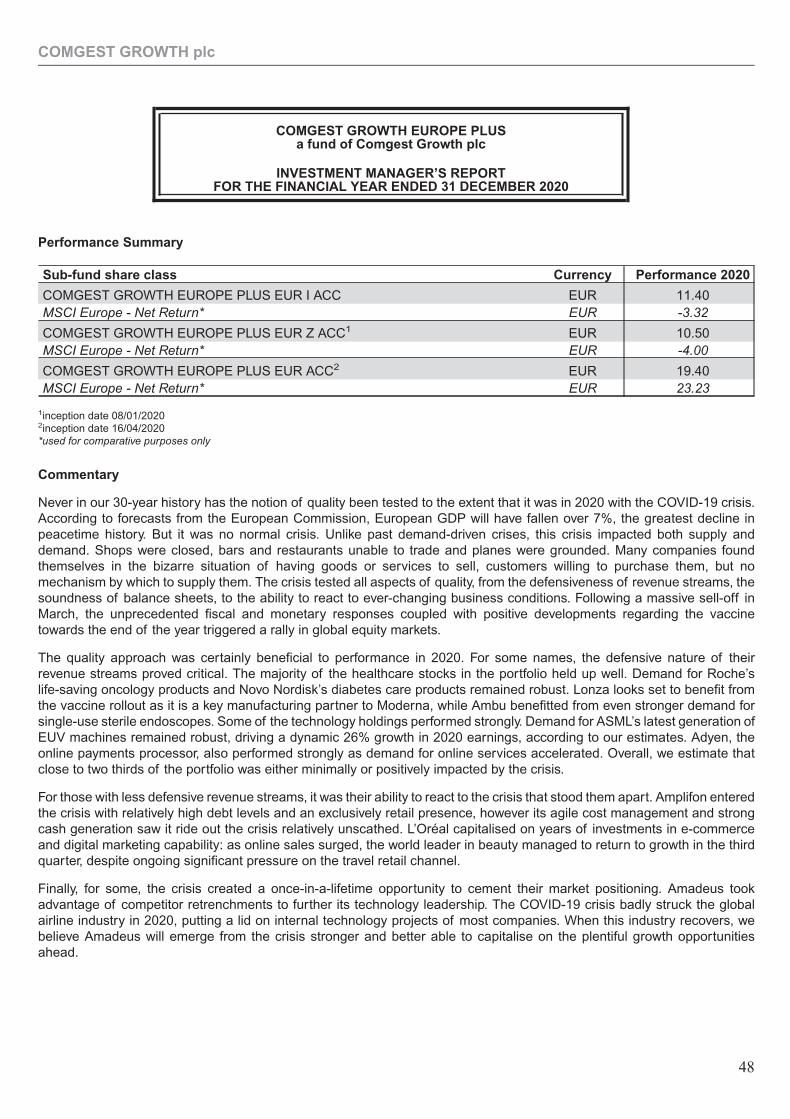
Performance Summary
Sub-fund share class Currency Performance 2020
COMGEST GROWTH EUROPE PLUS EUR I ACC EUR 11.40MSCI Europe - Net Return* EUR -3.32
COMGEST GROWTH EUROPE PLUS EUR Z ACC1 EUR 10.50MSCI Europe - Net Return* EUR -4.00
COMGEST GROWTH EUROPE PLUS EUR ACC2 EUR 19.40MSCI Europe - Net Return* EUR 23.23
1inception date 08/01/20202inception date 16/04/2020*used for comparative purposes only
Commentary
Never in our 30-year history has the notion of quality been tested to the extent that it was in 2020 with the COVID-19 crisis.According to forecasts from the European Commission, European GDP will have fallen over 7%, the greatest decline inpeacetime history. But it was no normal crisis. Unlike past demand-driven crises, this crisis impacted both supply anddemand. Shops were closed, bars and restaurants unable to trade and planes were grounded. Many companies foundthemselves in the bizarre situation of having goods or services to sell, customers willing to purchase them, but nomechanism by which to supply them. The crisis tested all aspects of quality, from the defensiveness of revenue streams, thesoundness of balance sheets, to the ability to react to ever-changing business conditions. Following a massive sell-off inMarch, the unprecedented fiscal and monetary responses coupled with positive developments regarding the vaccinetowards the end of the year triggered a rally in global equity markets.
The quality approach was certainly beneficial to performance in 2020. For some names, the defensive nature of theirrevenue streams proved critical. The majority of the healthcare stocks in the portfolio held up well. Demand for Roche’slife-saving oncology products and Novo Nordisk’s diabetes care products remained robust. Lonza looks set to benefit fromthe vaccine rollout as it is a key manufacturing partner to Moderna, while Ambu benefitted from even stronger demand forsingle-use sterile endoscopes. Some of the technology holdings performed strongly. Demand for ASML’s latest generation ofEUV machines remained robust, driving a dynamic 26% growth in 2020 earnings, according to our estimates. Adyen, theonline payments processor, also performed strongly as demand for online services accelerated. Overall, we estimate thatclose to two thirds of the portfolio was either minimally or positively impacted by the crisis.
For those with less defensive revenue streams, it was their ability to react to the crisis that stood them apart. Amplifon enteredthe crisis with relatively high debt levels and an exclusively retail presence, however its agile cost management and strongcash generation saw it ride out the crisis relatively unscathed. L’Oréal capitalised on years of investments in e-commerceand digital marketing capability: as online sales surged, the world leader in beauty managed to return to growth in the thirdquarter, despite ongoing significant pressure on the travel retail channel.
Finally, for some, the crisis created a once-in-a-lifetime opportunity to cement their market positioning. Amadeus tookadvantage of competitor retrenchments to further its technology leadership. The COVID-19 crisis badly struck the globalairline industry in 2020, putting a lid on internal technology projects of most companies. When this industry recovers, webelieve Amadeus will emerge from the crisis stronger and better able to capitalise on the plentiful growth opportunitiesahead.
COMGEST GROWTH plc
COMGEST GROWTH EUROPE PLUSa fund of Comgest Growth plc
INVESTMENT MANAGER’S REPORTFOR THE FINANCIAL YEAR ENDED 31 DECEMBER 2020
48
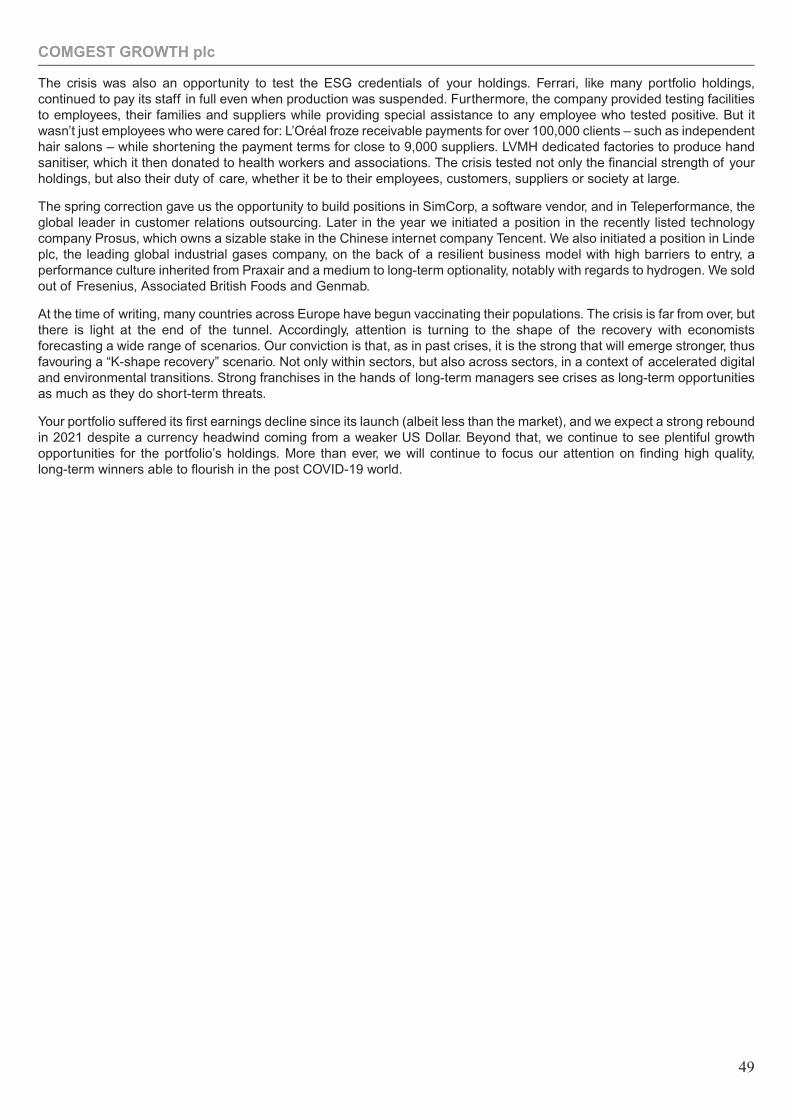
The crisis was also an opportunity to test the ESG credentials of your holdings. Ferrari, like many portfolio holdings,continued to pay its staff in full even when production was suspended. Furthermore, the company provided testing facilitiesto employees, their families and suppliers while providing special assistance to any employee who tested positive. But itwasn’t just employees who were cared for: L’Oréal froze receivable payments for over 100,000 clients – such as independenthair salons – while shortening the payment terms for close to 9,000 suppliers. LVMH dedicated factories to produce handsanitiser, which it then donated to health workers and associations. The crisis tested not only the financial strength of yourholdings, but also their duty of care, whether it be to their employees, customers, suppliers or society at large.
The spring correction gave us the opportunity to build positions in SimCorp, a software vendor, and in Teleperformance, theglobal leader in customer relations outsourcing. Later in the year we initiated a position in the recently listed technologycompany Prosus, which owns a sizable stake in the Chinese internet company Tencent. We also initiated a position in Lindeplc, the leading global industrial gases company, on the back of a resilient business model with high barriers to entry, aperformance culture inherited from Praxair and a medium to long-term optionality, notably with regards to hydrogen. We soldout of Fresenius, Associated British Foods and Genmab.
At the time of writing, many countries across Europe have begun vaccinating their populations. The crisis is far from over, butthere is light at the end of the tunnel. Accordingly, attention is turning to the shape of the recovery with economistsforecasting a wide range of scenarios. Our conviction is that, as in past crises, it is the strong that will emerge stronger, thusfavouring a “K-shape recovery” scenario. Not only within sectors, but also across sectors, in a context of accelerated digitaland environmental transitions. Strong franchises in the hands of long-term managers see crises as long-term opportunitiesas much as they do short-term threats.
Your portfolio suffered its first earnings decline since its launch (albeit less than the market), and we expect a strong reboundin 2021 despite a currency headwind coming from a weaker US Dollar. Beyond that, we continue to see plentiful growthopportunities for the portfolio’s holdings. More than ever, we will continue to focus our attention on finding high quality,long-term winners able to flourish in the post COVID-19 world.
COMGEST GROWTH plc
49
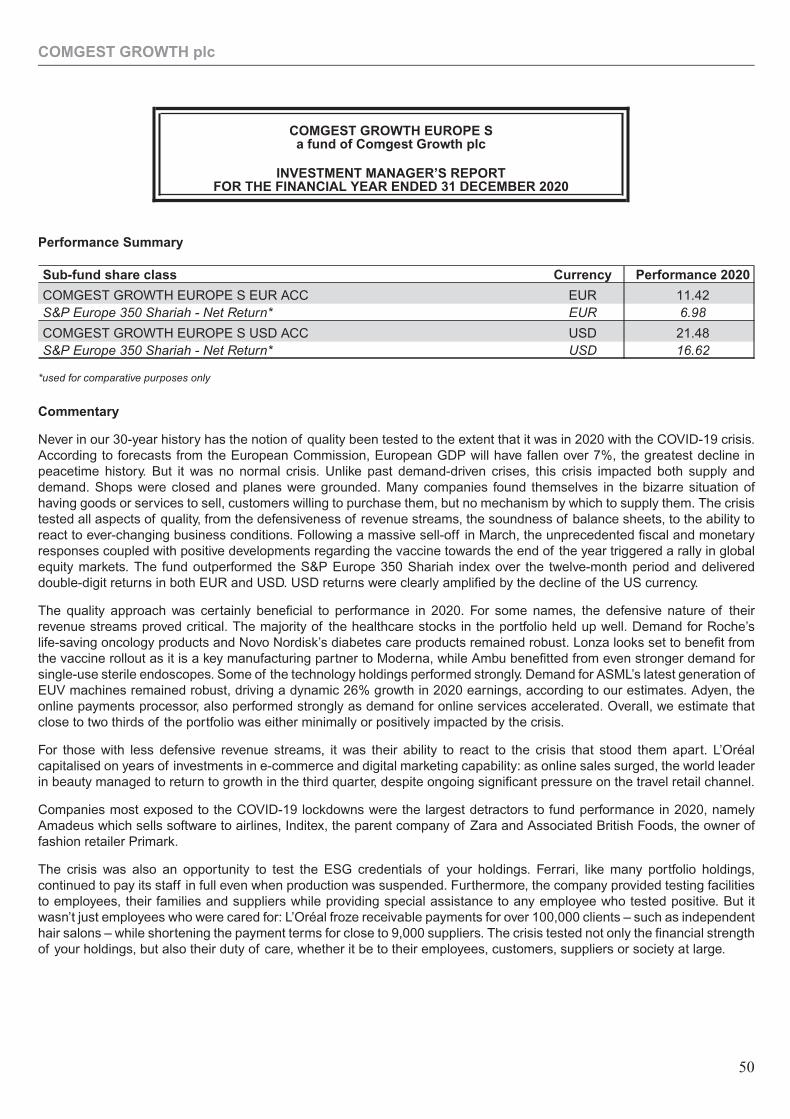
Performance Summary
Sub-fund share class Currency Performance 2020
COMGEST GROWTH EUROPE S EUR ACC EUR 11.42S&P Europe 350 Shariah - Net Return* EUR 6.98
COMGEST GROWTH EUROPE S USD ACC USD 21.48S&P Europe 350 Shariah - Net Return* USD 16.62
*used for comparative purposes only
Commentary
Never in our 30-year history has the notion of quality been tested to the extent that it was in 2020 with the COVID-19 crisis.According to forecasts from the European Commission, European GDP will have fallen over 7%, the greatest decline inpeacetime history. But it was no normal crisis. Unlike past demand-driven crises, this crisis impacted both supply anddemand. Shops were closed and planes were grounded. Many companies found themselves in the bizarre situation ofhaving goods or services to sell, customers willing to purchase them, but no mechanism by which to supply them. The crisistested all aspects of quality, from the defensiveness of revenue streams, the soundness of balance sheets, to the ability toreact to ever-changing business conditions. Following a massive sell-off in March, the unprecedented fiscal and monetaryresponses coupled with positive developments regarding the vaccine towards the end of the year triggered a rally in globalequity markets. The fund outperformed the S&P Europe 350 Shariah index over the twelve-month period and delivereddouble-digit returns in both EUR and USD. USD returns were clearly amplified by the decline of the US currency.
The quality approach was certainly beneficial to performance in 2020. For some names, the defensive nature of theirrevenue streams proved critical. The majority of the healthcare stocks in the portfolio held up well. Demand for Roche’slife-saving oncology products and Novo Nordisk’s diabetes care products remained robust. Lonza looks set to benefit fromthe vaccine rollout as it is a key manufacturing partner to Moderna, while Ambu benefitted from even stronger demand forsingle-use sterile endoscopes. Some of the technology holdings performed strongly. Demand for ASML’s latest generation ofEUV machines remained robust, driving a dynamic 26% growth in 2020 earnings, according to our estimates. Adyen, theonline payments processor, also performed strongly as demand for online services accelerated. Overall, we estimate thatclose to two thirds of the portfolio was either minimally or positively impacted by the crisis.
For those with less defensive revenue streams, it was their ability to react to the crisis that stood them apart. L’Oréalcapitalised on years of investments in e-commerce and digital marketing capability: as online sales surged, the world leaderin beauty managed to return to growth in the third quarter, despite ongoing significant pressure on the travel retail channel.
Companies most exposed to the COVID-19 lockdowns were the largest detractors to fund performance in 2020, namelyAmadeus which sells software to airlines, Inditex, the parent company of Zara and Associated British Foods, the owner offashion retailer Primark.
The crisis was also an opportunity to test the ESG credentials of your holdings. Ferrari, like many portfolio holdings,continued to pay its staff in full even when production was suspended. Furthermore, the company provided testing facilitiesto employees, their families and suppliers while providing special assistance to any employee who tested positive. But itwasn’t just employees who were cared for: L’Oréal froze receivable payments for over 100,000 clients – such as independenthair salons – while shortening the payment terms for close to 9,000 suppliers. The crisis tested not only the financial strengthof your holdings, but also their duty of care, whether it be to their employees, customers, suppliers or society at large.
COMGEST GROWTH plc
COMGEST GROWTH EUROPE Sa fund of Comgest Growth plc
INVESTMENT MANAGER’S REPORTFOR THE FINANCIAL YEAR ENDED 31 DECEMBER 2020
50
In 2020, we added five names to the portfolio and exited four. The spring correction gave us the opportunity to build a positionin MTU Aero, the engine manufacturer. We also found an entry point in Geberit, the Switzerland-based sanitary productscompany. Later in the year, we initiated a position in Teleperformance, the global leader in customer relations outsourcing, aswell as the recently listed technology company Prosus, which owns a sizable stake in the Chinese internet company Tencent.We also initiated a position in Linde plc, the leading global industrial gases company, on the back of a resilient businessmodel with high barriers to entry, a performance culture inherited from Praxair and a medium to long-term optionality, notablywith regards to hydrogen. We sold out of SGS, Associated British Foods, Ryanair and Genmab.
A volatile year and highly heterogenous returns in the portfolio gave us the opportunity to adjust position sizes on valuationgrounds: we notably took profits on names such as Lonza and Coloplast. Conversely, early in the year we added to positionssuch as Ferrari and Temenos.
At the time of writing, many countries across Europe have begun vaccinating their populations. The crisis is far from over, butthere is light at the end of the tunnel. Accordingly, attention is turning to the shape of the recovery with economistsforecasting a wide range of scenarios. Our conviction is that, as in past crises, it is the strong that will emerge stronger, thusfavouring a “K-shape recovery” scenario. Not only within sectors, but also across sectors, in a context of accelerated digitaland environmental transitions. Strong franchises in the hands of long-term managers see crises as long-term opportunitiesas much as they do short-term threats.
In 2020, the portfolio suffered an earnings decline, but we expect a strong rebound in 2021 despite a likely currencyheadwind for companies reporting in Euro. Beyond that, we continue to see plentiful growth opportunities for the portfolio’sholdings. More than ever, we will continue to focus our attention on finding high quality, long-term winners able to flourish inthe post COVID-19 world.
COMGEST GROWTH plc
51
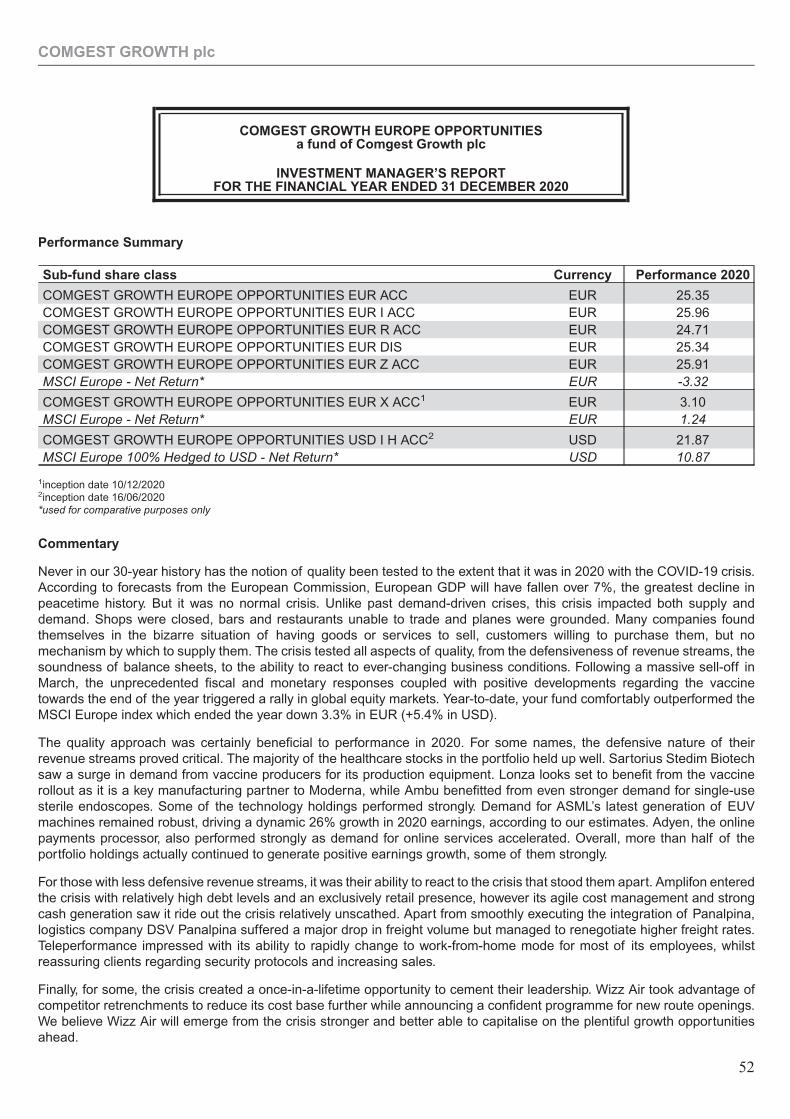
Performance Summary
Sub-fund share class Currency Performance 2020
COMGEST GROWTH EUROPE OPPORTUNITIES EUR ACC EUR 25.35COMGEST GROWTH EUROPE OPPORTUNITIES EUR I ACC EUR 25.96COMGEST GROWTH EUROPE OPPORTUNITIES EUR R ACC EUR 24.71COMGEST GROWTH EUROPE OPPORTUNITIES EUR DIS EUR 25.34COMGEST GROWTH EUROPE OPPORTUNITIES EUR Z ACC EUR 25.91MSCI Europe - Net Return* EUR -3.32
COMGEST GROWTH EUROPE OPPORTUNITIES EUR X ACC1 EUR 3.10MSCI Europe - Net Return* EUR 1.24
COMGEST GROWTH EUROPE OPPORTUNITIES USD I H ACC2 USD 21.87MSCI Europe 100% Hedged to USD - Net Return* USD 10.87
1inception date 10/12/20202inception date 16/06/2020*used for comparative purposes only
Commentary
Never in our 30-year history has the notion of quality been tested to the extent that it was in 2020 with the COVID-19 crisis.According to forecasts from the European Commission, European GDP will have fallen over 7%, the greatest decline inpeacetime history. But it was no normal crisis. Unlike past demand-driven crises, this crisis impacted both supply anddemand. Shops were closed, bars and restaurants unable to trade and planes were grounded. Many companies foundthemselves in the bizarre situation of having goods or services to sell, customers willing to purchase them, but nomechanism by which to supply them. The crisis tested all aspects of quality, from the defensiveness of revenue streams, thesoundness of balance sheets, to the ability to react to ever-changing business conditions. Following a massive sell-off inMarch, the unprecedented fiscal and monetary responses coupled with positive developments regarding the vaccinetowards the end of the year triggered a rally in global equity markets. Year-to-date, your fund comfortably outperformed theMSCI Europe index which ended the year down 3.3% in EUR (+5.4% in USD).
The quality approach was certainly beneficial to performance in 2020. For some names, the defensive nature of theirrevenue streams proved critical. The majority of the healthcare stocks in the portfolio held up well. Sartorius Stedim Biotechsaw a surge in demand from vaccine producers for its production equipment. Lonza looks set to benefit from the vaccinerollout as it is a key manufacturing partner to Moderna, while Ambu benefitted from even stronger demand for single-usesterile endoscopes. Some of the technology holdings performed strongly. Demand for ASML’s latest generation of EUVmachines remained robust, driving a dynamic 26% growth in 2020 earnings, according to our estimates. Adyen, the onlinepayments processor, also performed strongly as demand for online services accelerated. Overall, more than half of theportfolio holdings actually continued to generate positive earnings growth, some of them strongly.
For those with less defensive revenue streams, it was their ability to react to the crisis that stood them apart. Amplifon enteredthe crisis with relatively high debt levels and an exclusively retail presence, however its agile cost management and strongcash generation saw it ride out the crisis relatively unscathed. Apart from smoothly executing the integration of Panalpina,logistics company DSV Panalpina suffered a major drop in freight volume but managed to renegotiate higher freight rates.Teleperformance impressed with its ability to rapidly change to work-from-home mode for most of its employees, whilstreassuring clients regarding security protocols and increasing sales.
Finally, for some, the crisis created a once-in-a-lifetime opportunity to cement their leadership. Wizz Air took advantage ofcompetitor retrenchments to reduce its cost base further while announcing a confident programme for new route openings.We believe Wizz Air will emerge from the crisis stronger and better able to capitalise on the plentiful growth opportunitiesahead.
COMGEST GROWTH plc
COMGEST GROWTH EUROPE OPPORTUNITIESa fund of Comgest Growth plc
INVESTMENT MANAGER’S REPORTFOR THE FINANCIAL YEAR ENDED 31 DECEMBER 2020
52
The crisis was also an opportunity to test the ESG credentials of your holdings. Ferrari, like many portfolio holdings,continued to pay its staff in full even when production was suspended. Furthermore, the company provided testing facilitiesto employees, their families and suppliers while providing special assistance to any employee who tested positive. But itwasn’t just employees who were cared for: LVMH dedicated factories to produce hand sanitiser, which it then donated tohealth workers and associations. The crisis tested not only the financial strength of your holdings, but also their duty of care,whether it be to their employees, customers, suppliers or society at large.
The correction in spring 2020 gave us the opportunity to build positions in Campari, Symrise and LVMH. The fund alsoincreased positions in B&M, Capgemini, Temenos, Wizz Air, DSV Panalpina and Orpea. Later in the year, we initiatedpositions in TKH, Varta, Bakkafrost, Keywords Studios, Zalando and AstraZeneca. We sold out of companies such asSafran, Grenke and Edenred due to crisis-related uncertainties, whilst Wirecard was exited following the publication of aworrying forensic audit. Biomérieux and Sartorius Stedim were sold purely for valuation reasons. A volatile year and highlyheterogenous returns in the portfolio gave us the opportunity to adjust position sizes on valuation grounds: we notably tookprofits on names such Adyen, Ambu and Lonza.
At the time of writing, many countries across Europe have begun vaccinating their populations. The crisis is far from over, butthere is light at the end of the tunnel. Accordingly, attention is turning to the shape of the recovery with economistsforecasting a wide range of scenarios. Our conviction is that, as in past crises, it is the strong that will emerge stronger, thusfavouring a “K-shape recovery” scenario. Not only within sectors, but also across sectors, in a context of accelerated digitaland environmental transitions. Strong franchises in the hands of long-term managers see crises as long-term opportunitiesas much as they do short-term threats.
In 2020, your portfolio suffered its first earnings decline since its launch (albeit less than the market), and we expect a strongrebound in 2021 despite a currency headwind coming from a weaker US Dollar. Beyond that, we continue to see plentifulgrowth opportunities for the portfolio’s holdings. More than ever, we will continue to focus our attention on finding high quality,long-term winners able to flourish in the post COVID-19 world.
COMGEST GROWTH plc
53
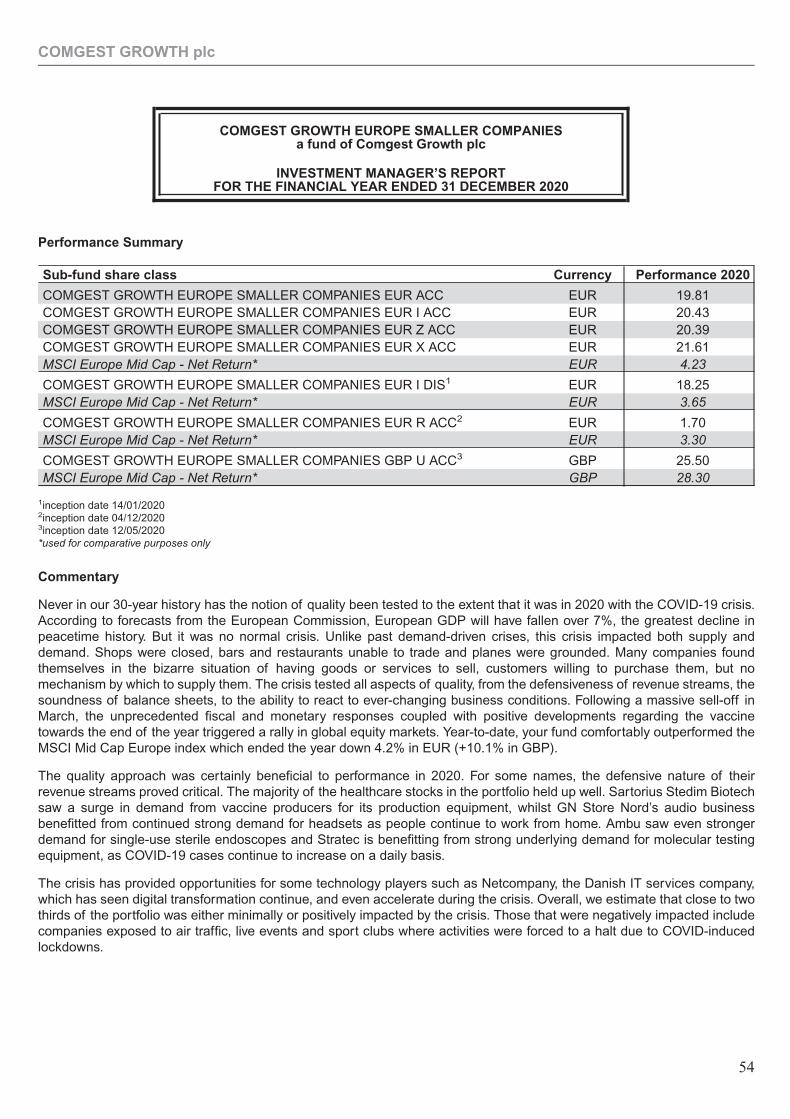
Performance Summary
Sub-fund share class Currency Performance 2020
COMGEST GROWTH EUROPE SMALLER COMPANIES EUR ACC EUR 19.81COMGEST GROWTH EUROPE SMALLER COMPANIES EUR I ACC EUR 20.43COMGEST GROWTH EUROPE SMALLER COMPANIES EUR Z ACC EUR 20.39COMGEST GROWTH EUROPE SMALLER COMPANIES EUR X ACC EUR 21.61MSCI Europe Mid Cap - Net Return* EUR 4.23
COMGEST GROWTH EUROPE SMALLER COMPANIES EUR I DIS1 EUR 18.25MSCI Europe Mid Cap - Net Return* EUR 3.65
COMGEST GROWTH EUROPE SMALLER COMPANIES EUR R ACC2 EUR 1.70MSCI Europe Mid Cap - Net Return* EUR 3.30
COMGEST GROWTH EUROPE SMALLER COMPANIES GBP U ACC3 GBP 25.50MSCI Europe Mid Cap - Net Return* GBP 28.30
1inception date 14/01/20202inception date 04/12/20203inception date 12/05/2020*used for comparative purposes only
Commentary
Never in our 30-year history has the notion of quality been tested to the extent that it was in 2020 with the COVID-19 crisis.According to forecasts from the European Commission, European GDP will have fallen over 7%, the greatest decline inpeacetime history. But it was no normal crisis. Unlike past demand-driven crises, this crisis impacted both supply anddemand. Shops were closed, bars and restaurants unable to trade and planes were grounded. Many companies foundthemselves in the bizarre situation of having goods or services to sell, customers willing to purchase them, but nomechanism by which to supply them. The crisis tested all aspects of quality, from the defensiveness of revenue streams, thesoundness of balance sheets, to the ability to react to ever-changing business conditions. Following a massive sell-off inMarch, the unprecedented fiscal and monetary responses coupled with positive developments regarding the vaccinetowards the end of the year triggered a rally in global equity markets. Year-to-date, your fund comfortably outperformed theMSCI Mid Cap Europe index which ended the year down 4.2% in EUR (+10.1% in GBP).
The quality approach was certainly beneficial to performance in 2020. For some names, the defensive nature of theirrevenue streams proved critical. The majority of the healthcare stocks in the portfolio held up well. Sartorius Stedim Biotechsaw a surge in demand from vaccine producers for its production equipment, whilst GN Store Nord’s audio businessbenefitted from continued strong demand for headsets as people continue to work from home. Ambu saw even strongerdemand for single-use sterile endoscopes and Stratec is benefitting from strong underlying demand for molecular testingequipment, as COVID-19 cases continue to increase on a daily basis.
The crisis has provided opportunities for some technology players such as Netcompany, the Danish IT services company,which has seen digital transformation continue, and even accelerate during the crisis. Overall, we estimate that close to twothirds of the portfolio was either minimally or positively impacted by the crisis. Those that were negatively impacted includecompanies exposed to air traffic, live events and sport clubs where activities were forced to a halt due to COVID-inducedlockdowns.
COMGEST GROWTH plc
COMGEST GROWTH EUROPE SMALLER COMPANIESa fund of Comgest Growth plc
INVESTMENT MANAGER’S REPORTFOR THE FINANCIAL YEAR ENDED 31 DECEMBER 2020
54
For some portfolio holdings, it was their ability to react to the crisis that stood them apart. Amplifon entered the crisis withrelatively high debt levels and an exclusively retail presence, however its agile cost management and strong cash generationsaw it ride out the crisis relatively unscathed. ICON showed resilience in an environment that was materially impacted whenit comes to site network availability and patient recruitment. Teleperformance impressed with its ability to rapidly move to awork-from-home mode for most of its employees, whilst reassuring clients regarding security protocols and increasing sales.
Finally, for some, the crisis created a once-in-a-lifetime opportunity to cement their leadership. Wizz Air took advantage ofcompetitor retrenchments to reduce its cost base further while announcing a confident programme for new route openings.We believe Wizz Air will emerge from the crisis stronger and better able to capitalise on the plentiful growth opportunitiesahead.
The crisis was also an opportunity for some companies to reflect about the environment, think longer term and strengthensustainability credentials. Sustainability is becoming central to all businesses and many of them are embracing moresustainable or circular models. Within fashion retail, Moncler on the one hand embraced a new strategy with the launch of itsBorn to Protect Sustainability Plan with key commitments across five pillars: 1) climate change; 2) think circular; 3) be fair; 4)nurture genius; and 5) give back. Boohoo on the other hand came under heavy pressure to enhance internal audits andgovernance to materially improve its supply chain quality.
The correction and continued uncertainty in spring 2020 gave us the opportunity to build positions in Vitrolife, Rational, NewWork, Dechra and Wizz Air. Later in the year, we initiated positions in Bakkafrost, Keywords Studios, Carl Zeiss and MIPS.We sold Grenke, Edenred, Eurofins and Dormakaba due to crisis and growth-related uncertainties. Sartorius Stedim wasliquidated for valuation and high market capitalisation reasons. A volatile year and highly heterogenous returns in theportfolio gave us the opportunity to adjust position sizes on valuation grounds: we notably took profits on names such Ambuand Straumann and increased others where we saw better value, such B&M, Orpea and Genus. We also reduced CTSEventim after its relatively quick recovery.
At the time of writing, many countries across Europe have begun vaccinating their populations. The crisis is far from over, butthere is light at the end of the tunnel. Accordingly, attention is turning to the shape of the recovery with economistsforecasting a wide range of scenarios. Our conviction is that, as in past crises, it is the strong that will emerge stronger, thusfavouring a “K-shape recovery” scenario. Not only within sectors, but also across sectors, in a context of accelerated digitaland environmental transitions. Strong franchises in the hands of long-term managers see crises as long-term opportunitiesas much as they do short-term threats.
Your portfolio suffered an earnings decline in 2020 (albeit less than the market), and we expect a strong rebound in2021 despite a currency headwind coming from a weaker US Dollar. Beyond that, we continue to see plentiful growthopportunities for the portfolio’s holdings. More than ever, we will continue to focus our attention on finding high quality,long-term winners able to flourish in the post COVID-19 world.
COMGEST GROWTH plc
55
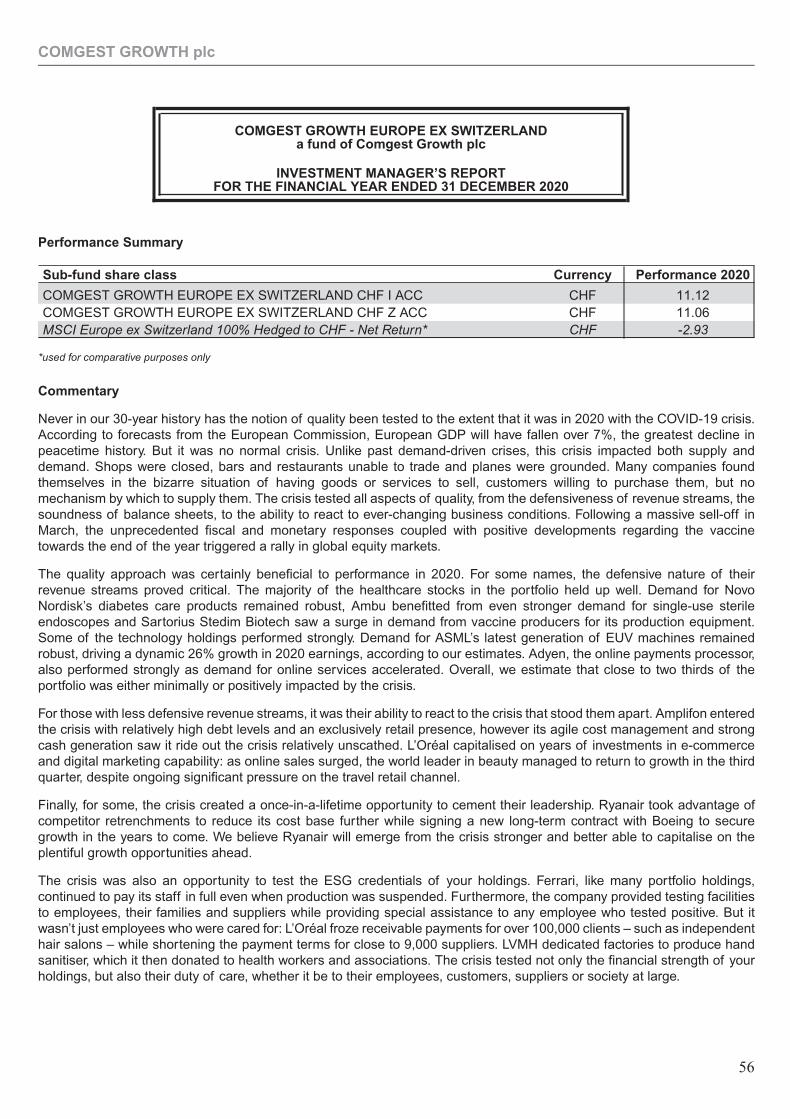
Performance Summary
Sub-fund share class Currency Performance 2020
COMGEST GROWTH EUROPE EX SWITZERLAND CHF I ACC CHF 11.12COMGEST GROWTH EUROPE EX SWITZERLAND CHF Z ACC CHF 11.06MSCI Europe ex Switzerland 100% Hedged to CHF - Net Return* CHF -2.93
*used for comparative purposes only
Commentary
Never in our 30-year history has the notion of quality been tested to the extent that it was in 2020 with the COVID-19 crisis.According to forecasts from the European Commission, European GDP will have fallen over 7%, the greatest decline inpeacetime history. But it was no normal crisis. Unlike past demand-driven crises, this crisis impacted both supply anddemand. Shops were closed, bars and restaurants unable to trade and planes were grounded. Many companies foundthemselves in the bizarre situation of having goods or services to sell, customers willing to purchase them, but nomechanism by which to supply them. The crisis tested all aspects of quality, from the defensiveness of revenue streams, thesoundness of balance sheets, to the ability to react to ever-changing business conditions. Following a massive sell-off inMarch, the unprecedented fiscal and monetary responses coupled with positive developments regarding the vaccinetowards the end of the year triggered a rally in global equity markets.
The quality approach was certainly beneficial to performance in 2020. For some names, the defensive nature of theirrevenue streams proved critical. The majority of the healthcare stocks in the portfolio held up well. Demand for NovoNordisk’s diabetes care products remained robust, Ambu benefitted from even stronger demand for single-use sterileendoscopes and Sartorius Stedim Biotech saw a surge in demand from vaccine producers for its production equipment.Some of the technology holdings performed strongly. Demand for ASML’s latest generation of EUV machines remainedrobust, driving a dynamic 26% growth in 2020 earnings, according to our estimates. Adyen, the online payments processor,also performed strongly as demand for online services accelerated. Overall, we estimate that close to two thirds of theportfolio was either minimally or positively impacted by the crisis.
For those with less defensive revenue streams, it was their ability to react to the crisis that stood them apart. Amplifon enteredthe crisis with relatively high debt levels and an exclusively retail presence, however its agile cost management and strongcash generation saw it ride out the crisis relatively unscathed. L’Oréal capitalised on years of investments in e-commerceand digital marketing capability: as online sales surged, the world leader in beauty managed to return to growth in the thirdquarter, despite ongoing significant pressure on the travel retail channel.
Finally, for some, the crisis created a once-in-a-lifetime opportunity to cement their leadership. Ryanair took advantage ofcompetitor retrenchments to reduce its cost base further while signing a new long-term contract with Boeing to securegrowth in the years to come. We believe Ryanair will emerge from the crisis stronger and better able to capitalise on theplentiful growth opportunities ahead.
The crisis was also an opportunity to test the ESG credentials of your holdings. Ferrari, like many portfolio holdings,continued to pay its staff in full even when production was suspended. Furthermore, the company provided testing facilitiesto employees, their families and suppliers while providing special assistance to any employee who tested positive. But itwasn’t just employees who were cared for: L’Oréal froze receivable payments for over 100,000 clients – such as independenthair salons – while shortening the payment terms for close to 9,000 suppliers. LVMH dedicated factories to produce handsanitiser, which it then donated to health workers and associations. The crisis tested not only the financial strength of yourholdings, but also their duty of care, whether it be to their employees, customers, suppliers or society at large.
COMGEST GROWTH plc
COMGEST GROWTH EUROPE EX SWITZERLANDa fund of Comgest Growth plc
INVESTMENT MANAGER’S REPORTFOR THE FINANCIAL YEAR ENDED 31 DECEMBER 2020
56
The correction in spring 2020 gave us the opportunity to build new positions in SimCorp, a software vendor, and inTeleperformance, the global leader in customer relations outsourcing. Later in the year we initiated a position in the recentlylisted technology company Prosus, which owns a sizable stake in the Chinese internet company Tencent. We also initiatedpositions in AstraZeneca, B&M and Linde plc, the industrial gases company, on the back of a resilient business model withhigh barriers to entry, a performance culture inherited from Praxair and a medium to long-term optionality, notably withregards to hydrogen. We sold out of Fresenius, Sartorius Stedim, Grenke, Eurofins, Edenred and Genmab.
A volatile year and highly heterogenous returns in the portfolio gave us the opportunity to adjust position sizes on valuationgrounds: we notably took profits on names such as Chr. Hansen, L’Oréal, Coloplast and Ambu. Conversely, early in the yearwe added to positions such as Adyen, Campari, Jeronimo Martins, MTU and Orpea.
At the time of writing, many countries across Europe have begun vaccinating their populations. The crisis is far from over, butthere is light at the end of the tunnel. Accordingly, attention is turning to the shape of the recovery with economistsforecasting a wide range of scenarios. Our conviction is that, as in past crises, it is the strong that will emerge stronger, thusfavouring a “K-shape recovery” scenario. Not only within sectors, but also across sectors, in a context of accelerated digitaland environmental transitions. Strong franchises in the hands of long-term managers see crises as long-term opportunitiesas much as they do short-term threats.
Your portfolio suffered an uncharacteristic earnings decline in 2020 (albeit less than the market), and we expect a strongrebound in 2021 despite a currency headwind coming from a weaker US Dollar. Beyond that, we continue to see plentifulgrowth opportunities for the portfolio’s holdings. More than ever, we will continue to focus our attention on finding high quality,long-term winners able to flourish in the post COVID-19 world.
COMGEST GROWTH plc
57
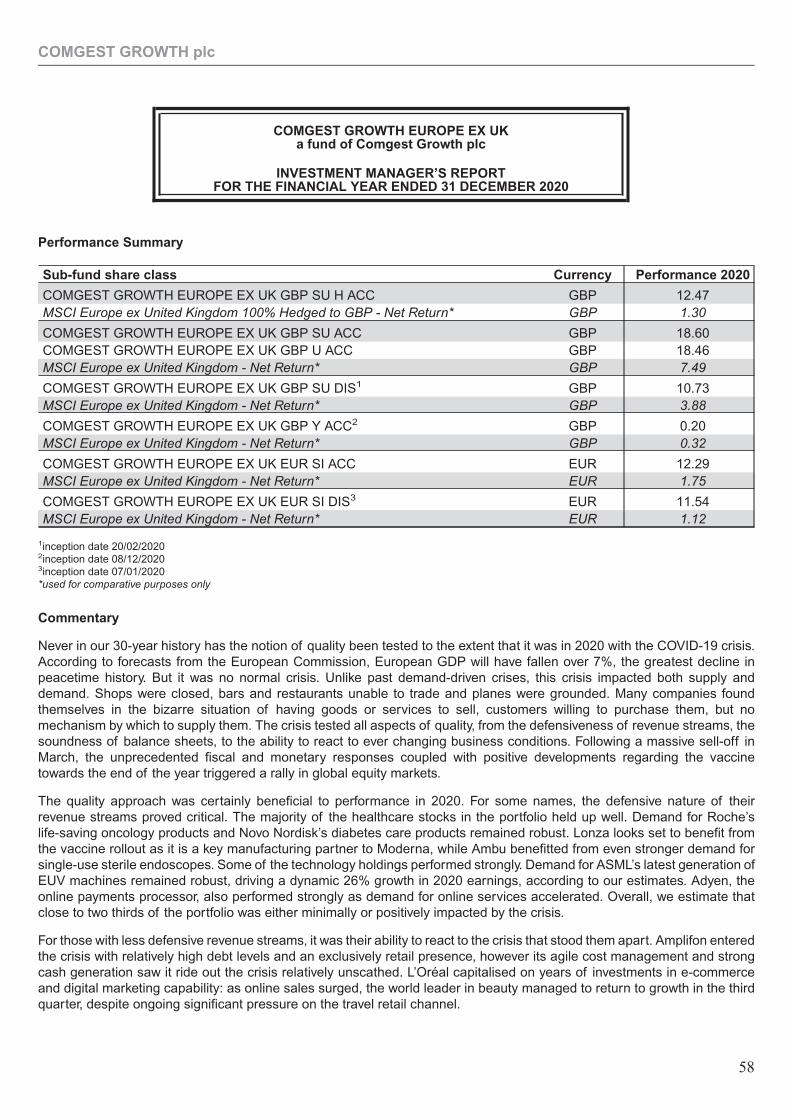
Performance Summary
Sub-fund share class Currency Performance 2020
COMGEST GROWTH EUROPE EX UK GBP SU H ACC GBP 12.47MSCI Europe ex United Kingdom 100% Hedged to GBP - Net Return* GBP 1.30
COMGEST GROWTH EUROPE EX UK GBP SU ACC GBP 18.60COMGEST GROWTH EUROPE EX UK GBP U ACC GBP 18.46MSCI Europe ex United Kingdom - Net Return* GBP 7.49
COMGEST GROWTH EUROPE EX UK GBP SU DIS1 GBP 10.73MSCI Europe ex United Kingdom - Net Return* GBP 3.88
COMGEST GROWTH EUROPE EX UK GBP Y ACC2 GBP 0.20MSCI Europe ex United Kingdom - Net Return* GBP 0.32
COMGEST GROWTH EUROPE EX UK EUR SI ACC EUR 12.29MSCI Europe ex United Kingdom - Net Return* EUR 1.75
COMGEST GROWTH EUROPE EX UK EUR SI DIS3 EUR 11.54MSCI Europe ex United Kingdom - Net Return* EUR 1.12
1inception date 20/02/20202inception date 08/12/20203inception date 07/01/2020*used for comparative purposes only
Commentary
Never in our 30-year history has the notion of quality been tested to the extent that it was in 2020 with the COVID-19 crisis.According to forecasts from the European Commission, European GDP will have fallen over 7%, the greatest decline inpeacetime history. But it was no normal crisis. Unlike past demand-driven crises, this crisis impacted both supply anddemand. Shops were closed, bars and restaurants unable to trade and planes were grounded. Many companies foundthemselves in the bizarre situation of having goods or services to sell, customers willing to purchase them, but nomechanism by which to supply them. The crisis tested all aspects of quality, from the defensiveness of revenue streams, thesoundness of balance sheets, to the ability to react to ever changing business conditions. Following a massive sell-off inMarch, the unprecedented fiscal and monetary responses coupled with positive developments regarding the vaccinetowards the end of the year triggered a rally in global equity markets.
The quality approach was certainly beneficial to performance in 2020. For some names, the defensive nature of theirrevenue streams proved critical. The majority of the healthcare stocks in the portfolio held up well. Demand for Roche’slife-saving oncology products and Novo Nordisk’s diabetes care products remained robust. Lonza looks set to benefit fromthe vaccine rollout as it is a key manufacturing partner to Moderna, while Ambu benefitted from even stronger demand forsingle-use sterile endoscopes. Some of the technology holdings performed strongly. Demand for ASML’s latest generation ofEUV machines remained robust, driving a dynamic 26% growth in 2020 earnings, according to our estimates. Adyen, theonline payments processor, also performed strongly as demand for online services accelerated. Overall, we estimate thatclose to two thirds of the portfolio was either minimally or positively impacted by the crisis.
For those with less defensive revenue streams, it was their ability to react to the crisis that stood them apart. Amplifon enteredthe crisis with relatively high debt levels and an exclusively retail presence, however its agile cost management and strongcash generation saw it ride out the crisis relatively unscathed. L’Oréal capitalised on years of investments in e-commerceand digital marketing capability: as online sales surged, the world leader in beauty managed to return to growth in the thirdquarter, despite ongoing significant pressure on the travel retail channel.
COMGEST GROWTH plc
COMGEST GROWTH EUROPE EX UKa fund of Comgest Growth plc
INVESTMENT MANAGER’S REPORTFOR THE FINANCIAL YEAR ENDED 31 DECEMBER 2020
58
Finally, for some, the crisis created a once-in-a-lifetime opportunity to cement their leadership. Ryanair took advantage ofcompetitor retrenchments to reduce its cost base further while signing a new long-term contract with Boeing to securegrowth in the years to come. We believe Ryanair will emerge from the crisis stronger and better able to capitalise on theplentiful growth opportunities ahead.
The crisis was also an opportunity to test the ESG credentials of your holdings. Ferrari, like many portfolio holdings,continued to pay its staff in full even when production was suspended. Furthermore, the company provided testing facilitiesto employees, their families and suppliers while providing special assistance to any employee who tested positive. But itwasn’t just employees who were cared for: L’Oréal froze receivable payments for over 100,000 clients – such as independenthair salons – while shortening the payment terms for close to 9,000 suppliers. LVMH dedicated factories to produce handsanitiser, which it then donated to health workers and associations. The crisis tested not only the financial strength of yourholdings, but also their duty of care, whether it be to their employees, customers, suppliers or society at large.
In 2020, we added three names to the portfolio and exited two. The spring correction gave us the opportunity to buildpositions in the luxury group LVMH and in Teleperformance, the global leader in customer relations outsourcing. Later in theyear, we initiated a position in the recently listed technology company Prosus, which owns a sizable stake in the Chineseinternet company Tencent. We sold out of Fresenius and Eurofins.
A volatile year and highly heterogenous returns in the portfolio gave us the opportunity to adjust position sizes on valuationgrounds: we notably took profits on names such as Lonza, Coloplast, Sartorius Stedim and Ambu. Conversely, early in theyear we added to positions such as Ferrari, Campari and Amplifon.
At the time of writing, many countries across Europe have begun vaccinating their populations. The crisis is far from over, butthere is light at the end of the tunnel. Accordingly, attention is turning to the shape of the recovery with economistsforecasting a wide range of scenarios. Our conviction is that, as in past crises, it is the strong that will emerge stronger, thusfavouring a “K-shape recovery” scenario. Not only within sectors, but also across sectors, in a context of accelerated digitaland environmental transitions. Strong franchises in the hands of long-term managers see crises as long-term opportunitiesas much as they do short-term threats.
Your portfolio suffered an uncharacteristic earnings decline in 2020 (albeit less than the market), and we expect a strongrebound in 2021 despite a currency headwind coming from a weaker US Dollar. Beyond that, we continue to see plentifulgrowth opportunities for the portfolio’s holdings. More than ever, we will continue to focus our attention on finding high quality,long-term winners able to flourish in the post COVID-19 world.
COMGEST GROWTH plc
59
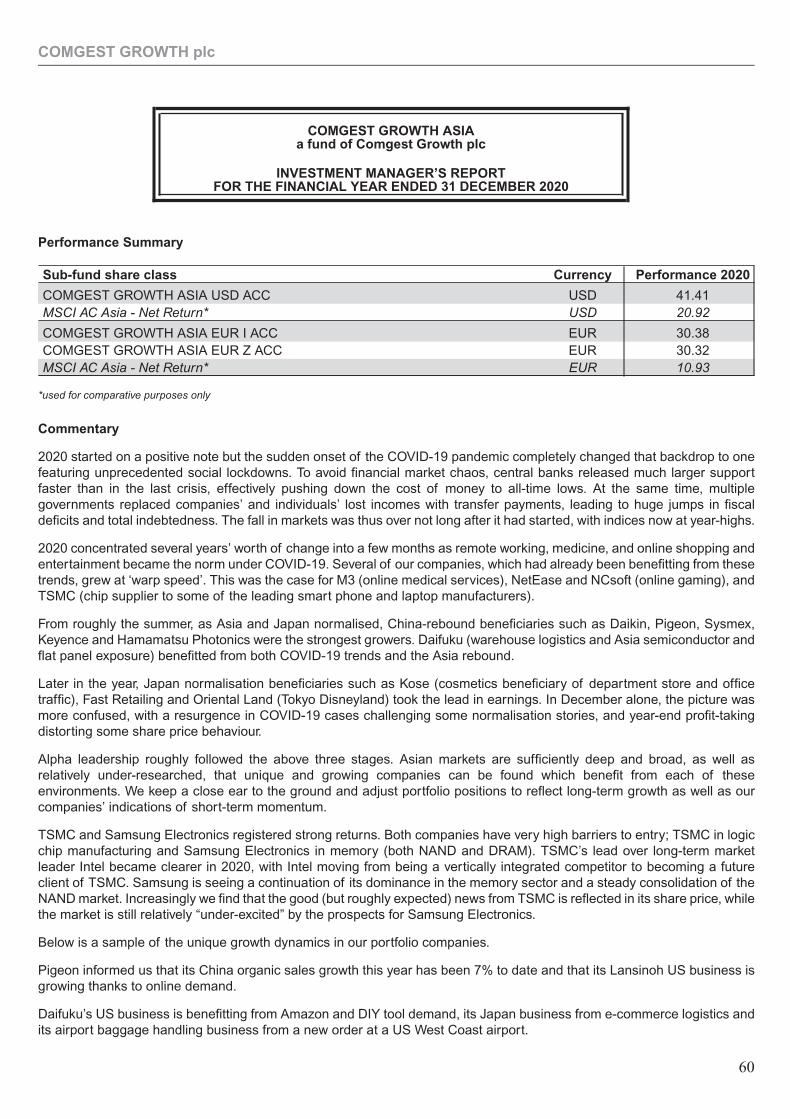
Performance Summary
Sub-fund share class Currency Performance 2020
COMGEST GROWTH ASIA USD ACC USD 41.41MSCI AC Asia - Net Return* USD 20.92
COMGEST GROWTH ASIA EUR I ACC EUR 30.38COMGEST GROWTH ASIA EUR Z ACC EUR 30.32MSCI AC Asia - Net Return* EUR 10.93
*used for comparative purposes only
Commentary
2020 started on a positive note but the sudden onset of the COVID-19 pandemic completely changed that backdrop to onefeaturing unprecedented social lockdowns. To avoid financial market chaos, central banks released much larger supportfaster than in the last crisis, effectively pushing down the cost of money to all-time lows. At the same time, multiplegovernments replaced companies’ and individuals’ lost incomes with transfer payments, leading to huge jumps in fiscaldeficits and total indebtedness. The fall in markets was thus over not long after it had started, with indices now at year-highs.
2020 concentrated several years’ worth of change into a few months as remote working, medicine, and online shopping andentertainment became the norm under COVID-19. Several of our companies, which had already been benefitting from thesetrends, grew at ‘warp speed’. This was the case for M3 (online medical services), NetEase and NCsoft (online gaming), andTSMC (chip supplier to some of the leading smart phone and laptop manufacturers).
From roughly the summer, as Asia and Japan normalised, China-rebound beneficiaries such as Daikin, Pigeon, Sysmex,Keyence and Hamamatsu Photonics were the strongest growers. Daifuku (warehouse logistics and Asia semiconductor andflat panel exposure) benefitted from both COVID-19 trends and the Asia rebound.
Later in the year, Japan normalisation beneficiaries such as Kose (cosmetics beneficiary of department store and officetraffic), Fast Retailing and Oriental Land (Tokyo Disneyland) took the lead in earnings. In December alone, the picture wasmore confused, with a resurgence in COVID-19 cases challenging some normalisation stories, and year-end profit-takingdistorting some share price behaviour.
Alpha leadership roughly followed the above three stages. Asian markets are sufficiently deep and broad, as well asrelatively under-researched, that unique and growing companies can be found which benefit from each of theseenvironments. We keep a close ear to the ground and adjust portfolio positions to reflect long-term growth as well as ourcompanies’ indications of short-term momentum.
TSMC and Samsung Electronics registered strong returns. Both companies have very high barriers to entry; TSMC in logicchip manufacturing and Samsung Electronics in memory (both NAND and DRAM). TSMC’s lead over long-term marketleader Intel became clearer in 2020, with Intel moving from being a vertically integrated competitor to becoming a futureclient of TSMC. Samsung is seeing a continuation of its dominance in the memory sector and a steady consolidation of theNAND market. Increasingly we find that the good (but roughly expected) news from TSMC is reflected in its share price, whilethe market is still relatively “under-excited” by the prospects for Samsung Electronics.
Below is a sample of the unique growth dynamics in our portfolio companies.
Pigeon informed us that its China organic sales growth this year has been 7% to date and that its Lansinoh US business isgrowing thanks to online demand.
Daifuku’s US business is benefitting from Amazon and DIY tool demand, its Japan business from e-commerce logistics andits airport baggage handling business from a new order at a US West Coast airport.
COMGEST GROWTH plc
COMGEST GROWTH ASIAa fund of Comgest Growth plc
INVESTMENT MANAGER’S REPORTFOR THE FINANCIAL YEAR ENDED 31 DECEMBER 2020
60
Hikari Tsushin has ten or so new product areas in incubation, although it is not yet confident that any can be as big as itscurrent ones.
Detractors to performance included health insurer Ping An, which suffered from a lack of face-to-face meetings to sell itsproducts, and 3SBio, which was affected by the government’s efforts to cut costs in the Chinese healthcare system.
We sold positions in which we had less conviction and which we believed would be relatively hard hit by the crisis, namelySuzuki Motors, Yamaha Corporation and Samsonite. We replaced them with stronger franchises that would be beneficiariesof the COVID-19 crisis: Alibaba, Shimano (a former holding which re-entered the portfolio following our conviction that itsprincipal market of European sports bicycles has returned to growth) and Cheil Worldwide (a Korean advertising agency thatbenefits from a pick-up in marketing spending by the Samsung Group).
Commentators talk about deglobalisation, but Japan has just signed the Regional Comprehensive Economic Partnershipwith its Asian neighbours, a wide-ranging pact with the UK, and in 2019 a similarly broad agreement with the EU. Japan’sability to export its technology and brands especially along the ‘Silk Road’, its historical and natural conduit to Asia, seemssecure; and Japanese equities are rightly becoming understood as a platform to invest in Asian growth.
At the same time, Japan’s changes of regulation, governance and society itself continue under their own momentum,catalysed by the returning domestic investor and encouraged by a government which changed leadership in 2020 soseamlessly that the market barely noticed. They offer another rich hunting ground for investment candidates which benefitfrom these changes, as providers of transforming services, as consolidators, as shareholder-oriented managements often –paradoxical as it may sound - because of family ownership.
Berkshire Hathaway’s arrival in Japan symbolises the foreign investor’s growing awareness of these opportunities. ActiveJapan funds have now beaten the S&P 500 index over five years or more, even though the Nikkei index is the only majorindex still below its all-time high (although it is heading steadily towards it).
We are positive on Asian markets and our stocks in particular. Clearly the pandemic has hit every economy to some extent,but in Asia we have seen social restraint combined with an aggregate fiscal reaction which has been relatively moreconstrained than in Developed Markets. This will likely turn out to be a blessing over time: no country can grow rich on debtor the printing of money.
Companies across Asia, thanks to much healthier balance sheets, withstood the extreme challenges well. Earnings PerShare (EPS) fell less than in past recessions and are now better placed to grow long term.
Our decade-plus office presence in Japan, Hong Kong and Singapore, along with our multi-decade experience in Asia andour template for finding unique and inherently growing companies, support our search for the best companies in the region.
COMGEST GROWTH plc
61
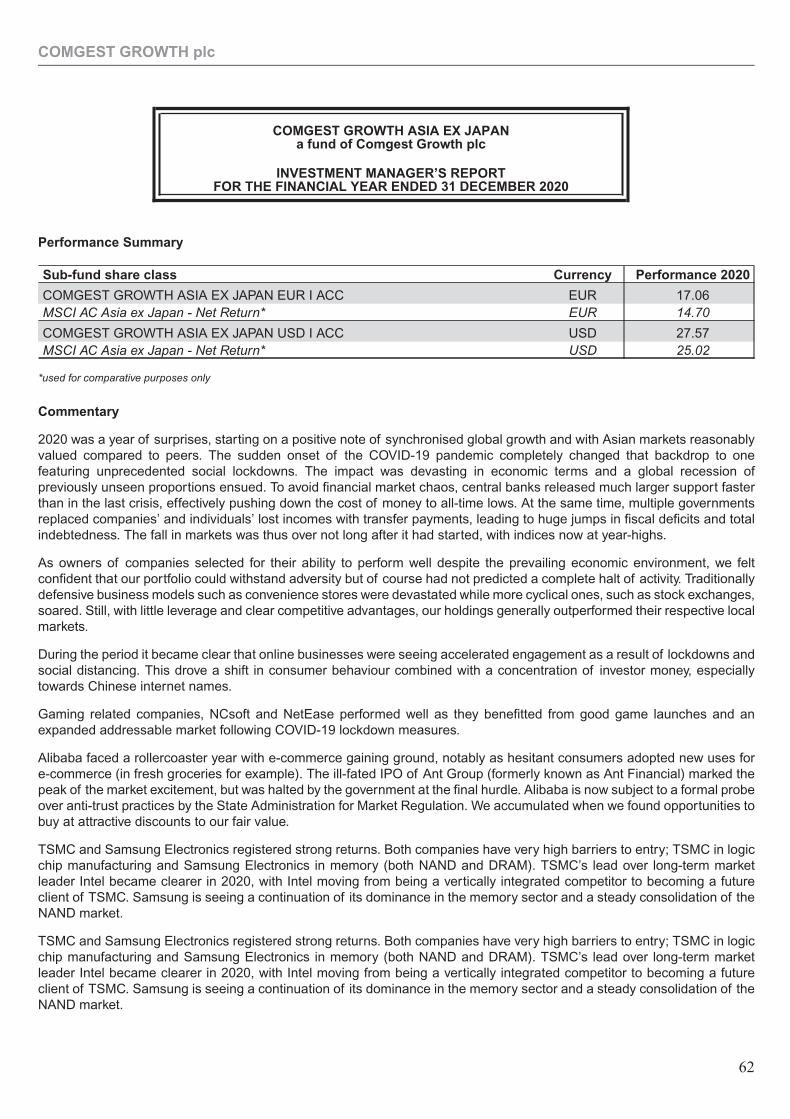
Performance Summary
Sub-fund share class Currency Performance 2020
COMGEST GROWTH ASIA EX JAPAN EUR I ACC EUR 17.06MSCI AC Asia ex Japan - Net Return* EUR 14.70
COMGEST GROWTH ASIA EX JAPAN USD I ACC USD 27.57MSCI AC Asia ex Japan - Net Return* USD 25.02
*used for comparative purposes only
Commentary
2020 was a year of surprises, starting on a positive note of synchronised global growth and with Asian markets reasonablyvalued compared to peers. The sudden onset of the COVID-19 pandemic completely changed that backdrop to onefeaturing unprecedented social lockdowns. The impact was devasting in economic terms and a global recession ofpreviously unseen proportions ensued. To avoid financial market chaos, central banks released much larger support fasterthan in the last crisis, effectively pushing down the cost of money to all-time lows. At the same time, multiple governmentsreplaced companies’ and individuals’ lost incomes with transfer payments, leading to huge jumps in fiscal deficits and totalindebtedness. The fall in markets was thus over not long after it had started, with indices now at year-highs.
As owners of companies selected for their ability to perform well despite the prevailing economic environment, we feltconfident that our portfolio could withstand adversity but of course had not predicted a complete halt of activity. Traditionallydefensive business models such as convenience stores were devastated while more cyclical ones, such as stock exchanges,soared. Still, with little leverage and clear competitive advantages, our holdings generally outperformed their respective localmarkets.
During the period it became clear that online businesses were seeing accelerated engagement as a result of lockdowns andsocial distancing. This drove a shift in consumer behaviour combined with a concentration of investor money, especiallytowards Chinese internet names.
Gaming related companies, NCsoft and NetEase performed well as they benefitted from good game launches and anexpanded addressable market following COVID-19 lockdown measures.
Alibaba faced a rollercoaster year with e-commerce gaining ground, notably as hesitant consumers adopted new uses fore-commerce (in fresh groceries for example). The ill-fated IPO of Ant Group (formerly known as Ant Financial) marked thepeak of the market excitement, but was halted by the government at the final hurdle. Alibaba is now subject to a formal probeover anti-trust practices by the State Administration for Market Regulation. We accumulated when we found opportunities tobuy at attractive discounts to our fair value.
TSMC and Samsung Electronics registered strong returns. Both companies have very high barriers to entry; TSMC in logicchip manufacturing and Samsung Electronics in memory (both NAND and DRAM). TSMC’s lead over long-term marketleader Intel became clearer in 2020, with Intel moving from being a vertically integrated competitor to becoming a futureclient of TSMC. Samsung is seeing a continuation of its dominance in the memory sector and a steady consolidation of theNAND market.
TSMC and Samsung Electronics registered strong returns. Both companies have very high barriers to entry; TSMC in logicchip manufacturing and Samsung Electronics in memory (both NAND and DRAM). TSMC’s lead over long-term marketleader Intel became clearer in 2020, with Intel moving from being a vertically integrated competitor to becoming a futureclient of TSMC. Samsung is seeing a continuation of its dominance in the memory sector and a steady consolidation of theNAND market.
COMGEST GROWTH plc
COMGEST GROWTH ASIA EX JAPANa fund of Comgest Growth plc
INVESTMENT MANAGER’S REPORTFOR THE FINANCIAL YEAR ENDED 31 DECEMBER 2020
62
The insurance sector as a whole was also weak operationally. We expected that demand for protection would be robust, orperhaps even strong, in the face of a pandemic. However, partly affected by a lack of face-to-face meetings and partly by aneed for cashflow, protection sales were slow in 2020. As a result, Ping An and China Life contributed negatively to fundperformance in 2020, although AIA posted a solid performance. Structurally we believe the growth profile remains robust forthe longer term.
The Chinese healthcare sector was volatile during 2020 as the government continued to work to reduce the layers of costsin the system. The results for the portfolio were mixed: Shandong Weigao, the medical consumables company, was verystrong, but 3SBio’s stock price suffered on market concerns about the additional price cuts taken by the group, which webelieve will result in revenue growth from significant volume increases. We used similar volatility to continue to accumulateLepu Medical Technology, which manufactures cardiovascular devices.
We looked for outliers all year. In February that meant trimming some names which seemed to be immune to bad news, thenin March and April accumulating companies with robust roadmaps that were being overly discounted. We sold Catcher and58.com due to corporate events and exited Samsung Life, Focus Media, Zhengzhou Yutong Bus and Shriram Transport dueto operational uncertainty. Naver was liquidated on valuation whilst Hangzhou Hikvision was sold on ESG grounds. Newpositions were initiated in Housing Development Finance Corporation Limited, Cheil Worldwide, Lepu Medical Technlogy,Suofeiya Home Collection and L’Occitane. The fund increased its positions in Alibaba, Samsung Electronics, Suzuki Motor,Orion Corp and Vinamilk, while Power Grid, TSMC and NetEase were reduced to fund these purchases.
Investing responsibly is a considerable challenge globally today. With the environment so framed by monetary excesses,economic extremes, financial distortions, accelerating ecologic trends and blatant shortcomings in governance, it can behard to tell dream from reality. Yet, we are positive on Asian markets and our stocks in particular. Clearly the pandemic has hitevery economy to some extent, but in Asia we have seen social restraint combined with aggregate fiscal reaction being moreconstrained than in developed markets. This will likely turn out to be a blessing over time: no country grows rich on debt or theprinting of money.
Companies across Asia, thanks to much healthier balance sheets, withstood the extreme challenges well. Earnings PerShare (EPS) fell less than in past recessions and are now better placed to grow long term.
Of course, the fund’s concentrated portfolio of carefully selected quality growth companies represents just a small part ofthe broader market. With hindsight, we capped our exposure prematurely - but consistent with time-tested risk managementprinciples - in several increasingly fully-valued companies, while acquiring future upside from other strong franchises in lessfashionable but steadily growing areas of our universe. The result was a de-rating of the fund vs a market where returns werehighly concentrated, even within our specific style.
As illustrated by ours, it is possible to build a portfolio with robust EPS growth prospects from quality companies with above-average ESG credentials (and thus lower risk) at multiples that are attractive both vs history and the broader market. Weexpect the de-rating to reverse as investor interest broadens thanks to an economic normalisation, allowing for the fund’sstronger fundamentals to visibly play out in 2021 and beyond.
COMGEST GROWTH plc
63
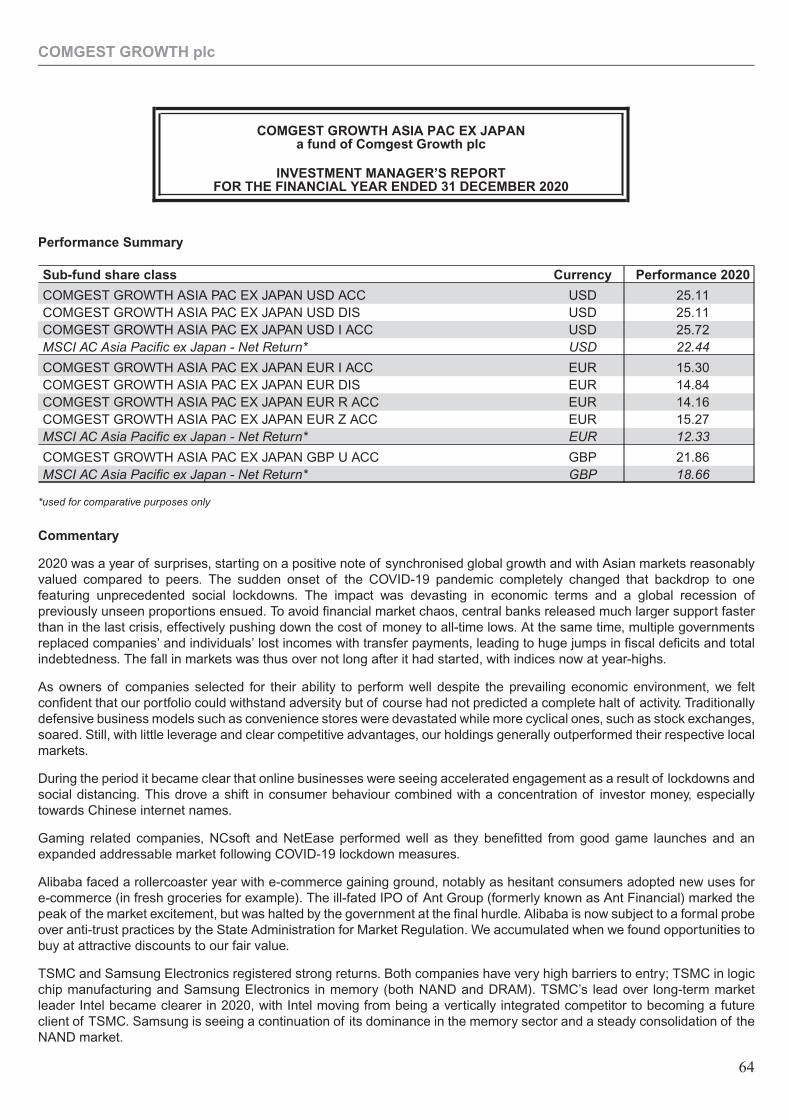
Performance Summary
Sub-fund share class Currency Performance 2020
COMGEST GROWTH ASIA PAC EX JAPAN USD ACC USD 25.11COMGEST GROWTH ASIA PAC EX JAPAN USD DIS USD 25.11COMGEST GROWTH ASIA PAC EX JAPAN USD I ACC USD 25.72MSCI AC Asia Pacific ex Japan - Net Return* USD 22.44
COMGEST GROWTH ASIA PAC EX JAPAN EUR I ACC EUR 15.30COMGEST GROWTH ASIA PAC EX JAPAN EUR DIS EUR 14.84COMGEST GROWTH ASIA PAC EX JAPAN EUR R ACC EUR 14.16COMGEST GROWTH ASIA PAC EX JAPAN EUR Z ACC EUR 15.27MSCI AC Asia Pacific ex Japan - Net Return* EUR 12.33
COMGEST GROWTH ASIA PAC EX JAPAN GBP U ACC GBP 21.86MSCI AC Asia Pacific ex Japan - Net Return* GBP 18.66
*used for comparative purposes only
Commentary
2020 was a year of surprises, starting on a positive note of synchronised global growth and with Asian markets reasonablyvalued compared to peers. The sudden onset of the COVID-19 pandemic completely changed that backdrop to onefeaturing unprecedented social lockdowns. The impact was devasting in economic terms and a global recession ofpreviously unseen proportions ensued. To avoid financial market chaos, central banks released much larger support fasterthan in the last crisis, effectively pushing down the cost of money to all-time lows. At the same time, multiple governmentsreplaced companies’ and individuals’ lost incomes with transfer payments, leading to huge jumps in fiscal deficits and totalindebtedness. The fall in markets was thus over not long after it had started, with indices now at year-highs.
As owners of companies selected for their ability to perform well despite the prevailing economic environment, we feltconfident that our portfolio could withstand adversity but of course had not predicted a complete halt of activity. Traditionallydefensive business models such as convenience stores were devastated while more cyclical ones, such as stock exchanges,soared. Still, with little leverage and clear competitive advantages, our holdings generally outperformed their respective localmarkets.
During the period it became clear that online businesses were seeing accelerated engagement as a result of lockdowns andsocial distancing. This drove a shift in consumer behaviour combined with a concentration of investor money, especiallytowards Chinese internet names.
Gaming related companies, NCsoft and NetEase performed well as they benefitted from good game launches and anexpanded addressable market following COVID-19 lockdown measures.
Alibaba faced a rollercoaster year with e-commerce gaining ground, notably as hesitant consumers adopted new uses fore-commerce (in fresh groceries for example). The ill-fated IPO of Ant Group (formerly known as Ant Financial) marked thepeak of the market excitement, but was halted by the government at the final hurdle. Alibaba is now subject to a formal probeover anti-trust practices by the State Administration for Market Regulation. We accumulated when we found opportunities tobuy at attractive discounts to our fair value.
TSMC and Samsung Electronics registered strong returns. Both companies have very high barriers to entry; TSMC in logicchip manufacturing and Samsung Electronics in memory (both NAND and DRAM). TSMC’s lead over long-term marketleader Intel became clearer in 2020, with Intel moving from being a vertically integrated competitor to becoming a futureclient of TSMC. Samsung is seeing a continuation of its dominance in the memory sector and a steady consolidation of theNAND market.
COMGEST GROWTH plc
COMGEST GROWTH ASIA PAC EX JAPANa fund of Comgest Growth plc
INVESTMENT MANAGER’S REPORTFOR THE FINANCIAL YEAR ENDED 31 DECEMBER 2020
64
Samsonite was among the performance detractors over the period. The spread of COVID-19 saw a shut-down in globalluggage sales. The market quickly discounted a ‘burnt earth scenario’. We worked hard to ensure we understood thecompany’s cash flows and debt management situation to reach the conclusion that Samsonite was unlikely to facebankruptcy under most scenarios and as such, the market was being overly negative. We accumulated lightly during theperiod of market distress and the share price has rebounded off its lows but still remains down.
The insurance sector as a whole was also weak operationally. We expected that demand for protection would be robust, orperhaps even strong, in the face of a pandemic. However, partly affected by a lack of face-to-face meetings and partly by aneed for cashflow, protection sales were slow in 2020. As a result, Ping An and China Life contributed negatively to fundperformance in 2020, although AIA posted a solid performance. Structurally we believe the growth profile remains robust forthe longer term.
The Chinese healthcare sector was volatile during 2020 as the government continued to work to reduce the layers of costsin the system. The results for the portfolio were mixed: Shandong Weigao, the medical consumables company, was verystrong, but 3SBio’s stock price suffered on market concerns about the additional price cuts taken by the group, which webelieve will result in revenue growth from significant volume increases. We used similar volatility to continue to accumulateLepu Medical Technology, which manufactures cardiovascular devices.
We looked for outliers all year. In February that meant trimming some names which seemed to be immune to bad news, thenin March and April accumulating companies with robust roadmaps that were being overly discounted. We sold Catcher and58.com due to corporate events and exited Samsung Life, Focus Media, Zhengzhou Yutong Bus and Shriram Transport dueto operational uncertainty. Naver was liquidated on valuation whilst Hangzhou Hikvision was sold on ESG grounds. Newpositions were initiated in Housing Development Finance Corporation Limited, Cheil Worldwide, Lepu Medical Technology,Suofeiya Home Collection and L’Occitane. The fund increased its positions in Alibaba, Suzuki Motor, Orion Corp andVinamilk, while Power Grid, TSMC and NetEase were reduced to fund these purchases.
Investing responsibly is a considerable challenge globally today. With the environment so framed by monetary excesses,economic extremes, financial distortions, accelerating ecologic trends and blatant shortcomings in governance, it can behard to tell dream from reality. Yet, we are positive on Asian markets and our stocks in particular. Clearly the pandemic has hitevery economy to some extent, but in Asia we have seen social restraint combined with aggregate fiscal reaction being moreconstrained than in developed markets. This will likely turn out to be a blessing over time: no country grows rich on debt or theprinting of money.
Companies across Asia, thanks to much healthier balance sheets, withstood the extreme challenges well. Earnings PerShare (EPS) fell less than in past recessions and are now better placed to grow long term.
Of course, the fund’s concentrated portfolio of carefully selected quality growth companies represents just a small part ofthe broader market. With hindsight, we capped our exposure prematurely - but consistent with time-tested risk managementprinciples - in several increasingly fully-valued companies, while acquiring future upside from other strong franchises in lessfashionable but steadily growing areas of our universe. The result was a de-rating of the fund vs a market where returns werehighly concentrated, even within our specific style.
As illustrated by ours, it is possible to build a portfolio with robust EPS growth prospects from quality companies with above-average ESG credentials (and thus lower risk) at multiples that are attractive both vs history and the broader market. Weexpect the de-rating to reverse as investor interest broadens thanks to an economic normalisation, allowing for the fund’sstronger fundamentals to visibly play out in 2021 and beyond.
COMGEST GROWTH plc
65
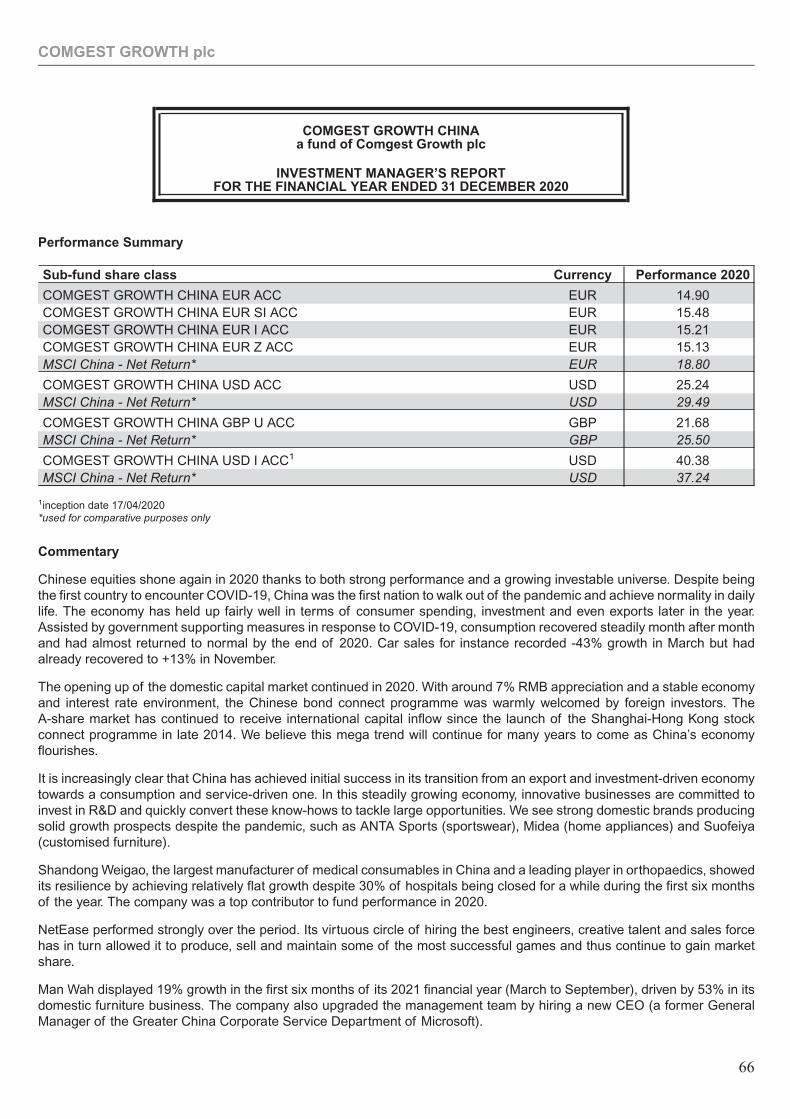
Performance Summary
Sub-fund share class Currency Performance 2020
COMGEST GROWTH CHINA EUR ACC EUR 14.90COMGEST GROWTH CHINA EUR SI ACC EUR 15.48COMGEST GROWTH CHINA EUR I ACC EUR 15.21COMGEST GROWTH CHINA EUR Z ACC EUR 15.13MSCI China - Net Return* EUR 18.80
COMGEST GROWTH CHINA USD ACC USD 25.24MSCI China - Net Return* USD 29.49
COMGEST GROWTH CHINA GBP U ACC GBP 21.68MSCI China - Net Return* GBP 25.50
COMGEST GROWTH CHINA USD I ACC1 USD 40.38MSCI China - Net Return* USD 37.24
1inception date 17/04/2020*used for comparative purposes only
Commentary
Chinese equities shone again in 2020 thanks to both strong performance and a growing investable universe. Despite beingthe first country to encounter COVID-19, China was the first nation to walk out of the pandemic and achieve normality in dailylife. The economy has held up fairly well in terms of consumer spending, investment and even exports later in the year.Assisted by government supporting measures in response to COVID-19, consumption recovered steadily month after monthand had almost returned to normal by the end of 2020. Car sales for instance recorded -43% growth in March but hadalready recovered to +13% in November.
The opening up of the domestic capital market continued in 2020. With around 7% RMB appreciation and a stable economyand interest rate environment, the Chinese bond connect programme was warmly welcomed by foreign investors. TheA-share market has continued to receive international capital inflow since the launch of the Shanghai-Hong Kong stockconnect programme in late 2014. We believe this mega trend will continue for many years to come as China’s economyflourishes.
It is increasingly clear that China has achieved initial success in its transition from an export and investment-driven economytowards a consumption and service-driven one. In this steadily growing economy, innovative businesses are committed toinvest in R&D and quickly convert these know-hows to tackle large opportunities. We see strong domestic brands producingsolid growth prospects despite the pandemic, such as ANTA Sports (sportswear), Midea (home appliances) and Suofeiya(customised furniture).
Shandong Weigao, the largest manufacturer of medical consumables in China and a leading player in orthopaedics, showedits resilience by achieving relatively flat growth despite 30% of hospitals being closed for a while during the first six monthsof the year. The company was a top contributor to fund performance in 2020.
NetEase performed strongly over the period. Its virtuous circle of hiring the best engineers, creative talent and sales forcehas in turn allowed it to produce, sell and maintain some of the most successful games and thus continue to gain marketshare.
Man Wah displayed 19% growth in the first six months of its 2021 financial year (March to September), driven by 53% in itsdomestic furniture business. The company also upgraded the management team by hiring a new CEO (a former GeneralManager of the Greater China Corporate Service Department of Microsoft).
COMGEST GROWTH plc
COMGEST GROWTH CHINAa fund of Comgest Growth plc
INVESTMENT MANAGER’S REPORTFOR THE FINANCIAL YEAR ENDED 31 DECEMBER 2020
66
Midea has executed strongly on domestic market share gain and its globalisation strategy. Revenue growth has shown asteady improvement. Its corporate structure reform, with greater focus on digital and smart drivers and user access, shouldcontinue to pave the way for long-term strong growth.
In contrast, Samsonite suffered from the spread of COVID-19 leading to a shut-down in global luggage sales. The marketquickly discounted a ‘burnt earth scenario’. We worked hard to ensure we understood the company’s cash flows and debtmanagement situation to reach the conclusion that Samsonite was unlikely to face bankruptcy under most scenarios and assuch, the market was being overly negative. We accumulated lightly during the period of market distress and the share pricehas rebounded off its lows but still remains down.
The insurance sector as a whole was also weak operationally. We expected that demand for protection would be robust, orperhaps even strong, in the face of a pandemic. However, partly affected by a lack of face-to-face meetings and partly by aneed for cashflow, protection sales were slow in 2020. As a result, Ping An and China Life contributed negatively to fundperformance in 2020, although AIA posted a solid performance. Structurally we believe the growth profile for the sectorremains robust for the longer term.
The Chinese healthcare sector was volatile during 2020 as the government continued to work to reduce the layers of costsin the system. The results for the portfolio were mixed: as mentioned, Shandong Weigao was very strong, but 3SBio’s stockprice suffered on market concerns about the additional price cuts taken by the group. Dong-E-E-Jiao experienced a longer-than-expected destocking period. This prompted us to exit the position due to a lack of visibility. We used similar volatility toincrease our holding in Lepu Medical Technology, which manufactures cardiovascular devices.
We purchased Fuyao Glass for its dominant position in auto glass and its long-term potential in aluminium parts used inelectric vehicles. We also initiated positions in Trip.com, Opple Lighting, JOYY and Yuexiu. We upgraded the portfolio byselling companies such as Zhengzhou Yutong Bus, Weifu High-Technology, Focus Media and Goodbaby on operationaluncertainty. Hikvision was sold in January after a prolonged engagement failed to overcome ESG concerns. 58.com andCatcher were also sold because of their asset disposal or privatisation deals. We reinforced 3SBio, Samsonite, Alibaba,Autohome, China Resources Gas, Noah, SAIC, Suofeiya and TravelSky, at the expense of Shangdong Weigao, TSMC,NetEase, Midea and ANTA Sports.
The GDP gap between China and the US is shrinking, at a faster-than-expected pace. By the end of 2020, China reached70% of the US GDP level. In contrast, the Chinese capital market is still relatively underdeveloped in terms of participationfrom institutions and the breadth of businesses listed. In the near future, we should see Chinese equities continue to growand develop with higher participation from institutions. We continue to believe that an allocation to this asset class isrewarding in terms of asset return, and meaningful in terms of allocation size.
Quality growth franchises remain our focus. We are confident in strong brand owners and distributors that can grow theirbusiness and cashflow such as Inner Mongolia Yili, ANTA Sports, Midea, Suofeiya and Opple Lighting. We also like theleading players with strong R&D pipelines in healthcare where price cuts should lead to volume increases amid an enormousamount of unmet demand such as Lepu Medical Technology, Shangdong Weigao and 3SBio. We are also confident that topinternet companies will continue to explore various opportunities from traditional less efficient areas in our daily life includingAlibaba, Tencent and many other niche market leaders such as Weibo and JOYY.
We believe our local presence, spanning more than two decades, and our fundamental research framework will continue toidentify strong franchises in this growing asset class. In aggregate, we are excited about the prospects for the Chinese equityasset class and especially for our fund.
COMGEST GROWTH plc
67
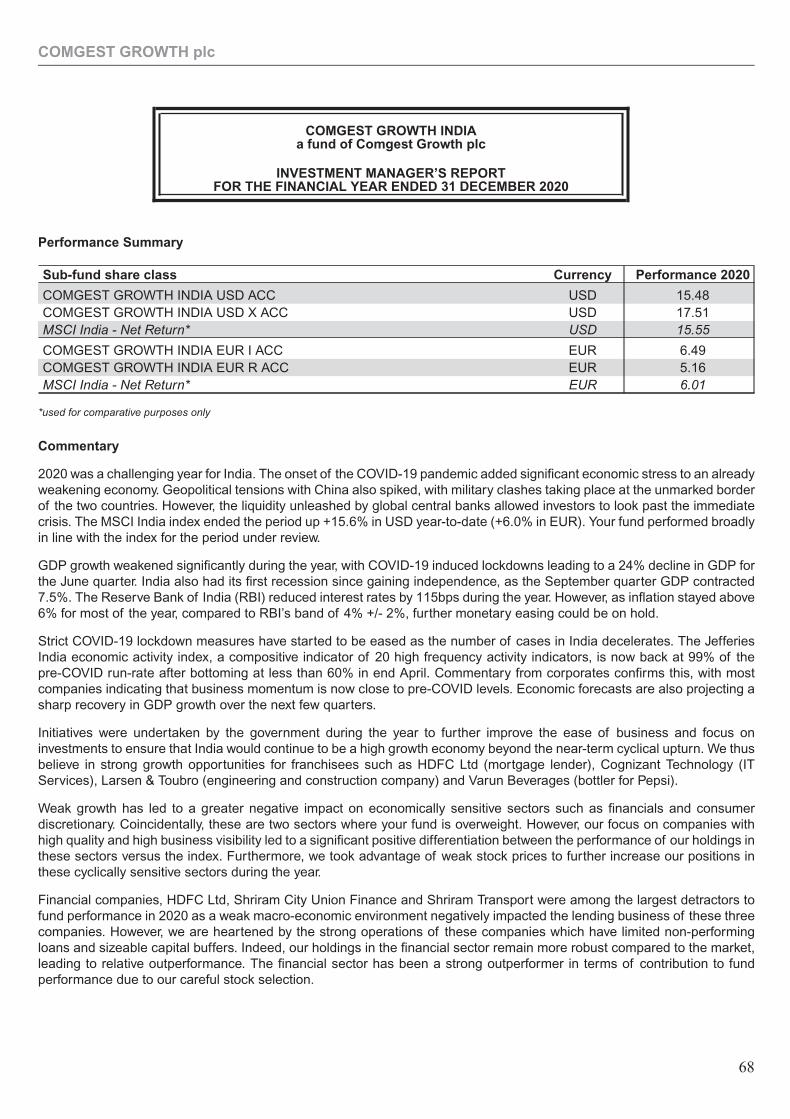
Performance Summary
Sub-fund share class Currency Performance 2020
COMGEST GROWTH INDIA USD ACC USD 15.48COMGEST GROWTH INDIA USD X ACC USD 17.51MSCI India - Net Return* USD 15.55
COMGEST GROWTH INDIA EUR I ACC EUR 6.49COMGEST GROWTH INDIA EUR R ACC EUR 5.16MSCI India - Net Return* EUR 6.01
*used for comparative purposes only
Commentary
2020 was a challenging year for India. The onset of the COVID-19 pandemic added significant economic stress to an alreadyweakening economy. Geopolitical tensions with China also spiked, with military clashes taking place at the unmarked borderof the two countries. However, the liquidity unleashed by global central banks allowed investors to look past the immediatecrisis. The MSCI India index ended the period up +15.6% in USD year-to-date (+6.0% in EUR). Your fund performed broadlyin line with the index for the period under review.
GDP growth weakened significantly during the year, with COVID-19 induced lockdowns leading to a 24% decline in GDP forthe June quarter. India also had its first recession since gaining independence, as the September quarter GDP contracted7.5%. The Reserve Bank of India (RBI) reduced interest rates by 115bps during the year. However, as inflation stayed above6% for most of the year, compared to RBI’s band of 4% +/- 2%, further monetary easing could be on hold.
Strict COVID-19 lockdown measures have started to be eased as the number of cases in India decelerates. The JefferiesIndia economic activity index, a compositive indicator of 20 high frequency activity indicators, is now back at 99% of thepre-COVID run-rate after bottoming at less than 60% in end April. Commentary from corporates confirms this, with mostcompanies indicating that business momentum is now close to pre-COVID levels. Economic forecasts are also projecting asharp recovery in GDP growth over the next few quarters.
Initiatives were undertaken by the government during the year to further improve the ease of business and focus oninvestments to ensure that India would continue to be a high growth economy beyond the near-term cyclical upturn. We thusbelieve in strong growth opportunities for franchisees such as HDFC Ltd (mortgage lender), Cognizant Technology (ITServices), Larsen & Toubro (engineering and construction company) and Varun Beverages (bottler for Pepsi).
Weak growth has led to a greater negative impact on economically sensitive sectors such as financials and consumerdiscretionary. Coincidentally, these are two sectors where your fund is overweight. However, our focus on companies withhigh quality and high business visibility led to a significant positive differentiation between the performance of our holdings inthese sectors versus the index. Furthermore, we took advantage of weak stock prices to further increase our positions inthese cyclically sensitive sectors during the year.
Financial companies, HDFC Ltd, Shriram City Union Finance and Shriram Transport were among the largest detractors tofund performance in 2020 as a weak macro-economic environment negatively impacted the lending business of these threecompanies. However, we are heartened by the strong operations of these companies which have limited non-performingloans and sizeable capital buffers. Indeed, our holdings in the financial sector remain more robust compared to the market,leading to relative outperformance. The financial sector has been a strong outperformer in terms of contribution to fundperformance due to our careful stock selection.
COMGEST GROWTH plc
COMGEST GROWTH INDIAa fund of Comgest Growth plc
INVESTMENT MANAGER’S REPORTFOR THE FINANCIAL YEAR ENDED 31 DECEMBER 2020
68
IT services stocks Infosys and Cognizant were among the largest contributors to fund performance during the year. Bothcompanies benefitted from higher technology spending as corporates scramble to adapt to the new work-from-home (WFH)regime. Earnings for these companies have remained resilient and there could be a cyclical upturn in their revenues goingforward.
Info Edge India, an internet stock with a strong recruitment platform and investment in various other consumer-facinginternet franchises (food delivery, internet insurance brokerage) rallied 84.2% in USD (+69.0% in EUR) during the year dueto its resilient core business and its investee companies benefitting from the WFH regime.
CDSL Ltd, a share depository company, rallied 136.1% in USD (+116.6% in EUR) during the year, as trading volumesremained robust and investors were willing to pay a premium for growth visibility. We took some profits in this position asvaluations became expensive.
We took advantage of the low prices during the year to buy some high-quality cyclical companies. We bought Bandhan bank,India’s largest micro finance company, Oberoi Realty, Mumbai’s largest real estate developer and Eicher Motors, a maker ofpremium motorcycles. We upgraded the quality of portfolio by selling companies with operational uncertainty such asContainer Corporation, Engineers India and GAIL Ltd. We sold NTPC due to ESG concerns. We exhibited strong valuationdiscipline by buying Bharti Airtel, a position which we had previously exited in December 2019, as the share price corrected.We sold Syngene Ltd, a stock which we had started building a position in earlier in the year.
India’s economic potential remains strong and the country has delivered 6% GDP growth over the past decade. Thegovernment’s conservative macro policies have ensured that this has been achieved with a strong control on inflation andleverage. The Indian government has also focused on increasing the ease of business and strong investment ininfrastructure. A reduction in corporate tax rates, production-linked incentives in a few sectors as well as changes in land andlabour laws are some of the policy changes which could make India an attractive investment destination. Recent investmentsin India, for example by several global mobile phone supply chain companies, suggest that government initiatives areworking well. India is also benefitting from some shifts in supply chains away from China.
Within our long-term investment horizon, we are focused on companies which can take advantage of this improvement in thebusiness environment and hence deliver strong earnings growth backed by stock price returns.
COMGEST GROWTH plc
69
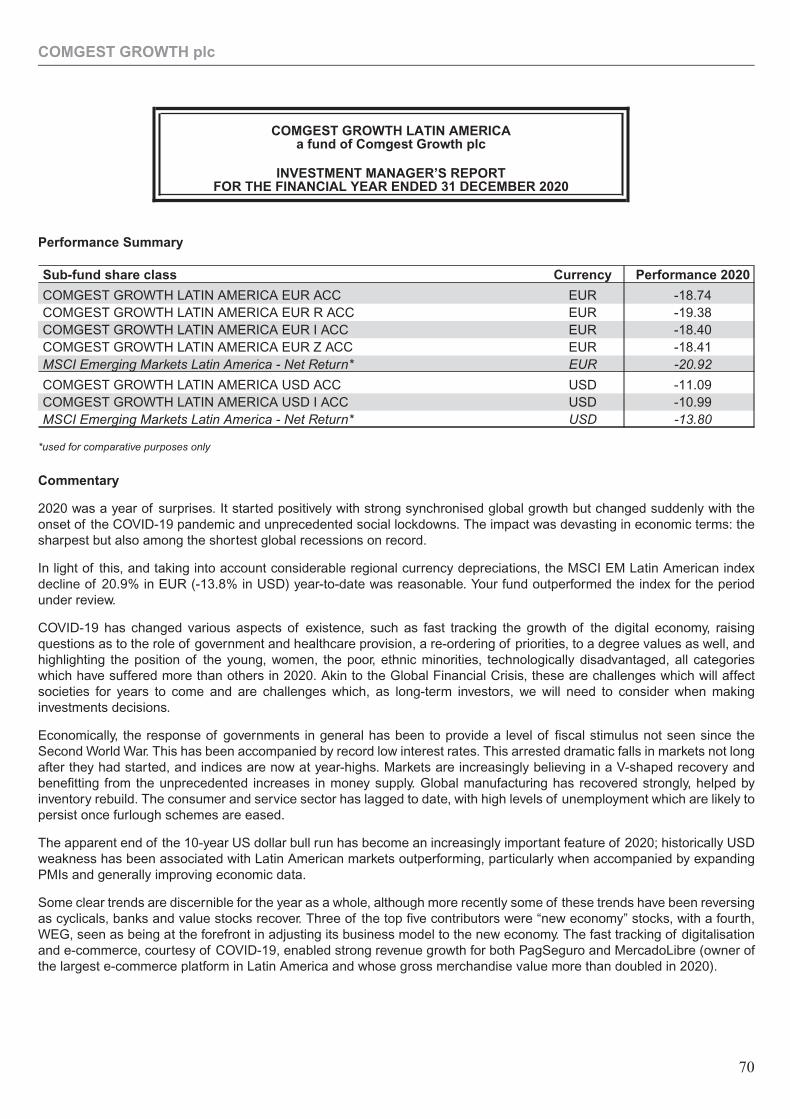
Performance Summary
Sub-fund share class Currency Performance 2020
COMGEST GROWTH LATIN AMERICA EUR ACC EUR -18.74COMGEST GROWTH LATIN AMERICA EUR R ACC EUR -19.38COMGEST GROWTH LATIN AMERICA EUR I ACC EUR -18.40COMGEST GROWTH LATIN AMERICA EUR Z ACC EUR -18.41MSCI Emerging Markets Latin America - Net Return* EUR -20.92
COMGEST GROWTH LATIN AMERICA USD ACC USD -11.09COMGEST GROWTH LATIN AMERICA USD I ACC USD -10.99MSCI Emerging Markets Latin America - Net Return* USD -13.80
*used for comparative purposes only
Commentary
2020 was a year of surprises. It started positively with strong synchronised global growth but changed suddenly with theonset of the COVID-19 pandemic and unprecedented social lockdowns. The impact was devasting in economic terms: thesharpest but also among the shortest global recessions on record.
In light of this, and taking into account considerable regional currency depreciations, the MSCI EM Latin American indexdecline of 20.9% in EUR (-13.8% in USD) year-to-date was reasonable. Your fund outperformed the index for the periodunder review.
COVID-19 has changed various aspects of existence, such as fast tracking the growth of the digital economy, raisingquestions as to the role of government and healthcare provision, a re-ordering of priorities, to a degree values as well, andhighlighting the position of the young, women, the poor, ethnic minorities, technologically disadvantaged, all categorieswhich have suffered more than others in 2020. Akin to the Global Financial Crisis, these are challenges which will affectsocieties for years to come and are challenges which, as long-term investors, we will need to consider when makinginvestments decisions.
Economically, the response of governments in general has been to provide a level of fiscal stimulus not seen since theSecond World War. This has been accompanied by record low interest rates. This arrested dramatic falls in markets not longafter they had started, and indices are now at year-highs. Markets are increasingly believing in a V-shaped recovery andbenefitting from the unprecedented increases in money supply. Global manufacturing has recovered strongly, helped byinventory rebuild. The consumer and service sector has lagged to date, with high levels of unemployment which are likely topersist once furlough schemes are eased.
The apparent end of the 10-year US dollar bull run has become an increasingly important feature of 2020; historically USDweakness has been associated with Latin American markets outperforming, particularly when accompanied by expandingPMIs and generally improving economic data.
Some clear trends are discernible for the year as a whole, although more recently some of these trends have been reversingas cyclicals, banks and value stocks recover. Three of the top five contributors were “new economy” stocks, with a fourth,WEG, seen as being at the forefront in adjusting its business model to the new economy. The fast tracking of digitalisationand e-commerce, courtesy of COVID-19, enabled strong revenue growth for both PagSeguro and MercadoLibre (owner ofthe largest e-commerce platform in Latin America and whose gross merchandise value more than doubled in 2020).
COMGEST GROWTH plc
COMGEST GROWTH LATIN AMERICAa fund of Comgest Growth plc
INVESTMENT MANAGER’S REPORTFOR THE FINANCIAL YEAR ENDED 31 DECEMBER 2020
70
Globant, as an increasingly successful global but Argentine-domiciled IT services provider, rose strongly; its revenues areinvoiced in USD. Localiza, the Brazilian car rental company, performed well in 2020 following its strong quality managementand excellent execution, and further supported by its merger with Unidas, the number two player. B3 in Brazil benefitted fromthe increases in volumes in both cash equities and derivatives. Much of this has been inspired by the declines in interestrates and the increase in retail interest in markets. Klabin, with 34% of its revenue derived from pulp, benefitted from theBrazilian Real depreciation and higher pulp prices. Its domestic paper business saw a pickup in demand, partially inspired bye-commerce packaging as well as increased use of paper compared to plastic.
Of the stocks that detracted from performance, six of the top ten were domestic consumption companies, five being in Brazil,which are unlikely to recover most of their pandemic-induced loss of earnings. Lojas Renner, the apparel retailer, CCR, thetoll road company, OdontoPrev, the dental insurer and Hoteles City Express, the Mexican business hotel operator, all fell intothis category, not helped by having purely domestic revenue streams.
In Mexico, Sempra, the majority owner of IEnova, made a stock-for-stock offer to acquire IEnova’s minorities, implying avalue of 80MEX/share for IEnova, a premium we felt failed to reflect the value of the company and the recently approvedECA project. Comgest coordinated a letter signed by various minority shareholders and sent it to the IEnova CorporatePractices Committee, expressing our dissatisfaction.
Early in the year we increased exposure to new economy companies (MercadoLibre for example), while as the yearprogressed, we added to real economy companies that are likely to benefit from the recovery in economic activity (CCR,Mills, InRetail Peru and Falabella for example). Remaining true to our sell discipline, we reduced positions in quality growthcompanies such as WEG and Globant when valuations have become too excessive. Software companies TOTVS and Linxwere reduced after the share prices benefitted from corporate activity. Cogna, the Brazilian education company, was sold onconcerns of the immediate COVID-19 impact on campus attendance and the longer-term impact on demand due to a weakerconsumption. Ultrapar was sold on continued disappointment with regards to its management, strategy and business modeldevelopment. We exited Fibra Uno in Mexico due to ongoing ESG concerns about the company which we have raised withthe firm but which were effectively unaddressed. We sold Santos and Terpel, good companies in the transportation sector,but which are likely to have medium-term volume issues.
There are many more positive factors which suggest that Latin American markets will finally produce reasonable returns forthe foreseeable future. From an economic perspective, Latin American markets have an increasing number of positives suchas current account surpluses, rising commodity prices and growing global market shares in important commodities, cheapcurrencies, low inflation and rapidly recovering GDP growth. Certainly, there are areas of concern such as Mexico’s weakGDP growth and Brazil’s expanding fiscal deficit. However, in a global environment of next to zero interest rates, a weakeningUS Dollar and what so far appears to be a post-pandemic V-shaped recovery, Latin America is well placed. Despite suchpositive fundamentals, Latin American assets have been shunned by investors and trade on sizable valuation discounts toDeveloped Markets, a situation which is in the early stages of adjustment.
Despite the valuation excesses experienced in some sectors and companies, it is still possible to build a Latin Americanportfolio of quality companies with robust EPS growth prospects, combined with above-average ESG credentials (and thuslower risk) at multiples that are attractive both versus history and the broader market.
The fund is made up of a concentrated number of carefully selected Quality Growth companies with strong and/or improvingESG credentials. This will remain our focus, while remaining cognizant of taking profits in even these quality companieswhen over-valuation dictates. At the same time, we are constantly on the lookout for new, strong franchises which offer goodupside but which might be in less fashionable but steadily growing areas of our universe.
COMGEST GROWTH plc
71
INDEPENDENT AUDITOR’S REPORT TO THE SHAREHOLDERS OF COMGEST GROWTH PLC
Report on the audit of the financial statements Opinion on the financial statements of Comgest Growth Plc (“the company”) In our opinion the financial statements:
• give a true and fair view of the assets, liabilities and financial position of the company as at 31 December 2020 and of the profit for the financial year then ended; and
• have been properly prepared in accordance with the relevant financial reporting framework, the applicable Regulations and, in particular, with the requirements of the Companies Act 2014.
The financial statements we have audited comprise:
• the Statement of Comprehensive Income;
• the Statement of Financial Position;
• the Statement of Changes in Net Assets attributable to holders of Redeemable Shares;
• the Statement of Cash Flows; and
• the related notes 1 to 20, including a summary of significant accounting policies as set out in note 2. The relevant financial reporting framework that has been applied in their preparation is the Companies Act 2014 and International Financial Reporting Standards (IFRS) as adopted by the European Union (“the relevant financial reporting framework”). The applicable regulations that have been applied in their preparation is the European Communities (Undertakings for Collective Investment in Transferable Securities) Regulations, 2011 and Central Bank (Supervision and Enforcement) Act 2013 (Section 48(1)) (Undertakings for Collective Investment in Transferable Securities) Regulations, 2019 (“the applicable Regulations”). Basis for opinion We conducted our audit in accordance with International Standards on Auditing (Ireland) (ISAs (Ireland)) and applicable law. Our responsibilities under those standards are described below in the “Auditor's responsibilities for the audit of the financial statements” section of our report. We are independent of the company in accordance with the ethical requirements that are relevant to our audit of the financial statements in Ireland, including the Ethical Standard issued by the Irish Auditing and Accounting Supervisory Authority, and we have fulfilled our other ethical responsibilities in accordance with these requirements. We believe that the audit evidence we have obtained is sufficient and appropriate to provide a basis for our opinion. Conclusions relating to going concern In auditing the financial statements, we have concluded that the directors’ use of the going concern basis of accounting in the preparation of the financial statements is appropriate. Based on the work we have performed, we have not identified any material uncertainties relating to events or conditions that, individually or collectively , may cast significant doubt on the company’s ability to continue as a going concern for a period of at least twelve months from when the financial statements are authorised for issue. Our responsibilities and the responsibilities of the directors with respect to going concern are described in the relevant sections of this report.
Other information The other information comprises the information included in the the annual report, other than the financial statements and our auditor’s report thereon. The directors are responsible for the other information contained within the annual report. Our opinion on the financial statements does not cover the other information and, except to the extent otherwise explicitly stated in our report, we do not express any form of assurance conclusion thereon. Our responsibility is to read the other information and, in doing so, consider whether the other information is materially inconsistent with the financial statements or our knowledge obtained in the audit or otherwise appears to be materially misstated. If we identify such material inconsistencies or apparent material misstatements, we are required to determine whether there is a material misstatement in the financial statements or a material misstatement of the other information. If, based on the work we have performed, we conclude that there is a material misstatement of this other information, we are required to report that fact. We have nothing to report in this regard. Responsibilities of directors As explained more fully in the Directors’ Responsibilities Statement, the directors are responsible for the preparation of the financial statements and for being satisfied that they give a true and fair view and otherwise comply with the Companies Act 2014, and for such internal control as the directors determine is necessary to enable the preparation of financial statements that are free from material misstatement, whether due to fraud or error. In preparing the financial statements, the directors are responsible for assessing the company’s ability to continue as a going concern, disclosing, as applicable, matters related to going concern and using the going concern basis of accounting unless the directors either intend to liquidate the company or to cease operations, or have no realistic alternative but to do so. Auditor’s responsibilities for the audit of the financial statements Our objectives are to obtain reasonable assurance about whether the financial statements as a whole are free from material misstatement, whether due to fraud or error, and to issue an auditor's report that includes our opinion. Reasonable assurance is a high level of assurance, but is not a guarantee that an audit conducted in accordance with ISAs (Ireland) will always detect a material misstatement when it exists. Misstatements can arise from fraud or error and are considered material if, individually or in the aggregate, they could reasonably be expected to influence the economic decisions of users taken on the basis of these financial statements. As part of an audit in accordance with ISAs (Ireland), we exercise professional judgment and maintain professional scepticism throughout the audit. We also:
• Identify and assess the risks of material misstatement of the financial statements, whether due to fraud or error, design and perform audit procedures responsive to those risks, and obtain audit evidence that is sufficient and appropriate to provide a basis for our opinion. The risk of not detecting a material misstatement resulting from fraud is higher than for one resulting from error, as fraud may involve collusion, forgery, intentional omissions, misrepresentations, or the override of internal control.
• Obtain an understanding of internal control relevant to the audit in order to design audit procedures that are appropriate in the circumstances, but not for the purpose of expressing an opinion on the effectiveness of the company’s internal control.
• Evaluate the appropriateness of accounting policies used and the reasonableness of accounting estimates and related disclosures made by the directors.
• Conclude on the appropriateness of the directors’ use of the going concern basis of accounting and, based on the audit evidence obtained, whether a material uncertainty exists related to events or conditions that may cast significant doubt on the company’s ability to continue as a going concern. If we conclude that a material uncertainty exists, we are required to draw attention in our auditor’s report to the related disclosures in the financial statements or, if such disclosures are inadequate, to modify our opinion. Our conclusions are based on the audit evidence obtained up to the date of the auditor’s report. However, future events or conditions may cause the entity (or where relevant, the group) to cease to continue as a going concern.
• Evaluate the overall presentation, structure and content of the financial statements, including the disclosures, and whether the financial statements represent the underlying transactions and events in a manner that achieves fair presentation.
We communicate with those charged with governance regarding, among other matters, the planned scope and timing of the audit and significant audit findings, including any significant deficiencies in internal control that the auditor identifies during the audit. Report on other legal and regulatory requirements Opinion on other matters prescribed by the Companies Act 2014 Based solely on the work undertaken in the course of the audit, we report that:
• We have obtained all the information and explanations which we consider necessary for the purposes of our audit.
• In our opinion the accounting records of the company were sufficient to permit the financial statements to be readily and properly audited.
• The financial statements are in agreement with the accounting records.
• In our opinion the information given in the directors’ report is consistent with the financial statements and the directors’ report has been prepared in accordance with the Companies Act 2014.
Matters on which we are required to report by exception Based on the knowledge and understanding of the company and its environment obtained in the course of the audit, we have not identified material misstatements in the directors' report. We have nothing to report in respect of the provisions in the Companies Act 2014 which require us to report to you if, in our opinion, the disclosures of directors’ remuneration and transactions specified by law are not made. Use of our report This report is made solely to the company’s shareholders, as a body, in accordance with Section 391 of the Companies Act 2014. Our audit work has been undertaken so that we might state to the company’s shareholders those matters we are required to state to them in an auditor’s report and for no other purpose. To the fullest extent permitted by law, we do not accept or assume responsibility to anyone other than the company and the company’s shareholders as a body, for our audit work, for this report, or for the opinions we have formed.
Brian Forrester For and on behalf of Deloitte Ireland LLP Chartered Accountants and Statutory Audit Firm Deloitte & Touche House, Earlsfort Terrace, Dublin 2 19 April 2021
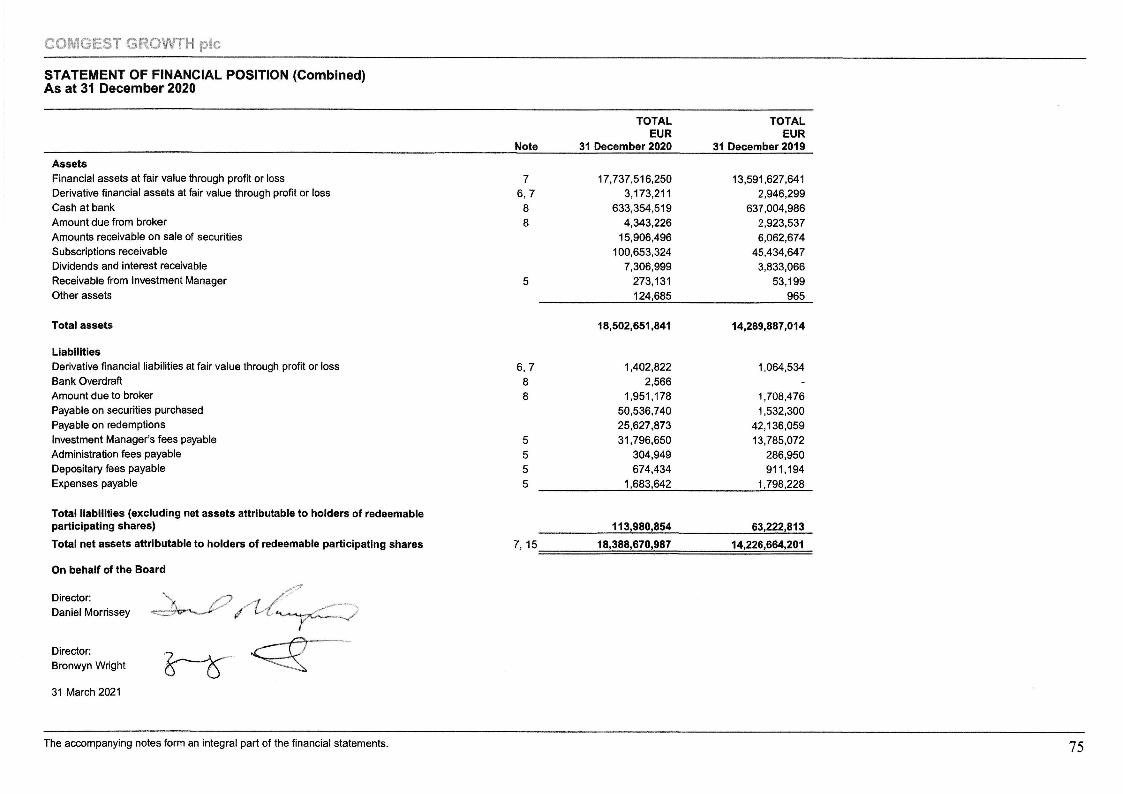
(rlt--
ooE(l)oaE(u
Eq,Ets(Eo-6(,)0)
_cc(oEaC)
occ'=cooE()()(tr
osl-
o6rtt(o(o-(t.\I(\{tl\6o,G
'N(ood@c)od
G'
6.$l6I(\Iat(o
(oooc!o$6F
-C)t{)F
-tOO
)(rlV
- a1- o-
O- O
i- -- ry
@C
{(olr)(ge@O
(r)(r)cO@
FO
)\u)--_r--N
o\F
sc{o<
fF
C!(O
€OO
('JO(D
!+N
N(O
l-+l'-rr{(9\f
@ra)ri-@
(O<
,).+(0
c.ic.i.jqiF-to{rc,)
O
lf) (f)
C\I
O)
O
f.- 6
$- o)- rr)- (o- F
- (r) (o (0_
FO
IJ)r F
lr) c\r (Y
)
to-tO(o-(\tou)od
sf(Y)
ro-.{.(oo-
!to_t\o€-ctoG'
qf
rO)(ol-stN
(oO)tO
<rt' O
) cO c., F
- t (o d)
(O@
- o{ oD
- ro- (o- (o- o- r- O
)F
-(g{(f)(\lsf(r)(O6t:fO
N(O
(f)(Olr)
(o- o)_ o- o)- o- t^
@^
-NtsS
.l(O()f)
O)
(O
<f
60c.t
C)-O
)(O(O
rlCD
-tOlr)re(\tO
rNO
rCr@
e\IN-lr)-ryqcD
-or-t-:(o-@
(og(o(o(o(o(rvF
lsr{){Ou)O
F-C
{1rr- e-
(7)- (O_ O
)- (O- a.r- C
.,l rF
-(?)(Y)!+
rJ)OF
-(t)
c, F
o\(oF
-
tlrf)6-eoor(!,
I.-
F.
F-
rc, r, r, ro
-@@
(oF
.- -O
@(o
tfl
tu\j*/illI
araE
HF
E6o€P€-Eo.9skE
Ee*oE=
ots=o
oEE
EP
oo6pooO
E
Ei
e€E
Irrf ^
g :
EE
E f
r.,?,-6 5.Y
n (l)
=d'9,
o
E-E
i E
-o: g
6't rE
&
lfL9
88P
5
@,r,IoEpo.C
D3I€o6lor.E
!6(l)>
60G-^
aE
o-g
E B
f=
,0-O
$
6
E b frE
E E
EE
t'E F
$ a B,
o -o =
fi:9.o:-oE
E*H
EE
EE
$gE
EE
EE
EE
FE
EiE
E$S
gEB
SJodr<
rLo-E<
orJ
thooa.E
3oF
og,IoE
oQ8=bgE
gO.c
6os0)
'E-c -f,
'- ii
or(E
rl 6,
di H
,E
EE
;
€gs6
-6 .EE
E8 xB
,EE
EE
iSE
EE
6E
:5P-C
Sg P
E
9 E.g
E
HE
;EE
eE€T
sE#*E
€-$*Em
EE
E€E
E{E
Te
<irO
O<
<C
r)6dO
Eo, (\t
ER
!-E
*
6=
sE
b 1
O co
c.)
ooaLoi:Eo-6.9oc.=
(ooC
f
J,Io,<
lE6,7F
o,trEoa,oo(t
dgEt'rFO,oEo(,ooaa,
ooz
totr5EoozoFooo.
(J^zG
t<
o2${Lor.
.Cl
ot,oF(J
za)rJl oE
-IJJ (v'
<(E
tsoo<
?r
I-Bfi(?Fs,HJ
r&Es
).1\:'I
t
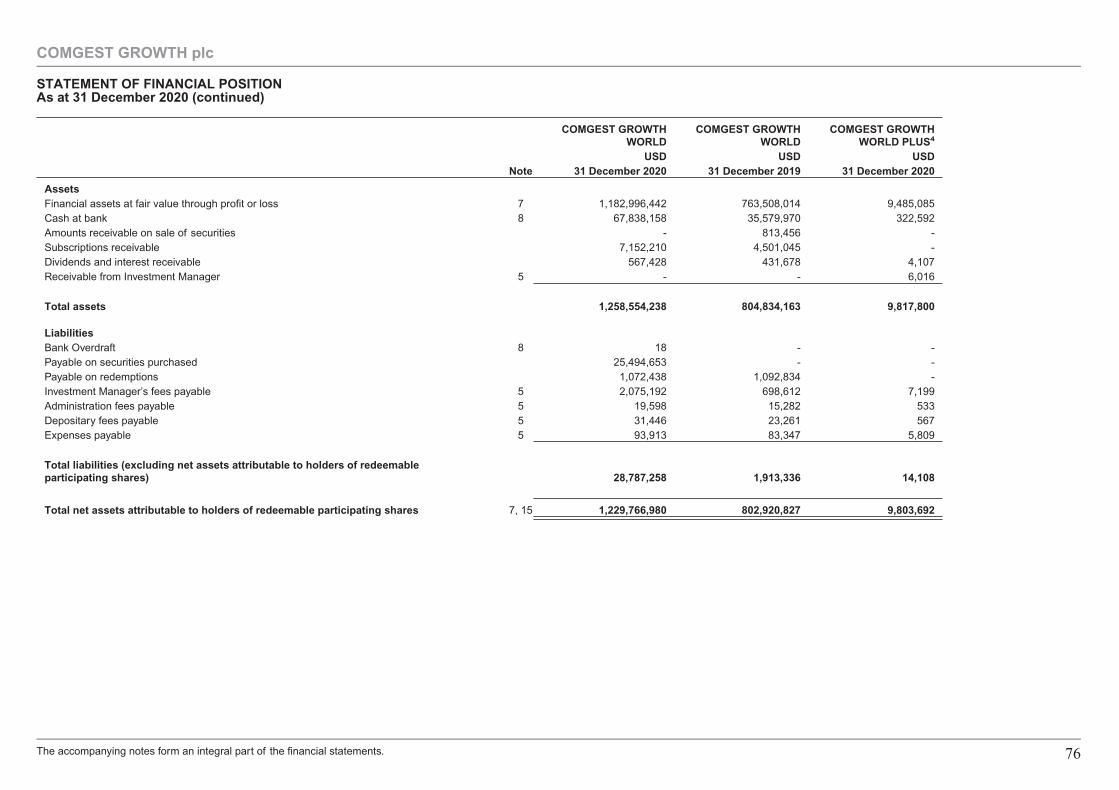
COMGEST GROWTHWORLD
COMGEST GROWTHWORLD
COMGEST GROWTHWORLD PLUS4
USD USD USDNote 31 December 2020 31 December 2019 31 December 2020
AssetsFinancial assets at fair value through profit or loss 7 1,182,996,442 763,508,014 9,485,085Cash at bank 8 67,838,158 35,579,970 322,592Amounts receivable on sale of securities - 813,456 -Subscriptions receivable 7,152,210 4,501,045 -Dividends and interest receivable 567,428 431,678 4,107Receivable from Investment Manager 5 - - 6,016
Total assets 1,258,554,238 804,834,163 9,817,800
LiabilitiesBank Overdraft 8 18 - -Payable on securities purchased 25,494,653 - -Payable on redemptions 1,072,438 1,092,834 -Investment Manager’s fees payable 5 2,075,192 698,612 7,199Administration fees payable 5 19,598 15,282 533Depositary fees payable 5 31,446 23,261 567Expenses payable 5 93,913 83,347 5,809
Total liabilities (excluding net assets attributable to holders of redeemableparticipating shares) 28,787,258 1,913,336 14,108
Total net assets attributable to holders of redeemable participating shares 7, 15 1,229,766,980 802,920,827 9,803,692
COMGEST GROWTH plc
STATEMENT OF FINANCIAL POSITIONAs at 31 December 2020 (continued)
The accompanying notes form an integral part of the financial statements. 76
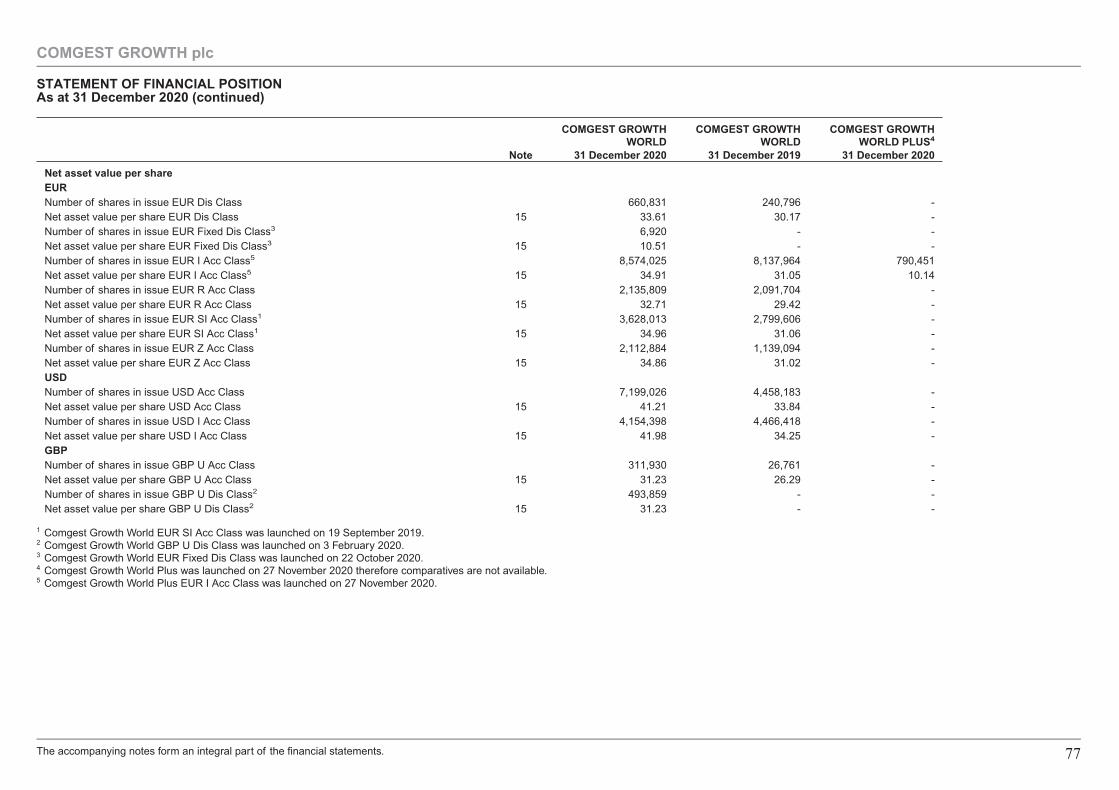
COMGEST GROWTHWORLD
COMGEST GROWTHWORLD
COMGEST GROWTHWORLD PLUS4
Note 31 December 2020 31 December 2019 31 December 2020
Net asset value per shareEURNumber of shares in issue EUR Dis Class 660,831 240,796 -Net asset value per share EUR Dis Class 15 33.61 30.17 -Number of shares in issue EUR Fixed Dis Class3 6,920 - -Net asset value per share EUR Fixed Dis Class3 15 10.51 - -Number of shares in issue EUR I Acc Class5 8,574,025 8,137,964 790,451Net asset value per share EUR I Acc Class5 15 34.91 31.05 10.14Number of shares in issue EUR R Acc Class 2,135,809 2,091,704 -Net asset value per share EUR R Acc Class 15 32.71 29.42 -Number of shares in issue EUR SI Acc Class1 3,628,013 2,799,606 -Net asset value per share EUR SI Acc Class1 15 34.96 31.06 -Number of shares in issue EUR Z Acc Class 2,112,884 1,139,094 -Net asset value per share EUR Z Acc Class 15 34.86 31.02 -USDNumber of shares in issue USD Acc Class 7,199,026 4,458,183 -Net asset value per share USD Acc Class 15 41.21 33.84 -Number of shares in issue USD I Acc Class 4,154,398 4,466,418 -Net asset value per share USD I Acc Class 15 41.98 34.25 -GBPNumber of shares in issue GBP U Acc Class 311,930 26,761 -Net asset value per share GBP U Acc Class 15 31.23 26.29 -Number of shares in issue GBP U Dis Class2 493,859 - -Net asset value per share GBP U Dis Class2 15 31.23 - -
1 Comgest Growth World EUR SI Acc Class was launched on 19 September 2019.2 Comgest Growth World GBP U Dis Class was launched on 3 February 2020.3 Comgest Growth World EUR Fixed Dis Class was launched on 22 October 2020.4 Comgest Growth World Plus was launched on 27 November 2020 therefore comparatives are not available.5 Comgest Growth World Plus EUR I Acc Class was launched on 27 November 2020.
COMGEST GROWTH plc
STATEMENT OF FINANCIAL POSITIONAs at 31 December 2020 (continued)
The accompanying notes form an integral part of the financial statements. 77
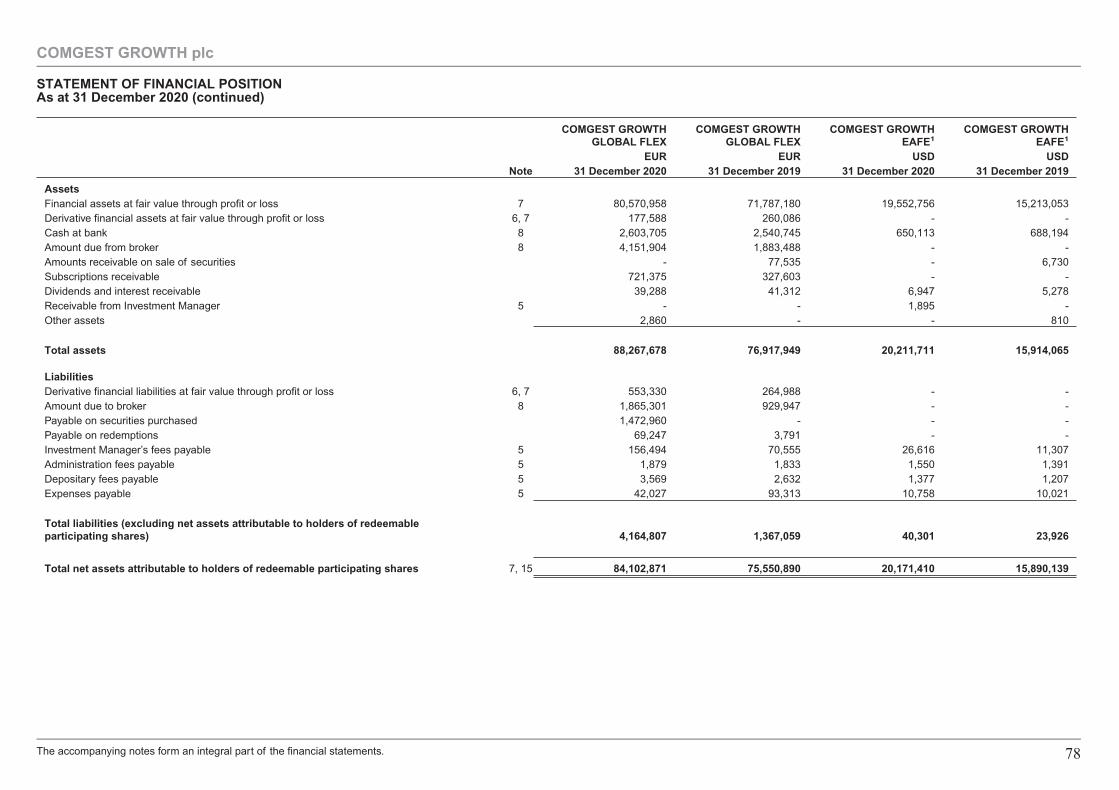
COMGEST GROWTHGLOBAL FLEX
COMGEST GROWTHGLOBAL FLEX
COMGEST GROWTHEAFE1
COMGEST GROWTHEAFE1
EUR EUR USD USDNote 31 December 2020 31 December 2019 31 December 2020 31 December 2019
AssetsFinancial assets at fair value through profit or loss 7 80,570,958 71,787,180 19,552,756 15,213,053Derivative financial assets at fair value through profit or loss 6, 7 177,588 260,086 - -Cash at bank 8 2,603,705 2,540,745 650,113 688,194Amount due from broker 8 4,151,904 1,883,488 - -Amounts receivable on sale of securities - 77,535 - 6,730Subscriptions receivable 721,375 327,603 - -Dividends and interest receivable 39,288 41,312 6,947 5,278Receivable from Investment Manager 5 - - 1,895 -Other assets 2,860 - - 810
Total assets 88,267,678 76,917,949 20,211,711 15,914,065
LiabilitiesDerivative financial liabilities at fair value through profit or loss 6, 7 553,330 264,988 - -Amount due to broker 8 1,865,301 929,947 - -Payable on securities purchased 1,472,960 - - -Payable on redemptions 69,247 3,791 - -Investment Manager’s fees payable 5 156,494 70,555 26,616 11,307Administration fees payable 5 1,879 1,833 1,550 1,391Depositary fees payable 5 3,569 2,632 1,377 1,207Expenses payable 5 42,027 93,313 10,758 10,021
Total liabilities (excluding net assets attributable to holders of redeemableparticipating shares) 4,164,807 1,367,059 40,301 23,926
Total net assets attributable to holders of redeemable participating shares 7, 15 84,102,871 75,550,890 20,171,410 15,890,139
COMGEST GROWTH plc
STATEMENT OF FINANCIAL POSITIONAs at 31 December 2020 (continued)
The accompanying notes form an integral part of the financial statements. 78
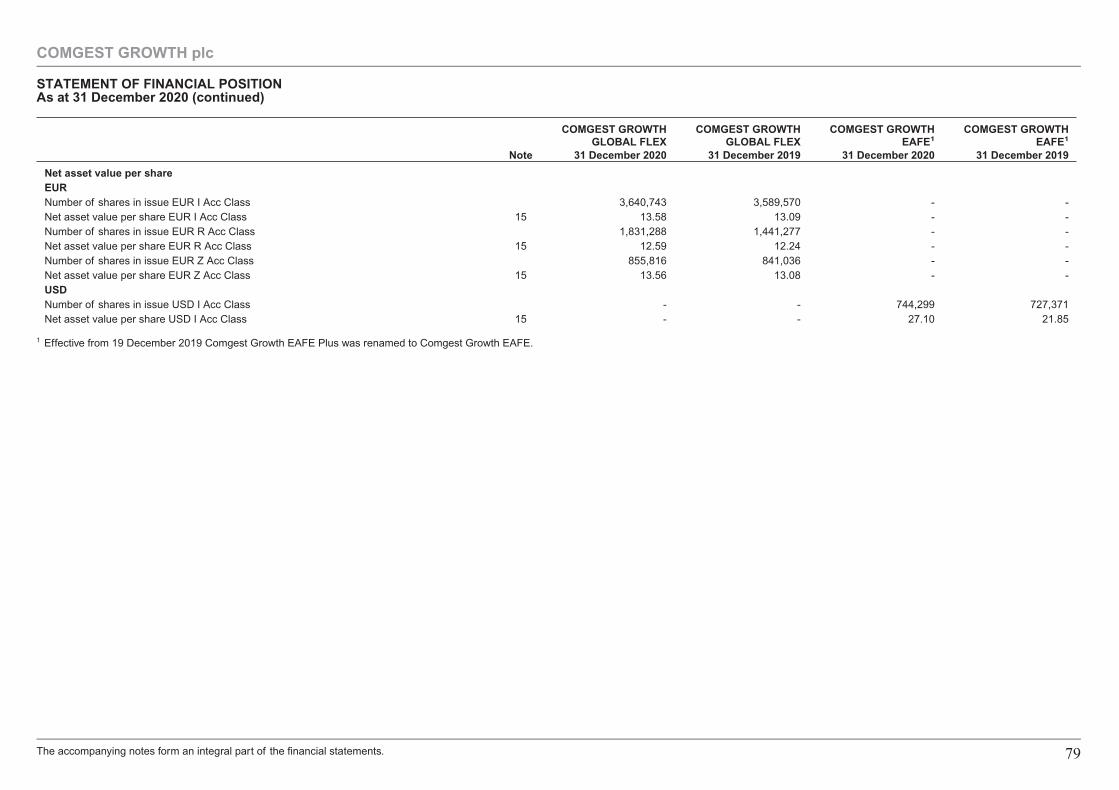
COMGEST GROWTHGLOBAL FLEX
COMGEST GROWTHGLOBAL FLEX
COMGEST GROWTHEAFE1
COMGEST GROWTHEAFE1
Note 31 December 2020 31 December 2019 31 December 2020 31 December 2019
Net asset value per shareEURNumber of shares in issue EUR I Acc Class 3,640,743 3,589,570 - -Net asset value per share EUR I Acc Class 15 13.58 13.09 - -Number of shares in issue EUR R Acc Class 1,831,288 1,441,277 - -Net asset value per share EUR R Acc Class 15 12.59 12.24 - -Number of shares in issue EUR Z Acc Class 855,816 841,036 - -Net asset value per share EUR Z Acc Class 15 13.56 13.08 - -USDNumber of shares in issue USD I Acc Class - - 744,299 727,371Net asset value per share USD I Acc Class 15 - - 27.10 21.85
1 Effective from 19 December 2019 Comgest Growth EAFE Plus was renamed to Comgest Growth EAFE.
COMGEST GROWTH plc
STATEMENT OF FINANCIAL POSITIONAs at 31 December 2020 (continued)
The accompanying notes form an integral part of the financial statements. 79
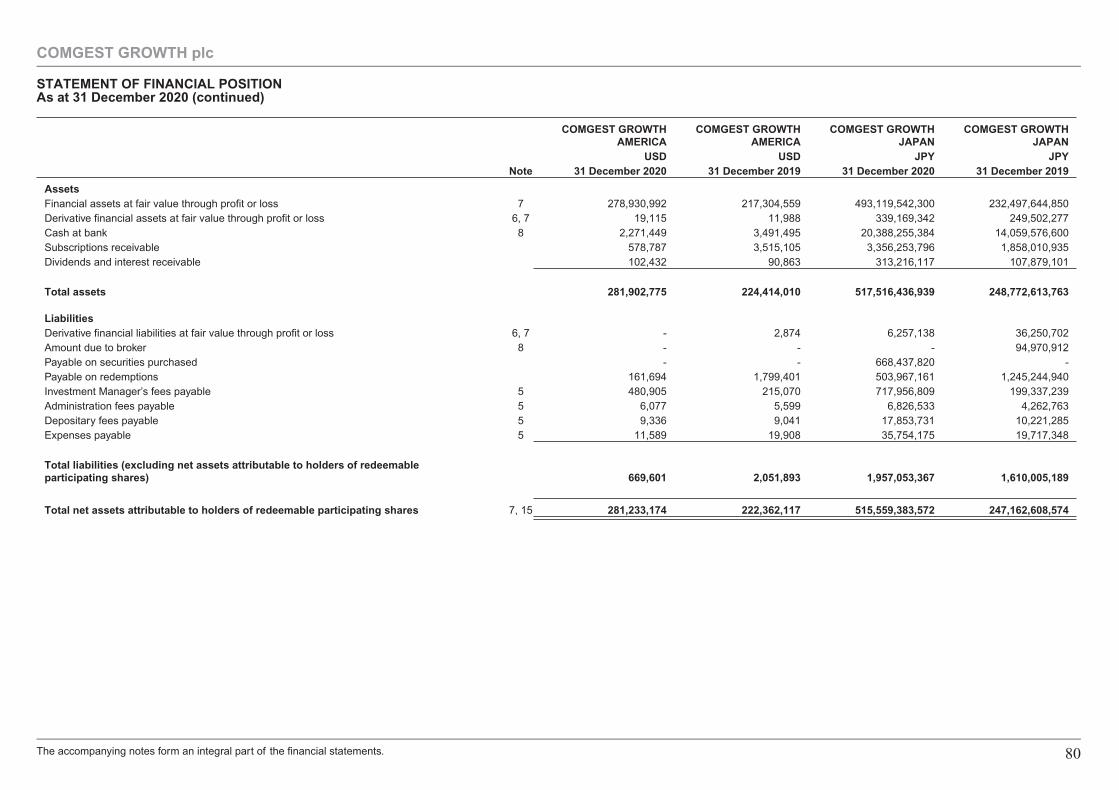
COMGEST GROWTHAMERICA
COMGEST GROWTHAMERICA
COMGEST GROWTHJAPAN
COMGEST GROWTHJAPAN
USD USD JPY JPYNote 31 December 2020 31 December 2019 31 December 2020 31 December 2019
AssetsFinancial assets at fair value through profit or loss 7 278,930,992 217,304,559 493,119,542,300 232,497,644,850Derivative financial assets at fair value through profit or loss 6, 7 19,115 11,988 339,169,342 249,502,277Cash at bank 8 2,271,449 3,491,495 20,388,255,384 14,059,576,600Subscriptions receivable 578,787 3,515,105 3,356,253,796 1,858,010,935Dividends and interest receivable 102,432 90,863 313,216,117 107,879,101
Total assets 281,902,775 224,414,010 517,516,436,939 248,772,613,763
LiabilitiesDerivative financial liabilities at fair value through profit or loss 6, 7 - 2,874 6,257,138 36,250,702Amount due to broker 8 - - - 94,970,912Payable on securities purchased - - 668,437,820 -Payable on redemptions 161,694 1,799,401 503,967,161 1,245,244,940Investment Manager’s fees payable 5 480,905 215,070 717,956,809 199,337,239Administration fees payable 5 6,077 5,599 6,826,533 4,262,763Depositary fees payable 5 9,336 9,041 17,853,731 10,221,285Expenses payable 5 11,589 19,908 35,754,175 19,717,348
Total liabilities (excluding net assets attributable to holders of redeemableparticipating shares) 669,601 2,051,893 1,957,053,367 1,610,005,189
Total net assets attributable to holders of redeemable participating shares 7, 15 281,233,174 222,362,117 515,559,383,572 247,162,608,574
COMGEST GROWTH plc
STATEMENT OF FINANCIAL POSITIONAs at 31 December 2020 (continued)
The accompanying notes form an integral part of the financial statements. 80
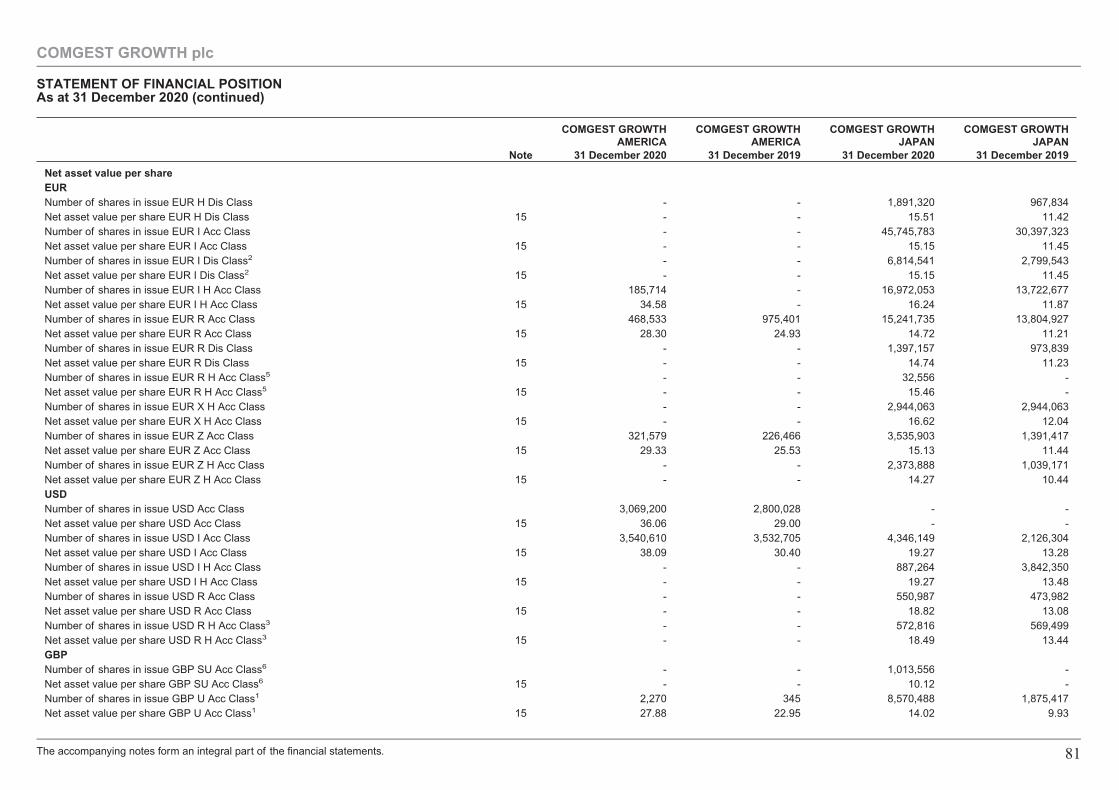
COMGEST GROWTHAMERICA
COMGEST GROWTHAMERICA
COMGEST GROWTHJAPAN
COMGEST GROWTHJAPAN
Note 31 December 2020 31 December 2019 31 December 2020 31 December 2019
Net asset value per shareEURNumber of shares in issue EUR H Dis Class - - 1,891,320 967,834Net asset value per share EUR H Dis Class 15 - - 15.51 11.42Number of shares in issue EUR I Acc Class - - 45,745,783 30,397,323Net asset value per share EUR I Acc Class 15 - - 15.15 11.45Number of shares in issue EUR I Dis Class2 - - 6,814,541 2,799,543Net asset value per share EUR I Dis Class2 15 - - 15.15 11.45Number of shares in issue EUR I H Acc Class 185,714 - 16,972,053 13,722,677Net asset value per share EUR I H Acc Class 15 34.58 - 16.24 11.87Number of shares in issue EUR R Acc Class 468,533 975,401 15,241,735 13,804,927Net asset value per share EUR R Acc Class 15 28.30 24.93 14.72 11.21Number of shares in issue EUR R Dis Class - - 1,397,157 973,839Net asset value per share EUR R Dis Class 15 - - 14.74 11.23Number of shares in issue EUR R H Acc Class5 - - 32,556 -Net asset value per share EUR R H Acc Class5 15 - - 15.46 -Number of shares in issue EUR X H Acc Class - - 2,944,063 2,944,063Net asset value per share EUR X H Acc Class 15 - - 16.62 12.04Number of shares in issue EUR Z Acc Class 321,579 226,466 3,535,903 1,391,417Net asset value per share EUR Z Acc Class 15 29.33 25.53 15.13 11.44Number of shares in issue EUR Z H Acc Class - - 2,373,888 1,039,171Net asset value per share EUR Z H Acc Class 15 - - 14.27 10.44USDNumber of shares in issue USD Acc Class 3,069,200 2,800,028 - -Net asset value per share USD Acc Class 15 36.06 29.00 - -Number of shares in issue USD I Acc Class 3,540,610 3,532,705 4,346,149 2,126,304Net asset value per share USD I Acc Class 15 38.09 30.40 19.27 13.28Number of shares in issue USD I H Acc Class - - 887,264 3,842,350Net asset value per share USD I H Acc Class 15 - - 19.27 13.48Number of shares in issue USD R Acc Class - - 550,987 473,982Net asset value per share USD R Acc Class 15 - - 18.82 13.08Number of shares in issue USD R H Acc Class3 - - 572,816 569,499Net asset value per share USD R H Acc Class3 15 - - 18.49 13.44GBPNumber of shares in issue GBP SU Acc Class6 - - 1,013,556 -Net asset value per share GBP SU Acc Class6 15 - - 10.12 -Number of shares in issue GBP U Acc Class1 2,270 345 8,570,488 1,875,417Net asset value per share GBP U Acc Class1 15 27.88 22.95 14.02 9.93
COMGEST GROWTH plc
STATEMENT OF FINANCIAL POSITIONAs at 31 December 2020 (continued)
The accompanying notes form an integral part of the financial statements. 81
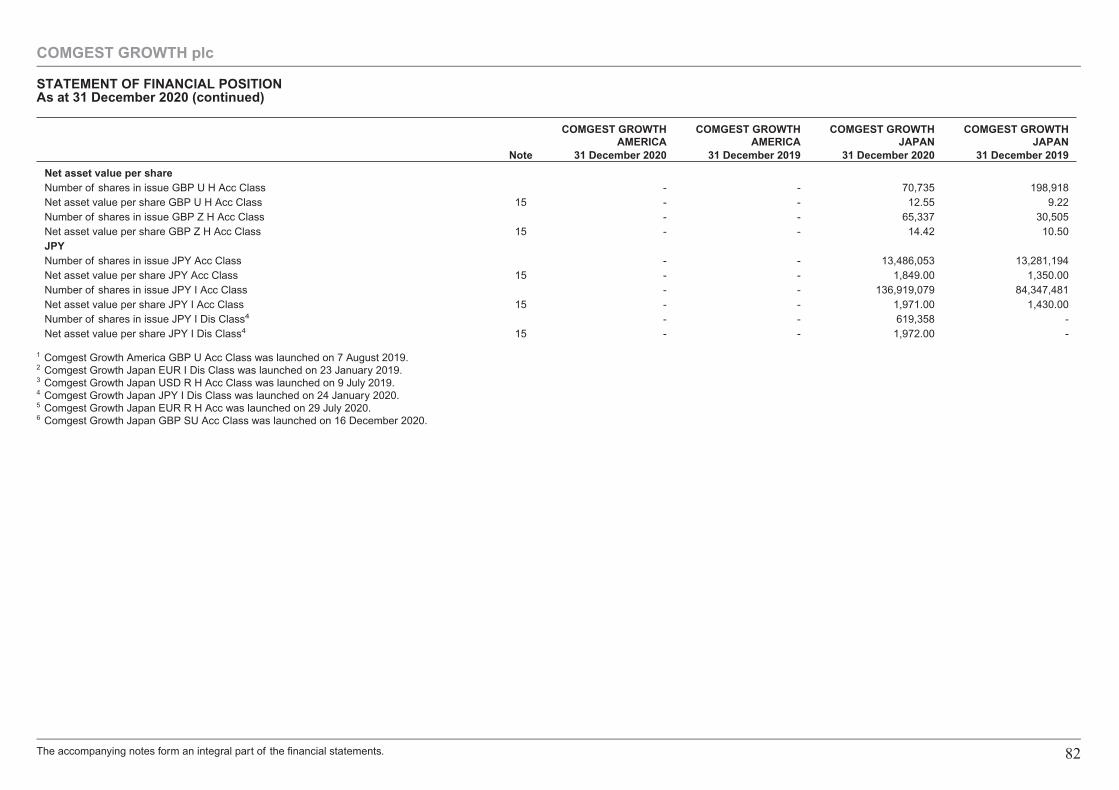
COMGEST GROWTHAMERICA
COMGEST GROWTHAMERICA
COMGEST GROWTHJAPAN
COMGEST GROWTHJAPAN
Note 31 December 2020 31 December 2019 31 December 2020 31 December 2019
Net asset value per shareNumber of shares in issue GBP U H Acc Class - - 70,735 198,918Net asset value per share GBP U H Acc Class 15 - - 12.55 9.22Number of shares in issue GBP Z H Acc Class - - 65,337 30,505Net asset value per share GBP Z H Acc Class 15 - - 14.42 10.50JPYNumber of shares in issue JPY Acc Class - - 13,486,053 13,281,194Net asset value per share JPY Acc Class 15 - - 1,849.00 1,350.00Number of shares in issue JPY I Acc Class - - 136,919,079 84,347,481Net asset value per share JPY I Acc Class 15 - - 1,971.00 1,430.00Number of shares in issue JPY I Dis Class4 - - 619,358 -Net asset value per share JPY I Dis Class4 15 - - 1,972.00 -
1 Comgest Growth America GBP U Acc Class was launched on 7 August 2019.2 Comgest Growth Japan EUR I Dis Class was launched on 23 January 2019.3 Comgest Growth Japan USD R H Acc Class was launched on 9 July 2019.4 Comgest Growth Japan JPY I Dis Class was launched on 24 January 2020.5 Comgest Growth Japan EUR R H Acc was launched on 29 July 2020.6 Comgest Growth Japan GBP SU Acc Class was launched on 16 December 2020.
COMGEST GROWTH plc
STATEMENT OF FINANCIAL POSITIONAs at 31 December 2020 (continued)
The accompanying notes form an integral part of the financial statements. 82
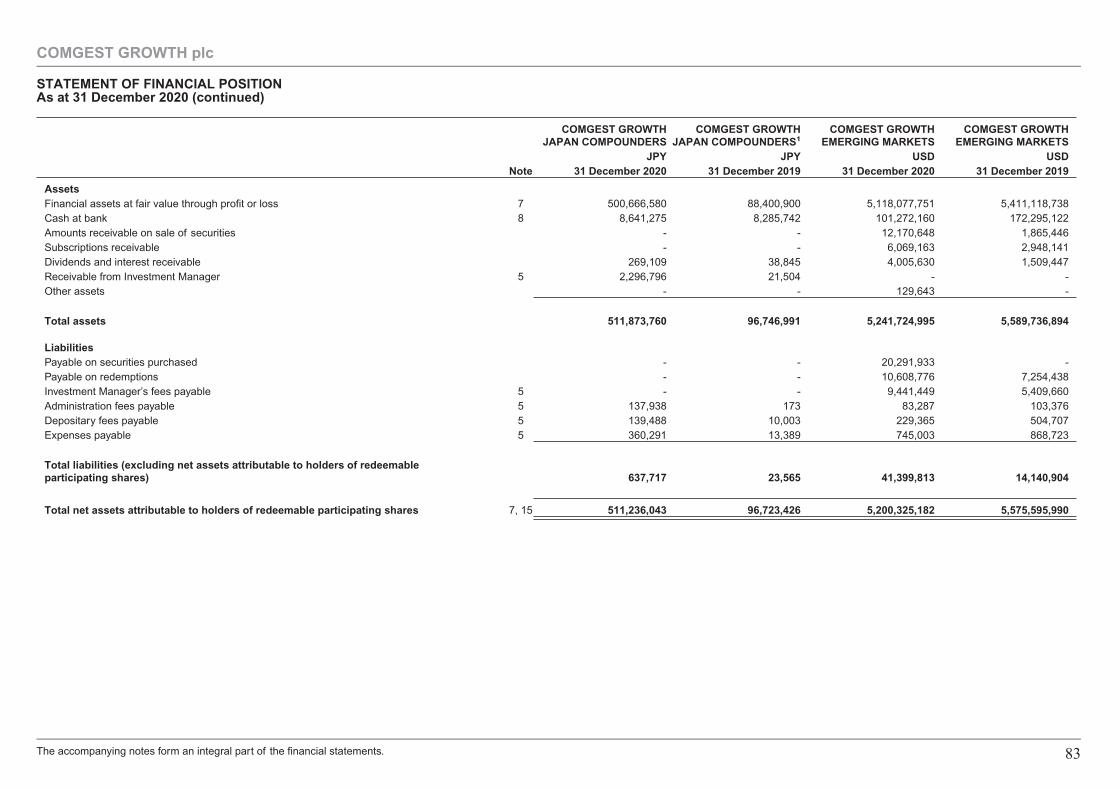
COMGEST GROWTHJAPAN COMPOUNDERS
COMGEST GROWTHJAPAN COMPOUNDERS1
COMGEST GROWTHEMERGING MARKETS
COMGEST GROWTHEMERGING MARKETS
JPY JPY USD USDNote 31 December 2020 31 December 2019 31 December 2020 31 December 2019
AssetsFinancial assets at fair value through profit or loss 7 500,666,580 88,400,900 5,118,077,751 5,411,118,738Cash at bank 8 8,641,275 8,285,742 101,272,160 172,295,122Amounts receivable on sale of securities - - 12,170,648 1,865,446Subscriptions receivable - - 6,069,163 2,948,141Dividends and interest receivable 269,109 38,845 4,005,630 1,509,447Receivable from Investment Manager 5 2,296,796 21,504 - -Other assets - - 129,643 -
Total assets 511,873,760 96,746,991 5,241,724,995 5,589,736,894
LiabilitiesPayable on securities purchased - - 20,291,933 -Payable on redemptions - - 10,608,776 7,254,438Investment Manager’s fees payable 5 - - 9,441,449 5,409,660Administration fees payable 5 137,938 173 83,287 103,376Depositary fees payable 5 139,488 10,003 229,365 504,707Expenses payable 5 360,291 13,389 745,003 868,723
Total liabilities (excluding net assets attributable to holders of redeemableparticipating shares) 637,717 23,565 41,399,813 14,140,904
Total net assets attributable to holders of redeemable participating shares 7, 15 511,236,043 96,723,426 5,200,325,182 5,575,595,990
COMGEST GROWTH plc
STATEMENT OF FINANCIAL POSITIONAs at 31 December 2020 (continued)
The accompanying notes form an integral part of the financial statements. 83
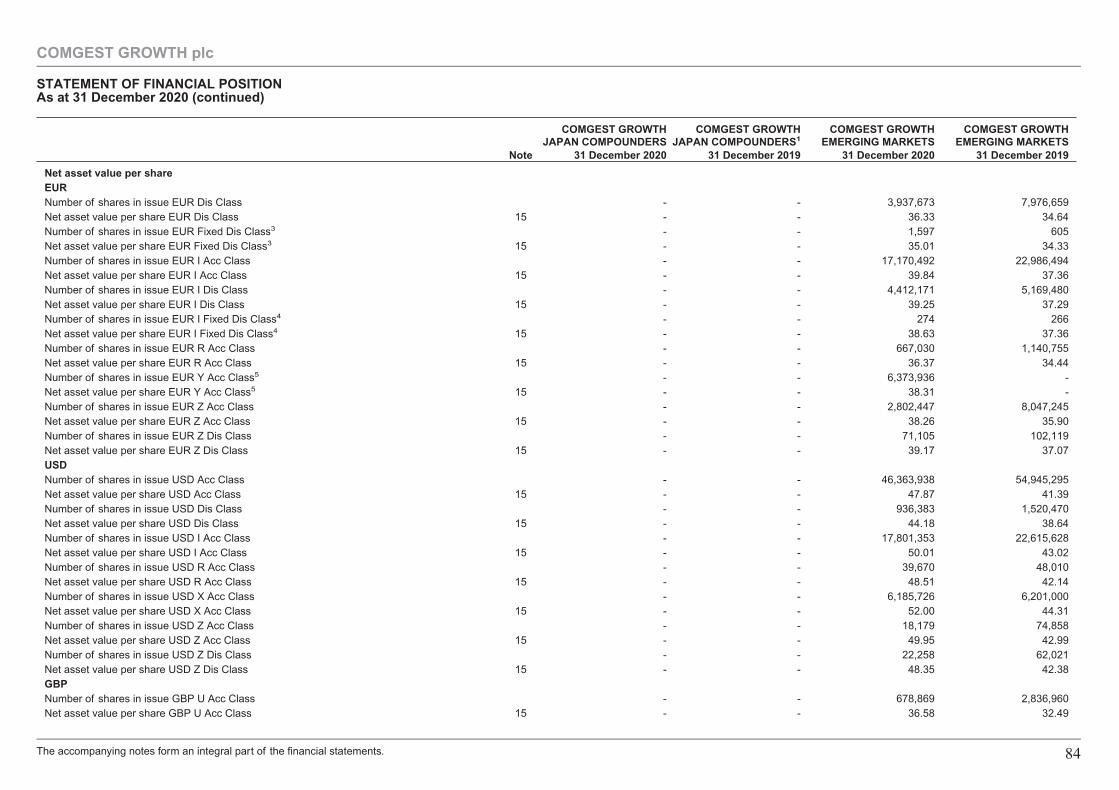
COMGEST GROWTHJAPAN COMPOUNDERS
COMGEST GROWTHJAPAN COMPOUNDERS1
COMGEST GROWTHEMERGING MARKETS
COMGEST GROWTHEMERGING MARKETS
Note 31 December 2020 31 December 2019 31 December 2020 31 December 2019
Net asset value per shareEURNumber of shares in issue EUR Dis Class - - 3,937,673 7,976,659Net asset value per share EUR Dis Class 15 - - 36.33 34.64Number of shares in issue EUR Fixed Dis Class3 - - 1,597 605Net asset value per share EUR Fixed Dis Class3 15 - - 35.01 34.33Number of shares in issue EUR I Acc Class - - 17,170,492 22,986,494Net asset value per share EUR I Acc Class 15 - - 39.84 37.36Number of shares in issue EUR I Dis Class - - 4,412,171 5,169,480Net asset value per share EUR I Dis Class 15 - - 39.25 37.29Number of shares in issue EUR I Fixed Dis Class4 - - 274 266Net asset value per share EUR I Fixed Dis Class4 15 - - 38.63 37.36Number of shares in issue EUR R Acc Class - - 667,030 1,140,755Net asset value per share EUR R Acc Class 15 - - 36.37 34.44Number of shares in issue EUR Y Acc Class5 - - 6,373,936 -Net asset value per share EUR Y Acc Class5 15 - - 38.31 -Number of shares in issue EUR Z Acc Class - - 2,802,447 8,047,245Net asset value per share EUR Z Acc Class 15 - - 38.26 35.90Number of shares in issue EUR Z Dis Class - - 71,105 102,119Net asset value per share EUR Z Dis Class 15 - - 39.17 37.07USDNumber of shares in issue USD Acc Class - - 46,363,938 54,945,295Net asset value per share USD Acc Class 15 - - 47.87 41.39Number of shares in issue USD Dis Class - - 936,383 1,520,470Net asset value per share USD Dis Class 15 - - 44.18 38.64Number of shares in issue USD I Acc Class - - 17,801,353 22,615,628Net asset value per share USD I Acc Class 15 - - 50.01 43.02Number of shares in issue USD R Acc Class - - 39,670 48,010Net asset value per share USD R Acc Class 15 - - 48.51 42.14Number of shares in issue USD X Acc Class - - 6,185,726 6,201,000Net asset value per share USD X Acc Class 15 - - 52.00 44.31Number of shares in issue USD Z Acc Class - - 18,179 74,858Net asset value per share USD Z Acc Class 15 - - 49.95 42.99Number of shares in issue USD Z Dis Class - - 22,258 62,021Net asset value per share USD Z Dis Class 15 - - 48.35 42.38GBPNumber of shares in issue GBP U Acc Class - - 678,869 2,836,960Net asset value per share GBP U Acc Class 15 - - 36.58 32.49
COMGEST GROWTH plc
STATEMENT OF FINANCIAL POSITIONAs at 31 December 2020 (continued)
The accompanying notes form an integral part of the financial statements. 84
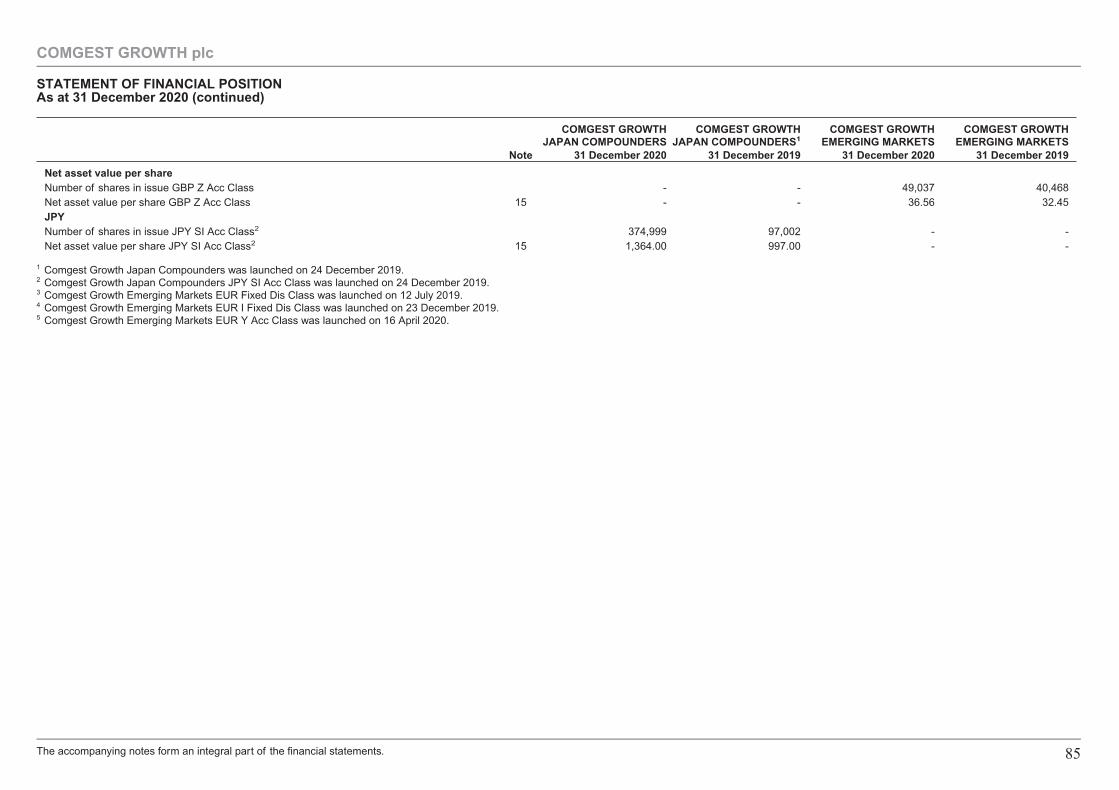
COMGEST GROWTHJAPAN COMPOUNDERS
COMGEST GROWTHJAPAN COMPOUNDERS1
COMGEST GROWTHEMERGING MARKETS
COMGEST GROWTHEMERGING MARKETS
Note 31 December 2020 31 December 2019 31 December 2020 31 December 2019
Net asset value per shareNumber of shares in issue GBP Z Acc Class - - 49,037 40,468Net asset value per share GBP Z Acc Class 15 - - 36.56 32.45JPYNumber of shares in issue JPY SI Acc Class2 374,999 97,002 - -Net asset value per share JPY SI Acc Class2 15 1,364.00 997.00 - -
1 Comgest Growth Japan Compounders was launched on 24 December 2019.2 Comgest Growth Japan Compounders JPY SI Acc Class was launched on 24 December 2019.3 Comgest Growth Emerging Markets EUR Fixed Dis Class was launched on 12 July 2019.4 Comgest Growth Emerging Markets EUR I Fixed Dis Class was launched on 23 December 2019.5 Comgest Growth Emerging Markets EUR Y Acc Class was launched on 16 April 2020.
COMGEST GROWTH plc
STATEMENT OF FINANCIAL POSITIONAs at 31 December 2020 (continued)
The accompanying notes form an integral part of the financial statements. 85
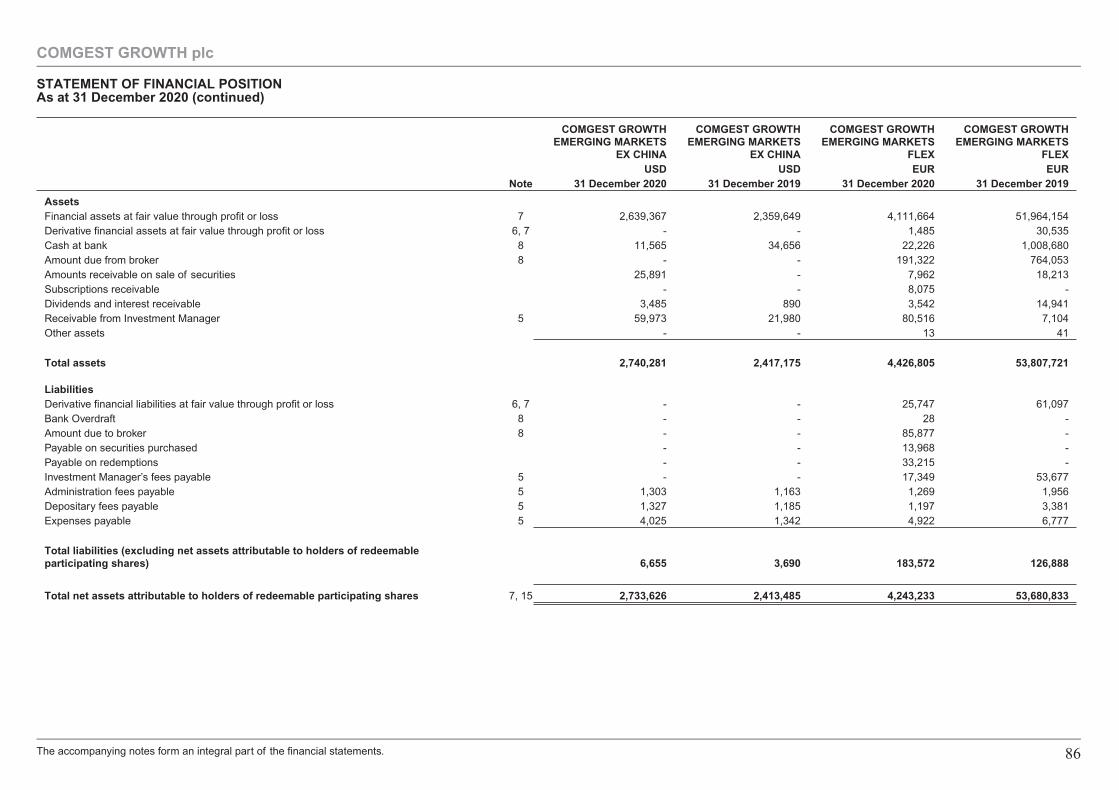
COMGEST GROWTHEMERGING MARKETS
EX CHINA
COMGEST GROWTHEMERGING MARKETS
EX CHINA
COMGEST GROWTHEMERGING MARKETS
FLEX
COMGEST GROWTHEMERGING MARKETS
FLEXUSD USD EUR EUR
Note 31 December 2020 31 December 2019 31 December 2020 31 December 2019
AssetsFinancial assets at fair value through profit or loss 7 2,639,367 2,359,649 4,111,664 51,964,154Derivative financial assets at fair value through profit or loss 6, 7 - - 1,485 30,535Cash at bank 8 11,565 34,656 22,226 1,008,680Amount due from broker 8 - - 191,322 764,053Amounts receivable on sale of securities 25,891 - 7,962 18,213Subscriptions receivable - - 8,075 -Dividends and interest receivable 3,485 890 3,542 14,941Receivable from Investment Manager 5 59,973 21,980 80,516 7,104Other assets - - 13 41
Total assets 2,740,281 2,417,175 4,426,805 53,807,721
LiabilitiesDerivative financial liabilities at fair value through profit or loss 6, 7 - - 25,747 61,097Bank Overdraft 8 - - 28 -Amount due to broker 8 - - 85,877 -Payable on securities purchased - - 13,968 -Payable on redemptions - - 33,215 -Investment Manager’s fees payable 5 - - 17,349 53,677Administration fees payable 5 1,303 1,163 1,269 1,956Depositary fees payable 5 1,327 1,185 1,197 3,381Expenses payable 5 4,025 1,342 4,922 6,777
Total liabilities (excluding net assets attributable to holders of redeemableparticipating shares) 6,655 3,690 183,572 126,888
Total net assets attributable to holders of redeemable participating shares 7, 15 2,733,626 2,413,485 4,243,233 53,680,833
COMGEST GROWTH plc
STATEMENT OF FINANCIAL POSITIONAs at 31 December 2020 (continued)
The accompanying notes form an integral part of the financial statements. 86
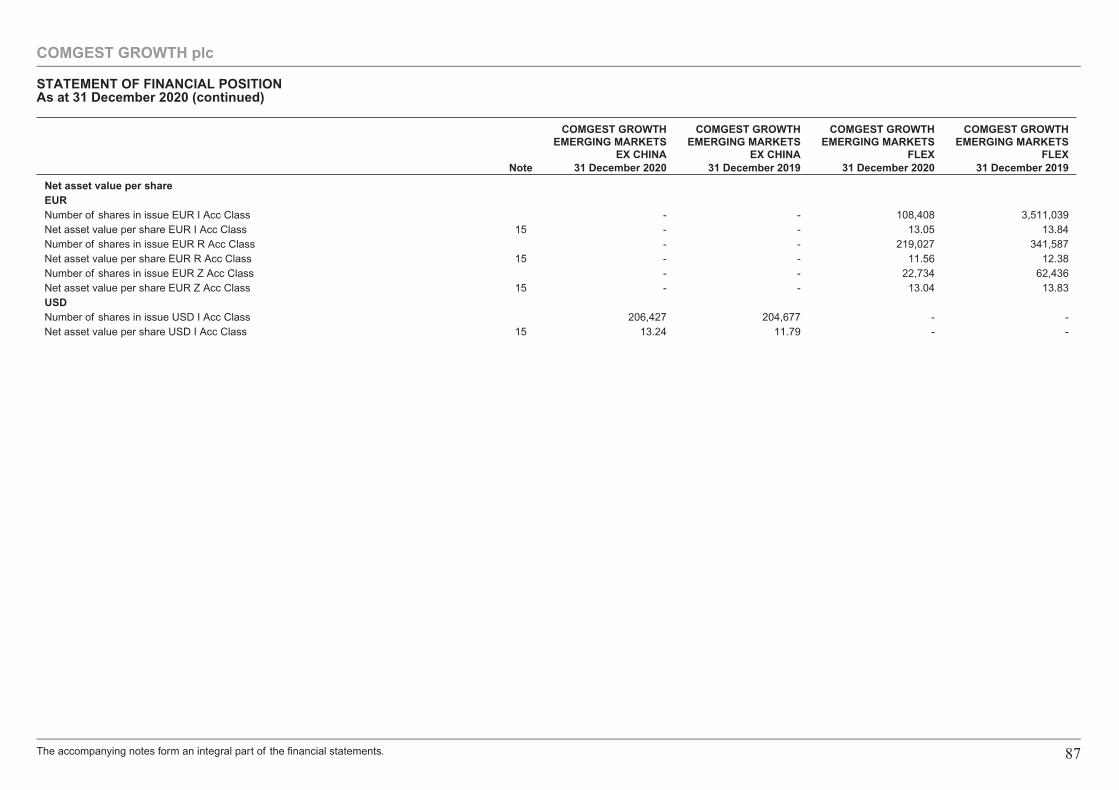
COMGEST GROWTHEMERGING MARKETS
EX CHINA
COMGEST GROWTHEMERGING MARKETS
EX CHINA
COMGEST GROWTHEMERGING MARKETS
FLEX
COMGEST GROWTHEMERGING MARKETS
FLEXNote 31 December 2020 31 December 2019 31 December 2020 31 December 2019
Net asset value per shareEURNumber of shares in issue EUR I Acc Class - - 108,408 3,511,039Net asset value per share EUR I Acc Class 15 - - 13.05 13.84Number of shares in issue EUR R Acc Class - - 219,027 341,587Net asset value per share EUR R Acc Class 15 - - 11.56 12.38Number of shares in issue EUR Z Acc Class - - 22,734 62,436Net asset value per share EUR Z Acc Class 15 - - 13.04 13.83USDNumber of shares in issue USD I Acc Class 206,427 204,677 - -Net asset value per share USD I Acc Class 15 13.24 11.79 - -
COMGEST GROWTH plc
STATEMENT OF FINANCIAL POSITIONAs at 31 December 2020 (continued)
The accompanying notes form an integral part of the financial statements. 87
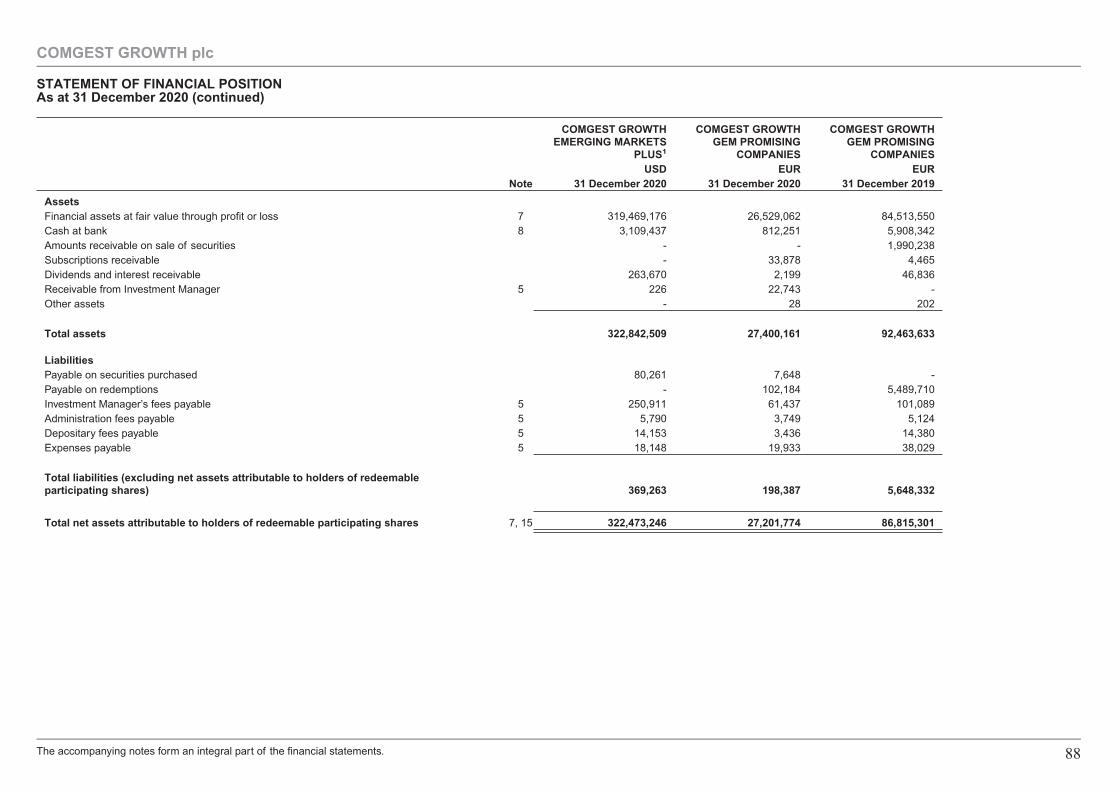
COMGEST GROWTHEMERGING MARKETS
PLUS1
COMGEST GROWTHGEM PROMISING
COMPANIES
COMGEST GROWTHGEM PROMISING
COMPANIESUSD EUR EUR
Note 31 December 2020 31 December 2020 31 December 2019
AssetsFinancial assets at fair value through profit or loss 7 319,469,176 26,529,062 84,513,550Cash at bank 8 3,109,437 812,251 5,908,342Amounts receivable on sale of securities - - 1,990,238Subscriptions receivable - 33,878 4,465Dividends and interest receivable 263,670 2,199 46,836Receivable from Investment Manager 5 226 22,743 -Other assets - 28 202
Total assets 322,842,509 27,400,161 92,463,633
LiabilitiesPayable on securities purchased 80,261 7,648 -Payable on redemptions - 102,184 5,489,710Investment Manager’s fees payable 5 250,911 61,437 101,089Administration fees payable 5 5,790 3,749 5,124Depositary fees payable 5 14,153 3,436 14,380Expenses payable 5 18,148 19,933 38,029
Total liabilities (excluding net assets attributable to holders of redeemableparticipating shares) 369,263 198,387 5,648,332
Total net assets attributable to holders of redeemable participating shares 7, 15 322,473,246 27,201,774 86,815,301
COMGEST GROWTH plc
STATEMENT OF FINANCIAL POSITIONAs at 31 December 2020 (continued)
The accompanying notes form an integral part of the financial statements. 88
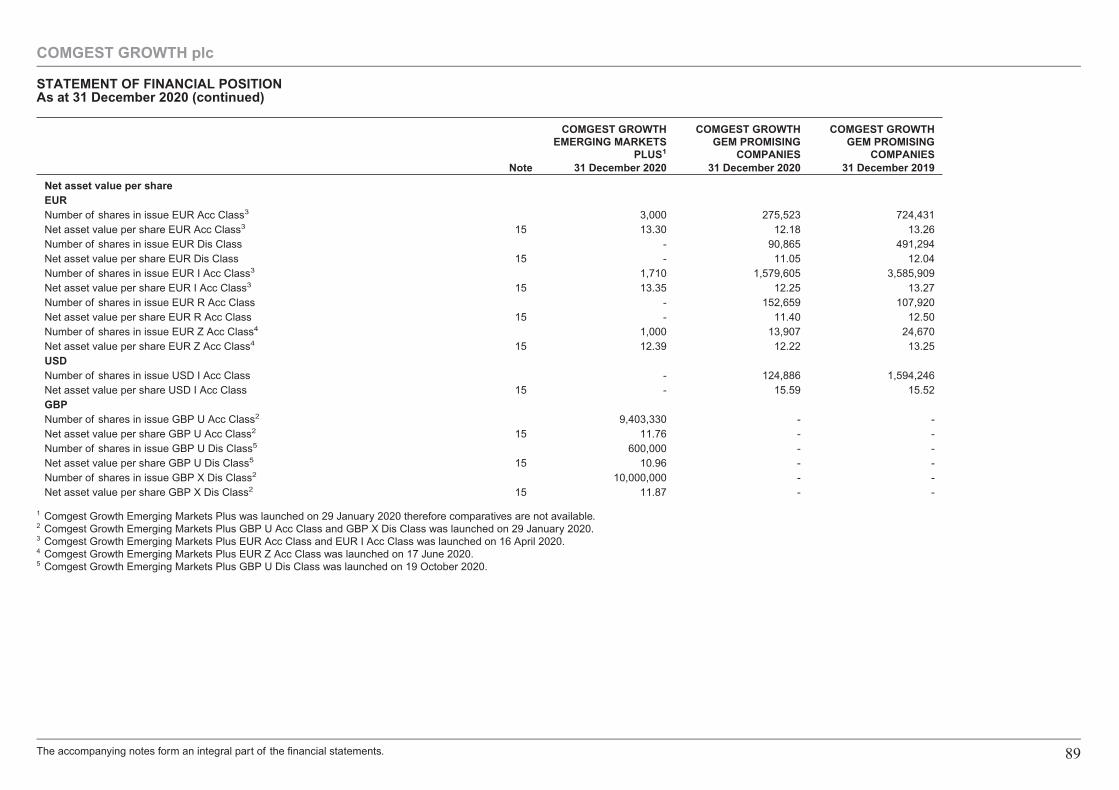
COMGEST GROWTHEMERGING MARKETS
PLUS1
COMGEST GROWTHGEM PROMISING
COMPANIES
COMGEST GROWTHGEM PROMISING
COMPANIESNote 31 December 2020 31 December 2020 31 December 2019
Net asset value per shareEURNumber of shares in issue EUR Acc Class3 3,000 275,523 724,431Net asset value per share EUR Acc Class3 15 13.30 12.18 13.26Number of shares in issue EUR Dis Class - 90,865 491,294Net asset value per share EUR Dis Class 15 - 11.05 12.04Number of shares in issue EUR I Acc Class3 1,710 1,579,605 3,585,909Net asset value per share EUR I Acc Class3 15 13.35 12.25 13.27Number of shares in issue EUR R Acc Class - 152,659 107,920Net asset value per share EUR R Acc Class 15 - 11.40 12.50Number of shares in issue EUR Z Acc Class4 1,000 13,907 24,670Net asset value per share EUR Z Acc Class4 15 12.39 12.22 13.25USDNumber of shares in issue USD I Acc Class - 124,886 1,594,246Net asset value per share USD I Acc Class 15 - 15.59 15.52GBPNumber of shares in issue GBP U Acc Class2 9,403,330 - -Net asset value per share GBP U Acc Class2 15 11.76 - -Number of shares in issue GBP U Dis Class5 600,000 - -Net asset value per share GBP U Dis Class5 15 10.96 - -Number of shares in issue GBP X Dis Class2 10,000,000 - -Net asset value per share GBP X Dis Class2 15 11.87 - -
1 Comgest Growth Emerging Markets Plus was launched on 29 January 2020 therefore comparatives are not available.2 Comgest Growth Emerging Markets Plus GBP U Acc Class and GBP X Dis Class was launched on 29 January 2020.3 Comgest Growth Emerging Markets Plus EUR Acc Class and EUR I Acc Class was launched on 16 April 2020.4 Comgest Growth Emerging Markets Plus EUR Z Acc Class was launched on 17 June 2020.5 Comgest Growth Emerging Markets Plus GBP U Dis Class was launched on 19 October 2020.
COMGEST GROWTH plc
STATEMENT OF FINANCIAL POSITIONAs at 31 December 2020 (continued)
The accompanying notes form an integral part of the financial statements. 89
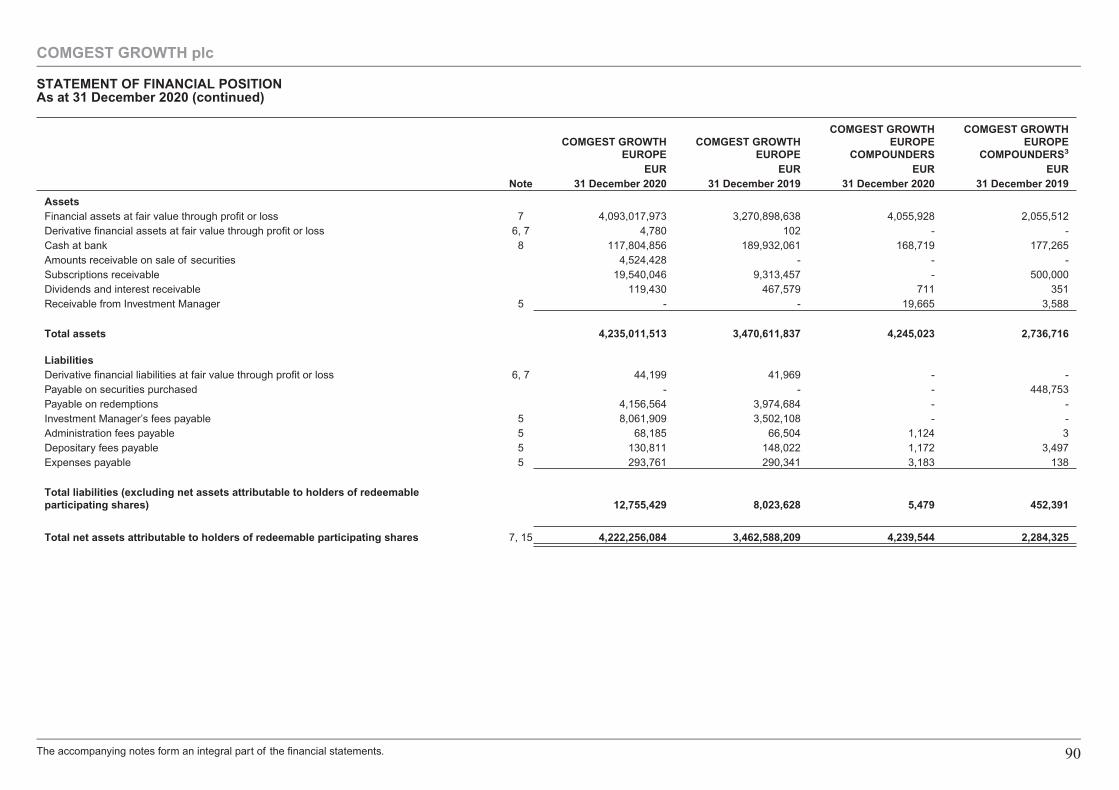
COMGEST GROWTHEUROPE
COMGEST GROWTHEUROPE
COMGEST GROWTHEUROPE
COMPOUNDERS
COMGEST GROWTHEUROPE
COMPOUNDERS3
EUR EUR EUR EURNote 31 December 2020 31 December 2019 31 December 2020 31 December 2019
AssetsFinancial assets at fair value through profit or loss 7 4,093,017,973 3,270,898,638 4,055,928 2,055,512Derivative financial assets at fair value through profit or loss 6, 7 4,780 102 - -Cash at bank 8 117,804,856 189,932,061 168,719 177,265Amounts receivable on sale of securities 4,524,428 - - -Subscriptions receivable 19,540,046 9,313,457 - 500,000Dividends and interest receivable 119,430 467,579 711 351Receivable from Investment Manager 5 - - 19,665 3,588
Total assets 4,235,011,513 3,470,611,837 4,245,023 2,736,716
LiabilitiesDerivative financial liabilities at fair value through profit or loss 6, 7 44,199 41,969 - -Payable on securities purchased - - - 448,753Payable on redemptions 4,156,564 3,974,684 - -Investment Manager’s fees payable 5 8,061,909 3,502,108 - -Administration fees payable 5 68,185 66,504 1,124 3Depositary fees payable 5 130,811 148,022 1,172 3,497Expenses payable 5 293,761 290,341 3,183 138
Total liabilities (excluding net assets attributable to holders of redeemableparticipating shares) 12,755,429 8,023,628 5,479 452,391
Total net assets attributable to holders of redeemable participating shares 7, 15 4,222,256,084 3,462,588,209 4,239,544 2,284,325
COMGEST GROWTH plc
STATEMENT OF FINANCIAL POSITIONAs at 31 December 2020 (continued)
The accompanying notes form an integral part of the financial statements. 90
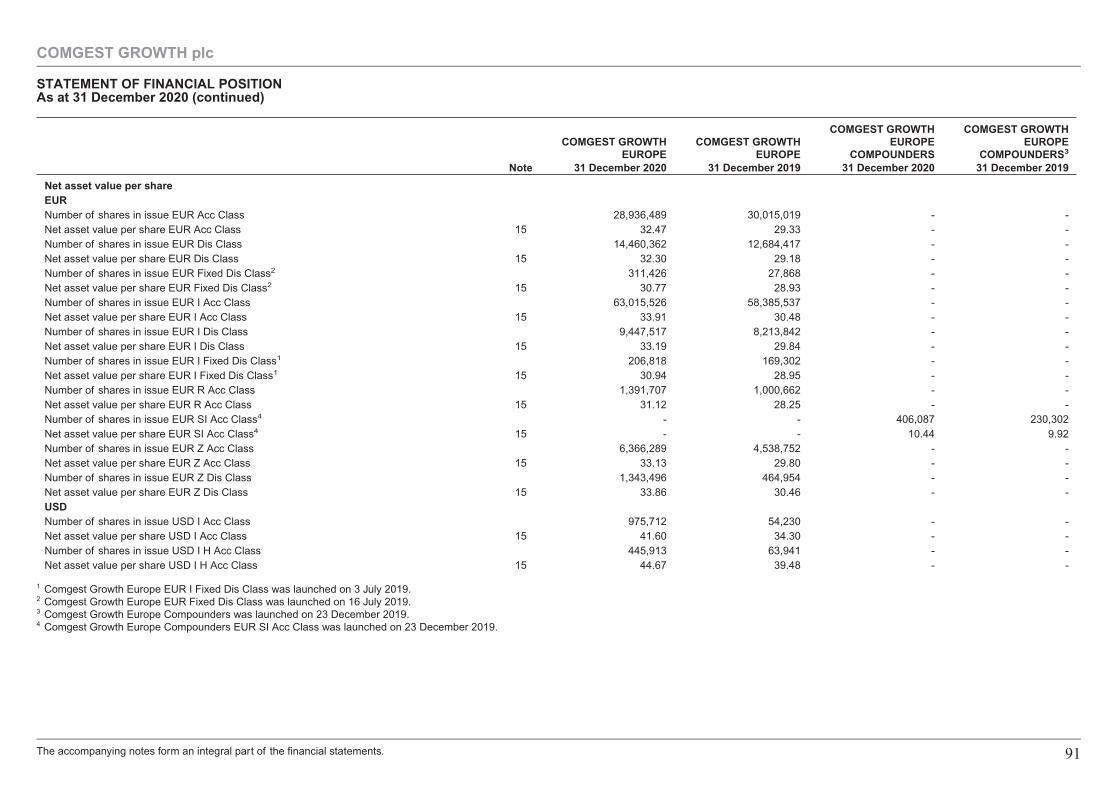
COMGEST GROWTHEUROPE
COMGEST GROWTHEUROPE
COMGEST GROWTHEUROPE
COMPOUNDERS
COMGEST GROWTHEUROPE
COMPOUNDERS3
Note 31 December 2020 31 December 2019 31 December 2020 31 December 2019
Net asset value per shareEURNumber of shares in issue EUR Acc Class 28,936,489 30,015,019 - -Net asset value per share EUR Acc Class 15 32.47 29.33 - -Number of shares in issue EUR Dis Class 14,460,362 12,684,417 - -Net asset value per share EUR Dis Class 15 32.30 29.18 - -Number of shares in issue EUR Fixed Dis Class2 311,426 27,868 - -Net asset value per share EUR Fixed Dis Class2 15 30.77 28.93 - -Number of shares in issue EUR I Acc Class 63,015,526 58,385,537 - -Net asset value per share EUR I Acc Class 15 33.91 30.48 - -Number of shares in issue EUR I Dis Class 9,447,517 8,213,842 - -Net asset value per share EUR I Dis Class 15 33.19 29.84 - -Number of shares in issue EUR I Fixed Dis Class1 206,818 169,302 - -Net asset value per share EUR I Fixed Dis Class1 15 30.94 28.95 - -Number of shares in issue EUR R Acc Class 1,391,707 1,000,662 - -Net asset value per share EUR R Acc Class 15 31.12 28.25 - -Number of shares in issue EUR SI Acc Class4 - - 406,087 230,302Net asset value per share EUR SI Acc Class4 15 - - 10.44 9.92Number of shares in issue EUR Z Acc Class 6,366,289 4,538,752 - -Net asset value per share EUR Z Acc Class 15 33.13 29.80 - -Number of shares in issue EUR Z Dis Class 1,343,496 464,954 - -Net asset value per share EUR Z Dis Class 15 33.86 30.46 - -USDNumber of shares in issue USD I Acc Class 975,712 54,230 - -Net asset value per share USD I Acc Class 15 41.60 34.30 - -Number of shares in issue USD I H Acc Class 445,913 63,941 - -Net asset value per share USD I H Acc Class 15 44.67 39.48 - -
1 Comgest Growth Europe EUR I Fixed Dis Class was launched on 3 July 2019.2 Comgest Growth Europe EUR Fixed Dis Class was launched on 16 July 2019.3 Comgest Growth Europe Compounders was launched on 23 December 2019.4 Comgest Growth Europe Compounders EUR SI Acc Class was launched on 23 December 2019.
COMGEST GROWTH plc
STATEMENT OF FINANCIAL POSITIONAs at 31 December 2020 (continued)
The accompanying notes form an integral part of the financial statements. 91
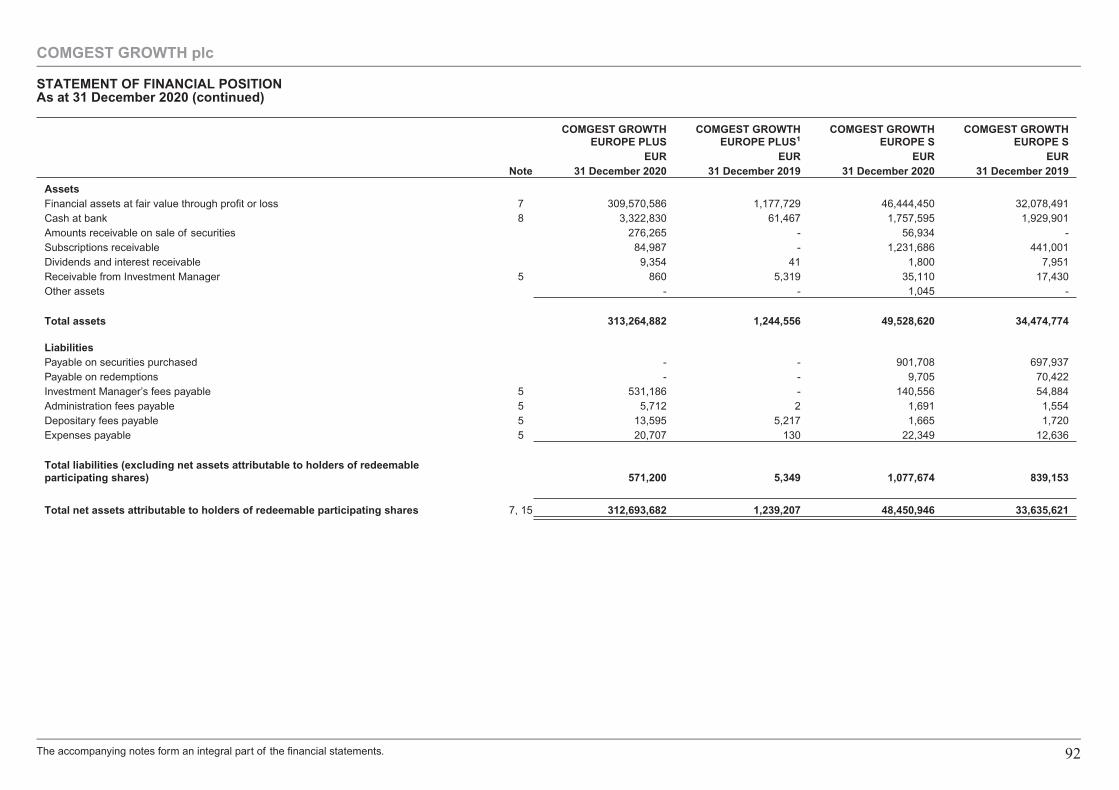
COMGEST GROWTHEUROPE PLUS
COMGEST GROWTHEUROPE PLUS1
COMGEST GROWTHEUROPE S
COMGEST GROWTHEUROPE S
EUR EUR EUR EURNote 31 December 2020 31 December 2019 31 December 2020 31 December 2019
AssetsFinancial assets at fair value through profit or loss 7 309,570,586 1,177,729 46,444,450 32,078,491Cash at bank 8 3,322,830 61,467 1,757,595 1,929,901Amounts receivable on sale of securities 276,265 - 56,934 -Subscriptions receivable 84,987 - 1,231,686 441,001Dividends and interest receivable 9,354 41 1,800 7,951Receivable from Investment Manager 5 860 5,319 35,110 17,430Other assets - - 1,045 -
Total assets 313,264,882 1,244,556 49,528,620 34,474,774
LiabilitiesPayable on securities purchased - - 901,708 697,937Payable on redemptions - - 9,705 70,422Investment Manager’s fees payable 5 531,186 - 140,556 54,884Administration fees payable 5 5,712 2 1,691 1,554Depositary fees payable 5 13,595 5,217 1,665 1,720Expenses payable 5 20,707 130 22,349 12,636
Total liabilities (excluding net assets attributable to holders of redeemableparticipating shares) 571,200 5,349 1,077,674 839,153
Total net assets attributable to holders of redeemable participating shares 7, 15 312,693,682 1,239,207 48,450,946 33,635,621
COMGEST GROWTH plc
STATEMENT OF FINANCIAL POSITIONAs at 31 December 2020 (continued)
The accompanying notes form an integral part of the financial statements. 92
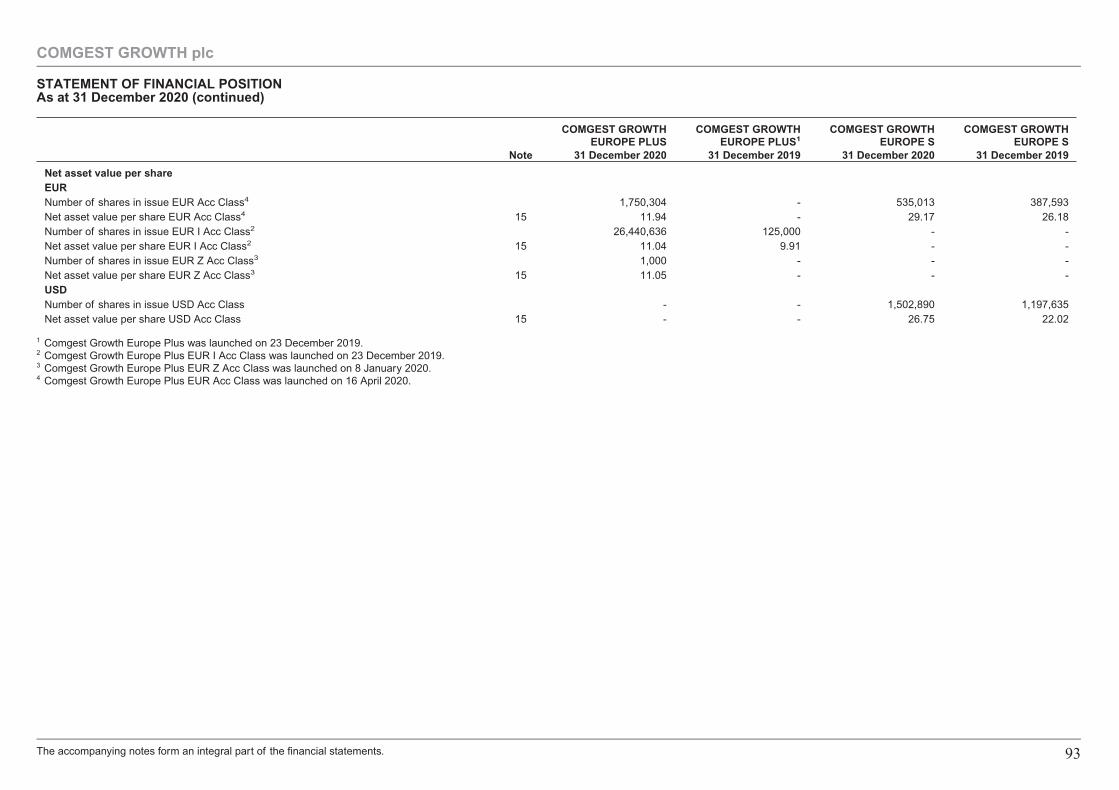
COMGEST GROWTHEUROPE PLUS
COMGEST GROWTHEUROPE PLUS1
COMGEST GROWTHEUROPE S
COMGEST GROWTHEUROPE S
Note 31 December 2020 31 December 2019 31 December 2020 31 December 2019
Net asset value per shareEURNumber of shares in issue EUR Acc Class4 1,750,304 - 535,013 387,593Net asset value per share EUR Acc Class4 15 11.94 - 29.17 26.18Number of shares in issue EUR I Acc Class2 26,440,636 125,000 - -Net asset value per share EUR I Acc Class2 15 11.04 9.91 - -Number of shares in issue EUR Z Acc Class3 1,000 - - -Net asset value per share EUR Z Acc Class3 15 11.05 - - -USDNumber of shares in issue USD Acc Class - - 1,502,890 1,197,635Net asset value per share USD Acc Class 15 - - 26.75 22.02
1 Comgest Growth Europe Plus was launched on 23 December 2019.2 Comgest Growth Europe Plus EUR I Acc Class was launched on 23 December 2019.3 Comgest Growth Europe Plus EUR Z Acc Class was launched on 8 January 2020.4 Comgest Growth Europe Plus EUR Acc Class was launched on 16 April 2020.
COMGEST GROWTH plc
STATEMENT OF FINANCIAL POSITIONAs at 31 December 2020 (continued)
The accompanying notes form an integral part of the financial statements. 93
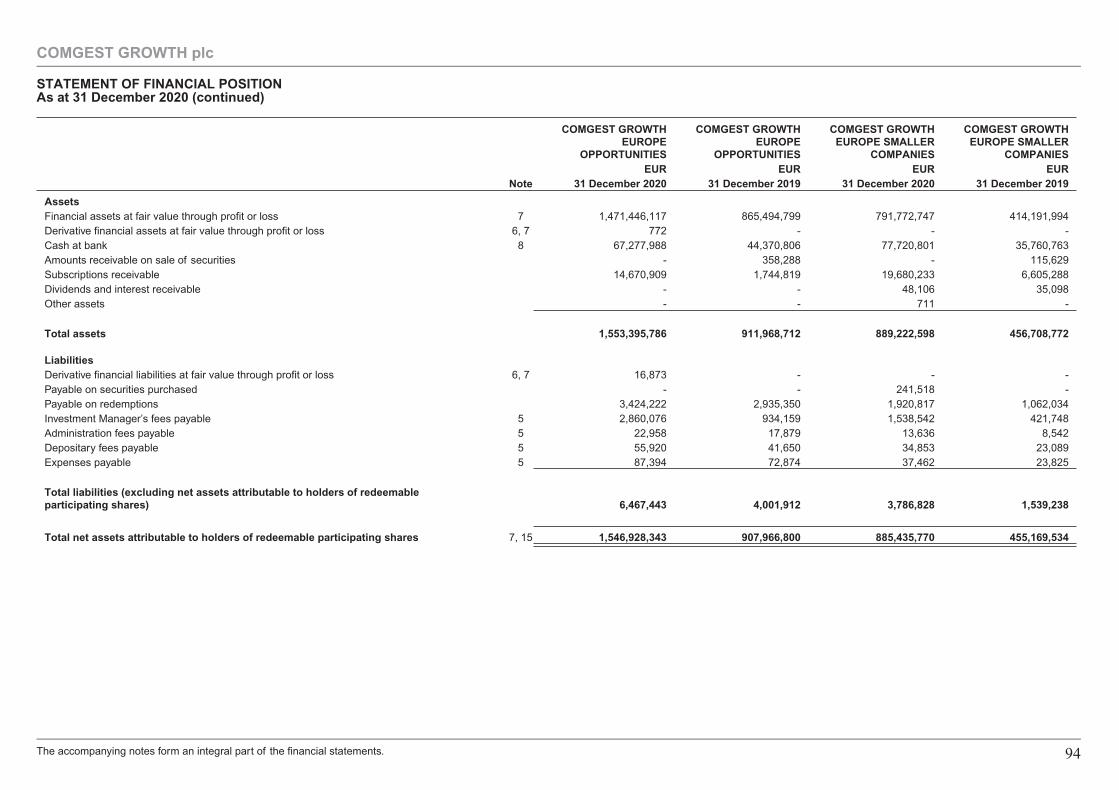
COMGEST GROWTHEUROPE
OPPORTUNITIES
COMGEST GROWTHEUROPE
OPPORTUNITIES
COMGEST GROWTHEUROPE SMALLER
COMPANIES
COMGEST GROWTHEUROPE SMALLER
COMPANIESEUR EUR EUR EUR
Note 31 December 2020 31 December 2019 31 December 2020 31 December 2019
AssetsFinancial assets at fair value through profit or loss 7 1,471,446,117 865,494,799 791,772,747 414,191,994Derivative financial assets at fair value through profit or loss 6, 7 772 - - -Cash at bank 8 67,277,988 44,370,806 77,720,801 35,760,763Amounts receivable on sale of securities - 358,288 - 115,629Subscriptions receivable 14,670,909 1,744,819 19,680,233 6,605,288Dividends and interest receivable - - 48,106 35,098Other assets - - 711 -
Total assets 1,553,395,786 911,968,712 889,222,598 456,708,772
LiabilitiesDerivative financial liabilities at fair value through profit or loss 6, 7 16,873 - - -Payable on securities purchased - - 241,518 -Payable on redemptions 3,424,222 2,935,350 1,920,817 1,062,034Investment Manager’s fees payable 5 2,860,076 934,159 1,538,542 421,748Administration fees payable 5 22,958 17,879 13,636 8,542Depositary fees payable 5 55,920 41,650 34,853 23,089Expenses payable 5 87,394 72,874 37,462 23,825
Total liabilities (excluding net assets attributable to holders of redeemableparticipating shares) 6,467,443 4,001,912 3,786,828 1,539,238
Total net assets attributable to holders of redeemable participating shares 7, 15 1,546,928,343 907,966,800 885,435,770 455,169,534
COMGEST GROWTH plc
STATEMENT OF FINANCIAL POSITIONAs at 31 December 2020 (continued)
The accompanying notes form an integral part of the financial statements. 94
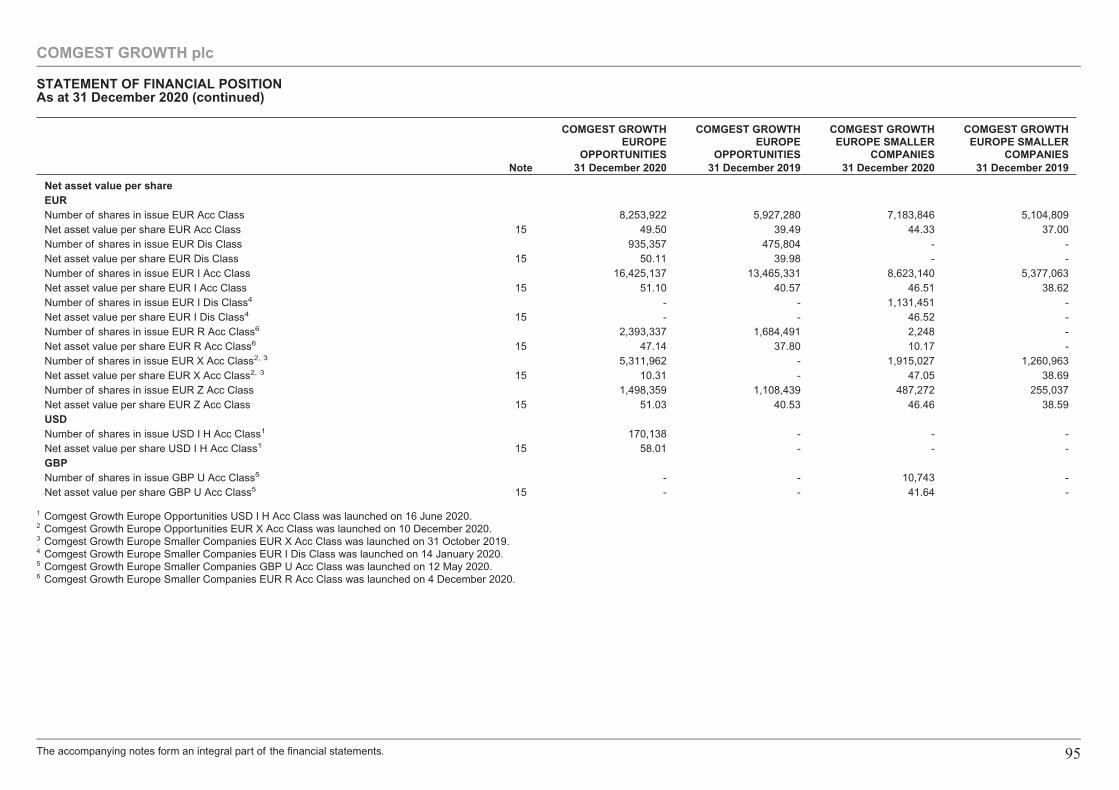
COMGEST GROWTHEUROPE
OPPORTUNITIES
COMGEST GROWTHEUROPE
OPPORTUNITIES
COMGEST GROWTHEUROPE SMALLER
COMPANIES
COMGEST GROWTHEUROPE SMALLER
COMPANIESNote 31 December 2020 31 December 2019 31 December 2020 31 December 2019
Net asset value per shareEURNumber of shares in issue EUR Acc Class 8,253,922 5,927,280 7,183,846 5,104,809Net asset value per share EUR Acc Class 15 49.50 39.49 44.33 37.00Number of shares in issue EUR Dis Class 935,357 475,804 - -Net asset value per share EUR Dis Class 15 50.11 39.98 - -Number of shares in issue EUR I Acc Class 16,425,137 13,465,331 8,623,140 5,377,063Net asset value per share EUR I Acc Class 15 51.10 40.57 46.51 38.62Number of shares in issue EUR I Dis Class4 - - 1,131,451 -Net asset value per share EUR I Dis Class4 15 - - 46.52 -Number of shares in issue EUR R Acc Class6 2,393,337 1,684,491 2,248 -Net asset value per share EUR R Acc Class6 15 47.14 37.80 10.17 -Number of shares in issue EUR X Acc Class2, 3 5,311,962 - 1,915,027 1,260,963Net asset value per share EUR X Acc Class2, 3 15 10.31 - 47.05 38.69Number of shares in issue EUR Z Acc Class 1,498,359 1,108,439 487,272 255,037Net asset value per share EUR Z Acc Class 15 51.03 40.53 46.46 38.59USDNumber of shares in issue USD I H Acc Class1 170,138 - - -Net asset value per share USD I H Acc Class1 15 58.01 - - -GBPNumber of shares in issue GBP U Acc Class5 - - 10,743 -Net asset value per share GBP U Acc Class5 15 - - 41.64 -
1 Comgest Growth Europe Opportunities USD I H Acc Class was launched on 16 June 2020.2 Comgest Growth Europe Opportunities EUR X Acc Class was launched on 10 December 2020.3 Comgest Growth Europe Smaller Companies EUR X Acc Class was launched on 31 October 2019.4 Comgest Growth Europe Smaller Companies EUR I Dis Class was launched on 14 January 2020.5 Comgest Growth Europe Smaller Companies GBP U Acc Class was launched on 12 May 2020.6 Comgest Growth Europe Smaller Companies EUR R Acc Class was launched on 4 December 2020.
COMGEST GROWTH plc
STATEMENT OF FINANCIAL POSITIONAs at 31 December 2020 (continued)
The accompanying notes form an integral part of the financial statements. 95
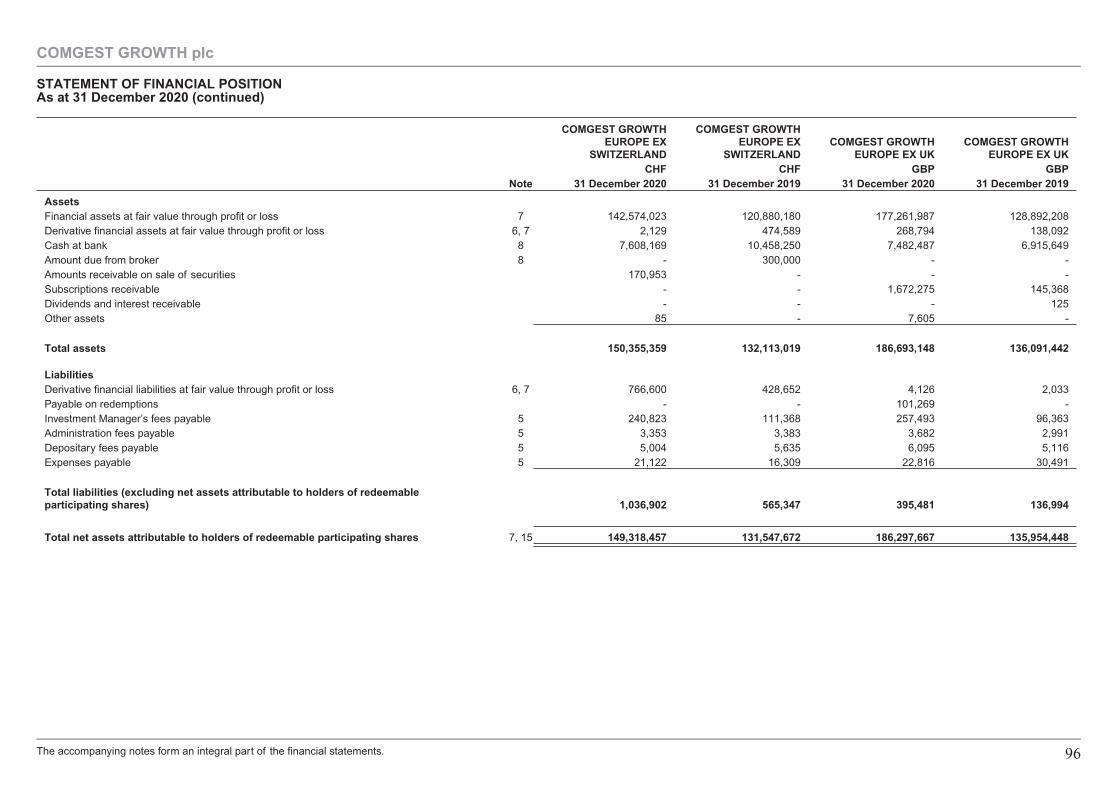
COMGEST GROWTHEUROPE EX
SWITZERLAND
COMGEST GROWTHEUROPE EX
SWITZERLANDCOMGEST GROWTH
EUROPE EX UKCOMGEST GROWTH
EUROPE EX UKCHF CHF GBP GBP
Note 31 December 2020 31 December 2019 31 December 2020 31 December 2019
AssetsFinancial assets at fair value through profit or loss 7 142,574,023 120,880,180 177,261,987 128,892,208Derivative financial assets at fair value through profit or loss 6, 7 2,129 474,589 268,794 138,092Cash at bank 8 7,608,169 10,458,250 7,482,487 6,915,649Amount due from broker 8 - 300,000 - -Amounts receivable on sale of securities 170,953 - - -Subscriptions receivable - - 1,672,275 145,368Dividends and interest receivable - - - 125Other assets 85 - 7,605 -
Total assets 150,355,359 132,113,019 186,693,148 136,091,442
LiabilitiesDerivative financial liabilities at fair value through profit or loss 6, 7 766,600 428,652 4,126 2,033Payable on redemptions - - 101,269 -Investment Manager’s fees payable 5 240,823 111,368 257,493 96,363Administration fees payable 5 3,353 3,383 3,682 2,991Depositary fees payable 5 5,004 5,635 6,095 5,116Expenses payable 5 21,122 16,309 22,816 30,491
Total liabilities (excluding net assets attributable to holders of redeemableparticipating shares) 1,036,902 565,347 395,481 136,994
Total net assets attributable to holders of redeemable participating shares 7, 15 149,318,457 131,547,672 186,297,667 135,954,448
COMGEST GROWTH plc
STATEMENT OF FINANCIAL POSITIONAs at 31 December 2020 (continued)
The accompanying notes form an integral part of the financial statements. 96
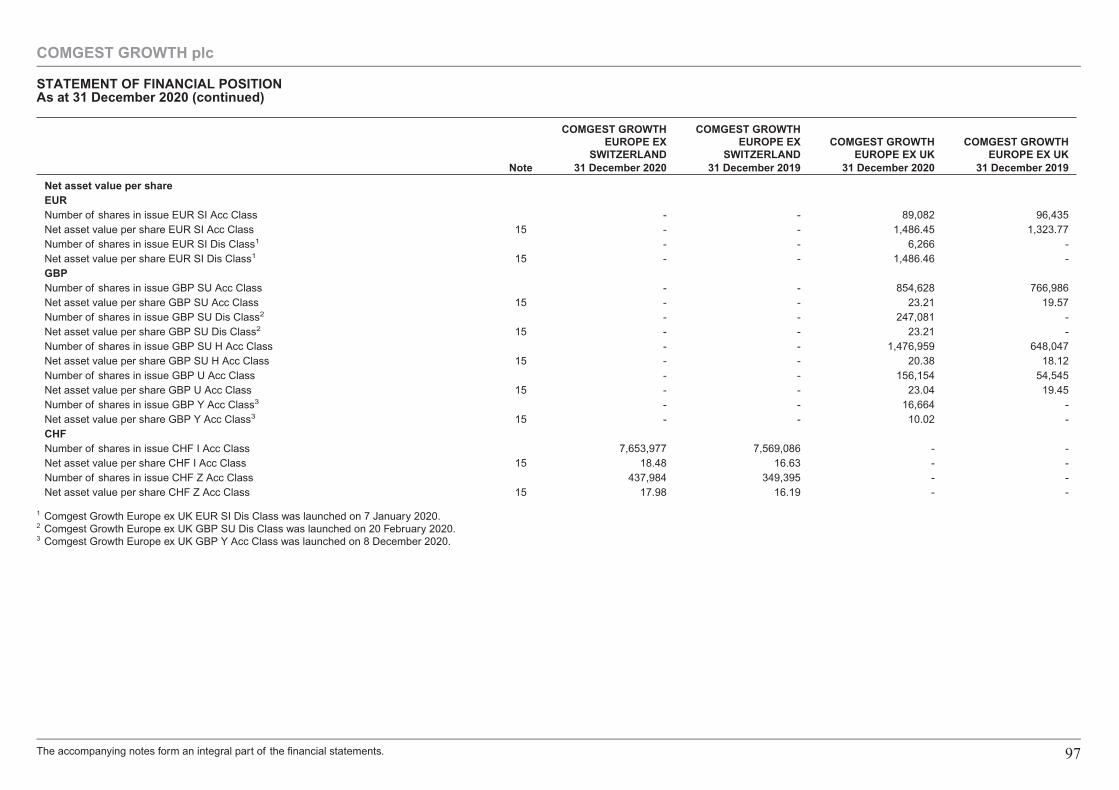
COMGEST GROWTHEUROPE EX
SWITZERLAND
COMGEST GROWTHEUROPE EX
SWITZERLANDCOMGEST GROWTH
EUROPE EX UKCOMGEST GROWTH
EUROPE EX UKNote 31 December 2020 31 December 2019 31 December 2020 31 December 2019
Net asset value per shareEURNumber of shares in issue EUR SI Acc Class - - 89,082 96,435Net asset value per share EUR SI Acc Class 15 - - 1,486.45 1,323.77Number of shares in issue EUR SI Dis Class1 - - 6,266 -Net asset value per share EUR SI Dis Class1 15 - - 1,486.46 -GBPNumber of shares in issue GBP SU Acc Class - - 854,628 766,986Net asset value per share GBP SU Acc Class 15 - - 23.21 19.57Number of shares in issue GBP SU Dis Class2 - - 247,081 -Net asset value per share GBP SU Dis Class2 15 - - 23.21 -Number of shares in issue GBP SU H Acc Class - - 1,476,959 648,047Net asset value per share GBP SU H Acc Class 15 - - 20.38 18.12Number of shares in issue GBP U Acc Class - - 156,154 54,545Net asset value per share GBP U Acc Class 15 - - 23.04 19.45Number of shares in issue GBP Y Acc Class3 - - 16,664 -Net asset value per share GBP Y Acc Class3 15 - - 10.02 -CHFNumber of shares in issue CHF I Acc Class 7,653,977 7,569,086 - -Net asset value per share CHF I Acc Class 15 18.48 16.63 - -Number of shares in issue CHF Z Acc Class 437,984 349,395 - -Net asset value per share CHF Z Acc Class 15 17.98 16.19 - -
1 Comgest Growth Europe ex UK EUR SI Dis Class was launched on 7 January 2020.2 Comgest Growth Europe ex UK GBP SU Dis Class was launched on 20 February 2020.3 Comgest Growth Europe ex UK GBP Y Acc Class was launched on 8 December 2020.
COMGEST GROWTH plc
STATEMENT OF FINANCIAL POSITIONAs at 31 December 2020 (continued)
The accompanying notes form an integral part of the financial statements. 97
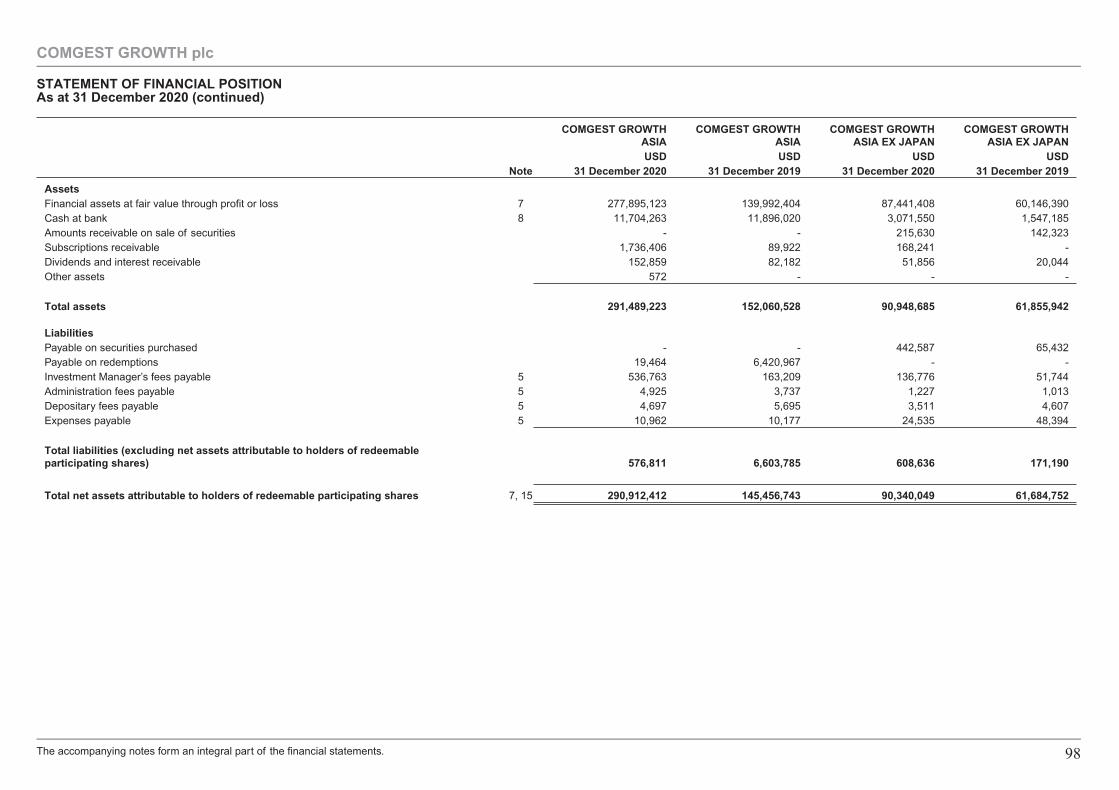
COMGEST GROWTHASIA
COMGEST GROWTHASIA
COMGEST GROWTHASIA EX JAPAN
COMGEST GROWTHASIA EX JAPAN
USD USD USD USDNote 31 December 2020 31 December 2019 31 December 2020 31 December 2019
AssetsFinancial assets at fair value through profit or loss 7 277,895,123 139,992,404 87,441,408 60,146,390Cash at bank 8 11,704,263 11,896,020 3,071,550 1,547,185Amounts receivable on sale of securities - - 215,630 142,323Subscriptions receivable 1,736,406 89,922 168,241 -Dividends and interest receivable 152,859 82,182 51,856 20,044Other assets 572 - - -
Total assets 291,489,223 152,060,528 90,948,685 61,855,942
LiabilitiesPayable on securities purchased - - 442,587 65,432Payable on redemptions 19,464 6,420,967 - -Investment Manager’s fees payable 5 536,763 163,209 136,776 51,744Administration fees payable 5 4,925 3,737 1,227 1,013Depositary fees payable 5 4,697 5,695 3,511 4,607Expenses payable 5 10,962 10,177 24,535 48,394
Total liabilities (excluding net assets attributable to holders of redeemableparticipating shares) 576,811 6,603,785 608,636 171,190
Total net assets attributable to holders of redeemable participating shares 7, 15 290,912,412 145,456,743 90,340,049 61,684,752
COMGEST GROWTH plc
STATEMENT OF FINANCIAL POSITIONAs at 31 December 2020 (continued)
The accompanying notes form an integral part of the financial statements. 98
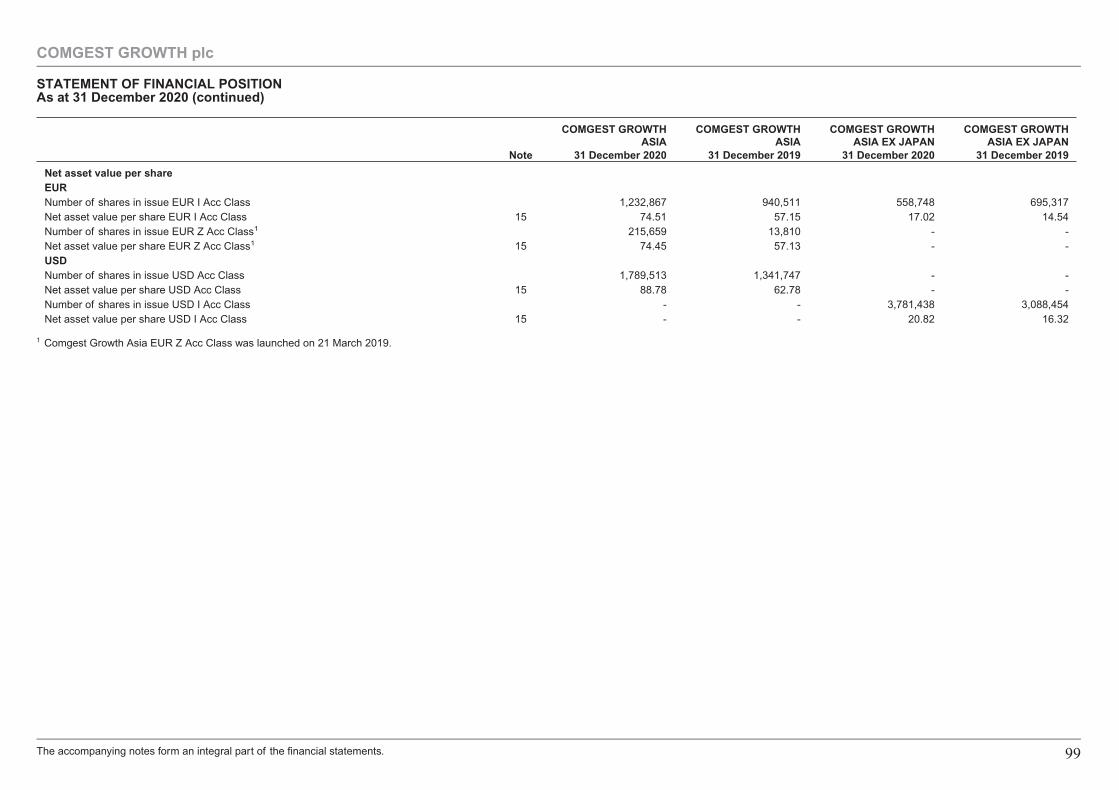
COMGEST GROWTHASIA
COMGEST GROWTHASIA
COMGEST GROWTHASIA EX JAPAN
COMGEST GROWTHASIA EX JAPAN
Note 31 December 2020 31 December 2019 31 December 2020 31 December 2019
Net asset value per shareEURNumber of shares in issue EUR I Acc Class 1,232,867 940,511 558,748 695,317Net asset value per share EUR I Acc Class 15 74.51 57.15 17.02 14.54Number of shares in issue EUR Z Acc Class1 215,659 13,810 - -Net asset value per share EUR Z Acc Class1 15 74.45 57.13 - -USDNumber of shares in issue USD Acc Class 1,789,513 1,341,747 - -Net asset value per share USD Acc Class 15 88.78 62.78 - -Number of shares in issue USD I Acc Class - - 3,781,438 3,088,454Net asset value per share USD I Acc Class 15 - - 20.82 16.32
1 Comgest Growth Asia EUR Z Acc Class was launched on 21 March 2019.
COMGEST GROWTH plc
STATEMENT OF FINANCIAL POSITIONAs at 31 December 2020 (continued)
The accompanying notes form an integral part of the financial statements. 99
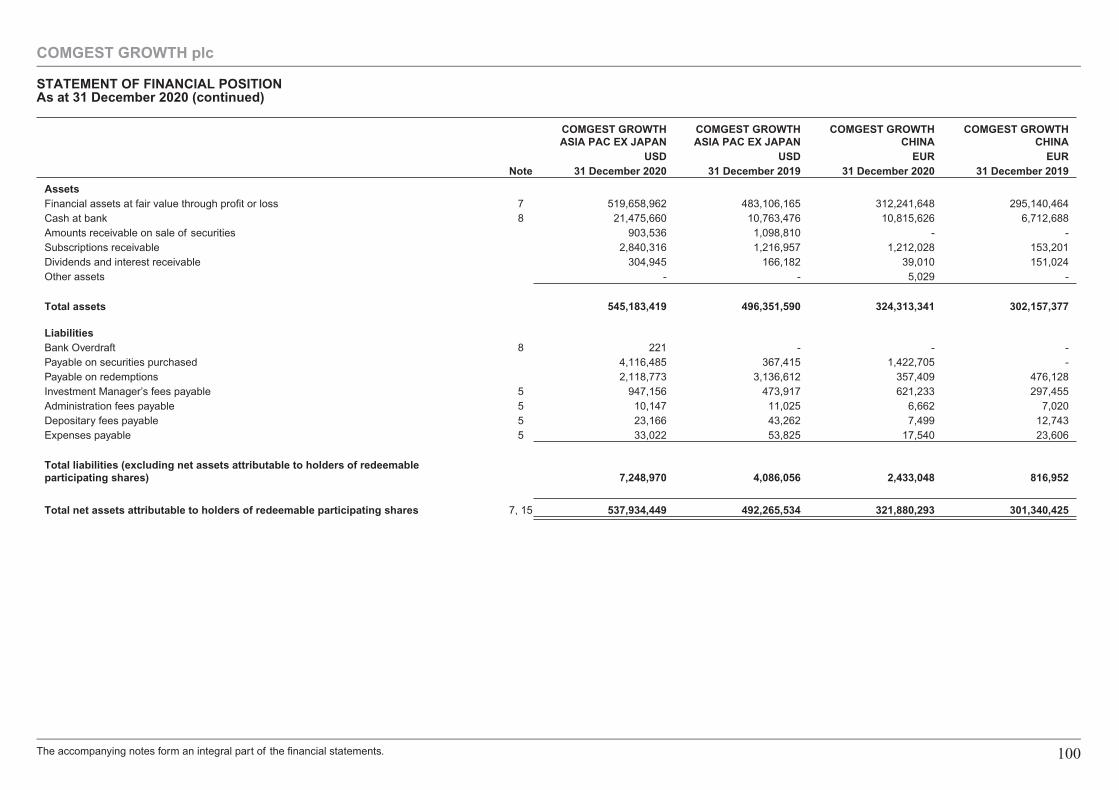
COMGEST GROWTHASIA PAC EX JAPAN
COMGEST GROWTHASIA PAC EX JAPAN
COMGEST GROWTHCHINA
COMGEST GROWTHCHINA
USD USD EUR EURNote 31 December 2020 31 December 2019 31 December 2020 31 December 2019
AssetsFinancial assets at fair value through profit or loss 7 519,658,962 483,106,165 312,241,648 295,140,464Cash at bank 8 21,475,660 10,763,476 10,815,626 6,712,688Amounts receivable on sale of securities 903,536 1,098,810 - -Subscriptions receivable 2,840,316 1,216,957 1,212,028 153,201Dividends and interest receivable 304,945 166,182 39,010 151,024Other assets - - 5,029 -
Total assets 545,183,419 496,351,590 324,313,341 302,157,377
LiabilitiesBank Overdraft 8 221 - - -Payable on securities purchased 4,116,485 367,415 1,422,705 -Payable on redemptions 2,118,773 3,136,612 357,409 476,128Investment Manager’s fees payable 5 947,156 473,917 621,233 297,455Administration fees payable 5 10,147 11,025 6,662 7,020Depositary fees payable 5 23,166 43,262 7,499 12,743Expenses payable 5 33,022 53,825 17,540 23,606
Total liabilities (excluding net assets attributable to holders of redeemableparticipating shares) 7,248,970 4,086,056 2,433,048 816,952
Total net assets attributable to holders of redeemable participating shares 7, 15 537,934,449 492,265,534 321,880,293 301,340,425
COMGEST GROWTH plc
STATEMENT OF FINANCIAL POSITIONAs at 31 December 2020 (continued)
The accompanying notes form an integral part of the financial statements. 100
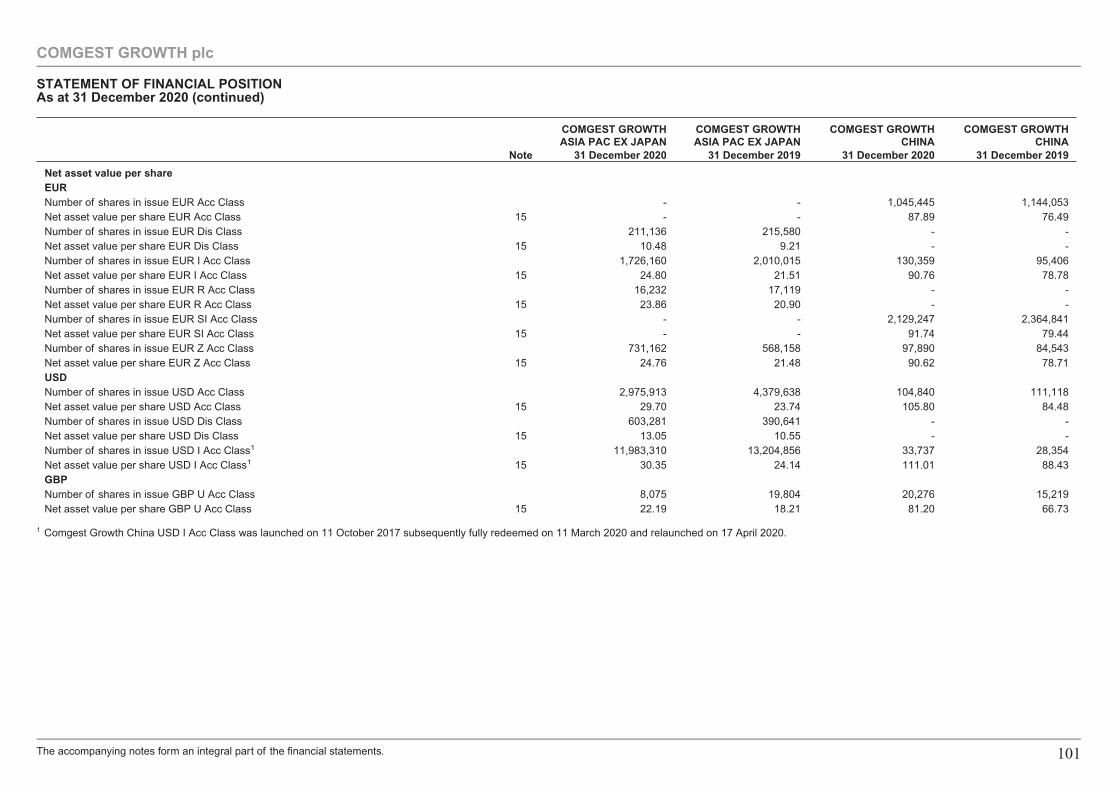
COMGEST GROWTHASIA PAC EX JAPAN
COMGEST GROWTHASIA PAC EX JAPAN
COMGEST GROWTHCHINA
COMGEST GROWTHCHINA
Note 31 December 2020 31 December 2019 31 December 2020 31 December 2019
Net asset value per shareEURNumber of shares in issue EUR Acc Class - - 1,045,445 1,144,053Net asset value per share EUR Acc Class 15 - - 87.89 76.49Number of shares in issue EUR Dis Class 211,136 215,580 - -Net asset value per share EUR Dis Class 15 10.48 9.21 - -Number of shares in issue EUR I Acc Class 1,726,160 2,010,015 130,359 95,406Net asset value per share EUR I Acc Class 15 24.80 21.51 90.76 78.78Number of shares in issue EUR R Acc Class 16,232 17,119 - -Net asset value per share EUR R Acc Class 15 23.86 20.90 - -Number of shares in issue EUR SI Acc Class - - 2,129,247 2,364,841Net asset value per share EUR SI Acc Class 15 - - 91.74 79.44Number of shares in issue EUR Z Acc Class 731,162 568,158 97,890 84,543Net asset value per share EUR Z Acc Class 15 24.76 21.48 90.62 78.71USDNumber of shares in issue USD Acc Class 2,975,913 4,379,638 104,840 111,118Net asset value per share USD Acc Class 15 29.70 23.74 105.80 84.48Number of shares in issue USD Dis Class 603,281 390,641 - -Net asset value per share USD Dis Class 15 13.05 10.55 - -Number of shares in issue USD I Acc Class1 11,983,310 13,204,856 33,737 28,354Net asset value per share USD I Acc Class1 15 30.35 24.14 111.01 88.43GBPNumber of shares in issue GBP U Acc Class 8,075 19,804 20,276 15,219Net asset value per share GBP U Acc Class 15 22.19 18.21 81.20 66.73
1 Comgest Growth China USD I Acc Class was launched on 11 October 2017 subsequently fully redeemed on 11 March 2020 and relaunched on 17 April 2020.
COMGEST GROWTH plc
STATEMENT OF FINANCIAL POSITIONAs at 31 December 2020 (continued)
The accompanying notes form an integral part of the financial statements. 101
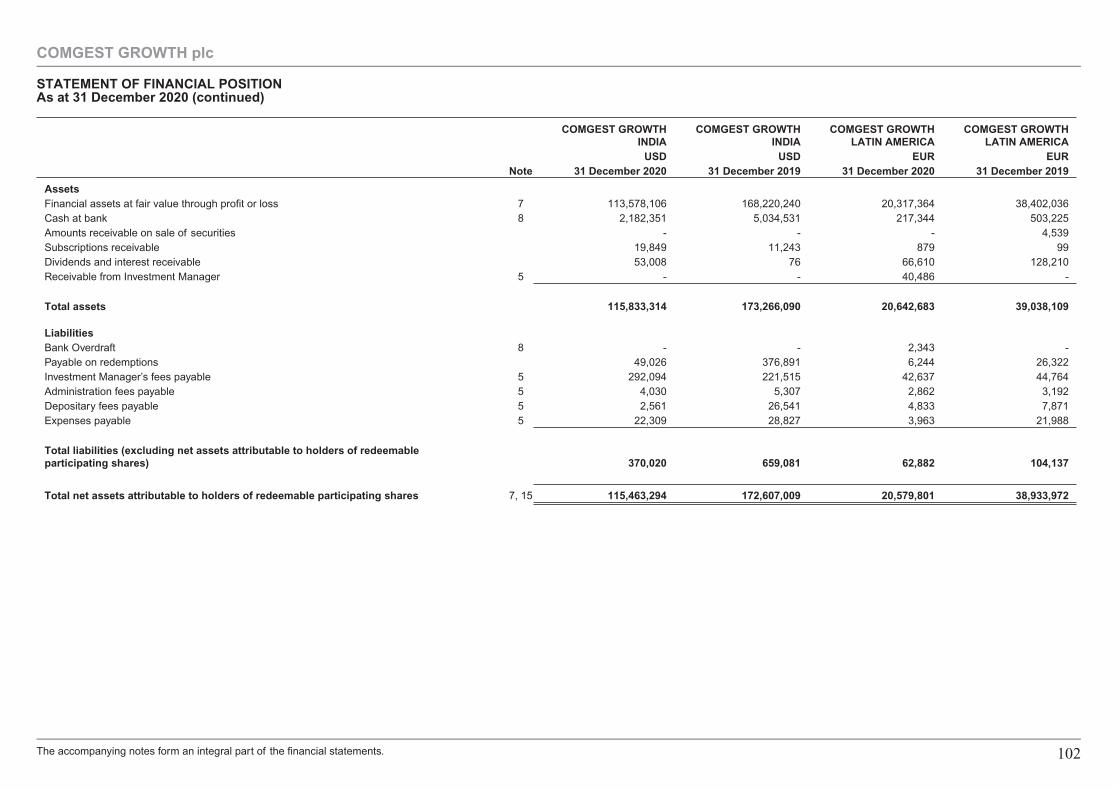
COMGEST GROWTHINDIA
COMGEST GROWTHINDIA
COMGEST GROWTHLATIN AMERICA
COMGEST GROWTHLATIN AMERICA
USD USD EUR EURNote 31 December 2020 31 December 2019 31 December 2020 31 December 2019
AssetsFinancial assets at fair value through profit or loss 7 113,578,106 168,220,240 20,317,364 38,402,036Cash at bank 8 2,182,351 5,034,531 217,344 503,225Amounts receivable on sale of securities - - - 4,539Subscriptions receivable 19,849 11,243 879 99Dividends and interest receivable 53,008 76 66,610 128,210Receivable from Investment Manager 5 - - 40,486 -
Total assets 115,833,314 173,266,090 20,642,683 39,038,109
LiabilitiesBank Overdraft 8 - - 2,343 -Payable on redemptions 49,026 376,891 6,244 26,322Investment Manager’s fees payable 5 292,094 221,515 42,637 44,764Administration fees payable 5 4,030 5,307 2,862 3,192Depositary fees payable 5 2,561 26,541 4,833 7,871Expenses payable 5 22,309 28,827 3,963 21,988
Total liabilities (excluding net assets attributable to holders of redeemableparticipating shares) 370,020 659,081 62,882 104,137
Total net assets attributable to holders of redeemable participating shares 7, 15 115,463,294 172,607,009 20,579,801 38,933,972
COMGEST GROWTH plc
STATEMENT OF FINANCIAL POSITIONAs at 31 December 2020 (continued)
The accompanying notes form an integral part of the financial statements. 102
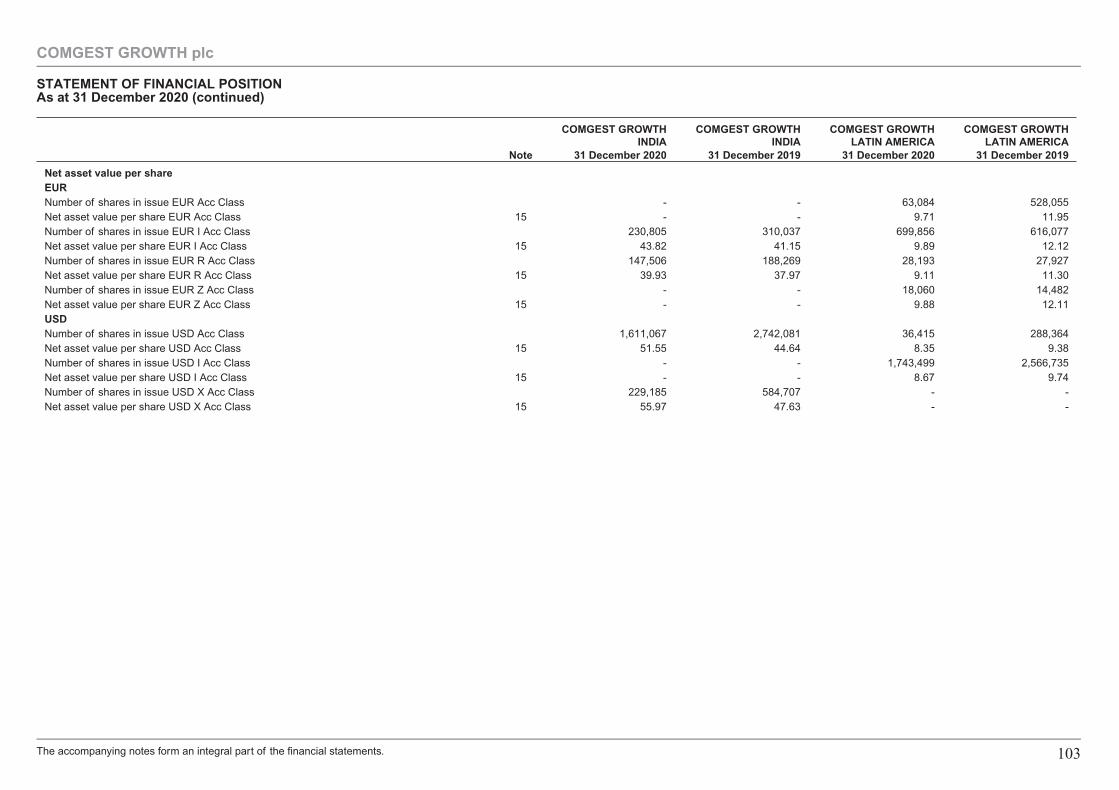
COMGEST GROWTHINDIA
COMGEST GROWTHINDIA
COMGEST GROWTHLATIN AMERICA
COMGEST GROWTHLATIN AMERICA
Note 31 December 2020 31 December 2019 31 December 2020 31 December 2019
Net asset value per shareEURNumber of shares in issue EUR Acc Class - - 63,084 528,055Net asset value per share EUR Acc Class 15 - - 9.71 11.95Number of shares in issue EUR I Acc Class 230,805 310,037 699,856 616,077Net asset value per share EUR I Acc Class 15 43.82 41.15 9.89 12.12Number of shares in issue EUR R Acc Class 147,506 188,269 28,193 27,927Net asset value per share EUR R Acc Class 15 39.93 37.97 9.11 11.30Number of shares in issue EUR Z Acc Class - - 18,060 14,482Net asset value per share EUR Z Acc Class 15 - - 9.88 12.11USDNumber of shares in issue USD Acc Class 1,611,067 2,742,081 36,415 288,364Net asset value per share USD Acc Class 15 51.55 44.64 8.35 9.38Number of shares in issue USD I Acc Class - - 1,743,499 2,566,735Net asset value per share USD I Acc Class 15 - - 8.67 9.74Number of shares in issue USD X Acc Class 229,185 584,707 - -Net asset value per share USD X Acc Class 15 55.97 47.63 - -
COMGEST GROWTH plc
STATEMENT OF FINANCIAL POSITIONAs at 31 December 2020 (continued)
The accompanying notes form an integral part of the financial statements. 103
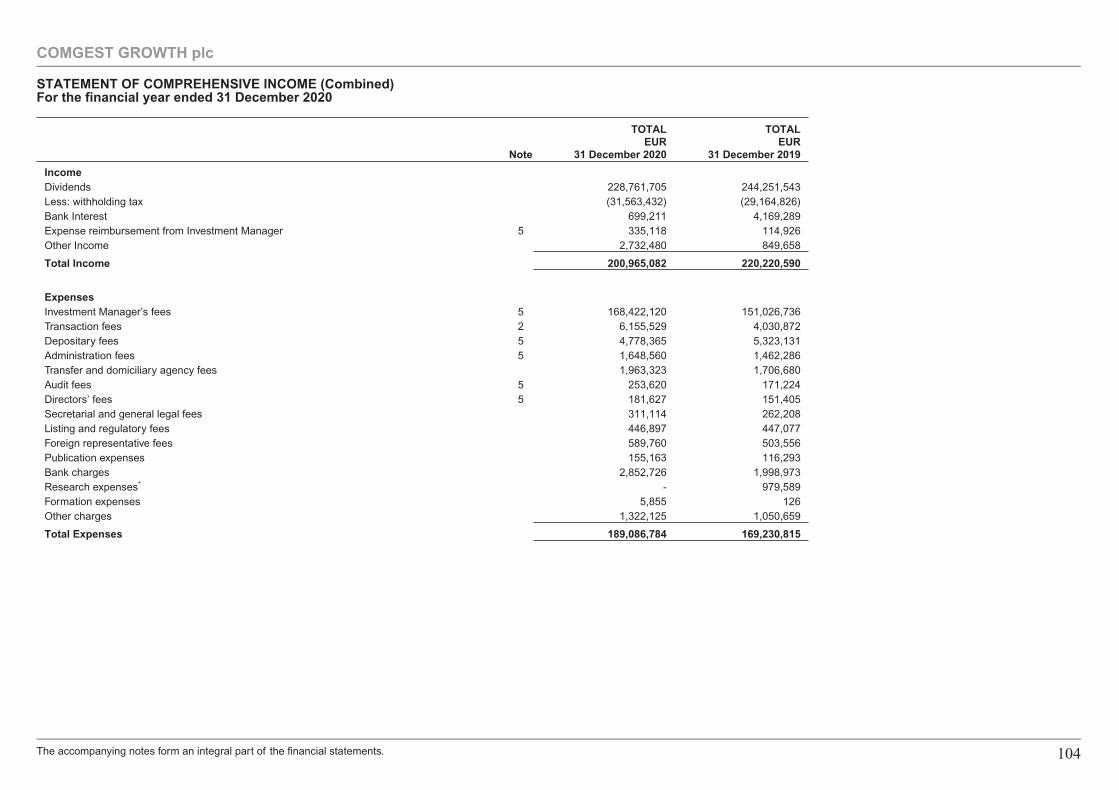
Note
TOTALEUR
31 December 2020
TOTALEUR
31 December 2019
IncomeDividends 228,761,705 244,251,543Less: withholding tax (31,563,432) (29,164,826)Bank Interest 699,211 4,169,289Expense reimbursement from Investment Manager 5 335,118 114,926Other Income 2,732,480 849,658
Total Income 200,965,082 220,220,590
ExpensesInvestment Manager’s fees 5 168,422,120 151,026,736Transaction fees 2 6,155,529 4,030,872Depositary fees 5 4,778,365 5,323,131Administration fees 5 1,648,560 1,462,286Transfer and domiciliary agency fees 1,963,323 1,706,680Audit fees 5 253,620 171,224Directors’ fees 5 181,627 151,405Secretarial and general legal fees 311,114 262,208Listing and regulatory fees 446,897 447,077Foreign representative fees 589,760 503,556Publication expenses 155,163 116,293Bank charges 2,852,726 1,998,973Research expenses* - 979,589Formation expenses 5,855 126Other charges 1,322,125 1,050,659
Total Expenses 189,086,784 169,230,815
COMGEST GROWTH plc
STATEMENT OF COMPREHENSIVE INCOME (Combined)For the financial year ended 31 December 2020
The accompanying notes form an integral part of the financial statements. 104
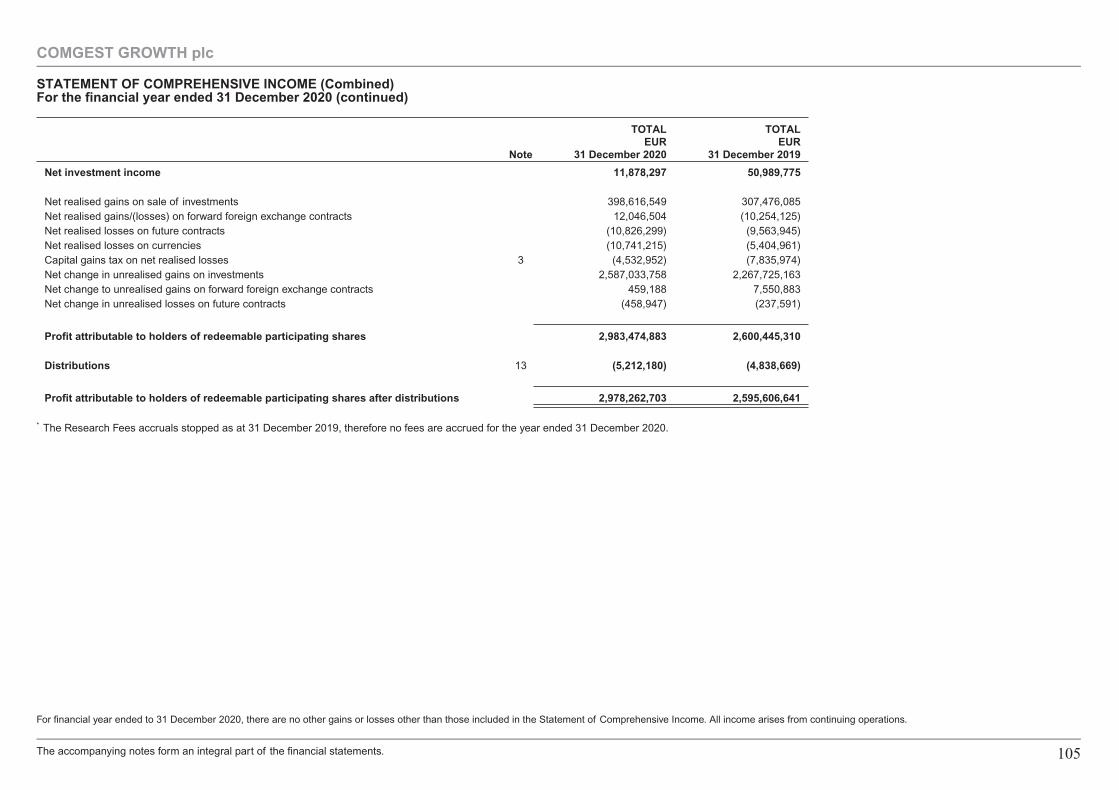
Note
TOTALEUR
31 December 2020
TOTALEUR
31 December 2019
Net investment income 11,878,297 50,989,775
Net realised gains on sale of investments 398,616,549 307,476,085Net realised gains/(losses) on forward foreign exchange contracts 12,046,504 (10,254,125)Net realised losses on future contracts (10,826,299) (9,563,945)Net realised losses on currencies (10,741,215) (5,404,961)Capital gains tax on net realised losses 3 (4,532,952) (7,835,974)Net change in unrealised gains on investments 2,587,033,758 2,267,725,163Net change to unrealised gains on forward foreign exchange contracts 459,188 7,550,883Net change in unrealised losses on future contracts (458,947) (237,591)
Profit attributable to holders of redeemable participating shares 2,983,474,883 2,600,445,310
Distributions 13 (5,212,180) (4,838,669)
Profit attributable to holders of redeemable participating shares after distributions 2,978,262,703 2,595,606,641
* The Research Fees accruals stopped as at 31 December 2019, therefore no fees are accrued for the year ended 31 December 2020.
For financial year ended to 31 December 2020, there are no other gains or losses other than those included in the Statement of Comprehensive Income. All income arises from continuing operations.
COMGEST GROWTH plc
STATEMENT OF COMPREHENSIVE INCOME (Combined)For the financial year ended 31 December 2020 (continued)
The accompanying notes form an integral part of the financial statements. 105
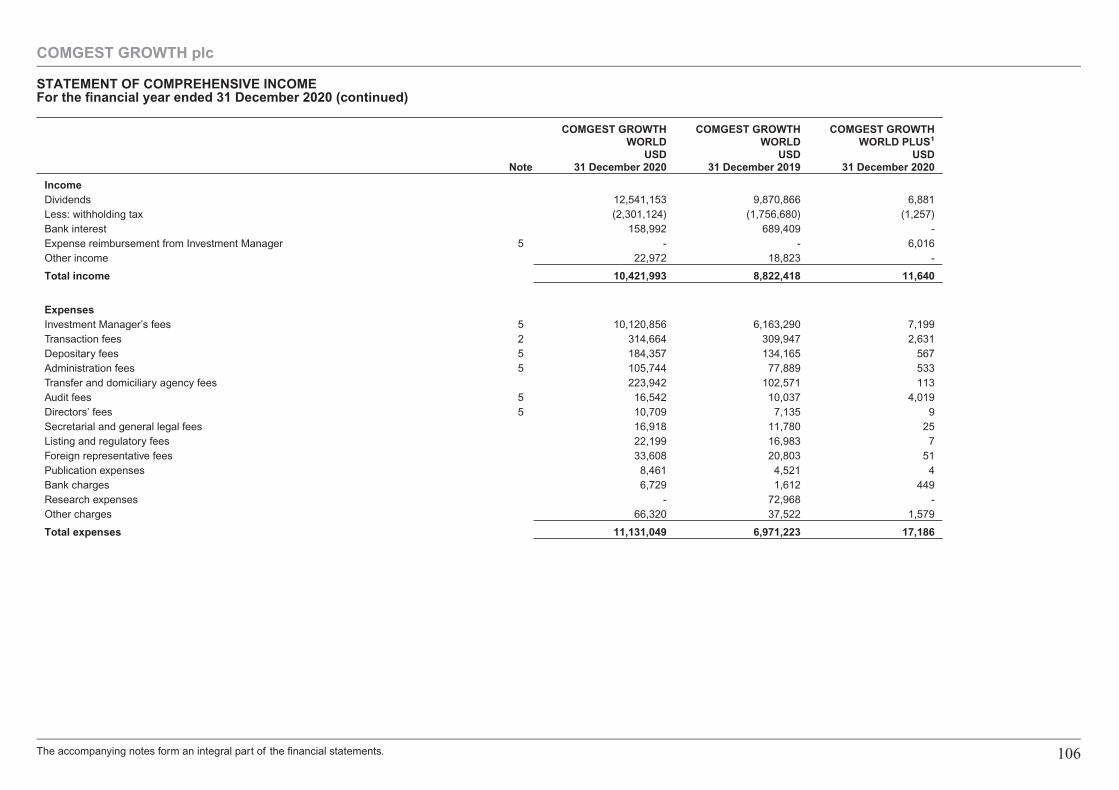
Note
COMGEST GROWTHWORLD
USD31 December 2020
COMGEST GROWTHWORLD
USD31 December 2019
COMGEST GROWTHWORLD PLUS1
USD31 December 2020
IncomeDividends 12,541,153 9,870,866 6,881Less: withholding tax (2,301,124) (1,756,680) (1,257)Bank interest 158,992 689,409 -Expense reimbursement from Investment Manager 5 - - 6,016Other income 22,972 18,823 -
Total income 10,421,993 8,822,418 11,640
ExpensesInvestment Manager’s fees 5 10,120,856 6,163,290 7,199Transaction fees 2 314,664 309,947 2,631Depositary fees 5 184,357 134,165 567Administration fees 5 105,744 77,889 533Transfer and domiciliary agency fees 223,942 102,571 113Audit fees 5 16,542 10,037 4,019Directors’ fees 5 10,709 7,135 9Secretarial and general legal fees 16,918 11,780 25Listing and regulatory fees 22,199 16,983 7Foreign representative fees 33,608 20,803 51Publication expenses 8,461 4,521 4Bank charges 6,729 1,612 449Research expenses - 72,968 -Other charges 66,320 37,522 1,579
Total expenses 11,131,049 6,971,223 17,186
COMGEST GROWTH plc
STATEMENT OF COMPREHENSIVE INCOMEFor the financial year ended 31 December 2020 (continued)
The accompanying notes form an integral part of the financial statements. 106
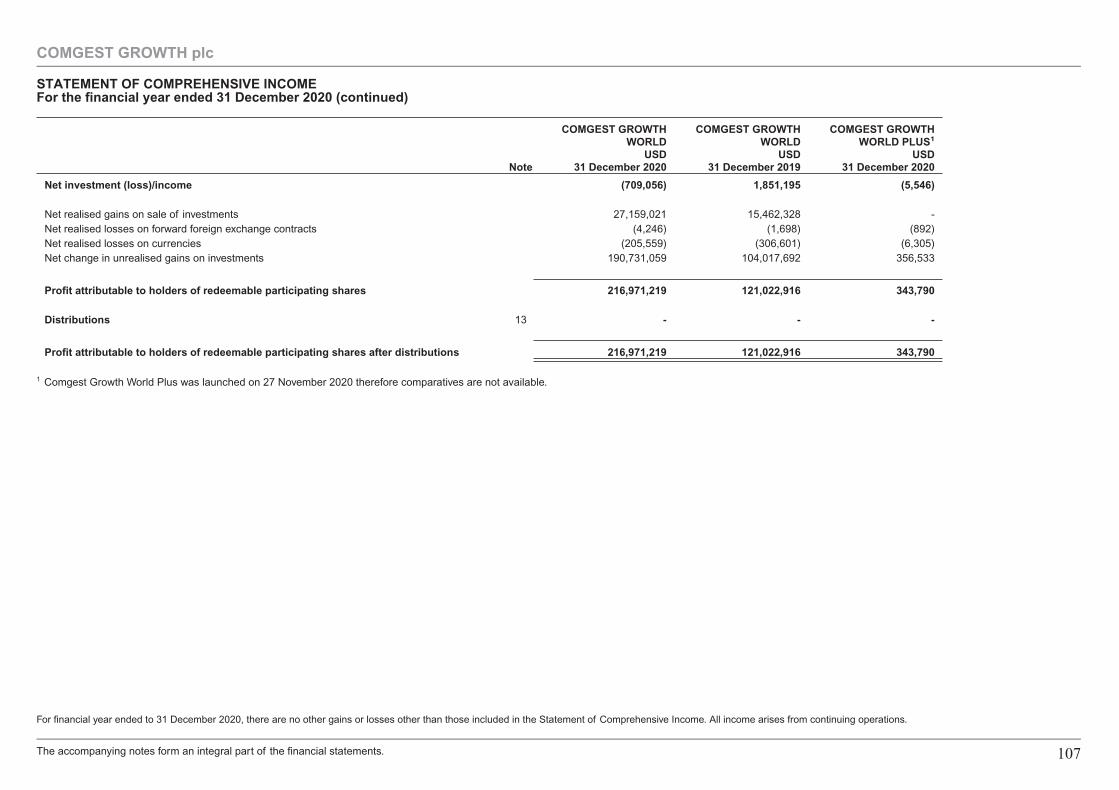
Note
COMGEST GROWTHWORLD
USD31 December 2020
COMGEST GROWTHWORLD
USD31 December 2019
COMGEST GROWTHWORLD PLUS1
USD31 December 2020
Net investment (loss)/income (709,056) 1,851,195 (5,546)
Net realised gains on sale of investments 27,159,021 15,462,328 -Net realised losses on forward foreign exchange contracts (4,246) (1,698) (892)Net realised losses on currencies (205,559) (306,601) (6,305)Net change in unrealised gains on investments 190,731,059 104,017,692 356,533
Profit attributable to holders of redeemable participating shares 216,971,219 121,022,916 343,790
Distributions 13 - - -
Profit attributable to holders of redeemable participating shares after distributions 216,971,219 121,022,916 343,790
1 Comgest Growth World Plus was launched on 27 November 2020 therefore comparatives are not available.
For financial year ended to 31 December 2020, there are no other gains or losses other than those included in the Statement of Comprehensive Income. All income arises from continuing operations.
COMGEST GROWTH plc
STATEMENT OF COMPREHENSIVE INCOMEFor the financial year ended 31 December 2020 (continued)
The accompanying notes form an integral part of the financial statements. 107
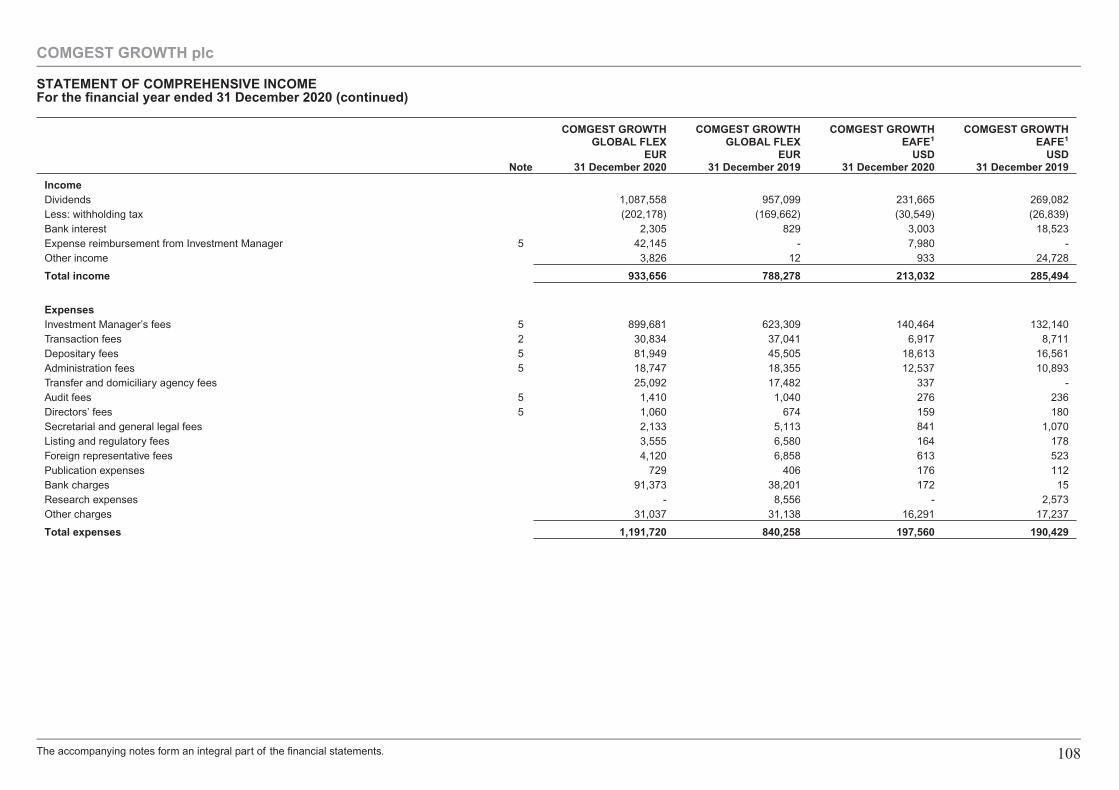
Note
COMGEST GROWTHGLOBAL FLEX
EUR31 December 2020
COMGEST GROWTHGLOBAL FLEX
EUR31 December 2019
COMGEST GROWTHEAFE1
USD31 December 2020
COMGEST GROWTHEAFE1
USD31 December 2019
IncomeDividends 1,087,558 957,099 231,665 269,082Less: withholding tax (202,178) (169,662) (30,549) (26,839)Bank interest 2,305 829 3,003 18,523Expense reimbursement from Investment Manager 5 42,145 - 7,980 -Other income 3,826 12 933 24,728
Total income 933,656 788,278 213,032 285,494
ExpensesInvestment Manager’s fees 5 899,681 623,309 140,464 132,140Transaction fees 2 30,834 37,041 6,917 8,711Depositary fees 5 81,949 45,505 18,613 16,561Administration fees 5 18,747 18,355 12,537 10,893Transfer and domiciliary agency fees 25,092 17,482 337 -Audit fees 5 1,410 1,040 276 236Directors’ fees 5 1,060 674 159 180Secretarial and general legal fees 2,133 5,113 841 1,070Listing and regulatory fees 3,555 6,580 164 178Foreign representative fees 4,120 6,858 613 523Publication expenses 729 406 176 112Bank charges 91,373 38,201 172 15Research expenses - 8,556 - 2,573Other charges 31,037 31,138 16,291 17,237
Total expenses 1,191,720 840,258 197,560 190,429
COMGEST GROWTH plc
STATEMENT OF COMPREHENSIVE INCOMEFor the financial year ended 31 December 2020 (continued)
The accompanying notes form an integral part of the financial statements. 108
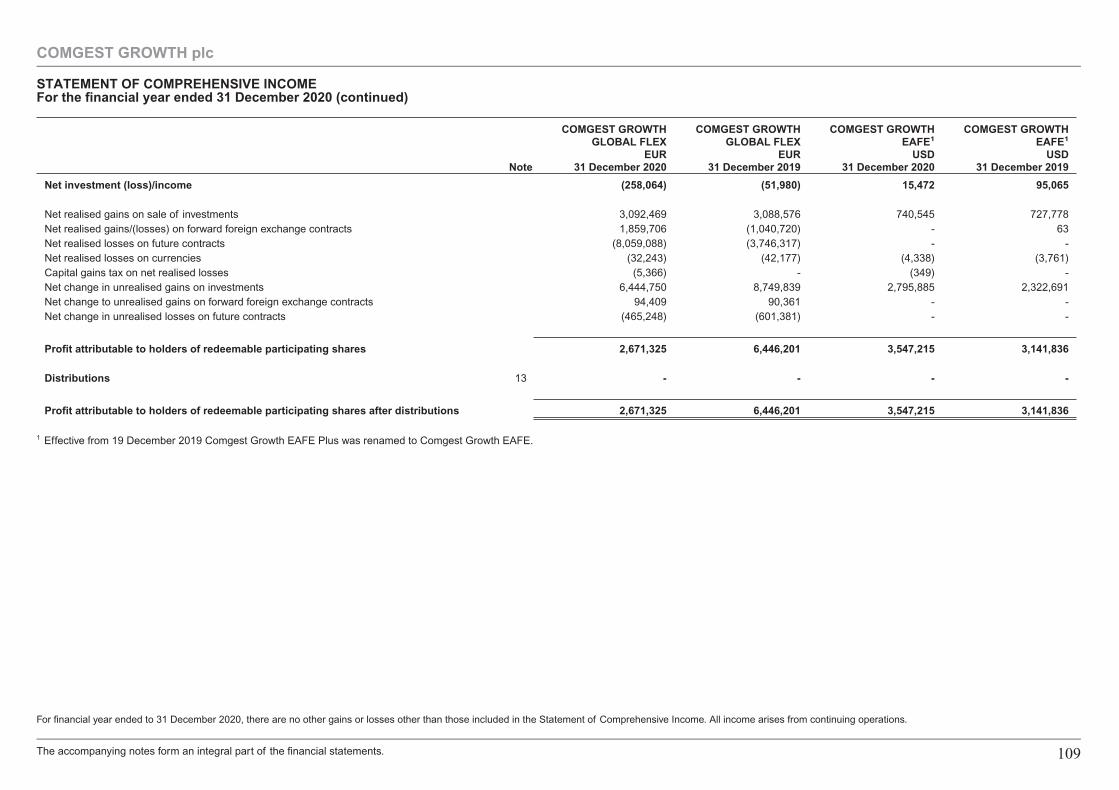
Note
COMGEST GROWTHGLOBAL FLEX
EUR31 December 2020
COMGEST GROWTHGLOBAL FLEX
EUR31 December 2019
COMGEST GROWTHEAFE1
USD31 December 2020
COMGEST GROWTHEAFE1
USD31 December 2019
Net investment (loss)/income (258,064) (51,980) 15,472 95,065
Net realised gains on sale of investments 3,092,469 3,088,576 740,545 727,778Net realised gains/(losses) on forward foreign exchange contracts 1,859,706 (1,040,720) - 63Net realised losses on future contracts (8,059,088) (3,746,317) - -Net realised losses on currencies (32,243) (42,177) (4,338) (3,761)Capital gains tax on net realised losses (5,366) - (349) -Net change in unrealised gains on investments 6,444,750 8,749,839 2,795,885 2,322,691Net change to unrealised gains on forward foreign exchange contracts 94,409 90,361 - -Net change in unrealised losses on future contracts (465,248) (601,381) - -
Profit attributable to holders of redeemable participating shares 2,671,325 6,446,201 3,547,215 3,141,836
Distributions 13 - - - -
Profit attributable to holders of redeemable participating shares after distributions 2,671,325 6,446,201 3,547,215 3,141,836
1 Effective from 19 December 2019 Comgest Growth EAFE Plus was renamed to Comgest Growth EAFE.
For financial year ended to 31 December 2020, there are no other gains or losses other than those included in the Statement of Comprehensive Income. All income arises from continuing operations.
COMGEST GROWTH plc
STATEMENT OF COMPREHENSIVE INCOMEFor the financial year ended 31 December 2020 (continued)
The accompanying notes form an integral part of the financial statements. 109
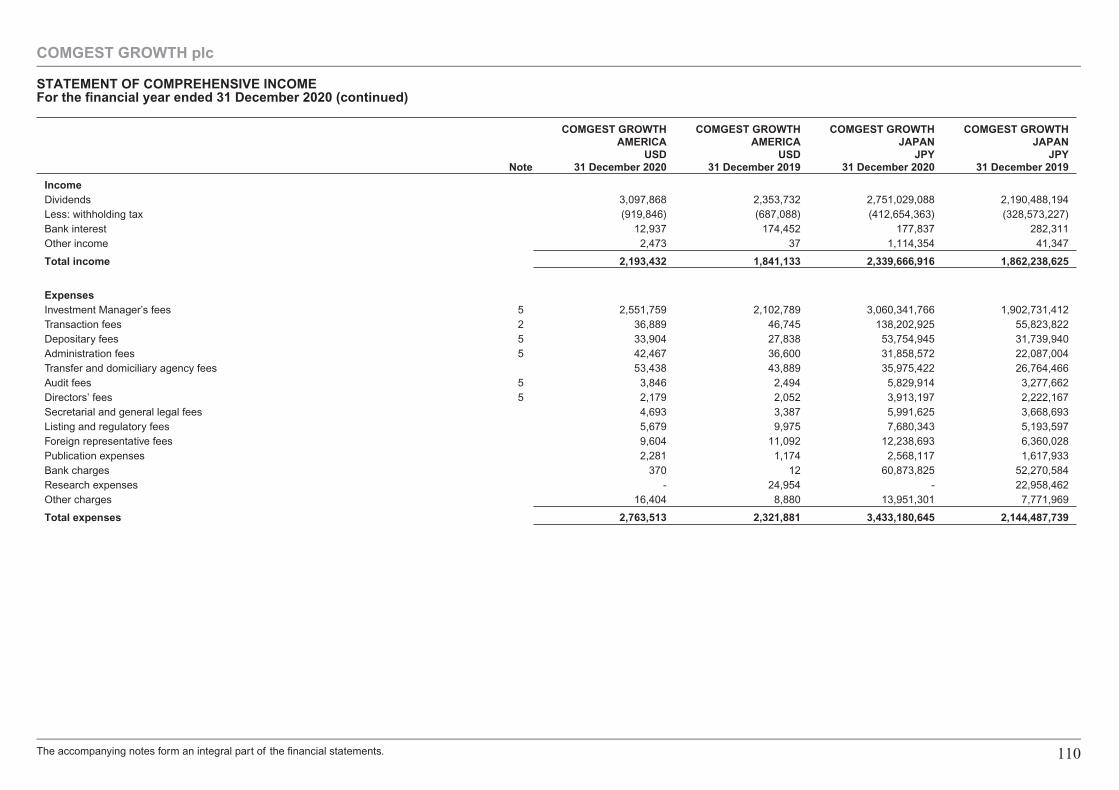
Note
COMGEST GROWTHAMERICA
USD31 December 2020
COMGEST GROWTHAMERICA
USD31 December 2019
COMGEST GROWTHJAPAN
JPY31 December 2020
COMGEST GROWTHJAPAN
JPY31 December 2019
IncomeDividends 3,097,868 2,353,732 2,751,029,088 2,190,488,194Less: withholding tax (919,846) (687,088) (412,654,363) (328,573,227)Bank interest 12,937 174,452 177,837 282,311Other income 2,473 37 1,114,354 41,347
Total income 2,193,432 1,841,133 2,339,666,916 1,862,238,625
ExpensesInvestment Manager’s fees 5 2,551,759 2,102,789 3,060,341,766 1,902,731,412Transaction fees 2 36,889 46,745 138,202,925 55,823,822Depositary fees 5 33,904 27,838 53,754,945 31,739,940Administration fees 5 42,467 36,600 31,858,572 22,087,004Transfer and domiciliary agency fees 53,438 43,889 35,975,422 26,764,466Audit fees 5 3,846 2,494 5,829,914 3,277,662Directors’ fees 5 2,179 2,052 3,913,197 2,222,167Secretarial and general legal fees 4,693 3,387 5,991,625 3,668,693Listing and regulatory fees 5,679 9,975 7,680,343 5,193,597Foreign representative fees 9,604 11,092 12,238,693 6,360,028Publication expenses 2,281 1,174 2,568,117 1,617,933Bank charges 370 12 60,873,825 52,270,584Research expenses - 24,954 - 22,958,462Other charges 16,404 8,880 13,951,301 7,771,969
Total expenses 2,763,513 2,321,881 3,433,180,645 2,144,487,739
COMGEST GROWTH plc
STATEMENT OF COMPREHENSIVE INCOMEFor the financial year ended 31 December 2020 (continued)
The accompanying notes form an integral part of the financial statements. 110
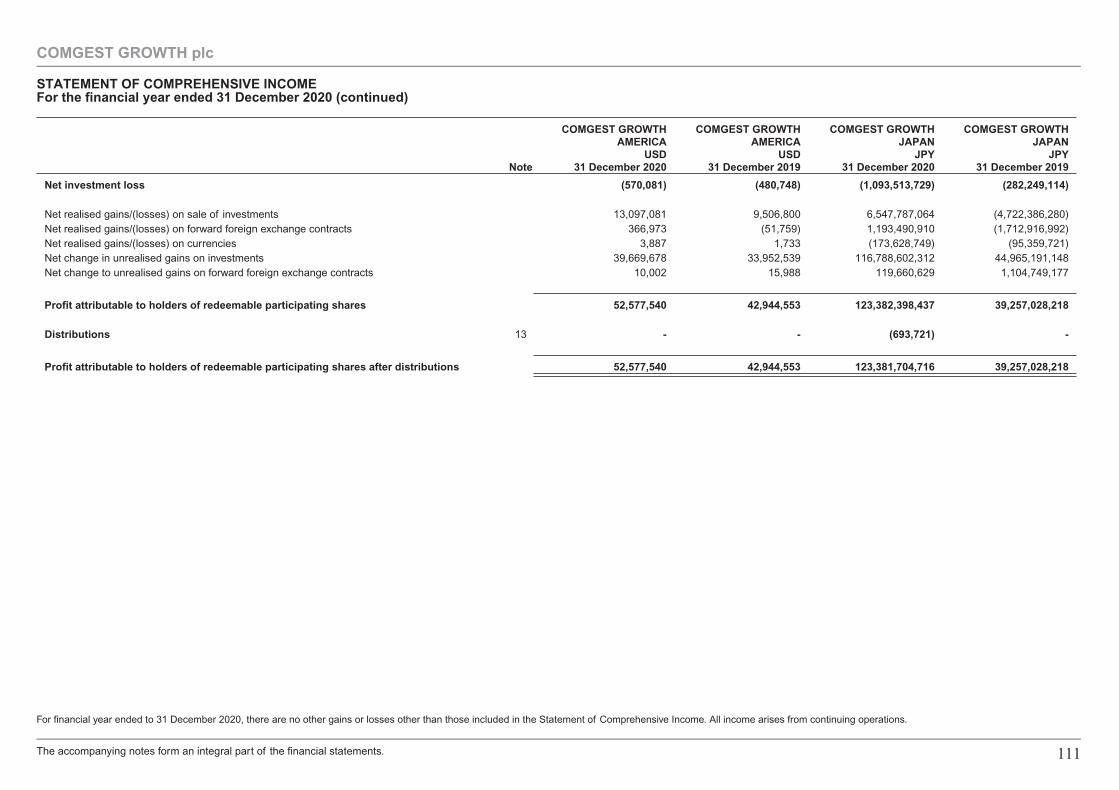
Note
COMGEST GROWTHAMERICA
USD31 December 2020
COMGEST GROWTHAMERICA
USD31 December 2019
COMGEST GROWTHJAPAN
JPY31 December 2020
COMGEST GROWTHJAPAN
JPY31 December 2019
Net investment loss (570,081) (480,748) (1,093,513,729) (282,249,114)
Net realised gains/(losses) on sale of investments 13,097,081 9,506,800 6,547,787,064 (4,722,386,280)Net realised gains/(losses) on forward foreign exchange contracts 366,973 (51,759) 1,193,490,910 (1,712,916,992)Net realised gains/(losses) on currencies 3,887 1,733 (173,628,749) (95,359,721)Net change in unrealised gains on investments 39,669,678 33,952,539 116,788,602,312 44,965,191,148Net change to unrealised gains on forward foreign exchange contracts 10,002 15,988 119,660,629 1,104,749,177
Profit attributable to holders of redeemable participating shares 52,577,540 42,944,553 123,382,398,437 39,257,028,218
Distributions 13 - - (693,721) -
Profit attributable to holders of redeemable participating shares after distributions 52,577,540 42,944,553 123,381,704,716 39,257,028,218
For financial year ended to 31 December 2020, there are no other gains or losses other than those included in the Statement of Comprehensive Income. All income arises from continuing operations.
COMGEST GROWTH plc
STATEMENT OF COMPREHENSIVE INCOMEFor the financial year ended 31 December 2020 (continued)
The accompanying notes form an integral part of the financial statements. 111
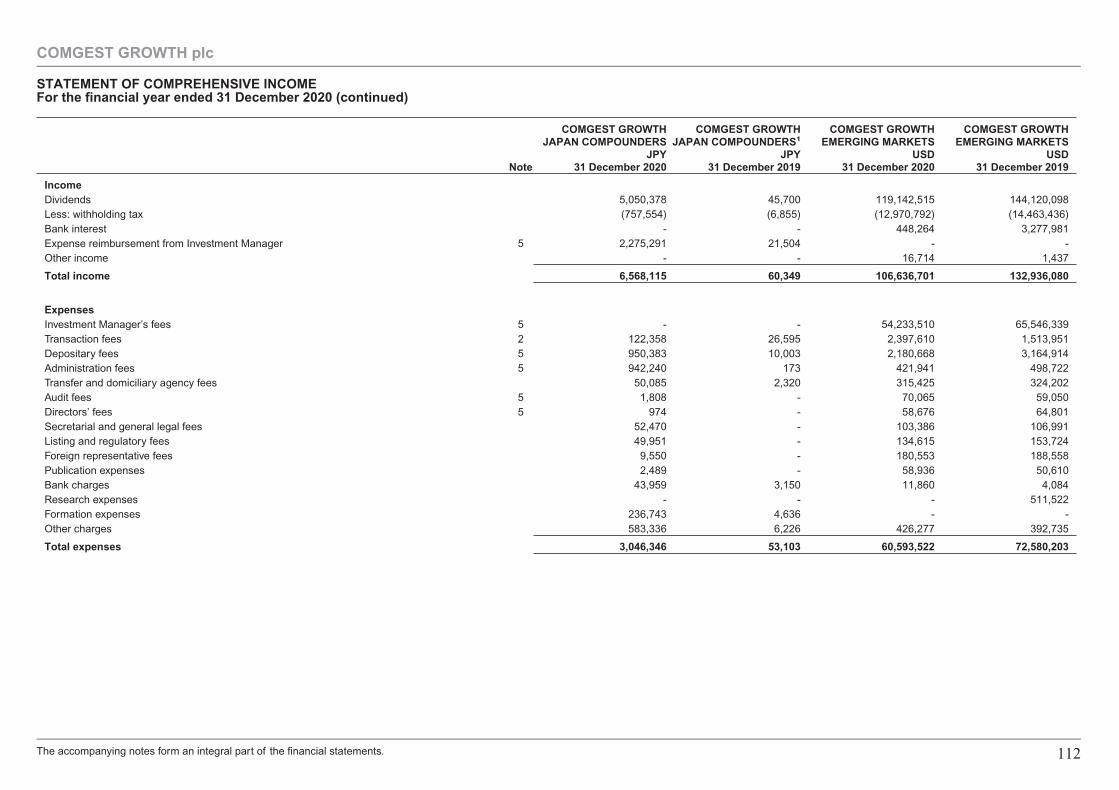
Note
COMGEST GROWTHJAPAN COMPOUNDERS
JPY31 December 2020
COMGEST GROWTHJAPAN COMPOUNDERS1
JPY31 December 2019
COMGEST GROWTHEMERGING MARKETS
USD31 December 2020
COMGEST GROWTHEMERGING MARKETS
USD31 December 2019
IncomeDividends 5,050,378 45,700 119,142,515 144,120,098Less: withholding tax (757,554) (6,855) (12,970,792) (14,463,436)Bank interest - - 448,264 3,277,981Expense reimbursement from Investment Manager 5 2,275,291 21,504 - -Other income - - 16,714 1,437
Total income 6,568,115 60,349 106,636,701 132,936,080
ExpensesInvestment Manager’s fees 5 - - 54,233,510 65,546,339Transaction fees 2 122,358 26,595 2,397,610 1,513,951Depositary fees 5 950,383 10,003 2,180,668 3,164,914Administration fees 5 942,240 173 421,941 498,722Transfer and domiciliary agency fees 50,085 2,320 315,425 324,202Audit fees 5 1,808 - 70,065 59,050Directors’ fees 5 974 - 58,676 64,801Secretarial and general legal fees 52,470 - 103,386 106,991Listing and regulatory fees 49,951 - 134,615 153,724Foreign representative fees 9,550 - 180,553 188,558Publication expenses 2,489 - 58,936 50,610Bank charges 43,959 3,150 11,860 4,084Research expenses - - - 511,522Formation expenses 236,743 4,636 - -Other charges 583,336 6,226 426,277 392,735
Total expenses 3,046,346 53,103 60,593,522 72,580,203
COMGEST GROWTH plc
STATEMENT OF COMPREHENSIVE INCOMEFor the financial year ended 31 December 2020 (continued)
The accompanying notes form an integral part of the financial statements. 112
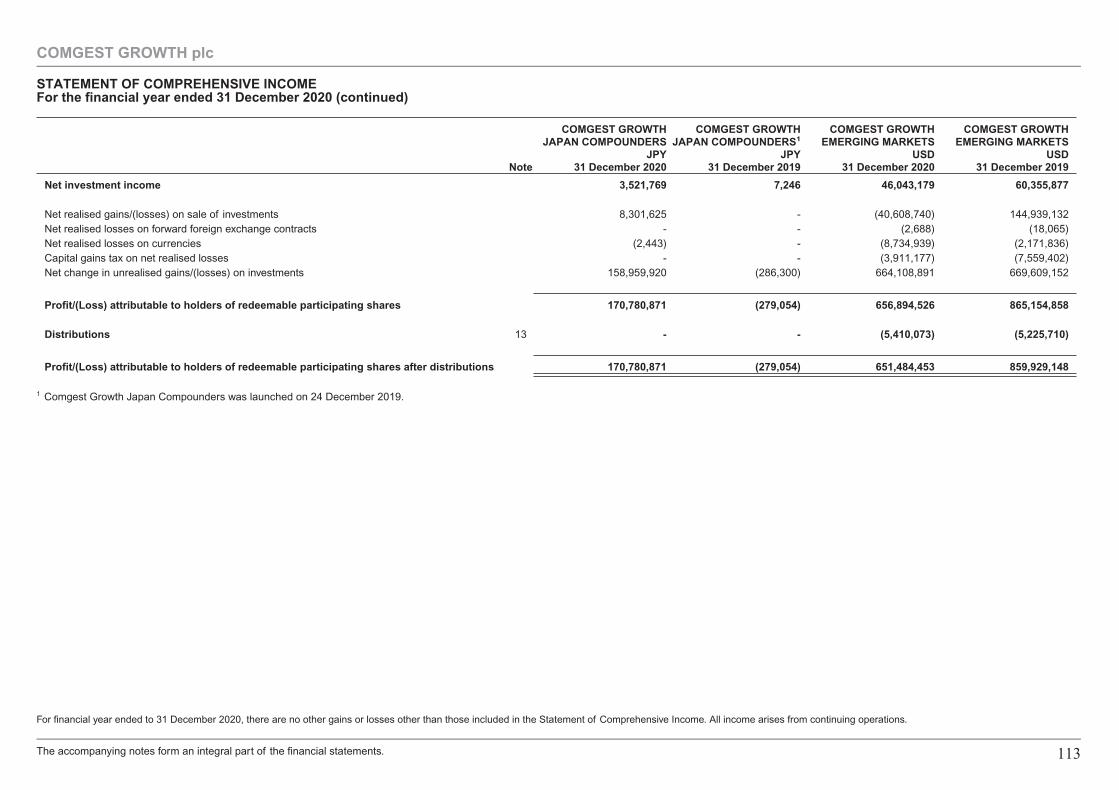
Note
COMGEST GROWTHJAPAN COMPOUNDERS
JPY31 December 2020
COMGEST GROWTHJAPAN COMPOUNDERS1
JPY31 December 2019
COMGEST GROWTHEMERGING MARKETS
USD31 December 2020
COMGEST GROWTHEMERGING MARKETS
USD31 December 2019
Net investment income 3,521,769 7,246 46,043,179 60,355,877
Net realised gains/(losses) on sale of investments 8,301,625 - (40,608,740) 144,939,132Net realised losses on forward foreign exchange contracts - - (2,688) (18,065)Net realised losses on currencies (2,443) - (8,734,939) (2,171,836)Capital gains tax on net realised losses - - (3,911,177) (7,559,402)Net change in unrealised gains/(losses) on investments 158,959,920 (286,300) 664,108,891 669,609,152
Profit/(Loss) attributable to holders of redeemable participating shares 170,780,871 (279,054) 656,894,526 865,154,858
Distributions 13 - - (5,410,073) (5,225,710)
Profit/(Loss) attributable to holders of redeemable participating shares after distributions 170,780,871 (279,054) 651,484,453 859,929,148
1 Comgest Growth Japan Compounders was launched on 24 December 2019.
For financial year ended to 31 December 2020, there are no other gains or losses other than those included in the Statement of Comprehensive Income. All income arises from continuing operations.
COMGEST GROWTH plc
STATEMENT OF COMPREHENSIVE INCOMEFor the financial year ended 31 December 2020 (continued)
The accompanying notes form an integral part of the financial statements. 113
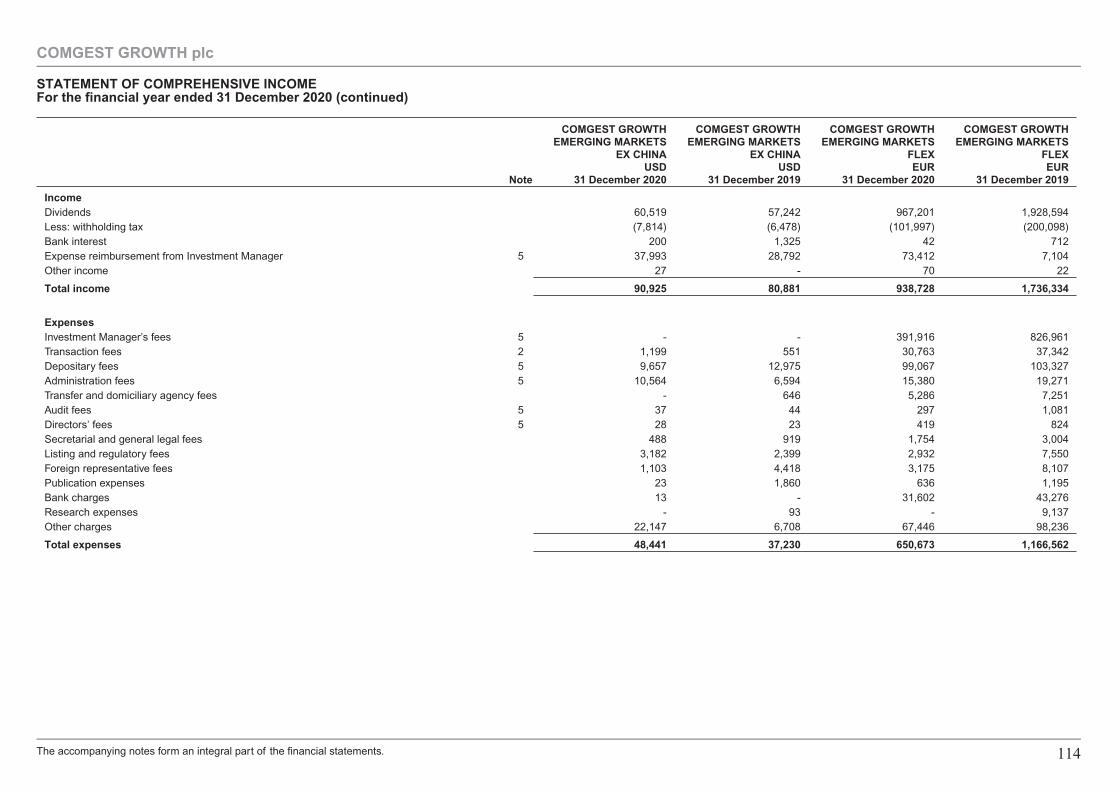
Note
COMGEST GROWTHEMERGING MARKETS
EX CHINAUSD
31 December 2020
COMGEST GROWTHEMERGING MARKETS
EX CHINAUSD
31 December 2019
COMGEST GROWTHEMERGING MARKETS
FLEXEUR
31 December 2020
COMGEST GROWTHEMERGING MARKETS
FLEXEUR
31 December 2019
IncomeDividends 60,519 57,242 967,201 1,928,594Less: withholding tax (7,814) (6,478) (101,997) (200,098)Bank interest 200 1,325 42 712Expense reimbursement from Investment Manager 5 37,993 28,792 73,412 7,104Other income 27 - 70 22
Total income 90,925 80,881 938,728 1,736,334
ExpensesInvestment Manager’s fees 5 - - 391,916 826,961Transaction fees 2 1,199 551 30,763 37,342Depositary fees 5 9,657 12,975 99,067 103,327Administration fees 5 10,564 6,594 15,380 19,271Transfer and domiciliary agency fees - 646 5,286 7,251Audit fees 5 37 44 297 1,081Directors’ fees 5 28 23 419 824Secretarial and general legal fees 488 919 1,754 3,004Listing and regulatory fees 3,182 2,399 2,932 7,550Foreign representative fees 1,103 4,418 3,175 8,107Publication expenses 23 1,860 636 1,195Bank charges 13 - 31,602 43,276Research expenses - 93 - 9,137Other charges 22,147 6,708 67,446 98,236
Total expenses 48,441 37,230 650,673 1,166,562
COMGEST GROWTH plc
STATEMENT OF COMPREHENSIVE INCOMEFor the financial year ended 31 December 2020 (continued)
The accompanying notes form an integral part of the financial statements. 114
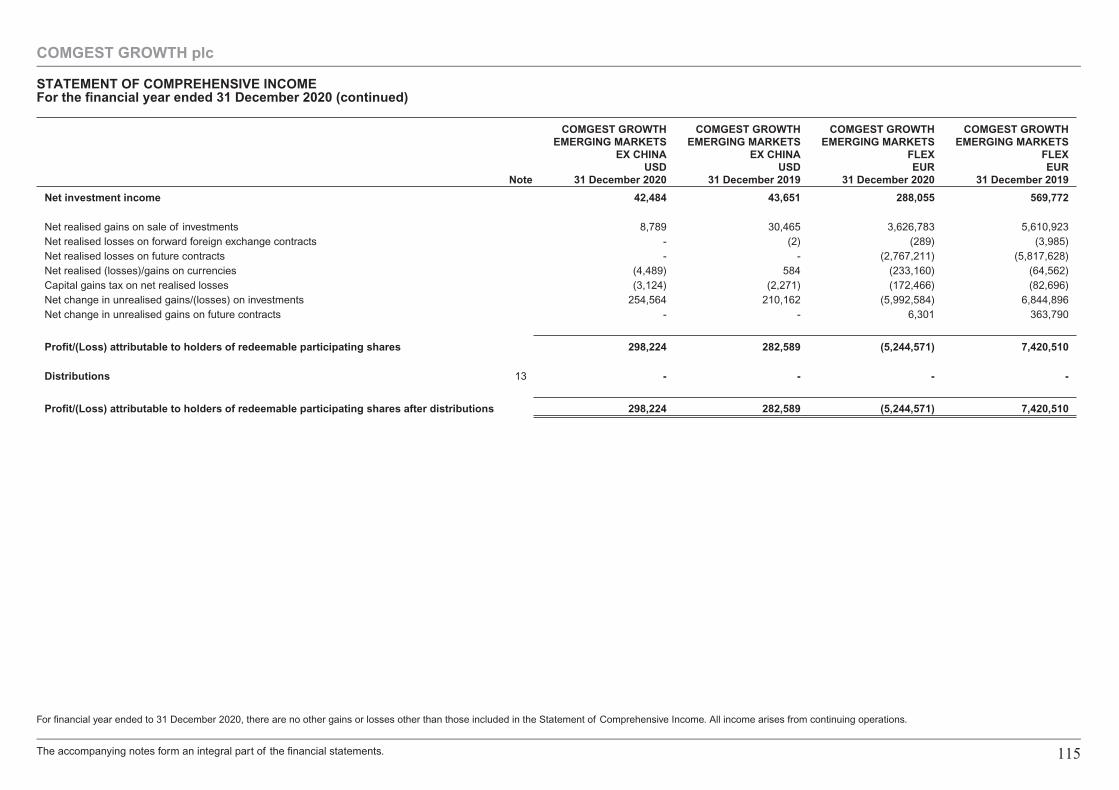
Note
COMGEST GROWTHEMERGING MARKETS
EX CHINAUSD
31 December 2020
COMGEST GROWTHEMERGING MARKETS
EX CHINAUSD
31 December 2019
COMGEST GROWTHEMERGING MARKETS
FLEXEUR
31 December 2020
COMGEST GROWTHEMERGING MARKETS
FLEXEUR
31 December 2019
Net investment income 42,484 43,651 288,055 569,772
Net realised gains on sale of investments 8,789 30,465 3,626,783 5,610,923Net realised losses on forward foreign exchange contracts - (2) (289) (3,985)Net realised losses on future contracts - - (2,767,211) (5,817,628)Net realised (losses)/gains on currencies (4,489) 584 (233,160) (64,562)Capital gains tax on net realised losses (3,124) (2,271) (172,466) (82,696)Net change in unrealised gains/(losses) on investments 254,564 210,162 (5,992,584) 6,844,896Net change in unrealised gains on future contracts - - 6,301 363,790
Profit/(Loss) attributable to holders of redeemable participating shares 298,224 282,589 (5,244,571) 7,420,510
Distributions 13 - - - -
Profit/(Loss) attributable to holders of redeemable participating shares after distributions 298,224 282,589 (5,244,571) 7,420,510
For financial year ended to 31 December 2020, there are no other gains or losses other than those included in the Statement of Comprehensive Income. All income arises from continuing operations.
COMGEST GROWTH plc
STATEMENT OF COMPREHENSIVE INCOMEFor the financial year ended 31 December 2020 (continued)
The accompanying notes form an integral part of the financial statements. 115
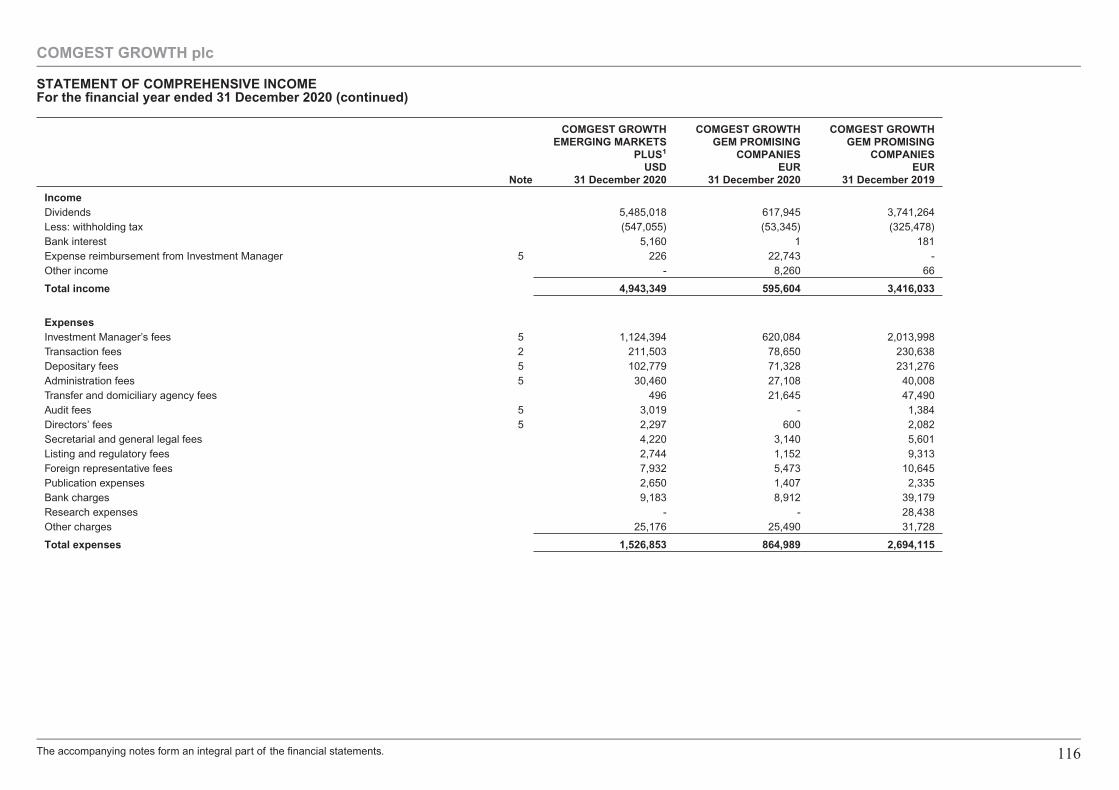
Note
COMGEST GROWTHEMERGING MARKETS
PLUS1
USD31 December 2020
COMGEST GROWTHGEM PROMISING
COMPANIESEUR
31 December 2020
COMGEST GROWTHGEM PROMISING
COMPANIESEUR
31 December 2019
IncomeDividends 5,485,018 617,945 3,741,264Less: withholding tax (547,055) (53,345) (325,478)Bank interest 5,160 1 181Expense reimbursement from Investment Manager 5 226 22,743 -Other income - 8,260 66
Total income 4,943,349 595,604 3,416,033
ExpensesInvestment Manager’s fees 5 1,124,394 620,084 2,013,998Transaction fees 2 211,503 78,650 230,638Depositary fees 5 102,779 71,328 231,276Administration fees 5 30,460 27,108 40,008Transfer and domiciliary agency fees 496 21,645 47,490Audit fees 5 3,019 - 1,384Directors’ fees 5 2,297 600 2,082Secretarial and general legal fees 4,220 3,140 5,601Listing and regulatory fees 2,744 1,152 9,313Foreign representative fees 7,932 5,473 10,645Publication expenses 2,650 1,407 2,335Bank charges 9,183 8,912 39,179Research expenses - - 28,438Other charges 25,176 25,490 31,728
Total expenses 1,526,853 864,989 2,694,115
COMGEST GROWTH plc
STATEMENT OF COMPREHENSIVE INCOMEFor the financial year ended 31 December 2020 (continued)
The accompanying notes form an integral part of the financial statements. 116
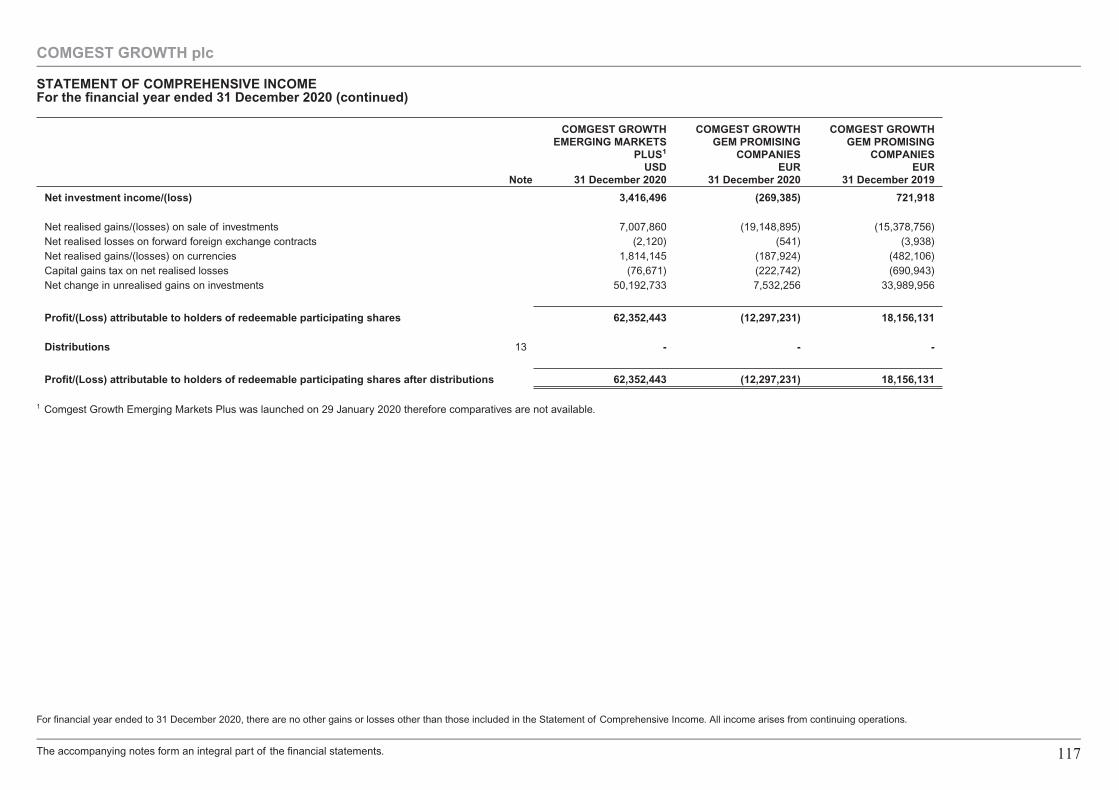
Note
COMGEST GROWTHEMERGING MARKETS
PLUS1
USD31 December 2020
COMGEST GROWTHGEM PROMISING
COMPANIESEUR
31 December 2020
COMGEST GROWTHGEM PROMISING
COMPANIESEUR
31 December 2019
Net investment income/(loss) 3,416,496 (269,385) 721,918
Net realised gains/(losses) on sale of investments 7,007,860 (19,148,895) (15,378,756)Net realised losses on forward foreign exchange contracts (2,120) (541) (3,938)Net realised gains/(losses) on currencies 1,814,145 (187,924) (482,106)Capital gains tax on net realised losses (76,671) (222,742) (690,943)Net change in unrealised gains on investments 50,192,733 7,532,256 33,989,956
Profit/(Loss) attributable to holders of redeemable participating shares 62,352,443 (12,297,231) 18,156,131
Distributions 13 - - -
Profit/(Loss) attributable to holders of redeemable participating shares after distributions 62,352,443 (12,297,231) 18,156,131
1 Comgest Growth Emerging Markets Plus was launched on 29 January 2020 therefore comparatives are not available.
For financial year ended to 31 December 2020, there are no other gains or losses other than those included in the Statement of Comprehensive Income. All income arises from continuing operations.
COMGEST GROWTH plc
STATEMENT OF COMPREHENSIVE INCOMEFor the financial year ended 31 December 2020 (continued)
The accompanying notes form an integral part of the financial statements. 117
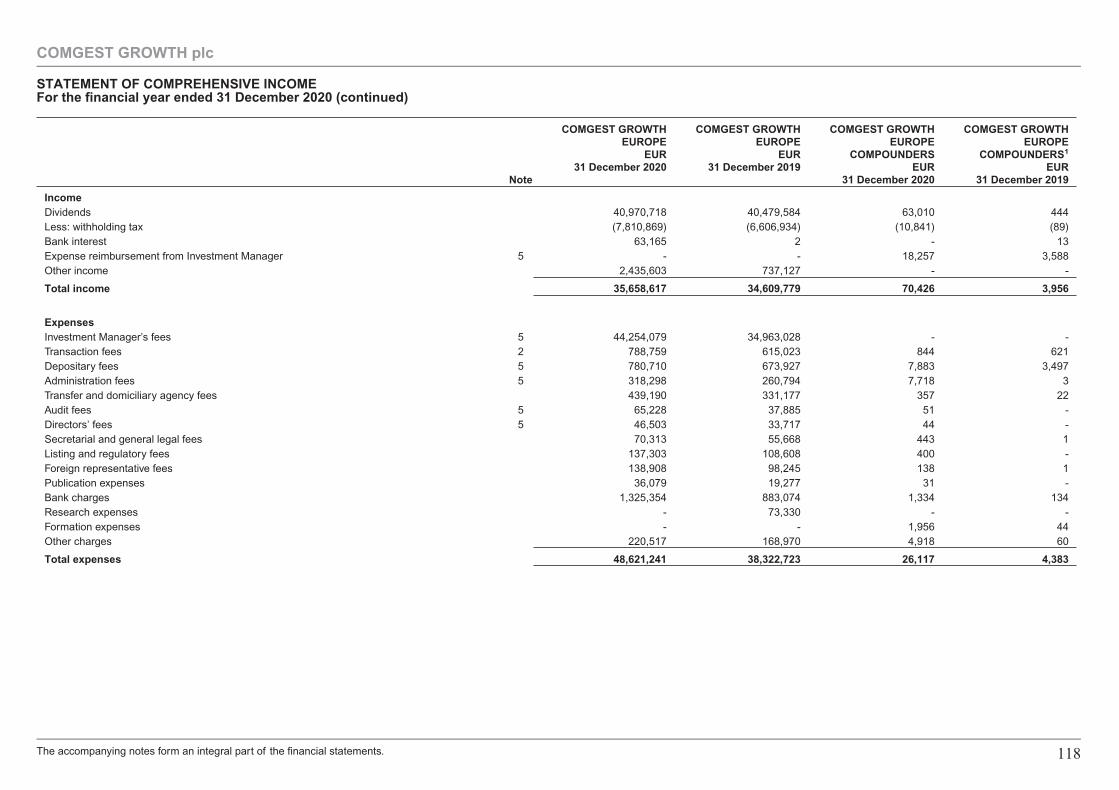
Note
COMGEST GROWTHEUROPE
EUR31 December 2020
COMGEST GROWTHEUROPE
EUR31 December 2019
COMGEST GROWTHEUROPE
COMPOUNDERSEUR
31 December 2020
COMGEST GROWTHEUROPE
COMPOUNDERS1
EUR31 December 2019
IncomeDividends 40,970,718 40,479,584 63,010 444Less: withholding tax (7,810,869) (6,606,934) (10,841) (89)Bank interest 63,165 2 - 13Expense reimbursement from Investment Manager 5 - - 18,257 3,588Other income 2,435,603 737,127 - -
Total income 35,658,617 34,609,779 70,426 3,956
ExpensesInvestment Manager’s fees 5 44,254,079 34,963,028 - -Transaction fees 2 788,759 615,023 844 621Depositary fees 5 780,710 673,927 7,883 3,497Administration fees 5 318,298 260,794 7,718 3Transfer and domiciliary agency fees 439,190 331,177 357 22Audit fees 5 65,228 37,885 51 -Directors’ fees 5 46,503 33,717 44 -Secretarial and general legal fees 70,313 55,668 443 1Listing and regulatory fees 137,303 108,608 400 -Foreign representative fees 138,908 98,245 138 1Publication expenses 36,079 19,277 31 -Bank charges 1,325,354 883,074 1,334 134Research expenses - 73,330 - -Formation expenses - - 1,956 44Other charges 220,517 168,970 4,918 60
Total expenses 48,621,241 38,322,723 26,117 4,383
COMGEST GROWTH plc
STATEMENT OF COMPREHENSIVE INCOMEFor the financial year ended 31 December 2020 (continued)
The accompanying notes form an integral part of the financial statements. 118
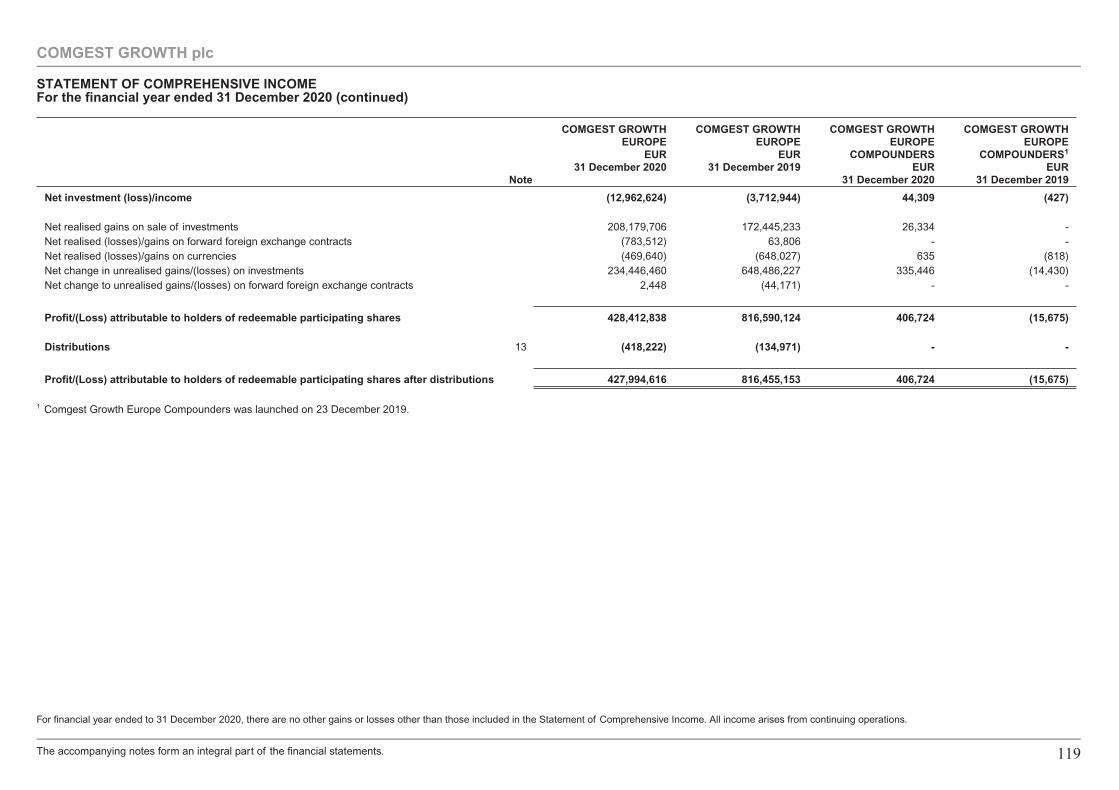
Note
COMGEST GROWTHEUROPE
EUR31 December 2020
COMGEST GROWTHEUROPE
EUR31 December 2019
COMGEST GROWTHEUROPE
COMPOUNDERSEUR
31 December 2020
COMGEST GROWTHEUROPE
COMPOUNDERS1
EUR31 December 2019
Net investment (loss)/income (12,962,624) (3,712,944) 44,309 (427)
Net realised gains on sale of investments 208,179,706 172,445,233 26,334 -Net realised (losses)/gains on forward foreign exchange contracts (783,512) 63,806 - -Net realised (losses)/gains on currencies (469,640) (648,027) 635 (818)Net change in unrealised gains/(losses) on investments 234,446,460 648,486,227 335,446 (14,430)Net change to unrealised gains/(losses) on forward foreign exchange contracts 2,448 (44,171) - -
Profit/(Loss) attributable to holders of redeemable participating shares 428,412,838 816,590,124 406,724 (15,675)
Distributions 13 (418,222) (134,971) - -
Profit/(Loss) attributable to holders of redeemable participating shares after distributions 427,994,616 816,455,153 406,724 (15,675)
1 Comgest Growth Europe Compounders was launched on 23 December 2019.
For financial year ended to 31 December 2020, there are no other gains or losses other than those included in the Statement of Comprehensive Income. All income arises from continuing operations.
COMGEST GROWTH plc
STATEMENT OF COMPREHENSIVE INCOMEFor the financial year ended 31 December 2020 (continued)
The accompanying notes form an integral part of the financial statements. 119
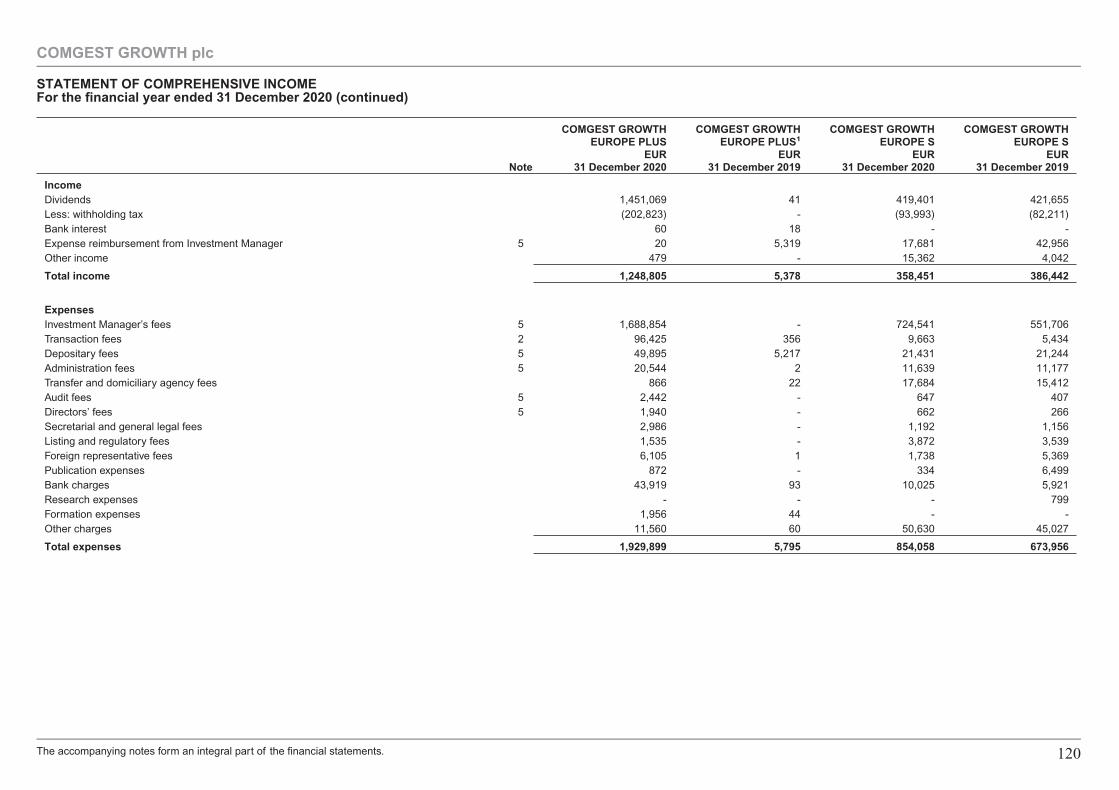
Note
COMGEST GROWTHEUROPE PLUS
EUR31 December 2020
COMGEST GROWTHEUROPE PLUS1
EUR31 December 2019
COMGEST GROWTHEUROPE S
EUR31 December 2020
COMGEST GROWTHEUROPE S
EUR31 December 2019
IncomeDividends 1,451,069 41 419,401 421,655Less: withholding tax (202,823) - (93,993) (82,211)Bank interest 60 18 - -Expense reimbursement from Investment Manager 5 20 5,319 17,681 42,956Other income 479 - 15,362 4,042
Total income 1,248,805 5,378 358,451 386,442
ExpensesInvestment Manager’s fees 5 1,688,854 - 724,541 551,706Transaction fees 2 96,425 356 9,663 5,434Depositary fees 5 49,895 5,217 21,431 21,244Administration fees 5 20,544 2 11,639 11,177Transfer and domiciliary agency fees 866 22 17,684 15,412Audit fees 5 2,442 - 647 407Directors’ fees 5 1,940 - 662 266Secretarial and general legal fees 2,986 - 1,192 1,156Listing and regulatory fees 1,535 - 3,872 3,539Foreign representative fees 6,105 1 1,738 5,369Publication expenses 872 - 334 6,499Bank charges 43,919 93 10,025 5,921Research expenses - - - 799Formation expenses 1,956 44 - -Other charges 11,560 60 50,630 45,027
Total expenses 1,929,899 5,795 854,058 673,956
COMGEST GROWTH plc
STATEMENT OF COMPREHENSIVE INCOMEFor the financial year ended 31 December 2020 (continued)
The accompanying notes form an integral part of the financial statements. 120
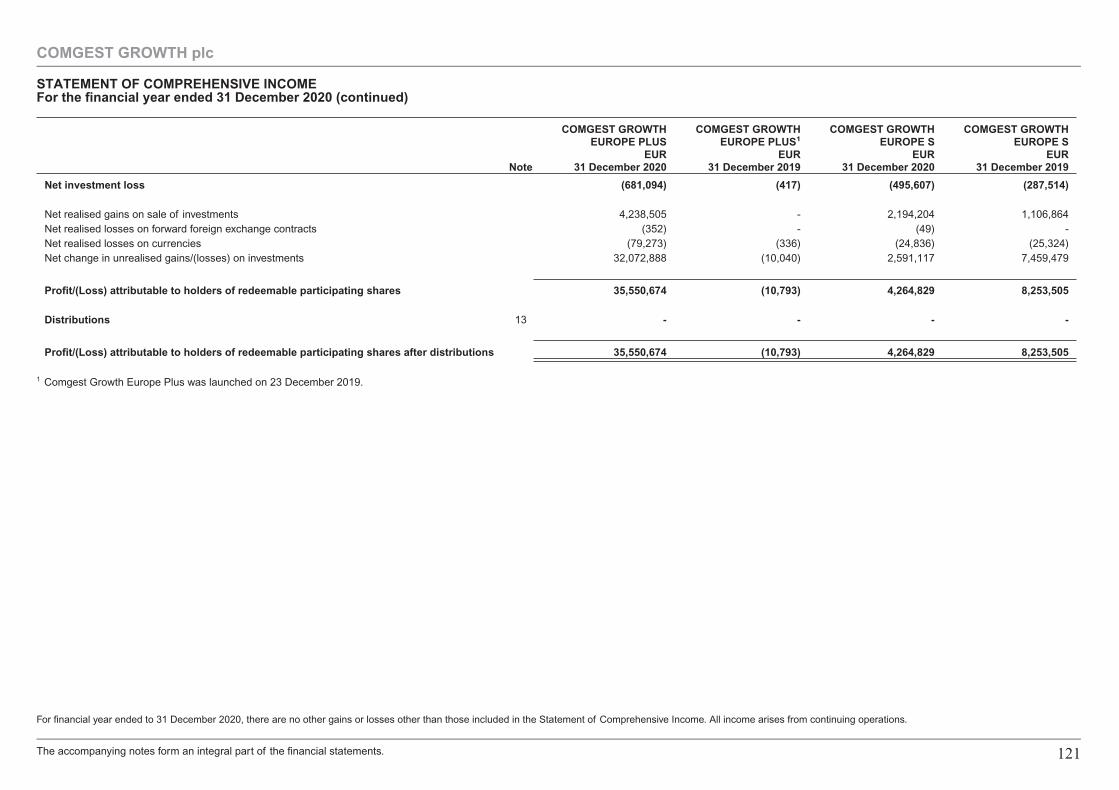
Note
COMGEST GROWTHEUROPE PLUS
EUR31 December 2020
COMGEST GROWTHEUROPE PLUS1
EUR31 December 2019
COMGEST GROWTHEUROPE S
EUR31 December 2020
COMGEST GROWTHEUROPE S
EUR31 December 2019
Net investment loss (681,094) (417) (495,607) (287,514)
Net realised gains on sale of investments 4,238,505 - 2,194,204 1,106,864Net realised losses on forward foreign exchange contracts (352) - (49) -Net realised losses on currencies (79,273) (336) (24,836) (25,324)Net change in unrealised gains/(losses) on investments 32,072,888 (10,040) 2,591,117 7,459,479
Profit/(Loss) attributable to holders of redeemable participating shares 35,550,674 (10,793) 4,264,829 8,253,505
Distributions 13 - - - -
Profit/(Loss) attributable to holders of redeemable participating shares after distributions 35,550,674 (10,793) 4,264,829 8,253,505
1 Comgest Growth Europe Plus was launched on 23 December 2019.
For financial year ended to 31 December 2020, there are no other gains or losses other than those included in the Statement of Comprehensive Income. All income arises from continuing operations.
COMGEST GROWTH plc
STATEMENT OF COMPREHENSIVE INCOMEFor the financial year ended 31 December 2020 (continued)
The accompanying notes form an integral part of the financial statements. 121
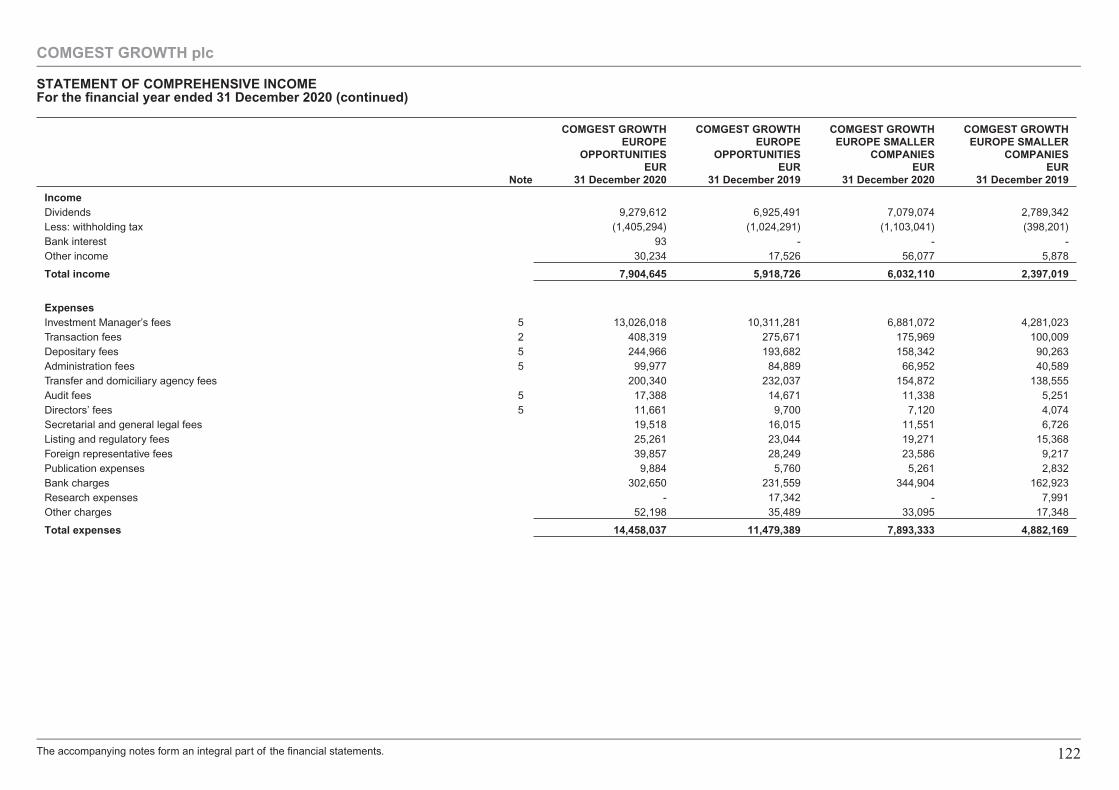
Note
COMGEST GROWTHEUROPE
OPPORTUNITIESEUR
31 December 2020
COMGEST GROWTHEUROPE
OPPORTUNITIESEUR
31 December 2019
COMGEST GROWTHEUROPE SMALLER
COMPANIESEUR
31 December 2020
COMGEST GROWTHEUROPE SMALLER
COMPANIESEUR
31 December 2019
IncomeDividends 9,279,612 6,925,491 7,079,074 2,789,342Less: withholding tax (1,405,294) (1,024,291) (1,103,041) (398,201)Bank interest 93 - - -Other income 30,234 17,526 56,077 5,878
Total income 7,904,645 5,918,726 6,032,110 2,397,019
ExpensesInvestment Manager’s fees 5 13,026,018 10,311,281 6,881,072 4,281,023Transaction fees 2 408,319 275,671 175,969 100,009Depositary fees 5 244,966 193,682 158,342 90,263Administration fees 5 99,977 84,889 66,952 40,589Transfer and domiciliary agency fees 200,340 232,037 154,872 138,555Audit fees 5 17,388 14,671 11,338 5,251Directors’ fees 5 11,661 9,700 7,120 4,074Secretarial and general legal fees 19,518 16,015 11,551 6,726Listing and regulatory fees 25,261 23,044 19,271 15,368Foreign representative fees 39,857 28,249 23,586 9,217Publication expenses 9,884 5,760 5,261 2,832Bank charges 302,650 231,559 344,904 162,923Research expenses - 17,342 - 7,991Other charges 52,198 35,489 33,095 17,348
Total expenses 14,458,037 11,479,389 7,893,333 4,882,169
COMGEST GROWTH plc
STATEMENT OF COMPREHENSIVE INCOMEFor the financial year ended 31 December 2020 (continued)
The accompanying notes form an integral part of the financial statements. 122
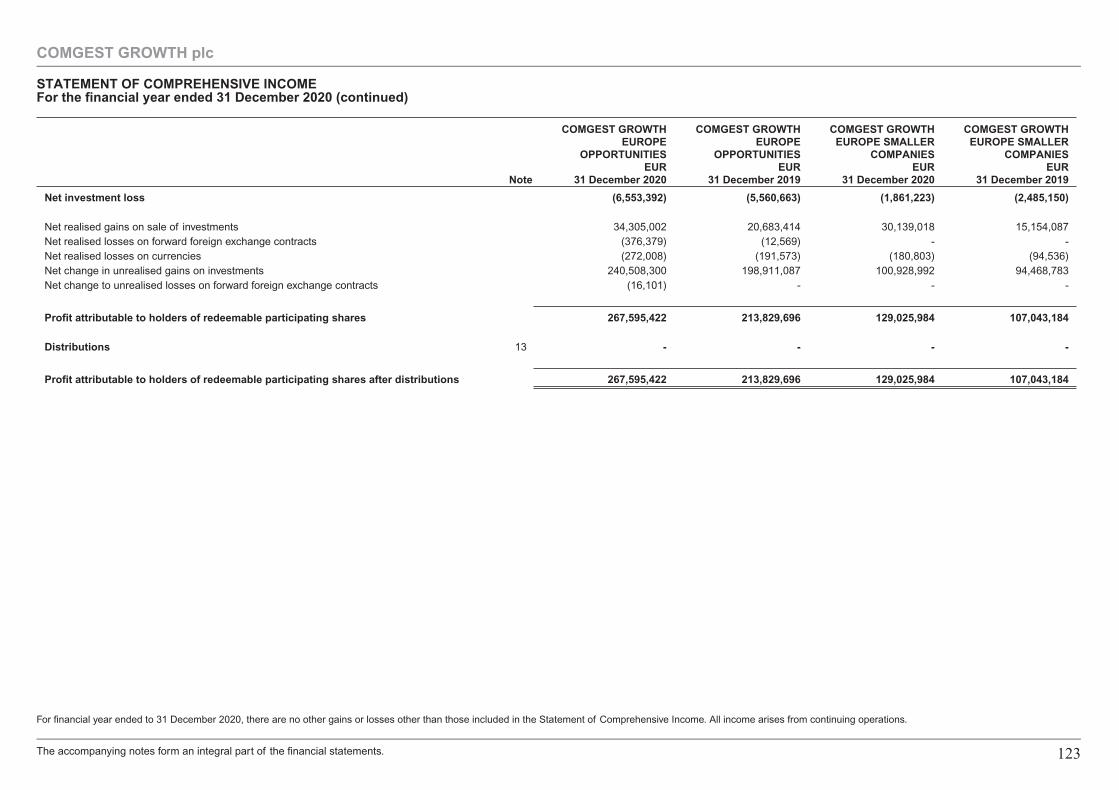
Note
COMGEST GROWTHEUROPE
OPPORTUNITIESEUR
31 December 2020
COMGEST GROWTHEUROPE
OPPORTUNITIESEUR
31 December 2019
COMGEST GROWTHEUROPE SMALLER
COMPANIESEUR
31 December 2020
COMGEST GROWTHEUROPE SMALLER
COMPANIESEUR
31 December 2019
Net investment loss (6,553,392) (5,560,663) (1,861,223) (2,485,150)
Net realised gains on sale of investments 34,305,002 20,683,414 30,139,018 15,154,087Net realised losses on forward foreign exchange contracts (376,379) (12,569) - -Net realised losses on currencies (272,008) (191,573) (180,803) (94,536)Net change in unrealised gains on investments 240,508,300 198,911,087 100,928,992 94,468,783Net change to unrealised losses on forward foreign exchange contracts (16,101) - - -
Profit attributable to holders of redeemable participating shares 267,595,422 213,829,696 129,025,984 107,043,184
Distributions 13 - - - -
Profit attributable to holders of redeemable participating shares after distributions 267,595,422 213,829,696 129,025,984 107,043,184
For financial year ended to 31 December 2020, there are no other gains or losses other than those included in the Statement of Comprehensive Income. All income arises from continuing operations.
COMGEST GROWTH plc
STATEMENT OF COMPREHENSIVE INCOMEFor the financial year ended 31 December 2020 (continued)
The accompanying notes form an integral part of the financial statements. 123
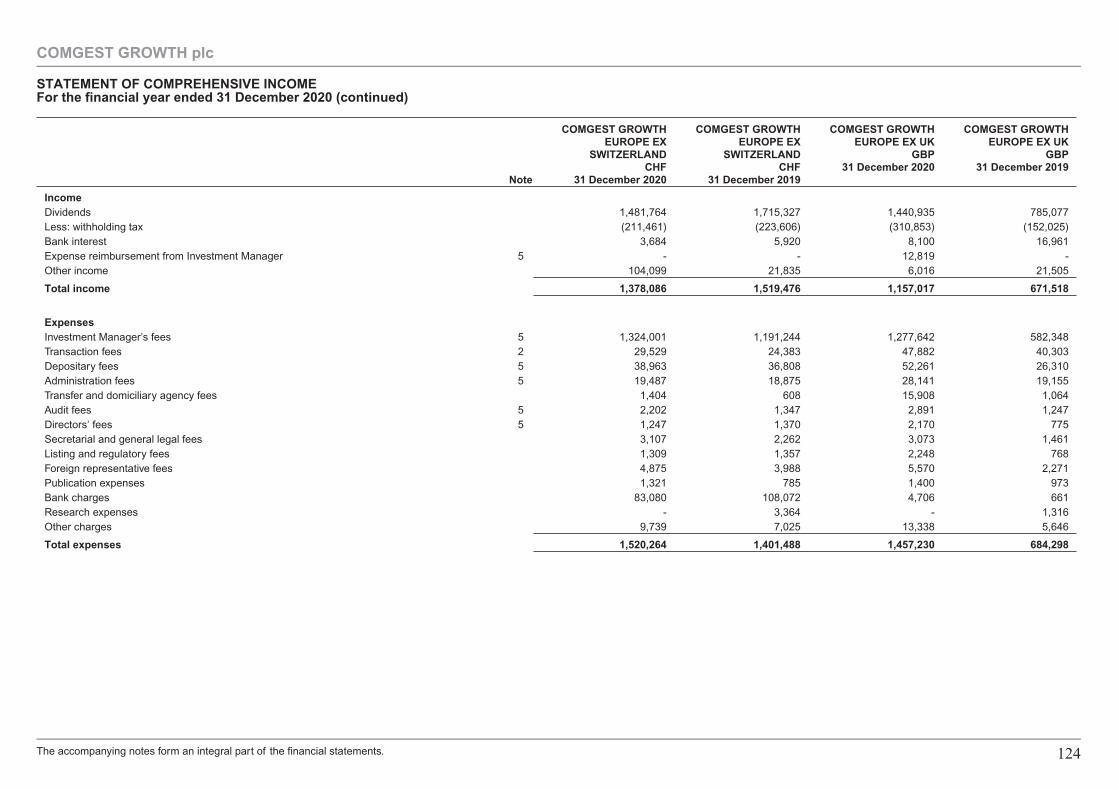
Note
COMGEST GROWTHEUROPE EX
SWITZERLANDCHF
31 December 2020
COMGEST GROWTHEUROPE EX
SWITZERLANDCHF
31 December 2019
COMGEST GROWTHEUROPE EX UK
GBP31 December 2020
COMGEST GROWTHEUROPE EX UK
GBP31 December 2019
IncomeDividends 1,481,764 1,715,327 1,440,935 785,077Less: withholding tax (211,461) (223,606) (310,853) (152,025)Bank interest 3,684 5,920 8,100 16,961Expense reimbursement from Investment Manager 5 - - 12,819 -Other income 104,099 21,835 6,016 21,505
Total income 1,378,086 1,519,476 1,157,017 671,518
ExpensesInvestment Manager’s fees 5 1,324,001 1,191,244 1,277,642 582,348Transaction fees 2 29,529 24,383 47,882 40,303Depositary fees 5 38,963 36,808 52,261 26,310Administration fees 5 19,487 18,875 28,141 19,155Transfer and domiciliary agency fees 1,404 608 15,908 1,064Audit fees 5 2,202 1,347 2,891 1,247Directors’ fees 5 1,247 1,370 2,170 775Secretarial and general legal fees 3,107 2,262 3,073 1,461Listing and regulatory fees 1,309 1,357 2,248 768Foreign representative fees 4,875 3,988 5,570 2,271Publication expenses 1,321 785 1,400 973Bank charges 83,080 108,072 4,706 661Research expenses - 3,364 - 1,316Other charges 9,739 7,025 13,338 5,646
Total expenses 1,520,264 1,401,488 1,457,230 684,298
COMGEST GROWTH plc
STATEMENT OF COMPREHENSIVE INCOMEFor the financial year ended 31 December 2020 (continued)
The accompanying notes form an integral part of the financial statements. 124
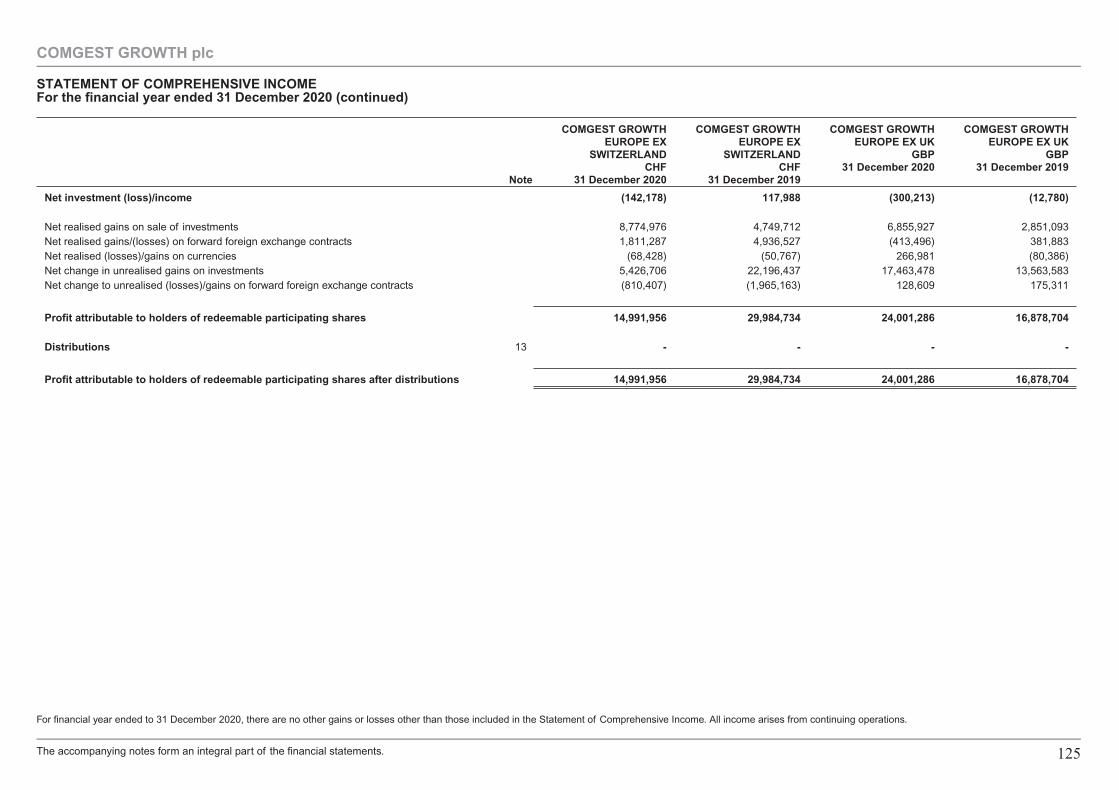
Note
COMGEST GROWTHEUROPE EX
SWITZERLANDCHF
31 December 2020
COMGEST GROWTHEUROPE EX
SWITZERLANDCHF
31 December 2019
COMGEST GROWTHEUROPE EX UK
GBP31 December 2020
COMGEST GROWTHEUROPE EX UK
GBP31 December 2019
Net investment (loss)/income (142,178) 117,988 (300,213) (12,780)
Net realised gains on sale of investments 8,774,976 4,749,712 6,855,927 2,851,093Net realised gains/(losses) on forward foreign exchange contracts 1,811,287 4,936,527 (413,496) 381,883Net realised (losses)/gains on currencies (68,428) (50,767) 266,981 (80,386)Net change in unrealised gains on investments 5,426,706 22,196,437 17,463,478 13,563,583Net change to unrealised (losses)/gains on forward foreign exchange contracts (810,407) (1,965,163) 128,609 175,311
Profit attributable to holders of redeemable participating shares 14,991,956 29,984,734 24,001,286 16,878,704
Distributions 13 - - - -
Profit attributable to holders of redeemable participating shares after distributions 14,991,956 29,984,734 24,001,286 16,878,704
For financial year ended to 31 December 2020, there are no other gains or losses other than those included in the Statement of Comprehensive Income. All income arises from continuing operations.
COMGEST GROWTH plc
STATEMENT OF COMPREHENSIVE INCOMEFor the financial year ended 31 December 2020 (continued)
The accompanying notes form an integral part of the financial statements. 125

Note
COMGEST GROWTHASIAUSD
31 December 2020
COMGEST GROWTHASIAUSD
31 December 2019
COMGEST GROWTHASIA EX JAPAN
USD31 December 2020
COMGEST GROWTHASIA EX JAPAN
USD31 December 2019
IncomeDividends 1,908,896 2,229,299 1,232,732 1,486,134Less: withholding tax (259,069) (300,136) (136,227) (133,528)Bank interest 16,794 93,968 9,031 49,905Expense reimbursement from Investment Manager 5 - - 24,986 -Other income 15,624 31 227 16
Total income 1,682,245 2,023,162 1,130,749 1,402,527
ExpensesInvestment Manager’s fees 5 2,282,526 1,815,867 672,039 613,760Transaction fees 2 62,655 33,486 54,112 23,482Depositary fees 5 49,536 44,144 49,581 51,644Administration fees 5 29,858 23,993 12,004 12,116Transfer and domiciliary agency fees 51,801 37,287 4,073 2,505Audit fees 5 2,984 2,122 1,094 1,097Directors’ fees 5 2,028 1,606 697 711Secretarial and general legal fees 4,221 3,743 2,028 1,990Listing and regulatory fees 5,142 14,809 3,606 10,546Foreign representative fees 7,485 9,851 3,821 8,988Publication expenses 1,645 2,062 693 574Bank charges 915 13 737 8Research expenses - 12,113 - 5,873Other charges 28,540 19,934 31,354 35,504
Total expenses 2,529,336 2,021,030 835,839 768,798
COMGEST GROWTH plc
STATEMENT OF COMPREHENSIVE INCOMEFor the financial year ended 31 December 2020 (continued)
The accompanying notes form an integral part of the financial statements. 126
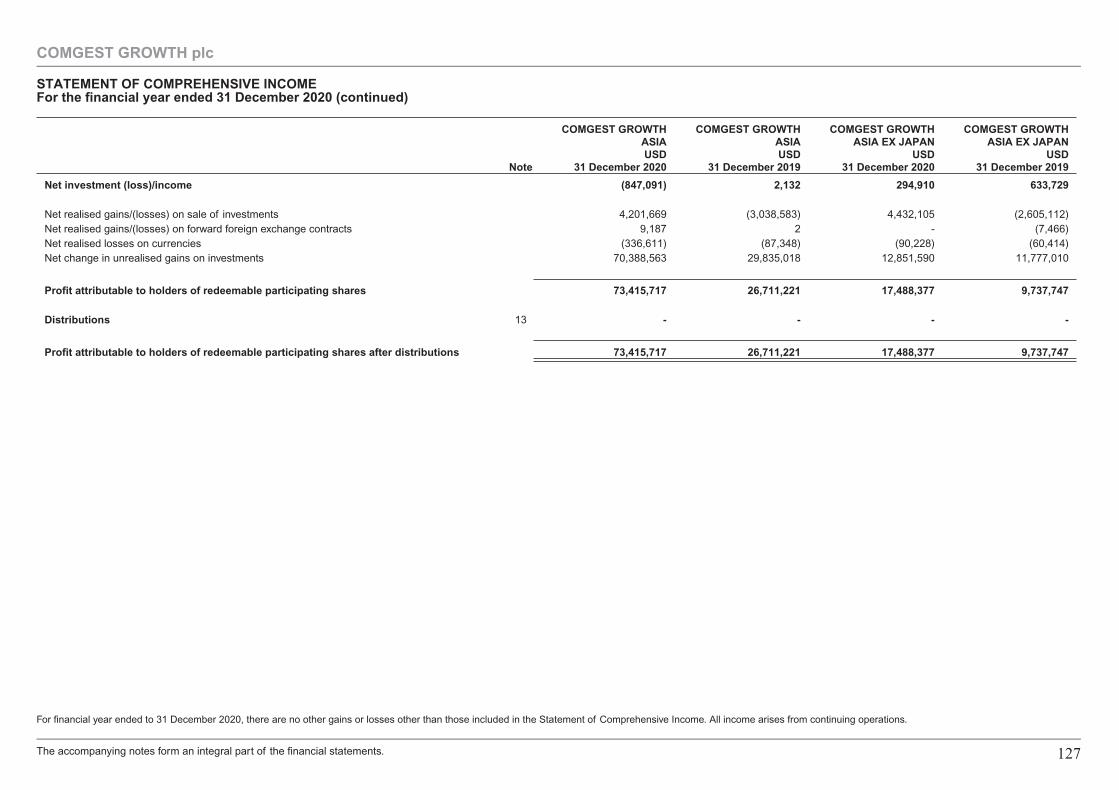
Note
COMGEST GROWTHASIAUSD
31 December 2020
COMGEST GROWTHASIAUSD
31 December 2019
COMGEST GROWTHASIA EX JAPAN
USD31 December 2020
COMGEST GROWTHASIA EX JAPAN
USD31 December 2019
Net investment (loss)/income (847,091) 2,132 294,910 633,729
Net realised gains/(losses) on sale of investments 4,201,669 (3,038,583) 4,432,105 (2,605,112)Net realised gains/(losses) on forward foreign exchange contracts 9,187 2 - (7,466)Net realised losses on currencies (336,611) (87,348) (90,228) (60,414)Net change in unrealised gains on investments 70,388,563 29,835,018 12,851,590 11,777,010
Profit attributable to holders of redeemable participating shares 73,415,717 26,711,221 17,488,377 9,737,747
Distributions 13 - - - -
Profit attributable to holders of redeemable participating shares after distributions 73,415,717 26,711,221 17,488,377 9,737,747
For financial year ended to 31 December 2020, there are no other gains or losses other than those included in the Statement of Comprehensive Income. All income arises from continuing operations.
COMGEST GROWTH plc
STATEMENT OF COMPREHENSIVE INCOMEFor the financial year ended 31 December 2020 (continued)
The accompanying notes form an integral part of the financial statements. 127
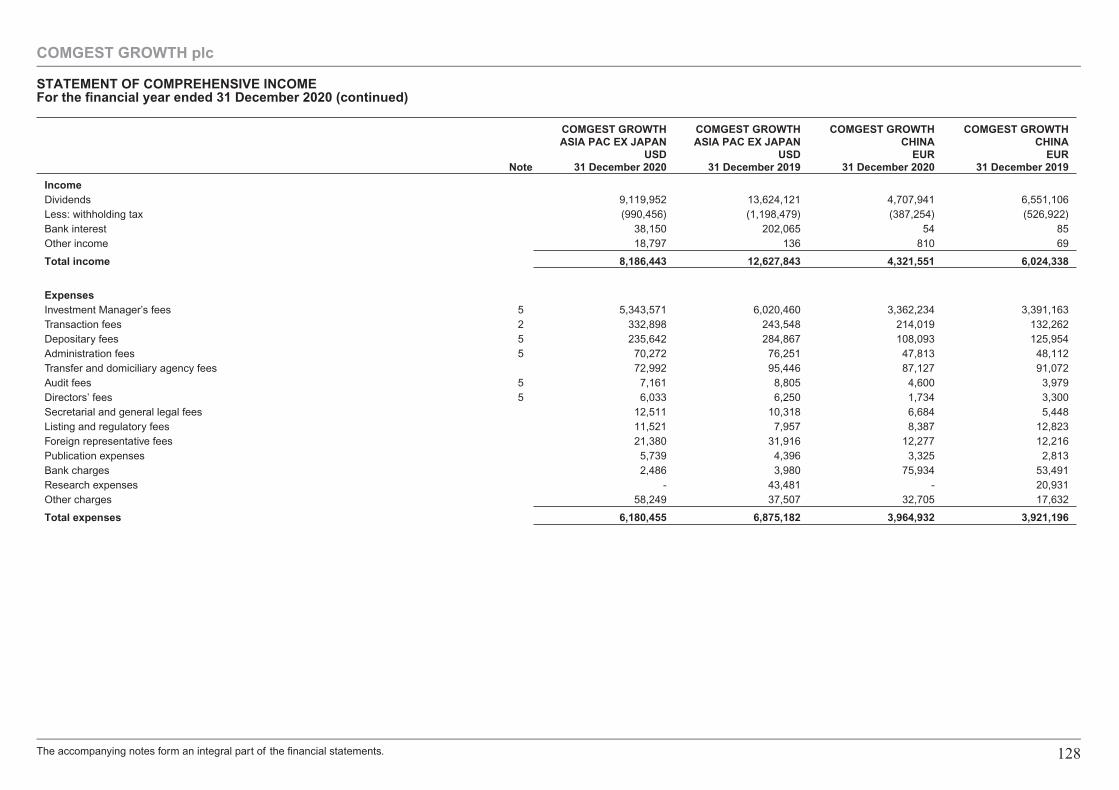
Note
COMGEST GROWTHASIA PAC EX JAPAN
USD31 December 2020
COMGEST GROWTHASIA PAC EX JAPAN
USD31 December 2019
COMGEST GROWTHCHINA
EUR31 December 2020
COMGEST GROWTHCHINA
EUR31 December 2019
IncomeDividends 9,119,952 13,624,121 4,707,941 6,551,106Less: withholding tax (990,456) (1,198,479) (387,254) (526,922)Bank interest 38,150 202,065 54 85Other income 18,797 136 810 69
Total income 8,186,443 12,627,843 4,321,551 6,024,338
ExpensesInvestment Manager’s fees 5 5,343,571 6,020,460 3,362,234 3,391,163Transaction fees 2 332,898 243,548 214,019 132,262Depositary fees 5 235,642 284,867 108,093 125,954Administration fees 5 70,272 76,251 47,813 48,112Transfer and domiciliary agency fees 72,992 95,446 87,127 91,072Audit fees 5 7,161 8,805 4,600 3,979Directors’ fees 5 6,033 6,250 1,734 3,300Secretarial and general legal fees 12,511 10,318 6,684 5,448Listing and regulatory fees 11,521 7,957 8,387 12,823Foreign representative fees 21,380 31,916 12,277 12,216Publication expenses 5,739 4,396 3,325 2,813Bank charges 2,486 3,980 75,934 53,491Research expenses - 43,481 - 20,931Other charges 58,249 37,507 32,705 17,632
Total expenses 6,180,455 6,875,182 3,964,932 3,921,196
COMGEST GROWTH plc
STATEMENT OF COMPREHENSIVE INCOMEFor the financial year ended 31 December 2020 (continued)
The accompanying notes form an integral part of the financial statements. 128
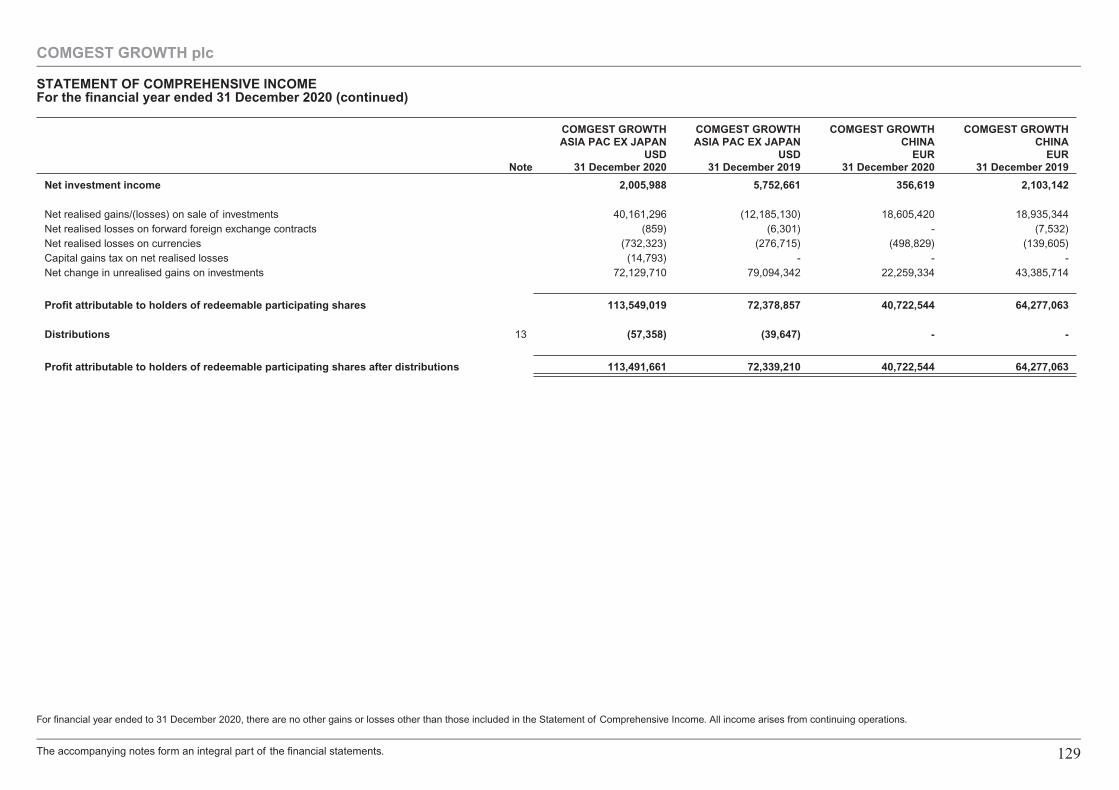
Note
COMGEST GROWTHASIA PAC EX JAPAN
USD31 December 2020
COMGEST GROWTHASIA PAC EX JAPAN
USD31 December 2019
COMGEST GROWTHCHINA
EUR31 December 2020
COMGEST GROWTHCHINA
EUR31 December 2019
Net investment income 2,005,988 5,752,661 356,619 2,103,142
Net realised gains/(losses) on sale of investments 40,161,296 (12,185,130) 18,605,420 18,935,344Net realised losses on forward foreign exchange contracts (859) (6,301) - (7,532)Net realised losses on currencies (732,323) (276,715) (498,829) (139,605)Capital gains tax on net realised losses (14,793) - - -Net change in unrealised gains on investments 72,129,710 79,094,342 22,259,334 43,385,714
Profit attributable to holders of redeemable participating shares 113,549,019 72,378,857 40,722,544 64,277,063
Distributions 13 (57,358) (39,647) - -
Profit attributable to holders of redeemable participating shares after distributions 113,491,661 72,339,210 40,722,544 64,277,063
For financial year ended to 31 December 2020, there are no other gains or losses other than those included in the Statement of Comprehensive Income. All income arises from continuing operations.
COMGEST GROWTH plc
STATEMENT OF COMPREHENSIVE INCOMEFor the financial year ended 31 December 2020 (continued)
The accompanying notes form an integral part of the financial statements. 129

Note
COMGEST GROWTHINDIA
USD31 December 2020
COMGEST GROWTHINDIA
USD31 December 2019
COMGEST GROWTHLATIN AMERICA
EUR31 December 2020
COMGEST GROWTHLATIN AMERICA
EUR31 December 2019
IncomeDividends 2,457,672 4,021,592 496,902 1,019,440Less: withholding tax (325,521) (69,368) (58,572) (109,293)Bank interest 14,800 127,228 14 31Expense reimbursement from Investment Manager 5 - - 60,158 30,062Other income 482 51 66 9
Total income 2,147,433 4,079,503 498,568 940,249
ExpensesInvestment Manager’s fees 5 1,721,452 2,925,229 297,385 511,170Transaction fees 2 107,486 112,888 14,267 22,050Depositary fees 5 69,599 123,604 40,193 56,973Administration fees 5 29,427 34,150 24,633 24,901Transfer and domiciliary agency fees 58,953 57,307 11,491 11,911Audit fees 5 1,418 956 306 231Directors’ fees 5 1,532 2,328 283 425Secretarial and general legal fees 4,016 3,843 1,135 1,023Listing and regulatory fees 8,926 15,437 2,814 8,317Foreign representative fees 7,731 11,704 3,175 9,184Publication expenses 1,993 1,668 357 264Bank charges 1,717 138 3,484 5,825Research expenses - 17,680 - 2,793Other charges 36,587 28,026 10,757 6,699
Total expenses 2,050,837 3,334,958 410,280 661,766
COMGEST GROWTH plc
STATEMENT OF COMPREHENSIVE INCOMEFor the financial year ended 31 December 2020 (continued)
The accompanying notes form an integral part of the financial statements. 130
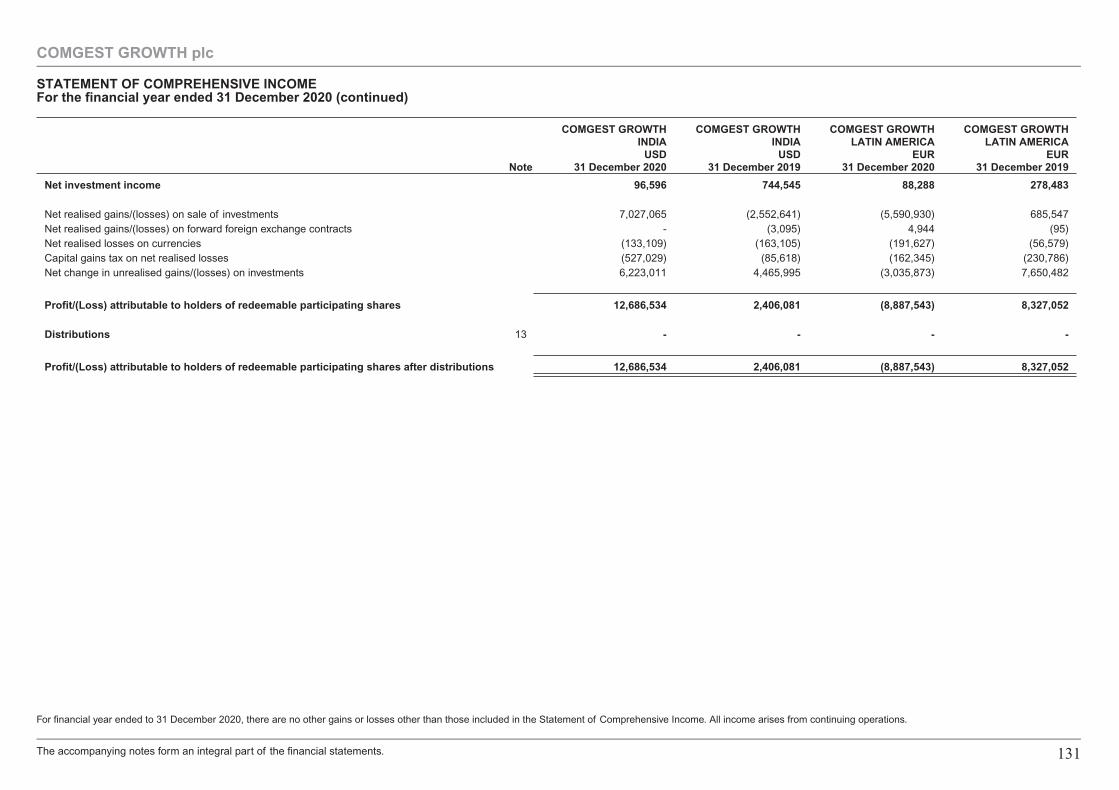
Note
COMGEST GROWTHINDIA
USD31 December 2020
COMGEST GROWTHINDIA
USD31 December 2019
COMGEST GROWTHLATIN AMERICA
EUR31 December 2020
COMGEST GROWTHLATIN AMERICA
EUR31 December 2019
Net investment income 96,596 744,545 88,288 278,483
Net realised gains/(losses) on sale of investments 7,027,065 (2,552,641) (5,590,930) 685,547Net realised gains/(losses) on forward foreign exchange contracts - (3,095) 4,944 (95)Net realised losses on currencies (133,109) (163,105) (191,627) (56,579)Capital gains tax on net realised losses (527,029) (85,618) (162,345) (230,786)Net change in unrealised gains/(losses) on investments 6,223,011 4,465,995 (3,035,873) 7,650,482
Profit/(Loss) attributable to holders of redeemable participating shares 12,686,534 2,406,081 (8,887,543) 8,327,052
Distributions 13 - - - -
Profit/(Loss) attributable to holders of redeemable participating shares after distributions 12,686,534 2,406,081 (8,887,543) 8,327,052
For financial year ended to 31 December 2020, there are no other gains or losses other than those included in the Statement of Comprehensive Income. All income arises from continuing operations.
COMGEST GROWTH plc
STATEMENT OF COMPREHENSIVE INCOMEFor the financial year ended 31 December 2020 (continued)
The accompanying notes form an integral part of the financial statements. 131
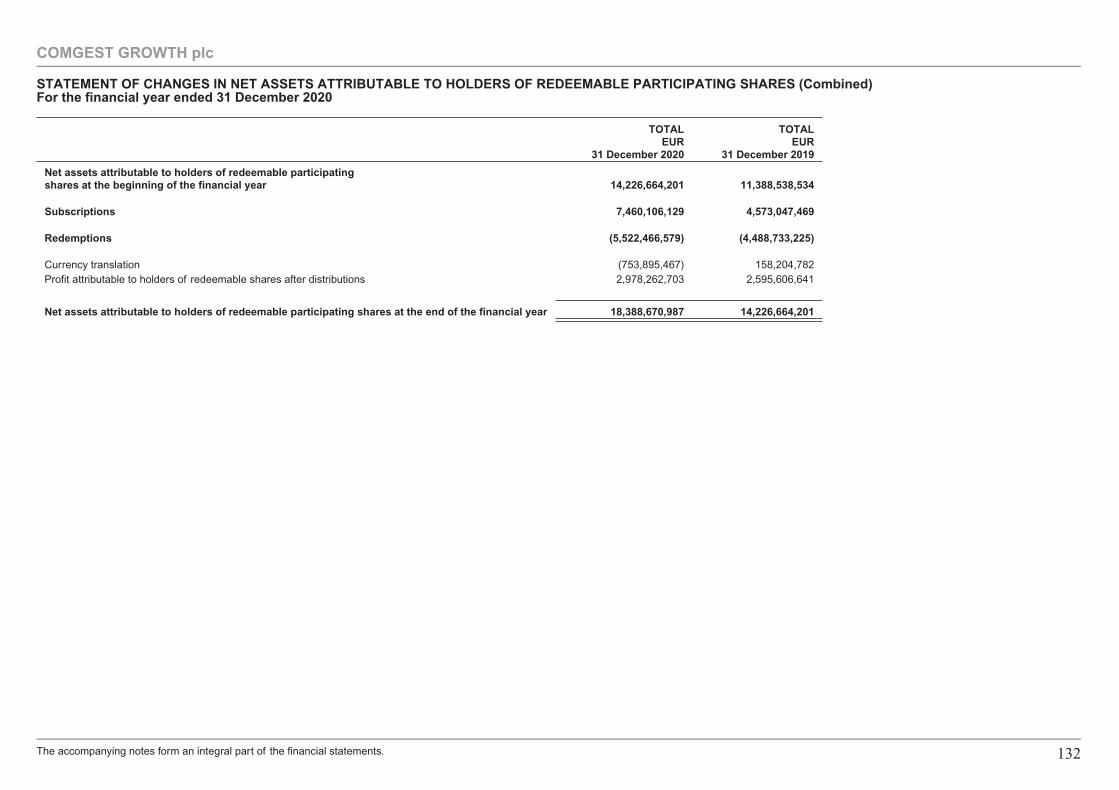
TOTALEUR
31 December 2020
TOTALEUR
31 December 2019
Net assets attributable to holders of redeemable participatingshares at the beginning of the financial year 14,226,664,201 11,388,538,534
Subscriptions 7,460,106,129 4,573,047,469
Redemptions (5,522,466,579) (4,488,733,225)
Currency translation (753,895,467) 158,204,782Profit attributable to holders of redeemable shares after distributions 2,978,262,703 2,595,606,641
Net assets attributable to holders of redeemable participating shares at the end of the financial year 18,388,670,987 14,226,664,201
COMGEST GROWTH plc
STATEMENT OF CHANGES IN NET ASSETS ATTRIBUTABLE TO HOLDERS OF REDEEMABLE PARTICIPATING SHARES (Combined)For the financial year ended 31 December 2020
The accompanying notes form an integral part of the financial statements. 132
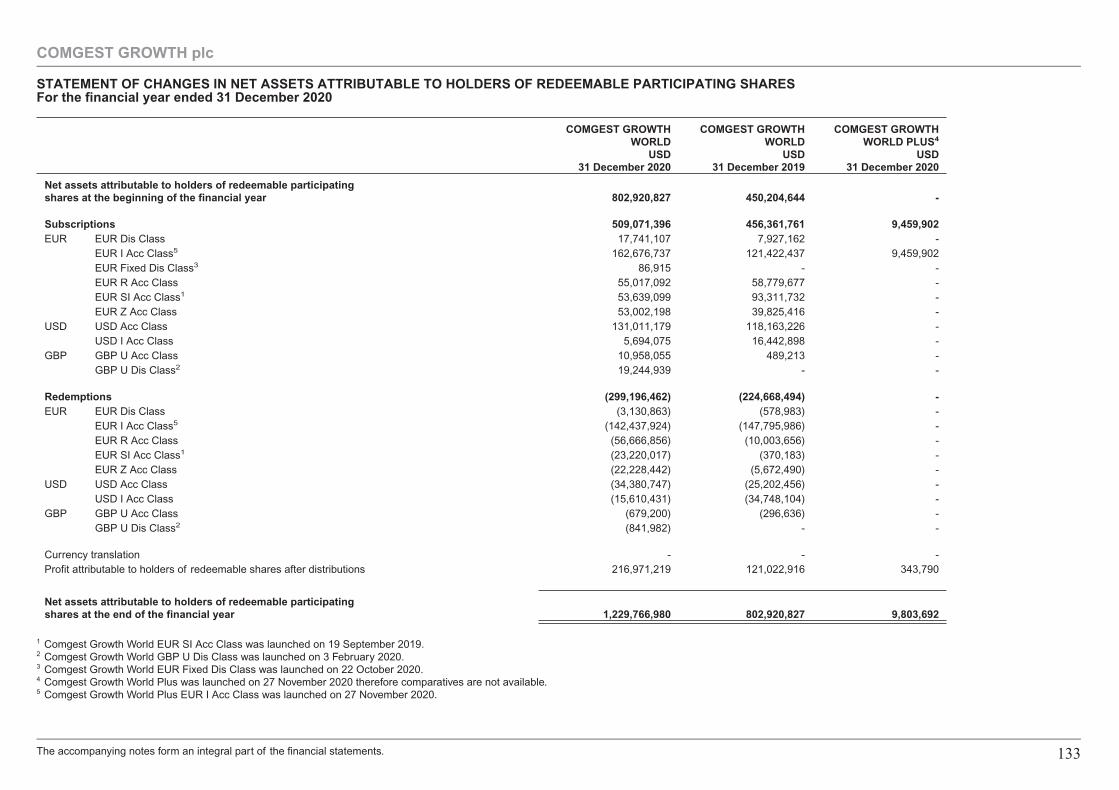
COMGEST GROWTHWORLD
USD31 December 2020
COMGEST GROWTHWORLD
USD31 December 2019
COMGEST GROWTHWORLD PLUS4
USD31 December 2020
Net assets attributable to holders of redeemable participatingshares at the beginning of the financial year 802,920,827 450,204,644 -
Subscriptions 509,071,396 456,361,761 9,459,902EUR EUR Dis Class 17,741,107 7,927,162 -
EUR I Acc Class5 162,676,737 121,422,437 9,459,902EUR Fixed Dis Class3 86,915 - -EUR R Acc Class 55,017,092 58,779,677 -EUR SI Acc Class1 53,639,099 93,311,732 -EUR Z Acc Class 53,002,198 39,825,416 -
USD USD Acc Class 131,011,179 118,163,226 -USD I Acc Class 5,694,075 16,442,898 -
GBP GBP U Acc Class 10,958,055 489,213 -GBP U Dis Class2 19,244,939 - -
Redemptions (299,196,462) (224,668,494) -EUR EUR Dis Class (3,130,863) (578,983) -
EUR I Acc Class5 (142,437,924) (147,795,986) -EUR R Acc Class (56,666,856) (10,003,656) -EUR SI Acc Class1 (23,220,017) (370,183) -EUR Z Acc Class (22,228,442) (5,672,490) -
USD USD Acc Class (34,380,747) (25,202,456) -USD I Acc Class (15,610,431) (34,748,104) -
GBP GBP U Acc Class (679,200) (296,636) -GBP U Dis Class2 (841,982) - -
Currency translation - - -Profit attributable to holders of redeemable shares after distributions 216,971,219 121,022,916 343,790
Net assets attributable to holders of redeemable participatingshares at the end of the financial year 1,229,766,980 802,920,827 9,803,692
1 Comgest Growth World EUR SI Acc Class was launched on 19 September 2019.2 Comgest Growth World GBP U Dis Class was launched on 3 February 2020.3 Comgest Growth World EUR Fixed Dis Class was launched on 22 October 2020.4 Comgest Growth World Plus was launched on 27 November 2020 therefore comparatives are not available.5 Comgest Growth World Plus EUR I Acc Class was launched on 27 November 2020.
COMGEST GROWTH plc
STATEMENT OF CHANGES IN NET ASSETS ATTRIBUTABLE TO HOLDERS OF REDEEMABLE PARTICIPATING SHARESFor the financial year ended 31 December 2020
The accompanying notes form an integral part of the financial statements. 133
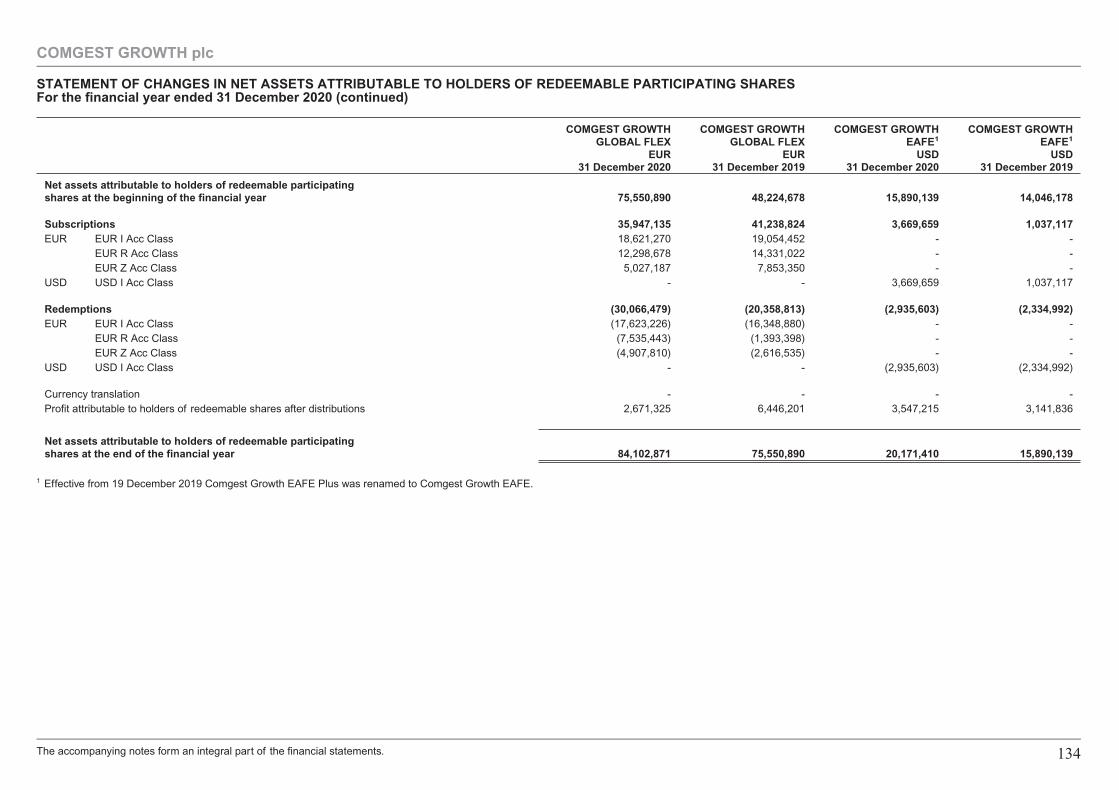
COMGEST GROWTHGLOBAL FLEX
EUR31 December 2020
COMGEST GROWTHGLOBAL FLEX
EUR31 December 2019
COMGEST GROWTHEAFE1
USD31 December 2020
COMGEST GROWTHEAFE1
USD31 December 2019
Net assets attributable to holders of redeemable participatingshares at the beginning of the financial year 75,550,890 48,224,678 15,890,139 14,046,178
Subscriptions 35,947,135 41,238,824 3,669,659 1,037,117EUR EUR I Acc Class 18,621,270 19,054,452 - -
EUR R Acc Class 12,298,678 14,331,022 - -EUR Z Acc Class 5,027,187 7,853,350 - -
USD USD I Acc Class - - 3,669,659 1,037,117
Redemptions (30,066,479) (20,358,813) (2,935,603) (2,334,992)EUR EUR I Acc Class (17,623,226) (16,348,880) - -
EUR R Acc Class (7,535,443) (1,393,398) - -EUR Z Acc Class (4,907,810) (2,616,535) - -
USD USD I Acc Class - - (2,935,603) (2,334,992)
Currency translation - - - -Profit attributable to holders of redeemable shares after distributions 2,671,325 6,446,201 3,547,215 3,141,836
Net assets attributable to holders of redeemable participatingshares at the end of the financial year 84,102,871 75,550,890 20,171,410 15,890,139
1 Effective from 19 December 2019 Comgest Growth EAFE Plus was renamed to Comgest Growth EAFE.
COMGEST GROWTH plc
STATEMENT OF CHANGES IN NET ASSETS ATTRIBUTABLE TO HOLDERS OF REDEEMABLE PARTICIPATING SHARESFor the financial year ended 31 December 2020 (continued)
The accompanying notes form an integral part of the financial statements. 134
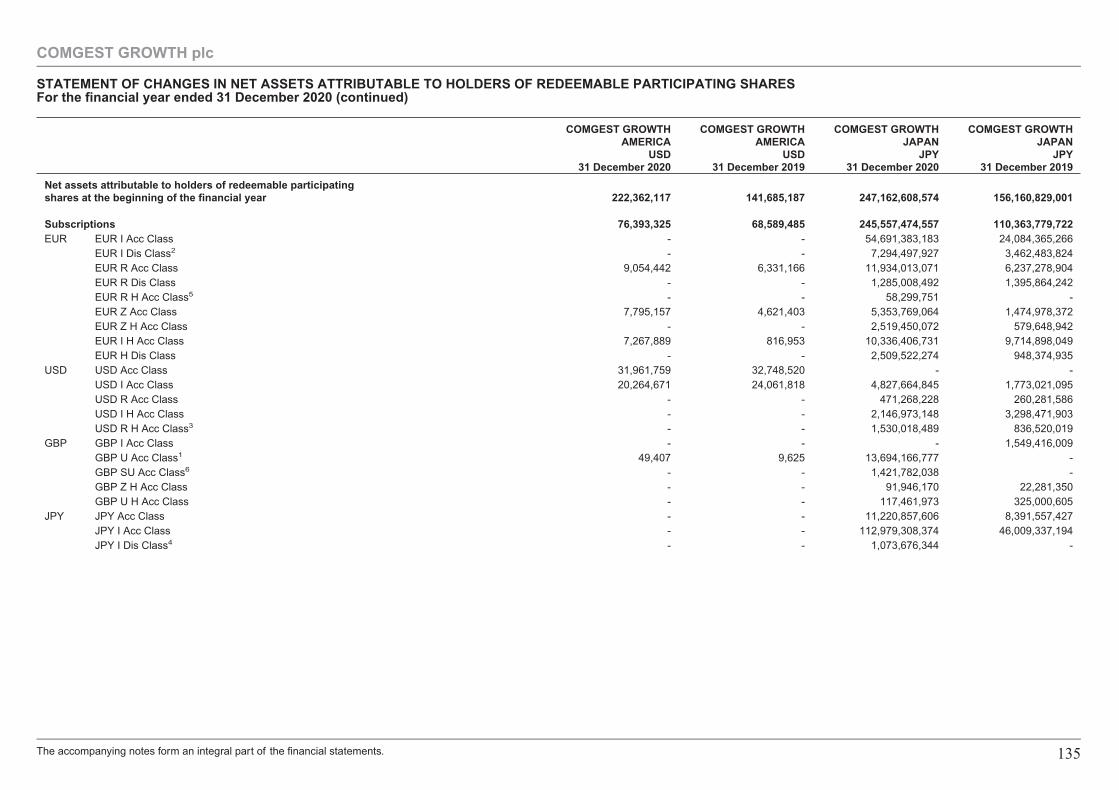
COMGEST GROWTHAMERICA
USD31 December 2020
COMGEST GROWTHAMERICA
USD31 December 2019
COMGEST GROWTHJAPAN
JPY31 December 2020
COMGEST GROWTHJAPAN
JPY31 December 2019
Net assets attributable to holders of redeemable participatingshares at the beginning of the financial year 222,362,117 141,685,187 247,162,608,574 156,160,829,001
Subscriptions 76,393,325 68,589,485 245,557,474,557 110,363,779,722EUR EUR I Acc Class - - 54,691,383,183 24,084,365,266
EUR I Dis Class2 - - 7,294,497,927 3,462,483,824EUR R Acc Class 9,054,442 6,331,166 11,934,013,071 6,237,278,904EUR R Dis Class - - 1,285,008,492 1,395,864,242EUR R H Acc Class5 - - 58,299,751 -EUR Z Acc Class 7,795,157 4,621,403 5,353,769,064 1,474,978,372EUR Z H Acc Class - - 2,519,450,072 579,648,942EUR I H Acc Class 7,267,889 816,953 10,336,406,731 9,714,898,049EUR H Dis Class - - 2,509,522,274 948,374,935
USD USD Acc Class 31,961,759 32,748,520 - -USD I Acc Class 20,264,671 24,061,818 4,827,664,845 1,773,021,095USD R Acc Class - - 471,268,228 260,281,586USD I H Acc Class - - 2,146,973,148 3,298,471,903USD R H Acc Class3 - - 1,530,018,489 836,520,019
GBP GBP I Acc Class - - - 1,549,416,009GBP U Acc Class1 49,407 9,625 13,694,166,777 -GBP SU Acc Class6 - - 1,421,782,038 -GBP Z H Acc Class - - 91,946,170 22,281,350GBP U H Acc Class - - 117,461,973 325,000,605
JPY JPY Acc Class - - 11,220,857,606 8,391,557,427JPY I Acc Class - - 112,979,308,374 46,009,337,194JPY I Dis Class4 - - 1,073,676,344 -
COMGEST GROWTH plc
STATEMENT OF CHANGES IN NET ASSETS ATTRIBUTABLE TO HOLDERS OF REDEEMABLE PARTICIPATING SHARESFor the financial year ended 31 December 2020 (continued)
The accompanying notes form an integral part of the financial statements. 135
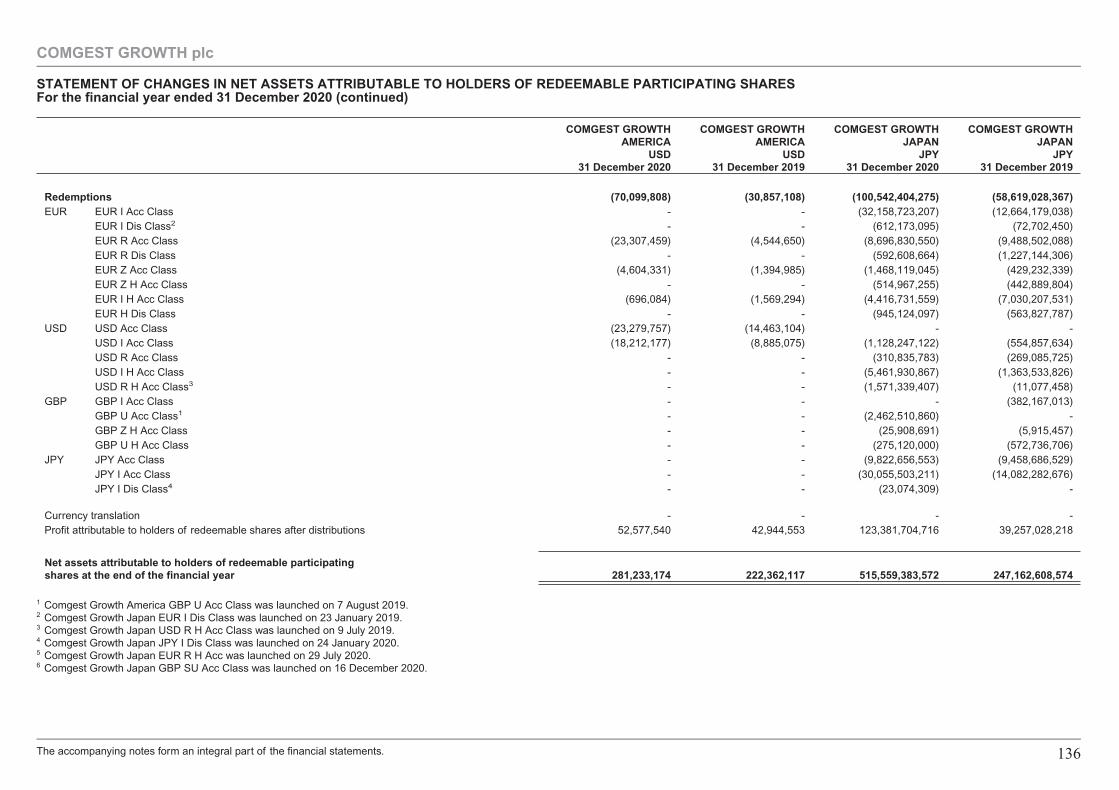
COMGEST GROWTHAMERICA
USD31 December 2020
COMGEST GROWTHAMERICA
USD31 December 2019
COMGEST GROWTHJAPAN
JPY31 December 2020
COMGEST GROWTHJAPAN
JPY31 December 2019
Redemptions (70,099,808) (30,857,108) (100,542,404,275) (58,619,028,367)EUR EUR I Acc Class - - (32,158,723,207) (12,664,179,038)
EUR I Dis Class2 - - (612,173,095) (72,702,450)EUR R Acc Class (23,307,459) (4,544,650) (8,696,830,550) (9,488,502,088)EUR R Dis Class - - (592,608,664) (1,227,144,306)EUR Z Acc Class (4,604,331) (1,394,985) (1,468,119,045) (429,232,339)EUR Z H Acc Class - - (514,967,255) (442,889,804)EUR I H Acc Class (696,084) (1,569,294) (4,416,731,559) (7,030,207,531)EUR H Dis Class - - (945,124,097) (563,827,787)
USD USD Acc Class (23,279,757) (14,463,104) - -USD I Acc Class (18,212,177) (8,885,075) (1,128,247,122) (554,857,634)USD R Acc Class - - (310,835,783) (269,085,725)USD I H Acc Class - - (5,461,930,867) (1,363,533,826)USD R H Acc Class3 - - (1,571,339,407) (11,077,458)
GBP GBP I Acc Class - - - (382,167,013)GBP U Acc Class1 - - (2,462,510,860) -GBP Z H Acc Class - - (25,908,691) (5,915,457)GBP U H Acc Class - - (275,120,000) (572,736,706)
JPY JPY Acc Class - - (9,822,656,553) (9,458,686,529)JPY I Acc Class - - (30,055,503,211) (14,082,282,676)JPY I Dis Class4 - - (23,074,309) -
Currency translation - - - -Profit attributable to holders of redeemable shares after distributions 52,577,540 42,944,553 123,381,704,716 39,257,028,218
Net assets attributable to holders of redeemable participatingshares at the end of the financial year 281,233,174 222,362,117 515,559,383,572 247,162,608,574
1 Comgest Growth America GBP U Acc Class was launched on 7 August 2019.2 Comgest Growth Japan EUR I Dis Class was launched on 23 January 2019.3 Comgest Growth Japan USD R H Acc Class was launched on 9 July 2019.4 Comgest Growth Japan JPY I Dis Class was launched on 24 January 2020.5 Comgest Growth Japan EUR R H Acc was launched on 29 July 2020.6 Comgest Growth Japan GBP SU Acc Class was launched on 16 December 2020.
COMGEST GROWTH plc
STATEMENT OF CHANGES IN NET ASSETS ATTRIBUTABLE TO HOLDERS OF REDEEMABLE PARTICIPATING SHARESFor the financial year ended 31 December 2020 (continued)
The accompanying notes form an integral part of the financial statements. 136
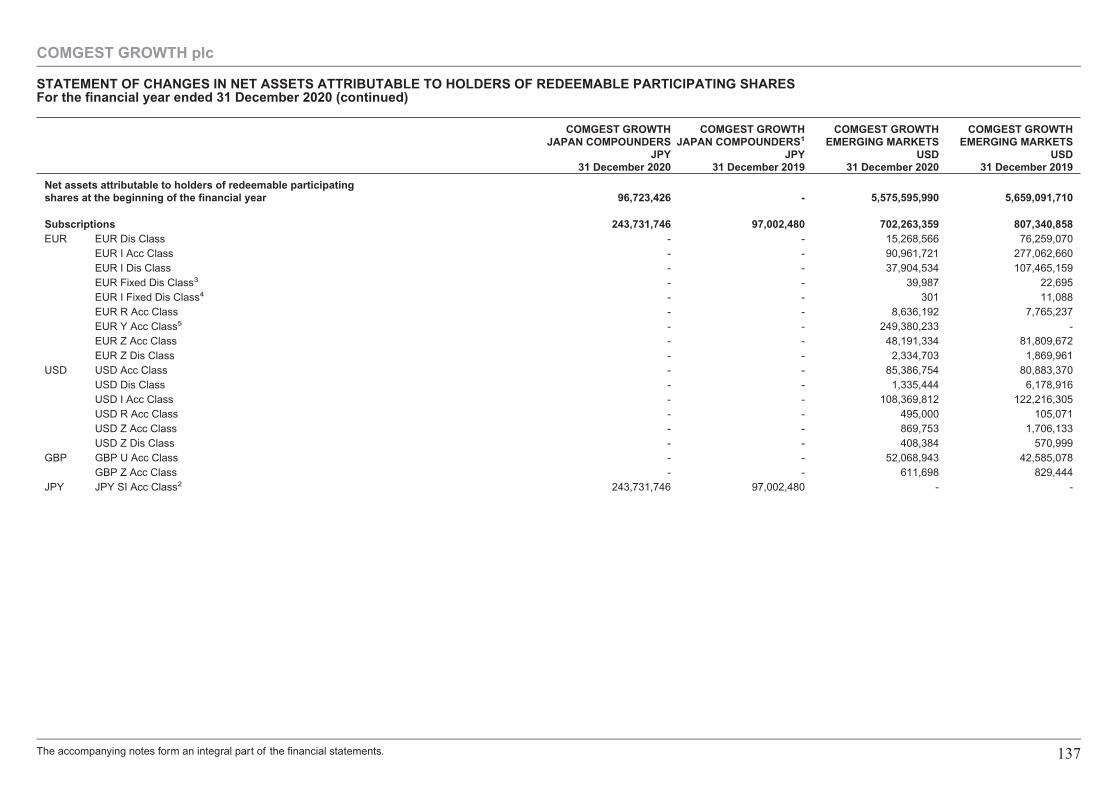
COMGEST GROWTHJAPAN COMPOUNDERS
JPY31 December 2020
COMGEST GROWTHJAPAN COMPOUNDERS1
JPY31 December 2019
COMGEST GROWTHEMERGING MARKETS
USD31 December 2020
COMGEST GROWTHEMERGING MARKETS
USD31 December 2019
Net assets attributable to holders of redeemable participatingshares at the beginning of the financial year 96,723,426 - 5,575,595,990 5,659,091,710
Subscriptions 243,731,746 97,002,480 702,263,359 807,340,858EUR EUR Dis Class - - 15,268,566 76,259,070
EUR I Acc Class - - 90,961,721 277,062,660EUR I Dis Class - - 37,904,534 107,465,159EUR Fixed Dis Class3 - - 39,987 22,695EUR I Fixed Dis Class4 - - 301 11,088EUR R Acc Class - - 8,636,192 7,765,237EUR Y Acc Class5 - - 249,380,233 -EUR Z Acc Class - - 48,191,334 81,809,672EUR Z Dis Class - - 2,334,703 1,869,961
USD USD Acc Class - - 85,386,754 80,883,370USD Dis Class - - 1,335,444 6,178,916USD I Acc Class - - 108,369,812 122,216,305USD R Acc Class - - 495,000 105,071USD Z Acc Class - - 869,753 1,706,133USD Z Dis Class - - 408,384 570,999
GBP GBP U Acc Class - - 52,068,943 42,585,078GBP Z Acc Class - - 611,698 829,444
JPY JPY SI Acc Class2 243,731,746 97,002,480 - -
COMGEST GROWTH plc
STATEMENT OF CHANGES IN NET ASSETS ATTRIBUTABLE TO HOLDERS OF REDEEMABLE PARTICIPATING SHARESFor the financial year ended 31 December 2020 (continued)
The accompanying notes form an integral part of the financial statements. 137
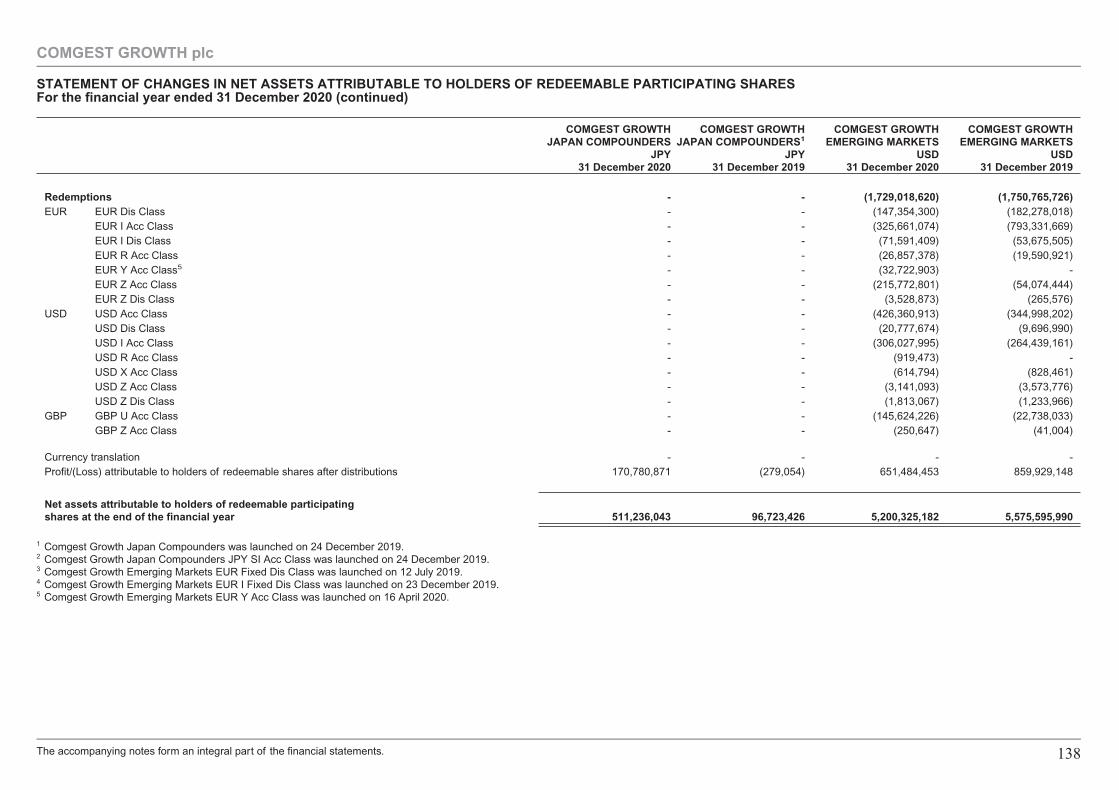
COMGEST GROWTHJAPAN COMPOUNDERS
JPY31 December 2020
COMGEST GROWTHJAPAN COMPOUNDERS1
JPY31 December 2019
COMGEST GROWTHEMERGING MARKETS
USD31 December 2020
COMGEST GROWTHEMERGING MARKETS
USD31 December 2019
Redemptions - - (1,729,018,620) (1,750,765,726)EUR EUR Dis Class - - (147,354,300) (182,278,018)
EUR I Acc Class - - (325,661,074) (793,331,669)EUR I Dis Class - - (71,591,409) (53,675,505)EUR R Acc Class - - (26,857,378) (19,590,921)EUR Y Acc Class5 - - (32,722,903) -EUR Z Acc Class - - (215,772,801) (54,074,444)EUR Z Dis Class - - (3,528,873) (265,576)
USD USD Acc Class - - (426,360,913) (344,998,202)USD Dis Class - - (20,777,674) (9,696,990)USD I Acc Class - - (306,027,995) (264,439,161)USD R Acc Class - - (919,473) -USD X Acc Class - - (614,794) (828,461)USD Z Acc Class - - (3,141,093) (3,573,776)USD Z Dis Class - - (1,813,067) (1,233,966)
GBP GBP U Acc Class - - (145,624,226) (22,738,033)GBP Z Acc Class - - (250,647) (41,004)
Currency translation - - - -Profit/(Loss) attributable to holders of redeemable shares after distributions 170,780,871 (279,054) 651,484,453 859,929,148
Net assets attributable to holders of redeemable participatingshares at the end of the financial year 511,236,043 96,723,426 5,200,325,182 5,575,595,990
1 Comgest Growth Japan Compounders was launched on 24 December 2019.2 Comgest Growth Japan Compounders JPY SI Acc Class was launched on 24 December 2019.3 Comgest Growth Emerging Markets EUR Fixed Dis Class was launched on 12 July 2019.4 Comgest Growth Emerging Markets EUR I Fixed Dis Class was launched on 23 December 2019.5 Comgest Growth Emerging Markets EUR Y Acc Class was launched on 16 April 2020.
COMGEST GROWTH plc
STATEMENT OF CHANGES IN NET ASSETS ATTRIBUTABLE TO HOLDERS OF REDEEMABLE PARTICIPATING SHARESFor the financial year ended 31 December 2020 (continued)
The accompanying notes form an integral part of the financial statements. 138
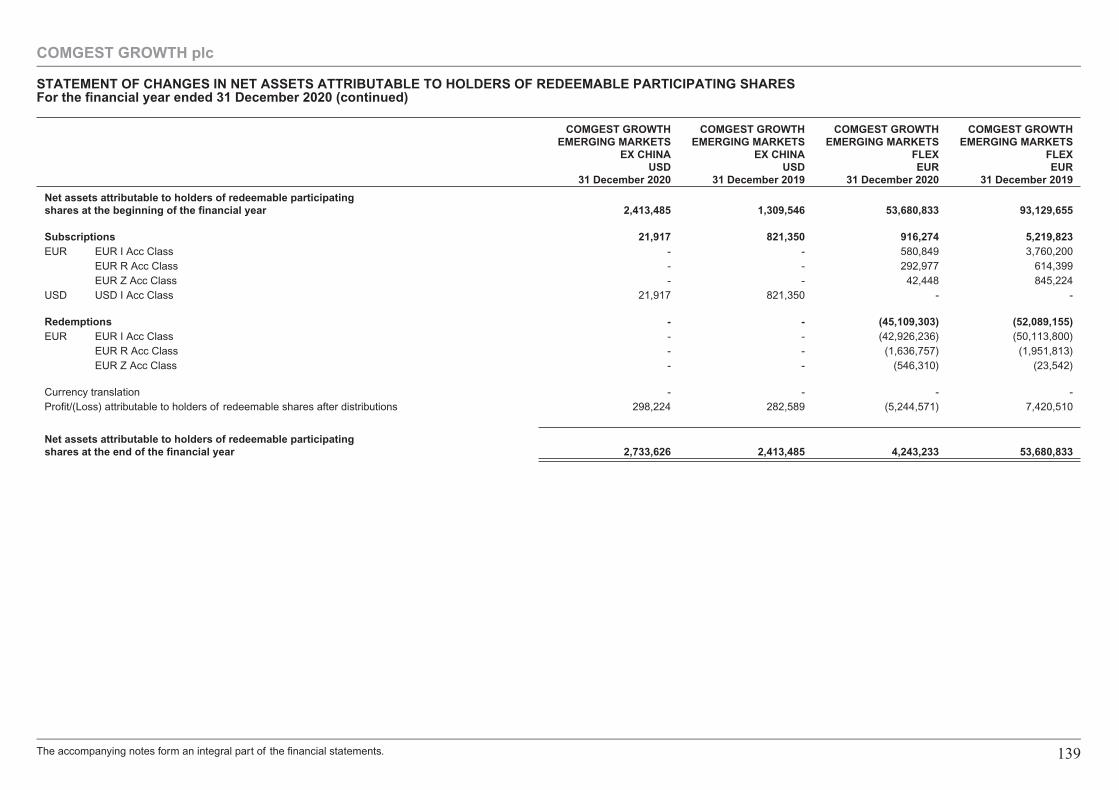
COMGEST GROWTHEMERGING MARKETS
EX CHINAUSD
31 December 2020
COMGEST GROWTHEMERGING MARKETS
EX CHINAUSD
31 December 2019
COMGEST GROWTHEMERGING MARKETS
FLEXEUR
31 December 2020
COMGEST GROWTHEMERGING MARKETS
FLEXEUR
31 December 2019
Net assets attributable to holders of redeemable participatingshares at the beginning of the financial year 2,413,485 1,309,546 53,680,833 93,129,655
Subscriptions 21,917 821,350 916,274 5,219,823EUR EUR I Acc Class - - 580,849 3,760,200
EUR R Acc Class - - 292,977 614,399EUR Z Acc Class - - 42,448 845,224
USD USD I Acc Class 21,917 821,350 - -
Redemptions - - (45,109,303) (52,089,155)EUR EUR I Acc Class - - (42,926,236) (50,113,800)
EUR R Acc Class - - (1,636,757) (1,951,813)EUR Z Acc Class - - (546,310) (23,542)
Currency translation - - - -Profit/(Loss) attributable to holders of redeemable shares after distributions 298,224 282,589 (5,244,571) 7,420,510
Net assets attributable to holders of redeemable participatingshares at the end of the financial year 2,733,626 2,413,485 4,243,233 53,680,833
COMGEST GROWTH plc
STATEMENT OF CHANGES IN NET ASSETS ATTRIBUTABLE TO HOLDERS OF REDEEMABLE PARTICIPATING SHARESFor the financial year ended 31 December 2020 (continued)
The accompanying notes form an integral part of the financial statements. 139
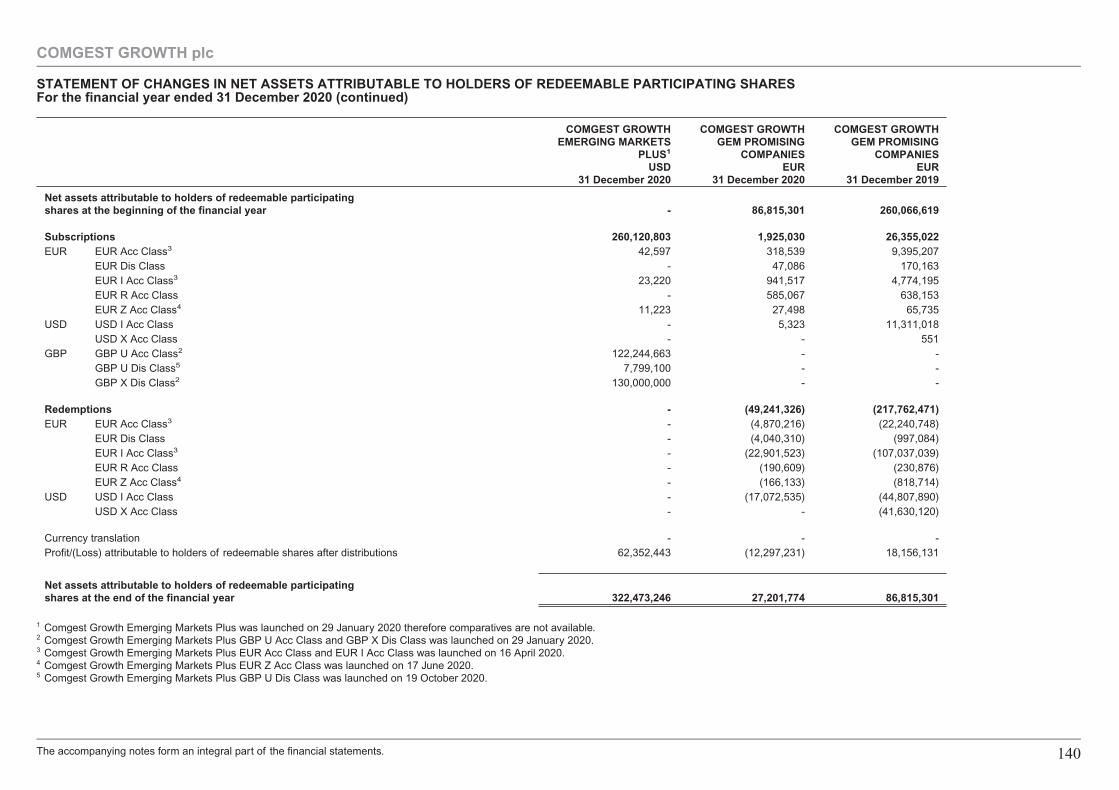
COMGEST GROWTHEMERGING MARKETS
PLUS1
USD31 December 2020
COMGEST GROWTHGEM PROMISING
COMPANIESEUR
31 December 2020
COMGEST GROWTHGEM PROMISING
COMPANIESEUR
31 December 2019
Net assets attributable to holders of redeemable participatingshares at the beginning of the financial year - 86,815,301 260,066,619
Subscriptions 260,120,803 1,925,030 26,355,022EUR EUR Acc Class3 42,597 318,539 9,395,207
EUR Dis Class - 47,086 170,163EUR I Acc Class3 23,220 941,517 4,774,195EUR R Acc Class - 585,067 638,153EUR Z Acc Class4 11,223 27,498 65,735
USD USD I Acc Class - 5,323 11,311,018USD X Acc Class - - 551
GBP GBP U Acc Class2 122,244,663 - -GBP U Dis Class5 7,799,100 - -GBP X Dis Class2 130,000,000 - -
Redemptions - (49,241,326) (217,762,471)EUR EUR Acc Class3 - (4,870,216) (22,240,748)
EUR Dis Class - (4,040,310) (997,084)EUR I Acc Class3 - (22,901,523) (107,037,039)EUR R Acc Class - (190,609) (230,876)EUR Z Acc Class4 - (166,133) (818,714)
USD USD I Acc Class - (17,072,535) (44,807,890)USD X Acc Class - - (41,630,120)
Currency translation - - -Profit/(Loss) attributable to holders of redeemable shares after distributions 62,352,443 (12,297,231) 18,156,131
Net assets attributable to holders of redeemable participatingshares at the end of the financial year 322,473,246 27,201,774 86,815,301
1 Comgest Growth Emerging Markets Plus was launched on 29 January 2020 therefore comparatives are not available.2 Comgest Growth Emerging Markets Plus GBP U Acc Class and GBP X Dis Class was launched on 29 January 2020.3 Comgest Growth Emerging Markets Plus EUR Acc Class and EUR I Acc Class was launched on 16 April 2020.4 Comgest Growth Emerging Markets Plus EUR Z Acc Class was launched on 17 June 2020.5 Comgest Growth Emerging Markets Plus GBP U Dis Class was launched on 19 October 2020.
COMGEST GROWTH plc
STATEMENT OF CHANGES IN NET ASSETS ATTRIBUTABLE TO HOLDERS OF REDEEMABLE PARTICIPATING SHARESFor the financial year ended 31 December 2020 (continued)
The accompanying notes form an integral part of the financial statements. 140
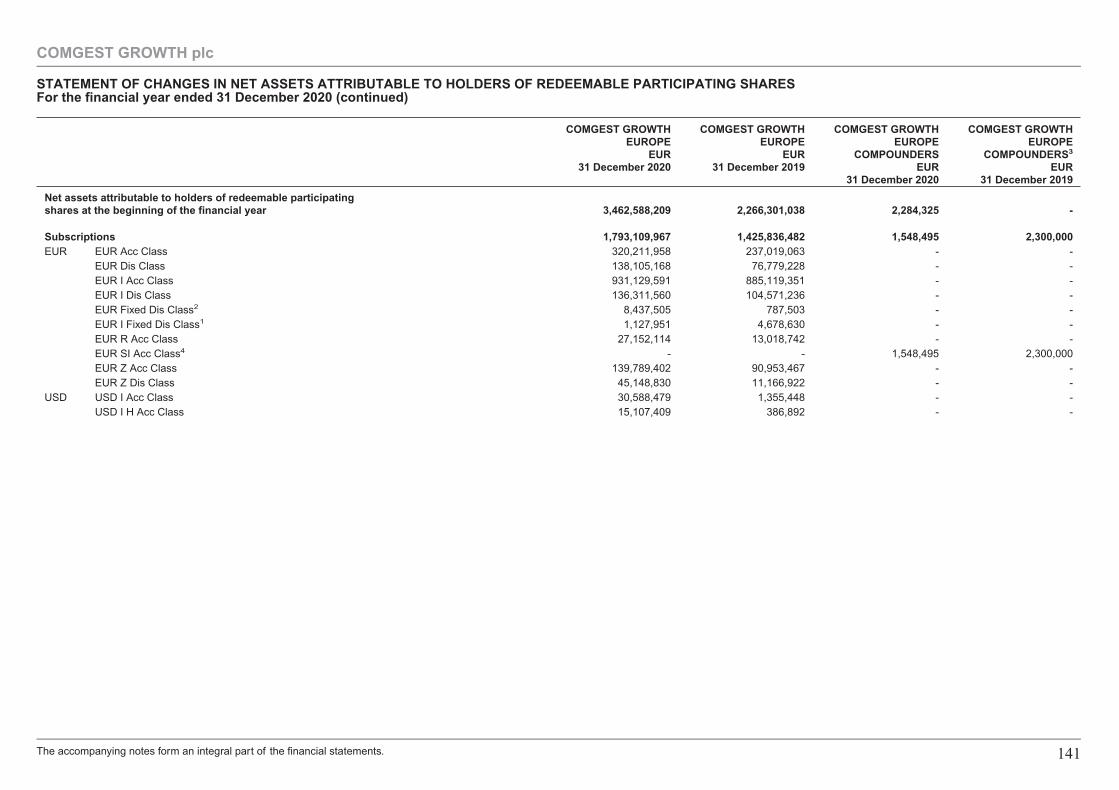
COMGEST GROWTHEUROPE
EUR31 December 2020
COMGEST GROWTHEUROPE
EUR31 December 2019
COMGEST GROWTHEUROPE
COMPOUNDERSEUR
31 December 2020
COMGEST GROWTHEUROPE
COMPOUNDERS3
EUR31 December 2019
Net assets attributable to holders of redeemable participatingshares at the beginning of the financial year 3,462,588,209 2,266,301,038 2,284,325 -
Subscriptions 1,793,109,967 1,425,836,482 1,548,495 2,300,000EUR EUR Acc Class 320,211,958 237,019,063 - -
EUR Dis Class 138,105,168 76,779,228 - -EUR I Acc Class 931,129,591 885,119,351 - -EUR I Dis Class 136,311,560 104,571,236 - -EUR Fixed Dis Class2 8,437,505 787,503 - -EUR I Fixed Dis Class1 1,127,951 4,678,630 - -EUR R Acc Class 27,152,114 13,018,742 - -EUR SI Acc Class4 - - 1,548,495 2,300,000EUR Z Acc Class 139,789,402 90,953,467 - -EUR Z Dis Class 45,148,830 11,166,922 - -
USD USD I Acc Class 30,588,479 1,355,448 - -USD I H Acc Class 15,107,409 386,892 - -
COMGEST GROWTH plc
STATEMENT OF CHANGES IN NET ASSETS ATTRIBUTABLE TO HOLDERS OF REDEEMABLE PARTICIPATING SHARESFor the financial year ended 31 December 2020 (continued)
The accompanying notes form an integral part of the financial statements. 141
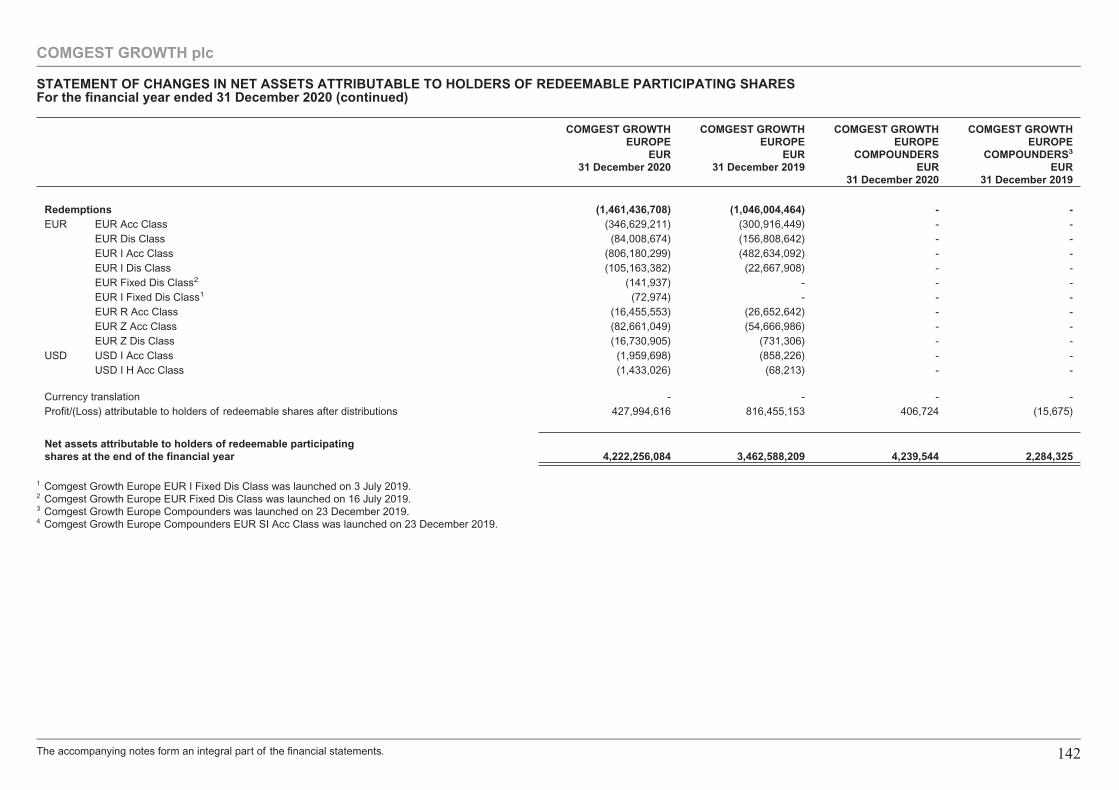
COMGEST GROWTHEUROPE
EUR31 December 2020
COMGEST GROWTHEUROPE
EUR31 December 2019
COMGEST GROWTHEUROPE
COMPOUNDERSEUR
31 December 2020
COMGEST GROWTHEUROPE
COMPOUNDERS3
EUR31 December 2019
Redemptions (1,461,436,708) (1,046,004,464) - -EUR EUR Acc Class (346,629,211) (300,916,449) - -
EUR Dis Class (84,008,674) (156,808,642) - -EUR I Acc Class (806,180,299) (482,634,092) - -EUR I Dis Class (105,163,382) (22,667,908) - -EUR Fixed Dis Class2 (141,937) - - -EUR I Fixed Dis Class1 (72,974) - - -EUR R Acc Class (16,455,553) (26,652,642) - -EUR Z Acc Class (82,661,049) (54,666,986) - -EUR Z Dis Class (16,730,905) (731,306) - -
USD USD I Acc Class (1,959,698) (858,226) - -USD I H Acc Class (1,433,026) (68,213) - -
Currency translation - - - -Profit/(Loss) attributable to holders of redeemable shares after distributions 427,994,616 816,455,153 406,724 (15,675)
Net assets attributable to holders of redeemable participatingshares at the end of the financial year 4,222,256,084 3,462,588,209 4,239,544 2,284,325
1 Comgest Growth Europe EUR I Fixed Dis Class was launched on 3 July 2019.2 Comgest Growth Europe EUR Fixed Dis Class was launched on 16 July 2019.3 Comgest Growth Europe Compounders was launched on 23 December 2019.4 Comgest Growth Europe Compounders EUR SI Acc Class was launched on 23 December 2019.
COMGEST GROWTH plc
STATEMENT OF CHANGES IN NET ASSETS ATTRIBUTABLE TO HOLDERS OF REDEEMABLE PARTICIPATING SHARESFor the financial year ended 31 December 2020 (continued)
The accompanying notes form an integral part of the financial statements. 142
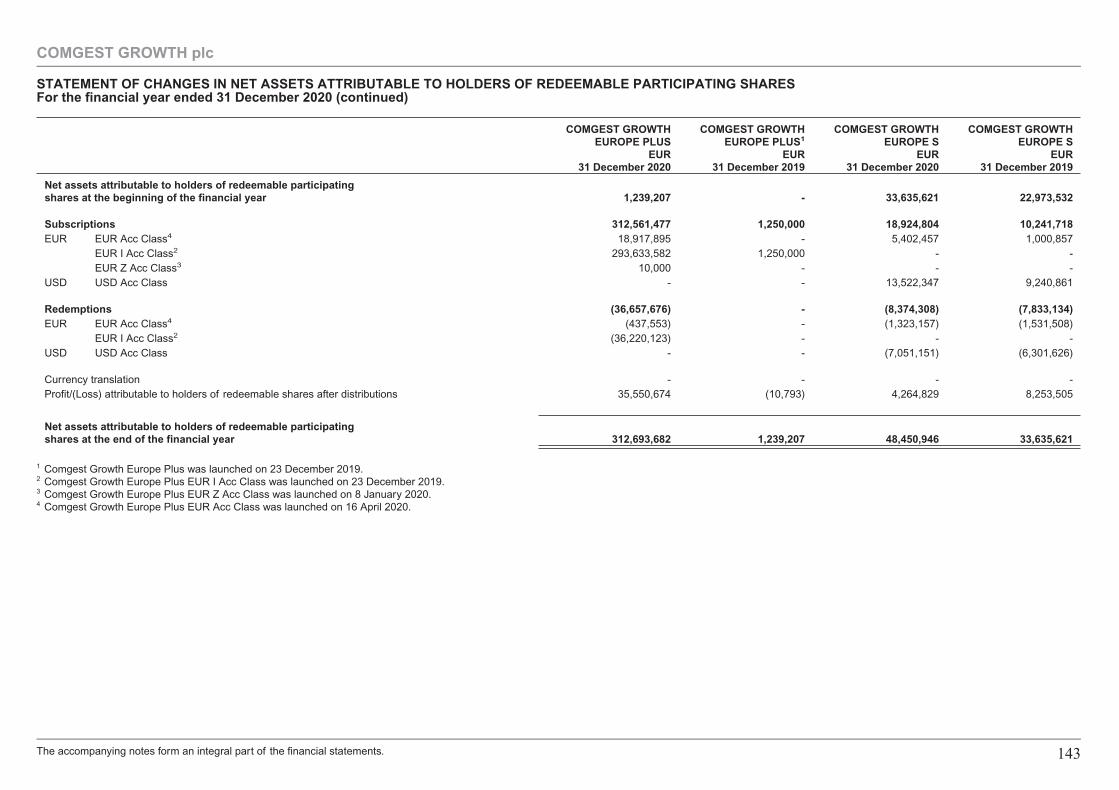
COMGEST GROWTHEUROPE PLUS
EUR31 December 2020
COMGEST GROWTHEUROPE PLUS1
EUR31 December 2019
COMGEST GROWTHEUROPE S
EUR31 December 2020
COMGEST GROWTHEUROPE S
EUR31 December 2019
Net assets attributable to holders of redeemable participatingshares at the beginning of the financial year 1,239,207 - 33,635,621 22,973,532
Subscriptions 312,561,477 1,250,000 18,924,804 10,241,718EUR EUR Acc Class4 18,917,895 - 5,402,457 1,000,857
EUR I Acc Class2 293,633,582 1,250,000 - -EUR Z Acc Class3 10,000 - - -
USD USD Acc Class - - 13,522,347 9,240,861
Redemptions (36,657,676) - (8,374,308) (7,833,134)EUR EUR Acc Class4 (437,553) - (1,323,157) (1,531,508)
EUR I Acc Class2 (36,220,123) - - -USD USD Acc Class - - (7,051,151) (6,301,626)
Currency translation - - - -Profit/(Loss) attributable to holders of redeemable shares after distributions 35,550,674 (10,793) 4,264,829 8,253,505
Net assets attributable to holders of redeemable participatingshares at the end of the financial year 312,693,682 1,239,207 48,450,946 33,635,621
1 Comgest Growth Europe Plus was launched on 23 December 2019.2 Comgest Growth Europe Plus EUR I Acc Class was launched on 23 December 2019.3 Comgest Growth Europe Plus EUR Z Acc Class was launched on 8 January 2020.4 Comgest Growth Europe Plus EUR Acc Class was launched on 16 April 2020.
COMGEST GROWTH plc
STATEMENT OF CHANGES IN NET ASSETS ATTRIBUTABLE TO HOLDERS OF REDEEMABLE PARTICIPATING SHARESFor the financial year ended 31 December 2020 (continued)
The accompanying notes form an integral part of the financial statements. 143
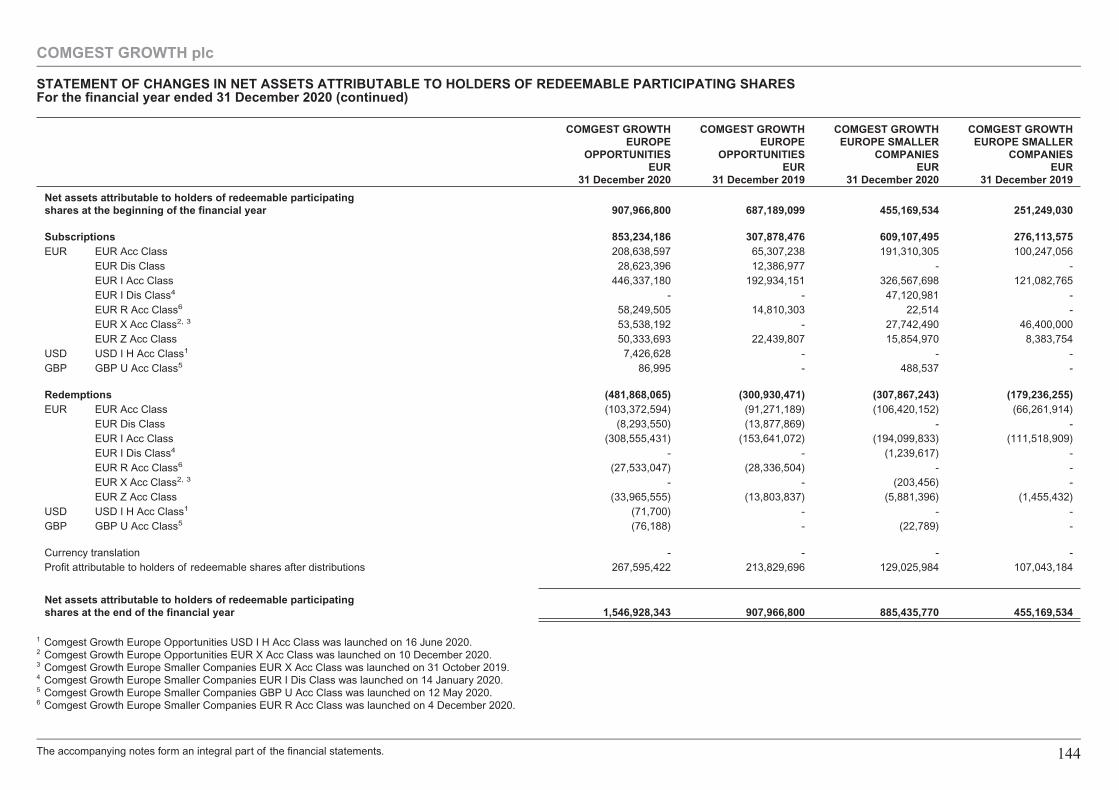
COMGEST GROWTHEUROPE
OPPORTUNITIESEUR
31 December 2020
COMGEST GROWTHEUROPE
OPPORTUNITIESEUR
31 December 2019
COMGEST GROWTHEUROPE SMALLER
COMPANIESEUR
31 December 2020
COMGEST GROWTHEUROPE SMALLER
COMPANIESEUR
31 December 2019
Net assets attributable to holders of redeemable participatingshares at the beginning of the financial year 907,966,800 687,189,099 455,169,534 251,249,030
Subscriptions 853,234,186 307,878,476 609,107,495 276,113,575EUR EUR Acc Class 208,638,597 65,307,238 191,310,305 100,247,056
EUR Dis Class 28,623,396 12,386,977 - -EUR I Acc Class 446,337,180 192,934,151 326,567,698 121,082,765EUR I Dis Class4 - - 47,120,981 -EUR R Acc Class6 58,249,505 14,810,303 22,514 -EUR X Acc Class2, 3 53,538,192 - 27,742,490 46,400,000EUR Z Acc Class 50,333,693 22,439,807 15,854,970 8,383,754
USD USD I H Acc Class1 7,426,628 - - -GBP GBP U Acc Class5 86,995 - 488,537 -
Redemptions (481,868,065) (300,930,471) (307,867,243) (179,236,255)EUR EUR Acc Class (103,372,594) (91,271,189) (106,420,152) (66,261,914)
EUR Dis Class (8,293,550) (13,877,869) - -EUR I Acc Class (308,555,431) (153,641,072) (194,099,833) (111,518,909)EUR I Dis Class4 - - (1,239,617) -EUR R Acc Class6 (27,533,047) (28,336,504) - -EUR X Acc Class2, 3 - - (203,456) -EUR Z Acc Class (33,965,555) (13,803,837) (5,881,396) (1,455,432)
USD USD I H Acc Class1 (71,700) - - -GBP GBP U Acc Class5 (76,188) - (22,789) -
Currency translation - - - -Profit attributable to holders of redeemable shares after distributions 267,595,422 213,829,696 129,025,984 107,043,184
Net assets attributable to holders of redeemable participatingshares at the end of the financial year 1,546,928,343 907,966,800 885,435,770 455,169,534
1 Comgest Growth Europe Opportunities USD I H Acc Class was launched on 16 June 2020.2 Comgest Growth Europe Opportunities EUR X Acc Class was launched on 10 December 2020.3 Comgest Growth Europe Smaller Companies EUR X Acc Class was launched on 31 October 2019.4 Comgest Growth Europe Smaller Companies EUR I Dis Class was launched on 14 January 2020.5 Comgest Growth Europe Smaller Companies GBP U Acc Class was launched on 12 May 2020.6 Comgest Growth Europe Smaller Companies EUR R Acc Class was launched on 4 December 2020.
COMGEST GROWTH plc
STATEMENT OF CHANGES IN NET ASSETS ATTRIBUTABLE TO HOLDERS OF REDEEMABLE PARTICIPATING SHARESFor the financial year ended 31 December 2020 (continued)
The accompanying notes form an integral part of the financial statements. 144
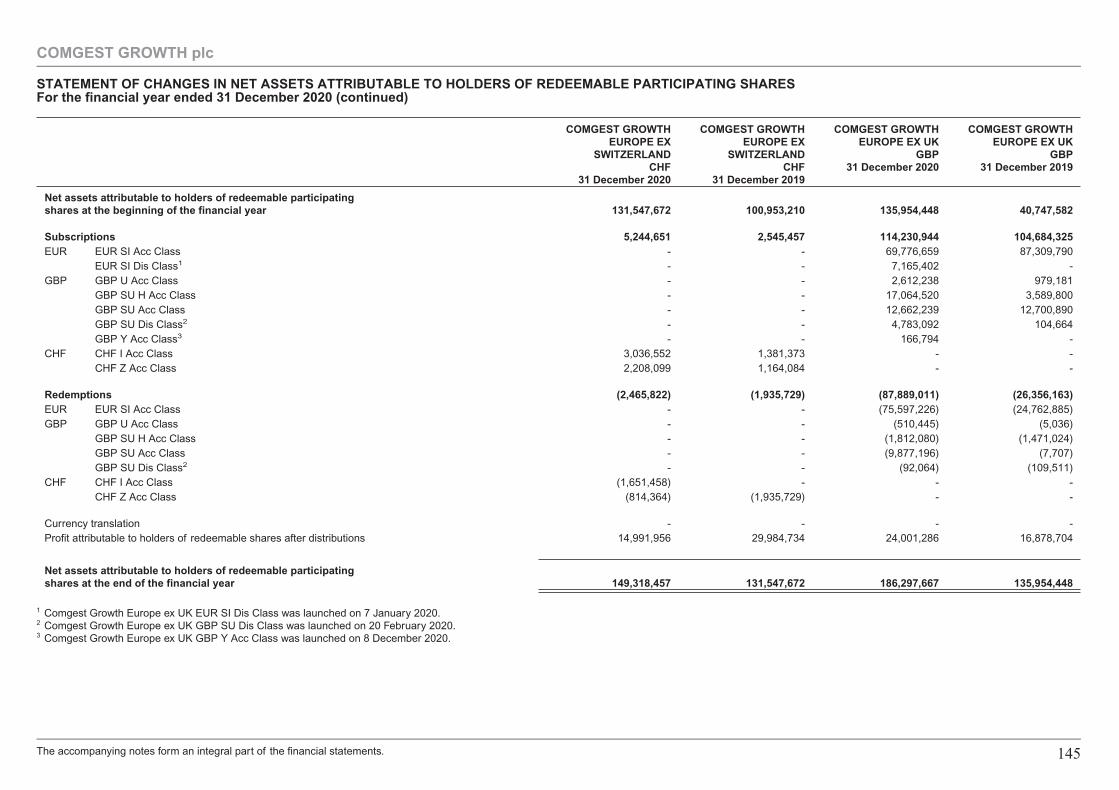
COMGEST GROWTHEUROPE EX
SWITZERLANDCHF
31 December 2020
COMGEST GROWTHEUROPE EX
SWITZERLANDCHF
31 December 2019
COMGEST GROWTHEUROPE EX UK
GBP31 December 2020
COMGEST GROWTHEUROPE EX UK
GBP31 December 2019
Net assets attributable to holders of redeemable participatingshares at the beginning of the financial year 131,547,672 100,953,210 135,954,448 40,747,582
Subscriptions 5,244,651 2,545,457 114,230,944 104,684,325EUR EUR SI Acc Class - - 69,776,659 87,309,790
EUR SI Dis Class1 - - 7,165,402 -GBP GBP U Acc Class - - 2,612,238 979,181
GBP SU H Acc Class - - 17,064,520 3,589,800GBP SU Acc Class - - 12,662,239 12,700,890GBP SU Dis Class2 - - 4,783,092 104,664GBP Y Acc Class3 - - 166,794 -
CHF CHF I Acc Class 3,036,552 1,381,373 - -CHF Z Acc Class 2,208,099 1,164,084 - -
Redemptions (2,465,822) (1,935,729) (87,889,011) (26,356,163)EUR EUR SI Acc Class - - (75,597,226) (24,762,885)GBP GBP U Acc Class - - (510,445) (5,036)
GBP SU H Acc Class - - (1,812,080) (1,471,024)GBP SU Acc Class - - (9,877,196) (7,707)GBP SU Dis Class2 - - (92,064) (109,511)
CHF CHF I Acc Class (1,651,458) - - -CHF Z Acc Class (814,364) (1,935,729) - -
Currency translation - - - -Profit attributable to holders of redeemable shares after distributions 14,991,956 29,984,734 24,001,286 16,878,704
Net assets attributable to holders of redeemable participatingshares at the end of the financial year 149,318,457 131,547,672 186,297,667 135,954,448
1 Comgest Growth Europe ex UK EUR SI Dis Class was launched on 7 January 2020.2 Comgest Growth Europe ex UK GBP SU Dis Class was launched on 20 February 2020.3 Comgest Growth Europe ex UK GBP Y Acc Class was launched on 8 December 2020.
COMGEST GROWTH plc
STATEMENT OF CHANGES IN NET ASSETS ATTRIBUTABLE TO HOLDERS OF REDEEMABLE PARTICIPATING SHARESFor the financial year ended 31 December 2020 (continued)
The accompanying notes form an integral part of the financial statements. 145
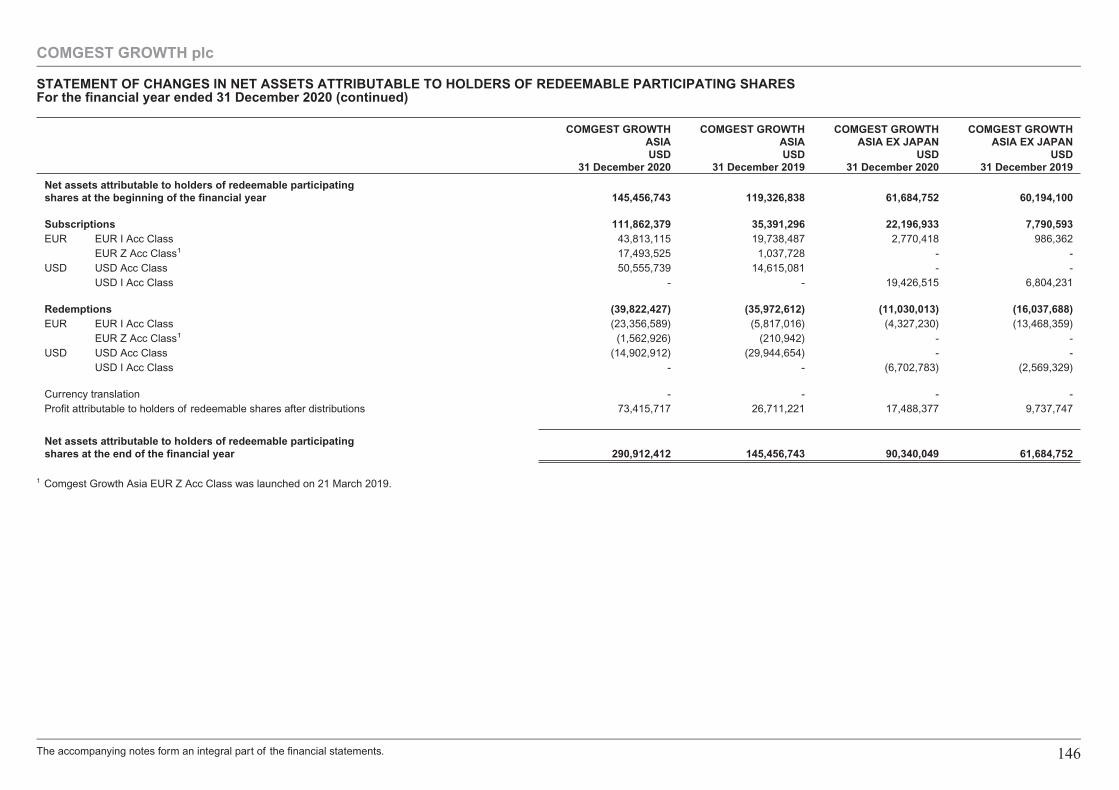
COMGEST GROWTHASIAUSD
31 December 2020
COMGEST GROWTHASIAUSD
31 December 2019
COMGEST GROWTHASIA EX JAPAN
USD31 December 2020
COMGEST GROWTHASIA EX JAPAN
USD31 December 2019
Net assets attributable to holders of redeemable participatingshares at the beginning of the financial year 145,456,743 119,326,838 61,684,752 60,194,100
Subscriptions 111,862,379 35,391,296 22,196,933 7,790,593EUR EUR I Acc Class 43,813,115 19,738,487 2,770,418 986,362
EUR Z Acc Class1 17,493,525 1,037,728 - -USD USD Acc Class 50,555,739 14,615,081 - -
USD I Acc Class - - 19,426,515 6,804,231
Redemptions (39,822,427) (35,972,612) (11,030,013) (16,037,688)EUR EUR I Acc Class (23,356,589) (5,817,016) (4,327,230) (13,468,359)
EUR Z Acc Class1 (1,562,926) (210,942) - -USD USD Acc Class (14,902,912) (29,944,654) - -
USD I Acc Class - - (6,702,783) (2,569,329)
Currency translation - - - -Profit attributable to holders of redeemable shares after distributions 73,415,717 26,711,221 17,488,377 9,737,747
Net assets attributable to holders of redeemable participatingshares at the end of the financial year 290,912,412 145,456,743 90,340,049 61,684,752
1 Comgest Growth Asia EUR Z Acc Class was launched on 21 March 2019.
COMGEST GROWTH plc
STATEMENT OF CHANGES IN NET ASSETS ATTRIBUTABLE TO HOLDERS OF REDEEMABLE PARTICIPATING SHARESFor the financial year ended 31 December 2020 (continued)
The accompanying notes form an integral part of the financial statements. 146
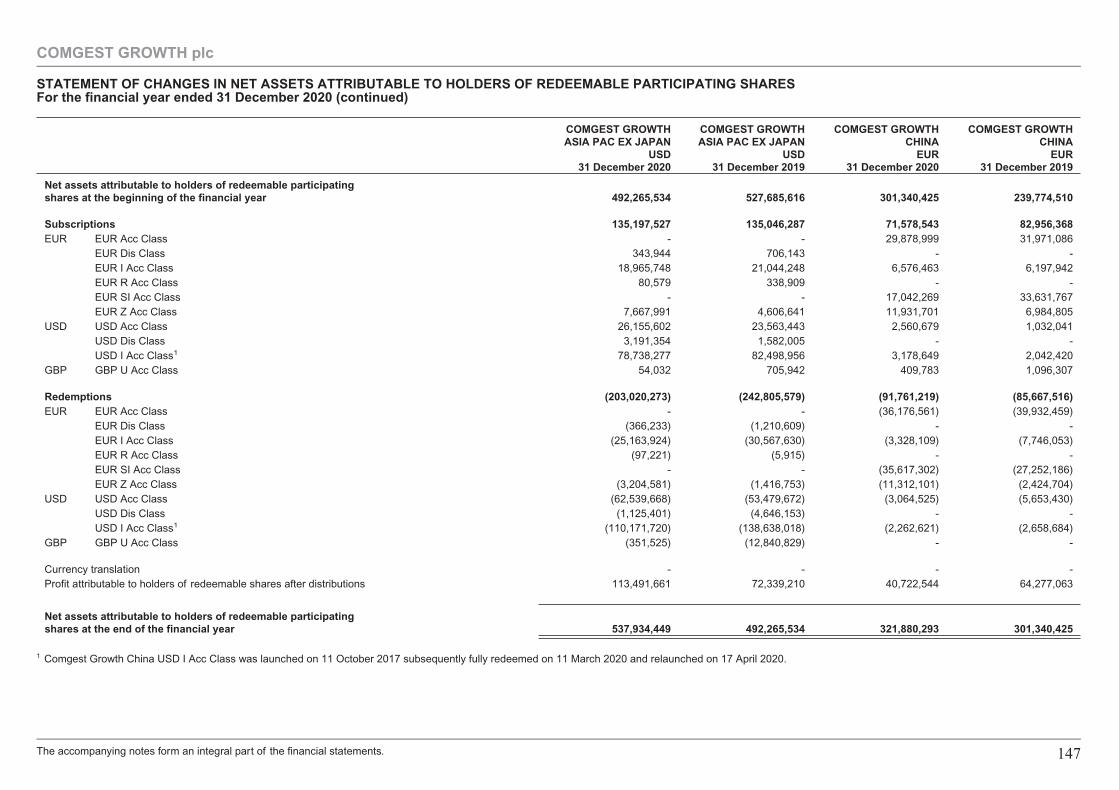
COMGEST GROWTHASIA PAC EX JAPAN
USD31 December 2020
COMGEST GROWTHASIA PAC EX JAPAN
USD31 December 2019
COMGEST GROWTHCHINA
EUR31 December 2020
COMGEST GROWTHCHINA
EUR31 December 2019
Net assets attributable to holders of redeemable participatingshares at the beginning of the financial year 492,265,534 527,685,616 301,340,425 239,774,510
Subscriptions 135,197,527 135,046,287 71,578,543 82,956,368EUR EUR Acc Class - - 29,878,999 31,971,086
EUR Dis Class 343,944 706,143 - -EUR I Acc Class 18,965,748 21,044,248 6,576,463 6,197,942EUR R Acc Class 80,579 338,909 - -EUR SI Acc Class - - 17,042,269 33,631,767EUR Z Acc Class 7,667,991 4,606,641 11,931,701 6,984,805
USD USD Acc Class 26,155,602 23,563,443 2,560,679 1,032,041USD Dis Class 3,191,354 1,582,005 - -USD I Acc Class1 78,738,277 82,498,956 3,178,649 2,042,420
GBP GBP U Acc Class 54,032 705,942 409,783 1,096,307
Redemptions (203,020,273) (242,805,579) (91,761,219) (85,667,516)EUR EUR Acc Class - - (36,176,561) (39,932,459)
EUR Dis Class (366,233) (1,210,609) - -EUR I Acc Class (25,163,924) (30,567,630) (3,328,109) (7,746,053)EUR R Acc Class (97,221) (5,915) - -EUR SI Acc Class - - (35,617,302) (27,252,186)EUR Z Acc Class (3,204,581) (1,416,753) (11,312,101) (2,424,704)
USD USD Acc Class (62,539,668) (53,479,672) (3,064,525) (5,653,430)USD Dis Class (1,125,401) (4,646,153) - -USD I Acc Class1 (110,171,720) (138,638,018) (2,262,621) (2,658,684)
GBP GBP U Acc Class (351,525) (12,840,829) - -
Currency translation - - - -Profit attributable to holders of redeemable shares after distributions 113,491,661 72,339,210 40,722,544 64,277,063
Net assets attributable to holders of redeemable participatingshares at the end of the financial year 537,934,449 492,265,534 321,880,293 301,340,425
1 Comgest Growth China USD I Acc Class was launched on 11 October 2017 subsequently fully redeemed on 11 March 2020 and relaunched on 17 April 2020.
COMGEST GROWTH plc
STATEMENT OF CHANGES IN NET ASSETS ATTRIBUTABLE TO HOLDERS OF REDEEMABLE PARTICIPATING SHARESFor the financial year ended 31 December 2020 (continued)
The accompanying notes form an integral part of the financial statements. 147
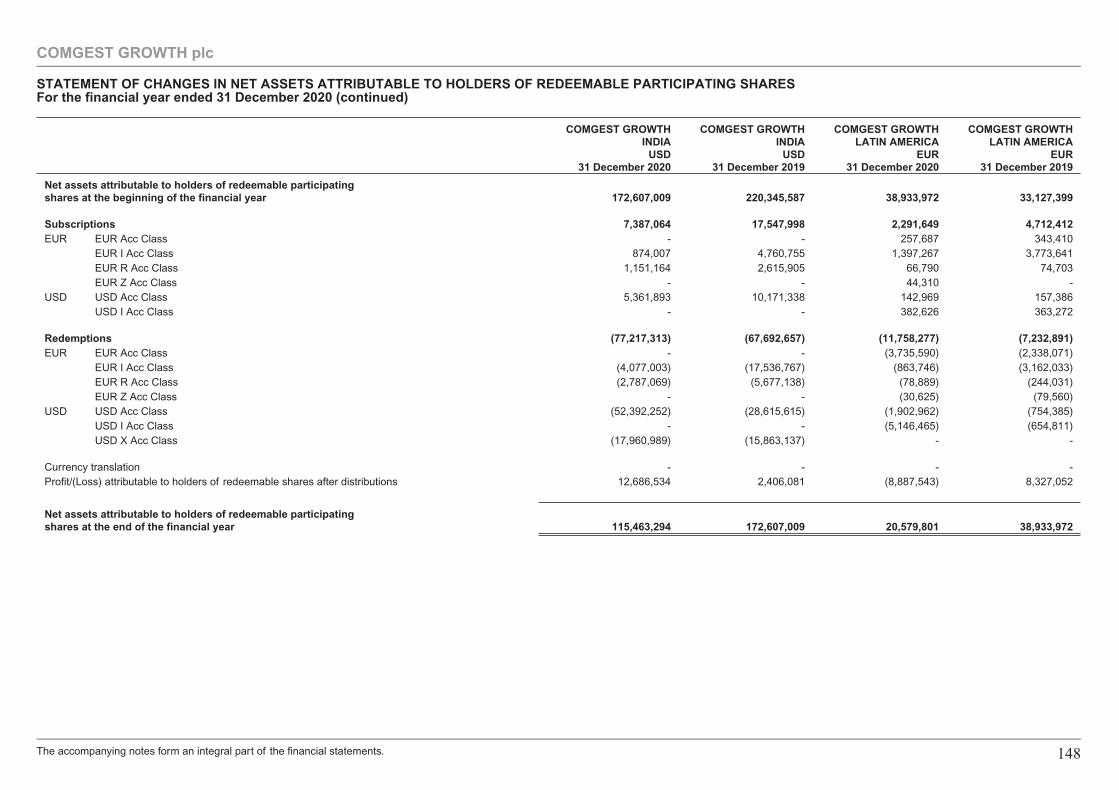
COMGEST GROWTHINDIA
USD31 December 2020
COMGEST GROWTHINDIA
USD31 December 2019
COMGEST GROWTHLATIN AMERICA
EUR31 December 2020
COMGEST GROWTHLATIN AMERICA
EUR31 December 2019
Net assets attributable to holders of redeemable participatingshares at the beginning of the financial year 172,607,009 220,345,587 38,933,972 33,127,399
Subscriptions 7,387,064 17,547,998 2,291,649 4,712,412EUR EUR Acc Class - - 257,687 343,410
EUR I Acc Class 874,007 4,760,755 1,397,267 3,773,641EUR R Acc Class 1,151,164 2,615,905 66,790 74,703EUR Z Acc Class - - 44,310 -
USD USD Acc Class 5,361,893 10,171,338 142,969 157,386USD I Acc Class - - 382,626 363,272
Redemptions (77,217,313) (67,692,657) (11,758,277) (7,232,891)EUR EUR Acc Class - - (3,735,590) (2,338,071)
EUR I Acc Class (4,077,003) (17,536,767) (863,746) (3,162,033)EUR R Acc Class (2,787,069) (5,677,138) (78,889) (244,031)EUR Z Acc Class - - (30,625) (79,560)
USD USD Acc Class (52,392,252) (28,615,615) (1,902,962) (754,385)USD I Acc Class - - (5,146,465) (654,811)USD X Acc Class (17,960,989) (15,863,137) - -
Currency translation - - - -Profit/(Loss) attributable to holders of redeemable shares after distributions 12,686,534 2,406,081 (8,887,543) 8,327,052
Net assets attributable to holders of redeemable participatingshares at the end of the financial year 115,463,294 172,607,009 20,579,801 38,933,972
COMGEST GROWTH plc
STATEMENT OF CHANGES IN NET ASSETS ATTRIBUTABLE TO HOLDERS OF REDEEMABLE PARTICIPATING SHARESFor the financial year ended 31 December 2020 (continued)
The accompanying notes form an integral part of the financial statements. 148
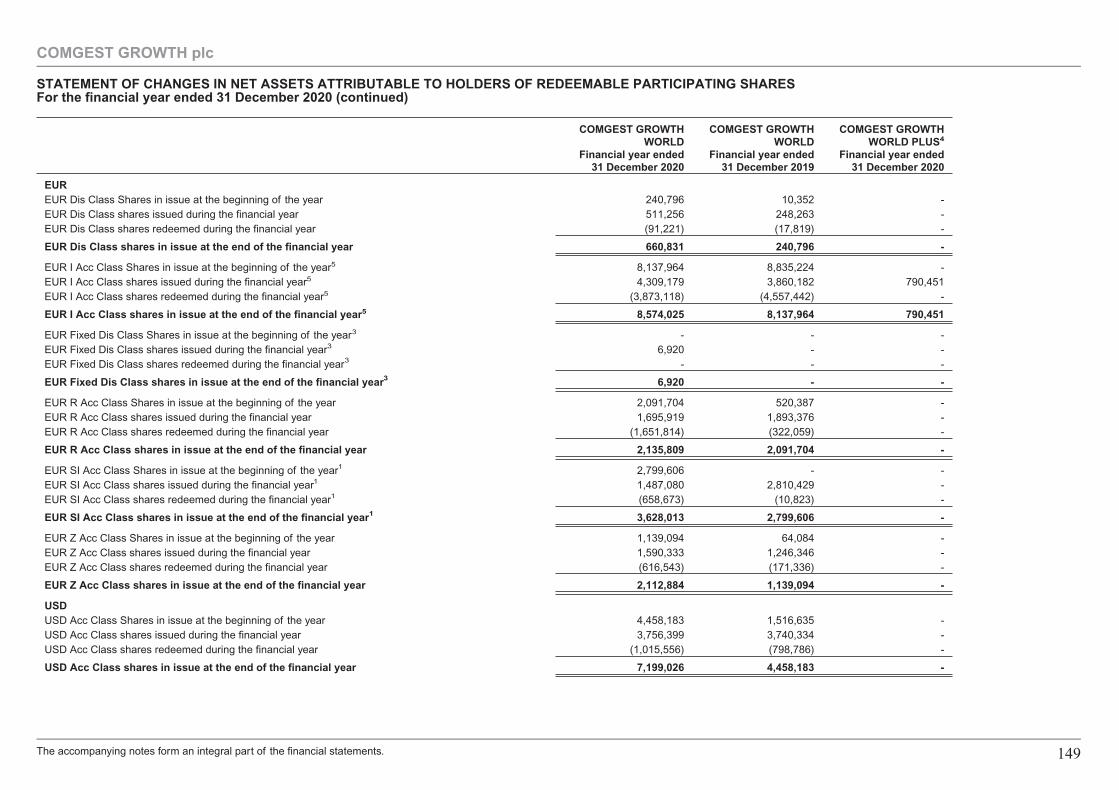
COMGEST GROWTHWORLD
Financial year ended31 December 2020
COMGEST GROWTHWORLD
Financial year ended31 December 2019
COMGEST GROWTHWORLD PLUS4
Financial year ended31 December 2020
EUREUR Dis Class Shares in issue at the beginning of the year 240,796 10,352 -EUR Dis Class shares issued during the financial year 511,256 248,263 -EUR Dis Class shares redeemed during the financial year (91,221) (17,819) -
EUR Dis Class shares in issue at the end of the financial year 660,831 240,796 -
EUR I Acc Class Shares in issue at the beginning of the year5 8,137,964 8,835,224 -EUR I Acc Class shares issued during the financial year5 4,309,179 3,860,182 790,451EUR I Acc Class shares redeemed during the financial year5 (3,873,118) (4,557,442) -
EUR I Acc Class shares in issue at the end of the financial year5 8,574,025 8,137,964 790,451
EUR Fixed Dis Class Shares in issue at the beginning of the year - - -EUR Fixed Dis Class shares issued during the financial year 6,920 - -EUR Fixed Dis Class shares redeemed during the financial year - - -
EUR Fixed Dis Class shares in issue at the end of the financial year 6,920 - -
EUR R Acc Class Shares in issue at the beginning of the year 2,091,704 520,387 -EUR R Acc Class shares issued during the financial year 1,695,919 1,893,376 -EUR R Acc Class shares redeemed during the financial year (1,651,814) (322,059) -
EUR R Acc Class shares in issue at the end of the financial year 2,135,809 2,091,704 -
EUR SI Acc Class Shares in issue at the beginning of the year 2,799,606 - -EUR SI Acc Class shares issued during the financial year 1,487,080 2,810,429 -EUR SI Acc Class shares redeemed during the financial year (658,673) (10,823) -
EUR SI Acc Class shares in issue at the end of the financial year 3,628,013 2,799,606 -
EUR Z Acc Class Shares in issue at the beginning of the year 1,139,094 64,084 -EUR Z Acc Class shares issued during the financial year 1,590,333 1,246,346 -EUR Z Acc Class shares redeemed during the financial year (616,543) (171,336) -
EUR Z Acc Class shares in issue at the end of the financial year 2,112,884 1,139,094 -
USDUSD Acc Class Shares in issue at the beginning of the year 4,458,183 1,516,635 -USD Acc Class shares issued during the financial year 3,756,399 3,740,334 -USD Acc Class shares redeemed during the financial year (1,015,556) (798,786) -
USD Acc Class shares in issue at the end of the financial year 7,199,026 4,458,183 -
COMGEST GROWTH plc
STATEMENT OF CHANGES IN NET ASSETS ATTRIBUTABLE TO HOLDERS OF REDEEMABLE PARTICIPATING SHARESFor the financial year ended 31 December 2020 (continued)
The accompanying notes form an integral part of the financial statements. 149
3
3
3
3
1
1
1
1
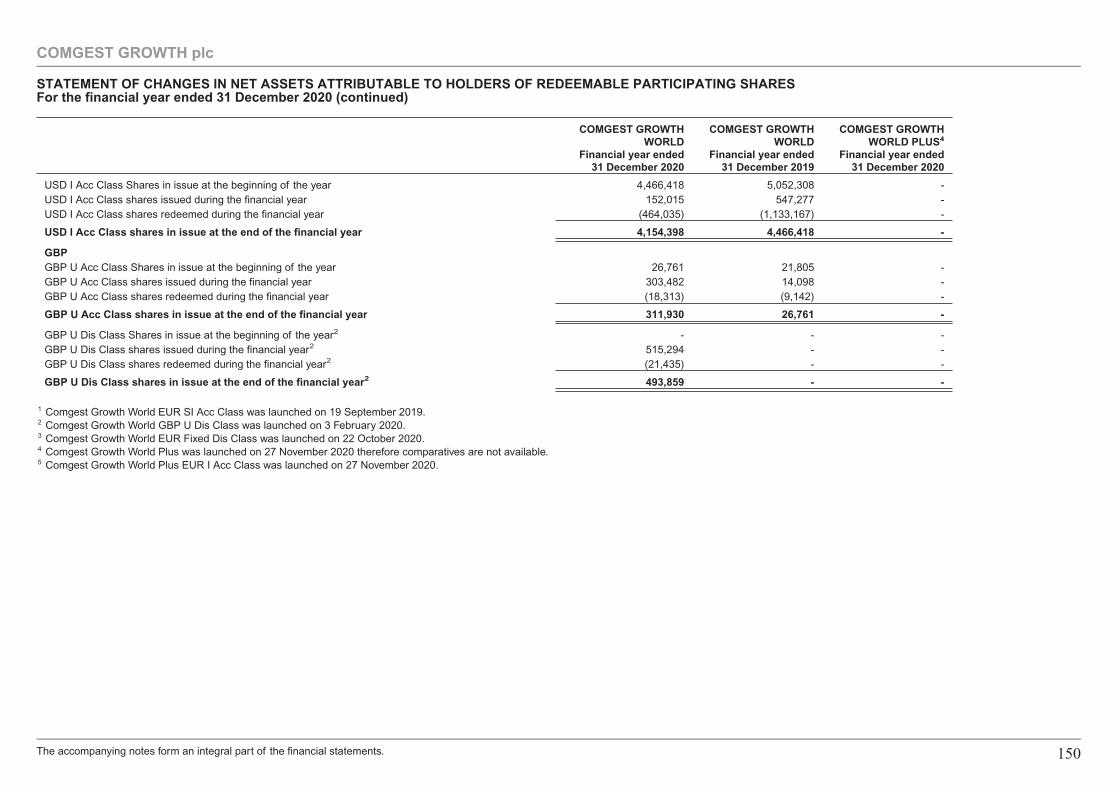
COMGEST GROWTHWORLD
Financial year ended31 December 2020
COMGEST GROWTHWORLD
Financial year ended31 December 2019
COMGEST GROWTHWORLD PLUS4
Financial year ended31 December 2020
USD I Acc Class Shares in issue at the beginning of the year 4,466,418 5,052,308 -USD I Acc Class shares issued during the financial year 152,015 547,277 -USD I Acc Class shares redeemed during the financial year (464,035) (1,133,167) -
USD I Acc Class shares in issue at the end of the financial year 4,154,398 4,466,418 -
GBPGBP U Acc Class Shares in issue at the beginning of the year 26,761 21,805 -GBP U Acc Class shares issued during the financial year 303,482 14,098 -GBP U Acc Class shares redeemed during the financial year (18,313) (9,142) -
GBP U Acc Class shares in issue at the end of the financial year 311,930 26,761 -
GBP U Dis Class Shares in issue at the beginning of the year - - -GBP U Dis Class shares issued during the financial year 515,294 - -GBP U Dis Class shares redeemed during the financial year (21,435) - -
GBP U Dis Class shares in issue at the end of the financial year 493,859 - -
COMGEST GROWTH plc
STATEMENT OF CHANGES IN NET ASSETS ATTRIBUTABLE TO HOLDERS OF REDEEMABLE PARTICIPATING SHARESFor the financial year ended 31 December 2020 (continued)
The accompanying notes form an integral part of the financial statements. 150
2
2
2
2
1 Comgest Growth World EUR SI Acc Class was launched on 19 September 2019.2 Comgest Growth World GBP U Dis Class was launched on 3 February 2020.3 Comgest Growth World EUR Fixed Dis Class was launched on 22 October 2020.4 Comgest Growth World Plus was launched on 27 November 2020 therefore comparatives are not available.5 Comgest Growth World Plus EUR I Acc Class was launched on 27 November 2020.
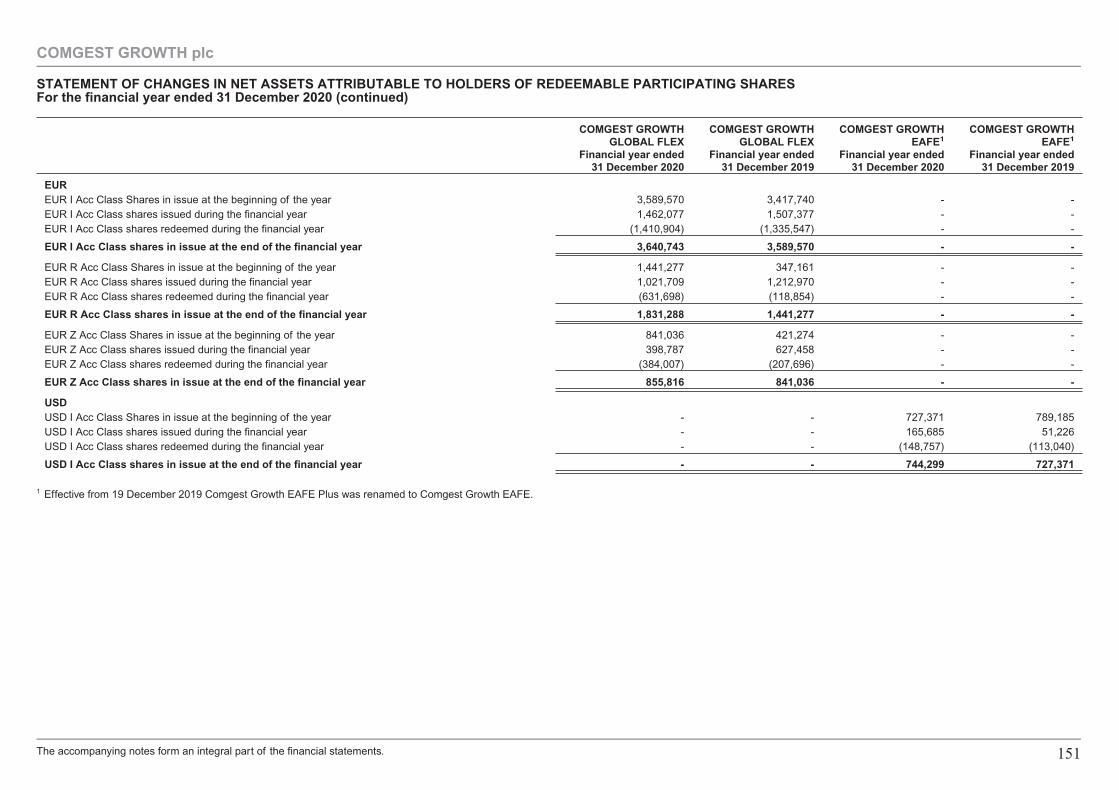
COMGEST GROWTHGLOBAL FLEX
Financial year ended31 December 2020
COMGEST GROWTHGLOBAL FLEX
Financial year ended31 December 2019
COMGEST GROWTHEAFE1
Financial year ended31 December 2020
COMGEST GROWTHEAFE1
Financial year ended31 December 2019
EUREUR I Acc Class Shares in issue at the beginning of the year 3,589,570 3,417,740 - -EUR I Acc Class shares issued during the financial year 1,462,077 1,507,377 - -EUR I Acc Class shares redeemed during the financial year (1,410,904) (1,335,547) - -
EUR I Acc Class shares in issue at the end of the financial year 3,640,743 3,589,570 - -
EUR R Acc Class Shares in issue at the beginning of the year 1,441,277 347,161 - -EUR R Acc Class shares issued during the financial year 1,021,709 1,212,970 - -EUR R Acc Class shares redeemed during the financial year (631,698) (118,854) - -
EUR R Acc Class shares in issue at the end of the financial year 1,831,288 1,441,277 - -
EUR Z Acc Class Shares in issue at the beginning of the year 841,036 421,274 - -EUR Z Acc Class shares issued during the financial year 398,787 627,458 - -EUR Z Acc Class shares redeemed during the financial year (384,007) (207,696) - -
EUR Z Acc Class shares in issue at the end of the financial year 855,816 841,036 - -
USDUSD I Acc Class Shares in issue at the beginning of the year - - 727,371 789,185USD I Acc Class shares issued during the financial year - - 165,685 51,226USD I Acc Class shares redeemed during the financial year - - (148,757) (113,040)
USD I Acc Class shares in issue at the end of the financial year - - 744,299 727,371
1 Effective from 19 December 2019 Comgest Growth EAFE Plus was renamed to Comgest Growth EAFE.
COMGEST GROWTH plc
STATEMENT OF CHANGES IN NET ASSETS ATTRIBUTABLE TO HOLDERS OF REDEEMABLE PARTICIPATING SHARESFor the financial year ended 31 December 2020 (continued)
The accompanying notes form an integral part of the financial statements. 151
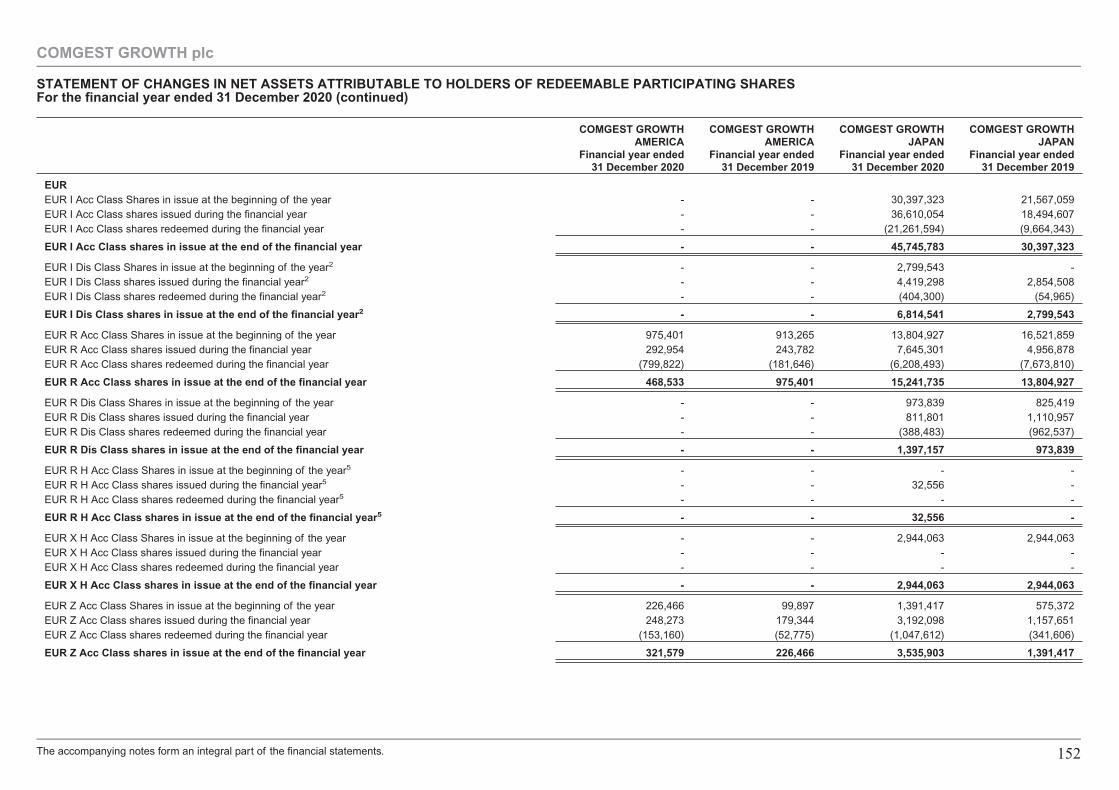
COMGEST GROWTHAMERICA
Financial year ended31 December 2020
COMGEST GROWTHAMERICA
Financial year ended31 December 2019
COMGEST GROWTHJAPAN
Financial year ended31 December 2020
COMGEST GROWTHJAPAN
Financial year ended31 December 2019
EUREUR I Acc Class Shares in issue at the beginning of the year - - 30,397,323 21,567,059EUR I Acc Class shares issued during the financial year - - 36,610,054 18,494,607EUR I Acc Class shares redeemed during the financial year - - (21,261,594) (9,664,343)
EUR I Acc Class shares in issue at the end of the financial year - - 45,745,783 30,397,323
EUR I Dis Class Shares in issue at the beginning of the year2 - - 2,799,543 -EUR I Dis Class shares issued during the financial year2 - - 4,419,298 2,854,508EUR I Dis Class shares redeemed during the financial year2 - - (404,300) (54,965)
EUR I Dis Class shares in issue at the end of the financial year2 - - 6,814,541 2,799,543
EUR R Acc Class Shares in issue at the beginning of the year 975,401 913,265 13,804,927 16,521,859EUR R Acc Class shares issued during the financial year 292,954 243,782 7,645,301 4,956,878EUR R Acc Class shares redeemed during the financial year (799,822) (181,646) (6,208,493) (7,673,810)
EUR R Acc Class shares in issue at the end of the financial year 468,533 975,401 15,241,735 13,804,927
EUR R Dis Class Shares in issue at the beginning of the year - - 973,839 825,419EUR R Dis Class shares issued during the financial year - - 811,801 1,110,957EUR R Dis Class shares redeemed during the financial year - - (388,483) (962,537)
EUR R Dis Class shares in issue at the end of the financial year - - 1,397,157 973,839
EUR R H Acc Class Shares in issue at the beginning of the year5 - - - -EUR R H Acc Class shares issued during the financial year5 - - 32,556 -EUR R H Acc Class shares redeemed during the financial year5 - - - -
EUR R H Acc Class shares in issue at the end of the financial year5 - - 32,556 -
EUR X H Acc Class Shares in issue at the beginning of the year - - 2,944,063 2,944,063EUR X H Acc Class shares issued during the financial year - - - -EUR X H Acc Class shares redeemed during the financial year - - - -
EUR X H Acc Class shares in issue at the end of the financial year - - 2,944,063 2,944,063
EUR Z Acc Class Shares in issue at the beginning of the year 226,466 99,897 1,391,417 575,372EUR Z Acc Class shares issued during the financial year 248,273 179,344 3,192,098 1,157,651EUR Z Acc Class shares redeemed during the financial year (153,160) (52,775) (1,047,612) (341,606)
EUR Z Acc Class shares in issue at the end of the financial year 321,579 226,466 3,535,903 1,391,417
COMGEST GROWTH plc
STATEMENT OF CHANGES IN NET ASSETS ATTRIBUTABLE TO HOLDERS OF REDEEMABLE PARTICIPATING SHARESFor the financial year ended 31 December 2020 (continued)
The accompanying notes form an integral part of the financial statements. 152
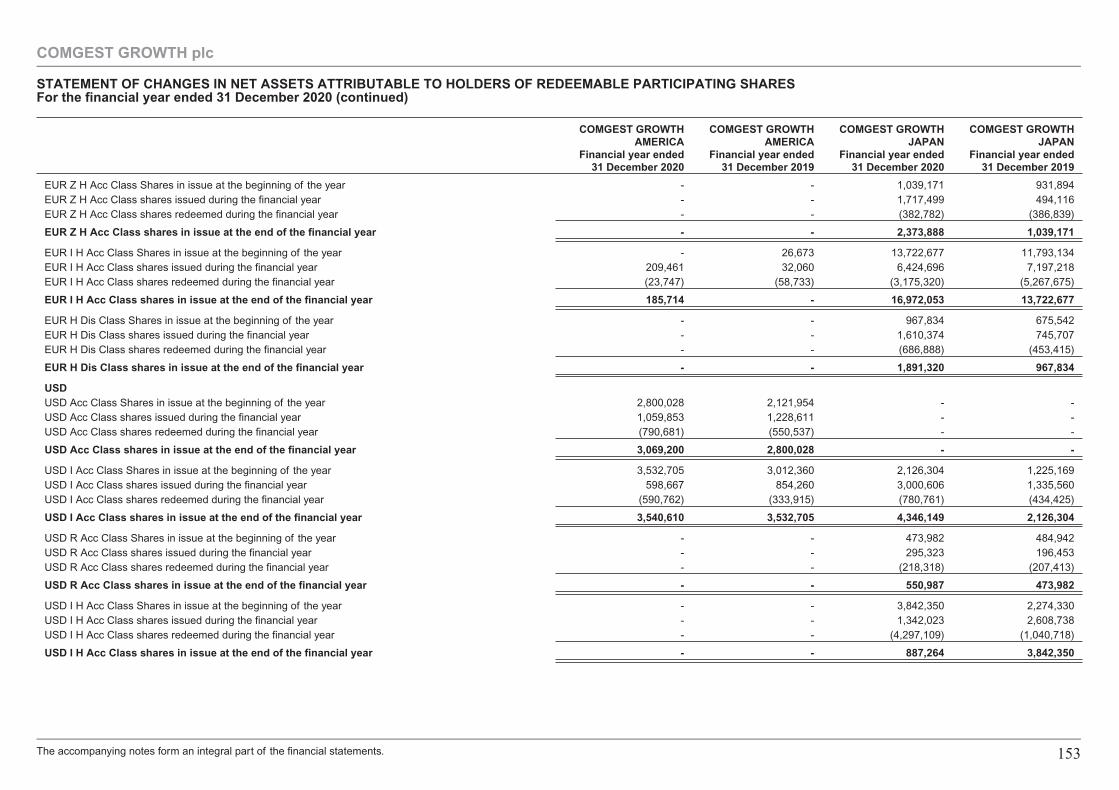
COMGEST GROWTHAMERICA
Financial year ended31 December 2020
COMGEST GROWTHAMERICA
Financial year ended31 December 2019
COMGEST GROWTHJAPAN
Financial year ended31 December 2020
COMGEST GROWTHJAPAN
Financial year ended31 December 2019
EUR Z H Acc Class Shares in issue at the beginning of the year - - 1,039,171 931,894EUR Z H Acc Class shares issued during the financial year - - 1,717,499 494,116EUR Z H Acc Class shares redeemed during the financial year - - (382,782) (386,839)
EUR Z H Acc Class shares in issue at the end of the financial year - - 2,373,888 1,039,171
EUR I H Acc Class Shares in issue at the beginning of the year - 26,673 13,722,677 11,793,134EUR I H Acc Class shares issued during the financial year 209,461 32,060 6,424,696 7,197,218EUR I H Acc Class shares redeemed during the financial year (23,747) (58,733) (3,175,320) (5,267,675)
EUR I H Acc Class shares in issue at the end of the financial year 185,714 - 16,972,053 13,722,677
EUR H Dis Class Shares in issue at the beginning of the year - - 967,834 675,542EUR H Dis Class shares issued during the financial year - - 1,610,374 745,707EUR H Dis Class shares redeemed during the financial year - - (686,888) (453,415)
EUR H Dis Class shares in issue at the end of the financial year - - 1,891,320 967,834
USDUSD Acc Class Shares in issue at the beginning of the year 2,800,028 2,121,954 - -USD Acc Class shares issued during the financial year 1,059,853 1,228,611 - -USD Acc Class shares redeemed during the financial year (790,681) (550,537) - -
USD Acc Class shares in issue at the end of the financial year 3,069,200 2,800,028 - -
USD I Acc Class Shares in issue at the beginning of the year 3,532,705 3,012,360 2,126,304 1,225,169USD I Acc Class shares issued during the financial year 598,667 854,260 3,000,606 1,335,560USD I Acc Class shares redeemed during the financial year (590,762) (333,915) (780,761) (434,425)
USD I Acc Class shares in issue at the end of the financial year 3,540,610 3,532,705 4,346,149 2,126,304
USD R Acc Class Shares in issue at the beginning of the year - - 473,982 484,942USD R Acc Class shares issued during the financial year - - 295,323 196,453USD R Acc Class shares redeemed during the financial year - - (218,318) (207,413)
USD R Acc Class shares in issue at the end of the financial year - - 550,987 473,982
USD I H Acc Class Shares in issue at the beginning of the year - - 3,842,350 2,274,330USD I H Acc Class shares issued during the financial year - - 1,342,023 2,608,738USD I H Acc Class shares redeemed during the financial year - - (4,297,109) (1,040,718)
USD I H Acc Class shares in issue at the end of the financial year - - 887,264 3,842,350
COMGEST GROWTH plc
STATEMENT OF CHANGES IN NET ASSETS ATTRIBUTABLE TO HOLDERS OF REDEEMABLE PARTICIPATING SHARESFor the financial year ended 31 December 2020 (continued)
The accompanying notes form an integral part of the financial statements. 153
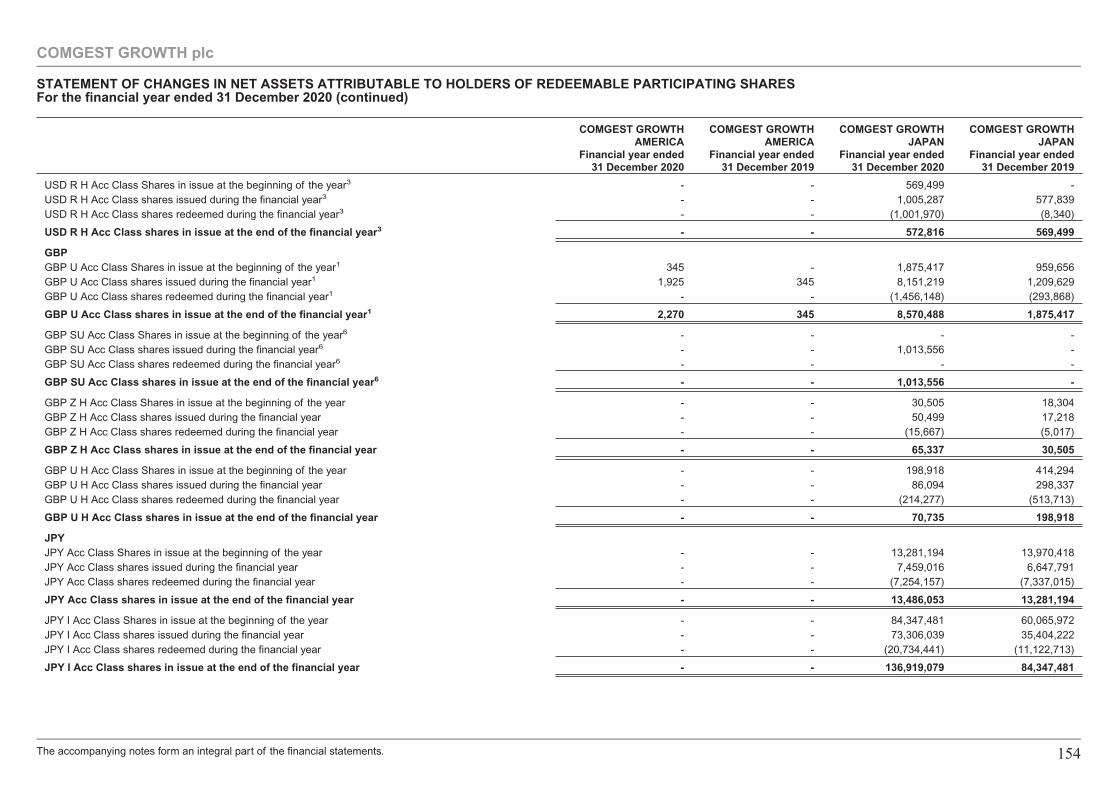
COMGEST GROWTHAMERICA
Financial year ended31 December 2020
COMGEST GROWTHAMERICA
Financial year ended31 December 2019
COMGEST GROWTHJAPAN
Financial year ended31 December 2020
COMGEST GROWTHJAPAN
Financial year ended31 December 2019
USD R H Acc Class Shares in issue at the beginning of the year3 - - 569,499 -USD R H Acc Class shares issued during the financial year3 - - 1,005,287 577,839USD R H Acc Class shares redeemed during the financial year3 - - (1,001,970) (8,340)
USD R H Acc Class shares in issue at the end of the financial year3 - - 572,816 569,499
GBPGBP U Acc Class Shares in issue at the beginning of the year1 345 - 1,875,417 959,656GBP U Acc Class shares issued during the financial year1 1,925 345 8,151,219 1,209,629GBP U Acc Class shares redeemed during the financial year1 - - (1,456,148) (293,868)
GBP U Acc Class shares in issue at the end of the financial year1 2,270 345 8,570,488 1,875,417
GBP SU Acc Class Shares in issue at the beginning of the year6 - - - -GBP SU Acc Class shares issued during the financial year6 - - 1,013,556 -GBP SU Acc Class shares redeemed during the financial year6 - - - -
GBP SU Acc Class shares in issue at the end of the financial year6 - - 1,013,556 -
GBP Z H Acc Class Shares in issue at the beginning of the year - - 30,505 18,304GBP Z H Acc Class shares issued during the financial year - - 50,499 17,218GBP Z H Acc Class shares redeemed during the financial year - - (15,667) (5,017)
GBP Z H Acc Class shares in issue at the end of the financial year - - 65,337 30,505
GBP U H Acc Class Shares in issue at the beginning of the year - - 198,918 414,294GBP U H Acc Class shares issued during the financial year - - 86,094 298,337GBP U H Acc Class shares redeemed during the financial year - - (214,277) (513,713)
GBP U H Acc Class shares in issue at the end of the financial year - - 70,735 198,918
JPYJPY Acc Class Shares in issue at the beginning of the year - - 13,281,194 13,970,418JPY Acc Class shares issued during the financial year - - 7,459,016 6,647,791JPY Acc Class shares redeemed during the financial year - - (7,254,157) (7,337,015)
JPY Acc Class shares in issue at the end of the financial year - - 13,486,053 13,281,194
JPY I Acc Class Shares in issue at the beginning of the year - - 84,347,481 60,065,972JPY I Acc Class shares issued during the financial year - - 73,306,039 35,404,222JPY I Acc Class shares redeemed during the financial year - - (20,734,441) (11,122,713)
JPY I Acc Class shares in issue at the end of the financial year - - 136,919,079 84,347,481
COMGEST GROWTH plc
STATEMENT OF CHANGES IN NET ASSETS ATTRIBUTABLE TO HOLDERS OF REDEEMABLE PARTICIPATING SHARESFor the financial year ended 31 December 2020 (continued)
The accompanying notes form an integral part of the financial statements. 154
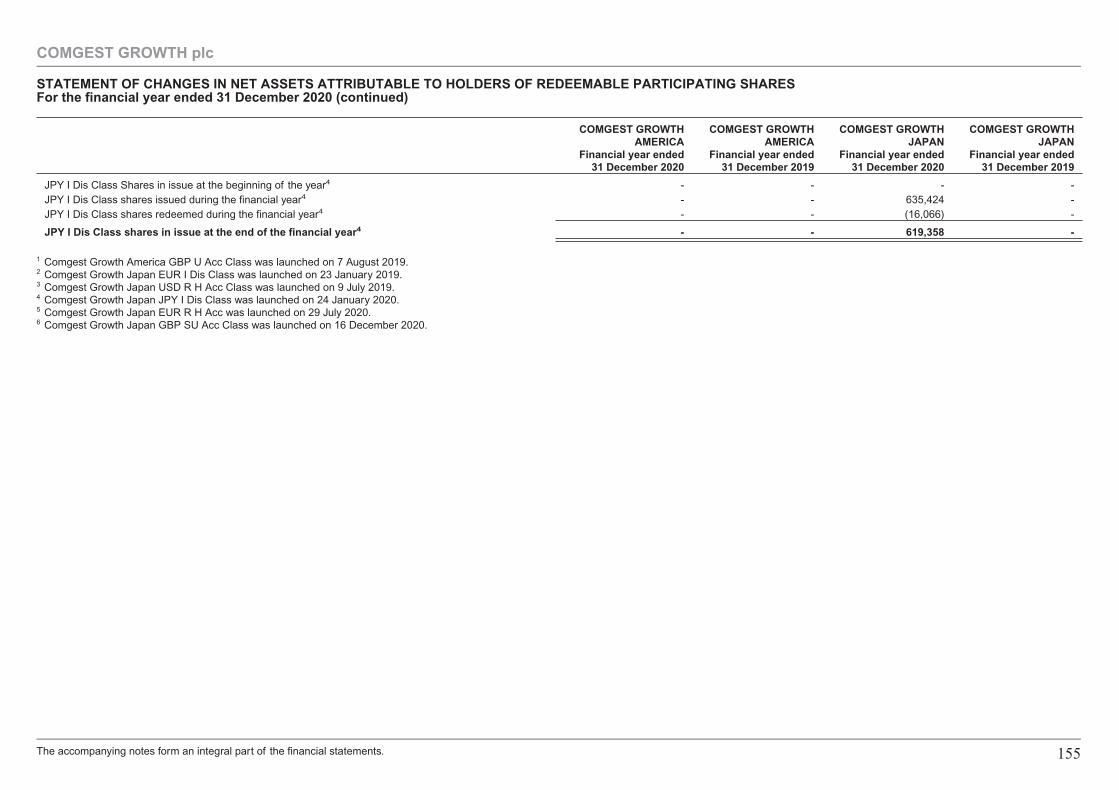
COMGEST GROWTHAMERICA
Financial year ended31 December 2020
COMGEST GROWTHAMERICA
Financial year ended31 December 2019
COMGEST GROWTHJAPAN
Financial year ended31 December 2020
COMGEST GROWTHJAPAN
Financial year ended31 December 2019
JPY I Dis Class Shares in issue at the beginning of the year4 - - - -JPY I Dis Class shares issued during the financial year4 - - 635,424 -JPY I Dis Class shares redeemed during the financial year4 - - (16,066) -
JPY I Dis Class shares in issue at the end of the financial year4 - - 619,358 -
1 Comgest Growth America GBP U Acc Class was launched on 7 August 2019.2 Comgest Growth Japan EUR I Dis Class was launched on 23 January 2019.3 Comgest Growth Japan USD R H Acc Class was launched on 9 July 2019.4 Comgest Growth Japan JPY I Dis Class was launched on 24 January 2020.5 Comgest Growth Japan EUR R H Acc was launched on 29 July 2020.6 Comgest Growth Japan GBP SU Acc Class was launched on 16 December 2020.
COMGEST GROWTH plc
STATEMENT OF CHANGES IN NET ASSETS ATTRIBUTABLE TO HOLDERS OF REDEEMABLE PARTICIPATING SHARESFor the financial year ended 31 December 2020 (continued)
The accompanying notes form an integral part of the financial statements. 155
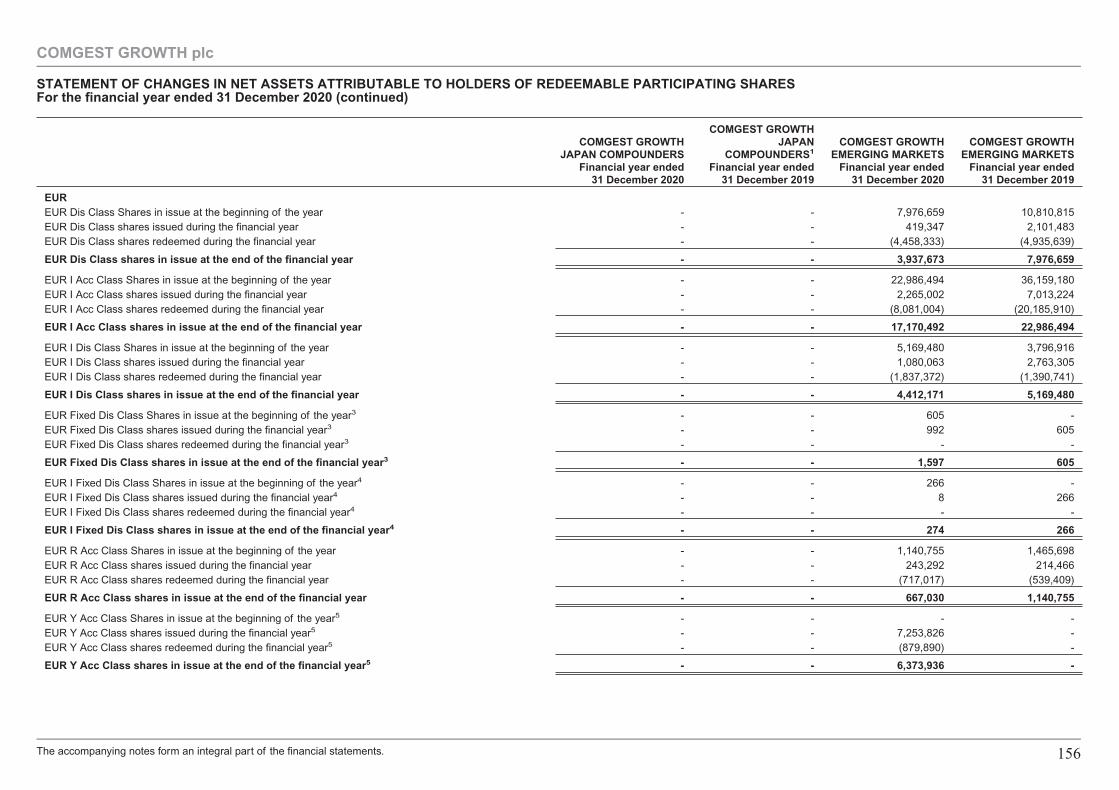
COMGEST GROWTHJAPAN COMPOUNDERS
Financial year ended31 December 2020
COMGEST GROWTHJAPAN
COMPOUNDERS1
Financial year ended31 December 2019
COMGEST GROWTHEMERGING MARKETS
Financial year ended31 December 2020
COMGEST GROWTHEMERGING MARKETS
Financial year ended31 December 2019
EUREUR Dis Class Shares in issue at the beginning of the year - - 7,976,659 10,810,815EUR Dis Class shares issued during the financial year - - 419,347 2,101,483EUR Dis Class shares redeemed during the financial year - - (4,458,333) (4,935,639)
EUR Dis Class shares in issue at the end of the financial year - - 3,937,673 7,976,659
EUR I Acc Class Shares in issue at the beginning of the year - - 22,986,494 36,159,180EUR I Acc Class shares issued during the financial year - - 2,265,002 7,013,224EUR I Acc Class shares redeemed during the financial year - - (8,081,004) (20,185,910)
EUR I Acc Class shares in issue at the end of the financial year - - 17,170,492 22,986,494
EUR I Dis Class Shares in issue at the beginning of the year - - 5,169,480 3,796,916EUR I Dis Class shares issued during the financial year - - 1,080,063 2,763,305EUR I Dis Class shares redeemed during the financial year - - (1,837,372) (1,390,741)
EUR I Dis Class shares in issue at the end of the financial year - - 4,412,171 5,169,480
EUR Fixed Dis Class Shares in issue at the beginning of the year3 - - 605 -EUR Fixed Dis Class shares issued during the financial year3 - - 992 605EUR Fixed Dis Class shares redeemed during the financial year3 - - - -
EUR Fixed Dis Class shares in issue at the end of the financial year3 - - 1,597 605
EUR I Fixed Dis Class Shares in issue at the beginning of the year4 - - 266 -EUR I Fixed Dis Class shares issued during the financial year4 - - 8 266EUR I Fixed Dis Class shares redeemed during the financial year4 - - - -
EUR I Fixed Dis Class shares in issue at the end of the financial year4 - - 274 266
EUR R Acc Class Shares in issue at the beginning of the year - - 1,140,755 1,465,698EUR R Acc Class shares issued during the financial year - - 243,292 214,466EUR R Acc Class shares redeemed during the financial year - - (717,017) (539,409)
EUR R Acc Class shares in issue at the end of the financial year - - 667,030 1,140,755
EUR Y Acc Class Shares in issue at the beginning of the year5 - - - -EUR Y Acc Class shares issued during the financial year5 - - 7,253,826 -EUR Y Acc Class shares redeemed during the financial year5 - - (879,890) -
EUR Y Acc Class shares in issue at the end of the financial year5 - - 6,373,936 -
COMGEST GROWTH plc
STATEMENT OF CHANGES IN NET ASSETS ATTRIBUTABLE TO HOLDERS OF REDEEMABLE PARTICIPATING SHARESFor the financial year ended 31 December 2020 (continued)
The accompanying notes form an integral part of the financial statements. 156
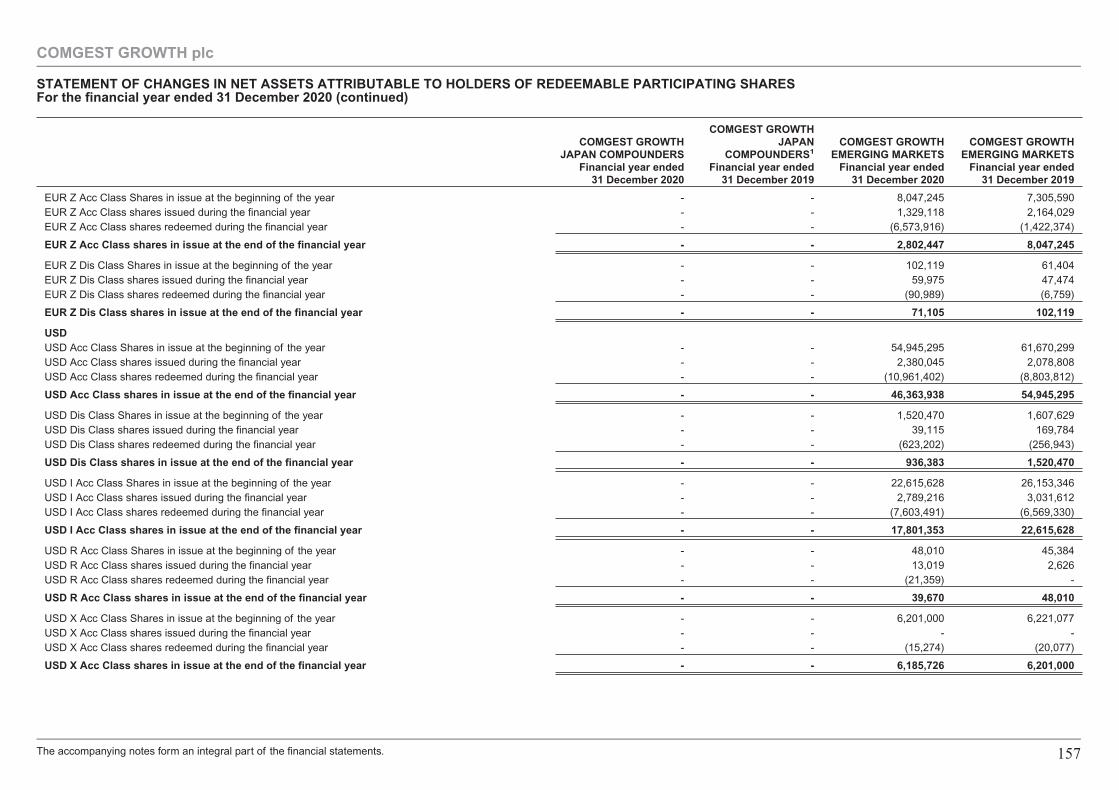
COMGEST GROWTHJAPAN COMPOUNDERS
Financial year ended31 December 2020
COMGEST GROWTHJAPAN
COMPOUNDERS1
Financial year ended31 December 2019
COMGEST GROWTHEMERGING MARKETS
Financial year ended31 December 2020
COMGEST GROWTHEMERGING MARKETS
Financial year ended31 December 2019
EUR Z Acc Class Shares in issue at the beginning of the year - - 8,047,245 7,305,590EUR Z Acc Class shares issued during the financial year - - 1,329,118 2,164,029EUR Z Acc Class shares redeemed during the financial year - - (6,573,916) (1,422,374)
EUR Z Acc Class shares in issue at the end of the financial year - - 2,802,447 8,047,245
EUR Z Dis Class Shares in issue at the beginning of the year - - 102,119 61,404EUR Z Dis Class shares issued during the financial year - - 59,975 47,474EUR Z Dis Class shares redeemed during the financial year - - (90,989) (6,759)
EUR Z Dis Class shares in issue at the end of the financial year - - 71,105 102,119
USDUSD Acc Class Shares in issue at the beginning of the year - - 54,945,295 61,670,299USD Acc Class shares issued during the financial year - - 2,380,045 2,078,808USD Acc Class shares redeemed during the financial year - - (10,961,402) (8,803,812)
USD Acc Class shares in issue at the end of the financial year - - 46,363,938 54,945,295
USD Dis Class Shares in issue at the beginning of the year - - 1,520,470 1,607,629USD Dis Class shares issued during the financial year - - 39,115 169,784USD Dis Class shares redeemed during the financial year - - (623,202) (256,943)
USD Dis Class shares in issue at the end of the financial year - - 936,383 1,520,470
USD I Acc Class Shares in issue at the beginning of the year - - 22,615,628 26,153,346USD I Acc Class shares issued during the financial year - - 2,789,216 3,031,612USD I Acc Class shares redeemed during the financial year - - (7,603,491) (6,569,330)
USD I Acc Class shares in issue at the end of the financial year - - 17,801,353 22,615,628
USD R Acc Class Shares in issue at the beginning of the year - - 48,010 45,384USD R Acc Class shares issued during the financial year - - 13,019 2,626USD R Acc Class shares redeemed during the financial year - - (21,359) -
USD R Acc Class shares in issue at the end of the financial year - - 39,670 48,010
USD X Acc Class Shares in issue at the beginning of the year - - 6,201,000 6,221,077USD X Acc Class shares issued during the financial year - - - -USD X Acc Class shares redeemed during the financial year - - (15,274) (20,077)
USD X Acc Class shares in issue at the end of the financial year - - 6,185,726 6,201,000
COMGEST GROWTH plc
STATEMENT OF CHANGES IN NET ASSETS ATTRIBUTABLE TO HOLDERS OF REDEEMABLE PARTICIPATING SHARESFor the financial year ended 31 December 2020 (continued)
The accompanying notes form an integral part of the financial statements. 157
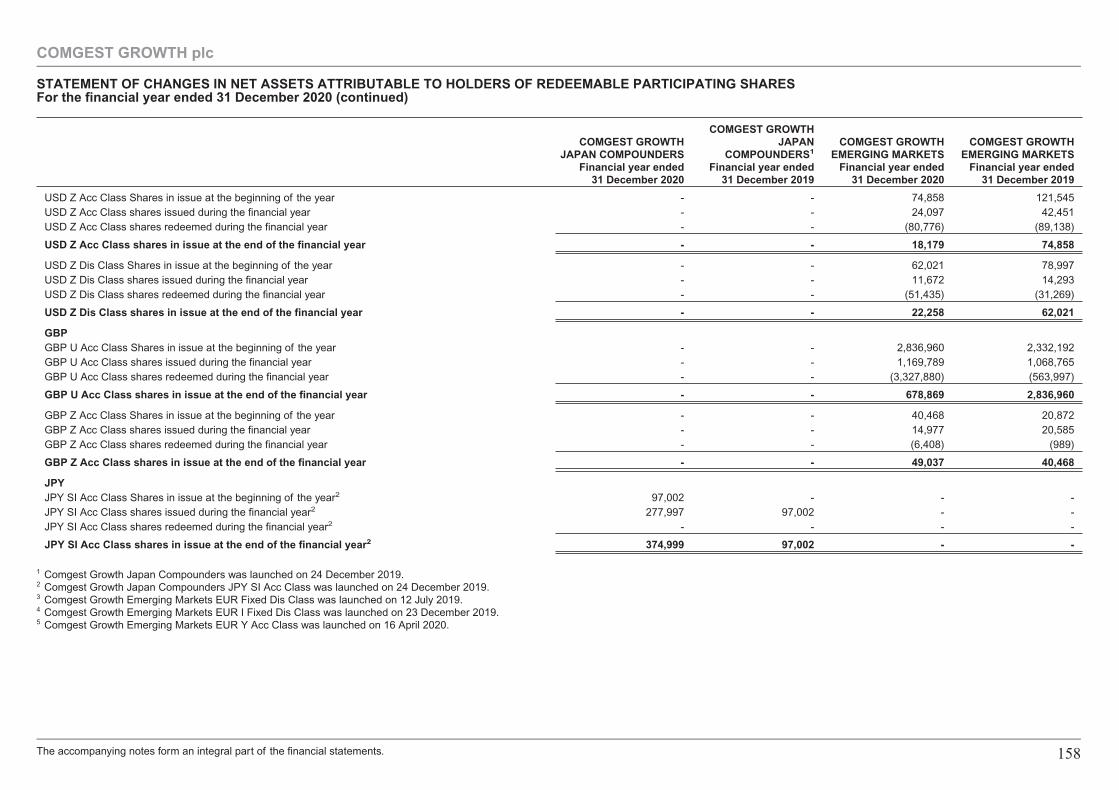
COMGEST GROWTHJAPAN COMPOUNDERS
Financial year ended31 December 2020
COMGEST GROWTHJAPAN
COMPOUNDERS1
Financial year ended31 December 2019
COMGEST GROWTHEMERGING MARKETS
Financial year ended31 December 2020
COMGEST GROWTHEMERGING MARKETS
Financial year ended31 December 2019
USD Z Acc Class Shares in issue at the beginning of the year - - 74,858 121,545USD Z Acc Class shares issued during the financial year - - 24,097 42,451USD Z Acc Class shares redeemed during the financial year - - (80,776) (89,138)
USD Z Acc Class shares in issue at the end of the financial year - - 18,179 74,858
USD Z Dis Class Shares in issue at the beginning of the year - - 62,021 78,997USD Z Dis Class shares issued during the financial year - - 11,672 14,293USD Z Dis Class shares redeemed during the financial year - - (51,435) (31,269)
USD Z Dis Class shares in issue at the end of the financial year - - 22,258 62,021
GBPGBP U Acc Class Shares in issue at the beginning of the year - - 2,836,960 2,332,192GBP U Acc Class shares issued during the financial year - - 1,169,789 1,068,765GBP U Acc Class shares redeemed during the financial year - - (3,327,880) (563,997)
GBP U Acc Class shares in issue at the end of the financial year - - 678,869 2,836,960
GBP Z Acc Class Shares in issue at the beginning of the year - - 40,468 20,872GBP Z Acc Class shares issued during the financial year - - 14,977 20,585GBP Z Acc Class shares redeemed during the financial year - - (6,408) (989)
GBP Z Acc Class shares in issue at the end of the financial year - - 49,037 40,468
JPYJPY SI Acc Class Shares in issue at the beginning of the year2 97,002 - - -JPY SI Acc Class shares issued during the financial year2 277,997 97,002 - -JPY SI Acc Class shares redeemed during the financial year2 - - - -
JPY SI Acc Class shares in issue at the end of the financial year2 374,999 97,002 - -
1 Comgest Growth Japan Compounders was launched on 24 December 2019.2 Comgest Growth Japan Compounders JPY SI Acc Class was launched on 24 December 2019.3 Comgest Growth Emerging Markets EUR Fixed Dis Class was launched on 12 July 2019.4 Comgest Growth Emerging Markets EUR I Fixed Dis Class was launched on 23 December 2019.5 Comgest Growth Emerging Markets EUR Y Acc Class was launched on 16 April 2020.
COMGEST GROWTH plc
STATEMENT OF CHANGES IN NET ASSETS ATTRIBUTABLE TO HOLDERS OF REDEEMABLE PARTICIPATING SHARESFor the financial year ended 31 December 2020 (continued)
The accompanying notes form an integral part of the financial statements. 158
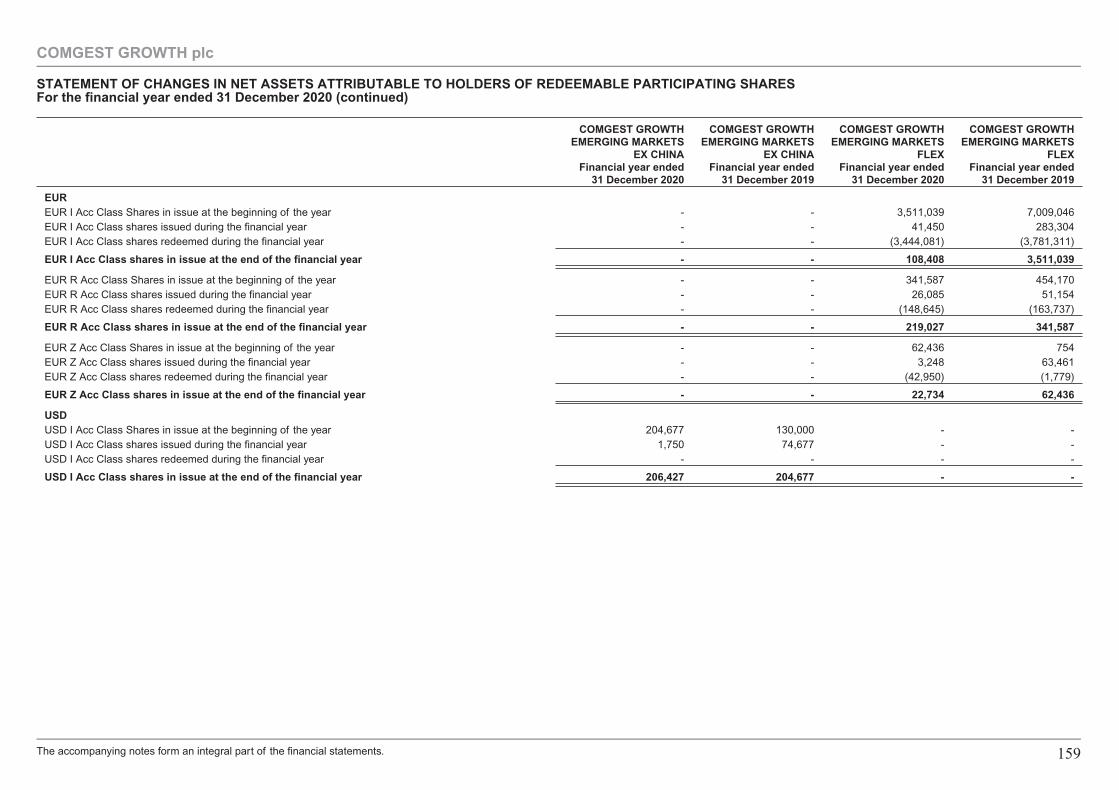
COMGEST GROWTHEMERGING MARKETS
EX CHINAFinancial year ended
31 December 2020
COMGEST GROWTHEMERGING MARKETS
EX CHINAFinancial year ended
31 December 2019
COMGEST GROWTHEMERGING MARKETS
FLEXFinancial year ended
31 December 2020
COMGEST GROWTHEMERGING MARKETS
FLEXFinancial year ended
31 December 2019
EUREUR I Acc Class Shares in issue at the beginning of the year - - 3,511,039 7,009,046EUR I Acc Class shares issued during the financial year - - 41,450 283,304EUR I Acc Class shares redeemed during the financial year - - (3,444,081) (3,781,311)
EUR I Acc Class shares in issue at the end of the financial year - - 108,408 3,511,039
EUR R Acc Class Shares in issue at the beginning of the year - - 341,587 454,170EUR R Acc Class shares issued during the financial year - - 26,085 51,154EUR R Acc Class shares redeemed during the financial year - - (148,645) (163,737)
EUR R Acc Class shares in issue at the end of the financial year - - 219,027 341,587
EUR Z Acc Class Shares in issue at the beginning of the year - - 62,436 754EUR Z Acc Class shares issued during the financial year - - 3,248 63,461EUR Z Acc Class shares redeemed during the financial year - - (42,950) (1,779)
EUR Z Acc Class shares in issue at the end of the financial year - - 22,734 62,436
USDUSD I Acc Class Shares in issue at the beginning of the year 204,677 130,000 - -USD I Acc Class shares issued during the financial year 1,750 74,677 - -USD I Acc Class shares redeemed during the financial year - - - -
USD I Acc Class shares in issue at the end of the financial year 206,427 204,677 - -
COMGEST GROWTH plc
STATEMENT OF CHANGES IN NET ASSETS ATTRIBUTABLE TO HOLDERS OF REDEEMABLE PARTICIPATING SHARESFor the financial year ended 31 December 2020 (continued)
The accompanying notes form an integral part of the financial statements. 159
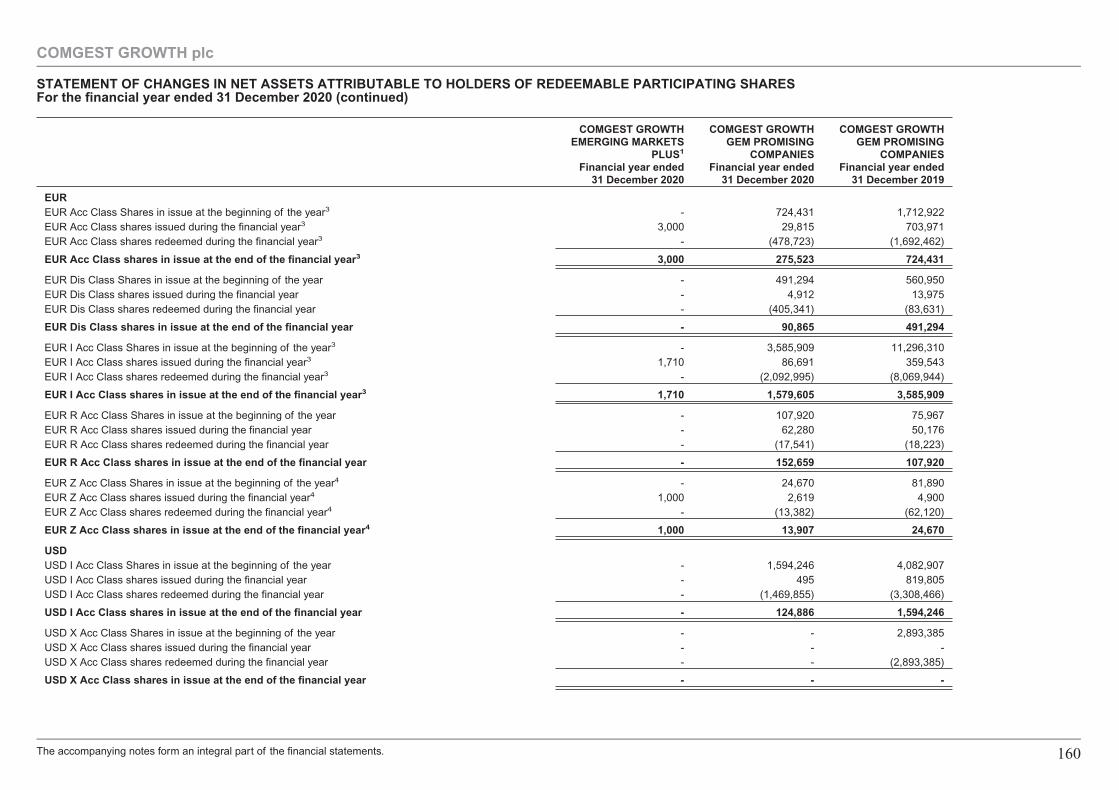
COMGEST GROWTHEMERGING MARKETS
PLUS1
Financial year ended31 December 2020
COMGEST GROWTHGEM PROMISING
COMPANIESFinancial year ended
31 December 2020
COMGEST GROWTHGEM PROMISING
COMPANIESFinancial year ended
31 December 2019
EUREUR Acc Class Shares in issue at the beginning of the year3 - 724,431 1,712,922EUR Acc Class shares issued during the financial year3 3,000 29,815 703,971EUR Acc Class shares redeemed during the financial year3 - (478,723) (1,692,462)
EUR Acc Class shares in issue at the end of the financial year3 3,000 275,523 724,431
EUR Dis Class Shares in issue at the beginning of the year - 491,294 560,950EUR Dis Class shares issued during the financial year - 4,912 13,975EUR Dis Class shares redeemed during the financial year - (405,341) (83,631)
EUR Dis Class shares in issue at the end of the financial year - 90,865 491,294
EUR I Acc Class Shares in issue at the beginning of the year3 - 3,585,909 11,296,310EUR I Acc Class shares issued during the financial year3 1,710 86,691 359,543EUR I Acc Class shares redeemed during the financial year3 - (2,092,995) (8,069,944)
EUR I Acc Class shares in issue at the end of the financial year3 1,710 1,579,605 3,585,909
EUR R Acc Class Shares in issue at the beginning of the year - 107,920 75,967EUR R Acc Class shares issued during the financial year - 62,280 50,176EUR R Acc Class shares redeemed during the financial year - (17,541) (18,223)
EUR R Acc Class shares in issue at the end of the financial year - 152,659 107,920
EUR Z Acc Class Shares in issue at the beginning of the year4 - 24,670 81,890EUR Z Acc Class shares issued during the financial year4 1,000 2,619 4,900EUR Z Acc Class shares redeemed during the financial year4 - (13,382) (62,120)
EUR Z Acc Class shares in issue at the end of the financial year4 1,000 13,907 24,670
USDUSD I Acc Class Shares in issue at the beginning of the year - 1,594,246 4,082,907USD I Acc Class shares issued during the financial year - 495 819,805USD I Acc Class shares redeemed during the financial year - (1,469,855) (3,308,466)
USD I Acc Class shares in issue at the end of the financial year - 124,886 1,594,246
USD X Acc Class Shares in issue at the beginning of the year - - 2,893,385USD X Acc Class shares issued during the financial year - - -USD X Acc Class shares redeemed during the financial year - - (2,893,385)
USD X Acc Class shares in issue at the end of the financial year - - -
COMGEST GROWTH plc
STATEMENT OF CHANGES IN NET ASSETS ATTRIBUTABLE TO HOLDERS OF REDEEMABLE PARTICIPATING SHARESFor the financial year ended 31 December 2020 (continued)
The accompanying notes form an integral part of the financial statements. 160
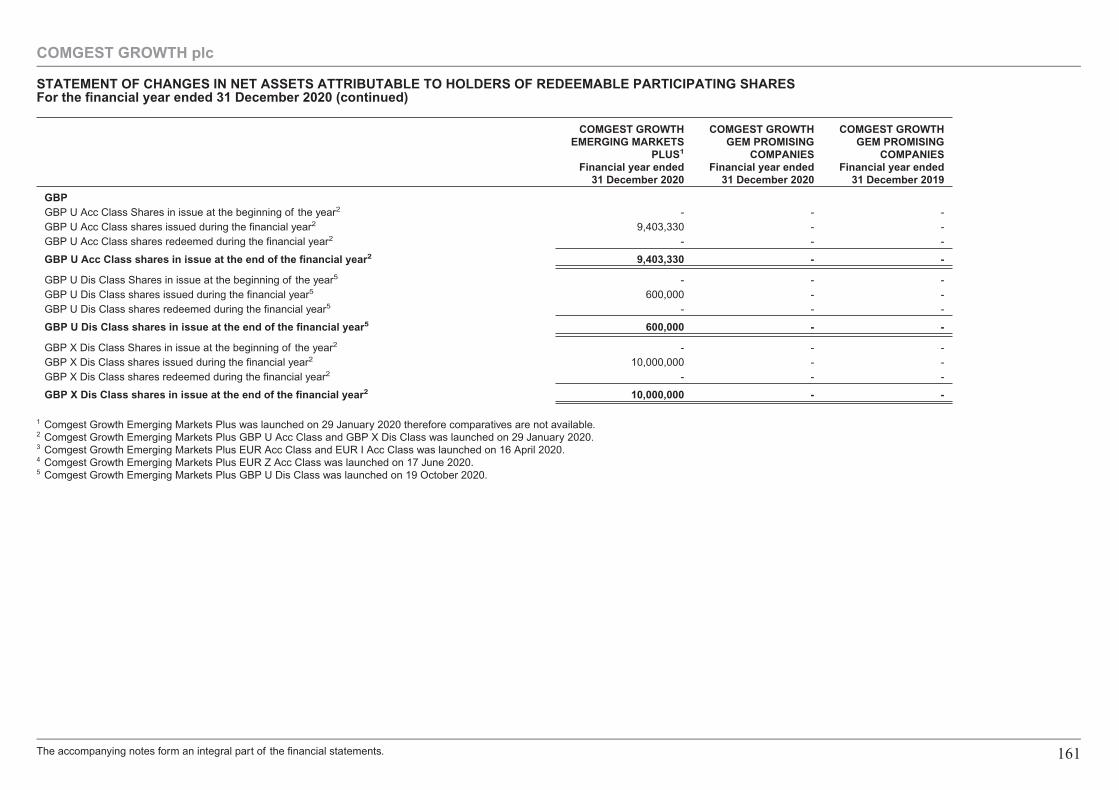
COMGEST GROWTHEMERGING MARKETS
PLUS1
Financial year ended31 December 2020
COMGEST GROWTHGEM PROMISING
COMPANIESFinancial year ended
31 December 2020
COMGEST GROWTHGEM PROMISING
COMPANIESFinancial year ended
31 December 2019
GBPGBP U Acc Class Shares in issue at the beginning of the year2 - - -GBP U Acc Class shares issued during the financial year2 9,403,330 - -GBP U Acc Class shares redeemed during the financial year2 - - -
GBP U Acc Class shares in issue at the end of the financial year2 9,403,330 - -
GBP U Dis Class Shares in issue at the beginning of the year5 - - -GBP U Dis Class shares issued during the financial year5 600,000 - -GBP U Dis Class shares redeemed during the financial year5 - - -
GBP U Dis Class shares in issue at the end of the financial year5 600,000 - -
GBP X Dis Class Shares in issue at the beginning of the year2 - - -GBP X Dis Class shares issued during the financial year2 10,000,000 - -GBP X Dis Class shares redeemed during the financial year2 - - -
GBP X Dis Class shares in issue at the end of the financial year2 10,000,000 - -
1 Comgest Growth Emerging Markets Plus was launched on 29 January 2020 therefore comparatives are not available.2 Comgest Growth Emerging Markets Plus GBP U Acc Class and GBP X Dis Class was launched on 29 January 2020.3 Comgest Growth Emerging Markets Plus EUR Acc Class and EUR I Acc Class was launched on 16 April 2020.4 Comgest Growth Emerging Markets Plus EUR Z Acc Class was launched on 17 June 2020.5 Comgest Growth Emerging Markets Plus GBP U Dis Class was launched on 19 October 2020.
COMGEST GROWTH plc
STATEMENT OF CHANGES IN NET ASSETS ATTRIBUTABLE TO HOLDERS OF REDEEMABLE PARTICIPATING SHARESFor the financial year ended 31 December 2020 (continued)
The accompanying notes form an integral part of the financial statements. 161
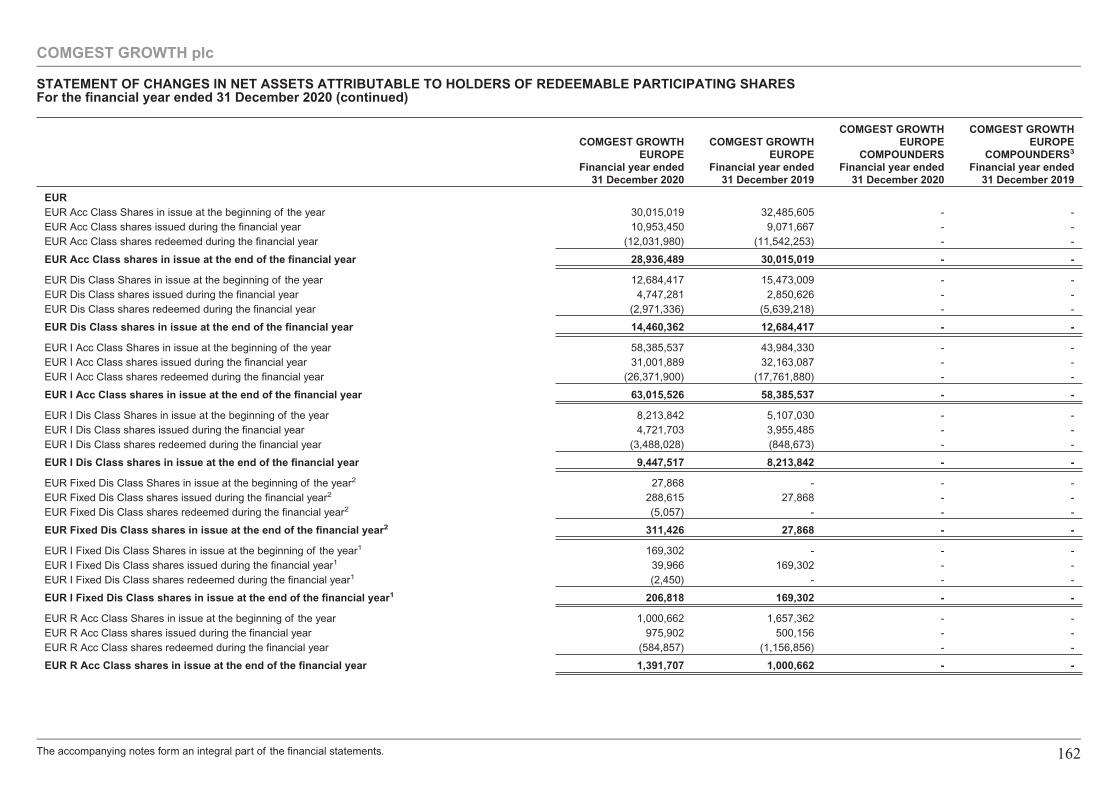
COMGEST GROWTHEUROPE
Financial year ended31 December 2020
COMGEST GROWTHEUROPE
Financial year ended31 December 2019
COMGEST GROWTHEUROPE
COMPOUNDERSFinancial year ended
31 December 2020
COMGEST GROWTHEUROPE
COMPOUNDERS3
Financial year ended31 December 2019
EUREUR Acc Class Shares in issue at the beginning of the year 30,015,019 32,485,605 - -EUR Acc Class shares issued during the financial year 10,953,450 9,071,667 - -EUR Acc Class shares redeemed during the financial year (12,031,980) (11,542,253) - -
EUR Acc Class shares in issue at the end of the financial year 28,936,489 30,015,019 - -
EUR Dis Class Shares in issue at the beginning of the year 12,684,417 15,473,009 - -EUR Dis Class shares issued during the financial year 4,747,281 2,850,626 - -EUR Dis Class shares redeemed during the financial year (2,971,336) (5,639,218) - -
EUR Dis Class shares in issue at the end of the financial year 14,460,362 12,684,417 - -
EUR I Acc Class Shares in issue at the beginning of the year 58,385,537 43,984,330 - -EUR I Acc Class shares issued during the financial year 31,001,889 32,163,087 - -EUR I Acc Class shares redeemed during the financial year (26,371,900) (17,761,880) - -
EUR I Acc Class shares in issue at the end of the financial year 63,015,526 58,385,537 - -
EUR I Dis Class Shares in issue at the beginning of the year 8,213,842 5,107,030 - -EUR I Dis Class shares issued during the financial year 4,721,703 3,955,485 - -EUR I Dis Class shares redeemed during the financial year (3,488,028) (848,673) - -
EUR I Dis Class shares in issue at the end of the financial year 9,447,517 8,213,842 - -
EUR Fixed Dis Class Shares in issue at the beginning of the year2 27,868 - - -EUR Fixed Dis Class shares issued during the financial year2 288,615 27,868 - -EUR Fixed Dis Class shares redeemed during the financial year2 (5,057) - - -
EUR Fixed Dis Class shares in issue at the end of the financial year2 311,426 27,868 - -
EUR I Fixed Dis Class Shares in issue at the beginning of the year1 169,302 - - -EUR I Fixed Dis Class shares issued during the financial year1 39,966 169,302 - -EUR I Fixed Dis Class shares redeemed during the financial year1 (2,450) - - -
EUR I Fixed Dis Class shares in issue at the end of the financial year1 206,818 169,302 - -
EUR R Acc Class Shares in issue at the beginning of the year 1,000,662 1,657,362 - -EUR R Acc Class shares issued during the financial year 975,902 500,156 - -EUR R Acc Class shares redeemed during the financial year (584,857) (1,156,856) - -
EUR R Acc Class shares in issue at the end of the financial year 1,391,707 1,000,662 - -
COMGEST GROWTH plc
STATEMENT OF CHANGES IN NET ASSETS ATTRIBUTABLE TO HOLDERS OF REDEEMABLE PARTICIPATING SHARESFor the financial year ended 31 December 2020 (continued)
The accompanying notes form an integral part of the financial statements. 162
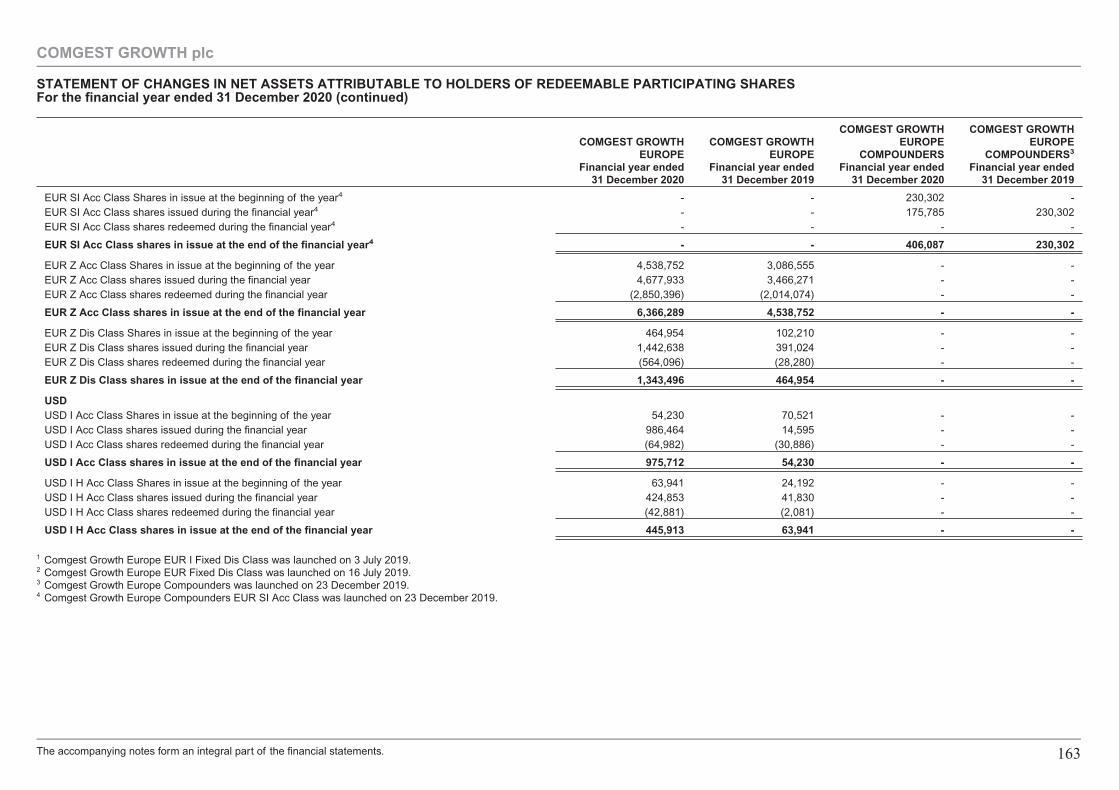
COMGEST GROWTHEUROPE
Financial year ended31 December 2020
COMGEST GROWTHEUROPE
Financial year ended31 December 2019
COMGEST GROWTHEUROPE
COMPOUNDERSFinancial year ended
31 December 2020
COMGEST GROWTHEUROPE
COMPOUNDERS3
Financial year ended31 December 2019
EUR SI Acc Class Shares in issue at the beginning of the year4 - - 230,302 -EUR SI Acc Class shares issued during the financial year4 - - 175,785 230,302EUR SI Acc Class shares redeemed during the financial year4 - - - -
EUR SI Acc Class shares in issue at the end of the financial year4 - - 406,087 230,302
EUR Z Acc Class Shares in issue at the beginning of the year 4,538,752 3,086,555 - -EUR Z Acc Class shares issued during the financial year 4,677,933 3,466,271 - -EUR Z Acc Class shares redeemed during the financial year (2,850,396) (2,014,074) - -
EUR Z Acc Class shares in issue at the end of the financial year 6,366,289 4,538,752 - -
EUR Z Dis Class Shares in issue at the beginning of the year 464,954 102,210 - -EUR Z Dis Class shares issued during the financial year 1,442,638 391,024 - -EUR Z Dis Class shares redeemed during the financial year (564,096) (28,280) - -
EUR Z Dis Class shares in issue at the end of the financial year 1,343,496 464,954 - -
USDUSD I Acc Class Shares in issue at the beginning of the year 54,230 70,521 - -USD I Acc Class shares issued during the financial year 986,464 14,595 - -USD I Acc Class shares redeemed during the financial year (64,982) (30,886) - -
USD I Acc Class shares in issue at the end of the financial year 975,712 54,230 - -
USD I H Acc Class Shares in issue at the beginning of the year 63,941 24,192 - -USD I H Acc Class shares issued during the financial year 424,853 41,830 - -USD I H Acc Class shares redeemed during the financial year (42,881) (2,081) - -
USD I H Acc Class shares in issue at the end of the financial year 445,913 63,941 - -
1 Comgest Growth Europe EUR I Fixed Dis Class was launched on 3 July 2019.2 Comgest Growth Europe EUR Fixed Dis Class was launched on 16 July 2019.3 Comgest Growth Europe Compounders was launched on 23 December 2019.4 Comgest Growth Europe Compounders EUR SI Acc Class was launched on 23 December 2019.
COMGEST GROWTH plc
STATEMENT OF CHANGES IN NET ASSETS ATTRIBUTABLE TO HOLDERS OF REDEEMABLE PARTICIPATING SHARESFor the financial year ended 31 December 2020 (continued)
The accompanying notes form an integral part of the financial statements. 163
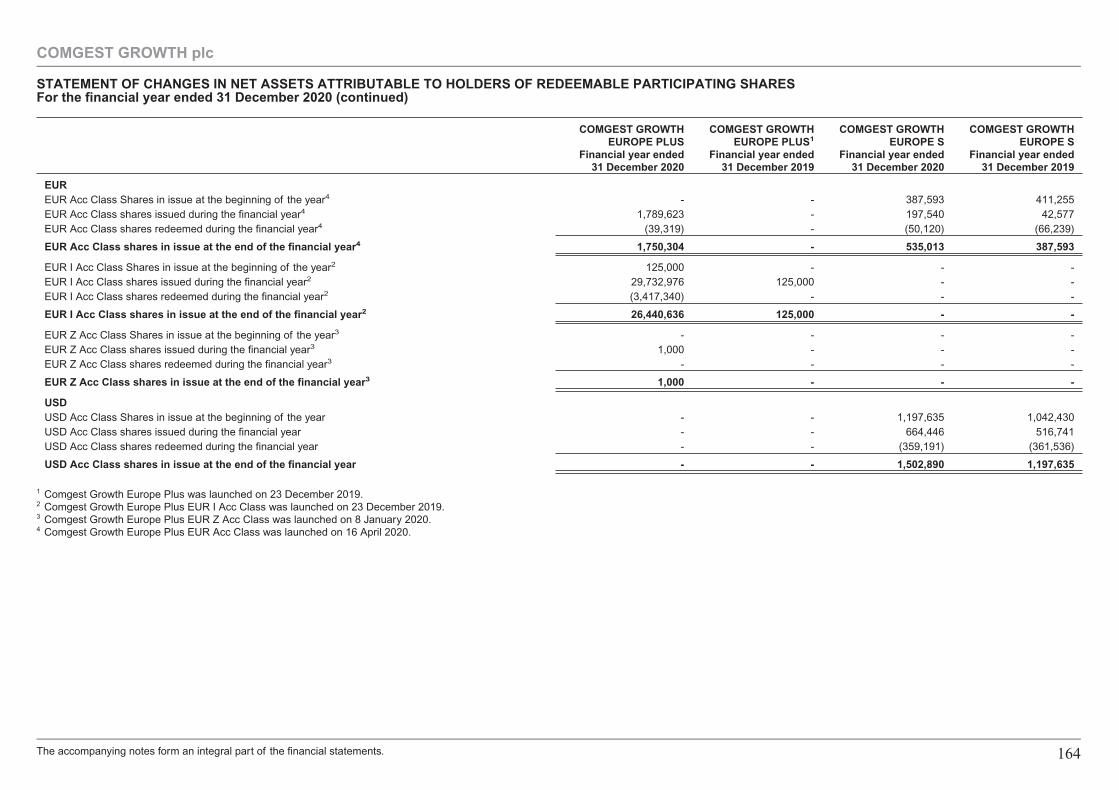
COMGEST GROWTHEUROPE PLUS
Financial year ended31 December 2020
COMGEST GROWTHEUROPE PLUS1
Financial year ended31 December 2019
COMGEST GROWTHEUROPE S
Financial year ended31 December 2020
COMGEST GROWTHEUROPE S
Financial year ended31 December 2019
EUREUR Acc Class Shares in issue at the beginning of the year4 - - 387,593 411,255EUR Acc Class shares issued during the financial year4 1,789,623 - 197,540 42,577EUR Acc Class shares redeemed during the financial year4 (39,319) - (50,120) (66,239)
EUR Acc Class shares in issue at the end of the financial year4 1,750,304 - 535,013 387,593
EUR I Acc Class Shares in issue at the beginning of the year2 125,000 - - -EUR I Acc Class shares issued during the financial year2 29,732,976 125,000 - -EUR I Acc Class shares redeemed during the financial year2 (3,417,340) - - -
EUR I Acc Class shares in issue at the end of the financial year2 26,440,636 125,000 - -
EUR Z Acc Class Shares in issue at the beginning of the year3 - - - -EUR Z Acc Class shares issued during the financial year3 1,000 - - -EUR Z Acc Class shares redeemed during the financial year3 - - - -
EUR Z Acc Class shares in issue at the end of the financial year3 1,000 - - -
USDUSD Acc Class Shares in issue at the beginning of the year - - 1,197,635 1,042,430USD Acc Class shares issued during the financial year - - 664,446 516,741USD Acc Class shares redeemed during the financial year - - (359,191) (361,536)
USD Acc Class shares in issue at the end of the financial year - - 1,502,890 1,197,635
1 Comgest Growth Europe Plus was launched on 23 December 2019.2 Comgest Growth Europe Plus EUR I Acc Class was launched on 23 December 2019.3 Comgest Growth Europe Plus EUR Z Acc Class was launched on 8 January 2020.4 Comgest Growth Europe Plus EUR Acc Class was launched on 16 April 2020.
COMGEST GROWTH plc
STATEMENT OF CHANGES IN NET ASSETS ATTRIBUTABLE TO HOLDERS OF REDEEMABLE PARTICIPATING SHARESFor the financial year ended 31 December 2020 (continued)
The accompanying notes form an integral part of the financial statements. 164
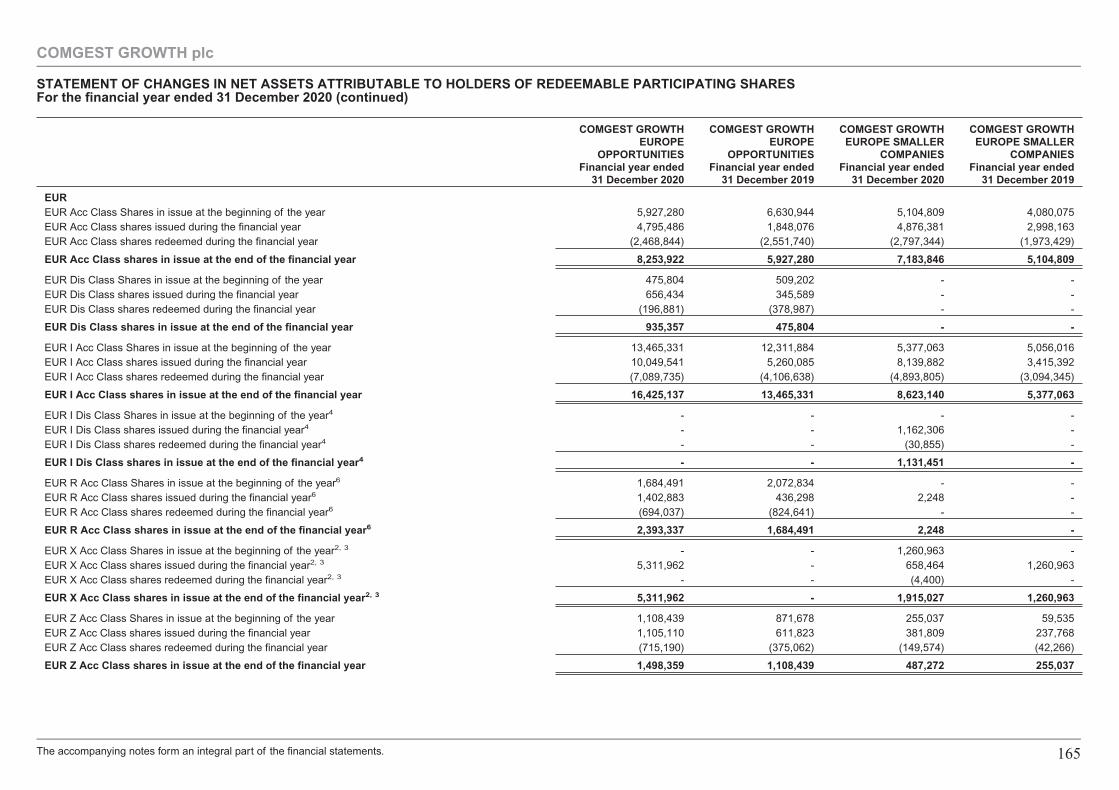
COMGEST GROWTHEUROPE
OPPORTUNITIESFinancial year ended
31 December 2020
COMGEST GROWTHEUROPE
OPPORTUNITIESFinancial year ended
31 December 2019
COMGEST GROWTHEUROPE SMALLER
COMPANIESFinancial year ended
31 December 2020
COMGEST GROWTHEUROPE SMALLER
COMPANIESFinancial year ended
31 December 2019
EUREUR Acc Class Shares in issue at the beginning of the year 5,927,280 6,630,944 5,104,809 4,080,075EUR Acc Class shares issued during the financial year 4,795,486 1,848,076 4,876,381 2,998,163EUR Acc Class shares redeemed during the financial year (2,468,844) (2,551,740) (2,797,344) (1,973,429)
EUR Acc Class shares in issue at the end of the financial year 8,253,922 5,927,280 7,183,846 5,104,809
EUR Dis Class Shares in issue at the beginning of the year 475,804 509,202 - -EUR Dis Class shares issued during the financial year 656,434 345,589 - -EUR Dis Class shares redeemed during the financial year (196,881) (378,987) - -
EUR Dis Class shares in issue at the end of the financial year 935,357 475,804 - -
EUR I Acc Class Shares in issue at the beginning of the year 13,465,331 12,311,884 5,377,063 5,056,016EUR I Acc Class shares issued during the financial year 10,049,541 5,260,085 8,139,882 3,415,392EUR I Acc Class shares redeemed during the financial year (7,089,735) (4,106,638) (4,893,805) (3,094,345)
EUR I Acc Class shares in issue at the end of the financial year 16,425,137 13,465,331 8,623,140 5,377,063
EUR I Dis Class Shares in issue at the beginning of the year4 - - - -EUR I Dis Class shares issued during the financial year4 - - 1,162,306 -EUR I Dis Class shares redeemed during the financial year4 - - (30,855) -
EUR I Dis Class shares in issue at the end of the financial year4 - - 1,131,451 -
EUR R Acc Class Shares in issue at the beginning of the year6 1,684,491 2,072,834 - -EUR R Acc Class shares issued during the financial year6 1,402,883 436,298 2,248 -EUR R Acc Class shares redeemed during the financial year6 (694,037) (824,641) - -
EUR R Acc Class shares in issue at the end of the financial year6 2,393,337 1,684,491 2,248 -
EUR X Acc Class Shares in issue at the beginning of the year2, 3 - - 1,260,963 -EUR X Acc Class shares issued during the financial year2, 3 5,311,962 - 658,464 1,260,963EUR X Acc Class shares redeemed during the financial year2, 3 - - (4,400) -
EUR X Acc Class shares in issue at the end of the financial year2, 3 5,311,962 - 1,915,027 1,260,963
EUR Z Acc Class Shares in issue at the beginning of the year 1,108,439 871,678 255,037 59,535EUR Z Acc Class shares issued during the financial year 1,105,110 611,823 381,809 237,768EUR Z Acc Class shares redeemed during the financial year (715,190) (375,062) (149,574) (42,266)
EUR Z Acc Class shares in issue at the end of the financial year 1,498,359 1,108,439 487,272 255,037
COMGEST GROWTH plc
STATEMENT OF CHANGES IN NET ASSETS ATTRIBUTABLE TO HOLDERS OF REDEEMABLE PARTICIPATING SHARESFor the financial year ended 31 December 2020 (continued)
The accompanying notes form an integral part of the financial statements. 165
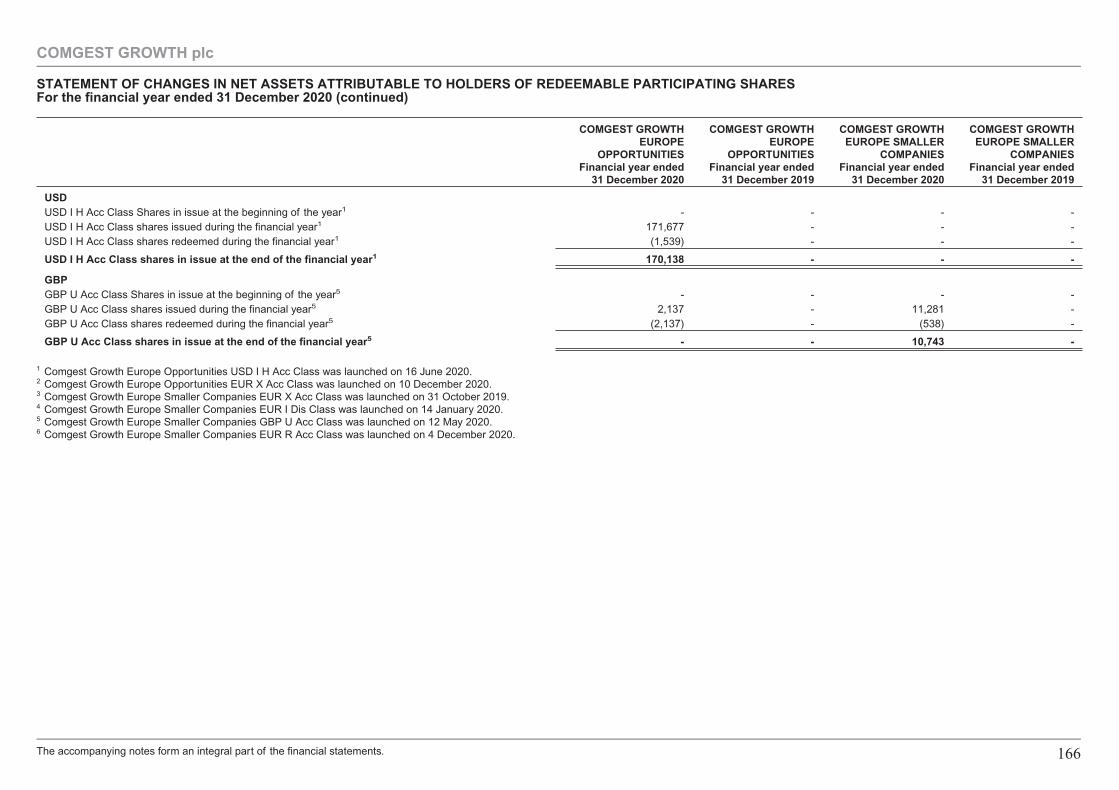
COMGEST GROWTHEUROPE
OPPORTUNITIESFinancial year ended
31 December 2020
COMGEST GROWTHEUROPE
OPPORTUNITIESFinancial year ended
31 December 2019
COMGEST GROWTHEUROPE SMALLER
COMPANIESFinancial year ended
31 December 2020
COMGEST GROWTHEUROPE SMALLER
COMPANIESFinancial year ended
31 December 2019
USDUSD I H Acc Class Shares in issue at the beginning of the year1 - - - -USD I H Acc Class shares issued during the financial year1 171,677 - - -USD I H Acc Class shares redeemed during the financial year1 (1,539) - - -
USD I H Acc Class shares in issue at the end of the financial year1 170,138 - - -
GBPGBP U Acc Class Shares in issue at the beginning of the year5 - - - -GBP U Acc Class shares issued during the financial year5 2,137 - 11,281 -GBP U Acc Class shares redeemed during the financial year5 (2,137) - (538) -
GBP U Acc Class shares in issue at the end of the financial year5 - - 10,743 -
1 Comgest Growth Europe Opportunities USD I H Acc Class was launched on 16 June 2020.2 Comgest Growth Europe Opportunities EUR X Acc Class was launched on 10 December 2020.3 Comgest Growth Europe Smaller Companies EUR X Acc Class was launched on 31 October 2019.4 Comgest Growth Europe Smaller Companies EUR I Dis Class was launched on 14 January 2020.5 Comgest Growth Europe Smaller Companies GBP U Acc Class was launched on 12 May 2020.6 Comgest Growth Europe Smaller Companies EUR R Acc Class was launched on 4 December 2020.
COMGEST GROWTH plc
STATEMENT OF CHANGES IN NET ASSETS ATTRIBUTABLE TO HOLDERS OF REDEEMABLE PARTICIPATING SHARESFor the financial year ended 31 December 2020 (continued)
The accompanying notes form an integral part of the financial statements. 166
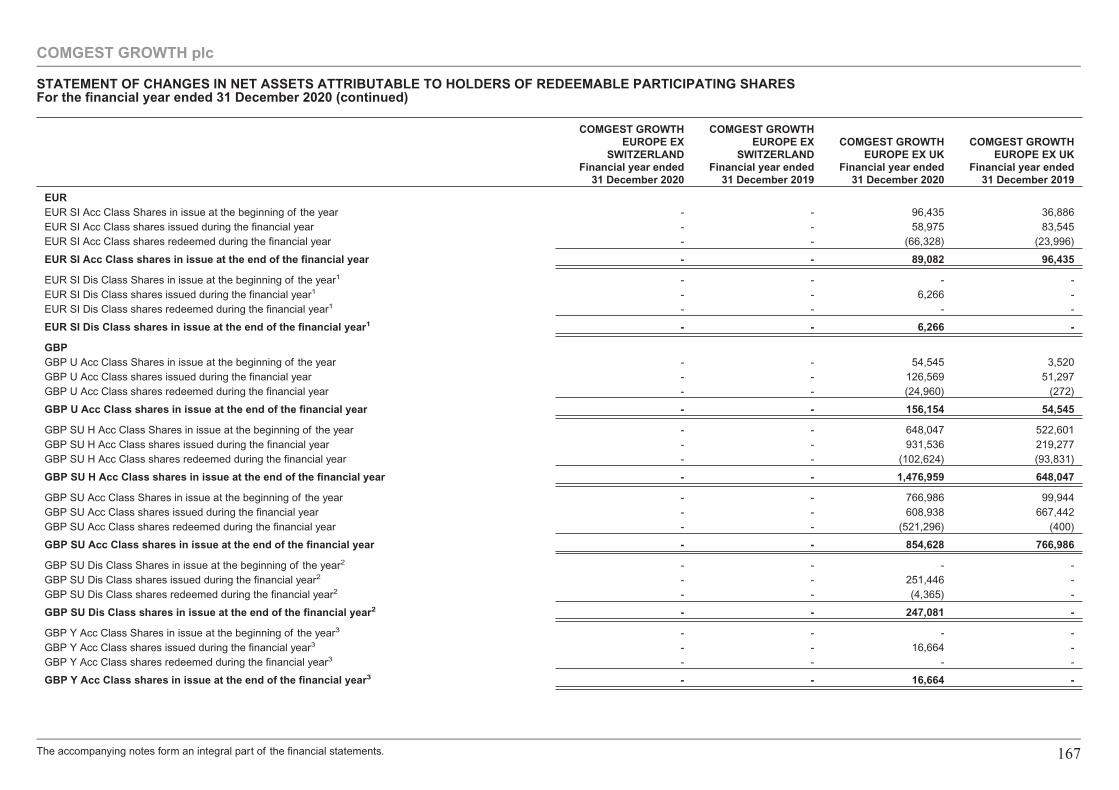
COMGEST GROWTHEUROPE EX
SWITZERLANDFinancial year ended
31 December 2020
COMGEST GROWTHEUROPE EX
SWITZERLANDFinancial year ended
31 December 2019
COMGEST GROWTHEUROPE EX UK
Financial year ended31 December 2020
COMGEST GROWTHEUROPE EX UK
Financial year ended31 December 2019
EUREUR SI Acc Class Shares in issue at the beginning of the year - - 96,435 36,886EUR SI Acc Class shares issued during the financial year - - 58,975 83,545EUR SI Acc Class shares redeemed during the financial year - - (66,328) (23,996)
EUR SI Acc Class shares in issue at the end of the financial year - - 89,082 96,435
EUR SI Dis Class Shares in issue at the beginning of the year1 - - - -EUR SI Dis Class shares issued during the financial year1 - - 6,266 -EUR SI Dis Class shares redeemed during the financial year1 - - - -
EUR SI Dis Class shares in issue at the end of the financial year1 - - 6,266 -
GBPGBP U Acc Class Shares in issue at the beginning of the year - - 54,545 3,520GBP U Acc Class shares issued during the financial year - - 126,569 51,297GBP U Acc Class shares redeemed during the financial year - - (24,960) (272)
GBP U Acc Class shares in issue at the end of the financial year - - 156,154 54,545
GBP SU H Acc Class Shares in issue at the beginning of the year - - 648,047 522,601GBP SU H Acc Class shares issued during the financial year - - 931,536 219,277GBP SU H Acc Class shares redeemed during the financial year - - (102,624) (93,831)
GBP SU H Acc Class shares in issue at the end of the financial year - - 1,476,959 648,047
GBP SU Acc Class Shares in issue at the beginning of the year - - 766,986 99,944GBP SU Acc Class shares issued during the financial year - - 608,938 667,442GBP SU Acc Class shares redeemed during the financial year - - (521,296) (400)
GBP SU Acc Class shares in issue at the end of the financial year - - 854,628 766,986
GBP SU Dis Class Shares in issue at the beginning of the year2 - - - -GBP SU Dis Class shares issued during the financial year2 - - 251,446 -GBP SU Dis Class shares redeemed during the financial year2 - - (4,365) -
GBP SU Dis Class shares in issue at the end of the financial year2 - - 247,081 -
GBP Y Acc Class Shares in issue at the beginning of the year3 - - - -GBP Y Acc Class shares issued during the financial year3 - - 16,664 -GBP Y Acc Class shares redeemed during the financial year3 - - - -
GBP Y Acc Class shares in issue at the end of the financial year3 - - 16,664 -
COMGEST GROWTH plc
STATEMENT OF CHANGES IN NET ASSETS ATTRIBUTABLE TO HOLDERS OF REDEEMABLE PARTICIPATING SHARESFor the financial year ended 31 December 2020 (continued)
The accompanying notes form an integral part of the financial statements. 167
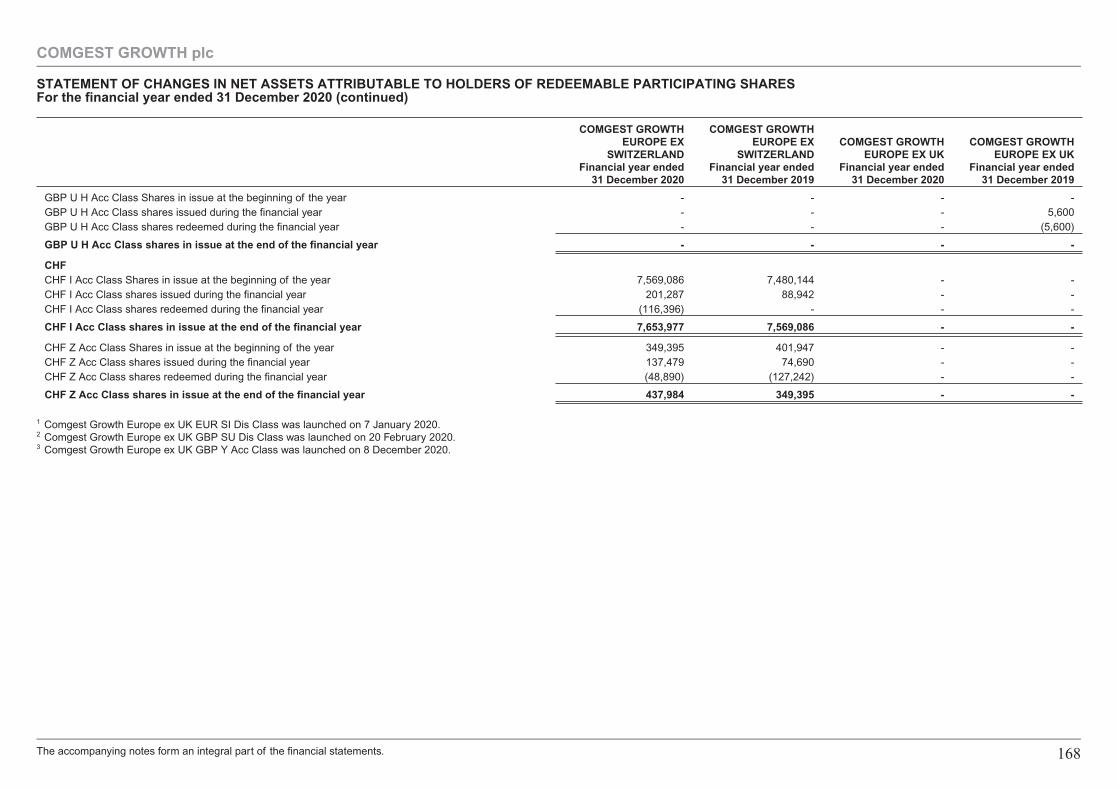
COMGEST GROWTHEUROPE EX
SWITZERLANDFinancial year ended
31 December 2020
COMGEST GROWTHEUROPE EX
SWITZERLANDFinancial year ended
31 December 2019
COMGEST GROWTHEUROPE EX UK
Financial year ended31 December 2020
COMGEST GROWTHEUROPE EX UK
Financial year ended31 December 2019
GBP U H Acc Class Shares in issue at the beginning of the year - - - -GBP U H Acc Class shares issued during the financial year - - - 5,600GBP U H Acc Class shares redeemed during the financial year - - - (5,600)
GBP U H Acc Class shares in issue at the end of the financial year - - - -
CHFCHF I Acc Class Shares in issue at the beginning of the year 7,569,086 7,480,144 - -CHF I Acc Class shares issued during the financial year 201,287 88,942 - -CHF I Acc Class shares redeemed during the financial year (116,396) - - -
CHF I Acc Class shares in issue at the end of the financial year 7,653,977 7,569,086 - -
CHF Z Acc Class Shares in issue at the beginning of the year 349,395 401,947 - -CHF Z Acc Class shares issued during the financial year 137,479 74,690 - -CHF Z Acc Class shares redeemed during the financial year (48,890) (127,242) - -
CHF Z Acc Class shares in issue at the end of the financial year 437,984 349,395 - -
1 Comgest Growth Europe ex UK EUR SI Dis Class was launched on 7 January 2020.2 Comgest Growth Europe ex UK GBP SU Dis Class was launched on 20 February 2020.3 Comgest Growth Europe ex UK GBP Y Acc Class was launched on 8 December 2020.
COMGEST GROWTH plc
STATEMENT OF CHANGES IN NET ASSETS ATTRIBUTABLE TO HOLDERS OF REDEEMABLE PARTICIPATING SHARESFor the financial year ended 31 December 2020 (continued)
The accompanying notes form an integral part of the financial statements. 168
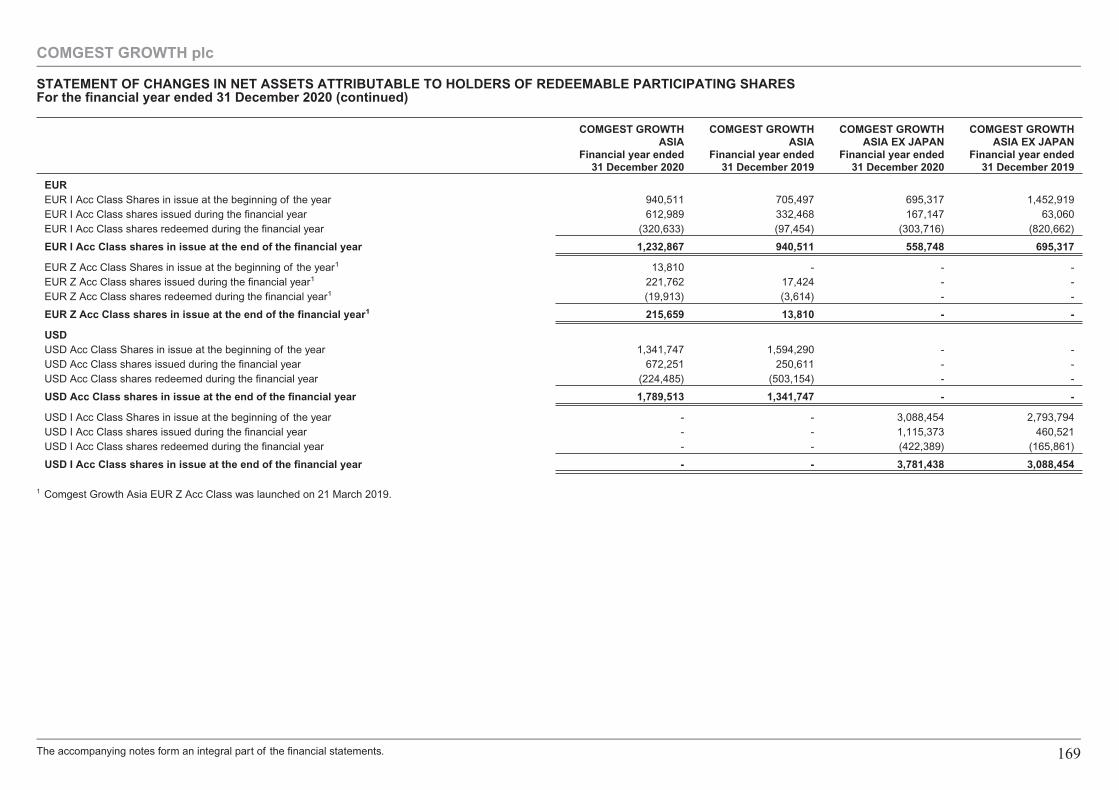
COMGEST GROWTHASIA
Financial year ended31 December 2020
COMGEST GROWTHASIA
Financial year ended31 December 2019
COMGEST GROWTHASIA EX JAPAN
Financial year ended31 December 2020
COMGEST GROWTHASIA EX JAPAN
Financial year ended31 December 2019
EUREUR I Acc Class Shares in issue at the beginning of the year 940,511 705,497 695,317 1,452,919EUR I Acc Class shares issued during the financial year 612,989 332,468 167,147 63,060EUR I Acc Class shares redeemed during the financial year (320,633) (97,454) (303,716) (820,662)
EUR I Acc Class shares in issue at the end of the financial year 1,232,867 940,511 558,748 695,317
EUR Z Acc Class Shares in issue at the beginning of the year1 13,810 - - -EUR Z Acc Class shares issued during the financial year1 221,762 17,424 - -EUR Z Acc Class shares redeemed during the financial year1 (19,913) (3,614) - -
EUR Z Acc Class shares in issue at the end of the financial year1 215,659 13,810 - -
USDUSD Acc Class Shares in issue at the beginning of the year 1,341,747 1,594,290 - -USD Acc Class shares issued during the financial year 672,251 250,611 - -USD Acc Class shares redeemed during the financial year (224,485) (503,154) - -
USD Acc Class shares in issue at the end of the financial year 1,789,513 1,341,747 - -
USD I Acc Class Shares in issue at the beginning of the year - - 3,088,454 2,793,794USD I Acc Class shares issued during the financial year - - 1,115,373 460,521USD I Acc Class shares redeemed during the financial year - - (422,389) (165,861)
USD I Acc Class shares in issue at the end of the financial year - - 3,781,438 3,088,454
1 Comgest Growth Asia EUR Z Acc Class was launched on 21 March 2019.
COMGEST GROWTH plc
STATEMENT OF CHANGES IN NET ASSETS ATTRIBUTABLE TO HOLDERS OF REDEEMABLE PARTICIPATING SHARESFor the financial year ended 31 December 2020 (continued)
The accompanying notes form an integral part of the financial statements. 169
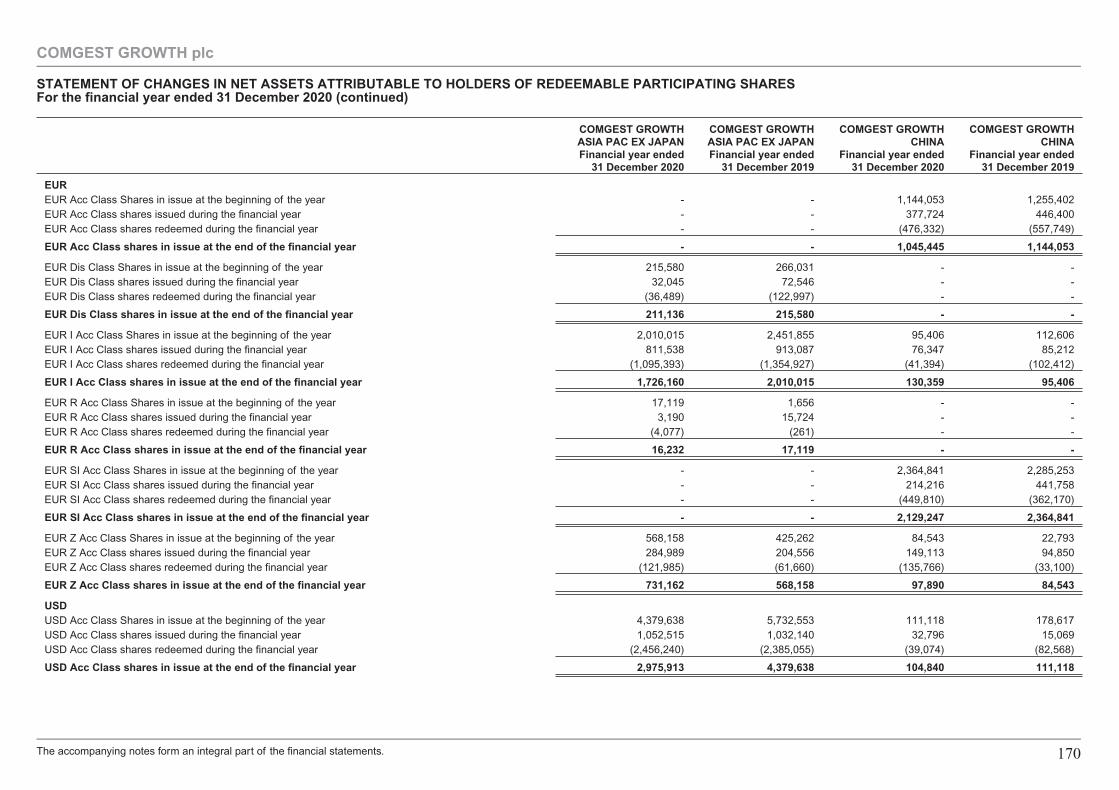
COMGEST GROWTHASIA PAC EX JAPANFinancial year ended
31 December 2020
COMGEST GROWTHASIA PAC EX JAPANFinancial year ended
31 December 2019
COMGEST GROWTHCHINA
Financial year ended31 December 2020
COMGEST GROWTHCHINA
Financial year ended31 December 2019
EUREUR Acc Class Shares in issue at the beginning of the year - - 1,144,053 1,255,402EUR Acc Class shares issued during the financial year - - 377,724 446,400EUR Acc Class shares redeemed during the financial year - - (476,332) (557,749)
EUR Acc Class shares in issue at the end of the financial year - - 1,045,445 1,144,053
EUR Dis Class Shares in issue at the beginning of the year 215,580 266,031 - -EUR Dis Class shares issued during the financial year 32,045 72,546 - -EUR Dis Class shares redeemed during the financial year (36,489) (122,997) - -
EUR Dis Class shares in issue at the end of the financial year 211,136 215,580 - -
EUR I Acc Class Shares in issue at the beginning of the year 2,010,015 2,451,855 95,406 112,606EUR I Acc Class shares issued during the financial year 811,538 913,087 76,347 85,212EUR I Acc Class shares redeemed during the financial year (1,095,393) (1,354,927) (41,394) (102,412)
EUR I Acc Class shares in issue at the end of the financial year 1,726,160 2,010,015 130,359 95,406
EUR R Acc Class Shares in issue at the beginning of the year 17,119 1,656 - -EUR R Acc Class shares issued during the financial year 3,190 15,724 - -EUR R Acc Class shares redeemed during the financial year (4,077) (261) - -
EUR R Acc Class shares in issue at the end of the financial year 16,232 17,119 - -
EUR SI Acc Class Shares in issue at the beginning of the year - - 2,364,841 2,285,253EUR SI Acc Class shares issued during the financial year - - 214,216 441,758EUR SI Acc Class shares redeemed during the financial year - - (449,810) (362,170)
EUR SI Acc Class shares in issue at the end of the financial year - - 2,129,247 2,364,841
EUR Z Acc Class Shares in issue at the beginning of the year 568,158 425,262 84,543 22,793EUR Z Acc Class shares issued during the financial year 284,989 204,556 149,113 94,850EUR Z Acc Class shares redeemed during the financial year (121,985) (61,660) (135,766) (33,100)
EUR Z Acc Class shares in issue at the end of the financial year 731,162 568,158 97,890 84,543
USDUSD Acc Class Shares in issue at the beginning of the year 4,379,638 5,732,553 111,118 178,617USD Acc Class shares issued during the financial year 1,052,515 1,032,140 32,796 15,069USD Acc Class shares redeemed during the financial year (2,456,240) (2,385,055) (39,074) (82,568)
USD Acc Class shares in issue at the end of the financial year 2,975,913 4,379,638 104,840 111,118
COMGEST GROWTH plc
STATEMENT OF CHANGES IN NET ASSETS ATTRIBUTABLE TO HOLDERS OF REDEEMABLE PARTICIPATING SHARESFor the financial year ended 31 December 2020 (continued)
The accompanying notes form an integral part of the financial statements. 170
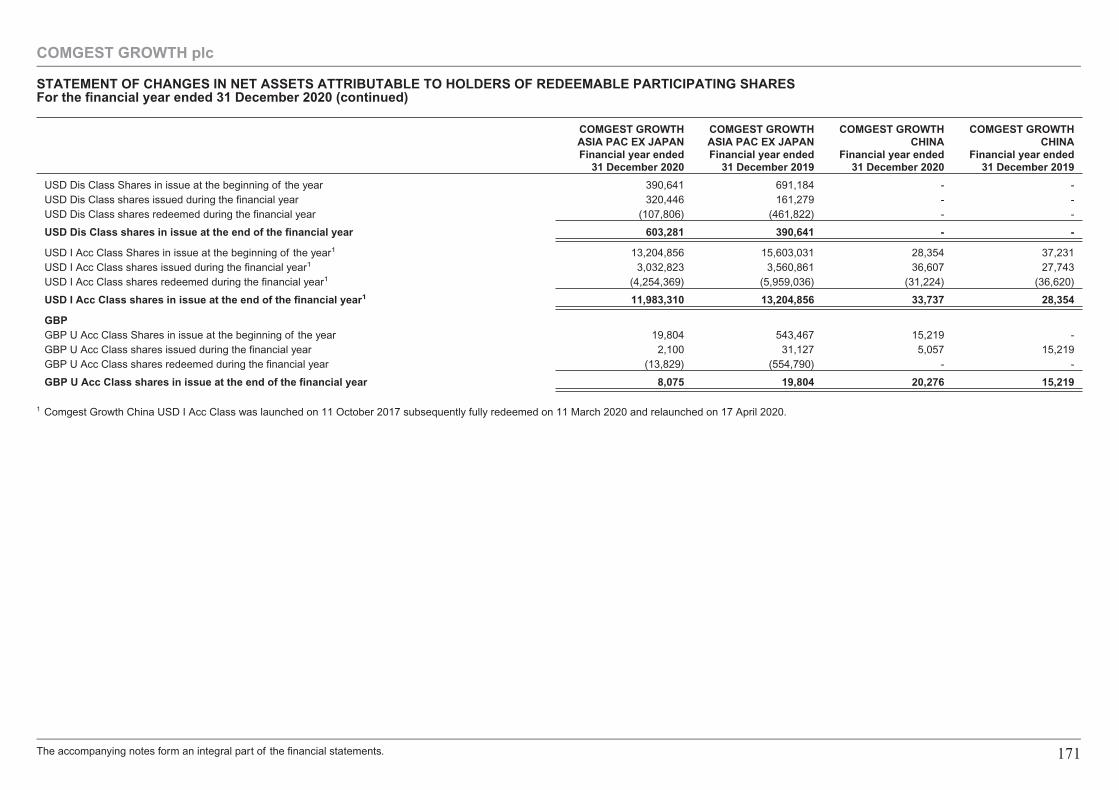
COMGEST GROWTHASIA PAC EX JAPANFinancial year ended
31 December 2020
COMGEST GROWTHASIA PAC EX JAPANFinancial year ended
31 December 2019
COMGEST GROWTHCHINA
Financial year ended31 December 2020
COMGEST GROWTHCHINA
Financial year ended31 December 2019
USD Dis Class Shares in issue at the beginning of the year 390,641 691,184 - -USD Dis Class shares issued during the financial year 320,446 161,279 - -USD Dis Class shares redeemed during the financial year (107,806) (461,822) - -
USD Dis Class shares in issue at the end of the financial year 603,281 390,641 - -
USD I Acc Class Shares in issue at the beginning of the year1 13,204,856 15,603,031 28,354 37,231USD I Acc Class shares issued during the financial year1 3,032,823 3,560,861 36,607 27,743USD I Acc Class shares redeemed during the financial year1 (4,254,369) (5,959,036) (31,224) (36,620)
USD I Acc Class shares in issue at the end of the financial year1 11,983,310 13,204,856 33,737 28,354
GBPGBP U Acc Class Shares in issue at the beginning of the year 19,804 543,467 15,219 -GBP U Acc Class shares issued during the financial year 2,100 31,127 5,057 15,219GBP U Acc Class shares redeemed during the financial year (13,829) (554,790) - -
GBP U Acc Class shares in issue at the end of the financial year 8,075 19,804 20,276 15,219
1 Comgest Growth China USD I Acc Class was launched on 11 October 2017 subsequently fully redeemed on 11 March 2020 and relaunched on 17 April 2020.
COMGEST GROWTH plc
STATEMENT OF CHANGES IN NET ASSETS ATTRIBUTABLE TO HOLDERS OF REDEEMABLE PARTICIPATING SHARESFor the financial year ended 31 December 2020 (continued)
The accompanying notes form an integral part of the financial statements. 171
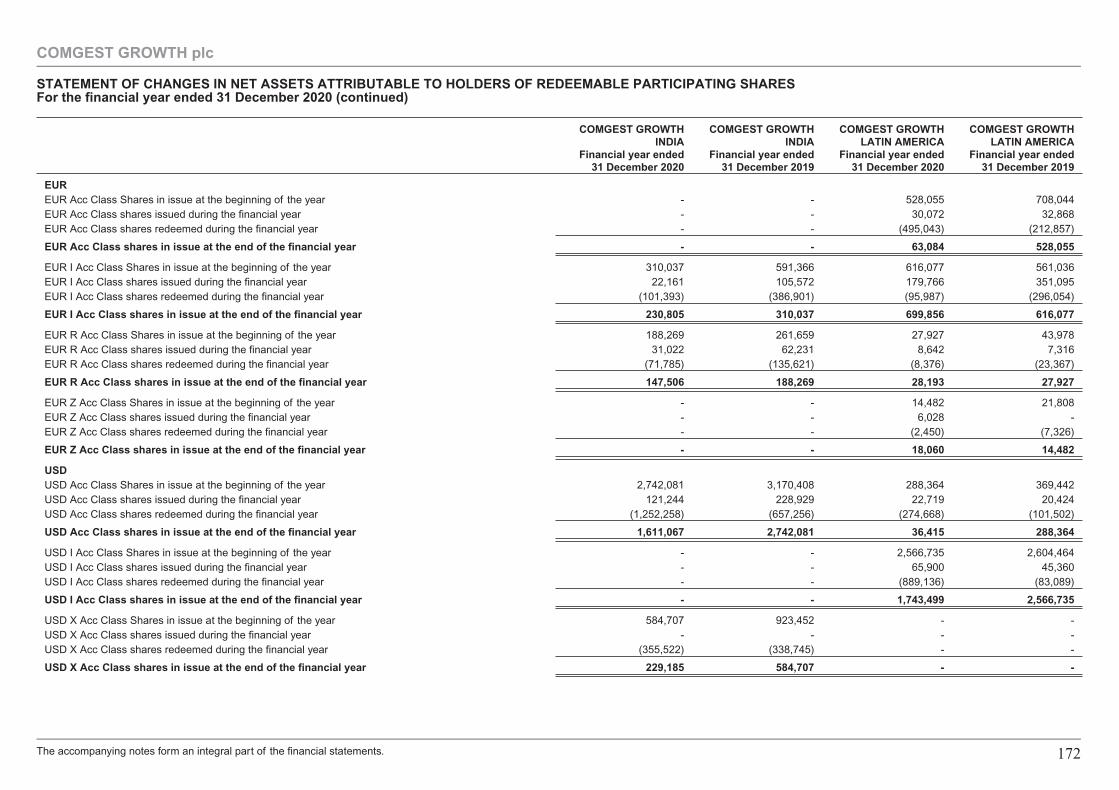
COMGEST GROWTHINDIA
Financial year ended31 December 2020
COMGEST GROWTHINDIA
Financial year ended31 December 2019
COMGEST GROWTHLATIN AMERICA
Financial year ended31 December 2020
COMGEST GROWTHLATIN AMERICA
Financial year ended31 December 2019
EUREUR Acc Class Shares in issue at the beginning of the year - - 528,055 708,044EUR Acc Class shares issued during the financial year - - 30,072 32,868EUR Acc Class shares redeemed during the financial year - - (495,043) (212,857)
EUR Acc Class shares in issue at the end of the financial year - - 63,084 528,055
EUR I Acc Class Shares in issue at the beginning of the year 310,037 591,366 616,077 561,036EUR I Acc Class shares issued during the financial year 22,161 105,572 179,766 351,095EUR I Acc Class shares redeemed during the financial year (101,393) (386,901) (95,987) (296,054)
EUR I Acc Class shares in issue at the end of the financial year 230,805 310,037 699,856 616,077
EUR R Acc Class Shares in issue at the beginning of the year 188,269 261,659 27,927 43,978EUR R Acc Class shares issued during the financial year 31,022 62,231 8,642 7,316EUR R Acc Class shares redeemed during the financial year (71,785) (135,621) (8,376) (23,367)
EUR R Acc Class shares in issue at the end of the financial year 147,506 188,269 28,193 27,927
EUR Z Acc Class Shares in issue at the beginning of the year - - 14,482 21,808EUR Z Acc Class shares issued during the financial year - - 6,028 -EUR Z Acc Class shares redeemed during the financial year - - (2,450) (7,326)
EUR Z Acc Class shares in issue at the end of the financial year - - 18,060 14,482
USDUSD Acc Class Shares in issue at the beginning of the year 2,742,081 3,170,408 288,364 369,442USD Acc Class shares issued during the financial year 121,244 228,929 22,719 20,424USD Acc Class shares redeemed during the financial year (1,252,258) (657,256) (274,668) (101,502)
USD Acc Class shares in issue at the end of the financial year 1,611,067 2,742,081 36,415 288,364
USD I Acc Class Shares in issue at the beginning of the year - - 2,566,735 2,604,464USD I Acc Class shares issued during the financial year - - 65,900 45,360USD I Acc Class shares redeemed during the financial year - - (889,136) (83,089)
USD I Acc Class shares in issue at the end of the financial year - - 1,743,499 2,566,735
USD X Acc Class Shares in issue at the beginning of the year 584,707 923,452 - -USD X Acc Class shares issued during the financial year - - - -USD X Acc Class shares redeemed during the financial year (355,522) (338,745) - -
USD X Acc Class shares in issue at the end of the financial year 229,185 584,707 - -
COMGEST GROWTH plc
STATEMENT OF CHANGES IN NET ASSETS ATTRIBUTABLE TO HOLDERS OF REDEEMABLE PARTICIPATING SHARESFor the financial year ended 31 December 2020 (continued)
The accompanying notes form an integral part of the financial statements. 172
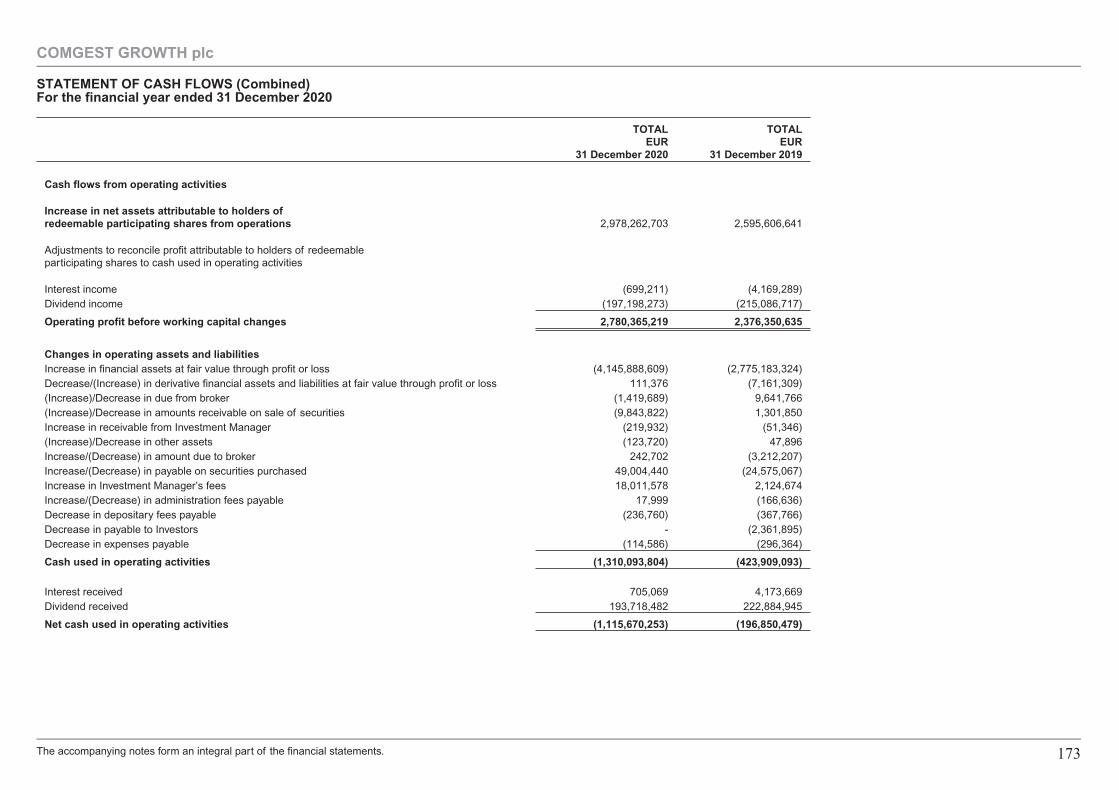
TOTALEUR
31 December 2020
TOTALEUR
31 December 2019
Cash flows from operating activities
Increase in net assets attributable to holders ofredeemable participating shares from operations 2,978,262,703 2,595,606,641
Adjustments to reconcile profit attributable to holders of redeemableparticipating shares to cash used in operating activities
Interest income (699,211) (4,169,289)Dividend income (197,198,273) (215,086,717)
Operating profit before working capital changes 2,780,365,219 2,376,350,635
Changes in operating assets and liabilitiesIncrease in financial assets at fair value through profit or loss (4,145,888,609) (2,775,183,324)Decrease/(Increase) in derivative financial assets and liabilities at fair value through profit or loss 111,376 (7,161,309)(Increase)/Decrease in due from broker (1,419,689) 9,641,766(Increase)/Decrease in amounts receivable on sale of securities (9,843,822) 1,301,850Increase in receivable from Investment Manager (219,932) (51,346)(Increase)/Decrease in other assets (123,720) 47,896Increase/(Decrease) in amount due to broker 242,702 (3,212,207)Increase/(Decrease) in payable on securities purchased 49,004,440 (24,575,067)Increase in Investment Manager’s fees 18,011,578 2,124,674Increase/(Decrease) in administration fees payable 17,999 (166,636)Decrease in depositary fees payable (236,760) (367,766)Decrease in payable to Investors - (2,361,895)Decrease in expenses payable (114,586) (296,364)
Cash used in operating activities (1,310,093,804) (423,909,093)
Interest received 705,069 4,173,669Dividend received 193,718,482 222,884,945
Net cash used in operating activities (1,115,670,253) (196,850,479)
COMGEST GROWTH plc
STATEMENT OF CASH FLOWS (Combined)For the financial year ended 31 December 2020
The accompanying notes form an integral part of the financial statements. 173
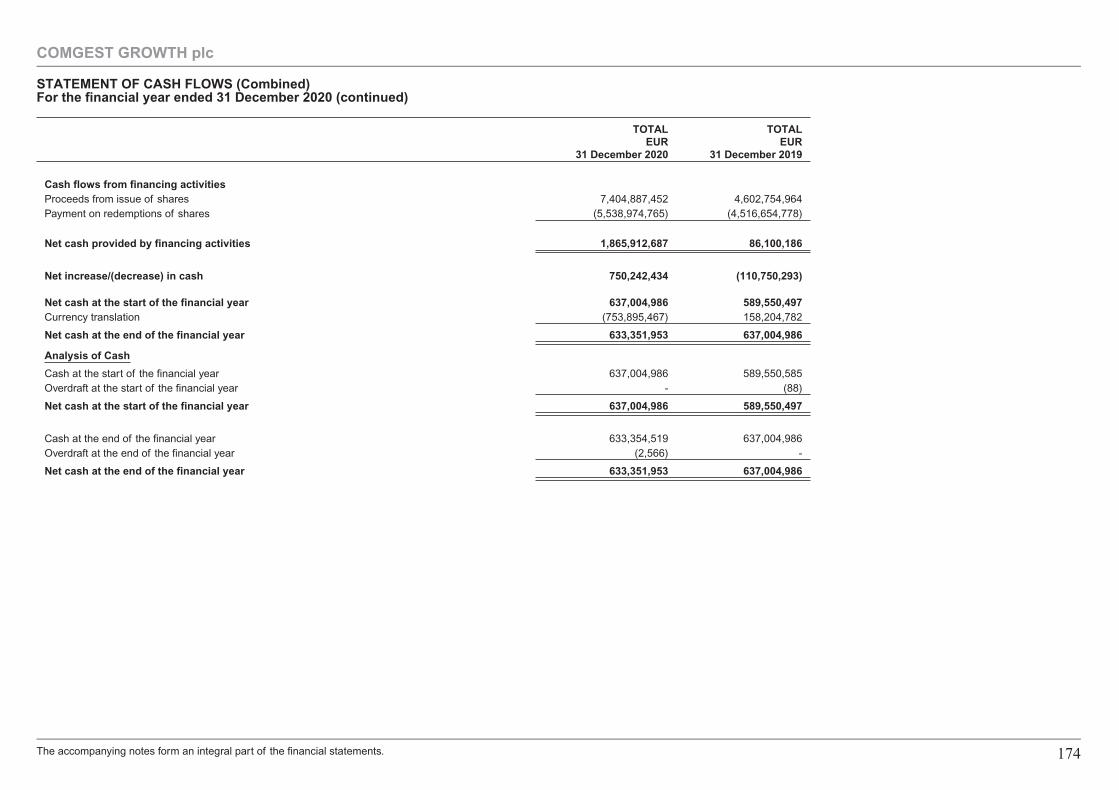
TOTALEUR
31 December 2020
TOTALEUR
31 December 2019
Cash flows from financing activitiesProceeds from issue of shares 7,404,887,452 4,602,754,964Payment on redemptions of shares (5,538,974,765) (4,516,654,778)
Net cash provided by financing activities 1,865,912,687 86,100,186
Net increase/(decrease) in cash 750,242,434 (110,750,293)
Net cash at the start of the financial year 637,004,986 589,550,497Currency translation (753,895,467) 158,204,782
Net cash at the end of the financial year 633,351,953 637,004,986
Analysis of Cash
Cash at the start of the financial year 637,004,986 589,550,585Overdraft at the start of the financial year - (88)
Net cash at the start of the financial year 637,004,986 589,550,497
Cash at the end of the financial year 633,354,519 637,004,986Overdraft at the end of the financial year (2,566) -
Net cash at the end of the financial year 633,351,953 637,004,986
COMGEST GROWTH plc
STATEMENT OF CASH FLOWS (Combined)For the financial year ended 31 December 2020 (continued)
The accompanying notes form an integral part of the financial statements. 174
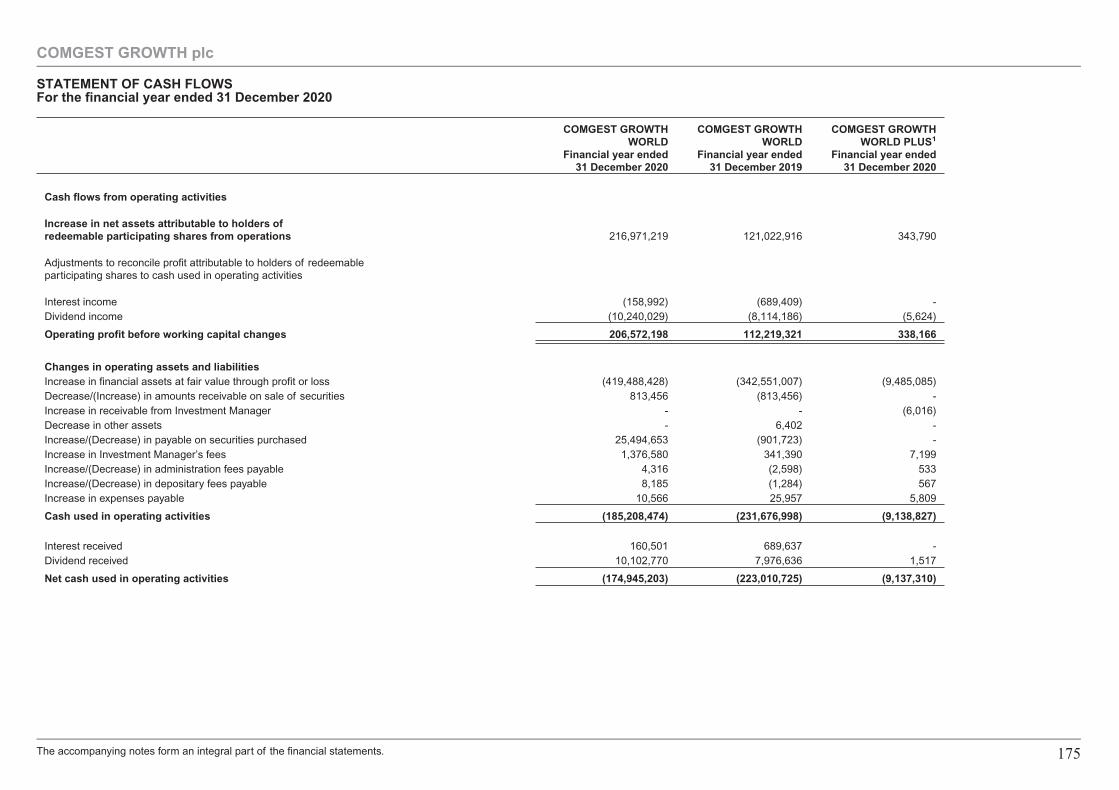
COMGEST GROWTHWORLD
Financial year ended31 December 2020
COMGEST GROWTHWORLD
Financial year ended31 December 2019
COMGEST GROWTHWORLD PLUS1
Financial year ended31 December 2020
Cash flows from operating activities
Increase in net assets attributable to holders ofredeemable participating shares from operations 216,971,219 121,022,916 343,790
Adjustments to reconcile profit attributable to holders of redeemableparticipating shares to cash used in operating activities
Interest income (158,992) (689,409) -Dividend income (10,240,029) (8,114,186) (5,624)
Operating profit before working capital changes 206,572,198 112,219,321 338,166
Changes in operating assets and liabilitiesIncrease in financial assets at fair value through profit or loss (419,488,428) (342,551,007) (9,485,085)Decrease/(Increase) in amounts receivable on sale of securities 813,456 (813,456) -Increase in receivable from Investment Manager - - (6,016)Decrease in other assets - 6,402 -Increase/(Decrease) in payable on securities purchased 25,494,653 (901,723) -Increase in Investment Manager’s fees 1,376,580 341,390 7,199Increase/(Decrease) in administration fees payable 4,316 (2,598) 533Increase/(Decrease) in depositary fees payable 8,185 (1,284) 567Increase in expenses payable 10,566 25,957 5,809
Cash used in operating activities (185,208,474) (231,676,998) (9,138,827)
Interest received 160,501 689,637 -Dividend received 10,102,770 7,976,636 1,517
Net cash used in operating activities (174,945,203) (223,010,725) (9,137,310)
COMGEST GROWTH plc
STATEMENT OF CASH FLOWSFor the financial year ended 31 December 2020
The accompanying notes form an integral part of the financial statements. 175
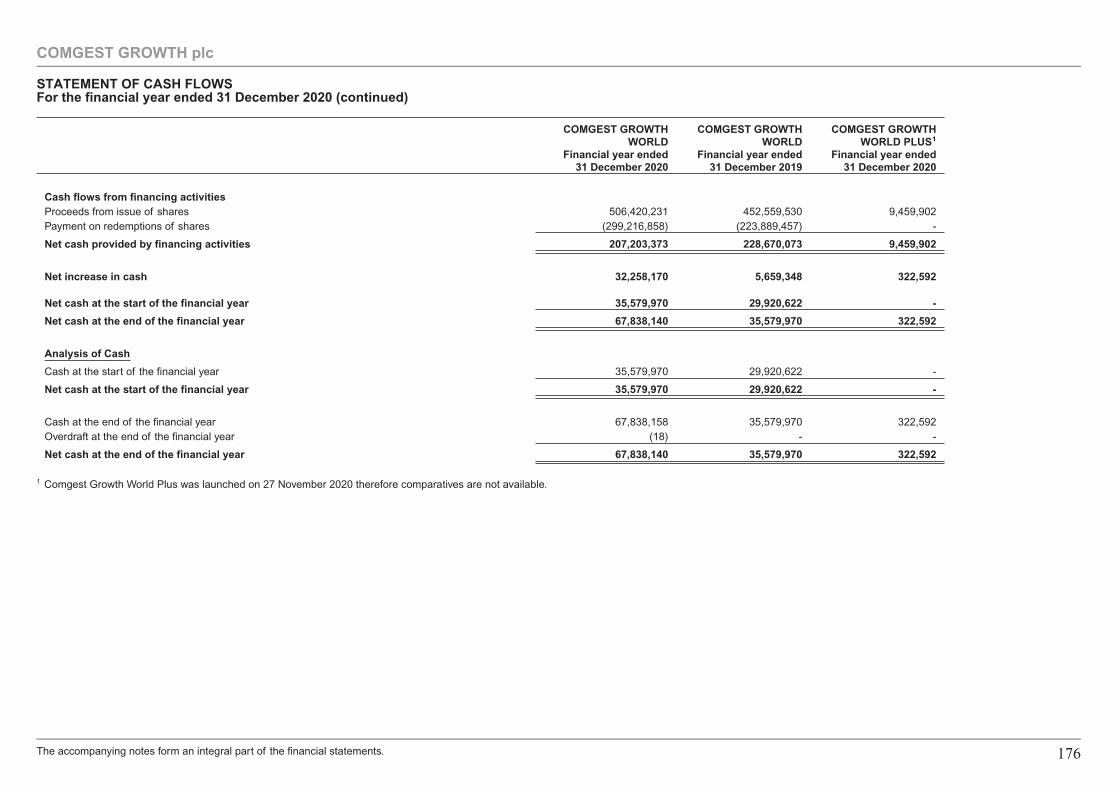
COMGEST GROWTHWORLD
Financial year ended31 December 2020
COMGEST GROWTHWORLD
Financial year ended31 December 2019
COMGEST GROWTHWORLD PLUS1
Financial year ended31 December 2020
Cash flows from financing activitiesProceeds from issue of shares 506,420,231 452,559,530 9,459,902Payment on redemptions of shares (299,216,858) (223,889,457) -
Net cash provided by financing activities 207,203,373 228,670,073 9,459,902
Net increase in cash 32,258,170 5,659,348 322,592
Net cash at the start of the financial year 35,579,970 29,920,622 -
Net cash at the end of the financial year 67,838,140 35,579,970 322,592
Analysis of Cash
Cash at the start of the financial year 35,579,970 29,920,622 -
Net cash at the start of the financial year 35,579,970 29,920,622 -
Cash at the end of the financial year 67,838,158 35,579,970 322,592Overdraft at the end of the financial year (18) - -
Net cash at the end of the financial year 67,838,140 35,579,970 322,592
1 Comgest Growth World Plus was launched on 27 November 2020 therefore comparatives are not available.
COMGEST GROWTH plc
STATEMENT OF CASH FLOWSFor the financial year ended 31 December 2020 (continued)
The accompanying notes form an integral part of the financial statements. 176
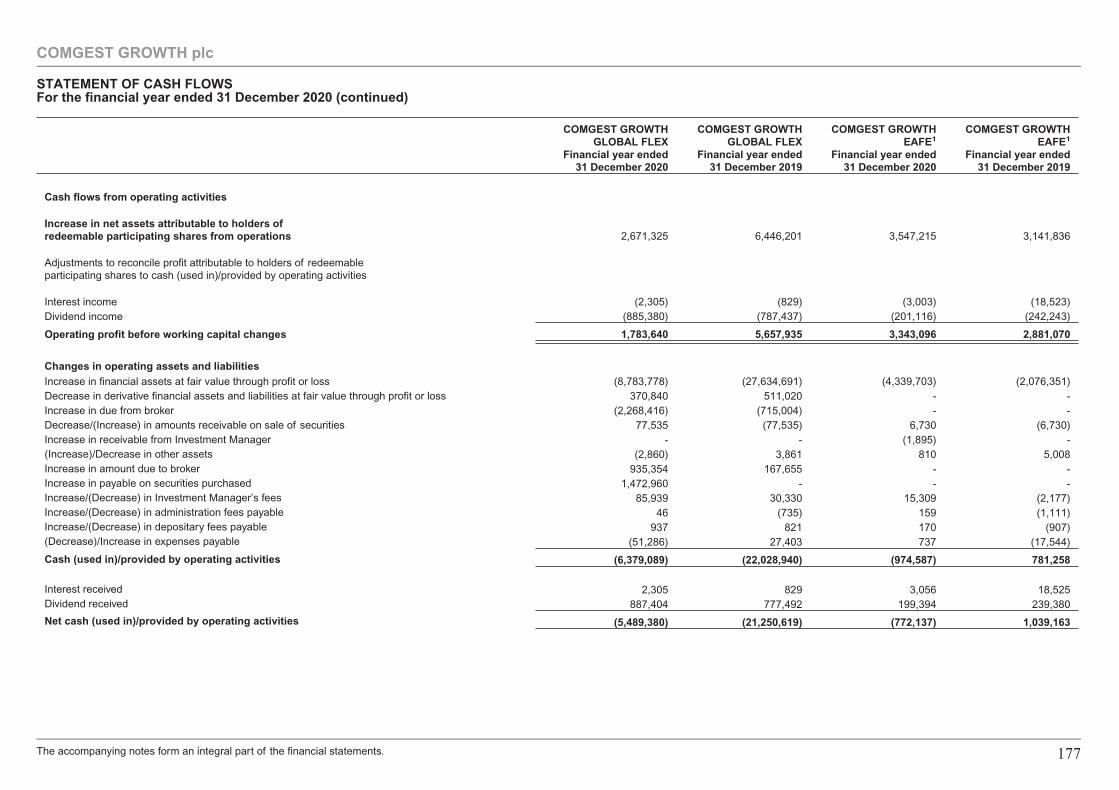
COMGEST GROWTHGLOBAL FLEX
Financial year ended31 December 2020
COMGEST GROWTHGLOBAL FLEX
Financial year ended31 December 2019
COMGEST GROWTHEAFE1
Financial year ended31 December 2020
COMGEST GROWTHEAFE1
Financial year ended31 December 2019
2,671,325 6,446,201 3,547,215 3,141,836
(2,305) (829) (3,003) (18,523)(885,380) (787,437) (201,116) (242,243)
1,783,640 5,657,935 3,343,096 2,881,070
(8,783,778) (27,634,691) (4,339,703) (2,076,351)370,840 511,020 - -
(2,268,416) (715,004) - -77,535 (77,535) 6,730 (6,730)
- - (1,895) -(2,860) 3,861 810 5,008
935,354 167,655 - -1,472,960 - - -
85,939 30,330 15,309 (2,177)46 (735) 159 (1,111)
937 821 170 (907)(51,286) 27,403 737 (17,544)
(6,379,089) (22,028,940) (974,587) 781,258
2,305 829 3,056 18,525887,404 777,492 199,394 239,380
Cash flows from operating activities
Increase in net assets attributable to holders ofredeemable participating shares from operations
Adjustments to reconcile profit attributable to holders of redeemableparticipating shares to cash (used in)/provided by operating activities
Interest incomeDividend income
Operating profit before working capital changes
Changes in operating assets and liabilitiesIncrease in financial assets at fair value through profit or lossDecrease in derivative financial assets and liabilities at fair value through profit or loss Increase in due from brokerDecrease/(Increase) in amounts receivable on sale of securitiesIncrease in receivable from Investment Manager(Increase)/Decrease in other assetsIncrease in amount due to brokerIncrease in payable on securities purchasedIncrease/(Decrease) in Investment Manager’s feesIncrease/(Decrease) in administration fees payableIncrease/(Decrease) in depositary fees payable(Decrease)/Increase in expenses payable
Cash (used in)/provided by operating activities
Interest receivedDividend received
Net cash (used in)/provided by operating activities (5,489,380) (21,250,619) (772,137) 1,039,163
COMGEST GROWTH plc
STATEMENT OF CASH FLOWSFor the financial year ended 31 December 2020 (continued)
The accompanying notes form an integral part of the financial statements. 177
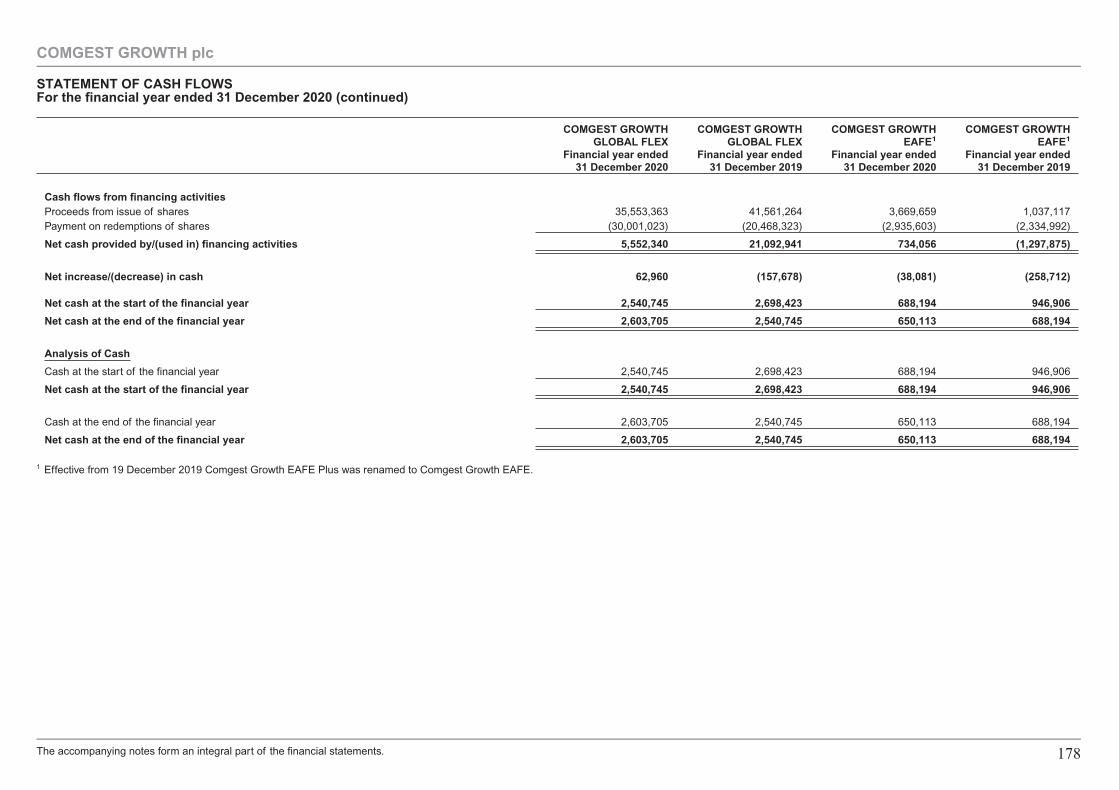
COMGEST GROWTHGLOBAL FLEX
Financial year ended31 December 2020
COMGEST GROWTHGLOBAL FLEX
Financial year ended31 December 2019
COMGEST GROWTHEAFE1
Financial year ended31 December 2020
COMGEST GROWTHEAFE1
Financial year ended31 December 2019
Cash flows from financing activitiesProceeds from issue of shares 35,553,363 41,561,264 3,669,659 1,037,117Payment on redemptions of shares (30,001,023) (20,468,323) (2,935,603) (2,334,992)
Net cash provided by/(used in) financing activities 5,552,340 21,092,941 734,056 (1,297,875)
Net increase/(decrease) in cash 62,960 (157,678) (38,081) (258,712)
Net cash at the start of the financial year 2,540,745 2,698,423 688,194 946,906
Net cash at the end of the financial year 2,603,705 2,540,745 650,113 688,194
Analysis of Cash
Cash at the start of the financial year 2,540,745 2,698,423 688,194 946,906
Net cash at the start of the financial year 2,540,745 2,698,423 688,194 946,906
Cash at the end of the financial year 2,603,705 2,540,745 650,113 688,194
Net cash at the end of the financial year 2,603,705 2,540,745 650,113 688,194
1 Effective from 19 December 2019 Comgest Growth EAFE Plus was renamed to Comgest Growth EAFE.
COMGEST GROWTH plc
STATEMENT OF CASH FLOWSFor the financial year ended 31 December 2020 (continued)
The accompanying notes form an integral part of the financial statements. 178
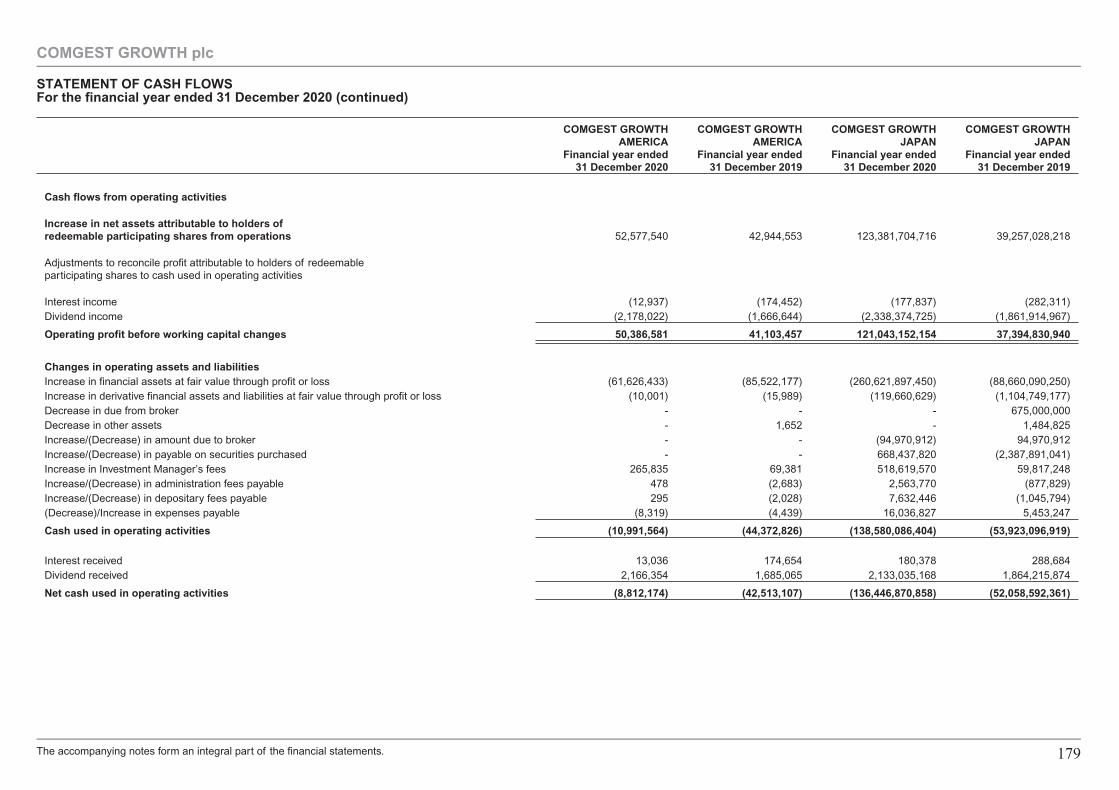
COMGEST GROWTHAMERICA
Financial year ended31 December 2020
COMGEST GROWTHAMERICA
Financial year ended31 December 2019
COMGEST GROWTHJAPAN
Financial year ended31 December 2020
COMGEST GROWTHJAPAN
Financial year ended31 December 2019
Cash flows from operating activities
Increase in net assets attributable to holders ofredeemable participating shares from operations 52,577,540 42,944,553 123,381,704,716 39,257,028,218
Adjustments to reconcile profit attributable to holders of redeemableparticipating shares to cash used in operating activities
Interest income (12,937) (174,452) (177,837) (282,311)Dividend income (2,178,022) (1,666,644) (2,338,374,725) (1,861,914,967)
Operating profit before working capital changes 50,386,581 41,103,457 121,043,152,154 37,394,830,940
Changes in operating assets and liabilitiesIncrease in financial assets at fair value through profit or loss (61,626,433) (85,522,177) (260,621,897,450) (88,660,090,250)Increase in derivative financial assets and liabilities at fair value through profit or loss (10,001) (15,989) (119,660,629) (1,104,749,177)Decrease in due from broker - - - 675,000,000Decrease in other assets - 1,652 - 1,484,825Increase/(Decrease) in amount due to broker - - (94,970,912) 94,970,912Increase/(Decrease) in payable on securities purchased - - 668,437,820 (2,387,891,041)Increase in Investment Manager’s fees 265,835 69,381 518,619,570 59,817,248Increase/(Decrease) in administration fees payable 478 (2,683) 2,563,770 (877,829)Increase/(Decrease) in depositary fees payable 295 (2,028) 7,632,446 (1,045,794)(Decrease)/Increase in expenses payable (8,319) (4,439) 16,036,827 5,453,247
Cash used in operating activities (10,991,564) (44,372,826) (138,580,086,404) (53,923,096,919)
Interest received 13,036 174,654 180,378 288,684Dividend received 2,166,354 1,685,065 2,133,035,168 1,864,215,874
Net cash used in operating activities (8,812,174) (42,513,107) (136,446,870,858) (52,058,592,361)
COMGEST GROWTH plc
STATEMENT OF CASH FLOWSFor the financial year ended 31 December 2020 (continued)
The accompanying notes form an integral part of the financial statements. 179
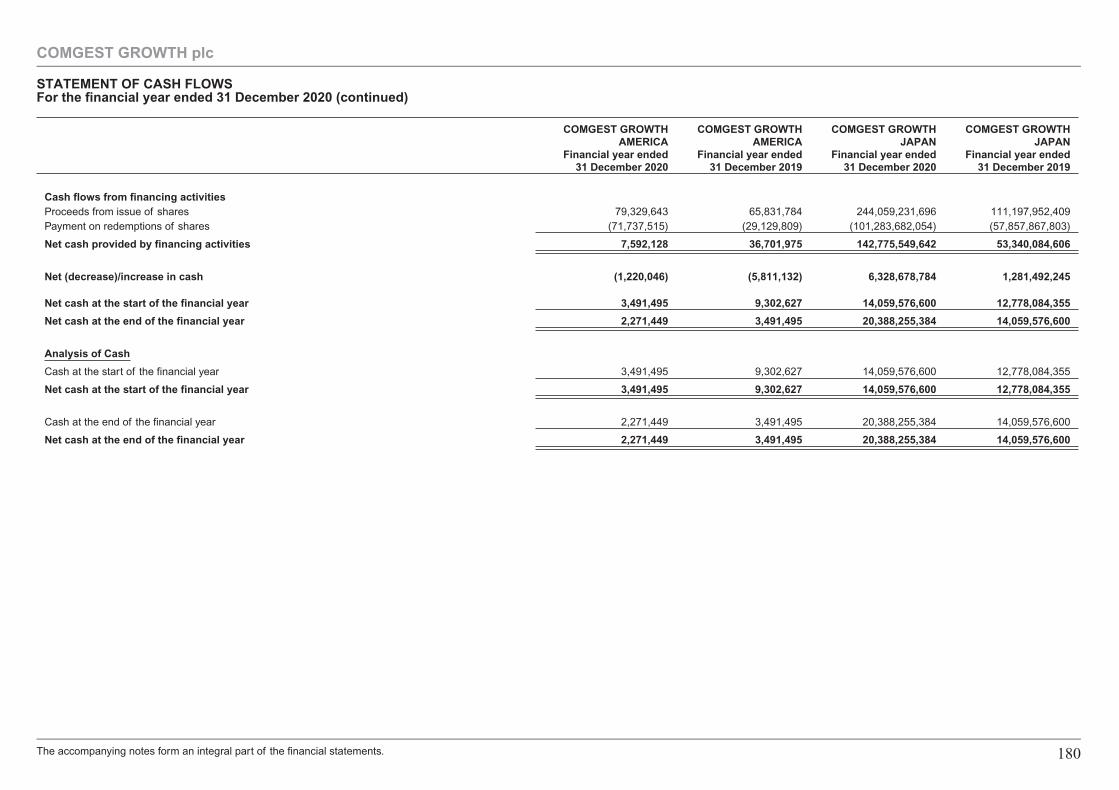
COMGEST GROWTHAMERICA
Financial year ended31 December 2020
COMGEST GROWTHAMERICA
Financial year ended31 December 2019
COMGEST GROWTHJAPAN
Financial year ended31 December 2020
COMGEST GROWTHJAPAN
Financial year ended31 December 2019
Cash flows from financing activitiesProceeds from issue of shares 79,329,643 65,831,784 244,059,231,696 111,197,952,409Payment on redemptions of shares (71,737,515) (29,129,809) (101,283,682,054) (57,857,867,803)
Net cash provided by financing activities 7,592,128 36,701,975 142,775,549,642 53,340,084,606
Net (decrease)/increase in cash (1,220,046) (5,811,132) 6,328,678,784 1,281,492,245
Net cash at the start of the financial year 3,491,495 9,302,627 14,059,576,600 12,778,084,355
Net cash at the end of the financial year 2,271,449 3,491,495 20,388,255,384 14,059,576,600
Analysis of Cash
Cash at the start of the financial year 3,491,495 9,302,627 14,059,576,600 12,778,084,355
Net cash at the start of the financial year 3,491,495 9,302,627 14,059,576,600 12,778,084,355
Cash at the end of the financial year 2,271,449 3,491,495 20,388,255,384 14,059,576,600
Net cash at the end of the financial year 2,271,449 3,491,495 20,388,255,384 14,059,576,600
COMGEST GROWTH plc
STATEMENT OF CASH FLOWSFor the financial year ended 31 December 2020 (continued)
The accompanying notes form an integral part of the financial statements. 180
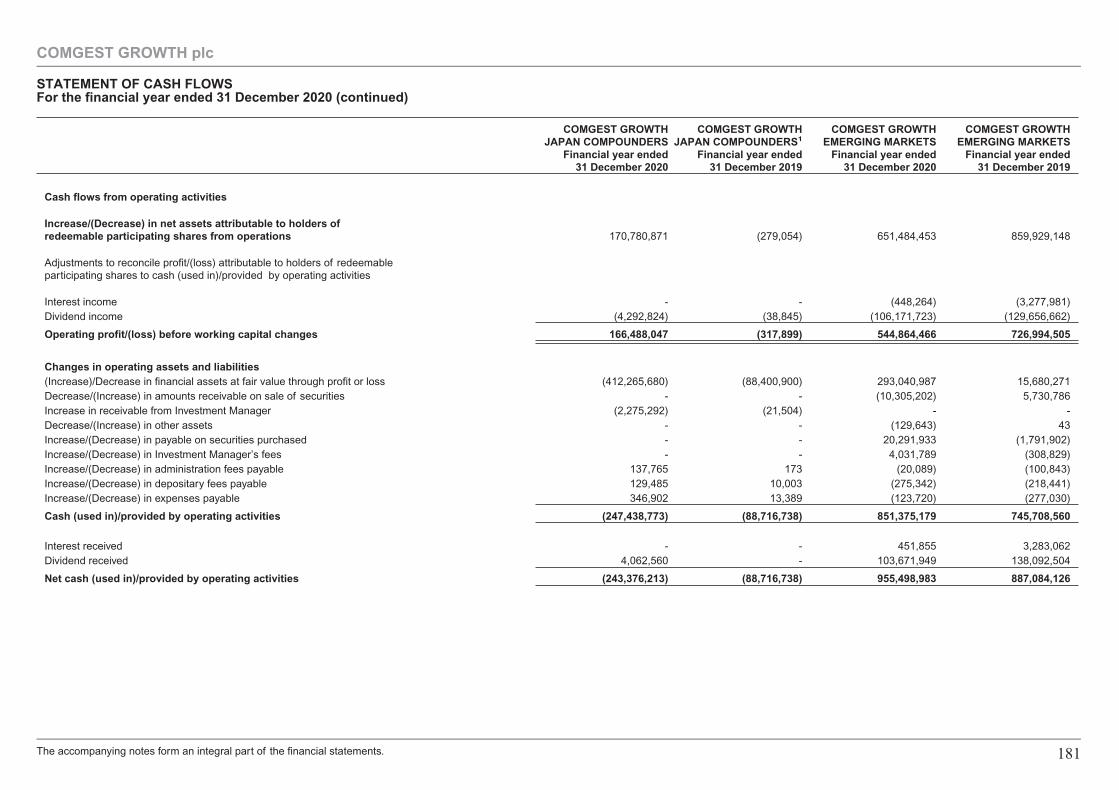
COMGEST GROWTHJAPAN COMPOUNDERS
Financial year ended31 December 2020
COMGEST GROWTHJAPAN COMPOUNDERS1
Financial year ended31 December 2019
COMGEST GROWTHEMERGING MARKETS
Financial year ended31 December 2020
COMGEST GROWTHEMERGING MARKETS
Financial year ended31 December 2019
Cash flows from operating activities
Increase/(Decrease) in net assets attributable to holders ofredeemable participating shares from operations 170,780,871 (279,054) 651,484,453 859,929,148
Adjustments to reconcile profit/(loss) attributable to holders of redeemableparticipating shares to cash (used in)/provided by operating activities
Interest income - - (448,264) (3,277,981)Dividend income (4,292,824) (38,845) (106,171,723) (129,656,662)
Operating profit/(loss) before working capital changes 166,488,047 (317,899) 544,864,466 726,994,505
Changes in operating assets and liabilities(Increase)/Decrease in financial assets at fair value through profit or loss (412,265,680) (88,400,900) 293,040,987 15,680,271Decrease/(Increase) in amounts receivable on sale of securities - - (10,305,202) 5,730,786Increase in receivable from Investment Manager (2,275,292) (21,504) - -Decrease/(Increase) in other assets - - (129,643) 43Increase/(Decrease) in payable on securities purchased - - 20,291,933 (1,791,902)Increase/(Decrease) in Investment Manager’s fees - - 4,031,789 (308,829)Increase/(Decrease) in administration fees payable 137,765 173 (20,089) (100,843)Increase/(Decrease) in depositary fees payable 129,485 10,003 (275,342) (218,441)Increase/(Decrease) in expenses payable 346,902 13,389 (123,720) (277,030)
Cash (used in)/provided by operating activities (247,438,773) (88,716,738) 851,375,179 745,708,560
Interest received - - 451,855 3,283,062Dividend received 4,062,560 - 103,671,949 138,092,504
Net cash (used in)/provided by operating activities (243,376,213) (88,716,738) 955,498,983 887,084,126
COMGEST GROWTH plc
STATEMENT OF CASH FLOWSFor the financial year ended 31 December 2020 (continued)
The accompanying notes form an integral part of the financial statements. 181
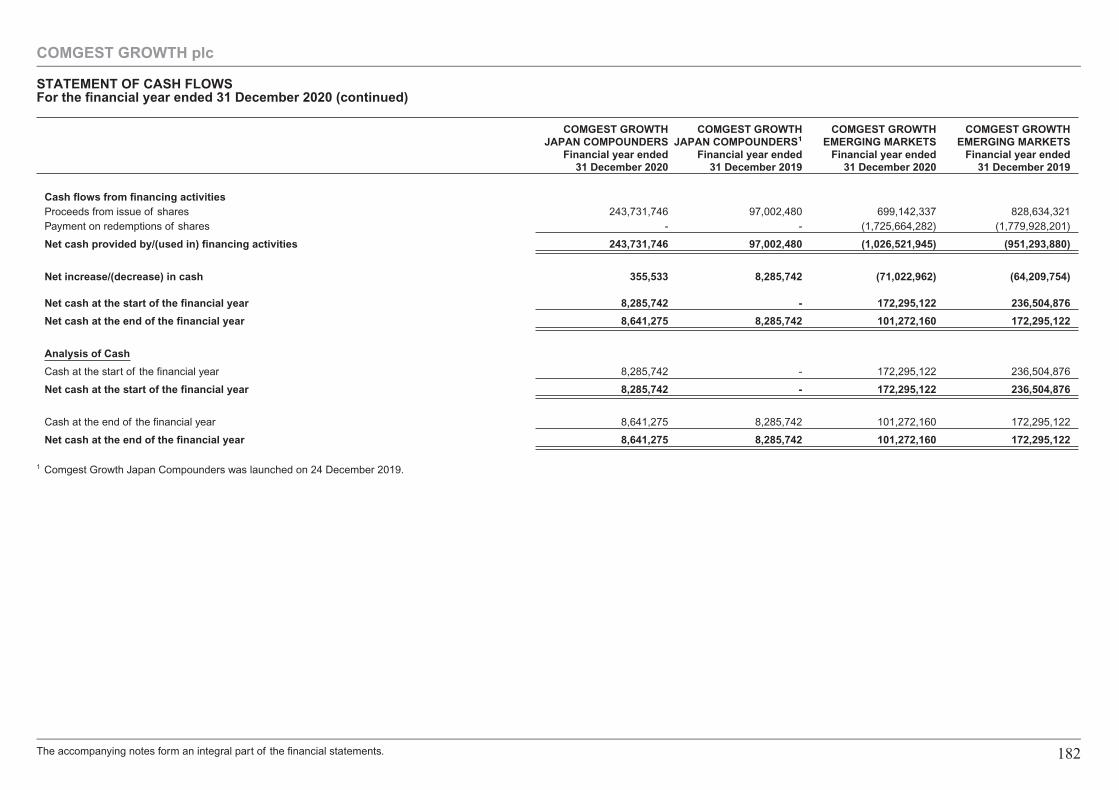
COMGEST GROWTHJAPAN COMPOUNDERS
Financial year ended31 December 2020
COMGEST GROWTHJAPAN COMPOUNDERS1
Financial year ended31 December 2019
COMGEST GROWTHEMERGING MARKETS
Financial year ended31 December 2020
COMGEST GROWTHEMERGING MARKETS
Financial year ended31 December 2019
Cash flows from financing activitiesProceeds from issue of shares 243,731,746 97,002,480 699,142,337 828,634,321Payment on redemptions of shares - - (1,725,664,282) (1,779,928,201)
Net cash provided by/(used in) financing activities 243,731,746 97,002,480 (1,026,521,945) (951,293,880)
Net increase/(decrease) in cash 355,533 8,285,742 (71,022,962) (64,209,754)
Net cash at the start of the financial year 8,285,742 - 172,295,122 236,504,876
Net cash at the end of the financial year 8,641,275 8,285,742 101,272,160 172,295,122
Analysis of Cash
Cash at the start of the financial year 8,285,742 - 172,295,122 236,504,876
Net cash at the start of the financial year 8,285,742 - 172,295,122 236,504,876
Cash at the end of the financial year 8,641,275 8,285,742 101,272,160 172,295,122
Net cash at the end of the financial year 8,641,275 8,285,742 101,272,160 172,295,122
1 Comgest Growth Japan Compounders was launched on 24 December 2019.
COMGEST GROWTH plc
STATEMENT OF CASH FLOWSFor the financial year ended 31 December 2020 (continued)
The accompanying notes form an integral part of the financial statements. 182
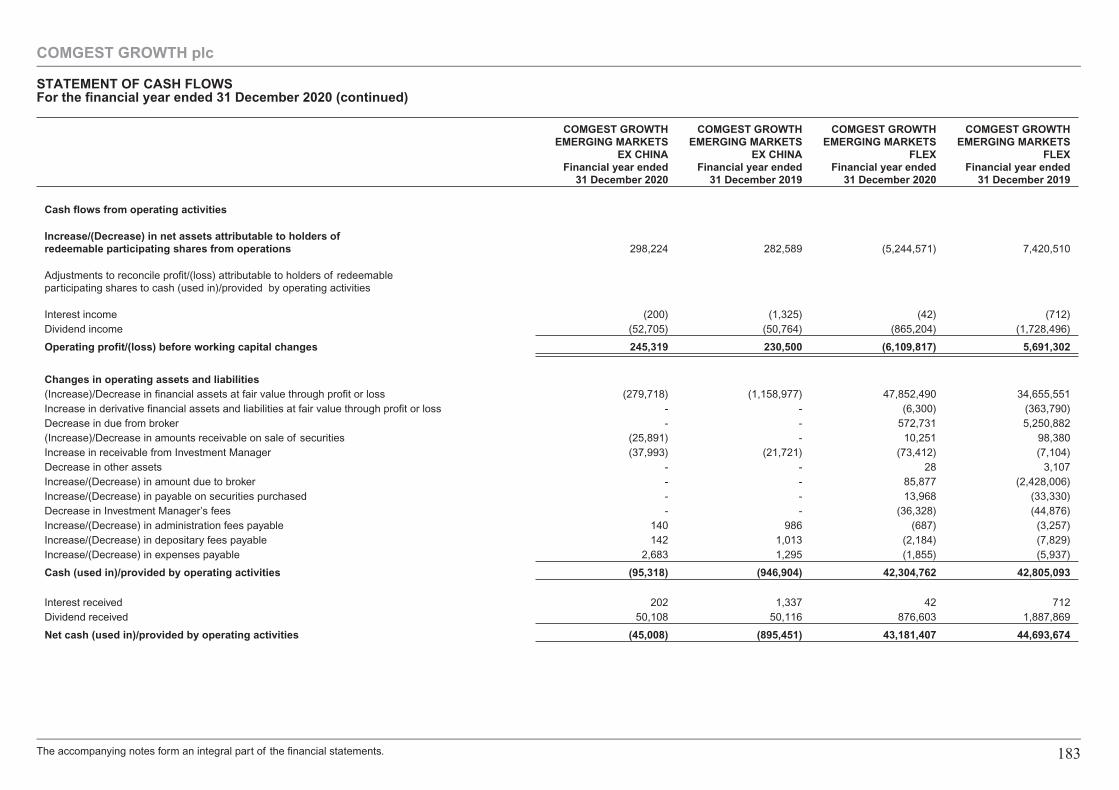
COMGEST GROWTHEMERGING MARKETS
EX CHINAFinancial year ended
31 December 2020
COMGEST GROWTHEMERGING MARKETS
EX CHINAFinancial year ended
31 December 2019
COMGEST GROWTHEMERGING MARKETS
FLEXFinancial year ended
31 December 2020
COMGEST GROWTHEMERGING MARKETS
FLEXFinancial year ended
31 December 2019
Cash flows from operating activities
Increase/(Decrease) in net assets attributable to holders ofredeemable participating shares from operations 298,224 282,589 (5,244,571) 7,420,510
Adjustments to reconcile profit/(loss) attributable to holders of redeemableparticipating shares to cash (used in)/provided by operating activities
Interest income (200) (1,325) (42) (712)Dividend income (52,705) (50,764) (865,204) (1,728,496)
Operating profit/(loss) before working capital changes 245,319 230,500 (6,109,817) 5,691,302
Changes in operating assets and liabilities(Increase)/Decrease in financial assets at fair value through profit or loss (279,718) (1,158,977) 47,852,490 34,655,551Increase in derivative financial assets and liabilities at fair value through profit or loss - - (6,300) (363,790)Decrease in due from broker - - 572,731 5,250,882(Increase)/Decrease in amounts receivable on sale of securities (25,891) - 10,251 98,380Increase in receivable from Investment Manager (37,993) (21,721) (73,412) (7,104)Decrease in other assets - - 28 3,107Increase/(Decrease) in amount due to broker - - 85,877 (2,428,006)Increase/(Decrease) in payable on securities purchased - - 13,968 (33,330)Decrease in Investment Manager’s fees - - (36,328) (44,876)Increase/(Decrease) in administration fees payable 140 986 (687) (3,257)Increase/(Decrease) in depositary fees payable 142 1,013 (2,184) (7,829)Increase/(Decrease) in expenses payable 2,683 1,295 (1,855) (5,937)
Cash (used in)/provided by operating activities (95,318) (946,904) 42,304,762 42,805,093
Interest received 202 1,337 42 712Dividend received 50,108 50,116 876,603 1,887,869
Net cash (used in)/provided by operating activities (45,008) (895,451) 43,181,407 44,693,674
COMGEST GROWTH plc
STATEMENT OF CASH FLOWSFor the financial year ended 31 December 2020 (continued)
The accompanying notes form an integral part of the financial statements. 183
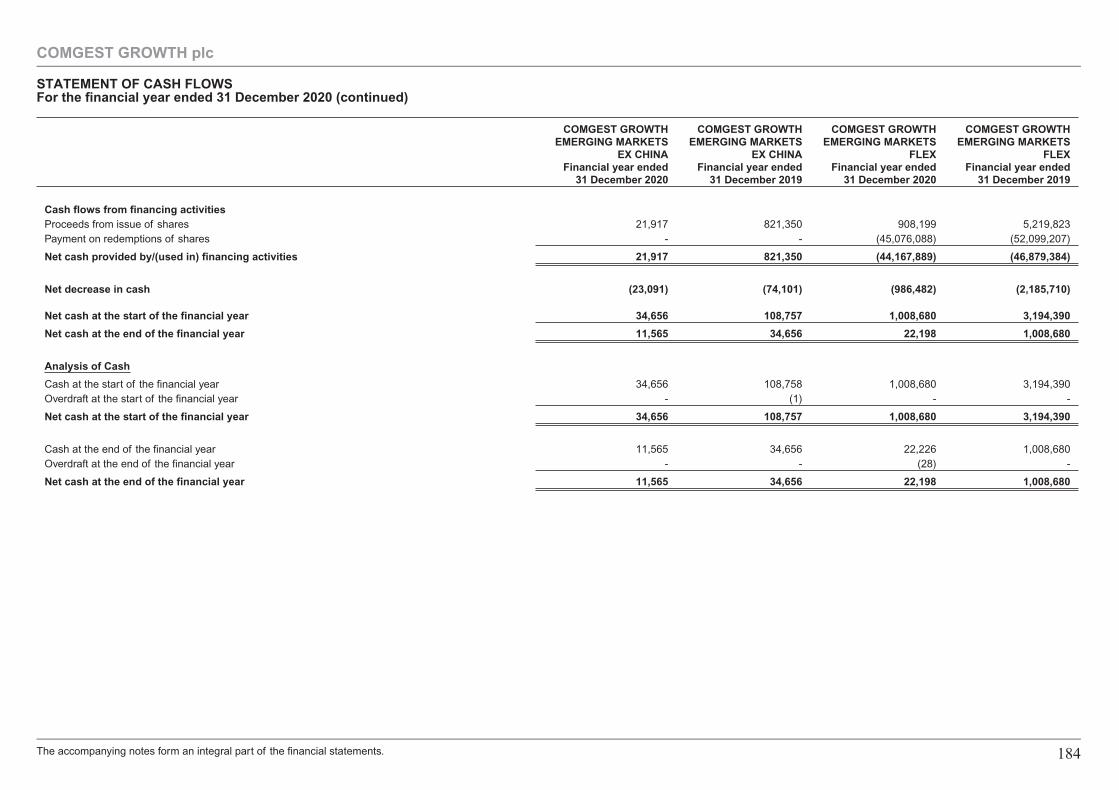
COMGEST GROWTHEMERGING MARKETS
EX CHINAFinancial year ended
31 December 2020
COMGEST GROWTHEMERGING MARKETS
EX CHINAFinancial year ended
31 December 2019
COMGEST GROWTHEMERGING MARKETS
FLEXFinancial year ended
31 December 2020
COMGEST GROWTHEMERGING MARKETS
FLEXFinancial year ended
31 December 2019
Cash flows from financing activitiesProceeds from issue of shares 21,917 821,350 908,199 5,219,823Payment on redemptions of shares - - (45,076,088) (52,099,207)
Net cash provided by/(used in) financing activities 21,917 821,350 (44,167,889) (46,879,384)
Net decrease in cash (23,091) (74,101) (986,482) (2,185,710)
Net cash at the start of the financial year 34,656 108,757 1,008,680 3,194,390
Net cash at the end of the financial year 11,565 34,656 22,198 1,008,680
Analysis of Cash
Cash at the start of the financial year 34,656 108,758 1,008,680 3,194,390Overdraft at the start of the financial year - (1) - -
Net cash at the start of the financial year 34,656 108,757 1,008,680 3,194,390
Cash at the end of the financial year 11,565 34,656 22,226 1,008,680Overdraft at the end of the financial year - - (28) -
Net cash at the end of the financial year 11,565 34,656 22,198 1,008,680
COMGEST GROWTH plc
STATEMENT OF CASH FLOWSFor the financial year ended 31 December 2020 (continued)
The accompanying notes form an integral part of the financial statements. 184
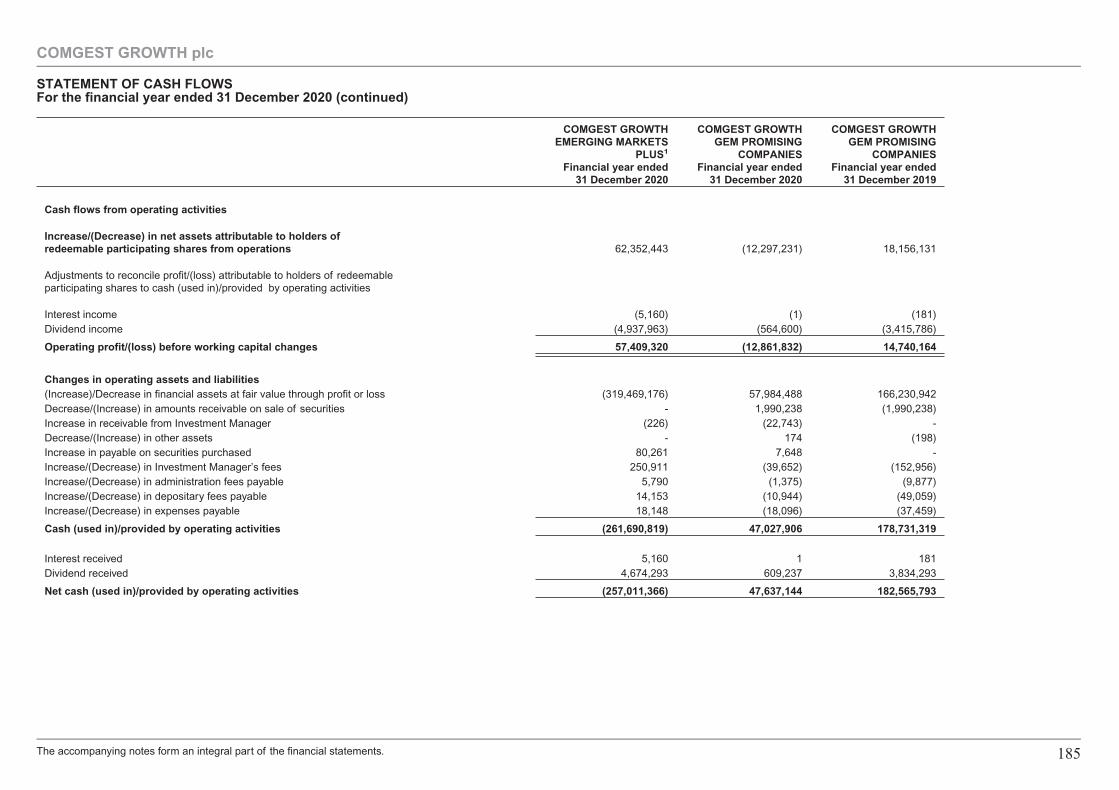
COMGEST GROWTHEMERGING MARKETS
PLUS1
Financial year ended31 December 2020
COMGEST GROWTHGEM PROMISING
COMPANIESFinancial year ended
31 December 2020
COMGEST GROWTHGEM PROMISING
COMPANIESFinancial year ended
31 December 2019
Cash flows from operating activities
Increase/(Decrease) in net assets attributable to holders ofredeemable participating shares from operations 62,352,443 (12,297,231) 18,156,131
Adjustments to reconcile profit/(loss) attributable to holders of redeemableparticipating shares to cash (used in)/provided by operating activities
Interest income (5,160) (1) (181)Dividend income (4,937,963) (564,600) (3,415,786)
Operating profit/(loss) before working capital changes 57,409,320 (12,861,832) 14,740,164
Changes in operating assets and liabilities(Increase)/Decrease in financial assets at fair value through profit or loss (319,469,176) 57,984,488 166,230,942Decrease/(Increase) in amounts receivable on sale of securities - 1,990,238 (1,990,238)Increase in receivable from Investment Manager (226) (22,743) -Decrease/(Increase) in other assets - 174 (198)Increase in payable on securities purchased 80,261 7,648 -Increase/(Decrease) in Investment Manager’s fees 250,911 (39,652) (152,956)Increase/(Decrease) in administration fees payable 5,790 (1,375) (9,877)Increase/(Decrease) in depositary fees payable 14,153 (10,944) (49,059)Increase/(Decrease) in expenses payable 18,148 (18,096) (37,459)
Cash (used in)/provided by operating activities (261,690,819) 47,027,906 178,731,319
Interest received 5,160 1 181Dividend received 4,674,293 609,237 3,834,293
Net cash (used in)/provided by operating activities (257,011,366) 47,637,144 182,565,793
COMGEST GROWTH plc
STATEMENT OF CASH FLOWSFor the financial year ended 31 December 2020 (continued)
The accompanying notes form an integral part of the financial statements. 185
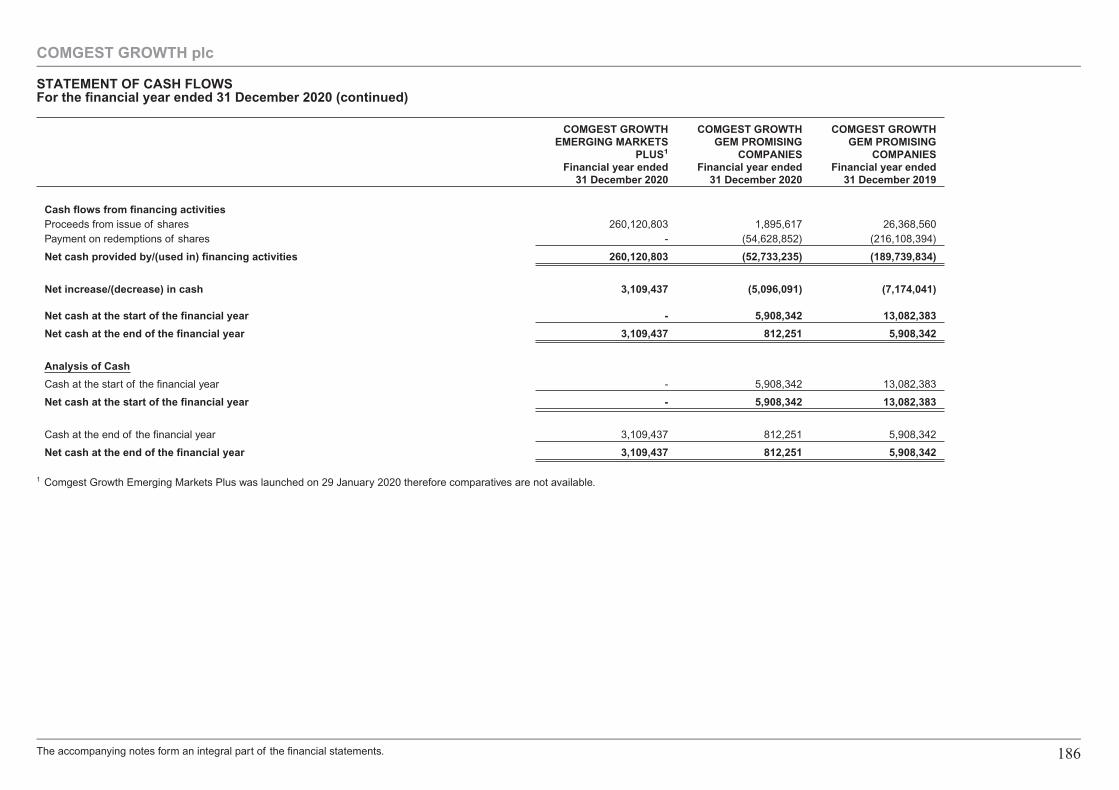
COMGEST GROWTHEMERGING MARKETS
PLUS1
Financial year ended31 December 2020
COMGEST GROWTHGEM PROMISING
COMPANIESFinancial year ended
31 December 2020
COMGEST GROWTHGEM PROMISING
COMPANIESFinancial year ended
31 December 2019
Cash flows from financing activitiesProceeds from issue of shares 260,120,803 1,895,617 26,368,560Payment on redemptions of shares - (54,628,852) (216,108,394)
Net cash provided by/(used in) financing activities 260,120,803 (52,733,235) (189,739,834)
Net increase/(decrease) in cash 3,109,437 (5,096,091) (7,174,041)
Net cash at the start of the financial year - 5,908,342 13,082,383
Net cash at the end of the financial year 3,109,437 812,251 5,908,342
Analysis of Cash
Cash at the start of the financial year - 5,908,342 13,082,383
Net cash at the start of the financial year - 5,908,342 13,082,383
Cash at the end of the financial year 3,109,437 812,251 5,908,342
Net cash at the end of the financial year 3,109,437 812,251 5,908,342
1 Comgest Growth Emerging Markets Plus was launched on 29 January 2020 therefore comparatives are not available.
COMGEST GROWTH plc
STATEMENT OF CASH FLOWSFor the financial year ended 31 December 2020 (continued)
The accompanying notes form an integral part of the financial statements. 186
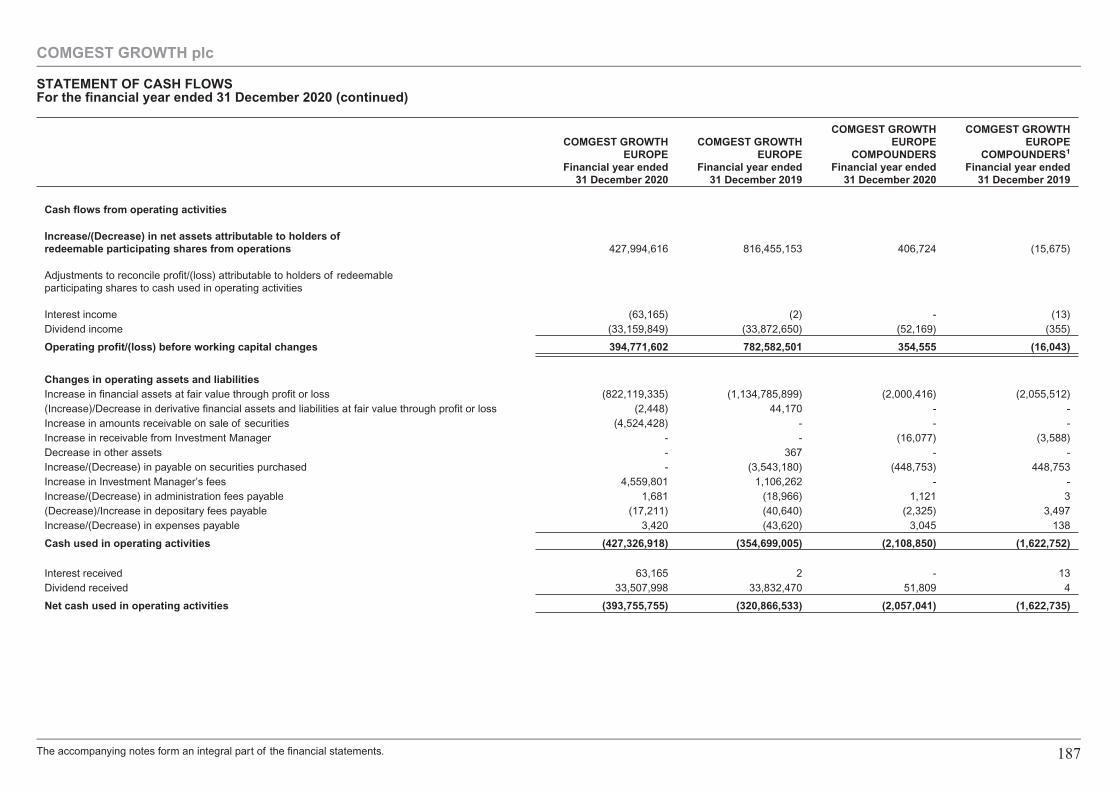
COMGEST GROWTHEUROPE
Financial year ended31 December 2020
COMGEST GROWTHEUROPE
Financial year ended31 December 2019
COMGEST GROWTHEUROPE
COMPOUNDERSFinancial year ended
31 December 2020
COMGEST GROWTHEUROPE
COMPOUNDERS1
Financial year ended31 December 2019
Cash flows from operating activities
Increase/(Decrease) in net assets attributable to holders ofredeemable participating shares from operations 427,994,616 816,455,153 406,724 (15,675)
Adjustments to reconcile profit/(loss) attributable to holders of redeemableparticipating shares to cash used in operating activities
Interest income (63,165) (2) - (13)Dividend income (33,159,849) (33,872,650) (52,169) (355)
Operating profit/(loss) before working capital changes 394,771,602 782,582,501 354,555 (16,043)
Changes in operating assets and liabilitiesIncrease in financial assets at fair value through profit or loss (822,119,335) (1,134,785,899) (2,000,416) (2,055,512)(Increase)/Decrease in derivative financial assets and liabilities at fair value through profit or loss (2,448) 44,170 - -Increase in amounts receivable on sale of securities (4,524,428) - - -Increase in receivable from Investment Manager - - (16,077) (3,588)Decrease in other assets - 367 - -Increase/(Decrease) in payable on securities purchased - (3,543,180) (448,753) 448,753Increase in Investment Manager’s fees 4,559,801 1,106,262 - -Increase/(Decrease) in administration fees payable 1,681 (18,966) 1,121 3(Decrease)/Increase in depositary fees payable (17,211) (40,640) (2,325) 3,497Increase/(Decrease) in expenses payable 3,420 (43,620) 3,045 138
Cash used in operating activities (427,326,918) (354,699,005) (2,108,850) (1,622,752)
Interest received 63,165 2 - 13Dividend received 33,507,998 33,832,470 51,809 4
Net cash used in operating activities (393,755,755) (320,866,533) (2,057,041) (1,622,735)
COMGEST GROWTH plc
STATEMENT OF CASH FLOWSFor the financial year ended 31 December 2020 (continued)
The accompanying notes form an integral part of the financial statements. 187
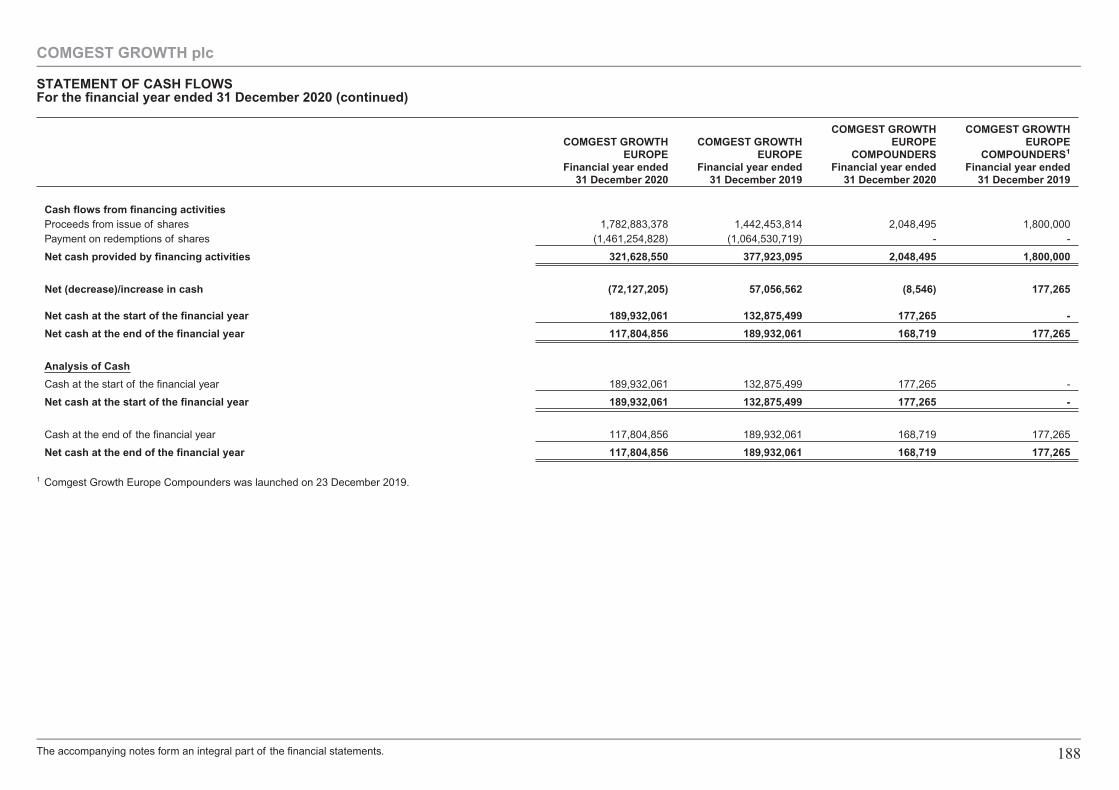
COMGEST GROWTHEUROPE
Financial year ended31 December 2020
COMGEST GROWTHEUROPE
Financial year ended31 December 2019
COMGEST GROWTHEUROPE
COMPOUNDERSFinancial year ended
31 December 2020
COMGEST GROWTHEUROPE
COMPOUNDERS1
Financial year ended31 December 2019
Cash flows from financing activitiesProceeds from issue of shares 1,782,883,378 1,442,453,814 2,048,495 1,800,000Payment on redemptions of shares (1,461,254,828) (1,064,530,719) - -
Net cash provided by financing activities 321,628,550 377,923,095 2,048,495 1,800,000
Net (decrease)/increase in cash (72,127,205) 57,056,562 (8,546) 177,265
Net cash at the start of the financial year 189,932,061 132,875,499 177,265 -
Net cash at the end of the financial year 117,804,856 189,932,061 168,719 177,265
Analysis of Cash
Cash at the start of the financial year 189,932,061 132,875,499 177,265 -
Net cash at the start of the financial year 189,932,061 132,875,499 177,265 -
Cash at the end of the financial year 117,804,856 189,932,061 168,719 177,265
Net cash at the end of the financial year 117,804,856 189,932,061 168,719 177,265
1 Comgest Growth Europe Compounders was launched on 23 December 2019.
COMGEST GROWTH plc
STATEMENT OF CASH FLOWSFor the financial year ended 31 December 2020 (continued)
The accompanying notes form an integral part of the financial statements. 188
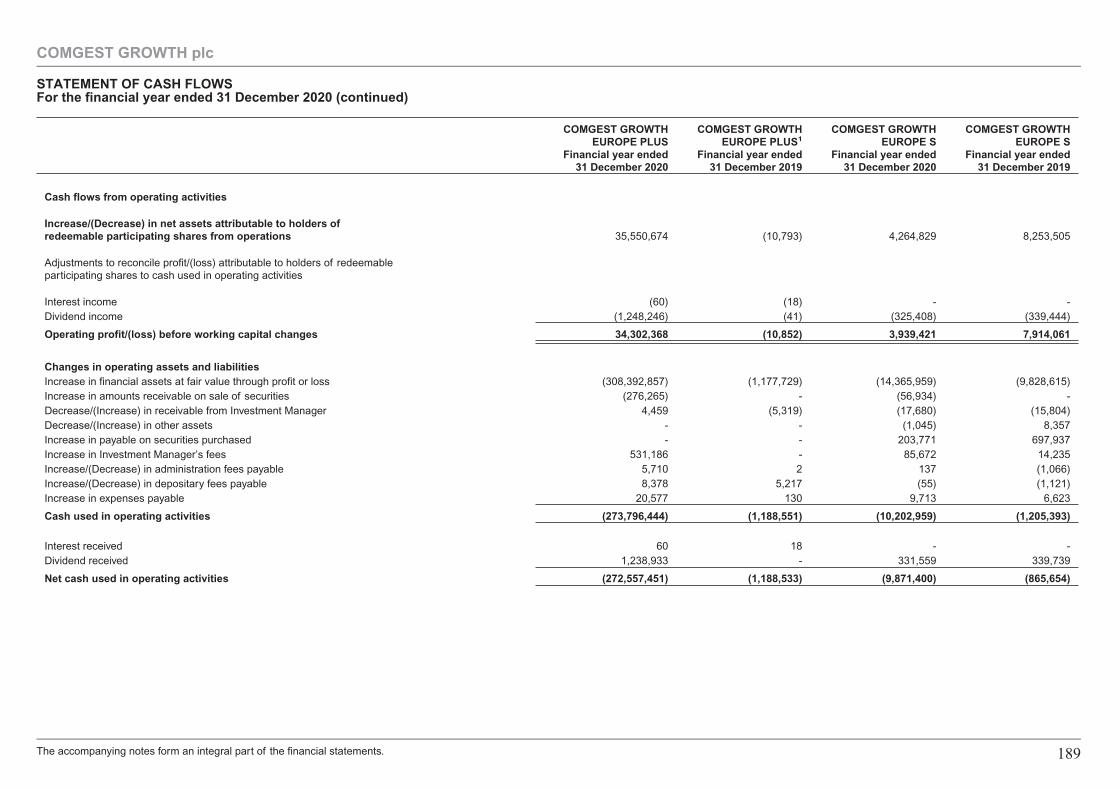
COMGEST GROWTHEUROPE PLUS
Financial year ended31 December 2020
COMGEST GROWTHEUROPE PLUS1
Financial year ended31 December 2019
COMGEST GROWTHEUROPE S
Financial year ended31 December 2020
COMGEST GROWTHEUROPE S
Financial year ended31 December 2019
Cash flows from operating activities
Increase/(Decrease) in net assets attributable to holders ofredeemable participating shares from operations 35,550,674 (10,793) 4,264,829 8,253,505
Adjustments to reconcile profit/(loss) attributable to holders of redeemableparticipating shares to cash used in operating activities
Interest income (60) (18) - -Dividend income (1,248,246) (41) (325,408) (339,444)
Operating profit/(loss) before working capital changes 34,302,368 (10,852) 3,939,421 7,914,061
Changes in operating assets and liabilitiesIncrease in financial assets at fair value through profit or loss (308,392,857) (1,177,729) (14,365,959) (9,828,615)Increase in amounts receivable on sale of securities (276,265) - (56,934) -Decrease/(Increase) in receivable from Investment Manager 4,459 (5,319) (17,680) (15,804)Decrease/(Increase) in other assets - - (1,045) 8,357Increase in payable on securities purchased - - 203,771 697,937Increase in Investment Manager’s fees 531,186 - 85,672 14,235Increase/(Decrease) in administration fees payable 5,710 2 137 (1,066)Increase/(Decrease) in depositary fees payable 8,378 5,217 (55) (1,121)Increase in expenses payable 20,577 130 9,713 6,623
Cash used in operating activities (273,796,444) (1,188,551) (10,202,959) (1,205,393)
Interest received 60 18 - -Dividend received 1,238,933 - 331,559 339,739
Net cash used in operating activities (272,557,451) (1,188,533) (9,871,400) (865,654)
COMGEST GROWTH plc
STATEMENT OF CASH FLOWSFor the financial year ended 31 December 2020 (continued)
The accompanying notes form an integral part of the financial statements. 189
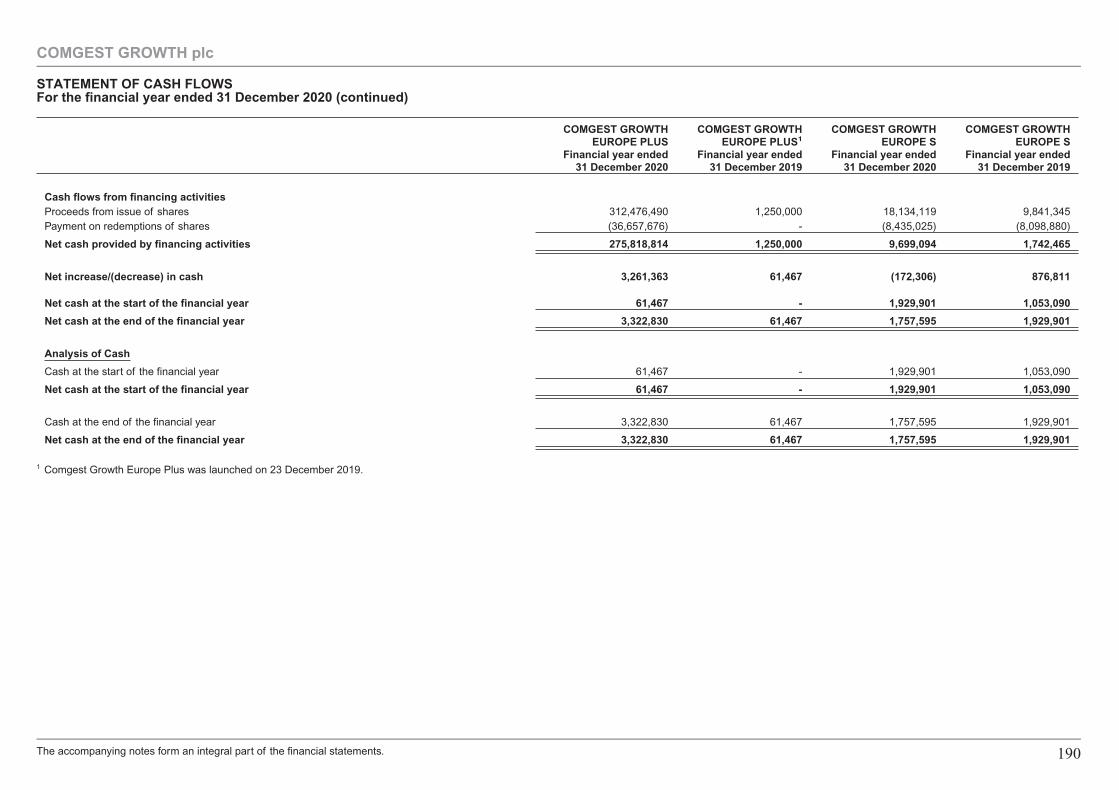
COMGEST GROWTHEUROPE PLUS
Financial year ended31 December 2020
COMGEST GROWTHEUROPE PLUS1
Financial year ended31 December 2019
COMGEST GROWTHEUROPE S
Financial year ended31 December 2020
COMGEST GROWTHEUROPE S
Financial year ended31 December 2019
Cash flows from financing activitiesProceeds from issue of shares 312,476,490 1,250,000 18,134,119 9,841,345Payment on redemptions of shares (36,657,676) - (8,435,025) (8,098,880)
Net cash provided by financing activities 275,818,814 1,250,000 9,699,094 1,742,465
Net increase/(decrease) in cash 3,261,363 61,467 (172,306) 876,811
Net cash at the start of the financial year 61,467 - 1,929,901 1,053,090
Net cash at the end of the financial year 3,322,830 61,467 1,757,595 1,929,901
Analysis of Cash
Cash at the start of the financial year 61,467 - 1,929,901 1,053,090
Net cash at the start of the financial year 61,467 - 1,929,901 1,053,090
Cash at the end of the financial year 3,322,830 61,467 1,757,595 1,929,901
Net cash at the end of the financial year 3,322,830 61,467 1,757,595 1,929,901
1 Comgest Growth Europe Plus was launched on 23 December 2019.
COMGEST GROWTH plc
STATEMENT OF CASH FLOWSFor the financial year ended 31 December 2020 (continued)
The accompanying notes form an integral part of the financial statements. 190
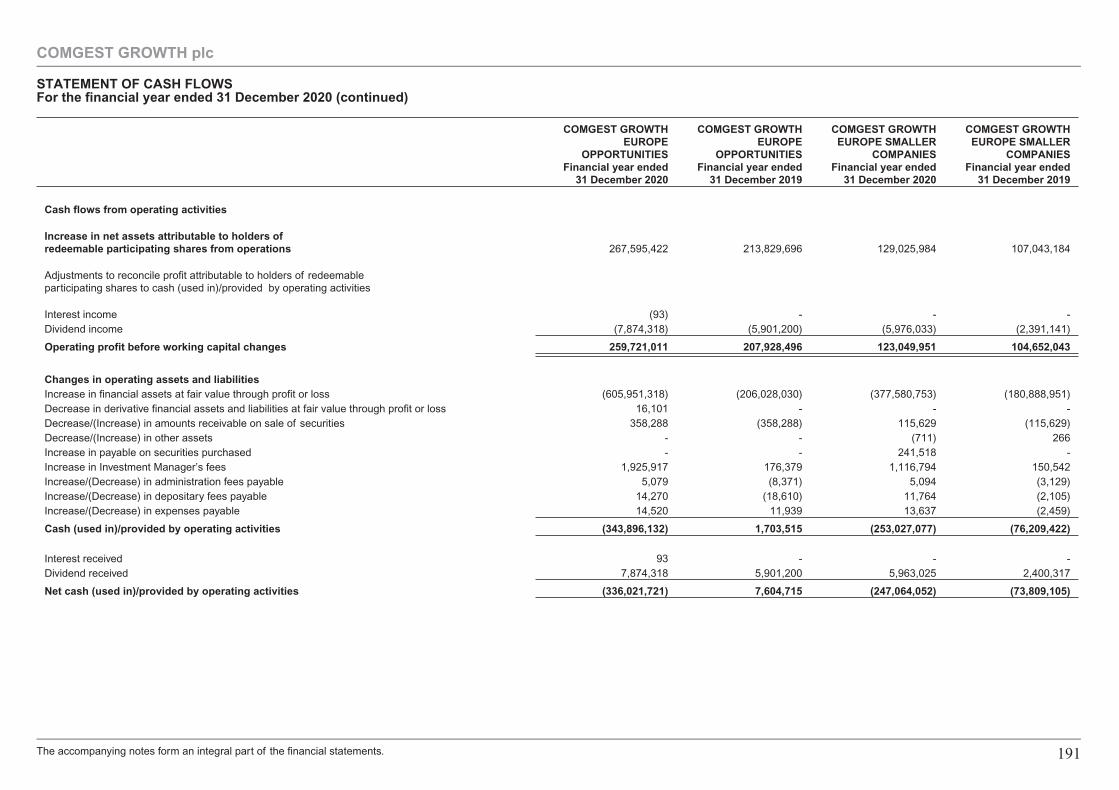
COMGEST GROWTHEUROPE
OPPORTUNITIESFinancial year ended
31 December 2020
COMGEST GROWTHEUROPE
OPPORTUNITIESFinancial year ended
31 December 2019
COMGEST GROWTHEUROPE SMALLER
COMPANIESFinancial year ended
31 December 2020
COMGEST GROWTHEUROPE SMALLER
COMPANIESFinancial year ended
31 December 2019
Cash flows from operating activities
Increase in net assets attributable to holders ofredeemable participating shares from operations 267,595,422 213,829,696 129,025,984 107,043,184
Adjustments to reconcile profit attributable to holders of redeemableparticipating shares to cash (used in)/provided by operating activities
Interest income (93) - - -Dividend income (7,874,318) (5,901,200) (5,976,033) (2,391,141)
Operating profit before working capital changes 259,721,011 207,928,496 123,049,951 104,652,043
Changes in operating assets and liabilitiesIncrease in financial assets at fair value through profit or loss (605,951,318) (206,028,030) (377,580,753) (180,888,951)Decrease in derivative financial assets and liabilities at fair value through profit or loss 16,101 - - -Decrease/(Increase) in amounts receivable on sale of securities 358,288 (358,288) 115,629 (115,629)Decrease/(Increase) in other assets - - (711) 266Increase in payable on securities purchased - - 241,518 -Increase in Investment Manager’s fees 1,925,917 176,379 1,116,794 150,542Increase/(Decrease) in administration fees payable 5,079 (8,371) 5,094 (3,129)Increase/(Decrease) in depositary fees payable 14,270 (18,610) 11,764 (2,105)Increase/(Decrease) in expenses payable 14,520 11,939 13,637 (2,459)
Cash (used in)/provided by operating activities (343,896,132) 1,703,515 (253,027,077) (76,209,422)
Interest received 93 - - -Dividend received 7,874,318 5,901,200 5,963,025 2,400,317
Net cash (used in)/provided by operating activities (336,021,721) 7,604,715 (247,064,052) (73,809,105)
COMGEST GROWTH plc
STATEMENT OF CASH FLOWSFor the financial year ended 31 December 2020 (continued)
The accompanying notes form an integral part of the financial statements. 191
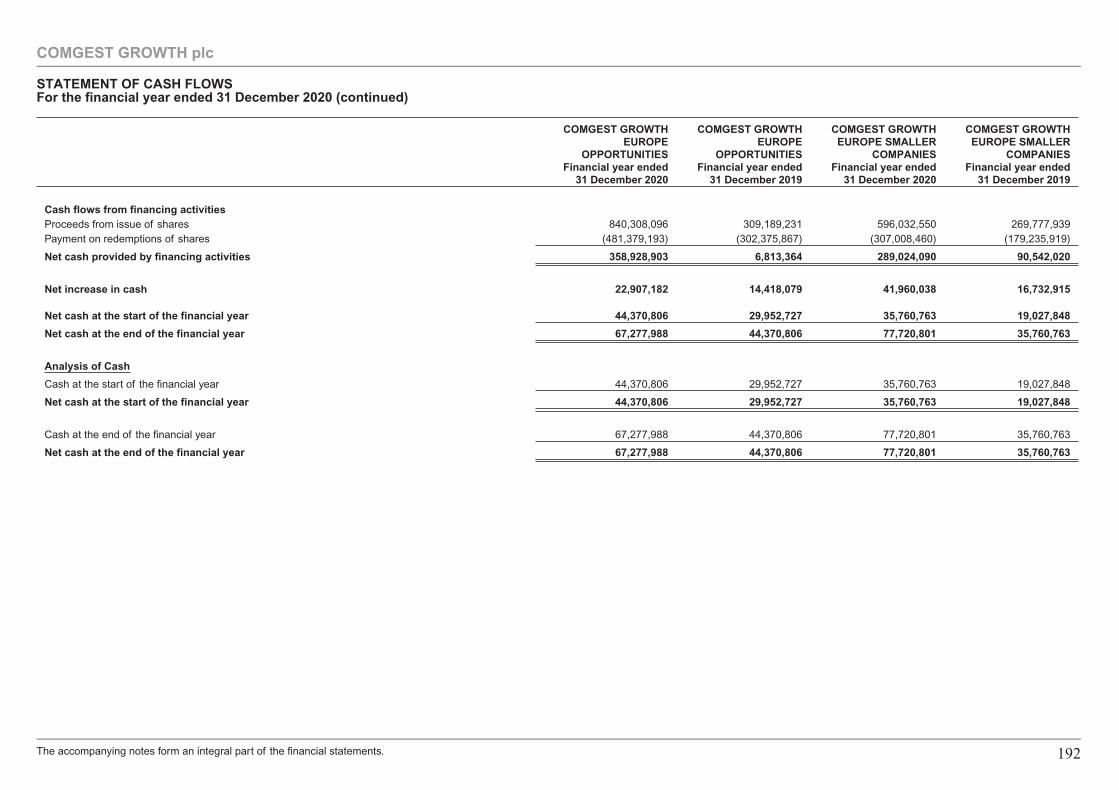
COMGEST GROWTHEUROPE
OPPORTUNITIESFinancial year ended
31 December 2020
COMGEST GROWTHEUROPE
OPPORTUNITIESFinancial year ended
31 December 2019
COMGEST GROWTHEUROPE SMALLER
COMPANIESFinancial year ended
31 December 2020
COMGEST GROWTHEUROPE SMALLER
COMPANIESFinancial year ended
31 December 2019
Cash flows from financing activitiesProceeds from issue of shares 840,308,096 309,189,231 596,032,550 269,777,939Payment on redemptions of shares (481,379,193) (302,375,867) (307,008,460) (179,235,919)
Net cash provided by financing activities 358,928,903 6,813,364 289,024,090 90,542,020
Net increase in cash 22,907,182 14,418,079 41,960,038 16,732,915
Net cash at the start of the financial year 44,370,806 29,952,727 35,760,763 19,027,848
Net cash at the end of the financial year 67,277,988 44,370,806 77,720,801 35,760,763
Analysis of Cash
Cash at the start of the financial year 44,370,806 29,952,727 35,760,763 19,027,848
Net cash at the start of the financial year 44,370,806 29,952,727 35,760,763 19,027,848
Cash at the end of the financial year 67,277,988 44,370,806 77,720,801 35,760,763
Net cash at the end of the financial year 67,277,988 44,370,806 77,720,801 35,760,763
COMGEST GROWTH plc
STATEMENT OF CASH FLOWSFor the financial year ended 31 December 2020 (continued)
The accompanying notes form an integral part of the financial statements. 192
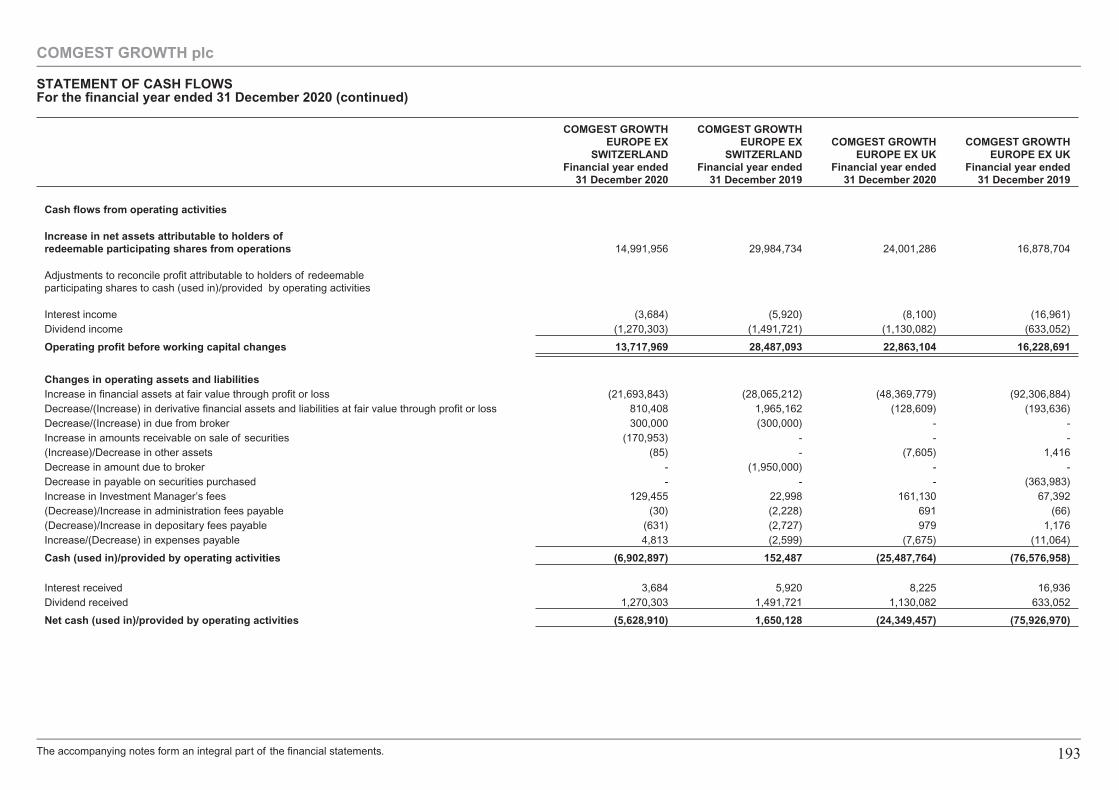
COMGEST GROWTHEUROPE EX
SWITZERLANDFinancial year ended
31 December 2020
COMGEST GROWTHEUROPE EX
SWITZERLANDFinancial year ended
31 December 2019
COMGEST GROWTHEUROPE EX UK
Financial year ended31 December 2020
COMGEST GROWTHEUROPE EX UK
Financial year ended31 December 2019
Cash flows from operating activities
Increase in net assets attributable to holders ofredeemable participating shares from operations 14,991,956 29,984,734 24,001,286 16,878,704
Adjustments to reconcile profit attributable to holders of redeemableparticipating shares to cash (used in)/provided by operating activities
Interest income (3,684) (5,920) (8,100) (16,961)Dividend income (1,270,303) (1,491,721) (1,130,082) (633,052)
Operating profit before working capital changes 13,717,969 28,487,093 22,863,104 16,228,691
Changes in operating assets and liabilitiesIncrease in financial assets at fair value through profit or loss (21,693,843) (28,065,212) (48,369,779) (92,306,884)Decrease/(Increase) in derivative financial assets and liabilities at fair value through profit or loss 810,408 1,965,162 (128,609) (193,636)Decrease/(Increase) in due from broker 300,000 (300,000) - -Increase in amounts receivable on sale of securities (170,953) - - -(Increase)/Decrease in other assets (85) - (7,605) 1,416Decrease in amount due to broker - (1,950,000) - -Decrease in payable on securities purchased - - - (363,983)Increase in Investment Manager’s fees 129,455 22,998 161,130 67,392(Decrease)/Increase in administration fees payable (30) (2,228) 691 (66)(Decrease)/Increase in depositary fees payable (631) (2,727) 979 1,176Increase/(Decrease) in expenses payable 4,813 (2,599) (7,675) (11,064)
Cash (used in)/provided by operating activities (6,902,897) 152,487 (25,487,764) (76,576,958)
Interest received 3,684 5,920 8,225 16,936Dividend received 1,270,303 1,491,721 1,130,082 633,052
Net cash (used in)/provided by operating activities (5,628,910) 1,650,128 (24,349,457) (75,926,970)
COMGEST GROWTH plc
STATEMENT OF CASH FLOWSFor the financial year ended 31 December 2020 (continued)
The accompanying notes form an integral part of the financial statements. 193
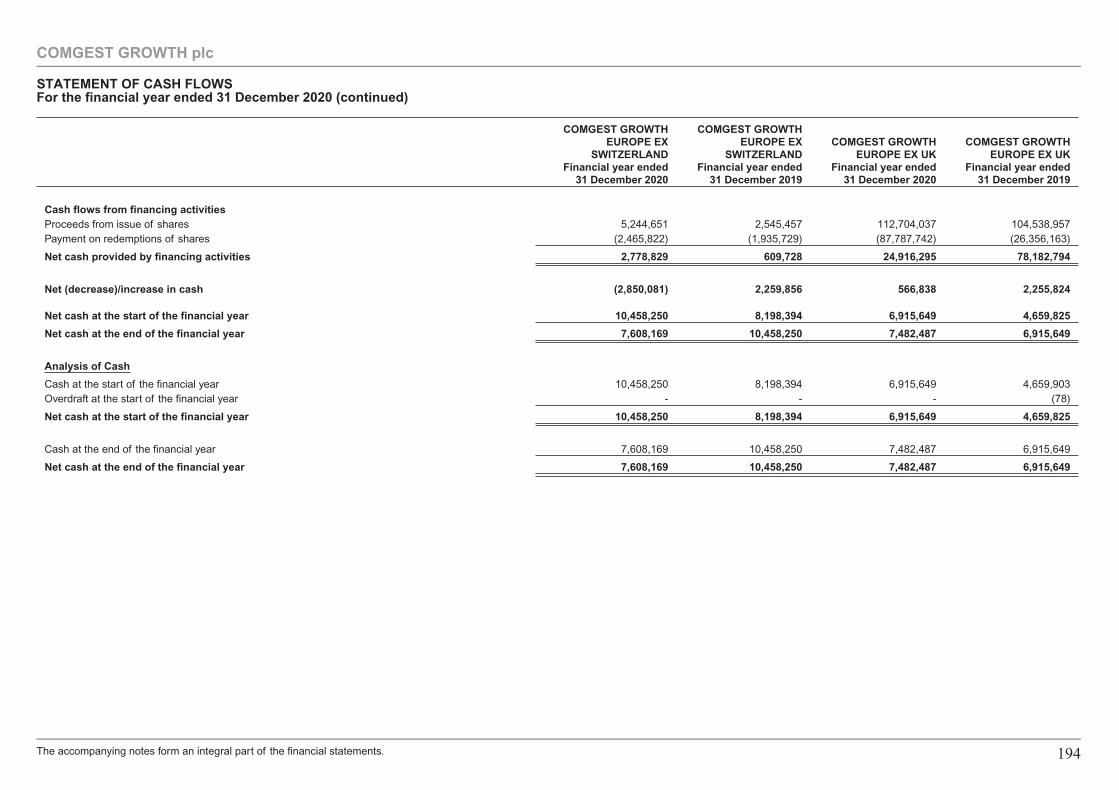
COMGEST GROWTHEUROPE EX
SWITZERLANDFinancial year ended
31 December 2020
COMGEST GROWTHEUROPE EX
SWITZERLANDFinancial year ended
31 December 2019
COMGEST GROWTHEUROPE EX UK
Financial year ended31 December 2020
COMGEST GROWTHEUROPE EX UK
Financial year ended31 December 2019
Cash flows from financing activitiesProceeds from issue of shares 5,244,651 2,545,457 112,704,037 104,538,957Payment on redemptions of shares (2,465,822) (1,935,729) (87,787,742) (26,356,163)
Net cash provided by financing activities 2,778,829 609,728 24,916,295 78,182,794
Net (decrease)/increase in cash (2,850,081) 2,259,856 566,838 2,255,824
Net cash at the start of the financial year 10,458,250 8,198,394 6,915,649 4,659,825
Net cash at the end of the financial year 7,608,169 10,458,250 7,482,487 6,915,649
Analysis of Cash
Cash at the start of the financial year 10,458,250 8,198,394 6,915,649 4,659,903Overdraft at the start of the financial year - - - (78)
Net cash at the start of the financial year 10,458,250 8,198,394 6,915,649 4,659,825
Cash at the end of the financial year 7,608,169 10,458,250 7,482,487 6,915,649
Net cash at the end of the financial year 7,608,169 10,458,250 7,482,487 6,915,649
COMGEST GROWTH plc
STATEMENT OF CASH FLOWSFor the financial year ended 31 December 2020 (continued)
The accompanying notes form an integral part of the financial statements. 194
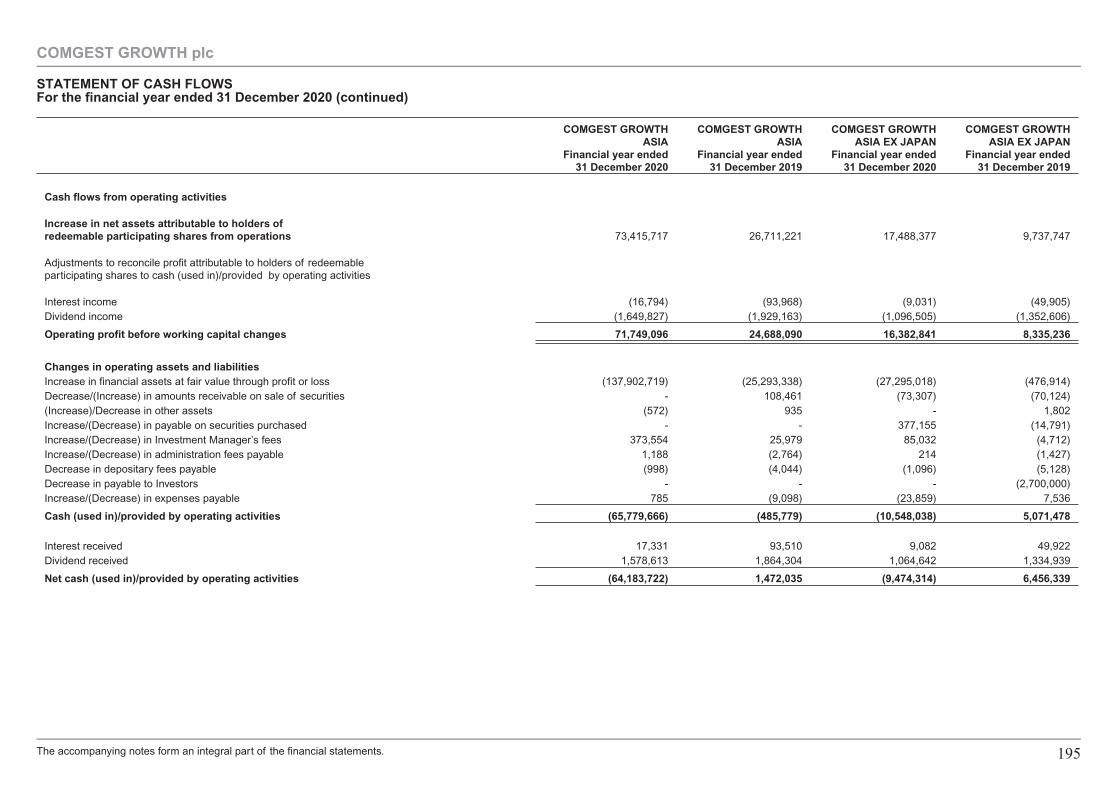
COMGEST GROWTHASIA
Financial year ended31 December 2020
COMGEST GROWTHASIA
Financial year ended31 December 2019
COMGEST GROWTHASIA EX JAPAN
Financial year ended31 December 2020
COMGEST GROWTHASIA EX JAPAN
Financial year ended31 December 2019
Cash flows from operating activities
Increase in net assets attributable to holders ofredeemable participating shares from operations 73,415,717 26,711,221 17,488,377 9,737,747
Adjustments to reconcile profit attributable to holders of redeemableparticipating shares to cash (used in)/provided by operating activities
Interest income (16,794) (93,968) (9,031) (49,905)Dividend income (1,649,827) (1,929,163) (1,096,505) (1,352,606)
Operating profit before working capital changes 71,749,096 24,688,090 16,382,841 8,335,236
Changes in operating assets and liabilitiesIncrease in financial assets at fair value through profit or loss (137,902,719) (25,293,338) (27,295,018) (476,914)Decrease/(Increase) in amounts receivable on sale of securities - 108,461 (73,307) (70,124)(Increase)/Decrease in other assets (572) 935 - 1,802Increase/(Decrease) in payable on securities purchased - - 377,155 (14,791)Increase/(Decrease) in Investment Manager’s fees 373,554 25,979 85,032 (4,712)Increase/(Decrease) in administration fees payable 1,188 (2,764) 214 (1,427)Decrease in depositary fees payable (998) (4,044) (1,096) (5,128)Decrease in payable to Investors - - - (2,700,000)Increase/(Decrease) in expenses payable 785 (9,098) (23,859) 7,536
Cash (used in)/provided by operating activities (65,779,666) (485,779) (10,548,038) 5,071,478
Interest received 17,331 93,510 9,082 49,922Dividend received 1,578,613 1,864,304 1,064,642 1,334,939
Net cash (used in)/provided by operating activities (64,183,722) 1,472,035 (9,474,314) 6,456,339
COMGEST GROWTH plc
STATEMENT OF CASH FLOWSFor the financial year ended 31 December 2020 (continued)
The accompanying notes form an integral part of the financial statements. 195
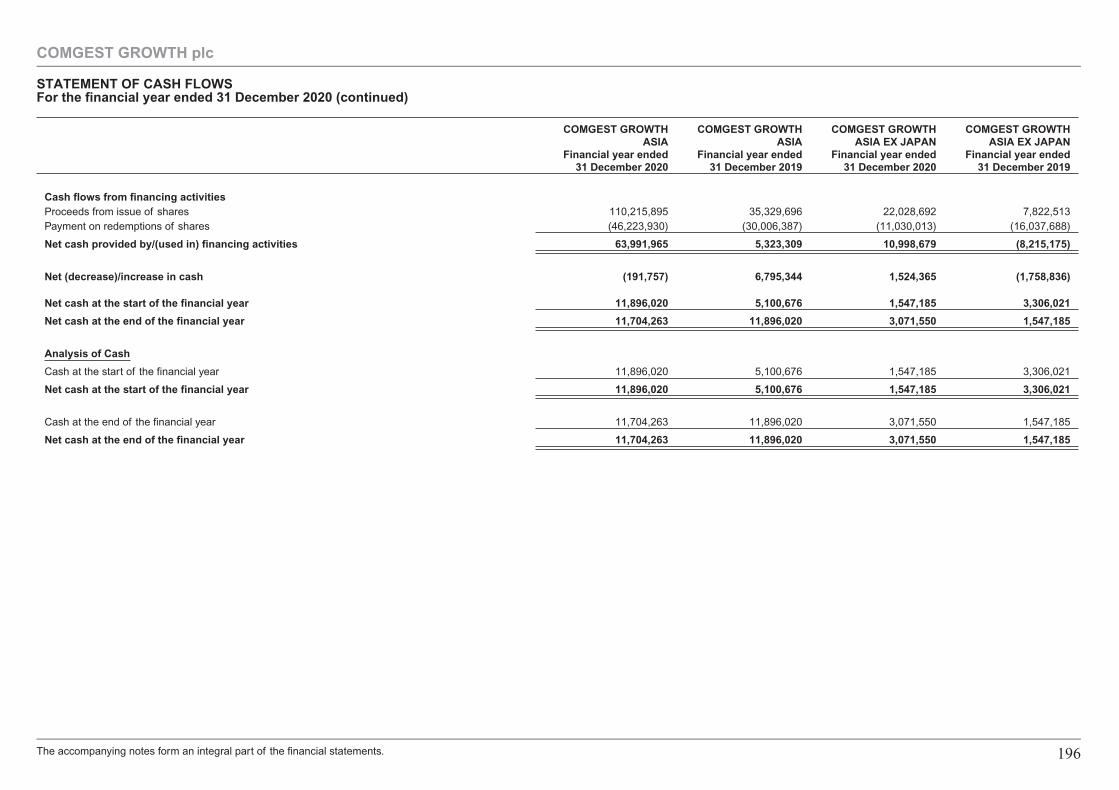
COMGEST GROWTHASIA
Financial year ended31 December 2020
COMGEST GROWTHASIA
Financial year ended31 December 2019
COMGEST GROWTHASIA EX JAPAN
Financial year ended31 December 2020
COMGEST GROWTHASIA EX JAPAN
Financial year ended31 December 2019
Cash flows from financing activitiesProceeds from issue of shares 110,215,895 35,329,696 22,028,692 7,822,513Payment on redemptions of shares (46,223,930) (30,006,387) (11,030,013) (16,037,688)
Net cash provided by/(used in) financing activities 63,991,965 5,323,309 10,998,679 (8,215,175)
Net (decrease)/increase in cash (191,757) 6,795,344 1,524,365 (1,758,836)
Net cash at the start of the financial year 11,896,020 5,100,676 1,547,185 3,306,021
Net cash at the end of the financial year 11,704,263 11,896,020 3,071,550 1,547,185
Analysis of Cash
Cash at the start of the financial year 11,896,020 5,100,676 1,547,185 3,306,021
Net cash at the start of the financial year 11,896,020 5,100,676 1,547,185 3,306,021
Cash at the end of the financial year 11,704,263 11,896,020 3,071,550 1,547,185
Net cash at the end of the financial year 11,704,263 11,896,020 3,071,550 1,547,185
COMGEST GROWTH plc
STATEMENT OF CASH FLOWSFor the financial year ended 31 December 2020 (continued)
The accompanying notes form an integral part of the financial statements. 196
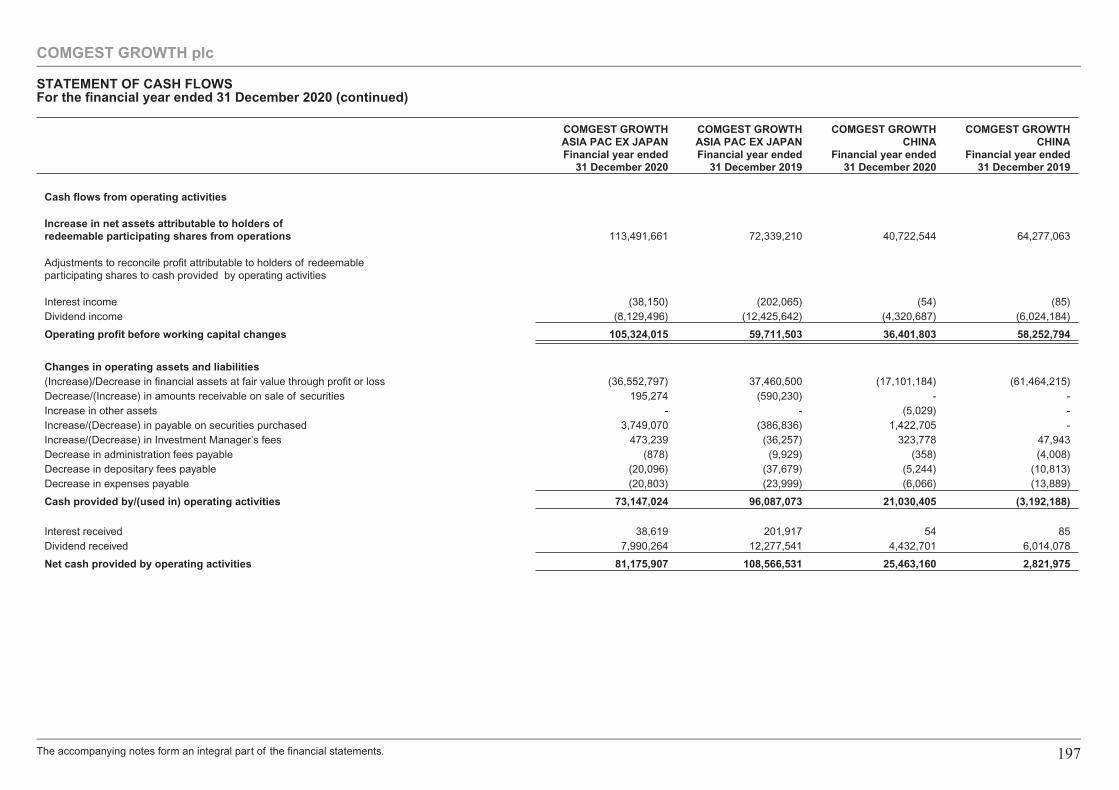
COMGEST GROWTHASIA PAC EX JAPANFinancial year ended
31 December 2020
COMGEST GROWTHASIA PAC EX JAPANFinancial year ended
31 December 2019
COMGEST GROWTHCHINA
Financial year ended31 December 2020
COMGEST GROWTHCHINA
Financial year ended31 December 2019
Cash flows from operating activities
Increase in net assets attributable to holders ofredeemable participating shares from operations 113,491,661 72,339,210 40,722,544 64,277,063
Adjustments to reconcile profit attributable to holders of redeemableparticipating shares to cash provided by operating activities
Interest income (38,150) (202,065) (54) (85)Dividend income (8,129,496) (12,425,642) (4,320,687) (6,024,184)
Operating profit before working capital changes 105,324,015 59,711,503 36,401,803 58,252,794
Changes in operating assets and liabilities(Increase)/Decrease in financial assets at fair value through profit or loss (36,552,797) 37,460,500 (17,101,184) (61,464,215)Decrease/(Increase) in amounts receivable on sale of securities 195,274 (590,230) - -Increase in other assets - - (5,029) -Increase/(Decrease) in payable on securities purchased 3,749,070 (386,836) 1,422,705 -Increase/(Decrease) in Investment Manager’s fees 473,239 (36,257) 323,778 47,943Decrease in administration fees payable (878) (9,929) (358) (4,008)Decrease in depositary fees payable (20,096) (37,679) (5,244) (10,813)Decrease in expenses payable (20,803) (23,999) (6,066) (13,889)
Cash provided by/(used in) operating activities 73,147,024 96,087,073 21,030,405 (3,192,188)
Interest received 38,619 201,917 54 85Dividend received 7,990,264 12,277,541 4,432,701 6,014,078
Net cash provided by operating activities 81,175,907 108,566,531 25,463,160 2,821,975
COMGEST GROWTH plc
STATEMENT OF CASH FLOWSFor the financial year ended 31 December 2020 (continued)
The accompanying notes form an integral part of the financial statements. 197
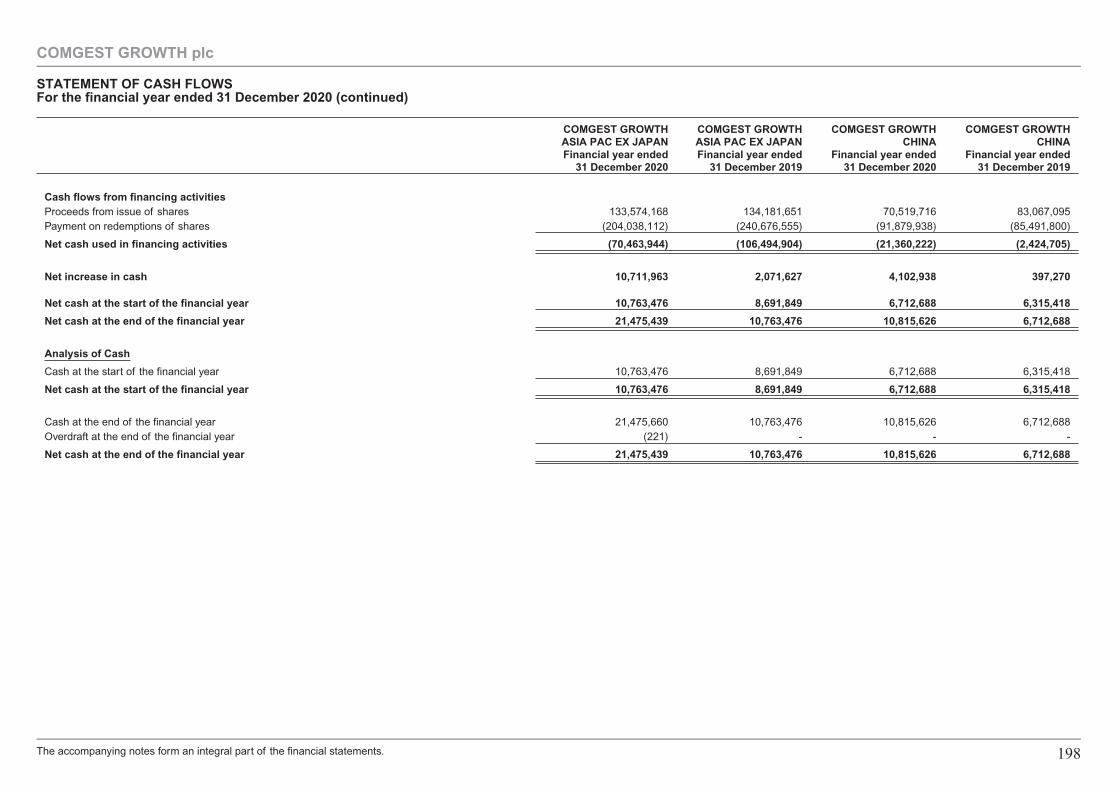
COMGEST GROWTHASIA PAC EX JAPANFinancial year ended
31 December 2020
COMGEST GROWTHASIA PAC EX JAPANFinancial year ended
31 December 2019
COMGEST GROWTHCHINA
Financial year ended31 December 2020
COMGEST GROWTHCHINA
Financial year ended31 December 2019
Cash flows from financing activitiesProceeds from issue of shares 133,574,168 134,181,651 70,519,716 83,067,095Payment on redemptions of shares (204,038,112) (240,676,555) (91,879,938) (85,491,800)
Net cash used in financing activities (70,463,944) (106,494,904) (21,360,222) (2,424,705)
Net increase in cash 10,711,963 2,071,627 4,102,938 397,270
Net cash at the start of the financial year 10,763,476 8,691,849 6,712,688 6,315,418
Net cash at the end of the financial year 21,475,439 10,763,476 10,815,626 6,712,688
Analysis of Cash
Cash at the start of the financial year 10,763,476 8,691,849 6,712,688 6,315,418
Net cash at the start of the financial year 10,763,476 8,691,849 6,712,688 6,315,418
Cash at the end of the financial year 21,475,660 10,763,476 10,815,626 6,712,688Overdraft at the end of the financial year (221) - - -
Net cash at the end of the financial year 21,475,439 10,763,476 10,815,626 6,712,688
COMGEST GROWTH plc
STATEMENT OF CASH FLOWSFor the financial year ended 31 December 2020 (continued)
The accompanying notes form an integral part of the financial statements. 198
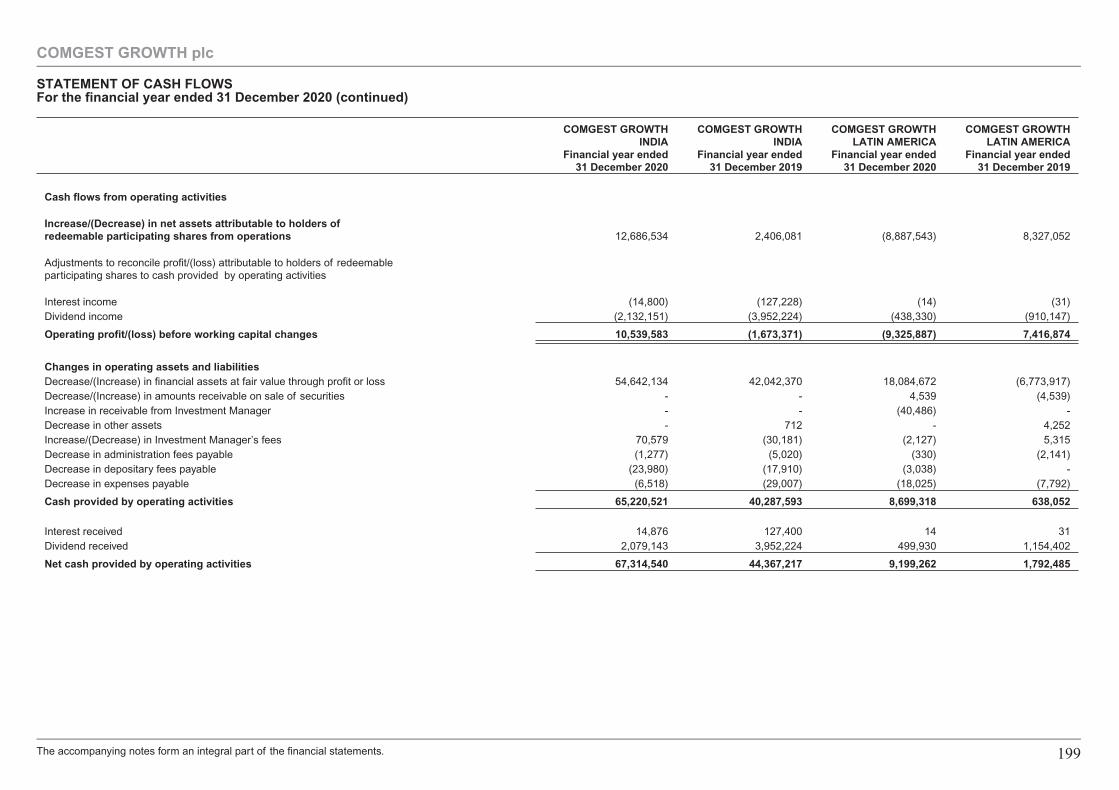
COMGEST GROWTHINDIA
Financial year ended31 December 2020
COMGEST GROWTHINDIA
Financial year ended31 December 2019
COMGEST GROWTHLATIN AMERICA
Financial year ended31 December 2020
COMGEST GROWTHLATIN AMERICA
Financial year ended31 December 2019
Cash flows from operating activities
Increase/(Decrease) in net assets attributable to holders ofredeemable participating shares from operations 12,686,534 2,406,081 (8,887,543) 8,327,052
Adjustments to reconcile profit/(loss) attributable to holders of redeemableparticipating shares to cash provided by operating activities
Interest income (14,800) (127,228) (14) (31)Dividend income (2,132,151) (3,952,224) (438,330) (910,147)
Operating profit/(loss) before working capital changes 10,539,583 (1,673,371) (9,325,887) 7,416,874
Changes in operating assets and liabilitiesDecrease/(Increase) in financial assets at fair value through profit or loss 54,642,134 42,042,370 18,084,672 (6,773,917)Decrease/(Increase) in amounts receivable on sale of securities - - 4,539 (4,539)Increase in receivable from Investment Manager - - (40,486) -Decrease in other assets - 712 - 4,252Increase/(Decrease) in Investment Manager’s fees 70,579 (30,181) (2,127) 5,315Decrease in administration fees payable (1,277) (5,020) (330) (2,141)Decrease in depositary fees payable (23,980) (17,910) (3,038) -Decrease in expenses payable (6,518) (29,007) (18,025) (7,792)
Cash provided by operating activities 65,220,521 40,287,593 8,699,318 638,052
Interest received 14,876 127,400 14 31Dividend received 2,079,143 3,952,224 499,930 1,154,402
Net cash provided by operating activities 67,314,540 44,367,217 9,199,262 1,792,485
COMGEST GROWTH plc
STATEMENT OF CASH FLOWSFor the financial year ended 31 December 2020 (continued)
The accompanying notes form an integral part of the financial statements. 199
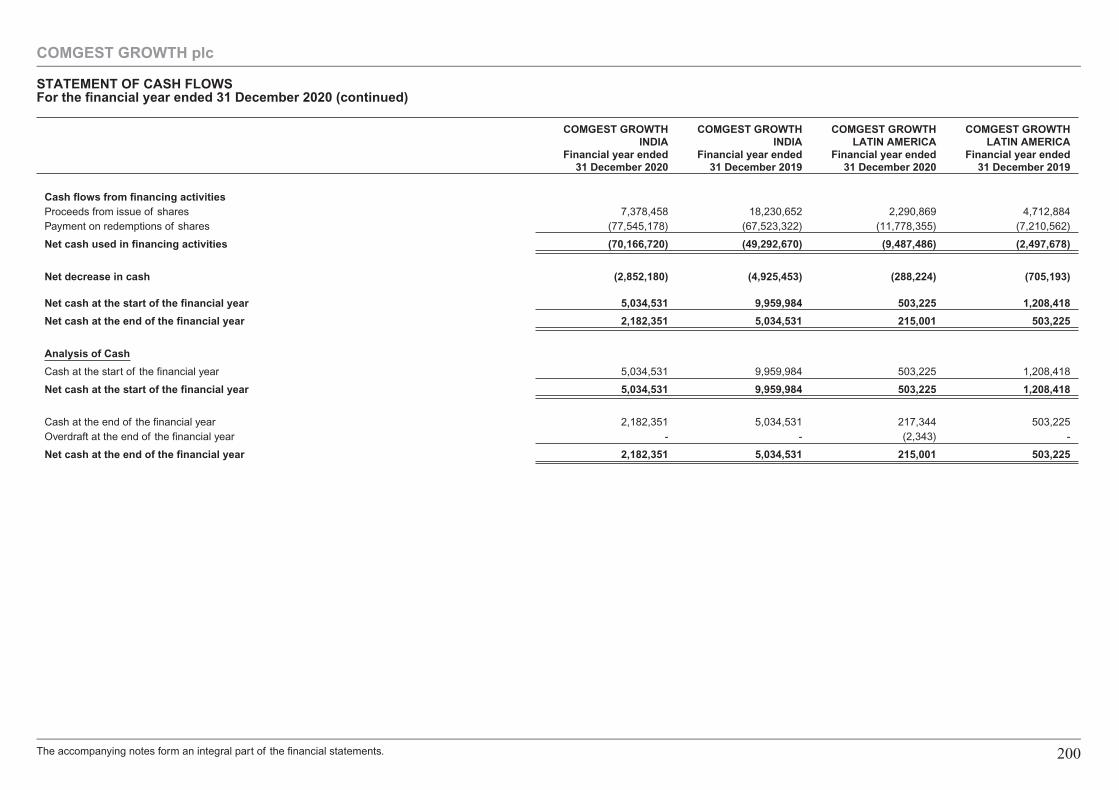
COMGEST GROWTHINDIA
Financial year ended31 December 2020
COMGEST GROWTHINDIA
Financial year ended31 December 2019
COMGEST GROWTHLATIN AMERICA
Financial year ended31 December 2020
COMGEST GROWTHLATIN AMERICA
Financial year ended31 December 2019
Cash flows from financing activitiesProceeds from issue of shares 7,378,458 18,230,652 2,290,869 4,712,884Payment on redemptions of shares (77,545,178) (67,523,322) (11,778,355) (7,210,562)
Net cash used in financing activities (70,166,720) (49,292,670) (9,487,486) (2,497,678)
Net decrease in cash (2,852,180) (4,925,453) (288,224) (705,193)
Net cash at the start of the financial year 5,034,531 9,959,984 503,225 1,208,418
Net cash at the end of the financial year 2,182,351 5,034,531 215,001 503,225
Analysis of Cash
Cash at the start of the financial year 5,034,531 9,959,984 503,225 1,208,418
Net cash at the start of the financial year 5,034,531 9,959,984 503,225 1,208,418
Cash at the end of the financial year 2,182,351 5,034,531 217,344 503,225Overdraft at the end of the financial year - - (2,343) -
Net cash at the end of the financial year 2,182,351 5,034,531 215,001 503,225
COMGEST GROWTH plc
STATEMENT OF CASH FLOWSFor the financial year ended 31 December 2020 (continued)
The accompanying notes form an integral part of the financial statements. 200
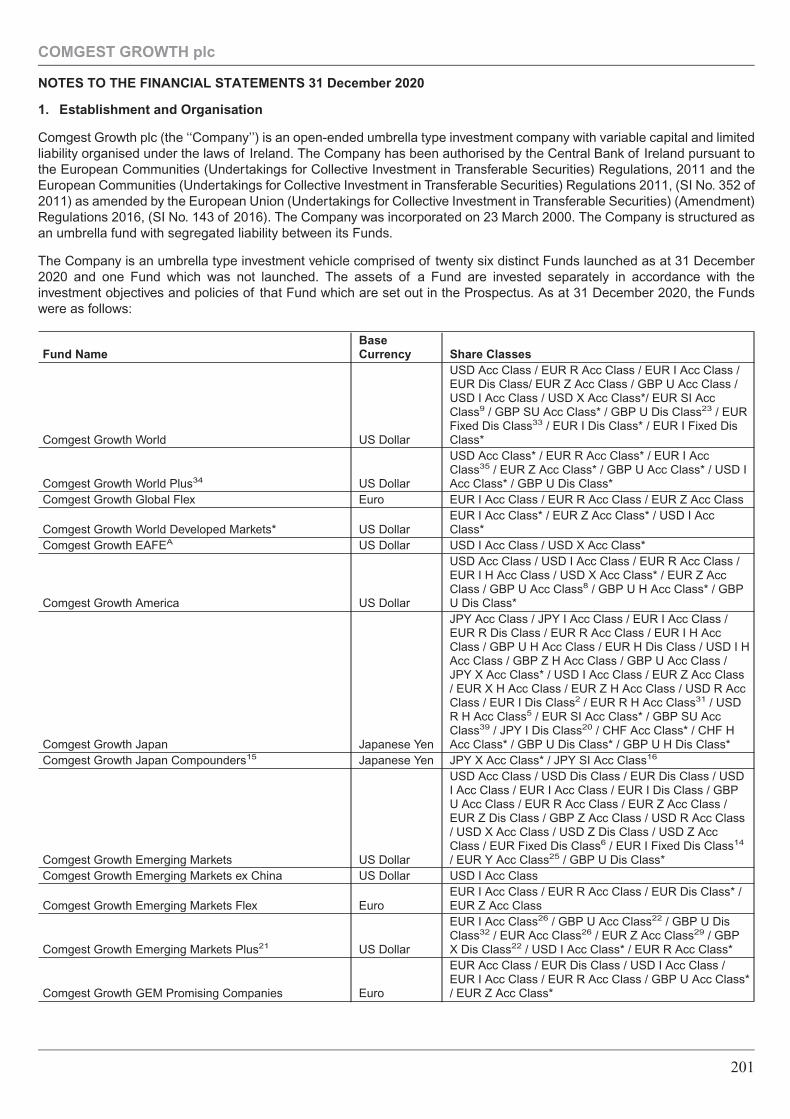
1. Establishment and Organisation
Comgest Growth plc (the ‘‘Company’’) is an open-ended umbrella type investment company with variable capital and limitedliability organised under the laws of Ireland. The Company has been authorised by the Central Bank of Ireland pursuant tothe European Communities (Undertakings for Collective Investment in Transferable Securities) Regulations, 2011 and theEuropean Communities (Undertakings for Collective Investment in Transferable Securities) Regulations 2011, (SI No. 352 of2011) as amended by the European Union (Undertakings for Collective Investment in Transferable Securities) (Amendment)Regulations 2016, (SI No. 143 of 2016). The Company was incorporated on 23 March 2000. The Company is structured asan umbrella fund with segregated liability between its Funds.
The Company is an umbrella type investment vehicle comprised of twenty six distinct Funds launched as at 31 December2020 and one Fund which was not launched. The assets of a Fund are invested separately in accordance with theinvestment objectives and policies of that Fund which are set out in the Prospectus. As at 31 December 2020, the Fundswere as follows:
Fund NameBaseCurrency Share Classes
Comgest Growth World US Dollar
USD Acc Class / EUR R Acc Class / EUR I Acc Class /EUR Dis Class/ EUR Z Acc Class / GBP U Acc Class /USD I Acc Class / USD X Acc Class*/ EUR SI AccClass9 / GBP SU Acc Class* / GBP U Dis Class23 / EURFixed Dis Class33 / EUR I Dis Class* / EUR I Fixed DisClass*
Comgest Growth World Plus34 US Dollar
USD Acc Class* / EUR R Acc Class* / EUR I AccClass35 / EUR Z Acc Class* / GBP U Acc Class* / USD IAcc Class* / GBP U Dis Class*
Comgest Growth Global Flex Euro EUR I Acc Class / EUR R Acc Class / EUR Z Acc Class
Comgest Growth World Developed Markets* US DollarEUR I Acc Class* / EUR Z Acc Class* / USD I AccClass*
Comgest Growth EAFEA US Dollar USD I Acc Class / USD X Acc Class*
Comgest Growth America US Dollar
USD Acc Class / USD I Acc Class / EUR R Acc Class /EUR I H Acc Class / USD X Acc Class* / EUR Z AccClass / GBP U Acc Class8 / GBP U H Acc Class* / GBPU Dis Class*
Comgest Growth Japan Japanese Yen
JPY Acc Class / JPY I Acc Class / EUR I Acc Class /EUR R Dis Class / EUR R Acc Class / EUR I H AccClass / GBP U H Acc Class / EUR H Dis Class / USD I HAcc Class / GBP Z H Acc Class / GBP U Acc Class /JPY X Acc Class* / USD I Acc Class / EUR Z Acc Class/ EUR X H Acc Class / EUR Z H Acc Class / USD R AccClass / EUR I Dis Class2 / EUR R H Acc Class31 / USDR H Acc Class5 / EUR SI Acc Class* / GBP SU AccClass39 / JPY I Dis Class20 / CHF Acc Class* / CHF HAcc Class* / GBP U Dis Class* / GBP U H Dis Class*
Comgest Growth Japan Compounders15 Japanese Yen JPY X Acc Class* / JPY SI Acc Class16
Comgest Growth Emerging Markets US Dollar
USD Acc Class / USD Dis Class / EUR Dis Class / USDI Acc Class / EUR I Acc Class / EUR I Dis Class / GBPU Acc Class / EUR R Acc Class / EUR Z Acc Class /EUR Z Dis Class / GBP Z Acc Class / USD R Acc Class/ USD X Acc Class / USD Z Dis Class / USD Z AccClass / EUR Fixed Dis Class6 / EUR I Fixed Dis Class14
/ EUR Y Acc Class25 / GBP U Dis Class*Comgest Growth Emerging Markets ex China US Dollar USD I Acc Class
Comgest Growth Emerging Markets Flex EuroEUR I Acc Class / EUR R Acc Class / EUR Dis Class* /EUR Z Acc Class
Comgest Growth Emerging Markets Plus21 US Dollar
EUR I Acc Class26 / GBP U Acc Class22 / GBP U DisClass32 / EUR Acc Class26 / EUR Z Acc Class29 / GBPX Dis Class22 / USD I Acc Class* / EUR R Acc Class*
Comgest Growth GEM Promising Companies Euro
EUR Acc Class / EUR Dis Class / USD I Acc Class /EUR I Acc Class / EUR R Acc Class / GBP U Acc Class*/ EUR Z Acc Class*
COMGEST GROWTH plc
NOTES TO THE FINANCIAL STATEMENTS 31 December 2020
201

1. Establishment and Organisation (continued)
Fund NameBaseCurrency Share Classes
Comgest Growth Europe Euro
EUR Acc Class / EUR Dis Class / EUR I Acc Class /EUR I Dis Class / EUR R Acc Class / EUR Z Acc Class /EUR Z Dis Class / USD I Acc Class / USD I H Acc Class/ EUR X Acc Class* / EUR I Fixed Dis Class4 / EURFixed Dis Class7 / GBP U Acc Class* / USD Acc Class*/ USD Z Acc Class*
Comgest Growth Europe Compounders12 Euro EUR X Acc Class* / EUR SI Acc Class13
Comgest Growth Europe Plus12 Euro
EUR I Acc Class13 / GBP U Acc Class* / GBP U DisClass*/ EUR Acc Class25 / EUR Z Acc Class18/ EUR RAcc Class*
Comgest Growth Europe S EuroEUR Acc Class / USD Acc Class / EUR Z Acc Class* /USD Z Acc Class*
Comgest Growth Europe Opportunities Euro
EUR Acc Class / EUR Dis Class / EUR R Acc Class /EUR I Acc Class / EUR X Acc Class38 / EUR Z AccClass / GBP U Acc Class40 / GBP U H Acc Class* / GBPU Dis Class* / USD I Acc Class* / USD I H Acc Class28
Comgest Growth Europe Smaller Companies Euro
EUR Acc Class / EUR I Acc Class / EUR Dis Class* /EUR X Acc Class11 / EUR Z Acc Class / GBP U AccClass27 / GBP U H Acc Class* / EUR I Dis Class19 /EUR R Acc Class36
Comgest Growth Europe ex Switzerland Swiss Franc CHF I Acc Class / CHF Z Acc Class
Comgest Growth Europe ex UK British Pound
GBP SU Acc Class / GBP SU H Acc Class / GBP U AccClass / GBP U H Acc Class10 / EUR SI Acc Class / EURX Acc Class* / EUR SI Dis Class17 / GBP Y Acc Class37
/ GBP SU Dis Class24
Comgest Growth Asia US DollarEUR I Acc Class / USD Acc Class / EUR I Dis Class* /EUR Z Acc Class3/ EUR Acc Class*
Comgest Growth Asia ex Japan US Dollar USD I Acc Class / EUR I Acc Class / GBP U Acc Class*
Comgest Growth Asia Pac ex Japan US Dollar
USD Acc Class / USD Dis Class / USD I Acc Class /EUR I Acc Class / EUR R Acc Class / EUR Dis Class /GBP U Acc Class / EUR Z Acc Class / USD X AccClass* / EUR H Acc Class* / EUR SI Acc Class* / GBPSU Acc Class* / GBP U Dis Class* / USD SI Acc Class*
Comgest Growth China Euro
EUR Acc Class / USD Acc Class / EUR I Acc Class /EUR SI Acc Class / USD I Acc Class30 / EUR X AccClass* / EUR Z Acc Class / GBP U Acc Class1 / EUR RAcc Class*
Comgest Growth India US Dollar
USD Acc Class / EUR I Acc Class / EUR R Acc Class /EUR Z Acc Class* / USD I Acc Class* / USD X AccClass / GBP U Acc Class*
Comgest Growth Latin America EuroEUR Acc Class / USD Acc Class / USD I Acc Class /EUR R Acc Class / EUR I Acc Class / EUR Z Acc Class
AEffective from 19 December 2019 Comgest Growth EAFE Plus was renamed to Comgest Growth EAFE.* Not launched as at 31 December 2020.1Comgest Growth China GBP U Acc Class was launched on 16 January 2019.2Comgest Growth Japan EUR I Dis Class was launched on 23 January 2019.3Comgest Growth Asia EUR Z Acc Class was launched on 21 March 2019.4Comgest Growth Europe EUR I Fixed Dis Class was launched on 3 July 2019.5Comgest Growth Japan USD R H Acc Class was launched on 9 July 2019.6Comgest Growth Emerging Markets EUR Fixed Dis Class was launched on 12 July 2019.7Comgest Growth Europe EUR Fixed Dis Class was launched on 16 July 2019.8Comgest Growth America GBP U Acc Class was launched on 7 August 2019.9Comgest Growth World EUR SI Acc Class was launched on 19 September 2019.10Comgest Growth Europe ex UK GBP U H Acc Class was launched on 26 September 2019, subsequently fully redeemed on 21 November 2019.11Comgest Growth Europe Smaller Companies EUR X Acc Class were launched on 31 October 2019.12Comgest Growth Europe Compounders and Comgest Growth Europe Plus were launched on 23 December 2019.13Comgest Growth Europe Compounders EUR SI Acc Class and Comgest Growth Europe Plus EUR I Acc Class was launched on 23 December 2019.14Comgest Growth Emerging Markets EUR I Fixed Dis Class was launched on 23 December 2019.15Comgest Growth Japan Compounders was launched on 24 December 2019.16Comgest Growth Japan Compounders JPY SI Acc Class was launched on 24 December 2019.
COMGEST GROWTH plc
NOTES TO THE FINANCIAL STATEMENTS 31 December 2020 (continued)
202
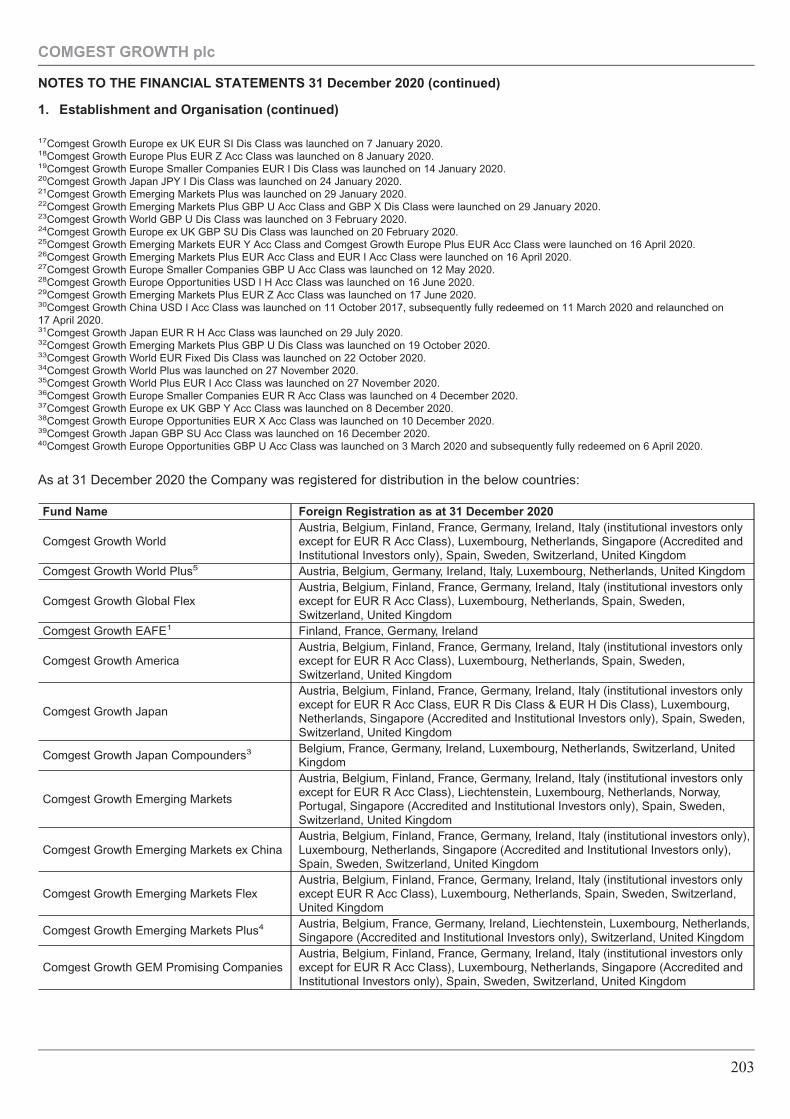
1. Establishment and Organisation (continued)
17Comgest Growth Europe ex UK EUR SI Dis Class was launched on 7 January 2020.18Comgest Growth Europe Plus EUR Z Acc Class was launched on 8 January 2020.19Comgest Growth Europe Smaller Companies EUR I Dis Class was launched on 14 January 2020.20Comgest Growth Japan JPY I Dis Class was launched on 24 January 2020.21Comgest Growth Emerging Markets Plus was launched on 29 January 2020.22Comgest Growth Emerging Markets Plus GBP U Acc Class and GBP X Dis Class were launched on 29 January 2020.23Comgest Growth World GBP U Dis Class was launched on 3 February 2020.24Comgest Growth Europe ex UK GBP SU Dis Class was launched on 20 February 2020.25Comgest Growth Emerging Markets EUR Y Acc Class and Comgest Growth Europe Plus EUR Acc Class were launched on 16 April 2020.26Comgest Growth Emerging Markets Plus EUR Acc Class and EUR I Acc Class were launched on 16 April 2020.27Comgest Growth Europe Smaller Companies GBP U Acc Class was launched on 12 May 2020.28Comgest Growth Europe Opportunities USD I H Acc Class was launched on 16 June 2020.29Comgest Growth Emerging Markets Plus EUR Z Acc Class was launched on 17 June 2020.30Comgest Growth China USD I Acc Class was launched on 11 October 2017, subsequently fully redeemed on 11 March 2020 and relaunched on17 April 2020.31Comgest Growth Japan EUR R H Acc Class was launched on 29 July 2020.32Comgest Growth Emerging Markets Plus GBP U Dis Class was launched on 19 October 2020.33Comgest Growth World EUR Fixed Dis Class was launched on 22 October 2020.34Comgest Growth World Plus was launched on 27 November 2020.35Comgest Growth World Plus EUR I Acc Class was launched on 27 November 2020.36Comgest Growth Europe Smaller Companies EUR R Acc Class was launched on 4 December 2020.37Comgest Growth Europe ex UK GBP Y Acc Class was launched on 8 December 2020.38Comgest Growth Europe Opportunities EUR X Acc Class was launched on 10 December 2020.39Comgest Growth Japan GBP SU Acc Class was launched on 16 December 2020.40Comgest Growth Europe Opportunities GBP U Acc Class was launched on 3 March 2020 and subsequently fully redeemed on 6 April 2020.
As at 31 December 2020 the Company was registered for distribution in the below countries:
Fund Name Foreign Registration as at 31 December 2020
Comgest Growth WorldAustria, Belgium, Finland, France, Germany, Ireland, Italy (institutional investors onlyexcept for EUR R Acc Class), Luxembourg, Netherlands, Singapore (Accredited andInstitutional Investors only), Spain, Sweden, Switzerland, United Kingdom
Comgest Growth World Plus5 Austria, Belgium, Germany, Ireland, Italy, Luxembourg, Netherlands, United Kingdom
Comgest Growth Global FlexAustria, Belgium, Finland, France, Germany, Ireland, Italy (institutional investors onlyexcept for EUR R Acc Class), Luxembourg, Netherlands, Spain, Sweden,Switzerland, United Kingdom
Comgest Growth EAFE1 Finland, France, Germany, Ireland
Comgest Growth AmericaAustria, Belgium, Finland, France, Germany, Ireland, Italy (institutional investors onlyexcept for EUR R Acc Class), Luxembourg, Netherlands, Spain, Sweden,Switzerland, United Kingdom
Comgest Growth Japan
Austria, Belgium, Finland, France, Germany, Ireland, Italy (institutional investors onlyexcept for EUR R Acc Class, EUR R Dis Class & EUR H Dis Class), Luxembourg,Netherlands, Singapore (Accredited and Institutional Investors only), Spain, Sweden,Switzerland, United Kingdom
Comgest Growth Japan Compounders3 Belgium, France, Germany, Ireland, Luxembourg, Netherlands, Switzerland, UnitedKingdom
Comgest Growth Emerging Markets
Austria, Belgium, Finland, France, Germany, Ireland, Italy (institutional investors onlyexcept for EUR R Acc Class), Liechtenstein, Luxembourg, Netherlands, Norway,Portugal, Singapore (Accredited and Institutional Investors only), Spain, Sweden,Switzerland, United Kingdom
Comgest Growth Emerging Markets ex ChinaAustria, Belgium, Finland, France, Germany, Ireland, Italy (institutional investors only),Luxembourg, Netherlands, Singapore (Accredited and Institutional Investors only),Spain, Sweden, Switzerland, United Kingdom
Comgest Growth Emerging Markets FlexAustria, Belgium, Finland, France, Germany, Ireland, Italy (institutional investors onlyexcept EUR R Acc Class), Luxembourg, Netherlands, Spain, Sweden, Switzerland,United Kingdom
Comgest Growth Emerging Markets Plus4 Austria, Belgium, France, Germany, Ireland, Liechtenstein, Luxembourg, Netherlands,Singapore (Accredited and Institutional Investors only), Switzerland, United Kingdom
Comgest Growth GEM Promising CompaniesAustria, Belgium, Finland, France, Germany, Ireland, Italy (institutional investors onlyexcept for EUR R Acc Class), Luxembourg, Netherlands, Singapore (Accredited andInstitutional Investors only), Spain, Sweden, Switzerland, United Kingdom
COMGEST GROWTH plc
NOTES TO THE FINANCIAL STATEMENTS 31 December 2020 (continued)
203
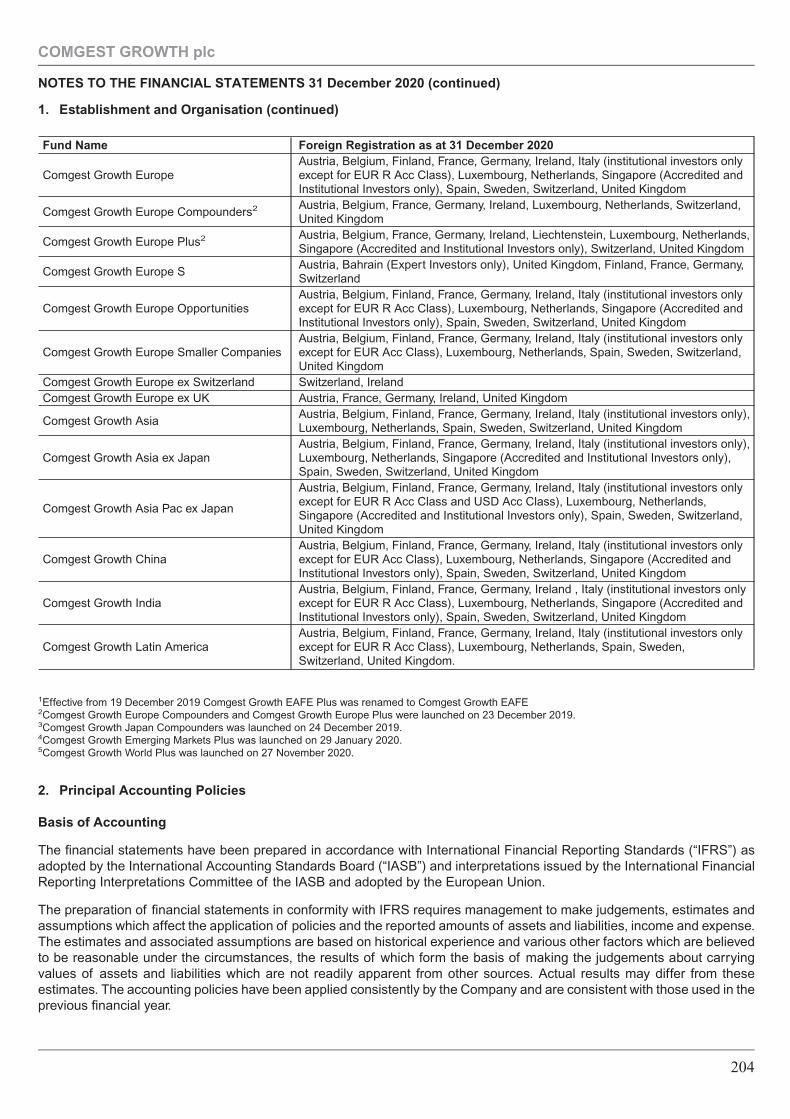
1. Establishment and Organisation (continued)
Fund Name Foreign Registration as at 31 December 2020
Comgest Growth EuropeAustria, Belgium, Finland, France, Germany, Ireland, Italy (institutional investors onlyexcept for EUR R Acc Class), Luxembourg, Netherlands, Singapore (Accredited andInstitutional Investors only), Spain, Sweden, Switzerland, United Kingdom
Comgest Growth Europe Compounders2 Austria, Belgium, France, Germany, Ireland, Luxembourg, Netherlands, Switzerland,United Kingdom
Comgest Growth Europe Plus2 Austria, Belgium, France, Germany, Ireland, Liechtenstein, Luxembourg, Netherlands,Singapore (Accredited and Institutional Investors only), Switzerland, United Kingdom
Comgest Growth Europe SAustria, Bahrain (Expert Investors only), United Kingdom, Finland, France, Germany,Switzerland
Comgest Growth Europe OpportunitiesAustria, Belgium, Finland, France, Germany, Ireland, Italy (institutional investors onlyexcept for EUR R Acc Class), Luxembourg, Netherlands, Singapore (Accredited andInstitutional Investors only), Spain, Sweden, Switzerland, United Kingdom
Comgest Growth Europe Smaller CompaniesAustria, Belgium, Finland, France, Germany, Ireland, Italy (institutional investors onlyexcept for EUR Acc Class), Luxembourg, Netherlands, Spain, Sweden, Switzerland,United Kingdom
Comgest Growth Europe ex Switzerland Switzerland, IrelandComgest Growth Europe ex UK Austria, France, Germany, Ireland, United Kingdom
Comgest Growth AsiaAustria, Belgium, Finland, France, Germany, Ireland, Italy (institutional investors only),Luxembourg, Netherlands, Spain, Sweden, Switzerland, United Kingdom
Comgest Growth Asia ex JapanAustria, Belgium, Finland, France, Germany, Ireland, Italy (institutional investors only),Luxembourg, Netherlands, Singapore (Accredited and Institutional Investors only),Spain, Sweden, Switzerland, United Kingdom
Comgest Growth Asia Pac ex Japan
Austria, Belgium, Finland, France, Germany, Ireland, Italy (institutional investors onlyexcept for EUR R Acc Class and USD Acc Class), Luxembourg, Netherlands,Singapore (Accredited and Institutional Investors only), Spain, Sweden, Switzerland,United Kingdom
Comgest Growth ChinaAustria, Belgium, Finland, France, Germany, Ireland, Italy (institutional investors onlyexcept for EUR Acc Class), Luxembourg, Netherlands, Singapore (Accredited andInstitutional Investors only), Spain, Sweden, Switzerland, United Kingdom
Comgest Growth IndiaAustria, Belgium, Finland, France, Germany, Ireland , Italy (institutional investors onlyexcept for EUR R Acc Class), Luxembourg, Netherlands, Singapore (Accredited andInstitutional Investors only), Spain, Sweden, Switzerland, United Kingdom
Comgest Growth Latin AmericaAustria, Belgium, Finland, France, Germany, Ireland, Italy (institutional investors onlyexcept for EUR R Acc Class), Luxembourg, Netherlands, Spain, Sweden,Switzerland, United Kingdom.
1Effective from 19 December 2019 Comgest Growth EAFE Plus was renamed to Comgest Growth EAFE2Comgest Growth Europe Compounders and Comgest Growth Europe Plus were launched on 23 December 2019.3Comgest Growth Japan Compounders was launched on 24 December 2019.4Comgest Growth Emerging Markets Plus was launched on 29 January 2020.5Comgest Growth World Plus was launched on 27 November 2020.
2. Principal Accounting Policies
Basis of Accounting
The financial statements have been prepared in accordance with International Financial Reporting Standards (“IFRS”) asadopted by the International Accounting Standards Board (“IASB”) and interpretations issued by the International FinancialReporting Interpretations Committee of the IASB and adopted by the European Union.
The preparation of financial statements in conformity with IFRS requires management to make judgements, estimates andassumptions which affect the application of policies and the reported amounts of assets and liabilities, income and expense.The estimates and associated assumptions are based on historical experience and various other factors which are believedto be reasonable under the circumstances, the results of which form the basis of making the judgements about carryingvalues of assets and liabilities which are not readily apparent from other sources. Actual results may differ from theseestimates. The accounting policies have been applied consistently by the Company and are consistent with those used in theprevious financial year.
COMGEST GROWTH plc
NOTES TO THE FINANCIAL STATEMENTS 31 December 2020 (continued)
204
2. Principal Accounting Policies (continued)
Basis of Accounting (continued)
The financial statements have been prepared under the historical cost convention as modified by the revaluation of financialassets and financial liabilities at fair value through profit or loss.
Net Asset Value
The Net Asset Value of a Fund and the Net Asset Value per Share of each class in each Fund are calculated on eachDealing Day by ascertaining the value of the assets of the Fund attributed to the class on such Dealing Day and deductingfrom such value the liabilities of the Fund attributed to the class on such Dealing Day.
Redeemable Participating Shares
All redeemable shares issued by the Company provide the investors with the right to require redemption for cash at the valueproportionate to the investor’s share in the Company’s net assets at the redemption date. In accordance with IAS 32 suchinstruments give rise to a financial liability for the present value of the redemption amount.
Investment Income
Income received arising on fixed income securities and liquidity investments is recognised as a component of the net gainson financial assets and liabilities held for trading. Dividends are recorded on the ex-dividend date. Income is shown gross ofwithholding tax.
Other Income
Other income includes miscellaneous items such as tax refunds or amounts paid into the Company in compensation.
Operating Expenses
The Company pays out of the assets of each Fund all normal operating expenses including Depositary fees, Administrationfees, Investment Manager fees, Directors’ fees, NAV publication and circulation fees, distribution fees, listing, regulatory andforeign representative fees, audit and other professional fees, stamp duties and charges incurred on the acquisition andrealisation of investments. Such costs are expensed in the year to which they relate.
All expenses, including management fees, are recognised in the Statement of Comprehensive Income on an accrual basis.
Offsetting Financial Instruments
Financial assets and liabilities can be offset and the net amount reported in the Statement of Financial Position when thereis a legally enforceable right to offset the recognised amounts and there is an intention to settle on a net basis, or realise theasset and settle the liability simultaneously.
Transaction fees
Transaction fees include fees and commissions paid to agents, advisers, brokers and dealers, levies by regulatory agenciesand security exchanges, and transfer taxes and duties. Transaction fees do not include debt premiums or discounts,financing costs or internal administrative or holding costs. Transaction fees relate to the purchase and sale of investments.
The Funds have not been accruing for any research costs post 31 December 2019 as the Investment Manager does not seekto recover any research costs incurred by it post 31 December 2019.
COMGEST GROWTH plc
NOTES TO THE FINANCIAL STATEMENTS 31 December 2020 (continued)
205
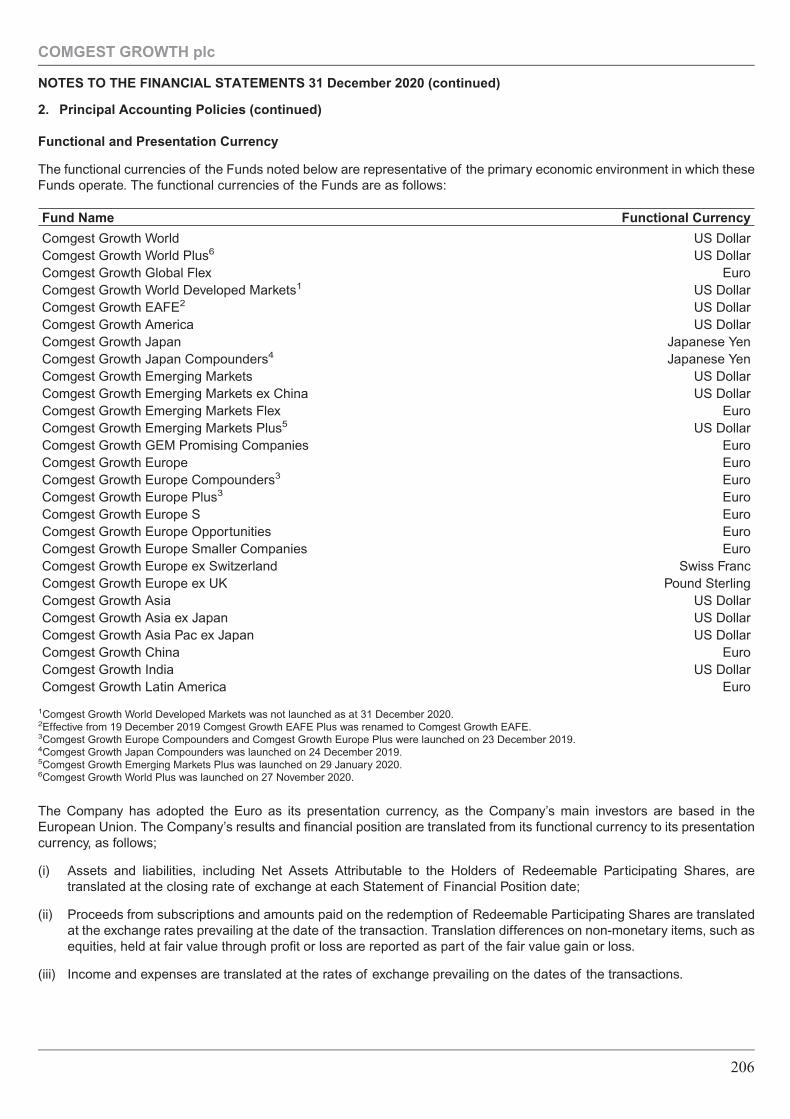
2. Principal Accounting Policies (continued)
Functional and Presentation Currency
The functional currencies of the Funds noted below are representative of the primary economic environment in which theseFunds operate. The functional currencies of the Funds are as follows:
Fund Name Functional Currency
Comgest Growth World US DollarComgest Growth World Plus6 US DollarComgest Growth Global Flex EuroComgest Growth World Developed Markets1 US DollarComgest Growth EAFE2 US DollarComgest Growth America US DollarComgest Growth Japan Japanese YenComgest Growth Japan Compounders4 Japanese YenComgest Growth Emerging Markets US DollarComgest Growth Emerging Markets ex China US DollarComgest Growth Emerging Markets Flex EuroComgest Growth Emerging Markets Plus5 US DollarComgest Growth GEM Promising Companies EuroComgest Growth Europe EuroComgest Growth Europe Compounders3 EuroComgest Growth Europe Plus3 EuroComgest Growth Europe S EuroComgest Growth Europe Opportunities EuroComgest Growth Europe Smaller Companies EuroComgest Growth Europe ex Switzerland Swiss FrancComgest Growth Europe ex UK Pound SterlingComgest Growth Asia US DollarComgest Growth Asia ex Japan US DollarComgest Growth Asia Pac ex Japan US DollarComgest Growth China EuroComgest Growth India US DollarComgest Growth Latin America Euro
1Comgest Growth World Developed Markets was not launched as at 31 December 2020.2Effective from 19 December 2019 Comgest Growth EAFE Plus was renamed to Comgest Growth EAFE.3Comgest Growth Europe Compounders and Comgest Growth Europe Plus were launched on 23 December 2019.4Comgest Growth Japan Compounders was launched on 24 December 2019.5Comgest Growth Emerging Markets Plus was launched on 29 January 2020.6Comgest Growth World Plus was launched on 27 November 2020.
The Company has adopted the Euro as its presentation currency, as the Company’s main investors are based in theEuropean Union. The Company’s results and financial position are translated from its functional currency to its presentationcurrency, as follows;
(i) Assets and liabilities, including Net Assets Attributable to the Holders of Redeemable Participating Shares, aretranslated at the closing rate of exchange at each Statement of Financial Position date;
(ii) Proceeds from subscriptions and amounts paid on the redemption of Redeemable Participating Shares are translatedat the exchange rates prevailing at the date of the transaction. Translation differences on non-monetary items, such asequities, held at fair value through profit or loss are reported as part of the fair value gain or loss.
(iii) Income and expenses are translated at the rates of exchange prevailing on the dates of the transactions.
COMGEST GROWTH plc
NOTES TO THE FINANCIAL STATEMENTS 31 December 2020 (continued)
206
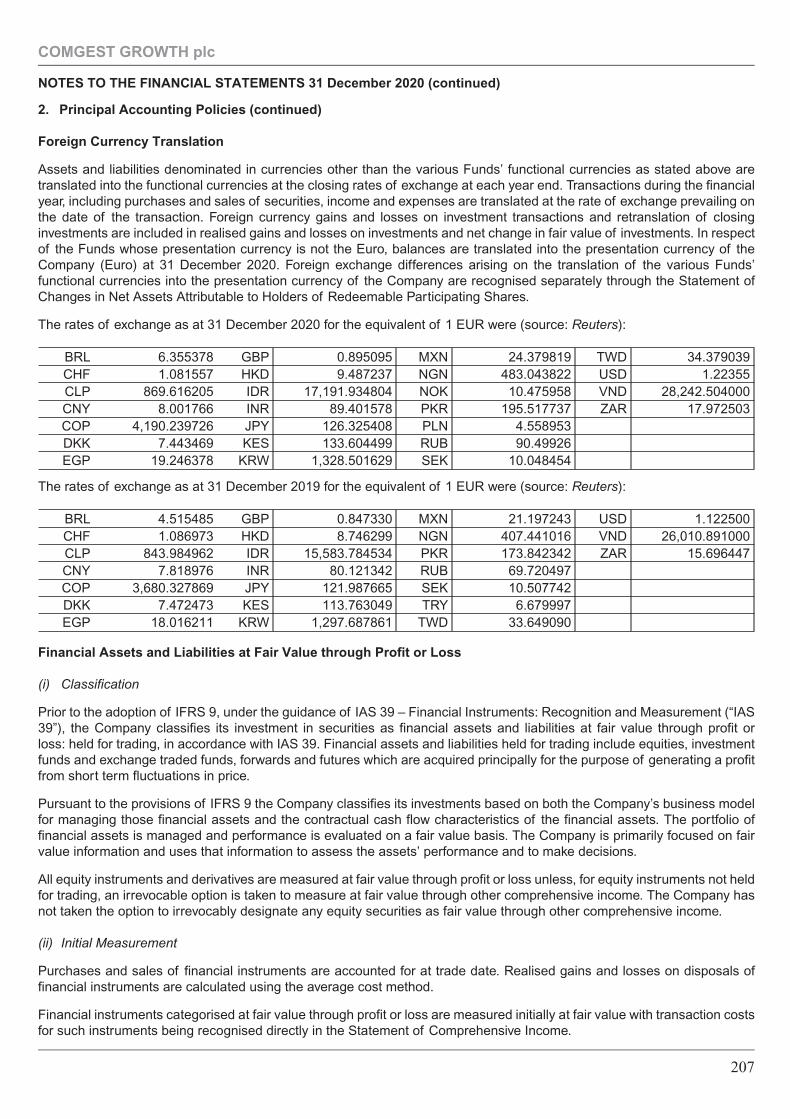
2. Principal Accounting Policies (continued)
Foreign Currency Translation
Assets and liabilities denominated in currencies other than the various Funds’ functional currencies as stated above aretranslated into the functional currencies at the closing rates of exchange at each year end. Transactions during the financialyear, including purchases and sales of securities, income and expenses are translated at the rate of exchange prevailing onthe date of the transaction. Foreign currency gains and losses on investment transactions and retranslation of closinginvestments are included in realised gains and losses on investments and net change in fair value of investments. In respectof the Funds whose presentation currency is not the Euro, balances are translated into the presentation currency of theCompany (Euro) at 31 December 2020. Foreign exchange differences arising on the translation of the various Funds’functional currencies into the presentation currency of the Company are recognised separately through the Statement ofChanges in Net Assets Attributable to Holders of Redeemable Participating Shares.
The rates of exchange as at 31 December 2020 for the equivalent of 1 EUR were (source: Reuters):
BRL 6.355378 GBP 0.895095 MXN 24.379819 TWD 34.379039CHF 1.081557 HKD 9.487237 NGN 483.043822 USD 1.22355CLP 869.616205 IDR 17,191.934804 NOK 10.475958 VND 28,242.504000CNY 8.001766 INR 89.401578 PKR 195.517737 ZAR 17.972503COP 4,190.239726 JPY 126.325408 PLN 4.558953DKK 7.443469 KES 133.604499 RUB 90.49926EGP 19.246378 KRW 1,328.501629 SEK 10.048454
The rates of exchange as at 31 December 2019 for the equivalent of 1 EUR were (source: Reuters):
BRL 4.515485 GBP 0.847330 MXN 21.197243 USD 1.122500CHF 1.086973 HKD 8.746299 NGN 407.441016 VND 26,010.891000CLP 843.984962 IDR 15,583.784534 PKR 173.842342 ZAR 15.696447CNY 7.818976 INR 80.121342 RUB 69.720497COP 3,680.327869 JPY 121.987665 SEK 10.507742DKK 7.472473 KES 113.763049 TRY 6.679997EGP 18.016211 KRW 1,297.687861 TWD 33.649090
Financial Assets and Liabilities at Fair Value through Profit or Loss
(i) Classification
Prior to the adoption of IFRS 9, under the guidance of IAS 39 – Financial Instruments: Recognition and Measurement (“IAS39”), the Company classifies its investment in securities as financial assets and liabilities at fair value through profit orloss: held for trading, in accordance with IAS 39. Financial assets and liabilities held for trading include equities, investmentfunds and exchange traded funds, forwards and futures which are acquired principally for the purpose of generating a profitfrom short term fluctuations in price.
Pursuant to the provisions of IFRS 9 the Company classifies its investments based on both the Company’s business modelfor managing those financial assets and the contractual cash flow characteristics of the financial assets. The portfolio offinancial assets is managed and performance is evaluated on a fair value basis. The Company is primarily focused on fairvalue information and uses that information to assess the assets’ performance and to make decisions.
All equity instruments and derivatives are measured at fair value through profit or loss unless, for equity instruments not heldfor trading, an irrevocable option is taken to measure at fair value through other comprehensive income. The Company hasnot taken the option to irrevocably designate any equity securities as fair value through other comprehensive income.
(ii) Initial Measurement
Purchases and sales of financial instruments are accounted for at trade date. Realised gains and losses on disposals offinancial instruments are calculated using the average cost method.
Financial instruments categorised at fair value through profit or loss are measured initially at fair value with transaction costsfor such instruments being recognised directly in the Statement of Comprehensive Income.
COMGEST GROWTH plc
NOTES TO THE FINANCIAL STATEMENTS 31 December 2020 (continued)
207
2. Principal Accounting Policies (continued)
Financial Assets and Liabilities at Fair Value through Profit or Loss (continued)
(iii) Subsequent Measurement
After initial measurement, the Company measures financial instruments, which are classified as at fair value through profit orloss at their fair values. Fair value is the price that would be received to sell an asset or paid to transfer a liability in an orderlytransaction between market participants at the measurement date. The fair value of financial instruments traded in activemarkets is based on their quoted market prices on a recognised exchange or sourced from a reputable broker/counterpartyin the case of non-exchange-traded instruments, at the financial period end, without any deduction for estimated futureselling costs. Fair Value of underlying investment funds is based on the Net Asset Values as supplied by the administratorsof the underlying fund.
If a quoted market price is not available on a recognised stock exchange or from a broker/counterparty, the fair value of thefinancial instruments may be estimated by a competent person using valuation techniques, including the use of recent arm’slength market transactions, reference to the current fair value of another instrument that is substantially the same,discounted cash flow techniques, option pricing models or any other valuation technique that provides a reliable estimate ofprices obtained in actual market transactions.
On 1 October 2020, in light of a notification of a temporary suspension of trading on the Tokyo Stock Exchange (“TSE”), thecompetent person made estimations in relation to the valuation of the securities listed on the TSE for the following Funds:
Comgest Growth Japan CompoundersComgest Growth AsiaComgest Growth Asia Pac ex JapanComgest Growth Asia ex JapanComgest Growth EAFEComgest Growth WorldComgest Growth Global FlexComgest Growth Emerging MarketsComgest Growth Emerging Markets FlexComgest Growth Emerging Markets ex China
The Directors declared 1 October 2020 to be a non-dealing day for the Comgest Growth Japan Fund.
There were no other competent person estimations or valuations during the year ended 31 December 2020.
Forward Foreign Exchange Contracts
The fair value of open forward foreign exchange contracts is calculated as the difference between the contracted rate and thecurrent forward rate that would close out the contract on the valuation date for a forward foreign exchange contract or thespot rate for an fx spot contract. For each relevant Fund, gains or losses on open forward foreign exchange contracts andforeign exchange swap contracts are included in unrealised gain/(loss) on forward foreign exchange contracts in theStatement of Financial Position and are shown in Note 6.
Futures Contracts
A futures contract is an agreement between two parties to buy or sell a financial instrument for a set price on a future date.Initial margin deposits are made in cash upon entering into futures contracts. During the financial year the futures contract isopen, changes in the value of the contracts are recognised as unrealised gains or losses by �marking to-market� on a dailybasis to reflect the market value of the contract at the end of each day’s trading. Variation margin payments are made orreceived, depending on whether unrealised losses or gains are incurred. When the contract is closed or expires, theCompany records a realised gain or loss equal to the difference between the proceeds from (or cost of) the closingtransaction and the Company’s basis in the contract.
COMGEST GROWTH plc
NOTES TO THE FINANCIAL STATEMENTS 31 December 2020 (continued)
208
2. Principal Accounting Policies (continued)
Swing Pricing
The Prospectus has been updated to provide the Company with the flexibility to engage in swing pricing for all of its Funds,further to the approval by the shareholders of the update of the Company’s constitution to permit same at an EGM held on8 April 2019.
Swing pricing operates in a manner that ensures that when, on any particular Dealing Day, the net dealing position exceedsa certain threshold (the “Swing Threshold”), the Company will have the discretion to adjust the price for the relevant Fund’sShares on that day so as to include a provision for the relevant costs. In this way, on any Dealing Day on which such anadjustment is applied (the “Swing Adjustment”), investors dealing in a Fund’s Shares on that day, rather than the Fund itself(i.e. not the then existing or continuing Shareholders of that Fund), will bear the costs incurred when buying or sellingportfolio assets in order to satisfy or give effect to the dealing requests received.
The Swing Adjustment is a percentage factor determined by the Company from time to time at its sole discretion. The SwingAdjustment, where applied to a Fund, shall at no time exceed 0.5% of the relevant Net Asset Value per Share.
Where a Fund is in a net subscription position on any particular Dealing Day (i.e. where total purchases of the Fund’s Sharesexceeds total redemptions) and that net position exceeds a certain threshold determined by the Company at its discretion,the Net Asset Value per Share may be increased by an appropriate percentage factor (not exceeding 0.5% of the Net AssetValue per Share) to account for duties and charges and spreads. Investors subscribing and/or redeeming Shares of a Classin the Fund on that particular Dealing Day will deal at this single price.
Where the Fund is in a net redemption position on a particular Dealing Day (i.e. where total redemptions of the Fund’sShares exceeds total subscriptions), and that net position exceeds a certain threshold determined by the Company at itsdiscretion, the Net Asset Value per Share may be decreased by an appropriate percentage factor (not exceeding 0.5% of theNet Asset Value per Share) to account for duties, charges and spreads. Investors subscribing and/or redeeming Shares of aClass in the Fund on that particular Dealing Day will deal at this single price.
As at 31 December 2020, there were no Net Asset Value adjustments for swing pricing.
New Standards, Amendments and Interpretations effective from 1 January 2020
A number of new standards, amendments to standards and interpretations are effective for all financial periods beginning onor after 1 January 2020, and have not been applied in preparing these financial statements.
Those standards, amendments and interpretations considered included:
• Amendments to IFRS 3, “Business Combinations”, definition of a business (1 January 2020);• Amendments to IAS 1 and IAS 8, “Presentation of Financial Statements” and “Accounting Policies, Changes in
Accounting Estimates and Errors”, definition of material (1 January 2020);• Amendments to IFRS 7 and IFRS 9, “Financial Instruments: Disclosures” and “Financial Instruments”, pre-
replacement issues in the context of the IBOR reform (1 January 2020); and• Amendments to References to the Conceptual Framework in IFRS Standards (1 January 2020).
The adoption of the above standards as of 1 January 2020 did not have an impact on the Company’s financial statements.
New Standards, Amendments and Interpretations effective after 1 January 2021 and not yet adopted
There were no new standards, amendments to standards or interpretations which will be effective from 1 January 2021 thatwould have a material impact on the financial statements.
COMGEST GROWTH plc
NOTES TO THE FINANCIAL STATEMENTS 31 December 2020 (continued)
209
3. Taxation
Under current law and practice the Company qualifies as an investment undertaking as defined under Section 739B of theTaxes Consolidations Act, 1997, as amended. On that basis it is not chargeable to Irish tax on its income or gains.
However, Irish tax may arise on the happening of a ‘‘chargeable event’’. A chargeable event includes any distributionpayments to Shareholders or any encashment, redemption, cancellation or transfer of shares.
No Irish tax will arise on the Company in respect of chargeable events in respect of:
a) A Shareholder who is neither Irish resident nor ordinarily resident in Ireland for tax purposes, at the time of thechargeable event, provided appropriate valid declarations in accordance with the provisions of the TaxesConsolidation Act, 1997, as amended, are held by the Company; and
b) Certain exempted Irish tax resident Shareholders who have provided the Company with the necessary signedstatutory declarations.
Dividends, interest and capital gains (if any) received on investments made by the Company may be subject to withholdingtaxes imposed by the country from which the investment income/gains are received and such taxes may not be recoverableby the Company or its Shareholders. Gains on disposal of equities held by the Company may be subject to capital gainstaxes imposed by the country in which such capital gains originated. The amount of capital gains tax realised during thecurrent and comparative financial year have been noted in the Statement of Comprehensive Income.
IFRIC 23 Uncertainty over Income Tax Treatments (IFRIC 23 or the Interpretation) was put in place to address how to reflectuncertainty in the recognition and measurement of income taxes. IFRIC 23 is effective for annual periods beginning on orafter 1 January 2019, with early application permitted. The new standard does not have a significant impact on theCompany’s financial position, performance or disclosures in its financial statements.
4. Share Capital
On incorporation the authorised share capital of the Company was €40,000 divided into 40,000 Subscriber Shares of a parvalue of €1.00 each and 500,000,000,000 shares of no par value initially designated as unclassified shares. Theunclassified shares are available for issue as Redeemable Participating Shares. Save as set out in the Prospectus, all sharesshall rank pari passu.
a) Subscriber Shares
In order to provide for the minimum share capital on incorporation required under Irish law, Comgest Far East Limitedsubscribed for 39,993 Subscriber Shares for cash at par paid up in full and a further seven Subscriber Shares havebeen issued fully paid up in cash at par to nominees. No further Subscriber Shares will be issued. The SubscriberShares held by Comgest Far East Limited were subsequently repurchased by the Company at the repurchase price of€1.00 per Subscriber Share.
The Company’s Subscriber Shares are classified as equity in accordance with the Company’s Articles. These sharesdo not participate in the profits of the Company.
In the event of a winding up or dissolution of the Company, Subscriber Shares shall be entitled, (after payment to holders ofthe Redeemable Participating Shares of a sum equal to the Net Asset Value of the Redeemable Participating Shares as atthe date of commencement to wind up), to payment in respect of nominal amount paid up thereon out of the assets of theCompany, but shall not be entitled to any further or other amount.
b) Redeemable Participating Shares
The holders of Redeemable Participating Shares shall be entitled to:
(i) One vote per Redeemable Participating Share,(ii) Such dividends that the Directors may from time to time declare, and(iii) In the event of a winding up or dissolution of the Company, in priority to the holders of the Subscriber Shares,
firstly an amount equal to the Net Asset Value of the Participating Shares of each class or series held at the dateof winding up and, after payment to the holders of the Subscriber Shares of the nominal amount paid up thereon,to participate in surplus assets of the Company (if any).
COMGEST GROWTH plc
NOTES TO THE FINANCIAL STATEMENTS 31 December 2020 (continued)
210
5. Fees
Investment Manager’s Fees
The Investment Manager’s fees are accrued daily and payable monthly in arrears out of the assets of each of the Funds aspresented in following table.
The table below presents figures for Funds and share classes which were in issue as at 31 December 2020.
Fund Name Share Class % of Net Asset ValueComgest Growth World USD Acc Class 1.50%
EUR I Acc Class, USD I Acc Class, GBP U Acc Class &GBP U Dis Class24 0.85%EUR R Acc Class 2.00%EUR Dis Class & EUR Fixed Dis Class36 1.80%EUR Z Acc Class 0.90%EUR SI Acc Class9 0.75%
Comgest Growth World Plus37 EUR I Acc Class38 0.85%Comgest Growth Global Flex EUR I Acc Class 0.90%
EUR R Acc Class 1.80%EUR Z Acc Class 0.95%
Comgest Growth EAFEA USD I Acc Class 0.85%Comgest Growth America USD Acc Class 1.50%
USD I Acc Class, EUR I H Acc Class & GBP U Acc Class8 0.75%EUR Z Acc Class 0.80%EUR R Acc Class 2.00%
Comgest Growth Japan JPY Acc Class 1.50%JPY I Acc Class, EUR I Acc Class, EUR I H Acc Class,USD I Acc Class, GBP U H Acc Class, USD I H Acc Class,GBP U Acc Class, GBP Z H Acc Class, EUR I Dis Class2 &JPY I Dis Class20 0.85%EUR H Dis Class, EUR R Acc Class, EUR R Dis Class,USD R Acc Class, USD R H Acc Class5, JPY I Dis Class &EUR R H Acc Class34 1.70%EUR Z Acc Class & EUR Z H Acc Class 0.90%EUR X H Acc Class 0.00%GBP SU Acc Class42 0.75%
Comgest Growth Japan Compounders15 JPY SI Acc Class16 0.60%Comgest Growth Emerging Markets USD Acc Class, USD Dis Class, EUR Dis Class & EUR
Fixed Dis Class6 1.50%EUR I Acc Class, EUR I Dis Class, EUR I Fixed DisClass14, USD I Acc Class, GBP U Acc Class & GBP Z AccClass 1.00%EUR R Acc Class & USD R Acc Class 2.00%EUR Z Acc Class, EUR Z Dis Class, USD Z Acc Class &USD Z Dis Class 1.05%USD X Acc Class 0.00%EUR Y Acc Class26 0.85%
Comgest Growth Emerging Markets ex China USD I Acc Class 1.00%Comgest Growth Emerging Markets Flex EUR I Acc Class 1.10%
EUR Z Acc Class 1.15%EUR R Acc Class 2.20%
Comgest Growth Emerging Markets Plus23 EUR Acc Class28 1.50%EUR I Acc Class29, GBP U Acc Class21& GBP U DisClass35 1.00%EUR Z Acc Class32 1.05%GBP X Dis Class22 0.00%
COMGEST GROWTH plc
NOTES TO THE FINANCIAL STATEMENTS 31 December 2020 (continued)
211
5. Fees (continued)
Investment Manager’s Fees (continued)
Fund Name Share Class % of Net Asset ValueComgest Growth GEM Promising Companies EUR Acc Class & EUR Dis Class 1.75%
EUR I Acc Class & USD I Acc Class 1.25%EUR R Acc Class 2.50%EUR Z Acc Class 1.30%
Comgest Growth Europe EUR Acc Class, EUR Dis Class & EUR Fixed Dis Class4 1.50%EUR I Acc Class, USD I Acc Class, USD I H Acc Class,EUR I Dis Class & EUR I Fixed Dis Class7 1.00%EUR R Acc Class 2.00%EUR Z Acc Class & EUR Z Dis Class 1.05%
Comgest Growth Europe Compounders12 EUR SI Acc Class13 0.60%Comgest Growth Europe Plus12 EUR I Acc Class13 1.00%
EUR Acc Class27 1.50%EUR Z Acc Class18 1.05%
Comgest Growth Europe S EUR Acc Class & USD Acc Class 2.00%Comgest Growth Europe Opportunities EUR Acc Class & EUR Dis Class 1.50%
EUR I Acc Class, USD I H Acc Class31 & GBP U AccClass43 1.00%EUR R Acc Class 2.00%EUR Z Acc Class 1.05%EUR X Acc Class41 0.00%
Comgest Growth Europe Smaller Companies EUR Acc Class 1.50%EUR X Acc Class11 0.00%EUR Z Acc Class 1.05%EUR I Acc Class, EUR I Dis Class18 & GBP U Acc Class30 1.00%EUR R Acc Class39 2.00%
Comgest Growth Europe ex Switzerland CHF I Acc Class 1.00%CHF Z Acc Class 1.05%
Comgest Growth Europe ex UK GBP Y Acc Class40 0.75%GBP SU Acc Class, GBP SU H Acc Class, GBP SU DisClass25, EUR SI Acc Class & EUR SI Dis Class17 0.85%GBP U Acc Class 1.00%
Comgest Growth Asia USD Acc Class 1.50%EUR I Acc Class 1.00%EUR Z Acc Class3 1.05%
Comgest Growth Asia ex Japan EUR I Acc Class, USD I Acc Class & GBP U Acc Class 1.00%Comgest Growth Asia Pac ex Japan USD Acc Class, USD Dis Class & EUR Dis Class 1.50%
USD I Acc Class, EUR I Acc Class & GBP U Acc Class 1.00%EUR Z Acc Class 1.05%EUR R Acc Class 2.00%
Comgest Growth China EUR Acc Class & USD Acc Class 1.50%EUR SI Acc Class 1.00%EUR I Acc Class, USD I Acc Class33 & GBP U Acc Class1 1.25%EUR Z Acc Class 1.30%
Comgest Growth India USD Acc Class 1.75%EUR R Acc Class 2.50%EUR I Acc Class & GBP U Acc Class 1.25%USD X Acc Class 0.00%
Comgest Growth Latin America EUR Acc Class & USD Acc Class 1.75%EUR R Acc Class 2.50%USD I Acc Class & EUR I Acc Class 1.25%EUR Z Acc Class 1.30%
AEffective from 19 December 2019 Comgest Growth EAFE Plus was renamed to Comgest Growth EAFE.1Comgest Growth China GBP U Acc Class was launched on 16 January 2019.
COMGEST GROWTH plc
NOTES TO THE FINANCIAL STATEMENTS 31 December 2020 (continued)
212
5. Fees (continued)
Investment Manager’s Fees (continued)
2Comgest Growth Japan EUR I Dis Class was launched on 23 January 2019.3Comgest Growth Asia EUR Z Acc Class was launched on 21 March 2019.4Comgest Growth Europe EUR I Fixed Dis Class was launched on 3 July 2019.5Comgest Growth Japan USD R H Acc Class was launched on 9 July 2019.6Comgest Growth Emerging Markets EUR Fixed Dis Class was launched on 12 July 2019.7Comgest Growth Europe EUR Fixed Dis Class was launched on 16 July 2019.8Comgest Growth America GBP U Acc Class was launched on 7 August 2019.9Comgest Growth World EUR SI Acc Class was launched on 19 September 2019.10Comgest Growth Europe ex UK GBP U H Acc Class was launched on 26 September 2019, subsequently fully redeemed on 21 November 2019.11Comgest Growth Europe Smaller Companies EUR X Acc Class was launched on 31 October 2019.12Comgest Growth Europe Compounders and Comgest Growth Europe Plus were launched on 23 December 2019.13Comgest Growth Europe Compounders EUR SI Acc Class and Comgest Growth Europe Plus EUR I Acc Class was launched on 23 December 2019.14Comgest Growth Emerging Markets EUR I Fixed Dis Class was launched on 23 December 2019.15Comgest Growth Japan Compounders was launched on 24 December 2019.16Comgest Growth Japan Compounders JPY SI Acc Class was launched on 24 December 2019.17Comgest Growth Europe ex UK EUR SI Dis Class was launched on 7 January 2020.18Comgest Growth Europe Plus EUR Z Acc Class was launched on 8 January 2020.19Comgest Growth Europe Smaller Companies EUR I Dis Class was launched on 14 January 2020.20Comgest Growth Japan JPY I Dis Class was launched on 24 January 2020.21Comgest Growth Emerging Markets Plus GBP U Acc Class was launched on 29 January 2020.22Comgest Growth Emerging Markets Plus GBP X Dis Class was launched on 29 January 2020.23Comgest Growth Emerging Markets Plus was launched on 29 January 2020.24Comgest Growth World GBP U Dis Class was launched on 3 February 2020.25Comgest Growth Europe ex UK GBP SU Dis Class was launched on 20 February 2020.26Comgest Growth Emerging Markets EUR Y Acc Class was launched on 16 April 2020.27Comgest Growth Europe Plus EUR Acc Class was launched on 16 April 2020.28Comgest Growth Emerging Markets Plus EUR Acc Class was launched on 16 April 2020.29Comgest Growth Emerging Markets Plus EUR I Acc Class was launched on 16 April 2020.30Comgest Growth Europe Smaller Companies GBP U Acc Class was launched on 12 May 2020.31Comgest Growth Europe Opportunities USD I H Acc Class was launched on 16 June 2020.32Comgest Growth Emerging Markets Plus EUR Z Acc Class was launched on 17 June 2020.33Comgest Growth China USD I Acc Class was launched on 11 October 2017, subsequently fully redeemed on 11 March 2020 and relaunched on17 April 2020.34Comgest Growth Japan EUR R H Acc Class was launched on 29 July 2020.35Comgest Growth Emerging Markets Plus GBP U Dis Class was launched on 19 October 2020.36Comgest Growth World EUR Fixed Dis Class was launched on 22 October 2020.37Comgest Growth World Plus was launched on 27 November 2020.38Comgest Growth World Plus EUR I Acc Class was launched on 27 November 2020.39Comgest Growth Europe Smaller Companies EUR R Acc Class was launched on 4 December 202040Comgest Growth Europe ex UK GBP Y Acc Class was launched on 8 December 2020.41Comgest Growth Europe Opportunities EUR X Acc Class was launched on 10 December 2020.42Comgest Growth Japan GBP SU Acc Class was launched on 16 December 2020.43Comgest Growth Europe Opportunities GBP U Acc Class was launched on 3 March 2020 and subsequently fully redeemed on 6 April 2020.
There is no management fee charged on assets of the Funds invested in other Collective Investment Schemes andUndertakings for Collective Investment in Transferable Securities managed by the Investment Manager or an associatedcompany.
No investment management fees are payable out of the assets attributable to the X Acc share classes. These share classesare available to investors who are subject to the criteria noted within the Prospectus.
The Company shall reimburse for all reasonable and properly vouched out of pocket expenses incurred by the InvestmentManager in the performance of its duties and responsibilities under the Investment Management Agreement.
The amount of Investment Manager’s fees payable and charged for each Fund during the financial year ended 31 December2020 and 2019 have been noted on the Statement of Financial Position and the Statement of Comprehensive Incomerespectively. The total investment management fees charged for the financial year ended 31 December 2020 were€168,422,120 (31 December 2019: €151,026,736) and the amount payable as at 31 December 2020 was€31,796,650 (31 December 2019: €13,785,072).
The Investment Manager waived its fees in their entirety on the following Sub-Funds for the period to 31 December 2020;Comgest Growth Emerging Markets ex China, Comgest Growth Japan Compounders, Comgest Growth EuropeCompounders and Comgest Growth Europe Plus (no longer waived as of 28 April 2020). There will also be a fee waiverapplied to Comgest Growth GEM Flex from 11 February 2021.
COMGEST GROWTH plc
NOTES TO THE FINANCIAL STATEMENTS 31 December 2020 (continued)
213
5. Fees (continued)
Investment Manager’s Fees (continued)
As set out in the prospectus under ‘Fees and Expenses’ (TER section), the Company may impose a cap on expenditure suchthat the expenditure of a Share Class does not exceed thresholds agreed between the Investment Manager and theCompany. In the event of expenditure exceeding an agreed cap, the Investment Manager shall reimburse the affected ShareClass(es). Where such instances arose in the period, the detail of any and all reimbursement by the Investment Manager iscaptured for the relevant Sub-Fund in the Statement of Comprehensive Income.
Sub-Investment Manager Fees
The fees and expenses of a Sub-Investment Manager will be paid by the Investment Manager out of its investmentmanagement fee.
Administrator’s Fees
The Administrator shall be entitled to receive an annual fee from the Company, accrued daily and payable monthly in arrears,not exceeding 0.05% of the Net Asset Value of the Company, subject to such minimum fee as agreed between the Companyand the Administrator.
The minimum fee includes €2,500 per Fund for the production of annual financial statements and €1,750 per Fund for theproduction of semi-annual financial statements.
The Administrator is entitled to a minimum annual fee of €29,000 per Fund which includes two share classes. For eachadditional share class in excess of two per Fund, a fee of €3,000 per annum will be incurred and charged to the relevantFund. The minimum annual fee will increase by €29,000 for each additional Fund. The annual fee will be charged pro rata inthe event of a Fund commencing or ceasing during a financial year.
The Administrator is also entitled to a domiciliary and corporate agent services fee of €3,000 per annum for the Company asa whole and to be reimbursed for all agreed maintenance fees, Shareholder servicing fees, systems connection andprogramming fees, registered certificate fees and transaction fees (which shall all be at normal commercial rates and as setout in the Administration Agreement) and all reasonable out of pocket expenses properly incurred by it in the performance ofits duties and responsibilities under the Administration Agreement, all of which will also be applied to the minimum fee.
The Administrator is also entitled to a fee for services provided to the Company in relation to the Foreign Account TaxCompliance Act (FATCA). Fees of €1,250 per year were charged to the Funds for FATCA services during the financial yearended 31 December 2020 and 31 December 2019.
The Administrator is also entitled to a fee for services provided to the Company in relation to the requirements of theCommon Reporting Standard (CRS). There were fees of €1,250 charged for CRS services during the financial year ended31 December 2020 and 31 December 2019.
The Administrator fees were updated, effective 1 January 2021. A summary of the changes can be seen in note 18.
The amount of Administrator’s fees payable and charged for each Fund during the financial year ended 31 December2020 and 31 December 2019 have been noted on the Statement of Financial Position and the Statement of ComprehensiveIncome respectively. The total Administrator’s fees charged for the financial year ended 31 December 2020 were€1,648,560 (2019: €1,462,286) and the amount payable as at 31 December 2020 was €304,949 (31 December 2019:€286,950).
Depositary
The Depositary shall be entitled to receive an annual fee from the Company accrued daily and payable monthly in arrears notexceeding 0.0105% of the Net Asset Value of the Company with a minimum annual depositary fee of €4,200 per Fund permonth. The Company shall also pay and reimburse the Depositary in respect of all out-of-pocket expenses incurred by it onbehalf of the Company. The Company will also be responsible for transaction charges and sub-custody charges (which willbe charged at normal commercial rates).
COMGEST GROWTH plc
NOTES TO THE FINANCIAL STATEMENTS 31 December 2020 (continued)
214
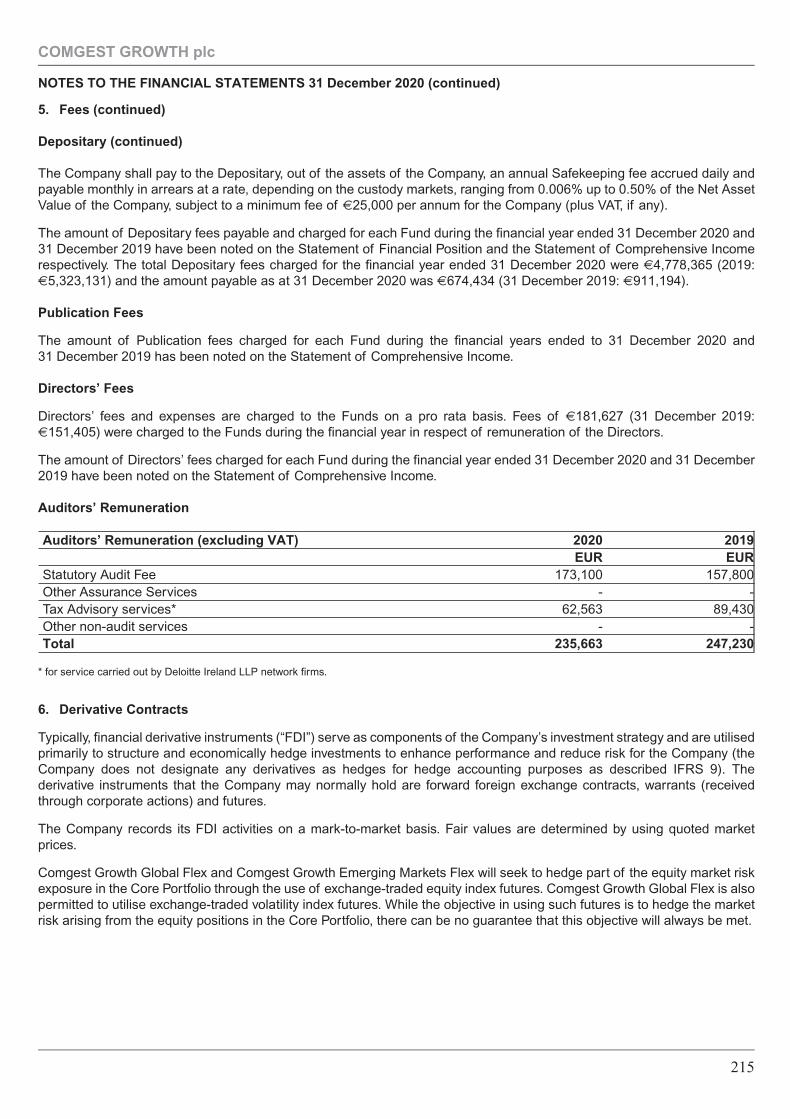
5. Fees (continued)
Depositary (continued)
The Company shall pay to the Depositary, out of the assets of the Company, an annual Safekeeping fee accrued daily andpayable monthly in arrears at a rate, depending on the custody markets, ranging from 0.006% up to 0.50% of the Net AssetValue of the Company, subject to a minimum fee of €25,000 per annum for the Company (plus VAT, if any).
The amount of Depositary fees payable and charged for each Fund during the financial year ended 31 December 2020 and31 December 2019 have been noted on the Statement of Financial Position and the Statement of Comprehensive Incomerespectively. The total Depositary fees charged for the financial year ended 31 December 2020 were €4,778,365 (2019:€5,323,131) and the amount payable as at 31 December 2020 was €674,434 (31 December 2019: €911,194).
Publication Fees
The amount of Publication fees charged for each Fund during the financial years ended to 31 December 2020 and31 December 2019 has been noted on the Statement of Comprehensive Income.
Directors’ Fees
Directors’ fees and expenses are charged to the Funds on a pro rata basis. Fees of €181,627 (31 December 2019:€151,405) were charged to the Funds during the financial year in respect of remuneration of the Directors.
The amount of Directors’ fees charged for each Fund during the financial year ended 31 December 2020 and 31 December2019 have been noted on the Statement of Comprehensive Income.
Auditors’ Remuneration
Auditors’ Remuneration (excluding VAT) 2020 2019EUR EUR
Statutory Audit Fee 173,100 157,800Other Assurance Services - -Tax Advisory services* 62,563 89,430Other non-audit services - -Total 235,663 247,230
* for service carried out by Deloitte Ireland LLP network firms.
6. Derivative Contracts
Typically, financial derivative instruments (“FDI”) serve as components of the Company’s investment strategy and are utilisedprimarily to structure and economically hedge investments to enhance performance and reduce risk for the Company (theCompany does not designate any derivatives as hedges for hedge accounting purposes as described IFRS 9). Thederivative instruments that the Company may normally hold are forward foreign exchange contracts, warrants (receivedthrough corporate actions) and futures.
The Company records its FDI activities on a mark-to-market basis. Fair values are determined by using quoted marketprices.
Comgest Growth Global Flex and Comgest Growth Emerging Markets Flex will seek to hedge part of the equity market riskexposure in the Core Portfolio through the use of exchange-traded equity index futures. Comgest Growth Global Flex is alsopermitted to utilise exchange-traded volatility index futures. While the objective in using such futures is to hedge the marketrisk arising from the equity positions in the Core Portfolio, there can be no guarantee that this objective will always be met.
COMGEST GROWTH plc
NOTES TO THE FINANCIAL STATEMENTS 31 December 2020 (continued)
215
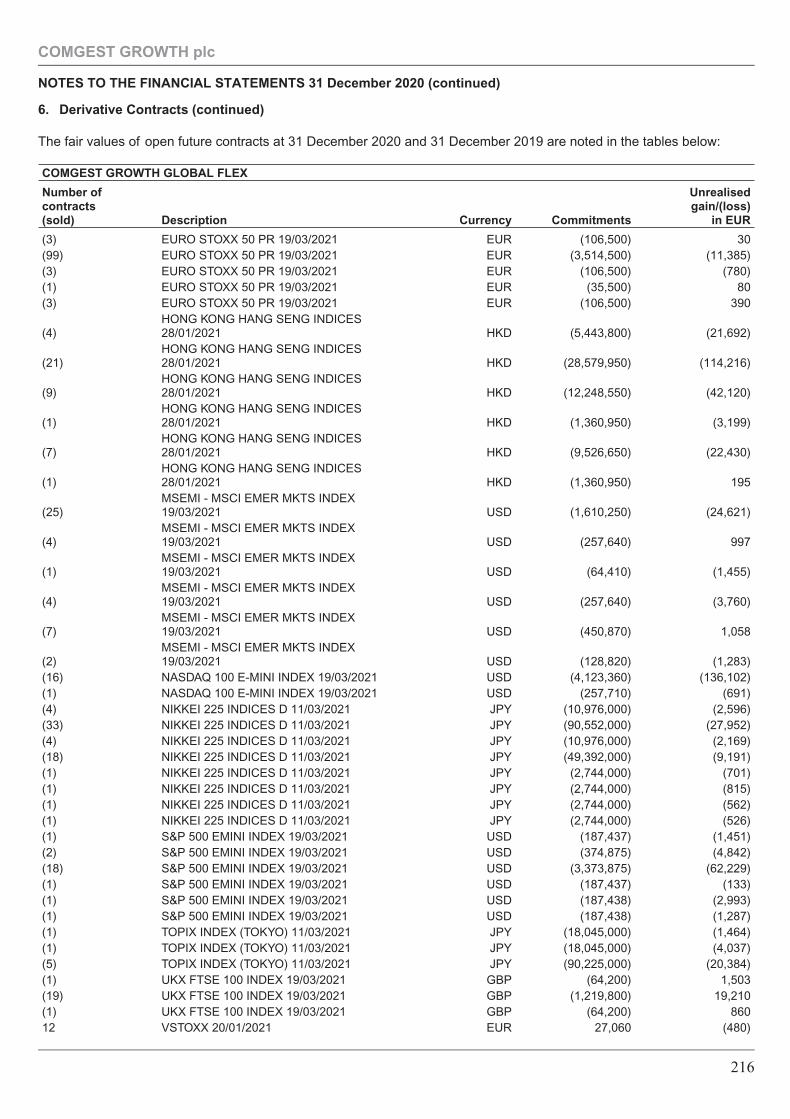
6. Derivative Contracts (continued)
The fair values of open future contracts at 31 December 2020 and 31 December 2019 are noted in the tables below:
COMGEST GROWTH GLOBAL FLEX
Number ofcontracts(sold) Description Currency Commitments
Unrealisedgain/(loss)
in EUR
(3) EURO STOXX 50 PR 19/03/2021 EUR (106,500) 30(99) EURO STOXX 50 PR 19/03/2021 EUR (3,514,500) (11,385)(3) EURO STOXX 50 PR 19/03/2021 EUR (106,500) (780)(1) EURO STOXX 50 PR 19/03/2021 EUR (35,500) 80(3) EURO STOXX 50 PR 19/03/2021 EUR (106,500) 390
(4)HONG KONG HANG SENG INDICES28/01/2021 HKD (5,443,800) (21,692)
(21)HONG KONG HANG SENG INDICES28/01/2021 HKD (28,579,950) (114,216)
(9)HONG KONG HANG SENG INDICES28/01/2021 HKD (12,248,550) (42,120)
(1)HONG KONG HANG SENG INDICES28/01/2021 HKD (1,360,950) (3,199)
(7)HONG KONG HANG SENG INDICES28/01/2021 HKD (9,526,650) (22,430)
(1)HONG KONG HANG SENG INDICES28/01/2021 HKD (1,360,950) 195
(25)MSEMI - MSCI EMER MKTS INDEX19/03/2021 USD (1,610,250) (24,621)
(4)MSEMI - MSCI EMER MKTS INDEX19/03/2021 USD (257,640) 997
(1)MSEMI - MSCI EMER MKTS INDEX19/03/2021 USD (64,410) (1,455)
(4)MSEMI - MSCI EMER MKTS INDEX19/03/2021 USD (257,640) (3,760)
(7)MSEMI - MSCI EMER MKTS INDEX19/03/2021 USD (450,870) 1,058
(2)MSEMI - MSCI EMER MKTS INDEX19/03/2021 USD (128,820) (1,283)
(16) NASDAQ 100 E-MINI INDEX 19/03/2021 USD (4,123,360) (136,102)(1) NASDAQ 100 E-MINI INDEX 19/03/2021 USD (257,710) (691)(4) NIKKEI 225 INDICES D 11/03/2021 JPY (10,976,000) (2,596)(33) NIKKEI 225 INDICES D 11/03/2021 JPY (90,552,000) (27,952)(4) NIKKEI 225 INDICES D 11/03/2021 JPY (10,976,000) (2,169)(18) NIKKEI 225 INDICES D 11/03/2021 JPY (49,392,000) (9,191)(1) NIKKEI 225 INDICES D 11/03/2021 JPY (2,744,000) (701)(1) NIKKEI 225 INDICES D 11/03/2021 JPY (2,744,000) (815)(1) NIKKEI 225 INDICES D 11/03/2021 JPY (2,744,000) (562)(1) NIKKEI 225 INDICES D 11/03/2021 JPY (2,744,000) (526)(1) S&P 500 EMINI INDEX 19/03/2021 USD (187,437) (1,451)(2) S&P 500 EMINI INDEX 19/03/2021 USD (374,875) (4,842)(18) S&P 500 EMINI INDEX 19/03/2021 USD (3,373,875) (62,229)(1) S&P 500 EMINI INDEX 19/03/2021 USD (187,437) (133)(1) S&P 500 EMINI INDEX 19/03/2021 USD (187,438) (2,993)(1) S&P 500 EMINI INDEX 19/03/2021 USD (187,438) (1,287)(1) TOPIX INDEX (TOKYO) 11/03/2021 JPY (18,045,000) (1,464)(1) TOPIX INDEX (TOKYO) 11/03/2021 JPY (18,045,000) (4,037)(5) TOPIX INDEX (TOKYO) 11/03/2021 JPY (90,225,000) (20,384)(1) UKX FTSE 100 INDEX 19/03/2021 GBP (64,200) 1,503(19) UKX FTSE 100 INDEX 19/03/2021 GBP (1,219,800) 19,210(1) UKX FTSE 100 INDEX 19/03/2021 GBP (64,200) 86012 VSTOXX 20/01/2021 EUR 27,060 (480)
COMGEST GROWTH plc
NOTES TO THE FINANCIAL STATEMENTS 31 December 2020 (continued)
216
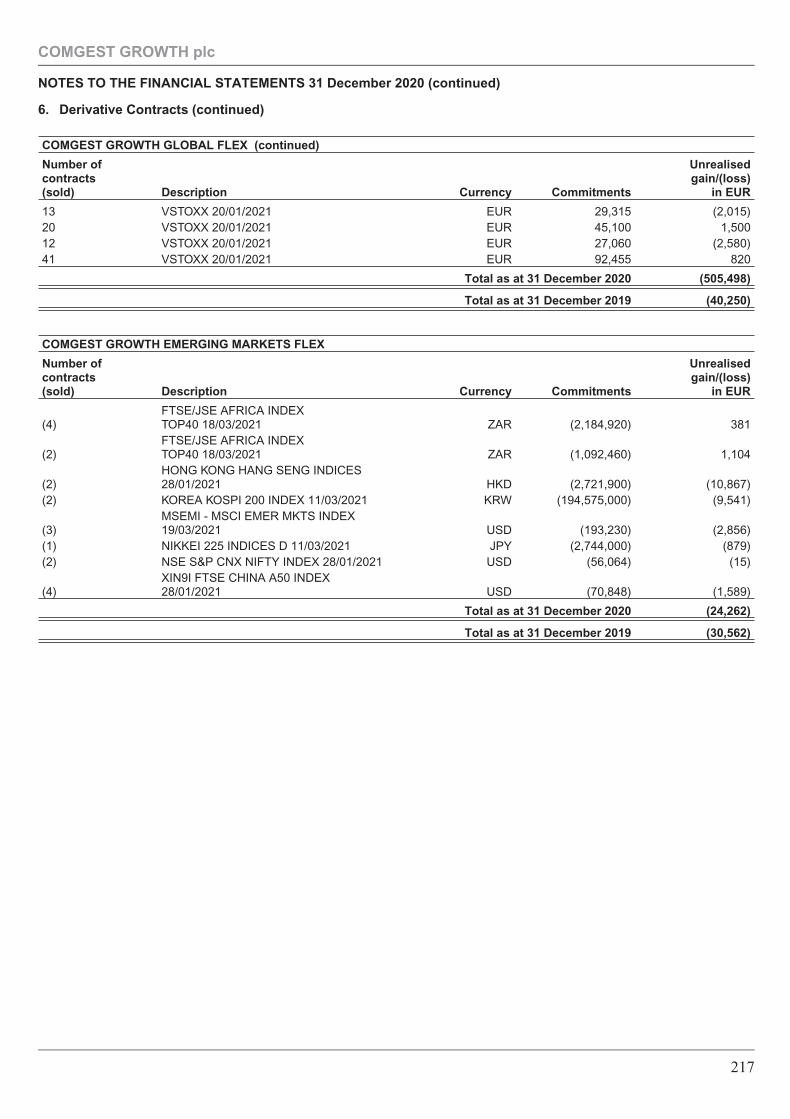
6. Derivative Contracts (continued)
COMGEST GROWTH GLOBAL FLEX (continued)
Number ofcontracts(sold) Description Currency Commitments
Unrealisedgain/(loss)
in EUR
13 VSTOXX 20/01/2021 EUR 29,315 (2,015)20 VSTOXX 20/01/2021 EUR 45,100 1,50012 VSTOXX 20/01/2021 EUR 27,060 (2,580)41 VSTOXX 20/01/2021 EUR 92,455 820
Total as at 31 December 2020 (505,498)
Total as at 31 December 2019 (40,250)
COMGEST GROWTH EMERGING MARKETS FLEX
Number ofcontracts(sold) Description Currency Commitments
Unrealisedgain/(loss)
in EUR
(4)FTSE/JSE AFRICA INDEXTOP40 18/03/2021 ZAR (2,184,920) 381
(2)FTSE/JSE AFRICA INDEXTOP40 18/03/2021 ZAR (1,092,460) 1,104
(2)HONG KONG HANG SENG INDICES28/01/2021 HKD (2,721,900) (10,867)
(2) KOREA KOSPI 200 INDEX 11/03/2021 KRW (194,575,000) (9,541)
(3)MSEMI - MSCI EMER MKTS INDEX19/03/2021 USD (193,230) (2,856)
(1) NIKKEI 225 INDICES D 11/03/2021 JPY (2,744,000) (879)(2) NSE S&P CNX NIFTY INDEX 28/01/2021 USD (56,064) (15)
(4)XIN9I FTSE CHINA A50 INDEX28/01/2021 USD (70,848) (1,589)
Total as at 31 December 2020 (24,262)
Total as at 31 December 2019 (30,562)
COMGEST GROWTH plc
NOTES TO THE FINANCIAL STATEMENTS 31 December 2020 (continued)
217
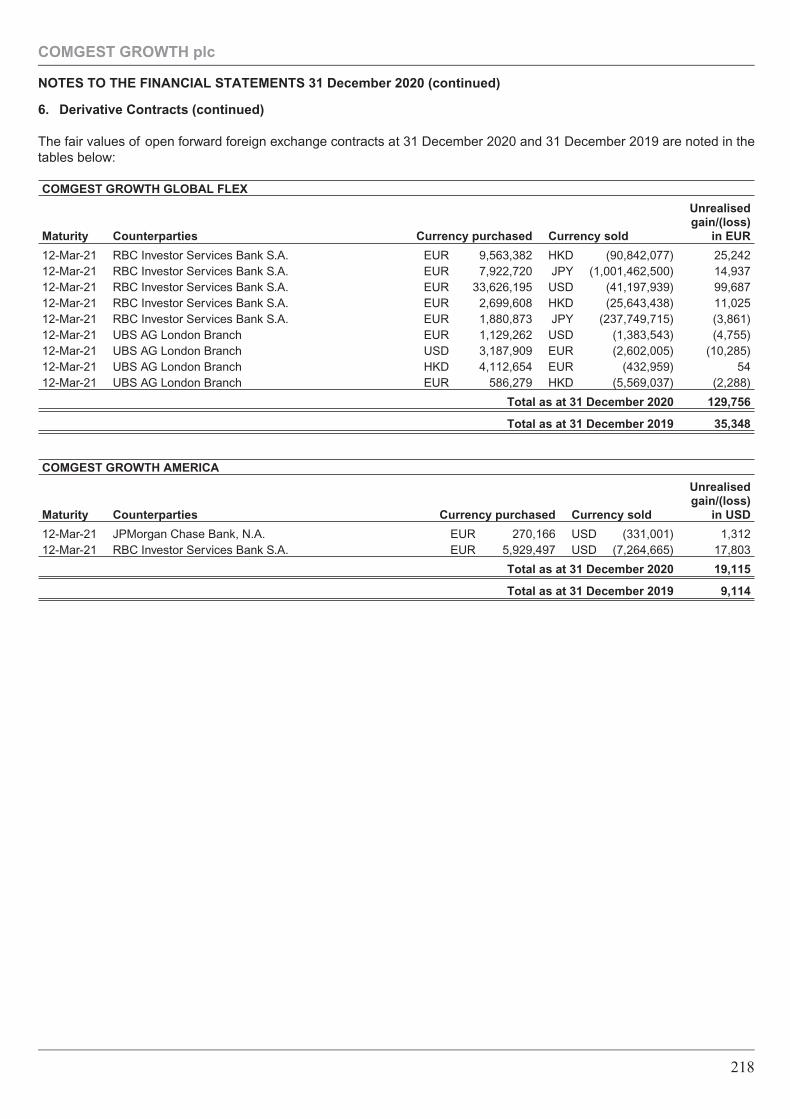
6. Derivative Contracts (continued)
The fair values of open forward foreign exchange contracts at 31 December 2020 and 31 December 2019 are noted in thetables below:
COMGEST GROWTH GLOBAL FLEX
Maturity Counterparties Currency purchased Currency sold
Unrealisedgain/(loss)
in EUR
12-Mar-21 RBC Investor Services Bank S.A. EUR 9,563,382 HKD (90,842,077) 25,24212-Mar-21 RBC Investor Services Bank S.A. EUR 7,922,720 JPY (1,001,462,500) 14,93712-Mar-21 RBC Investor Services Bank S.A. EUR 33,626,195 USD (41,197,939) 99,68712-Mar-21 RBC Investor Services Bank S.A. EUR 2,699,608 HKD (25,643,438) 11,02512-Mar-21 RBC Investor Services Bank S.A. EUR 1,880,873 JPY (237,749,715) (3,861)12-Mar-21 UBS AG London Branch EUR 1,129,262 USD (1,383,543) (4,755)12-Mar-21 UBS AG London Branch USD 3,187,909 EUR (2,602,005) (10,285)12-Mar-21 UBS AG London Branch HKD 4,112,654 EUR (432,959) 5412-Mar-21 UBS AG London Branch EUR 586,279 HKD (5,569,037) (2,288)
Total as at 31 December 2020 129,756
Total as at 31 December 2019 35,348
COMGEST GROWTH AMERICA
Maturity Counterparties Currency purchased Currency sold
Unrealisedgain/(loss)
in USD
12-Mar-21 JPMorgan Chase Bank, N.A. EUR 270,166 USD (331,001) 1,31212-Mar-21 RBC Investor Services Bank S.A. EUR 5,929,497 USD (7,264,665) 17,803
Total as at 31 December 2020 19,115
Total as at 31 December 2019 9,114
COMGEST GROWTH plc
NOTES TO THE FINANCIAL STATEMENTS 31 December 2020 (continued)
218
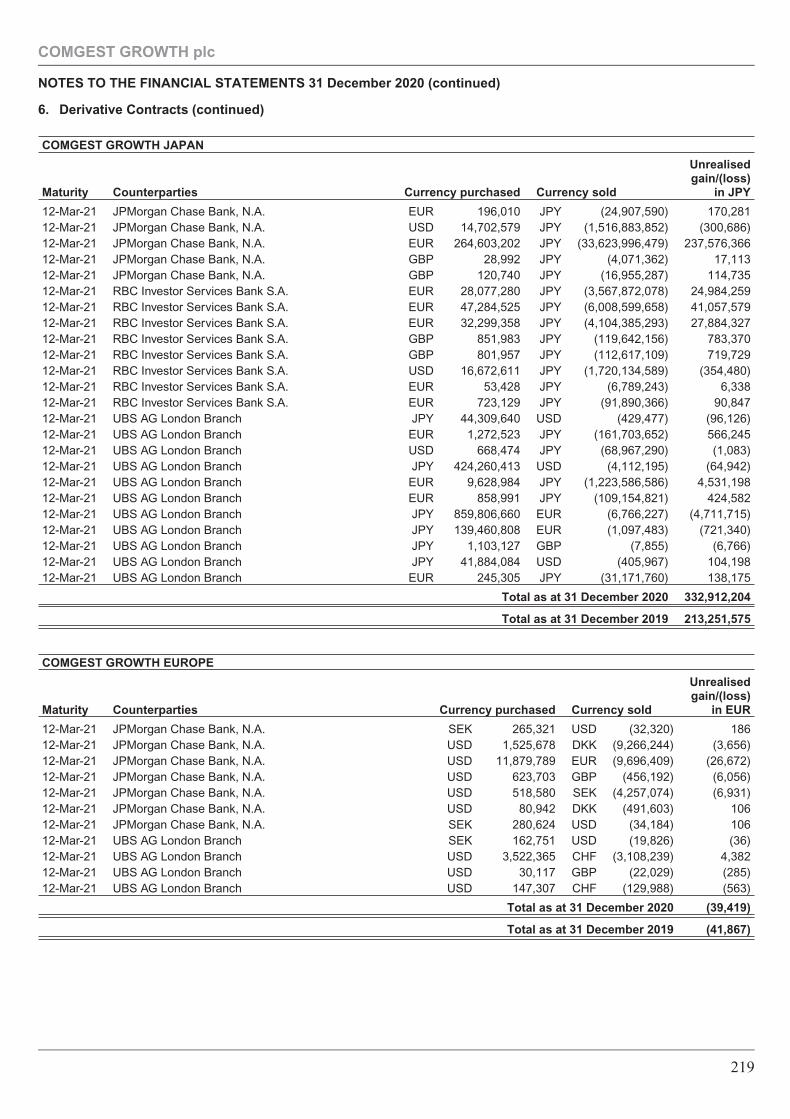
6. Derivative Contracts (continued)
COMGEST GROWTH JAPAN
Maturity Counterparties Currency purchased Currency sold
Unrealisedgain/(loss)
in JPY
12-Mar-21 JPMorgan Chase Bank, N.A. EUR 196,010 JPY (24,907,590) 170,28112-Mar-21 JPMorgan Chase Bank, N.A. USD 14,702,579 JPY (1,516,883,852) (300,686)12-Mar-21 JPMorgan Chase Bank, N.A. EUR 264,603,202 JPY (33,623,996,479) 237,576,36612-Mar-21 JPMorgan Chase Bank, N.A. GBP 28,992 JPY (4,071,362) 17,11312-Mar-21 JPMorgan Chase Bank, N.A. GBP 120,740 JPY (16,955,287) 114,73512-Mar-21 RBC Investor Services Bank S.A. EUR 28,077,280 JPY (3,567,872,078) 24,984,25912-Mar-21 RBC Investor Services Bank S.A. EUR 47,284,525 JPY (6,008,599,658) 41,057,57912-Mar-21 RBC Investor Services Bank S.A. EUR 32,299,358 JPY (4,104,385,293) 27,884,32712-Mar-21 RBC Investor Services Bank S.A. GBP 851,983 JPY (119,642,156) 783,37012-Mar-21 RBC Investor Services Bank S.A. GBP 801,957 JPY (112,617,109) 719,72912-Mar-21 RBC Investor Services Bank S.A. USD 16,672,611 JPY (1,720,134,589) (354,480)12-Mar-21 RBC Investor Services Bank S.A. EUR 53,428 JPY (6,789,243) 6,33812-Mar-21 RBC Investor Services Bank S.A. EUR 723,129 JPY (91,890,366) 90,84712-Mar-21 UBS AG London Branch JPY 44,309,640 USD (429,477) (96,126)12-Mar-21 UBS AG London Branch EUR 1,272,523 JPY (161,703,652) 566,24512-Mar-21 UBS AG London Branch USD 668,474 JPY (68,967,290) (1,083)12-Mar-21 UBS AG London Branch JPY 424,260,413 USD (4,112,195) (64,942)12-Mar-21 UBS AG London Branch EUR 9,628,984 JPY (1,223,586,586) 4,531,19812-Mar-21 UBS AG London Branch EUR 858,991 JPY (109,154,821) 424,58212-Mar-21 UBS AG London Branch JPY 859,806,660 EUR (6,766,227) (4,711,715)12-Mar-21 UBS AG London Branch JPY 139,460,808 EUR (1,097,483) (721,340)12-Mar-21 UBS AG London Branch JPY 1,103,127 GBP (7,855) (6,766)12-Mar-21 UBS AG London Branch JPY 41,884,084 USD (405,967) 104,19812-Mar-21 UBS AG London Branch EUR 245,305 JPY (31,171,760) 138,175
Total as at 31 December 2020 332,912,204
Total as at 31 December 2019 213,251,575
COMGEST GROWTH EUROPE
Maturity Counterparties Currency purchased Currency sold
Unrealisedgain/(loss)
in EUR
12-Mar-21 JPMorgan Chase Bank, N.A. SEK 265,321 USD (32,320) 18612-Mar-21 JPMorgan Chase Bank, N.A. USD 1,525,678 DKK (9,266,244) (3,656)12-Mar-21 JPMorgan Chase Bank, N.A. USD 11,879,789 EUR (9,696,409) (26,672)12-Mar-21 JPMorgan Chase Bank, N.A. USD 623,703 GBP (456,192) (6,056)12-Mar-21 JPMorgan Chase Bank, N.A. USD 518,580 SEK (4,257,074) (6,931)12-Mar-21 JPMorgan Chase Bank, N.A. USD 80,942 DKK (491,603) 10612-Mar-21 JPMorgan Chase Bank, N.A. SEK 280,624 USD (34,184) 10612-Mar-21 UBS AG London Branch SEK 162,751 USD (19,826) (36)12-Mar-21 UBS AG London Branch USD 3,522,365 CHF (3,108,239) 4,38212-Mar-21 UBS AG London Branch USD 30,117 GBP (22,029) (285)12-Mar-21 UBS AG London Branch USD 147,307 CHF (129,988) (563)
Total as at 31 December 2020 (39,419)
Total as at 31 December 2019 (41,867)
COMGEST GROWTH plc
NOTES TO THE FINANCIAL STATEMENTS 31 December 2020 (continued)
219
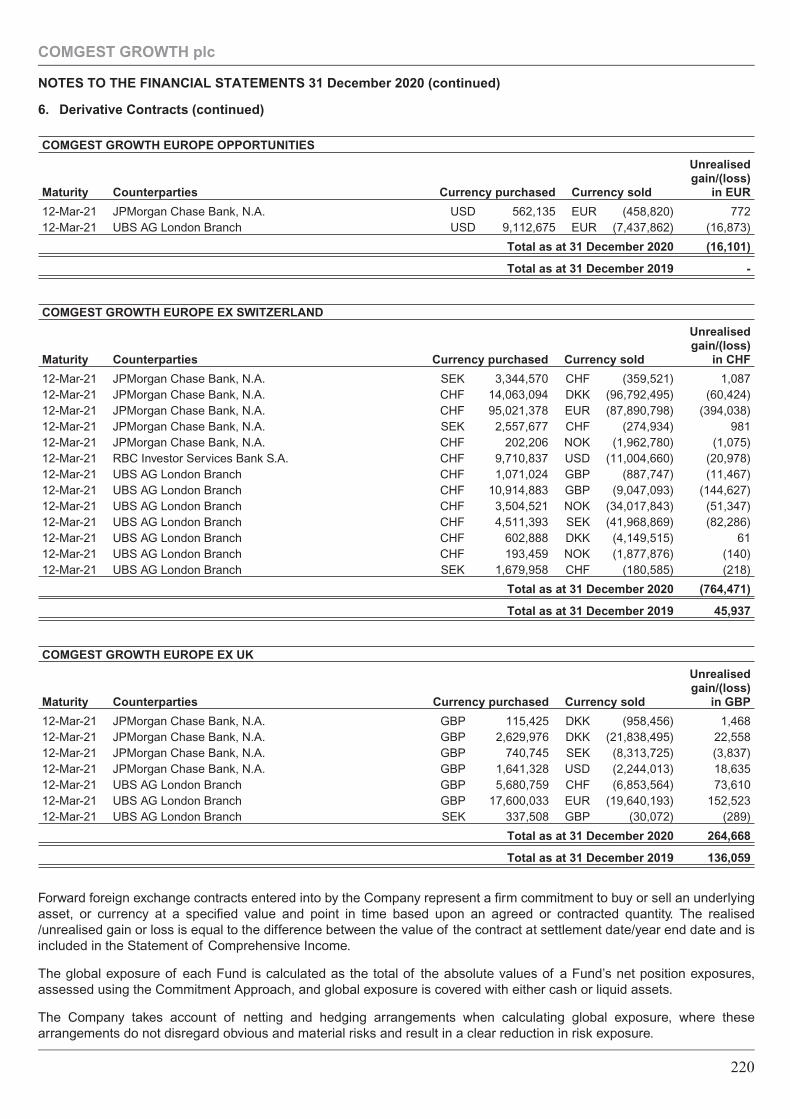
6. Derivative Contracts (continued)
COMGEST GROWTH EUROPE OPPORTUNITIES
Maturity Counterparties Currency purchased Currency sold
Unrealisedgain/(loss)
in EUR
12-Mar-21 JPMorgan Chase Bank, N.A. USD 562,135 EUR (458,820) 77212-Mar-21 UBS AG London Branch USD 9,112,675 EUR (7,437,862) (16,873)
Total as at 31 December 2020 (16,101)
Total as at 31 December 2019 -
COMGEST GROWTH EUROPE EX SWITZERLAND
Maturity Counterparties Currency purchased Currency sold
Unrealisedgain/(loss)
in CHF
12-Mar-21 JPMorgan Chase Bank, N.A. SEK 3,344,570 CHF (359,521) 1,08712-Mar-21 JPMorgan Chase Bank, N.A. CHF 14,063,094 DKK (96,792,495) (60,424)12-Mar-21 JPMorgan Chase Bank, N.A. CHF 95,021,378 EUR (87,890,798) (394,038)12-Mar-21 JPMorgan Chase Bank, N.A. SEK 2,557,677 CHF (274,934) 98112-Mar-21 JPMorgan Chase Bank, N.A. CHF 202,206 NOK (1,962,780) (1,075)12-Mar-21 RBC Investor Services Bank S.A. CHF 9,710,837 USD (11,004,660) (20,978)12-Mar-21 UBS AG London Branch CHF 1,071,024 GBP (887,747) (11,467)12-Mar-21 UBS AG London Branch CHF 10,914,883 GBP (9,047,093) (144,627)12-Mar-21 UBS AG London Branch CHF 3,504,521 NOK (34,017,843) (51,347)12-Mar-21 UBS AG London Branch CHF 4,511,393 SEK (41,968,869) (82,286)12-Mar-21 UBS AG London Branch CHF 602,888 DKK (4,149,515) 6112-Mar-21 UBS AG London Branch CHF 193,459 NOK (1,877,876) (140)12-Mar-21 UBS AG London Branch SEK 1,679,958 CHF (180,585) (218)
Total as at 31 December 2020 (764,471)
Total as at 31 December 2019 45,937
COMGEST GROWTH EUROPE EX UK
Maturity Counterparties Currency purchased Currency sold
Unrealisedgain/(loss)
in GBP
12-Mar-21 JPMorgan Chase Bank, N.A. GBP 115,425 DKK (958,456) 1,46812-Mar-21 JPMorgan Chase Bank, N.A. GBP 2,629,976 DKK (21,838,495) 22,55812-Mar-21 JPMorgan Chase Bank, N.A. GBP 740,745 SEK (8,313,725) (3,837)12-Mar-21 JPMorgan Chase Bank, N.A. GBP 1,641,328 USD (2,244,013) 18,63512-Mar-21 UBS AG London Branch GBP 5,680,759 CHF (6,853,564) 73,61012-Mar-21 UBS AG London Branch GBP 17,600,033 EUR (19,640,193) 152,52312-Mar-21 UBS AG London Branch SEK 337,508 GBP (30,072) (289)
Total as at 31 December 2020 264,668
Total as at 31 December 2019 136,059
Forward foreign exchange contracts entered into by the Company represent a firm commitment to buy or sell an underlyingasset, or currency at a specified value and point in time based upon an agreed or contracted quantity. The realised/unrealised gain or loss is equal to the difference between the value of the contract at settlement date/year end date and isincluded in the Statement of Comprehensive Income.
The global exposure of each Fund is calculated as the total of the absolute values of a Fund’s net position exposures,assessed using the Commitment Approach, and global exposure is covered with either cash or liquid assets.
The Company takes account of netting and hedging arrangements when calculating global exposure, where thesearrangements do not disregard obvious and material risks and result in a clear reduction in risk exposure.
COMGEST GROWTH plc
NOTES TO THE FINANCIAL STATEMENTS 31 December 2020 (continued)
220
6. Derivative Contracts (continued)
The Company applies the Commitment Approach to all FDI, including embedded FDI, whether used as part of a Fund’sgeneral investment policy, for the purposes of risk reduction or for the purposes of efficient portfolio management.
Limits: The global exposure of a Fund arising from the use of FDIs, including embedded FDI, will, at all times, be limited to100% of the Net Asset Value of the Fund.
Monitoring: The Company calculates the global exposure of each Fund on at least a daily basis, as the incremental exposureand leverage generated by a Fund through the use of FDI, including embedded FDI, may not exceed the total of the Fund’sNAV.
7. Risk Associated with Financial Instruments
The Investment Manager maintains investment guidelines that set out its overall business strategies. The investmentobjectives and policies are set out for each Fund of the Company in the Prospectus. The Company further maintains a riskmanagement process which sets out its general risk management philosophy and processes by which the InvestmentManager monitors and controls economic hedging transactions in a timely and accurate manner.
Investment Guidelines and Investment Processes
In selecting companies for the Funds’ portfolios, the Investment Manager looks for companies with the following qualitygrowth criteria:
Business Model• Transparency.• Recurring revenues.• Pricing power.• Client/supplier concentration.
Financial criteria• Proven ability to generate a strong increase in earnings (EPS + dividends >10%).• Return on equity (>15%), strong cash flow generation.• Return on capital employed above the cost of capital.• Sound balance sheet, low gearing.• Above-average profit margins versus peers.
Organic Growth• Geographic expansion.• Product expansion.• Growing market.• Innovation.
Barriers to Entry• Brand/franchise.• Patents.• Durable know-how.• Switching cost.• Customer loyalty.• Scale.
Sustainability• People and culture.• Environment.• Social utility.• Political/regulatory risk.
COMGEST GROWTH plc
NOTES TO THE FINANCIAL STATEMENTS 31 December 2020 (continued)
221
7. Risk Associated with Financial Instruments (continued)
Investment Guidelines and Investment Processes (continued)
Management• Industrial vision.• Integrity.• Communication.• Corporate Governance.
Sub-Investment Managers screen the above criteria on a continuous basis through their own evaluation of companyinformation, use of research provided by brokers, contacts with the company and industry consultants and the occasionaluse of external screening tools.
This research is enriched by the rigorous groundwork of frequent contact with company executives, operationalmanagement and visits to manufacturing and distribution sites. Investment advisers also check on competitors, clients andsuppliers of the companies, tapping into any information likely to highlight their strengths and weaknesses.
This intensive work leads to the creation of the Investment Manager’s investment universe, comprising a restricted list ofrigorously selected quality growth stocks. A unanimous decision of the investment team must be reached in order to includea company in the investment universe. Subject to significant changes in the business environment, changes in managementor wholesale changes in the business strategy of the company, once a company enters the investment universe it tends tostay there for quite some time and (valuations) stays in a portfolio for typically 3-5 years.
The Sub-Investment Managers are free to select companies from the investment universe for inclusion in the portfolios,weighting the companies within the portfolio based on the relative attractiveness of each company and their personaljudgement.
Typically, there are 25-50 stocks held in the portfolios which the Investment Manager believes achieves appropriatediversification and reduction of overall risk of the portfolio. Depending on the risks associated with the target markets of theFunds, the Investment Manager may maintain a more or less diversified portfolio.
The intensive research, in-depth knowledge of the companies and long-term focus of the Funds naturally result in portfolioswith relatively high concentrations and a low turnover. The Investment Manager sells companies for which there are concernsor for which the valuation is too high. Cash holdings may increase significantly in years of market uncertainty and/or in yearsof obvious market overvaluation.
The Company’s assets and liabilities comprise of financial instruments which include:
• Cash liquid resources and short-term debtors and creditors that arise directly from its investment activities.• Investments including equities, depository receipts, market access products (such as P-Notes) and FDI. These are
held in accordance with the Company’s investment objectives and policies. The objectives of each of the Funds aresummarised below.
The investment objectives of the Funds of the Company are detailed in the Company’s Prospectus and summarised below:
Comgest Growth World: The investment objective of the Comgest Growth World Fund is to achieve capital appreciation bycreating a professionally managed portfolio consisting of what, in the opinion of the Investment Manager, are internationaland diversified growth securities.
Comgest Growth World Plus: The investment objective of the Comgest Growth World Plus Fund is to achieve capitalappreciation by creating a professionally managed portfolio consisting primarily of what, in the opinion of the InvestmentManager, are international and diversified growth securities.
Comgest Growth Global Flex: The investment objective of the Comgest Growth Global Flex Fund is to achieve capitalappreciation by creating a professionally managed portfolio consisting of what, in the opinion of the Investment Manager, areinternational and diversified growth securities.
Comgest Growth World Developed Markets: The investment objective of the Comgest Growth World Developed MarketsFund is to achieve capital appreciation by creating a professionally managed portfolio consisting of what in the opinion of theInvestment Manager, are international and diversified growth securities. This Fund was not launched as of 31 December2020.
COMGEST GROWTH plc
NOTES TO THE FINANCIAL STATEMENTS 31 December 2020 (continued)
222
7. Risk Associated with Financial Instruments (continued)
Investment Guidelines and Investment Processes (continued)
Comgest Growth EAFE: The investment objective of the Comgest Growth EAFE Fund (formerly known as ComgestGrowth EAFE Plus Fund) is to achieve capital appreciation by creating a professionally managed portfolio consisting ofwhat, in the opinion of the Investment Manager, are international and diversified growth securities.
Comgest Growth America: The investment objective of the Comgest Growth America Fund is to create a professionallymanaged portfolio consisting of what, in the opinion of the Investment Manager, are high quality long-term growthcompanies having their headquarters or carrying out their predominant activities in the United States of America.
Comgest Growth Japan: The investment objective of the Comgest Growth Japan Fund is to create a professionallymanaged portfolio consisting of what, in the opinion of the Investment Manager, are high quality long-term growthcompanies having their headquarters or carrying out their predominant activities in Japan.
Comgest Growth Japan Compounders: The investment objective of the Comgest Growth Japan Compounders Fund is tocreate a professionally managed portfolio consisting of what, in the opinion of the Investment Manager, are high qualitylong-term growth companies having their headquarters or carrying out their predominant activities in Japan.
Comgest Growth Emerging Markets: The investment objective of the Comgest Growth Emerging Markets Fund is toachieve capital appreciation by creating a professionally managed portfolio consisting of what, in the opinion of theInvestment Manager, are high quality long-term growth companies based or operating in Emerging Markets. EmergingMarkets are defined as countries, predominantly located in Africa, Asia, Latin America, Eastern and Southern Europe, whichhave strong economic growth compared to the average for the large, developed countries.
Comgest Growth Emerging Markets ex China: The investment objective of the Comgest Growth Emerging Markets exChina Fund is to achieve capital appreciation by creating a professionally managed portfolio consisting of what, in theopinion of the Investment Manager, are high quality long-term growth companies based or operating in Emerging Markets exChina. Emerging Markets are defined as countries, predominantly located in Africa, Asia, Latin America, Eastern andSouthern Europe, which have strong economic growth compared to the average for the large, developed countries.
Comgest Growth Emerging Markets Flex: The investment objective of the Comgest Growth Emerging Markets Flex Fundis to achieve capital appreciation by creating a professionally managed portfolio primarily consisting of what, in the opinionof the Investment Manager, are high quality long-term growth companies based or operating in Emerging Markets. EmergingMarkets are defined as countries, predominantly located in Africa, Asia, Latin America, Eastern and Southern Europe, whichhave strong economic growth when compared to the average of large, developed countries.
Comgest Growth Emerging Markets Plus: The investment objective of the Comgest Growth Emerging Markets Plus Fundis to achieve capital appreciation by creating a professionally managed portfolio consisting of what, in the opinion of theInvestment Manager, are high quality long-term growth companies based or operating in Emerging Markets. EmergingMarkets are defined as countries, predominantly located in Africa, Asia, Latin America, Eastern and Southern Europe, whichhave strong economic growth compared to the average for the large, developed countries.
Comgest Growth GEM Promising Companies: The investment objective of the Comgest Growth GEM PromisingCompanies Fund is to achieve capital appreciation by creating a professionally managed portfolio consisting primarily ofwhat, in the opinion of the Investment Manager, are high quality long-term growth promising companies based or operatingin Global Emerging Markets. Promising companies are companies that, in the opinion of the Investment Manager, are(i) seeking to rapidly gain market share and accordingly grow in size and (ii) deliver fast earnings growth. Promisingcompanies usually have shorter track records and higher capital requirements than more mature and establishedcompanies. As a result, promising companies normally have a higher risk profile.
Comgest Growth Europe: The investment objective of the Comgest Growth Europe Fund is to create a professionallymanaged portfolio consisting of what, in the opinion of the Investment Manager, are high quality long-term growthcompanies having their headquarters or carrying out their predominant activities in Europe.
Comgest Growth Europe Compounders: The investment objective of the Comgest Growth Europe Compounders Fund isto create a professionally managed portfolio consisting of what, in the opinion of the Investment Manager, are high qualitylong-term growth companies having their headquarters or carrying out their predominant activities in Europe.
COMGEST GROWTH plc
NOTES TO THE FINANCIAL STATEMENTS 31 December 2020 (continued)
223
7. Risk Associated with Financial Instruments (continued)
Investment Guidelines and Investment Processes (continued)
Comgest Growth Europe Plus: The investment objective of the Comgest Growth Europe Plus Fund is to create aprofessionally managed portfolio consisting of what, in the opinion of the Investment Manager, are high quality long-termgrowth companies having their headquarters or carrying out their predominant activities in Europe.
Comgest Growth Europe S: The investment objective of the Comgest Growth Europe S Fund is to seek to create aprofessionally managed portfolio consisting of what, in the opinion of the Investment Manager, are high quality long-termgrowth companies having their headquarters or carrying out their predominant activities in Europe. The Investment Managerintends to invest in Shariah compliant common shares issued by European companies at least two thirds of which will bequoted or traded on Regulated Markets in EU Member States, the UK and in Switzerland.
Comgest Growth Europe Opportunities: The investment objective of the Comgest Growth Europe Opportunities Fund isto create a professionally managed portfolio consisting primarily of what, in the opinion of the Investment Manager, areopportunities which have their headquarters or carry out their predominant activities in Europe. Portfolio construction will usea pure bottom-up stock picking approach. The Fund is eligible for the equity savings plan (�plan d’épargne en actions� or�PEA�) in France as it invests on a permanent basis at least 75% of its total assets in eligible shares or equity linked securitiesissued by companies having their registered office in the EEA or in the UK. However, with effect from 1 January 2021, theInvestment Manager will cease to observe the foregoing restriction when making investments and the Europe OpportunitiesFund will therefore no longer be eligible for the PEA.
Comgest Growth Europe Smaller Companies: The investment objective of the Comgest Growth EuropeSmaller Companies Fund is to create a professionally managed portfolio consisting primarily of what, in the opinion of theInvestment Manager, are high quality long-term growth mid-cap companies having their headquarters or carrying out theirpredominant activities in Europe. The Fund is eligible for the equity savings plan (�plan d’épargne en actions� or �PEA�) inFrance as it invests on a permanent basis at least 75% of its total assets in eligible shares or equity linked securities issuedby mid-cap companies having their registered office in the EEA or in the UK. However, with effect from 1 January 2021, theInvestment Manager will cease to observe the foregoing restriction when making investments and the EuropeSmaller Companies Fund will therefore no longer be eligible for the PEA.
Comgest Growth Europe ex Switzerland: The investment objective of the Comgest Growth Europe ex Switzerland Fundis to achieve capital appreciation by creating a professionally managed portfolio consisting of what, in opinion of theInvestment Manager, are high quality long-term growth companies having their headquarters or carrying out theirpredominant activities in any European country with the exception of Switzerland.
Comgest Growth Europe ex UK: The investment objective of the Comgest Growth Europe ex UK Fund is to achieve capitalappreciation by creating a professionally managed portfolio consisting of what, in the opinion of the Investment Manager, arehigh quality long-term growth companies having their headquarters or carrying out their predominant activities in anyEuropean country with the exception of the United Kingdom.
Comgest Growth Asia: The investment objective of the Comgest Growth Asia Fund is to achieve long-term capital growthby creating a professionally managed portfolio consisting of what, in the opinion of the Investment Manager, are high qualitylong-term growth companies based or operating in Asia, notably Hong Kong, Singapore, Malaysia, Thailand, Taiwan,Philippines, Indonesia, Pakistan, India, Japan, South Korea and China.
Comgest Growth Asia ex Japan: The investment objective of the Comgest Growth Asia ex Japan Fund is to achievelong-term capital growth by creating a professionally managed portfolio consisting of what, in the opinion of the InvestmentManager, are high quality long-term growth companies based or operating in Asia excluding Japan but including the Indiansub-continent.
Comgest Growth Asia Pac ex Japan: The investment objective of the Comgest Growth Asia Pac ex Japan Fund is toachieve long-term capital growth by creating a professionally managed portfolio consisting of what, in the opinion of theInvestment Manager, are high quality long-term growth companies based or operating in Asia excluding Japan but includingthe Indian sub-continent, Australia and New Zealand.
Comgest Growth China: The investment objective of the Comgest Growth China Fund is to create a professionallymanaged portfolio consisting primarily of what, in the opinion of the Investment Manager, are high quality long-term growthcompanies having their headquarters or carrying out their predominant activities in China.
COMGEST GROWTH plc
NOTES TO THE FINANCIAL STATEMENTS 31 December 2020 (continued)
224
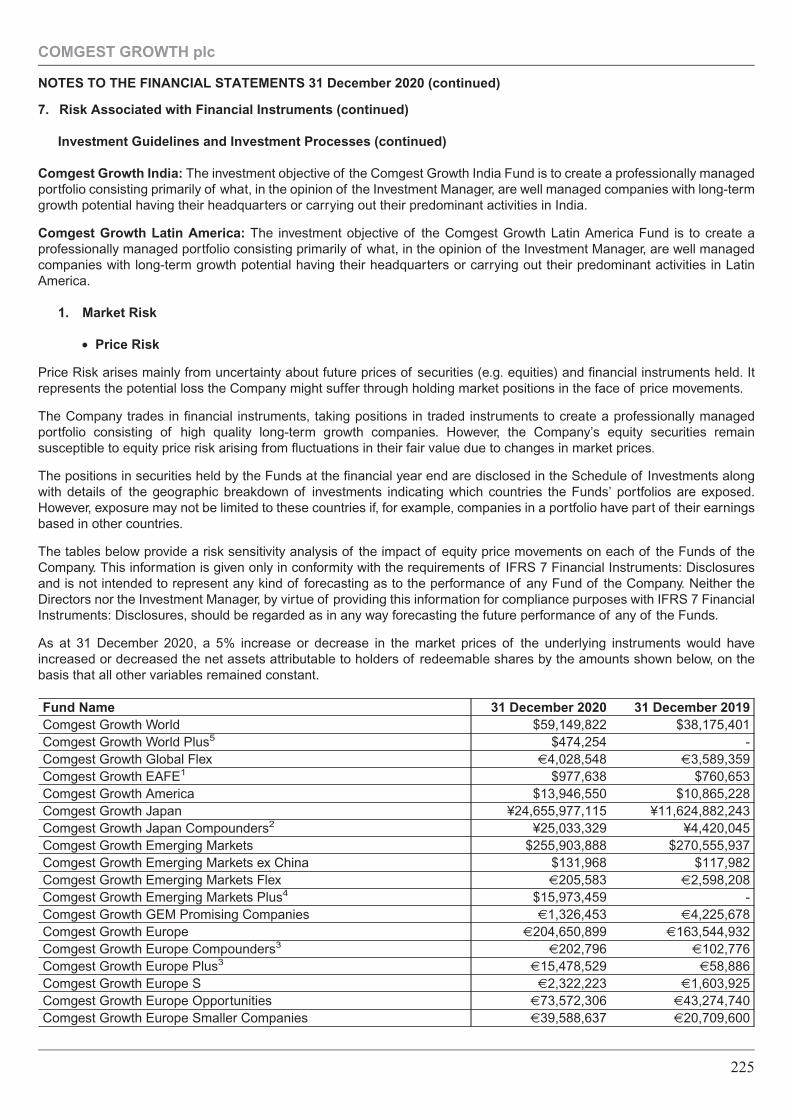
7. Risk Associated with Financial Instruments (continued)
Investment Guidelines and Investment Processes (continued)
Comgest Growth India: The investment objective of the Comgest Growth India Fund is to create a professionally managedportfolio consisting primarily of what, in the opinion of the Investment Manager, are well managed companies with long-termgrowth potential having their headquarters or carrying out their predominant activities in India.
Comgest Growth Latin America: The investment objective of the Comgest Growth Latin America Fund is to create aprofessionally managed portfolio consisting primarily of what, in the opinion of the Investment Manager, are well managedcompanies with long-term growth potential having their headquarters or carrying out their predominant activities in LatinAmerica.
1. Market Risk
• Price Risk
Price Risk arises mainly from uncertainty about future prices of securities (e.g. equities) and financial instruments held. Itrepresents the potential loss the Company might suffer through holding market positions in the face of price movements.
The Company trades in financial instruments, taking positions in traded instruments to create a professionally managedportfolio consisting of high quality long-term growth companies. However, the Company’s equity securities remainsusceptible to equity price risk arising from fluctuations in their fair value due to changes in market prices.
The positions in securities held by the Funds at the financial year end are disclosed in the Schedule of Investments alongwith details of the geographic breakdown of investments indicating which countries the Funds’ portfolios are exposed.However, exposure may not be limited to these countries if, for example, companies in a portfolio have part of their earningsbased in other countries.
The tables below provide a risk sensitivity analysis of the impact of equity price movements on each of the Funds of theCompany. This information is given only in conformity with the requirements of IFRS 7 Financial Instruments: Disclosuresand is not intended to represent any kind of forecasting as to the performance of any Fund of the Company. Neither theDirectors nor the Investment Manager, by virtue of providing this information for compliance purposes with IFRS 7 FinancialInstruments: Disclosures, should be regarded as in any way forecasting the future performance of any of the Funds.
As at 31 December 2020, a 5% increase or decrease in the market prices of the underlying instruments would haveincreased or decreased the net assets attributable to holders of redeemable shares by the amounts shown below, on thebasis that all other variables remained constant.
Fund Name 31 December 2020 31 December 2019Comgest Growth World $59,149,822 $38,175,401Comgest Growth World Plus5 $474,254 -Comgest Growth Global Flex €4,028,548 €3,589,359Comgest Growth EAFE1 $977,638 $760,653Comgest Growth America $13,946,550 $10,865,228Comgest Growth Japan ¥24,655,977,115 ¥11,624,882,243Comgest Growth Japan Compounders2 ¥25,033,329 ¥4,420,045Comgest Growth Emerging Markets $255,903,888 $270,555,937Comgest Growth Emerging Markets ex China $131,968 $117,982Comgest Growth Emerging Markets Flex €205,583 €2,598,208Comgest Growth Emerging Markets Plus4 $15,973,459 -Comgest Growth GEM Promising Companies €1,326,453 €4,225,678Comgest Growth Europe €204,650,899 €163,544,932Comgest Growth Europe Compounders3
€202,796 €102,776Comgest Growth Europe Plus3
€15,478,529 €58,886Comgest Growth Europe S €2,322,223 €1,603,925Comgest Growth Europe Opportunities €73,572,306 €43,274,740Comgest Growth Europe Smaller Companies €39,588,637 €20,709,600
COMGEST GROWTH plc
NOTES TO THE FINANCIAL STATEMENTS 31 December 2020 (continued)
225
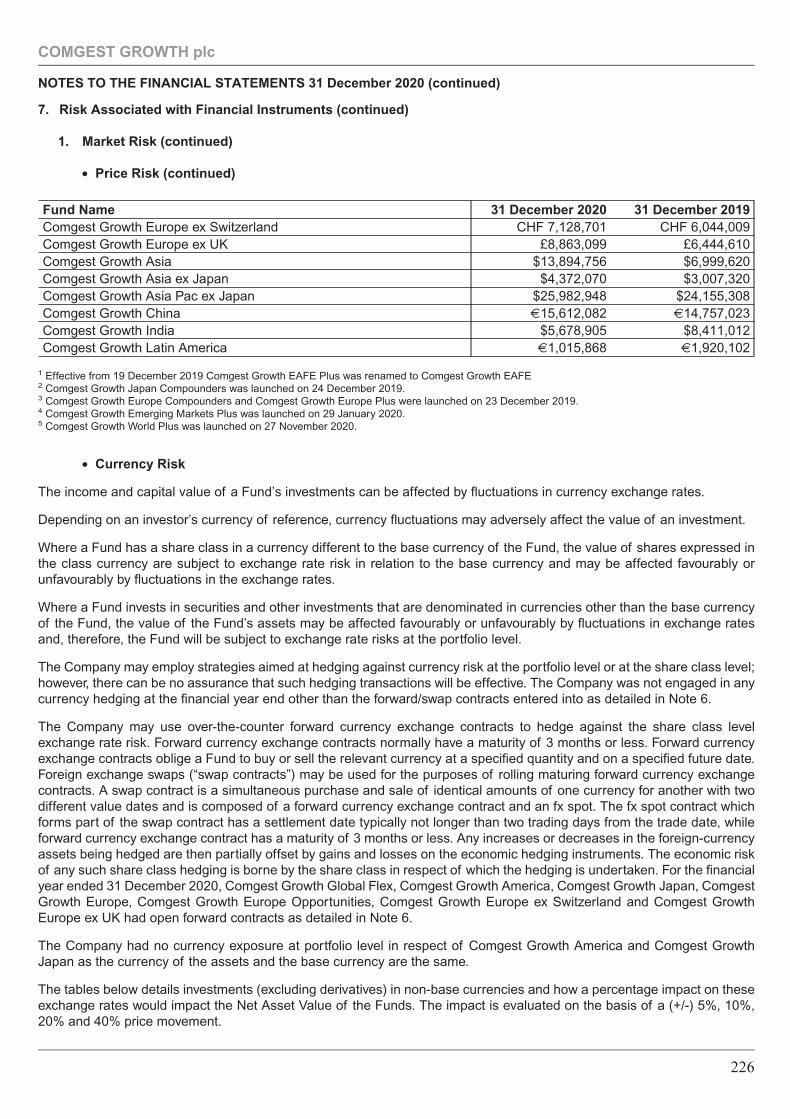
7. Risk Associated with Financial Instruments (continued)
1. Market Risk (continued)
• Price Risk (continued)
Fund Name 31 December 2020 31 December 2019Comgest Growth Europe ex Switzerland CHF 7,128,701 CHF 6,044,009Comgest Growth Europe ex UK £8,863,099 £6,444,610Comgest Growth Asia $13,894,756 $6,999,620Comgest Growth Asia ex Japan $4,372,070 $3,007,320Comgest Growth Asia Pac ex Japan $25,982,948 $24,155,308Comgest Growth China €15,612,082 €14,757,023Comgest Growth India $5,678,905 $8,411,012Comgest Growth Latin America €1,015,868 €1,920,102
1 Effective from 19 December 2019 Comgest Growth EAFE Plus was renamed to Comgest Growth EAFE2 Comgest Growth Japan Compounders was launched on 24 December 2019.3 Comgest Growth Europe Compounders and Comgest Growth Europe Plus were launched on 23 December 2019.4 Comgest Growth Emerging Markets Plus was launched on 29 January 2020.5 Comgest Growth World Plus was launched on 27 November 2020.
• Currency Risk
The income and capital value of a Fund’s investments can be affected by fluctuations in currency exchange rates.
Depending on an investor’s currency of reference, currency fluctuations may adversely affect the value of an investment.
Where a Fund has a share class in a currency different to the base currency of the Fund, the value of shares expressed inthe class currency are subject to exchange rate risk in relation to the base currency and may be affected favourably orunfavourably by fluctuations in the exchange rates.
Where a Fund invests in securities and other investments that are denominated in currencies other than the base currencyof the Fund, the value of the Fund’s assets may be affected favourably or unfavourably by fluctuations in exchange ratesand, therefore, the Fund will be subject to exchange rate risks at the portfolio level.
The Company may employ strategies aimed at hedging against currency risk at the portfolio level or at the share class level;however, there can be no assurance that such hedging transactions will be effective. The Company was not engaged in anycurrency hedging at the financial year end other than the forward/swap contracts entered into as detailed in Note 6.
The Company may use over-the-counter forward currency exchange contracts to hedge against the share class levelexchange rate risk. Forward currency exchange contracts normally have a maturity of 3 months or less. Forward currencyexchange contracts oblige a Fund to buy or sell the relevant currency at a specified quantity and on a specified future date.Foreign exchange swaps (“swap contracts”) may be used for the purposes of rolling maturing forward currency exchangecontracts. A swap contract is a simultaneous purchase and sale of identical amounts of one currency for another with twodifferent value dates and is composed of a forward currency exchange contract and an fx spot. The fx spot contract whichforms part of the swap contract has a settlement date typically not longer than two trading days from the trade date, whileforward currency exchange contract has a maturity of 3 months or less. Any increases or decreases in the foreign-currencyassets being hedged are then partially offset by gains and losses on the economic hedging instruments. The economic riskof any such share class hedging is borne by the share class in respect of which the hedging is undertaken. For the financialyear ended 31 December 2020, Comgest Growth Global Flex, Comgest Growth America, Comgest Growth Japan, ComgestGrowth Europe, Comgest Growth Europe Opportunities, Comgest Growth Europe ex Switzerland and Comgest GrowthEurope ex UK had open forward contracts as detailed in Note 6.
The Company had no currency exposure at portfolio level in respect of Comgest Growth America and Comgest GrowthJapan as the currency of the assets and the base currency are the same.
The tables below details investments (excluding derivatives) in non-base currencies and how a percentage impact on theseexchange rates would impact the Net Asset Value of the Funds. The impact is evaluated on the basis of a (+/-) 5%, 10%,20% and 40% price movement.
COMGEST GROWTH plc
NOTES TO THE FINANCIAL STATEMENTS 31 December 2020 (continued)
226
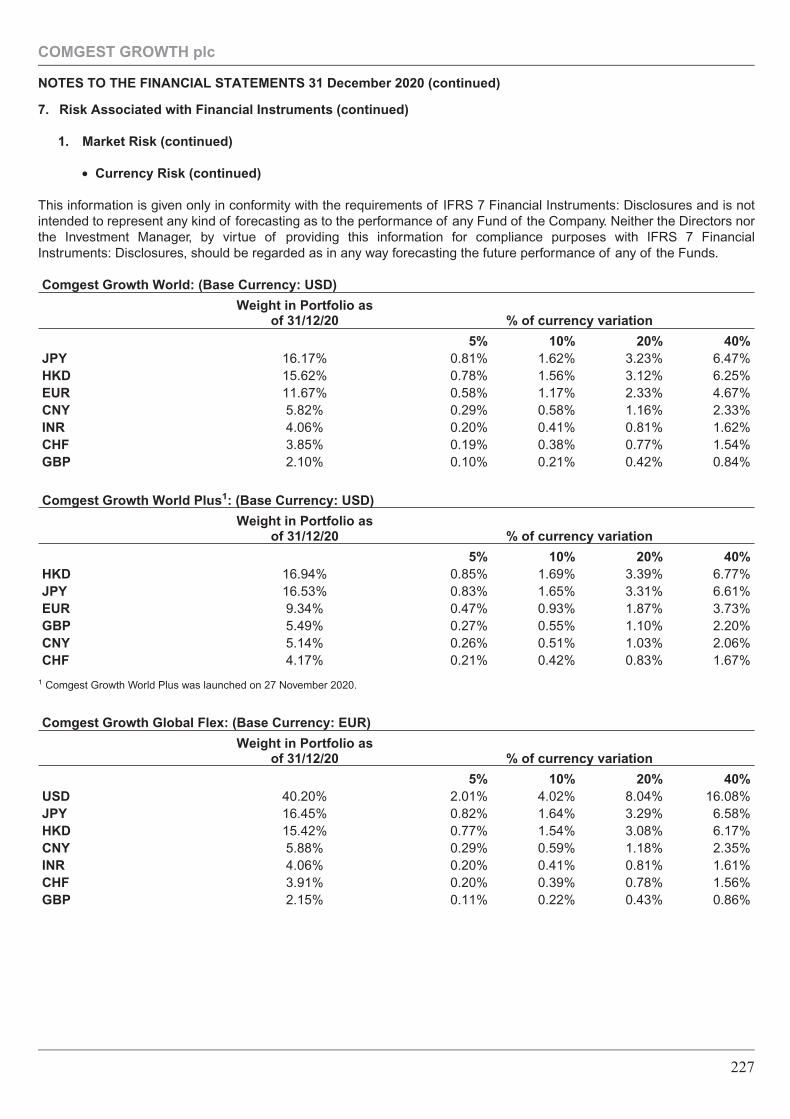
7. Risk Associated with Financial Instruments (continued)
1. Market Risk (continued)
• Currency Risk (continued)
This information is given only in conformity with the requirements of IFRS 7 Financial Instruments: Disclosures and is notintended to represent any kind of forecasting as to the performance of any Fund of the Company. Neither the Directors northe Investment Manager, by virtue of providing this information for compliance purposes with IFRS 7 FinancialInstruments: Disclosures, should be regarded as in any way forecasting the future performance of any of the Funds.
Comgest Growth World: (Base Currency: USD)
Weight in Portfolio asof 31/12/20 % of currency variation
5% 10% 20% 40%JPY 16.17% 0.81% 1.62% 3.23% 6.47%HKD 15.62% 0.78% 1.56% 3.12% 6.25%EUR 11.67% 0.58% 1.17% 2.33% 4.67%CNY 5.82% 0.29% 0.58% 1.16% 2.33%INR 4.06% 0.20% 0.41% 0.81% 1.62%CHF 3.85% 0.19% 0.38% 0.77% 1.54%GBP 2.10% 0.10% 0.21% 0.42% 0.84%
Comgest Growth World Plus1: (Base Currency: USD)
Weight in Portfolio asof 31/12/20 % of currency variation
5% 10% 20% 40%HKD 16.94% 0.85% 1.69% 3.39% 6.77%JPY 16.53% 0.83% 1.65% 3.31% 6.61%EUR 9.34% 0.47% 0.93% 1.87% 3.73%GBP 5.49% 0.27% 0.55% 1.10% 2.20%CNY 5.14% 0.26% 0.51% 1.03% 2.06%CHF 4.17% 0.21% 0.42% 0.83% 1.67%
1 Comgest Growth World Plus was launched on 27 November 2020.
Comgest Growth Global Flex: (Base Currency: EUR)
Weight in Portfolio asof 31/12/20 % of currency variation
5% 10% 20% 40%USD 40.20% 2.01% 4.02% 8.04% 16.08%JPY 16.45% 0.82% 1.64% 3.29% 6.58%HKD 15.42% 0.77% 1.54% 3.08% 6.17%CNY 5.88% 0.29% 0.59% 1.18% 2.35%INR 4.06% 0.20% 0.41% 0.81% 1.61%CHF 3.91% 0.20% 0.39% 0.78% 1.56%GBP 2.15% 0.11% 0.22% 0.43% 0.86%
COMGEST GROWTH plc
NOTES TO THE FINANCIAL STATEMENTS 31 December 2020 (continued)
227
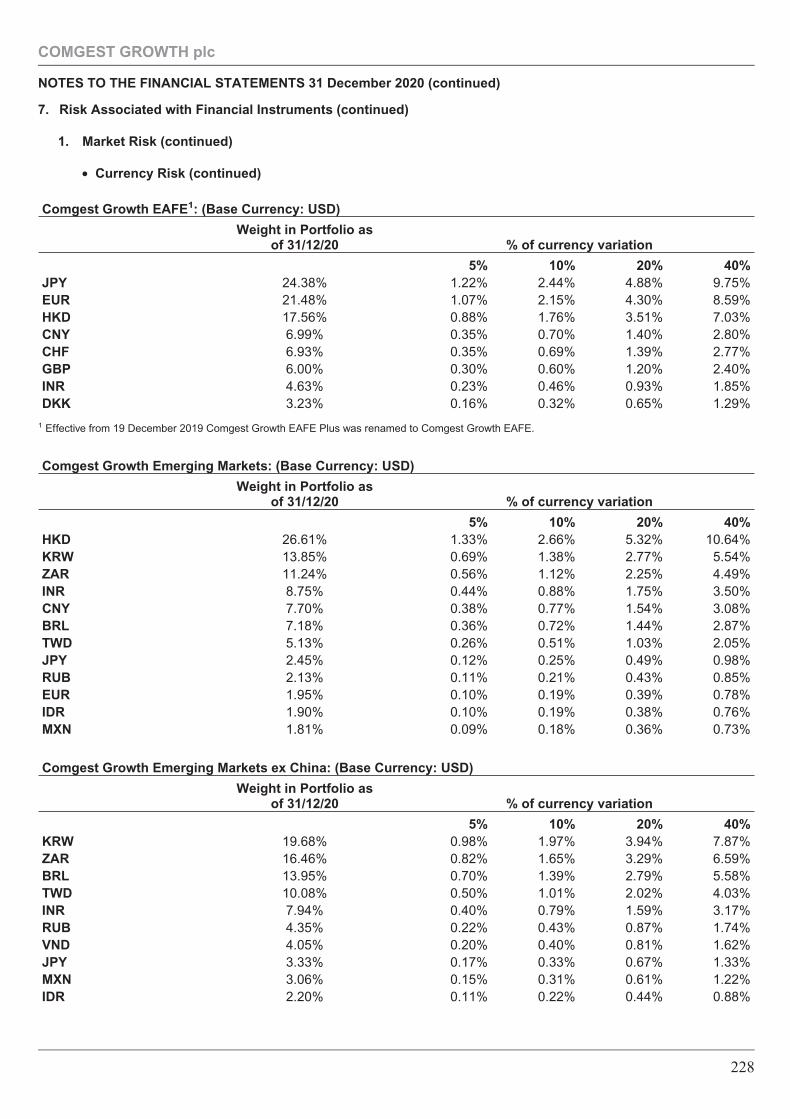
7. Risk Associated with Financial Instruments (continued)
1. Market Risk (continued)
• Currency Risk (continued)
Comgest Growth EAFE1: (Base Currency: USD)
Weight in Portfolio asof 31/12/20 % of currency variation
5% 10% 20% 40%JPY 24.38% 1.22% 2.44% 4.88% 9.75%EUR 21.48% 1.07% 2.15% 4.30% 8.59%HKD 17.56% 0.88% 1.76% 3.51% 7.03%CNY 6.99% 0.35% 0.70% 1.40% 2.80%CHF 6.93% 0.35% 0.69% 1.39% 2.77%GBP 6.00% 0.30% 0.60% 1.20% 2.40%INR 4.63% 0.23% 0.46% 0.93% 1.85%DKK 3.23% 0.16% 0.32% 0.65% 1.29%
1 Effective from 19 December 2019 Comgest Growth EAFE Plus was renamed to Comgest Growth EAFE.
Comgest Growth Emerging Markets: (Base Currency: USD)
Weight in Portfolio asof 31/12/20 % of currency variation
5% 10% 20% 40%HKD 26.61% 1.33% 2.66% 5.32% 10.64%KRW 13.85% 0.69% 1.38% 2.77% 5.54%ZAR 11.24% 0.56% 1.12% 2.25% 4.49%INR 8.75% 0.44% 0.88% 1.75% 3.50%CNY 7.70% 0.38% 0.77% 1.54% 3.08%BRL 7.18% 0.36% 0.72% 1.44% 2.87%TWD 5.13% 0.26% 0.51% 1.03% 2.05%JPY 2.45% 0.12% 0.25% 0.49% 0.98%RUB 2.13% 0.11% 0.21% 0.43% 0.85%EUR 1.95% 0.10% 0.19% 0.39% 0.78%IDR 1.90% 0.10% 0.19% 0.38% 0.76%MXN 1.81% 0.09% 0.18% 0.36% 0.73%
Comgest Growth Emerging Markets ex China: (Base Currency: USD)
Weight in Portfolio asof 31/12/20 % of currency variation
5% 10% 20% 40%KRW 19.68% 0.98% 1.97% 3.94% 7.87%ZAR 16.46% 0.82% 1.65% 3.29% 6.59%BRL 13.95% 0.70% 1.39% 2.79% 5.58%TWD 10.08% 0.50% 1.01% 2.02% 4.03%INR 7.94% 0.40% 0.79% 1.59% 3.17%RUB 4.35% 0.22% 0.43% 0.87% 1.74%VND 4.05% 0.20% 0.40% 0.81% 1.62%JPY 3.33% 0.17% 0.33% 0.67% 1.33%MXN 3.06% 0.15% 0.31% 0.61% 1.22%IDR 2.20% 0.11% 0.22% 0.44% 0.88%
COMGEST GROWTH plc
NOTES TO THE FINANCIAL STATEMENTS 31 December 2020 (continued)
228
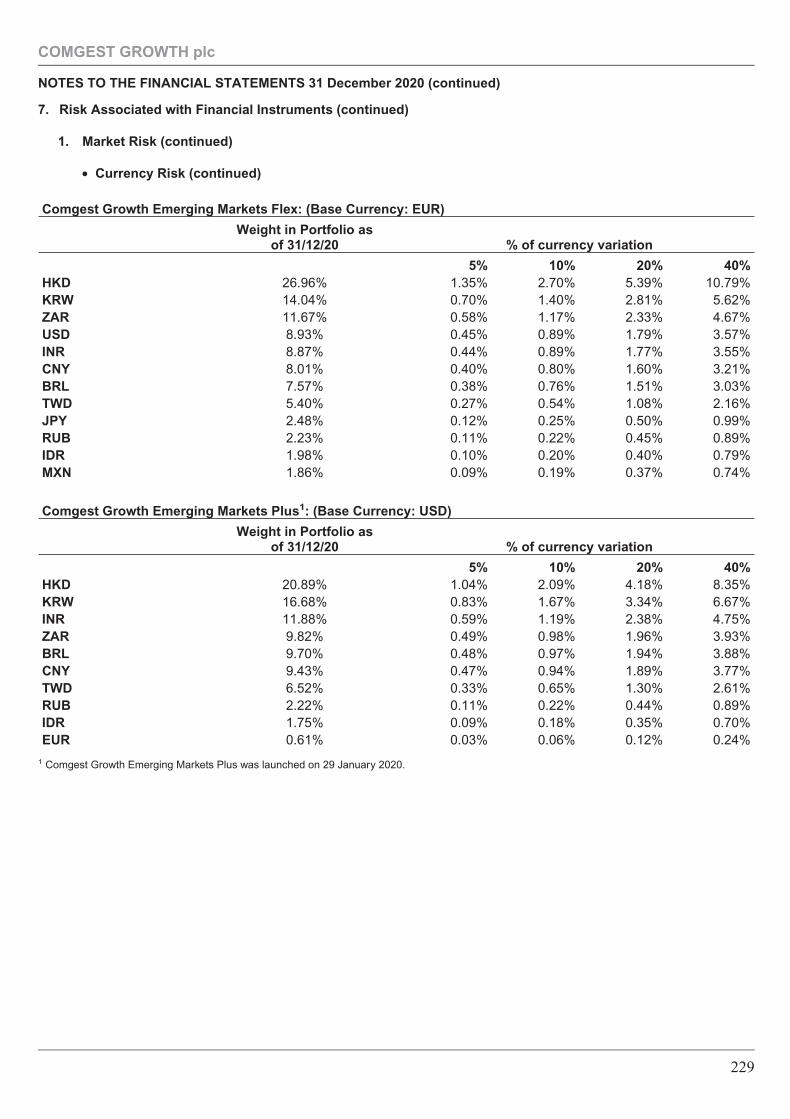
7. Risk Associated with Financial Instruments (continued)
1. Market Risk (continued)
• Currency Risk (continued)
Comgest Growth Emerging Markets Flex: (Base Currency: EUR)
Weight in Portfolio asof 31/12/20 % of currency variation
5% 10% 20% 40%HKD 26.96% 1.35% 2.70% 5.39% 10.79%KRW 14.04% 0.70% 1.40% 2.81% 5.62%ZAR 11.67% 0.58% 1.17% 2.33% 4.67%USD 8.93% 0.45% 0.89% 1.79% 3.57%INR 8.87% 0.44% 0.89% 1.77% 3.55%CNY 8.01% 0.40% 0.80% 1.60% 3.21%BRL 7.57% 0.38% 0.76% 1.51% 3.03%TWD 5.40% 0.27% 0.54% 1.08% 2.16%JPY 2.48% 0.12% 0.25% 0.50% 0.99%RUB 2.23% 0.11% 0.22% 0.45% 0.89%IDR 1.98% 0.10% 0.20% 0.40% 0.79%MXN 1.86% 0.09% 0.19% 0.37% 0.74%
Comgest Growth Emerging Markets Plus1: (Base Currency: USD)
Weight in Portfolio asof 31/12/20 % of currency variation
5% 10% 20% 40%HKD 20.89% 1.04% 2.09% 4.18% 8.35%KRW 16.68% 0.83% 1.67% 3.34% 6.67%INR 11.88% 0.59% 1.19% 2.38% 4.75%ZAR 9.82% 0.49% 0.98% 1.96% 3.93%BRL 9.70% 0.48% 0.97% 1.94% 3.88%CNY 9.43% 0.47% 0.94% 1.89% 3.77%TWD 6.52% 0.33% 0.65% 1.30% 2.61%RUB 2.22% 0.11% 0.22% 0.44% 0.89%IDR 1.75% 0.09% 0.18% 0.35% 0.70%EUR 0.61% 0.03% 0.06% 0.12% 0.24%
1 Comgest Growth Emerging Markets Plus was launched on 29 January 2020.
COMGEST GROWTH plc
NOTES TO THE FINANCIAL STATEMENTS 31 December 2020 (continued)
229
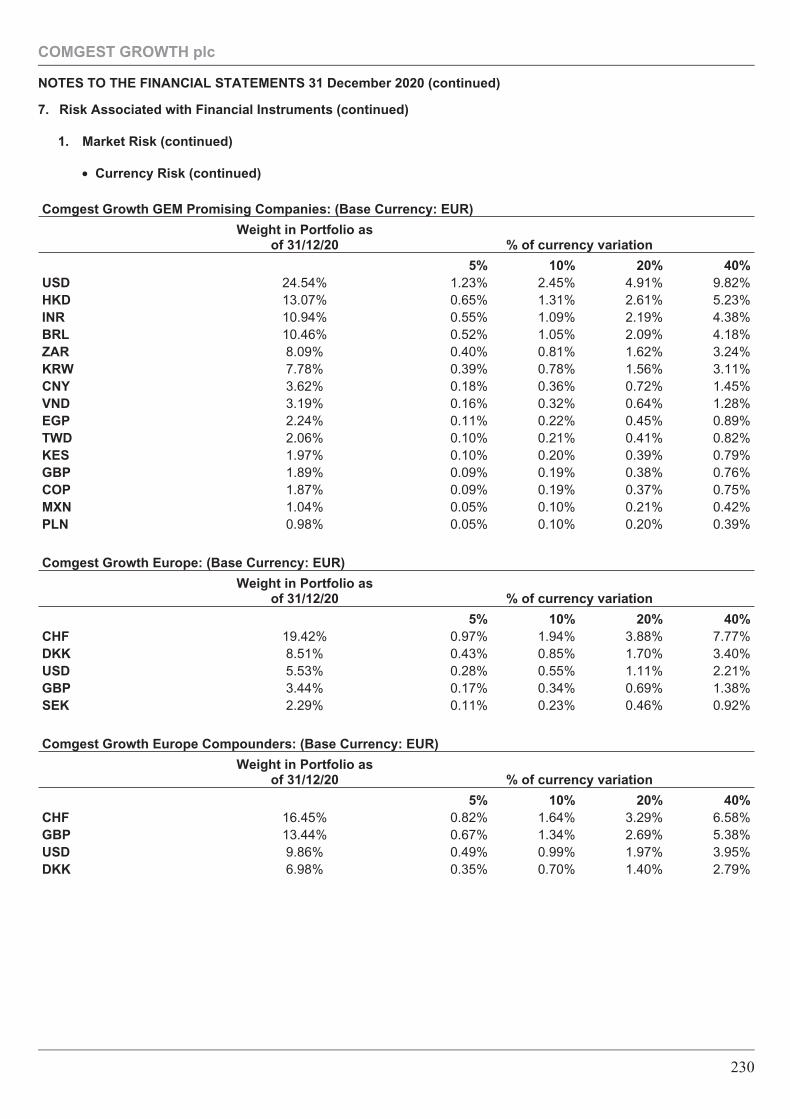
7. Risk Associated with Financial Instruments (continued)
1. Market Risk (continued)
• Currency Risk (continued)
Comgest Growth GEM Promising Companies: (Base Currency: EUR)
Weight in Portfolio asof 31/12/20 % of currency variation
5% 10% 20% 40%USD 24.54% 1.23% 2.45% 4.91% 9.82%HKD 13.07% 0.65% 1.31% 2.61% 5.23%INR 10.94% 0.55% 1.09% 2.19% 4.38%BRL 10.46% 0.52% 1.05% 2.09% 4.18%ZAR 8.09% 0.40% 0.81% 1.62% 3.24%KRW 7.78% 0.39% 0.78% 1.56% 3.11%CNY 3.62% 0.18% 0.36% 0.72% 1.45%VND 3.19% 0.16% 0.32% 0.64% 1.28%EGP 2.24% 0.11% 0.22% 0.45% 0.89%TWD 2.06% 0.10% 0.21% 0.41% 0.82%KES 1.97% 0.10% 0.20% 0.39% 0.79%GBP 1.89% 0.09% 0.19% 0.38% 0.76%COP 1.87% 0.09% 0.19% 0.37% 0.75%MXN 1.04% 0.05% 0.10% 0.21% 0.42%PLN 0.98% 0.05% 0.10% 0.20% 0.39%
Comgest Growth Europe: (Base Currency: EUR)
Weight in Portfolio asof 31/12/20 % of currency variation
5% 10% 20% 40%CHF 19.42% 0.97% 1.94% 3.88% 7.77%DKK 8.51% 0.43% 0.85% 1.70% 3.40%USD 5.53% 0.28% 0.55% 1.11% 2.21%GBP 3.44% 0.17% 0.34% 0.69% 1.38%SEK 2.29% 0.11% 0.23% 0.46% 0.92%
Comgest Growth Europe Compounders: (Base Currency: EUR)
Weight in Portfolio asof 31/12/20 % of currency variation
5% 10% 20% 40%CHF 16.45% 0.82% 1.64% 3.29% 6.58%GBP 13.44% 0.67% 1.34% 2.69% 5.38%USD 9.86% 0.49% 0.99% 1.97% 3.95%DKK 6.98% 0.35% 0.70% 1.40% 2.79%
COMGEST GROWTH plc
NOTES TO THE FINANCIAL STATEMENTS 31 December 2020 (continued)
230
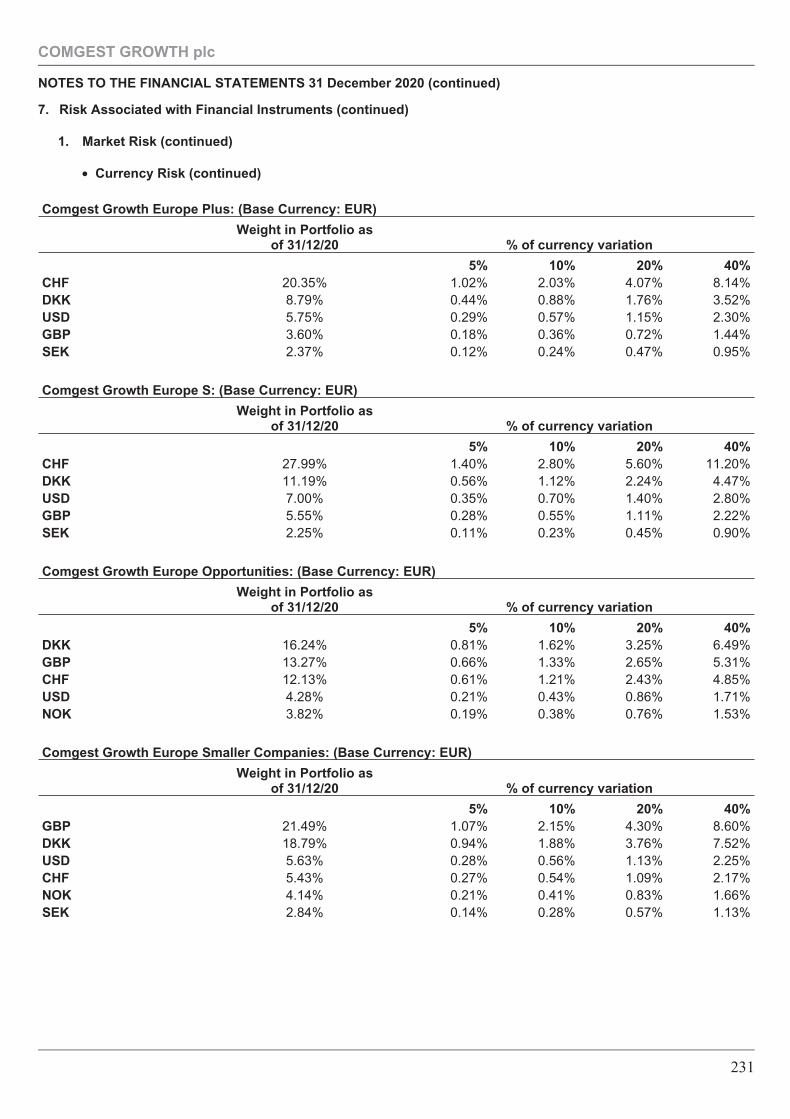
7. Risk Associated with Financial Instruments (continued)
1. Market Risk (continued)
• Currency Risk (continued)
Comgest Growth Europe Plus: (Base Currency: EUR)
Weight in Portfolio asof 31/12/20 % of currency variation
5% 10% 20% 40%CHF 20.35% 1.02% 2.03% 4.07% 8.14%DKK 8.79% 0.44% 0.88% 1.76% 3.52%USD 5.75% 0.29% 0.57% 1.15% 2.30%GBP 3.60% 0.18% 0.36% 0.72% 1.44%SEK 2.37% 0.12% 0.24% 0.47% 0.95%
Comgest Growth Europe S: (Base Currency: EUR)
Weight in Portfolio asof 31/12/20 % of currency variation
5% 10% 20% 40%CHF 27.99% 1.40% 2.80% 5.60% 11.20%DKK 11.19% 0.56% 1.12% 2.24% 4.47%USD 7.00% 0.35% 0.70% 1.40% 2.80%GBP 5.55% 0.28% 0.55% 1.11% 2.22%SEK 2.25% 0.11% 0.23% 0.45% 0.90%
Comgest Growth Europe Opportunities: (Base Currency: EUR)
Weight in Portfolio asof 31/12/20 % of currency variation
5% 10% 20% 40%DKK 16.24% 0.81% 1.62% 3.25% 6.49%GBP 13.27% 0.66% 1.33% 2.65% 5.31%CHF 12.13% 0.61% 1.21% 2.43% 4.85%USD 4.28% 0.21% 0.43% 0.86% 1.71%NOK 3.82% 0.19% 0.38% 0.76% 1.53%
Comgest Growth Europe Smaller Companies: (Base Currency: EUR)
Weight in Portfolio asof 31/12/20 % of currency variation
5% 10% 20% 40%GBP 21.49% 1.07% 2.15% 4.30% 8.60%DKK 18.79% 0.94% 1.88% 3.76% 7.52%USD 5.63% 0.28% 0.56% 1.13% 2.25%CHF 5.43% 0.27% 0.54% 1.09% 2.17%NOK 4.14% 0.21% 0.41% 0.83% 1.66%SEK 2.84% 0.14% 0.28% 0.57% 1.13%
COMGEST GROWTH plc
NOTES TO THE FINANCIAL STATEMENTS 31 December 2020 (continued)
231
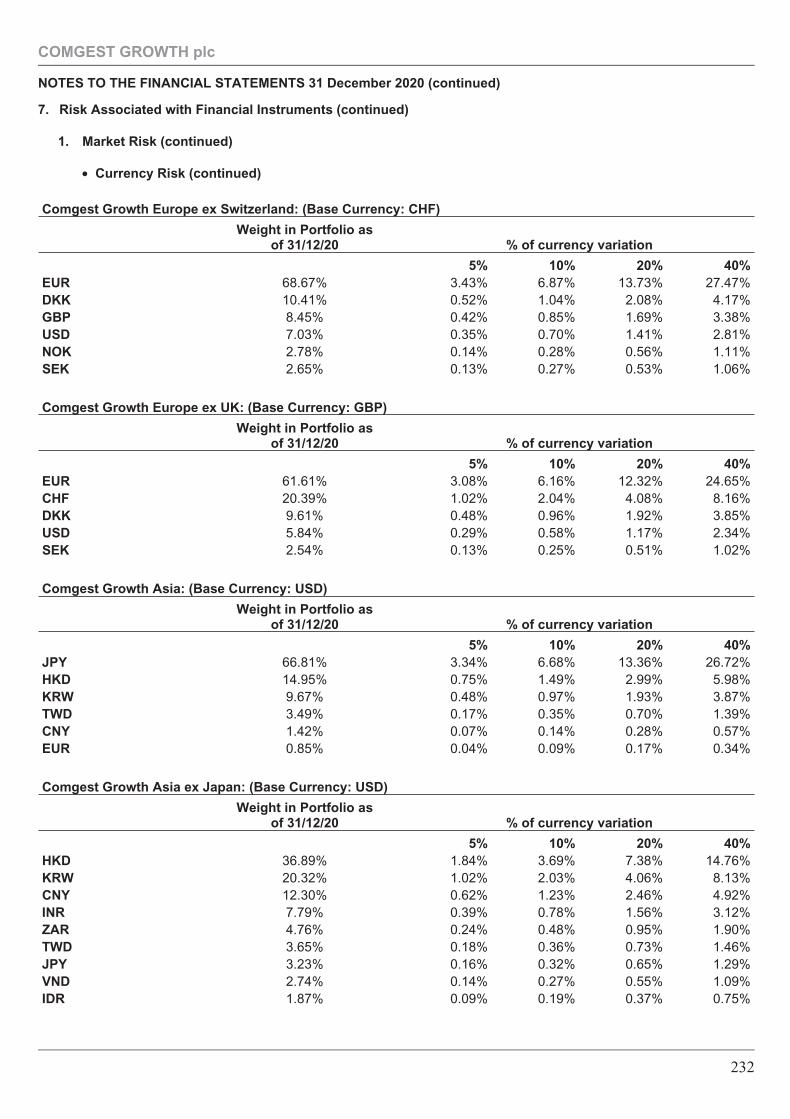
7. Risk Associated with Financial Instruments (continued)
1. Market Risk (continued)
• Currency Risk (continued)
Comgest Growth Europe ex Switzerland: (Base Currency: CHF)
Weight in Portfolio asof 31/12/20 % of currency variation
5% 10% 20% 40%EUR 68.67% 3.43% 6.87% 13.73% 27.47%DKK 10.41% 0.52% 1.04% 2.08% 4.17%GBP 8.45% 0.42% 0.85% 1.69% 3.38%USD 7.03% 0.35% 0.70% 1.41% 2.81%NOK 2.78% 0.14% 0.28% 0.56% 1.11%SEK 2.65% 0.13% 0.27% 0.53% 1.06%
Comgest Growth Europe ex UK: (Base Currency: GBP)
Weight in Portfolio asof 31/12/20 % of currency variation
5% 10% 20% 40%EUR 61.61% 3.08% 6.16% 12.32% 24.65%CHF 20.39% 1.02% 2.04% 4.08% 8.16%DKK 9.61% 0.48% 0.96% 1.92% 3.85%USD 5.84% 0.29% 0.58% 1.17% 2.34%SEK 2.54% 0.13% 0.25% 0.51% 1.02%
Comgest Growth Asia: (Base Currency: USD)
Weight in Portfolio asof 31/12/20 % of currency variation
5% 10% 20% 40%JPY 66.81% 3.34% 6.68% 13.36% 26.72%HKD 14.95% 0.75% 1.49% 2.99% 5.98%KRW 9.67% 0.48% 0.97% 1.93% 3.87%TWD 3.49% 0.17% 0.35% 0.70% 1.39%CNY 1.42% 0.07% 0.14% 0.28% 0.57%EUR 0.85% 0.04% 0.09% 0.17% 0.34%
Comgest Growth Asia ex Japan: (Base Currency: USD)
Weight in Portfolio asof 31/12/20 % of currency variation
5% 10% 20% 40%HKD 36.89% 1.84% 3.69% 7.38% 14.76%KRW 20.32% 1.02% 2.03% 4.06% 8.13%CNY 12.30% 0.62% 1.23% 2.46% 4.92%INR 7.79% 0.39% 0.78% 1.56% 3.12%ZAR 4.76% 0.24% 0.48% 0.95% 1.90%TWD 3.65% 0.18% 0.36% 0.73% 1.46%JPY 3.23% 0.16% 0.32% 0.65% 1.29%VND 2.74% 0.14% 0.27% 0.55% 1.09%IDR 1.87% 0.09% 0.19% 0.37% 0.75%
COMGEST GROWTH plc
NOTES TO THE FINANCIAL STATEMENTS 31 December 2020 (continued)
232
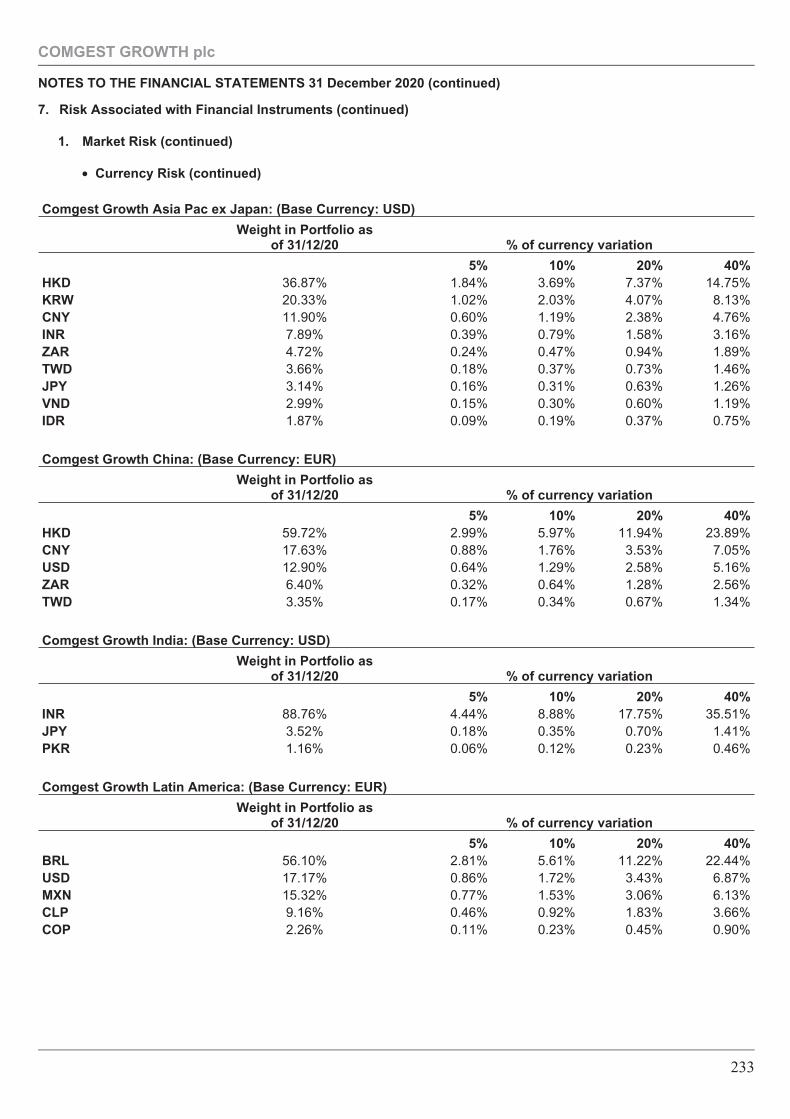
7. Risk Associated with Financial Instruments (continued)
1. Market Risk (continued)
• Currency Risk (continued)
Comgest Growth Asia Pac ex Japan: (Base Currency: USD)
Weight in Portfolio asof 31/12/20 % of currency variation
5% 10% 20% 40%HKD 36.87% 1.84% 3.69% 7.37% 14.75%KRW 20.33% 1.02% 2.03% 4.07% 8.13%CNY 11.90% 0.60% 1.19% 2.38% 4.76%INR 7.89% 0.39% 0.79% 1.58% 3.16%ZAR 4.72% 0.24% 0.47% 0.94% 1.89%TWD 3.66% 0.18% 0.37% 0.73% 1.46%JPY 3.14% 0.16% 0.31% 0.63% 1.26%VND 2.99% 0.15% 0.30% 0.60% 1.19%IDR 1.87% 0.09% 0.19% 0.37% 0.75%
Comgest Growth China: (Base Currency: EUR)
Weight in Portfolio asof 31/12/20 % of currency variation
5% 10% 20% 40%HKD 59.72% 2.99% 5.97% 11.94% 23.89%CNY 17.63% 0.88% 1.76% 3.53% 7.05%USD 12.90% 0.64% 1.29% 2.58% 5.16%ZAR 6.40% 0.32% 0.64% 1.28% 2.56%TWD 3.35% 0.17% 0.34% 0.67% 1.34%
Comgest Growth India: (Base Currency: USD)
Weight in Portfolio asof 31/12/20 % of currency variation
5% 10% 20% 40%INR 88.76% 4.44% 8.88% 17.75% 35.51%JPY 3.52% 0.18% 0.35% 0.70% 1.41%PKR 1.16% 0.06% 0.12% 0.23% 0.46%
Comgest Growth Latin America: (Base Currency: EUR)
Weight in Portfolio asof 31/12/20 % of currency variation
5% 10% 20% 40%BRL 56.10% 2.81% 5.61% 11.22% 22.44%USD 17.17% 0.86% 1.72% 3.43% 6.87%MXN 15.32% 0.77% 1.53% 3.06% 6.13%CLP 9.16% 0.46% 0.92% 1.83% 3.66%COP 2.26% 0.11% 0.23% 0.45% 0.90%
COMGEST GROWTH plc
NOTES TO THE FINANCIAL STATEMENTS 31 December 2020 (continued)
233
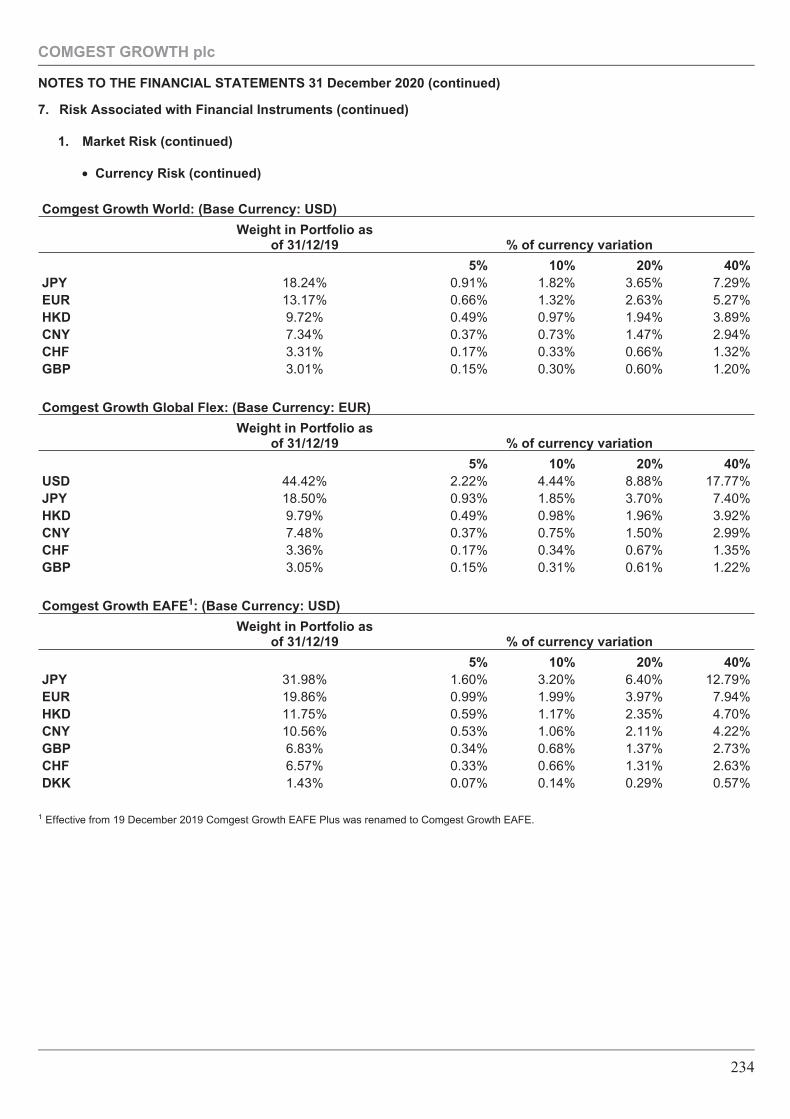
7. Risk Associated with Financial Instruments (continued)
1. Market Risk (continued)
• Currency Risk (continued)
Comgest Growth World: (Base Currency: USD)
Weight in Portfolio asof 31/12/19 % of currency variation
5% 10% 20% 40%JPY 18.24% 0.91% 1.82% 3.65% 7.29%EUR 13.17% 0.66% 1.32% 2.63% 5.27%HKD 9.72% 0.49% 0.97% 1.94% 3.89%CNY 7.34% 0.37% 0.73% 1.47% 2.94%CHF 3.31% 0.17% 0.33% 0.66% 1.32%GBP 3.01% 0.15% 0.30% 0.60% 1.20%
Comgest Growth Global Flex: (Base Currency: EUR)
Weight in Portfolio asof 31/12/19 % of currency variation
5% 10% 20% 40%USD 44.42% 2.22% 4.44% 8.88% 17.77%JPY 18.50% 0.93% 1.85% 3.70% 7.40%HKD 9.79% 0.49% 0.98% 1.96% 3.92%CNY 7.48% 0.37% 0.75% 1.50% 2.99%CHF 3.36% 0.17% 0.34% 0.67% 1.35%GBP 3.05% 0.15% 0.31% 0.61% 1.22%
Comgest Growth EAFE1: (Base Currency: USD)
Weight in Portfolio asof 31/12/19 % of currency variation
5% 10% 20% 40%JPY 31.98% 1.60% 3.20% 6.40% 12.79%EUR 19.86% 0.99% 1.99% 3.97% 7.94%HKD 11.75% 0.59% 1.17% 2.35% 4.70%CNY 10.56% 0.53% 1.06% 2.11% 4.22%GBP 6.83% 0.34% 0.68% 1.37% 2.73%CHF 6.57% 0.33% 0.66% 1.31% 2.63%DKK 1.43% 0.07% 0.14% 0.29% 0.57%
1 Effective from 19 December 2019 Comgest Growth EAFE Plus was renamed to Comgest Growth EAFE.
COMGEST GROWTH plc
NOTES TO THE FINANCIAL STATEMENTS 31 December 2020 (continued)
234
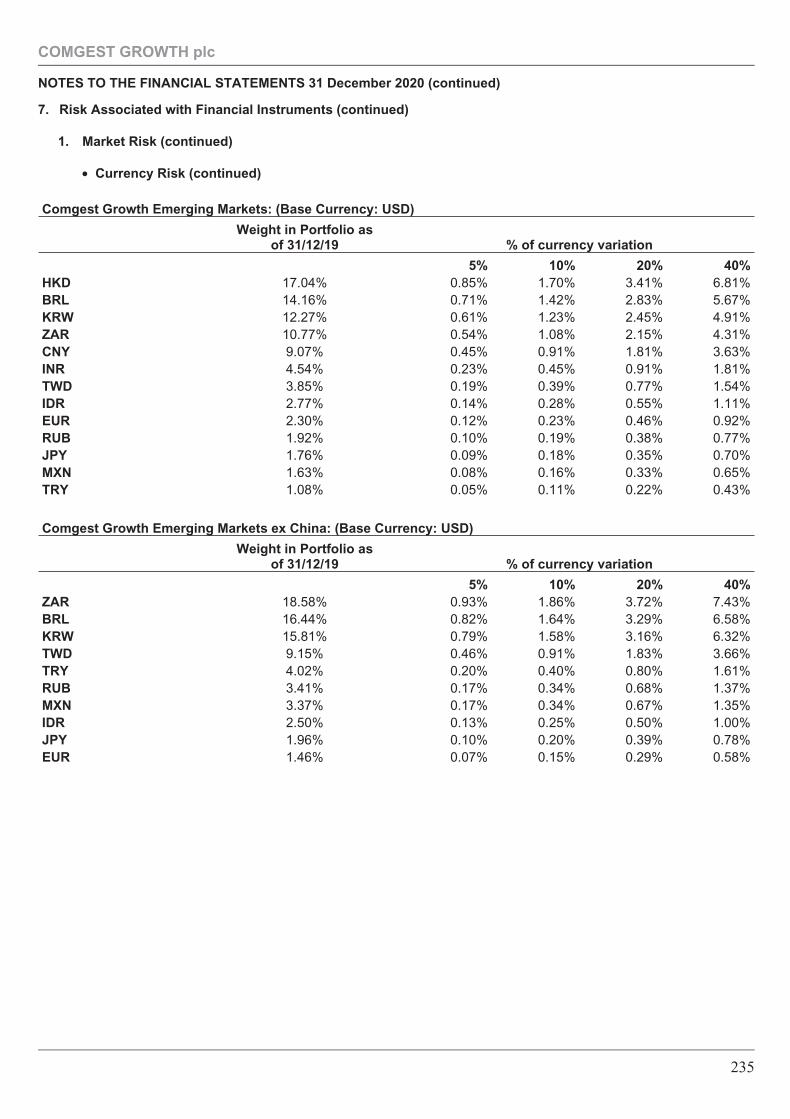
7. Risk Associated with Financial Instruments (continued)
1. Market Risk (continued)
• Currency Risk (continued)
Comgest Growth Emerging Markets: (Base Currency: USD)
Weight in Portfolio asof 31/12/19 % of currency variation
5% 10% 20% 40%HKD 17.04% 0.85% 1.70% 3.41% 6.81%BRL 14.16% 0.71% 1.42% 2.83% 5.67%KRW 12.27% 0.61% 1.23% 2.45% 4.91%ZAR 10.77% 0.54% 1.08% 2.15% 4.31%CNY 9.07% 0.45% 0.91% 1.81% 3.63%INR 4.54% 0.23% 0.45% 0.91% 1.81%TWD 3.85% 0.19% 0.39% 0.77% 1.54%IDR 2.77% 0.14% 0.28% 0.55% 1.11%EUR 2.30% 0.12% 0.23% 0.46% 0.92%RUB 1.92% 0.10% 0.19% 0.38% 0.77%JPY 1.76% 0.09% 0.18% 0.35% 0.70%MXN 1.63% 0.08% 0.16% 0.33% 0.65%TRY 1.08% 0.05% 0.11% 0.22% 0.43%
Comgest Growth Emerging Markets ex China: (Base Currency: USD)
Weight in Portfolio asof 31/12/19 % of currency variation
5% 10% 20% 40%ZAR 18.58% 0.93% 1.86% 3.72% 7.43%BRL 16.44% 0.82% 1.64% 3.29% 6.58%KRW 15.81% 0.79% 1.58% 3.16% 6.32%TWD 9.15% 0.46% 0.91% 1.83% 3.66%TRY 4.02% 0.20% 0.40% 0.80% 1.61%RUB 3.41% 0.17% 0.34% 0.68% 1.37%MXN 3.37% 0.17% 0.34% 0.67% 1.35%IDR 2.50% 0.13% 0.25% 0.50% 1.00%JPY 1.96% 0.10% 0.20% 0.39% 0.78%EUR 1.46% 0.07% 0.15% 0.29% 0.58%
COMGEST GROWTH plc
NOTES TO THE FINANCIAL STATEMENTS 31 December 2020 (continued)
235
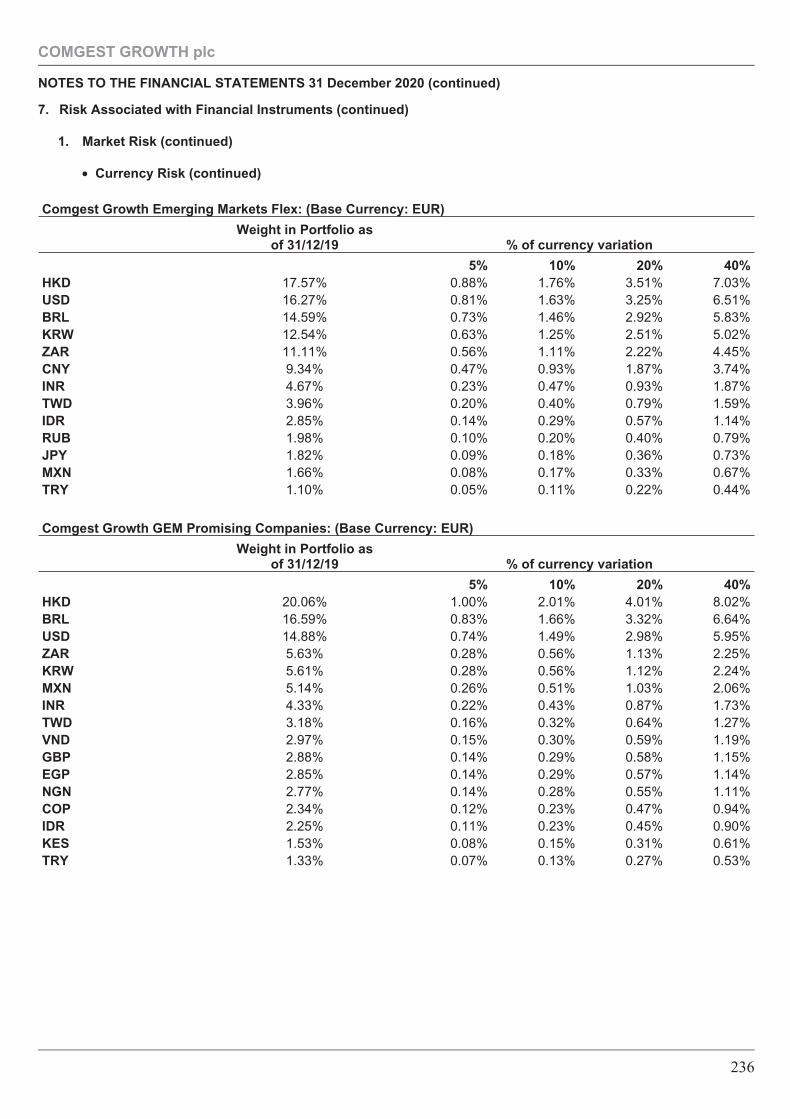
7. Risk Associated with Financial Instruments (continued)
1. Market Risk (continued)
• Currency Risk (continued)
Comgest Growth Emerging Markets Flex: (Base Currency: EUR)
Weight in Portfolio asof 31/12/19 % of currency variation
5% 10% 20% 40%HKD 17.57% 0.88% 1.76% 3.51% 7.03%USD 16.27% 0.81% 1.63% 3.25% 6.51%BRL 14.59% 0.73% 1.46% 2.92% 5.83%KRW 12.54% 0.63% 1.25% 2.51% 5.02%ZAR 11.11% 0.56% 1.11% 2.22% 4.45%CNY 9.34% 0.47% 0.93% 1.87% 3.74%INR 4.67% 0.23% 0.47% 0.93% 1.87%TWD 3.96% 0.20% 0.40% 0.79% 1.59%IDR 2.85% 0.14% 0.29% 0.57% 1.14%RUB 1.98% 0.10% 0.20% 0.40% 0.79%JPY 1.82% 0.09% 0.18% 0.36% 0.73%MXN 1.66% 0.08% 0.17% 0.33% 0.67%TRY 1.10% 0.05% 0.11% 0.22% 0.44%
Comgest Growth GEM Promising Companies: (Base Currency: EUR)
Weight in Portfolio asof 31/12/19 % of currency variation
5% 10% 20% 40%HKD 20.06% 1.00% 2.01% 4.01% 8.02%BRL 16.59% 0.83% 1.66% 3.32% 6.64%USD 14.88% 0.74% 1.49% 2.98% 5.95%ZAR 5.63% 0.28% 0.56% 1.13% 2.25%KRW 5.61% 0.28% 0.56% 1.12% 2.24%MXN 5.14% 0.26% 0.51% 1.03% 2.06%INR 4.33% 0.22% 0.43% 0.87% 1.73%TWD 3.18% 0.16% 0.32% 0.64% 1.27%VND 2.97% 0.15% 0.30% 0.59% 1.19%GBP 2.88% 0.14% 0.29% 0.58% 1.15%EGP 2.85% 0.14% 0.29% 0.57% 1.14%NGN 2.77% 0.14% 0.28% 0.55% 1.11%COP 2.34% 0.12% 0.23% 0.47% 0.94%IDR 2.25% 0.11% 0.23% 0.45% 0.90%KES 1.53% 0.08% 0.15% 0.31% 0.61%TRY 1.33% 0.07% 0.13% 0.27% 0.53%
COMGEST GROWTH plc
NOTES TO THE FINANCIAL STATEMENTS 31 December 2020 (continued)
236
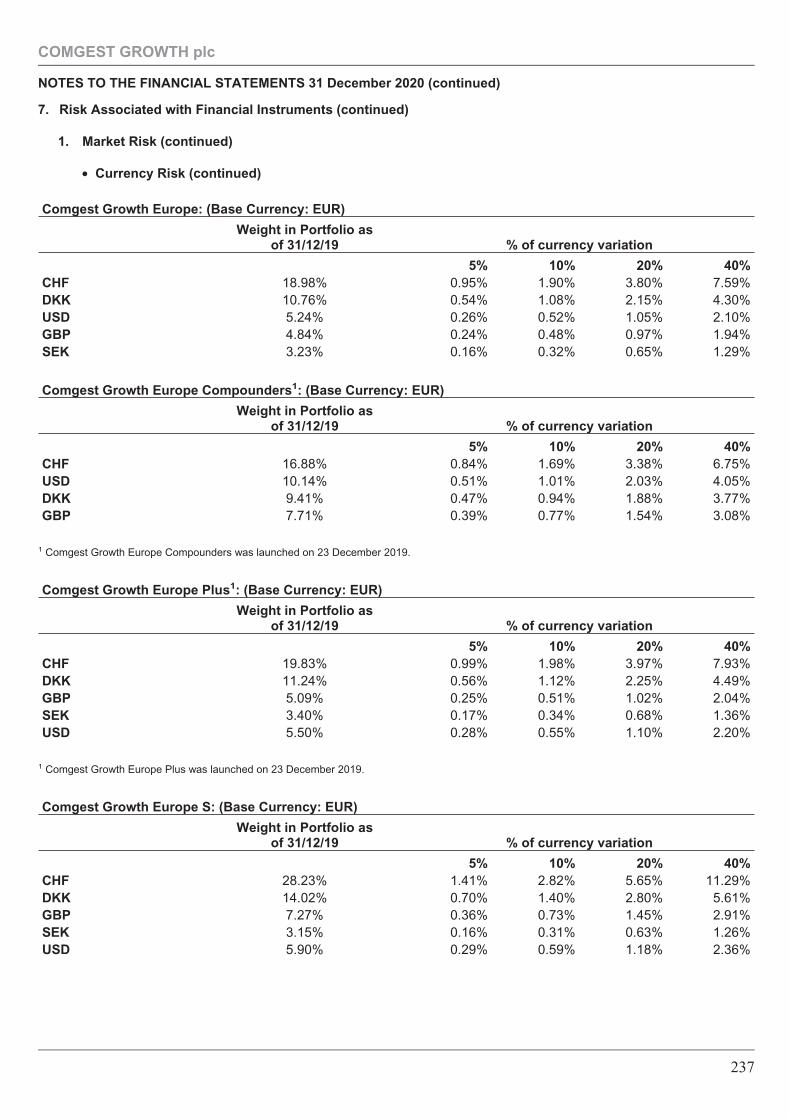
7. Risk Associated with Financial Instruments (continued)
1. Market Risk (continued)
• Currency Risk (continued)
Comgest Growth Europe: (Base Currency: EUR)
Weight in Portfolio asof 31/12/19 % of currency variation
5% 10% 20% 40%CHF 18.98% 0.95% 1.90% 3.80% 7.59%DKK 10.76% 0.54% 1.08% 2.15% 4.30%USD 5.24% 0.26% 0.52% 1.05% 2.10%GBP 4.84% 0.24% 0.48% 0.97% 1.94%SEK 3.23% 0.16% 0.32% 0.65% 1.29%
Comgest Growth Europe Compounders1: (Base Currency: EUR)
Weight in Portfolio asof 31/12/19 % of currency variation
5% 10% 20% 40%CHF 16.88% 0.84% 1.69% 3.38% 6.75%USD 10.14% 0.51% 1.01% 2.03% 4.05%DKK 9.41% 0.47% 0.94% 1.88% 3.77%GBP 7.71% 0.39% 0.77% 1.54% 3.08%
1 Comgest Growth Europe Compounders was launched on 23 December 2019.
Comgest Growth Europe Plus1: (Base Currency: EUR)
Weight in Portfolio asof 31/12/19 % of currency variation
5% 10% 20% 40%CHF 19.83% 0.99% 1.98% 3.97% 7.93%DKK 11.24% 0.56% 1.12% 2.25% 4.49%GBP 5.09% 0.25% 0.51% 1.02% 2.04%SEK 3.40% 0.17% 0.34% 0.68% 1.36%USD 5.50% 0.28% 0.55% 1.10% 2.20%
1 Comgest Growth Europe Plus was launched on 23 December 2019.
Comgest Growth Europe S: (Base Currency: EUR)
Weight in Portfolio asof 31/12/19 % of currency variation
5% 10% 20% 40%CHF 28.23% 1.41% 2.82% 5.65% 11.29%DKK 14.02% 0.70% 1.40% 2.80% 5.61%GBP 7.27% 0.36% 0.73% 1.45% 2.91%SEK 3.15% 0.16% 0.31% 0.63% 1.26%USD 5.90% 0.29% 0.59% 1.18% 2.36%
COMGEST GROWTH plc
NOTES TO THE FINANCIAL STATEMENTS 31 December 2020 (continued)
237
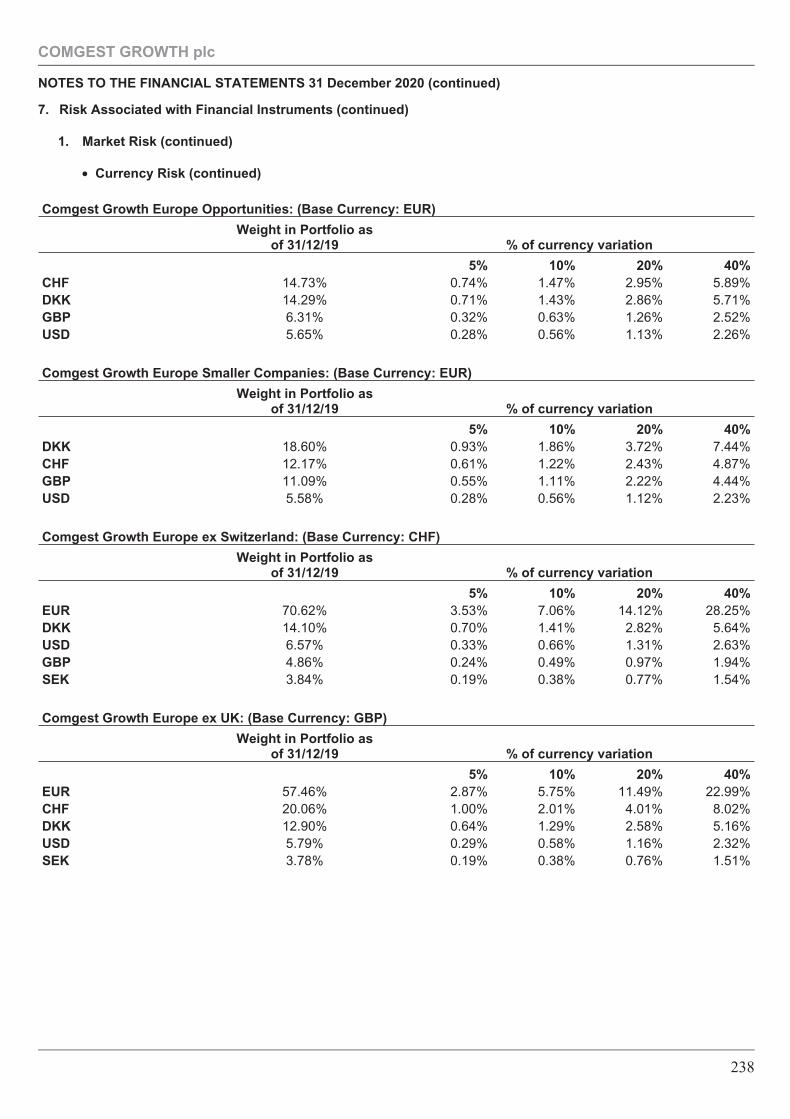
7. Risk Associated with Financial Instruments (continued)
1. Market Risk (continued)
• Currency Risk (continued)
Comgest Growth Europe Opportunities: (Base Currency: EUR)
Weight in Portfolio asof 31/12/19 % of currency variation
5% 10% 20% 40%CHF 14.73% 0.74% 1.47% 2.95% 5.89%DKK 14.29% 0.71% 1.43% 2.86% 5.71%GBP 6.31% 0.32% 0.63% 1.26% 2.52%USD 5.65% 0.28% 0.56% 1.13% 2.26%
Comgest Growth Europe Smaller Companies: (Base Currency: EUR)
Weight in Portfolio asof 31/12/19 % of currency variation
5% 10% 20% 40%DKK 18.60% 0.93% 1.86% 3.72% 7.44%CHF 12.17% 0.61% 1.22% 2.43% 4.87%GBP 11.09% 0.55% 1.11% 2.22% 4.44%USD 5.58% 0.28% 0.56% 1.12% 2.23%
Comgest Growth Europe ex Switzerland: (Base Currency: CHF)
Weight in Portfolio asof 31/12/19 % of currency variation
5% 10% 20% 40%EUR 70.62% 3.53% 7.06% 14.12% 28.25%DKK 14.10% 0.70% 1.41% 2.82% 5.64%USD 6.57% 0.33% 0.66% 1.31% 2.63%GBP 4.86% 0.24% 0.49% 0.97% 1.94%SEK 3.84% 0.19% 0.38% 0.77% 1.54%
Comgest Growth Europe ex UK: (Base Currency: GBP)
Weight in Portfolio asof 31/12/19 % of currency variation
5% 10% 20% 40%EUR 57.46% 2.87% 5.75% 11.49% 22.99%CHF 20.06% 1.00% 2.01% 4.01% 8.02%DKK 12.90% 0.64% 1.29% 2.58% 5.16%USD 5.79% 0.29% 0.58% 1.16% 2.32%SEK 3.78% 0.19% 0.38% 0.76% 1.51%
COMGEST GROWTH plc
NOTES TO THE FINANCIAL STATEMENTS 31 December 2020 (continued)
238
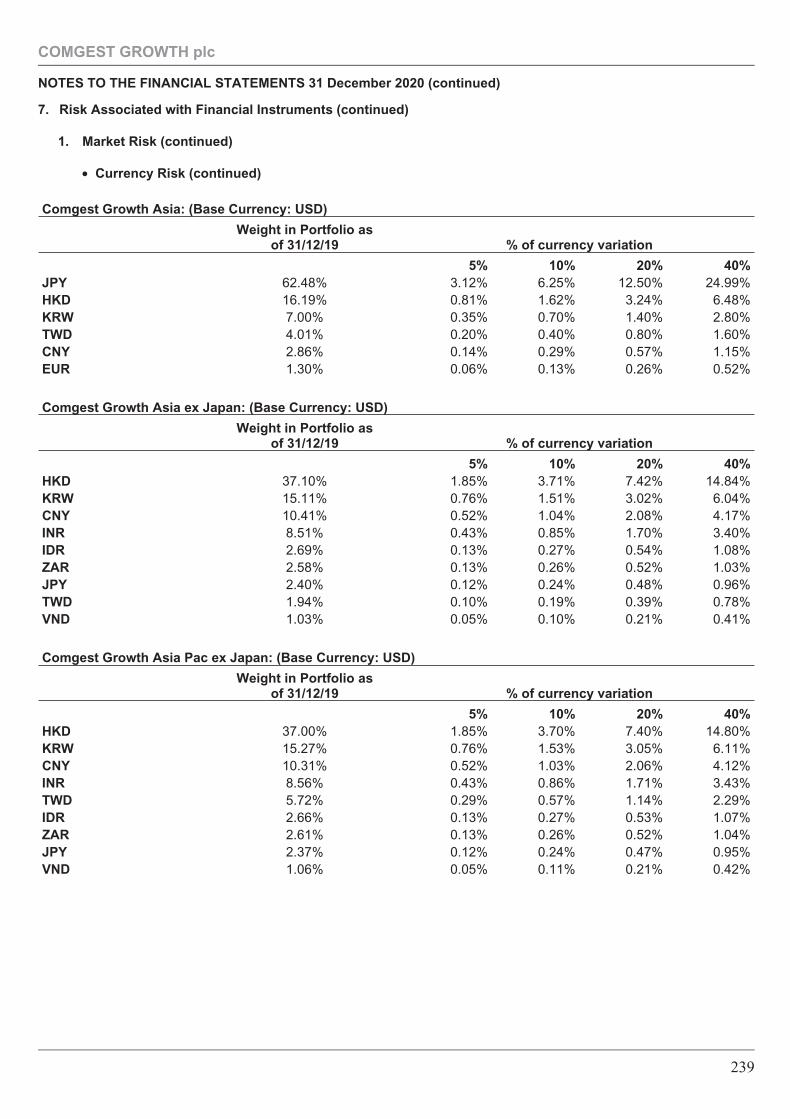
7. Risk Associated with Financial Instruments (continued)
1. Market Risk (continued)
• Currency Risk (continued)
Comgest Growth Asia: (Base Currency: USD)
Weight in Portfolio asof 31/12/19 % of currency variation
5% 10% 20% 40%JPY 62.48% 3.12% 6.25% 12.50% 24.99%HKD 16.19% 0.81% 1.62% 3.24% 6.48%KRW 7.00% 0.35% 0.70% 1.40% 2.80%TWD 4.01% 0.20% 0.40% 0.80% 1.60%CNY 2.86% 0.14% 0.29% 0.57% 1.15%EUR 1.30% 0.06% 0.13% 0.26% 0.52%
Comgest Growth Asia ex Japan: (Base Currency: USD)
Weight in Portfolio asof 31/12/19 % of currency variation
5% 10% 20% 40%HKD 37.10% 1.85% 3.71% 7.42% 14.84%KRW 15.11% 0.76% 1.51% 3.02% 6.04%CNY 10.41% 0.52% 1.04% 2.08% 4.17%INR 8.51% 0.43% 0.85% 1.70% 3.40%IDR 2.69% 0.13% 0.27% 0.54% 1.08%ZAR 2.58% 0.13% 0.26% 0.52% 1.03%JPY 2.40% 0.12% 0.24% 0.48% 0.96%TWD 1.94% 0.10% 0.19% 0.39% 0.78%VND 1.03% 0.05% 0.10% 0.21% 0.41%
Comgest Growth Asia Pac ex Japan: (Base Currency: USD)
Weight in Portfolio asof 31/12/19 % of currency variation
5% 10% 20% 40%HKD 37.00% 1.85% 3.70% 7.40% 14.80%KRW 15.27% 0.76% 1.53% 3.05% 6.11%CNY 10.31% 0.52% 1.03% 2.06% 4.12%INR 8.56% 0.43% 0.86% 1.71% 3.43%TWD 5.72% 0.29% 0.57% 1.14% 2.29%IDR 2.66% 0.13% 0.27% 0.53% 1.07%ZAR 2.61% 0.13% 0.26% 0.52% 1.04%JPY 2.37% 0.12% 0.24% 0.47% 0.95%VND 1.06% 0.05% 0.11% 0.21% 0.42%
COMGEST GROWTH plc
NOTES TO THE FINANCIAL STATEMENTS 31 December 2020 (continued)
239
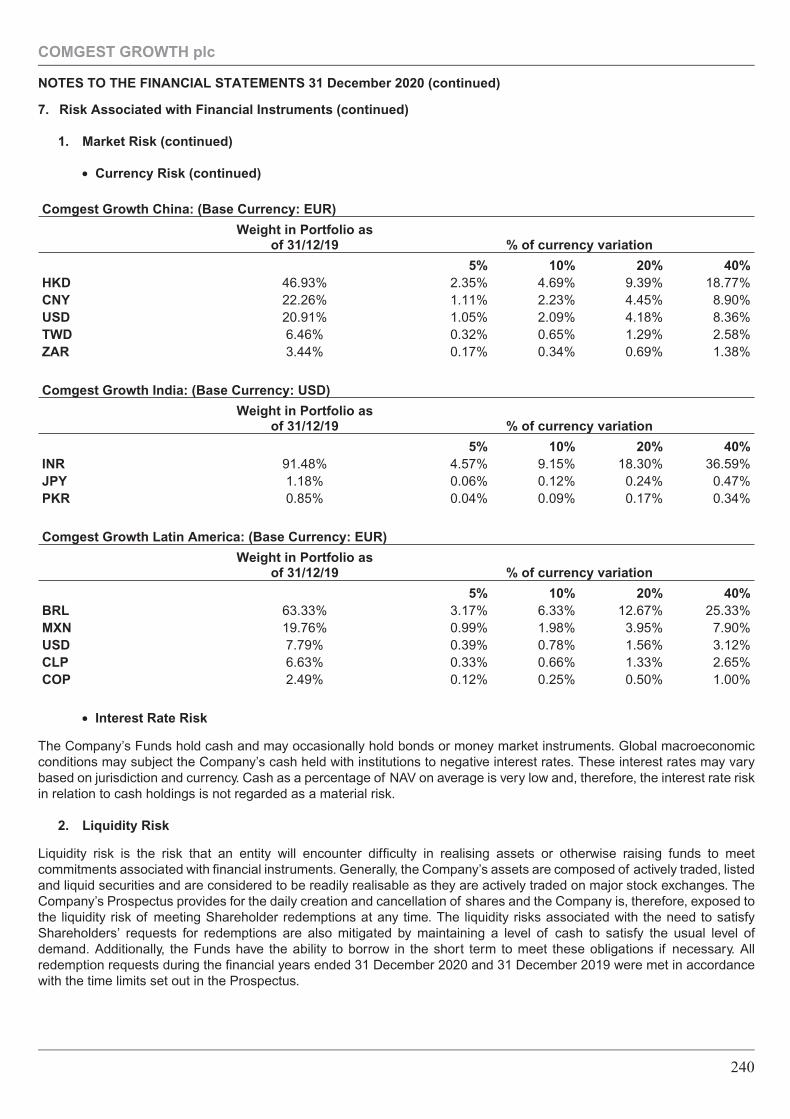
7. Risk Associated with Financial Instruments (continued)
1. Market Risk (continued)
• Currency Risk (continued)
Comgest Growth China: (Base Currency: EUR)
Weight in Portfolio asof 31/12/19 % of currency variation
5% 10% 20% 40%HKD 46.93% 2.35% 4.69% 9.39% 18.77%CNY 22.26% 1.11% 2.23% 4.45% 8.90%USD 20.91% 1.05% 2.09% 4.18% 8.36%TWD 6.46% 0.32% 0.65% 1.29% 2.58%ZAR 3.44% 0.17% 0.34% 0.69% 1.38%
Comgest Growth India: (Base Currency: USD)
Weight in Portfolio asof 31/12/19 % of currency variation
5% 10% 20% 40%INR 91.48% 4.57% 9.15% 18.30% 36.59%JPY 1.18% 0.06% 0.12% 0.24% 0.47%PKR 0.85% 0.04% 0.09% 0.17% 0.34%
Comgest Growth Latin America: (Base Currency: EUR)
Weight in Portfolio asof 31/12/19 % of currency variation
5% 10% 20% 40%BRL 63.33% 3.17% 6.33% 12.67% 25.33%MXN 19.76% 0.99% 1.98% 3.95% 7.90%USD 7.79% 0.39% 0.78% 1.56% 3.12%CLP 6.63% 0.33% 0.66% 1.33% 2.65%COP 2.49% 0.12% 0.25% 0.50% 1.00%
• Interest Rate Risk
The Company’s Funds hold cash and may occasionally hold bonds or money market instruments. Global macroeconomicconditions may subject the Company’s cash held with institutions to negative interest rates. These interest rates may varybased on jurisdiction and currency. Cash as a percentage of NAV on average is very low and, therefore, the interest rate riskin relation to cash holdings is not regarded as a material risk.
2. Liquidity Risk
Liquidity risk is the risk that an entity will encounter difficulty in realising assets or otherwise raising funds to meetcommitments associated with financial instruments. Generally, the Company’s assets are composed of actively traded, listedand liquid securities and are considered to be readily realisable as they are actively traded on major stock exchanges. TheCompany’s Prospectus provides for the daily creation and cancellation of shares and the Company is, therefore, exposed tothe liquidity risk of meeting Shareholder redemptions at any time. The liquidity risks associated with the need to satisfyShareholders’ requests for redemptions are also mitigated by maintaining a level of cash to satisfy the usual level ofdemand. Additionally, the Funds have the ability to borrow in the short term to meet these obligations if necessary. Allredemption requests during the financial years ended 31 December 2020 and 31 December 2019 were met in accordancewith the time limits set out in the Prospectus.
COMGEST GROWTH plc
NOTES TO THE FINANCIAL STATEMENTS 31 December 2020 (continued)
240
7. Risk Associated with Financial Instruments (continued)
2. Liquidity Risk (continued)
If total requests for redemption on any Dealing Day for any Fund exceed 10% of the total number of shares in that Fundoutstanding, each redemption request in respect of shares in such Fund may, if in their sole discretion the Directors acting ingood faith believe it shall be necessary or desirable in order not to prejudice the interests of the Shareholders not requestingredemption or on grounds of liquidity or other like reason, be reduced ‘‘pro rata’’ so that the total number of shares of eachFund for redemption on that Dealing Day shall not exceed 10% of the shares in issue in the Fund. Any redemption requestso reduced shall be effected in priority to subsequent redemption requests on the following Dealing Day, subject always tothe foregoing provisions.
Certain Funds make use of Market Access Products.
Market Access Products such as Participatory Notes (“P-Notes”) are financial instruments that may be used by a Fund toobtain exposure to an equity investment in a local market where direct ownership is not allowed, is restricted or is more costly.Investment in Market Access Products may involve an over-the-counter transaction with a third party. Market AccessProducts generally are issued by banks or broker dealers and are designed to replicate the performance of a particularunderlying equity security. Consequently, although the underlying equity may be actively traded, the Market Access Productsthemselves may have terms restricting their transferability resulting in a limited secondary market, if any. Market AccessProducts are generally sold back to the bank or broker dealer issuer of the Market Access Product. As the InvestmentManager only contracts with a diversified group of highly rated or recognised banks or dealers in their sectors and as theunderlying equity security to a Market Access Product is listed and actively traded, the Investment Manager regards thisliquidity risk as low.
The Company avoids entering into derivative contractual arrangements that produce an exposure not covered by sufficientliquid assets or a total investment exposure in excess of Shareholders’ funds. The risk management process adopted by theCompany requires coverage to be composed of cash reserves or liquid securities.
There is a limited use of FDI in Comgest Growth Global Flex, Comgest Growth America, Comgest Growth Japan, ComgestGrowth Emerging Markets Flex, Comgest Growth Europe, Comgest Growth Europe Opportunities, Comgest Growth Europeex Switzerland and Comgest Growth Europe ex UK, and, consequently, there is no material liquidity risk arising in the Fundsfrom their use of these FDI. Forward currency exchange contracts and foreign exchange swap contracts are used to hedgecurrency risk for Comgest Growth Global Flex, Comgest Growth America, Comgest Growth Japan, Comgest Growth Europe,Comgest Growth Europe Opportunities, Comgest Growth Europe ex Switzerland and Comgest Growth Europe ex UK. Thesettlement date of forward currency exchange contracts is either 1 month or 3 months from the trade date which limitscounterparty credit risk as well as the mark to market impact of changing interest rate differentials on the forward rate. Dueto the currencies involved and the relatively low portion sizes of these contracts, the level of liquidity risk is low in relation tothis type of derivative. The fx spot contract which forms part of the foreign exchange swap contract, has a settlement datetypically not longer than two trading days from the trade date, while the foreign currency exchange contract has a settlementdate either 1 month or 3 months from the trade date. Each of Comgest Growth Emerging Markets Flex and Comgest GrowthGlobal Flex seeks to hedge part of its equity market risk exposure through the use of exchange-traded equity index futures.Comgest Growth Global Flex is also permitted to utilise exchange-traded volatility index futures. The settlement date of thesefutures contracts is a maximum of 3 months which limits the counterparty credit risk. Due to the nature of the future contractsheld, the level of liquidity risk is low. With the exception of Comgest Growth Global Flex, Comgest Growth America, ComgestGrowth Japan, Comgest Growth Emerging Markets Flex, Comgest Growth Europe, Comgest Growth Europe Opportunities,Comgest Growth Europe ex Switzerland and Comgest Growth Europe ex UK, there were no other Funds invested in FDIs asat 31 December 2020 and 31 December 2019.
The following tables analyse for each Fund the liabilities and net settled derivative financial liabilities into relevant maturitygroupings based on the remaining financial year at the Statement of Financial Position date to the contractual maturity date,based on normal market conditions.
COMGEST GROWTH plc
NOTES TO THE FINANCIAL STATEMENTS 31 December 2020 (continued)
241
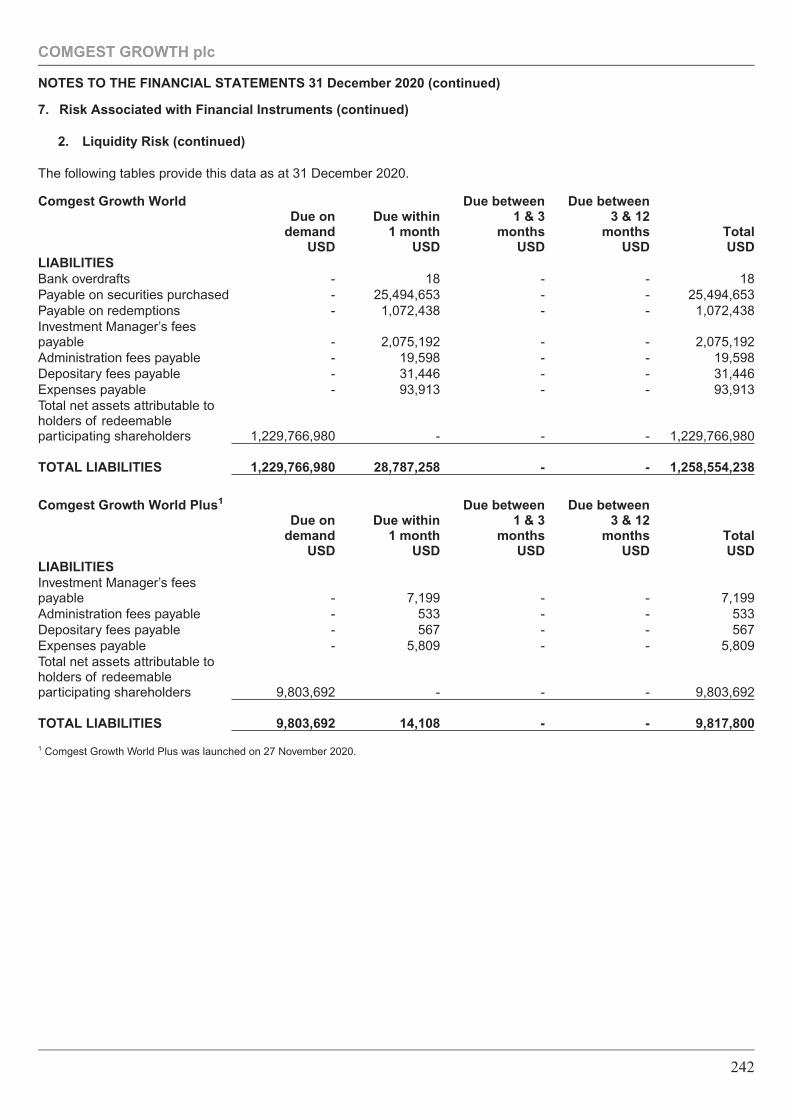
7. Risk Associated with Financial Instruments (continued)
2. Liquidity Risk (continued)
The following tables provide this data as at 31 December 2020.
Comgest Growth WorldDue on
demandUSD
Due within1 month
USD
Due between1 & 3
monthsUSD
Due between3 & 12
monthsUSD
TotalUSD
LIABILITIESBank overdrafts - 18 - - 18Payable on securities purchased - 25,494,653 - - 25,494,653Payable on redemptions - 1,072,438 - - 1,072,438Investment Manager’s feespayable - 2,075,192 - - 2,075,192Administration fees payable - 19,598 - - 19,598Depositary fees payable - 31,446 - - 31,446Expenses payable - 93,913 - - 93,913Total net assets attributable toholders of redeemableparticipating shareholders 1,229,766,980 - - - 1,229,766,980
TOTAL LIABILITIES 1,229,766,980 28,787,258 - - 1,258,554,238
Comgest Growth World Plus1
Due ondemand
USD
Due within1 month
USD
Due between1 & 3
monthsUSD
Due between3 & 12
monthsUSD
TotalUSD
LIABILITIESInvestment Manager’s feespayable - 7,199 - - 7,199Administration fees payable - 533 - - 533Depositary fees payable - 567 - - 567Expenses payable - 5,809 - - 5,809Total net assets attributable toholders of redeemableparticipating shareholders 9,803,692 - - - 9,803,692
TOTAL LIABILITIES 9,803,692 14,108 - - 9,817,800
1 Comgest Growth World Plus was launched on 27 November 2020.
COMGEST GROWTH plc
NOTES TO THE FINANCIAL STATEMENTS 31 December 2020 (continued)
242
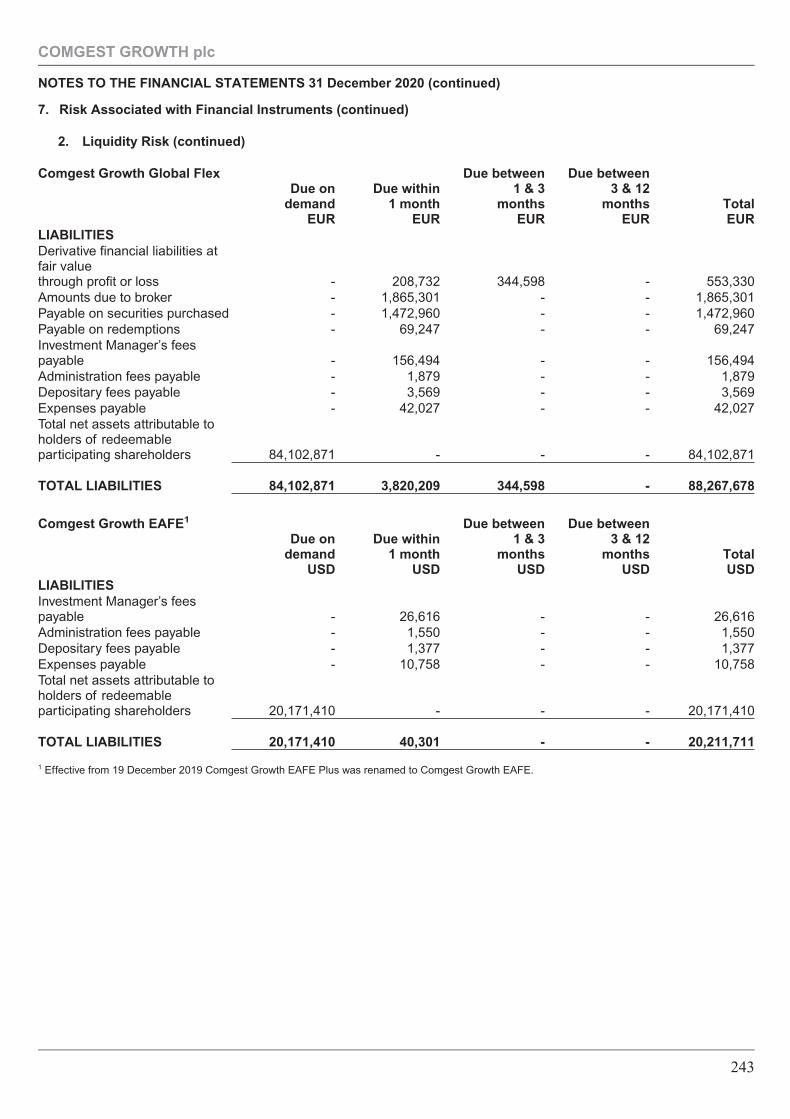
7. Risk Associated with Financial Instruments (continued)
2. Liquidity Risk (continued)
Comgest Growth Global FlexDue on
demandEUR
Due within1 month
EUR
Due between1 & 3
monthsEUR
Due between3 & 12
monthsEUR
TotalEUR
LIABILITIESDerivative financial liabilities atfair valuethrough profit or loss - 208,732 344,598 - 553,330Amounts due to broker - 1,865,301 - - 1,865,301Payable on securities purchased - 1,472,960 - - 1,472,960Payable on redemptions - 69,247 - - 69,247Investment Manager’s feespayable - 156,494 - - 156,494Administration fees payable - 1,879 - - 1,879Depositary fees payable - 3,569 - - 3,569Expenses payable - 42,027 - - 42,027Total net assets attributable toholders of redeemableparticipating shareholders 84,102,871 - - - 84,102,871
TOTAL LIABILITIES 84,102,871 3,820,209 344,598 - 88,267,678
Comgest Growth EAFE1
Due ondemand
USD
Due within1 month
USD
Due between1 & 3
monthsUSD
Due between3 & 12
monthsUSD
TotalUSD
LIABILITIESInvestment Manager’s feespayable - 26,616 - - 26,616Administration fees payable - 1,550 - - 1,550Depositary fees payable - 1,377 - - 1,377Expenses payable - 10,758 - - 10,758Total net assets attributable toholders of redeemableparticipating shareholders 20,171,410 - - - 20,171,410
TOTAL LIABILITIES 20,171,410 40,301 - - 20,211,711
1 Effective from 19 December 2019 Comgest Growth EAFE Plus was renamed to Comgest Growth EAFE.
COMGEST GROWTH plc
NOTES TO THE FINANCIAL STATEMENTS 31 December 2020 (continued)
243
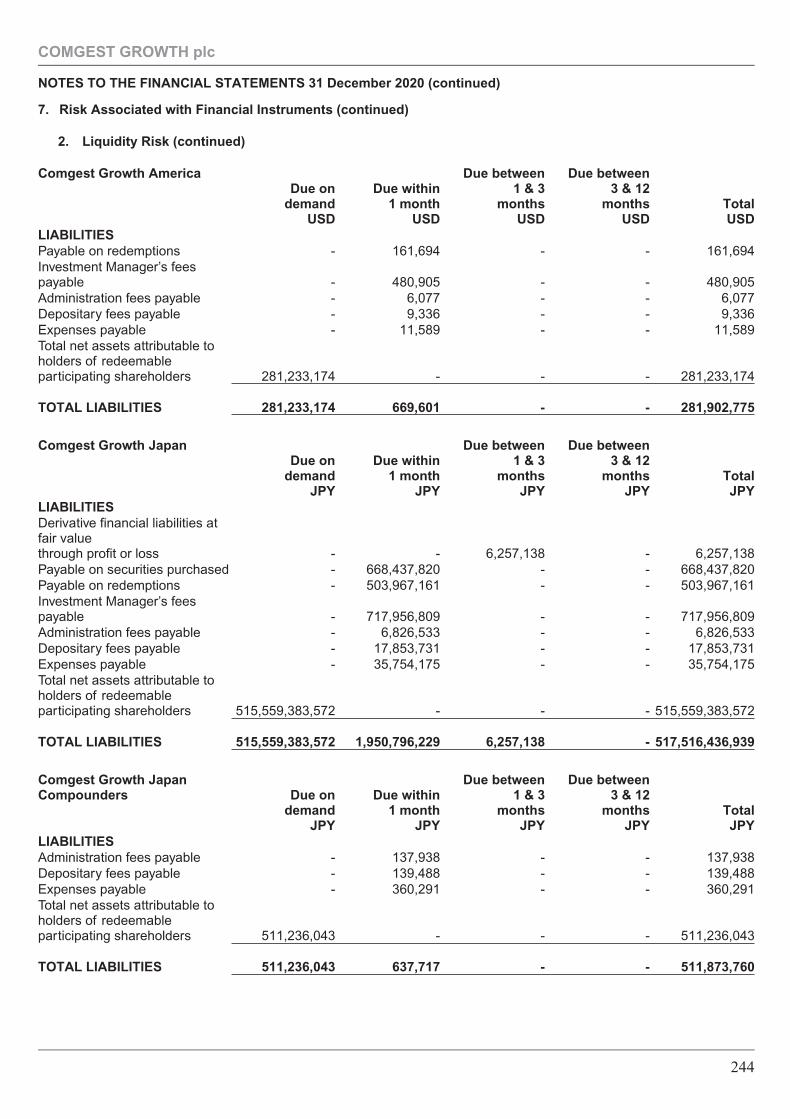
7. Risk Associated with Financial Instruments (continued)
2. Liquidity Risk (continued)
Comgest Growth AmericaDue on
demandUSD
Due within1 month
USD
Due between1 & 3
monthsUSD
Due between3 & 12
monthsUSD
TotalUSD
LIABILITIESPayable on redemptions - 161,694 - - 161,694Investment Manager’s feespayable - 480,905 - - 480,905Administration fees payable - 6,077 - - 6,077Depositary fees payable - 9,336 - - 9,336Expenses payable - 11,589 - - 11,589Total net assets attributable toholders of redeemableparticipating shareholders 281,233,174 - - - 281,233,174
TOTAL LIABILITIES 281,233,174 669,601 - - 281,902,775
Comgest Growth JapanDue on
demandJPY
Due within1 month
JPY
Due between1 & 3
monthsJPY
Due between3 & 12
monthsJPY
TotalJPY
LIABILITIESDerivative financial liabilities atfair valuethrough profit or loss - - 6,257,138 - 6,257,138Payable on securities purchased - 668,437,820 - - 668,437,820Payable on redemptions - 503,967,161 - - 503,967,161Investment Manager’s feespayable - 717,956,809 - - 717,956,809Administration fees payable - 6,826,533 - - 6,826,533Depositary fees payable - 17,853,731 - - 17,853,731Expenses payable - 35,754,175 - - 35,754,175Total net assets attributable toholders of redeemableparticipating shareholders 515,559,383,572 - - - 515,559,383,572
TOTAL LIABILITIES 515,559,383,572 1,950,796,229 6,257,138 - 517,516,436,939
Comgest Growth JapanCompounders Due on
demandJPY
Due within1 month
JPY
Due between1 & 3
monthsJPY
Due between3 & 12
monthsJPY
TotalJPY
LIABILITIESAdministration fees payable - 137,938 - - 137,938Depositary fees payable - 139,488 - - 139,488Expenses payable - 360,291 - - 360,291Total net assets attributable toholders of redeemableparticipating shareholders 511,236,043 - - - 511,236,043
TOTAL LIABILITIES 511,236,043 637,717 - - 511,873,760
COMGEST GROWTH plc
NOTES TO THE FINANCIAL STATEMENTS 31 December 2020 (continued)
244
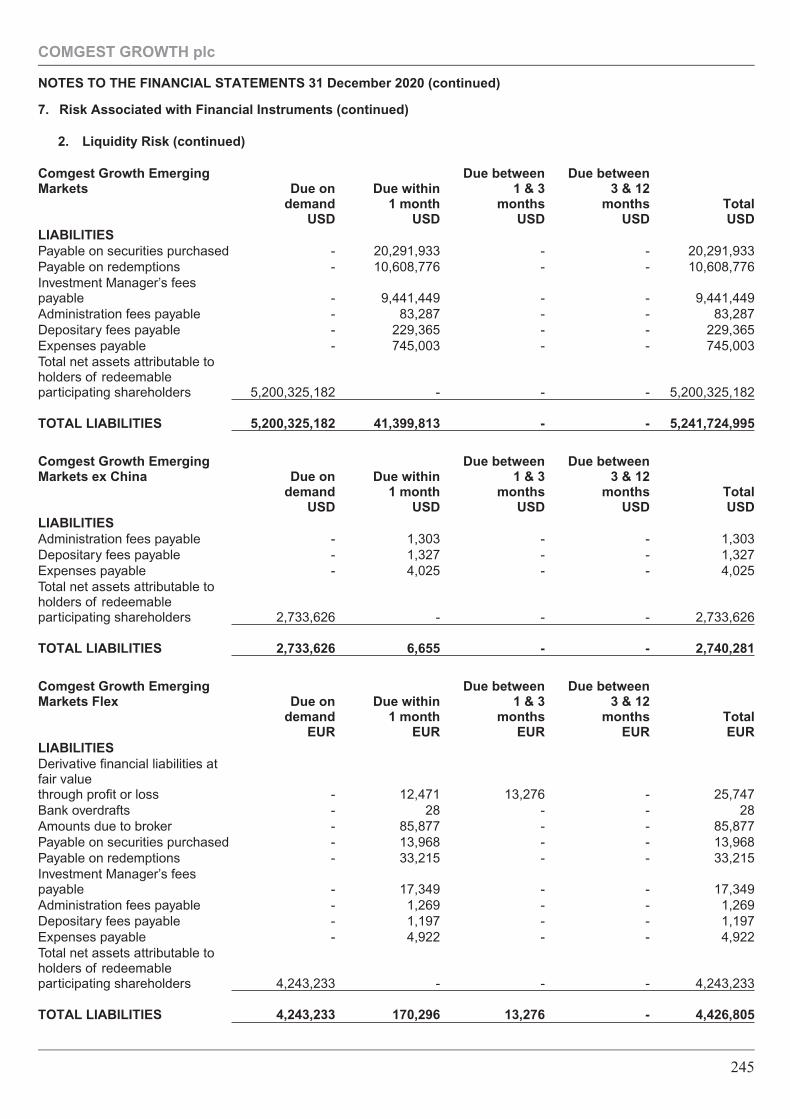
7. Risk Associated with Financial Instruments (continued)
2. Liquidity Risk (continued)
Comgest Growth EmergingMarkets Due on
demandUSD
Due within1 month
USD
Due between1 & 3
monthsUSD
Due between3 & 12
monthsUSD
TotalUSD
LIABILITIESPayable on securities purchased - 20,291,933 - - 20,291,933Payable on redemptions - 10,608,776 - - 10,608,776Investment Manager’s feespayable - 9,441,449 - - 9,441,449Administration fees payable - 83,287 - - 83,287Depositary fees payable - 229,365 - - 229,365Expenses payable - 745,003 - - 745,003Total net assets attributable toholders of redeemableparticipating shareholders 5,200,325,182 - - - 5,200,325,182
TOTAL LIABILITIES 5,200,325,182 41,399,813 - - 5,241,724,995
Comgest Growth EmergingMarkets ex China Due on
demandUSD
Due within1 month
USD
Due between1 & 3
monthsUSD
Due between3 & 12
monthsUSD
TotalUSD
LIABILITIESAdministration fees payable - 1,303 - - 1,303Depositary fees payable - 1,327 - - 1,327Expenses payable - 4,025 - - 4,025Total net assets attributable toholders of redeemableparticipating shareholders 2,733,626 - - - 2,733,626
TOTAL LIABILITIES 2,733,626 6,655 - - 2,740,281
Comgest Growth EmergingMarkets Flex Due on
demandEUR
Due within1 month
EUR
Due between1 & 3
monthsEUR
Due between3 & 12
monthsEUR
TotalEUR
LIABILITIESDerivative financial liabilities atfair valuethrough profit or loss - 12,471 13,276 - 25,747Bank overdrafts - 28 - - 28Amounts due to broker - 85,877 - - 85,877Payable on securities purchased - 13,968 - - 13,968Payable on redemptions - 33,215 - - 33,215Investment Manager’s feespayable - 17,349 - - 17,349Administration fees payable - 1,269 - - 1,269Depositary fees payable - 1,197 - - 1,197Expenses payable - 4,922 - - 4,922Total net assets attributable toholders of redeemableparticipating shareholders 4,243,233 - - - 4,243,233
TOTAL LIABILITIES 4,243,233 170,296 13,276 - 4,426,805
COMGEST GROWTH plc
NOTES TO THE FINANCIAL STATEMENTS 31 December 2020 (continued)
245
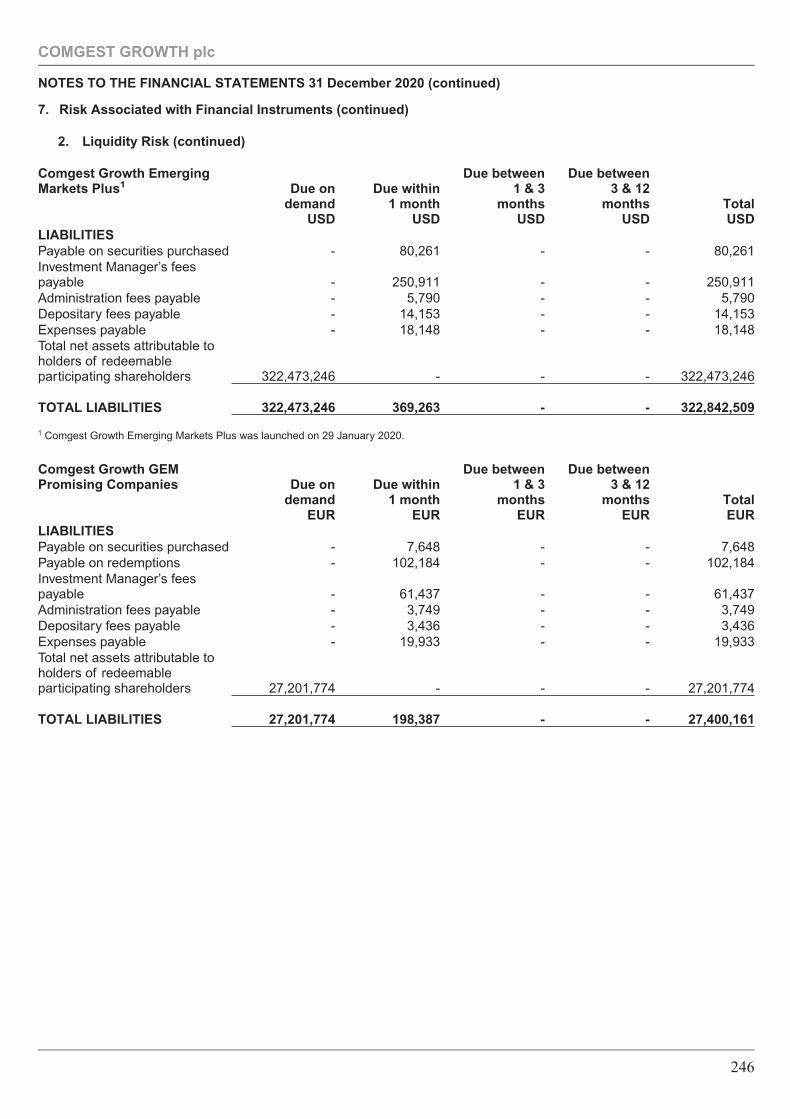
7. Risk Associated with Financial Instruments (continued)
2. Liquidity Risk (continued)
Comgest Growth EmergingMarkets Plus1 Due on
demandUSD
Due within1 month
USD
Due between1 & 3
monthsUSD
Due between3 & 12
monthsUSD
TotalUSD
LIABILITIESPayable on securities purchased - 80,261 - - 80,261Investment Manager’s feespayable - 250,911 - - 250,911Administration fees payable - 5,790 - - 5,790Depositary fees payable - 14,153 - - 14,153Expenses payable - 18,148 - - 18,148Total net assets attributable toholders of redeemableparticipating shareholders 322,473,246 - - - 322,473,246
TOTAL LIABILITIES 322,473,246 369,263 - - 322,842,509
1 Comgest Growth Emerging Markets Plus was launched on 29 January 2020.
Comgest Growth GEMPromising Companies Due on
demandEUR
Due within1 month
EUR
Due between1 & 3
monthsEUR
Due between3 & 12
monthsEUR
TotalEUR
LIABILITIESPayable on securities purchased - 7,648 - - 7,648Payable on redemptions - 102,184 - - 102,184Investment Manager’s feespayable - 61,437 - - 61,437Administration fees payable - 3,749 - - 3,749Depositary fees payable - 3,436 - - 3,436Expenses payable - 19,933 - - 19,933Total net assets attributable toholders of redeemableparticipating shareholders 27,201,774 - - - 27,201,774
TOTAL LIABILITIES 27,201,774 198,387 - - 27,400,161
COMGEST GROWTH plc
NOTES TO THE FINANCIAL STATEMENTS 31 December 2020 (continued)
246
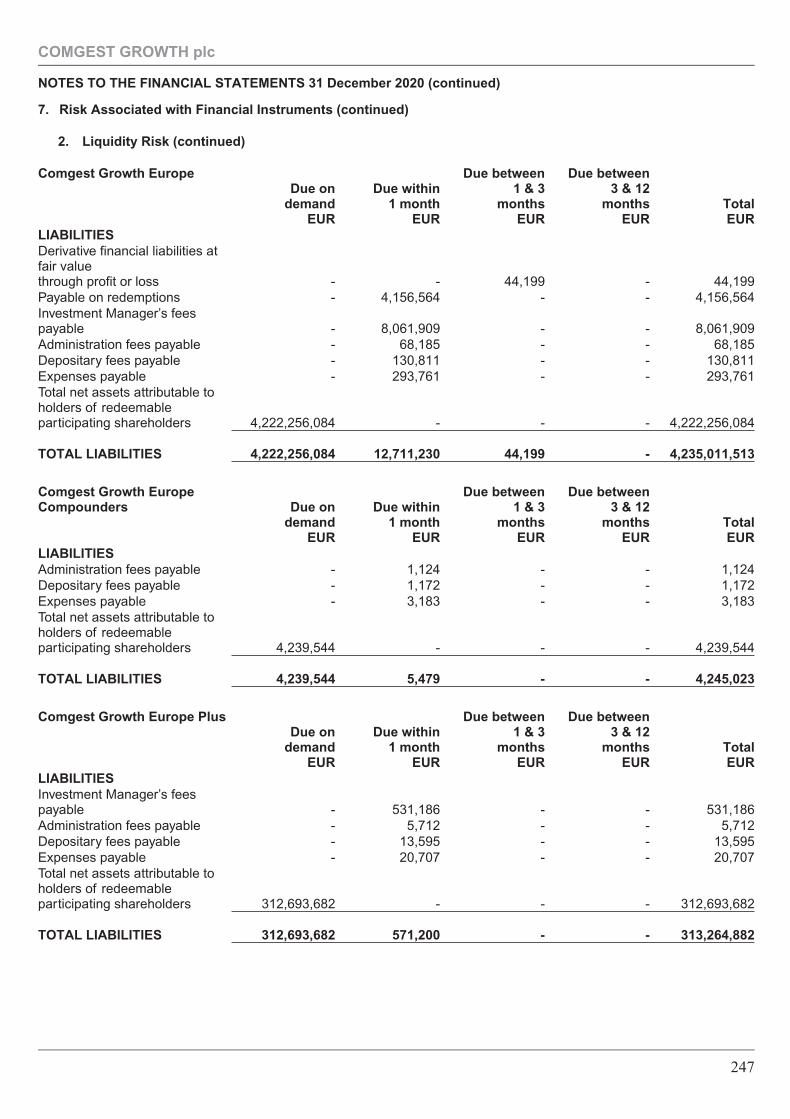
7. Risk Associated with Financial Instruments (continued)
2. Liquidity Risk (continued)
Comgest Growth EuropeDue on
demandEUR
Due within1 month
EUR
Due between1 & 3
monthsEUR
Due between3 & 12
monthsEUR
TotalEUR
LIABILITIESDerivative financial liabilities atfair valuethrough profit or loss - - 44,199 - 44,199Payable on redemptions - 4,156,564 - - 4,156,564Investment Manager’s feespayable - 8,061,909 - - 8,061,909Administration fees payable - 68,185 - - 68,185Depositary fees payable - 130,811 - - 130,811Expenses payable - 293,761 - - 293,761Total net assets attributable toholders of redeemableparticipating shareholders 4,222,256,084 - - - 4,222,256,084
TOTAL LIABILITIES 4,222,256,084 12,711,230 44,199 - 4,235,011,513
Comgest Growth EuropeCompounders Due on
demandEUR
Due within1 month
EUR
Due between1 & 3
monthsEUR
Due between3 & 12
monthsEUR
TotalEUR
LIABILITIESAdministration fees payable - 1,124 - - 1,124Depositary fees payable - 1,172 - - 1,172Expenses payable - 3,183 - - 3,183Total net assets attributable toholders of redeemableparticipating shareholders 4,239,544 - - - 4,239,544
TOTAL LIABILITIES 4,239,544 5,479 - - 4,245,023
Comgest Growth Europe PlusDue on
demandEUR
Due within1 month
EUR
Due between1 & 3
monthsEUR
Due between3 & 12
monthsEUR
TotalEUR
LIABILITIESInvestment Manager’s feespayable - 531,186 - - 531,186Administration fees payable - 5,712 - - 5,712Depositary fees payable - 13,595 - - 13,595Expenses payable - 20,707 - - 20,707Total net assets attributable toholders of redeemableparticipating shareholders 312,693,682 - - - 312,693,682
TOTAL LIABILITIES 312,693,682 571,200 - - 313,264,882
COMGEST GROWTH plc
NOTES TO THE FINANCIAL STATEMENTS 31 December 2020 (continued)
247
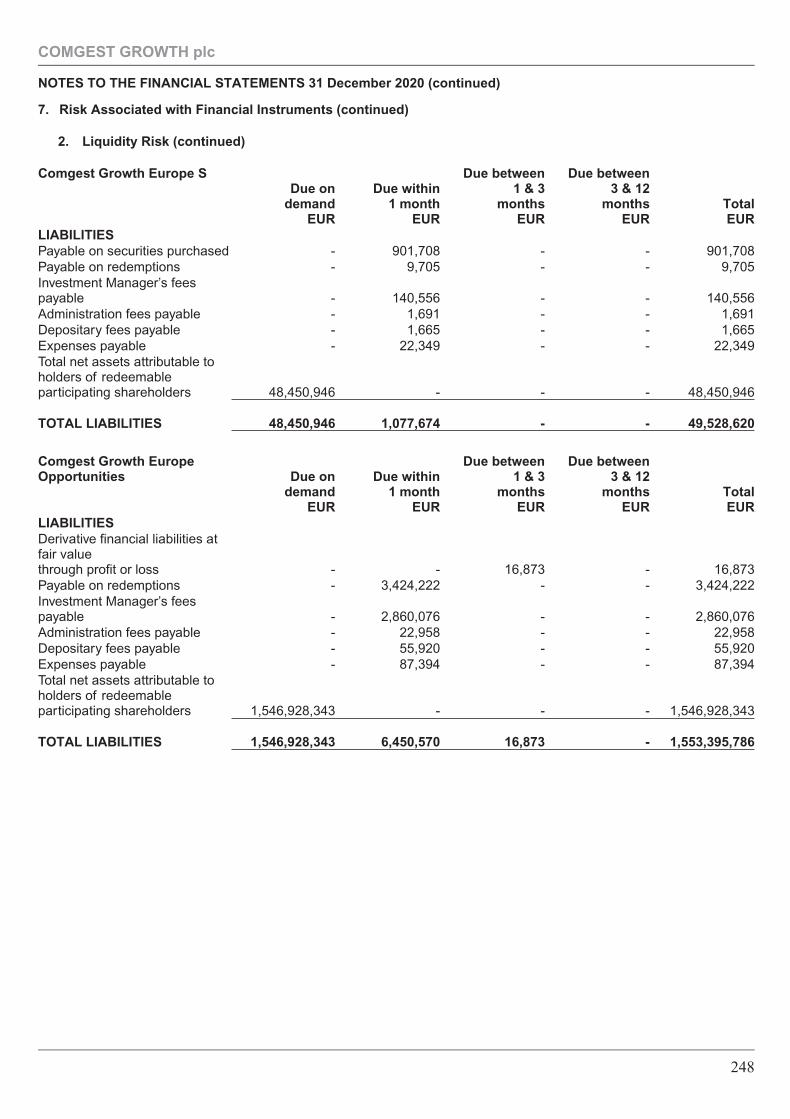
7. Risk Associated with Financial Instruments (continued)
2. Liquidity Risk (continued)
Comgest Growth Europe SDue on
demandEUR
Due within1 month
EUR
Due between1 & 3
monthsEUR
Due between3 & 12
monthsEUR
TotalEUR
LIABILITIESPayable on securities purchased - 901,708 - - 901,708Payable on redemptions - 9,705 - - 9,705Investment Manager’s feespayable - 140,556 - - 140,556Administration fees payable - 1,691 - - 1,691Depositary fees payable - 1,665 - - 1,665Expenses payable - 22,349 - - 22,349Total net assets attributable toholders of redeemableparticipating shareholders 48,450,946 - - - 48,450,946
TOTAL LIABILITIES 48,450,946 1,077,674 - - 49,528,620
Comgest Growth EuropeOpportunities Due on
demandEUR
Due within1 month
EUR
Due between1 & 3
monthsEUR
Due between3 & 12
monthsEUR
TotalEUR
LIABILITIESDerivative financial liabilities atfair valuethrough profit or loss - - 16,873 - 16,873Payable on redemptions - 3,424,222 - - 3,424,222Investment Manager’s feespayable - 2,860,076 - - 2,860,076Administration fees payable - 22,958 - - 22,958Depositary fees payable - 55,920 - - 55,920Expenses payable - 87,394 - - 87,394Total net assets attributable toholders of redeemableparticipating shareholders 1,546,928,343 - - - 1,546,928,343
TOTAL LIABILITIES 1,546,928,343 6,450,570 16,873 - 1,553,395,786
COMGEST GROWTH plc
NOTES TO THE FINANCIAL STATEMENTS 31 December 2020 (continued)
248
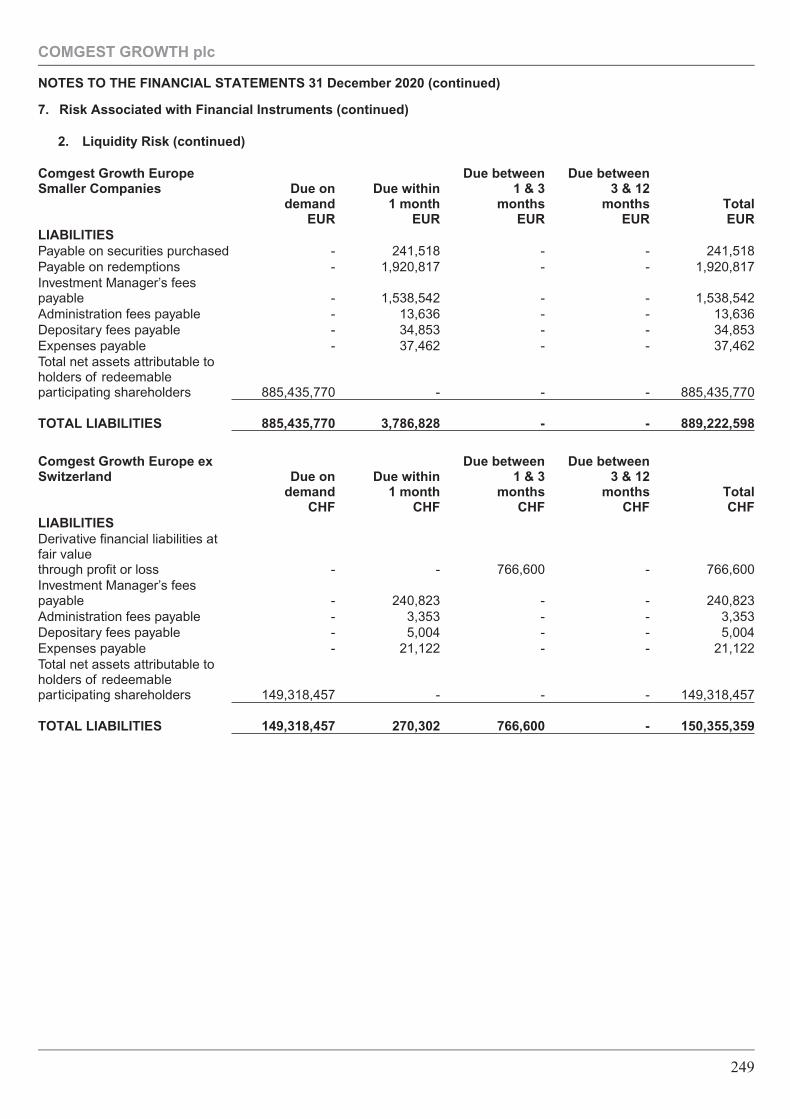
7. Risk Associated with Financial Instruments (continued)
2. Liquidity Risk (continued)
Comgest Growth EuropeSmaller Companies Due on
demandEUR
Due within1 month
EUR
Due between1 & 3
monthsEUR
Due between3 & 12
monthsEUR
TotalEUR
LIABILITIESPayable on securities purchased - 241,518 - - 241,518Payable on redemptions - 1,920,817 - - 1,920,817Investment Manager’s feespayable - 1,538,542 - - 1,538,542Administration fees payable - 13,636 - - 13,636Depositary fees payable - 34,853 - - 34,853Expenses payable - 37,462 - - 37,462Total net assets attributable toholders of redeemableparticipating shareholders 885,435,770 - - - 885,435,770
TOTAL LIABILITIES 885,435,770 3,786,828 - - 889,222,598
Comgest Growth Europe exSwitzerland Due on
demandCHF
Due within1 month
CHF
Due between1 & 3
monthsCHF
Due between3 & 12
monthsCHF
TotalCHF
LIABILITIESDerivative financial liabilities atfair valuethrough profit or loss - - 766,600 - 766,600Investment Manager’s feespayable - 240,823 - - 240,823Administration fees payable - 3,353 - - 3,353Depositary fees payable - 5,004 - - 5,004Expenses payable - 21,122 - - 21,122Total net assets attributable toholders of redeemableparticipating shareholders 149,318,457 - - - 149,318,457
TOTAL LIABILITIES 149,318,457 270,302 766,600 - 150,355,359
COMGEST GROWTH plc
NOTES TO THE FINANCIAL STATEMENTS 31 December 2020 (continued)
249
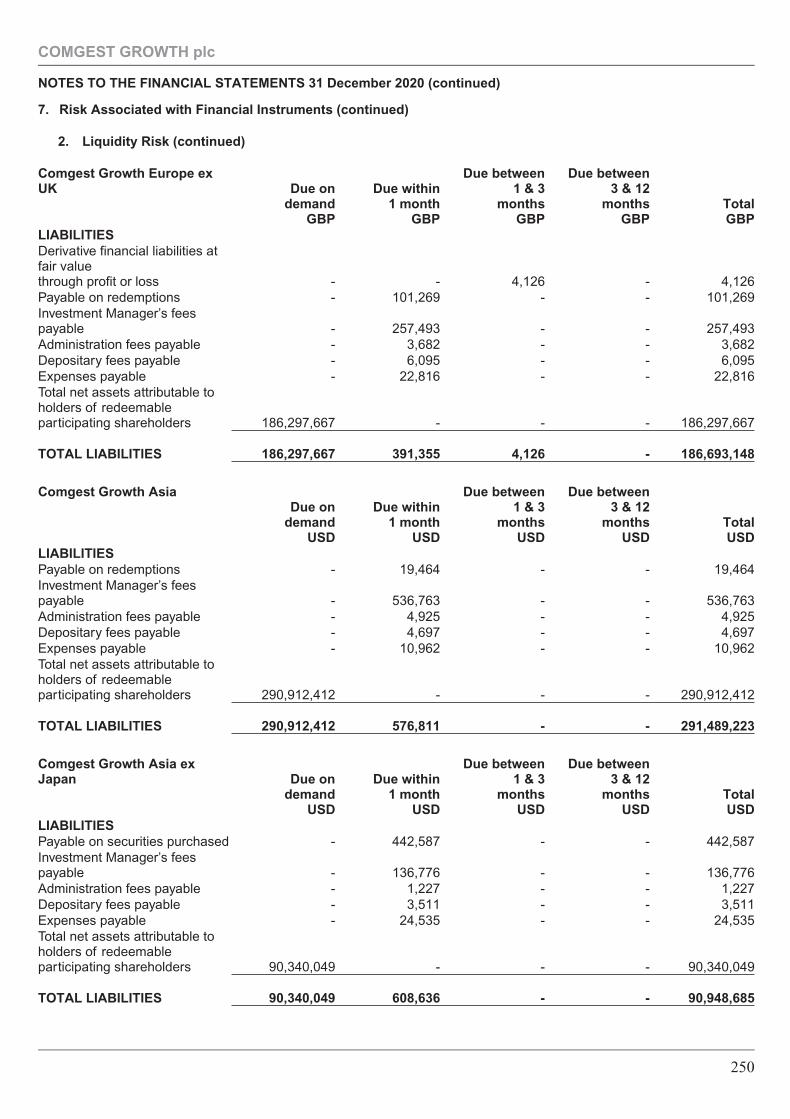
7. Risk Associated with Financial Instruments (continued)
2. Liquidity Risk (continued)
Comgest Growth Europe exUK Due on
demandGBP
Due within1 month
GBP
Due between1 & 3
monthsGBP
Due between3 & 12
monthsGBP
TotalGBP
LIABILITIESDerivative financial liabilities atfair valuethrough profit or loss - - 4,126 - 4,126Payable on redemptions - 101,269 - - 101,269Investment Manager’s feespayable - 257,493 - - 257,493Administration fees payable - 3,682 - - 3,682Depositary fees payable - 6,095 - - 6,095Expenses payable - 22,816 - - 22,816Total net assets attributable toholders of redeemableparticipating shareholders 186,297,667 - - - 186,297,667
TOTAL LIABILITIES 186,297,667 391,355 4,126 - 186,693,148
Comgest Growth AsiaDue on
demandUSD
Due within1 month
USD
Due between1 & 3
monthsUSD
Due between3 & 12
monthsUSD
TotalUSD
LIABILITIESPayable on redemptions - 19,464 - - 19,464Investment Manager’s feespayable - 536,763 - - 536,763Administration fees payable - 4,925 - - 4,925Depositary fees payable - 4,697 - - 4,697Expenses payable - 10,962 - - 10,962Total net assets attributable toholders of redeemableparticipating shareholders 290,912,412 - - - 290,912,412
TOTAL LIABILITIES 290,912,412 576,811 - - 291,489,223
Comgest Growth Asia exJapan Due on
demandUSD
Due within1 month
USD
Due between1 & 3
monthsUSD
Due between3 & 12
monthsUSD
TotalUSD
LIABILITIESPayable on securities purchased - 442,587 - - 442,587Investment Manager’s feespayable - 136,776 - - 136,776Administration fees payable - 1,227 - - 1,227Depositary fees payable - 3,511 - - 3,511Expenses payable - 24,535 - - 24,535Total net assets attributable toholders of redeemableparticipating shareholders 90,340,049 - - - 90,340,049
TOTAL LIABILITIES 90,340,049 608,636 - - 90,948,685
COMGEST GROWTH plc
NOTES TO THE FINANCIAL STATEMENTS 31 December 2020 (continued)
250
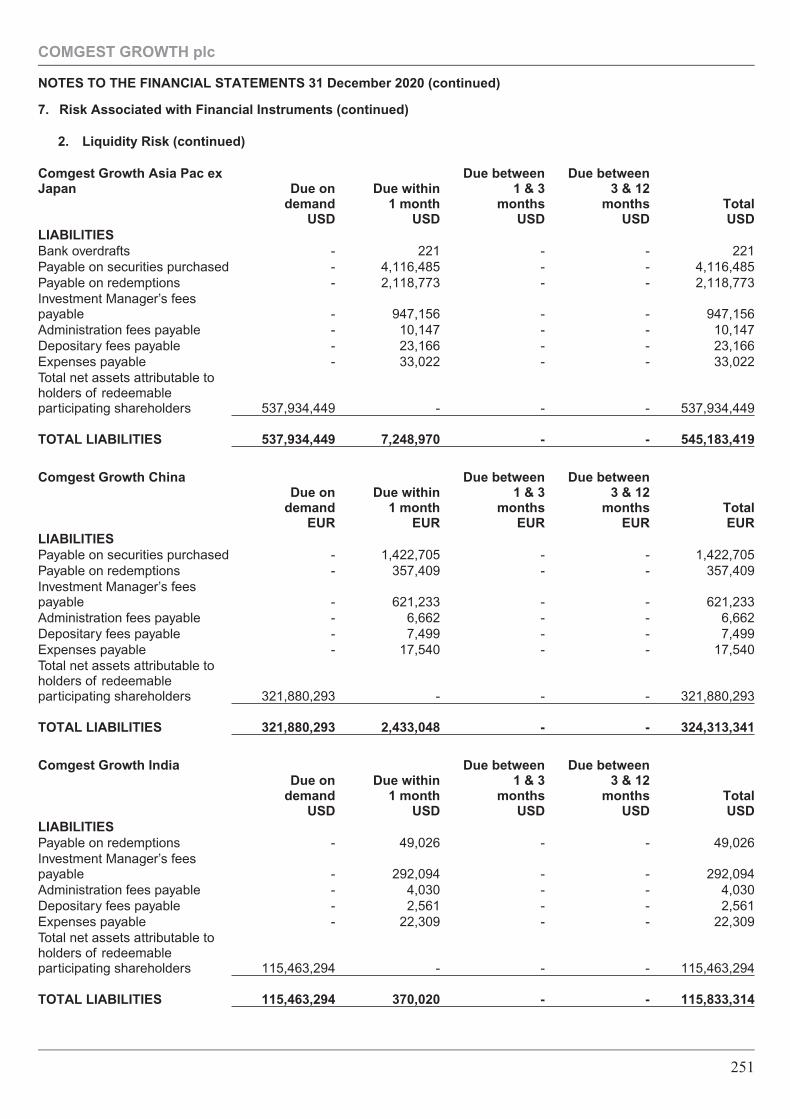
7. Risk Associated with Financial Instruments (continued)
2. Liquidity Risk (continued)
Comgest Growth Asia Pac exJapan Due on
demandUSD
Due within1 month
USD
Due between1 & 3
monthsUSD
Due between3 & 12
monthsUSD
TotalUSD
LIABILITIESBank overdrafts - 221 - - 221Payable on securities purchased - 4,116,485 - - 4,116,485Payable on redemptions - 2,118,773 - - 2,118,773Investment Manager’s feespayable - 947,156 - - 947,156Administration fees payable - 10,147 - - 10,147Depositary fees payable - 23,166 - - 23,166Expenses payable - 33,022 - - 33,022Total net assets attributable toholders of redeemableparticipating shareholders 537,934,449 - - - 537,934,449
TOTAL LIABILITIES 537,934,449 7,248,970 - - 545,183,419
Comgest Growth ChinaDue on
demandEUR
Due within1 month
EUR
Due between1 & 3
monthsEUR
Due between3 & 12
monthsEUR
TotalEUR
LIABILITIESPayable on securities purchased - 1,422,705 - - 1,422,705Payable on redemptions - 357,409 - - 357,409Investment Manager’s feespayable - 621,233 - - 621,233Administration fees payable - 6,662 - - 6,662Depositary fees payable - 7,499 - - 7,499Expenses payable - 17,540 - - 17,540Total net assets attributable toholders of redeemableparticipating shareholders 321,880,293 - - - 321,880,293
TOTAL LIABILITIES 321,880,293 2,433,048 - - 324,313,341
Comgest Growth IndiaDue on
demandUSD
Due within1 month
USD
Due between1 & 3
monthsUSD
Due between3 & 12
monthsUSD
TotalUSD
LIABILITIESPayable on redemptions - 49,026 - - 49,026Investment Manager’s feespayable - 292,094 - - 292,094Administration fees payable - 4,030 - - 4,030Depositary fees payable - 2,561 - - 2,561Expenses payable - 22,309 - - 22,309Total net assets attributable toholders of redeemableparticipating shareholders 115,463,294 - - - 115,463,294
TOTAL LIABILITIES 115,463,294 370,020 - - 115,833,314
COMGEST GROWTH plc
NOTES TO THE FINANCIAL STATEMENTS 31 December 2020 (continued)
251
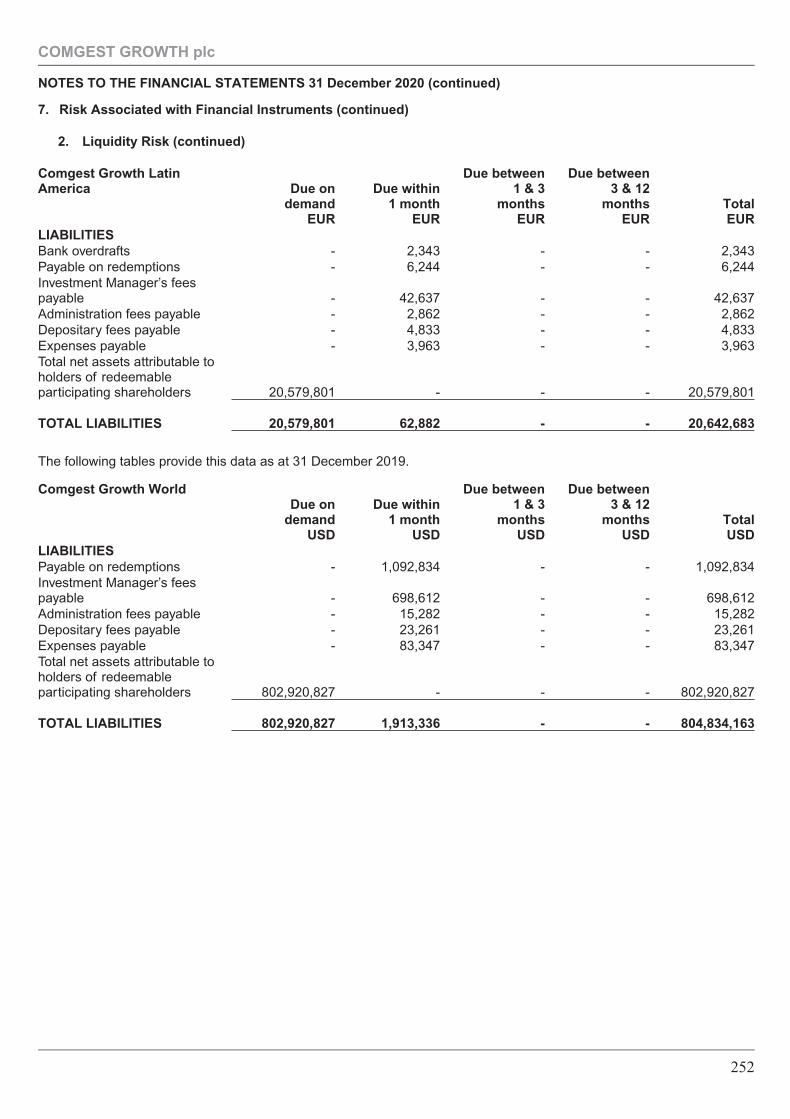
7. Risk Associated with Financial Instruments (continued)
2. Liquidity Risk (continued)
Comgest Growth LatinAmerica Due on
demandEUR
Due within1 month
EUR
Due between1 & 3
monthsEUR
Due between3 & 12
monthsEUR
TotalEUR
LIABILITIESBank overdrafts - 2,343 - - 2,343Payable on redemptions - 6,244 - - 6,244Investment Manager’s feespayable - 42,637 - - 42,637Administration fees payable - 2,862 - - 2,862Depositary fees payable - 4,833 - - 4,833Expenses payable - 3,963 - - 3,963Total net assets attributable toholders of redeemableparticipating shareholders 20,579,801 - - - 20,579,801
TOTAL LIABILITIES 20,579,801 62,882 - - 20,642,683
The following tables provide this data as at 31 December 2019.
Comgest Growth WorldDue on
demandUSD
Due within1 month
USD
Due between1 & 3
monthsUSD
Due between3 & 12
monthsUSD
TotalUSD
LIABILITIESPayable on redemptions - 1,092,834 - - 1,092,834Investment Manager’s feespayable - 698,612 - - 698,612Administration fees payable - 15,282 - - 15,282Depositary fees payable - 23,261 - - 23,261Expenses payable - 83,347 - - 83,347Total net assets attributable toholders of redeemableparticipating shareholders 802,920,827 - - - 802,920,827
TOTAL LIABILITIES 802,920,827 1,913,336 - - 804,834,163
COMGEST GROWTH plc
NOTES TO THE FINANCIAL STATEMENTS 31 December 2020 (continued)
252
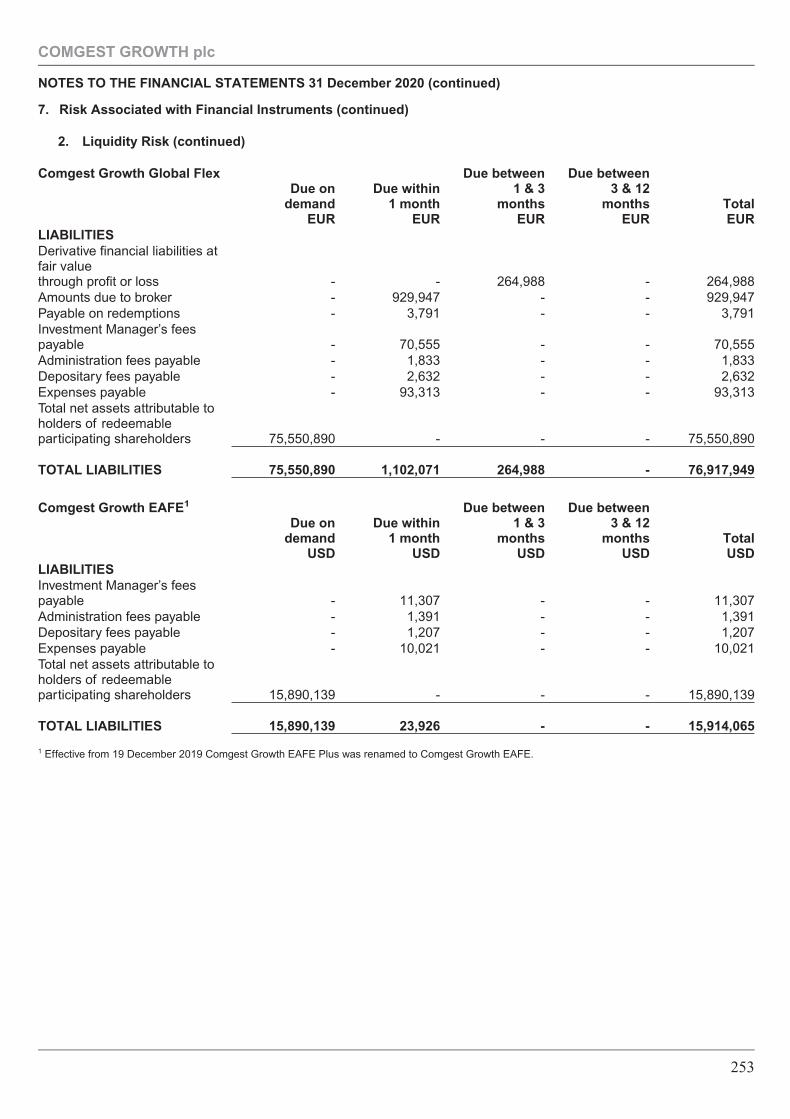
7. Risk Associated with Financial Instruments (continued)
2. Liquidity Risk (continued)
Comgest Growth Global FlexDue on
demandEUR
Due within1 month
EUR
Due between1 & 3
monthsEUR
Due between3 & 12
monthsEUR
TotalEUR
LIABILITIESDerivative financial liabilities atfair valuethrough profit or loss - - 264,988 - 264,988Amounts due to broker - 929,947 - - 929,947Payable on redemptions - 3,791 - - 3,791Investment Manager’s feespayable - 70,555 - - 70,555Administration fees payable - 1,833 - - 1,833Depositary fees payable - 2,632 - - 2,632Expenses payable - 93,313 - - 93,313Total net assets attributable toholders of redeemableparticipating shareholders 75,550,890 - - - 75,550,890
TOTAL LIABILITIES 75,550,890 1,102,071 264,988 - 76,917,949
Comgest Growth EAFE1
Due ondemand
USD
Due within1 month
USD
Due between1 & 3
monthsUSD
Due between3 & 12
monthsUSD
TotalUSD
LIABILITIESInvestment Manager’s feespayable - 11,307 - - 11,307Administration fees payable - 1,391 - - 1,391Depositary fees payable - 1,207 - - 1,207Expenses payable - 10,021 - - 10,021Total net assets attributable toholders of redeemableparticipating shareholders 15,890,139 - - - 15,890,139
TOTAL LIABILITIES 15,890,139 23,926 - - 15,914,065
1 Effective from 19 December 2019 Comgest Growth EAFE Plus was renamed to Comgest Growth EAFE.
COMGEST GROWTH plc
NOTES TO THE FINANCIAL STATEMENTS 31 December 2020 (continued)
253
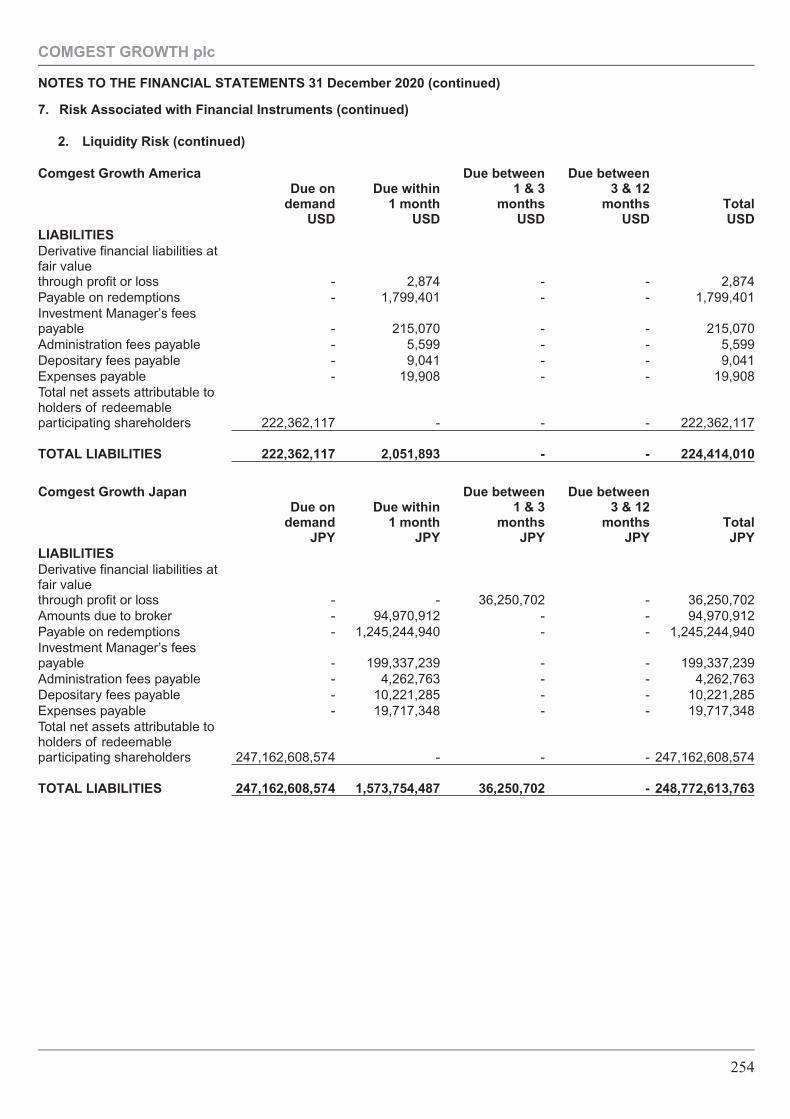
7. Risk Associated with Financial Instruments (continued)
2. Liquidity Risk (continued)
Comgest Growth AmericaDue on
demandUSD
Due within1 month
USD
Due between1 & 3
monthsUSD
Due between3 & 12
monthsUSD
TotalUSD
LIABILITIESDerivative financial liabilities atfair valuethrough profit or loss - 2,874 - - 2,874Payable on redemptions - 1,799,401 - - 1,799,401Investment Manager’s feespayable - 215,070 - - 215,070Administration fees payable - 5,599 - - 5,599Depositary fees payable - 9,041 - - 9,041Expenses payable - 19,908 - - 19,908Total net assets attributable toholders of redeemableparticipating shareholders 222,362,117 - - - 222,362,117
TOTAL LIABILITIES 222,362,117 2,051,893 - - 224,414,010
Comgest Growth JapanDue on
demandJPY
Due within1 month
JPY
Due between1 & 3
monthsJPY
Due between3 & 12
monthsJPY
TotalJPY
LIABILITIESDerivative financial liabilities atfair valuethrough profit or loss - - 36,250,702 - 36,250,702Amounts due to broker - 94,970,912 - - 94,970,912Payable on redemptions - 1,245,244,940 - - 1,245,244,940Investment Manager’s feespayable - 199,337,239 - - 199,337,239Administration fees payable - 4,262,763 - - 4,262,763Depositary fees payable - 10,221,285 - - 10,221,285Expenses payable - 19,717,348 - - 19,717,348Total net assets attributable toholders of redeemableparticipating shareholders 247,162,608,574 - - - 247,162,608,574
TOTAL LIABILITIES 247,162,608,574 1,573,754,487 36,250,702 - 248,772,613,763
COMGEST GROWTH plc
NOTES TO THE FINANCIAL STATEMENTS 31 December 2020 (continued)
254
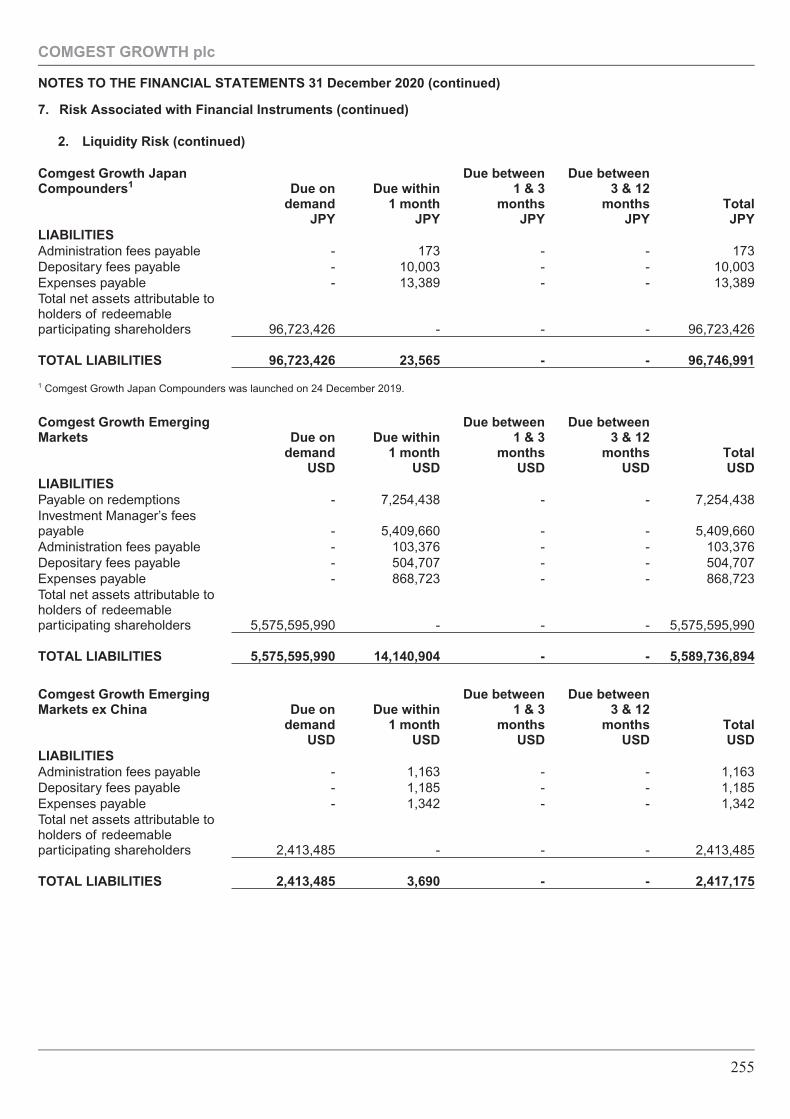
7. Risk Associated with Financial Instruments (continued)
2. Liquidity Risk (continued)
Comgest Growth JapanCompounders1 Due on
demandJPY
Due within1 month
JPY
Due between1 & 3
monthsJPY
Due between3 & 12
monthsJPY
TotalJPY
LIABILITIESAdministration fees payable - 173 - - 173Depositary fees payable - 10,003 - - 10,003Expenses payable - 13,389 - - 13,389Total net assets attributable toholders of redeemableparticipating shareholders 96,723,426 - - - 96,723,426
TOTAL LIABILITIES 96,723,426 23,565 - - 96,746,991
1 Comgest Growth Japan Compounders was launched on 24 December 2019.
Comgest Growth EmergingMarkets Due on
demandUSD
Due within1 month
USD
Due between1 & 3
monthsUSD
Due between3 & 12
monthsUSD
TotalUSD
LIABILITIESPayable on redemptions - 7,254,438 - - 7,254,438Investment Manager’s feespayable - 5,409,660 - - 5,409,660Administration fees payable - 103,376 - - 103,376Depositary fees payable - 504,707 - - 504,707Expenses payable - 868,723 - - 868,723Total net assets attributable toholders of redeemableparticipating shareholders 5,575,595,990 - - - 5,575,595,990
TOTAL LIABILITIES 5,575,595,990 14,140,904 - - 5,589,736,894
Comgest Growth EmergingMarkets ex China Due on
demandUSD
Due within1 month
USD
Due between1 & 3
monthsUSD
Due between3 & 12
monthsUSD
TotalUSD
LIABILITIESAdministration fees payable - 1,163 - - 1,163Depositary fees payable - 1,185 - - 1,185Expenses payable - 1,342 - - 1,342Total net assets attributable toholders of redeemableparticipating shareholders 2,413,485 - - - 2,413,485
TOTAL LIABILITIES 2,413,485 3,690 - - 2,417,175
COMGEST GROWTH plc
NOTES TO THE FINANCIAL STATEMENTS 31 December 2020 (continued)
255
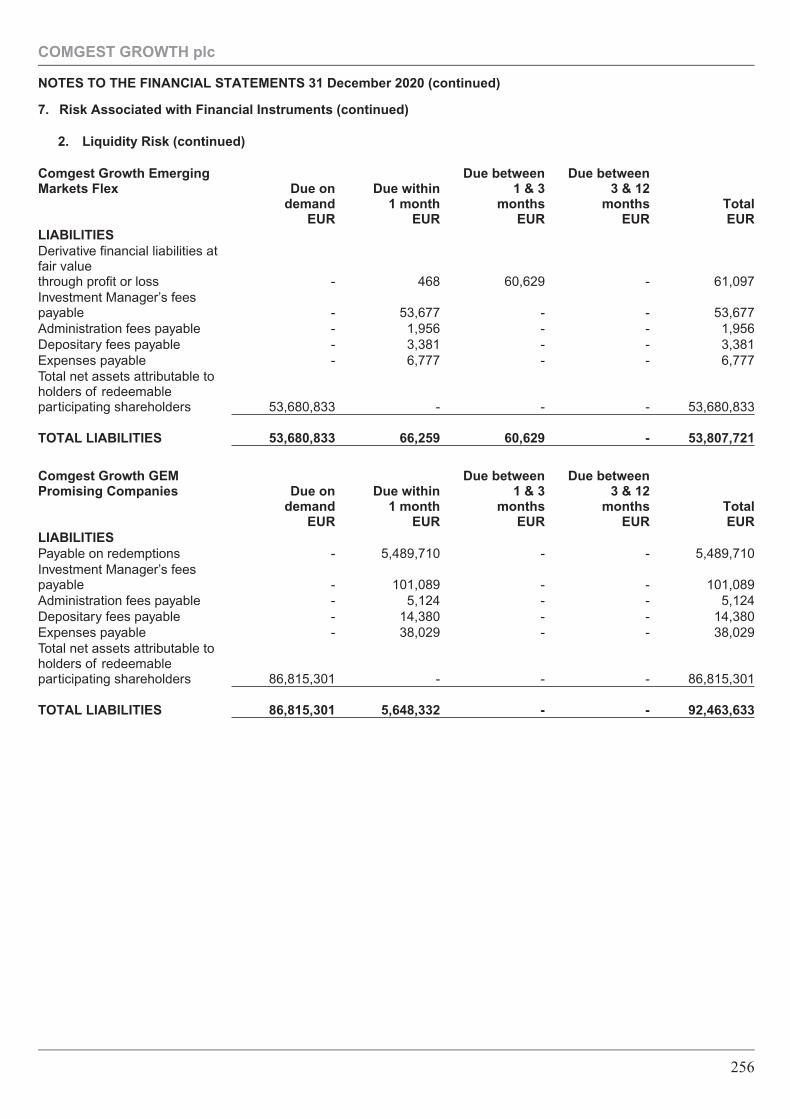
7. Risk Associated with Financial Instruments (continued)
2. Liquidity Risk (continued)
Comgest Growth EmergingMarkets Flex Due on
demandEUR
Due within1 month
EUR
Due between1 & 3
monthsEUR
Due between3 & 12
monthsEUR
TotalEUR
LIABILITIESDerivative financial liabilities atfair valuethrough profit or loss - 468 60,629 - 61,097Investment Manager’s feespayable - 53,677 - - 53,677Administration fees payable - 1,956 - - 1,956Depositary fees payable - 3,381 - - 3,381Expenses payable - 6,777 - - 6,777Total net assets attributable toholders of redeemableparticipating shareholders 53,680,833 - - - 53,680,833
TOTAL LIABILITIES 53,680,833 66,259 60,629 - 53,807,721
Comgest Growth GEMPromising Companies Due on
demandEUR
Due within1 month
EUR
Due between1 & 3
monthsEUR
Due between3 & 12
monthsEUR
TotalEUR
LIABILITIESPayable on redemptions - 5,489,710 - - 5,489,710Investment Manager’s feespayable - 101,089 - - 101,089Administration fees payable - 5,124 - - 5,124Depositary fees payable - 14,380 - - 14,380Expenses payable - 38,029 - - 38,029Total net assets attributable toholders of redeemableparticipating shareholders 86,815,301 - - - 86,815,301
TOTAL LIABILITIES 86,815,301 5,648,332 - - 92,463,633
COMGEST GROWTH plc
NOTES TO THE FINANCIAL STATEMENTS 31 December 2020 (continued)
256
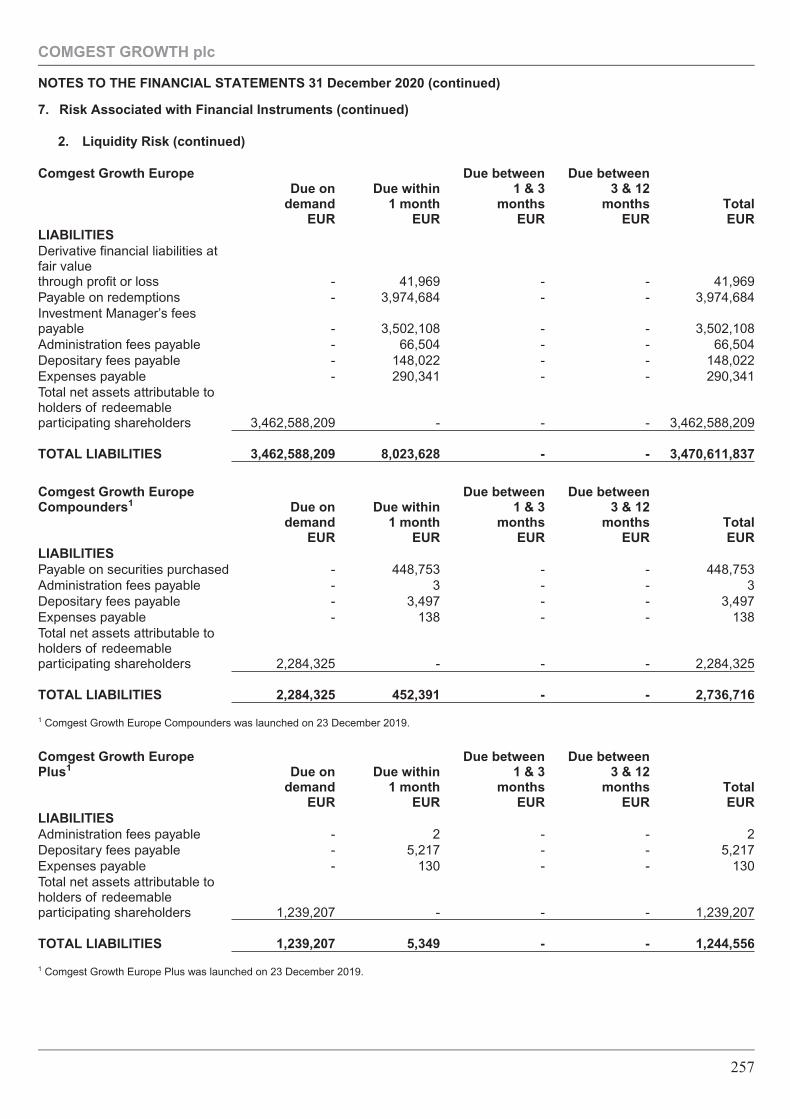
7. Risk Associated with Financial Instruments (continued)
2. Liquidity Risk (continued)
Comgest Growth EuropeDue on
demandEUR
Due within1 month
EUR
Due between1 & 3
monthsEUR
Due between3 & 12
monthsEUR
TotalEUR
LIABILITIESDerivative financial liabilities atfair valuethrough profit or loss - 41,969 - - 41,969Payable on redemptions - 3,974,684 - - 3,974,684Investment Manager’s feespayable - 3,502,108 - - 3,502,108Administration fees payable - 66,504 - - 66,504Depositary fees payable - 148,022 - - 148,022Expenses payable - 290,341 - - 290,341Total net assets attributable toholders of redeemableparticipating shareholders 3,462,588,209 - - - 3,462,588,209
TOTAL LIABILITIES 3,462,588,209 8,023,628 - - 3,470,611,837
Comgest Growth EuropeCompounders1 Due on
demandEUR
Due within1 month
EUR
Due between1 & 3
monthsEUR
Due between3 & 12
monthsEUR
TotalEUR
LIABILITIESPayable on securities purchased - 448,753 - - 448,753Administration fees payable - 3 - - 3Depositary fees payable - 3,497 - - 3,497Expenses payable - 138 - - 138Total net assets attributable toholders of redeemableparticipating shareholders 2,284,325 - - - 2,284,325
TOTAL LIABILITIES 2,284,325 452,391 - - 2,736,716
1 Comgest Growth Europe Compounders was launched on 23 December 2019.
Comgest Growth EuropePlus1 Due on
demandEUR
Due within1 month
EUR
Due between1 & 3
monthsEUR
Due between3 & 12
monthsEUR
TotalEUR
LIABILITIESAdministration fees payable - 2 - - 2Depositary fees payable - 5,217 - - 5,217Expenses payable - 130 - - 130Total net assets attributable toholders of redeemableparticipating shareholders 1,239,207 - - - 1,239,207
TOTAL LIABILITIES 1,239,207 5,349 - - 1,244,556
1 Comgest Growth Europe Plus was launched on 23 December 2019.
COMGEST GROWTH plc
NOTES TO THE FINANCIAL STATEMENTS 31 December 2020 (continued)
257
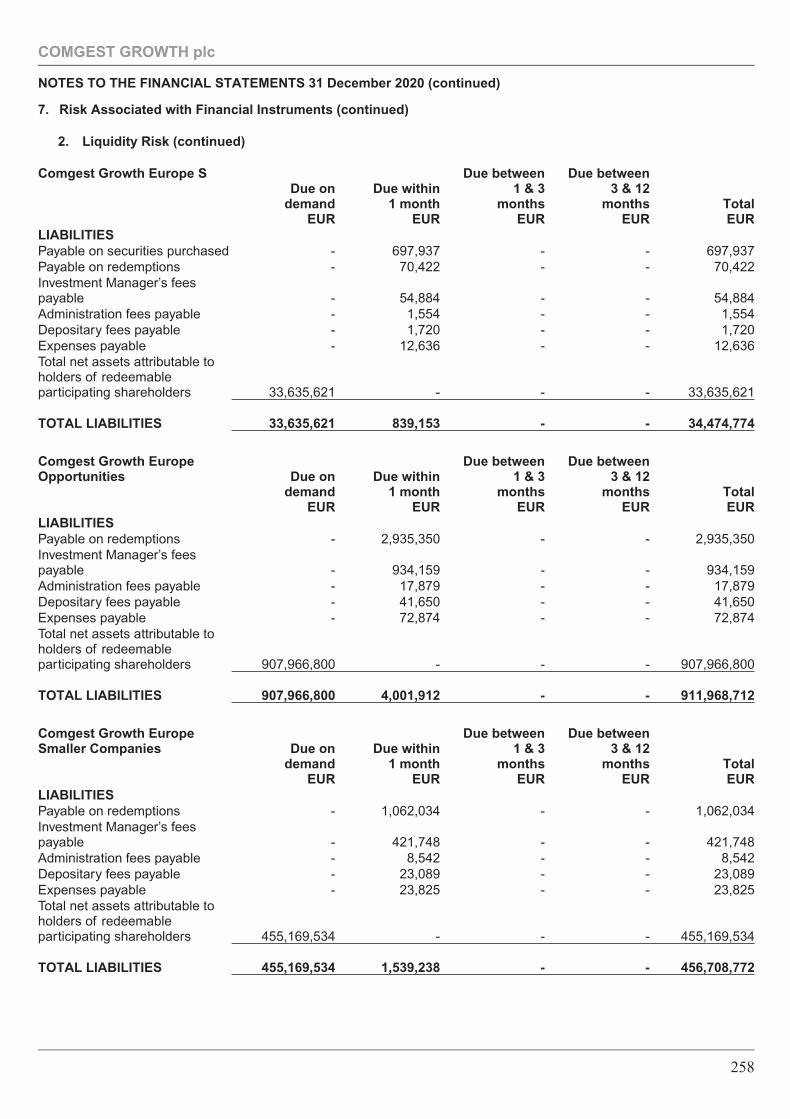
7. Risk Associated with Financial Instruments (continued)
2. Liquidity Risk (continued)
Comgest Growth Europe SDue on
demandEUR
Due within1 month
EUR
Due between1 & 3
monthsEUR
Due between3 & 12
monthsEUR
TotalEUR
LIABILITIESPayable on securities purchased - 697,937 - - 697,937Payable on redemptions - 70,422 - - 70,422Investment Manager’s feespayable - 54,884 - - 54,884Administration fees payable - 1,554 - - 1,554Depositary fees payable - 1,720 - - 1,720Expenses payable - 12,636 - - 12,636Total net assets attributable toholders of redeemableparticipating shareholders 33,635,621 - - - 33,635,621
TOTAL LIABILITIES 33,635,621 839,153 - - 34,474,774
Comgest Growth EuropeOpportunities Due on
demandEUR
Due within1 month
EUR
Due between1 & 3
monthsEUR
Due between3 & 12
monthsEUR
TotalEUR
LIABILITIESPayable on redemptions - 2,935,350 - - 2,935,350Investment Manager’s feespayable - 934,159 - - 934,159Administration fees payable - 17,879 - - 17,879Depositary fees payable - 41,650 - - 41,650Expenses payable - 72,874 - - 72,874Total net assets attributable toholders of redeemableparticipating shareholders 907,966,800 - - - 907,966,800
TOTAL LIABILITIES 907,966,800 4,001,912 - - 911,968,712
Comgest Growth EuropeSmaller Companies Due on
demandEUR
Due within1 month
EUR
Due between1 & 3
monthsEUR
Due between3 & 12
monthsEUR
TotalEUR
LIABILITIESPayable on redemptions - 1,062,034 - - 1,062,034Investment Manager’s feespayable - 421,748 - - 421,748Administration fees payable - 8,542 - - 8,542Depositary fees payable - 23,089 - - 23,089Expenses payable - 23,825 - - 23,825Total net assets attributable toholders of redeemableparticipating shareholders 455,169,534 - - - 455,169,534
TOTAL LIABILITIES 455,169,534 1,539,238 - - 456,708,772
COMGEST GROWTH plc
NOTES TO THE FINANCIAL STATEMENTS 31 December 2020 (continued)
258
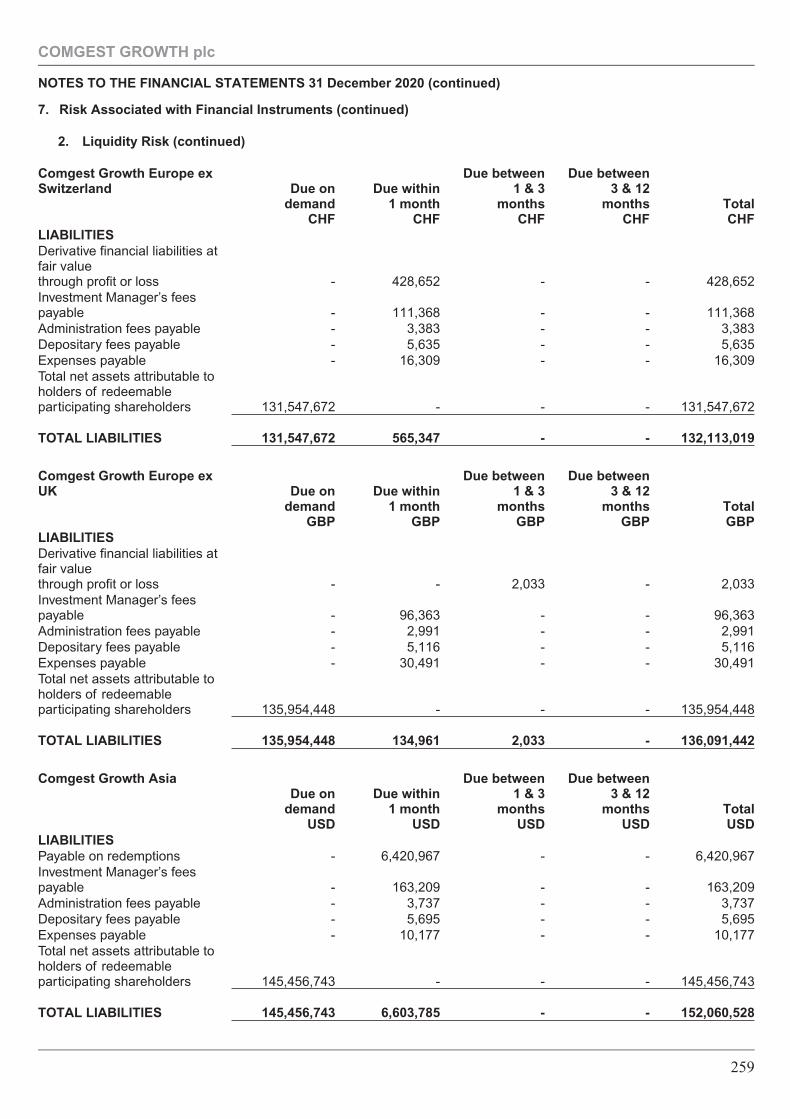
7. Risk Associated with Financial Instruments (continued)
2. Liquidity Risk (continued)
Comgest Growth Europe exSwitzerland Due on
demandCHF
Due within1 month
CHF
Due between1 & 3
monthsCHF
Due between3 & 12
monthsCHF
TotalCHF
LIABILITIESDerivative financial liabilities atfair valuethrough profit or loss - 428,652 - - 428,652Investment Manager’s feespayable - 111,368 - - 111,368Administration fees payable - 3,383 - - 3,383Depositary fees payable - 5,635 - - 5,635Expenses payable - 16,309 - - 16,309Total net assets attributable toholders of redeemableparticipating shareholders 131,547,672 - - - 131,547,672
TOTAL LIABILITIES 131,547,672 565,347 - - 132,113,019
Comgest Growth Europe exUK Due on
demandGBP
Due within1 month
GBP
Due between1 & 3
monthsGBP
Due between3 & 12
monthsGBP
TotalGBP
LIABILITIESDerivative financial liabilities atfair valuethrough profit or loss - - 2,033 - 2,033Investment Manager’s feespayable - 96,363 - - 96,363Administration fees payable - 2,991 - - 2,991Depositary fees payable - 5,116 - - 5,116Expenses payable - 30,491 - - 30,491Total net assets attributable toholders of redeemableparticipating shareholders 135,954,448 - - - 135,954,448
TOTAL LIABILITIES 135,954,448 134,961 2,033 - 136,091,442
Comgest Growth AsiaDue on
demandUSD
Due within1 month
USD
Due between1 & 3
monthsUSD
Due between3 & 12
monthsUSD
TotalUSD
LIABILITIESPayable on redemptions - 6,420,967 - - 6,420,967Investment Manager’s feespayable - 163,209 - - 163,209Administration fees payable - 3,737 - - 3,737Depositary fees payable - 5,695 - - 5,695Expenses payable - 10,177 - - 10,177Total net assets attributable toholders of redeemableparticipating shareholders 145,456,743 - - - 145,456,743
TOTAL LIABILITIES 145,456,743 6,603,785 - - 152,060,528
COMGEST GROWTH plc
NOTES TO THE FINANCIAL STATEMENTS 31 December 2020 (continued)
259
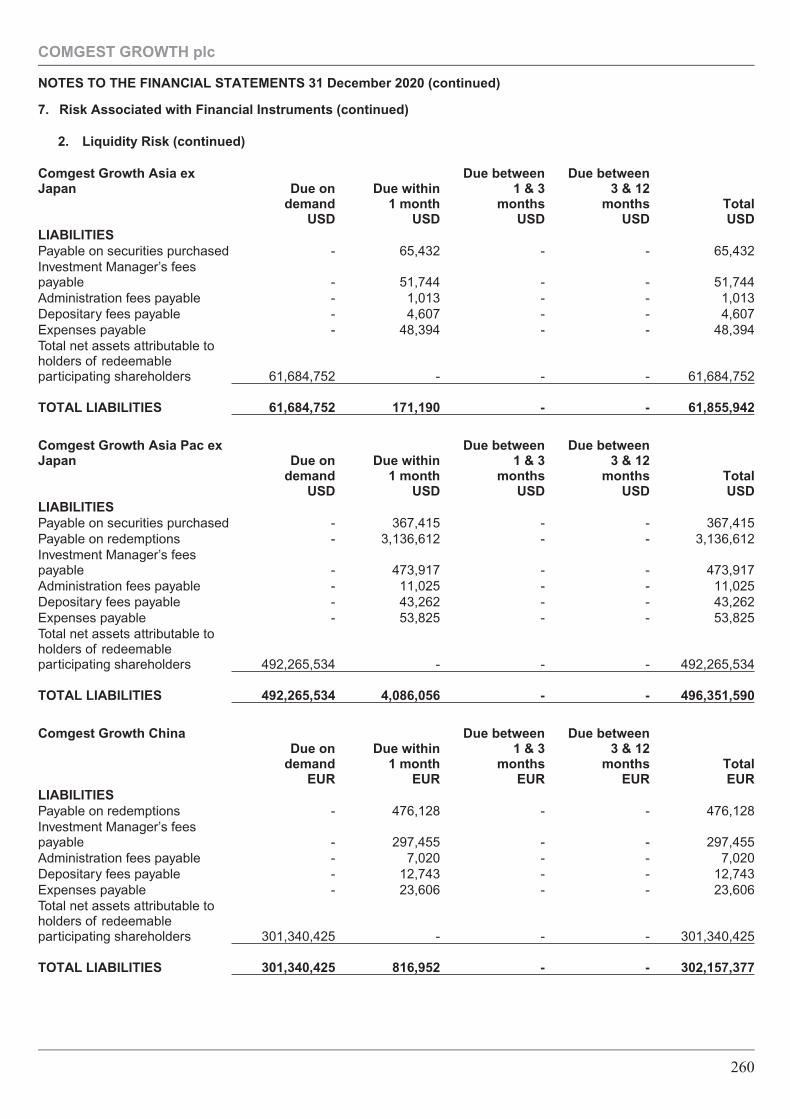
7. Risk Associated with Financial Instruments (continued)
2. Liquidity Risk (continued)
Comgest Growth Asia exJapan Due on
demandUSD
Due within1 month
USD
Due between1 & 3
monthsUSD
Due between3 & 12
monthsUSD
TotalUSD
LIABILITIESPayable on securities purchased - 65,432 - - 65,432Investment Manager’s feespayable - 51,744 - - 51,744Administration fees payable - 1,013 - - 1,013Depositary fees payable - 4,607 - - 4,607Expenses payable - 48,394 - - 48,394Total net assets attributable toholders of redeemableparticipating shareholders 61,684,752 - - - 61,684,752
TOTAL LIABILITIES 61,684,752 171,190 - - 61,855,942
Comgest Growth Asia Pac exJapan Due on
demandUSD
Due within1 month
USD
Due between1 & 3
monthsUSD
Due between3 & 12
monthsUSD
TotalUSD
LIABILITIESPayable on securities purchased - 367,415 - - 367,415Payable on redemptions - 3,136,612 - - 3,136,612Investment Manager’s feespayable - 473,917 - - 473,917Administration fees payable - 11,025 - - 11,025Depositary fees payable - 43,262 - - 43,262Expenses payable - 53,825 - - 53,825Total net assets attributable toholders of redeemableparticipating shareholders 492,265,534 - - - 492,265,534
TOTAL LIABILITIES 492,265,534 4,086,056 - - 496,351,590
Comgest Growth ChinaDue on
demandEUR
Due within1 month
EUR
Due between1 & 3
monthsEUR
Due between3 & 12
monthsEUR
TotalEUR
LIABILITIESPayable on redemptions - 476,128 - - 476,128Investment Manager’s feespayable - 297,455 - - 297,455Administration fees payable - 7,020 - - 7,020Depositary fees payable - 12,743 - - 12,743Expenses payable - 23,606 - - 23,606Total net assets attributable toholders of redeemableparticipating shareholders 301,340,425 - - - 301,340,425
TOTAL LIABILITIES 301,340,425 816,952 - - 302,157,377
COMGEST GROWTH plc
NOTES TO THE FINANCIAL STATEMENTS 31 December 2020 (continued)
260
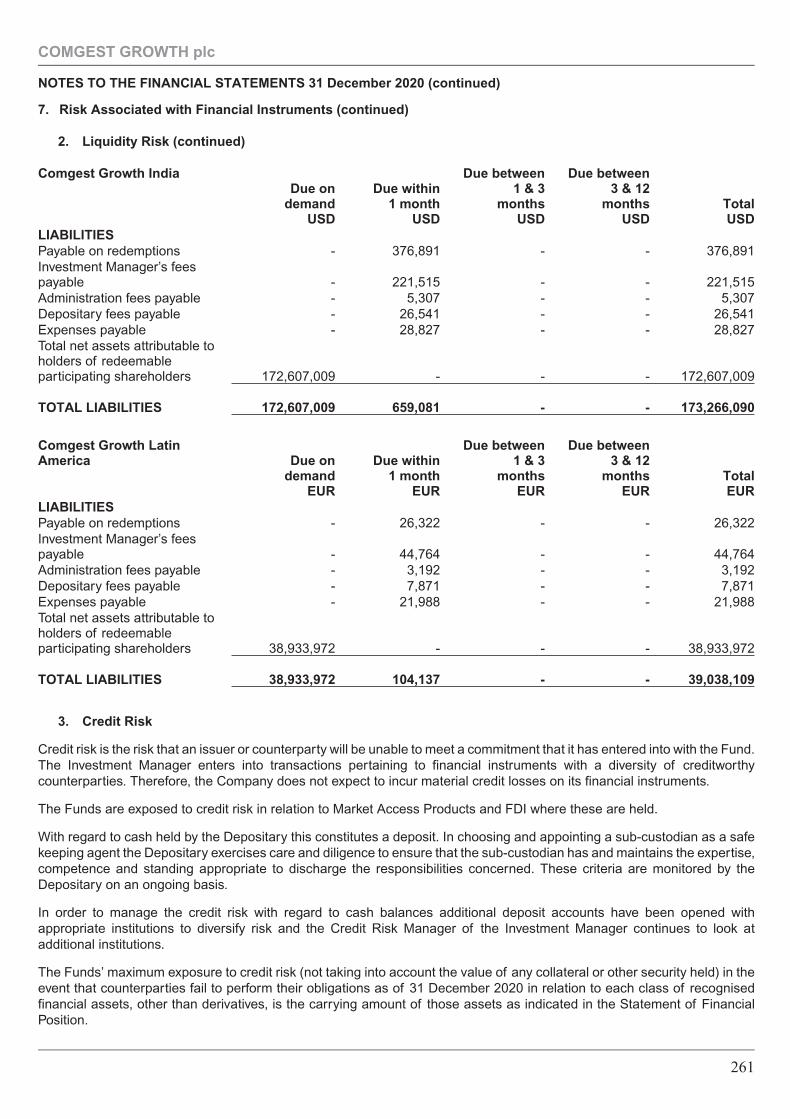
7. Risk Associated with Financial Instruments (continued)
2. Liquidity Risk (continued)
Comgest Growth IndiaDue on
demandUSD
Due within1 month
USD
Due between1 & 3
monthsUSD
Due between3 & 12
monthsUSD
TotalUSD
LIABILITIESPayable on redemptions - 376,891 - - 376,891Investment Manager’s feespayable - 221,515 - - 221,515Administration fees payable - 5,307 - - 5,307Depositary fees payable - 26,541 - - 26,541Expenses payable - 28,827 - - 28,827Total net assets attributable toholders of redeemableparticipating shareholders 172,607,009 - - - 172,607,009
TOTAL LIABILITIES 172,607,009 659,081 - - 173,266,090
Comgest Growth LatinAmerica Due on
demandEUR
Due within1 month
EUR
Due between1 & 3
monthsEUR
Due between3 & 12
monthsEUR
TotalEUR
LIABILITIESPayable on redemptions - 26,322 - - 26,322Investment Manager’s feespayable - 44,764 - - 44,764Administration fees payable - 3,192 - - 3,192Depositary fees payable - 7,871 - - 7,871Expenses payable - 21,988 - - 21,988Total net assets attributable toholders of redeemableparticipating shareholders 38,933,972 - - - 38,933,972
TOTAL LIABILITIES 38,933,972 104,137 - - 39,038,109
3. Credit Risk
Credit risk is the risk that an issuer or counterparty will be unable to meet a commitment that it has entered into with the Fund.The Investment Manager enters into transactions pertaining to financial instruments with a diversity of creditworthycounterparties. Therefore, the Company does not expect to incur material credit losses on its financial instruments.
The Funds are exposed to credit risk in relation to Market Access Products and FDI where these are held.
With regard to cash held by the Depositary this constitutes a deposit. In choosing and appointing a sub-custodian as a safekeeping agent the Depositary exercises care and diligence to ensure that the sub-custodian has and maintains the expertise,competence and standing appropriate to discharge the responsibilities concerned. These criteria are monitored by theDepositary on an ongoing basis.
In order to manage the credit risk with regard to cash balances additional deposit accounts have been opened withappropriate institutions to diversify risk and the Credit Risk Manager of the Investment Manager continues to look atadditional institutions.
The Funds’ maximum exposure to credit risk (not taking into account the value of any collateral or other security held) in theevent that counterparties fail to perform their obligations as of 31 December 2020 in relation to each class of recognisedfinancial assets, other than derivatives, is the carrying amount of those assets as indicated in the Statement of FinancialPosition.
COMGEST GROWTH plc
NOTES TO THE FINANCIAL STATEMENTS 31 December 2020 (continued)
261
7. Risk Associated with Financial Instruments (continued)
3. Credit Risk (continued)
Market Access Products are financial instruments that may be used by a Fund to obtain exposure to an equity investment ina local market where direct ownership is not allowed, is restricted or is more costly. Investment in Market Access Productsmay involve an over-the-counter transaction with a third party. Consequently, investing in Market Access Products mayexpose a Fund not only to movements in the value of the underlying equity but also to the risk of counterparty default, whichmay in the event of counterparty default, result in the loss of the full market value of the economic interest in the underlyingequity. Market Access Products generally are issued by banks or broker dealers and are designed to replicate theperformance of a particular underlying equity security. The return on a Market Access Product that is linked to a particularunderlying security generally is increased to the extent of any dividends paid in connection with the underlying security.However, typically the holder of a Market Access Product does not receive voting rights as it would if it directly owned theunderlying security.
With respect to FDIs, credit risk arises from the potential failure of counterparties to meet their obligations under the contractor arrangement.
It is the Company’s intention at this time to limit the use of FDIs to forward currency exchange contracts, foreign exchangeswap contacts, warrants (corporate action), convertible bonds, exchange-traded equity index futures and exchange-tradedvolatility index futures. A Fund may from time to time hold a small number of valueless warrants normally granted by theissuer through corporate actions as a result of the Fund holding shares of the issuer. Funds may also invest in convertiblebonds but they have not invested in any convertible bonds as at 31 December 2020 (2019: Nil). The Company maintains arisk management process to monitor and manage the risks associated with the use of FDIs.
Other than the FDIs noted above, the Company did not use any complex FDIs, such as credit default swaps during theperiods ended 31 December 2020 and 31 December 2019.
A Fund’s maximum credit risk exposure for forward currency exchange contracts and foreign exchange swap contracts is thefull amount of the foreign currency the Fund will be required to pay or purchase when settling the forward currency exchangecontracts and the foreign exchange swap contracts, should the counterparties not pay the currency they are committed todeliver to the Fund. Credit risk may be reduced by the receipt of collateral from the counterparty.
As noted on page 216 Comgest Growth Global Flex and Comgest Growth Emerging Markets Flex seeks to hedge part of itsequity market risk exposure through the use of exchange-traded equity index futures. Comgest Growth Global Flex is alsopermitted to utilise exchange-traded volatility index futures. All futures are cleared by Société Générale International Limited(“SGIL”).
Cash held with SGIL is monitored on a daily basis to assess if funding is required to meet a margin call or a pre-fundingrequirement. Furthermore, cash balances are monitored daily to assess if excess cash at SGIL can be called back to theDepositary. “Cash held as collateral” at SGIL includes margin excess of €1,865,301 in Comgest Growth Global Flex (2019:€929,947) and €85,877 in Comgest Growth Emerging Markets Flex (2019: €Nil) and initial margin requirements of€1,865,301 in Comgest Growth Global Flex (2019: €929,947) and €85,877 in Comgest Growth Emerging Markets Flex(2019: €Nil), “Due to broker” includes margin deficit of €1,865,301 in Comgest Growth Global Flex (2019: €929,947) and€85,877 in Comgest Growth Emerging Markets Flex (2019: €Nil). As margin excess was greater than margin deficit as at31 December 2020 there was excess cash of €Nil in Comgest Growth Global Flex (2019: €Nil) and €Nil in Comgest GrowthEmerging Markets Flex (2019: €Nil) held on deposit at SGIL.
SGIL does not have a credit rating. It is authorised and regulated by the Financial Conduct Authority (“FCA”) in the UK as aninvestment firm and is categorised as a Limited Activity Firm, a status which prohibits proprietary activity (other than forfacilitation of client orders). SGIL is subject to the FCA’s Client Assets regime. SGIL is a wholly owned UK subsidiary ofSociété Générale SA since 29 October 2015. As at 31 December 2020 its parent company, Société Générale SA had a creditrating of A1, A and A- with Moody’s, S&P’s and Fitch respectively.
The Investment Manager’s approved counterparties for trading are limited to highly rated or recognised dealers in theirsectors. The Investment Manager contracts with multiple counterparties with the aim of risk spreading. The InvestmentManager’s risk manager performs ongoing monitoring of the counterparties. In particular, all over-the-counter counterpartiesmust meet the following criteria as set out in the UCITS Regulations, namely:
(i) a credit institution in accordance with the UCITS Regulations; or
COMGEST GROWTH plc
NOTES TO THE FINANCIAL STATEMENTS 31 December 2020 (continued)
262
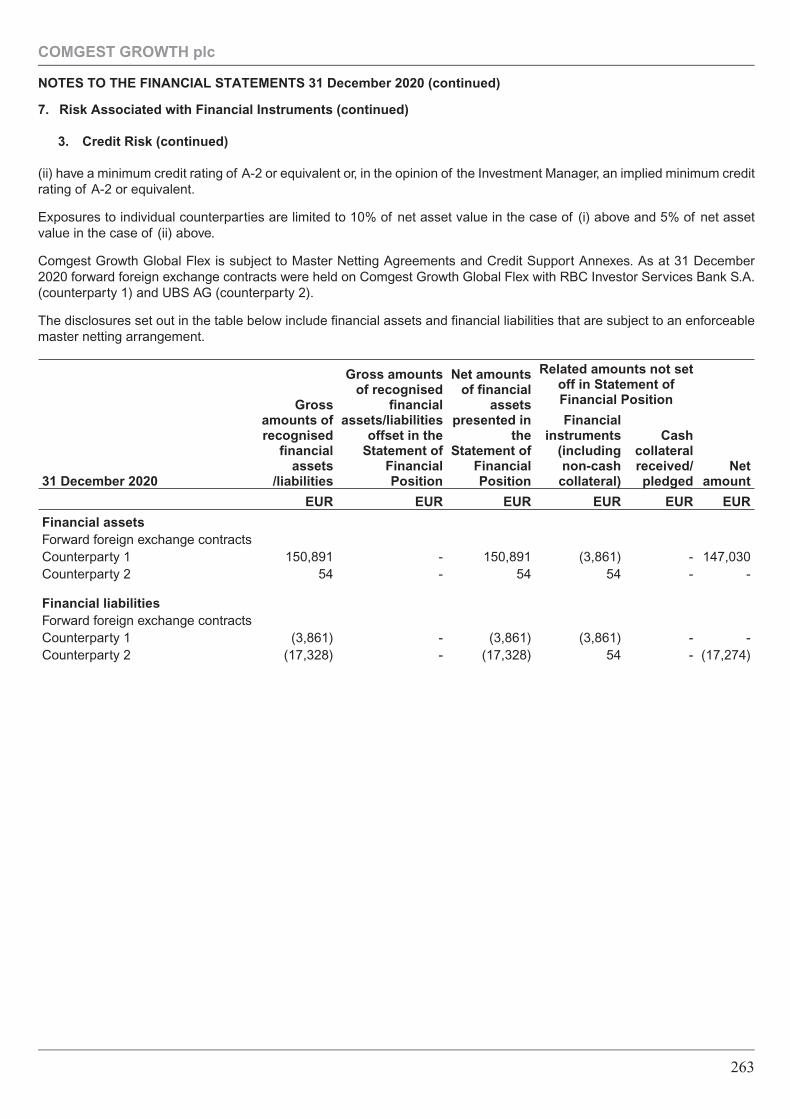
7. Risk Associated with Financial Instruments (continued)
3. Credit Risk (continued)
(ii) have a minimum credit rating of A-2 or equivalent or, in the opinion of the Investment Manager, an implied minimum creditrating of A-2 or equivalent.
Exposures to individual counterparties are limited to 10% of net asset value in the case of (i) above and 5% of net assetvalue in the case of (ii) above.
Comgest Growth Global Flex is subject to Master Netting Agreements and Credit Support Annexes. As at 31 December2020 forward foreign exchange contracts were held on Comgest Growth Global Flex with RBC Investor Services Bank S.A.(counterparty 1) and UBS AG (counterparty 2).
The disclosures set out in the table below include financial assets and financial liabilities that are subject to an enforceablemaster netting arrangement.
31 December 2020
Grossamounts ofrecognised
financialassets
/liabilities
Gross amountsof recognised
financialassets/liabilities
offset in theStatement of
FinancialPosition
Net amountsof financial
assetspresented in
theStatement of
FinancialPosition
Related amounts not setoff in Statement ofFinancial Position
Financialinstruments
(includingnon-cashcollateral)
Cashcollateralreceived/pledged
Netamount
EUR EUR EUR EUR EUR EUR
Financial assetsForward foreign exchange contractsCounterparty 1 150,891 - 150,891 (3,861) - 147,030Counterparty 2 54 - 54 54 - -
Financial liabilitiesForward foreign exchange contractsCounterparty 1 (3,861) - (3,861) (3,861) - -Counterparty 2 (17,328) - (17,328) 54 - (17,274)
COMGEST GROWTH plc
NOTES TO THE FINANCIAL STATEMENTS 31 December 2020 (continued)
263
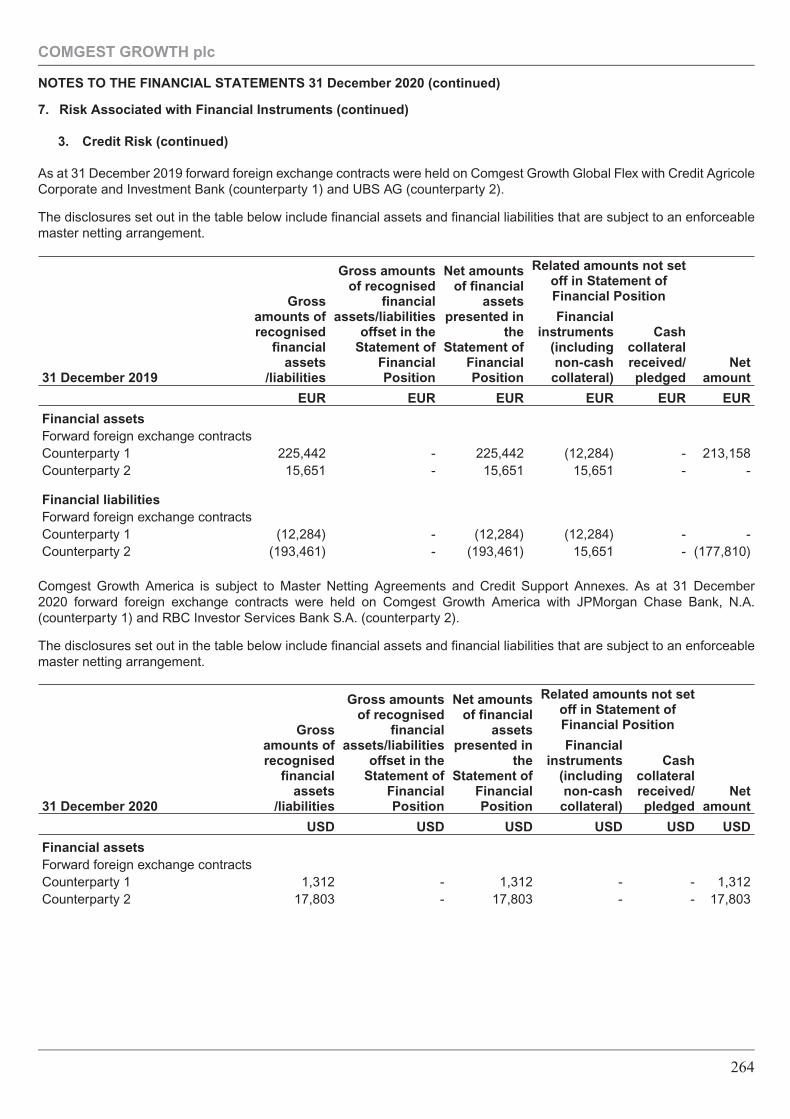
7. Risk Associated with Financial Instruments (continued)
3. Credit Risk (continued)
As at 31 December 2019 forward foreign exchange contracts were held on Comgest Growth Global Flex with Credit AgricoleCorporate and Investment Bank (counterparty 1) and UBS AG (counterparty 2).
The disclosures set out in the table below include financial assets and financial liabilities that are subject to an enforceablemaster netting arrangement.
31 December 2019
Grossamounts ofrecognised
financialassets
/liabilities
Gross amountsof recognised
financialassets/liabilities
offset in theStatement of
FinancialPosition
Net amountsof financial
assetspresented in
theStatement of
FinancialPosition
Related amounts not setoff in Statement ofFinancial Position
Financialinstruments
(includingnon-cashcollateral)
Cashcollateralreceived/pledged
Netamount
EUR EUR EUR EUR EUR EUR
Financial assetsForward foreign exchange contractsCounterparty 1 225,442 - 225,442 (12,284) - 213,158Counterparty 2 15,651 - 15,651 15,651 - -
Financial liabilitiesForward foreign exchange contractsCounterparty 1 (12,284) - (12,284) (12,284) - -Counterparty 2 (193,461) - (193,461) 15,651 - (177,810)
Comgest Growth America is subject to Master Netting Agreements and Credit Support Annexes. As at 31 December2020 forward foreign exchange contracts were held on Comgest Growth America with JPMorgan Chase Bank, N.A.(counterparty 1) and RBC Investor Services Bank S.A. (counterparty 2).
The disclosures set out in the table below include financial assets and financial liabilities that are subject to an enforceablemaster netting arrangement.
31 December 2020
Grossamounts ofrecognised
financialassets
/liabilities
Gross amountsof recognised
financialassets/liabilities
offset in theStatement of
FinancialPosition
Net amountsof financial
assetspresented in
theStatement of
FinancialPosition
Related amounts not setoff in Statement ofFinancial Position
Financialinstruments
(includingnon-cashcollateral)
Cashcollateralreceived/pledged
Netamount
USD USD USD USD USD USD
Financial assetsForward foreign exchange contractsCounterparty 1 1,312 - 1,312 - - 1,312Counterparty 2 17,803 - 17,803 - - 17,803
COMGEST GROWTH plc
NOTES TO THE FINANCIAL STATEMENTS 31 December 2020 (continued)
264
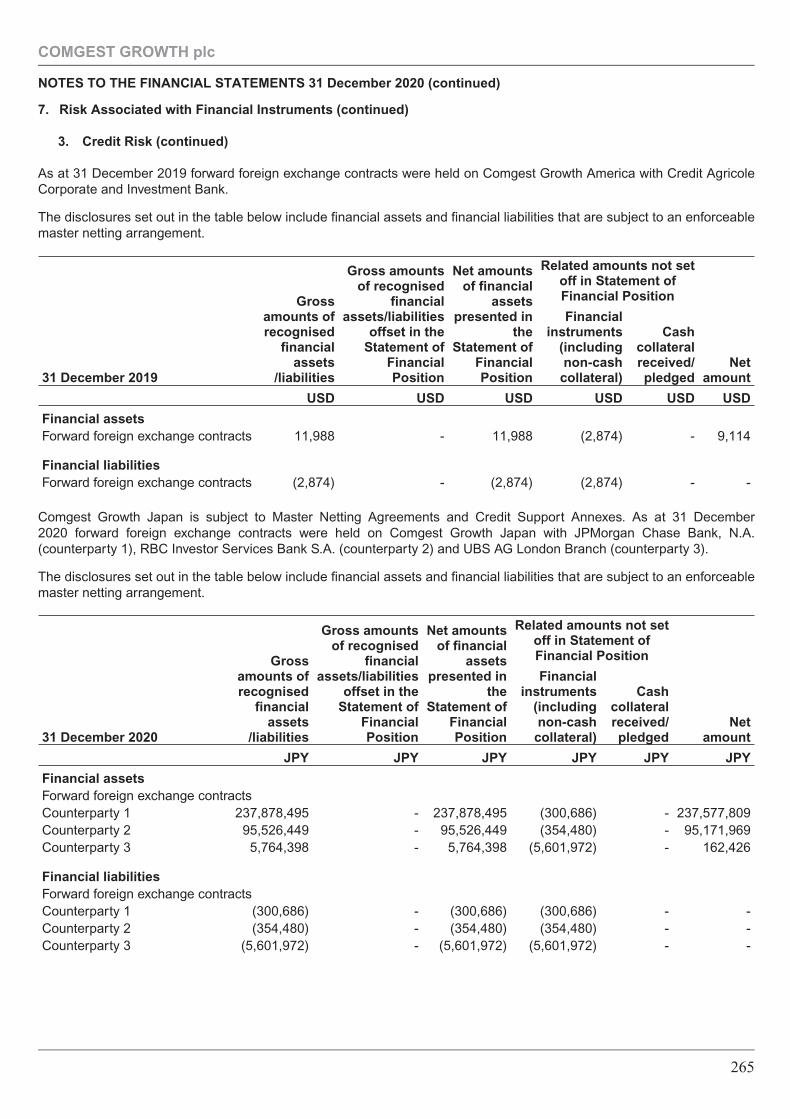
7. Risk Associated with Financial Instruments (continued)
3. Credit Risk (continued)
As at 31 December 2019 forward foreign exchange contracts were held on Comgest Growth America with Credit AgricoleCorporate and Investment Bank.
The disclosures set out in the table below include financial assets and financial liabilities that are subject to an enforceablemaster netting arrangement.
31 December 2019
Grossamounts ofrecognised
financialassets
/liabilities
Gross amountsof recognised
financialassets/liabilities
offset in theStatement of
FinancialPosition
Net amountsof financial
assetspresented in
theStatement of
FinancialPosition
Related amounts not setoff in Statement ofFinancial Position
Financialinstruments
(includingnon-cashcollateral)
Cashcollateralreceived/pledged
Netamount
USD USD USD USD USD USD
Financial assetsForward foreign exchange contracts 11,988 - 11,988 (2,874) - 9,114
Financial liabilitiesForward foreign exchange contracts (2,874) - (2,874) (2,874) - -
Comgest Growth Japan is subject to Master Netting Agreements and Credit Support Annexes. As at 31 December2020 forward foreign exchange contracts were held on Comgest Growth Japan with JPMorgan Chase Bank, N.A.(counterparty 1), RBC Investor Services Bank S.A. (counterparty 2) and UBS AG London Branch (counterparty 3).
The disclosures set out in the table below include financial assets and financial liabilities that are subject to an enforceablemaster netting arrangement.
31 December 2020
Grossamounts ofrecognised
financialassets
/liabilities
Gross amountsof recognised
financialassets/liabilities
offset in theStatement of
FinancialPosition
Net amountsof financial
assetspresented in
theStatement of
FinancialPosition
Related amounts not setoff in Statement ofFinancial Position
Financialinstruments
(includingnon-cashcollateral)
Cashcollateralreceived/pledged
Netamount
JPY JPY JPY JPY JPY JPY
Financial assetsForward foreign exchange contractsCounterparty 1 237,878,495 - 237,878,495 (300,686) - 237,577,809Counterparty 2 95,526,449 - 95,526,449 (354,480) - 95,171,969Counterparty 3 5,764,398 - 5,764,398 (5,601,972) - 162,426
Financial liabilitiesForward foreign exchange contractsCounterparty 1 (300,686) - (300,686) (300,686) - -Counterparty 2 (354,480) - (354,480) (354,480) - -Counterparty 3 (5,601,972) - (5,601,972) (5,601,972) - -
COMGEST GROWTH plc
NOTES TO THE FINANCIAL STATEMENTS 31 December 2020 (continued)
265
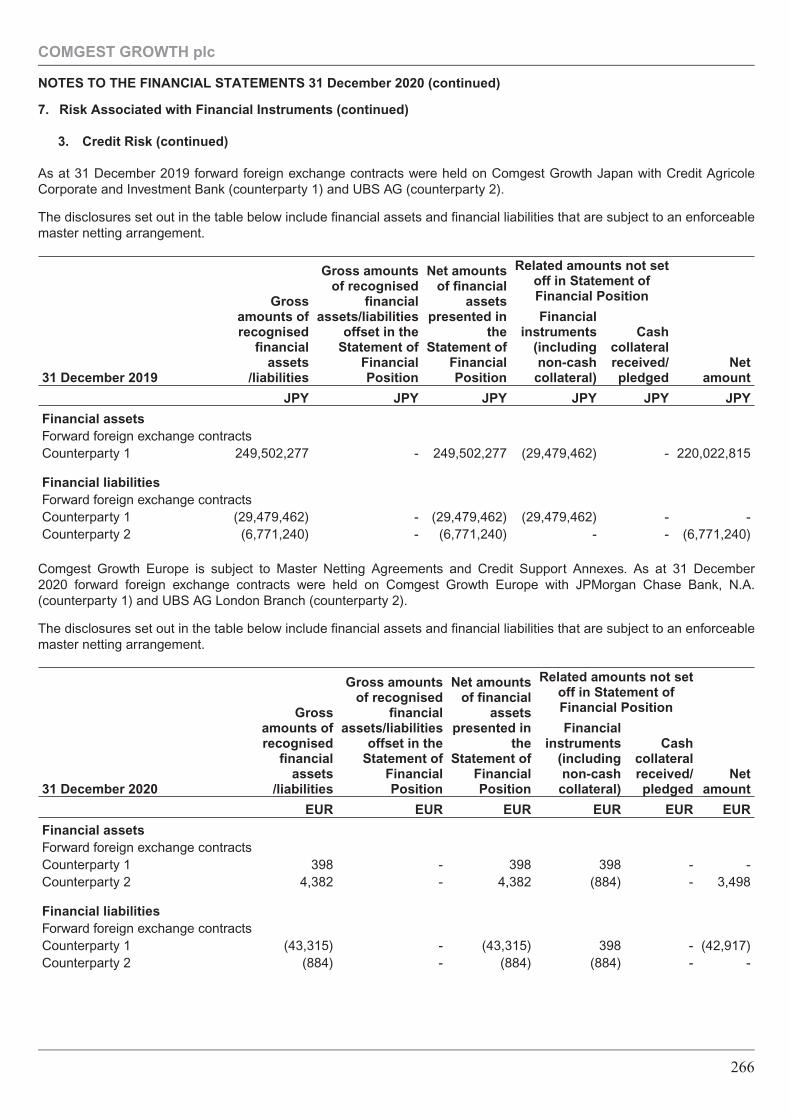
7. Risk Associated with Financial Instruments (continued)
3. Credit Risk (continued)
As at 31 December 2019 forward foreign exchange contracts were held on Comgest Growth Japan with Credit AgricoleCorporate and Investment Bank (counterparty 1) and UBS AG (counterparty 2).
The disclosures set out in the table below include financial assets and financial liabilities that are subject to an enforceablemaster netting arrangement.
31 December 2019
Grossamounts ofrecognised
financialassets
/liabilities
Gross amountsof recognised
financialassets/liabilities
offset in theStatement of
FinancialPosition
Net amountsof financial
assetspresented in
theStatement of
FinancialPosition
Related amounts not setoff in Statement ofFinancial Position
Financialinstruments
(includingnon-cashcollateral)
Cashcollateralreceived/pledged
Netamount
JPY JPY JPY JPY JPY JPY
Financial assetsForward foreign exchange contractsCounterparty 1 249,502,277 - 249,502,277 (29,479,462) - 220,022,815
Financial liabilitiesForward foreign exchange contractsCounterparty 1 (29,479,462) - (29,479,462) (29,479,462) - -Counterparty 2 (6,771,240) - (6,771,240) - - (6,771,240)
Comgest Growth Europe is subject to Master Netting Agreements and Credit Support Annexes. As at 31 December2020 forward foreign exchange contracts were held on Comgest Growth Europe with JPMorgan Chase Bank, N.A.(counterparty 1) and UBS AG London Branch (counterparty 2).
The disclosures set out in the table below include financial assets and financial liabilities that are subject to an enforceablemaster netting arrangement.
31 December 2020
Grossamounts ofrecognised
financialassets
/liabilities
Gross amountsof recognised
financialassets/liabilities
offset in theStatement of
FinancialPosition
Net amountsof financial
assetspresented in
theStatement of
FinancialPosition
Related amounts not setoff in Statement ofFinancial Position
Financialinstruments
(includingnon-cashcollateral)
Cashcollateralreceived/pledged
Netamount
EUR EUR EUR EUR EUR EUR
Financial assetsForward foreign exchange contractsCounterparty 1 398 - 398 398 - -Counterparty 2 4,382 - 4,382 (884) - 3,498
Financial liabilitiesForward foreign exchange contractsCounterparty 1 (43,315) - (43,315) 398 - (42,917)Counterparty 2 (884) - (884) (884) - -
COMGEST GROWTH plc
NOTES TO THE FINANCIAL STATEMENTS 31 December 2020 (continued)
266
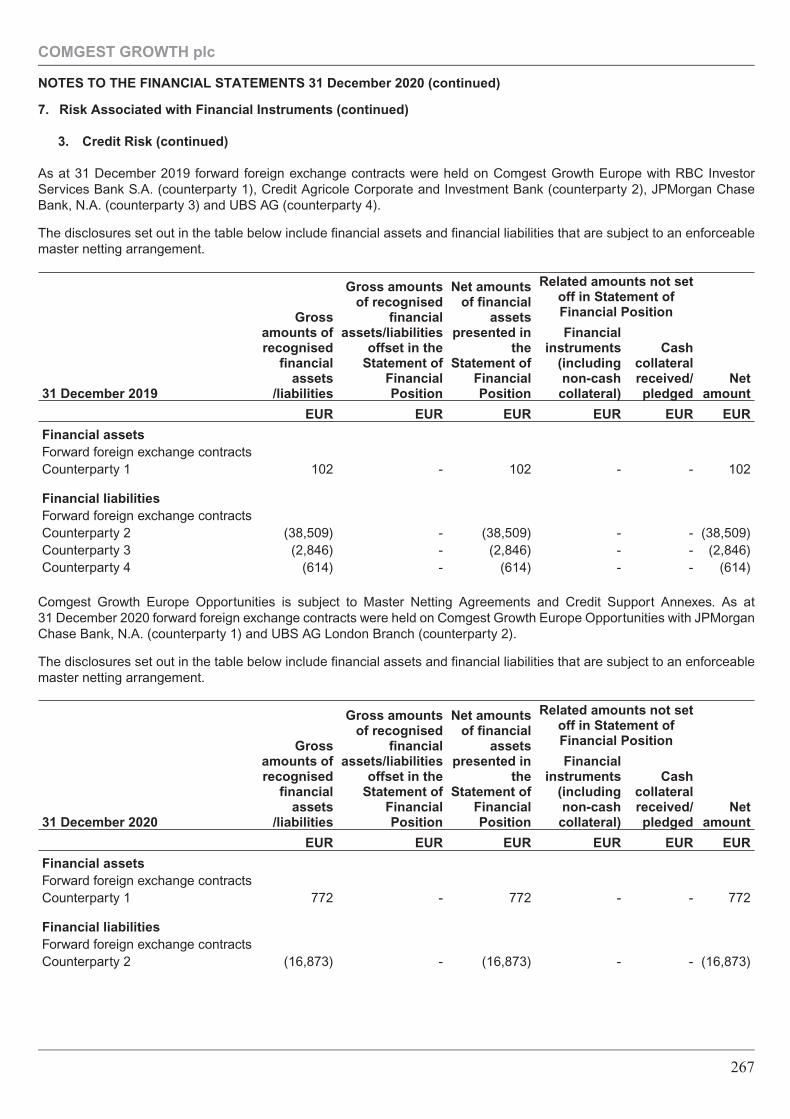
7. Risk Associated with Financial Instruments (continued)
3. Credit Risk (continued)
As at 31 December 2019 forward foreign exchange contracts were held on Comgest Growth Europe with RBC InvestorServices Bank S.A. (counterparty 1), Credit Agricole Corporate and Investment Bank (counterparty 2), JPMorgan ChaseBank, N.A. (counterparty 3) and UBS AG (counterparty 4).
The disclosures set out in the table below include financial assets and financial liabilities that are subject to an enforceablemaster netting arrangement.
31 December 2019
Grossamounts ofrecognised
financialassets
/liabilities
Gross amountsof recognised
financialassets/liabilities
offset in theStatement of
FinancialPosition
Net amountsof financial
assetspresented in
theStatement of
FinancialPosition
Related amounts not setoff in Statement ofFinancial Position
Financialinstruments
(includingnon-cashcollateral)
Cashcollateralreceived/pledged
Netamount
EUR EUR EUR EUR EUR EUR
Financial assetsForward foreign exchange contractsCounterparty 1 102 - 102 - - 102
Financial liabilitiesForward foreign exchange contractsCounterparty 2 (38,509) - (38,509) - - (38,509)Counterparty 3 (2,846) - (2,846) - - (2,846)Counterparty 4 (614) - (614) - - (614)
Comgest Growth Europe Opportunities is subject to Master Netting Agreements and Credit Support Annexes. As at31 December 2020 forward foreign exchange contracts were held on Comgest Growth Europe Opportunities with JPMorganChase Bank, N.A. (counterparty 1) and UBS AG London Branch (counterparty 2).
The disclosures set out in the table below include financial assets and financial liabilities that are subject to an enforceablemaster netting arrangement.
31 December 2020
Grossamounts ofrecognised
financialassets
/liabilities
Gross amountsof recognised
financialassets/liabilities
offset in theStatement of
FinancialPosition
Net amountsof financial
assetspresented in
theStatement of
FinancialPosition
Related amounts not setoff in Statement ofFinancial Position
Financialinstruments
(includingnon-cashcollateral)
Cashcollateralreceived/pledged
Netamount
EUR EUR EUR EUR EUR EUR
Financial assetsForward foreign exchange contractsCounterparty 1 772 - 772 - - 772
Financial liabilitiesForward foreign exchange contractsCounterparty 2 (16,873) - (16,873) - - (16,873)
COMGEST GROWTH plc
NOTES TO THE FINANCIAL STATEMENTS 31 December 2020 (continued)
267
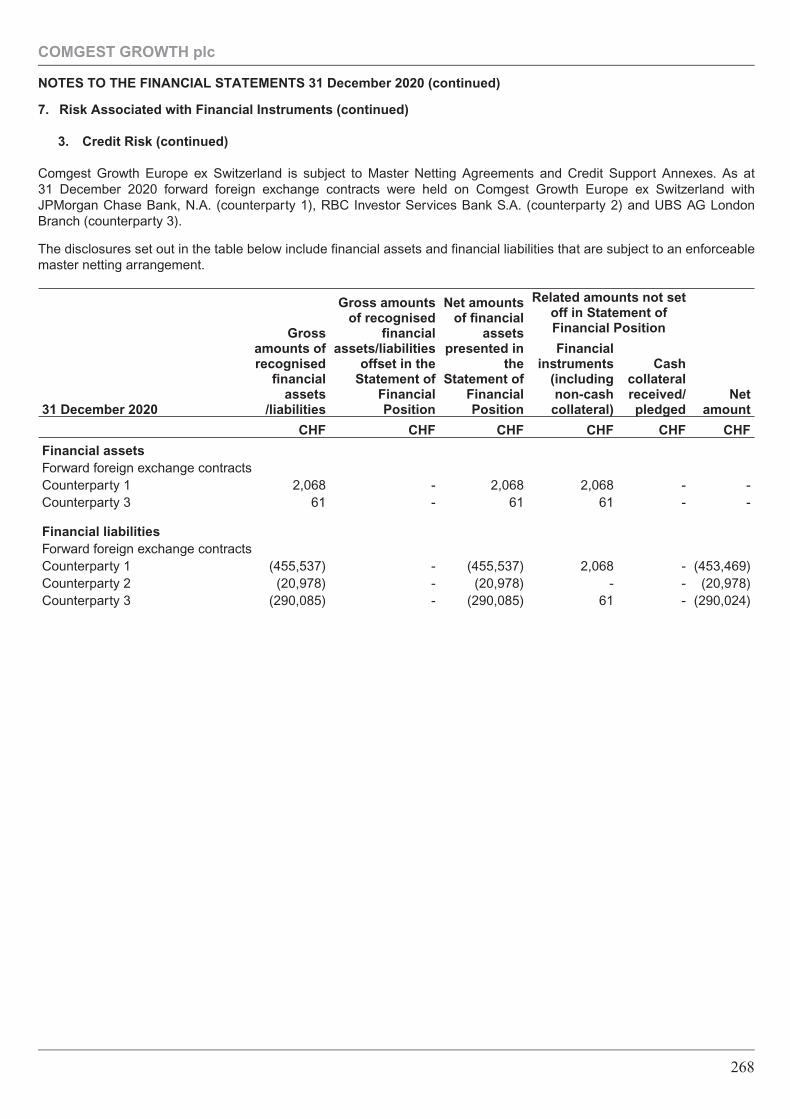
7. Risk Associated with Financial Instruments (continued)
3. Credit Risk (continued)
Comgest Growth Europe ex Switzerland is subject to Master Netting Agreements and Credit Support Annexes. As at31 December 2020 forward foreign exchange contracts were held on Comgest Growth Europe ex Switzerland withJPMorgan Chase Bank, N.A. (counterparty 1), RBC Investor Services Bank S.A. (counterparty 2) and UBS AG LondonBranch (counterparty 3).
The disclosures set out in the table below include financial assets and financial liabilities that are subject to an enforceablemaster netting arrangement.
31 December 2020
Grossamounts ofrecognised
financialassets
/liabilities
Gross amountsof recognised
financialassets/liabilities
offset in theStatement of
FinancialPosition
Net amountsof financial
assetspresented in
theStatement of
FinancialPosition
Related amounts not setoff in Statement ofFinancial Position
Financialinstruments
(includingnon-cashcollateral)
Cashcollateralreceived/pledged
Netamount
CHF CHF CHF CHF CHF CHF
Financial assetsForward foreign exchange contractsCounterparty 1 2,068 - 2,068 2,068 - -Counterparty 3 61 - 61 61 - -
Financial liabilitiesForward foreign exchange contractsCounterparty 1 (455,537) - (455,537) 2,068 - (453,469)Counterparty 2 (20,978) - (20,978) - - (20,978)Counterparty 3 (290,085) - (290,085) 61 - (290,024)
COMGEST GROWTH plc
NOTES TO THE FINANCIAL STATEMENTS 31 December 2020 (continued)
268
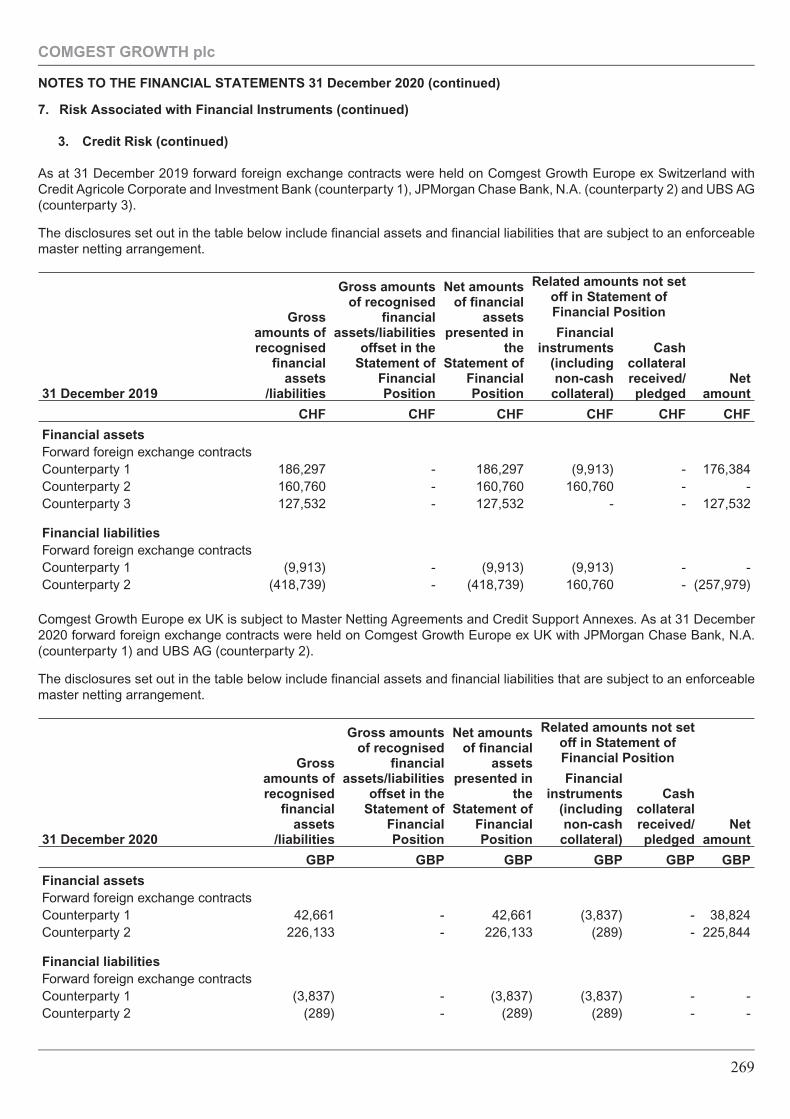
7. Risk Associated with Financial Instruments (continued)
3. Credit Risk (continued)
As at 31 December 2019 forward foreign exchange contracts were held on Comgest Growth Europe ex Switzerland withCredit Agricole Corporate and Investment Bank (counterparty 1), JPMorgan Chase Bank, N.A. (counterparty 2) and UBS AG(counterparty 3).
The disclosures set out in the table below include financial assets and financial liabilities that are subject to an enforceablemaster netting arrangement.
31 December 2019
Grossamounts ofrecognised
financialassets
/liabilities
Gross amountsof recognised
financialassets/liabilities
offset in theStatement of
FinancialPosition
Net amountsof financial
assetspresented in
theStatement of
FinancialPosition
Related amounts not setoff in Statement ofFinancial Position
Financialinstruments
(includingnon-cashcollateral)
Cashcollateralreceived/pledged
Netamount
CHF CHF CHF CHF CHF CHF
Financial assetsForward foreign exchange contractsCounterparty 1 186,297 - 186,297 (9,913) - 176,384Counterparty 2 160,760 - 160,760 160,760 - -Counterparty 3 127,532 - 127,532 - - 127,532
Financial liabilitiesForward foreign exchange contractsCounterparty 1 (9,913) - (9,913) (9,913) - -Counterparty 2 (418,739) - (418,739) 160,760 - (257,979)
Comgest Growth Europe ex UK is subject to Master Netting Agreements and Credit Support Annexes. As at 31 December2020 forward foreign exchange contracts were held on Comgest Growth Europe ex UK with JPMorgan Chase Bank, N.A.(counterparty 1) and UBS AG (counterparty 2).
The disclosures set out in the table below include financial assets and financial liabilities that are subject to an enforceablemaster netting arrangement.
31 December 2020
Grossamounts ofrecognised
financialassets
/liabilities
Gross amountsof recognised
financialassets/liabilities
offset in theStatement of
FinancialPosition
Net amountsof financial
assetspresented in
theStatement of
FinancialPosition
Related amounts not setoff in Statement ofFinancial Position
Financialinstruments
(includingnon-cashcollateral)
Cashcollateralreceived/pledged
Netamount
GBP GBP GBP GBP GBP GBP
Financial assetsForward foreign exchange contractsCounterparty 1 42,661 - 42,661 (3,837) - 38,824Counterparty 2 226,133 - 226,133 (289) - 225,844
Financial liabilitiesForward foreign exchange contractsCounterparty 1 (3,837) - (3,837) (3,837) - -Counterparty 2 (289) - (289) (289) - -
COMGEST GROWTH plc
NOTES TO THE FINANCIAL STATEMENTS 31 December 2020 (continued)
269
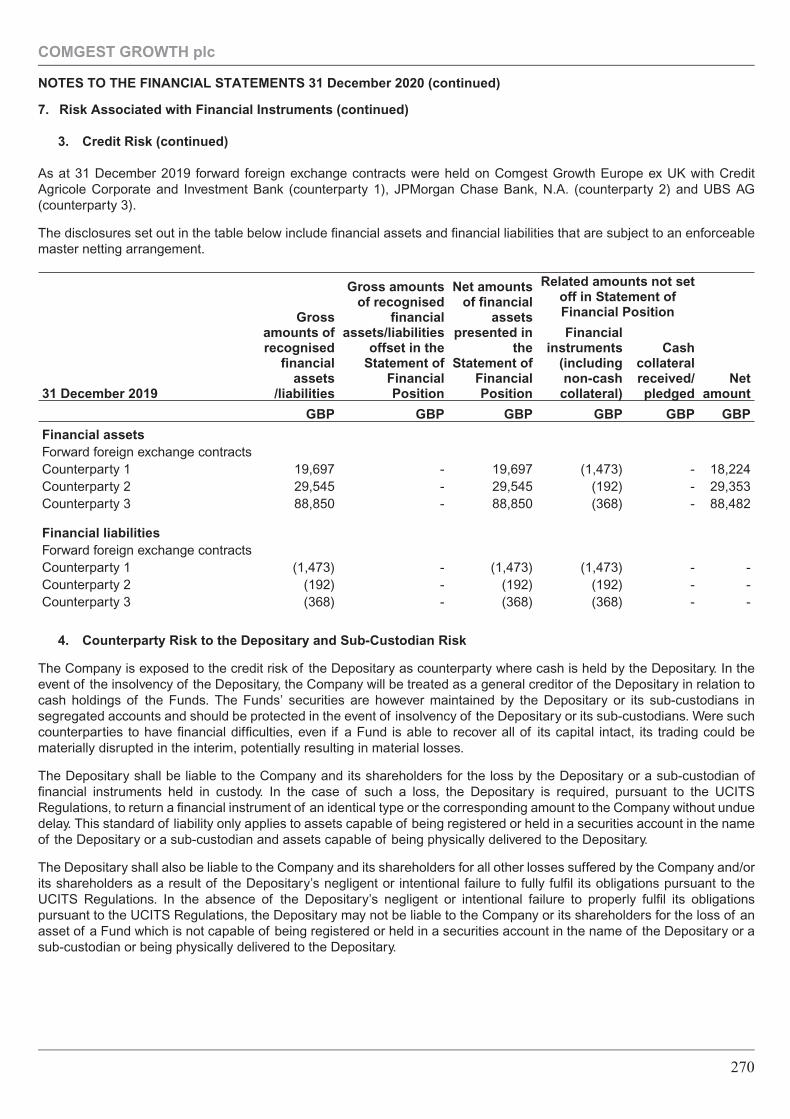
7. Risk Associated with Financial Instruments (continued)
3. Credit Risk (continued)
As at 31 December 2019 forward foreign exchange contracts were held on Comgest Growth Europe ex UK with CreditAgricole Corporate and Investment Bank (counterparty 1), JPMorgan Chase Bank, N.A. (counterparty 2) and UBS AG(counterparty 3).
The disclosures set out in the table below include financial assets and financial liabilities that are subject to an enforceablemaster netting arrangement.
31 December 2019
Grossamounts ofrecognised
financialassets
/liabilities
Gross amountsof recognised
financialassets/liabilities
offset in theStatement of
FinancialPosition
Net amountsof financial
assetspresented in
theStatement of
FinancialPosition
Related amounts not setoff in Statement ofFinancial Position
Financialinstruments
(includingnon-cashcollateral)
Cashcollateralreceived/pledged
Netamount
GBP GBP GBP GBP GBP GBP
Financial assetsForward foreign exchange contractsCounterparty 1 19,697 - 19,697 (1,473) - 18,224Counterparty 2 29,545 - 29,545 (192) - 29,353Counterparty 3 88,850 - 88,850 (368) - 88,482
Financial liabilitiesForward foreign exchange contractsCounterparty 1 (1,473) - (1,473) (1,473) - -Counterparty 2 (192) - (192) (192) - -Counterparty 3 (368) - (368) (368) - -
4. Counterparty Risk to the Depositary and Sub-Custodian Risk
The Company is exposed to the credit risk of the Depositary as counterparty where cash is held by the Depositary. In theevent of the insolvency of the Depositary, the Company will be treated as a general creditor of the Depositary in relation tocash holdings of the Funds. The Funds’ securities are however maintained by the Depositary or its sub-custodians insegregated accounts and should be protected in the event of insolvency of the Depositary or its sub-custodians. Were suchcounterparties to have financial difficulties, even if a Fund is able to recover all of its capital intact, its trading could bematerially disrupted in the interim, potentially resulting in material losses.
The Depositary shall be liable to the Company and its shareholders for the loss by the Depositary or a sub-custodian offinancial instruments held in custody. In the case of such a loss, the Depositary is required, pursuant to the UCITSRegulations, to return a financial instrument of an identical type or the corresponding amount to the Company without unduedelay. This standard of liability only applies to assets capable of being registered or held in a securities account in the nameof the Depositary or a sub-custodian and assets capable of being physically delivered to the Depositary.
The Depositary shall also be liable to the Company and its shareholders for all other losses suffered by the Company and/orits shareholders as a result of the Depositary’s negligent or intentional failure to fully fulfil its obligations pursuant to theUCITS Regulations. In the absence of the Depositary’s negligent or intentional failure to properly fulfil its obligationspursuant to the UCITS Regulations, the Depositary may not be liable to the Company or its shareholders for the loss of anasset of a Fund which is not capable of being registered or held in a securities account in the name of the Depositary or asub-custodian or being physically delivered to the Depositary.
COMGEST GROWTH plc
NOTES TO THE FINANCIAL STATEMENTS 31 December 2020 (continued)
270
7. Risk Associated with Financial Instruments (continued)
4. Counterparty Risk to the Depositary and Sub-Custodian Risk (continued)
The liability of the Depositary is not affected by the fact that it has entrusted the custody of the Company’s assets to a thirdparty. In the event that custody is delegated to local entities that are not subject to effective prudential regulation, includingminimum capital requirements, and supervision in the jurisdiction concerned, prior shareholder notice will be providedadvising of the risks involved in such delegation. As noted above, in the absence of the Depositary’s negligent or intentionalfailure to properly fulfil its obligations pursuant to the UCITS Regulations, the Depositary may not be liable to the Companyor its shareholders for the loss of an asset of a Fund which is not capable of being registered or held in a securities accountin the name of the Depositary or a sub-custodian or being physically delivered to the Depositary. Accordingly, while theliability of the Depositary is not affected by the fact that it has entrusted the custody of the Company’s assets to a third party,in markets where custodial and/or settlement systems may not be fully developed, a Fund may be exposed to sub-custodialrisk in respect of the loss of such assets in circumstances whereby the Depositary will have no liability.
5. Fair Value Hierarchy
IFRS 7, Financial Instruments: Disclosures establishes a fair value hierarchy classifying Fair Value measurements thatreflect the significance of the inputs used in making the measurement. The fair value hierarchy is categorised into threelevels based on the inputs as follows:
Level 1 - Valuations based on quoted prices in active markets for identical assets or liabilities (level 1);
Level 2 - Valuations based on quoted prices in markets that are not active or other than quoted prices included within level 1that are observable, either directly (as prices) or indirectly (derived from prices) (level 2); and
Level 3 - Valuations based on inputs that are unobservable and significant to the overall fair value measurement.
Inputs are used in applying the various valuation techniques and broadly refer to the assumptions that market participantsuse to make valuation decisions, including assumptions about risk. Inputs may include price information, volatility statistics,specific and broad credit data, liquidity statistics, and other factors. A financial instrument’s level within the fair valuehierarchy is based on the lowest level of any input that is significant to the fair value measurement.
Observable inputs are those that market participants would use in pricing the asset or liability based on market data obtainedfrom sources independent of the Company’s management. Unobservable inputs reflect the Company’s management’sassumptions, made in good faith, about the inputs market participants would use in pricing the asset or liability based on thebest information available in the circumstances. However, the determination of what constitutes ‘‘observable’’ requiressignificant judgment by the Company’s management. Company’s management considers observable data to be that marketdata which is readily available, regularly distributed or updated, reliable and verifiable, not proprietary, and provided byindependent sources that are actively involved in the relevant market. The categorisation of a financial instrument within thehierarchy is based upon the pricing transparency of the instrument and does not necessarily correspond to the Company’smanagement’s perceived risk of that instrument.
Fair value is a market-based measure considered from the perspective of a market participant rather than an entity-specificmeasure. Therefore, even when market assumptions are not readily available, the Company’s management’s ownassumptions are set to reflect those that market participants would use in pricing the asset or liability at the measurementdate. Company management uses prices and inputs that are current as of the measurement date, including in periods ofmarket dislocation. In periods of market dislocation, the observability of prices and inputs may be reduced for manysecurities. This condition could cause a security to be reclassified to a lower level within the fair value hierarchy. The Fundsclassify their investment in underlying funds based on the ability to redeem at the NAV supplied by the underlying fund’sadministrator and considerations for any restrictions on liquidity imposed by the underlying funds.
COMGEST GROWTH plc
NOTES TO THE FINANCIAL STATEMENTS 31 December 2020 (continued)
271
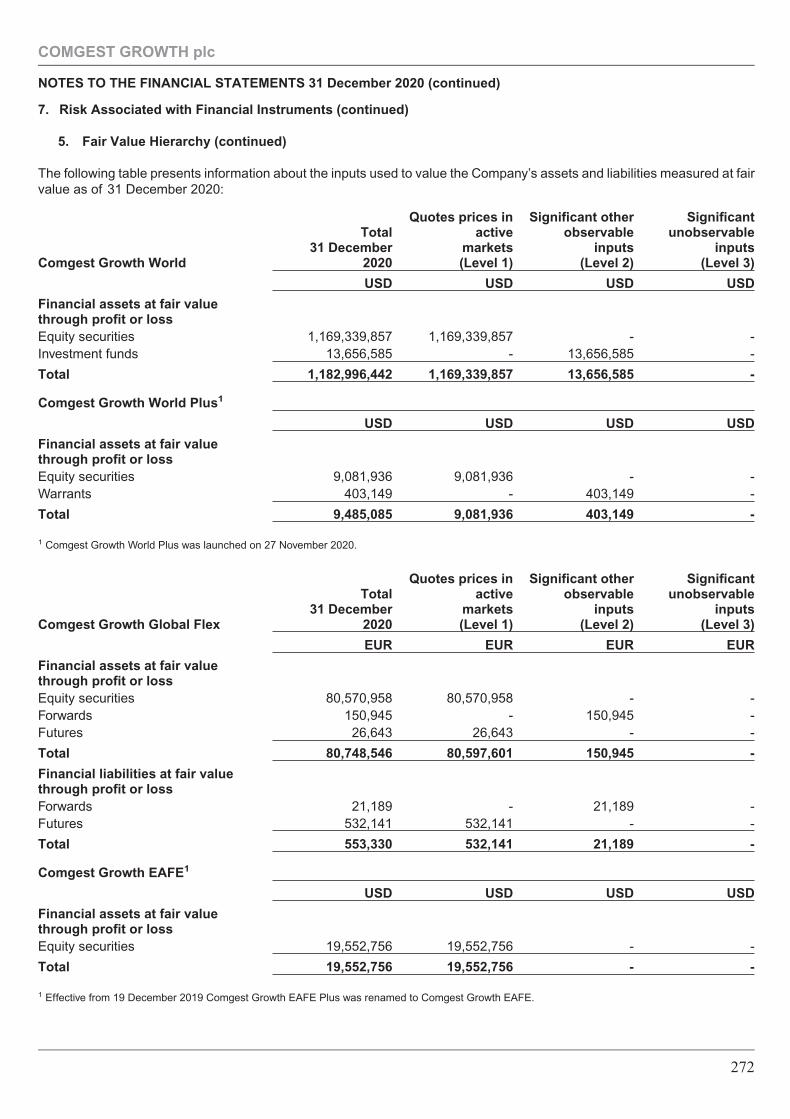
7. Risk Associated with Financial Instruments (continued)
5. Fair Value Hierarchy (continued)
The following table presents information about the inputs used to value the Company’s assets and liabilities measured at fairvalue as of 31 December 2020:
Comgest Growth World
Total31 December
2020
Quotes prices inactive
markets(Level 1)
Significant otherobservable
inputs(Level 2)
Significantunobservable
inputs(Level 3)
USD USD USD USD
Financial assets at fair valuethrough profit or lossEquity securities 1,169,339,857 1,169,339,857 - -Investment funds 13,656,585 - 13,656,585 -
Total 1,182,996,442 1,169,339,857 13,656,585 -
Comgest Growth World Plus1
USD USD USD USD
Financial assets at fair valuethrough profit or lossEquity securities 9,081,936 9,081,936 - -Warrants 403,149 - 403,149 -
Total 9,485,085 9,081,936 403,149 -
1 Comgest Growth World Plus was launched on 27 November 2020.
Comgest Growth Global Flex
Total31 December
2020
Quotes prices inactive
markets(Level 1)
Significant otherobservable
inputs(Level 2)
Significantunobservable
inputs(Level 3)
EUR EUR EUR EUR
Financial assets at fair valuethrough profit or lossEquity securities 80,570,958 80,570,958 - -Forwards 150,945 - 150,945 -Futures 26,643 26,643 - -
Total 80,748,546 80,597,601 150,945 -
Financial liabilities at fair valuethrough profit or lossForwards 21,189 - 21,189 -Futures 532,141 532,141 - -
Total 553,330 532,141 21,189 -
Comgest Growth EAFE1
USD USD USD USD
Financial assets at fair valuethrough profit or lossEquity securities 19,552,756 19,552,756 - -
Total 19,552,756 19,552,756 - -
1 Effective from 19 December 2019 Comgest Growth EAFE Plus was renamed to Comgest Growth EAFE.
COMGEST GROWTH plc
NOTES TO THE FINANCIAL STATEMENTS 31 December 2020 (continued)
272
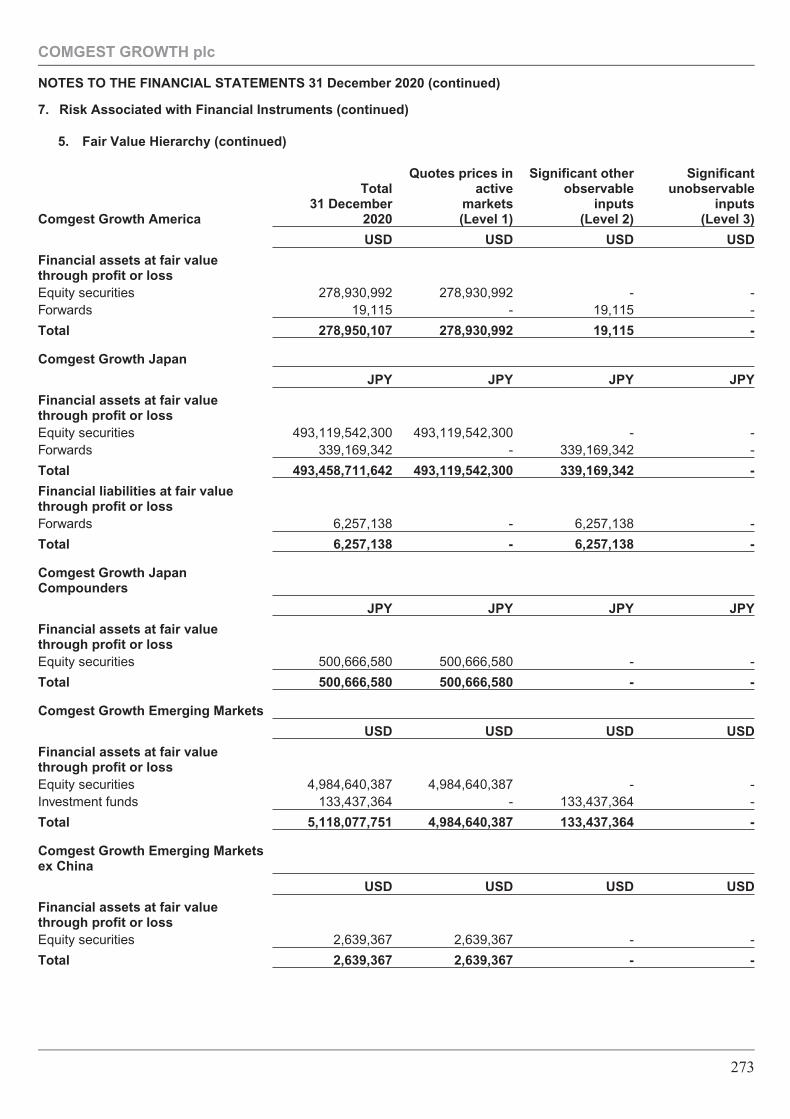
7. Risk Associated with Financial Instruments (continued)
5. Fair Value Hierarchy (continued)
Comgest Growth America
Total31 December
2020
Quotes prices inactive
markets(Level 1)
Significant otherobservable
inputs(Level 2)
Significantunobservable
inputs(Level 3)
USD USD USD USD
Financial assets at fair valuethrough profit or lossEquity securities 278,930,992 278,930,992 - -Forwards 19,115 - 19,115 -
Total 278,950,107 278,930,992 19,115 -
Comgest Growth Japan
JPY JPY JPY JPY
Financial assets at fair valuethrough profit or lossEquity securities 493,119,542,300 493,119,542,300 - -Forwards 339,169,342 - 339,169,342 -
Total 493,458,711,642 493,119,542,300 339,169,342 -
Financial liabilities at fair valuethrough profit or lossForwards 6,257,138 - 6,257,138 -
Total 6,257,138 - 6,257,138 -
Comgest Growth JapanCompounders
JPY JPY JPY JPY
Financial assets at fair valuethrough profit or lossEquity securities 500,666,580 500,666,580 - -
Total 500,666,580 500,666,580 - -
Comgest Growth Emerging Markets
USD USD USD USD
Financial assets at fair valuethrough profit or lossEquity securities 4,984,640,387 4,984,640,387 - -Investment funds 133,437,364 - 133,437,364 -
Total 5,118,077,751 4,984,640,387 133,437,364 -
Comgest Growth Emerging Marketsex China
USD USD USD USD
Financial assets at fair valuethrough profit or lossEquity securities 2,639,367 2,639,367 - -
Total 2,639,367 2,639,367 - -
COMGEST GROWTH plc
NOTES TO THE FINANCIAL STATEMENTS 31 December 2020 (continued)
273
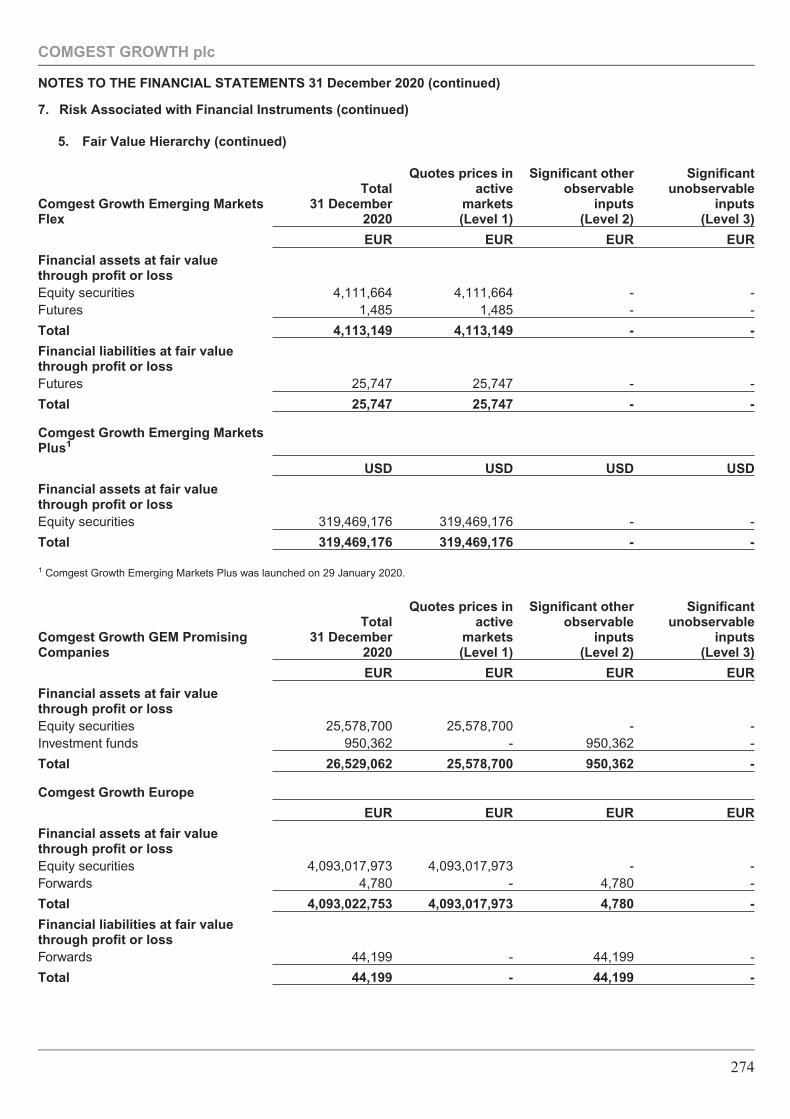
7. Risk Associated with Financial Instruments (continued)
5. Fair Value Hierarchy (continued)
Comgest Growth Emerging MarketsFlex
Total31 December
2020
Quotes prices inactive
markets(Level 1)
Significant otherobservable
inputs(Level 2)
Significantunobservable
inputs(Level 3)
EUR EUR EUR EUR
Financial assets at fair valuethrough profit or lossEquity securities 4,111,664 4,111,664 - -Futures 1,485 1,485 - -
Total 4,113,149 4,113,149 - -
Financial liabilities at fair valuethrough profit or lossFutures 25,747 25,747 - -
Total 25,747 25,747 - -
Comgest Growth Emerging MarketsPlus1
USD USD USD USD
Financial assets at fair valuethrough profit or lossEquity securities 319,469,176 319,469,176 - -
Total 319,469,176 319,469,176 - -
1 Comgest Growth Emerging Markets Plus was launched on 29 January 2020.
Comgest Growth GEM PromisingCompanies
Total31 December
2020
Quotes prices inactive
markets(Level 1)
Significant otherobservable
inputs(Level 2)
Significantunobservable
inputs(Level 3)
EUR EUR EUR EUR
Financial assets at fair valuethrough profit or lossEquity securities 25,578,700 25,578,700 - -Investment funds 950,362 - 950,362 -
Total 26,529,062 25,578,700 950,362 -
Comgest Growth Europe
EUR EUR EUR EUR
Financial assets at fair valuethrough profit or lossEquity securities 4,093,017,973 4,093,017,973 - -Forwards 4,780 - 4,780 -
Total 4,093,022,753 4,093,017,973 4,780 -
Financial liabilities at fair valuethrough profit or lossForwards 44,199 - 44,199 -
Total 44,199 - 44,199 -
COMGEST GROWTH plc
NOTES TO THE FINANCIAL STATEMENTS 31 December 2020 (continued)
274
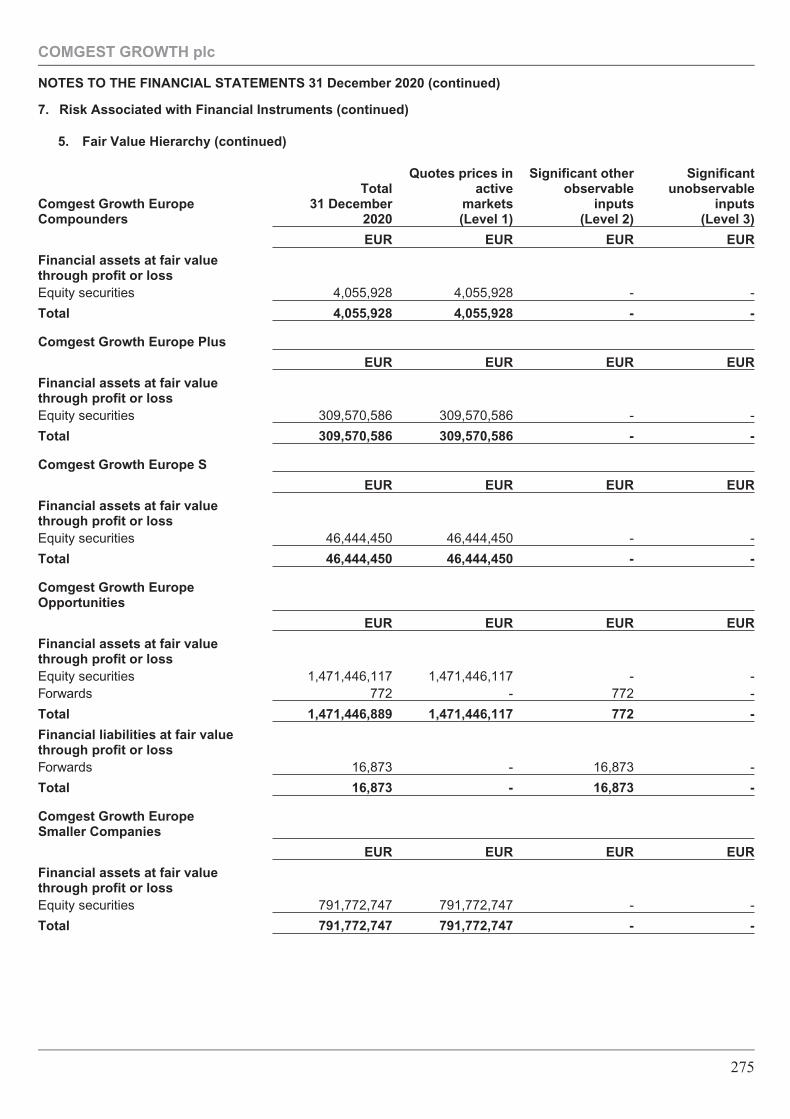
7. Risk Associated with Financial Instruments (continued)
5. Fair Value Hierarchy (continued)
Comgest Growth EuropeCompounders
Total31 December
2020
Quotes prices inactive
markets(Level 1)
Significant otherobservable
inputs(Level 2)
Significantunobservable
inputs(Level 3)
EUR EUR EUR EUR
Financial assets at fair valuethrough profit or lossEquity securities 4,055,928 4,055,928 - -
Total 4,055,928 4,055,928 - -
Comgest Growth Europe Plus
EUR EUR EUR EUR
Financial assets at fair valuethrough profit or lossEquity securities 309,570,586 309,570,586 - -
Total 309,570,586 309,570,586 - -
Comgest Growth Europe S
EUR EUR EUR EUR
Financial assets at fair valuethrough profit or lossEquity securities 46,444,450 46,444,450 - -
Total 46,444,450 46,444,450 - -
Comgest Growth EuropeOpportunities
EUR EUR EUR EUR
Financial assets at fair valuethrough profit or lossEquity securities 1,471,446,117 1,471,446,117 - -Forwards 772 - 772 -
Total 1,471,446,889 1,471,446,117 772 -
Financial liabilities at fair valuethrough profit or lossForwards 16,873 - 16,873 -
Total 16,873 - 16,873 -
Comgest Growth EuropeSmaller Companies
EUR EUR EUR EUR
Financial assets at fair valuethrough profit or lossEquity securities 791,772,747 791,772,747 - -
Total 791,772,747 791,772,747 - -
COMGEST GROWTH plc
NOTES TO THE FINANCIAL STATEMENTS 31 December 2020 (continued)
275
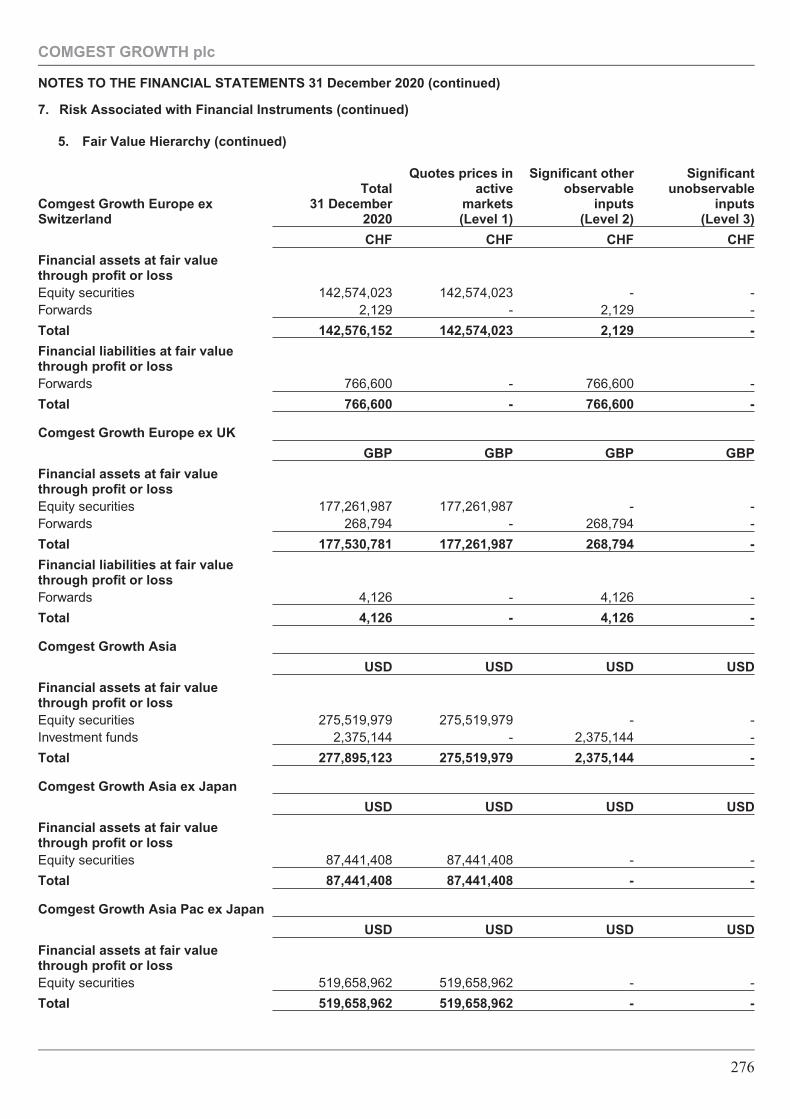
7. Risk Associated with Financial Instruments (continued)
5. Fair Value Hierarchy (continued)
Comgest Growth Europe exSwitzerland
Total31 December
2020
Quotes prices inactive
markets(Level 1)
Significant otherobservable
inputs(Level 2)
Significantunobservable
inputs(Level 3)
CHF CHF CHF CHF
Financial assets at fair valuethrough profit or lossEquity securities 142,574,023 142,574,023 - -Forwards 2,129 - 2,129 -
Total 142,576,152 142,574,023 2,129 -
Financial liabilities at fair valuethrough profit or lossForwards 766,600 - 766,600 -
Total 766,600 - 766,600 -
Comgest Growth Europe ex UK
GBP GBP GBP GBP
Financial assets at fair valuethrough profit or lossEquity securities 177,261,987 177,261,987 - -Forwards 268,794 - 268,794 -
Total 177,530,781 177,261,987 268,794 -
Financial liabilities at fair valuethrough profit or lossForwards 4,126 - 4,126 -
Total 4,126 - 4,126 -
Comgest Growth Asia
USD USD USD USD
Financial assets at fair valuethrough profit or lossEquity securities 275,519,979 275,519,979 - -Investment funds 2,375,144 - 2,375,144 -
Total 277,895,123 275,519,979 2,375,144 -
Comgest Growth Asia ex Japan
USD USD USD USD
Financial assets at fair valuethrough profit or lossEquity securities 87,441,408 87,441,408 - -
Total 87,441,408 87,441,408 - -
Comgest Growth Asia Pac ex Japan
USD USD USD USD
Financial assets at fair valuethrough profit or lossEquity securities 519,658,962 519,658,962 - -
Total 519,658,962 519,658,962 - -
COMGEST GROWTH plc
NOTES TO THE FINANCIAL STATEMENTS 31 December 2020 (continued)
276
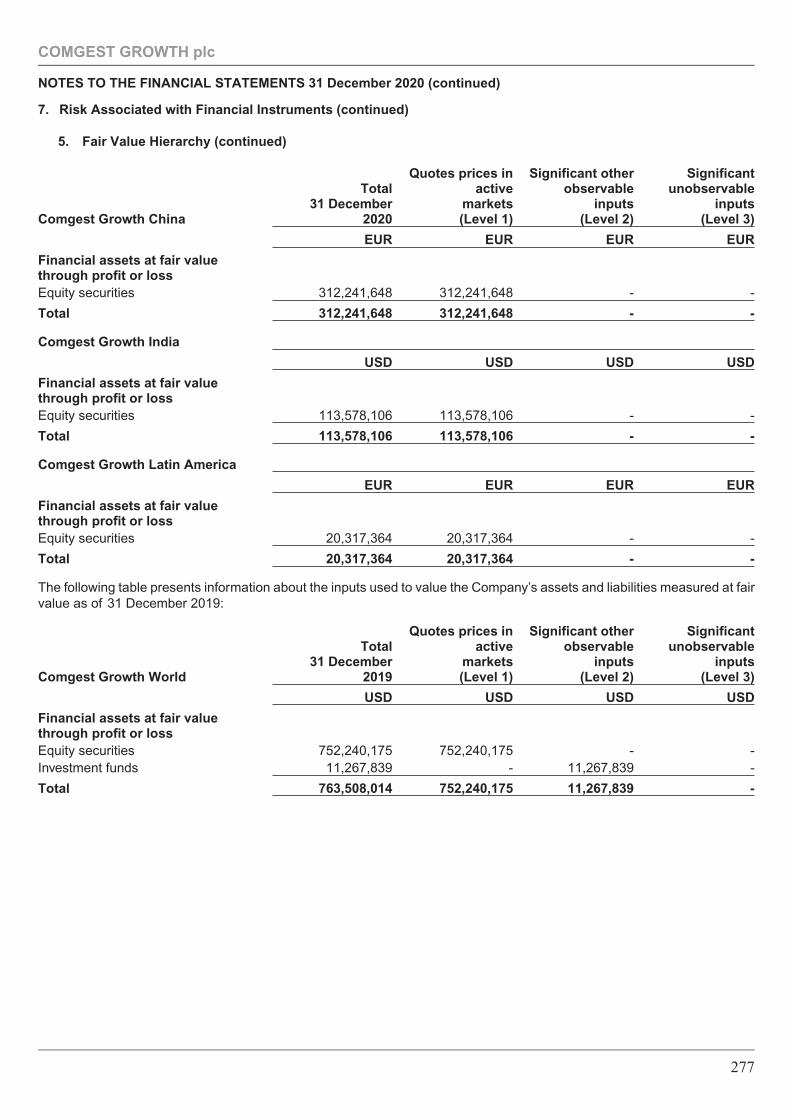
7. Risk Associated with Financial Instruments (continued)
5. Fair Value Hierarchy (continued)
Comgest Growth China
Total31 December
2020
Quotes prices inactive
markets(Level 1)
Significant otherobservable
inputs(Level 2)
Significantunobservable
inputs(Level 3)
EUR EUR EUR EUR
Financial assets at fair valuethrough profit or lossEquity securities 312,241,648 312,241,648 - -
Total 312,241,648 312,241,648 - -
Comgest Growth India
USD USD USD USD
Financial assets at fair valuethrough profit or lossEquity securities 113,578,106 113,578,106 - -
Total 113,578,106 113,578,106 - -
Comgest Growth Latin America
EUR EUR EUR EUR
Financial assets at fair valuethrough profit or lossEquity securities 20,317,364 20,317,364 - -
Total 20,317,364 20,317,364 - -
The following table presents information about the inputs used to value the Company’s assets and liabilities measured at fairvalue as of 31 December 2019:
Comgest Growth World
Total31 December
2019
Quotes prices inactive
markets(Level 1)
Significant otherobservable
inputs(Level 2)
Significantunobservable
inputs(Level 3)
USD USD USD USD
Financial assets at fair valuethrough profit or lossEquity securities 752,240,175 752,240,175 - -Investment funds 11,267,839 - 11,267,839 -
Total 763,508,014 752,240,175 11,267,839 -
COMGEST GROWTH plc
NOTES TO THE FINANCIAL STATEMENTS 31 December 2020 (continued)
277
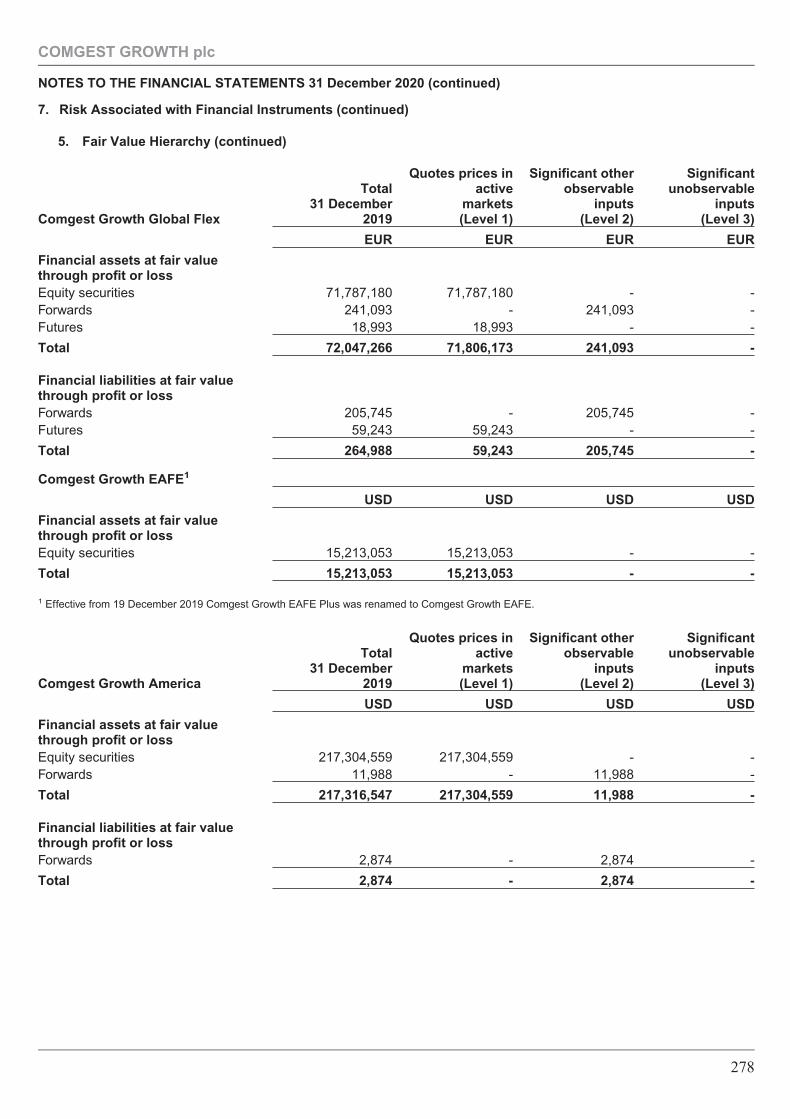
7. Risk Associated with Financial Instruments (continued)
5. Fair Value Hierarchy (continued)
Comgest Growth Global Flex
Total31 December
2019
Quotes prices inactive
markets(Level 1)
Significant otherobservable
inputs(Level 2)
Significantunobservable
inputs(Level 3)
EUR EUR EUR EUR
Financial assets at fair valuethrough profit or lossEquity securities 71,787,180 71,787,180 - -Forwards 241,093 - 241,093 -Futures 18,993 18,993 - -
Total 72,047,266 71,806,173 241,093 -
Financial liabilities at fair valuethrough profit or lossForwards 205,745 - 205,745 -Futures 59,243 59,243 - -
Total 264,988 59,243 205,745 -
Comgest Growth EAFE1
USD USD USD USD
Financial assets at fair valuethrough profit or lossEquity securities 15,213,053 15,213,053 - -
Total 15,213,053 15,213,053 - -
1 Effective from 19 December 2019 Comgest Growth EAFE Plus was renamed to Comgest Growth EAFE.
Comgest Growth America
Total31 December
2019
Quotes prices inactive
markets(Level 1)
Significant otherobservable
inputs(Level 2)
Significantunobservable
inputs(Level 3)
USD USD USD USD
Financial assets at fair valuethrough profit or lossEquity securities 217,304,559 217,304,559 - -Forwards 11,988 - 11,988 -
Total 217,316,547 217,304,559 11,988 -
Financial liabilities at fair valuethrough profit or lossForwards 2,874 - 2,874 -
Total 2,874 - 2,874 -
COMGEST GROWTH plc
NOTES TO THE FINANCIAL STATEMENTS 31 December 2020 (continued)
278
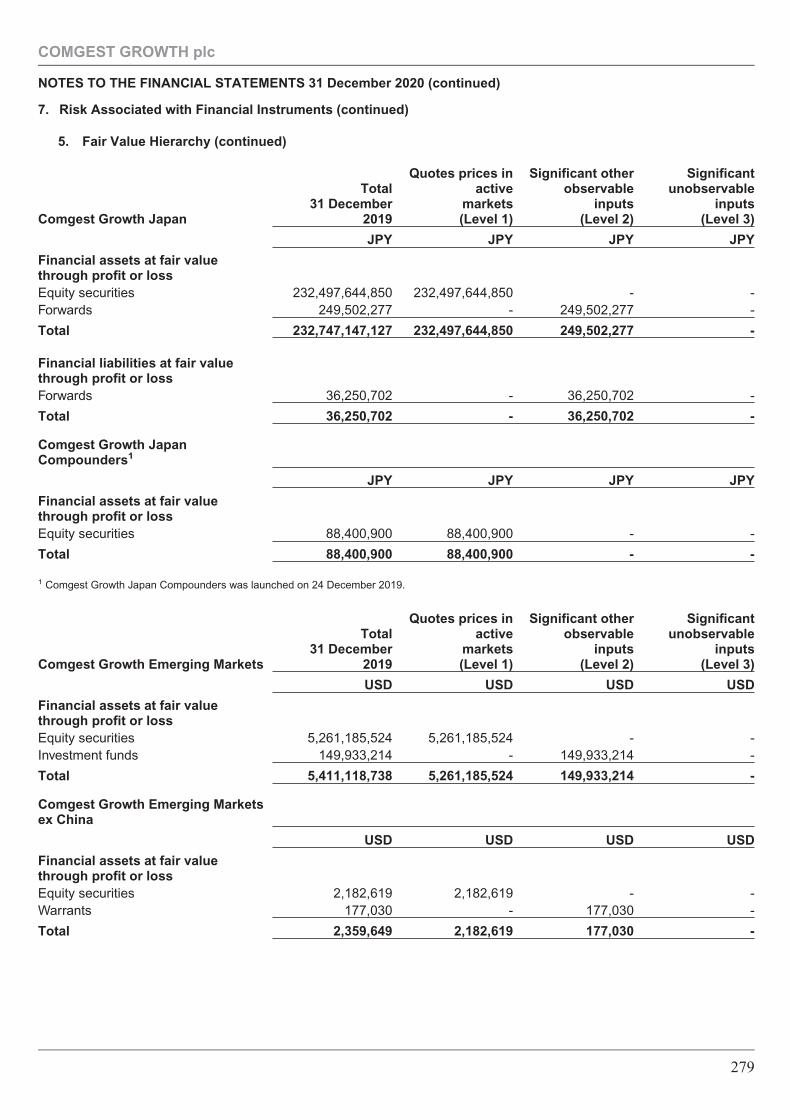
7. Risk Associated with Financial Instruments (continued)
5. Fair Value Hierarchy (continued)
Comgest Growth Japan
Total31 December
2019
Quotes prices inactive
markets(Level 1)
Significant otherobservable
inputs(Level 2)
Significantunobservable
inputs(Level 3)
JPY JPY JPY JPY
Financial assets at fair valuethrough profit or lossEquity securities 232,497,644,850 232,497,644,850 - -Forwards 249,502,277 - 249,502,277 -
Total 232,747,147,127 232,497,644,850 249,502,277 -
Financial liabilities at fair valuethrough profit or lossForwards 36,250,702 - 36,250,702 -
Total 36,250,702 - 36,250,702 -
Comgest Growth JapanCompounders1
JPY JPY JPY JPY
Financial assets at fair valuethrough profit or lossEquity securities 88,400,900 88,400,900 - -
Total 88,400,900 88,400,900 - -
1 Comgest Growth Japan Compounders was launched on 24 December 2019.
Comgest Growth Emerging Markets
Total31 December
2019
Quotes prices inactive
markets(Level 1)
Significant otherobservable
inputs(Level 2)
Significantunobservable
inputs(Level 3)
USD USD USD USD
Financial assets at fair valuethrough profit or lossEquity securities 5,261,185,524 5,261,185,524 - -Investment funds 149,933,214 - 149,933,214 -
Total 5,411,118,738 5,261,185,524 149,933,214 -
Comgest Growth Emerging Marketsex China
USD USD USD USD
Financial assets at fair valuethrough profit or lossEquity securities 2,182,619 2,182,619 - -Warrants 177,030 - 177,030 -
Total 2,359,649 2,182,619 177,030 -
COMGEST GROWTH plc
NOTES TO THE FINANCIAL STATEMENTS 31 December 2020 (continued)
279
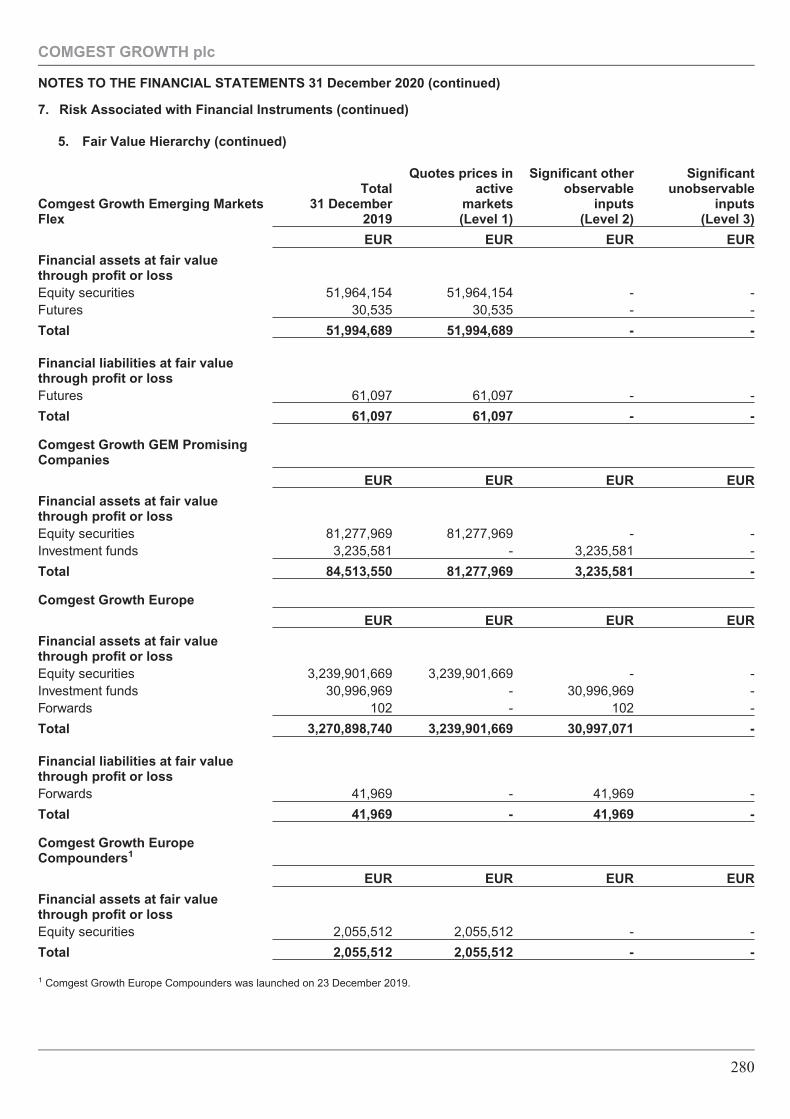
7. Risk Associated with Financial Instruments (continued)
5. Fair Value Hierarchy (continued)
Comgest Growth Emerging MarketsFlex
Total31 December
2019
Quotes prices inactive
markets(Level 1)
Significant otherobservable
inputs(Level 2)
Significantunobservable
inputs(Level 3)
EUR EUR EUR EUR
Financial assets at fair valuethrough profit or lossEquity securities 51,964,154 51,964,154 - -Futures 30,535 30,535 - -
Total 51,994,689 51,994,689 - -
Financial liabilities at fair valuethrough profit or lossFutures 61,097 61,097 - -
Total 61,097 61,097 - -
Comgest Growth GEM PromisingCompanies
EUR EUR EUR EUR
Financial assets at fair valuethrough profit or lossEquity securities 81,277,969 81,277,969 - -Investment funds 3,235,581 - 3,235,581 -
Total 84,513,550 81,277,969 3,235,581 -
Comgest Growth Europe
EUR EUR EUR EUR
Financial assets at fair valuethrough profit or lossEquity securities 3,239,901,669 3,239,901,669 - -Investment funds 30,996,969 - 30,996,969 -Forwards 102 - 102 -
Total 3,270,898,740 3,239,901,669 30,997,071 -
Financial liabilities at fair valuethrough profit or lossForwards 41,969 - 41,969 -
Total 41,969 - 41,969 -
Comgest Growth EuropeCompounders1
EUR EUR EUR EUR
Financial assets at fair valuethrough profit or lossEquity securities 2,055,512 2,055,512 - -
Total 2,055,512 2,055,512 - -
1 Comgest Growth Europe Compounders was launched on 23 December 2019.
COMGEST GROWTH plc
NOTES TO THE FINANCIAL STATEMENTS 31 December 2020 (continued)
280
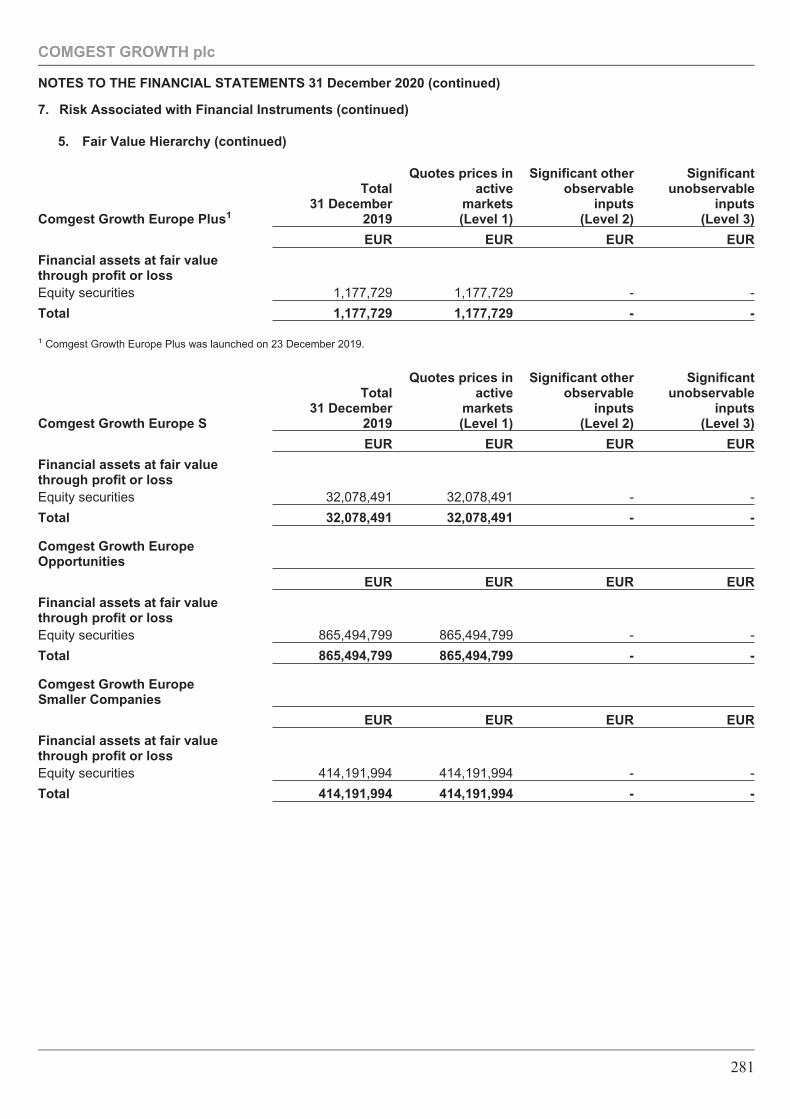
7. Risk Associated with Financial Instruments (continued)
5. Fair Value Hierarchy (continued)
Comgest Growth Europe Plus1
Total31 December
2019
Quotes prices inactive
markets(Level 1)
Significant otherobservable
inputs(Level 2)
Significantunobservable
inputs(Level 3)
EUR EUR EUR EUR
Financial assets at fair valuethrough profit or lossEquity securities 1,177,729 1,177,729 - -
Total 1,177,729 1,177,729 - -
1 Comgest Growth Europe Plus was launched on 23 December 2019.
Comgest Growth Europe S
Total31 December
2019
Quotes prices inactive
markets(Level 1)
Significant otherobservable
inputs(Level 2)
Significantunobservable
inputs(Level 3)
EUR EUR EUR EUR
Financial assets at fair valuethrough profit or lossEquity securities 32,078,491 32,078,491 - -
Total 32,078,491 32,078,491 - -
Comgest Growth EuropeOpportunities
EUR EUR EUR EUR
Financial assets at fair valuethrough profit or lossEquity securities 865,494,799 865,494,799 - -
Total 865,494,799 865,494,799 - -
Comgest Growth EuropeSmaller Companies
EUR EUR EUR EUR
Financial assets at fair valuethrough profit or lossEquity securities 414,191,994 414,191,994 - -
Total 414,191,994 414,191,994 - -
COMGEST GROWTH plc
NOTES TO THE FINANCIAL STATEMENTS 31 December 2020 (continued)
281
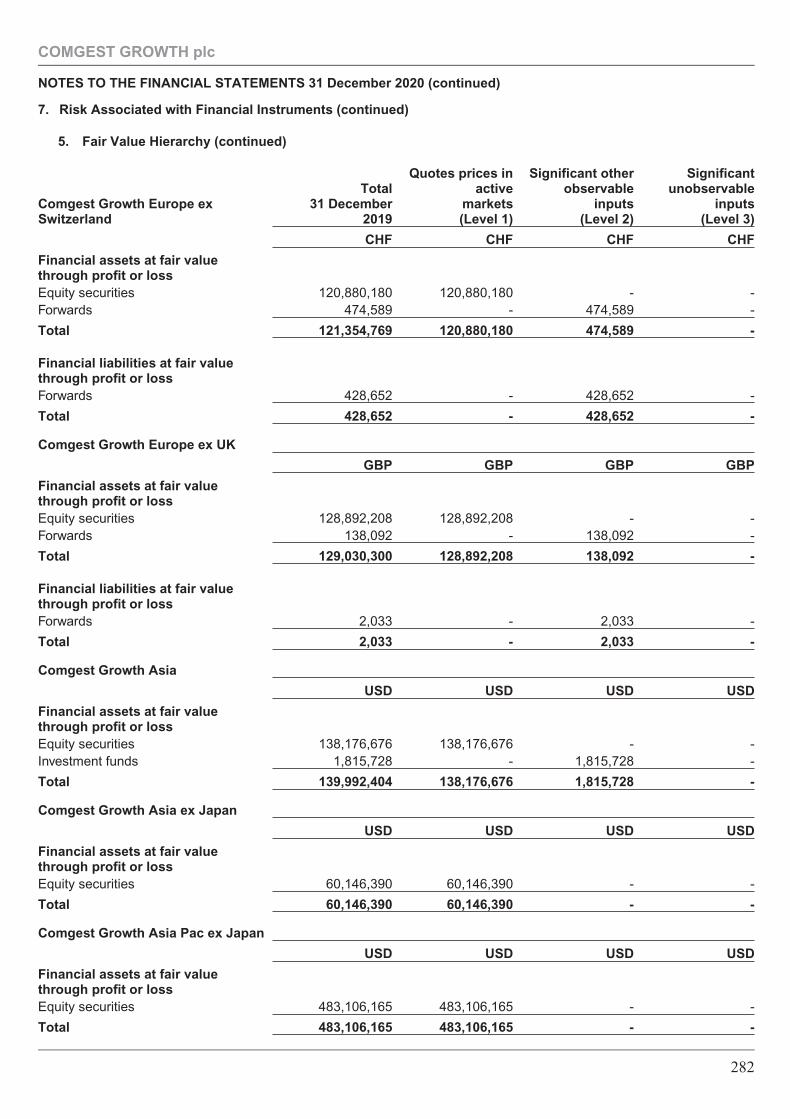
7. Risk Associated with Financial Instruments (continued)
5. Fair Value Hierarchy (continued)
Comgest Growth Europe exSwitzerland
Total31 December
2019
Quotes prices inactive
markets(Level 1)
Significant otherobservable
inputs(Level 2)
Significantunobservable
inputs(Level 3)
CHF CHF CHF CHF
Financial assets at fair valuethrough profit or lossEquity securities 120,880,180 120,880,180 - -Forwards 474,589 - 474,589 -
Total 121,354,769 120,880,180 474,589 -
Financial liabilities at fair valuethrough profit or lossForwards 428,652 - 428,652 -
Total 428,652 - 428,652 -
Comgest Growth Europe ex UK
GBP GBP GBP GBP
Financial assets at fair valuethrough profit or lossEquity securities 128,892,208 128,892,208 - -Forwards 138,092 - 138,092 -
Total 129,030,300 128,892,208 138,092 -
Financial liabilities at fair valuethrough profit or lossForwards 2,033 - 2,033 -
Total 2,033 - 2,033 -
Comgest Growth Asia
USD USD USD USD
Financial assets at fair valuethrough profit or lossEquity securities 138,176,676 138,176,676 - -Investment funds 1,815,728 - 1,815,728 -
Total 139,992,404 138,176,676 1,815,728 -
Comgest Growth Asia ex Japan
USD USD USD USD
Financial assets at fair valuethrough profit or lossEquity securities 60,146,390 60,146,390 - -
Total 60,146,390 60,146,390 - -
Comgest Growth Asia Pac ex Japan
USD USD USD USD
Financial assets at fair valuethrough profit or lossEquity securities 483,106,165 483,106,165 - -
Total 483,106,165 483,106,165 - -
COMGEST GROWTH plc
NOTES TO THE FINANCIAL STATEMENTS 31 December 2020 (continued)
282
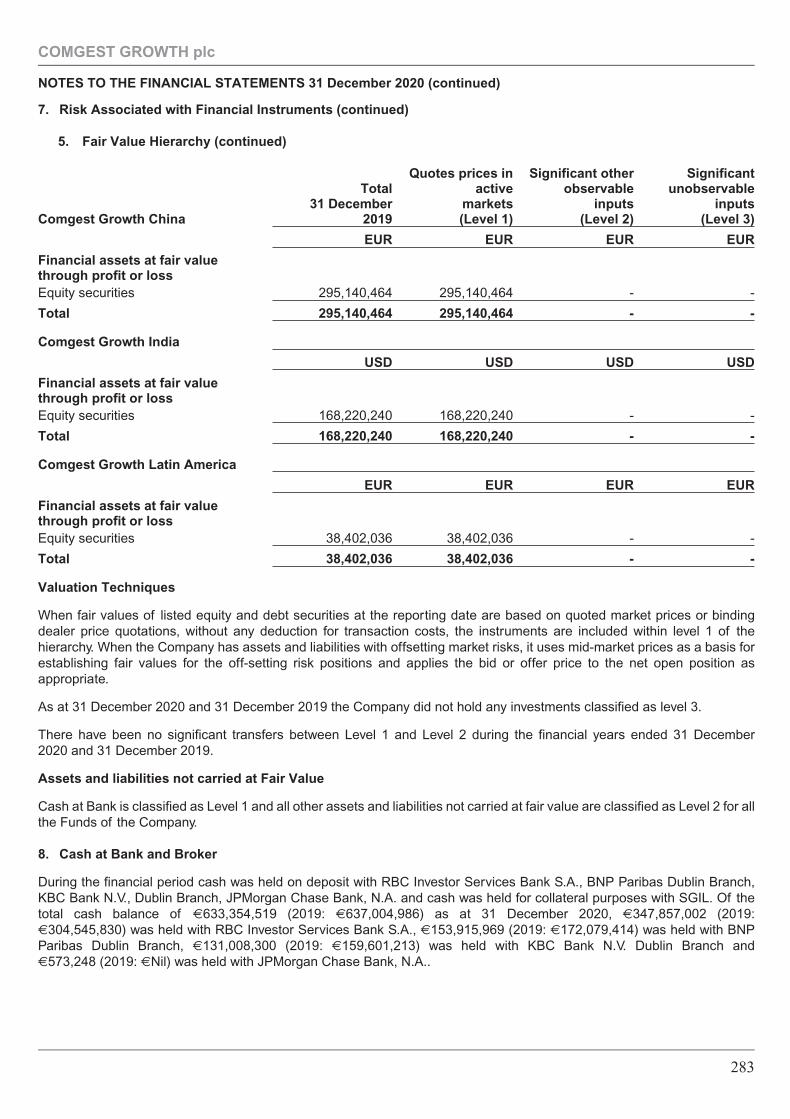
7. Risk Associated with Financial Instruments (continued)
5. Fair Value Hierarchy (continued)
Comgest Growth China
Total31 December
2019
Quotes prices inactive
markets(Level 1)
Significant otherobservable
inputs(Level 2)
Significantunobservable
inputs(Level 3)
EUR EUR EUR EUR
Financial assets at fair valuethrough profit or lossEquity securities 295,140,464 295,140,464 - -
Total 295,140,464 295,140,464 - -
Comgest Growth India
USD USD USD USD
Financial assets at fair valuethrough profit or lossEquity securities 168,220,240 168,220,240 - -
Total 168,220,240 168,220,240 - -
Comgest Growth Latin America
EUR EUR EUR EUR
Financial assets at fair valuethrough profit or lossEquity securities 38,402,036 38,402,036 - -
Total 38,402,036 38,402,036 - -
Valuation Techniques
When fair values of listed equity and debt securities at the reporting date are based on quoted market prices or bindingdealer price quotations, without any deduction for transaction costs, the instruments are included within level 1 of thehierarchy. When the Company has assets and liabilities with offsetting market risks, it uses mid-market prices as a basis forestablishing fair values for the off-setting risk positions and applies the bid or offer price to the net open position asappropriate.
As at 31 December 2020 and 31 December 2019 the Company did not hold any investments classified as level 3.
There have been no significant transfers between Level 1 and Level 2 during the financial years ended 31 December2020 and 31 December 2019.
Assets and liabilities not carried at Fair Value
Cash at Bank is classified as Level 1 and all other assets and liabilities not carried at fair value are classified as Level 2 for allthe Funds of the Company.
8. Cash at Bank and Broker
During the financial period cash was held on deposit with RBC Investor Services Bank S.A., BNP Paribas Dublin Branch,KBC Bank N.V., Dublin Branch, JPMorgan Chase Bank, N.A. and cash was held for collateral purposes with SGIL. Of thetotal cash balance of €633,354,519 (2019: €637,004,986) as at 31 December 2020, €347,857,002 (2019:€304,545,830) was held with RBC Investor Services Bank S.A., €153,915,969 (2019: €172,079,414) was held with BNPParibas Dublin Branch, €131,008,300 (2019: €159,601,213) was held with KBC Bank N.V. Dublin Branch and€573,248 (2019: €Nil) was held with JPMorgan Chase Bank, N.A..
COMGEST GROWTH plc
NOTES TO THE FINANCIAL STATEMENTS 31 December 2020 (continued)
283
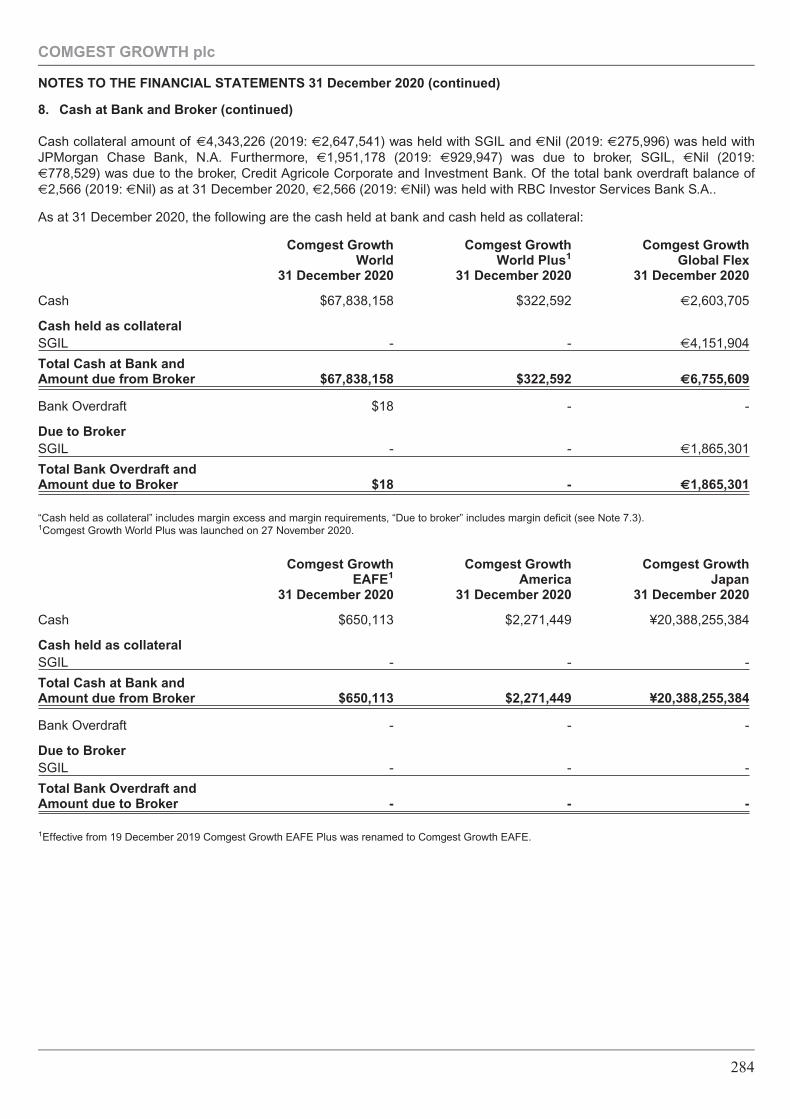
8. Cash at Bank and Broker (continued)
Cash collateral amount of €4,343,226 (2019: €2,647,541) was held with SGIL and €Nil (2019: €275,996) was held withJPMorgan Chase Bank, N.A. Furthermore, €1,951,178 (2019: €929,947) was due to broker, SGIL, €Nil (2019:€778,529) was due to the broker, Credit Agricole Corporate and Investment Bank. Of the total bank overdraft balance of€2,566 (2019: €Nil) as at 31 December 2020, €2,566 (2019: €Nil) was held with RBC Investor Services Bank S.A..
As at 31 December 2020, the following are the cash held at bank and cash held as collateral:
Comgest GrowthWorld
31 December 2020
Comgest GrowthWorld Plus1
31 December 2020
Comgest GrowthGlobal Flex
31 December 2020
Cash $67,838,158 $322,592 €2,603,705
Cash held as collateralSGIL - - €4,151,904
Total Cash at Bank andAmount due from Broker $67,838,158 $322,592 €6,755,609
Bank Overdraft $18 - -
Due to BrokerSGIL - - €1,865,301
Total Bank Overdraft andAmount due to Broker $18 - €1,865,301
“Cash held as collateral” includes margin excess and margin requirements, “Due to broker” includes margin deficit (see Note 7.3).1Comgest Growth World Plus was launched on 27 November 2020.
Comgest GrowthEAFE1
31 December 2020
Comgest GrowthAmerica
31 December 2020
Comgest GrowthJapan
31 December 2020
Cash $650,113 $2,271,449 ¥20,388,255,384
Cash held as collateralSGIL - - -
Total Cash at Bank andAmount due from Broker $650,113 $2,271,449 ¥20,388,255,384
Bank Overdraft - - -
Due to BrokerSGIL - - -
Total Bank Overdraft andAmount due to Broker - - -
1Effective from 19 December 2019 Comgest Growth EAFE Plus was renamed to Comgest Growth EAFE.
COMGEST GROWTH plc
NOTES TO THE FINANCIAL STATEMENTS 31 December 2020 (continued)
284
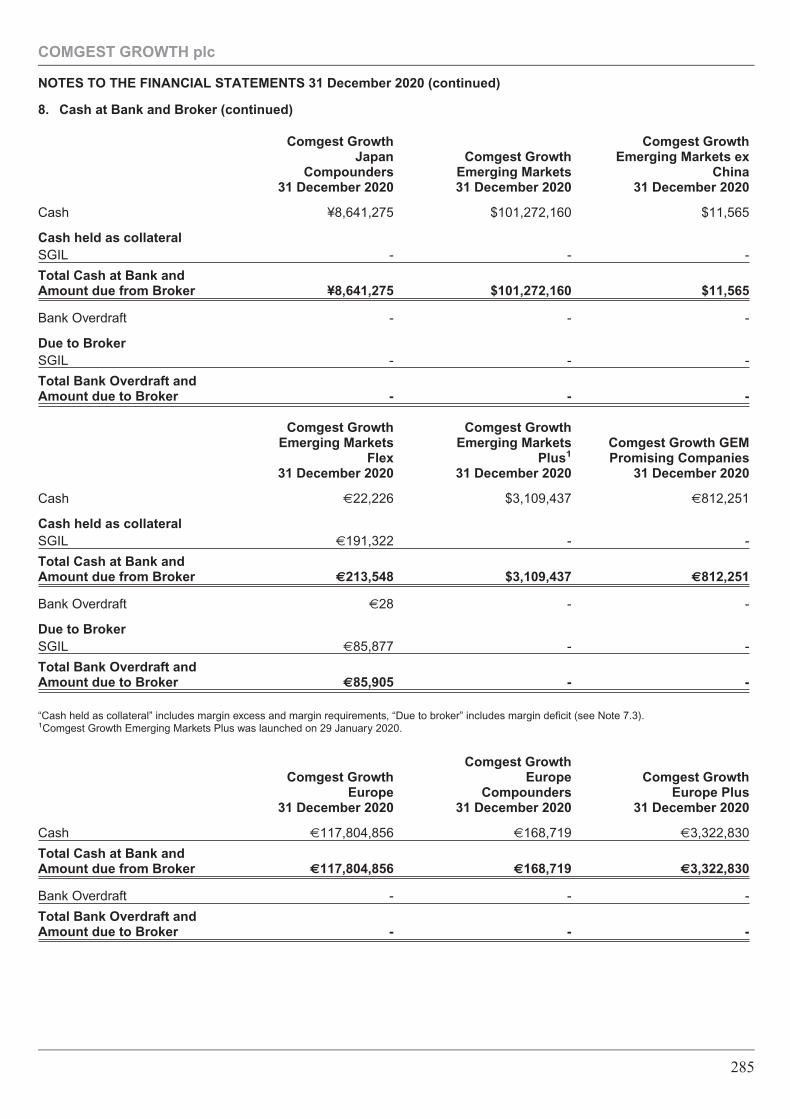
8. Cash at Bank and Broker (continued)
Comgest GrowthJapan
Compounders31 December 2020
Comgest GrowthEmerging Markets31 December 2020
Comgest GrowthEmerging Markets ex
China31 December 2020
Cash ¥8,641,275 $101,272,160 $11,565
Cash held as collateralSGIL - - -
Total Cash at Bank andAmount due from Broker ¥8,641,275 $101,272,160 $11,565
Bank Overdraft - - -
Due to BrokerSGIL - - -
Total Bank Overdraft andAmount due to Broker - - -
Comgest GrowthEmerging Markets
Flex31 December 2020
Comgest GrowthEmerging Markets
Plus1
31 December 2020
Comgest Growth GEMPromising Companies
31 December 2020
Cash €22,226 $3,109,437 €812,251
Cash held as collateralSGIL €191,322 - -
Total Cash at Bank andAmount due from Broker €213,548 $3,109,437 €812,251
Bank Overdraft €28 - -
Due to BrokerSGIL €85,877 - -
Total Bank Overdraft andAmount due to Broker €85,905 - -
“Cash held as collateral” includes margin excess and margin requirements, “Due to broker” includes margin deficit (see Note 7.3).1Comgest Growth Emerging Markets Plus was launched on 29 January 2020.
Comgest GrowthEurope
31 December 2020
Comgest GrowthEurope
Compounders31 December 2020
Comgest GrowthEurope Plus
31 December 2020
Cash €117,804,856 €168,719 €3,322,830
Total Cash at Bank andAmount due from Broker €117,804,856 €168,719 €3,322,830
Bank Overdraft - - -
Total Bank Overdraft andAmount due to Broker - - -
COMGEST GROWTH plc
NOTES TO THE FINANCIAL STATEMENTS 31 December 2020 (continued)
285
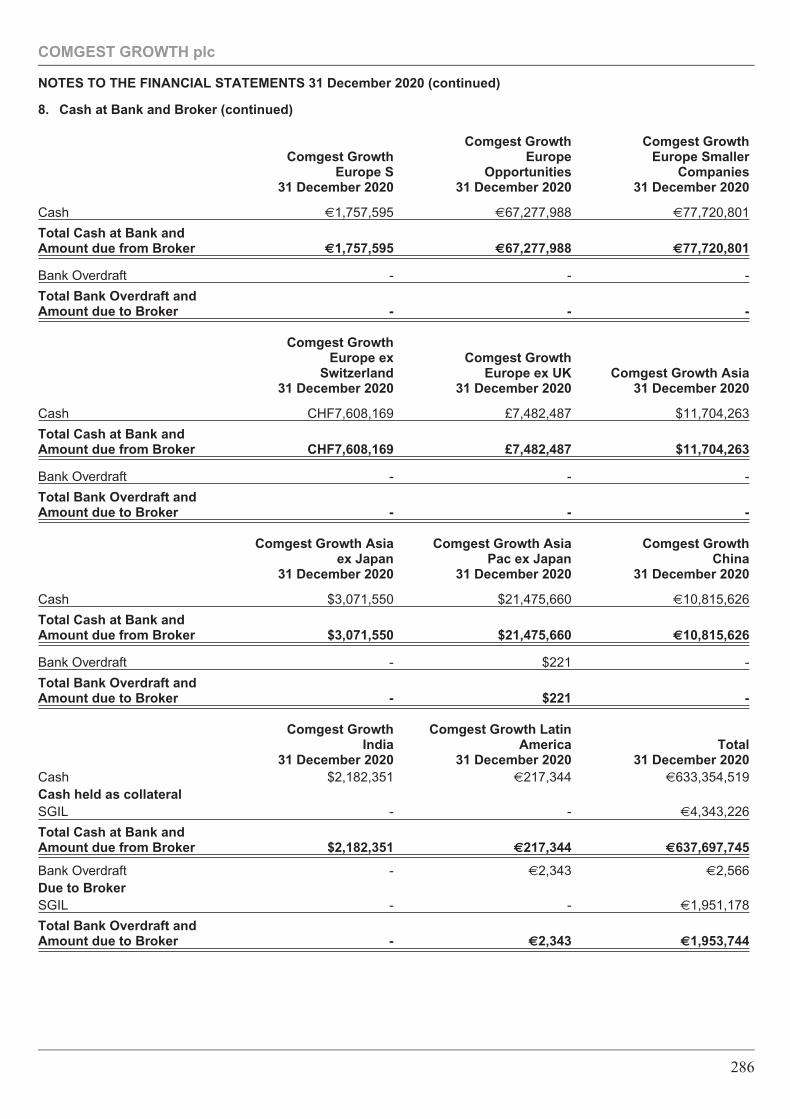
8. Cash at Bank and Broker (continued)
Comgest GrowthEurope S
31 December 2020
Comgest GrowthEurope
Opportunities31 December 2020
Comgest GrowthEurope Smaller
Companies31 December 2020
Cash €1,757,595 €67,277,988 €77,720,801
Total Cash at Bank andAmount due from Broker €1,757,595 €67,277,988 €77,720,801
Bank Overdraft - - -
Total Bank Overdraft andAmount due to Broker - - -
Comgest GrowthEurope ex
Switzerland31 December 2020
Comgest GrowthEurope ex UK
31 December 2020Comgest Growth Asia
31 December 2020
Cash CHF7,608,169 £7,482,487 $11,704,263
Total Cash at Bank andAmount due from Broker CHF7,608,169 £7,482,487 $11,704,263
Bank Overdraft - - -
Total Bank Overdraft andAmount due to Broker - - -
Comgest Growth Asiaex Japan
31 December 2020
Comgest Growth AsiaPac ex Japan
31 December 2020
Comgest GrowthChina
31 December 2020
Cash $3,071,550 $21,475,660 €10,815,626
Total Cash at Bank andAmount due from Broker $3,071,550 $21,475,660 €10,815,626
Bank Overdraft - $221 -
Total Bank Overdraft andAmount due to Broker - $221 -
Comgest GrowthIndia
31 December 2020
Comgest Growth LatinAmerica
31 December 2020Total
31 December 2020Cash $2,182,351 €217,344 €633,354,519Cash held as collateralSGIL - - €4,343,226
Total Cash at Bank andAmount due from Broker $2,182,351 €217,344 €637,697,745
Bank Overdraft - €2,343 €2,566Due to BrokerSGIL - - €1,951,178
Total Bank Overdraft andAmount due to Broker - €2,343 €1,953,744
COMGEST GROWTH plc
NOTES TO THE FINANCIAL STATEMENTS 31 December 2020 (continued)
286
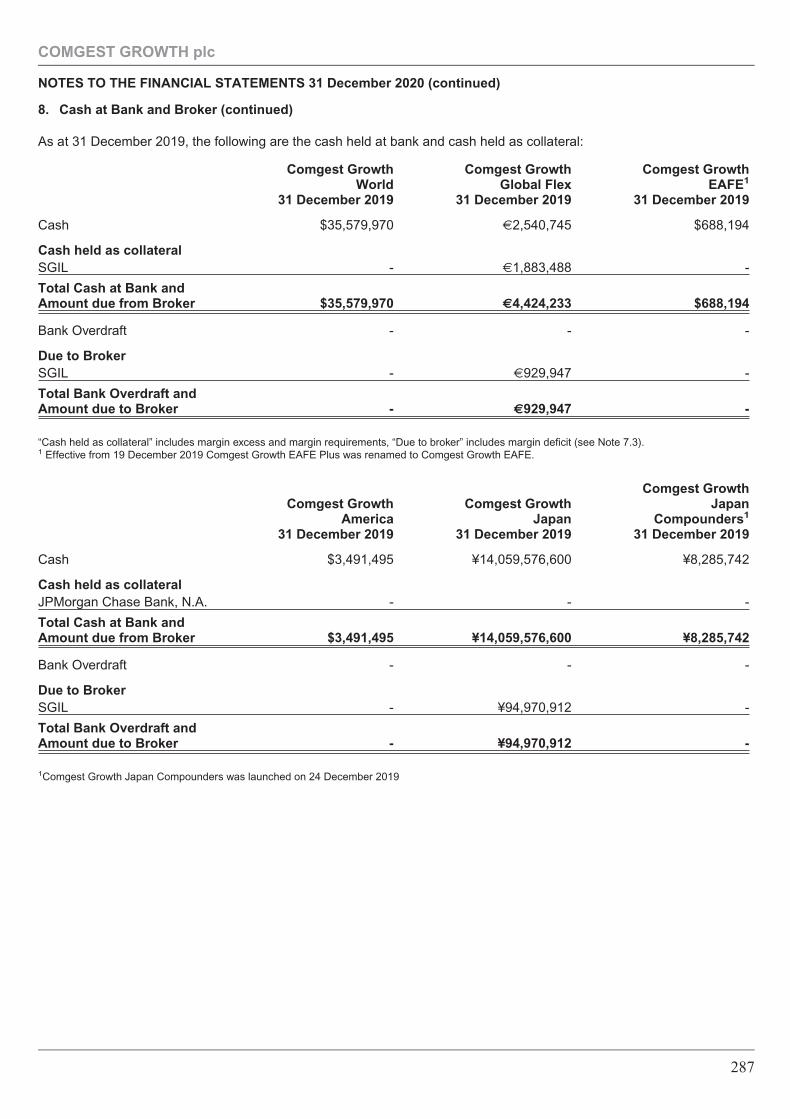
8. Cash at Bank and Broker (continued)
As at 31 December 2019, the following are the cash held at bank and cash held as collateral:
Comgest GrowthWorld
31 December 2019
Comgest GrowthGlobal Flex
31 December 2019
Comgest GrowthEAFE1
31 December 2019
Cash $35,579,970 €2,540,745 $688,194
Cash held as collateralSGIL - €1,883,488 -
Total Cash at Bank andAmount due from Broker $35,579,970 €4,424,233 $688,194
Bank Overdraft - - -
Due to BrokerSGIL - €929,947 -
Total Bank Overdraft andAmount due to Broker - €929,947 -
“Cash held as collateral” includes margin excess and margin requirements, “Due to broker” includes margin deficit (see Note 7.3).1 Effective from 19 December 2019 Comgest Growth EAFE Plus was renamed to Comgest Growth EAFE.
Comgest GrowthAmerica
31 December 2019
Comgest GrowthJapan
31 December 2019
Comgest GrowthJapan
Compounders1
31 December 2019
Cash $3,491,495 ¥14,059,576,600 ¥8,285,742
Cash held as collateralJPMorgan Chase Bank, N.A. - - -
Total Cash at Bank andAmount due from Broker $3,491,495 ¥14,059,576,600 ¥8,285,742
Bank Overdraft - - -
Due to BrokerSGIL - ¥94,970,912 -
Total Bank Overdraft andAmount due to Broker - ¥94,970,912 -
1Comgest Growth Japan Compounders was launched on 24 December 2019
COMGEST GROWTH plc
NOTES TO THE FINANCIAL STATEMENTS 31 December 2020 (continued)
287
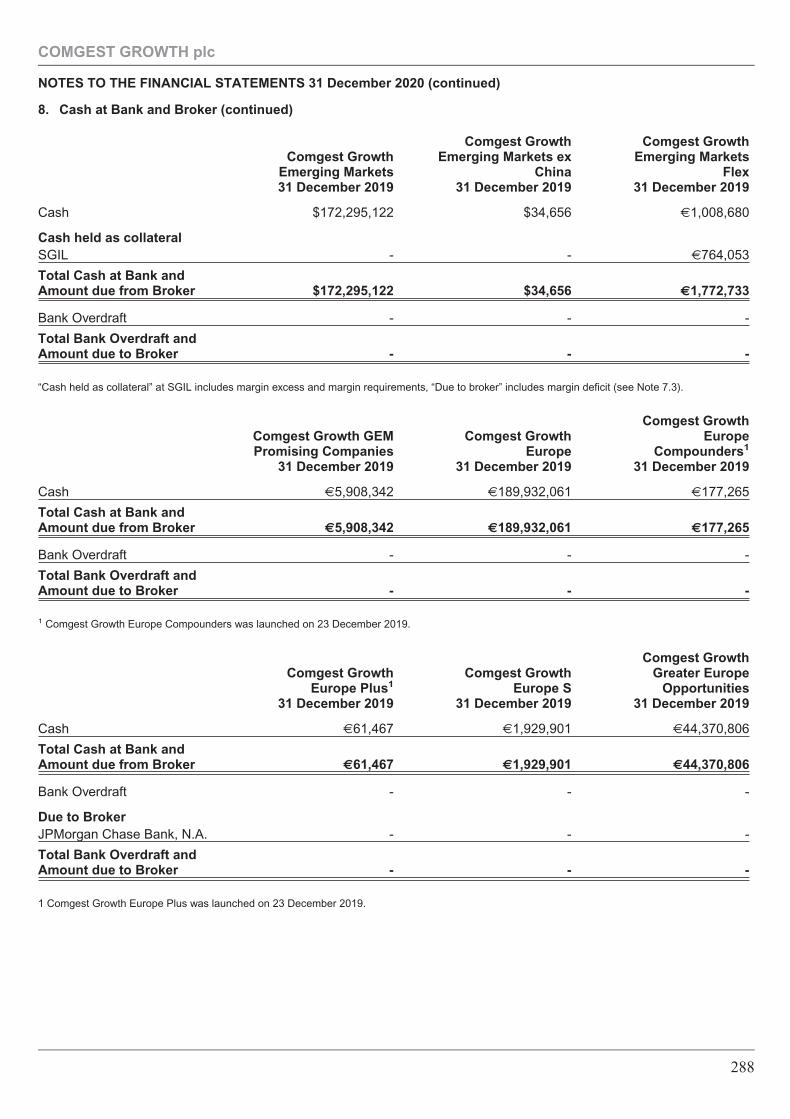
8. Cash at Bank and Broker (continued)
Comgest GrowthEmerging Markets31 December 2019
Comgest GrowthEmerging Markets ex
China31 December 2019
Comgest GrowthEmerging Markets
Flex31 December 2019
Cash $172,295,122 $34,656 €1,008,680
Cash held as collateralSGIL - - €764,053
Total Cash at Bank andAmount due from Broker $172,295,122 $34,656 €1,772,733
Bank Overdraft - - -
Total Bank Overdraft andAmount due to Broker - - -
“Cash held as collateral” at SGIL includes margin excess and margin requirements, “Due to broker” includes margin deficit (see Note 7.3).
Comgest Growth GEMPromising Companies
31 December 2019
Comgest GrowthEurope
31 December 2019
Comgest GrowthEurope
Compounders1
31 December 2019
Cash €5,908,342 €189,932,061 €177,265
Total Cash at Bank andAmount due from Broker €5,908,342 €189,932,061 €177,265
Bank Overdraft - - -
Total Bank Overdraft andAmount due to Broker - - -
1 Comgest Growth Europe Compounders was launched on 23 December 2019.
Comgest GrowthEurope Plus1
31 December 2019
Comgest GrowthEurope S
31 December 2019
Comgest GrowthGreater Europe
Opportunities31 December 2019
Cash €61,467 €1,929,901 €44,370,806
Total Cash at Bank andAmount due from Broker €61,467 €1,929,901 €44,370,806
Bank Overdraft - - -
Due to BrokerJPMorgan Chase Bank, N.A. - - -
Total Bank Overdraft andAmount due to Broker - - -
1 Comgest Growth Europe Plus was launched on 23 December 2019.
COMGEST GROWTH plc
NOTES TO THE FINANCIAL STATEMENTS 31 December 2020 (continued)
288
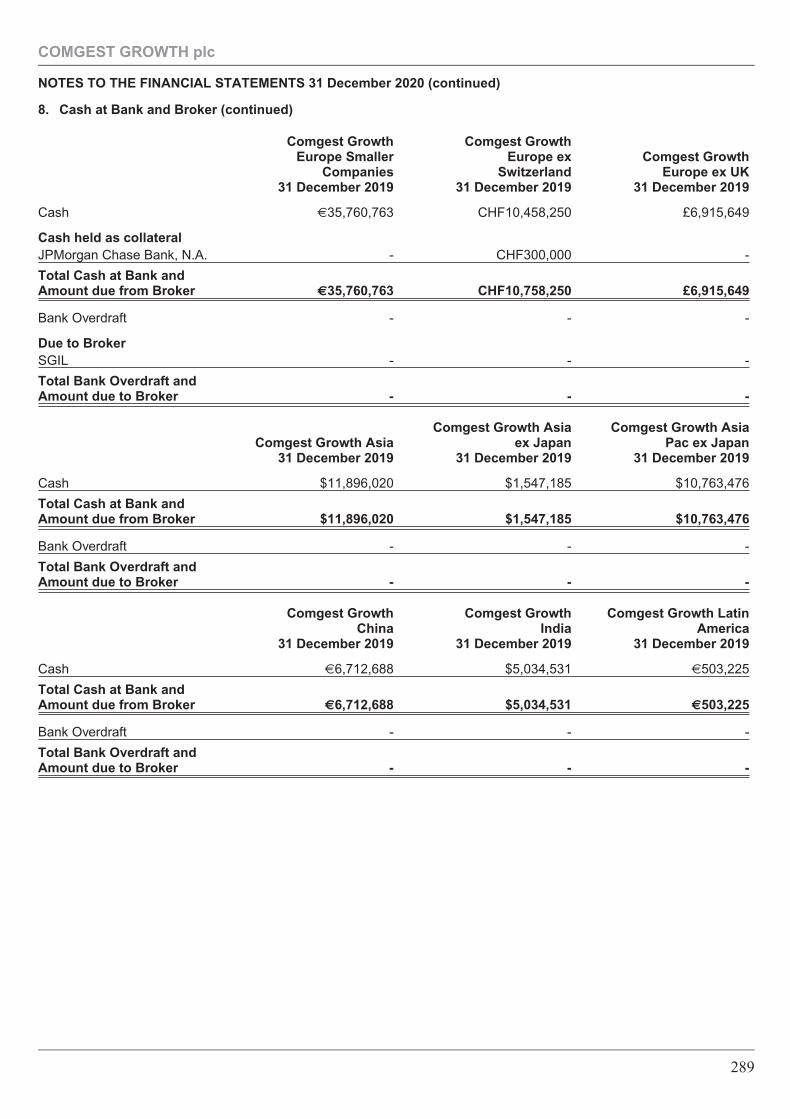
8. Cash at Bank and Broker (continued)
Comgest GrowthEurope Smaller
Companies31 December 2019
Comgest GrowthEurope ex
Switzerland31 December 2019
Comgest GrowthEurope ex UK
31 December 2019
Cash €35,760,763 CHF10,458,250 £6,915,649
Cash held as collateralJPMorgan Chase Bank, N.A. - CHF300,000 -
Total Cash at Bank andAmount due from Broker €35,760,763 CHF10,758,250 £6,915,649
Bank Overdraft - - -
Due to BrokerSGIL - - -
Total Bank Overdraft andAmount due to Broker - - -
Comgest Growth Asia31 December 2019
Comgest Growth Asiaex Japan
31 December 2019
Comgest Growth AsiaPac ex Japan
31 December 2019
Cash $11,896,020 $1,547,185 $10,763,476
Total Cash at Bank andAmount due from Broker $11,896,020 $1,547,185 $10,763,476
Bank Overdraft - - -
Total Bank Overdraft andAmount due to Broker - - -
Comgest GrowthChina
31 December 2019
Comgest GrowthIndia
31 December 2019
Comgest Growth LatinAmerica
31 December 2019
Cash €6,712,688 $5,034,531 €503,225
Total Cash at Bank andAmount due from Broker €6,712,688 $5,034,531 €503,225
Bank Overdraft - - -
Total Bank Overdraft andAmount due to Broker - - -
COMGEST GROWTH plc
NOTES TO THE FINANCIAL STATEMENTS 31 December 2020 (continued)
289
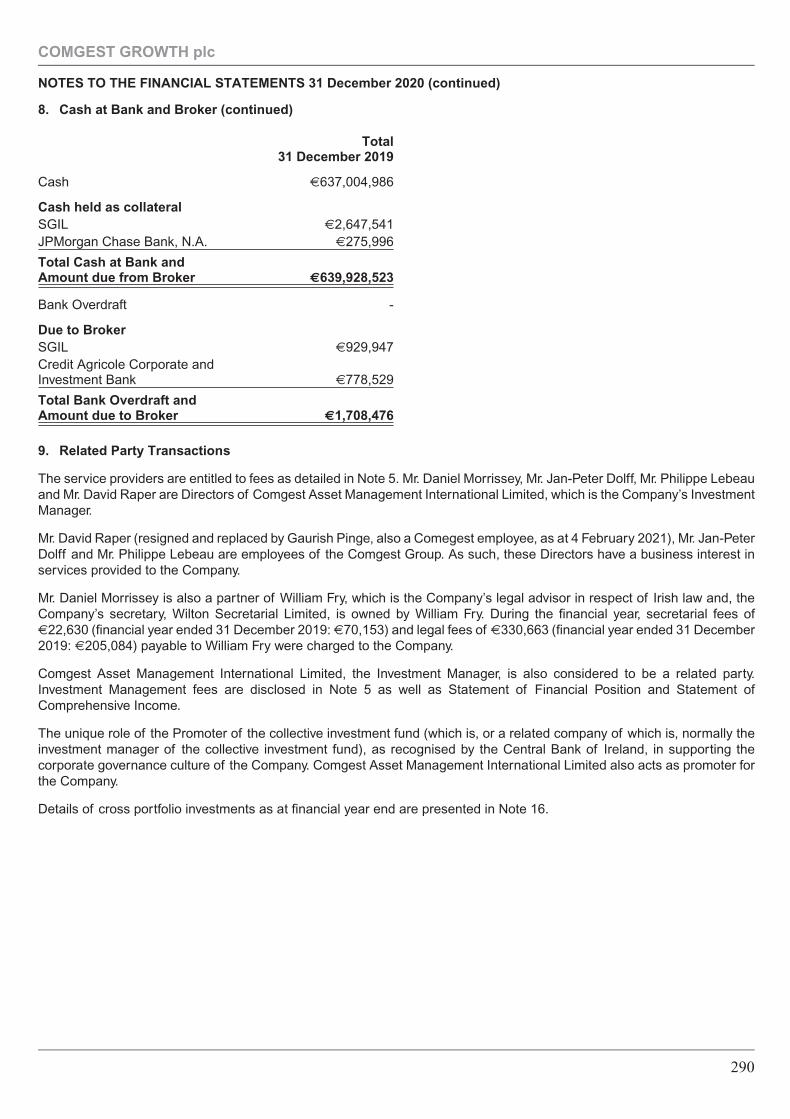
8. Cash at Bank and Broker (continued)
Total31 December 2019
Cash €637,004,986
Cash held as collateralSGIL €2,647,541JPMorgan Chase Bank, N.A. €275,996
Total Cash at Bank andAmount due from Broker €639,928,523
Bank Overdraft -
Due to BrokerSGIL €929,947Credit Agricole Corporate andInvestment Bank €778,529
Total Bank Overdraft andAmount due to Broker €1,708,476
9. Related Party Transactions
The service providers are entitled to fees as detailed in Note 5. Mr. Daniel Morrissey, Mr. Jan-Peter Dolff, Mr. Philippe Lebeauand Mr. David Raper are Directors of Comgest Asset Management International Limited, which is the Company’s InvestmentManager.
Mr. David Raper (resigned and replaced by Gaurish Pinge, also a Comegest employee, as at 4 February 2021), Mr. Jan-PeterDolff and Mr. Philippe Lebeau are employees of the Comgest Group. As such, these Directors have a business interest inservices provided to the Company.
Mr. Daniel Morrissey is also a partner of William Fry, which is the Company’s legal advisor in respect of Irish law and, theCompany’s secretary, Wilton Secretarial Limited, is owned by William Fry. During the financial year, secretarial fees of€22,630 (financial year ended 31 December 2019: €70,153) and legal fees of €330,663 (financial year ended 31 December2019: €205,084) payable to William Fry were charged to the Company.
Comgest Asset Management International Limited, the Investment Manager, is also considered to be a related party.Investment Management fees are disclosed in Note 5 as well as Statement of Financial Position and Statement ofComprehensive Income.
The unique role of the Promoter of the collective investment fund (which is, or a related company of which is, normally theinvestment manager of the collective investment fund), as recognised by the Central Bank of Ireland, in supporting thecorporate governance culture of the Company. Comgest Asset Management International Limited also acts as promoter forthe Company.
Details of cross portfolio investments as at financial year end are presented in Note 16.
COMGEST GROWTH plc
NOTES TO THE FINANCIAL STATEMENTS 31 December 2020 (continued)
290
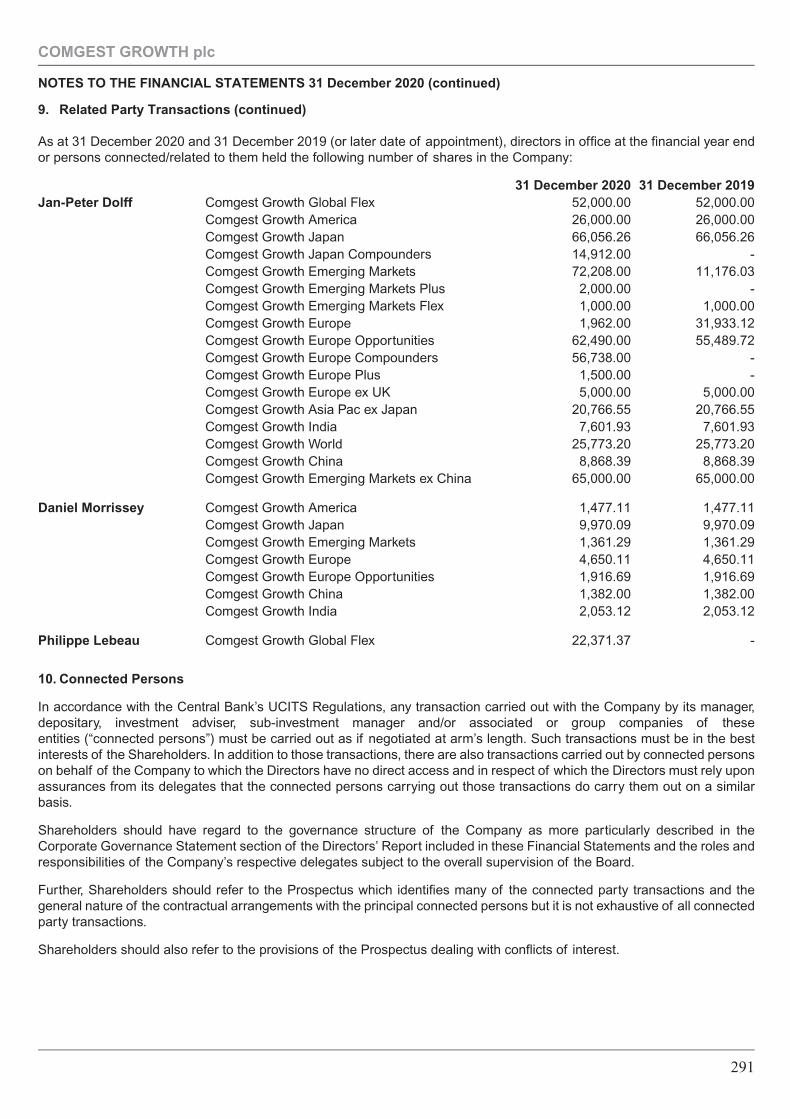
9. Related Party Transactions (continued)
As at 31 December 2020 and 31 December 2019 (or later date of appointment), directors in office at the financial year endor persons connected/related to them held the following number of shares in the Company:
31 December 2020 31 December 2019Jan-Peter Dolff Comgest Growth Global Flex 52,000.00 52,000.00
Comgest Growth America 26,000.00 26,000.00Comgest Growth Japan 66,056.26 66,056.26Comgest Growth Japan Compounders 14,912.00 -Comgest Growth Emerging Markets 72,208.00 11,176.03Comgest Growth Emerging Markets Plus 2,000.00 -Comgest Growth Emerging Markets Flex 1,000.00 1,000.00Comgest Growth Europe 1,962.00 31,933.12Comgest Growth Europe Opportunities 62,490.00 55,489.72Comgest Growth Europe Compounders 56,738.00 -Comgest Growth Europe Plus 1,500.00 -Comgest Growth Europe ex UK 5,000.00 5,000.00Comgest Growth Asia Pac ex Japan 20,766.55 20,766.55Comgest Growth India 7,601.93 7,601.93Comgest Growth World 25,773.20 25,773.20Comgest Growth China 8,868.39 8,868.39Comgest Growth Emerging Markets ex China 65,000.00 65,000.00
Daniel Morrissey Comgest Growth America 1,477.11 1,477.11Comgest Growth Japan 9,970.09 9,970.09Comgest Growth Emerging Markets 1,361.29 1,361.29Comgest Growth Europe 4,650.11 4,650.11Comgest Growth Europe Opportunities 1,916.69 1,916.69Comgest Growth China 1,382.00 1,382.00Comgest Growth India 2,053.12 2,053.12
Philippe Lebeau Comgest Growth Global Flex 22,371.37 -
10. Connected Persons
In accordance with the Central Bank’s UCITS Regulations, any transaction carried out with the Company by its manager,depositary, investment adviser, sub-investment manager and/or associated or group companies of theseentities (“connected persons”) must be carried out as if negotiated at arm’s length. Such transactions must be in the bestinterests of the Shareholders. In addition to those transactions, there are also transactions carried out by connected personson behalf of the Company to which the Directors have no direct access and in respect of which the Directors must rely uponassurances from its delegates that the connected persons carrying out those transactions do carry them out on a similarbasis.
Shareholders should have regard to the governance structure of the Company as more particularly described in theCorporate Governance Statement section of the Directors’ Report included in these Financial Statements and the roles andresponsibilities of the Company’s respective delegates subject to the overall supervision of the Board.
Further, Shareholders should refer to the Prospectus which identifies many of the connected party transactions and thegeneral nature of the contractual arrangements with the principal connected persons but it is not exhaustive of all connectedparty transactions.
Shareholders should also refer to the provisions of the Prospectus dealing with conflicts of interest.
COMGEST GROWTH plc
NOTES TO THE FINANCIAL STATEMENTS 31 December 2020 (continued)
291
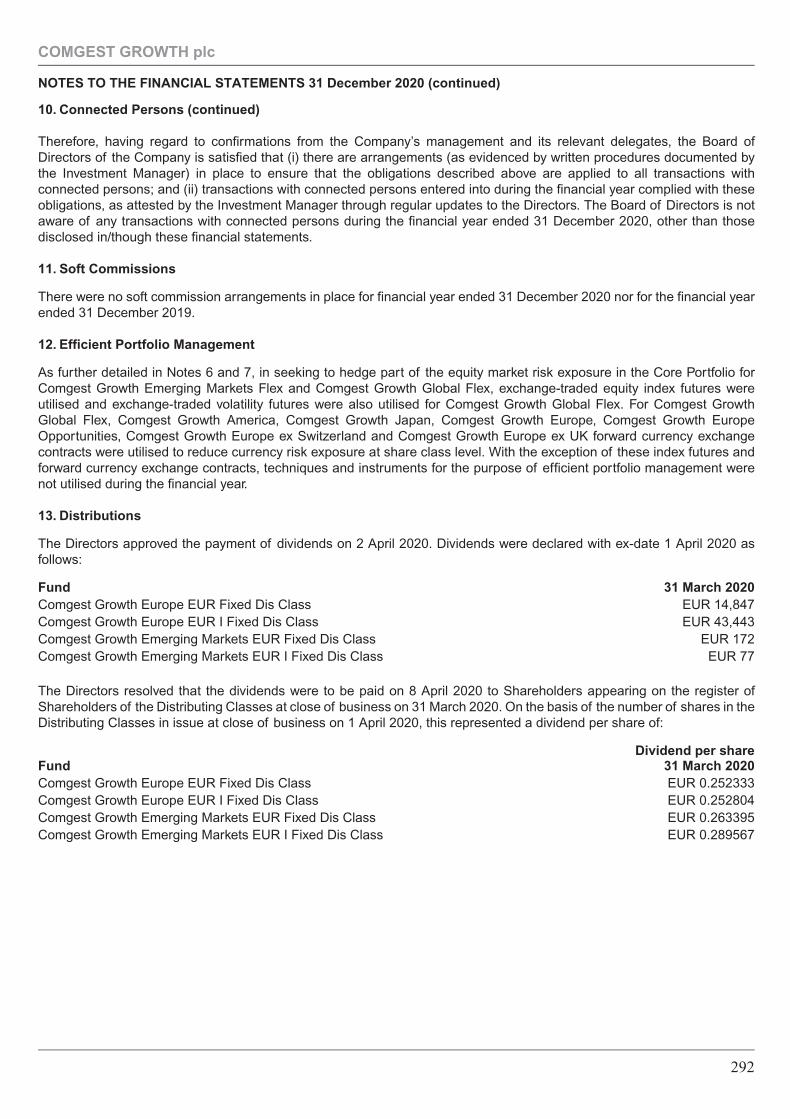
10. Connected Persons (continued)
Therefore, having regard to confirmations from the Company’s management and its relevant delegates, the Board ofDirectors of the Company is satisfied that (i) there are arrangements (as evidenced by written procedures documented bythe Investment Manager) in place to ensure that the obligations described above are applied to all transactions withconnected persons; and (ii) transactions with connected persons entered into during the financial year complied with theseobligations, as attested by the Investment Manager through regular updates to the Directors. The Board of Directors is notaware of any transactions with connected persons during the financial year ended 31 December 2020, other than thosedisclosed in/though these financial statements.
11. Soft Commissions
There were no soft commission arrangements in place for financial year ended 31 December 2020 nor for the financial yearended 31 December 2019.
12. Efficient Portfolio Management
As further detailed in Notes 6 and 7, in seeking to hedge part of the equity market risk exposure in the Core Portfolio forComgest Growth Emerging Markets Flex and Comgest Growth Global Flex, exchange-traded equity index futures wereutilised and exchange-traded volatility futures were also utilised for Comgest Growth Global Flex. For Comgest GrowthGlobal Flex, Comgest Growth America, Comgest Growth Japan, Comgest Growth Europe, Comgest Growth EuropeOpportunities, Comgest Growth Europe ex Switzerland and Comgest Growth Europe ex UK forward currency exchangecontracts were utilised to reduce currency risk exposure at share class level. With the exception of these index futures andforward currency exchange contracts, techniques and instruments for the purpose of efficient portfolio management werenot utilised during the financial year.
13. Distributions
The Directors approved the payment of dividends on 2 April 2020. Dividends were declared with ex-date 1 April 2020 asfollows:
Fund 31 March 2020Comgest Growth Europe EUR Fixed Dis Class EUR 14,847Comgest Growth Europe EUR I Fixed Dis Class EUR 43,443Comgest Growth Emerging Markets EUR Fixed Dis Class EUR 172Comgest Growth Emerging Markets EUR I Fixed Dis Class EUR 77
The Directors resolved that the dividends were to be paid on 8 April 2020 to Shareholders appearing on the register ofShareholders of the Distributing Classes at close of business on 31 March 2020. On the basis of the number of shares in theDistributing Classes in issue at close of business on 1 April 2020, this represented a dividend per share of:
FundDividend per share
31 March 2020Comgest Growth Europe EUR Fixed Dis Class EUR 0.252333Comgest Growth Europe EUR I Fixed Dis Class EUR 0.252804Comgest Growth Emerging Markets EUR Fixed Dis Class EUR 0.263395Comgest Growth Emerging Markets EUR I Fixed Dis Class EUR 0.289567
COMGEST GROWTH plc
NOTES TO THE FINANCIAL STATEMENTS 31 December 2020 (continued)
292
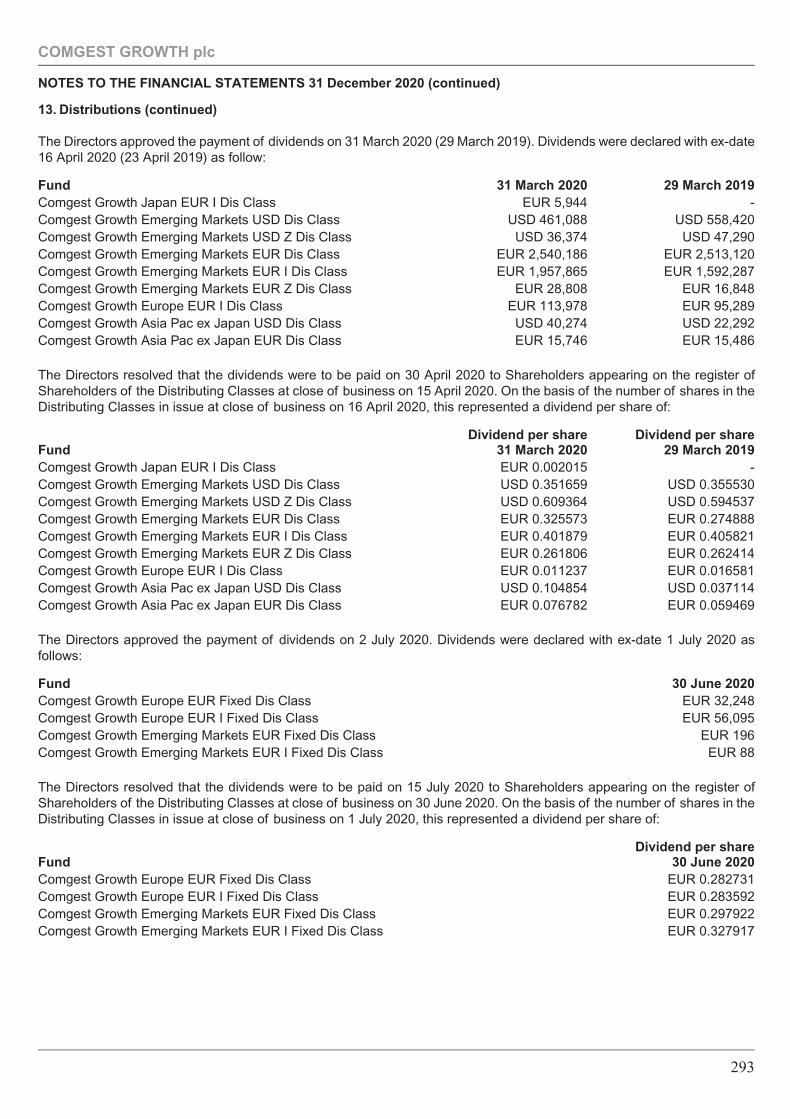
13. Distributions (continued)
The Directors approved the payment of dividends on 31 March 2020 (29 March 2019). Dividends were declared with ex-date16 April 2020 (23 April 2019) as follow:
Fund 31 March 2020 29 March 2019Comgest Growth Japan EUR I Dis Class EUR 5,944 -Comgest Growth Emerging Markets USD Dis Class USD 461,088 USD 558,420Comgest Growth Emerging Markets USD Z Dis Class USD 36,374 USD 47,290Comgest Growth Emerging Markets EUR Dis Class EUR 2,540,186 EUR 2,513,120Comgest Growth Emerging Markets EUR I Dis Class EUR 1,957,865 EUR 1,592,287Comgest Growth Emerging Markets EUR Z Dis Class EUR 28,808 EUR 16,848Comgest Growth Europe EUR I Dis Class EUR 113,978 EUR 95,289Comgest Growth Asia Pac ex Japan USD Dis Class USD 40,274 USD 22,292Comgest Growth Asia Pac ex Japan EUR Dis Class EUR 15,746 EUR 15,486
The Directors resolved that the dividends were to be paid on 30 April 2020 to Shareholders appearing on the register ofShareholders of the Distributing Classes at close of business on 15 April 2020. On the basis of the number of shares in theDistributing Classes in issue at close of business on 16 April 2020, this represented a dividend per share of:
FundDividend per share
31 March 2020Dividend per share
29 March 2019Comgest Growth Japan EUR I Dis Class EUR 0.002015 -Comgest Growth Emerging Markets USD Dis Class USD 0.351659 USD 0.355530Comgest Growth Emerging Markets USD Z Dis Class USD 0.609364 USD 0.594537Comgest Growth Emerging Markets EUR Dis Class EUR 0.325573 EUR 0.274888Comgest Growth Emerging Markets EUR I Dis Class EUR 0.401879 EUR 0.405821Comgest Growth Emerging Markets EUR Z Dis Class EUR 0.261806 EUR 0.262414Comgest Growth Europe EUR I Dis Class EUR 0.011237 EUR 0.016581Comgest Growth Asia Pac ex Japan USD Dis Class USD 0.104854 USD 0.037114Comgest Growth Asia Pac ex Japan EUR Dis Class EUR 0.076782 EUR 0.059469
The Directors approved the payment of dividends on 2 July 2020. Dividends were declared with ex-date 1 July 2020 asfollows:
Fund 30 June 2020Comgest Growth Europe EUR Fixed Dis Class EUR 32,248Comgest Growth Europe EUR I Fixed Dis Class EUR 56,095Comgest Growth Emerging Markets EUR Fixed Dis Class EUR 196Comgest Growth Emerging Markets EUR I Fixed Dis Class EUR 88
The Directors resolved that the dividends were to be paid on 15 July 2020 to Shareholders appearing on the register ofShareholders of the Distributing Classes at close of business on 30 June 2020. On the basis of the number of shares in theDistributing Classes in issue at close of business on 1 July 2020, this represented a dividend per share of:
FundDividend per share
30 June 2020Comgest Growth Europe EUR Fixed Dis Class EUR 0.282731Comgest Growth Europe EUR I Fixed Dis Class EUR 0.283592Comgest Growth Emerging Markets EUR Fixed Dis Class EUR 0.297922Comgest Growth Emerging Markets EUR I Fixed Dis Class EUR 0.327917
COMGEST GROWTH plc
NOTES TO THE FINANCIAL STATEMENTS 31 December 2020 (continued)
293
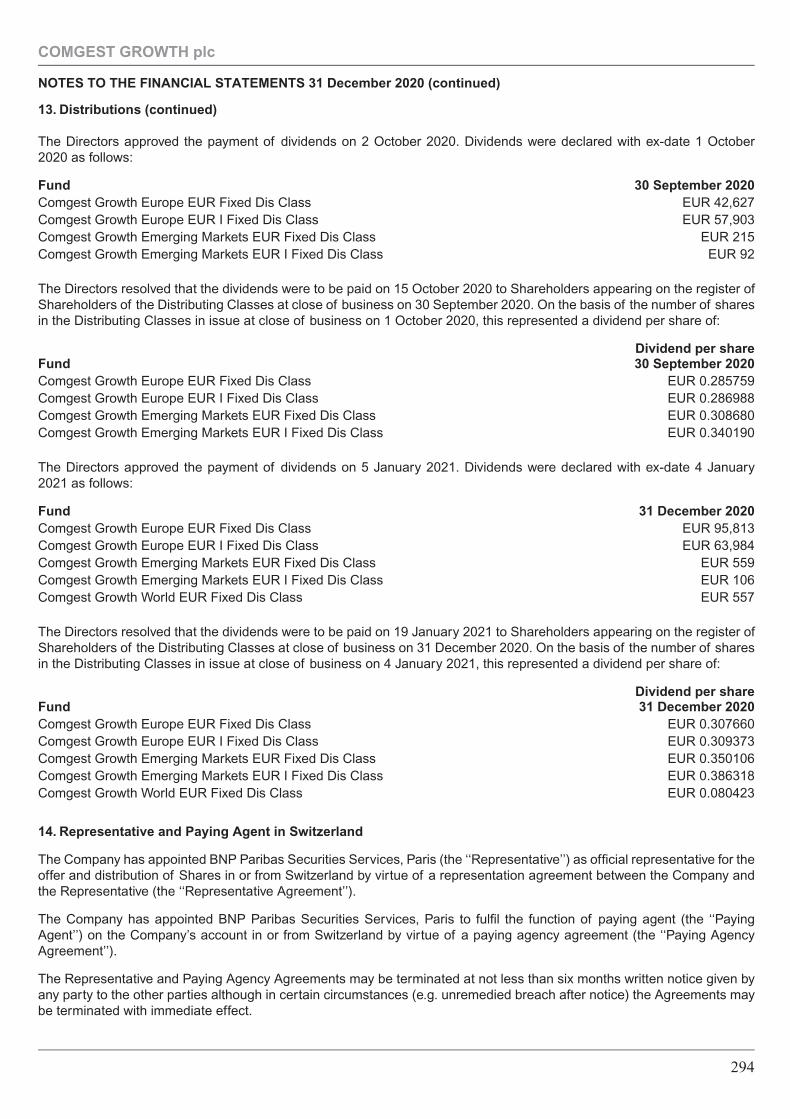
13. Distributions (continued)
The Directors approved the payment of dividends on 2 October 2020. Dividends were declared with ex-date 1 October2020 as follows:
Fund 30 September 2020Comgest Growth Europe EUR Fixed Dis Class EUR 42,627Comgest Growth Europe EUR I Fixed Dis Class EUR 57,903Comgest Growth Emerging Markets EUR Fixed Dis Class EUR 215Comgest Growth Emerging Markets EUR I Fixed Dis Class EUR 92
The Directors resolved that the dividends were to be paid on 15 October 2020 to Shareholders appearing on the register ofShareholders of the Distributing Classes at close of business on 30 September 2020. On the basis of the number of sharesin the Distributing Classes in issue at close of business on 1 October 2020, this represented a dividend per share of:
FundDividend per share30 September 2020
Comgest Growth Europe EUR Fixed Dis Class EUR 0.285759Comgest Growth Europe EUR I Fixed Dis Class EUR 0.286988Comgest Growth Emerging Markets EUR Fixed Dis Class EUR 0.308680Comgest Growth Emerging Markets EUR I Fixed Dis Class EUR 0.340190
The Directors approved the payment of dividends on 5 January 2021. Dividends were declared with ex-date 4 January2021 as follows:
Fund 31 December 2020Comgest Growth Europe EUR Fixed Dis Class EUR 95,813Comgest Growth Europe EUR I Fixed Dis Class EUR 63,984Comgest Growth Emerging Markets EUR Fixed Dis Class EUR 559Comgest Growth Emerging Markets EUR I Fixed Dis Class EUR 106Comgest Growth World EUR Fixed Dis Class EUR 557
The Directors resolved that the dividends were to be paid on 19 January 2021 to Shareholders appearing on the register ofShareholders of the Distributing Classes at close of business on 31 December 2020. On the basis of the number of sharesin the Distributing Classes in issue at close of business on 4 January 2021, this represented a dividend per share of:
FundDividend per share31 December 2020
Comgest Growth Europe EUR Fixed Dis Class EUR 0.307660Comgest Growth Europe EUR I Fixed Dis Class EUR 0.309373Comgest Growth Emerging Markets EUR Fixed Dis Class EUR 0.350106Comgest Growth Emerging Markets EUR I Fixed Dis Class EUR 0.386318Comgest Growth World EUR Fixed Dis Class EUR 0.080423
14. Representative and Paying Agent in Switzerland
The Company has appointed BNP Paribas Securities Services, Paris (the ‘‘Representative’’) as official representative for theoffer and distribution of Shares in or from Switzerland by virtue of a representation agreement between the Company andthe Representative (the ‘‘Representative Agreement’’).
The Company has appointed BNP Paribas Securities Services, Paris to fulfil the function of paying agent (the ‘‘PayingAgent’’) on the Company’s account in or from Switzerland by virtue of a paying agency agreement (the ‘‘Paying AgencyAgreement’’).
The Representative and Paying Agency Agreements may be terminated at not less than six months written notice given byany party to the other parties although in certain circumstances (e.g. unremedied breach after notice) the Agreements maybe terminated with immediate effect.
COMGEST GROWTH plc
NOTES TO THE FINANCIAL STATEMENTS 31 December 2020 (continued)
294
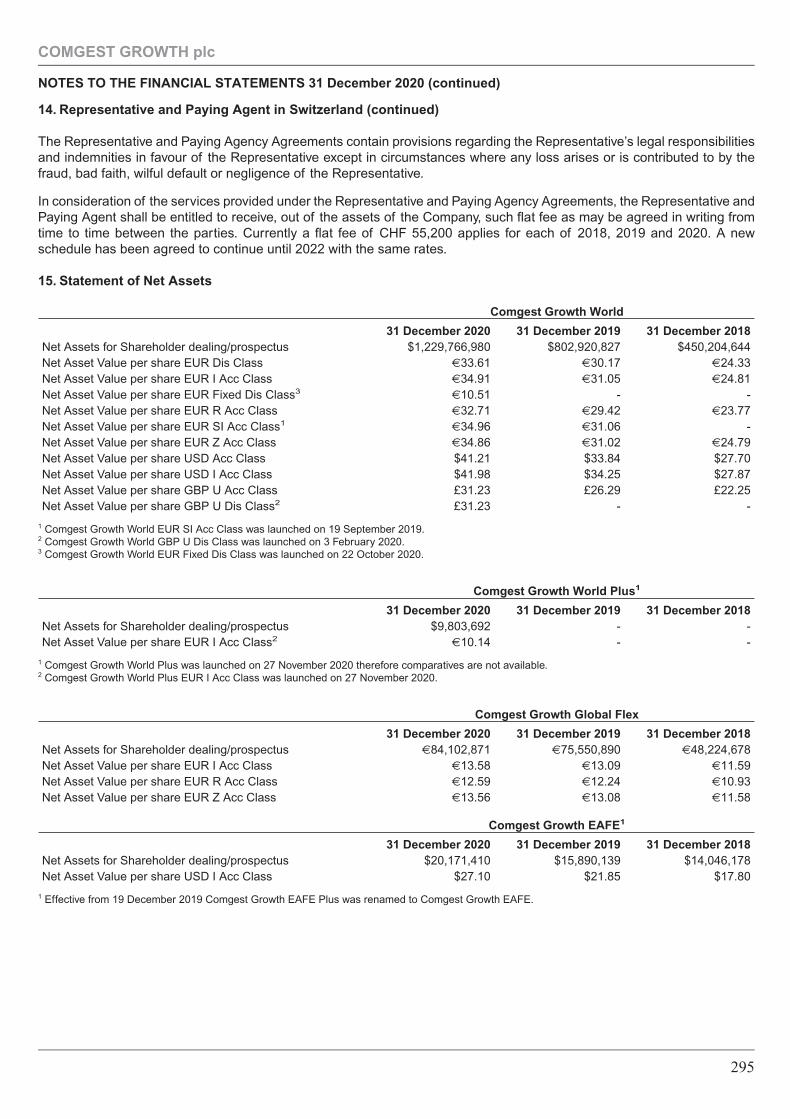
14. Representative and Paying Agent in Switzerland (continued)
The Representative and Paying Agency Agreements contain provisions regarding the Representative’s legal responsibilitiesand indemnities in favour of the Representative except in circumstances where any loss arises or is contributed to by thefraud, bad faith, wilful default or negligence of the Representative.
In consideration of the services provided under the Representative and Paying Agency Agreements, the Representative andPaying Agent shall be entitled to receive, out of the assets of the Company, such flat fee as may be agreed in writing fromtime to time between the parties. Currently a flat fee of CHF 55,200 applies for each of 2018, 2019 and 2020. A newschedule has been agreed to continue until 2022 with the same rates.
15. Statement of Net Assets
Comgest Growth World
31 December 2020 31 December 2019 31 December 2018Net Assets for Shareholder dealing/prospectus $1,229,766,980 $802,920,827 $450,204,644Net Asset Value per share EUR Dis Class €33.61 €30.17 €24.33Net Asset Value per share EUR I Acc Class €34.91 €31.05 €24.81Net Asset Value per share EUR Fixed Dis Class3
€10.51 - -Net Asset Value per share EUR R Acc Class €32.71 €29.42 €23.77Net Asset Value per share EUR SI Acc Class1
€34.96 €31.06 -Net Asset Value per share EUR Z Acc Class €34.86 €31.02 €24.79Net Asset Value per share USD Acc Class $41.21 $33.84 $27.70Net Asset Value per share USD I Acc Class $41.98 $34.25 $27.87Net Asset Value per share GBP U Acc Class £31.23 £26.29 £22.25Net Asset Value per share GBP U Dis Class2 £31.23 - -
1 Comgest Growth World EUR SI Acc Class was launched on 19 September 2019.2 Comgest Growth World GBP U Dis Class was launched on 3 February 2020.3 Comgest Growth World EUR Fixed Dis Class was launched on 22 October 2020.
Comgest Growth World Plus1
31 December 2020 31 December 2019 31 December 2018Net Assets for Shareholder dealing/prospectus $9,803,692 - -Net Asset Value per share EUR I Acc Class2
€10.14 - -
1 Comgest Growth World Plus was launched on 27 November 2020 therefore comparatives are not available.2 Comgest Growth World Plus EUR I Acc Class was launched on 27 November 2020.
Comgest Growth Global Flex
31 December 2020 31 December 2019 31 December 2018Net Assets for Shareholder dealing/prospectus €84,102,871 €75,550,890 €48,224,678Net Asset Value per share EUR I Acc Class €13.58 €13.09 €11.59Net Asset Value per share EUR R Acc Class €12.59 €12.24 €10.93Net Asset Value per share EUR Z Acc Class €13.56 €13.08 €11.58
Comgest Growth EAFE1
31 December 2020 31 December 2019 31 December 2018Net Assets for Shareholder dealing/prospectus $20,171,410 $15,890,139 $14,046,178Net Asset Value per share USD I Acc Class $27.10 $21.85 $17.80
1 Effective from 19 December 2019 Comgest Growth EAFE Plus was renamed to Comgest Growth EAFE.
COMGEST GROWTH plc
NOTES TO THE FINANCIAL STATEMENTS 31 December 2020 (continued)
295
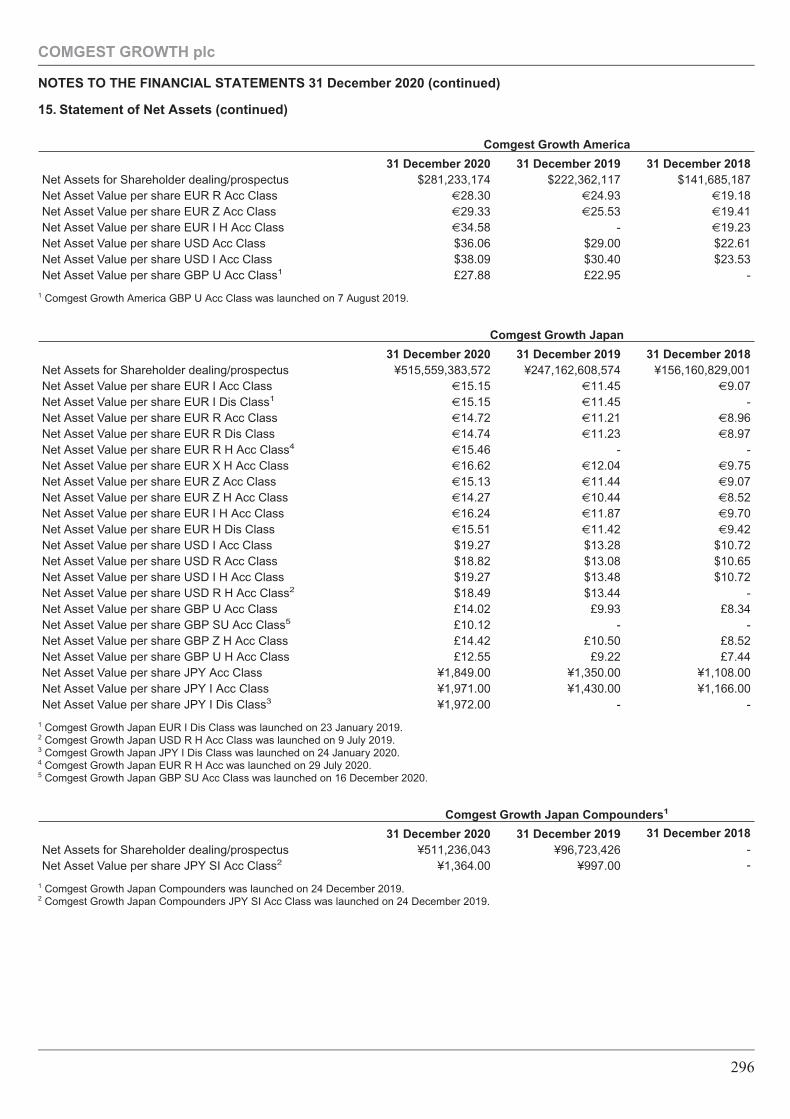
15. Statement of Net Assets (continued)
Comgest Growth America
31 December 2020 31 December 2019 31 December 2018Net Assets for Shareholder dealing/prospectus $281,233,174 $222,362,117 $141,685,187Net Asset Value per share EUR R Acc Class €28.30 €24.93 €19.18Net Asset Value per share EUR Z Acc Class €29.33 €25.53 €19.41Net Asset Value per share EUR I H Acc Class €34.58 - €19.23Net Asset Value per share USD Acc Class $36.06 $29.00 $22.61Net Asset Value per share USD I Acc Class $38.09 $30.40 $23.53Net Asset Value per share GBP U Acc Class1 £27.88 £22.95 -
1 Comgest Growth America GBP U Acc Class was launched on 7 August 2019.
Comgest Growth Japan
31 December 2020 31 December 2019 31 December 2018Net Assets for Shareholder dealing/prospectus ¥515,559,383,572 ¥247,162,608,574 ¥156,160,829,001Net Asset Value per share EUR I Acc Class €15.15 €11.45 €9.07Net Asset Value per share EUR I Dis Class1
€15.15 €11.45 -Net Asset Value per share EUR R Acc Class €14.72 €11.21 €8.96Net Asset Value per share EUR R Dis Class €14.74 €11.23 €8.97Net Asset Value per share EUR R H Acc Class4
€15.46 - -Net Asset Value per share EUR X H Acc Class €16.62 €12.04 €9.75Net Asset Value per share EUR Z Acc Class €15.13 €11.44 €9.07Net Asset Value per share EUR Z H Acc Class €14.27 €10.44 €8.52Net Asset Value per share EUR I H Acc Class €16.24 €11.87 €9.70Net Asset Value per share EUR H Dis Class €15.51 €11.42 €9.42Net Asset Value per share USD I Acc Class $19.27 $13.28 $10.72Net Asset Value per share USD R Acc Class $18.82 $13.08 $10.65Net Asset Value per share USD I H Acc Class $19.27 $13.48 $10.72Net Asset Value per share USD R H Acc Class2 $18.49 $13.44 -Net Asset Value per share GBP U Acc Class £14.02 £9.93 £8.34Net Asset Value per share GBP SU Acc Class5 £10.12 - -Net Asset Value per share GBP Z H Acc Class £14.42 £10.50 £8.52Net Asset Value per share GBP U H Acc Class £12.55 £9.22 £7.44Net Asset Value per share JPY Acc Class ¥1,849.00 ¥1,350.00 ¥1,108.00Net Asset Value per share JPY I Acc Class ¥1,971.00 ¥1,430.00 ¥1,166.00Net Asset Value per share JPY I Dis Class3 ¥1,972.00 - -
1 Comgest Growth Japan EUR I Dis Class was launched on 23 January 2019.2 Comgest Growth Japan USD R H Acc Class was launched on 9 July 2019.3 Comgest Growth Japan JPY I Dis Class was launched on 24 January 2020.4 Comgest Growth Japan EUR R H Acc was launched on 29 July 2020.5 Comgest Growth Japan GBP SU Acc Class was launched on 16 December 2020.
Comgest Growth Japan Compounders1
31 December 2020 31 December 2019Net Assets for Shareholder dealing/prospectus ¥511,236,043 ¥96,723,426Net Asset Value per share JPY SI Acc Class2 ¥1,364.00 ¥997.00
31 December 2018--
1 Comgest Growth Japan Compounders was launched on 24 December 2019.2 Comgest Growth Japan Compounders JPY SI Acc Class was launched on 24 December 2019.
COMGEST GROWTH plc
NOTES TO THE FINANCIAL STATEMENTS 31 December 2020 (continued)
296
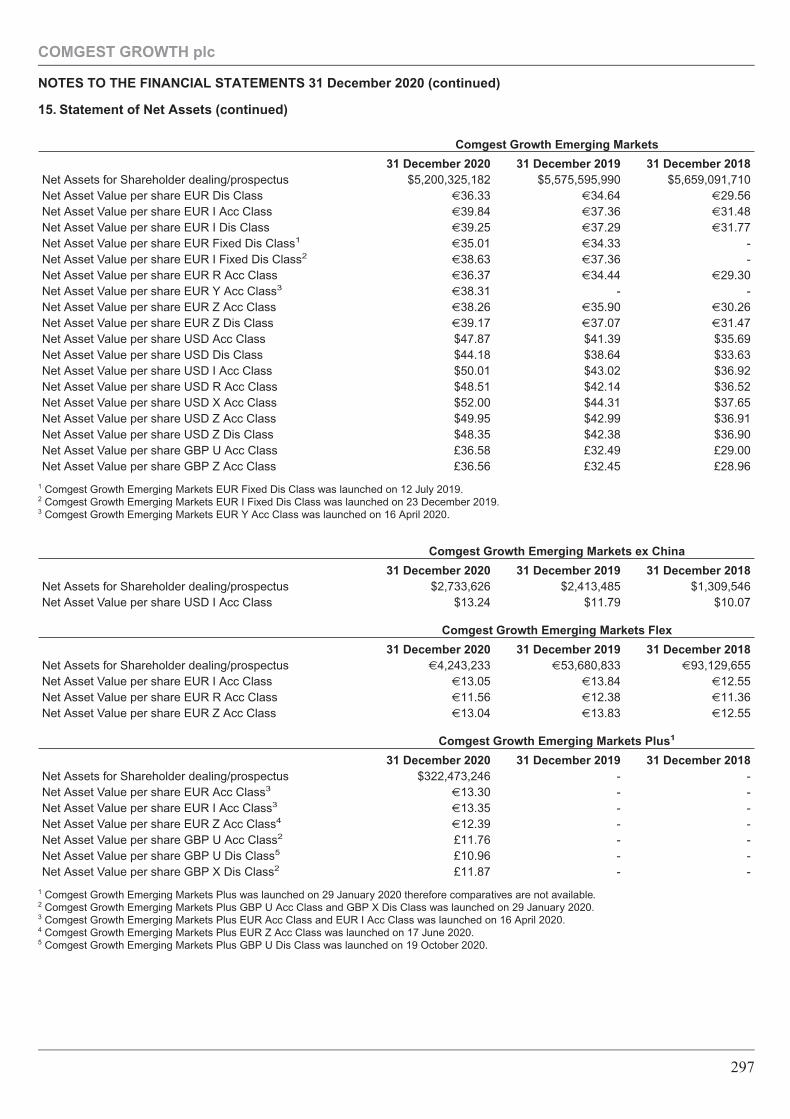
15. Statement of Net Assets (continued)
Comgest Growth Emerging Markets
31 December 2020 31 December 2019 31 December 2018Net Assets for Shareholder dealing/prospectus $5,200,325,182 $5,575,595,990 $5,659,091,710Net Asset Value per share EUR Dis Class €36.33 €34.64 €29.56Net Asset Value per share EUR I Acc Class €39.84 €37.36 €31.48Net Asset Value per share EUR I Dis Class €39.25 €37.29 €31.77Net Asset Value per share EUR Fixed Dis Class1
€35.01 €34.33 -Net Asset Value per share EUR I Fixed Dis Class2
€38.63 €37.36 -Net Asset Value per share EUR R Acc Class €36.37 €34.44 €29.30Net Asset Value per share EUR Y Acc Class3
€38.31 - -Net Asset Value per share EUR Z Acc Class €38.26 €35.90 €30.26Net Asset Value per share EUR Z Dis Class €39.17 €37.07 €31.47Net Asset Value per share USD Acc Class $47.87 $41.39 $35.69Net Asset Value per share USD Dis Class $44.18 $38.64 $33.63Net Asset Value per share USD I Acc Class $50.01 $43.02 $36.92Net Asset Value per share USD R Acc Class $48.51 $42.14 $36.52Net Asset Value per share USD X Acc Class $52.00 $44.31 $37.65Net Asset Value per share USD Z Acc Class $49.95 $42.99 $36.91Net Asset Value per share USD Z Dis Class $48.35 $42.38 $36.90Net Asset Value per share GBP U Acc Class £36.58 £32.49 £29.00Net Asset Value per share GBP Z Acc Class £36.56 £32.45 £28.96
1 Comgest Growth Emerging Markets EUR Fixed Dis Class was launched on 12 July 2019.2 Comgest Growth Emerging Markets EUR I Fixed Dis Class was launched on 23 December 2019.3 Comgest Growth Emerging Markets EUR Y Acc Class was launched on 16 April 2020.
Comgest Growth Emerging Markets ex China
31 December 2020 31 December 2019 31 December 2018Net Assets for Shareholder dealing/prospectus $2,733,626 $2,413,485 $1,309,546Net Asset Value per share USD I Acc Class $13.24 $11.79 $10.07
Comgest Growth Emerging Markets Flex
31 December 2020 31 December 2019 31 December 2018Net Assets for Shareholder dealing/prospectus €4,243,233 €53,680,833 €93,129,655Net Asset Value per share EUR I Acc Class €13.05 €13.84 €12.55Net Asset Value per share EUR R Acc Class €11.56 €12.38 €11.36Net Asset Value per share EUR Z Acc Class €13.04 €13.83 €12.55
Comgest Growth Emerging Markets Plus1
31 December 2020 31 December 2019 31 December 2018Net Assets for Shareholder dealing/prospectus $322,473,246 - -Net Asset Value per share EUR Acc Class3
€13.30 - -Net Asset Value per share EUR I Acc Class3
€13.35 - -Net Asset Value per share EUR Z Acc Class4
€12.39 - -Net Asset Value per share GBP U Acc Class2 £11.76 - -Net Asset Value per share GBP U Dis Class5 £10.96 - -Net Asset Value per share GBP X Dis Class2 £11.87 - -
1 Comgest Growth Emerging Markets Plus was launched on 29 January 2020 therefore comparatives are not available.2 Comgest Growth Emerging Markets Plus GBP U Acc Class and GBP X Dis Class was launched on 29 January 2020.3 Comgest Growth Emerging Markets Plus EUR Acc Class and EUR I Acc Class was launched on 16 April 2020.4 Comgest Growth Emerging Markets Plus EUR Z Acc Class was launched on 17 June 2020.5 Comgest Growth Emerging Markets Plus GBP U Dis Class was launched on 19 October 2020.
COMGEST GROWTH plc
NOTES TO THE FINANCIAL STATEMENTS 31 December 2020 (continued)
297
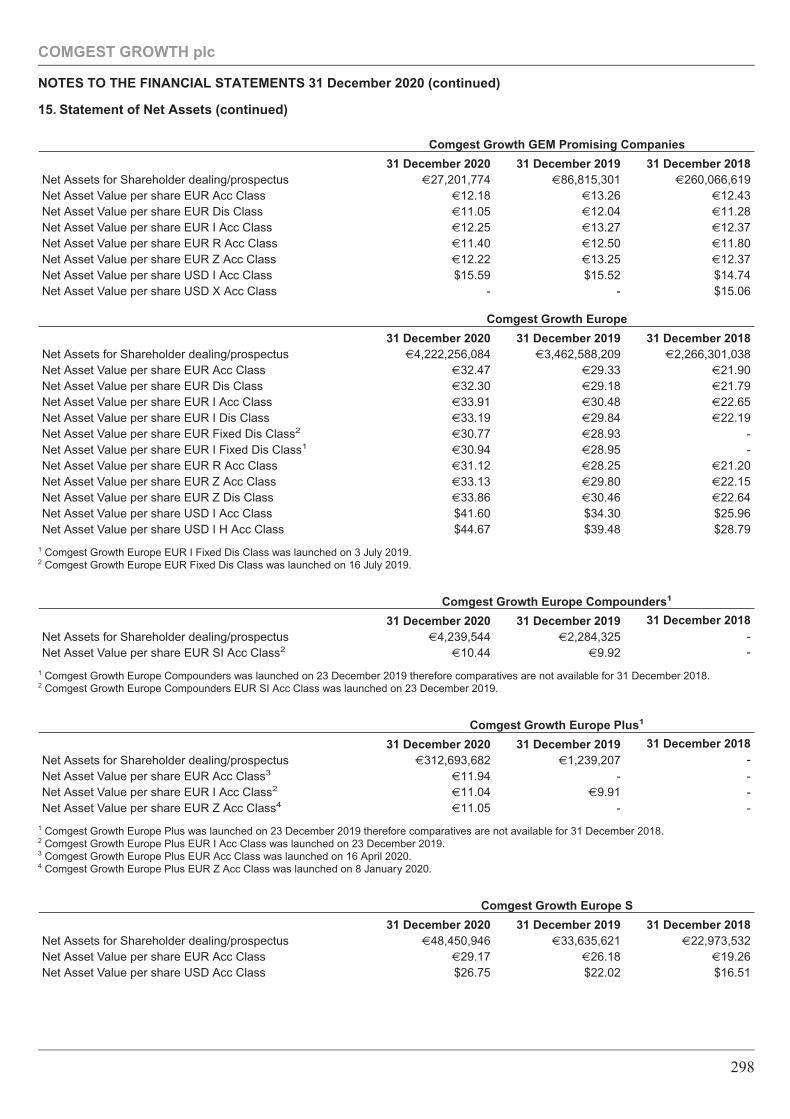
15. Statement of Net Assets (continued)
Comgest Growth GEM Promising Companies
31 December 2020 31 December 2019 31 December 2018Net Assets for Shareholder dealing/prospectus €27,201,774 €86,815,301 €260,066,619Net Asset Value per share EUR Acc Class €12.18 €13.26 €12.43Net Asset Value per share EUR Dis Class €11.05 €12.04 €11.28Net Asset Value per share EUR I Acc Class €12.25 €13.27 €12.37Net Asset Value per share EUR R Acc Class €11.40 €12.50 €11.80Net Asset Value per share EUR Z Acc Class €12.22 €13.25 €12.37Net Asset Value per share USD I Acc Class $15.59 $15.52 $14.74Net Asset Value per share USD X Acc Class - - $15.06
Comgest Growth Europe
31 December 2020 31 December 2019 31 December 2018Net Assets for Shareholder dealing/prospectus €4,222,256,084 €3,462,588,209 €2,266,301,038Net Asset Value per share EUR Acc Class €32.47 €29.33 €21.90Net Asset Value per share EUR Dis Class €32.30 €29.18 €21.79Net Asset Value per share EUR I Acc Class €33.91 €30.48 €22.65Net Asset Value per share EUR I Dis Class €33.19 €29.84 €22.19Net Asset Value per share EUR Fixed Dis Class2
€30.77 €28.93 -Net Asset Value per share EUR I Fixed Dis Class1
€30.94 €28.95 -Net Asset Value per share EUR R Acc Class €31.12 €28.25 €21.20Net Asset Value per share EUR Z Acc Class €33.13 €29.80 €22.15Net Asset Value per share EUR Z Dis Class €33.86 €30.46 €22.64Net Asset Value per share USD I Acc Class $41.60 $34.30 $25.96Net Asset Value per share USD I H Acc Class $44.67 $39.48 $28.79
1 Comgest Growth Europe EUR I Fixed Dis Class was launched on 3 July 2019.2 Comgest Growth Europe EUR Fixed Dis Class was launched on 16 July 2019.
Comgest Growth Europe Compounders1
31 December 2020 31 December 2019Net Assets for Shareholder dealing/prospectus €4,239,544 €2,284,325Net Asset Value per share EUR SI Acc Class2
€10.44 €9.92
31 December 2018--
1 Comgest Growth Europe Compounders was launched on 23 December 2019 therefore comparatives are not available for 31 December 2018.2 Comgest Growth Europe Compounders EUR SI Acc Class was launched on 23 December 2019.
Comgest Growth Europe Plus1
31 December 2020 31 December 2019Net Assets for Shareholder dealing/prospectus €312,693,682 €1,239,207
31 December 2018-
Net Asset Value per share EUR Acc Class3€11.94 - -
Net Asset Value per share EUR I Acc Class2€11.04 €9.91 -
Net Asset Value per share EUR Z Acc Class4€11.05 - -
1 Comgest Growth Europe Plus was launched on 23 December 2019 therefore comparatives are not available for 31 December 2018.2 Comgest Growth Europe Plus EUR I Acc Class was launched on 23 December 2019.3 Comgest Growth Europe Plus EUR Acc Class was launched on 16 April 2020.4 Comgest Growth Europe Plus EUR Z Acc Class was launched on 8 January 2020.
Comgest Growth Europe S
31 December 2020 31 December 2019 31 December 2018Net Assets for Shareholder dealing/prospectus €48,450,946 €33,635,621 €22,973,532Net Asset Value per share EUR Acc Class €29.17 €26.18 €19.26Net Asset Value per share USD Acc Class $26.75 $22.02 $16.51
COMGEST GROWTH plc
NOTES TO THE FINANCIAL STATEMENTS 31 December 2020 (continued)
298
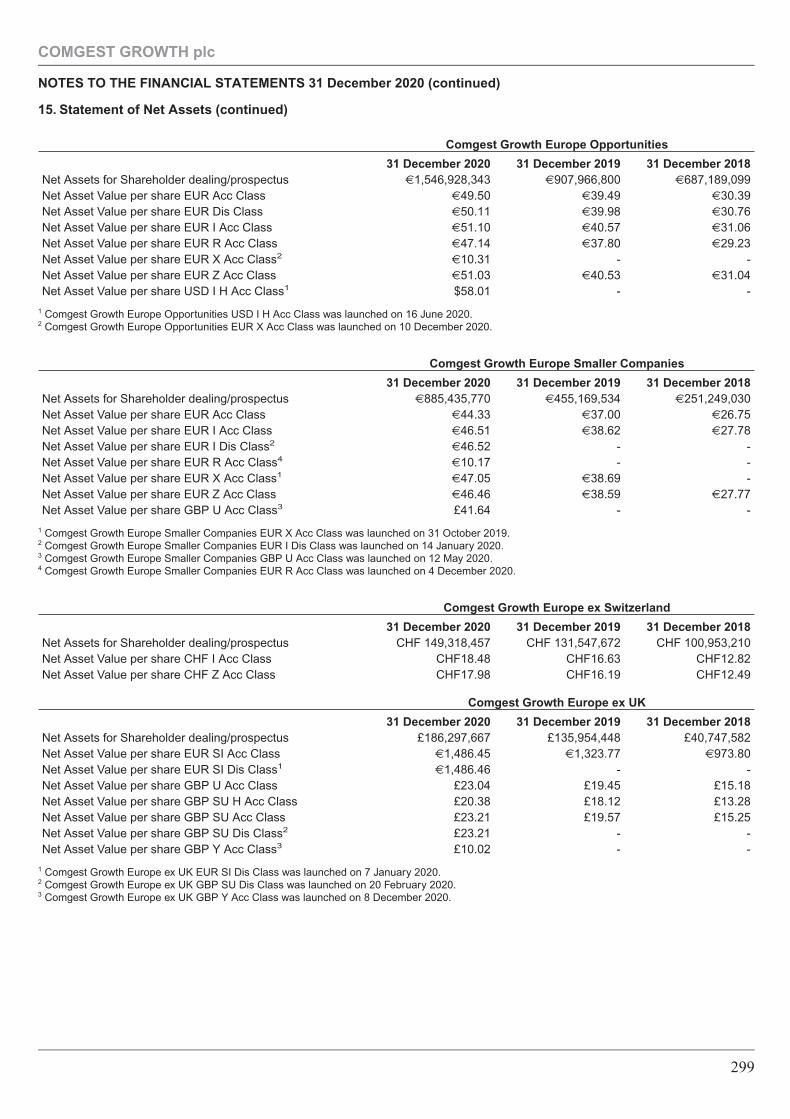
15. Statement of Net Assets (continued)
Comgest Growth Europe Opportunities
31 December 2020 31 December 2019 31 December 2018Net Assets for Shareholder dealing/prospectus €1,546,928,343 €907,966,800 €687,189,099Net Asset Value per share EUR Acc Class €49.50 €39.49 €30.39Net Asset Value per share EUR Dis Class €50.11 €39.98 €30.76Net Asset Value per share EUR I Acc Class €51.10 €40.57 €31.06Net Asset Value per share EUR R Acc Class €47.14 €37.80 €29.23Net Asset Value per share EUR X Acc Class2
€10.31 - -Net Asset Value per share EUR Z Acc Class €51.03 €40.53 €31.04Net Asset Value per share USD I H Acc Class1 $58.01 - -
1 Comgest Growth Europe Opportunities USD I H Acc Class was launched on 16 June 2020.2 Comgest Growth Europe Opportunities EUR X Acc Class was launched on 10 December 2020.
Comgest Growth Europe Smaller Companies
31 December 2020 31 December 2019 31 December 2018Net Assets for Shareholder dealing/prospectus €885,435,770 €455,169,534 €251,249,030Net Asset Value per share EUR Acc Class €44.33 €37.00 €26.75Net Asset Value per share EUR I Acc Class €46.51 €38.62 €27.78Net Asset Value per share EUR I Dis Class2
€46.52 - -Net Asset Value per share EUR R Acc Class4
€10.17 - -Net Asset Value per share EUR X Acc Class1
€47.05 €38.69 -Net Asset Value per share EUR Z Acc Class €46.46 €38.59 €27.77Net Asset Value per share GBP U Acc Class3 £41.64 - -
1 Comgest Growth Europe Smaller Companies EUR X Acc Class was launched on 31 October 2019.2 Comgest Growth Europe Smaller Companies EUR I Dis Class was launched on 14 January 2020.3 Comgest Growth Europe Smaller Companies GBP U Acc Class was launched on 12 May 2020.4 Comgest Growth Europe Smaller Companies EUR R Acc Class was launched on 4 December 2020.
Comgest Growth Europe ex Switzerland
31 December 2020 31 December 2019 31 December 2018Net Assets for Shareholder dealing/prospectus CHF 149,318,457 CHF 131,547,672 CHF 100,953,210Net Asset Value per share CHF I Acc Class CHF18.48 CHF16.63 CHF12.82Net Asset Value per share CHF Z Acc Class CHF17.98 CHF16.19 CHF12.49
Comgest Growth Europe ex UK
31 December 2020 31 December 2019 31 December 2018Net Assets for Shareholder dealing/prospectus £186,297,667 £135,954,448 £40,747,582Net Asset Value per share EUR SI Acc Class €1,486.45 €1,323.77 €973.80Net Asset Value per share EUR SI Dis Class1
€1,486.46 - -Net Asset Value per share GBP U Acc Class £23.04 £19.45 £15.18Net Asset Value per share GBP SU H Acc Class £20.38 £18.12 £13.28Net Asset Value per share GBP SU Acc Class £23.21 £19.57 £15.25Net Asset Value per share GBP SU Dis Class2 £23.21 - -Net Asset Value per share GBP Y Acc Class3 £10.02 - -
1 Comgest Growth Europe ex UK EUR SI Dis Class was launched on 7 January 2020.2 Comgest Growth Europe ex UK GBP SU Dis Class was launched on 20 February 2020.3 Comgest Growth Europe ex UK GBP Y Acc Class was launched on 8 December 2020.
COMGEST GROWTH plc
NOTES TO THE FINANCIAL STATEMENTS 31 December 2020 (continued)
299
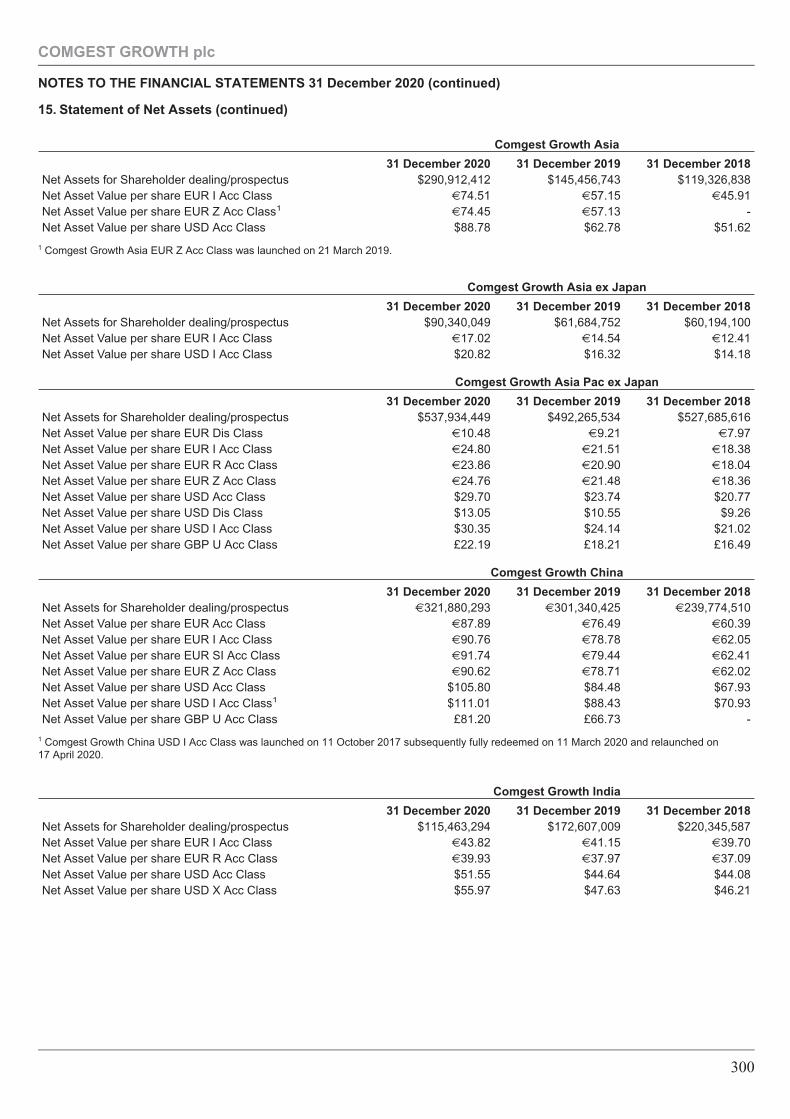
15. Statement of Net Assets (continued)
Comgest Growth Asia
31 December 2020 31 December 2019 31 December 2018Net Assets for Shareholder dealing/prospectus $290,912,412 $145,456,743 $119,326,838Net Asset Value per share EUR I Acc Class €74.51 €57.15 €45.91Net Asset Value per share EUR Z Acc Class1
€74.45 €57.13 -Net Asset Value per share USD Acc Class $88.78 $62.78 $51.62
1 Comgest Growth Asia EUR Z Acc Class was launched on 21 March 2019.
Comgest Growth Asia ex Japan
31 December 2020 31 December 2019 31 December 2018Net Assets for Shareholder dealing/prospectus $90,340,049 $61,684,752 $60,194,100Net Asset Value per share EUR I Acc Class €17.02 €14.54 €12.41Net Asset Value per share USD I Acc Class $20.82 $16.32 $14.18
Comgest Growth Asia Pac ex Japan
31 December 2020 31 December 2019 31 December 2018Net Assets for Shareholder dealing/prospectus $537,934,449 $492,265,534 $527,685,616Net Asset Value per share EUR Dis Class €10.48 €9.21 €7.97Net Asset Value per share EUR I Acc Class €24.80 €21.51 €18.38Net Asset Value per share EUR R Acc Class €23.86 €20.90 €18.04Net Asset Value per share EUR Z Acc Class €24.76 €21.48 €18.36Net Asset Value per share USD Acc Class $29.70 $23.74 $20.77Net Asset Value per share USD Dis Class $13.05 $10.55 $9.26Net Asset Value per share USD I Acc Class $30.35 $24.14 $21.02Net Asset Value per share GBP U Acc Class £22.19 £18.21 £16.49
Comgest Growth China
31 December 2020 31 December 2019 31 December 2018Net Assets for Shareholder dealing/prospectus €321,880,293 €301,340,425 €239,774,510Net Asset Value per share EUR Acc Class €87.89 €76.49 €60.39Net Asset Value per share EUR I Acc Class €90.76 €78.78 €62.05Net Asset Value per share EUR SI Acc Class €91.74 €79.44 €62.41Net Asset Value per share EUR Z Acc Class €90.62 €78.71 €62.02Net Asset Value per share USD Acc Class $105.80 $84.48 $67.93Net Asset Value per share USD I Acc Class1 $111.01 $88.43 $70.93Net Asset Value per share GBP U Acc Class £81.20 £66.73 -
1 Comgest Growth China USD I Acc Class was launched on 11 October 2017 subsequently fully redeemed on 11 March 2020 and relaunched on17 April 2020.
Comgest Growth India
31 December 2020 31 December 2019 31 December 2018Net Assets for Shareholder dealing/prospectus $115,463,294 $172,607,009 $220,345,587Net Asset Value per share EUR I Acc Class €43.82 €41.15 €39.70Net Asset Value per share EUR R Acc Class €39.93 €37.97 €37.09Net Asset Value per share USD Acc Class $51.55 $44.64 $44.08Net Asset Value per share USD X Acc Class $55.97 $47.63 $46.21
COMGEST GROWTH plc
NOTES TO THE FINANCIAL STATEMENTS 31 December 2020 (continued)
300
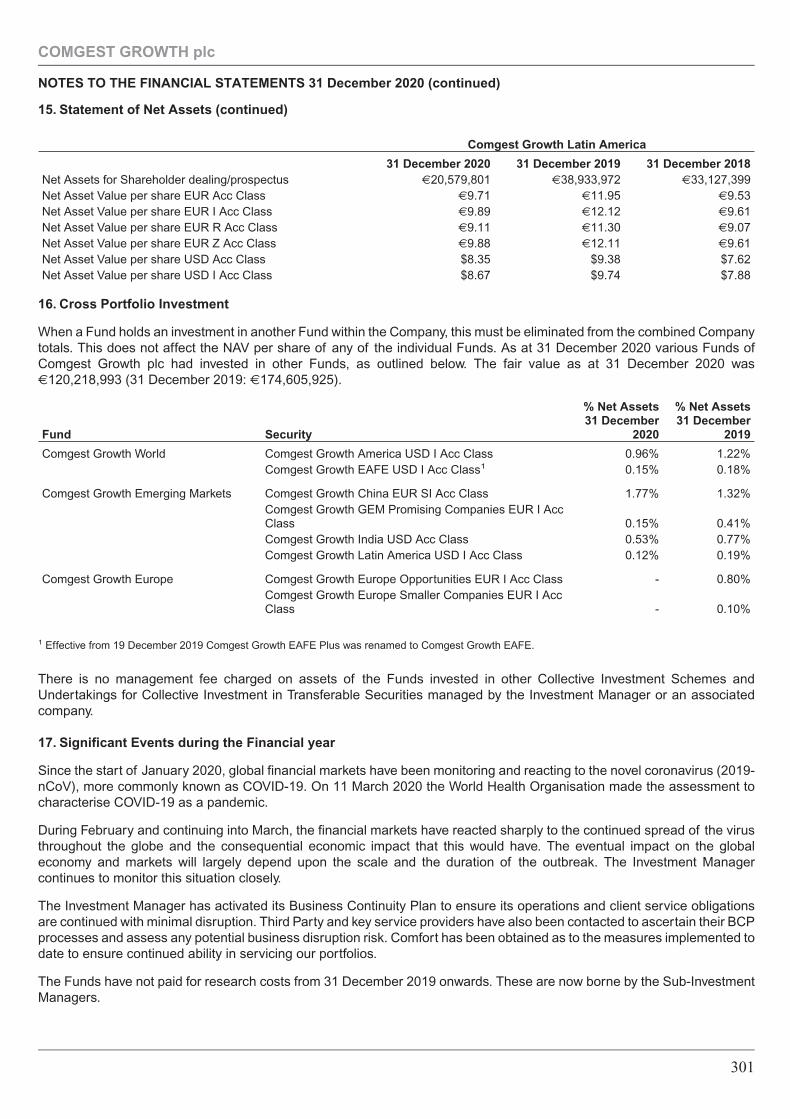
15. Statement of Net Assets (continued)
Comgest Growth Latin America
31 December 2020 31 December 2019 31 December 2018Net Assets for Shareholder dealing/prospectus €20,579,801 €38,933,972 €33,127,399Net Asset Value per share EUR Acc Class €9.71 €11.95 €9.53Net Asset Value per share EUR I Acc Class €9.89 €12.12 €9.61Net Asset Value per share EUR R Acc Class €9.11 €11.30 €9.07Net Asset Value per share EUR Z Acc Class €9.88 €12.11 €9.61Net Asset Value per share USD Acc Class $8.35 $9.38 $7.62Net Asset Value per share USD I Acc Class $8.67 $9.74 $7.88
16. Cross Portfolio Investment
When a Fund holds an investment in another Fund within the Company, this must be eliminated from the combined Companytotals. This does not affect the NAV per share of any of the individual Funds. As at 31 December 2020 various Funds ofComgest Growth plc had invested in other Funds, as outlined below. The fair value as at 31 December 2020 was€120,218,993 (31 December 2019: €174,605,925).
Fund Security
% Net Assets31 December
2020
% Net Assets31 December
2019
Comgest Growth World Comgest Growth America USD I Acc Class 0.96% 1.22%Comgest Growth EAFE USD I Acc Class1 0.15% 0.18%
Comgest Growth Emerging Markets Comgest Growth China EUR SI Acc Class 1.77% 1.32%Comgest Growth GEM Promising Companies EUR I AccClass 0.15% 0.41%Comgest Growth India USD Acc Class 0.53% 0.77%Comgest Growth Latin America USD I Acc Class 0.12% 0.19%
Comgest Growth Europe Comgest Growth Europe Opportunities EUR I Acc Class - 0.80%Comgest Growth Europe Smaller Companies EUR I AccClass - 0.10%
1 Effective from 19 December 2019 Comgest Growth EAFE Plus was renamed to Comgest Growth EAFE.
There is no management fee charged on assets of the Funds invested in other Collective Investment Schemes andUndertakings for Collective Investment in Transferable Securities managed by the Investment Manager or an associatedcompany.
17. Significant Events during the Financial year
Since the start of January 2020, global financial markets have been monitoring and reacting to the novel coronavirus (2019-nCoV), more commonly known as COVID-19. On 11 March 2020 the World Health Organisation made the assessment tocharacterise COVID-19 as a pandemic.
During February and continuing into March, the financial markets have reacted sharply to the continued spread of the virusthroughout the globe and the consequential economic impact that this would have. The eventual impact on the globaleconomy and markets will largely depend upon the scale and the duration of the outbreak. The Investment Managercontinues to monitor this situation closely.
The Investment Manager has activated its Business Continuity Plan to ensure its operations and client service obligationsare continued with minimal disruption. Third Party and key service providers have also been contacted to ascertain their BCPprocesses and assess any potential business disruption risk. Comfort has been obtained as to the measures implemented todate to ensure continued ability in servicing our portfolios.
The Funds have not paid for research costs from 31 December 2019 onwards. These are now borne by the Sub-InvestmentManagers.
COMGEST GROWTH plc
NOTES TO THE FINANCIAL STATEMENTS 31 December 2020 (continued)
301
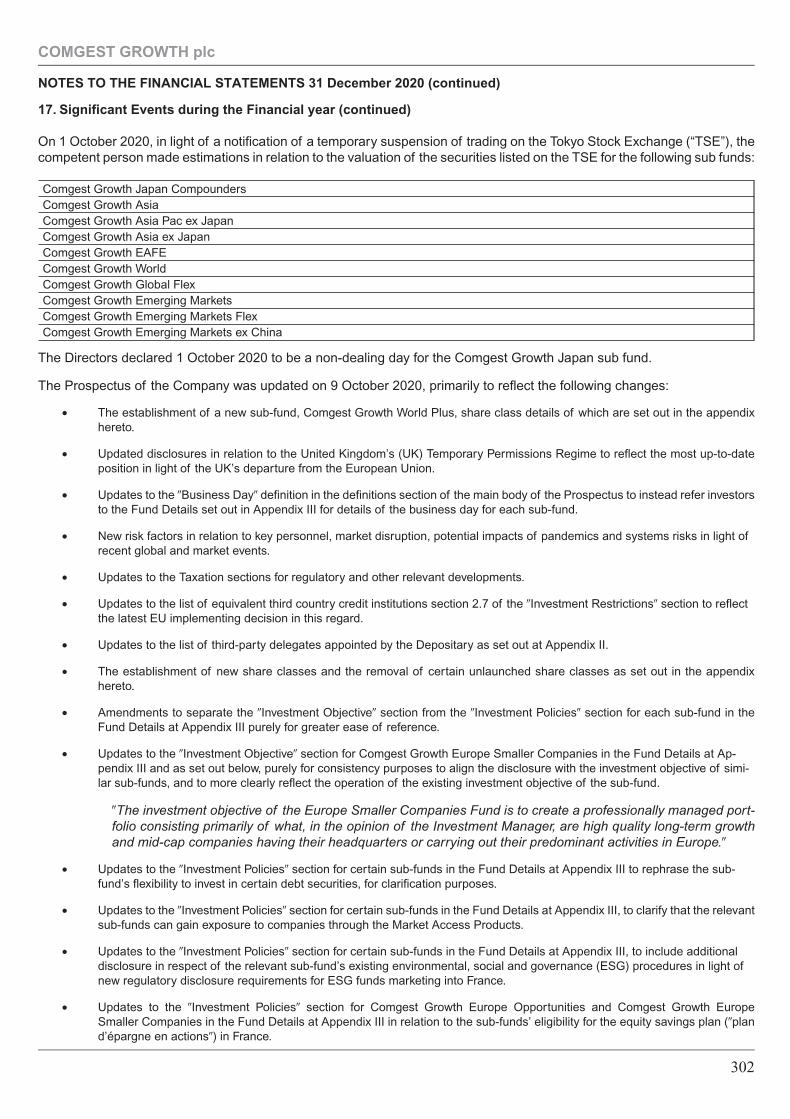
17. Significant Events during the Financial year (continued)
On 1 October 2020, in light of a notification of a temporary suspension of trading on the Tokyo Stock Exchange (“TSE”), thecompetent person made estimations in relation to the valuation of the securities listed on the TSE for the following sub funds:
Comgest Growth Japan CompoundersComgest Growth AsiaComgest Growth Asia Pac ex JapanComgest Growth Asia ex JapanComgest Growth EAFEComgest Growth WorldComgest Growth Global FlexComgest Growth Emerging MarketsComgest Growth Emerging Markets FlexComgest Growth Emerging Markets ex China
The Directors declared 1 October 2020 to be a non-dealing day for the Comgest Growth Japan sub fund.
The Prospectus of the Company was updated on 9 October 2020, primarily to reflect the following changes:
• The establishment of a new sub-fund, Comgest Growth World Plus, share class details of which are set out in the appendixhereto.
• Updated disclosures in relation to the United Kingdom’s (UK) Temporary Permissions Regime to reflect the most up-to-dateposition in light of the UK’s departure from the European Union.
• Updates to the �Business Day� definition in the definitions section of the main body of the Prospectus to instead refer investorsto the Fund Details set out in Appendix III for details of the business day for each sub-fund.
• New risk factors in relation to key personnel, market disruption, potential impacts of pandemics and systems risks in light ofrecent global and market events.
• Updates to the Taxation sections for regulatory and other relevant developments.
• Updates to the list of equivalent third country credit institutions section 2.7 of the �Investment Restrictions� section to reflectthe latest EU implementing decision in this regard.
• Updates to the list of third-party delegates appointed by the Depositary as set out at Appendix II.
• The establishment of new share classes and the removal of certain unlaunched share classes as set out in the appendixhereto.
• Amendments to separate the �Investment Objective� section from the �Investment Policies� section for each sub-fund in theFund Details at Appendix III purely for greater ease of reference.
• Updates to the �Investment Objective� section for Comgest Growth Europe Smaller Companies in the Fund Details at Ap-pendix III and as set out below, purely for consistency purposes to align the disclosure with the investment objective of simi-lar sub-funds, and to more clearly reflect the operation of the existing investment objective of the sub-fund.
�The investment objective of the Europe Smaller Companies Fund is to create a professionally managed port-folio consisting primarily of what, in the opinion of the Investment Manager, are high quality long-term growthand mid-cap companies having their headquarters or carrying out their predominant activities in Europe.�
• Updates to the �Investment Policies� section for certain sub-funds in the Fund Details at Appendix III to rephrase the sub-fund’s flexibility to invest in certain debt securities, for clarification purposes.
• Updates to the �Investment Policies� section for certain sub-funds in the Fund Details at Appendix III, to clarify that the relevantsub-funds can gain exposure to companies through the Market Access Products.
• Updates to the �Investment Policies� section for certain sub-funds in the Fund Details at Appendix III, to include additionaldisclosure in respect of the relevant sub-fund’s existing environmental, social and governance (ESG) procedures in light ofnew regulatory disclosure requirements for ESG funds marketing into France.
• Updates to the �Investment Policies� section for Comgest Growth Europe Opportunities and Comgest Growth EuropeSmaller Companies in the Fund Details at Appendix III in relation to the sub-funds’ eligibility for the equity savings plan (�pland’épargne en actions�) in France.
COMGEST GROWTH plc
NOTES TO THE FINANCIAL STATEMENTS 31 December 2020 (continued)
302
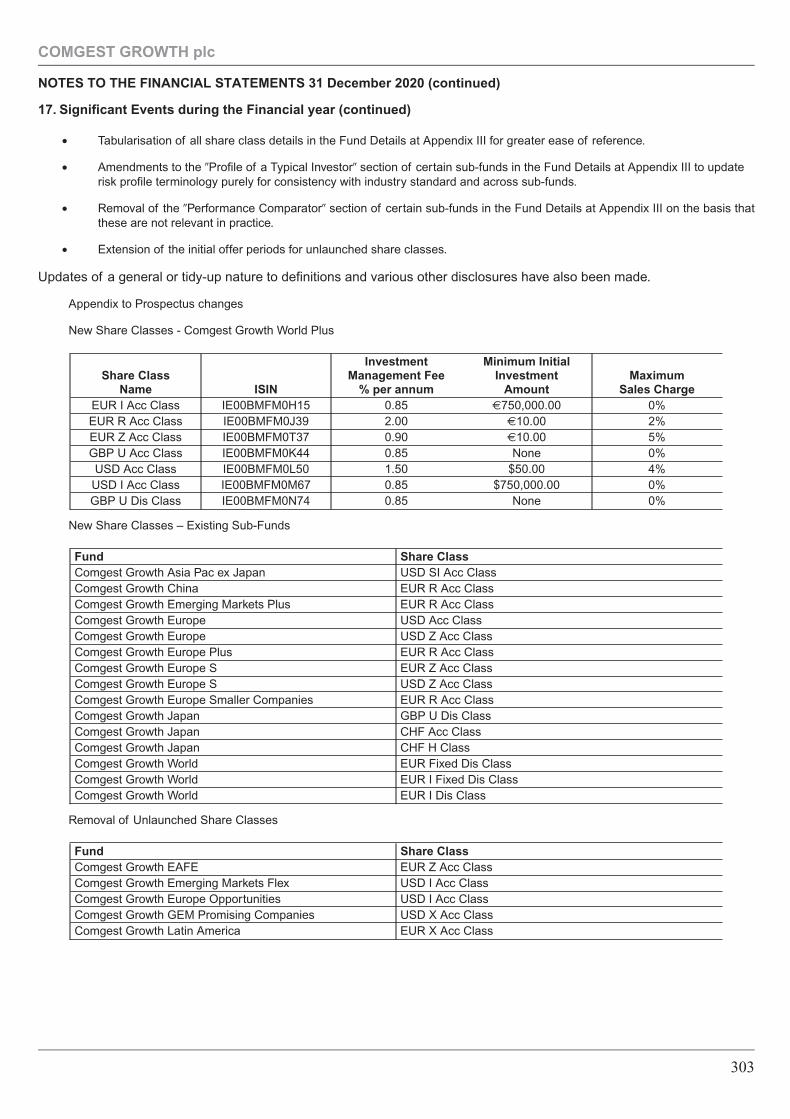
17. Significant Events during the Financial year (continued)
• Tabularisation of all share class details in the Fund Details at Appendix III for greater ease of reference.
• Amendments to the �Profile of a Typical Investor� section of certain sub-funds in the Fund Details at Appendix III to updaterisk profile terminology purely for consistency with industry standard and across sub-funds.
• Removal of the �Performance Comparator� section of certain sub-funds in the Fund Details at Appendix III on the basis thatthese are not relevant in practice.
• Extension of the initial offer periods for unlaunched share classes.
Updates of a general or tidy-up nature to definitions and various other disclosures have also been made.
Appendix to Prospectus changes
New Share Classes - Comgest Growth World Plus
Share ClassName ISIN
InvestmentManagement Fee
% per annum
Minimum InitialInvestment
AmountMaximum
Sales ChargeEUR I Acc Class IE00BMFM0H15 0.85 €750,000.00 0%EUR R Acc Class IE00BMFM0J39 2.00 €10.00 2%EUR Z Acc Class IE00BMFM0T37 0.90 €10.00 5%GBP U Acc Class IE00BMFM0K44 0.85 None 0%USD Acc Class IE00BMFM0L50 1.50 $50.00 4%USD I Acc Class IE00BMFM0M67 0.85 $750,000.00 0%GBP U Dis Class IE00BMFM0N74 0.85 None 0%
New Share Classes – Existing Sub-Funds
Fund Share ClassComgest Growth Asia Pac ex Japan USD SI Acc ClassComgest Growth China EUR R Acc ClassComgest Growth Emerging Markets Plus EUR R Acc ClassComgest Growth Europe USD Acc ClassComgest Growth Europe USD Z Acc ClassComgest Growth Europe Plus EUR R Acc ClassComgest Growth Europe S EUR Z Acc ClassComgest Growth Europe S USD Z Acc ClassComgest Growth Europe Smaller Companies EUR R Acc ClassComgest Growth Japan GBP U Dis ClassComgest Growth Japan CHF Acc ClassComgest Growth Japan CHF H ClassComgest Growth World EUR Fixed Dis ClassComgest Growth World EUR I Fixed Dis ClassComgest Growth World EUR I Dis Class
Removal of Unlaunched Share Classes
Fund Share ClassComgest Growth EAFE EUR Z Acc ClassComgest Growth Emerging Markets Flex USD I Acc ClassComgest Growth Europe Opportunities USD I Acc ClassComgest Growth GEM Promising Companies USD X Acc ClassComgest Growth Latin America EUR X Acc Class
COMGEST GROWTH plc
NOTES TO THE FINANCIAL STATEMENTS 31 December 2020 (continued)
303
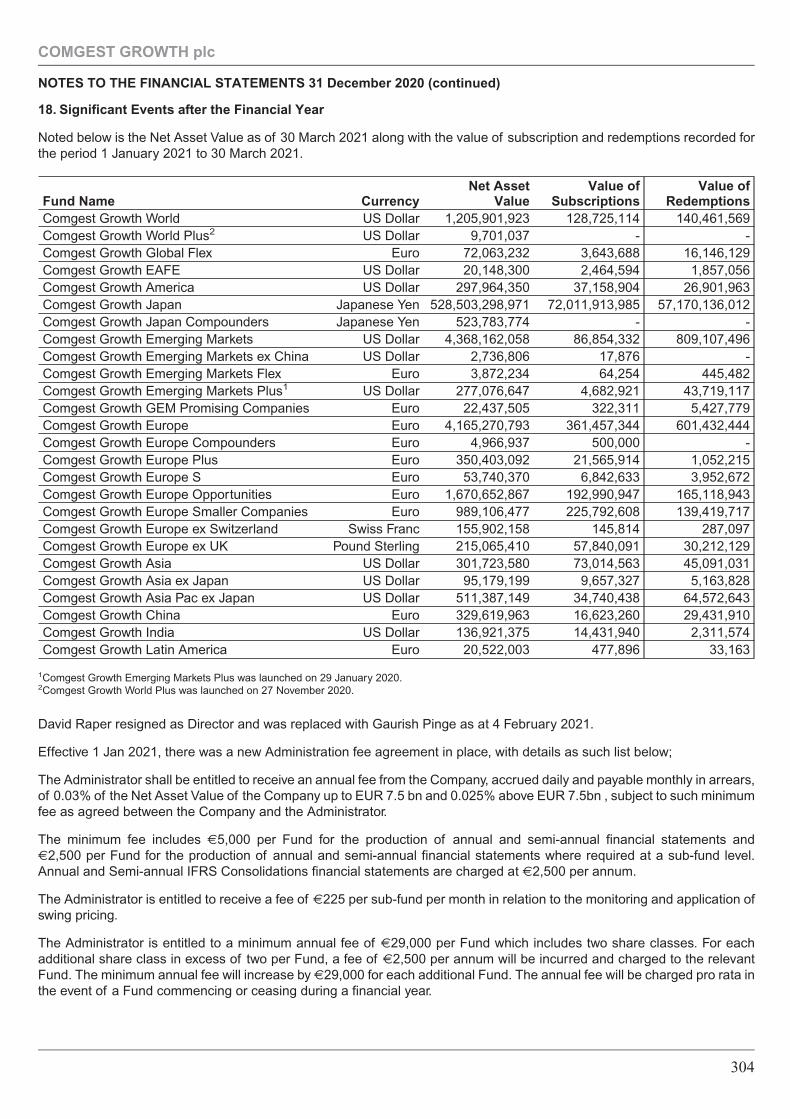
18. Significant Events after the Financial Year
Noted below is the Net Asset Value as of 30 March 2021 along with the value of subscription and redemptions recorded forthe period 1 January 2021 to 30 March 2021.
Fund Name CurrencyNet Asset
ValueValue of
SubscriptionsValue of
RedemptionsComgest Growth World US Dollar 1,205,901,923 128,725,114 140,461,569Comgest Growth World Plus2 US Dollar 9,701,037 - -Comgest Growth Global Flex Euro 72,063,232 3,643,688 16,146,129Comgest Growth EAFE US Dollar 20,148,300 2,464,594 1,857,056Comgest Growth America US Dollar 297,964,350 37,158,904 26,901,963Comgest Growth Japan Japanese Yen 528,503,298,971 72,011,913,985 57,170,136,012Comgest Growth Japan Compounders Japanese Yen 523,783,774 - -Comgest Growth Emerging Markets US Dollar 4,368,162,058 86,854,332 809,107,496Comgest Growth Emerging Markets ex China US Dollar 2,736,806 17,876 -Comgest Growth Emerging Markets Flex Euro 3,872,234 64,254 445,482Comgest Growth Emerging Markets Plus1 US Dollar 277,076,647 4,682,921 43,719,117Comgest Growth GEM Promising Companies Euro 22,437,505 322,311 5,427,779Comgest Growth Europe Euro 4,165,270,793 361,457,344 601,432,444Comgest Growth Europe Compounders Euro 4,966,937 500,000 -Comgest Growth Europe Plus Euro 350,403,092 21,565,914 1,052,215Comgest Growth Europe S Euro 53,740,370 6,842,633 3,952,672Comgest Growth Europe Opportunities Euro 1,670,652,867 192,990,947 165,118,943Comgest Growth Europe Smaller Companies Euro 989,106,477 225,792,608 139,419,717Comgest Growth Europe ex Switzerland Swiss Franc 155,902,158 145,814 287,097Comgest Growth Europe ex UK Pound Sterling 215,065,410 57,840,091 30,212,129Comgest Growth Asia US Dollar 301,723,580 73,014,563 45,091,031Comgest Growth Asia ex Japan US Dollar 95,179,199 9,657,327 5,163,828Comgest Growth Asia Pac ex Japan US Dollar 511,387,149 34,740,438 64,572,643Comgest Growth China Euro 329,619,963 16,623,260 29,431,910Comgest Growth India US Dollar 136,921,375 14,431,940 2,311,574Comgest Growth Latin America Euro 20,522,003 477,896 33,163
1Comgest Growth Emerging Markets Plus was launched on 29 January 2020.2Comgest Growth World Plus was launched on 27 November 2020.
David Raper resigned as Director and was replaced with Gaurish Pinge as at 4 February 2021.
Effective 1 Jan 2021, there was a new Administration fee agreement in place, with details as such list below;
The Administrator shall be entitled to receive an annual fee from the Company, accrued daily and payable monthly in arrears,of 0.03% of the Net Asset Value of the Company up to EUR 7.5 bn and 0.025% above EUR 7.5bn , subject to such minimumfee as agreed between the Company and the Administrator.
The minimum fee includes €5,000 per Fund for the production of annual and semi-annual financial statements and€2,500 per Fund for the production of annual and semi-annual financial statements where required at a sub-fund level.Annual and Semi-annual IFRS Consolidations financial statements are charged at €2,500 per annum.
The Administrator is entitled to receive a fee of €225 per sub-fund per month in relation to the monitoring and application ofswing pricing.
The Administrator is entitled to a minimum annual fee of €29,000 per Fund which includes two share classes. For eachadditional share class in excess of two per Fund, a fee of €2,500 per annum will be incurred and charged to the relevantFund. The minimum annual fee will increase by €29,000 for each additional Fund. The annual fee will be charged pro rata inthe event of a Fund commencing or ceasing during a financial year.
COMGEST GROWTH plc
NOTES TO THE FINANCIAL STATEMENTS 31 December 2020 (continued)
304
18. Significant Events after the Financial Year (continued)
The Administrator is also entitled to a fee for services provided to the Company in relation to the Foreign Account TaxCompliance Act (FATCA) and Common Reporting Standard (CRS). This fee will be €1,250 for the transmission of theRegulatory Tax Reporting per reporting entity per reporting run and €1,000 for the provision of the Regulatory Tax Reportingper reporting entity per reporting run and will be charged separately for FATCA and CRS.
Effective 19 February 2021, an Addendum to the Supplement of to the Comgest Growth Europe ex UK fund was approvedwhereby a new share class, GBP Y Dis Share Class was added for investors.
19. Securities Lending
During the financial year ended 31 December 2020, the Company did not enter into securities lending transactions (financialyear ended 31 December 2019: none).
20. Approval of the Financial Statements
The Board of Directors authorised the financial statements on 31 March 2021 for issue.
COMGEST GROWTH plc
NOTES TO THE FINANCIAL STATEMENTS 31 December 2020 (continued)
305
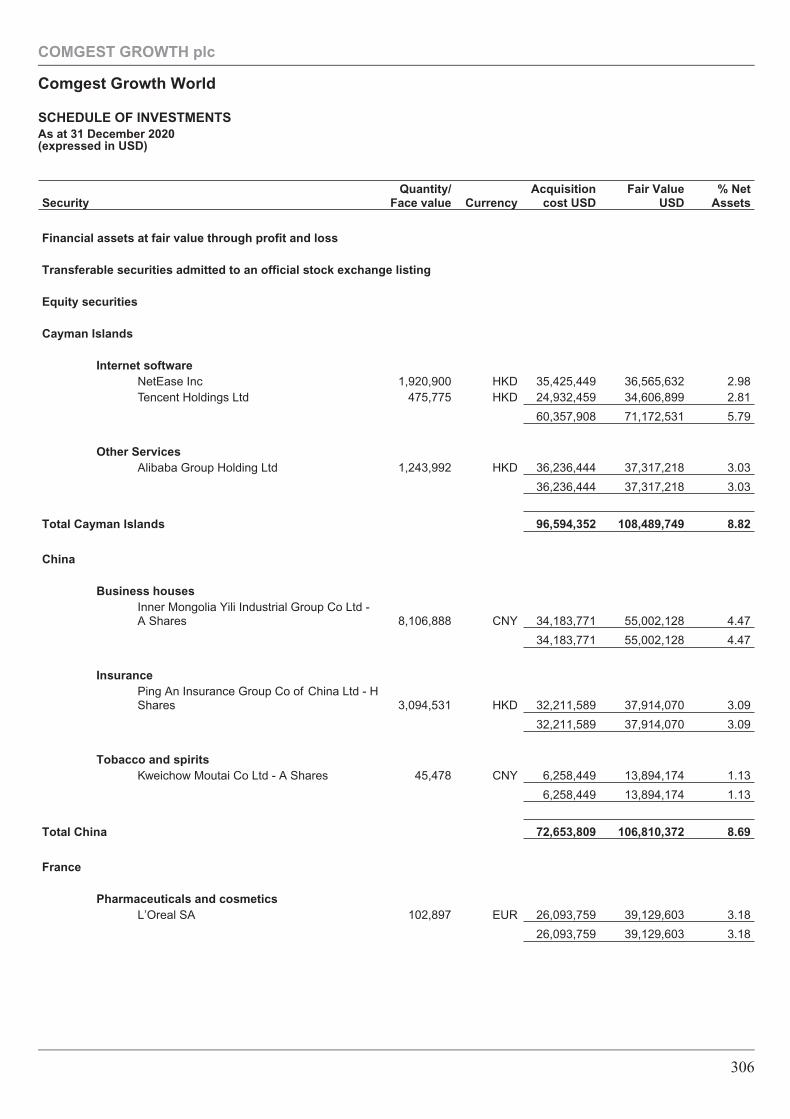
SecurityQuantity/
Face value CurrencyAcquisition
cost USDFair Value
USD% Net
Assets
Financial assets at fair value through profit and loss
Transferable securities admitted to an official stock exchange listing
Equity securities
Cayman Islands
Internet softwareNetEase Inc 1,920,900 HKD 35,425,449 36,565,632 2.98Tencent Holdings Ltd 475,775 HKD 24,932,459 34,606,899 2.81
60,357,908 71,172,531 5.79
Other ServicesAlibaba Group Holding Ltd 1,243,992 HKD 36,236,444 37,317,218 3.03
36,236,444 37,317,218 3.03
Total Cayman Islands 96,594,352 108,489,749 8.82
China
Business housesInner Mongolia Yili Industrial Group Co Ltd -A Shares 8,106,888 CNY 34,183,771 55,002,128 4.47
34,183,771 55,002,128 4.47
InsurancePing An Insurance Group Co of China Ltd - HShares 3,094,531 HKD 32,211,589 37,914,070 3.09
32,211,589 37,914,070 3.09
Tobacco and spiritsKweichow Moutai Co Ltd - A Shares 45,478 CNY 6,258,449 13,894,174 1.13
6,258,449 13,894,174 1.13
Total China 72,653,809 106,810,372 8.69
France
Pharmaceuticals and cosmeticsL’Oreal SA 102,897 EUR 26,093,759 39,129,603 3.18
26,093,759 39,129,603 3.18
COMGEST GROWTH plc
Comgest Growth World
SCHEDULE OF INVESTMENTSAs at 31 December 2020(expressed in USD)
306
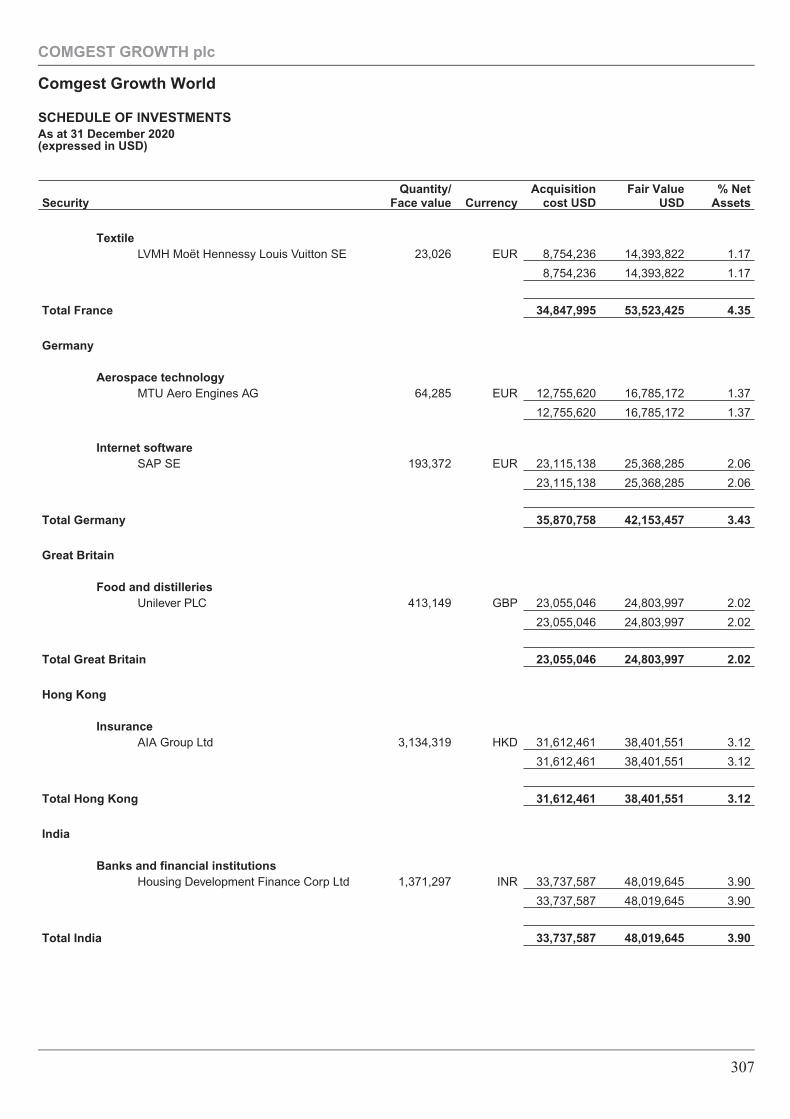
SecurityQuantity/
Face value CurrencyAcquisition
cost USDFair Value
USD% Net
Assets
TextileLVMH Moët Hennessy Louis Vuitton SE 23,026 EUR 8,754,236 14,393,822 1.17
8,754,236 14,393,822 1.17
Total France 34,847,995 53,523,425 4.35
Germany
Aerospace technologyMTU Aero Engines AG 64,285 EUR 12,755,620 16,785,172 1.37
12,755,620 16,785,172 1.37
Internet softwareSAP SE 193,372 EUR 23,115,138 25,368,285 2.06
23,115,138 25,368,285 2.06
Total Germany 35,870,758 42,153,457 3.43
Great Britain
Food and distilleriesUnilever PLC 413,149 GBP 23,055,046 24,803,997 2.02
23,055,046 24,803,997 2.02
Total Great Britain 23,055,046 24,803,997 2.02
Hong Kong
InsuranceAIA Group Ltd 3,134,319 HKD 31,612,461 38,401,551 3.12
31,612,461 38,401,551 3.12
Total Hong Kong 31,612,461 38,401,551 3.12
India
Banks and financial institutionsHousing Development Finance Corp Ltd 1,371,297 INR 33,737,587 48,019,645 3.90
33,737,587 48,019,645 3.90
Total India 33,737,587 48,019,645 3.90
COMGEST GROWTH plc
Comgest Growth World
SCHEDULE OF INVESTMENTSAs at 31 December 2020(expressed in USD)
307
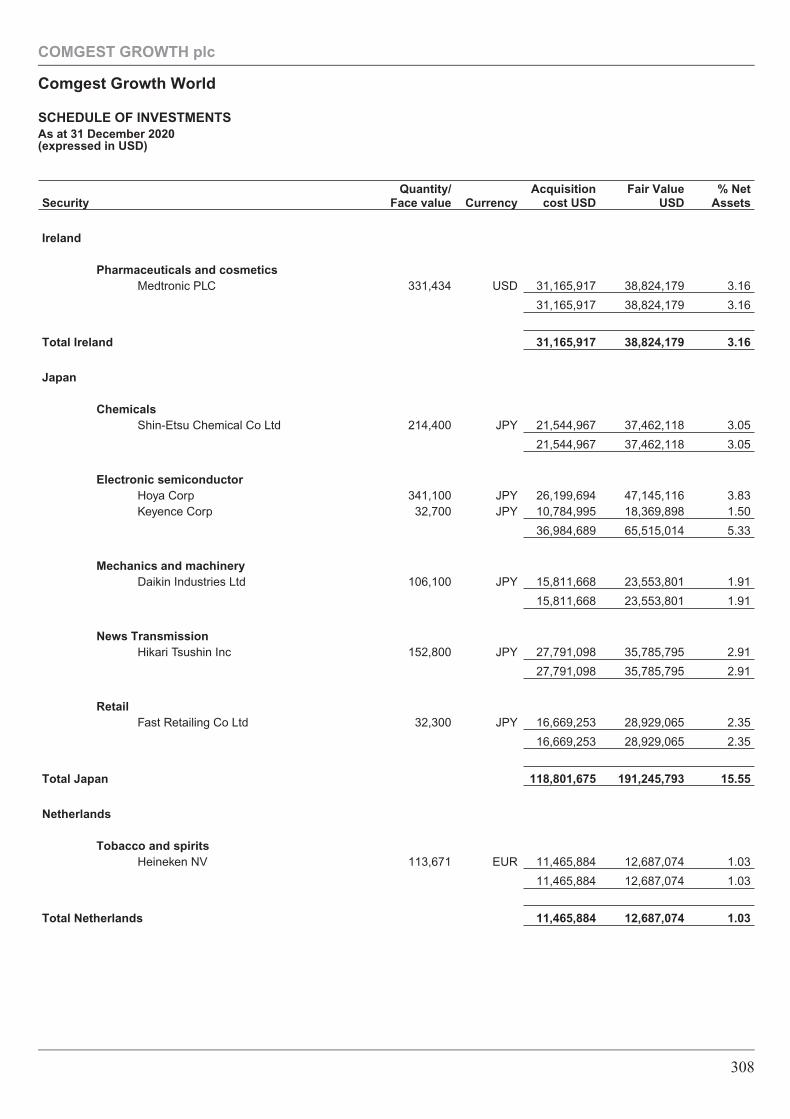
SecurityQuantity/
Face value CurrencyAcquisition
cost USDFair Value
USD% Net
Assets
Ireland
Pharmaceuticals and cosmeticsMedtronic PLC 331,434 USD 31,165,917 38,824,179 3.16
31,165,917 38,824,179 3.16
Total Ireland 31,165,917 38,824,179 3.16
Japan
ChemicalsShin-Etsu Chemical Co Ltd 214,400 JPY 21,544,967 37,462,118 3.05
21,544,967 37,462,118 3.05
Electronic semiconductorHoya Corp 341,100 JPY 26,199,694 47,145,116 3.83Keyence Corp 32,700 JPY 10,784,995 18,369,898 1.50
36,984,689 65,515,014 5.33
Mechanics and machineryDaikin Industries Ltd 106,100 JPY 15,811,668 23,553,801 1.91
15,811,668 23,553,801 1.91
News TransmissionHikari Tsushin Inc 152,800 JPY 27,791,098 35,785,795 2.91
27,791,098 35,785,795 2.91
RetailFast Retailing Co Ltd 32,300 JPY 16,669,253 28,929,065 2.35
16,669,253 28,929,065 2.35
Total Japan 118,801,675 191,245,793 15.55
Netherlands
Tobacco and spiritsHeineken NV 113,671 EUR 11,465,884 12,687,074 1.03
11,465,884 12,687,074 1.03
Total Netherlands 11,465,884 12,687,074 1.03
COMGEST GROWTH plc
Comgest Growth World
SCHEDULE OF INVESTMENTSAs at 31 December 2020(expressed in USD)
308
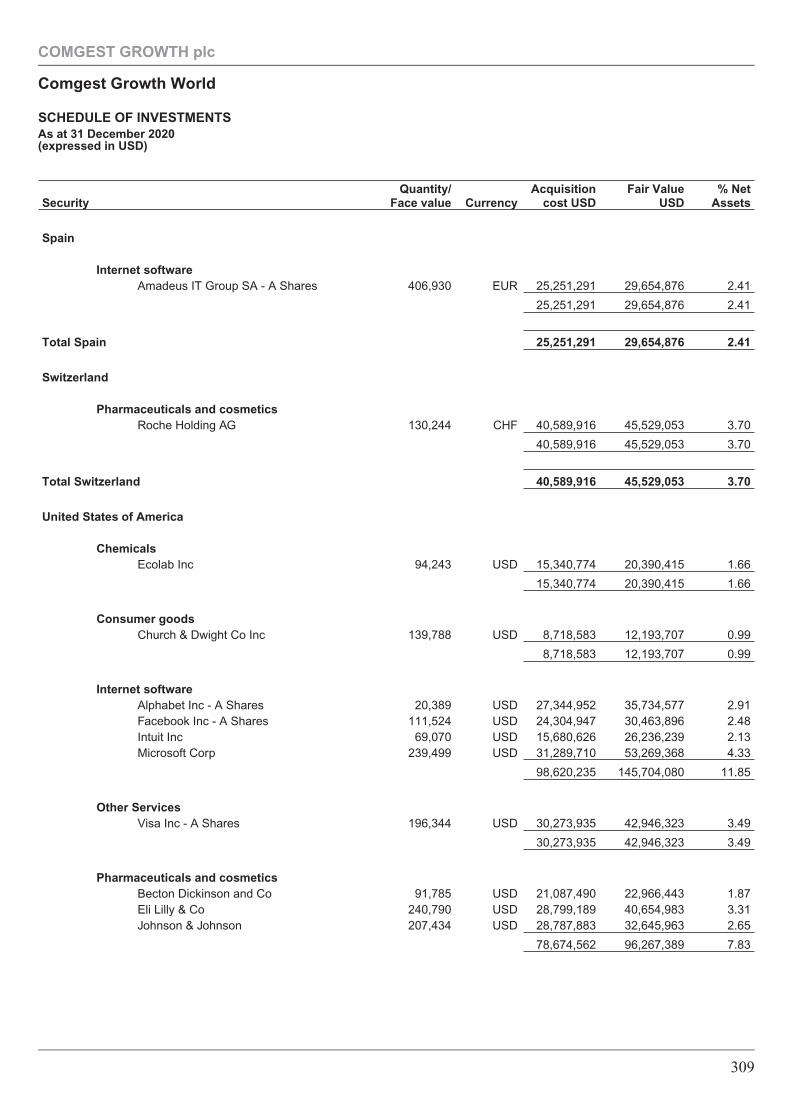
SecurityQuantity/
Face value CurrencyAcquisition
cost USDFair Value
USD% Net
Assets
Spain
Internet softwareAmadeus IT Group SA - A Shares 406,930 EUR 25,251,291 29,654,876 2.41
25,251,291 29,654,876 2.41
Total Spain 25,251,291 29,654,876 2.41
Switzerland
Pharmaceuticals and cosmeticsRoche Holding AG 130,244 CHF 40,589,916 45,529,053 3.70
40,589,916 45,529,053 3.70
Total Switzerland 40,589,916 45,529,053 3.70
United States of America
ChemicalsEcolab Inc 94,243 USD 15,340,774 20,390,415 1.66
15,340,774 20,390,415 1.66
Consumer goodsChurch & Dwight Co Inc 139,788 USD 8,718,583 12,193,707 0.99
8,718,583 12,193,707 0.99
Internet softwareAlphabet Inc - A Shares 20,389 USD 27,344,952 35,734,577 2.91Facebook Inc - A Shares 111,524 USD 24,304,947 30,463,896 2.48Intuit Inc 69,070 USD 15,680,626 26,236,239 2.13Microsoft Corp 239,499 USD 31,289,710 53,269,368 4.33
98,620,235 145,704,080 11.85
Other ServicesVisa Inc - A Shares 196,344 USD 30,273,935 42,946,323 3.49
30,273,935 42,946,323 3.49
Pharmaceuticals and cosmeticsBecton Dickinson and Co 91,785 USD 21,087,490 22,966,443 1.87Eli Lilly & Co 240,790 USD 28,799,189 40,654,983 3.31Johnson & Johnson 207,434 USD 28,787,883 32,645,963 2.65
78,674,562 96,267,389 7.83
COMGEST GROWTH plc
Comgest Growth World
SCHEDULE OF INVESTMENTSAs at 31 December 2020(expressed in USD)
309
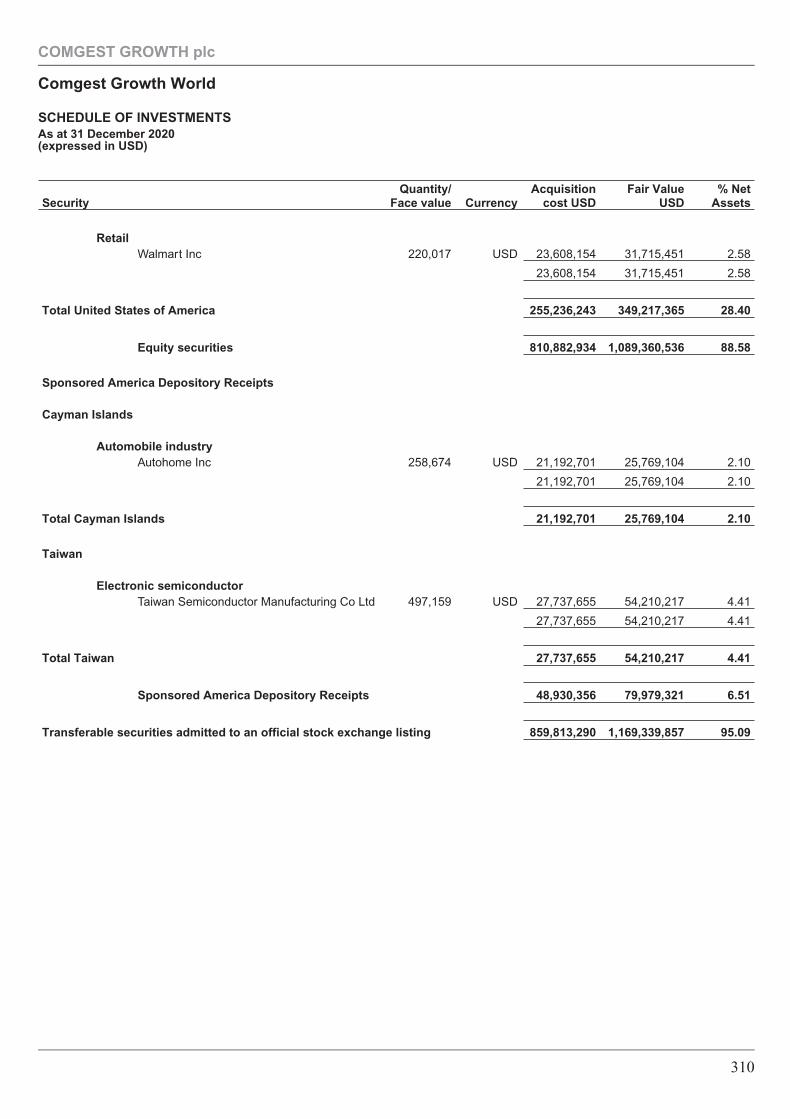
SecurityQuantity/
Face value CurrencyAcquisition
cost USDFair Value
USD% Net
Assets
RetailWalmart Inc 220,017 USD 23,608,154 31,715,451 2.58
23,608,154 31,715,451 2.58
Total United States of America 255,236,243 349,217,365 28.40
Equity securities 810,882,934 1,089,360,536 88.58
Sponsored America Depository Receipts
Cayman Islands
Automobile industryAutohome Inc 258,674 USD 21,192,701 25,769,104 2.10
21,192,701 25,769,104 2.10
Total Cayman Islands 21,192,701 25,769,104 2.10
Taiwan
Electronic semiconductorTaiwan Semiconductor Manufacturing Co Ltd 497,159 USD 27,737,655 54,210,217 4.41
27,737,655 54,210,217 4.41
Total Taiwan 27,737,655 54,210,217 4.41
Sponsored America Depository Receipts 48,930,356 79,979,321 6.51
Transferable securities admitted to an official stock exchange listing 859,813,290 1,169,339,857 95.09
COMGEST GROWTH plc
Comgest Growth World
SCHEDULE OF INVESTMENTSAs at 31 December 2020(expressed in USD)
310
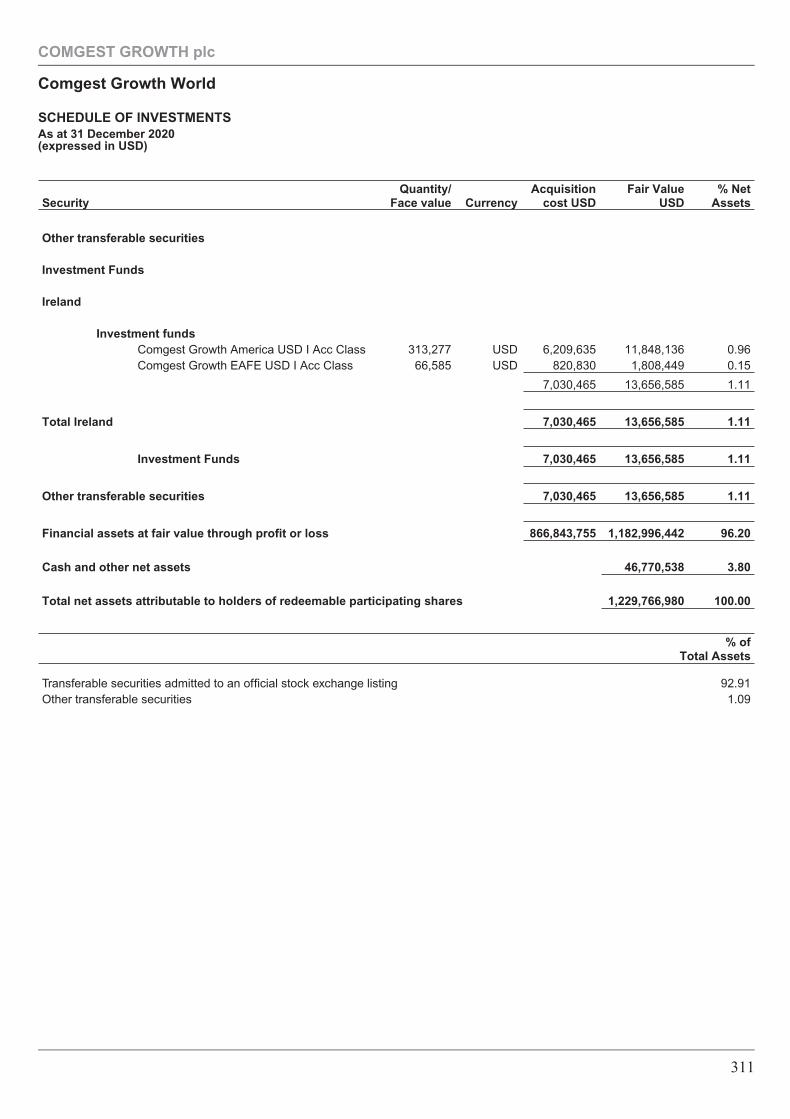
SecurityQuantity/
Face value CurrencyAcquisition
cost USDFair Value
USD% Net
Assets
Other transferable securities
Investment Funds
Ireland
Investment fundsComgest Growth America USD I Acc Class 313,277 USD 6,209,635 11,848,136 0.96Comgest Growth EAFE USD I Acc Class 66,585 USD 820,830 1,808,449 0.15
7,030,465 13,656,585 1.11
Total Ireland 7,030,465 13,656,585 1.11
Investment Funds 7,030,465 13,656,585 1.11
Other transferable securities 7,030,465 13,656,585 1.11
Financial assets at fair value through profit or loss 866,843,755 1,182,996,442 96.20
Cash and other net assets 46,770,538 3.80
Total net assets attributable to holders of redeemable participating shares 1,229,766,980 100.00
% ofTotal Assets
Transferable securities admitted to an official stock exchange listing 92.91Other transferable securities 1.09
COMGEST GROWTH plc
Comgest Growth World
SCHEDULE OF INVESTMENTSAs at 31 December 2020(expressed in USD)
311
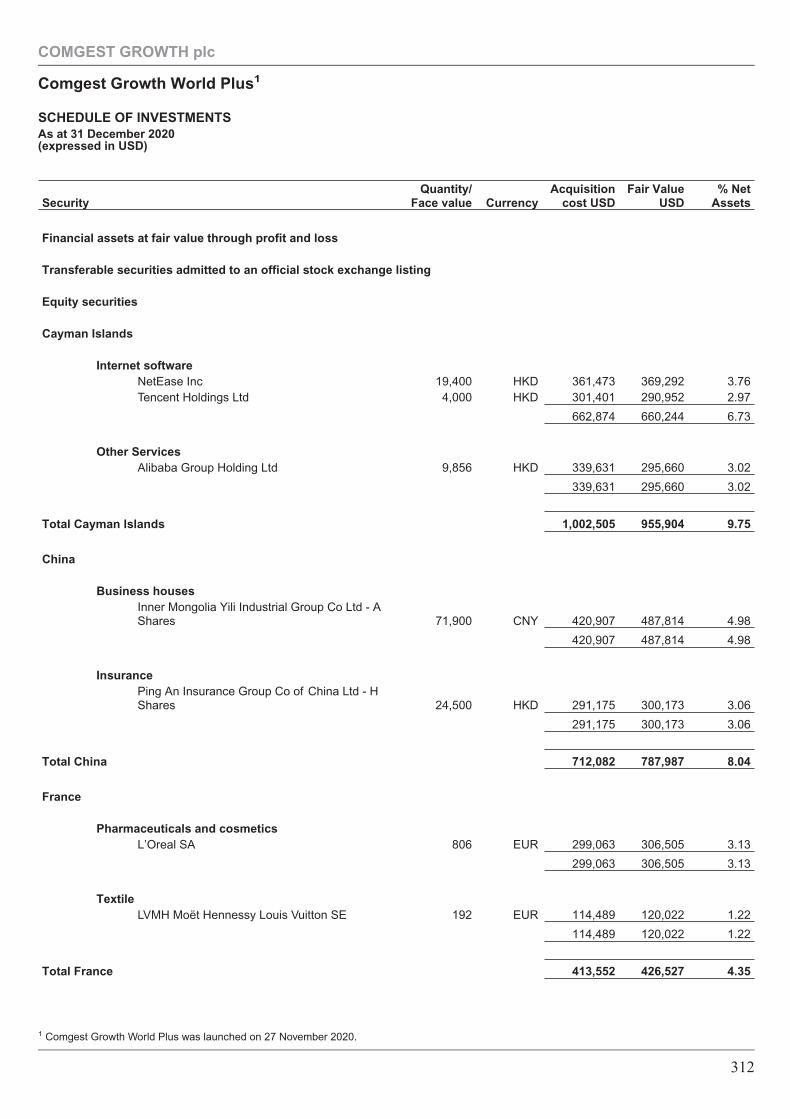
SecurityQuantity/
Face value CurrencyAcquisition
cost USDFair Value
USD% Net
Assets
Financial assets at fair value through profit and loss
Transferable securities admitted to an official stock exchange listing
Equity securities
Cayman Islands
Internet softwareNetEase Inc 19,400 HKD 361,473 369,292 3.76Tencent Holdings Ltd 4,000 HKD 301,401 290,952 2.97
662,874 660,244 6.73
Other ServicesAlibaba Group Holding Ltd 9,856 HKD 339,631 295,660 3.02
339,631 295,660 3.02
Total Cayman Islands 1,002,505 955,904 9.75
China
Business housesInner Mongolia Yili Industrial Group Co Ltd - AShares 71,900 CNY 420,907 487,814 4.98
420,907 487,814 4.98
InsurancePing An Insurance Group Co of China Ltd - HShares 24,500 HKD 291,175 300,173 3.06
291,175 300,173 3.06
Total China 712,082 787,987 8.04
France
Pharmaceuticals and cosmeticsL’Oreal SA 806 EUR 299,063 306,505 3.13
299,063 306,505 3.13
TextileLVMH Moët Hennessy Louis Vuitton SE 192 EUR 114,489 120,022 1.22
114,489 120,022 1.22
Total France 413,552 426,527 4.35
COMGEST GROWTH plc
Comgest Growth World Plus1
SCHEDULE OF INVESTMENTSAs at 31 December 2020(expressed in USD)
1 Comgest Growth World Plus was launched on 27 November 2020.
312
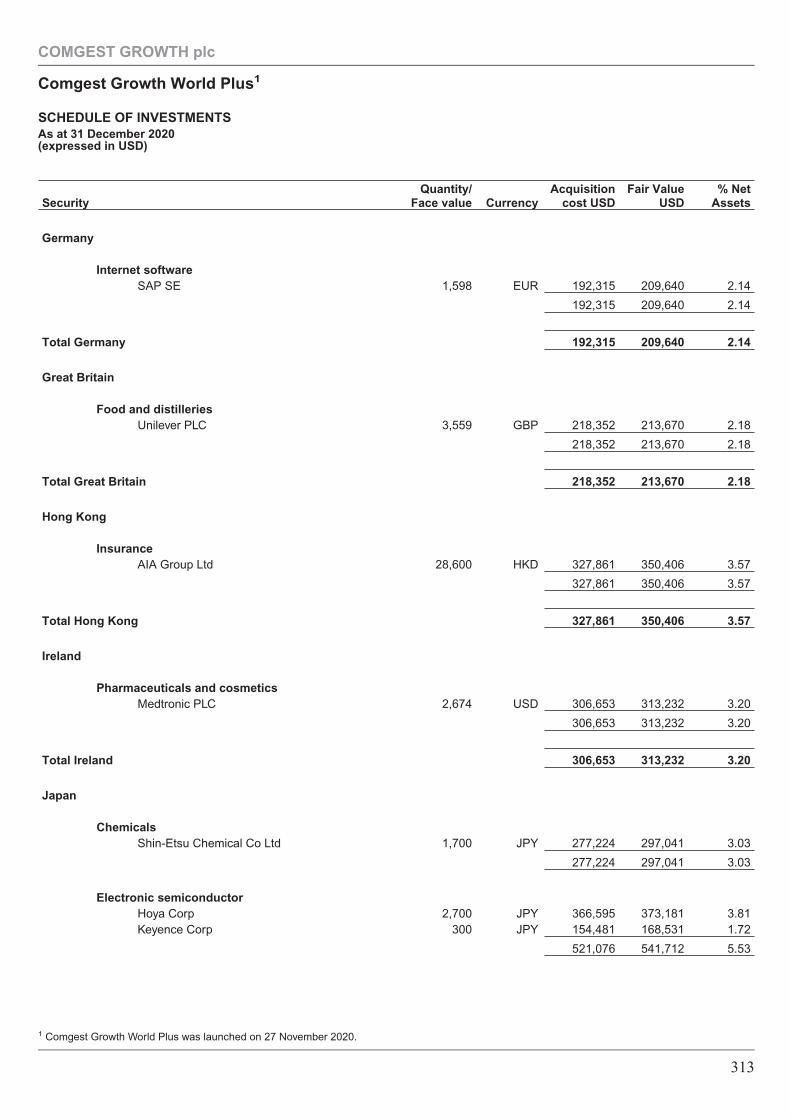
SecurityQuantity/
Face value CurrencyAcquisition
cost USDFair Value
USD% Net
Assets
Germany
Internet softwareSAP SE 1,598 EUR 192,315 209,640 2.14
192,315 209,640 2.14
Total Germany 192,315 209,640 2.14
Great Britain
Food and distilleriesUnilever PLC 3,559 GBP 218,352 213,670 2.18
218,352 213,670 2.18
Total Great Britain 218,352 213,670 2.18
Hong Kong
InsuranceAIA Group Ltd 28,600 HKD 327,861 350,406 3.57
327,861 350,406 3.57
Total Hong Kong 327,861 350,406 3.57
Ireland
Pharmaceuticals and cosmeticsMedtronic PLC 2,674 USD 306,653 313,232 3.20
306,653 313,232 3.20
Total Ireland 306,653 313,232 3.20
Japan
ChemicalsShin-Etsu Chemical Co Ltd 1,700 JPY 277,224 297,041 3.03
277,224 297,041 3.03
Electronic semiconductorHoya Corp 2,700 JPY 366,595 373,181 3.81Keyence Corp 300 JPY 154,481 168,531 1.72
521,076 541,712 5.53
COMGEST GROWTH plc
Comgest Growth World Plus1
SCHEDULE OF INVESTMENTSAs at 31 December 2020(expressed in USD)
1 Comgest Growth World Plus was launched on 27 November 2020.
313
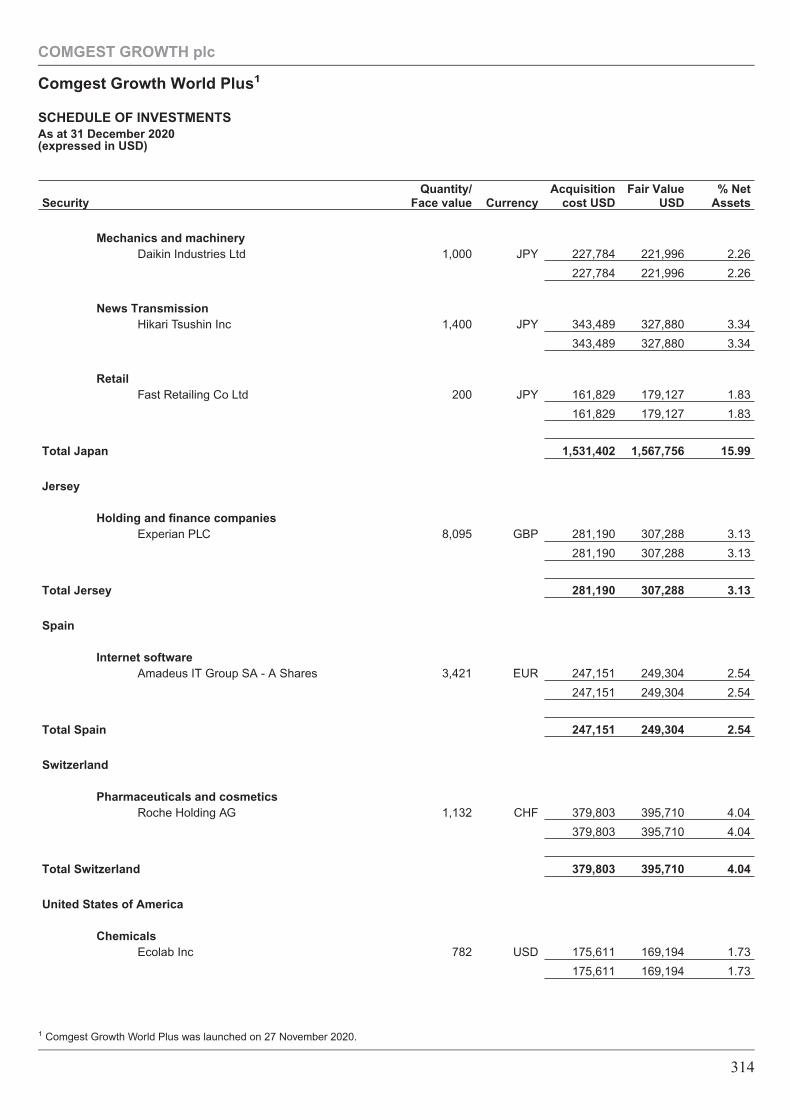
SecurityQuantity/
Face value CurrencyAcquisition
cost USDFair Value
USD% Net
Assets
Mechanics and machineryDaikin Industries Ltd 1,000 JPY 227,784 221,996 2.26
227,784 221,996 2.26
News TransmissionHikari Tsushin Inc 1,400 JPY 343,489 327,880 3.34
343,489 327,880 3.34
RetailFast Retailing Co Ltd 200 JPY 161,829 179,127 1.83
161,829 179,127 1.83
Total Japan 1,531,402 1,567,756 15.99
Jersey
Holding and finance companiesExperian PLC 8,095 GBP 281,190 307,288 3.13
281,190 307,288 3.13
Total Jersey 281,190 307,288 3.13
Spain
Internet softwareAmadeus IT Group SA - A Shares 3,421 EUR 247,151 249,304 2.54
247,151 249,304 2.54
Total Spain 247,151 249,304 2.54
Switzerland
Pharmaceuticals and cosmeticsRoche Holding AG 1,132 CHF 379,803 395,710 4.04
379,803 395,710 4.04
Total Switzerland 379,803 395,710 4.04
United States of America
ChemicalsEcolab Inc 782 USD 175,611 169,194 1.73
175,611 169,194 1.73
COMGEST GROWTH plc
Comgest Growth World Plus1
SCHEDULE OF INVESTMENTSAs at 31 December 2020(expressed in USD)
1 Comgest Growth World Plus was launched on 27 November 2020.
314
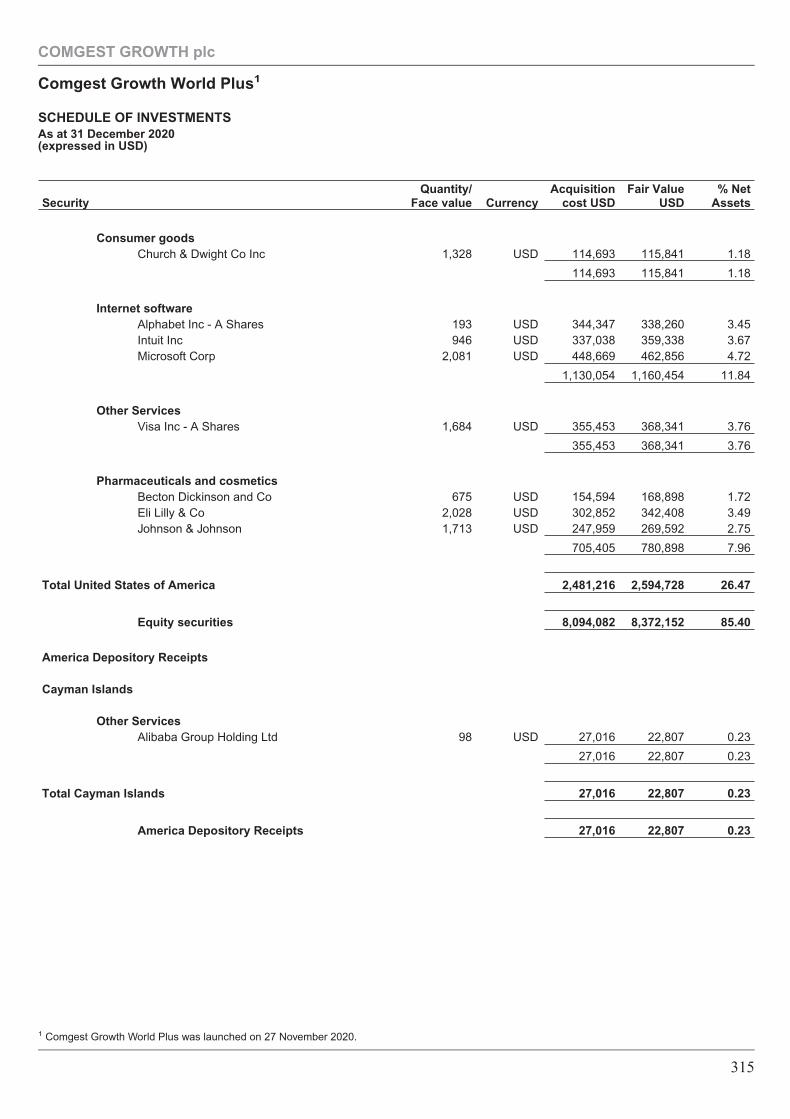
SecurityQuantity/
Face value CurrencyAcquisition
cost USDFair Value
USD% Net
Assets
Consumer goodsChurch & Dwight Co Inc 1,328 USD 114,693 115,841 1.18
114,693 115,841 1.18
Internet softwareAlphabet Inc - A Shares 193 USD 344,347 338,260 3.45Intuit Inc 946 USD 337,038 359,338 3.67Microsoft Corp 2,081 USD 448,669 462,856 4.72
1,130,054 1,160,454 11.84
Other ServicesVisa Inc - A Shares 1,684 USD 355,453 368,341 3.76
355,453 368,341 3.76
Pharmaceuticals and cosmeticsBecton Dickinson and Co 675 USD 154,594 168,898 1.72Eli Lilly & Co 2,028 USD 302,852 342,408 3.49Johnson & Johnson 1,713 USD 247,959 269,592 2.75
705,405 780,898 7.96
Total United States of America 2,481,216 2,594,728 26.47
Equity securities 8,094,082 8,372,152 85.40
America Depository Receipts
Cayman Islands
Other ServicesAlibaba Group Holding Ltd 98 USD 27,016 22,807 0.23
27,016 22,807 0.23
Total Cayman Islands 27,016 22,807 0.23
America Depository Receipts 27,016 22,807 0.23
COMGEST GROWTH plc
Comgest Growth World Plus1
SCHEDULE OF INVESTMENTSAs at 31 December 2020(expressed in USD)
1 Comgest Growth World Plus was launched on 27 November 2020.
315
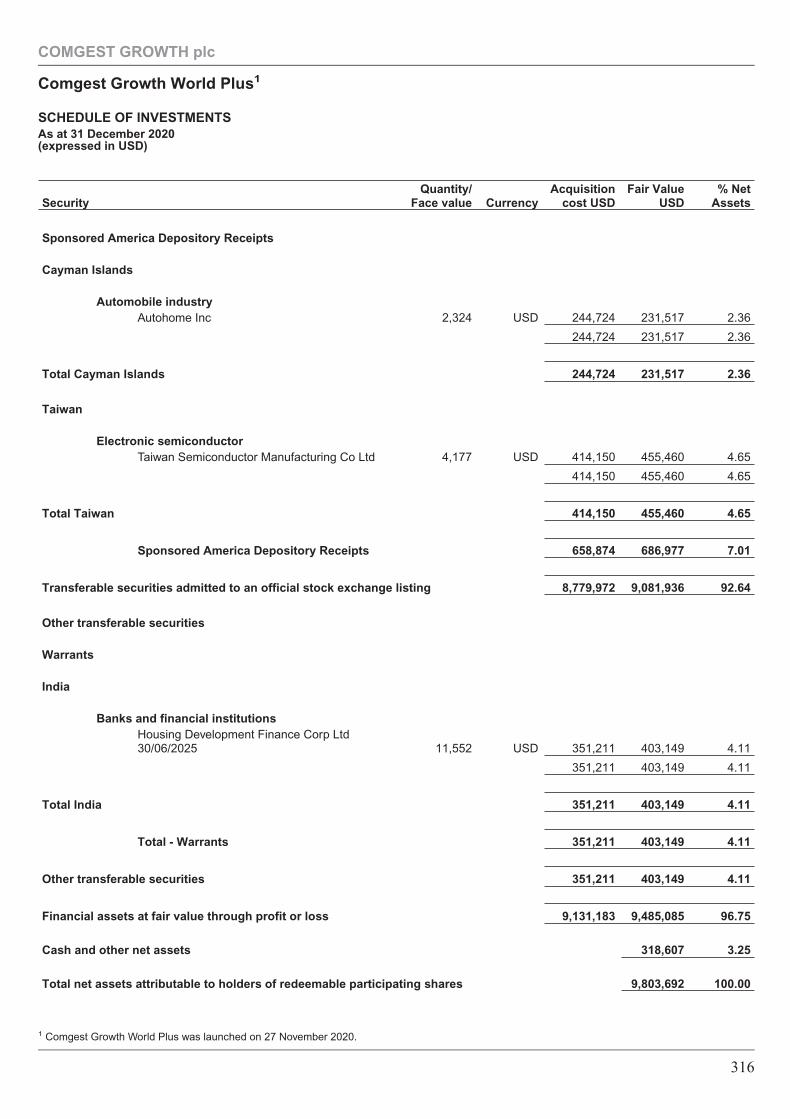
SecurityQuantity/
Face value CurrencyAcquisition
cost USDFair Value
USD% Net
Assets
Sponsored America Depository Receipts
Cayman Islands
Automobile industryAutohome Inc 2,324 USD 244,724 231,517 2.36
244,724 231,517 2.36
Total Cayman Islands 244,724 231,517 2.36
Taiwan
Electronic semiconductorTaiwan Semiconductor Manufacturing Co Ltd 4,177 USD 414,150 455,460 4.65
414,150 455,460 4.65
Total Taiwan 414,150 455,460 4.65
Sponsored America Depository Receipts 658,874 686,977 7.01
Transferable securities admitted to an official stock exchange listing 8,779,972 9,081,936 92.64
Other transferable securities
Warrants
India
Banks and financial institutionsHousing Development Finance Corp Ltd30/06/2025 11,552 USD 351,211 403,149 4.11
351,211 403,149 4.11
Total India 351,211 403,149 4.11
Total - Warrants 351,211 403,149 4.11
Other transferable securities 351,211 403,149 4.11
Financial assets at fair value through profit or loss 9,131,183 9,485,085 96.75
Cash and other net assets 318,607 3.25
Total net assets attributable to holders of redeemable participating shares 9,803,692 100.00
COMGEST GROWTH plc
Comgest Growth World Plus1
SCHEDULE OF INVESTMENTSAs at 31 December 2020(expressed in USD)
1 Comgest Growth World Plus was launched on 27 November 2020.
316
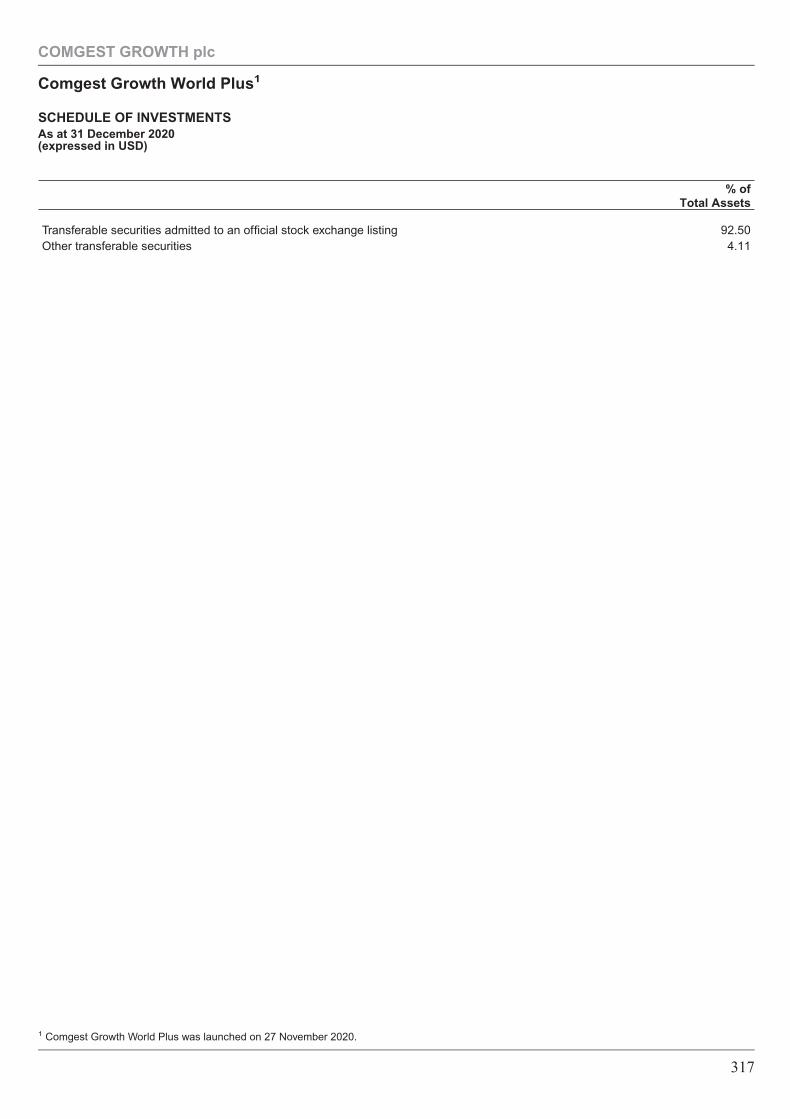
% ofTotal Assets
Transferable securities admitted to an official stock exchange listing 92.50Other transferable securities 4.11
COMGEST GROWTH plc
Comgest Growth World Plus1
SCHEDULE OF INVESTMENTSAs at 31 December 2020(expressed in USD)
1 Comgest Growth World Plus was launched on 27 November 2020.
317
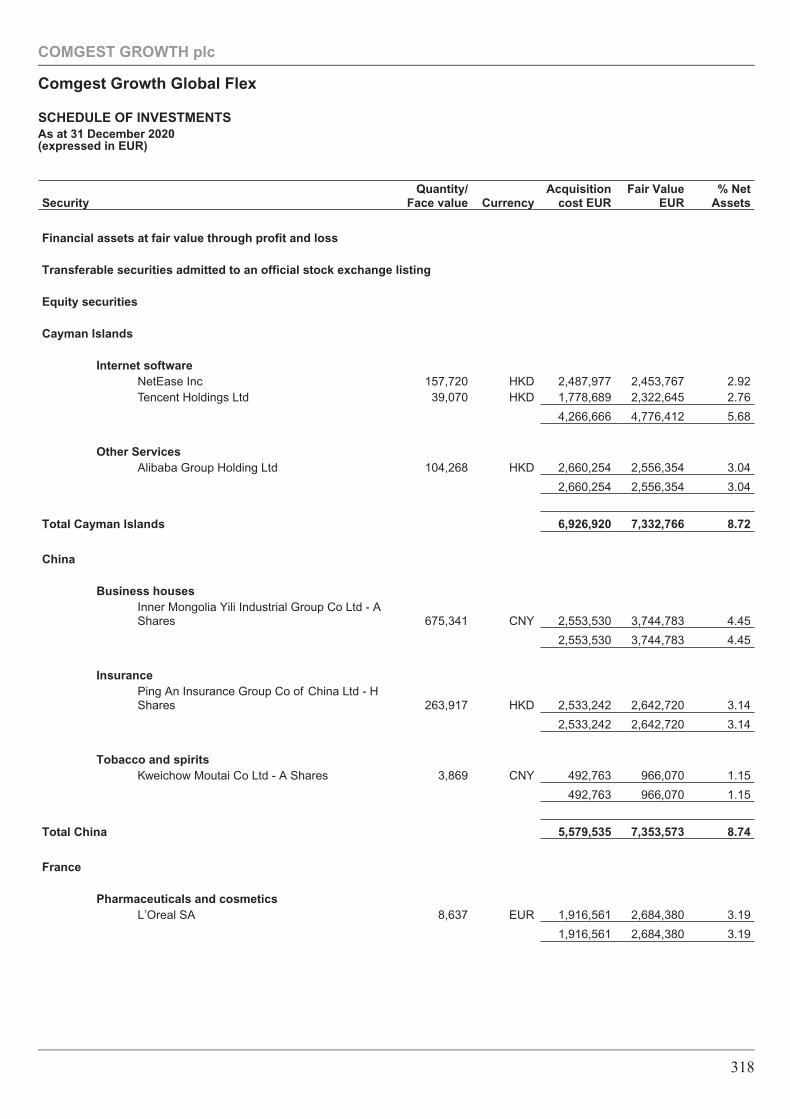
SecurityQuantity/
Face value CurrencyAcquisition
cost EURFair Value
EUR% Net
Assets
Financial assets at fair value through profit and loss
Transferable securities admitted to an official stock exchange listing
Equity securities
Cayman Islands
Internet softwareNetEase Inc 157,720 HKD 2,487,977 2,453,767 2.92Tencent Holdings Ltd 39,070 HKD 1,778,689 2,322,645 2.76
4,266,666 4,776,412 5.68
Other ServicesAlibaba Group Holding Ltd 104,268 HKD 2,660,254 2,556,354 3.04
2,660,254 2,556,354 3.04
Total Cayman Islands 6,926,920 7,332,766 8.72
China
Business housesInner Mongolia Yili Industrial Group Co Ltd - AShares 675,341 CNY 2,553,530 3,744,783 4.45
2,553,530 3,744,783 4.45
InsurancePing An Insurance Group Co of China Ltd - HShares 263,917 HKD 2,533,242 2,642,720 3.14
2,533,242 2,642,720 3.14
Tobacco and spiritsKweichow Moutai Co Ltd - A Shares 3,869 CNY 492,763 966,070 1.15
492,763 966,070 1.15
Total China 5,579,535 7,353,573 8.74
France
Pharmaceuticals and cosmeticsL’Oreal SA 8,637 EUR 1,916,561 2,684,380 3.19
1,916,561 2,684,380 3.19
COMGEST GROWTH plc
Comgest Growth Global Flex
SCHEDULE OF INVESTMENTSAs at 31 December 2020(expressed in EUR)
318
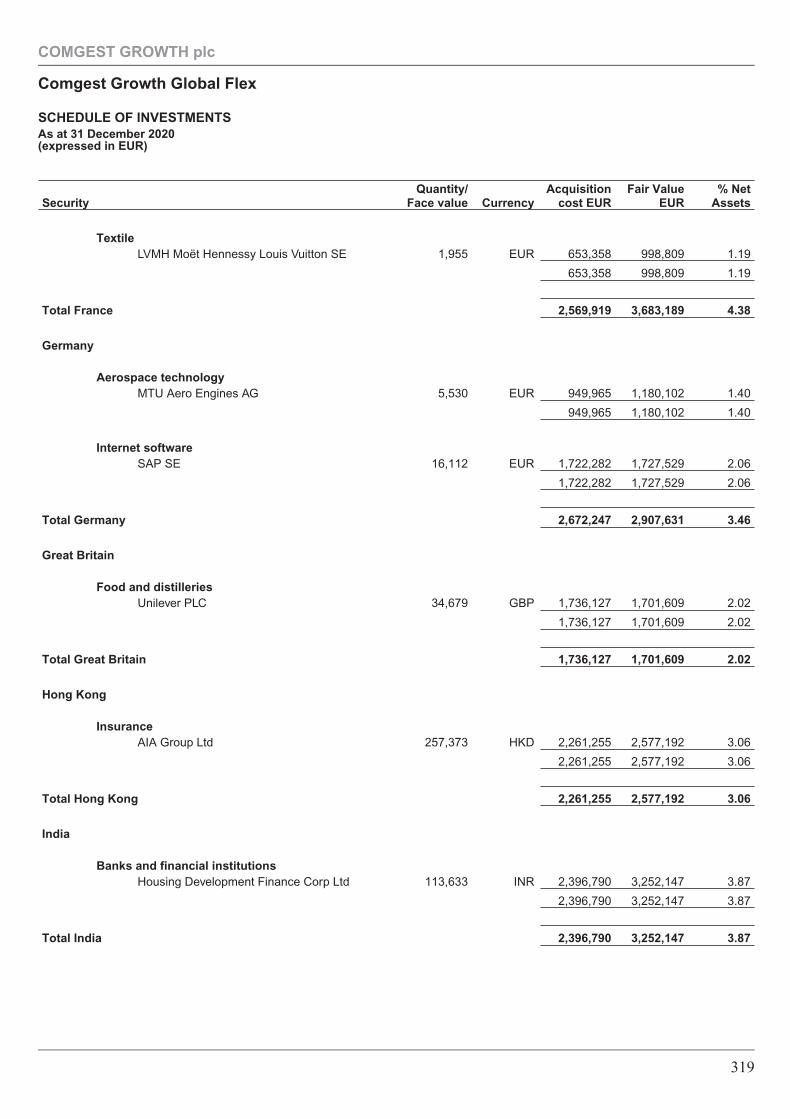
SecurityQuantity/
Face value CurrencyAcquisition
cost EURFair Value
EUR% Net
Assets
TextileLVMH Moët Hennessy Louis Vuitton SE 1,955 EUR 653,358 998,809 1.19
653,358 998,809 1.19
Total France 2,569,919 3,683,189 4.38
Germany
Aerospace technologyMTU Aero Engines AG 5,530 EUR 949,965 1,180,102 1.40
949,965 1,180,102 1.40
Internet softwareSAP SE 16,112 EUR 1,722,282 1,727,529 2.06
1,722,282 1,727,529 2.06
Total Germany 2,672,247 2,907,631 3.46
Great Britain
Food and distilleriesUnilever PLC 34,679 GBP 1,736,127 1,701,609 2.02
1,736,127 1,701,609 2.02
Total Great Britain 1,736,127 1,701,609 2.02
Hong Kong
InsuranceAIA Group Ltd 257,373 HKD 2,261,255 2,577,192 3.06
2,261,255 2,577,192 3.06
Total Hong Kong 2,261,255 2,577,192 3.06
India
Banks and financial institutionsHousing Development Finance Corp Ltd 113,633 INR 2,396,790 3,252,147 3.87
2,396,790 3,252,147 3.87
Total India 2,396,790 3,252,147 3.87
COMGEST GROWTH plc
Comgest Growth Global Flex
SCHEDULE OF INVESTMENTSAs at 31 December 2020(expressed in EUR)
319
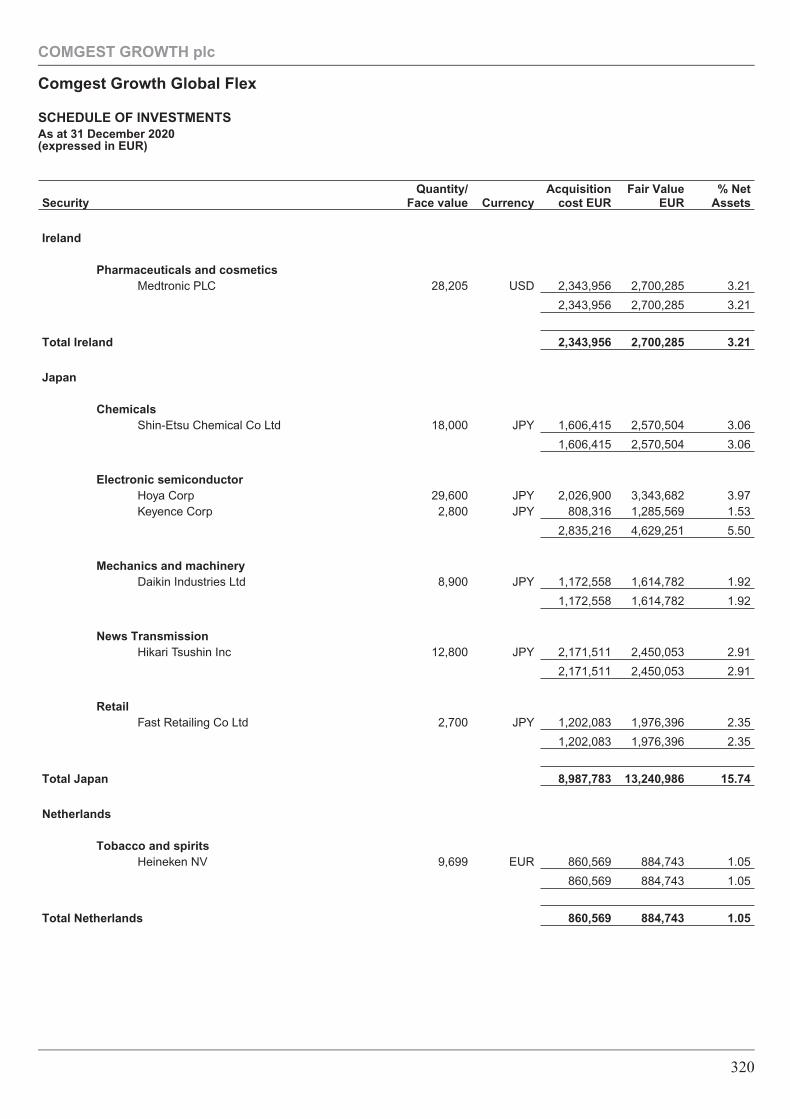
SecurityQuantity/
Face value CurrencyAcquisition
cost EURFair Value
EUR% Net
Assets
Ireland
Pharmaceuticals and cosmeticsMedtronic PLC 28,205 USD 2,343,956 2,700,285 3.21
2,343,956 2,700,285 3.21
Total Ireland 2,343,956 2,700,285 3.21
Japan
ChemicalsShin-Etsu Chemical Co Ltd 18,000 JPY 1,606,415 2,570,504 3.06
1,606,415 2,570,504 3.06
Electronic semiconductorHoya Corp 29,600 JPY 2,026,900 3,343,682 3.97Keyence Corp 2,800 JPY 808,316 1,285,569 1.53
2,835,216 4,629,251 5.50
Mechanics and machineryDaikin Industries Ltd 8,900 JPY 1,172,558 1,614,782 1.92
1,172,558 1,614,782 1.92
News TransmissionHikari Tsushin Inc 12,800 JPY 2,171,511 2,450,053 2.91
2,171,511 2,450,053 2.91
RetailFast Retailing Co Ltd 2,700 JPY 1,202,083 1,976,396 2.35
1,202,083 1,976,396 2.35
Total Japan 8,987,783 13,240,986 15.74
Netherlands
Tobacco and spiritsHeineken NV 9,699 EUR 860,569 884,743 1.05
860,569 884,743 1.05
Total Netherlands 860,569 884,743 1.05
COMGEST GROWTH plc
Comgest Growth Global Flex
SCHEDULE OF INVESTMENTSAs at 31 December 2020(expressed in EUR)
320
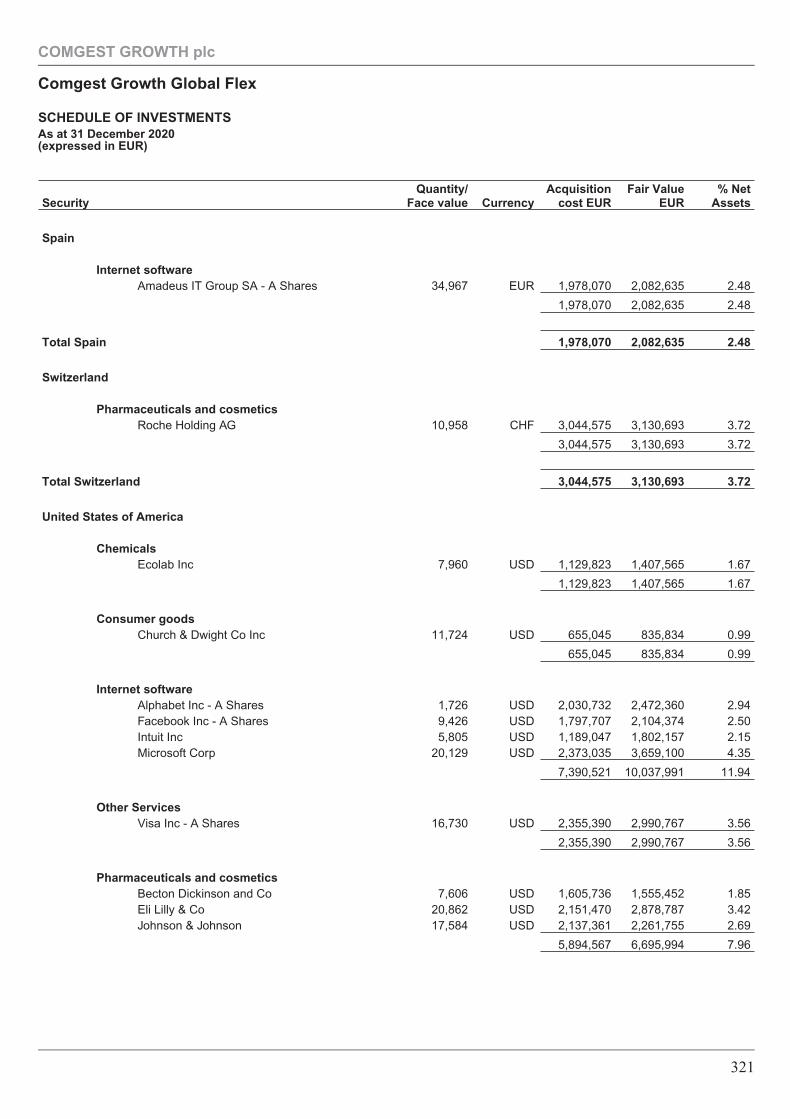
SecurityQuantity/
Face value CurrencyAcquisition
cost EURFair Value
EUR% Net
Assets
Spain
Internet softwareAmadeus IT Group SA - A Shares 34,967 EUR 1,978,070 2,082,635 2.48
1,978,070 2,082,635 2.48
Total Spain 1,978,070 2,082,635 2.48
Switzerland
Pharmaceuticals and cosmeticsRoche Holding AG 10,958 CHF 3,044,575 3,130,693 3.72
3,044,575 3,130,693 3.72
Total Switzerland 3,044,575 3,130,693 3.72
United States of America
ChemicalsEcolab Inc 7,960 USD 1,129,823 1,407,565 1.67
1,129,823 1,407,565 1.67
Consumer goodsChurch & Dwight Co Inc 11,724 USD 655,045 835,834 0.99
655,045 835,834 0.99
Internet softwareAlphabet Inc - A Shares 1,726 USD 2,030,732 2,472,360 2.94Facebook Inc - A Shares 9,426 USD 1,797,707 2,104,374 2.50Intuit Inc 5,805 USD 1,189,047 1,802,157 2.15Microsoft Corp 20,129 USD 2,373,035 3,659,100 4.35
7,390,521 10,037,991 11.94
Other ServicesVisa Inc - A Shares 16,730 USD 2,355,390 2,990,767 3.56
2,355,390 2,990,767 3.56
Pharmaceuticals and cosmeticsBecton Dickinson and Co 7,606 USD 1,605,736 1,555,452 1.85Eli Lilly & Co 20,862 USD 2,151,470 2,878,787 3.42Johnson & Johnson 17,584 USD 2,137,361 2,261,755 2.69
5,894,567 6,695,994 7.96
COMGEST GROWTH plc
Comgest Growth Global Flex
SCHEDULE OF INVESTMENTSAs at 31 December 2020(expressed in EUR)
321
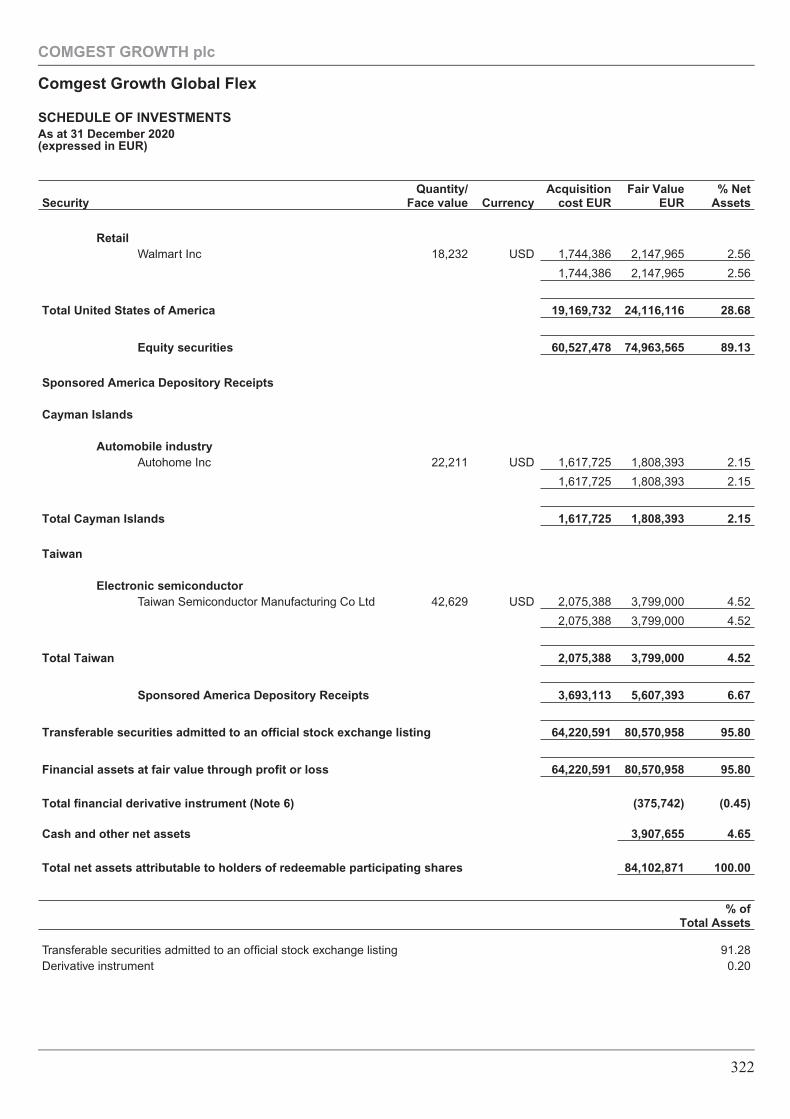
SecurityQuantity/
Face value CurrencyAcquisition
cost EURFair Value
EUR% Net
Assets
RetailWalmart Inc 18,232 USD 1,744,386 2,147,965 2.56
1,744,386 2,147,965 2.56
Total United States of America 19,169,732 24,116,116 28.68
Equity securities 60,527,478 74,963,565 89.13
Sponsored America Depository Receipts
Cayman Islands
Automobile industryAutohome Inc 22,211 USD 1,617,725 1,808,393 2.15
1,617,725 1,808,393 2.15
Total Cayman Islands 1,617,725 1,808,393 2.15
Taiwan
Electronic semiconductorTaiwan Semiconductor Manufacturing Co Ltd 42,629 USD 2,075,388 3,799,000 4.52
2,075,388 3,799,000 4.52
Total Taiwan 2,075,388 3,799,000 4.52
Sponsored America Depository Receipts 3,693,113 5,607,393 6.67
Transferable securities admitted to an official stock exchange listing 64,220,591 80,570,958 95.80
Financial assets at fair value through profit or loss 64,220,591 80,570,958 95.80
Total financial derivative instrument (Note 6) (375,742) (0.45)
Cash and other net assets 3,907,655 4.65
Total net assets attributable to holders of redeemable participating shares 84,102,871 100.00
% ofTotal Assets
Transferable securities admitted to an official stock exchange listing 91.28Derivative instrument 0.20
COMGEST GROWTH plc
Comgest Growth Global Flex
SCHEDULE OF INVESTMENTSAs at 31 December 2020(expressed in EUR)
322
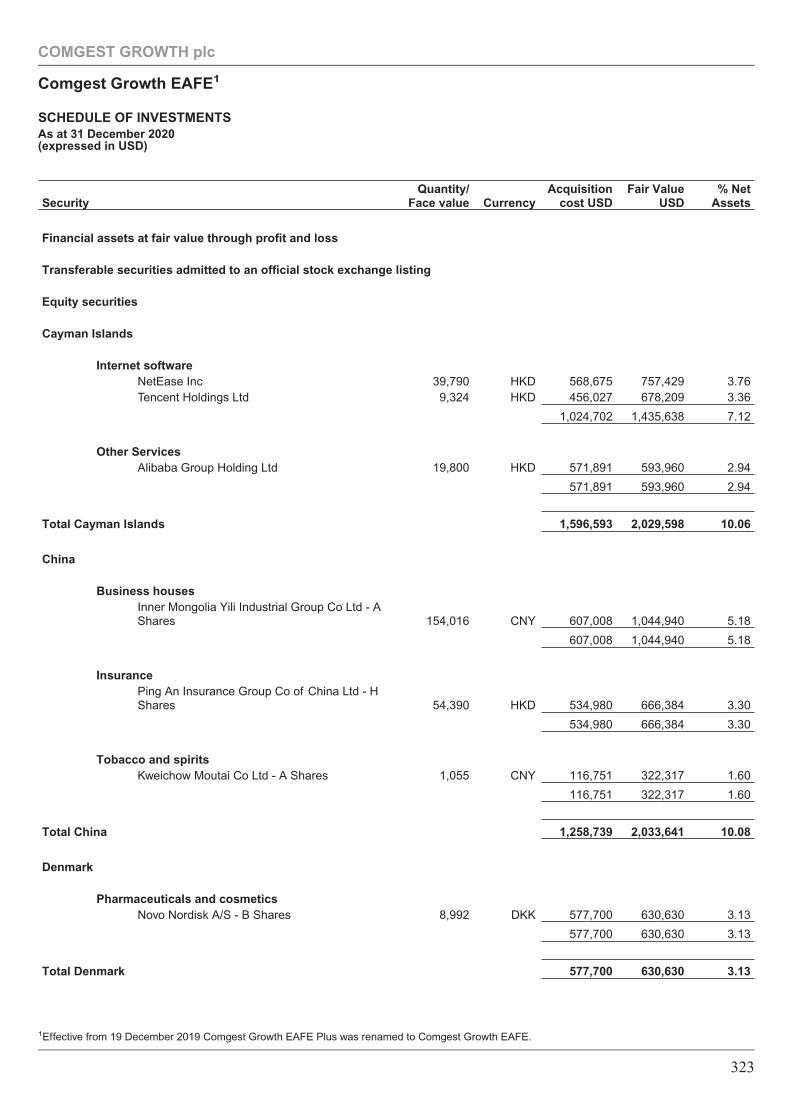
SecurityQuantity/
Face value CurrencyAcquisition
cost USDFair Value
USD% Net
Assets
Financial assets at fair value through profit and loss
Transferable securities admitted to an official stock exchange listing
Equity securities
Cayman Islands
Internet softwareNetEase Inc 39,790 HKD 568,675 757,429 3.76Tencent Holdings Ltd 9,324 HKD 456,027 678,209 3.36
1,024,702 1,435,638 7.12
Other ServicesAlibaba Group Holding Ltd 19,800 HKD 571,891 593,960 2.94
571,891 593,960 2.94
Total Cayman Islands 1,596,593 2,029,598 10.06
China
Business housesInner Mongolia Yili Industrial Group Co Ltd - AShares 154,016 CNY 607,008 1,044,940 5.18
607,008 1,044,940 5.18
InsurancePing An Insurance Group Co of China Ltd - HShares 54,390 HKD 534,980 666,384 3.30
534,980 666,384 3.30
Tobacco and spiritsKweichow Moutai Co Ltd - A Shares 1,055 CNY 116,751 322,317 1.60
116,751 322,317 1.60
Total China 1,258,739 2,033,641 10.08
Denmark
Pharmaceuticals and cosmeticsNovo Nordisk A/S - B Shares 8,992 DKK 577,700 630,630 3.13
577,700 630,630 3.13
Total Denmark 577,700 630,630 3.13
COMGEST GROWTH plc
Comgest Growth EAFE1
SCHEDULE OF INVESTMENTSAs at 31 December 2020(expressed in USD)
1Effective from 19 December 2019 Comgest Growth EAFE Plus was renamed to Comgest Growth EAFE.
323
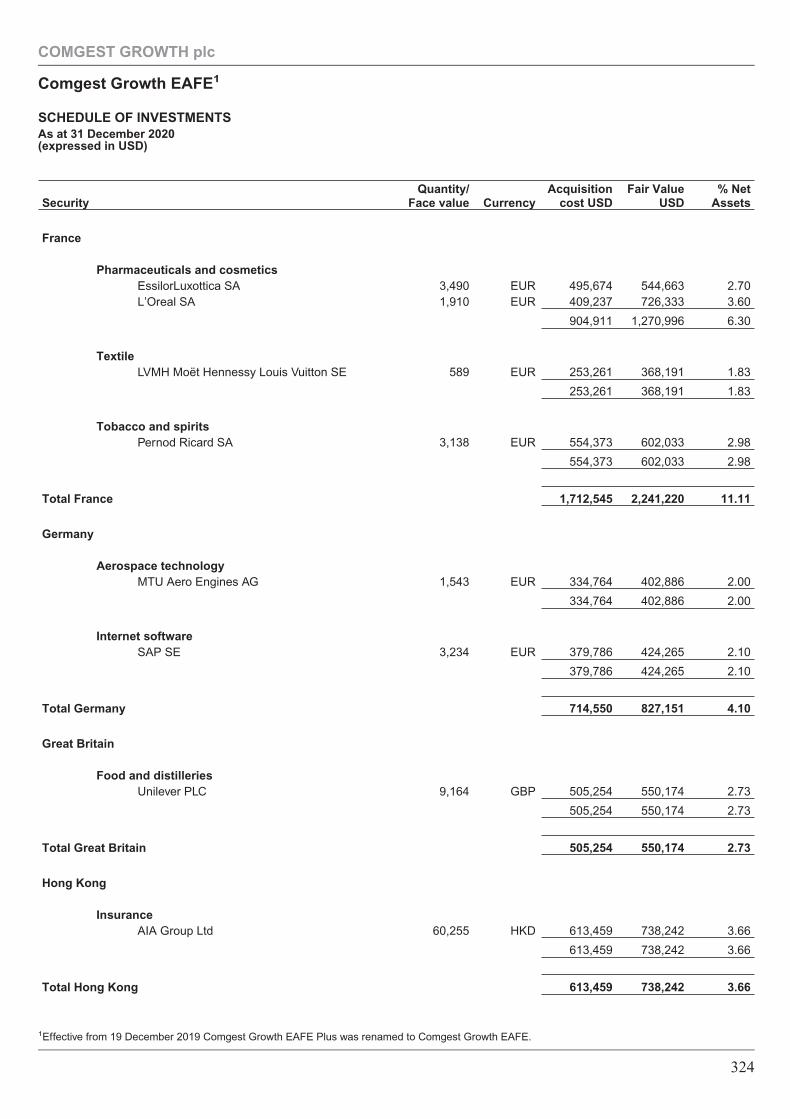
SecurityQuantity/
Face value CurrencyAcquisition
cost USDFair Value
USD% Net
Assets
France
Pharmaceuticals and cosmeticsEssilorLuxottica SA 3,490 EUR 495,674 544,663 2.70L’Oreal SA 1,910 EUR 409,237 726,333 3.60
904,911 1,270,996 6.30
TextileLVMH Moët Hennessy Louis Vuitton SE 589 EUR 253,261 368,191 1.83
253,261 368,191 1.83
Tobacco and spiritsPernod Ricard SA 3,138 EUR 554,373 602,033 2.98
554,373 602,033 2.98
Total France 1,712,545 2,241,220 11.11
Germany
Aerospace technologyMTU Aero Engines AG 1,543 EUR 334,764 402,886 2.00
334,764 402,886 2.00
Internet softwareSAP SE 3,234 EUR 379,786 424,265 2.10
379,786 424,265 2.10
Total Germany 714,550 827,151 4.10
Great Britain
Food and distilleriesUnilever PLC 9,164 GBP 505,254 550,174 2.73
505,254 550,174 2.73
Total Great Britain 505,254 550,174 2.73
Hong Kong
InsuranceAIA Group Ltd 60,255 HKD 613,459 738,242 3.66
613,459 738,242 3.66
Total Hong Kong 613,459 738,242 3.66
COMGEST GROWTH plc
Comgest Growth EAFE1
SCHEDULE OF INVESTMENTSAs at 31 December 2020(expressed in USD)
1Effective from 19 December 2019 Comgest Growth EAFE Plus was renamed to Comgest Growth EAFE.
324
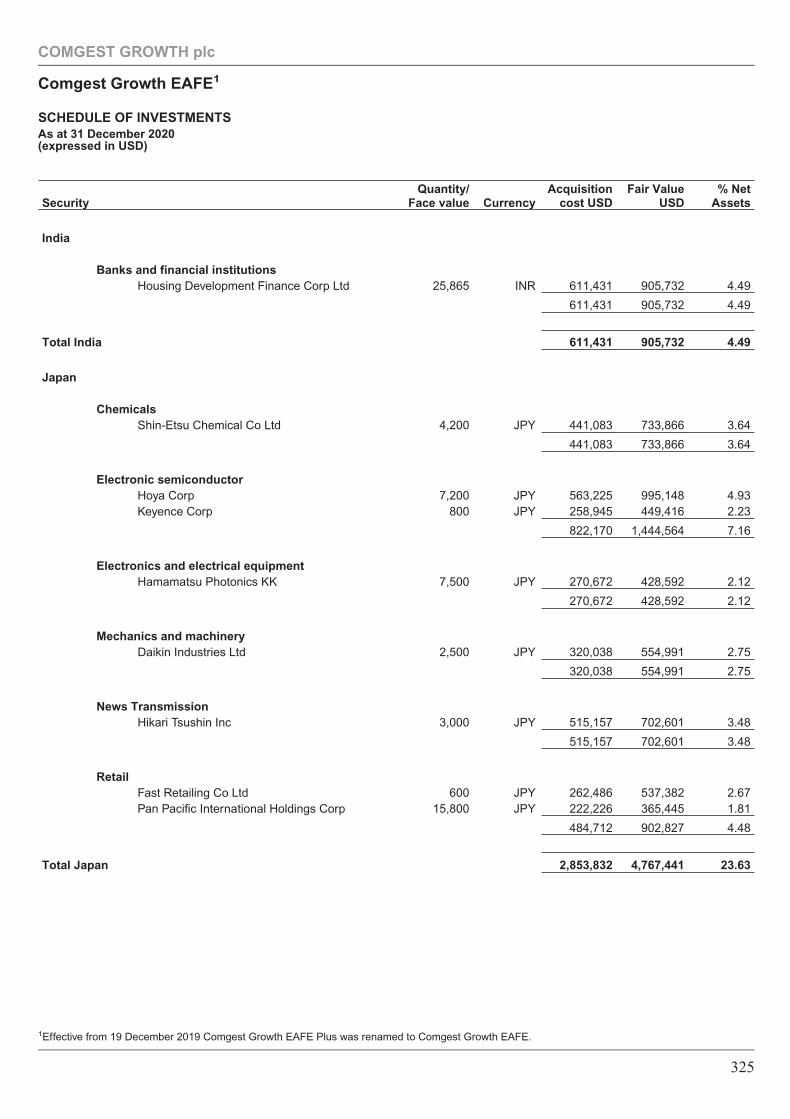
SecurityQuantity/
Face value CurrencyAcquisition
cost USDFair Value
USD% Net
Assets
India
Banks and financial institutionsHousing Development Finance Corp Ltd 25,865 INR 611,431 905,732 4.49
611,431 905,732 4.49
Total India 611,431 905,732 4.49
Japan
ChemicalsShin-Etsu Chemical Co Ltd 4,200 JPY 441,083 733,866 3.64
441,083 733,866 3.64
Electronic semiconductorHoya Corp 7,200 JPY 563,225 995,148 4.93Keyence Corp 800 JPY 258,945 449,416 2.23
822,170 1,444,564 7.16
Electronics and electrical equipmentHamamatsu Photonics KK 7,500 JPY 270,672 428,592 2.12
270,672 428,592 2.12
Mechanics and machineryDaikin Industries Ltd 2,500 JPY 320,038 554,991 2.75
320,038 554,991 2.75
News TransmissionHikari Tsushin Inc 3,000 JPY 515,157 702,601 3.48
515,157 702,601 3.48
RetailFast Retailing Co Ltd 600 JPY 262,486 537,382 2.67Pan Pacific International Holdings Corp 15,800 JPY 222,226 365,445 1.81
484,712 902,827 4.48
Total Japan 2,853,832 4,767,441 23.63
COMGEST GROWTH plc
Comgest Growth EAFE1
SCHEDULE OF INVESTMENTSAs at 31 December 2020(expressed in USD)
1Effective from 19 December 2019 Comgest Growth EAFE Plus was renamed to Comgest Growth EAFE.
325
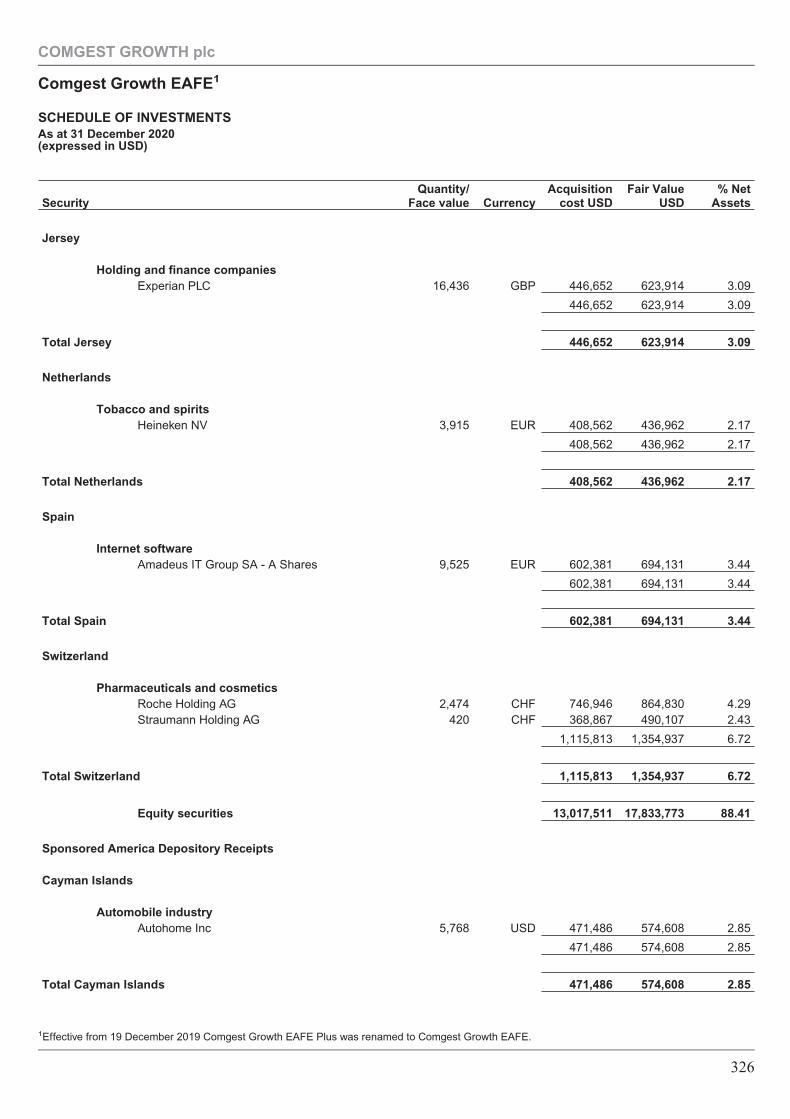
SecurityQuantity/
Face value CurrencyAcquisition
cost USDFair Value
USD% Net
Assets
Jersey
Holding and finance companiesExperian PLC 16,436 GBP 446,652 623,914 3.09
446,652 623,914 3.09
Total Jersey 446,652 623,914 3.09
Netherlands
Tobacco and spiritsHeineken NV 3,915 EUR 408,562 436,962 2.17
408,562 436,962 2.17
Total Netherlands 408,562 436,962 2.17
Spain
Internet softwareAmadeus IT Group SA - A Shares 9,525 EUR 602,381 694,131 3.44
602,381 694,131 3.44
Total Spain 602,381 694,131 3.44
Switzerland
Pharmaceuticals and cosmeticsRoche Holding AG 2,474 CHF 746,946 864,830 4.29Straumann Holding AG 420 CHF 368,867 490,107 2.43
1,115,813 1,354,937 6.72
Total Switzerland 1,115,813 1,354,937 6.72
Equity securities 13,017,511 17,833,773 88.41
Sponsored America Depository Receipts
Cayman Islands
Automobile industryAutohome Inc 5,768 USD 471,486 574,608 2.85
471,486 574,608 2.85
Total Cayman Islands 471,486 574,608 2.85
COMGEST GROWTH plc
Comgest Growth EAFE1
SCHEDULE OF INVESTMENTSAs at 31 December 2020(expressed in USD)
1Effective from 19 December 2019 Comgest Growth EAFE Plus was renamed to Comgest Growth EAFE.
326
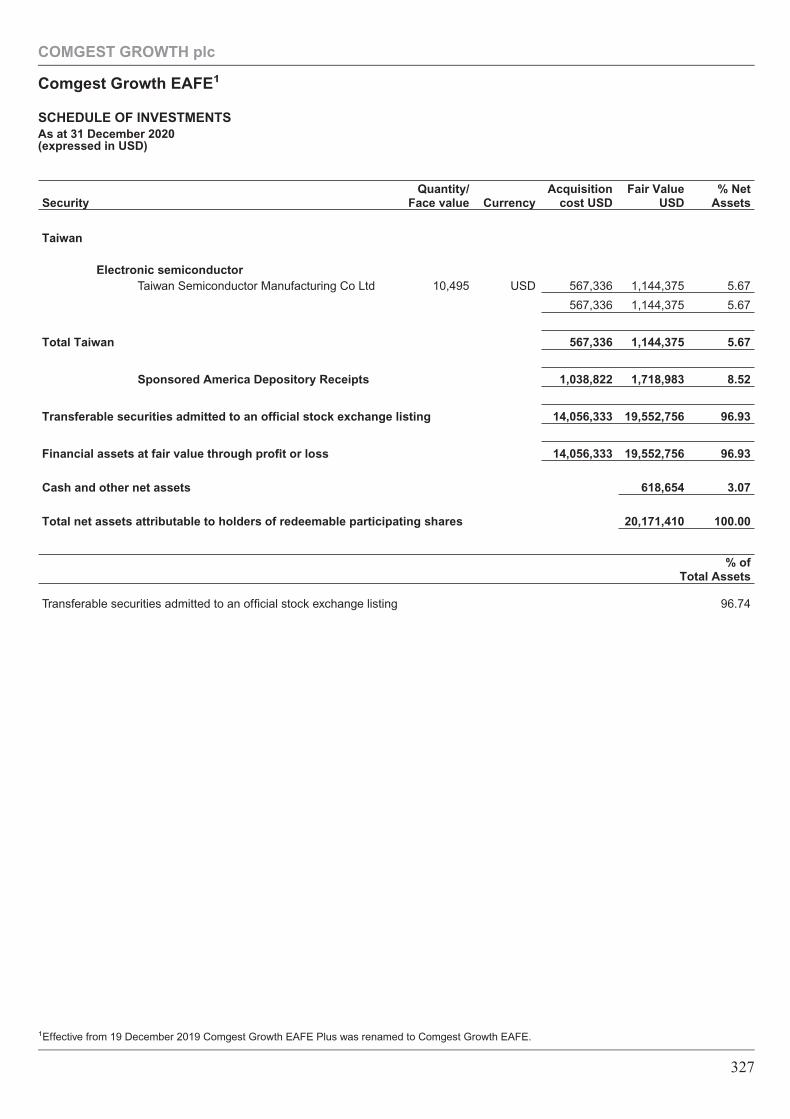
SecurityQuantity/
Face value CurrencyAcquisition
cost USDFair Value
USD% Net
Assets
Taiwan
Electronic semiconductorTaiwan Semiconductor Manufacturing Co Ltd 10,495 USD 567,336 1,144,375 5.67
567,336 1,144,375 5.67
Total Taiwan 567,336 1,144,375 5.67
Sponsored America Depository Receipts 1,038,822 1,718,983 8.52
Transferable securities admitted to an official stock exchange listing 14,056,333 19,552,756 96.93
Financial assets at fair value through profit or loss 14,056,333 19,552,756 96.93
Cash and other net assets 618,654 3.07
Total net assets attributable to holders of redeemable participating shares 20,171,410 100.00
% ofTotal Assets
Transferable securities admitted to an official stock exchange listing 96.74
COMGEST GROWTH plc
Comgest Growth EAFE1
SCHEDULE OF INVESTMENTSAs at 31 December 2020(expressed in USD)
1Effective from 19 December 2019 Comgest Growth EAFE Plus was renamed to Comgest Growth EAFE.
327
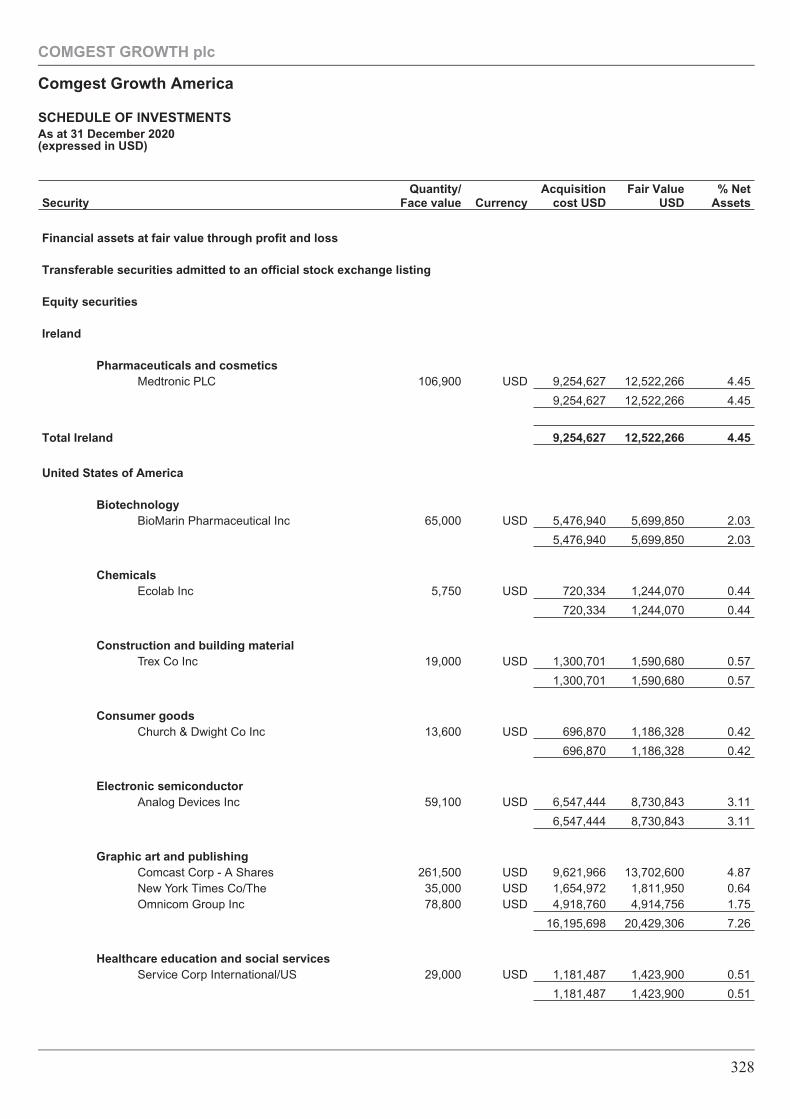
SecurityQuantity/
Face value CurrencyAcquisition
cost USDFair Value
USD% Net
Assets
Financial assets at fair value through profit and loss
Transferable securities admitted to an official stock exchange listing
Equity securities
Ireland
Pharmaceuticals and cosmeticsMedtronic PLC 106,900 USD 9,254,627 12,522,266 4.45
9,254,627 12,522,266 4.45
Total Ireland 9,254,627 12,522,266 4.45
United States of America
BiotechnologyBioMarin Pharmaceutical Inc 65,000 USD 5,476,940 5,699,850 2.03
5,476,940 5,699,850 2.03
ChemicalsEcolab Inc 5,750 USD 720,334 1,244,070 0.44
720,334 1,244,070 0.44
Construction and building materialTrex Co Inc 19,000 USD 1,300,701 1,590,680 0.57
1,300,701 1,590,680 0.57
Consumer goodsChurch & Dwight Co Inc 13,600 USD 696,870 1,186,328 0.42
696,870 1,186,328 0.42
Electronic semiconductorAnalog Devices Inc 59,100 USD 6,547,444 8,730,843 3.11
6,547,444 8,730,843 3.11
Graphic art and publishingComcast Corp - A Shares 261,500 USD 9,621,966 13,702,600 4.87New York Times Co/The 35,000 USD 1,654,972 1,811,950 0.64Omnicom Group Inc 78,800 USD 4,918,760 4,914,756 1.75
16,195,698 20,429,306 7.26
Healthcare education and social servicesService Corp International/US 29,000 USD 1,181,487 1,423,900 0.51
1,181,487 1,423,900 0.51
COMGEST GROWTH plc
Comgest Growth America
SCHEDULE OF INVESTMENTSAs at 31 December 2020(expressed in USD)
328
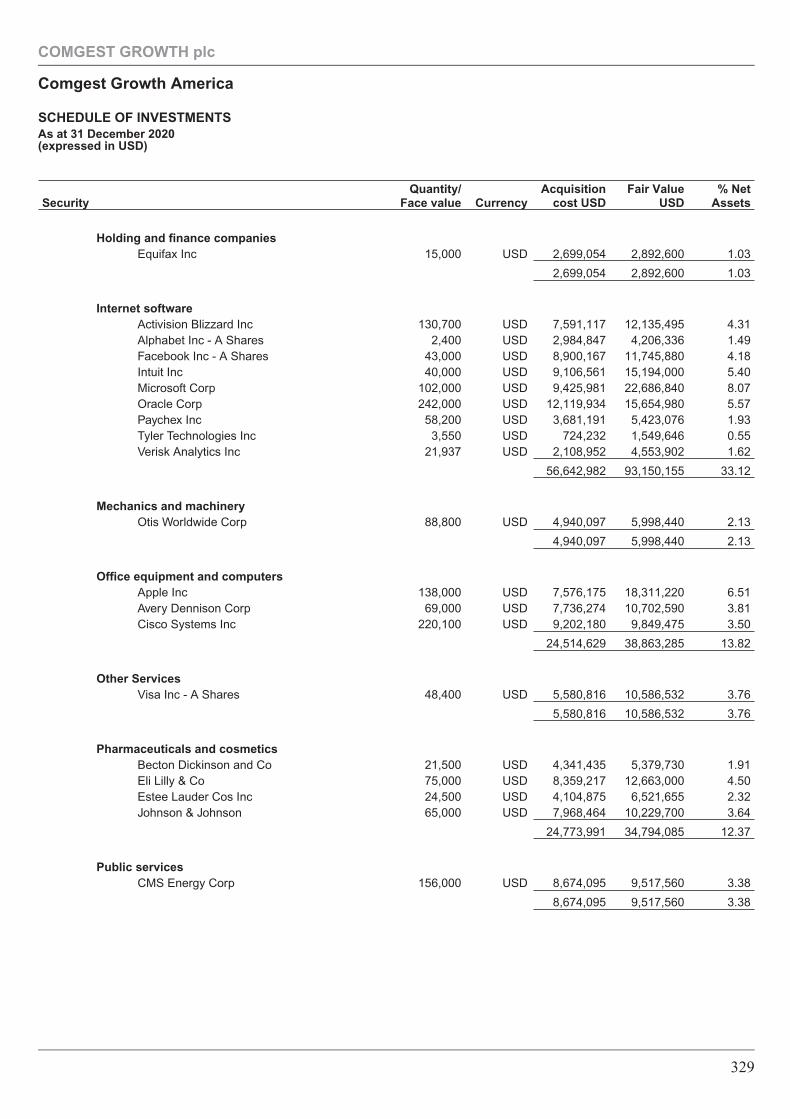
SecurityQuantity/
Face value CurrencyAcquisition
cost USDFair Value
USD% Net
Assets
Holding and finance companiesEquifax Inc 15,000 USD 2,699,054 2,892,600 1.03
2,699,054 2,892,600 1.03
Internet softwareActivision Blizzard Inc 130,700 USD 7,591,117 12,135,495 4.31Alphabet Inc - A Shares 2,400 USD 2,984,847 4,206,336 1.49Facebook Inc - A Shares 43,000 USD 8,900,167 11,745,880 4.18Intuit Inc 40,000 USD 9,106,561 15,194,000 5.40Microsoft Corp 102,000 USD 9,425,981 22,686,840 8.07Oracle Corp 242,000 USD 12,119,934 15,654,980 5.57Paychex Inc 58,200 USD 3,681,191 5,423,076 1.93Tyler Technologies Inc 3,550 USD 724,232 1,549,646 0.55Verisk Analytics Inc 21,937 USD 2,108,952 4,553,902 1.62
56,642,982 93,150,155 33.12
Mechanics and machineryOtis Worldwide Corp 88,800 USD 4,940,097 5,998,440 2.13
4,940,097 5,998,440 2.13
Office equipment and computersApple Inc 138,000 USD 7,576,175 18,311,220 6.51Avery Dennison Corp 69,000 USD 7,736,274 10,702,590 3.81Cisco Systems Inc 220,100 USD 9,202,180 9,849,475 3.50
24,514,629 38,863,285 13.82
Other ServicesVisa Inc - A Shares 48,400 USD 5,580,816 10,586,532 3.76
5,580,816 10,586,532 3.76
Pharmaceuticals and cosmeticsBecton Dickinson and Co 21,500 USD 4,341,435 5,379,730 1.91Eli Lilly & Co 75,000 USD 8,359,217 12,663,000 4.50Estee Lauder Cos Inc 24,500 USD 4,104,875 6,521,655 2.32Johnson & Johnson 65,000 USD 7,968,464 10,229,700 3.64
24,773,991 34,794,085 12.37
Public servicesCMS Energy Corp 156,000 USD 8,674,095 9,517,560 3.38
8,674,095 9,517,560 3.38
COMGEST GROWTH plc
Comgest Growth America
SCHEDULE OF INVESTMENTSAs at 31 December 2020(expressed in USD)
329
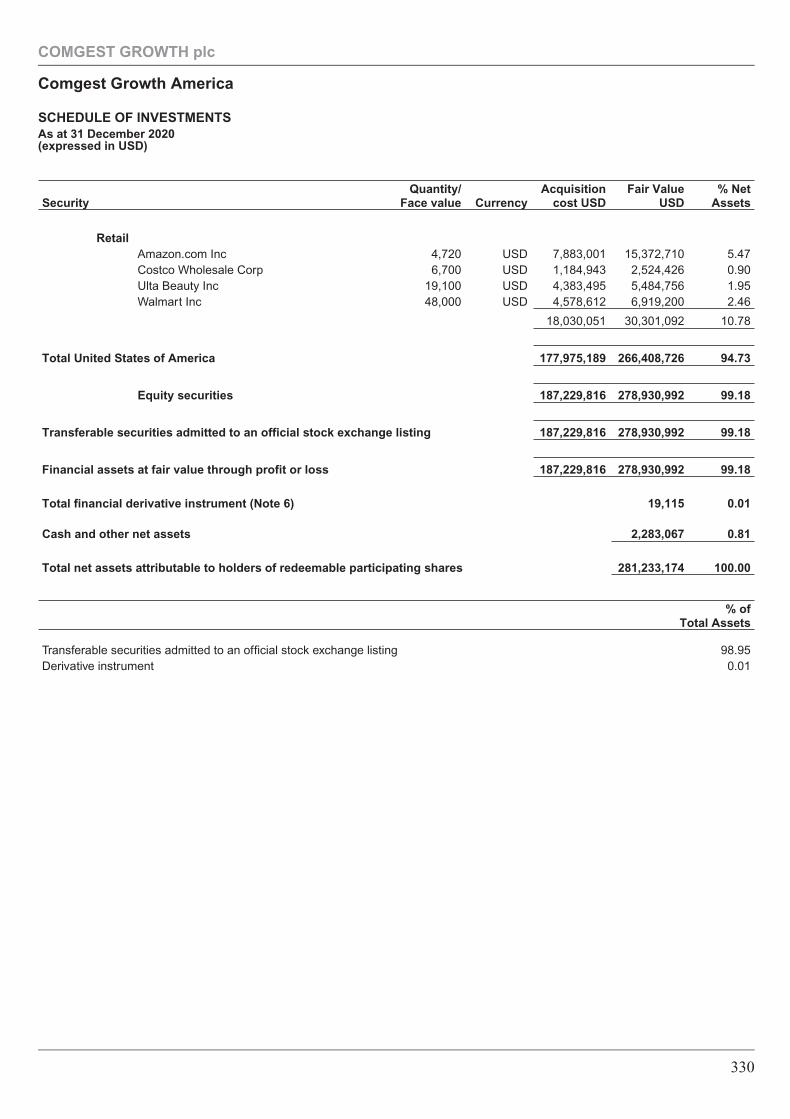
SecurityQuantity/
Face value CurrencyAcquisition
cost USDFair Value
USD% Net
Assets
RetailAmazon.com Inc 4,720 USD 7,883,001 15,372,710 5.47Costco Wholesale Corp 6,700 USD 1,184,943 2,524,426 0.90Ulta Beauty Inc 19,100 USD 4,383,495 5,484,756 1.95Walmart Inc 48,000 USD 4,578,612 6,919,200 2.46
18,030,051 30,301,092 10.78
Total United States of America 177,975,189 266,408,726 94.73
Equity securities 187,229,816 278,930,992 99.18
Transferable securities admitted to an official stock exchange listing 187,229,816 278,930,992 99.18
Financial assets at fair value through profit or loss 187,229,816 278,930,992 99.18
Total financial derivative instrument (Note 6) 19,115 0.01
Cash and other net assets 2,283,067 0.81
Total net assets attributable to holders of redeemable participating shares 281,233,174 100.00
% ofTotal Assets
Transferable securities admitted to an official stock exchange listing 98.95Derivative instrument 0.01
COMGEST GROWTH plc
Comgest Growth America
SCHEDULE OF INVESTMENTSAs at 31 December 2020(expressed in USD)
330
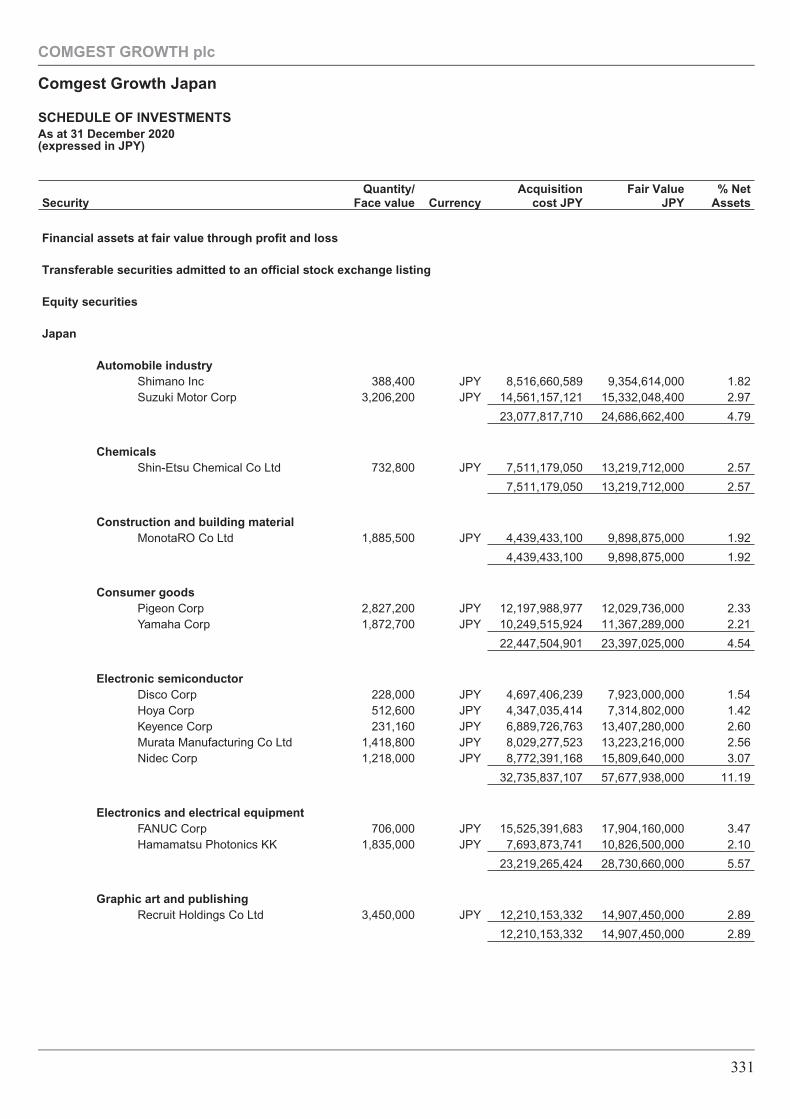
SecurityQuantity/
Face value CurrencyAcquisition
cost JPYFair Value
JPY% Net
Assets
Financial assets at fair value through profit and loss
Transferable securities admitted to an official stock exchange listing
Equity securities
Japan
Automobile industryShimano Inc 388,400 JPY 8,516,660,589 9,354,614,000 1.82Suzuki Motor Corp 3,206,200 JPY 14,561,157,121 15,332,048,400 2.97
23,077,817,710 24,686,662,400 4.79
ChemicalsShin-Etsu Chemical Co Ltd 732,800 JPY 7,511,179,050 13,219,712,000 2.57
7,511,179,050 13,219,712,000 2.57
Construction and building materialMonotaRO Co Ltd 1,885,500 JPY 4,439,433,100 9,898,875,000 1.92
4,439,433,100 9,898,875,000 1.92
Consumer goodsPigeon Corp 2,827,200 JPY 12,197,988,977 12,029,736,000 2.33Yamaha Corp 1,872,700 JPY 10,249,515,924 11,367,289,000 2.21
22,447,504,901 23,397,025,000 4.54
Electronic semiconductorDisco Corp 228,000 JPY 4,697,406,239 7,923,000,000 1.54Hoya Corp 512,600 JPY 4,347,035,414 7,314,802,000 1.42Keyence Corp 231,160 JPY 6,889,726,763 13,407,280,000 2.60Murata Manufacturing Co Ltd 1,418,800 JPY 8,029,277,523 13,223,216,000 2.56Nidec Corp 1,218,000 JPY 8,772,391,168 15,809,640,000 3.07
32,735,837,107 57,677,938,000 11.19
Electronics and electrical equipmentFANUC Corp 706,000 JPY 15,525,391,683 17,904,160,000 3.47Hamamatsu Photonics KK 1,835,000 JPY 7,693,873,741 10,826,500,000 2.10
23,219,265,424 28,730,660,000 5.57
Graphic art and publishingRecruit Holdings Co Ltd 3,450,000 JPY 12,210,153,332 14,907,450,000 2.89
12,210,153,332 14,907,450,000 2.89
COMGEST GROWTH plc
Comgest Growth Japan
SCHEDULE OF INVESTMENTSAs at 31 December 2020(expressed in JPY)
331
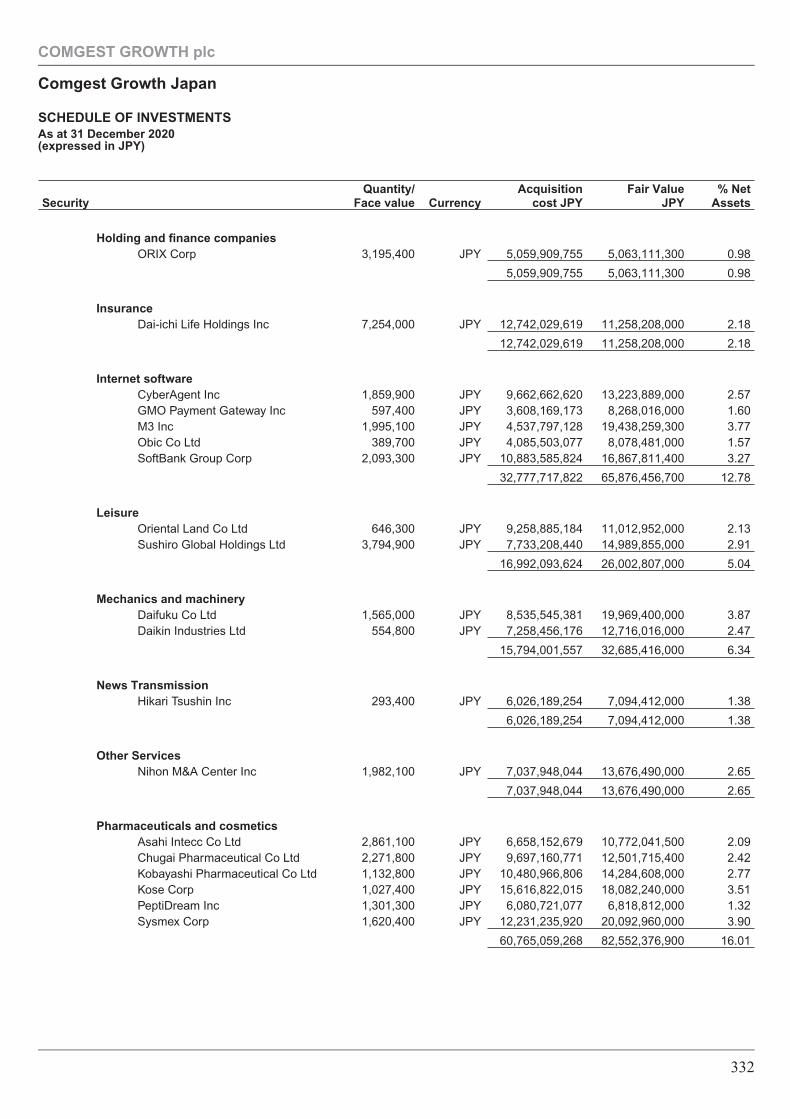
SecurityQuantity/
Face value CurrencyAcquisition
cost JPYFair Value
JPY% Net
Assets
Holding and finance companiesORIX Corp 3,195,400 JPY 5,059,909,755 5,063,111,300 0.98
5,059,909,755 5,063,111,300 0.98
InsuranceDai-ichi Life Holdings Inc 7,254,000 JPY 12,742,029,619 11,258,208,000 2.18
12,742,029,619 11,258,208,000 2.18
Internet softwareCyberAgent Inc 1,859,900 JPY 9,662,662,620 13,223,889,000 2.57GMO Payment Gateway Inc 597,400 JPY 3,608,169,173 8,268,016,000 1.60M3 Inc 1,995,100 JPY 4,537,797,128 19,438,259,300 3.77Obic Co Ltd 389,700 JPY 4,085,503,077 8,078,481,000 1.57SoftBank Group Corp 2,093,300 JPY 10,883,585,824 16,867,811,400 3.27
32,777,717,822 65,876,456,700 12.78
LeisureOriental Land Co Ltd 646,300 JPY 9,258,885,184 11,012,952,000 2.13Sushiro Global Holdings Ltd 3,794,900 JPY 7,733,208,440 14,989,855,000 2.91
16,992,093,624 26,002,807,000 5.04
Mechanics and machineryDaifuku Co Ltd 1,565,000 JPY 8,535,545,381 19,969,400,000 3.87Daikin Industries Ltd 554,800 JPY 7,258,456,176 12,716,016,000 2.47
15,794,001,557 32,685,416,000 6.34
News TransmissionHikari Tsushin Inc 293,400 JPY 6,026,189,254 7,094,412,000 1.38
6,026,189,254 7,094,412,000 1.38
Other ServicesNihon M&A Center Inc 1,982,100 JPY 7,037,948,044 13,676,490,000 2.65
7,037,948,044 13,676,490,000 2.65
Pharmaceuticals and cosmeticsAsahi Intecc Co Ltd 2,861,100 JPY 6,658,152,679 10,772,041,500 2.09Chugai Pharmaceutical Co Ltd 2,271,800 JPY 9,697,160,771 12,501,715,400 2.42Kobayashi Pharmaceutical Co Ltd 1,132,800 JPY 10,480,966,806 14,284,608,000 2.77Kose Corp 1,027,400 JPY 15,616,822,015 18,082,240,000 3.51PeptiDream Inc 1,301,300 JPY 6,080,721,077 6,818,812,000 1.32Sysmex Corp 1,620,400 JPY 12,231,235,920 20,092,960,000 3.90
60,765,059,268 82,552,376,900 16.01
COMGEST GROWTH plc
Comgest Growth Japan
SCHEDULE OF INVESTMENTSAs at 31 December 2020(expressed in JPY)
332
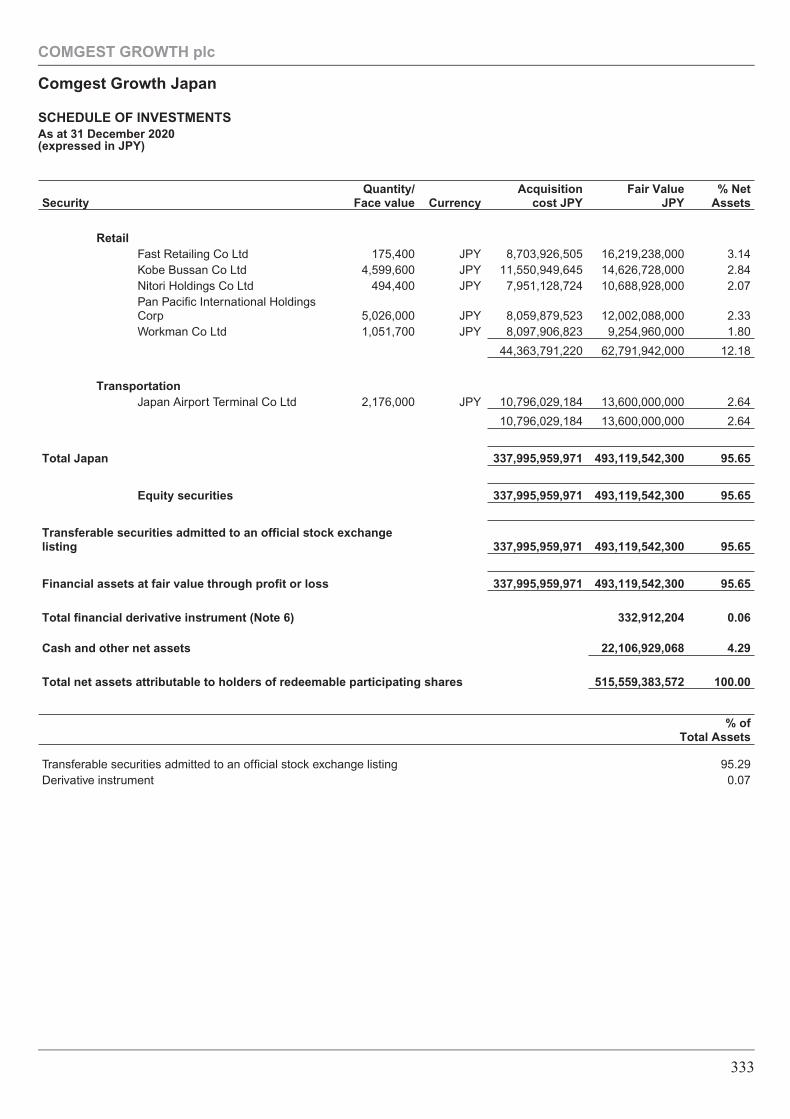
SecurityQuantity/
Face value CurrencyAcquisition
cost JPYFair Value
JPY% Net
Assets
RetailFast Retailing Co Ltd 175,400 JPY 8,703,926,505 16,219,238,000 3.14Kobe Bussan Co Ltd 4,599,600 JPY 11,550,949,645 14,626,728,000 2.84Nitori Holdings Co Ltd 494,400 JPY 7,951,128,724 10,688,928,000 2.07Pan Pacific International HoldingsCorp 5,026,000 JPY 8,059,879,523 12,002,088,000 2.33Workman Co Ltd 1,051,700 JPY 8,097,906,823 9,254,960,000 1.80
44,363,791,220 62,791,942,000 12.18
TransportationJapan Airport Terminal Co Ltd 2,176,000 JPY 10,796,029,184 13,600,000,000 2.64
10,796,029,184 13,600,000,000 2.64
Total Japan 337,995,959,971 493,119,542,300 95.65
Equity securities 337,995,959,971 493,119,542,300 95.65
Transferable securities admitted to an official stock exchangelisting 337,995,959,971 493,119,542,300 95.65
Financial assets at fair value through profit or loss 337,995,959,971 493,119,542,300 95.65
Total financial derivative instrument (Note 6) 332,912,204 0.06
Cash and other net assets 22,106,929,068 4.29
Total net assets attributable to holders of redeemable participating shares 515,559,383,572 100.00
% ofTotal Assets
Transferable securities admitted to an official stock exchange listing 95.29Derivative instrument 0.07
COMGEST GROWTH plc
Comgest Growth Japan
SCHEDULE OF INVESTMENTSAs at 31 December 2020(expressed in JPY)
333
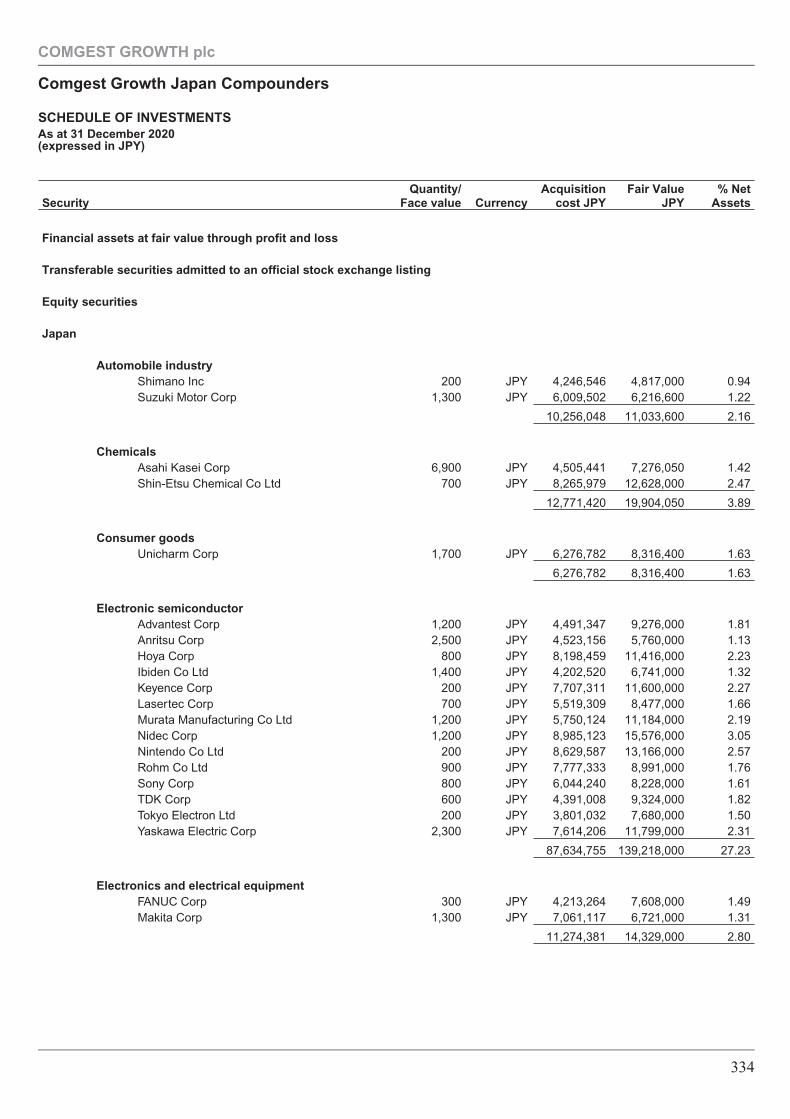
SecurityQuantity/
Face value CurrencyAcquisition
cost JPYFair Value
JPY% Net
Assets
Financial assets at fair value through profit and loss
Transferable securities admitted to an official stock exchange listing
Equity securities
Japan
Automobile industryShimano Inc 200 JPY 4,246,546 4,817,000 0.94Suzuki Motor Corp 1,300 JPY 6,009,502 6,216,600 1.22
10,256,048 11,033,600 2.16
ChemicalsAsahi Kasei Corp 6,900 JPY 4,505,441 7,276,050 1.42Shin-Etsu Chemical Co Ltd 700 JPY 8,265,979 12,628,000 2.47
12,771,420 19,904,050 3.89
Consumer goodsUnicharm Corp 1,700 JPY 6,276,782 8,316,400 1.63
6,276,782 8,316,400 1.63
Electronic semiconductorAdvantest Corp 1,200 JPY 4,491,347 9,276,000 1.81Anritsu Corp 2,500 JPY 4,523,156 5,760,000 1.13Hoya Corp 800 JPY 8,198,459 11,416,000 2.23Ibiden Co Ltd 1,400 JPY 4,202,520 6,741,000 1.32Keyence Corp 200 JPY 7,707,311 11,600,000 2.27Lasertec Corp 700 JPY 5,519,309 8,477,000 1.66Murata Manufacturing Co Ltd 1,200 JPY 5,750,124 11,184,000 2.19Nidec Corp 1,200 JPY 8,985,123 15,576,000 3.05Nintendo Co Ltd 200 JPY 8,629,587 13,166,000 2.57Rohm Co Ltd 900 JPY 7,777,333 8,991,000 1.76Sony Corp 800 JPY 6,044,240 8,228,000 1.61TDK Corp 600 JPY 4,391,008 9,324,000 1.82Tokyo Electron Ltd 200 JPY 3,801,032 7,680,000 1.50Yaskawa Electric Corp 2,300 JPY 7,614,206 11,799,000 2.31
87,634,755 139,218,000 27.23
Electronics and electrical equipmentFANUC Corp 300 JPY 4,213,264 7,608,000 1.49Makita Corp 1,300 JPY 7,061,117 6,721,000 1.31
11,274,381 14,329,000 2.80
COMGEST GROWTH plc
Comgest Growth Japan Compounders
SCHEDULE OF INVESTMENTSAs at 31 December 2020(expressed in JPY)
334
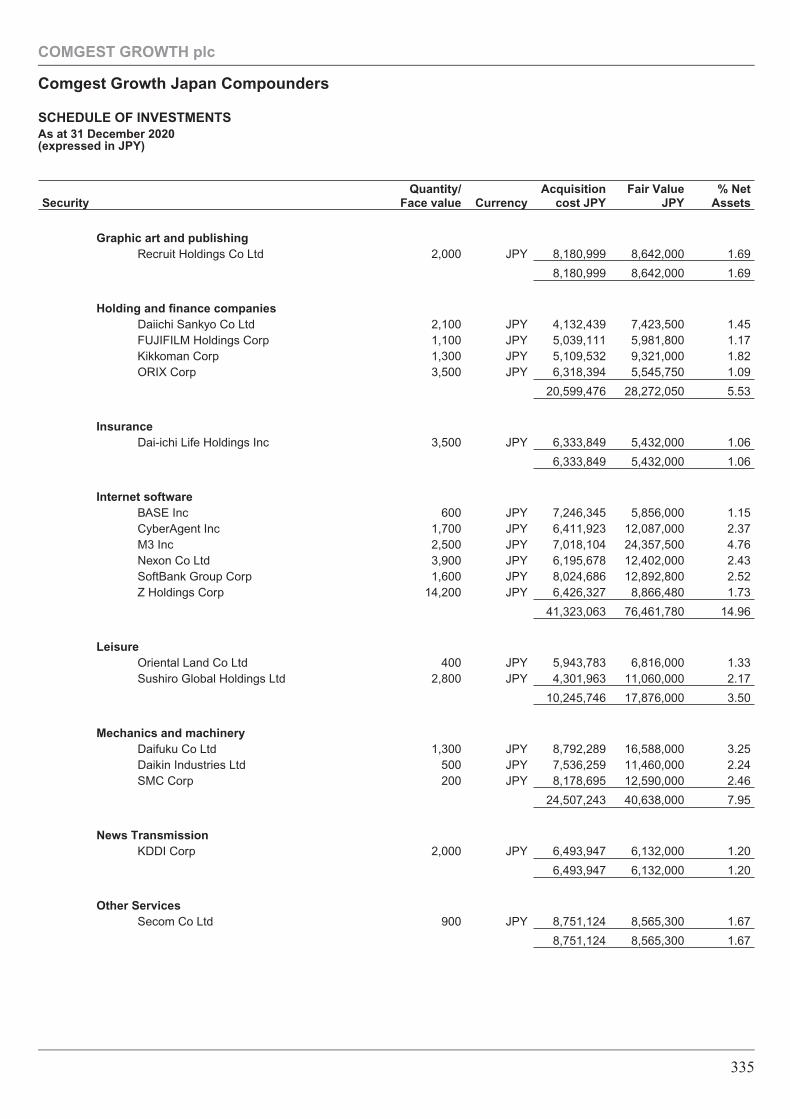
SecurityQuantity/
Face value CurrencyAcquisition
cost JPYFair Value
JPY% Net
Assets
Graphic art and publishingRecruit Holdings Co Ltd 2,000 JPY 8,180,999 8,642,000 1.69
8,180,999 8,642,000 1.69
Holding and finance companiesDaiichi Sankyo Co Ltd 2,100 JPY 4,132,439 7,423,500 1.45FUJIFILM Holdings Corp 1,100 JPY 5,039,111 5,981,800 1.17Kikkoman Corp 1,300 JPY 5,109,532 9,321,000 1.82ORIX Corp 3,500 JPY 6,318,394 5,545,750 1.09
20,599,476 28,272,050 5.53
InsuranceDai-ichi Life Holdings Inc 3,500 JPY 6,333,849 5,432,000 1.06
6,333,849 5,432,000 1.06
Internet softwareBASE Inc 600 JPY 7,246,345 5,856,000 1.15CyberAgent Inc 1,700 JPY 6,411,923 12,087,000 2.37M3 Inc 2,500 JPY 7,018,104 24,357,500 4.76Nexon Co Ltd 3,900 JPY 6,195,678 12,402,000 2.43SoftBank Group Corp 1,600 JPY 8,024,686 12,892,800 2.52Z Holdings Corp 14,200 JPY 6,426,327 8,866,480 1.73
41,323,063 76,461,780 14.96
LeisureOriental Land Co Ltd 400 JPY 5,943,783 6,816,000 1.33Sushiro Global Holdings Ltd 2,800 JPY 4,301,963 11,060,000 2.17
10,245,746 17,876,000 3.50
Mechanics and machineryDaifuku Co Ltd 1,300 JPY 8,792,289 16,588,000 3.25Daikin Industries Ltd 500 JPY 7,536,259 11,460,000 2.24SMC Corp 200 JPY 8,178,695 12,590,000 2.46
24,507,243 40,638,000 7.95
News TransmissionKDDI Corp 2,000 JPY 6,493,947 6,132,000 1.20
6,493,947 6,132,000 1.20
Other ServicesSecom Co Ltd 900 JPY 8,751,124 8,565,300 1.67
8,751,124 8,565,300 1.67
COMGEST GROWTH plc
Comgest Growth Japan Compounders
SCHEDULE OF INVESTMENTSAs at 31 December 2020(expressed in JPY)
335
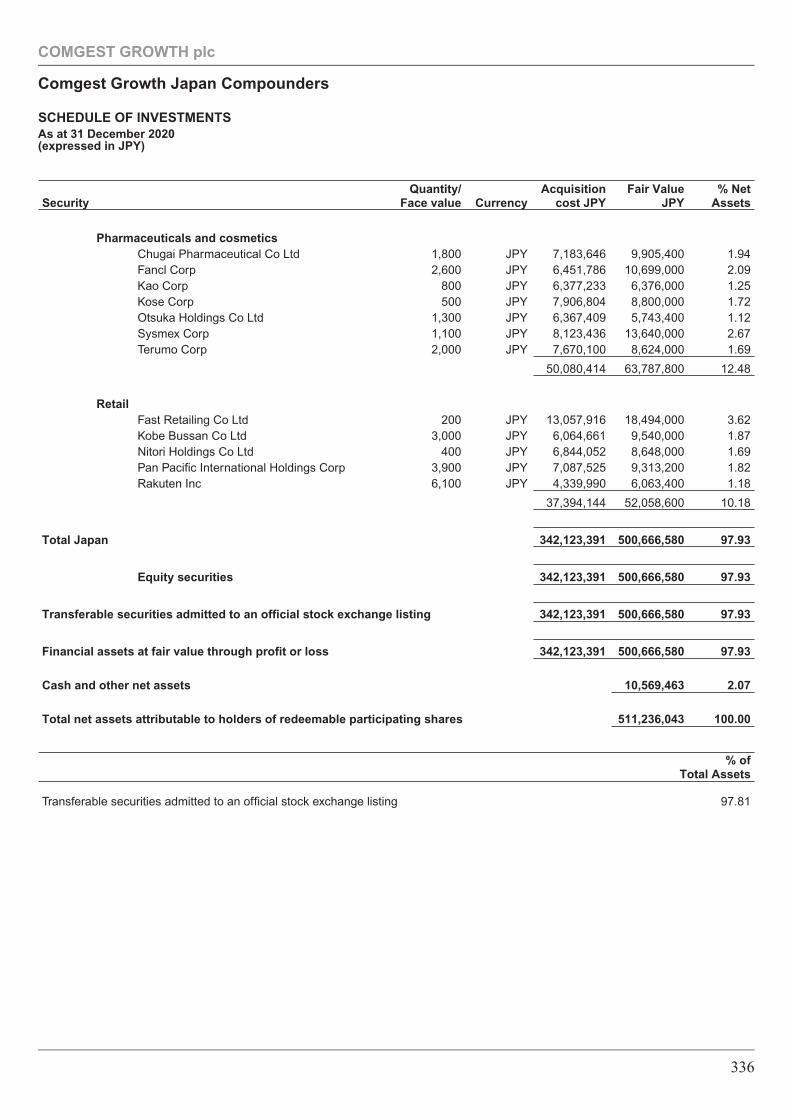
SecurityQuantity/
Face value CurrencyAcquisition
cost JPYFair Value
JPY% Net
Assets
Pharmaceuticals and cosmeticsChugai Pharmaceutical Co Ltd 1,800 JPY 7,183,646 9,905,400 1.94Fancl Corp 2,600 JPY 6,451,786 10,699,000 2.09Kao Corp 800 JPY 6,377,233 6,376,000 1.25Kose Corp 500 JPY 7,906,804 8,800,000 1.72Otsuka Holdings Co Ltd 1,300 JPY 6,367,409 5,743,400 1.12Sysmex Corp 1,100 JPY 8,123,436 13,640,000 2.67Terumo Corp 2,000 JPY 7,670,100 8,624,000 1.69
50,080,414 63,787,800 12.48
RetailFast Retailing Co Ltd 200 JPY 13,057,916 18,494,000 3.62Kobe Bussan Co Ltd 3,000 JPY 6,064,661 9,540,000 1.87Nitori Holdings Co Ltd 400 JPY 6,844,052 8,648,000 1.69Pan Pacific International Holdings Corp 3,900 JPY 7,087,525 9,313,200 1.82Rakuten Inc 6,100 JPY 4,339,990 6,063,400 1.18
37,394,144 52,058,600 10.18
Total Japan 342,123,391 500,666,580 97.93
Equity securities 342,123,391 500,666,580 97.93
Transferable securities admitted to an official stock exchange listing 342,123,391 500,666,580 97.93
Financial assets at fair value through profit or loss 342,123,391 500,666,580 97.93
Cash and other net assets 10,569,463 2.07
Total net assets attributable to holders of redeemable participating shares 511,236,043 100.00
% ofTotal Assets
Transferable securities admitted to an official stock exchange listing 97.81
COMGEST GROWTH plc
Comgest Growth Japan Compounders
SCHEDULE OF INVESTMENTSAs at 31 December 2020(expressed in JPY)
336
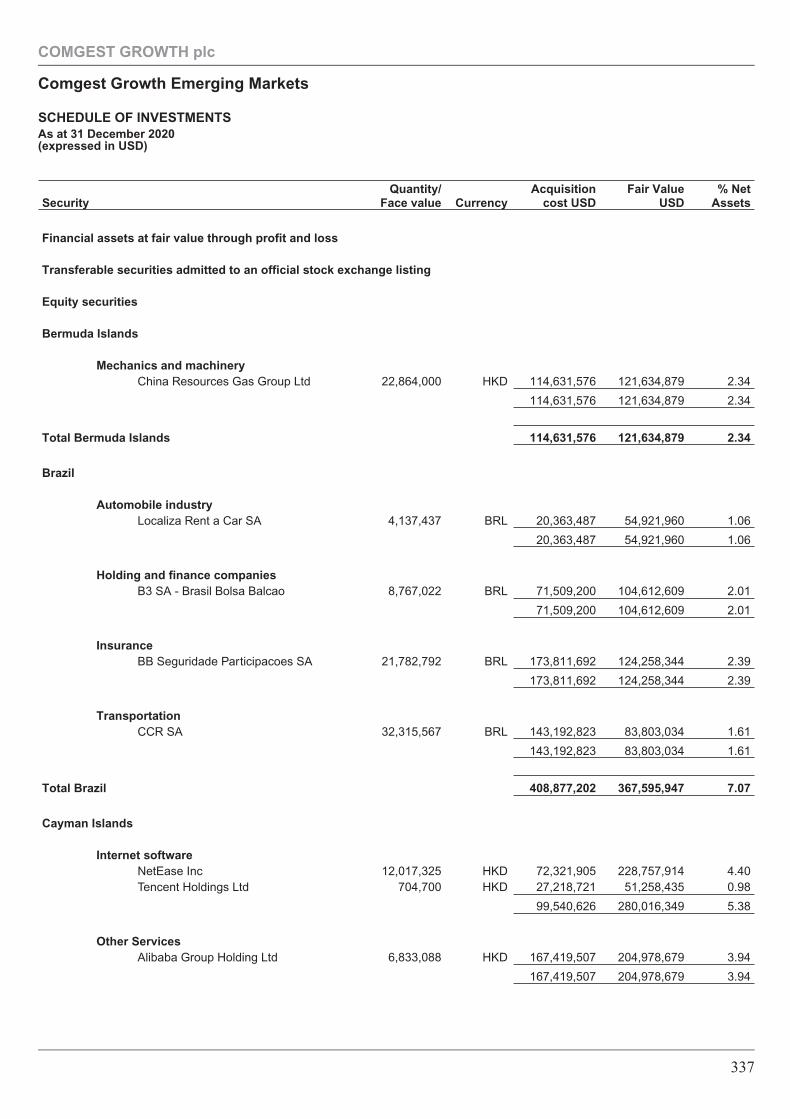
SecurityQuantity/
Face value CurrencyAcquisition
cost USDFair Value
USD% Net
Assets
Financial assets at fair value through profit and loss
Transferable securities admitted to an official stock exchange listing
Equity securities
Bermuda Islands
Mechanics and machineryChina Resources Gas Group Ltd 22,864,000 HKD 114,631,576 121,634,879 2.34
114,631,576 121,634,879 2.34
Total Bermuda Islands 114,631,576 121,634,879 2.34
Brazil
Automobile industryLocaliza Rent a Car SA 4,137,437 BRL 20,363,487 54,921,960 1.06
20,363,487 54,921,960 1.06
Holding and finance companiesB3 SA - Brasil Bolsa Balcao 8,767,022 BRL 71,509,200 104,612,609 2.01
71,509,200 104,612,609 2.01
InsuranceBB Seguridade Participacoes SA 21,782,792 BRL 173,811,692 124,258,344 2.39
173,811,692 124,258,344 2.39
TransportationCCR SA 32,315,567 BRL 143,192,823 83,803,034 1.61
143,192,823 83,803,034 1.61
Total Brazil 408,877,202 367,595,947 7.07
Cayman Islands
Internet softwareNetEase Inc 12,017,325 HKD 72,321,905 228,757,914 4.40Tencent Holdings Ltd 704,700 HKD 27,218,721 51,258,435 0.98
99,540,626 280,016,349 5.38
Other ServicesAlibaba Group Holding Ltd 6,833,088 HKD 167,419,507 204,978,679 3.94
167,419,507 204,978,679 3.94
COMGEST GROWTH plc
Comgest Growth Emerging Markets
SCHEDULE OF INVESTMENTSAs at 31 December 2020(expressed in USD)
337
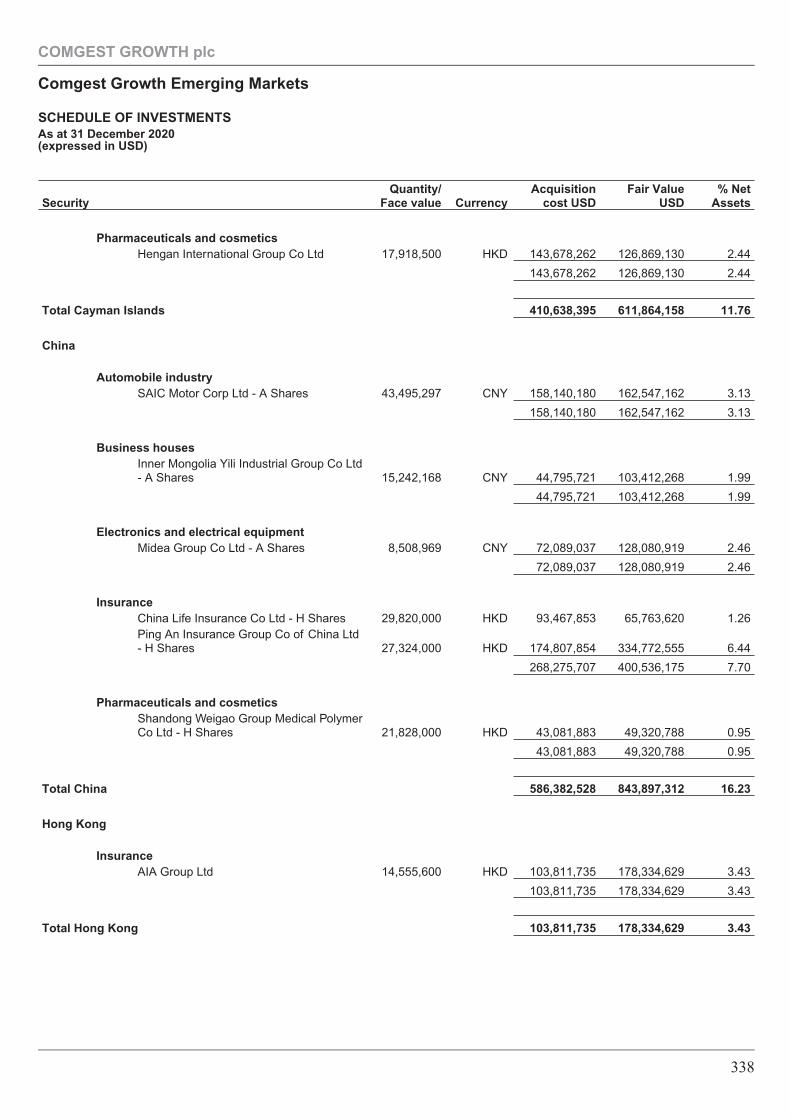
SecurityQuantity/
Face value CurrencyAcquisition
cost USDFair Value
USD% Net
Assets
Pharmaceuticals and cosmeticsHengan International Group Co Ltd 17,918,500 HKD 143,678,262 126,869,130 2.44
143,678,262 126,869,130 2.44
Total Cayman Islands 410,638,395 611,864,158 11.76
China
Automobile industrySAIC Motor Corp Ltd - A Shares 43,495,297 CNY 158,140,180 162,547,162 3.13
158,140,180 162,547,162 3.13
Business housesInner Mongolia Yili Industrial Group Co Ltd- A Shares 15,242,168 CNY 44,795,721 103,412,268 1.99
44,795,721 103,412,268 1.99
Electronics and electrical equipmentMidea Group Co Ltd - A Shares 8,508,969 CNY 72,089,037 128,080,919 2.46
72,089,037 128,080,919 2.46
InsuranceChina Life Insurance Co Ltd - H Shares 29,820,000 HKD 93,467,853 65,763,620 1.26Ping An Insurance Group Co of China Ltd- H Shares 27,324,000 HKD 174,807,854 334,772,555 6.44
268,275,707 400,536,175 7.70
Pharmaceuticals and cosmeticsShandong Weigao Group Medical PolymerCo Ltd - H Shares 21,828,000 HKD 43,081,883 49,320,788 0.95
43,081,883 49,320,788 0.95
Total China 586,382,528 843,897,312 16.23
Hong Kong
InsuranceAIA Group Ltd 14,555,600 HKD 103,811,735 178,334,629 3.43
103,811,735 178,334,629 3.43
Total Hong Kong 103,811,735 178,334,629 3.43
COMGEST GROWTH plc
Comgest Growth Emerging Markets
SCHEDULE OF INVESTMENTSAs at 31 December 2020(expressed in USD)
338
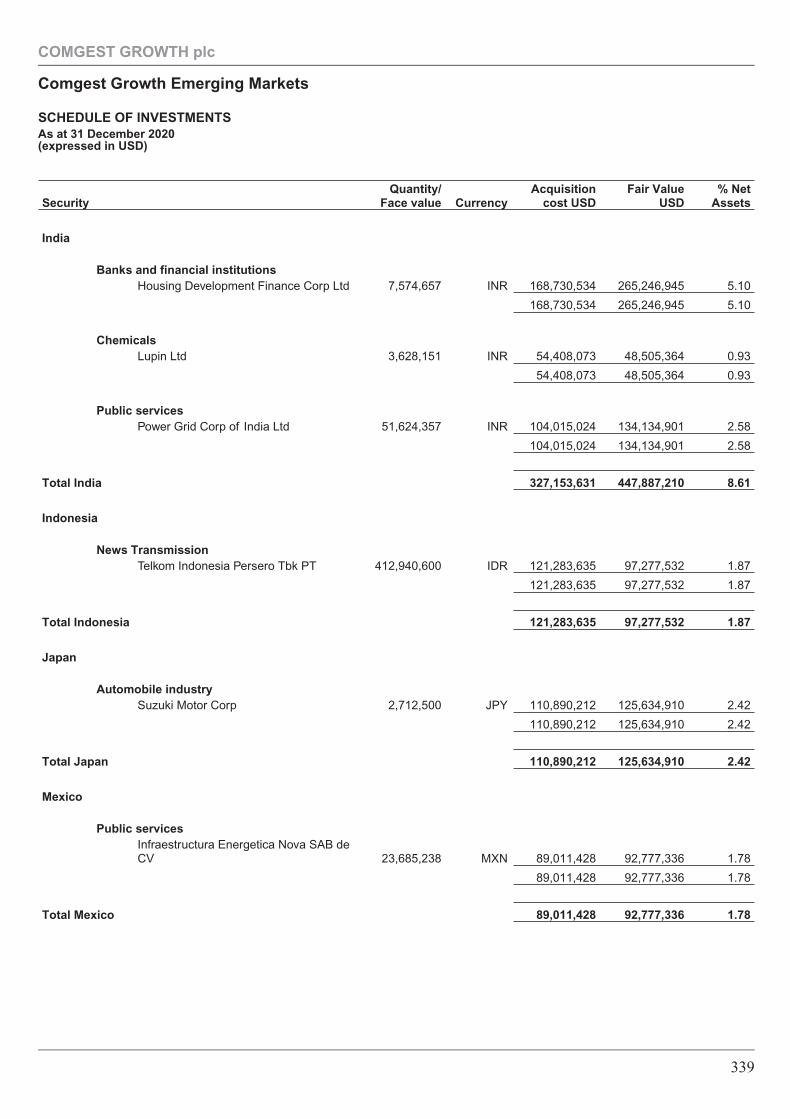
SecurityQuantity/
Face value CurrencyAcquisition
cost USDFair Value
USD% Net
Assets
India
Banks and financial institutionsHousing Development Finance Corp Ltd 7,574,657 INR 168,730,534 265,246,945 5.10
168,730,534 265,246,945 5.10
ChemicalsLupin Ltd 3,628,151 INR 54,408,073 48,505,364 0.93
54,408,073 48,505,364 0.93
Public servicesPower Grid Corp of India Ltd 51,624,357 INR 104,015,024 134,134,901 2.58
104,015,024 134,134,901 2.58
Total India 327,153,631 447,887,210 8.61
Indonesia
News TransmissionTelkom Indonesia Persero Tbk PT 412,940,600 IDR 121,283,635 97,277,532 1.87
121,283,635 97,277,532 1.87
Total Indonesia 121,283,635 97,277,532 1.87
Japan
Automobile industrySuzuki Motor Corp 2,712,500 JPY 110,890,212 125,634,910 2.42
110,890,212 125,634,910 2.42
Total Japan 110,890,212 125,634,910 2.42
Mexico
Public servicesInfraestructura Energetica Nova SAB deCV 23,685,238 MXN 89,011,428 92,777,336 1.78
89,011,428 92,777,336 1.78
Total Mexico 89,011,428 92,777,336 1.78
COMGEST GROWTH plc
Comgest Growth Emerging Markets
SCHEDULE OF INVESTMENTSAs at 31 December 2020(expressed in USD)
339
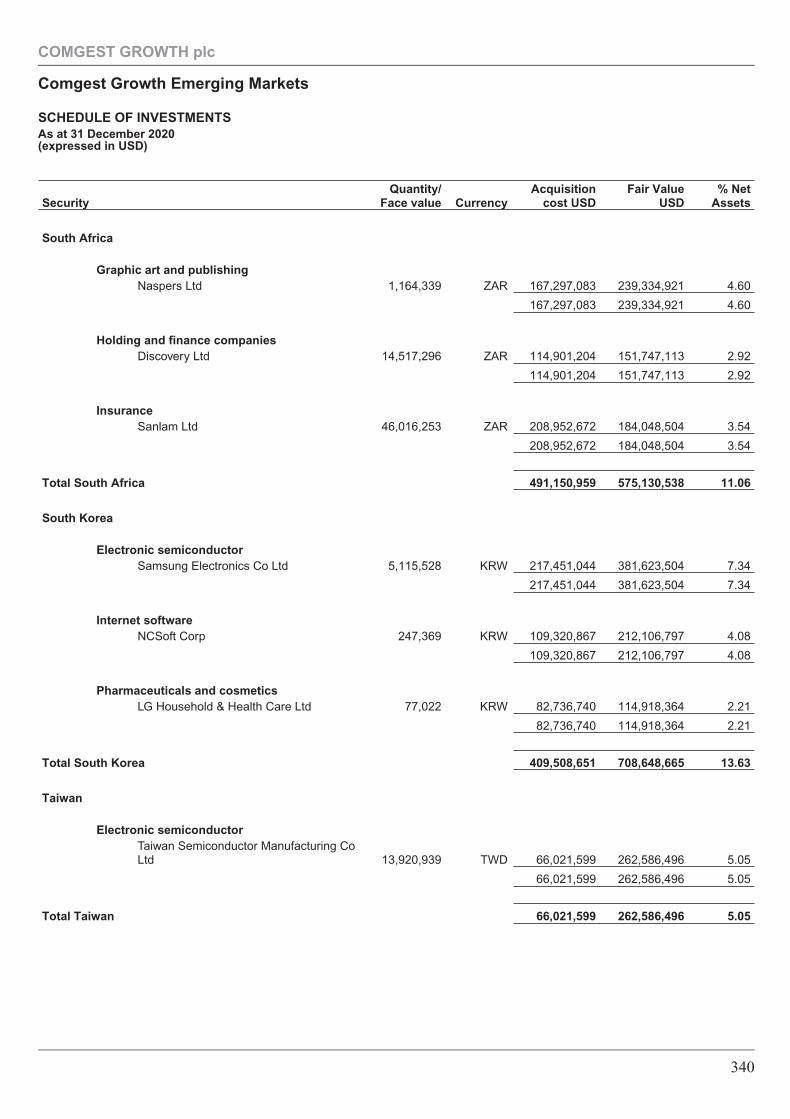
SecurityQuantity/
Face value CurrencyAcquisition
cost USDFair Value
USD% Net
Assets
South Africa
Graphic art and publishingNaspers Ltd 1,164,339 ZAR 167,297,083 239,334,921 4.60
167,297,083 239,334,921 4.60
Holding and finance companiesDiscovery Ltd 14,517,296 ZAR 114,901,204 151,747,113 2.92
114,901,204 151,747,113 2.92
InsuranceSanlam Ltd 46,016,253 ZAR 208,952,672 184,048,504 3.54
208,952,672 184,048,504 3.54
Total South Africa 491,150,959 575,130,538 11.06
South Korea
Electronic semiconductorSamsung Electronics Co Ltd 5,115,528 KRW 217,451,044 381,623,504 7.34
217,451,044 381,623,504 7.34
Internet softwareNCSoft Corp 247,369 KRW 109,320,867 212,106,797 4.08
109,320,867 212,106,797 4.08
Pharmaceuticals and cosmeticsLG Household & Health Care Ltd 77,022 KRW 82,736,740 114,918,364 2.21
82,736,740 114,918,364 2.21
Total South Korea 409,508,651 708,648,665 13.63
Taiwan
Electronic semiconductorTaiwan Semiconductor Manufacturing CoLtd 13,920,939 TWD 66,021,599 262,586,496 5.05
66,021,599 262,586,496 5.05
Total Taiwan 66,021,599 262,586,496 5.05
COMGEST GROWTH plc
Comgest Growth Emerging Markets
SCHEDULE OF INVESTMENTSAs at 31 December 2020(expressed in USD)
340
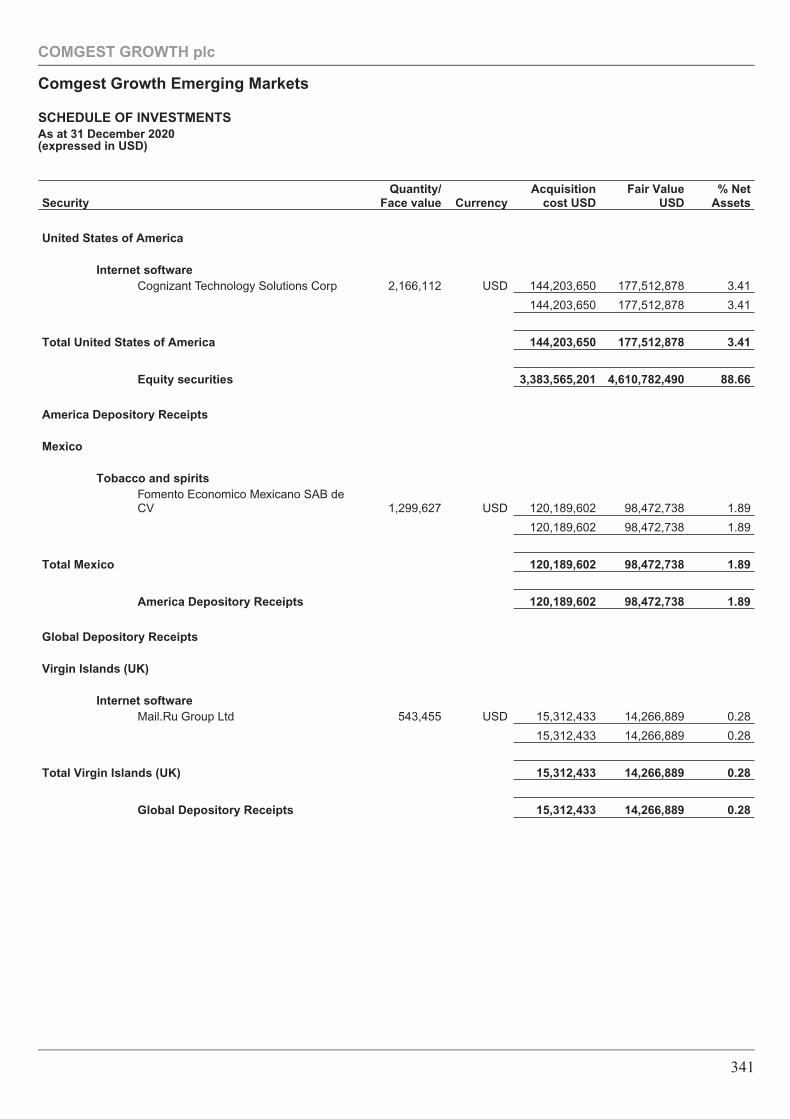
SecurityQuantity/
Face value CurrencyAcquisition
cost USDFair Value
USD% Net
Assets
United States of America
Internet softwareCognizant Technology Solutions Corp 2,166,112 USD 144,203,650 177,512,878 3.41
144,203,650 177,512,878 3.41
Total United States of America 144,203,650 177,512,878 3.41
Equity securities 3,383,565,201 4,610,782,490 88.66
America Depository Receipts
Mexico
Tobacco and spiritsFomento Economico Mexicano SAB deCV 1,299,627 USD 120,189,602 98,472,738 1.89
120,189,602 98,472,738 1.89
Total Mexico 120,189,602 98,472,738 1.89
America Depository Receipts 120,189,602 98,472,738 1.89
Global Depository Receipts
Virgin Islands (UK)
Internet softwareMail.Ru Group Ltd 543,455 USD 15,312,433 14,266,889 0.28
15,312,433 14,266,889 0.28
Total Virgin Islands (UK) 15,312,433 14,266,889 0.28
Global Depository Receipts 15,312,433 14,266,889 0.28
COMGEST GROWTH plc
Comgest Growth Emerging Markets
SCHEDULE OF INVESTMENTSAs at 31 December 2020(expressed in USD)
341
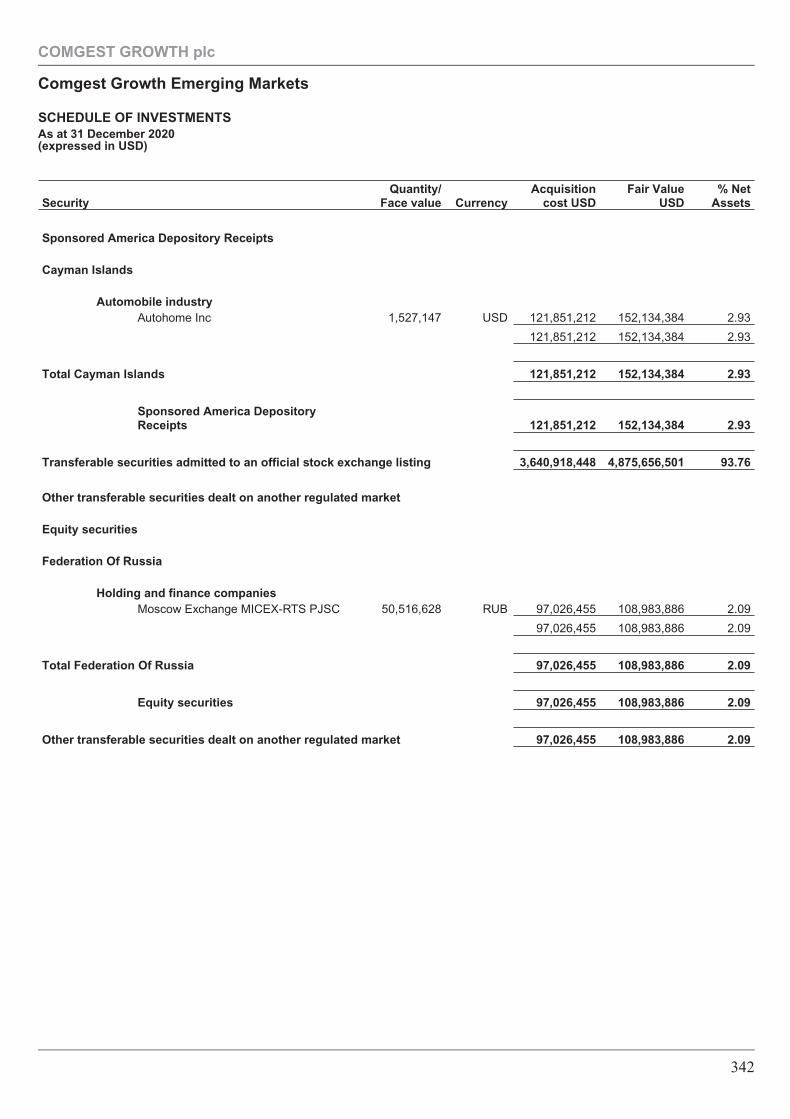
SecurityQuantity/
Face value CurrencyAcquisition
cost USDFair Value
USD% Net
Assets
Sponsored America Depository Receipts
Cayman Islands
Automobile industryAutohome Inc 1,527,147 USD 121,851,212 152,134,384 2.93
121,851,212 152,134,384 2.93
Total Cayman Islands 121,851,212 152,134,384 2.93
Sponsored America DepositoryReceipts 121,851,212 152,134,384 2.93
Transferable securities admitted to an official stock exchange listing 3,640,918,448 4,875,656,501 93.76
Other transferable securities dealt on another regulated market
Equity securities
Federation Of Russia
Holding and finance companiesMoscow Exchange MICEX-RTS PJSC 50,516,628 RUB 97,026,455 108,983,886 2.09
97,026,455 108,983,886 2.09
Total Federation Of Russia 97,026,455 108,983,886 2.09
Equity securities 97,026,455 108,983,886 2.09
Other transferable securities dealt on another regulated market 97,026,455 108,983,886 2.09
COMGEST GROWTH plc
Comgest Growth Emerging Markets
SCHEDULE OF INVESTMENTSAs at 31 December 2020(expressed in USD)
342
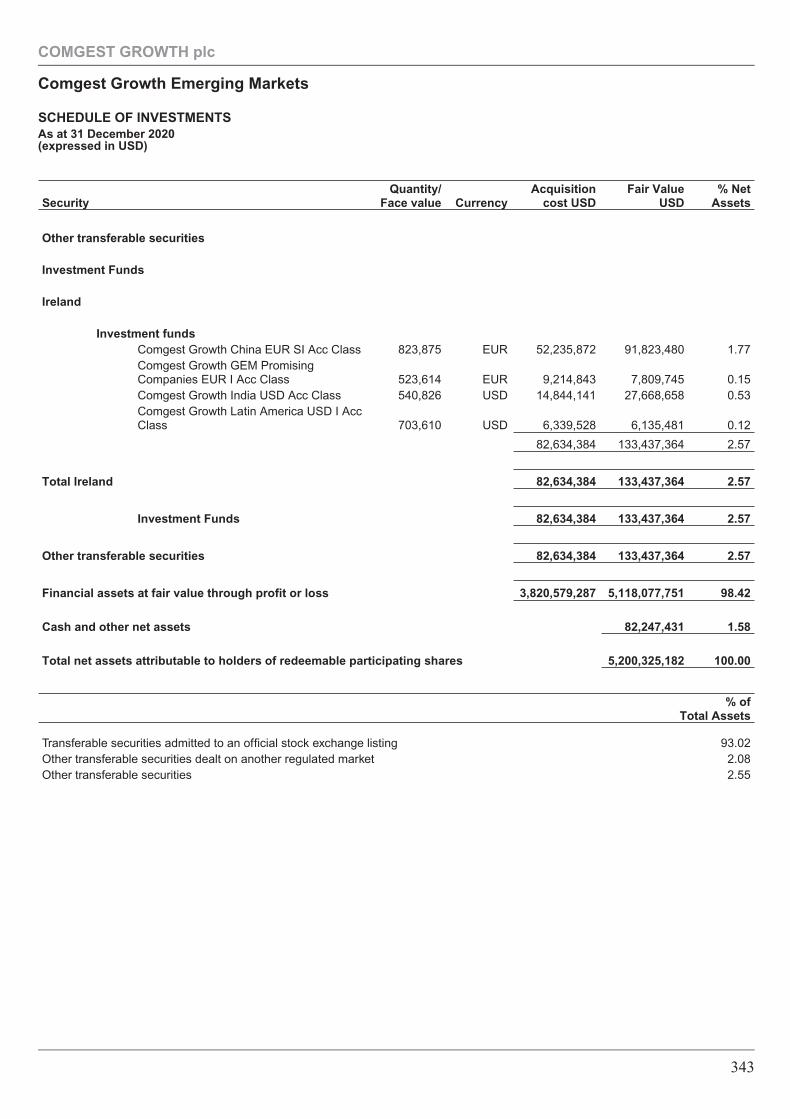
SecurityQuantity/
Face value CurrencyAcquisition
cost USDFair Value
USD% Net
Assets
Other transferable securities
Investment Funds
Ireland
Investment fundsComgest Growth China EUR SI Acc Class 823,875 EUR 52,235,872 91,823,480 1.77Comgest Growth GEM PromisingCompanies EUR I Acc Class 523,614 EUR 9,214,843 7,809,745 0.15Comgest Growth India USD Acc Class 540,826 USD 14,844,141 27,668,658 0.53Comgest Growth Latin America USD I AccClass 703,610 USD 6,339,528 6,135,481 0.12
82,634,384 133,437,364 2.57
Total Ireland 82,634,384 133,437,364 2.57
Investment Funds 82,634,384 133,437,364 2.57
Other transferable securities 82,634,384 133,437,364 2.57
Financial assets at fair value through profit or loss 3,820,579,287 5,118,077,751 98.42
Cash and other net assets 82,247,431 1.58
Total net assets attributable to holders of redeemable participating shares 5,200,325,182 100.00
% ofTotal Assets
Transferable securities admitted to an official stock exchange listing 93.02Other transferable securities dealt on another regulated market 2.08Other transferable securities 2.55
COMGEST GROWTH plc
Comgest Growth Emerging Markets
SCHEDULE OF INVESTMENTSAs at 31 December 2020(expressed in USD)
343
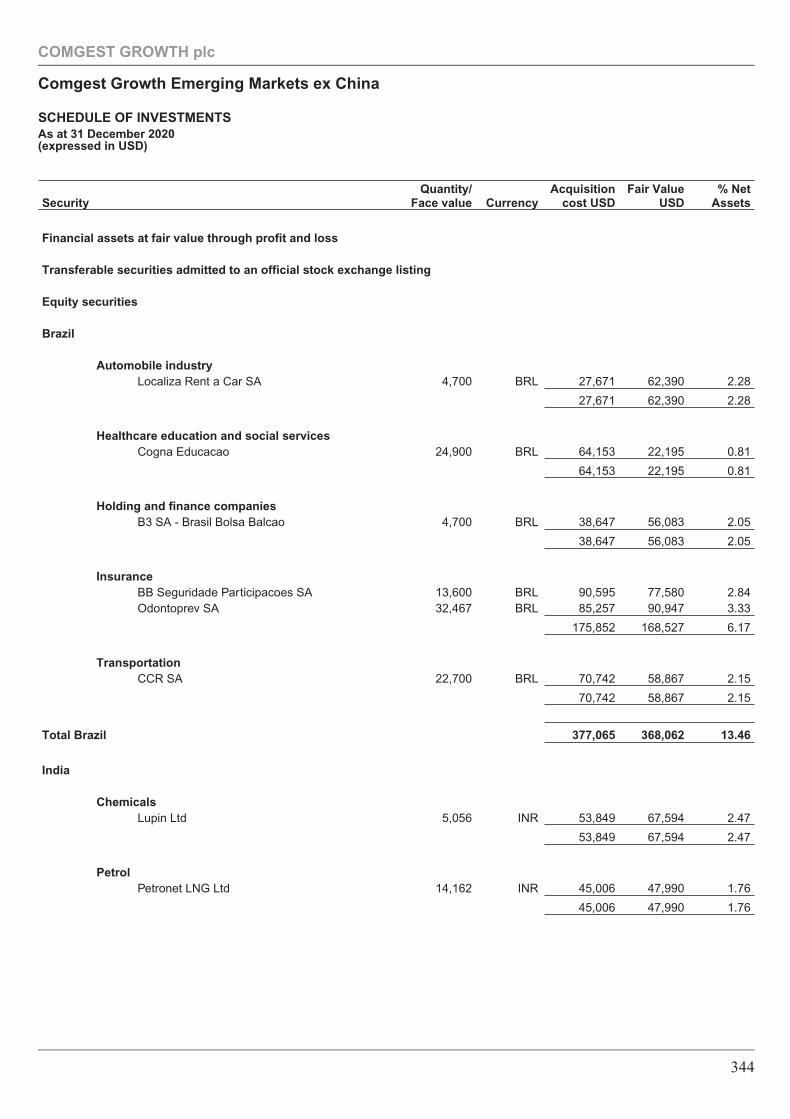
SecurityQuantity/
Face value CurrencyAcquisition
cost USDFair Value
USD% Net
Assets
Financial assets at fair value through profit and loss
Transferable securities admitted to an official stock exchange listing
Equity securities
Brazil
Automobile industryLocaliza Rent a Car SA 4,700 BRL 27,671 62,390 2.28
27,671 62,390 2.28
Healthcare education and social servicesCogna Educacao 24,900 BRL 64,153 22,195 0.81
64,153 22,195 0.81
Holding and finance companiesB3 SA - Brasil Bolsa Balcao 4,700 BRL 38,647 56,083 2.05
38,647 56,083 2.05
InsuranceBB Seguridade Participacoes SA 13,600 BRL 90,595 77,580 2.84Odontoprev SA 32,467 BRL 85,257 90,947 3.33
175,852 168,527 6.17
TransportationCCR SA 22,700 BRL 70,742 58,867 2.15
70,742 58,867 2.15
Total Brazil 377,065 368,062 13.46
India
ChemicalsLupin Ltd 5,056 INR 53,849 67,594 2.47
53,849 67,594 2.47
PetrolPetronet LNG Ltd 14,162 INR 45,006 47,990 1.76
45,006 47,990 1.76
COMGEST GROWTH plc
Comgest Growth Emerging Markets ex China
SCHEDULE OF INVESTMENTSAs at 31 December 2020(expressed in USD)
344
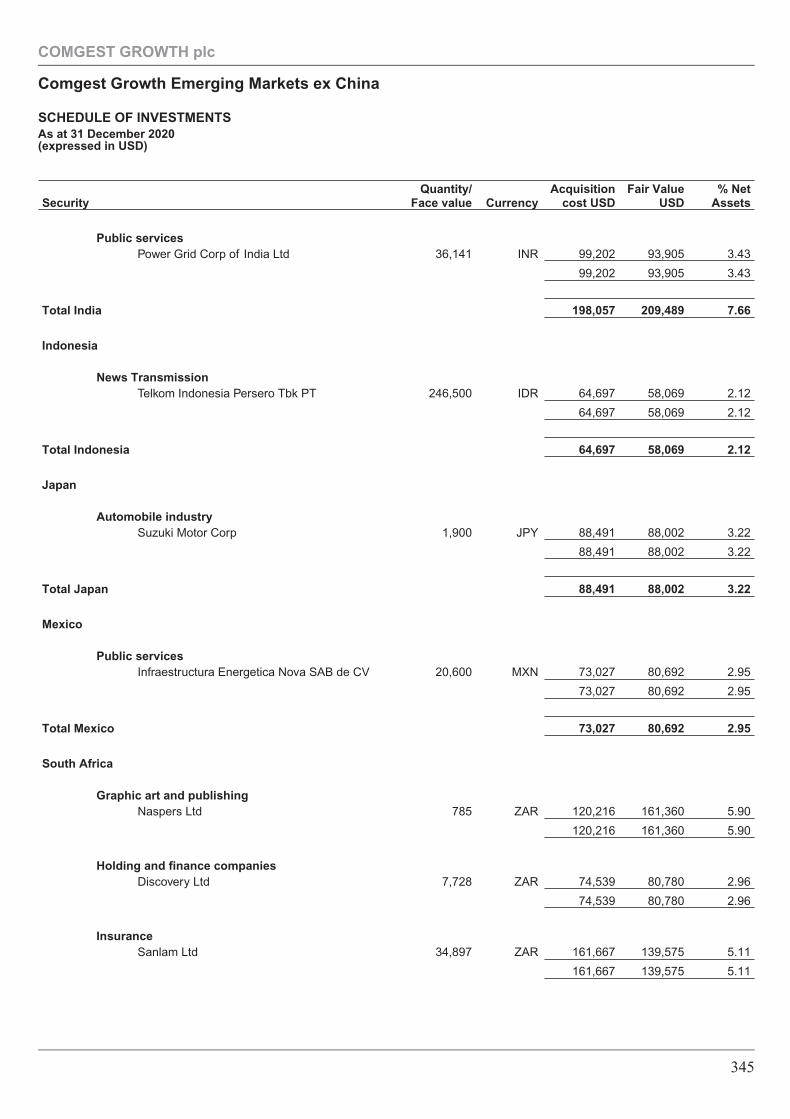
SecurityQuantity/
Face value CurrencyAcquisition
cost USDFair Value
USD% Net
Assets
Public servicesPower Grid Corp of India Ltd 36,141 INR 99,202 93,905 3.43
99,202 93,905 3.43
Total India 198,057 209,489 7.66
Indonesia
News TransmissionTelkom Indonesia Persero Tbk PT 246,500 IDR 64,697 58,069 2.12
64,697 58,069 2.12
Total Indonesia 64,697 58,069 2.12
Japan
Automobile industrySuzuki Motor Corp 1,900 JPY 88,491 88,002 3.22
88,491 88,002 3.22
Total Japan 88,491 88,002 3.22
Mexico
Public servicesInfraestructura Energetica Nova SAB de CV 20,600 MXN 73,027 80,692 2.95
73,027 80,692 2.95
Total Mexico 73,027 80,692 2.95
South Africa
Graphic art and publishingNaspers Ltd 785 ZAR 120,216 161,360 5.90
120,216 161,360 5.90
Holding and finance companiesDiscovery Ltd 7,728 ZAR 74,539 80,780 2.96
74,539 80,780 2.96
InsuranceSanlam Ltd 34,897 ZAR 161,667 139,575 5.11
161,667 139,575 5.11
COMGEST GROWTH plc
Comgest Growth Emerging Markets ex China
SCHEDULE OF INVESTMENTSAs at 31 December 2020(expressed in USD)
345
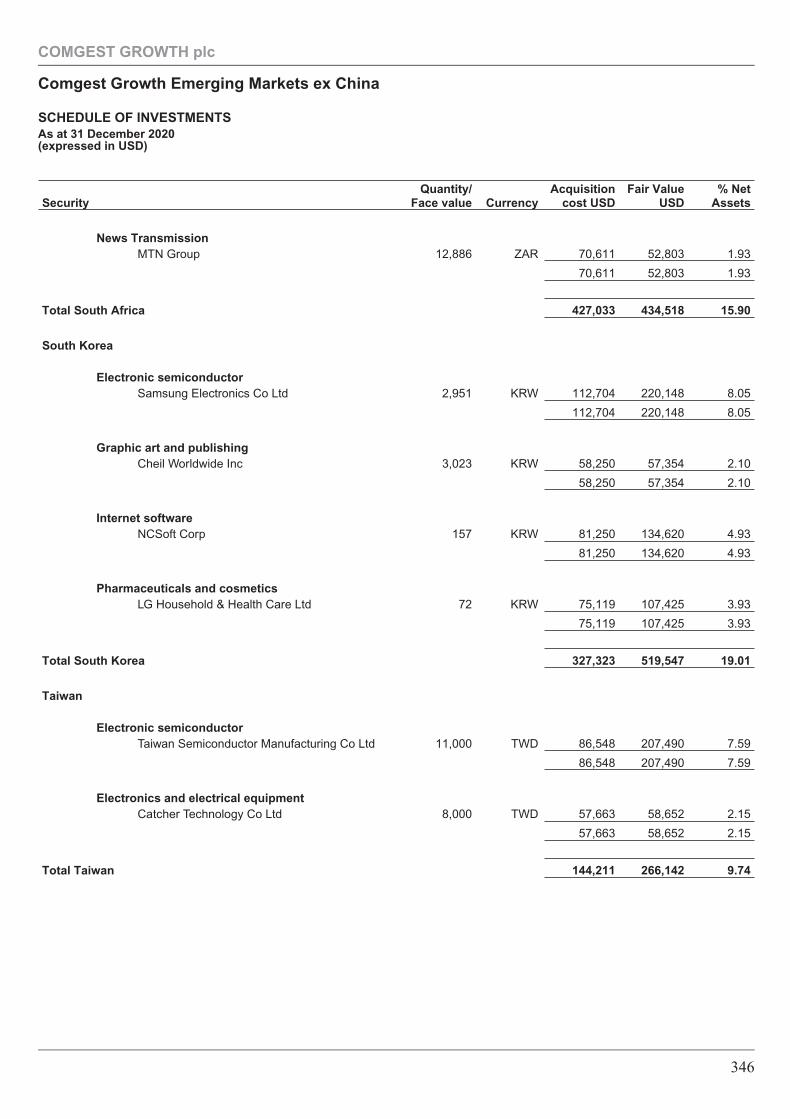
SecurityQuantity/
Face value CurrencyAcquisition
cost USDFair Value
USD% Net
Assets
News TransmissionMTN Group 12,886 ZAR 70,611 52,803 1.93
70,611 52,803 1.93
Total South Africa 427,033 434,518 15.90
South Korea
Electronic semiconductorSamsung Electronics Co Ltd 2,951 KRW 112,704 220,148 8.05
112,704 220,148 8.05
Graphic art and publishingCheil Worldwide Inc 3,023 KRW 58,250 57,354 2.10
58,250 57,354 2.10
Internet softwareNCSoft Corp 157 KRW 81,250 134,620 4.93
81,250 134,620 4.93
Pharmaceuticals and cosmeticsLG Household & Health Care Ltd 72 KRW 75,119 107,425 3.93
75,119 107,425 3.93
Total South Korea 327,323 519,547 19.01
Taiwan
Electronic semiconductorTaiwan Semiconductor Manufacturing Co Ltd 11,000 TWD 86,548 207,490 7.59
86,548 207,490 7.59
Electronics and electrical equipmentCatcher Technology Co Ltd 8,000 TWD 57,663 58,652 2.15
57,663 58,652 2.15
Total Taiwan 144,211 266,142 9.74
COMGEST GROWTH plc
Comgest Growth Emerging Markets ex China
SCHEDULE OF INVESTMENTSAs at 31 December 2020(expressed in USD)
346
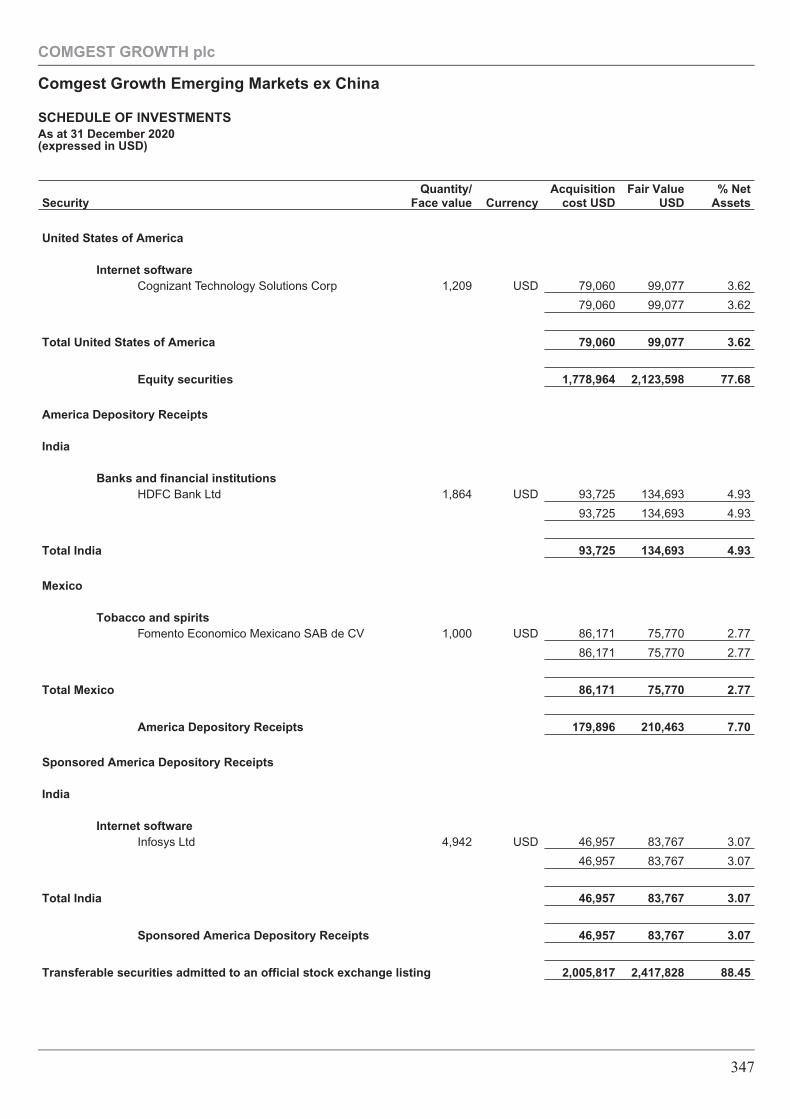
SecurityQuantity/
Face value CurrencyAcquisition
cost USDFair Value
USD% Net
Assets
United States of America
Internet softwareCognizant Technology Solutions Corp 1,209 USD 79,060 99,077 3.62
79,060 99,077 3.62
Total United States of America 79,060 99,077 3.62
Equity securities 1,778,964 2,123,598 77.68
America Depository Receipts
India
Banks and financial institutionsHDFC Bank Ltd 1,864 USD 93,725 134,693 4.93
93,725 134,693 4.93
Total India 93,725 134,693 4.93
Mexico
Tobacco and spiritsFomento Economico Mexicano SAB de CV 1,000 USD 86,171 75,770 2.77
86,171 75,770 2.77
Total Mexico 86,171 75,770 2.77
America Depository Receipts 179,896 210,463 7.70
Sponsored America Depository Receipts
India
Internet softwareInfosys Ltd 4,942 USD 46,957 83,767 3.07
46,957 83,767 3.07
Total India 46,957 83,767 3.07
Sponsored America Depository Receipts 46,957 83,767 3.07
Transferable securities admitted to an official stock exchange listing 2,005,817 2,417,828 88.45
COMGEST GROWTH plc
Comgest Growth Emerging Markets ex China
SCHEDULE OF INVESTMENTSAs at 31 December 2020(expressed in USD)
347
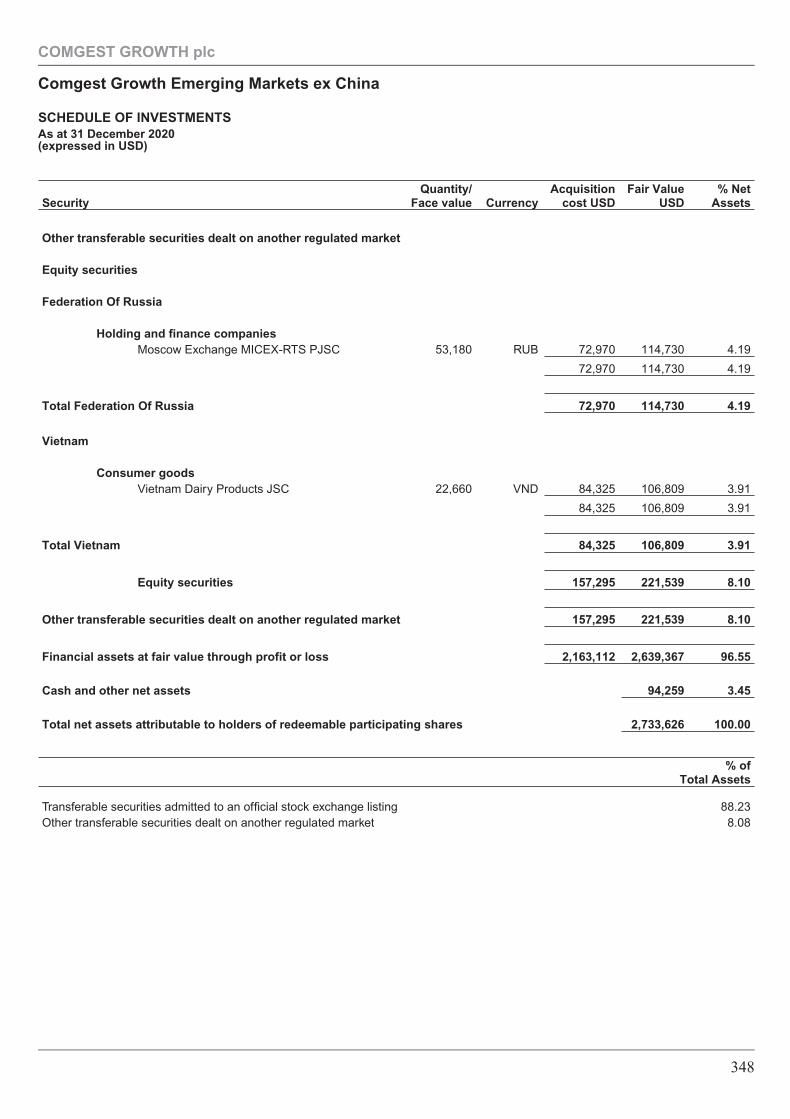
SecurityQuantity/
Face value CurrencyAcquisition
cost USDFair Value
USD% Net
Assets
Other transferable securities dealt on another regulated market
Equity securities
Federation Of Russia
Holding and finance companiesMoscow Exchange MICEX-RTS PJSC 53,180 RUB 72,970 114,730 4.19
72,970 114,730 4.19
Total Federation Of Russia 72,970 114,730 4.19
Vietnam
Consumer goodsVietnam Dairy Products JSC 22,660 VND 84,325 106,809 3.91
84,325 106,809 3.91
Total Vietnam 84,325 106,809 3.91
Equity securities 157,295 221,539 8.10
Other transferable securities dealt on another regulated market 157,295 221,539 8.10
Financial assets at fair value through profit or loss 2,163,112 2,639,367 96.55
Cash and other net assets 94,259 3.45
Total net assets attributable to holders of redeemable participating shares 2,733,626 100.00
% ofTotal Assets
Transferable securities admitted to an official stock exchange listing 88.23Other transferable securities dealt on another regulated market 8.08
COMGEST GROWTH plc
Comgest Growth Emerging Markets ex China
SCHEDULE OF INVESTMENTSAs at 31 December 2020(expressed in USD)
348
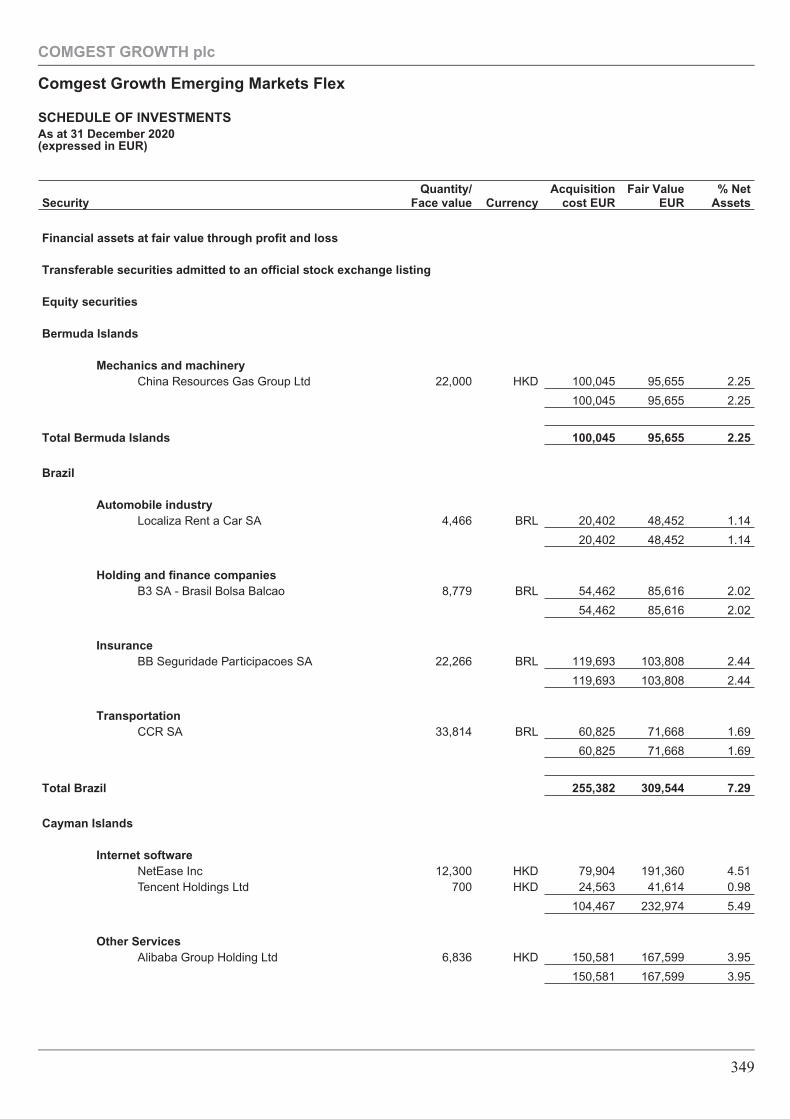
SecurityQuantity/
Face value CurrencyAcquisition
cost EURFair Value
EUR% Net
Assets
Financial assets at fair value through profit and loss
Transferable securities admitted to an official stock exchange listing
Equity securities
Bermuda Islands
Mechanics and machineryChina Resources Gas Group Ltd 22,000 HKD 100,045 95,655 2.25
100,045 95,655 2.25
Total Bermuda Islands 100,045 95,655 2.25
Brazil
Automobile industryLocaliza Rent a Car SA 4,466 BRL 20,402 48,452 1.14
20,402 48,452 1.14
Holding and finance companiesB3 SA - Brasil Bolsa Balcao 8,779 BRL 54,462 85,616 2.02
54,462 85,616 2.02
InsuranceBB Seguridade Participacoes SA 22,266 BRL 119,693 103,808 2.44
119,693 103,808 2.44
TransportationCCR SA 33,814 BRL 60,825 71,668 1.69
60,825 71,668 1.69
Total Brazil 255,382 309,544 7.29
Cayman Islands
Internet softwareNetEase Inc 12,300 HKD 79,904 191,360 4.51Tencent Holdings Ltd 700 HKD 24,563 41,614 0.98
104,467 232,974 5.49
Other ServicesAlibaba Group Holding Ltd 6,836 HKD 150,581 167,599 3.95
150,581 167,599 3.95
COMGEST GROWTH plc
Comgest Growth Emerging Markets Flex
SCHEDULE OF INVESTMENTSAs at 31 December 2020(expressed in EUR)
349
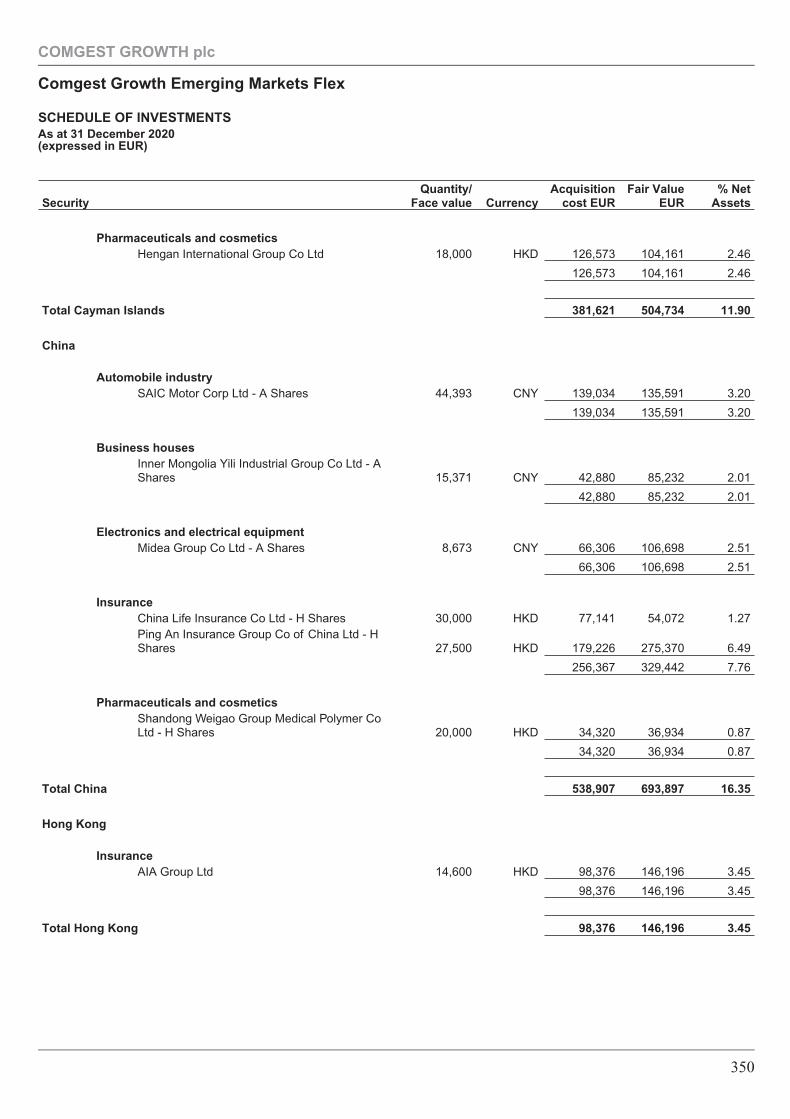
SecurityQuantity/
Face value CurrencyAcquisition
cost EURFair Value
EUR% Net
Assets
Pharmaceuticals and cosmeticsHengan International Group Co Ltd 18,000 HKD 126,573 104,161 2.46
126,573 104,161 2.46
Total Cayman Islands 381,621 504,734 11.90
China
Automobile industrySAIC Motor Corp Ltd - A Shares 44,393 CNY 139,034 135,591 3.20
139,034 135,591 3.20
Business housesInner Mongolia Yili Industrial Group Co Ltd - AShares 15,371 CNY 42,880 85,232 2.01
42,880 85,232 2.01
Electronics and electrical equipmentMidea Group Co Ltd - A Shares 8,673 CNY 66,306 106,698 2.51
66,306 106,698 2.51
InsuranceChina Life Insurance Co Ltd - H Shares 30,000 HKD 77,141 54,072 1.27Ping An Insurance Group Co of China Ltd - HShares 27,500 HKD 179,226 275,370 6.49
256,367 329,442 7.76
Pharmaceuticals and cosmeticsShandong Weigao Group Medical Polymer CoLtd - H Shares 20,000 HKD 34,320 36,934 0.87
34,320 36,934 0.87
Total China 538,907 693,897 16.35
Hong Kong
InsuranceAIA Group Ltd 14,600 HKD 98,376 146,196 3.45
98,376 146,196 3.45
Total Hong Kong 98,376 146,196 3.45
COMGEST GROWTH plc
Comgest Growth Emerging Markets Flex
SCHEDULE OF INVESTMENTSAs at 31 December 2020(expressed in EUR)
350
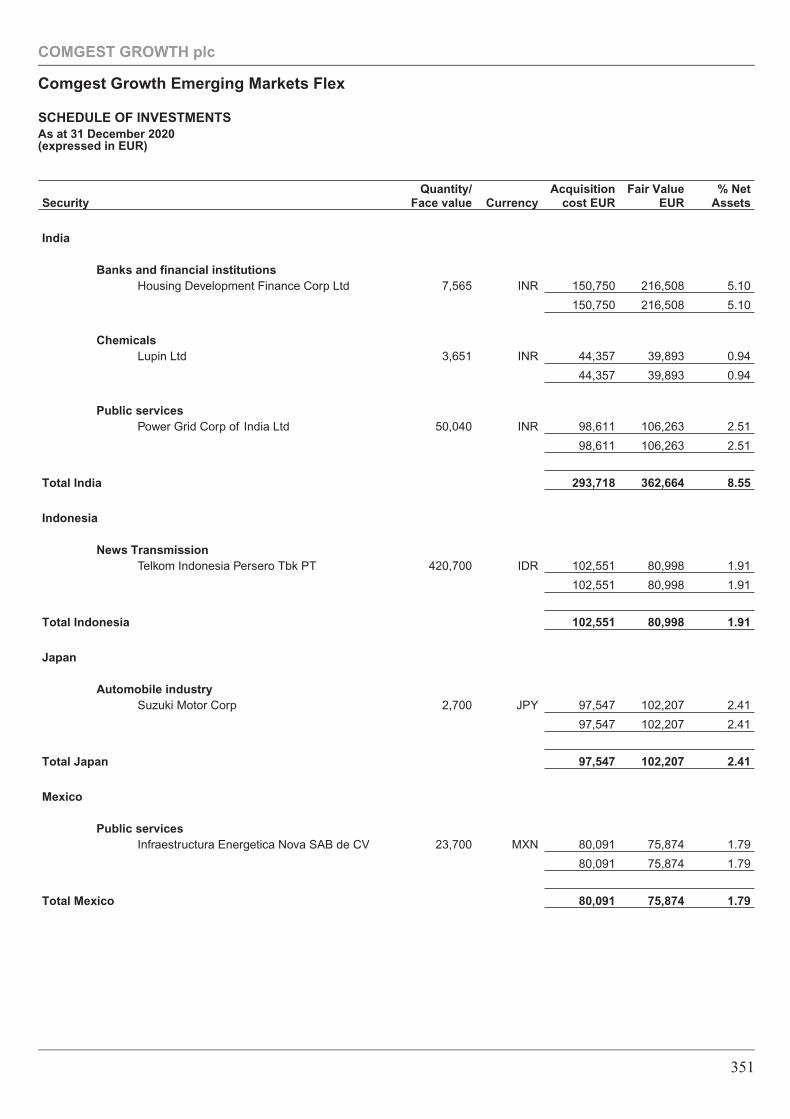
SecurityQuantity/
Face value CurrencyAcquisition
cost EURFair Value
EUR% Net
Assets
India
Banks and financial institutionsHousing Development Finance Corp Ltd 7,565 INR 150,750 216,508 5.10
150,750 216,508 5.10
ChemicalsLupin Ltd 3,651 INR 44,357 39,893 0.94
44,357 39,893 0.94
Public servicesPower Grid Corp of India Ltd 50,040 INR 98,611 106,263 2.51
98,611 106,263 2.51
Total India 293,718 362,664 8.55
Indonesia
News TransmissionTelkom Indonesia Persero Tbk PT 420,700 IDR 102,551 80,998 1.91
102,551 80,998 1.91
Total Indonesia 102,551 80,998 1.91
Japan
Automobile industrySuzuki Motor Corp 2,700 JPY 97,547 102,207 2.41
97,547 102,207 2.41
Total Japan 97,547 102,207 2.41
Mexico
Public servicesInfraestructura Energetica Nova SAB de CV 23,700 MXN 80,091 75,874 1.79
80,091 75,874 1.79
Total Mexico 80,091 75,874 1.79
COMGEST GROWTH plc
Comgest Growth Emerging Markets Flex
SCHEDULE OF INVESTMENTSAs at 31 December 2020(expressed in EUR)
351
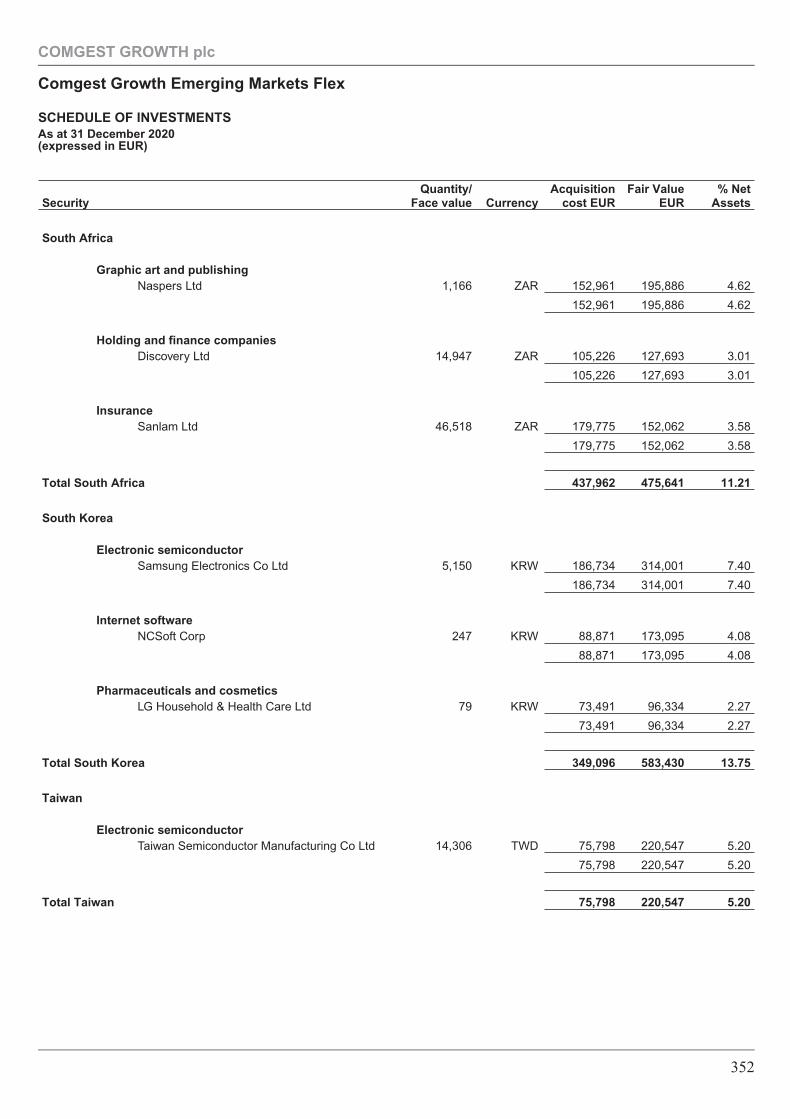
SecurityQuantity/
Face value CurrencyAcquisition
cost EURFair Value
EUR% Net
Assets
South Africa
Graphic art and publishingNaspers Ltd 1,166 ZAR 152,961 195,886 4.62
152,961 195,886 4.62
Holding and finance companiesDiscovery Ltd 14,947 ZAR 105,226 127,693 3.01
105,226 127,693 3.01
InsuranceSanlam Ltd 46,518 ZAR 179,775 152,062 3.58
179,775 152,062 3.58
Total South Africa 437,962 475,641 11.21
South Korea
Electronic semiconductorSamsung Electronics Co Ltd 5,150 KRW 186,734 314,001 7.40
186,734 314,001 7.40
Internet softwareNCSoft Corp 247 KRW 88,871 173,095 4.08
88,871 173,095 4.08
Pharmaceuticals and cosmeticsLG Household & Health Care Ltd 79 KRW 73,491 96,334 2.27
73,491 96,334 2.27
Total South Korea 349,096 583,430 13.75
Taiwan
Electronic semiconductorTaiwan Semiconductor Manufacturing Co Ltd 14,306 TWD 75,798 220,547 5.20
75,798 220,547 5.20
Total Taiwan 75,798 220,547 5.20
COMGEST GROWTH plc
Comgest Growth Emerging Markets Flex
SCHEDULE OF INVESTMENTSAs at 31 December 2020(expressed in EUR)
352
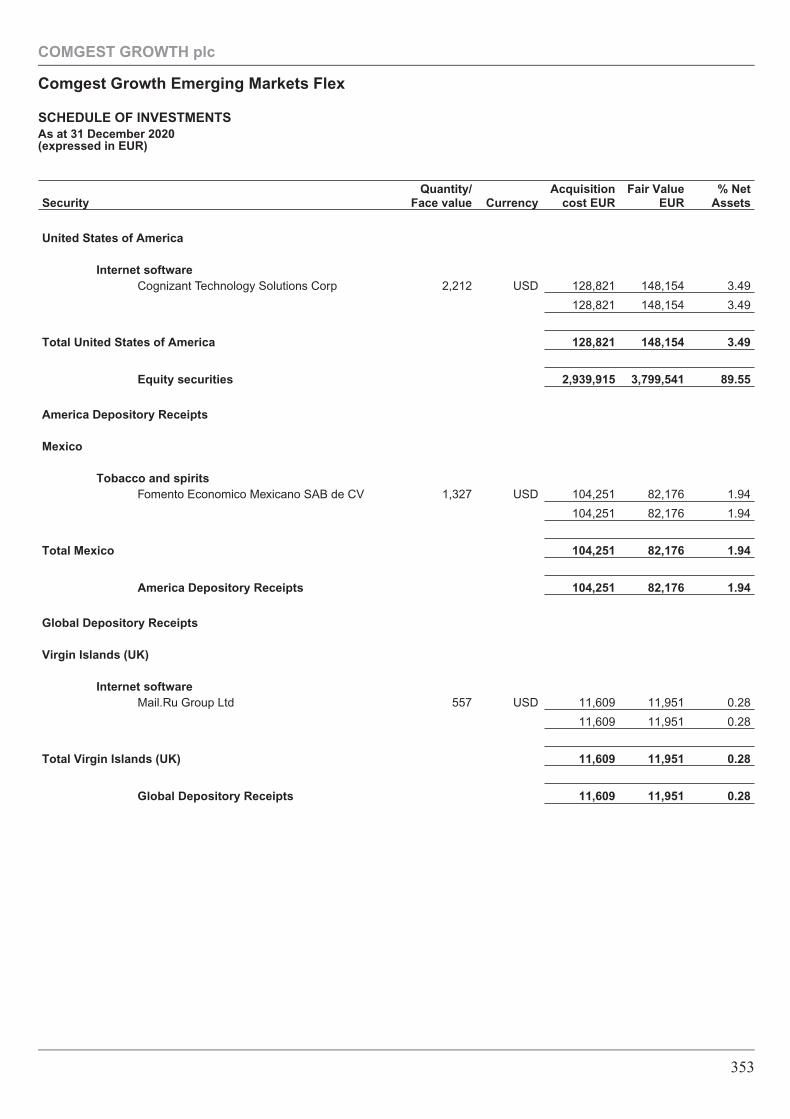
SecurityQuantity/
Face value CurrencyAcquisition
cost EURFair Value
EUR% Net
Assets
United States of America
Internet softwareCognizant Technology Solutions Corp 2,212 USD 128,821 148,154 3.49
128,821 148,154 3.49
Total United States of America 128,821 148,154 3.49
Equity securities 2,939,915 3,799,541 89.55
America Depository Receipts
Mexico
Tobacco and spiritsFomento Economico Mexicano SAB de CV 1,327 USD 104,251 82,176 1.94
104,251 82,176 1.94
Total Mexico 104,251 82,176 1.94
America Depository Receipts 104,251 82,176 1.94
Global Depository Receipts
Virgin Islands (UK)
Internet softwareMail.Ru Group Ltd 557 USD 11,609 11,951 0.28
11,609 11,951 0.28
Total Virgin Islands (UK) 11,609 11,951 0.28
Global Depository Receipts 11,609 11,951 0.28
COMGEST GROWTH plc
Comgest Growth Emerging Markets Flex
SCHEDULE OF INVESTMENTSAs at 31 December 2020(expressed in EUR)
353
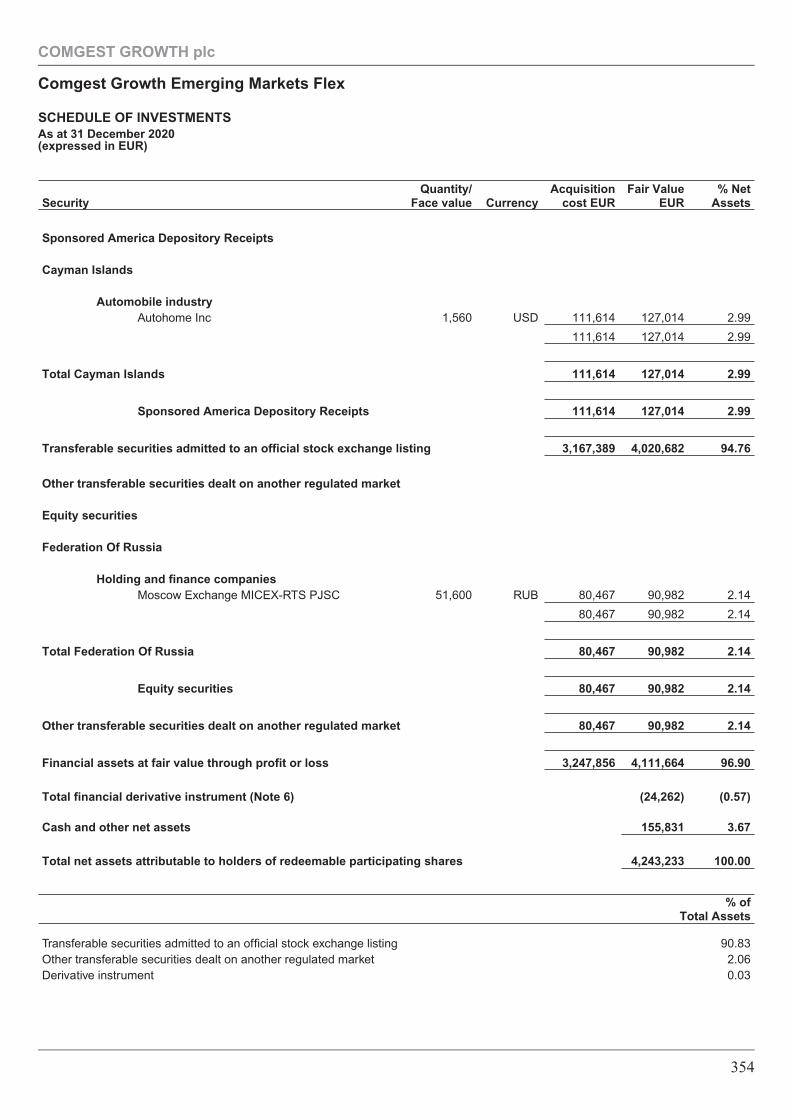
SecurityQuantity/
Face value CurrencyAcquisition
cost EURFair Value
EUR% Net
Assets
Sponsored America Depository Receipts
Cayman Islands
Automobile industryAutohome Inc 1,560 USD 111,614 127,014 2.99
111,614 127,014 2.99
Total Cayman Islands 111,614 127,014 2.99
Sponsored America Depository Receipts 111,614 127,014 2.99
Transferable securities admitted to an official stock exchange listing 3,167,389 4,020,682 94.76
Other transferable securities dealt on another regulated market
Equity securities
Federation Of Russia
Holding and finance companiesMoscow Exchange MICEX-RTS PJSC 51,600 RUB 80,467 90,982 2.14
80,467 90,982 2.14
Total Federation Of Russia 80,467 90,982 2.14
Equity securities 80,467 90,982 2.14
Other transferable securities dealt on another regulated market 80,467 90,982 2.14
Financial assets at fair value through profit or loss 3,247,856 4,111,664 96.90
Total financial derivative instrument (Note 6) (24,262) (0.57)
Cash and other net assets 155,831 3.67
Total net assets attributable to holders of redeemable participating shares 4,243,233 100.00
% ofTotal Assets
Transferable securities admitted to an official stock exchange listing 90.83Other transferable securities dealt on another regulated market 2.06Derivative instrument 0.03
COMGEST GROWTH plc
Comgest Growth Emerging Markets Flex
SCHEDULE OF INVESTMENTSAs at 31 December 2020(expressed in EUR)
354
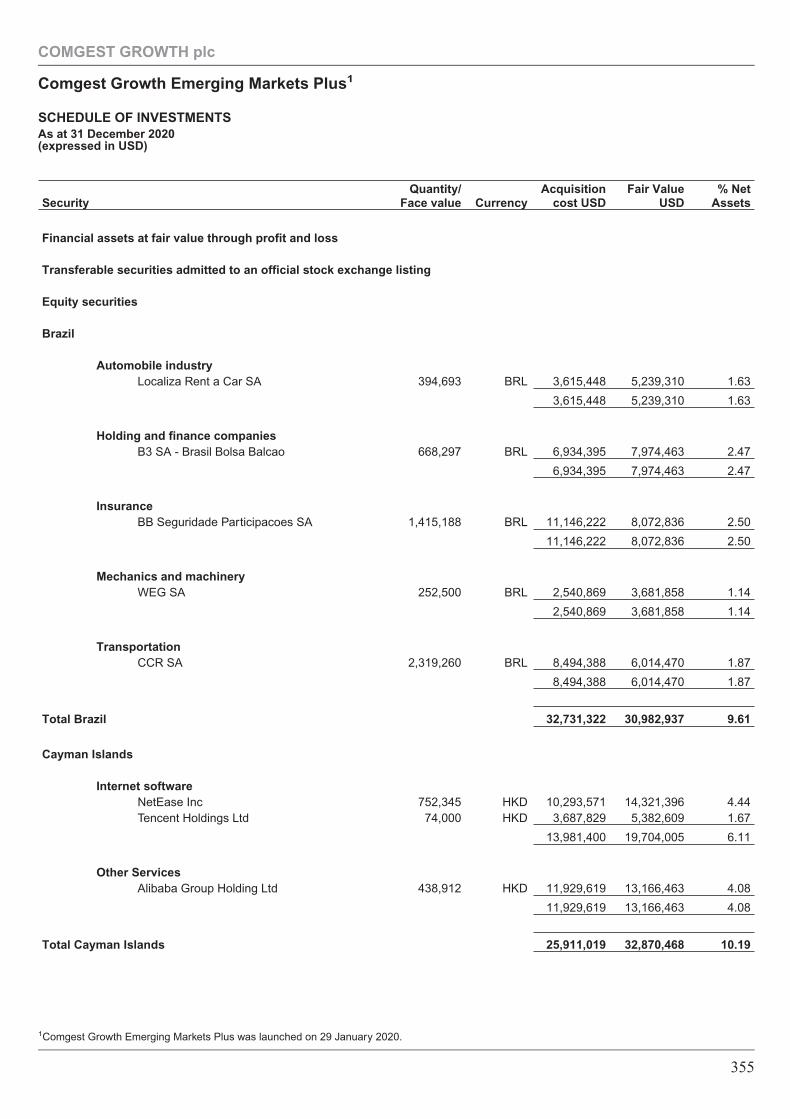
SecurityQuantity/
Face value CurrencyAcquisition
cost USDFair Value
USD% Net
Assets
Financial assets at fair value through profit and loss
Transferable securities admitted to an official stock exchange listing
Equity securities
Brazil
Automobile industryLocaliza Rent a Car SA 394,693 BRL 3,615,448 5,239,310 1.63
3,615,448 5,239,310 1.63
Holding and finance companiesB3 SA - Brasil Bolsa Balcao 668,297 BRL 6,934,395 7,974,463 2.47
6,934,395 7,974,463 2.47
InsuranceBB Seguridade Participacoes SA 1,415,188 BRL 11,146,222 8,072,836 2.50
11,146,222 8,072,836 2.50
Mechanics and machineryWEG SA 252,500 BRL 2,540,869 3,681,858 1.14
2,540,869 3,681,858 1.14
TransportationCCR SA 2,319,260 BRL 8,494,388 6,014,470 1.87
8,494,388 6,014,470 1.87
Total Brazil 32,731,322 30,982,937 9.61
Cayman Islands
Internet softwareNetEase Inc 752,345 HKD 10,293,571 14,321,396 4.44Tencent Holdings Ltd 74,000 HKD 3,687,829 5,382,609 1.67
13,981,400 19,704,005 6.11
Other ServicesAlibaba Group Holding Ltd 438,912 HKD 11,929,619 13,166,463 4.08
11,929,619 13,166,463 4.08
Total Cayman Islands 25,911,019 32,870,468 10.19
COMGEST GROWTH plc
Comgest Growth Emerging Markets Plus1
SCHEDULE OF INVESTMENTSAs at 31 December 2020(expressed in USD)
1Comgest Growth Emerging Markets Plus was launched on 29 January 2020.
355
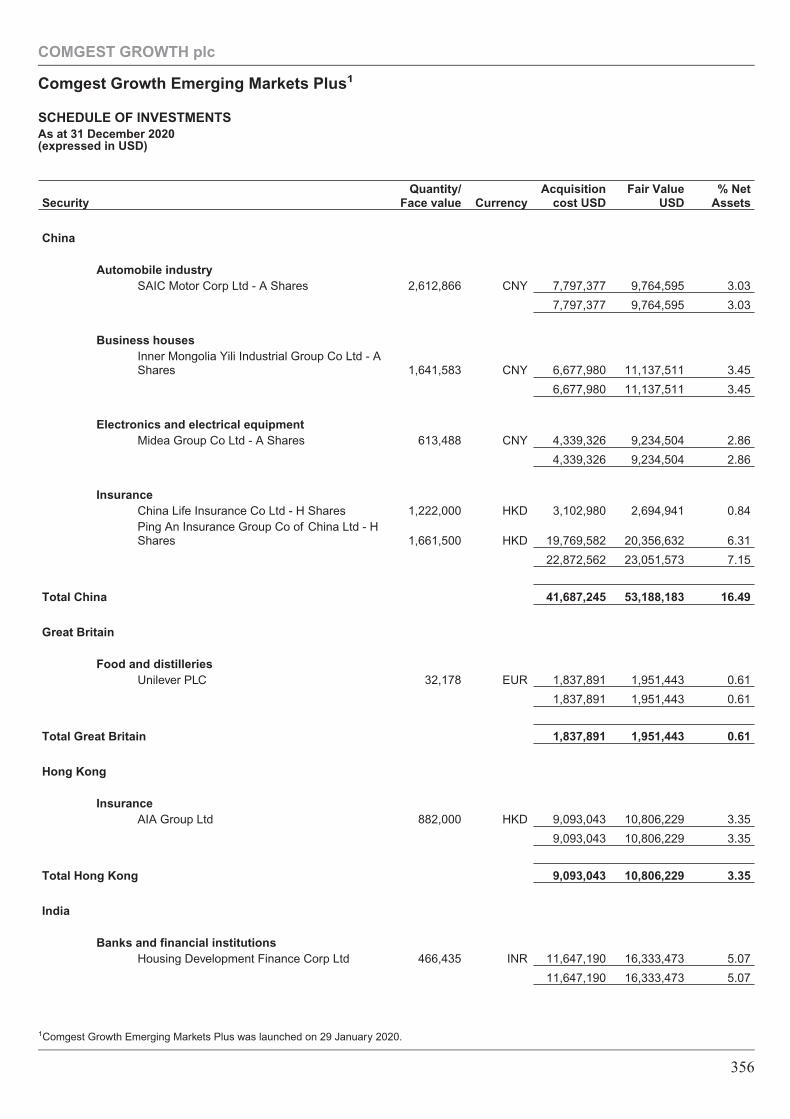
SecurityQuantity/
Face value CurrencyAcquisition
cost USDFair Value
USD% Net
Assets
China
Automobile industrySAIC Motor Corp Ltd - A Shares 2,612,866 CNY 7,797,377 9,764,595 3.03
7,797,377 9,764,595 3.03
Business housesInner Mongolia Yili Industrial Group Co Ltd - AShares 1,641,583 CNY 6,677,980 11,137,511 3.45
6,677,980 11,137,511 3.45
Electronics and electrical equipmentMidea Group Co Ltd - A Shares 613,488 CNY 4,339,326 9,234,504 2.86
4,339,326 9,234,504 2.86
InsuranceChina Life Insurance Co Ltd - H Shares 1,222,000 HKD 3,102,980 2,694,941 0.84Ping An Insurance Group Co of China Ltd - HShares 1,661,500 HKD 19,769,582 20,356,632 6.31
22,872,562 23,051,573 7.15
Total China 41,687,245 53,188,183 16.49
Great Britain
Food and distilleriesUnilever PLC 32,178 EUR 1,837,891 1,951,443 0.61
1,837,891 1,951,443 0.61
Total Great Britain 1,837,891 1,951,443 0.61
Hong Kong
InsuranceAIA Group Ltd 882,000 HKD 9,093,043 10,806,229 3.35
9,093,043 10,806,229 3.35
Total Hong Kong 9,093,043 10,806,229 3.35
India
Banks and financial institutionsHousing Development Finance Corp Ltd 466,435 INR 11,647,190 16,333,473 5.07
11,647,190 16,333,473 5.07
COMGEST GROWTH plc
Comgest Growth Emerging Markets Plus1
SCHEDULE OF INVESTMENTSAs at 31 December 2020(expressed in USD)
1Comgest Growth Emerging Markets Plus was launched on 29 January 2020.
356
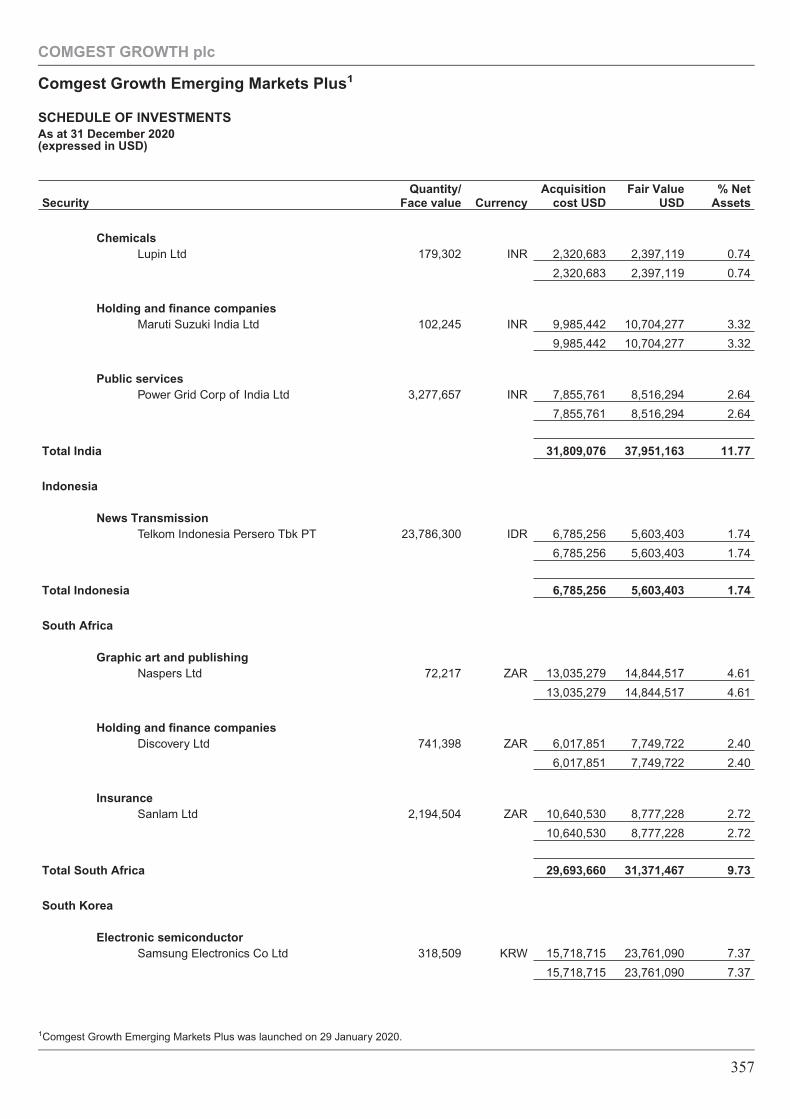
SecurityQuantity/
Face value CurrencyAcquisition
cost USDFair Value
USD% Net
Assets
ChemicalsLupin Ltd 179,302 INR 2,320,683 2,397,119 0.74
2,320,683 2,397,119 0.74
Holding and finance companiesMaruti Suzuki India Ltd 102,245 INR 9,985,442 10,704,277 3.32
9,985,442 10,704,277 3.32
Public servicesPower Grid Corp of India Ltd 3,277,657 INR 7,855,761 8,516,294 2.64
7,855,761 8,516,294 2.64
Total India 31,809,076 37,951,163 11.77
Indonesia
News TransmissionTelkom Indonesia Persero Tbk PT 23,786,300 IDR 6,785,256 5,603,403 1.74
6,785,256 5,603,403 1.74
Total Indonesia 6,785,256 5,603,403 1.74
South Africa
Graphic art and publishingNaspers Ltd 72,217 ZAR 13,035,279 14,844,517 4.61
13,035,279 14,844,517 4.61
Holding and finance companiesDiscovery Ltd 741,398 ZAR 6,017,851 7,749,722 2.40
6,017,851 7,749,722 2.40
InsuranceSanlam Ltd 2,194,504 ZAR 10,640,530 8,777,228 2.72
10,640,530 8,777,228 2.72
Total South Africa 29,693,660 31,371,467 9.73
South Korea
Electronic semiconductorSamsung Electronics Co Ltd 318,509 KRW 15,718,715 23,761,090 7.37
15,718,715 23,761,090 7.37
COMGEST GROWTH plc
Comgest Growth Emerging Markets Plus1
SCHEDULE OF INVESTMENTSAs at 31 December 2020(expressed in USD)
1Comgest Growth Emerging Markets Plus was launched on 29 January 2020.
357
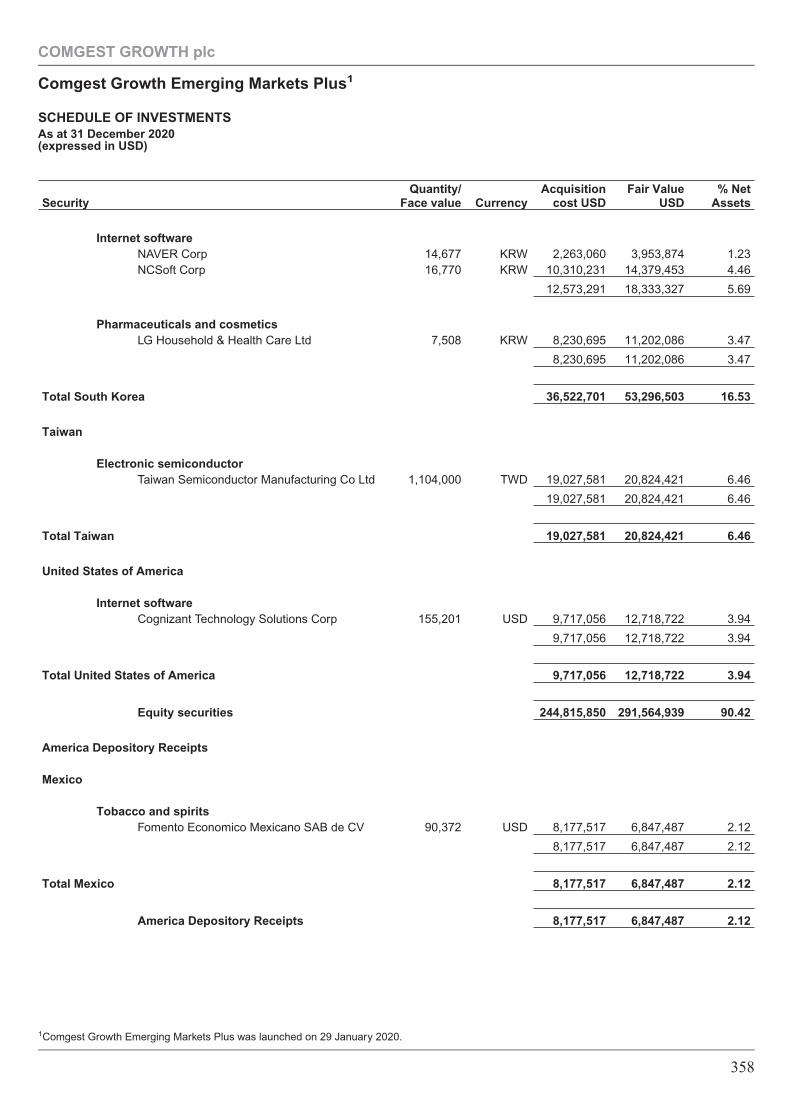
SecurityQuantity/
Face value CurrencyAcquisition
cost USDFair Value
USD% Net
Assets
Internet softwareNAVER Corp 14,677 KRW 2,263,060 3,953,874 1.23NCSoft Corp 16,770 KRW 10,310,231 14,379,453 4.46
12,573,291 18,333,327 5.69
Pharmaceuticals and cosmeticsLG Household & Health Care Ltd 7,508 KRW 8,230,695 11,202,086 3.47
8,230,695 11,202,086 3.47
Total South Korea 36,522,701 53,296,503 16.53
Taiwan
Electronic semiconductorTaiwan Semiconductor Manufacturing Co Ltd 1,104,000 TWD 19,027,581 20,824,421 6.46
19,027,581 20,824,421 6.46
Total Taiwan 19,027,581 20,824,421 6.46
United States of America
Internet softwareCognizant Technology Solutions Corp 155,201 USD 9,717,056 12,718,722 3.94
9,717,056 12,718,722 3.94
Total United States of America 9,717,056 12,718,722 3.94
Equity securities 244,815,850 291,564,939 90.42
America Depository Receipts
Mexico
Tobacco and spiritsFomento Economico Mexicano SAB de CV 90,372 USD 8,177,517 6,847,487 2.12
8,177,517 6,847,487 2.12
Total Mexico 8,177,517 6,847,487 2.12
America Depository Receipts 8,177,517 6,847,487 2.12
COMGEST GROWTH plc
Comgest Growth Emerging Markets Plus1
SCHEDULE OF INVESTMENTSAs at 31 December 2020(expressed in USD)
1Comgest Growth Emerging Markets Plus was launched on 29 January 2020.
358
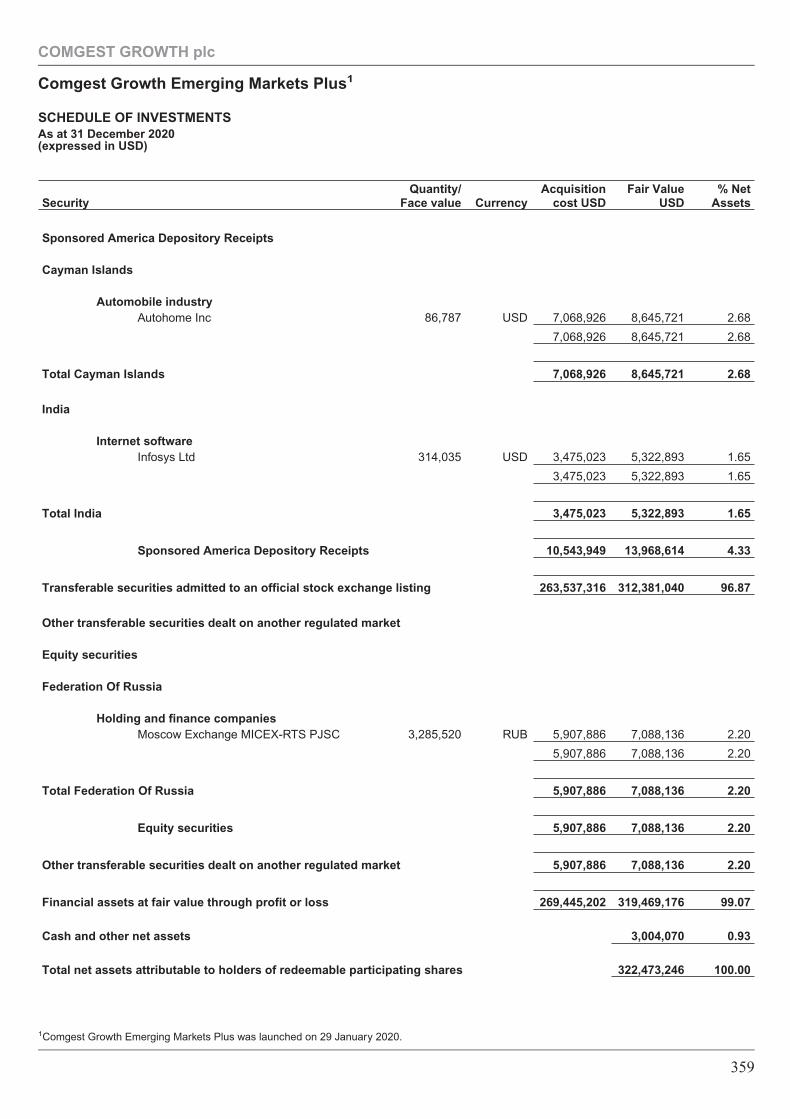
SecurityQuantity/
Face value CurrencyAcquisition
cost USDFair Value
USD% Net
Assets
Sponsored America Depository Receipts
Cayman Islands
Automobile industryAutohome Inc 86,787 USD 7,068,926 8,645,721 2.68
7,068,926 8,645,721 2.68
Total Cayman Islands 7,068,926 8,645,721 2.68
India
Internet softwareInfosys Ltd 314,035 USD 3,475,023 5,322,893 1.65
3,475,023 5,322,893 1.65
Total India 3,475,023 5,322,893 1.65
Sponsored America Depository Receipts 10,543,949 13,968,614 4.33
Transferable securities admitted to an official stock exchange listing 263,537,316 312,381,040 96.87
Other transferable securities dealt on another regulated market
Equity securities
Federation Of Russia
Holding and finance companiesMoscow Exchange MICEX-RTS PJSC 3,285,520 RUB 5,907,886 7,088,136 2.20
5,907,886 7,088,136 2.20
Total Federation Of Russia 5,907,886 7,088,136 2.20
Equity securities 5,907,886 7,088,136 2.20
Other transferable securities dealt on another regulated market 5,907,886 7,088,136 2.20
Financial assets at fair value through profit or loss 269,445,202 319,469,176 99.07
Cash and other net assets 3,004,070 0.93
Total net assets attributable to holders of redeemable participating shares 322,473,246 100.00
COMGEST GROWTH plc
Comgest Growth Emerging Markets Plus1
SCHEDULE OF INVESTMENTSAs at 31 December 2020(expressed in USD)
1Comgest Growth Emerging Markets Plus was launched on 29 January 2020.
359
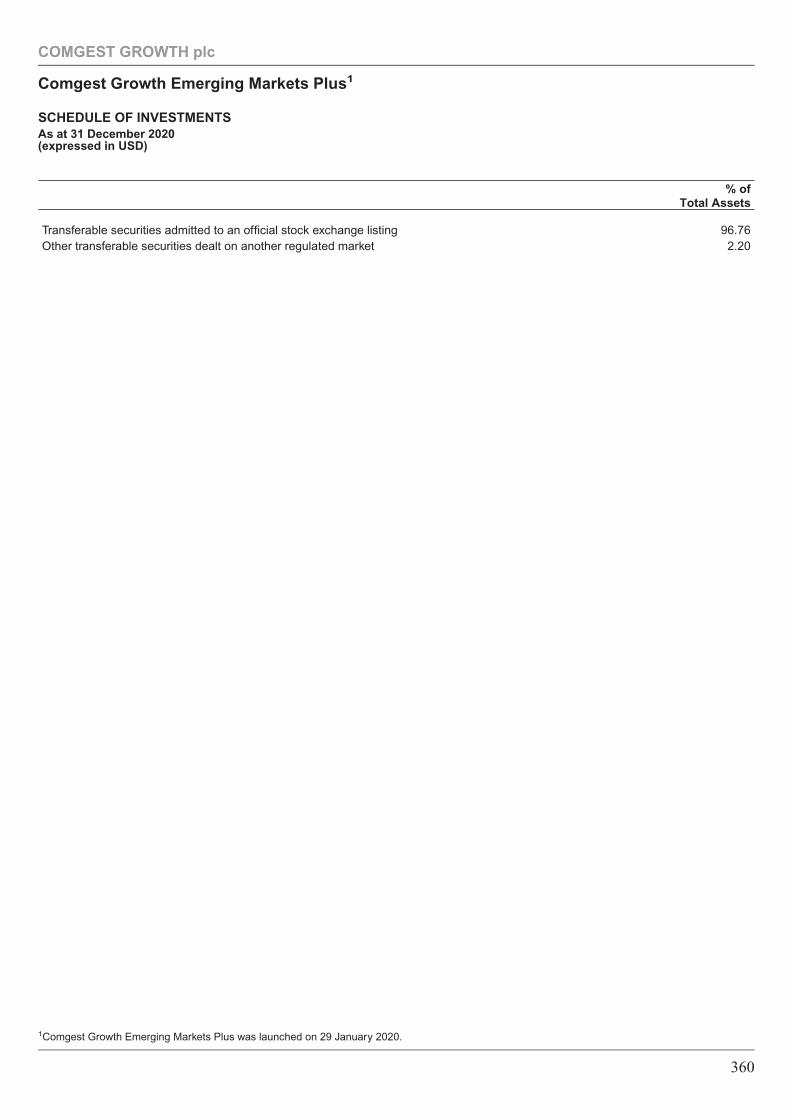
% ofTotal Assets
Transferable securities admitted to an official stock exchange listing 96.76Other transferable securities dealt on another regulated market 2.20
COMGEST GROWTH plc
Comgest Growth Emerging Markets Plus1
SCHEDULE OF INVESTMENTSAs at 31 December 2020(expressed in USD)
1Comgest Growth Emerging Markets Plus was launched on 29 January 2020.
360
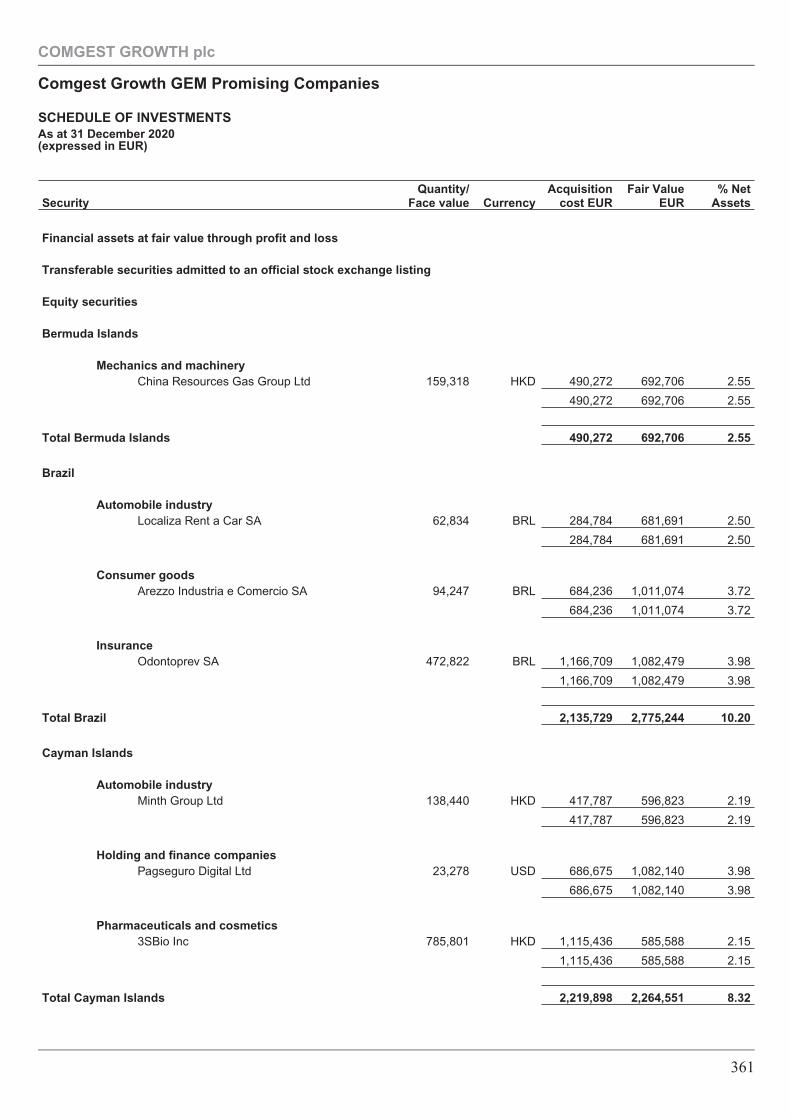
SecurityQuantity/
Face value CurrencyAcquisition
cost EURFair Value
EUR% Net
Assets
Financial assets at fair value through profit and loss
Transferable securities admitted to an official stock exchange listing
Equity securities
Bermuda Islands
Mechanics and machineryChina Resources Gas Group Ltd 159,318 HKD 490,272 692,706 2.55
490,272 692,706 2.55
Total Bermuda Islands 490,272 692,706 2.55
Brazil
Automobile industryLocaliza Rent a Car SA 62,834 BRL 284,784 681,691 2.50
284,784 681,691 2.50
Consumer goodsArezzo Industria e Comercio SA 94,247 BRL 684,236 1,011,074 3.72
684,236 1,011,074 3.72
InsuranceOdontoprev SA 472,822 BRL 1,166,709 1,082,479 3.98
1,166,709 1,082,479 3.98
Total Brazil 2,135,729 2,775,244 10.20
Cayman Islands
Automobile industryMinth Group Ltd 138,440 HKD 417,787 596,823 2.19
417,787 596,823 2.19
Holding and finance companiesPagseguro Digital Ltd 23,278 USD 686,675 1,082,140 3.98
686,675 1,082,140 3.98
Pharmaceuticals and cosmetics3SBio Inc 785,801 HKD 1,115,436 585,588 2.15
1,115,436 585,588 2.15
Total Cayman Islands 2,219,898 2,264,551 8.32
COMGEST GROWTH plc
Comgest Growth GEM Promising Companies
SCHEDULE OF INVESTMENTSAs at 31 December 2020(expressed in EUR)
361
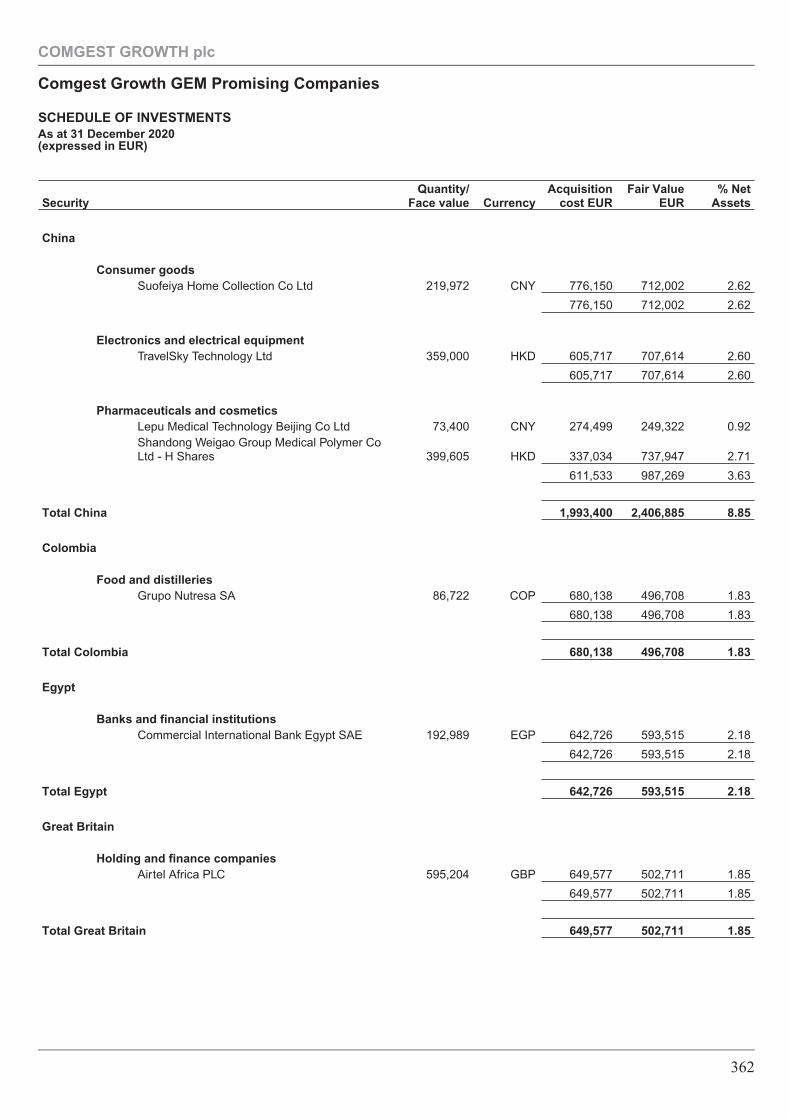
SecurityQuantity/
Face value CurrencyAcquisition
cost EURFair Value
EUR% Net
Assets
China
Consumer goodsSuofeiya Home Collection Co Ltd 219,972 CNY 776,150 712,002 2.62
776,150 712,002 2.62
Electronics and electrical equipmentTravelSky Technology Ltd 359,000 HKD 605,717 707,614 2.60
605,717 707,614 2.60
Pharmaceuticals and cosmeticsLepu Medical Technology Beijing Co Ltd 73,400 CNY 274,499 249,322 0.92Shandong Weigao Group Medical Polymer CoLtd - H Shares 399,605 HKD 337,034 737,947 2.71
611,533 987,269 3.63
Total China 1,993,400 2,406,885 8.85
Colombia
Food and distilleriesGrupo Nutresa SA 86,722 COP 680,138 496,708 1.83
680,138 496,708 1.83
Total Colombia 680,138 496,708 1.83
Egypt
Banks and financial institutionsCommercial International Bank Egypt SAE 192,989 EGP 642,726 593,515 2.18
642,726 593,515 2.18
Total Egypt 642,726 593,515 2.18
Great Britain
Holding and finance companiesAirtel Africa PLC 595,204 GBP 649,577 502,711 1.85
649,577 502,711 1.85
Total Great Britain 649,577 502,711 1.85
COMGEST GROWTH plc
Comgest Growth GEM Promising Companies
SCHEDULE OF INVESTMENTSAs at 31 December 2020(expressed in EUR)
362
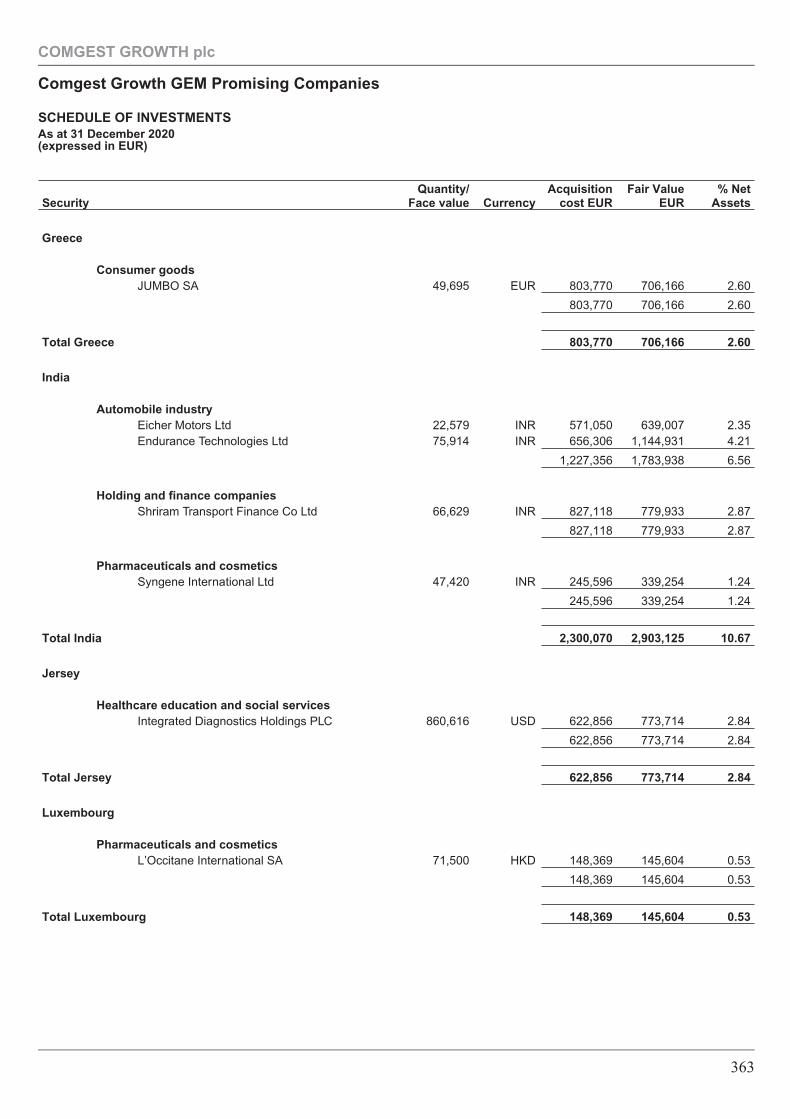
SecurityQuantity/
Face value CurrencyAcquisition
cost EURFair Value
EUR% Net
Assets
Greece
Consumer goodsJUMBO SA 49,695 EUR 803,770 706,166 2.60
803,770 706,166 2.60
Total Greece 803,770 706,166 2.60
India
Automobile industryEicher Motors Ltd 22,579 INR 571,050 639,007 2.35Endurance Technologies Ltd 75,914 INR 656,306 1,144,931 4.21
1,227,356 1,783,938 6.56
Holding and finance companiesShriram Transport Finance Co Ltd 66,629 INR 827,118 779,933 2.87
827,118 779,933 2.87
Pharmaceuticals and cosmeticsSyngene International Ltd 47,420 INR 245,596 339,254 1.24
245,596 339,254 1.24
Total India 2,300,070 2,903,125 10.67
Jersey
Healthcare education and social servicesIntegrated Diagnostics Holdings PLC 860,616 USD 622,856 773,714 2.84
622,856 773,714 2.84
Total Jersey 622,856 773,714 2.84
Luxembourg
Pharmaceuticals and cosmeticsL’Occitane International SA 71,500 HKD 148,369 145,604 0.53
148,369 145,604 0.53
Total Luxembourg 148,369 145,604 0.53
COMGEST GROWTH plc
Comgest Growth GEM Promising Companies
SCHEDULE OF INVESTMENTSAs at 31 December 2020(expressed in EUR)
363
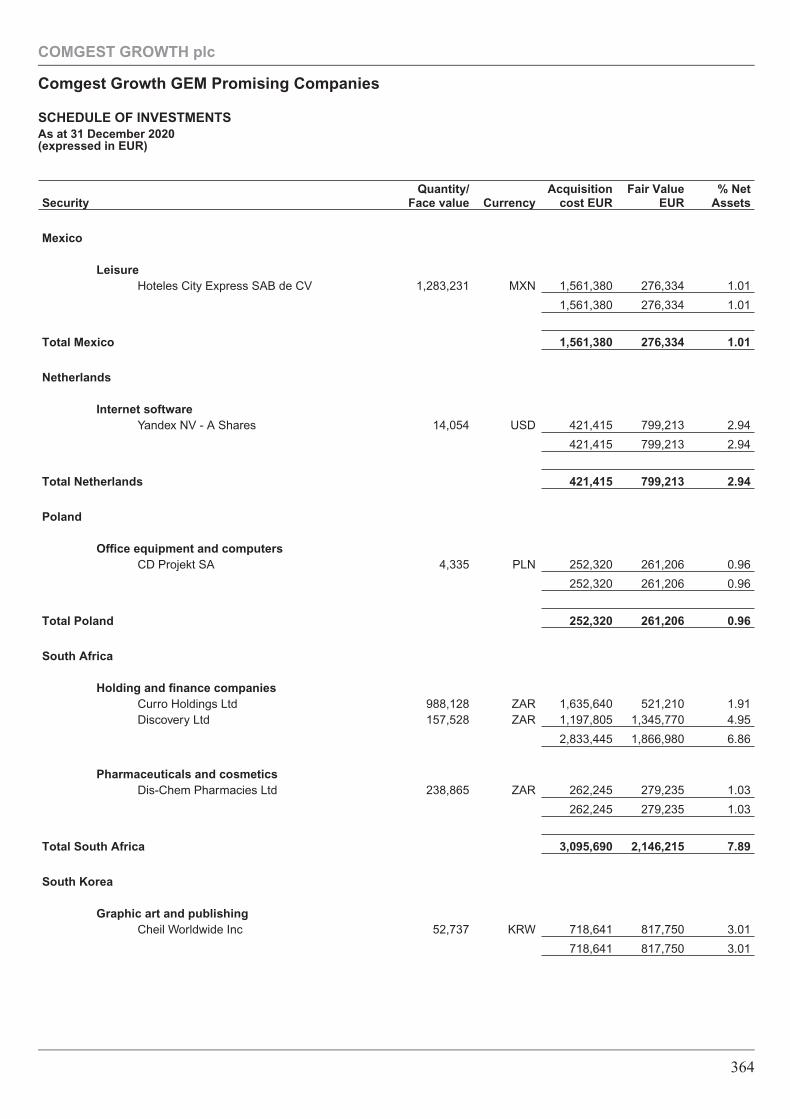
SecurityQuantity/
Face value CurrencyAcquisition
cost EURFair Value
EUR% Net
Assets
Mexico
LeisureHoteles City Express SAB de CV 1,283,231 MXN 1,561,380 276,334 1.01
1,561,380 276,334 1.01
Total Mexico 1,561,380 276,334 1.01
Netherlands
Internet softwareYandex NV - A Shares 14,054 USD 421,415 799,213 2.94
421,415 799,213 2.94
Total Netherlands 421,415 799,213 2.94
Poland
Office equipment and computersCD Projekt SA 4,335 PLN 252,320 261,206 0.96
252,320 261,206 0.96
Total Poland 252,320 261,206 0.96
South Africa
Holding and finance companiesCurro Holdings Ltd 988,128 ZAR 1,635,640 521,210 1.91Discovery Ltd 157,528 ZAR 1,197,805 1,345,770 4.95
2,833,445 1,866,980 6.86
Pharmaceuticals and cosmeticsDis-Chem Pharmacies Ltd 238,865 ZAR 262,245 279,235 1.03
262,245 279,235 1.03
Total South Africa 3,095,690 2,146,215 7.89
South Korea
Graphic art and publishingCheil Worldwide Inc 52,737 KRW 718,641 817,750 3.01
718,641 817,750 3.01
COMGEST GROWTH plc
Comgest Growth GEM Promising Companies
SCHEDULE OF INVESTMENTSAs at 31 December 2020(expressed in EUR)
364
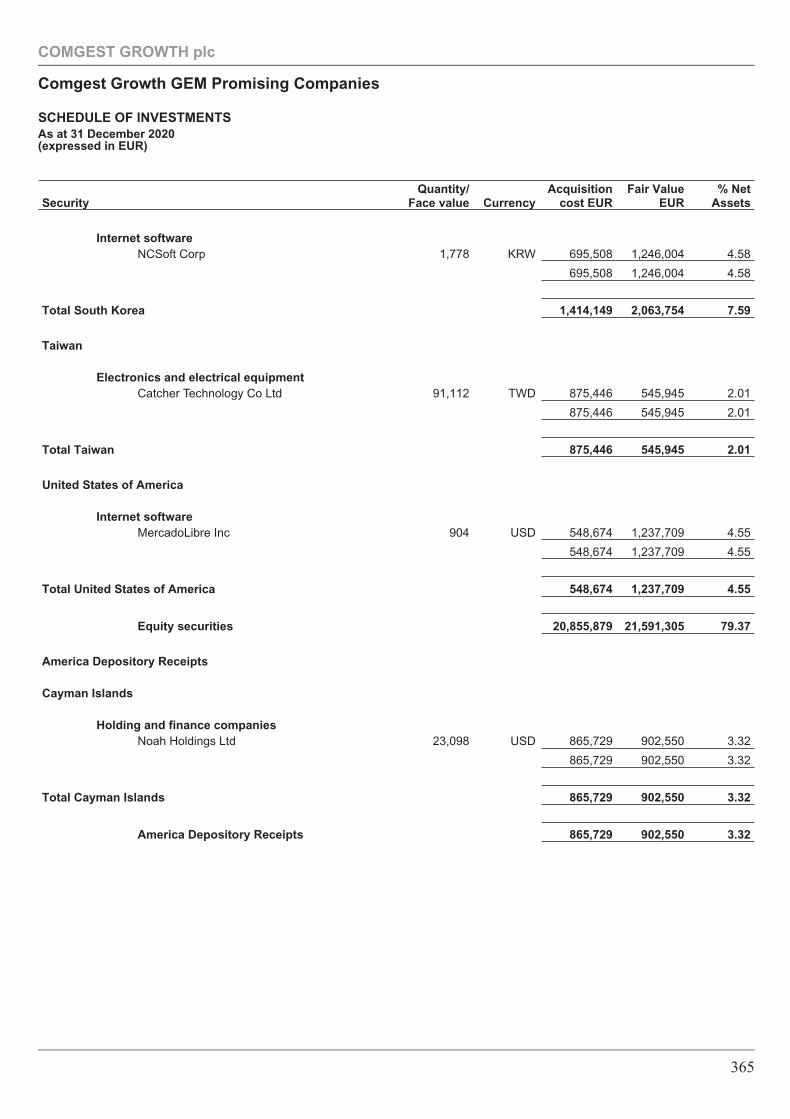
SecurityQuantity/
Face value CurrencyAcquisition
cost EURFair Value
EUR% Net
Assets
Internet softwareNCSoft Corp 1,778 KRW 695,508 1,246,004 4.58
695,508 1,246,004 4.58
Total South Korea 1,414,149 2,063,754 7.59
Taiwan
Electronics and electrical equipmentCatcher Technology Co Ltd 91,112 TWD 875,446 545,945 2.01
875,446 545,945 2.01
Total Taiwan 875,446 545,945 2.01
United States of America
Internet softwareMercadoLibre Inc 904 USD 548,674 1,237,709 4.55
548,674 1,237,709 4.55
Total United States of America 548,674 1,237,709 4.55
Equity securities 20,855,879 21,591,305 79.37
America Depository Receipts
Cayman Islands
Holding and finance companiesNoah Holdings Ltd 23,098 USD 865,729 902,550 3.32
865,729 902,550 3.32
Total Cayman Islands 865,729 902,550 3.32
America Depository Receipts 865,729 902,550 3.32
COMGEST GROWTH plc
Comgest Growth GEM Promising Companies
SCHEDULE OF INVESTMENTSAs at 31 December 2020(expressed in EUR)
365
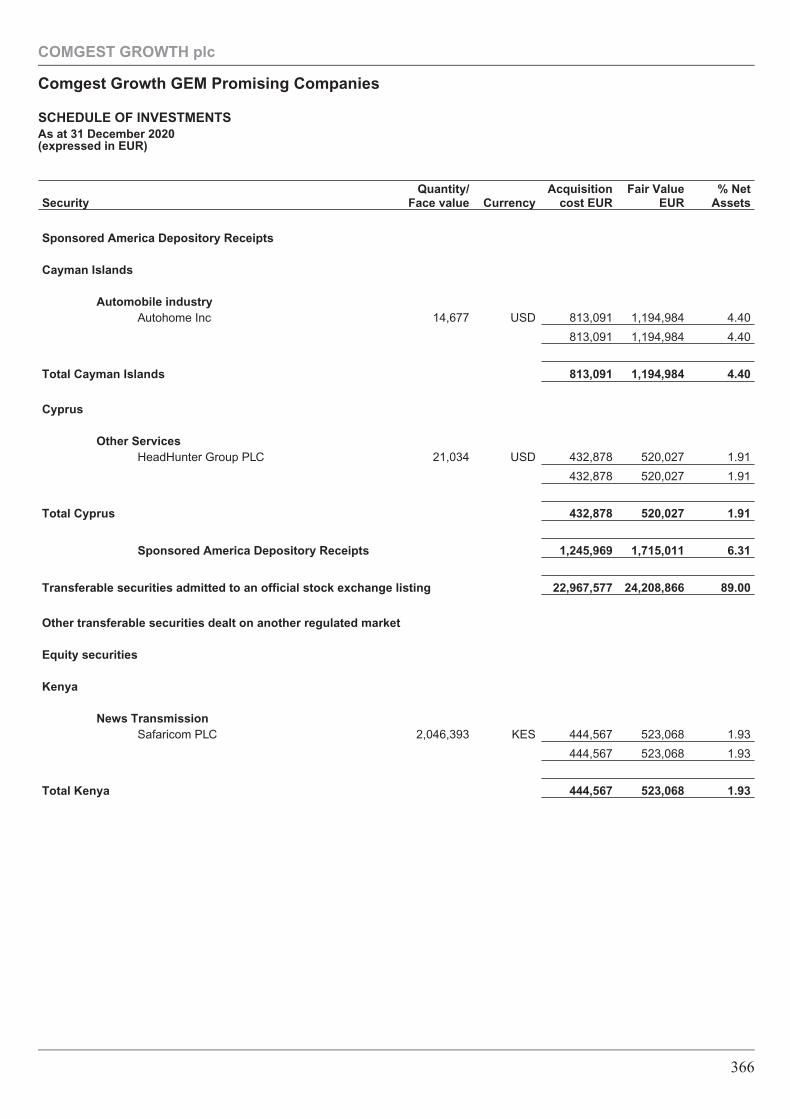
SecurityQuantity/
Face value CurrencyAcquisition
cost EURFair Value
EUR% Net
Assets
Sponsored America Depository Receipts
Cayman Islands
Automobile industryAutohome Inc 14,677 USD 813,091 1,194,984 4.40
813,091 1,194,984 4.40
Total Cayman Islands 813,091 1,194,984 4.40
Cyprus
Other ServicesHeadHunter Group PLC 21,034 USD 432,878 520,027 1.91
432,878 520,027 1.91
Total Cyprus 432,878 520,027 1.91
Sponsored America Depository Receipts 1,245,969 1,715,011 6.31
Transferable securities admitted to an official stock exchange listing 22,967,577 24,208,866 89.00
Other transferable securities dealt on another regulated market
Equity securities
Kenya
News TransmissionSafaricom PLC 2,046,393 KES 444,567 523,068 1.93
444,567 523,068 1.93
Total Kenya 444,567 523,068 1.93
COMGEST GROWTH plc
Comgest Growth GEM Promising Companies
SCHEDULE OF INVESTMENTSAs at 31 December 2020(expressed in EUR)
366
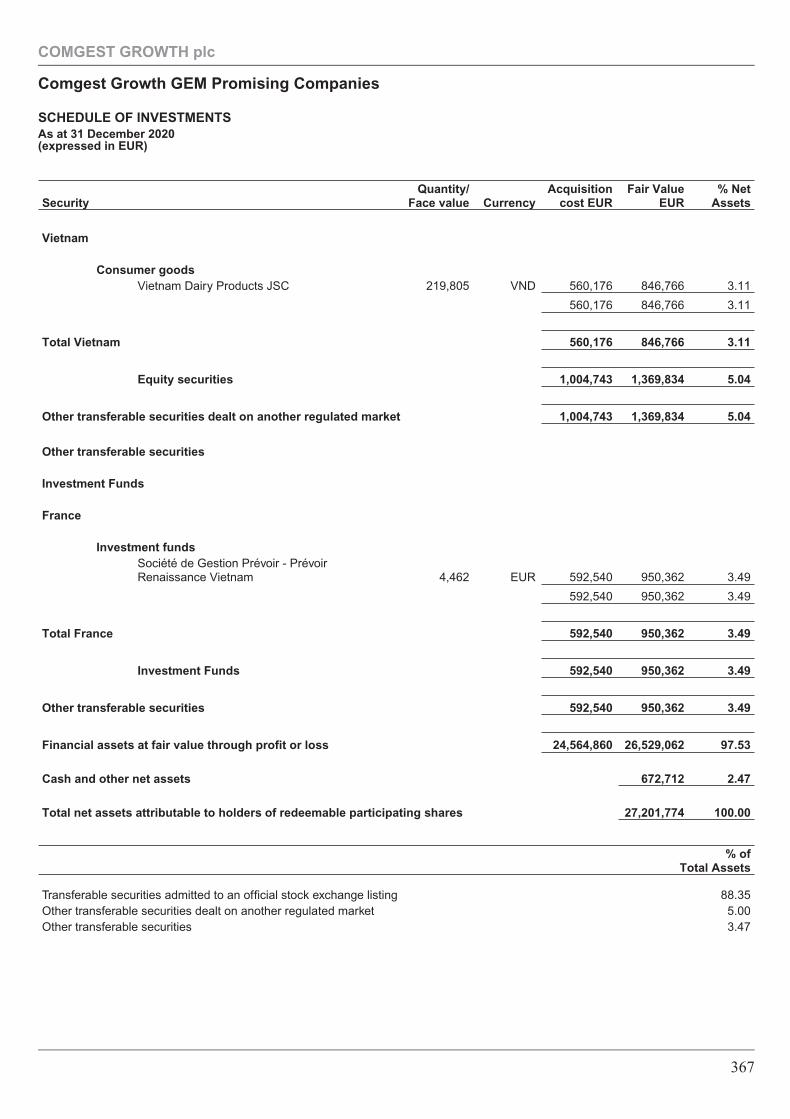
SecurityQuantity/
Face value CurrencyAcquisition
cost EURFair Value
EUR% Net
Assets
Vietnam
Consumer goodsVietnam Dairy Products JSC 219,805 VND 560,176 846,766 3.11
560,176 846,766 3.11
Total Vietnam 560,176 846,766 3.11
Equity securities 1,004,743 1,369,834 5.04
Other transferable securities dealt on another regulated market 1,004,743 1,369,834 5.04
Other transferable securities
Investment Funds
France
Investment fundsSociété de Gestion Prévoir - PrévoirRenaissance Vietnam 4,462 EUR 592,540 950,362 3.49
592,540 950,362 3.49
Total France 592,540 950,362 3.49
Investment Funds 592,540 950,362 3.49
Other transferable securities 592,540 950,362 3.49
Financial assets at fair value through profit or loss 24,564,860 26,529,062 97.53
Cash and other net assets 672,712 2.47
Total net assets attributable to holders of redeemable participating shares 27,201,774 100.00
% ofTotal Assets
Transferable securities admitted to an official stock exchange listing 88.35Other transferable securities dealt on another regulated market 5.00Other transferable securities 3.47
COMGEST GROWTH plc
Comgest Growth GEM Promising Companies
SCHEDULE OF INVESTMENTSAs at 31 December 2020(expressed in EUR)
367
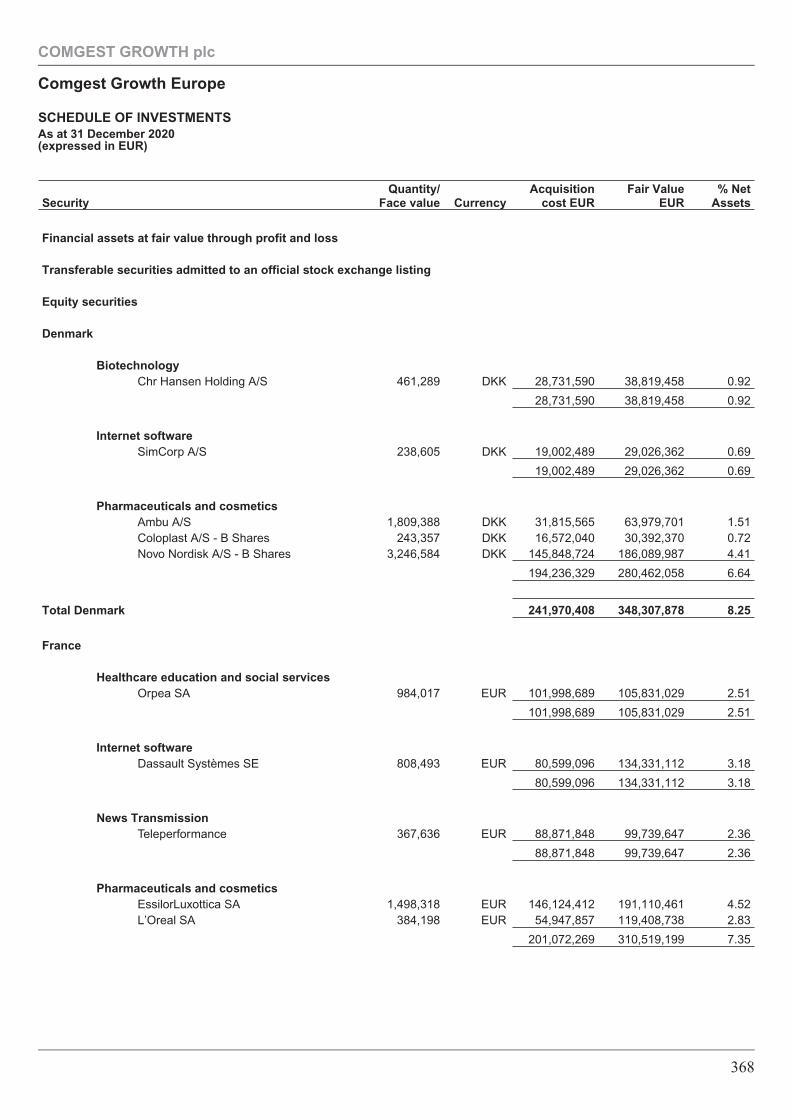
SecurityQuantity/
Face value CurrencyAcquisition
cost EURFair Value
EUR% Net
Assets
Financial assets at fair value through profit and loss
Transferable securities admitted to an official stock exchange listing
Equity securities
Denmark
BiotechnologyChr Hansen Holding A/S 461,289 DKK 28,731,590 38,819,458 0.92
28,731,590 38,819,458 0.92
Internet softwareSimCorp A/S 238,605 DKK 19,002,489 29,026,362 0.69
19,002,489 29,026,362 0.69
Pharmaceuticals and cosmeticsAmbu A/S 1,809,388 DKK 31,815,565 63,979,701 1.51Coloplast A/S - B Shares 243,357 DKK 16,572,040 30,392,370 0.72Novo Nordisk A/S - B Shares 3,246,584 DKK 145,848,724 186,089,987 4.41
194,236,329 280,462,058 6.64
Total Denmark 241,970,408 348,307,878 8.25
France
Healthcare education and social servicesOrpea SA 984,017 EUR 101,998,689 105,831,029 2.51
101,998,689 105,831,029 2.51
Internet softwareDassault Systèmes SE 808,493 EUR 80,599,096 134,331,112 3.18
80,599,096 134,331,112 3.18
News TransmissionTeleperformance 367,636 EUR 88,871,848 99,739,647 2.36
88,871,848 99,739,647 2.36
Pharmaceuticals and cosmeticsEssilorLuxottica SA 1,498,318 EUR 146,124,412 191,110,461 4.52L’Oreal SA 384,198 EUR 54,947,857 119,408,738 2.83
201,072,269 310,519,199 7.35
COMGEST GROWTH plc
Comgest Growth Europe
SCHEDULE OF INVESTMENTSAs at 31 December 2020(expressed in EUR)
368
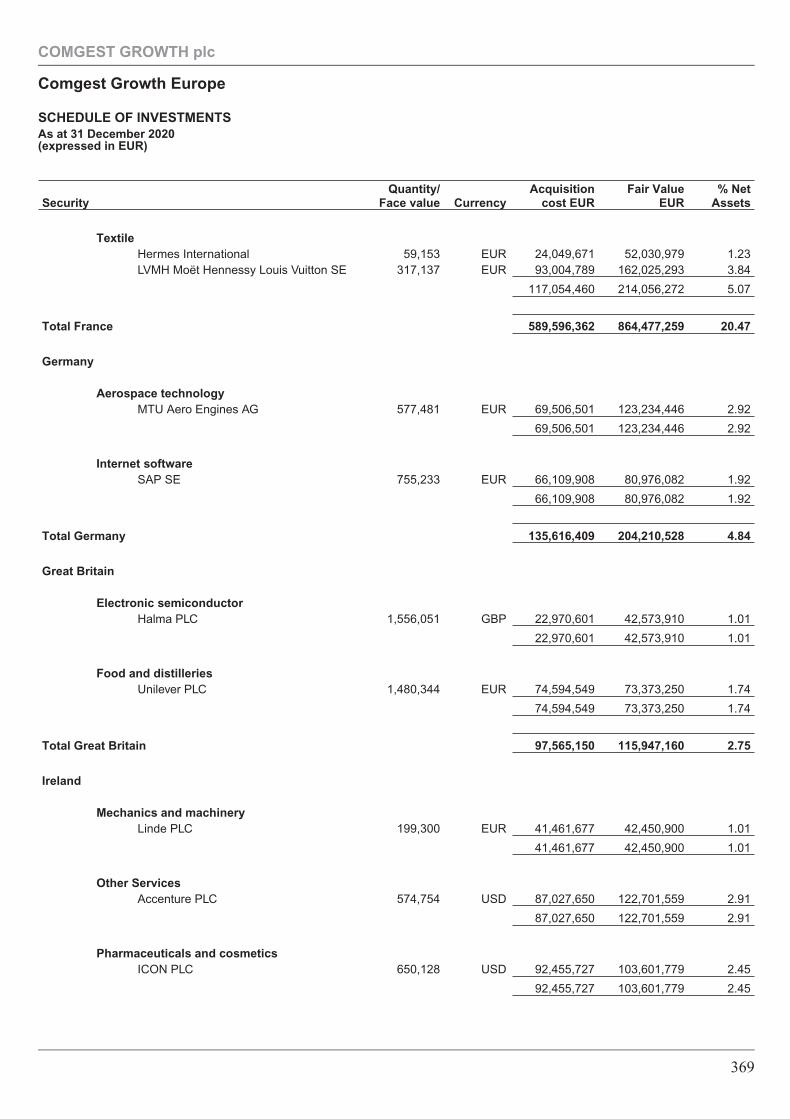
SecurityQuantity/
Face value CurrencyAcquisition
cost EURFair Value
EUR% Net
Assets
TextileHermes International 59,153 EUR 24,049,671 52,030,979 1.23LVMH Moët Hennessy Louis Vuitton SE 317,137 EUR 93,004,789 162,025,293 3.84
117,054,460 214,056,272 5.07
Total France 589,596,362 864,477,259 20.47
Germany
Aerospace technologyMTU Aero Engines AG 577,481 EUR 69,506,501 123,234,446 2.92
69,506,501 123,234,446 2.92
Internet softwareSAP SE 755,233 EUR 66,109,908 80,976,082 1.92
66,109,908 80,976,082 1.92
Total Germany 135,616,409 204,210,528 4.84
Great Britain
Electronic semiconductorHalma PLC 1,556,051 GBP 22,970,601 42,573,910 1.01
22,970,601 42,573,910 1.01
Food and distilleriesUnilever PLC 1,480,344 EUR 74,594,549 73,373,250 1.74
74,594,549 73,373,250 1.74
Total Great Britain 97,565,150 115,947,160 2.75
Ireland
Mechanics and machineryLinde PLC 199,300 EUR 41,461,677 42,450,900 1.01
41,461,677 42,450,900 1.01
Other ServicesAccenture PLC 574,754 USD 87,027,650 122,701,559 2.91
87,027,650 122,701,559 2.91
Pharmaceuticals and cosmeticsICON PLC 650,128 USD 92,455,727 103,601,779 2.45
92,455,727 103,601,779 2.45
COMGEST GROWTH plc
Comgest Growth Europe
SCHEDULE OF INVESTMENTSAs at 31 December 2020(expressed in EUR)
369
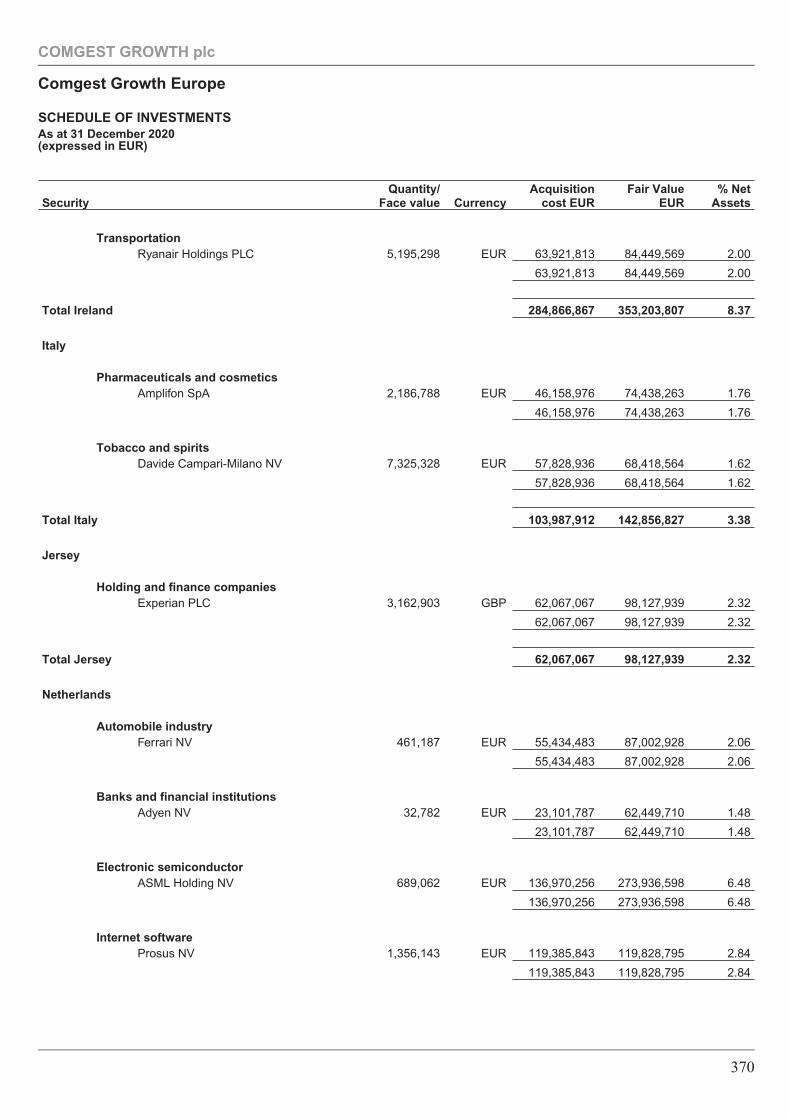
SecurityQuantity/
Face value CurrencyAcquisition
cost EURFair Value
EUR% Net
Assets
TransportationRyanair Holdings PLC 5,195,298 EUR 63,921,813 84,449,569 2.00
63,921,813 84,449,569 2.00
Total Ireland 284,866,867 353,203,807 8.37
Italy
Pharmaceuticals and cosmeticsAmplifon SpA 2,186,788 EUR 46,158,976 74,438,263 1.76
46,158,976 74,438,263 1.76
Tobacco and spiritsDavide Campari-Milano NV 7,325,328 EUR 57,828,936 68,418,564 1.62
57,828,936 68,418,564 1.62
Total Italy 103,987,912 142,856,827 3.38
Jersey
Holding and finance companiesExperian PLC 3,162,903 GBP 62,067,067 98,127,939 2.32
62,067,067 98,127,939 2.32
Total Jersey 62,067,067 98,127,939 2.32
Netherlands
Automobile industryFerrari NV 461,187 EUR 55,434,483 87,002,928 2.06
55,434,483 87,002,928 2.06
Banks and financial institutionsAdyen NV 32,782 EUR 23,101,787 62,449,710 1.48
23,101,787 62,449,710 1.48
Electronic semiconductorASML Holding NV 689,062 EUR 136,970,256 273,936,598 6.48
136,970,256 273,936,598 6.48
Internet softwareProsus NV 1,356,143 EUR 119,385,843 119,828,795 2.84
119,385,843 119,828,795 2.84
COMGEST GROWTH plc
Comgest Growth Europe
SCHEDULE OF INVESTMENTSAs at 31 December 2020(expressed in EUR)
370
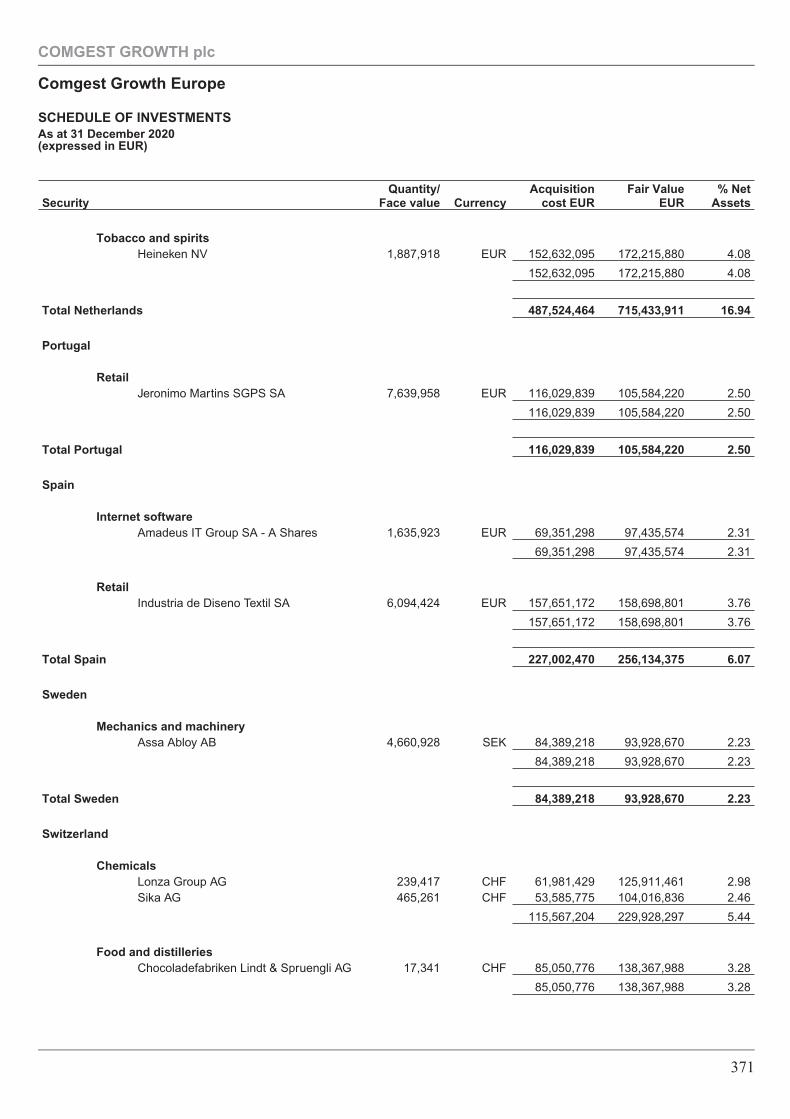
SecurityQuantity/
Face value CurrencyAcquisition
cost EURFair Value
EUR% Net
Assets
Tobacco and spiritsHeineken NV 1,887,918 EUR 152,632,095 172,215,880 4.08
152,632,095 172,215,880 4.08
Total Netherlands 487,524,464 715,433,911 16.94
Portugal
RetailJeronimo Martins SGPS SA 7,639,958 EUR 116,029,839 105,584,220 2.50
116,029,839 105,584,220 2.50
Total Portugal 116,029,839 105,584,220 2.50
Spain
Internet softwareAmadeus IT Group SA - A Shares 1,635,923 EUR 69,351,298 97,435,574 2.31
69,351,298 97,435,574 2.31
RetailIndustria de Diseno Textil SA 6,094,424 EUR 157,651,172 158,698,801 3.76
157,651,172 158,698,801 3.76
Total Spain 227,002,470 256,134,375 6.07
Sweden
Mechanics and machineryAssa Abloy AB 4,660,928 SEK 84,389,218 93,928,670 2.23
84,389,218 93,928,670 2.23
Total Sweden 84,389,218 93,928,670 2.23
Switzerland
ChemicalsLonza Group AG 239,417 CHF 61,981,429 125,911,461 2.98Sika AG 465,261 CHF 53,585,775 104,016,836 2.46
115,567,204 229,928,297 5.44
Food and distilleriesChocoladefabriken Lindt & Spruengli AG 17,341 CHF 85,050,776 138,367,988 3.28
85,050,776 138,367,988 3.28
COMGEST GROWTH plc
Comgest Growth Europe
SCHEDULE OF INVESTMENTSAs at 31 December 2020(expressed in EUR)
371
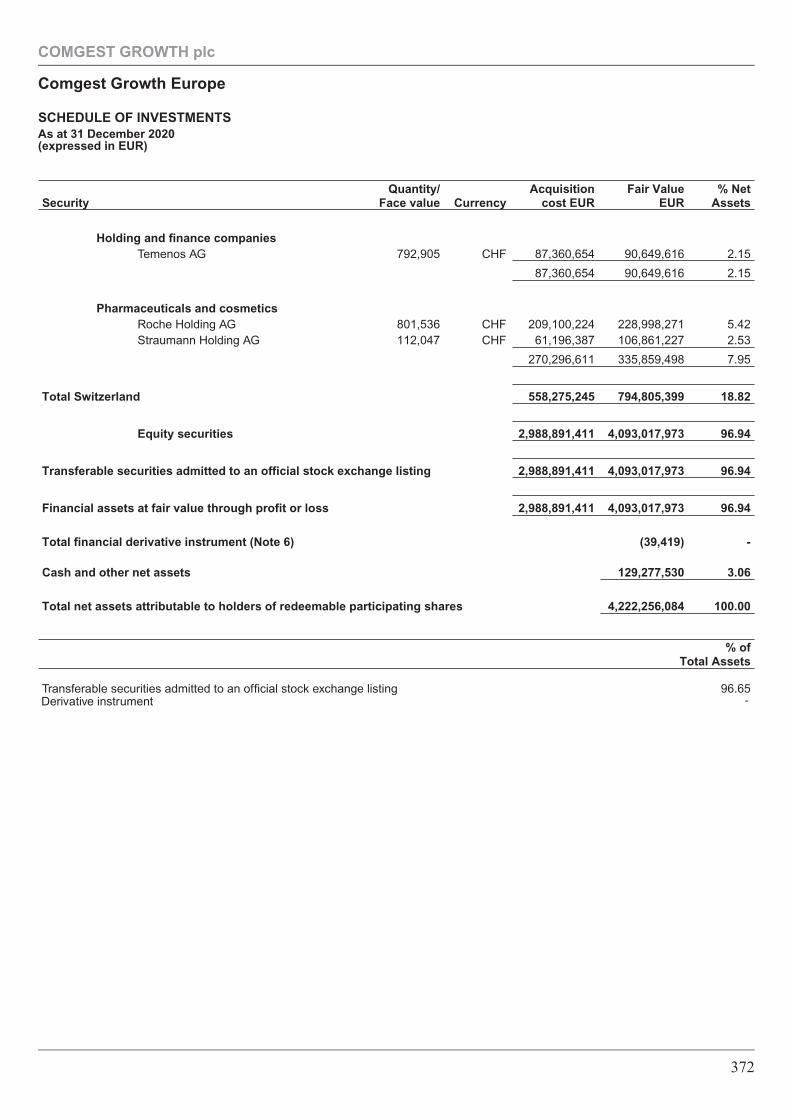
SecurityQuantity/
Face value CurrencyAcquisition
cost EURFair Value
EUR% Net
Assets
Holding and finance companiesTemenos AG 792,905 CHF 87,360,654 90,649,616 2.15
87,360,654 90,649,616 2.15
Pharmaceuticals and cosmeticsRoche Holding AG 801,536 CHF 209,100,224 228,998,271 5.42Straumann Holding AG 112,047 CHF 61,196,387 106,861,227 2.53
270,296,611 335,859,498 7.95
Total Switzerland 558,275,245 794,805,399 18.82
Equity securities 2,988,891,411 4,093,017,973 96.94
Transferable securities admitted to an official stock exchange listing 2,988,891,411 4,093,017,973 96.94
Financial assets at fair value through profit or loss 2,988,891,411 4,093,017,973 96.94
Total financial derivative instrument (Note 6) (39,419) -
Cash and other net assets 129,277,530 3.06
Total net assets attributable to holders of redeemable participating shares 4,222,256,084 100.00
% ofTotal Assets
Transferable securities admitted to an official stock exchange listing 96.65
COMGEST GROWTH plc
Comgest Growth Europe
SCHEDULE OF INVESTMENTSAs at 31 December 2020(expressed in EUR)
372
Derivative instrument -
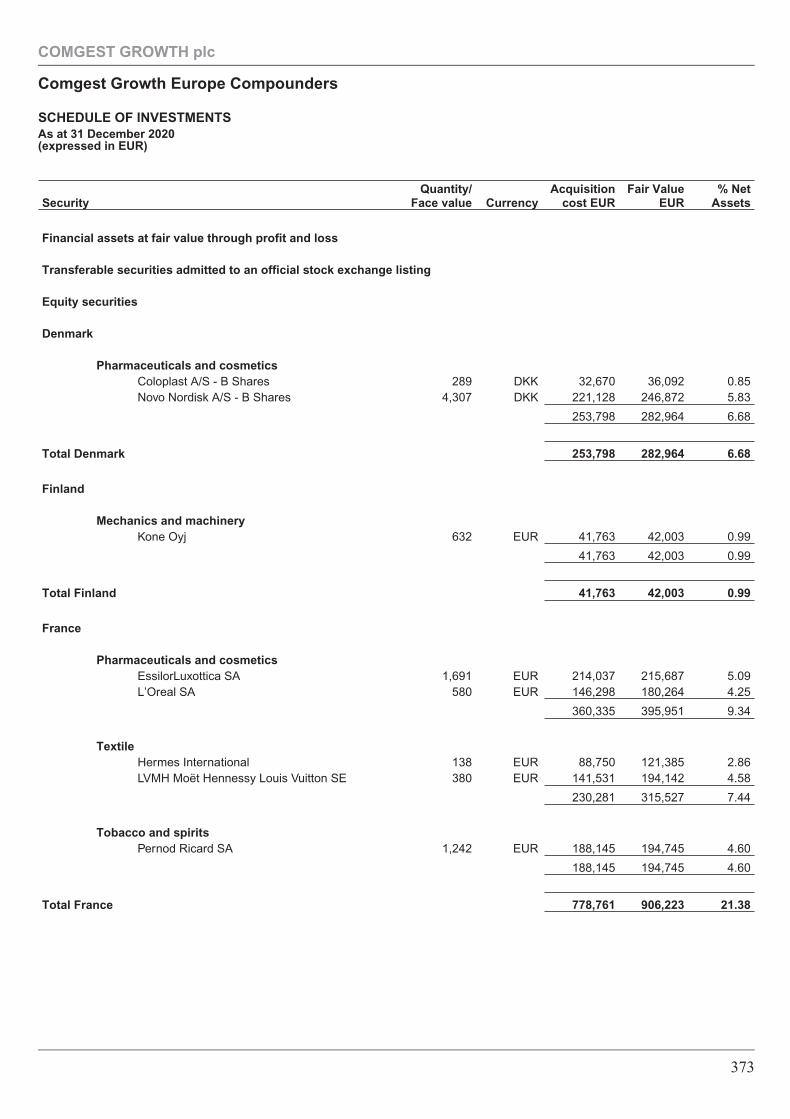
SecurityQuantity/
Face value CurrencyAcquisition
cost EURFair Value
EUR% Net
Assets
Financial assets at fair value through profit and loss
Transferable securities admitted to an official stock exchange listing
Equity securities
Denmark
Pharmaceuticals and cosmeticsColoplast A/S - B Shares 289 DKK 32,670 36,092 0.85Novo Nordisk A/S - B Shares 4,307 DKK 221,128 246,872 5.83
253,798 282,964 6.68
Total Denmark 253,798 282,964 6.68
Finland
Mechanics and machineryKone Oyj 632 EUR 41,763 42,003 0.99
41,763 42,003 0.99
Total Finland 41,763 42,003 0.99
France
Pharmaceuticals and cosmeticsEssilorLuxottica SA 1,691 EUR 214,037 215,687 5.09L’Oreal SA 580 EUR 146,298 180,264 4.25
360,335 395,951 9.34
TextileHermes International 138 EUR 88,750 121,385 2.86LVMH Moët Hennessy Louis Vuitton SE 380 EUR 141,531 194,142 4.58
230,281 315,527 7.44
Tobacco and spiritsPernod Ricard SA 1,242 EUR 188,145 194,745 4.60
188,145 194,745 4.60
Total France 778,761 906,223 21.38
COMGEST GROWTH plc
Comgest Growth Europe Compounders
SCHEDULE OF INVESTMENTSAs at 31 December 2020(expressed in EUR)
373
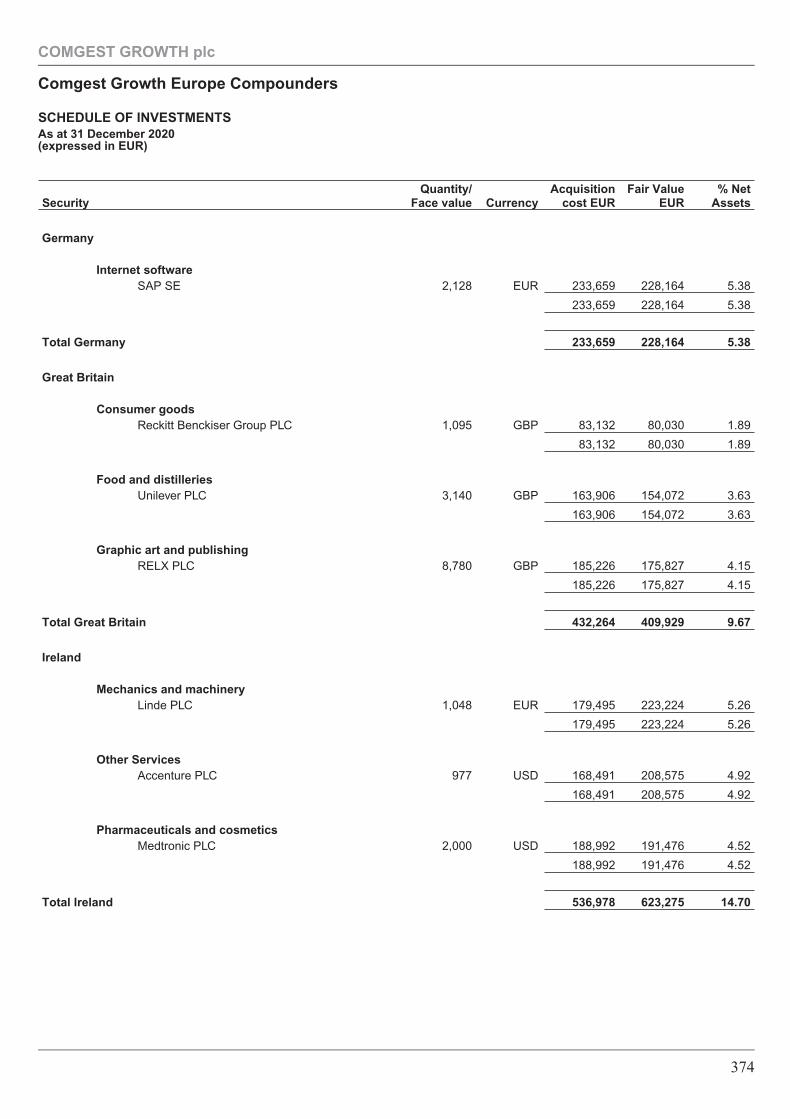
SecurityQuantity/
Face value CurrencyAcquisition
cost EURFair Value
EUR% Net
Assets
Germany
Internet softwareSAP SE 2,128 EUR 233,659 228,164 5.38
233,659 228,164 5.38
Total Germany 233,659 228,164 5.38
Great Britain
Consumer goodsReckitt Benckiser Group PLC 1,095 GBP 83,132 80,030 1.89
83,132 80,030 1.89
Food and distilleriesUnilever PLC 3,140 GBP 163,906 154,072 3.63
163,906 154,072 3.63
Graphic art and publishingRELX PLC 8,780 GBP 185,226 175,827 4.15
185,226 175,827 4.15
Total Great Britain 432,264 409,929 9.67
Ireland
Mechanics and machineryLinde PLC 1,048 EUR 179,495 223,224 5.26
179,495 223,224 5.26
Other ServicesAccenture PLC 977 USD 168,491 208,575 4.92
168,491 208,575 4.92
Pharmaceuticals and cosmeticsMedtronic PLC 2,000 USD 188,992 191,476 4.52
188,992 191,476 4.52
Total Ireland 536,978 623,275 14.70
COMGEST GROWTH plc
Comgest Growth Europe Compounders
SCHEDULE OF INVESTMENTSAs at 31 December 2020(expressed in EUR)
374
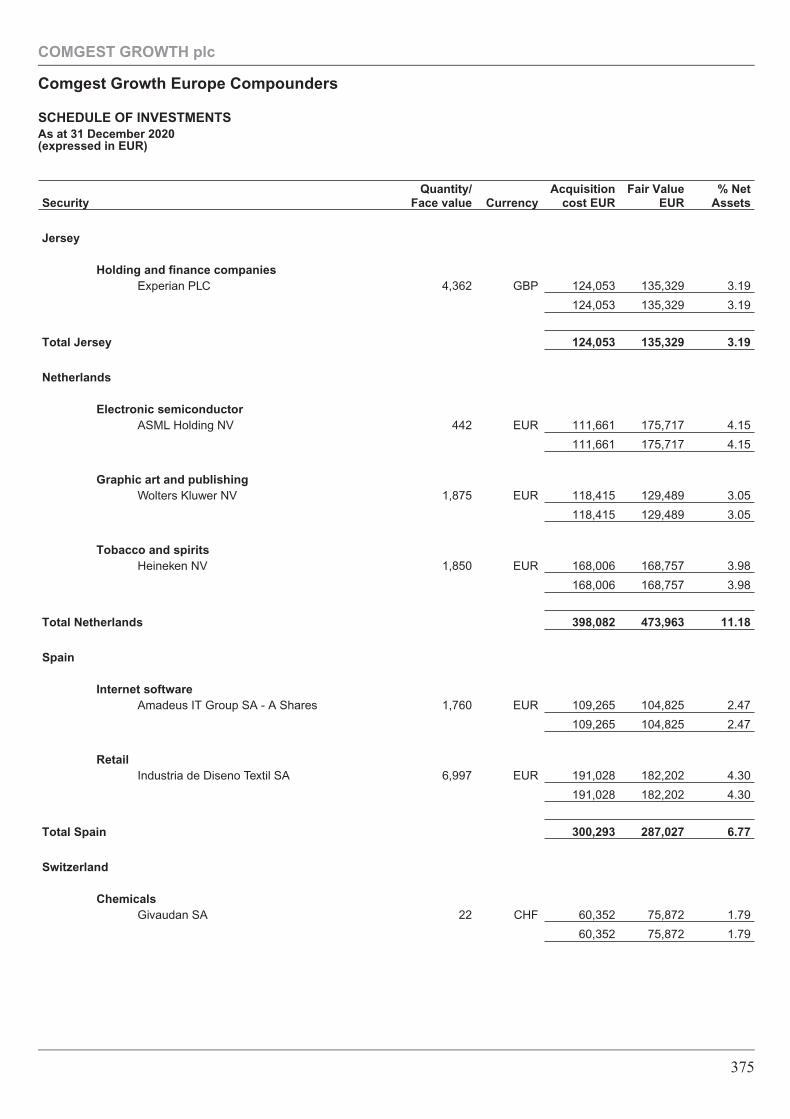
SecurityQuantity/
Face value CurrencyAcquisition
cost EURFair Value
EUR% Net
Assets
Jersey
Holding and finance companiesExperian PLC 4,362 GBP 124,053 135,329 3.19
124,053 135,329 3.19
Total Jersey 124,053 135,329 3.19
Netherlands
Electronic semiconductorASML Holding NV 442 EUR 111,661 175,717 4.15
111,661 175,717 4.15
Graphic art and publishingWolters Kluwer NV 1,875 EUR 118,415 129,489 3.05
118,415 129,489 3.05
Tobacco and spiritsHeineken NV 1,850 EUR 168,006 168,757 3.98
168,006 168,757 3.98
Total Netherlands 398,082 473,963 11.18
Spain
Internet softwareAmadeus IT Group SA - A Shares 1,760 EUR 109,265 104,825 2.47
109,265 104,825 2.47
RetailIndustria de Diseno Textil SA 6,997 EUR 191,028 182,202 4.30
191,028 182,202 4.30
Total Spain 300,293 287,027 6.77
Switzerland
ChemicalsGivaudan SA 22 CHF 60,352 75,872 1.79
60,352 75,872 1.79
COMGEST GROWTH plc
Comgest Growth Europe Compounders
SCHEDULE OF INVESTMENTSAs at 31 December 2020(expressed in EUR)
375
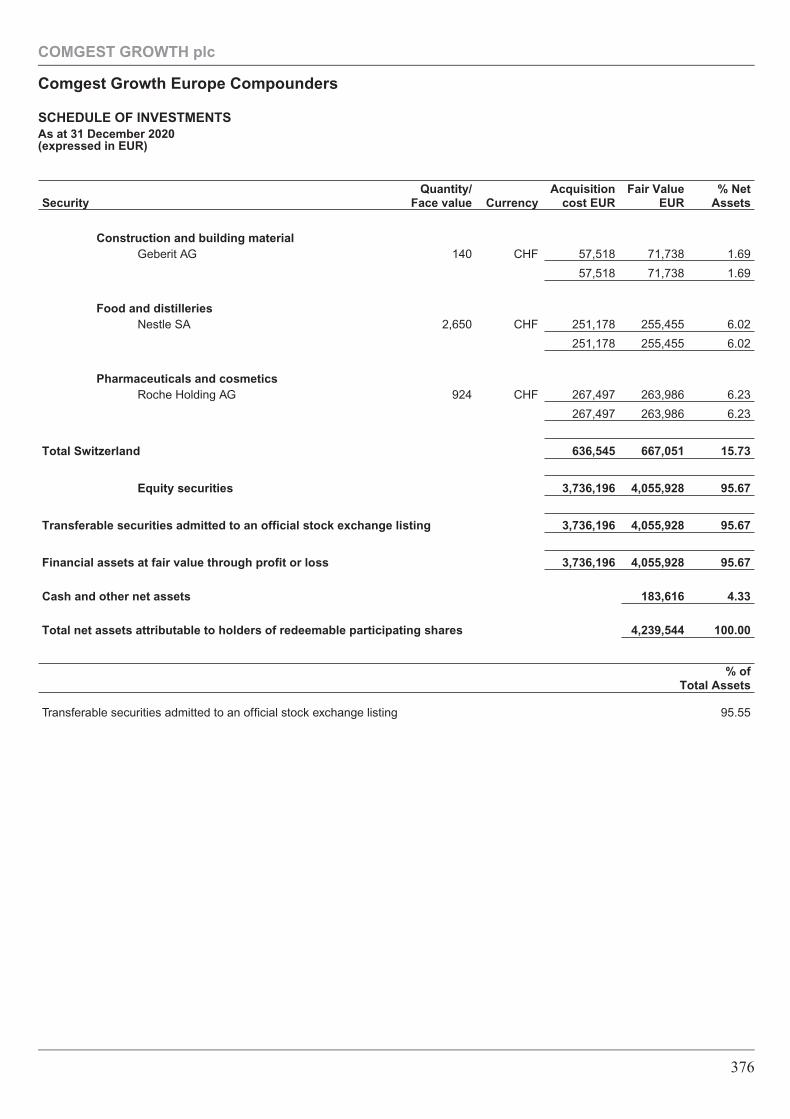
SecurityQuantity/
Face value CurrencyAcquisition
cost EURFair Value
EUR% Net
Assets
Construction and building materialGeberit AG 140 CHF 57,518 71,738 1.69
57,518 71,738 1.69
Food and distilleriesNestle SA 2,650 CHF 251,178 255,455 6.02
251,178 255,455 6.02
Pharmaceuticals and cosmeticsRoche Holding AG 924 CHF 267,497 263,986 6.23
267,497 263,986 6.23
Total Switzerland 636,545 667,051 15.73
Equity securities 3,736,196 4,055,928 95.67
Transferable securities admitted to an official stock exchange listing 3,736,196 4,055,928 95.67
Financial assets at fair value through profit or loss 3,736,196 4,055,928 95.67
Cash and other net assets 183,616 4.33
Total net assets attributable to holders of redeemable participating shares 4,239,544 100.00
% ofTotal Assets
Transferable securities admitted to an official stock exchange listing 95.55
COMGEST GROWTH plc
Comgest Growth Europe Compounders
SCHEDULE OF INVESTMENTSAs at 31 December 2020(expressed in EUR)
376
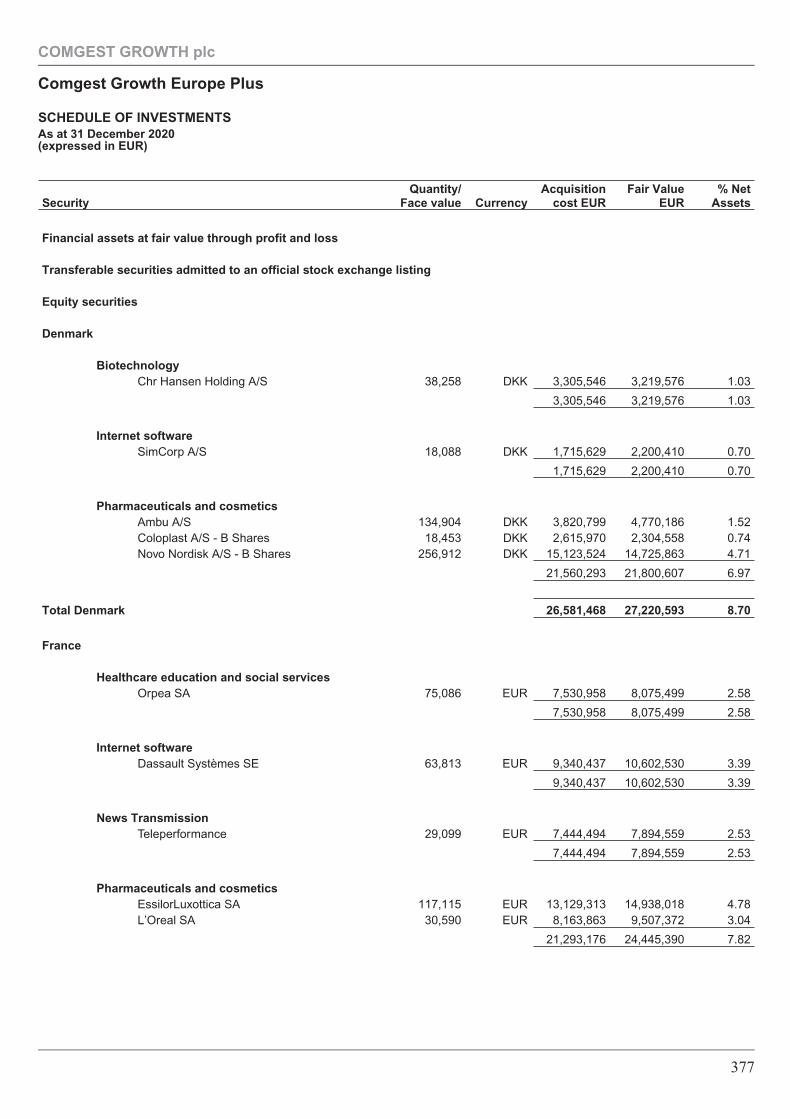
SecurityQuantity/
Face value CurrencyAcquisition
cost EURFair Value
EUR% Net
Assets
Financial assets at fair value through profit and loss
Transferable securities admitted to an official stock exchange listing
Equity securities
Denmark
BiotechnologyChr Hansen Holding A/S 38,258 DKK 3,305,546 3,219,576 1.03
3,305,546 3,219,576 1.03
Internet softwareSimCorp A/S 18,088 DKK 1,715,629 2,200,410 0.70
1,715,629 2,200,410 0.70
Pharmaceuticals and cosmeticsAmbu A/S 134,904 DKK 3,820,799 4,770,186 1.52Coloplast A/S - B Shares 18,453 DKK 2,615,970 2,304,558 0.74Novo Nordisk A/S - B Shares 256,912 DKK 15,123,524 14,725,863 4.71
21,560,293 21,800,607 6.97
Total Denmark 26,581,468 27,220,593 8.70
France
Healthcare education and social servicesOrpea SA 75,086 EUR 7,530,958 8,075,499 2.58
7,530,958 8,075,499 2.58
Internet softwareDassault Systèmes SE 63,813 EUR 9,340,437 10,602,530 3.39
9,340,437 10,602,530 3.39
News TransmissionTeleperformance 29,099 EUR 7,444,494 7,894,559 2.53
7,444,494 7,894,559 2.53
Pharmaceuticals and cosmeticsEssilorLuxottica SA 117,115 EUR 13,129,313 14,938,018 4.78L’Oreal SA 30,590 EUR 8,163,863 9,507,372 3.04
21,293,176 24,445,390 7.82
COMGEST GROWTH plc
Comgest Growth Europe Plus
SCHEDULE OF INVESTMENTSAs at 31 December 2020(expressed in EUR)
377
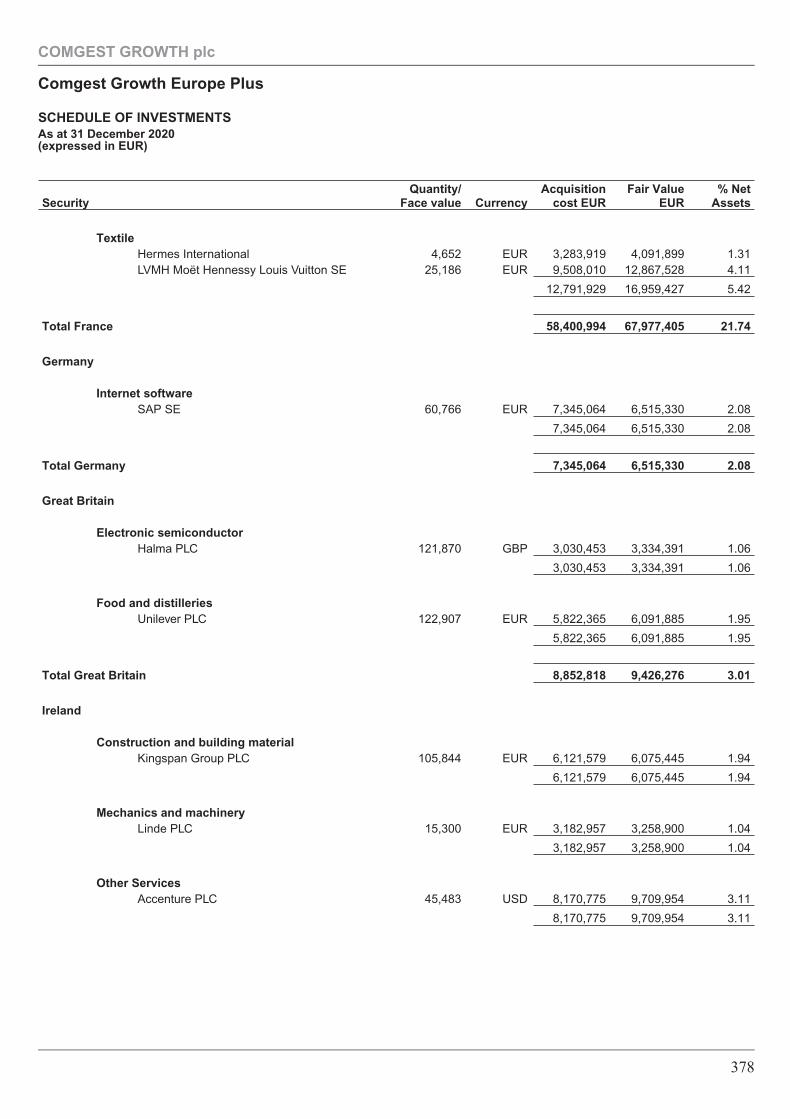
SecurityQuantity/
Face value CurrencyAcquisition
cost EURFair Value
EUR% Net
Assets
TextileHermes International 4,652 EUR 3,283,919 4,091,899 1.31LVMH Moët Hennessy Louis Vuitton SE 25,186 EUR 9,508,010 12,867,528 4.11
12,791,929 16,959,427 5.42
Total France 58,400,994 67,977,405 21.74
Germany
Internet softwareSAP SE 60,766 EUR 7,345,064 6,515,330 2.08
7,345,064 6,515,330 2.08
Total Germany 7,345,064 6,515,330 2.08
Great Britain
Electronic semiconductorHalma PLC 121,870 GBP 3,030,453 3,334,391 1.06
3,030,453 3,334,391 1.06
Food and distilleriesUnilever PLC 122,907 EUR 5,822,365 6,091,885 1.95
5,822,365 6,091,885 1.95
Total Great Britain 8,852,818 9,426,276 3.01
Ireland
Construction and building materialKingspan Group PLC 105,844 EUR 6,121,579 6,075,445 1.94
6,121,579 6,075,445 1.94
Mechanics and machineryLinde PLC 15,300 EUR 3,182,957 3,258,900 1.04
3,182,957 3,258,900 1.04
Other ServicesAccenture PLC 45,483 USD 8,170,775 9,709,954 3.11
8,170,775 9,709,954 3.11
COMGEST GROWTH plc
Comgest Growth Europe Plus
SCHEDULE OF INVESTMENTSAs at 31 December 2020(expressed in EUR)
378
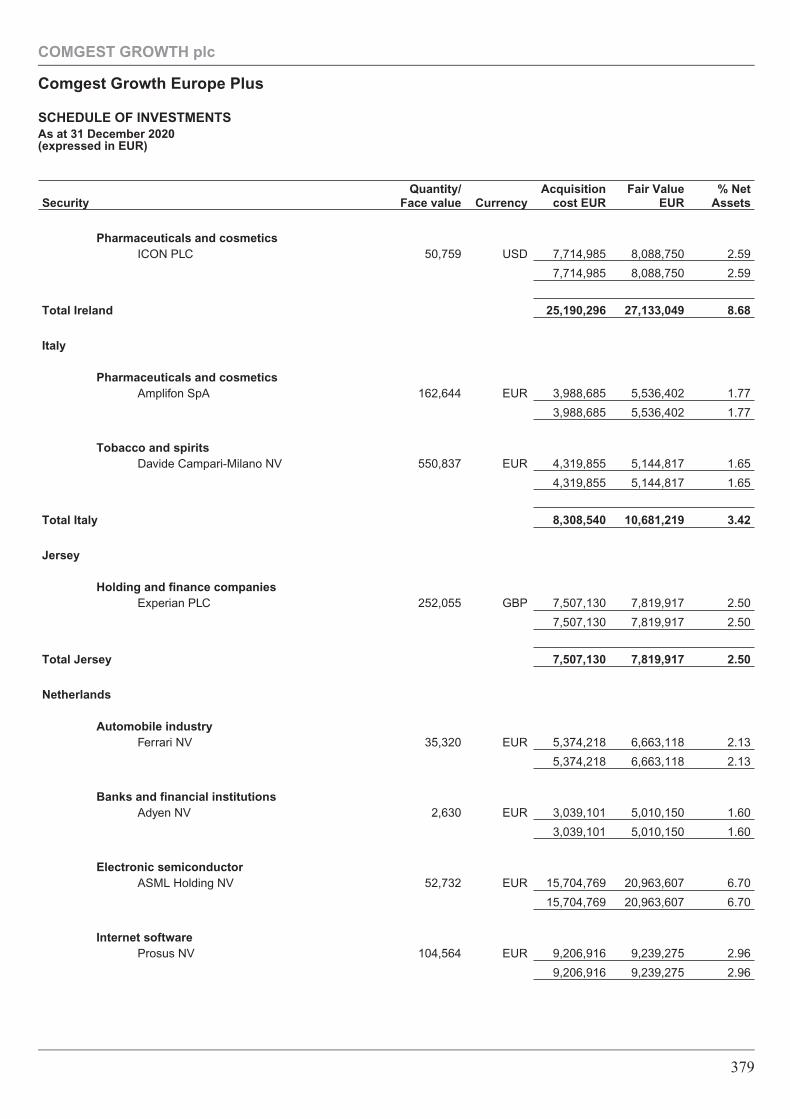
SecurityQuantity/
Face value CurrencyAcquisition
cost EURFair Value
EUR% Net
Assets
Pharmaceuticals and cosmeticsICON PLC 50,759 USD 7,714,985 8,088,750 2.59
7,714,985 8,088,750 2.59
Total Ireland 25,190,296 27,133,049 8.68
Italy
Pharmaceuticals and cosmeticsAmplifon SpA 162,644 EUR 3,988,685 5,536,402 1.77
3,988,685 5,536,402 1.77
Tobacco and spiritsDavide Campari-Milano NV 550,837 EUR 4,319,855 5,144,817 1.65
4,319,855 5,144,817 1.65
Total Italy 8,308,540 10,681,219 3.42
Jersey
Holding and finance companiesExperian PLC 252,055 GBP 7,507,130 7,819,917 2.50
7,507,130 7,819,917 2.50
Total Jersey 7,507,130 7,819,917 2.50
Netherlands
Automobile industryFerrari NV 35,320 EUR 5,374,218 6,663,118 2.13
5,374,218 6,663,118 2.13
Banks and financial institutionsAdyen NV 2,630 EUR 3,039,101 5,010,150 1.60
3,039,101 5,010,150 1.60
Electronic semiconductorASML Holding NV 52,732 EUR 15,704,769 20,963,607 6.70
15,704,769 20,963,607 6.70
Internet softwareProsus NV 104,564 EUR 9,206,916 9,239,275 2.96
9,206,916 9,239,275 2.96
COMGEST GROWTH plc
Comgest Growth Europe Plus
SCHEDULE OF INVESTMENTSAs at 31 December 2020(expressed in EUR)
379
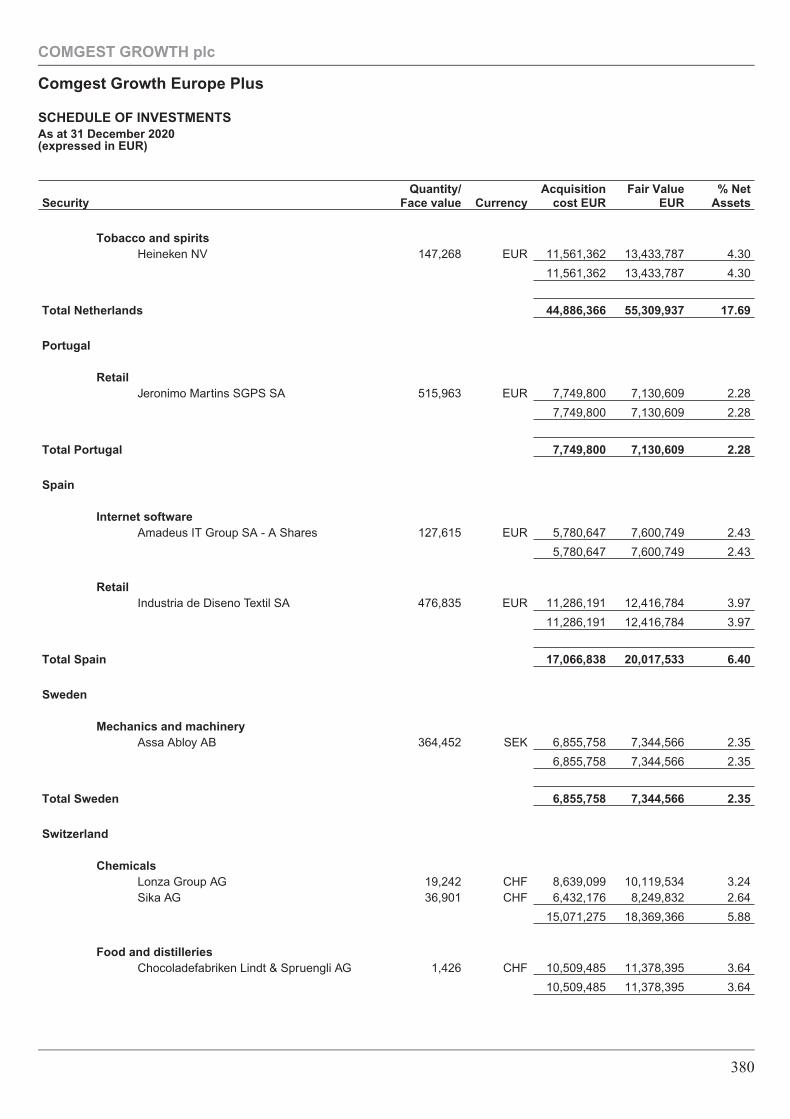
SecurityQuantity/
Face value CurrencyAcquisition
cost EURFair Value
EUR% Net
Assets
Tobacco and spiritsHeineken NV 147,268 EUR 11,561,362 13,433,787 4.30
11,561,362 13,433,787 4.30
Total Netherlands 44,886,366 55,309,937 17.69
Portugal
RetailJeronimo Martins SGPS SA 515,963 EUR 7,749,800 7,130,609 2.28
7,749,800 7,130,609 2.28
Total Portugal 7,749,800 7,130,609 2.28
Spain
Internet softwareAmadeus IT Group SA - A Shares 127,615 EUR 5,780,647 7,600,749 2.43
5,780,647 7,600,749 2.43
RetailIndustria de Diseno Textil SA 476,835 EUR 11,286,191 12,416,784 3.97
11,286,191 12,416,784 3.97
Total Spain 17,066,838 20,017,533 6.40
Sweden
Mechanics and machineryAssa Abloy AB 364,452 SEK 6,855,758 7,344,566 2.35
6,855,758 7,344,566 2.35
Total Sweden 6,855,758 7,344,566 2.35
Switzerland
ChemicalsLonza Group AG 19,242 CHF 8,639,099 10,119,534 3.24Sika AG 36,901 CHF 6,432,176 8,249,832 2.64
15,071,275 18,369,366 5.88
Food and distilleriesChocoladefabriken Lindt & Spruengli AG 1,426 CHF 10,509,485 11,378,395 3.64
10,509,485 11,378,395 3.64
COMGEST GROWTH plc
Comgest Growth Europe Plus
SCHEDULE OF INVESTMENTSAs at 31 December 2020(expressed in EUR)
380
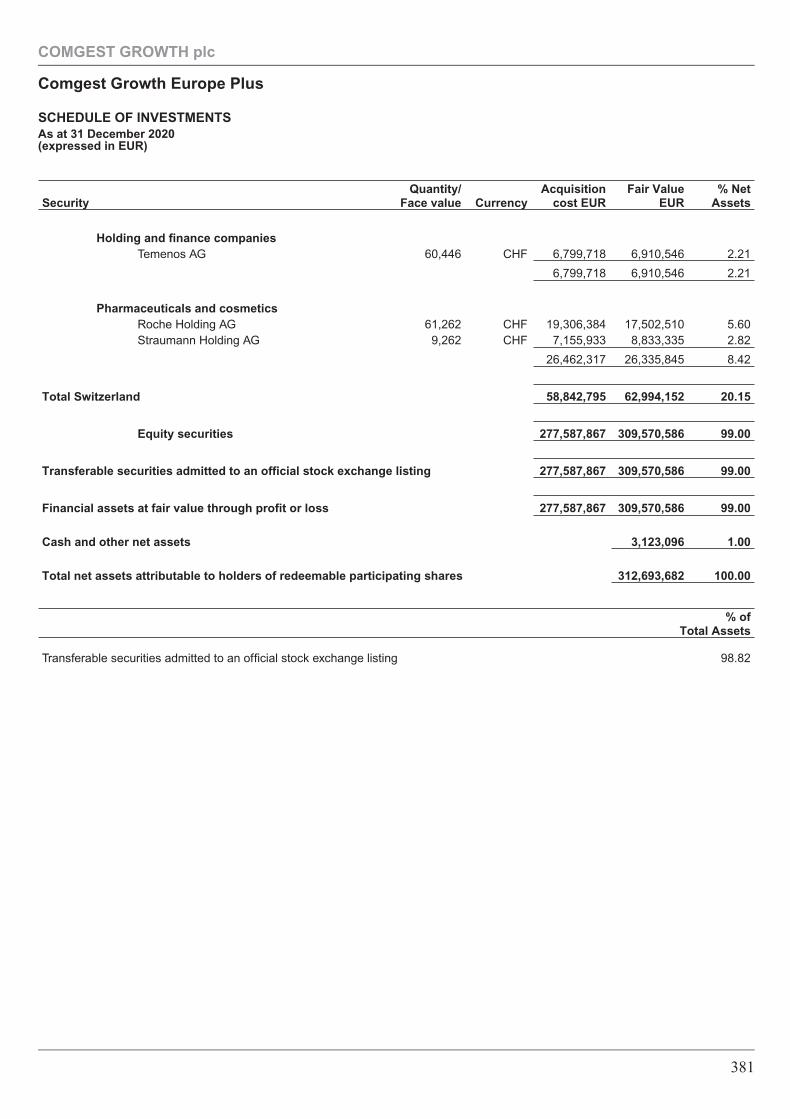
SecurityQuantity/
Face value CurrencyAcquisition
cost EURFair Value
EUR% Net
Assets
Holding and finance companiesTemenos AG 60,446 CHF 6,799,718 6,910,546 2.21
6,799,718 6,910,546 2.21
Pharmaceuticals and cosmeticsRoche Holding AG 61,262 CHF 19,306,384 17,502,510 5.60Straumann Holding AG 9,262 CHF 7,155,933 8,833,335 2.82
26,462,317 26,335,845 8.42
Total Switzerland 58,842,795 62,994,152 20.15
Equity securities 277,587,867 309,570,586 99.00
Transferable securities admitted to an official stock exchange listing 277,587,867 309,570,586 99.00
Financial assets at fair value through profit or loss 277,587,867 309,570,586 99.00
Cash and other net assets 3,123,096 1.00
Total net assets attributable to holders of redeemable participating shares 312,693,682 100.00
% ofTotal Assets
Transferable securities admitted to an official stock exchange listing 98.82
COMGEST GROWTH plc
Comgest Growth Europe Plus
SCHEDULE OF INVESTMENTSAs at 31 December 2020(expressed in EUR)
381
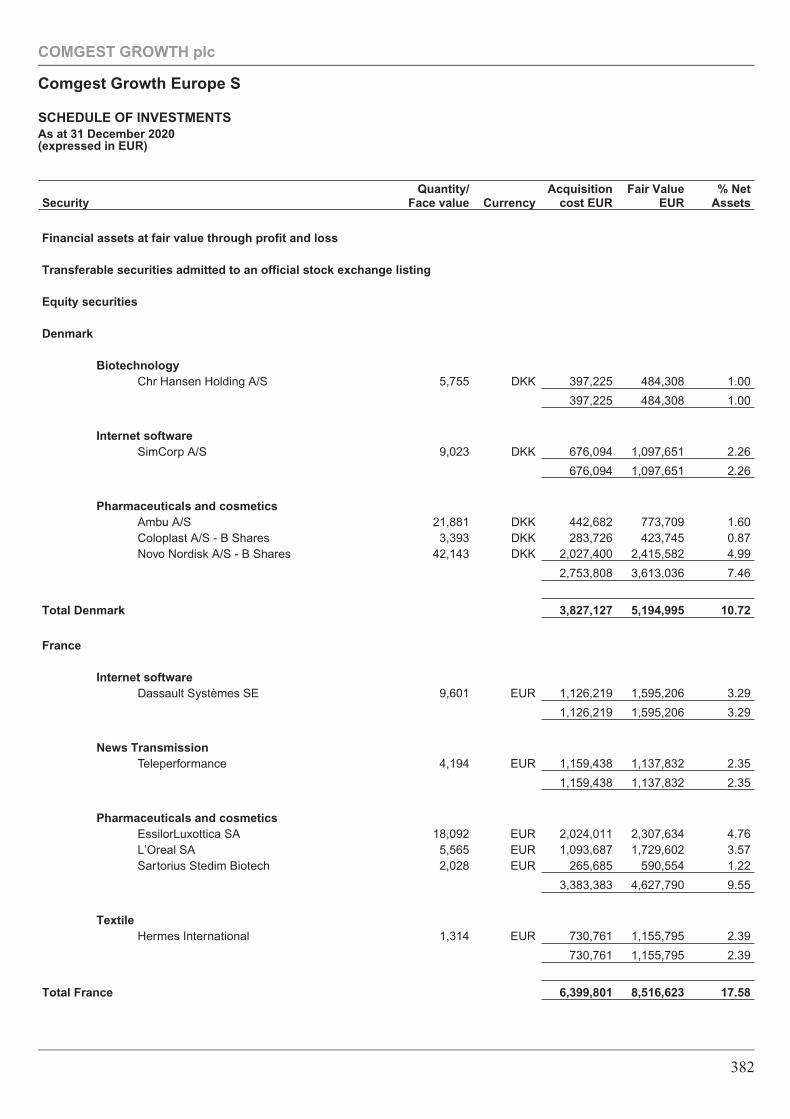
SecurityQuantity/
Face value CurrencyAcquisition
cost EURFair Value
EUR% Net
Assets
Financial assets at fair value through profit and loss
Transferable securities admitted to an official stock exchange listing
Equity securities
Denmark
BiotechnologyChr Hansen Holding A/S 5,755 DKK 397,225 484,308 1.00
397,225 484,308 1.00
Internet softwareSimCorp A/S 9,023 DKK 676,094 1,097,651 2.26
676,094 1,097,651 2.26
Pharmaceuticals and cosmeticsAmbu A/S 21,881 DKK 442,682 773,709 1.60Coloplast A/S - B Shares 3,393 DKK 283,726 423,745 0.87Novo Nordisk A/S - B Shares 42,143 DKK 2,027,400 2,415,582 4.99
2,753,808 3,613,036 7.46
Total Denmark 3,827,127 5,194,995 10.72
France
Internet softwareDassault Systèmes SE 9,601 EUR 1,126,219 1,595,206 3.29
1,126,219 1,595,206 3.29
News TransmissionTeleperformance 4,194 EUR 1,159,438 1,137,832 2.35
1,159,438 1,137,832 2.35
Pharmaceuticals and cosmeticsEssilorLuxottica SA 18,092 EUR 2,024,011 2,307,634 4.76L’Oreal SA 5,565 EUR 1,093,687 1,729,602 3.57Sartorius Stedim Biotech 2,028 EUR 265,685 590,554 1.22
3,383,383 4,627,790 9.55
TextileHermes International 1,314 EUR 730,761 1,155,795 2.39
730,761 1,155,795 2.39
Total France 6,399,801 8,516,623 17.58
COMGEST GROWTH plc
Comgest Growth Europe S
SCHEDULE OF INVESTMENTSAs at 31 December 2020(expressed in EUR)
382
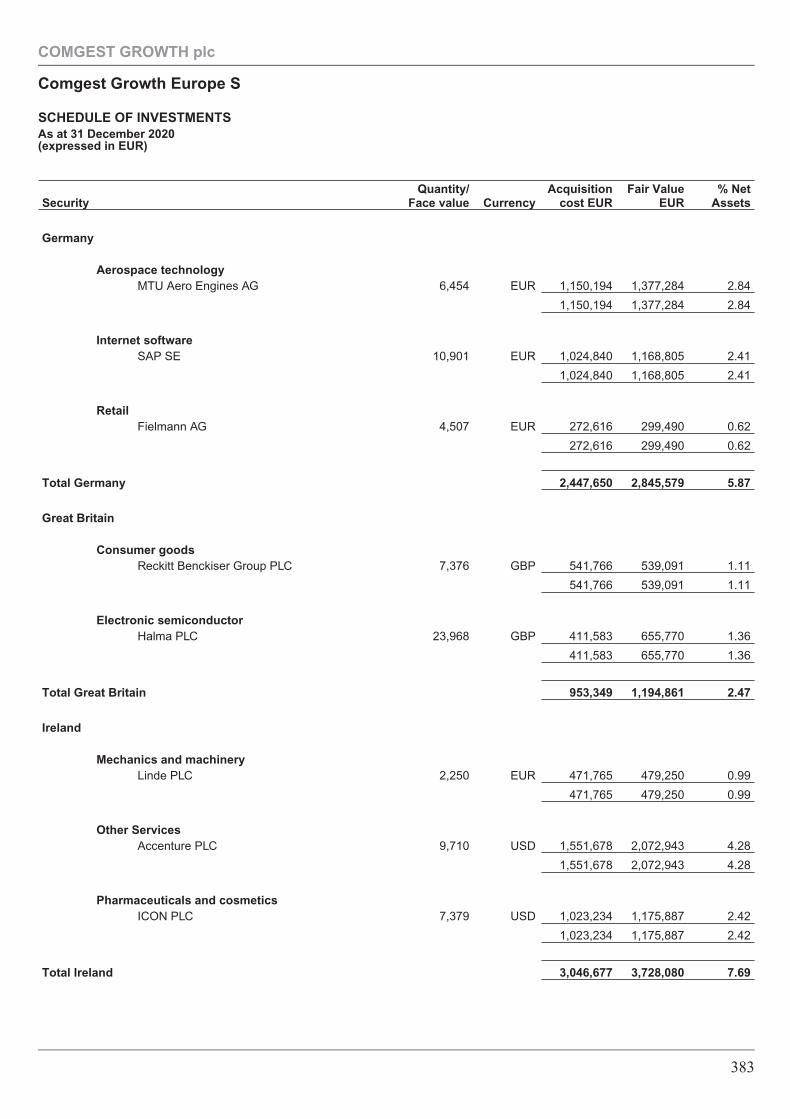
SecurityQuantity/
Face value CurrencyAcquisition
cost EURFair Value
EUR% Net
Assets
Germany
Aerospace technologyMTU Aero Engines AG 6,454 EUR 1,150,194 1,377,284 2.84
1,150,194 1,377,284 2.84
Internet softwareSAP SE 10,901 EUR 1,024,840 1,168,805 2.41
1,024,840 1,168,805 2.41
RetailFielmann AG 4,507 EUR 272,616 299,490 0.62
272,616 299,490 0.62
Total Germany 2,447,650 2,845,579 5.87
Great Britain
Consumer goodsReckitt Benckiser Group PLC 7,376 GBP 541,766 539,091 1.11
541,766 539,091 1.11
Electronic semiconductorHalma PLC 23,968 GBP 411,583 655,770 1.36
411,583 655,770 1.36
Total Great Britain 953,349 1,194,861 2.47
Ireland
Mechanics and machineryLinde PLC 2,250 EUR 471,765 479,250 0.99
471,765 479,250 0.99
Other ServicesAccenture PLC 9,710 USD 1,551,678 2,072,943 4.28
1,551,678 2,072,943 4.28
Pharmaceuticals and cosmeticsICON PLC 7,379 USD 1,023,234 1,175,887 2.42
1,023,234 1,175,887 2.42
Total Ireland 3,046,677 3,728,080 7.69
COMGEST GROWTH plc
Comgest Growth Europe S
SCHEDULE OF INVESTMENTSAs at 31 December 2020(expressed in EUR)
383
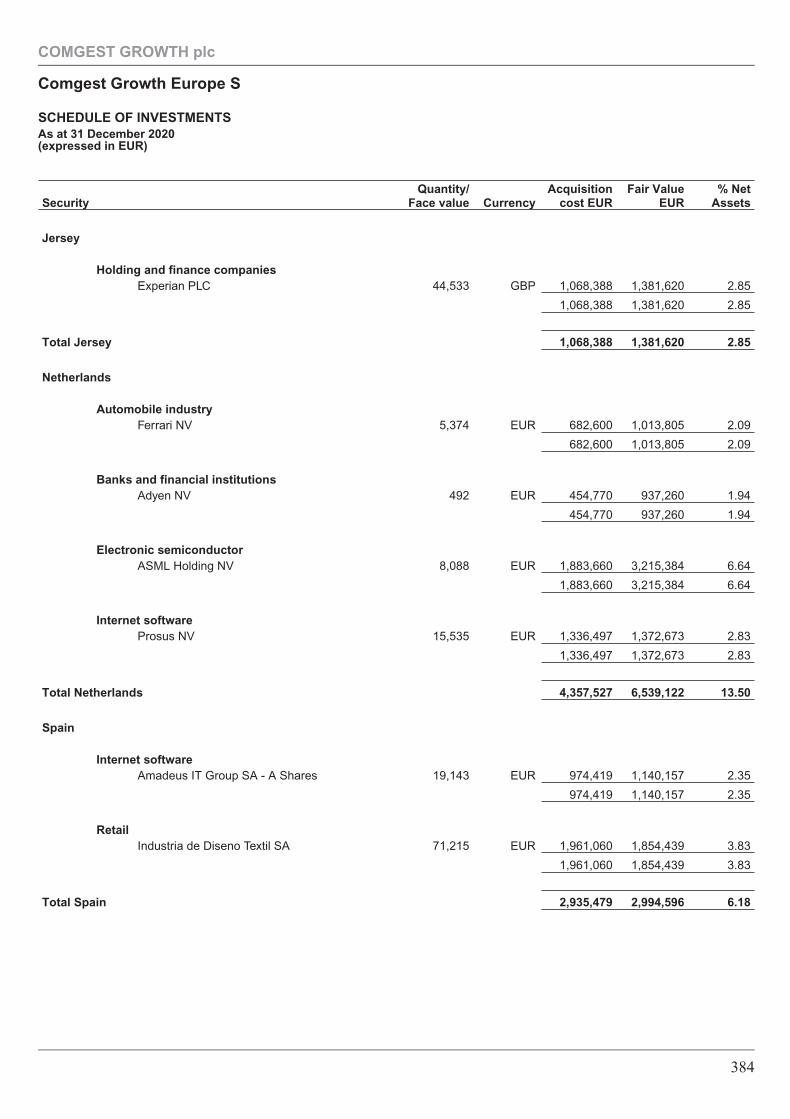
SecurityQuantity/
Face value CurrencyAcquisition
cost EURFair Value
EUR% Net
Assets
Jersey
Holding and finance companiesExperian PLC 44,533 GBP 1,068,388 1,381,620 2.85
1,068,388 1,381,620 2.85
Total Jersey 1,068,388 1,381,620 2.85
Netherlands
Automobile industryFerrari NV 5,374 EUR 682,600 1,013,805 2.09
682,600 1,013,805 2.09
Banks and financial institutionsAdyen NV 492 EUR 454,770 937,260 1.94
454,770 937,260 1.94
Electronic semiconductorASML Holding NV 8,088 EUR 1,883,660 3,215,384 6.64
1,883,660 3,215,384 6.64
Internet softwareProsus NV 15,535 EUR 1,336,497 1,372,673 2.83
1,336,497 1,372,673 2.83
Total Netherlands 4,357,527 6,539,122 13.50
Spain
Internet softwareAmadeus IT Group SA - A Shares 19,143 EUR 974,419 1,140,157 2.35
974,419 1,140,157 2.35
RetailIndustria de Diseno Textil SA 71,215 EUR 1,961,060 1,854,439 3.83
1,961,060 1,854,439 3.83
Total Spain 2,935,479 2,994,596 6.18
COMGEST GROWTH plc
Comgest Growth Europe S
SCHEDULE OF INVESTMENTSAs at 31 December 2020(expressed in EUR)
384
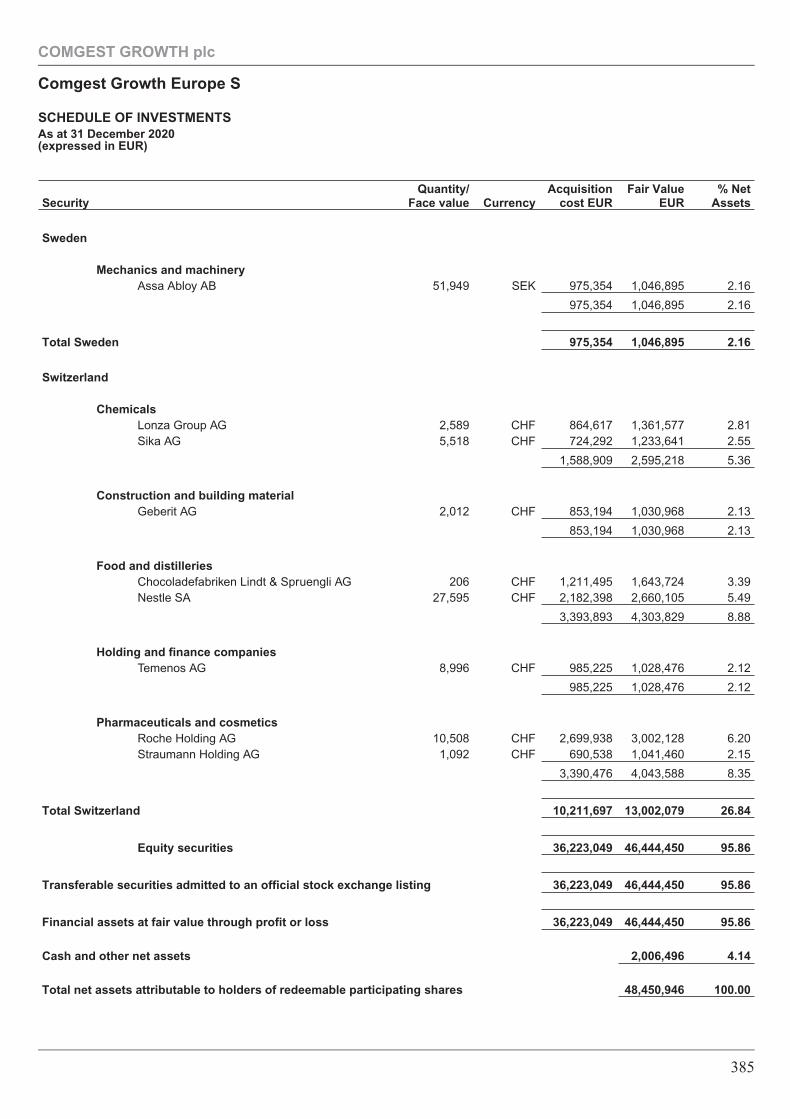
SecurityQuantity/
Face value CurrencyAcquisition
cost EURFair Value
EUR% Net
Assets
Sweden
Mechanics and machineryAssa Abloy AB 51,949 SEK 975,354 1,046,895 2.16
975,354 1,046,895 2.16
Total Sweden 975,354 1,046,895 2.16
Switzerland
ChemicalsLonza Group AG 2,589 CHF 864,617 1,361,577 2.81Sika AG 5,518 CHF 724,292 1,233,641 2.55
1,588,909 2,595,218 5.36
Construction and building materialGeberit AG 2,012 CHF 853,194 1,030,968 2.13
853,194 1,030,968 2.13
Food and distilleriesChocoladefabriken Lindt & Spruengli AG 206 CHF 1,211,495 1,643,724 3.39Nestle SA 27,595 CHF 2,182,398 2,660,105 5.49
3,393,893 4,303,829 8.88
Holding and finance companiesTemenos AG 8,996 CHF 985,225 1,028,476 2.12
985,225 1,028,476 2.12
Pharmaceuticals and cosmeticsRoche Holding AG 10,508 CHF 2,699,938 3,002,128 6.20Straumann Holding AG 1,092 CHF 690,538 1,041,460 2.15
3,390,476 4,043,588 8.35
Total Switzerland 10,211,697 13,002,079 26.84
Equity securities 36,223,049 46,444,450 95.86
Transferable securities admitted to an official stock exchange listing 36,223,049 46,444,450 95.86
Financial assets at fair value through profit or loss 36,223,049 46,444,450 95.86
Cash and other net assets 2,006,496 4.14
Total net assets attributable to holders of redeemable participating shares 48,450,946 100.00
COMGEST GROWTH plc
Comgest Growth Europe S
SCHEDULE OF INVESTMENTSAs at 31 December 2020(expressed in EUR)
385
% ofTotal Assets
Transferable securities admitted to an official stock exchange listing 93.77
COMGEST GROWTH plc
Comgest Growth Europe S
SCHEDULE OF INVESTMENTSAs at 31 December 2020(expressed in EUR)
386
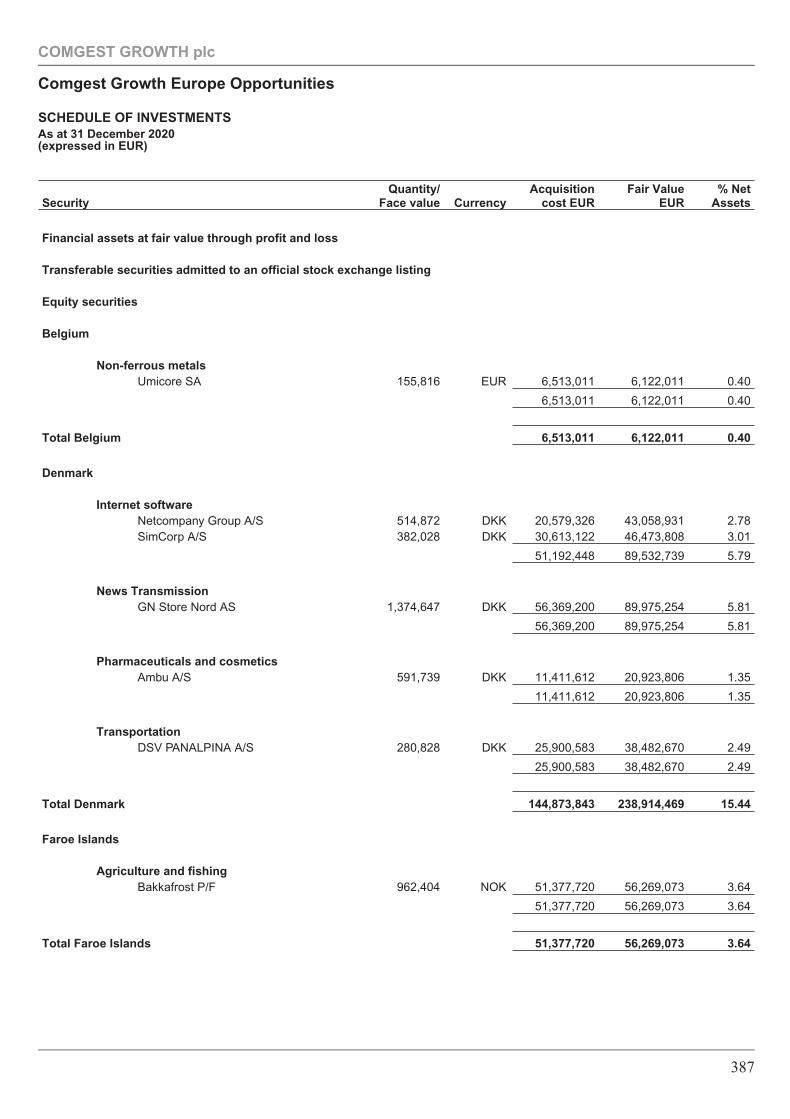
SecurityQuantity/
Face value CurrencyAcquisition
cost EURFair Value
EUR% Net
Assets
Financial assets at fair value through profit and loss
Transferable securities admitted to an official stock exchange listing
Equity securities
Belgium
Non-ferrous metalsUmicore SA 155,816 EUR 6,513,011 6,122,011 0.40
6,513,011 6,122,011 0.40
Total Belgium 6,513,011 6,122,011 0.40
Denmark
Internet softwareNetcompany Group A/S 514,872 DKK 20,579,326 43,058,931 2.78SimCorp A/S 382,028 DKK 30,613,122 46,473,808 3.01
51,192,448 89,532,739 5.79
News TransmissionGN Store Nord AS 1,374,647 DKK 56,369,200 89,975,254 5.81
56,369,200 89,975,254 5.81
Pharmaceuticals and cosmeticsAmbu A/S 591,739 DKK 11,411,612 20,923,806 1.35
11,411,612 20,923,806 1.35
TransportationDSV PANALPINA A/S 280,828 DKK 25,900,583 38,482,670 2.49
25,900,583 38,482,670 2.49
Total Denmark 144,873,843 238,914,469 15.44
Faroe Islands
Agriculture and fishingBakkafrost P/F 962,404 NOK 51,377,720 56,269,073 3.64
51,377,720 56,269,073 3.64
Total Faroe Islands 51,377,720 56,269,073 3.64
COMGEST GROWTH plc
Comgest Growth Europe Opportunities
SCHEDULE OF INVESTMENTSAs at 31 December 2020(expressed in EUR)
387
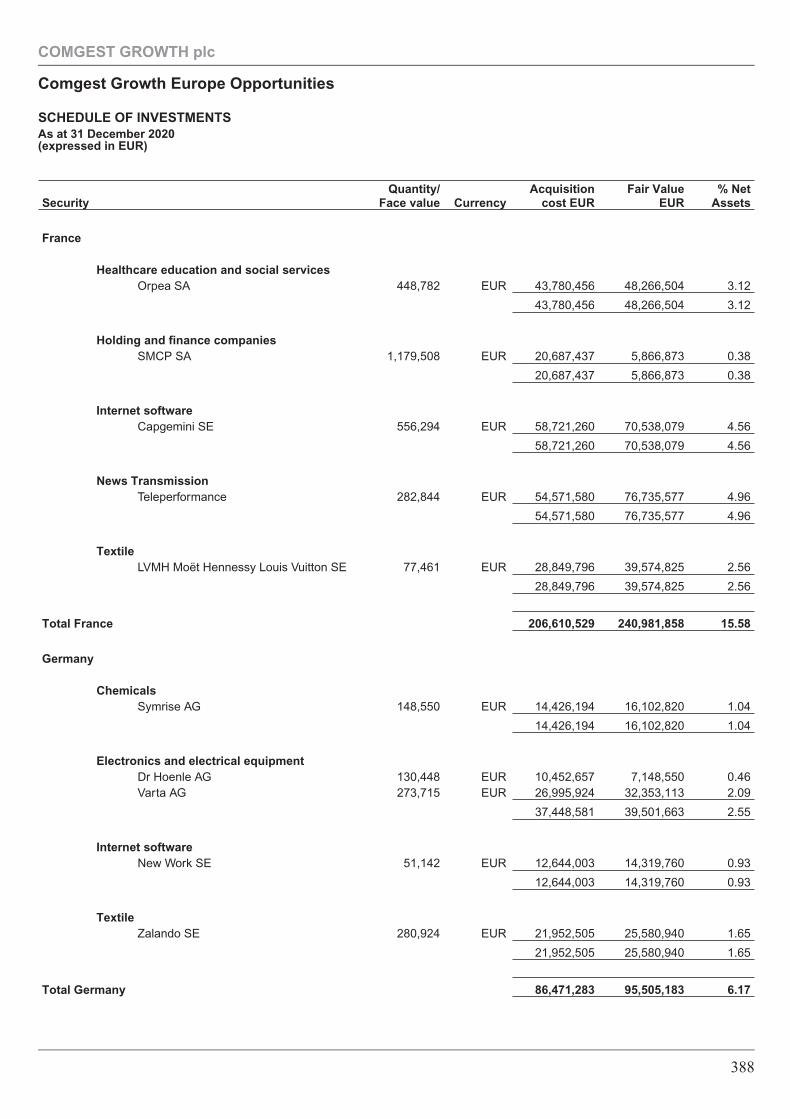
SecurityQuantity/
Face value CurrencyAcquisition
cost EURFair Value
EUR% Net
Assets
France
Healthcare education and social servicesOrpea SA 448,782 EUR 43,780,456 48,266,504 3.12
43,780,456 48,266,504 3.12
Holding and finance companiesSMCP SA 1,179,508 EUR 20,687,437 5,866,873 0.38
20,687,437 5,866,873 0.38
Internet softwareCapgemini SE 556,294 EUR 58,721,260 70,538,079 4.56
58,721,260 70,538,079 4.56
News TransmissionTeleperformance 282,844 EUR 54,571,580 76,735,577 4.96
54,571,580 76,735,577 4.96
TextileLVMH Moët Hennessy Louis Vuitton SE 77,461 EUR 28,849,796 39,574,825 2.56
28,849,796 39,574,825 2.56
Total France 206,610,529 240,981,858 15.58
Germany
ChemicalsSymrise AG 148,550 EUR 14,426,194 16,102,820 1.04
14,426,194 16,102,820 1.04
Electronics and electrical equipmentDr Hoenle AG 130,448 EUR 10,452,657 7,148,550 0.46Varta AG 273,715 EUR 26,995,924 32,353,113 2.09
37,448,581 39,501,663 2.55
Internet softwareNew Work SE 51,142 EUR 12,644,003 14,319,760 0.93
12,644,003 14,319,760 0.93
TextileZalando SE 280,924 EUR 21,952,505 25,580,940 1.65
21,952,505 25,580,940 1.65
Total Germany 86,471,283 95,505,183 6.17
COMGEST GROWTH plc
Comgest Growth Europe Opportunities
SCHEDULE OF INVESTMENTSAs at 31 December 2020(expressed in EUR)
388
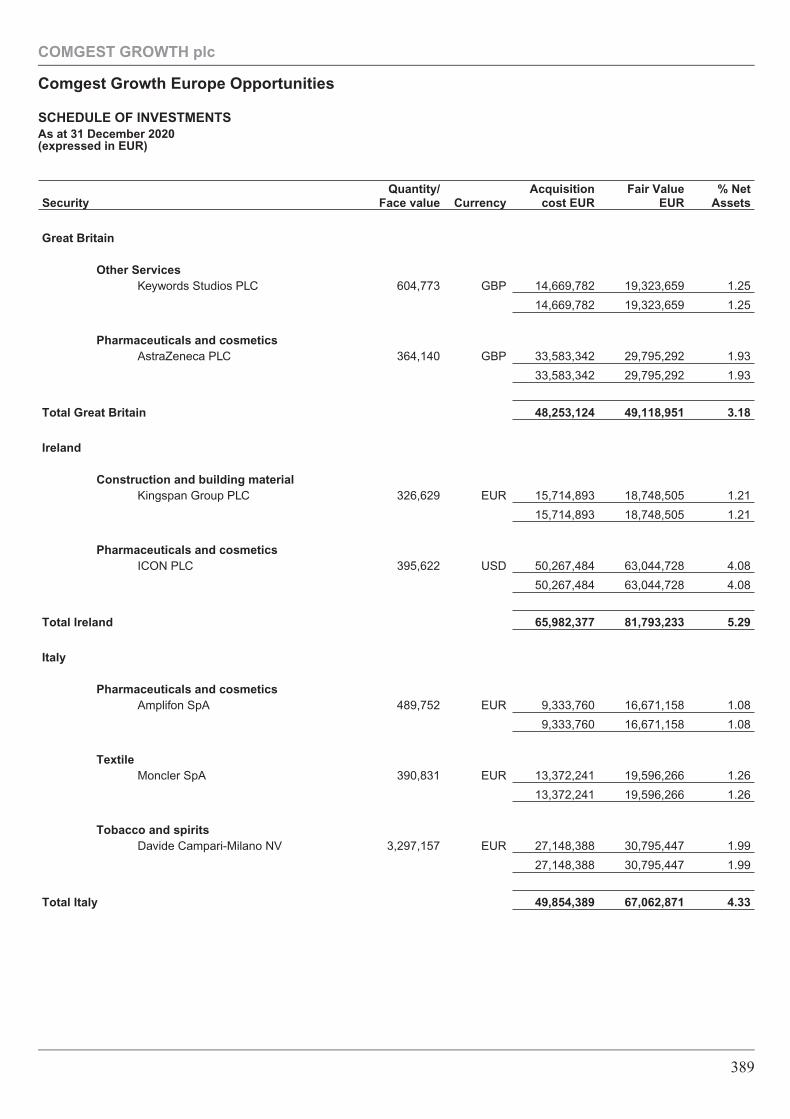
SecurityQuantity/
Face value CurrencyAcquisition
cost EURFair Value
EUR% Net
Assets
Great Britain
Other ServicesKeywords Studios PLC 604,773 GBP 14,669,782 19,323,659 1.25
14,669,782 19,323,659 1.25
Pharmaceuticals and cosmeticsAstraZeneca PLC 364,140 GBP 33,583,342 29,795,292 1.93
33,583,342 29,795,292 1.93
Total Great Britain 48,253,124 49,118,951 3.18
Ireland
Construction and building materialKingspan Group PLC 326,629 EUR 15,714,893 18,748,505 1.21
15,714,893 18,748,505 1.21
Pharmaceuticals and cosmeticsICON PLC 395,622 USD 50,267,484 63,044,728 4.08
50,267,484 63,044,728 4.08
Total Ireland 65,982,377 81,793,233 5.29
Italy
Pharmaceuticals and cosmeticsAmplifon SpA 489,752 EUR 9,333,760 16,671,158 1.08
9,333,760 16,671,158 1.08
TextileMoncler SpA 390,831 EUR 13,372,241 19,596,266 1.26
13,372,241 19,596,266 1.26
Tobacco and spiritsDavide Campari-Milano NV 3,297,157 EUR 27,148,388 30,795,447 1.99
27,148,388 30,795,447 1.99
Total Italy 49,854,389 67,062,871 4.33
COMGEST GROWTH plc
Comgest Growth Europe Opportunities
SCHEDULE OF INVESTMENTSAs at 31 December 2020(expressed in EUR)
389
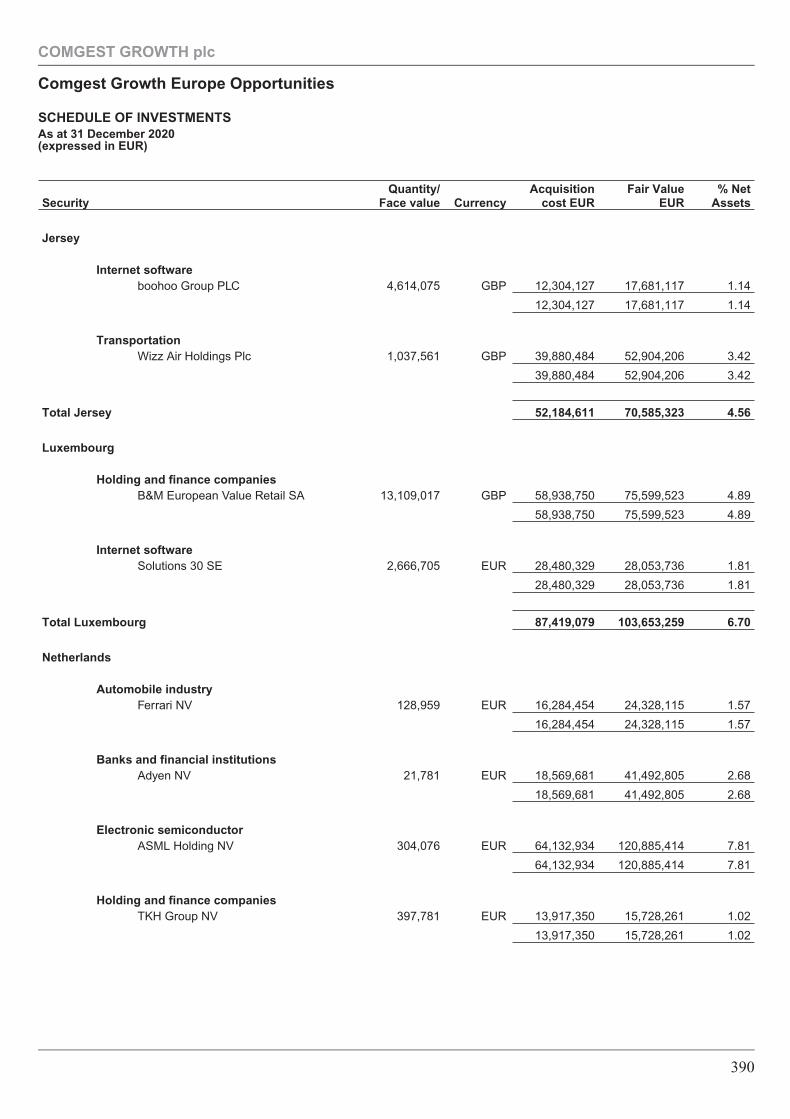
SecurityQuantity/
Face value CurrencyAcquisition
cost EURFair Value
EUR% Net
Assets
Jersey
Internet softwareboohoo Group PLC 4,614,075 GBP 12,304,127 17,681,117 1.14
12,304,127 17,681,117 1.14
TransportationWizz Air Holdings Plc 1,037,561 GBP 39,880,484 52,904,206 3.42
39,880,484 52,904,206 3.42
Total Jersey 52,184,611 70,585,323 4.56
Luxembourg
Holding and finance companiesB&M European Value Retail SA 13,109,017 GBP 58,938,750 75,599,523 4.89
58,938,750 75,599,523 4.89
Internet softwareSolutions 30 SE 2,666,705 EUR 28,480,329 28,053,736 1.81
28,480,329 28,053,736 1.81
Total Luxembourg 87,419,079 103,653,259 6.70
Netherlands
Automobile industryFerrari NV 128,959 EUR 16,284,454 24,328,115 1.57
16,284,454 24,328,115 1.57
Banks and financial institutionsAdyen NV 21,781 EUR 18,569,681 41,492,805 2.68
18,569,681 41,492,805 2.68
Electronic semiconductorASML Holding NV 304,076 EUR 64,132,934 120,885,414 7.81
64,132,934 120,885,414 7.81
Holding and finance companiesTKH Group NV 397,781 EUR 13,917,350 15,728,261 1.02
13,917,350 15,728,261 1.02
COMGEST GROWTH plc
Comgest Growth Europe Opportunities
SCHEDULE OF INVESTMENTSAs at 31 December 2020(expressed in EUR)
390
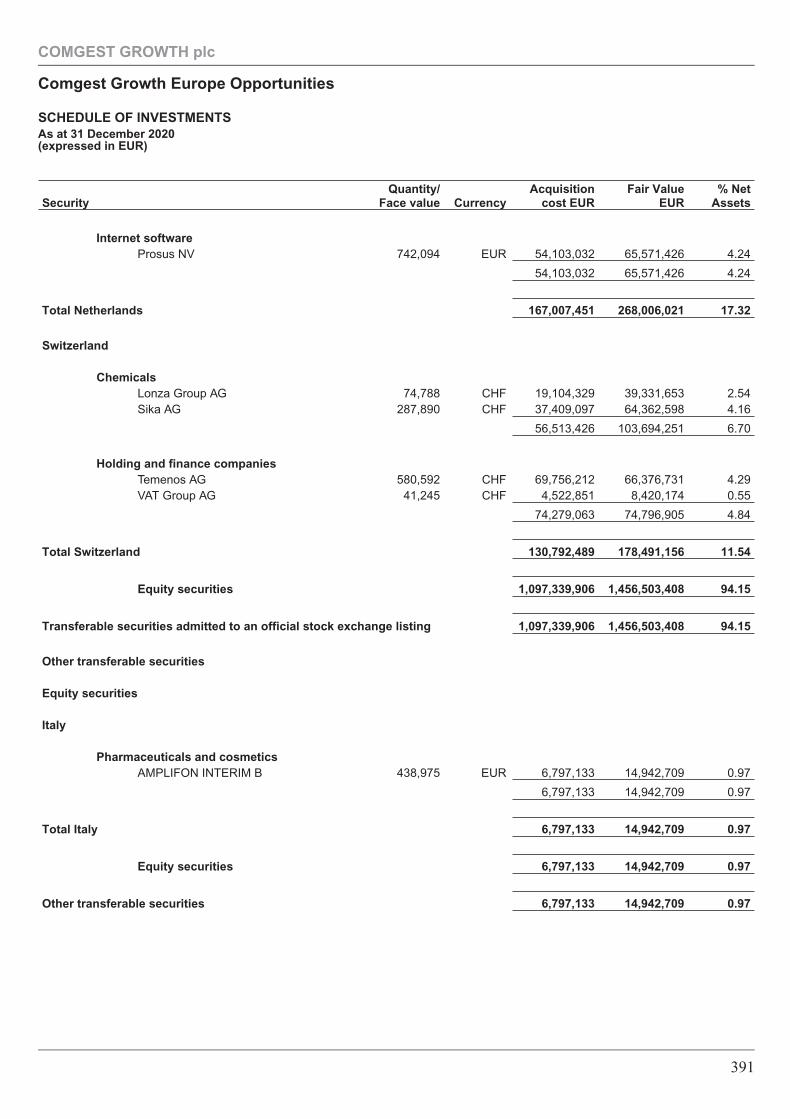
SecurityQuantity/
Face value CurrencyAcquisition
cost EURFair Value
EUR% Net
Assets
Internet softwareProsus NV 742,094 EUR 54,103,032 65,571,426 4.24
54,103,032 65,571,426 4.24
Total Netherlands 167,007,451 268,006,021 17.32
Switzerland
ChemicalsLonza Group AG 74,788 CHF 19,104,329 39,331,653 2.54Sika AG 287,890 CHF 37,409,097 64,362,598 4.16
56,513,426 103,694,251 6.70
Holding and finance companiesTemenos AG 580,592 CHF 69,756,212 66,376,731 4.29VAT Group AG 41,245 CHF 4,522,851 8,420,174 0.55
74,279,063 74,796,905 4.84
Total Switzerland 130,792,489 178,491,156 11.54
Equity securities 1,097,339,906 1,456,503,408 94.15
Transferable securities admitted to an official stock exchange listing 1,097,339,906 1,456,503,408 94.15
Other transferable securities
Equity securities
Italy
Pharmaceuticals and cosmeticsAMPLIFON INTERIM B 438,975 EUR 6,797,133 14,942,709 0.97
6,797,133 14,942,709 0.97
Total Italy 6,797,133 14,942,709 0.97
Equity securities 6,797,133 14,942,709 0.97
Other transferable securities 6,797,133 14,942,709 0.97
COMGEST GROWTH plc
Comgest Growth Europe Opportunities
SCHEDULE OF INVESTMENTSAs at 31 December 2020(expressed in EUR)
391
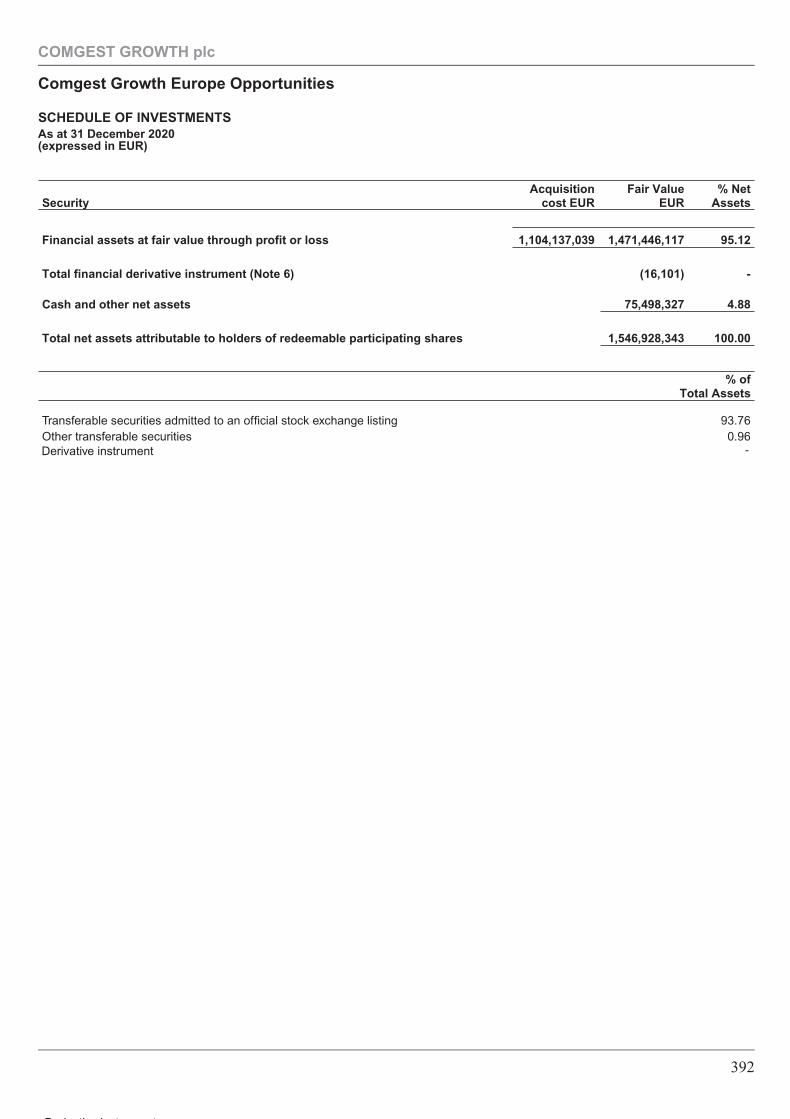
SecurityAcquisition
cost EURFair Value
EUR% Net
Assets
Financial assets at fair value through profit or loss 1,104,137,039 1,471,446,117 95.12
Total financial derivative instrument (Note 6) (16,101) -
Cash and other net assets 75,498,327 4.88
Total net assets attributable to holders of redeemable participating shares 1,546,928,343 100.00
% ofTotal Assets
Transferable securities admitted to an official stock exchange listing 93.76Other transferable securities 0.96
COMGEST GROWTH plc
Comgest Growth Europe Opportunities
SCHEDULE OF INVESTMENTSAs at 31 December 2020(expressed in EUR)
392
Derivative instrument -
Derivative instrument -
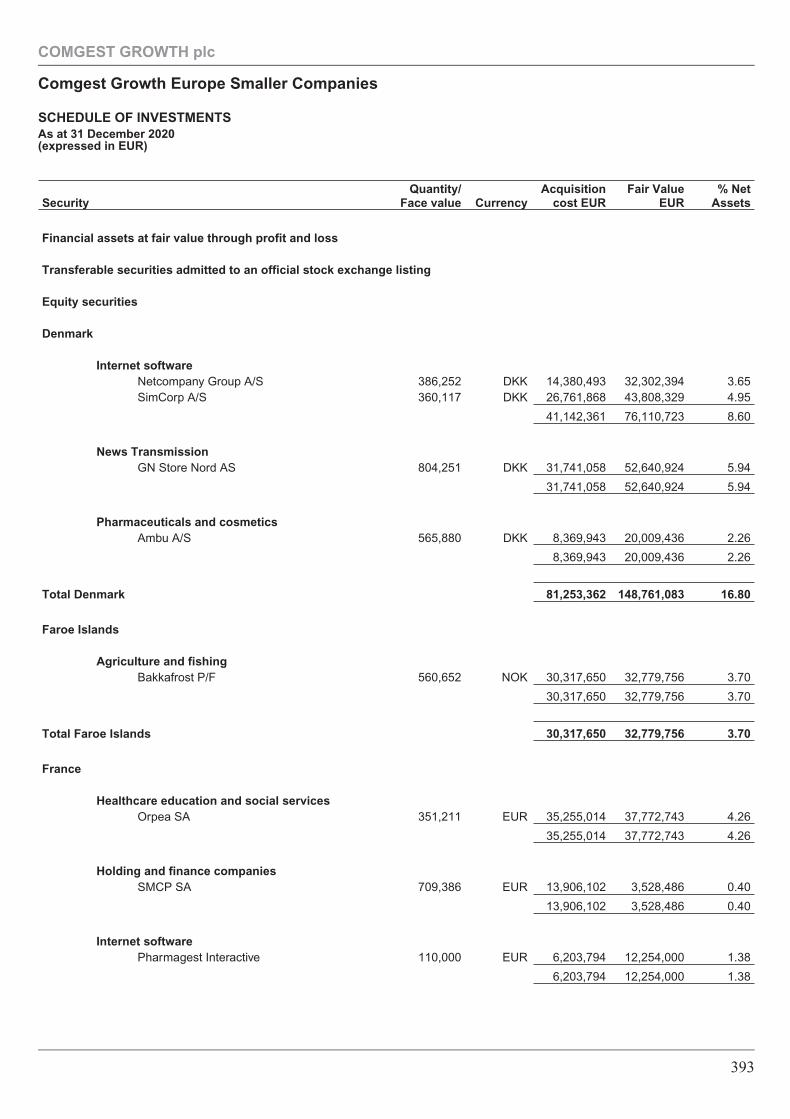
SecurityQuantity/
Face value CurrencyAcquisition
cost EURFair Value
EUR% Net
Assets
Financial assets at fair value through profit and loss
Transferable securities admitted to an official stock exchange listing
Equity securities
Denmark
Internet softwareNetcompany Group A/S 386,252 DKK 14,380,493 32,302,394 3.65SimCorp A/S 360,117 DKK 26,761,868 43,808,329 4.95
41,142,361 76,110,723 8.60
News TransmissionGN Store Nord AS 804,251 DKK 31,741,058 52,640,924 5.94
31,741,058 52,640,924 5.94
Pharmaceuticals and cosmeticsAmbu A/S 565,880 DKK 8,369,943 20,009,436 2.26
8,369,943 20,009,436 2.26
Total Denmark 81,253,362 148,761,083 16.80
Faroe Islands
Agriculture and fishingBakkafrost P/F 560,652 NOK 30,317,650 32,779,756 3.70
30,317,650 32,779,756 3.70
Total Faroe Islands 30,317,650 32,779,756 3.70
France
Healthcare education and social servicesOrpea SA 351,211 EUR 35,255,014 37,772,743 4.26
35,255,014 37,772,743 4.26
Holding and finance companiesSMCP SA 709,386 EUR 13,906,102 3,528,486 0.40
13,906,102 3,528,486 0.40
Internet softwarePharmagest Interactive 110,000 EUR 6,203,794 12,254,000 1.38
6,203,794 12,254,000 1.38
COMGEST GROWTH plc
Comgest Growth Europe Smaller Companies
SCHEDULE OF INVESTMENTSAs at 31 December 2020(expressed in EUR)
393
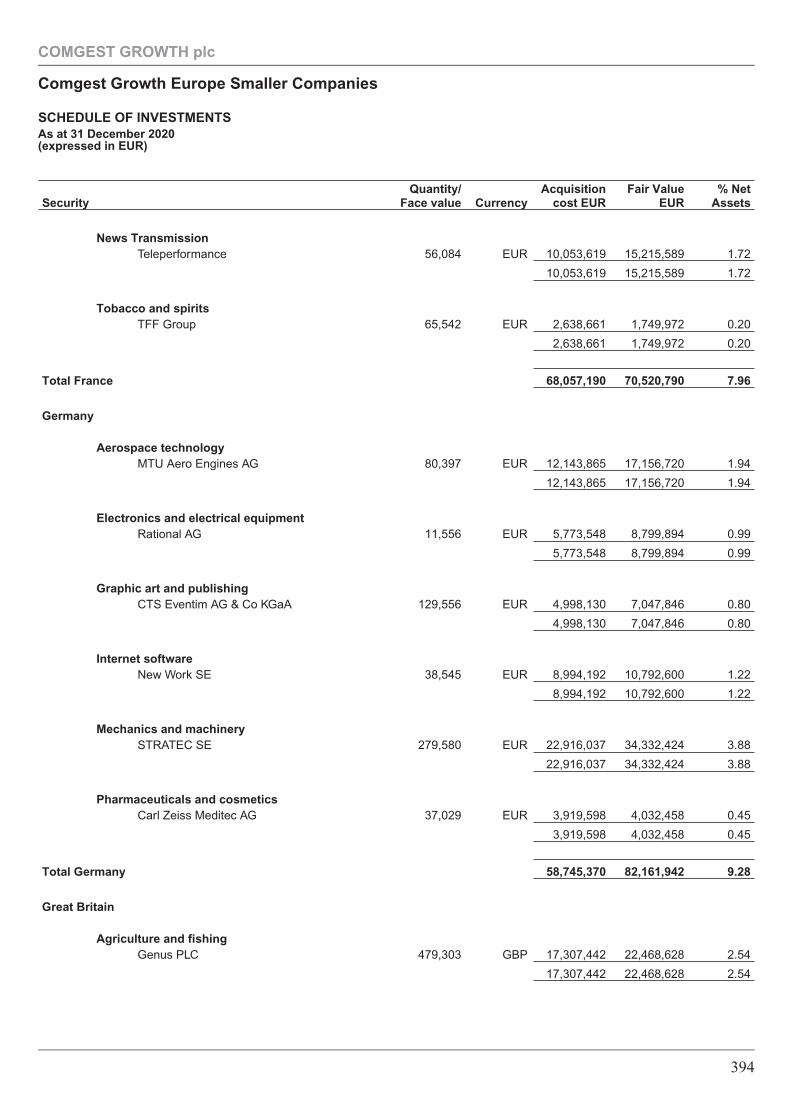
SecurityQuantity/
Face value CurrencyAcquisition
cost EURFair Value
EUR% Net
Assets
News TransmissionTeleperformance 56,084 EUR 10,053,619 15,215,589 1.72
10,053,619 15,215,589 1.72
Tobacco and spiritsTFF Group 65,542 EUR 2,638,661 1,749,972 0.20
2,638,661 1,749,972 0.20
Total France 68,057,190 70,520,790 7.96
Germany
Aerospace technologyMTU Aero Engines AG 80,397 EUR 12,143,865 17,156,720 1.94
12,143,865 17,156,720 1.94
Electronics and electrical equipmentRational AG 11,556 EUR 5,773,548 8,799,894 0.99
5,773,548 8,799,894 0.99
Graphic art and publishingCTS Eventim AG & Co KGaA 129,556 EUR 4,998,130 7,047,846 0.80
4,998,130 7,047,846 0.80
Internet softwareNew Work SE 38,545 EUR 8,994,192 10,792,600 1.22
8,994,192 10,792,600 1.22
Mechanics and machinerySTRATEC SE 279,580 EUR 22,916,037 34,332,424 3.88
22,916,037 34,332,424 3.88
Pharmaceuticals and cosmeticsCarl Zeiss Meditec AG 37,029 EUR 3,919,598 4,032,458 0.45
3,919,598 4,032,458 0.45
Total Germany 58,745,370 82,161,942 9.28
Great Britain
Agriculture and fishingGenus PLC 479,303 GBP 17,307,442 22,468,628 2.54
17,307,442 22,468,628 2.54
COMGEST GROWTH plc
Comgest Growth Europe Smaller Companies
SCHEDULE OF INVESTMENTSAs at 31 December 2020(expressed in EUR)
394
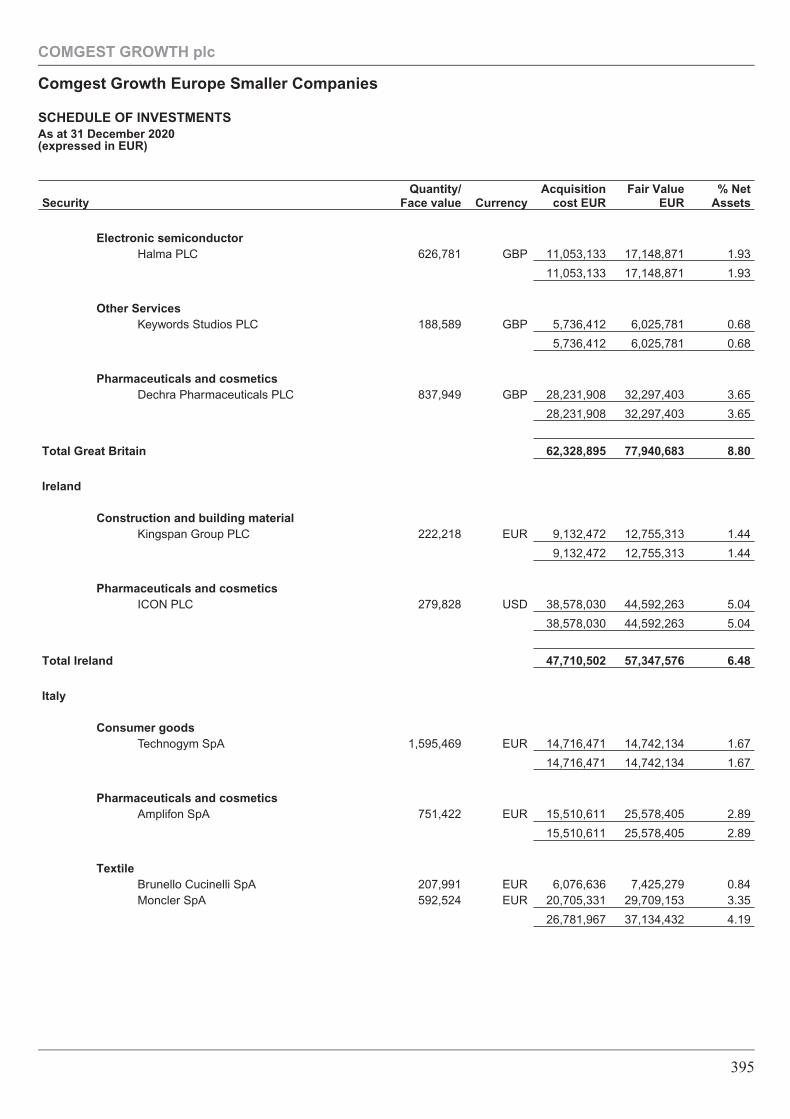
SecurityQuantity/
Face value CurrencyAcquisition
cost EURFair Value
EUR% Net
Assets
Electronic semiconductorHalma PLC 626,781 GBP 11,053,133 17,148,871 1.93
11,053,133 17,148,871 1.93
Other ServicesKeywords Studios PLC 188,589 GBP 5,736,412 6,025,781 0.68
5,736,412 6,025,781 0.68
Pharmaceuticals and cosmeticsDechra Pharmaceuticals PLC 837,949 GBP 28,231,908 32,297,403 3.65
28,231,908 32,297,403 3.65
Total Great Britain 62,328,895 77,940,683 8.80
Ireland
Construction and building materialKingspan Group PLC 222,218 EUR 9,132,472 12,755,313 1.44
9,132,472 12,755,313 1.44
Pharmaceuticals and cosmeticsICON PLC 279,828 USD 38,578,030 44,592,263 5.04
38,578,030 44,592,263 5.04
Total Ireland 47,710,502 57,347,576 6.48
Italy
Consumer goodsTechnogym SpA 1,595,469 EUR 14,716,471 14,742,134 1.67
14,716,471 14,742,134 1.67
Pharmaceuticals and cosmeticsAmplifon SpA 751,422 EUR 15,510,611 25,578,405 2.89
15,510,611 25,578,405 2.89
TextileBrunello Cucinelli SpA 207,991 EUR 6,076,636 7,425,279 0.84Moncler SpA 592,524 EUR 20,705,331 29,709,153 3.35
26,781,967 37,134,432 4.19
COMGEST GROWTH plc
Comgest Growth Europe Smaller Companies
SCHEDULE OF INVESTMENTSAs at 31 December 2020(expressed in EUR)
395
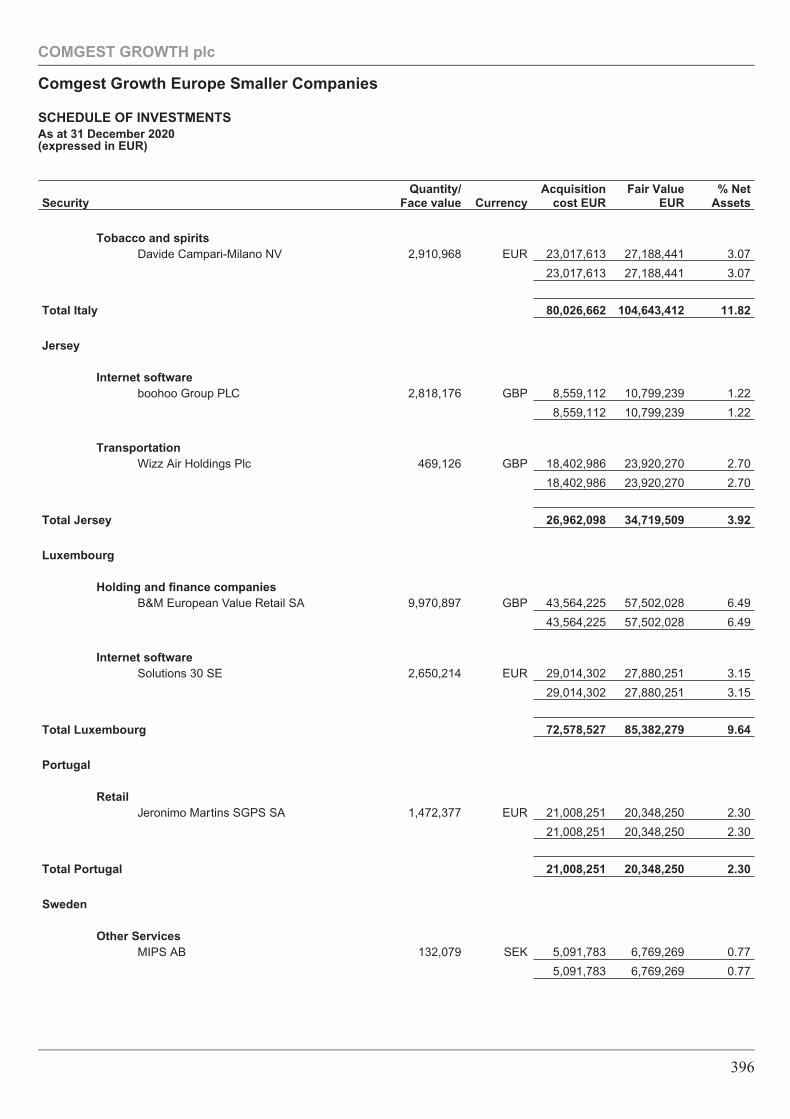
SecurityQuantity/
Face value CurrencyAcquisition
cost EURFair Value
EUR% Net
Assets
Tobacco and spiritsDavide Campari-Milano NV 2,910,968 EUR 23,017,613 27,188,441 3.07
23,017,613 27,188,441 3.07
Total Italy 80,026,662 104,643,412 11.82
Jersey
Internet softwareboohoo Group PLC 2,818,176 GBP 8,559,112 10,799,239 1.22
8,559,112 10,799,239 1.22
TransportationWizz Air Holdings Plc 469,126 GBP 18,402,986 23,920,270 2.70
18,402,986 23,920,270 2.70
Total Jersey 26,962,098 34,719,509 3.92
Luxembourg
Holding and finance companiesB&M European Value Retail SA 9,970,897 GBP 43,564,225 57,502,028 6.49
43,564,225 57,502,028 6.49
Internet softwareSolutions 30 SE 2,650,214 EUR 29,014,302 27,880,251 3.15
29,014,302 27,880,251 3.15
Total Luxembourg 72,578,527 85,382,279 9.64
Portugal
RetailJeronimo Martins SGPS SA 1,472,377 EUR 21,008,251 20,348,250 2.30
21,008,251 20,348,250 2.30
Total Portugal 21,008,251 20,348,250 2.30
Sweden
Other ServicesMIPS AB 132,079 SEK 5,091,783 6,769,269 0.77
5,091,783 6,769,269 0.77
COMGEST GROWTH plc
Comgest Growth Europe Smaller Companies
SCHEDULE OF INVESTMENTSAs at 31 December 2020(expressed in EUR)
396
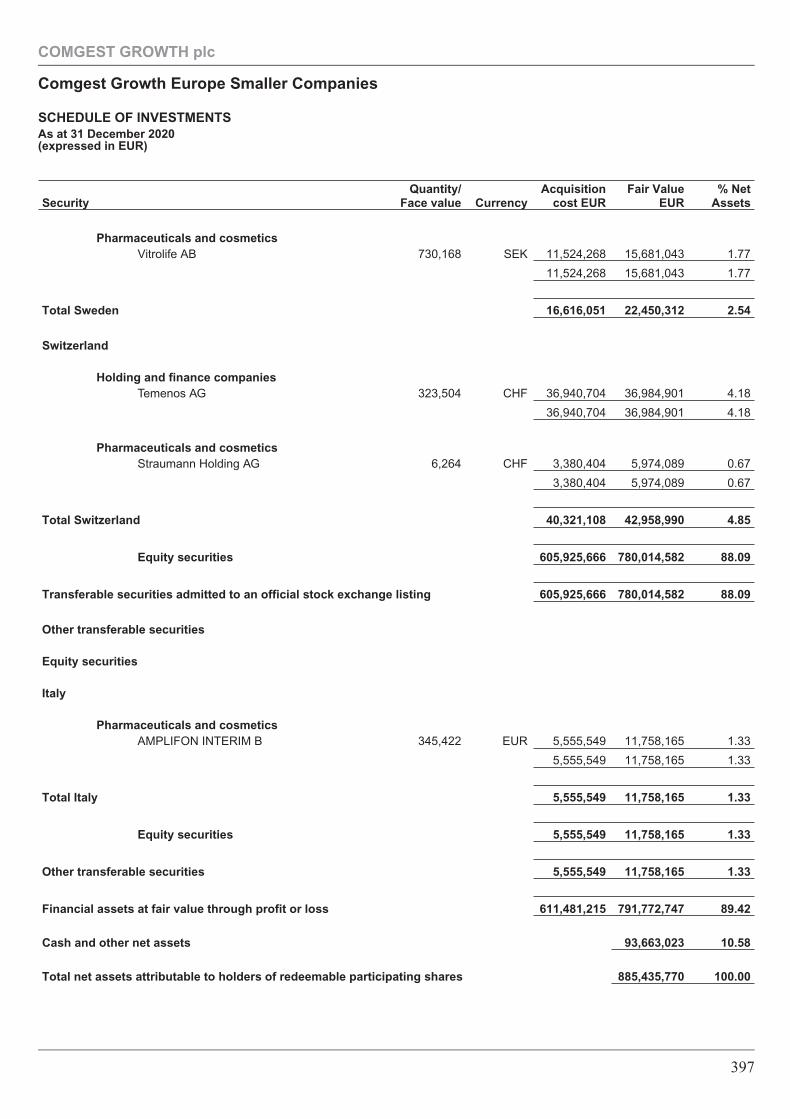
SecurityQuantity/
Face value CurrencyAcquisition
cost EURFair Value
EUR% Net
Assets
Pharmaceuticals and cosmeticsVitrolife AB 730,168 SEK 11,524,268 15,681,043 1.77
11,524,268 15,681,043 1.77
Total Sweden 16,616,051 22,450,312 2.54
Switzerland
Holding and finance companiesTemenos AG 323,504 CHF 36,940,704 36,984,901 4.18
36,940,704 36,984,901 4.18
Pharmaceuticals and cosmeticsStraumann Holding AG 6,264 CHF 3,380,404 5,974,089 0.67
3,380,404 5,974,089 0.67
Total Switzerland 40,321,108 42,958,990 4.85
Equity securities 605,925,666 780,014,582 88.09
Transferable securities admitted to an official stock exchange listing 605,925,666 780,014,582 88.09
Other transferable securities
Equity securities
Italy
Pharmaceuticals and cosmeticsAMPLIFON INTERIM B 345,422 EUR 5,555,549 11,758,165 1.33
5,555,549 11,758,165 1.33
Total Italy 5,555,549 11,758,165 1.33
Equity securities 5,555,549 11,758,165 1.33
Other transferable securities 5,555,549 11,758,165 1.33
Financial assets at fair value through profit or loss 611,481,215 791,772,747 89.42
Cash and other net assets 93,663,023 10.58
Total net assets attributable to holders of redeemable participating shares 885,435,770 100.00
COMGEST GROWTH plc
Comgest Growth Europe Smaller Companies
SCHEDULE OF INVESTMENTSAs at 31 December 2020(expressed in EUR)
397
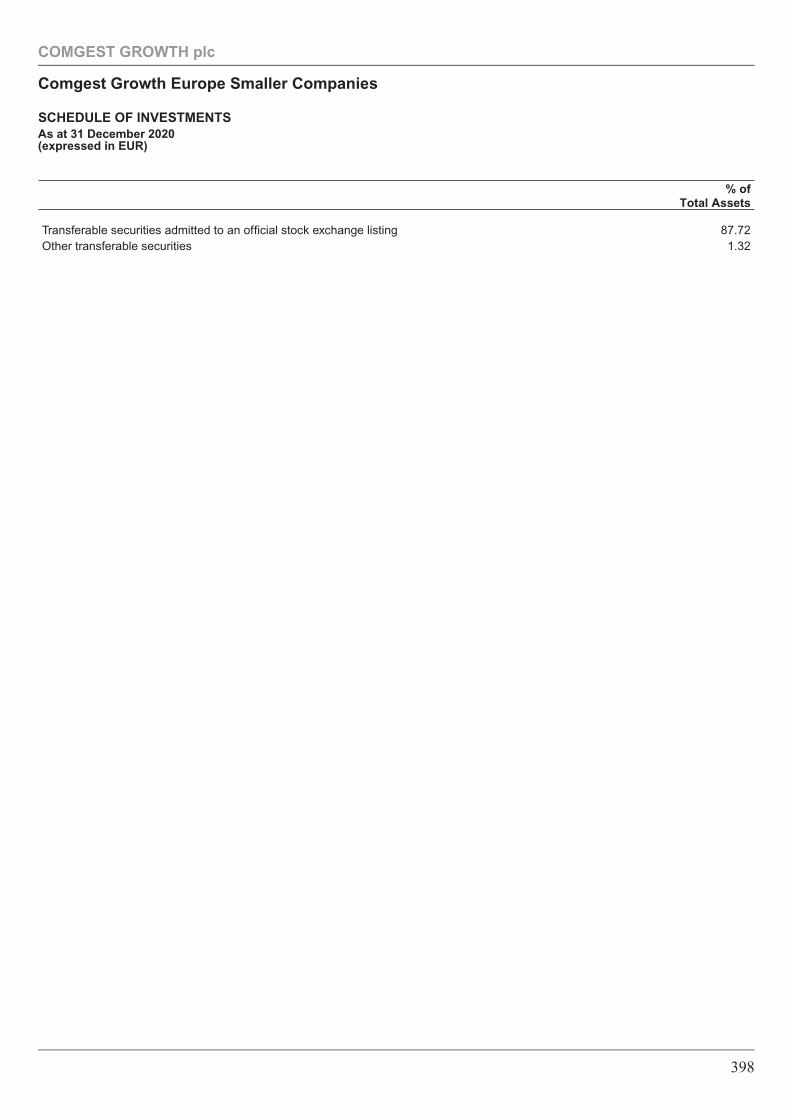
% ofTotal Assets
Transferable securities admitted to an official stock exchange listing 87.72Other transferable securities 1.32
COMGEST GROWTH plc
Comgest Growth Europe Smaller Companies
SCHEDULE OF INVESTMENTSAs at 31 December 2020(expressed in EUR)
398
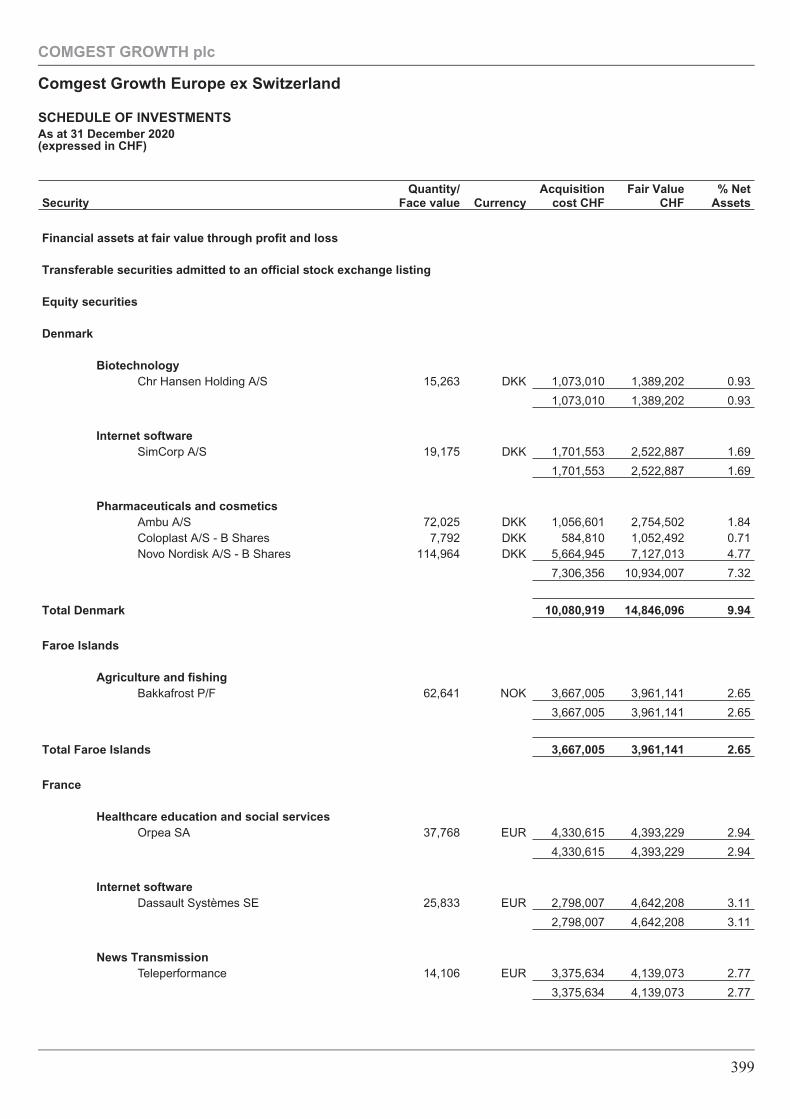
SecurityQuantity/
Face value CurrencyAcquisition
cost CHFFair Value
CHF% Net
Assets
Financial assets at fair value through profit and loss
Transferable securities admitted to an official stock exchange listing
Equity securities
Denmark
BiotechnologyChr Hansen Holding A/S 15,263 DKK 1,073,010 1,389,202 0.93
1,073,010 1,389,202 0.93
Internet softwareSimCorp A/S 19,175 DKK 1,701,553 2,522,887 1.69
1,701,553 2,522,887 1.69
Pharmaceuticals and cosmeticsAmbu A/S 72,025 DKK 1,056,601 2,754,502 1.84Coloplast A/S - B Shares 7,792 DKK 584,810 1,052,492 0.71Novo Nordisk A/S - B Shares 114,964 DKK 5,664,945 7,127,013 4.77
7,306,356 10,934,007 7.32
Total Denmark 10,080,919 14,846,096 9.94
Faroe Islands
Agriculture and fishingBakkafrost P/F 62,641 NOK 3,667,005 3,961,141 2.65
3,667,005 3,961,141 2.65
Total Faroe Islands 3,667,005 3,961,141 2.65
France
Healthcare education and social servicesOrpea SA 37,768 EUR 4,330,615 4,393,229 2.94
4,330,615 4,393,229 2.94
Internet softwareDassault Systèmes SE 25,833 EUR 2,798,007 4,642,208 3.11
2,798,007 4,642,208 3.11
News TransmissionTeleperformance 14,106 EUR 3,375,634 4,139,073 2.77
3,375,634 4,139,073 2.77
COMGEST GROWTH plc
Comgest Growth Europe ex Switzerland
SCHEDULE OF INVESTMENTSAs at 31 December 2020(expressed in CHF)
399
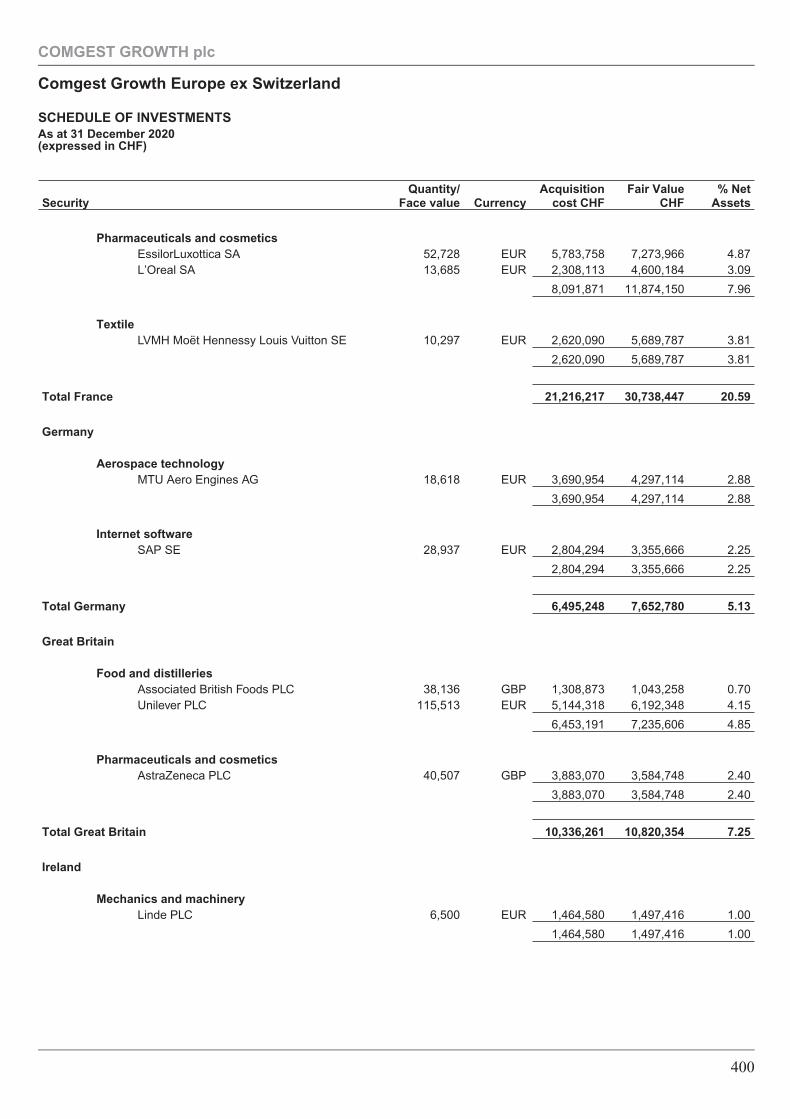
SecurityQuantity/
Face value CurrencyAcquisition
cost CHFFair Value
CHF% Net
Assets
Pharmaceuticals and cosmeticsEssilorLuxottica SA 52,728 EUR 5,783,758 7,273,966 4.87L’Oreal SA 13,685 EUR 2,308,113 4,600,184 3.09
8,091,871 11,874,150 7.96
TextileLVMH Moët Hennessy Louis Vuitton SE 10,297 EUR 2,620,090 5,689,787 3.81
2,620,090 5,689,787 3.81
Total France 21,216,217 30,738,447 20.59
Germany
Aerospace technologyMTU Aero Engines AG 18,618 EUR 3,690,954 4,297,114 2.88
3,690,954 4,297,114 2.88
Internet softwareSAP SE 28,937 EUR 2,804,294 3,355,666 2.25
2,804,294 3,355,666 2.25
Total Germany 6,495,248 7,652,780 5.13
Great Britain
Food and distilleriesAssociated British Foods PLC 38,136 GBP 1,308,873 1,043,258 0.70Unilever PLC 115,513 EUR 5,144,318 6,192,348 4.15
6,453,191 7,235,606 4.85
Pharmaceuticals and cosmeticsAstraZeneca PLC 40,507 GBP 3,883,070 3,584,748 2.40
3,883,070 3,584,748 2.40
Total Great Britain 10,336,261 10,820,354 7.25
Ireland
Mechanics and machineryLinde PLC 6,500 EUR 1,464,580 1,497,416 1.00
1,464,580 1,497,416 1.00
COMGEST GROWTH plc
Comgest Growth Europe ex Switzerland
SCHEDULE OF INVESTMENTSAs at 31 December 2020(expressed in CHF)
400
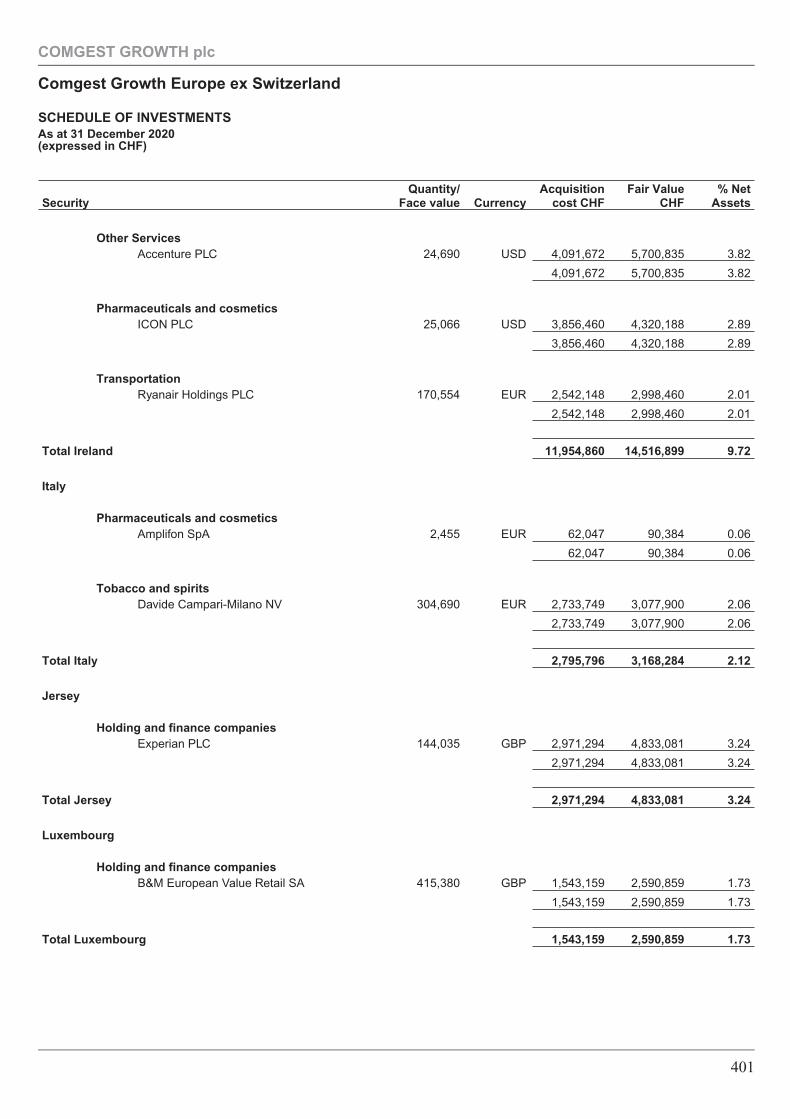
SecurityQuantity/
Face value CurrencyAcquisition
cost CHFFair Value
CHF% Net
Assets
Other ServicesAccenture PLC 24,690 USD 4,091,672 5,700,835 3.82
4,091,672 5,700,835 3.82
Pharmaceuticals and cosmeticsICON PLC 25,066 USD 3,856,460 4,320,188 2.89
3,856,460 4,320,188 2.89
TransportationRyanair Holdings PLC 170,554 EUR 2,542,148 2,998,460 2.01
2,542,148 2,998,460 2.01
Total Ireland 11,954,860 14,516,899 9.72
Italy
Pharmaceuticals and cosmeticsAmplifon SpA 2,455 EUR 62,047 90,384 0.06
62,047 90,384 0.06
Tobacco and spiritsDavide Campari-Milano NV 304,690 EUR 2,733,749 3,077,900 2.06
2,733,749 3,077,900 2.06
Total Italy 2,795,796 3,168,284 2.12
Jersey
Holding and finance companiesExperian PLC 144,035 GBP 2,971,294 4,833,081 3.24
2,971,294 4,833,081 3.24
Total Jersey 2,971,294 4,833,081 3.24
Luxembourg
Holding and finance companiesB&M European Value Retail SA 415,380 GBP 1,543,159 2,590,859 1.73
1,543,159 2,590,859 1.73
Total Luxembourg 1,543,159 2,590,859 1.73
COMGEST GROWTH plc
Comgest Growth Europe ex Switzerland
SCHEDULE OF INVESTMENTSAs at 31 December 2020(expressed in CHF)
401
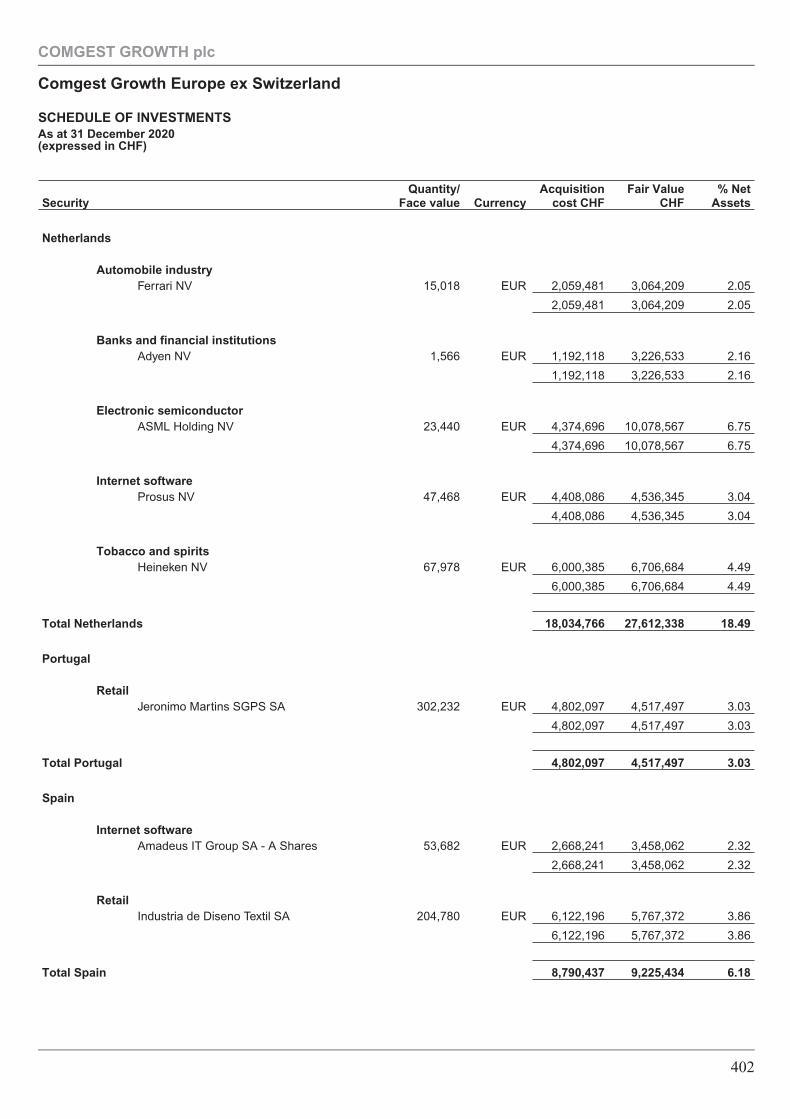
SecurityQuantity/
Face value CurrencyAcquisition
cost CHFFair Value
CHF% Net
Assets
Netherlands
Automobile industryFerrari NV 15,018 EUR 2,059,481 3,064,209 2.05
2,059,481 3,064,209 2.05
Banks and financial institutionsAdyen NV 1,566 EUR 1,192,118 3,226,533 2.16
1,192,118 3,226,533 2.16
Electronic semiconductorASML Holding NV 23,440 EUR 4,374,696 10,078,567 6.75
4,374,696 10,078,567 6.75
Internet softwareProsus NV 47,468 EUR 4,408,086 4,536,345 3.04
4,408,086 4,536,345 3.04
Tobacco and spiritsHeineken NV 67,978 EUR 6,000,385 6,706,684 4.49
6,000,385 6,706,684 4.49
Total Netherlands 18,034,766 27,612,338 18.49
Portugal
RetailJeronimo Martins SGPS SA 302,232 EUR 4,802,097 4,517,497 3.03
4,802,097 4,517,497 3.03
Total Portugal 4,802,097 4,517,497 3.03
Spain
Internet softwareAmadeus IT Group SA - A Shares 53,682 EUR 2,668,241 3,458,062 2.32
2,668,241 3,458,062 2.32
RetailIndustria de Diseno Textil SA 204,780 EUR 6,122,196 5,767,372 3.86
6,122,196 5,767,372 3.86
Total Spain 8,790,437 9,225,434 6.18
COMGEST GROWTH plc
Comgest Growth Europe ex Switzerland
SCHEDULE OF INVESTMENTSAs at 31 December 2020(expressed in CHF)
402
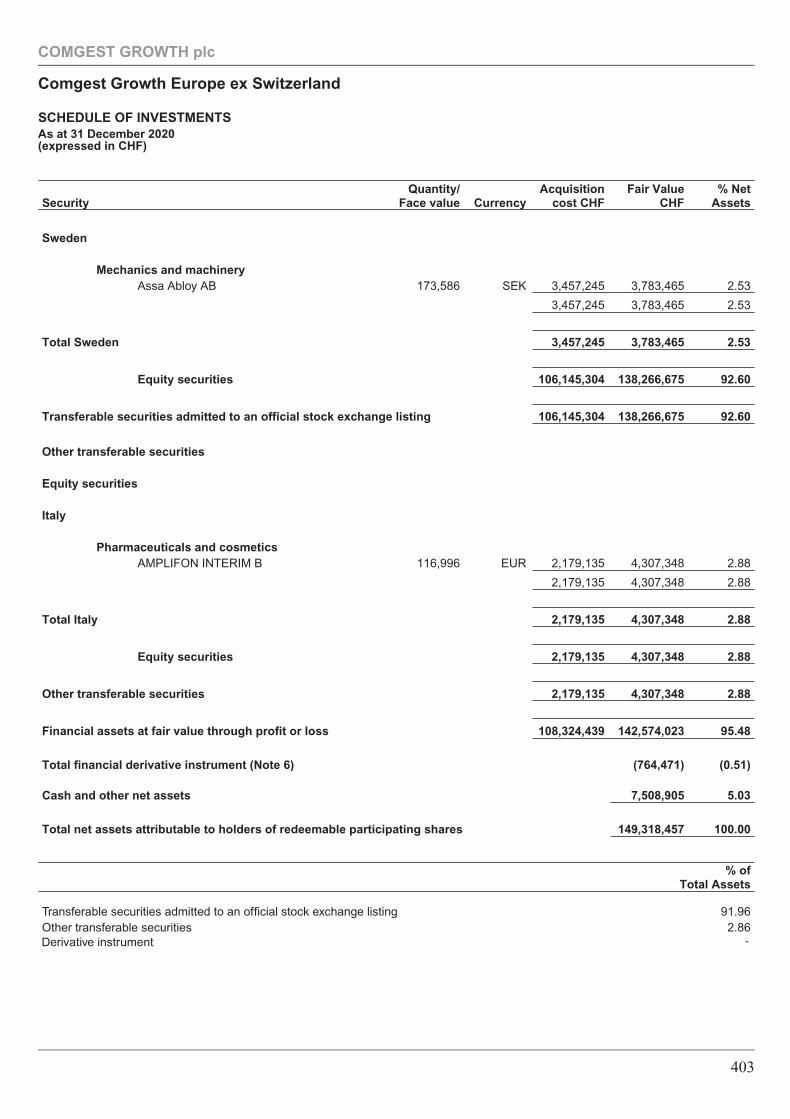
SecurityQuantity/
Face value CurrencyAcquisition
cost CHFFair Value
CHF% Net
Assets
Sweden
Mechanics and machineryAssa Abloy AB 173,586 SEK 3,457,245 3,783,465 2.53
3,457,245 3,783,465 2.53
Total Sweden 3,457,245 3,783,465 2.53
Equity securities 106,145,304 138,266,675 92.60
Transferable securities admitted to an official stock exchange listing 106,145,304 138,266,675 92.60
Other transferable securities
Equity securities
Italy
Pharmaceuticals and cosmeticsAMPLIFON INTERIM B 116,996 EUR 2,179,135 4,307,348 2.88
2,179,135 4,307,348 2.88
Total Italy 2,179,135 4,307,348 2.88
Equity securities 2,179,135 4,307,348 2.88
Other transferable securities 2,179,135 4,307,348 2.88
Financial assets at fair value through profit or loss 108,324,439 142,574,023 95.48
Total financial derivative instrument (Note 6) (764,471) (0.51)
Cash and other net assets 7,508,905 5.03
Total net assets attributable to holders of redeemable participating shares 149,318,457 100.00
% ofTotal Assets
Transferable securities admitted to an official stock exchange listing 91.96Other transferable securities 2.86
COMGEST GROWTH plc
Comgest Growth Europe ex Switzerland
SCHEDULE OF INVESTMENTSAs at 31 December 2020(expressed in CHF)
403
Derivative instrument -
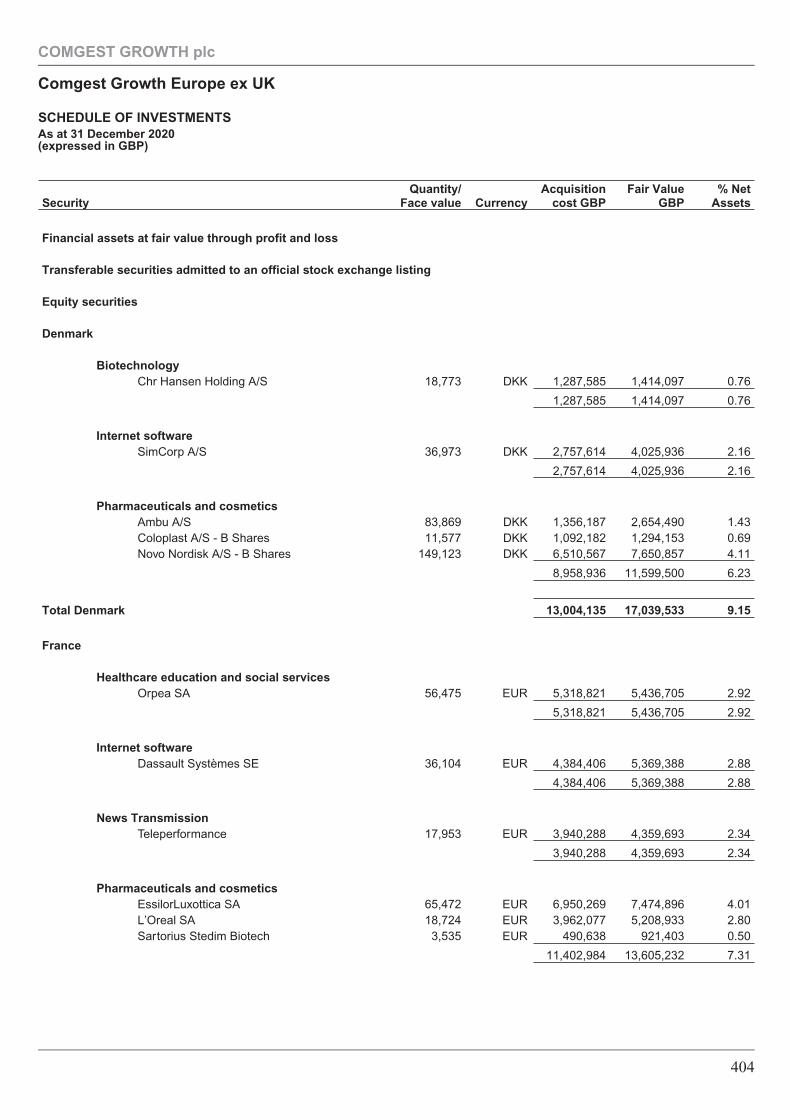
SecurityQuantity/
Face value CurrencyAcquisition
cost GBPFair Value
GBP% Net
Assets
Financial assets at fair value through profit and loss
Transferable securities admitted to an official stock exchange listing
Equity securities
Denmark
BiotechnologyChr Hansen Holding A/S 18,773 DKK 1,287,585 1,414,097 0.76
1,287,585 1,414,097 0.76
Internet softwareSimCorp A/S 36,973 DKK 2,757,614 4,025,936 2.16
2,757,614 4,025,936 2.16
Pharmaceuticals and cosmeticsAmbu A/S 83,869 DKK 1,356,187 2,654,490 1.43Coloplast A/S - B Shares 11,577 DKK 1,092,182 1,294,153 0.69Novo Nordisk A/S - B Shares 149,123 DKK 6,510,567 7,650,857 4.11
8,958,936 11,599,500 6.23
Total Denmark 13,004,135 17,039,533 9.15
France
Healthcare education and social servicesOrpea SA 56,475 EUR 5,318,821 5,436,705 2.92
5,318,821 5,436,705 2.92
Internet softwareDassault Systèmes SE 36,104 EUR 4,384,406 5,369,388 2.88
4,384,406 5,369,388 2.88
News TransmissionTeleperformance 17,953 EUR 3,940,288 4,359,693 2.34
3,940,288 4,359,693 2.34
Pharmaceuticals and cosmeticsEssilorLuxottica SA 65,472 EUR 6,950,269 7,474,896 4.01L’Oreal SA 18,724 EUR 3,962,077 5,208,933 2.80Sartorius Stedim Biotech 3,535 EUR 490,638 921,403 0.50
11,402,984 13,605,232 7.31
COMGEST GROWTH plc
Comgest Growth Europe ex UK
SCHEDULE OF INVESTMENTSAs at 31 December 2020(expressed in GBP)
404
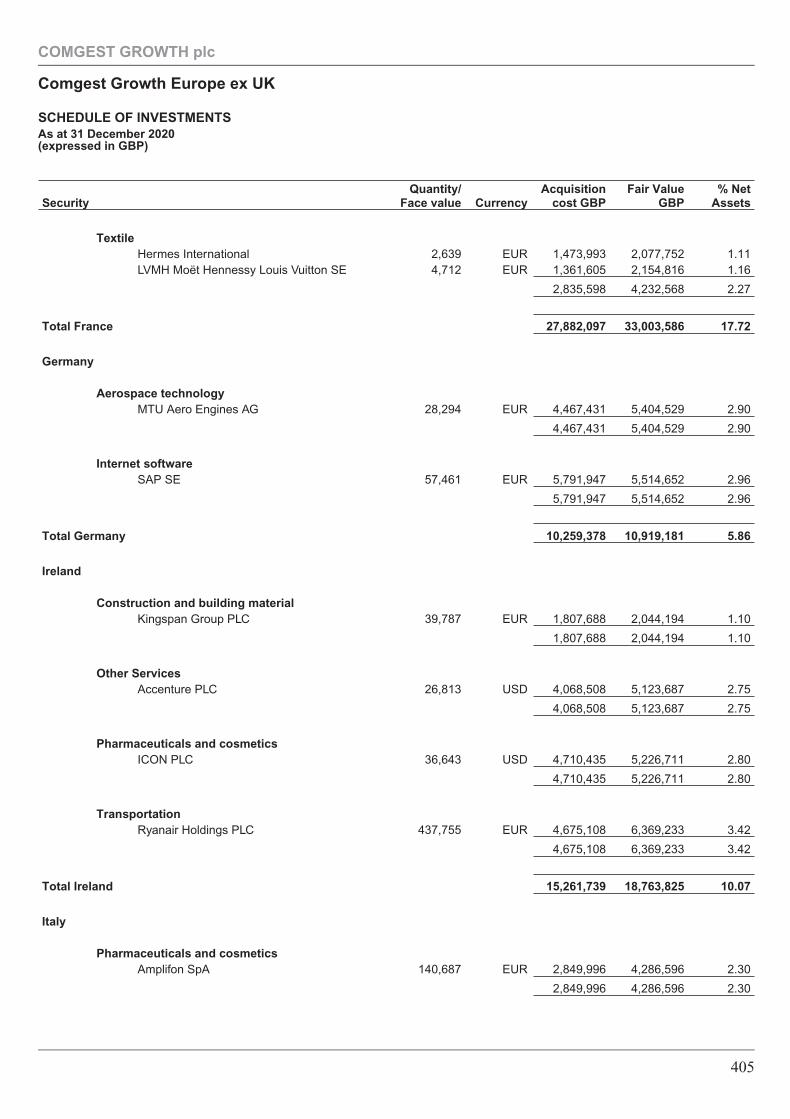
SecurityQuantity/
Face value CurrencyAcquisition
cost GBPFair Value
GBP% Net
Assets
TextileHermes International 2,639 EUR 1,473,993 2,077,752 1.11LVMH Moët Hennessy Louis Vuitton SE 4,712 EUR 1,361,605 2,154,816 1.16
2,835,598 4,232,568 2.27
Total France 27,882,097 33,003,586 17.72
Germany
Aerospace technologyMTU Aero Engines AG 28,294 EUR 4,467,431 5,404,529 2.90
4,467,431 5,404,529 2.90
Internet softwareSAP SE 57,461 EUR 5,791,947 5,514,652 2.96
5,791,947 5,514,652 2.96
Total Germany 10,259,378 10,919,181 5.86
Ireland
Construction and building materialKingspan Group PLC 39,787 EUR 1,807,688 2,044,194 1.10
1,807,688 2,044,194 1.10
Other ServicesAccenture PLC 26,813 USD 4,068,508 5,123,687 2.75
4,068,508 5,123,687 2.75
Pharmaceuticals and cosmeticsICON PLC 36,643 USD 4,710,435 5,226,711 2.80
4,710,435 5,226,711 2.80
TransportationRyanair Holdings PLC 437,755 EUR 4,675,108 6,369,233 3.42
4,675,108 6,369,233 3.42
Total Ireland 15,261,739 18,763,825 10.07
Italy
Pharmaceuticals and cosmeticsAmplifon SpA 140,687 EUR 2,849,996 4,286,596 2.30
2,849,996 4,286,596 2.30
COMGEST GROWTH plc
Comgest Growth Europe ex UK
SCHEDULE OF INVESTMENTSAs at 31 December 2020(expressed in GBP)
405
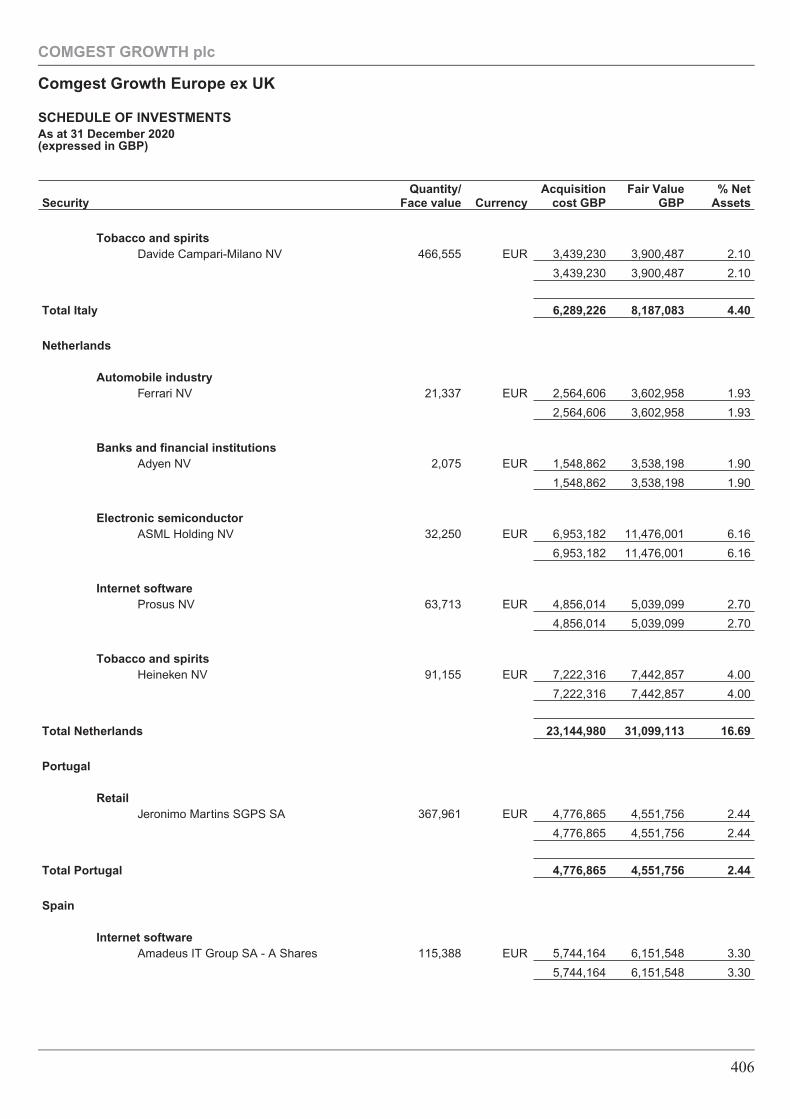
SecurityQuantity/
Face value CurrencyAcquisition
cost GBPFair Value
GBP% Net
Assets
Tobacco and spiritsDavide Campari-Milano NV 466,555 EUR 3,439,230 3,900,487 2.10
3,439,230 3,900,487 2.10
Total Italy 6,289,226 8,187,083 4.40
Netherlands
Automobile industryFerrari NV 21,337 EUR 2,564,606 3,602,958 1.93
2,564,606 3,602,958 1.93
Banks and financial institutionsAdyen NV 2,075 EUR 1,548,862 3,538,198 1.90
1,548,862 3,538,198 1.90
Electronic semiconductorASML Holding NV 32,250 EUR 6,953,182 11,476,001 6.16
6,953,182 11,476,001 6.16
Internet softwareProsus NV 63,713 EUR 4,856,014 5,039,099 2.70
4,856,014 5,039,099 2.70
Tobacco and spiritsHeineken NV 91,155 EUR 7,222,316 7,442,857 4.00
7,222,316 7,442,857 4.00
Total Netherlands 23,144,980 31,099,113 16.69
Portugal
RetailJeronimo Martins SGPS SA 367,961 EUR 4,776,865 4,551,756 2.44
4,776,865 4,551,756 2.44
Total Portugal 4,776,865 4,551,756 2.44
Spain
Internet softwareAmadeus IT Group SA - A Shares 115,388 EUR 5,744,164 6,151,548 3.30
5,744,164 6,151,548 3.30
COMGEST GROWTH plc
Comgest Growth Europe ex UK
SCHEDULE OF INVESTMENTSAs at 31 December 2020(expressed in GBP)
406
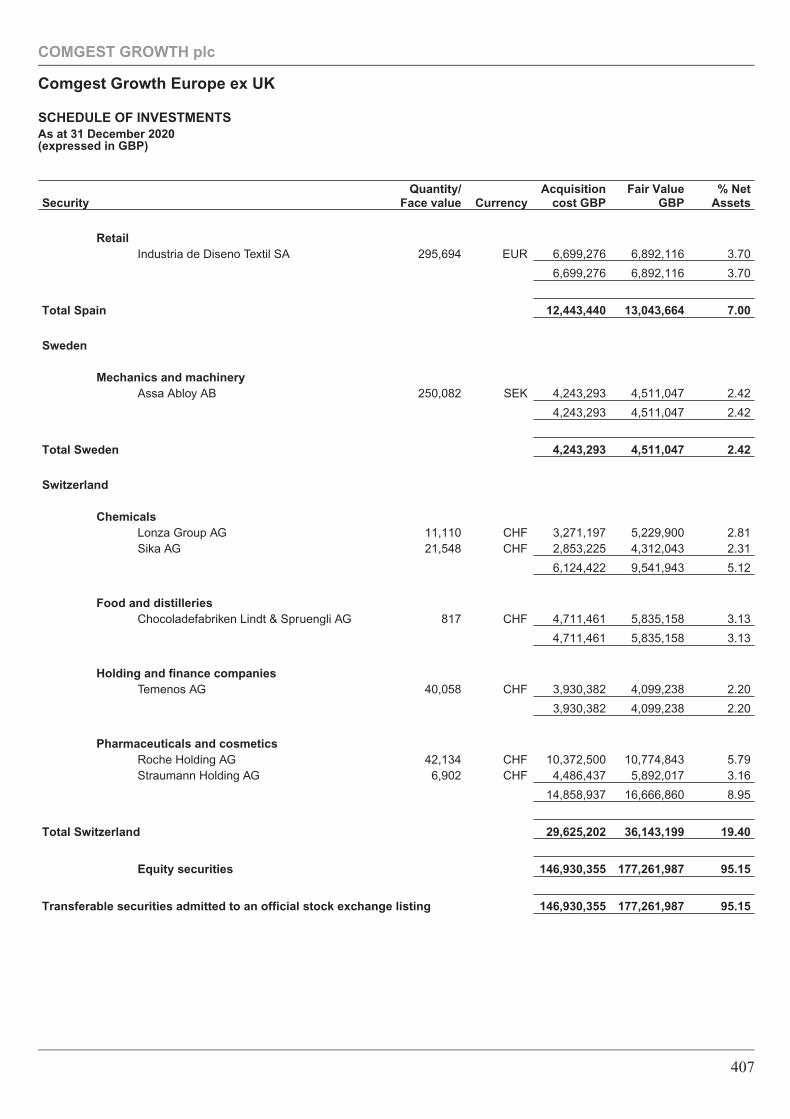
SecurityQuantity/
Face value CurrencyAcquisition
cost GBPFair Value
GBP% Net
Assets
RetailIndustria de Diseno Textil SA 295,694 EUR 6,699,276 6,892,116 3.70
6,699,276 6,892,116 3.70
Total Spain 12,443,440 13,043,664 7.00
Sweden
Mechanics and machineryAssa Abloy AB 250,082 SEK 4,243,293 4,511,047 2.42
4,243,293 4,511,047 2.42
Total Sweden 4,243,293 4,511,047 2.42
Switzerland
ChemicalsLonza Group AG 11,110 CHF 3,271,197 5,229,900 2.81Sika AG 21,548 CHF 2,853,225 4,312,043 2.31
6,124,422 9,541,943 5.12
Food and distilleriesChocoladefabriken Lindt & Spruengli AG 817 CHF 4,711,461 5,835,158 3.13
4,711,461 5,835,158 3.13
Holding and finance companiesTemenos AG 40,058 CHF 3,930,382 4,099,238 2.20
3,930,382 4,099,238 2.20
Pharmaceuticals and cosmeticsRoche Holding AG 42,134 CHF 10,372,500 10,774,843 5.79Straumann Holding AG 6,902 CHF 4,486,437 5,892,017 3.16
14,858,937 16,666,860 8.95
Total Switzerland 29,625,202 36,143,199 19.40
Equity securities 146,930,355 177,261,987 95.15
Transferable securities admitted to an official stock exchange listing 146,930,355 177,261,987 95.15
COMGEST GROWTH plc
Comgest Growth Europe ex UK
SCHEDULE OF INVESTMENTSAs at 31 December 2020(expressed in GBP)
407
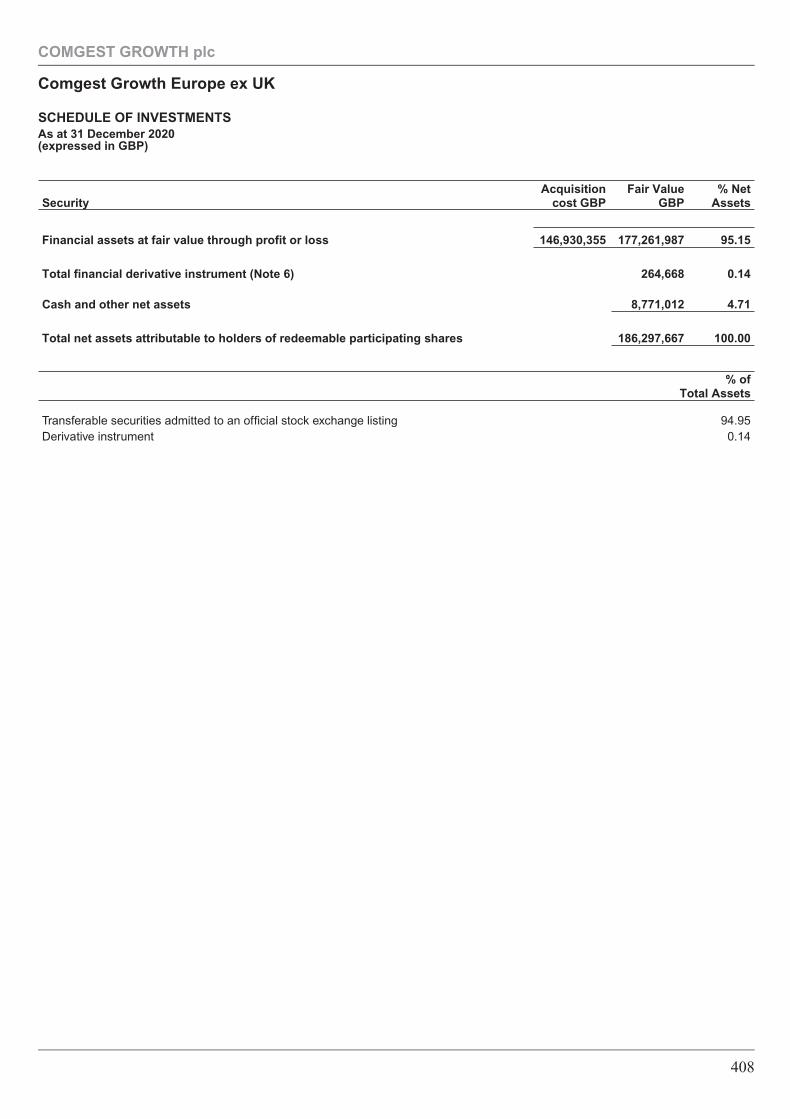
SecurityAcquisition
cost GBPFair Value
GBP% Net
Assets
Financial assets at fair value through profit or loss 146,930,355 177,261,987 95.15
Total financial derivative instrument (Note 6) 264,668 0.14
Cash and other net assets 8,771,012 4.71
Total net assets attributable to holders of redeemable participating shares 186,297,667 100.00
% ofTotal Assets
Transferable securities admitted to an official stock exchange listing 94.95Derivative instrument 0.14
COMGEST GROWTH plc
Comgest Growth Europe ex UK
SCHEDULE OF INVESTMENTSAs at 31 December 2020(expressed in GBP)
408
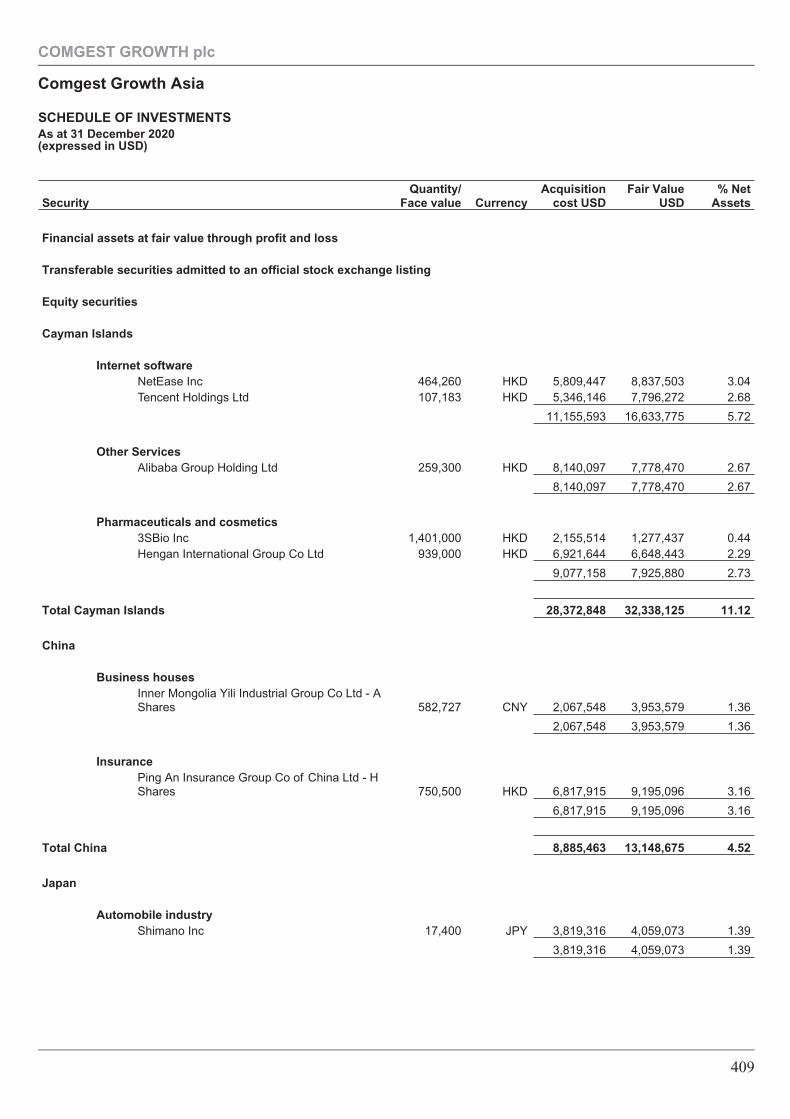
SecurityQuantity/
Face value CurrencyAcquisition
cost USDFair Value
USD% Net
Assets
Financial assets at fair value through profit and loss
Transferable securities admitted to an official stock exchange listing
Equity securities
Cayman Islands
Internet softwareNetEase Inc 464,260 HKD 5,809,447 8,837,503 3.04Tencent Holdings Ltd 107,183 HKD 5,346,146 7,796,272 2.68
11,155,593 16,633,775 5.72
Other ServicesAlibaba Group Holding Ltd 259,300 HKD 8,140,097 7,778,470 2.67
8,140,097 7,778,470 2.67
Pharmaceuticals and cosmetics3SBio Inc 1,401,000 HKD 2,155,514 1,277,437 0.44Hengan International Group Co Ltd 939,000 HKD 6,921,644 6,648,443 2.29
9,077,158 7,925,880 2.73
Total Cayman Islands 28,372,848 32,338,125 11.12
China
Business housesInner Mongolia Yili Industrial Group Co Ltd - AShares 582,727 CNY 2,067,548 3,953,579 1.36
2,067,548 3,953,579 1.36
InsurancePing An Insurance Group Co of China Ltd - HShares 750,500 HKD 6,817,915 9,195,096 3.16
6,817,915 9,195,096 3.16
Total China 8,885,463 13,148,675 4.52
Japan
Automobile industryShimano Inc 17,400 JPY 3,819,316 4,059,073 1.39
3,819,316 4,059,073 1.39
COMGEST GROWTH plc
Comgest Growth Asia
SCHEDULE OF INVESTMENTSAs at 31 December 2020(expressed in USD)
409
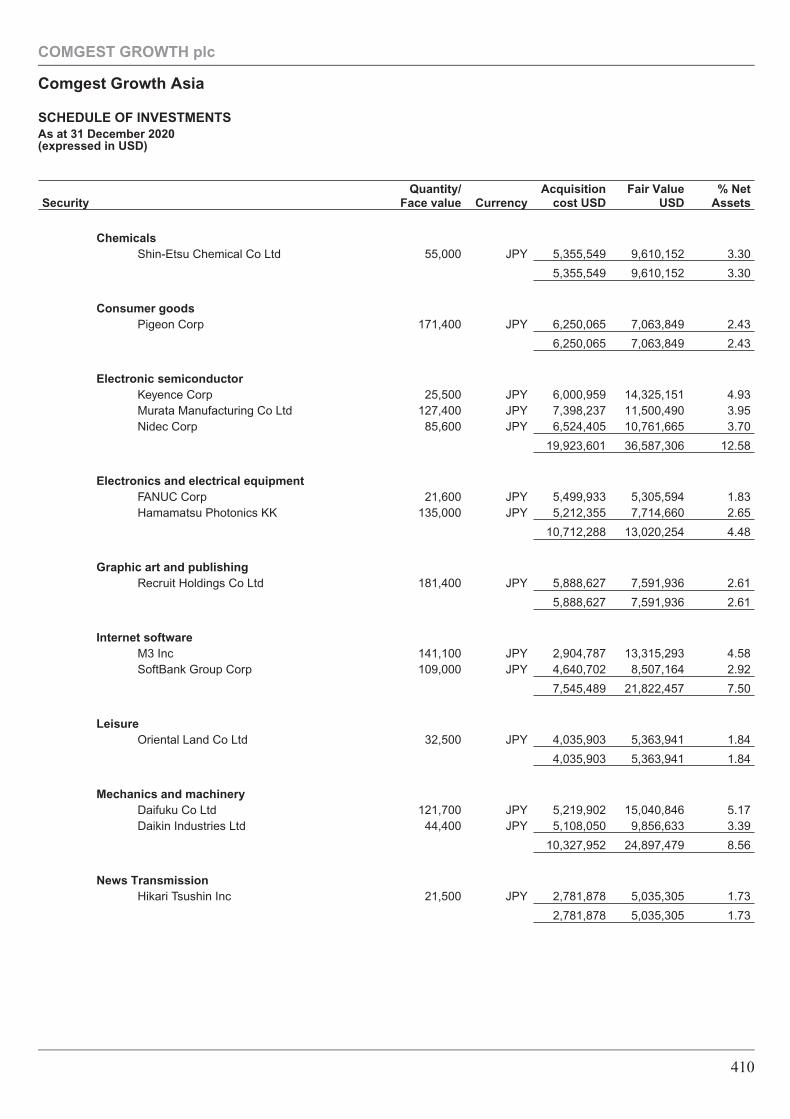
SecurityQuantity/
Face value CurrencyAcquisition
cost USDFair Value
USD% Net
Assets
ChemicalsShin-Etsu Chemical Co Ltd 55,000 JPY 5,355,549 9,610,152 3.30
5,355,549 9,610,152 3.30
Consumer goodsPigeon Corp 171,400 JPY 6,250,065 7,063,849 2.43
6,250,065 7,063,849 2.43
Electronic semiconductorKeyence Corp 25,500 JPY 6,000,959 14,325,151 4.93Murata Manufacturing Co Ltd 127,400 JPY 7,398,237 11,500,490 3.95Nidec Corp 85,600 JPY 6,524,405 10,761,665 3.70
19,923,601 36,587,306 12.58
Electronics and electrical equipmentFANUC Corp 21,600 JPY 5,499,933 5,305,594 1.83Hamamatsu Photonics KK 135,000 JPY 5,212,355 7,714,660 2.65
10,712,288 13,020,254 4.48
Graphic art and publishingRecruit Holdings Co Ltd 181,400 JPY 5,888,627 7,591,936 2.61
5,888,627 7,591,936 2.61
Internet softwareM3 Inc 141,100 JPY 2,904,787 13,315,293 4.58SoftBank Group Corp 109,000 JPY 4,640,702 8,507,164 2.92
7,545,489 21,822,457 7.50
LeisureOriental Land Co Ltd 32,500 JPY 4,035,903 5,363,941 1.84
4,035,903 5,363,941 1.84
Mechanics and machineryDaifuku Co Ltd 121,700 JPY 5,219,902 15,040,846 5.17Daikin Industries Ltd 44,400 JPY 5,108,050 9,856,633 3.39
10,327,952 24,897,479 8.56
News TransmissionHikari Tsushin Inc 21,500 JPY 2,781,878 5,035,305 1.73
2,781,878 5,035,305 1.73
COMGEST GROWTH plc
Comgest Growth Asia
SCHEDULE OF INVESTMENTSAs at 31 December 2020(expressed in USD)
410
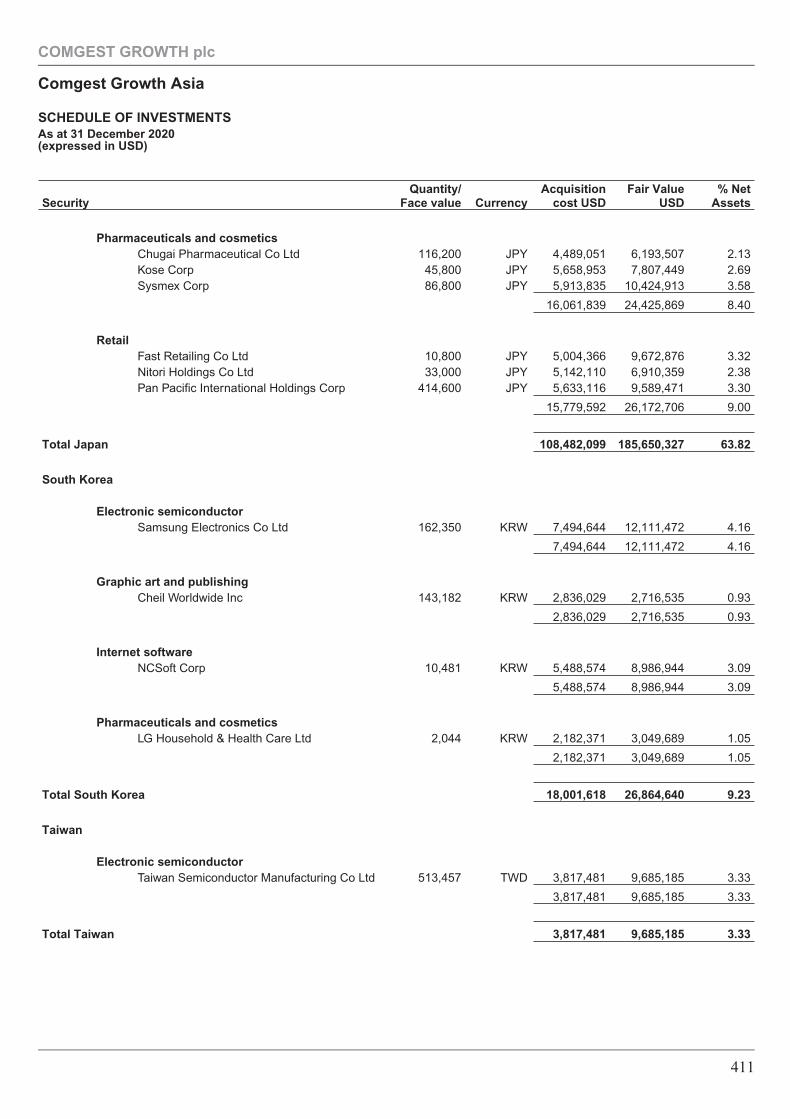
SecurityQuantity/
Face value CurrencyAcquisition
cost USDFair Value
USD% Net
Assets
Pharmaceuticals and cosmeticsChugai Pharmaceutical Co Ltd 116,200 JPY 4,489,051 6,193,507 2.13Kose Corp 45,800 JPY 5,658,953 7,807,449 2.69Sysmex Corp 86,800 JPY 5,913,835 10,424,913 3.58
16,061,839 24,425,869 8.40
RetailFast Retailing Co Ltd 10,800 JPY 5,004,366 9,672,876 3.32Nitori Holdings Co Ltd 33,000 JPY 5,142,110 6,910,359 2.38Pan Pacific International Holdings Corp 414,600 JPY 5,633,116 9,589,471 3.30
15,779,592 26,172,706 9.00
Total Japan 108,482,099 185,650,327 63.82
South Korea
Electronic semiconductorSamsung Electronics Co Ltd 162,350 KRW 7,494,644 12,111,472 4.16
7,494,644 12,111,472 4.16
Graphic art and publishingCheil Worldwide Inc 143,182 KRW 2,836,029 2,716,535 0.93
2,836,029 2,716,535 0.93
Internet softwareNCSoft Corp 10,481 KRW 5,488,574 8,986,944 3.09
5,488,574 8,986,944 3.09
Pharmaceuticals and cosmeticsLG Household & Health Care Ltd 2,044 KRW 2,182,371 3,049,689 1.05
2,182,371 3,049,689 1.05
Total South Korea 18,001,618 26,864,640 9.23
Taiwan
Electronic semiconductorTaiwan Semiconductor Manufacturing Co Ltd 513,457 TWD 3,817,481 9,685,185 3.33
3,817,481 9,685,185 3.33
Total Taiwan 3,817,481 9,685,185 3.33
COMGEST GROWTH plc
Comgest Growth Asia
SCHEDULE OF INVESTMENTSAs at 31 December 2020(expressed in USD)
411
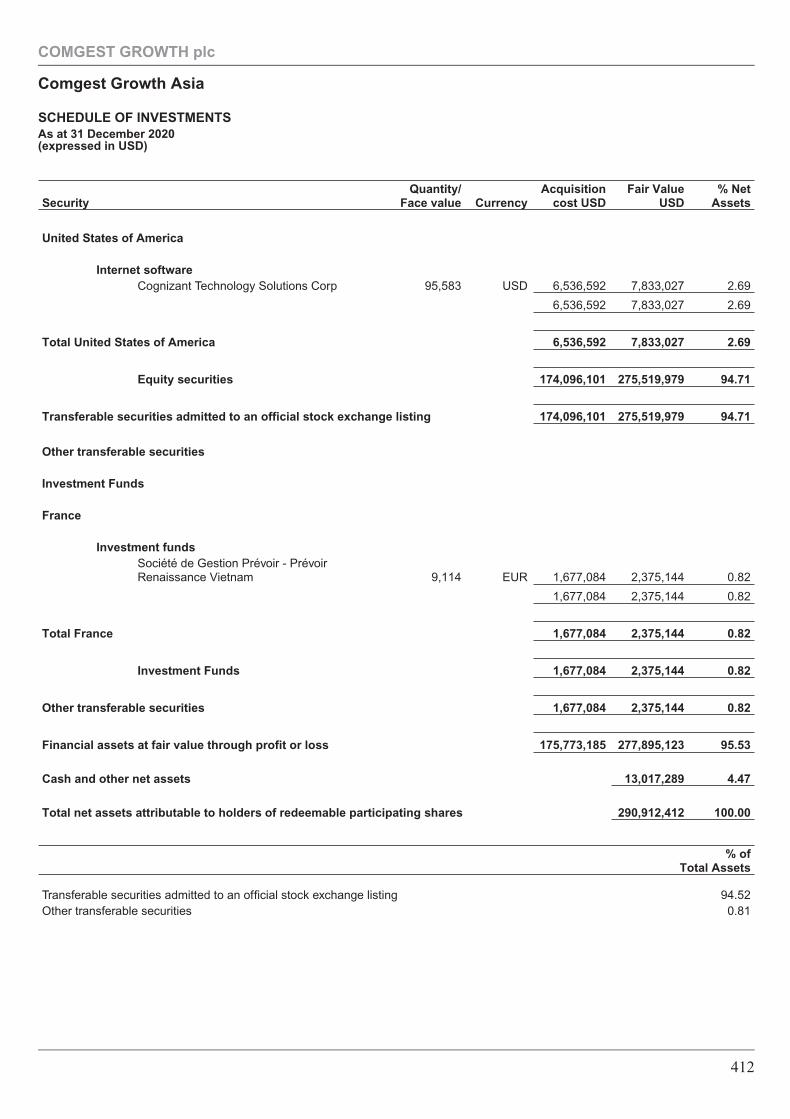
SecurityQuantity/
Face value CurrencyAcquisition
cost USDFair Value
USD% Net
Assets
United States of America
Internet softwareCognizant Technology Solutions Corp 95,583 USD 6,536,592 7,833,027 2.69
6,536,592 7,833,027 2.69
Total United States of America 6,536,592 7,833,027 2.69
Equity securities 174,096,101 275,519,979 94.71
Transferable securities admitted to an official stock exchange listing 174,096,101 275,519,979 94.71
Other transferable securities
Investment Funds
France
Investment fundsSociété de Gestion Prévoir - PrévoirRenaissance Vietnam 9,114 EUR 1,677,084 2,375,144 0.82
1,677,084 2,375,144 0.82
Total France 1,677,084 2,375,144 0.82
Investment Funds 1,677,084 2,375,144 0.82
Other transferable securities 1,677,084 2,375,144 0.82
Financial assets at fair value through profit or loss 175,773,185 277,895,123 95.53
Cash and other net assets 13,017,289 4.47
Total net assets attributable to holders of redeemable participating shares 290,912,412 100.00
% ofTotal Assets
Transferable securities admitted to an official stock exchange listing 94.52Other transferable securities 0.81
COMGEST GROWTH plc
Comgest Growth Asia
SCHEDULE OF INVESTMENTSAs at 31 December 2020(expressed in USD)
412
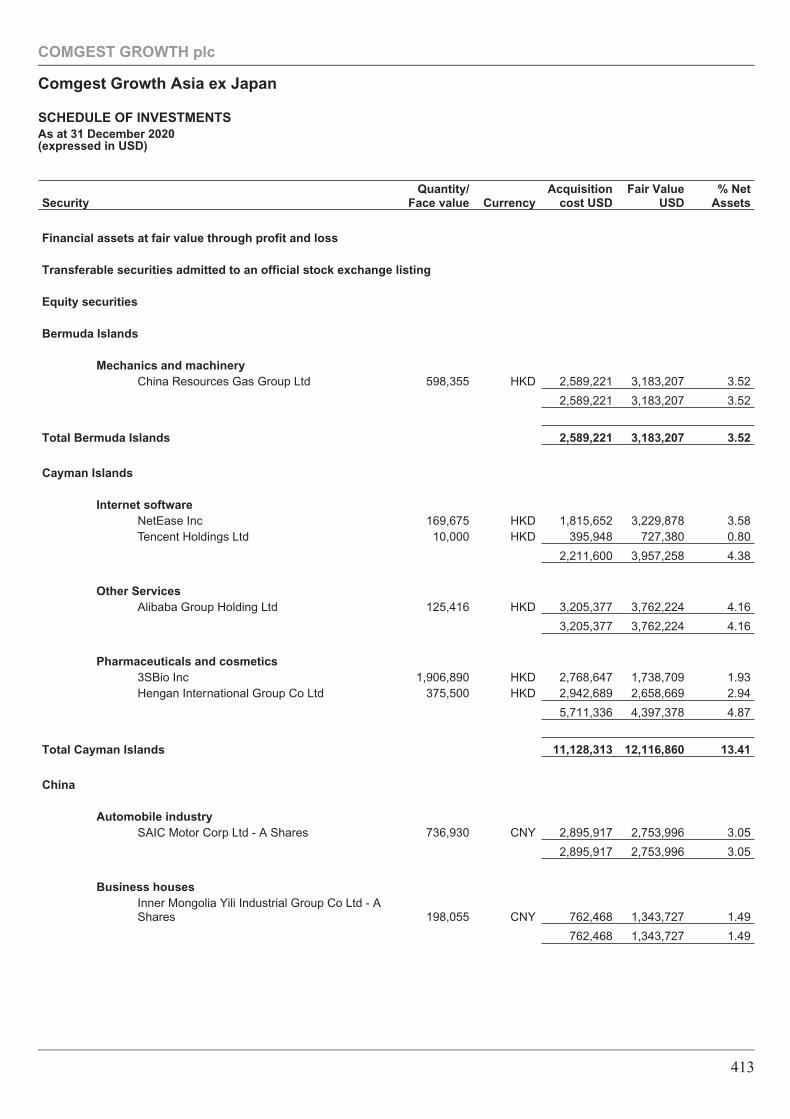
SecurityQuantity/
Face value CurrencyAcquisition
cost USDFair Value
USD% Net
Assets
Financial assets at fair value through profit and loss
Transferable securities admitted to an official stock exchange listing
Equity securities
Bermuda Islands
Mechanics and machineryChina Resources Gas Group Ltd 598,355 HKD 2,589,221 3,183,207 3.52
2,589,221 3,183,207 3.52
Total Bermuda Islands 2,589,221 3,183,207 3.52
Cayman Islands
Internet softwareNetEase Inc 169,675 HKD 1,815,652 3,229,878 3.58Tencent Holdings Ltd 10,000 HKD 395,948 727,380 0.80
2,211,600 3,957,258 4.38
Other ServicesAlibaba Group Holding Ltd 125,416 HKD 3,205,377 3,762,224 4.16
3,205,377 3,762,224 4.16
Pharmaceuticals and cosmetics3SBio Inc 1,906,890 HKD 2,768,647 1,738,709 1.93Hengan International Group Co Ltd 375,500 HKD 2,942,689 2,658,669 2.94
5,711,336 4,397,378 4.87
Total Cayman Islands 11,128,313 12,116,860 13.41
China
Automobile industrySAIC Motor Corp Ltd - A Shares 736,930 CNY 2,895,917 2,753,996 3.05
2,895,917 2,753,996 3.05
Business housesInner Mongolia Yili Industrial Group Co Ltd - AShares 198,055 CNY 762,468 1,343,727 1.49
762,468 1,343,727 1.49
COMGEST GROWTH plc
Comgest Growth Asia ex Japan
SCHEDULE OF INVESTMENTSAs at 31 December 2020(expressed in USD)
413
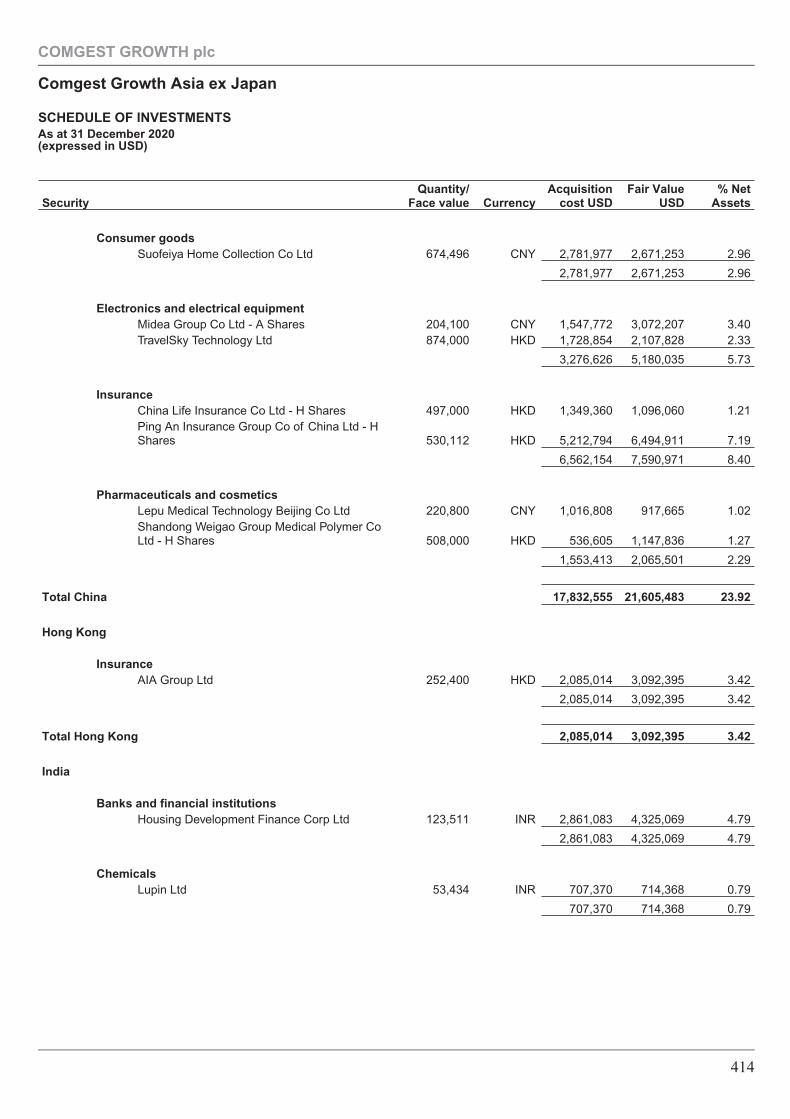
SecurityQuantity/
Face value CurrencyAcquisition
cost USDFair Value
USD% Net
Assets
Consumer goodsSuofeiya Home Collection Co Ltd 674,496 CNY 2,781,977 2,671,253 2.96
2,781,977 2,671,253 2.96
Electronics and electrical equipmentMidea Group Co Ltd - A Shares 204,100 CNY 1,547,772 3,072,207 3.40TravelSky Technology Ltd 874,000 HKD 1,728,854 2,107,828 2.33
3,276,626 5,180,035 5.73
InsuranceChina Life Insurance Co Ltd - H Shares 497,000 HKD 1,349,360 1,096,060 1.21Ping An Insurance Group Co of China Ltd - HShares 530,112 HKD 5,212,794 6,494,911 7.19
6,562,154 7,590,971 8.40
Pharmaceuticals and cosmeticsLepu Medical Technology Beijing Co Ltd 220,800 CNY 1,016,808 917,665 1.02Shandong Weigao Group Medical Polymer CoLtd - H Shares 508,000 HKD 536,605 1,147,836 1.27
1,553,413 2,065,501 2.29
Total China 17,832,555 21,605,483 23.92
Hong Kong
InsuranceAIA Group Ltd 252,400 HKD 2,085,014 3,092,395 3.42
2,085,014 3,092,395 3.42
Total Hong Kong 2,085,014 3,092,395 3.42
India
Banks and financial institutionsHousing Development Finance Corp Ltd 123,511 INR 2,861,083 4,325,069 4.79
2,861,083 4,325,069 4.79
ChemicalsLupin Ltd 53,434 INR 707,370 714,368 0.79
707,370 714,368 0.79
COMGEST GROWTH plc
Comgest Growth Asia ex Japan
SCHEDULE OF INVESTMENTSAs at 31 December 2020(expressed in USD)
414
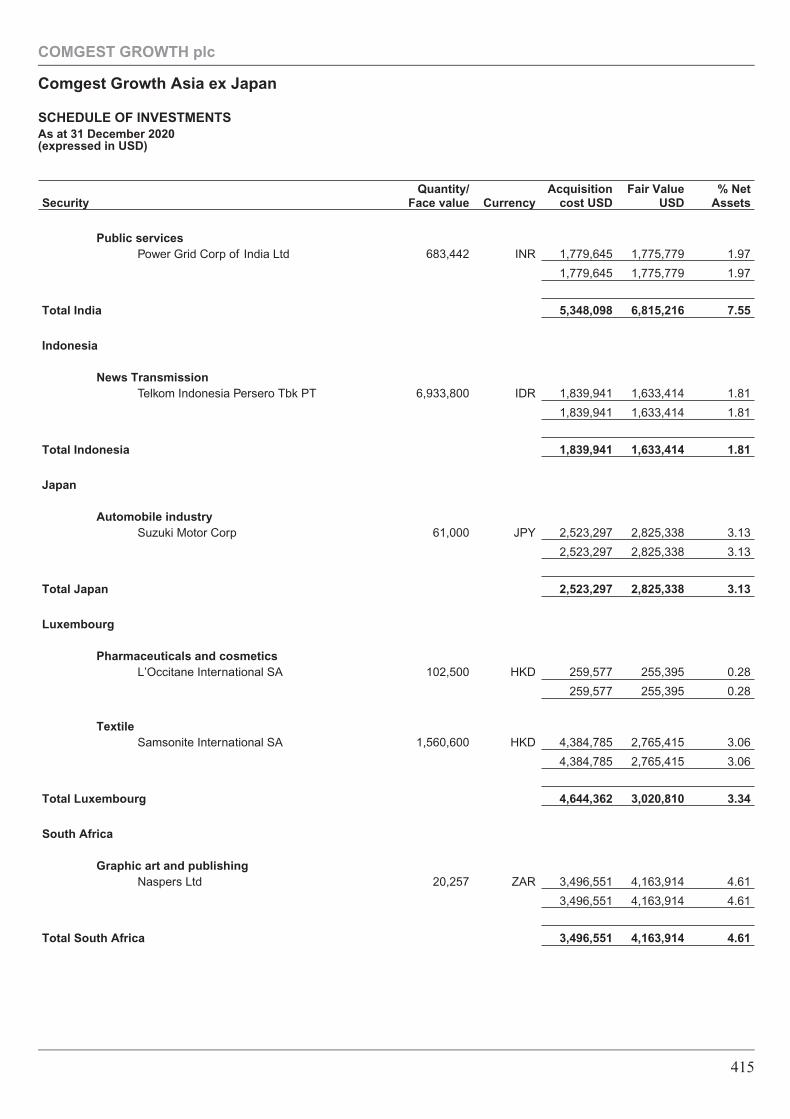
SecurityQuantity/
Face value CurrencyAcquisition
cost USDFair Value
USD% Net
Assets
Public servicesPower Grid Corp of India Ltd 683,442 INR 1,779,645 1,775,779 1.97
1,779,645 1,775,779 1.97
Total India 5,348,098 6,815,216 7.55
Indonesia
News TransmissionTelkom Indonesia Persero Tbk PT 6,933,800 IDR 1,839,941 1,633,414 1.81
1,839,941 1,633,414 1.81
Total Indonesia 1,839,941 1,633,414 1.81
Japan
Automobile industrySuzuki Motor Corp 61,000 JPY 2,523,297 2,825,338 3.13
2,523,297 2,825,338 3.13
Total Japan 2,523,297 2,825,338 3.13
Luxembourg
Pharmaceuticals and cosmeticsL’Occitane International SA 102,500 HKD 259,577 255,395 0.28
259,577 255,395 0.28
TextileSamsonite International SA 1,560,600 HKD 4,384,785 2,765,415 3.06
4,384,785 2,765,415 3.06
Total Luxembourg 4,644,362 3,020,810 3.34
South Africa
Graphic art and publishingNaspers Ltd 20,257 ZAR 3,496,551 4,163,914 4.61
3,496,551 4,163,914 4.61
Total South Africa 3,496,551 4,163,914 4.61
COMGEST GROWTH plc
Comgest Growth Asia ex Japan
SCHEDULE OF INVESTMENTSAs at 31 December 2020(expressed in USD)
415
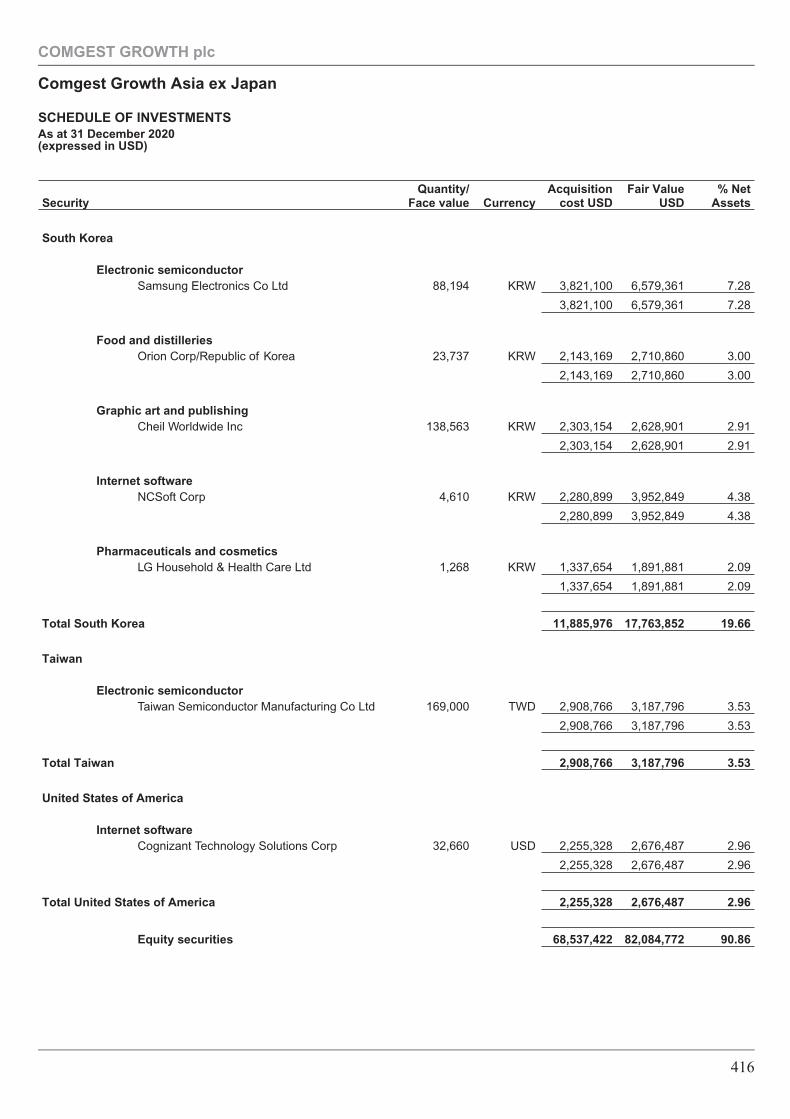
SecurityQuantity/
Face value CurrencyAcquisition
cost USDFair Value
USD% Net
Assets
South Korea
Electronic semiconductorSamsung Electronics Co Ltd 88,194 KRW 3,821,100 6,579,361 7.28
3,821,100 6,579,361 7.28
Food and distilleriesOrion Corp/Republic of Korea 23,737 KRW 2,143,169 2,710,860 3.00
2,143,169 2,710,860 3.00
Graphic art and publishingCheil Worldwide Inc 138,563 KRW 2,303,154 2,628,901 2.91
2,303,154 2,628,901 2.91
Internet softwareNCSoft Corp 4,610 KRW 2,280,899 3,952,849 4.38
2,280,899 3,952,849 4.38
Pharmaceuticals and cosmeticsLG Household & Health Care Ltd 1,268 KRW 1,337,654 1,891,881 2.09
1,337,654 1,891,881 2.09
Total South Korea 11,885,976 17,763,852 19.66
Taiwan
Electronic semiconductorTaiwan Semiconductor Manufacturing Co Ltd 169,000 TWD 2,908,766 3,187,796 3.53
2,908,766 3,187,796 3.53
Total Taiwan 2,908,766 3,187,796 3.53
United States of America
Internet softwareCognizant Technology Solutions Corp 32,660 USD 2,255,328 2,676,487 2.96
2,255,328 2,676,487 2.96
Total United States of America 2,255,328 2,676,487 2.96
Equity securities 68,537,422 82,084,772 90.86
COMGEST GROWTH plc
Comgest Growth Asia ex Japan
SCHEDULE OF INVESTMENTSAs at 31 December 2020(expressed in USD)
416

SecurityQuantity/
Face value CurrencyAcquisition
cost USDFair Value
USD% Net
Assets
Sponsored America Depository Receipts
Cayman Islands
Automobile industryAutohome Inc 29,746 USD 2,364,826 2,963,297 3.28
2,364,826 2,963,297 3.28
Total Cayman Islands 2,364,826 2,963,297 3.28
Sponsored America Depository Receipts 2,364,826 2,963,297 3.28
Transferable securities admitted to an official stock exchange listing 70,902,248 85,048,069 94.14
Other transferable securities dealt on another regulated market
Equity securities
Vietnam
Consumer goodsVietnam Dairy Products JSC 507,758 VND 2,021,923 2,393,339 2.65
2,021,923 2,393,339 2.65
Total Vietnam 2,021,923 2,393,339 2.65
Equity securities 2,021,923 2,393,339 2.65
Other transferable securities dealt on another regulated market 2,021,923 2,393,339 2.65
Financial assets at fair value through profit or loss 72,924,171 87,441,408 96.79
Cash and other net assets 2,898,641 3.21
Total net assets attributable to holders of redeemable participating shares 90,340,049 100.00
% ofTotal Assets
Transferable securities admitted to an official stock exchange listing 93.51Other transferable securities dealt on another regulated market 2.63
COMGEST GROWTH plc
Comgest Growth Asia ex Japan
SCHEDULE OF INVESTMENTSAs at 31 December 2020(expressed in USD)
417
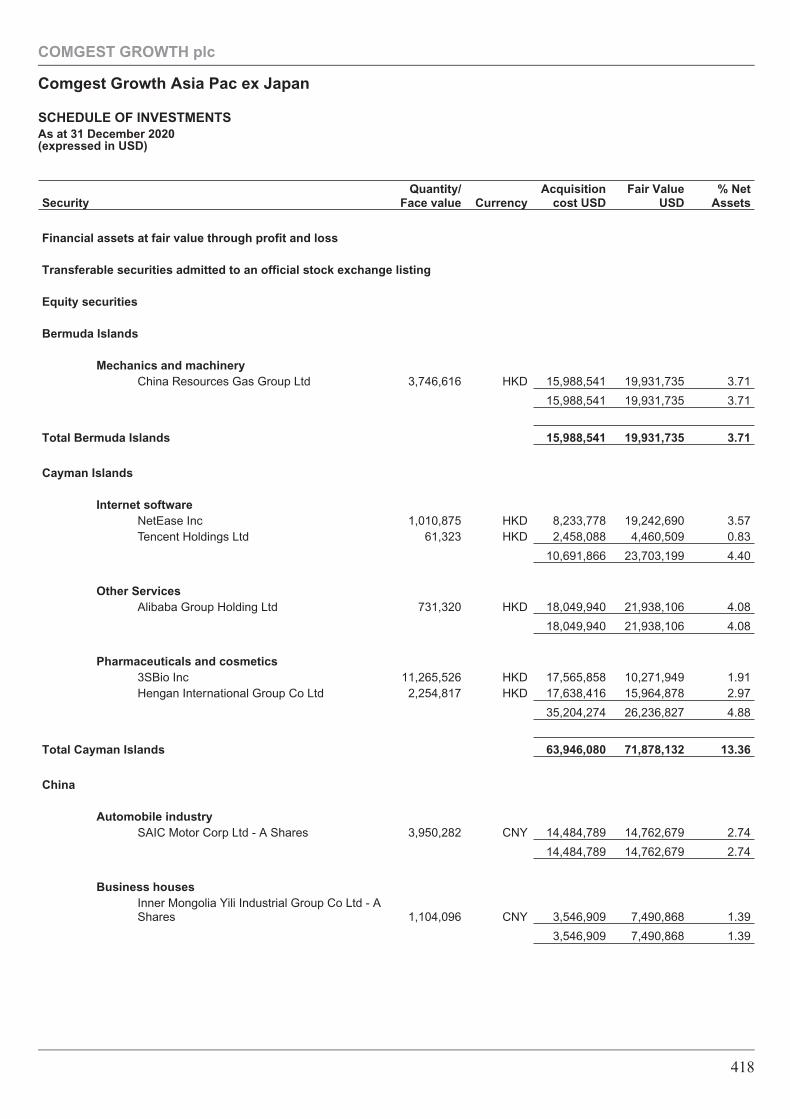
SecurityQuantity/
Face value CurrencyAcquisition
cost USDFair Value
USD% Net
Assets
Financial assets at fair value through profit and loss
Transferable securities admitted to an official stock exchange listing
Equity securities
Bermuda Islands
Mechanics and machineryChina Resources Gas Group Ltd 3,746,616 HKD 15,988,541 19,931,735 3.71
15,988,541 19,931,735 3.71
Total Bermuda Islands 15,988,541 19,931,735 3.71
Cayman Islands
Internet softwareNetEase Inc 1,010,875 HKD 8,233,778 19,242,690 3.57Tencent Holdings Ltd 61,323 HKD 2,458,088 4,460,509 0.83
10,691,866 23,703,199 4.40
Other ServicesAlibaba Group Holding Ltd 731,320 HKD 18,049,940 21,938,106 4.08
18,049,940 21,938,106 4.08
Pharmaceuticals and cosmetics3SBio Inc 11,265,526 HKD 17,565,858 10,271,949 1.91Hengan International Group Co Ltd 2,254,817 HKD 17,638,416 15,964,878 2.97
35,204,274 26,236,827 4.88
Total Cayman Islands 63,946,080 71,878,132 13.36
China
Automobile industrySAIC Motor Corp Ltd - A Shares 3,950,282 CNY 14,484,789 14,762,679 2.74
14,484,789 14,762,679 2.74
Business housesInner Mongolia Yili Industrial Group Co Ltd - AShares 1,104,096 CNY 3,546,909 7,490,868 1.39
3,546,909 7,490,868 1.39
COMGEST GROWTH plc
Comgest Growth Asia Pac ex Japan
SCHEDULE OF INVESTMENTSAs at 31 December 2020(expressed in USD)
418
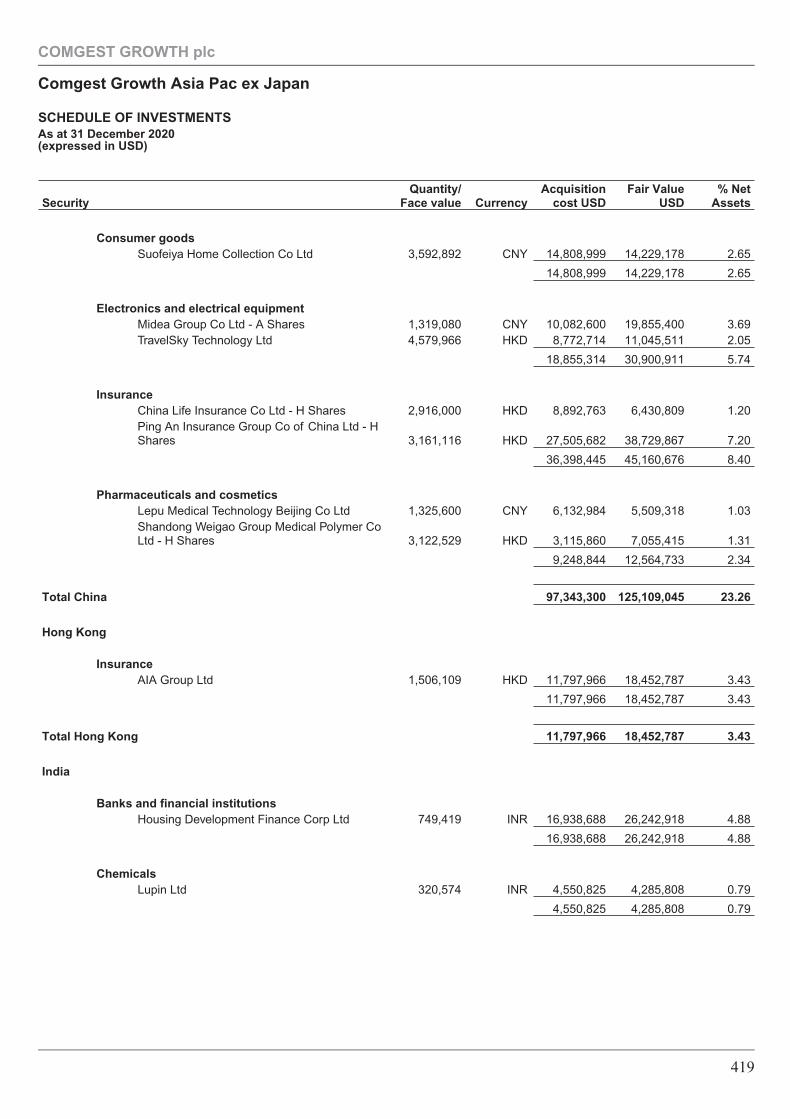
SecurityQuantity/
Face value CurrencyAcquisition
cost USDFair Value
USD% Net
Assets
Consumer goodsSuofeiya Home Collection Co Ltd 3,592,892 CNY 14,808,999 14,229,178 2.65
14,808,999 14,229,178 2.65
Electronics and electrical equipmentMidea Group Co Ltd - A Shares 1,319,080 CNY 10,082,600 19,855,400 3.69TravelSky Technology Ltd 4,579,966 HKD 8,772,714 11,045,511 2.05
18,855,314 30,900,911 5.74
InsuranceChina Life Insurance Co Ltd - H Shares 2,916,000 HKD 8,892,763 6,430,809 1.20Ping An Insurance Group Co of China Ltd - HShares 3,161,116 HKD 27,505,682 38,729,867 7.20
36,398,445 45,160,676 8.40
Pharmaceuticals and cosmeticsLepu Medical Technology Beijing Co Ltd 1,325,600 CNY 6,132,984 5,509,318 1.03Shandong Weigao Group Medical Polymer CoLtd - H Shares 3,122,529 HKD 3,115,860 7,055,415 1.31
9,248,844 12,564,733 2.34
Total China 97,343,300 125,109,045 23.26
Hong Kong
InsuranceAIA Group Ltd 1,506,109 HKD 11,797,966 18,452,787 3.43
11,797,966 18,452,787 3.43
Total Hong Kong 11,797,966 18,452,787 3.43
India
Banks and financial institutionsHousing Development Finance Corp Ltd 749,419 INR 16,938,688 26,242,918 4.88
16,938,688 26,242,918 4.88
ChemicalsLupin Ltd 320,574 INR 4,550,825 4,285,808 0.79
4,550,825 4,285,808 0.79
COMGEST GROWTH plc
Comgest Growth Asia Pac ex Japan
SCHEDULE OF INVESTMENTSAs at 31 December 2020(expressed in USD)
419
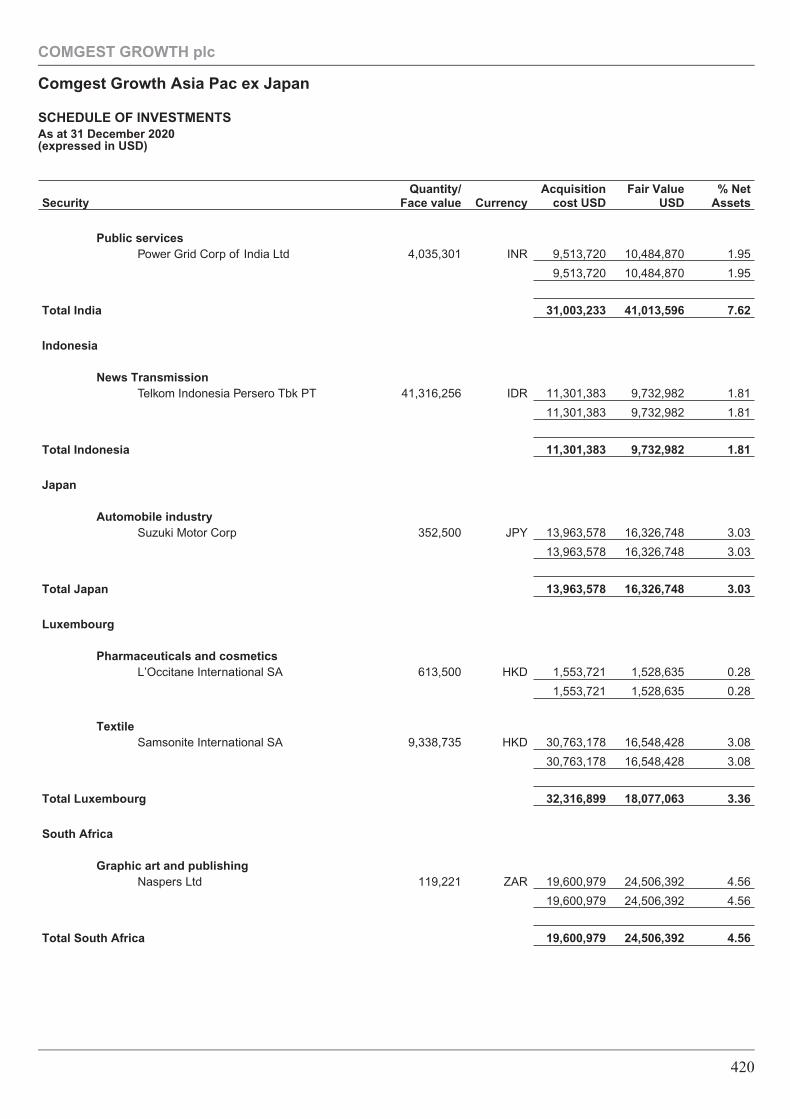
SecurityQuantity/
Face value CurrencyAcquisition
cost USDFair Value
USD% Net
Assets
Public servicesPower Grid Corp of India Ltd 4,035,301 INR 9,513,720 10,484,870 1.95
9,513,720 10,484,870 1.95
Total India 31,003,233 41,013,596 7.62
Indonesia
News TransmissionTelkom Indonesia Persero Tbk PT 41,316,256 IDR 11,301,383 9,732,982 1.81
11,301,383 9,732,982 1.81
Total Indonesia 11,301,383 9,732,982 1.81
Japan
Automobile industrySuzuki Motor Corp 352,500 JPY 13,963,578 16,326,748 3.03
13,963,578 16,326,748 3.03
Total Japan 13,963,578 16,326,748 3.03
Luxembourg
Pharmaceuticals and cosmeticsL’Occitane International SA 613,500 HKD 1,553,721 1,528,635 0.28
1,553,721 1,528,635 0.28
TextileSamsonite International SA 9,338,735 HKD 30,763,178 16,548,428 3.08
30,763,178 16,548,428 3.08
Total Luxembourg 32,316,899 18,077,063 3.36
South Africa
Graphic art and publishingNaspers Ltd 119,221 ZAR 19,600,979 24,506,392 4.56
19,600,979 24,506,392 4.56
Total South Africa 19,600,979 24,506,392 4.56
COMGEST GROWTH plc
Comgest Growth Asia Pac ex Japan
SCHEDULE OF INVESTMENTSAs at 31 December 2020(expressed in USD)
420
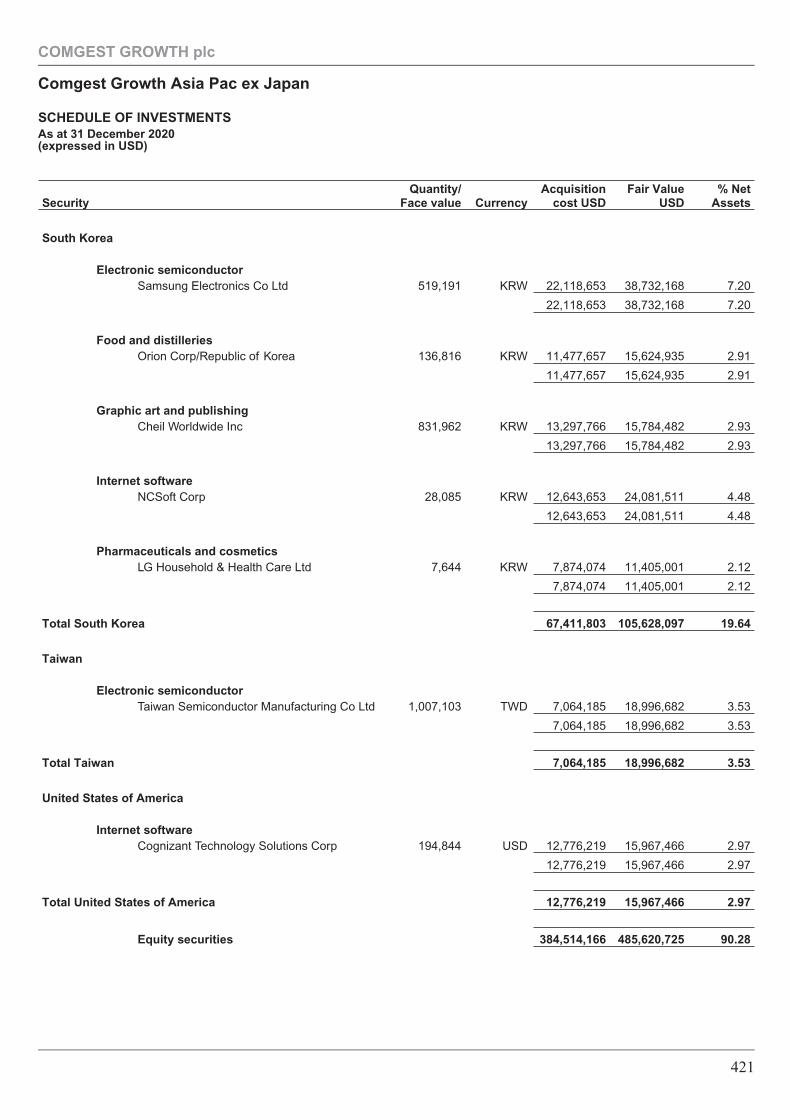
SecurityQuantity/
Face value CurrencyAcquisition
cost USDFair Value
USD% Net
Assets
South Korea
Electronic semiconductorSamsung Electronics Co Ltd 519,191 KRW 22,118,653 38,732,168 7.20
22,118,653 38,732,168 7.20
Food and distilleriesOrion Corp/Republic of Korea 136,816 KRW 11,477,657 15,624,935 2.91
11,477,657 15,624,935 2.91
Graphic art and publishingCheil Worldwide Inc 831,962 KRW 13,297,766 15,784,482 2.93
13,297,766 15,784,482 2.93
Internet softwareNCSoft Corp 28,085 KRW 12,643,653 24,081,511 4.48
12,643,653 24,081,511 4.48
Pharmaceuticals and cosmeticsLG Household & Health Care Ltd 7,644 KRW 7,874,074 11,405,001 2.12
7,874,074 11,405,001 2.12
Total South Korea 67,411,803 105,628,097 19.64
Taiwan
Electronic semiconductorTaiwan Semiconductor Manufacturing Co Ltd 1,007,103 TWD 7,064,185 18,996,682 3.53
7,064,185 18,996,682 3.53
Total Taiwan 7,064,185 18,996,682 3.53
United States of America
Internet softwareCognizant Technology Solutions Corp 194,844 USD 12,776,219 15,967,466 2.97
12,776,219 15,967,466 2.97
Total United States of America 12,776,219 15,967,466 2.97
Equity securities 384,514,166 485,620,725 90.28
COMGEST GROWTH plc
Comgest Growth Asia Pac ex Japan
SCHEDULE OF INVESTMENTSAs at 31 December 2020(expressed in USD)
421
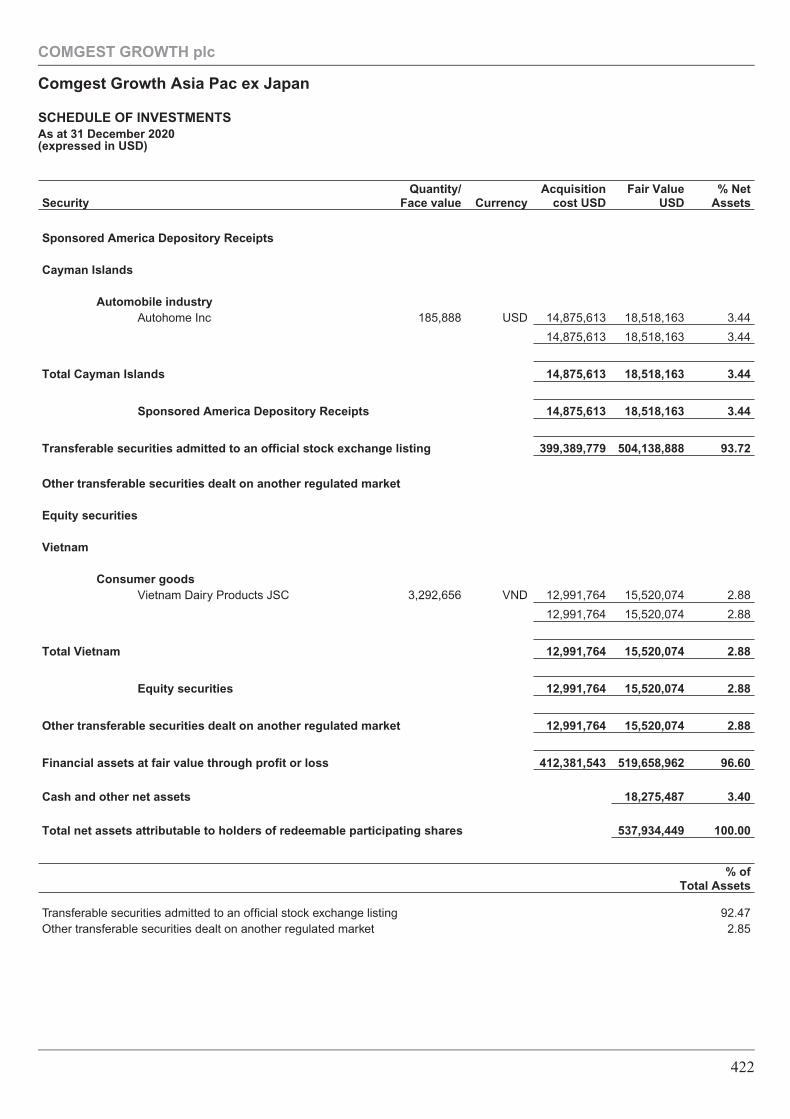
SecurityQuantity/
Face value CurrencyAcquisition
cost USDFair Value
USD% Net
Assets
Sponsored America Depository Receipts
Cayman Islands
Automobile industryAutohome Inc 185,888 USD 14,875,613 18,518,163 3.44
14,875,613 18,518,163 3.44
Total Cayman Islands 14,875,613 18,518,163 3.44
Sponsored America Depository Receipts 14,875,613 18,518,163 3.44
Transferable securities admitted to an official stock exchange listing 399,389,779 504,138,888 93.72
Other transferable securities dealt on another regulated market
Equity securities
Vietnam
Consumer goodsVietnam Dairy Products JSC 3,292,656 VND 12,991,764 15,520,074 2.88
12,991,764 15,520,074 2.88
Total Vietnam 12,991,764 15,520,074 2.88
Equity securities 12,991,764 15,520,074 2.88
Other transferable securities dealt on another regulated market 12,991,764 15,520,074 2.88
Financial assets at fair value through profit or loss 412,381,543 519,658,962 96.60
Cash and other net assets 18,275,487 3.40
Total net assets attributable to holders of redeemable participating shares 537,934,449 100.00
% ofTotal Assets
Transferable securities admitted to an official stock exchange listing 92.47Other transferable securities dealt on another regulated market 2.85
COMGEST GROWTH plc
Comgest Growth Asia Pac ex Japan
SCHEDULE OF INVESTMENTSAs at 31 December 2020(expressed in USD)
422
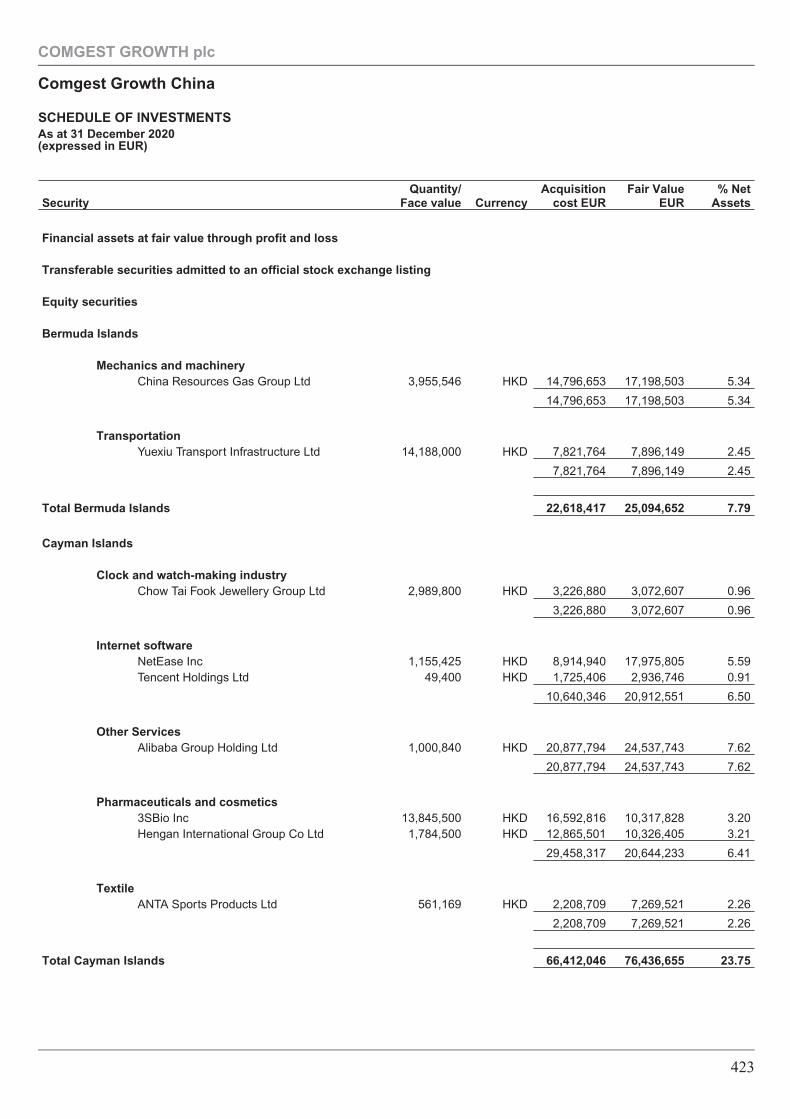
SecurityQuantity/
Face value CurrencyAcquisition
cost EURFair Value
EUR% Net
Assets
Financial assets at fair value through profit and loss
Transferable securities admitted to an official stock exchange listing
Equity securities
Bermuda Islands
Mechanics and machineryChina Resources Gas Group Ltd 3,955,546 HKD 14,796,653 17,198,503 5.34
14,796,653 17,198,503 5.34
TransportationYuexiu Transport Infrastructure Ltd 14,188,000 HKD 7,821,764 7,896,149 2.45
7,821,764 7,896,149 2.45
Total Bermuda Islands 22,618,417 25,094,652 7.79
Cayman Islands
Clock and watch-making industryChow Tai Fook Jewellery Group Ltd 2,989,800 HKD 3,226,880 3,072,607 0.96
3,226,880 3,072,607 0.96
Internet softwareNetEase Inc 1,155,425 HKD 8,914,940 17,975,805 5.59Tencent Holdings Ltd 49,400 HKD 1,725,406 2,936,746 0.91
10,640,346 20,912,551 6.50
Other ServicesAlibaba Group Holding Ltd 1,000,840 HKD 20,877,794 24,537,743 7.62
20,877,794 24,537,743 7.62
Pharmaceuticals and cosmetics3SBio Inc 13,845,500 HKD 16,592,816 10,317,828 3.20Hengan International Group Co Ltd 1,784,500 HKD 12,865,501 10,326,405 3.21
29,458,317 20,644,233 6.41
TextileANTA Sports Products Ltd 561,169 HKD 2,208,709 7,269,521 2.26
2,208,709 7,269,521 2.26
Total Cayman Islands 66,412,046 76,436,655 23.75
COMGEST GROWTH plc
Comgest Growth China
SCHEDULE OF INVESTMENTSAs at 31 December 2020(expressed in EUR)
423
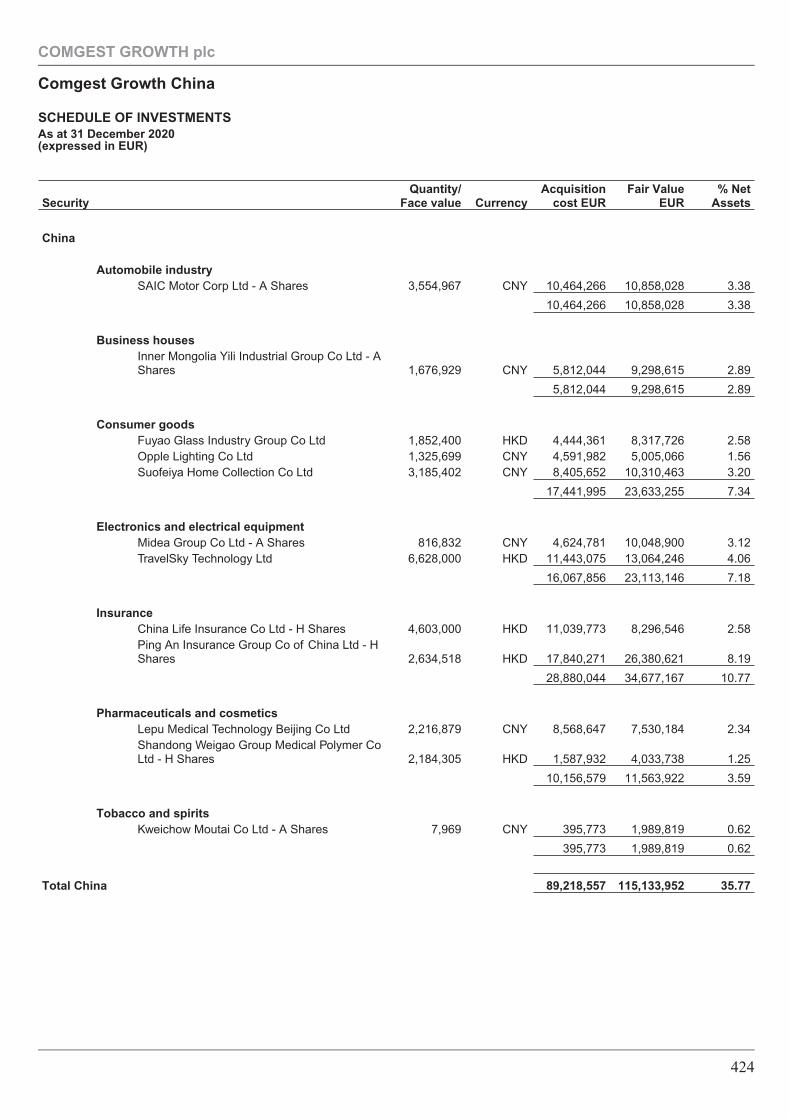
SecurityQuantity/
Face value CurrencyAcquisition
cost EURFair Value
EUR% Net
Assets
China
Automobile industrySAIC Motor Corp Ltd - A Shares 3,554,967 CNY 10,464,266 10,858,028 3.38
10,464,266 10,858,028 3.38
Business housesInner Mongolia Yili Industrial Group Co Ltd - AShares 1,676,929 CNY 5,812,044 9,298,615 2.89
5,812,044 9,298,615 2.89
Consumer goodsFuyao Glass Industry Group Co Ltd 1,852,400 HKD 4,444,361 8,317,726 2.58Opple Lighting Co Ltd 1,325,699 CNY 4,591,982 5,005,066 1.56Suofeiya Home Collection Co Ltd 3,185,402 CNY 8,405,652 10,310,463 3.20
17,441,995 23,633,255 7.34
Electronics and electrical equipmentMidea Group Co Ltd - A Shares 816,832 CNY 4,624,781 10,048,900 3.12TravelSky Technology Ltd 6,628,000 HKD 11,443,075 13,064,246 4.06
16,067,856 23,113,146 7.18
InsuranceChina Life Insurance Co Ltd - H Shares 4,603,000 HKD 11,039,773 8,296,546 2.58Ping An Insurance Group Co of China Ltd - HShares 2,634,518 HKD 17,840,271 26,380,621 8.19
28,880,044 34,677,167 10.77
Pharmaceuticals and cosmeticsLepu Medical Technology Beijing Co Ltd 2,216,879 CNY 8,568,647 7,530,184 2.34Shandong Weigao Group Medical Polymer CoLtd - H Shares 2,184,305 HKD 1,587,932 4,033,738 1.25
10,156,579 11,563,922 3.59
Tobacco and spiritsKweichow Moutai Co Ltd - A Shares 7,969 CNY 395,773 1,989,819 0.62
395,773 1,989,819 0.62
Total China 89,218,557 115,133,952 35.77
COMGEST GROWTH plc
Comgest Growth China
SCHEDULE OF INVESTMENTSAs at 31 December 2020(expressed in EUR)
424
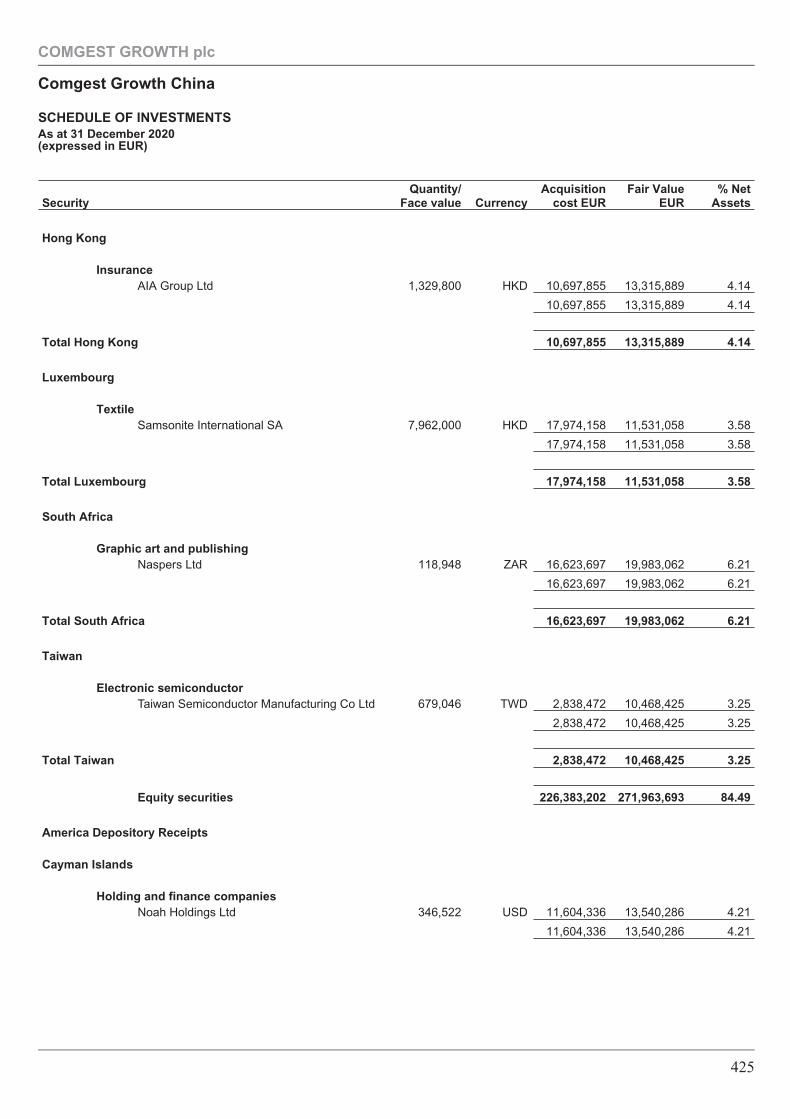
SecurityQuantity/
Face value CurrencyAcquisition
cost EURFair Value
EUR% Net
Assets
Hong Kong
InsuranceAIA Group Ltd 1,329,800 HKD 10,697,855 13,315,889 4.14
10,697,855 13,315,889 4.14
Total Hong Kong 10,697,855 13,315,889 4.14
Luxembourg
TextileSamsonite International SA 7,962,000 HKD 17,974,158 11,531,058 3.58
17,974,158 11,531,058 3.58
Total Luxembourg 17,974,158 11,531,058 3.58
South Africa
Graphic art and publishingNaspers Ltd 118,948 ZAR 16,623,697 19,983,062 6.21
16,623,697 19,983,062 6.21
Total South Africa 16,623,697 19,983,062 6.21
Taiwan
Electronic semiconductorTaiwan Semiconductor Manufacturing Co Ltd 679,046 TWD 2,838,472 10,468,425 3.25
2,838,472 10,468,425 3.25
Total Taiwan 2,838,472 10,468,425 3.25
Equity securities 226,383,202 271,963,693 84.49
America Depository Receipts
Cayman Islands
Holding and finance companiesNoah Holdings Ltd 346,522 USD 11,604,336 13,540,286 4.21
11,604,336 13,540,286 4.21
COMGEST GROWTH plc
Comgest Growth China
SCHEDULE OF INVESTMENTSAs at 31 December 2020(expressed in EUR)
425
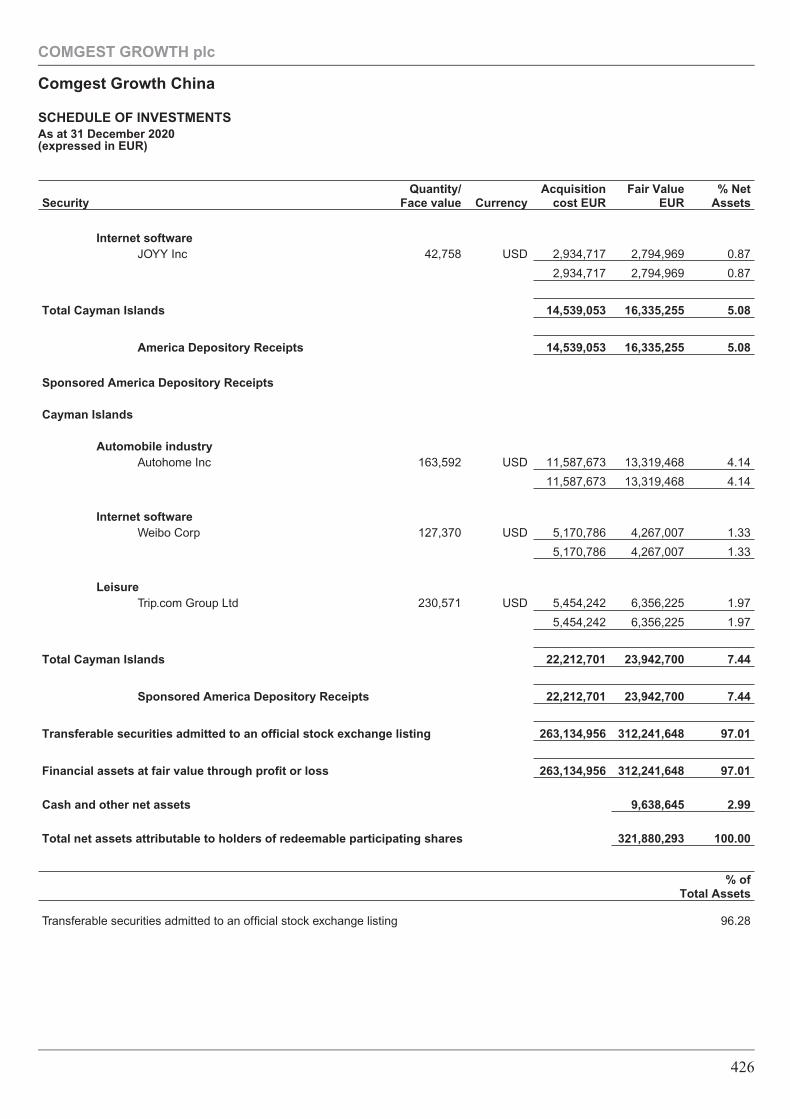
SecurityQuantity/
Face value CurrencyAcquisition
cost EURFair Value
EUR% Net
Assets
Internet softwareJOYY Inc 42,758 USD 2,934,717 2,794,969 0.87
2,934,717 2,794,969 0.87
Total Cayman Islands 14,539,053 16,335,255 5.08
America Depository Receipts 14,539,053 16,335,255 5.08
Sponsored America Depository Receipts
Cayman Islands
Automobile industryAutohome Inc 163,592 USD 11,587,673 13,319,468 4.14
11,587,673 13,319,468 4.14
Internet softwareWeibo Corp 127,370 USD 5,170,786 4,267,007 1.33
5,170,786 4,267,007 1.33
LeisureTrip.com Group Ltd 230,571 USD 5,454,242 6,356,225 1.97
5,454,242 6,356,225 1.97
Total Cayman Islands 22,212,701 23,942,700 7.44
Sponsored America Depository Receipts 22,212,701 23,942,700 7.44
Transferable securities admitted to an official stock exchange listing 263,134,956 312,241,648 97.01
Financial assets at fair value through profit or loss 263,134,956 312,241,648 97.01
Cash and other net assets 9,638,645 2.99
Total net assets attributable to holders of redeemable participating shares 321,880,293 100.00
% ofTotal Assets
Transferable securities admitted to an official stock exchange listing 96.28
COMGEST GROWTH plc
Comgest Growth China
SCHEDULE OF INVESTMENTSAs at 31 December 2020(expressed in EUR)
426
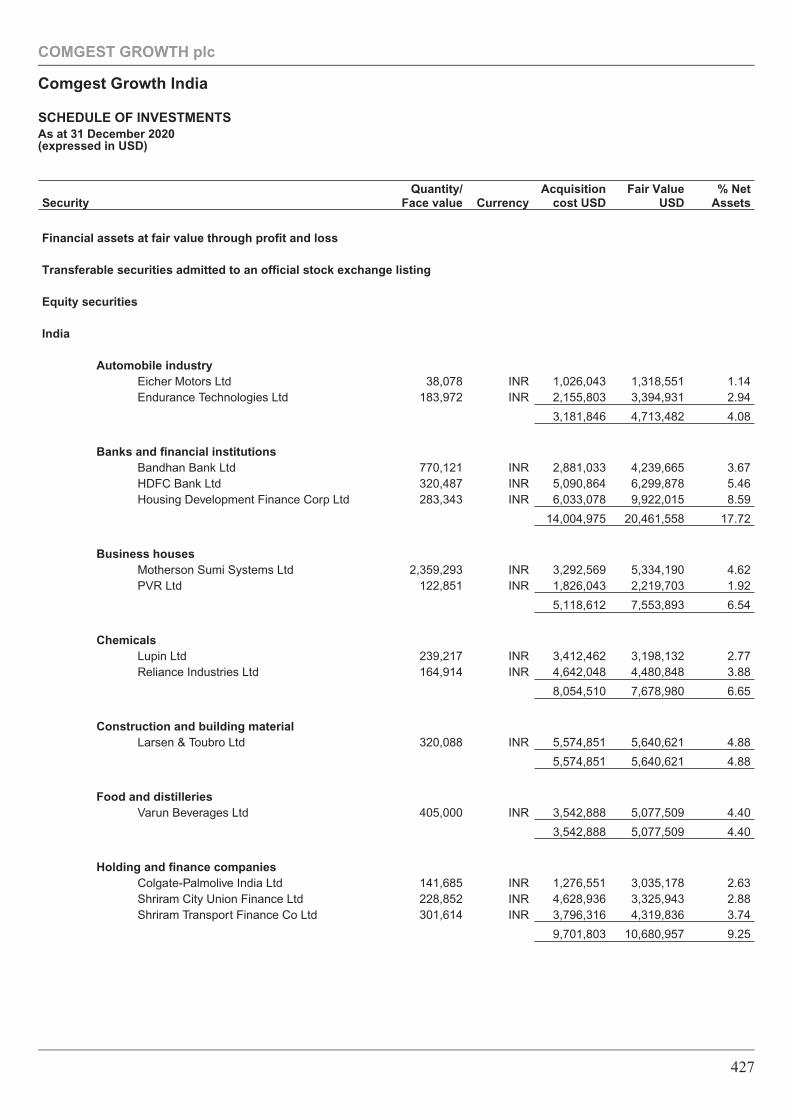
SecurityQuantity/
Face value CurrencyAcquisition
cost USDFair Value
USD% Net
Assets
Financial assets at fair value through profit and loss
Transferable securities admitted to an official stock exchange listing
Equity securities
India
Automobile industryEicher Motors Ltd 38,078 INR 1,026,043 1,318,551 1.14Endurance Technologies Ltd 183,972 INR 2,155,803 3,394,931 2.94
3,181,846 4,713,482 4.08
Banks and financial institutionsBandhan Bank Ltd 770,121 INR 2,881,033 4,239,665 3.67HDFC Bank Ltd 320,487 INR 5,090,864 6,299,878 5.46Housing Development Finance Corp Ltd 283,343 INR 6,033,078 9,922,015 8.59
14,004,975 20,461,558 17.72
Business housesMotherson Sumi Systems Ltd 2,359,293 INR 3,292,569 5,334,190 4.62PVR Ltd 122,851 INR 1,826,043 2,219,703 1.92
5,118,612 7,553,893 6.54
ChemicalsLupin Ltd 239,217 INR 3,412,462 3,198,132 2.77Reliance Industries Ltd 164,914 INR 4,642,048 4,480,848 3.88
8,054,510 7,678,980 6.65
Construction and building materialLarsen & Toubro Ltd 320,088 INR 5,574,851 5,640,621 4.88
5,574,851 5,640,621 4.88
Food and distilleriesVarun Beverages Ltd 405,000 INR 3,542,888 5,077,509 4.40
3,542,888 5,077,509 4.40
Holding and finance companiesColgate-Palmolive India Ltd 141,685 INR 1,276,551 3,035,178 2.63Shriram City Union Finance Ltd 228,852 INR 4,628,936 3,325,943 2.88Shriram Transport Finance Co Ltd 301,614 INR 3,796,316 4,319,836 3.74
9,701,803 10,680,957 9.25
COMGEST GROWTH plc
Comgest Growth India
SCHEDULE OF INVESTMENTSAs at 31 December 2020(expressed in USD)
427
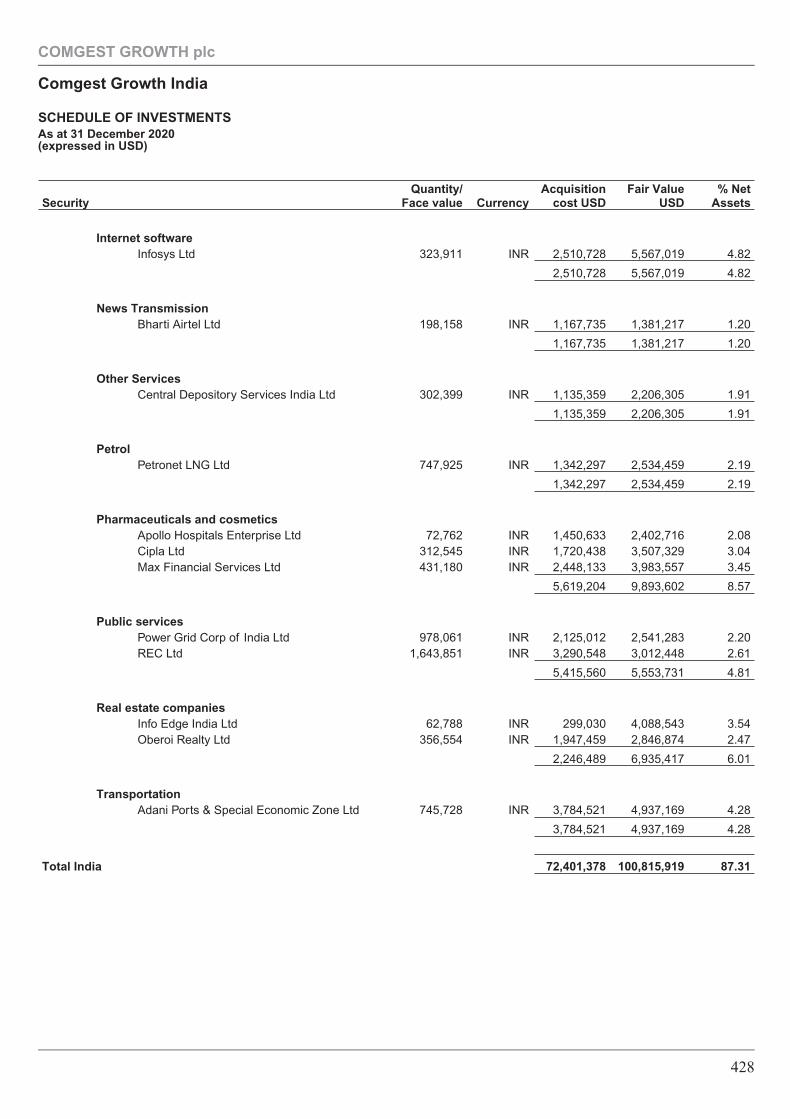
SecurityQuantity/
Face value CurrencyAcquisition
cost USDFair Value
USD% Net
Assets
Internet softwareInfosys Ltd 323,911 INR 2,510,728 5,567,019 4.82
2,510,728 5,567,019 4.82
News TransmissionBharti Airtel Ltd 198,158 INR 1,167,735 1,381,217 1.20
1,167,735 1,381,217 1.20
Other ServicesCentral Depository Services India Ltd 302,399 INR 1,135,359 2,206,305 1.91
1,135,359 2,206,305 1.91
PetrolPetronet LNG Ltd 747,925 INR 1,342,297 2,534,459 2.19
1,342,297 2,534,459 2.19
Pharmaceuticals and cosmeticsApollo Hospitals Enterprise Ltd 72,762 INR 1,450,633 2,402,716 2.08Cipla Ltd 312,545 INR 1,720,438 3,507,329 3.04Max Financial Services Ltd 431,180 INR 2,448,133 3,983,557 3.45
5,619,204 9,893,602 8.57
Public servicesPower Grid Corp of India Ltd 978,061 INR 2,125,012 2,541,283 2.20REC Ltd 1,643,851 INR 3,290,548 3,012,448 2.61
5,415,560 5,553,731 4.81
Real estate companiesInfo Edge India Ltd 62,788 INR 299,030 4,088,543 3.54Oberoi Realty Ltd 356,554 INR 1,947,459 2,846,874 2.47
2,246,489 6,935,417 6.01
TransportationAdani Ports & Special Economic Zone Ltd 745,728 INR 3,784,521 4,937,169 4.28
3,784,521 4,937,169 4.28
Total India 72,401,378 100,815,919 87.31
COMGEST GROWTH plc
Comgest Growth India
SCHEDULE OF INVESTMENTSAs at 31 December 2020(expressed in USD)
428
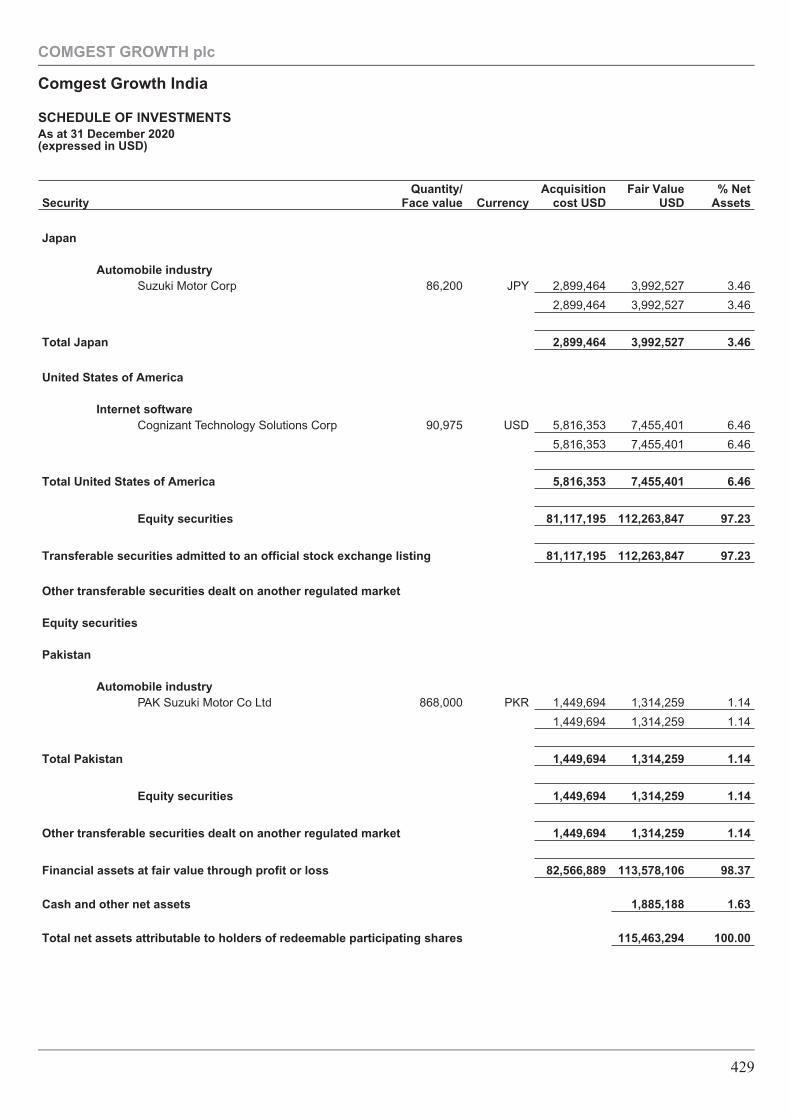
SecurityQuantity/
Face value CurrencyAcquisition
cost USDFair Value
USD% Net
Assets
Japan
Automobile industrySuzuki Motor Corp 86,200 JPY 2,899,464 3,992,527 3.46
2,899,464 3,992,527 3.46
Total Japan 2,899,464 3,992,527 3.46
United States of America
Internet softwareCognizant Technology Solutions Corp 90,975 USD 5,816,353 7,455,401 6.46
5,816,353 7,455,401 6.46
Total United States of America 5,816,353 7,455,401 6.46
Equity securities 81,117,195 112,263,847 97.23
Transferable securities admitted to an official stock exchange listing 81,117,195 112,263,847 97.23
Other transferable securities dealt on another regulated market
Equity securities
Pakistan
Automobile industryPAK Suzuki Motor Co Ltd 868,000 PKR 1,449,694 1,314,259 1.14
1,449,694 1,314,259 1.14
Total Pakistan 1,449,694 1,314,259 1.14
Equity securities 1,449,694 1,314,259 1.14
Other transferable securities dealt on another regulated market 1,449,694 1,314,259 1.14
Financial assets at fair value through profit or loss 82,566,889 113,578,106 98.37
Cash and other net assets 1,885,188 1.63
Total net assets attributable to holders of redeemable participating shares 115,463,294 100.00
COMGEST GROWTH plc
Comgest Growth India
SCHEDULE OF INVESTMENTSAs at 31 December 2020(expressed in USD)
429
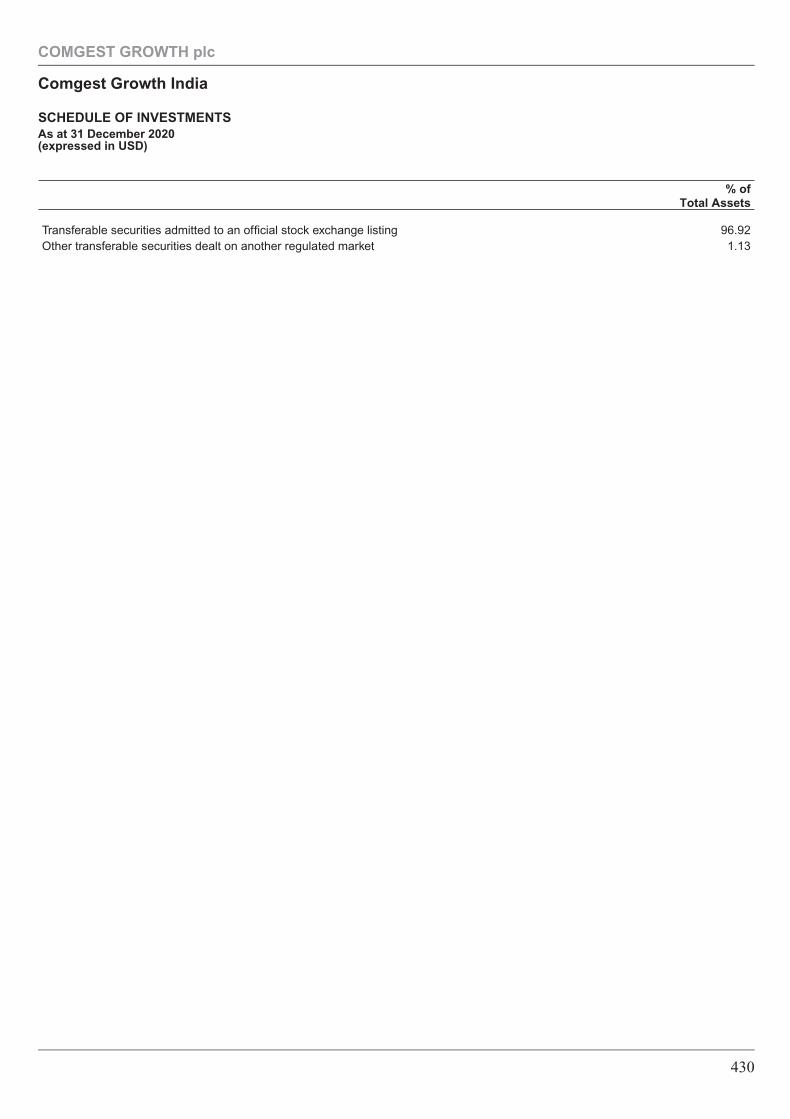
% ofTotal Assets
Transferable securities admitted to an official stock exchange listing 96.92Other transferable securities dealt on another regulated market 1.13
COMGEST GROWTH plc
Comgest Growth India
SCHEDULE OF INVESTMENTSAs at 31 December 2020(expressed in USD)
430
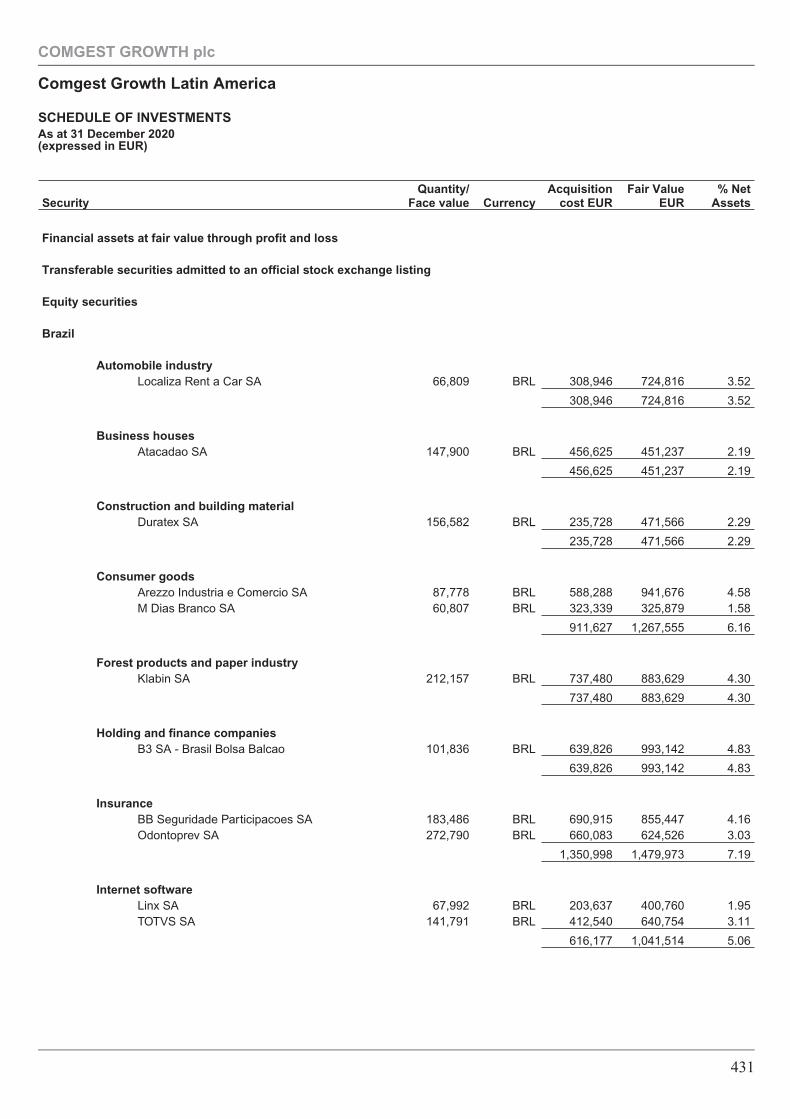
SecurityQuantity/
Face value CurrencyAcquisition
cost EURFair Value
EUR% Net
Assets
Financial assets at fair value through profit and loss
Transferable securities admitted to an official stock exchange listing
Equity securities
Brazil
Automobile industryLocaliza Rent a Car SA 66,809 BRL 308,946 724,816 3.52
308,946 724,816 3.52
Business housesAtacadao SA 147,900 BRL 456,625 451,237 2.19
456,625 451,237 2.19
Construction and building materialDuratex SA 156,582 BRL 235,728 471,566 2.29
235,728 471,566 2.29
Consumer goodsArezzo Industria e Comercio SA 87,778 BRL 588,288 941,676 4.58M Dias Branco SA 60,807 BRL 323,339 325,879 1.58
911,627 1,267,555 6.16
Forest products and paper industryKlabin SA 212,157 BRL 737,480 883,629 4.30
737,480 883,629 4.30
Holding and finance companiesB3 SA - Brasil Bolsa Balcao 101,836 BRL 639,826 993,142 4.83
639,826 993,142 4.83
InsuranceBB Seguridade Participacoes SA 183,486 BRL 690,915 855,447 4.16Odontoprev SA 272,790 BRL 660,083 624,526 3.03
1,350,998 1,479,973 7.19
Internet softwareLinx SA 67,992 BRL 203,637 400,760 1.95TOTVS SA 141,791 BRL 412,540 640,754 3.11
616,177 1,041,514 5.06
COMGEST GROWTH plc
Comgest Growth Latin America
SCHEDULE OF INVESTMENTSAs at 31 December 2020(expressed in EUR)
431
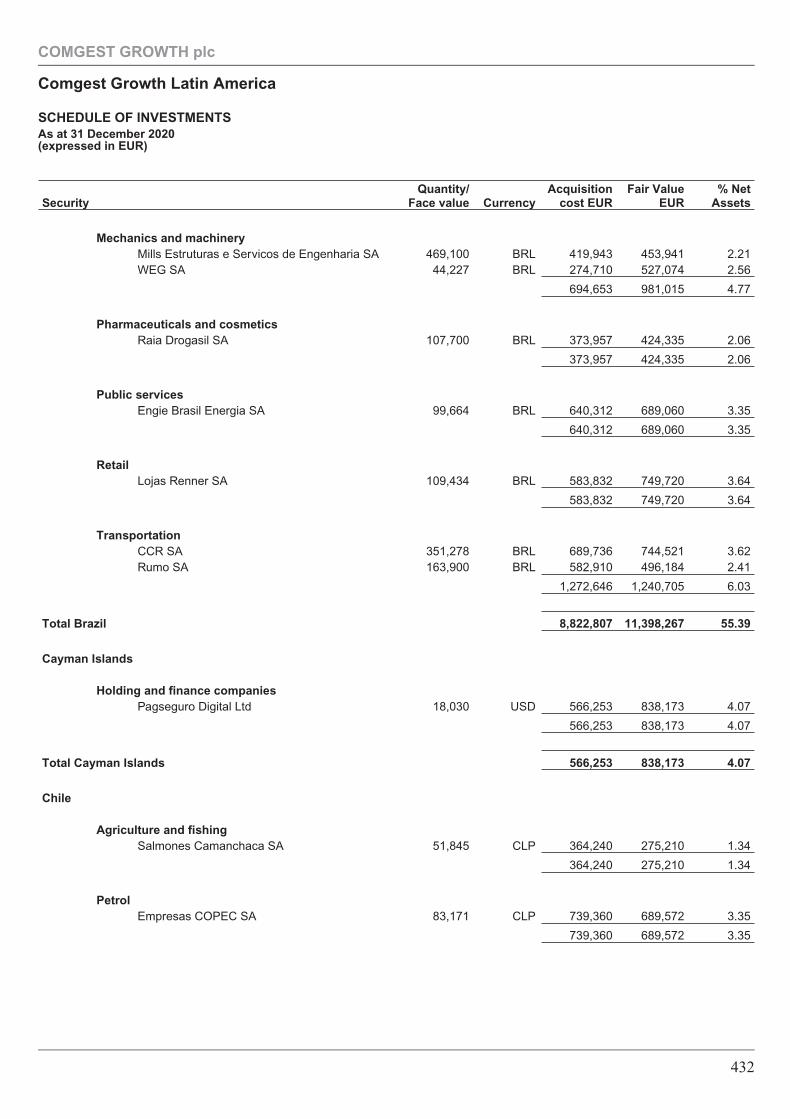
SecurityQuantity/
Face value CurrencyAcquisition
cost EURFair Value
EUR% Net
Assets
Mechanics and machineryMills Estruturas e Servicos de Engenharia SA 469,100 BRL 419,943 453,941 2.21WEG SA 44,227 BRL 274,710 527,074 2.56
694,653 981,015 4.77
Pharmaceuticals and cosmeticsRaia Drogasil SA 107,700 BRL 373,957 424,335 2.06
373,957 424,335 2.06
Public servicesEngie Brasil Energia SA 99,664 BRL 640,312 689,060 3.35
640,312 689,060 3.35
RetailLojas Renner SA 109,434 BRL 583,832 749,720 3.64
583,832 749,720 3.64
TransportationCCR SA 351,278 BRL 689,736 744,521 3.62Rumo SA 163,900 BRL 582,910 496,184 2.41
1,272,646 1,240,705 6.03
Total Brazil 8,822,807 11,398,267 55.39
Cayman Islands
Holding and finance companiesPagseguro Digital Ltd 18,030 USD 566,253 838,173 4.07
566,253 838,173 4.07
Total Cayman Islands 566,253 838,173 4.07
Chile
Agriculture and fishingSalmones Camanchaca SA 51,845 CLP 364,240 275,210 1.34
364,240 275,210 1.34
PetrolEmpresas COPEC SA 83,171 CLP 739,360 689,572 3.35
739,360 689,572 3.35
COMGEST GROWTH plc
Comgest Growth Latin America
SCHEDULE OF INVESTMENTSAs at 31 December 2020(expressed in EUR)
432
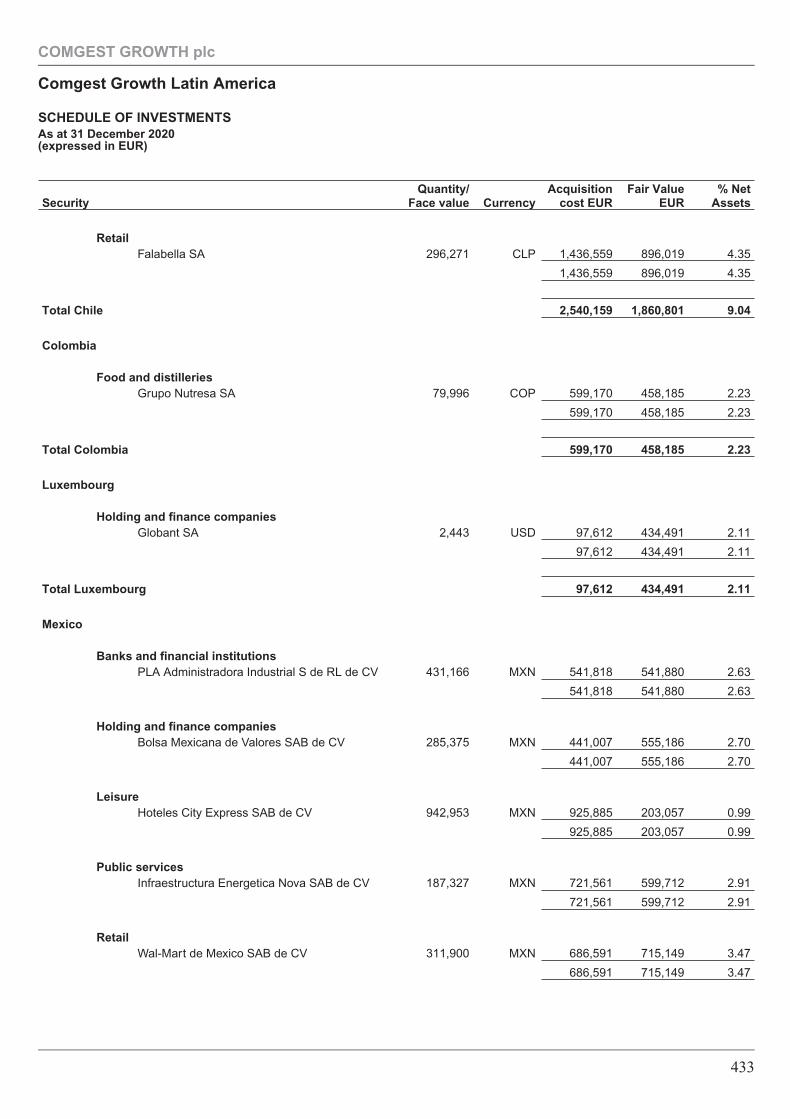
SecurityQuantity/
Face value CurrencyAcquisition
cost EURFair Value
EUR% Net
Assets
RetailFalabella SA 296,271 CLP 1,436,559 896,019 4.35
1,436,559 896,019 4.35
Total Chile 2,540,159 1,860,801 9.04
Colombia
Food and distilleriesGrupo Nutresa SA 79,996 COP 599,170 458,185 2.23
599,170 458,185 2.23
Total Colombia 599,170 458,185 2.23
Luxembourg
Holding and finance companiesGlobant SA 2,443 USD 97,612 434,491 2.11
97,612 434,491 2.11
Total Luxembourg 97,612 434,491 2.11
Mexico
Banks and financial institutionsPLA Administradora Industrial S de RL de CV 431,166 MXN 541,818 541,880 2.63
541,818 541,880 2.63
Holding and finance companiesBolsa Mexicana de Valores SAB de CV 285,375 MXN 441,007 555,186 2.70
441,007 555,186 2.70
LeisureHoteles City Express SAB de CV 942,953 MXN 925,885 203,057 0.99
925,885 203,057 0.99
Public servicesInfraestructura Energetica Nova SAB de CV 187,327 MXN 721,561 599,712 2.91
721,561 599,712 2.91
RetailWal-Mart de Mexico SAB de CV 311,900 MXN 686,591 715,149 3.47
686,591 715,149 3.47
COMGEST GROWTH plc
Comgest Growth Latin America
SCHEDULE OF INVESTMENTSAs at 31 December 2020(expressed in EUR)
433
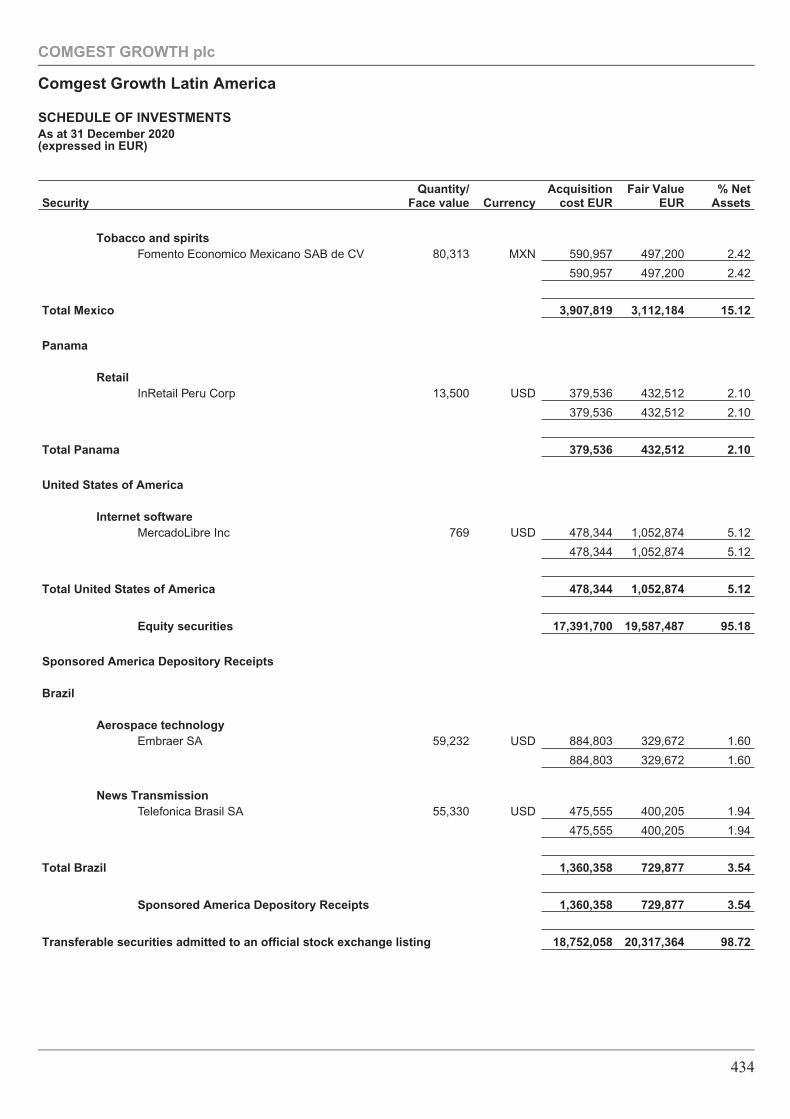
SecurityQuantity/
Face value CurrencyAcquisition
cost EURFair Value
EUR% Net
Assets
Tobacco and spiritsFomento Economico Mexicano SAB de CV 80,313 MXN 590,957 497,200 2.42
590,957 497,200 2.42
Total Mexico 3,907,819 3,112,184 15.12
Panama
RetailInRetail Peru Corp 13,500 USD 379,536 432,512 2.10
379,536 432,512 2.10
Total Panama 379,536 432,512 2.10
United States of America
Internet softwareMercadoLibre Inc 769 USD 478,344 1,052,874 5.12
478,344 1,052,874 5.12
Total United States of America 478,344 1,052,874 5.12
Equity securities 17,391,700 19,587,487 95.18
Sponsored America Depository Receipts
Brazil
Aerospace technologyEmbraer SA 59,232 USD 884,803 329,672 1.60
884,803 329,672 1.60
News TransmissionTelefonica Brasil SA 55,330 USD 475,555 400,205 1.94
475,555 400,205 1.94
Total Brazil 1,360,358 729,877 3.54
Sponsored America Depository Receipts 1,360,358 729,877 3.54
Transferable securities admitted to an official stock exchange listing 18,752,058 20,317,364 98.72
COMGEST GROWTH plc
Comgest Growth Latin America
SCHEDULE OF INVESTMENTSAs at 31 December 2020(expressed in EUR)
434
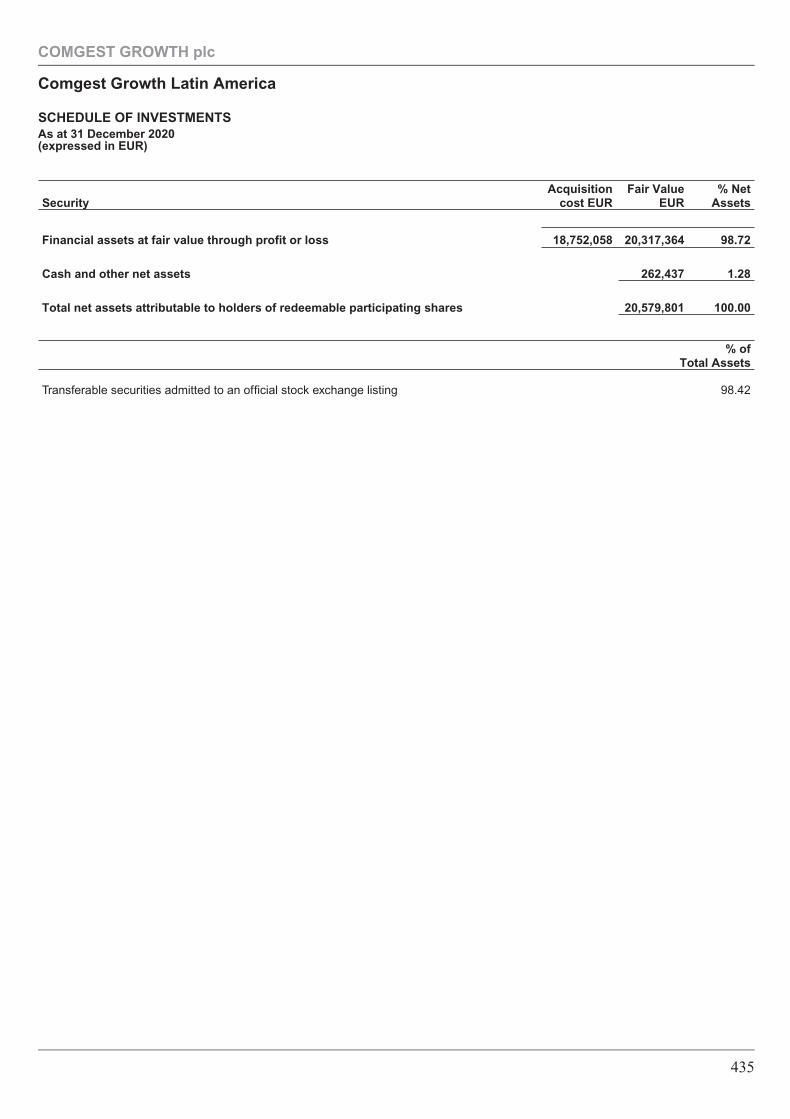
SecurityAcquisition
cost EURFair Value
EUR% Net
Assets
Financial assets at fair value through profit or loss 18,752,058 20,317,364 98.72
Cash and other net assets 262,437 1.28
Total net assets attributable to holders of redeemable participating shares 20,579,801 100.00
% ofTotal Assets
Transferable securities admitted to an official stock exchange listing 98.42
COMGEST GROWTH plc
Comgest Growth Latin America
SCHEDULE OF INVESTMENTSAs at 31 December 2020(expressed in EUR)
435
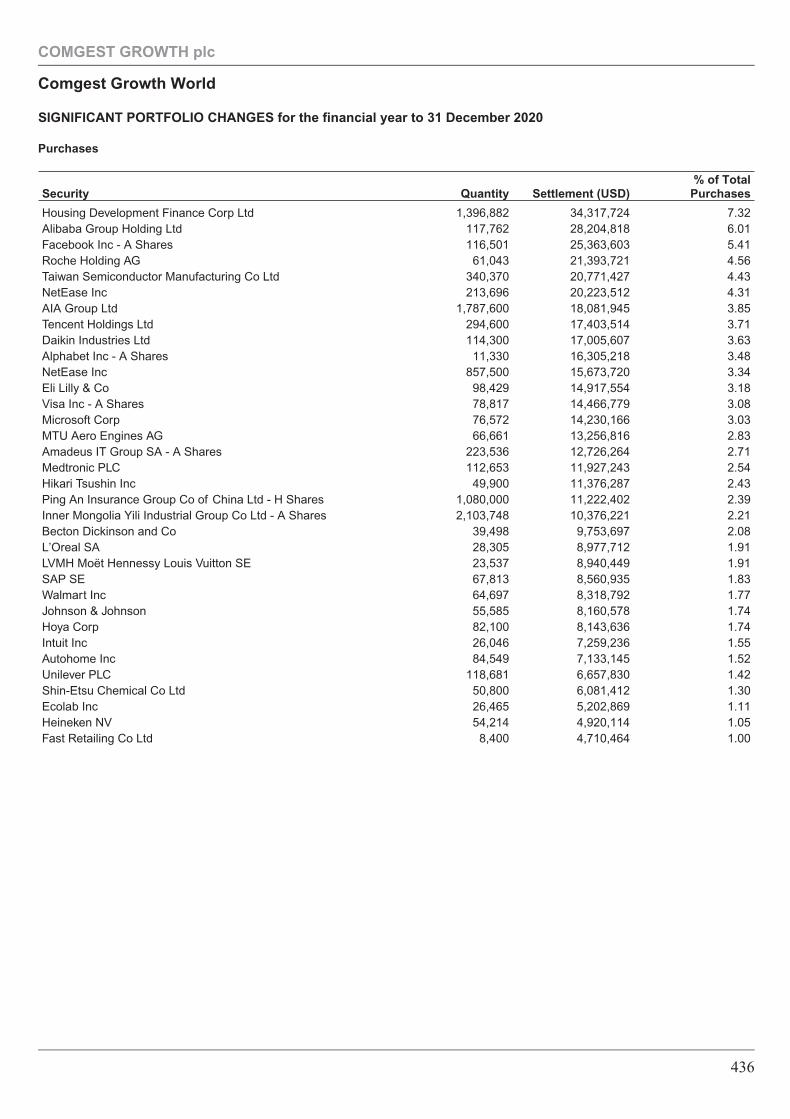
Purchases
Security Quantity Settlement (USD)% of Total
Purchases
Housing Development Finance Corp Ltd 1,396,882 34,317,724 7.32Alibaba Group Holding Ltd 117,762 28,204,818 6.01Facebook Inc - A Shares 116,501 25,363,603 5.41Roche Holding AG 61,043 21,393,721 4.56Taiwan Semiconductor Manufacturing Co Ltd 340,370 20,771,427 4.43NetEase Inc 213,696 20,223,512 4.31AIA Group Ltd 1,787,600 18,081,945 3.85Tencent Holdings Ltd 294,600 17,403,514 3.71Daikin Industries Ltd 114,300 17,005,607 3.63Alphabet Inc - A Shares 11,330 16,305,218 3.48NetEase Inc 857,500 15,673,720 3.34Eli Lilly & Co 98,429 14,917,554 3.18Visa Inc - A Shares 78,817 14,466,779 3.08Microsoft Corp 76,572 14,230,166 3.03MTU Aero Engines AG 66,661 13,256,816 2.83Amadeus IT Group SA - A Shares 223,536 12,726,264 2.71Medtronic PLC 112,653 11,927,243 2.54Hikari Tsushin Inc 49,900 11,376,287 2.43Ping An Insurance Group Co of China Ltd - H Shares 1,080,000 11,222,402 2.39Inner Mongolia Yili Industrial Group Co Ltd - A Shares 2,103,748 10,376,221 2.21Becton Dickinson and Co 39,498 9,753,697 2.08L’Oreal SA 28,305 8,977,712 1.91LVMH Moët Hennessy Louis Vuitton SE 23,537 8,940,449 1.91SAP SE 67,813 8,560,935 1.83Walmart Inc 64,697 8,318,792 1.77Johnson & Johnson 55,585 8,160,578 1.74Hoya Corp 82,100 8,143,636 1.74Intuit Inc 26,046 7,259,236 1.55Autohome Inc 84,549 7,133,145 1.52Unilever PLC 118,681 6,657,830 1.42Shin-Etsu Chemical Co Ltd 50,800 6,081,412 1.30Ecolab Inc 26,465 5,202,869 1.11Heineken NV 54,214 4,920,114 1.05Fast Retailing Co Ltd 8,400 4,710,464 1.00
COMGEST GROWTH plc
Comgest Growth World
SIGNIFICANT PORTFOLIO CHANGES for the financial year to 31 December 2020
436
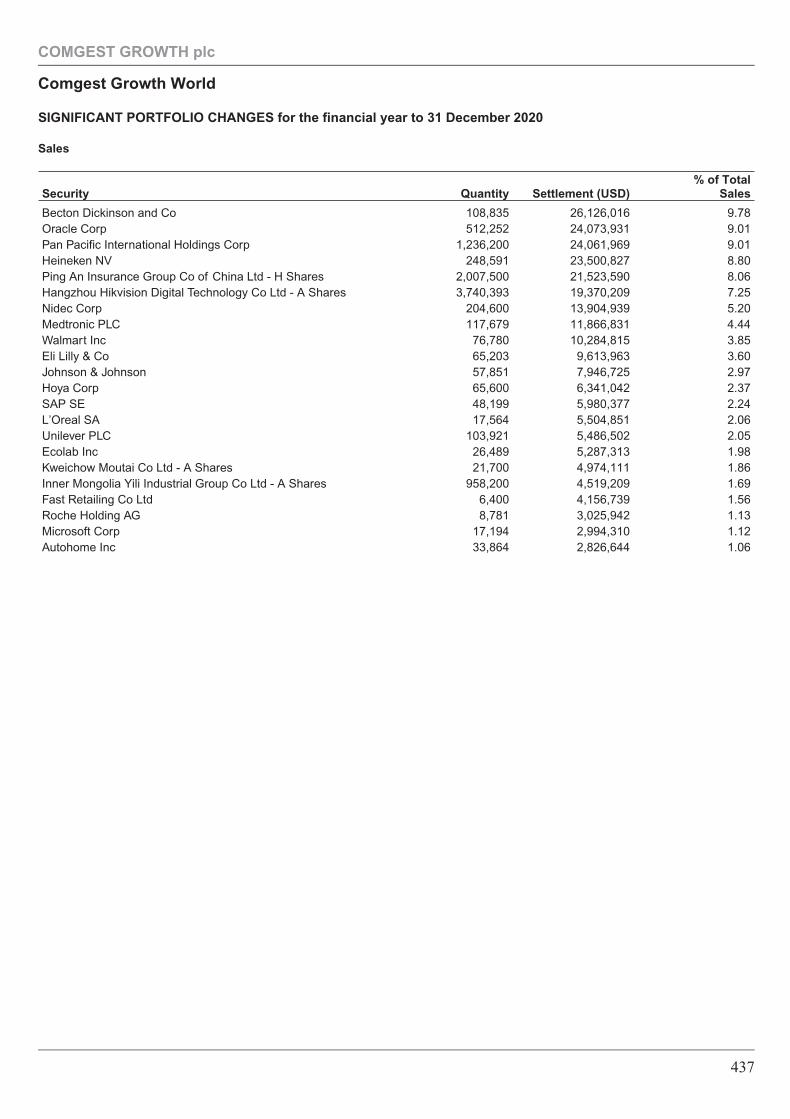
Sales
Security Quantity Settlement (USD)% of Total
Sales
Becton Dickinson and Co 108,835 26,126,016 9.78Oracle Corp 512,252 24,073,931 9.01Pan Pacific International Holdings Corp 1,236,200 24,061,969 9.01Heineken NV 248,591 23,500,827 8.80Ping An Insurance Group Co of China Ltd - H Shares 2,007,500 21,523,590 8.06Hangzhou Hikvision Digital Technology Co Ltd - A Shares 3,740,393 19,370,209 7.25Nidec Corp 204,600 13,904,939 5.20Medtronic PLC 117,679 11,866,831 4.44Walmart Inc 76,780 10,284,815 3.85Eli Lilly & Co 65,203 9,613,963 3.60Johnson & Johnson 57,851 7,946,725 2.97Hoya Corp 65,600 6,341,042 2.37SAP SE 48,199 5,980,377 2.24L’Oreal SA 17,564 5,504,851 2.06Unilever PLC 103,921 5,486,502 2.05Ecolab Inc 26,489 5,287,313 1.98Kweichow Moutai Co Ltd - A Shares 21,700 4,974,111 1.86Inner Mongolia Yili Industrial Group Co Ltd - A Shares 958,200 4,519,209 1.69Fast Retailing Co Ltd 6,400 4,156,739 1.56Roche Holding AG 8,781 3,025,942 1.13Microsoft Corp 17,194 2,994,310 1.12Autohome Inc 33,864 2,826,644 1.06
COMGEST GROWTH plc
Comgest Growth World
SIGNIFICANT PORTFOLIO CHANGES for the financial year to 31 December 2020
437
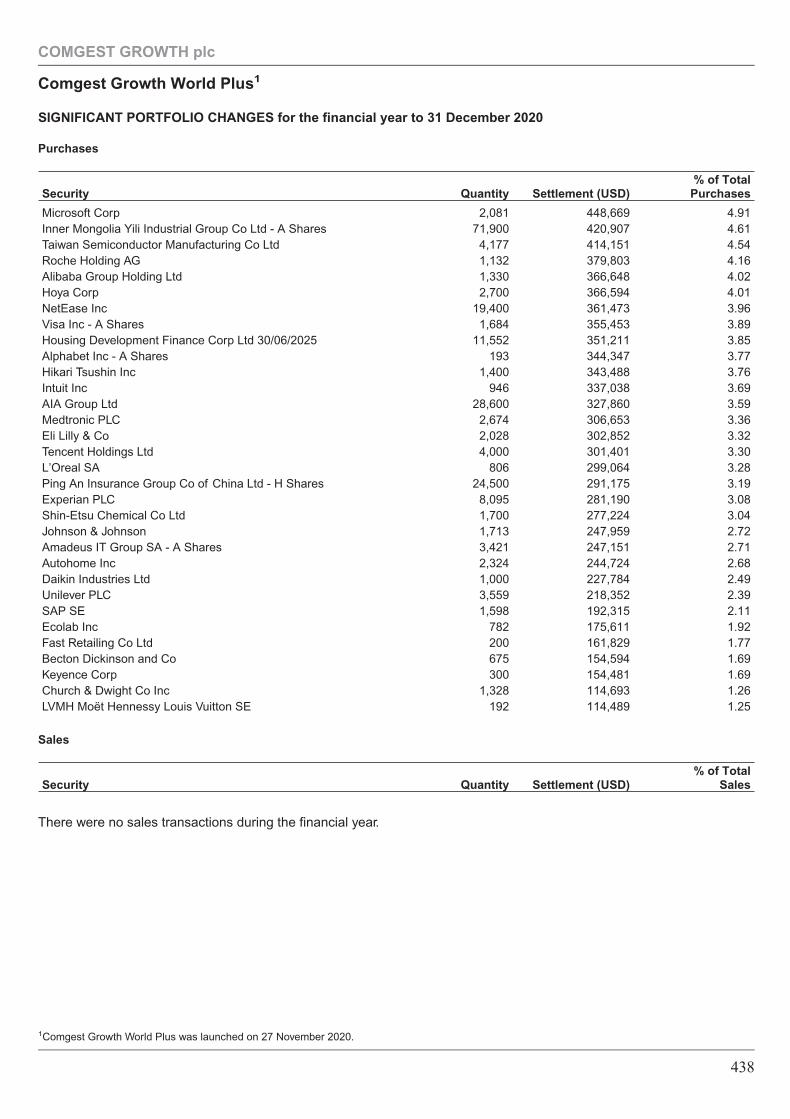
Purchases
Security Quantity Settlement (USD)% of Total
Purchases
Microsoft Corp 2,081 448,669 4.91Inner Mongolia Yili Industrial Group Co Ltd - A Shares 71,900 420,907 4.61Taiwan Semiconductor Manufacturing Co Ltd 4,177 414,151 4.54Roche Holding AG 1,132 379,803 4.16Alibaba Group Holding Ltd 1,330 366,648 4.02Hoya Corp 2,700 366,594 4.01NetEase Inc 19,400 361,473 3.96Visa Inc - A Shares 1,684 355,453 3.89Housing Development Finance Corp Ltd 30/06/2025 11,552 351,211 3.85Alphabet Inc - A Shares 193 344,347 3.77Hikari Tsushin Inc 1,400 343,488 3.76Intuit Inc 946 337,038 3.69AIA Group Ltd 28,600 327,860 3.59Medtronic PLC 2,674 306,653 3.36Eli Lilly & Co 2,028 302,852 3.32Tencent Holdings Ltd 4,000 301,401 3.30L’Oreal SA 806 299,064 3.28Ping An Insurance Group Co of China Ltd - H Shares 24,500 291,175 3.19Experian PLC 8,095 281,190 3.08Shin-Etsu Chemical Co Ltd 1,700 277,224 3.04Johnson & Johnson 1,713 247,959 2.72Amadeus IT Group SA - A Shares 3,421 247,151 2.71Autohome Inc 2,324 244,724 2.68Daikin Industries Ltd 1,000 227,784 2.49Unilever PLC 3,559 218,352 2.39SAP SE 1,598 192,315 2.11Ecolab Inc 782 175,611 1.92Fast Retailing Co Ltd 200 161,829 1.77Becton Dickinson and Co 675 154,594 1.69Keyence Corp 300 154,481 1.69Church & Dwight Co Inc 1,328 114,693 1.26LVMH Moët Hennessy Louis Vuitton SE 192 114,489 1.25
Sales
Security Quantity Settlement (USD)% of Total
Sales
There were no sales transactions during the financial year.
COMGEST GROWTH plc
Comgest Growth World Plus1
SIGNIFICANT PORTFOLIO CHANGES for the financial year to 31 December 2020
1Comgest Growth World Plus was launched on 27 November 2020.
438
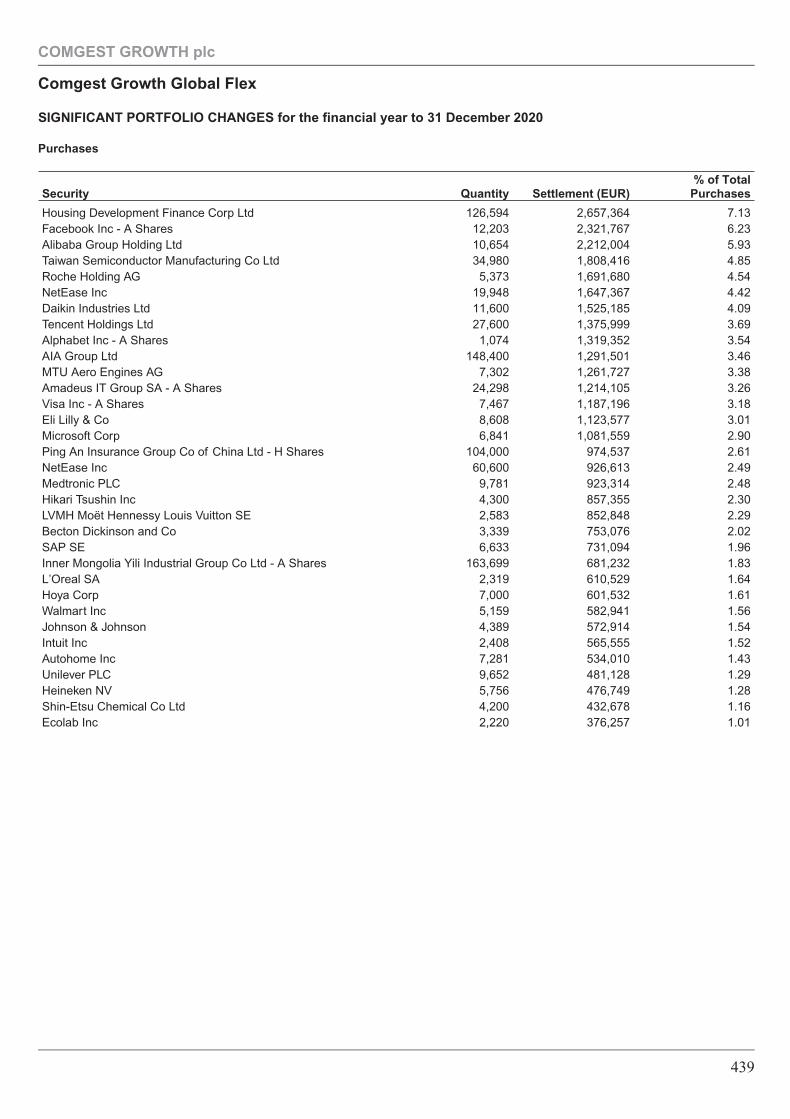
Purchases
Security Quantity Settlement (EUR)% of Total
Purchases
Housing Development Finance Corp Ltd 126,594 2,657,364 7.13Facebook Inc - A Shares 12,203 2,321,767 6.23Alibaba Group Holding Ltd 10,654 2,212,004 5.93Taiwan Semiconductor Manufacturing Co Ltd 34,980 1,808,416 4.85Roche Holding AG 5,373 1,691,680 4.54NetEase Inc 19,948 1,647,367 4.42Daikin Industries Ltd 11,600 1,525,185 4.09Tencent Holdings Ltd 27,600 1,375,999 3.69Alphabet Inc - A Shares 1,074 1,319,352 3.54AIA Group Ltd 148,400 1,291,501 3.46MTU Aero Engines AG 7,302 1,261,727 3.38Amadeus IT Group SA - A Shares 24,298 1,214,105 3.26Visa Inc - A Shares 7,467 1,187,196 3.18Eli Lilly & Co 8,608 1,123,577 3.01Microsoft Corp 6,841 1,081,559 2.90Ping An Insurance Group Co of China Ltd - H Shares 104,000 974,537 2.61NetEase Inc 60,600 926,613 2.49Medtronic PLC 9,781 923,314 2.48Hikari Tsushin Inc 4,300 857,355 2.30LVMH Moët Hennessy Louis Vuitton SE 2,583 852,848 2.29Becton Dickinson and Co 3,339 753,076 2.02SAP SE 6,633 731,094 1.96Inner Mongolia Yili Industrial Group Co Ltd - A Shares 163,699 681,232 1.83L’Oreal SA 2,319 610,529 1.64Hoya Corp 7,000 601,532 1.61Walmart Inc 5,159 582,941 1.56Johnson & Johnson 4,389 572,914 1.54Intuit Inc 2,408 565,555 1.52Autohome Inc 7,281 534,010 1.43Unilever PLC 9,652 481,128 1.29Heineken NV 5,756 476,749 1.28Shin-Etsu Chemical Co Ltd 4,200 432,678 1.16Ecolab Inc 2,220 376,257 1.01
COMGEST GROWTH plc
Comgest Growth Global Flex
SIGNIFICANT PORTFOLIO CHANGES for the financial year to 31 December 2020
439
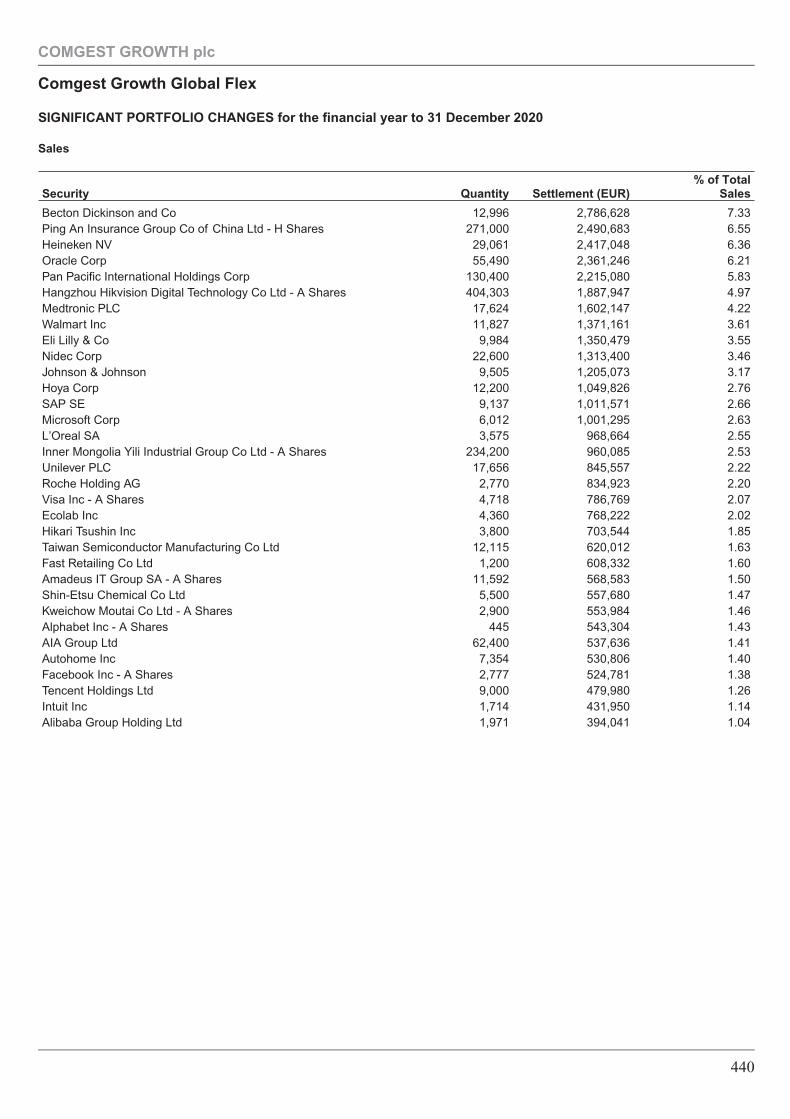
Sales
Security Quantity Settlement (EUR)% of Total
Sales
Becton Dickinson and Co 12,996 2,786,628 7.33Ping An Insurance Group Co of China Ltd - H Shares 271,000 2,490,683 6.55Heineken NV 29,061 2,417,048 6.36Oracle Corp 55,490 2,361,246 6.21Pan Pacific International Holdings Corp 130,400 2,215,080 5.83Hangzhou Hikvision Digital Technology Co Ltd - A Shares 404,303 1,887,947 4.97Medtronic PLC 17,624 1,602,147 4.22Walmart Inc 11,827 1,371,161 3.61Eli Lilly & Co 9,984 1,350,479 3.55Nidec Corp 22,600 1,313,400 3.46Johnson & Johnson 9,505 1,205,073 3.17Hoya Corp 12,200 1,049,826 2.76SAP SE 9,137 1,011,571 2.66Microsoft Corp 6,012 1,001,295 2.63L’Oreal SA 3,575 968,664 2.55Inner Mongolia Yili Industrial Group Co Ltd - A Shares 234,200 960,085 2.53Unilever PLC 17,656 845,557 2.22Roche Holding AG 2,770 834,923 2.20Visa Inc - A Shares 4,718 786,769 2.07Ecolab Inc 4,360 768,222 2.02Hikari Tsushin Inc 3,800 703,544 1.85Taiwan Semiconductor Manufacturing Co Ltd 12,115 620,012 1.63Fast Retailing Co Ltd 1,200 608,332 1.60Amadeus IT Group SA - A Shares 11,592 568,583 1.50Shin-Etsu Chemical Co Ltd 5,500 557,680 1.47Kweichow Moutai Co Ltd - A Shares 2,900 553,984 1.46Alphabet Inc - A Shares 445 543,304 1.43AIA Group Ltd 62,400 537,636 1.41Autohome Inc 7,354 530,806 1.40Facebook Inc - A Shares 2,777 524,781 1.38Tencent Holdings Ltd 9,000 479,980 1.26Intuit Inc 1,714 431,950 1.14Alibaba Group Holding Ltd 1,971 394,041 1.04
COMGEST GROWTH plc
Comgest Growth Global Flex
SIGNIFICANT PORTFOLIO CHANGES for the financial year to 31 December 2020
440
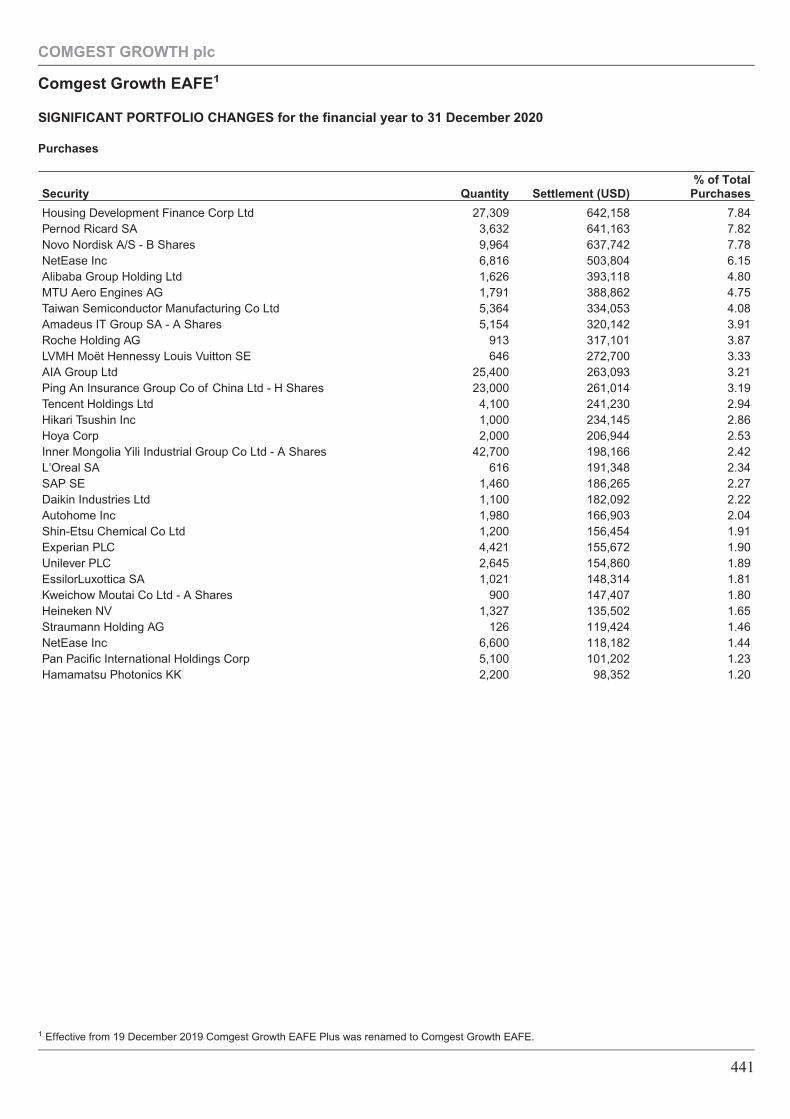
Purchases
Security Quantity Settlement (USD)% of Total
Purchases
Housing Development Finance Corp Ltd 27,309 642,158 7.84Pernod Ricard SA 3,632 641,163 7.82Novo Nordisk A/S - B Shares 9,964 637,742 7.78NetEase Inc 6,816 503,804 6.15Alibaba Group Holding Ltd 1,626 393,118 4.80MTU Aero Engines AG 1,791 388,862 4.75Taiwan Semiconductor Manufacturing Co Ltd 5,364 334,053 4.08Amadeus IT Group SA - A Shares 5,154 320,142 3.91Roche Holding AG 913 317,101 3.87LVMH Moët Hennessy Louis Vuitton SE 646 272,700 3.33AIA Group Ltd 25,400 263,093 3.21Ping An Insurance Group Co of China Ltd - H Shares 23,000 261,014 3.19Tencent Holdings Ltd 4,100 241,230 2.94Hikari Tsushin Inc 1,000 234,145 2.86Hoya Corp 2,000 206,944 2.53Inner Mongolia Yili Industrial Group Co Ltd - A Shares 42,700 198,166 2.42L’Oreal SA 616 191,348 2.34SAP SE 1,460 186,265 2.27Daikin Industries Ltd 1,100 182,092 2.22Autohome Inc 1,980 166,903 2.04Shin-Etsu Chemical Co Ltd 1,200 156,454 1.91Experian PLC 4,421 155,672 1.90Unilever PLC 2,645 154,860 1.89EssilorLuxottica SA 1,021 148,314 1.81Kweichow Moutai Co Ltd - A Shares 900 147,407 1.80Heineken NV 1,327 135,502 1.65Straumann Holding AG 126 119,424 1.46NetEase Inc 6,600 118,182 1.44Pan Pacific International Holdings Corp 5,100 101,202 1.23Hamamatsu Photonics KK 2,200 98,352 1.20
COMGEST GROWTH plc
Comgest Growth EAFE1
SIGNIFICANT PORTFOLIO CHANGES for the financial year to 31 December 2020
1 Effective from 19 December 2019 Comgest Growth EAFE Plus was renamed to Comgest Growth EAFE.
441
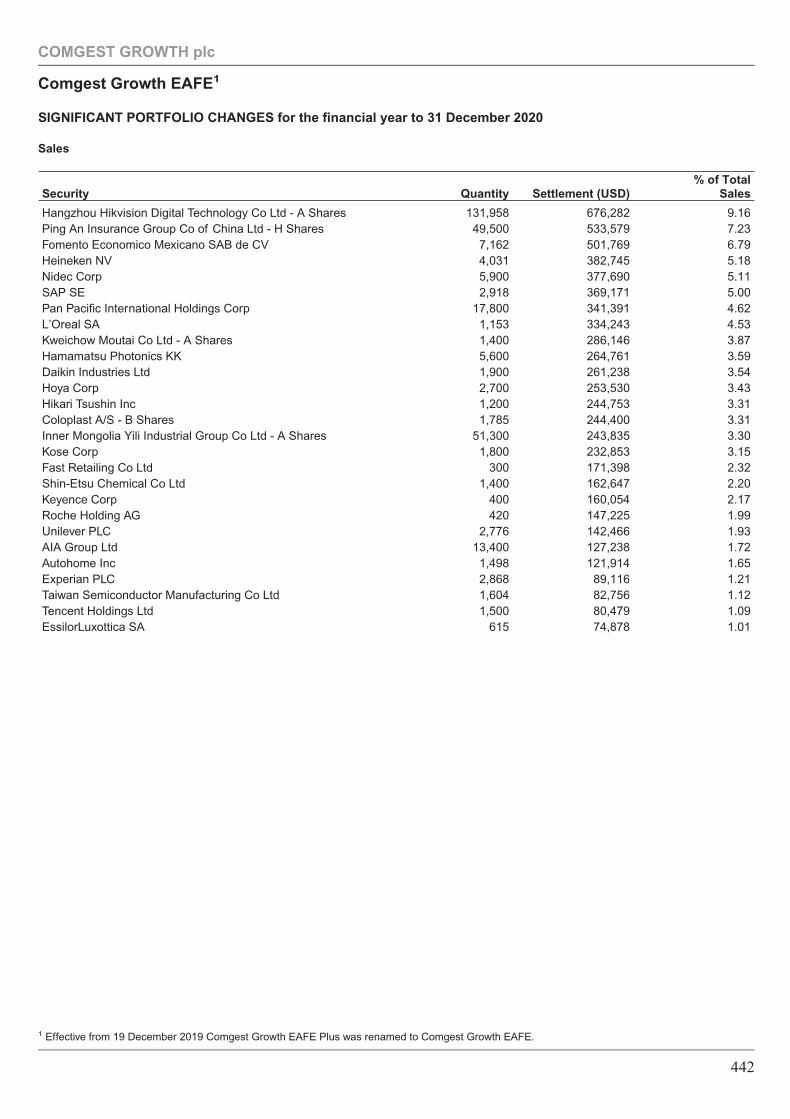
Sales
Security Quantity Settlement (USD)% of Total
Sales
Hangzhou Hikvision Digital Technology Co Ltd - A Shares 131,958 676,282 9.16Ping An Insurance Group Co of China Ltd - H Shares 49,500 533,579 7.23Fomento Economico Mexicano SAB de CV 7,162 501,769 6.79Heineken NV 4,031 382,745 5.18Nidec Corp 5,900 377,690 5.11SAP SE 2,918 369,171 5.00Pan Pacific International Holdings Corp 17,800 341,391 4.62L’Oreal SA 1,153 334,243 4.53Kweichow Moutai Co Ltd - A Shares 1,400 286,146 3.87Hamamatsu Photonics KK 5,600 264,761 3.59Daikin Industries Ltd 1,900 261,238 3.54Hoya Corp 2,700 253,530 3.43Hikari Tsushin Inc 1,200 244,753 3.31Coloplast A/S - B Shares 1,785 244,400 3.31Inner Mongolia Yili Industrial Group Co Ltd - A Shares 51,300 243,835 3.30Kose Corp 1,800 232,853 3.15Fast Retailing Co Ltd 300 171,398 2.32Shin-Etsu Chemical Co Ltd 1,400 162,647 2.20Keyence Corp 400 160,054 2.17Roche Holding AG 420 147,225 1.99Unilever PLC 2,776 142,466 1.93AIA Group Ltd 13,400 127,238 1.72Autohome Inc 1,498 121,914 1.65Experian PLC 2,868 89,116 1.21Taiwan Semiconductor Manufacturing Co Ltd 1,604 82,756 1.12Tencent Holdings Ltd 1,500 80,479 1.09EssilorLuxottica SA 615 74,878 1.01
COMGEST GROWTH plc
Comgest Growth EAFE1
SIGNIFICANT PORTFOLIO CHANGES for the financial year to 31 December 2020
1 Effective from 19 December 2019 Comgest Growth EAFE Plus was renamed to Comgest Growth EAFE.
442
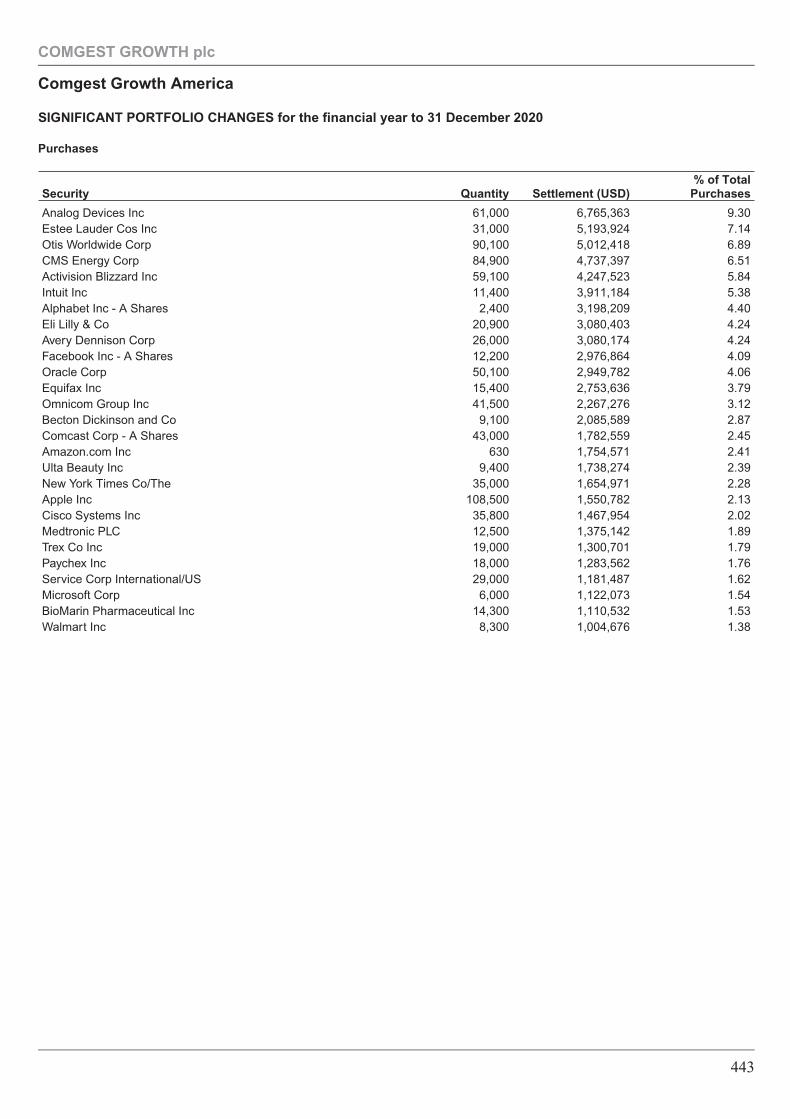
Purchases
Security Quantity Settlement (USD)% of Total
Purchases
Analog Devices Inc 61,000 6,765,363 9.30Estee Lauder Cos Inc 31,000 5,193,924 7.14Otis Worldwide Corp 90,100 5,012,418 6.89CMS Energy Corp 84,900 4,737,397 6.51Activision Blizzard Inc 59,100 4,247,523 5.84Intuit Inc 11,400 3,911,184 5.38Alphabet Inc - A Shares 2,400 3,198,209 4.40Eli Lilly & Co 20,900 3,080,403 4.24Avery Dennison Corp 26,000 3,080,174 4.24Facebook Inc - A Shares 12,200 2,976,864 4.09Oracle Corp 50,100 2,949,782 4.06Equifax Inc 15,400 2,753,636 3.79Omnicom Group Inc 41,500 2,267,276 3.12Becton Dickinson and Co 9,100 2,085,589 2.87Comcast Corp - A Shares 43,000 1,782,559 2.45Amazon.com Inc 630 1,754,571 2.41Ulta Beauty Inc 9,400 1,738,274 2.39New York Times Co/The 35,000 1,654,971 2.28Apple Inc 108,500 1,550,782 2.13Cisco Systems Inc 35,800 1,467,954 2.02Medtronic PLC 12,500 1,375,142 1.89Trex Co Inc 19,000 1,300,701 1.79Paychex Inc 18,000 1,283,562 1.76Service Corp International/US 29,000 1,181,487 1.62Microsoft Corp 6,000 1,122,073 1.54BioMarin Pharmaceutical Inc 14,300 1,110,532 1.53Walmart Inc 8,300 1,004,676 1.38
COMGEST GROWTH plc
Comgest Growth America
SIGNIFICANT PORTFOLIO CHANGES for the financial year to 31 December 2020
443
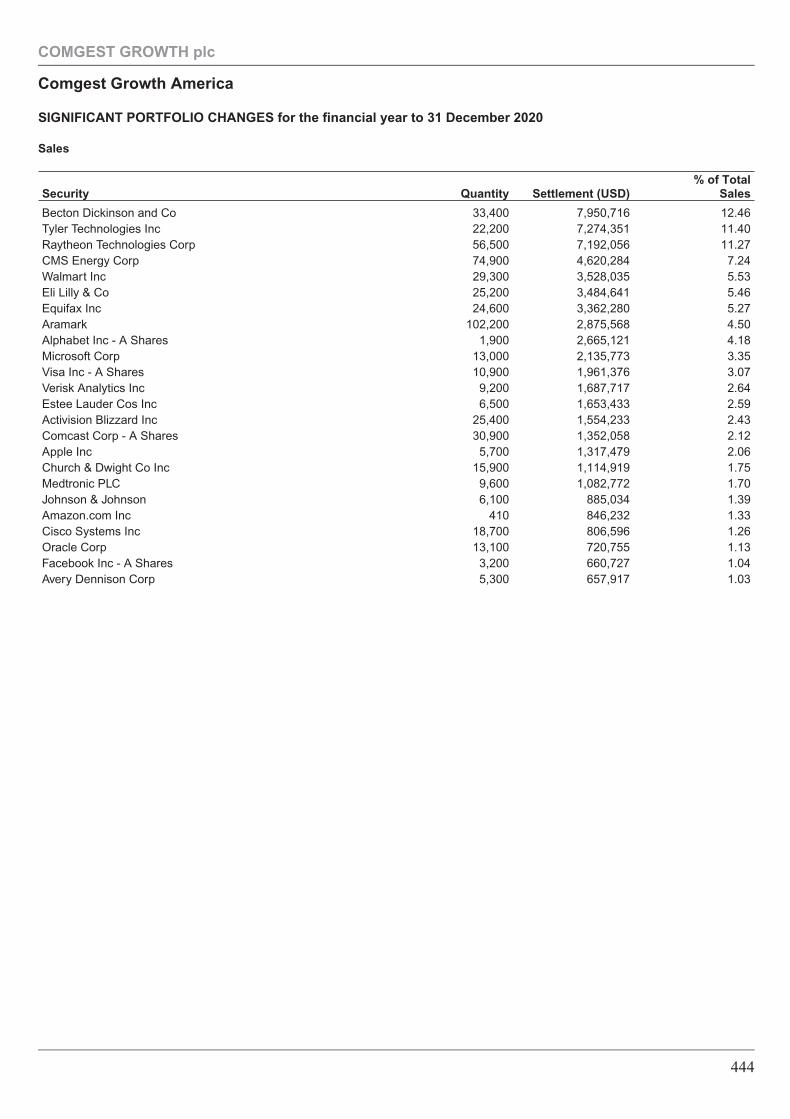
Sales
Security Quantity Settlement (USD)% of Total
Sales
Becton Dickinson and Co 33,400 7,950,716 12.46Tyler Technologies Inc 22,200 7,274,351 11.40Raytheon Technologies Corp 56,500 7,192,056 11.27CMS Energy Corp 74,900 4,620,284 7.24Walmart Inc 29,300 3,528,035 5.53Eli Lilly & Co 25,200 3,484,641 5.46Equifax Inc 24,600 3,362,280 5.27Aramark 102,200 2,875,568 4.50Alphabet Inc - A Shares 1,900 2,665,121 4.18Microsoft Corp 13,000 2,135,773 3.35Visa Inc - A Shares 10,900 1,961,376 3.07Verisk Analytics Inc 9,200 1,687,717 2.64Estee Lauder Cos Inc 6,500 1,653,433 2.59Activision Blizzard Inc 25,400 1,554,233 2.43Comcast Corp - A Shares 30,900 1,352,058 2.12Apple Inc 5,700 1,317,479 2.06Church & Dwight Co Inc 15,900 1,114,919 1.75Medtronic PLC 9,600 1,082,772 1.70Johnson & Johnson 6,100 885,034 1.39Amazon.com Inc 410 846,232 1.33Cisco Systems Inc 18,700 806,596 1.26Oracle Corp 13,100 720,755 1.13Facebook Inc - A Shares 3,200 660,727 1.04Avery Dennison Corp 5,300 657,917 1.03
COMGEST GROWTH plc
Comgest Growth America
SIGNIFICANT PORTFOLIO CHANGES for the financial year to 31 December 2020
444
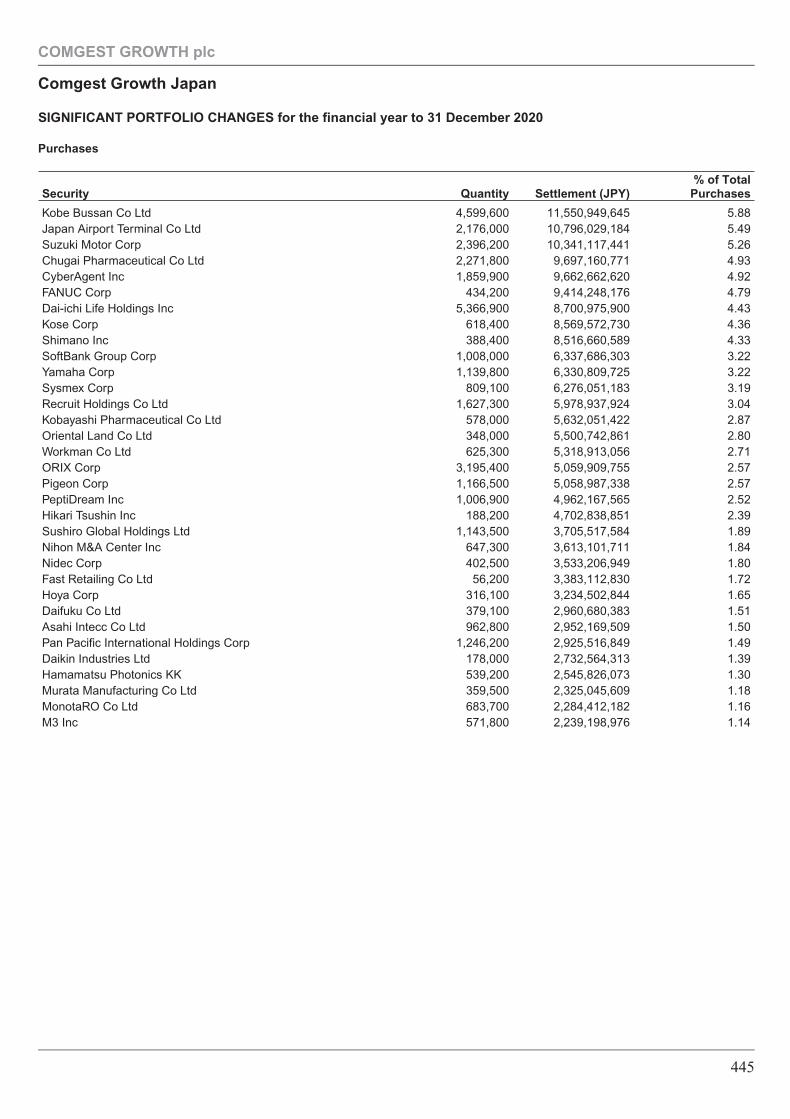
Purchases
Security Quantity Settlement (JPY)% of Total
Purchases
Kobe Bussan Co Ltd 4,599,600 11,550,949,645 5.88Japan Airport Terminal Co Ltd 2,176,000 10,796,029,184 5.49Suzuki Motor Corp 2,396,200 10,341,117,441 5.26Chugai Pharmaceutical Co Ltd 2,271,800 9,697,160,771 4.93CyberAgent Inc 1,859,900 9,662,662,620 4.92FANUC Corp 434,200 9,414,248,176 4.79Dai-ichi Life Holdings Inc 5,366,900 8,700,975,900 4.43Kose Corp 618,400 8,569,572,730 4.36Shimano Inc 388,400 8,516,660,589 4.33SoftBank Group Corp 1,008,000 6,337,686,303 3.22Yamaha Corp 1,139,800 6,330,809,725 3.22Sysmex Corp 809,100 6,276,051,183 3.19Recruit Holdings Co Ltd 1,627,300 5,978,937,924 3.04Kobayashi Pharmaceutical Co Ltd 578,000 5,632,051,422 2.87Oriental Land Co Ltd 348,000 5,500,742,861 2.80Workman Co Ltd 625,300 5,318,913,056 2.71ORIX Corp 3,195,400 5,059,909,755 2.57Pigeon Corp 1,166,500 5,058,987,338 2.57PeptiDream Inc 1,006,900 4,962,167,565 2.52Hikari Tsushin Inc 188,200 4,702,838,851 2.39Sushiro Global Holdings Ltd 1,143,500 3,705,517,584 1.89Nihon M&A Center Inc 647,300 3,613,101,711 1.84Nidec Corp 402,500 3,533,206,949 1.80Fast Retailing Co Ltd 56,200 3,383,112,830 1.72Hoya Corp 316,100 3,234,502,844 1.65Daifuku Co Ltd 379,100 2,960,680,383 1.51Asahi Intecc Co Ltd 962,800 2,952,169,509 1.50Pan Pacific International Holdings Corp 1,246,200 2,925,516,849 1.49Daikin Industries Ltd 178,000 2,732,564,313 1.39Hamamatsu Photonics KK 539,200 2,545,826,073 1.30Murata Manufacturing Co Ltd 359,500 2,325,045,609 1.18MonotaRO Co Ltd 683,700 2,284,412,182 1.16M3 Inc 571,800 2,239,198,976 1.14
COMGEST GROWTH plc
Comgest Growth Japan
SIGNIFICANT PORTFOLIO CHANGES for the financial year to 31 December 2020
445
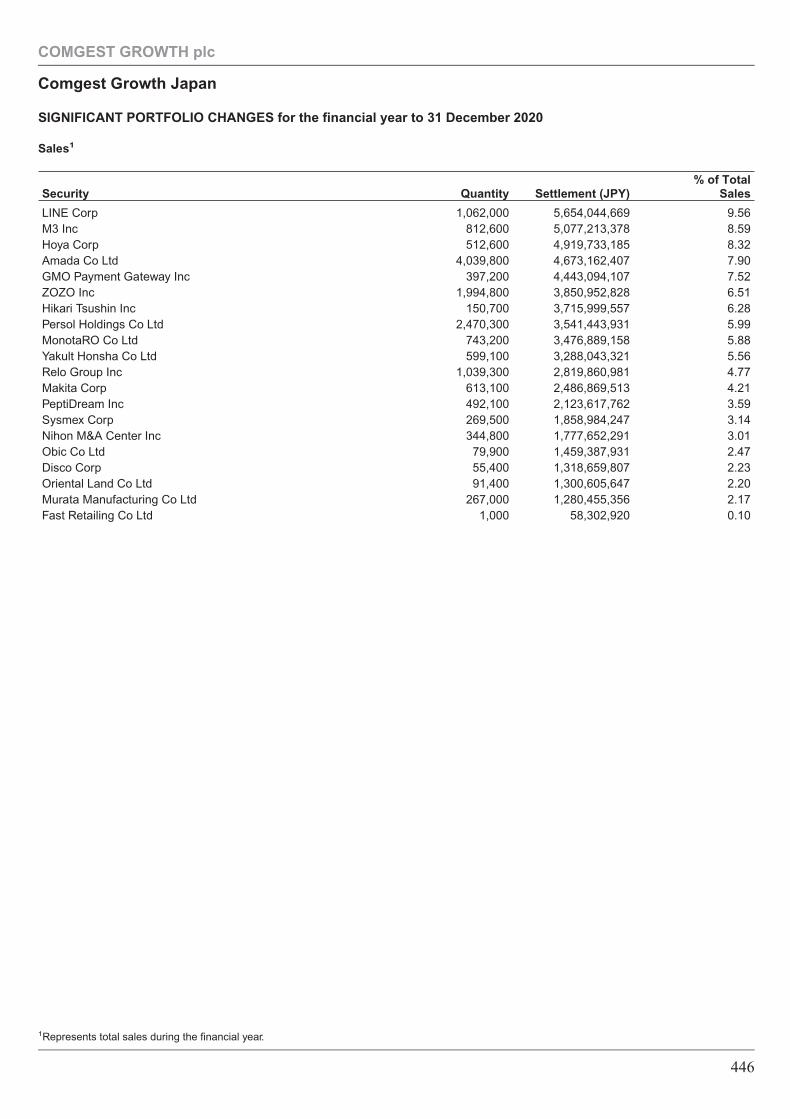
Sales1
Security Quantity Settlement (JPY)% of Total
Sales
LINE Corp 1,062,000 5,654,044,669 9.56M3 Inc 812,600 5,077,213,378 8.59Hoya Corp 512,600 4,919,733,185 8.32Amada Co Ltd 4,039,800 4,673,162,407 7.90GMO Payment Gateway Inc 397,200 4,443,094,107 7.52ZOZO Inc 1,994,800 3,850,952,828 6.51Hikari Tsushin Inc 150,700 3,715,999,557 6.28Persol Holdings Co Ltd 2,470,300 3,541,443,931 5.99MonotaRO Co Ltd 743,200 3,476,889,158 5.88Yakult Honsha Co Ltd 599,100 3,288,043,321 5.56Relo Group Inc 1,039,300 2,819,860,981 4.77Makita Corp 613,100 2,486,869,513 4.21PeptiDream Inc 492,100 2,123,617,762 3.59Sysmex Corp 269,500 1,858,984,247 3.14Nihon M&A Center Inc 344,800 1,777,652,291 3.01Obic Co Ltd 79,900 1,459,387,931 2.47Disco Corp 55,400 1,318,659,807 2.23Oriental Land Co Ltd 91,400 1,300,605,647 2.20Murata Manufacturing Co Ltd 267,000 1,280,455,356 2.17Fast Retailing Co Ltd 1,000 58,302,920 0.10
COMGEST GROWTH plc
Comgest Growth Japan
SIGNIFICANT PORTFOLIO CHANGES for the financial year to 31 December 2020
1Represents total sales during the financial year.
446
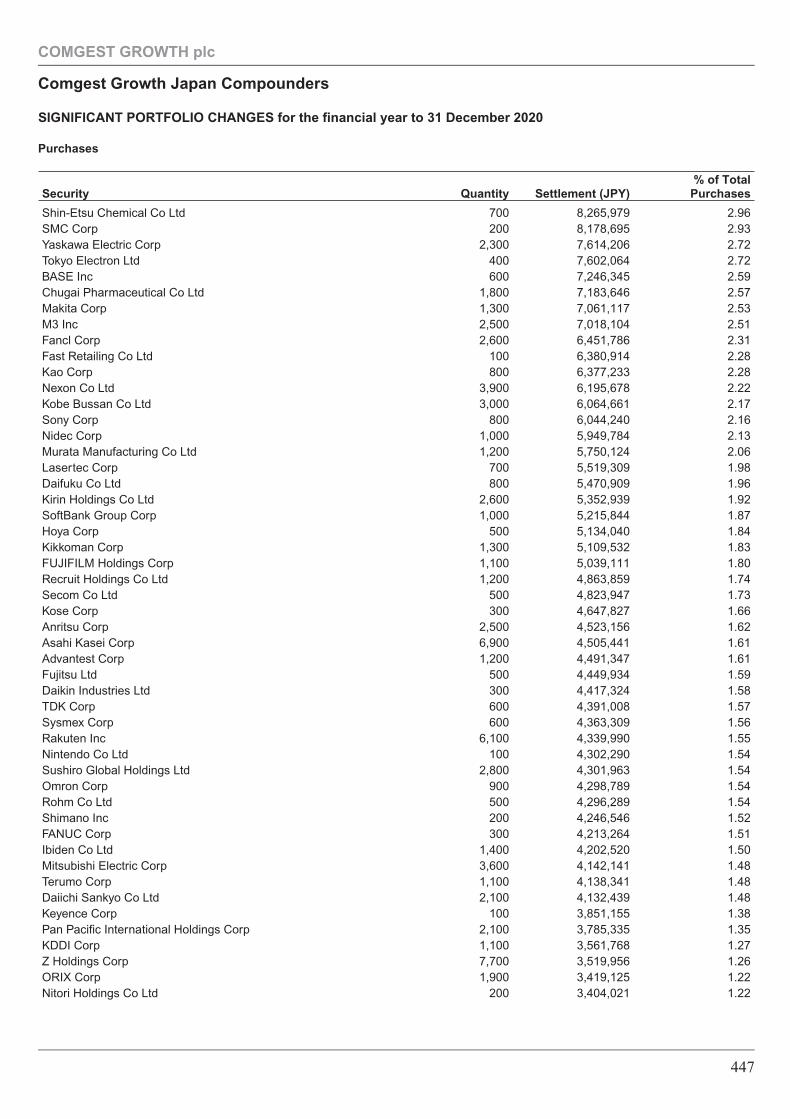
Purchases
Security Quantity Settlement (JPY)% of Total
Purchases
Shin-Etsu Chemical Co Ltd 700 8,265,979 2.96SMC Corp 200 8,178,695 2.93Yaskawa Electric Corp 2,300 7,614,206 2.72Tokyo Electron Ltd 400 7,602,064 2.72BASE Inc 600 7,246,345 2.59Chugai Pharmaceutical Co Ltd 1,800 7,183,646 2.57Makita Corp 1,300 7,061,117 2.53M3 Inc 2,500 7,018,104 2.51Fancl Corp 2,600 6,451,786 2.31Fast Retailing Co Ltd 100 6,380,914 2.28Kao Corp 800 6,377,233 2.28Nexon Co Ltd 3,900 6,195,678 2.22Kobe Bussan Co Ltd 3,000 6,064,661 2.17Sony Corp 800 6,044,240 2.16Nidec Corp 1,000 5,949,784 2.13Murata Manufacturing Co Ltd 1,200 5,750,124 2.06Lasertec Corp 700 5,519,309 1.98Daifuku Co Ltd 800 5,470,909 1.96Kirin Holdings Co Ltd 2,600 5,352,939 1.92SoftBank Group Corp 1,000 5,215,844 1.87Hoya Corp 500 5,134,040 1.84Kikkoman Corp 1,300 5,109,532 1.83FUJIFILM Holdings Corp 1,100 5,039,111 1.80Recruit Holdings Co Ltd 1,200 4,863,859 1.74Secom Co Ltd 500 4,823,947 1.73Kose Corp 300 4,647,827 1.66Anritsu Corp 2,500 4,523,156 1.62Asahi Kasei Corp 6,900 4,505,441 1.61Advantest Corp 1,200 4,491,347 1.61Fujitsu Ltd 500 4,449,934 1.59Daikin Industries Ltd 300 4,417,324 1.58TDK Corp 600 4,391,008 1.57Sysmex Corp 600 4,363,309 1.56Rakuten Inc 6,100 4,339,990 1.55Nintendo Co Ltd 100 4,302,290 1.54Sushiro Global Holdings Ltd 2,800 4,301,963 1.54Omron Corp 900 4,298,789 1.54Rohm Co Ltd 500 4,296,289 1.54Shimano Inc 200 4,246,546 1.52FANUC Corp 300 4,213,264 1.51Ibiden Co Ltd 1,400 4,202,520 1.50Mitsubishi Electric Corp 3,600 4,142,141 1.48Terumo Corp 1,100 4,138,341 1.48Daiichi Sankyo Co Ltd 2,100 4,132,439 1.48Keyence Corp 100 3,851,155 1.38Pan Pacific International Holdings Corp 2,100 3,785,335 1.35KDDI Corp 1,100 3,561,768 1.27Z Holdings Corp 7,700 3,519,956 1.26ORIX Corp 1,900 3,419,125 1.22Nitori Holdings Co Ltd 200 3,404,021 1.22
COMGEST GROWTH plc
Comgest Growth Japan Compounders
SIGNIFICANT PORTFOLIO CHANGES for the financial year to 31 December 2020
447
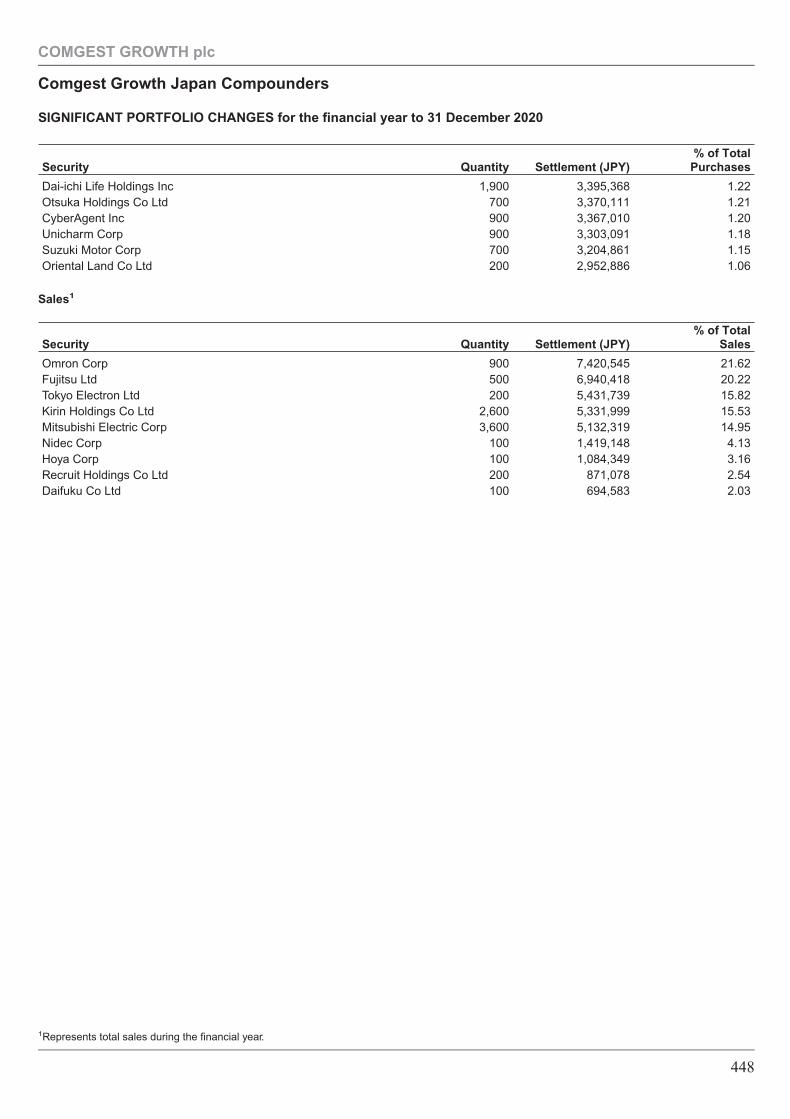
Security Quantity Settlement (JPY)% of Total
Purchases
Dai-ichi Life Holdings Inc 1,900 3,395,368 1.22Otsuka Holdings Co Ltd 700 3,370,111 1.21CyberAgent Inc 900 3,367,010 1.20Unicharm Corp 900 3,303,091 1.18Suzuki Motor Corp 700 3,204,861 1.15Oriental Land Co Ltd 200 2,952,886 1.06
Sales1
Security Quantity Settlement (JPY)% of Total
Sales
Omron Corp 900 7,420,545 21.62Fujitsu Ltd 500 6,940,418 20.22Tokyo Electron Ltd 200 5,431,739 15.82Kirin Holdings Co Ltd 2,600 5,331,999 15.53Mitsubishi Electric Corp 3,600 5,132,319 14.95Nidec Corp 100 1,419,148 4.13Hoya Corp 100 1,084,349 3.16Recruit Holdings Co Ltd 200 871,078 2.54Daifuku Co Ltd 100 694,583 2.03
COMGEST GROWTH plc
Comgest Growth Japan Compounders
SIGNIFICANT PORTFOLIO CHANGES for the financial year to 31 December 2020
1Represents total sales during the financial year.
448
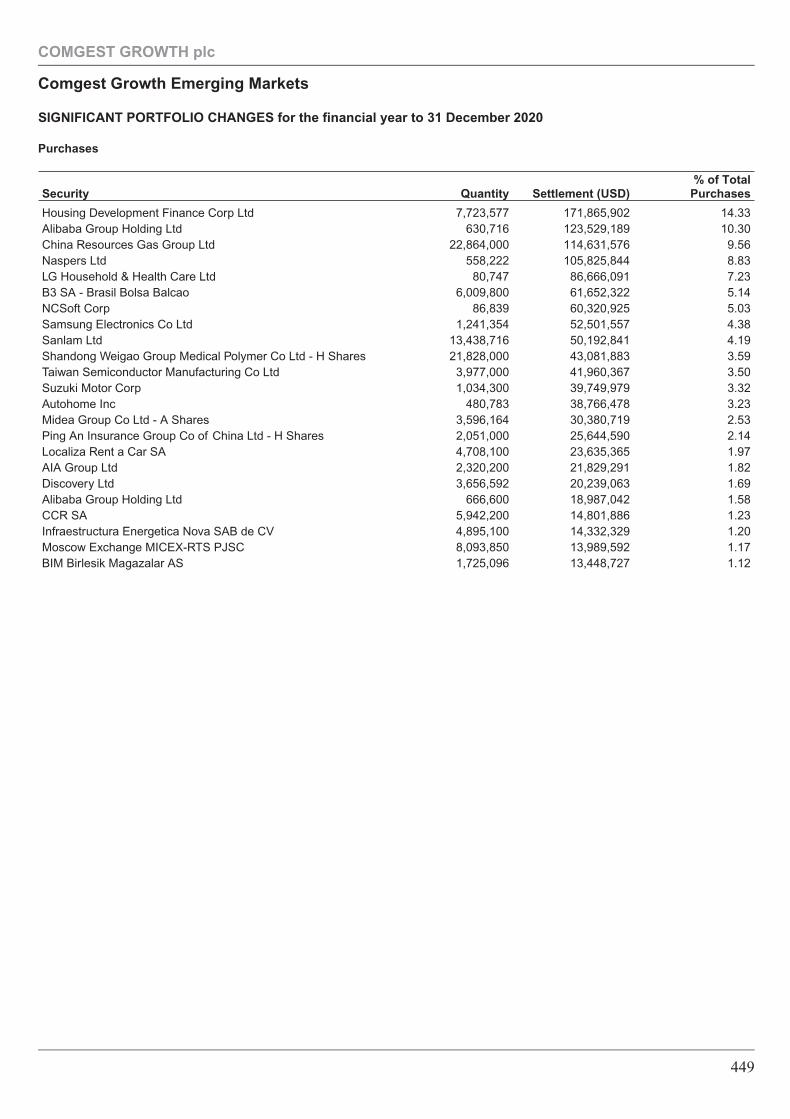
Purchases
Security Quantity Settlement (USD)% of Total
Purchases
Housing Development Finance Corp Ltd 7,723,577 171,865,902 14.33Alibaba Group Holding Ltd 630,716 123,529,189 10.30China Resources Gas Group Ltd 22,864,000 114,631,576 9.56Naspers Ltd 558,222 105,825,844 8.83LG Household & Health Care Ltd 80,747 86,666,091 7.23B3 SA - Brasil Bolsa Balcao 6,009,800 61,652,322 5.14NCSoft Corp 86,839 60,320,925 5.03Samsung Electronics Co Ltd 1,241,354 52,501,557 4.38Sanlam Ltd 13,438,716 50,192,841 4.19Shandong Weigao Group Medical Polymer Co Ltd - H Shares 21,828,000 43,081,883 3.59Taiwan Semiconductor Manufacturing Co Ltd 3,977,000 41,960,367 3.50Suzuki Motor Corp 1,034,300 39,749,979 3.32Autohome Inc 480,783 38,766,478 3.23Midea Group Co Ltd - A Shares 3,596,164 30,380,719 2.53Ping An Insurance Group Co of China Ltd - H Shares 2,051,000 25,644,590 2.14Localiza Rent a Car SA 4,708,100 23,635,365 1.97AIA Group Ltd 2,320,200 21,829,291 1.82Discovery Ltd 3,656,592 20,239,063 1.69Alibaba Group Holding Ltd 666,600 18,987,042 1.58CCR SA 5,942,200 14,801,886 1.23Infraestructura Energetica Nova SAB de CV 4,895,100 14,332,329 1.20Moscow Exchange MICEX-RTS PJSC 8,093,850 13,989,592 1.17BIM Birlesik Magazalar AS 1,725,096 13,448,727 1.12
COMGEST GROWTH plc
Comgest Growth Emerging Markets
SIGNIFICANT PORTFOLIO CHANGES for the financial year to 31 December 2020
449
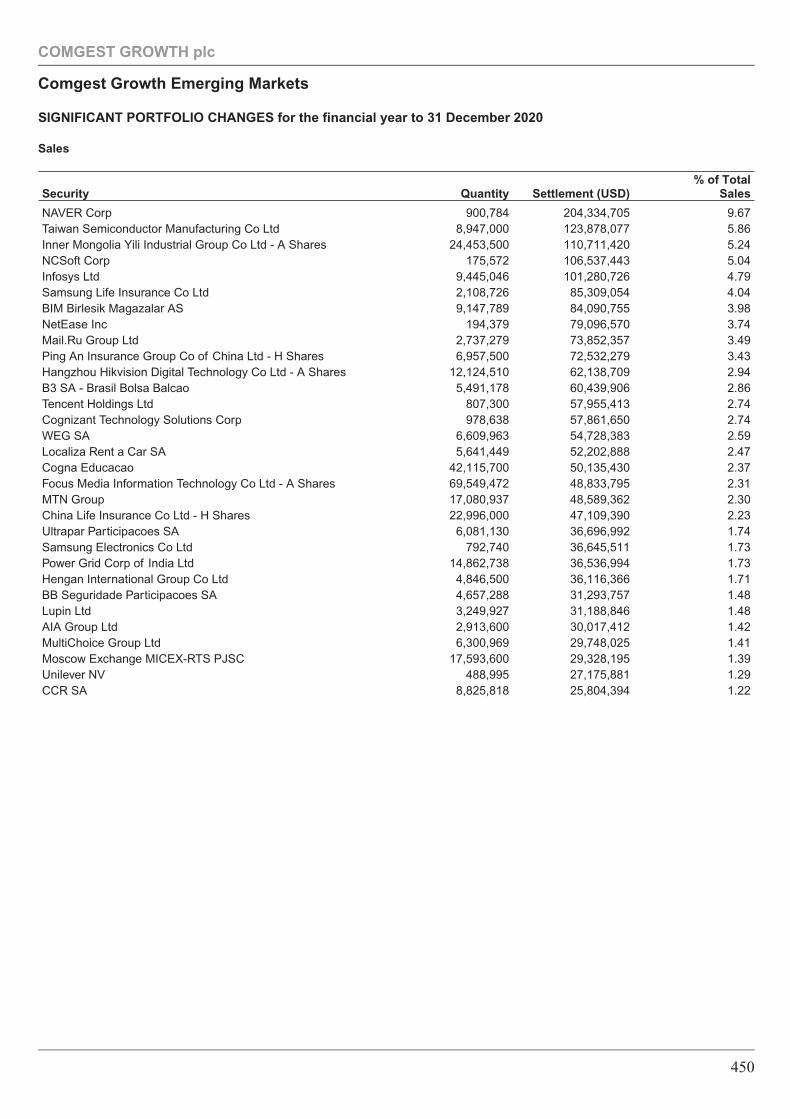
Sales
Security Quantity Settlement (USD)% of Total
Sales
NAVER Corp 900,784 204,334,705 9.67Taiwan Semiconductor Manufacturing Co Ltd 8,947,000 123,878,077 5.86Inner Mongolia Yili Industrial Group Co Ltd - A Shares 24,453,500 110,711,420 5.24NCSoft Corp 175,572 106,537,443 5.04Infosys Ltd 9,445,046 101,280,726 4.79Samsung Life Insurance Co Ltd 2,108,726 85,309,054 4.04BIM Birlesik Magazalar AS 9,147,789 84,090,755 3.98NetEase Inc 194,379 79,096,570 3.74Mail.Ru Group Ltd 2,737,279 73,852,357 3.49Ping An Insurance Group Co of China Ltd - H Shares 6,957,500 72,532,279 3.43Hangzhou Hikvision Digital Technology Co Ltd - A Shares 12,124,510 62,138,709 2.94B3 SA - Brasil Bolsa Balcao 5,491,178 60,439,906 2.86Tencent Holdings Ltd 807,300 57,955,413 2.74Cognizant Technology Solutions Corp 978,638 57,861,650 2.74WEG SA 6,609,963 54,728,383 2.59Localiza Rent a Car SA 5,641,449 52,202,888 2.47Cogna Educacao 42,115,700 50,135,430 2.37Focus Media Information Technology Co Ltd - A Shares 69,549,472 48,833,795 2.31MTN Group 17,080,937 48,589,362 2.30China Life Insurance Co Ltd - H Shares 22,996,000 47,109,390 2.23Ultrapar Participacoes SA 6,081,130 36,696,992 1.74Samsung Electronics Co Ltd 792,740 36,645,511 1.73Power Grid Corp of India Ltd 14,862,738 36,536,994 1.73Hengan International Group Co Ltd 4,846,500 36,116,366 1.71BB Seguridade Participacoes SA 4,657,288 31,293,757 1.48Lupin Ltd 3,249,927 31,188,846 1.48AIA Group Ltd 2,913,600 30,017,412 1.42MultiChoice Group Ltd 6,300,969 29,748,025 1.41Moscow Exchange MICEX-RTS PJSC 17,593,600 29,328,195 1.39Unilever NV 488,995 27,175,881 1.29CCR SA 8,825,818 25,804,394 1.22
COMGEST GROWTH plc
Comgest Growth Emerging Markets
SIGNIFICANT PORTFOLIO CHANGES for the financial year to 31 December 2020
450
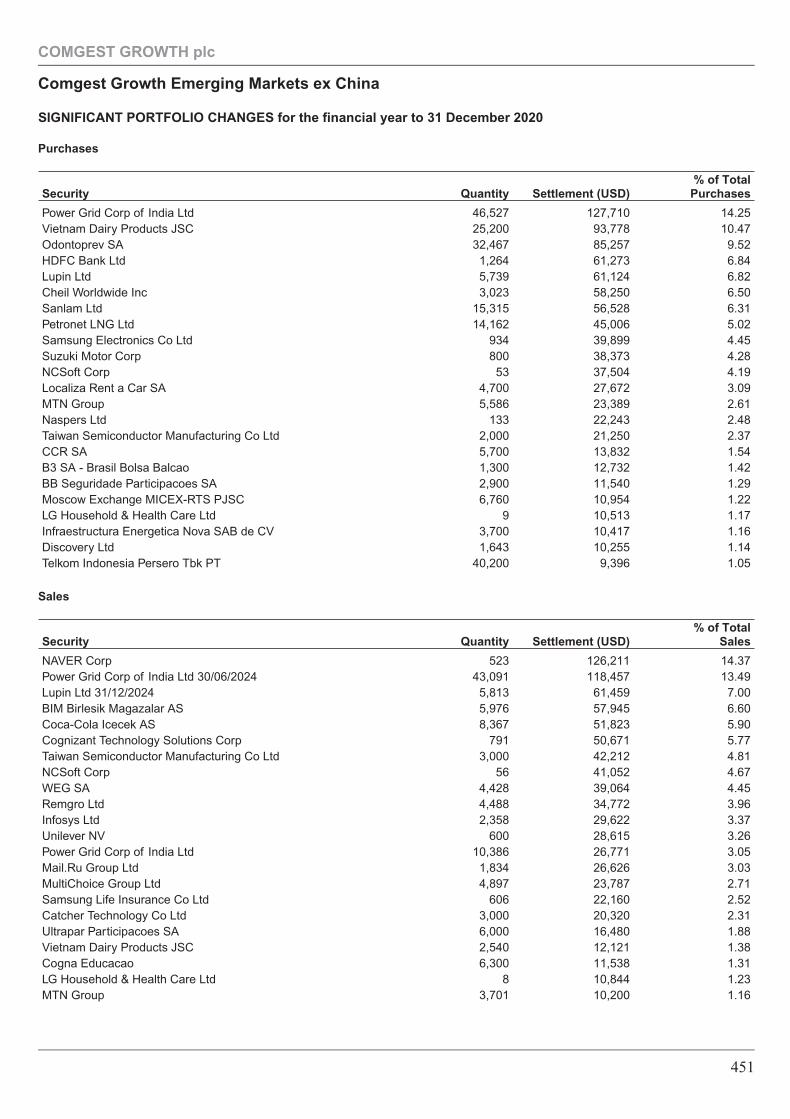
Purchases
Security Quantity Settlement (USD)% of Total
Purchases
Power Grid Corp of India Ltd 46,527 127,710 14.25Vietnam Dairy Products JSC 25,200 93,778 10.47Odontoprev SA 32,467 85,257 9.52HDFC Bank Ltd 1,264 61,273 6.84Lupin Ltd 5,739 61,124 6.82Cheil Worldwide Inc 3,023 58,250 6.50Sanlam Ltd 15,315 56,528 6.31Petronet LNG Ltd 14,162 45,006 5.02Samsung Electronics Co Ltd 934 39,899 4.45Suzuki Motor Corp 800 38,373 4.28NCSoft Corp 53 37,504 4.19Localiza Rent a Car SA 4,700 27,672 3.09MTN Group 5,586 23,389 2.61Naspers Ltd 133 22,243 2.48Taiwan Semiconductor Manufacturing Co Ltd 2,000 21,250 2.37CCR SA 5,700 13,832 1.54B3 SA - Brasil Bolsa Balcao 1,300 12,732 1.42BB Seguridade Participacoes SA 2,900 11,540 1.29Moscow Exchange MICEX-RTS PJSC 6,760 10,954 1.22LG Household & Health Care Ltd 9 10,513 1.17Infraestructura Energetica Nova SAB de CV 3,700 10,417 1.16Discovery Ltd 1,643 10,255 1.14Telkom Indonesia Persero Tbk PT 40,200 9,396 1.05
Sales
Security Quantity Settlement (USD)% of Total
Sales
NAVER Corp 523 126,211 14.37Power Grid Corp of India Ltd 30/06/2024 43,091 118,457 13.49Lupin Ltd 31/12/2024 5,813 61,459 7.00BIM Birlesik Magazalar AS 5,976 57,945 6.60Coca-Cola Icecek AS 8,367 51,823 5.90Cognizant Technology Solutions Corp 791 50,671 5.77Taiwan Semiconductor Manufacturing Co Ltd 3,000 42,212 4.81NCSoft Corp 56 41,052 4.67WEG SA 4,428 39,064 4.45Remgro Ltd 4,488 34,772 3.96Infosys Ltd 2,358 29,622 3.37Unilever NV 600 28,615 3.26Power Grid Corp of India Ltd 10,386 26,771 3.05Mail.Ru Group Ltd 1,834 26,626 3.03MultiChoice Group Ltd 4,897 23,787 2.71Samsung Life Insurance Co Ltd 606 22,160 2.52Catcher Technology Co Ltd 3,000 20,320 2.31Ultrapar Participacoes SA 6,000 16,480 1.88Vietnam Dairy Products JSC 2,540 12,121 1.38Cogna Educacao 6,300 11,538 1.31LG Household & Health Care Ltd 8 10,844 1.23MTN Group 3,701 10,200 1.16
COMGEST GROWTH plc
Comgest Growth Emerging Markets ex China
SIGNIFICANT PORTFOLIO CHANGES for the financial year to 31 December 2020
451
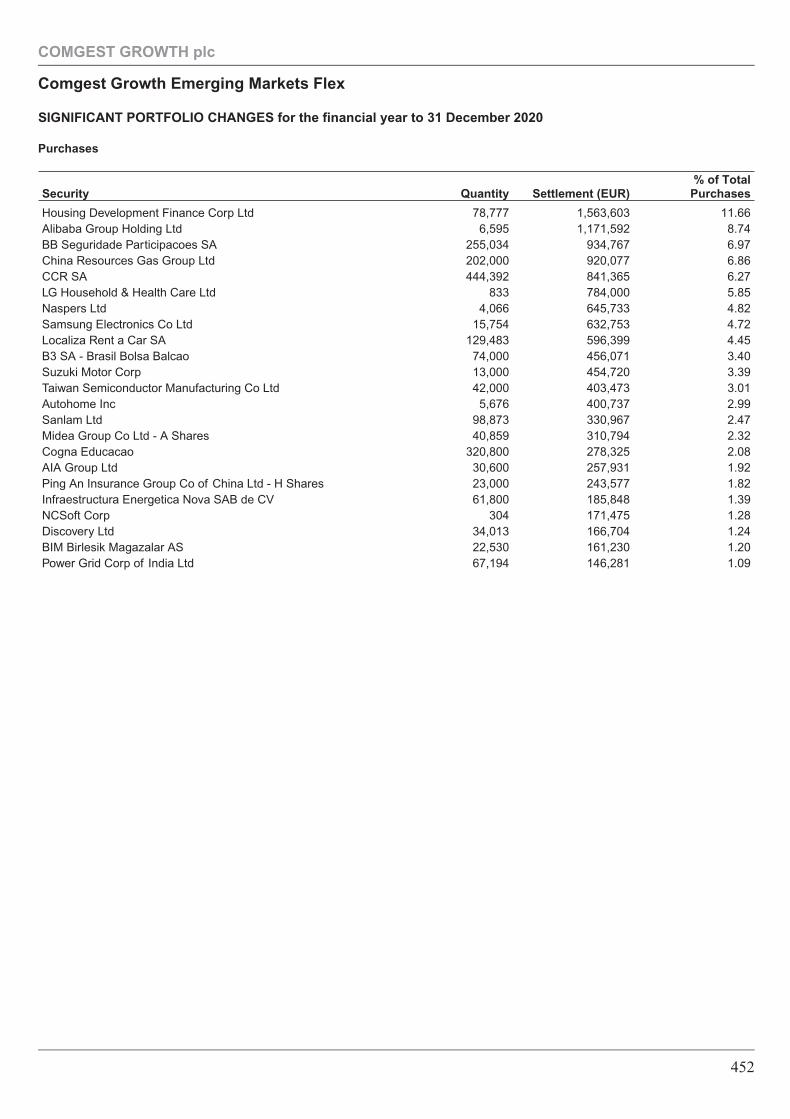
Purchases
Security Quantity Settlement (EUR)% of Total
Purchases
Housing Development Finance Corp Ltd 78,777 1,563,603 11.66Alibaba Group Holding Ltd 6,595 1,171,592 8.74BB Seguridade Participacoes SA 255,034 934,767 6.97China Resources Gas Group Ltd 202,000 920,077 6.86CCR SA 444,392 841,365 6.27LG Household & Health Care Ltd 833 784,000 5.85Naspers Ltd 4,066 645,733 4.82Samsung Electronics Co Ltd 15,754 632,753 4.72Localiza Rent a Car SA 129,483 596,399 4.45B3 SA - Brasil Bolsa Balcao 74,000 456,071 3.40Suzuki Motor Corp 13,000 454,720 3.39Taiwan Semiconductor Manufacturing Co Ltd 42,000 403,473 3.01Autohome Inc 5,676 400,737 2.99Sanlam Ltd 98,873 330,967 2.47Midea Group Co Ltd - A Shares 40,859 310,794 2.32Cogna Educacao 320,800 278,325 2.08AIA Group Ltd 30,600 257,931 1.92Ping An Insurance Group Co of China Ltd - H Shares 23,000 243,577 1.82Infraestructura Energetica Nova SAB de CV 61,800 185,848 1.39NCSoft Corp 304 171,475 1.28Discovery Ltd 34,013 166,704 1.24BIM Birlesik Magazalar AS 22,530 161,230 1.20Power Grid Corp of India Ltd 67,194 146,281 1.09
COMGEST GROWTH plc
Comgest Growth Emerging Markets Flex
SIGNIFICANT PORTFOLIO CHANGES for the financial year to 31 December 2020
452
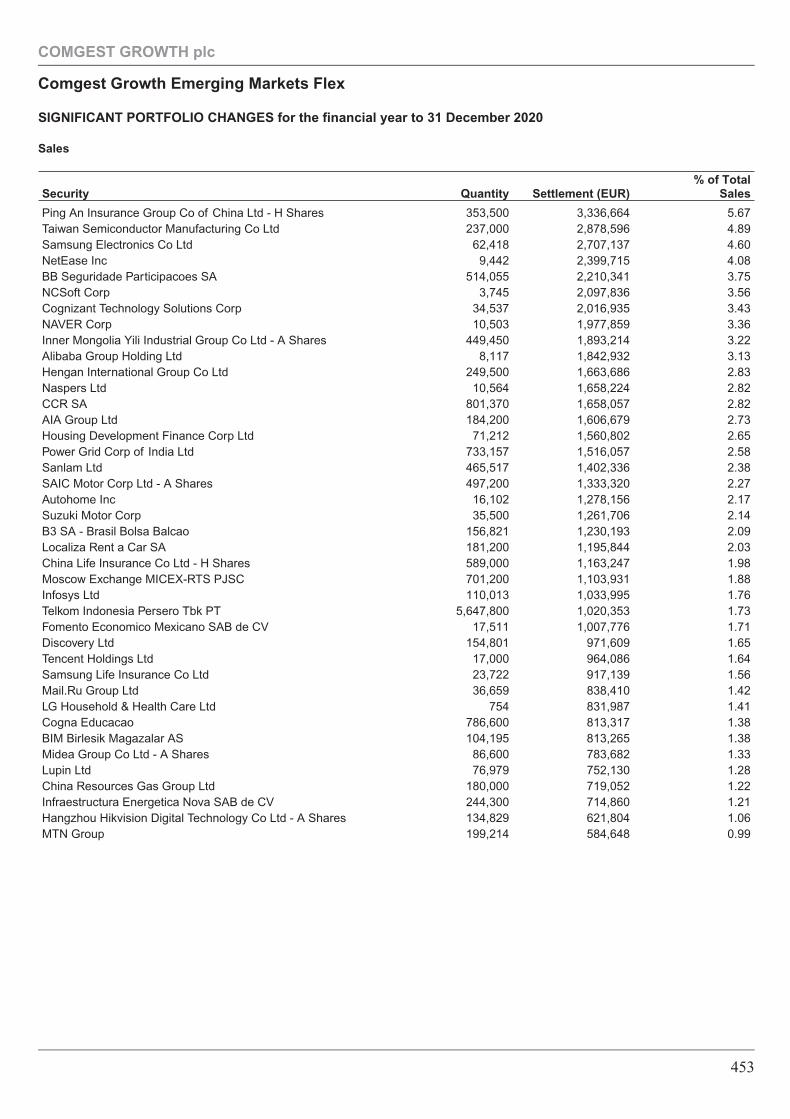
Sales
Security Quantity Settlement (EUR)% of Total
Sales
Ping An Insurance Group Co of China Ltd - H Shares 353,500 3,336,664 5.67Taiwan Semiconductor Manufacturing Co Ltd 237,000 2,878,596 4.89Samsung Electronics Co Ltd 62,418 2,707,137 4.60NetEase Inc 9,442 2,399,715 4.08BB Seguridade Participacoes SA 514,055 2,210,341 3.75NCSoft Corp 3,745 2,097,836 3.56Cognizant Technology Solutions Corp 34,537 2,016,935 3.43NAVER Corp 10,503 1,977,859 3.36Inner Mongolia Yili Industrial Group Co Ltd - A Shares 449,450 1,893,214 3.22Alibaba Group Holding Ltd 8,117 1,842,932 3.13Hengan International Group Co Ltd 249,500 1,663,686 2.83Naspers Ltd 10,564 1,658,224 2.82CCR SA 801,370 1,658,057 2.82AIA Group Ltd 184,200 1,606,679 2.73Housing Development Finance Corp Ltd 71,212 1,560,802 2.65Power Grid Corp of India Ltd 733,157 1,516,057 2.58Sanlam Ltd 465,517 1,402,336 2.38SAIC Motor Corp Ltd - A Shares 497,200 1,333,320 2.27Autohome Inc 16,102 1,278,156 2.17Suzuki Motor Corp 35,500 1,261,706 2.14B3 SA - Brasil Bolsa Balcao 156,821 1,230,193 2.09Localiza Rent a Car SA 181,200 1,195,844 2.03China Life Insurance Co Ltd - H Shares 589,000 1,163,247 1.98Moscow Exchange MICEX-RTS PJSC 701,200 1,103,931 1.88Infosys Ltd 110,013 1,033,995 1.76Telkom Indonesia Persero Tbk PT 5,647,800 1,020,353 1.73Fomento Economico Mexicano SAB de CV 17,511 1,007,776 1.71Discovery Ltd 154,801 971,609 1.65Tencent Holdings Ltd 17,000 964,086 1.64Samsung Life Insurance Co Ltd 23,722 917,139 1.56Mail.Ru Group Ltd 36,659 838,410 1.42LG Household & Health Care Ltd 754 831,987 1.41Cogna Educacao 786,600 813,317 1.38BIM Birlesik Magazalar AS 104,195 813,265 1.38Midea Group Co Ltd - A Shares 86,600 783,682 1.33Lupin Ltd 76,979 752,130 1.28China Resources Gas Group Ltd 180,000 719,052 1.22Infraestructura Energetica Nova SAB de CV 244,300 714,860 1.21Hangzhou Hikvision Digital Technology Co Ltd - A Shares 134,829 621,804 1.06MTN Group 199,214 584,648 0.99
COMGEST GROWTH plc
Comgest Growth Emerging Markets Flex
SIGNIFICANT PORTFOLIO CHANGES for the financial year to 31 December 2020
453
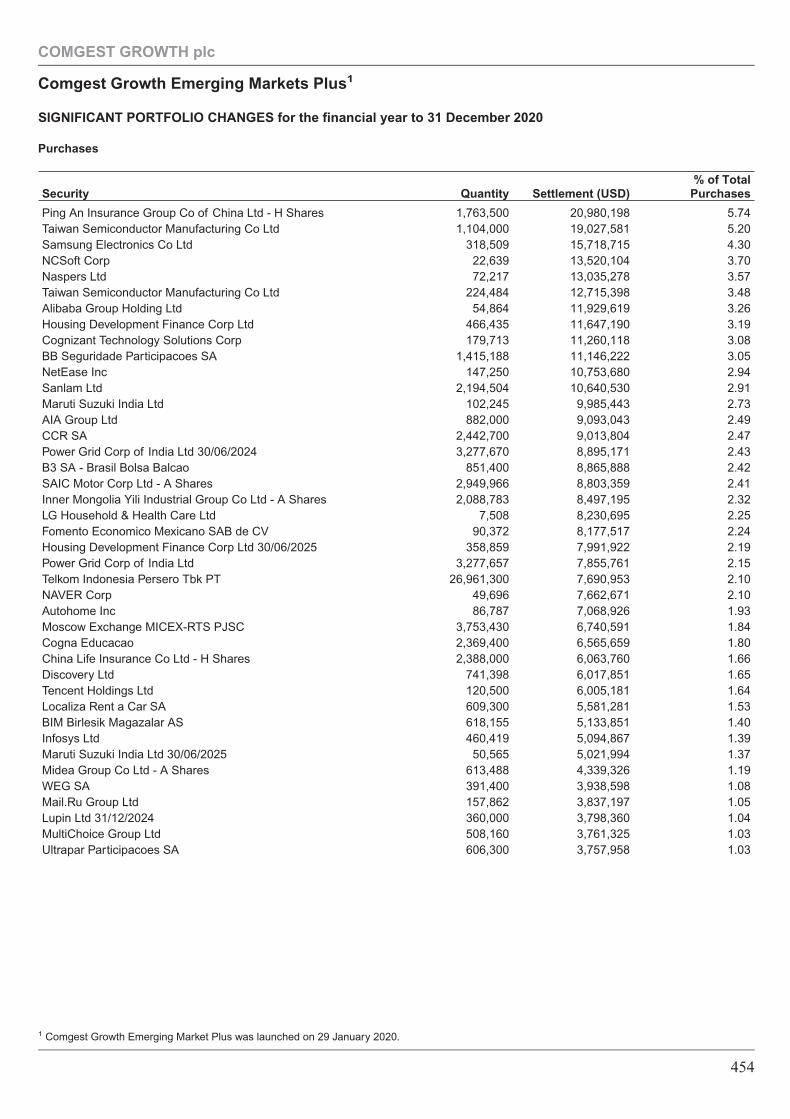
Purchases
Security Quantity Settlement (USD)% of Total
Purchases
Ping An Insurance Group Co of China Ltd - H Shares 1,763,500 20,980,198 5.74Taiwan Semiconductor Manufacturing Co Ltd 1,104,000 19,027,581 5.20Samsung Electronics Co Ltd 318,509 15,718,715 4.30NCSoft Corp 22,639 13,520,104 3.70Naspers Ltd 72,217 13,035,278 3.57Taiwan Semiconductor Manufacturing Co Ltd 224,484 12,715,398 3.48Alibaba Group Holding Ltd 54,864 11,929,619 3.26Housing Development Finance Corp Ltd 466,435 11,647,190 3.19Cognizant Technology Solutions Corp 179,713 11,260,118 3.08BB Seguridade Participacoes SA 1,415,188 11,146,222 3.05NetEase Inc 147,250 10,753,680 2.94Sanlam Ltd 2,194,504 10,640,530 2.91Maruti Suzuki India Ltd 102,245 9,985,443 2.73AIA Group Ltd 882,000 9,093,043 2.49CCR SA 2,442,700 9,013,804 2.47Power Grid Corp of India Ltd 30/06/2024 3,277,670 8,895,171 2.43B3 SA - Brasil Bolsa Balcao 851,400 8,865,888 2.42SAIC Motor Corp Ltd - A Shares 2,949,966 8,803,359 2.41Inner Mongolia Yili Industrial Group Co Ltd - A Shares 2,088,783 8,497,195 2.32LG Household & Health Care Ltd 7,508 8,230,695 2.25Fomento Economico Mexicano SAB de CV 90,372 8,177,517 2.24Housing Development Finance Corp Ltd 30/06/2025 358,859 7,991,922 2.19Power Grid Corp of India Ltd 3,277,657 7,855,761 2.15Telkom Indonesia Persero Tbk PT 26,961,300 7,690,953 2.10NAVER Corp 49,696 7,662,671 2.10Autohome Inc 86,787 7,068,926 1.93Moscow Exchange MICEX-RTS PJSC 3,753,430 6,740,591 1.84Cogna Educacao 2,369,400 6,565,659 1.80China Life Insurance Co Ltd - H Shares 2,388,000 6,063,760 1.66Discovery Ltd 741,398 6,017,851 1.65Tencent Holdings Ltd 120,500 6,005,181 1.64Localiza Rent a Car SA 609,300 5,581,281 1.53BIM Birlesik Magazalar AS 618,155 5,133,851 1.40Infosys Ltd 460,419 5,094,867 1.39Maruti Suzuki India Ltd 30/06/2025 50,565 5,021,994 1.37Midea Group Co Ltd - A Shares 613,488 4,339,326 1.19WEG SA 391,400 3,938,598 1.08Mail.Ru Group Ltd 157,862 3,837,197 1.05Lupin Ltd 31/12/2024 360,000 3,798,360 1.04MultiChoice Group Ltd 508,160 3,761,325 1.03Ultrapar Participacoes SA 606,300 3,757,958 1.03
COMGEST GROWTH plc
Comgest Growth Emerging Markets Plus1
SIGNIFICANT PORTFOLIO CHANGES for the financial year to 31 December 2020
1 Comgest Growth Emerging Market Plus was launched on 29 January 2020.
454
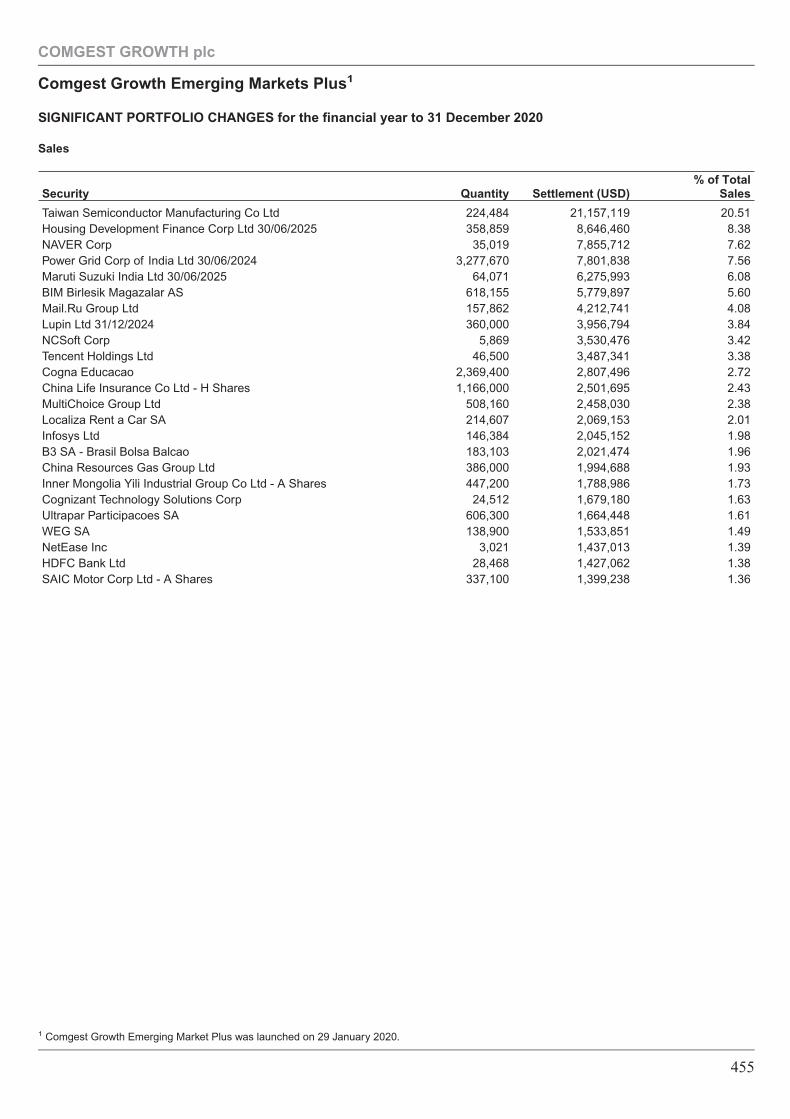
Sales
Security Quantity Settlement (USD)% of Total
Sales
Taiwan Semiconductor Manufacturing Co Ltd 224,484 21,157,119 20.51Housing Development Finance Corp Ltd 30/06/2025 358,859 8,646,460 8.38NAVER Corp 35,019 7,855,712 7.62Power Grid Corp of India Ltd 30/06/2024 3,277,670 7,801,838 7.56Maruti Suzuki India Ltd 30/06/2025 64,071 6,275,993 6.08BIM Birlesik Magazalar AS 618,155 5,779,897 5.60Mail.Ru Group Ltd 157,862 4,212,741 4.08Lupin Ltd 31/12/2024 360,000 3,956,794 3.84NCSoft Corp 5,869 3,530,476 3.42Tencent Holdings Ltd 46,500 3,487,341 3.38Cogna Educacao 2,369,400 2,807,496 2.72China Life Insurance Co Ltd - H Shares 1,166,000 2,501,695 2.43MultiChoice Group Ltd 508,160 2,458,030 2.38Localiza Rent a Car SA 214,607 2,069,153 2.01Infosys Ltd 146,384 2,045,152 1.98B3 SA - Brasil Bolsa Balcao 183,103 2,021,474 1.96China Resources Gas Group Ltd 386,000 1,994,688 1.93Inner Mongolia Yili Industrial Group Co Ltd - A Shares 447,200 1,788,986 1.73Cognizant Technology Solutions Corp 24,512 1,679,180 1.63Ultrapar Participacoes SA 606,300 1,664,448 1.61WEG SA 138,900 1,533,851 1.49NetEase Inc 3,021 1,437,013 1.39HDFC Bank Ltd 28,468 1,427,062 1.38SAIC Motor Corp Ltd - A Shares 337,100 1,399,238 1.36
COMGEST GROWTH plc
Comgest Growth Emerging Markets Plus1
SIGNIFICANT PORTFOLIO CHANGES for the financial year to 31 December 2020
1 Comgest Growth Emerging Market Plus was launched on 29 January 2020.
455
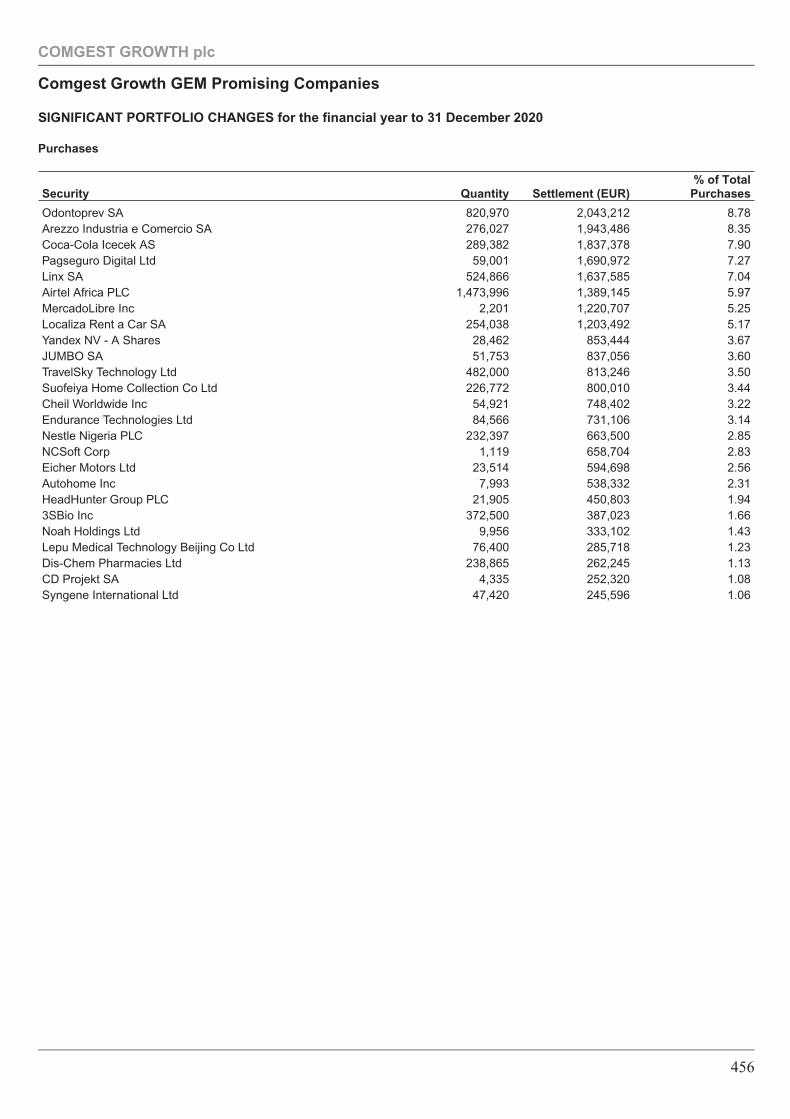
Purchases
Security Quantity Settlement (EUR)% of Total
Purchases
Odontoprev SA 820,970 2,043,212 8.78Arezzo Industria e Comercio SA 276,027 1,943,486 8.35Coca-Cola Icecek AS 289,382 1,837,378 7.90Pagseguro Digital Ltd 59,001 1,690,972 7.27Linx SA 524,866 1,637,585 7.04Airtel Africa PLC 1,473,996 1,389,145 5.97MercadoLibre Inc 2,201 1,220,707 5.25Localiza Rent a Car SA 254,038 1,203,492 5.17Yandex NV - A Shares 28,462 853,444 3.67JUMBO SA 51,753 837,056 3.60TravelSky Technology Ltd 482,000 813,246 3.50Suofeiya Home Collection Co Ltd 226,772 800,010 3.44Cheil Worldwide Inc 54,921 748,402 3.22Endurance Technologies Ltd 84,566 731,106 3.14Nestle Nigeria PLC 232,397 663,500 2.85NCSoft Corp 1,119 658,704 2.83Eicher Motors Ltd 23,514 594,698 2.56Autohome Inc 7,993 538,332 2.31HeadHunter Group PLC 21,905 450,803 1.943SBio Inc 372,500 387,023 1.66Noah Holdings Ltd 9,956 333,102 1.43Lepu Medical Technology Beijing Co Ltd 76,400 285,718 1.23Dis-Chem Pharmacies Ltd 238,865 262,245 1.13CD Projekt SA 4,335 252,320 1.08Syngene International Ltd 47,420 245,596 1.06
COMGEST GROWTH plc
Comgest Growth GEM Promising Companies
SIGNIFICANT PORTFOLIO CHANGES for the financial year to 31 December 2020
456
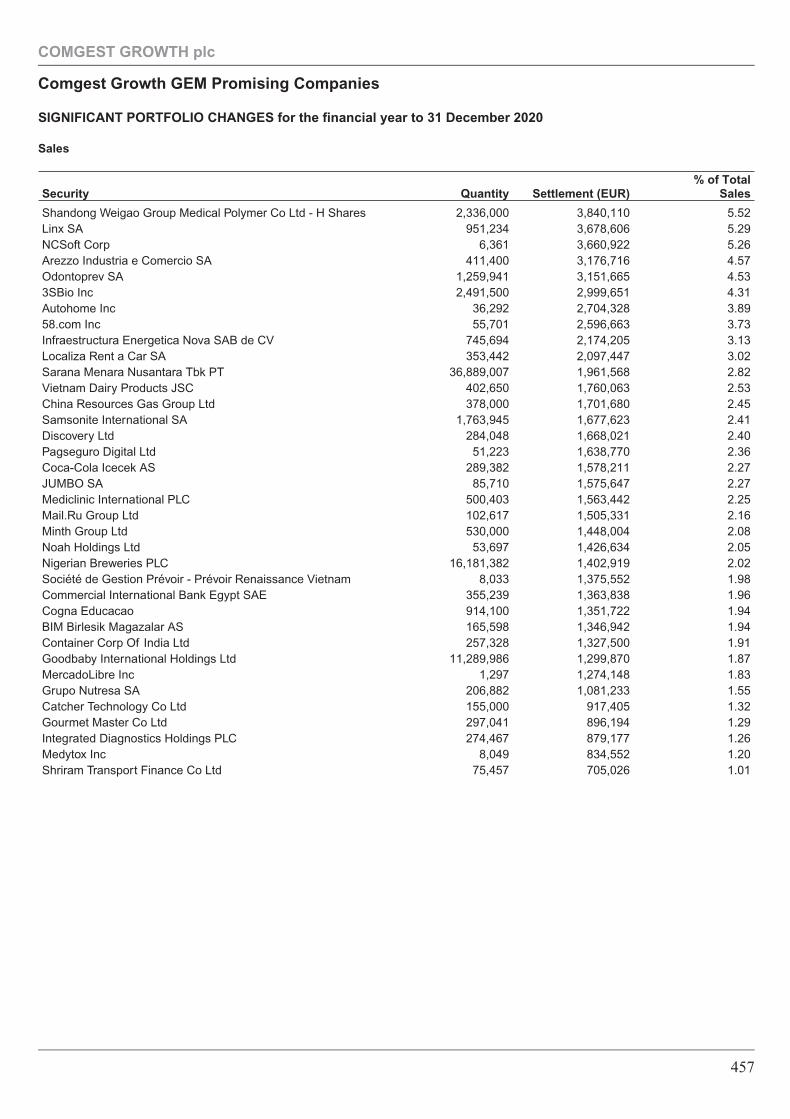
Sales
Security Quantity Settlement (EUR)% of Total
Sales
Shandong Weigao Group Medical Polymer Co Ltd - H Shares 2,336,000 3,840,110 5.52Linx SA 951,234 3,678,606 5.29NCSoft Corp 6,361 3,660,922 5.26Arezzo Industria e Comercio SA 411,400 3,176,716 4.57Odontoprev SA 1,259,941 3,151,665 4.533SBio Inc 2,491,500 2,999,651 4.31Autohome Inc 36,292 2,704,328 3.8958.com Inc 55,701 2,596,663 3.73Infraestructura Energetica Nova SAB de CV 745,694 2,174,205 3.13Localiza Rent a Car SA 353,442 2,097,447 3.02Sarana Menara Nusantara Tbk PT 36,889,007 1,961,568 2.82Vietnam Dairy Products JSC 402,650 1,760,063 2.53China Resources Gas Group Ltd 378,000 1,701,680 2.45Samsonite International SA 1,763,945 1,677,623 2.41Discovery Ltd 284,048 1,668,021 2.40Pagseguro Digital Ltd 51,223 1,638,770 2.36Coca-Cola Icecek AS 289,382 1,578,211 2.27JUMBO SA 85,710 1,575,647 2.27Mediclinic International PLC 500,403 1,563,442 2.25Mail.Ru Group Ltd 102,617 1,505,331 2.16Minth Group Ltd 530,000 1,448,004 2.08Noah Holdings Ltd 53,697 1,426,634 2.05Nigerian Breweries PLC 16,181,382 1,402,919 2.02Société de Gestion Prévoir - Prévoir Renaissance Vietnam 8,033 1,375,552 1.98Commercial International Bank Egypt SAE 355,239 1,363,838 1.96Cogna Educacao 914,100 1,351,722 1.94BIM Birlesik Magazalar AS 165,598 1,346,942 1.94Container Corp Of India Ltd 257,328 1,327,500 1.91Goodbaby International Holdings Ltd 11,289,986 1,299,870 1.87MercadoLibre Inc 1,297 1,274,148 1.83Grupo Nutresa SA 206,882 1,081,233 1.55Catcher Technology Co Ltd 155,000 917,405 1.32Gourmet Master Co Ltd 297,041 896,194 1.29Integrated Diagnostics Holdings PLC 274,467 879,177 1.26Medytox Inc 8,049 834,552 1.20Shriram Transport Finance Co Ltd 75,457 705,026 1.01
COMGEST GROWTH plc
Comgest Growth GEM Promising Companies
SIGNIFICANT PORTFOLIO CHANGES for the financial year to 31 December 2020
457
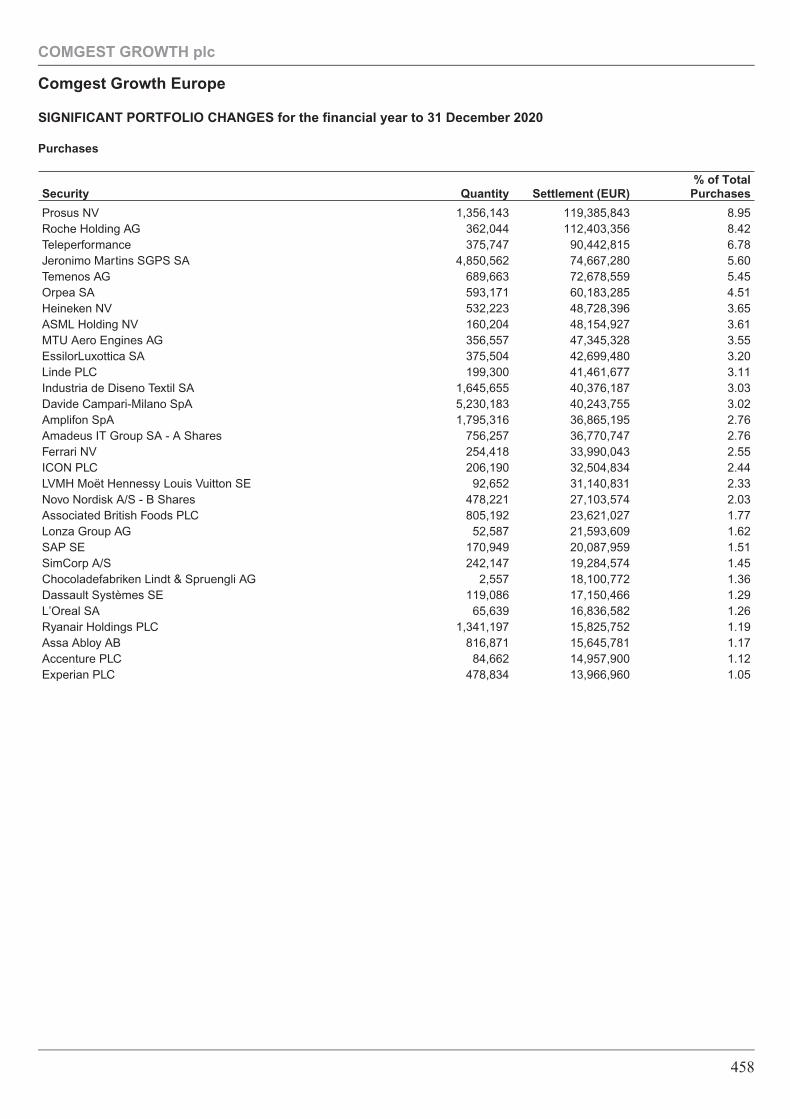
Purchases
Security Quantity Settlement (EUR)% of Total
Purchases
Prosus NV 1,356,143 119,385,843 8.95Roche Holding AG 362,044 112,403,356 8.42Teleperformance 375,747 90,442,815 6.78Jeronimo Martins SGPS SA 4,850,562 74,667,280 5.60Temenos AG 689,663 72,678,559 5.45Orpea SA 593,171 60,183,285 4.51Heineken NV 532,223 48,728,396 3.65ASML Holding NV 160,204 48,154,927 3.61MTU Aero Engines AG 356,557 47,345,328 3.55EssilorLuxottica SA 375,504 42,699,480 3.20Linde PLC 199,300 41,461,677 3.11Industria de Diseno Textil SA 1,645,655 40,376,187 3.03Davide Campari-Milano SpA 5,230,183 40,243,755 3.02Amplifon SpA 1,795,316 36,865,195 2.76Amadeus IT Group SA - A Shares 756,257 36,770,747 2.76Ferrari NV 254,418 33,990,043 2.55ICON PLC 206,190 32,504,834 2.44LVMH Moët Hennessy Louis Vuitton SE 92,652 31,140,831 2.33Novo Nordisk A/S - B Shares 478,221 27,103,574 2.03Associated British Foods PLC 805,192 23,621,027 1.77Lonza Group AG 52,587 21,593,609 1.62SAP SE 170,949 20,087,959 1.51SimCorp A/S 242,147 19,284,574 1.45Chocoladefabriken Lindt & Spruengli AG 2,557 18,100,772 1.36Dassault Systèmes SE 119,086 17,150,466 1.29L’Oreal SA 65,639 16,836,582 1.26Ryanair Holdings PLC 1,341,197 15,825,752 1.19Assa Abloy AB 816,871 15,645,781 1.17Accenture PLC 84,662 14,957,900 1.12Experian PLC 478,834 13,966,960 1.05
COMGEST GROWTH plc
Comgest Growth Europe
SIGNIFICANT PORTFOLIO CHANGES for the financial year to 31 December 2020
458
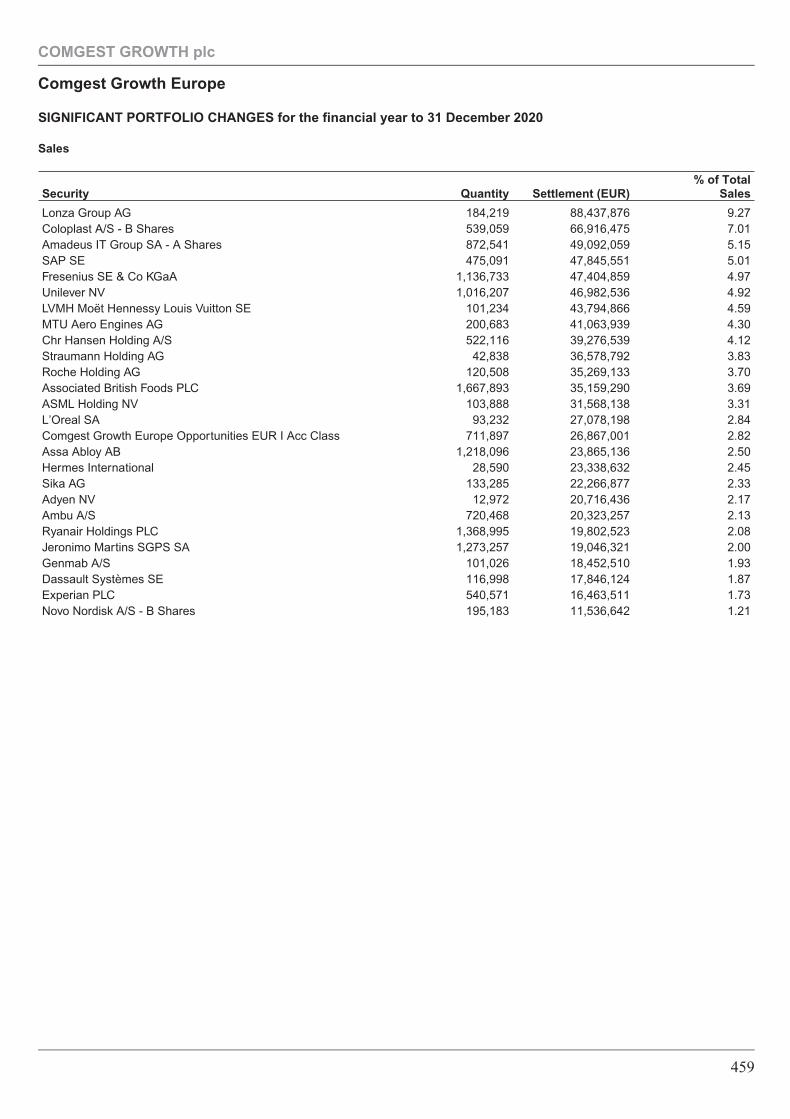
Sales
Security Quantity Settlement (EUR)% of Total
Sales
Lonza Group AG 184,219 88,437,876 9.27Coloplast A/S - B Shares 539,059 66,916,475 7.01Amadeus IT Group SA - A Shares 872,541 49,092,059 5.15SAP SE 475,091 47,845,551 5.01Fresenius SE & Co KGaA 1,136,733 47,404,859 4.97Unilever NV 1,016,207 46,982,536 4.92LVMH Moët Hennessy Louis Vuitton SE 101,234 43,794,866 4.59MTU Aero Engines AG 200,683 41,063,939 4.30Chr Hansen Holding A/S 522,116 39,276,539 4.12Straumann Holding AG 42,838 36,578,792 3.83Roche Holding AG 120,508 35,269,133 3.70Associated British Foods PLC 1,667,893 35,159,290 3.69ASML Holding NV 103,888 31,568,138 3.31L’Oreal SA 93,232 27,078,198 2.84Comgest Growth Europe Opportunities EUR I Acc Class 711,897 26,867,001 2.82Assa Abloy AB 1,218,096 23,865,136 2.50Hermes International 28,590 23,338,632 2.45Sika AG 133,285 22,266,877 2.33Adyen NV 12,972 20,716,436 2.17Ambu A/S 720,468 20,323,257 2.13Ryanair Holdings PLC 1,368,995 19,802,523 2.08Jeronimo Martins SGPS SA 1,273,257 19,046,321 2.00Genmab A/S 101,026 18,452,510 1.93Dassault Systèmes SE 116,998 17,846,124 1.87Experian PLC 540,571 16,463,511 1.73Novo Nordisk A/S - B Shares 195,183 11,536,642 1.21
COMGEST GROWTH plc
Comgest Growth Europe
SIGNIFICANT PORTFOLIO CHANGES for the financial year to 31 December 2020
459
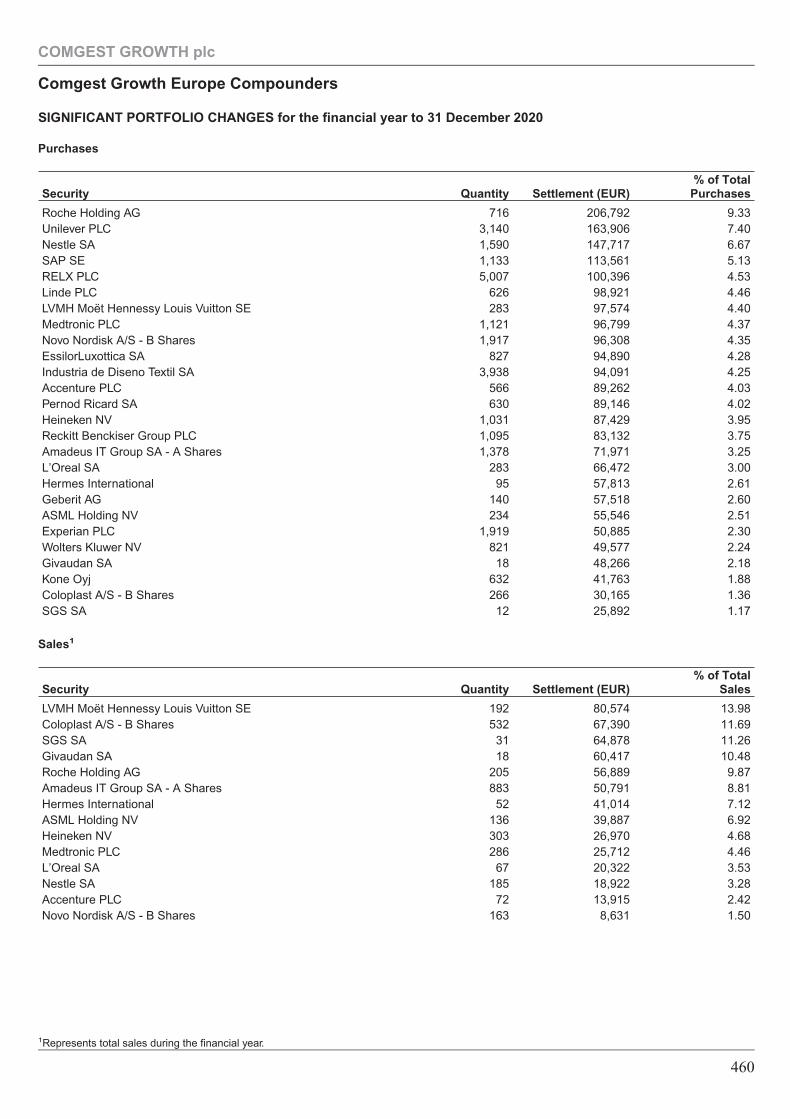
Purchases
Security Quantity Settlement (EUR)% of Total
Purchases
Roche Holding AG 716 206,792 9.33Unilever PLC 3,140 163,906 7.40Nestle SA 1,590 147,717 6.67SAP SE 1,133 113,561 5.13RELX PLC 5,007 100,396 4.53Linde PLC 626 98,921 4.46LVMH Moët Hennessy Louis Vuitton SE 283 97,574 4.40Medtronic PLC 1,121 96,799 4.37Novo Nordisk A/S - B Shares 1,917 96,308 4.35EssilorLuxottica SA 827 94,890 4.28Industria de Diseno Textil SA 3,938 94,091 4.25Accenture PLC 566 89,262 4.03Pernod Ricard SA 630 89,146 4.02Heineken NV 1,031 87,429 3.95Reckitt Benckiser Group PLC 1,095 83,132 3.75Amadeus IT Group SA - A Shares 1,378 71,971 3.25L’Oreal SA 283 66,472 3.00Hermes International 95 57,813 2.61Geberit AG 140 57,518 2.60ASML Holding NV 234 55,546 2.51Experian PLC 1,919 50,885 2.30Wolters Kluwer NV 821 49,577 2.24Givaudan SA 18 48,266 2.18Kone Oyj 632 41,763 1.88Coloplast A/S - B Shares 266 30,165 1.36SGS SA 12 25,892 1.17
Sales1
Security Quantity Settlement (EUR)% of Total
Sales
LVMH Moët Hennessy Louis Vuitton SE 192 80,574 13.98Coloplast A/S - B Shares 532 67,390 11.69SGS SA 31 64,878 11.26Givaudan SA 18 60,417 10.48Roche Holding AG 205 56,889 9.87Amadeus IT Group SA - A Shares 883 50,791 8.81Hermes International 52 41,014 7.12ASML Holding NV 136 39,887 6.92Heineken NV 303 26,970 4.68Medtronic PLC 286 25,712 4.46L’Oreal SA 67 20,322 3.53Nestle SA 185 18,922 3.28Accenture PLC 72 13,915 2.42Novo Nordisk A/S - B Shares 163 8,631 1.50
COMGEST GROWTH plc
Comgest Growth Europe Compounders
SIGNIFICANT PORTFOLIO CHANGES for the financial year to 31 December 2020
460
1Represents total sales during the financial year.
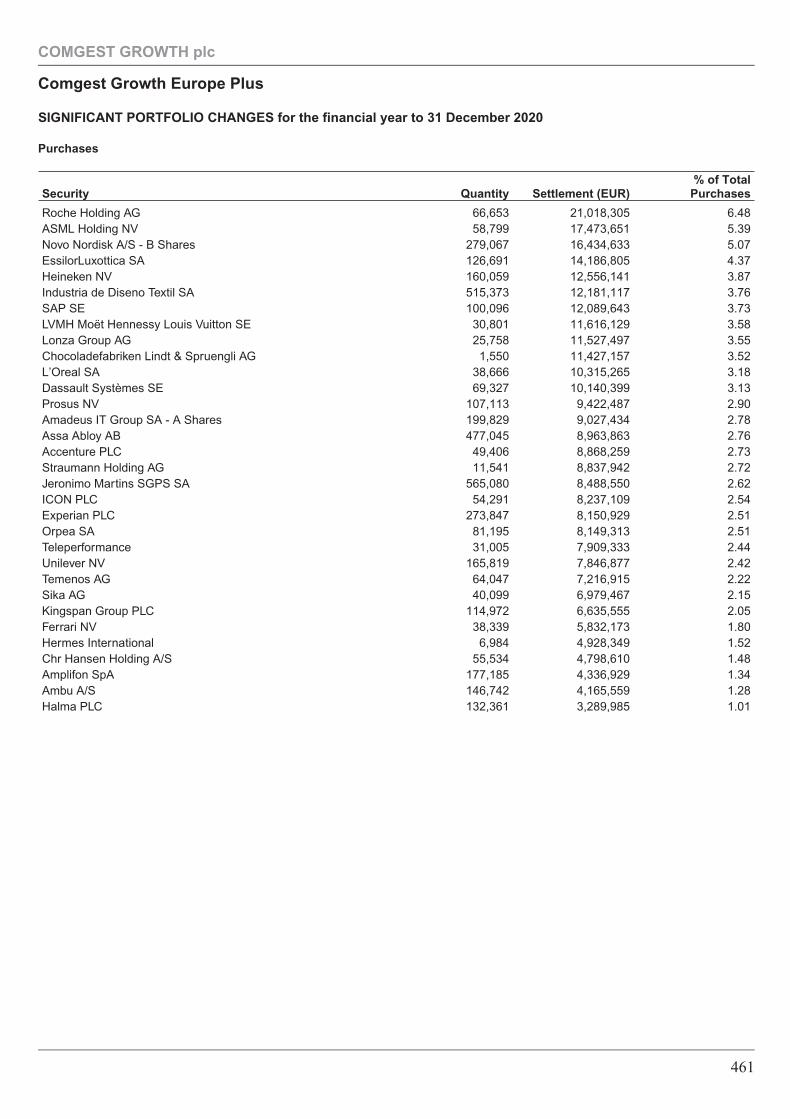
Purchases
Security Quantity Settlement (EUR)% of Total
Purchases
Roche Holding AG 66,653 21,018,305 6.48ASML Holding NV 58,799 17,473,651 5.39Novo Nordisk A/S - B Shares 279,067 16,434,633 5.07EssilorLuxottica SA 126,691 14,186,805 4.37Heineken NV 160,059 12,556,141 3.87Industria de Diseno Textil SA 515,373 12,181,117 3.76SAP SE 100,096 12,089,643 3.73LVMH Moët Hennessy Louis Vuitton SE 30,801 11,616,129 3.58Lonza Group AG 25,758 11,527,497 3.55Chocoladefabriken Lindt & Spruengli AG 1,550 11,427,157 3.52L’Oreal SA 38,666 10,315,265 3.18Dassault Systèmes SE 69,327 10,140,399 3.13Prosus NV 107,113 9,422,487 2.90Amadeus IT Group SA - A Shares 199,829 9,027,434 2.78Assa Abloy AB 477,045 8,963,863 2.76Accenture PLC 49,406 8,868,259 2.73Straumann Holding AG 11,541 8,837,942 2.72Jeronimo Martins SGPS SA 565,080 8,488,550 2.62ICON PLC 54,291 8,237,109 2.54Experian PLC 273,847 8,150,929 2.51Orpea SA 81,195 8,149,313 2.51Teleperformance 31,005 7,909,333 2.44Unilever NV 165,819 7,846,877 2.42Temenos AG 64,047 7,216,915 2.22Sika AG 40,099 6,979,467 2.15Kingspan Group PLC 114,972 6,635,555 2.05Ferrari NV 38,339 5,832,173 1.80Hermes International 6,984 4,928,349 1.52Chr Hansen Holding A/S 55,534 4,798,610 1.48Amplifon SpA 177,185 4,336,929 1.34Ambu A/S 146,742 4,165,559 1.28Halma PLC 132,361 3,289,985 1.01
COMGEST GROWTH plc
Comgest Growth Europe Plus
SIGNIFICANT PORTFOLIO CHANGES for the financial year to 31 December 2020
461
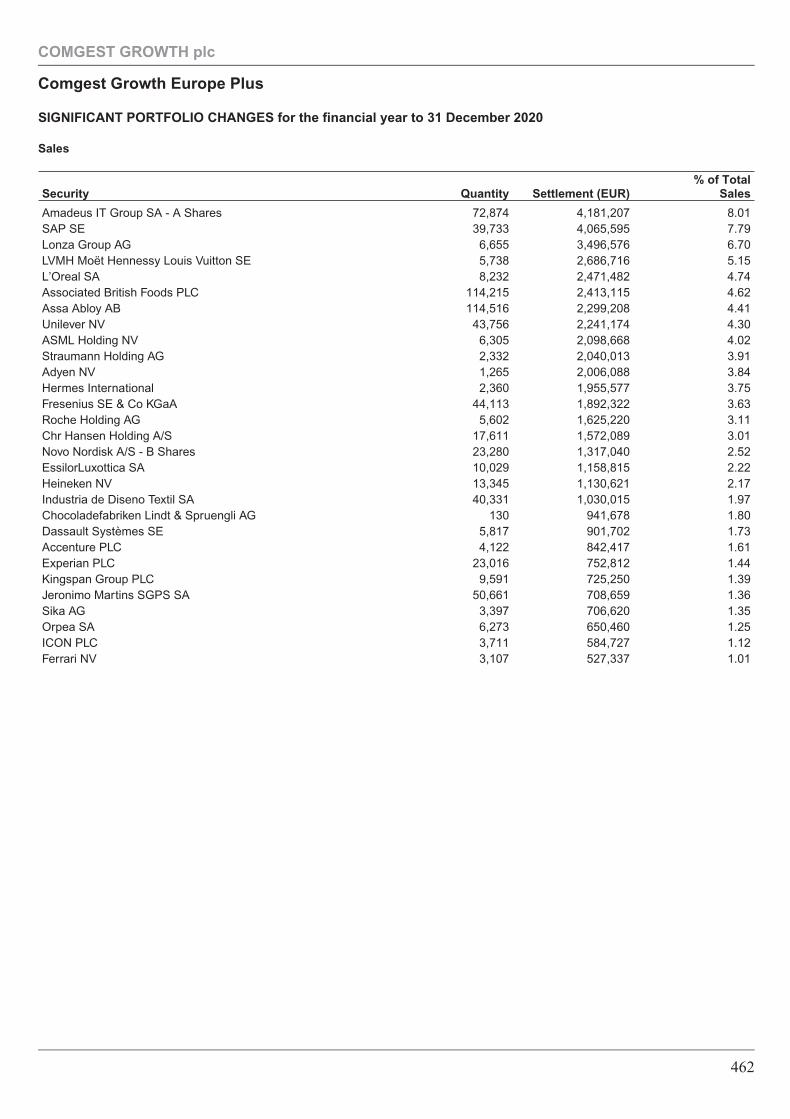
Sales
Security Quantity Settlement (EUR)% of Total
Sales
Amadeus IT Group SA - A Shares 72,874 4,181,207 8.01SAP SE 39,733 4,065,595 7.79Lonza Group AG 6,655 3,496,576 6.70LVMH Moët Hennessy Louis Vuitton SE 5,738 2,686,716 5.15L’Oreal SA 8,232 2,471,482 4.74Associated British Foods PLC 114,215 2,413,115 4.62Assa Abloy AB 114,516 2,299,208 4.41Unilever NV 43,756 2,241,174 4.30ASML Holding NV 6,305 2,098,668 4.02Straumann Holding AG 2,332 2,040,013 3.91Adyen NV 1,265 2,006,088 3.84Hermes International 2,360 1,955,577 3.75Fresenius SE & Co KGaA 44,113 1,892,322 3.63Roche Holding AG 5,602 1,625,220 3.11Chr Hansen Holding A/S 17,611 1,572,089 3.01Novo Nordisk A/S - B Shares 23,280 1,317,040 2.52EssilorLuxottica SA 10,029 1,158,815 2.22Heineken NV 13,345 1,130,621 2.17Industria de Diseno Textil SA 40,331 1,030,015 1.97Chocoladefabriken Lindt & Spruengli AG 130 941,678 1.80Dassault Systèmes SE 5,817 901,702 1.73Accenture PLC 4,122 842,417 1.61Experian PLC 23,016 752,812 1.44Kingspan Group PLC 9,591 725,250 1.39Jeronimo Martins SGPS SA 50,661 708,659 1.36Sika AG 3,397 706,620 1.35Orpea SA 6,273 650,460 1.25ICON PLC 3,711 584,727 1.12Ferrari NV 3,107 527,337 1.01
COMGEST GROWTH plc
Comgest Growth Europe Plus
SIGNIFICANT PORTFOLIO CHANGES for the financial year to 31 December 2020
462
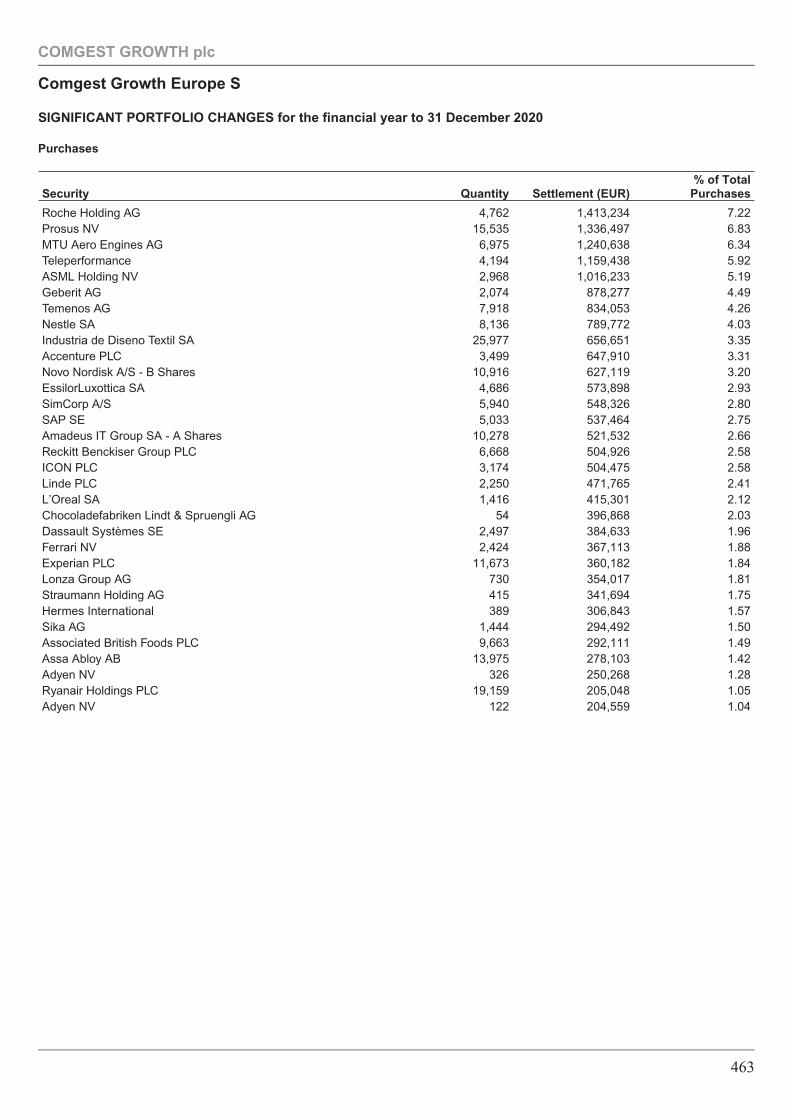
Purchases
Security Quantity Settlement (EUR)% of Total
Purchases
Roche Holding AG 4,762 1,413,234 7.22Prosus NV 15,535 1,336,497 6.83MTU Aero Engines AG 6,975 1,240,638 6.34Teleperformance 4,194 1,159,438 5.92ASML Holding NV 2,968 1,016,233 5.19Geberit AG 2,074 878,277 4.49Temenos AG 7,918 834,053 4.26Nestle SA 8,136 789,772 4.03Industria de Diseno Textil SA 25,977 656,651 3.35Accenture PLC 3,499 647,910 3.31Novo Nordisk A/S - B Shares 10,916 627,119 3.20EssilorLuxottica SA 4,686 573,898 2.93SimCorp A/S 5,940 548,326 2.80SAP SE 5,033 537,464 2.75Amadeus IT Group SA - A Shares 10,278 521,532 2.66Reckitt Benckiser Group PLC 6,668 504,926 2.58ICON PLC 3,174 504,475 2.58Linde PLC 2,250 471,765 2.41L’Oreal SA 1,416 415,301 2.12Chocoladefabriken Lindt & Spruengli AG 54 396,868 2.03Dassault Systèmes SE 2,497 384,633 1.96Ferrari NV 2,424 367,113 1.88Experian PLC 11,673 360,182 1.84Lonza Group AG 730 354,017 1.81Straumann Holding AG 415 341,694 1.75Hermes International 389 306,843 1.57Sika AG 1,444 294,492 1.50Associated British Foods PLC 9,663 292,111 1.49Assa Abloy AB 13,975 278,103 1.42Adyen NV 326 250,268 1.28Ryanair Holdings PLC 19,159 205,048 1.05Adyen NV 122 204,559 1.04
COMGEST GROWTH plc
Comgest Growth Europe S
SIGNIFICANT PORTFOLIO CHANGES for the financial year to 31 December 2020
463
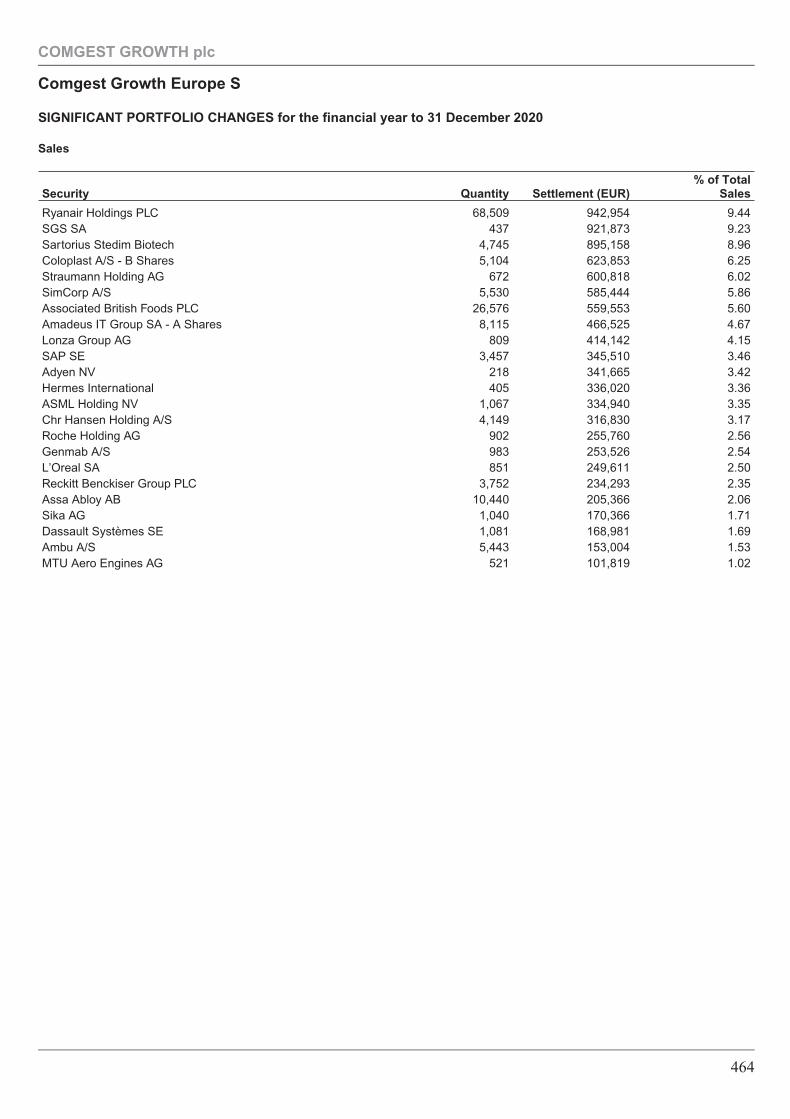
Sales
Security Quantity Settlement (EUR)% of Total
Sales
Ryanair Holdings PLC 68,509 942,954 9.44SGS SA 437 921,873 9.23Sartorius Stedim Biotech 4,745 895,158 8.96Coloplast A/S - B Shares 5,104 623,853 6.25Straumann Holding AG 672 600,818 6.02SimCorp A/S 5,530 585,444 5.86Associated British Foods PLC 26,576 559,553 5.60Amadeus IT Group SA - A Shares 8,115 466,525 4.67Lonza Group AG 809 414,142 4.15SAP SE 3,457 345,510 3.46Adyen NV 218 341,665 3.42Hermes International 405 336,020 3.36ASML Holding NV 1,067 334,940 3.35Chr Hansen Holding A/S 4,149 316,830 3.17Roche Holding AG 902 255,760 2.56Genmab A/S 983 253,526 2.54L’Oreal SA 851 249,611 2.50Reckitt Benckiser Group PLC 3,752 234,293 2.35Assa Abloy AB 10,440 205,366 2.06Sika AG 1,040 170,366 1.71Dassault Systèmes SE 1,081 168,981 1.69Ambu A/S 5,443 153,004 1.53MTU Aero Engines AG 521 101,819 1.02
COMGEST GROWTH plc
Comgest Growth Europe S
SIGNIFICANT PORTFOLIO CHANGES for the financial year to 31 December 2020
464
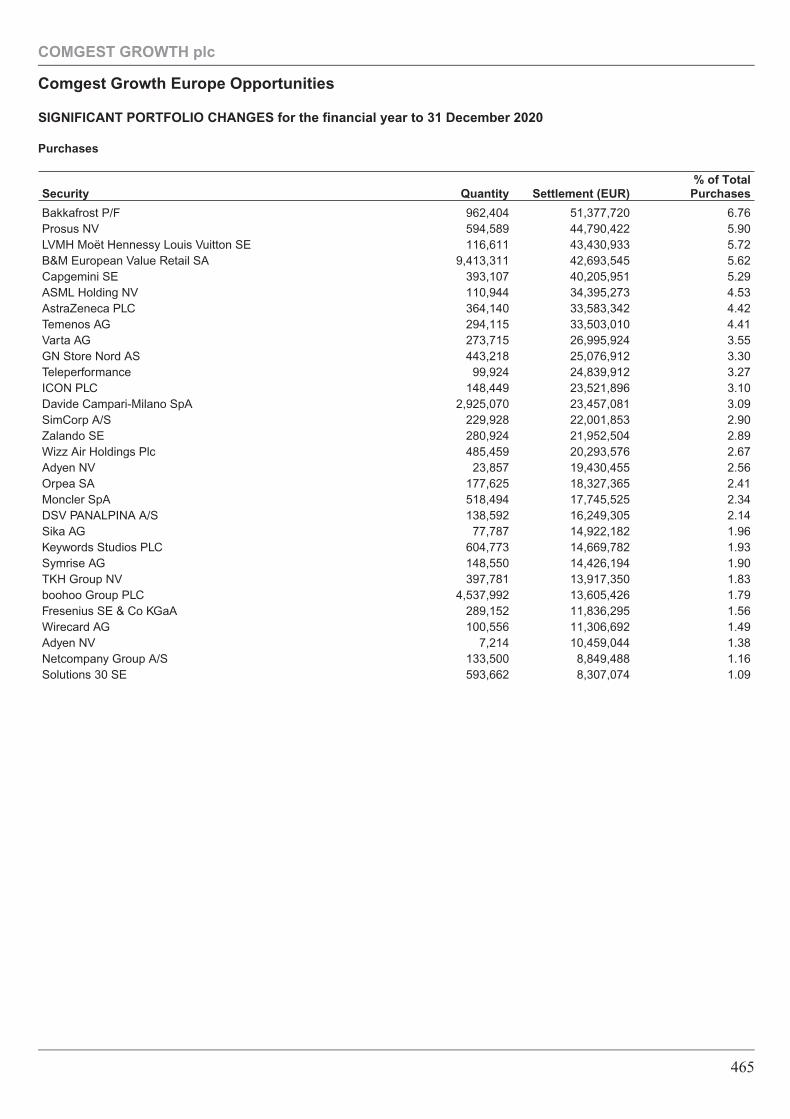
Purchases
Security Quantity Settlement (EUR)% of Total
Purchases
Bakkafrost P/F 962,404 51,377,720 6.76Prosus NV 594,589 44,790,422 5.90LVMH Moët Hennessy Louis Vuitton SE 116,611 43,430,933 5.72B&M European Value Retail SA 9,413,311 42,693,545 5.62Capgemini SE 393,107 40,205,951 5.29ASML Holding NV 110,944 34,395,273 4.53AstraZeneca PLC 364,140 33,583,342 4.42Temenos AG 294,115 33,503,010 4.41Varta AG 273,715 26,995,924 3.55GN Store Nord AS 443,218 25,076,912 3.30Teleperformance 99,924 24,839,912 3.27ICON PLC 148,449 23,521,896 3.10Davide Campari-Milano SpA 2,925,070 23,457,081 3.09SimCorp A/S 229,928 22,001,853 2.90Zalando SE 280,924 21,952,504 2.89Wizz Air Holdings Plc 485,459 20,293,576 2.67Adyen NV 23,857 19,430,455 2.56Orpea SA 177,625 18,327,365 2.41Moncler SpA 518,494 17,745,525 2.34DSV PANALPINA A/S 138,592 16,249,305 2.14Sika AG 77,787 14,922,182 1.96Keywords Studios PLC 604,773 14,669,782 1.93Symrise AG 148,550 14,426,194 1.90TKH Group NV 397,781 13,917,350 1.83boohoo Group PLC 4,537,992 13,605,426 1.79Fresenius SE & Co KGaA 289,152 11,836,295 1.56Wirecard AG 100,556 11,306,692 1.49Adyen NV 7,214 10,459,044 1.38Netcompany Group A/S 133,500 8,849,488 1.16Solutions 30 SE 593,662 8,307,074 1.09
COMGEST GROWTH plc
Comgest Growth Europe Opportunities
SIGNIFICANT PORTFOLIO CHANGES for the financial year to 31 December 2020
465
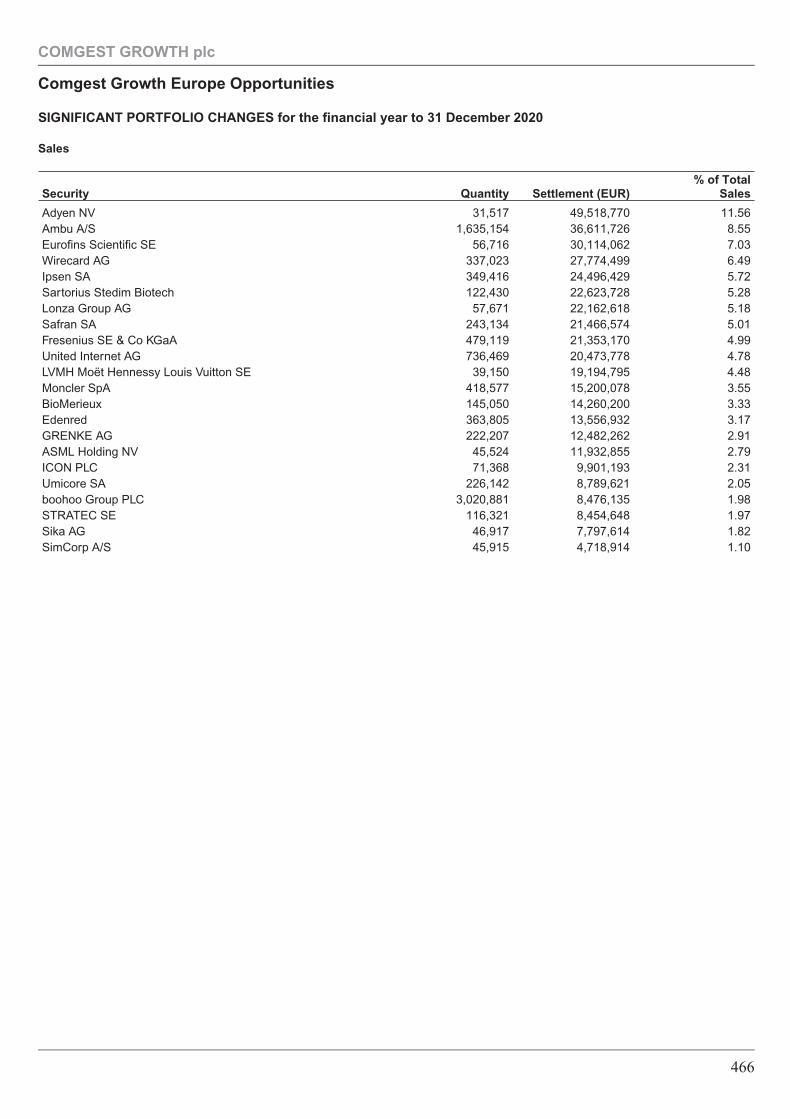
Sales
Security Quantity Settlement (EUR)% of Total
Sales
Adyen NV 31,517 49,518,770 11.56Ambu A/S 1,635,154 36,611,726 8.55Eurofins Scientific SE 56,716 30,114,062 7.03Wirecard AG 337,023 27,774,499 6.49Ipsen SA 349,416 24,496,429 5.72Sartorius Stedim Biotech 122,430 22,623,728 5.28Lonza Group AG 57,671 22,162,618 5.18Safran SA 243,134 21,466,574 5.01Fresenius SE & Co KGaA 479,119 21,353,170 4.99United Internet AG 736,469 20,473,778 4.78LVMH Moët Hennessy Louis Vuitton SE 39,150 19,194,795 4.48Moncler SpA 418,577 15,200,078 3.55BioMerieux 145,050 14,260,200 3.33Edenred 363,805 13,556,932 3.17GRENKE AG 222,207 12,482,262 2.91ASML Holding NV 45,524 11,932,855 2.79ICON PLC 71,368 9,901,193 2.31Umicore SA 226,142 8,789,621 2.05boohoo Group PLC 3,020,881 8,476,135 1.98STRATEC SE 116,321 8,454,648 1.97Sika AG 46,917 7,797,614 1.82SimCorp A/S 45,915 4,718,914 1.10
COMGEST GROWTH plc
Comgest Growth Europe Opportunities
SIGNIFICANT PORTFOLIO CHANGES for the financial year to 31 December 2020
466
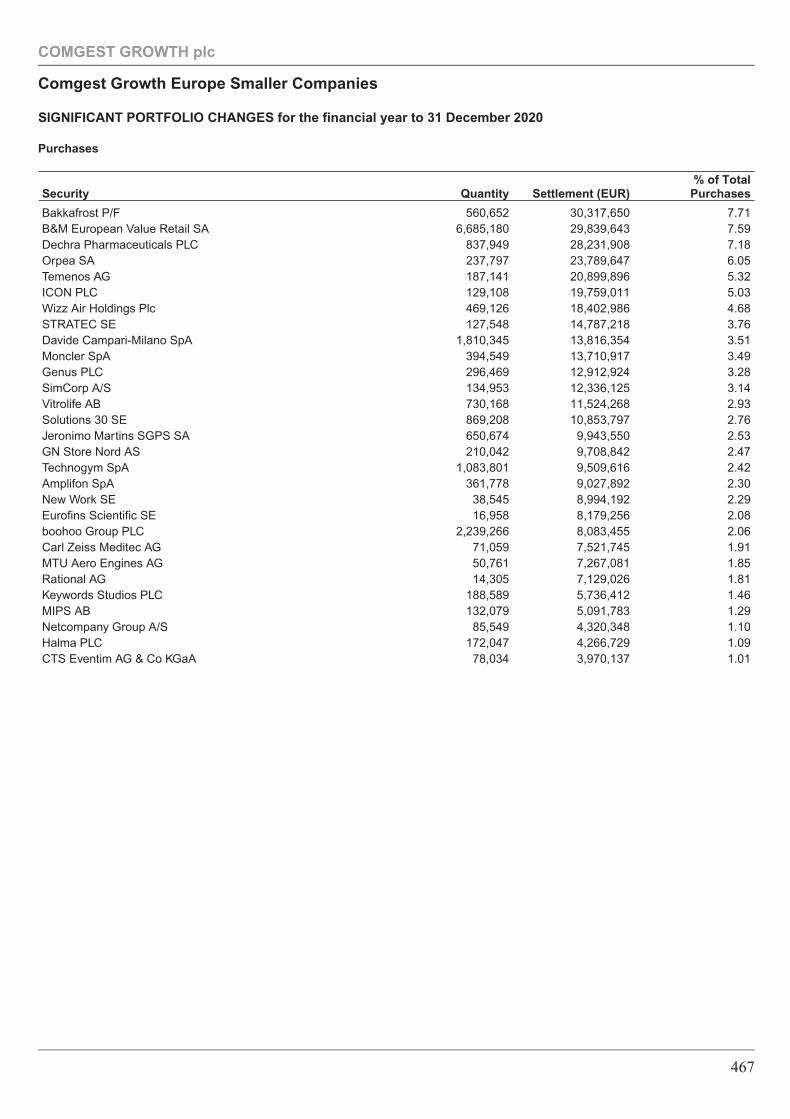
Purchases
Security Quantity Settlement (EUR)% of Total
Purchases
Bakkafrost P/F 560,652 30,317,650 7.71B&M European Value Retail SA 6,685,180 29,839,643 7.59Dechra Pharmaceuticals PLC 837,949 28,231,908 7.18Orpea SA 237,797 23,789,647 6.05Temenos AG 187,141 20,899,896 5.32ICON PLC 129,108 19,759,011 5.03Wizz Air Holdings Plc 469,126 18,402,986 4.68STRATEC SE 127,548 14,787,218 3.76Davide Campari-Milano SpA 1,810,345 13,816,354 3.51Moncler SpA 394,549 13,710,917 3.49Genus PLC 296,469 12,912,924 3.28SimCorp A/S 134,953 12,336,125 3.14Vitrolife AB 730,168 11,524,268 2.93Solutions 30 SE 869,208 10,853,797 2.76Jeronimo Martins SGPS SA 650,674 9,943,550 2.53GN Store Nord AS 210,042 9,708,842 2.47Technogym SpA 1,083,801 9,509,616 2.42Amplifon SpA 361,778 9,027,892 2.30New Work SE 38,545 8,994,192 2.29Eurofins Scientific SE 16,958 8,179,256 2.08boohoo Group PLC 2,239,266 8,083,455 2.06Carl Zeiss Meditec AG 71,059 7,521,745 1.91MTU Aero Engines AG 50,761 7,267,081 1.85Rational AG 14,305 7,129,026 1.81Keywords Studios PLC 188,589 5,736,412 1.46MIPS AB 132,079 5,091,783 1.29Netcompany Group A/S 85,549 4,320,348 1.10Halma PLC 172,047 4,266,729 1.09CTS Eventim AG & Co KGaA 78,034 3,970,137 1.01
COMGEST GROWTH plc
Comgest Growth Europe Smaller Companies
SIGNIFICANT PORTFOLIO CHANGES for the financial year to 31 December 2020
467
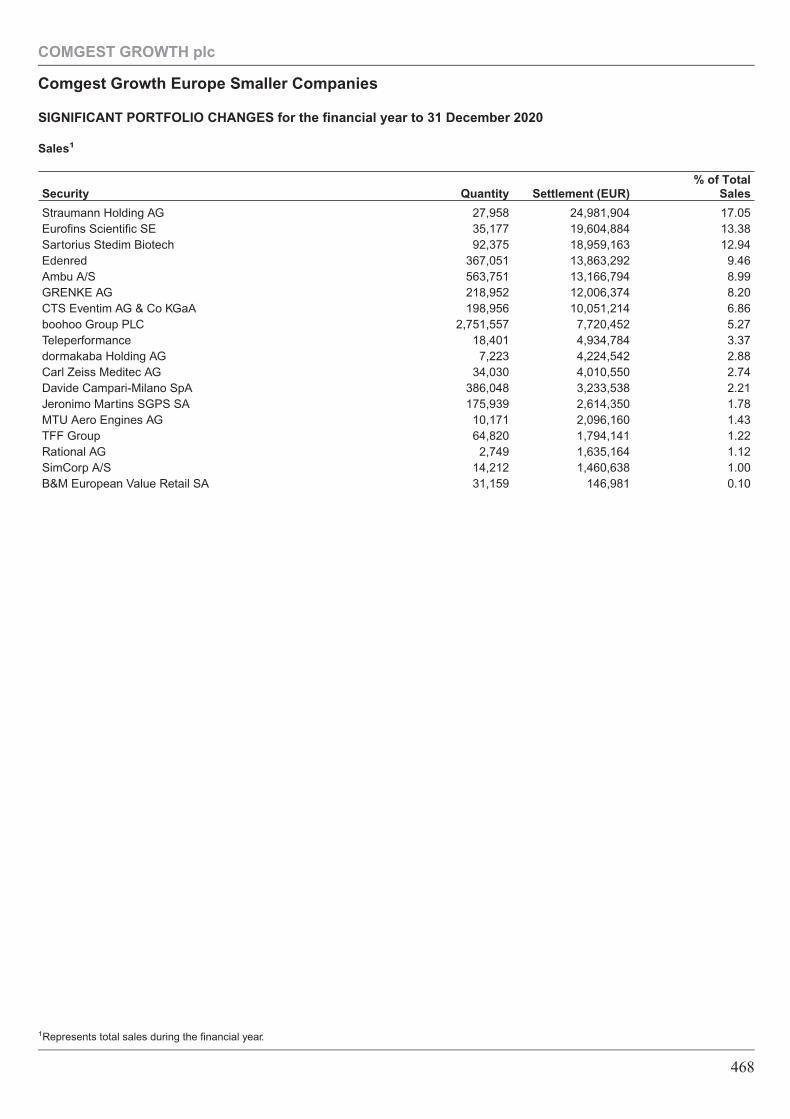
Sales1
Security Quantity Settlement (EUR)% of Total
Sales
Straumann Holding AG 27,958 24,981,904 17.05Eurofins Scientific SE 35,177 19,604,884 13.38Sartorius Stedim Biotech 92,375 18,959,163 12.94Edenred 367,051 13,863,292 9.46Ambu A/S 563,751 13,166,794 8.99GRENKE AG 218,952 12,006,374 8.20CTS Eventim AG & Co KGaA 198,956 10,051,214 6.86boohoo Group PLC 2,751,557 7,720,452 5.27Teleperformance 18,401 4,934,784 3.37dormakaba Holding AG 7,223 4,224,542 2.88Carl Zeiss Meditec AG 34,030 4,010,550 2.74Davide Campari-Milano SpA 386,048 3,233,538 2.21Jeronimo Martins SGPS SA 175,939 2,614,350 1.78MTU Aero Engines AG 10,171 2,096,160 1.43TFF Group 64,820 1,794,141 1.22Rational AG 2,749 1,635,164 1.12SimCorp A/S 14,212 1,460,638 1.00B&M European Value Retail SA 31,159 146,981 0.10
COMGEST GROWTH plc
Comgest Growth Europe Smaller Companies
SIGNIFICANT PORTFOLIO CHANGES for the financial year to 31 December 2020
1Represents total sales during the financial year.
468
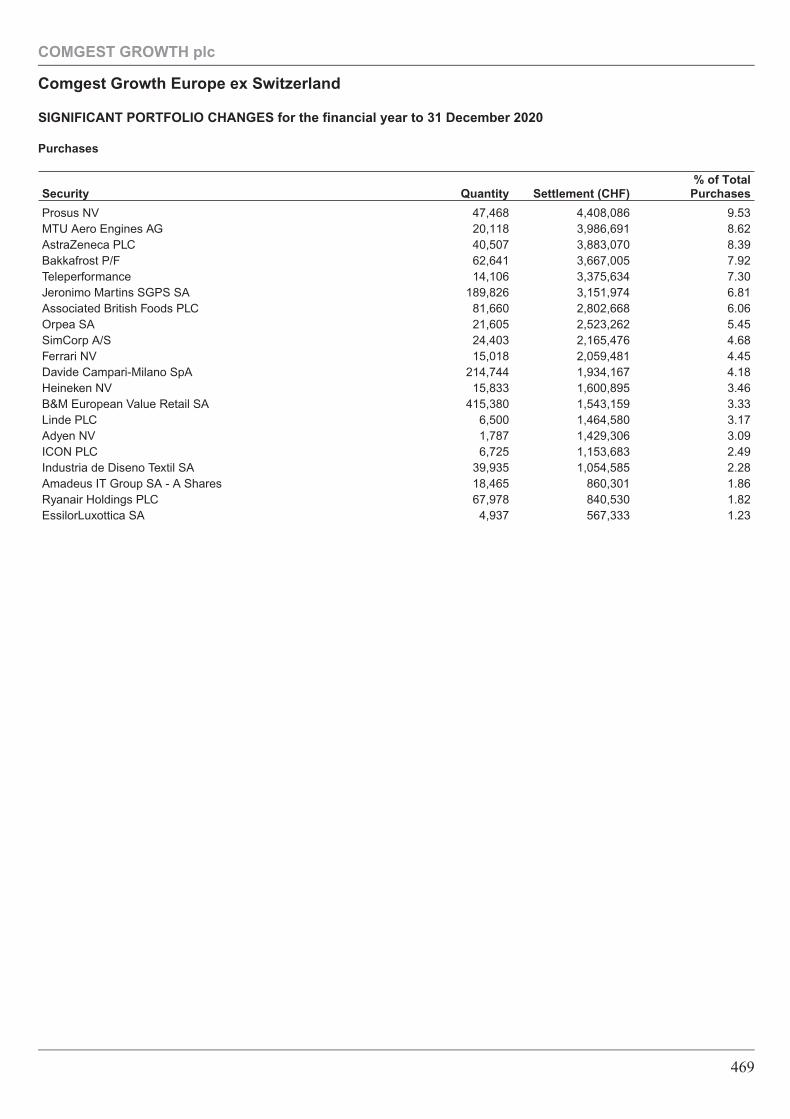
Purchases
Security Quantity Settlement (CHF)% of Total
Purchases
Prosus NV 47,468 4,408,086 9.53MTU Aero Engines AG 20,118 3,986,691 8.62AstraZeneca PLC 40,507 3,883,070 8.39Bakkafrost P/F 62,641 3,667,005 7.92Teleperformance 14,106 3,375,634 7.30Jeronimo Martins SGPS SA 189,826 3,151,974 6.81Associated British Foods PLC 81,660 2,802,668 6.06Orpea SA 21,605 2,523,262 5.45SimCorp A/S 24,403 2,165,476 4.68Ferrari NV 15,018 2,059,481 4.45Davide Campari-Milano SpA 214,744 1,934,167 4.18Heineken NV 15,833 1,600,895 3.46B&M European Value Retail SA 415,380 1,543,159 3.33Linde PLC 6,500 1,464,580 3.17Adyen NV 1,787 1,429,306 3.09ICON PLC 6,725 1,153,683 2.49Industria de Diseno Textil SA 39,935 1,054,585 2.28Amadeus IT Group SA - A Shares 18,465 860,301 1.86Ryanair Holdings PLC 67,978 840,530 1.82EssilorLuxottica SA 4,937 567,333 1.23
COMGEST GROWTH plc
Comgest Growth Europe ex Switzerland
SIGNIFICANT PORTFOLIO CHANGES for the financial year to 31 December 2020
469
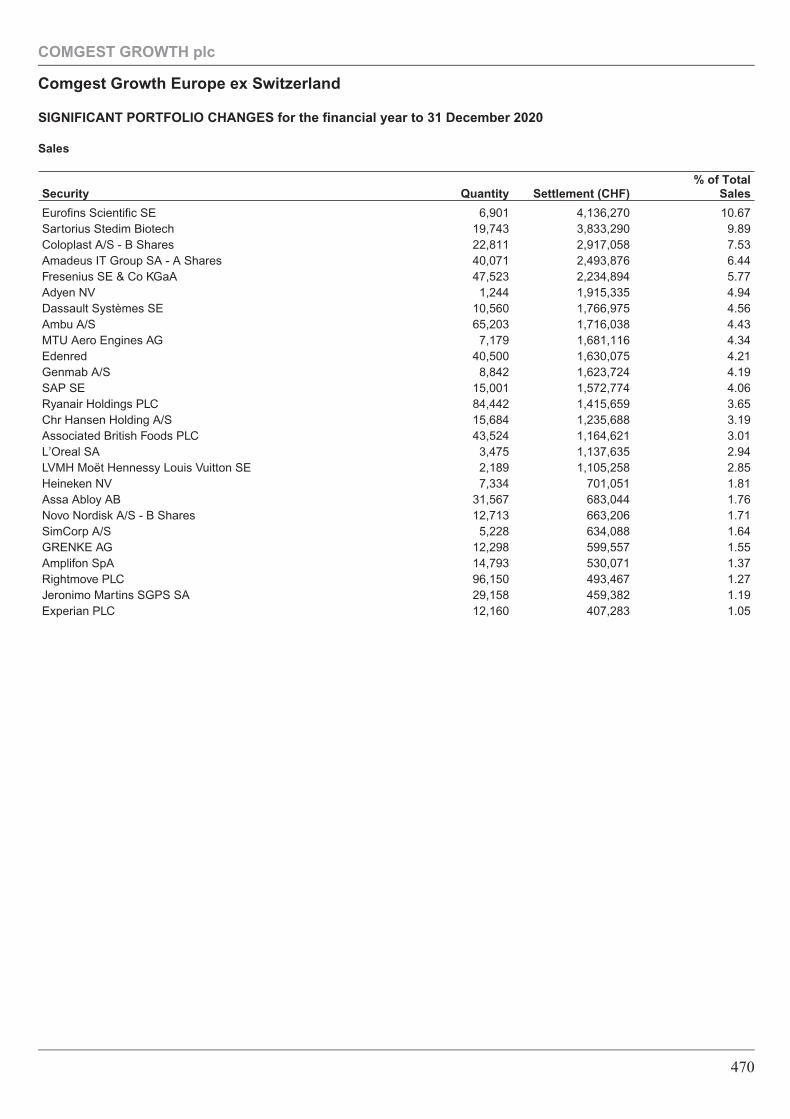
Sales
Security Quantity Settlement (CHF)% of Total
Sales
Eurofins Scientific SE 6,901 4,136,270 10.67Sartorius Stedim Biotech 19,743 3,833,290 9.89Coloplast A/S - B Shares 22,811 2,917,058 7.53Amadeus IT Group SA - A Shares 40,071 2,493,876 6.44Fresenius SE & Co KGaA 47,523 2,234,894 5.77Adyen NV 1,244 1,915,335 4.94Dassault Systèmes SE 10,560 1,766,975 4.56Ambu A/S 65,203 1,716,038 4.43MTU Aero Engines AG 7,179 1,681,116 4.34Edenred 40,500 1,630,075 4.21Genmab A/S 8,842 1,623,724 4.19SAP SE 15,001 1,572,774 4.06Ryanair Holdings PLC 84,442 1,415,659 3.65Chr Hansen Holding A/S 15,684 1,235,688 3.19Associated British Foods PLC 43,524 1,164,621 3.01L’Oreal SA 3,475 1,137,635 2.94LVMH Moët Hennessy Louis Vuitton SE 2,189 1,105,258 2.85Heineken NV 7,334 701,051 1.81Assa Abloy AB 31,567 683,044 1.76Novo Nordisk A/S - B Shares 12,713 663,206 1.71SimCorp A/S 5,228 634,088 1.64GRENKE AG 12,298 599,557 1.55Amplifon SpA 14,793 530,071 1.37Rightmove PLC 96,150 493,467 1.27Jeronimo Martins SGPS SA 29,158 459,382 1.19Experian PLC 12,160 407,283 1.05
COMGEST GROWTH plc
Comgest Growth Europe ex Switzerland
SIGNIFICANT PORTFOLIO CHANGES for the financial year to 31 December 2020
470
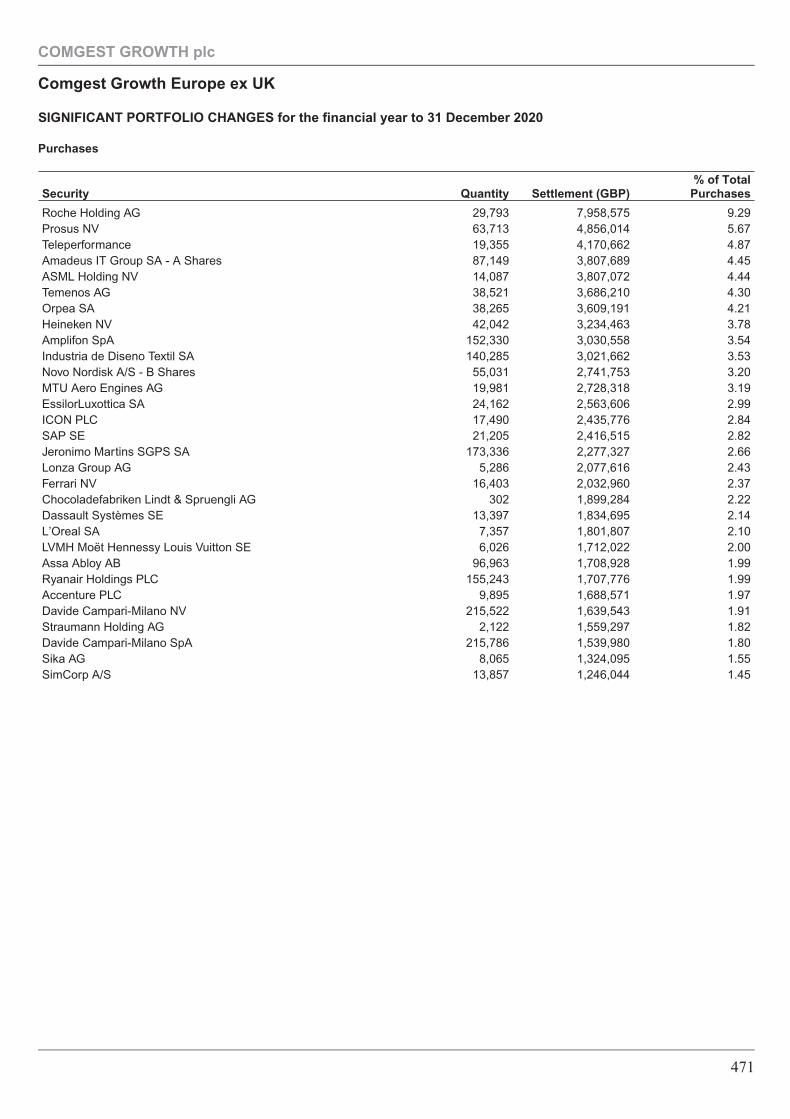
Purchases
Security Quantity Settlement (GBP)% of Total
Purchases
Roche Holding AG 29,793 7,958,575 9.29Prosus NV 63,713 4,856,014 5.67Teleperformance 19,355 4,170,662 4.87Amadeus IT Group SA - A Shares 87,149 3,807,689 4.45ASML Holding NV 14,087 3,807,072 4.44Temenos AG 38,521 3,686,210 4.30Orpea SA 38,265 3,609,191 4.21Heineken NV 42,042 3,234,463 3.78Amplifon SpA 152,330 3,030,558 3.54Industria de Diseno Textil SA 140,285 3,021,662 3.53Novo Nordisk A/S - B Shares 55,031 2,741,753 3.20MTU Aero Engines AG 19,981 2,728,318 3.19EssilorLuxottica SA 24,162 2,563,606 2.99ICON PLC 17,490 2,435,776 2.84SAP SE 21,205 2,416,515 2.82Jeronimo Martins SGPS SA 173,336 2,277,327 2.66Lonza Group AG 5,286 2,077,616 2.43Ferrari NV 16,403 2,032,960 2.37Chocoladefabriken Lindt & Spruengli AG 302 1,899,284 2.22Dassault Systèmes SE 13,397 1,834,695 2.14L’Oreal SA 7,357 1,801,807 2.10LVMH Moët Hennessy Louis Vuitton SE 6,026 1,712,022 2.00Assa Abloy AB 96,963 1,708,928 1.99Ryanair Holdings PLC 155,243 1,707,776 1.99Accenture PLC 9,895 1,688,571 1.97Davide Campari-Milano NV 215,522 1,639,543 1.91Straumann Holding AG 2,122 1,559,297 1.82Davide Campari-Milano SpA 215,786 1,539,980 1.80Sika AG 8,065 1,324,095 1.55SimCorp A/S 13,857 1,246,044 1.45
COMGEST GROWTH plc
Comgest Growth Europe ex UK
SIGNIFICANT PORTFOLIO CHANGES for the financial year to 31 December 2020
471
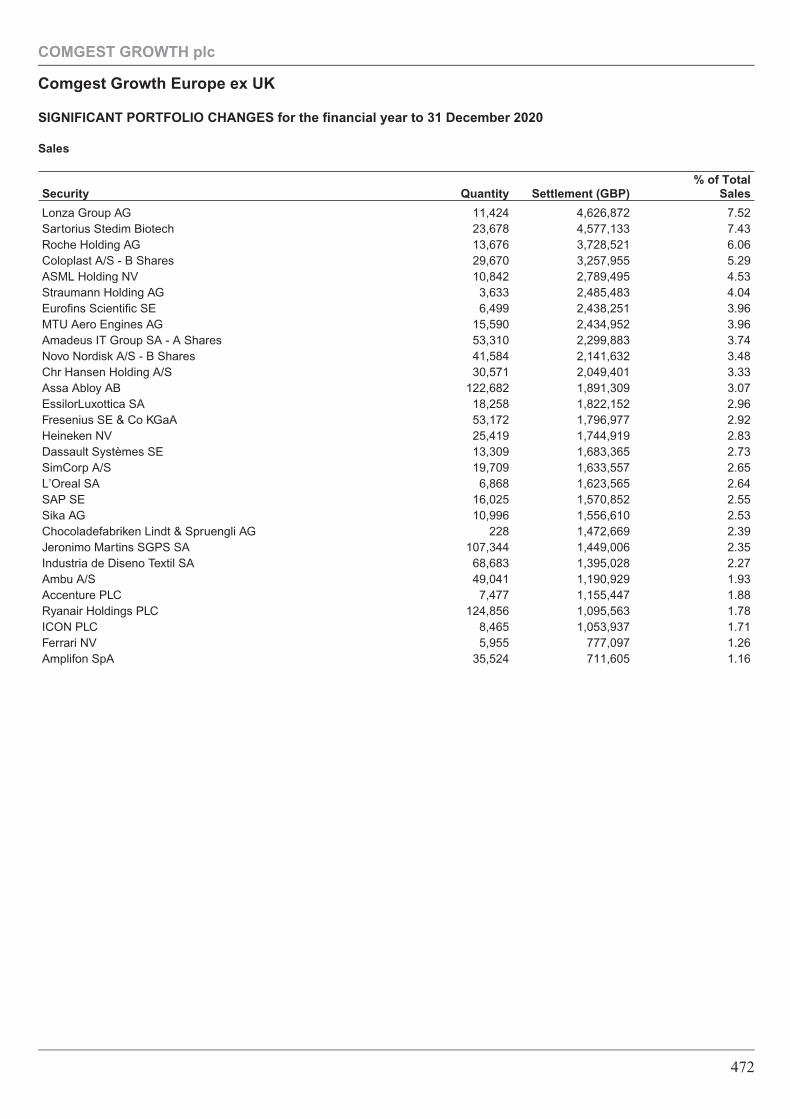
Sales
Security Quantity Settlement (GBP)% of Total
Sales
Lonza Group AG 11,424 4,626,872 7.52Sartorius Stedim Biotech 23,678 4,577,133 7.43Roche Holding AG 13,676 3,728,521 6.06Coloplast A/S - B Shares 29,670 3,257,955 5.29ASML Holding NV 10,842 2,789,495 4.53Straumann Holding AG 3,633 2,485,483 4.04Eurofins Scientific SE 6,499 2,438,251 3.96MTU Aero Engines AG 15,590 2,434,952 3.96Amadeus IT Group SA - A Shares 53,310 2,299,883 3.74Novo Nordisk A/S - B Shares 41,584 2,141,632 3.48Chr Hansen Holding A/S 30,571 2,049,401 3.33Assa Abloy AB 122,682 1,891,309 3.07EssilorLuxottica SA 18,258 1,822,152 2.96Fresenius SE & Co KGaA 53,172 1,796,977 2.92Heineken NV 25,419 1,744,919 2.83Dassault Systèmes SE 13,309 1,683,365 2.73SimCorp A/S 19,709 1,633,557 2.65L’Oreal SA 6,868 1,623,565 2.64SAP SE 16,025 1,570,852 2.55Sika AG 10,996 1,556,610 2.53Chocoladefabriken Lindt & Spruengli AG 228 1,472,669 2.39Jeronimo Martins SGPS SA 107,344 1,449,006 2.35Industria de Diseno Textil SA 68,683 1,395,028 2.27Ambu A/S 49,041 1,190,929 1.93Accenture PLC 7,477 1,155,447 1.88Ryanair Holdings PLC 124,856 1,095,563 1.78ICON PLC 8,465 1,053,937 1.71Ferrari NV 5,955 777,097 1.26Amplifon SpA 35,524 711,605 1.16
COMGEST GROWTH plc
Comgest Growth Europe ex UK
SIGNIFICANT PORTFOLIO CHANGES for the financial year to 31 December 2020
472
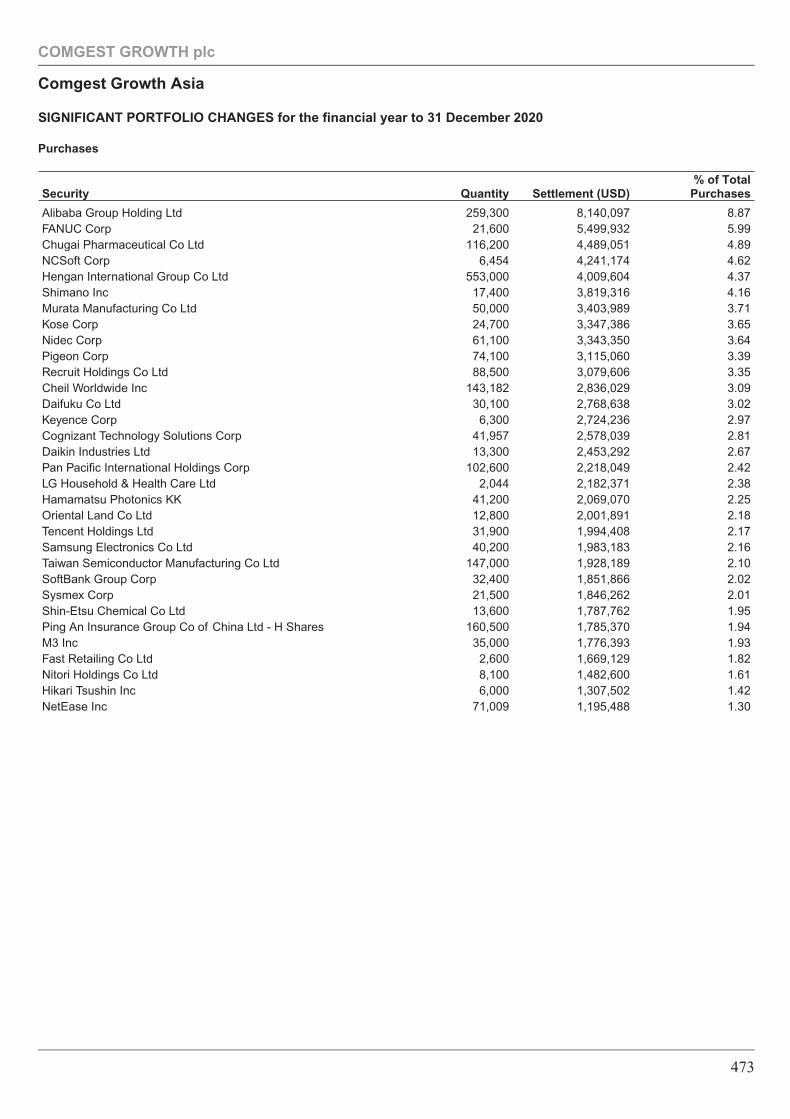
Purchases
Security Quantity Settlement (USD)% of Total
Purchases
Alibaba Group Holding Ltd 259,300 8,140,097 8.87FANUC Corp 21,600 5,499,932 5.99Chugai Pharmaceutical Co Ltd 116,200 4,489,051 4.89NCSoft Corp 6,454 4,241,174 4.62Hengan International Group Co Ltd 553,000 4,009,604 4.37Shimano Inc 17,400 3,819,316 4.16Murata Manufacturing Co Ltd 50,000 3,403,989 3.71Kose Corp 24,700 3,347,386 3.65Nidec Corp 61,100 3,343,350 3.64Pigeon Corp 74,100 3,115,060 3.39Recruit Holdings Co Ltd 88,500 3,079,606 3.35Cheil Worldwide Inc 143,182 2,836,029 3.09Daifuku Co Ltd 30,100 2,768,638 3.02Keyence Corp 6,300 2,724,236 2.97Cognizant Technology Solutions Corp 41,957 2,578,039 2.81Daikin Industries Ltd 13,300 2,453,292 2.67Pan Pacific International Holdings Corp 102,600 2,218,049 2.42LG Household & Health Care Ltd 2,044 2,182,371 2.38Hamamatsu Photonics KK 41,200 2,069,070 2.25Oriental Land Co Ltd 12,800 2,001,891 2.18Tencent Holdings Ltd 31,900 1,994,408 2.17Samsung Electronics Co Ltd 40,200 1,983,183 2.16Taiwan Semiconductor Manufacturing Co Ltd 147,000 1,928,189 2.10SoftBank Group Corp 32,400 1,851,866 2.02Sysmex Corp 21,500 1,846,262 2.01Shin-Etsu Chemical Co Ltd 13,600 1,787,762 1.95Ping An Insurance Group Co of China Ltd - H Shares 160,500 1,785,370 1.94M3 Inc 35,000 1,776,393 1.93Fast Retailing Co Ltd 2,600 1,669,129 1.82Nitori Holdings Co Ltd 8,100 1,482,600 1.61Hikari Tsushin Inc 6,000 1,307,502 1.42NetEase Inc 71,009 1,195,488 1.30
COMGEST GROWTH plc
Comgest Growth Asia
SIGNIFICANT PORTFOLIO CHANGES for the financial year to 31 December 2020
473
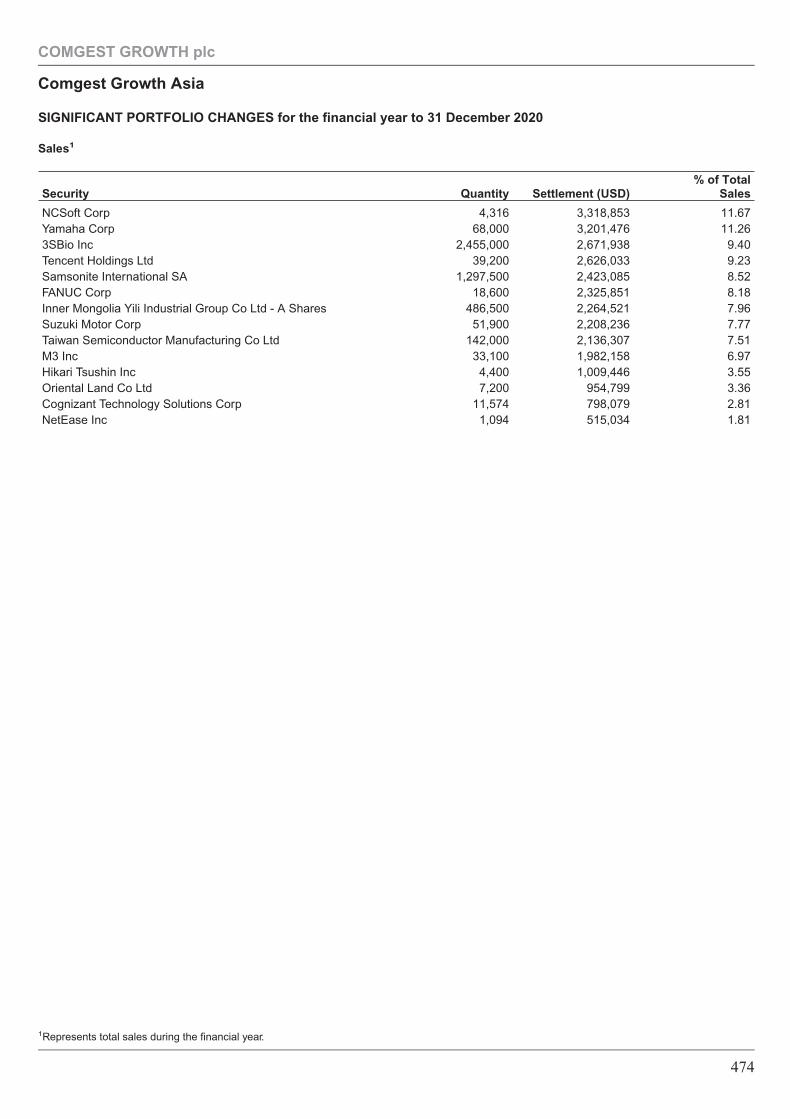
Sales1
Security Quantity Settlement (USD)% of Total
Sales
NCSoft Corp 4,316 3,318,853 11.67Yamaha Corp 68,000 3,201,476 11.263SBio Inc 2,455,000 2,671,938 9.40Tencent Holdings Ltd 39,200 2,626,033 9.23Samsonite International SA 1,297,500 2,423,085 8.52FANUC Corp 18,600 2,325,851 8.18Inner Mongolia Yili Industrial Group Co Ltd - A Shares 486,500 2,264,521 7.96Suzuki Motor Corp 51,900 2,208,236 7.77Taiwan Semiconductor Manufacturing Co Ltd 142,000 2,136,307 7.51M3 Inc 33,100 1,982,158 6.97Hikari Tsushin Inc 4,400 1,009,446 3.55Oriental Land Co Ltd 7,200 954,799 3.36Cognizant Technology Solutions Corp 11,574 798,079 2.81NetEase Inc 1,094 515,034 1.81
COMGEST GROWTH plc
Comgest Growth Asia
SIGNIFICANT PORTFOLIO CHANGES for the financial year to 31 December 2020
1Represents total sales during the financial year.
474
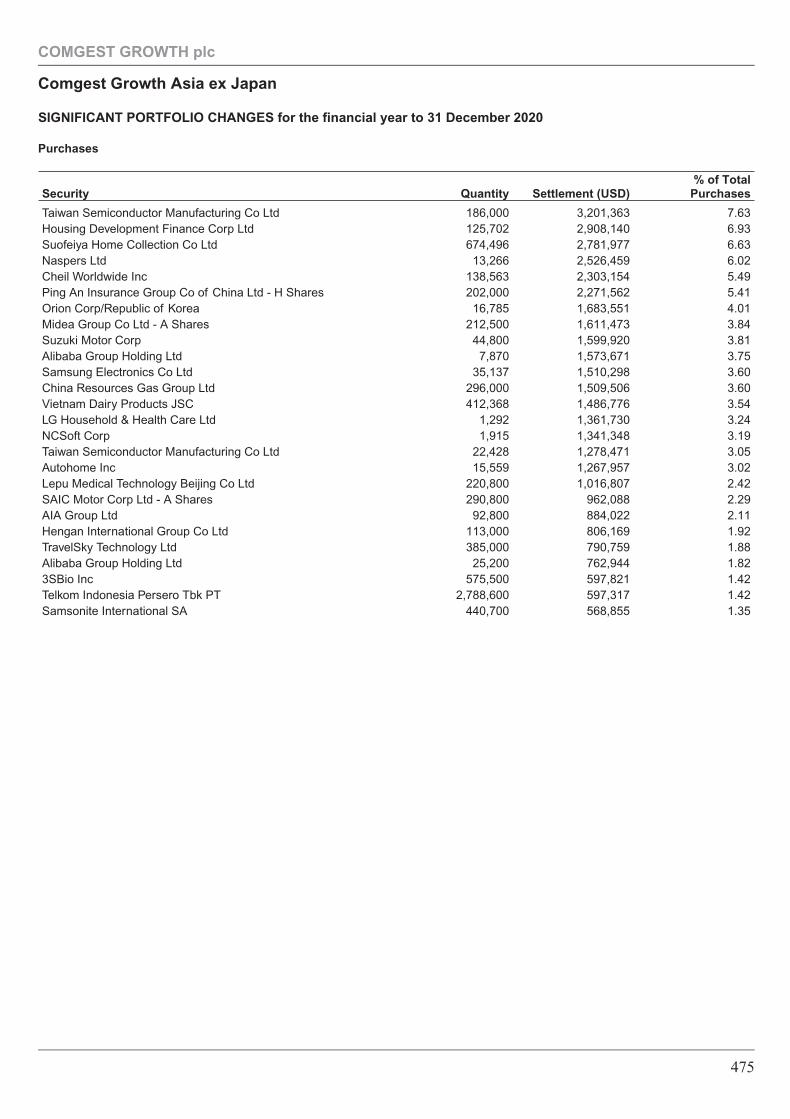
Purchases
Security Quantity Settlement (USD)% of Total
Purchases
Taiwan Semiconductor Manufacturing Co Ltd 186,000 3,201,363 7.63Housing Development Finance Corp Ltd 125,702 2,908,140 6.93Suofeiya Home Collection Co Ltd 674,496 2,781,977 6.63Naspers Ltd 13,266 2,526,459 6.02Cheil Worldwide Inc 138,563 2,303,154 5.49Ping An Insurance Group Co of China Ltd - H Shares 202,000 2,271,562 5.41Orion Corp/Republic of Korea 16,785 1,683,551 4.01Midea Group Co Ltd - A Shares 212,500 1,611,473 3.84Suzuki Motor Corp 44,800 1,599,920 3.81Alibaba Group Holding Ltd 7,870 1,573,671 3.75Samsung Electronics Co Ltd 35,137 1,510,298 3.60China Resources Gas Group Ltd 296,000 1,509,506 3.60Vietnam Dairy Products JSC 412,368 1,486,776 3.54LG Household & Health Care Ltd 1,292 1,361,730 3.24NCSoft Corp 1,915 1,341,348 3.19Taiwan Semiconductor Manufacturing Co Ltd 22,428 1,278,471 3.05Autohome Inc 15,559 1,267,957 3.02Lepu Medical Technology Beijing Co Ltd 220,800 1,016,807 2.42SAIC Motor Corp Ltd - A Shares 290,800 962,088 2.29AIA Group Ltd 92,800 884,022 2.11Hengan International Group Co Ltd 113,000 806,169 1.92TravelSky Technology Ltd 385,000 790,759 1.88Alibaba Group Holding Ltd 25,200 762,944 1.823SBio Inc 575,500 597,821 1.42Telkom Indonesia Persero Tbk PT 2,788,600 597,317 1.42Samsonite International SA 440,700 568,855 1.35
COMGEST GROWTH plc
Comgest Growth Asia ex Japan
SIGNIFICANT PORTFOLIO CHANGES for the financial year to 31 December 2020
475
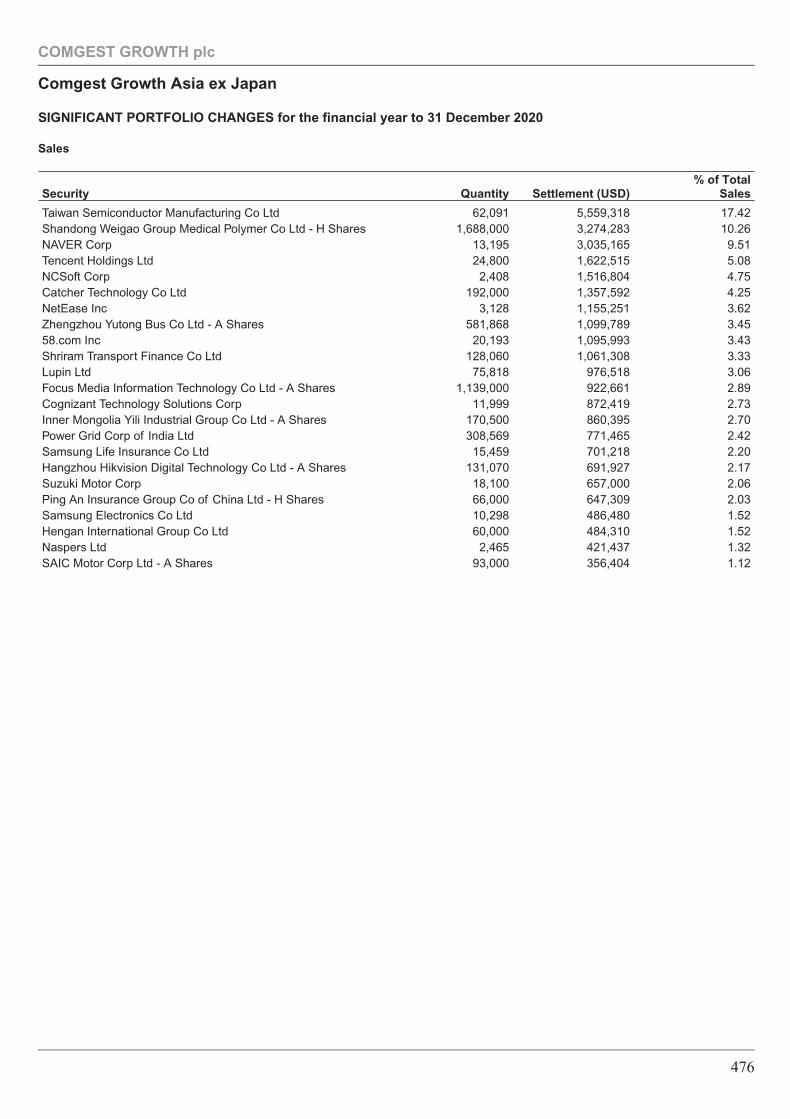
Sales
Security Quantity Settlement (USD)% of Total
Sales
Taiwan Semiconductor Manufacturing Co Ltd 62,091 5,559,318 17.42Shandong Weigao Group Medical Polymer Co Ltd - H Shares 1,688,000 3,274,283 10.26NAVER Corp 13,195 3,035,165 9.51Tencent Holdings Ltd 24,800 1,622,515 5.08NCSoft Corp 2,408 1,516,804 4.75Catcher Technology Co Ltd 192,000 1,357,592 4.25NetEase Inc 3,128 1,155,251 3.62Zhengzhou Yutong Bus Co Ltd - A Shares 581,868 1,099,789 3.4558.com Inc 20,193 1,095,993 3.43Shriram Transport Finance Co Ltd 128,060 1,061,308 3.33Lupin Ltd 75,818 976,518 3.06Focus Media Information Technology Co Ltd - A Shares 1,139,000 922,661 2.89Cognizant Technology Solutions Corp 11,999 872,419 2.73Inner Mongolia Yili Industrial Group Co Ltd - A Shares 170,500 860,395 2.70Power Grid Corp of India Ltd 308,569 771,465 2.42Samsung Life Insurance Co Ltd 15,459 701,218 2.20Hangzhou Hikvision Digital Technology Co Ltd - A Shares 131,070 691,927 2.17Suzuki Motor Corp 18,100 657,000 2.06Ping An Insurance Group Co of China Ltd - H Shares 66,000 647,309 2.03Samsung Electronics Co Ltd 10,298 486,480 1.52Hengan International Group Co Ltd 60,000 484,310 1.52Naspers Ltd 2,465 421,437 1.32SAIC Motor Corp Ltd - A Shares 93,000 356,404 1.12
COMGEST GROWTH plc
Comgest Growth Asia ex Japan
SIGNIFICANT PORTFOLIO CHANGES for the financial year to 31 December 2020
476
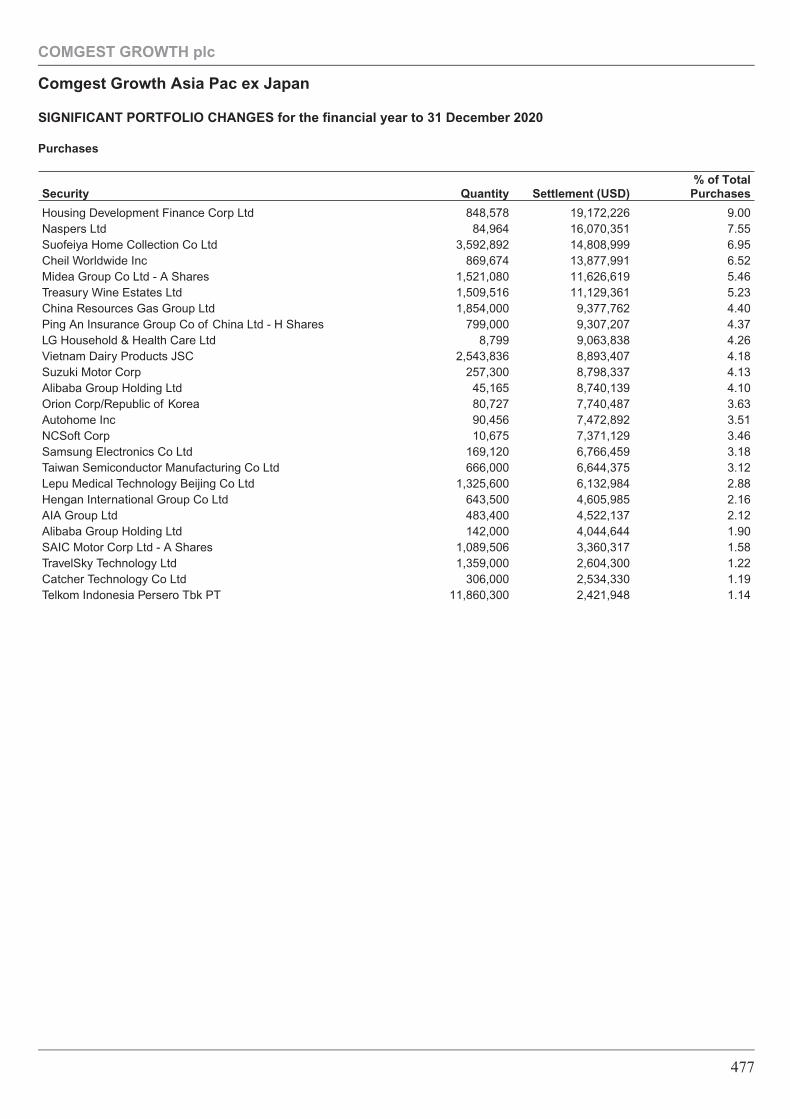
Purchases
Security Quantity Settlement (USD)% of Total
Purchases
Housing Development Finance Corp Ltd 848,578 19,172,226 9.00Naspers Ltd 84,964 16,070,351 7.55Suofeiya Home Collection Co Ltd 3,592,892 14,808,999 6.95Cheil Worldwide Inc 869,674 13,877,991 6.52Midea Group Co Ltd - A Shares 1,521,080 11,626,619 5.46Treasury Wine Estates Ltd 1,509,516 11,129,361 5.23China Resources Gas Group Ltd 1,854,000 9,377,762 4.40Ping An Insurance Group Co of China Ltd - H Shares 799,000 9,307,207 4.37LG Household & Health Care Ltd 8,799 9,063,838 4.26Vietnam Dairy Products JSC 2,543,836 8,893,407 4.18Suzuki Motor Corp 257,300 8,798,337 4.13Alibaba Group Holding Ltd 45,165 8,740,139 4.10Orion Corp/Republic of Korea 80,727 7,740,487 3.63Autohome Inc 90,456 7,472,892 3.51NCSoft Corp 10,675 7,371,129 3.46Samsung Electronics Co Ltd 169,120 6,766,459 3.18Taiwan Semiconductor Manufacturing Co Ltd 666,000 6,644,375 3.12Lepu Medical Technology Beijing Co Ltd 1,325,600 6,132,984 2.88Hengan International Group Co Ltd 643,500 4,605,985 2.16AIA Group Ltd 483,400 4,522,137 2.12Alibaba Group Holding Ltd 142,000 4,044,644 1.90SAIC Motor Corp Ltd - A Shares 1,089,506 3,360,317 1.58TravelSky Technology Ltd 1,359,000 2,604,300 1.22Catcher Technology Co Ltd 306,000 2,534,330 1.19Telkom Indonesia Persero Tbk PT 11,860,300 2,421,948 1.14
COMGEST GROWTH plc
Comgest Growth Asia Pac ex Japan
SIGNIFICANT PORTFOLIO CHANGES for the financial year to 31 December 2020
477
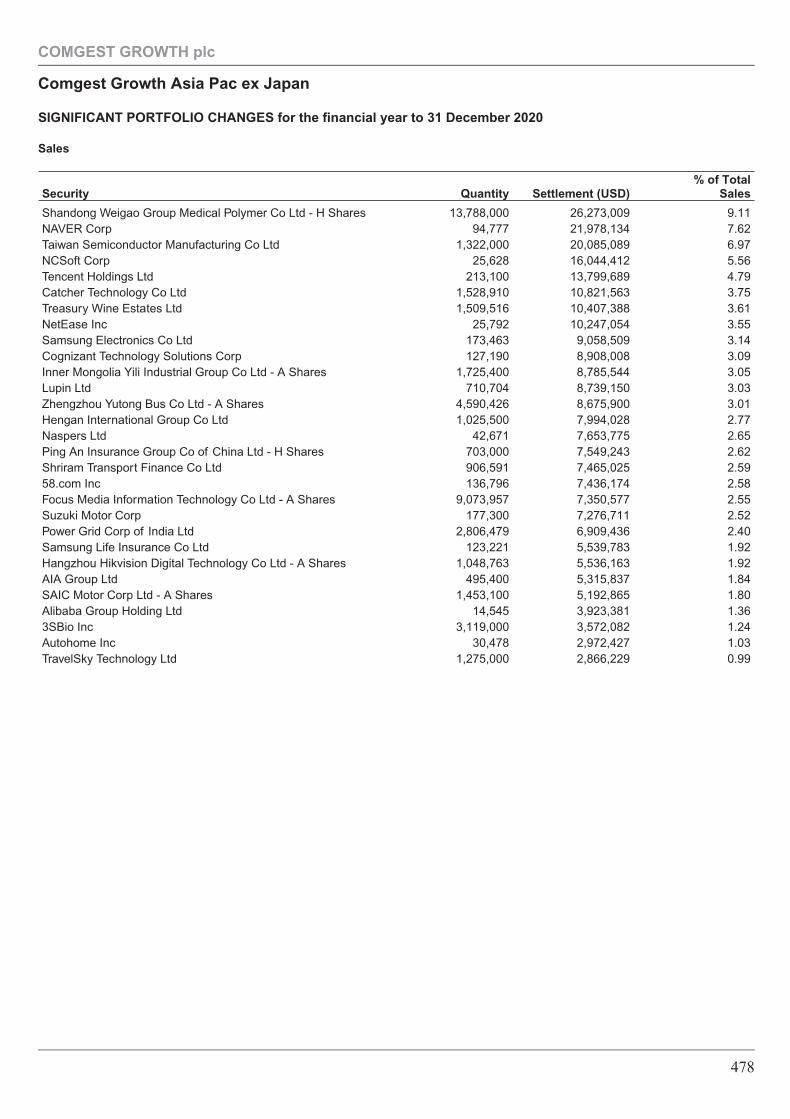
Sales
Security Quantity Settlement (USD)% of Total
Sales
Shandong Weigao Group Medical Polymer Co Ltd - H Shares 13,788,000 26,273,009 9.11NAVER Corp 94,777 21,978,134 7.62Taiwan Semiconductor Manufacturing Co Ltd 1,322,000 20,085,089 6.97NCSoft Corp 25,628 16,044,412 5.56Tencent Holdings Ltd 213,100 13,799,689 4.79Catcher Technology Co Ltd 1,528,910 10,821,563 3.75Treasury Wine Estates Ltd 1,509,516 10,407,388 3.61NetEase Inc 25,792 10,247,054 3.55Samsung Electronics Co Ltd 173,463 9,058,509 3.14Cognizant Technology Solutions Corp 127,190 8,908,008 3.09Inner Mongolia Yili Industrial Group Co Ltd - A Shares 1,725,400 8,785,544 3.05Lupin Ltd 710,704 8,739,150 3.03Zhengzhou Yutong Bus Co Ltd - A Shares 4,590,426 8,675,900 3.01Hengan International Group Co Ltd 1,025,500 7,994,028 2.77Naspers Ltd 42,671 7,653,775 2.65Ping An Insurance Group Co of China Ltd - H Shares 703,000 7,549,243 2.62Shriram Transport Finance Co Ltd 906,591 7,465,025 2.5958.com Inc 136,796 7,436,174 2.58Focus Media Information Technology Co Ltd - A Shares 9,073,957 7,350,577 2.55Suzuki Motor Corp 177,300 7,276,711 2.52Power Grid Corp of India Ltd 2,806,479 6,909,436 2.40Samsung Life Insurance Co Ltd 123,221 5,539,783 1.92Hangzhou Hikvision Digital Technology Co Ltd - A Shares 1,048,763 5,536,163 1.92AIA Group Ltd 495,400 5,315,837 1.84SAIC Motor Corp Ltd - A Shares 1,453,100 5,192,865 1.80Alibaba Group Holding Ltd 14,545 3,923,381 1.363SBio Inc 3,119,000 3,572,082 1.24Autohome Inc 30,478 2,972,427 1.03TravelSky Technology Ltd 1,275,000 2,866,229 0.99
COMGEST GROWTH plc
Comgest Growth Asia Pac ex Japan
SIGNIFICANT PORTFOLIO CHANGES for the financial year to 31 December 2020
478
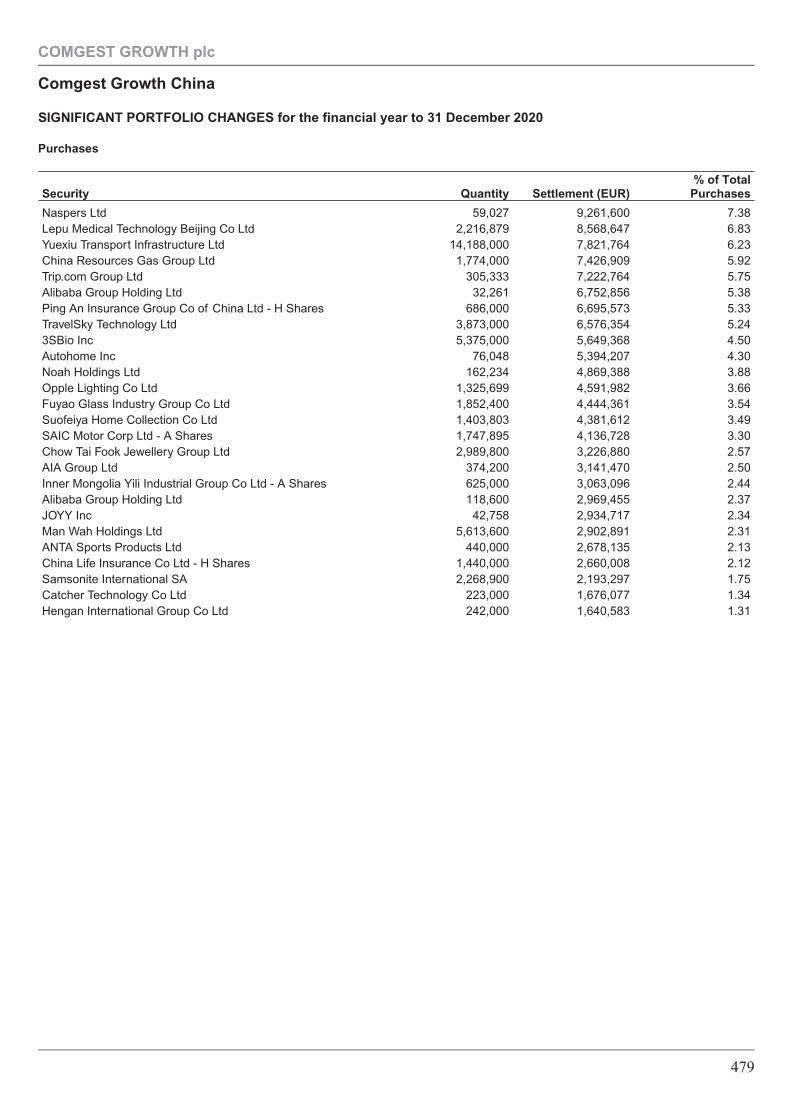
Purchases
Security Quantity Settlement (EUR)% of Total
Purchases
Naspers Ltd 59,027 9,261,600 7.38Lepu Medical Technology Beijing Co Ltd 2,216,879 8,568,647 6.83Yuexiu Transport Infrastructure Ltd 14,188,000 7,821,764 6.23China Resources Gas Group Ltd 1,774,000 7,426,909 5.92Trip.com Group Ltd 305,333 7,222,764 5.75Alibaba Group Holding Ltd 32,261 6,752,856 5.38Ping An Insurance Group Co of China Ltd - H Shares 686,000 6,695,573 5.33TravelSky Technology Ltd 3,873,000 6,576,354 5.243SBio Inc 5,375,000 5,649,368 4.50Autohome Inc 76,048 5,394,207 4.30Noah Holdings Ltd 162,234 4,869,388 3.88Opple Lighting Co Ltd 1,325,699 4,591,982 3.66Fuyao Glass Industry Group Co Ltd 1,852,400 4,444,361 3.54Suofeiya Home Collection Co Ltd 1,403,803 4,381,612 3.49SAIC Motor Corp Ltd - A Shares 1,747,895 4,136,728 3.30Chow Tai Fook Jewellery Group Ltd 2,989,800 3,226,880 2.57AIA Group Ltd 374,200 3,141,470 2.50Inner Mongolia Yili Industrial Group Co Ltd - A Shares 625,000 3,063,096 2.44Alibaba Group Holding Ltd 118,600 2,969,455 2.37JOYY Inc 42,758 2,934,717 2.34Man Wah Holdings Ltd 5,613,600 2,902,891 2.31ANTA Sports Products Ltd 440,000 2,678,135 2.13China Life Insurance Co Ltd - H Shares 1,440,000 2,660,008 2.12Samsonite International SA 2,268,900 2,193,297 1.75Catcher Technology Co Ltd 223,000 1,676,077 1.34Hengan International Group Co Ltd 242,000 1,640,583 1.31
COMGEST GROWTH plc
Comgest Growth China
SIGNIFICANT PORTFOLIO CHANGES for the financial year to 31 December 2020
479
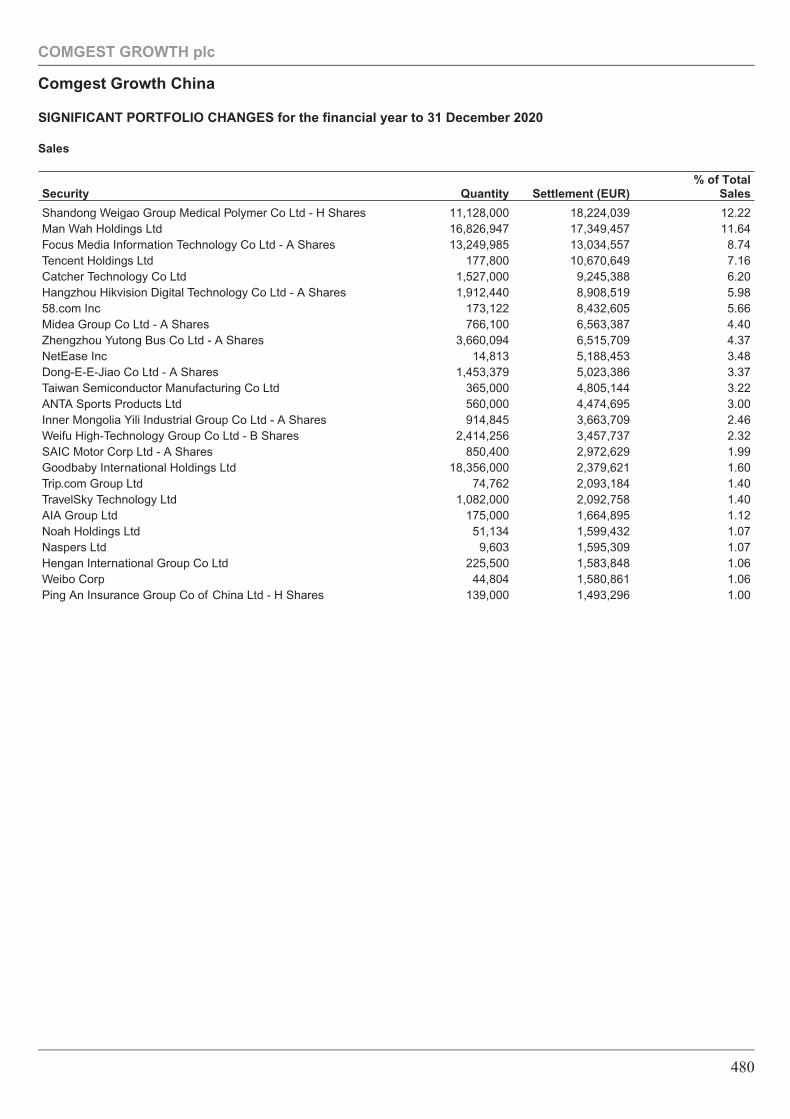
Sales
Security Quantity Settlement (EUR)% of Total
Sales
Shandong Weigao Group Medical Polymer Co Ltd - H Shares 11,128,000 18,224,039 12.22Man Wah Holdings Ltd 16,826,947 17,349,457 11.64Focus Media Information Technology Co Ltd - A Shares 13,249,985 13,034,557 8.74Tencent Holdings Ltd 177,800 10,670,649 7.16Catcher Technology Co Ltd 1,527,000 9,245,388 6.20Hangzhou Hikvision Digital Technology Co Ltd - A Shares 1,912,440 8,908,519 5.9858.com Inc 173,122 8,432,605 5.66Midea Group Co Ltd - A Shares 766,100 6,563,387 4.40Zhengzhou Yutong Bus Co Ltd - A Shares 3,660,094 6,515,709 4.37NetEase Inc 14,813 5,188,453 3.48Dong-E-E-Jiao Co Ltd - A Shares 1,453,379 5,023,386 3.37Taiwan Semiconductor Manufacturing Co Ltd 365,000 4,805,144 3.22ANTA Sports Products Ltd 560,000 4,474,695 3.00Inner Mongolia Yili Industrial Group Co Ltd - A Shares 914,845 3,663,709 2.46Weifu High-Technology Group Co Ltd - B Shares 2,414,256 3,457,737 2.32SAIC Motor Corp Ltd - A Shares 850,400 2,972,629 1.99Goodbaby International Holdings Ltd 18,356,000 2,379,621 1.60Trip.com Group Ltd 74,762 2,093,184 1.40TravelSky Technology Ltd 1,082,000 2,092,758 1.40AIA Group Ltd 175,000 1,664,895 1.12Noah Holdings Ltd 51,134 1,599,432 1.07Naspers Ltd 9,603 1,595,309 1.07Hengan International Group Co Ltd 225,500 1,583,848 1.06Weibo Corp 44,804 1,580,861 1.06Ping An Insurance Group Co of China Ltd - H Shares 139,000 1,493,296 1.00
COMGEST GROWTH plc
Comgest Growth China
SIGNIFICANT PORTFOLIO CHANGES for the financial year to 31 December 2020
480
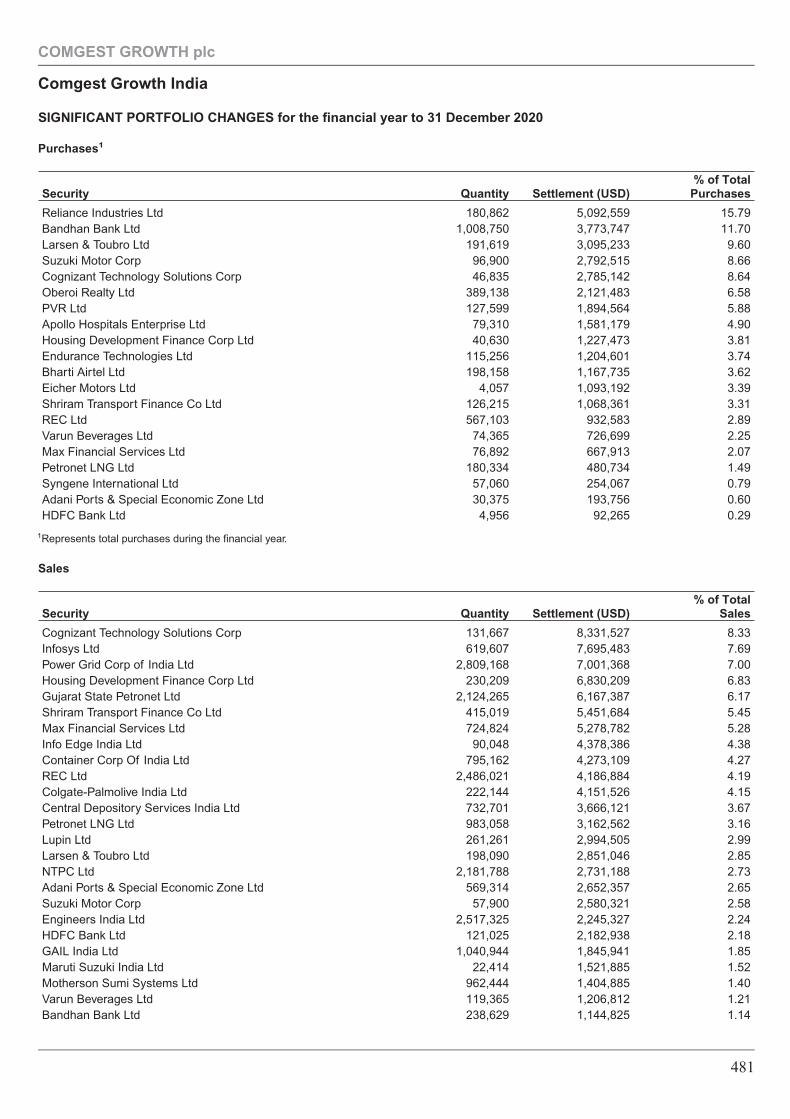
Purchases1
Security Quantity Settlement (USD)% of Total
Purchases
Reliance Industries Ltd 180,862 5,092,559 15.79Bandhan Bank Ltd 1,008,750 3,773,747 11.70Larsen & Toubro Ltd 191,619 3,095,233 9.60Suzuki Motor Corp 96,900 2,792,515 8.66Cognizant Technology Solutions Corp 46,835 2,785,142 8.64Oberoi Realty Ltd 389,138 2,121,483 6.58PVR Ltd 127,599 1,894,564 5.88Apollo Hospitals Enterprise Ltd 79,310 1,581,179 4.90Housing Development Finance Corp Ltd 40,630 1,227,473 3.81Endurance Technologies Ltd 115,256 1,204,601 3.74Bharti Airtel Ltd 198,158 1,167,735 3.62Eicher Motors Ltd 4,057 1,093,192 3.39Shriram Transport Finance Co Ltd 126,215 1,068,361 3.31REC Ltd 567,103 932,583 2.89Varun Beverages Ltd 74,365 726,699 2.25Max Financial Services Ltd 76,892 667,913 2.07Petronet LNG Ltd 180,334 480,734 1.49Syngene International Ltd 57,060 254,067 0.79Adani Ports & Special Economic Zone Ltd 30,375 193,756 0.60HDFC Bank Ltd 4,956 92,265 0.29
Sales
Security Quantity Settlement (USD)% of Total
Sales
Cognizant Technology Solutions Corp 131,667 8,331,527 8.33Infosys Ltd 619,607 7,695,483 7.69Power Grid Corp of India Ltd 2,809,168 7,001,368 7.00Housing Development Finance Corp Ltd 230,209 6,830,209 6.83Gujarat State Petronet Ltd 2,124,265 6,167,387 6.17Shriram Transport Finance Co Ltd 415,019 5,451,684 5.45Max Financial Services Ltd 724,824 5,278,782 5.28Info Edge India Ltd 90,048 4,378,386 4.38Container Corp Of India Ltd 795,162 4,273,109 4.27REC Ltd 2,486,021 4,186,884 4.19Colgate-Palmolive India Ltd 222,144 4,151,526 4.15Central Depository Services India Ltd 732,701 3,666,121 3.67Petronet LNG Ltd 983,058 3,162,562 3.16Lupin Ltd 261,261 2,994,505 2.99Larsen & Toubro Ltd 198,090 2,851,046 2.85NTPC Ltd 2,181,788 2,731,188 2.73Adani Ports & Special Economic Zone Ltd 569,314 2,652,357 2.65Suzuki Motor Corp 57,900 2,580,321 2.58Engineers India Ltd 2,517,325 2,245,327 2.24HDFC Bank Ltd 121,025 2,182,938 2.18GAIL India Ltd 1,040,944 1,845,941 1.85Maruti Suzuki India Ltd 22,414 1,521,885 1.52Motherson Sumi Systems Ltd 962,444 1,404,885 1.40Varun Beverages Ltd 119,365 1,206,812 1.21Bandhan Bank Ltd 238,629 1,144,825 1.14
COMGEST GROWTH plc
Comgest Growth India
SIGNIFICANT PORTFOLIO CHANGES for the financial year to 31 December 2020
481
1Represents total purchases during the financial year.
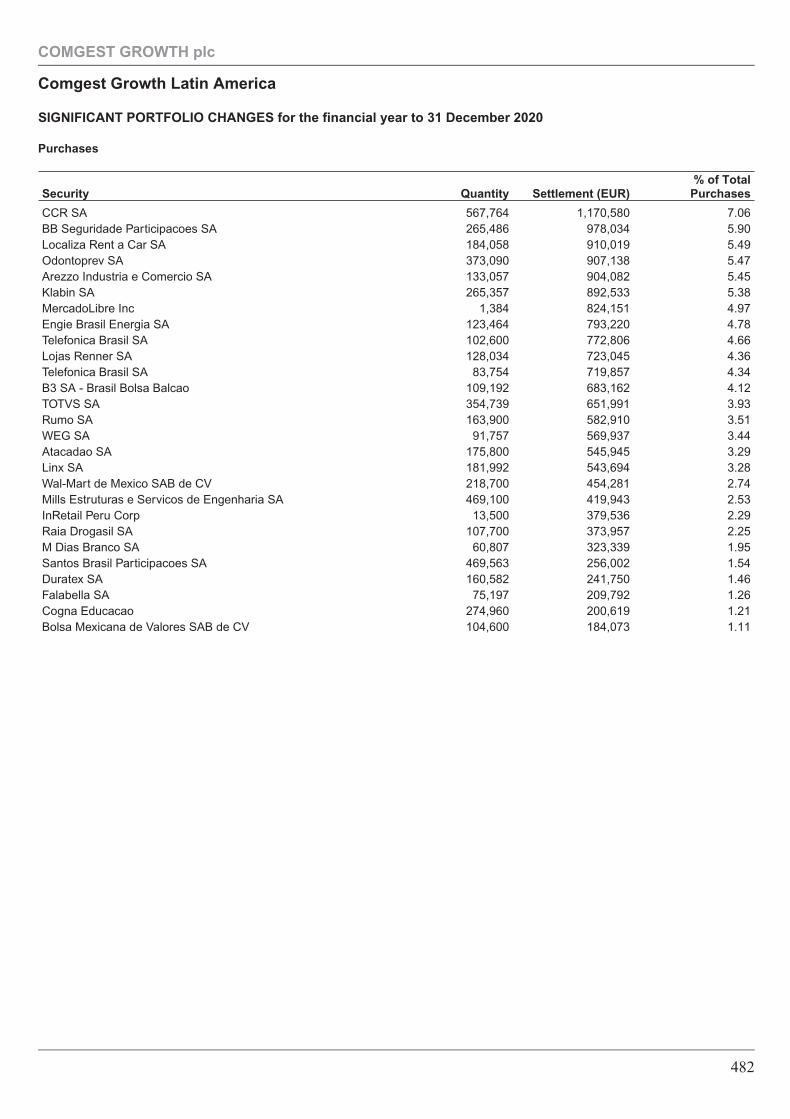
Purchases
Security Quantity Settlement (EUR)% of Total
Purchases
CCR SA 567,764 1,170,580 7.06BB Seguridade Participacoes SA 265,486 978,034 5.90Localiza Rent a Car SA 184,058 910,019 5.49Odontoprev SA 373,090 907,138 5.47Arezzo Industria e Comercio SA 133,057 904,082 5.45Klabin SA 265,357 892,533 5.38MercadoLibre Inc 1,384 824,151 4.97Engie Brasil Energia SA 123,464 793,220 4.78Telefonica Brasil SA 102,600 772,806 4.66Lojas Renner SA 128,034 723,045 4.36Telefonica Brasil SA 83,754 719,857 4.34B3 SA - Brasil Bolsa Balcao 109,192 683,162 4.12TOTVS SA 354,739 651,991 3.93Rumo SA 163,900 582,910 3.51WEG SA 91,757 569,937 3.44Atacadao SA 175,800 545,945 3.29Linx SA 181,992 543,694 3.28Wal-Mart de Mexico SAB de CV 218,700 454,281 2.74Mills Estruturas e Servicos de Engenharia SA 469,100 419,943 2.53InRetail Peru Corp 13,500 379,536 2.29Raia Drogasil SA 107,700 373,957 2.25M Dias Branco SA 60,807 323,339 1.95Santos Brasil Participacoes SA 469,563 256,002 1.54Duratex SA 160,582 241,750 1.46Falabella SA 75,197 209,792 1.26Cogna Educacao 274,960 200,619 1.21Bolsa Mexicana de Valores SAB de CV 104,600 184,073 1.11
COMGEST GROWTH plc
Comgest Growth Latin America
SIGNIFICANT PORTFOLIO CHANGES for the financial year to 31 December 2020
482
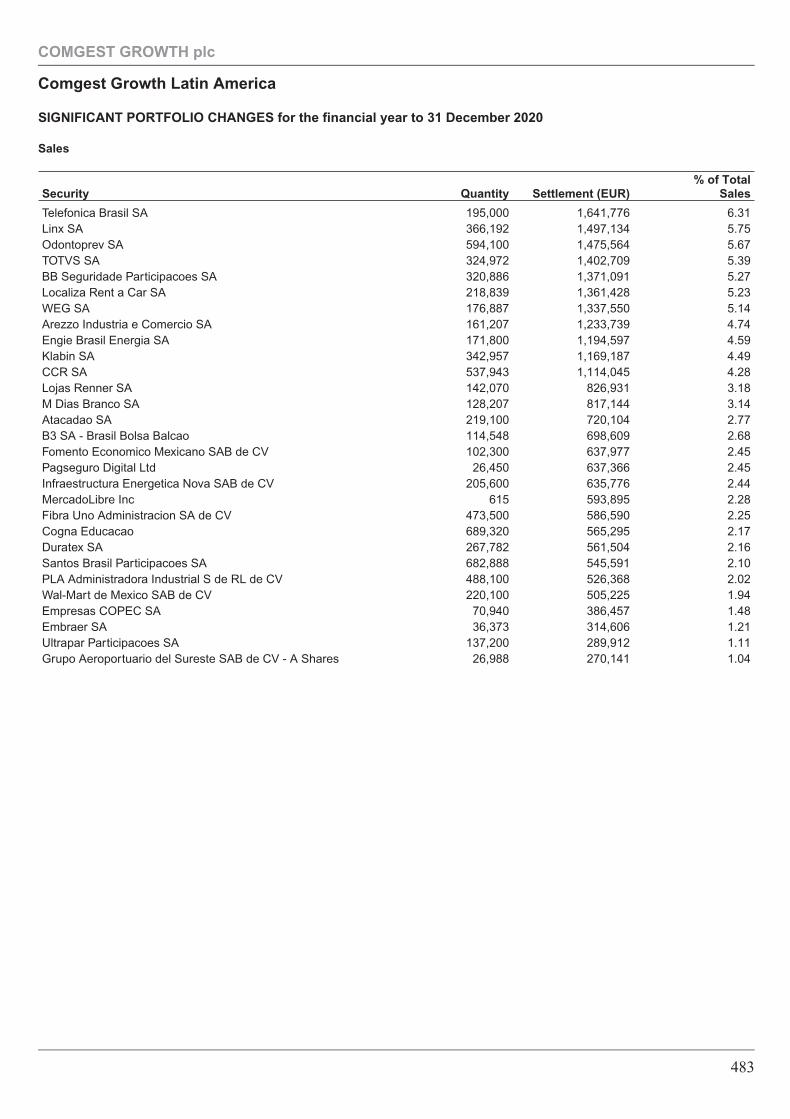
Sales
Security Quantity Settlement (EUR)% of Total
Sales
Telefonica Brasil SA 195,000 1,641,776 6.31Linx SA 366,192 1,497,134 5.75Odontoprev SA 594,100 1,475,564 5.67TOTVS SA 324,972 1,402,709 5.39BB Seguridade Participacoes SA 320,886 1,371,091 5.27Localiza Rent a Car SA 218,839 1,361,428 5.23WEG SA 176,887 1,337,550 5.14Arezzo Industria e Comercio SA 161,207 1,233,739 4.74Engie Brasil Energia SA 171,800 1,194,597 4.59Klabin SA 342,957 1,169,187 4.49CCR SA 537,943 1,114,045 4.28Lojas Renner SA 142,070 826,931 3.18M Dias Branco SA 128,207 817,144 3.14Atacadao SA 219,100 720,104 2.77B3 SA - Brasil Bolsa Balcao 114,548 698,609 2.68Fomento Economico Mexicano SAB de CV 102,300 637,977 2.45Pagseguro Digital Ltd 26,450 637,366 2.45Infraestructura Energetica Nova SAB de CV 205,600 635,776 2.44MercadoLibre Inc 615 593,895 2.28Fibra Uno Administracion SA de CV 473,500 586,590 2.25Cogna Educacao 689,320 565,295 2.17Duratex SA 267,782 561,504 2.16Santos Brasil Participacoes SA 682,888 545,591 2.10PLA Administradora Industrial S de RL de CV 488,100 526,368 2.02Wal-Mart de Mexico SAB de CV 220,100 505,225 1.94Empresas COPEC SA 70,940 386,457 1.48Embraer SA 36,373 314,606 1.21Ultrapar Participacoes SA 137,200 289,912 1.11Grupo Aeroportuario del Sureste SAB de CV - A Shares 26,988 270,141 1.04
COMGEST GROWTH plc
Comgest Growth Latin America
SIGNIFICANT PORTFOLIO CHANGES for the financial year to 31 December 2020
483
Additional Provisions for Investors in Switzerland
Terms for Distribution of the Company within and from Switzerland
For the distribution of the Company within or from Switzerland the following shall apply in addition to the terms and conditionsof the Prospectus:
Paying Agent in Switzerland
BNP Paribas Securities Services, ParisSuccursale de ZurichSelnaustrasse 168002 ZurichSwitzerland
Representative in Switzerland
BNP Paribas Securities Services, ParisSuccursale de ZurichSelnaustrasse 168002 ZurichSwitzerland
Place of Performance and Place of Jurisdiction
For shares of the Company distributed in Switzerland, the place of performance and the place of jurisdiction shall be at theseat of the Representative in Zürich.
Order of the Company’s Publications
The Prospectus, KIID, Memorandum and Articles of Association, annual report and audited financial statements and semi-annual report and financial statements as well as list of purchases and sales are available free of charge at the registeredoffice of the Swiss Representative in Switzerland.
Publications
The publications of the Company in Switzerland shall be made in one of the Swiss official languages on the Fundinfo website(www.fundinfo.com).
Publications of the Net Asset Value per Share in Switzerland
The publication of the Net Asset Value per Share in Switzerland shall take place daily each time the Net Asset Value perShare is calculated (other than bank holidays) on the Fundinfo website (www. fundinfo.com).
COMGEST GROWTH plc
Appendix I
484
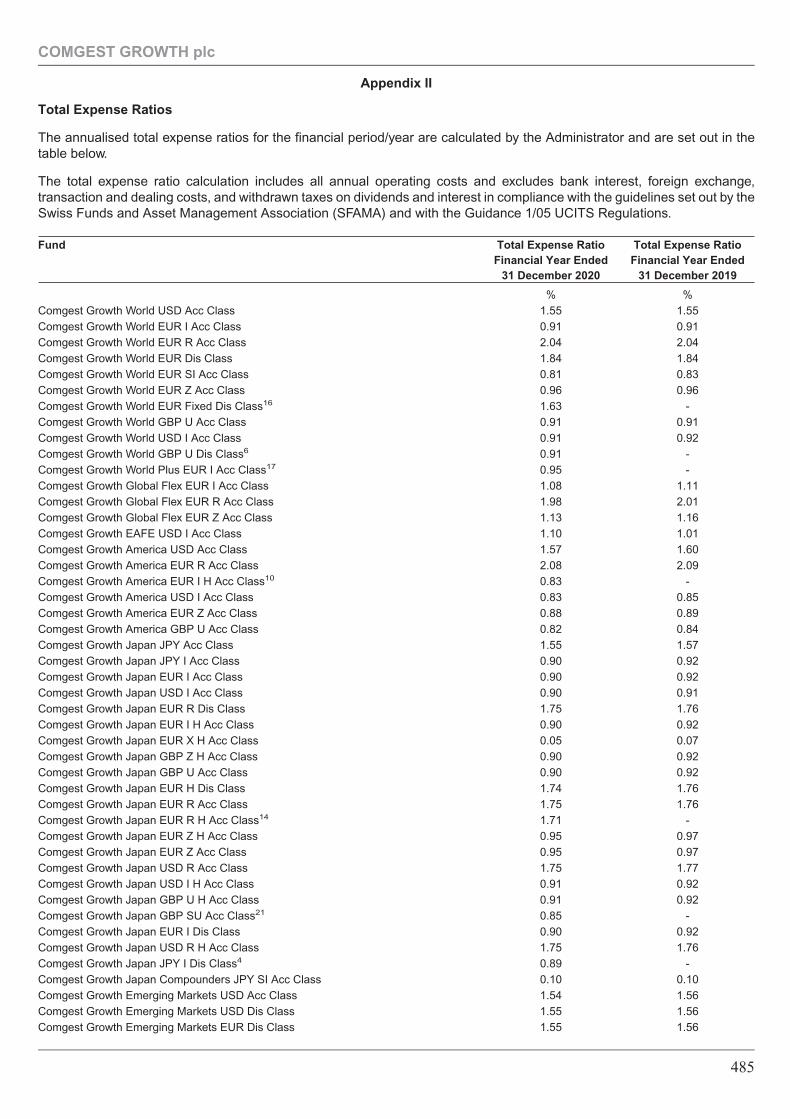
Total Expense Ratios
The annualised total expense ratios for the financial period/year are calculated by the Administrator and are set out in thetable below.
The total expense ratio calculation includes all annual operating costs and excludes bank interest, foreign exchange,transaction and dealing costs, and withdrawn taxes on dividends and interest in compliance with the guidelines set out by theSwiss Funds and Asset Management Association (SFAMA) and with the Guidance 1/05 UCITS Regulations.
Fund Total Expense RatioFinancial Year Ended
31 December 2020
Total Expense RatioFinancial Year Ended
31 December 2019
% %Comgest Growth World USD Acc Class 1.55 1.55Comgest Growth World EUR I Acc Class 0.91 0.91Comgest Growth World EUR R Acc Class 2.04 2.04Comgest Growth World EUR Dis Class 1.84 1.84Comgest Growth World EUR SI Acc Class 0.81 0.83Comgest Growth World EUR Z Acc Class 0.96 0.96Comgest Growth World EUR Fixed Dis Class16 1.63 -Comgest Growth World GBP U Acc Class 0.91 0.91Comgest Growth World USD I Acc Class 0.91 0.92Comgest Growth World GBP U Dis Class6 0.91 -Comgest Growth World Plus EUR I Acc Class17 0.95 -Comgest Growth Global Flex EUR I Acc Class 1.08 1.11Comgest Growth Global Flex EUR R Acc Class 1.98 2.01Comgest Growth Global Flex EUR Z Acc Class 1.13 1.16Comgest Growth EAFE USD I Acc Class 1.10 1.01Comgest Growth America USD Acc Class 1.57 1.60Comgest Growth America EUR R Acc Class 2.08 2.09Comgest Growth America EUR I H Acc Class10 0.83 -Comgest Growth America USD I Acc Class 0.83 0.85Comgest Growth America EUR Z Acc Class 0.88 0.89Comgest Growth America GBP U Acc Class 0.82 0.84Comgest Growth Japan JPY Acc Class 1.55 1.57Comgest Growth Japan JPY I Acc Class 0.90 0.92Comgest Growth Japan EUR I Acc Class 0.90 0.92Comgest Growth Japan USD I Acc Class 0.90 0.91Comgest Growth Japan EUR R Dis Class 1.75 1.76Comgest Growth Japan EUR I H Acc Class 0.90 0.92Comgest Growth Japan EUR X H Acc Class 0.05 0.07Comgest Growth Japan GBP Z H Acc Class 0.90 0.92Comgest Growth Japan GBP U Acc Class 0.90 0.92Comgest Growth Japan EUR H Dis Class 1.74 1.76Comgest Growth Japan EUR R Acc Class 1.75 1.76Comgest Growth Japan EUR R H Acc Class14 1.71 -Comgest Growth Japan EUR Z H Acc Class 0.95 0.97Comgest Growth Japan EUR Z Acc Class 0.95 0.97Comgest Growth Japan USD R Acc Class 1.75 1.77Comgest Growth Japan USD I H Acc Class 0.91 0.92Comgest Growth Japan GBP U H Acc Class 0.91 0.92Comgest Growth Japan GBP SU Acc Class21 0.85 -Comgest Growth Japan EUR I Dis Class 0.90 0.92Comgest Growth Japan USD R H Acc Class 1.75 1.76Comgest Growth Japan JPY I Dis Class4 0.89 -Comgest Growth Japan Compounders JPY SI Acc Class 0.10 0.10Comgest Growth Emerging Markets USD Acc Class 1.54 1.56Comgest Growth Emerging Markets USD Dis Class 1.55 1.56Comgest Growth Emerging Markets EUR Dis Class 1.55 1.56
COMGEST GROWTH plc
Appendix II
485
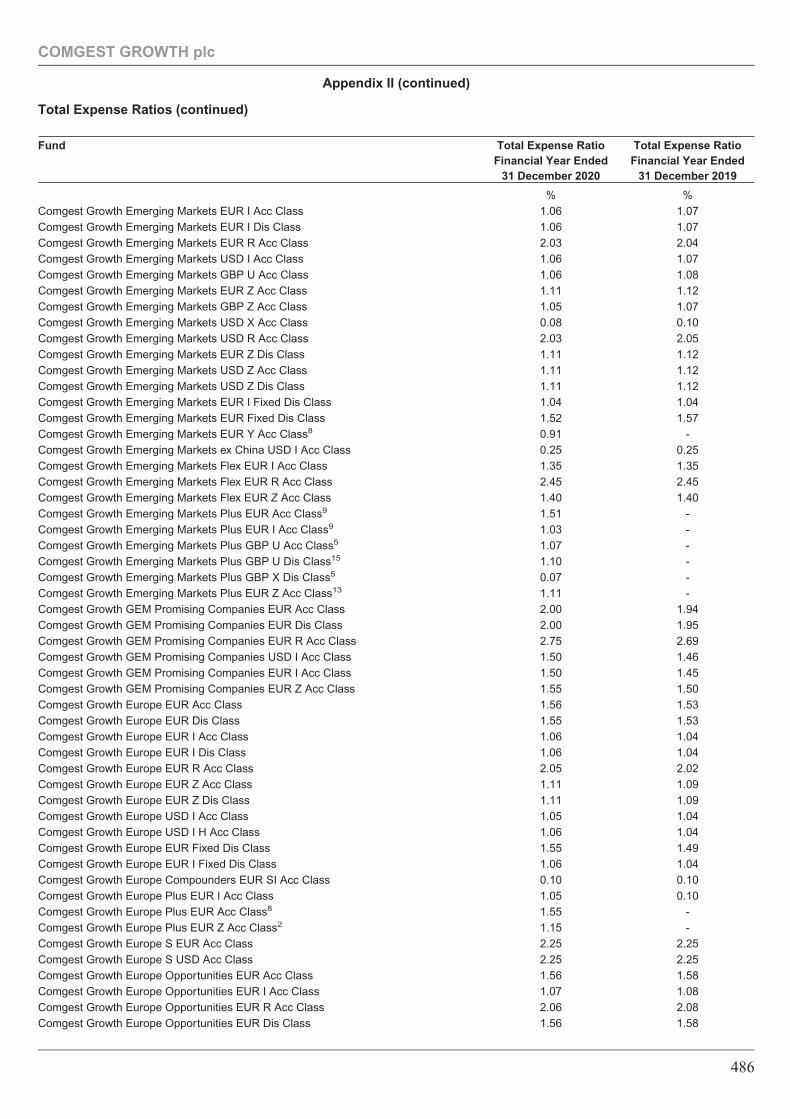
Total Expense Ratios (continued)
Fund Total Expense RatioFinancial Year Ended
31 December 2020
Total Expense RatioFinancial Year Ended
31 December 2019
% %Comgest Growth Emerging Markets EUR I Acc Class 1.06 1.07Comgest Growth Emerging Markets EUR I Dis Class 1.06 1.07Comgest Growth Emerging Markets EUR R Acc Class 2.03 2.04Comgest Growth Emerging Markets USD I Acc Class 1.06 1.07Comgest Growth Emerging Markets GBP U Acc Class 1.06 1.08Comgest Growth Emerging Markets EUR Z Acc Class 1.11 1.12Comgest Growth Emerging Markets GBP Z Acc Class 1.05 1.07Comgest Growth Emerging Markets USD X Acc Class 0.08 0.10Comgest Growth Emerging Markets USD R Acc Class 2.03 2.05Comgest Growth Emerging Markets EUR Z Dis Class 1.11 1.12Comgest Growth Emerging Markets USD Z Acc Class 1.11 1.12Comgest Growth Emerging Markets USD Z Dis Class 1.11 1.12Comgest Growth Emerging Markets EUR I Fixed Dis Class 1.04 1.04Comgest Growth Emerging Markets EUR Fixed Dis Class 1.52 1.57Comgest Growth Emerging Markets EUR Y Acc Class8 0.91 -Comgest Growth Emerging Markets ex China USD I Acc Class 0.25 0.25Comgest Growth Emerging Markets Flex EUR I Acc Class 1.35 1.35Comgest Growth Emerging Markets Flex EUR R Acc Class 2.45 2.45Comgest Growth Emerging Markets Flex EUR Z Acc Class 1.40 1.40Comgest Growth Emerging Markets Plus EUR Acc Class9 1.51 -Comgest Growth Emerging Markets Plus EUR I Acc Class9 1.03 -Comgest Growth Emerging Markets Plus GBP U Acc Class5 1.07 -Comgest Growth Emerging Markets Plus GBP U Dis Class15 1.10 -Comgest Growth Emerging Markets Plus GBP X Dis Class5 0.07 -Comgest Growth Emerging Markets Plus EUR Z Acc Class13 1.11 -Comgest Growth GEM Promising Companies EUR Acc Class 2.00 1.94Comgest Growth GEM Promising Companies EUR Dis Class 2.00 1.95Comgest Growth GEM Promising Companies EUR R Acc Class 2.75 2.69Comgest Growth GEM Promising Companies USD I Acc Class 1.50 1.46Comgest Growth GEM Promising Companies EUR I Acc Class 1.50 1.45Comgest Growth GEM Promising Companies EUR Z Acc Class 1.55 1.50Comgest Growth Europe EUR Acc Class 1.56 1.53Comgest Growth Europe EUR Dis Class 1.55 1.53Comgest Growth Europe EUR I Acc Class 1.06 1.04Comgest Growth Europe EUR I Dis Class 1.06 1.04Comgest Growth Europe EUR R Acc Class 2.05 2.02Comgest Growth Europe EUR Z Acc Class 1.11 1.09Comgest Growth Europe EUR Z Dis Class 1.11 1.09Comgest Growth Europe USD I Acc Class 1.05 1.04Comgest Growth Europe USD I H Acc Class 1.06 1.04Comgest Growth Europe EUR Fixed Dis Class 1.55 1.49Comgest Growth Europe EUR I Fixed Dis Class 1.06 1.04Comgest Growth Europe Compounders EUR SI Acc Class 0.10 0.10Comgest Growth Europe Plus EUR I Acc Class 1.05 0.10Comgest Growth Europe Plus EUR Acc Class8 1.55 -Comgest Growth Europe Plus EUR Z Acc Class2 1.15 -Comgest Growth Europe S EUR Acc Class 2.25 2.25Comgest Growth Europe S USD Acc Class 2.25 2.25Comgest Growth Europe Opportunities EUR Acc Class 1.56 1.58Comgest Growth Europe Opportunities EUR I Acc Class 1.07 1.08Comgest Growth Europe Opportunities EUR R Acc Class 2.06 2.08Comgest Growth Europe Opportunities EUR Dis Class 1.56 1.58
COMGEST GROWTH plc
Appendix II (continued)
486
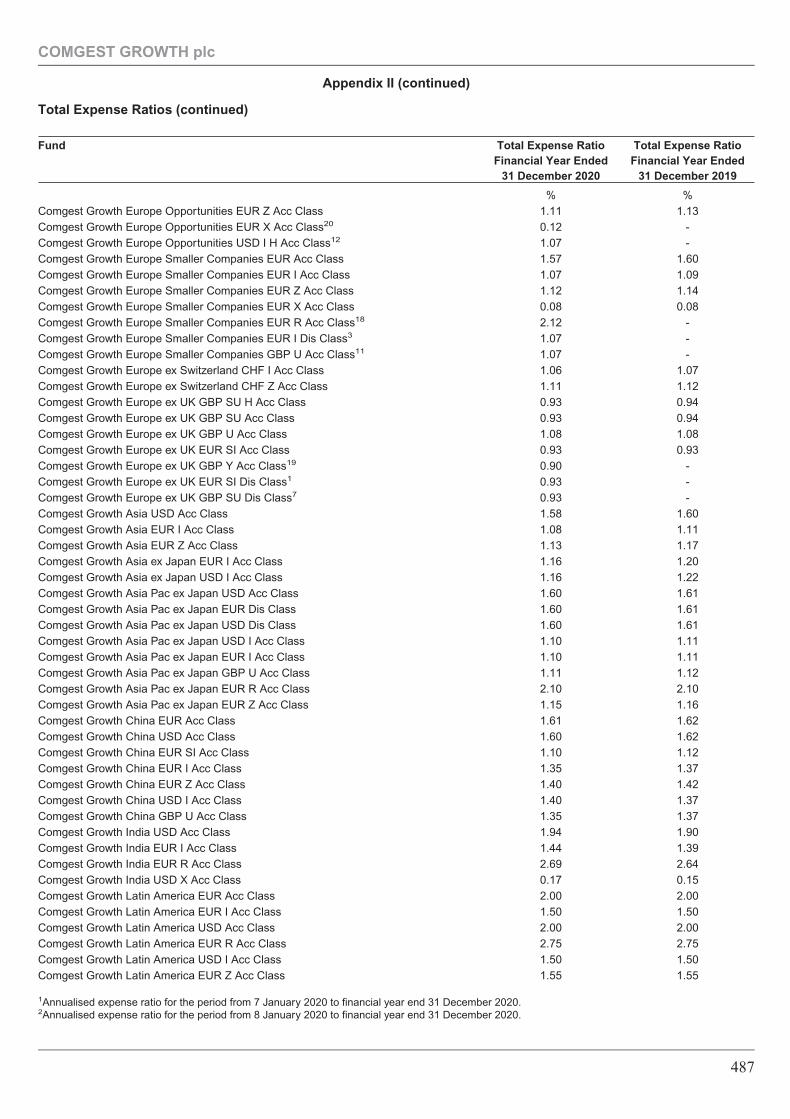
Total Expense Ratios (continued)
Fund Total Expense RatioFinancial Year Ended
31 December 2020
Total Expense RatioFinancial Year Ended
31 December 2019
% %Comgest Growth Europe Opportunities EUR Z Acc Class 1.11 1.13Comgest Growth Europe Opportunities EUR X Acc Class20 0.12 -Comgest Growth Europe Opportunities USD I H Acc Class12 1.07 -Comgest Growth Europe Smaller Companies EUR Acc Class 1.57 1.60Comgest Growth Europe Smaller Companies EUR I Acc Class 1.07 1.09Comgest Growth Europe Smaller Companies EUR Z Acc Class 1.12 1.14Comgest Growth Europe Smaller Companies EUR X Acc Class 0.08 0.08Comgest Growth Europe Smaller Companies EUR R Acc Class18 2.12 -Comgest Growth Europe Smaller Companies EUR I Dis Class3 1.07 -Comgest Growth Europe Smaller Companies GBP U Acc Class11 1.07 -Comgest Growth Europe ex Switzerland CHF I Acc Class 1.06 1.07Comgest Growth Europe ex Switzerland CHF Z Acc Class 1.11 1.12Comgest Growth Europe ex UK GBP SU H Acc Class 0.93 0.94Comgest Growth Europe ex UK GBP SU Acc Class 0.93 0.94Comgest Growth Europe ex UK GBP U Acc Class 1.08 1.08Comgest Growth Europe ex UK EUR SI Acc Class 0.93 0.93Comgest Growth Europe ex UK GBP Y Acc Class19 0.90 -Comgest Growth Europe ex UK EUR SI Dis Class1 0.93 -Comgest Growth Europe ex UK GBP SU Dis Class7 0.93 -Comgest Growth Asia USD Acc Class 1.58 1.60Comgest Growth Asia EUR I Acc Class 1.08 1.11Comgest Growth Asia EUR Z Acc Class 1.13 1.17Comgest Growth Asia ex Japan EUR I Acc Class 1.16 1.20Comgest Growth Asia ex Japan USD I Acc Class 1.16 1.22Comgest Growth Asia Pac ex Japan USD Acc Class 1.60 1.61Comgest Growth Asia Pac ex Japan EUR Dis Class 1.60 1.61Comgest Growth Asia Pac ex Japan USD Dis Class 1.60 1.61Comgest Growth Asia Pac ex Japan USD I Acc Class 1.10 1.11Comgest Growth Asia Pac ex Japan EUR I Acc Class 1.10 1.11Comgest Growth Asia Pac ex Japan GBP U Acc Class 1.11 1.12Comgest Growth Asia Pac ex Japan EUR R Acc Class 2.10 2.10Comgest Growth Asia Pac ex Japan EUR Z Acc Class 1.15 1.16Comgest Growth China EUR Acc Class 1.61 1.62Comgest Growth China USD Acc Class 1.60 1.62Comgest Growth China EUR SI Acc Class 1.10 1.12Comgest Growth China EUR I Acc Class 1.35 1.37Comgest Growth China EUR Z Acc Class 1.40 1.42Comgest Growth China USD I Acc Class 1.40 1.37Comgest Growth China GBP U Acc Class 1.35 1.37Comgest Growth India USD Acc Class 1.94 1.90Comgest Growth India EUR I Acc Class 1.44 1.39Comgest Growth India EUR R Acc Class 2.69 2.64Comgest Growth India USD X Acc Class 0.17 0.15Comgest Growth Latin America EUR Acc Class 2.00 2.00Comgest Growth Latin America EUR I Acc Class 1.50 1.50Comgest Growth Latin America USD Acc Class 2.00 2.00Comgest Growth Latin America EUR R Acc Class 2.75 2.75Comgest Growth Latin America USD I Acc Class 1.50 1.50Comgest Growth Latin America EUR Z Acc Class 1.55 1.55
1Annualised expense ratio for the period from 7 January 2020 to financial year end 31 December 2020.2Annualised expense ratio for the period from 8 January 2020 to financial year end 31 December 2020.
COMGEST GROWTH plc
Appendix II (continued)
487
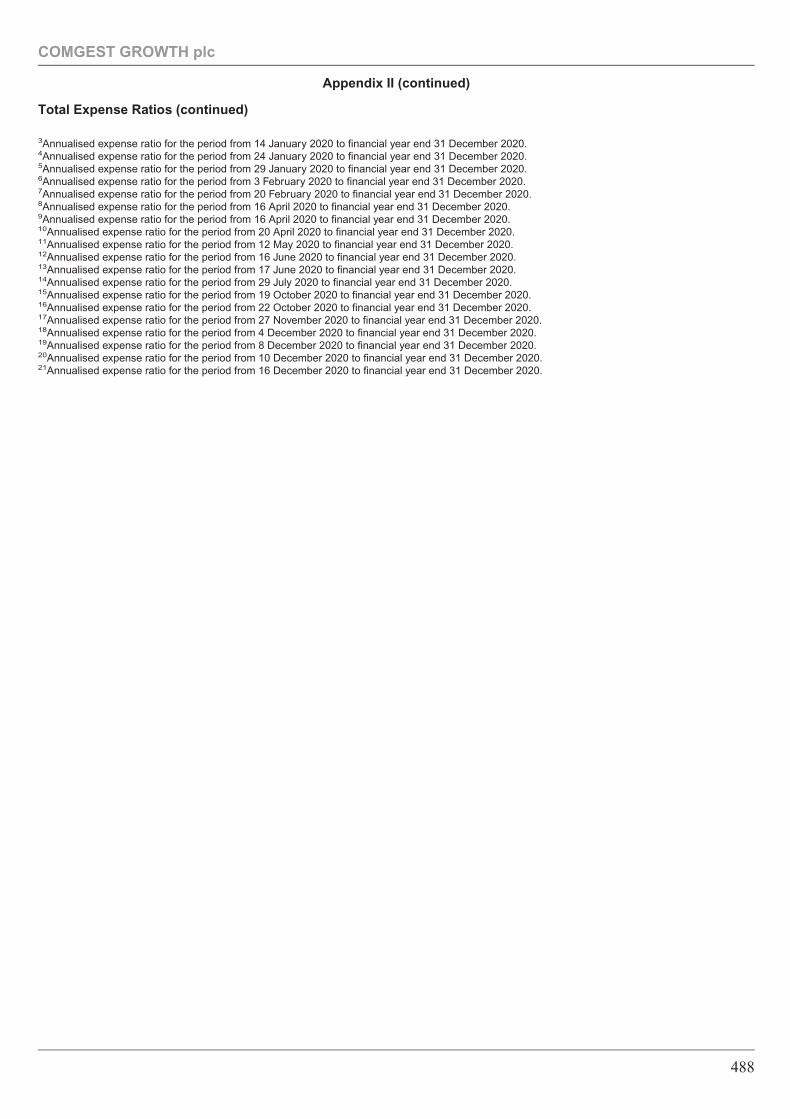
Total Expense Ratios (continued)
3Annualised expense ratio for the period from 14 January 2020 to financial year end 31 December 2020.4Annualised expense ratio for the period from 24 January 2020 to financial year end 31 December 2020.5Annualised expense ratio for the period from 29 January 2020 to financial year end 31 December 2020.6Annualised expense ratio for the period from 3 February 2020 to financial year end 31 December 2020.7Annualised expense ratio for the period from 20 February 2020 to financial year end 31 December 2020.8Annualised expense ratio for the period from 16 April 2020 to financial year end 31 December 2020.9Annualised expense ratio for the period from 16 April 2020 to financial year end 31 December 2020.10Annualised expense ratio for the period from 20 April 2020 to financial year end 31 December 2020.11Annualised expense ratio for the period from 12 May 2020 to financial year end 31 December 2020.12Annualised expense ratio for the period from 16 June 2020 to financial year end 31 December 2020.13Annualised expense ratio for the period from 17 June 2020 to financial year end 31 December 2020.14Annualised expense ratio for the period from 29 July 2020 to financial year end 31 December 2020.15Annualised expense ratio for the period from 19 October 2020 to financial year end 31 December 2020.16Annualised expense ratio for the period from 22 October 2020 to financial year end 31 December 2020.17Annualised expense ratio for the period from 27 November 2020 to financial year end 31 December 2020.18Annualised expense ratio for the period from 4 December 2020 to financial year end 31 December 2020.19Annualised expense ratio for the period from 8 December 2020 to financial year end 31 December 2020.20Annualised expense ratio for the period from 10 December 2020 to financial year end 31 December 2020.21Annualised expense ratio for the period from 16 December 2020 to financial year end 31 December 2020.
COMGEST GROWTH plc
Appendix II (continued)
488
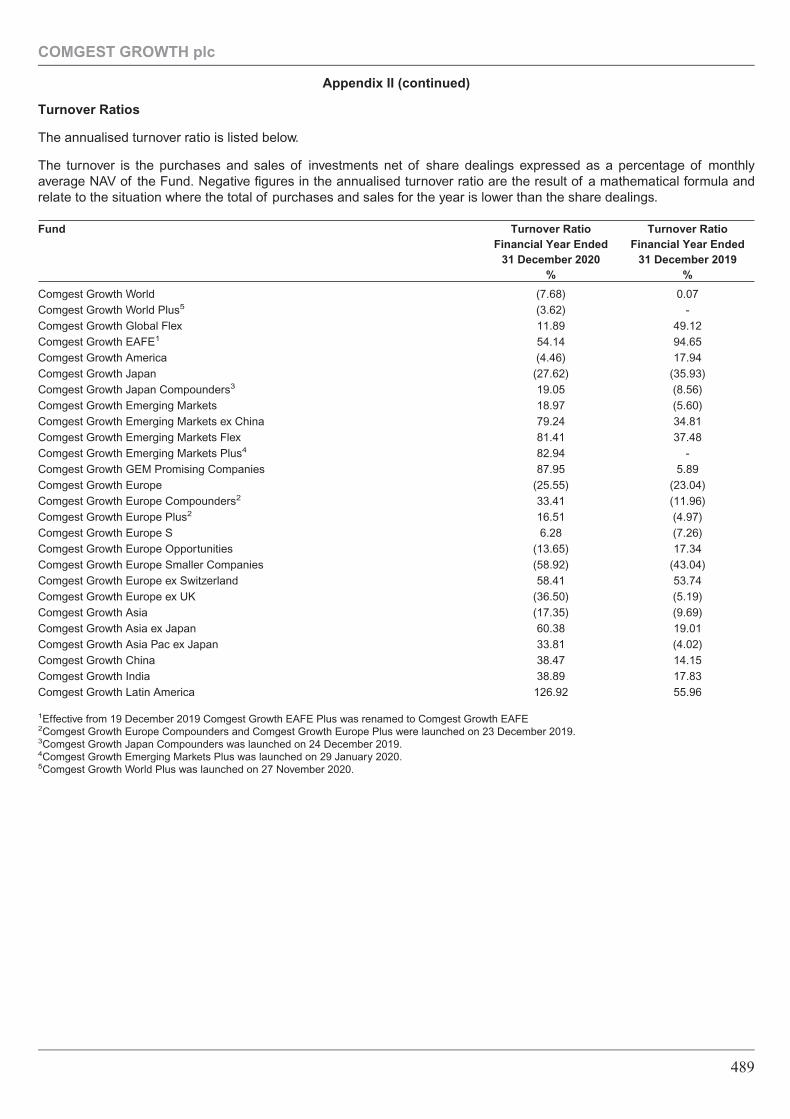
Turnover Ratios
The annualised turnover ratio is listed below.
The turnover is the purchases and sales of investments net of share dealings expressed as a percentage of monthlyaverage NAV of the Fund. Negative figures in the annualised turnover ratio are the result of a mathematical formula andrelate to the situation where the total of purchases and sales for the year is lower than the share dealings.
Fund Turnover RatioFinancial Year Ended
31 December 2020%
Turnover RatioFinancial Year Ended
31 December 2019%
Comgest Growth World (7.68) 0.07Comgest Growth World Plus5 (3.62) -Comgest Growth Global Flex 11.89 49.12Comgest Growth EAFE1 54.14 94.65Comgest Growth America (4.46) 17.94Comgest Growth Japan (27.62) (35.93)Comgest Growth Japan Compounders3 19.05 (8.56)Comgest Growth Emerging Markets 18.97 (5.60)Comgest Growth Emerging Markets ex China 79.24 34.81Comgest Growth Emerging Markets Flex 81.41 37.48Comgest Growth Emerging Markets Plus4 82.94 -Comgest Growth GEM Promising Companies 87.95 5.89Comgest Growth Europe (25.55) (23.04)Comgest Growth Europe Compounders2 33.41 (11.96)Comgest Growth Europe Plus2 16.51 (4.97)Comgest Growth Europe S 6.28 (7.26)Comgest Growth Europe Opportunities (13.65) 17.34Comgest Growth Europe Smaller Companies (58.92) (43.04)Comgest Growth Europe ex Switzerland 58.41 53.74Comgest Growth Europe ex UK (36.50) (5.19)Comgest Growth Asia (17.35) (9.69)Comgest Growth Asia ex Japan 60.38 19.01Comgest Growth Asia Pac ex Japan 33.81 (4.02)Comgest Growth China 38.47 14.15Comgest Growth India 38.89 17.83Comgest Growth Latin America 126.92 55.96
1Effective from 19 December 2019 Comgest Growth EAFE Plus was renamed to Comgest Growth EAFE2Comgest Growth Europe Compounders and Comgest Growth Europe Plus were launched on 23 December 2019.3Comgest Growth Japan Compounders was launched on 24 December 2019.4Comgest Growth Emerging Markets Plus was launched on 29 January 2020.5Comgest Growth World Plus was launched on 27 November 2020.
COMGEST GROWTH plc
Appendix II (continued)
489
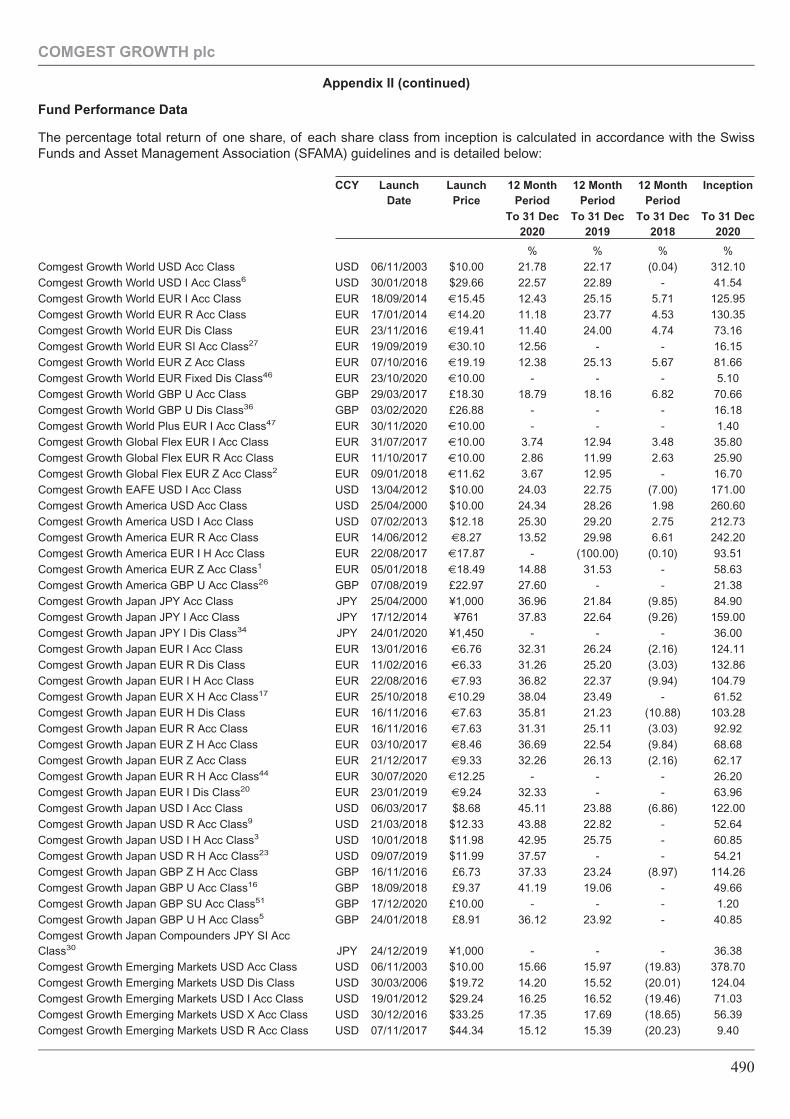
Fund Performance Data
The percentage total return of one share, of each share class from inception is calculated in accordance with the SwissFunds and Asset Management Association (SFAMA) guidelines and is detailed below:
CCY LaunchDate
LaunchPrice
12 MonthPeriod
12 MonthPeriod
12 MonthPeriod
Inception
To 31 Dec2020
To 31 Dec2019
To 31 Dec2018
To 31 Dec2020
% % % %Comgest Growth World USD Acc Class USD 06/11/2003 $10.00 21.78 22.17 (0.04) 312.10Comgest Growth World USD I Acc Class6 USD 30/01/2018 $29.66 22.57 22.89 - 41.54Comgest Growth World EUR I Acc Class EUR 18/09/2014 €15.45 12.43 25.15 5.71 125.95Comgest Growth World EUR R Acc Class EUR 17/01/2014 €14.20 11.18 23.77 4.53 130.35Comgest Growth World EUR Dis Class EUR 23/11/2016 €19.41 11.40 24.00 4.74 73.16Comgest Growth World EUR SI Acc Class27 EUR 19/09/2019 €30.10 12.56 - - 16.15Comgest Growth World EUR Z Acc Class EUR 07/10/2016 €19.19 12.38 25.13 5.67 81.66Comgest Growth World EUR Fixed Dis Class46 EUR 23/10/2020 €10.00 - - - 5.10Comgest Growth World GBP U Acc Class GBP 29/03/2017 £18.30 18.79 18.16 6.82 70.66Comgest Growth World GBP U Dis Class36 GBP 03/02/2020 £26.88 - - - 16.18Comgest Growth World Plus EUR I Acc Class47 EUR 30/11/2020 €10.00 - - - 1.40Comgest Growth Global Flex EUR I Acc Class EUR 31/07/2017 €10.00 3.74 12.94 3.48 35.80Comgest Growth Global Flex EUR R Acc Class EUR 11/10/2017 €10.00 2.86 11.99 2.63 25.90Comgest Growth Global Flex EUR Z Acc Class2 EUR 09/01/2018 €11.62 3.67 12.95 - 16.70Comgest Growth EAFE USD I Acc Class USD 13/04/2012 $10.00 24.03 22.75 (7.00) 171.00Comgest Growth America USD Acc Class USD 25/04/2000 $10.00 24.34 28.26 1.98 260.60Comgest Growth America USD I Acc Class USD 07/02/2013 $12.18 25.30 29.20 2.75 212.73Comgest Growth America EUR R Acc Class EUR 14/06/2012 €8.27 13.52 29.98 6.61 242.20Comgest Growth America EUR I H Acc Class EUR 22/08/2017 €17.87 - (100.00) (0.10) 93.51Comgest Growth America EUR Z Acc Class1 EUR 05/01/2018 €18.49 14.88 31.53 - 58.63Comgest Growth America GBP U Acc Class26 GBP 07/08/2019 £22.97 27.60 - - 21.38Comgest Growth Japan JPY Acc Class JPY 25/04/2000 ¥1,000 36.96 21.84 (9.85) 84.90Comgest Growth Japan JPY I Acc Class JPY 17/12/2014 ¥761 37.83 22.64 (9.26) 159.00Comgest Growth Japan JPY I Dis Class34 JPY 24/01/2020 ¥1,450 - - - 36.00Comgest Growth Japan EUR I Acc Class EUR 13/01/2016 €6.76 32.31 26.24 (2.16) 124.11Comgest Growth Japan EUR R Dis Class EUR 11/02/2016 €6.33 31.26 25.20 (3.03) 132.86Comgest Growth Japan EUR I H Acc Class EUR 22/08/2016 €7.93 36.82 22.37 (9.94) 104.79Comgest Growth Japan EUR X H Acc Class17 EUR 25/10/2018 €10.29 38.04 23.49 - 61.52Comgest Growth Japan EUR H Dis Class EUR 16/11/2016 €7.63 35.81 21.23 (10.88) 103.28Comgest Growth Japan EUR R Acc Class EUR 16/11/2016 €7.63 31.31 25.11 (3.03) 92.92Comgest Growth Japan EUR Z H Acc Class EUR 03/10/2017 €8.46 36.69 22.54 (9.84) 68.68Comgest Growth Japan EUR Z Acc Class EUR 21/12/2017 €9.33 32.26 26.13 (2.16) 62.17Comgest Growth Japan EUR R H Acc Class44 EUR 30/07/2020 €12.25 - - - 26.20Comgest Growth Japan EUR I Dis Class20 EUR 23/01/2019 €9.24 32.33 - - 63.96Comgest Growth Japan USD I Acc Class USD 06/03/2017 $8.68 45.11 23.88 (6.86) 122.00Comgest Growth Japan USD R Acc Class9 USD 21/03/2018 $12.33 43.88 22.82 - 52.64Comgest Growth Japan USD I H Acc Class3 USD 10/01/2018 $11.98 42.95 25.75 - 60.85Comgest Growth Japan USD R H Acc Class23 USD 09/07/2019 $11.99 37.57 - - 54.21Comgest Growth Japan GBP Z H Acc Class GBP 16/11/2016 £6.73 37.33 23.24 (8.97) 114.26Comgest Growth Japan GBP U Acc Class16 GBP 18/09/2018 £9.37 41.19 19.06 - 49.66Comgest Growth Japan GBP SU Acc Class51 GBP 17/12/2020 £10.00 - - - 1.20Comgest Growth Japan GBP U H Acc Class5 GBP 24/01/2018 £8.91 36.12 23.92 - 40.85Comgest Growth Japan Compounders JPY SI AccClass30 JPY 24/12/2019 ¥1,000 - - - 36.38Comgest Growth Emerging Markets USD Acc Class USD 06/11/2003 $10.00 15.66 15.97 (19.83) 378.70Comgest Growth Emerging Markets USD Dis Class USD 30/03/2006 $19.72 14.20 15.52 (20.01) 124.04Comgest Growth Emerging Markets USD I Acc Class USD 19/01/2012 $29.24 16.25 16.52 (19.46) 71.03Comgest Growth Emerging Markets USD X Acc Class USD 30/12/2016 $33.25 17.35 17.69 (18.65) 56.39Comgest Growth Emerging Markets USD R Acc Class USD 07/11/2017 $44.34 15.12 15.39 (20.23) 9.40
COMGEST GROWTH plc
Appendix II (continued)
490
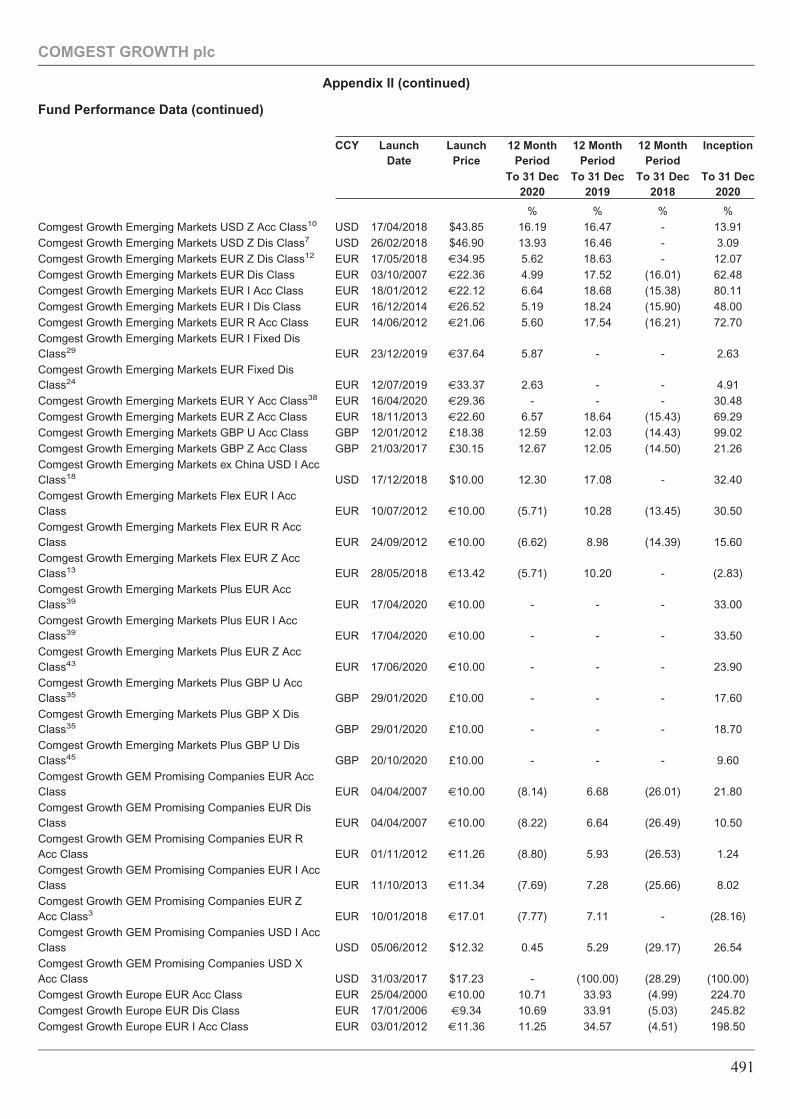
Fund Performance Data (continued)
CCY LaunchDate
LaunchPrice
12 MonthPeriod
12 MonthPeriod
12 MonthPeriod
Inception
To 31 Dec2020
To 31 Dec2019
To 31 Dec2018
To 31 Dec2020
% % % %Comgest Growth Emerging Markets USD Z Acc Class10 USD 17/04/2018 $43.85 16.19 16.47 - 13.91Comgest Growth Emerging Markets USD Z Dis Class7 USD 26/02/2018 $46.90 13.93 16.46 - 3.09Comgest Growth Emerging Markets EUR Z Dis Class12 EUR 17/05/2018 €34.95 5.62 18.63 - 12.07Comgest Growth Emerging Markets EUR Dis Class EUR 03/10/2007 €22.36 4.99 17.52 (16.01) 62.48Comgest Growth Emerging Markets EUR I Acc Class EUR 18/01/2012 €22.12 6.64 18.68 (15.38) 80.11Comgest Growth Emerging Markets EUR I Dis Class EUR 16/12/2014 €26.52 5.19 18.24 (15.90) 48.00Comgest Growth Emerging Markets EUR R Acc Class EUR 14/06/2012 €21.06 5.60 17.54 (16.21) 72.70Comgest Growth Emerging Markets EUR I Fixed DisClass29 EUR 23/12/2019 €37.64 5.87 - - 2.63Comgest Growth Emerging Markets EUR Fixed DisClass24 EUR 12/07/2019 €33.37 2.63 - - 4.91Comgest Growth Emerging Markets EUR Y Acc Class38 EUR 16/04/2020 €29.36 - - - 30.48Comgest Growth Emerging Markets EUR Z Acc Class EUR 18/11/2013 €22.60 6.57 18.64 (15.43) 69.29Comgest Growth Emerging Markets GBP U Acc Class GBP 12/01/2012 £18.38 12.59 12.03 (14.43) 99.02Comgest Growth Emerging Markets GBP Z Acc Class GBP 21/03/2017 £30.15 12.67 12.05 (14.50) 21.26Comgest Growth Emerging Markets ex China USD I AccClass18 USD 17/12/2018 $10.00 12.30 17.08 - 32.40Comgest Growth Emerging Markets Flex EUR I AccClass EUR 10/07/2012 €10.00 (5.71) 10.28 (13.45) 30.50Comgest Growth Emerging Markets Flex EUR R AccClass EUR 24/09/2012 €10.00 (6.62) 8.98 (14.39) 15.60Comgest Growth Emerging Markets Flex EUR Z AccClass13 EUR 28/05/2018 €13.42 (5.71) 10.20 - (2.83)Comgest Growth Emerging Markets Plus EUR AccClass39 EUR 17/04/2020 €10.00 - - - 33.00Comgest Growth Emerging Markets Plus EUR I AccClass39 EUR 17/04/2020 €10.00 - - - 33.50Comgest Growth Emerging Markets Plus EUR Z AccClass43 EUR 17/06/2020 €10.00 - - - 23.90Comgest Growth Emerging Markets Plus GBP U AccClass35 GBP 29/01/2020 £10.00 - - - 17.60Comgest Growth Emerging Markets Plus GBP X DisClass35 GBP 29/01/2020 £10.00 - - - 18.70Comgest Growth Emerging Markets Plus GBP U DisClass45 GBP 20/10/2020 £10.00 - - - 9.60Comgest Growth GEM Promising Companies EUR AccClass EUR 04/04/2007 €10.00 (8.14) 6.68 (26.01) 21.80Comgest Growth GEM Promising Companies EUR DisClass EUR 04/04/2007 €10.00 (8.22) 6.64 (26.49) 10.50Comgest Growth GEM Promising Companies EUR RAcc Class EUR 01/11/2012 €11.26 (8.80) 5.93 (26.53) 1.24Comgest Growth GEM Promising Companies EUR I AccClass EUR 11/10/2013 €11.34 (7.69) 7.28 (25.66) 8.02Comgest Growth GEM Promising Companies EUR ZAcc Class3 EUR 10/01/2018 €17.01 (7.77) 7.11 - (28.16)Comgest Growth GEM Promising Companies USD I AccClass USD 05/06/2012 $12.32 0.45 5.29 (29.17) 26.54Comgest Growth GEM Promising Companies USD XAcc Class USD 31/03/2017 $17.23 - (100.00) (28.29) (100.00)Comgest Growth Europe EUR Acc Class EUR 25/04/2000 €10.00 10.71 33.93 (4.99) 224.70Comgest Growth Europe EUR Dis Class EUR 17/01/2006 €9.34 10.69 33.91 (5.03) 245.82Comgest Growth Europe EUR I Acc Class EUR 03/01/2012 €11.36 11.25 34.57 (4.51) 198.50
COMGEST GROWTH plc
Appendix II (continued)
491
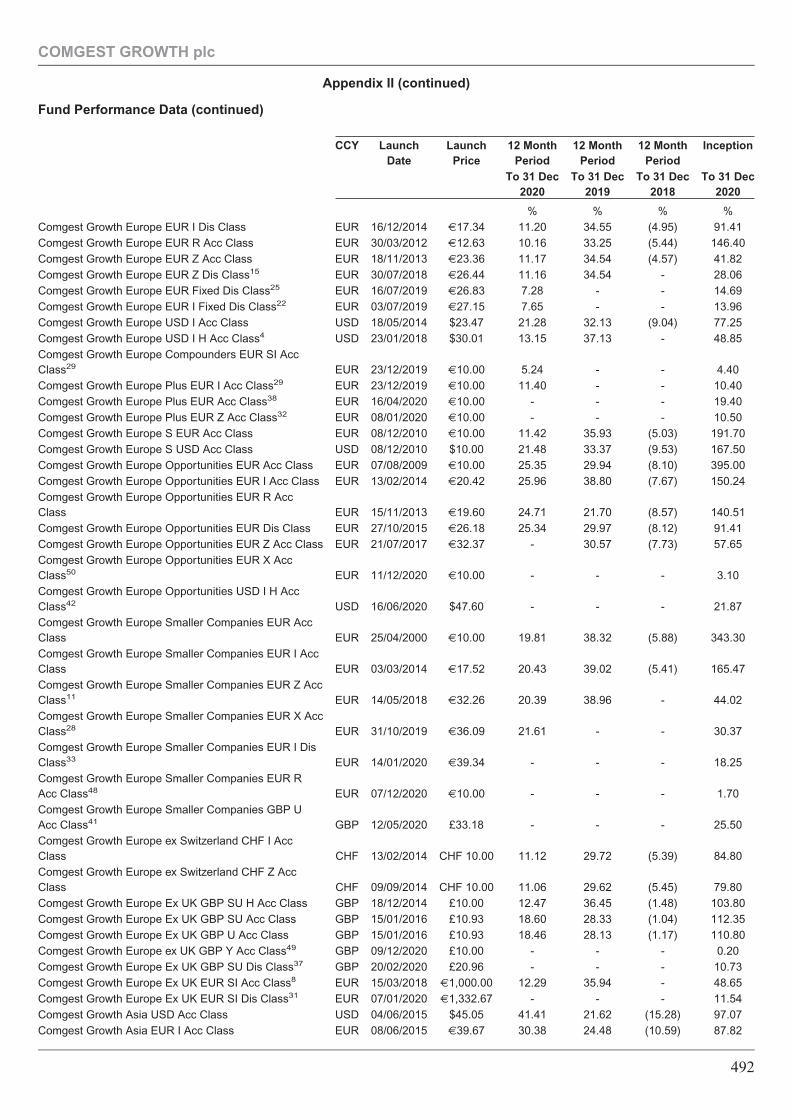
Fund Performance Data (continued)
CCY LaunchDate
LaunchPrice
12 MonthPeriod
12 MonthPeriod
12 MonthPeriod
Inception
To 31 Dec2020
To 31 Dec2019
To 31 Dec2018
To 31 Dec2020
% % % %Comgest Growth Europe EUR I Dis Class EUR 16/12/2014 €17.34 11.20 34.55 (4.95) 91.41Comgest Growth Europe EUR R Acc Class EUR 30/03/2012 €12.63 10.16 33.25 (5.44) 146.40Comgest Growth Europe EUR Z Acc Class EUR 18/11/2013 €23.36 11.17 34.54 (4.57) 41.82Comgest Growth Europe EUR Z Dis Class15 EUR 30/07/2018 €26.44 11.16 34.54 - 28.06Comgest Growth Europe EUR Fixed Dis Class25 EUR 16/07/2019 €26.83 7.28 - - 14.69Comgest Growth Europe EUR I Fixed Dis Class22 EUR 03/07/2019 €27.15 7.65 - - 13.96Comgest Growth Europe USD I Acc Class USD 18/05/2014 $23.47 21.28 32.13 (9.04) 77.25Comgest Growth Europe USD I H Acc Class4 USD 23/01/2018 $30.01 13.15 37.13 - 48.85Comgest Growth Europe Compounders EUR SI AccClass29 EUR 23/12/2019 €10.00 5.24 - - 4.40Comgest Growth Europe Plus EUR I Acc Class29 EUR 23/12/2019 €10.00 11.40 - - 10.40Comgest Growth Europe Plus EUR Acc Class38 EUR 16/04/2020 €10.00 - - - 19.40Comgest Growth Europe Plus EUR Z Acc Class32 EUR 08/01/2020 €10.00 - - - 10.50Comgest Growth Europe S EUR Acc Class EUR 08/12/2010 €10.00 11.42 35.93 (5.03) 191.70Comgest Growth Europe S USD Acc Class USD 08/12/2010 $10.00 21.48 33.37 (9.53) 167.50Comgest Growth Europe Opportunities EUR Acc Class EUR 07/08/2009 €10.00 25.35 29.94 (8.10) 395.00Comgest Growth Europe Opportunities EUR I Acc Class EUR 13/02/2014 €20.42 25.96 38.80 (7.67) 150.24Comgest Growth Europe Opportunities EUR R AccClass EUR 15/11/2013 €19.60 24.71 21.70 (8.57) 140.51Comgest Growth Europe Opportunities EUR Dis Class EUR 27/10/2015 €26.18 25.34 29.97 (8.12) 91.41Comgest Growth Europe Opportunities EUR Z Acc Class EUR 21/07/2017 €32.37 - 30.57 (7.73) 57.65Comgest Growth Europe Opportunities EUR X AccClass50 EUR 11/12/2020 €10.00 - - - 3.10Comgest Growth Europe Opportunities USD I H AccClass42 USD 16/06/2020 $47.60 - - - 21.87Comgest Growth Europe Smaller Companies EUR AccClass EUR 25/04/2000 €10.00 19.81 38.32 (5.88) 343.30Comgest Growth Europe Smaller Companies EUR I AccClass EUR 03/03/2014 €17.52 20.43 39.02 (5.41) 165.47Comgest Growth Europe Smaller Companies EUR Z AccClass11 EUR 14/05/2018 €32.26 20.39 38.96 - 44.02Comgest Growth Europe Smaller Companies EUR X AccClass28 EUR 31/10/2019 €36.09 21.61 - - 30.37Comgest Growth Europe Smaller Companies EUR I DisClass33 EUR 14/01/2020 €39.34 - - - 18.25Comgest Growth Europe Smaller Companies EUR RAcc Class48 EUR 07/12/2020 €10.00 - - - 1.70Comgest Growth Europe Smaller Companies GBP UAcc Class41 GBP 12/05/2020 £33.18 - - - 25.50Comgest Growth Europe ex Switzerland CHF I AccClass CHF 13/02/2014 CHF 10.00 11.12 29.72 (5.39) 84.80Comgest Growth Europe ex Switzerland CHF Z AccClass CHF 09/09/2014 CHF 10.00 11.06 29.62 (5.45) 79.80Comgest Growth Europe Ex UK GBP SU H Acc Class GBP 18/12/2014 £10.00 12.47 36.45 (1.48) 103.80Comgest Growth Europe Ex UK GBP SU Acc Class GBP 15/01/2016 £10.93 18.60 28.33 (1.04) 112.35Comgest Growth Europe Ex UK GBP U Acc Class GBP 15/01/2016 £10.93 18.46 28.13 (1.17) 110.80Comgest Growth Europe ex UK GBP Y Acc Class49 GBP 09/12/2020 £10.00 - - - 0.20Comgest Growth Europe Ex UK GBP SU Dis Class37 GBP 20/02/2020 £20.96 - - - 10.73Comgest Growth Europe Ex UK EUR SI Acc Class8 EUR 15/03/2018 €1,000.00 12.29 35.94 - 48.65Comgest Growth Europe Ex UK EUR SI Dis Class31 EUR 07/01/2020 €1,332.67 - - - 11.54Comgest Growth Asia USD Acc Class USD 04/06/2015 $45.05 41.41 21.62 (15.28) 97.07Comgest Growth Asia EUR I Acc Class EUR 08/06/2015 €39.67 30.38 24.48 (10.59) 87.82
COMGEST GROWTH plc
Appendix II (continued)
492
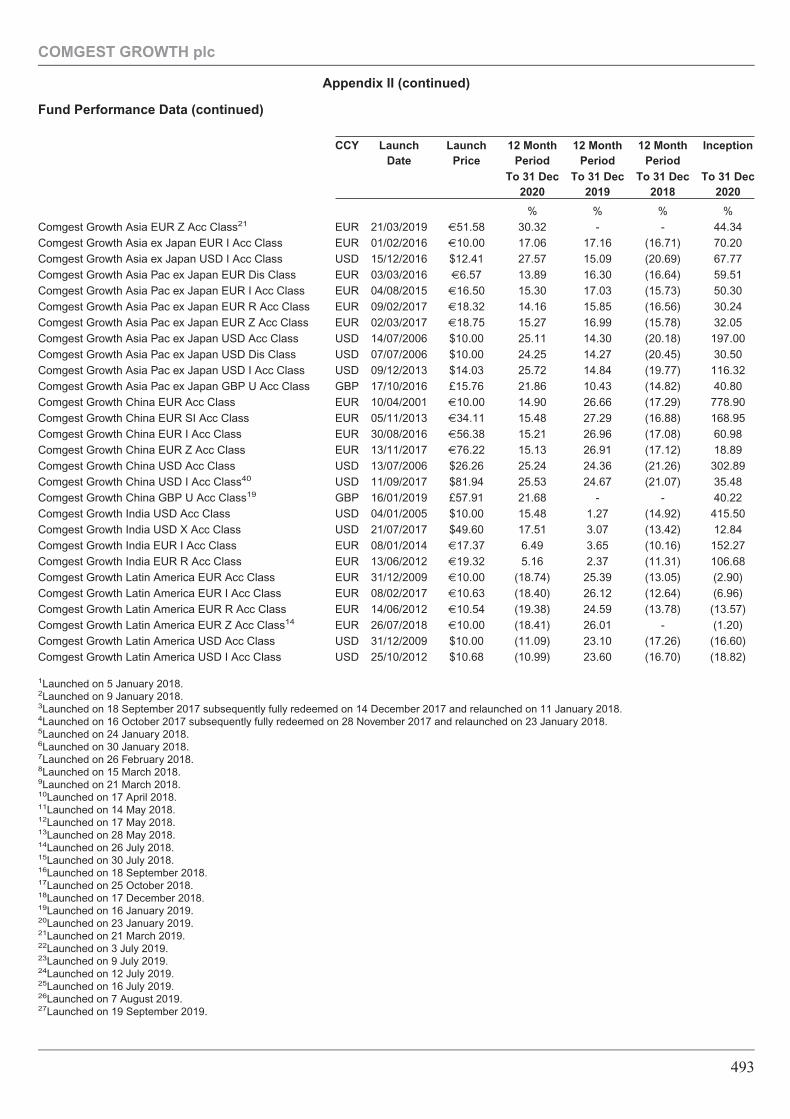
Fund Performance Data (continued)
CCY LaunchDate
LaunchPrice
12 MonthPeriod
12 MonthPeriod
12 MonthPeriod
Inception
To 31 Dec2020
To 31 Dec2019
To 31 Dec2018
To 31 Dec2020
% % % %Comgest Growth Asia EUR Z Acc Class21 EUR 21/03/2019 €51.58 30.32 - - 44.34Comgest Growth Asia ex Japan EUR I Acc Class EUR 01/02/2016 €10.00 17.06 17.16 (16.71) 70.20Comgest Growth Asia ex Japan USD I Acc Class USD 15/12/2016 $12.41 27.57 15.09 (20.69) 67.77Comgest Growth Asia Pac ex Japan EUR Dis Class EUR 03/03/2016 €6.57 13.89 16.30 (16.64) 59.51Comgest Growth Asia Pac ex Japan EUR I Acc Class EUR 04/08/2015 €16.50 15.30 17.03 (15.73) 50.30Comgest Growth Asia Pac ex Japan EUR R Acc Class EUR 09/02/2017 €18.32 14.16 15.85 (16.56) 30.24Comgest Growth Asia Pac ex Japan EUR Z Acc Class EUR 02/03/2017 €18.75 15.27 16.99 (15.78) 32.05Comgest Growth Asia Pac ex Japan USD Acc Class USD 14/07/2006 $10.00 25.11 14.30 (20.18) 197.00Comgest Growth Asia Pac ex Japan USD Dis Class USD 07/07/2006 $10.00 24.25 14.27 (20.45) 30.50Comgest Growth Asia Pac ex Japan USD I Acc Class USD 09/12/2013 $14.03 25.72 14.84 (19.77) 116.32Comgest Growth Asia Pac ex Japan GBP U Acc Class GBP 17/10/2016 £15.76 21.86 10.43 (14.82) 40.80Comgest Growth China EUR Acc Class EUR 10/04/2001 €10.00 14.90 26.66 (17.29) 778.90Comgest Growth China EUR SI Acc Class EUR 05/11/2013 €34.11 15.48 27.29 (16.88) 168.95Comgest Growth China EUR I Acc Class EUR 30/08/2016 €56.38 15.21 26.96 (17.08) 60.98Comgest Growth China EUR Z Acc Class EUR 13/11/2017 €76.22 15.13 26.91 (17.12) 18.89Comgest Growth China USD Acc Class USD 13/07/2006 $26.26 25.24 24.36 (21.26) 302.89Comgest Growth China USD I Acc Class40 USD 11/09/2017 $81.94 25.53 24.67 (21.07) 35.48Comgest Growth China GBP U Acc Class19 GBP 16/01/2019 £57.91 21.68 - - 40.22Comgest Growth India USD Acc Class USD 04/01/2005 $10.00 15.48 1.27 (14.92) 415.50Comgest Growth India USD X Acc Class USD 21/07/2017 $49.60 17.51 3.07 (13.42) 12.84Comgest Growth India EUR I Acc Class EUR 08/01/2014 €17.37 6.49 3.65 (10.16) 152.27Comgest Growth India EUR R Acc Class EUR 13/06/2012 €19.32 5.16 2.37 (11.31) 106.68Comgest Growth Latin America EUR Acc Class EUR 31/12/2009 €10.00 (18.74) 25.39 (13.05) (2.90)Comgest Growth Latin America EUR I Acc Class EUR 08/02/2017 €10.63 (18.40) 26.12 (12.64) (6.96)Comgest Growth Latin America EUR R Acc Class EUR 14/06/2012 €10.54 (19.38) 24.59 (13.78) (13.57)Comgest Growth Latin America EUR Z Acc Class14 EUR 26/07/2018 €10.00 (18.41) 26.01 - (1.20)Comgest Growth Latin America USD Acc Class USD 31/12/2009 $10.00 (11.09) 23.10 (17.26) (16.60)Comgest Growth Latin America USD I Acc Class USD 25/10/2012 $10.68 (10.99) 23.60 (16.70) (18.82)
1Launched on 5 January 2018.2Launched on 9 January 2018.3Launched on 18 September 2017 subsequently fully redeemed on 14 December 2017 and relaunched on 11 January 2018.4Launched on 16 October 2017 subsequently fully redeemed on 28 November 2017 and relaunched on 23 January 2018.5Launched on 24 January 2018.6Launched on 30 January 2018.7Launched on 26 February 2018.8Launched on 15 March 2018.9Launched on 21 March 2018.10Launched on 17 April 2018.11Launched on 14 May 2018.12Launched on 17 May 2018.13Launched on 28 May 2018.14Launched on 26 July 2018.15Launched on 30 July 2018.16Launched on 18 September 2018.17Launched on 25 October 2018.18Launched on 17 December 2018.19Launched on 16 January 2019.20Launched on 23 January 2019.21Launched on 21 March 2019.22Launched on 3 July 2019.23Launched on 9 July 2019.24Launched on 12 July 2019.25Launched on 16 July 2019.26Launched on 7 August 2019.27Launched on 19 September 2019.
COMGEST GROWTH plc
Appendix II (continued)
493
Fund Performance Data (continued)
28Launched on 31 October 2019.29Launched on 23 December 2019.30Launched on 24 December 2019.31Launched on 7 January 202032Launched on 8 January 202033Launched on 14 January 202034Launched on 24 January 202035Launched on 29 January 202036Launched on 3 February 202037Launched on 20 February 202038Launched on 16 April 202039Launched on 16 April 202040Launched on 11 October 2017 subsequently fully redeemed on 11 March 2020 and relaunched on 17 April 202041Launched on 12 May 2020.42Launched on 16 June 2020.43Launched on 17 June 2020.44Launched on 29 July 2020.45Launched on 19 October 2020.46Launched on 22 October 2020.47Launched on 27 November 2020.48Launched on 4 December 2020.49Launched on 8 December 2020.50Launched on 10 December 2020.51Launched on 16 December 2020.
Note: Past performance is no indication of current or future performance. The performance data above does not take intoaccount commissions and costs incurred on the redemption of units. The performance data is based upon the publisheddealing Net Asset Values per unit, in the currency that is attributable to that class.
Comgest Asset Management International Limited (the �Investment Manager�) does not use benchmarks when analysingportfolio returns on a Fund. The Investment Manager’s investment policy in the portfolio construction is meant to be flexibleand the choice of stocks is independent of any benchmark. A strong bias towards absolute performance has priority.Securities are purchased based on their intrinsic quality and merit, with the largest positions reflecting the best combinationof growth, risk and valuation.
COMGEST GROWTH plc
Appendix II (continued)
494
Cybersecurity Risk
With the increased use of technologies such as the Internet and the dependence on computer systems to perform businessand operational functions, investment companies (such as the Company) and their service providers (including theInvestment Manager, Administrator and Depositary) may be prone to operational and information security risks resultingfrom cyber-attacks and/or technological malfunctions. In general, cyber-attacks are deliberate, but unintentional events mayhave similar effects.
Cyber-attacks include, among others, gaining unauthorised access to digital systems for the purposes of misappropriatingassets or sensitive information, stealing or corrupting data maintained online or digitally, preventing legitimate users fromaccessing information or services on a website, releasing confidential information without authorisation and causingoperational disruption or various other forms of cyber security breaches. Successful cyber-attacks against, or securitybreakdowns of, the Company or the Company’s third-party service providers including, but not limited to the InvestmentManager, a Sub-Investment Manager, the Depositary, the Administrator or other affiliated or third-party service providers(each a “Service Provider” and collectively the “Service Providers”), may adversely affect the Company or its Shareholders.
For instance, cyber-attacks may interfere with the processing of Shareholder transactions, affect the Company’s ability tocalculate the Net Asset Value of one or more Funds, cause the release of private Shareholder information or confidentialinformation relating to the Company or any one or more Funds, impede trading, cause reputational damage, causedisruptions and impact business operations, potentially resulting in financial losses, cause violations of applicable dataprotection and other laws, and subject the Company to regulatory fines, penalties or financial losses, reimbursement or othercompensation costs, and additional compliance costs. Cyber-attacks may render records of assets and transactions of aFund, Shareholder ownership of Shares, and other data integral to the functioning of the Company inaccessible, inaccurateor incomplete.
The Company may also incur substantial costs for cyber security risk management in order to prevent cyber incidents in thefuture. While each Service Provider has established business continuity plans and systems designed to minimise the risk ofcyber-attacks through the use of technology, processes and controls, there are inherent limitations in such plans andsystems, including the possibility that certain risks have not been identified given the evolving nature of the threat of cyber-attacks.
The Company relies on its third-party Service Providers for many of its day-to-day operations and will be subject to the riskthat the protections and protocols implemented by those Service Providers will be ineffective to protect the Company fromcyber-attack. Similar types of cyber security risks also are present for issuers of securities in which each Fund invests andfor the markets and exchanges on which those securities may be listed or traded which could result in material adverseconsequences for such issuers, markets and exchanges and which may cause a Fund’s investment in such securities to losevalue. The Company cannot control the cyber security plans and systems put in place by issuers in which a Fund invests orby such markets and exchanges.
COMGEST GROWTH plc
Appendix III
495
UCITS V Remuneration Disclosure (unaudited)
In line with the requirements of the European Communities (Undertakings for Collective Investment in TransferableSecurities) Regulations 2011, (SI No. 352 of 2011) as amended by the European Union (Undertakings for CollectiveInvestment in Transferable Securities) (Amendment) Regulations 2016, (SI No. 143 of 2016) and as may be further modified,amended, supplemented, consolidated or re-enacted from time to time (the “UCITS Regulations”), the Company adopted aremuneration policy (the “Remuneration Policy”) which aims to ensure that:
(i) it does not encourage risk taking that is inconsistent with the risk profile and Articles of Association of the Company;and
(ii) it is consistent with and promotes sound and effective risk management.
The only categories of the Company’s staff, including senior management, risk takers and control functions, whoseprofessional activities may have a material impact on the risk profile of the Company (the “Identified Staff”) are the Directors.
The remuneration policy applies to all forms of payments or benefits paid by the Company to the Identified Staff, whichincludes Directors and Designated Persons, in exchange for professional services. The Company currently only pays theindependent of Comgest non-executive directors (namely Mr. Daniel Morrissey and Ms. Bronwyn Wright) fixed remunerationand does not pay any variable remuneration. Therefore, it is only payments to Directors, as identified staff, which has amaterial impact.
Directors who are also employees within the Comgest Group, (namely Philippe Lebeau, David Raper (resigned and replacedby Gaurish Pinge, also a Comgest employee, as at 4 February 2021) and Jan-Peter Dolff), do not receive any remunerationfrom the Company, whether fixed or variable.
The Company’s policy is to pay the relevant Identified Staff fixed remuneration only, with no variable component being paid.
The Company complies with the remuneration-related disclosure requirements set out in:
(a) Directive 2009/65/EC of the European Parliament and of the Council of 13 July 2009 on the coordination of laws,regulations and administrative provisions relating to undertakings for collective investment in transferable securitiesas amended by Directive 2014/91/EU of the European Parliament and of the Council of 23 July 2014 as regardsdepositary functions, remuneration policies and sanctions, including its mandatory implementing regulations on anEU or Home Member State level and as further amended from time to time;
(b) the UCITS Regulations; and(c) the European Securities and Markets Authority (“ESMA”) Guidelines on sound remuneration policies under the
UCITS Directive and AIFMD issued pursuant to Article 14a(4) of the UCITS Directive (the “UCITS RemunerationGuidelines”).
Accordingly, the remuneration policy is kept up-to-date reviewed annually, and is disclosed on the followingwebsite: www.comgest.com.
The Board has determined in light of the size, internal operations, nature, scale and complexity of the Company that aremuneration committee is not required.
To ensure compliance with the ESMA Remuneration Guidelines, the Company has revised the Investment ManagementAgreement to insert an express statement to the effect that the Investment Manager will comply with the ESMARemuneration Guidelines, particularly in the context of payments made to the Investment Manager’s employees ascompensation for the performance of investment management activities on behalf of the Company.
The Board will review the implementation of the remuneration policy on an annual basis.
COMGEST GROWTH plc
Appendix IV
496
Securities Financing Transactions Regulation
The Securities Financing Transactions Regulation, as published by the European Securities and Markets Authority, aims toimprove the transparency of the securities financing markets. Disclosures regarding exposure to Securities FinancingTransactions (SFTs) will be required on all report and accounts published after 13 January 2017. During the financial yearended 31 December 2020, none of the Funds entered into any Securities Financing Transactions.
CRS Data Protection Information Notice
The Company hereby provides the following data protection information notice to all Shareholders in the Company either asat 31 December 2015 or at any point of time since this date.
For the avoidance of doubt, this notice applies equally to any Shareholders that have ceased to hold shares in the Companysince January 1, 2016. Furthermore, it should be noted that this notice may be applicable to Controlling Persons of certainShareholders.
The Company hereby confirms that it intends to take such steps as may be required to satisfy any obligations imposed by(i) the OECD’s Standard for Automatic Exchange of Financial Account Information in Tax Matters (“the Standard”), whichtherein contains the Common Reporting Standard (“CRS”), as applied in Ireland by means of the relevant international legalframework and Irish tax legislation and (ii) EU Council Directive 2014/107/EU, amending Directive 2011/16/EU as regardsmandatory automatic exchange information in the field of taxation (“DAC2”), as applied in Ireland by means of the relevantIrish tax legislation, so as to ensure compliance or deemed compliance (as the case may be) with the Standard/CRS and theDAC2 from 1 January 2016.
In this regard, the Company is obliged under Section 891F and Section 891G of the Irish Taxes Consolidation Act, 1997 (asamended) and regulations made pursuant to those sections to collect certain information about each Shareholder’s taxarrangements (and also collect information in relation to relevant Controlling Persons of specific Shareholders).
In certain circumstances, the Company may be legally obliged to share this information and other financial information withrespect to a Shareholder’s interests in the Company with the Irish Revenue Commissioners (and, in particular situations,also share information in relation to relevant Controlling Persons of specific Shareholders). In turn, and to the extent theaccount has been identified as a Reportable Account, the Irish Revenue Commissioners will exchange this information withthe country of residence of the Reportable Person(s) in respect of that Reportable Account.
In particular, information that may be reported in respect of a Shareholder (and relevant Controlling Persons, if applicable)includes name, address, date of birth, place of birth, account number, account balance or value at year end (or, if theaccount was closed during such year, the balance or value at the date of closure of the account), any payments (includingredemption and dividend/interest payments) made with respect to the account during the calendar year, tax residency(ies)and tax identification number(s).
COMGEST GROWTH plc
Appendix IV (continued)
497