fy22/3 q1 corporate presentation
TRANSCRIPT
August 5, 2021
FY22/3 Q1 Corporate Presentation
FY22/3 Q1 Overview
Copyright 2021 Japan Display Inc. All Rights Reserved. Slide 3
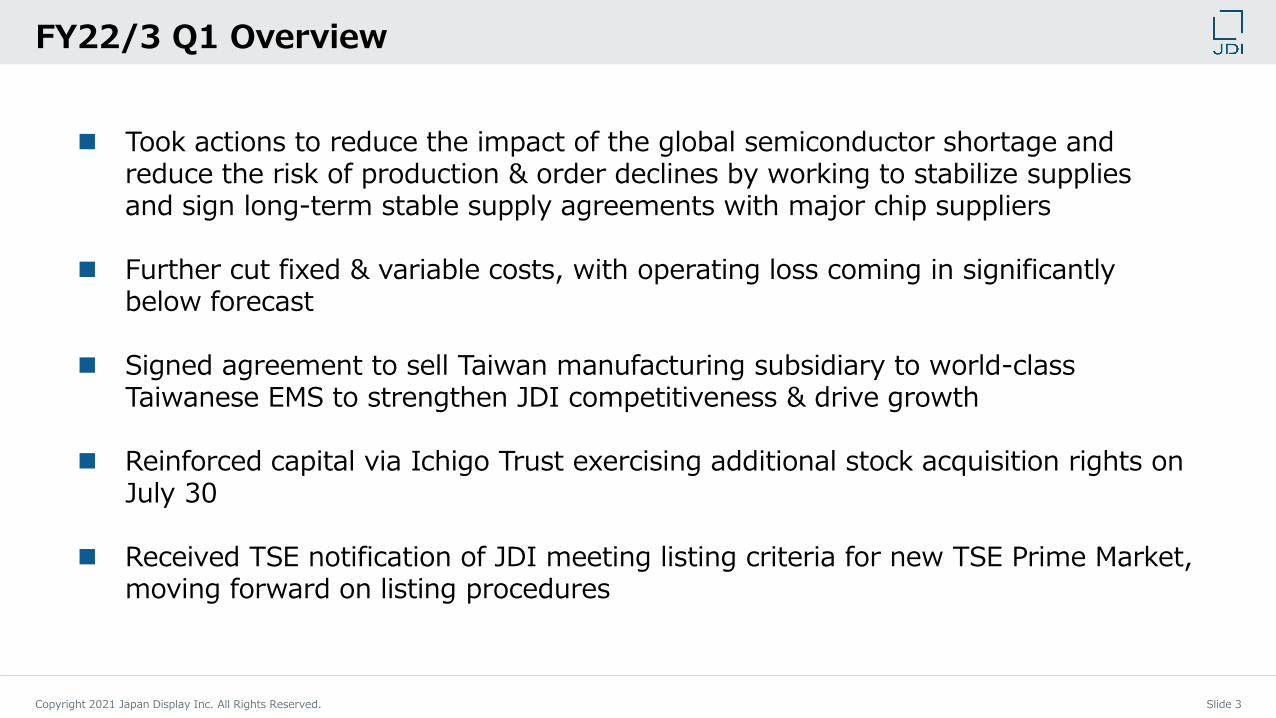
FY22/3 Q1 Overview
◼ Took actions to reduce the impact of the global semiconductor shortage and reduce the risk of production & order declines by working to stabilize supplies and sign long-term stable supply agreements with major chip suppliers
◼ Further cut fixed & variable costs, with operating loss coming in significantly below forecast
◼ Signed agreement to sell Taiwan manufacturing subsidiary to world-class Taiwanese EMS to strengthen JDI competitiveness & drive growth
◼ Reinforced capital via Ichigo Trust exercising additional stock acquisition rights on July 30
◼ Received TSE notification of JDI meeting listing criteria for new TSE Prime Market, moving forward on listing procedures
Copyright 2021 Japan Display Inc. All Rights Reserved. Slide 4
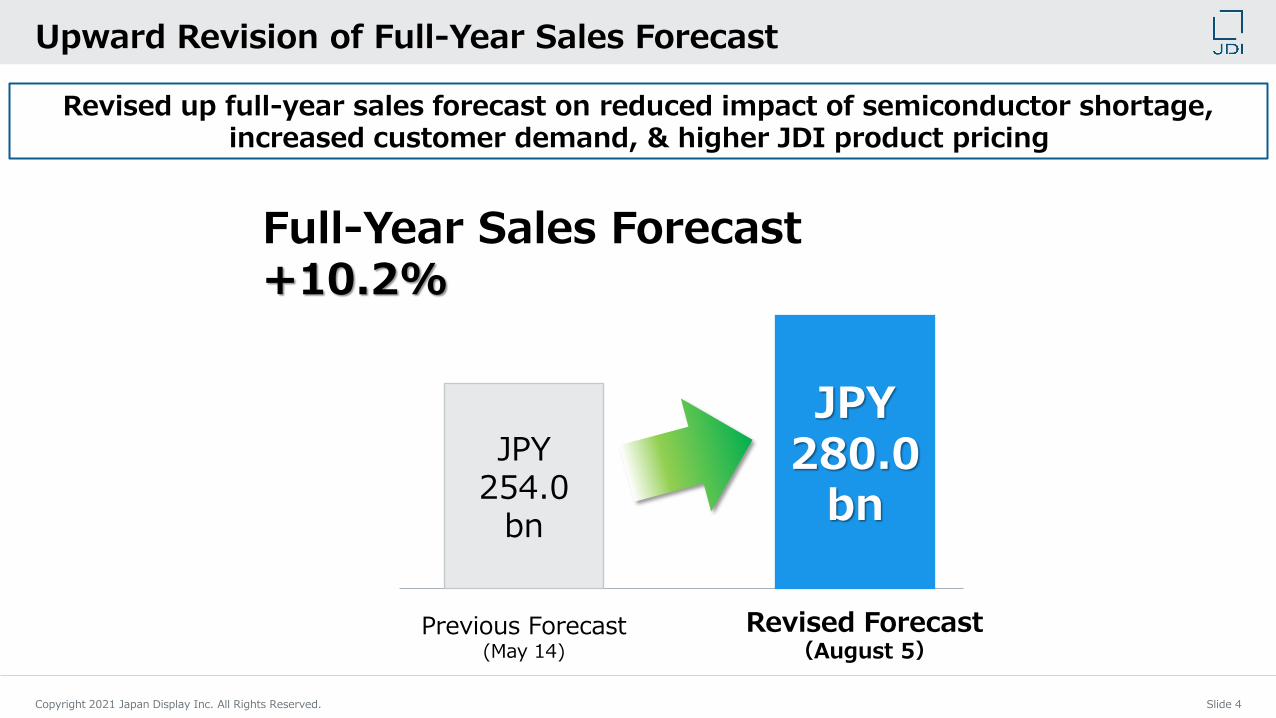
Revised up full-year sales forecast on reduced impact of semiconductor shortage,increased customer demand, & higher JDI product pricing
Upward Revision of Full-Year Sales Forecast
JPY 254.0
bn
JPY280.0
bn
Previous Forecast(May 14)
Revised Forecast(August 5)
Full-Year Sales Forecast+10.2%
Copyright 2021 Japan Display Inc. All Rights Reserved. Slide 5
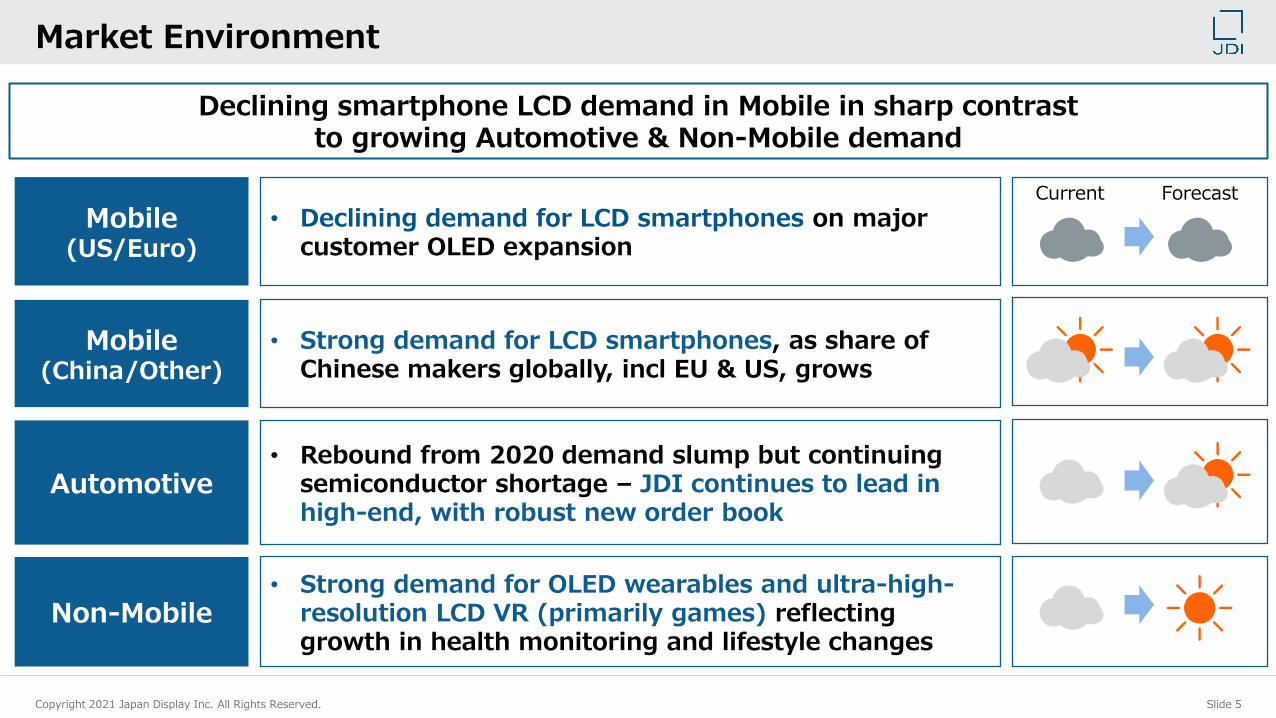
Declining smartphone LCD demand in Mobile in sharp contrast to growing Automotive & Non-Mobile demand
Market Environment
Non-Mobile• Strong demand for OLED wearables and ultra-high-
resolution LCD VR (primarily games) reflecting growth in health monitoring and lifestyle changes
☁ ☀
☁ ☁Mobile
(US/Euro)
• Declining demand for LCD smartphones on major customer OLED expansion
Current Forecast
☀Mobile(China/Other)
• Strong demand for LCD smartphones, as share of Chinese makers globally, incl EU & US, grows ☁☀☁
Automotive• Rebound from 2020 demand slump but continuing
semiconductor shortage – JDI continues to lead in high-end, with robust new order book ☁ ☀☁
Copyright 2021 Japan Display Inc. All Rights Reserved. Slide 6
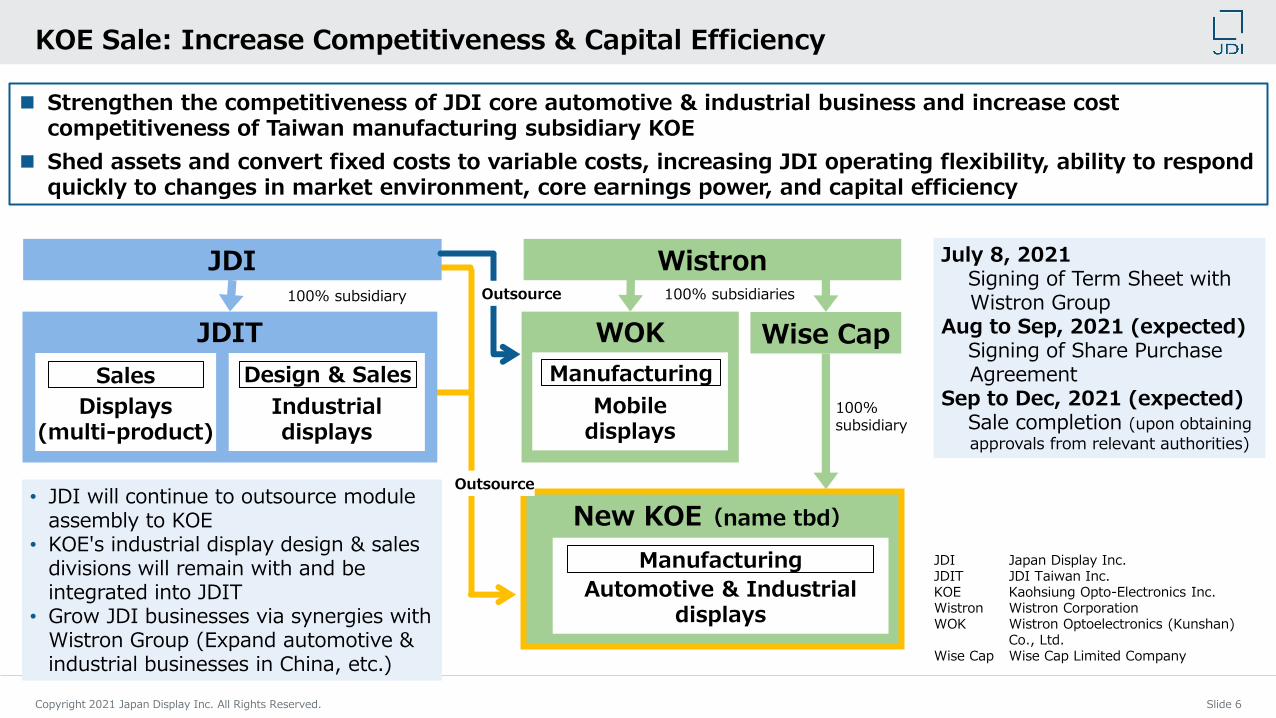
KOE Sale: Increase Competitiveness & Capital Efficiency
July 8, 2021Signing of Term Sheet with Wistron Group
Aug to Sep, 2021 (expected)Signing of Share Purchase Agreement
Sep to Dec, 2021 (expected)Sale completion (upon obtaining approvals from relevant authorities)
• JDI will continue to outsource module assembly to KOE
• KOE's industrial display design & sales divisions will remain with and be integrated into JDIT
• Grow JDI businesses via synergies with Wistron Group (Expand automotive & industrial businesses in China, etc.)
◼ Strengthen the competitiveness of JDI core automotive & industrial business and increase cost competitiveness of Taiwan manufacturing subsidiary KOE
◼ Shed assets and convert fixed costs to variable costs, increasing JDI operating flexibility, ability to respond quickly to changes in market environment, core earnings power, and capital efficiency
JDIT
JDI
Displays(multi-product)
Sales
Industrialdisplays
Design & Sales
100% subsidiary
Wise CapWOK
Mobiledisplays
Manufacturing
Wistron
New KOE(name tbd)
Automotive & Industrialdisplays
Manufacturing
100% subsidiaries
100% subsidiary
Outsource
Outsource
JDI Japan Display Inc.JDIT JDI Taiwan Inc.KOE Kaohsiung Opto-Electronics Inc.Wistron Wistron CorporationWOK Wistron Optoelectronics (Kunshan)
Co., Ltd.Wise Cap Wise Cap Limited Company
Copyright 2021 Japan Display Inc. All Rights Reserved. Slide 7
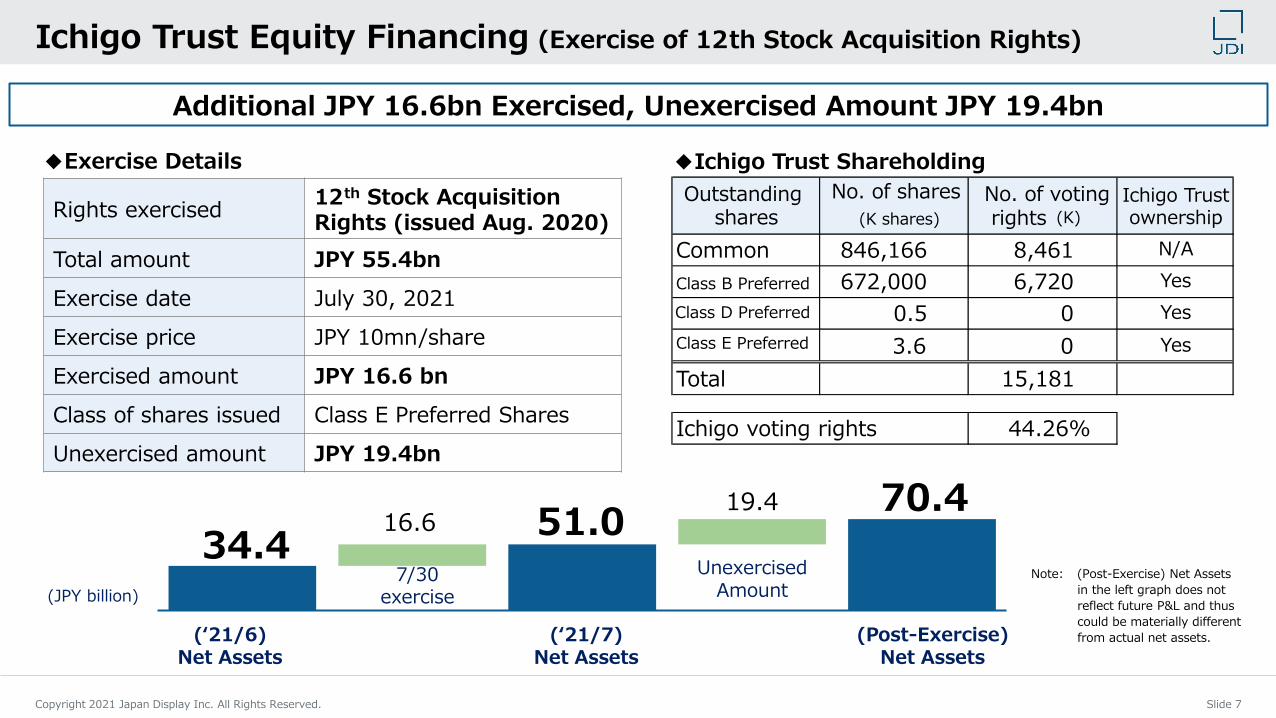
Ichigo Trust Equity Financing (Exercise of 12th Stock Acquisition Rights)
◆Exercise Details ◆Ichigo Trust Shareholding
34.4 51.0
70.4 16.6
19.4
7/30 exercise(JPY billion)
Unexercised Amount
Outstanding shares
No. of shares
(K shares)
No. of votingrights (K)
Ichigo Trust ownership
Common 846,166 8,461
Class B Preferred 672,000 6,720 Yes
0.5 0 Yes
3.6 0 Yes
Total 15,181
Ichigo voting rights 44.26%
N/A
Additional JPY 16.6bn Exercised, Unexercised Amount JPY 19.4bn
Rights exercised12th Stock Acquisition Rights (issued Aug. 2020)
Total amount JPY 55.4bn
Exercise date July 30, 2021
Exercise price JPY 10mn/share
Exercised amount JPY 16.6 bn
Class of shares issued Class E Preferred Shares
Unexercised amount JPY 19.4bn
Class D Preferred
Class E Preferred
(‘21/6)Net Assets
(‘21/7)Net Assets
(Post-Exercise)Net Assets
Note: (Post-Exercise) Net Assets
in the left graph does not
reflect future P&L and thus
could be materially different
from actual net assets.

Copyright 2021 Japan Display Inc. All Rights Reserved. Slide 8
PersonalTechFor A Better World
FY22/3 Q1 Earnings ReviewQ2 Forecast
Copyright 2021 Japan Display Inc. All Rights Reserved. Slide 10
FY22/3 Q1 Financial Results
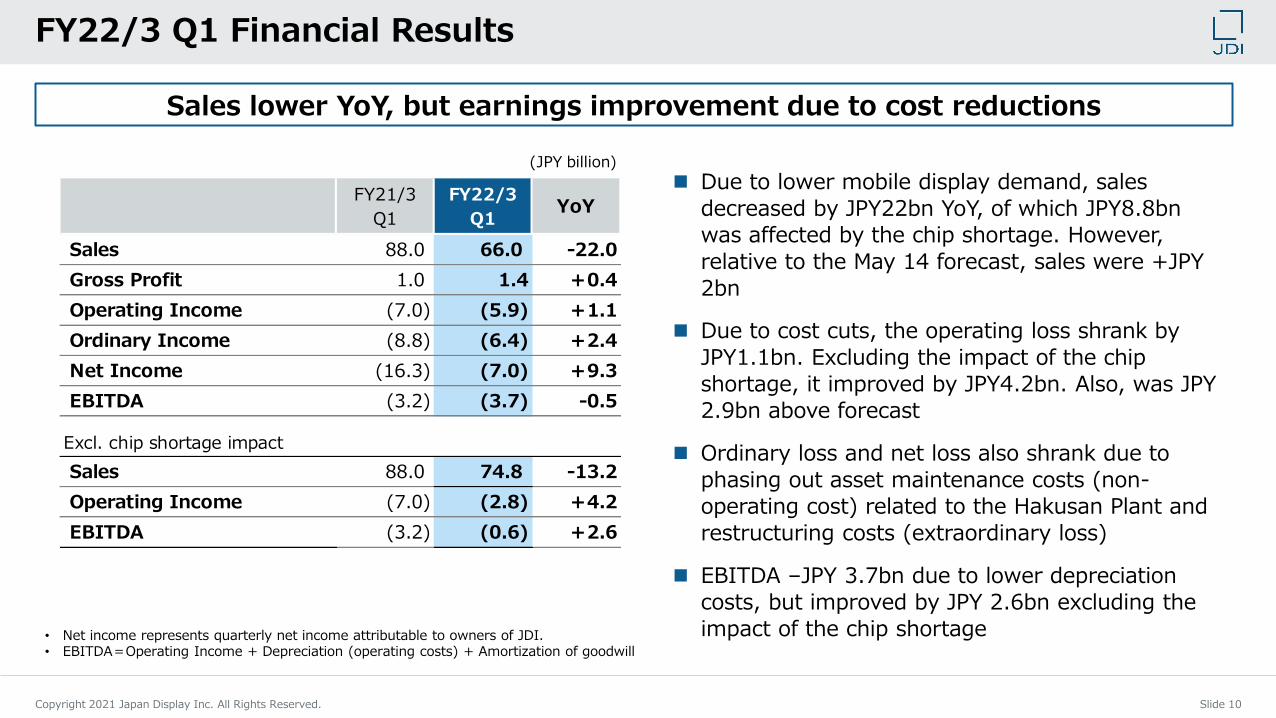
◼ Due to lower mobile display demand, sales
decreased by JPY22bn YoY, of which JPY8.8bn was affected by the chip shortage. However,
relative to the May 14 forecast, sales were +JPY
2bn
◼ Due to cost cuts, the operating loss shrank by
JPY1.1bn. Excluding the impact of the chip
shortage, it improved by JPY4.2bn. Also, was JPY 2.9bn above forecast
◼ Ordinary loss and net loss also shrank due to
phasing out asset maintenance costs (non-operating cost) related to the Hakusan Plant and
restructuring costs (extraordinary loss)
◼ EBITDA –JPY 3.7bn due to lower depreciation costs, but improved by JPY 2.6bn excluding the
impact of the chip shortage
Sales lower YoY, but earnings improvement due to cost reductions
• Net income represents quarterly net income attributable to owners of JDI.• EBITDA=Operating Income + Depreciation (operating costs) + Amortization of goodwill
(JPY billion)
FY21/3
Q1
FY22/3
Q1YoY
Sales 88.0 66.0 -22.0
Gross Profit 1.0 1.4 +0.4
Operating Income (7.0) (5.9) +1.1
Ordinary Income (8.8) (6.4) +2.4
Net Income (16.3) (7.0) +9.3
EBITDA (3.2) (3.7) -0.5
Excl. chip shortage impact
Sales 88.0 74.8 -13.2
Operating Income (7.0) (2.8) +4.2
EBITDA (3.2) (0.6) +2.6
Copyright 2021 Japan Display Inc. All Rights Reserved. Slide 11
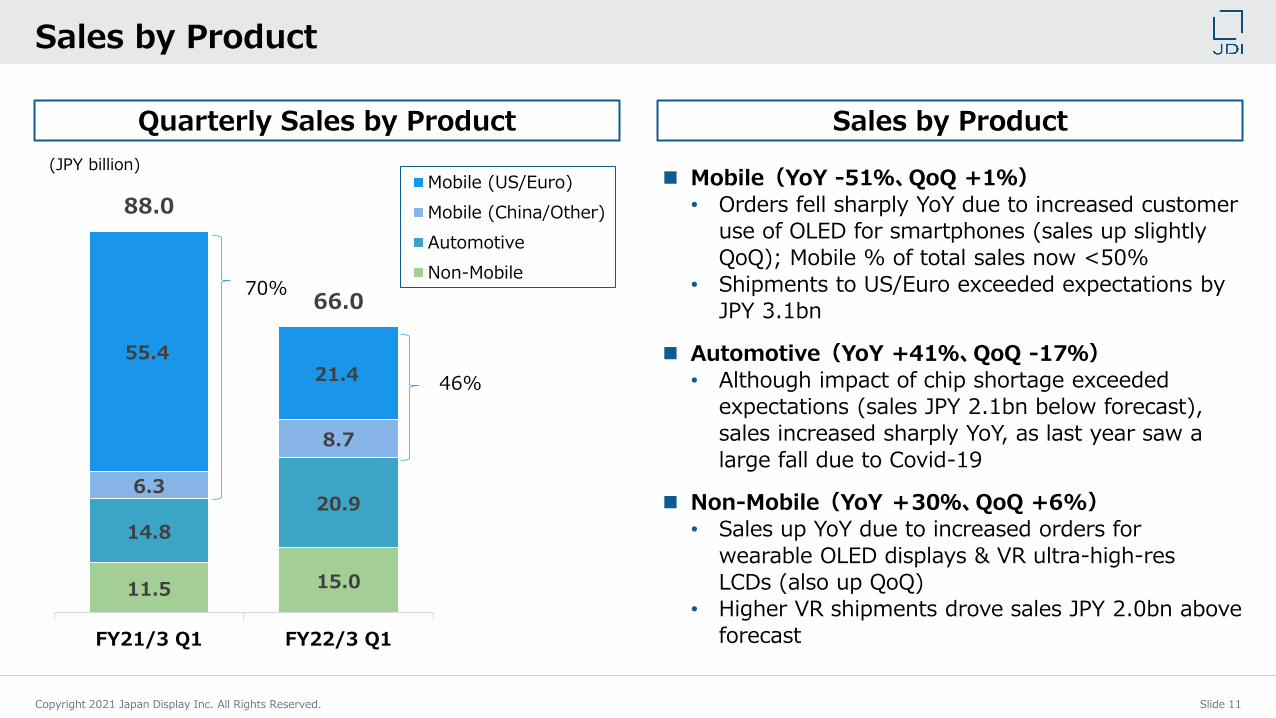
Quarterly Sales by Product
11.5 15.0
14.8
20.96.3
8.7
55.421.4
88.0
66.0
FY21/3 Q1 FY22/3 Q1
Mobile (US/Euro)
Mobile (China/Other)
Automotive
Non-Mobile
Sales by Product
Sales by Product
(JPY billion)
46%
70%
◼ Mobile(YoY -51%、QoQ +1%)
• Orders fell sharply YoY due to increased customer use of OLED for smartphones (sales up slightly
QoQ); Mobile % of total sales now <50%
• Shipments to US/Euro exceeded expectations by JPY 3.1bn
◼ Automotive(YoY +41%、QoQ -17%)
• Although impact of chip shortage exceeded expectations (sales JPY 2.1bn below forecast),
sales increased sharply YoY, as last year saw a
large fall due to Covid-19
◼ Non-Mobile(YoY +30%、QoQ +6%)
• Sales up YoY due to increased orders for
wearable OLED displays & VR ultra-high-res LCDs (also up QoQ)
• Higher VR shipments drove sales JPY 2.0bn above
forecast
Copyright 2021 Japan Display Inc. All Rights Reserved. Slide 12
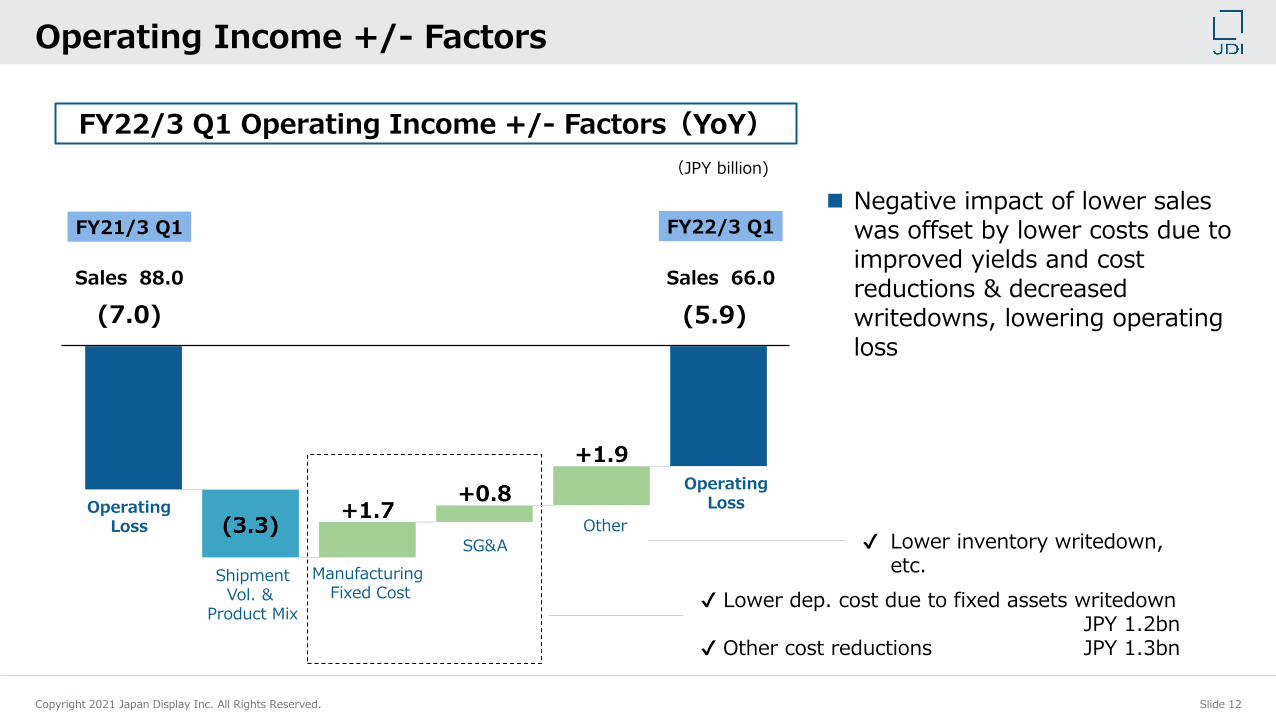
Operating Income +/- Factors
✔ Lower inventory writedown, etc.
FY22/3 Q1 Operating Income +/- Factors(YoY)
Manufacturing Fixed Cost
SG&A
Other
OperatingLoss
FY22/3 Q1
(5.9)
Sales 66.0
FY21/3 Q1
(7.0)
Sales 88.0
(JPY billion)
✔ Lower dep. cost due to fixed assets writedownJPY 1.2bn
✔ Other cost reductions JPY 1.3bn
OperatingLoss
ShipmentVol. &
Product Mix
◼ Negative impact of lower sales was offset by lower costs due to improved yields and cost reductions & decreased writedowns, lowering operating loss
Copyright 2021 Japan Display Inc. All Rights Reserved. Slide 13
Revised FY22/3 Full-Year Sales Forecast
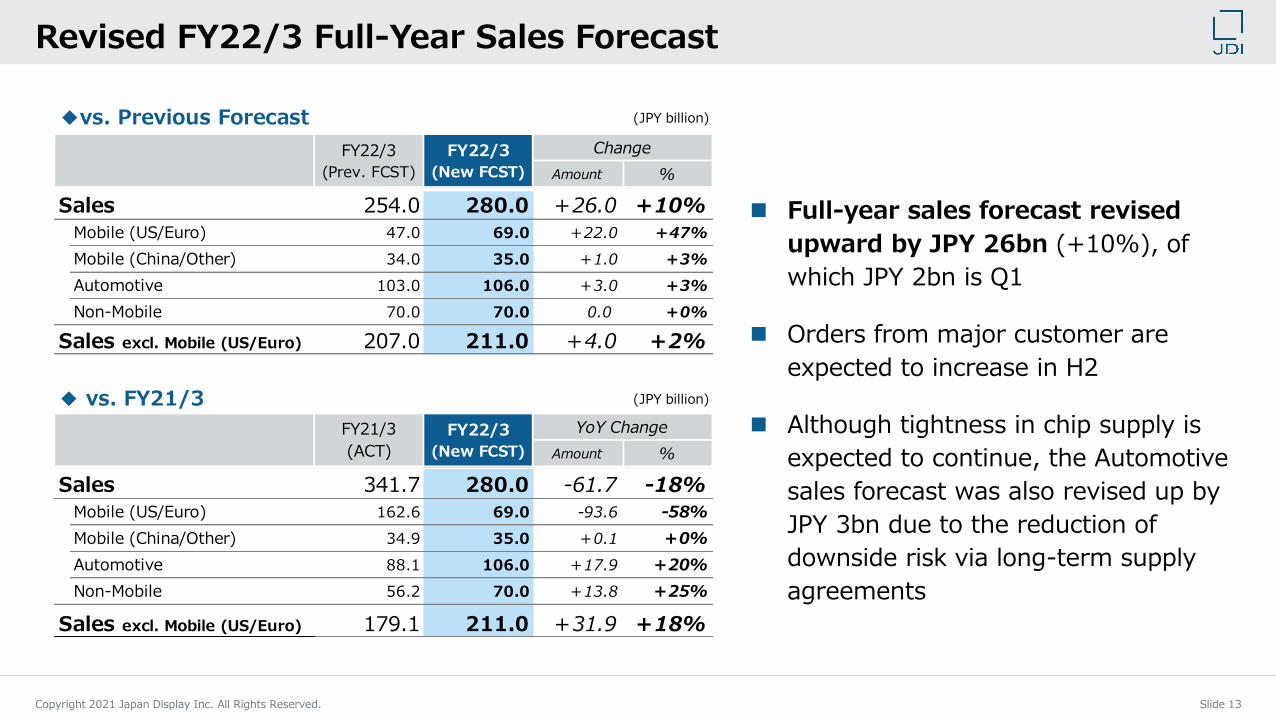
◼ Full-year sales forecast revised
upward by JPY 26bn (+10%), of
which JPY 2bn is Q1
◼ Orders from major customer are
expected to increase in H2
◼ Although tightness in chip supply is
expected to continue, the Automotive
sales forecast was also revised up by
JPY 3bn due to the reduction of
downside risk via long-term supply
agreements
(JPY billion)
Amount %
Sales 254.0 280.0 +26.0 +10%
Mobile (US/Euro) 47.0 69.0 +22.0 +47%
Mobile (China/Other) 34.0 35.0 +1.0 +3%
Automotive 103.0 106.0 +3.0 +3%
Non-Mobile 70.0 70.0 0.0 +0%
Sales excl. Mobile (US/Euro) 207.0 211.0 +4.0 +2%
(JPY billion)
Amount %
Sales 341.7 280.0 -61.7 -18%
Mobile (US/Euro) 162.6 69.0 -93.6 -58%
Mobile (China/Other) 34.9 35.0 +0.1 +0%
Automotive 88.1 106.0 +17.9 +20%
Non-Mobile 56.2 70.0 +13.8 +25%
Sales excl. Mobile (US/Euro) 179.1 211.0 +31.9 +18%
FY21/3
(ACT)
FY22/3
(New FCST)
YoY Change
FY22/3
(Prev. FCST)
FY22/3
(New FCST)
Change
◆ vs. FY21/3
◆vs. Previous Forecast
Copyright 2021 Japan Display Inc. All Rights Reserved. Slide 14
FY22/3 Q2 Sales & Operating Income Forecast
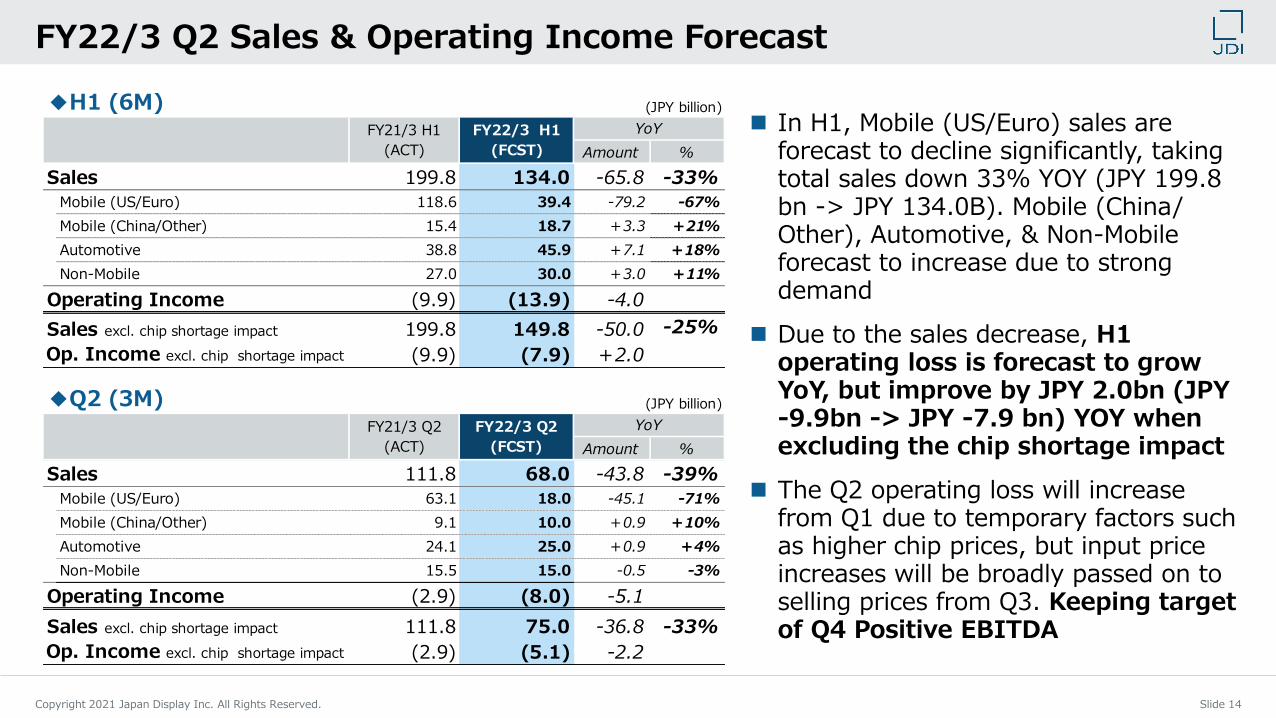
◼ In H1, Mobile (US/Euro) sales are forecast to decline significantly, taking total sales down 33% YOY (JPY 199.8 bn -> JPY 134.0B). Mobile (China/Other), Automotive, & Non-Mobile forecast to increase due to strong demand
◼ Due to the sales decrease, H1 operating loss is forecast to grow YoY, but improve by JPY 2.0bn (JPY -9.9bn -> JPY -7.9 bn) YOY when excluding the chip shortage impact
◼ The Q2 operating loss will increase from Q1 due to temporary factors such as higher chip prices, but input price increases will be broadly passed on to selling prices from Q3. Keeping target of Q4 Positive EBITDA
(JPY billion)
Amount %
Sales 199.8 134.0 -65.8 -33%
Mobile (US/Euro) 118.6 39.4 -79.2 -67%
Mobile (China/Other) 15.4 18.7 +3.3 +21%
Automotive 38.8 45.9 +7.1 +18%
Non-Mobile 27.0 30.0 +3.0 +11%
Operating Income (9.9) (13.9) -4.0
Sales excl. chip shortage impact 199.8 149.8 -50.0 -25%
(9.9) (7.9) +2.0
(JPY billion)
Amount %
Sales 111.8 68.0 -43.8 -39%
Mobile (US/Euro) 63.1 18.0 -45.1 -71%
Mobile (China/Other) 9.1 10.0 +0.9 +10%
Automotive 24.1 25.0 +0.9 +4%
Non-Mobile 15.5 15.0 -0.5 -3%
Operating Income (2.9) (8.0) -5.1
Sales excl. chip shortage impact 111.8 75.0 -36.8 -33%
(2.9) (5.1) -2.2
FY22/3 Q2
(FCST)
YoY
Op. Income excl. chip shortage impact
FY21/3 Q2
(ACT)
FY22/3 H1
(FCST)
YoY
Op. Income excl. chip shortage impact
◆Q2 (3M)
◆H1 (6M)FY21/3 H1
(ACT)

Appendix
Copyright 2021 Japan Display Inc. All Rights Reserved. Slide 16
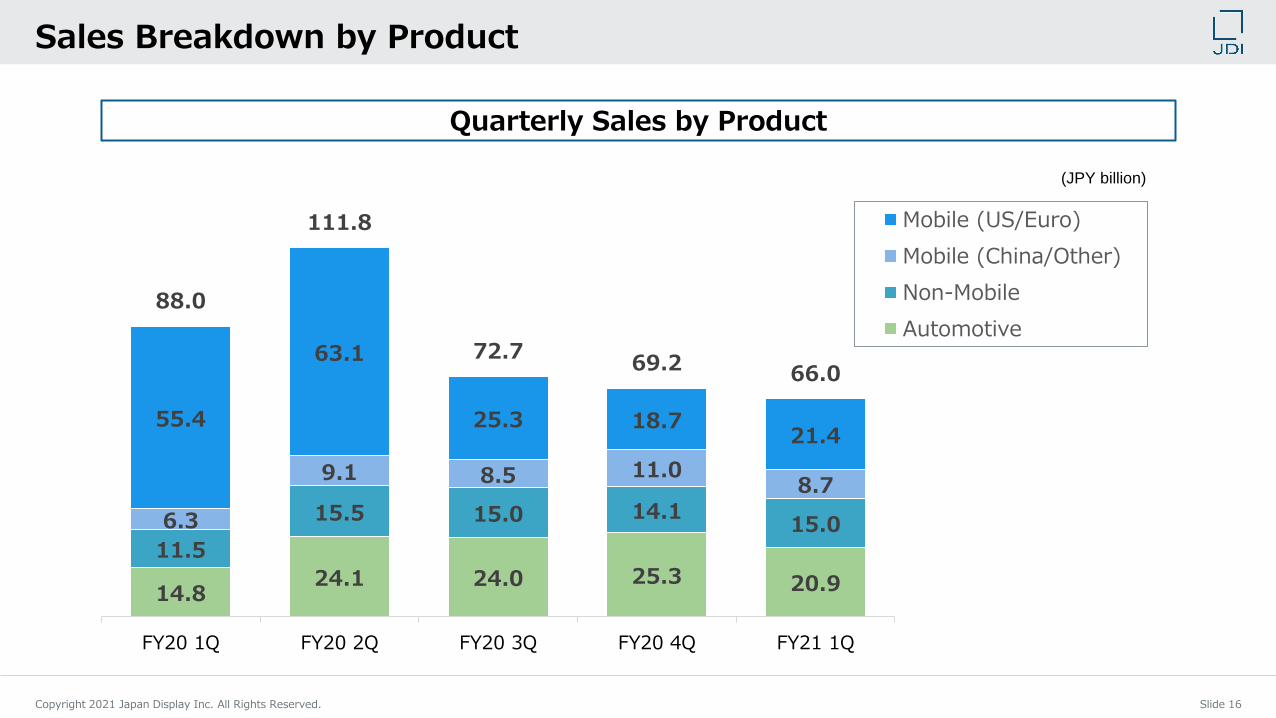
Quarterly Sales by Product
14.824.1 24.0 25.3 20.9
11.5
15.5 15.0 14.115.06.3
9.1 8.5 11.08.7
55.4
63.1
25.3 18.721.4
88.0
111.8
72.769.2
66.0
FY20 1Q FY20 2Q FY20 3Q FY20 4Q FY21 1Q
Mobile (US/Euro)
Mobile (China/Other)
Non-Mobile
Automotive
(JPY billion)
Sales Breakdown by Product
Copyright 2021 Japan Display Inc. All Rights Reserved. Slide 17
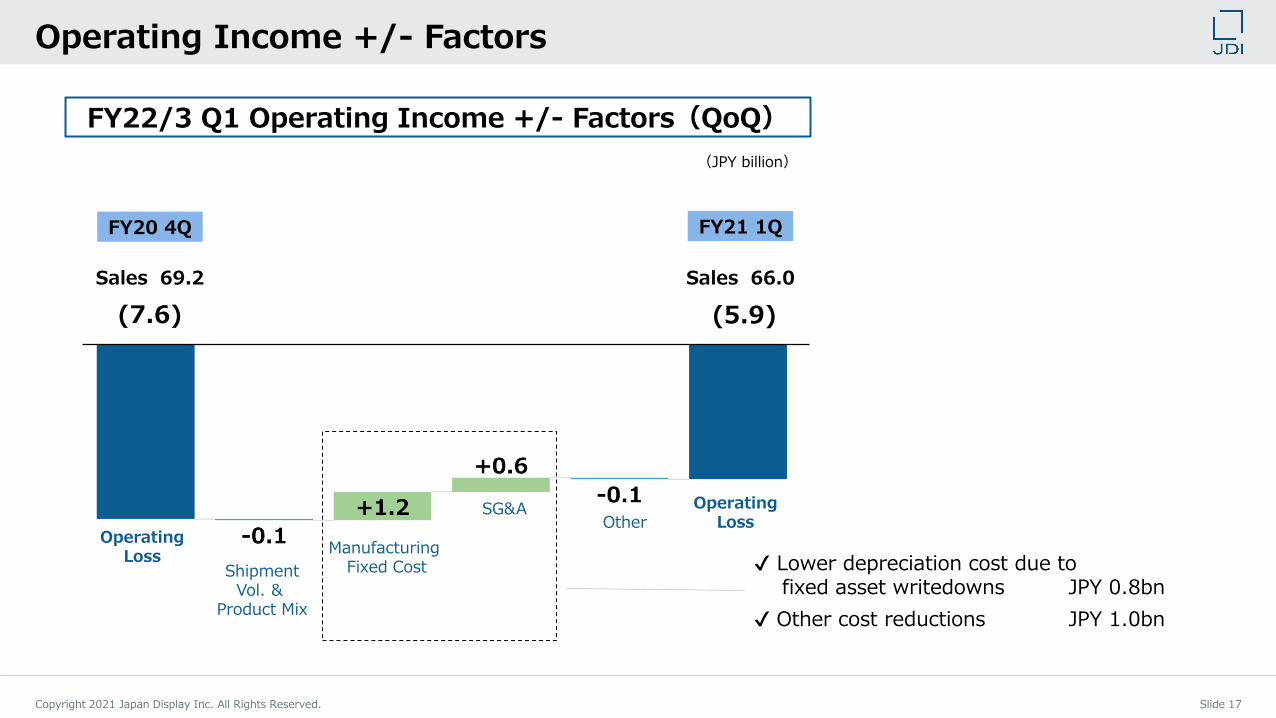
Operating Income +/- Factors
FY20 4Q
(7.6)
Sales 69.2
FY21 1Q
(5.9)
Sales 66.0
(JPY billion)
FY22/3 Q1 Operating Income +/- Factors(QoQ)
Manufacturing Fixed Cost
SG&AOther
OperatingLoss
OperatingLoss
ShipmentVol. &
Product Mix
✔ Lower depreciation cost due to fixed asset writedowns JPY 0.8bn
✔ Other cost reductions JPY 1.0bn
Copyright 2021 Japan Display Inc. All Rights Reserved. Slide 18
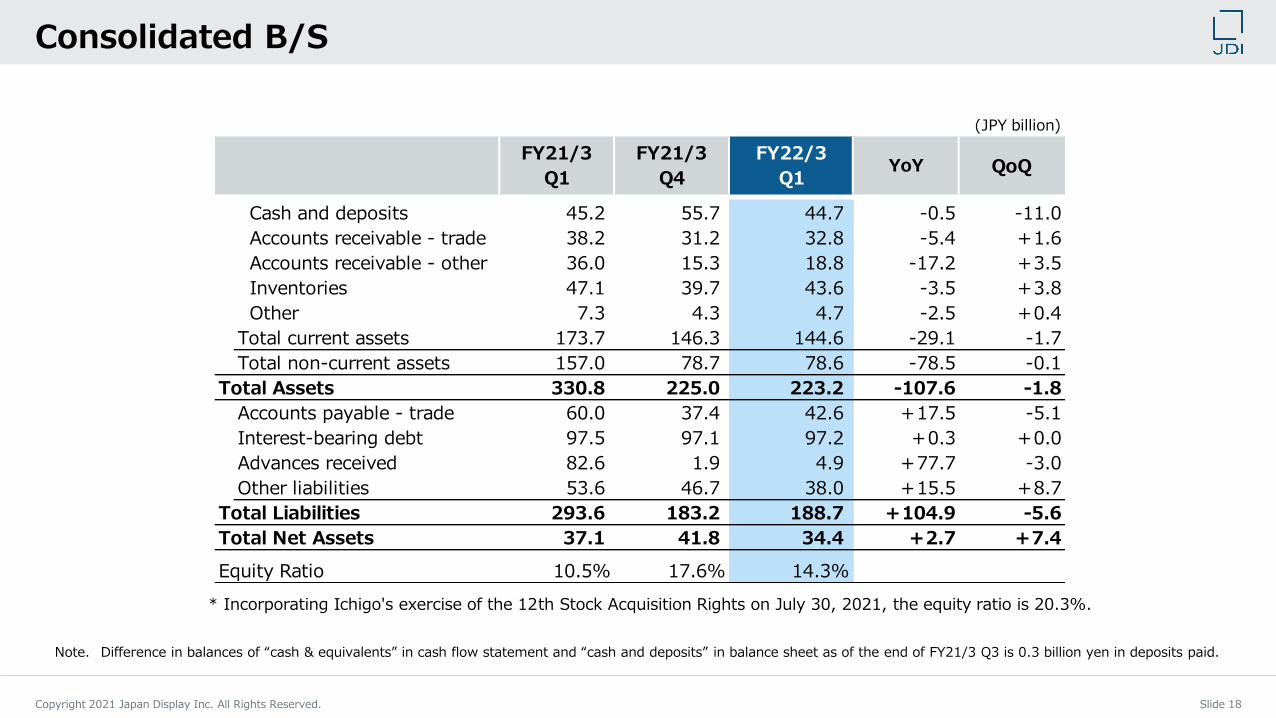
Consolidated B/S
* Incorporating Ichigo's exercise of the 12th Stock Acquisition Rights on July 30, 2021, the equity ratio is 20.3%.
Note. Difference in balances of “cash & equivalents” in cash flow statement and “cash and deposits” in balance sheet as of the end of FY21/3 Q3 is 0.3 billion yen in deposits paid.
*
(JPY billion)
FY21/3
Q1
FY21/3
Q4
FY22/3
Q1YoY QoQ
Cash and deposits 45.2 55.7 44.7 -0.5 -11.0
Accounts receivable - trade 38.2 31.2 32.8 -5.4 +1.6
Accounts receivable - other 36.0 15.3 18.8 -17.2 +3.5
Inventories 47.1 39.7 43.6 -3.5 +3.8
Other 7.3 4.3 4.7 -2.5 +0.4
Total current assets 173.7 146.3 144.6 -29.1 -1.7
Total non-current assets 157.0 78.7 78.6 -78.5 -0.1
Total Assets 330.8 225.0 223.2 -107.6 -1.8
Accounts payable - trade 60.0 37.4 42.6 +17.5 -5.1
Interest-bearing debt 97.5 97.1 97.2 +0.3 +0.0
Advances received 82.6 1.9 4.9 +77.7 -3.0
Other liabilities 53.6 46.7 38.0 +15.5 +8.7
Total Liabilities 293.6 183.2 188.7 +104.9 -5.6
Total Net Assets 37.1 41.8 34.4 +2.7 +7.4
Equity Ratio 10.5% 17.6% 14.3%
Copyright 2021 Japan Display Inc. All Rights Reserved. Slide 19
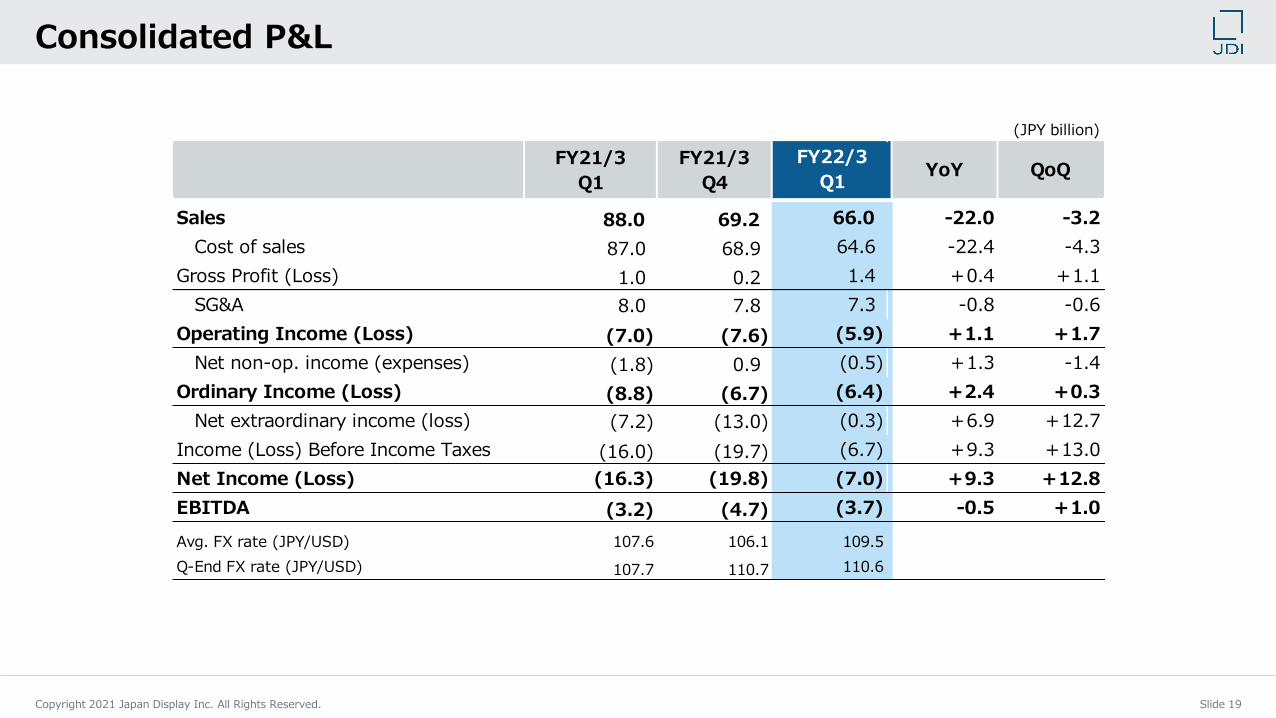
Consolidated P&L
(JPY billion)
FY21/3
Q1
FY21/3
Q4YoY QoQ
Sales 88.0 69.2 66.0 -22.0 -3.2
Cost of sales 87.0 68.9 64.6 -22.4 -4.3
Gross Profit (Loss) 1.0 0.2 1.4 +0.4 +1.1
SG&A 8.0 7.8 7.3 -0.8 -0.6
Operating Income (Loss) (7.0) (7.6) (5.9) +1.1 +1.7
Net non-op. income (expenses) (1.8) 0.9 (0.5) +1.3 -1.4
Ordinary Income (Loss) (8.8) (6.7) (6.4) +2.4 +0.3
Net extraordinary income (loss) (7.2) (13.0) (0.3) +6.9 +12.7
Income (Loss) Before Income Taxes (16.0) (19.7) (6.7) +9.3 +13.0
Net Income (Loss) (16.3) (19.8) (7.0) +9.3 +12.8
EBITDA (3.2) (4.7) (3.7) -0.5 +1.0
Avg. FX rate (JPY/USD) 107.6 106.1 109.5
Q-End FX rate (JPY/USD) 107.7 110.7 110.6
FY22/3
Q1
Copyright 2021 Japan Display Inc. All Rights Reserved. Slide 20
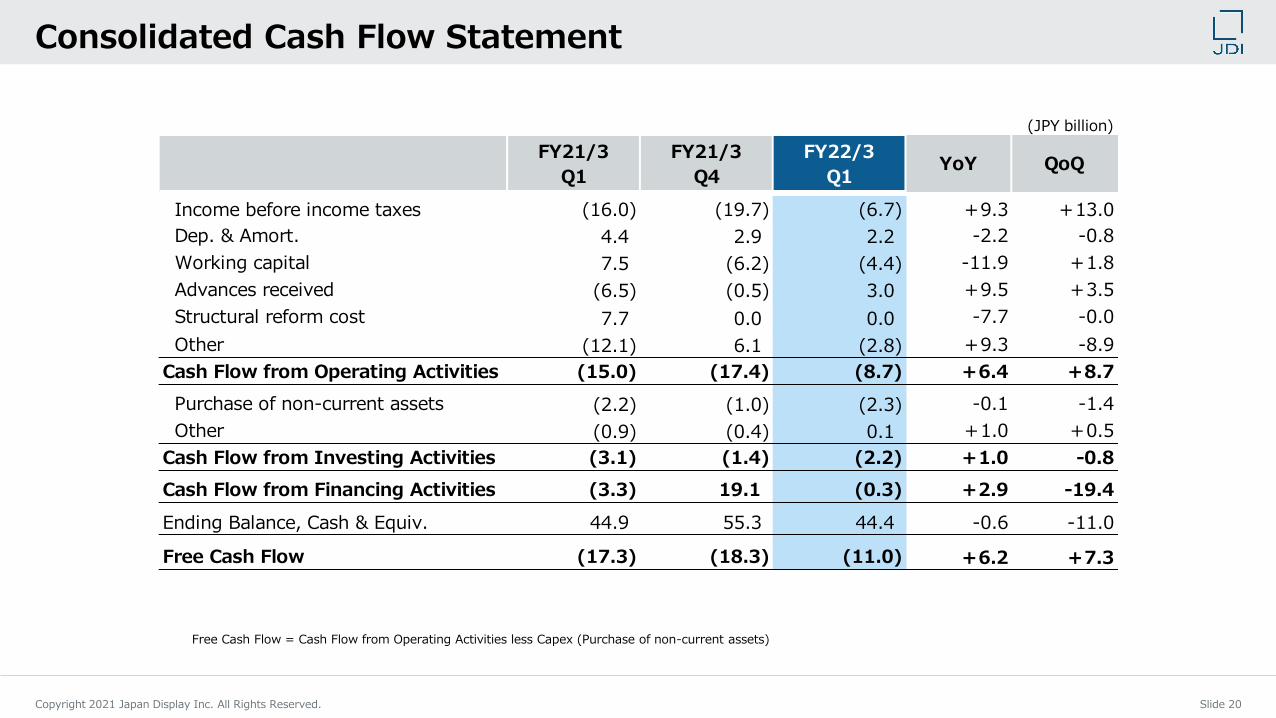
Consolidated Cash Flow Statement
Free Cash Flow = Cash Flow from Operating Activities less Capex (Purchase of non-current assets)
(JPY billion)
FY21/3
Q1
FY21/3
Q4
FY22/3
Q1YoY QoQ
Income before income taxes (16.0) (19.7) (6.7) +9.3 +13.0
Dep. & Amort. 4.4 2.9 2.2 -2.2 -0.8
Working capital 7.5 (6.2) (4.4) -11.9 +1.8
Advances received (6.5) (0.5) 3.0 +9.5 +3.5
Structural reform cost 7.7 0.0 0.0 -7.7 -0.0
Other (12.1) 6.1 (2.8) +9.3 -8.9
Cash Flow from Operating Activities (15.0) (17.4) (8.7) +6.4 +8.7
Purchase of non-current assets (2.2) (1.0) (2.3) -0.1 -1.4
Other (0.9) (0.4) 0.1 +1.0 +0.5
Cash Flow from Investing Activities (3.1) (1.4) (2.2) +1.0 -0.8
Cash Flow from Financing Activities (3.3) 19.1 (0.3) +2.9 -19.4
Ending Balance, Cash & Equiv. 44.9 55.3 44.4 -0.6 -11.0
Free Cash Flow (17.3) (18.3) (11.0) +6.2 +7.3
Copyright 2021 Japan Display Inc. All Rights Reserved. Slide 21
THANK YOU
Any information related to market trends or industries mentioned in this document is based on information available at present and JDI does not guarantee that this informationis accurate or complete.
Any plan, estimation, calculation, quotation, evaluation, prediction, expectation or other forward-looking information in this document is based on the current assumptions andbeliefs of JDI in light of the information currently available to it, and involves known and unknown risks, uncertainties, and other factors. Such risks, uncertainties and otherfactors may cause JDI’s actual results, performance, achievements or financial position to be materially different from any future results, performance, achievements or financialposition expressed or implied by such forward-looking information. Such risks, uncertainties and other factors include, without limitation: economic conditions and individualconsumption trends in Japan and overseas, currency exchange rate movements, trends in the market for smartphones and other electronic equipment, the management policiesof our major business partners and fluctuations in the price of raw materials.