q2fy19 earnings presentation october 2018 - godawari
TRANSCRIPT
Q2FY19 Earnings Presentation October 2018
Disclaimer
This presentation and the accompanying slides (the “Presentation”), which have been prepared by Godawari Power and Ispat Limited(the “Company”) solely for the information purposes and do not constitute any offer, recommendation or invitation to purchase orsubscribe for any securities, and shall not form the basis or be relied on in connection with any contract or binding commitment what soever. No offering of securities of the Company will be made except by means of a statutory offering document containing detailedinformation about the Company
Certain statements in this presentation concerning our future growth prospects are forwad looking statements which involve a numberof risks and uncertainties that could cause actual results to differ materially from those in such forward-looking statements. The Riskand uncertainties relating to the statements include, but are not limited to, risks and uncertainties regarding fiscal policy, competition,inflationary pressures and general economic conditions affecting demand / supply and price conditions in domestic and internationalmarkets. The company does not under take to update any forward -looking statement that may be made from time to time by or onbehalf of the company.
This Presentation has been prepared by the Company based on information and data which the Company considers reliable. ThisPresentation may not be all inclusive and may not contain all of the information that you may consider material. Any liability in respect ofthe contents of, or any omission from, this Presentation is expressly excluded. The Company does not make any promise toupdate/provide such presentation along with results to be declared in the coming years.
2
GPIL - Delivering Strong Quarterly Results
Q2FY19 Operational Highlights
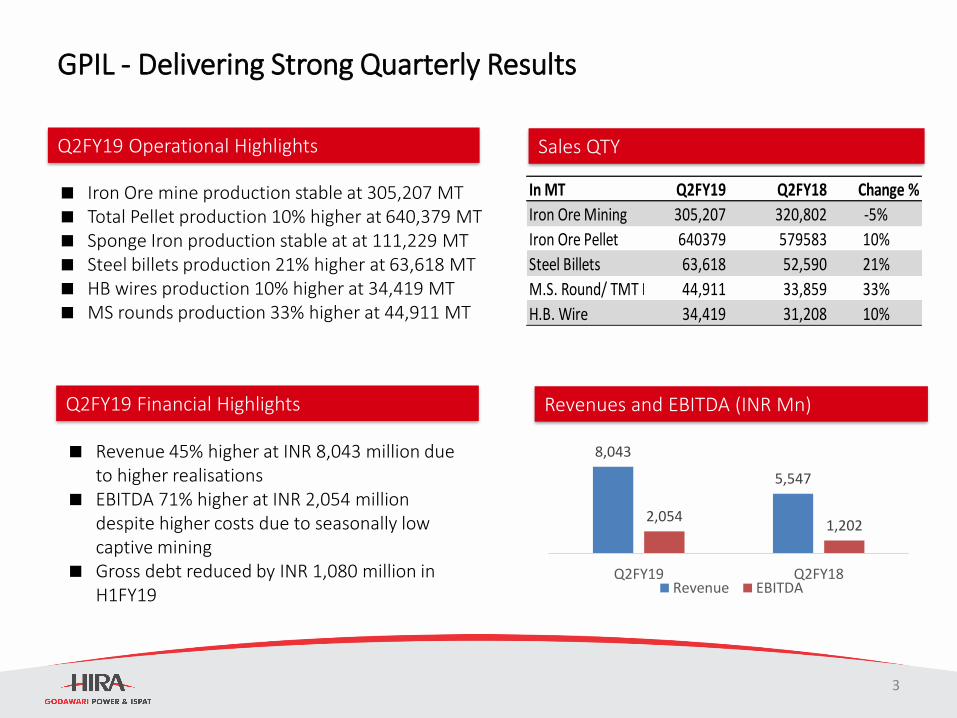
Iron Ore mine production stable at 305,207 MT Total Pellet production 10% higher at 640,379 MT Sponge Iron production stable at at 111,229 MT Steel billets production 21% higher at 63,618 MT HB wires production 10% higher at 34,419 MT MS rounds production 33% higher at 44,911 MT
Q2FY19 Financial Highlights
Revenue 45% higher at INR 8,043 million due to higher realisations
EBITDA 71% higher at INR 2,054 million despite higher costs due to seasonally low captive mining
Gross debt reduced by INR 1,080 million in H1FY19
Revenues and EBITDA (INR Mn)
Sales QTY
8,043
5,547
2,0541,202
Q2FY19 Q2FY18Revenue EBITDA
In MT Q2FY19 Q2FY18 Change %
Iron Ore Mining 305,207 320,802 -5%
Iron Ore Pellet 640379 579583 10%
Steel Billets 63,618 52,590 21%
M.S. Round/ TMT Bar 44,911 33,859 33%
H.B. Wire 34,419 31,208 10%
3
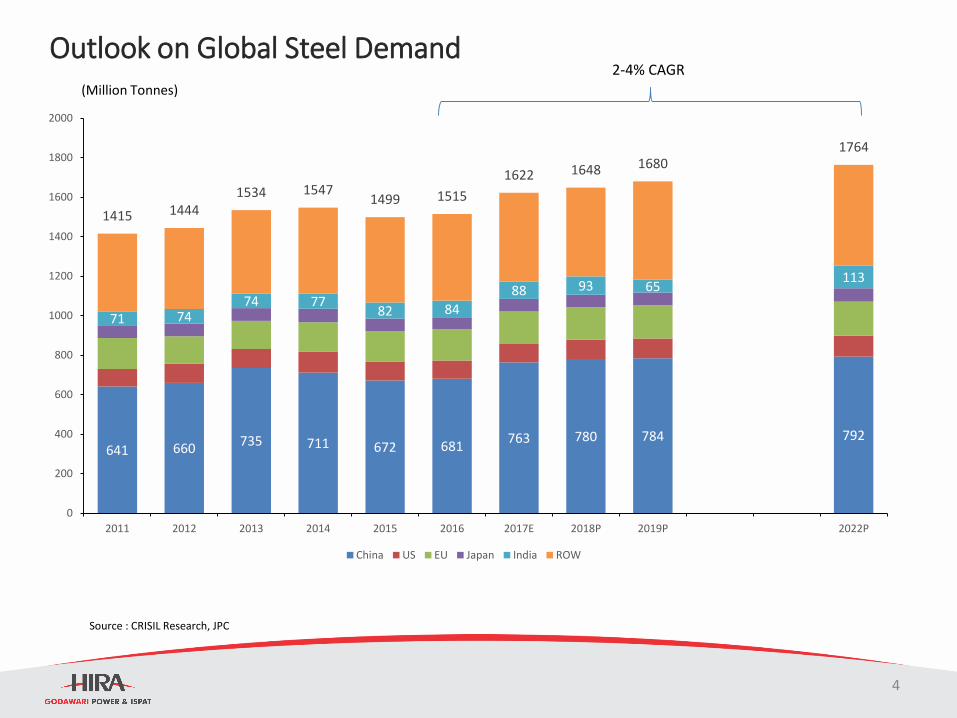
Outlook on Global Steel Demand
641 660735 711 672 681
763 780 784 792
71 7474 77
82 84
88 93 65113
1415 14441534 1547
1499 1515
1622 1648 16801764
0
200
400
600
800
1000
1200
1400
1600
1800
2000
2011 2012 2013 2014 2015 2016 2017E 2018P 2019P 2022P
China US EU Japan India ROW
Source : CRISIL Research, JPC
(Million Tonnes)
2-4% CAGR
4
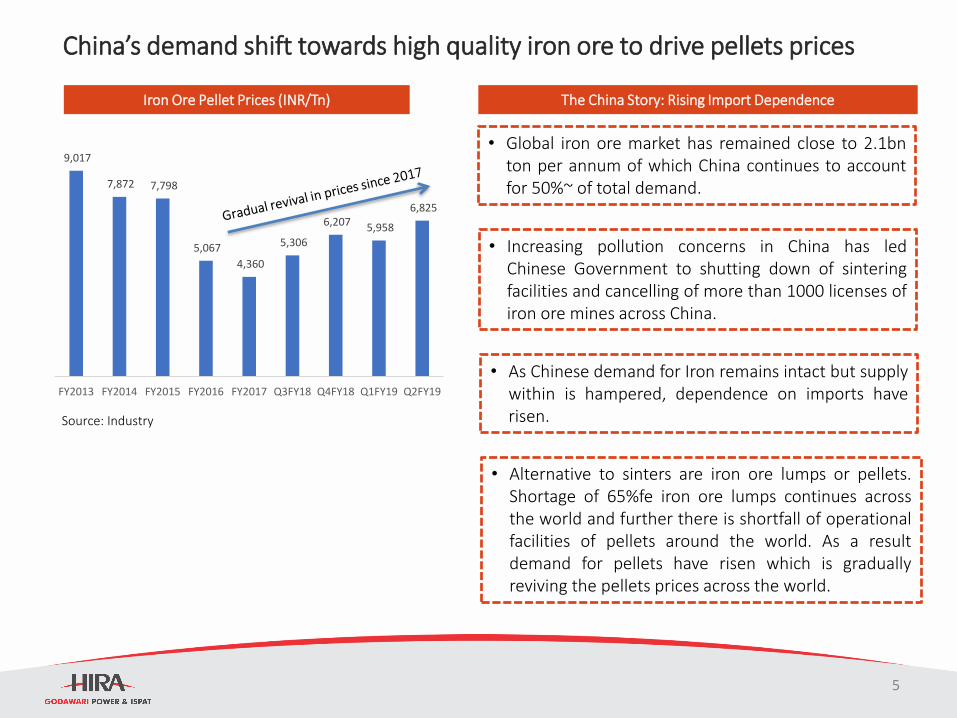
9,017
7,872 7,798
5,067
4,360
5,306
6,207 5,958
6,825
FY2013 FY2014 FY2015 FY2016 FY2017 Q3FY18 Q4FY18 Q1FY19 Q2FY19
China’s demand shift towards high quality iron ore to drive pellets prices
Iron Ore Pellet Prices (INR/Tn)
Source: Industry
The China Story: Rising Import Dependence
• As Chinese demand for Iron remains intact but supplywithin is hampered, dependence on imports haverisen.
• Alternative to sinters are iron ore lumps or pellets.Shortage of 65%fe iron ore lumps continues acrossthe world and further there is shortfall of operationalfacilities of pellets around the world. As a resultdemand for pellets have risen which is graduallyreviving the pellets prices across the world.
• Increasing pollution concerns in China has ledChinese Government to shutting down of sinteringfacilities and cancelling of more than 1000 licenses ofiron ore mines across China.
• Global iron ore market has remained close to 2.1bnton per annum of which China continues to accountfor 50%~ of total demand.
5
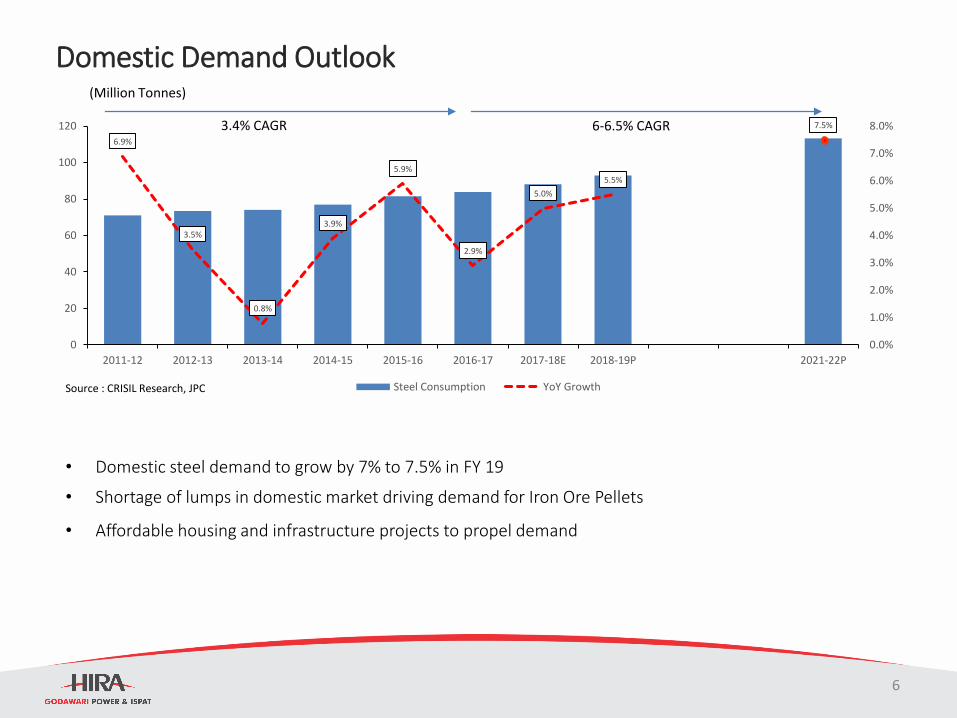
Domestic Demand Outlook
6.9%
3.5%
0.8%
3.9%
5.9%
2.9%
5.0%
5.5%
7.5%
0.0%
1.0%
2.0%
3.0%
4.0%
5.0%
6.0%
7.0%
8.0%
0
20
40
60
80
100
120
2011-12 2012-13 2013-14 2014-15 2015-16 2016-17 2017-18E 2018-19P 2021-22P
Steel Consumption YoY GrowthSource : CRISIL Research, JPC
• Domestic steel demand to grow by 7% to 7.5% in FY 19
• Shortage of lumps in domestic market driving demand for Iron Ore Pellets
• Affordable housing and infrastructure projects to propel demand
(Million Tonnes)
3.4% CAGR 6-6.5% CAGR
6
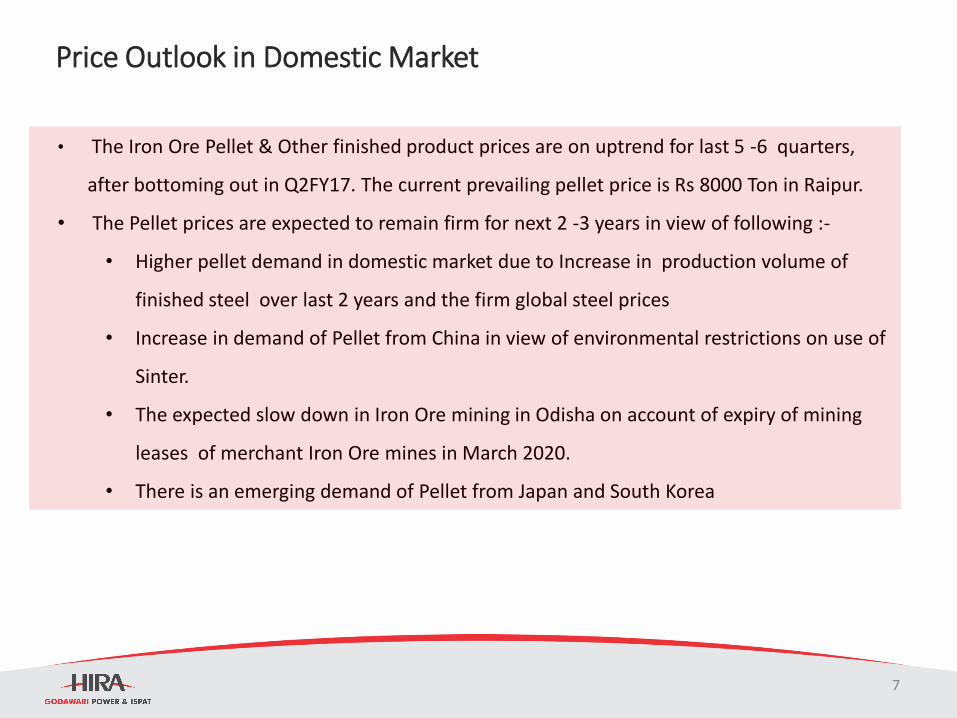
Price Outlook in Domestic Market
• The Iron Ore Pellet & Other finished product prices are on uptrend for last 5 -6 quarters,
after bottoming out in Q2FY17. The current prevailing pellet price is Rs 8000 Ton in Raipur.
• The Pellet prices are expected to remain firm for next 2 -3 years in view of following :-
• Higher pellet demand in domestic market due to Increase in production volume of
finished steel over last 2 years and the firm global steel prices
• Increase in demand of Pellet from China in view of environmental restrictions on use of
Sinter.
• The expected slow down in Iron Ore mining in Odisha on account of expiry of mining
leases of merchant Iron Ore mines in March 2020.
• There is an emerging demand of Pellet from Japan and South Korea
7
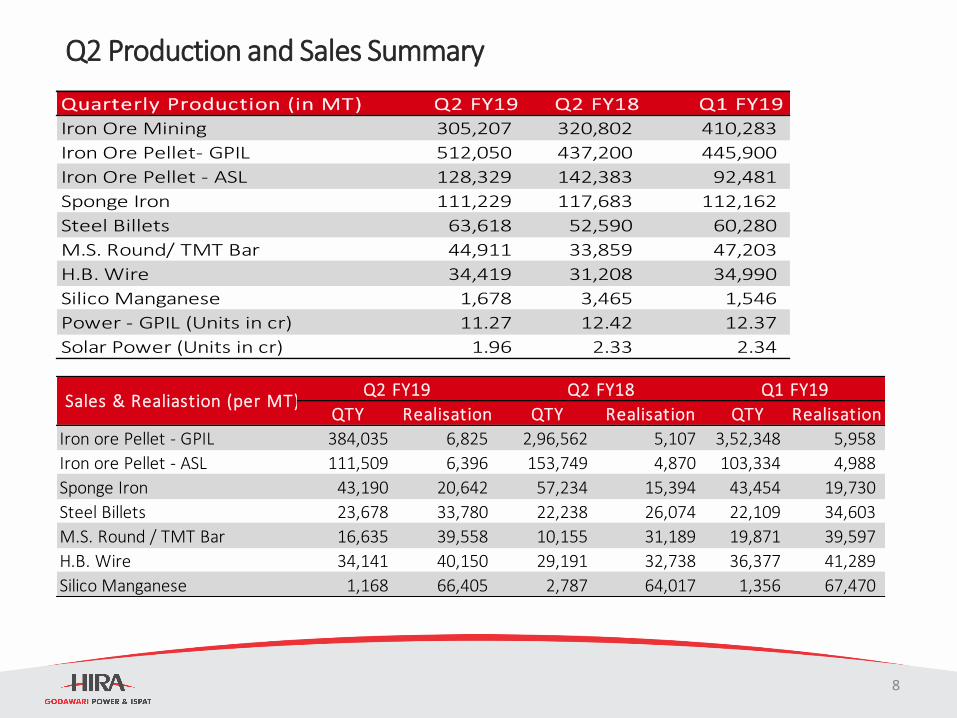
Q2 Production and Sales Summary
Quarterly Production (in MT) Q2 FY19 Q2 FY18 Q1 FY19
Iron Ore Mining 305,207 320,802 410,283
Iron Ore Pellet- GPIL 512,050 437,200 445,900
Iron Ore Pellet - ASL 128,329 142,383 92,481
Sponge Iron 111,229 117,683 112,162
Steel Billets 63,618 52,590 60,280
M.S. Round/ TMT Bar 44,911 33,859 47,203
H.B. Wire 34,419 31,208 34,990
Silico Manganese 1,678 3,465 1,546
Power - GPIL (Units in cr) 11.27 12.42 12.37
Solar Power (Units in cr) 1.96 2.33 2.34
QTY Realisation QTY Realisation QTY Realisation
Iron ore Pellet - GPIL 384,035 6,825 2,96,562 5,107 3,52,348 5,958
Iron ore Pellet - ASL 111,509 6,396 153,749 4,870 103,334 4,988
Sponge Iron 43,190 20,642 57,234 15,394 43,454 19,730
Steel Billets 23,678 33,780 22,238 26,074 22,109 34,603
M.S. Round / TMT Bar 16,635 39,558 10,155 31,189 19,871 39,597
H.B. Wire 34,141 40,150 29,191 32,738 36,377 41,289
Silico Manganese 1,168 66,405 2,787 64,017 1,356 67,470
Q2 FY19 Q2 FY18 Q1 FY19 Sales & Realiastion (per MT)
8
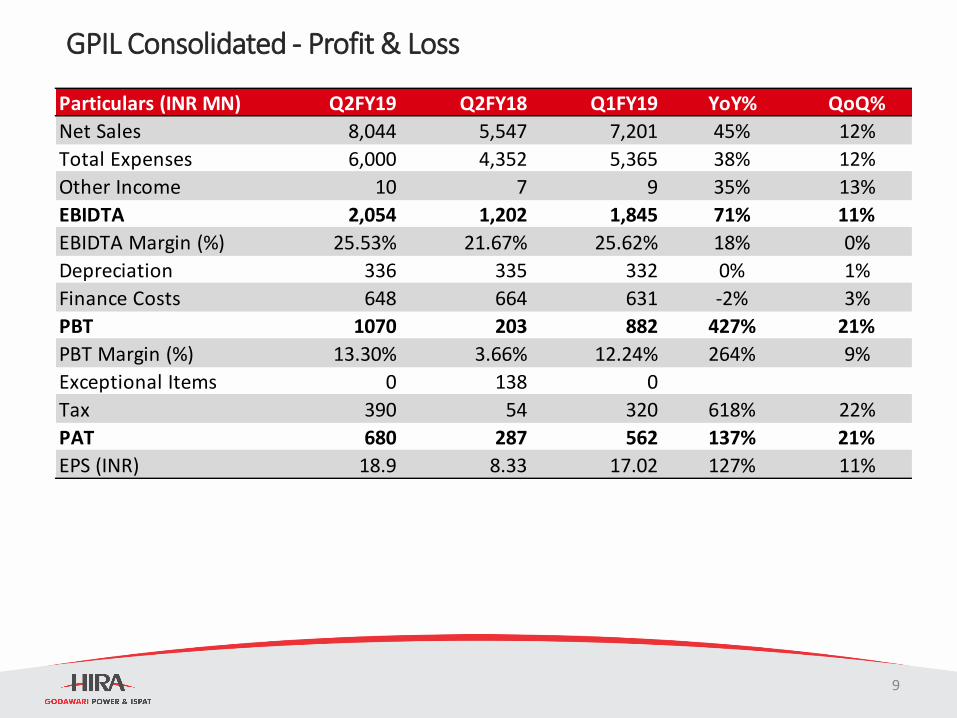
GPIL Consolidated - Profit & Loss
Particulars (INR MN) Q2FY19 Q2FY18 Q1FY19 YoY% QoQ%
Net Sales 8,044 5,547 7,201 45% 12%
Total Expenses 6,000 4,352 5,365 38% 12%
Other Income 10 7 9 35% 13%
EBIDTA 2,054 1,202 1,845 71% 11%
EBIDTA Margin (%) 25.53% 21.67% 25.62% 18% 0%
Depreciation 336 335 332 0% 1%
Finance Costs 648 664 631 -2% 3%
PBT 1070 203 882 427% 21%
PBT Margin (%) 13.30% 3.66% 12.24% 264% 9%
Exceptional Items 0 138 0
Tax 390 54 320 618% 22%
PAT 680 287 562 137% 21%
EPS (INR) 18.9 8.33 17.02 127% 11%
9
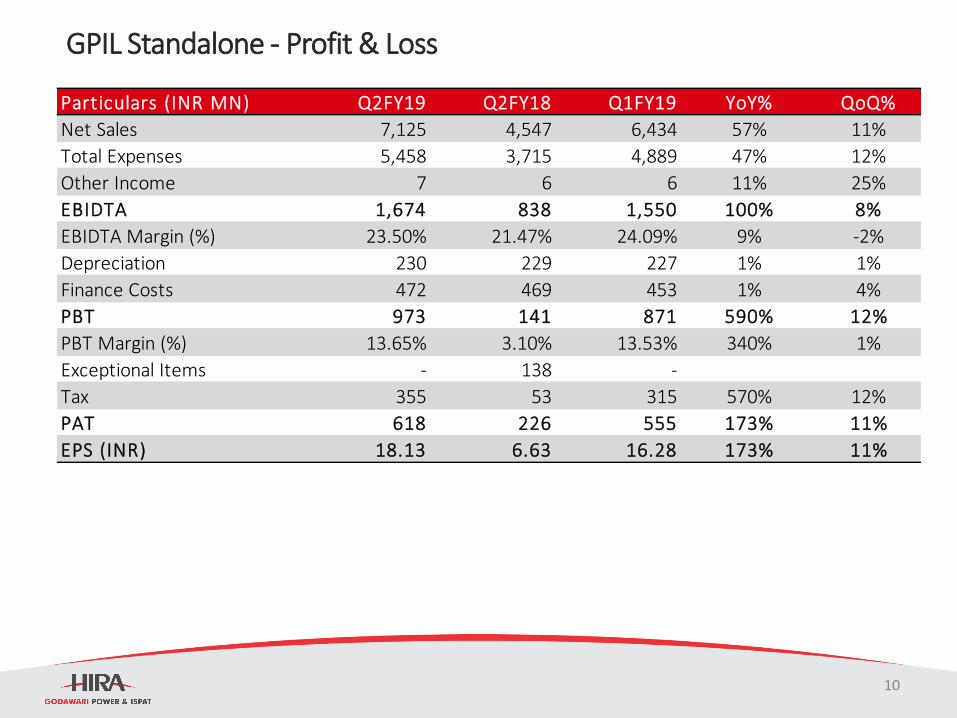
GPIL Standalone - Profit & Loss
Particulars (INR MN) Q2FY19 Q2FY18 Q1FY19 YoY% QoQ%
Net Sales 7,125 4,547 6,434 57% 11%
Total Expenses 5,458 3,715 4,889 47% 12%
Other Income 7 6 6 11% 25%
EBIDTA 1,674 838 1,550 100% 8%
EBIDTA Margin (%) 23.50% 21.47% 24.09% 9% -2%
Depreciation 230 229 227 1% 1%
Finance Costs 472 469 453 1% 4%
PBT 973 141 871 590% 12%
PBT Margin (%) 13.65% 3.10% 13.53% 340% 1%
Exceptional Items - 138 -
Tax 355 53 315 570% 12%
PAT 618 226 555 173% 11%
EPS (INR) 18.13 6.63 16.28 173% 11%
10
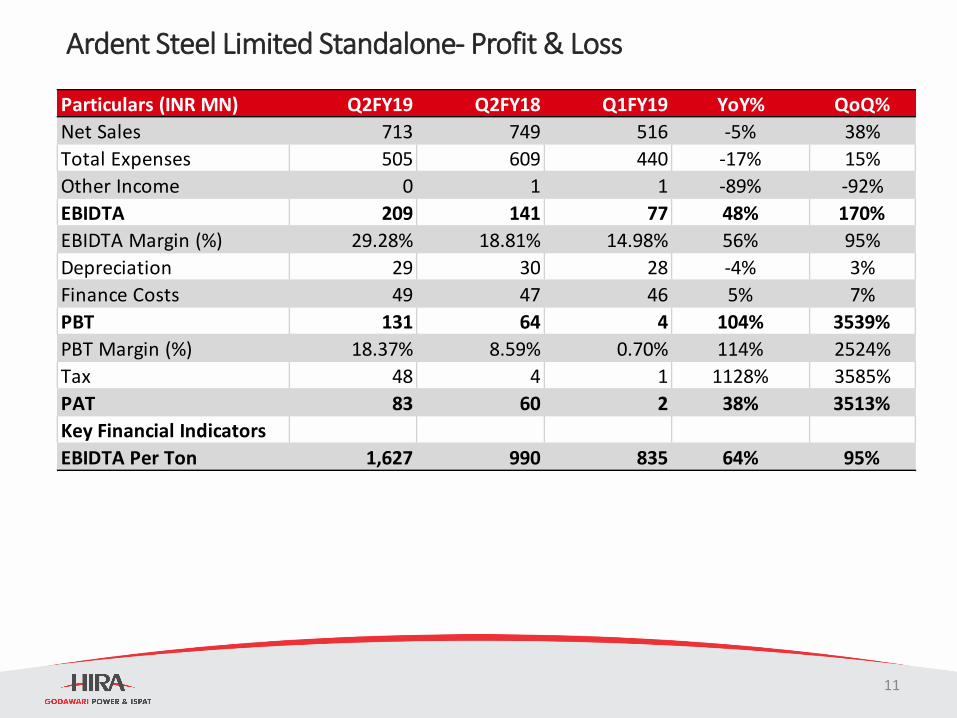
Ardent Steel Limited Standalone- Profit & Loss
Particulars (INR MN) Q2FY19 Q2FY18 Q1FY19 YoY% QoQ%
Net Sales 713 749 516 -5% 38%
Total Expenses 505 609 440 -17% 15%
Other Income 0 1 1 -89% -92%
EBIDTA 209 141 77 48% 170%
EBIDTA Margin (%) 29.28% 18.81% 14.98% 56% 95%
Depreciation 29 30 28 -4% 3%
Finance Costs 49 47 46 5% 7%
PBT 131 64 4 104% 3539%
PBT Margin (%) 18.37% 8.59% 0.70% 114% 2524%
Tax 48 4 1 1128% 3585%
PAT 83 60 2 38% 3513%
Key Financial Indicators
EBIDTA Per Ton 1,627 990 835 64% 95%
11
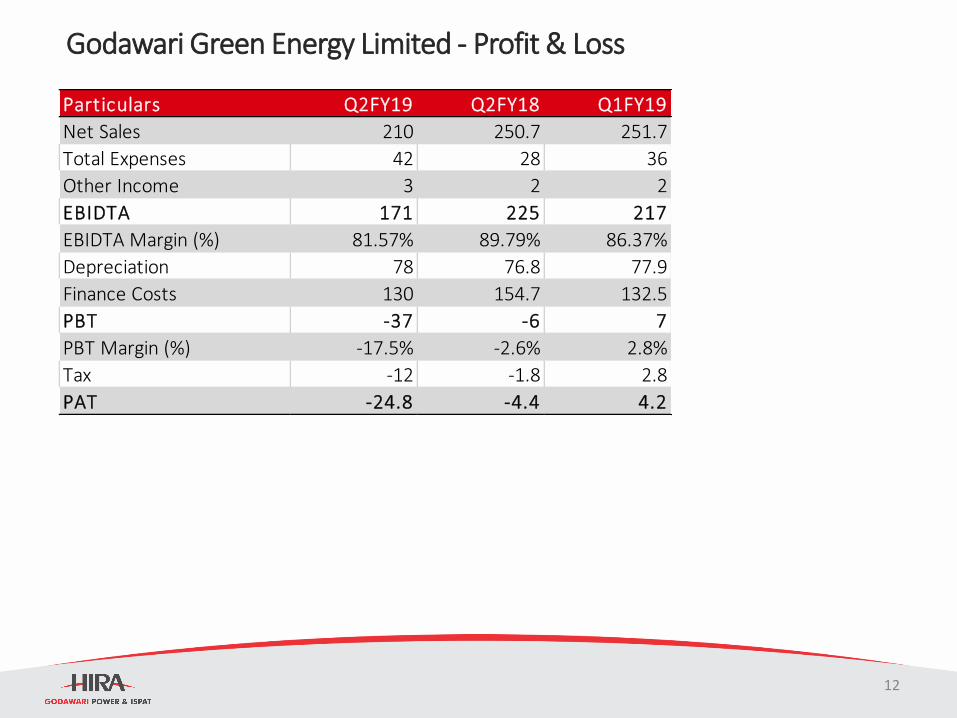
Godawari Green Energy Limited - Profit & Loss
Particulars Q2FY19 Q2FY18 Q1FY19
Net Sales 210 250.7 251.7
Total Expenses 42 28 36
Other Income 3 2 2
EBIDTA 171 225 217
EBIDTA Margin (%) 81.57% 89.79% 86.37%
Depreciation 78 76.8 77.9
Finance Costs 130 154.7 132.5
PBT -37 -6 7
PBT Margin (%) -17.5% -2.6% 2.8%
Tax -12 -1.8 2.8
PAT -24.8 -4.4 4.2
12
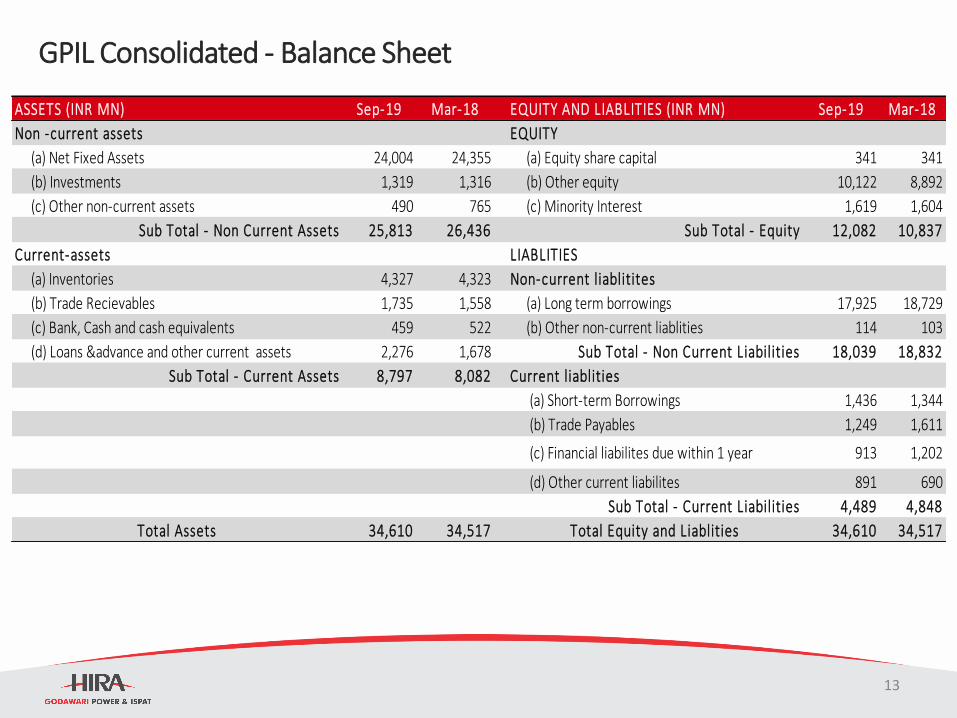
GPIL Consolidated - Balance Sheet
ASSETS (INR MN) Sep-19 Mar-18 EQUITY AND LIABLITIES (INR MN) Sep-19 Mar-18
Non -current assets EQUITY
(a) Net Fixed Assets 24,004 24,355 (a) Equity share capital 341 341
(b) Investments 1,319 1,316 (b) Other equity 10,122 8,892
(c) Other non-current assets 490 765 (c) Minority Interest 1,619 1,604
Sub Total - Non Current Assets 25,813 26,436 Sub Total - Equity 12,082 10,837
Current-assets LIABLITIES
(a) Inventories 4,327 4,323 Non-current liablitites
(b) Trade Recievables 1,735 1,558 (a) Long term borrowings 17,925 18,729
(c) Bank, Cash and cash equivalents 459 522 (b) Other non-current liablities 114 103
(d) Loans &advance and other current assets 2,276 1,678 Sub Total - Non Current Liabilities 18,039 18,832
Sub Total - Current Assets 8,797 8,082 Current liablities
(a) Short-term Borrowings 1,436 1,344
(b) Trade Payables 1,249 1,611
(c) Financial liabilites due within 1 year 913 1,202
(d) Other current liabilites 891 690
Sub Total - Current Liabilities 4,489 4,848
Total Assets 34,610 34,517 Total Equity and Liablities 34,610 34,517
13
Investor PresentationOctober 2018
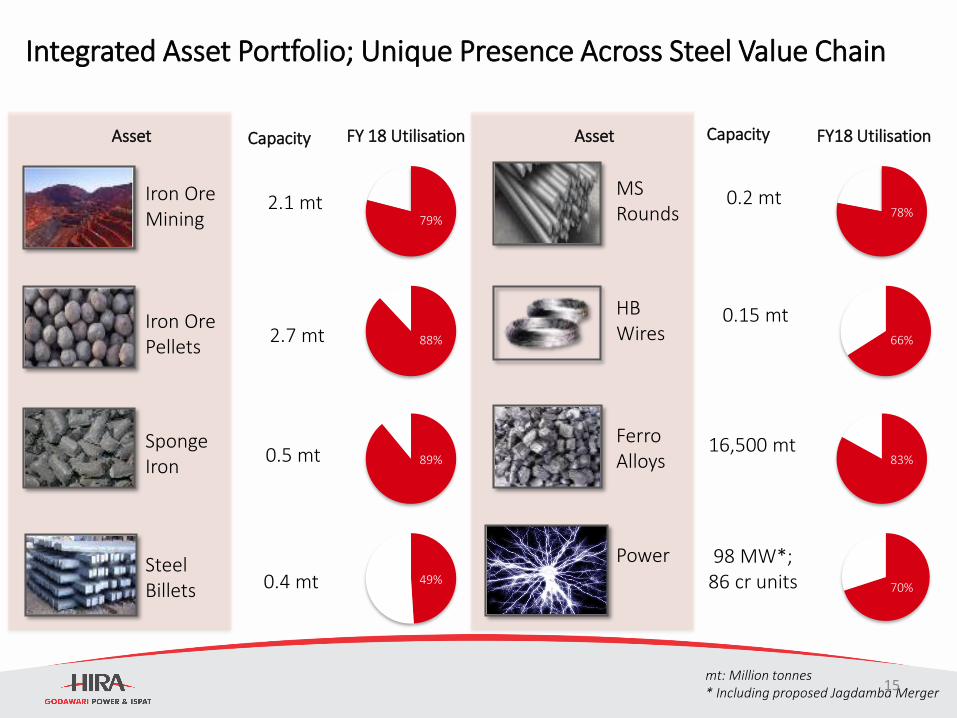
Integrated Asset Portfolio; Unique Presence Across Steel Value Chain
Iron OreMining
Steel Billets
SpongeIron
Iron OrePellets
HB Wires
MSRounds
FerroAlloys
Power
2.1 mt
2.7 mt
0.5 mt
0.4 mt
0.2 mt
0.15 mt
16,500 mt
98 MW*;86 cr units
Asset Capacity FY 18 Utilisation Asset Capacity FY18 Utilisation
79%
88%
89%
49%
78%
66%
83%
70%
mt: Million tonnes* Including proposed Jagdamba Merger15
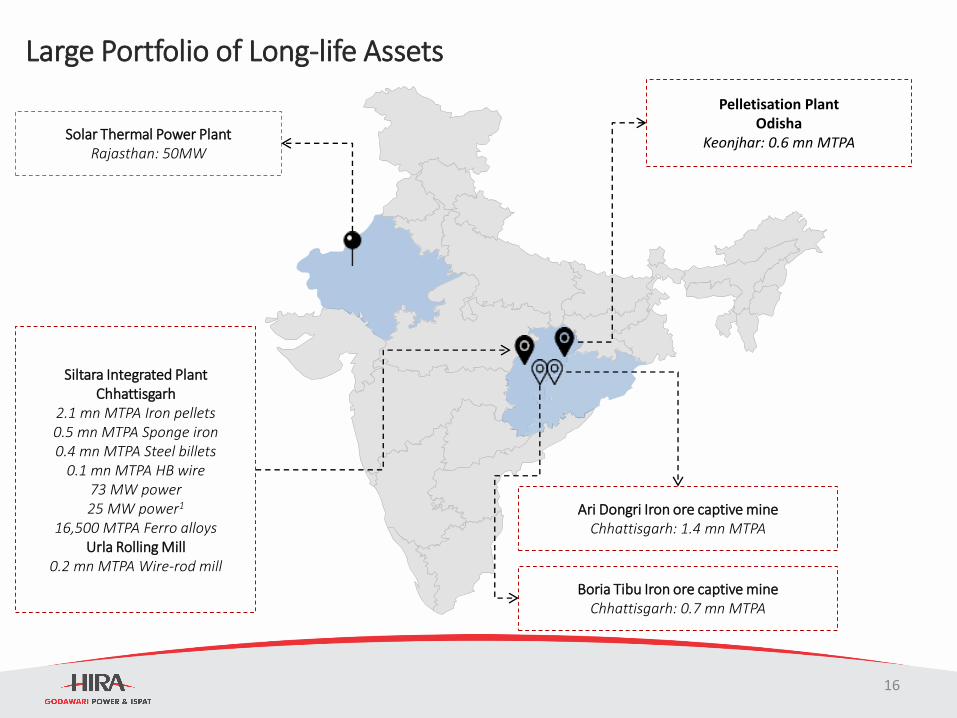
Large Portfolio of Long-life Assets
Solar Thermal Power PlantRajasthan: 50MW
Ari Dongri Iron ore captive mineChhattisgarh: 1.4 mn MTPA
Boria Tibu Iron ore captive mineChhattisgarh: 0.7 mn MTPA
Siltara Integrated PlantChhattisgarh
2.1 mn MTPA Iron pellets0.5 mn MTPA Sponge iron0.4 mn MTPA Steel billets
0.1 mn MTPA HB wire73 MW power25 MW power1
16,500 MTPA Ferro alloysUrla Rolling Mill
0.2 mn MTPA Wire-rod mill
Pelletisation PlantOdisha
Keonjhar: 0.6 mn MTPA
16
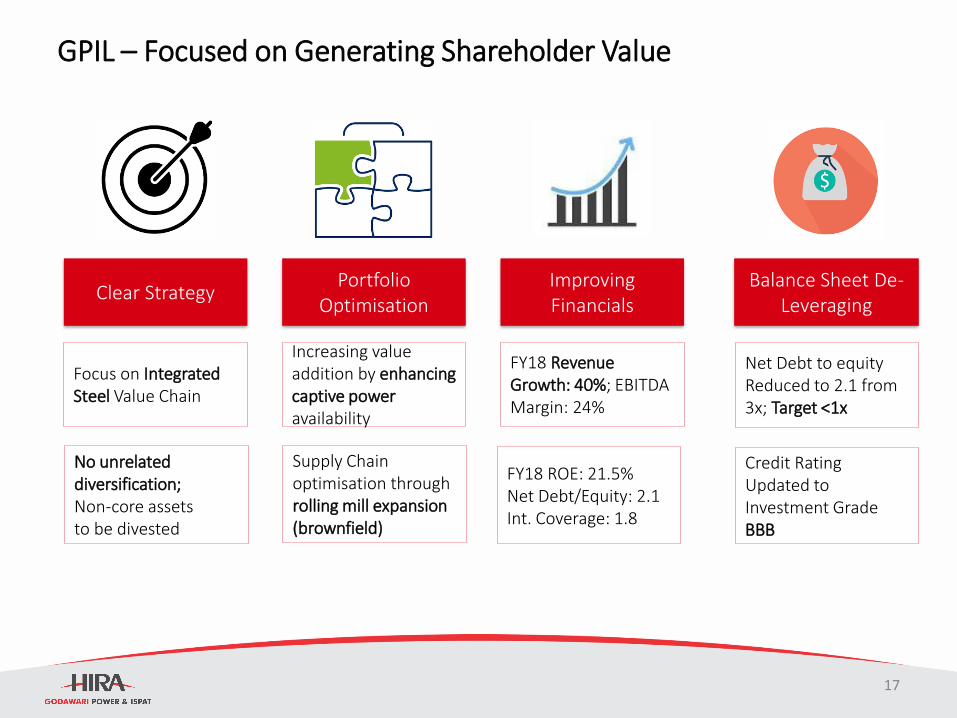
GPIL – Focused on Generating Shareholder Value
Credit Rating Updated to Investment Grade BBB
No unrelated diversification; Non-core assets to be divested
Supply Chain optimisation through rolling mill expansion (brownfield)
Balance Sheet De-Leveraging
Clear StrategyPortfolio
OptimisationImproving Financials
Net Debt to equity Reduced to 2.1 from 3x; Target <1x
Focus on Integrated Steel Value Chain
Increasing value addition by enhancing captive poweravailability
FY18 Revenue Growth: 40%; EBITDA Margin: 24%
FY18 ROE: 21.5%Net Debt/Equity: 2.1Int. Coverage: 1.8
17
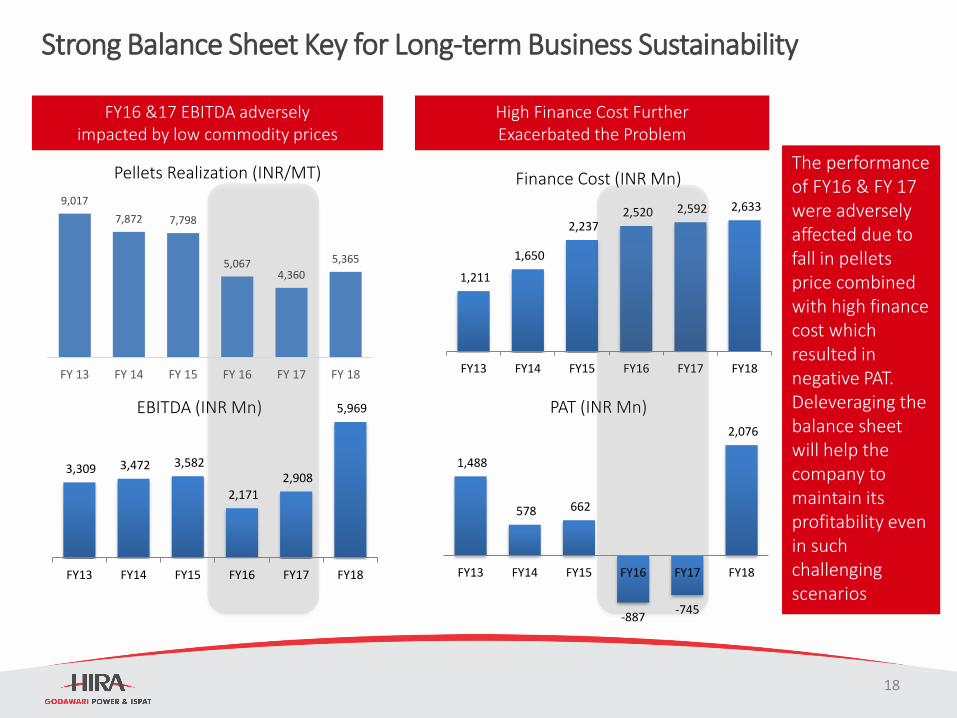
Strong Balance Sheet Key for Long-term Business Sustainability
FY16 &17 EBITDA adversely impacted by low commodity prices
High Finance Cost Further Exacerbated the Problem
The performance of FY16 & FY 17 were adversely affected due to fall in pellets price combined with high finance cost which resulted in negative PAT.Deleveraging the balance sheet will help the company to maintain its profitability even in such challenging scenarios
EBITDA (INR Mn) PAT (INR Mn)
Finance Cost (INR Mn)9,017
7,872 7,798
5,0674,360
5,365
FY 13 FY 14 FY 15 FY 16 FY 17 FY 18
1,211
1,650
2,237 2,520 2,592 2,633
FY13 FY14 FY15 FY16 FY17 FY18
3,309 3,472 3,582
2,171
2,908
5,969
FY13 FY14 FY15 FY16 FY17 FY18
1,488
578 662
-887 -745
2,076
FY13 FY14 FY15 FY16 FY17 FY18
Pellets Realization (INR/MT)
18
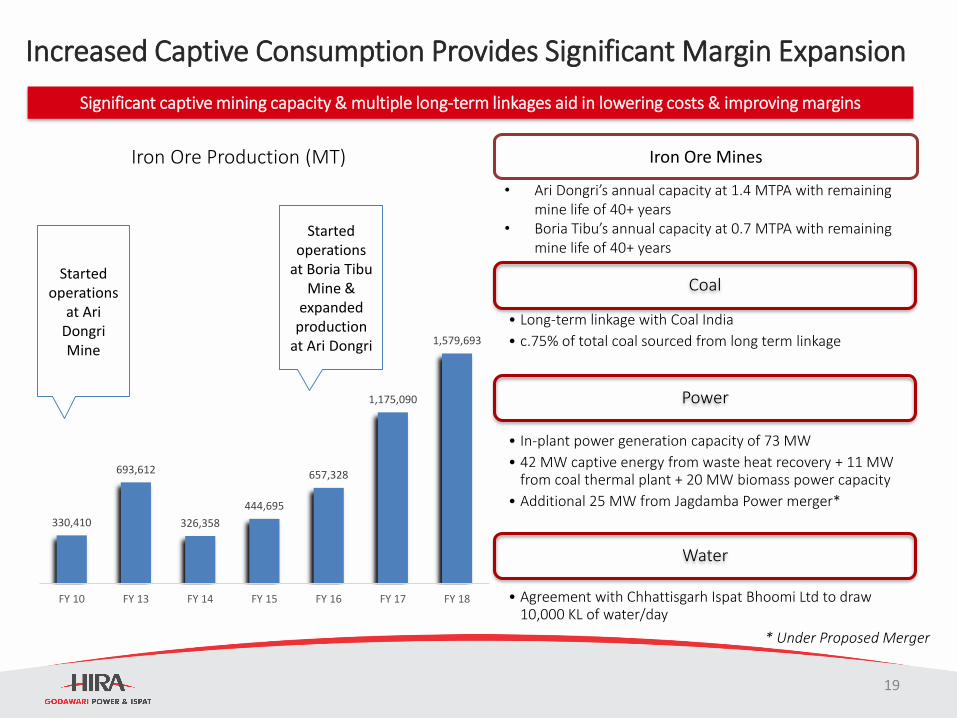
Increased Captive Consumption Provides Significant Margin Expansion
Coal
• Long-term linkage with Coal India
• c.75% of total coal sourced from long term linkage
Power
• In-plant power generation capacity of 73 MW
• 42 MW captive energy from waste heat recovery + 11 MW from coal thermal plant + 20 MW biomass power capacity
• Additional 25 MW from Jagdamba Power merger*
Water
• Agreement with Chhattisgarh Ispat Bhoomi Ltd to draw 10,000 KL of water/day
Significant captive mining capacity & multiple long-term linkages aid in lowering costs & improving margins
Iron Ore Production (MT)
330,410
693,612
326,358
444,695
657,328
1,175,090
1,579,693
FY 10 FY 13 FY 14 FY 15 FY 16 FY 17 FY 18
Started operations
at Ari DongriMine
Started operations
at Boria TibuMine &
expanded production
at Ari Dongri
* Under Proposed Merger
Iron Ore Mines
• Ari Dongri’s annual capacity at 1.4 MTPA with remaining mine life of 40+ years
• Boria Tibu’s annual capacity at 0.7 MTPA with remaining mine life of 40+ years
19
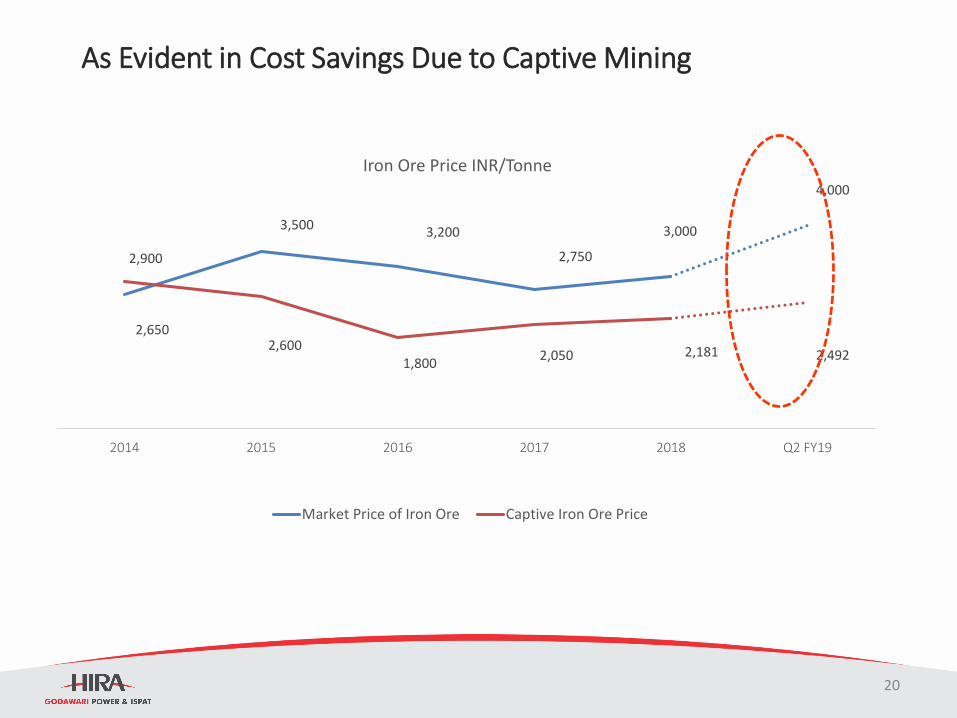
As Evident in Cost Savings Due to Captive Mining
2,650
3,500 3,200
2,750
3,000
4,000
2,900
2,6001,800
2,050 2,181 2,492
2014 2015 2016 2017 2018 Q2 FY19
Iron Ore Price INR/Tonne
Market Price of Iron Ore Captive Iron Ore Price
20
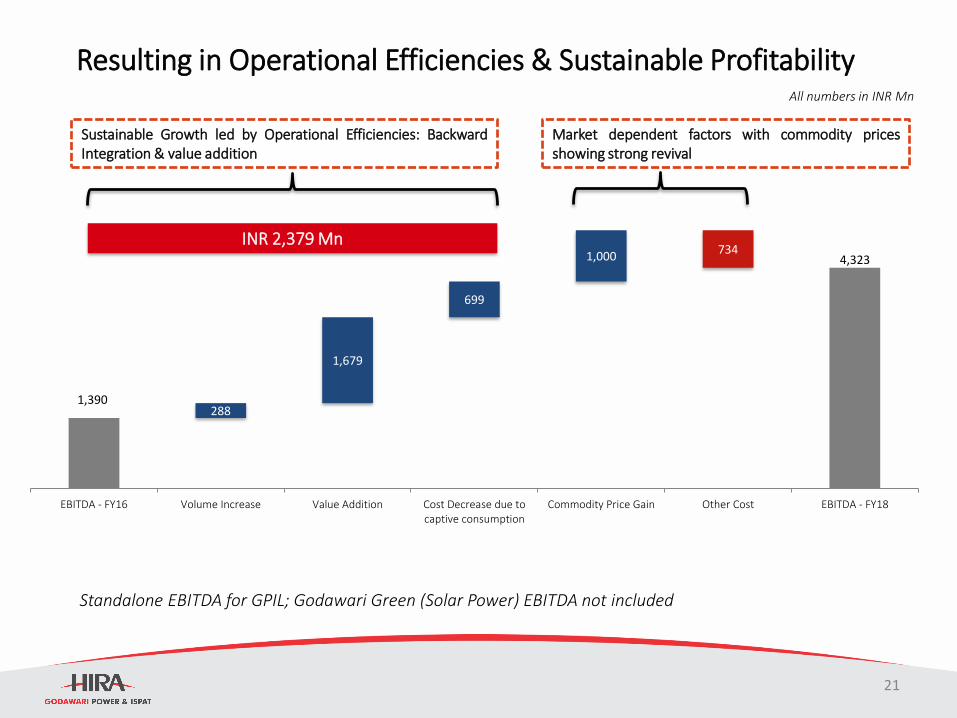
Resulting in Operational Efficiencies & Sustainable Profitability
1,390
4,323
288
1,679
699
1,000734
EBITDA - FY16 Volume Increase Value Addition Cost Decrease due tocaptive consumption
Commodity Price Gain Other Cost EBITDA - FY18
Sustainable Growth led by Operational Efficiencies: BackwardIntegration & value addition
Market dependent factors with commodity pricesshowing strong revival
INR 2,379 Mn
All numbers in INR Mn
Standalone EBITDA for GPIL; Godawari Green (Solar Power) EBITDA not included
21
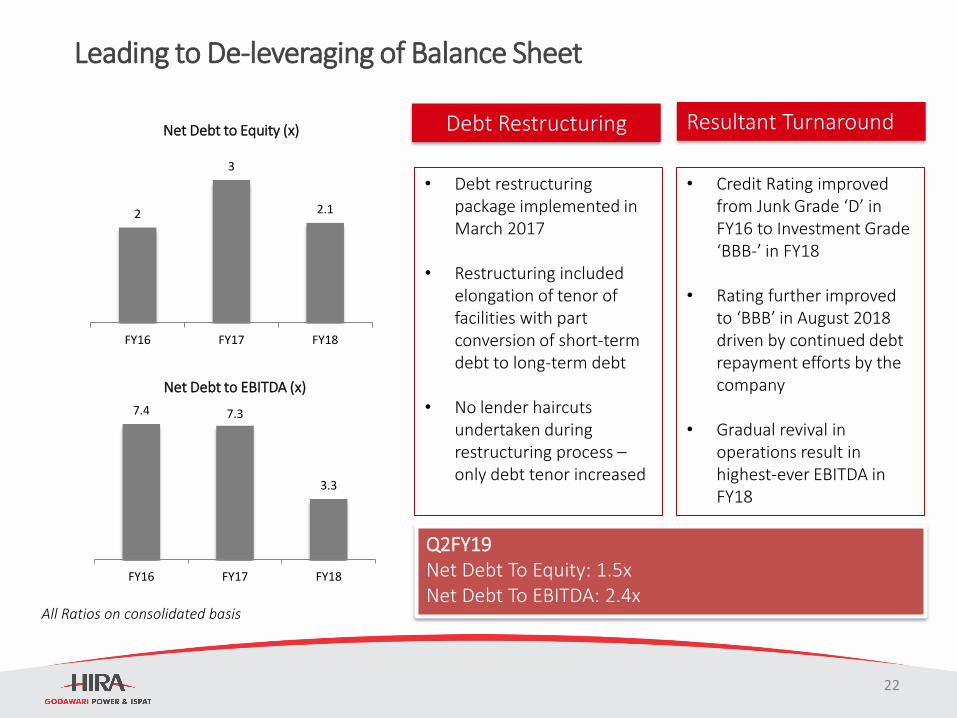
Leading to De-leveraging of Balance Sheet
2
3
2.1
FY16 FY17 FY18
Net Debt to Equity (x)
7.4 7.3
3.3
FY16 FY17 FY18
Net Debt to EBITDA (x)
• Debt restructuring package implemented in March 2017
• Restructuring included elongation of tenor of facilities with part conversion of short-term debt to long-term debt
• No lender haircuts undertaken during restructuring process –only debt tenor increased
Debt Restructuring
• Credit Rating improved from Junk Grade ‘D’ in FY16 to Investment Grade ‘BBB-’ in FY18
• Rating further improved to ‘BBB’ in August 2018 driven by continued debt repayment efforts by the company
• Gradual revival in operations result in highest-ever EBITDA in FY18
Resultant Turnaround
All Ratios on consolidated basis
Q2FY19Net Debt To Equity: 1.5xNet Debt To EBITDA: 2.4x
22
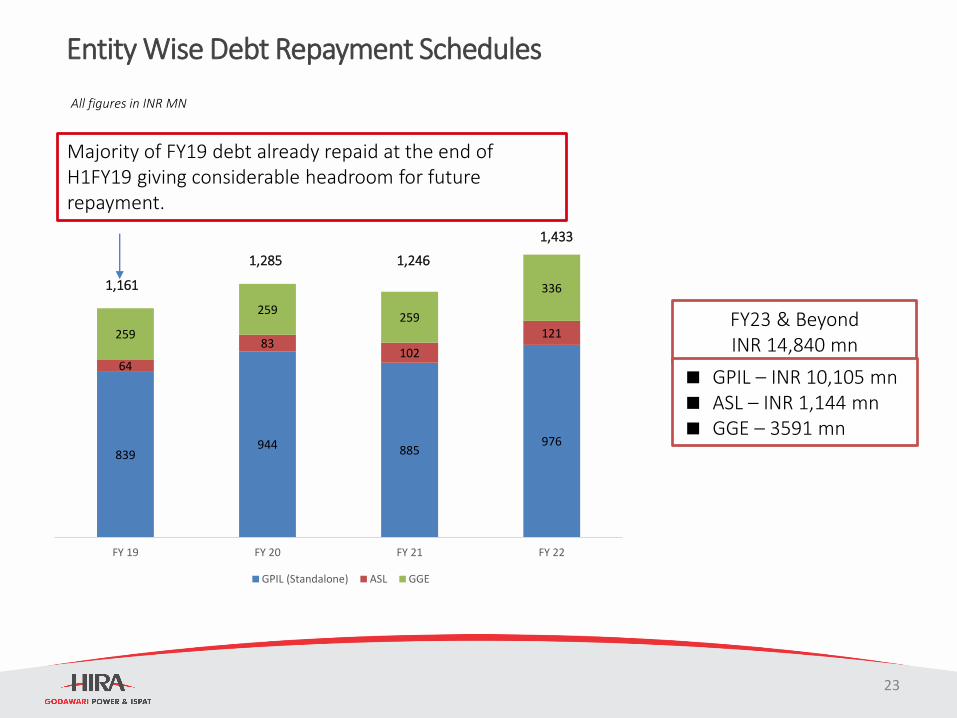
Entity Wise Debt Repayment Schedules
All figures in INR MN
Majority of FY19 debt already repaid at the end of H1FY19 giving considerable headroom for future repayment.
839944 885
976
64
83102
121259
259259
336
FY 19 FY 20 FY 21 FY 22
GPIL (Standalone) ASL GGE
FY23 & Beyond INR 14,840 mn
GPIL – INR 10,105 mn ASL – INR 1,144 mn GGE – 3591 mn
1,161
1,285 1,246
1,433
23
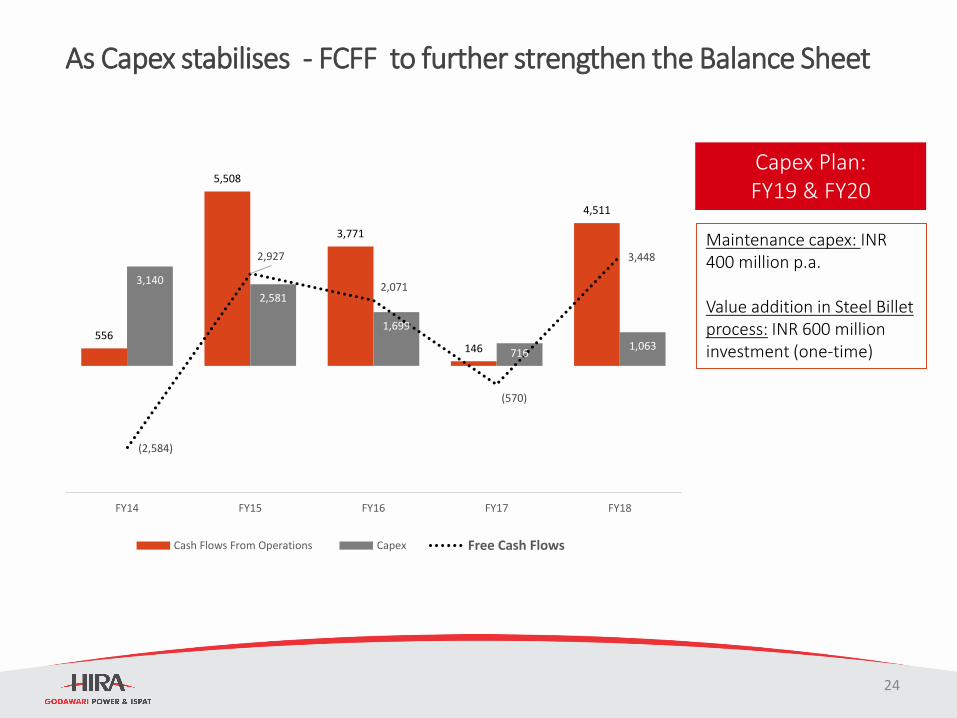
As Capex stabilises - FCFF to further strengthen the Balance Sheet
Capex Plan: FY19 & FY20
Maintenance capex: INR 400 million p.a.
Value addition in Steel Billet process: INR 600 million investment (one-time)
556
5,508
3,771
146
4,511
3,140
2,581
1,699
716 1,063
(2,584)
2,927
2,071
(570)
3,448
FY14 FY15 FY16 FY17 FY18
Cash Flows From Operations Capex Free Cash Flows
24
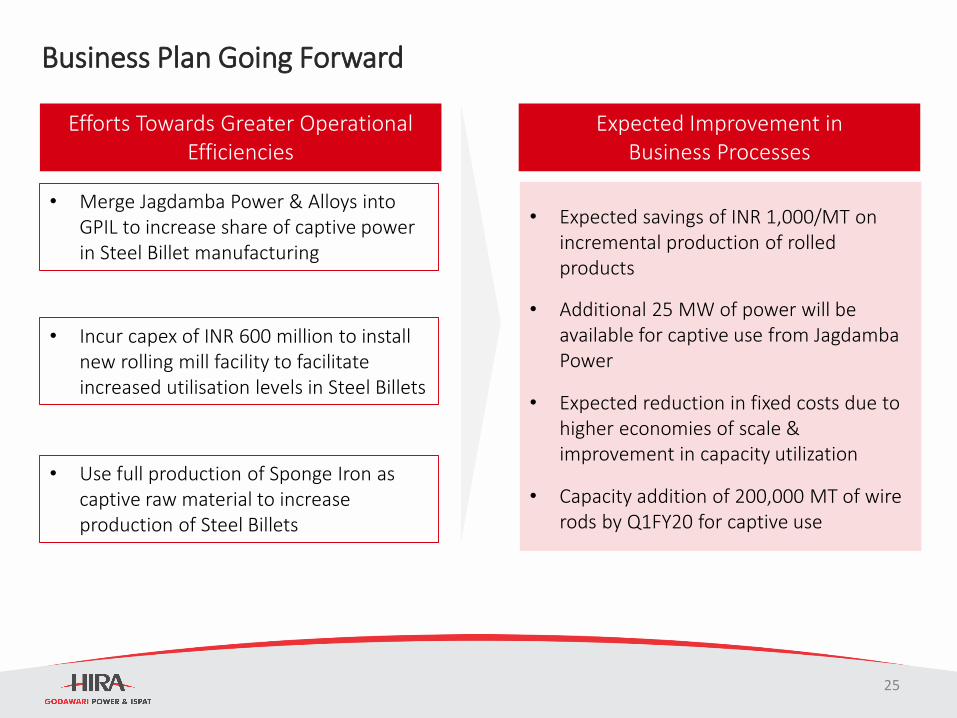
Efforts Towards Greater Operational Efficiencies
• Merge Jagdamba Power & Alloys into GPIL to increase share of captive power in Steel Billet manufacturing
• Incur capex of INR 600 million to install new rolling mill facility to facilitate increased utilisation levels in Steel Billets
• Use full production of Sponge Iron as captive raw material to increase production of Steel Billets
Business Plan Going Forward
Expected Improvement in Business Processes
• Expected savings of INR 1,000/MT on incremental production of rolled products
• Additional 25 MW of power will be available for captive use from JagdambaPower
• Expected reduction in fixed costs due to higher economies of scale & improvement in capacity utilization
• Capacity addition of 200,000 MT of wire rods by Q1FY20 for captive use
25
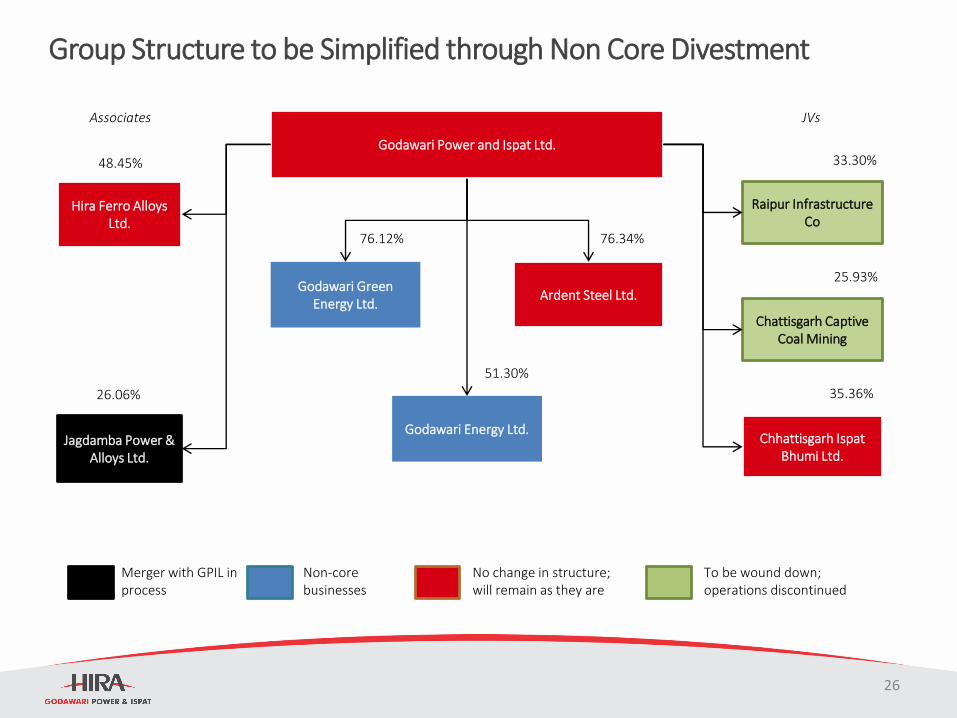
Group Structure to be Simplified through Non Core Divestment
Godawari Power and Ispat Ltd.
Ardent Steel Ltd.
Godawari Energy Ltd.
Godawari Green Energy Ltd.
76.34%
51.30%
76.12%
Raipur Infrastructure Co
Chattisgarh Captive Coal Mining
Chhattisgarh Ispat Bhumi Ltd.
33.30%
25.93%
35.36%
Hira Ferro Alloys Ltd.
Jagdamba Power & Alloys Ltd.
48.45%
26.06%
Associates JVs
Merger with GPIL in process
Non-core businesses
No change in structure; will remain as they are
To be wound down; operations discontinued
26
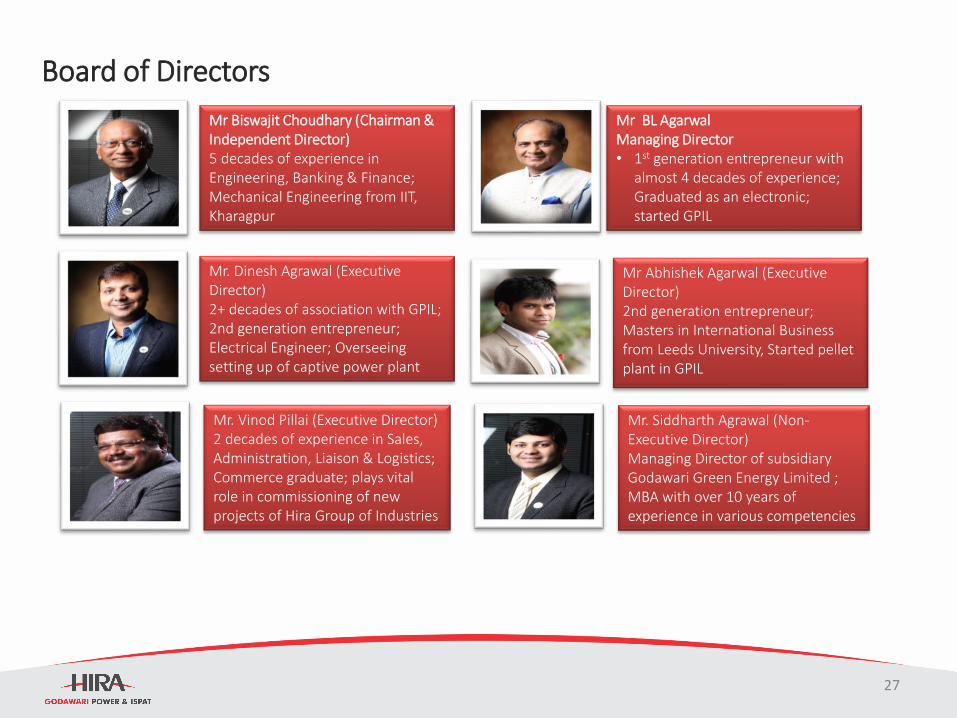
Board of Directors
Mr Biswajit Choudhary (Chairman & Independent Director)5 decades of experience in Engineering, Banking & Finance; Mechanical Engineering from IIT, Kharagpur
Mr BL Agarwal Managing Director• 1st generation entrepreneur with
almost 4 decades of experience; Graduated as an electronic; started GPIL
Mr. Dinesh Agrawal (Executive Director)2+ decades of association with GPIL; 2nd generation entrepreneur; Electrical Engineer; Overseeing setting up of captive power plant
Mr Abhishek Agarwal (Executive Director)2nd generation entrepreneur; Masters in International Business from Leeds University, Started pellet plant in GPIL
Mr. Vinod Pillai (Executive Director)2 decades of experience in Sales, Administration, Liaison & Logistics; Commerce graduate; plays vital role in commissioning of new projects of Hira Group of Industries
Mr. Siddharth Agrawal (Non-Executive Director)Managing Director of subsidiary Godawari Green Energy Limited ; MBA with over 10 years of experience in various competencies
27
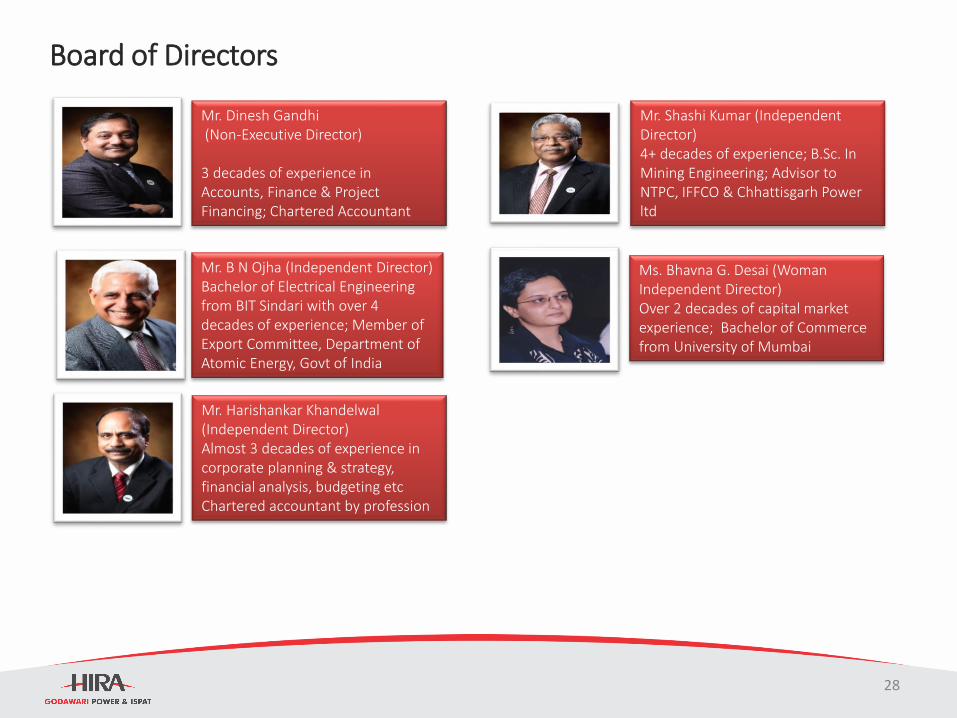
Board of Directors
Mr. Dinesh Gandhi(Non-Executive Director)
3 decades of experience in Accounts, Finance & Project Financing; Chartered Accountant
Mr. Shashi Kumar (Independent Director)4+ decades of experience; B.Sc. In Mining Engineering; Advisor to NTPC, IFFCO & Chhattisgarh Power ltd
Mr. B N Ojha (Independent Director)Bachelor of Electrical Engineering from BIT Sindari with over 4 decades of experience; Member of Export Committee, Department of Atomic Energy, Govt of India
Ms. Bhavna G. Desai (Woman Independent Director)Over 2 decades of capital market experience; Bachelor of Commerce from University of Mumbai
Mr. Harishankar Khandelwal (Independent Director)Almost 3 decades of experience in corporate planning & strategy, financial analysis, budgeting etcChartered accountant by profession
28
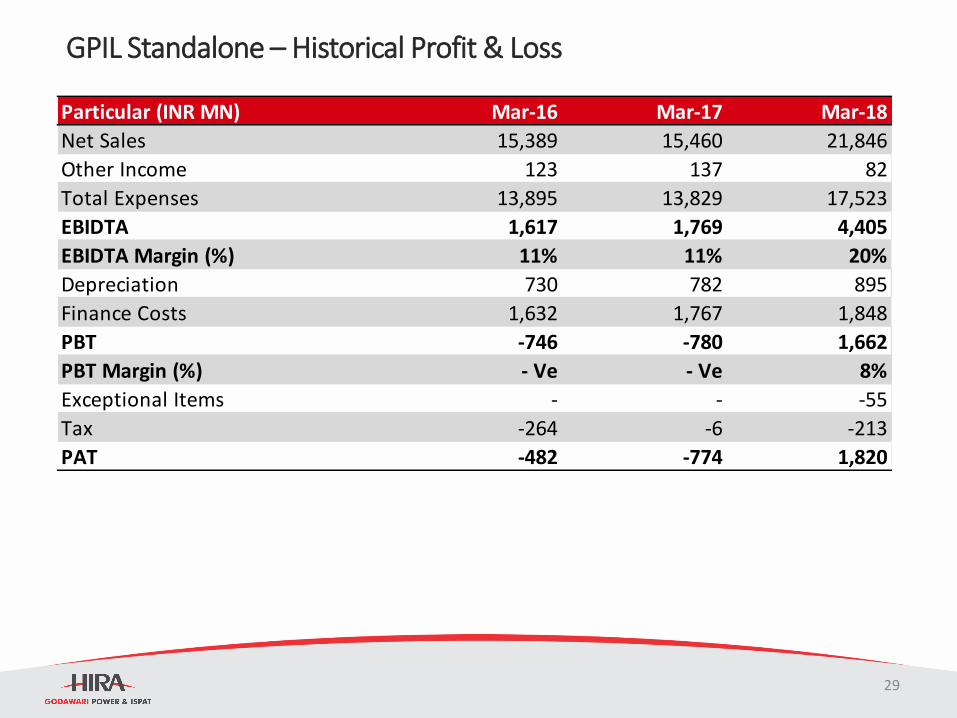
GPIL Standalone – Historical Profit & Loss
Particular (INR MN) Mar-16 Mar-17 Mar-18
Net Sales 15,389 15,460 21,846
Other Income 123 137 82
Total Expenses 13,895 13,829 17,523
EBIDTA 1,617 1,769 4,405
EBIDTA Margin (%) 11% 11% 20%
Depreciation 730 782 895
Finance Costs 1,632 1,767 1,848
PBT -746 -780 1,662
PBT Margin (%) - Ve - Ve 8%
Exceptional Items - - -55
Tax -264 -6 -213
PAT -482 -774 1,820
29
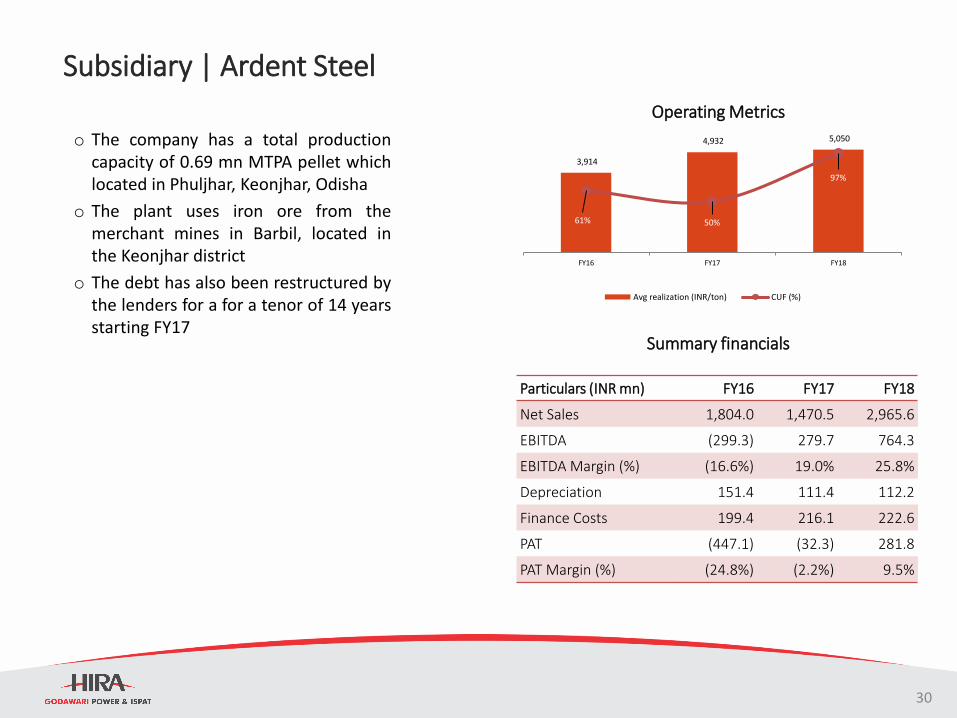
Subsidiary | Ardent Steel
o The company has a total productioncapacity of 0.69 mn MTPA pellet whichlocated in Phuljhar, Keonjhar, Odisha
o The plant uses iron ore from themerchant mines in Barbil, located inthe Keonjhar district
o The debt has also been restructured bythe lenders for a for a tenor of 14 yearsstarting FY17
30
Summary financials
Particulars (INR mn) FY16 FY17 FY18
Net Sales 1,804.0 1,470.5 2,965.6
EBITDA (299.3) 279.7 764.3
EBITDA Margin (%) (16.6%) 19.0% 25.8%
Depreciation 151.4 111.4 112.2
Finance Costs 199.4 216.1 222.6
PAT (447.1) (32.3) 281.8
PAT Margin (%) (24.8%) (2.2%) 9.5%
3,914
4,932 5,050
61% 50%
97%
FY16 FY17 FY18
Avg realization (INR/ton) CUF (%)
Operating Metrics
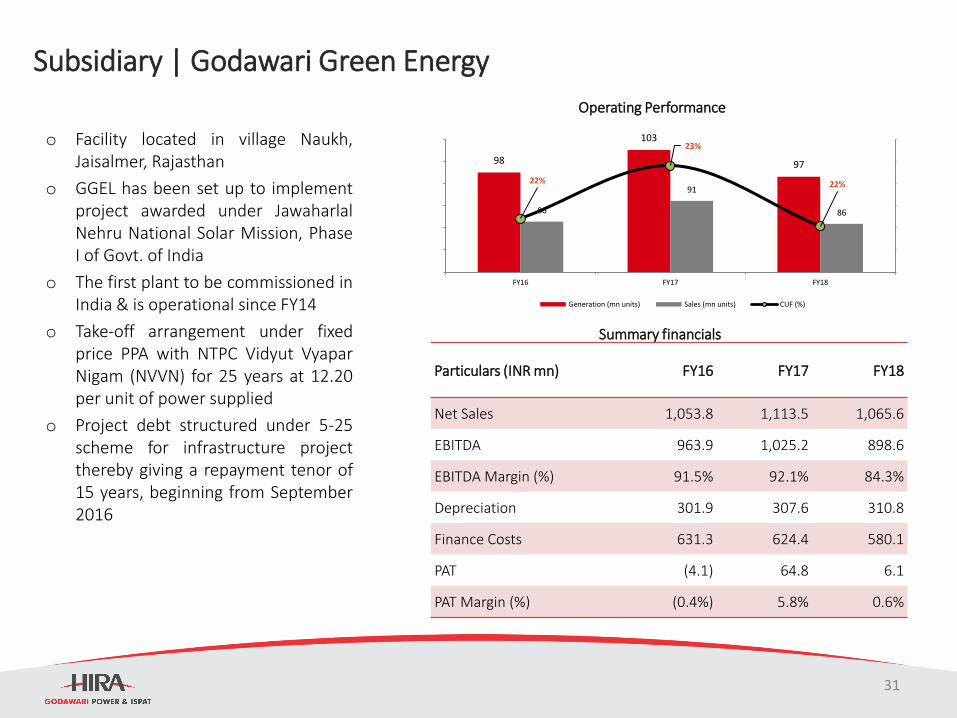
Subsidiary | Godawari Green Energy
o Facility located in village Naukh,Jaisalmer, Rajasthan
o GGEL has been set up to implementproject awarded under JawaharlalNehru National Solar Mission, PhaseI of Govt. of India
o The first plant to be commissioned inIndia & is operational since FY14
o Take-off arrangement under fixedprice PPA with NTPC Vidyut VyaparNigam (NVVN) for 25 years at 12.20per unit of power supplied
o Project debt structured under 5-25scheme for infrastructure projectthereby giving a repayment tenor of15 years, beginning from September2016
Summary financials
Particulars (INR mn) FY16 FY17 FY18
Net Sales 1,053.8 1,113.5 1,065.6
EBITDA 963.9 1,025.2 898.6
EBITDA Margin (%) 91.5% 92.1% 84.3%
Depreciation 301.9 307.6 310.8
Finance Costs 631.3 624.4 580.1
PAT (4.1) 64.8 6.1
PAT Margin (%) (0.4%) 5.8% 0.6%
98
103
97
86
91
86
22%
23%
22%
FY16 FY17 FY18
Generation (mn units) Sales (mn units) CUF (%)
Operating Performance
31
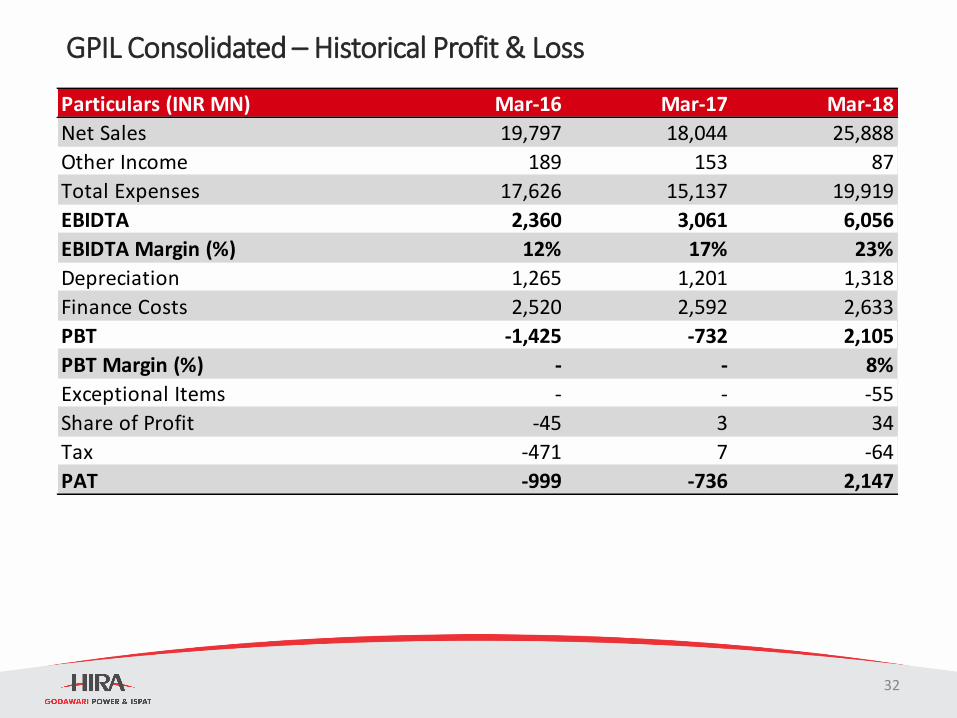
GPIL Consolidated – Historical Profit & Loss
Particulars (INR MN) Mar-16 Mar-17 Mar-18
Net Sales 19,797 18,044 25,888
Other Income 189 153 87
Total Expenses 17,626 15,137 19,919
EBIDTA 2,360 3,061 6,056
EBIDTA Margin (%) 12% 17% 23%
Depreciation 1,265 1,201 1,318
Finance Costs 2,520 2,592 2,633
PBT -1,425 -732 2,105
PBT Margin (%) - - 8%
Exceptional Items - - -55
Share of Profit -45 3 34
Tax -471 7 -64
PAT -999 -736 2,147
32
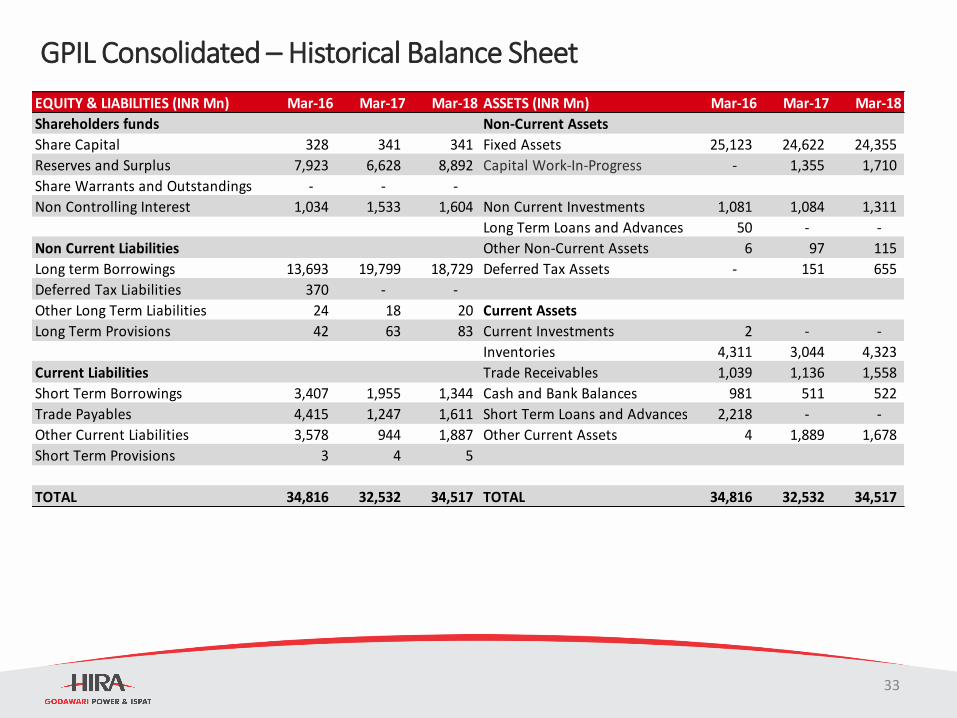
GPIL Consolidated – Historical Balance Sheet
EQUITY & LIABILITIES (INR Mn) Mar-16 Mar-17 Mar-18 ASSETS (INR Mn) Mar-16 Mar-17 Mar-18
Shareholders funds Non‐Current Assets
Share Capital 328 341 341 Fixed Assets 25,123 24,622 24,355
Reserves and Surplus 7,923 6,628 8,892 Capital Work-In-Progress - 1,355 1,710
Share Warrants and Outstandings - - -
Non Controlling Interest 1,034 1,533 1,604 Non Current Investments 1,081 1,084 1,311
Long Term Loans and Advances 50 - -
Non Current Liabilities Other Non‐Current Assets 6 97 115
Long term Borrowings 13,693 19,799 18,729 Deferred Tax Assets - 151 655
Deferred Tax Liabilities 370 - -
Other Long Term Liabilities 24 18 20 Current Assets
Long Term Provisions 42 63 83 Current Investments 2 - -
Inventories 4,311 3,044 4,323
Current Liabilities Trade Receivables 1,039 1,136 1,558
Short Term Borrowings 3,407 1,955 1,344 Cash and Bank Balances 981 511 522
Trade Payables 4,415 1,247 1,611 Short Term Loans and Advances 2,218 - -
Other Current Liabilities 3,578 944 1,887 Other Current Assets 4 1,889 1,678
Short Term Provisions 3 4 5
TOTAL 34,816 32,532 34,517 TOTAL 34,816 32,532 34,517
33
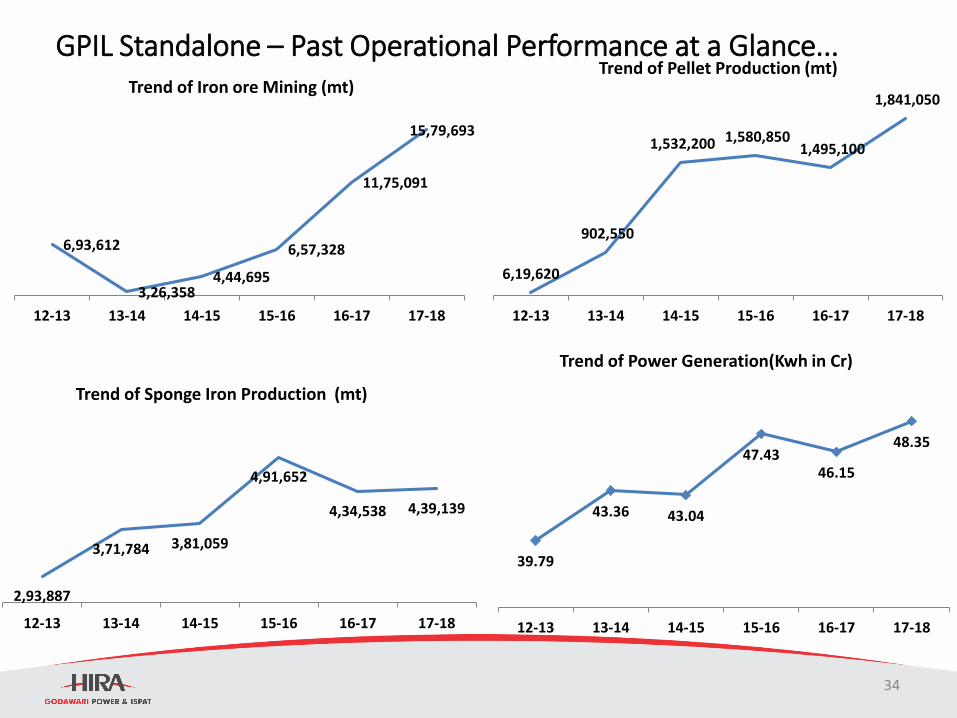
GPIL Standalone – Past Operational Performance at a Glance...
6,19,620
902,550
1,532,200 1,580,850 1,495,100
1,841,050
12-13 13-14 14-15 15-16 16-17 17-18
Trend of Pellet Production (mt)
2,93,887
3,71,784 3,81,059
4,91,652
4,34,538 4,39,139
12-13 13-14 14-15 15-16 16-17 17-18
Trend of Sponge Iron Production (mt)
39.79
43.36 43.04
47.4346.15
48.35
12-13 13-14 14-15 15-16 16-17 17-18
Trend of Power Generation(Kwh in Cr)
6,93,612
3,26,3584,44,695
6,57,328
11,75,091
15,79,693
12-13 13-14 14-15 15-16 16-17 17-18
Trend of Iron ore Mining (mt)
34
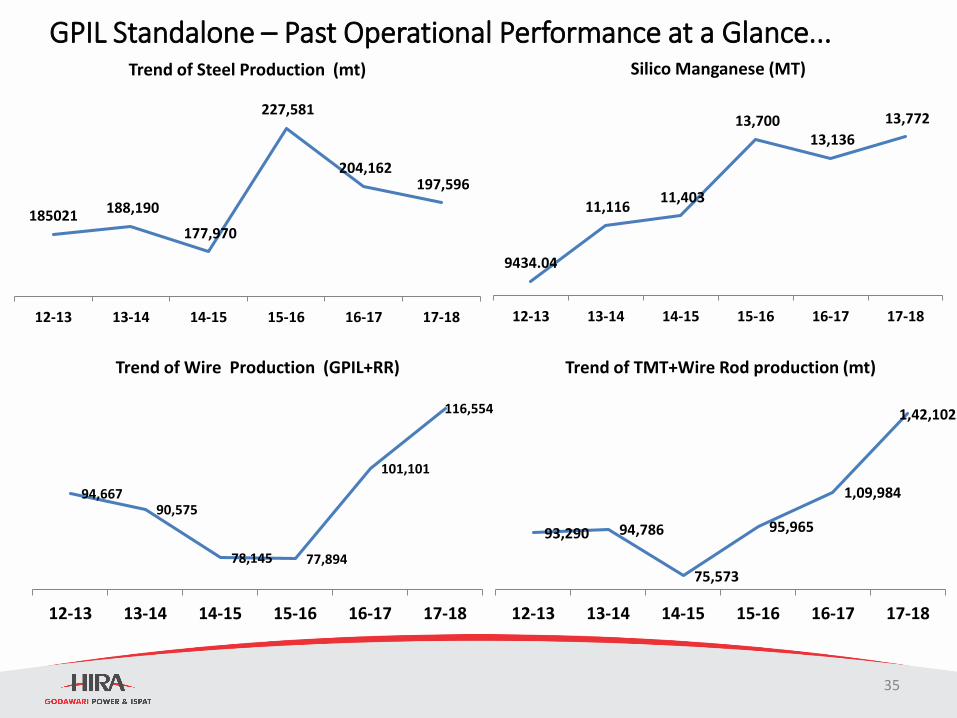
GPIL Standalone – Past Operational Performance at a Glance...
185021 188,190
177,970
227,581
204,162 197,596
12-13 13-14 14-15 15-16 16-17 17-18
Trend of Steel Production (mt)
9434.04
11,116 11,403
13,700 13,136
13,772
12-13 13-14 14-15 15-16 16-17 17-18
Silico Manganese (MT)
94,66790,575
78,145 77,894
101,101
116,554
12-13 13-14 14-15 15-16 16-17 17-18
Trend of Wire Production (GPIL+RR)
93,290 94,786
75,573
95,965
1,09,984
1,42,102
12-13 13-14 14-15 15-16 16-17 17-18
Trend of TMT+Wire Rod production (mt)
35
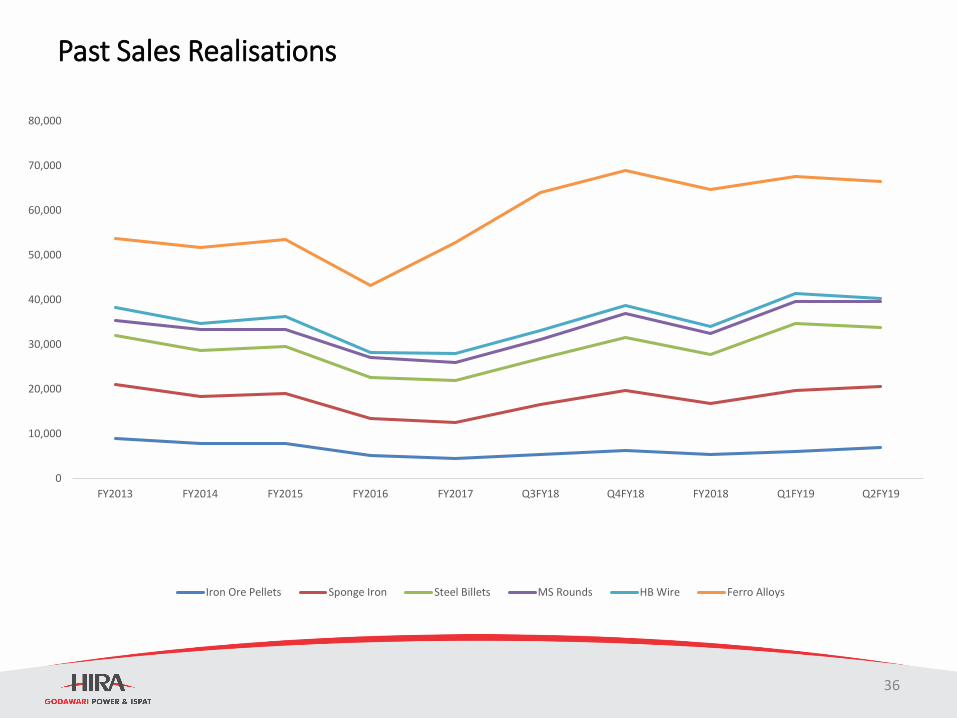
Past Sales Realisations
0
10,000
20,000
30,000
40,000
50,000
60,000
70,000
80,000
FY2013 FY2014 FY2015 FY2016 FY2017 Q3FY18 Q4FY18 FY2018 Q1FY19 Q2FY19
Iron Ore Pellets Sponge Iron Steel Billets MS Rounds HB Wire Ferro Alloys
36
Thank you