asymmetric supercapacitors jian chang
TRANSCRIPT
www.afm-journal.de
FULL P
APER
© 2013 WILEY-VCH Verlag GmbH & Co. KGaA, Weinheim 1
www.MaterialsViews.com
wileyonlinelibrary.com
1 . Introduction
Energy storage devices, in particular elec-trochemical capacitors, have attracted tremendous attention for future energy storage applications. Electrochemical capacitors, [ 1 ] also known as supercapaci-tors or ultracapacitors, have been widely used in numerous areas such as hybrid electric vehicles (HEVs), mobile electronic devices, military device and memory backup systems due to their ultra high power density, long cycling stability, wide operation temperature range and improved safety. [ 2–4 ] However, they suffer from a lower energy density, which has restricted their potential applications. Therefore, improvement of the energy density of supercapacitors is crucial to meet the future energy demands. [ 5 ] The increase of energy (E) can be achieved by maximizing the specifi c capacitance (C) and the opera-
tion voltage (V), E = 1/2 CV 2 . [ 6 ] For this purpose, Organic elec-trolyte based symmetric supercapacitors can effectively increase the operation voltage while their low capacitance and unfriendly electrolyte undermine their overall effectiveness for superca-pacitor applications. [ 6,7 ] On the other hand, aqueous solution is environmentally robust and easy to handle but suffers from narrow operation voltage window of less than 1 V, limiting the use to asymmetric supercapacitors (ASCs). Traditionally, ASCs can make full use of a battery type (faradaic) electrode and a capacitor type (electrochemical double layer) electrode to exhibit two different potential windows in the same electro-lyte. [ 8–10 ] As a consequence, operation voltage window can be opened and thus the energy density of the supercapacitor could be enhanced signifi cantly.
Among all kinds of electrode materals for ASCs, metal oxides have been investigated extensively since they provide higher specifi c capacitance and better cycling stability com-pared to carbon materials and conducting polymers. [ 11 ] How-ever, the intrinsic semiconducting nature of metal oxides shows poor electrical conductivity, eventually leading to low power density in ASCs. [ 12 ] Graphene, a two dimensional carbon mate-rial, is known as a good electrode candidate due to its large sur-face area, high electrical conductivity, and superior mechanical properties. [ 13 ] Previously, Wu and co-workers described ASCs with MnO 2 nanowire/reduced graphene oxide composite
Asymmetric Supercapacitors Based on Graphene/MnO 2 Nanospheres and Graphene/MoO 3 Nanosheets with High Energy Density
Jian Chang , Meihua Jin , Fei Yao , Tae Hyung Kim , Viet Thong Le , Hongyan Yue , Fethullah Gunes , Bing Li , Arunabha Ghosh , Sishen Xie , and Young Hee Lee *
Asymmetric supercapacitors with high energy density are fabricated using a self-assembled reduced graphene oxide (RGO)/MnO 2 (GrMnO 2 ) composite as a positive electrode and a RGO/MoO 3 (GrMoO 3 ) composite as a nega-tive electrode in safe aqueous Na 2 SO 4 electrolyte. The operation voltage is maximized by choosing two metal oxides with the largest work function dif-ference. Because of the synergistic effects of highly conductive graphene and highly pseudocapacitive metal oxides, the hybrid nanostructure electrodes exhibit better charge transport and cycling stability. The operation voltage is expanded to 2.0 V in spite of the use of aqueous electrolyte, revealing a high energy density of 42.6 Wh kg −1 at a power density of 276 W kg −1 and a maxi-mum specifi c capacitance of 307 F g −1 , consequently giving rise to an excel-lent Ragone plot. In addition, the GrMnO 2 //GrMoO 3 supercapacitor exhibits improved capacitance with cycling up to 1000 cycles, which is explained by the development of micropore structures during the repetition of ion transfer. This strategy for the choice of metal oxides provides a promising route for next-generation supercapacitors with high energy and high power densities.
DOI: 10.1002/adfm201301851
J. Chang, Dr. M. Jin, F. Yao, T. H. Kim, V. T. Le, Dr. H. Yue, Dr. F. Gunes, B. Li, A. Ghosh, Dr. S. Xie, Prof. Y. H. LeeIBS Center for Integrated Nanostructure Physics Institute for Basic Science (IBS) Daejon , 305-701 , Republic of Korea E-mail: [email protected] J. Chang, Dr. M. Jin, F. Yao, T. H. Kim, V. T. Le, Dr. H. Yue, Dr. F. Gunes, B. Li, A. Ghosh, Dr. S. Xie, Prof. Y. H. LeeDepartment of Energy Science Department of Physics Sungkyunkwan University Suwon , 440-746 , Republic of Korea Prof. S. XieDepartment of Energy Science Sungkyunkwan University Suwon , 440-746 , Korea Prof. S. XieInstitute of Physics Chinese Academy of Sciences Beijing , 100190 , PR China Dr. M. JinNational Center for Nanoscience and Technology Beijing , 100190 , PR China Dr. H. YueSchool of Materials Science and Engineering Harbin University of Science and Technology Harbin , 150040 , PR China
Adv. Funct. Mater. 2013, DOI: 10.1002/adfm201301851
FULL
PAPER
2
www.afm-journal.dewww.MaterialsViews.com
wileyonlinelibrary.com © 2013 WILEY-VCH Verlag GmbH & Co. KGaA, Weinheim
both energy density and power density. The hybridized nano-structure electrode materials and cell confi guration of the ASC reported here will strongly impact on improving energy density of not only generalized supercapacitors but also solid state fl ex-ible supercapacitors with high power density in future.
2 . Results and Discussion
2.1 . Principle for the Choice of Metal Oxides
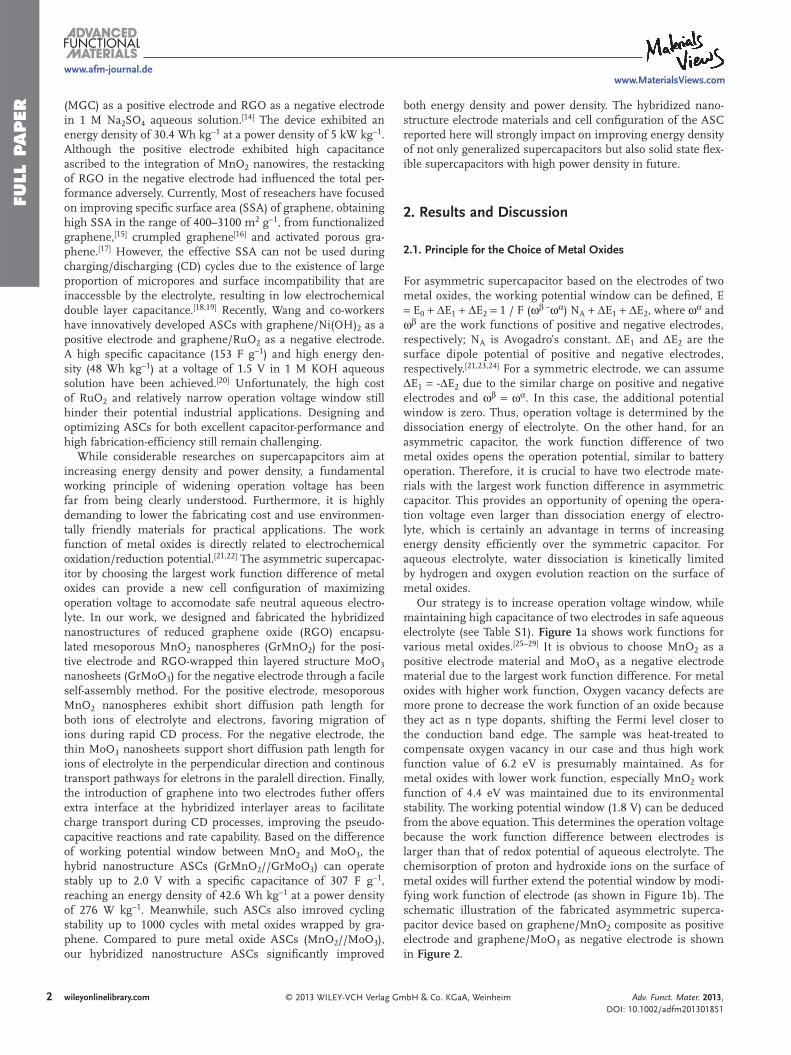
For asymmetric supercapacitor based on the electrodes of two metal oxides, the working potential window can be defi ned, E = E 0 + Δ E 1 + Δ E 2 = 1 / F ( ω β – ω α ) N A + Δ E 1 + Δ E 2 , where ω α and ω β are the work functions of positive and negative electrodes, respectively; N A is Avogadro’s constant. Δ E 1 and Δ E 2 are the surface dipole potential of positive and negative electrodes, respectively. [ 21,23,24 ] For a symmetric electrode, we can assume Δ E 1 = - Δ E 2 due to the similar charge on positive and negative electrodes and ω β = ω α . In this case, the additional potential window is zero. Thus, operation voltage is determined by the dissociation energy of electrolyte. On the other hand, for an asymmetric capacitor, the work function difference of two metal oxides opens the operation potential, similar to battery operation. Therefore, it is crucial to have two electrode mate-rials with the largest work function difference in asymmetric capacitor. This provides an opportunity of opening the opera-tion voltage even larger than dissociation energy of electro-lyte, which is certainly an advantage in terms of increasing energy density effi ciently over the symmetric capacitor. For aqueous electrolyte, water dissociation is kinetically limited by hydrogen and oxygen evolution reaction on the surface of metal oxides.
Our strategy is to increase operation voltage window, while maintaining high capacitance of two electrodes in safe aqueous electrolyte (see Table S1). Figure 1 a shows work functions for various metal oxides. [ 25–29 ] It is obvious to choose MnO 2 as a positive electrode material and MoO 3 as a negative electrode material due to the largest work function difference. For metal oxides with higher work function, Oxygen vacancy defects are more prone to decrease the work function of an oxide because they act as n type dopants, shifting the Fermi level closer to the conduction band edge. The sample was heat-treated to compensate oxygen vacancy in our case and thus high work function value of 6.2 eV is presumably maintained. As for metal oxides with lower work function, especially MnO 2 work function of 4.4 eV was maintained due to its environmental stability. The working potential window (1.8 V) can be deduced from the above equation. This determines the operation voltage because the work function difference between electrodes is larger than that of redox potential of aqueous electrolyte. The chemisorption of proton and hydroxide ions on the surface of metal oxides will further extend the potential window by modi-fying work function of electrode (as shown in Figure 1 b). The schematic illustration of the fabricated asymmetric superca-pacitor device based on graphene/MnO 2 composite as positive electrode and graphene/MoO 3 as negative electrode is shown in Figure 2 .
(MGC) as a positive electrode and RGO as a negative electrode in 1 M Na 2 SO 4 aqueous solution. [ 14 ] The device exhibited an energy density of 30.4 Wh kg −1 at a power density of 5 kW kg −1 . Although the positive electrode exhibited high capacitance ascribed to the integration of MnO 2 nanowires, the restacking of RGO in the negative electrode had infl uenced the total per-formance adversely. Currently, Most of reseachers have focused on improving specifi c surface area (SSA) of graphene, obtaining high SSA in the range of 400–3100 m 2 g −1 , from functionalized graphene, [ 15 ] crumpled graphene [ 16 ] and activated porous gra-phene. [ 17 ] However, the effective SSA can not be used during charging/discharging (CD) cycles due to the existence of large proportion of micropores and surface incompatibility that are inaccessble by the electrolyte, resulting in low electrochemical double layer capacitance. [ 18,19 ] Recently, Wang and co-workers have innovatively developed ASCs with graphene/Ni(OH) 2 as a positive electrode and graphene/RuO 2 as a negative electrode. A high specifi c capacitance (153 F g −1 ) and high energy den-sity (48 Wh kg −1 ) at a voltage of 1.5 V in 1 M KOH aqueous solution have been achieved. [ 20 ] Unfortunately, the high cost of RuO 2 and relatively narrow operation voltage window still hinder their potential industrial applications. Designing and optimizing ASCs for both excellent capacitor-performance and high fabrication-effi ciency still remain challenging.
While considerable researches on supercapapcitors aim at increasing energy density and power density, a fundamental working principle of widening operation voltage has been far from being clearly understood. Furthermore, it is highly demanding to lower the fabricating cost and use environmen-tally friendly materials for practical applications. The work function of metal oxides is directly related to electrochemical oxidation/reduction potential. [ 21,22 ] The asymmetric supercapac-itor by choosing the largest work function difference of metal oxides can provide a new cell confi guration of maximizing operation voltage to accomodate safe neutral aqueous electro-lyte. In our work, we designed and fabricated the hybridized nanostructures of reduced graphene oxide (RGO) encapsu-lated mesoporous MnO 2 nanospheres (GrMnO 2 ) for the posi-tive electrode and RGO-wrapped thin layered structure MoO 3 nanosheets (GrMoO 3 ) for the negative electrode through a facile self-assembly method. For the positive electrode, mesoporous MnO 2 nanospheres exhibit short diffusion path length for both ions of electrolyte and electrons, favoring migration of ions during rapid CD process. For the negative electrode, the thin MoO 3 nanosheets support short diffusion path length for ions of electrolyte in the perpendicular direction and continous transport pathways for eletrons in the paralell direction. Finally, the introduction of graphene into two electrodes futher offers extra interface at the hybridized interlayer areas to facilitate charge transport during CD processes, improving the pseudo-capacitive reactions and rate capability. Based on the difference of working potential window between MnO 2 and MoO 3 , the hybrid nanostructure ASCs (GrMnO 2 //GrMoO 3 ) can operate stably up to 2.0 V with a specifi c capacitance of 307 F g −1 , reaching an energy density of 42.6 Wh kg −1 at a power density of 276 W kg −1 . Meanwhile, such ASCs also imroved cycling stability up to 1000 cycles with metal oxides wrapped by gra-phene. Compared to pure metal oxide ASCs (MnO 2 //MoO 3 ), our hybridized nanostructure ASCs signifi cantly improved
Adv. Funct. Mater. 2013, DOI: 10.1002/adfm201301851
FULL P
APER
3
www.afm-journal.dewww.MaterialsViews.com
wileyonlinelibrary.com© 2013 WILEY-VCH Verlag GmbH & Co. KGaA, Weinheim
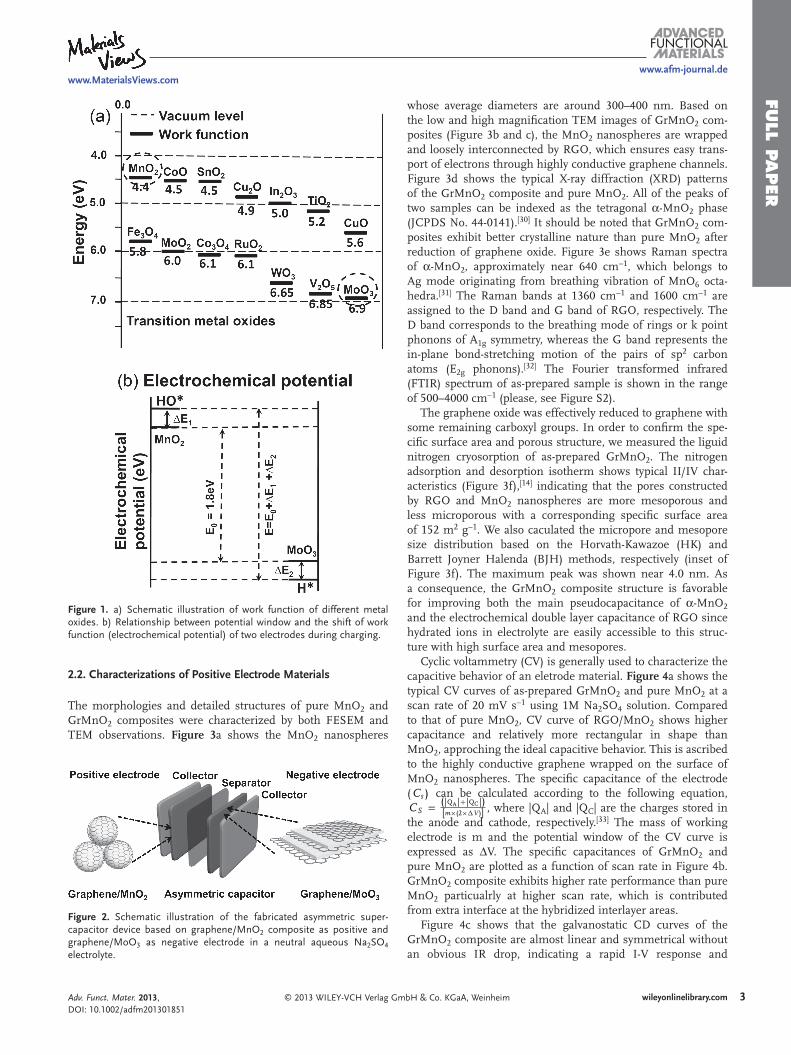
whose average diameters are around 300–400 nm. Based on the low and high magnifi cation TEM images of GrMnO 2 com-posites (Figure 3 b and c), the MnO 2 nanospheres are wrapped and loosely interconnected by RGO, which ensures easy trans-port of electrons through highly conductive graphene channels. Figure 3 d shows the typical X-ray diffraction (XRD) patterns of the GrMnO 2 composite and pure MnO 2 . All of the peaks of two samples can be indexed as the tetragonal α -MnO 2 phase (JCPDS No. 44-0141). [ 30 ] It should be noted that GrMnO 2 com-posites exhibit better crystalline nature than pure MnO 2 after reduction of graphene oxide. Figure 3 e shows Raman spectra of α -MnO 2 , approximately near 640 cm −1 , which belongs to Ag mode originating from breathing vibration of MnO 6 octa-hedra. [ 31 ] The Raman bands at 1360 cm −1 and 1600 cm −1 are assigned to the D band and G band of RGO, respectively. The D band corresponds to the breathing mode of rings or k point phonons of A 1g symmetry, whereas the G band represents the in-plane bond-stretching motion of the pairs of sp 2 carbon atoms (E 2g phonons). [ 32 ] The Fourier transformed infrared (FTIR) spectrum of as-prepared sample is shown in the range of 500–4000 cm −1 (please, see Figure S2).
The graphene oxide was effectively reduced to graphene with some remaining carboxyl groups. In order to confi rm the spe-cifi c surface area and porous structure, we measured the liguid nitrogen cryosorption of as-prepared GrMnO 2 . The nitrogen adsorption and desorption isotherm shows typical II/IV char-acteristics (Figure 3 f), [ 14 ] indicating that the pores constructed by RGO and MnO 2 nanospheres are more mesoporous and less microporous with a corresponding specifi c surface area of 152 m 2 g −1 . We also caculated the micropore and mesopore size distribution based on the Horvath-Kawazoe (HK) and Barrett Joyner Halenda (BJH) methods, respectively (inset of Figure 3 f). The maximum peak was shown near 4.0 nm. As a consequence, the GrMnO 2 composite structure is favorable for improving both the main pseudocapacitance of α -MnO 2 and the electrochemical double layer capacitance of RGO since hydrated ions in electrolyte are easily accessible to this struc-ture with high surface area and mesopores.
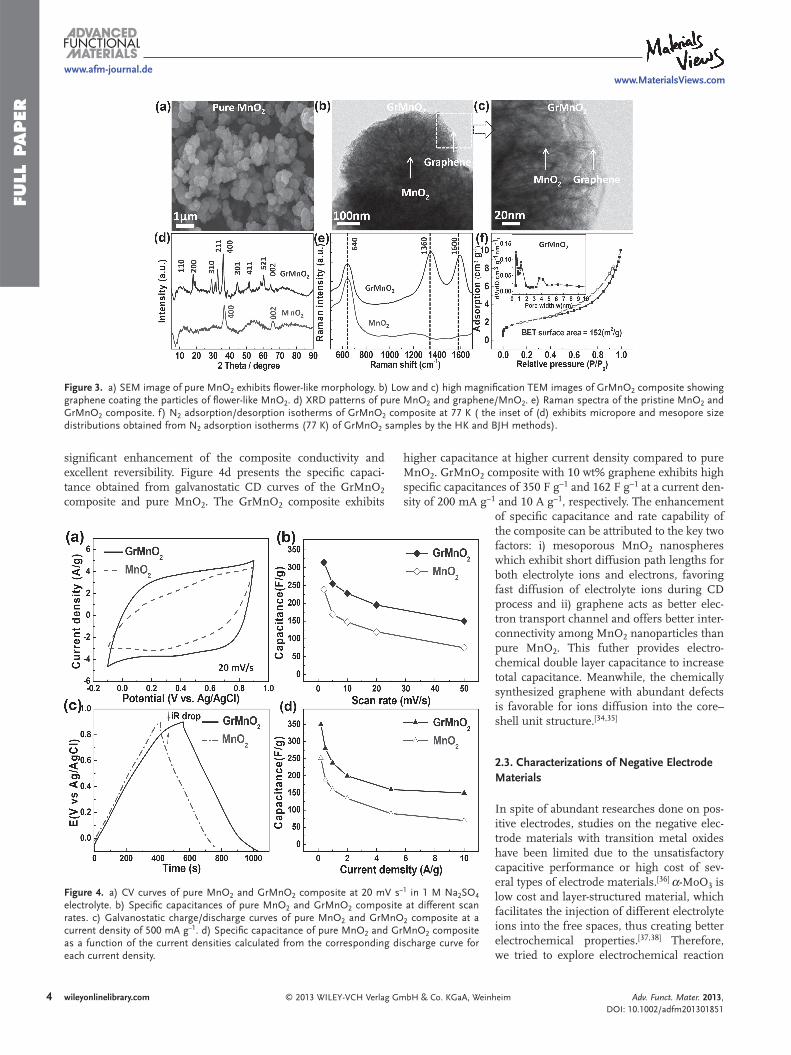
Cyclic voltammetry (CV) is generally used to characterize the capacitive behavior of an eletrode material. Figure 4 a shows the typical CV curves of as-prepared GrMnO 2 and pure MnO 2 at a scan rate of 20 mV s −1 using 1M Na 2 SO 4 solution. Compared to that of pure MnO 2 , CV curve of RGO/MnO 2 shows higher capacitance and relatively more rectangular in shape than MnO 2 , approching the ideal capacitive behavior. This is ascribed to the highly conductive graphene wrapped on the surface of MnO 2 nanospheres. The specifi c capacitance of the electrode ( Cs ) can be calculated according to the following equation, CS =
(|QA|+|QC|)[m×(2×�V )] , where |Q A | and |Q C | are the charges stored in
the anode and cathode, respectively. [ 33 ] The mass of working electrode is m and the potential window of the CV curve is expressed as Δ V. The specifi c capacitances of GrMnO 2 and pure MnO 2 are plotted as a function of scan rate in Figure 4 b. GrMnO 2 composite exhibits higher rate performance than pure MnO 2 particualrly at higher scan rate, which is contributed from extra interface at the hybridized interlayer areas.
Figure 4 c shows that the galvanostatic CD curves of the GrMnO 2 composite are almost linear and symmetrical without an obvious IR drop, indicating a rapid I-V response and
2.2 . Characterizations of Positive Electrode Materials
The morphologies and detailed structures of pure MnO 2 and GrMnO 2 composites were characterized by both FESEM and TEM observations. Figure 3 a shows the MnO 2 nanospheres
Figure 1. a) Schematic illustration of work function of different metal oxides. b) Relationship between potential window and the shift of work function (electrochemical potential) of two electrodes during charging.
Figure 2. Schematic illustration of the fabricated asymmetric super-capacitor device based on graphene/MnO 2 composite as positive and graphene/MoO 3 as negative electrode in a neutral aqueous Na 2 SO 4 electrolyte.
Adv. Funct. Mater. 2013, DOI: 10.1002/adfm201301851
FULL
PAPER
4
www.afm-journal.dewww.MaterialsViews.com
wileyonlinelibrary.com © 2013 WILEY-VCH Verlag GmbH & Co. KGaA, Weinheim
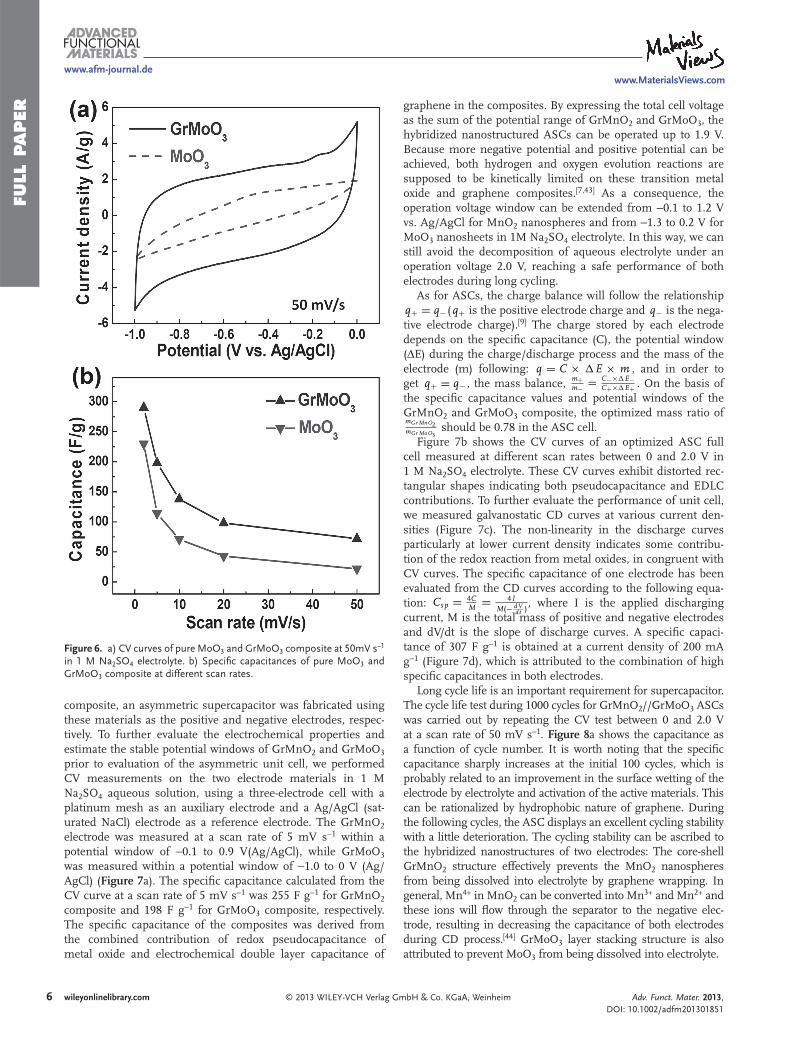
higher capacitance at higher current density compared to pure MnO 2 . GrMnO 2 composite with 10 wt% graphene exhibits high specifi c capacitances of 350 F g −1 and 162 F g −1 at a current den-sity of 200 mA g −1 and 10 A g −1 , respectively. The enhancement
of specifi c capacitance and rate capability of the composite can be attributed to the key two factors: i) mesoporous MnO 2 nanospheres which exhibit short diffusion path lengths for both electrolyte ions and electrons, favoring fast diffusion of electrolyte ions during CD process and ii) graphene acts as better elec-tron transport channel and offers better inter-connectivity among MnO 2 nanoparticles than pure MnO 2 . This futher provides electro-chemical double layer capacitance to increase total capacitance. Meanwhile, the chemically synthesized graphene with abundant defects is favorable for ions diffusion into the core–shell unit structure. [ 34,35 ]
2.3 . Characterizations of Negative Electrode Materials
In spite of abundant researches done on pos-itive electrodes, studies on the negative elec-trode materials with transition metal oxides have been limited due to the unsatisfactory capacitive performance or high cost of sev-eral types of electrode materials. [ 36 ] α -MoO 3 is low cost and layer-structured material, which facilitates the injection of different electrolyte ions into the free spaces, thus creating better electrochemical properties. [ 37,38 ] Therefore, we tried to explore electrochemical reaction
signifi cant enhancement of the composite conductivity and excellent reversibility. Figure 4 d presents the specifi c capaci-tance obtained from galvanostatic CD curves of the GrMnO 2 composite and pure MnO 2 . The GrMnO 2 composite exhibits
Figure 3. a) SEM image of pure MnO 2 exhibits fl ower-like morphology. b) Low and c) high magnifi cation TEM images of GrMnO 2 composite showing graphene coating the particles of fl ower-like MnO 2 . d) XRD patterns of pure MnO 2 and graphene/MnO 2 . e) Raman spectra of the pristine MnO 2 and GrMnO 2 composite. f) N 2 adsorption/desorption isotherms of GrMnO 2 composite at 77 K ( the inset of (d) exhibits micropore and mesopore size distributions obtained from N 2 adsorption isotherms (77 K) of GrMnO 2 samples by the HK and BJH methods).
Figure 4. a) CV curves of pure MnO 2 and GrMnO 2 composite at 20 mV s −1 in 1 M Na 2 SO 4 electrolyte. b) Specifi c capacitances of pure MnO 2 and GrMnO 2 composite at different scan rates. c) Galvanostatic charge/discharge curves of pure MnO 2 and GrMnO 2 composite at a current density of 500 mA g −1 . d) Specifi c capacitance of pure MnO 2 and GrMnO 2 composite as a function of the current densities calculated from the corresponding discharge curve for each current density.
Adv. Funct. Mater. 2013, DOI: 10.1002/adfm201301851
FULL P
APER
5
www.afm-journal.dewww.MaterialsViews.com
wileyonlinelibrary.com© 2013 WILEY-VCH Verlag GmbH & Co. KGaA, Weinheim
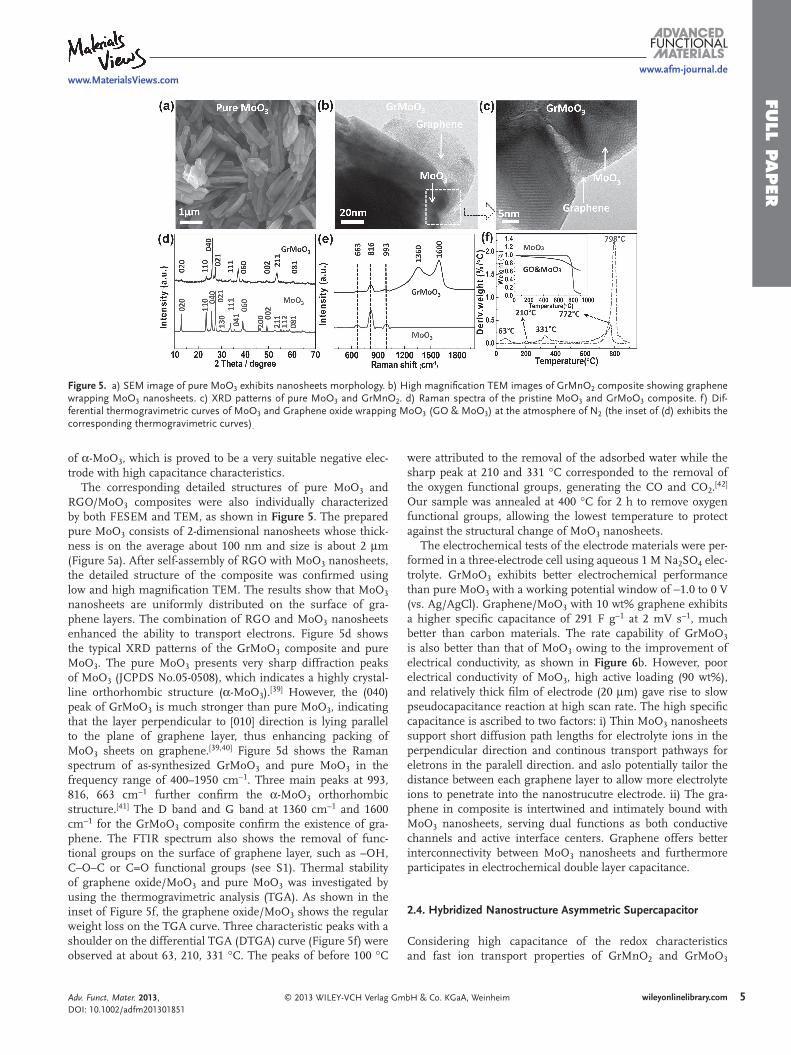
were attributed to the removal of the adsorbed water while the sharp peak at 210 and 331 °C corresponded to the removal of the oxygen functional groups, generating the CO and CO 2 . [ 42 ] Our sample was annealed at 400 °C for 2 h to remove oxygen functional groups, allowing the lowest temperature to protect against the structural change of MoO 3 nanosheets.
The electrochemical tests of the electrode materials were per-formed in a three-electrode cell using aqueous 1 M Na 2 SO 4 elec-trolyte. GrMoO 3 exhibits better electrochemical performance than pure MoO 3 with a working potential window of −1.0 to 0 V (vs. Ag/AgCl). Graphene/MoO 3 with 10 wt% graphene exhibits a higher specifi c capacitance of 291 F g −1 at 2 mV s −1 , much better than carbon materials. The rate capability of GrMoO 3 is also better than that of MoO 3 owing to the improvement of electrical conductivity, as shown in Figure 6 b. However, poor electrical conductivity of MoO 3 , high active loading (90 wt%), and relatively thick fi lm of electrode (20 μ m) gave rise to slow pseudocapacitance reaction at high scan rate. The high specifi c capacitance is ascribed to two factors: i) Thin MoO 3 nanosheets support short diffusion path lengths for electrolyte ions in the perpendicular direction and continous transport pathways for eletrons in the paralell direction. and aslo potentially tailor the distance between each graphene layer to allow more electrolyte ions to penetrate into the nanostrucutre electrode. ii) The gra-phene in composite is intertwined and intimately bound with MoO 3 nanosheets, serving dual functions as both conductive channels and active interface centers. Graphene offers better interconnectivity between MoO 3 nanosheets and furthermore participates in electrochemical double layer capacitance.
2.4 . Hybridized Nanostructure Asymmetric Supercapacitor
Considering high capacitance of the redox characteristics and fast ion transport properties of GrMnO 2 and GrMoO 3
of α -MoO 3 , which is proved to be a very suitable negative elec-trode with high capacitance characteristics.
The corresponding detailed structures of pure MoO 3 and RGO/MoO 3 composites were also individually characterized by both FESEM and TEM, as shown in Figure 5 . The prepared pure MoO 3 consists of 2-dimensional nanosheets whose thick-ness is on the average about 100 nm and size is about 2 μ m (Figure 5 a). After self-assembly of RGO with MoO 3 nanosheets, the detailed structure of the composite was confi rmed using low and high magnifi cation TEM. The results show that MoO 3 nanosheets are uniformly distributed on the surface of gra-phene layers. The combination of RGO and MoO 3 nanosheets enhanced the ability to transport electrons. Figure 5 d shows the typical XRD patterns of the GrMoO 3 composite and pure MoO 3 . The pure MoO 3 presents very sharp diffraction peaks of MoO 3 (JCPDS No.05-0508), which indicates a highly crystal-line orthorhombic structure ( α -MoO 3 ). [ 39 ] However, the (040) peak of GrMoO 3 is much stronger than pure MoO 3 , indicating that the layer perpendicular to [010] direction is lying parallel to the plane of graphene layer, thus enhancing packing of MoO 3 sheets on graphene. [ 39,40 ] Figure 5 d shows the Raman spectrum of as-synthesized GrMoO 3 and pure MoO 3 in the frequency range of 400–1950 cm −1 . Three main peaks at 993, 816, 663 cm −1 further confi rm the α -MoO 3 orthorhombic structure. [ 41 ] The D band and G band at 1360 cm −1 and 1600 cm −1 for the GrMoO 3 composite confi rm the existence of gra-phene. The FTIR spectrum also shows the removal of func-tional groups on the surface of graphene layer, such as –OH, C–O–C or C=O functional groups (see S1). Thermal stability of graphene oxide/MoO 3 and pure MoO 3 was investigated by using the thermogravimetric analysis (TGA). As shown in the inset of Figure 5 f, the graphene oxide/MoO 3 shows the regular weight loss on the TGA curve. Three characteristic peaks with a shoulder on the differential TGA (DTGA) curve (Figure 5 f) were observed at about 63, 210, 331 °C. The peaks of before 100 °C
Figure 5. a) SEM image of pure MoO 3 exhibits nanosheets morphology. b) High magnifi cation TEM images of GrMnO 2 composite showing graphene wrapping MoO 3 nanosheets. c) XRD patterns of pure MoO 3 and GrMnO 2 . d) Raman spectra of the pristine MoO 3 and GrMoO 3 composite. f) Dif-ferential thermogravimetric curves of MoO 3 and Graphene oxide wrapping MoO 3 (GO & MoO 3 ) at the atmosphere of N 2 (the inset of (d) exhibits the corresponding thermogravimetric curves) .
Adv. Funct. Mater. 2013, DOI: 10.1002/adfm201301851
FULL
PAPER
6
www.afm-journal.dewww.MaterialsViews.com
wileyonlinelibrary.com © 2013 WILEY-VCH Verlag GmbH & Co. KGaA, Weinheim
graphene in the composites. By expressing the total cell voltage as the sum of the potential range of GrMnO 2 and GrMoO 3 , the hybridized nanostructured ASCs can be operated up to 1.9 V. Because more negative potential and positive potential can be achieved, both hydrogen and oxygen evolution reactions are supposed to be kinetically limited on these transition metal oxide and graphene composites. [ 7,43 ] As a consequence, the operation voltage window can be extended from −0.1 to 1.2 V vs. Ag/AgCl for MnO 2 nanospheres and from −1.3 to 0.2 V for MoO 3 nanosheets in 1M Na 2 SO 4 electrolyte. In this way, we can still avoid the decomposition of aqueous electrolyte under an operation voltage 2.0 V, reaching a safe performance of both electrodes during long cycling.
As for ASCs, the charge balance will follow the relationship q+ = q− ( q+ is the positive electrode charge and q− is the nega-tive electrode charge). [ 9 ] The charge stored by each electrode depends on the specifi c capacitance (C), the potential window ( Δ E) during the charge/discharge process and the mass of the electrode (m) following: q = C × �E × m , and in order to get q+ = q− , the mass balance, m+
m− = C−×�E−C+×�E+ . On the basis of
the specifi c capacitance values and potential windows of the GrMnO 2 and GrMoO 3 composite, the optimized mass ratio of mGr MnO2mGr Mo O3
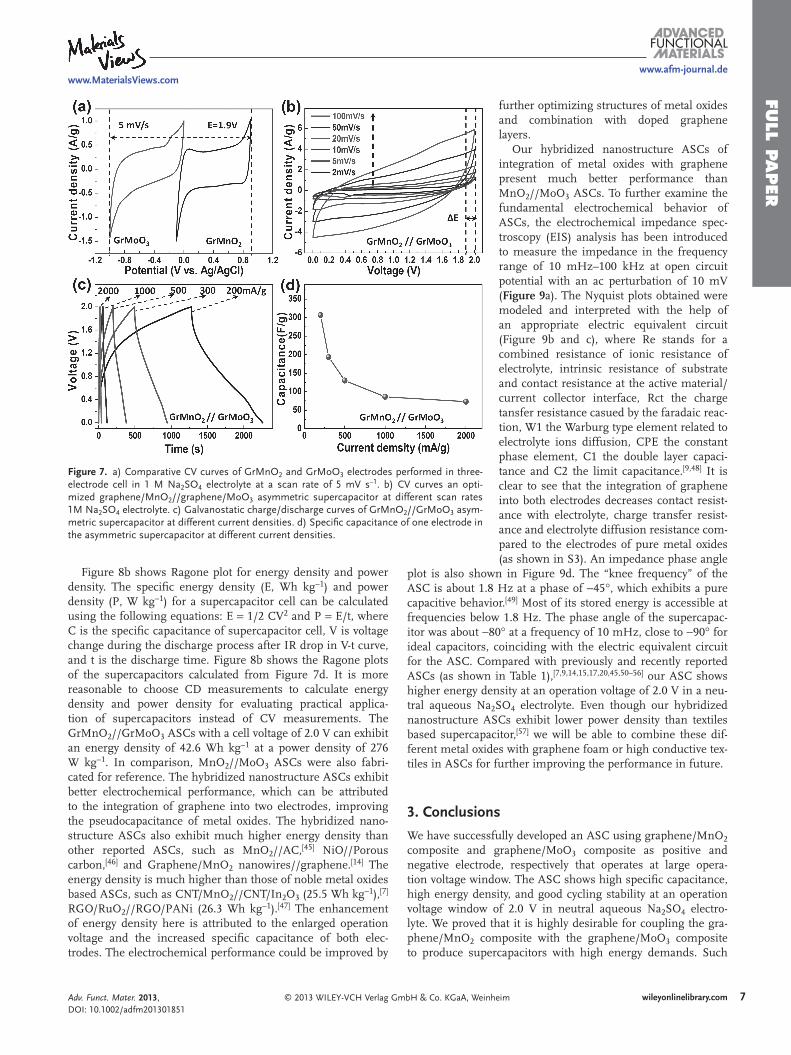
should be 0.78 in the ASC cell. Figure 7 b shows the CV curves of an optimized ASC full
cell measured at different scan rates between 0 and 2.0 V in 1 M Na 2 SO 4 electrolyte. These CV curves exhibit distorted rec-tangular shapes indicating both pseudocapacitance and EDLC contributions. To further evaluate the performance of unit cell, we measured galvanostatic CD curves at various current den-sities (Figure 7 c). The non-linearity in the discharge curves particularly at lower current density indicates some contribu-tion of the redox reaction from metal oxides, in congruent with CV curves. The specifi c capacitance of one electrode has been evaluated from the CD curves according to the following equa-tion: Cs p = 4C
M = 4IM(− dV
dt ) , where I is the applied discharging
current, M is the total mass of positive and negative electrodes and dV/dt is the slope of discharge curves. A specifi c capaci-tance of 307 F g −1 is obtained at a current density of 200 mA g −1 (Figure 7 d), which is attributed to the combination of high specifi c capacitances in both electrodes.
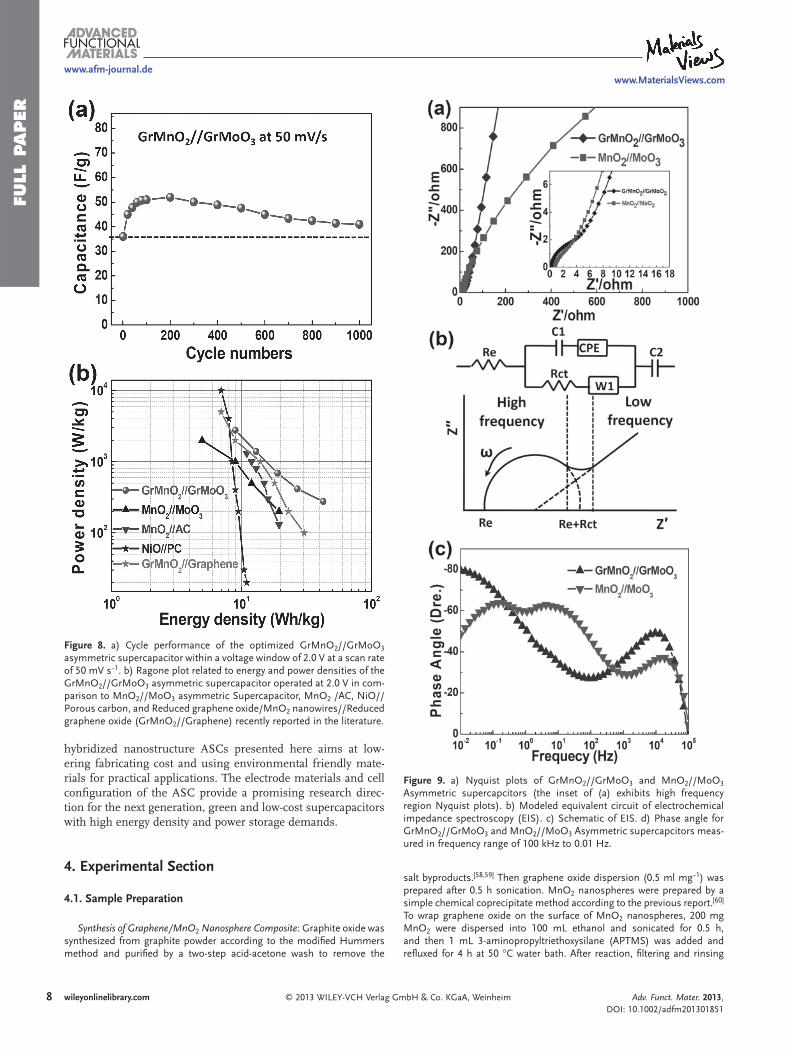
Long cycle life is an important requirement for supercapacitor. The cycle life test during 1000 cycles for GrMnO 2 //GrMoO 3 ASCs was carried out by repeating the CV test between 0 and 2.0 V at a scan rate of 50 mV s −1 . Figure 8 a shows the capacitance as a function of cycle number. It is worth noting that the specifi c capacitance sharply increases at the initial 100 cycles, which is probably related to an improvement in the surface wetting of the electrode by electrolyte and activation of the active materials. This can be rationalized by hydrophobic nature of graphene. During the following cycles, the ASC displays an excellent cycling stability with a little deterioration. The cycling stability can be ascribed to the hybridized nanostructures of two electrodes: The core-shell GrMnO 2 structure effectively prevents the MnO 2 nanospheres from being dissolved into electrolyte by graphene wrapping. In general, Mn 4+ in MnO 2 can be converted into Mn 3+ and Mn 2+ and these ions will fl ow through the separator to the negative elec-trode, resulting in decreasing the capacitance of both electrodes during CD process. [ 44 ] GrMoO 3 layer stacking structure is also attributed to prevent MoO 3 from being dissolved into electrolyte.
composite, an asymmetric supercapacitor was fabricated using these materials as the positive and negative electrodes, respec-tively. To further evaluate the electrochemical properties and estimate the stable potential windows of GrMnO 2 and GrMoO 3 prior to evaluation of the asymmetric unit cell, we performed CV measurements on the two electrode materials in 1 M Na 2 SO 4 aqueous solution, using a three-electrode cell with a platinum mesh as an auxiliary electrode and a Ag/AgCl (sat-urated NaCl) electrode as a reference electrode. The GrMnO 2 electrode was measured at a scan rate of 5 mV s −1 within a potential window of −0.1 to 0.9 V(Ag/AgCl), while GrMoO 3 was measured within a potential window of −1.0 to 0 V (Ag/AgCl) ( Figure 7 a). The specifi c capacitance calculated from the CV curve at a scan rate of 5 mV s −1 was 255 F g −1 for GrMnO 2 composite and 198 F g −1 for GrMoO 3 composite, respectively. The specifi c capacitance of the composites was derived from the combined contribution of redox pseudocapacitance of metal oxide and electrochemical double layer capacitance of
Figure 6. a) CV curves of pure MoO 3 and GrMoO 3 composite at 50mV s −1 in 1 M Na 2 SO 4 electrolyte. b) Specifi c capacitances of pure MoO 3 and GrMoO 3 composite at different scan rates.
Adv. Funct. Mater. 2013, DOI: 10.1002/adfm201301851
FULL P
APER
7
www.afm-journal.dewww.MaterialsViews.com
wileyonlinelibrary.com© 2013 WILEY-VCH Verlag GmbH & Co. KGaA, Weinheim
further optimizing structures of metal oxides and combination with doped graphene layers.
Our hybridized nanostructure ASCs of integration of metal oxides with graphene present much better performance than MnO 2 //MoO 3 ASCs. To further examine the fundamental electrochemical behavior of ASCs, the electrochemical impedance spec-troscopy (EIS) analysis has been introduced to measure the impedance in the frequency range of 10 mHz–100 kHz at open circuit potential with an ac perturbation of 10 mV ( Figure 9 a). The Nyquist plots obtained were modeled and interpreted with the help of an appropriate electric equivalent circuit (Figure 9 b and c), where Re stands for a combined resistance of ionic resistance of electrolyte, intrinsic resistance of substrate and contact resistance at the active material/current collector interface, Rct the charge tansfer resistance casued by the faradaic reac-tion, W1 the Warburg type element related to electrolyte ions diffusion, CPE the constant phase element, C1 the double layer capaci-tance and C2 the limit capacitance. [ 9,48 ] It is clear to see that the integration of graphene into both electrodes decreases contact resist-ance with electrolyte, charge transfer resist-ance and electrolyte diffusion resistance com-pared to the electrodes of pure metal oxides (as shown in S3). An impedance phase angle
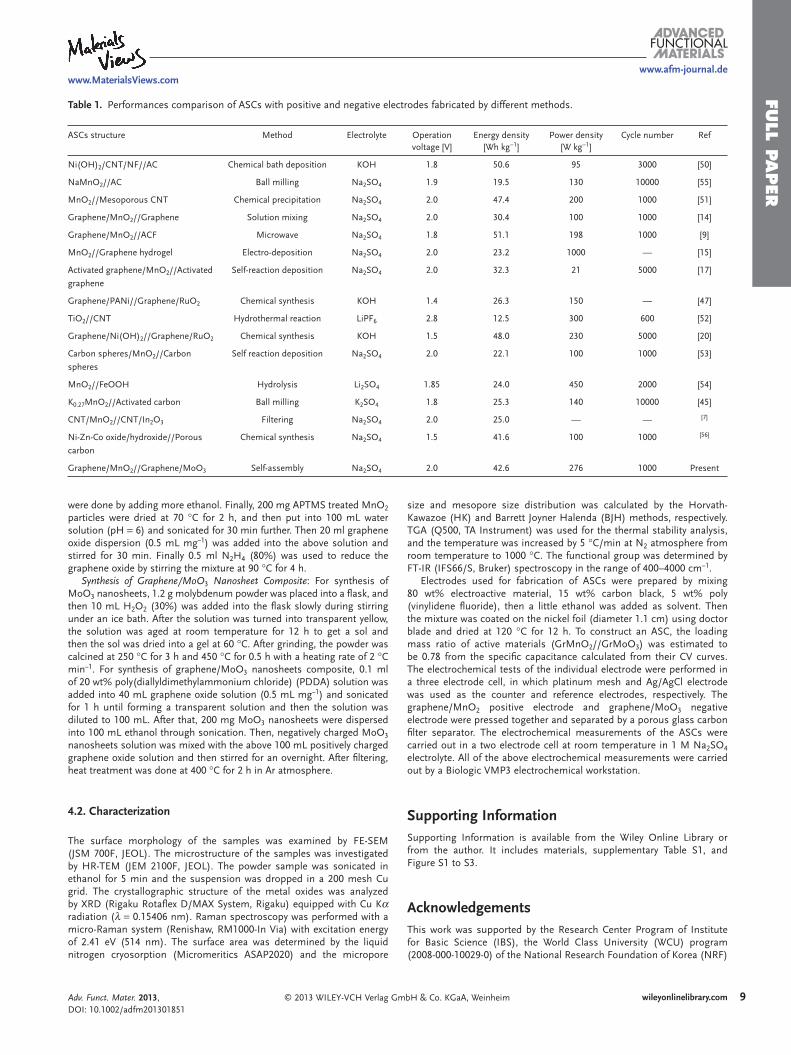
plot is also shown in Figure 9 d. The “knee frequency” of the ASC is about 1.8 Hz at a phase of −45°, which exhibits a pure capacitive behavior. [ 49 ] Most of its stored energy is accessible at frequencies below 1.8 Hz. The phase angle of the supercapac-itor was about −80° at a frequency of 10 mHz, close to −90° for ideal capacitors, coinciding with the electric equivalent circuit for the ASC. Compared with previously and recently reported ASCs (as shown in Table 1 ), [ 7,9,14,15,17,20,45,50–56 ] our ASC shows higher energy density at an operation voltage of 2.0 V in a neu-tral aqueous Na 2 SO 4 electrolyte. Even though our hybridized nanostructure ASCs exhibit lower power density than textiles based supercapacitor, [ 57 ] we will be able to combine these dif-ferent metal oxides with graphene foam or high conductive tex-tiles in ASCs for further improving the performance in future.
3 . Conclusions
We have successfully developed an ASC using graphene/MnO 2 composite and graphene/MoO 3 composite as positive and negative electrode, respectively that operates at large opera-tion voltage window. The ASC shows high specifi c capacitance, high energy density, and good cycling stability at an operation voltage window of 2.0 V in neutral aqueous Na 2 SO 4 electro-lyte. We proved that it is highly desirable for coupling the gra-phene/MnO 2 composite with the graphene/MoO 3 composite to produce supercapacitors with high energy demands. Such
Figure 8 b shows Ragone plot for energy density and power density. The specifi c energy density (E, Wh kg −1 ) and power density (P, W kg −1 ) for a supercapacitor cell can be calculated using the following equations: E = 1/2 CV 2 and P = E/t, where C is the specifi c capacitance of supercapacitor cell, V is voltage change during the discharge process after IR drop in V-t curve, and t is the discharge time. Figure 8 b shows the Ragone plots of the supercapacitors calculated from Figure 7 d. It is more reasonable to choose CD measurements to calculate energy density and power density for evaluating practical applica-tion of supercapacitors instead of CV measurements. The GrMnO 2 //GrMoO 3 ASCs with a cell voltage of 2.0 V can exhibit an energy density of 42.6 Wh kg −1 at a power density of 276 W kg −1 . In comparison, MnO 2 //MoO 3 ASCs were also fabri-cated for reference. The hybridized nanostructure ASCs exhibit better electrochemical performance, which can be attributed to the integration of graphene into two electrodes, improving the pseudocapacitance of metal oxides. The hybridized nano-structure ASCs also exhibit much higher energy density than other reported ASCs, such as MnO 2 //AC, [ 45 ] NiO//Porous carbon, [ 46 ] and Graphene/MnO 2 nanowires//graphene. [ 14 ] The energy density is much higher than those of noble metal oxides based ASCs, such as CNT/MnO 2 //CNT/In 2 O 3 (25.5 Wh kg −1 ), [ 7 ] RGO/RuO 2 //RGO/PANi (26.3 Wh kg −1 ). [ 47 ] The enhancement of energy density here is attributed to the enlarged operation voltage and the increased specifi c capacitance of both elec-trodes. The electrochemical performance could be improved by
Figure 7. a) Comparative CV curves of GrMnO 2 and GrMoO 3 electrodes performed in three-electrode cell in 1 M Na 2 SO 4 electrolyte at a scan rate of 5 mV s −1 . b) CV curves an opti-mized graphene/MnO 2 //graphene/MoO 3 asymmetric supercapacitor at different scan rates 1M Na 2 SO 4 electrolyte. c) Galvanostatic charge/discharge curves of GrMnO 2 //GrMoO 3 asym-metric supercapacitor at different current densities. d) Specifi c capacitance of one electrode in the asymmetric supercapacitor at different current densities.
Adv. Funct. Mater. 2013, DOI: 10.1002/adfm201301851
FULL
PAPER
8
www.afm-journal.dewww.MaterialsViews.com
wileyonlinelibrary.com © 2013 WILEY-VCH Verlag GmbH & Co. KGaA, Weinheim
salt byproducts. [ 58,59 ] Then graphene oxide dispersion (0.5 ml mg −1 ) was prepared after 0.5 h sonication. MnO 2 nanospheres were prepared by a simple chemical coprecipitate method according to the previous report. [ 60 ] To wrap graphene oxide on the surface of MnO 2 nanospheres, 200 mg MnO 2 were dispersed into 100 mL ethanol and sonicated for 0.5 h, and then 1 mL 3-aminopropyltriethoxysilane (APTMS) was added and refl uxed for 4 h at 50 °C water bath. After reaction, fi ltering and rinsing
hybridized nanostructure ASCs presented here aims at low-ering fabricating cost and using environmental friendly mate-rials for practical applications. The electrode materials and cell confi guration of the ASC provide a promising research direc-tion for the next generation, green and low-cost supercapacitors with high energy density and power storage demands.
4 . Experimental Section
4.1 . Sample Preparation
Synthesis of Graphene/MnO 2 Nanosphere Composite : Graphite oxide was synthesized from graphite powder according to the modifi ed Hummers method and purifi ed by a two-step acid-acetone wash to remove the
Figure 9. a) Nyquist plots of GrMnO 2 //GrMoO 3 and MnO 2 //MoO 3 Asymmetric supercapcitors (the inset of (a) exhibits high frequency region Nyquist plots). b) Modeled equivalent circuit of electrochemical impedance spectroscopy (EIS). c) Schematic of EIS. d) Phase angle for GrMnO 2 //GrMoO 3 and MnO 2 //MoO 3 Asymmetric supercapcitors meas-ured in frequency range of 100 kHz to 0.01 Hz.
Figure 8. a) Cycle performance of the optimized GrMnO 2 //GrMoO 3 asymmetric supercapacitor within a voltage window of 2.0 V at a scan rate of 50 mV s −1 . b) Ragone plot related to energy and power densities of the GrMnO 2 //GrMoO 3 asymmetric supercapacitor operated at 2.0 V in com-parison to MnO 2 //MoO 3 asymmetric Supercapacitor, MnO 2 /AC, NiO//Porous carbon, and Reduced graphene oxide/MnO 2 nanowires//Reduced graphene oxide (GrMnO 2 //Graphene) recently reported in the literature.
Adv. Funct. Mater. 2013, DOI: 10.1002/adfm201301851
FULL P
APER
9
www.afm-journal.dewww.MaterialsViews.com
wileyonlinelibrary.com© 2013 WILEY-VCH Verlag GmbH & Co. KGaA, Weinheim
size and mesopore size distribution was calculated by the Horvath-Kawazoe (HK) and Barrett Joyner Halenda (BJH) methods, respectively. TGA (Q500, TA Instrument) was used for the thermal stability analysis, and the temperature was increased by 5 °C/min at N 2 atmosphere from room temperature to 1000 °C. The functional group was determined by FT-IR (IFS66/S, Bruker) spectroscopy in the range of 400–4000 cm −1 .
Electrodes used for fabrication of ASCs were prepared by mixing 80 wt% electroactive material, 15 wt% carbon black, 5 wt% poly (vinylidene fl uoride), then a little ethanol was added as solvent. Then the mixture was coated on the nickel foil (diameter 1.1 cm) using doctor blade and dried at 120 °C for 12 h. To construct an ASC, the loading mass ratio of active materials (GrMnO 2 //GrMoO 3 ) was estimated to be 0.78 from the specifi c capacitance calculated from their CV curves. The electrochemical tests of the individual electrode were performed in a three electrode cell, in which platinum mesh and Ag/AgCl electrode was used as the counter and reference electrodes, respectively. The graphene/MnO 2 positive electrode and graphene/MoO 3 negative electrode were pressed together and separated by a porous glass carbon fi lter separator. The electrochemical measurements of the ASCs were carried out in a two electrode cell at room temperature in 1 M Na 2 SO 4 electrolyte. All of the above electrochemical measurements were carried out by a Biologic VMP3 electrochemical workstation.
Supporting Information Supporting Information is available from the Wiley Online Library or from the author. It includes materials, supplementary Table S1, and Figure S1 to S3.
Acknowledgements This work was supported by the Research Center Program of Institute for Basic Science (IBS), the World Class University (WCU) program (2008-000-10029-0) of the National Research Foundation of Korea (NRF)
were done by adding more ethanol. Finally, 200 mg APTMS treated MnO 2 particles were dried at 70 °C for 2 h, and then put into 100 mL water solution (pH = 6) and sonicated for 30 min further. Then 20 ml graphene oxide dispersion (0.5 mL mg −1 ) was added into the above solution and stirred for 30 min. Finally 0.5 ml N 2 H 4 (80%) was used to reduce the graphene oxide by stirring the mixture at 90 °C for 4 h.
Synthesis of Graphene/MoO 3 Nanosheet Composite : For synthesis of MoO 3 nanosheets, 1.2 g molybdenum powder was placed into a fl ask, and then 10 mL H 2 O 2 (30%) was added into the fl ask slowly during stirring under an ice bath. After the solution was turned into transparent yellow, the solution was aged at room temperature for 12 h to get a sol and then the sol was dried into a gel at 60 °C. After grinding, the powder was calcined at 250 °C for 3 h and 450 °C for 0.5 h with a heating rate of 2 °C min −1 . For synthesis of graphene/MoO 3 nanosheets composite, 0.1 ml of 20 wt% poly(diallyldimethylammonium chloride) (PDDA) solution was added into 40 mL graphene oxide solution (0.5 mL mg −1 ) and sonicated for 1 h until forming a transparent solution and then the solution was diluted to 100 mL. After that, 200 mg MoO 3 nanosheets were dispersed into 100 mL ethanol through sonication. Then, negatively charged MoO 3 nanosheets solution was mixed with the above 100 mL positively charged graphene oxide solution and then stirred for an overnight. After fi ltering, heat treatment was done at 400 °C for 2 h in Ar atmosphere.
4.2. Characterization
The surface morphology of the samples was examined by FE-SEM (JSM 700F, JEOL). The microstructure of the samples was investigated by HR-TEM (JEM 2100F, JEOL). The powder sample was sonicated in ethanol for 5 min and the suspension was dropped in a 200 mesh Cu grid. The crystallographic structure of the metal oxides was analyzed by XRD (Rigaku Rotafl ex D/MAX System, Rigaku) equipped with Cu K α radiation ( λ = 0.15406 nm). Raman spectroscopy was performed with a micro-Raman system (Renishaw, RM1000-In Via) with excitation energy of 2.41 eV (514 nm). The surface area was determined by the liquid nitrogen cryosorption (Micromeritics ASAP2020) and the micropore
Table 1. Performances comparison of ASCs with positive and negative electrodes fabricated by different methods.
ASCs structure Method Electrolyte Operation voltage [V]
Energy density [Wh kg −1 ]
Power density [W kg −1 ]
Cycle number Ref
Ni(OH) 2 /CNT/NF//AC Chemical bath deposition KOH 1.8 50.6 95 3000 [ 50 ]
NaMnO 2 //AC Ball milling Na 2 SO 4 1.9 19.5 130 10000 [ 55 ]
MnO 2 //Mesoporous CNT Chemical precipitation Na 2 SO 4 2.0 47.4 200 1000 [ 51 ]
Graphene/MnO 2 //Graphene Solution mixing Na 2 SO 4 2.0 30.4 100 1000 [ 14 ]
Graphene/MnO 2 //ACF Microwave Na 2 SO 4 1.8 51.1 198 1000 [ 9 ]
MnO 2 //Graphene hydrogel Electro-deposition Na 2 SO 4 2.0 23.2 1000 — [ 15 ]
Activated graphene/MnO 2 //Activated
graphene
Self-reaction deposition Na 2 SO 4 2.0 32.3 21 5000 [ 17 ]
Graphene/PANi//Graphene/RuO 2 Chemical synthesis KOH 1.4 26.3 150 — [ 47 ]
TiO 2 //CNT Hydrothermal reaction LiPF 6 2.8 12.5 300 600 [ 52 ]
Graphene/Ni(OH) 2 //Graphene/RuO 2 Chemical synthesis KOH 1.5 48.0 230 5000 [ 20 ]
Carbon spheres/MnO 2 //Carbon
spheres
Self reaction deposition Na 2 SO 4 2.0 22.1 100 1000 [ 53 ]
MnO 2 //FeOOH Hydrolysis Li 2 SO 4 1.85 24.0 450 2000 [ 54 ]
K 0.27 MnO 2 //Activated carbon Ball milling K 2 SO 4 1.8 25.3 140 10000 [ 45 ]
CNT/MnO 2 //CNT/In 2 O 3 Filtering Na 2 SO 4 2.0 25.0 — — [ 7 ]
Ni-Zn-Co oxide/hydroxide//Porous
carbon
Chemical synthesis Na 2 SO 4 1.5 41.6 100 1000 [ 56 ]
Graphene/MnO 2 //Graphene/MoO 3 Self-assembly Na 2 SO 4 2.0 42.6 276 1000 Present
Adv. Funct. Mater. 2013, DOI: 10.1002/adfm201301851
FULL
PAPER
10
www.afm-journal.dewww.MaterialsViews.com
wileyonlinelibrary.com © 2013 WILEY-VCH Verlag GmbH & Co. KGaA, Weinheim
[28] F. Chen , R. Schafranek , W. Wu , A. Klein , J. Phys. D: Appl. Phys. 2011 , 44 , 1 .
[29] M. N. Islam , M. O. Hakim , J. Mater. Science Lett. 1986 , 5 , 63 . [30] T. T. Truong , Y. Liu , Y. Ren , L. Trahey , Y. G. Sun , ACS Nano 2012 , 6 ,
8067 . [31] Y. K. Hsu , Y. C. Chen , Y. G. Lin , L. C. Chen , K. H. Chen , Chem.
Commun. 2011 , 47 , 1252 . [32] J. S. Lee , K. H. You , C. B. Park , Adv. Mater. 2012 , 24 , 1084 . [33] A. Ghosh , E. J. Ra , M. Jin , H. K. Jeong , T. H. Kim , C. Biswas ,
Y. H. Lee , Adv. Funct. Mater. 2011 , 21 , 2541 . [34] F. Yao , F. Günes , H. Q. Ta , S. M. Lee , S. J. Chae , K. Y. Sheem ,
C. S. Cojocaru , S. S. Xie , Y. H. Lee , J. Am. Chem. Soc. 2012 , 134 , 8646 .
[35] K. Fic , G. Lota , M. Meller , E. Frackowiak , Energy Environ. Sci. 2012 , 5 , 5842 .
[36] Q. Qu , S. B. Yang , X. L. Feng , Adv. Mater. 2011 , 23 , 5574 . [37] W. C. Chang , X. Qi , J. C. Kuo , S. C. Lee , S. K. Ng , D. Chen , CrystEng-
Comm. 2011 , 13 , 5125 . [38] T. Brezesinski , J. Wang , S. H. Tolbert , B. Dunn , Nat. Mater. 2010 , 9 ,
146 . [39] W. Tang , L. Liu , S. Tian , L. Li , Y. Yue , Y. Wu , K. Zhu , Chem. Commun.
2011 , 47 , 10058 . [40] L. Cai , P. M. Rao , X. L. Zheng , Nano Lett. 2011 , 11 , 872 . [41] R. Liang , H. Q. Cao , D. Qian , Chem. Commun. 2011 , 47 , 10305 . [42] E. Y. Choi , T. H. Han , J. Hong , J. E. Kim , S. H. Lee , H. W. Kim ,
S. O. Kim , J. Mater. Chem. 2010 , 20 , 1907 . [43] G. R. Li , Z. L. Wang , F. L. Zheng , Y. N. Ou , X. Tong , J. Mater. Chem.
2011 , 21 , 4217 . [44] F. Ataherian , N. L. Wu , J. Electrochem. Soc. 2011 , 158 , A422 . [45] Q. T. Qu , Y. Shi , S. Tian , Y. H. Chen , Y. P. Wu , R. Holze , J. Power
Sources 2009 , 194 , 1222 . [46] W. Wang , F. Li , H. M. Cheng , J. Power Sources 2008 , 185 , 1563 . [47] J. Zhang , J. Jiang , H. Li , X. S. A. Zhao , Energy Environ. Sci. 2011 , 4 ,
4009 . [48] M. S. Wu , C. Y. Huang , K. H. Lin , J. Power Sources 2009 , 186 , 557 . [49] L. Yuan , X. H. Lu , X. Xiao , T. Zhai , J. Dai , F. Zhang , B. Hu , X. Wang ,
L. Gong , J. Chen , C. Hu , Y. Tong , J. Zhou , Z. L. Wang , ACS Nano 2011 , 6 , 656 .
[50] Z. Tang , C. H. Tang , H. A. Gong , Adv. Funct. Mater. 2012 , 22 , 1272 . [51] H. Jiang , C. Li , T. Sun , J. Ma , Nanoscale 2012 , 4 , 807 . [52] Q. Wang , Z. Wen , J. H. Li , Adv. Funct. Mater. 2006 , 16 , 2141 . [53] Z. Lei , J. Zhang , X. S. Zhao , J. Mater. Chem. 2012 , 22 , 153 . [54] W. H. Jin , G. T. Cao , J. Y. Sun , J. Power Sources 2008 , 175 , 686 . [55] Q. T. Qu , L. Li , S. Tian , W. Guo , Y. P. Wu , R. Holze , J. Power Sources
2010 , 195 , 2789 . [56] H. Wang , Q. Gao , J. Hu , J. Power Sources 2010 , 195 , 3017 . [57] G. H. Yu , L. B. Hu , N. Liu , H. Wang , M. Vosgueritchian , Y. Yang ,
Y. Cui , Z. Bao , Nano Lett. 2011 , 11 , 4438 . [58] W. S. Hummers , R. E. Offeman , J. Am. Chem. Soc. 1958 , 80 , 1339 . [59] Y. T. Chen , F. Guo , A. Jachak , S. P. Kim , D. Datta , J. Y. Liu , I. Kulaots ,
C. Vaslet , H. D. Jang , J. X. Huang , A. Kane , V. B. Shenoy , H. Robert , Nano Lett. 2012 , 12 , 1996 .
[60] H. Jiang , T. Sun , C. Li , J. Ma , J. Mater. Chem. 2011 , 22 , 2751 .
funded by the Ministry of Education, Science and Technology (MEST) of Korea.
Received: May 30, 2013 Published online:
[1] P. Simon , Y. Gogotsi , Nat. Mater. 2008 , 7 , 845 . [2] J. R. Miller , P. Simon , Science 2008 , 321 , 651 . [3] H. K. Jeong , M. Jin , E. J. Ra , K. Y. Sheem , G. H. Han , S. Arepalli ,
Y. H. Lee , ACS Nano 2010 , 4 , 1162 . [4] A. Baducci , R. Dugas , P. L. Taberna , P. Simon , D. PLee , M. Mastragostino ,
S. Passerini , J. Power Sources 2007 , 165 , 922 . [5] G. Wang , L. Zhang , J. Zhang , Chem. Soc. Rev. 2012 , 41 , 797 . [6] P. J. Hall , M. Mirzaeian , S. I. Fletcher , F. B. Sillars , A. J. R. Rennie ,
G. O. Shitta-Bey , G. Wilson , A. Cruden , R. Carter , Energy Environ. Sci. 2010 , 3 , 1238 .
[7] P. C. Chen , G. Shen , Y. Shi , H. Chen , X. Zhou , ACS Nano 2010 , 4 , 4403 .
[8] Y. G. Wang , Y. Y. Xia , Electrochem. Commun. 2005 , 7 , 1138 . [9] Z. Fan , J. Yan , T. Wei , L. Zhi , G. Ning , T. Li , F. Wei , Adv. Funct. Mater.
2011 , 21 , 2366 . [10] J. Yan , Z. Fan , W. Sun , G. Ning , T. Wei , Q. Zhang , R. Zhang , L. J. Zhi ,
F. Wei , Adv. Funct. Mater. 2012 , 22 , 2632 . [11] H. Jiang , J. Ma , C. Z. Li , Adv. Mater. 2012 , 24 , 4197 . [12] X. Lu , T. Zhai , X. Zhang , Y. Shen , L. Yuan , B. Hu , L. Gong , J. Chen ,
Y. Gao , J. Zhou , Y. Tong , Z. L. Wang , Adv. Mater. 2012 , 24 , 938 . [13] J. Han , L. L. Zhang , S. Lee , J. Oh , K. S. Lee , J. R. Potts , J. Ji , X. Zhao ,
R. S. Ruoff , S. J. Park , ACS Nano 2012 , 7 , 19 . [14] Z. S. Wu , W. Ren , D. W. Wang , F. Li , B. Liu , H. M. Cheng , ACS Nano
2010 , 4 , 5835 . [15] H. Gao , F. Xiao , C. B. Ching , H. Duan , ACS Appl. Mater. Interfaces
2012 , 4 , 2801 . [16] Z. Wen , X. Wang , S. Mao , Z. Bo , H. Kim , S. Cui , G. Lu , X. Feng ,
J. Chen , Adv. Mater. 2012 , 24 , 5610 . [17] X. Zhao , L. Zhang , S. Murali , M. D. Stoller , Q. Zhang , Y. Zhu ,
R. S. Ruoff , ACS Nano 2012 , 6 , 5404 . [18] C. Liu , Z. Yu , D. Neff , A. Zhamu , B. Z. Jang , Nano Lett. 2010 , 10 , 4863 . [19] L. Wei , M. Sevilla , A. B. Fuertes , R. Mokaya , G. Yushin , Adv. Funct.
Mater. 2012 , 22 , 827 . [20] H. L. Wang , Y. Liang , T. Mirfakhrai , Z. Chen , H. S. Casalongue ,
H. J. Dai , Nano Res. 2011 , 4 , 729 . [21] J. Cheng , M. Sprik , Phys. Chem. Chem. Phys. 2012 , 14 , 1 1245 . [22] V. Chakrapani , C. Pendyala , K. Kash , A. B. Anderson , M. K. Sunkara ,
J. C. Angus , J. Am. Chem. Soc. 2008 , 130 , 1 2944 . [23] S. Trasatti , Pure Appl. Chem. 1986 , 58 , 955 . [24] P. V. Rysselberghe , Appl. Phys. Lett. 1953 , 21 , 1550 . [25] M. T. Greiner , M. G. Helander , W. M. Tang , Z. B. Wang , J. Qiu ,
Z. H. Lu , Nat. Mater. 2012 , 11 , 76 . [26] C. A. Pan , T. B. Ma , Appl. Phys. Lett. 1980 , 37 , 714 . [27] Z. Viskadourakis , M. L. Parames , O. Conde , M. Zervos ,
J. Giapintzakis , Appl. Phys. Lett. 2012 , 101 , 033505 .
Adv. Funct. Mater. 2013, DOI: 10.1002/adfm201301851