quantifying social asymmetric structures
TRANSCRIPT
Copyright 2006 Psychonomic Society, Inc. 390
Journal2006, ?? (?), ???-???
Social phenomena have often been investigated by methods focused on individuals, even when the social studies have involved more than one agent. In the individu-alistic approach, agents are represented as making choices and behaving without considering the behaviors of other agents. These research methods focus on agents’ attributes but are not concerned with their social relations and do not generally take into account the social environment within which agents are embedded. It should be noted that if the individualistic approach is used, the independence of each agent’s behavior from other agents’ actions is assumed. There is no doubt that the individualistic approach allows researchers to discover significant patterns in social sys-tems, but it is not so obvious to what extent it is useful for extracting regularities from agents’ interactions.
As an alternative, in many social interaction studies, round-robin designs (Kenny, 1994) are used to investigate social interactions among agents. In reciprocal round-robin designs (Kenny & Albright, 1987), each agent in-teracts with every other agent in the group. An agent is called an actor when he or she initiates some kind of ac-tion addressed at other entities. The recipients of the ac-
tors’ actions are called receivers, or partners. However, in other research, an exhaustive study of the interactions between every pair of agents is not planned: The number of actions each agent directs at other agents is recorded, and it is assumed that all the agents are able to interact in a dyad. In both cases, the dyad is the unit of analysis, and some measurements of dyadic relations can be used to describe the whole social system, at either the group or the individual level. Because research carried out with round-robin designs does not usually take into consider-ation self-directed actions, the principal diagonal of a so-ciomatrix will be empty, a dash often being employed to denote that this measurement is not allowed.
Social interactions between members of a group are fre-quently nontransitive, and the measure of the relationship between each pair in a finite aggregate of individuals is commonly asymmetric. Unfortunately, many statistical techniques are not appropriate for analyzing asymmet-ric and nontransitive data. The inconsistency between the characteristics of social phenomena and the assumptions of statistical techniques has been recognized when a pair of agents has been set as the unit of analysis. Hence, there is a need to develop and propose appropriate statistical tests (Appleby, 1983; de Vries, 1993, 1995, 1998; Hemel-rijk, 1990a, 1990b; Kendall & Babington Smith, 1940; Landau, 1951; Rapoport, 1949; Warner, Kenny, & Stoto, 1979).
A correlation statistical approach has been proposed whose intent is to develop a statistical test in which reci-procity and interchange can be quantified as a correlation value (Hemelrijk, 1990a, 1990b). The procedure takes into
This research was partially supported by the Ministerio de Educación y Ciencia, Grant SEJ2005-07310-C02-01/PSIC, and the Generalitat de Catalunya, Grant 2001SGR-00140. We thank Carme Maté for allowing us partial use of data recorded for her doctoral thesis. Correspondence concerning this article should be addressed to A. Solanas, Departament de Metodologia de les Ciències del Comportament, Facultat de Psicolo-gia, Universitat de Barcelona, Passeig de la Vall d’Hebron, 171, 08035 Barcelona, Spain (e-mail: [email protected]).
Quantifying social asymmetric structures
ANTONIO SOLANAS, LLUÍS SALAFRANCA, and CARLES RIBAUniversity of Barcelona, Barcelona, Spain
VICENTA SIERRAESADE-Ramon Llull University, Barcelona, Spain
and
DAVID LEIVAUniversity of Barcelona, Barcelona, Spain
Many social phenomena involve a set of dyadic relations among agents whose actions may be de-pendent. Although individualistic approaches have frequently been applied to analyze social processes, these are not generally concerned with dyadic relations, nor do they deal with dependency. This article describes a mathematical procedure for analyzing dyadic interactions in a social system. The proposed method consists mainly of decomposing asymmetric data into their symmetric and skew-symmetric parts. A quantification of skew symmetry for a social system can be obtained by dividing the norm of the skew-symmetric matrix by the norm of the asymmetric matrix. This calculation makes available to researchers a quantity related to the amount of dyadic reciprocity. With regard to agents, the pro-cedure enables researchers to identify those whose behavior is asymmetric with respect to all agents. It is also possible to derive symmetric measurements among agents and to use multivariate statistical techniques.
Behavior Research Methods2006, 38 (3), 390-399
SOCIAL ASYMMETRIC STRUCTURES 391
consideration the dependency within dyads of agents, and statistical significance is found by means of permutation tests. In Hemelrijk’s articles, the concepts of reciprocity and interchange in social interactions have been clearly distinguished. Briefly, animals may make interchanges between themselves by directing dissimilar kinds of be-haviors at each other and not always establishing the same reciprocation. For instance, one can think of an animal’s helping its partners in fighting but receiving grooming in return. In fact, studies in which one category of behavior is considered to measure reciprocity in the social system could not represent group social interactions at all, it being also necessary to take interchangeable behaviors into ac-count in the mathematical and statistical analysis.
Another approach decomposes the variance of a so-ciomatrix into several effects (Warner et al., 1979). This model is called the social relations model (SRM; Kenny & La Voie, 1984) and assumes that the individual attraction of Agent i toward Agent j is an additive linear function of a constant parameter, the actor effect, the partner effect, and the relationship effect. The constant parameter equals the mean of all the round-robin data in the study. The actor ef-fect represents the tendency of an agent to act. The partner effect measures the tendency of an agent to be the receiver of actions from other agents. In the SRM, actor and part-ner effects are considered unobservable quantities about which inferences must be made (Lashley & Bond, 1997). For inference purposes, the SRM uses a two-way ANOVA, in which the columns and rows of the sociomatrix corre-spond to the factors of the ANOVA statistical model. The actors are a sample of a population and, as a consequence, a random effects ANOVA is needed to carry out the social relations analysis. The SRM separates reciprocity at gen-eralized and dyadic levels. Whereas generalized reciproc-ity refers, for example, to whether people who are seen by others as having a given trait also see others as possess-ing the same trait, dyadic reciprocity corresponds to the relationship between individuals in pairs. This model has been extended to triadic relations (Bond, Horn, & Kenny, 1997). The SRM also allows estimation of the degree of dyadic and generalized reciprocity by means of correla-tion coefficient values, but it does not enable researchers to know to what extent each agent contributes to reciprocity.
The hierarchy index proposed by Landau (1951) al-lows researchers to quantify a latent dimension of the social structure and requires each agent in a pair to be categorized as dominating or not dominating with respect to the other. This transformation suppresses quantitative information and does not take into consideration the mag-nitude of the difference between two-way measurements in a dyad. Thus, Landau’s index dichotomizes the domi-nance relations between every pair of agents in a dyad, even though a dominating relationship between them may not be clear. If the index took into account the magnitude of the difference between the two-way measurements in a dyad, it could make a distinction between apparent and ambiguous dominance relations. In the next sections, we will describe and put forward a new method that may be a
solution to this problem, although it specifically refers to social reciprocity and interchange.
In general, a sociomatrix is a square matrix because re-searchers are often interested in studying all the possible social interactions between members of a group. However, a common problem with square matrices with respect to interpersonal perceptions or social interaction data is that although it often seems reasonable to assume that a distance interpretation underlies the empirical data, the lack of symmetry makes statistical methods unavailable. According to Constantine and Gower (1978), a distance interpretation is often so attractive that a matrix X, which contains any kind of interaction data between entities, is not infrequently transformed into a symmetric matrix, ig-noring departures from symmetry that may be informa-tive. Decomposing a square matrix X into its symmetric and skew-symmetric parts makes it possible to represent the objects in two geometrical spaces (Constantine & Gower, 1978), but social researchers may prefer a unique display in which the interpretation can be more parsimoni-ous. Borg and Groenen (1997) used a ratio to quantify the magnitude of symmetry in an asymmetric square matrix X, although no substantive interpretation was made. The method we will present in the following sections is based on Constantine and Gower’s propositions and on those of Borg and Groenen. The decomposition of a square ma-trix into its symmetric and skew-symmetric parts has also been used to analyze proximity data in social studies (de Vries, 1993).
In short, although many important problems in social interaction analysis seem to have been resolved, some still await a solution. Regarding these remaining prob-lems, it has been pointed out that a procedure capable of detecting how much each agent contributes to the effects in reciprocity quantification at the group level would be useful for analyzing social systems (Hemelrijk, 1990b). Our study also tries to achieve some insight into this prob-lem by means of decomposing the skew symmetry—or if preferred, the symmetry—into those parts that can be assigned to agents.
Our main purpose was to develop an analytic method for carrying out a holistic analysis of social groups, but as-suming that global phenomena depend on dyadic interac-tions. The model is intended to describe the social system as an entire entity, in order to quantify the agents’ dyadic relations and to achieve a numerical description that en-ables social researchers to represent agents in a unique geometric space. Other techniques have been put forward, but these do not take absolute differences among agents’ behavioral frequencies into account. Most are concerned with association patterns, and that is why different coeffi-cients of association are being proposed to quantify social phenomena.
A Quantification of Skew SymmetryTo analyze asymmetric matrices, Constantine and
Gower (1978) proposed decomposing these types of ma-trix into their symmetric and skew-symmetric parts. An
392 SOLANAS, SALAFRANCA, RIBA, SIERRA, AND LEIVA
independent geometrical representation of each part can then be obtained as a solution to the problem of represent-ing entities or objects in a Euclidean space. Although this procedure enables social researchers to represent agents in an underlying geometrical space, it does not give a global quantification of the reciprocity in the whole social sys-tem at the group level. This matrix decomposition is used in the present study to quantify the global reciprocity in social systems.
Following Hemelrijk (1990b), reciprocity and inter-change among all the pairs of group members can be stud-ied in two ways: via a model based on acting by one agent and reacting by another (the actor–reactor model) and another based on acting and receiving by the same indi-vidual (the actor–receiver model). In accord with Hemel-rijk (1990b), we define dyadic reciprocity in this article as the exact matching between the number of actions that an agent directs to others and what it receives from them in return. In other words, each agent compares what it directs to its partners with what it has received from them. Thus, each receiving agent does not take into account what these partners direct to others. This definition of dyadic reci-procity corresponds to that of the actor–receiver model.
By means of the matrix X, a sociomatrix is represented in which rows correspond to actors and columns represent receivers or partners. The elements of the matrix X can be qualitative, frequency, or relative values. Duration of so-cial actions during an established observation period can also be used. The form of the matrix X is as follows:
X
0
0
0
12 13 1
21 23 2
31 32 3
1
x x x
x x x
x x x
x
n
n
n
n
f
f
f
h h h j h
xx xn n2 3
0f
,
where xij and n denote a measure of any behavior that the ith agent directs to the jth agent and the number of agents, respectively. Note that xii 0 for all the agents, meaning that self-directed actions are not allowed.
Every square asymmetric matrix X with n rows and n columns can be additively decomposed into a symmetric matrix and a skew-symmetric matrix. That is,
X X X X X S K
2 2,
(1)
where S is a symmetric matrix and K a skew-symmetric matrix, also called an anti-symmetry matrix. S is a sym-metric matrix if S S, and K is a skew-symmetric matrix if K K. It should be noted that the diagonal elements of S and K would always be zero. Hereafter, we will repre-sent the elements of matrices S and K by sij and kij, respec-tively. The matrix K corresponds to the departures from symmetry, and the elements of a skew-symmetric matrix can be understood as representing the lack of balance in reciprocity between agents. According to the definition of a skew-symmetric matrix, its elements show the fol-lowing property: kij kji. This property describes the
departures from the symmetry that is represented by the matrix S. A symmetry matrix is defined as the average of the elements xij and xji, which corresponds to the reciproc-ity balance, and then sij sji.
Formula 1 enables the decomposition of the sum of squares into two parts, one due to symmetry and the other to skew symmetry. Given that S and K are orthogonal ma-trices, the cross-products are all equal to zero (Borg & Groenen, 1997, pp. 403–404) or, equally, tr(SK) 0. This result allows us to rewrite the sum of squares due to the symmetry and the sum of squares due to the skew sym-metry as a ratio with respect to the sum of squares of the matrix X. That is,
tr
tr
tr
trtr
S S
X X
K K
X XX X1, 0,
(2)
where and denote the proportion of the symmetric and skew-symmetric parts of an X matrix, respectively. The value of tr(X X) will equal zero only if all the ele-ments of the X matrix are zero, X being a null matrix. The previous equality relates the indices of symmetry and skew symmetry, denoted by and , in such a way that it allows social researchers to compute a whole measure-ment of the skew symmetry or, if preferred, the symme-try of a sociomatrix, at the group level. In other words, the two indices enable researchers to measure the global degree of reciprocation among all the agents, although the interpretation of the values is opposed. These indi-ces, which are founded on discrepancy and not on a cor-relation coefficient, are alternative measurements of the global dyadic reciprocity in the social system. The main problem of the two indices is that both are affected by the agents’ degree of activity. That is, those agents that are more responsive contribute to a greater extent to the lack of symmetry. However, if one is interested in making a comparison regarding exact matching of the number of directed actions between agents, the two indices seem a reasonable way of quantifying dyadic reciprocity.
One can also note that the algebraic expressions cor-responding to the traces of the previous matrix multiplica-tions are as follows:
tr trX X S Sx sij
j
n
i
n
ijj
n
i
2
11
2
1
,11
2
11
n
ijj
n
i
n
k
,
and tr K K .
(3)
ranges from .5 to 1, and complementarily, varies from 0 to .5 (see Appendix A). The value 1 corre-sponds to a matrix of complete reciprocation. On the other hand, a value of of nearly .5 should be interpreted as close to the minimum degree of reciprocity that can be measured in a social system. Complementarily, the value
0 also indicates a complete reciprocity among agents, whereas a value of nearly .5 suggests skew-symmetric re-lations among agents. Note that the index of skew sym-metry would take a value of .5 if xij or xji for all the agents equaled zero. Now we can write,

SOCIAL ASYMMETRIC STRUCTURES 393
.5 1 and 0 .5.
Both indices satisfy the invariance property for any change in scale, but this is not true for a change in location (see Appendix B).
Up to now, we have proposed measuring the reciprocity of a social system by means of any two complementary indices, but researchers may prefer a unique quantity to describe the degree of reciprocation at the group level. This can be achieved by computing the value of the fol-lowing ratio (Solanas, Salafranca, & Riba, 2004):
, .0 1
(4)
If 0, social systems are symmetric with respect to the registered behavior; there is an absolute reciprocation. If the value of is nearly 1, the social system shows an ap-preciable skew symmetry.
Decomposing the Skew SymmetryAlthough a quantification of skew symmetry allows
social researchers to describe the lack of reciprocity at the group level, most researchers are interested in extract-ing information about individual agents. That is why it is necessary to decompose the total sum of squares assigned to skew symmetry into the agents’ contributions. The fol-lowing expression shows how this can be done:
tr
tr tr
K K
X X X X
k
k
ijj
n
i
n
ji
2
11
2
ii
n
j
nj j
j
n
jj
n
1
1 1
1
tr trX X
k k
X X
, ; .0 11
j
j
j
n
(5)
In the latter expression, kj denotes the jth column vector of the K matrix. The quantity j describes the contribution of the jth agent to the whole skew symmetry. It is also pos-sible to obtain the contribution of each agent to the total symmetry as follows:
tr
tr tr
S S
X X X X
s
s
ijj
n
i
n
ji
2
11
2
ii
n
j
nj j
j
n
jj
n
1
1 1
1
tr trX X
s s
X X
, . ; ,5 11
j
j
j
n
(6)
where sj represents the jth column vector of the S matrix. Since the data are usually duration or frequency, interpre-tation of the indices j and j is not appropriate, because these measurements are affected by the magnitude of the
agents’ activity. Therefore, one agent could contribute more than others to the measure of skew symmetry only as a result of a higher degree of activity. To obtain nor-malized measurements, the following equality is defined:
j j j. It should be noted that j includes the whole contribution of agent j. Now, the symmetry and skew sym-metry ratio for each agent can be written as follows:
j
j
j
j
jj
j j
j j
1 1
5 1 0 5
1
,
. ; . ;
;; .j
j
n
11
(7)
The indices j and j take into account the whole contribu-tion of each agent for achieving a normalized quantifica-tion. These indices can be used to identify those agents that are mainly skew symmetric in their relationships. Now, by means of algebraic calculus,
j j
jj
nj
jj
nj
jj
n
ij
j j
s
1 1 1
2
s s k k
s s k k
j ji
n
j
n
ij
j j j ji
n
j
n k
11
2
11
i ji
n
j
n
i ji
n
j
n
11 11
.
(8)
The ratios i j and i j correspond to the symmetric and skew-symmetric parts of agent j assigned to agent i, re-spectively. Their boundaries are the following:
0 i j j and 0 i j j.
The ratios i j and i j are normalized to make compari-sons, but researchers would also be interested in com-paring i j with j i. In other words, to obtain a dyadic reciprocity measurement that does not depend on the agents’ degree of activity, we need only to compute the quantity i j / j and make all the possible comparisons to determine the dyadic reciprocity. Nonreciprocal pairs of agents will show an appreciable difference in their values. A global quantification of this dyadic reciprocity can be accomplished by computing a correlation coefficient as follows:
Corri j
j
j i
i
i j
j
ij
j j
k, , .
2
k k
The values of correlation coefficients must be close to 1 if there is a high degree of dyadic reciprocity but, in prac-tice, are required only to be very similar. Regarding this point, it has to be borne in mind that correlation coeffi-cient values are often optimistic descriptions. The reason is that the product–moment correlation coefficient quan-
394 SOLANAS, SALAFRANCA, RIBA, SIERRA, AND LEIVA
tifying association is not a discrepancy measure. That is why we propose the following index to measure the degree of dyadic reciprocity:
1 0 11
1
ni j
j
j i
ii j
n
j
n
, .
(9)
This index takes values of nearly 1 if all the agents re-ciprocate equally and, conversely, close to 0 if the agents do not reciprocate similarly. The index compares, for each pair of agents, the discrepancy between the ratios of the skew-symmetric part of agent j assigned to agent i and that of agent i assigned to agent j. If agents recip-rocate each other, they will be equally skew symmetric. Here, the definition of dyadic reciprocity is founded on the actor–reactor model, since the index is a relative measure of agreement.
Another usual description of social interactions is founded on generalized reciprocity. In the present con-text, we adapt the concept of generalized reciprocity in the direction of this question: Is there a match between the global skew symmetry that each agent gives others and what it receives in return? A minor modification of Formula 9 is used to propose a quantification of general-ized reciprocity:
11
1
1j
j
n
i ji j
n
j ii j
n
j
n
,, .0 1
(10)
This index should be interpreted as indicating a high de-gree of generalized reciprocity if its values are nearly 1. The social system shows generalized reciprocity if there is a match between the global proportion of skew sym-metry that each agent assigns others and what it receives in return. As was mentioned above, it would also be pos-sible to compute a correlation coefficient between all the pairs of data included in the absolute function, but we are interested here in discrepancy measurements.
Finally, a symmetric matrix, denoted by , can be de-fined, its elements being as follows:
i j
i j
i j
ij
j j j j
ij
k
s
2
2
s s k k
sjj j j j
ji
i i i i
k
s
s k k
s s k k
2
jji
i i i i
j i
j i
j i i
2
0
s s k k
,jj
1.
(11)
The elements i j of the matrix correspond to the bal-anced dyadic reciprocity, or equilibrium point, between
every pair of agents. In other words, this matrix shows what is mutual and joint in each specific relationship. Note that dyadic reciprocity and balanced dyadic reci-procity are not identical concepts. Whereas dyadic reci-procity refers to the correspondence between what each agent gives others and what it receives from them in re-turn, balanced dyadic reciprocity describes the similarity in their relationships. is a proximity matrix and can be analyzed by multidimensional scaling to determine the underlying dimensions in the social group and to represent the agents in a Euclidean space. Note that i j expresses the balanced dyadic reciprocity as a function of skew sym-metry and symmetry in a unique quantification. If i j equals 0, the agents reciprocate mutually, but if i j ap-proaches 1, the agents establish a joint balance that is far from reciprocation.
Social InterchangeSocial research is frequently built on observational re-
cordings in which several behavioral data are gathered. Suppose again that some agents help others in fighting and that the way in which this help is returned consists of grooming. That is not an exact reciprocation, although it seems clear that a kind of interchange exists in the re-lationship. If the matrices of fighting and grooming are analyzed separately by the procedure described above, the social relations among agents will show unbalanced rela-tionships, probably clearly skew symmetric. It should be emphasized that the skew symmetry in the social system would be a spurious outcome of carrying out a separate analysis. In order to assess interchange as a characteristic form of showing reciprocity, another method is needed.
If the behaviors are comparable, in the sense that ac-tions consisting of Behaviors 1, 2, and so on have identical social value, the problem can be solved by generalizing the method above as follows:
X Xk
k
p
1
,
(12)
where p denotes the number of different behaviors and Xk symbolizes the social interaction matrices for each inter-action behavior. The method described could be applied to measure the degree of interchanging at the group level and at the dyadic level.
It does not seem likely that social interaction behaviors are identical regarding their social values, although this is a common assumption in most research when multivariate statistical analysis is carried out. To approach this prob-lem, a correction should be made in the previous expres-sion, it being reasonable to include weights in Formula 12. That is,
X Xw wk k k
k
p
k
p
, ,111
where wk represents the corresponding weight for each kind of behavior. How weights are established could vary among species. For instance, the energetic cost of each be-havior might be one solution. Another possibility is con-
SOCIAL ASYMMETRIC STRUCTURES 395
sidering the time-consuming element of each behavior, but this does not seem a general solution.
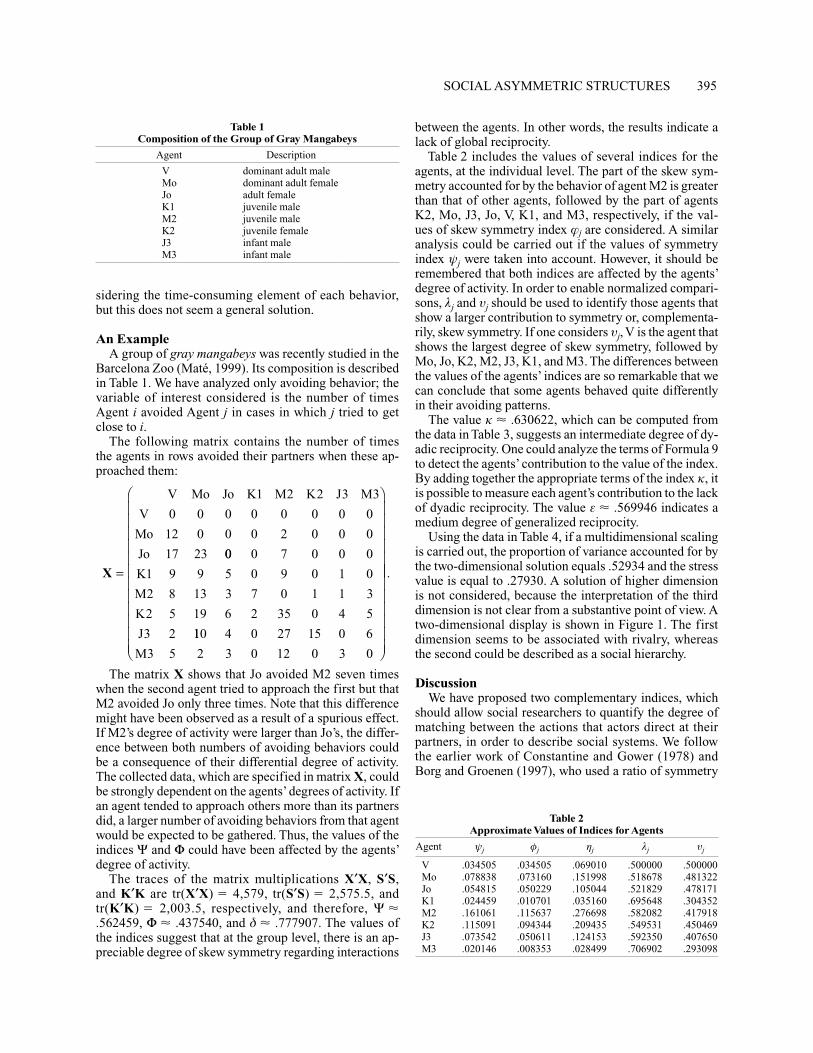
An ExampleA group of gray mangabeys was recently studied in the
Barcelona Zoo (Maté, 1999). Its composition is described in Table 1. We have analyzed only avoiding behavior; the variable of interest considered is the number of times Agent i avoided Agent j in cases in which j tried to get close to i.
The following matrix contains the number of times the agents in rows avoided their partners when these ap-proached them:
X
V Mo Jo K M K J M
V
Mo
Jo
1 2 2 3 3
0 0 0 0 0 0 0 0
12 0 0 0 2 0 0 0
17 23 00 0 7 0 0 0
1 9 9 5 0 9 0 1 0
2 8 13 3 7 0 1 1 3
2 5 19 6 2 35 0 4 5
3 2
K
M
K
J 110 4 0 27 15 0 6
3 5 2 3 0 12 0 3 0M
.
The matrix X shows that Jo avoided M2 seven times
when the second agent tried to approach the first but that M2 avoided Jo only three times. Note that this difference might have been observed as a result of a spurious effect. If M2’s degree of activity were larger than Jo’s, the differ-ence between both numbers of avoiding behaviors could be a consequence of their differential degree of activity. The collected data, which are specified in matrix X, could be strongly dependent on the agents’ degrees of activity. If an agent tended to approach others more than its partners did, a larger number of avoiding behaviors from that agent would be expected to be gathered. Thus, the values of the indices and could have been affected by the agents’ degree of activity.
The traces of the matrix multiplications X X, S S, and K K are tr(X X) 4,579, tr(S S) 2,575.5, and tr(K K) 2,003.5, respectively, and therefore, .562459, .437540, and .777907. The values of the indices suggest that at the group level, there is an ap-preciable degree of skew symmetry regarding interactions
between the agents. In other words, the results indicate a lack of global reciprocity.
Table 2 includes the values of several indices for the agents, at the individual level. The part of the skew sym-metry accounted for by the behavior of agent M2 is greater than that of other agents, followed by the part of agents K2, Mo, J3, Jo, V, K1, and M3, respectively, if the val-ues of skew symmetry index j are considered. A similar analysis could be carried out if the values of symmetry index j were taken into account. However, it should be remembered that both indices are affected by the agents’ degree of activity. In order to enable normalized compari-sons, j and j should be used to identify those agents that show a larger contribution to symmetry or, complementa-rily, skew symmetry. If one considers j, V is the agent that shows the largest degree of skew symmetry, followed by Mo, Jo, K2, M2, J3, K1, and M3. The differences between the values of the agents’ indices are so remarkable that we can conclude that some agents behaved quite differently in their avoiding patterns.
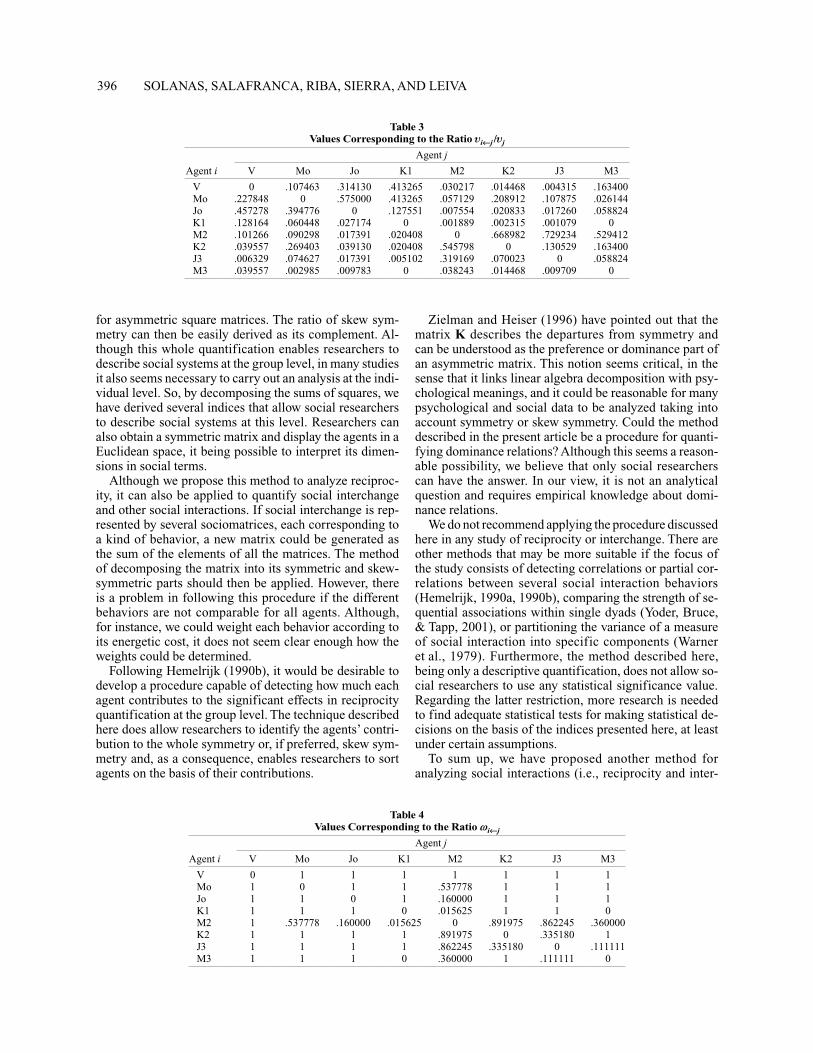
The value .630622, which can be computed from the data in Table 3, suggests an intermediate degree of dy-adic reciprocity. One could analyze the terms of Formula 9 to detect the agents’ contribution to the value of the index. By adding together the appropriate terms of the index , it is possible to measure each agent’s contribution to the lack of dyadic reciprocity. The value .569946 indicates a medium degree of generalized reciprocity.
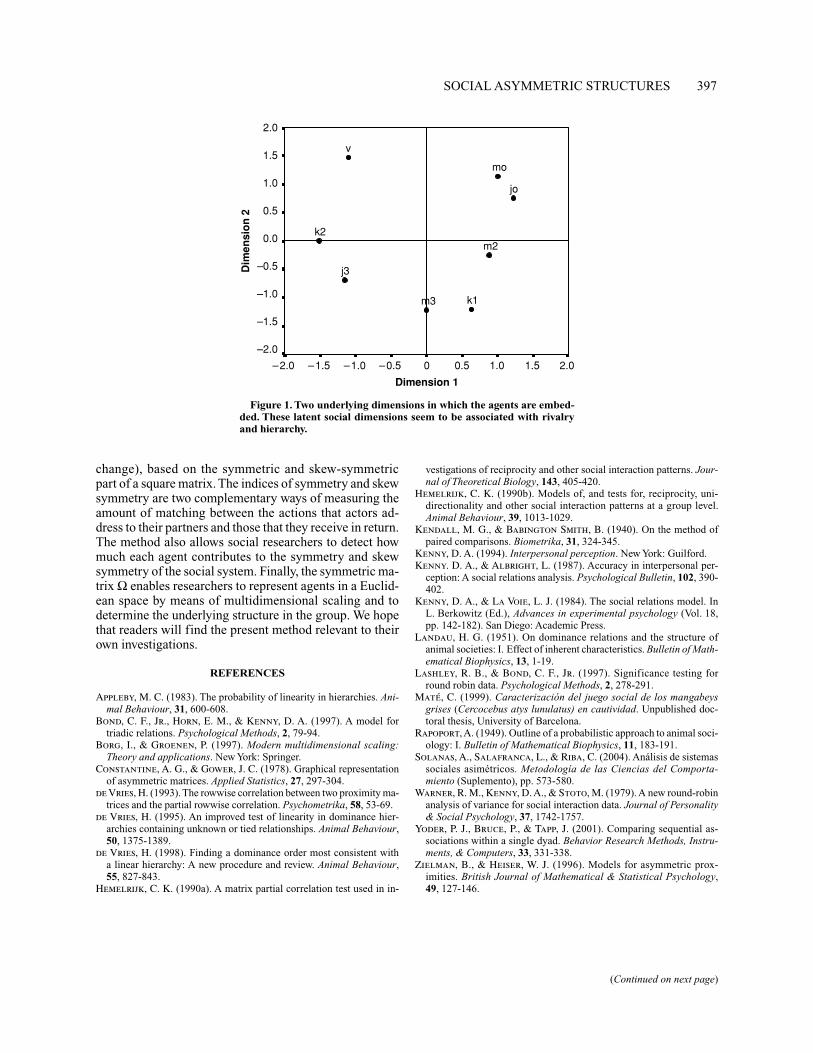
Using the data in Table 4, if a multidimensional scaling is carried out, the proportion of variance accounted for by the two-dimensional solution equals .52934 and the stress value is equal to .27930. A solution of higher dimension is not considered, because the interpretation of the third dimension is not clear from a substantive point of view. A two-dimensional display is shown in Figure 1. The first dimension seems to be associated with rivalry, whereas the second could be described as a social hierarchy.
DiscussionWe have proposed two complementary indices, which
should allow social researchers to quantify the degree of matching between the actions that actors direct at their partners, in order to describe social systems. We follow the earlier work of Constantine and Gower (1978) and Borg and Groenen (1997), who used a ratio of symmetry
Table 1
Composition of the Group of Gray Mangabeys
Agent Description
V dominant adult maleMo dominant adult femaleJo adult femaleK1 juvenile maleM2 juvenile maleK2 juvenile femaleJ3 infant male
M3 infant male
Table 2
Approximate Values of Indices for Agents
Agent j j j j j
V .034505 .034505 .069010 .500000 .500000Mo .078838 .073160 .151998 .518678 .481322Jo .054815 .050229 .105044 .521829 .478171K1 .024459 .010701 .035160 .695648 .304352M2 .161061 .115637 .276698 .582082 .417918K2 .115091 .094344 .209435 .549531 .450469J3 .073542 .050611 .124153 .592350 .407650M3 .020146 .008353 .028499 .706902 .293098
396 SOLANAS, SALAFRANCA, RIBA, SIERRA, AND LEIVA
for asymmetric square matrices. The ratio of skew sym-metry can then be easily derived as its complement. Al-though this whole quantification enables researchers to describe social systems at the group level, in many studies it also seems necessary to carry out an analysis at the indi-vidual level. So, by decomposing the sums of squares, we have derived several indices that allow social researchers to describe social systems at this level. Researchers can also obtain a symmetric matrix and display the agents in a Euclidean space, it being possible to interpret its dimen-sions in social terms.
Although we propose this method to analyze reciproc-ity, it can also be applied to quantify social interchange and other social interactions. If social interchange is rep-resented by several sociomatrices, each corresponding to a kind of behavior, a new matrix could be generated as the sum of the elements of all the matrices. The method of decomposing the matrix into its symmetric and skew-symmetric parts should then be applied. However, there is a problem in following this procedure if the different behaviors are not comparable for all agents. Although, for instance, we could weight each behavior according to its energetic cost, it does not seem clear enough how the weights could be determined.
Following Hemelrijk (1990b), it would be desirable to develop a procedure capable of detecting how much each agent contributes to the significant effects in reciprocity quantification at the group level. The technique described here does allow researchers to identify the agents’ contri-bution to the whole symmetry or, if preferred, skew sym-metry and, as a consequence, enables researchers to sort agents on the basis of their contributions.
Zielman and Heiser (1996) have pointed out that the matrix K describes the departures from symmetry and can be understood as the preference or dominance part of an asymmetric matrix. This notion seems critical, in the sense that it links linear algebra decomposition with psy-chological meanings, and it could be reasonable for many psychological and social data to be analyzed taking into account symmetry or skew symmetry. Could the method described in the present article be a procedure for quanti-fying dominance relations? Although this seems a reason-able possibility, we believe that only social researchers can have the answer. In our view, it is not an analytical question and requires empirical knowledge about domi-nance relations.
We do not recommend applying the procedure discussed here in any study of reciprocity or interchange. There are other methods that may be more suitable if the focus of the study consists of detecting correlations or partial cor-relations between several social interaction behaviors (Hemelrijk, 1990a, 1990b), comparing the strength of se-quential associations within single dyads (Yoder, Bruce, & Tapp, 2001), or partitioning the variance of a measure of social interaction into specific components (Warner et al., 1979). Furthermore, the method described here, being only a descriptive quantification, does not allow so-cial researchers to use any statistical significance value. Regarding the latter restriction, more research is needed to find adequate statistical tests for making statistical de-cisions on the basis of the indices presented here, at least under certain assumptions.
To sum up, we have proposed another method for analyzing social interactions (i.e., reciprocity and inter-
Table 3
Values Corresponding to the Ratio i j / j
Agent j
Agent i V Mo Jo K1 M2 K2 J3 M3
V 0 .107463 .314130 .413265 .030217 .014468 .004315 .163400Mo .227848 0 .575000 .413265 .057129 .208912 .107875 .026144Jo .457278 .394776 0 .127551 .007554 .020833 .017260 .058824K1 .128164 .060448 .027174 0 .001889 .002315 .001079 0M2 .101266 .090298 .017391 .020408 0 .668982 .729234 .529412K2 .039557 .269403 .039130 .020408 .545798 0 .130529 .163400J3 .006329 .074627 .017391 .005102 .319169 .070023 0 .058824M3 .039557 .002985 .009783 0 .038243 .014468 .009709 0
Table 4
Values Corresponding to the Ratio i j
Agent j
Agent i V Mo Jo K1 M2 K2 J3 M3
V 0 1 1 1 1 1 1 1Mo 1 0 1 1 .537778 1 1 1Jo 1 1 0 1 .160000 1 1 1K1 1 1 1 0 .015625 1 1 0M2 1 .537778 .160000 .015625 0 .891975 .862245 .360000K2 1 1 1 1 .891975 0 .335180 1J3 1 1 1 1 .862245 .335180 0 .111111M3 1 1 1 0 .360000 1 .111111 0
SOCIAL ASYMMETRIC STRUCTURES 397
change), based on the symmetric and skew-symmetric part of a square matrix. The indices of symmetry and skew symmetry are two complementary ways of measuring the amount of matching between the actions that actors ad-dress to their partners and those that they receive in return. The method also allows social researchers to detect how much each agent contributes to the symmetry and skew symmetry of the social system. Finally, the symmetric ma-trix enables researchers to represent agents in a Euclid-ean space by means of multidimensional scaling and to determine the underlying structure in the group. We hope that readers will find the present method relevant to their own investigations.
REFERENCES
Appleby, M. C. (1983). The probability of linearity in hierarchies. Ani-mal Behaviour, 31, 600-608.
Bond, C. F., Jr., Horn, E. M., & Kenny, D. A. (1997). A model for triadic relations. Psychological Methods, 2, 79-94.
Borg, I., & Groenen, P. (1997). Modern multidimensional scaling: Theory and applications. New York: Springer.
Constantine, A. G., & Gower, J. C. (1978). Graphical representation of asymmetric matrices. Applied Statistics, 27, 297-304.
de Vries, H. (1993). The rowwise correlation between two proximity ma-trices and the partial rowwise correlation. Psychometrika, 58, 53-69.
de Vries, H. (1995). An improved test of linearity in dominance hier-archies containing unknown or tied relationships. Animal Behaviour, 50, 1375-1389.
de Vries, H. (1998). Finding a dominance order most consistent with a linear hierarchy: A new procedure and review. Animal Behaviour, 55, 827-843.
Hemelrijk, C. K. (1990a). A matrix partial correlation test used in in-
vestigations of reciprocity and other social interaction patterns. Jour-nal of Theoretical Biology, 143, 405-420.
Hemelrijk, C. K. (1990b). Models of, and tests for, reciprocity, uni-directionality and other social interaction patterns at a group level. Animal Behaviour, 39, 1013-1029.
Kendall, M. G., & Babington Smith, B. (1940). On the method of paired comparisons. Biometrika, 31, 324-345.
Kenny, D. A. (1994). Interpersonal perception. New York: Guilford.Kenny. D. A., & Albright, L. (1987). Accuracy in interpersonal per-
ception: A social relations analysis. Psychological Bulletin, 102, 390-402.
Kenny, D. A., & La Voie, L. J. (1984). The social relations model. In L. Berkowitz (Ed.), Advances in experimental psychology (Vol. 18, pp. 142-182). San Diego: Academic Press.
Landau, H. G. (1951). On dominance relations and the structure of animal societies: I. Effect of inherent characteristics. Bulletin of Math-ematical Biophysics, 13, 1-19.
Lashley, R. B., & Bond, C. F., Jr. (1997). Significance testing for round robin data. Psychological Methods, 2, 278-291.
Maté, C. (1999). Caracterización del juego social de los mangabeys grises (Cercocebus atys lunulatus) en cautividad. Unpublished doc-toral thesis, University of Barcelona.
Rapoport, A. (1949). Outline of a probabilistic approach to animal soci-ology: I. Bulletin of Mathematical Biophysics, 11, 183-191.
Solanas, A., Salafranca, L., & Riba, C. (2004). Análisis de sistemas sociales asimétricos. Metodología de las Ciencias del Comporta-miento (Suplemento), pp. 573-580.
Warner, R. M., Kenny, D. A., & Stoto, M. (1979). A new round-robin analysis of variance for social interaction data. Journal of Personality & Social Psychology, 37, 1742-1757.
Yoder, P. J., Bruce, P., & Tapp, J. (2001). Comparing sequential as-sociations within a single dyad. Behavior Research Methods, Instru-ments, & Computers, 33, 331-338.
Zielman, B., & Heiser, W. J. (1996). Models for asymmetric prox-imities. British Journal of Mathematical & Statistical Psychology, 49, 127-146.
Figure 1. Two underlying dimensions in which the agents are embed-
ded. These latent social dimensions seem to be associated with rivalry
and hierarchy.
m3
j3
k2
m2
k1
jo
mo
v
2.0
1.5
1.0
0.5
0.0
–0.5
–1.0
–1.5
–2.0
–2.0 2.0–1.5
Dimension 1
Dim
en
sio
n 2
–1.0 1.0 1.5–0.5 0.50
(Continued on next page)
398 SOLANAS, SALAFRANCA, RIBA, SIERRA, AND LEIVA
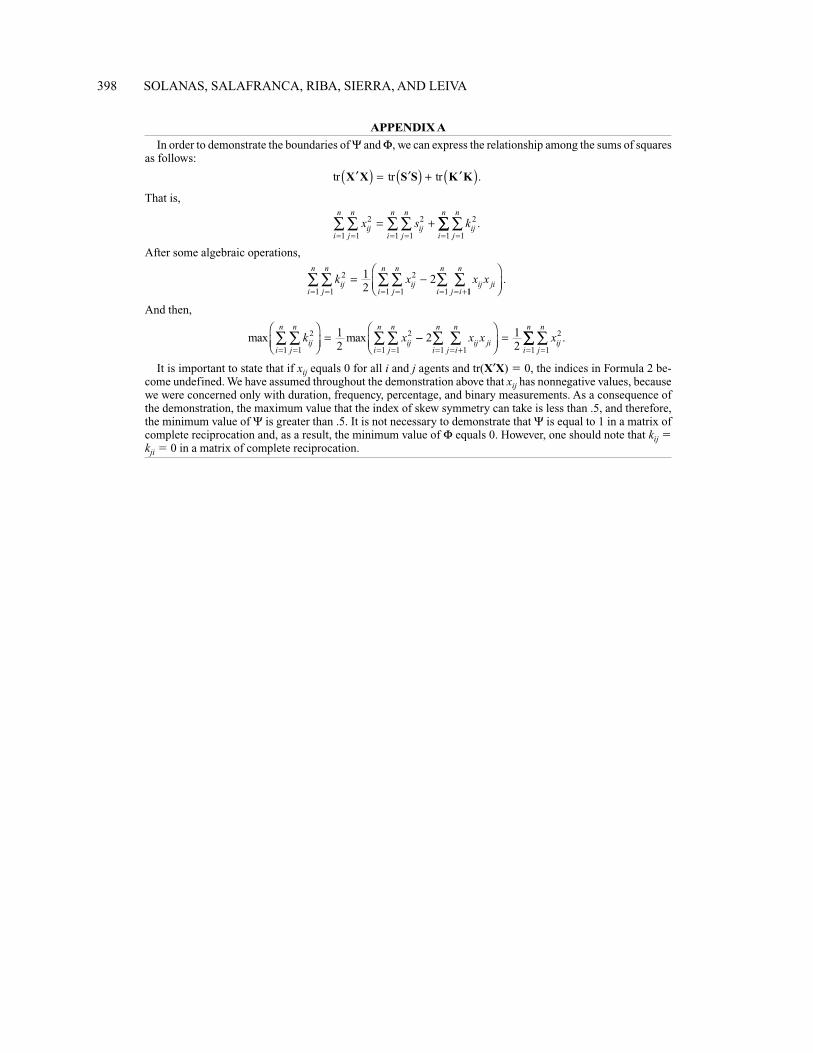
APPENDIX A
In order to demonstrate the boundaries of and , we can express the relationship among the sums of squares as follows:
tr tr trX X S S K K .
That is,
x s kij
j
n
i
n
ijj
n
i
n
ijj
n
i
n2
11
2
11
2
11
.
After some algebraic operations,
k x x xij
j
n
i
n
ijj
n
i
n
ij jij i
2
11
2
11
12
2111
n
i
n
.
And then,
max maxk xij
j
n
i
n
ijj
n
i
n2
11
2
11
12
2 1211
2
11
x x xij ji
j i
n
i
n
ijj
n
i
n
.
It is important to state that if xij equals 0 for all i and j agents and tr(X X) 0, the indices in Formula 2 be-
come undefined. We have assumed throughout the demonstration above that xij has nonnegative values, because we were concerned only with duration, frequency, percentage, and binary measurements. As a consequence of the demonstration, the maximum value that the index of skew symmetry can take is less than .5, and therefore, the minimum value of is greater than .5. It is not necessary to demonstrate that is equal to 1 in a matrix of complete reciprocation and, as a result, the minimum value of equals 0. However, one should note that kij kji 0 in a matrix of complete reciprocation.
SOCIAL ASYMMETRIC STRUCTURES 399
APPENDIX B
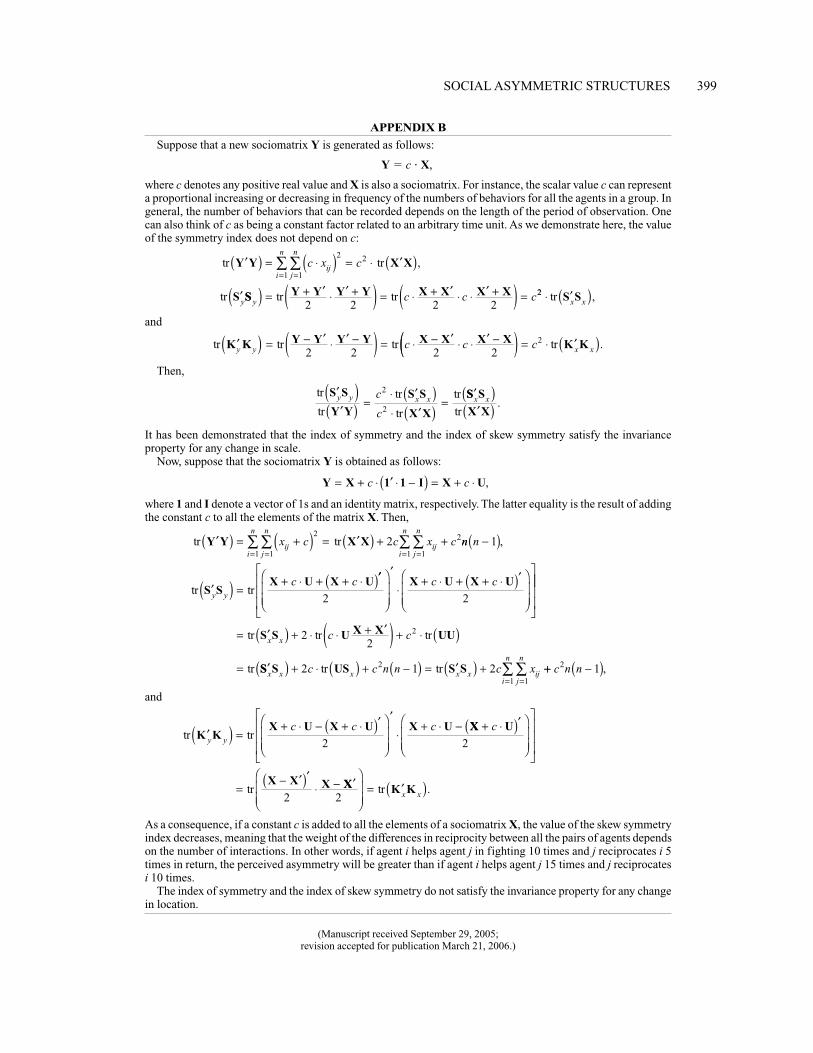
Suppose that a new sociomatrix Y is generated as follows:
Y c X,
where c denotes any positive real value and X is also a sociomatrix. For instance, the scalar value c can represent a proportional increasing or decreasing in frequency of the numbers of behaviors for all the agents in a group. In general, the number of behaviors that can be recorded depends on the length of the period of observation. One can also think of c as being a constant factor related to an arbitrary time unit. As we demonstrate here, the value of the symmetry index does not depend on c:
tr tr
tr
Y Y X X
S
c x cij
j
n
i
n
y
2 2
11
,
SS Y Y Y Y X X X Xy
c c ctr tr2 2 2 2
22 tr S Sx x
,
and
tr tr trK K Y Y Y Y X X X Xy y
c c2 2 2 2
cx x
2 tr K K .
Then,
tr
tr
tr
tr
trS S
Y Y
S S
X X
y y x xc
c
2
2
SS S
X X
x x
tr.
It has been demonstrated that the index of symmetry and the index of skew symmetry satisfy the invariance property for any change in scale.
Now, suppose that the sociomatrix Y is obtained as follows:
Y X 1 1 I X Uc c ,
where 1 and I denote a vector of 1s and an identity matrix, respectively. The latter equality is the result of adding the constant c to all the elements of the matrix X. Then,
tr trY Y X Xx c c x cij
j
n
i
n
ij
2
11
22 nn n
c c
j
n
i
n
y y
111
,
tr trS SX U X U
2 2
X U X Uc c
tr tr tr
tr
S S U X X UUx x
c c22
2
SS S US S Sx x x x x ij
c c n n c x2 1 22tr tr c n nj
n
i
n2
11
1 ,
and
tr trK KX U X U X U
y y
c c c
2
XX U
X X X
c
2
2tr XX K K
2tr
x x.
As a consequence, if a constant c is added to all the elements of a sociomatrix X, the value of the skew symmetry index decreases, meaning that the weight of the differences in reciprocity between all the pairs of agents depends on the number of interactions. In other words, if agent i helps agent j in fighting 10 times and j reciprocates i 5 times in return, the perceived asymmetry will be greater than if agent i helps agent j 15 times and j reciprocates i 10 times.
The index of symmetry and the index of skew symmetry do not satisfy the invariance property for any change in location.
(Manuscript received September 29, 2005; revision accepted for publication March 21, 2006.)