temporal overlap of excitatory and inhibitory afferent input in guinea-pig ca1 pyramidal cells
TRANSCRIPT

The response to afferent fibre stimulation (‘orthodromicresponse’) is a commonly used measure of excitability ofneuronal populations. An excitatory (EPSP) and inhibitory(IPSP) component was identified by studies of theorthodromic response in hippocampal pyramidal cells in
vivo (Kandel et al. 1961; Andersen et al. 1963, 1964). Thisbasic sequence of orthodromic EPSP—IPSP has beenconfirmed since then: the response that is elicited bystimulation of the Schaffer collateral—commissural pathwayconsists of a fast EPSPÏEPSC mediated primarily byAMPA receptors, followed by an early IPSPÏIPSC mediatedby GABAA receptors and a late IPSPÏIPSC mediated byGABAB receptors. Despite such clear separation ofpostsynaptic potentials (PSPs) or currents (PSCs), it isconceivable that inhibitory influences may be present longbefore the population IPSP is expressed. If so, how large isthe temporal overlap with the orthodromic EPSPÏEPSC?
This study has focused on three points. First, the kinetics ofdendritic inhibition were studied. Several previous studieshave reported that the kinetics of dendritic inhibitoryresponses were slower than those of somatic responses inpyramidal cells (Miles, 1990b; Pearce, 1993; Buhl et al.
1994a). Second, kinetics of different inhibitory responses,i.e. IPSPs, IPSCs and conductance changes, wereinvestigated. It was suggested that inhibitory conductancechanges are faster than IPSPs (Araki et al. 1960) or inhibitorycurrents (Koch, 1985). Third, time courses of variouscomponents of the circuitry were studied: a monosynapticinhibitory response is elicited via direct electrical stimulationof interneuron processes (Davies et al. 1990). Activation ofafferent fibres results in a feedforward inhibitory responsein CA1 pyramidal cells via synaptic activation of CA1interneurons (Knowles & Schwartzkroin, 1981; Alger &Nicoll, 1982; Buzsaki & Eidelberg, 1982; Ashwood et al.
Journal of Physiology (1999), 516.2 pp.485—504 485
Temporal overlap of excitatory and inhibitory afferent input
in guinea-pig CA1 pyramidal cells
Sergei Karnup and Armin Stelzer
Department of Physiology and Pharmacology, State University of New York,
Health Science Center at Brooklyn, Brooklyn, NY 11203, USA
(Received 13 July 1998; accepted after revision 11 January 1999)
1. The temporal interaction of evoked synaptic excitation and GABAA-mediated inhibition wasexamined in CA1 pyramidal cells. Single and paired intracellular recordings were carried outin pyramidal cell dendrites and somata, and interneurons of the guinea-pig hippocampalslice. Current-clamp, sharp electrode and whole-cell voltage-clamp recordings were made.
2. Kinetics of dendritic and somatic inhibitory responses were similar. Notably, kinetics ofdendritic unitary IPSPs were as fast as kinetics of somatic unitary IPSPs.
3. GABAA-mediated influences were present throughout the orthodromic pyramidal cellEPSPÏEPSC. Comparison of the kinetics of pharmacologically isolated monosynaptic IPSPs,IPSCs and inhibitory conductances (gGABA
A), showed fastest kinetics for gGABA
A. Close
temporal overlap was observed between monosynaptic gGABAAand the rising phase of the
evoked EPSPÏEPSC. The onset of gGABAAcoincided with or preceded onset of the
EPSPÏEPSC.
4. Onsets of feedforward IPSPs coincided with the rising phase of the pyramidal cell EPSPin > 80% of paired recordings. Fastest feedforward inhibitory responses exerted nearcomplete overlap with evoked excitation.
5. Onsets of recurrent IPSPs did not occur during the rising phase of the evoked EPSP,but > 3·0 ms after the peak of the pyramidal cell EPSP.
6. Orthodromically evoked interneuron spikes were observed at stimulation intensities thatwere below the threshold for eliciting EPSPs in concomitantly recorded pyramidal cells. Theactivation of feedforward inhibitory responses by weakest excitatory input, and the largetemporal overlap between feedforward inhibition and evoked excitation, suggest that in situ
any excitatory input in CA1 is effectively controlled by fast synaptic inhibition.
8475
Keywords:

1984; Lacaille & Schwartzkroin, 1988; Lacaille, 1991; Buhlet al. 1994b). A recurrent inhibitory response is activated bysynaptic pyramidal cell action potentials (APs) (Kandel etal. 1961; Andersen et al. 1963, 1964).
Knowledge of the temporal interaction between inhibitorycomponents and orthodromic excitation is pivotal for theunderstanding of how activity-dependent changes ofinhibition will affect the orthodromic EPSP. Activity-dependent impairment of GABAA receptor function (Stelzeret al. 1994; Wang & Stelzer, 1996) decreases the efficacy ofall three inhibitory components. Possible increase of inter-neuron excitability (interneuron long-term potentiation;Buzsaki & Eidelberg, 1982; Taube & Schwartzkroin, 1987;Stelzer et al. 1994; Quardouz & Lacaille, 1995) will enhancethe efficacy of feedforward inhibition. The efficacy ofrecurrent inhibition is enhanced by both pyramidal celllong-term potentiation (LTP) and interneuron LTP.
METHODS
Brain slices
Transverse hippocampal slices (Yamamoto, 1972; Schwartzkroin,1975) were obtained from adult guinea-pigs (Hartley, from HarlanSprague—Dawley, Inc., Indianapolis, IN, USA; 150—200 g). Guinea-pigs were anaesthetized by inhalation of halothane (2_bromo-2-chloro-1, 1, 1-trifluoroethane) before decapitation with an animalguillotine. After removal of the brain and isolation of thehippocampus, slices of 450 ìm thickness were cut on a McIlwaintissue chopper. The procedures conformed with the guidelines of theInstitutional Animal Care and Use Committee (protocol no.9808069). Slices were superfused in an interface recording chamber(Fine Science Tools, Belmont, CA, USA) with a solution saturatedwith 95% Oµ and 5% COµ (temperature, 30—32°C) of the followingcomposition (mÒ): 118 NaCl, 3 KCl, 25 NaHCO×, 1·2 NaHµPOÚ,1·2 MgClµ, 1·7 CaClµ and 11 ª_glucose.
Electrophysiological recordings
Sharp electrode recordings. Sharp microelectrode recordings incurrent clamp or discontinuous single-electrode voltage clamp(dSEVC) were carried out in CA1 pyramidal cells (n = 43 insomata, n = 62 in apical dendrites) and stratum pyramidaleinterneurons (n = 29). Impalements were made with glass pipettes(World Precision Instruments, Inc., Sarasota, FL, USA) pulledusing a Brown—Flaming electrode puller (Model P_87, SutterInstrument Co., Novato, CA, USA). Tracking was performed withmanually controlled manipulators (Narishige, Tokyo, Japan). Thestandard electrode content of pyramidal cell recordings waspotassium acetate (2—3 Ò) yielding 40—100 MÙ electroderesistances. Identification criteria for dendritic recordings were therecording site in stratum radiatum (between 150 and 400 ìmperpendicular to stratum pyramidale) and burst responses tocurrent injection (Wong et al. 1979).
Interneuron identification. Interneurons were recorded singly orsimultaneously with pyramidal cells. The following criteria wereused to identify interneurons physiologically (Schwartzkroin &Mathers, 1978): symmetrical spike shape (Fig. 5A, inset),prominent spike afterhyperpolarization (AHP; Fig. 5B , inset) andfiring patterns (e.g. Fig. 5B, inset). Intracellular biocytin staining(2% in 2 Ò potassium acetate; see Somogyi & Takagi, 1982; Buhl etal. 1994a) was used to distinguish three subtypes of CA1 stratumpyramidale interneurons based on their axonal arborization
(Fig. 5E) (Buhl et al. 1994a; Miles et al. 1996). Stained cells wereviewed in a Nikon Optiphot_2 microscope. Twenty-eight of 97physiologically identified interneurons could be held long enoughfor sufficient biocytin filling and conclusive subtype identification(see Table 3).
For dual interneuron—pyramidal cell recordings, the interneuronrecording was always established first. Only interneurons thatexhibited no spontaneous firing at resting membrane potential werestudied; spontaneously firing cells were discarded. A concomitantdendritic pyramidal cell recording — without biocytin in therecording pipette — was then established in stratum radiatum(within 100—400 ìm from the interneuron location). Synapticcoupling between the two neurons was tested by eliciting APs inthe interneuron (through injection of depolarizing current pulses,0·1—0·6 nA, 200—300 ms duration). If a monosynaptic IPSP inresponse to interneuron AP could not be established, the dendriticrecording was usually discontinued after a few orthodromicresponses. Additional dendritic (up to eight in two pairs) and thensomatic pyramidal cell recordings were carried out as long as theinterneuron lasted.
Whole-cell voltage-clamp recordings. Whole-cell voltage-clamprecordings were performed in pyramidal cell somata using the‘blind’ tracking method (Blanton et al. 1989; Marty & Neher, 1995).Patch pipettes were pulled from thin-walled borosilicate glasswithout filaments (1·5 mm o.d., 1·17 mm i.d.; TW 150_6, fromWPI) on a Brown—Flaming puller (Sutter Instruments). Tipdiameters (1 ìm), which were routinely assessed under the lightmicroscope, yielded electrode resistances between 3 and 6 MÙ. Forseal formation, the amplifier (Axoclamp_2A, Axon Instruments,Inc., Foster City, CA, USA) was set to continuous (‘bridge’) modeand current pulses (0·1—0·2 nA, 20 ms, repeated every 100 ms)were injected. Patch electrode settling and capacitance compensationwere performed in current clamp. Electrode time constants wereshortened with capacitance compensation to 10—30 ìs. Samplingfrequencies were 5—7 kHz.
Data aquisition and analysis
Evoked responses were elicited by stimulation of stratum radiatumSchaffer collateral—commissural fibres through a pair of insulatedtungsten bipolar electrodes (stimulation range 15—800 ìA). Voltagesignals of dual recordings were recorded and amplified with anAxoprobe_1A (Axon Instruments). Voltage and current signals ofsingle recordings recorded in both dSEVC and current clamp wereamplified by Axoclamp (Axon Instriments). Data were sampled atrates ranging from 2·5 to 10 kHz (−3 dB) and filtered with a cut-offfrequency of 1·5 kHz. The voltage and current signals were fed intoseparate channels of an AÏD converter (Digidata 1200, AxonInstruments) digitized, stored and analysed off-line using pCLAMP6software from Axon Instruments on a Pentium PC. Statisticalsignificance was accepted at the P < 0·05 level in various tests.
Drugs
With the exception of intracellularly applied biocytin (Sigma), alldrugs, bicuculline (Bic), picrotoxin (PTX), 6-cyano_7-nitro-quinoxaline-2,3-dione (CNQX), ª_aminophosphonovalerate (ª_AP5)and saclofen, were applied by bath perfusion. CNQX, ª_AP5 andsaclofen were purchased from Tocris Cookson, Inc. (Ballwin, MO,USA); all other drugs were from Sigma.
Abbreviations
t(i) is the poststimulation latency to the event specified by thesubscript. For example, t (P,mono IPSP,onset) denotes the latencybetween stimulation artifact and onset of the stimulation-evokedmonosynaptic IPSP in a pyramidal (P) cell.
S. Karnup and A. Stelzer J. Physiol. 516.2486

Ät (i—j) is the time lag between two events. For example,Ät (I,AP,peak—P,IPSP,onset) denotes the latency between peak of an APin an interneuron (I) and onset of the unitary IPSP in asynaptically coupled pyramidal cell.
gGABAA
is the GABAA receptor-mediated conductance. AHPdenotes afterhyperpolarization; Vm is membrane potential, Vthres isAP threshold potential, and Vrest is resting membrane potential.
RESULTS
The aim of this study was to evaluate the temporal overlapbetween the excitatory and inhibitory components of theorthodromic response in CA1 pyramidal cells. At whatpoststimulation latency of the orthodromic response areGABAA-mediated influences present? The large enhancementof all non-GABAA components of the orthodromic response(EPSP and late IPSP, respectively) during PTX application(Fig. 1A) indicates that GABAA-mediated influences arepresent throughout the orthodromic response. Notably,enhancement of the EPSP slope by GABAA antagonists(Fig. 1Aa and B) suggests that fast synaptic inhibitioncontrols the rising phase of the orthodromic EPSP: in sixdendritic pyramidal cell recordings, bicuculline (100 ìÒ)application increased EPSP slopes between 167 and 1048%(mean, 372 ± 69%). ª_AP5 (40—100 ìÒ) was presentthroughout the experiments (see Fig. 1B), whichdemonstrates that the EPSP increase was not caused byNMDA-dependent potentiation of AMPA currents (cf.Pananceau et al. 1997). In about a third of dendriticrecordings, a small IPSP preceded the onset of theorthodromic EPSP (Fig. 1B).
Monosynaptic inhibition
Comparison of the kinetics of orthodromic excitation andmonosynaptic inhibition in the same cells was achieved by
the following protocol: the orthodromic response wasrecorded first. The same stimulation (with respect to siteand intensity) was then applied following application ofCNQX, ª_AP5 and saclofen (Figs 2—4; Table 1). Theresulting pharmacologically isolated inhibitory responses(monosynaptic IPSP, IPSC and conductance change (gGABA
A))
were in all cases completely blocked by bicuculline (100 ìÒ,not shown).
Temporal comparison of monosynaptic IPSPÏIPSC and
EPSPÏEPSC. In nine dendritic and seven somaticpreparations, recordings were carried out in both currentclamp and dSEVC (Figs 2—4; Table 1A).
Kinetics of IPSCs were faster than IPSPs (Table 1A;Fig. 2D). Mean differences between t (IPSP,peak) and t (IPSC,peak)
were 5·7 ± 0·7 ms in dendritic (n = 9) and 5·2 ± 0·5 ms insomatic (n = 7) recordings. In contrast to IPSPÏIPSCs, nosignificant differences in kinetics were observed betweenEPSPs and EPSCs: mean differences between t (EPSP,peak)
and t (EPSC,peak) were only 0·8 ± 0·2 ms in dendritic (n = 9)and 0·7 ± 0·3 ms in somatic (n = 7) recordings.
The latencies to onsets of all responses — orthodromic EPSP/EPSCs, monosynaptic IPSPÏIPSCs — were statisticallyidentical in both groups of recordings, somata and dendrites(ANOVA) (Table 1A). With the exception of latencies toonset, however, kinetics of IPSPÏIPSCs were considerablyslower than those of EPSPÏEPSCs. For example, rise times(10—90%) and latencies to peak of the monosynaptic IPSP,were on average more than twice as long as those of theorthodromic EPSP (Table 1A and B, Fig. 2B). Meandifferences between t (EPSP,peak) and t (IPSP,peak) were8·0 ± 1·1 ms in dendritic and 10·6 ± 1·6 ms in somaticrecordings. Temporal overlap between EPSP and IPSP wasmodest (Fig. 2B). Due to the faster kinetics of IPSCs, mean
Temporal overlap of excitation and inhibitionJ. Physiol. 516.2 487
Figure 1. Effects of GABAA receptor blockade on orthodromic
potentials in CA1 pyramidal cells
Aa, superimposed responses in a pyramidal cell soma before and afterapplication of picrotoxin (PTX, 100 ìÒ). Control and PTX recordingswere obtained at Vrest (−64 mV; 150 ìA stimulation intensities; 1000 ìmdistance between stratum radiatum stimulation site and perpendicularline through stratum pyramidale recording site). Ab, depiction of samerecordings (shown above) on an extended time scale. B, superimposedorthodromic responses in a CA1 pyramidal cell apical dendrite before(Con) and after application of bicuculline (Bic, 100 ìÒ). Bicuculline wasadded to ª_AP5 (40 ìÒ)- and saclofen (100 ìÒ)-containing controlsolution. Each trace (Con and Bic) represents the average of 15 individualrecordings. Recordings were obtained at Vrest (−63 mV) by the samestimulation protocol (65 ìA, 100 ìs). All recordings in A and B werecarried out in ‘minislices’ in which the CA3 region was cut off bydissection.

S. Karnup and A. Stelzer J. Physiol. 516.2488
––––––––––––––––––––––––––––––––––––––––––––––––––––––––––––––––––––––––––––––––––––––––––––Table 1. Kinetics of stimulation-evoked excitatory (EPSP, EPSC) and monosynaptic inhibitory
responses (IPSP, IPSC, gGABAA)
––––––––––––––––––––––––––––––––––––––––––––––A. PSPÏCs Dendrites (n = 9) Somata (n = 7)
––––––––––––––––––––––––––––––––––––––––––––––t (EPSP,onset) (ms) 2·8 ± 0·5 2·9 ± 0·5t (IPSP,onset) (ms) 2·8 ± 0·3 2·8 ± 0·6t (EPSC,onset) (ms) 2·7 ± 0·3 3·0 ± 0·5t (IPSC,onset) (ms) 3·1 ± 0·7 3·0 ± 0·3t (EPSP,peak) (ms) 7·7 ± 0·5 7·6 ± 0·7t (IPSP,peak) (ms) 16·7 ± 1·3 * 18·1 ± 1·9 *t (EPSC,peak) (ms) 7·0 ± 0·6 7·1 ± 0·6t (IPSC,peak) (ms) 11·2 ± 2·1 *† 13·3 ± 1·7 *†
––––––––––––––––––––––––––––––––––––––––––––––B. PSPs and gGABA
ADendrites (n = 14) Somata (n = 11)
––––––––––––––––––––––––––––––––––––––––––––––gGABA
A, rise time (ms) 2·7 ± 0·4 2·9 ± 0·6
IPSP, rise time (ms) 5·7 ± 1·1 * 6·6 ± 0·8 *EPSP, rise time (ms) 2·6 ± 0·5 2·7 ± 0·6t (peak,g
GABA,A) (ms) 6·1 ± 0·7 6·9 ± 0·9
t (IPSP,peak) (ms) 15·2 ± 2·1 * 18·3 ± 2·4 *t (EPSP,peak) (ms) 7·0 ± 0·6 6·8 ± 0·8t (AP,peak) (ms) 7·1 ± 1·4 (n = 3) 7·0 ± 1·1 (n = 4)
––––––––––––––––––––––––––––––––––––––––––––––C. gGABA
A(% of peak) Dendrites (n = 14) Somata (n = 11)
––––––––––––––––––––––––––––––––––––––––––––––Percentage of peak at t (IPSP,onset) 15·8 ± 3·6 11·1 ± 2·3Percentage of peak at t (IPSP,peak) 75·5 ± 8·4 70·5 ± 10·9Percentage of peak at t (EPSP,onset) 13·8 ± 4·6 10·7 ± 3·7Percentage of peak at t (EPSP,peak) 94·1 ± 5·5 91·9 ± 7·3Percentage of peak at t (AP,onset) 94·5 ± 7·4 (n = 3) 93·2 ± 9·4 (n = 4)
––––––––––––––––––––––––––––––––––––––––––––––D. PSPÏCs and gGABA
ADendrites (n = 7) Somata (n = 4)
––––––––––––––––––––––––––––––––––––––––––––––t (IPSP,peak) (ms) 18·4 ± 3·6 20·4 ± 4·2t (IPSC,peak) (ms) 12·3 ± 2·3 * 13·9 ± 3·3 *t (peak,g
GABA,A) (ms) 6·5 ± 0·9 * 7·1 ± 2·1 *
t (EPSP,peak) (ms) 6·1 ± 1·0 6·7 ± 1·5t (EPSC,peak) (ms) 6·2 ± 0·8 6·5 ± 1·2
––––––––––––––––––––––––––––––––––––––––––––––A, kinetics of stimulation-evoked EPSPs, EPSCs, IPSPs and IPSCs recorded alternately in current-clampand voltage-clamp mode in the same cells. In all comparisons, values of latencies to onset (EPSP, EPSC,IPSP, IPSC) were statistically identical in dendritic and somatic recordings (P > 0·05, ANOVA). B and C,kinetics of inhibitory conductances (gGABA
A), EPSP and IPSP. B, comparison of rise time and latencies to
peaks; C, percentage of the peak value of gGABAAat the time of denoted parameters. Peak gGABA
Awere
13·5 ± 4·6 nS (mean ± s.e.m. in 14 dendritic recordings) and 11·3 ± 3·6 nS (11 somatic recordings).D, latencies to peaks of gGABA
A, IPSC, IPSP, EPSP and EPSC recorded in current clamp and discontinuous
single-electrode voltage clamp in the same cells. In all recordings, respective orthodromic excitatoryresponses (EPSPs, EPSCs) were recorded first, respective inhibitory responses (IPSPs, IPSCs, gGABA
A)
following application of CNQX (20—100 ìÒ), ª_AP5 (40—100 ìÒ) and saclofen (100 ìÒ). The stimulationprotocol (intensity adjusted to generate half-maximal EPSPs; 500 ìm distance between recording andstimulation sites) was applied to elicit EPSPÏEPSCs and IPSPÏIPSCs, gGABA
A. Data are depicted as
means ± s.e.m. separated into recordings of somata and apical dendrites of CA1 pyramidal cells(n = number of recordings). t denotes the time of poststimulation latency measured from the onset of thestimulation artifact (see Fig. 2B). In all comparisons (A—D), kinetics of the same parameter showed nosignificant differences between dendritic and somatic recordings. *Significant difference between theinhibitory and excitatory parameter listed in the row above (e.g. t (IPSP,peak) and t (EPSP,peak)); † significantdifference between t (IPSC,peak) and t (IPSP,peak).––––––––––––––––––––––––––––––––––––––––––––––––––––––––––––––––––––––––––––––––––––––––––––

differences between t (EPSC,peak) and t (IPSC,peak) weresomewhat smaller: 4·3 ± 0·7 ms in dendritic (n = 9) and7·1 ± 0·9 ms in somatic recordings (n = 7). However,temporal overlap between EPSC and IPSC was still rathersmall (Fig. 2C). The same conclusion was reached whencomparing EPSCs and IPSCs that were measured in somaticwhole-cell recordings. Latencies to t (EPSC,peak) (5·8 ± 1·2 ms;n = 5) and to t (IPSC,peak) (12·5 ± 1·5 ms; n = 5) and meandifferences (6·8 ± 1·2 ms) were not statistically differentwhen comparing the respective values obtained from sharp-electrode and whole-cell recordings (P > 0·05, ANOVA).
Kinetics of GABAA-mediated conductances (gGABAA).
Inhibitory conductance changes (gGABAA) were obtained by
the membrane voltage deflection in response to short hyper-polarizing current pulses during the monosynaptic
inhibitory response (Fig. 3A). In 14 dendritic and 11 somaticrecordings, both gGABA
Aand corresponding IPSPs were
measured (Table 1B and Fig. 3C). The comparisondemonstrated considerably faster kinetics of conductances.Rise times (10—90%) of gGABA
Awere on average > 2 times
faster than those of IPSPs (Table 1B). Poststimulationlatencies to peak of gGABA
A(t (peak g
GABA,A)) were about 2·5
times faster than latencies to IPSP peak in the samerecordings (Table 1B). Similar to inhibitory conductancechanges in motoneurons (Araki et al. 1960), peak values ofgGABA
Acoincided with the rising phase of the monosynaptic
IPSP (Fig. 3C). In addition, net expression of gGABAAwas
observed at t (IPSP,onset) in 7 of 11 somatic and 12 of 14dendritic recordings (Table 1B; Fig. 3B and C). At t (IPSP,onset),gGABA
Awas expressed between 10—15% of maximal values.
Temporal overlap of excitation and inhibitionJ. Physiol. 516.2 489
Figure 2. Comparison of time courses of stimulation-evoked monosynaptic EPSPÏEPSCs and
IPSPÏIPSCs
A, schematic depiction of the CA1 circuitry and experimental protocol. Stratum (Str.) radiatum stimulationproduced an initial monosynaptic EPSPÏEPSC (B and C) through excitatory afferents (Schaffer collaterals).Block of synaptic excitation and GABAB-mediated inhibition revealed a monosynaptic GABAA receptor-mediated IPSPÏIPSC (Davies et al. 1990) (B and D) via direct stimulation of interneuron cell processes(dashed line, I-cell axon; see Fig. 5). B, superimposed recordings of stimulation-evoked EPSP andmonosynaptic IPSP following application of CNQX (40 ìÒ), ª_AP5 (50 ìÒ) and saclofen (100 ìÒ).Recordings were obtained in the same CA1 pyramidal cell apical dendrite (150 ìm from stratumpyramidale) at different Vm: EPSP at −79 mV, IPSP at −64 mV (i.e. Vrest). The distance between stratumradiatum stimulation and dendritic recording site was about 0·5 mm. Poststimulation latencies weremeasured from the onset of the stimulation artifact. Values calculated for this recording were: EPSP peak(t(EPSP,peak), a), 5·8 ms; EPSP onset (t (EPSP,onset), b), 2·3 ms; IPSP onset (t (IPSP,onset), c), 2·5 ms; IPSP peak(t (IPSP peak), d), 12·4 ms. EPSP slope (10—90%) was 5·83 mV ms¢, IPSP slope during the samepoststimulation latencies was 1·22 mV ms¢. C, superimposed EPSC and IPSC (in dSEVC, sampling rate:4·8 kHz). EPSC was recorded under control conditions near the chloride reversal potential (−79 mV). TheIPSC was recorded after pharmacological isolation of GABAA response at Vrest −64 mV. The EPSC slope(10—90%) was 47·34 pA ms¢; IPSC slope in the same time range was 12·11 pA ms¢. D, superimposedrecordings of stimulation-evoked IPSC and IPSP. Latency to IPSC peak was 9·8 ms. All recordings wereobtained in the same cell by the same stimulation protocol (120 ìA intensity, 80 ìs duration), which waschosen during control to generate about 50% of the subthreshold EPSP amplitude.

Inhibitory conductances also exhibited faster kinetics thanIPSCs; experiments in which all parameters, EPSPÏEPSC,IPSPÏIPSC and gGABA
A, were measured in a given cell
(7 dendrites, 4 somata: e.g. cell shown in Figs 2—4) confirmeda distinct order of ‘speed’ (Table 1D): gGABA
A> IPSC >
IPSP. For example, in the seven dendritic recordings inwhich all three inhibitory parameters (IPSP, IPSC, gGABA
A)
were measured, average poststimulation latencies to peakswere 6·5 ms (gGABA
A), 12·3 ms (IPSC) and 18·4 ms (IPSP).
Similar differences were observed in somatic recordings(Table 1D).
Temporal comparison of EPSPÏEPSCs and gGABAA.
Close temporal correlation was observed between the risingphases of gGABA
Aand orthodromic excitation (Fig. 4A—C):
comparing EPSP and gGABAA, both the rise times (10—90%)
and latencies to peak were statistically not different indendritic and somatic recordings (Table 1B). At t (EPSP,peak),gGABA
Awere > 90% of their respective peak values in all
recordings. The best correlation (r = 0·941) was observedbetween t (EPSC,peak) and g (peak,GABA
A) in dendritic recordings.
Onset of gGABAApreceded onset of EPSP in 13 of 14
dendritic and 8 of 11 somatic recordings. At EPSP onset,
S. Karnup and A. Stelzer J. Physiol. 516.2490
Figure 3. Membrane conductance increases during the monosynaptic inhibitory response
(gGABAA)
A, experimental protocol of measuring gGABAA. Recordings were carried out in the presence of CNQX
(40 ìÒ), ª_AP5 (50 ìÒ) and saclofen (100 ìÒ) in CA1 pyramidal cell apical dendrite at Vrest (−64 mV).Two hyperpolarizing current pulses (each 2 ms duration, −0·6 nA) were applied, one before electricalstimulation, the second at various points of time following stimulation. Membrane voltage deflections inresponse to current injection were isolated from the underlying IPSP by subtracting a second response inwhich the IPSP was elicited without concomitant current pulses (Stelzer et al. 1994). The voltage deflectionin response to the pulse before electrical stimulation (‘ÄV (l)’) was used for the assessment of leakconductance, the voltage deflection caused by the second pulse for assessment of net conductance increaseduring the inhibitory response. Depicted are two superimposed traces with poststimulation pulses appliedat t = 3 and t = 5 ms, respectively. Values of gGABA
A(as shown in B) were calculated based on the voltage
deflections measured at the end of the 2 ms current pulse: the voltage deflection at t = 3 ms (ÄV (3)) wasused for calculation of gGABA
Aat t = 3 ms; ÄV (5) was used for calculation of gGABA
Aat t = 5 ms. Reliable
measurements of ÄV (t) by 2 ms pulses required careful bridge balancing and capacitance neutralization.During the rising phase of gGABA
A(t = 2 to t = 6 ms), measurements and calculations were carried out at
1 ms intervals, whereas 2 ms intervals were applied from t = 6 to t = 20 ms. gGABAAwas calculated by the
following formula: gGABAA= (i (1 − exp (−tpÏôm))ÏÄV(t)) − g leak, with g leak = i (1 − exp (−tpÏôm))ÏÄV leak;
g leak is leak conductance; i is (hyperpolarizing) current injected during the 2 ms pulse (in the cell depicted,−0·6 nA); tp is duration of current pulse; and ôm is membrane time constant (here 20 ms; assessed by300 ms hyperpolarizing current pulse, not shown). B, graph of gGABA
Aas a function of poststimulation
latency for the recording shown in Figs 2 and 3A. The value of peak conductance (g (GABAA,peak)) was defined
as maximal value of all measurements (in the recording depicted, 22·5 nS at t = 6 ms). GABA conductancesat t (IPSP,onset) and t (IPSP,peak) were determined by extrapolation from the curve of gGABA
Aat the respective
latencies t (IPSP,onset) = 2·5 ms and t (IPSP,peak) = 12·4 ms. In the depicted recording, g (IPSP,onset) was 1·9 nS,which was 8·4% of g (GABA
A,peak), and g (IPSP,peak) was 16·6 nS, which was 74·1% of g (GABA
A,peak).
C, superimposed traces of stimulation-evoked gGABAA(shown in Fig. 3B) and monosynaptic IPSP (shown in
Fig. 2B). Both traces were normalized with respect to peak and polarity to enable temporal comparison.D, superimposition of scaled gGABA
Aand IPSC (shown in Fig. 2C).

gGABAAvalues were on average 2·1 nS (i.e. 13·8% of their
peak value) in dendrites and 1·3 nS (i.e. 10·7% of peak) insomata (Table 1B).
Temporal comparison of orthodromic AP and gGABAA.
In 3 of 14 dendritic and 4 of 11 somatic recordings, afferentstimulation elicited some suprathreshold responses at theselected stimulation intensities (Fig. 4B). Temporalcomparison of latencies of APs and gGABA
Ain these cells
showed near maximal expression of gGABAAat the time of
onset of the synaptic APs: the average delay between APonset and peak of gGABA
Awas 0·4 ± 0·2 ms (n = 4 somatic
recordings). Values of t (AP,onset) and t (peak,GABAA) correlated
with r = 0·82. At t (AP,onset), gGABAA
was on average93·2 ± 9·4% of its peak (Table 1C). Similar values wereobtained from dendritic recordings (Table 1B and C; Fig. 4B).
Components of monosynaptic inhibition
In a second approach, latency to onset of the evokedmonosynaptic IPSP was obtained through the evaluation ofits components: (a) antidromic AP in an interneuron (Fig. 5)and (b) unitary IPSP (Fig. 6). The values of latency to onsetof the monosynaptic IPSP were similar in the two modes ofmeasurements, i.e. via summation of components (Figs 5and 6) and directly during pharmacological isolation(Figs 2—4, Table 1): the ranges of IPSP onsets were1—3·9 ms (summation of components) and 1·7—3·9 ms(during isolation); the means were 2·6 ms (summation ofcomponents) and 2·8 ms (during isolation).
Antidromic action potentials in interneurons. Inrecordings of stratum pyramidale interneurons (n = 7) inthe presence of CNQX (20—40 ìÒ) and ª_AP5 (50 ìÒ),short-latency antidromic spikes could be elicited in twocases (Fig. 5A—C). Evidence for directly (as opposed tosynaptically) evoked APs in these interneuron recordings is3_fold. First, APs were elicited during blockade ofexcitatory transmission. Second, APs rose from the baselinein the absence of underlying EPSPs (Fig. 5A). Third, APswere elicited with short latencies (Fig. 5A): 0·4—0·7 ms(onsets) and 0·8—1·6 ms (peaks). In contrast, latencies toonset of synaptically evoked APs were > 2·5 ms in allinterneuron recordings (n = 28) (Figs 8, 9 and 11).
As shown in Fig. 5C, the probability of eliciting antidromicinterneuron APs is a function of (a) distance betweenstimulation and recording site, and (b) stimulation intensity.Antidromic APs could be elicited at relatively lowstimulation intensities (50 ìA in the cell shown in Fig. 5).With regard to distance, the percentage of antidromicspikes dropped to about 50% when the stimulation electrodewas moved to a 1000 ìm distance (compared with a 500 ìmdistance between stimulation and recording site; Fig. 5C).Latencies to onset of antidromic APs in the recordingdepicted in Fig. 5 increased from an average 0·42 ms (at500 ìm distance) to 0·78 ms (at 1000 ìm). These values oft (I,anti-AP,onset) translate into velocities of AP propagation ininterneuron axons of 1·39 mm ms¢.
Temporal overlap of excitation and inhibitionJ. Physiol. 516.2 491
Figure 4. Temporal comparison of gGABAAand orthodromic EPSPÏEPSC
A—C, superimposed traces (shown up to poststimulation t = 18 ms) of gGABAAand EPSP (A), gGABA
Aand
suprathreshold EPSP (B), and gGABAAand EPSC (C). All traces were scaled to the same peak amplitude and
polarity. D, superimposition of gGABAAand the entire orthodromic response. Amplitude scalings in D were
arbitrarily chosen to allow clear separation of postsynaptic potential and gGABAA. All recordings and calculations
were obtained from the same CA1 apical dendrite shown in Fig. 2 (EPSPÏEPSC) and Fig. 3 (gGABAA).

S. Karnup and A. Stelzer J. Physiol. 516.2492
Figure 5. Antidromic APs and physiological properties in interneurons
A—C, intracellular recording of an interneuron (identified by physiological properties) in the presence ofCNQX (40 ìÒ) and ª_AP5 (50 ìÒ). A, stimulation elicited short-latency AP (truncated; shown in full ininset on enlarged time scale). B, superimposed recordings of antidromic AP and monosynaptic IPSP in theabsence of antidromic AP. Both recordings were obtained consecutively under the same conditions (at Vrest
−65 mV, 100 ìA stimulation intensity). Latencies of the monosynaptic IPSP were: t (I,IPSP,onset), 1·68 ms;t (I,IPSP,peak), 11·96 ms. Superimposed recordings show that the hyperpolarization following the spike iscomposed of two components, a fast AHP that peaked at 1·89 ms (also seen in response to current injection,inset in B) followed by a larger, delayed monosynaptic IPSP. Inset: responses to current injection (300 ms,+0·2 nA at Vrest −65 mV). AP properties (averaged values): frequency of spike firing upon 0·2 nA currentinjection at Vrest, 22·4 Hz; t (I,anti-AP,onset), 0·47 ms (measured from the first leg of the stimulation artifact);t (I,anti-AP,peak), 0·925 ms; AP duration at half-width, 0·39 ms; at base, 1·04 ms; AHP, 9·8 mV (at Vrest).C, probability of (antidromic) spike elicitation as a function of stimulation intensity measured at twodistances between stimulation and recording electrodes: 0·5 and 1 mm after repositioning of stimulationelectrode. Averaged values are based on 15—23 recordings from the cell shown in A and B. Frequency ofstimulation was 0·025 Hz. D, antidromic and orthodromic APs in a different interneuron (bistratified cell).Stimulation in stratum radiatum (distance to recording, 500 ìm) produced two consecutive APs withpoststimulation latencies to onsets of 0·4 and 5·3 ms, respectively. Duration at half-amplitude was 0·7 msin antidromic and synaptic AP; AP height, 77 mV; AHP (of antidromic spike), −13·5 mV; recordings atVrest −61 mV; Rin, 67 MÙ. E, camera lucida reconstruction of a bistratified cell recorded with a biocytin-
In two bistratified cell recordings obtained under controlconditions (i.e. in the presence of excitation), both antidromicand synaptic APs were clearly distinguishable (Fig. 5D). Thedelay between peaks (Ät (I,anti_AP,peak)— I,ortho_AP,peak)) rangedfrom 2·3 to 10·4 ms (mean ± s.e.m., 4·7 ± 1·6 ms).
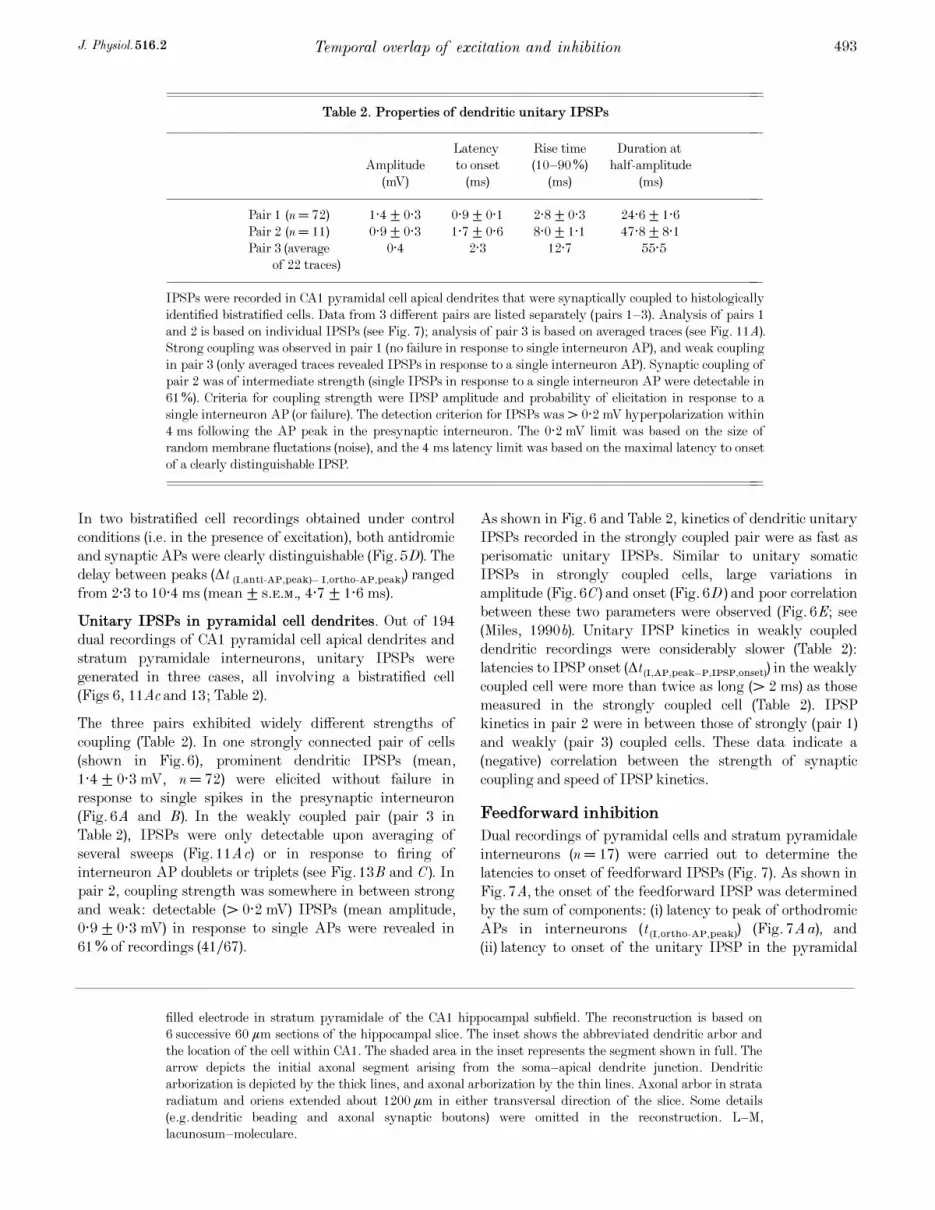
Unitary IPSPs in pyramidal cell dendrites. Out of 194dual recordings of CA1 pyramidal cell apical dendrites andstratum pyramidale interneurons, unitary IPSPs weregenerated in three cases, all involving a bistratified cell(Figs 6, 11Ac and 13; Table 2).
The three pairs exhibited widely different strengths ofcoupling (Table 2). In one strongly connected pair of cells(shown in Fig. 6), prominent dendritic IPSPs (mean,1·4 ± 0·3 mV, n = 72) were elicited without failure inresponse to single spikes in the presynaptic interneuron(Fig. 6A and B). In the weakly coupled pair (pair 3 inTable 2), IPSPs were only detectable upon averaging ofseveral sweeps (Fig. 11Ac) or in response to firing ofinterneuron AP doublets or triplets (see Fig. 13B and C). Inpair 2, coupling strength was somewhere in between strongand weak: detectable (> 0·2 mV) IPSPs (mean amplitude,0·9 ± 0·3 mV) in response to single APs were revealed in61% of recordings (41Ï67).
As shown in Fig. 6 and Table 2, kinetics of dendritic unitaryIPSPs recorded in the strongly coupled pair were as fast asperisomatic unitary IPSPs. Similar to unitary somaticIPSPs in strongly coupled cells, large variations inamplitude (Fig. 6C) and onset (Fig. 6D) and poor correlationbetween these two parameters were observed (Fig. 6E; see(Miles, 1990b). Unitary IPSP kinetics in weakly coupleddendritic recordings were considerably slower (Table 2):latencies to IPSP onset (Ät (I,AP,peak—P,IPSP,onset)) in the weaklycoupled cell were more than twice as long (> 2 ms) as thosemeasured in the strongly coupled cell (Table 2). IPSPkinetics in pair 2 were in between those of strongly (pair 1)and weakly (pair 3) coupled cells. These data indicate a(negative) correlation between the strength of synapticcoupling and speed of IPSP kinetics.
Feedforward inhibition
Dual recordings of pyramidal cells and stratum pyramidaleinterneurons (n = 17) were carried out to determine thelatencies to onset of feedforward IPSPs (Fig. 7). As shown inFig. 7A, the onset of the feedforward IPSP was determinedby the sum of components: (i) latency to peak of orthodromicAPs in interneurons (t (I,ortho-AP,peak)) (Fig. 7Aa), and(ii) latency to onset of the unitary IPSP in the pyramidal
Temporal overlap of excitation and inhibitionJ. Physiol. 516.2 493
filled electrode in stratum pyramidale of the CA1 hippocampal subfield. The reconstruction is based on6 successive 60 ìm sections of the hippocampal slice. The inset shows the abbreviated dendritic arbor andthe location of the cell within CA1. The shaded area in the inset represents the segment shown in full. Thearrow depicts the initial axonal segment arising from the soma—apical dendrite junction. Dendriticarborization is depicted by the thick lines, and axonal arborization by the thin lines. Axonal arbor in strataradiatum and oriens extended about 1200 ìm in either transversal direction of the slice. Some details(e.g. dendritic beading and axonal synaptic boutons) were omitted in the reconstruction. L—M,lacunosum—moleculare.
––––––––––––––––––––––––––––––––––––––––––––––––––––––––––––––––––––––––––––––––––––––––––––Table 2. Properties of dendritic unitary IPSPs
––––––––––––––––––––––––––––––––––––––––––––––Latency Rise time Duration at
Amplitude to onset (10—90%) half-amplitude(mV) (ms) (ms) (ms)
––––––––––––––––––––––––––––––––––––––––––––––Pair 1 (n = 72) 1·4 ± 0·3 0·9 ± 0·1 2·8 ± 0·3 24·6 ± 1·6Pair 2 (n = 11) 0·9 ± 0·3 1·7 ± 0·6 8·0 ± 1·1 47·8 ± 8·1Pair 3 (average 0·4 2·3 12·7 55·5
of 22 traces)––––––––––––––––––––––––––––––––––––––––––––––IPSPs were recorded in CA1 pyramidal cell apical dendrites that were synaptically coupled to histologicallyidentified bistratified cells. Data from 3 different pairs are listed separately (pairs 1—3). Analysis of pairs 1and 2 is based on individual IPSPs (see Fig. 7); analysis of pair 3 is based on averaged traces (see Fig. 11A).Strong coupling was observed in pair 1 (no failure in response to single interneuron AP), and weak couplingin pair 3 (only averaged traces revealed IPSPs in response to a single interneuron AP). Synaptic coupling ofpair 2 was of intermediate strength (single IPSPs in response to a single interneuron AP were detectable in61%). Criteria for coupling strength were IPSP amplitude and probability of elicitation in response to asingle interneuron AP (or failure). The detection criterion for IPSPs was > 0·2 mV hyperpolarization within4 ms following the AP peak in the presynaptic interneuron. The 0·2 mV limit was based on the size ofrandom membrane fluctations (noise), and the 4 ms latency limit was based on the maximal latency to onsetof a clearly distinguishable IPSP.––––––––––––––––––––––––––––––––––––––––––––––––––––––––––––––––––––––––––––––––––––––––––––

cell (Ät (I,AP,peak—P,IPSP,onset)) (Fig. 7Ab). A 1 ms constant wasgenerally substituted for Ät (I,AP,peak—P,IPSP,onset) in non-coupled pairs (see Fig. 7A).
The temporal overlap between feedforward inhibition andorthodromic EPSP in pyramidal cells was measured byprojecting the latency of the feedforward IPSP onto the
orthodromic EPSP elicited in the simultaneously recordedpyramidal cell (Fig. 7B). Onsets of the feedforward IPSPoccurred in 13 of 17 dual recordings during the EPSP risingphase. Temporal overlap was quantified by a scale definedby onset (assigned value ‘1’) and peak of the pyramidal cellEPSP (assigned value ‘0’) (see legend to Fig. 7). By this
S. Karnup and A. Stelzer J. Physiol. 516.2494
Figure 6. Characteristics of unitary IPSPs
recorded in a CA1 pyramidal cell dendrite
Paired recording of a bistratified cell (recorded instratum pyramidale) and pyramidal cell apical dendrite(recorded in stratum radiatum, 250 ìm from stratumpyramidale). A, single spontaneous spikes in theinterneuron (lower trace) elicited corresponding IPSPsin the simultaneously recorded pyramidal cell (uppertrace; filtered at 0·3 kHz) without failure. Allrecordings were carried out at respective Vrest (−65 mVin pyramidal cell dendrite, −58 mV in interneuron).B, single interneuron AP and corresponding IPSP onan extended time scale. Peak amplitude of the IPSP inthe depicted recording was 1·48 mV, latency to onset(from AP peak of interneuron) was 0·97 ms, rise time(10—90%) was 3·6 ms, and duration at half-amplitudewas 21 ms. C, distribution of IPSP amplitudes rangingfrom 0·4 to 2·2 mV (bin width, 0·2 mV). D, distributionof latency to onset (measured from peak of AP inpresynaptic interneuron) ranging from 0·2 to 1·6 ms(bin width, 0·2 ms; n = 72). E, linear regressionanalysis of IPSP amplitude and latency (same values asshown in C and D) shows poor correlation between thetwo parameters (r = −0·39; n = 72, P > 0·066). Cellcharacteristics (means): interneuron: spike width athalf-amplitude, 0·55 ms; AHP (peak), −18 mV; Rin,83 MÙ; dendrite: spike width at half-amplitude,1·25 ms; Rin, 39 MÙ.
––––––––––––––––––––––––––––––––––––––––––––––––––––––––––––––––––––––––––––––––––––––––––––Table 3. Properties of CA1 neurons
––––––––––––––––––––––––––––––––––––––––––––––A. Pyramidal cells Interneurons Statistics
––––––––––––––––––––––––––––––––––––––––––––––Vrest (mV) −64·5 ± 1·3 (n = 17) −66·2 ± 2·2 (n = 17)AP threshold (mV) −53·2 ± 2·1 (n = 17) −55·4 ± 1·9 (n = 17)t (EPSP,onset) 2·9 ± 0·3 (n = 17) 2·7 ± 0·5 (n = 17)EPSP slope (mV ms¢) 1·6 ± 0·4 (n = 17) 4·0 ± 0·7 (n = 17) *ôm (ms) 21·1 ± 1·2 (n = 17) 16·2 ± 1·5 (n = 17) *Rin 53·3 ± 7·7 (n = 17) 96·9 ± 10·7(n = 17) *
––––––––––––––––––––––––––––––––––––––––––––––B. I cells Basket cells Axo-axonic cells Bistratified cells
(n = 28) (n = 15) (n = 6) (n = 7)––––––––––––––––––––––––––––––––––––––––––––––
t (EPSP,onset) 2·7 ± 0·3 2·8 ± 0·5 2·4 ± 0·6 2·7 ± 0·4t (EPSP,peak) 5·6 ± 0·5 5·8 ± 0·7 5·0 ± 1·1 5·9 ± 0·6t (AP,onset) 5·3 ± 0·3 5·7 ± 0·9 4·8 ± 1·2 5·2 ± 0·5t (AP,peak) 5·8 ± 0·3 6·1 ± 0·7 5·2 ± 1·0 5·8 ± 0·7
––––––––––––––––––––––––––––––––––––––––––––––A, properties of pyramidal cells and stratum pyramidale interneurons recorded simultaneously.B, activation kinetics in CA1 stratum pyramidale interneurons (total, n = 28; and various subtypes).* indicates significant difference between pyramidal cell and interneuron values (P < 0·05, Student’s t test).––––––––––––––––––––––––––––––––––––––––––––––––––––––––––––––––––––––––––––––––––––––––––––

measure, temporal overlap ranged from 0·75 (i.e. feed-forward inhibition was present during 75% of the EPSPrising phase) to −0·21 (i.e. feedforward inhibition startedduring the early decay phase of the EPSP). On average (allinterneurons taken together, n = 17), the onset of thefeedforward inhibitory response coincided with the lastquarter of the EPSP rising phase (factor 0·255). Slightlyfaster onsets of feedforward inhibition were mediated byaxo-axonic cells (mean overlap, 0·43 ± 0·22) compared withthose of bistratified cells (mean overlap, 0·20 ± 0·1) andbasket cells (mean overlap, 0·23 ± 0·1).
In Fig. 7C, the values of feedfoward IPSP onset (measuredin the interneurons of the 17 pairs shown in Fig. 7B), wereprojected onto a standard EPSP (2·8 ms latency to onsetand 7·8 ms latency to peak: these values were the averagefrom 39 dendritic and 24 somatic pyramidal cell recordings).Comparing Fig. 7B and C shows that the distribution offeedforward IPSP onsets was similar. Using the standardEPSP (as in Fig. 7C), a measure of feedforward inhibition
can be obtained from single interneuron recordings(e.g. from the basket cell shown in Fig. 9 and recordings ofLucifer Yellow-stained interneurons from a previous study(Stelzer et al. 1994). The calculated values of temporaloverlap feedforward IPSP—orthodromic EPSP based on allinterneuron recordings (n = 37; shown in Fig. 7D) confirmthe results of the smaller stratum pyramidale interneuronpopulation (n = 17; shown in Fig. 7C): in 31 of 37comparisons of stratum pyramidale interneuron-mediatedIPSPs, feedforward inhibition occurred during the risingphase of the average pyramidal cell EPSP.
A very similar distribution was seen for IPSPs mediated bystratum lacunosum—moleculare (L—M) interneurons: in 10of 14 recordings, L—M-mediated IPSPs coincided with theEPSP rising phase, and 4 of 14 with the early decay phaseof the averaged EPSP.
IPSP onsets obtained from alveus—oriens (A—O) interneuronrecordings were significantly slower (Fig. 7D). In 6 of 7 A—O
Temporal overlap of excitation and inhibitionJ. Physiol. 516.2 495
Figure 7. Onsets of feedforward IPSP in CA1 pyramidal cell dendrites
A, experimental protocol of assessing onset of feedforward IPSPs in pyramidal cells. Onset of feedforwardinhibition was determined by summation of its underlying components: in concomitant recordings ofpyramidal cell dendrite and stratum pyramidale interneuron, latency to peak of synaptic interneuron AP(I) (t (I,ortho-AP,peak)) (a) and onset of unitary IPSP (Ät (I,AP,peak−P,IPSP,onset)) (b) were measured. The sum ofthe latency of both components was projected onto the EPSP of the concomitantly recorded pyramidal cell(oblique arrow in a). In non-coupled pairs, a 1 ms value was used for Ät (I,AP,peak−P,IPSP,onset). B, dots denotethe calculated values of feedforward IPSP in temporal relation to the EPSP of the concomitantly recordedpyramidal cell (n = 17 pairs). In C, the same values of latencies to onset of the feedforward IPSP(measured in the interneurons of the 17 pairs shown in B), were projected onto an EPSP whose latencies toonset and peak represent the mean values of several pyramidal cell recordings. D, calculated onsets offeedforward inhibition from all interneuron recordings are shown in temporal comparison with theaveraged EPSP. In B and C, a small arrow denotes the mean value in each group, the larger arrow (pointingtowards the EPSP) represents the mean value of all 17 recordings. The number scale (at the bottom of B—D)was defined by the pyramidal cell EPSP onset and peak: the value ‘1·0’ was assigned to onset, the value ‘0’to peak, and negative values accordingly to EPSP decay.

interneurons, IPSP onsets coincided with the decay phase ofthe EPSP, and in only 1 of 7 with the EPSP rising phase.Furthermore, the mean of temporal overlap between A—Ocell-mediated IPSPs and the EPSP (−0·24 ± 0·16) wassignificantly different from that of pyramidale interneurons(0·30 ± 0·05; P < 0·002, ANOVA) and L—M interneurons(0·24 ± 0·09; P < 0·01). The late onset of A—O cell-mediatedIPSPs is probably due to the fact that A—O interneuronactivation was implemented via recurrent excitation throughCA1 pyramidal cell APs (Blasco-Ibanez & Freund, 1995;Maccaferri & McBain, 1995). This notion is supported by thedelayed onset of the stimulation-evoked EPSP in A—O inter-
neurons (6·4 ± 1·3 ms, mean ± s.e.m., n = 7). In comparison,mean onset of orthodromic EPSPs in stratum pyramidaleinterneurons was 2·7 ± 0·3 ms (n = 28; Table 3B).
Differential excitability of interneurons and
pyramidal cells
The protocol of comparing time courses of feedforwardinhibition and EPSP required the concomitant elicitation ofsynaptic APs in the interneuron, but subthreshold EPSPs inthe pyramidal cell (Fig. 7A). This condition was met in alarge range of stimulation intensities due to differentialexcitability of interneurons and pyramidal cells (Scharfman,
S. Karnup and A. Stelzer J. Physiol. 516.2496
Figure 8. Elicitation of synaptic APs in interneurons and pyramidal cells
Aa, concomitant recordings at four representative stimulation intensities (20, 300, 500 and 700 ìA) in anaxo-axonic cell and pyramidal cell apical dendrite. Ab, plot of spike elicitation probability versus stimulationintensity. Ac, plot of probability of double spike elicitation in interneurons as a function of stimulationintensity. Analysis is based on 6—12 recordings at each stimulation intensity. Arrows at 300 and 500 ìA (ina) depict the sum of latencies of interneuron spike plus 0·2 ms. Cellular properties: Rin, bistratified cell,38 MÙ; pyramidal cell, 21 MÙ; Vrest, bistratified cell, −63 mV; pyramidal cell, −65 mV; spike width athalf-amplitude in bistratified cell, 0·45 ms; AHP, −16 mV. B, comparison of spike elicitation probability inbasket cell and four pyramidal cells (three apical dendrites, one soma) that were consecutively recorded incombination with the basket cell. Orthodromic responses were elicited at various stimulation intensities(from 150 to 700 ìA) for each of the four basket cell—pyramidal cell pairs. Ba, schematic depiction ofinterneuron and pyramidal cell recording sites. Bb, probabilities of spike elicitation in basket cell (0), soma(1) and dendrites (²). Arrows mark the stimulation intensity at which pyramidal cells exhibited half-maximal EPSP peak amplitudes. Cellular properties: Rin, basket cell, 96 MÙ; pyramidal cells, 41 ± 9 MÙ(mean ± s.e.m., n = 3); Vrest, basket cell, −72 mV; pyramidal cells, −64 ± 3 mV; spike width at half-amplitude in interneuron, 0·5 ms; AHP, −14 mV.
1991). For example, in the paired recording shown in Fig. 8A,synaptic spikes in the axo-axonic cell were elicited at 20 ìA,whereas > 500 ìA was required for synaptic spikes in theconcomitantly recorded pyramidal cell dendrite. In addition,double spike responses in the interneuron were accompaniedby subthreshold EPSP responses in the pyramidal cell over alarge range of stimulation intensities (Fig. 8Ac). In Fig. 8B,probabilities of synaptic spikes were compared in a basketcell and four pyramidal cells (3 dendrites and 1 soma) thatwere recorded consecutively during the same interneuronrecording. The basket cell responded with synaptic APs atany intensity (with 100% probability at intensities> 300 ìA). In contrast, none of the three concomitantlyrecorded pyramidal cell dendrites exhibited spike responsesat any of the selected stimulation intensities. In thepyramidal cell soma, 10—20% of synaptic APs wereobserved at intensities of 500 and 700 ìA, respectively.
It seems that in CA1 pyramidal cells — similar to neocorticalpyramidal cells (Ling & Benardo, 1998) — the magnitude ofinhibitory responses reaches an upper limit at stimulationintensities at which excitation is far below its maximum. Inthe dual recordings shown in Fig. 8A and B, interneuronsresponded in all recordings with synaptic spikes at thestimulation intensities that elicited half-maximal EPSPs inthe pyramidal cells (at 300 ìA in Fig. 8A; marked byarrows in Fig. 8Bb). With stimulation intensities adjusted togenerate about half-maximal EPSPs in the pyramidal cells(e.g. in the experiments shown in Fig. 7), synaptic inter-neuron APs were elicited in 57 of 62 pairs (in 39 of 57 caseswith a 100% probability, in 18 cases with probabilitiesbetween 34 and 90%). Taken together, these data show that
maximal efficacy of feedforward inhibition is reached bystimulation intensities that generate only about 50% ofmaximal EPSPs in pyramidal cells.
Temporal overlap of feedforward inhibition and
EPSP: role of stimulation intensity
As shown in Fig. 8A (at 20 ìA), synaptic interneuron APscould be elicited at stimulation intensities that were below thethreshold for eliciting pyramidal cell EPSPs. This wasobserved in 16 of 24 combinations of interneuron—pyramidalcell recordings at which such low intensities were applied.These data demonstrate that the weakest excitatory inputinto CA1 is accompanied by large activation of the feed-forward inhibitory pathway. What is the temporal overlapbetween feedforward inhibition and evoked excitation forsuch weak excitatory input?
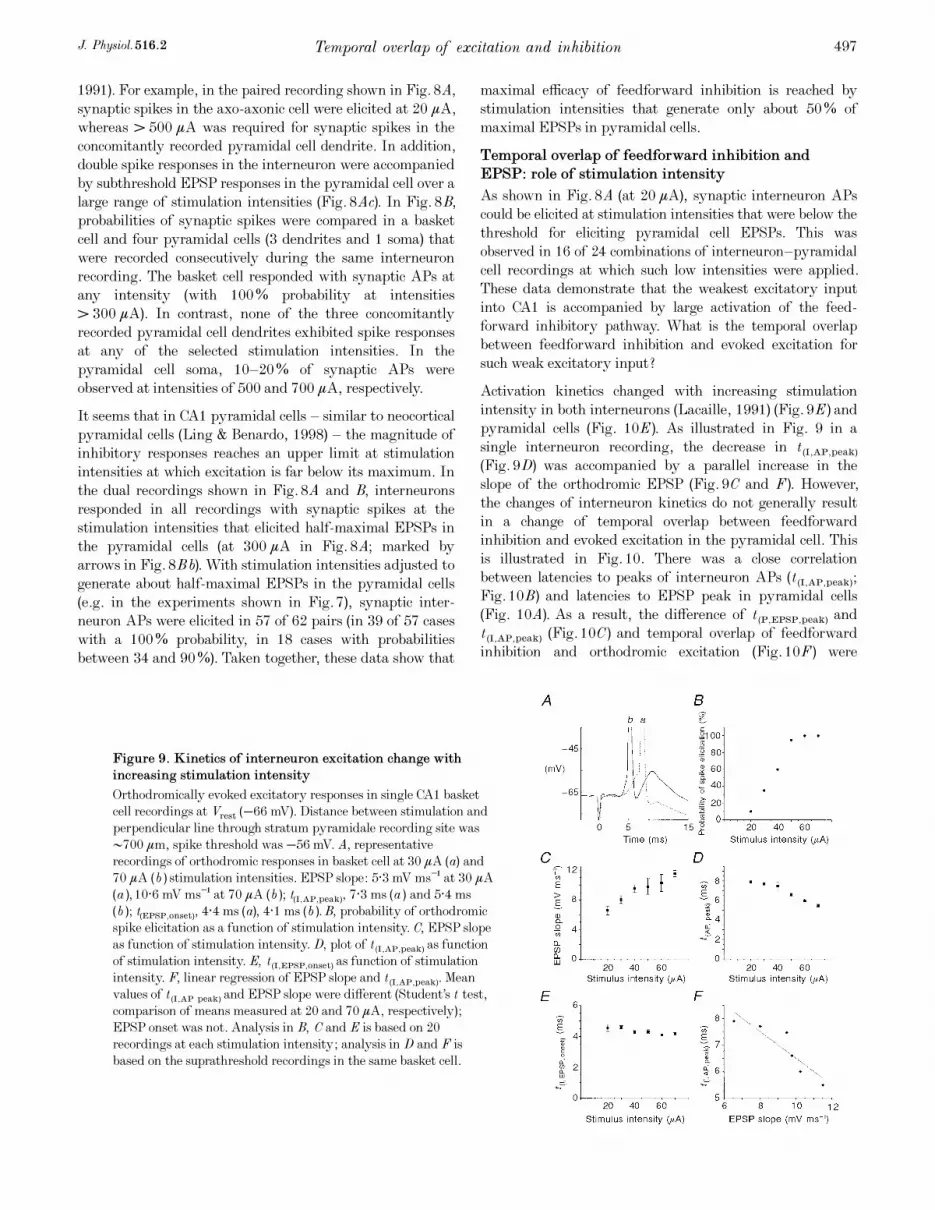
Activation kinetics changed with increasing stimulationintensity in both interneurons (Lacaille, 1991) (Fig. 9E) andpyramidal cells (Fig. 10E). As illustrated in Fig. 9 in asingle interneuron recording, the decrease in t (I,AP,peak)
(Fig. 9D) was accompanied by a parallel increase in theslope of the orthodromic EPSP (Fig. 9C and F). However,the changes of interneuron kinetics do not generally resultin a change of temporal overlap between feedforwardinhibition and evoked excitation in the pyramidal cell. Thisis illustrated in Fig. 10. There was a close correlationbetween latencies to peaks of interneuron APs (t (I,AP,peak);Fig. 10B) and latencies to EPSP peak in pyramidal cells(Fig. 10A). As a result, the difference of t (P,EPSP,peak) andt (I,AP,peak) (Fig. 10C) and temporal overlap of feedforwardinhibition and orthodromic excitation (Fig. 10F) were
Temporal overlap of excitation and inhibitionJ. Physiol. 516.2 497
Figure 9. Kinetics of interneuron excitation change with
increasing stimulation intensity
Orthodromically evoked excitatory responses in single CA1 basketcell recordings at Vrest (−66 mV). Distance between stimulation andperpendicular line through stratum pyramidale recording site was•700 ìm, spike threshold was −56 mV. A, representativerecordings of orthodromic responses in basket cell at 30 ìA (a) and70 ìA (b) stimulation intensities. EPSP slope: 5·3 mV ms¢ at 30 ìA(a), 10·6 mV ms¢ at 70 ìA (b); t(I,AP,peak), 7·3 ms (a) and 5·4 ms(b); t(EPSP,onset), 4·4 ms (a), 4·1 ms (b). B, probability of orthodromicspike elicitation as a function of stimulation intensity. C, EPSP slopeas function of stimulation intensity. D, plot of t (I,AP,peak) as functionof stimulation intensity. E, t (I,EPSP,onset) as function of stimulationintensity. F, linear regression of EPSP slope and t (I,AP,peak). Meanvalues of t (I,AP peak) and EPSP slope were different (Student’s t test,comparison of means measured at 20 and 70 ìA, respectively);EPSP onset was not. Analysis in B, C and E is based on 20recordings at each stimulation intensity; analysis in D and F isbased on the suprathreshold recordings in the same basket cell.

similar in the entire range of stimulation. Latencies to onsetwere not generally affected by stimulation intensity(Figs 9E and 10E). These data show that the high degree oftemporal overlap between feedforward inhibition andexcitation — measured at half-maximal EPSPs (Fig. 7) — isalso seen at lower stimulation intensities and smaller EPSPs.
Recurrent inhibition
The time course of the recurrent inhibitory response wasevaluated via measurements of its underlying components(Fig. 11): (1) latency to peak of synaptic pyramidal cell AP(t (P,AP,peak); Fig. 11Aa, P); (2) latency between pyramidalcell AP peak and unitary AP peak in a coupledinterneuron (Ät (P,AP,peak—I,unitaryAP,peak); Figs 11Ab and12A and B); (3) latency between interneuron AP peak andonset of unitary IPSP in the pyramidal cell(Ät (I,AP,peak—P,mono—IPSP,onset); Fig. 11Ac).
The results of this approach can be summarized as follows(see below for details). First, the earliest onsets of therecurrent IPSP occur several milliseconds (> 3 ms) after thepeak of the orthodromic EPSP in pyramidal cells. Thusrecurrent inhibition is not a factor in the control of theEPSP rising phase. Second, recurrent inhibitory responsesare prominently expressed at the time of the peak of theorthodromic population IPSP: in the recordings ofFigs 11—13, earliest onsets of recurrent inhibition occurredat poststimulation latency t = 11 ms (see Fig. 11B); thepeak of the population IPSP was measured at t = 26 ms.Third, a widespread range of recurrent IPSP onsets (in thepyramidal cell shown in Figs 11—13 from 11 to 99·8 ms; seeFig. 11B)were observed.
Measurements of all three components could be obtainedfrom a mutually coupled bistratified cell and pyramidal cellapical dendrite (Figs 11—13). In this pair, strong couplingwas observed between the pyramidal cell and theinterneuron: pyramidal cell APs elicited large unitaryEPSP without failure (in many cases suprathreshold) in theinterneuron (Fig. 12). In reverse, the interneuron was (albeitweakly) coupled to the recorded dendrite (Fig. 13). The onsetsof mono- and feedforward IPSPs in relation to the pyramidalcell EPSP in this pair (Fig. 11B) were in the general range ofrespective onsets seen in other cells (see Figs 2 and 7).
Latencies to peak of pyramidal cell AP
In pyramidal cells, the latencies to peaks of synaptic APs(component a, Fig. 11A) coincided roughly with thelatencies to their EPSP peaks (e.g. Fig. 4B; Table 1B forsingle recordings; Figs 8A and 11A for dual recordings). Inthe pyramidal cell of the dual recording shown inFigs 11—13, mean latency to synaptic AP peak was9·8 ± 0·3 ms (n = 27; range 8·6—11·4 ms; Figs 11Aa and12D); mean latency to EPSP peak was 9·4 ± 1·1 ms(n = 12, range 5·6—12·0 ms). Since the onset of recurrentinhibition starts several milliseconds after the EPSP peak(i.e. the delay is the sum of components b and c, see below),it is clear that recurrent inhibitory influences are notpresent during the slope or peak of the orthodromic EPSP.
Latencies of recurrent disynaptic IPSPs
Component b. Strong coupling between the pyramidal celland the interneuron (Figs 11 and 12) allowed measurementsof (a) latencies to onset of unitary EPSPs that ranged from0·4 to 1·5 ms (mean, 1·04 ± 0·07 ms, n = 268); and
S. Karnup and A. Stelzer J. Physiol. 516.2498
Figure 10. Degree of temporal overlap between
feedforward inhibition and pyramidal cell EPSP as a
function of stimulation intensity
A, kinetic parameters that determine temporal overlapbetween feedforward inhibition and pyramidal cell EPSP.t (P,EPSP,peak) (A) and t (I,AP,peak) (B) exhibited similardecreases in the selected stimulation range. Correlationcoefficient between t (P,EPSP,peak) and t (I,AP,peak) (C) wasr = 0·7. D, the difference between pyramidal cell EPSPpeak and AP peak in interneuron remained unchanged byincreased stimulation. E, t (P,EPSP,onset)was variable, but notchanged. F, temporal overlap between onset of feedforwardinhibition and EPSP was statistically the same in thedepicted stimulation range. Data were calculated from thedual recording of pyramidal cell dendrite and axo-axoniccell shown in Fig. 8A.

(b) latencies to unitary AP peaks in the interneuron(Ät (P,AP,peak—I,unitary AP,peak)). This parameter exhibited largevariability, ranging from 2·6 to 86·4 ms (shown inhistogram of Fig. 12C). Two types of unitary interneuronAPs were observed (Fig. 12B and C): (a) early APs that roseduring the EPSP rising phase (Fig. 12Ba); and (b) late APsthat originated during the plateau phase of unitary EPSPs(Fig. 12Bb). Early APs ranged from 2·6 to 8·8 ms(mean ± s.e.m., 6·0 ± 0·2 ms, n = 61); latencies to late APsranged from 6 to 86 ms (mean ± s.e.m., 30·8 ± 1·4 ms;n = 174).
Component c. Weak inhibitory coupling with the pyramidalcell was observed in the same pair of cells (Figs 11Ac and13). A monosynaptic IPSP was revealed by averagingseveral traces (e.g. Fig. 11Ac) or in response to double andtriple spikes in the presynaptic interneuron (Fig. 13).Latencies to onsets of IPSPs (apparently triggered by thesecond of multiple spikes, see Fig. 13) were on average2·4 ± 0·4 ms (n = 22; range between 1·5 and 3·1 ms). Incomparison, latency between interneuron AP peak andonset of the averaged (n = 22) monosynaptic IPSP inresponse to a single interneuron spike was 2·3 ms
Temporal overlap of excitation and inhibitionJ. Physiol. 516.2 499
Figure 11. Onsets of recurrent IPSPs in a CA1 pyramidal cell dendrite
A, experimental protocol of measuring latencies to onset of recurrent IPSPs in a CA1 pyramidal cell.A schematic depiction of the feedback inhibitory pathway and recording arrangements in the CA1hippocampal subfield is shown top left. The onset of the feedback inhibitory response was evaluated byseparately measuring the three underlying components (a—c) in a mutually coupled pair of pyramidal cell(dendritic recording, 100 ìm from stratum pyramidale) and interneuron (bistratified cell, recorded instratum pyramidale). a, poststimulation latencies to peaks of synaptic APs in pyramidal cell (9·6 ms) andinterneuron (7·4 ms in the recording depicted). b, measurements of latency between the pyramidal cell AP(spontaneously generated) and the interneuron AP on top of a unitary EPSP in the synaptically coupledinterneuron (6·3 ms in the recording depicted, see Fig. 12). c, latency between interneuron AP peak andonset of the averaged (n = 22) monosynaptic IPSP in the coupled pyramidal cell was 2·3 ms. All recordingswere obtained at respective Vrest (between −55 and −58 mV in pyramidal cell, −65 mV in interneuron).Duration of interneuron AP at half-width was 0·7 ms, AHP was 9 mV. The distance between the two cellsin the transverse direction was 50 ìm. Distances between stimulation and recording electrodes were about1 mm. B, latencies to onset of the recurrent IPSP were calculated by summation of components a—c. Theonset of the recurrent IPSP based on the summation of the three components was on average 29·4 ± 1·3 ms(n = 235; early and late APs taken together, see Fig. 13). Based on early APs alone, latencies to onset offeedback IPSPs were on average 16·0 ± 0·2 ms (n = 61); based on late APs alone, 38·9 ± 1·4 ms (n = 174).FF, range of onsets of feedforward IPSPs; M, onsets of monosynaptic IPSPs in the same pyramidal cell.
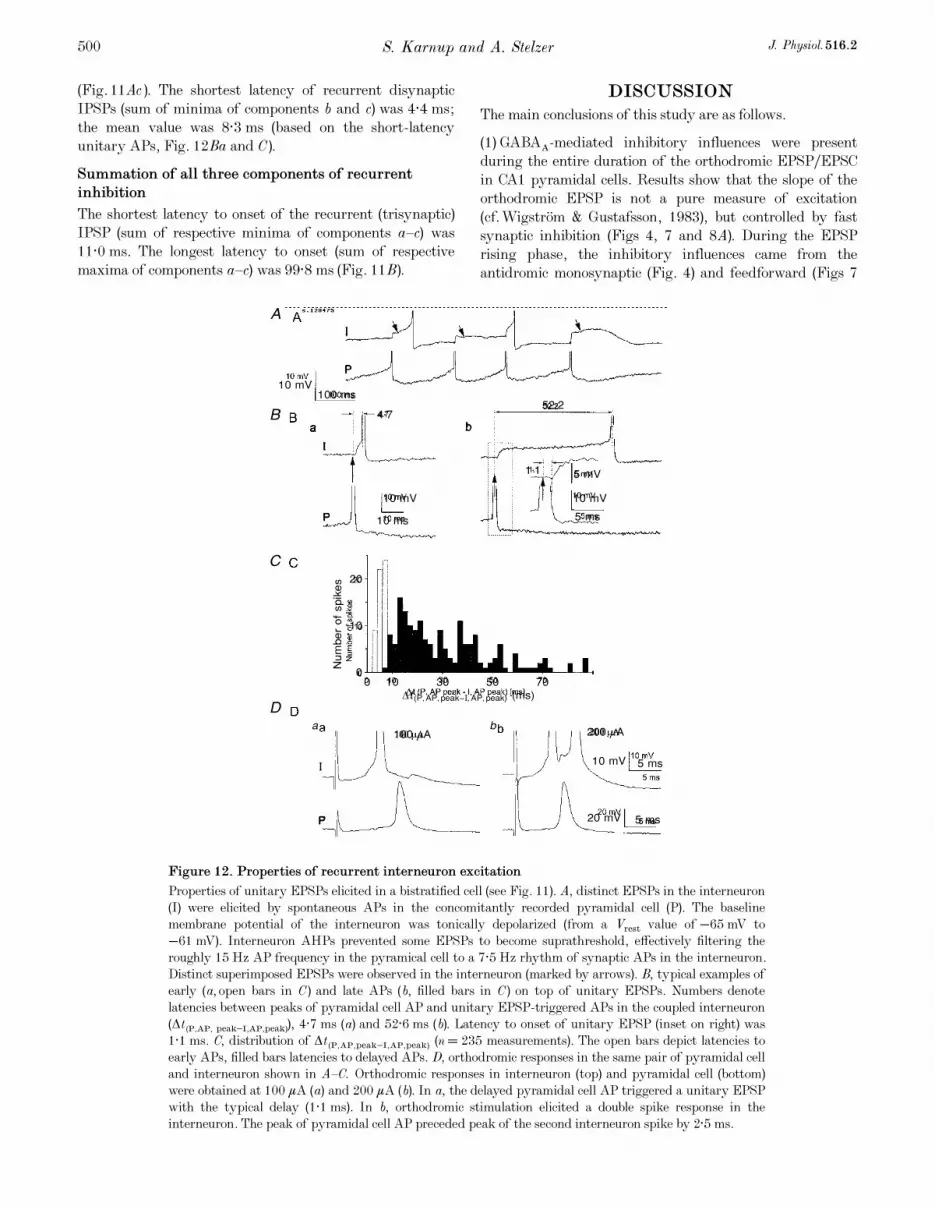
(Fig. 11Ac). The shortest latency of recurrent disynapticIPSPs (sum of minima of components b and c) was 4·4 ms;the mean value was 8·3 ms (based on the short-latencyunitary APs, Fig. 12Ba and C).
Summation of all three components of recurrent
inhibition
The shortest latency to onset of the recurrent (trisynaptic)IPSP (sum of respective minima of components a—c) was11·0 ms. The longest latency to onset (sum of respectivemaxima of components a—c) was 99·8 ms (Fig. 11B).
DISCUSSION
The main conclusions of this study are as follows.
(1) GABAA-mediated inhibitory influences were presentduring the entire duration of the orthodromic EPSPÏEPSCin CA1 pyramidal cells. Results show that the slope of theorthodromic EPSP is not a pure measure of excitation(cf. Wigstr�om & Gustafsson, 1983), but controlled by fastsynaptic inhibition (Figs 4, 7 and 8A). During the EPSPrising phase, the inhibitory influences came from theantidromic monosynaptic (Fig. 4) and feedforward (Figs 7
S. Karnup and A. Stelzer J. Physiol. 516.2500
10 mV100 ms
P
I
4·7
10 mV
10 ms
52·2
1·1
5 ms
Num
berof
spikes
I
P
100 ìA 200 ìA
10 mV 5 ms
20 mV 5 ms
P
I
5 mV
10 mV
20
10
00 10 30 50 70
a b
ò
®
@
£
a b
Ät (P,AP,peak−I,AP,peak) (ms)
Figure 12. Properties of recurrent interneuron excitation
Properties of unitary EPSPs elicited in a bistratified cell (see Fig. 11). A, distinct EPSPs in the interneuron(I) were elicited by spontaneous APs in the concomitantly recorded pyramidal cell (P). The baselinemembrane potential of the interneuron was tonically depolarized (from a Vrest value of −65 mV to−61 mV). Interneuron AHPs prevented some EPSPs to become suprathreshold, effectively filtering theroughly 15 Hz AP frequency in the pyramical cell to a 7·5 Hz rhythm of synaptic APs in the interneuron.Distinct superimposed EPSPs were observed in the interneuron (marked by arrows). B, typical examples ofearly (a, open bars in C) and late APs (b, filled bars in C) on top of unitary EPSPs. Numbers denotelatencies between peaks of pyramidal cell AP and unitary EPSP-triggered APs in the coupled interneuron(Ät (P,AP, peak−I,AP,peak)), 4·7 ms (a) and 52·6 ms (b). Latency to onset of unitary EPSP (inset on right) was1·1 ms. C, distribution of Ät (P,AP,peak−I,AP,peak) (n = 235 measurements). The open bars depict latencies toearly APs, filled bars latencies to delayed APs. D, orthodromic responses in the same pair of pyramidal celland interneuron shown in A—C. Orthodromic responses in interneuron (top) and pyramidal cell (bottom)were obtained at 100 ìA (a) and 200 ìA (b). In a, the delayed pyramidal cell AP triggered a unitary EPSPwith the typical delay (1·1 ms). In b, orthodromic stimulation elicited a double spike response in theinterneuron. The peak of pyramidal cell AP preceded peak of the second interneuron spike by 2·5 ms.

and 8A) component. In contrast, onset of recurrentinhibition started several milliseconds after the EPSP peak(Fig. 11).
(2) Kinetics of GABAA-mediated conductance changes wereconsiderably faster than those of the IPSP or IPSC of thesame evoked event (Table 1, Fig. 4). These data underlinethe pivotal role of the actions of inhibitory shunting in thecontrol of excitatory input in CA1.
(3) Synaptic interneuron spikes could be elicited bystimulation intensities that were below the threshold ofEPSP elicitation in the pyramidal cell (Fig. 8A). In addition,firing of a single pyramidal cell induced unitaryinterneuron APs (Fig. 12). These data indicate that weakestexcitatory input into CA1, e.g. unitary pyramidal cellEPSPs (Turner, 1988; Sayer et al. 1989), activates CA1interneurons in a feedforward manner. Feedforwardinhibition exerted a high degree of temporal overlap withevoked excitation at any strength of excitatory input(Figs 7, 8 and 10). Taken together, these results suggest thatin situ, any excitatory input in CA1 is controlled by fastsynaptic inhibition.
Monosynaptic inhibition
Since the monosynaptic inhibitory response is elicited bydirect electrical stimulation of interneuron processes (Fig. 5)and is therefore not observed in situ, the question arises asto why such detailed examination of the kinetics was carriedout (Figs 2—5; Table 1). First, the orthodromic response ofCA1 pyramidal cells is a frequently used experimentalmeasure of excitability. The presented data (Figs 2—4;Table 1) show that — with monosynaptic inhibition being anintegral component — GABAA-mediated influences arepresent before the onset of the orthodromic EPSP in
dendrites. Second, the monosynaptic inhibitory responsecould be isolated pharmacologically (Davies et al. 1990). It isinferred that the main finding regarding the kinetics ofmonosynaptic inhibition (gGABA
Afaster than IPSCs and
IPSPs) applies also to feedforward and feedback inhibitoryresponses. Third, the similarity of latencies to IPSPsmeasured directly (Figs 2—4; Table 1) and indirectly viasummation of components (Figs 5 and 6) demonstrated thefeasibility of the indirect approach via summation ofcomponents. The latter was the sole approach in theevaluation of feedforward (Fig. 7) and feedback inhibition(Fig. 11).
Feedforward inhibition
The kinetics of interneuron activation reported here are inagreement with those reported previously: overall latencyto disynaptic IPSPs (Miles, 1990b), poststimulation intervalsto interneuron AP peaks (Lacaille, 1991; Scharfman, 1991),and differences in latency between interneuron andpyramidal cell firing (Ashwood et al. 1984). Kinetics ofdendritic unitary IPSPs, however, were found to be faster incases of strongly coupled cells (see Table 2) than reportedpreviously (Miles, 1990b; Buhl et al. 1994a .
Data in Fig. 7B—D show that fastest feedforward inhibitoryresponses cover 75% of the EPSP rising phase. There isconvincing evidence that onsets of feedforward inhibitoryresponses are even faster than illustrated in Fig. 7. First, asinferred from the analysis of monosynaptic inhibition (seeFig. 3B, Table 1B), onsets of gGABA
Acould be detected before
the corresponding IPSPs. Second, the interneurons used inthe dual recordings shown in Fig. 7 represent a selection ofnon-spontaneously firing cells (with a higher Vrest and thussomewhat longer latencies to synaptic spikes). Third, onsetsof feedforward IPSPs (Fig. 7) were calculated by substituting
Temporal overlap of excitation and inhibitionJ. Physiol. 516.2 501
Figure 13. Properties of monosynaptic IPSPs in a weakly coupled pyramidal cell
IPSPs in the pyramidal cell shown in Figs 11 and 12 (also pair 3 in Table 2) were prominent in response tointerneuron double (B) or triple spikes (C), but not in response to single spikes (A) (see inset). IPSPs inresponse to single spikes were revealed upon averaging of several traces (see Fig. 11Ac). Onsets ofmonosynaptic IPSPs in response to multiple presynaptic interneuron spikes were apparently triggered bythe second spike as indicated in C and D (average latency was 2·4 ± 0·4 ms, n = 22; in comparison, latencyto onset of the averaged IPSP in response to single interneuron APs was 2·3 ms, see Fig. 11Ac). IPSPamplitudes were on average 1·9 ± 0·5 mV (following double spikes in B) and 5·2 ± 0·9 mV (following triplespikes in C).

a 1 ms latency for the onset of the unitary dendritic IPSP.However, latencies to onsets of unitary IPSP could be asshort as 0·2 ms (Fig. 6D). Therefore — by taking variabilityof onsets into account — fast onsets of feedforward IPSPscould precede those shown in Fig. 7 by 0·8 ms. Using 0·2 msinstead of 1 ms as latency to unitary IPSP (shown inFig. 8A, see arrows at 300 and 500 ìA), complete temporaloverlap with the orthodromic pyramidal cell EPSP wasobserved.
The high degree of temporal overlap between feedforwardinhibition and orthodromic excitation (Figs 7 and 8A) is aconsequence of considerably shorter latencies of interneuronAPs (Fig. 12D) (Ashwood et al. 1984). Steeper EPSP slopesof the interneuron at a given intensity (Table 3A) indicatethat the differences in activation kinetics and excitability inthe two cell types were linked. Cellular properties of inter-neurons such as higher input resistance (Table 3A) or differentAMPA receptor subunit expression (McBain & Dingledine,1993; Jonas et al. 1994) could be responsible.
Recurrent inhibition
Results show that recurrent inhibitory responses have noimpact on the rising phase and peak of the orthodromicEPSP in CA1 pyramidal cells: earliest onsets of recurrentIPSPs occur several milliseconds after the EPSP peak(Table 1B; Fig. 11B). Moreover, orthodromic activation ofthe recurrent inhibitory pathway is the exception. First,elicitation of orthodromic APs in pyramidal cells occurs ingeneral only at very high stimulation intensities (Fig. 8). Inaddition, orthodromic activation of recurrent inhibition ismost probably confined to interneurons that are notconnected in a feedforward fashion. In interneurons thatare connected in a feedforward manner, the AHP of thesynaptic AP prevents recurrent unitary APs (Fig. 12Da).The second of synaptic double spikes is more likely to begenerated by feedforward excitation (cf. Fig. 8A at 700 ìA,and Fig. 12Db).
The importance of recurrent inhibition in CA1 may lie — inanalogy to the CA3 region (Miles & Wong, 1986, 1987) — incontaining recurrent excitation (Deuchars & Thomson,1996; Ali et al. 1998). The average latencies of recurrentIPSPs (8·3 ms) in the dual recording (Figs 11—13) weresomewhat longer than described for disynaptic recurrentIPSPs in CA3 (Miles, 1990a) and CA1 (Sik et al. 1995).Possible reasons are as follows. First, interneuron Vrest wassomewhat higher than average due to the interneuronselection criteria of lack of spontaneous firing. Second, thevalue of the onset of the unitary IPSP (about 2 ms) waslonger due to weak inhibitory coupling (see Table 2). Third,recurrent activation kinetics of bistratified cells could havebeen slower in comparison with basket cells (Ali et al. 1998).
A suprising observation in the mutually coupled pair of cellsshown in Figs 11—13 was the occurrence of delayed unitaryAPs riding on plateau EPSPs in interneurons (Fig. 12). Thecombination of the slow and fast unitary interneuron APs(Fig. 12C) — even faster values have been reported (Miles,
1990a; Sik et al. 1995) — generated a wide range of latencies(Figs 11B and 12C). This could be a mechanism in theobserved long-lasting presence of GABAA-mediated synapticinfluences following afferent stimulation (see Fig. 1Aa). Theprolonged presence of inhibition conceivably enhances theefficacy of containing recurrent excitation. However,delayed unitary interneuron APs were obtained in a singlepair of cells and the general occurrence of this phenomenonremains to be established.
Inhibitory conductances
Although IPSPÏIPSCs and gGABAAwere evoked by the same
stimulus (Figs 2—4), they may not represent the same event.It was shown in motoneurons that the inhibitory action wasconsiderably faster than indicated by the IPSP (Araki et al.1960). Our kinetic measurements of gGABA
Asuggest that
GABAA-mediated inhibition may also be considerably fasterthan indicated by the IPSC (Fig. 3D; Table 1). Currentmeasurements were used in previous studies for assessingthe effects of inhibitory shunting (Edwards, 1990; Staley &Mody, 1992). While efficacy of shunting can be measured bythe time integral of the current waveform, which is subjectto much less distortion than the amplitude (Jack et al. 1975;Carnevale & Johnston, 1982), measurements of chargetransfer to soma do not decrease errors of kinetics that areassociated with current measurements. In contrast toIPSPÏIPSCs that are derived from spatially diverse sourcescontaining axial and membrane components, inhibitoryconductance changes occur in the immediate vicinity of thesynapse (Araki et al. 1960; Andersen et al. 1980; Koch et al.
1983).
Based on the temporal interaction of EPSCs and IPSCs, itcould have been concluded that synaptic inhibition mayprimarily affect later parts of the orthodromic EPSPÏEPSCsuch as the delayed NMDA component (Staley & Mody,1992). Based on the kinetics of gGABA
A(Table 1; Fig. 4),
however, it can be concluded — at least in CA1 — that theorthodromic EPSPÏEPSC rising phase is tightly controlledby GABAA-mediated inhibition.
How will activity-dependent modification of
inhibition change the orthodromic EPSPÏEPSC?
A consequence of the shown complete temporal overlap ofafferent excitation and inhibition in CA1 pyramidal cells(Figs 4 and 8) is that any modification of GABAA-mediatedinhibition will affect the slope and peak of the EPSP. InCA1, the net effect of LTP-inducing tetanization onsynaptic inhibition is an EPSP potentiation due to long-term disinhibition caused by impairment of GABAA receptorfunction. The evidence is as follows. First, barring effects onGABA release mechanisms, the main action of tetanizationon monosynaptic inhibition is impairment of GABAA
receptor function (Stelzer et al. 1994). More importantly, along-term reduction of monosynaptic inhibitory responsesby tetanization was demonstrated (Stelzer et al. 1994).Second, impairment of GABAA receptor function is also themain modification of the efficacy of feedforward inhibitory
S. Karnup and A. Stelzer J. Physiol. 516.2502

responses. At the stimulation intensities that are typicallyused for controls in LTP studies (e.g. 50% of pyramidal cellEPSP amplitudes, arguably higher in field potential studies),feedforward inhibitory responses are close to their upperlimit (see Fig. 8A and B). The maximal expression offeedforward inhibition during control occludes a potentialtetanization-induced increase of interneuron excitability.An enhancement of recurrent inhibition caused by pyramidalcell LTP has no impact on the pyramidal cell EPSP risingphase or peak due to lack of temporal overlap (Fig. 11B). Insummary, the presented data of temporal interaction ofafferent excitation and inhibition in CA1 pyramidal cellssupport the previous postulate of disinhibition as LTPmechanism (Stelzer et al. 1994; Wang & Stelzer, 1996).
Alger, B. E. & Nicoll, R. A. (1982). Feedforward dendriticinhibition in rat hippocampal pyramidal cells studied in vitro.
Journal of Physiology 328, 105—123.
Ali, A. B., Deuchars, J., Pawelzik, H. & Thomson, A. M. (1998).CA1 pyramidal to basket and bistratified cell EPSPs: dual intra-cellular recordings in rat hippocampal slices. Journal of Physiology
597, 201—217.
Andersen, P., Dingledine, R., Gjerstad, L., Langmoen, I. A. &Mosfeldt Laursen, A. (1980). Two different responses ofhippocampal pyramidal cells to application of ã-aminobutyric acid.Journal of Physiology 305, 279—296.
Andersen, P., Eccles, J. C. & Loyning, Y. (1963). Recurrentinhibition in the hippocampus with identification of the inhibitorycell and its synapses. Nature 198, 540—542.
Andersen, P., Eccles, J. C. & Loyning, Y. (1964). Pathway ofpostsynaptic inhibition in the hippocampus. Journal of
Neurophysiology 27, 608—619.
Araki, T., Eccles, J. C. & Ito, M. (1960). Correlation of theinhibitory postsynaptic potential of motoneurones with the latencyand time course of inhibition of monosynaptic reflexes. Journal of
Physiology 154, 354—377.
Ashwood, T. J., Lancaster, B. & Wheal, H. V. (1984). In vivo andin vitro studies on putative interneurons in the rat hippocampus:possible mediators of feedforward inhibition. Brain Research 293,279—291.
Blanton, M. G., Lo Turco, J. L. & Kriegstein, A. R. (1989).Whole-cell recording from neurons in slices of reptilian andmammalian cortex. Journal of Neuroscience Methods 30, 203—210.
Blasco-Ibanez, J. M. & Freund, T. F. (1995). Synaptic input ofhorizontal interneurons in stratum oriens of the hippocampal CA1subfield: structural basis of feedback activation. European Journal
of Neuroscience 7, 2170—2180.
Buhl, E. H., Halasy, K. & Somogyi, P. (1994a). Diverse sources ofhippocampal unitary inhibitory postsynaptic potentials and thenumber of synaptic release sites. Nature 368, 823—828.
Buhl, E. H., Han, Z. S., Lorinczi, Z., Stezhik, A. S.,
Karnup, S. V. & Somogyi, P. (1994b). Physiological properties ofanatomically identified axo-axonic cells in the rat hippocampus.Journal of Neurophysiology 71, 1289—1307.
Buzsaki, G. & Eidelberg, E. (1982). Direct afferent excitation andlong-term potentiation of hippocampal. Journal of Neurophysiology
48, 597—607.
Carnevale, N. T. & Johnston, D. (1982). Electrophysiologicalcharacterization of remote chemical synapses. Journal of
Neurophysiology 47, 606—621.
Davies, C. H., Davies, S. N. & Collingridge, G. L. (1990). Paired-pulsed depression of monosynaptic GABA-mediated inhibitorypostsynaptic responses in rat hippocampus. Journal of Physiology
424, 513—531.
Deuchars, J. & Thomson, A. M. (1996). CA1 pyramid—pyramidconnections in rat hippocampus in vitro: dual intracellularrecordings with biocytin filling. Neuroscience 74, 1009—1018.
Edwards, D. H. (1990). Mechanisms of depolarizing inhibition at thecrayfish giant motor synapse. I. Electrophysiology. Journal of
Neurophysiology 64, 532—540.
Jack, J. J. B., Noble, D. & Tsien, R. W. (1975). Electric Current Flowin Excitable Cells. Oxford University Press, London.
Jonas, P., Racca, C., Sakmann, B., Seeburg, P. H. & Monyer, H.(1994). Differences in Ca¥ permeability of AMPA-type glutamatereceptor channels in neocortical neurons caused by differentialGluR-B subunit expression. Neuron 12, 1281—1289.
Kandel, E. R., Spencer, W. A. & Brinley, F. J. (1961). Electro-physiology of hippocampal neurons. I. Sequential invasion andsynaptic organization. Journal of Neurophysiology 24, 225—242.
Knowles, W. D. & Schwartzkroin, P. A. (1981). Axonalramifications of hippocampal CA1 pyramidal cells. Journal of
Neuroscience 1, 1236—1241.
Koch, C. (1985). Understanding the intrinsic circuitry of the cat’slateral geniculate nucleus: electrical properties of the spine-triadarrangement. Proceedings of the Royal Society of London B 225,365—390.
Koch, C., Poggio, T. & Torre, V. (1983). Non-linear interactions in adendritic tree: localization, timing, and role in informationprocessing. Proceedings of the National Academy of Sciences of the
USA 80, 2799—2802.
Lacaille, J.-C. (1991). Postsynaptic potentials mediated byexcitatory and inhibitory amino acids in interneurons of stratumpyramidale of the CA1 region of rat hippocampal slices in vitro.
Journal of Neurophysiology 66, 1441—1454.
Lacaille, J.-C. & Schwartzkroin, P. A. (1988). Stratum lacunosum-moleculare interneurons of hippocampal CA1 region.II. Intrasomatic and intradendritic recordings of local circuitsynaptic interactions. Journal of Neuroscience 8, 1411—1424.
Ling, D. S. F. & Benardo, L. S. (1998). Synchronous firing ofinhibitory interneurons results in saturation of fast GABAA IPSCmagnitude but not saturation of fast inhibitory efficacy in ratneocortical pyramidal cells. Synapse 28, 91—102.
McBain, C. J. & Dingledine, R. (1993). Heterogeneity of synapticglutamate receptors on CA3 stratum radiatum interneurons of rathippocampus. Journal of Physiology 462, 373—392.
Maccaferri, G. & McBain, C. J. (1995). Passive propagation of LTDto stratum oriens-alveus inhibitory neurons modulates thetemporoammonic input to the hippocampal CA1 region. Neuron 15,135—145.
Marty, A. & Neher, E. (1995). Tight-seal whole-cell recording.In Single-Channel Recording, ed. Sakmann, B. & Neher, E.,pp. 31—52. Plenum Press, New York and London.
Miles, R. (1990a). Synaptic excitation of inhibitory cells by singleCA3 hippocampal pyramidal cells of the guinea-pig in vitro. Journal
of Physiology 428, 61—77.
Miles, R. (1990b). Variation in strength of inhibitory synapses in theCA3 region of guinea-pig hippocampus in vitro. Journal of
Physiology 431, 659—676.
Temporal overlap of excitation and inhibitionJ. Physiol. 516.2 503

Miles, R., Toth, G., Gulyas, A. I., Hajos, N. & Freund, T. (1996).Differences between somatic and dendritic inhibition in thehippocampus. Neuron 16, 815—823.
Miles, R. & Wong, R. K. S. (1986). Excitatory synaptic interactionsbetween CA3 neurones in the guinea-pig hippocampus. Journal of
Physiology 373, 397—418.
Miles, R. & Wong, R. K. S. (1987). Inhibitory control of localexcitatory synaptic circuits in the guinea-pig hippocampus. Journalof Physiology 388, 611—629.
Pananceau, M., Chen, H. X. & Gustafsson, B. (1997). Long-termpotentiation by single volley activation: a mechanism forbicuculline-induced enhancement of synaptic field potentials in theCA1 hippocampal region. Neuroscience 79, 95—101.
Pearce, R. A. (1993). Physiological evidence for two distinct GABAA
responses in rat hippocampus. Neuron 10, 189—200.
Quardouz, M. & Lacaille, J.-C. (1995). Mechanisms of selective long-term potentiation of EPSCs in interneurons of stratum oriens in rathippocampal slices. Journal of Neurophysiology 73, 810—819.
Sayer, R. J., Redman, S. J. & Andersen, P. (1989). Amplitudefluctuations in small EPSPs recorded from CA1 pyramidal cells inthe guinea-pig hippocampal slice. Journal of Neuroscience 9,840—840.
Scharfman, H. E. (1991). Dentate hilar cells with dendrites in themolecular layer have lower thresholds for synaptic activation byperforant path than granule cells. Journal of Neuroscience 11,1660—1673.
Schwartzkroin, P. A. (1975). Characteristics of CA1 neuronsrecorded intracellularly in the hippocampal in vitro slicepreparation. Brain Research 85, 423—436.
Schwartzkroin, P. A. & Mathers, L. (1978). Physiological andmorphological identification of a non-pyramidal hippocampal celltype. Brain Research 157, 1—10.
Sik, A., Penttonen, M., Ylinen, A. & Buzsaki, G. (1995).Hippocampal CA1 interneurons: an in vivo intracellular labelingstudy. Journal of Neuroscience 15, 6651—6665.
Somogyi, P. & Takagi, H. (1982). A note on the use of picric acid-paraformaldehyde fixative for correlated light and electronmicroscopic immunocytochemistry. Neuroscience 7, 1779—1783.
Staley, K. J. & Mody, I. (1992). Shunting of excitatory input todentate gyrus granule cells by a depolarizing GABAA receptor-mediated postsynaptic conductance. Journal of Neurophysiology
68, 197—212.
Stelzer, A., Simon, G., Kovacs, G. & Rai, R. (1994). Synapticdisinhibition during maintenance of long-term potentiation in theCA1 hippocampal subfield. Proceedings of the National Academy of
Sciences of the USA 91, 3058—3062.
Taube, J. S. & Schwartzkroin, P. A. (1987). Intracellular recordingfrom hippocampal interneurons before and after development oflong-term potentiation. Brain Research 419, 32—38.
Turner, D. A. (1988). Waveform and amplitude characteristics ofevoked responses to dendritic stimulation of CA1 guinea-pigpyramidal cells. Journal of Physiology 395, 419—439.
Wang, J.-H. & Stelzer, A. (1996). Shared calcium signalingpathways in the induction of long-term potentiation and synapticdisinhibition in CA1 pyramidal cells. Journal of Neurophysiology
75, 1687—1702.
Wigstr�om, H. & Gustafsson, B. (1983). Facilitated induction ofhippocampal long-lasting potentiation during blockade of inhibition.Nature 301, 603—604.
Wong, R. K. S., Prince, D. A. & Basbaum, A. I. (1979). Intradendriticrecordings from hippocampal neurons. Proceedings of the National
Academy of Sciences of the USA 76, 986—990.
Yamamoto, C. (1972). Intracellular study of seizure-likeafterdischarges elicited in thin hippocampal sections in vitro.
Experimental Neurology 35, 154—164.
Acknowledgements
These studies were supported by the NIH (NS30144_01). We thankDr R. Bianchi and Dr D. Ling for critically reading the manuscript.
Corresponding author
A. Stelzer: Department of Physiology and Pharmacology, Box 29,State University of New York, 450 Clarkson Avenue, Brooklyn,NY 11203, USA.
Email: [email protected]
Author’s permanent address
S. Karnup: Institute of Theoretical and Experimental Biophysics,142292 Puschino, Russia.
S. Karnup and A. Stelzer J. Physiol. 516.2504