spike phase locking in ca1 pyramidal neurons depends on background conductance and firing rate
TRANSCRIPT

Spike Phase Locking in CA1 Pyramidal Neurons depends onBackground Conductance and Firing Rate
Tilman Broiche1,*, Paola Malerba1,*, Alan D. Dorval1, Alla Borisyuk2, Fernando R.Fernandez1, and John A. White1
1Brain Institute, University of Utah, Dept. of Bioengineering2University of Utah, Dept. of Mathematics
AbstractOscillatory activity in neuronal networks correlates with different behavioral states throughout thenervous system, and the frequency-response characteristics of individual neurons are believed tobe critical for network oscillations. Recent in vivo studies suggest that neurons experience periodsof high membrane conductance, and that action potentials are often driven by membrane-potentialfluctuations in the living animal. To investigate the frequency-response characteristics of CA1pyramidal neurons in the presence of high conductance and voltage fluctuations, we performeddynamic-clamp experiments in rat hippocampal brain slices. We drove neurons with noisy stimulithat included a sinusoidal component ranging, in different trials, from 0.1 to 500 Hz. In subsequentdata analysis, we determined action potential phase-locking profiles with respect to backgroundconductance, average firing rate, and frequency of the sinusoidal component. We found thatbackground conductance and firing rate qualitatively change the phase-locking profiles of CA1pyramidal neurons vs. frequency. In particular, higher average spiking rates promoted band-passprofiles, and the high-conductance state promoted phase-locking at frequencies well above whatwould be predicted from changes in the membrane time constant. Mechanistically, spike-rateadaptation and frequency resonance in the spike-generating mechanism are implicated in shapingthe different phase-locking profiles. Our results demonstrate that CA1 pyramidal cells can activelychange their synchronization properties in response to global changes in activity associated withdifferent behavioral states.
IntroductionRhythmic activity in a wide range of frequencies has been observed in the central nervoussystem during different behavioral states (Engel et al., 2001; Buzsáki and Draguhn, 2004;Steriade, 2006). In rodents, hippocampal theta oscillations coincide with periods of activeexploration and REM sleep, and are involved in spatial information processing and memoryformation (Buzsáki, 2002; Andersen et al., 2007). CA1 pyramidal neurons, which project thehippocampal output to the enthorhinal cortex (Andersen et al., 2007), have a preferentialtheta phase of firing in vivo (Klausberger et al., 2003; Harvey et al., 2009). However, thenetwork and cellular mechanisms involved in the generation and maintenance ofhippocampal theta oscillations are still unclear. In particular, knowing how the firing rate ofpyramidal neurons encodes time-varying stimuli requires understanding of the biophysicalmechanisms governing their spiking activity.
Corresponding author: Tilman Broicher, address: Brain Institute, 36 South Wasatch Drive, SLC, UT 84112,[email protected].*shared first authorship
Conflict of Interest: The Authors declare no conflict of interests.
NIH Public AccessAuthor ManuscriptJ Neurosci. Author manuscript; available in PMC 2013 April 10.
Published in final edited form as:J Neurosci. 2012 October 10; 32(41): 14374–14388. doi:10.1523/JNEUROSCI.0842-12.2012.
$waterm
ark-text$w
atermark-text
$waterm
ark-text
In vitro experiments have shown that CA1 pyramidal cells have an intrinsic preference fortheta frequency input (Leung and Yu, 1998; Pike et al., 2000; Hu et al., 2002; Narayananand Johnston, 2007; Zemankovics et al., 2010). However, these works mostly focus on theentrainment of subthreshold membrane potentials, whose relation to spike phase locking isundetermined. Moreover, recent work shows that the in vitro scenario differs considerablyfrom the in vivo one: during active states neurons are bombarded with synaptic inputs(Penttonen et al., 1998; Henze and Buzsáki, 2001; Destexhe et al., 2003; Harvey et al., 2009;Epsztein et al., 2011); this bombardment leads to increased membrane conductance andhighly irregular membrane potential fluctuations, which drive spiking. In CA1 pyramidalneurons, these effects alter basic electrophysiological properties, and introduce changes inthe input-output function (Prescott et al., 2006, 2008; Fernandez and White, 2010;Fernandez et al., 2011).
Dynamic-clamp technology allows the introduction of membrane voltage fluctuations andconductance to cells in vitro. Using this technique, we can create an in vivo-like state, andinvestigate the action potential phase-locking profile of CA1 pyramidal neurons in responseto a wide range of input frequencies. We performed recordings under low and highbackground conductance, at different firing rates, to account for in vivo data showing task-related variations in mean rates of CA1 pyramidal cells (Harvey et al., 2009; Epsztein et al.,2011). We here show that in CA1 pyramidal neurons spike-frequency adaptation acts as ahigh pass filter, which interacts with the cutoff frequency and an intrinsic frequencypreference of the spike-generating mechanism, to set their phase-locking profile. Thesensitivity of these properties to background conductance and firing rate accounts for thedifferent locking profiles: this implies that pyramidal neurons are dynamic entities, changedby the state of their input.
Materials and MethodsTissue preparation
All experimental protocols were approved by the University of Utah Institutional AnimalCare and Use Committee. Horizontal sections of hippocampus and entorhinal cortex wereprepared from 21 to 36 day-old Long-Evans rats of either sex. All chemicals were obtainedfrom Sigma (St. Louis, MO) unless otherwise noted. After anesthetization with isofluraneand decapitation, brains were removed and immersed in 0 °C solution consisting of thefollowing (in mM): Sucrose (215), NaHCO3 (25), D-glucose (20), KCl (2.5), CaCl2 (0.5),NaH2PO4 (1.25), MgCl2 (3), buffered to pH 7.4 with 95/5% O2/CO2. Horizontal slices werecut to a thickness of 400 μm (Leica VT 1200, Leica Microsystems GMBH, Wetzlar,Germany). After the cutting procedure, slices were incubated in artificial cerebrospinal fluid(ACSF) at 30 °C for 20 minutes before being cooled to room temperature (20 °C). Sliceswere allowed to recover for at least 60 min before recordings commenced. The ACSFconsisted of the following (in mM): NaCl(125), NaHCO3 (25), D-glucose (25), KCl (2),CaCl2 (2), NaH2PO4 (1.25), MgCl2 (1), and was buffered to pH 7.4 with 95/5% O2/CO2.After the incubation period, slices were moved to the stage of an infrared differentialinterference contrast-equipped microscope (Axioscope 2+; Zeiss, Oberkochen, Germany).ACSF contained 10 μM CNQX and 50 μM picrotoxin to block ionotropic synaptic activity.All recordings were conducted between 32 and 34 °C.
ElectrophysiologyElectrodes were drawn on a horizontal puller (P97; Sutter Instruments, Novato, CA) andfilled with an intracellular solution consisting of the following (in mM): K-gluconate (120),KCl (20), HEPES (10), diTrisPhCr (7), Na2ATP (4), MgCl2 (2), Tris-GTP (0.3), EGTA(0.2) and buffered to pH 7.3 with KOH. Final electrode resistances were between 1.5 and 3
Broiche et al. Page 2
J Neurosci. Author manuscript; available in PMC 2013 April 10.
$waterm
ark-text$w
atermark-text
$waterm
ark-text
MΩ, with access resistance values between 5 and 15 MΩ. Electrophysiological recordingswere performed with a Multiclamp 700B amplifier (Molecular Devices, Union City, CA),and data were acquired using pClamp 10 (v. 10, Molecular Devices, Union City, CA) or theReal-Time Experimental Interface software (RTXI - www.rtxi.org; Bettencourt et al. (2008);Lin et al. (2010)). In some experiments, tetrodotoxin (TTX, 5nM) was bath-applied andrecordings were taken after a 10–15 minute incubation period. For dynamic clampexperiments, the patch-clamp amplifier was driven by an analog signal from a personalcomputer running RTXI. Membrane-potential fluctuations (i.e. background noise) wereintroduced by two independent Poisson processes, triggering unitary artificial synapticevents. Frequency modulation was introduced by injection of a separate current-basedcosine, or through manipulation of the rate of one of the two Poisson processes. One Poissonprocess triggered excitatory synaptic events at a rate of 600 Hz, the other process triggeredinhibitory events at a rate of 1000 Hz. These rates were used to obtain membrane-potentialfluctuations consistent with in vivo results (Harvey et al., 2009; Epsztein et al., 2011).Individual synaptic waveforms were generated using a bi-exponential function. For bothexcitation and inhibition the rise time constant was 0.5 ms. For excitation, the decay timeconstant was 2 ms, while it was 8 ms for inhibition. All synaptic events were modeled ascurrents. For both low-and high-conductance trials, the magnitude of the input-currentfluctuations was adjusted to yield subthreshold membrane-potential fluctuations with astandard deviation of 2 mV; for these measurements neurons were held at mean membranepotentials close to −75 mV. This corresponded to high-conductance recordings havingindividual synaptic events of roughly twice the size as low-conductance recordings. In caseswhere conductance was added, a linear leak conductance was introduced via dynamic clampusing the equation IL = gL(v − EL), where v is the membrane voltage. For all experiments,EL was set to −75 mV and gL was set to 15 nS. Modulation amplitudes were tuned at 1 Hzmodulation frequency at average rate of 2 spike/s in preceding experiments, and chosen toyield spike phase-locking strengths of a given value (vector strength around 0.3, seeAnalysis and Statistics). Values used for the average firing rate and the magnitude ofmembrane-potential fluctuations were chosen in accordance to in vivo recordings(Klausberger et al., 2003; Harvey et al., 2009; Epsztein et al., 2011). A measured junctionpotential of about 10 mV was subtracted from all recordings, and taken into account duringdynamic-clamp experiments. The sample rate of the dynamic clamp was set to 20 kHz. Datawere collected at 20 kHz and low-pass filtered at 3 kHz. When spike phase-locking wasrecorded, firing rates were monitored on-line and DC injection was used to control the rates.We recorded four one-minute trials for low modulation frequencies (0.1 and 0.5 Hz) at anaverage firing rate of 2 spikes/s, and three one-minute trials for all other frequencies. Forcases with an average firing rate of 8 spikes/s, we recorded three one-minute trials for 0.1and 0.5 Hz modulations and two one-minute trials for all other frequencies. Fast-Fouriertransforms of the membrane voltage and of the binary action-potential trains revealed clearpeaks at the modulation frequencies, confirming the effectiveness of our stimulus paradigm(data not shown). Spike trains were irregular and displayed CV values between 0.8 and 1 for2 spikes/s average rate and between 0.5 and 0.7 at 8 spikes/s mean rate.
In the case of frequency modulation through current-based cosines, we used cosineamplitudes of 15 pA in the high conductance and 7.5 pA in the low conductance condition,except for the experiment shown in Figure 6, where an amplitude of 5 pA was used. Themodulation frequencies considered in the different experiments are always reported in therespective figure legends. When 5 nM of TTX were applied, the high g condition wasrecorded at 1.5 spikes/s. This was due to the inability of some neurons to spike at 2 spikes/sin the presence of 5 nM TTX under high g.
For introduction of an artificial adaptation current we used a spike triggered bi-exponentialcurrent with a rise time constant of 1 ms and a decay time constant of 500 ms. The
Broiche et al. Page 3
J Neurosci. Author manuscript; available in PMC 2013 April 10.
$waterm
ark-text$w
atermark-text
$waterm
ark-text
adaptation currents peak amplitude was set to 50 pA. The adaptation current was injectedafter every spike and summed with previously triggered injections. Introduction of theadaptation current required an increased DC injection to keep the average spike rate similarin control and adapting conditions.
When f-I relationships were measured, we used current steps whose amplitude coveredtwice the range of the modulatory cosines for high and low conductance (±15 pA for low g:range of 30 pA; ±30 pA for high g: range of 60 pA).
Analysis and StatisticsAll analysis was carried out in MATLAB, (v. 2010b, The MathWorks, Natick, MA) usingcustom software and/or built-in functions and/or Origin (v7.5, OriginLab, Northampton,MA). Spike times were determined by finding the maxima of suprathreshold (> 10 mV)intervals of membrane voltage. Phase locking to a given modulation frequency wasdetermined by computing the vector strength, using the phases of individual spikes. Eachspike tk was treated as a unit vector with an angle φk corresponding to the phase of themodulation frequency. The vector strength |v⃗| is defined as the length of the normalizedvector sum:
(1)
for a total of N spikes. The current protocol for input impedance measurements consisted ofa white-noise-current input with a frequency cutoff of 100 Hz. Impedance (Z(f)) measureswere calculated by taking the ratio of the Fourier transform of the membrane-voltageresponse and current-input stimulus. We evaluated the operating voltage as the meanmembrane voltage from 500 to 475 ms preceding each spike. Statistical significance wasdetermined using either a one-way ANOVA, or paired or unpaired t-tests. For repeatedmeasures, statistical difference was determined using Tukey’s honestly-significant criteria,which increases the threshold for significance. Means are presented with the standard errorof the mean.
Relating Gain to Vector StrengthBy definition, the vector strength |v⃗| is the modulus of the normalized vector sum of all theunit complex vectors with angles equal to the phase of each spike. The number of spikes perphase is given by the instantaneous firing rate f(φ), so that
(2)
When experimentally measured, f(φ) was found via spike-phase histograms, which appearedsinusoidal (Figure 1Aiii, B iii). If f(φ) was indeed sinusoidal, then it could be expressed asf(φ) = ⟨f⟩ + A cos(φ + φ0), where ⟨f⟩ indicates the mean firing rate, and φ0 is a phase shiftinduced by the integration time of the cell. We then embedded such expression for f(φ) inequation (2); note that because the vector strength is invariant under rotation, it wassufficient to consider the case φ0 = 0. From standard integration we have
(3)
Broiche et al. Page 4
J Neurosci. Author manuscript; available in PMC 2013 April 10.
$waterm
ark-text$w
atermark-text
$waterm
ark-text
The vector strength is computed as the length of v⃗, in our case v⃗ is real, so the vectorstrength equals v⃗. We could then estimate the amplitude A of the histograms of firing phasesas a function of the vector strength and mean firing rate, for each frequency modulation.When using those amplitudes to fit the f(φ) profiles, we had a good agreement for allfrequency modulations below 100 Hz (Pearson’s correlation coefficient > 0.94). Thus, theinstantaneous firing-rate histograms were well approximated by cosines.
We then proceeded by incorporating the potential role of gain in the vector strength. Themain assumption in this case was that, for slow frequency modulations, the amplitude of theinstantaneous firing rate would be linear in the amplitude of the input current, scaled bygain. This assumption formalizes as f(φ) = ⟨f⟩ + mIA cos(φ + φ0), where m is the gain valueand IA is the amplitude of the input current. Thus, equation (3) re-writes as
(4)
Once we derived equation (4), we compared the estimated vector strength to the vectorstrength measured in the experiments.
Principal-Component Analysis and frequency-preference indexIn defining the principal components, we follow Jolliffe (1986). Given a finite number ofsample observations of a random vector, looking for its principal components corresponds toidentifying, in progressive ranking, the best fitting subspaces such that the distances betweenthe samples and each subspace is minimized. Practically, this means decomposing the spaceaccording to the eigen-values and the eigen-directions of the covariance matrix of the givencollection, and choosing only subspaces corresponding to higher spectral values. For eachcell in a given condition (high or low conductance, 2 or 8 spikes/s firing rate, addition ofTTX to the preparation) we use principal-component analysis (PCA) to identify a first-orderlinear kernel the cell might be using to filter the input it receives. We therefore performedexperiments in which each pyramidal cell received the noise current but no cosinemodulation, and its firing rate was controlled by DC. The exact noise realizations that thecell received in the experiment could then be used to extract its first-order kernel.
The input noise received by the cells during experiments had an autocorrelation time scaleof about 201 ms, which affected the shape of the kernel we were looking for. To remove theinfluence of the noise autocorrelation from this estimate of the linear filter, we de-convolvedeach noise realization by its autocorrelation. Our sample collection consisted of all thespike-triggering events (parts of the de-convolved input given to the cell in the experiments,each 200 ms long, ending at each spike time) and an equal number of randomly-sampledparts of the de-convolved input (each sample 200 ms long as well). We constructed thecovariance matrix of the sample, and diagonalized the matrix, selecting the eigen-vector ofthe highest eigen-value as the first principal component (PC1). We chose to use only onecomponent once we verified that there was some distance between the maximum of thespectrum and the following values.
The first component PC1 (Figure 7Cii) was then considered the first-order kernel of a linearsystem. We tested whether such a system, when receiving inputs like the ones given to thepyramidal cells in our experiments, showed preferential frequency locking. Specifically, weconsidered as its input minutes of de-convolved noise traces plus cosine currents (withfrequencies of 0.1, 0.5, 1, 2, 4, 8, 10, 20, 50, 100, and 500 Hz). Note that the amplitudes ofthe cosine currents used for the convolutions were scaled by the ratio of the standarddeviations of the noise and its de-convolved version, this was done to preserve the relative
Broiche et al. Page 5
J Neurosci. Author manuscript; available in PMC 2013 April 10.
$waterm
ark-text$w
atermark-text
$waterm
ark-text
size of the cosine currents and the standard deviation of the noise. We then convolved suchinputs with the filter (the PC1), to estimate instantaneous activity, consistent with thestandard approach which uses the spike-triggered average to predict the instantaneous firingrate of a cell given its input (Dayan and Abbott, 2001). The cycle-averaged activity profileswere cosine shaped (Figure 7Ciii), and we rescaled the amplitude in each experimentalcondition by its maximum across all modulation frequencies and cells in that condition, sothat the activity would have a maximum of 1 spike/s. Modulation frequency significantlyaffected the activity amplitudes, in both the high- and low-conductance conditions (low g, p< 0.001, n = 10; high g, p < 0.001, n = 10; both one-way ANOVA). We consider the sum ofthe normalized activities and mean firing-rate values as instantaneous firing-ratedistributions. We computed the frequency-preference index as each amplitude divided bytwice the mean firing rate, in agreement with equation (3). The resulting frequency-preference index is higher for normalized activities with higher amplitudes, and lower forthose closer to a uniform distribution (i.e. a flat line). Overall the frequency-preference-index profiles for cells spiking at 8 spikes/s mean firing rates are lower than for cells spikingat 2 spikes/s. Plots of the mean and standard error of the frequency-preference indices forcells in all experimental conditions are reported in Figures 7 and 8.
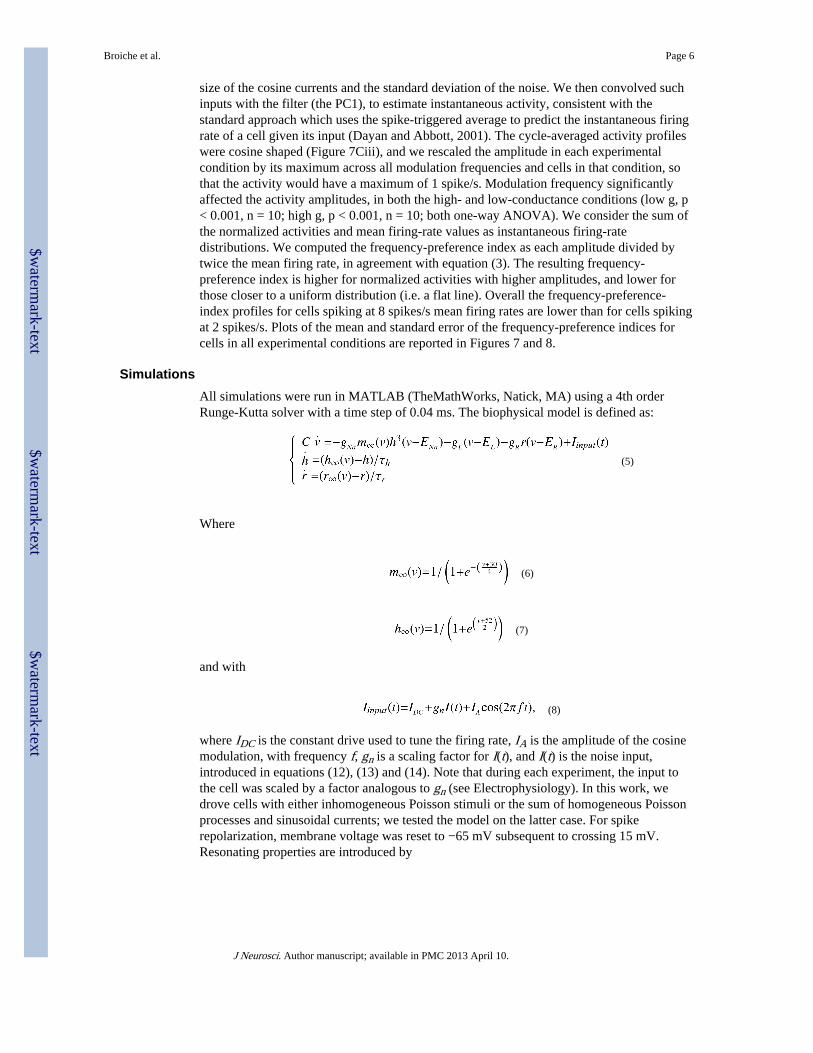
SimulationsAll simulations were run in MATLAB (TheMathWorks, Natick, MA) using a 4th orderRunge-Kutta solver with a time step of 0.04 ms. The biophysical model is defined as:
(5)
Where
(6)
(7)
and with
(8)
where IDC is the constant drive used to tune the firing rate, IA is the amplitude of the cosinemodulation, with frequency f, gn is a scaling factor for I(t), and I(t) is the noise input,introduced in equations (12), (13) and (14). Note that during each experiment, the input tothe cell was scaled by a factor analogous to gn (see Electrophysiology). In this work, wedrove cells with either inhomogeneous Poisson stimuli or the sum of homogeneous Poissonprocesses and sinusoidal currents; we tested the model on the latter case. For spikerepolarization, membrane voltage was reset to −65 mV subsequent to crossing 15 mV.Resonating properties are introduced by
Broiche et al. Page 6
J Neurosci. Author manuscript; available in PMC 2013 April 10.
$waterm
ark-text$w
atermark-text
$waterm
ark-text
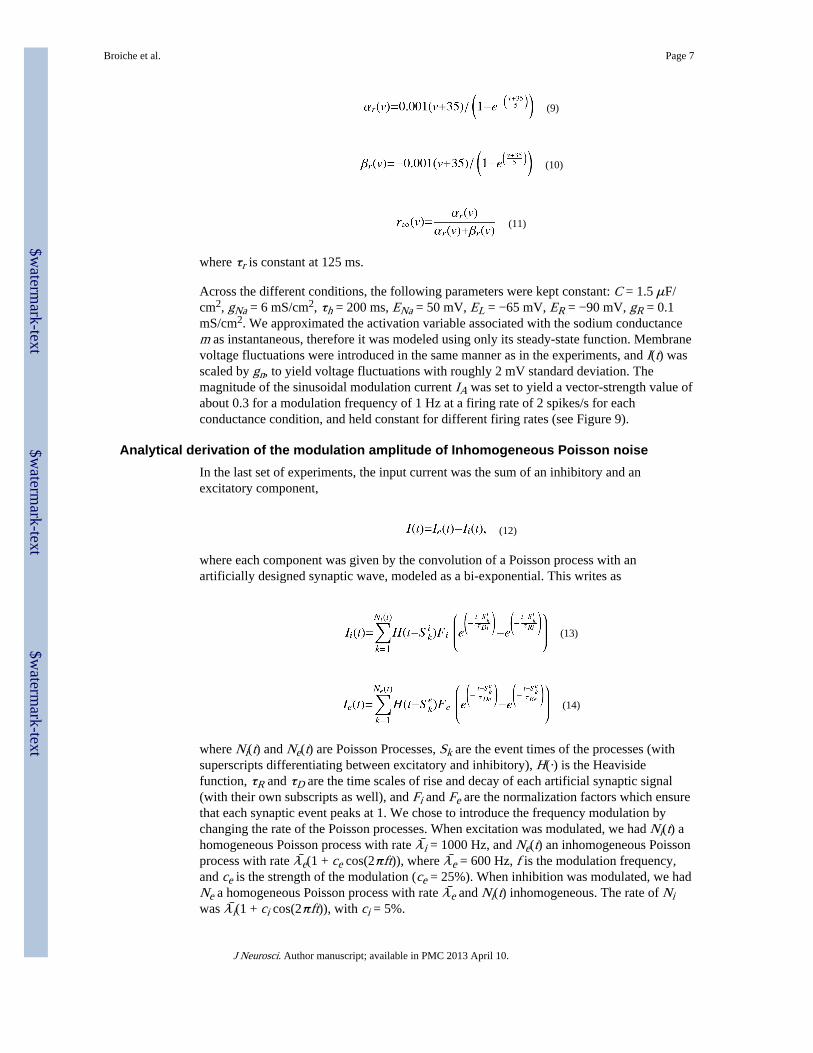
(9)
(10)
(11)
where τr is constant at 125 ms.
Across the different conditions, the following parameters were kept constant: C = 1.5 μF/cm2, gNa = 6 mS/cm2, τh = 200 ms, ENa = 50 mV, EL = −65 mV, ER = −90 mV, gR = 0.1mS/cm2. We approximated the activation variable associated with the sodium conductancem as instantaneous, therefore it was modeled using only its steady-state function. Membranevoltage fluctuations were introduced in the same manner as in the experiments, and I(t) wasscaled by gn, to yield voltage fluctuations with roughly 2 mV standard deviation. Themagnitude of the sinusoidal modulation current IA was set to yield a vector-strength value ofabout 0.3 for a modulation frequency of 1 Hz at a firing rate of 2 spikes/s for eachconductance condition, and held constant for different firing rates (see Figure 9).
Analytical derivation of the modulation amplitude of Inhomogeneous Poisson noiseIn the last set of experiments, the input current was the sum of an inhibitory and anexcitatory component,
(12)
where each component was given by the convolution of a Poisson process with anartificially designed synaptic wave, modeled as a bi-exponential. This writes as
(13)
(14)
where Ni(t) and Ne(t) are Poisson Processes, Sk are the event times of the processes (withsuperscripts differentiating between excitatory and inhibitory), H(·) is the Heavisidefunction, τR and τD are the time scales of rise and decay of each artificial synaptic signal(with their own subscripts as well), and Fi and Fe are the normalization factors which ensurethat each synaptic event peaks at 1. We chose to introduce the frequency modulation bychanging the rate of the Poisson processes. When excitation was modulated, we had Ni(t) ahomogeneous Poisson process with rate λ̄i = 1000 Hz, and Ne(t) an inhomogeneous Poissonprocess with rate λ̄e(1 + ce cos(2πft)), where λ̄e = 600 Hz, f is the modulation frequency,and ce is the strength of the modulation (ce = 25%). When inhibition was modulated, we hadNe a homogeneous Poisson process with rate λ̄e and Ni(t) inhomogeneous. The rate of Niwas λ̄i(1 + ci cos(2πft)), with ci = 5%.
Broiche et al. Page 7
J Neurosci. Author manuscript; available in PMC 2013 April 10.
$waterm
ark-text$w
atermark-text
$waterm
ark-text
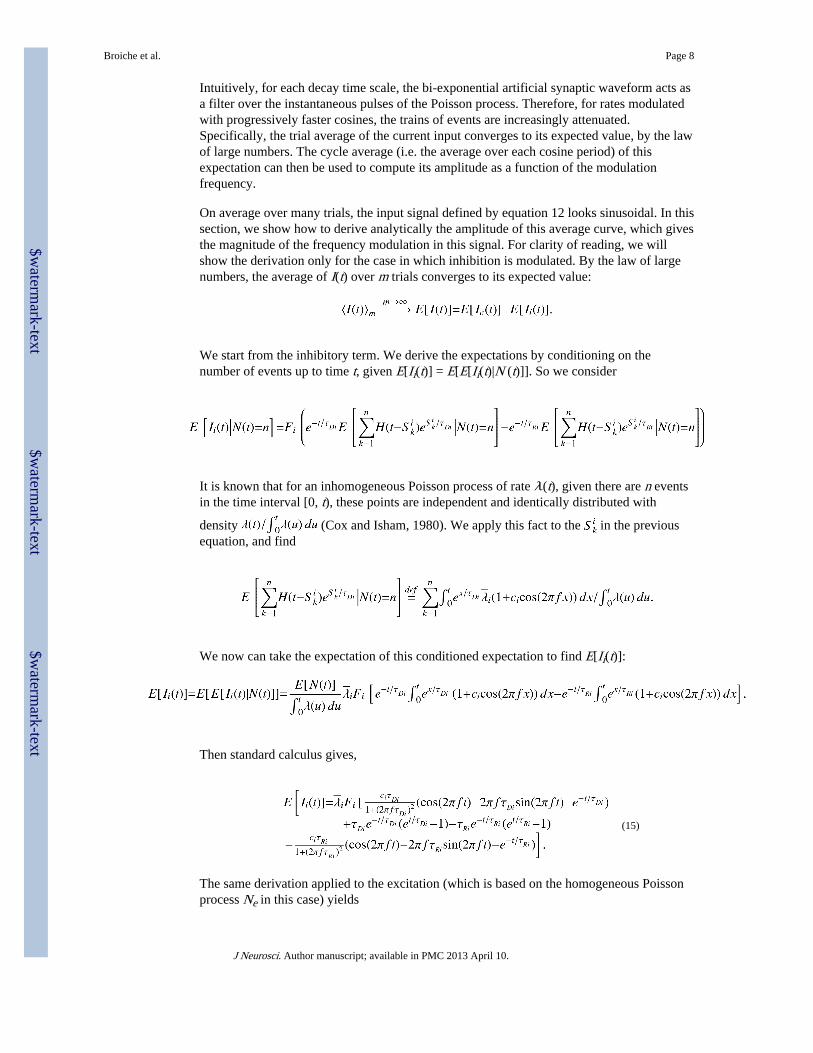
Intuitively, for each decay time scale, the bi-exponential artificial synaptic waveform acts asa filter over the instantaneous pulses of the Poisson process. Therefore, for rates modulatedwith progressively faster cosines, the trains of events are increasingly attenuated.Specifically, the trial average of the current input converges to its expected value, by the lawof large numbers. The cycle average (i.e. the average over each cosine period) of thisexpectation can then be used to compute its amplitude as a function of the modulationfrequency.
On average over many trials, the input signal defined by equation 12 looks sinusoidal. In thissection, we show how to derive analytically the amplitude of this average curve, which givesthe magnitude of the frequency modulation in this signal. For clarity of reading, we willshow the derivation only for the case in which inhibition is modulated. By the law of largenumbers, the average of I(t) over m trials converges to its expected value:
We start from the inhibitory term. We derive the expectations by conditioning on thenumber of events up to time t, given E[Ii(t)] = E[E[Ii(t)|N (t)]]. So we consider
It is known that for an inhomogeneous Poisson process of rate λ(t), given there are n eventsin the time interval [0, t), these points are independent and identically distributed with
density (Cox and Isham, 1980). We apply this fact to the in the previousequation, and find
We now can take the expectation of this conditioned expectation to find E[Ii(t)]:
Then standard calculus gives,
(15)
The same derivation applied to the excitation (which is based on the homogeneous Poissonprocess Ne in this case) yields
Broiche et al. Page 8
J Neurosci. Author manuscript; available in PMC 2013 April 10.
$waterm
ark-text$w
atermark-text
$waterm
ark-text
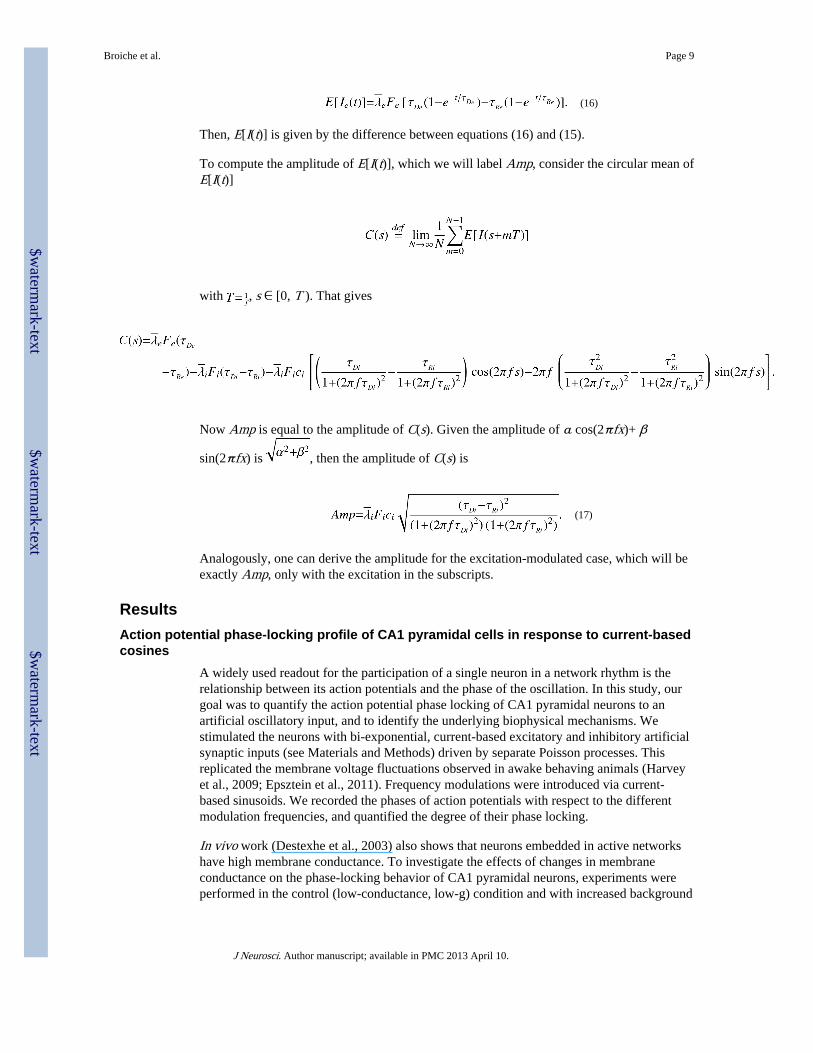
(16)
Then, E[I(t)] is given by the difference between equations (16) and (15).
To compute the amplitude of E[I(t)], which we will label Amp, consider the circular mean ofE[I(t)]
with , s ∈ [0, T ). That gives
Now Amp is equal to the amplitude of C(s). Given the amplitude of α cos(2πfx)+ β
sin(2πfx) is , then the amplitude of C(s) is
(17)
Analogously, one can derive the amplitude for the excitation-modulated case, which will beexactly Amp, only with the excitation in the subscripts.
ResultsAction potential phase-locking profile of CA1 pyramidal cells in response to current-basedcosines
A widely used readout for the participation of a single neuron in a network rhythm is therelationship between its action potentials and the phase of the oscillation. In this study, ourgoal was to quantify the action potential phase locking of CA1 pyramidal neurons to anartificial oscillatory input, and to identify the underlying biophysical mechanisms. Westimulated the neurons with bi-exponential, current-based excitatory and inhibitory artificialsynaptic inputs (see Materials and Methods) driven by separate Poisson processes. Thisreplicated the membrane voltage fluctuations observed in awake behaving animals (Harveyet al., 2009; Epsztein et al., 2011). Frequency modulations were introduced via current-based sinusoids. We recorded the phases of action potentials with respect to the differentmodulation frequencies, and quantified the degree of their phase locking.
In vivo work (Destexhe et al., 2003) also shows that neurons embedded in active networkshave high membrane conductance. To investigate the effects of changes in membraneconductance on the phase-locking behavior of CA1 pyramidal neurons, experiments wereperformed in the control (low-conductance, low-g) condition and with increased background
Broiche et al. Page 9
J Neurosci. Author manuscript; available in PMC 2013 April 10.
$waterm
ark-text$w
atermark-text
$waterm
ark-text
conductance (high conductance, high g), by injecting a linear leak of 15 nS. The addedlinear leak reduced the apparent input resistance from 84 ± 1 to 39 ± 0.3 MΩ (n = 353).
To span a wide frequency region above and below the delta, theta, beta, and gamma bands,we used modulation frequencies of 0.1, 0.5, 1, 4, 8, 12, 20, 50, 100, and 500 Hz (Figure 1).The phases of individual action potentials were used to compute the vector strength for eachfrequency (see Material and Methods). The vector strength is a measure of phase lockingwhich yields values between 0 and 1, where 0 indicates a uniform distribution and 1indicates perfect locking. At average firing rates of 2 spikes/s, we found that changes inbackground conductance induce qualitative differences in the phase-locking behavior inCA1 pyramidal cells. In the low-conductance case, we observed a low pass-like phase-locking profile, while under high conductance the profile was band pass, peaking at 4 Hz(Figure 1C, solid symbols). In both cases the modulation frequency significantly influencedthe action potential phase locking (low g, n = 7 to 25, p < 0.001; high g, n = 8 to 22, p <0.001, both one-way ANOVA).
The experiments described so far were performed at an average firing rate of 2 spikes/s,which matched observations in CA1 pyramidal neurons during exploratory behavior andunder anesthesia (Klausberger et al., 2003; Harvey et al., 2009). In vivo data also indicatethat the firing rate of CA1 pyramidal neurons increases under certain physiologicalconditions, for example, when the animal enters the place field of the neuron (O’Keefe,1976; Harvey et al., 2009; Epsztein et al., 2011). We investigated the influence of anincreased firing rate on the phase-locking profile by recording the responses of CA1pyramidal cells to current cosines of varying frequencies at an average firing rate of 8spikes/s (Figure 1B). We found that an increase in firing rate qualitatively affected thephase-locking behavior: under low conductance the profile changed from low pass to bandpass, peaking at 4 Hz, while under high conductance the band-pass profile changed into ahigh pass-like profile (Figure 1C, open symbols). As before, the modulation frequencysignificantly influenced the phase-locking strength (low g, n = 6 to 17, p < 0.001; high g, n =4 to 15, p < 0.001; both one-way ANOVA).
Overall, our data shows a strong dependence of phase locking on both average firing rateand background conductance. With increasing firing rate we observed an overall drop inphase-locking strength, under both high and low g. Moreover, an increase in backgroundconductance shifted the cutoff frequency of action potential phase locking to a higher value.Note that this quantity is distinct from the cutoff frequency of the membrane potential(compare Figures 1C and 7A). This discrepancy has been found in other cell types (du Lacand Lisberger, 1995; Carandini et al., 1996; Köndgen et al., 2008).
Gain of the f-I relationship can be used to predict the action potential phase-locking profileof CA1 pyramidal neurons for lower modulation frequencies
Our investigation so far revealed that pyramidal cells phase-locking behavior can display avariety of profiles depending on average firing rate and background conductance, and ismore complex than previously suggested (Leung and Yu, 1998; Pike et al., 2000; Fellous etal., 2001; Hu et al., 2002; Narayanan and Johnston, 2007; Zemankovics et al., 2010). Wewere interested in identifying the biophysical mechanisms underlying such diversity ofresponses. In particular, the action potential phase locking to low modulation frequencies(<4 Hz) was different across conductance conditions at average fring rates of 2 spikes/s, butsimilar for average firing rates of 8 spikes/s (Figure 1C). For slow enough input frequencies,we conjectured that variations of the cosine current in time could exert effects similar to DCvariations. Consequently, we hypothesized that phase locking to low modulation frequenciesmay be approximated by the firing frequency vs. injected current relationship (f-I curve),which can be derived from step responses. Previous work has shown that changes in
Broiche et al. Page 10
J Neurosci. Author manuscript; available in PMC 2013 April 10.
$waterm
ark-text$w
atermark-text
$waterm
ark-text
background conductance change the slope (gain) of the f-I relationship of CA1 pyramidalneurons, and that gain is influenced by the mean operating voltage (Fernandez and White,2010; Fernandez et al., 2011). We conjectured that, for low modulation frequencies,differences in gain across conductance conditions and mean firing rates may account for theobserved differences in vector strength. To test this hypothesis, we held CA1 pyramidalneurons at average firing rates of 2 or 8 spikes/s and recorded action potentials evoked inresponse to de- and hyper-polarizing current steps of 5 s duration (n = 11, Figure 2). Wechose the step length as half the slowest modulation period. In addition to the current steps,the neurons received the same fluctuating background current input generated using non-modulated Poisson processes as before. Gain was computed as the slope of the linear fit tothe f-I relationships (Figure 2Bi–ii, C i). The gain values were then used to estimate thevector strength for a modulation frequency of 0.1 Hz.
The phase-locking estimate was derived analytically (see Materials and Methods), yieldingequation (4), which was the basis to test whether gain regulated the response of thepyramidal cells at the slowest frequency modulation tested in the experiments. We foundgood agreement between the estimate and the experimental data for action potential phaselocking to a modulation frequency of 0.1 Hz for all four experimental conditions (Figure2Cii). We thus concluded that the gain derived from step responses was sufficient to predictaction potential phase locking to slow time varying stimuli. Furthermore, equation (4) showsthat the vector strength is inversely proportional to the mean firing rate. This explains thesmall difference in vector-strength values below 1 Hz modulation observed for high and lowg at average firing rates of 8 spikes/s. This relationship could also account for the overalldrop in vector strength observed when firing rates were increased from 2 to 8 spikes/s in theexperiments.
To investigate whether the accuracy of the estimate extended to higher frequencies, wecompared the predicted and the measured vector strength for such frequencies. Except forone case (2 spikes/s firing rate, low g), we observed decreasing prediction accuracies withincreasing modulation frequencies up to the peak or the plateau of the respectiveexperimental condition. This indicated that the gain measured using 5 s current steps wasmost accurate for predictions of phase locking to a modulation frequency of 0.1 Hz. Giventhat spike-frequency adaptation has been shown to be important for setting the gain of CA1pyramidal neurons (Fernandez and White, 2010; Fernandez et al., 2011), and because theinfluence of spike-frequency adaptation depends on the length of the step considered, weconjectured that shorter steps might be more accurate for predictions of phase locking tohigher frequencies. To test this hypothesis, we chose modulation frequencies between 0.5and 10 Hz, and considered step lengths of half their period. We then re-analyzed the samedataset, considering only spikes in the time windows corresponding to a given modulationfrequency. Due to the low number of spikes in the shorter time windows in the 2 spikes/smean firing rate condition, we restricted this analysis to 8 spikes/s mean firing rate. Wefound significant differences in gain with different step lengths (low g, p < 0.05, n = 11;high g, p < 0.001, n = 11, one-way ANOVA; Figure 3A). For both high and low g, the gainincreased as the step length was decreased from 5 s to 125 ms. This result indicated acontribution of spike-frequency adaptation to establishing the gain of CA1 pyramidalneurons. We used equation (4) to estimate the vector strength for faster modulationfrequencies with the respective gain values. In the low-conductance condition, the predictionfitted the measured vector strength well up to 1 Hz, after which the estimates decreased inaccuracy, but still captured the general trend (Figure 3B). For high conductance, we found agood agreement from 0.1 to 10 Hz (Figure 3C).
In summary, our gain data using different step lengths indicated a prominent influence ofspike-frequency adaptation on the phase-locking profiles at mean firing rates of 8 spikes/s.
Broiche et al. Page 11
J Neurosci. Author manuscript; available in PMC 2013 April 10.
$waterm
ark-text$w
atermark-text
$waterm
ark-text
In agreement with the high-pass filter properties ascribed to spike-frequency adaptation(Benda and Herz, 2003), lower modulation frequencies were associated with lower vectorstrengths. Different profiles were associated with different action potential cutofffrequencies, depending on background conductance. Under high conductance the cutoff waslocated at high frequencies, thus revealing a phase-locking plateau, while the band-passprofile under low conductance was due to an earlier cutoff. Thus, at mean fring rates of 8spikes/s, we could relate gain measured using current steps to responses to time-varyingstimuli in CA1 pyramidal neurons, and show that the phase-locking strength is given by thecombination of spike-frequency adaptation, gain, and the action potential cutoff.
Spike-frequency adaptation reduces phase locking to low frequenciesBased on results from Figures 1–3, we concluded that (1) differences at low modulationfrequencies in Figure 1C are caused by differences in gain, and (2) the shape of the vectorstrength curve for the 8 spikes/s firing rate and modulation frequencies below 10 Hz isdominated by stimulus induced changes in spike frequency adaptation. To provide a proof ofprinciple that adaptation reduces locking to low modulation frequencies, we introduced aspike triggered adaptation current into CA1 pyramidal neurons via dynamic-clamp (seeMaterials and Methods). We recorded phase-locking at an average rate of 4 spikes/s underlow conductance (n = 8, Figure 4). Confirming our predictions, introduction of theadaptation current selectively reduced locking to low modulation frequencies (0.1 and 1 Hzmodulation frequency, control vs. adaptation both p < 0.001, 4 and 10 Hz modulation notsignificant, all paired t-test).
Action potential phase-locking peaks are sensitive to changes in firing rateWe used gain to establish the relation between spike-frequency adaptation and phase-locking profiles for higher firing rates. At average firing rates of 2 spikes/s, this was onlypossible for the modulation frequency of 0.1 Hz. To investigate the role of spike-frequencyadaptation in the locking profiles at low firing rates, we introduced a different approach. Ifspike frequency adaptation has a prominent influence on the action potential phase-lockingprofile at low mean firing rates, it should be possible to change it through manipulationslikely to influence adaptation. It has been shown that increasing firing rate and conductanceenhances spike-frequency adaptation (Fernandez and White, 2010). Hence, the phase-locking profile at 2 spikes/s firing rate in high conductance should change from band pass tolow pass if spike-frequency adaptation is decreased via a reduction in firing rate.Analogously, the phase-locking profile at 2 spikes/s firing rate under low conductanceshould change from low pass to band pass when spike-frequency adaptation increases byincreasing the average firing rate.
To test these predictions, we first recorded the action potential phase-locking profile of CA1pyramidal neurons under high conductance at an average firing rate of around 1 spike/s, andobserved a low pass phase-locking profile (Figure 5A, n = 8). We then recorded the actionpotential phase-locking profile at 3 spikes/s and observed a band-pass profile (Figure 5B, n= 9, p < 0.05, one-way ANOVA, 0.1 Hz vs. 1 Hz modulation p < 0.001, paired t-test). Theseresults confirmed our prediction that spike-frequency adaptation is involved in shaping thelocking profile at 2 spikes/s average firing rate under high and low conductance.
Low concentrations of TTX reduce phase locking to low modulation frequenciesOur results so far demonstrated the importance of spike-frequency adaptation in shaping thephase-locking profiles of CA1 pyramidal cells. Previous work suggests the involvement ofcumulative sodium-current inactivation in setting spike-frequency adaptation and gain inCA1 pyramidal neurons (Fernandez and White, 2010). In particular, our past work showsthat low concentrations of TTX reduce the gain of CA1 pyramidal neurons through an
Broiche et al. Page 12
J Neurosci. Author manuscript; available in PMC 2013 April 10.
$waterm
ark-text$w
atermark-text
$waterm
ark-text
increase of spike-frequency adaptation (Fernandez et al., 2011). To test whether a reductionin gain through a reduction in sodium-current availability would affect the action potentialphase-locking profile, we recorded from CA1 pyramidal cells in the presence of 5 nM TTX(n = 8, Figure 6). In both cases, the locking profile was band-pass, peaking at 4 Hz underlow conductance and between 4 and 8 Hz under high conductance (influence of modulationwas significant: low g, p < 0.001; high g, p < 0.001; both one-way ANOVA).
Comparing control and TTX conditions revealed a selective reduction of locking to lowfrequencies (0.1–1 Hz, Figure 6B), consistent with a decrease in gain through an increasedspike-frequency adaptation, which only affects the locking strength at low frequencies. Theenhanced adaptation was likely due to two factors. First, the reduced total sodium currentavailable renders the neuron more susceptible to a further loss of sodium current caused bycumulative inactivation. Second, the mean operating voltage for a given firing rate in thepresence of TTX was increased by 8–10 mV, thus augmenting cumulative inactivation.
In summary, our data shows that sodium-current is involved in setting the phase-lockingprofile of CA1 pyramidal neurons. This further supports our interpretation of the role ofspike-frequency adaptation in the locking behavior of these cells.
Evidence for an intrinsic frequency preference in the spike generation mechanismWe showed that spike-frequency adaptation is a main factor in the phase locking of CA1pyramidal neurons. Consistently, at an average firing rate of 8 spikes/s, we found a sustainedplateau-like profile across a band of higher frequencies. If spike-frequency adaptation wasthe only factor involved in setting the action potential phase-locking profile, a similarbehavior should have been observed in the presence of TTX at low rates under highconductance, but this was not the case. Furthermore, spike-frequency adaptation can notaccount for the preference for modulation at 4 Hz in the high-conductance case at 2 spikes/sunder control conditions. Given these results, we hypothesized that an intrinsic frequencypreference could also be involved in shaping the phase-locking profiles (Brumberg andGutkin, 2007). This would point to a scenario in which the overall behavior of CA1pyramidal neurons firing at 2 spikes/s under high conductance would result from thecombined influence of spike-frequency adaptation, setting a plateau at higher modulationfrequencies, and an additional intrinsic frequency preference around 4 Hz, resulting in asuperimposed small peak. Hence, we continued by probing CA1 pyramidal neurons for apossible frequency preference in addition to spike-frequency adaptation.
Previously, subthreshold resonance phenomena have been proposed to be involved in settinga frequency preference for CA1 pyramidal neurons in the theta band (Leung and Yu, 1998;Pike et al., 2000; Hu et al., 2002; Narayanan and Johnston, 2007; Zemankovics et al., 2010).If subthreshold resonant currents were the major cause for a phase-locking peak, increasingconductance should shunt these currents, reducing the subthreshold resonance (Hutcheon etal., 1996; Fernandez and White, 2008; Fernandez et al., 2011) and thus reducing the lockingpreference. To test this prediction, we recorded the impedance profile under low and highconductance (Figure 7A, see Materials and Methods). As expected, the Q-value droppedunder high conductance ( p<0.01, n = 12, paired t-test; Q-values: low g = 1.21 ± 0.03, high g= 1.12 ± 0.02). Therefore, increasing background conductance has opposite effects on thesubthreshold impedance and the action potential phase-locking profile.
On the other end, a change in background conductance could affect the operating voltage,which in turn can influence the impedance profile (Hu et al., 2002; Narayanan and Johnston,2007; Zemankovics et al., 2010). This effect could counter-act the effect of backgroundconductance shown in Figure 7A. We observed no significant difference in the operatingvoltage between high and low g at either a mean rate of 2 or 8 spikes/s (Figure 7B). This
Broiche et al. Page 13
J Neurosci. Author manuscript; available in PMC 2013 April 10.
$waterm
ark-text$w
atermark-text
$waterm
ark-text
argues against a differential activation of resonant properties between high and lowconductance.
Our analysis suggests no strong relationship between the phase-locking profiles of CA1pyramidal neurons and subthreshold resonance. For this reason, we investigated a possiblefrequency preference in the spike-generation mechanism (see also Brumberg and Gutkin,2007). To test whether the spike-triggering events derived from input without any frequencymodulation showed any inherent preference, we recorded from CA1 pyramidal neuronsfiring at an average rate of 2 spikes/s under low and high conductance. The neurons receivedthe same background current inputs as before, without any frequency modulation.
We performed principal-component analysis on the population of spike-triggering inputevents (PCA, see Materials and Methods). We used the Principal Components to define afrequency-preference index (Figure 7Civ), which ranges between 0 and 1, where highervalues represent increased locking (for details, see Materials and Methods). The indexshowed a band-pass profile in both low and high conductance, peaking at 2 and 4 Hz,respectively. These results indicated a frequency preference of the spike-generationmechanism, which was sensitive to changes in background conductance, at mean firing ratesof 2 spikes/s. Thus, we concluded that the low pass phase-locking profile in the low-g caseresulted from the absence of adaptation and the action potential cutoff frequency, whichoverrode the intrinsic frequency preference. In the high-conductance case, the cutoff shiftedto higher frequencies, and the band-pass profile resulted from adaptation, and the intrinsicfrequency preference, unmasked by the shifted cutoff.
Note that, given the absence of cosine modulation in the spike-triggering events used for thePCA, the effect of adaptation on the phase-locking profiles could not be evaluated by thisanalysis. In fact, the sinusoidal modulation itself recruits adaptation, which acts differentlyat different modulation frequencies. Furthermore, the voltage fluctuation inducedirregularity of the spike trains (CVs between 0.8 and 1 for 2 spikes/s mean rate and between0.5 and 0.7 for 8 spikes/s mean rate) in combination with the absence of cosine modulationin the input argues against a strong influence of firing-rate resonance (i.e. preferentiallocking to modulation frequency equal to firing rate) to the frequency preference describedhere (see below).
Next, we performed the same analysis on recordings at firing rates of 8 spikes/s. We foundband pass-like profiles for both conductance conditions (Figure 8A), with peaks at 4 Hzunder low g and between 8 and 10 Hz under high g. The higher mean rate led to an overalldrop of the frequency-preference index. This indicated that the intrinsic frequencypreference of the spike-generation mechanism was sensitive to the mean firing rate. Notethat our analysis can not address the relative importance of the different mechanismsinvolved in shaping the phase-locking profiles. Therefore, consistent with the lower indicesfound in this case, we think that at firing rates of 8 spikes/s, the intrinsic frequencypreference was overridden by spike-frequency adaptation.
Finally, we performed the same analysis on recordings done in the presence of 5 nM TTX,without frequency modulation. The resultant frequency-preference index was found to beband pass for both high and low conductance (Figure 8B), with peak frequency at 4 Hz inboth conditions.
In summary, PCA provided evidence for the existence of an intrinsic frequency preferencein the spike-generating mechanism across the different experimental conditions. In ourinterpretation of these results, the preference of the spike-generating mechanism acted inconcert with adaptation, the cutoff, and possibly additional factors, to set the phase-lockingprofile of CA1 pyramidal neurons.
Broiche et al. Page 14
J Neurosci. Author manuscript; available in PMC 2013 April 10.
$waterm
ark-text$w
atermark-text
$waterm
ark-text
Action potential phase-locking profiles can be qualitatively reproduced in a simple modelNext, we tried to qualitatively reproduce the phase-locking behavior of CA1 pyramidalneurons in a computational model. We started from the simplest spiking model, the leakyintegrate and fire (LIF), and found that it responded to inputs similar to the ones wepresented to pyramidal cells with low pass action potential phase-locking profiles, for highand low conductance, and high and low firing rates. Moreover, for reduced sizes ofmembrane potential fluctuations, the model responded with a phase-locking peak at thefiring frequency. This behavior is consistent with the LIF receiving white noise (Tateno,2002) and the generalized Integrate-and-Fire (GIF), which incorporates a resonant variable(Brunel et al., 2003). If the LIF or GIF were a good representation of our observations, CA1pyramidal neurons should show firing-rate resonance. To test this, we recorded the phaselocking to 4 Hz modulation frequency, in the presence of membrane potential fluctuations,at different average firing rates. No locking peak was present at an average firing rate of 4spikes/s, under either high or low conductance. In fact, the vector strength decreased withincreasing rate (low g, n = 5; high g, n = 6; data not shown). We therefore conclude thatfiring-rate resonance does not play a major role in setting the spike phase locking under ourrecording conditions.
Our experiments indicated that changes in gain, through changes in spike-frequencyadaptation, in combination with an intrinsic frequency preference were crucial for obtainingdifferent phase-locking profiles. To test this idea, we started from a previously-publishedmodel, which reproduced changes in gain and spike-frequency adaptation in response toincreases in conductance due to sodium-current inactivation (Fernandez and White, 2010).We adapted this model by incorporating a resonant current; frequency modulation andmembrane-potential fluctuations were introduced as before (see Materials and Methods).
The model qualitatively reproduced the effects of changes in background conductance andfiring rate on the phase-locking profiles of CA1 pyramidal neurons (Figure 9). In fact, underlow conductance, increasing the firing rate changed the locking profile from low pass toband pass. Under high conductance, the transition was more complex: at the lowest firingrates the profile was low pass, changing to band pass - with peaks in the theta range - forintermediate rates; at the highest rates tested the peaks broadened into plateaus. While thecurves reported in Figure 9 qualitatively reproduce the behavior shown in Figure 1C, thefiring rates of model and cells are not an exact match. In addition, the apparent cutofffrequency for action potential phase locking was at lower frequencies in the model whencompared to real neurons. However, the model reproduces the locking profiles with verysteep voltage dependencies for sodium-current inactivation, as well as activation andinactivation of the resonant current. As we have observed before, this is necessary, becausethe changes in mean operating voltage with firing rate are much smaller in the model than inCA1 pyramidal neurons (Fernandez et al., 2011). Furthermore, having an artificial reset rulesimplified the model at the expense of a full spike-generating mechanism, and served tohighlight the role of the sodium current in the locking dynamics. Despite thesediscrepancies, our simulations indicate that the different action potential phase-lockingprofiles observed in CA1 pyramidal neurons can be qualitatively reproduced in a simplemodel incorporating spike-frequency adaptation and a resonant property.
Modulation amplitude attenuates with inhomogeneous Poisson processesRhythmic activity is likely experienced as synaptic input rate variation by a recipientneuron. To investigate the phase locking profiles of CA1 pyramidal neurons in response tofrequency modulation via synaptic input rate oscillation, we changed our experimentalparadigm. In this series of experiments, we modulated the rate of either the excitatory orinhibitory Poisson process using a cosine function. We recorded phase-locking at average
Broiche et al. Page 15
J Neurosci. Author manuscript; available in PMC 2013 April 10.
$waterm
ark-text$w
atermark-text
$waterm
ark-text
firing rates of 2 spikes/s under low and high conductance. Under all conditions, phaselocking was significantly affected by modulation frequency (excitation modulated: low g: p< 0.001, high g: p < 0.01, both one-way ANOVA, both n = 18; inhibition modulated: low g:p < 0.001, high g: p < 0.001, both one-way ANOVA, both n = 8). For both excitation andinhibition, we observed low-pass profiles under low g, and weakly band-pass profiles underhigh g. To directly compare the responses to current-based cosines and rate modulatedsynaptic events, we normalized profiles to their value at 1 Hz (Figure 10Ai and ii). Whileresponses at low g were comparable, we observed a drop in vector strength with modulatedinhibition at frequencies higher than 10 Hz and a smaller peak at 4 Hz for both modulatedexcitation and inhibition under high g.
We hypothesized that these effects could result from filtering of the input, with the timeconstants of the synaptic-like waveforms dampening the modulation at higher cosinefrequencies. This attenuation would likely be different between the excitation-modulatedand the inhibition-modulated case, because of the different τDe and τDi. We quantified theaverage current injected per cycle and measured its amplitude (see Materials and Methods).We found significant differences in the average current amplitude for different frequenciesin both the excitation-modulated and the inhibition-modulated inputs (excitation: low g, p <0.05, high g, p < 0.001, n = 18; inhibition: low g, p < 0.01; high g: p < 0.001; n = 8 all one-way ANOVA). For both low- and high-conductance recordings, the average currentamplitude decreased with increasing modulation frequency. The dependence on modulationfrequency was greater for inhibition-modulated inputs than for excitation-modulated inputs(data not shown).
To highlight the mechanism underlying the decreasing per-cycle current amplitude withincreasing modulation frequency, we derived this average analytically (see equation (17),Materials and Methods). The role the decay time constant plays in shaping this function isshown in Figure 10B: the larger the τD, the steeper the decay of the modulation amplitudewith increasing frequency. Because the inhibitory decay-time scale is larger than the decay-time scale of excitation, their trends for the frequency dependence of the per-cycle currentamplitude are different. It should be noted that for synaptic time constants of about 6–8 ms(commonly associated with GABAA currents) the frequency-dependent attenuation wasalready about 40% at 20 Hz modulation.
DiscussionThis study demonstrates that CA1 pyramidal neurons dynamically change their frequency-response characteristics depending on background conductance and firing rate. We identifythree main biophysical mechanisms underlying this phenomenon: spike-frequencyadaptation, the cutoff frequency of action potential phase-locking, and an intrinsic frequencypreference in the spike-generation mechanism. We propose that these properties of CA1pyramidal neurons may enable them to adjust the processing of time-varying stimuli inresponse to global changes in hippocampal activity.
Phase-locking profiles of CA1 pyramidal neuronsAt low firing rates, increasing background conductance changes the locking profile fromlow-pass to band-pass, peaking within the theta range. Increasing firing rate results inbandpass profiles, peaking in the theta band under low-conductance, and in the beta-gammaband under high conductance. Firing rate affects phase locking mainly by altering the degreeof spike-rate adaptation, which implements a high-pass filter, as predicted by theoreticalstudies (Benda and Herz, 2003; Benda et al., 2010). While higher background conductanceincreases the high-frequency cutoff for action potential phase locking, the intrinsic
Broiche et al. Page 16
J Neurosci. Author manuscript; available in PMC 2013 April 10.
$waterm
ark-text$w
atermark-text
$waterm
ark-text
frequency preference of spike generation has a more subtle effect, changing the peak of thefrequency-response curve.
Implications for network functionNetwork oscillations of varying frequencies have been implicated in a plethora of systemicfunctions in animals and humans, ranging from sensory processing to memory formation(Engel et al., 2001; Buzsáki, 2002; Buzsáki and Draguhn, 2004; Steriade, 2006; Andersen etal., 2007). The overall network state translates into the drive, magnitude of voltagefluctuations and total synaptic conductance a neuron will be exposed to (Destexhe et al.,2003; Destexhe and Contreras, 2006). We show the dependence of action potential phaselocking on these parameters. In this context, our findings imply that the ability of CA1pyramidal neurons to participate in a network rhythm of a given frequency depends on theoverall network state. Thus, CA1 pyramidal neurons should not be thought of as invariablenetwork elements, but rather as active units, able to modify their behavior according toglobal changes in hippocampal activity.
This work focuses on postsynaptic properties exclusively. Other network properties,including short- and long-term synaptic plasticity, also play a role in networkrhythmogenesis. For example, recent theoretical work (Muller et al., 2011) shows that spike-time-dependent plasticity (STDP), a form of long-term synaptic plasticity (Dan and Poo,2004; Caporale and Dan, 2008), can induce synchrony in a population of neurons inresponse to oscillatory inputs. Cells with higher locking to a given input frequency will bemore effectively synchronized by this kind of STDP mechanism. Here we measure thespiking responses in relationship to oscillatory inputs with different frequencies, and showthat pyramidal cells change their locking preference depending on background conductanceand firing rate. Given the dependence of STDP on neuro-modulators and the generalnetwork state, it would be interesting to investigate whether the frequencies associated withhigher locking as we measure it correlate with those inducing stronger plasticity acrossnetwork conditions.
Evidence for the distinction of sub- and supra-threshold regimesFor the last few decades, subthreshold properties of neurons have been subject of intensiveinvestigation, under the natural, implicit or explicit assumption that observations made in thesub-threshold regime are strongly predictive of neuronal spiking responses, especially in thecontext of network oscillations (Alonso and Llinas, 1989; McCormick and Pape, 1990;Llinas et al., 1991; McCormick and Bal, 1997; Leung and Yu, 1998; Pike et al., 2000; Hu etal., 2002; Narayanan and Johnston, 2007). Although sub-threshold properties can influenceneuronal firing properties and phase locking (Richardson et al., 2003; Acker et al., 2003;Gutkin et al., 2005), our data show that spike phase locking is not a simple reflection of thesub-threshold impedance profile in CA1 pyramidal neurons. We find that the spike-cutofffrequency is much greater than the cutoff of sub-threshold membrane voltage, particularly inthe high-conductance state. The cause for this behavior, which has also been observed inother cell types (Köndgen et al., 2008; Higgs and Spain, 2009), remains unclear. Theoreticalwork (Fourcaud-Trocme et al., 2003; Wei and Wolf, 2011) suggests that the speed of spikeinitiation in combination with the firing rate and the spectral composition of the input noiseare involved in setting the spike cutoff frequency. Furthermore, our data demonstrates thatincreasing background conductance has opposite effects on the sub-threshold impedance andaction potential phase locking profiles at low firing rates: increasing backgroundconductance greatly reduced the sub-threshold resonant peak, while introducing a peak inthe action potential locking profile. A discrepancy between subthreshold and spikingregimes has been observed before (Carandini et al., 1996; Haas et al., 2007; Brumberg and
Broiche et al. Page 17
J Neurosci. Author manuscript; available in PMC 2013 April 10.
$waterm
ark-text$w
atermark-text
$waterm
ark-text
Gutkin, 2007; Fernandez and White, 2008; Kispersky et al., 2012), calling into question thegeneral validity of predictions of the spiking regime based on sub-threshold observations.
Representing in vivo inputsAccumulating evidence suggests that CA1 pyramidal neurons in vivo experience periods ofhigh membrane conductance associated with membrane-voltage fluctuations (Penttonen etal., 1998; Henze and Buzsáki, 2001; Destexhe et al., 2003; Harvey et al., 2009; Epsztein etal., 2011). We introduced membrane-voltage fluctuations by injecting artficial synapticwaveforms driven by Poisson processes: such inputs capture uncorrelated firing rates ofindividual neurons observed in vivo (Softky and Koch, 1993). However, this signal is still animperfect representation of the actual in vivo input: for example, excitation-inhibitioncorrelations (Okun and Lampl, 2008; Atallah and Scanziani, 2009; Gentet et al., 2010), andthe variability within synaptic waveforms are not included. We found that introducingfrequency modulation in the rate of the Poisson processes resulted in the dependence of itsintensity on frequency. It can be expected that other more complex stimulation paradigmswill display some form of non-uniform modulation strength across frequencies as well. Toavoid this confound, we introduced frequency modulation via independent current-basedcosine waveforms in the major part of this study. Spiking responses to this simple input canbe used to predict the locking profiles to more complex inputs, once the dependence of theirmodulation strength on frequency is known. Furthermore, we believe the basic effects ofchanges in background conductance and firing rate on the phase-locking behavior can beobserved more readily using this form of modulation. In the work presented here, we choseto simulate the high-conductance state by introducing a linear leak conductance instead ofusing conductance-based synaptic events. In preceding experiments, we found no obviousdifference in phase locking behavior between the two paradigms. We found a stronginfluence of firing rate on phase locking in our dataset, highlighting the importance ofcontrolling this parameter.
Contribution of sodium-current inactivation to adaptation and phase lockingPrevious work has emphasized the contribution of M-type and Ca2+ activated potassiumcurrents to spike frequency adaptation in CA1 pyramidal neurons (Madison and Nicoll,1984; Pedarzani and Storm, 1993; Aiken et al., 1995; Peters et al., 2004; Otto et al., 2006).Although a contribution of these conductances cannot be ruled out, we are able to show thata reduction in sodium-current availability can account for most of the effects of spike-frequency adaptation on locking profiles.
The degree of spike-frequency adaptation sets the gain of the input-output function of CA1pyramidal neurons (Fernandez and White, 2010; Fernandez et al., 2011), and cumulativesodium-current inactivation strongly affects adaptation in CA1 pyramidal neurons. For lowto medium modulation frequencies, we relate gain to vector strength, and show that the locallinearization of the f-I relationship predicts the responses to time-varying stimuli. Moreover,reducing sodium-current availability through TTX selectively reduces locking to lowmodulation frequencies. All together, this makes a strong argument for the role of sodium-current inactivation in phase locking of CA1 pyramidal neurons.
AcknowledgmentsThis work was funded by NIH R01 MH085074 and R01 MH084387(to J.A. White) and DFG grant BR2916/2-1 (toT. Broicher) and NSF-DMS-1022945 (to A. Borisyuk). We thank Dr. Michael N. Economo for helpful discussionsand technical assistance.
Broiche et al. Page 18
J Neurosci. Author manuscript; available in PMC 2013 April 10.
$waterm
ark-text$w
atermark-text
$waterm
ark-text
ReferencesAcker C, Kopell N, White J. Synchronization of strongly coupled excitatory neurons: relating network
behavior to biophysics. J Comput Neurosci. 2003; 15(1):71–90. [PubMed: 12843696]
Aiken S, Lampe B, Murphy P, Brown B. Reduction of spike frequency adaptation and blockade of M-current in rat CA1 pyramidal neurones by linopirdine (DuP 996), a neurotransmitter releaseenhancer. Brit J Pharmacol. 1995; 115(7):1163. [PubMed: 7582539]
Alonso A, Llinas R. Subthreshold Na+-dependent theta-like rhythmicity in stellate cells of entorhinalcortex layer II. Nature. 1989; 342(6246):175–177. [PubMed: 2812013]
Andersen, P.; Morris, R.; Amaral, D.; Bliss, T.; OḰeefe, J. The hippocampus book. Oxford UniversityPress; USA: 2007.
Atallah B, Scanziani M. Instantaneous modulation of gamma oscillation frequency by balancingexcitation with inhibition. Neuron. 2009; 62(4):566–577. [PubMed: 19477157]
Benda J, Herz A. A universal model for spike-frequency adaptation. Neural Comput. 2003; 15(11):2523–2564. [PubMed: 14577853]
Benda J, Maler L, Longtin A. Linear versus nonlinear signal transmission in neuron models withadaptation currents or dynamic thresholds. J Neurophysiol. 2010; 104(5):2806. [PubMed:21045213]
Bettencourt J, Lillis K, Stupin L, White J. Effects of imperfect dynamic clamp: computational andexperimental results. J Neurosci Methods. 2008; 169(2):282–289. [PubMed: 18076999]
Brumberg J, Gutkin B. Cortical pyramidal cells as non-linear oscillators: experiment and spike-generation theory. Brain Res. 2007; 1171:122–137. [PubMed: 17716635]
Brunel N, Hakim V, Richardson M. Firing-rate resonance in a generalized integrate-and-fire neuronwith subthreshold resonance. Physical Review E. 2003; 67(5):051,916.
Buzáki G. Theta oscillations in the hippocampus. Neuron. 2002; 33(3):325–340. [PubMed: 11832222]
Buzsáki G, Draguhn A. Neuronal oscillations in cortical networks. Science. 2004; 304(5679):1926.[PubMed: 15218136]
Caporale N, Dan Y. Spike timing-dependent plasticity: a Hebbian learning rule. Annu Rev Neurosci.2008; 31:25–46. [PubMed: 18275283]
Carandini M, Mechler F, Leonard C, Movshon J. Spike train encoding by regular-spiking cells of thevisual cortex. J Neurophysiol. 1996; 76(5):3425–3441. [PubMed: 8930283]
Cox, D.; Isham, V. Point processes. Vol. 12. Chapman & Hall/CRC; 1980.
Dan Y, Poo M. Spike timing-dependent plasticity of neural circuits. Neuron. 2004; 44(1):23–30.[PubMed: 15450157]
Dayan, P.; Abbott, L. Theoretical Neuroscience. MIT Press; 2001.
Destexhe A, Contreras D. Neuronal computations with stochastic network states. Science. 2006;314(5796):85–90. [PubMed: 17023650]
Destexhe A, Paré D. Impact of network activity on the integrative properties of neocortical pyramidalneurons in vivo. J Neurophysiol. 1999; 81(4):1531. [PubMed: 10200189]
Destexhe A, Rudolph M, Paré D. The high-conductance state of neocortical neurons in vivo. Nat RevNeurosci. 2003; 4(9):739–751. [PubMed: 12951566]
Engel A, Fries P, Singer W. Dynamic predictions: oscillations and synchrony in top-down processing.Nat Rev Neurosci. 2001; 2(10):704–716. [PubMed: 11584308]
Epsztein J, Brecht M, Lee A. Intracellular determinants of hippocampal CA1 place and silent cellactivity in a novel environment. Neuron. 2011; 70(1):109–120. [PubMed: 21482360]
Fellous J, Houweling A, Modi R, Rao R, Tiesinga P, Sejnowski T. Frequency dependence of spiketiming reliability in cortical pyramidal cells and interneurons. J Neurophysiol. 2001; 85(4):1782–1787. [PubMed: 11287500]
Fernandez F, White J. Artficial synaptic conductances reduce subthreshold oscillations and periodicfiring in stellate cells of the entorhinal cortex. J Neurosci. 2008; 28(14):3790–3803. [PubMed:18385337]
Fernandez F, White J. Gain control in CA1 pyramidal cells using changes in somatic conductance. JNeurosci. 2010; 30(1):230–241. [PubMed: 20053905]
Broiche et al. Page 19
J Neurosci. Author manuscript; available in PMC 2013 April 10.
$waterm
ark-text$w
atermark-text
$waterm
ark-text
Fernandez F, Broicher T, Truong A, White J. Membrane Voltage Fluctuations Reduce SpikeFrequency Adaptation and Preserve Output Gain in CA1 Pyramidal Neurons in a High-Conductance State. J Neurosci. 2011; 31(10):3880–93. [PubMed: 21389243]
Fourcaud-Trocme N, Hansel D, van Vreeswijk C, Brunel N. How spike generation mechanismsdetermine the neuronal response to fluctuating inputs. J Neurosci. 2003; 23(37):11628–40.[PubMed: 14684865]
Gentet L, Avermann M, Matyas F, Staiger J, Petersen C. Membrane potential dynamics of GABAergicneurons in the barrel cortex of behaving mice. Neuron. 2010; 65(3):422–435. [PubMed:20159454]
Gutkin B, Ermentrout G, Reyes A. Phase-response curves give the responses of neurons to transientinputs. J Neurophysiol. 2005; 94(2):1623–1635. [PubMed: 15829595]
Haas J, Dorval A, White J. Contributions of Ih to feature selectivity in layer II stellate cells of theentorhinal cortex. J Comput Neurosci. 2007; 22(2):161–171. [PubMed: 17053992]
Harvey C, Collman F, Dombeck D, Tank D. Intracellular dynamics of hippocampal place cells duringvirtual navigation. Nature. 2009; 461(7266):941–946. [PubMed: 19829374]
Henze D, Buzsáki G. Action potential threshold of hippocampal pyramidal cells in vivo is increased byrecent spiking activity. Neuroscience. 2001; 105(1):121–130. [PubMed: 11483306]
Higgs M, Spain W. Conditional bursting enhances resonant firing in neocortical layer 2–3 pyramidalneurons. J Neurosci. 2009; 29(5):1285–1299. [PubMed: 19193876]
Hu H, Vervaeke K, Storm J. Two forms of electrical resonance at theta frequencies, generated by M-current, h-current and persistent Na+ current in rat hippocampal pyramidal cells. J Physiol (Lond).2002; 545(3):783–805. [PubMed: 12482886]
Hutcheon B, Miura R, Puil E. Models of subthreshold membrane resonance in neocortical neurons. JNeurophysiol. 1996; 76(2):698. [PubMed: 8871192]
Jolliffe, I. Principal component analysis. Springer-Verlag; 1986.
Kispersky T, Fernandez F, Economo M, White J. Spike Resonance Properties in Hippocampal O-LMCells Are Dependent on Refractory Dynamics. J Neurosci. 2012; 32(11):3637–3651. [PubMed:22423087]
Klausberger T, Magill P, Márton L, Roberts J, Cobden P, Buzsáki G, Somogyi P, et al. Brain-state-andcell-type-specific firing of hippocampal interneurons in vivo. Nature. 2003; 421(6925):844–848.[PubMed: 12594513]
Köndgen H, Geisler C, Fusi S, Wang X, Lüscher H, Giugliano M. The dynamical response propertiesof neocortical neurons to temporally modulated noisy inputs in vitro. Cereb Cortex. 2008; 18(9):2086–2097. [PubMed: 18263893]
du Lac S, Lisberger S. Cellular processing of temporal information in medial vestibular nucleusneurons. J Neurosci. 1995; 15(12):8000–8010. [PubMed: 8613737]
Leung L, Yu H. Theta-frequency resonance in hippocampal CA1 neurons in vitro demonstrated bysinusoidal current injection. J Neurophysiol. 1998; 79(3):1592–1596. [PubMed: 9497437]
Lin, R.; Bettencourt, J.; White, J.; Christini, D.; Butera, R. Real-time experiment interface forbiological control applications. Engineering in Medicine and Biology Society (EMBC); 2010Annual International Conference of the IEEE; IEEE. 2010. p. 4160-4163.
Llinas R, Grace A, Yarom Y. In vitro neurons in mammalian cortical layer 4 exhibit intrinsicoscillatory activity in the 10-to-50 Hz frequency range. Proc Natl Acad Sci. 1991; 88(3):897.[PubMed: 1992481]
Madison D, Nicoll R. Control of the repetitive discharge of rat CA 1 pyramidal neurones in vitro. JPhysiol (Lond). 1984; 354(1):319–331. [PubMed: 6434729]
McCormick D, Bal T. Sleep and arousal: thalamocortical mechanisms. Annu Rev Neurosci. 1997;20(1):185–215. [PubMed: 9056712]
McCormick D, Pape H. Properties of a hyperpolarization-activated cation current and its role inrhythmic oscillation in thalamic relay neurones. J Physiol (Lond). 1990; 431(1):291–318.[PubMed: 1712843]
Muller L, Brette R, Gutkin B. Spike-Timing Dependent Plasticity and Feed-Forward Input OscillationsProduce Precise and Invariant Spike Phase-Locking. Front Computat Neurosci. 2011:5.
Broiche et al. Page 20
J Neurosci. Author manuscript; available in PMC 2013 April 10.
$waterm
ark-text$w
atermark-text
$waterm
ark-text
Narayanan R, Johnston D. Long-term potentiation in rat hippocampal neurons is accompanied byspatially widespread changes in intrinsic oscillatory dynamics and excitability. Neuron. 2007;56(6):1061–1075. [PubMed: 18093527]
O’Keefe J. Place units in the hippocampus of the freely moving rat. Exp Neurol. 1976; 51(1):78–109.[PubMed: 1261644]
Okun M, Lampl I. Instantaneous correlation of excitation and inhibition during on-going and sensory-evoked activities. Nat Neurosci. 2008; 11(5):535–537. [PubMed: 18376400]
Otto J, Yang Y, Frankel W, White H, Wilcox K. A spontaneous mutation involving Kcnq2 (Kv7. 2)reduces M-current density and spike frequency adaptation in mouse CA1 neurons. J Neurosci.2006; 26(7):2053–2059. [PubMed: 16481438]
Paré D, Shink E, Gaudreau H, Destexhe A, Lang E. Impact of spontaneous synaptic activity on theresting properties of cat neocortical pyramidal neurons in vivo. J Neurophysiol. 1998; 79(3):1450.[PubMed: 9497424]
Pedarzani P, Storm J. PKA mediates the effects of monoamine transmitters on the K+ currentunderlying the slow spike frequency adaptation in hippocampal neurons. Neuron. 1993; 11(6):1023–1035. [PubMed: 8274274]
Penttonen M, Kamondi A, Acsády L, Buzsáki G. Gamma frequency oscillation in the hippocampus ofthe rat: intracellular analysis in vivo. Eur J Neurosci. 1998; 10(2):718–728. [PubMed: 9749733]
Peters H, Hu H, Pongs O, Storm J, Isbrandt D. Conditional transgenic suppression of M channels inmouse brain reveals functions in neuronal excitability, resonance and behavior. Nat Neurosci.2004; 8(1):51–60. [PubMed: 15608631]
Pike F, Goddard R, Suckling J, Ganter P, Kasthuri N, Paulsen O. Distinct frequency preferences ofdifferent types of rat hippocampal neurones in response to oscillatory input currents. J Physiol(Lond). 2000; 529(1):205–213. [PubMed: 11080262]
Prescott S, Ratté S, De Koninck Y, Sejnowski T. Nonlinear interaction between shunting andadaptation controls a switch between integration and coincidence detection in pyramidal neurons. JNeurosci. 2006; 26(36):9084–9097. [PubMed: 16957065]
Prescott S, Ratté S, De Koninck Y, Sejnowski T. Pyramidal neurons switch from integrators in vitro toresonators under in vivo-like conditions. J Neurophysiol. 2008; 100(6):3030–3042. [PubMed:18829848]
Richardson M, Brunel N, Hakim V. From subthreshold to firing-rate resonance. J Neurophysiol. 2003;89(5):2538–2554. [PubMed: 12611957]
Softky W, Koch C. The highly irregular firing of cortical cells is inconsistent with temporal integrationof random EPSPs. J Neurosci. 1993; 13(1):334–350. [PubMed: 8423479]
Steriade M. Grouping of brain rhythms in corticothalamic systems. Neuroscience. 2006; 137(4):1087–1106. [PubMed: 16343791]
Tateno T. Noise-induced effects on period-doubling bifurcation for integrate-and-fire oscillators.Physical Review E. 2002; 65(2):021,901.
Wei W, Wolf F. Spike Onset Dynamics and Response Speed in Neuronal Populations. Phys Rev Lett.2011; 106(8):088102-1, 088102-4. [PubMed: 21405604]
Zemankovics R, Káli S, Paulsen O, Freund T, Hájos N. Differences in subthreshold resonance ofhippocampal pyramidal cells and interneurons: the role of h-current and passive membranecharacteristics. J Physiol (Lond). 2010; 588(12):2109–2132. [PubMed: 20421280]
Broiche et al. Page 21
J Neurosci. Author manuscript; available in PMC 2013 April 10.
$waterm
ark-text$w
atermark-text
$waterm
ark-text
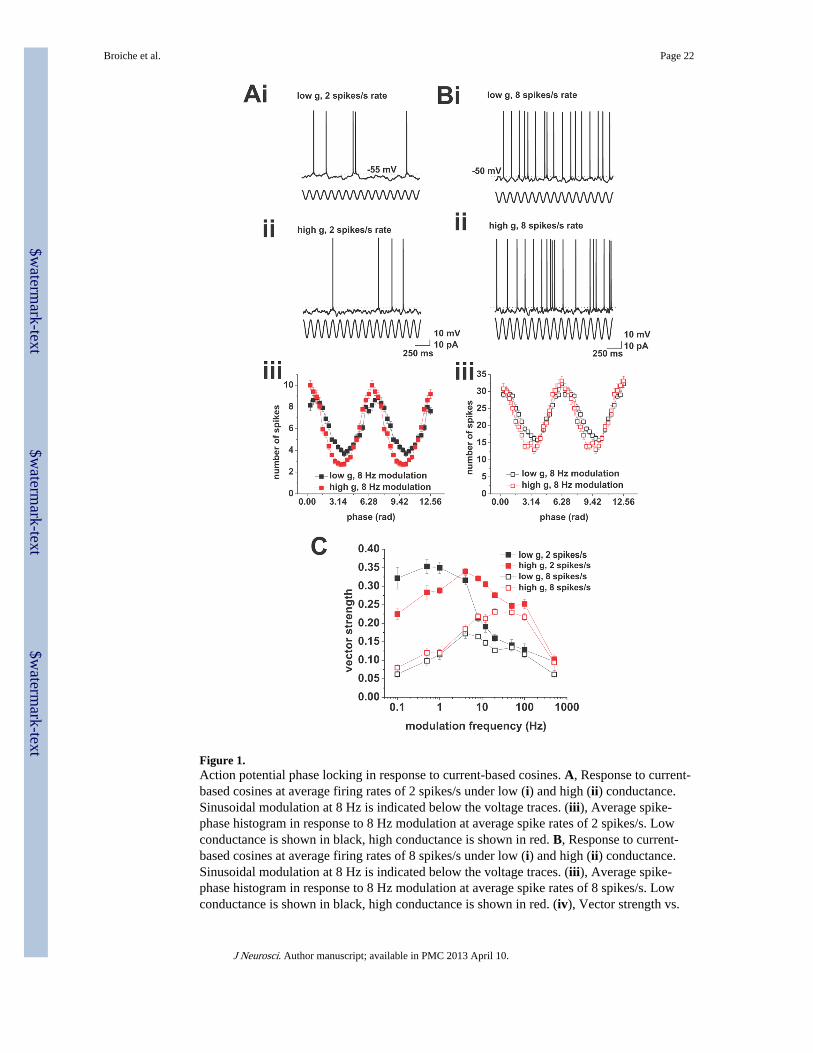
Figure 1.Action potential phase locking in response to current-based cosines. A, Response to current-based cosines at average firing rates of 2 spikes/s under low (i) and high (ii) conductance.Sinusoidal modulation at 8 Hz is indicated below the voltage traces. (iii), Average spike-phase histogram in response to 8 Hz modulation at average spike rates of 2 spikes/s. Lowconductance is shown in black, high conductance is shown in red. B, Response to current-based cosines at average firing rates of 8 spikes/s under low (i) and high (ii) conductance.Sinusoidal modulation at 8 Hz is indicated below the voltage traces. (iii), Average spike-phase histogram in response to 8 Hz modulation at average spike rates of 8 spikes/s. Lowconductance is shown in black, high conductance is shown in red. (iv), Vector strength vs.
Broiche et al. Page 22
J Neurosci. Author manuscript; available in PMC 2013 April 10.
$waterm
ark-text$w
atermark-text
$waterm
ark-text
modulation frequency under low (black) and high (red) conductance at average firing ratesof 8 spikes/s. Tested modulation frequencies were: 0.1, 0.5, 1, 4, 8, 12, 20, 50, 100, and 500Hz. C, Overlay of vector strength vs. modulation frequency plots for low (black) and high(red) conductance at average firing rates of 2 (closed squares) and 8 (open squares) spikes/s.Tested modulation frequencies were: 0.1, 0.5, 1, 4, 8, 12, 20, 50, 100, and 500 Hz.
Broiche et al. Page 23
J Neurosci. Author manuscript; available in PMC 2013 April 10.
$waterm
ark-text$w
atermark-text
$waterm
ark-text
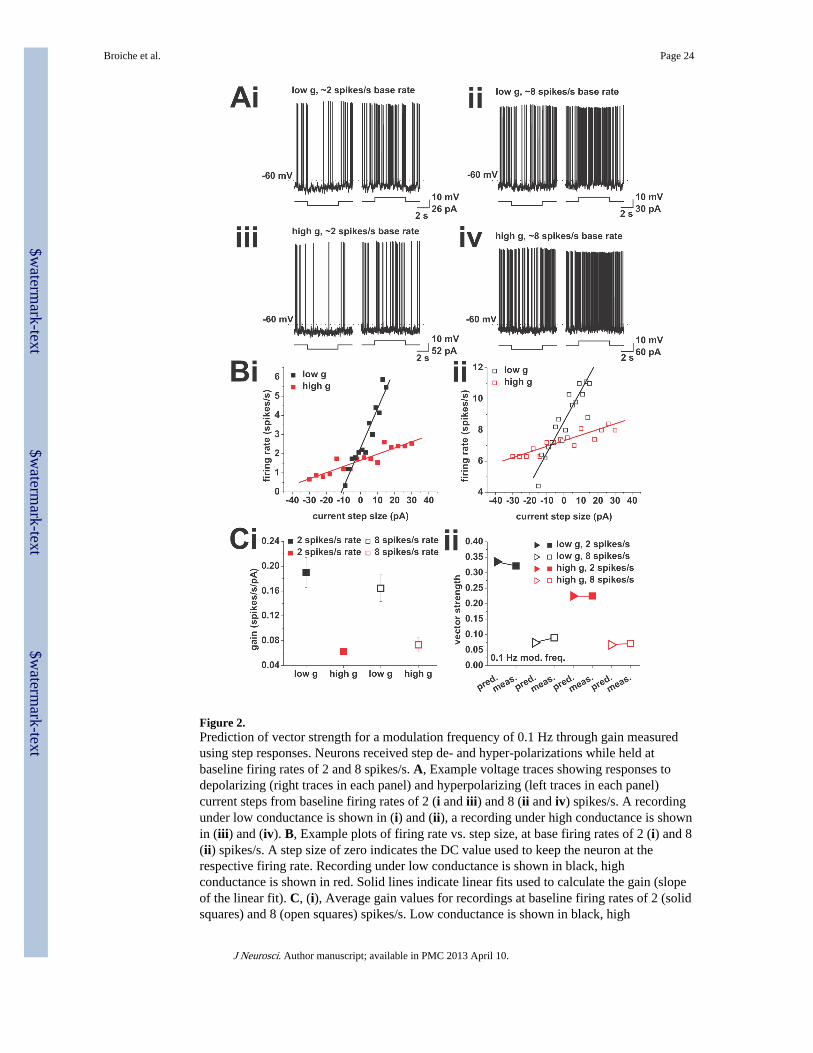
Figure 2.Prediction of vector strength for a modulation frequency of 0.1 Hz through gain measuredusing step responses. Neurons received step de- and hyper-polarizations while held atbaseline firing rates of 2 and 8 spikes/s. A, Example voltage traces showing responses todepolarizing (right traces in each panel) and hyperpolarizing (left traces in each panel)current steps from baseline firing rates of 2 (i and iii) and 8 (ii and iv) spikes/s. A recordingunder low conductance is shown in (i) and (ii), a recording under high conductance is shownin (iii) and (iv). B, Example plots of firing rate vs. step size, at base firing rates of 2 (i) and 8(ii) spikes/s. A step size of zero indicates the DC value used to keep the neuron at therespective firing rate. Recording under low conductance is shown in black, highconductance is shown in red. Solid lines indicate linear fits used to calculate the gain (slopeof the linear fit). C, (i), Average gain values for recordings at baseline firing rates of 2 (solidsquares) and 8 (open squares) spikes/s. Low conductance is shown in black, high
Broiche et al. Page 24
J Neurosci. Author manuscript; available in PMC 2013 April 10.
$waterm
ark-text$w
atermark-text
$waterm
ark-text
conductance in red. (ii), Comparison of measured and predicted vector strength. Predictionswere derived using equation (4) for a modulation frequency of 0.1 Hz, and are denoted bytriangles. Measured vector strength are given for the same modulation frequency and areshown as squares. Closed symbols refer to 2 spikes/s average firing rate, open symbols referto mean rates of 8 spikes/s. Low conductance is shown in black, high conductance in red.
Broiche et al. Page 25
J Neurosci. Author manuscript; available in PMC 2013 April 10.
$waterm
ark-text$w
atermark-text
$waterm
ark-text
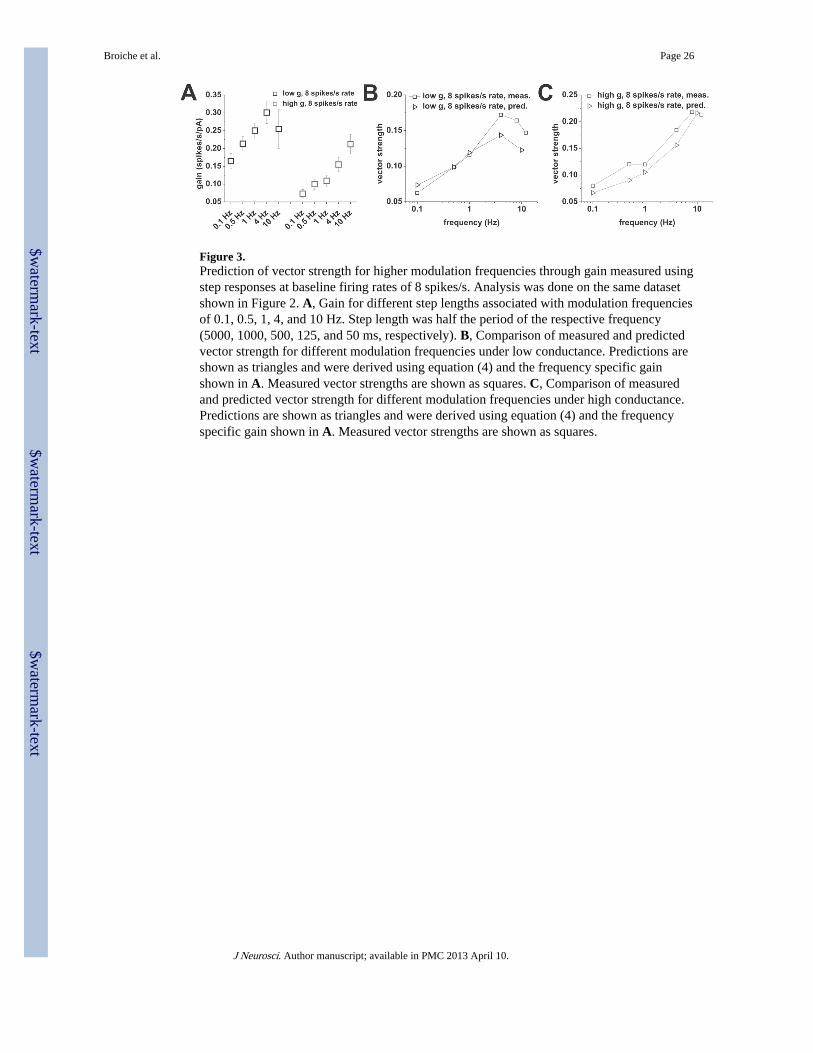
Figure 3.Prediction of vector strength for higher modulation frequencies through gain measured usingstep responses at baseline firing rates of 8 spikes/s. Analysis was done on the same datasetshown in Figure 2. A, Gain for different step lengths associated with modulation frequenciesof 0.1, 0.5, 1, 4, and 10 Hz. Step length was half the period of the respective frequency(5000, 1000, 500, 125, and 50 ms, respectively). B, Comparison of measured and predictedvector strength for different modulation frequencies under low conductance. Predictions areshown as triangles and were derived using equation (4) and the frequency specific gainshown in A. Measured vector strengths are shown as squares. C, Comparison of measuredand predicted vector strength for different modulation frequencies under high conductance.Predictions are shown as triangles and were derived using equation (4) and the frequencyspecific gain shown in A. Measured vector strengths are shown as squares.
Broiche et al. Page 26
J Neurosci. Author manuscript; available in PMC 2013 April 10.
$waterm
ark-text$w
atermark-text
$waterm
ark-text
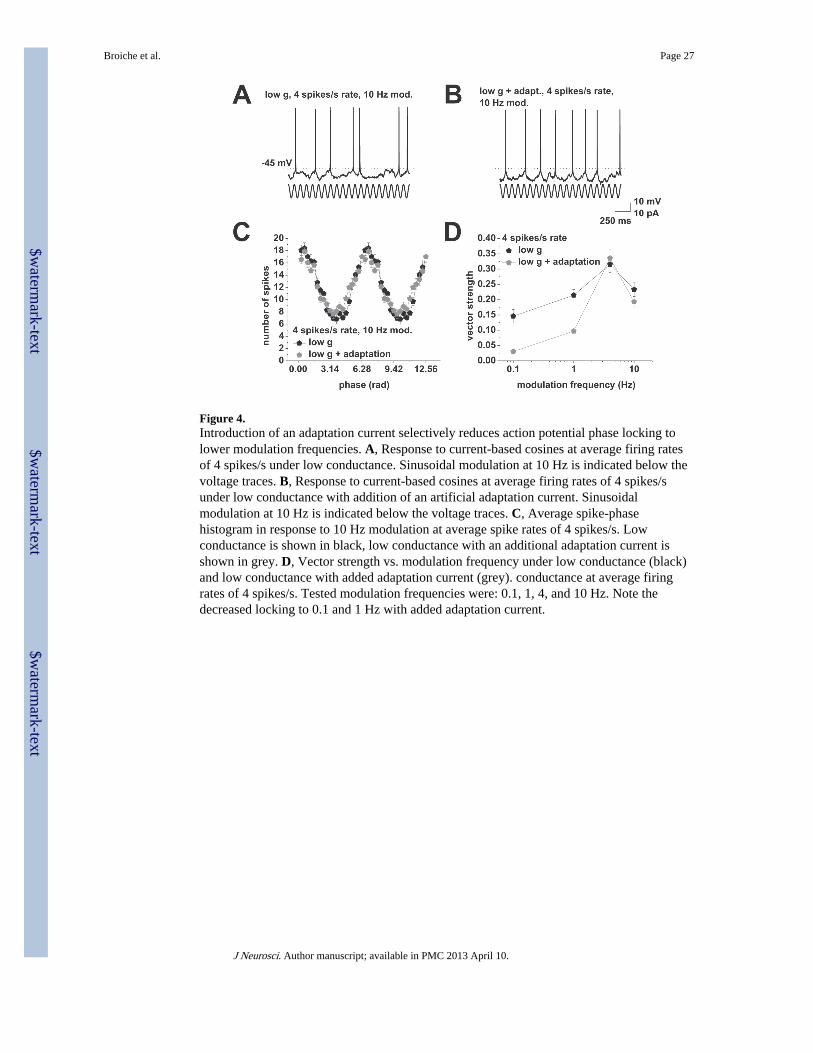
Figure 4.Introduction of an adaptation current selectively reduces action potential phase locking tolower modulation frequencies. A, Response to current-based cosines at average firing ratesof 4 spikes/s under low conductance. Sinusoidal modulation at 10 Hz is indicated below thevoltage traces. B, Response to current-based cosines at average firing rates of 4 spikes/sunder low conductance with addition of an artificial adaptation current. Sinusoidalmodulation at 10 Hz is indicated below the voltage traces. C, Average spike-phasehistogram in response to 10 Hz modulation at average spike rates of 4 spikes/s. Lowconductance is shown in black, low conductance with an additional adaptation current isshown in grey. D, Vector strength vs. modulation frequency under low conductance (black)and low conductance with added adaptation current (grey). conductance at average firingrates of 4 spikes/s. Tested modulation frequencies were: 0.1, 1, 4, and 10 Hz. Note thedecreased locking to 0.1 and 1 Hz with added adaptation current.
Broiche et al. Page 27
J Neurosci. Author manuscript; available in PMC 2013 April 10.
$waterm
ark-text$w
atermark-text
$waterm
ark-text
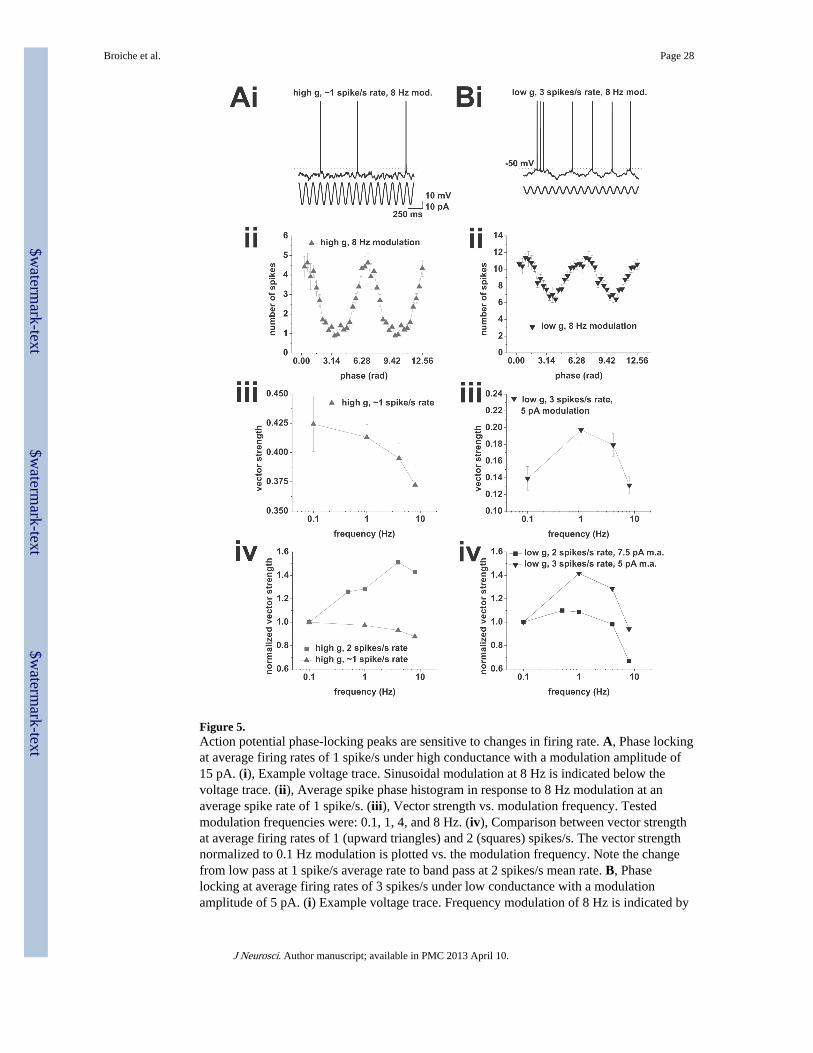
Figure 5.Action potential phase-locking peaks are sensitive to changes in firing rate. A, Phase lockingat average firing rates of 1 spike/s under high conductance with a modulation amplitude of15 pA. (i), Example voltage trace. Sinusoidal modulation at 8 Hz is indicated below thevoltage trace. (ii), Average spike phase histogram in response to 8 Hz modulation at anaverage spike rate of 1 spike/s. (iii), Vector strength vs. modulation frequency. Testedmodulation frequencies were: 0.1, 1, 4, and 8 Hz. (iv), Comparison between vector strengthat average firing rates of 1 (upward triangles) and 2 (squares) spikes/s. The vector strengthnormalized to 0.1 Hz modulation is plotted vs. the modulation frequency. Note the changefrom low pass at 1 spike/s average rate to band pass at 2 spikes/s mean rate. B, Phaselocking at average firing rates of 3 spikes/s under low conductance with a modulationamplitude of 5 pA. (i) Example voltage trace. Frequency modulation of 8 Hz is indicated by
Broiche et al. Page 28
J Neurosci. Author manuscript; available in PMC 2013 April 10.
$waterm
ark-text$w
atermark-text
$waterm
ark-text
the sinusoid below the voltage trace. (ii), Average spike-phase histogram in response to 8 Hzmodulation at an average spike rate of 3 spikes/s. (iii), Vector strength vs. modulationfrequency. Tested modulation frequencies were: 0.1, 1, 4, and 8 Hz. (iv), Comparisonbetween vector strength at average firing rates of 3 (downward triangles) and 2 (squares)spikes/s. Vector strength normalized to 0.1 Hz modulation is plotted vs. the modulationfrequency. Modulation amplitude for 2 spikes/s mean rates was 7.5 pA, amplitude for 3spikes/s mean rate was 5 pA. Note the change from low pass at 2 spikes/s average rate toband pass at 3 spikes/s mean rate.
Broiche et al. Page 29
J Neurosci. Author manuscript; available in PMC 2013 April 10.
$waterm
ark-text$w
atermark-text
$waterm
ark-text
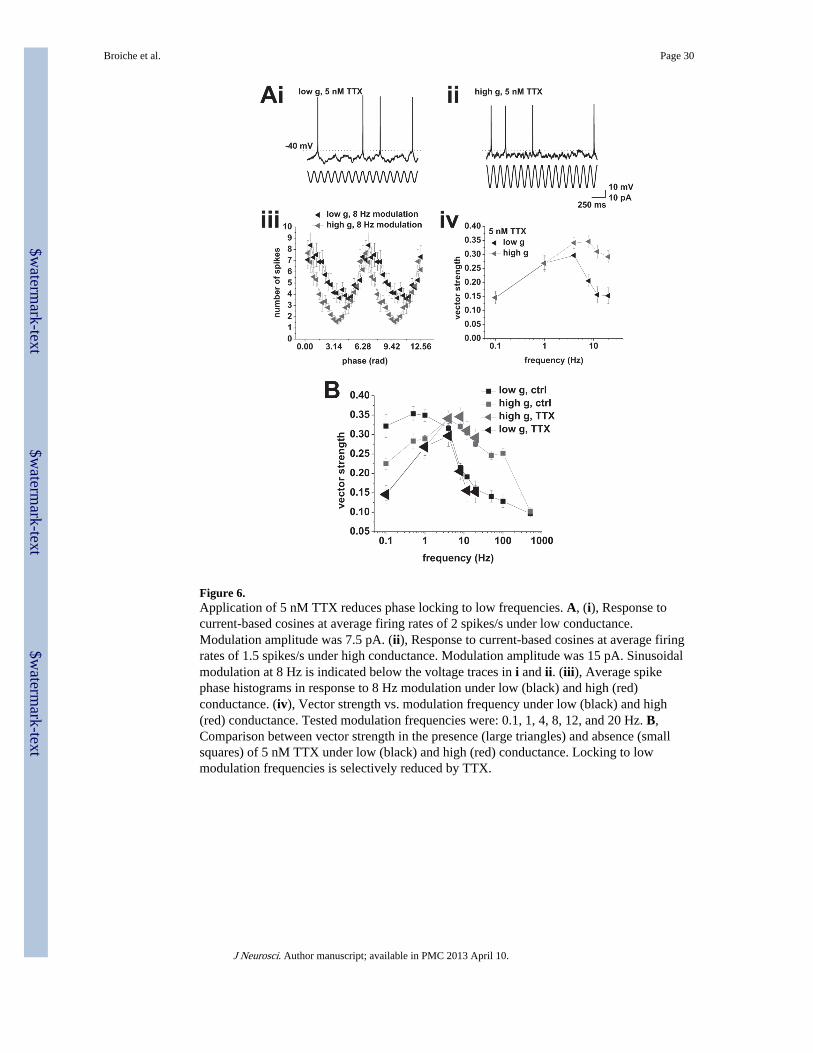
Figure 6.Application of 5 nM TTX reduces phase locking to low frequencies. A, (i), Response tocurrent-based cosines at average firing rates of 2 spikes/s under low conductance.Modulation amplitude was 7.5 pA. (ii), Response to current-based cosines at average firingrates of 1.5 spikes/s under high conductance. Modulation amplitude was 15 pA. Sinusoidalmodulation at 8 Hz is indicated below the voltage traces in i and ii. (iii), Average spikephase histograms in response to 8 Hz modulation under low (black) and high (red)conductance. (iv), Vector strength vs. modulation frequency under low (black) and high(red) conductance. Tested modulation frequencies were: 0.1, 1, 4, 8, 12, and 20 Hz. B,Comparison between vector strength in the presence (large triangles) and absence (smallsquares) of 5 nM TTX under low (black) and high (red) conductance. Locking to lowmodulation frequencies is selectively reduced by TTX.
Broiche et al. Page 30
J Neurosci. Author manuscript; available in PMC 2013 April 10.
$waterm
ark-text$w
atermark-text
$waterm
ark-text
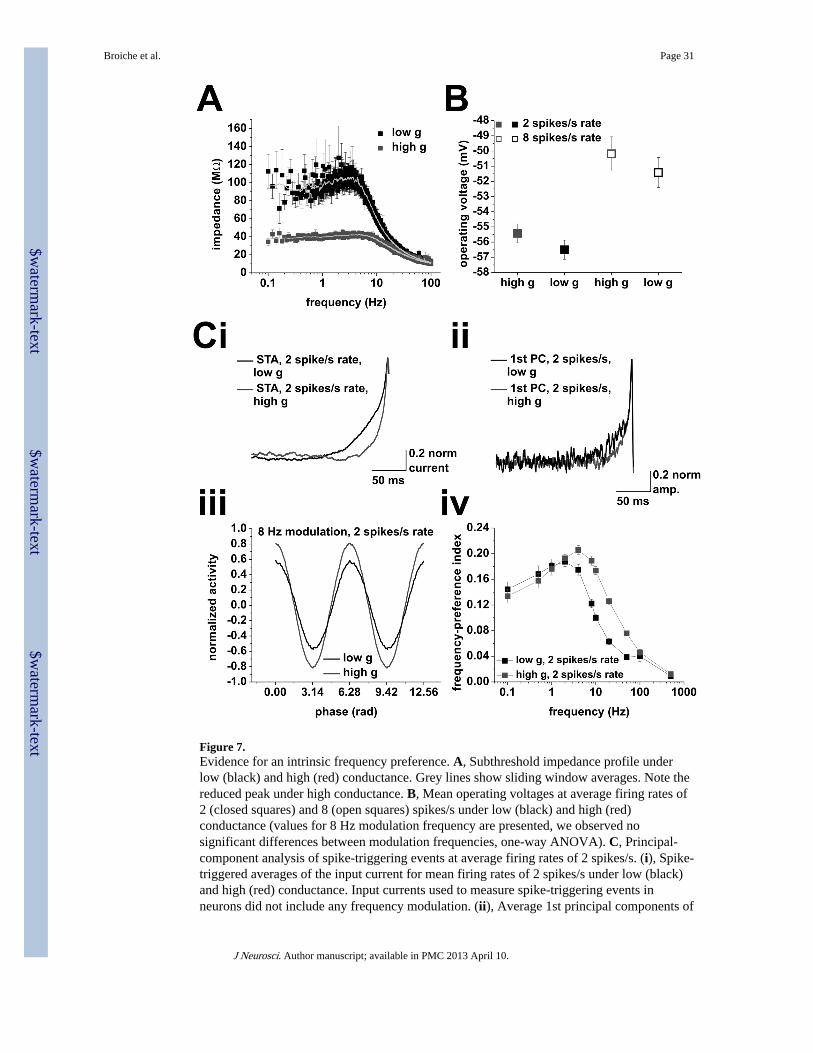
Figure 7.Evidence for an intrinsic frequency preference. A, Subthreshold impedance profile underlow (black) and high (red) conductance. Grey lines show sliding window averages. Note thereduced peak under high conductance. B, Mean operating voltages at average firing rates of2 (closed squares) and 8 (open squares) spikes/s under low (black) and high (red)conductance (values for 8 Hz modulation frequency are presented, we observed nosignificant differences between modulation frequencies, one-way ANOVA). C, Principal-component analysis of spike-triggering events at average firing rates of 2 spikes/s. (i), Spike-triggered averages of the input current for mean firing rates of 2 spikes/s under low (black)and high (red) conductance. Input currents used to measure spike-triggering events inneurons did not include any frequency modulation. (ii), Average 1st principal components of
Broiche et al. Page 31
J Neurosci. Author manuscript; available in PMC 2013 April 10.
$waterm
ark-text$w
atermark-text
$waterm
ark-text
the spike-triggering events under low (black) and high (red) conductance at mean firing ratesof 2 spikes/s. (iii), Average normalized activity vs. phase for a modulation frequency of 8Hz. Activity for low conductance is shown in black, high conductance shown in red. (iv),Frequency-preference index of the 1st principal components under low (black) and high(red) conductance. Tested modulation frequencies were: 0.1, 0.5, 1, 2, 4, 8, 10, 20, 50, 100,and 500 Hz.
Broiche et al. Page 32
J Neurosci. Author manuscript; available in PMC 2013 April 10.
$waterm
ark-text$w
atermark-text
$waterm
ark-text
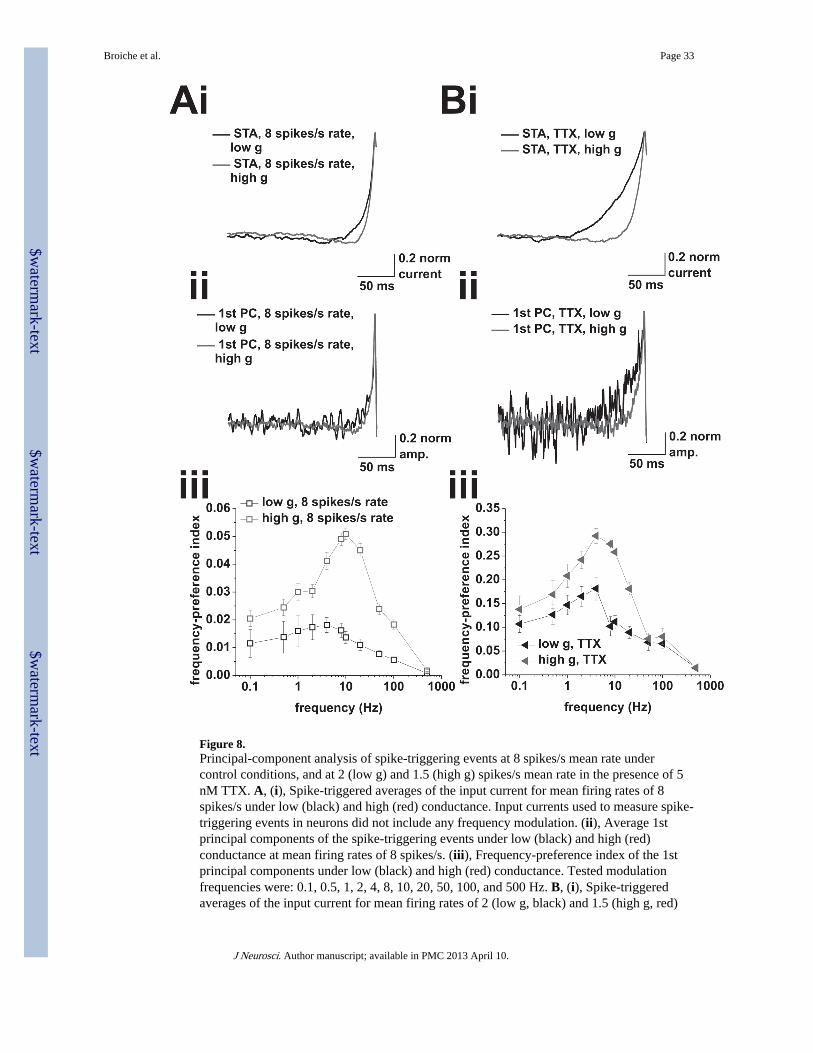
Figure 8.Principal-component analysis of spike-triggering events at 8 spikes/s mean rate undercontrol conditions, and at 2 (low g) and 1.5 (high g) spikes/s mean rate in the presence of 5nM TTX. A, (i), Spike-triggered averages of the input current for mean firing rates of 8spikes/s under low (black) and high (red) conductance. Input currents used to measure spike-triggering events in neurons did not include any frequency modulation. (ii), Average 1stprincipal components of the spike-triggering events under low (black) and high (red)conductance at mean firing rates of 8 spikes/s. (iii), Frequency-preference index of the 1stprincipal components under low (black) and high (red) conductance. Tested modulationfrequencies were: 0.1, 0.5, 1, 2, 4, 8, 10, 20, 50, 100, and 500 Hz. B, (i), Spike-triggeredaverages of the input current for mean firing rates of 2 (low g, black) and 1.5 (high g, red)
Broiche et al. Page 33
J Neurosci. Author manuscript; available in PMC 2013 April 10.
$waterm
ark-text$w
atermark-text
$waterm
ark-text
spikes/s, in the presence of 5 nM TTX. Input currents used to measure spike-triggeringevents in neurons did not include any frequency modulation. (ii), Average 1st principalcomponents of the spike triggering events under low (black) and high (red) conductance inthe presence of 5 nM TTX. (iii), Frequency-preference index of the 1st principalcomponents under low (black) and high (red) conductance. Tested modulation frequencieswere: 0.1, 0.5, 1, 2, 4, 8, 10, 20, 50, 100, and 500 Hz.
Broiche et al. Page 34
J Neurosci. Author manuscript; available in PMC 2013 April 10.
$waterm
ark-text$w
atermark-text
$waterm
ark-text
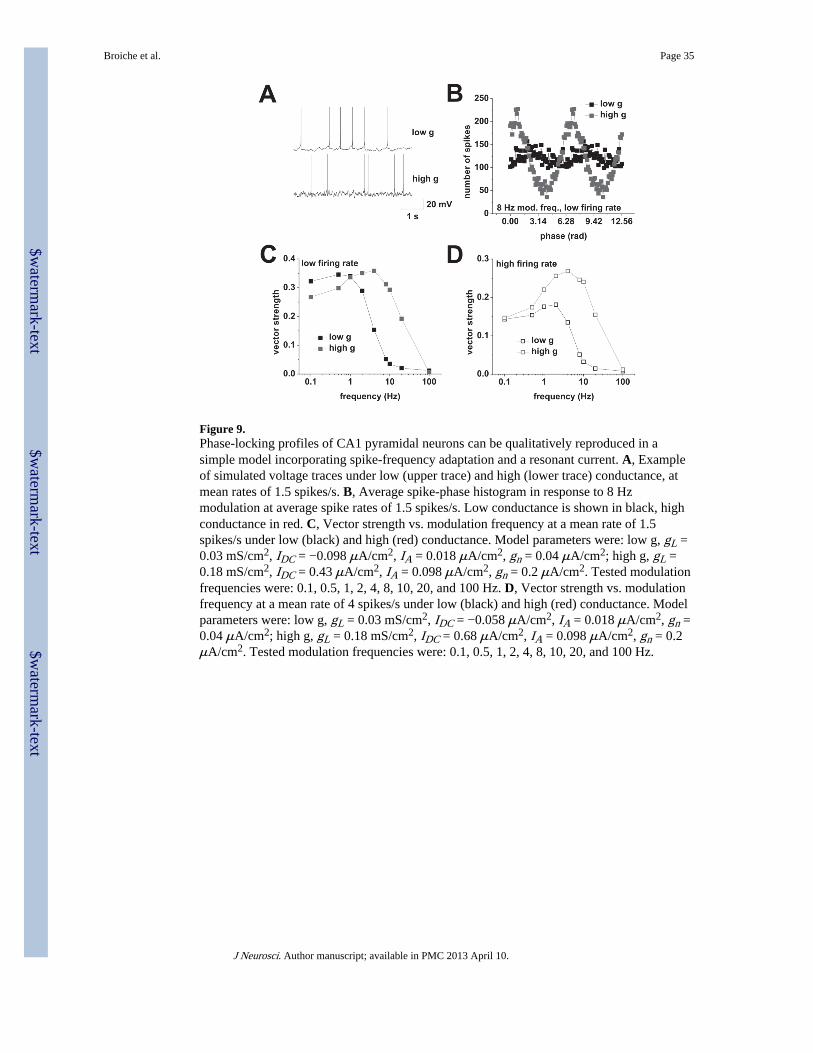
Figure 9.Phase-locking profiles of CA1 pyramidal neurons can be qualitatively reproduced in asimple model incorporating spike-frequency adaptation and a resonant current. A, Exampleof simulated voltage traces under low (upper trace) and high (lower trace) conductance, atmean rates of 1.5 spikes/s. B, Average spike-phase histogram in response to 8 Hzmodulation at average spike rates of 1.5 spikes/s. Low conductance is shown in black, highconductance in red. C, Vector strength vs. modulation frequency at a mean rate of 1.5spikes/s under low (black) and high (red) conductance. Model parameters were: low g, gL =0.03 mS/cm2, IDC = −0.098 μA/cm2, IA = 0.018 μA/cm2, gn = 0.04 μA/cm2; high g, gL =0.18 mS/cm2, IDC = 0.43 μA/cm2, IA = 0.098 μA/cm2, gn = 0.2 μA/cm2. Tested modulationfrequencies were: 0.1, 0.5, 1, 2, 4, 8, 10, 20, and 100 Hz. D, Vector strength vs. modulationfrequency at a mean rate of 4 spikes/s under low (black) and high (red) conductance. Modelparameters were: low g, gL = 0.03 mS/cm2, IDC = −0.058 μA/cm2, IA = 0.018 μA/cm2, gn =0.04 μA/cm2; high g, gL = 0.18 mS/cm2, IDC = 0.68 μA/cm2, IA = 0.098 μA/cm2, gn = 0.2μA/cm2. Tested modulation frequencies were: 0.1, 0.5, 1, 2, 4, 8, 10, 20, and 100 Hz.
Broiche et al. Page 35
J Neurosci. Author manuscript; available in PMC 2013 April 10.
$waterm
ark-text$w
atermark-text
$waterm
ark-text
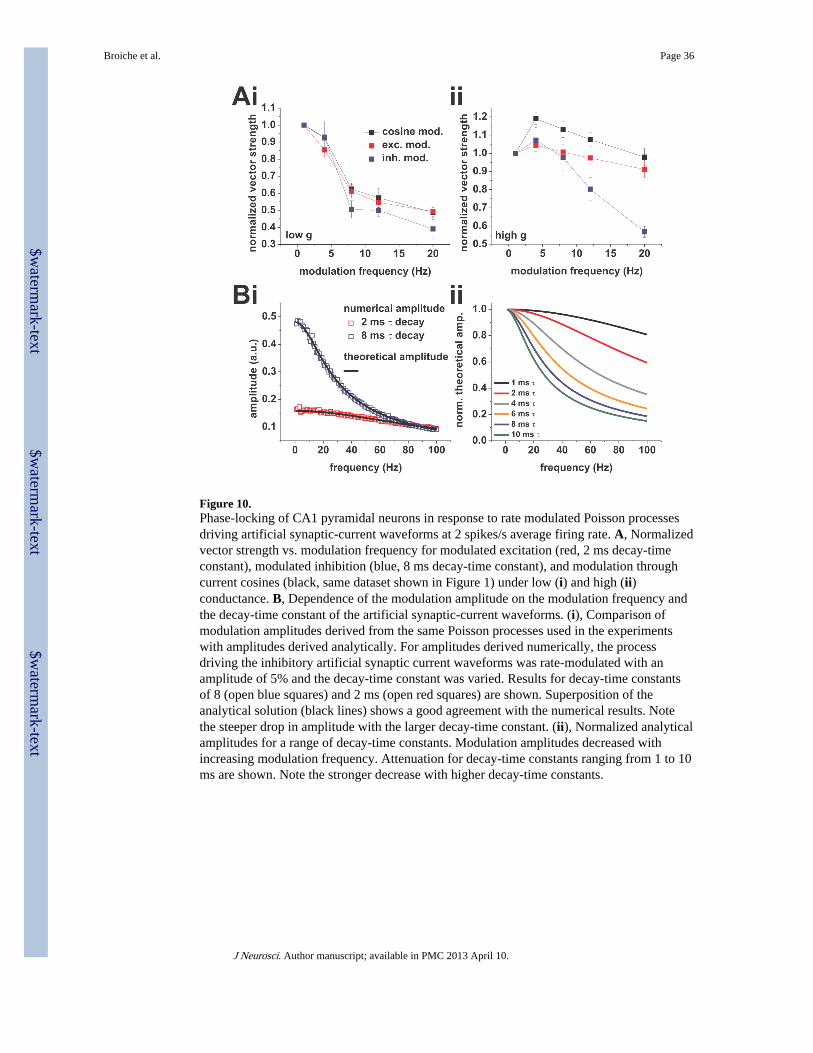
Figure 10.Phase-locking of CA1 pyramidal neurons in response to rate modulated Poisson processesdriving artificial synaptic-current waveforms at 2 spikes/s average firing rate. A, Normalizedvector strength vs. modulation frequency for modulated excitation (red, 2 ms decay-timeconstant), modulated inhibition (blue, 8 ms decay-time constant), and modulation throughcurrent cosines (black, same dataset shown in Figure 1) under low (i) and high (ii)conductance. B, Dependence of the modulation amplitude on the modulation frequency andthe decay-time constant of the artificial synaptic-current waveforms. (i), Comparison ofmodulation amplitudes derived from the same Poisson processes used in the experimentswith amplitudes derived analytically. For amplitudes derived numerically, the processdriving the inhibitory artificial synaptic current waveforms was rate-modulated with anamplitude of 5% and the decay-time constant was varied. Results for decay-time constantsof 8 (open blue squares) and 2 ms (open red squares) are shown. Superposition of theanalytical solution (black lines) shows a good agreement with the numerical results. Notethe steeper drop in amplitude with the larger decay-time constant. (ii), Normalized analyticalamplitudes for a range of decay-time constants. Modulation amplitudes decreased withincreasing modulation frequency. Attenuation for decay-time constants ranging from 1 to 10ms are shown. Note the stronger decrease with higher decay-time constants.
Broiche et al. Page 36
J Neurosci. Author manuscript; available in PMC 2013 April 10.
$waterm
ark-text$w
atermark-text
$waterm
ark-text