mode-locking in semiconductor fabry-pérot lasers
TRANSCRIPT
IEEE JOURNAL OF QUANTUM ELECTRONICS, VOL. 46, NO. 7, JULY 2010 1023
Mode-Locking in Semiconductor Fabry-Pérot LasersJulien Javaloyes and Salvador Balle
Abstract—We theoretically study the dynamics and the mode-locking properties of semiconductor Fabry–Pérot lasers with in-tracavity saturable absorber by using a travelling-wave model anda time-domain description of the optical response of the semicon-ductor materials. Our description enables us to incorporate impor-tant features as for instance the abrupt spectral variations of theabsorption in the saturable absorber. We analyze the influence ofseveral key parameters that affect the stability of the mode-lockingregime and show that this modelling approach can be used, uponproper fitting of the material parameters, for optimization of thedesign of semiconductor mode-locked lasers.
Index Terms—Mode locked lasers, saturable absorber, semicon-ductor lasers, travelling-wave modelling.
I. INTRODUCTION
M ODE-LOCKING (ML) of lasers is a subject of intenseresearch both theoretically and experimentally. The
theoretical challenge arises from the complex nonlinear dy-namics involving the self-organization of many laser modeswhile the experimental motivation comes from the large numberof applications of short pulse sources in medicine, metrologyand telecommunications [1]. ML has led to the shortest andmost intense optical pulses ever generated. Semiconductormode-locked lasers have the added attraction of being compact,low cost and adaptable to many cavity geometries [2].
A multimode laser can be forced to operate in a mode-lockedstate either passively or actively. Active ML is achieved by mod-ulating one control parameter of the laser at a frequency reso-nant with the separation between modes. A drawback of activeML is the requirement of a precise external modulation whichcan be unreachable at ultra-fast speeds. On the other hand, pas-sive ML does not require any external modulation and it is thepreferred approach for generating optical pulses at multi-giga-hertz repetition rates [1]. Passive ML is commonly achieved bycombining two elements, a laser amplifier which provides gainand a saturable absorber (SA) acting as a pulse shortening el-ement. A window for amplification is opened around the pulsedue to the faster recovery time of the absorption that can be ei-ther smaller or faster than the pulse width thereby defining the
Manuscript received October 23, 2009; revised January 20, 2010. Currentversion published March 31, 2010. This work was supported by the EPSRC(Project EP/E065112/1) and the Project BLANCO (TEC2006-13887-C05-03).
J. Javaloyes is with the Department of Electronics and Electrical Engineering,University of Glasgow, G12 8LT Glasgow, Scotland, U.K. (e-mail: [email protected]).
S. Balle is with the Institut Mediterrani d’Estudis Avançcats (IMEDEA),Consejo Superior de Investigaciones Científicas-Universitat de les Illes Balears,E-07071 Esporles, Spain (e-mail: [email protected]).
Color versions of one or more of the figures in this paper are available onlineat http://ieeexplore.ieee.org.
Digital Object Identifier 10.1109/JQE.2010.2042792
two so-called regimes of slow [3] and fast [4] SA. Often, thetwo methods can be combined effectively (hybrid ML) to re-duce pulse jitter, as for instance in [5], where timing jitter as lowas 570 fs is obtained by direct modulation of the SA section.Notice however that alternative methods exist, e.g., nonlinearpolarization rotation [6], Kerr lens mode locking [7] as well ascrossed-polarization gain modulation [8] or ultrafast Stark ef-fect modulation [9].
Despite the effort that has been dedicated to it, modelingof ML lasers continues to present a challenge. Haus’ masterequation is a widely used approach to study passive ML in thetime domain. Because analytical predictions on the pulse prop-erties can be assessed, these pulse iterative models have pro-vided some very useful insights into the ML problem. However,these approaches when applied to a particular design provideonly some very qualitative predictions due to the many simpli-fying hypothesis involved. For instance, the assumption of weakgain and saturation is difficult to justify in semiconductor media.This hypothesis was however lifted by the more refined modelpresented in [10]. Still, the work presented in [10] assumes alumped element approach, where gain, loss and linear spectralfiltering happen in different sections of the device, as well asan ideal unidirectional ring configuration. While the former hy-pothesis of lumping gain and a linear filtering element could bevalid when a strong filter is present within the cavity, e.g., a dis-tributed Bragg reflector, it is however usually the gain mediumitself that provides the spectral filtering of the pulse. This spec-tral transformation is furthermore nonlinear [11], [12]. In ad-dition, the saturable loss section also provides a strongly asym-metric and non linear filtering, a point that is usually overlooked.The latter hypothesis of unidirectional emission strongly re-stricts the scope of the possible cavity geometries thereby ex-cluding the common case of a Fabry–Pérot cavity.
On the other hand, approaches based on a finite differencetime domain description of the electromagnetic field [13] andthe many body semiconductor Bloch equations description ofthe active medium [14] allow to satisfactorily describe ultrafastdynamics. However, they require an enormous computationalpower which impedes parametric studies thereby hindering acomprehensive understanding of the ML scenario: even if MLis by definition a fast phenomenon, pulses being of the orderof the picoseconds, the transient time needed to reach a stableemission regime can be as long as several tens of nanoseconds,representing thousands of cycles; in addition, assessing timingjitter or pulse fluctuations requires computing long time series.
To circumvent the limitations of these models and shed somelight onto the ML scenario, another approach consists of de-scribing the dynamics by spatially resolving the propagation ofthe electromagnetic waves under the slowly varying approxi-mation, thereby going from resolutions below the wavelengthto resolutions of a few tens of the wavelength. Such an ap-
0018-9197/$26.00 © 2010 IEEE
1024 IEEE JOURNAL OF QUANTUM ELECTRONICS, VOL. 46, NO. 7, JULY 2010
proach, based on a travelling-wave model (TWM) of the device,allows to directly incorporate the inhomogeneous spatial distri-butions of the optical field and material variables, the so-calledspatial-hole burning effects. Moreover, this approach allows tostudy different designs irrespective of the geometry, which en-ters the description of the system via the boundary conditions tobe satisfied by the optical field.
Although the TWM can be used with a frequency-inde-pendent gain spectrum [15], more quantitative studies have toinclude this feature, which poses the main difficulty faced inTWMs: to correctly describe the interaction of the optical fieldwith the active material in time domain. A pioneering workincorporating frequency-dependent gain in a TWM dates backto the late 1960s [16] and was successfully used in, e.g., [17].Still, these works assume the presence of a two-level activemedium, for which the optical response in time domain is wellknown [18]. This is generally not the case of semiconductormaterials, where the presence of energy bands induces a largeinhomogeneous broadening [19] that profoundly affects thedynamics in semiconductor lasers. This has stimulated thesearch of approximate descriptions of the optical response ofsemiconductor media. In [20] the optical response, determinedfrom the semiconductor Bloch equations, was fitted to the sumof several lorentzians, each of them allowing for a two-level likedescription. Other approaches [21], [22] have also developedtwo-level like approximations to the optical response of bulksemiconductor active media. Finally, analytical expressions forthe optical response of quantum-well active media in simplifiedcases have been developed in [23] and [24]. These latter results,given only in the frequency domain, have been used in [25]by transforming them into a rational fraction by using a Padéapproximation. While good for narrow band spectra, the resultsbased on the rational fit presented in [25] are expected to beless accurate when a SA is present in the device. The firstreason being simply that the SA induces broad band multimodedynamics; the second reason is that the spectral shape of theband-edge of the SA semiconductor material, which presentsa sharp transition from transparent to absorptive behavior, isexpected to be poorly described by any kind of fit based onpolynomials or rational functions.
More recently, the analytical results of [24] have been trans-formed exactly into a time domain description [26] capable ofdealing even with the sharp band-edge of SAs. This improvedmodel allows us to study important physical effects that were be-yond the reach of the model presented in [25] as for instance thestrong influence of the relative position between the gain peakand the SA band-edge on the pulses [27]. This effect is particu-larly important in materials like AlGaInAs since their band-edgeis extremely sharp (10–15 nm).
In this manuscript, we use the method presented in [26] toanalyze the simple, yet poorly understood, configuration of aFabry–Pérot laser with one section of SA at one end. Althoughcommonly encountered in ML lasers, this configuration canhardly be studied by pulse iterative models. We discuss the dy-namics of this specific system, focusing on the key parametersaffecting the mode-locked regimes: length and recovery timeof the SA section, gain bandwidth and relative position of the
band-edge of the SA with respect to the gain peak. We postponefor future studies the statistics of the pulse train.
This paper is organized as follows. In Section II, we recallthe basis of our TWM and the implementation of the time do-main polarization by a convolution presented in [26]. Section IIIdiscusses the parametric dependencies of the ML dynamics. Fi-nally, we draw some conclusions in Section IV.
II. MODEL
Our theoretical framework is a TWM for the slowly-varyingamplitudes of the forward and backward waves [18], , whichevolve in space and time according to
(1)
where are the internal losses of the system, is the opticalconfinement factor, and for numerical purposes we have scaledtime and space to the cavity transit time and to the optical lengthof the cavity, respectively. A typical 1.17 mm long device wouldhave a transit time 12.5 ps.
In (1), the source for are the projections of the total po-larization of the active material onto the forward and backwardpropagation directions, , which are obtained by a coarsegraining procedure by averaging the polarization over a fewwavelengths. In addition, appropriate boundary conditionsfor the field amplitudes have to be provided for describingthe geometry of the device. In our case, we shall consider aFabry–Pérot cavity divided in two sections. The first one, from
to is electrically pumped and correspondsto the amplifier section; the second one, from to
, is reverse biased and corresponds to a SA section ofrelative length . We consider that there is no reflectivity at theamplifier-SA interface, and that the cavity is defined by simplecleaved facets.
Within each section, the link between the polarization andfield amplitudes is given by [26]
(2)
where and is the Fourier transform of thefrequency-dependent susceptibility of the active material. Inaddition, is the quasi-homogeneous component ofthe spatially dependent, time evolving carrier density, while
is the complex amplitude of the carrierdensity grating at half the wavelength that develops due to thepresence of the two counter-propagating waves. In deriving(2), we assumed that the grating in the carrier density is smalldue to carrier diffusion [25]. Using the analytical susceptibilitydeveloped in [23], [24], we have that [26]
(3)
JAVALOYES AND BALLE: MODE-LOCKING IN SEMICONDUCTOR FABRY-PÉROT LASERS 1025
where is the Heaviside function. Moreover, is the po-larization dephasing rate, is the transparency carrier density,
the frequency corresponding to the bandgap, the normal-ized energy span of the semiconductor bands and the ma-terial’s susceptibility constant (see [24] for details). Note thatthis response function is causal and well behaved at . Thedecaying exponential represents the memory time of the activemedium, which is proportional to as intuition dictates.
We note that a typical polarization relaxation time of 125 fscorresponds in our scaled units to . In addition, the en-ergy span of a semiconductor typically gives[24]. It is however possible to choose a much lower value forthe top of the band without any noticeable deformation of thegain and of the index spectra in the frequency range where thedynamics occurs [26], which very much simplifies the numer-ical implementation. In the following we use , whichcorresponds to an energy span 16 THz, i.e.,much larger than the optical width considered.
It is worth remarking that both the amplifier and the SA sec-tions will be described with exactly the same functional form forthe optical response, although with different parameter values.The reason is that both sections, even if having the same nominalcomposition, work in very different conditions for the carrierdensity. The polarization relaxation is typically mediated by twosources, phonon assisted and carrier induced relaxation. Whilethe former one does not depend on the carrier density but mainlyupon the quantity of phonons available, the second one is an in-creasing function of the carrier density. Since the gain and ab-sorber sections operate in very different regimes where the car-rier density is respectively large and small, the relaxation timein the SA must be longer, hereby determining that the values of
are different in the two sections. We will denote andtheir values in the gain and SA sections. In addition, we allowthe band-edge of the SA section to be shifted in frequencywith respect to the one of the gain section, thereby including ina phenomenological way the quantum confined stark effect. Wechoose our reference frame to be the band-edge of the gain sec-tion, therefore .
Within the gain section, the carrier density is determined by
(4)
(5)
where is the current density injected per unit time (normalizedto the electron charge) into the section and is theoptical carrier wavevector. The recombination term is assumedto be of the form
(6)
where , , and the non radiative, bi-molecular and Augerrecombination coefficients, respectively, and the ambipolar dif-fusion coefficient is .
Within the SA section, there is no current injection (hence) but the optically generated carriers are swept out at a
rate that depends on the reverse voltage applied to the SA sec-tion. In addition, impurities and defects—created e. g. by protonbombardment—can largely increase the non-radiative recombi-nation rate in this section. As a result, the evolution of the carrierdensity in the SA section is given by formally the same equa-tions as those in the gain section, with
(7)
(8)
The method used to numerically integrate the model is de-tailed in [26] and [28]. For numerical purposes it is convenientto scale the carrier densities within each section to the corre-sponding transparency carrier density, in the gain sectionand in the SA section. The fields and polarizations are thenaccordingly scaled. The field is spatially discretized on a meshof samples, hence the temporal discretization, fixed by theCourant–Friedrichs–Lewy condition is (the speed oflight and the length of the cavity are unity in our notations).This means that our signal is sampled and that the convolutionhas to be computed from a discretized signal. The highest orderof integration achievable in this case is second order accurate,consistent with our integration algorithm for the partial differen-tial equations. For a given second order accuracy, several varia-tions for the integral can be used and we choose the trapezoidalrule, which besides being the simplest also happens to be thebest (see [26] for more details). In addition, we simulate spon-taneous emission noise by adding after each step a stochasticterm to the polarization at each point in space and in each direc-tion of variance . We assume for the sake of simplicity that isboth frequency and carrier density independent. The noise wasgenerated by the Box–Muller method and a Mersenne twister[29].
III. RESULTS
We consider unless otherwise specified the device parame-ters listed in Table I. The fundamental repetition rate of our MLdevice is 40 GHz. We have considered that the intraband relax-ation time in the SA is double of that in the gain section andconsequently . This represents closely the case of Alquaternary materials as presented for instance in [30].
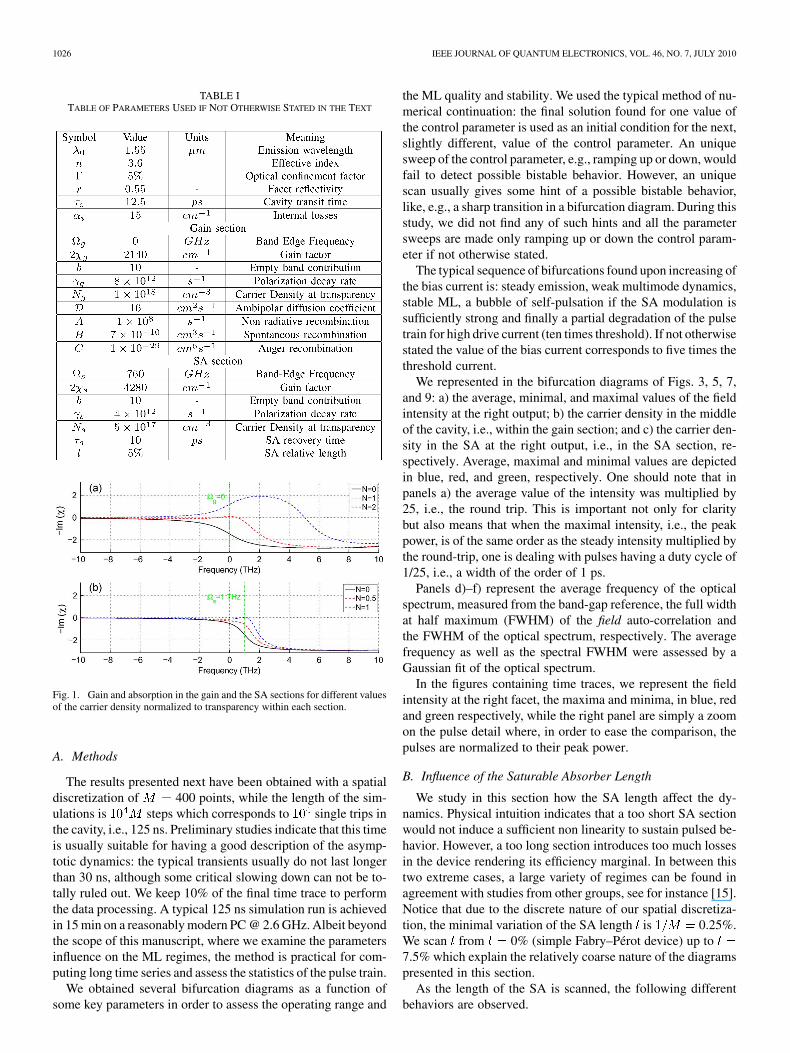
We summarize in Fig. 1 the various frequency scales presentin the problem by representing the imaginary part of the sus-ceptibility in the amplifier and SA sections for different valuesof the carrier density. The chosen values are smaller in the SAsection since it is usually operating below transparency, i.e.,
. The gain and absorption of the active medium in thetwo sections have different references band-edge frequencies,i.e., and . Notice also that the SA band-edge is sharpersince we have chosen .
In this configuration and for the parameters of Table I thelasing threshold of the pure Fabry–Pérot laser is achieved whenthe carrier density in the gain section is around .Therefore the effective FWHM of the gain spectrum estimatedfrom Fig. 1(a) is 5 THz, i.e., 40 nm around the lasing wavelengthof 1550 nm. With the parameters of Table I, this corresponds toa normalized current value of .
1026 IEEE JOURNAL OF QUANTUM ELECTRONICS, VOL. 46, NO. 7, JULY 2010
TABLE ITABLE OF PARAMETERS USED IF NOT OTHERWISE STATED IN THE TEXT
Fig. 1. Gain and absorption in the gain and the SA sections for different valuesof the carrier density normalized to transparency within each section.
A. Methods
The results presented next have been obtained with a spatialdiscretization of 400 points, while the length of the sim-ulations is steps which corresponds to single trips inthe cavity, i.e., 125 ns. Preliminary studies indicate that this timeis usually suitable for having a good description of the asymp-totic dynamics: the typical transients usually do not last longerthan 30 ns, although some critical slowing down can not be to-tally ruled out. We keep 10% of the final time trace to performthe data processing. A typical 125 ns simulation run is achievedin 15 min on a reasonably modern PC @ 2.6 GHz. Albeit beyondthe scope of this manuscript, where we examine the parametersinfluence on the ML regimes, the method is practical for com-puting long time series and assess the statistics of the pulse train.
We obtained several bifurcation diagrams as a function ofsome key parameters in order to assess the operating range and
the ML quality and stability. We used the typical method of nu-merical continuation: the final solution found for one value ofthe control parameter is used as an initial condition for the next,slightly different, value of the control parameter. An uniquesweep of the control parameter, e.g., ramping up or down, wouldfail to detect possible bistable behavior. However, an uniquescan usually gives some hint of a possible bistable behavior,like, e.g., a sharp transition in a bifurcation diagram. During thisstudy, we did not find any of such hints and all the parametersweeps are made only ramping up or down the control param-eter if not otherwise stated.
The typical sequence of bifurcations found upon increasing ofthe bias current is: steady emission, weak multimode dynamics,stable ML, a bubble of self-pulsation if the SA modulation issufficiently strong and finally a partial degradation of the pulsetrain for high drive current (ten times threshold). If not otherwisestated the value of the bias current corresponds to five times thethreshold current.
We represented in the bifurcation diagrams of Figs. 3, 5, 7,and 9: a) the average, minimal, and maximal values of the fieldintensity at the right output; b) the carrier density in the middleof the cavity, i.e., within the gain section; and c) the carrier den-sity in the SA at the right output, i.e., in the SA section, re-spectively. Average, maximal and minimal values are depictedin blue, red, and green, respectively. One should note that inpanels a) the average value of the intensity was multiplied by25, i.e., the round trip. This is important not only for claritybut also means that when the maximal intensity, i.e., the peakpower, is of the same order as the steady intensity multiplied bythe round-trip, one is dealing with pulses having a duty cycle of1/25, i.e., a width of the order of 1 ps.
Panels d)–f) represent the average frequency of the opticalspectrum, measured from the band-gap reference, the full widthat half maximum (FWHM) of the field auto-correlation andthe FWHM of the optical spectrum, respectively. The averagefrequency as well as the spectral FWHM were assessed by aGaussian fit of the optical spectrum.
In the figures containing time traces, we represent the fieldintensity at the right facet, the maxima and minima, in blue, redand green respectively, while the right panel are simply a zoomon the pulse detail where, in order to ease the comparison, thepulses are normalized to their peak power.
B. Influence of the Saturable Absorber Length
We study in this section how the SA length affect the dy-namics. Physical intuition indicates that a too short SA sectionwould not induce a sufficient non linearity to sustain pulsed be-havior. However, a too long section introduces too much lossesin the device rendering its efficiency marginal. In between thistwo extreme cases, a large variety of regimes can be found inagreement with studies from other groups, see for instance [15].Notice that due to the discrete nature of our spatial discretiza-tion, the minimal variation of the SA length is 0.25%.We scan from 0% (simple Fabry–Pérot device) up to7.5% which explain the relatively coarse nature of the diagramspresented in this section.
As the length of the SA is scanned, the following differentbehaviors are observed.
JAVALOYES AND BALLE: MODE-LOCKING IN SEMICONDUCTOR FABRY-PÉROT LASERS 1027
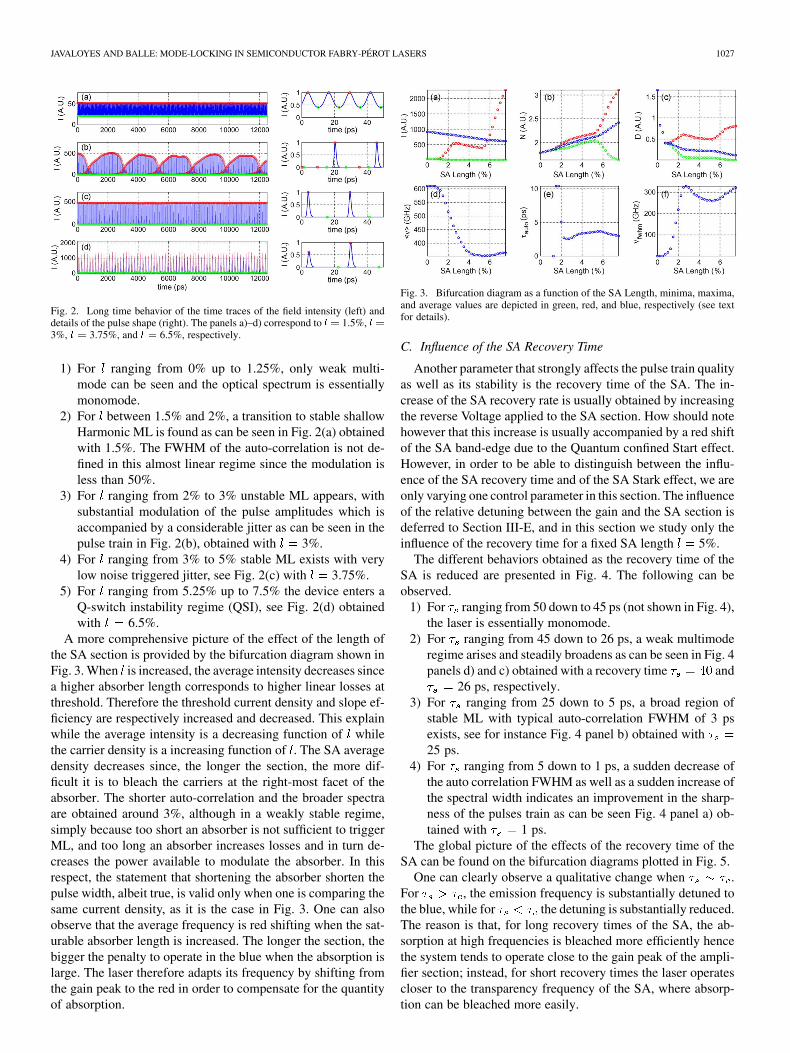
Fig. 2. Long time behavior of the time traces of the field intensity (left) anddetails of the pulse shape (right). The panels a)–d) correspond to � � 1.5%, � �
3%, � � 3.75%, and � � 6.5%, respectively.
1) For ranging from 0% up to 1.25%, only weak multi-mode can be seen and the optical spectrum is essentiallymonomode.
2) For between 1.5% and 2%, a transition to stable shallowHarmonic ML is found as can be seen in Fig. 2(a) obtainedwith 1.5%. The FWHM of the auto-correlation is not de-fined in this almost linear regime since the modulation isless than 50%.
3) For ranging from 2% to 3% unstable ML appears, withsubstantial modulation of the pulse amplitudes which isaccompanied by a considerable jitter as can be seen in thepulse train in Fig. 2(b), obtained with 3%.
4) For ranging from 3% to 5% stable ML exists with verylow noise triggered jitter, see Fig. 2(c) with 3.75%.
5) For ranging from 5.25% up to 7.5% the device enters aQ-switch instability regime (QSI), see Fig. 2(d) obtainedwith 6.5%.
A more comprehensive picture of the effect of the length ofthe SA section is provided by the bifurcation diagram shown inFig. 3. When is increased, the average intensity decreases sincea higher absorber length corresponds to higher linear losses atthreshold. Therefore the threshold current density and slope ef-ficiency are respectively increased and decreased. This explainwhile the average intensity is a decreasing function of whilethe carrier density is a increasing function of . The SA averagedensity decreases since, the longer the section, the more dif-ficult it is to bleach the carriers at the right-most facet of theabsorber. The shorter auto-correlation and the broader spectraare obtained around 3%, although in a weakly stable regime,simply because too short an absorber is not sufficient to triggerML, and too long an absorber increases losses and in turn de-creases the power available to modulate the absorber. In thisrespect, the statement that shortening the absorber shorten thepulse width, albeit true, is valid only when one is comparing thesame current density, as it is the case in Fig. 3. One can alsoobserve that the average frequency is red shifting when the sat-urable absorber length is increased. The longer the section, thebigger the penalty to operate in the blue when the absorption islarge. The laser therefore adapts its frequency by shifting fromthe gain peak to the red in order to compensate for the quantityof absorption.
Fig. 3. Bifurcation diagram as a function of the SA Length, minima, maxima,and average values are depicted in green, red, and blue, respectively (see textfor details).
C. Influence of the SA Recovery Time
Another parameter that strongly affects the pulse train qualityas well as its stability is the recovery time of the SA. The in-crease of the SA recovery rate is usually obtained by increasingthe reverse Voltage applied to the SA section. How should notehowever that this increase is usually accompanied by a red shiftof the SA band-edge due to the Quantum confined Start effect.However, in order to be able to distinguish between the influ-ence of the SA recovery time and of the SA Stark effect, we areonly varying one control parameter in this section. The influenceof the relative detuning between the gain and the SA section isdeferred to Section III-E, and in this section we study only theinfluence of the recovery time for a fixed SA length 5%.
The different behaviors obtained as the recovery time of theSA is reduced are presented in Fig. 4. The following can beobserved.
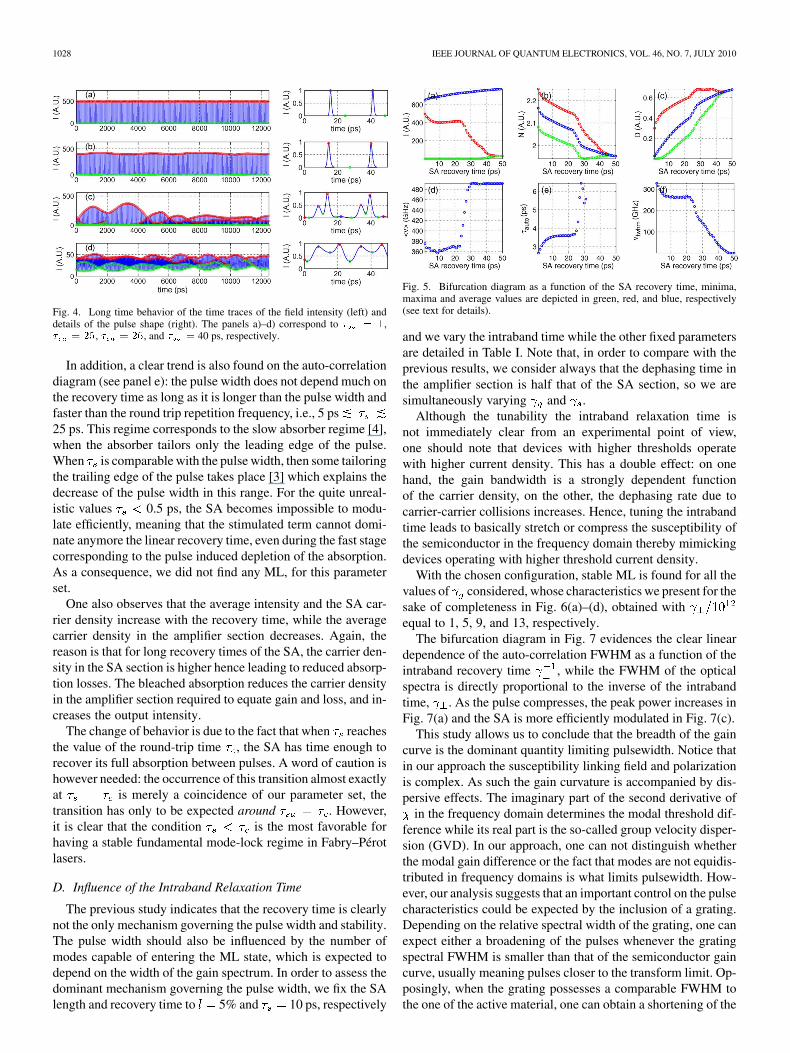
1) For ranging from 50 down to 45 ps (not shown in Fig. 4),the laser is essentially monomode.
2) For ranging from 45 down to 26 ps, a weak multimoderegime arises and steadily broadens as can be seen in Fig. 4panels d) and c) obtained with a recovery time and
26 ps, respectively.3) For ranging from 25 down to 5 ps, a broad region of
stable ML with typical auto-correlation FWHM of 3 psexists, see for instance Fig. 4 panel b) obtained with25 ps.
4) For ranging from 5 down to 1 ps, a sudden decrease ofthe auto correlation FWHM as well as a sudden increase ofthe spectral width indicates an improvement in the sharp-ness of the pulses train as can be seen Fig. 4 panel a) ob-tained with 1 ps.
The global picture of the effects of the recovery time of theSA can be found on the bifurcation diagrams plotted in Fig. 5.
One can clearly observe a qualitative change when .For , the emission frequency is substantially detuned tothe blue, while for the detuning is substantially reduced.The reason is that, for long recovery times of the SA, the ab-sorption at high frequencies is bleached more efficiently hencethe system tends to operate close to the gain peak of the ampli-fier section; instead, for short recovery times the laser operatescloser to the transparency frequency of the SA, where absorp-tion can be bleached more easily.
1028 IEEE JOURNAL OF QUANTUM ELECTRONICS, VOL. 46, NO. 7, JULY 2010
Fig. 4. Long time behavior of the time traces of the field intensity (left) anddetails of the pulse shape (right). The panels a)–d) correspond to � � �,� � ��, � � ��, and � � 40 ps, respectively.
In addition, a clear trend is also found on the auto-correlationdiagram (see panel e): the pulse width does not depend much onthe recovery time as long as it is longer than the pulse width andfaster than the round trip repetition frequency, i.e., 5 ps25 ps. This regime corresponds to the slow absorber regime [4],when the absorber tailors only the leading edge of the pulse.When is comparable with the pulse width, then some tailoringthe trailing edge of the pulse takes place [3] which explains thedecrease of the pulse width in this range. For the quite unreal-istic values 0.5 ps, the SA becomes impossible to modu-late efficiently, meaning that the stimulated term cannot domi-nate anymore the linear recovery time, even during the fast stagecorresponding to the pulse induced depletion of the absorption.As a consequence, we did not find any ML, for this parameterset.
One also observes that the average intensity and the SA car-rier density increase with the recovery time, while the averagecarrier density in the amplifier section decreases. Again, thereason is that for long recovery times of the SA, the carrier den-sity in the SA section is higher hence leading to reduced absorp-tion losses. The bleached absorption reduces the carrier densityin the amplifier section required to equate gain and loss, and in-creases the output intensity.
The change of behavior is due to the fact that when reachesthe value of the round-trip time , the SA has time enough torecover its full absorption between pulses. A word of caution ishowever needed: the occurrence of this transition almost exactlyat is merely a coincidence of our parameter set, thetransition has only to be expected around . However,it is clear that the condition is the most favorable forhaving a stable fundamental mode-lock regime in Fabry–Pérotlasers.
D. Influence of the Intraband Relaxation Time
The previous study indicates that the recovery time is clearlynot the only mechanism governing the pulse width and stability.The pulse width should also be influenced by the number ofmodes capable of entering the ML state, which is expected todepend on the width of the gain spectrum. In order to assess thedominant mechanism governing the pulse width, we fix the SAlength and recovery time to 5% and 10 ps, respectively
Fig. 5. Bifurcation diagram as a function of the SA recovery time, minima,maxima and average values are depicted in green, red, and blue, respectively(see text for details).
and we vary the intraband time while the other fixed parametersare detailed in Table I. Note that, in order to compare with theprevious results, we consider always that the dephasing time inthe amplifier section is half that of the SA section, so we aresimultaneously varying and .
Although the tunability the intraband relaxation time isnot immediately clear from an experimental point of view,one should note that devices with higher thresholds operatewith higher current density. This has a double effect: on onehand, the gain bandwidth is a strongly dependent functionof the carrier density, on the other, the dephasing rate due tocarrier-carrier collisions increases. Hence, tuning the intrabandtime leads to basically stretch or compress the susceptibility ofthe semiconductor in the frequency domain thereby mimickingdevices operating with higher threshold current density.
With the chosen configuration, stable ML is found for all thevalues of considered, whose characteristics we present for thesake of completeness in Fig. 6(a)–(d), obtained withequal to 1, 5, 9, and 13, respectively.
The bifurcation diagram in Fig. 7 evidences the clear lineardependence of the auto-correlation FWHM as a function of theintraband recovery time , while the FWHM of the opticalspectra is directly proportional to the inverse of the intrabandtime, . As the pulse compresses, the peak power increases inFig. 7(a) and the SA is more efficiently modulated in Fig. 7(c).
This study allows us to conclude that the breadth of the gaincurve is the dominant quantity limiting pulsewidth. Notice thatin our approach the susceptibility linking field and polarizationis complex. As such the gain curvature is accompanied by dis-persive effects. The imaginary part of the second derivative of
in the frequency domain determines the modal threshold dif-ference while its real part is the so-called group velocity disper-sion (GVD). In our approach, one can not distinguish whetherthe modal gain difference or the fact that modes are not equidis-tributed in frequency domains is what limits pulsewidth. How-ever, our analysis suggests that an important control on the pulsecharacteristics could be expected by the inclusion of a grating.Depending on the relative spectral width of the grating, one canexpect either a broadening of the pulses whenever the gratingspectral FWHM is smaller than that of the semiconductor gaincurve, usually meaning pulses closer to the transform limit. Op-posingly, when the grating possesses a comparable FWHM tothe one of the active material, one can obtain a shortening of the
JAVALOYES AND BALLE: MODE-LOCKING IN SEMICONDUCTOR FABRY-PÉROT LASERS 1029
Fig. 6. Long time behavior of the time traces of the field intensity (left) anddetails of the pulse shape (right). The panels a)–d) correspond to � ��� equalto 1, 5, 9, and 13, respectively.
Fig. 7. Bifurcation diagram as a function of the intraband polarization de-phasing time, minima, maxima and average values are depicted in green, redand blue, respectively (see text for details). The black lines in panel e) and f)correspond to the best linear fits as a function of � and � , respectively.Note that semi-logarithmic plot is used only for clarity.
pulses by tuning the grating in order to compensate for the activematerial GVD. This is in full agreement with the experimentalliterature on semiconductor ML, see for instance the reviews in[31] and [32].
E. Influence of the Gain/Absorber Relative Frequency Shift
The former discussion indicates TGAT the detuning of theenergy gaps between the gain and the absorber section is ofparamount importance for generating stable ML. It was indeedpointed out in [27] that a careful tuning of the bandgap of the SAsection allows for a pulsewidth reduction of more than a factortwo. While the application of a reverse Voltage is an efficientway to increase the sweep out of carriers, this has also the sideeffect to red-shift the position of the SA band-edge frequency.For instance, typical values for the bandgap shift in Al quater-nary materials are of the order of 1 THzV [30].
As shown in Fig. 8, stable ML is only achieved for the properspectral alignment of the gain and absorption curves. The reasonis that if the SA band-edge is substantially red-detuned with re-spect to the amplifier, the absorption losses in the system will al-ways be high and barely saturable; conversely, for large blue-de-tuning of the SA band-edge, the absorption losses are small andwill always be bleached. In both cases, ML shall not occur, at
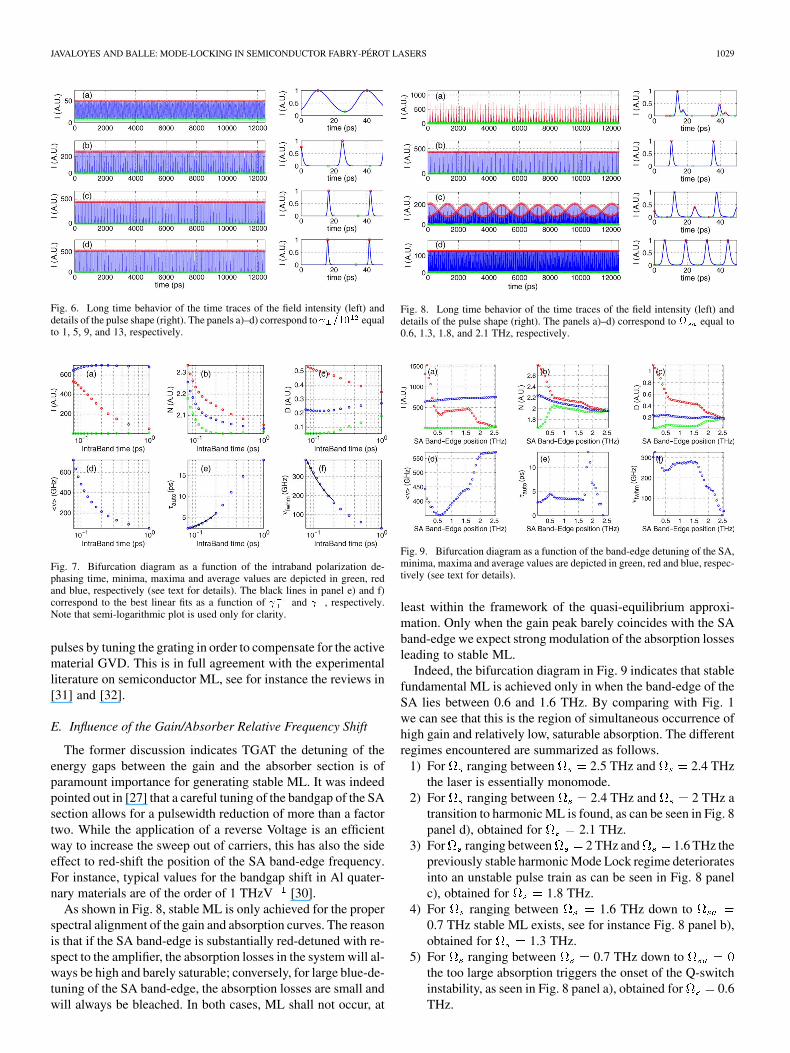
Fig. 8. Long time behavior of the time traces of the field intensity (left) anddetails of the pulse shape (right). The panels a)–d) correspond to � equal to0.6, 1.3, 1.8, and 2.1 THz, respectively.
Fig. 9. Bifurcation diagram as a function of the band-edge detuning of the SA,minima, maxima and average values are depicted in green, red and blue, respec-tively (see text for details).
least within the framework of the quasi-equilibrium approxi-mation. Only when the gain peak barely coincides with the SAband-edge we expect strong modulation of the absorption lossesleading to stable ML.
Indeed, the bifurcation diagram in Fig. 9 indicates that stablefundamental ML is achieved only in when the band-edge of theSA lies between 0.6 and 1.6 THz. By comparing with Fig. 1we can see that this is the region of simultaneous occurrence ofhigh gain and relatively low, saturable absorption. The differentregimes encountered are summarized as follows.
1) For ranging between 2.5 THz and 2.4 THzthe laser is essentially monomode.
2) For ranging between 2.4 THz and 2 THz atransition to harmonic ML is found, as can be seen in Fig. 8panel d), obtained for 2.1 THz.
3) For ranging between 2 THz and 1.6 THz thepreviously stable harmonic Mode Lock regime deterioratesinto an unstable pulse train as can be seen in Fig. 8 panelc), obtained for 1.8 THz.
4) For ranging between 1.6 THz down to0.7 THz stable ML exists, see for instance Fig. 8 panel b),obtained for 1.3 THz.
5) For ranging between 0.7 THz down tothe too large absorption triggers the onset of the Q-switchinstability, as seen in Fig. 8 panel a), obtained for 0.6THz.
1030 IEEE JOURNAL OF QUANTUM ELECTRONICS, VOL. 46, NO. 7, JULY 2010
IV. CONCLUSION
The ML dynamics of a semiconductor Fabry–Pérot laser hasbeen explored using a TWM complemented by a new descrip-tion of the active medium polarization presented in [26]. Theconvolution method allows us to correctly describe in time do-main the abrupt frequency dependence of the SA optical re-sponse. The effectiveness of our approach allowed us to sys-tematically explore the influence of several important controlparameters, e.g., length, recovery time and band-gap offset ofthe SA as well as the width of the gain curve. We have shownthat for Fabry–Pérot devices, the pulse properties are to a largeextent independent of the recovery time as long as it is shorterthan the pulse repetition rate. We also found that, for the pa-rameters considered, the optimal length of the SA is typicallyaround 4%, in agreement with published experimental results.Although not directly applicable to an experiment, the study as afunction of the gain bandwidth demonstrates that the main factorlimiting the pulse duration is the curvature of the gain curve aswell as the GVD. In addition, we thoroughly analyzed the strongdependence on the relative detuning between the gain curve andthe band-edge of the SA. All the results found in our study arephysically sound and in good qualitative agreement with the ex-perimental knowledge on ML. This indicates that our modellingapproach can be used, upon proper fitting of the material pa-rameters, for optimization of the design of semiconductor MLlasers.
ACKNOWLEDGMENT
The authors would like to thank P. Stolarz, M. Strain, R.Green and M. Sorel for their useful discussions.
REFERENCES
[1] H. A. Haus, “Mode-locking of lasers,” IEEE J. Sel. Topics QuantumElectron., vol. 6, no. 6, pp. 1173–1185, Dec. 2000.
[2] E. A. Avrutin, J. H. Marsh, and E. L. Portnoi, “Monolithic and multi-GigaHertz mode-locked semiconductor lasers: Constructions, experi-ments, models and applications,” IEE Proc.-Optoelectron., vol. 147,pp. 251–278, 2000.
[3] H. A. Haus, “Theory of mode locking with a fast saturable absorber,”J. Appl. Phys., vol. 46, pp. 3049–3058, 1975.
[4] H. A. Haus, “Theory of mode locking with a slow saturable absorber,”IEEE J. Quantum Electron., vol. 11, no. 9, pp. 736–746, Sep. 1975.
[5] K. Yvind, D. Larsson, L. Christiansen, J. Mørk, J. Hvam, and J. Han-berg, “High-performance 10 GHz all-active monolithic modelockedsemiconductor lasers,” Electron. Lett., vol. 40, no. 12, pp. 735–737,Jun. 2004.
[6] H. Dorren, D. Lenstra, Y. Liu, M. Hill, and G.-D. Khoe, “Nonlinearpolarization rotation in semiconductor optical amplifiers: Theory andapplication to all-optical flip-flop memories,” IEEE J. Quantum Elec-tron., vol. 39, no. 1, pp. 141–148, Jan. 2003.
[7] E. P. Ippen, “Principles of passive mode locking,” Appl. Phys. B, vol.58, pp. 159–170, 1994.
[8] J. Javaloyes, J. Mulet, and S. Balle, “Passive mode locking of lasers bycrossed-polarization gain modulation,” Phys. Rev. Lett., vol. 97, no. 16,p. 163902, 2006.
[9] K. G. Wilcox, Z. Mihoubi, G. J. Daniell, S. Elsmere, A. Quarterman,I. Farrer, D. A. Ritchie, and A. Tropper, “Ultrafast optical stark mode-locked semiconductor laser,” Opt. Lett., vol. 33, no. 23, pp. 2797–2799,2008.
[10] A. G. Vladimirov and D. Turaev, “Model for passive mode locking insemiconductor laser,” Phys. Rev. A, vol. 72, p. 033808, 2005.
[11] G. P. Agrawal and N. A. Olsson, “Self-phase modulation and spectralbroadening of optical pulses in semiconductor laser amplifiers,” IEEEJ. Quantum Electron., vol. 25, no. 11, pp. 2297–2306, Nov. 1989.
[12] G. P. Agrawal, “Effect of gain dispersion on ultrashort pulse amplifi-cation in semiconductor laser amplifiers,” IEEE J. Quantum Electron.,vol. 27, no. 6, pp. 1843–1849, Jun. 1991.
[13] K. Yee, “Numerical solution of initial boundary value problems in-volving maxwell’s equations in isotropic media,” IEEE Trans. Ant.Propag., vol. 14, no. 3, pp. 302–307, May 1966.
[14] J. Hader, J. Moloney, and S. Koch, “Microscopic theory of gain, ab-sorption, and refractive index in semiconductor laser materials-influ-ence of conduction-band nonparabolicity and coulomb-induced inter-subband coupling,” IEEE J. Quantum Electron., vol. 35, no. 12, pp.1878–1886, Dec. 1999.
[15] A. Vladimirov, A. S. Pimenov, and D. Rachinskii, “Numerical studyof dynamical regimes in a monolithic passively mode-locked semicon-ductor laser,” IEEE J. Quantum Electron., vol. 45, no. 5, pp. 462–468,May 2009.
[16] J. A. Fleck, “Emission of pulse trains by �-switched lasers,” Phys. Rev.Lett., vol. 21, no. 3, pp. 131–133, Jul. 1968.
[17] M. Homar, J. Moloney, and M. San Miguel, “Travelling wave model ofa multimode fabry-perot laser in free running and external cavity con-figurations,” IEEE J. Quantum Electron., vol. 32, no. 3, pp. 553–566,Mar. 1996.
[18] L. Narducci and N. B. Abraham, Laser Physics and Laser Instabili-ties. Singapore: World Scientific, 1988.
[19] H. Casey and M. Panish, Heterostructure Lasers. New York: Aca-demic, 1978.
[20] C. Ning, R. Indik, and J. Moloney, “Effective bloch equations for semi-conductor lasers and amplifiers,” IEEE J. Quantum Electron., vol. 33,no. 9, pp. 1543–1550, Sep. 1997.
[21] J. Yao, G. P. Agrawal, P. Gallion, and C. M. Bowden, “Semicon-ductor laser dynamics beyond the rate-equation approximation,” Opt.Commun., vol. 119, p. 246, 1995.
[22] S. Balle, “Effective two-level model with asymmetric gain for laserdiodes,” Opt. Commun., vol. 119, pp. 227–235, 1995.
[23] S. Balle, “Analytical description of spectral hole-burning effects in ac-tive semiconductors,” Opt. Lett., vol. 21, pp. 1923–1925, 2002.
[24] S. Balle, “Simple analytical approximations for the gain and refrac-tive index spectra in quantum well lasers,” Phys. Rev. A, vol. 57, pp.1304–1312, 1998.
[25] J. Javaloyes and S. Balle, “Emission directionality of semiconductorring lasers: A traveling-wave description,” IEEE J. Quantum Electron.,vol. 45, no. 5, pp. 431–438, May 2009.
[26] J. Javaloyes and S. Balle, “Time domain response of the semiconductormedia,” Phys. Rev. A, 2010, submitted for publication.
[27] D. Kunimatsu, S. Arahira, Y. Kato, and Y. Ogawa, “Passively mode-locked laser diodes with bandgap-wavelength detuned saturable ab-sorbers,” IEEE Photon. Technol. Lett., vol. 11, no. 11, pp. 1363–1365,Nov. 1999.
[28] A. Pérez-Serrano, J. Javaloyes, and S. Balle, “Bichromatic emissionand multimode dynamics in ring lasers,” Phys. Rev. A, 2010, submittedfor publication.
[29] M. Matsumoto and T. Nishimura, “Mersenne twister: A 623-dimen-sionally equidistributed uniform pseudo-random number generator,”ACM Trans. Model. Comput. Simul., vol. 8, no. 1, pp. 3–30, 1998.
[30] L. Hou, P. Stolarz, J. Javaloyes, R. Green, C. Ironside, M. Sorel, andA. Bryce, “Subpicosecond pulse generation at quasi-40-GHz using apassively mode-locked algainas-inp 1.55- �m strained quantum-welllaser,” IEEE Photon. Technol. Lett., vol. 21, no. 23, pp. 1731–1733,Dec. 1, 2009.
[31] K. A. Williams, M. G. Thompson, and I. H. White, “Long-wavelengthmonolithic mode-locked diode lasers,” New J. Phys., vol. 6, no. 1, p.179, 2004.
[32] R. Kaiser and B. Huttl, “Monolithic 40-GHz mode-locked MQW DBRlasers for high-speed optical communication systems,” IEEE J. Sel.Topics Quantum Electron., vol. 13, no. 1, pp. 125–135, Jan.–Feb. 2007.
Julien Javaloyes is with the Department of Electronics and Electrical Engi-neering, Glasgow, Scotland, U.K., where he focuses on the dynamics of semi-conductor lasers.
Salvador Balle is with the IMEDEA, Esporles, Spain. His research focuses onthe dynamics of semiconductor lasers and amplifiers.