spline-based non-parametric regression for periodic functions and its application to directional...
TRANSCRIPT

STATISTICS IN MEDICINEStatist. Med. 2005; 24:2255–2265Published online 10 May 2005 in Wiley InterScience (www.interscience.wiley.com). DOI: 10.1002/sim.2104
Spline-based non-parametric regression for periodic functionsand its application to directional tuning of neurons
Cari G. Kaufman1;∗;†, Val�erie Ventura1;2 and Robert E. Kass1;2
1Department of Statistics; Carnegie Mellon University; Pittsburgh; PA 15213; U.S.A.2Center for the Neural Basis of Cognition; Carnegie Mellon University; Pittsburgh; PA 15213; U.S.A.
SUMMARY
The activity of neurons in the brain often varies systematically with some quantitative feature of astimulus or action. A well-known example is the tendency of the �ring rates of neurons in the primarymotor cortex to vary with the direction of a subject’s arm or wrist movement. When this movementis constrained to vary in only two dimensions, the direction of movement may be characterized by anangle, and the neuronal �ring rate can be written as a function of this angle. The �ring rate functionhas traditionally been �t with a cosine, but recent evidence suggests that departures from cosine tuningoccur frequently. We report here a new non-parametric regression method for �tting periodic functionsand demonstrate its application to the �tting of neuronal data. The method is an extension of Bayesianadaptive regression splines (BARS) and applies both to normal and non-normal data, including Poissondata, which commonly arise in neuronal applications. We compare the new method to a periodic versionof smoothing splines and some parametric alternatives and �nd the new method to be especially valuablewhen the smoothness of the periodic function varies unevenly across its domain. Copyright ? 2005John Wiley & Sons, Ltd.
KEY WORDS: non-parametric regression; periodic functions; Bayesian adaptive regression splines;smoothing splines; neuronal data
1. INTRODUCTION
A striking �nding from the past 40 years of neurophysiological research is that the �ringrates of neurons in many parts of the brain are ‘tuned’ to features of a stimulus or action.In a variety of experiments in which the voltage changes of individual neurons have beenrecorded using microelectrodes, neuronal activity has been shown to vary systematically with
∗Correspondence to: Cari G. Kaufman, Department of Statistics, Carnegie Mellon University, 232 Baker Hall,Pittsburgh, PA 15213,U.S.A.
†E-mail: [email protected]
Contract=grant sponsor: National Institutes of Health; contract=grant number: R01 MH64537-01 (Kaufman, Venturaand Kass) and N01-NS-2-2346 (Ventura)
Received February 2004Copyright ? 2005 John Wiley & Sons, Ltd. Accepted October 2004

2256 C. G. KAUFMAN, V. VENTURA AND R. E. KASS
some externally de�ned quantitative variable, e.g. References [1–7]. We consider here therelationship of neuronal activity in the primary motor cortex of a monkey to the monkey’stwo-dimensional hand movement direction, which we characterize by an angle � between zeroand 2� radians. Taking the �ring rate of a neuron to be �, the scienti�c problem is to describehow � varies with �. The statistical problem, therefore, is to de�ne a periodic functional formfor �≡ �(�), the so-called ‘directional tuning curve,’ and to �t it to data.In the neurophysiology literature, a standard approach to �tting directional tuning curves to
motor cortical data for two-dimensional movements is as follows [8]. If � is the direction ofmovement in a given time interval of length T , let Y (�) be the number of times the neuron�res during that interval. The count Y (�) is assumed to be normally distributed with meanT · �(�) with
�(�) = �+ � cos(�− �0) (1)
= �+ �1 cos(�) + �2 sin(�) (2)
Linear regression is used to �t the resulting cosine tuning function. The parameter �0 in (1)is commonly referred to as the neuron’s ‘preferred direction’ and is the key component in thepioneering method for predicting movement based on neuronal activity, the Population VectorAlgorithm [9, 10]. However, the linear parameterization in (2) is easier to �t and can easilybe used to derive an estimate of �0 if needed.There are two di�culties with this approach. First, the counts Y (�) may not be even
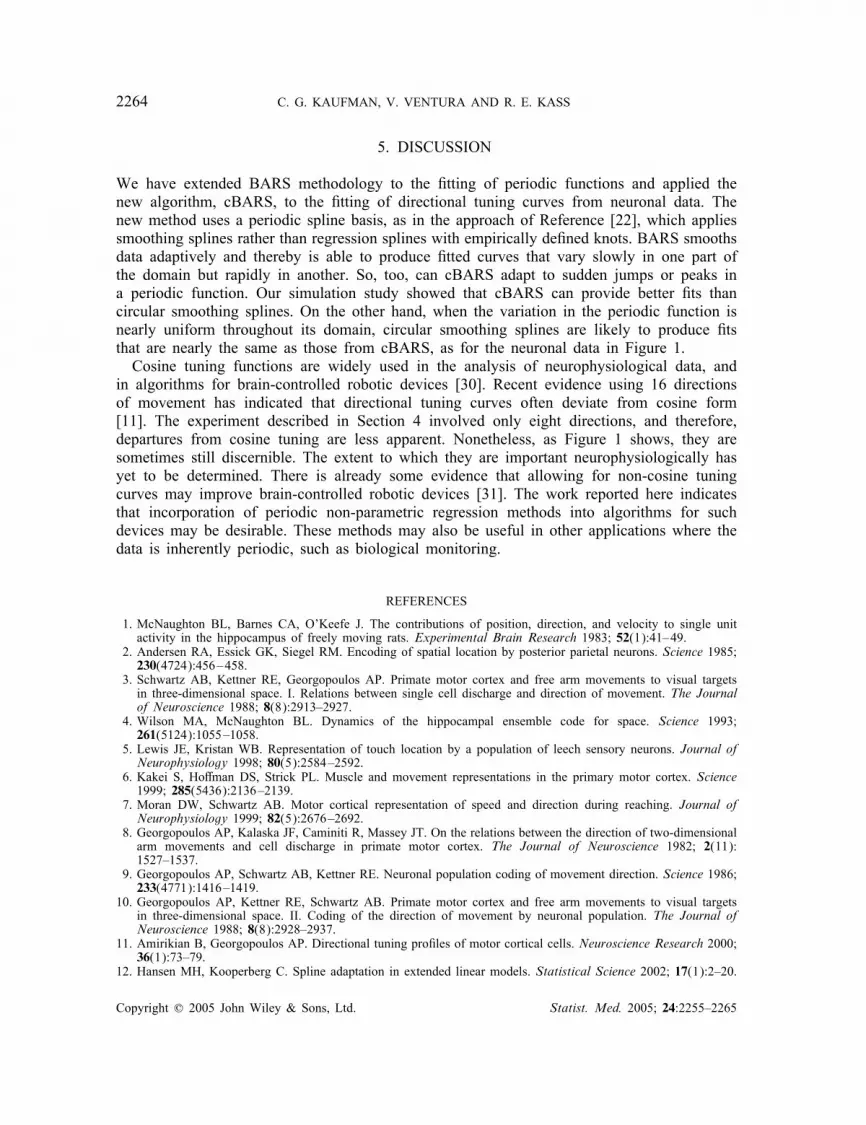
approximately normally distributed and may not have homogeneous variances with respectto �. Second, there is the more substantial problem that, in some cases, the cosine tuningfunction does not �t adequately. One approach to solving the latter problem is to use moregeneral parametric forms, and these may be used successfully for many data sets [11]. A stillmore �exible approach is to use non-parametric methods. In this paper we describe the �ttingof periodic functions by spline-based generalized non-parametric regression.Figure 1 illustrates several of the methods discussed here using data from two neurons
recorded in the primary motor cortex of a rhesus monkey performing a movement task(described in Section 4). The monkey made wrist movements to eight targets located radiallyin a plane; hence, � takes eight values. It is clear that the �ring rate � varies systematicallywith the angle of movement �. The data from the �rst neuron are approximately Poisson-distributed, with sample means and variances that �uctuate together from nearly zero to over100 spikes/s, whereas the data from the second neuron are approximately normally distributedwith approximately constant variance. For both neurons the cosine model �ts relatively well,although it clearly misses detailed features of the tuning curve. Attempts to improve the �tparametrically as suggested by Amirikian and Georgopoulos [11] are described in Section 2.1,but they are only marginally e�ective here.Spline-based generalized non-parametric regression has recently been reviewed by Hansen
and Kooperberg [12]. Spline �tting requires regularization in some form. Two general strate-gies are to penalize the likelihood, thereby shrinking the spline basis coe�cients toward zero,or to reduce the number of basis elements by selecting locations for a relatively small numberof knots. The former, used by smoothing splines, is e�ective in a wide range of settings [13].However, global penalization can be too crude to accommodate sharp local �uctuations inthe function being �tted, which has led many researchers to devise algorithms for selecting
Copyright ? 2005 John Wiley & Sons, Ltd. Statist. Med. 2005; 24:2255–2265

SPLINE-BASED NON-PARAMETRIC REGRESSION 2257
••••••••••••
••
••
••
•••
•
•
•
••
•••
•
•
•
••••
••••••
••••••
0 π 2π
0
50
100
150
Neuron 1
•
•
•••
•
•
••••
• •••
•
••
••
•
••
•
•••
•
••
•••
•
••
•••••
•
••
••••
0 π 2π
0
50
100
150
Neuron 2
Angle θ (Radians)
Rat
eλ(
θ)(S
pike
s/S
econ
d)
Cosine Fit von Mises Fit cBARS Fit
Figure 1. Fits to activity of two motor cortex neurons. Each data point represents the observed �r-ing rate of a neuron in the motor cortex of a monkey during one repetition of a wrist movementto a particular target at angle �. Firing rates are shown in spikes per second and the recording in-terval was 200 ms. The cosine �ts use the cosine function in (2) and the von Mises �ts use theparametric forms in (3) for Neuron 1 and (4) for Neuron 2. The cosine and von Mises parametricregressions were �t by numerically maximizing the likelihood function, based on a Poisson density forNeuron 1 and a normal density for Neuron 2. Poisson and normal versions of the cBARS algorithm
provide better �ts. (See Section 4).
a small set of knot locations [12]. To search through large spaces of alternative models (corre-sponding to alternative sets of knot locations), Bayesian methods using Markov chain MonteCarlo (MCMC) techniques have been shown to be e�ective [12, 14–17]. Among these meth-ods is Bayesian adaptive regression splines (BARS), proposed by DiMatteo, Genovese andKass [14]. Because BARS has worked well in many applications [18–20], and it has beenshown to be clearly superior to competitors in some examples [14], we developed a periodicversion of BARS, which we call cBARS (‘c’ for circular), to deal with periodic explanatoryvariables such as the angle of movement �. The �rst purpose of this paper is to report ourimplementation and application of cBARS.As mentioned, BARS and related methods perform better than global penalization methods
when the function being �tted has sharp variations. When the smoothness of the function ismore homogeneous, this advantage disappears. We compared cBARS to a periodic version ofsmoothing splines to determine whether this result also holds in the periodic case. An extensionof smoothing splines to periodic functions, which we will refer to as circular smoothingsplines, has been described by Wahba [21] and implemented by Wang et al. [22]. In addition,Wang and Ke [23] have made publicly available their ASSIST software, which may be usedfor a wide range of smoothing spline methods, including circular smoothing splines. Thesecond purpose of this paper, then, is to provide some comparison of cBARS with circularsmoothing splines in �tting directional tuning curves to �ring rate data from motor corticalneurons.Section 2 describes parametric and non-parametric methods for �tting periodic regression
models. Section 3 compares the e�ciency of these methods using simulated data. Before we
Copyright ? 2005 John Wiley & Sons, Ltd. Statist. Med. 2005; 24:2255–2265

2258 C. G. KAUFMAN, V. VENTURA AND R. E. KASS
conclude in Section 5, Section 4 returns to the experimental data shown in Figure 1 and givesfurther details about the experimental design and the application of each method to these data.
2. METHODS
In the case of a designed experiment in which a monkey is trained to make straight-linemovements to speci�c targets (as in the standard two-dimensional ‘centre-out’ task, e.g. [8, 6]),then although the movement time T may be on the order of 200–500 milliseconds, we maytake the direction of movement � to be constant throughout this interval. When the monkeymakes unrestrained movements in two dimensions, the angle of movement � will be measuredalong with the �ring count Y (�), and T usually will need to be smaller, on the order of 50ms, say, to capture temporal variations in movement direction. Here, we assume the datacome from a designed experiment, although the methods we describe could also be appliedto data involving free arm movements.Let Yi(�j) be the number of times a neuron �res during the ith trial (repetition of the
experiment) at angle �j, where j=1; : : : ; J , and J is the number of distinct angles. Althoughneuron spike trains typically follow non-Poisson point processes, neuronal spike count datain large intervals are often reasonably well approximated by the Poisson distribution [24–26].Sometimes, as for the second neuron in Figure 1, the normal distribution appears to be abetter approximation. The methods we discuss in this paper are relatively easy to modify tohandle various distributional assumptions.
2.1. Parametric models
The cosine tuning function in (1) may be generalized in various ways. Amirikianand Georgopoulos [11] describe a class of functions based on the form of the von Mises prob-ability density function. For example, the von Mises-like functions used to �t the data inFigure 1 are
�(�)=�+ � exp(� cos(�− �+ cos(�− �))) (3)
for the �rst neuron, and
�(�)=�+ �1 exp(�1 cos(�− �1)) + �2 exp(�2 cos(�− �2)) (4)
for the second neuron. The function in (3) includes parameters controlling the baseline �ringrate (�), the amplitude (�), width (�) and location (�) of the mode, and the skewness aboutthe mode (). The function in (4) includes parameters corresponding to two modes and doesnot allow for skewness. We chose the parametric form in (3) for the �rst neuron in Figure 1because by eye the �ring rates corresponding to the middle two angles (� and 5�=4 radians)seemed to suggest skewness. We chose the parametric form in (4) for the second neuronbecause by eye it appeared that the width and amplitude of the mode were not equal to thewidth and amplitude of the anti-mode. Some other von Mises-like functions are suggested inReference [11]. We explored several of these, but none improved the �t.To �t tuning curves like (3) or (4), the likelihood function may be maximized numeri-
cally using non-linear optimization software. When the data are normally distributed, this isequivalent to minimizing the sum of squared errors.
Copyright ? 2005 John Wiley & Sons, Ltd. Statist. Med. 2005; 24:2255–2265

SPLINE-BASED NON-PARAMETRIC REGRESSION 2259
2.2. Circular smoothing splines
Non-parametric methods are sometimes preferable to the parametric methods of the previoussection. They are more �exible and may be more convenient, for example, in the case thata parametric approach requires delicate non-linear optimization. One non-parametric option issmoothing splines, which we describe brie�y in this section. Another option is a regressionspline, and in the next section we discuss a Bayesian method for choosing the knots.In the case of the standard non-parametric regression model Yi(�j)= �(�j) + ij, with
independent and normally distributed errors, the smoothing spline estimate of � is the twicecontinuously di�erentiable function �̂ which minimizes
1IJ
I∑i=1
J∑j=1(yi(�j)− �̂(�j))2 + �
∫ 1
0(�̂
′′(�))2 d� (5)
The global smoothing parameter � determines the trade-o� between goodness of �t (in terms ofmean squared error) and smoothness (in terms of the integrated squared second derivative of �̂)[27]. It may be chosen by any of several existing data-based methods, such as generalized crossvalidation, generalized maximum likelihood and unbiased risk estimation; given a particularvalue of �, the unique minimizer of (5) is a natural cubic spline with knots at the distinctvalues of �j and spline coe�cients that are shrunk according to � [21].When the regression function � is restricted to be in the collection of all periodic functions
on [0; 1] of the form
�(�)=√2
∞∑k=1ak cos 2�k�+
√2
∞∑k=1bk sin 2�k� (6)
with∑∞
k=1 (a2k + b
2k)(2�k)
2m¡∞, the solution to (5) is a periodic spline basis expansion
�(x)=N∑i=1�iK(x; xi) (7)
where K(x; xi) is the reproducing kernel
K(x; xi)=∞∑k=1
2(2�k)4
cos(2�k(x − xi)) (8)
[21, 22].For non-normal data, the negative log likelihood is used in place of the mean squared error
in (5), but the solution is the same as in (7). Wang and Ke [23] have written software forR and S-PLUS called ASSIST that allows one to �t a variety of smoothing spline models,including circular smoothing splines, to data with various distributions (Bernoulli, binomial,Poisson, gamma and normal). Standard options are also available to determine the smoothingparameter � in (5).
2.3. Circular BARS
Bayesian adaptive regression splines (BARS, DiMatteo, Genovese, and Kass [14]) is a Bayesianmethod for �tting regression splines with an unknown number of knots and knot locations. DiMatteo et al. showed that BARS is sometimes more e�cient than other leading spline-based
Copyright ? 2005 John Wiley & Sons, Ltd. Statist. Med. 2005; 24:2255–2265

2260 C. G. KAUFMAN, V. VENTURA AND R. E. KASS
alternatives, such as the Bayesian version of multivariate adaptive regression splines (BayesianMARS) of Denison et al. [15] and the spatially adaptive regression splines (SARS) of Zhouand Shen [28]. Some additional interpretation, contrasting BARS with Bayesian MARS, isgiven by Kass and Wallstrom [16]. Because BARS is speci�cally designed to allocate addi-tional knots to regions of rapid functional variation, it is especially e�ective in �tting functionsthat vary slowly throughout most of their domain but have one or more sudden jumps or peaks.This behaviour is observed in many neuronal �ring rate intensity functions [18]. In this sectionwe describe the model on which BARS is based and the algorithm used to �t it. We givedetails of the implementation when the underlying function is assumed to be periodic.To make inference about a function �(�) (here, the �ring rate), BARS �ts the spline-based
generalized non-parametric regression model for the spike counts Yi(�j)
Yi(�j) ∼ p(yi|�(�j)) (9)
where � is a spline having knots at unknown locations �=(�1; : : : ; �k), and p is a speci�eddistribution. For a given knot set �, we may write �(�) in terms of basis functions b�; h(�)as �(�)=
∑h b�; h(�)��; h, where the index of summation h depends on the spline basis being
used; cubic splines and the natural spline basis have been used in most applications of BARS.However, to allow BARS to �t periodic functions, we use the periodic spline basis de�ned bythe reproducing kernel (8). Suppose the knots are �1; : : : ; �k in [0; 2�]. Then a periodic splinebasis of order 1 has k basis functions, excluding an intercept, and the ith basis element is acosine with maximum value occurring at the knot �i.For a given knot set �, model (9) poses a relatively easy estimation problem; for exponential-
family responses (such as Poisson) it becomes a generalized linear model. The di�cult prob-lem is to determine �. BARS begins by placing prior distributions on the number and locationsof the knots, generally Poisson and uniform, respectively. An MCMC algorithm is then usedto generate draws from the posterior distribution on the knot sets.Key features of the MCMC implementation of BARS include (i) a reversible-jump chain
[29] on � after integrating the marginal density
p(y|�)=∫p(y|��; �)�(��|�) d�� (10)
for observations y=(y1; : : : ; yn), (ii) continuous proposal distributions for �, in contrast to theproposal distributions used by Bayesian MARS, which allow knots only at the data points,and (iii) a locality heuristic for the proposals that attempts to place potential new knots nearexisting knots. Items (ii) and (iii) together allow proposal knots to be placed close to oneanother, which is advantageous when there is a sudden jump or peak in the function. For thecircular version of BARS, we must also ensure that the proposal distribution for new knotlocations in the MCMC algorithm is also periodic. We proceed as follows: a current knot �iis drawn randomly from the set of current knots. A proposal knot �c is given by
�c=[�i + 2�(X − 0:5)]; X ∼ Beta(�; �) (11)
where the operator [ ] signi�es modulo on [0; 2�], and � is an adjustable tuning parameterin the MCMC algorithm controlling how close the proposal knot �c tends to be to the currentknot �i. Changing � changes the proportion of proposal knots which are accepted and may beadjusted to improve the mixing of the chain. Note that Beta(�; �) has support on [0; 1] and is
Copyright ? 2005 John Wiley & Sons, Ltd. Statist. Med. 2005; 24:2255–2265

SPLINE-BASED NON-PARAMETRIC REGRESSION 2261
symmetric about 0.5, so that the distribution of �c is periodic on [0; 2�] and symmetric aboutthe current knot �. Clearly (11) can easily be scaled for periodic domains other than [0; 2�].For each sample �(g) drawn from the posterior distribution of �, a sample of regression
spline coe�cients �(g)� is obtained via generalized linear regression. The posterior distributionof (�; ��) is not of primary interest, however; what we want is a sample from the posteriordistribution of �(�̃) for any speci�ed �̃ in the range of the function, which can be obtainedby calculating �(g)(�̃)=
∑b(g)�; h(�̃)�
(g)�; h. Either the posterior mean or median across knot sets
may be used as a point estimate of �(�̃), and (pointwise) credible intervals may likewise beobtained using sample quantiles.
3. SIMULATION STUDY
We conducted a small simulation study to compare cBARS with circular smoothing splinesand cosine regression for the four periodic functions shown in Figure 2. We did not include acomparison with the von Mises-like functions of Section 2.1 because the non-linear optimiza-tion needed to �t such functions is di�cult to automate. The �rst test function is the cosinefunction
�1(�)=50 + 25 cos(�− �=2) (12)
The next two test functions are the actual cBARS �ts to neurons from the experiment describedin Section 4. The fourth function has a sharp peak, with
�4(�)=50 + 25 sin(�− 1:2�) + 75 exp(−10(15(�− �)=2�)2) (13)
For each test function �k(�), our e�ciency results are based on 1000 data sets of size100, simulated from a Poisson model with mean �k(�) and with � taking 100 equally spacedvalues in [0; 2�]. A simulated data set for each function is also shown in Figure 2.
0 π 2π0
50
100
Function 1
0 π 2π0
50
100
Function 2
0 π 2π0
50
100
Function 3
0 π 2π0
50
100
Function 4
Angle θ (Radians)
Rat
eλ(
θ)(S
pike
s/S
econ
d)
True Function
Figure 2. Four di�erent test functions were used in the simulation study (solid curves). For eachfunction, 1000 data sets were generated, each of size 100 data points. These data points were drawnfrom a Poisson distribution with mean function corresponding to one of the four test functions. Points
in the �gure are the data drawn in the �rst iteration of the simulation.
Copyright ? 2005 John Wiley & Sons, Ltd. Statist. Med. 2005; 24:2255–2265

2262 C. G. KAUFMAN, V. VENTURA AND R. E. KASS
Table I. Mean integrated squared errors (MISE) for each curve �tting method and four periodic testfunctions. Simulation errors were all less than 0.0013.
Simulation test function 1 2 3 4
Cosine (log link) 0.53 3.83 3.67 5.74Cosine (identity link) 0.30 NA 1.88 5.33Circular smoothing spline 0.50 0.90 1.40 3.84Circular BARS 0.47 0.59 1.12 1.80
The cosine model was �t to the simulated data via the glm function in S-PLUS, specifyingPoisson data and either the identity or log link function. We tried both link functions for eachtest function except �2(�), for which the identity link is problematic, because the many zerodata values often yield predicted rates that are negative. The smoothing spline was �t via thessr function in ASSIST, specifying Poisson data and with smoothing parameter determinedby generalized maximum likelihood. Finally, cBARS was �t by modifying recent C codeimplementing BARS, as described in Section 2.3‡. The prior distributions on the knots tooktheir number to be Poisson distributed with mean �ve and their locations to be uniformlydistributed on [0; 2�]. The adjustable parameter � in the distribution for proposal knots (11)was 25, which means that the proposal knot �c will be within approximately �=4 radiansof the current knot � with probability 95 per cent. We found this choice of � allowed theMCMC algorithm to mix well in the types of data we examined. For each simulated data set,a burn-in period of 100 iterations was used; the next 1000 iterations were treated as a samplefrom the posterior distribution, and the �tted curves according to each of the knot sets in thissample were averaged pointwise to create the �t to that data set.The integrated squared error between the true curve and a �t is the squared area be-
tween the two curves; it was approximated on a grid of size 100 and averaged across the1000 simulated data sets to produce the mean integrated squared errors (MISE) reported inTable I.For the cosine test function �1(�), the cosine parametric model �ts well, but for the other
three functions the non-parametric methods improve the �ts substantially. In every case cBARSperforms better than circular smoothing splines. As expected, for �2(�) and �4(�), for whichthe functional variation is non-uniform, circular smoothing splines perform considerably worsethan cBARS: the MISE for circular smoothing splines are, respectively, 50 and 110 per centgreater than those for cBARS. Figure 3 displays typical �tted curves for �2(�) and �4(�).
4. APPLICATION TO EXPERIMENTAL DATA
We applied the methods of Section 2 to data from an experiment involving wrist movementreported by Kakei et al. [6]. In this experiment, a monkey was trained to move its wristin one of eight directions located radially about a circle, while its forearm was restrained ineither a pronated (palm down), a supinated (palm up), or a middle (palm inward) position.
‡The cBARS code may be obtained via www.stat.cmu.edu/∼kass
Copyright ? 2005 John Wiley & Sons, Ltd. Statist. Med. 2005; 24:2255–2265

SPLINE-BASED NON-PARAMETRIC REGRESSION 2263
•••••••••••••••••••••••••••
•••••
••
••
••••
•
•
•
•
•
•
••
•
•
•
•
•
•
•
•
••
•
•
••
•
•
•
•
•
•
•
••
•••
•
•
•
•
•
•
•
•
••
•
•
•
•
•
•••
••••••••
0 π 2π
0
50
100
Function 2
•
•
••
•
••
•
•
•
••
•
••
•
•
•
•
•
•
•
•
•
•••
•
•
•
•
•
•
••
•
•
•••
•
•
•••
•
•
•
•••
•
•
•
•
•
•
•
•
•
•
•
•
•
•
•
•
•
••
•
•••••
•
•
••
•
•
•
•
•
•
•
•••
•
•
•
•
•
••
•
•
•
0 π 2π
0
50
100
Function 4
Angle θ (Radians)
Rat
eλ(
θ)(S
pike
s/S
econ
d)
Smoothing Spline Fit cBARS Fit
Figure 3. Fits from circular smoothing splines and cBARS for a single data set in the simulation studywith periodic test functions 2 and 4. Both functions have non-uniform variation across their domains,
which leads to better performance by cBARS.
Meanwhile, the �ring times of single neurons in the primary motor cortex were recorded.This experimental paradigm allowed the researchers to dissociate the e�ects of the directionof movement and the speci�c muscle needed to make the movement. First, tuning curveswere �t to the �ring rates for each forearm position (in Reference [6], modelled with acosine), then the direction at which the �tted curve achieved its maximum (the ‘preferreddirection’) was compared across forearm positions. Neurons with only small changes in pre-ferred direction were dubbed ‘extrinsic like,’ because their tuning properties depended only onmovement direction, while neurons with large shifts were dubbed ‘muscle like,’ because theirtuning properties changed with the muscle needed to make the movement. This study gaveevidence that variables de�ned on both extrinsic and intrinsic (physiological) co-ordinate sys-tems are encoded by neurons in the primary motor cortex, addressing a longstanding scienti�ccontroversy.In the Introduction we noted that cBARS provides better �ts than parametric models to
the data from the two neurons shown in Figure 1. The data for Neuron 1 appeared to beapproximately Poisson distributed and we �t Poisson regression models by numerically max-imizing the likelihood using the nlminb function in S-PLUS. (We used the log link to �tthe cosine model and the identity link to �t the von Mises model.) The data for Neuron2 were more closely approximated by a normal distribution with constant variance, and soto �nd the maximum likelihood estimates numerically, we used the least squares criterion.Note that to �t (4), we constrained �1 and �2 to be of opposite signs to stabilize the opti-mization. For Neuron 1 the Poisson deviances for the Cosine, von Mises, circular smoothingspline and cBARS �ts were, respectively, 57.5, 57.1, 37.5 and 36.0. For Neuron 2 the meansquared errors were 226, 161, 132 and 130. Circular smoothing splines were nearly iden-tical to those of cBARS in terms of �tted values and deviances and are therefore omittedfrom Figure 1.
Copyright ? 2005 John Wiley & Sons, Ltd. Statist. Med. 2005; 24:2255–2265
2264 C. G. KAUFMAN, V. VENTURA AND R. E. KASS
5. DISCUSSION
We have extended BARS methodology to the �tting of periodic functions and applied thenew algorithm, cBARS, to the �tting of directional tuning curves from neuronal data. Thenew method uses a periodic spline basis, as in the approach of Reference [22], which appliessmoothing splines rather than regression splines with empirically de�ned knots. BARS smoothsdata adaptively and thereby is able to produce �tted curves that vary slowly in one part ofthe domain but rapidly in another. So, too, can cBARS adapt to sudden jumps or peaks ina periodic function. Our simulation study showed that cBARS can provide better �ts thancircular smoothing splines. On the other hand, when the variation in the periodic function isnearly uniform throughout its domain, circular smoothing splines are likely to produce �tsthat are nearly the same as those from cBARS, as for the neuronal data in Figure 1.Cosine tuning functions are widely used in the analysis of neurophysiological data, and
in algorithms for brain-controlled robotic devices [30]. Recent evidence using 16 directionsof movement has indicated that directional tuning curves often deviate from cosine form[11]. The experiment described in Section 4 involved only eight directions, and therefore,departures from cosine tuning are less apparent. Nonetheless, as Figure 1 shows, they aresometimes still discernible. The extent to which they are important neurophysiologically hasyet to be determined. There is already some evidence that allowing for non-cosine tuningcurves may improve brain-controlled robotic devices [31]. The work reported here indicatesthat incorporation of periodic non-parametric regression methods into algorithms for suchdevices may be desirable. These methods may also be useful in other applications where thedata is inherently periodic, such as biological monitoring.
REFERENCES
1. McNaughton BL, Barnes CA, O’Keefe J. The contributions of position, direction, and velocity to single unitactivity in the hippocampus of freely moving rats. Experimental Brain Research 1983; 52(1):41–49.
2. Andersen RA, Essick GK, Siegel RM. Encoding of spatial location by posterior parietal neurons. Science 1985;230(4724):456–458.
3. Schwartz AB, Kettner RE, Georgopoulos AP. Primate motor cortex and free arm movements to visual targetsin three-dimensional space. I. Relations between single cell discharge and direction of movement. The Journalof Neuroscience 1988; 8(8):2913–2927.
4. Wilson MA, McNaughton BL. Dynamics of the hippocampal ensemble code for space. Science 1993;261(5124):1055–1058.
5. Lewis JE, Kristan WB. Representation of touch location by a population of leech sensory neurons. Journal ofNeurophysiology 1998; 80(5):2584–2592.
6. Kakei S, Ho�man DS, Strick PL. Muscle and movement representations in the primary motor cortex. Science1999; 285(5436):2136–2139.
7. Moran DW, Schwartz AB. Motor cortical representation of speed and direction during reaching. Journal ofNeurophysiology 1999; 82(5):2676–2692.
8. Georgopoulos AP, Kalaska JF, Caminiti R, Massey JT. On the relations between the direction of two-dimensionalarm movements and cell discharge in primate motor cortex. The Journal of Neuroscience 1982; 2(11):1527–1537.
9. Georgopoulos AP, Schwartz AB, Kettner RE. Neuronal population coding of movement direction. Science 1986;233(4771):1416–1419.
10. Georgopoulos AP, Kettner RE, Schwartz AB. Primate motor cortex and free arm movements to visual targetsin three-dimensional space. II. Coding of the direction of movement by neuronal population. The Journal ofNeuroscience 1988; 8(8):2928–2937.
11. Amirikian B, Georgopoulos AP. Directional tuning pro�les of motor cortical cells. Neuroscience Research 2000;36(1):73–79.
12. Hansen MH, Kooperberg C. Spline adaptation in extended linear models. Statistical Science 2002; 17(1):2–20.
Copyright ? 2005 John Wiley & Sons, Ltd. Statist. Med. 2005; 24:2255–2265

SPLINE-BASED NON-PARAMETRIC REGRESSION 2265
13. Ruppert D, Wand M, Carrol R. Nonparametric and Semiparametric Regression Modeling, Cambridge Seriesin Statistical and Probabilistic Mathematics. Cambridge University Press: Cambridge, 2003.
14. DiMatteo I, Genovese CR, Kass RE. Bayesian curve-�tting with free-knot splines. Biometrika 2001; 88(4):1055–1071.
15. Denison DGT, Mallick BK, Smith AFM. Automatic Bayesian curve �tting. Journal of the Royal StatisticalSociety, Series B, Methodological 1998; 60(2):333–350.
16. Kass RE, Wallstrom G. Comment on ‘Spline adaptation in extended linear models.’ Statistical Science 2002;17(1):24–29.
17. Smith M, Kohn R. Nonparametric regression using Bayesian variable selection. Journal of Econometrics 1996;75(2):317–344.
18. Kass RE, Ventura V, Cai C. Statistical smoothing of neuronal data. NETWORK: Computation in NeuralSystems 2003; 14(1):5–15.
19. Wallstrom G, Kass RE, Miller A, Cohn JF, Fox NA. Correction of ocular artifacts in EEG using Bayesianadaptive regression splines. In Case Studies in Bayesian Statistics, vol. VI, Gastonis CG, Kass RE, CarriquiryA, Higdon D, Pauler D, Verdinelli I (eds). Springer: New York, 2002.
20. Zhang X, Roeder K, Wallstrom G, Devlin B. Integration of association statistics over genomic regions usingBayesian adaptive regression splines. Human Genomics 2003; 1(1):20–29.
21. Wahba G. Spline Models for Observational Data. CBMS-NSF Regional Conference Series in AppliedMathematics. SIAM: Philadelphia, 1990.
22. Wang Y, Ke C, Brown MB. Shape invariant modeling of circadian rhythms with random e�ects and smoothingspline ANOVA decompositions. Biometrics 2003; 59(4):804–812.
23. Wang Y, Ke C. ASSIST: a suite of S functions implementing spline smoothing techniques.http://www.pstat.ucsb.edu/faculty/yuedong/software.html [3 July 2004].
24. Ventura V, Carta R, Kass RE, Gettner SN, Olson CR. Statistical analysis of temporal evolution in single-neuron�ring rates. Biostatistics 2001; 3(1):1–20.
25. Kass RE, Ventura V. A spike-train probability model. Neural Computation 2001; 13(8):1713–1720.26. Brown EN, Barbieri R, Ventura V, Kass RE, Frank LM. The time-rescaling theorem and its application to
neural spike train data analysis. Neural Computation 2002; 14(2):325–346.27. Hastie T, Tibshirani R, Friedman J. The Elements of Statistical Learning: Data Mining, Inference, and
Prediction. Springer: New York, 2001.28. Zhou S, Shen X. Spatially adaptive regression splines and accurate knot selection schemes. Journal of the
American Statistical Association 2001; 96(453):247–259.29. Green PJ. Reversible jump Markov chain Monte Carlo computation and Bayesian model determination.
Biometrika 1995; 82(4):711–732.30. Brockwell AE, Rojas A, Kass RE. Recursive Bayesian decoding of motor cortical signals by particle �ltering.
Journal of Neurophysiology 2004; 91(4):1899–1907.31. Gao Y, Black MJ, Bienenstock E, Wu W, Donoghue JP. A quantitative comparison of linear and non-linear
models of motor cortical activity for the encoding and decoding of arm motions. 1st International IEEE/EMBSConference on Neural Engineering, Capri, Italy, 20–22 March, 2003; 189–192.
Copyright ? 2005 John Wiley & Sons, Ltd. Statist. Med. 2005; 24:2255–2265