sim2018.pdf - edinburgh research archive
TRANSCRIPT
This thesis has been submitted in fulfilment of the requirements for a postgraduate degree
(e.g. PhD, MPhil, DClinPsychol) at the University of Edinburgh. Please note the following
terms and conditions of use:
This work is protected by copyright and other intellectual property rights, which are
retained by the thesis author, unless otherwise stated.
A copy can be downloaded for personal non-commercial research or study, without
prior permission or charge.
This thesis cannot be reproduced or quoted extensively from without first obtaining
permission in writing from the author.
The content must not be changed in any way or sold commercially in any format or
medium without the formal permission of the author.
When referring to this work, full bibliographic details including the author, title,
awarding institution and date of the thesis must be given.
Detection of Calcification in
Atherosclerotic Plaques Using Optical
Imaging
Alisia Mara Sim
A thesis submitted for the degree of
Doctor of Philosophy
The University of Edinburgh
2018

ii
Declaration
This thesis is submitted in part fulfilment of the requirement for the degree of Doctor of
Philosophy at the University of Edinburgh. Unless otherwise stated, the work described in this
thesis is original and has not been submitted previously in whole, or in part for any degree or
qualification at this, or any other university.
In accordance with the dissertation regulations as specified by The University of Edinburgh,
this thesis does not exceed 100,000 words in length.
Alisia Sim

iii
Acknowledgements
First and foremost, I would like to thank my PhD programme, OPTIMA CDT, for taking a
chance on me, I wouldn’t be writing this page if it wasn’t for them. I would like to thank them
for giving me the opportunity to pursue a career in science but also for allowing me to gain a
basic understanding of business and entrepreneurship. This experience has definitely shaped
my future career choices.
I would also like to thank my supervisors Professor Alison Hulme, Dr Fabio Nudelman and
Dr Marc Dweck. Without their imagination this project would have never taken shape, thank
you for all the help. A big thanks goes to Dr Vicky MacRae, although she’s not one of my
main supervisors, she has been a great support and has always considered me one of her own
students. Her words have always been kind and this has pushed me to persevere during times
when I needed the most guidance.
Special thanks go to the Hulme and MacRae group, past and present members as they have
made my 4-year journey a great experience not only academically but also outside of work.
Mention should go to my two ‘work best friends’: Sally and Fiona, they have kept me sane
during the long and depressing days at work whether in Chemistry or at the Roslin. I should
also thank the Skye crew (Annabel, Veronica, Piera, Lindsey, Pete, Sally, Stefan and Stefano);
that long weekend away was one of the best weekends I’ve had, and I can only hope we can
have many more in the future. Thanks to Nabil, Lucy and many of the Farquharson group who
have helped me during my period in biology. I cannot forget Fergus, he’s been my colleague,
my line manager (as I like to call him) and my friend; he’s helped me from day one.
Appreciations to Dr Junxi Wu from the Hadoke group who helped me with all the ApoE-/- work
and Dr Alistair Moss who has helped me with human tissue work and PET/CT.
The biggest thank you should go to my family, my parents always allowed me to do what I
wanted, apart from being a chef. They have supported me through all the ups and downs of
my undergraduate and PhD. I thank my sisters for all the love they have given me. I have been
distant and busy for the past 4 years and I am so happy to move closer to home now.
Lastly, because he’s been cheesy in his acknowledgements, I want to thank my fiancé, Stefan
who has supported me since the day we met. He has been a shoulder to cry on when I was
upset and has always been able to cheer me up. I swear I couldn’t love you more than I do
right now, and yet I know I will tomorrow. You are my best friend, and my other half. Thank
you.
iv
Abstract
PET imaging, using the bone tracer Na18F, allows the non-invasive location of atherosclerotic
plaques that are at risk of rupture. However, the spatial resolution of PET is only 4-5 mm,
limiting the mechanistic information this technique can provide. In this thesis, the use of
fluorescence and Raman imaging to elucidate the mechanism of micro-calcification within
atherosclerotic plaques has been investigated.
A number of fluorescent probes to detect fluoride and calcium have been synthesised. One of
the fluoride probes has been shown to be selective for fluoride however, the concentration of
fluoride required to activate the probe is order of magnitudes higher than the amount of Na18F
used for PET imaging making it problematic to use for future studies. On the other hand, a
calcium probe has been shown to: selectively bind to hydroxyapatite (HAP); permit
visualisation and quantification of HAP in both vascular and bone cell models; and effectively
stain cultured aortic sections and whole mouse aorta for OPT imaging. Building on these
preliminary data, fluorescence imaging and immunohistochemistry (IHC) imaging of both
healthy and atherosclerotic tissue that were previously subjected to PET imaging, were
successfully carried out showing the ability of the probe to detect HAP in human vascular
tissue. IHC staining for Osteoprotegerin (OPG) and Osteopontin (OPN), two bone proteins
recently detected in vascular tissue, showed the co-localization of OPG with the probe.
Conversely, the OPN was shown to localize in areas surrounding high OPG and probe signal.
To determine the exact composition of vascular calcification, Raman spectroscopy was also
used. It is believed that the biosynthetic pathway to HAP passes through a series of transitional
states; each of these has different structural characteristics which can be studied using Raman
spectroscopy. In particular, HAP has a strong characteristic Raman peak at 960 cm-1. An
increase in HAP concentration has been detected by Raman in both calcified cell models and
aortic sections. When human vascular tissue was analysed, an additional peak at 973 cm-1 was
present suggesting the presence of whitlockite (WTK) in this tissue as well as HAP.
v
Lay Abstract
Cardiovascular related deaths (CVD) are the second most common cause of death worldwide.
It was estimated that around 17 million people died in 2015 due to a complication of heart
disease. Atherosclerosis is one of the main causes of CVD and it consists of the build-up of
plaques in the arteries. The arteries are highly inflamed and could rupture leading to infarcts
and strokes. It is thought that the way the body tries to deal with the plaque formation is by
creating a barrier between the plaque and the artery, this barrier, known as calcification, is
formed of hydroxyapatite, a calcium mineral which is also present in bone. At the start, when
the calcification is weak, it increases the chances of plaque rupture however, once the
calcification is bigger it stabilizes the plaque.
Unfortunately, even though the field of cardiovascular diagnostic has advanced, there are only
a limited way of detecting the smaller calcification deposits which could cause sudden acute
death. Those that are currently available do not provide enough information into why
calcification forms. In this project, two imaging techniques are used to study the formation of
calcification in cells, rodent and human models. These imaging techniques have provided new
and important information into the process of calcification.
vi
Table of Contents
Declaration
ii
Acknowledgements
iii
Abstract
iv
Lay Abstract
v
Table of Contents
vi
Chapter 1 - Atherosclerosis 1
1.1 Cardiovascular disease 1
1.1.1 Atherosclerosis 1
1.2 The pathology of calcification 3
1.3 The inflammatory response and its link with calcification 6
1.4 Current imaging techniques 9
1.4.1 Invasive techniques 10
1.4.2 Non-Invasive techniques 12
1.5 Conclusion 15
1.6 Approach 16
1.7 References
17
Chapter 2- Synthesis of Fluorescent Dyes for the In Vitro Detection of
Calcification
23
2.1 Fluorophores 23
2.2 Approach for the detection of HAP 25
2.3 Fluoride probes 26
2.3.1 Probe selection 26
2.3.2 Naphthalene 2-cyanoacrylate 28
2.3.3 Imidazole bearing rhodamine 6G 29
2.3.4 Selectivity of fluoride probes 30
2.3.5 Conclusion 33
2.4 Calcium probes 35
vii
2.4.1 Cyanine dyes 35
2.4.2 Fluorescein 36
2.4.3 Examples of HAP binding molecules 38
2.4.4 Synthesis of Cy dyes 40
2.4.5 Synthesis of quaternary heterocyclic ammonium salt precursors 40
2.4.6 Cyanine dye assembly 42
2.4.7 Coupling and synthesis of bisphosphonate protected alendronate 47
2.4.8 HAP binding peptide 51
2.4.9 Characterization of the calcium probes 53
2.4.10 Binding affinity of probes to calcium compounds 55
2.5 Conclusion 59
2.6 References
60
Chapter 3- Characterization of Fluorescein-BP in an In Vitro Model of
Osteoblast Matrix Calcification
66
3.1 Importance of calcium 66
3.2 Gold standard methods of detecting calcification 67
3.2.1 Alizarin S 67
3.2.2 Von Kossa 68
3.2.3 HCl/DC assay 69
3.2.4 Calcein and other fluorescence methods 69
3.3 Models for calcification 70
3.3.1 Cells 70
3.3.2 Ex vivo rings 71
3.3.3 Genetically modified mouse models 71
3.4 Probe toxicity studies 73
3.5 Probe localization studies 74
3.6 Comparison of probe with Alizarin S and calcium leaching assay 76
3.6.1 MOVAS 76
3.6.2 VSMCs 78
3.6.3 MC3T3 80
3.7 Aortic rings 81
3.8 ApoE-/- mice 85
3.9 Conclusion 88
3.10 References 88
viii
Chapter 4- Human Tissue and Potential Biomarkers for Plaque Vulnerability 94
4.1 Carotid and coronary plaques 94
4.2 Rodent vs human models 95
4.3 Early detection of calcification, PET and Fluorescein-BP 96
4.4 Selectivity of Na18F PET tracer 96
4.5 PET/CT and Fluorescein-BP imaging of ex vivo coronary plaques 97
4.6 Fluorescein-BP imaging of ex vivo carotid plaques 99
4.7 Comparison of PET and Alizarin S with the upregulation of osteogenic
markers
100
4.8 Comparison of Alizarin S with the upregulation of osteogenic markers 103
4.9 Comparison of Fluorescein-BP, OPG and OPN on coronary plaques 104
4.10 Conclusion 105
4.11 References
106
Chapter 5- Chemical Composition of Vascular Calcification Deposits 110
5.1 Raman spectroscopy 110
5.2 Raman spectroscopy of biological samples 102
5.3 Raman spectroscopy of mineralized vascular tissue 113
5.4 Raman on Calcium species 114
5.5 Raman analysis on calcified cell pellet 115
5.6 Raman analysis of calcified cell monolayer 118
5.7 Raman analysis on calcified aortic rings 121
5.8 Raman on calcified human samples analysis and comparison to PET/CT 123
5.9 Conclusion 127
5.10 References
128
Chapter 6- Conclusion and Future Work
132
Chapter 7- Materials and Methods 135
7.1 Synthesis 135
7.1.1 General Information 135
7.1.2 Fluoride sensor 136
7.1.3 Cy dye building blocks 140
7.1.4 Solution phase approach 146
ix
7.1.5 On resin approach 150
7.1.6 Fluorescein compounds 152
7.1.7 Azide alendronate synthesis 154
7.1.8 Peptide synthesis 156
7.1.9 Incorporation of probes in calcium minerals 158
7.2 Biology 159
7.2.1 General procedures 159
7.2.2 Tissue culture 159
7.2.3 Imaging of cell and tissue cultures 162
7.2.4 Biochemical assays 165
7.2.5 Raman Spectroscopy 166
7.3 References
167
Chapter 8- Abbreviations
170
Chapter 9- Permissions 175
1.1 Chapter 1 175
1.2 Chapter 2 182
1.3 Chapter 3 186
1.4 Chapter 5
187
Appendix 1- Cyanine dyes 188
Appendix 2- Patient information 189
Appendix 2.1 Coronary tissue samples 189
Appendix 2.2 Carotid tissue samples 189
Appendix 3- IGG control 190
Appendix 4- Staining solutions 191
Chapter 1 - Atherosclerosis
1
Chapter 1 - Atherosclerosis
1.1 Cardiovascular disease
Cardiovascular disease (CVD) is a global concern which was responsible for taking more than
17 million lives in 2015.1–8 In 2012, CVD was classed as the second main cause of death in
the UK (28%), behind cancer (29%) (Table 1).6,9 CVDs are a group of disorders of the heart
and blood vessels which are caused by the formation of atherosclerotic plaques within the
arteries. Atherosclerotic plaques containing calcific lesions are reported in more than 65% of
the population over the age of 45.6
Table 1: Cause of death in the UK in 2014. All values obtained from the British Heart
Foundation (BHF) 2014 statistics.
Cause Number of people affected
CVDs 161,252
Cancer 165,818
Respiratory disease 79,899
Neurodegenerative diseases 49,899
Diabetes 7,638
1.1.1 Atherosclerosis
Atherosclerosis is a progressive disease characterized by macrophage infiltration within the
vessel and by the accumulation of lipids and fibrous elements in the large arteries. This is
frequently accompanied by inflammation and vascular remodelling of the vessel wall.3,8,10–13
Plaques are made up of various substances such as; fat, cholesterol, calcium and a wide range
of other entities commonly found in the blood.14 They are characterized histologically as an
atheroma with a fibrous cap, consisting of smooth muscle cells (VSMCs), extracellular
matrix,10,11 and a lower lipid-rich necrotic core.8,10 Over time, with the progression of the
disease, the accumulation of lipids and fibrous elements will harden making the arteries
narrower (Figure 1.1) which result in myocardial ischaemia and angina.8,10,11,15

Chapter 1 - Atherosclerosis
2
Figure 1.1: H&E of a normal (A) and atherosclerotic (B) coronary artery. H&E showing
the adventitia (Ad), media (M) and intimal layers (I) of the coronary artery with the positive
remodelling of the artery wall. Reproduced with permission.16
The most important clinical complication is caused by sudden plaque rupture or erosion of the
lesions, resulting in thrombosis or myocardial infarction.8,10,11,13,15,17–20 The chance of rupture
is determined by the plaque composition and vulnerability.7,11 Vulnerable plaques generally
have a thin fibrous caps and an increased number of inflammatory cells.2,10,11,21,22
The plaques can become progressively more complex, with calcification, ulceration and
neovascularisation affecting their stability (Figure 1.2).10,23
Figure 1.2: Schematic representation of an atherosclerotic plaque which has caused
positive remodelling of the vessel. Neovascularisation and spotty calcification start appearing
around the necrotic core.
Vascular calcification, a hallmark of atherosclerosis, is a complex biological process that
involves the deposition of calcium and phosphate.21,24–26 Calcification was only realised to be
important in vascular disease in 1990s.20,27 Research discovered osteogenic morphogens
present in calcifying blood vessels as well as the presence of bone matrix proteins (BMP) in
cardiovascular tissue. These findings established the ‘osteogenic hypothesis’ which suggested
Chapter 1 - Atherosclerosis
3
that vascular and valvular calcification is an active process regulated by a process similar to
the one in bone mineralization.6,23,25–33 This hypothesis has been strengthened by the
observation of events such as the production of matrix vesicles, apoptotic bodies and
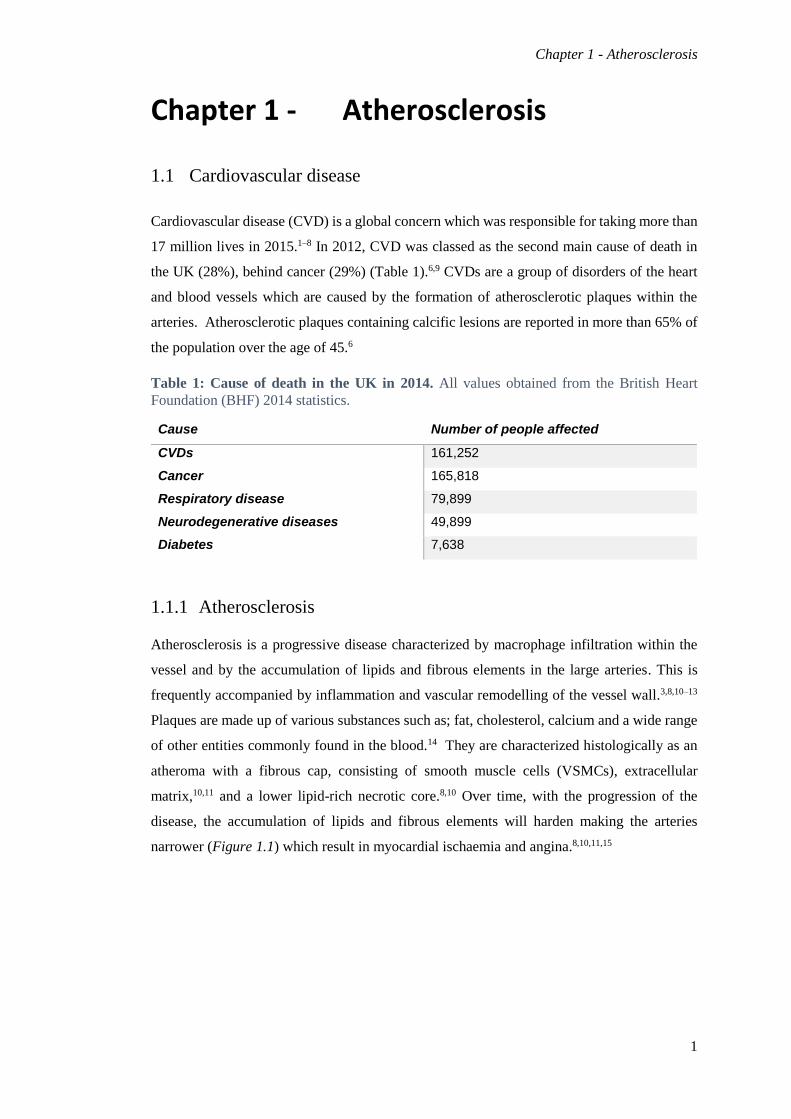
hydroxyapatite (HAP).10,25,34,35 Small calcified HAP micronodules (Figure 1.3 A) appear first
in the vessel and subsequently grow into much larger macroscopic deposits (Figure 1.3 B).24
Figure 1.3 Micro-calcification (A) and Macro-calcification (B). HAP crystal (blue) deposits
on the fibrous cap of the plaque. At the start, HAP is only small but with time it will grow and
stabilize the plaque. Reproduced with permission.22
The size of the deposits is very important in assessing the vulnerability of the plaque. The
presence of large deposits, >50 µm,24 known as macro-calcification (Figure 1.3 B),22 stabilize
the plaque while the occurrence of smaller deposits, <50 µm,24 known as micro-calcification
(Figure 1.3 A), the beginning of the mineralization of the vessel wall, is known to be involved
in plaque rupture.10,22,24–26 Micro-calcification is therefore associated with high risk lesions,13,17
and directly weakens the fibrous cap.13
Currently there are little to no methods for assessing the degree of vulnerability of the plaques.
As a consequence, developing techniques to identify micro-calcification is a major research
goal with the potential of improving patient outcome.
1.2 The pathology of calcification
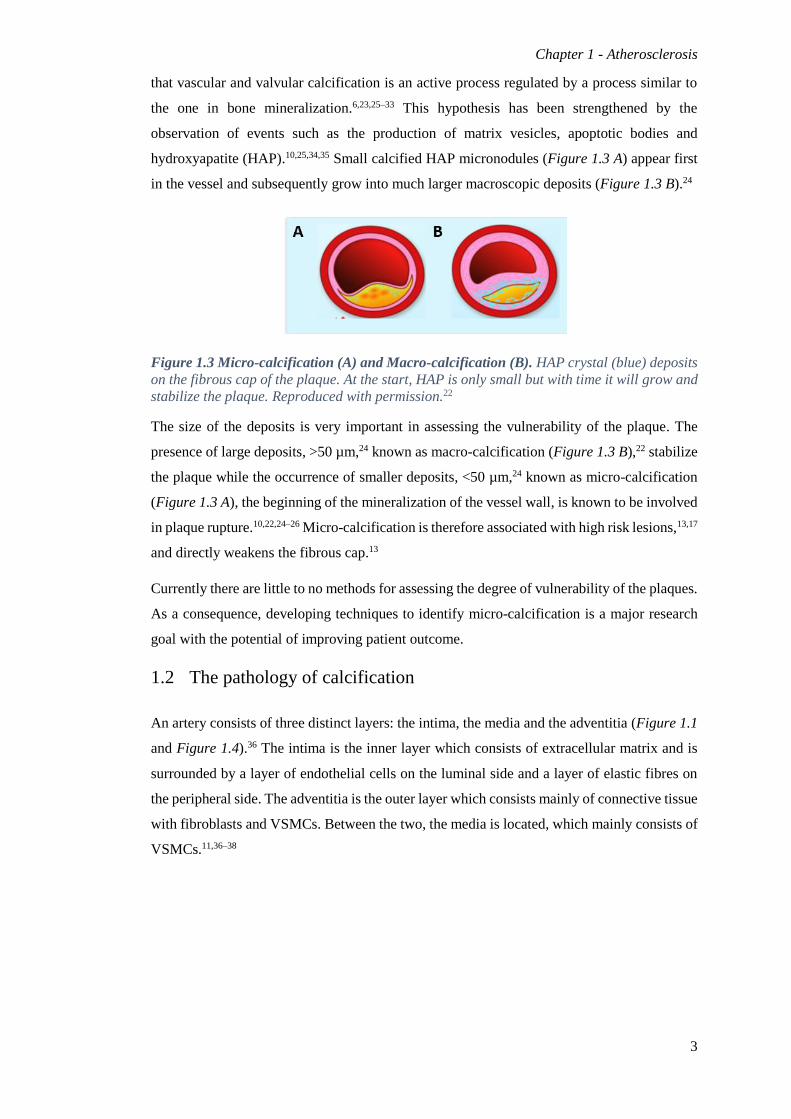
An artery consists of three distinct layers: the intima, the media and the adventitia (Figure 1.1
and Figure 1.4).36 The intima is the inner layer which consists of extracellular matrix and is
surrounded by a layer of endothelial cells on the luminal side and a layer of elastic fibres on
the peripheral side. The adventitia is the outer layer which consists mainly of connective tissue
with fibroblasts and VSMCs. Between the two, the media is located, which mainly consists of
VSMCs.11,36–38
Chapter 1 - Atherosclerosis
4
Figure 1.4: Schematic cross-sections showing the difference between a normal artery (A),
an atherosclerotic one where plaque deposits between the media and the endothelium of the
vessel wall (C) and a ruptured one (D). Over time the plaque will harden and cause
obstruction to the blood flow causing patients to have cardiac events. Reproduced with
permission.39
Vascular calcification can occur at different locations within the vessel wall, either in the
intima or in the media (Figure 1.4). Intimal calcification is mainly associated with
atherosclerosis while medial calcification is largely associated with chronic kidney disease
(CKD) and was also recently shown to be the main type of mineralisation in valve
calcification.20,22,23,29,32,34,40–42
Vascular calcification, as mentioned previously, is very similar to the physiological bone
formation process.23,26,28–30,43 Under stress, VSMCs can differentiate into different
mesenchymal-derived cell types such as osteoblasts, adipocytes and chondrocytes. This in turn
leads to calcification, altering lipid accumulation and matrix production.6,11,20,23,25,28,29,37,44,45
There are at least three key aspects to be considered regarding the role of VSMCs in the
pathogenesis of vascular calcification; 25,45
- endocytosis and toxicity of HAP crystals,
- transformation into osteochondrogenic phenotype,
- generation of nucleating structures for HAP deposition.
Endocytosis and cell death phase:
In order to activate osteogenic gene expression, HAP crystals need to be endocytosed and
accumulated in the lysosomes, where the calcium and phosphate crystals are then dissolved
(Figure 1.5). The release of calcium causes either apoptosis or osteogene expression which
causes the release of HAP-filled matrix vesicles.46

Chapter 1 - Atherosclerosis
5
Figure 1.5 The role of calcium and phosphate crystals in HAP deposition. Crystals of
calcium and phosphate in VSMC’s can be nucleated and either deposited on extracellular
elastin or endocytosed and directed to lysosomes where they are then dissolved, and free
calcium ions are released in the cytosol. Here, cell death or cell differentiation takes place.
Transformation phase:
At the sites where HAP nanocrystals are depositing, VSMCs undergo an osteochondrogenic
phenotypic change and increase the expression of mineralization-regulating proteins that
would otherwise only be found in bones and cartilage. Runx, Osterix, Osteopontin (OPN) and
Osteoprotegerin (OPG) are just a few.20,23,26,33,34,47 The upregulation of osteochondrogenic
genes concurrently downregulates smooth muscle cell genes. The transcription factor that is
responsible for this process is Runx2.26 It is the Bone Morphogenic Protein (BMP) that
activates the transcription activity of Runx2. Upon vascular injury, the differentiated VSMCs
increase osteogenic signalling though BMP and upregulate HAP deposition.26,29,48 The
deposition of HAP on the matrix has also been shown to upregulate not only BMP but also
OPN which in turn accelerates the calcification process (Figure 1.5).

Chapter 1 - Atherosclerosis
6
Nucleation site formation phase:
In order to create an environment that tolerates calcification, matrix vesicles are used as
nucleation sites for HAP.6,26,46 Normally, VSMCs do not calcify as they are loaded with
mineralization inhibitors such as Matrix Gla Protein (MGP), Fetuin-A and
Pyrophosphate.23,31,33,37,43,45 However, when the cells undergo a phenotypic change and there
are high levels of calcium and calcification inhibitors are low, VSMCs produce mineralization-
competent vesicles that contain already synthesised HAP.6,25,31,46 To permit the growth of the
crystals, the vesicles contain alkaline phosphate (ALK) which creates a phosphate source by
degrading pyrophosphate.
Over time the HAP sediments grow and eventually stabilize the plaque, however, at the
beginning when smaller deposits are being laid down, the plaque is very fragile and the HAP
deposits will weaken the plaque and cause its rupture.10,22,24–26 A new understanding is required
to appreciate the mechanism behind HAP deposition and to distinguish weakened plaques
before they rupture.
1.3 The inflammatory response and its link to calcification
Although significant progress has been achieved over recent years, the exact role and process
of calcification in atherosclerosis remains to be defined.22,26 Emerging evidence suggests that
intimal calcification occurs as a healing response to intense inflammation and cell death within
the atherosclerotic plaque.22,23,31,49 Aiwaka et al. were able to demonstrate the association of
inflammation and calcification in mouse atherosclerotic models, showing that macrophage
infiltration takes place before the osteogenic conversion of VSMCs and subsequently followed
by the release of matrix vesicles.30 This is one of the first studies that provides evidence that
inflammation is a powerful initiator of calcification. Recently, vesicles have been shown to
not only be released by VSMCs but also by inflammatory macrophages, suggesting that
macrophages are also a potential source of calcification.22 Pro-inflammatory cytokines,
produced as an immune response to inflammation, are also shown to promote the
differentiation of VSMCs to osteoblastic and/or chondrocytic cells which will then provide
HAP and lead to a more stabilized plaque with macro-calcification (Figure 1.6).22,36,50,51

Chapter 1 - Atherosclerosis
7
Figure 1.6 Relationship between inflammation, calcification and infarction. A large
necrotic core, thin fibrous cap and intense inflammation are key players in plaque rupture.
Calcification occurs as a healing process, however, at the early stages the calcification is
microscopic (blue) and causes increased stress on the cap, increasing the chance of plaque
rupture. However, once a large amount of calcification is deposited, the plaque is considered
clinically stable and therefore not at risk of rupture. Reproduced with permission.22
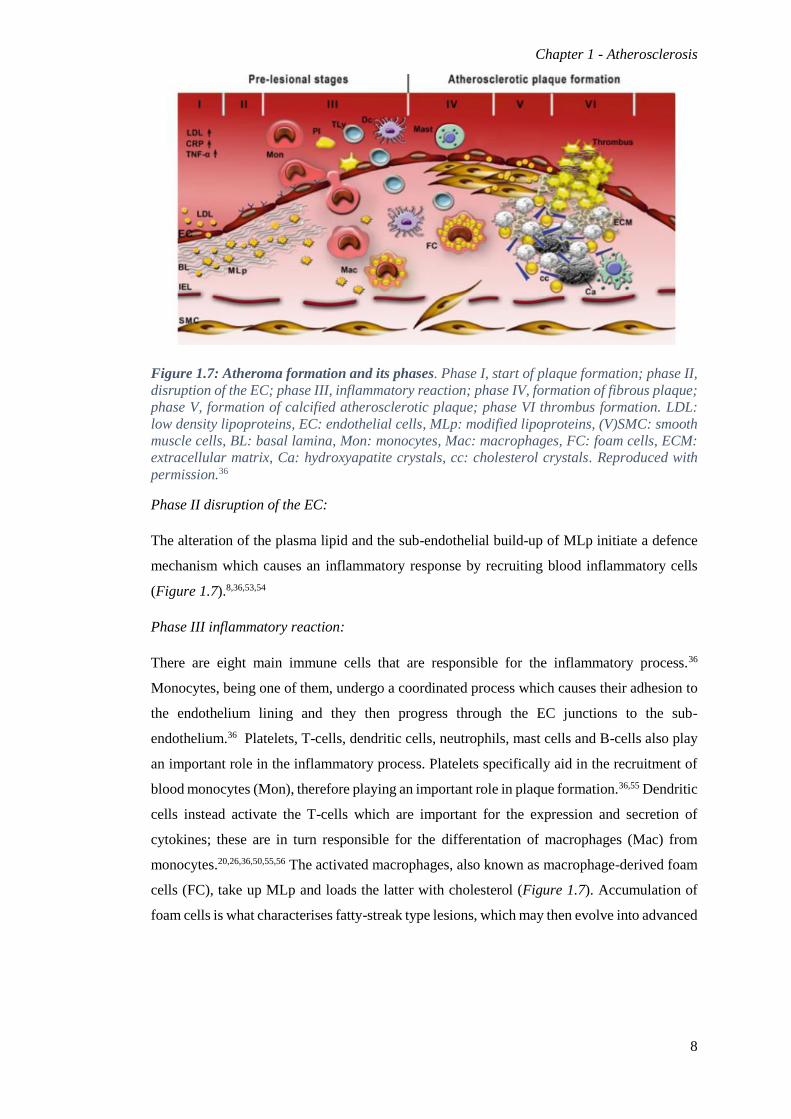
The continuous process of atherosclerosis and atheroma formation can be divided in six stages.
These are classified into pre-lesional stages (stages I, II, III) and progressive plaque formation
stages (stages IV, V, VI) (Figure 1.7).36
Stage I start of plaque formation:
In arterial lesion-prone areas, the initial event that takes place in response to a change in body
homeostasis is the alteration of endothelial cells (ECs). There are two main functions that are
affected: modification of EC permeability to allow for Low Density Lipoprotein (LDL)
deposition and change in EC phenotype.8,15,26,36,52–54 The LDLs that enter the vessel via the
modification of the EC permeability are then confined in the intima. Here, they interact with
the proteoglycans and matrix proteins converting them into modified lipoproteins (MLp), rich
in cholesterol (Figure 1.7). When the ECs allow the accumulation of MLp within the intima,
major changes to the biosynthetic capacity of ECs takes place. This change causes the
proliferation of the basal lamina (BL) and the disruption of the myo-endothelial junctions and
in turn leads to gaps between the neighbouring VSMCs.36
Chapter 1 - Atherosclerosis
8
Figure 1.7: Atheroma formation and its phases. Phase I, start of plaque formation; phase II,
disruption of the EC; phase III, inflammatory reaction; phase IV, formation of fibrous plaque;
phase V, formation of calcified atherosclerotic plaque; phase VI thrombus formation. LDL:
low density lipoproteins, EC: endothelial cells, MLp: modified lipoproteins, (V)SMC: smooth
muscle cells, BL: basal lamina, Mon: monocytes, Mac: macrophages, FC: foam cells, ECM:
extracellular matrix, Ca: hydroxyapatite crystals, cc: cholesterol crystals. Reproduced with
permission.36
Phase II disruption of the EC:
The alteration of the plasma lipid and the sub-endothelial build-up of MLp initiate a defence
mechanism which causes an inflammatory response by recruiting blood inflammatory cells
(Figure 1.7).8,36,53,54
Phase III inflammatory reaction:
There are eight main immune cells that are responsible for the inflammatory process.36
Monocytes, being one of them, undergo a coordinated process which causes their adhesion to
the endothelium lining and they then progress through the EC junctions to the sub-
endothelium.36 Platelets, T-cells, dendritic cells, neutrophils, mast cells and B-cells also play
an important role in the inflammatory process. Platelets specifically aid in the recruitment of
blood monocytes (Mon), therefore playing an important role in plaque formation.36,55 Dendritic
cells instead activate the T-cells which are important for the expression and secretion of
cytokines; these are in turn responsible for the differentation of macrophages (Mac) from
monocytes.20,26,36,50,55,56 The activated macrophages, also known as macrophage-derived foam
cells (FC), take up MLp and loads the latter with cholesterol (Figure 1.7). Accumulation of
foam cells is what characterises fatty-streak type lesions, which may then evolve into advanced
Chapter 1 - Atherosclerosis
9
plaques.8,26,36,55 The cytokines also convert the VSMCs to the osteoblastic phenotype which
initiates the start of the calcification pathway allowing the VSMCs to produce HAP.26,32,52
Stage IV formation of fibrous plaque:
The inflammatory cells send molecular messages which direct the plaque development,
specifically the build-up of VSMCs within the intima (Figure 1.7). This is known as intimal
thickening.36,51
Stage V and VI Calcified atherosclerotic plaque and thrombus formation:
The progression of the plaques is characterized by accumulation of extracellular lipid droplets,
macrophage foam cells, VSMC-derived foam cells and calcification mini clusters which will
then develop into macro-calcification.36,54 The accumulation of cholesterol in the plaque
causes apoptosis of both the macrophage-derived foam cells and the VSMCs. Upon cell death,
the cells release their content forming the necrotic core (Figure 1.7).8,23,26,36,51,54 Plaque
inflammation triggers VSMC loss and the production of Matrix Metalloproteinases (MMP)
that weaken the fibrous cap and lead to thrombus formation (stage VI).8,36 Calcification is
thought to be the healing response to intense necrotic plaque inflammation and when macro-
calcification is deposited it results in the separation of inflammatory regions from the lumen,
making the plaque less likely to rupture.
1.4 Current imaging techniques
Imaging inflammatory and calcific processes that take place in the arteries has the potential to
improve the understanding of the pathways that lead to CVD, and consequently to improve
patient outcomes.7 Advances have occurred in a variety of both invasive and non-invasive
imaging modalities.3,7,8,57 Invasive imaging relies on accessing the arteries with specifically
designed catheters via the coronary vessels and then administering contrast media. Novel
advances in the design and technology of such catheters allow for a selection of different
invasive approaches which can be coupled to the standard angiographic assessment. Examples
of these additional imaging technologies are intravascular ultrasonography (IVUS), optical
coherence tomography (OCT), near-infrared spectroscopy (NIRS) as well as near-infrared
fluorescence (NIRF). In the field of non-invasive modalities, developments in computed
tomography (CT), magnetic resonance imaging (MRI) and positron emission tomography
(PET) have taken place. Each approach provides complementary information and allows for a
comprehensive, multidimensional evaluation of coronary atherosclerosis.7,8,22
Chapter 1 - Atherosclerosis
10
The main assessment focus of coronary artery disease using imaging has been the detection of
luminal stenosis or obstruction to blood flow. However, the capacity of the angiography results
to prevent myocardial infarction leaves somewhat to be desired.3,58 Studies have shown that
the majority of lesions that go on to rupture and cause myocardial infarction are in fact non-
obstructive on previous angiographies.7,22,59,60
Plaque burden however can provide a powerful prognostic on the basis that the more plaques
a patient has, the greater the likelihood that one will rupture and cause myocardial infarction.
The wide range of invasive and non-invasive imaging techniques that are available are
described below.
1.4.1 Invasive techniques
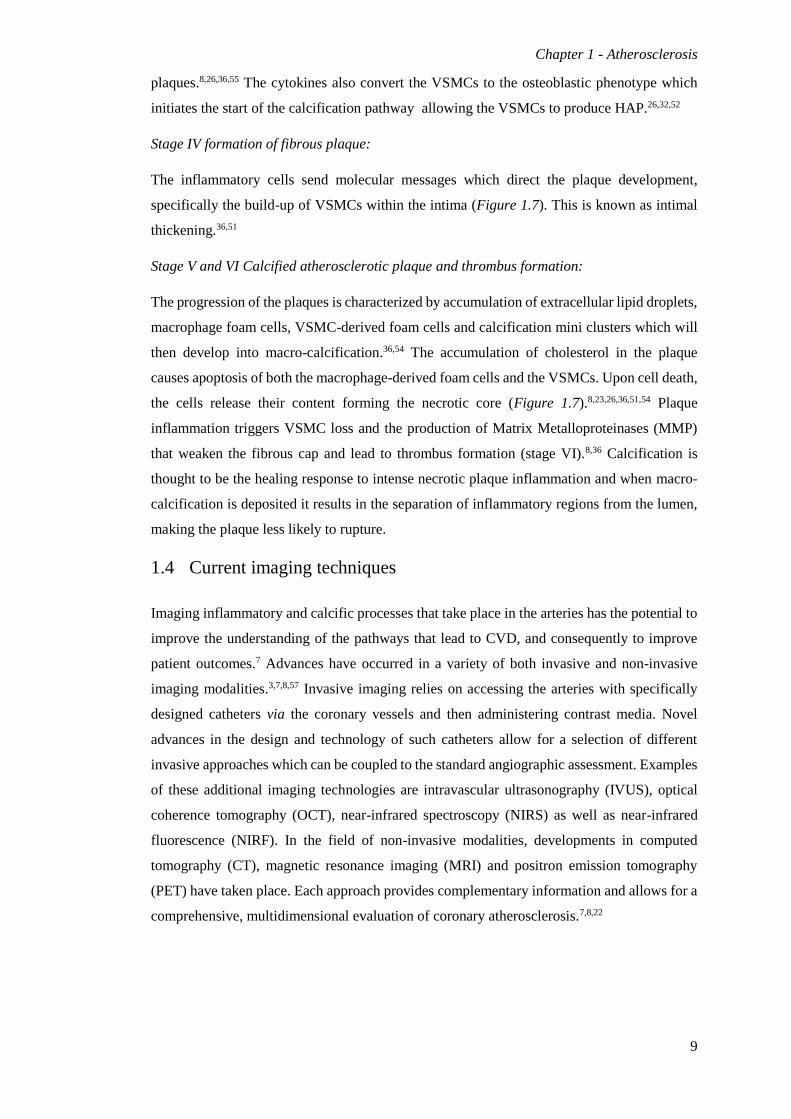
1.4.1.1 Angiography
Angiography is the most commonly used and reproducible technique to accurately assess the
lesion severity and is therefore used to diagnose coronary artery disease (Figure 1.8). An
angiogram is an X-ray of the blood vessels after they are filled with a contrast material, such
as gadolinium or iodine, which will reveal the extent and severity of a blockage. The technique
involves the selective intubation of the patient with a catheter, allowing for high spatial
resolution (0.1-0.2 mm)7,59 of the vessel wall. However, detailed analysis of the plaque cannot
be obtained.7 Angiography has been combined with IVUS, OCT and NIRS to provide more
information on the coronary plaque composition.7
Figure 1.8: Coronary angiography of the left coronary artery. (A) Total occlusion (white
arrow) of the mid left anterior descending artery. (B) After balloon angioplasty distal flow
was obtained. Reproduced with permission.61

Chapter 1 - Atherosclerosis
11
1.4.1.2 IVUS
IVUS involves using a small ultrasound transducer to record the reflection of high frequency
sound waves and therefore generating greyscale cross-sectional images of the arterial wall
(Figure 1.9).3 The transducer itself has limited ability to differentiate the individual plaque
components but virtual histology on the backscattered radiofrequency allows features such as
the necrotic core, the calcium fibrous density and the fatty plaques to be detected at an
exceptionally high spatial resolution (150-200 µm).7 IVUS can be used to accurately assess
the luminal dimensions and the volume of the plaque. By doing so it allows for an accurate
quantification of plaque burden and therefore acts as a powerful predictor of disease
progression.3,8 However, a major limitation of this technology is the low signal-to-noise ratio
and the increased number of artefacts making which render interpretation difficult. In addition,
the spatial resolution is too low to accurately and reliably detect the fibrous cap.7
Figure 1.9: Normal IVUS (A) and virtual histology IVUS (B). (A) shows three layers; intima
(white arrow), external elastic membrane that represents interface between media and
adventitia (yellow arrow). IVUS catheter shown with the red arrow. (B) virtual reconstruction
of the artery. Image shows necrotic core shown in red (white arrow) and fibrous plaque shown
in green (yellow arrow). Reproduced with permission.21
1.4.1.3 OCT
OCT uses a near-infrared (NIR) fibre-optic wire within the catheter which, by emitting light
in the NIR area is able to measure the backscatter signal from tissues while still inside the
artery.3,7 The fibre-optic wire is set with a rotating lens and thus allows high spatial resolution,
up to 10-15 µm, permitting accurate measurements of the thickness of the fibrous cap.3,7,21 In
contrast to IVUS, OCT is able to image the thrombus, plaque rupture and superficial plaque
erosion with improved sensitivity and definition.3,62 Measurement of the fibrous cap thickness
not only allows the assessment of the plaque vulnerability, but also disease progression and

Chapter 1 - Atherosclerosis
12
plaque stabilization in response to therapy.3,63 The major limitation of OCT is the lack of
penetration, 1-3 mm, which makes assessment of the entire plaque volume impossible.3,7,64
1.4.1.4 NIRS
NIRS works on the phenomenon that organic molecules absorb and reflect light differently at
specific wavelengths. When light is emitted onto the vessel wall, a chemogram based on the
absorption and emission pattern of the vessel wall components is created. This technique is
extremely useful in the detection of lipids within the plaque, thus allowing the identification
of areas of lipid-rich lesions and quantification of the lipid core.3,7,65,66 Apart from the ability
to provide information on lipid content, NIRS is not able to offer any structural information
on the plaque. This can be overcome by the development of NIRS-IVUS hybrids which have
been shown, in preclinical studies, to discriminate between vulnerable and non-vulnerable
plaques.67
In the research environment, NIR-OCT catheters have been used with an indocyanine green
(ICG) fluorophore to enhance the signal of in vivo lipid-rich inflamed plaques in rabbits and
of ex-vivo human atheroma specimens.68 This technology could not only be used to provide
read-outs of high risk plaques, but also to examine the mechanism and efficacy of
atherosclerosis therapeutics.7,68–70 Other NIRS tracers are undergoing preclinical evaluation
and include agents activated by proteases that localize inflamed plaques,3,71,72 tracers that target
fibrin,73 and expensive HAP specific tracers such as Osteosense.17,30,74–76 Unfortunately, the
cost of the HAP specific tracer has limited its use in a research environment resulting in the
synthesis of novel probes. Nonetheless, due to the higher spatial resolution, NIRS and
molecular imaging are already well positioned to further elucidate the first steps of
calcification and the role of inflammation in myocardial infarction.68–70
1.4.2 Non-Invasive techniques
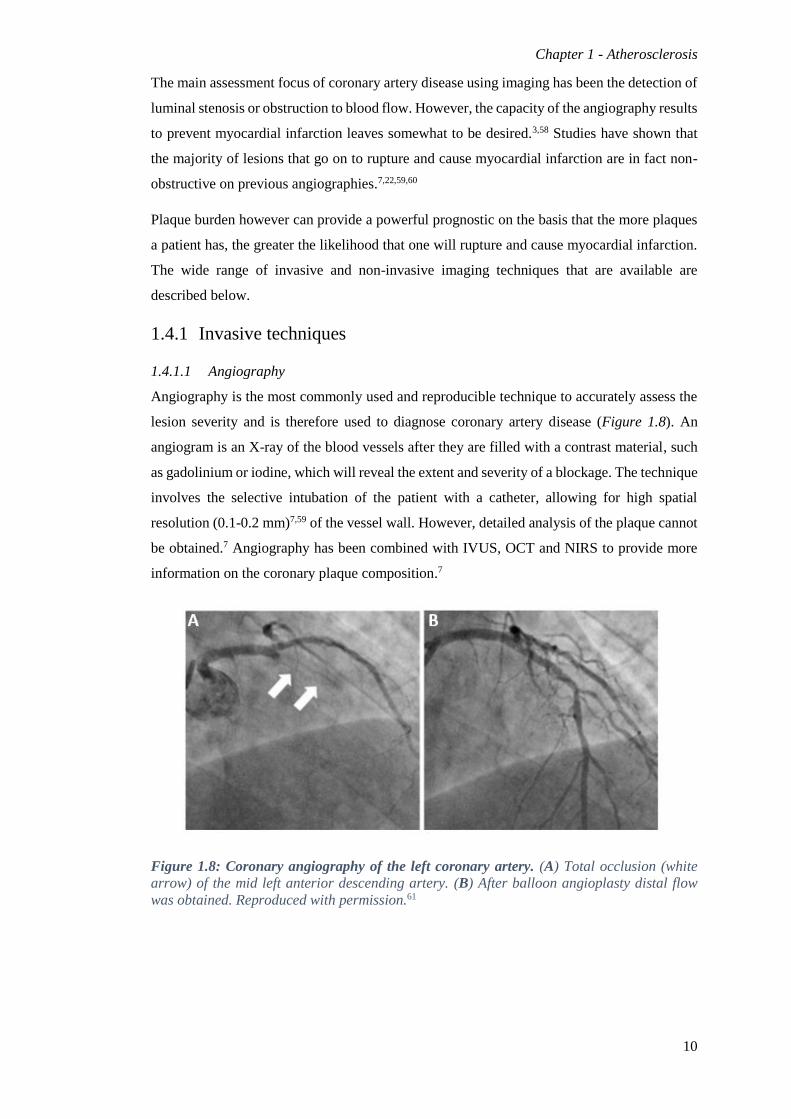
1.4.2.1 Coronary artery calcium scoring (CAC) using CT
CAC scoring uses electrocardiogram-gated CT, providing an accurate and simple measure of
the overall atherosclerotic burden, plaque morphology and composition (Figure 1.10).
Without the need for contrast agents, CAC scoring quantifies the macroscopic calcium within
the vessels.3,7,22,24,26,35 It can also provide some information on the less stable adjacent plaques.
However, as for IVUS, the spatial resolution is low and overall this technique underestimates
the size of non-calcified plaques and overestimates the size of calcified plaques due to
‘booming artefacts’.7,12,13,22
Chapter 1 - Atherosclerosis
13
Figure 1.10: Imaging of coronary calcification by CT. Coronary macro-calcification
deposits (white arrow) have high attenuation and are therefore clearly visible by CT.
Reproduced with permission.77
This makes the technique unsuitable for detecting micro-calcification as it is not able to
identify calcium deposits smaller than 200 µm in diameter.7,13 When compared to IVUS, CAC
is better for the detection of fibrous plaques and to a lesser extent the necrotic core and fibro-
fatty tissues.7 However, unstable lesions tend to be very sparsely calcified and therefore tend
to be unnoticed on CAC images.8
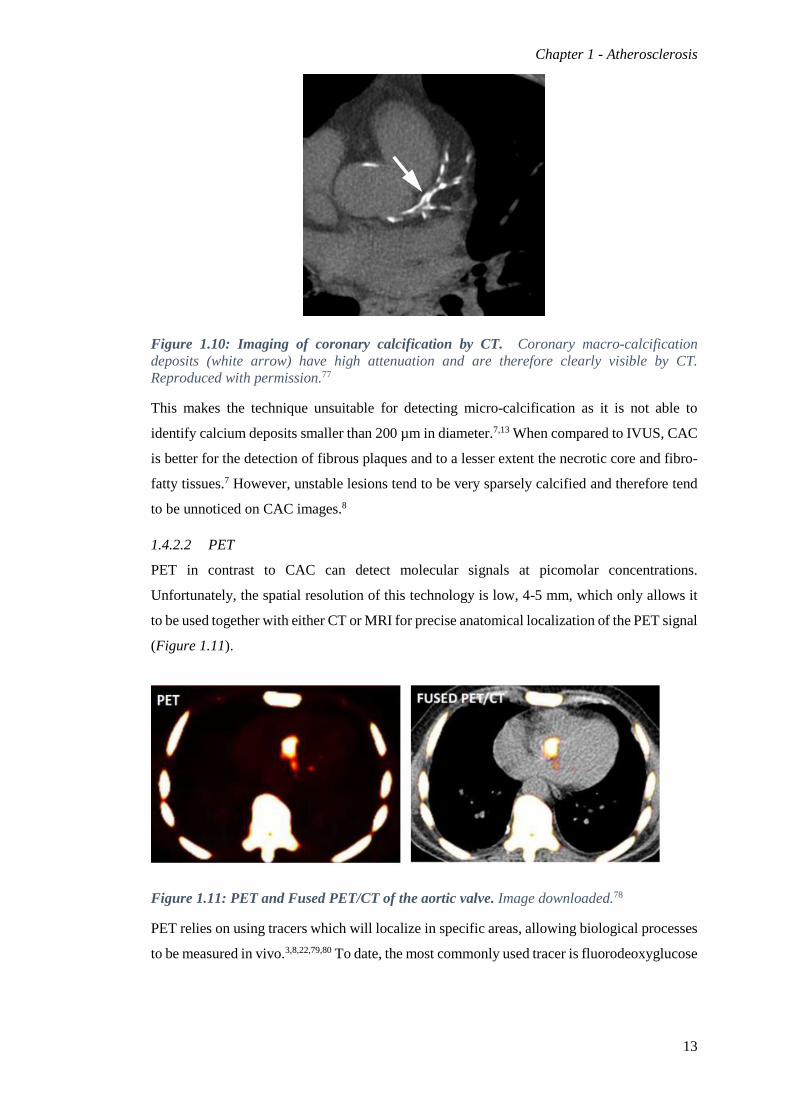
1.4.2.2 PET
PET in contrast to CAC can detect molecular signals at picomolar concentrations.
Unfortunately, the spatial resolution of this technology is low, 4-5 mm, which only allows it
to be used together with either CT or MRI for precise anatomical localization of the PET signal
(Figure 1.11).
Figure 1.11: PET and Fused PET/CT of the aortic valve. Image downloaded.78
PET relies on using tracers which will localize in specific areas, allowing biological processes
to be measured in vivo.3,8,22,79,80 To date, the most commonly used tracer is fluorodeoxyglucose
Chapter 1 - Atherosclerosis
14
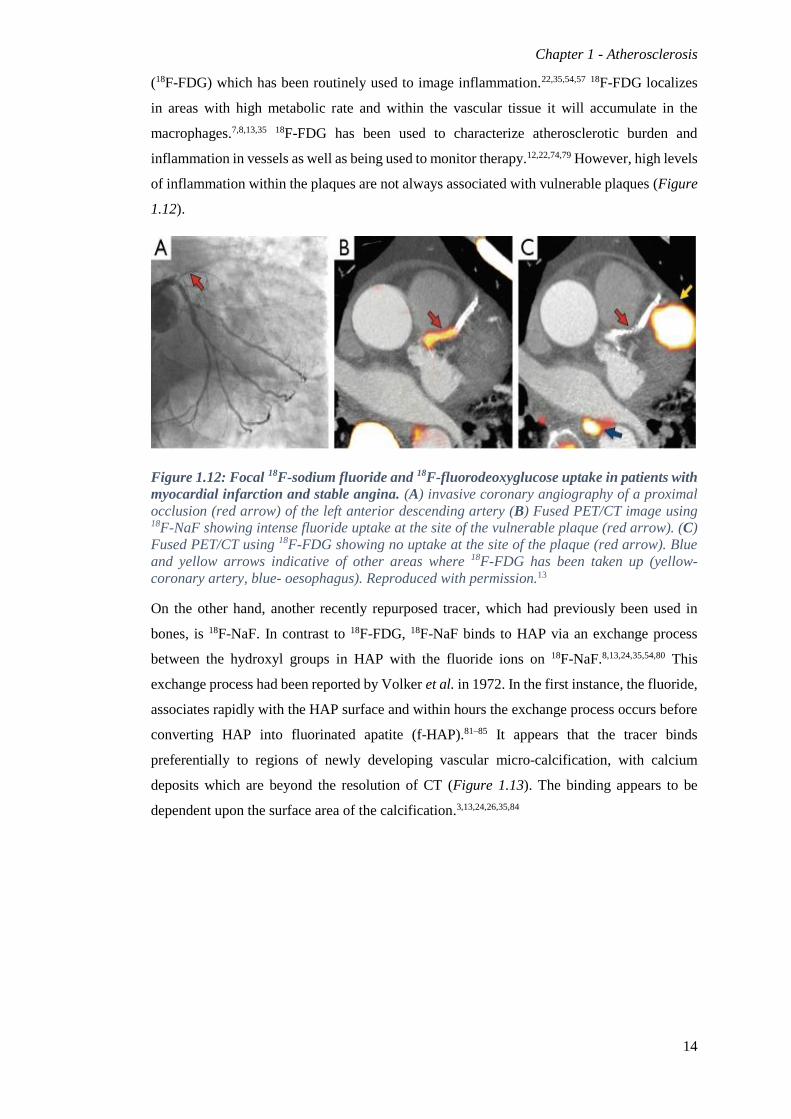
(18F-FDG) which has been routinely used to image inflammation.22,35,54,57 18F-FDG localizes
in areas with high metabolic rate and within the vascular tissue it will accumulate in the
macrophages.7,8,13,35 18F-FDG has been used to characterize atherosclerotic burden and
inflammation in vessels as well as being used to monitor therapy.12,22,74,79 However, high levels
of inflammation within the plaques are not always associated with vulnerable plaques (Figure
1.12).
Figure 1.12: Focal 18F-sodium fluoride and 18F-fluorodeoxyglucose uptake in patients with
myocardial infarction and stable angina. (A) invasive coronary angiography of a proximal
occlusion (red arrow) of the left anterior descending artery (B) Fused PET/CT image using 18F-NaF showing intense fluoride uptake at the site of the vulnerable plaque (red arrow). (C)
Fused PET/CT using 18F-FDG showing no uptake at the site of the plaque (red arrow). Blue
and yellow arrows indicative of other areas where 18F-FDG has been taken up (yellow-
coronary artery, blue- oesophagus). Reproduced with permission.13
On the other hand, another recently repurposed tracer, which had previously been used in
bones, is 18F-NaF. In contrast to 18F-FDG, 18F-NaF binds to HAP via an exchange process
between the hydroxyl groups in HAP with the fluoride ions on 18F-NaF.8,13,24,35,54,80 This
exchange process had been reported by Volker et al. in 1972. In the first instance, the fluoride,
associates rapidly with the HAP surface and within hours the exchange process occurs before
converting HAP into fluorinated apatite (f-HAP).81–85 It appears that the tracer binds
preferentially to regions of newly developing vascular micro-calcification, with calcium
deposits which are beyond the resolution of CT (Figure 1.13). The binding appears to be
dependent upon the surface area of the calcification.3,13,24,26,35,84

Chapter 1 - Atherosclerosis
15
Figure 1.13 Transaxial images of a patient with chronic stable angina. (A) CAC showing
high volume calcium in the left anterior artery (white arrow). (B) Intense 18F-NaF uptake on
fused PET–CT image (white arrows). Larger arrows show area where only 18F-NaF is picked
up with no CAC signal being observed. Reproduced with permission.86
A recent study by Irkle et al. shows that in patients with stable coronary artery disease 18F-
NaF uptake correlates with CAC, although nearly half the patients with a high CAC score do
not present any 18F-NaF signal and high 18F-NaF signal can be seen in areas with a low CAC
score.13,24 This is indicative that 18F-NaF can be used to identify high-risk coronary lesions and
hence plaques that are at high risk of rupture.24 18F-NaF has proven promising in the
identification of high risk plaques but lacks the resolution required to determine the specific
calcification that may contribute to plaque rupture. One strategy to access this is to use
molecular imaging techniques to study plaque and calcification morphology with higher
resolution than PET.68,70
1.5 Conclusion
Vulnerable atherosclerotic plaques are an important topic in cardiology as CVD is the second
highest cause of death and currently there is little understanding of the mechanism behind the
disease. Another major issue is the lack of imaging techniques that are able to assess the
vulnerability of the plaque. As a consequence, the development of techniques that can identify
micro-calcification and therefore plaque vulnerability is a major research goal with the
potential to improve the understanding of the disease pathology and also to reduce morbidity
and mortality rates. The emerging technique that has proven the most promising required for
the identification of plaques at high risk of rupture is 18F-NaF. However, it lacks the resolution
required to provide anatomical information on the vulnerability of the plaque. One strategy to
access this additional information is to use molecular imaging techniques such as fluorescence
Chapter 1 - Atherosclerosis
16
and Raman which have a much higher resolution and can provide us with additional molecular
and anatomical information about the plaque.
1.6 Approach
The focus of this thesis is on the development of optical probes to better understand the
mechanism behind plaque formation, looking specifically at calcification with the hope to
develop an improved and more suitable approach to detect micro-calcification at an early stage
before plaque rupture.
Two types of fluorescent probes were synthesized; a fluoride-specific probe to detect the
fluoride PET tracer, upon localization of the fluoride anions around the surface of the HAP,
and a calcium-specific probe to bind directly to HAP. It was anticipated that both probes would
provide a better understanding of the binding of NaF to calcified deposits and additional
information on the mechanism behind calcification and plaque formation.
Fluorescent fluoride and calcium probes were synthesized and their selectivity was tested
against different types of anions (fluoride probe) and calcium minerals (calcium probe)
(Chapter 2). For the fluoride probe to be valuable, its limit of detection (LOD) needed to be in
the pM concertation range for it to be able to detect Na18F, unfortunately, this did not appear
to be the case and therefore the fluoride probe was set aside. Upon examining the specificity
of the calcium probes for HAP, only one was shown to be selective for HAP and this was taken
forward into cell and ex vivo mouse studies (Chapter 3). At this point, the focus was on proving
that the probe was nontoxic at the concentration used and it was compared to the current gold
standard laboratory techniques used for the detection of calcification (Alizarin S, calcium
leaching assay and von Kossa).
Once cell and ex vivo models proved satisfactory, the probe was tested on calcified vascular
tissue (Chapter 4). Again, similarly to the previous chapter, the probe was compared to
Alizarin S and von Kossa stains.
In the final results chapter (Chapter 5) of this thesis, the focus was shifted on analyzing
calcified tissue (cells, ex vivo rat aortic tissue and human vascular tissue) by Raman
spectroscopy in order to understand the crystal form of the calcified deposits.
Together, fluorescence and Raman spectroscopy have provided us with additional scientific
knowledge that will hopefully shape the future of cardiovascular research.
Chapter 1 - Atherosclerosis
17
1.7 References
1 J. D. Hutcheson, M. C. Blaser and E. Aikawa, Circ. Res., 2017, 120, 270–273.
2 G. Anwaier, C. Chen, Y. Cao and R. Qi, Int. J. Nanomedicine, 2017, 12, 7681–7693.
3 M. R. Dweck, M. K. Doris, M. Motwani, P. D. Adamson, P. Slomka, D. Dey, Z. A.
Fayad, D. E. Newby and D. Berman, Nat. Rev. Cardiol., 2016, 13, 533–548.
4 W. Liu, Y. Zhang, C.-M. Yu, Q.-W. Ji, M. Cai, Y.-X. Zhao and Y.-J. Zhou, J. Geriatr.
Cardiol., 2015, 12, 668–75.
5 T. Benedek, I. Rodean, M. Ratiu, N. Rat, L. Y. Eremie, C. Biriș, L. Lazăr, M. Păcurar
and I. Benedek, J. Cardiovasc. Emergencies, 2018, 22, 40–265.
6 S. Bertazzo, E. Gentleman, K. L. Cloyd, A. H. Chester, M. H. Yacoub and M. M.
Stevens, Nat. Mater., 2013, 12, 576–583.
7 J. M. Tarkin, M. R. Dweck, N. R. Evans, R. A. P. Takx, A. J. Brown, A. Tawakol, Z.
A. Fayad and J. H. F. Rudd, Circ. Res., 2016, 118, 750–69.
8 J. P. M. Andrews, Z. A. Fayad and M. R. Dweck, Atherosclerosis, 2018, 272, 118–128.
9 N. Townsend, J. Williams, P. Bhatnagar, K. Wickramasinghe and M. Rayner,
Cardiovascular disease statistics, 2014, 2014.
10 A. J. Lusis, Nature, 2000, 407, 233–241.
11 I. Tabas, G. Garcia-Cardena and G. K. Owens, J. Cell Biol., 2015, 209, 13–22.
12 F. A. Jaffer, Methods Mol. Biol., 2011, 680, 131–40.
13 P. D. Adamson, A. T. Vesey, N. V. Joshi, D. E. Newby and M. R. Dweck, Cardiovasc.
Diagn. Ther., 2015, 5, 150–155.
14 L. Cui, N. A. Rashdan, D. Zhu, E. M. Milne, P. Ajuh, G. Milne, M. H. Helfrich, K.
Lim, S. Prasad, D. A. Lerman, A. T. Vesey, M. R. Dweck, W. S. Jenkins, D. E. Newby,
C. Farquharson and V. E. Macrae, J. Cell. Physiol., 2017, 232, 2985–2995.
15 S. Gargiulo, M. Gramanzini and M. Mancini, Int. J. Mol. Sci., ,
DOI:10.3390/ijms17091511.
16 A. Yamashita and Y. Asada, J. Biomed. Biotechnol., 2011, 2011, 424929.
17 J. D. Hutcheson, N. Maldonado and E. Aikawa, Curr. Opin. Lipidol., 2014, 25, 327–
Chapter 1 - Atherosclerosis
18
32.
18 D. Cheng, X. Li, C. Zhang, H. Tan, C. Wang, L. Pang and H. Shi, ACS Appl. Mater.
Interfaces, 2015, 7, 2847–55.
19 C. Liu, S. Boydston-White, A. Weisberg, W. Wang, L. A. Sordillo, A. Perotte, V. P.
Tomaselli, P. P. Sordillo, Z. Pei, L. Shi and R. R. Alfano, J. Biomed. Opt., 2016, 21,
127006.
20 A. L. Durham, M. Y. Speer, M. Scatena, C. M. Giachelli and C. M. Shanahan,
Cardiovasc. Res., 2018, 114, 590–600.
21 M. Asrar ul Haq, J. Layland, V. Mutha and P. Barlis, Heart Asia, 2013, 5, 154–161.
22 M. R. Dweck, E. Aikawa, D. E. Newby, J. M. Tarkin, J. H. F. Rudd, J. Narula and Z.
A. Fayad, Circ. Res., 2016, 119, 330–340.
23 T. M. Doherty, K. Asotra, L. A. Fitzpatrick, J.-H. Qiao, D. J. Wilkin, R. C. Detrano, C.
R. Dunstan, P. K. Shah and T. B. Rajavashisth, Proc. Natl. Acad. Sci., 2003, 100,
11201–11206.
24 A. Irkle, A. T. Vesey, D. Y. Lewis, J. N. Skepper, J. L. E. Bird, M. R. Dweck, F. R.
Joshi, F. A. Gallagher, E. A. Warburton, M. R. Bennett, K. M. Brindle, D. E. Newby,
J. H. Rudd and A. P. Davenport, Nat. Commun., 2015, 6, 7495.
25 P. Lanzer, M. Boehm, V. Sorribas, M. Thiriet, J. Janzen, T. Zeller, C. S. Hilaire and C.
Shanahan, Eur. Heart J., 2014, 35, 1–14.
26 L. Bessueille and D. Magne, Cell. Mol. Life Sci., 2015, 72, 2475–2489.
27 M. R. Rubin and S. J. Silverberg, J. Clin. Endocrinol. Metab., 2004, 89, 4243–4245.
28 R. Kramann, C. Goettsch, J. Wongboonsin, H. Iwata, R. K. Schneider, C. Kuppe, N.
Kaesler, M. Chang-Panesso, F. G. Machado, S. Gratwohl, K. Madhurima, J. D.
Hutcheson, S. Jain, E. Aikawa and B. D. Humphreys, Cell Stem Cell, 2016, 19, 628–
642.
29 R. Shroff, D. A. Long and C. Shanahan, J. Am. Soc. Nephrol., 2013, 24, 179–189.
30 E. Aikawa, M. Nahrendorf, J. L. Figueiredo, F. K. Swirski, T. Shtatland, R. H. Kohler,
F. A. Jaffer, M. Aikawa and R. Weissleder, Circulation, 2007, 116, 2841–2850.
31 C. M. Shanahan, Circulation, 2007, 116, 2782–2785.

Chapter 1 - Atherosclerosis
19
32 L. Hortells, S. Sur and C. St. Hilaire, Front. Cardiovasc. Med., 2018, 5, 27.
33 M. Abedin, Y. Tintut and L. L. Demer, Arterioscler. Thromb. Vasc. Biol., 2004, 24,
1161–1170.
34 M. R. Dweck, N. A. Boon and D. E. Newby, J. Am. Coll. Cardiol., 2012, 60, 1854–
1863.
35 T. A. Pawade, D. E. Newby and M. R. Dweck, J. Am. Coll. Cardiol., 2015, 66, 561–
577.
36 M. Simionescu and A. V Sima, Inflammation and Atherosclerosis, Springers, 2012.
37 N. Reznikov, J. A. M. Steele, P. Fratzl and M. M. Stevens, Nat. Rev. Mater., 2016, 1,
16041.
38 M. R. Bennett, S. Sinha and G. K. Owens, Circ. Res., 2016, 118, 692–702.
39 P. Libby, Nature, 2002, 420, 868–874.
40 P. A. McCullough, K. R. Sandberg, F. Dumler and J. E. Yanez, J. Nephrol., 2004, 17,
205–215.
41 M. M. Izquierdo-Gómez, I. Hernández-Betancor, J. García-Niebla, B. Marí-López, I.
Laynez-Cerdeña and J. Lacalzada-Almeida, Biomed Res. Int., 2017, 2017, 5178631.
42 N. M. Rajamannan, F. J. Evans, E. Aikawa, K. J. Grande-Allen, L. L. Demer, D. D.
Heistad, C. A. Simmons, K. S. Masters, P. Mathieu, K. D. O’Brien, F. J. Schoen, D. A.
Towler, A. P. Yoganathan and C. M. Otto, Circulation, 2011, 124, 1783–91.
43 T. Akiyoshi, H. Ota, K. Iijima, B. K. Son, T. Kahyo, M. Setou, S. Ogawa, Y. Ouchi
and M. Akishita, Atherosclerosis, 2016, 244, 51–58.
44 J. S. Lee, J. D. Morrisett and C.-H. Tung, Atherosclerosis, 2012, 224, 340–7.
45 K. Johnson, M. Polewski, D. Van Etten and R. Terkeltaub, Arterioscler. Thromb. Vasc.
Biol., 2005, 25, 686–691.
46 S. Boonrungsiman, E. Gentleman, R. Carzaniga, N. D. Evans, D. W. McComb, A. E.
Porter and M. M. Stevens, Proc. Natl. Acad. Sci., 2012, 109, 14170–14175.
47 J. L. Hunt, R. Fairman, M. E. Mitchell, J. P. Carpenter, M. Golden, T. Khalapyan, M.
Wolfe, D. Neschis, R. Milner, B. Scoll, A. Cusack and E. R. Mohler, Stroke, 2002, 33,
1214–9.

Chapter 1 - Atherosclerosis
20
48 C. F. T. van der Ven, P.-J. Wu, M. W. Tibbitt, A. van Mil, J. P. G. Sluijter, R. Langer
and E. Aikawa, Clin. Sci., 2017, 131, 181–195.
49 D. E. Andreou and I. Andreadou, Pharmakeftiki, 2009, 22, 83–96.
50 M. Rattazzi and M. E. Rosenfeld, Atherosclerosis, 2018, 270, 193–195.
51 F. Otsuka, K. Sakakura, K. Yahagi, M. Joner and R. Virmani, Arterioscler. Thromb.
Vasc. Biol., 2014, 34, 724–736.
52 A. Ferreira Mendes, J. D. Hutcheson, C. García-Rodríguez, I. Parra-Izquierdo, I.
Castaños-Mollor, J. López, J. A. San Román and M. S. Crespo, Front. Physiol. Front.
Physiol, 2018, 9, 201.
53 M. J. Goumans, A. Zwijsen, P. ten Dijke and S. Bailly, Cold Spring Harb. Perspect.
Biol., 2018, 10, a031989.
54 T. Nakahara, J. Narula and H. W. Strauss, J. Am. Coll. Cardiol., 2016, 67, 79–80.
55 E. P. C. van der Vorst, R. J. de Jong and M. M. P. C. Donners, Front. Cardiovasc.
Med., 2018, 5, 2.
56 R. Arvizo, R. Bhattacharya and P. Mukherjee, Expert Opin. Drug Deliv., 2010, 7, 753–
63.
57 J. H. F. Rudd, K. S. Myers, S. Bansilal, J. Machac, M. Woodward, V. Fuster, M. E.
Farkouh and Z. A. Fayad, Circ. Cardiovasc. Imaging, 2009, 2, 107–115.
58 P. J. Harris, K. L. Lee, F. E. Harrell, V. S. Behar, R. A. Rosati, J. A. Cabico, J. Friedman
and G. A. Diamond, Circulation, 1980, 62, 718–26.
59 J. A. Ambrose, M. A. Tannenbaum, D. Alexopoulos, C. E. Hjemdahl-Monsen, J.
Leavy, M. Weiss, S. Borrico, R. Gorlin and V. Fuster, J. Am. Coll. Cardiol., 1988, 12,
56–62.
60 E. Falk, P. K. Shah and V. Fuster, Circulation, 1995, 92, 657–671.
61 H.-S. Shin and T. S. Kang, Korean Circ. J., 2012, 42, 54.
62 F. Prati, S. Uemura, G. Souteyrand, R. Virmani, P. Motreff, L. Di Vito, G. Biondi-
Zoccai, J. Halperin, V. Fuster, Y. Ozaki and J. Narula, JACC Cardiovasc. Imaging,
2013, 6, 283–287.
63 K. Hattori, Y. Ozaki, T. F. Ismail, M. Okumura, H. Naruse, S. Kan, M. Ishikawa, T.
Chapter 1 - Atherosclerosis
21
Kawai, M. Ohta, H. Kawai, T. Hashimoto, Y. Takagi, J. Ishii, P. W. Serruys and J.
Narula, JACC Cardiovasc. Imaging, 2012, 5, 169–177.
64 G. J. Tearney, H. Yabushita, S. L. Houser, H. T. Aretz, I. K. Jang, K. H. Schlendorf,
C. R. Kauffman, M. Shishkov, E. F. Halpern and B. E. Bouma, Circulation, 2003, 107,
113–119.
65 C. M. Gardner, H. Tan, E. L. Hull, J. B. Lisauskas, S. T. Sum, T. M. Meese, C. Jiang,
S. P. Madden, J. D. Caplan, A. P. Burke, R. Virmani, J. Goldstein and J. E. Muller,
JACC Cardiovasc. Imaging, 2008, 1, 638–648.
66 S. Waxman, S. R. Dixon, P. L’Allier, J. W. Moses, J. L. Petersen, D. Cutlip, J. C.
Tardif, R. W. Nesto, J. E. Muller, M. J. Hendricks, S. T. Sum, C. M. Gardner, J. A.
Goldstein, G. W. Stone and M. W. Krucoff, JACC Cardiovasc. Imaging, 2009, 2, 858–
868.
67 R. D. Madder, J. A. Goldstein, S. P. Madden, R. Puri, K. Wolski, M. Hendricks, S. T.
Sum, A. Kini, S. Sharma, D. Rizik, E. S. Brilakis, K. A. Shunk, J. Petersen, G. Weisz,
R. Virmani, S. J. Nicholls, A. Maehara, G. S. Mintz, G. W. Stone and J. E. Muller,
JACC Cardiovasc. Interv., 2013, 6, 838–846.
68 C. Vinegoni, I. Botnaru, E. Aikawa, M. A. Calfon, Y. Iwamoto, E. J. Folco, V.
Ntziachristos, R. Weissleder, P. Libby and F. A. Jaffer, Sci. Transl. Med., 2011, 3,
84ra45.
69 D. M. Mizrahi, O. Ziv-Polat, B. Perlstein, E. Gluz and S. Margel, Eur. J. Med. Chem.,
2011, 46, 5175–83.
70 F. A. Jaffer, C.-H. Tung, R. E. Gerszten and R. Weissleder, Arterioscler. Thromb. Vasc.
Biol., 2002, 22, 1929–35.
71 F. A. Jaffer, C. Vinegoni, M. C. John, E. Aikawa, H. K. Gold, A. V Finn, V.
Ntziachristos, P. Libby and R. Weissleder, Circulation, 2008, 118, 1802–1809.
72 F. A. Jaffer, M. A. Calfon, A. Rosenthal, G. Mallas, R. N. Razansky, A. Mauskapf, R.
Weissleder, P. Libby and V. Ntziachristos, J. Am. Coll. Cardiol., 2011, 57, 2516–2526.
73 T. Hara, G. J. Ughi, J. R. McCarthy, S. S. Erdem, A. Mauskapf, S. C. Lyon, A. M.
Fard, E. R. Edelman, G. J. Tearney and F. A. Jaffer, Eur. Heart J., 2017, 38, 447–455.
74 A. Zaheer, M. Murshed, A. M. De Grand, T. G. Morgan, G. Karsenty and J. V
Frangioni, Arterioscler. Thromb. Vasc. Biol., 2006, 26, 1132–1136.
Chapter 1 - Atherosclerosis
22
75 E. Aikawa, M. Aikawa, G. Rusanescu, Y. Iwamoto, G. P. Shi, F. A. Jaffer, P. Libby, J.
L. Figueiredo, D. Fukuda, R. H. Kohler and R. Weissleder, Circulation, 2009, 119,
1785–1794.
76 H. Maeda, T. Kowada, J. Kikuta, M. Furuya, M. Shirazaki, S. Mizukami, M. Ishii and
K. Kikuchi, Nat. Chem. Biol., 2016, 12, 579–585.
77 S. Achenbach and P. Raggi, Eur. Heart J., 2010, 31, 1442–1448.
78 M. Dweck, Imaging Vascular Calcification and Inflammation Using PET/CT,
https://www.pathsoc.org/files/meetings/edinburghpresthurs/1000 Thurs Fintry
Dweck.pdf%0A.
79 W. Chen and V. Dilsizian, Curr. Cardiol. Rep., 2013, 15, 364.
80 T. Nakahara and H. W. Strauss, Eur. J. Nucl. Med. Mol. Imaging, 2017, 44, 858–860.
81 T. Gomwe, S. E. Both and J. W. Nicholson, Ceram. - Silikaty, 2012, 56, 85–88.
82 T. Aoba, Crit. Rev. Oral Biol. Med., 1997, 8, 136–53.
83 M. Braun and C. Jana, Chem. Phys. Lett., 1995, 245, 19–22.
84 M. Blau, R. Ganatra and M. A. Bender, Semin. Nucl. Med., 1972, 2, 31–37.
85 M. Blau, W. Nagler and M. A. Bender, J. Nucl. Med., 1962, 3, 332–334.
86 J. M. Tarkin, F. R. Joshi and J. H. F. Rudd, Nat. Rev. Cardiol., 2014, 11, 443–57.
Chapter 2- Synthesis of fluorescent dyes for the detection of calcification in vitro
23
Chapter 2- Synthesis of Fluorescent Dyes
for the In Vitro Detection of
Calcification
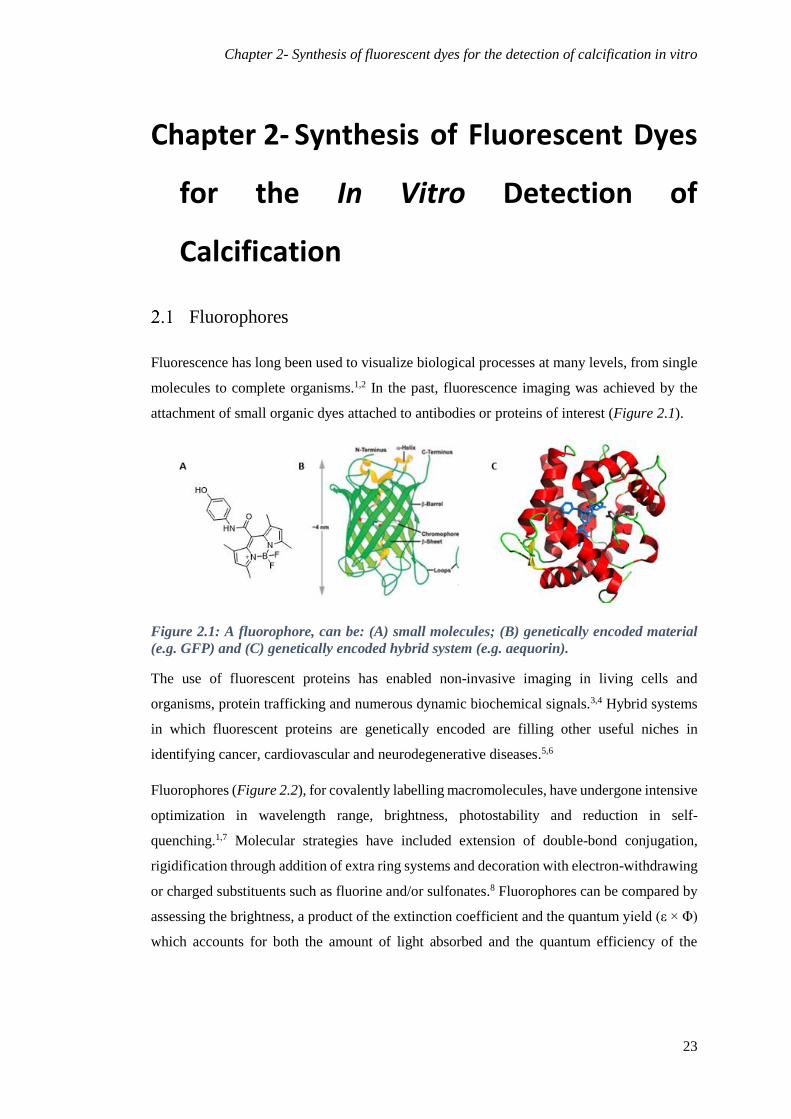
Fluorophores
Fluorescence has long been used to visualize biological processes at many levels, from single
molecules to complete organisms.1,2 In the past, fluorescence imaging was achieved by the
attachment of small organic dyes attached to antibodies or proteins of interest (Figure 2.1).
Figure 2.1: A fluorophore, can be: (A) small molecules; (B) genetically encoded material
(e.g. GFP) and (C) genetically encoded hybrid system (e.g. aequorin).
The use of fluorescent proteins has enabled non-invasive imaging in living cells and
organisms, protein trafficking and numerous dynamic biochemical signals.3,4 Hybrid systems
in which fluorescent proteins are genetically encoded are filling other useful niches in
identifying cancer, cardiovascular and neurodegenerative diseases.5,6
Fluorophores (Figure 2.2), for covalently labelling macromolecules, have undergone intensive
optimization in wavelength range, brightness, photostability and reduction in self-
quenching.1,7 Molecular strategies have included extension of double-bond conjugation,
rigidification through addition of extra ring systems and decoration with electron-withdrawing
or charged substituents such as fluorine and/or sulfonates.8 Fluorophores can be compared by
assessing the brightness, a product of the extinction coefficient and the quantum yield (ε × Φ)
which accounts for both the amount of light absorbed and the quantum efficiency of the

Chapter 2- Synthesis of fluorescent dyes for the detection of calcification in vitro
24
fluorophore.9 Hundreds of such dyes are commercially available and further progress is likely
to be incremental.1
Figure 2.2: Commonly used fluorophores. Fluorophores are reported in a graph plotting
brightness against emission wavelength.
Over the last several decades there has been a remarkable growth in the use of small-molecule
fluorescent probes in the field of biological sciences (Figure 2.3). Non-fluorescent molecules
of interest can be tagged with a fluorescent moiety using well established protocols, thus
allowing the visualisation of specific biological pathways. In addition to aiding imaging,
functional fluorescent probes have become indispensable tools in modern biology because
they provide dynamic information concerning the localization and a number of molecules of
interest.10

Chapter 2- Synthesis of fluorescent dyes for the detection of calcification in vitro
25
Figure 2.3: Small molecule probes. Illustrated are a zinc finger-small molecule probe (top
left), pH probe (top middle), protease probe for in vivo imaging (top right), β-galactosidase
probe (middle), Ca2+ probe (bottom left) and a hypochlorite specific reactive-oxygen species
probe (bottom right). Image reproduced with permission.10
Fluorescent dyes, in comparison to absorbance-based probes often used by researchers in the
nineteenth century, provide nearly infinite contrast, this arises from the release of light on a
dark background when illuminated with shorter-wavelength light.10 Fluorescent dyes can
provide single-molecule sensitivity, real time quantification and molecule localization.11 The
great potential utility for fluorescence visualisation of biomolecules, has led to the
development of a wide range of fluorophores for labelling biological molecules.10
Approach for the detection of HAP
As mentioned in Chapter 1, two different approaches have been identified to study vascular
calcification; one involving fluoride probes (section 2.3) and the other involving calcium
probes (section 2.4).
The fluoride probes, will allow the presence of Na18F localized around the HAP crystals to be
detected and will be correlated with PET while the calcium probes will bind directly to HAP
and will therefore allow for a more direct study of the calcification process.

Chapter 2- Synthesis of fluorescent dyes for the detection of calcification in vitro
26
Fluoride probes
Probe selection
The design and synthesis of fluorescent probes that allow for a selective and sensitive detection
of anions has gained a large amount of attention the past few years.12–14 Anions are known to
play an important role in a wide range of chemical and biological processes and have been the
target of investigations into these processes for the past decade.15 Effort has been put into the
development of rapid, selective and sensitive chemical sensors for the detection and imaging
of the location of fluoride ions by exploiting the unique reactivity of fluoride.13 These are based
on cleavage reactions, nucleophilic additions and molecular interactions. Most of them have
been proven to work only in anhydrous organic media, with slow response times and low
sensitivity. Very few have been reported to be tolerated in biological systems for cell imaging
applications.15,16
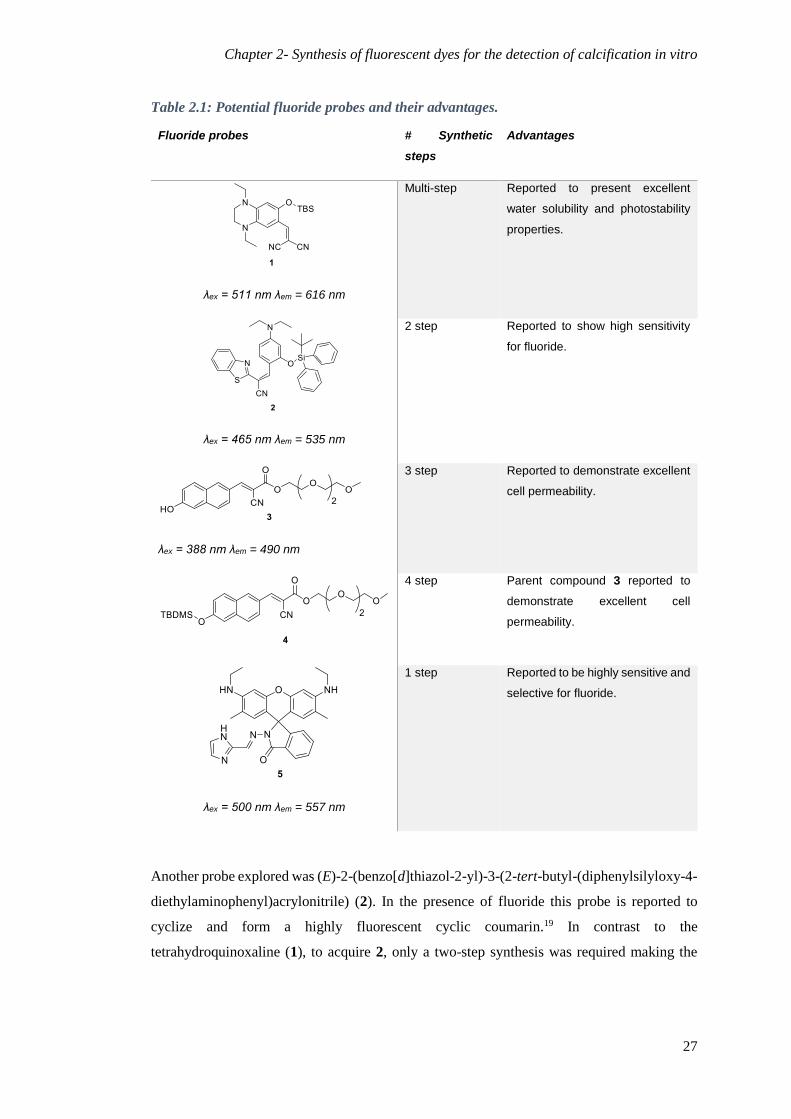
To investigate the Na18F PET tracer, a number of published fluoride sensors were analysed for
their potential application to this target. The selected fluorophore should: be cell permeable;
have high sensitivity for fluoride; and have excellent properties for fluorescent
microscopy.13,17–19 Five probes with the above characteristics were inspected further (Table
2.1), one of which is based on a tetrahydroquinoxaline motif (1) which had previously been
investigated by the Song group.15 The probe (1) was described to have excellent water
solubility, photostability properties and emission in the NIR region. However, the synthetic
approach to obtain the tetrahydroquinoxaline (1) involved several laborious synthesis and
purification steps making the other probes more appealing.
Chapter 2- Synthesis of fluorescent dyes for the detection of calcification in vitro
27
Table 2.1: Potential fluoride probes and their advantages.
Fluoride probes # Synthetic
steps
Advantages
λex = 511 nm λem = 616 nm
Multi-step Reported to present excellent
water solubility and photostability
properties.
λex = 465 nm λem = 535 nm
2 step Reported to show high sensitivity
for fluoride.
λex = 388 nm λem = 490 nm
3 step Reported to demonstrate excellent
cell permeability.
4 step
Parent compound 3 reported to
demonstrate excellent cell
permeability.
λex = 500 nm λem = 557 nm
1 step Reported to be highly sensitive and
selective for fluoride.
Another probe explored was (E)-2-(benzo[d]thiazol-2-yl)-3-(2-tert-butyl-(diphenylsilyloxy-4-
diethylaminophenyl)acrylonitrile) (2). In the presence of fluoride this probe is reported to
cyclize and form a highly fluorescent cyclic coumarin.19 In contrast to the
tetrahydroquinoxaline (1), to acquire 2, only a two-step synthesis was required making the
Chapter 2- Synthesis of fluorescent dyes for the detection of calcification in vitro
28
probe of interest in investigating the role of the Na18F PET tracer. However, upon close
inspection of the fluorescent characteristics of probe (2), a very strong background
fluorescence signal was observed even before the addition of NaF and therefore this probe was
also set aside.
Two other fluorophores, based on the naphthalene cyanoacrylate motif, were considered
excellent candidates for detecting fluoride. The naphthalene cyanoacrylate motif (3 and 4) has
been previously shown to have excellent cell permeability properties,13 in addition, the
synthesis appeared straightforward with only 3-4 steps required.
Rhodamine-based probe (5) was yet another probe with interesting properties and was recently
reported to detect fluoride in biological systems with high sensitivity and selectivity.20 Another
advantage of this probe was the rapid one-step reaction required to synthesise the probe,
making it very appealing for our application.
These three most biologically relevant fluoride sensors (3-5) were explored in more detail for
their potential to be used to analyse the mechanism underlying the uptake of the tracer.
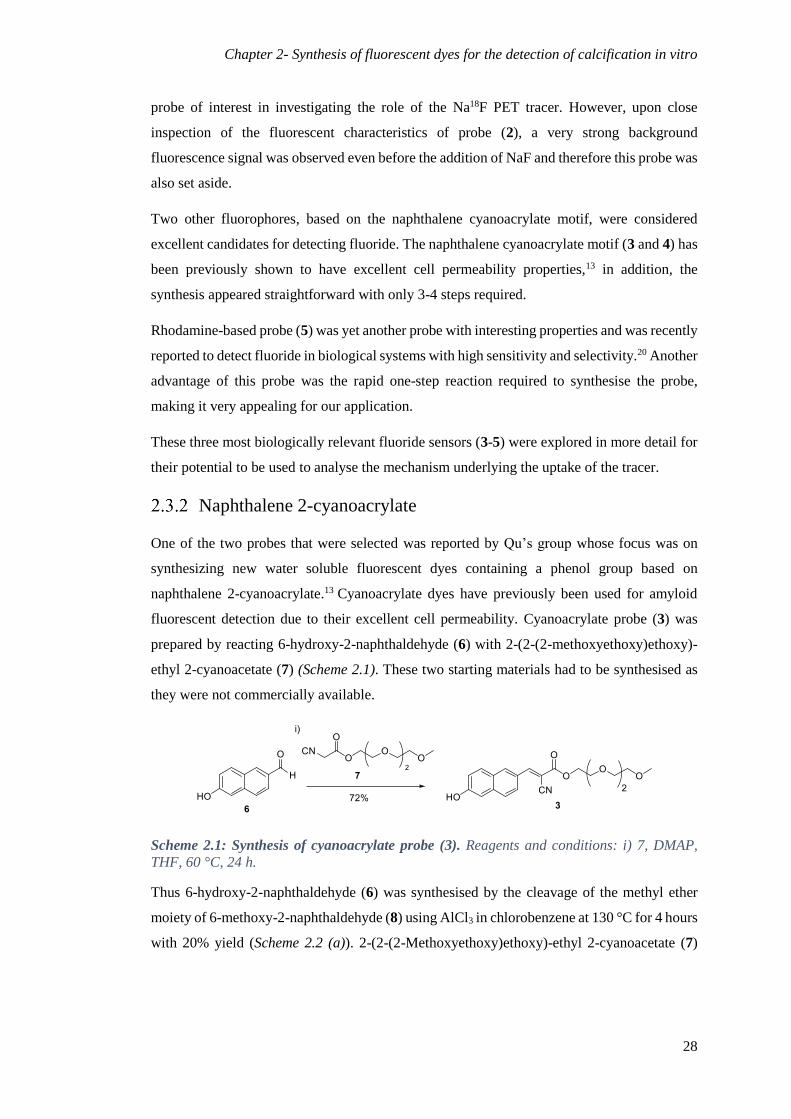
Naphthalene 2-cyanoacrylate
One of the two probes that were selected was reported by Qu’s group whose focus was on
synthesizing new water soluble fluorescent dyes containing a phenol group based on
naphthalene 2-cyanoacrylate.13 Cyanoacrylate dyes have previously been used for amyloid
fluorescent detection due to their excellent cell permeability. Cyanoacrylate probe (3) was
prepared by reacting 6-hydroxy-2-naphthaldehyde (6) with 2-(2-(2-methoxyethoxy)ethoxy)-
ethyl 2-cyanoacetate (7) (Scheme 2.1). These two starting materials had to be synthesised as
they were not commercially available.
Scheme 2.1: Synthesis of cyanoacrylate probe (3). Reagents and conditions: i) 7, DMAP,
THF, 60 °C, 24 h.
Thus 6-hydroxy-2-naphthaldehyde (6) was synthesised by the cleavage of the methyl ether
moiety of 6-methoxy-2-naphthaldehyde (8) using AlCl3 in chlorobenzene at 130 °C for 4 hours
with 20% yield (Scheme 2.2 (a)). 2-(2-(2-Methoxyethoxy)ethoxy)-ethyl 2-cyanoacetate (7)
Chapter 2- Synthesis of fluorescent dyes for the detection of calcification in vitro
29
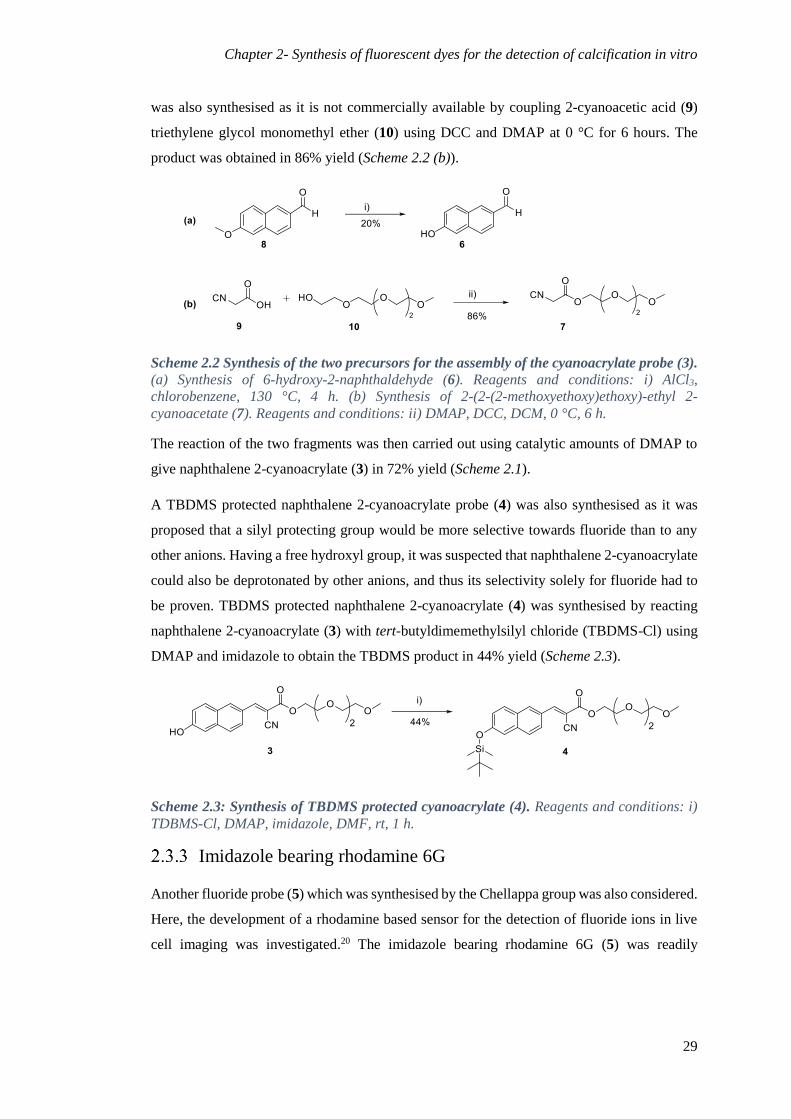
was also synthesised as it is not commercially available by coupling 2-cyanoacetic acid (9)
triethylene glycol monomethyl ether (10) using DCC and DMAP at 0 °C for 6 hours. The
product was obtained in 86% yield (Scheme 2.2 (b)).
Scheme 2.2 Synthesis of the two precursors for the assembly of the cyanoacrylate probe (3).
(a) Synthesis of 6-hydroxy-2-naphthaldehyde (6). Reagents and conditions: i) AlCl3, chlorobenzene, 130 °C, 4 h. (b) Synthesis of 2-(2-(2-methoxyethoxy)ethoxy)-ethyl 2-
cyanoacetate (7). Reagents and conditions: ii) DMAP, DCC, DCM, 0 °C, 6 h.
The reaction of the two fragments was then carried out using catalytic amounts of DMAP to
give naphthalene 2-cyanoacrylate (3) in 72% yield (Scheme 2.1).
A TBDMS protected naphthalene 2-cyanoacrylate probe (4) was also synthesised as it was
proposed that a silyl protecting group would be more selective towards fluoride than to any
other anions. Having a free hydroxyl group, it was suspected that naphthalene 2-cyanoacrylate
could also be deprotonated by other anions, and thus its selectivity solely for fluoride had to
be proven. TBDMS protected naphthalene 2-cyanoacrylate (4) was synthesised by reacting
naphthalene 2-cyanoacrylate (3) with tert-butyldimemethylsilyl chloride (TBDMS-Cl) using
DMAP and imidazole to obtain the TBDMS product in 44% yield (Scheme 2.3).
Scheme 2.3: Synthesis of TBDMS protected cyanoacrylate (4). Reagents and conditions: i)
TDBMS-Cl, DMAP, imidazole, DMF, rt, 1 h.
Imidazole bearing rhodamine 6G
Another fluoride probe (5) which was synthesised by the Chellappa group was also considered.
Here, the development of a rhodamine based sensor for the detection of fluoride ions in live
cell imaging was investigated.20 The imidazole bearing rhodamine 6G (5) was readily
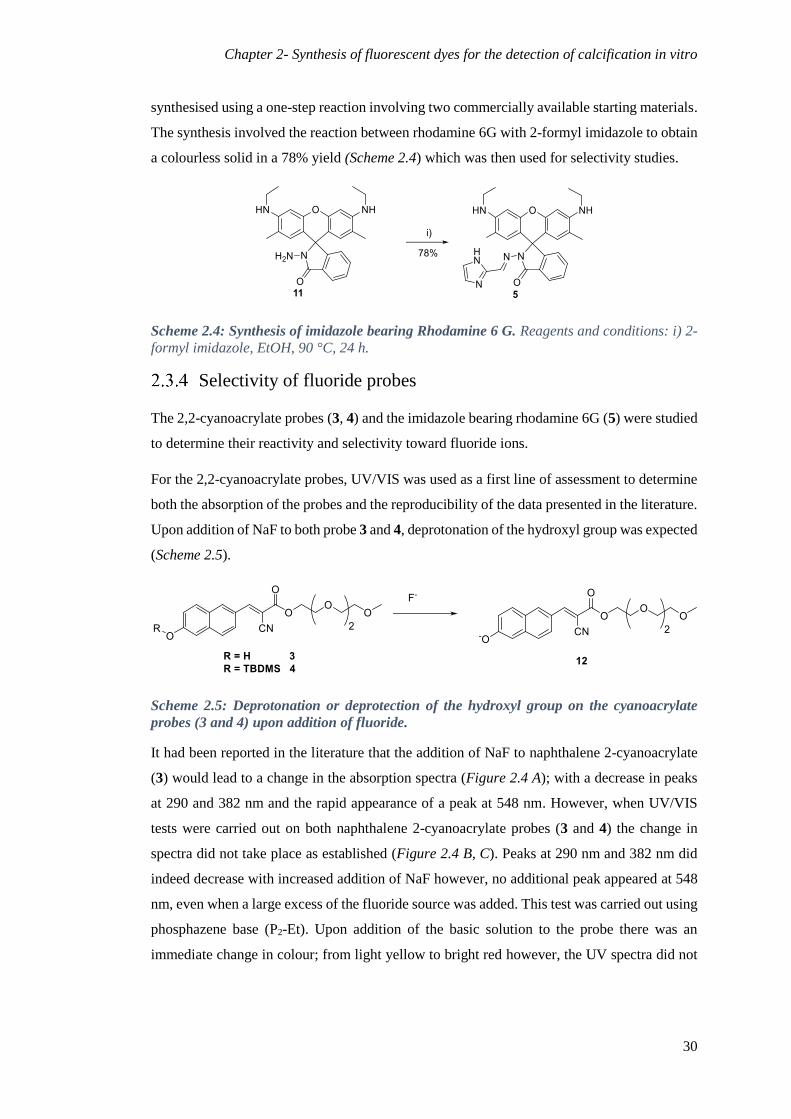
Chapter 2- Synthesis of fluorescent dyes for the detection of calcification in vitro
30
synthesised using a one-step reaction involving two commercially available starting materials.
The synthesis involved the reaction between rhodamine 6G with 2-formyl imidazole to obtain
a colourless solid in a 78% yield (Scheme 2.4) which was then used for selectivity studies.
Scheme 2.4: Synthesis of imidazole bearing Rhodamine 6 G. Reagents and conditions: i) 2-
formyl imidazole, EtOH, 90 °C, 24 h.
Selectivity of fluoride probes
The 2,2-cyanoacrylate probes (3, 4) and the imidazole bearing rhodamine 6G (5) were studied
to determine their reactivity and selectivity toward fluoride ions.
For the 2,2-cyanoacrylate probes, UV/VIS was used as a first line of assessment to determine
both the absorption of the probes and the reproducibility of the data presented in the literature.
Upon addition of NaF to both probe 3 and 4, deprotonation of the hydroxyl group was expected
(Scheme 2.5).
Scheme 2.5: Deprotonation or deprotection of the hydroxyl group on the cyanoacrylate
probes (3 and 4) upon addition of fluoride.
It had been reported in the literature that the addition of NaF to naphthalene 2-cyanoacrylate
(3) would lead to a change in the absorption spectra (Figure 2.4 A); with a decrease in peaks
at 290 and 382 nm and the rapid appearance of a peak at 548 nm. However, when UV/VIS
tests were carried out on both naphthalene 2-cyanoacrylate probes (3 and 4) the change in
spectra did not take place as established (Figure 2.4 B, C). Peaks at 290 nm and 382 nm did
indeed decrease with increased addition of NaF however, no additional peak appeared at 548
nm, even when a large excess of the fluoride source was added. This test was carried out using
phosphazene base (P2-Et). Upon addition of the basic solution to the probe there was an
immediate change in colour; from light yellow to bright red however, the UV spectra did not
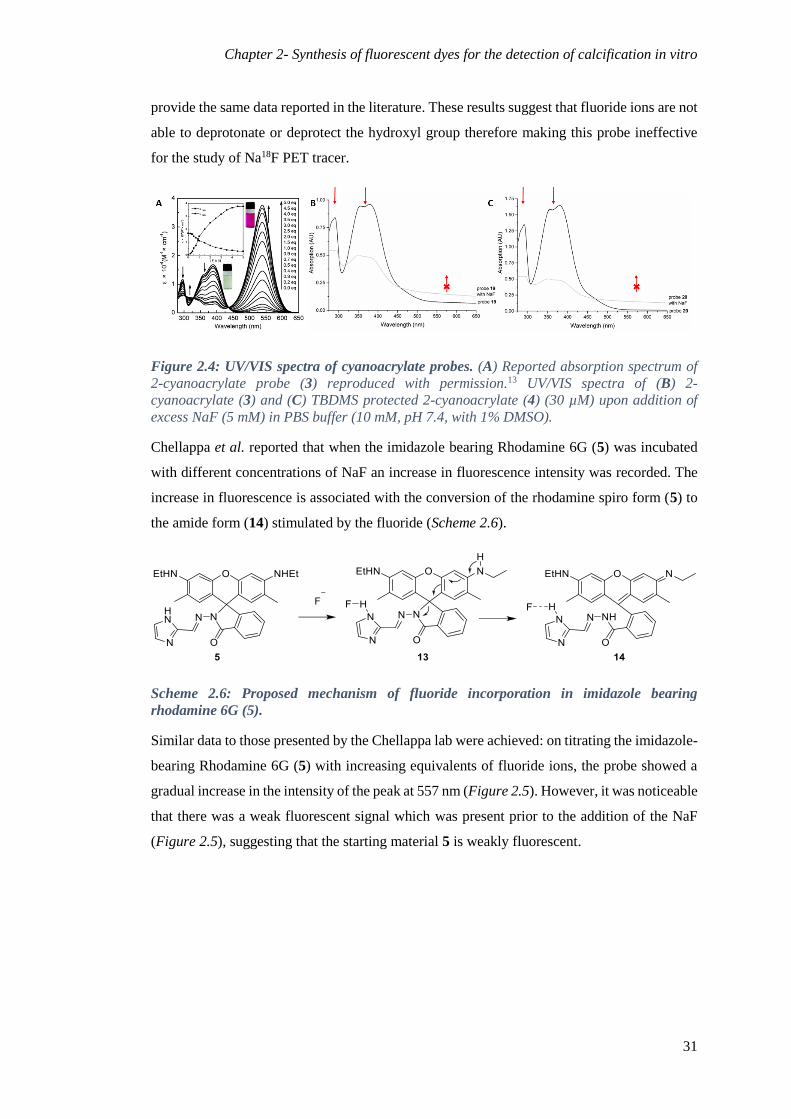
Chapter 2- Synthesis of fluorescent dyes for the detection of calcification in vitro
31
provide the same data reported in the literature. These results suggest that fluoride ions are not
able to deprotonate or deprotect the hydroxyl group therefore making this probe ineffective
for the study of Na18F PET tracer.
Figure 2.4: UV/VIS spectra of cyanoacrylate probes. (A) Reported absorption spectrum of
2-cyanoacrylate probe (3) reproduced with permission.13 UV/VIS spectra of (B) 2-
cyanoacrylate (3) and (C) TBDMS protected 2-cyanoacrylate (4) (30 µM) upon addition of
excess NaF (5 mM) in PBS buffer (10 mM, pH 7.4, with 1% DMSO).
Chellappa et al. reported that when the imidazole bearing Rhodamine 6G (5) was incubated
with different concentrations of NaF an increase in fluorescence intensity was recorded. The
increase in fluorescence is associated with the conversion of the rhodamine spiro form (5) to
the amide form (14) stimulated by the fluoride (Scheme 2.6).
Scheme 2.6: Proposed mechanism of fluoride incorporation in imidazole bearing
rhodamine 6G (5).
Similar data to those presented by the Chellappa lab were achieved: on titrating the imidazole-
bearing Rhodamine 6G (5) with increasing equivalents of fluoride ions, the probe showed a
gradual increase in the intensity of the peak at 557 nm (Figure 2.5). However, it was noticeable
that there was a weak fluorescent signal which was present prior to the addition of the NaF
(Figure 2.5), suggesting that the starting material 5 is weakly fluorescent.
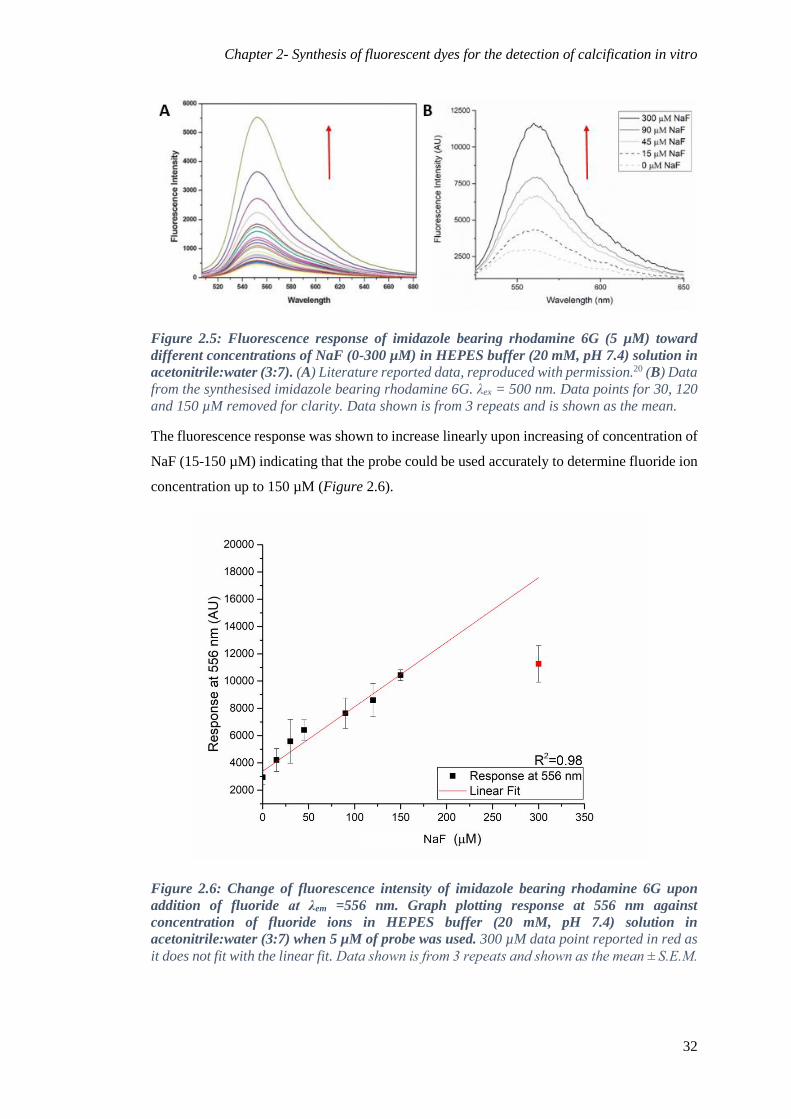
Chapter 2- Synthesis of fluorescent dyes for the detection of calcification in vitro
32
Figure 2.5: Fluorescence response of imidazole bearing rhodamine 6G (5 µM) toward
different concentrations of NaF (0-300 µM) in HEPES buffer (20 mM, pH 7.4) solution in
acetonitrile:water (3:7). (A) Literature reported data, reproduced with permission.20 (B) Data
from the synthesised imidazole bearing rhodamine 6G. λex = 500 nm. Data points for 30, 120
and 150 µM removed for clarity. Data shown is from 3 repeats and is shown as the mean.
The fluorescence response was shown to increase linearly upon increasing of concentration of
NaF (15-150 µM) indicating that the probe could be used accurately to determine fluoride ion
concentration up to 150 µM (Figure 2.6).
Figure 2.6: Change of fluorescence intensity of imidazole bearing rhodamine 6G upon
addition of fluoride at λem =556 nm. Graph plotting response at 556 nm against
concentration of fluoride ions in HEPES buffer (20 mM, pH 7.4) solution in
acetonitrile:water (3:7) when 5 µM of probe was used. 300 µM data point reported in red as
it does not fit with the linear fit. Data shown is from 3 repeats and shown as the mean ± S.E.M.
Chapter 2- Synthesis of fluorescent dyes for the detection of calcification in vitro
33
The limit of detection (LOD) of the probe was calculated using the formula mean blank + 3*
SD of blank. This suggests that 2.9 µM of NaF is required in order to detect any fluorescence
signal when 5 µM of rhodamine probe (5) is used. The LOD would have been lower if the
rhodamine probe (5) did not show any fluorescent signal prior to incubation with NaF.
Additional studies on the selectivity of the probe to NaF were carried out. The imidazole-
bearing rhodamine 6G (5) was incubated with a range of anions including F-, AcO-, Cl-, I-, Br-
and HPO4-. The other anions did not produce any colour change nor an increase in fluorescence
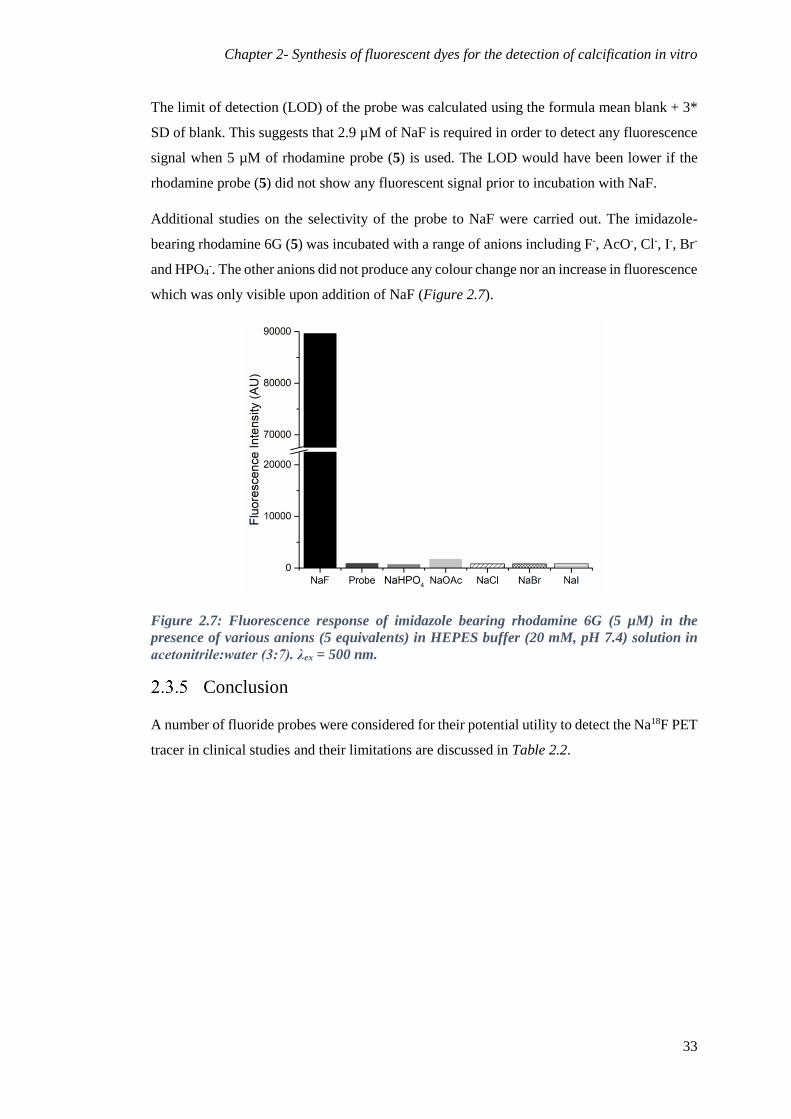
which was only visible upon addition of NaF (Figure 2.7).
Figure 2.7: Fluorescence response of imidazole bearing rhodamine 6G (5 µM) in the
presence of various anions (5 equivalents) in HEPES buffer (20 mM, pH 7.4) solution in
acetonitrile:water (3:7). λex = 500 nm.
Conclusion
A number of fluoride probes were considered for their potential utility to detect the Na18F PET
tracer in clinical studies and their limitations are discussed in Table 2.2.
Chapter 2- Synthesis of fluorescent dyes for the detection of calcification in vitro
34
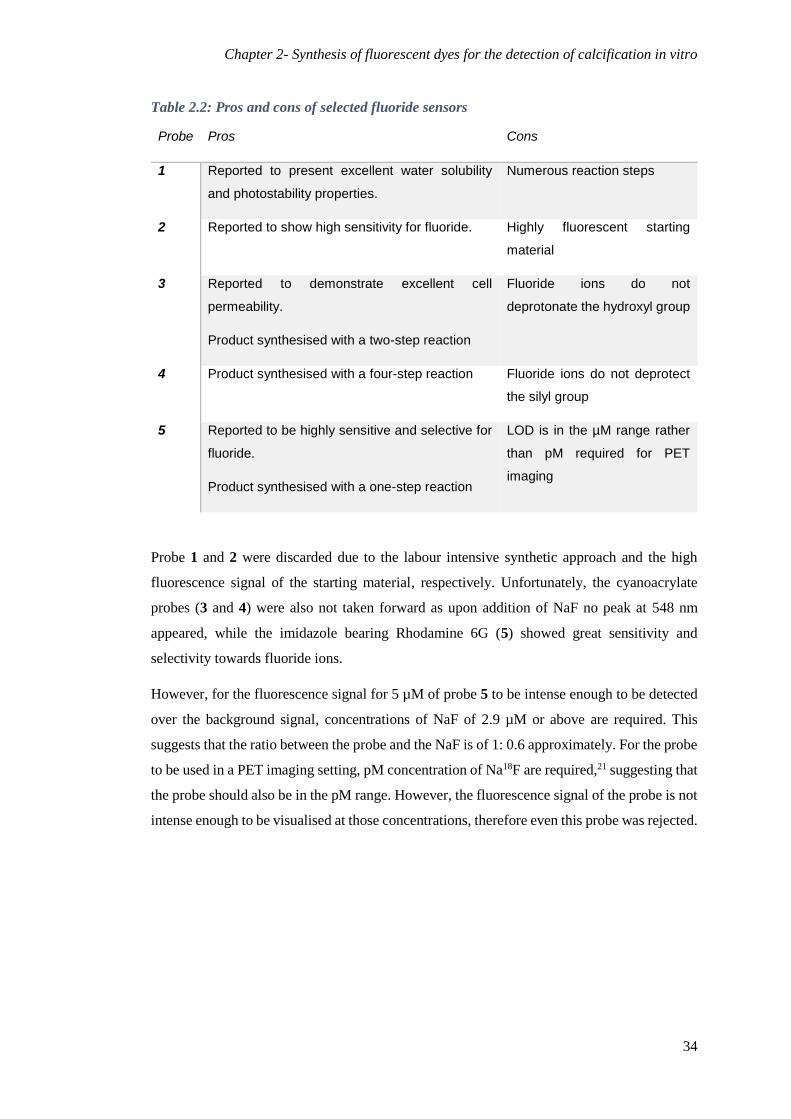
Table 2.2: Pros and cons of selected fluoride sensors
Probe Pros Cons
1 Reported to present excellent water solubility
and photostability properties.
Numerous reaction steps
2 Reported to show high sensitivity for fluoride. Highly fluorescent starting
material
3 Reported to demonstrate excellent cell
permeability.
Product synthesised with a two-step reaction
Fluoride ions do not
deprotonate the hydroxyl group
4 Product synthesised with a four-step reaction Fluoride ions do not deprotect
the silyl group
5 Reported to be highly sensitive and selective for
fluoride.
Product synthesised with a one-step reaction
LOD is in the µM range rather
than pM required for PET
imaging
Probe 1 and 2 were discarded due to the labour intensive synthetic approach and the high
fluorescence signal of the starting material, respectively. Unfortunately, the cyanoacrylate
probes (3 and 4) were also not taken forward as upon addition of NaF no peak at 548 nm
appeared, while the imidazole bearing Rhodamine 6G (5) showed great sensitivity and
selectivity towards fluoride ions.
However, for the fluorescence signal for 5 µM of probe 5 to be intense enough to be detected
over the background signal, concentrations of NaF of 2.9 µM or above are required. This
suggests that the ratio between the probe and the NaF is of 1: 0.6 approximately. For the probe
to be used in a PET imaging setting, pM concentration of Na18F are required,21 suggesting that
the probe should also be in the pM range. However, the fluorescence signal of the probe is not
intense enough to be visualised at those concentrations, therefore even this probe was rejected.
Chapter 2- Synthesis of fluorescent dyes for the detection of calcification in vitro
35
Calcium probes
A range of calcium probes precursors were examined and, two fluorophores and calcium
binding molecules were selected for coupling. For the fluorophore entity, cyanine dyes and
fluorescein were selected and these are discussed in more detail below, while as a binding
motif, bisphosphonates and a calcium binding peptide were carefully chosen due to their
ability to bind to HAP.
Cyanine dyes
The cyanine (Cy) dyes are a class of highly fluorescent compounds that possess the key
requirements necessary for highly sensitive multicolour detection, with wavelengths which are
tuneable upon the addition of specific functional groups, across the visible spectrum.22 They
also display excellent photophysical properties that include high extinction coefficients and
moderate quantum yields, while possessing fluorescent wavelengths removed from the natural
autofluorescence of biomolecules.22–24
Cy dyes are photosensitive structures composed of two heterocycles, one of which is a
quaternary ammonium salt, that are linked together through a polymethine bridge (15) which
allows for delocalization of the positive charge (Scheme 2.7).24,25 The absorbance and
fluorescence wavelengths can be controlled by a choice of the polymethine bridge length: Cy
dyes with a longer bridge posses higher absorbance and emission wavelengths up to the near
infrared region.
Scheme 2.7: Cy dye polymethine bridge structure. Polymethine bridge and delocalization of
the double bonds within the system.
There are a variety of Cy dyes which have been reported in the literature (Figure 2.8): non-
sulfonated (16-21) or sulfonated (sulfo; 22) being two key classes. For many applications they
are interchangeable, this is due to their spectral properties being nearly identical. Both can be
used for labelling biomolecules however, critically, sulfo-dyes are water soluble and do not
require organic co-solvent for the labelling of molecules in aqueous environments.

Chapter 2- Synthesis of fluorescent dyes for the detection of calcification in vitro
36
Inopportunely, the synthesis and purification of sulfo-Cy dyes is more challenging. Common
Cy dye core structures include Cy3 (16), Cy3.5 (19), Cy5 (17), Cy5.5 (20), Cy7 (18) and Cy7.5
(21) (Figure 2.8), where the number identifies the number of carbons between the two
indolenine groups. The suffix .5 is added for cyanine dyes which contain a benzo-fused indole
motif as part of the cyanine dyes.
Figure 2.8: Library of Cy dyes. Cy3 (16), Cy5 (17), Cy7 (18) all possess two indole groups
while Cy3.5 (19), Cy5.5 (20), Cy7.5 (21) contain two benzo-fused indoles. Sulfo-Cy7 (22)
contains sulfo groups.
In recent years cyanine dyes have been used as fluorescent probes in biomedical screening
techniques,22,23,26 as luminescent materials for labelling27 and as analyte-responsive fluorescent
probes in optoelectronic applications.14,28
Fluorescein
Fluorescein (23) is a common fluorophore used in microscopy with an absorption maximum
at 494 nm and emission maximum of 515 nm. Fluorescein (23) was first synthesised by Adolph
Von Baeyer in 1871 who reacted resorcinol (24) with phthalic anhydride (25).29,30 Scheme 2.8
shows a modern adaptation of this reaction.

Chapter 2- Synthesis of fluorescent dyes for the detection of calcification in vitro
37
Scheme 2.8: Synthesis of fluorescein via a modified Friedel-Craft acylation. Reagents and
conditions: i) ZnCl2, H2O, MW, 200 °C, 1 h.
To demonstrate the sensitivity of fluorescein (23), 10 kg of sodium fluorescein were placed in
the Danube and 60 hours later green fluorescence was detected in the river Rhine, 200 km
from where it was first introduced. In 1942, Albert Coons labelled antibodies with fluorescein
(23) thus giving birth to the field of immunofluorescence.31,32 Since then, c has been widely
used as a fluorophore bound to antibodies but also to other molecules of interest, allowing
scientists to utilise fluorescence immunocytochemical techniques to visualise cellular
mechanisms. Fluorescein (23) has many uses in the fields of biochemical and medical
research. In cellular biology, it is used to label and track cells in fluorescence microscopy,
specifically in flow cytometry.
Ten years later, in 1953, the use of sodium fluorescein (9) to assess in vivo circulation was
reported by Paul Ehrlich, who detected fluorescein in a rabbit eye following parenteral
administration.30,33 Once the nontoxic properties of fluorescein (23) were demonstrated it
started being used in human subjects mainly in the field of ophthalmology and especially in
the analysis of corneal abrasion and surface irregularities (Figure 2.9).30,34,35 This work was
pioneered by MacLean and Maumenee in the late 1950s where they injected fluorescein in a
patient’s eye and then observed a vascular anomaly under a lamp providing cobalt blue
illumination.30,35,36
Chapter 2- Synthesis of fluorescent dyes for the detection of calcification in vitro
38
Figure 2.9 Fluorescein angiography. (A) Early and (B) late phase of angiography of a
patient with multifocal choroiditis. Arrows indicate an area of fluorescein localization.
Image reproduced with permission.37
Another medical application is seen in the field of angiography, where it is used intravenously,
or orally, to diagnose and categorize vascular disorders including: retinal disease; macular
degeneration; diabetic retinopathy; and intraocular tumours. Most recently, it has discovered
an application in surgery for brain tumours,38 as well as in open heart surgery.39
Examples of HAP binding molecules
Bisphosphonates (BPs) are a class of drugs that are used to treat adult disease of high bone
turnover such as Paget’s, osteoporosis myeloma and metastatic bone disease.40–42 Alendronate
(26) is part of the bisphosphonate family together with pamidronate (27) and risedronate (28),
as well an numerous others (Figure 2.10).40,43,44
Figure 2.10: Bisphosphonates. Alendronate (26) pamidronate (27), risedronate (28) and
pyrophosphate (29).
BPs are structurally similar to pyrophosphate (29) which is a normal product of human
metabolism. BPs inhibit the farnesyl pyrophosphate synthase enzyme (Figure 2.11) and
eventually induce osteoclast apoptosis.45,46
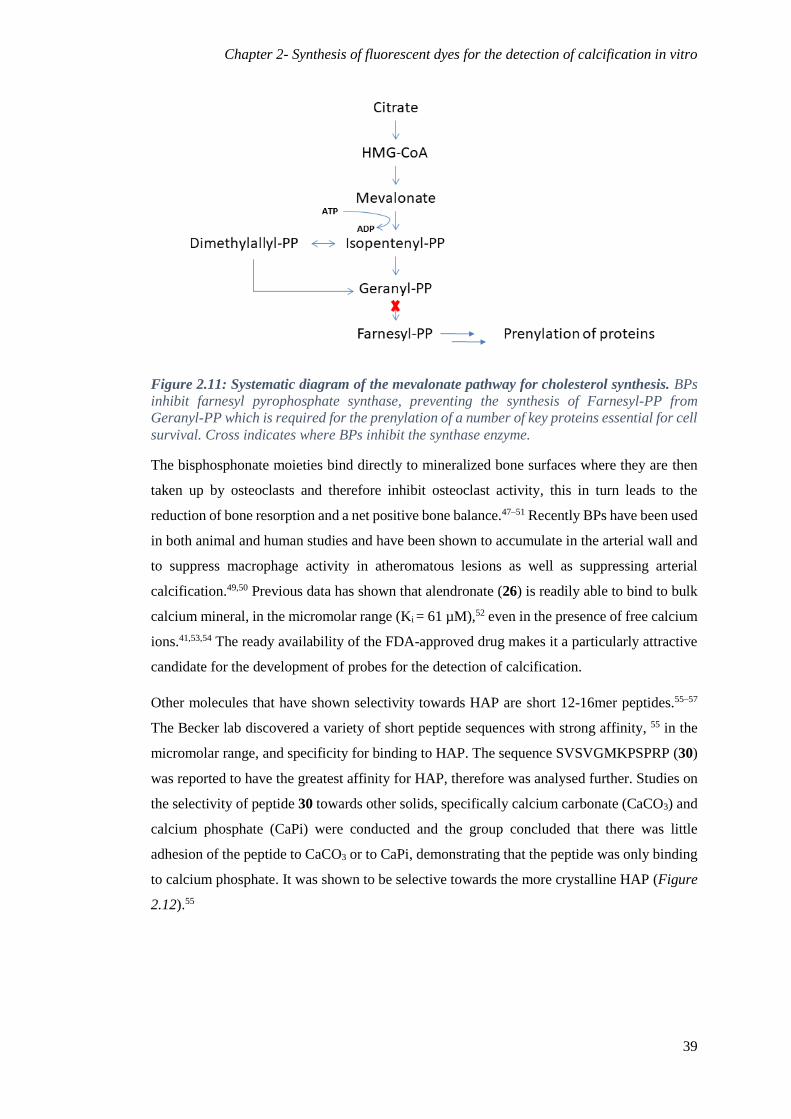
Chapter 2- Synthesis of fluorescent dyes for the detection of calcification in vitro
39
Figure 2.11: Systematic diagram of the mevalonate pathway for cholesterol synthesis. BPs
inhibit farnesyl pyrophosphate synthase, preventing the synthesis of Farnesyl-PP from
Geranyl-PP which is required for the prenylation of a number of key proteins essential for cell
survival. Cross indicates where BPs inhibit the synthase enzyme.
The bisphosphonate moieties bind directly to mineralized bone surfaces where they are then
taken up by osteoclasts and therefore inhibit osteoclast activity, this in turn leads to the
reduction of bone resorption and a net positive bone balance.47–51 Recently BPs have been used
in both animal and human studies and have been shown to accumulate in the arterial wall and
to suppress macrophage activity in atheromatous lesions as well as suppressing arterial
calcification.49,50 Previous data has shown that alendronate (26) is readily able to bind to bulk
calcium mineral, in the micromolar range (Ki = 61 µM),52 even in the presence of free calcium
ions.41,53,54 The ready availability of the FDA-approved drug makes it a particularly attractive
candidate for the development of probes for the detection of calcification.
Other molecules that have shown selectivity towards HAP are short 12-16mer peptides.55–57
The Becker lab discovered a variety of short peptide sequences with strong affinity, 55 in the
micromolar range, and specificity for binding to HAP. The sequence SVSVGMKPSPRP (30)
was reported to have the greatest affinity for HAP, therefore was analysed further. Studies on
the selectivity of peptide 30 towards other solids, specifically calcium carbonate (CaCO3) and
calcium phosphate (CaPi) were conducted and the group concluded that there was little
adhesion of the peptide to CaCO3 or to CaPi, demonstrating that the peptide was only binding
to calcium phosphate. It was shown to be selective towards the more crystalline HAP (Figure
2.12).55
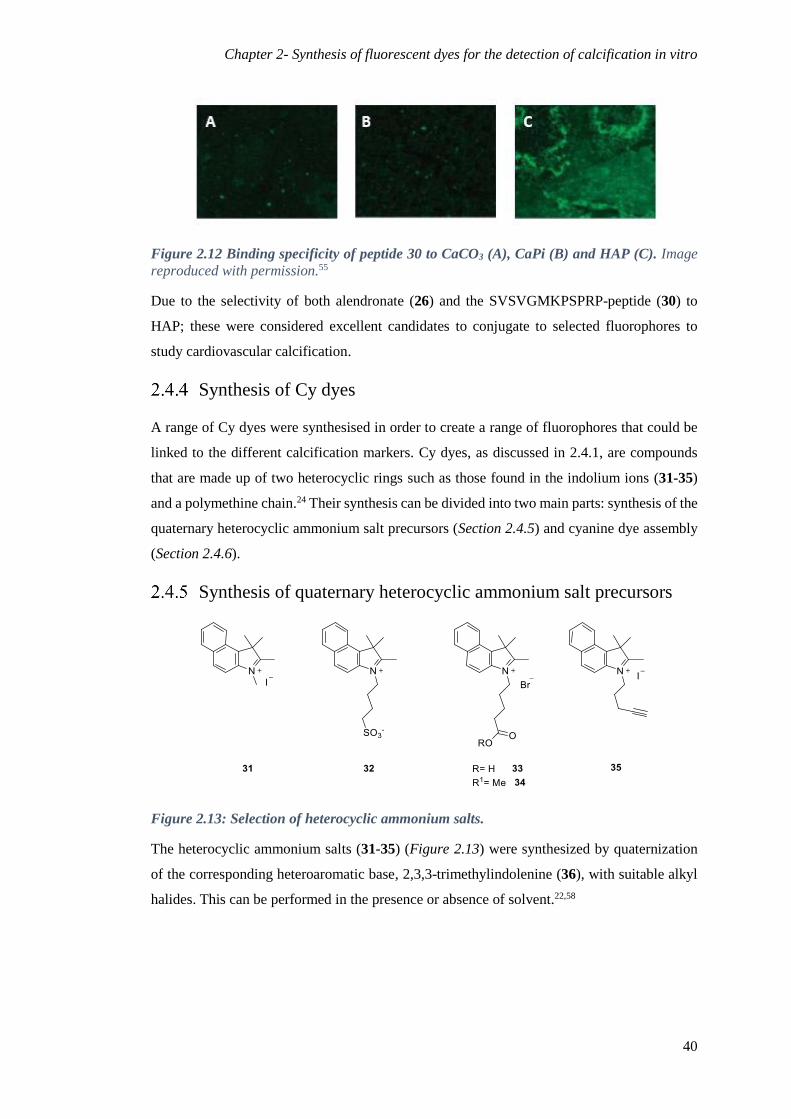
Chapter 2- Synthesis of fluorescent dyes for the detection of calcification in vitro
40
Figure 2.12 Binding specificity of peptide 30 to CaCO3 (A), CaPi (B) and HAP (C). Image
reproduced with permission.55
Due to the selectivity of both alendronate (26) and the SVSVGMKPSPRP-peptide (30) to
HAP; these were considered excellent candidates to conjugate to selected fluorophores to
study cardiovascular calcification.
Synthesis of Cy dyes
A range of Cy dyes were synthesised in order to create a range of fluorophores that could be
linked to the different calcification markers. Cy dyes, as discussed in 2.4.1, are compounds
that are made up of two heterocyclic rings such as those found in the indolium ions (31-35)
and a polymethine chain.24 Their synthesis can be divided into two main parts: synthesis of the
quaternary heterocyclic ammonium salt precursors (Section 2.4.5) and cyanine dye assembly
(Section 2.4.6).
Synthesis of quaternary heterocyclic ammonium salt precursors
Figure 2.13: Selection of heterocyclic ammonium salts.
The heterocyclic ammonium salts (31-35) (Figure 2.13) were synthesized by quaternization
of the corresponding heteroaromatic base, 2,3,3-trimethylindolenine (36), with suitable alkyl
halides. This can be performed in the presence or absence of solvent.22,58
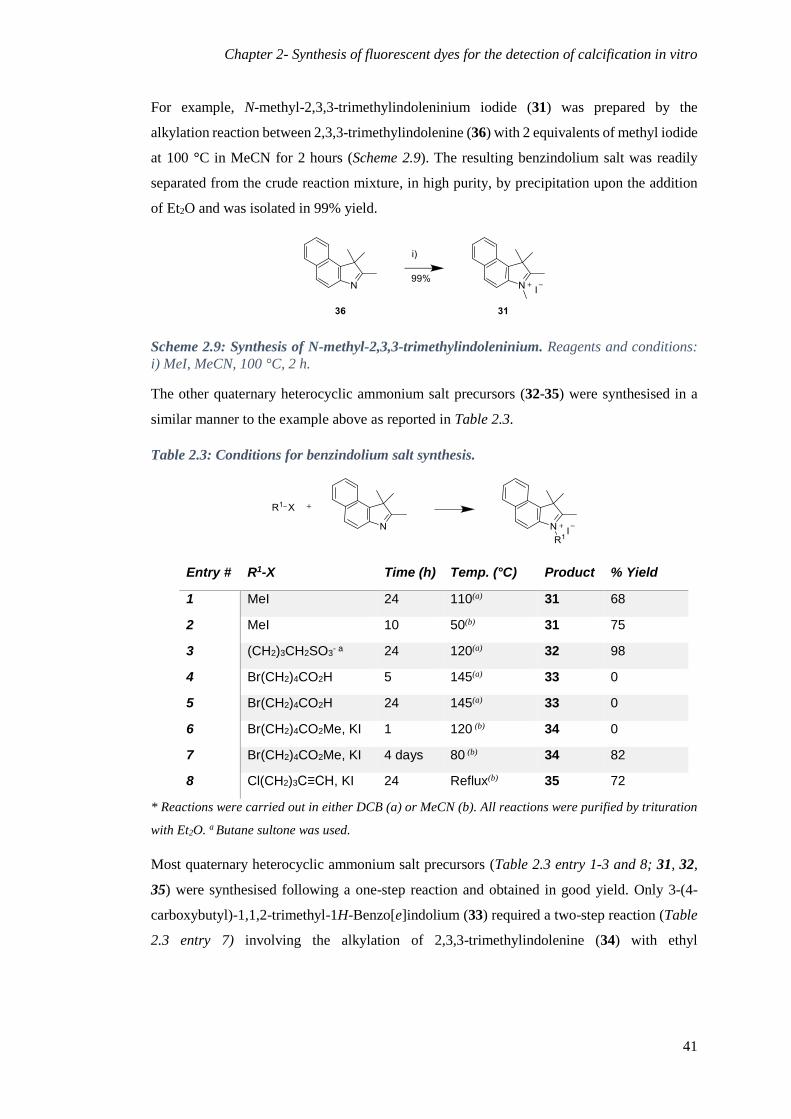
Chapter 2- Synthesis of fluorescent dyes for the detection of calcification in vitro
41
For example, N-methyl-2,3,3-trimethylindoleninium iodide (31) was prepared by the
alkylation reaction between 2,3,3-trimethylindolenine (36) with 2 equivalents of methyl iodide
at 100 °C in MeCN for 2 hours (Scheme 2.9). The resulting benzindolium salt was readily
separated from the crude reaction mixture, in high purity, by precipitation upon the addition
of Et2O and was isolated in 99% yield.
Scheme 2.9: Synthesis of N-methyl-2,3,3-trimethylindoleninium. Reagents and conditions:
i) MeI, MeCN, 100 °C, 2 h.
The other quaternary heterocyclic ammonium salt precursors (32-35) were synthesised in a
similar manner to the example above as reported in Table 2.3.
Table 2.3: Conditions for benzindolium salt synthesis.
Entry # R1-X Time (h) Temp. (°C) Product % Yield
1 MeI 24 110(a) 31 68
2 MeI 10 50(b) 31 75
3 (CH2)3CH2SO3- a 24 120(a) 32 98
4 Br(CH2)4CO2H 5 145(a) 33 0
5 Br(CH2)4CO2H 24 145(a) 33 0
6 Br(CH2)4CO2Me, KI 1 120 (b) 34 0
7 Br(CH2)4CO2Me, KI 4 days 80 (b) 34 82
8 Cl(CH2)3C≡CH, KI 24 Reflux(b) 35 72
* Reactions were carried out in either DCB (a) or MeCN (b). All reactions were purified by trituration
with Et2O. a Butane sultone was used.
Most quaternary heterocyclic ammonium salt precursors (Table 2.3 entry 1-3 and 8; 31, 32,
35) were synthesised following a one-step reaction and obtained in good yield. Only 3-(4-
carboxybutyl)-1,1,2-trimethyl-1H-Benzo[e]indolium (33) required a two-step reaction (Table
2.3 entry 7) involving the alkylation of 2,3,3-trimethylindolenine (34) with ethyl

Chapter 2- Synthesis of fluorescent dyes for the detection of calcification in vitro
42
bromovalerate, which was achieved in a 82% yield, followed by hydrolysis to the acid (33)
using HCl (5 N aq.) in a quantitative yield.
Cyanine dye assembly
A synthetic route to symmetrical and unsymmetrical Cy dyes involves the alkylation of
quaternary heterocyclic ammonium salt precursors containing an activated methyl group (31-
35) with derivatives of N-[5-(phenylamino)-2,4-pentadienylidene]aniline monohydrochloride (37). This reaction can be carried out both in solution and using a solid support resin, with
both routes described below.
2.4.6.1 Off resin approach
Unsymmetrical cyanine dyes are synthesized in two steps from benzindolium salt (31-35)
through activated hemicyanine intermediates, such as 2-[6-(acetylphenylamino)-1,3,5-
hexatrien-1-yl]-1,1-dimethyl-3-(methyl)-1H-Benz[e]indolium 38 as shown in Scheme 2.10.
Scheme 2.10: Synthesis of the acetylated hemicyanine dye activated intermediate (38).
Reagents and conditions: i) N-(5-Anilino-2,4-pentadienylidene)aniline hydrochloride (37),
acetic acid, acetic anhydride, 120 °C, 3 h.
The acetylated precursors were prepared by the reaction of equimolar amounts of the
corresponding benzindolium salt (31) and N-[5-(phenylamino)-2,4-pentadienylidene]aniline
monohydrochloride (37) under reflux in Ac2O over 3 hours. The clean product was obtained
by trituration of the reaction mixture with Et2O and water in a 1:1 mixture in 40% yield.
Scheme 2.10 describes the synthesis of one of the four activated hemicyanine intermediates
38, while Table 2.4 reports the yield for the synthesised compounds. The two benzindolium
salts selected were 1,1,2,3-tetramethyl-1H-benzo[e]indolium (31) and 1,1,2-trimethyl-3-(4-
sulfobutyl)-1H-Benzo[e]indolium (32) as their synthesis was more straightforward and took
less time in comparison to the carbonyl (33) and the alkyne (35) benzindolium salts. From the
two benzindolium salts, only four intermediates were synthesised, two using N-[5-
(phenylamino)-2,4-pentadienylidene]aniline monohydrochloride and two using
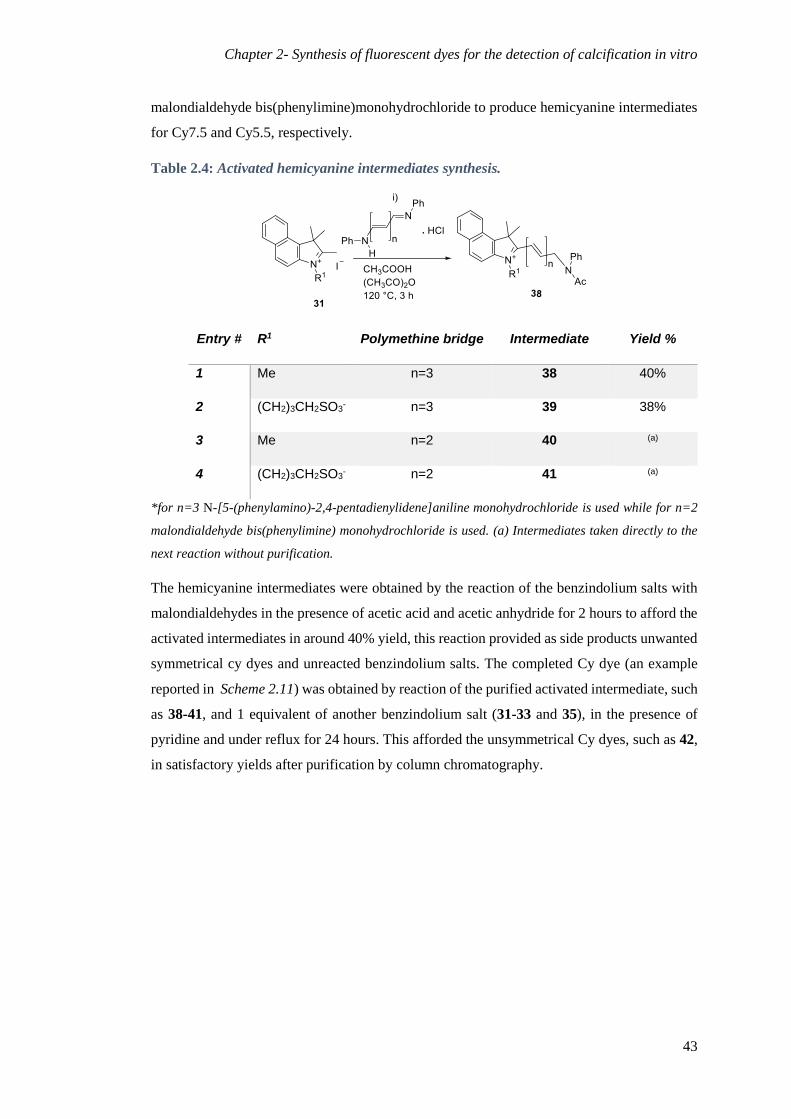
Chapter 2- Synthesis of fluorescent dyes for the detection of calcification in vitro
43
malondialdehyde bis(phenylimine)monohydrochloride to produce hemicyanine intermediates
for Cy7.5 and Cy5.5, respectively.
Table 2.4: Activated hemicyanine intermediates synthesis.
Entry # R1 Polymethine bridge Intermediate Yield %
1 Me n=3 38 40%
2 (CH2)3CH2SO3- n=3 39 38%
3 Me n=2 40 (a)
4 (CH2)3CH2SO3- n=2 41 (a)
*for n=3 N-[5-(phenylamino)-2,4-pentadienylidene]aniline monohydrochloride is used while for n=2
malondialdehyde bis(phenylimine) monohydrochloride is used. (a) Intermediates taken directly to the
next reaction without purification.
The hemicyanine intermediates were obtained by the reaction of the benzindolium salts with
malondialdehydes in the presence of acetic acid and acetic anhydride for 2 hours to afford the
activated intermediates in around 40% yield, this reaction provided as side products unwanted
symmetrical cy dyes and unreacted benzindolium salts. The completed Cy dye (an example
reported in Scheme 2.11) was obtained by reaction of the purified activated intermediate, such
as 38-41, and 1 equivalent of another benzindolium salt (31-33 and 35), in the presence of
pyridine and under reflux for 24 hours. This afforded the unsymmetrical Cy dyes, such as 42,
in satisfactory yields after purification by column chromatography.
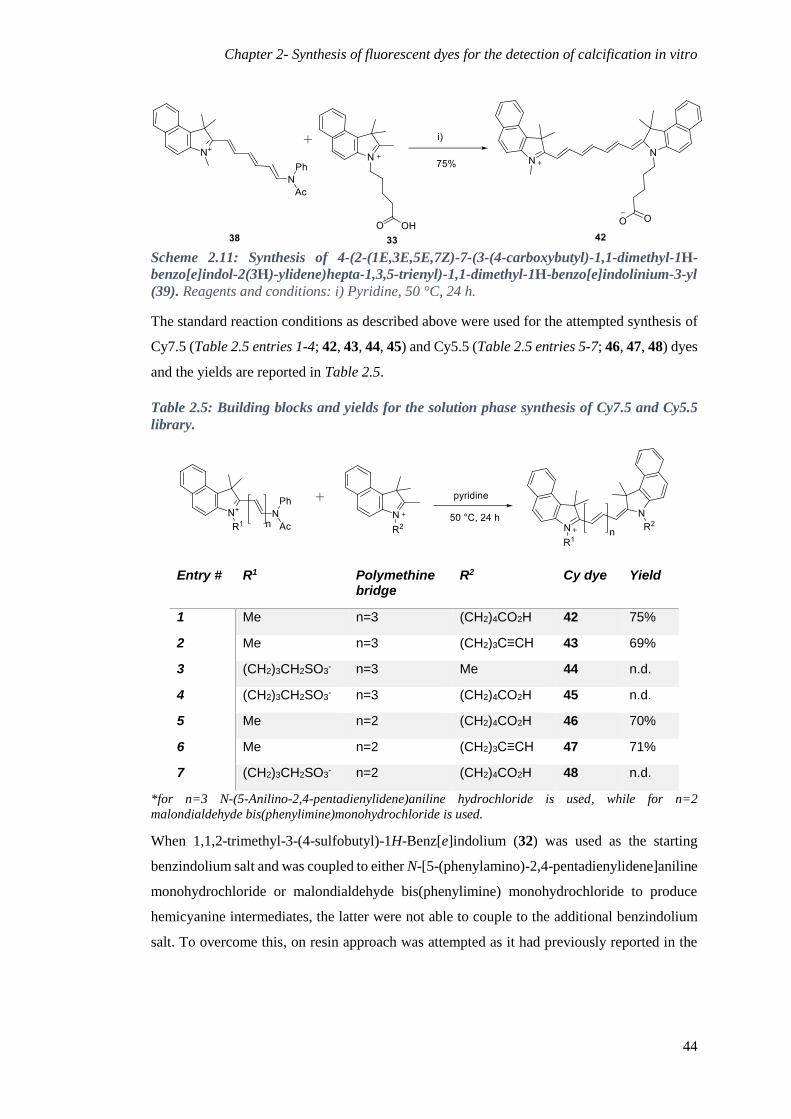
Chapter 2- Synthesis of fluorescent dyes for the detection of calcification in vitro
44
Scheme 2.11: Synthesis of 4-(2-(1E,3E,5E,7Z)-7-(3-(4-carboxybutyl)-1,1-dimethyl-1H-
benzo[e]indol-2(3H)-ylidene)hepta-1,3,5-trienyl)-1,1-dimethyl-1H-benzo[e]indolinium-3-yl
(39). Reagents and conditions: i) Pyridine, 50 °C, 24 h.
The standard reaction conditions as described above were used for the attempted synthesis of
Cy7.5 (Table 2.5 entries 1-4; 42, 43, 44, 45) and Cy5.5 (Table 2.5 entries 5-7; 46, 47, 48) dyes
and the yields are reported in Table 2.5.
Table 2.5: Building blocks and yields for the solution phase synthesis of Cy7.5 and Cy5.5
library.
Entry # R1 Polymethine bridge
R2 Cy dye Yield
1 Me n=3 (CH2)4CO2H 42 75%
2 Me n=3 (CH2)3C≡CH 43 69%
3 (CH2)3CH2SO3- n=3 Me 44 n.d.
4 (CH2)3CH2SO3- n=3 (CH2)4CO2H 45 n.d.
5 Me n=2 (CH2)4CO2H 46 70%
6 Me n=2 (CH2)3C≡CH 47 71%
7 (CH2)3CH2SO3- n=2 (CH2)4CO2H 48 n.d.
*for n=3 N-(5-Anilino-2,4-pentadienylidene)aniline hydrochloride is used, while for n=2
malondialdehyde bis(phenylimine)monohydrochloride is used.
When 1,1,2-trimethyl-3-(4-sulfobutyl)-1H-Benz[e]indolium (32) was used as the starting
benzindolium salt and was coupled to either N-[5-(phenylamino)-2,4-pentadienylidene]aniline
monohydrochloride or malondialdehyde bis(phenylimine) monohydrochloride to produce
hemicyanine intermediates, the latter were not able to couple to the additional benzindolium
salt. To overcome this, on resin approach was attempted as it had previously reported in the
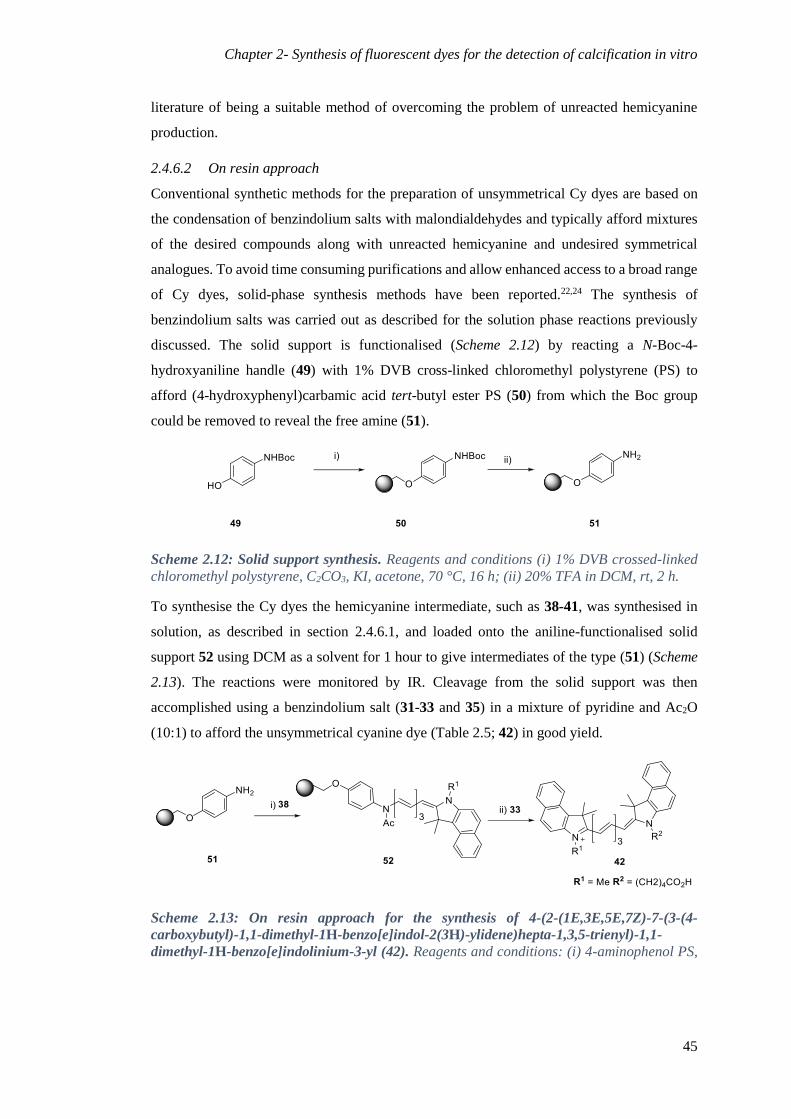
Chapter 2- Synthesis of fluorescent dyes for the detection of calcification in vitro
45
literature of being a suitable method of overcoming the problem of unreacted hemicyanine
production.
2.4.6.2 On resin approach
Conventional synthetic methods for the preparation of unsymmetrical Cy dyes are based on
the condensation of benzindolium salts with malondialdehydes and typically afford mixtures
of the desired compounds along with unreacted hemicyanine and undesired symmetrical
analogues. To avoid time consuming purifications and allow enhanced access to a broad range
of Cy dyes, solid-phase synthesis methods have been reported.22,24 The synthesis of
benzindolium salts was carried out as described for the solution phase reactions previously
discussed. The solid support is functionalised (Scheme 2.12) by reacting a N-Boc-4-
hydroxyaniline handle (49) with 1% DVB cross-linked chloromethyl polystyrene (PS) to
afford (4-hydroxyphenyl)carbamic acid tert-butyl ester PS (50) from which the Boc group
could be removed to reveal the free amine (51).
Scheme 2.12: Solid support synthesis. Reagents and conditions (i) 1% DVB crossed-linked
chloromethyl polystyrene, C2CO3, KI, acetone, 70 °C, 16 h; (ii) 20% TFA in DCM, rt, 2 h.
To synthesise the Cy dyes the hemicyanine intermediate, such as 38-41, was synthesised in
solution, as described in section 2.4.6.1, and loaded onto the aniline-functionalised solid
support 52 using DCM as a solvent for 1 hour to give intermediates of the type (51) (Scheme
2.13). The reactions were monitored by IR. Cleavage from the solid support was then
accomplished using a benzindolium salt (31-33 and 35) in a mixture of pyridine and Ac2O
(10:1) to afford the unsymmetrical cyanine dye (Table 2.5; 42) in good yield.
Scheme 2.13: On resin approach for the synthesis of 4-(2-(1E,3E,5E,7Z)-7-(3-(4-
carboxybutyl)-1,1-dimethyl-1H-benzo[e]indol-2(3H)-ylidene)hepta-1,3,5-trienyl)-1,1-
dimethyl-1H-benzo[e]indolinium-3-yl (42). Reagents and conditions: (i) 4-aminophenol PS,
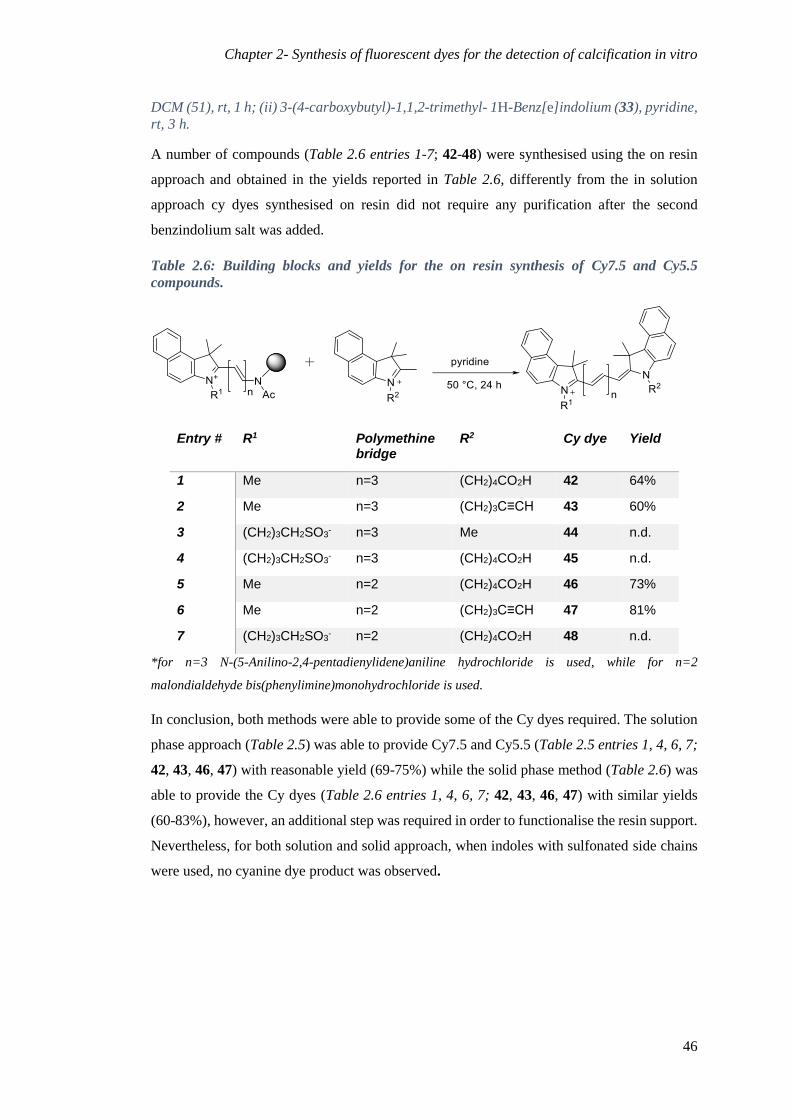
Chapter 2- Synthesis of fluorescent dyes for the detection of calcification in vitro
46
DCM (51), rt, 1 h; (ii) 3-(4-carboxybutyl)-1,1,2-trimethyl- 1H-Benz[e]indolium (33), pyridine,
rt, 3 h.
A number of compounds (Table 2.6 entries 1-7; 42-48) were synthesised using the on resin
approach and obtained in the yields reported in Table 2.6, differently from the in solution
approach cy dyes synthesised on resin did not require any purification after the second
benzindolium salt was added.
Table 2.6: Building blocks and yields for the on resin synthesis of Cy7.5 and Cy5.5
compounds.
Entry # R1 Polymethine bridge
R2 Cy dye Yield
1 Me n=3 (CH2)4CO2H 42 64%
2 Me n=3 (CH2)3C≡CH 43 60%
3 (CH2)3CH2SO3- n=3 Me 44 n.d.
4 (CH2)3CH2SO3- n=3 (CH2)4CO2H 45 n.d.
5 Me n=2 (CH2)4CO2H 46 73%
6 Me n=2 (CH2)3C≡CH 47 81%
7 (CH2)3CH2SO3- n=2 (CH2)4CO2H 48 n.d.
*for n=3 N-(5-Anilino-2,4-pentadienylidene)aniline hydrochloride is used, while for n=2
malondialdehyde bis(phenylimine)monohydrochloride is used.
In conclusion, both methods were able to provide some of the Cy dyes required. The solution
phase approach (Table 2.5) was able to provide Cy7.5 and Cy5.5 (Table 2.5 entries 1, 4, 6, 7;
42, 43, 46, 47) with reasonable yield (69-75%) while the solid phase method (Table 2.6) was
able to provide the Cy dyes (Table 2.6 entries 1, 4, 6, 7; 42, 43, 46, 47) with similar yields
(60-83%), however, an additional step was required in order to functionalise the resin support.
Nevertheless, for both solution and solid approach, when indoles with sulfonated side chains
were used, no cyanine dye product was observed.
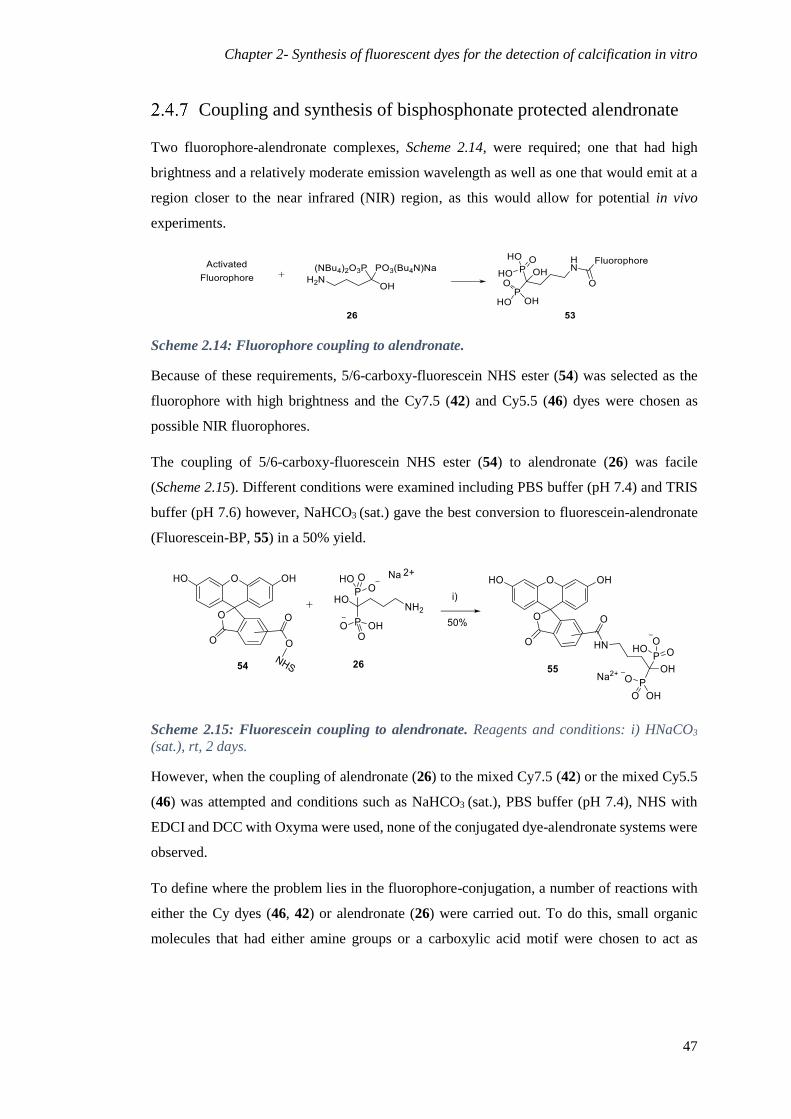
Chapter 2- Synthesis of fluorescent dyes for the detection of calcification in vitro
47
Coupling and synthesis of bisphosphonate protected alendronate
Two fluorophore-alendronate complexes, Scheme 2.14, were required; one that had high
brightness and a relatively moderate emission wavelength as well as one that would emit at a
region closer to the near infrared (NIR) region, as this would allow for potential in vivo
experiments.
Scheme 2.14: Fluorophore coupling to alendronate.
Because of these requirements, 5/6-carboxy-fluorescein NHS ester (54) was selected as the
fluorophore with high brightness and the Cy7.5 (42) and Cy5.5 (46) dyes were chosen as
possible NIR fluorophores.
The coupling of 5/6-carboxy-fluorescein NHS ester (54) to alendronate (26) was facile
(Scheme 2.15). Different conditions were examined including PBS buffer (pH 7.4) and TRIS
buffer (pH 7.6) however, NaHCO3 (sat.) gave the best conversion to fluorescein-alendronate
(Fluorescein-BP, 55) in a 50% yield.
Scheme 2.15: Fluorescein coupling to alendronate. Reagents and conditions: i) HNaCO3
(sat.), rt, 2 days.
However, when the coupling of alendronate (26) to the mixed Cy7.5 (42) or the mixed Cy5.5
(46) was attempted and conditions such as NaHCO3 (sat.), PBS buffer (pH 7.4), NHS with
EDCI and DCC with Oxyma were used, none of the conjugated dye-alendronate systems were
observed.
To define where the problem lies in the fluorophore-conjugation, a number of reactions with
either the Cy dyes (46, 42) or alendronate (26) were carried out. To do this, small organic
molecules that had either amine groups or a carboxylic acid motif were chosen to act as
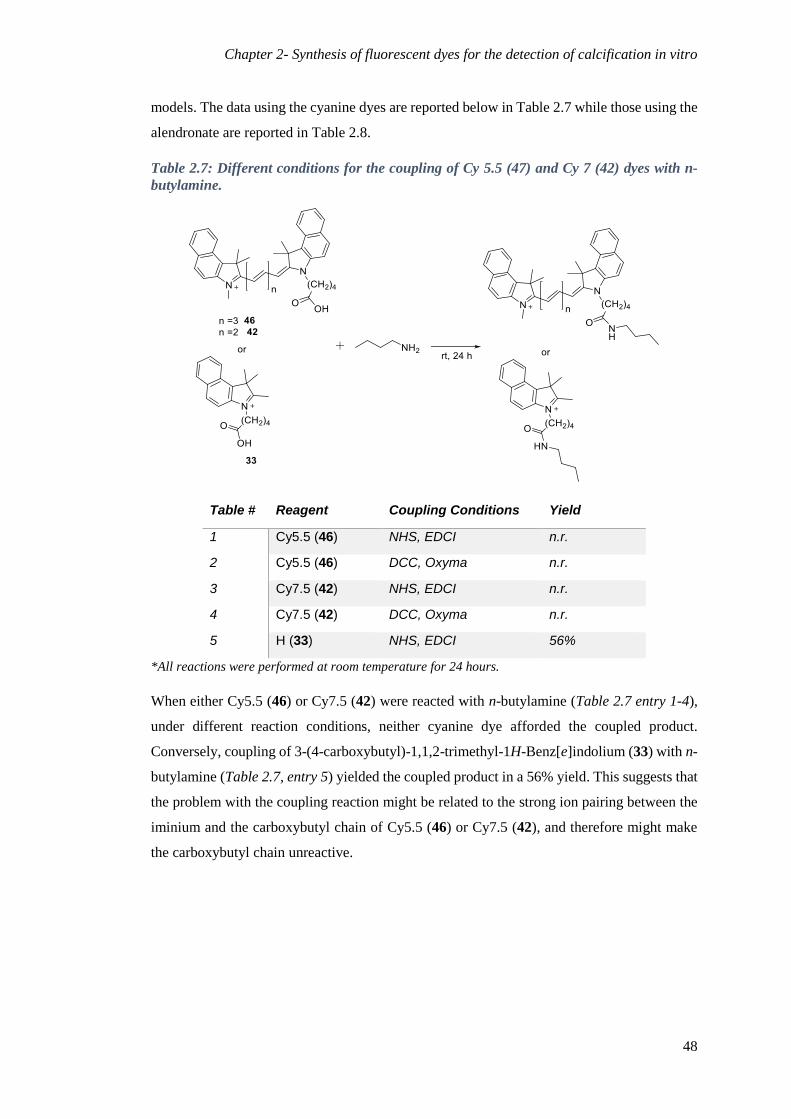
Chapter 2- Synthesis of fluorescent dyes for the detection of calcification in vitro
48
models. The data using the cyanine dyes are reported below in Table 2.7 while those using the
alendronate are reported in Table 2.8.
Table 2.7: Different conditions for the coupling of Cy 5.5 (47) and Cy 7 (42) dyes with n-
butylamine.
Table # Reagent Coupling Conditions Yield
1 Cy5.5 (46) NHS, EDCI n.r.
2 Cy5.5 (46) DCC, Oxyma n.r.
3 Cy7.5 (42) NHS, EDCI n.r.
4 Cy7.5 (42) DCC, Oxyma n.r.
5 H (33) NHS, EDCI 56%
*All reactions were performed at room temperature for 24 hours.
When either Cy5.5 (46) or Cy7.5 (42) were reacted with n-butylamine (Table 2.7 entry 1-4),
under different reaction conditions, neither cyanine dye afforded the coupled product.
Conversely, coupling of 3-(4-carboxybutyl)-1,1,2-trimethyl-1H-Benz[e]indolium (33) with n-
butylamine (Table 2.7, entry 5) yielded the coupled product in a 56% yield. This suggests that
the problem with the coupling reaction might be related to the strong ion pairing between the
iminium and the carboxybutyl chain of Cy5.5 (46) or Cy7.5 (42), and therefore might make
the carboxybutyl chain unreactive.

Chapter 2- Synthesis of fluorescent dyes for the detection of calcification in vitro
49
Table 2.8: Different conditions for the coupling of alendronate (26) with acid (33).
Entry #
Coupling Conditions R1 Time (h) Yield
1 NHS (1.5 eq), EDCI (1 eq) H 24 n.r.
2 PBS buffer (pH 7.4) Benzo-fused indole (33) 8 n.r.
3 NHS (1.5 eq), EDCI (1eq) Benzo-fused indole (33) 24 n.r.
4 HNaCO3 (sat) Benzo-fused indole (33) 24 n.r.
*All reactions were performed at room temperature.
The reaction of alendronate (26) with pentynoic acid or 3-(4-carboxybutyl)-1,1,2-trimethyl-
1H-Benz[e]indolium salt (33) was trialed under a range of conditions (Table 2.8 entry 1-4),
however, no coupled product was obtained. It can therefore be supposed that the phosphate
group is directly interfering with the coupling reaction.
With the lack of success in amide coupling reactions, it was decided that the phosphonate
groups on the alendronate would be protected in order to remove any potential interaction
between them and the cyanine dye itself. It was decided to attempt the synthesis of an azido-
alendronate substrate with protected phosphate groups (56) and to then: either (a) convert the
azide to the amine functionality required for amide bond formation; or (b) to attempt a copper
mediated 1,3-dipolar cycloaddition reaction (click) with the alkyne substituted Cy5.5 dye (47)
(Scheme 2.16). Triazoles have recently attracted a lot of attention as a bioisostere of the amide
bond moiety due to their similarity in size, dipole moment and H bond acceptor capacity. In
contrast to amide bonds, triazoles, offer the advantage of being extremely stable to hydrolysis
which therefore make them potential surrogates of the amide bonds.59
The azido-alendronate substrate with protected phosphate groups (56) could be used for both
click coupling to the Cy5.5 dye (47) to obtain the triazole linked protected product (59)

Chapter 2- Synthesis of fluorescent dyes for the detection of calcification in vitro
50
(Scheme 2.16) as well as reduction of the azide to a amine (57) to allow for amide bond
formation between the protected phosphate alendronate and the Cy7.5 dye (42) or Cy5.5 dye
(46) giving product 58 (Scheme 2.16).
Scheme 2.16: Proposed pathways to obtain click coupled Cy-alendronate and amide coupled
Cy-alendronate from the intermediate azide (56).
The synthesis of the azide protected bisphosphonate alendronate (56) was carried out using a
two-step reaction involving a two stage Michaelis-Arbuzov reaction from 4-chlorobutyryl
chloride (60) with triethylphosphite and diethylphosphite followed by a hydroxyl group
protection step with tert-butyl silyl chloride to obtain 61 followed by the substitution of the
chloride by an azide to obtain 56 in a 55% yield (Scheme 2.17).
Scheme 2.17: Synthesis of phosphate-protected azido alendronate. Reagents and conditions:
(i) triethyl phosphite, DCM, rt, 15 minutes; (ii) diethylphosphite, DMAP, DCM, rt, 2 h; (iii)
tert-butyldimethylsilyl chloride, rt, 24 h; (iv) NaN3, DMF, 75 °C, 3 h. * Yield over 3 steps.
After purification of 56, click chemistry was attempted with the alkyne substituted Cy5.5 dye
(47) (Scheme 2.18) using conditions previously reported in the Hulme group to give the
protected triazoles (62).60
Scheme 2.18: Click and deprotection. Reagents and Conditions i) 0.2 mol % CuSO4, 4 mol%
sodium ascorbate, rt, 24 h.
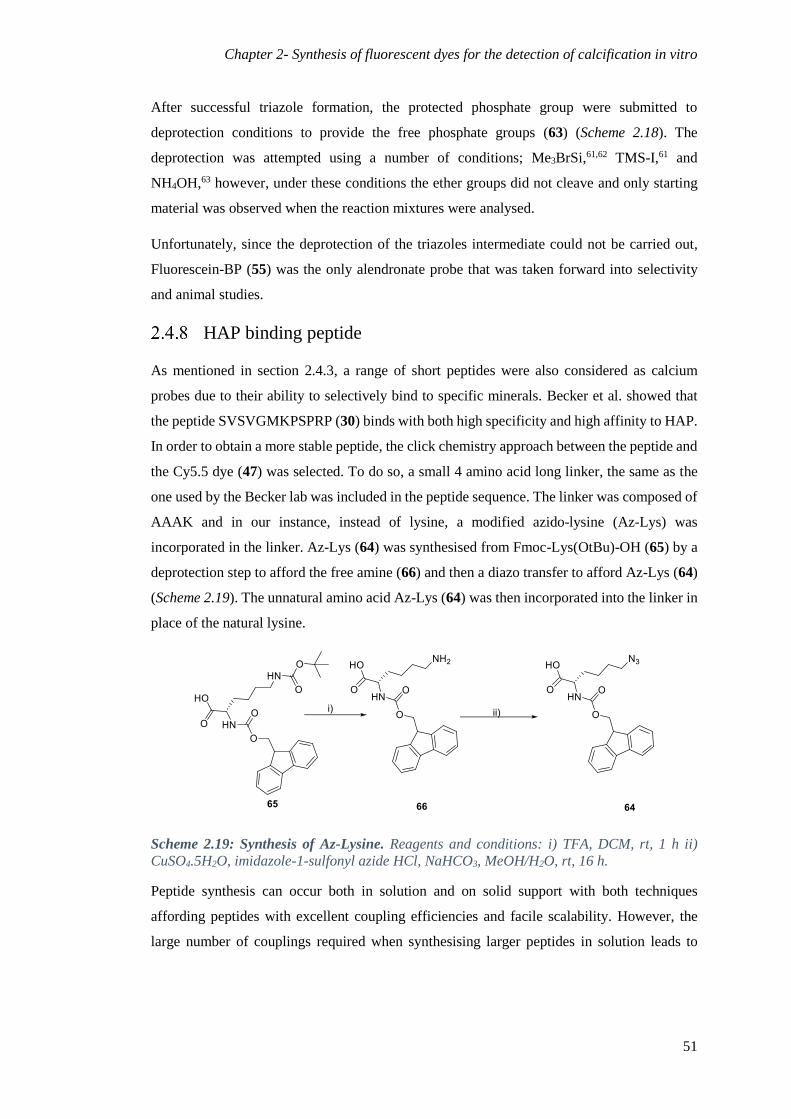
Chapter 2- Synthesis of fluorescent dyes for the detection of calcification in vitro
51
After successful triazole formation, the protected phosphate group were submitted to
deprotection conditions to provide the free phosphate groups (63) (Scheme 2.18). The
deprotection was attempted using a number of conditions; Me3BrSi,61,62 TMS-I,61 and
NH4OH,63 however, under these conditions the ether groups did not cleave and only starting
material was observed when the reaction mixtures were analysed.
Unfortunately, since the deprotection of the triazoles intermediate could not be carried out,
Fluorescein-BP (55) was the only alendronate probe that was taken forward into selectivity
and animal studies.
HAP binding peptide
As mentioned in section 2.4.3, a range of short peptides were also considered as calcium
probes due to their ability to selectively bind to specific minerals. Becker et al. showed that
the peptide SVSVGMKPSPRP (30) binds with both high specificity and high affinity to HAP.
In order to obtain a more stable peptide, the click chemistry approach between the peptide and
the Cy5.5 dye (47) was selected. To do so, a small 4 amino acid long linker, the same as the
one used by the Becker lab was included in the peptide sequence. The linker was composed of
AAAK and in our instance, instead of lysine, a modified azido-lysine (Az-Lys) was
incorporated in the linker. Az-Lys (64) was synthesised from Fmoc-Lys(OtBu)-OH (65) by a
deprotection step to afford the free amine (66) and then a diazo transfer to afford Az-Lys (64)
(Scheme 2.19). The unnatural amino acid Az-Lys (64) was then incorporated into the linker in
place of the natural lysine.
Scheme 2.19: Synthesis of Az-Lysine. Reagents and conditions: i) TFA, DCM, rt, 1 h ii)
CuSO4.5H2O, imidazole-1-sulfonyl azide HCl, NaHCO3, MeOH/H2O, rt, 16 h.
Peptide synthesis can occur both in solution and on solid support with both techniques
affording peptides with excellent coupling efficiencies and facile scalability. However, the
large number of couplings required when synthesising larger peptides in solution leads to

Chapter 2- Synthesis of fluorescent dyes for the detection of calcification in vitro
52
prolonged processes where isolating and recoupling the synthesised peptides offsets the
benefits of solution phase synthesis.64–66 On the other hand, solid phase synthesis (SPPS),67
involving a solid support resin to restrain and grow the peptide can fast-track the process and
it is for this reason that peptide 30 with Az-lysine (67) was synthesised on resin. An Fmoc/tBu
protection strategy was used as the Fmoc protecting group is orthogonal to an array of
protecting groups. Rink amide resin was selected firstly for its compatibility with the Fmoc
strategy and secondly because the resin releases a neutral C-terminal amide. SPPS synthesis
also allows facile peptide capping at the N-terminus with an N-acetyl cap at the end of the
synthesis. Capping at both the C and N termini ensures that charges on the peptide originate
from the residue side chains only. These charges are responsible for the interaction with HAP,
and removing any potential additional charges on the peptide will decrease the chances of
unselective interactions between the peptide and the HAP. The SPPS synthesis of peptide 67
was carried as shown below in Scheme 2.20.
Scheme 2.20: Synthesis of peptide 16 via SPPS. Reagents and conditions: i) 20% piperidine,
DMF, rt, 20 minutes; ii) Az-Lys, DIC, Oxyma, DMF, rt, 45 minutes; iii & deprotection) 20%
piperidine, DMF, rt, 20 minutes; coupling) a.a., DIC, Oxyma, DMF, rt, 45 minutes.
A number of conditions were tested for the coupling of the peptide to the Cy5.5 (47) with 5%
TBTA, 5% Cu(MeCN)4BF4 proving optimal coupling conditions to obtained Cy-Pep (71)
(Scheme 2.21).

Chapter 2- Synthesis of fluorescent dyes for the detection of calcification in vitro
53
Scheme 2.21: Coupling of Cy5.5 and HAP selective peptide by click chemistry approach.
Reagents and conditions: i) 5% TBTA, 5% Cu(MeCN)4BF4, rt, 24 h.
Characterization of the calcium probes
In H2O:DMF mix, Fluorescein-BP (55) and Cy-Pep (71) showed absorption maxima at 490
nm and 660 nm respectively. Upon excitation, Fluorescein-BP (55) showed maximum
fluorescence intensity at 515 nm with Cy-Pep (71) at 695 nm.
Upon increasing concentration of Fluorescein-BP (55) (Figure 2.14 A) there was an increase
in fluorescence signal when the fluorophore was excited at 488 nm. The signal response at 515
nm (Figure 2.14 B) also shows linear growth with increasing concentration (0.5-5 µM)
suggesting that, under these specific conditions, Fluorescein-BP (55) could be detected at a
concentration of 0.0065 µM. However, above 3 µM the response is not linear suggesting that
there might be some quenching taking place.
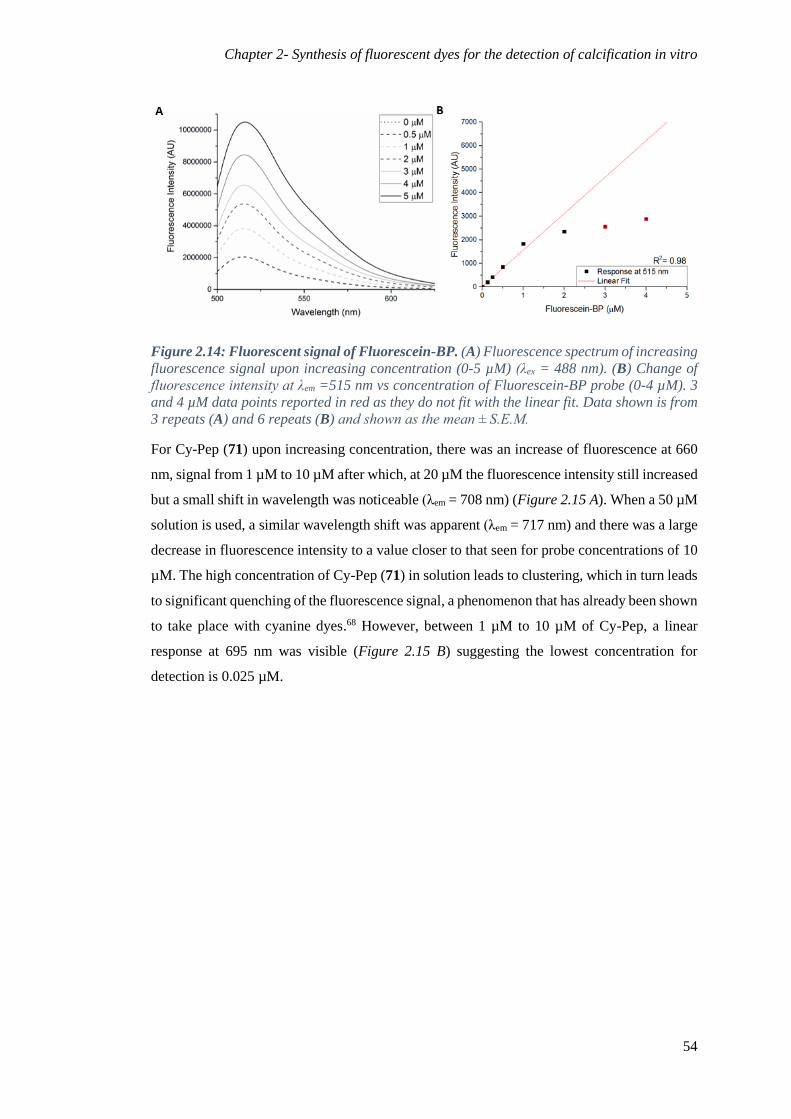
Chapter 2- Synthesis of fluorescent dyes for the detection of calcification in vitro
54
Figure 2.14: Fluorescent signal of Fluorescein-BP. (A) Fluorescence spectrum of increasing
fluorescence signal upon increasing concentration (0-5 µM) (λex = 488 nm). (B) Change of
fluorescence intensity at λem =515 nm vs concentration of Fluorescein-BP probe (0-4 µM). 3
and 4 µM data points reported in red as they do not fit with the linear fit. Data shown is from
3 repeats (A) and 6 repeats (B) and shown as the mean ± S.E.M.
For Cy-Pep (71) upon increasing concentration, there was an increase of fluorescence at 660
nm, signal from 1 µM to 10 µM after which, at 20 µM the fluorescence intensity still increased
but a small shift in wavelength was noticeable (λem = 708 nm) (Figure 2.15 A). When a 50 µM
solution is used, a similar wavelength shift was apparent (λem = 717 nm) and there was a large
decrease in fluorescence intensity to a value closer to that seen for probe concentrations of 10
µM. The high concentration of Cy-Pep (71) in solution leads to clustering, which in turn leads
to significant quenching of the fluorescence signal, a phenomenon that has already been shown
to take place with cyanine dyes.68 However, between 1 µM to 10 µM of Cy-Pep, a linear
response at 695 nm was visible (Figure 2.15 B) suggesting the lowest concentration for
detection is 0.025 µM.
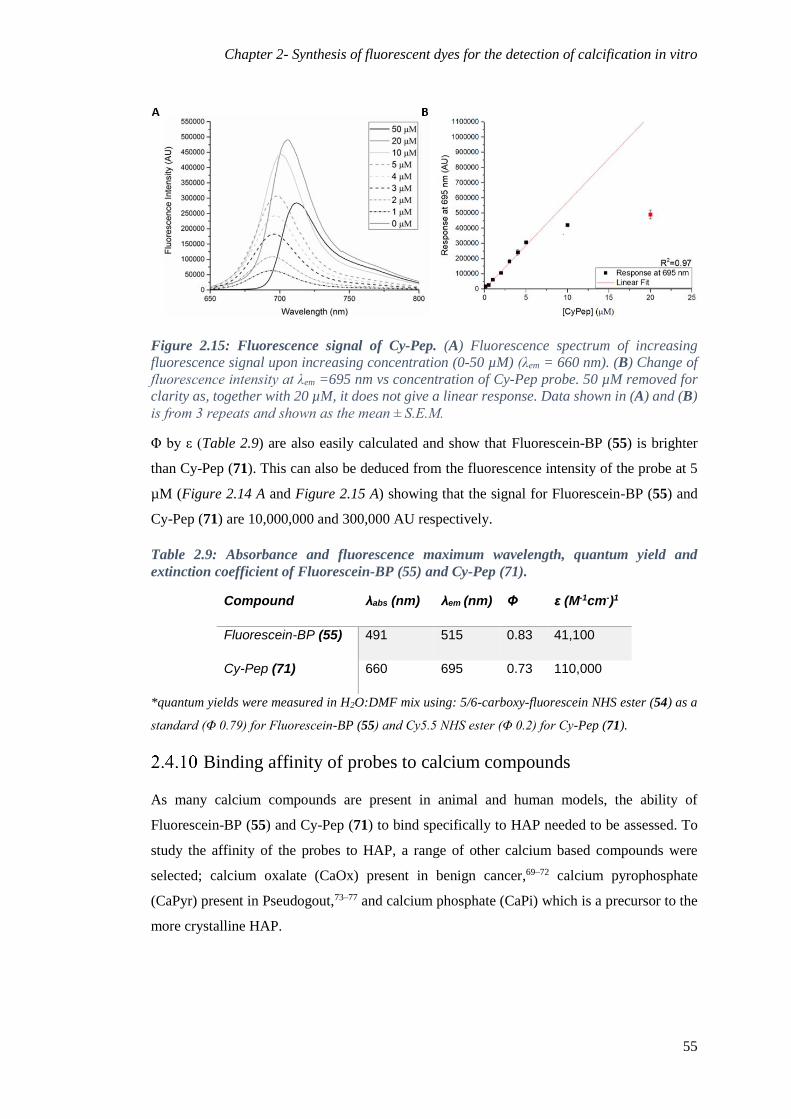
Chapter 2- Synthesis of fluorescent dyes for the detection of calcification in vitro
55
Figure 2.15: Fluorescence signal of Cy-Pep. (A) Fluorescence spectrum of increasing
fluorescence signal upon increasing concentration (0-50 µM) (λem = 660 nm). (B) Change of
fluorescence intensity at λem =695 nm vs concentration of Cy-Pep probe. 50 µM removed for
clarity as, together with 20 µM, it does not give a linear response. Data shown in (A) and (B)
is from 3 repeats and shown as the mean ± S.E.M.
Φ by ε (Table 2.9) are also easily calculated and show that Fluorescein-BP (55) is brighter
than Cy-Pep (71). This can also be deduced from the fluorescence intensity of the probe at 5
µM (Figure 2.14 A and Figure 2.15 A) showing that the signal for Fluorescein-BP (55) and
Cy-Pep (71) are 10,000,000 and 300,000 AU respectively.
Table 2.9: Absorbance and fluorescence maximum wavelength, quantum yield and
extinction coefficient of Fluorescein-BP (55) and Cy-Pep (71).
Compound λabs (nm) λem (nm) Φ ε (M-1cm-)1
Fluorescein-BP (55) 491 515 0.83 41,100
Cy-Pep (71) 660 695 0.73 110,000
*quantum yields were measured in H2O:DMF mix using: 5/6-carboxy-fluorescein NHS ester (54) as a
standard (Φ 0.79) for Fluorescein-BP (55) and Cy5.5 NHS ester (Φ 0.2) for Cy-Pep (71).
Binding affinity of probes to calcium compounds
As many calcium compounds are present in animal and human models, the ability of
Fluorescein-BP (55) and Cy-Pep (71) to bind specifically to HAP needed to be assessed. To
study the affinity of the probes to HAP, a range of other calcium based compounds were
selected; calcium oxalate (CaOx) present in benign cancer,69–72 calcium pyrophosphate
(CaPyr) present in Pseudogout,73–77 and calcium phosphate (CaPi) which is a precursor to the
more crystalline HAP.

Chapter 2- Synthesis of fluorescent dyes for the detection of calcification in vitro
56
Two methods were explored to determine the selectivity of the probe towards calcium
compounds. The first method used an aqueous suspension of these minerals, while the second
method used calcium minerals embedded into an agarose phantom.
Method 1 involved an aqueous suspension of the calcium minerals, at fixed w/v, which were
incubated with Fluorescein-BP (55) or Cy-Pep (71) for 2 hours, before removing any un-bound
probe from the solids through a series of centrifugation and washing steps. Fluorescence
analysis of the combined aqueous extracts (Figure 2.16) allowed the levels of un-bound probe
to be quantified and hence a direct comparison could be made between the levels of
Fluorescein-BP (55) or Cy-Pep (71) binding to each of the different calcium-containing
minerals. These data showed that Fluorescein-BP (55) exhibited almost an order of magnitude
higher selectivity towards HAP than any other calcium species tested. In contrast, when Cy-
Pep (71), was incubated with the calcium minerals it showed a very similar fluorescent
intensity for all of them indicating non-specific binding. There was also a sharp difference in
fluorescence intensity obtained from both probes where Fluorescein-BP (55) displays a
fluorescence intensity of around 32,500 AU upon binding to HAP while Cy-Pep (71) only
displays an intensity of 7,625 AU upon the same binding, proving that Fluorescein-BP is more
sensitive in comparison to Cy-Pep.
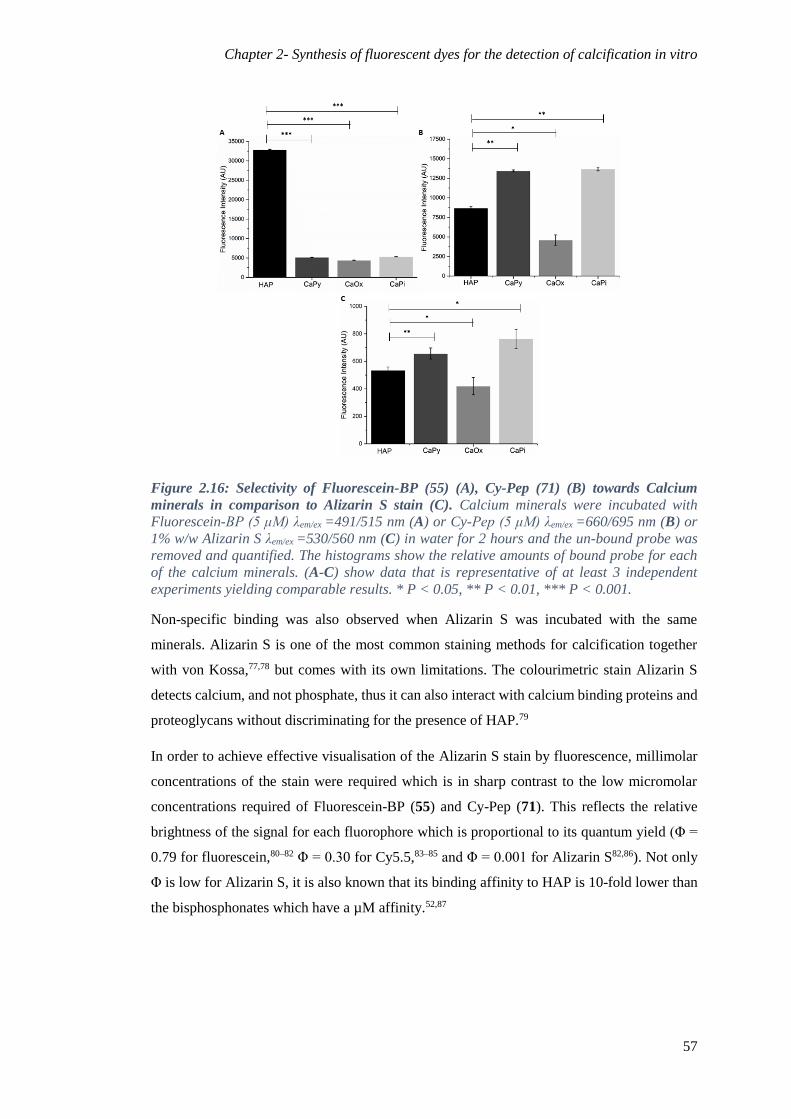
Chapter 2- Synthesis of fluorescent dyes for the detection of calcification in vitro
57
Figure 2.16: Selectivity of Fluorescein-BP (55) (A), Cy-Pep (71) (B) towards Calcium
minerals in comparison to Alizarin S stain (C). Calcium minerals were incubated with
Fluorescein-BP (5 μM) λem/ex =491/515 nm (A) or Cy-Pep (5 μM) λem/ex =660/695 nm (B) or
1% w/w Alizarin S λem/ex =530/560 nm (C) in water for 2 hours and the un-bound probe was
removed and quantified. The histograms show the relative amounts of bound probe for each
of the calcium minerals. (A-C) show data that is representative of at least 3 independent
experiments yielding comparable results. * P < 0.05, ** P < 0.01, *** P < 0.001.
Non-specific binding was also observed when Alizarin S was incubated with the same
minerals. Alizarin S is one of the most common staining methods for calcification together
with von Kossa,77,78 but comes with its own limitations. The colourimetric stain Alizarin S
detects calcium, and not phosphate, thus it can also interact with calcium binding proteins and
proteoglycans without discriminating for the presence of HAP.79
In order to achieve effective visualisation of the Alizarin S stain by fluorescence, millimolar
concentrations of the stain were required which is in sharp contrast to the low micromolar
concentrations required of Fluorescein-BP (55) and Cy-Pep (71). This reflects the relative
brightness of the signal for each fluorophore which is proportional to its quantum yield (Φ =
0.79 for fluorescein,80–82 Φ = 0.30 for Cy5.5,83–85 and Φ = 0.001 for Alizarin S82,86). Not only
Φ is low for Alizarin S, it is also known that its binding affinity to HAP is 10-fold lower than
the bisphosphonates which have a µM affinity.52,87
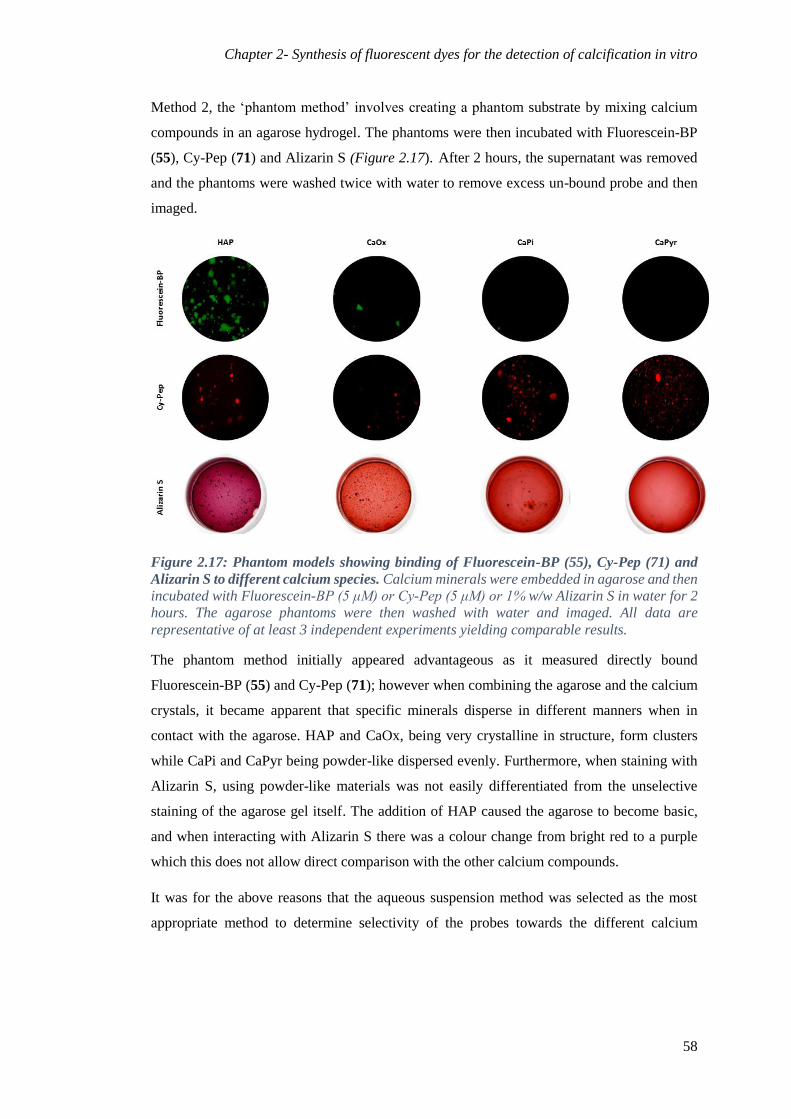
Chapter 2- Synthesis of fluorescent dyes for the detection of calcification in vitro
58
Method 2, the ‘phantom method’ involves creating a phantom substrate by mixing calcium
compounds in an agarose hydrogel. The phantoms were then incubated with Fluorescein-BP
(55), Cy-Pep (71) and Alizarin S (Figure 2.17). After 2 hours, the supernatant was removed
and the phantoms were washed twice with water to remove excess un-bound probe and then
imaged.
Figure 2.17: Phantom models showing binding of Fluorescein-BP (55), Cy-Pep (71) and
Alizarin S to different calcium species. Calcium minerals were embedded in agarose and then
incubated with Fluorescein-BP (5 μM) or Cy-Pep (5 μM) or 1% w/w Alizarin S in water for 2
hours. The agarose phantoms were then washed with water and imaged. All data are
representative of at least 3 independent experiments yielding comparable results.
The phantom method initially appeared advantageous as it measured directly bound
Fluorescein-BP (55) and Cy-Pep (71); however when combining the agarose and the calcium
crystals, it became apparent that specific minerals disperse in different manners when in
contact with the agarose. HAP and CaOx, being very crystalline in structure, form clusters
while CaPi and CaPyr being powder-like dispersed evenly. Furthermore, when staining with
Alizarin S, using powder-like materials was not easily differentiated from the unselective
staining of the agarose gel itself. The addition of HAP caused the agarose to become basic,
and when interacting with Alizarin S there was a colour change from bright red to a purple
which this does not allow direct comparison with the other calcium compounds.
It was for the above reasons that the aqueous suspension method was selected as the most
appropriate method to determine selectivity of the probes towards the different calcium
Chapter 2- Synthesis of fluorescent dyes for the detection of calcification in vitro
59
minerals. Due to the high selectivity of the Fluorescein-BP (55) probe towards HAP, it was
selected for the next step involving in vitro and ex vivo studies.
Conclusion
Several fluorescent probes with different optical properties were synthesised. Three fluoride
probes, two based on the cyanoacrylate motif; one with a free hydroxyl group (3) and one with
a TBDS protected group (4), as well as a rhodamine-based probe (5) were synthesised and
their selectivity towards NaF was tested. Upon addition of fluoride ions, a decrease in
absorption was visible for both the cyanoacrylate probes, however no novel peak appeared as
expected from the literature. On the other hand, when the imidazole bearing rhodamine 6G
probe (5) was incubated with NaF an increase in the fluorescence peak was observed and when
incubated with a range of anions the probe showed selectivity towards fluoride ions only,
suggesting that it could be a respectable probe to examine the mechanism of NaF uptake in
calcified models. However, for the florescence signal of probe 5 at 5 µM concentration to be
intense enough to be detected over the background signal, concentrations of NaF of 2.9 µM or
above are required; as previously mentioned, this suggests that the required ratio between the
probe and NaF is 1:0.6. For PET imaging, pM concentrations of NaF are used suggesting that
the probe will also need to be in the same concentration range. Unfortunately, the fluorescence
signal of the probe is not intense enough to be visualised at those concentrations, therefore
even this probe was rejected.
A number fluorophores were synthesised and their coupling to calcium targeting molecules
was investigated. Once synthesised, the Cy7.5 (42) and Cy5.5 (47) were reacted with
alendronate (26), however, the conjugated cyanine-alendronate system was never observed.
Cy5.5 bearing an alkyne group (48) was also synthesised and its coupling to the phosphate-
protected azido alendronate (56) was successful, however, the deprotection of the phosphate
protecting groups was never obtained. Cy5.5 (48) was nonetheless, coupled to a HAP selective
peptide (30) which was then studied further to characterise the fluorophore and assess the
selectivity of the probe. In contrast, Fluorescein-BP (55) was successfully synthesised without
any complication. Fluorophore characterisation showed that although the Cy5.5-pep (71)
emits in the NIR region, it is lacking in characteristics that the Fluorescein-BP (55) can
provide; high quantum yields and extinction coefficient. When selectivity studies were carried
out on different calcium minerals, Fluorescein-BP (55) provided a stronger fluorescence
response when bound to HAP in comparison to the other minerals. When the same experiment
was performed with Cy-Pep (71), although not using the same fluorophore, it was shown that
Chapter 2- Synthesis of fluorescent dyes for the detection of calcification in vitro
60
the peptide motif lacked the same selectivity and provided the roughly the same fluorescence
signal for all the calcium minerals. For this reason, Fluorescein-BP (55) was selected as a
robust selective calcium probe for application in biological systems.
References
1 B. N. G. Giepmans, S. R. Adams, M. H. Ellisman and R. Y. Tsien, Science, 2006, 312,
217–24.
2 L. E. Morrison, Methods Mol. Biol., 2008, 429, 3–19.
3 S. Gross and D. Piwnica-Worms, Cancer Cell, 2005, 7, 5–15.
4 H. Hong, Y. Yang and W. Cai, Cold Spring Harb. Protoc., 2011, 2011, pdb.top103.
5 M. Whitaker, Methods Cell Biol., 2010, 99, 153–182.
6 K. P. Carter, A. M. Young and A. E. Palmer, Chem. Rev., 2014, 114, 4564–4601.
7 M. Sauer, J. Hofkens and J. (Jorg) Enderlein, Handbook of fluorescence spectroscopy
and imaging : from single molecules to ensembles, Wiley-VCH, 2011.
8 A. Chevalier, P.-Y. Renard and A. Romieu, Chemistry, 2014, 20, 8330–7.
9 L. D. Lavis and R. T. Raines, ACS Chem. Biol., 2008, 3, 142–155.
10 T. Ueno and T. Nagano, Nat. Methods, 2011, 8, 642–645.
11 C. Greb, Handbook of Textile and Industrial Dyeing: Principles, Processes and Types
of Dyes, 2012, 564-567.
12 C. Saravanan, S. Easwaramoorthi, C. Y. Hsiow, K. Wang, M. Hayashi and L. Wang,
Org. Lett., 2014, 16, 354–357.
13 R. Liu, Y. Gao, Q. Zhang, X. Yang, X. Lu, Z. Ke, W. Zhou and J. Qu, New J. Chem.,
2014, 38, 2941.
14 Y. Jiao, B. Zhu, J. Chen and X. Duan, Theranostics, 2015, 5, 173–87.
15 P. Hou, S. Chen, H. Wang, J. Wang, K. Voitchovsky and X. Song, Chem. Commun.
(Camb)., 2013, 2, 1–3.
16 J. Gui, B. Liu, G. Cao, A. M. Lipchik, M. Perez, Z. Dekan, M. Mobli, N. L. Daly, P. F.
Alewood, L. L. Parker, G. F. King, Y. Zhou, S. E. Jordt and M. N. Nitabach, Curr.
Chapter 2- Synthesis of fluorescent dyes for the detection of calcification in vitro
61
Biol., 2014, 24, 473–483.
17 C. Delpivo, G. Micheletti and C. Boga, Synthesis (Stuttg)., 2013, 45, 1546–1552.
18 M. Kaur, M. J. Cho and D. H. Choi, Dye. Pigment., 2014, 103, 154–160.
19 J.-T. Yeh, P. Venkatesan and S.-P. Wu, New J. Chem., 2014, 38, 6198–6204.
20 G. Sivaraman and D. Chellappa, J. Mater. Chem. B, 2013, 1, 5768.
21 C. S. Levin, Proc. IEEE, 2008, 96, 439–467.
22 M. Lopalco, E. N. Koini, J. K. Cho and M. Bradley, Org. Biomol. Chem., 2009, 7, 856–
9.
23 D. M. Mizrahi, O. Ziv-Polat, B. Perlstein, E. Gluz and S. Margel, Eur. J. Med. Chem.,
2011, 46, 5175–83.
24 D. S. Pisoni, L. Todeschini, A. C. A. Borges, C. L. Petzhold, F. S. Rodembusch and L.
F. Campo, J. Org. Chem., 2014, 79, 5511–5520.
25 H. A. Shindy, M. A. El-Maghraby and F. M. Eissa, Eur. J. Chem., 2014, 5, 451–456.
26 S. Luo, E. Zhang, Y. Su, T. Cheng and C. Shi, Biomaterials, 2011, 32, 7127–7138.
27 M. S. T. Gonçalves, Chem. Rev., 2009, 109, 190–212.
28 F. Kong, L. Ge, X. Pan, K. Xu, X. Liu and B. Tang, Chem. Sci., 2016, 7, 1051–1056.
29 A. C. Morosanu, A. Gritco, D. G. Dimitriu, D. O. Dorohoi and C. Cheptea, E-Health
and Bioengineering Conference (EHB), IEEE, 2017, pp. 619–622.
30 J. F. Arevalo, Retinal angiography and optical coherence tomography, Springer, 2009.
31 A. H. Coons, J. Immunol., 1961, 87, 499–503.
32 A. H. Coons and M. H. Kaplan, J. Exp. Med., 1950, 91, 1–13.
33 F. Bosch and L. Rosich, Pharmacology, 2008, 82, 171–179.
34 N. Efron and N. Efron, in Contact Lens Complications, Elsevier, 2012, pp. 102–112.
35 B. R. Hurley and C. D. Regillo, in Retinal Angiography and Optical Coherence
Tomography, 2009, pp. 27–42.
36 A. L. MacLean and A. E. Maumenee, Trans. Am. Ophthalmol. Soc., 1959, 57, 171–94.
Chapter 2- Synthesis of fluorescent dyes for the detection of calcification in vitro
62
37 A. I. Kotsolis, F. A. Killian, I. D. Ladas and L. A. Yannuzzi, ,
DOI:10.1136/bjo.2009.159913.
38 K. Minkin, E. Naydenov, K. Gabrovski, P. Dimova, M. Penkov, R. Tanova, S. Nachev
and K. Romanski, Clin. Neurol. Neurosurg., 2016, 149, 22–26.
39 T. Mathew, S. Kundan, M. I. Abdulsamad, S. Menon, B. S. Dharan and K. Jayakumar,
Ann. Thorac. Surg., 2014, 97, e27–e28.
40 N. Li, J. Song, G. Zhu, X. Shi and Y. Wang, Colloids Surfaces B Biointerfaces, 2016,
142, 344–350.
41 A. Swami, M. R. Reagan, P. Basto, Y. Mishima, N. Kamaly, S. Glavey, S. Zhang, M.
Moschetta, D. Seevaratnam, Y. Zhang, J. Liu, M. Memarzadeh, J. Wu, S. Manier, J.
Shi, N. Bertrand, Z. N. Lu, K. Nagano, R. Baron, A. Sacco, A. M. Roccaro, O. C.
Farokhzad and I. M. Ghobrial, Proc. Natl. Acad. Sci., 2014, 111, 10287–10292.
42 T. Kowada, J. Kikuta, A. Kubo, M. Ishii, H. Maeda, S. Mizukami and K. Kikuchi, J.
Am. Chem. Soc., 2011, 133, 17772–17776.
43 M. L. Lolli, B. Rolando, P. Tosco, S. Chaurasia, A. Di Stilo, L. Lazzarato, E. Gorassini,
R. Ferracini, S. Oliaro-Bosso, R. Fruttero and A. Gasco, Bioorganic Med. Chem., 2010,
18, 2428–2438.
44 F. P. Coxon, K. Thompson, A. J. Roelofs, F. H. Ebetino and M. J. Rogers, Bone, 2008,
42, 848–860.
45 M. A. Lawson, Z. Xia, B. L. Barnett, J. T. Triffitt, R. J. Phipps, J. E. Dunford, R. M.
Locklin, F. H. Ebetino and R. G. G. Russell, J. Biomed. Mater. Res. B. Appl. Biomater.,
2010, 92, 149–55.
46 V. Chandrasekaran, S. Kalyan, V. Biel, M. Lettau, P. T. Nerdal, H.-H. Oberg, D.
Wesch, T. K. Lindhorst and D. Kabelitz, Med. Chem. Commun., 2015, 6, 919–925.
47 P. Vachal, J. J. Hale, Z. Lu, E. C. Streckfuss, S. G. Mills, M. MacCoss, D. H. Yin, K.
Algayer, K. Manser, F. Kesisoglou, S. Ghosh and L. L. Alani, J. Med. Chem., 2006,
49, 3060–3063.
48 K. M. Kozloff, L. I. Volakis, J. C. Marini and M. S. Caird, J. Bone Miner. Res., 2010,
25, 1748–58.
Chapter 2- Synthesis of fluorescent dyes for the detection of calcification in vitro
63
49 M. P. Yavropoulou, M. Pikilidou and J. G. Yovos, J. Vasc. Res., 2014, 51, 37–49.
50 R. Ylitalo, Gen. Pharmacol. Vasc. Syst., 2000, 35, 287–296.
51 A. Jung, S. Bisaz and H. Fleisch, Calcif. Tissue Res., 1973, 11, 269–80.
52 C. T. Leu, E. Luegmayr, L. P. Freedman, G. A. Rodan and A. A. Reszka, Bone, 2006,
38, 628–636.
53 J. Zhao, Y. Liu, W. Sun and X. Yang, J. Dent. Sci., 2012, 7, 316–323.
54 J. Zhao, Y. Liu, W.-B. Sun and H. Zhang, Chem. Cent. J., 2011, 5, 40.
55 M. D. Roy, S. K. Stanley, E. J. Amis and M. L. Becker, Adv. Mater., 2008, 20, 1830–
1836.
56 Y.-H. Yang, R. Rajaiah, E. Ruoslahti and K. D. Moudgil, Proc. Natl. Acad. Sci. U. S.
A., 2011, 108, 12857–62.
57 G. Mamone, G. Picariello, P. Ferranti and F. Addeo, Proteomics, 2010, 10, 380–393.
58 A. J. Winstead, R. Williams, Y. Zhang, C. McLean and S. Oyaghire, J. Microw. Power
Electromagn. Energy, 2010, 44, 207–12.
59 H. Li, R. Aneja and I. Chaiken, Molecules, 2013, 18, 9797–817.
60 R. C. Brewster, G. C. Gavins, B. Günthardt, S. Farr, K. M. Webb, P. Voigt and A. N.
Hulme, Chem. Commun., 2016, 52, 12230–12232.
61 Y. Xu, S. A. Lee, T. G. Kutateladze, D. Sbrissa, A. Shisheva and G. D. Prestwich, J.
Am. Chem. Soc., 2006, 128, 885–897.
62 T. Eisner, Charles University, Prague, 2014.
63 A. C. Spivey and D. Leese, Annu. Rep. Prog. Chem., Sect. B Org. Chem., 2002, 98,
41–60.
64 K. Hofmann, H. Yajima, T.-Y. Liu and N. Yanaihara, J. Am. Chem. Soc., 1962, 84,
4475–4480.
65 K. Hofmann, N. Yanaihara, S. Lands and H. Yajima, J. Am. Chem. Soc., 1962, 84,
4470–4474.
66 L. A. Carpino, S. Ghassemi, D. Ionescu, M. Ismail, D. Sadat-Aalaee, G. A. Truran, E.
Chapter 2- Synthesis of fluorescent dyes for the detection of calcification in vitro
64
M. E. Mansour, G. A. Siwruk, J. S. Eynon and B. Morgan, Org. Process Res. Dev.,
2003, 7, 28–37.
67 R. B. Merrifield, J. Am. Chem. Soc., 1963, 85, 2149–2154.
68 N. G. Zhegalova, S. He, H. Zhou, D. M. Kim and M. Y. Berezin, Contrast Media Mol.
Imaging, 2014, 9, 355–362.
69 G. H. Wilson, J. C. Gore, T. E. Yankeelov, S. Barnes, T. E. Peterson, J. M. True, S.
Shokouhi, J. O. McIntyre, M. Sanders, V. Abramson, T.-Q. Ngyuen, A. Mahadevan-
Jansen, M. N. Tantawy and M. N. Tantawy, J. Nucl. Med., 2014, 55, 1138–43.
70 J. E. Gonzalez, R. G. Caldwell and J. Valaitis, Am. J. Surg. Pathol., 1991, 15, 586–91.
71 R. F. Cox, A. Hernandez-Santana, S. Ramdass, G. McMahon, J. H. Harmey and M. P.
Morgan, Br. J. Cancer, 2012, 106, 525–537.
72 R. D. Motrich, G. M. Castro, B. L. Caputto, H. Ferreyra, B. L. Caputto, O. A. Pucci,
G. A. Gil, J. Bruha, O. Vycital and J. Finek, PLoS One, 2013, 8, e53211.
73 D. Resnick, G. Niwayama, T. G. Goergen, P. D. Utsinger, R. F. Shapiro, D. H.
Haselwood and K. B. Wiesner, Radiology, 1977, 122, 1–15.
74 L. Carpenter, N. Juliano and R. Herb, J. Am. Osteopath. Assoc., 2017, 117, 199.
75 A. Di Matteo, E. Filippucci, F. Salaffi, M. Carotti, D. Carboni, E. Di Donato and W.
Grassi, Clin. Exp. Rheumatol., 2017, 35, 647–652.
76 A. Williamson, J. Educ. Teach. Emerg. Med., 2017, 2, 8–9.
77 H. Paul, A. J. Reginato and H. R. Schumacher, Arthritis Rheum., 1983, 26, 191–200.
78 J. Rungby, M. Kassem, E. F. Eriksen and G. Danscher, Histochem. J., 1993, 25, 446–
451.
79 L. F. Bonewald, S. E. Harris, J. Rosser, M. R. Dallas, S. L. Dallas, N. P. Camacho, B.
Boyan and A. Boskey, in Calcified Tissue International, Springer-Verlag, 2003, vol.
72, pp. 537–547.
80 R. Sjöback, J. Nygren and M. Kubista, Spectrochim. Acta Part A Mol. Biomol.
Spectrosc., 1995, 51, L7–L21.
81 X. F. Zhang, J. Zhang and L. Liu, J. Fluoresc., 2014, 24, 819–826.

Chapter 2- Synthesis of fluorescent dyes for the detection of calcification in vitro
65
82 M. Neumann, S. Füldner, B. König and K. Zeitler, Angew. Chemie - Int. Ed., 2011, 50,
951–954.
83 V. E. Shershov, M. A. Spitsyn, V. E. Kuznetsova, E. N. Timofeev, O. A. Ivashkina, I.
S. Abramov, T. V. Nasedkina, A. S. Zasedatelev and A. V. Chudinov, Dye. Pigment.,
2013, 97, 353–360.
84 J.-F. Ge, Q.-Q. Zhang, J.-M. Lu, M. Kaiser, S. Wittlin, R. Brun and M. Ihara,
Medchemcomm, 2012, 3, 1435.
85 K. Rurack, in Standardization and Quality Assurance in Fluorescence Measurements
I, Springer Berlin Heidelberg, Berlin, Heidelberg, 2008, pp. 101–145.
86 L. Zhang, S. Dong and L. Zhu, Chem. Commun. (Camb)., 2007, 1891–3.
87 W. Jahnke and C. Henry, ChemMedChem, 2010, 5, 770–776.
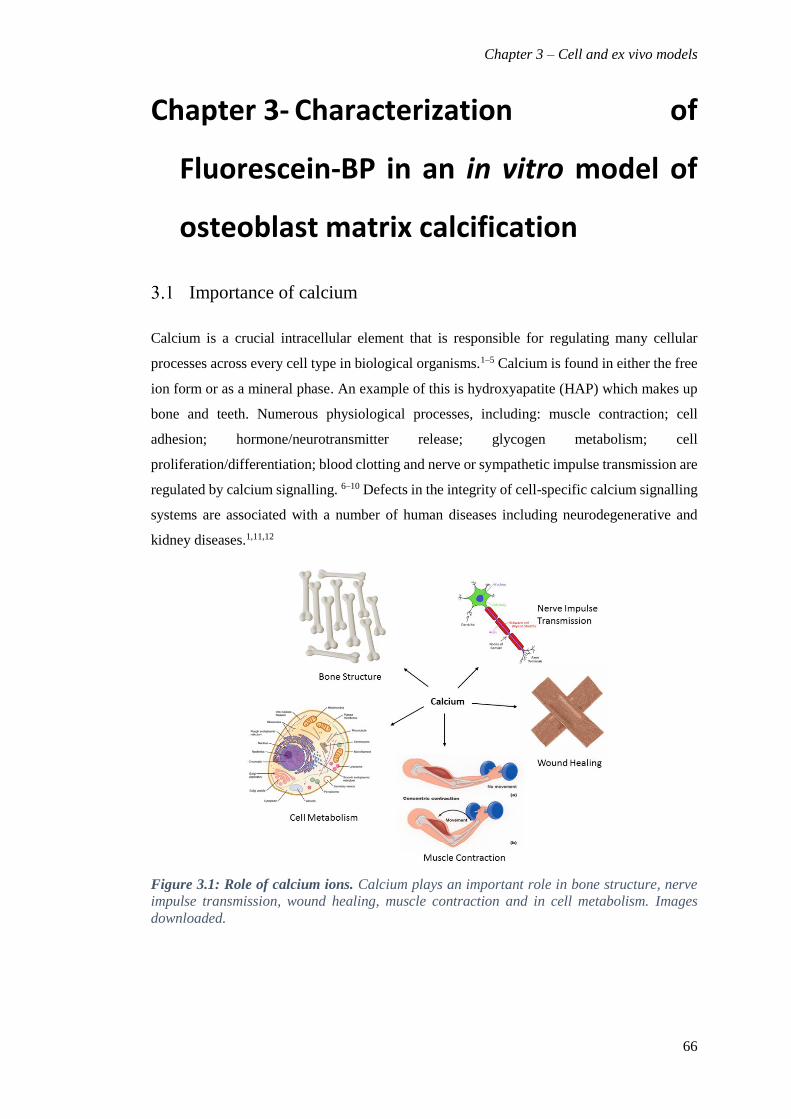
Chapter 3 – Cell and ex vivo models
66
Chapter 3- Characterization of
Fluorescein-BP in an in vitro model of
osteoblast matrix calcification
Importance of calcium
Calcium is a crucial intracellular element that is responsible for regulating many cellular
processes across every cell type in biological organisms.1–5 Calcium is found in either the free
ion form or as a mineral phase. An example of this is hydroxyapatite (HAP) which makes up
bone and teeth. Numerous physiological processes, including: muscle contraction; cell
adhesion; hormone/neurotransmitter release; glycogen metabolism; cell
proliferation/differentiation; blood clotting and nerve or sympathetic impulse transmission are
regulated by calcium signalling. 6–10 Defects in the integrity of cell-specific calcium signalling
systems are associated with a number of human diseases including neurodegenerative and
kidney diseases.1,11,12
Figure 3.1: Role of calcium ions. Calcium plays an important role in bone structure, nerve
impulse transmission, wound healing, muscle contraction and in cell metabolism. Images
downloaded.
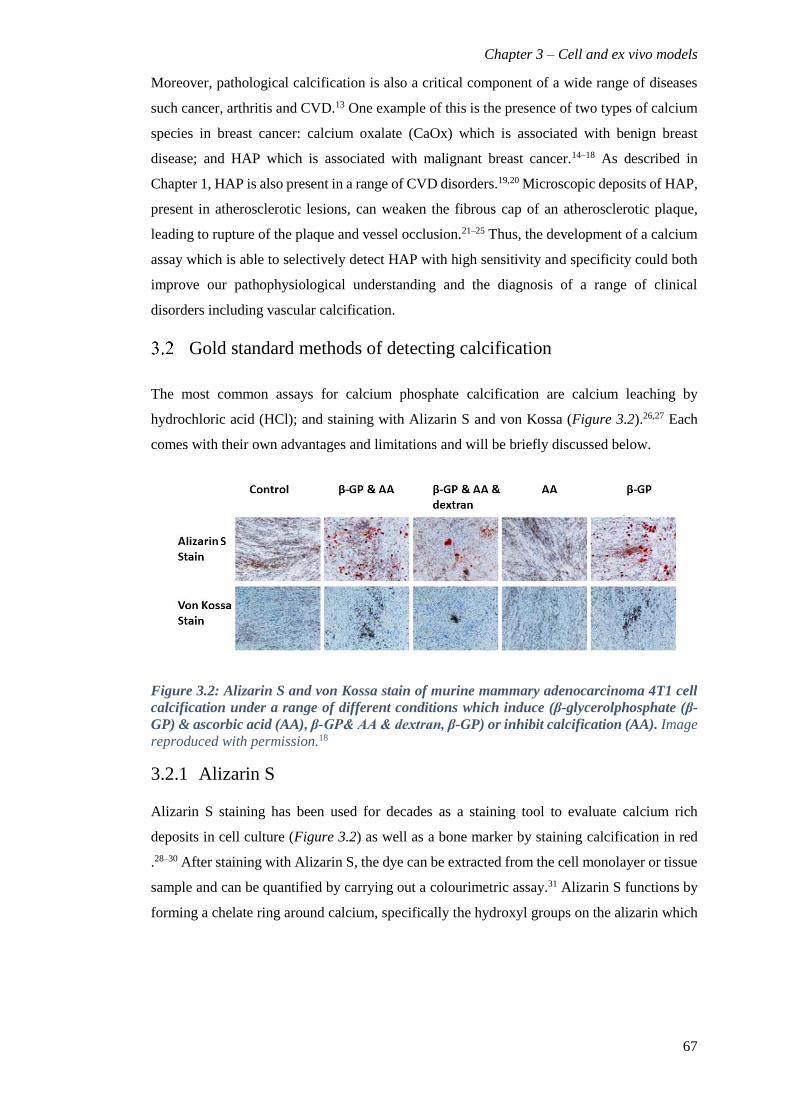
Chapter 3 – Cell and ex vivo models
67
Moreover, pathological calcification is also a critical component of a wide range of diseases
such cancer, arthritis and CVD.13 One example of this is the presence of two types of calcium
species in breast cancer: calcium oxalate (CaOx) which is associated with benign breast
disease; and HAP which is associated with malignant breast cancer.14–18 As described in
Chapter 1, HAP is also present in a range of CVD disorders.19,20 Microscopic deposits of HAP,
present in atherosclerotic lesions, can weaken the fibrous cap of an atherosclerotic plaque,
leading to rupture of the plaque and vessel occlusion.21–25 Thus, the development of a calcium
assay which is able to selectively detect HAP with high sensitivity and specificity could both
improve our pathophysiological understanding and the diagnosis of a range of clinical
disorders including vascular calcification.
Gold standard methods of detecting calcification
The most common assays for calcium phosphate calcification are calcium leaching by
hydrochloric acid (HCl); and staining with Alizarin S and von Kossa (Figure 3.2).26,27 Each
comes with their own advantages and limitations and will be briefly discussed below.
Figure 3.2: Alizarin S and von Kossa stain of murine mammary adenocarcinoma 4T1 cell
calcification under a range of different conditions which induce (β-glycerolphosphate (β-
GP) & ascorbic acid (AA), β-GP& AA & dextran, β-GP) or inhibit calcification (AA). Image
reproduced with permission.18
3.2.1 Alizarin S
Alizarin S staining has been used for decades as a staining tool to evaluate calcium rich
deposits in cell culture (Figure 3.2) as well as a bone marker by staining calcification in red
.28–30 After staining with Alizarin S, the dye can be extracted from the cell monolayer or tissue
sample and can be quantified by carrying out a colourimetric assay.31 Alizarin S functions by
forming a chelate ring around calcium, specifically the hydroxyl groups on the alizarin which
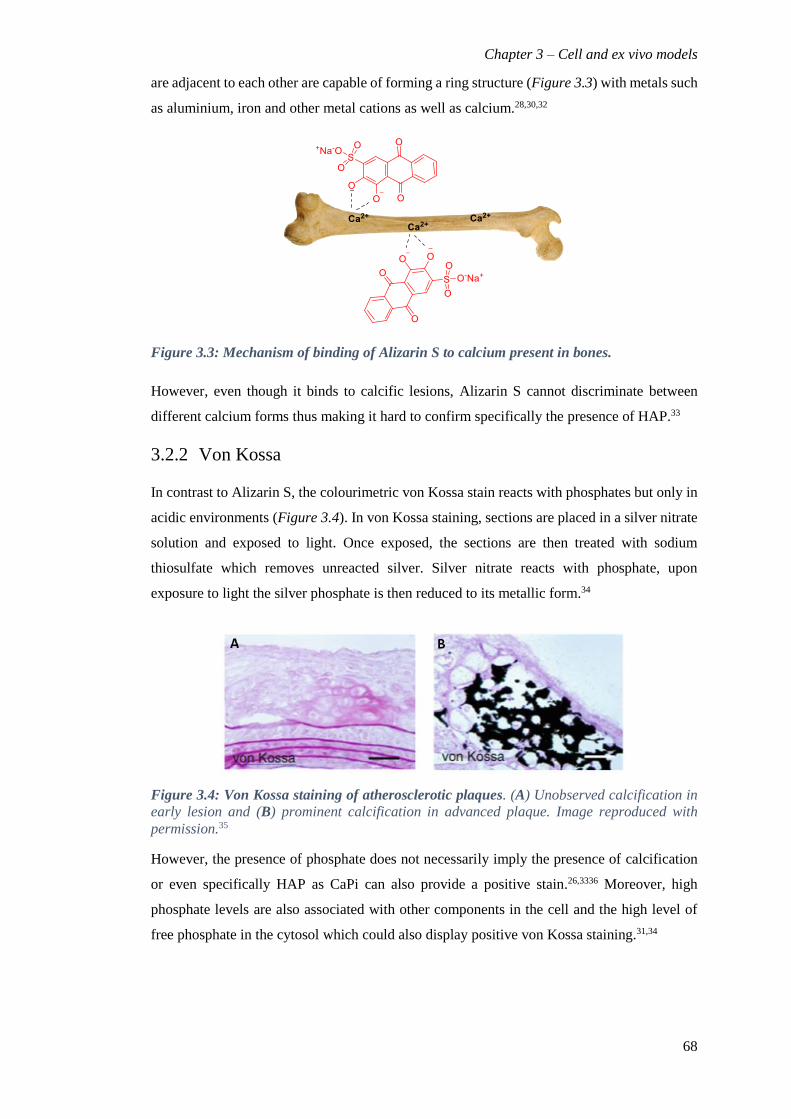
Chapter 3 – Cell and ex vivo models
68
are adjacent to each other are capable of forming a ring structure (Figure 3.3) with metals such
as aluminium, iron and other metal cations as well as calcium.28,30,32
Figure 3.3: Mechanism of binding of Alizarin S to calcium present in bones.
However, even though it binds to calcific lesions, Alizarin S cannot discriminate between
different calcium forms thus making it hard to confirm specifically the presence of HAP.33
3.2.2 Von Kossa
In contrast to Alizarin S, the colourimetric von Kossa stain reacts with phosphates but only in
acidic environments (Figure 3.4). In von Kossa staining, sections are placed in a silver nitrate
solution and exposed to light. Once exposed, the sections are then treated with sodium
thiosulfate which removes unreacted silver. Silver nitrate reacts with phosphate, upon
exposure to light the silver phosphate is then reduced to its metallic form.34
Figure 3.4: Von Kossa staining of atherosclerotic plaques. (A) Unobserved calcification in
early lesion and (B) prominent calcification in advanced plaque. Image reproduced with
permission.35
However, the presence of phosphate does not necessarily imply the presence of calcification
or even specifically HAP as CaPi can also provide a positive stain.26,3336 Moreover, high
phosphate levels are also associated with other components in the cell and the high level of
free phosphate in the cytosol which could also display positive von Kossa staining.31,34

Chapter 3 – Cell and ex vivo models
69
Both Alizarin S and von Kossa stains are used to indicate calcium depositions but at best give
only semi-quantitative calcium readings and often stain in different areas due to the different
binding abilities (Figure 3.2).37
3.2.3 HCl/DC assay
The calcium leaching assay is a further method used to determine calcium concentrations and
has been used in laboratory settings to determine the presence of calcification in vascular and
bone cell models.38–41 The assay involves treating cell monolayers with HCl which allows the
extraction of free calcium ions from the cells. The calcium content is then detected using a
colorimetric assay, typically using o-cresolphthalein complexone, and normalised against the
total number of cells per sample.42 However, the assay presents major disadvantages when a
large volume of cells are used as the HCl is not able to dissolve all the cell content and therefore
an accurate reading of the total protein concentration is not obtained which makes the
normalisation step hard. Furthermore, the calcium leaching assay is time intensive as it takes
around 24-48 hours, making it unsuitable for high-throughput applications.
3.2.4 Calcein and other fluorescence methods
The discrepancies between the amounts of calcium visualized by Alizarin S and von Kossa
has led scientists to develop novel calcium imaging probes that are more selective and more
sensitive.
An example of this is calcein, this probe has routinely been used as a tool for imaging calcium,
with higher sensitivity to Alizarin S and von Kossa. However, similarly to Alizarin S, calcein
interacts with calcium (Figure 3.5) as well as a range of other metals including aluminium and
zinc.43,44 Nonetheless, even though it is able to bind to a range of cations, it has mainly been
used for cell viability studies due to its ability to penetrate the cells and if alive fluoresce.
Figure 3.5: Calcein staining of zebrafish embryos. Calcein localization in the vertebrate
column which is mainly composed of calcium. Image reproduced with permission.45
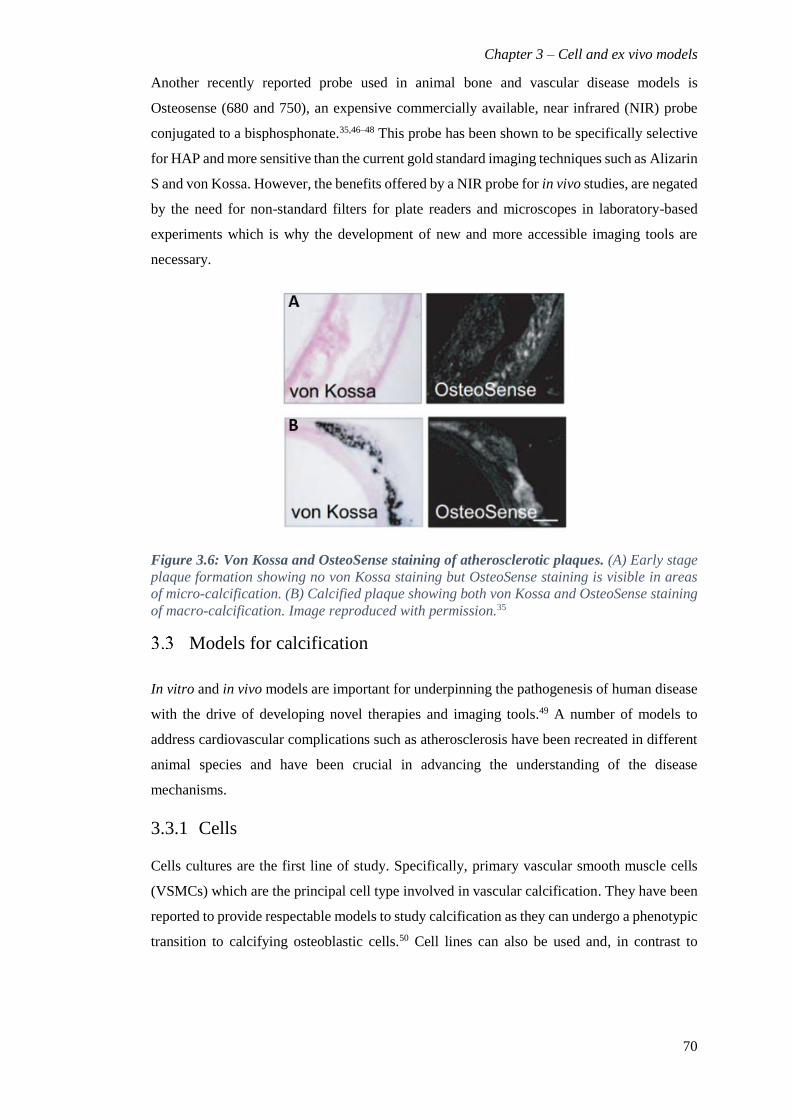
Chapter 3 – Cell and ex vivo models
70
Another recently reported probe used in animal bone and vascular disease models is
Osteosense (680 and 750), an expensive commercially available, near infrared (NIR) probe
conjugated to a bisphosphonate.35,46–48 This probe has been shown to be specifically selective
for HAP and more sensitive than the current gold standard imaging techniques such as Alizarin
S and von Kossa. However, the benefits offered by a NIR probe for in vivo studies, are negated
by the need for non-standard filters for plate readers and microscopes in laboratory-based
experiments which is why the development of new and more accessible imaging tools are
necessary.
Figure 3.6: Von Kossa and OsteoSense staining of atherosclerotic plaques. (A) Early stage
plaque formation showing no von Kossa staining but OsteoSense staining is visible in areas
of micro-calcification. (B) Calcified plaque showing both von Kossa and OsteoSense staining
of macro-calcification. Image reproduced with permission.35
Models for calcification
In vitro and in vivo models are important for underpinning the pathogenesis of human disease
with the drive of developing novel therapies and imaging tools.49 A number of models to
address cardiovascular complications such as atherosclerosis have been recreated in different
animal species and have been crucial in advancing the understanding of the disease
mechanisms.
3.3.1 Cells
Cells cultures are the first line of study. Specifically, primary vascular smooth muscle cells
(VSMCs) which are the principal cell type involved in vascular calcification. They have been
reported to provide respectable models to study calcification as they can undergo a phenotypic
transition to calcifying osteoblastic cells.50 Cell lines can also be used and, in contrast to
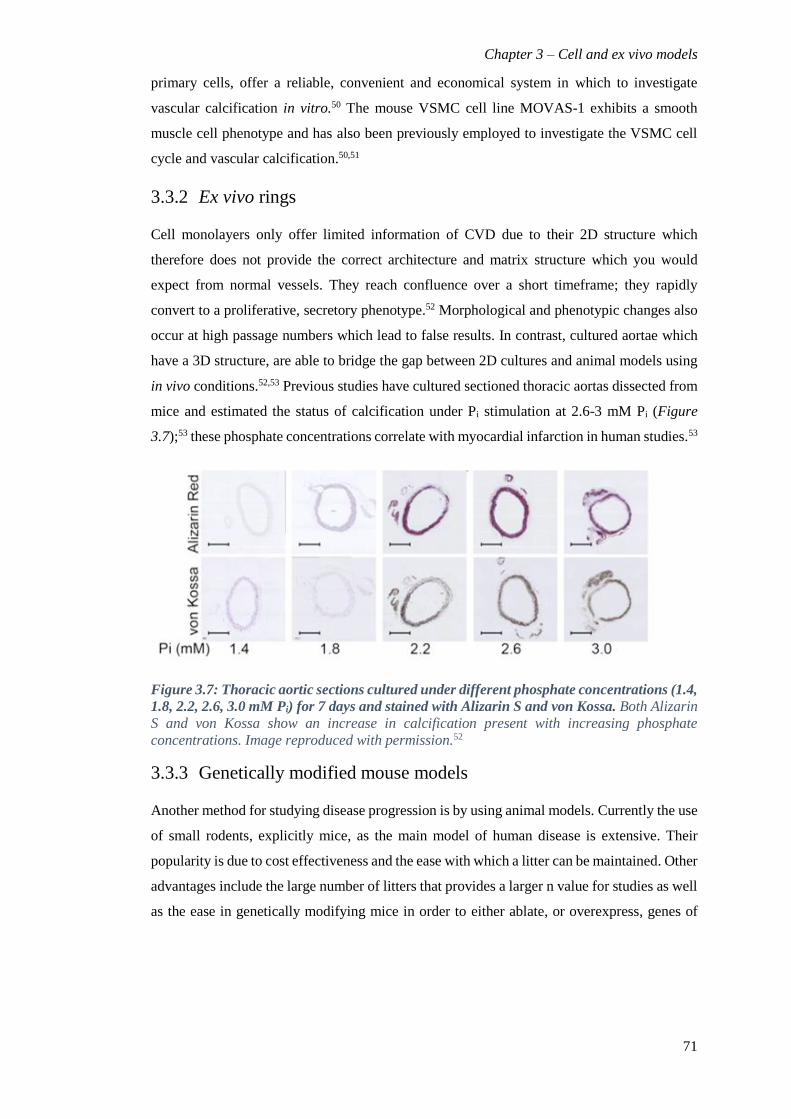
Chapter 3 – Cell and ex vivo models
71
primary cells, offer a reliable, convenient and economical system in which to investigate
vascular calcification in vitro.50 The mouse VSMC cell line MOVAS-1 exhibits a smooth
muscle cell phenotype and has also been previously employed to investigate the VSMC cell
cycle and vascular calcification.50,51
3.3.2 Ex vivo rings
Cell monolayers only offer limited information of CVD due to their 2D structure which
therefore does not provide the correct architecture and matrix structure which you would
expect from normal vessels. They reach confluence over a short timeframe; they rapidly
convert to a proliferative, secretory phenotype.52 Morphological and phenotypic changes also
occur at high passage numbers which lead to false results. In contrast, cultured aortae which
have a 3D structure, are able to bridge the gap between 2D cultures and animal models using
in vivo conditions.52,53 Previous studies have cultured sectioned thoracic aortas dissected from
mice and estimated the status of calcification under Pi stimulation at 2.6-3 mM Pi (Figure
3.7);53 these phosphate concentrations correlate with myocardial infarction in human studies.53
Figure 3.7: Thoracic aortic sections cultured under different phosphate concentrations (1.4,
1.8, 2.2, 2.6, 3.0 mM Pi) for 7 days and stained with Alizarin S and von Kossa. Both Alizarin
S and von Kossa show an increase in calcification present with increasing phosphate
concentrations. Image reproduced with permission.52
3.3.3 Genetically modified mouse models
Another method for studying disease progression is by using animal models. Currently the use
of small rodents, explicitly mice, as the main model of human disease is extensive. Their
popularity is due to cost effectiveness and the ease with which a litter can be maintained. Other
advantages include the large number of litters that provides a larger n value for studies as well
as the ease in genetically modifying mice in order to either ablate, or overexpress, genes of
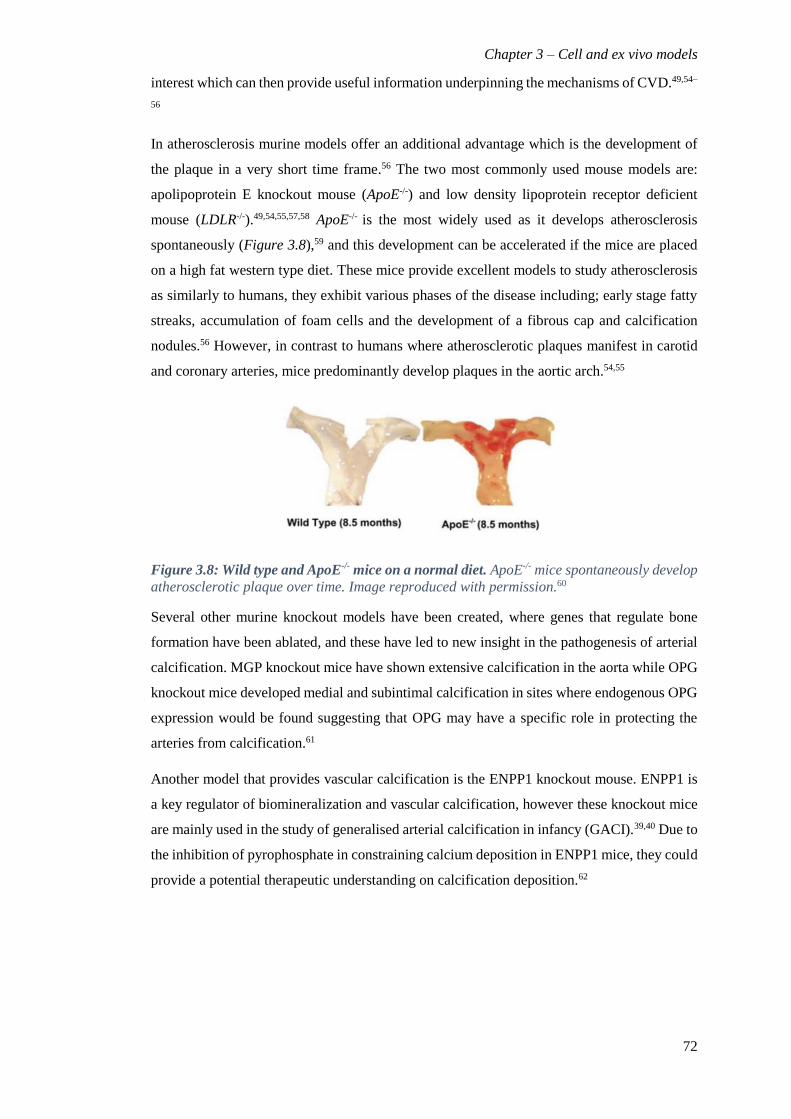
Chapter 3 – Cell and ex vivo models
72
interest which can then provide useful information underpinning the mechanisms of CVD.49,54–
56
In atherosclerosis murine models offer an additional advantage which is the development of
the plaque in a very short time frame.56 The two most commonly used mouse models are:
apolipoprotein E knockout mouse (ApoE-/-) and low density lipoprotein receptor deficient
mouse (LDLR-/-).49,54,55,57,58 ApoE-/- is the most widely used as it develops atherosclerosis
spontaneously (Figure 3.8),59 and this development can be accelerated if the mice are placed
on a high fat western type diet. These mice provide excellent models to study atherosclerosis
as similarly to humans, they exhibit various phases of the disease including; early stage fatty
streaks, accumulation of foam cells and the development of a fibrous cap and calcification
nodules.56 However, in contrast to humans where atherosclerotic plaques manifest in carotid
and coronary arteries, mice predominantly develop plaques in the aortic arch.54,55
Figure 3.8: Wild type and ApoE-/- mice on a normal diet. ApoE-/- mice spontaneously develop
atherosclerotic plaque over time. Image reproduced with permission.60
Several other murine knockout models have been created, where genes that regulate bone
formation have been ablated, and these have led to new insight in the pathogenesis of arterial
calcification. MGP knockout mice have shown extensive calcification in the aorta while OPG
knockout mice developed medial and subintimal calcification in sites where endogenous OPG
expression would be found suggesting that OPG may have a specific role in protecting the
arteries from calcification.61
Another model that provides vascular calcification is the ENPP1 knockout mouse. ENPP1 is
a key regulator of biomineralization and vascular calcification, however these knockout mice
are mainly used in the study of generalised arterial calcification in infancy (GACI).39,40 Due to
the inhibition of pyrophosphate in constraining calcium deposition in ENPP1 mice, they could
provide a potential therapeutic understanding on calcification deposition.62

Chapter 3 – Cell and ex vivo models
73
Probe toxicity studies
Before any cell and ex vivo experiments could be carried out with the new probe, toxicity study
to determine the optimum concentration of the probe that would not kill the cells had to be
determined. To do this, MOVAS-1 cells were treated with a range of different concentrations
of Fluorescein-BP (55) together with Alamar blue (Figure 3.9). Alamar blue is an accurate
and rapid indicator of cellular health which has been used for the past 50 years in studies on
cell viability and cytotoxicity.63 Cells were incubated with both probes for 4 hours. Two
controls were required, one which included cells with only Alamar Blue (positive control) and
the other containing cells, Alamar Blue and DTT (identified in Figure 3.9 as lysis buffer)
which in turn causes cell lysis. It was found that, high concentrations of the Fluorescein-BP
probe (5 and 10 µM) would cause the cells to die, while lower concentrations (0.5, 1, 2 µM)
caused reduced levels of cell death. It was decided to use 1 μM in subsequent studies as this
provides a higher fluorescence signal when incubated with a cell monolayer in comparison to
0.5 μM.
Figure 3.9: MOVAS-1 cell viability assay using Alamar Blue for different concentrations
of Fluorescein-BP (55). Cells were seeded and grown until confluent. Cells were either: left
untreated, treated with DTT to cause cell lysis, or treated with different concentrations of the
probe to determine the optimum concentration of probe. Alamar blue was added to the cells
for 4 hours before measuring the absorbance (λex= 570 nm). Data shown is from at least 6
repeats and shown as the mean ± S.E.M. * p< 0.05, ** p< 0.01, *** p < 0.001
Another cytotoxicity study with Alamar Blue assay was performed to determine whether the
Ca2+ concentrations used to induce calcification were too high and were leading to cell
apoptosis. 2.4 mM Ca2+ and 1.4 mM Pi and 2.7 mM Ca2+ and 2.5 mM Pi calcification
conditions were selected as they are reported to induce calcification in VSMCs and resonance
on real hypercalcemia and hyperphosphatemia conditions in patients.64 Control and calcified
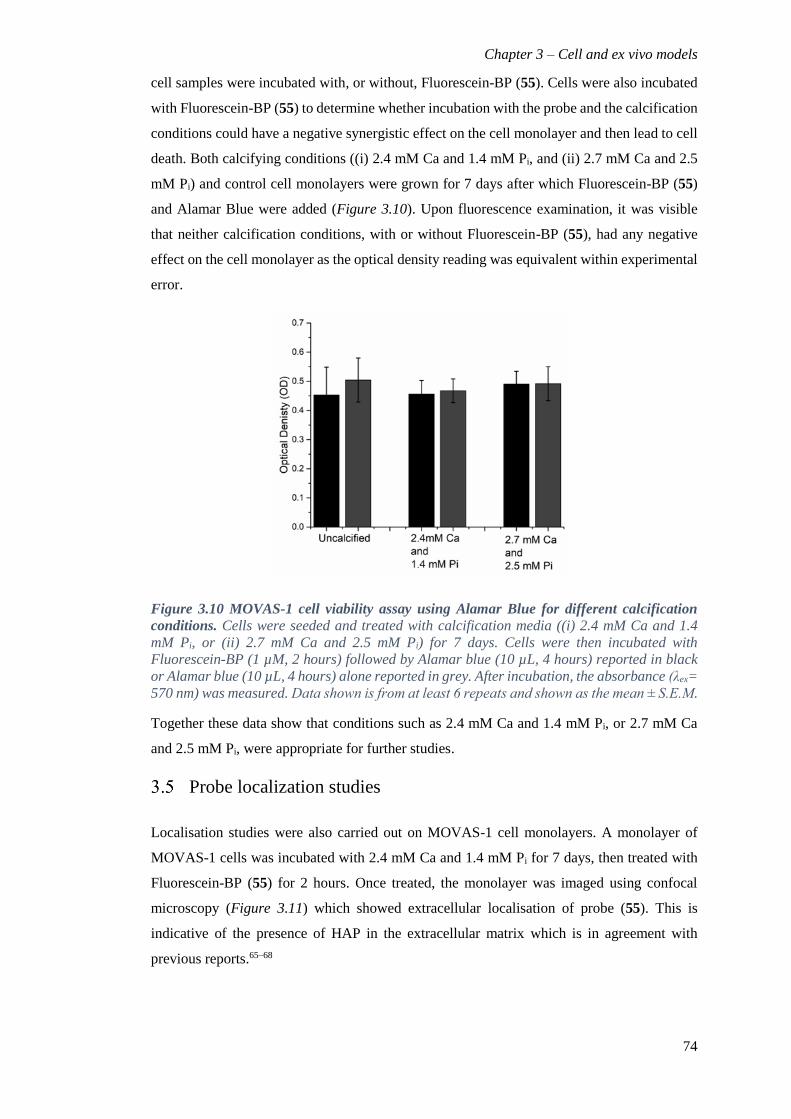
Chapter 3 – Cell and ex vivo models
74
cell samples were incubated with, or without, Fluorescein-BP (55). Cells were also incubated
with Fluorescein-BP (55) to determine whether incubation with the probe and the calcification
conditions could have a negative synergistic effect on the cell monolayer and then lead to cell
death. Both calcifying conditions ((i) 2.4 mM Ca and 1.4 mM Pi, and (ii) 2.7 mM Ca and 2.5
mM Pi) and control cell monolayers were grown for 7 days after which Fluorescein-BP (55)
and Alamar Blue were added (Figure 3.10). Upon fluorescence examination, it was visible
that neither calcification conditions, with or without Fluorescein-BP (55), had any negative
effect on the cell monolayer as the optical density reading was equivalent within experimental
error.
Figure 3.10 MOVAS-1 cell viability assay using Alamar Blue for different calcification
conditions. Cells were seeded and treated with calcification media ((i) 2.4 mM Ca and 1.4
mM Pi, or (ii) 2.7 mM Ca and 2.5 mM Pi) for 7 days. Cells were then incubated with
Fluorescein-BP (1 µM, 2 hours) followed by Alamar blue (10 µL, 4 hours) reported in black
or Alamar blue (10 µL, 4 hours) alone reported in grey. After incubation, the absorbance (λex=
570 nm) was measured. Data shown is from at least 6 repeats and shown as the mean ± S.E.M.
Together these data show that conditions such as 2.4 mM Ca and 1.4 mM Pi, or 2.7 mM Ca
and 2.5 mM Pi, were appropriate for further studies.
Probe localization studies
Localisation studies were also carried out on MOVAS-1 cell monolayers. A monolayer of
MOVAS-1 cells was incubated with 2.4 mM Ca and 1.4 mM Pi for 7 days, then treated with
Fluorescein-BP (55) for 2 hours. Once treated, the monolayer was imaged using confocal
microscopy (Figure 3.11) which showed extracellular localisation of probe (55). This is
indicative of the presence of HAP in the extracellular matrix which is in agreement with
previous reports.65–68

Chapter 3 – Cell and ex vivo models
75
Figure 3.11: Confocal imaging of calcified MOVAS-1 monolayers. Monolayers of MOVAS-
1 cells were grown to confluence (day 0) and then switched to calcification media (2.4 mM Ca
and 1.4 mM Pi) for 7 days, changing media on alternate days. The cell monolayers were
treated sequentially with Fluorescein-BP (1 μM, 2 hours; green); CellMask Orange (500 nM,
10 minutes, pink); NBF (10%, 15 minutes); Triton X (0.05%, 3 x 5 minutes); DAPI (300 nM,
5 minutes, blue); then imaged on an Zeiss Confocal LSM710 microscope (ex = 488 nm, 554
nm and 350 nm). Images are representative of at least 3 repeats. Scale bars = 100 µm. (A)
Incubation with Fluorescein-BP and DAPI. (B, C) Incubation with Fluorescein-BP, CellMask
Orange and DAPI.
In contrast to Fluorescein-BP (55) when the cells were incubated with Fluorescein-amino-1-
pentol (Fluorescein-OH, 73), a control fluorescein-based probe which lacks the
bisphosphonate motif, no signal was observed (Figure 3.12). This demonstrated that the
bisphosphonate motif was responsible for the Fluorescein-BP (55) binding to HAP in a cellular
environment.
Figure 3.12: Structure of Fluorescein-OH (73) (A) and fluorescence image of Calcified
MOVAS-1 cells incubated with Fluorescein-OH (B). A monolayer of MOVAS-1 cells was
grown to confluence (day 0) and then switched to calcification media (2.4 mM Ca and 1.4 mM
Pi) for 7 days, changing media on alternate days. The cell monolayer was incubated with
Fluorescein-OH (1 μM, 2 hours), fixed with NBF (10%, 15 minutes) and mounted using
ProLong Gold Antifade with DAPI. Scale bar = 100 µm.
Chapter 3 – Cell and ex vivo models
76
Comparison of probe with Alizarin S and calcium leaching assay
To investigate the range of conditions under which the Fluorescein-BP (55) probe can be used
and to compare its efficacy with the calcium leaching assay and Alizarin S stain a
supplementary series of calcification assays were conducted with both the MOVAS-1 cell line
and primary VSMC cells.
3.6.1 MOVAS
Monolayers of the MOVAS-1 cell line were incubated in both phosphate-enriched (3 mM and
5 mM Pi) and both phosphate and calcium-enriched (2.4 mM Ca and 1.4 mM Pi and 2.7 mM
Ca and 2.5 mM Pi) growth media. Both, the calcium leaching assay (4-fold, p < 0.001) (Figure
3.13 A) and the fluorescence assay (4-fold, p < 0.001) (Figure 3.13 B) demonstrated
significant levels of calcium deposition when incubated in calcium enriched media. A
comparison of the fluorescence images obtained for well plates with images of Alizarin S
staining of equivalent plates (Figure 3.13 C), suggest that both fail to distinguish calcification
in media only enriched with phosphate. Nevertheless, when cells are incubated in the presence
of both calcium and phosphate enriched media, the fluorescent probe can detect the deposition
of microcrystalline HAP with greater sensitivity than the Alizarin S stain. This is most notable
when using commonly applied in vitro vascular calcification conditions, where the growth
media have been enriched with 2.4 mM Ca and 1.4 mM Pi.38

Chapter 3 – Cell and ex vivo models
77
Figure 3.13: Determination of calcification in the MOVAS cell line at various
concentrations (3.0 mM Pi, 5.0 mM Pi, 2.4 mM Ca and 1.4 mM Pi, 2.7 mM Ca and 2.5 mM
Pi). Monolayers of MOVAS-1 cells were grown to confluence (day 0) and then switched to
calcification media. The monolayers were incubated in calcification media (3.0 mM Pi, 5.0
mM Pi, 2.4 mM Ca and 1.4 mM Pi, 2.7 mM Ca and 2.5 mM Pi) for 7 days, changing media on
alternate days. (A) Calcium leaching assay: o-cresolphthalein complexone. (B) Fluorescence
assay: cell monolayers were incubated with Fluorescein-BP (1 μM, 2 hours); NBF (10%, 15
minutes). (C) Fluorescence images and Alizarin S stain images: cell monolayers were either:
incubated with Fluorescein-BP (1 µM, 2 hours) and then fixed with NBF (10%, 15 minutes),
or fixed with NBF (10%, 15 minutes) and then incubated with Alizarin S (2%, 500 μL, 10
minutes). Data shown in (A) and (B) are from at least 6 repeats and shown as the mean
± S.E.M., * P < 0.05, ** P < 0.01, *** P < 0.001 compared to control. Images shown in (C)
are representative of at least 3 independent experiments yielding comparable results. Arrows
indicate the location of calcium deposits within the well. Scale bars = 250 μm.
In further experiments, MOVAS-1 cells (Figure 3.14) were incubated under the standard
vascular calcification conditions (2.4 mM Ca and 1.4 mM Pi) and the calcification on days 3,
5 and 7 was detected using Fluorescein-BP probe (55) (2.5-fold, p < 0.001). These results were
then compared with calcium leaching assay (5-fold, p < 0.001) and staining by Alizarin S.
Again in this instance, the fluorescent probe was shown to be more sensitive than both the
other assays.
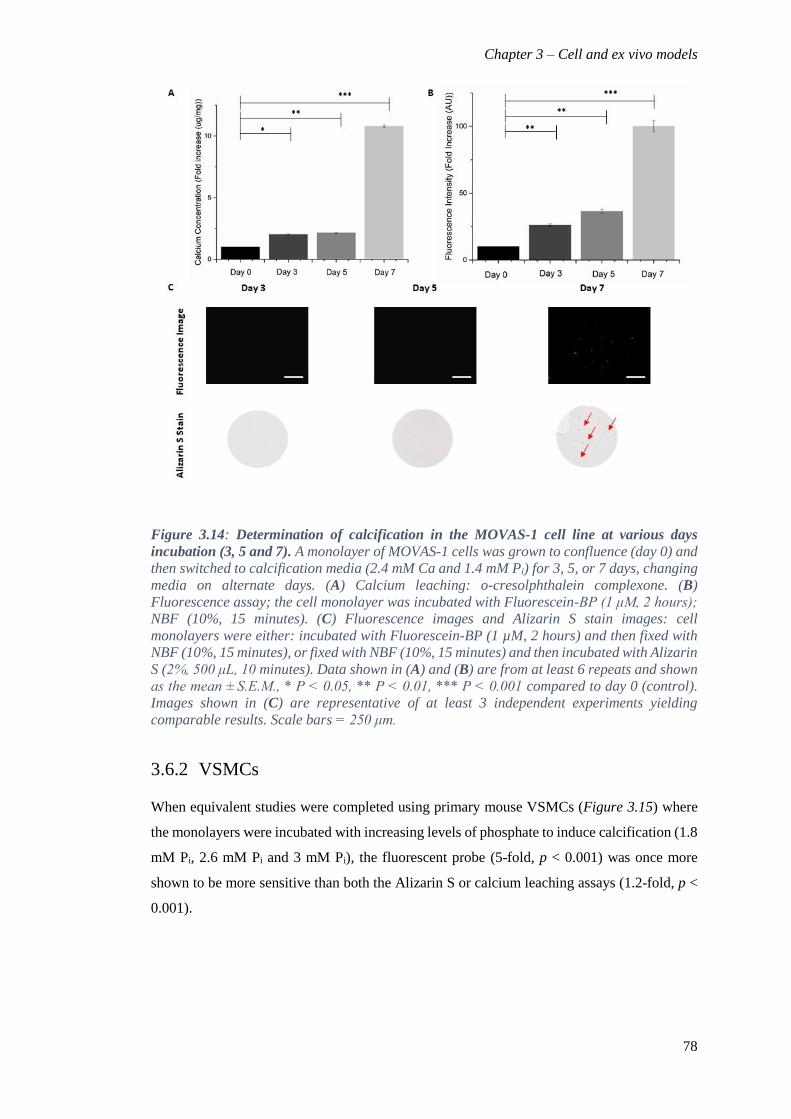
Chapter 3 – Cell and ex vivo models
78
Figure 3.14: Determination of calcification in the MOVAS-1 cell line at various days
incubation (3, 5 and 7). A monolayer of MOVAS-1 cells was grown to confluence (day 0) and
then switched to calcification media (2.4 mM Ca and 1.4 mM Pi) for 3, 5, or 7 days, changing
media on alternate days. (A) Calcium leaching: o-cresolphthalein complexone. (B)
Fluorescence assay; the cell monolayer was incubated with Fluorescein-BP (1 μM, 2 hours);
NBF (10%, 15 minutes). (C) Fluorescence images and Alizarin S stain images: cell
monolayers were either: incubated with Fluorescein-BP (1 µM, 2 hours) and then fixed with
NBF (10%, 15 minutes), or fixed with NBF (10%, 15 minutes) and then incubated with Alizarin
S (2%, 500 μL, 10 minutes). Data shown in (A) and (B) are from at least 6 repeats and shown
as the mean ± S.E.M., * P < 0.05, ** P < 0.01, *** P < 0.001 compared to day 0 (control).
Images shown in (C) are representative of at least 3 independent experiments yielding
comparable results. Scale bars = 250 μm.
3.6.2 VSMCs
When equivalent studies were completed using primary mouse VSMCs (Figure 3.15) where
the monolayers were incubated with increasing levels of phosphate to induce calcification (1.8
mM Pi, 2.6 mM Pi and 3 mM Pi), the fluorescent probe (5-fold, p < 0.001) was once more
shown to be more sensitive than both the Alizarin S or calcium leaching assays (1.2-fold, p <
0.001).
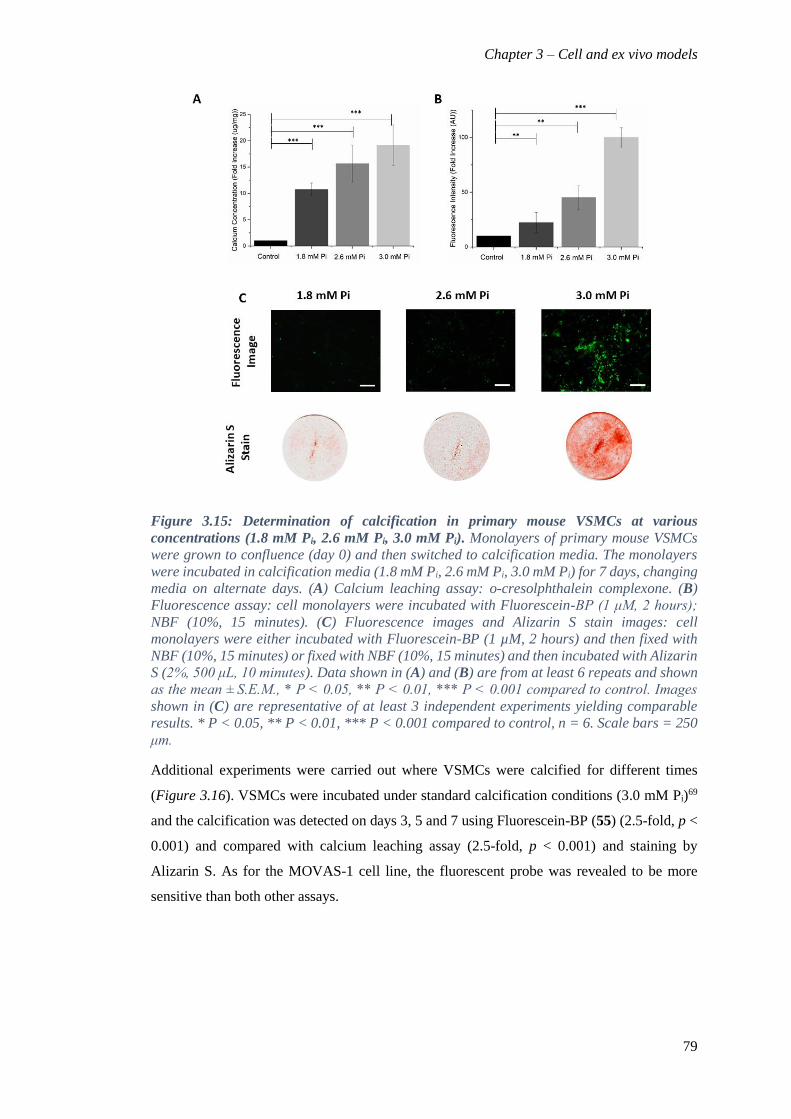
Chapter 3 – Cell and ex vivo models
79
Figure 3.15: Determination of calcification in primary mouse VSMCs at various
concentrations (1.8 mM Pi, 2.6 mM Pi, 3.0 mM Pi). Monolayers of primary mouse VSMCs
were grown to confluence (day 0) and then switched to calcification media. The monolayers
were incubated in calcification media (1.8 mM Pi, 2.6 mM Pi, 3.0 mM Pi) for 7 days, changing
media on alternate days. (A) Calcium leaching assay: o-cresolphthalein complexone. (B)
Fluorescence assay: cell monolayers were incubated with Fluorescein-BP (1 μM, 2 hours);
NBF (10%, 15 minutes). (C) Fluorescence images and Alizarin S stain images: cell
monolayers were either incubated with Fluorescein-BP (1 µM, 2 hours) and then fixed with
NBF (10%, 15 minutes) or fixed with NBF (10%, 15 minutes) and then incubated with Alizarin
S (2%, 500 μL, 10 minutes). Data shown in (A) and (B) are from at least 6 repeats and shown
as the mean ± S.E.M., * P < 0.05, ** P < 0.01, *** P < 0.001 compared to control. Images
shown in (C) are representative of at least 3 independent experiments yielding comparable
results. * P < 0.05, ** P < 0.01, *** P < 0.001 compared to control, n = 6. Scale bars = 250
μm.
Additional experiments were carried out where VSMCs were calcified for different times
(Figure 3.16). VSMCs were incubated under standard calcification conditions (3.0 mM Pi)69
and the calcification was detected on days 3, 5 and 7 using Fluorescein-BP (55) (2.5-fold, p <
0.001) and compared with calcium leaching assay (2.5-fold, p < 0.001) and staining by
Alizarin S. As for the MOVAS-1 cell line, the fluorescent probe was revealed to be more
sensitive than both other assays.
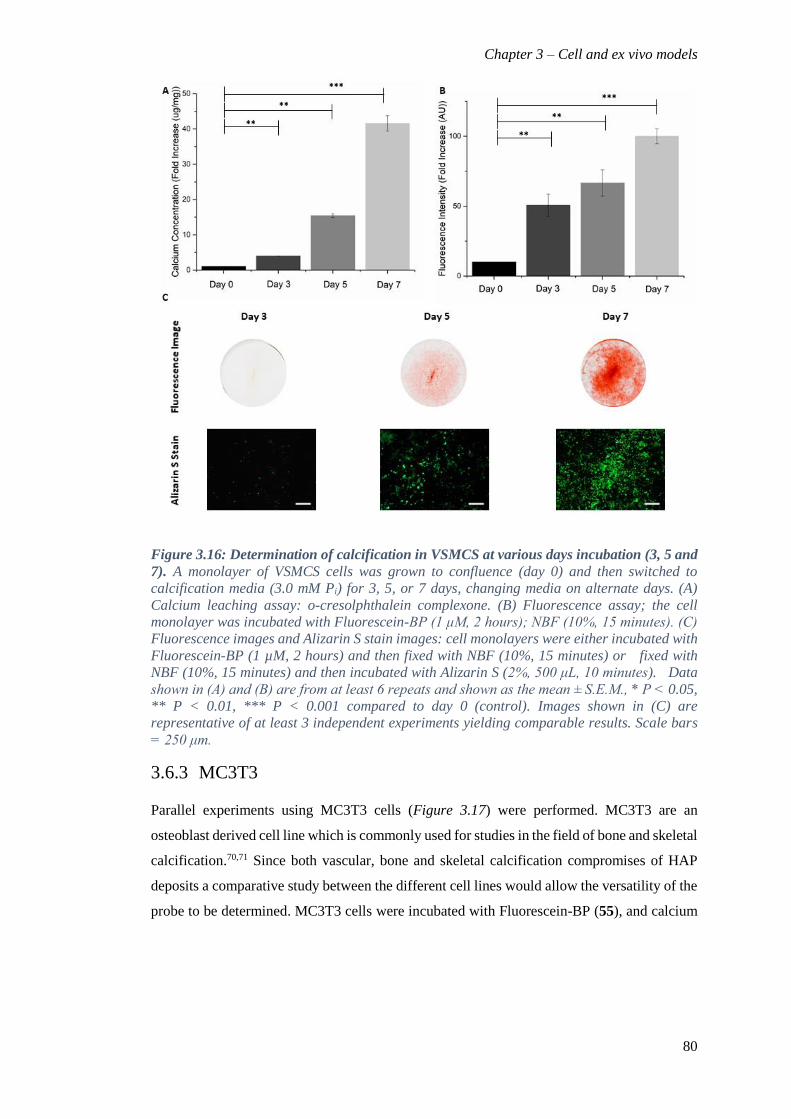
Chapter 3 – Cell and ex vivo models
80
Figure 3.16: Determination of calcification in VSMCS at various days incubation (3, 5 and
7). A monolayer of VSMCS cells was grown to confluence (day 0) and then switched to
calcification media (3.0 mM Pi) for 3, 5, or 7 days, changing media on alternate days. (A)
Calcium leaching assay: o-cresolphthalein complexone. (B) Fluorescence assay; the cell
monolayer was incubated with Fluorescein-BP (1 μM, 2 hours); NBF (10%, 15 minutes). (C)
Fluorescence images and Alizarin S stain images: cell monolayers were either incubated with
Fluorescein-BP (1 µM, 2 hours) and then fixed with NBF (10%, 15 minutes) or fixed with
NBF (10%, 15 minutes) and then incubated with Alizarin S (2%, 500 μL, 10 minutes). Data
shown in (A) and (B) are from at least 6 repeats and shown as the mean ± S.E.M., * P < 0.05,
** P < 0.01, *** P < 0.001 compared to day 0 (control). Images shown in (C) are
representative of at least 3 independent experiments yielding comparable results. Scale bars
= 250 μm.
3.6.3 MC3T3
Parallel experiments using MC3T3 cells (Figure 3.17) were performed. MC3T3 are an
osteoblast derived cell line which is commonly used for studies in the field of bone and skeletal
calcification.70,71 Since both vascular, bone and skeletal calcification compromises of HAP
deposits a comparative study between the different cell lines would allow the versatility of the
probe to be determined. MC3T3 cells were incubated with Fluorescein-BP (55), and calcium
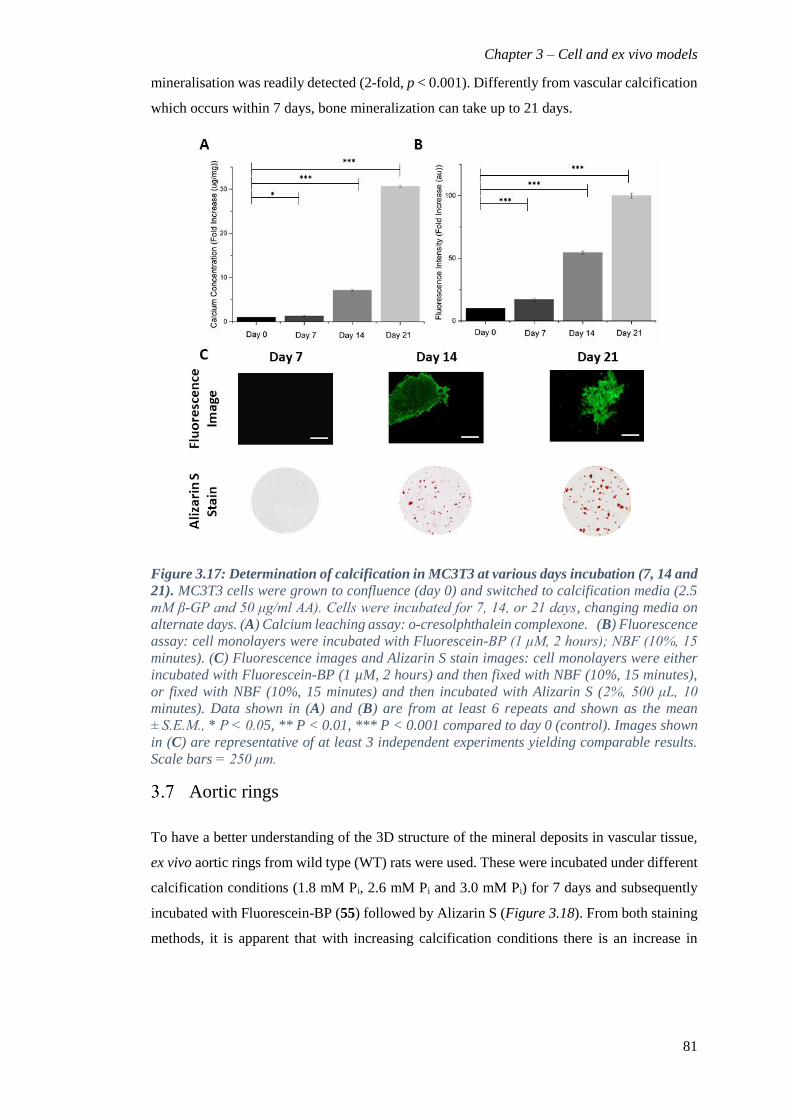
Chapter 3 – Cell and ex vivo models
81
mineralisation was readily detected (2-fold, p < 0.001). Differently from vascular calcification
which occurs within 7 days, bone mineralization can take up to 21 days.
Figure 3.17: Determination of calcification in MC3T3 at various days incubation (7, 14 and
21). MC3T3 cells were grown to confluence (day 0) and switched to calcification media (2.5
mM β-GP and 50 μg/ml AA). Cells were incubated for 7, 14, or 21 days, changing media on
alternate days. (A) Calcium leaching assay: o-cresolphthalein complexone. (B) Fluorescence
assay: cell monolayers were incubated with Fluorescein-BP (1 μM, 2 hours); NBF (10%, 15
minutes). (C) Fluorescence images and Alizarin S stain images: cell monolayers were either
incubated with Fluorescein-BP (1 µM, 2 hours) and then fixed with NBF (10%, 15 minutes),
or fixed with NBF (10%, 15 minutes) and then incubated with Alizarin S (2%, 500 μL, 10
minutes). Data shown in (A) and (B) are from at least 6 repeats and shown as the mean
± S.E.M., * P < 0.05, ** P < 0.01, *** P < 0.001 compared to day 0 (control). Images shown
in (C) are representative of at least 3 independent experiments yielding comparable results.
Scale bars = 250 μm.
Aortic rings
To have a better understanding of the 3D structure of the mineral deposits in vascular tissue,
ex vivo aortic rings from wild type (WT) rats were used. These were incubated under different
calcification conditions (1.8 mM Pi, 2.6 mM Pi and 3.0 mM Pi) for 7 days and subsequently
incubated with Fluorescein-BP (55) followed by Alizarin S (Figure 3.18). From both staining
methods, it is apparent that with increasing calcification conditions there is an increase in
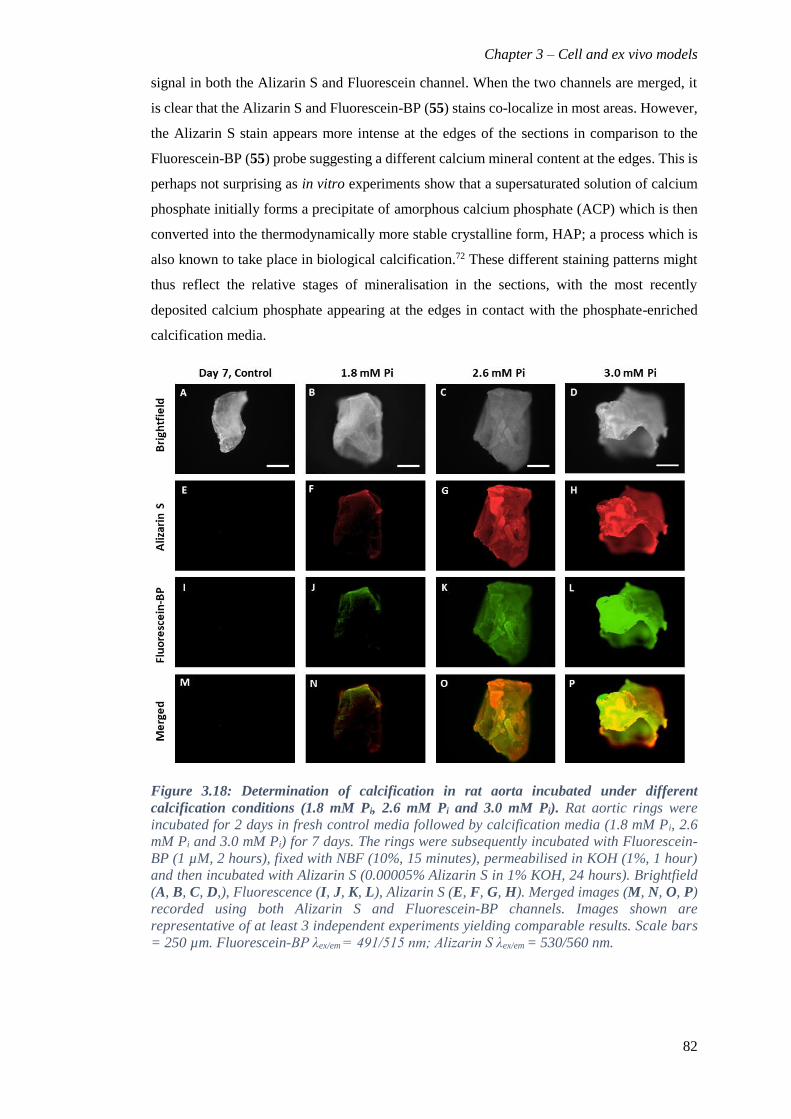
Chapter 3 – Cell and ex vivo models
82
signal in both the Alizarin S and Fluorescein channel. When the two channels are merged, it
is clear that the Alizarin S and Fluorescein-BP (55) stains co-localize in most areas. However,
the Alizarin S stain appears more intense at the edges of the sections in comparison to the
Fluorescein-BP (55) probe suggesting a different calcium mineral content at the edges. This is
perhaps not surprising as in vitro experiments show that a supersaturated solution of calcium
phosphate initially forms a precipitate of amorphous calcium phosphate (ACP) which is then
converted into the thermodynamically more stable crystalline form, HAP; a process which is
also known to take place in biological calcification.72 These different staining patterns might
thus reflect the relative stages of mineralisation in the sections, with the most recently
deposited calcium phosphate appearing at the edges in contact with the phosphate-enriched
calcification media.
Figure 3.18: Determination of calcification in rat aorta incubated under different
calcification conditions (1.8 mM Pi, 2.6 mM Pi and 3.0 mM Pi). Rat aortic rings were
incubated for 2 days in fresh control media followed by calcification media (1.8 mM Pi, 2.6
mM Pi and 3.0 mM Pi) for 7 days. The rings were subsequently incubated with Fluorescein-
BP (1 µM, 2 hours), fixed with NBF (10%, 15 minutes), permeabilised in KOH (1%, 1 hour)
and then incubated with Alizarin S (0.00005% Alizarin S in 1% KOH, 24 hours). Brightfield
(A, B, C, D,), Fluorescence (I, J, K, L), Alizarin S (E, F, G, H). Merged images (M, N, O, P)
recorded using both Alizarin S and Fluorescein-BP channels. Images shown are
representative of at least 3 independent experiments yielding comparable results. Scale bars
= 250 µm. Fluorescein-BP λex/em = 491/515 nm; Alizarin S λex/em = 530/560 nm.
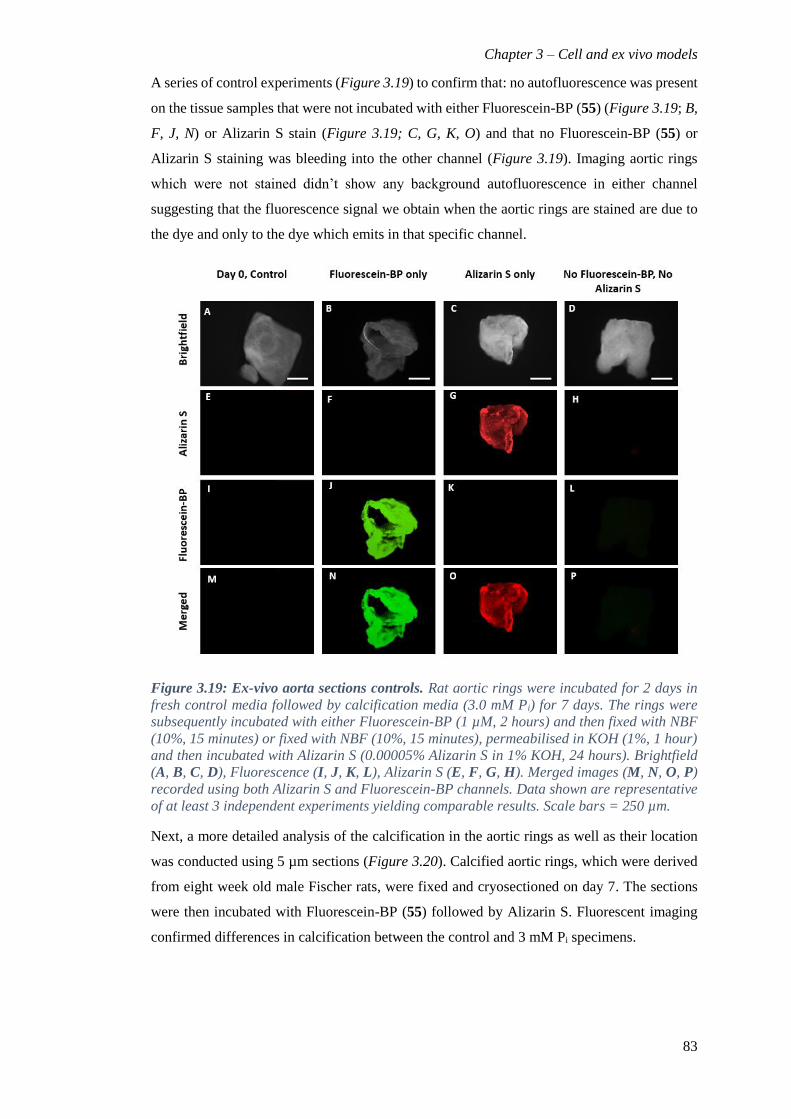
Chapter 3 – Cell and ex vivo models
83
A series of control experiments (Figure 3.19) to confirm that: no autofluorescence was present
on the tissue samples that were not incubated with either Fluorescein-BP (55) (Figure 3.19; B,
F, J, N) or Alizarin S stain (Figure 3.19; C, G, K, O) and that no Fluorescein-BP (55) or
Alizarin S staining was bleeding into the other channel (Figure 3.19). Imaging aortic rings
which were not stained didn’t show any background autofluorescence in either channel
suggesting that the fluorescence signal we obtain when the aortic rings are stained are due to
the dye and only to the dye which emits in that specific channel.
Figure 3.19: Ex-vivo aorta sections controls. Rat aortic rings were incubated for 2 days in
fresh control media followed by calcification media (3.0 mM Pi) for 7 days. The rings were
subsequently incubated with either Fluorescein-BP (1 µM, 2 hours) and then fixed with NBF
(10%, 15 minutes) or fixed with NBF (10%, 15 minutes), permeabilised in KOH (1%, 1 hour)
and then incubated with Alizarin S (0.00005% Alizarin S in 1% KOH, 24 hours). Brightfield
(A, B, C, D), Fluorescence (I, J, K, L), Alizarin S (E, F, G, H). Merged images (M, N, O, P)
recorded using both Alizarin S and Fluorescein-BP channels. Data shown are representative
of at least 3 independent experiments yielding comparable results. Scale bars = 250 µm.
Next, a more detailed analysis of the calcification in the aortic rings as well as their location
was conducted using 5 µm sections (Figure 3.20). Calcified aortic rings, which were derived
from eight week old male Fischer rats, were fixed and cryosectioned on day 7. The sections
were then incubated with Fluorescein-BP (55) followed by Alizarin S. Fluorescent imaging
confirmed differences in calcification between the control and 3 mM Pi specimens.
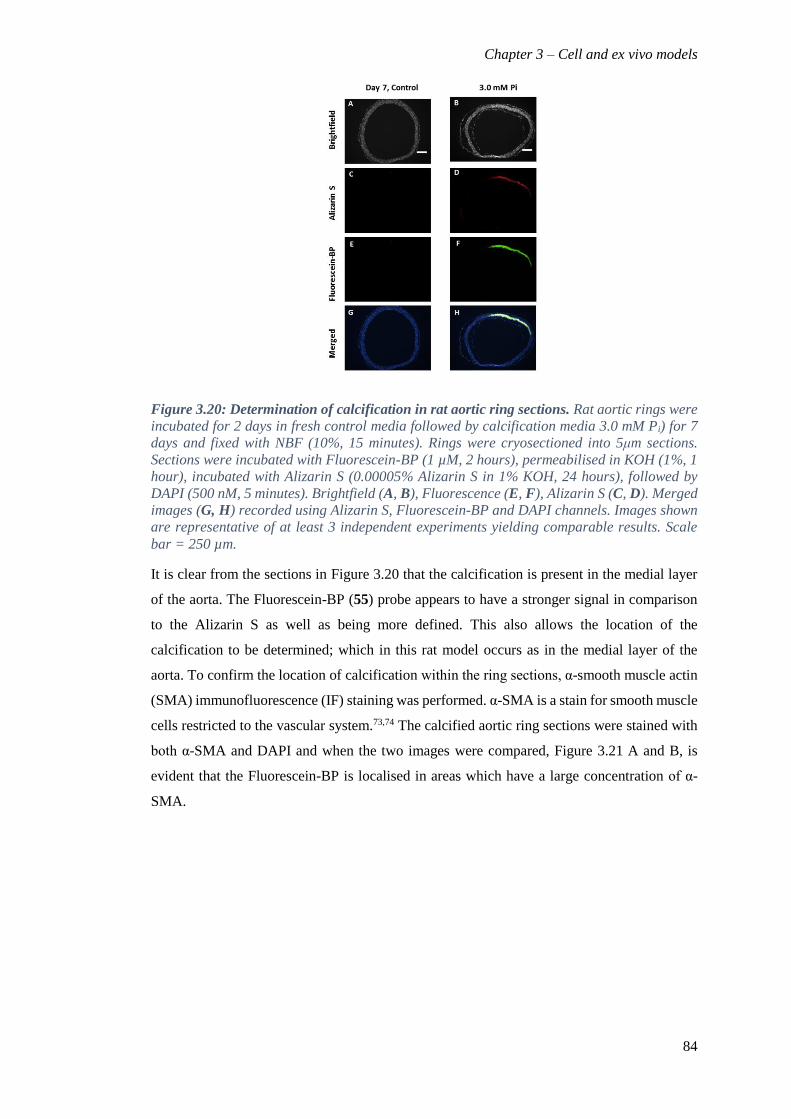
Chapter 3 – Cell and ex vivo models
84
Figure 3.20: Determination of calcification in rat aortic ring sections. Rat aortic rings were
incubated for 2 days in fresh control media followed by calcification media 3.0 mM Pi) for 7
days and fixed with NBF (10%, 15 minutes). Rings were cryosectioned into 5μm sections.
Sections were incubated with Fluorescein-BP (1 µM, 2 hours), permeabilised in KOH (1%, 1
hour), incubated with Alizarin S (0.00005% Alizarin S in 1% KOH, 24 hours), followed by
DAPI (500 nM, 5 minutes). Brightfield (A, B), Fluorescence (E, F), Alizarin S (C, D). Merged
images (G, H) recorded using Alizarin S, Fluorescein-BP and DAPI channels. Images shown
are representative of at least 3 independent experiments yielding comparable results. Scale
bar = 250 µm.
It is clear from the sections in Figure 3.20 that the calcification is present in the medial layer
of the aorta. The Fluorescein-BP (55) probe appears to have a stronger signal in comparison
to the Alizarin S as well as being more defined. This also allows the location of the
calcification to be determined; which in this rat model occurs as in the medial layer of the
aorta. To confirm the location of calcification within the ring sections, α-smooth muscle actin
(SMA) immunofluorescence (IF) staining was performed. α-SMA is a stain for smooth muscle
cells restricted to the vascular system.73,74 The calcified aortic ring sections were stained with
both α-SMA and DAPI and when the two images were compared, Figure 3.21 A and B, is
evident that the Fluorescein-BP is localised in areas which have a large concentration of α-
SMA.
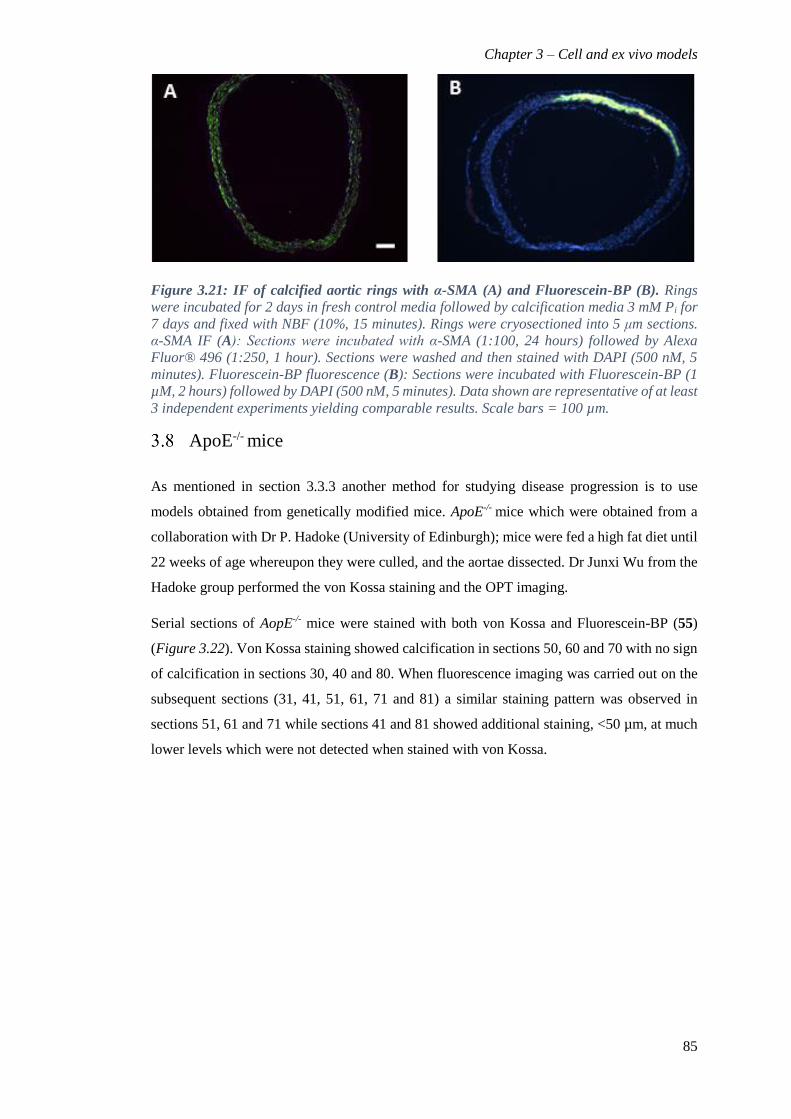
Chapter 3 – Cell and ex vivo models
85
Figure 3.21: IF of calcified aortic rings with α-SMA (A) and Fluorescein-BP (B). Rings
were incubated for 2 days in fresh control media followed by calcification media 3 mM Pi for
7 days and fixed with NBF (10%, 15 minutes). Rings were cryosectioned into 5 μm sections.
α-SMA IF (A): Sections were incubated with α-SMA (1:100, 24 hours) followed by Alexa
Fluor® 496 (1:250, 1 hour). Sections were washed and then stained with DAPI (500 nM, 5
minutes). Fluorescein-BP fluorescence (B): Sections were incubated with Fluorescein-BP (1
µM, 2 hours) followed by DAPI (500 nM, 5 minutes). Data shown are representative of at least
3 independent experiments yielding comparable results. Scale bars = 100 µm.
ApoE-/- mice
As mentioned in section 3.3.3 another method for studying disease progression is to use
models obtained from genetically modified mice. ApoE-/- mice which were obtained from a
collaboration with Dr P. Hadoke (University of Edinburgh); mice were fed a high fat diet until
22 weeks of age whereupon they were culled, and the aortae dissected. Dr Junxi Wu from the
Hadoke group performed the von Kossa staining and the OPT imaging.
Serial sections of AopE-/- mice were stained with both von Kossa and Fluorescein-BP (55)
(Figure 3.22). Von Kossa staining showed calcification in sections 50, 60 and 70 with no sign
of calcification in sections 30, 40 and 80. When fluorescence imaging was carried out on the
subsequent sections (31, 41, 51, 61, 71 and 81) a similar staining pattern was observed in
sections 51, 61 and 71 while sections 41 and 81 showed additional staining, <50 µm, at much
lower levels which were not detected when stained with von Kossa.

Chapter 3 – Cell and ex vivo models
86
Figure 3.22: Von Kossa (A-C and G-I) and fluorescence (D-F and J-L) imaging of aortic
sections of a 22 week old ApoE-/- mice fed a high fat diet. Sequential sections were stained
with either von Kossa (silver nitrate, 20 minutes; 5% sodium thiosulfate, 5 minutes; 0.1%
neutral red 2 minutes) or Fluorescein-BP (1 µM, 2 hours) and DAPI (500 nM, 5 minutes).
Scale bars = 0.1 cm for von Kossa and 100 µm for fluorescence. Von Kossa staining and
images were performed by Dr Junxi Wu.
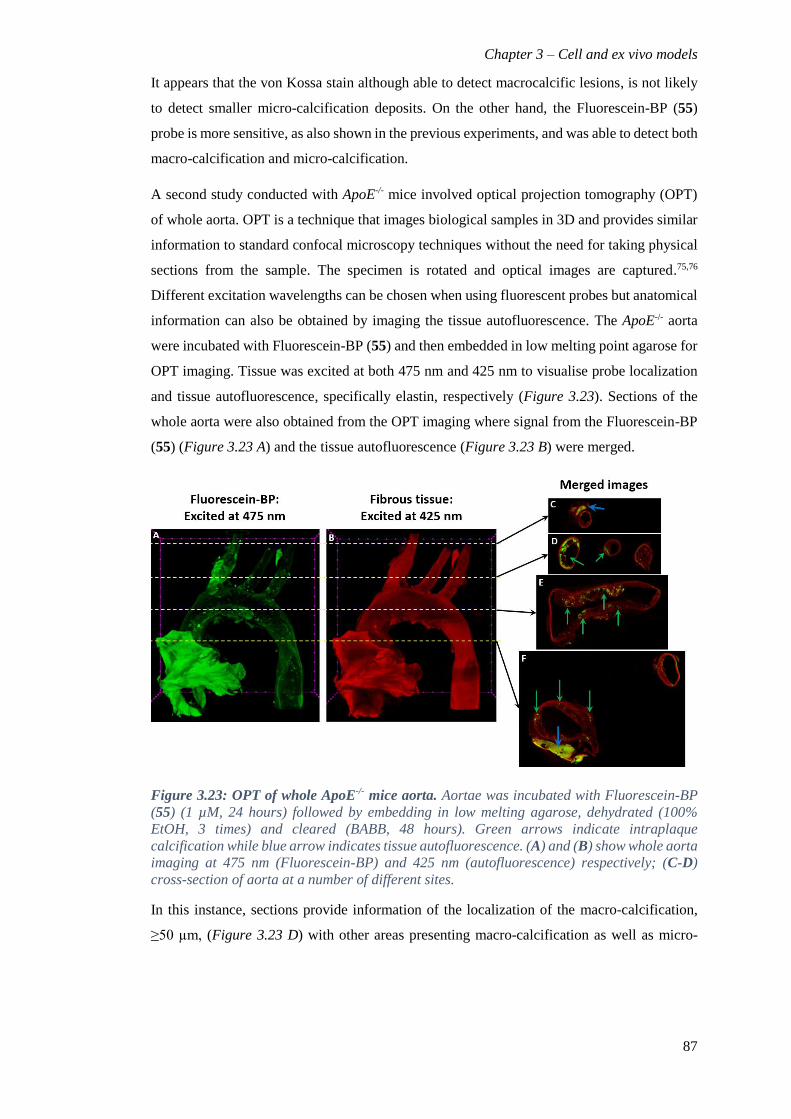
Chapter 3 – Cell and ex vivo models
87
It appears that the von Kossa stain although able to detect macrocalcific lesions, is not likely
to detect smaller micro-calcification deposits. On the other hand, the Fluorescein-BP (55)
probe is more sensitive, as also shown in the previous experiments, and was able to detect both
macro-calcification and micro-calcification.
A second study conducted with ApoE-/- mice involved optical projection tomography (OPT)
of whole aorta. OPT is a technique that images biological samples in 3D and provides similar
information to standard confocal microscopy techniques without the need for taking physical
sections from the sample. The specimen is rotated and optical images are captured.75,76
Different excitation wavelengths can be chosen when using fluorescent probes but anatomical
information can also be obtained by imaging the tissue autofluorescence. The ApoE-/- aorta
were incubated with Fluorescein-BP (55) and then embedded in low melting point agarose for
OPT imaging. Tissue was excited at both 475 nm and 425 nm to visualise probe localization
and tissue autofluorescence, specifically elastin, respectively (Figure 3.23). Sections of the
whole aorta were also obtained from the OPT imaging where signal from the Fluorescein-BP
(55) (Figure 3.23 A) and the tissue autofluorescence (Figure 3.23 B) were merged.
Figure 3.23: OPT of whole ApoE-/- mice aorta. Aortae was incubated with Fluorescein-BP
(55) (1 µM, 24 hours) followed by embedding in low melting agarose, dehydrated (100%
EtOH, 3 times) and cleared (BABB, 48 hours). Green arrows indicate intraplaque
calcification while blue arrow indicates tissue autofluorescence. (A) and (B) show whole aorta
imaging at 475 nm (Fluorescein-BP) and 425 nm (autofluorescence) respectively; (C-D)
cross-section of aorta at a number of different sites.
In this instance, sections provide information of the localization of the macro-calcification,
≥50 µm, (Figure 3.23 D) with other areas presenting macro-calcification as well as micro-
Chapter 3 – Cell and ex vivo models
88
calcification deposits (Figure 3.23 E) and other locations in the aortae that only show smaller
micro-calcification deposits (Figure 3.23 F) which would have perhaps not been identified by
conventional Alizarin S and von Kossa staining.
Conclusion
Fluorescein-BP (55) gives a dramatically enhanced signal output over more conservative
imaging methods such as Alizarin S and von Kossa stains for the detection of calcium
phosphate in a range of in vitro studies. It has been shown to be non-toxic and low µM
concentrations has been used in both condition-specific and temporal studies of calcification
in cell-based models of CVD and bone disease. In contrast to the calcium leaching assay which
is not suitable for high-throughput applications, Fluorescein-BP (55) can be applied to
experiment carried out in a 96-384 well plate which would allow for high-throughput multi-
well analysis of calcification. When applied to ex vivo WT aortic sections and ApoE-/- sections,
Fluorescein-BP (55) shows binding to intraplaque calcification. In ApoE-/- tissue, two different
scales of calcium-based deposits are visible which suggest that the Fluorescein-BP (55) probe
can detect both macro- and micro-calcification. When compared with von Kossa staining of
comparable sections, the latter is unable to detect the microcalcification suggesting that
Fluorescein-BP (55) can be used as a method for the detection of calcification in animal models
and has the potential to translate into human models. Furthermore, the employment of this
probe may enable the elucidation of key mechanisms underpinning these pathological
processes involved in CVD.
References
1 M. J. Berridge, P. Lipp and M. D. Bootman, Nat. Rev. Mol. Cell Biol., 2000, 1, 11–21.
2 R. Nair, S. Raina, T. Keshavarz and M. J. P. Kerrigan, Fungal Biol., 2011, 115, 326–
334.
3 G. Nelson, O. Kozlova-Zwinderman, A. J. Collis, M. R. Knight, J. R. S. Fincham, C.
P. Stanger, A. Renwick, J. G. M. Hessing, P. J. Punt, C. A. M. J. J. Van Den Hondel
and N. D. Read, Mol. Microbiol., 2004, 52, 1437–1450.
4 M. J. P. Kerrigan and A. C. Hall, Osteoarthr. Cartil., 2008, 16, 312–322.
5 E. A. Permyakov and R. H. Kretsinger, J. Inorg. Biochem., 2009, 103, 77–86.
6 A. F. Dulhunty, Clin. Exp. Pharmacol. Physiol., 2006, 33, 763–772.
Chapter 3 – Cell and ex vivo models
89
7 K. P. Lu and A. R. Means, Endocr. Rev., 1993, 14, 40–58.
8 S. Orrenius, B. Zhivotovsky and P. Nicotera, Nat. Rev. Mol. Cell Biol., 2003, 4, 552–
565.
9 C. Grienberger and A. Konnerth, Neuron, 2012, 73, 862–885.
10 L. B. Bailey and J. F. Gregory, J. Nutr., 1999, 129, 779–782.
11 I. Bezprozvanny, Trends Mol. Med., 2009, 15, 89–100.
12 F. T. Chebib, C. R. Sussman, X. Wang, P. C. Harris and V. E. Torres, Nat. Rev.
Nephrol., 2015, 11, 451–464.
13 S. M. Moe, Prim. Care, 2008, 35, 215–37, v–vi.
14 G. H. Wilson, J. C. Gore, T. E. Yankeelov, S. Barnes, T. E. Peterson, J. M. True, S.
Shokouhi, J. O. McIntyre, M. Sanders, V. Abramson, T.-Q. Ngyuen, A. Mahadevan-
Jansen, M. N. Tantawy and M. N. Tantawy, J. Nucl. Med., 2014, 55, 1138–43.
15 J. E. Gonzalez, R. G. Caldwell and J. Valaitis, Am. J. Surg. Pathol., 1991, 15, 586–91.
16 R. F. Cox, A. Hernandez-Santana, S. Ramdass, G. McMahon, J. H. Harmey and M. P.
Morgan, Br. J. Cancer, 2012, 106, 525–537.
17 R. D. Motrich, G. M. Castro, B. L. Caputto, H. Ferreyra, B. L. Caputto, O. A. Pucci,
G. A. Gil, J. Bruha, O. Vycital and J. Finek, PLoS One, 2013, 8, e53211.
18 R. F. Cox, A. Jenkinson, K. Pohl, F. J. O’Brien and M. P. Morgan, PLoS One, 2012, 7,
e41679.
19 A. Zaheer, M. Murshed, A. M. De Grand, T. G. Morgan, G. Karsenty and J. V
Frangioni, Arterioscler. Thromb. Vasc. Biol., 2006, 26, 1132–1136.
20 J. S. Lee, J. D. Morrisett and C.-H. Tung, Atherosclerosis, 2012, 224, 340–7.
21 J. D. Hutcheson, N. Maldonado and E. Aikawa, Curr. Opin. Lipidol., 2014, 25, 327–
32.
22 M. Sakaguchi, T. Hasegawa, S. Ehara, K. Matsumoto, K. Mizutani, T. Iguchi, H. Ishii,
M. Nakagawa, K. Shimada and M. Yoshiyama, Heart Vessels, 2016, 31, 1915–1922.
23 F. Otsuka, K. Sakakura, K. Yahagi, M. Joner and R. Virmani, Arterioscler. Thromb.
Vasc. Biol., 2014, 34, 724–736.
Chapter 3 – Cell and ex vivo models
90
24 B. Wu, X. Pei and Z.-Y. Li, ScientificWorldJournal., 2014, 2014, 417324.
25 A. Irkle, A. T. Vesey, D. Y. Lewis, J. N. Skepper, J. L. E. Bird, M. R. Dweck, F. R.
Joshi, F. A. Gallagher, E. A. Warburton, M. R. Bennett, K. M. Brindle, D. E. Newby,
J. H. Rudd and A. P. Davenport, Nat. Commun., 2015, 6, 7495.
26 J. Rungby, M. Kassem, E. F. Eriksen and G. Danscher, Histochem. J., 1993, 25, 446–
451.
27 H. Paul, A. J. Reginato and H. R. Schumacher, Arthritis Rheum., 1983, 26, 191–200.
28 H. M. Myers, Am. J. Phys. Anthropol., 1968, 29, 179–182.
29 A. Bensimon-Brito, J. Cardeira, G. Dionísio, A. Huysseune, M. L. Cancela and P. E.
Witten, BMC Dev. Biol., 2016, 16, 2.
30 D. Rigueur and K. M. Lyons, Methods Mol. Biol., 2014, 1130, 113–121.
31 C. A. Gregory, W. G. Gunn, A. Peister and D. J. Prockop, Anal. Biochem., 2004, 329,
77–84.
32 H. Puchtler, S. N. Meloan and M. S. Terry, J. Histochem. Cytochem., 1969, 17, 110–
124.
33 L. F. Bonewald, S. E. Harris, J. Rosser, M. R. Dallas, S. L. Dallas, N. P. Camacho, B.
Boyan and A. Boskey, in Calcified Tissue International, Springer-Verlag, 2003, vol.
72, pp. 537–547.
34 H. Puchtler and S. N. Meloan, Histochemistry, 1978, 56, 177–185.
35 E. Aikawa, M. Nahrendorf, J. L. Figueiredo, F. K. Swirski, T. Shtatland, R. H. Kohler,
F. A. Jaffer, M. Aikawa and R. Weissleder, Circulation, 2007, 116, 2841–2850.
36 L. M. Schäck, S. Noack, R. Winkler, G. Wißmann, P. Behrens, M. Wellmann, M.
Jagodzinski, C. Krettek and A. Hoffmann, PLoS One, 2013, 8, e65943.
37 L. V Hale, Y. F. Ma and R. F. Santerre, Calcif. Tissue Int., 2000, 67, 80–4.
38 L. Cui, N. A. Rashdan, D. Zhu, E. M. Milne, P. Ajuh, G. Milne, M. H. Helfrich, K.
Lim, S. Prasad, D. A. Lerman, A. T. Vesey, M. R. Dweck, W. S. Jenkins, D. E. Newby,
C. Farquharson and V. E. Macrae, J. Cell. Physiol., 2017, 232, 2985–2995.
39 C. Huesa, K. A. Staines, J. L. Millan and V. E. MacRae, Int J Mol Med, 2015, 36, 159–
165.
Chapter 3 – Cell and ex vivo models
91
40 N. C. W. Mackenzie, C. Huesa, F. Rutsch and V. E. MacRae, Bone, 2012, 51, 961–
968.
41 J. Stern and W. H. P. Lewis, Clin. Chim. Acta, 1957, 2, 576–580.
42 S. Jono, Y. Nishizawa, A. Shioi and H. Morii, Arterioscler. Thromb. Vasc. Biol., 1997,
17, 1135–42.
43 J. Furry, 1985.
44 H. Diehl and J. L. Ellingboe, Anal. Chem., 1956, 28, 882.
45 J. R. Chen, Y. H. Lai, J. J. Tsai and C. Der Hsiao, Molecules, 2017, 22, 2068.
46 M. Garland, J. J. Yim and M. Bogyo, Cell Chem. Biol., 2016, 23, 122–136.
47 D. Vonwil, J. Christensen, S. Fischer, O. Ronneberger and V. P. Shastri, Mol. Imaging
Biol., 2014, 16, 350–61.
48 K. M. Harmatys, E. L. Cole and B. D. Smith, Mol. Pharm., 2013, 10, 4263–71.
49 H. G. Tsang, N. A. Rashdan, C. B. A. Whitelaw, B. M. Corcoran, K. M. Summers and
V. E. MacRae, Cell Biochem. Funct., 2016, 34, 113–132.
50 MacRae, Int. J. Mol. Med., 2011, 27, 663–8.
51 T. Afroze, L. L. Yang, C. Wang, R. Gros, W. Kalair, A. N. Hoque, I. N. Mungrue, Z.
Zhu and M. Husain, AJP Cell Physiol., 2003, 285, C88–C95.
52 T. Akiyoshi, H. Ota, K. Iijima, B. K. Son, T. Kahyo, M. Setou, S. Ogawa, Y. Ouchi
and M. Akishita, Atherosclerosis, 2016, 244, 51–58.
53 K. A. Lomashvili, S. Cobbs, R. A. Hennigar, K. I. Hardcastle and W. C. O’Neill, J.
Am. Soc. Nephrol., 2004, 15, 1392–1401.
54 G. S. Getz, C. A. Reardon, G. S. Getz and C. A. Reardon, Arterioscler. Thromb. Vasc.
Biol., 2012, 32, 1104–1115.
55 G. Lo Sasso, W. K. Schlage, S. Boué, E. Veljkovic, M. C. Peitsch and J. Hoeng, J.
Transl. Med., 2016, 14, 146.
56 S. Gargiulo, M. Gramanzini and M. Mancini, Int. J. Mol. Sci., 2016, 17.
57 K. S. Meir and E. Leitersdorf, Arterioscler. Thromb. Vasc. Biol., 2004, 24, 1006–1014.
58 J. Jawien, Curr. Pharm. Biotechnol., 2012, 13, 2435–2439.
Chapter 3 – Cell and ex vivo models
92
59 Y. T. Lee, H. Y. Lin, Y. W. F. Chan, K. H. C. Li, O. T. L. To, B. P. Yan, T. Liu, G. Li,
W. T. Wong, W. Keung and G. Tse, Lipids Health Dis., 2017, 16, 12.
60 Y. Ma, C. C. Malbon, D. L. Williams and F. E. Thorngate, PLoS One, 2008, 3, e2503.
61 R. Wallin, N. Wajih, G. Todd Greenwood and D. C. Sane, Med. Res. Rev., 2001, 21,
274–301.
62 R. Villa-Bellosta and W. C. O’Neill, Kidney Int., 2018, 0.
63 S. N. Rampersad, Sensors (Switzerland), 2012, 12, 12347–12360.
64 A. N. Kapustin, J. D. Davies, J. L. Reynolds, R. McNair, G. T. Jones, A. Sidibe, L. J.
Schurgers, J. N. Skepper, D. Proudfoot, M. Mayr and C. M. Shanahan, Circ. Res., 2011,
109, e1-12.
65 M. Murshed and M. D. McKee, Curr. Opin. Nephrol. Hypertens., 2010, 19, 359–365.
66 M. Abedin, Y. Tintut and L. L. Demer, Arterioscler. Thromb. Vasc. Biol., 2004, 24,
1161–1170.
67 D. Zhu, N. C. W. Mackenzie, J. L. Millan, C. Farquharson and V. E. Macrae, J. Mol.
Endocrinol., 2014, 52, 77–85.
68 L. Cui, D. A. Houston, C. Farquharson and V. E. MacRae, Bone, 2016, 87, 147–158.
69 D. Zhu, P. W. F. Hadoke, J. Wu, A. T. Vesey, D. A. Lerman, M. R. Dweck, D. E.
Newby, L. B. Smith and V. E. MacRae, Sci. Rep., 2016, 6, 24807.
70 Y.-K. Lee, J. Song, S.-B. Lee, K.-M. Kim, S.-H. Choi, C.-K. Kim, R. Z. LeGeros and
K.-N. Kim, J. Biomed. Mater. Res., 2004, 69A, 188–195.
71 K. Hiura, K. Sumitani, T. Kawata, K. Higashino, M. Okawa, T. Sato, Y. Hakeda and
M. Kumegawa, Endocrinology, 1991, 128, 1630–1637.
72 S. C. Verberckmoes, V. Persy, G. J. Behets, E. Neven, A. Hufkens, H. Zebger-Gong,
D. Müller, D. Haffner, U. Querfeld, S. Bohic, M. E. De Broe and P. C. D’Haese, Kidney
Int., 2007, 71, 298–303.
73 R. I. Grant, D. A. Hartmann, R. G. Underly, A. A. Berthiaume, N. R. Bhat and A. Y.
Shih, J. Cereb. Blood Flow Metab., 2017.
74 J. Hu, C. Xie, H. Ma, B. Yang, P. X. Ma and Y. E. Chen, PLoS One, 2012, 7, e35580.

Chapter 3 – Cell and ex vivo models
93
75 S. R. Arridge, Inverse Probl., 1999, 15, R41–R93.
76 J. Sharpe, Rev. Lit. Arts Am., 2004, 6, 209–228.

Chapter 4- Human Tissue and Potential Biomarkers for Plaque Vulnerability
94
Chapter 4- Human Tissue and Potential
Biomarkers for Plaque Vulnerability
Carotid and coronary plaques
Atherosclerotic cardiovascular disease accounts for the vast majority of deaths worldwide.
Despite decades of investment in delivering effective medical therapy, the prevalence of
atherosclerotic cardiovascular disease continues to increase. Carotid plaques are found in
vessels in the neck that supply oxygen to the brain while coronary plaques are located on
vessels on the surface of the heart that supply blood to the heart.
Even though they have different characteristics (Table 4.1); carotid plaques have a thicker
fibrous cap, higher chance of plaque haemorrhage, lower erosion rate and higher percentage
of calcified nodules, recent evidence suggests that the pathophysiology is broadly similar in
the two vascular beds with similar risk factors and stages of plaque development.1–5 Indeed, a
strong connection between the extent of coronary atherosclerosis and the progression of
carotid atherosclerosis, as well the stabilizing effect that calcium deposits have on both carotid
and coronary arteries has been reported.6,7

Chapter 4- Human Tissue and Potential Biomarkers for Plaque Vulnerability
95
Table 4.1: Differences between coronary and carotid artery disease.
Rodent vs human models
Animal models, especially rodents have been used to investigate the pathology of
cardiovascular diseases, however, studying atherosclerosis using rodent models has several
limitations. One of the most prominent restrictions is in contrast to human plaques, rodents
plaques do not rupture and therefore do not reflect plaque instability very well. Another
difference between human and rodent models is that differently from human, rodents receive
a high cholesterol diet increasing their level of cholesterol in the serum, this is not normally
seen in patients with atherosclerotic plaques.12–18 Other differences arise in the immune system
and gene expression where T cells and monocyte markers are fairly different between the two
species.13,14,19 Another major limitation is the location of the plaque within the species, in
rodent models plaques occur mainly in the carotid artery and are not normally seen in the
coronary arteries.12,15,20 Due to these key differences between rodent and human models, it is
crucial that human plaque tissue is analysed and assessed in order to understand disease
progression, pathogenesis and prevention, in parallel to animal studies.
Coronary artery disease Carotid artery disease
Risk factors Hypertension, smoking, diabetes, hypercholesterolemia
Smoking, hypertension, hypercholesterolemia
Age of formation <40 years Men >40 years Women post-menopause
Shear stress Complex effect on arteries because of anatomical differences i.e. curvature, flow
Mainly in the carotid bifurcation area
Symptomatic mechanism of the disease
Acute thrombosis Acute thrombosis, stroke
Severe angiographic stenosis
Results in myocardial infarction Frequently results in stroke
Small plaques Often symptomatic, lipid rich Rarely symptomatic, intimal hyperplasia
Large occluding plaques
Fibrotic, stable Ulcerated, lipid rich, unstable
Thrombus Main cause of occlusion Rare cause of occlusion, usually small intramural thrombi
Plaque ulceration Thrombus related, acute event Chronic, small microemboli on the surface, rarely acute event
Calcification In 5-10% In 50-60%
Chapter 4- Human Tissue and Potential Biomarkers for Plaque Vulnerability
96
Early detection of calcification, PET and Fluorescein-BP
Calcification is a key feature of coronary atherosclerotic plaques and, in particular, the burden
of calcification correlates with the future risk of cardiovascular events. Large population
studies, such as the MESA study,8 have highlighted an inverse correlation with coronary artery
calcium density with low density calcium conferring the highest risk of cardiovascular events.9
As such, there is increasing interest in identifying markers of early micro-calcification that
may better improve risk stratification and downstream management of patients with
cardiovascular disease.10 Early coronary calcification can be detected with positron emission
tomography using the radiotracer Na18F.11 However PET has limited spatial resolution and
cannot be used in conjunction with existing invasive imaging techniques. Developing
alternatives techniques to identify micro-calcification with improved spatial resolution and
potential translation in to the cardiac catheterisation laboratory is an important research goal
with the potential to improve cardiovascular risk prediction.
A fluorescent dye, Fluorescein-BP (55), has been developed to detect HAP. Both probe
components, alendronate (26) and Fluorescein (54) are FDA approved and this therefore
makes the Fluorescein-BP (55) probe particularly attractive for human translation as a method
for the detection of vascular calcification.
Fluorescence spectroscopy can provide higher spatial resolution than PET and therefore is able
to afford better anatomical information on the plaque and its stability. Moreover the
fluorescent signal can potential be detected with modern invasive coronary catheters. Building
on cell and ex vivo mouse models (Chapter 3) which have provided exciting and promising
results, the translation of the Fluorescein-BP probe(55) to detect HAP in human vascular tissue
is essential.
Selectivity of Na18F PET tracer
In Chapter 2, the ability of Fluorescein-BP (55) to bind to specific calcium compounds was
determined. Fluorescein-BP (55) exhibited high specificity towards HAP in comparison to
other calcium compounds (CaOx, CaPi and CaPyr) analysed as well as greater selectivity in
comparison to the Alizarin S stain. The selectivity of the Na18F tracer for HAP, CaPi, CaOx
and CaPyr was quantified and compared with the discrimination of Fluorescein-BP. Calcium
minerals (HAP, CaOx, CaPi and CaPyr) were incubated in Na18F for 20 minutes after which
unbound tracer was removed by a series of centrifugation steps and the solid particles were
subsequently imaged using PET/CT. Similarly to Fluorescein-BP (55), Na18F shows no
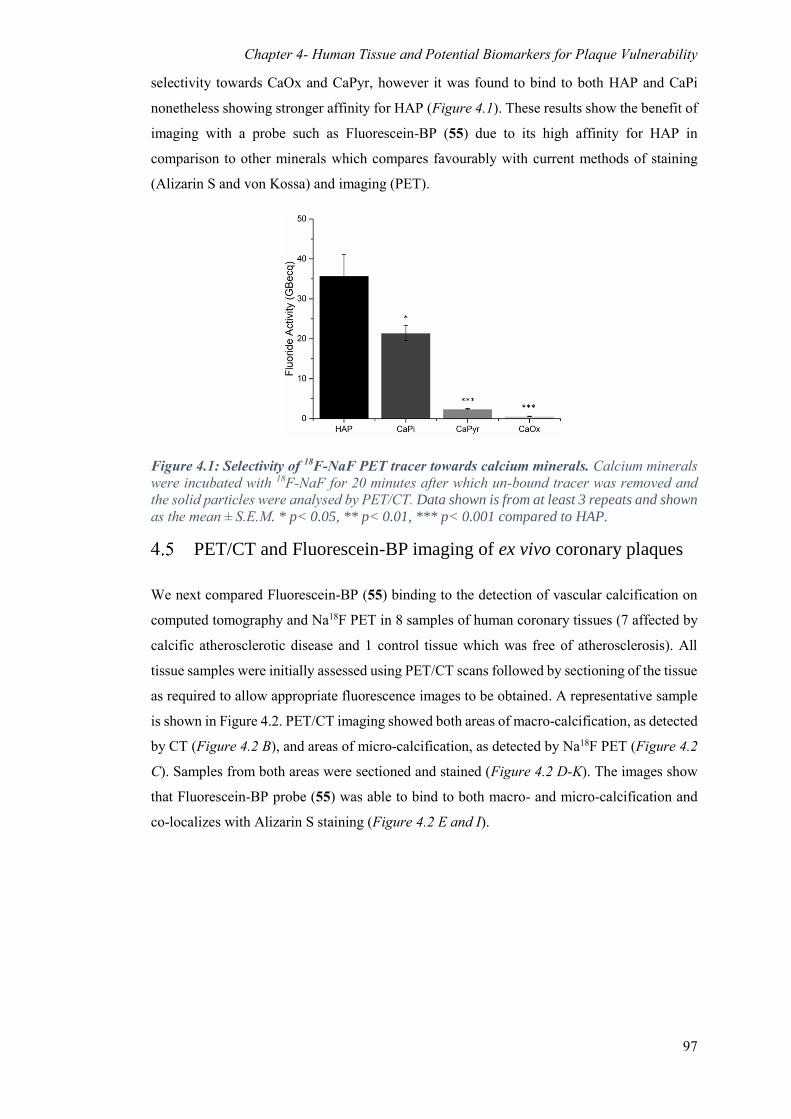
Chapter 4- Human Tissue and Potential Biomarkers for Plaque Vulnerability
97
selectivity towards CaOx and CaPyr, however it was found to bind to both HAP and CaPi
nonetheless showing stronger affinity for HAP (Figure 4.1). These results show the benefit of
imaging with a probe such as Fluorescein-BP (55) due to its high affinity for HAP in
comparison to other minerals which compares favourably with current methods of staining
(Alizarin S and von Kossa) and imaging (PET).
Figure 4.1: Selectivity of 18F-NaF PET tracer towards calcium minerals. Calcium minerals
were incubated with 18F-NaF for 20 minutes after which un-bound tracer was removed and
the solid particles were analysed by PET/CT. Data shown is from at least 3 repeats and shown
as the mean ± S.E.M. * p< 0.05, ** p< 0.01, *** p< 0.001 compared to HAP.
PET/CT and Fluorescein-BP imaging of ex vivo coronary plaques
We next compared Fluorescein-BP (55) binding to the detection of vascular calcification on
computed tomography and Na18F PET in 8 samples of human coronary tissues (7 affected by
calcific atherosclerotic disease and 1 control tissue which was free of atherosclerosis). All
tissue samples were initially assessed using PET/CT scans followed by sectioning of the tissue
as required to allow appropriate fluorescence images to be obtained. A representative sample
is shown in Figure 4.2. PET/CT imaging showed both areas of macro-calcification, as detected
by CT (Figure 4.2 B), and areas of micro-calcification, as detected by Na18F PET (Figure 4.2
C). Samples from both areas were sectioned and stained (Figure 4.2 D-K). The images show
that Fluorescein-BP probe (55) was able to bind to both macro- and micro-calcification and
co-localizes with Alizarin S staining (Figure 4.2 E and I).
Chapter 4- Human Tissue and Potential Biomarkers for Plaque Vulnerability
98
Figure 4.2: Imaging of calcified coronary tissue. (A) Volume rendered image; (B) CT image;
(C) PET image, with Na18F tracer, of vascular tissue. Yellow and purple boxes indicate the
areas selected for tissue sectioning where brightfield and fluorescence images of calcification
were taken. (D, E, F, G) Brightfield and fluorescence (Alizarin S, Fluorescein-BP, DAPI)
images of tissue in area in the yellow box presenting area of high CT activity. (H, I, J, K)
Brightfield and Fluorescence (Alizarin S, Fluorescein-BP, DAPI) images of tissue in area in
the purple box presenting area of high PET activity. Sections were incubated with Fluorescein-
BP (1 μM, 2 hours), Alizarin S (2%, 10 minutes) and DAPI (500 nM, 5 minutes) and
subsequently imaged. Scale bars = 0.2 cm for brightfield and 100 µm for fluorescence.
The control tissue sample (Figure 4.3), where there was no evidence of atheroma, displaced
neither increased PET/CT activity (Figure 4.3 B) signal nor fluorescence staining (Figure 4.3
C-F).

Chapter 4- Human Tissue and Potential Biomarkers for Plaque Vulnerability
99
Figure 4.3: Imaging of coronary tissue without atheromatous plaque. (A) Volume rendered
image; (B) PET image, with Na18F tracer, of vascular tissue. Orange box indicates the area
selected for tissue sectioning where Brightfield and Fluorescence images of calcification were
taken. (C, D, E, F). Sections were incubated with Fluorescein-BP (1 μM, 2 hours), Alizarin S
(2%, 10 minutes) and DAPI (500 nM, 5 minutes) and subsequently imaged. Scale bars = 0.2
cm for brightfield and 100 µm for fluorescence.
Fluorescein-BP imaging of ex vivo carotid plaques
Fluorescein-BP (55) imaging studies were repeated with ex vivo carotid plaque tissues from
patients that were admitted for a carotid endarterectomy following a recent stroke or transient
ischaemic attack. The samples were embedded, sectioned and stained using both Alizarin S
and Fluorescein-BP (55). A representative sample was selected and stained using both Alizarin
S (Figure 4.4 A and C) and Fluorescein-BP (55) (Figure 4.4 B and D). These results once
more show the ability of Fluorescein-BP (55) to stain areas of plaque calcification that co-
localised with the Alizarin S stain. Indeed Fluorescein-BP staining was observed in both areas
Chapter 4- Human Tissue and Potential Biomarkers for Plaque Vulnerability
100
of macro- (Figure 4.4 A and B), and micro-calcification (Figure 4.4 C and D) confirming the
observations in the rodent models reported in Chapter 3 and in the coronary samples.
Figure 4.4: Determination of calcification in human carotid tissue. (A, C) Alizarin S staining
of carotid tissue. Green boxes indicate the areas where Fluorescence images of calcification
were taken. (B, D) Fluorescence (Fluorescein-BP, DAPI) images of tissue. Sections were
incubated with Fluorescein-BP (1 μM, 2 hours) and DAPI (500 nM, 5 minutes) and
subsequently imaged. Scale bars = 0.2 cm for brightfield and 100 µm for fluorescence.
The coronary and carotid samples provide sections with both macro and micro calcification,
in stable and unstable plaques, all of which can be detected using Fluorescein-BP (55) showing
the reproducibility of the probe on different types of calcified samples. Another advantage of
the Fluorescein-BP (55) probe is the lack of background staining which could lead to false
positives. By contrast the control sample which was free from atheromatous plaque and
calcification did not demonstrate any staining while areas with micro and macro deposits
fluoresced. Although this might be the case when using Alizarin S on sections that are highly
calcified, when staining sections with micro-calcification, often the stain appears very weak
and not visible under the microscope.
Comparison of PET and Alizarin S with the upregulation of
osteogenic markers
Recently, Osteopontin (OPG) and Osteoprotegerin (OPN) have been reported to detect early
stage calcification in blood plasma. OPN and OPG (Figure 4.5) are two of the many bone
regulatory proteins that have been shown to be present in atherosclerotic plaques in vitro and
seem to be expressed by vascular cells in vivo.21–23
Chapter 4- Human Tissue and Potential Biomarkers for Plaque Vulnerability
101
OPG is a cytokine of the tumour necrosis factor receptor and acts as an inhibitor of the
RANKL-RANK interaction.22,24,25 By doing so it prevents the proliferation and differentiation
of osteoclast and leads to bone resorption.22,24,26–28 OPG deletion results in a significant
increase in aortic medial calcification which suggests the protective role of OPG against
atherosclerotic calcification.25,27,29 Recent studies showed that plasma levels of OPG were
increasingly high in patients with acute coronary syndrome in comparison to those with stable
angina or normal arteries; as a result, OPG may be a marker of onset atherosclerosis and plaque
stability.22,24,26,27
Figure 4.5: Role of OPG and OPN on VSMCs.
OPN is a multifunctional glycoprotein which is implicated in a range of acute and chronic
inflammatory processes and has been shown to act as an inhibitor of calcification.25,26,30,31
Recent studies have suggested that OPN antagonizes the macrophage mediated pathologic
mineralization process by inhibiting osteoclast formation and increasing the expression of
macrophage-derived inflammatory molecules.31 Recent studies have shown that the OPN
protein is upregulated in atherosclerotic plaques and is higher in patients with cardiovascular
disease than in the ones without, especially in lesions with active calcification where it
increases with increase of disease severity.24,26,31
Both OPG and OPN have been shown to have the potential to be used as early stage detection
of unstable plaques, however, no reports are available in the literature showing the correlation
between these biomarkers and Na18F PET activity. Here, tissues that exhibit Na18F PET
activity as well as no activity (Figure 4.6), were analysed for OPG and OPN and linked to
Alizarin S images. Na18F/CT analysis was categorised into tissue with Na18F signal
present/absent and/or increased CT attenuation (>1000 CT units) present/absent. Examples of
the range of Na18F activity are shown in Figure 4.6 where samples display no Na18F/CT
activity PET-CT- (Figure 4.6 A), high PET activity with little or no CT signal PET+CT-
(Figure 4.6 B, C – two different samples) and a sample with high CT signal and Na18F signal
PET+CT+ (Figure 4.6 D).

Chapter 4- Human Tissue and Potential Biomarkers for Plaque Vulnerability
102
Figure 4.6: PET/CT images of coronary tissue. Negative control sample not displaying any
type of calcification PET-CT- (A), 2 calcified samples displaying high level of Na18F PET
tracer uptake PET+CT- (B, C) and positive control sample displaying high CT signal
PET+CT+ (D).
While the intensity of Na18F activity did not correlate with fluorescence signal obtained from
the Fluorescein-BP (55) probe, macroscopic calcium deposits had a higher fluorescent signal
(Figure 4.2 F and Figure 4.4 B) in comparison with microscopic deposits (Figure 4.2 J and
Figure 4.4 D). OPG and OPN were only present in areas of with Na18F signal.
All tissue samples were initially assessed using PET/CT scans (Figure 4.6) followed by
sectioning of the tissue as required to allow appropriate sections to be taken and subsequently
analysed by immunohistochemistry (IHC). IHC revealed that, uncalcified tissue (Figure 4.7
A, E, I), PET-CT-, does not stain for Alizarin S, which was expected, and neither OPG and
OPN staining was visible. When looking at a PET+CT+ sample (Figure 4.6 D and Figure 4.7
D, H, L), Alizarin S staining was present around the arterial wall indicating the presence of
calcification, however, when OPG and OPN staining was carried out no staining was visible.
This supports previous findings on the lack of OPG and OPN expression in the blood of
patients with normal arteries or stable angina.24,30 However, when analysing two PET+CT-
samples (Figure 4.6 B and C and Figure 4.7 B, C, F, G, J, K) these show higher levels of OPG
and OPN in comparison to the controls confirming that these two proteins are highly expressed
in unstable coronary arteries. On closer inspection, OPG and OPN localized in different
locations within the PET active samples. While OPN signal was found in regions of high Na18F
activity, OPG expression was evident in the peripheral margin surrounding the micro-
calcification.

Chapter 4- Human Tissue and Potential Biomarkers for Plaque Vulnerability
103
Figure 4.7: Alizarin S staining, OPG and OPN immunohistochemistry of coronary tissue.
(A, E, I) control sample PET-CT-, non-calcified; (B, F, J) PET active sample 1, showing
active/unstable calcification; (C, G, K) 2 PET+CT- samples, showing active/unstable
calcification; (D, H, L) PET+CT+, showing inactive/stable calcification. (A, B, C, D) Alizarin
S staining of coronary tissue. (E, F, G, H) OPG IHC, (I, J, K, L) OPN IHC. IHC analysis
performed with Vectastain ABC kit (mouse IgG) where all antibodies were anti-human mouse
clones (I:100 dilution). All IHC were counterstained with H&E. Scale bars = 0.2 cm. IGG
controls shown in Appendix 3.
Comparison of Alizarin S with the upregulation of osteogenic
markers
OPG and OPN IHC on carotid specimens was carried out to determine whether the staining
pattern was similar to that observed in coronary tissue. In these samples Alizarin S and OPN
appear to co localize in most areas (Figure 4.8 A, B, E, F) while OPG staining is focussed in
the surrounding areas (Figure 4.8 A, B, E, F), suggesting that OPG might play a protective
Chapter 4- Human Tissue and Potential Biomarkers for Plaque Vulnerability
104
role in vascular calcification. This theory is supported by animal studies whereby a positive
association between OPG levels in serum and clinical cardiovascular disease severity has been
demonstrated.29,32
Figure 4.8: Alizarin S staining, OPG and OPN immunohistochemistry of carotid tissues.
(A, B) Alizarin S staining of carotid tissue. (C, D) OPG IHC, (E, F) OPN IHC. IHC analysis
performed with Vectastain ABC kit (mouse IgG) where all antibodies were anti-human mouse
clones (1:100 dilution). All IHC were counterstained with H&E. Scale bars = 0.2 cm. IGG
controls shown in Appendix 3.
Comparison of Fluorescein-BP, OPG and OPN on coronary plaques
From data shown in Figure 4.2 and Figure 4.4 it is evident that Fluorescein-BP (55) can be
used to detect both macro- and micro-calcification without discriminating between the disease
activity. In fact, in contrast to the Na18F PET signal, the Fluorescein-BP probe (55) shows a
stronger signal when binding to samples with macro-calcification in comparison to micro-
calcification. However, this does not imply that the probe is not able to detect submicron
calcification deposits as when analysing these samples a fluorescent signal is obvious. On the
other hand, from data shown in Figure 4.7 and Figure 4.8 it is apparent that OPG and OPN are
biomarkers for active disease and localize in areas with high Na18F PET signal. These sets of
data raise an important clinical question; does Fluorescein-BP (55) co-localize in the same
regions as OPG and OPN staining? To answer this question, tissue sequential sections that
were previously analysed for Fluorescein-BP (55) staining, were treated for OPG and OPN
IHC and were examined side by side (Figure 4.9). It is apparent that, Fluorescein-BP (55)
OPG and OPN co-localize in the same area. OPG shows a very faint stain around the
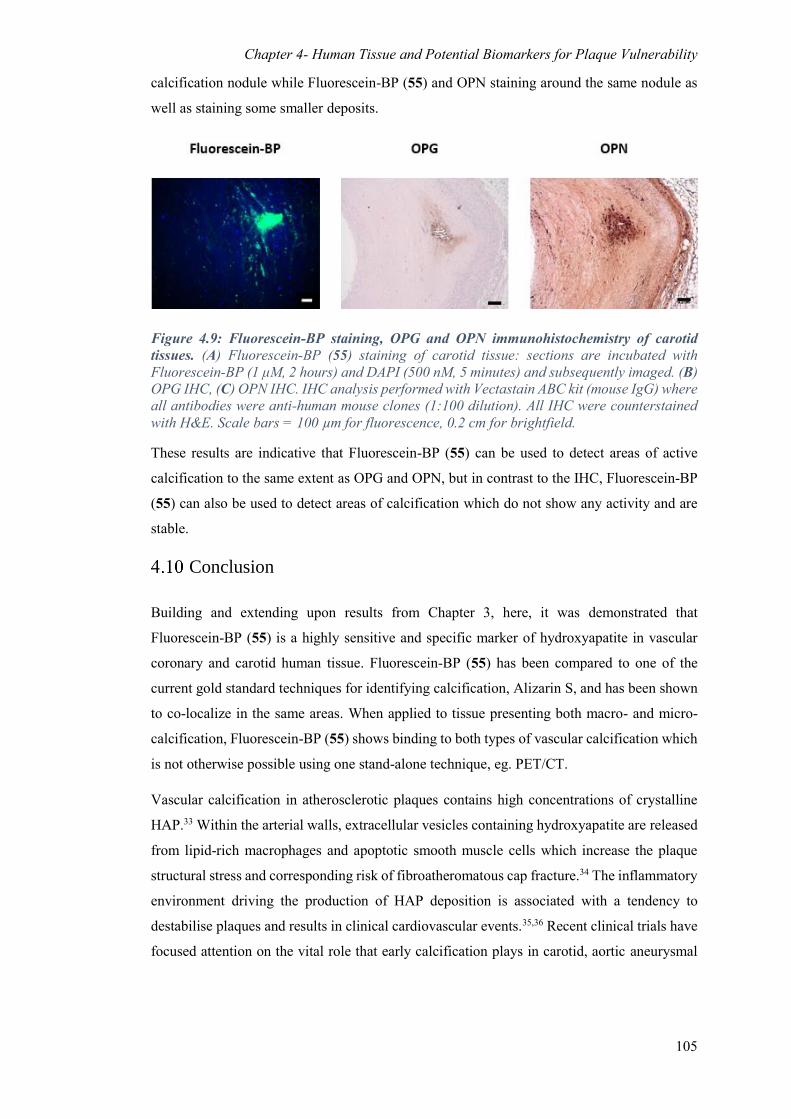
Chapter 4- Human Tissue and Potential Biomarkers for Plaque Vulnerability
105
calcification nodule while Fluorescein-BP (55) and OPN staining around the same nodule as
well as staining some smaller deposits.
Figure 4.9: Fluorescein-BP staining, OPG and OPN immunohistochemistry of carotid
tissues. (A) Fluorescein-BP (55) staining of carotid tissue: sections are incubated with
Fluorescein-BP (1 μM, 2 hours) and DAPI (500 nM, 5 minutes) and subsequently imaged. (B)
OPG IHC, (C) OPN IHC. IHC analysis performed with Vectastain ABC kit (mouse IgG) where
all antibodies were anti-human mouse clones (1:100 dilution). All IHC were counterstained
with H&E. Scale bars = 100 µm for fluorescence, 0.2 cm for brightfield.
These results are indicative that Fluorescein-BP (55) can be used to detect areas of active
calcification to the same extent as OPG and OPN, but in contrast to the IHC, Fluorescein-BP
(55) can also be used to detect areas of calcification which do not show any activity and are
stable.
Conclusion
Building and extending upon results from Chapter 3, here, it was demonstrated that
Fluorescein-BP (55) is a highly sensitive and specific marker of hydroxyapatite in vascular
coronary and carotid human tissue. Fluorescein-BP (55) has been compared to one of the
current gold standard techniques for identifying calcification, Alizarin S, and has been shown
to co-localize in the same areas. When applied to tissue presenting both macro- and micro-
calcification, Fluorescein-BP (55) shows binding to both types of vascular calcification which
is not otherwise possible using one stand-alone technique, eg. PET/CT.
Vascular calcification in atherosclerotic plaques contains high concentrations of crystalline
HAP.33 Within the arterial walls, extracellular vesicles containing hydroxyapatite are released
from lipid-rich macrophages and apoptotic smooth muscle cells which increase the plaque
structural stress and corresponding risk of fibroatheromatous cap fracture.34 The inflammatory
environment driving the production of HAP deposition is associated with a tendency to
destabilise plaques and results in clinical cardiovascular events.35,36 Recent clinical trials have
focused attention on the vital role that early calcification plays in carotid, aortic aneurysmal
Chapter 4- Human Tissue and Potential Biomarkers for Plaque Vulnerability
106
and coronary artery disease and hence there is a clinical imperative to better understand the
mechanisms governing early calcification in the vascular wall.35–37 The ability to differentiate
calcium derivatives in regions of calcification, specifically by detecting hydroxyapatite, will
facilitate the division of unstable and stable cardiovascular phenotypes in future clinical trials.
Moreover, OPG and OPN could also be used as biomarkers for unstable cardiovascular
phenotypes as they have been shown to be present in increasing concentrations in tissue
showing micro-calcification in comparison to sections which are atherosclerotic free or have
stable macro-calcification which do not stain for either protein. However, limited data is
available showing: 1) the relationship between OPG and calcification; as well as 2) the
relationship between PET-active vascular tissue, OPG and OPN. These studies are only the
beginning of understanding the mechanism behind the role of OPG in protecting and inhibiting
vascular calcification suggesting that more data is required before any valid explanation could
be presented.
Comparing Fluorescein-BP (55) with OPG and OPN IHCs reveals that all three can be used
to detect areas of active calcification to the same degree; however in contrast to the IHC,
Fluorescein-BP (55) also detects stable calcific lesions. This notably aids the field of
cardiovascular research as up to now, a range of imaging tools are required to visualise both
macro- and micro-calcification, however, the application of Fluorescein-BP (55) allows for
only one technique to be used, which can elucidate calcific structures and differentiate between
the different sizes of the calcification. This could allow for a more accurate definition of the
cut-off point for macro and micro-calcification compared to that provided by both PET and
CT.
References
1 F. Sigala, E. Oikonomou, A. S. Antonopoulos, G. Galyfos and D. Tousoulis, Curr.
Opin. Pharmacol., 2018, 39, 9–18.
2 M. Slevin, Q. Wang, M. A. Font, A. Luque, O. Juan-Babot, J. Gaffney, P. Kumar, S.
Kumar, L. Badimon and J. Krupinski, Pathobiology, 2008, 75, 209–25.
3 M. Kanadaşi, M. Çayli, M. Şan, K. Aikimbaev, C. C. Alhan, M. Demir and M.
Demirtaş, Angiology, 2006, 57, 585–592.
4 L. Saba, C. Yuan, T. S. Hatsukami, N. Balu, Y. Qiao, J. K. DeMarco, T. Saam, A. R.
Moody, D. Li, C. C. Matouk, M. H. Johnson, H. R. Jäger, M. Mossa-Basha, M. E.
Kooi, Z. Fan, D. Saloner, M. Wintermark, D. J. Mikulis and B. A. Wasserman, Am. J.
Chapter 4- Human Tissue and Potential Biomarkers for Plaque Vulnerability
107
Neuroradiol., 2018, 39, E9–E31.
5 J. F. Polak, R. Tracy, A. Harrington, A. E. H. Zavodni and D. H. O’Leary, J. Am. Soc.
Echocardiogr., 2013, 26, 548–555.
6 J. C. Grotta, F. M. Yatsu, L. C. Pettigrew, H. Rhoades, P. Bratina, D. Vital, R. Alam,
R. Earls and C. Picone, Neurology, 1989, 39, 1325–1331.
7 K. R. Nandalur, A. D. Hardie, P. Raghavan, M. J. Schipper, E. Baskurt and C. M.
Kramer, Stroke, 2007, 38, 935–40.
8 D. E. Bild, D. A. Bluemke, G. L. Burke, R. Detrano, A. V. Diez Roux, A. R. Folsom,
P. Greenland, D. R. Jacobs, R. Kronmal, K. Liu, J. C. Nelson, D. O’Leary, M. F. Saad,
S. Shea, M. Szklo and R. P. Tracy, Am. J. Epidemiol., 2002, 156, 871–881.
9 M. H. Criqui, J. B. Knox, J. O. Denenberg, N. I. Forbang, R. L. McClelland, T. E.
Novotny, V. Sandfort, J. Waalen, M. J. Blaha and M. A. Allison, JACC Cardiovasc.
Imaging, 2017, 10, 845–854.
10 J. M. Tarkin, F. R. Joshi, N. K. Rajani and J. H. Rudd, Future Cardiol., 2015, 11, 115–
131.
11 M. R. Dweck, N. A. Boon and D. E. Newby, J. Am. Coll. Cardiol., 2012, 60, 1854–
1863.
12 M. von Scheidt, Y. Zhao, Z. Kurt, C. Pan, L. Zeng, X. Yang, H. Schunkert and A. J.
Lusis, Cell Metab., 2017, 25, 248–261.
13 C. Erbel, D. Okuyucu, M. Akhavanpoor, L. Zhao, S. Wangler, M. Hakimi, A. Doesch,
T. J. Dengler, H. A. Katus and C. A. Gleissner, J. Vis. Exp., 2014, 1–6.
14 J. F. Bentzon and E. Falk, Curr. Opin. Lipidol., 2010, 21, 434–440.
15 Y. T. Lee, H. Y. Lin, Y. W. F. Chan, K. H. C. Li, O. T. L. To, B. P. Yan, T. Liu, G. Li,
W. T. Wong, W. Keung and G. Tse, Lipids Health Dis., 2017, 16, 12.
16 T. Hampton, Circulation, 2017, 135, 1757–1758.
17 B. Emini Veseli, P. Perrotta, G. R. A. De Meyer, L. Roth, C. Van der Donckt, W.
Martinet and G. R. Y. De Meyer, Eur. J. Pharmacol., 2017, 816, 3–13.
18 C. O’Rourke, G. Shelton, J. D. Hutcheson, M. F. Burke, T. Martyn, T. E. Thayer, H.
R. Shakartzi, M. D. Buswell, R. E. Tainsh, B. Yu, A. Bagchi, D. K. Rhee, C. Wu, M.

Chapter 4- Human Tissue and Potential Biomarkers for Plaque Vulnerability
108
Derwall, E. S. Buys, P. B. Yu, K. D. Bloch, E. Aikawa, D. B. Bloch and R. Malhotra,
J. Vis. Exp., 2016, e54017–e54017.
19 Y. V Bobryshev, E. A. Ivanova, D. A. Chistiakov, N. G. Nikiforov and A. N. Orekhov,
Biomed Res. Int., 2016, 2016, 9582430.
20 Y. C. Chen and K. Peter, Atherosclerosis, 2015, 241, 595–596.
21 O. Phan, O. Ivanovski, I. G. Nikolov, N. Joki, J. Maizel, L. Louvet, M. Chasseraud, T.
Nguyen-Khoa, B. Lacour, T. B. Drüeke and Z. A. Massy, Nephrol. Dial. Transplant.,
2008, 23, 82–90.
22 B. Znorko, E. Oksztulska-Kolanek, M. Michałowska, T. Kamiński and K. Pawlak, Adv.
Med. Sci., 2017, 62, 52–64.
23 Y. Nitschke, G. Weissen-Plenz, R. Terkeltaub and F. Rutsch, J. Cell. Mol. Med., 2011,
15, 2273–2283.
24 S. M. Venuraju, A. Yerramasu, R. Corder and A. Lahiri, J. Am. Coll. Cardiol., 2010,
55, 2049–2061.
25 O. Gungor, I. Kocyigit, M. I. Yilmaz and S. Sezer, Semin. Dial., 2018, 31, 72–81.
26 M. Abedin, Y. Tintut and L. L. Demer, Arterioscler. Thromb. Vasc. Biol., 2004, 24,
1161–1170.
27 C. Pérez De Ciriza, A. Lawrie and N. Varo, Int. J. Endocrinol., 2015, 2015, 564934.
28 K. A. Lomashvili, S. Cobbs, R. A. Hennigar, K. I. Hardcastle and W. C. O’Neill, J.
Am. Soc. Nephrol., 2004, 15, 1392–1401.
29 A. Van Campenhout and J. Golledge, Atherosclerosis, 2009, 204, 321–329.
30 M. Bjerre, S. H. Pedersen, R. Møgelvang, S. Lindberg, J. S. Jensen, S. Galatius and A.
Flyvbjerg, Eur. J. Prev. Cardiol., 2013, 20, 922–929.
31 Q. Ge, C.-C. Ruan, Y. Ma, X.-F. Tang, Q.-H. Wu, J.-G. Wang, D.-L. Zhu and P.-J.
Gao, Sci. Rep., 2017, 7, 40253.
32 S. Morony, Y. Tintut, Z. Zhang, R. C. Cattley, G. Van, D. Dwyer, M. Stolina, P. J.
Kostenuik and L. L. Demer, Circulation, 2008, 117, 411–420.
33 D. Carlstorm, B. Engfeldt, A. Engstrom and N. Ringrtz, Lab. Invest., 1953, 2, 325–35.

Chapter 4- Human Tissue and Potential Biomarkers for Plaque Vulnerability
109
34 A. Kelly-Arnold, N. Maldonado, D. Laudier, E. Aikawa, L. Cardoso and S. Weinbaum,
Proc. Natl. Acad. Sci., 2013, 110, 10741–10746.
35 A. T. Vesey, W. S. A. Jenkins, A. Irkle, A. Moss, G. Sng, R. O. Forsythe, T. Clark, G.
Roberts, A. Fletcher, C. Lucatelli, J. H. F. Rudd, A. P. Davenport, N. L. Mills, R. Al-
Shahi Salman, M. Dennis, W. N. Whiteley, E. J. R. van Beek, M. R. Dweck and D. E.
Newby, Circ. Cardiovasc. Imaging, 2017, 10, e004976.
36 N. V Joshi, I. Toor, A. S. V Shah, K. Carruthers, A. T. Vesey, S. R. Alam, A. Sills, T.
Y. Hoo, A. J. Melville, S. P. Langlands, W. S. A. Jenkins, N. G. Uren, N. L. Mills, A.
M. Fletcher, E. J. R. van Beek, J. H. F. Rudd, K. A. A. Fox, M. R. Dweck and D. E.
Newby, J. Am. Heart Assoc., 2015, 4, e001956.
37 R. O. Forsythe, M. R. Dweck, O. M. B. McBride, A. T. Vesey, S. I. Semple, A. S. V.
Shah, P. D. Adamson, W. A. Wallace, J. Kaczynski, W. Ho, E. J. R. van Beek, C. D.
Gray, A. Fletcher, C. Lucatelli, A. Marin, P. Burns, A. Tambyraja, R. T. A. Chalmers,
G. Weir, N. Mitchard, A. Tavares, J. M. J. Robson and D. E. Newby, J. Am. Coll.
Cardiol., 2018, 71, 513–523.
Chapter 5 – Anatomical information of vascular calcification
110
Chapter 5- Chemical Composition of
Vascular Calcification Deposits
Raman spectroscopy
Spectroscopy is the study the interactions of radiation with matter and is a field that
encompasses a wide range of techniques. Raman spectroscopy is based on the interaction of
light and matter and was initially observed by C.V. Raman in 1928.1–3 Raman and Krishnan
hypothesized that an energy transfer, similar to the one that takes place during X-ray
spectroscopy, should take place when electromagnetic radiation is scattered by atoms or
molecules.3–5
When a photon of light interacts with a molecule, it allows the molecule to transit to a virtual
energy state, and although this transition is short lived, this increase in energy means that the
molecule is at a higher energy state (Figure 5.1).2 The molecule can then relax back in two
manners:
- to the initial ground state in a single step by releasing the same amount of energy as
that of the incoming photon. This process is called Rayleigh (or elastic) scattering.2–
4,6 When this occurs, no energy is transferred to the molecule and therefore the process
does not yield any information.
- to a different ground state when the molecule releases a different quantum of energy
to that of the incident photon. This process is called Raman (inelastic) scattering and
can be divided into two further processes; Stokes and anti-Stokes scattering.4,6,7 Stokes
scattering occurs when energy is transferred to the molecule from the incident photon
while anti-Stokes scattering occurs when the molecule loses some energy to the
scattered photon which is then greater than the energy of the incident photon.1,3,4,6,7
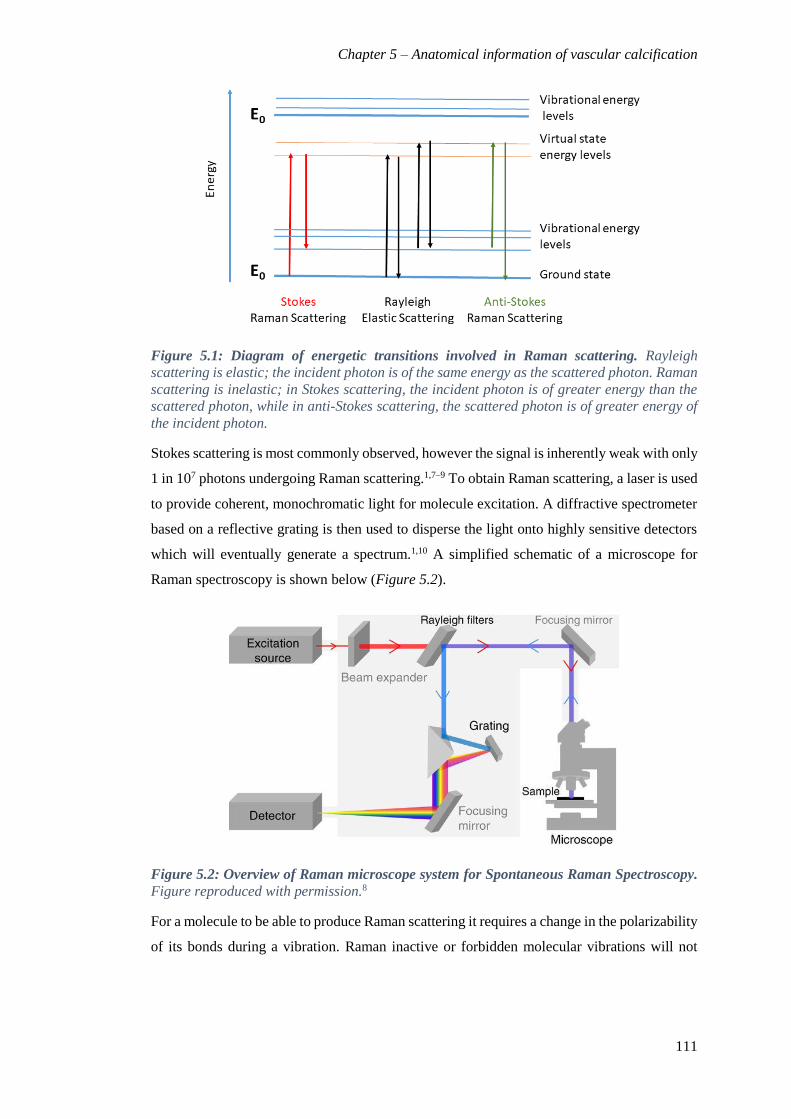
Chapter 5 – Anatomical information of vascular calcification
111
Figure 5.1: Diagram of energetic transitions involved in Raman scattering. Rayleigh
scattering is elastic; the incident photon is of the same energy as the scattered photon. Raman
scattering is inelastic; in Stokes scattering, the incident photon is of greater energy than the
scattered photon, while in anti-Stokes scattering, the scattered photon is of greater energy of
the incident photon.
Stokes scattering is most commonly observed, however the signal is inherently weak with only
1 in 107 photons undergoing Raman scattering.1,7–9 To obtain Raman scattering, a laser is used
to provide coherent, monochromatic light for molecule excitation. A diffractive spectrometer
based on a reflective grating is then used to disperse the light onto highly sensitive detectors
which will eventually generate a spectrum.1,10 A simplified schematic of a microscope for
Raman spectroscopy is shown below (Figure 5.2).
Figure 5.2: Overview of Raman microscope system for Spontaneous Raman Spectroscopy.
Figure reproduced with permission.8
For a molecule to be able to produce Raman scattering it requires a change in the polarizability
of its bonds during a vibration. Raman inactive or forbidden molecular vibrations will not

Chapter 5 – Anatomical information of vascular calcification
112
generate Raman scattering.11 A typical Raman spectrum is a plot of intensity of the scattered
light (in AU) relative to the frequency of the scattered light (in wavenumbers). Specific bonds
will vibrate at unique wavenumbers and therefore each molecule will have a characteristic
spectroscopic fingerprint.9,12 Raman can be applied to a wide range of samples; from solids, to
cells and tissues; very little preparation is required and spectra are easily obtained within
seconds.
Raman spectroscopy of biological samples
Raman spectroscopy has become increasingly popular in recent years as a tool to characterize
and analyse cells and tissues, as well as a diagnostic tool for diseases both in vitro and in
vivo.1,8,12–15 This is due to it being label-free, safe and non-invasive. It relies on the inherent
scattering nature of all biomolecules and can be used to detect specific extra- and intracellular
structures such as proteins, lipids and nucleic acids with submicron spatial resolution in both
living and fixed systems, allowing for characterization and comparison of biologically
interesting samples without alteration (Figure 5.3).5,12,16–18
Figure 5.3 Raman spectra of SKBR3 cells by Raman microscopy. Spontaneous Raman
spectrum of SKBR3 cell pellet measured using 785 nm excitation. Key bands are indicted.
Figure reproduced with permission.15
Current analytical techniques most frequently used to assess the morphology of samples
involve disrupting the very process under investigation, for example immunohistochemistry
and immunofluorescence. There is a need for a non-destructive, non-invasive technique that
is capable of analysing samples at a biomolecular level.1,19–21 Raman spectroscopy has been
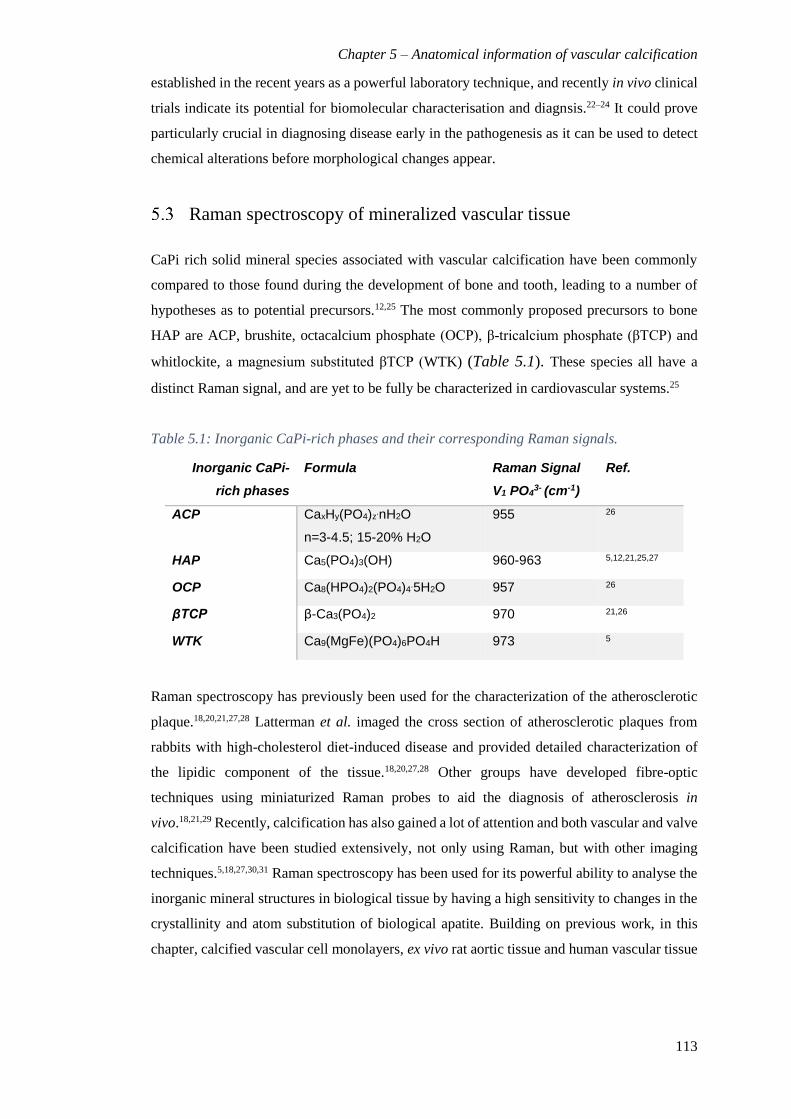
Chapter 5 – Anatomical information of vascular calcification
113
established in the recent years as a powerful laboratory technique, and recently in vivo clinical
trials indicate its potential for biomolecular characterisation and diagnsis.22–24 It could prove
particularly crucial in diagnosing disease early in the pathogenesis as it can be used to detect
chemical alterations before morphological changes appear.
Raman spectroscopy of mineralized vascular tissue
CaPi rich solid mineral species associated with vascular calcification have been commonly
compared to those found during the development of bone and tooth, leading to a number of
hypotheses as to potential precursors.12,25 The most commonly proposed precursors to bone
HAP are ACP, brushite, octacalcium phosphate (OCP), β-tricalcium phosphate (βTCP) and
whitlockite, a magnesium substituted βTCP (WTK) (Table 5.1). These species all have a
distinct Raman signal, and are yet to be fully be characterized in cardiovascular systems.25
Table 5.1: Inorganic CaPi-rich phases and their corresponding Raman signals.
Inorganic CaPi-
rich phases
Formula Raman Signal
V1 PO43- (cm-1)
Ref.
ACP CaxHy(PO4)z.nH2O
n=3-4.5; 15-20% H2O
955 26
HAP Ca5(PO4)3(OH) 960-963 5,12,21,25,27
OCP Ca8(HPO4)2(PO4)4.5H2O 957 26
βTCP β-Ca3(PO4)2 970 21,26
WTK Ca9(MgFe)(PO4)6PO4H 973 5
Raman spectroscopy has previously been used for the characterization of the atherosclerotic
plaque.18,20,21,27,28 Latterman et al. imaged the cross section of atherosclerotic plaques from
rabbits with high-cholesterol diet-induced disease and provided detailed characterization of
the lipidic component of the tissue.18,20,27,28 Other groups have developed fibre-optic
techniques using miniaturized Raman probes to aid the diagnosis of atherosclerosis in
vivo.18,21,29 Recently, calcification has also gained a lot of attention and both vascular and valve
calcification have been studied extensively, not only using Raman, but with other imaging
techniques.5,18,27,30,31 Raman spectroscopy has been used for its powerful ability to analyse the
inorganic mineral structures in biological tissue by having a high sensitivity to changes in the
crystallinity and atom substitution of biological apatite. Building on previous work, in this
chapter, calcified vascular cell monolayers, ex vivo rat aortic tissue and human vascular tissue

Chapter 5 – Anatomical information of vascular calcification
114
will be analysed. This allows for information, which is complementary to the results provided
by fluorescence, to be obtained. In particular it allows for the assessment of the crystallinity
of the calcium species, in order to shed further light on the calcification process. Additionally,
a comparison of Raman spectroscopy with PET/CT images will be carried out to improve
understanding of the binding of the Na18F PET tracer to the calcified plaques.
Raman on Calcium species
Spontaneous Raman spectroscopy is able to distinguish peaks that are at 1 cm-1 apart allowing
for an accurate characterisation of more subtle spectral features such as minor changes in the
shape or position of a peak thus allowing analysis of phenomena such as crystallinity and
polymorphism. In order to determine the chemical composition of cardiovascular calcification,
the Raman fingerprint of known calcium phosphate species was analysed. Literature reports
the presence of five potential calcium minerals in vascular tissue; with HAP being the only
mineral present in cellular models and ACP, OCP, βTCP and WTK present in vascular tissue
and valves.25,26,32 Raman spectra of synthetic, non-biogenic, commercial minerals were
obtained on the InVia Renishaw microscope using a 785 nm laser, and are reported below
(Figure 5.4). This allowed for a direct comparison between the minerals as well as aiding in
the subsequent determination of the mineral phase present in both cell and human models.
When analysing mixtures of different minerals, such as ACP and HAP, two distinct peaks are
visible (Figure 5.4), looking closely at the mixture of 3:7 ACP:HAP, one major peak with a
side peak were visible suggesting that the two compounds could be distinguished when
analysed together. Using Origin, peak fitting of the spectrum was performed and clearly
showed the distinct two peaks at 955 and 960 cm-1, it was also possible to analyse the area
under the two fitted peaks which in this instance accounted for 25% ACP and 75% HAP which
is only slightly different from the experimental mixture produced, indicating that this
technique can be used to analyse mixture and can fairly accurately report the ratios of
compounds present in the solid mix.

Chapter 5 – Anatomical information of vascular calcification
115
Figure 5.4: Phosphate (v1) Raman signal of different calcium species (A) and spectra of
ACP:HAP mixtures (B). Values and spectra obtained using an InVia Renishaw microscope
with a 785 nm laser. Red dashed line indicative of ACP, red dotted line indicative of HAP.
Raman analysis on calcified cell pellet
Calcification can occur in a wide range of tissues, spanning from soft tissues to vascular
tissues.33–35 In the field of vascular biology, calcification can occur at different locations, and
therefore different cell models are required to study the specific molecular biology and
pathways behind the disease.36,37
An example of a cell phenotype present in vascular tissues is the primary vascular smooth
muscle cell (VSMC) which is one of the cellular components of the normal blood vessel wall.
VSMCs provide structural integrity and regulate the diameter of the vessel by contracting and
relaxing in response to vasoactive stimuli. In contrast to skeletal and muscle cells, VSMCs are
not terminally differentiated and can change their phenotype in response to environmental
change to become calcifying osteoblastic cells, thereby facilitating the production of
extracellular matrix components.36–39 VSMCs are the principal cell type that are involved in
vascular calcification and are primarily used to study calcification in conditions such as
atherosclerosis and chronic kidney disease (CKD).36,38,40
Calcified rat VSMC cell pellets were analysed by Raman spectroscopy (Figure 5.5). Cells
were cultured for 7 days under two different conditions: control and calcifying media (1.4 mM
Ca and 2.4 mM Pi). The cell monolayer was then treated with trypsin to allow the cells to be
collected in the form of a pellet for Raman analysis.

Chapter 5 – Anatomical information of vascular calcification
116
Figure 5.5: Spontaneous Raman spectra of VSMC cell pellets. Calcified and control VSMCs
cell pellet. Raman spectroscopy of cell monolayers obtained using Renishaw InVia, 785 nm
laser, 30 s, 100%. Spectra are offset for clarity and normalized to the phenylalanine peak
(1003 cm-1). Spectra are a representative of at least three repeats. Red dashed line indicative
of 960 cm-1 HAP value. Spectra obtained from Raman analysis of the cell pellet showed the most common cellular
peaks; phenylalanine, amide bonds and lipid (Table 5.2). However, when the cell monolayer
was cultured in calcium and phosphate enriched media, which should induce calcification, no
peak corresponding to calcium mineralisation was observed amongst the other signals.
Table 5.2: Raman shift of common cell features
The lack of calcium mineral deposited in the cell pellet is due to the collection process
employed. When cells undergo treatment with trypsin and pelleted, the extracellular matrix
disintegrates and releases the calcification crystals which have been deposited on the
Peak position (cm-1) Major Assignments
855 C-C stretch
875 C-C stretch
960 Hydroxyapatite PO43- symmetric stretch
1003 Phenylalanine
1032 Proline
1128 C-N
1206 Hydroxyproline
1247-1270 Protein amide III band
1595-1720 Amide I (C=O stretching mode of proteins/ C=C of lipids)
2880 CH2, lipids
2940 CH3, proteins
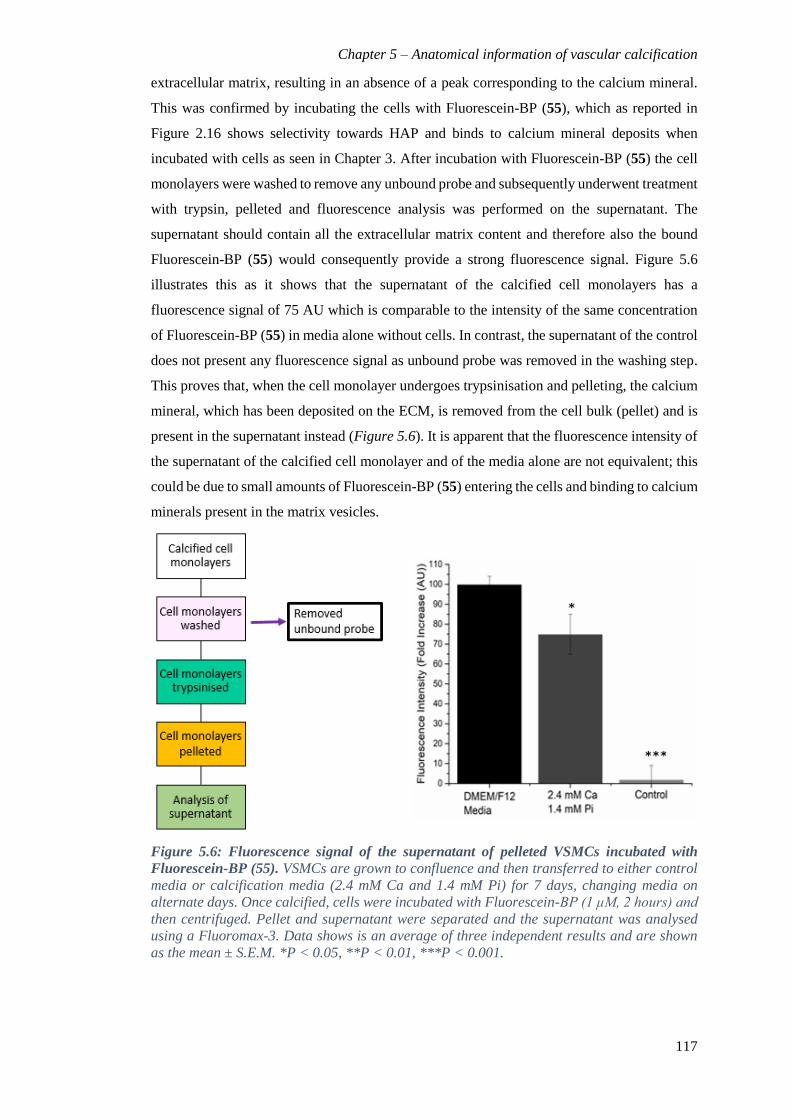
Chapter 5 – Anatomical information of vascular calcification
117
extracellular matrix, resulting in an absence of a peak corresponding to the calcium mineral.
This was confirmed by incubating the cells with Fluorescein-BP (55), which as reported in
Figure 2.16 shows selectivity towards HAP and binds to calcium mineral deposits when
incubated with cells as seen in Chapter 3. After incubation with Fluorescein-BP (55) the cell
monolayers were washed to remove any unbound probe and subsequently underwent treatment
with trypsin, pelleted and fluorescence analysis was performed on the supernatant. The
supernatant should contain all the extracellular matrix content and therefore also the bound
Fluorescein-BP (55) would consequently provide a strong fluorescence signal. Figure 5.6
illustrates this as it shows that the supernatant of the calcified cell monolayers has a
fluorescence signal of 75 AU which is comparable to the intensity of the same concentration
of Fluorescein-BP (55) in media alone without cells. In contrast, the supernatant of the control
does not present any fluorescence signal as unbound probe was removed in the washing step.
This proves that, when the cell monolayer undergoes trypsinisation and pelleting, the calcium
mineral, which has been deposited on the ECM, is removed from the cell bulk (pellet) and is
present in the supernatant instead (Figure 5.6). It is apparent that the fluorescence intensity of
the supernatant of the calcified cell monolayer and of the media alone are not equivalent; this
could be due to small amounts of Fluorescein-BP (55) entering the cells and binding to calcium
minerals present in the matrix vesicles.
Figure 5.6: Fluorescence signal of the supernatant of pelleted VSMCs incubated with
Fluorescein-BP (55). VSMCs are grown to confluence and then transferred to either control
media or calcification media (2.4 mM Ca and 1.4 mM Pi) for 7 days, changing media on
alternate days. Once calcified, cells were incubated with Fluorescein-BP (1 μM, 2 hours) and
then centrifuged. Pellet and supernatant were separated and the supernatant was analysed
using a Fluoromax-3. Data shows is an average of three independent results and are shown
as the mean ± S.E.M. *P < 0.05, **P < 0.01, ***P < 0.001.

Chapter 5 – Anatomical information of vascular calcification
118
Raman analysis of calcified cell monolayer
Another way of obtaining Raman spectra of calcified primary cells or cell lines is to analyse
the cell monolayer directly. This can be done by seeding and calcifying the cells on Raman-
inactive substrates such as CaF2 slides. In comparison to glass or plastic, CaF2 slides do not
produce any Raman signal and therefore do not mask the Raman spectrum of the cell
monolayer. Rat VSMCs were seeded on CaF2 slides that had previously been autoclaved, and
the cells were incubated with either control media or calcification media, (2.4 mM Ca and 1.4
mM Pi), for 7 days. On day 7, the monolayer was fixed and subsequently analysed by Raman
spectroscopy. In contrast to the cell pellet, the calcified rat VSMC monolayer grown on CaF2
slides shows the appearance of a peak at 960 cm-1 which is absent in the control (Figure 5.7),
corresponding to HAP.
Figure 5.7: Spontaneous Raman spectra of rat VSMC monolayer grown on CaF2 Raman
slides. Cells were seeded and then incubated with either control media or calcifying media
(2.4 mM Ca and 1.4 mM Pi). Cells were incubated with media for 7 days changing media on
alternate day. Raman spectroscopy of cell monolayer obtained using Renishaw InVia, 785 nm
laser, 30 s, 100%. Spectra are offset for clarity and normalized to the phenylalanine peak
(1003 cm-1). Spectra are a representative of at least three repeats. Red dashed line indicative
of 960 cm-1 peak (HAP).
Previously, in section 5.2.2, VSMCs were discussed as an example of cell phenotype present
in vascular tissue. Another important cell phenotype used to study vascular calcification is the
primary valve interstitial cell (VICS); these cells are the most prevalent cells in the heart valve
and are thought to be responsible for maintaining the structural integrity of the valve.41,42 In
contrast to the VSMCs, VICS are used to study conditions such as aortic valve stenosis, due
to calcification of the valve leaflets. Together with atherosclerosis, aortic valve stenosis is one
of the most common causes of cardiovascular disease.43,44 Aside from primary cells, cell lines
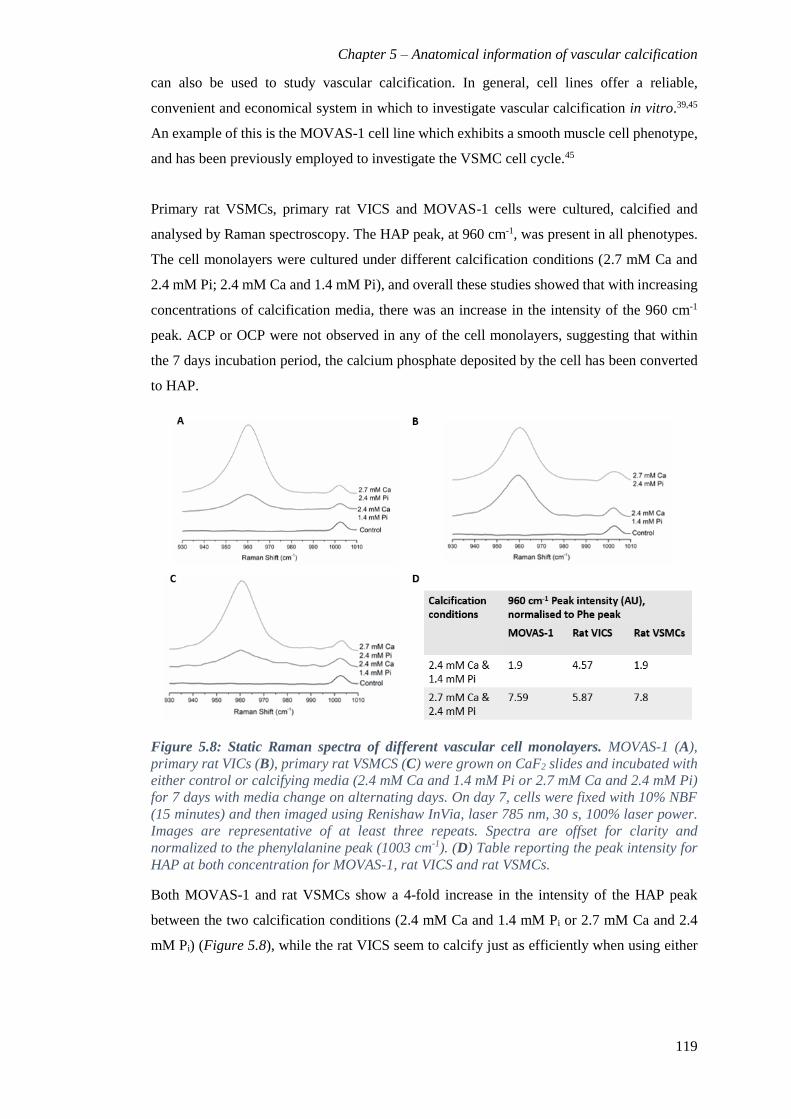
Chapter 5 – Anatomical information of vascular calcification
119
can also be used to study vascular calcification. In general, cell lines offer a reliable,
convenient and economical system in which to investigate vascular calcification in vitro.39,45
An example of this is the MOVAS-1 cell line which exhibits a smooth muscle cell phenotype,
and has been previously employed to investigate the VSMC cell cycle.45
Primary rat VSMCs, primary rat VICS and MOVAS-1 cells were cultured, calcified and
analysed by Raman spectroscopy. The HAP peak, at 960 cm-1, was present in all phenotypes.
The cell monolayers were cultured under different calcification conditions (2.7 mM Ca and
2.4 mM Pi; 2.4 mM Ca and 1.4 mM Pi), and overall these studies showed that with increasing
concentrations of calcification media, there was an increase in the intensity of the 960 cm-1
peak. ACP or OCP were not observed in any of the cell monolayers, suggesting that within
the 7 days incubation period, the calcium phosphate deposited by the cell has been converted
to HAP.
Figure 5.8: Static Raman spectra of different vascular cell monolayers. MOVAS-1 (A),
primary rat VICs (B), primary rat VSMCS (C) were grown on CaF2 slides and incubated with
either control or calcifying media (2.4 mM Ca and 1.4 mM Pi or 2.7 mM Ca and 2.4 mM Pi)
for 7 days with media change on alternating days. On day 7, cells were fixed with 10% NBF
(15 minutes) and then imaged using Renishaw InVia, laser 785 nm, 30 s, 100% laser power.
Images are representative of at least three repeats. Spectra are offset for clarity and
normalized to the phenylalanine peak (1003 cm-1). (D) Table reporting the peak intensity for
HAP at both concentration for MOVAS-1, rat VICS and rat VSMCs.
Both MOVAS-1 and rat VSMCs show a 4-fold increase in the intensity of the HAP peak
between the two calcification conditions (2.4 mM Ca and 1.4 mM Pi or 2.7 mM Ca and 2.4
mM Pi) (Figure 5.8), while the rat VICS seem to calcify just as efficiently when using either
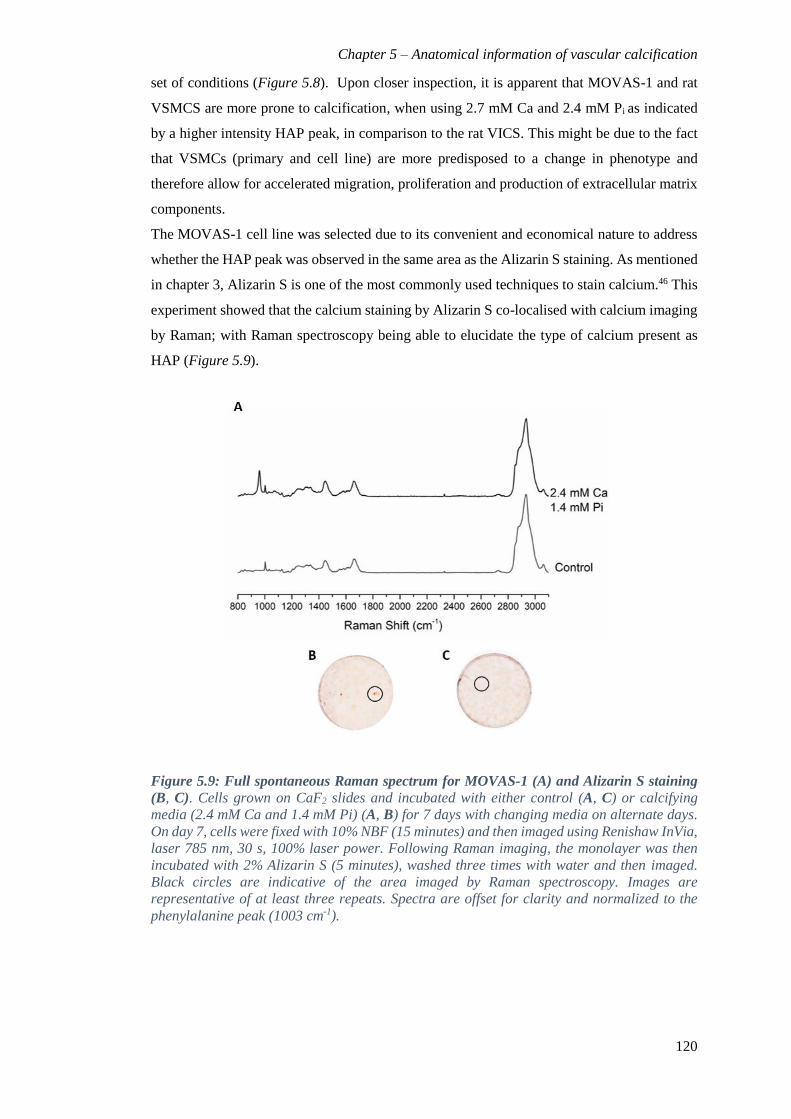
Chapter 5 – Anatomical information of vascular calcification
120
set of conditions (Figure 5.8). Upon closer inspection, it is apparent that MOVAS-1 and rat
VSMCS are more prone to calcification, when using 2.7 mM Ca and 2.4 mM Pi as indicated
by a higher intensity HAP peak, in comparison to the rat VICS. This might be due to the fact
that VSMCs (primary and cell line) are more predisposed to a change in phenotype and
therefore allow for accelerated migration, proliferation and production of extracellular matrix
components.
The MOVAS-1 cell line was selected due to its convenient and economical nature to address
whether the HAP peak was observed in the same area as the Alizarin S staining. As mentioned
in chapter 3, Alizarin S is one of the most commonly used techniques to stain calcium.46 This
experiment showed that the calcium staining by Alizarin S co-localised with calcium imaging
by Raman; with Raman spectroscopy being able to elucidate the type of calcium present as
HAP (Figure 5.9).
Figure 5.9: Full spontaneous Raman spectrum for MOVAS-1 (A) and Alizarin S staining
(B, C). Cells grown on CaF2 slides and incubated with either control (A, C) or calcifying
media (2.4 mM Ca and 1.4 mM Pi) (A, B) for 7 days with changing media on alternate days.
On day 7, cells were fixed with 10% NBF (15 minutes) and then imaged using Renishaw InVia,
laser 785 nm, 30 s, 100% laser power. Following Raman imaging, the monolayer was then
incubated with 2% Alizarin S (5 minutes), washed three times with water and then imaged.
Black circles are indicative of the area imaged by Raman spectroscopy. Images are
representative of at least three repeats. Spectra are offset for clarity and normalized to the
phenylalanine peak (1003 cm-1).
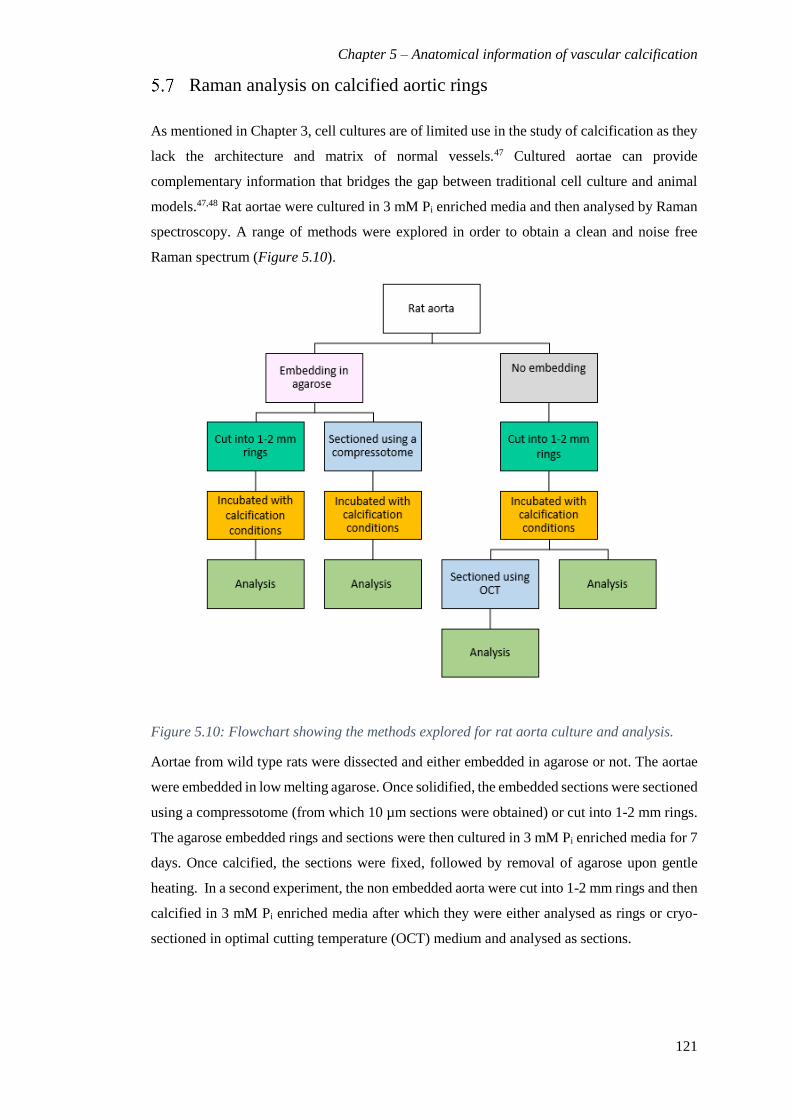
Chapter 5 – Anatomical information of vascular calcification
121
Raman analysis on calcified aortic rings
As mentioned in Chapter 3, cell cultures are of limited use in the study of calcification as they
lack the architecture and matrix of normal vessels.47 Cultured aortae can provide
complementary information that bridges the gap between traditional cell culture and animal
models.47,48 Rat aortae were cultured in 3 mM Pi enriched media and then analysed by Raman
spectroscopy. A range of methods were explored in order to obtain a clean and noise free
Raman spectrum (Figure 5.10).
Figure 5.10: Flowchart showing the methods explored for rat aorta culture and analysis.
Aortae from wild type rats were dissected and either embedded in agarose or not. The aortae
were embedded in low melting agarose. Once solidified, the embedded sections were sectioned
using a compressotome (from which 10 µm sections were obtained) or cut into 1-2 mm rings.
The agarose embedded rings and sections were then cultured in 3 mM Pi enriched media for 7
days. Once calcified, the sections were fixed, followed by removal of agarose upon gentle
heating. In a second experiment, the non embedded aorta were cut into 1-2 mm rings and then
calcified in 3 mM Pi enriched media after which they were either analysed as rings or cryo-
sectioned in optimal cutting temperature (OCT) medium and analysed as sections.

Chapter 5 – Anatomical information of vascular calcification
122
When analysed by Raman spectroscopy, both embedded and non-embedded aortic rings and
OCT samples gave a higher background signal in comparison to the agarose sections and
therefore the latter were selected for further analysis. Gentle heating allowed for the majority
of the agarose to be dissolved and washed off, however, a small amount was present when the
aortae were analysed. Nonetheless, the remains of agarose had no impact on the HAP peak,
which, as for the peak observed in cell models was visualised at 960 cm-1 (Figure 5.11 A). The
peak at 960 cm-1 only appears in the calcified sample and is not present in the control; within
the calcified sample the signal is obtained in the medial layer of the aorta which is consistent
with the fluorescence signal obtained from the Fluorescein-BP (55) in Chapter 3. The peak
found in the calcified samples co-localizes with the Alizarin S stain (Figure 5.11 B-C) carried
out on the rings and correspondingly there was no staining present in the control sample
(Figure 5.11 C). Once again, the Raman signal for HAP was mainly present in the medial layer
of the aorta (Figure 5.11 B).
Figure 5.11: Raman and Alizarin on aortic ring sections. (A) Raman spectra of calcified and
control aortic ring sections. Raman spectroscopy of cell monolayer obtained using Renishaw
InVia, 785 nm laser, 30 s, 100%. Spectra are offset for clarity and normalized to the
phenylalanine peak (1003 cm-1). Red dashed line indicative of the 960 cm-1 peak (HAP). (B)
Alizarin of aortic ring calcified at 3 mM Pi for 7 days (C) Alizarin S of aortic ring cultured in
control media for 7 days. Black circles indicate areas where the Raman spectra were taken.
Spectra and images are representative of at least three repeats. Scale bars = 0.1 cm.

Chapter 5 – Anatomical information of vascular calcification
123
Raman on calcified human samples analysis and comparison to
PET/CT
Rodent models offer the possibility of investigating the pathology of cardiovascular disease
however, as mentioned in Chapter 4, they have several limitations. For this reason, the ability
to analyse and assess human tissues is key in understanding disease progression and
prevention. Human tissue samples were obtained from a collaboration with a PhD student,
Alastair Moss, MD, in Marc Dweck’s group (UoE). Samples which had been collected during
autopsy from victims of sudden death (Appendix 2), were imaged by PET/CT using Na18F
PET tracer and divided into three categories (Table 5.3). The tissue was subsequently
processed and embedded in paraffin wax prior to Raman analysis.
Table 5.3: Study patient population. Tissue samples are divided into three groups: No
PET/CT activity, CT active and PET active.
Number of
samples
No PET/CT activity CT activity PET activity
1 4 3
PET/CT imaging using Na18F has been reported as a novel tool for vascular disease
diagnosis.49,50 Na18F can be used to identify areas of micro-calcification that are associated
with an unstable plaque phenotype, and which are beyond the resolution of CT. Indeed, Na18F
PET is currently being explored as a method for detecting high risk coronary plaques and
improving cardiovascular risk prediction (clinicaltrials.gov NCT02278211).49–51
Embedding samples in paraffin wax comes with its disadvantages as paraffin’s Raman
spectrum has peaks in the regions of amide I, III and in other areas in the low wavenumber
regions which overlap with signals obtained from tissue samples. Recent literature reported
that, when paraffin embedded, tissues require at least 30 minutes in xylene and ethanol to
completely remove the paraffin.52 However, there is a fine balance between removal of
paraffin and deterioration of tissue structure, as xylene can interfere with the lipid peaks.52 The
report mentioned that there are computational methods such as independent component
analysis (ICA), partial least square (PLS) and independent component partial least square (IC-
PLS) that would allow the removal of paraffin peaks. However, for the purpose of this study,
and the interest in the spectral window around 940-1010 cm-1 which displays no paraffin
bands, no computational tools were required.
The vascular tissue obtained was embedded, sectioned and subsequently placed on CaF2 slides.
Once dried, the slides were placed in xylene for 15 minutes followed by dehydration in ethanol.
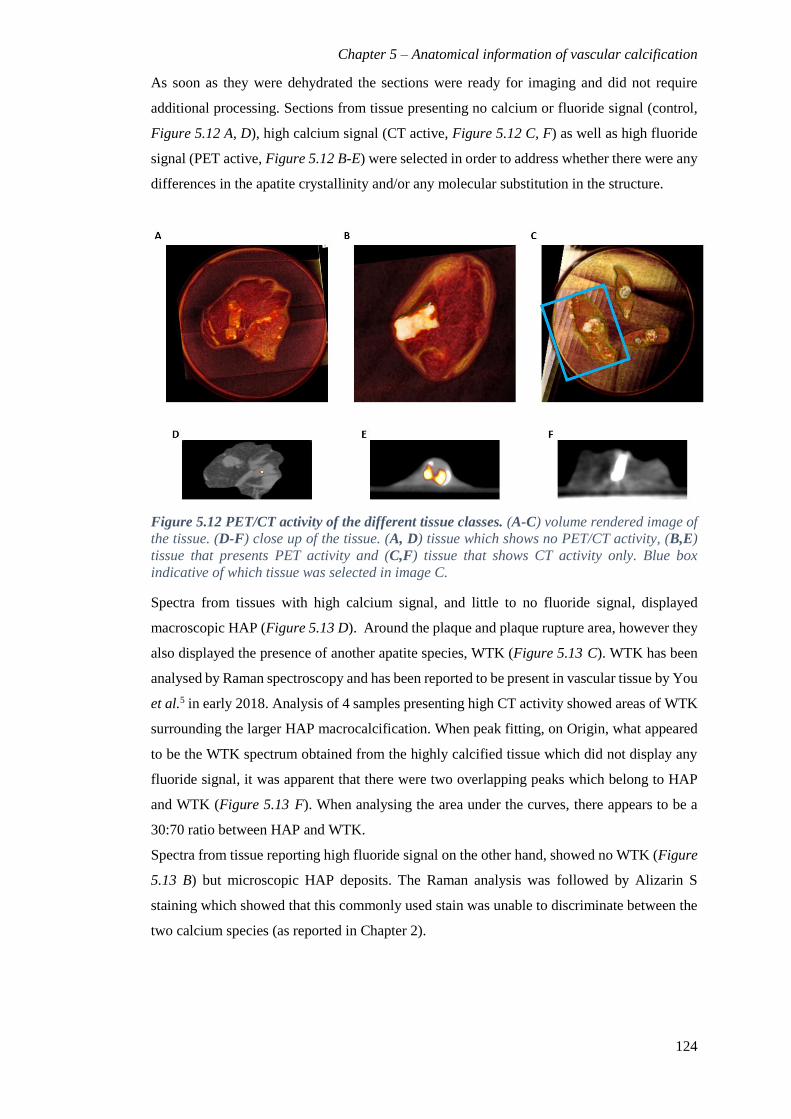
Chapter 5 – Anatomical information of vascular calcification
124
As soon as they were dehydrated the sections were ready for imaging and did not require
additional processing. Sections from tissue presenting no calcium or fluoride signal (control,
Figure 5.12 A, D), high calcium signal (CT active, Figure 5.12 C, F) as well as high fluoride
signal (PET active, Figure 5.12 B-E) were selected in order to address whether there were any
differences in the apatite crystallinity and/or any molecular substitution in the structure.
Figure 5.12 PET/CT activity of the different tissue classes. (A-C) volume rendered image of
the tissue. (D-F) close up of the tissue. (A, D) tissue which shows no PET/CT activity, (B,E)
tissue that presents PET activity and (C,F) tissue that shows CT activity only. Blue box
indicative of which tissue was selected in image C.
Spectra from tissues with high calcium signal, and little to no fluoride signal, displayed
macroscopic HAP (Figure 5.13 D). Around the plaque and plaque rupture area, however they
also displayed the presence of another apatite species, WTK (Figure 5.13 C). WTK has been
analysed by Raman spectroscopy and has been reported to be present in vascular tissue by You
et al.5 in early 2018. Analysis of 4 samples presenting high CT activity showed areas of WTK
surrounding the larger HAP macrocalcification. When peak fitting, on Origin, what appeared
to be the WTK spectrum obtained from the highly calcified tissue which did not display any
fluoride signal, it was apparent that there were two overlapping peaks which belong to HAP
and WTK (Figure 5.13 F). When analysing the area under the curves, there appears to be a
30:70 ratio between HAP and WTK.
Spectra from tissue reporting high fluoride signal on the other hand, showed no WTK (Figure
5.13 B) but microscopic HAP deposits. The Raman analysis was followed by Alizarin S
staining which showed that this commonly used stain was unable to discriminate between the
two calcium species (as reported in Chapter 2).

Chapter 5 – Anatomical information of vascular calcification
125
Figure 5.13 Raman spectroscopy (A-F) and Alizarin S staining (G-I) analysis of control,
PET active and CT active vascular tissue. Tissue was embedded in paraffin wax and sectioned
into 5 µm sections and placed on CaF2 slides. Sections were dehydrated using xylene and
ethanol washes and then imaged using Renishaw InVia, laser 785 nm, 60 s, 100% laser power.
Following Raman imaging, the monolayer was incubated with 2% Alizarin S (5 minutes),
washed three times with water and then imaged. Arrows are indicative of the location imaged
by Raman spectroscopy, black areas where no HAP or HAP was found while purple arrow
indicates area where WTK was found. (A) and (G) represent Raman spectrum and Alizarin S
image of control sample, (B) and (H) represent PET active sample while (C, D) and (I)
represent CT active sample. (E) Represents overlaid WTK and HAP spectra obtained from
CT active sample (C, D), while (F) shows the peak fitted analysis of the WTK experimental
spectrum showing the presence of both HAP and WTK. Red dotted line are indicative of the
970 cm-1 peak (WTK), red dashed line representative of the 960 cm-1 peak (HAP). Scale bars
= 0.2 cm.
Chapter 5 – Anatomical information of vascular calcification
126
However, one of the three PET active samples, in contrast to the other two, exhibited small
amounts of WTK around areas where larger calcification deposits were visible (spectrum not
shown). This sample belonged to a patient who had diabetes mellitus which would explain the
presence of high levels of magnesium in the body and therefore the substituted apatites.
The presence of WTK has been reported previously in patients with uraemia and end-stage
renal disease, where nanocrystals analysis showed the presence of both HAP and WTK.53,54 In
patients presenting with uraemia, WTK had been described as a preliminary stage in soft tissue
calcification prior to HAP deposition, however, the number of studies investigating WTK is
subordinate to those reporting HAP and ACP in uremic vascular calcification,53,55 while in
end-stage renal disease studies, WTK has been described in advanced conditions.54
Surprisingly, before 2010, WTK had rarely been reported to be a component of vascular
calcification.
The WTK studies resulted in the development of novel models to address the role of
magnesium in cell studies. In some cell-based models, magnesium is shown to have a
protective role in living organisms.56 Other literature also illustrates how magnesium
significantly reduces calcification both in bovine as well as human primary VSMCs, in
addition to downregulating known pro-calcification markers and upregulating anti-
calcification markers towards restoring more physiological conditions.56,57 Louvet et al. were
one of the first groups to show the inhibitory effect that magnesium has on hydroxyapatite
formation and precipitation. Their in vitro work showed that magnesium was able to stabilize
amorphous calcium phosphate and inhibit the formation of HAP by forming WTK.32,56,57
Louvet’s analysis elucidates the potential role of WTK around areas of macrocalcification in
the analysed CT active samples. However, when WTK and HAP (Figure 5.14) and CaPi,
CaOx, CaPyr (Chapter 4, Figure 4.2) were analysed by PET/CT, no fluoride uptake was
observed for both CaOx and CaPyr, but no difference was observed between the uptake by
WTK, CaPi and HAP, indicating that Na18F uptake is not specific to HAP and therefore cannot
give any anatomical information on the morphology of the crystals in the vascular tissue. On
the other hand, Raman spectroscopy is able to distinguish between the species and is therefore
able to provide additional information that PET lacks.

Chapter 5 – Anatomical information of vascular calcification
127
Figure 5.14: HAP and WTK incubation with Na18F. HAP and WTK were incubated with
Na18F for 20 minutes and then scanned using PET/CT scanner. Data shown is an average of
three independent results and are shown as the mean ± S.E.M.
Conclusion
Raman spectroscopy has been a useful tool in the study of vascular calcification to address the
specific nature of the mineral phase for both in vitro and ex vivo models. In cell models,
calcium and phosphate enriched media promotes the deposition of hydroxyapatite. It is
surprising that no other species is detectable, especially ACP, a precursor of HAP. But this
could be due to the immediate conversion, during fixation, of any ACP to HAP as the latter is
more thermodynamically stable.53,58 Interestingly, the level of calcification is different for
different primary cells. This could be due to the VSMCs being more prone to a change in
phenotype, and therefore extracellular matrix component production, however, in order to
validate this, additional studies employing immunofluorescence targeting cytoskeleton
markers are required. These studies would help elucidate whether VSMCs are more prone to
phenotypical change when compared to VICs. In ex vivo human tissue models, HAP was not
the only mineral observed. WTK co-existed with HAP in tissue samples which showed high
CT activity but not in tissue with high PET activity. However, due to the limited number of
samples no definite conclusion can be made as to whether WTK was present due to a tolerance
mechanism of the cells to inhibit HAP production, or whether it was caused by the disease or
diet. Additional studies, with a larger sample population, and more detailed medical charts on
the tissue provenance are required to address the active role of WTK in vascular calcification
caused by atherosclerosis.

Chapter 5 – Anatomical information of vascular calcification
128
References
1 K. J. I. Ember, M. A. Hoeve, S. L. McAughtrie, M. S. Bergholt, B. J. Dwyer, M. M.
Stevens, K. Faulds, S. J. Forbes and C. J. Campbell, npj Regen. Med., 2017, 2, 12.
2 A. Smekal, Naturwissenschaften, 1923, 11, 873–875.
3 C. V. Raman and K. S. Krishnan, Nature, 1928, 121, 501–502.
4 H. A. Szymanski, Raman Spectroscopy : Theory and Practice, Springer US, 1967.
5 A. Y. F. You, M. S. Bergholt, J. P. St-Pierre, W. Kit-Anan, I. J. Pence, A. H. Chester,
M. H. Yacoub, S. Bertazzo and M. M. Stevens, Sci. Adv., 2017, 3, e1701156.
6 G. Bruno, Raman Eff. A Unified Treat. Theory Raman Scatt. by Mol., 2002, 8, 31–48.
7 D. A. Long, The Raman Effect, John Wiley & Sons, Ltd, Chichester, UK, 2002.
8 H. J. Butler, L. Ashton, B. Bird, G. Cinque, K. Curtis, J. Dorney, K. Esmonde-white,
N. J. Fullwood, B. Gardner, P. L. Martin-Hirsch, M. J. Walsh, M. R. Mcainsh, N. Stone
and F. L. Martin, Nat. Protoc., 2016, 11, 664–687.
9 M. D. Morris and G. S. Mandair, Clin. Orthop. Relat. Res., 2011, 469, 2160–9.
10 A. Downes and A. Elfick, Sensors, 2010, 10, 1871–1889.
11 D. A. Long, in The Raman Effect, John Wiley & Sons, Ltd, Chichester, UK, pp. 85–
152.
12 M. B. Peres, L. Silveira, R. A. Zângaro, M. T. T. Pacheco and C. A. Pasqualucci, Lasers
Med. Sci., 2011, 26, 645–655.
13 S. Wachsmann-Hogiu, T. Weeks and T. Huser, Chemical analysis in vivo and in vitro
by Raman spectroscopy-from single cells to humans, Elsevier Current Trends, 2009,
vol. 20.
14 K. Kong, C. Kendall, N. Stone and I. Notingher, Adv. Drug Deliv. Rev., 2015, 89, 121–
134.
15 W. J. Tipping, M. Lee, A. Serrels, V. G. Brunton and A. N. Hulme, Chem. Soc. Rev.,
2016, 45, 2075–2089.
16 E. Gentleman, R. J. Swain, N. D. Evans, S. Boonrungsiman, G. Jell, M. D. Ball, T. A.
V. Shean, M. L. Oyen, A. Porter and M. M. Stevens, Nat. Mater., 2009, 8, 763–770.
17 L.-P. Choo-Smith, H. G. M. Edwards, H. P. Endtz, J. M. Kros, F. Heule, H. Barr, J. S.
Robinson, H. A. Bruining and G. J. Puppels, Biopolymers, 2002, 67, 1–9.
18 H. P. Buschman, G. Deinum, J. T. Motz, M. Fitzmaurice, J. R. Kramer, A. Van Der
Laarse, A. V Bruschke and M. S. Feld, Cardiovasc. Pathol., 2001, 10, 69–82.
19 P. Matousek, E. R. C. Draper, A. E. Goodship, I. P. Clark, K. L. Ronayne and A. W.
Parker, Appl. Spectrosc., 2006, 60, 758–763.
Chapter 5 – Anatomical information of vascular calcification
129
20 A. Lattermann, C. Matthäus, N. Bergner, C. Beleites, B. F. Romeike, C. Krafft, B. R.
Brehm and J. Popp, J. Biophotonics, 2013, 6, 110–121.
21 K. Czamara, J. Natorska, P. Kapusta, M. Baranska and A. Kaczor, Analyst, 2015, 140,
2164–2170.
22 R. J. Swain and M. M. Stevens, Biochem. Soc. Trans., 2007, 35, 544–549.
23 I. Notingher and L. L. Hench, Expert Rev. Med. Devices, 2006, 3, 215–234.
24 M. M. Kerssens, P. Matousek, K. Rogers and N. Stone, Analyst, 2010, 135, 3156–61.
25 C. Delogne, P. V. Lawford, S. M. Habesch and V. A. Carolan, J. Microsc., 2007, 228,
62–77.
26 M. Pilarczyk, K. Czamara, M. Baranska, J. Natorska, P. Kapusta, A. Undas and A.
Kaczor, J. Raman Spectrosc., 2013, 44, 1222–1229.
27 R. Manoharan, J. J. Baraga, M. S. Feld and R. P. Rava, J. Photochem. Photobiol. B
Biol., 1992, 16, 211–233.
28 C. Liu, S. Boydston-White, A. Weisberg, W. Wang, L. A. Sordillo, A. Perotte, V. P.
Tomaselli, P. P. Sordillo, Z. Pei, L. Shi and R. R. Alfano, J. Biomed. Opt., 2016, 21,
127006.
29 O. Tzang, K. Kfir, E. Flaxer, O. Cheshnovsky and S. Einav, Cardiovasc. Eng. Technol.,
2011, 2, 228–233.
30 J. S. Lee, J. D. Morrisett and C.-H. Tung, Atherosclerosis, 2012, 224, 340–7.
31 S. J. Gadaleta, E. P. Paschalis, F. Betts, R. Mendelsohn and A. L. Boskey, Calcif. Tissue
Int., 1996, 58, 9–16.
32 S. C. Verberckmoes, V. Persy, G. J. Behets, E. Neven, A. Hufkens, H. Zebger-Gong,
D. Müller, D. Haffner, U. Querfeld, S. Bohic, M. E. De Broe and P. C. D’Haese, Kidney
Int., 2007, 71, 298–303.
33 M. Abedin, Y. Tintut and L. L. Demer, Arterioscler. Thromb. Vasc. Biol., 2004, 24,
1161–1170.
34 A. S. Black and I. O. Kanat, J. Foot Surg., 24, 243–50.
35 G. Luo, P. Ducy, M. D. McKee, G. J. Pinero, E. Loyer, R. R. Behringer and G.
Karsenty, Nature, 1997, 386, 78–81.
36 R. P. Metz, J. L. Patterson and E. Wilson, Vascular smooth muscle cells: Isolation,
culture, and characterization, Humana Press, Totowa, NJ, 2012, vol. 843.
37 S. Lim and S. Park, BMB Rep., 2014, 47, 1–7.
38 A. Rudijanto, Acta Med. Indones., 39, 86–93.
39 MacRae, Int. J. Mol. Med., 2011, 27, 663–8.
40 C. M. Shanahan, M. H. Crouthamel, A. Kapustin and C. M. Giachelli, Circ. Res., 2011,
Chapter 5 – Anatomical information of vascular calcification
130
109, 697–711.
41 A. C. Liu, V. R. Joag and A. I. Gotlieb, Am. J. Pathol., 2007, 171, 1407–1418.
42 N. M. Rajamannan, F. J. Evans, E. Aikawa, K. J. Grande-Allen, L. L. Demer, D. D.
Heistad, C. A. Simmons, K. S. Masters, P. Mathieu, K. D. O’Brien, F. J. Schoen, D. A.
Towler, A. P. Yoganathan and C. M. Otto, Circulation, 2011, 124, 1783–91.
43 A. Rutkovskiy, A. Malashicheva, G. Sullivan, M. Bogdanova, A. Kostareva, K. O.
Stensløkken, A. Fiane and J. Vaage, J. Am. Heart Assoc., 2017, 6, e006339.
44 N. T. Lam, T. J. Muldoon, K. P. Quinn, N. Rajaram and K. Balachandran, Integr. Biol.
(Camb)., 2016, 8, 1079–1089.
45 T. Afroze, L. L. Yang, C. Wang, R. Gros, W. Kalair, A. N. Hoque, I. N. Mungrue, Z.
Zhu and M. Husain, AJP Cell Physiol., 2003, 285, C88–C95.
46 H. Paul, A. J. Reginato and H. R. Schumacher, Arthritis Rheum., 1983, 26, 191–200.
47 T. Akiyoshi, H. Ota, K. Iijima, B. K. Son, T. Kahyo, M. Setou, S. Ogawa, Y. Ouchi
and M. Akishita, Atherosclerosis, 2016, 244, 51–58.
48 K. A. Lomashvili, S. Cobbs, R. A. Hennigar, K. I. Hardcastle and W. C. O’Neill, J.
Am. Soc. Nephrol., 2004, 15, 1392–1401.
49 A. Irkle, A. T. Vesey, D. Y. Lewis, J. N. Skepper, J. L. E. Bird, M. R. Dweck, F. R.
Joshi, F. A. Gallagher, E. A. Warburton, M. R. Bennett, K. M. Brindle, D. E. Newby,
J. H. Rudd and A. P. Davenport, Nat. Commun., 2015, 6, 7495.
50 M. R. Dweck, M. K. Doris, M. Motwani, P. D. Adamson, P. Slomka, D. Dey, Z. A.
Fayad, D. E. Newby and D. Berman, Nat. Rev. Cardiol., 2016, 13, 533–548.
51 P. D. Adamson, A. T. Vesey, N. V. Joshi, D. E. Newby and M. R. Dweck, Cardiovasc.
Diagn. Ther., 2015, 5, 150–155.
52 P. Meksiarun, M. Ishigaki, V. A. C. Huck-Pezzei, C. W. Huck, K. Wongravee, H. Sato
and Y. Ozaki, Sci. Rep., 2017, 7, 44890.
53 G. Schlieper, A. Aretz, S. C. Verberckmoes, T. Kruger, G. J. Behets, R. Ghadimi, T.
E. Weirich, D. Rohrmann, S. Langer, J. H. Tordoir, K. Amann, R. Westenfeld, V. M.
Brandenburg, P. C. D’Haese, J. Mayer, M. Ketteler, M. D. McKee and J. Floege, J.
Am. Soc. Nephrol., 2010, 21, 689–696.
54 D. C. Fischer, G. J. Behets, O. W. Hakenberg, M. Voigt, B. A. Vervaet, S. Robijn, G.
Kundt, W. Schareck, P. C. D’Haese and D. Haffner, Calcif. Tissue Int., 2012, 90, 465–
472.
55 R. Lagier and C.-A. Baud, Pathol. - Res. Pract., 2003, 199, 329–335.
56 L. Louvet, J. Buchel, S. Steppan, J. Passlick-Deetjen and Z. A. Massy, Nephrol. Dial.
Transplant., 2013, 28, 869–878.

Chapter 5 – Anatomical information of vascular calcification
131
57 L. Louvet, D. Bazin, J. Büchel, S. Steppan, J. Passlick-Deetjen and Z. A. Massy, ,
DOI:10.1371/journal.pone.0115342.
58 S. Boonrungsiman, E. Gentleman, R. Carzaniga, N. D. Evans, D. W. McComb, A. E.
Porter and M. M. Stevens, Proc. Natl. Acad. Sci., 2012, 109, 14170–14175.
Chapter 6– Conclusion
132
Chapter 6- Conclusion and Future Work
In chapter 1 we discussed the importance of detecting vulnerable atherosclerotic plaques and
how the limitations of the current imaging modalities available to study CVD is lacking in
valuable patient diagnosis and positive outcomes. The only available technique that has shown
to somewhat detect vulnerable plaques is PET with the use of Na18F bone marker. However,
the understanding of the mode of action this probe and why it binds to vulnerable plaques and
not stable ones is yet to be understood.
We dealt with this problem, in chapter 2, by synthesising a range of fluorescent probes to study
the PET tracer as well as to look directly at the vulnerable plaques, mainly the HAP protective
layer. Three fluoride specific optical probes were synthesised, two based on the cyanoacrylate
motif and one based on rhodamine. Their selectivity towards anions, specifically, fluoride was
tested and only the rhodamine-based probe showed selectivity. However, unfortunately the
concentration required to activate the rhodamine-based probe was too high in comparison to
the MBq amount of Na18F which is used in humans.
The other way of assessing vulnerable plaques is by using fluorescent probes conjugated to
HAP selective molecules. A number of fluorophores were explored (Cy5.5, Cy7 and
fluorescein) and were either reacted with alendronate, an FDA approved BPs, or a HAP-
selective peptide. Selectivity tests to address whether the probes were selective to HAP and
would not interact with any other calcium minerals were performed and showed that only the
alendronate conjugated fluorophore was selective for HAP while the HAP selective peptide,
although conjugated to a different fluorophore, would interact with all species equally. Ideally,
both alendronate and HAP selective peptide should have been coupled to the same fluorophore
to be certain that the alendronate was more selective. Their binding was also compared to
Alizarin S, the gold standard stain for HAP, which showed that the alendronate conjugate was
more selective than Alizarin S as the latter interacted in a similar fashion to the HAP selective
peptide indicating the significant opportunity that the alendronate probe could provide in the
detection of HAP.
Fluorescein-BP (55) was then used in cell and ex vivo studies. Toxicity studies and localization
studies were carried out first and showed that at the concentration used the probe does not
cause cell apoptosis. Confocal imaging of the MOVAS-1 cell monolayer confirmed what had
previously been reported, the probe was localizing between cells in the extracellular matrix

Chapter 6– Conclusion
133
where the HAP crystals were depositing. Comparative studies with the calcium leaching assay
as well as Alizarin S stain showed that in both condition-specific and temporal studies of CVD,
the Fluorescein-BP is less time consuming and more sensitive than both assays which could
allow the probe to be used for high-throughput multi-well analysis of calcification.
Fluorescein-BP was also able to detect calcification in MC3T3 cells showing the versatility of
the probe and the potential to use to study other diseases that involve HAP deposition.
Fluorescein-BP was also used on ex vivo WT aortic sections as well as ApoE-/- mouse sections
and in both instances shows to bind to intraplaque calcification. ApoE-/- are genetically
modified mice that have been fed on a high fat diet and therefore should present symptoms
and plaque morphology similar to the ones found in humans. Upon closer inspection of the
intraplaque calcification, two different types of deposits were visible. Larger
macrocalcification and smaller microcalcification were both detected using Fluorescein-BP
while Von Kossa was only able to detect the larger deposits suggesting that this probe can be
used as a tool to study early detection of calcification.
Animal models have provided a good tool to investigate the pathology of CVD however, there
are key limitations when studying the disease using rodents. For this reason, in chapter 4
calcified coronary and carotid human tissue were also assessed. Coronary and carotid tissue,
calcified and control samples, were sectioned and stained with Fluorescein-BP and Alizarin S.
With these samples, we demonstrated that Fluorescein-BP is a highly sensitive and specific
biomarker for HAP in human tissue and when compared to Alizarin S co-localizes in the same
area. When compared to the current techniques used in the clinic to detect calcification, PET
and CT, Fluorescein-BP is able to detect both type of stable and unstable calcification which
neither PET nor CT can do, suggesting that the probe could have a potential application in the
clinic to detect early stage vulnerable calcification. Biomarkers that only detect early stage
calcification could also have a role in early diagnosis of CVD. In chapter 4, OPG and OPN as
two potential markers were assessed on both carotid and coronary vascular tissue and both are
present in high concentrations in vulnerable tissue while go undetected in control or stable
vascular tissue.
In the last chapter, chapter 5, we looked at using Raman spectroscopy to detect calcification
in vascular tissue. Throughout the thesis the biggest focus has been on the detection of HAP
which has a strong characteristic Raman peak at 960 cm-1. Studies to address whether this peak
was present in calcified cell models, ex vivo sections and human sections were carried out
showing that, in both cells and ex vivo sections, the characteristic peak at 960 cm-1 is present
and its intensity increases with increasing degree of calcification. However, when assessing
Chapter 6– Conclusion
134
human tissue, a different peak at 973 cm-1,WTK, appears in areas that are stained with Alizarin
S. This peak nevertheless, only appears in tissue samples that have stable phenotype and not
present in vulnerable plaques. Various assumptions have been made on the role of WTK in
cell and tissue models but additional studies are required to determine its actual role in vascular
tissue.
In this thesis we discussed the development of a highly fluorescent probe for the detection of
HAP in vitro and with the potential of in vivo applications. The probe has shown to be more
selective than the current techniques which are used in the lab and the clinic with Alizarin S
stain and Von Kossa binding to any calcium or any phosphate respectively and with Na18F
PET/CT not being able to distinguish between WTK and HAP. The probe has shown to have
great sensitivity in vitro and ex vivo mouse and human vascular tissue. The probe is synthesised
with two low cost reagents which have been approved by the FDA, making the translatability
of this probe from the bench to humans easier. Future in vivo studies in mouse and humans are
required and might be enabled by intravascular administration of the Fluorescein-BP probe
using catheters fitted with a confocal endomicroscope probe. This would negate the need for
use of costly NIR dye, such as Osteosense, as endomicroscope probes do not require the
fluorophore to be detectable through the skin.

Chapter 7– Material and Methods
135
Chapter 7- Materials and Methods
Synthesis
7.1.1 General Information
All non-aqueous reactions were carried out under an atmosphere of dry nitrogen using oven-
dried glassware that was cooled under a dry nitrogen atmosphere. Unless otherwise noted,
starting materials and reagents were obtained from commercial suppliers and were used
without further purification. Toluene, THF, MeCN, MeOH and DCM were dried and purified
by passage through activated alumina columns using a Glass Contour Solvent Purification
System. Saturated aqueous solutions of inorganic salts are represented as (volume, sat. aq.).
On resin chemistry was performed on functionalised 1% DVB crossed-linked chloromethyl
polysterene with a loading capacity of 1.75 mmol g-1 and performed using SPE tubes, draining
to a vacuum box and agitation on a Stuart B2 tube spinner at 20 rpm.
For peptide synthesis, all amino acids and resins were purchased from either Novasyn (Merck)
or Sigma-Aldrich. All amino acids were N-Fmoc protected and side chains were protected
with Boc (Lys); OtBu (Ser); Pbf (Arg). All peptides were synthesised on Rink Amide AM PS
resin with a loading capacity of 0.69 mmol g-1. Synthesis of peptides was performed manually
using SPE tubes, draining to a vacuum box and agitation on a Stuart B2 tube spinner at 20
rpm, while monitoring of coupling steps was performed using tandem chloranil and TNBS
testing
1H and 13C NMR spectra were obtained on Bruker instruments at the stated frequency using
TMS as a reference and residual solvent as an internal standard. Infra-red spectra were
recorded neat on a Shimadzu IRAffinity-1. Electrospray (ESI) mass spectra were obtained on
a Bruker micrOTOF II instrument. ESI-MS was performed in positive ion as well as negative
ion mode on a liquid chromatography-ion trap mass spectrometer. Mass to charge ratios (m/z)
of all parent (molecular) ions ([M]+/-) and their intensities are reported, followed by (major)
fragment or adduct ions and their intensities. UV/VIS absorption spectra were measured at
room temperature with a Shimadzu UV-1800 spectrometer with a 1.0 cm glass cell. The
scanning speed was set to fast with a sampling interval of 0.1. The scan mode was set to repeats
with 5 scans for each sample. Fluorescence spectra were measured using a Horiba Fluoromax-
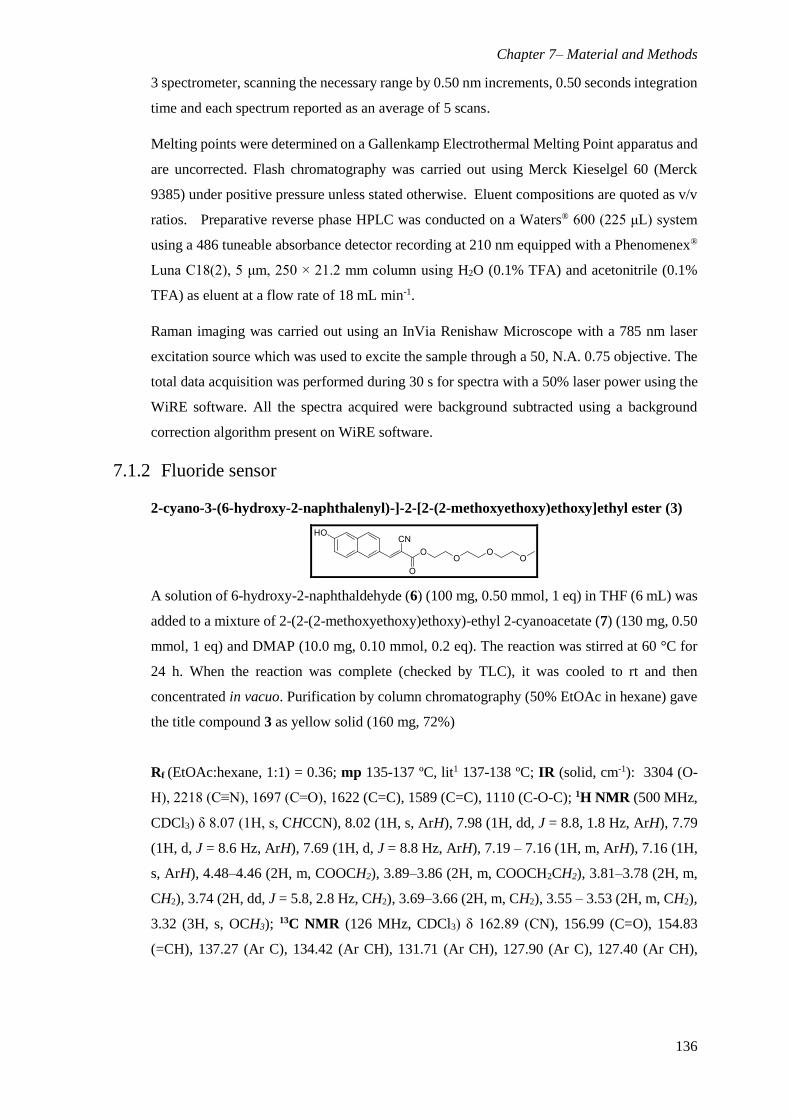
Chapter 7– Material and Methods
136
3 spectrometer, scanning the necessary range by 0.50 nm increments, 0.50 seconds integration
time and each spectrum reported as an average of 5 scans.
Melting points were determined on a Gallenkamp Electrothermal Melting Point apparatus and
are uncorrected. Flash chromatography was carried out using Merck Kieselgel 60 (Merck
9385) under positive pressure unless stated otherwise. Eluent compositions are quoted as v/v
ratios. Preparative reverse phase HPLC was conducted on a Waters® 600 (225 μL) system
using a 486 tuneable absorbance detector recording at 210 nm equipped with a Phenomenex®
Luna C18(2), 5 μm, 250 × 21.2 mm column using H2O (0.1% TFA) and acetonitrile (0.1%
TFA) as eluent at a flow rate of 18 mL min-1.
Raman imaging was carried out using an InVia Renishaw Microscope with a 785 nm laser
excitation source which was used to excite the sample through a 50, N.A. 0.75 objective. The
total data acquisition was performed during 30 s for spectra with a 50% laser power using the
WiRE software. All the spectra acquired were background subtracted using a background
correction algorithm present on WiRE software.
7.1.2 Fluoride sensor
2-cyano-3-(6-hydroxy-2-naphthalenyl)-]-2-[2-(2-methoxyethoxy)ethoxy]ethyl ester (3)
A solution of 6-hydroxy-2-naphthaldehyde (6) (100 mg, 0.50 mmol, 1 eq) in THF (6 mL) was
added to a mixture of 2-(2-(2-methoxyethoxy)ethoxy)-ethyl 2-cyanoacetate (7) (130 mg, 0.50
mmol, 1 eq) and DMAP (10.0 mg, 0.10 mmol, 0.2 eq). The reaction was stirred at 60 °C for
24 h. When the reaction was complete (checked by TLC), it was cooled to rt and then
concentrated in vacuo. Purification by column chromatography (50% EtOAc in hexane) gave
the title compound 3 as yellow solid (160 mg, 72%)
Rf (EtOAc:hexane, 1:1) = 0.36; mp 135-137 ºC, lit1 137-138 ºC; IR (solid, cm-1): 3304 (O-
H), 2218 (C≡N), 1697 (C=O), 1622 (C=C), 1589 (C=C), 1110 (C-O-C); 1H NMR (500 MHz,
CDCl3) δ 8.07 (1H, s, CHCCN), 8.02 (1H, s, ArH), 7.98 (1H, dd, J = 8.8, 1.8 Hz, ArH), 7.79
(1H, d, J = 8.6 Hz, ArH), 7.69 (1H, d, J = 8.8 Hz, ArH), 7.19 – 7.16 (1H, m, ArH), 7.16 (1H,
s, ArH), 4.48–4.46 (2H, m, COOCH2), 3.89–3.86 (2H, m, COOCH2CH2), 3.81–3.78 (2H, m,
CH2), 3.74 (2H, dd, J = 5.8, 2.8 Hz, CH2), 3.69–3.66 (2H, m, CH2), 3.55 – 3.53 (2H, m, CH2),
3.32 (3H, s, OCH3); 13C NMR (126 MHz, CDCl3) δ 162.89 (CN), 156.99 (C=O), 154.83
(=CH), 137.27 (Ar C), 134.42 (Ar CH), 131.71 (Ar CH), 127.90 (Ar C), 127.40 (Ar CH),
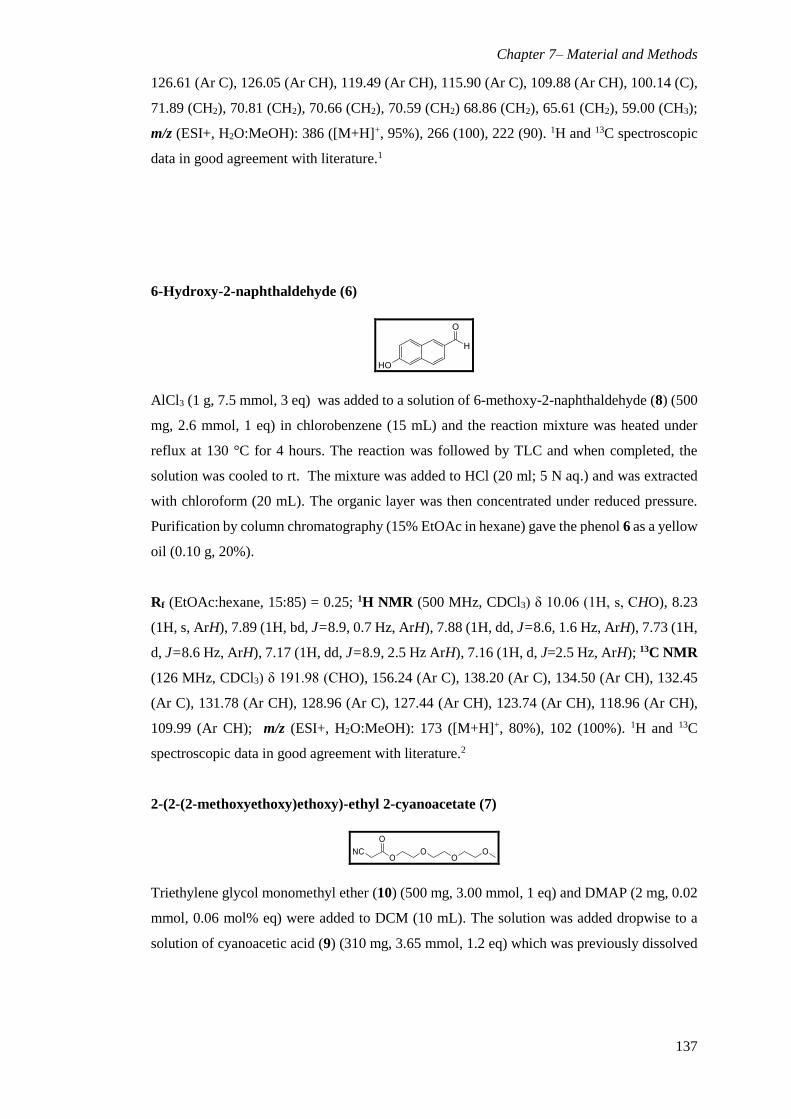
Chapter 7– Material and Methods
137
126.61 (Ar C), 126.05 (Ar CH), 119.49 (Ar CH), 115.90 (Ar C), 109.88 (Ar CH), 100.14 (C),
71.89 (CH2), 70.81 (CH2), 70.66 (CH2), 70.59 (CH2) 68.86 (CH2), 65.61 (CH2), 59.00 (CH3);
m/z (ESI+, H2O:MeOH): 386 ([M+H]+, 95%), 266 (100), 222 (90). 1H and 13C spectroscopic
data in good agreement with literature.1
6-Hydroxy-2-naphthaldehyde (6)
AlCl3 (1 g, 7.5 mmol, 3 eq) was added to a solution of 6-methoxy-2-naphthaldehyde (8) (500
mg, 2.6 mmol, 1 eq) in chlorobenzene (15 mL) and the reaction mixture was heated under
reflux at 130 °C for 4 hours. The reaction was followed by TLC and when completed, the
solution was cooled to rt. The mixture was added to HCl (20 ml; 5 N aq.) and was extracted
with chloroform (20 mL). The organic layer was then concentrated under reduced pressure.
Purification by column chromatography (15% EtOAc in hexane) gave the phenol 6 as a yellow
oil (0.10 g, 20%).
Rf (EtOAc:hexane, 15:85) = 0.25; 1H NMR (500 MHz, CDCl3) δ 10.06 (1H, s, CHO), 8.23
(1H, s, ArH), 7.89 (1H, bd, J=8.9, 0.7 Hz, ArH), 7.88 (1H, dd, J=8.6, 1.6 Hz, ArH), 7.73 (1H,
d, J=8.6 Hz, ArH), 7.17 (1H, dd, J=8.9, 2.5 Hz ArH), 7.16 (1H, d, J=2.5 Hz, ArH); 13C NMR
(126 MHz, CDCl3) δ 191.98 (CHO), 156.24 (Ar C), 138.20 (Ar C), 134.50 (Ar CH), 132.45
(Ar C), 131.78 (Ar CH), 128.96 (Ar C), 127.44 (Ar CH), 123.74 (Ar CH), 118.96 (Ar CH),
109.99 (Ar CH); m/z (ESI+, H2O:MeOH): 173 ([M+H]+, 80%), 102 (100%). 1H and 13C
spectroscopic data in good agreement with literature.2
2-(2-(2-methoxyethoxy)ethoxy)-ethyl 2-cyanoacetate (7)
Triethylene glycol monomethyl ether (10) (500 mg, 3.00 mmol, 1 eq) and DMAP (2 mg, 0.02
mmol, 0.06 mol% eq) were added to DCM (10 mL). The solution was added dropwise to a
solution of cyanoacetic acid (9) (310 mg, 3.65 mmol, 1.2 eq) which was previously dissolved
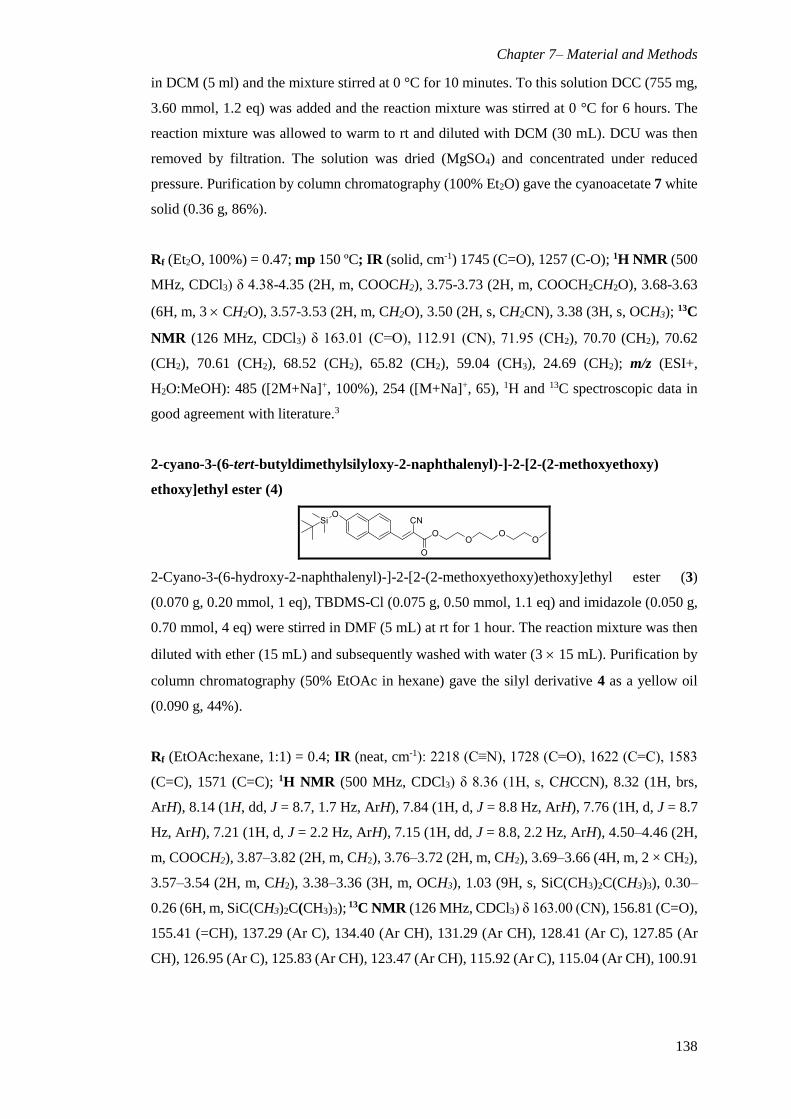
Chapter 7– Material and Methods
138
in DCM (5 ml) and the mixture stirred at 0 °C for 10 minutes. To this solution DCC (755 mg,
3.60 mmol, 1.2 eq) was added and the reaction mixture was stirred at 0 °C for 6 hours. The
reaction mixture was allowed to warm to rt and diluted with DCM (30 mL). DCU was then
removed by filtration. The solution was dried (MgSO4) and concentrated under reduced
pressure. Purification by column chromatography (100% Et2O) gave the cyanoacetate 7 white
solid (0.36 g, 86%).
Rf (Et2O, 100%) = 0.47; mp 150 ºC; IR (solid, cm-1) 1745 (C=O), 1257 (C-O); 1H NMR (500
MHz, CDCl3) δ 4.38-4.35 (2H, m, COOCH2), 3.75-3.73 (2H, m, COOCH2CH2O), 3.68-3.63
(6H, m, 3 CH2O), 3.57-3.53 (2H, m, CH2O), 3.50 (2H, s, CH2CN), 3.38 (3H, s, OCH3); 13C
NMR (126 MHz, CDCl3) δ 163.01 (C=O), 112.91 (CN), 71.95 (CH2), 70.70 (CH2), 70.62
(CH2), 70.61 (CH2), 68.52 (CH2), 65.82 (CH2), 59.04 (CH3), 24.69 (CH2); m/z (ESI+,
H2O:MeOH): 485 ([2M+Na]+, 100%), 254 ([M+Na]+, 65), 1H and 13C spectroscopic data in
good agreement with literature.3
2-cyano-3-(6-tert-butyldimethylsilyloxy-2-naphthalenyl)-]-2-[2-(2-methoxyethoxy)
ethoxy]ethyl ester (4)
2-Cyano-3-(6-hydroxy-2-naphthalenyl)-]-2-[2-(2-methoxyethoxy)ethoxy]ethyl ester (3)
(0.070 g, 0.20 mmol, 1 eq), TBDMS-Cl (0.075 g, 0.50 mmol, 1.1 eq) and imidazole (0.050 g,
0.70 mmol, 4 eq) were stirred in DMF (5 mL) at rt for 1 hour. The reaction mixture was then
diluted with ether (15 mL) and subsequently washed with water (3 15 mL). Purification by
column chromatography (50% EtOAc in hexane) gave the silyl derivative 4 as a yellow oil
(0.090 g, 44%).
Rf (EtOAc:hexane, 1:1) = 0.4; IR (neat, cm-1): 2218 (C≡N), 1728 (C=O), 1622 (C=C), 1583
(C=C), 1571 (C=C); 1H NMR (500 MHz, CDCl3) δ 8.36 (1H, s, CHCCN), 8.32 (1H, brs,
ArH), 8.14 (1H, dd, J = 8.7, 1.7 Hz, ArH), 7.84 (1H, d, J = 8.8 Hz, ArH), 7.76 (1H, d, J = 8.7
Hz, ArH), 7.21 (1H, d, J = 2.2 Hz, ArH), 7.15 (1H, dd, J = 8.8, 2.2 Hz, ArH), 4.50–4.46 (2H,
m, COOCH2), 3.87–3.82 (2H, m, CH2), 3.76–3.72 (2H, m, CH2), 3.69–3.66 (4H, m, 2 × CH2),
3.57–3.54 (2H, m, CH2), 3.38–3.36 (3H, m, OCH3), 1.03 (9H, s, SiC(CH3)2C(CH3)3), 0.30–
0.26 (6H, m, SiC(CH3)2C(CH3)3); 13C NMR (126 MHz, CDCl3) δ 163.00 (CN), 156.81 (C=O),
155.41 (=CH), 137.29 (Ar C), 134.40 (Ar CH), 131.29 (Ar CH), 128.41 (Ar C), 127.85 (Ar
CH), 126.95 (Ar C), 125.83 (Ar CH), 123.47 (Ar CH), 115.92 (Ar C), 115.04 (Ar CH), 100.91
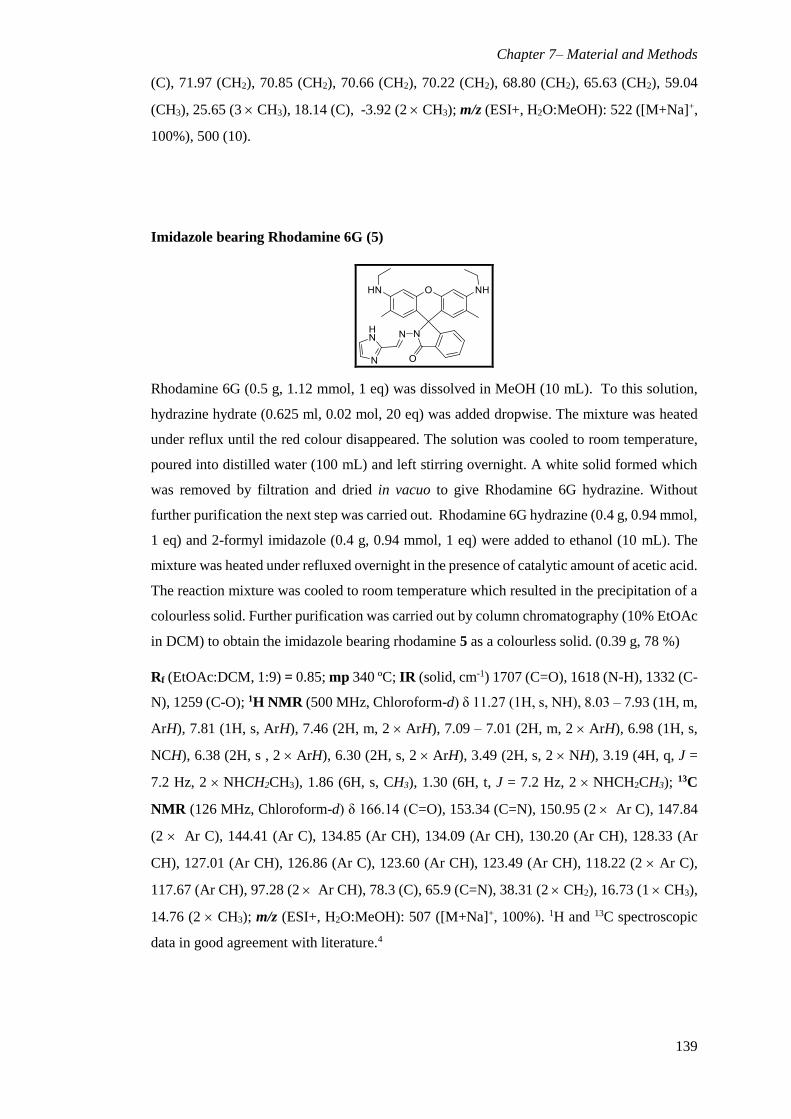
Chapter 7– Material and Methods
139
(C), 71.97 (CH2), 70.85 (CH2), 70.66 (CH2), 70.22 (CH2), 68.80 (CH2), 65.63 (CH2), 59.04
(CH3), 25.65 (3 CH3), 18.14 (C), -3.92 (2 CH3); m/z (ESI+, H2O:MeOH): 522 ([M+Na]+,
100%), 500 (10).
Imidazole bearing Rhodamine 6G (5)
Rhodamine 6G (0.5 g, 1.12 mmol, 1 eq) was dissolved in MeOH (10 mL). To this solution,
hydrazine hydrate (0.625 ml, 0.02 mol, 20 eq) was added dropwise. The mixture was heated
under reflux until the red colour disappeared. The solution was cooled to room temperature,
poured into distilled water (100 mL) and left stirring overnight. A white solid formed which
was removed by filtration and dried in vacuo to give Rhodamine 6G hydrazine. Without
further purification the next step was carried out. Rhodamine 6G hydrazine (0.4 g, 0.94 mmol,
1 eq) and 2-formyl imidazole (0.4 g, 0.94 mmol, 1 eq) were added to ethanol (10 mL). The
mixture was heated under refluxed overnight in the presence of catalytic amount of acetic acid.
The reaction mixture was cooled to room temperature which resulted in the precipitation of a
colourless solid. Further purification was carried out by column chromatography (10% EtOAc
in DCM) to obtain the imidazole bearing rhodamine 5 as a colourless solid. (0.39 g, 78 %)
Rf (EtOAc:DCM, 1:9) = 0.85; mp 340 ºC; IR (solid, cm-1) 1707 (C=O), 1618 (N-H), 1332 (C-
N), 1259 (C-O); 1H NMR (500 MHz, Chloroform-d) δ 11.27 (1H, s, NH), 8.03 – 7.93 (1H, m,
ArH), 7.81 (1H, s, ArH), 7.46 (2H, m, 2 ArH), 7.09 – 7.01 (2H, m, 2 ArH), 6.98 (1H, s,
NCH), 6.38 (2H, s , 2 ArH), 6.30 (2H, s, 2 ArH), 3.49 (2H, s, 2 NH), 3.19 (4H, q, J =
7.2 Hz, 2 NHCH2CH3), 1.86 (6H, s, CH3), 1.30 (6H, t, J = 7.2 Hz, 2 NHCH2CH3); 13C
NMR (126 MHz, Chloroform-d) δ 166.14 (C=O), 153.34 (C=N), 150.95 (2 Ar C), 147.84
(2 Ar C), 144.41 (Ar C), 134.85 (Ar CH), 134.09 (Ar CH), 130.20 (Ar CH), 128.33 (Ar
CH), 127.01 (Ar CH), 126.86 (Ar C), 123.60 (Ar CH), 123.49 (Ar CH), 118.22 (2 Ar C),
117.67 (Ar CH), 97.28 (2 Ar CH), 78.3 (C), 65.9 (C=N), 38.31 (2 CH2), 16.73 (1 CH3),
14.76 (2 CH3); m/z (ESI+, H2O:MeOH): 507 ([M+Na]+, 100%). 1H and 13C spectroscopic
data in good agreement with literature.4

Chapter 7– Material and Methods
140
7.1.3 Cy dye building blocks
1,1,2,3-tetramethyl-1H-benz[e]indolium (31)
1,1,2-Trimethyl-1H-benz[e]indole (36) (250 mg, 0.42 mmol, 1 eq) was stirred in 1,2-
dichlorobenzene (5 mL). To this, MeI (500 mg, 3.8 mmol, 3.1 eq) was added and the reaction
was stirred under reflux at 110 °C for 24 h under argon. When complete, the reaction was
cooled to rt. The solvent was removed under reduced pressure and the resultant solid was
triturated with ether (20 mL) which was removed by decantation after the mixture was
centrifuged to give the desired product as a white solid. (0.25 g, 99%)
mp 220-221 °C, lit5 199 °C; IR (solid, cm-1) 1581 (C=C), 1524 (C=C); 1H NMR (500 MHz,
DMSO-d6) δ 8.33 (1H, dd, J = 8.4, 1.1 Hz, ArH), 8.29 (1H, d, J = 8.9 Hz, ArH), 8.21 (1H, dd,
J = 8.2, 1.3 Hz, ArH), 8.06 (1H, d, J = 8.9 Hz, ArH), 7.78 (1H, ddd, J = 8.4, 6.9, 1.4 Hz, ArH),
7.72 (1H, ddd, J = 8.1, 6.9, 1.3 Hz, ArH), 4.05 (3H, s, NCH3), 2.83 (3H, s, NCCH3), 1.72 (6H,
s, NCC(CH3)2); 13C NMR (126 MHz, DMSO-d6) δ 139.94 (Ar C), 137.02 (Ar C), 133.53 (Ar
C), 131.02 (Ar CH), 130.23 (Ar CH), 128.87 (Ar CH), 127.63 (Ar CH), 123.88 (Ar CH),
113.59 (Ar CH), 55.74 (Ar C), 35.47 (CH3), 21.76 (2 × CH3), 14.32 (CH3); m/z (ESI+,
H2O:MeOH): 224 ([M]+, 100%), 209 (80). 1H and 13C spectroscopic data in good agreement
with literature.6
1,1,2-Trimethyl-3-(4-sulfobutyl)- 1H-Benz[e]indolium (32)
1,1,2-Trimethyl-1H-benz[e]indole (36) (1.00 g, 4.80 mmol, 1 eq) was dissolved in 1,2-
dichlorobenzene (20 mL) to give a golden solution. 1,4-Butane sultone (1.86 g, 13.7 mmol,
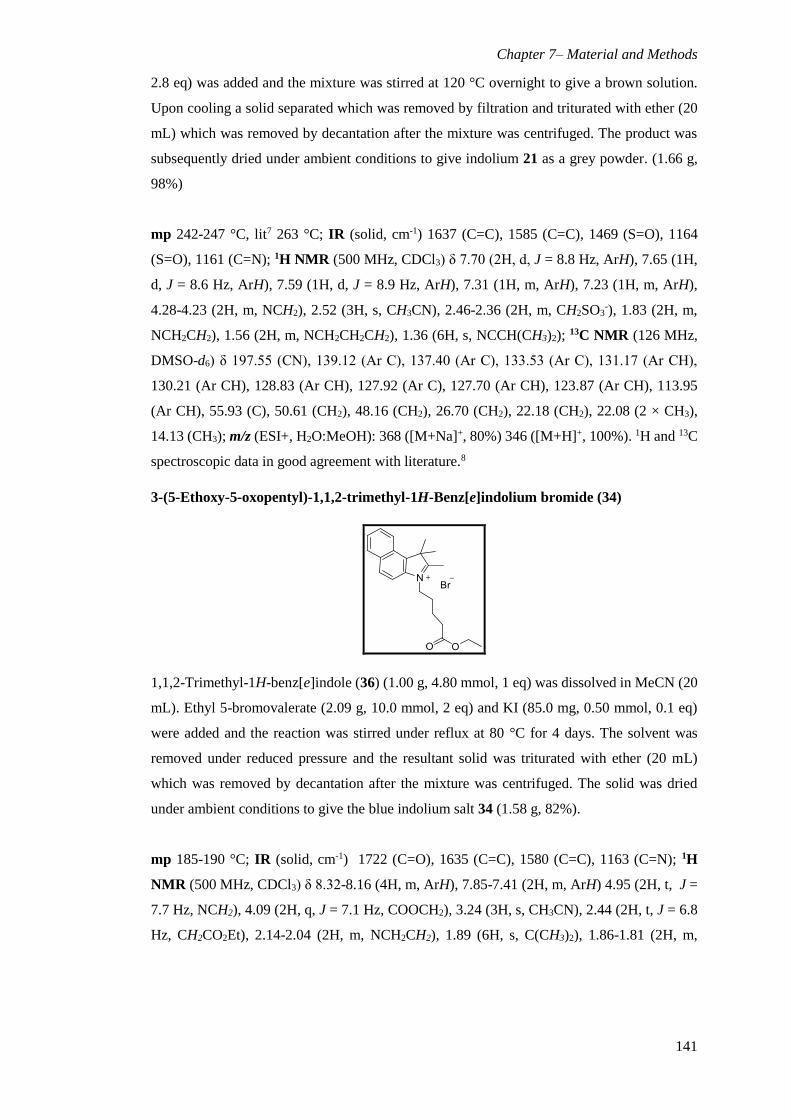
Chapter 7– Material and Methods
141
2.8 eq) was added and the mixture was stirred at 120 °C overnight to give a brown solution.
Upon cooling a solid separated which was removed by filtration and triturated with ether (20
mL) which was removed by decantation after the mixture was centrifuged. The product was
subsequently dried under ambient conditions to give indolium 21 as a grey powder. (1.66 g,
98%)
mp 242-247 °C, lit7 263 °C; IR (solid, cm-1) 1637 (C=C), 1585 (C=C), 1469 (S=O), 1164
(S=O), 1161 (C=N); 1H NMR (500 MHz, CDCl3) δ 7.70 (2H, d, J = 8.8 Hz, ArH), 7.65 (1H,
d, J = 8.6 Hz, ArH), 7.59 (1H, d, J = 8.9 Hz, ArH), 7.31 (1H, m, ArH), 7.23 (1H, m, ArH),
4.28-4.23 (2H, m, NCH2), 2.52 (3H, s, CH3CN), 2.46-2.36 (2H, m, CH2SO3-), 1.83 (2H, m,
NCH2CH2), 1.56 (2H, m, NCH2CH2CH2), 1.36 (6H, s, NCCH(CH3)2); 13C NMR (126 MHz,
DMSO-d6) δ 197.55 (CN), 139.12 (Ar C), 137.40 (Ar C), 133.53 (Ar C), 131.17 (Ar CH),
130.21 (Ar CH), 128.83 (Ar CH), 127.92 (Ar C), 127.70 (Ar CH), 123.87 (Ar CH), 113.95
(Ar CH), 55.93 (C), 50.61 (CH2), 48.16 (CH2), 26.70 (CH2), 22.18 (CH2), 22.08 (2 × CH3),
14.13 (CH3); m/z (ESI+, H2O:MeOH): 368 ([M+Na]+, 80%) 346 ([M+H]+, 100%). 1H and 13C
spectroscopic data in good agreement with literature.8
3-(5-Ethoxy-5-oxopentyl)-1,1,2-trimethyl-1H-Benz[e]indolium bromide (34)
1,1,2-Trimethyl-1H-benz[e]indole (36) (1.00 g, 4.80 mmol, 1 eq) was dissolved in MeCN (20
mL). Ethyl 5-bromovalerate (2.09 g, 10.0 mmol, 2 eq) and KI (85.0 mg, 0.50 mmol, 0.1 eq)
were added and the reaction was stirred under reflux at 80 °C for 4 days. The solvent was
removed under reduced pressure and the resultant solid was triturated with ether (20 mL)
which was removed by decantation after the mixture was centrifuged. The solid was dried
under ambient conditions to give the blue indolium salt 34 (1.58 g, 82%).
mp 185-190 °C; IR (solid, cm-1) 1722 (C=O), 1635 (C=C), 1580 (C=C), 1163 (C=N); 1H
NMR (500 MHz, CDCl3) δ 8.32-8.16 (4H, m, ArH), 7.85-7.41 (2H, m, ArH) 4.95 (2H, t, J =
7.7 Hz, NCH2), 4.09 (2H, q, J = 7.1 Hz, COOCH2), 3.24 (3H, s, CH3CN), 2.44 (2H, t, J = 6.8
Hz, CH2CO2Et), 2.14-2.04 (2H, m, NCH2CH2), 1.89 (6H, s, C(CH3)2), 1.86-1.81 (2H, m,
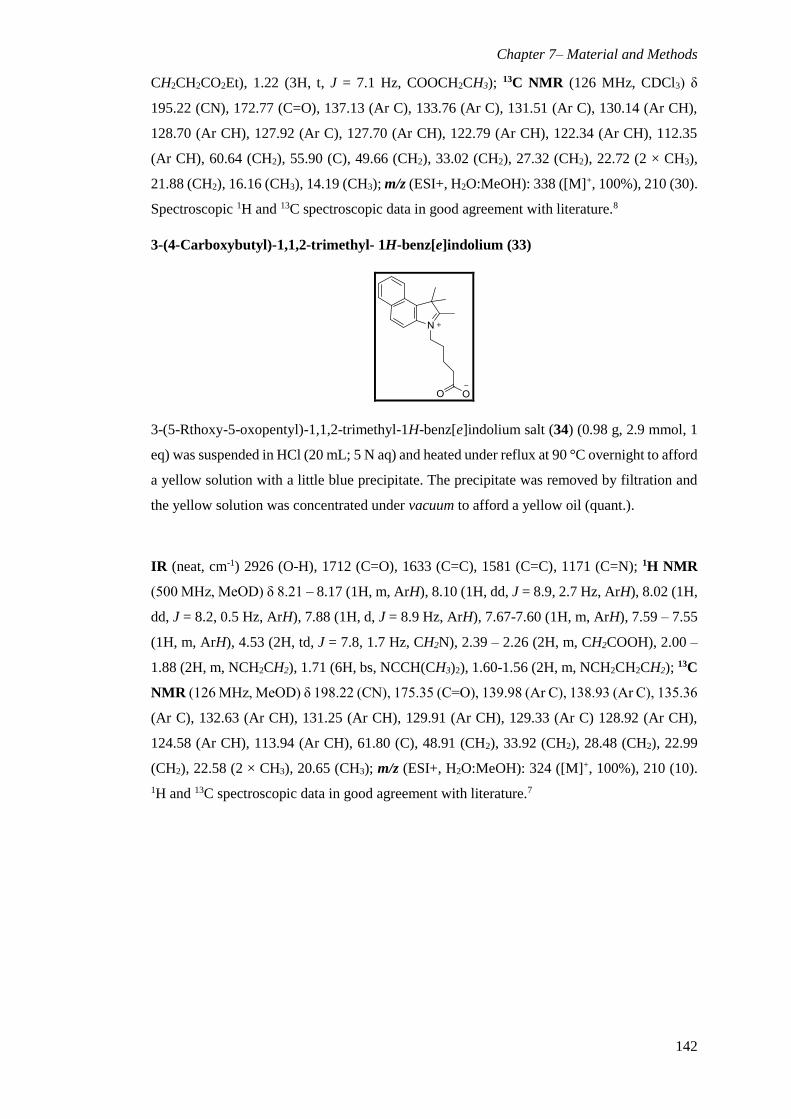
Chapter 7– Material and Methods
142
CH2CH2CO2Et), 1.22 (3H, t, J = 7.1 Hz, COOCH2CH3); 13C NMR (126 MHz, CDCl3) δ
195.22 (CN), 172.77 (C=O), 137.13 (Ar C), 133.76 (Ar C), 131.51 (Ar C), 130.14 (Ar CH),
128.70 (Ar CH), 127.92 (Ar C), 127.70 (Ar CH), 122.79 (Ar CH), 122.34 (Ar CH), 112.35
(Ar CH), 60.64 (CH2), 55.90 (C), 49.66 (CH2), 33.02 (CH2), 27.32 (CH2), 22.72 (2 × CH3),
21.88 (CH2), 16.16 (CH3), 14.19 (CH3); m/z (ESI+, H2O:MeOH): 338 ([M]+, 100%), 210 (30).
Spectroscopic 1H and 13C spectroscopic data in good agreement with literature.8
3-(4-Carboxybutyl)-1,1,2-trimethyl- 1H-benz[e]indolium (33)
3-(5-Rthoxy-5-oxopentyl)-1,1,2-trimethyl-1H-benz[e]indolium salt (34) (0.98 g, 2.9 mmol, 1
eq) was suspended in HCl (20 mL; 5 N aq) and heated under reflux at 90 °C overnight to afford
a yellow solution with a little blue precipitate. The precipitate was removed by filtration and
the yellow solution was concentrated under vacuum to afford a yellow oil (quant.).
IR (neat, cm-1) 2926 (O-H), 1712 (C=O), 1633 (C=C), 1581 (C=C), 1171 (C=N); 1H NMR
(500 MHz, MeOD) δ 8.21 – 8.17 (1H, m, ArH), 8.10 (1H, dd, J = 8.9, 2.7 Hz, ArH), 8.02 (1H,
dd, J = 8.2, 0.5 Hz, ArH), 7.88 (1H, d, J = 8.9 Hz, ArH), 7.67-7.60 (1H, m, ArH), 7.59 – 7.55
(1H, m, ArH), 4.53 (2H, td, J = 7.8, 1.7 Hz, CH2N), 2.39 – 2.26 (2H, m, CH2COOH), 2.00 –
1.88 (2H, m, NCH2CH2), 1.71 (6H, bs, NCCH(CH3)2), 1.60-1.56 (2H, m, NCH2CH2CH2); 13C
NMR (126 MHz, MeOD) δ 198.22 (CN), 175.35 (C=O), 139.98 (Ar C), 138.93 (Ar C), 135.36
(Ar C), 132.63 (Ar CH), 131.25 (Ar CH), 129.91 (Ar CH), 129.33 (Ar C) 128.92 (Ar CH),
124.58 (Ar CH), 113.94 (Ar CH), 61.80 (C), 48.91 (CH2), 33.92 (CH2), 28.48 (CH2), 22.99
(CH2), 22.58 (2 × CH3), 20.65 (CH3); m/z (ESI+, H2O:MeOH): 324 ([M]+, 100%), 210 (10).
1H and 13C spectroscopic data in good agreement with literature.7
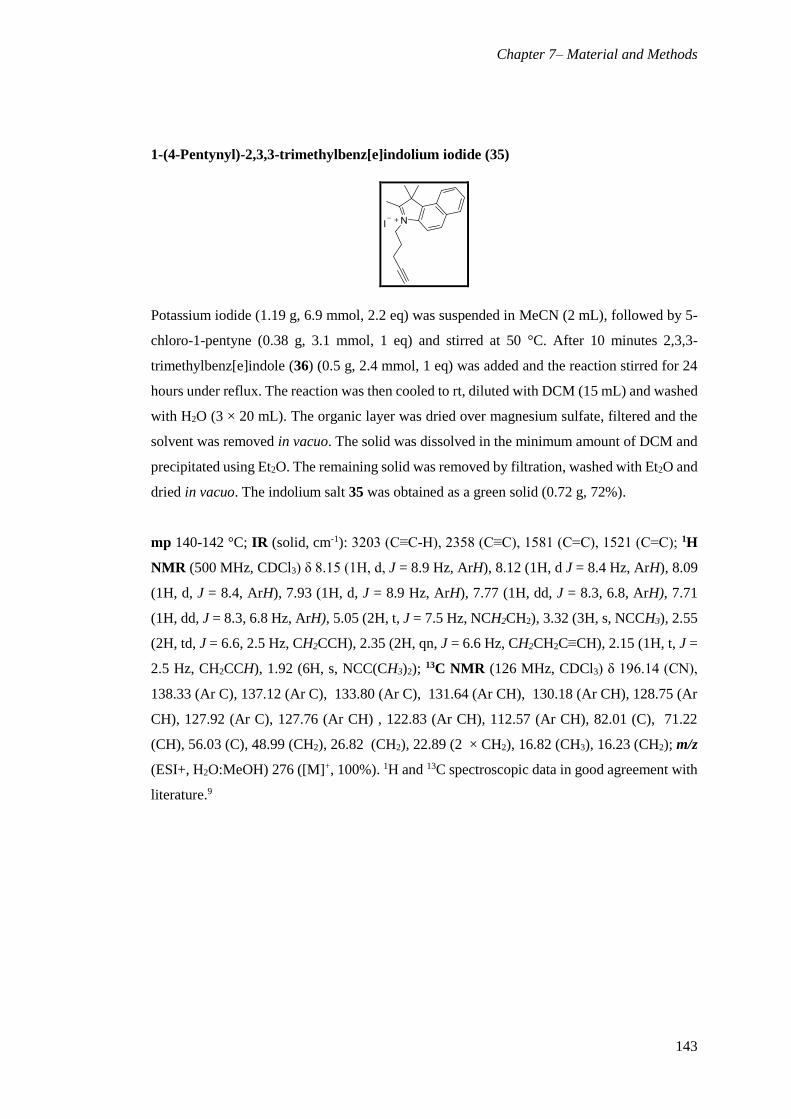
Chapter 7– Material and Methods
143
1-(4-Pentynyl)-2,3,3-trimethylbenz[e]indolium iodide (35)
Potassium iodide (1.19 g, 6.9 mmol, 2.2 eq) was suspended in MeCN (2 mL), followed by 5-
chloro-1-pentyne (0.38 g, 3.1 mmol, 1 eq) and stirred at 50 °C. After 10 minutes 2,3,3-
trimethylbenz[e]indole (36) (0.5 g, 2.4 mmol, 1 eq) was added and the reaction stirred for 24
hours under reflux. The reaction was then cooled to rt, diluted with DCM (15 mL) and washed
with H2O (3 × 20 mL). The organic layer was dried over magnesium sulfate, filtered and the
solvent was removed in vacuo. The solid was dissolved in the minimum amount of DCM and
precipitated using Et2O. The remaining solid was removed by filtration, washed with Et2O and
dried in vacuo. The indolium salt 35 was obtained as a green solid (0.72 g, 72%).
mp 140-142 °C; IR (solid, cm-1): 3203 (C≡C-H), 2358 (C≡C), 1581 (C=C), 1521 (C=C); 1H
NMR (500 MHz, CDCl3) δ 8.15 (1H, d, J = 8.9 Hz, ArH), 8.12 (1H, d J = 8.4 Hz, ArH), 8.09
(1H, d, J = 8.4, ArH), 7.93 (1H, d, J = 8.9 Hz, ArH), 7.77 (1H, dd, J = 8.3, 6.8, ArH), 7.71
(1H, dd, J = 8.3, 6.8 Hz, ArH), 5.05 (2H, t, J = 7.5 Hz, NCH2CH2), 3.32 (3H, s, NCCH3), 2.55
(2H, td, J = 6.6, 2.5 Hz, CH2CCH), 2.35 (2H, qn, J = 6.6 Hz, CH2CH2C≡CH), 2.15 (1H, t, J =
2.5 Hz, CH2CCH), 1.92 (6H, s, NCC(CH3)2); 13C NMR (126 MHz, CDCl3) δ 196.14 (CN),
138.33 (Ar C), 137.12 (Ar C), 133.80 (Ar C), 131.64 (Ar CH), 130.18 (Ar CH), 128.75 (Ar
CH), 127.92 (Ar C), 127.76 (Ar CH) , 122.83 (Ar CH), 112.57 (Ar CH), 82.01 (C), 71.22
(CH), 56.03 (C), 48.99 (CH2), 26.82 (CH2), 22.89 (2 × CH2), 16.82 (CH3), 16.23 (CH2); m/z
(ESI+, H2O:MeOH) 276 ([M]+, 100%). 1H and 13C spectroscopic data in good agreement with
literature.9

Chapter 7– Material and Methods
144
2-[(1E,3E,5E)-6-(Acetylphenylamino)-1,3,5-hexatrien-1-yl]-1,1,3-trimethyl-1H-benz[e]
indolium iodide (38)
1,1,2,3-Tetramethyl-1H-benz[e]indolium iodide (31) (120 mg, 0.28 mmol, 1 eq) and
glutaconaldehyde dianyl hydrochloride salt (37) (70.0 mg, 0.31 mmol, 1.1 eq) were added to
a round bottom flask containing acetic acid (3 mL) and acetic anhydride (3 mL). The reaction
mixture was stirred at 120 °C for 2.5 hours. The solvent was removed in vacuo and the
resulting solid was triturated with EtOAc:H2O (20 mL, 1:1) which was removed by
decantation after the mixture was centrifuged to give a dark purple solid 38 (52 mg, 40%).
mp 200-202 °C; IR (solid, cm-1) 1681 (C=O), 1548 (C=C), 1504 (C=C); 1H NMR (500 MHz,
DMSO-d6) δ 8.33-7.32 (12H, m, 9 × ArH & 3 × =CH), δ 7.28 (1H, d, J = 14.2 Hz, =CH), 7.02-
6.99 (1H, t, J = 7.4 Hz, ArH), 6.90 (1H, d, J = 15.3 Hz, =CH), 6.58 (1H, dd, J = 15.3, 11.1 Hz,
ArH), 5.27 (1H, dd, J = 14.2, 11.5 Hz, =CH), 4.01 (3H, s, CH3), 2.04 (3H, s, CH3), 1.92 (6H,
s, 2 × CH3); 13C NMR (126 MHz, DMSO-d6) δ 181.51 (CN), 168.72 (C=O), 154.34 (CH),
150.59 (CH), 139.98 (Ar C), 139.80 (Ar C), 138.71 (Ar C), 137.61 (Ar C), 133.31 (Ar C),
131.21 (Ar CH), 130.82 (Ar CH), 130.46 (Ar CH), 129.87 (CH), 129.80 (Ar CH), 129.11
(CH), 129.04 (Ar CH), 128.76 (Ar CH), 127.25 (Ar CH), 123.51 (Ar CH), 123.42 (Ar CH),
119.44 (Ar CH), 113.45 (CH), 112.89 (Ar CH), 112.78 (CH), 53.42 (C) 34.43 (CH3), 25.94 (2
× CH3), 24.49 (CH3); m/z (ESI+, H2O:MeOH): 421 ([M]+, 100%). 1H and 13C spectroscopic
data in good agreement with literature.6
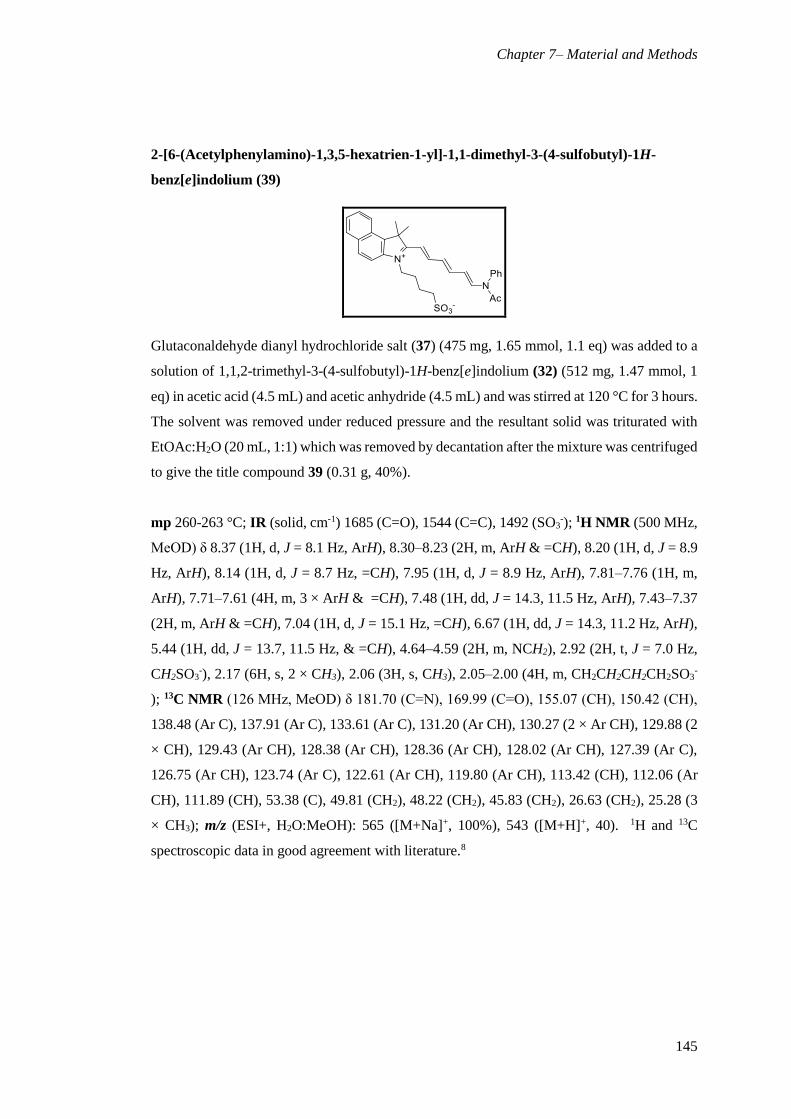
Chapter 7– Material and Methods
145
2-[6-(Acetylphenylamino)-1,3,5-hexatrien-1-yl]-1,1-dimethyl-3-(4-sulfobutyl)-1H-
benz[e]indolium (39)
Glutaconaldehyde dianyl hydrochloride salt (37) (475 mg, 1.65 mmol, 1.1 eq) was added to a
solution of 1,1,2-trimethyl-3-(4-sulfobutyl)-1H-benz[e]indolium (32) (512 mg, 1.47 mmol, 1
eq) in acetic acid (4.5 mL) and acetic anhydride (4.5 mL) and was stirred at 120 °C for 3 hours.
The solvent was removed under reduced pressure and the resultant solid was triturated with
EtOAc:H2O (20 mL, 1:1) which was removed by decantation after the mixture was centrifuged
to give the title compound 39 (0.31 g, 40%).
mp 260-263 °C; IR (solid, cm-1) 1685 (C=O), 1544 (C=C), 1492 (SO3-); 1H NMR (500 MHz,
MeOD) δ 8.37 (1H, d, J = 8.1 Hz, ArH), 8.30–8.23 (2H, m, ArH & =CH), 8.20 (1H, d, J = 8.9
Hz, ArH), 8.14 (1H, d, J = 8.7 Hz, =CH), 7.95 (1H, d, J = 8.9 Hz, ArH), 7.81–7.76 (1H, m,
ArH), 7.71–7.61 (4H, m, 3 × ArH & =CH), 7.48 (1H, dd, J = 14.3, 11.5 Hz, ArH), 7.43–7.37
(2H, m, ArH & =CH), 7.04 (1H, d, J = 15.1 Hz, =CH), 6.67 (1H, dd, J = 14.3, 11.2 Hz, ArH),
5.44 (1H, dd, J = 13.7, 11.5 Hz, & =CH), 4.64–4.59 (2H, m, NCH2), 2.92 (2H, t, J = 7.0 Hz,
CH2SO3-), 2.17 (6H, s, 2 × CH3), 2.06 (3H, s, CH3), 2.05–2.00 (4H, m, CH2CH2CH2CH2SO3
-
); 13C NMR (126 MHz, MeOD) δ 181.70 (C=N), 169.99 (C=O), 155.07 (CH), 150.42 (CH),
138.48 (Ar C), 137.91 (Ar C), 133.61 (Ar C), 131.20 (Ar CH), 130.27 (2 × Ar CH), 129.88 (2
× CH), 129.43 (Ar CH), 128.38 (Ar CH), 128.36 (Ar CH), 128.02 (Ar CH), 127.39 (Ar C),
126.75 (Ar CH), 123.74 (Ar C), 122.61 (Ar CH), 119.80 (Ar CH), 113.42 (CH), 112.06 (Ar
CH), 111.89 (CH), 53.38 (C), 49.81 (CH2), 48.22 (CH2), 45.83 (CH2), 26.63 (CH2), 25.28 (3
× CH3); m/z (ESI+, H2O:MeOH): 565 ([M+Na]+, 100%), 543 ([M+H]+, 40). 1H and 13C
spectroscopic data in good agreement with literature.8

Chapter 7– Material and Methods
146
7.1.4 Solution phase approach
4-(2-(1E,3E,5E,7Z)-7-(3-(4-Carboxybutyl)-1,1-dimethyl-1H-benzo[e]indol-2(3H)-
ylidene)hepta-1,3,5-trienyl)-1,1-dimethyl-1H-benzo[e]indolinium-3-yl (42)
3-(4-Carboxybutyl)-1,1,2-trimethyl-1H-benz[e]indolium (33) (5.0 mg, 0.01 mmol, 1.2 eq) was
added to a solution of 2-[(1E,3E,5E)-6-(acetylphenylamino)-1,3,5-hexatrien-1-yl]-1,1,3-
trimethyl-1H-benz[e]indolium (38) (6.0 mg, 0.01 mmol, 1 eq) in anhydrous pyridine (5 mL)
and stirred at rt for 24 hours. The reaction mix was triturated with ether and the solid was
filtered off, washed with ether and dried in vacuo. Column chromatography (0-2 %
MeOH/DCM) gave compound 42 as a green solid (6.02 mg, 75%).
mp 234-236 °C; IR (solid, cm-1) 3394 (OH), 2922 (CH), 1666 (C=O); 1H NMR (601 MHz,
MeOD) δ 8.28 (2H, d, J = 8.5 Hz, ArH), 8.09 - 8.04 (5H, m, 3 × ArH & 2 × =CH), 7.92 (1H,
dd, J = 20.7, 8.6 Hz, =CH), 7.71 - 7.64 (4H, m, 4 ArH), 7.51 - 7.54 (2H, m, =CH), 7.48 - 7.33
(1H, m, =CH), 6.66 - 6.64 (2H, m, ArH), 6.47 - 6.34 (2H, m, ArH & =CH), 4.29 (2H, t, J =
7.6, NCH2CH2CH2CH2COOH) 3.76 (3H, s, CH3), 2.32 (2H, t, J = 7.1 Hz,
NCH2CH2CH2CH2COOH), 2.02 (12H, s, 4 × CH3), 1.95 - 1.90 (2H, m,
NCH2CH2CH2CH2COOH), 1.84 - 1.79 (2H, m, NCH2CH2CH2CH2COOH); 13C NMR (151
MHz, MeOD) δ 194.06 (C=O), 178.97 (CN), 173.15 (CN), 149.63 (CH), 140.60 (Ar C),
140.33 (Ar C), 133.63 (Ar C), 131.91 (2 × Ar C), 131.85 (2 × Ar C), 130.44 (Ar CH), 130.36
(Ar CH), 129.93 (3 × Ar CH), 129.55 (CH), 128.13 (4 × Ar CH), 127.56 (Ar CH), 126.60
(CH), 124.73 (Ar CH), 122.18 (Ar CH), 122.15 (Ar CH), 111.02 (CH), 110.98 (Ar C), 110.11
(CH), 103.56 (CH), 103.21 (Ar CH) 50.81 (C), 48.11 (C), 43.88 (CH2), 36.16 (CH2), 30.73
(CH3), 26.42 (CH2), 25.90 (4 × CH3), 23.20 (CH2); m/z (ESI+, H2O:MeOH): 595 ([M]+,
100%). 1H and 13C spectroscopic data in good agreement with literature.10

Chapter 7– Material and Methods
147
4-(2-(1E,3E,5E,7Z)-7-(3-(4-Pentynyl)-1,1-dimethyl-1H-benzo[e]indol-2(3H)-
ylidene)hepta-1,3,5-trienyl)-1,1-dimethyl-1H-benzo[e]indolinium-3-yl chloride(43)
1-(4-Pentynyl)-2,3,3-trimethylbenz[e]indolium indole (35) (30 mg, 0.1 mmol, 1.2 eq) was
added to a solution of 2-[(1E,3E,5E)-6-(acetylphenylamino)-1,3,5-hexatrien-1-yl]-1,1,3-
trimethyl-1H-benz[e]indolium chloride (38) (38 mg, 0.09 mmol, 1 eq) in anhydrous pyridine
(5 mL) and stirred at rt for 24 hours. Column chromatography (0-2 % MeOH/DCM) provided
the title product 43 as a green solid (300 mg, 69%).
mp 207 °C; IR (solid, cm-1) 2929 (C≡C-H), 2113 (C≡C), 1666 (C=C); 1H NMR (500 MHz,
MeOD) δ 8.25 (2H, t, J = 9.5 Hz, ArH & =CH), 8.09 – 7.94 (5H, m, 3 × ArCH & =CH), 7.68
– 7.56 (5H, m, 4 ArH & 1 =CH), 7.54 – 7.40 (3H, m, =CH), 6.66 – 6.56 (2H, m, ArH), 6.44 –
6.32 (2H, m, ArH & =CH), 4.31 (2H, t, J = 6.7 Hz, NCH2), 3.77 (3H, s, NCH3), 2.53 (1H, t, J
= 2.6 Hz, C≡CH), 2.43 (2H, td, J = 6.7, 2.6 Hz, CH2C≡CH), 2.08 – 2.05 (2H, m,
CH2CH2C≡CH), 2.01 (12H, s, 4 × CH3); 13C NMR (126 MHz, MeOD) δ 174.52 (CN), 172.30
(CN), 151.13 (CH), 150.95 (Ar CH), 139.84 (Ar C), 133.63 (Ar C), 133.23 (Ar C), 133.00 (Ar
C), 132.12 (Ar C), 131.83 (Ar C), 130.30 (Ar CH), 130.26 (Ar CH), 129.72 (Ar CH), 129.70
(Ar C), 128.09 (Ar C), 127.31 (CH), 127.25 (CH), 125.70 (Ar CH), 125.35 (Ar CH), 124.73
(CH), 124.41 (CH), 121.93 (Ar CH), 121.85 (Ar CH), 110.47 (2 × Ar CH), 110.32 (2 × Ar
CH), 103.74 (Ar CH), 102.40 (CH), 82.45 (C), 69.93 (≡CH), 53.40 (C), 42.38 (CH2), 35.54
(C), 30.43 (CH3), 26.28 (2 × CH3), 26.15 (CH2), 26.07 (2 × CH3), 15.18 (CH2); m/z (ESI+,
H2O:MeOH): 561 ([M]+, 100%), 318 (100). 1H and 13C spectroscopic data in good agreement
with literature.10
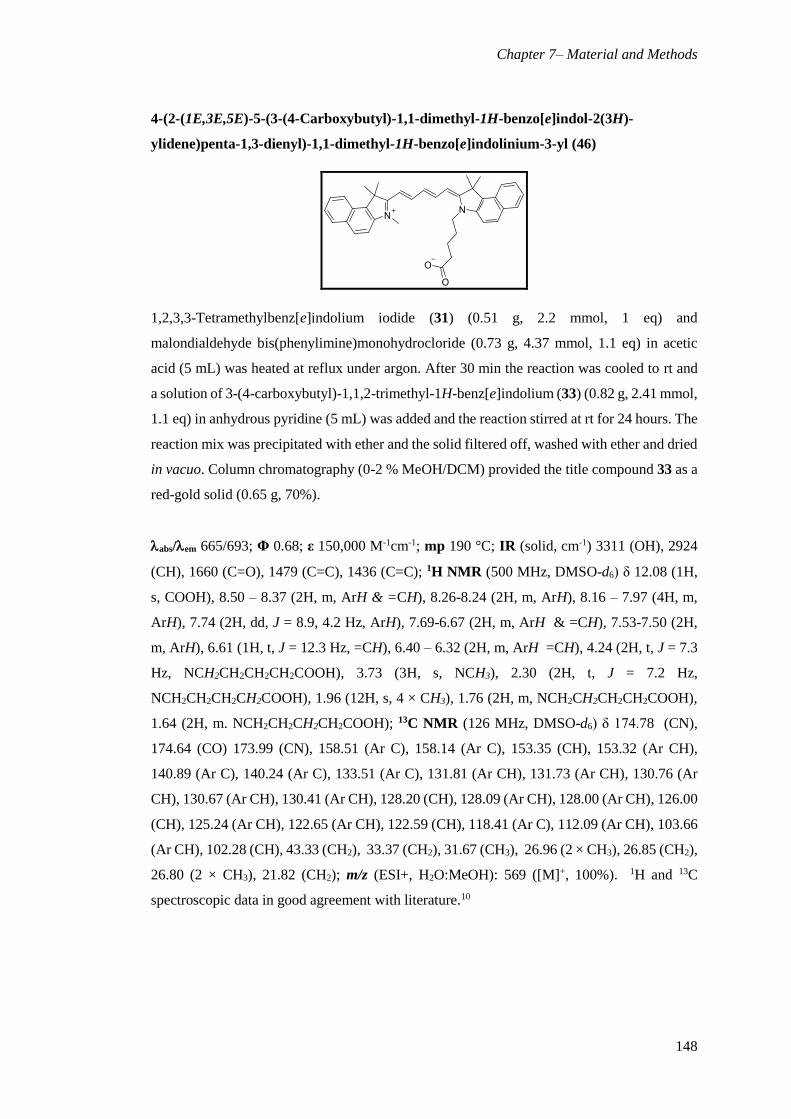
Chapter 7– Material and Methods
148
4-(2-(1E,3E,5E)-5-(3-(4-Carboxybutyl)-1,1-dimethyl-1H-benzo[e]indol-2(3H)-
ylidene)penta-1,3-dienyl)-1,1-dimethyl-1H-benzo[e]indolinium-3-yl (46)
1,2,3,3-Tetramethylbenz[e]indolium iodide (31) (0.51 g, 2.2 mmol, 1 eq) and
malondialdehyde bis(phenylimine)monohydrocloride (0.73 g, 4.37 mmol, 1.1 eq) in acetic
acid (5 mL) was heated at reflux under argon. After 30 min the reaction was cooled to rt and
a solution of 3-(4-carboxybutyl)-1,1,2-trimethyl-1H-benz[e]indolium (33) (0.82 g, 2.41 mmol,
1.1 eq) in anhydrous pyridine (5 mL) was added and the reaction stirred at rt for 24 hours. The
reaction mix was precipitated with ether and the solid filtered off, washed with ether and dried
in vacuo. Column chromatography (0-2 % MeOH/DCM) provided the title compound 33 as a
red-gold solid (0.65 g, 70%).
abs/em 665/693; Φ 0.68; ε 150,000 M-1cm-1; mp 190 °C; IR (solid, cm-1) 3311 (OH), 2924
(CH), 1660 (C=O), 1479 (C=C), 1436 (C=C); 1H NMR (500 MHz, DMSO-d6) δ 12.08 (1H,
s, COOH), 8.50 – 8.37 (2H, m, ArH & =CH), 8.26-8.24 (2H, m, ArH), 8.16 – 7.97 (4H, m,
ArH), 7.74 (2H, dd, J = 8.9, 4.2 Hz, ArH), 7.69-6.67 (2H, m, ArH & =CH), 7.53-7.50 (2H,
m, ArH), 6.61 (1H, t, J = 12.3 Hz, =CH), 6.40 – 6.32 (2H, m, ArH =CH), 4.24 (2H, t, J = 7.3
Hz, NCH2CH2CH2CH2COOH), 3.73 (3H, s, NCH3), 2.30 (2H, t, J = 7.2 Hz,
NCH2CH2CH2CH2COOH), 1.96 (12H, s, 4 × CH3), 1.76 (2H, m, NCH2CH2CH2CH2COOH),
1.64 (2H, m. NCH2CH2CH2CH2COOH); 13C NMR (126 MHz, DMSO-d6) δ 174.78 (CN),
174.64 (CO) 173.99 (CN), 158.51 (Ar C), 158.14 (Ar C), 153.35 (CH), 153.32 (Ar CH),
140.89 (Ar C), 140.24 (Ar C), 133.51 (Ar C), 131.81 (Ar CH), 131.73 (Ar CH), 130.76 (Ar
CH), 130.67 (Ar CH), 130.41 (Ar CH), 128.20 (CH), 128.09 (Ar CH), 128.00 (Ar CH), 126.00
(CH), 125.24 (Ar CH), 122.65 (Ar CH), 122.59 (CH), 118.41 (Ar C), 112.09 (Ar CH), 103.66
(Ar CH), 102.28 (CH), 43.33 (CH2), 33.37 (CH2), 31.67 (CH3), 26.96 (2 × CH3), 26.85 (CH2),
26.80 (2 × CH3), 21.82 (CH2); m/z (ESI+, H2O:MeOH): 569 ([M]+, 100%). 1H and 13C
spectroscopic data in good agreement with literature.10
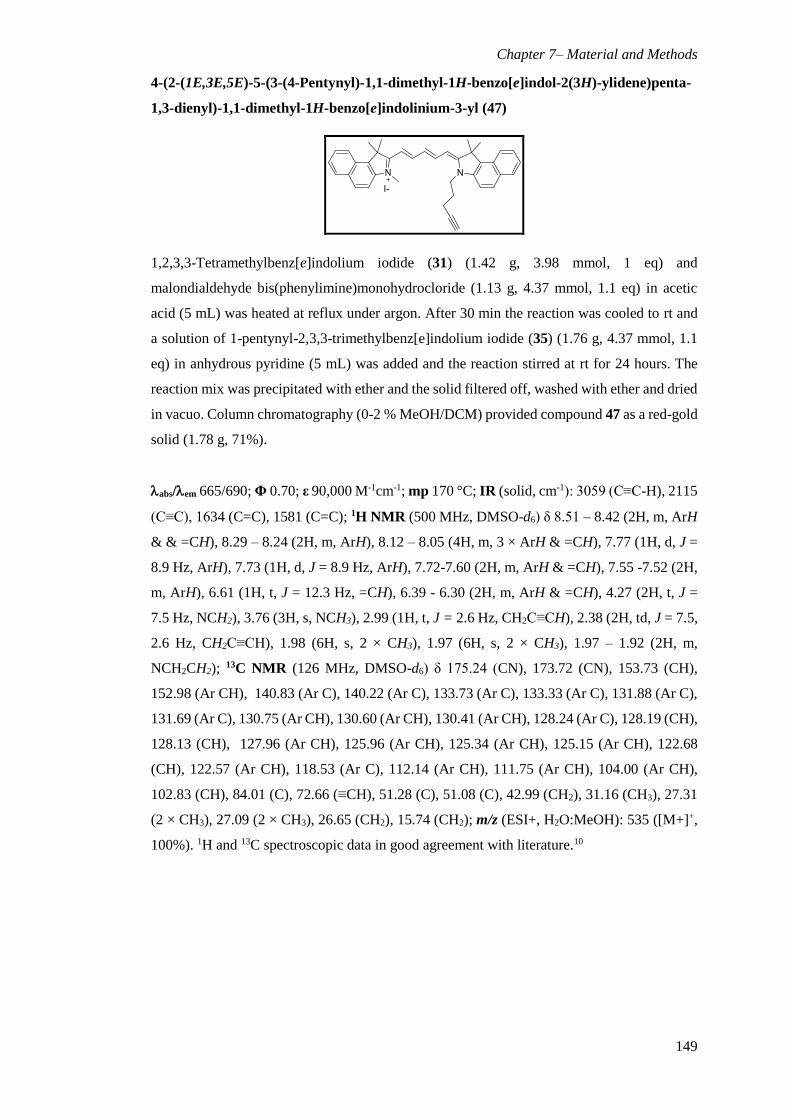
Chapter 7– Material and Methods
149
4-(2-(1E,3E,5E)-5-(3-(4-Pentynyl)-1,1-dimethyl-1H-benzo[e]indol-2(3H)-ylidene)penta-
1,3-dienyl)-1,1-dimethyl-1H-benzo[e]indolinium-3-yl (47)
1,2,3,3-Tetramethylbenz[e]indolium iodide (31) (1.42 g, 3.98 mmol, 1 eq) and
malondialdehyde bis(phenylimine)monohydrocloride (1.13 g, 4.37 mmol, 1.1 eq) in acetic
acid (5 mL) was heated at reflux under argon. After 30 min the reaction was cooled to rt and
a solution of 1-pentynyl-2,3,3-trimethylbenz[e]indolium iodide (35) (1.76 g, 4.37 mmol, 1.1
eq) in anhydrous pyridine (5 mL) was added and the reaction stirred at rt for 24 hours. The
reaction mix was precipitated with ether and the solid filtered off, washed with ether and dried
in vacuo. Column chromatography (0-2 % MeOH/DCM) provided compound 47 as a red-gold
solid (1.78 g, 71%).
abs/em 665/690; Φ 0.70; ε 90,000 M-1cm-1; mp 170 °C; IR (solid, cm-1): 3059 (C≡C-H), 2115
(C≡C), 1634 (C=C), 1581 (C=C); 1H NMR (500 MHz, DMSO-d6) δ 8.51 – 8.42 (2H, m, ArH
& & =CH), 8.29 – 8.24 (2H, m, ArH), 8.12 – 8.05 (4H, m, 3 × ArH & =CH), 7.77 (1H, d, J =
8.9 Hz, ArH), 7.73 (1H, d, J = 8.9 Hz, ArH), 7.72-7.60 (2H, m, ArH & =CH), 7.55 -7.52 (2H,
m, ArH), 6.61 (1H, t, J = 12.3 Hz, =CH), 6.39 - 6.30 (2H, m, ArH & =CH), 4.27 (2H, t, J =
7.5 Hz, NCH2), 3.76 (3H, s, NCH3), 2.99 (1H, t, J = 2.6 Hz, CH2C≡CH), 2.38 (2H, td, J = 7.5,
2.6 Hz, CH2C≡CH), 1.98 (6H, s, 2 × CH3), 1.97 (6H, s, 2 × CH3), 1.97 – 1.92 (2H, m,
NCH2CH2); 13C NMR (126 MHz, DMSO-d6) δ 175.24 (CN), 173.72 (CN), 153.73 (CH),
152.98 (Ar CH), 140.83 (Ar C), 140.22 (Ar C), 133.73 (Ar C), 133.33 (Ar C), 131.88 (Ar C),
131.69 (Ar C), 130.75 (Ar CH), 130.60 (Ar CH), 130.41 (Ar CH), 128.24 (Ar C), 128.19 (CH),
128.13 (CH), 127.96 (Ar CH), 125.96 (Ar CH), 125.34 (Ar CH), 125.15 (Ar CH), 122.68
(CH), 122.57 (Ar CH), 118.53 (Ar C), 112.14 (Ar CH), 111.75 (Ar CH), 104.00 (Ar CH),
102.83 (CH), 84.01 (C), 72.66 (≡CH), 51.28 (C), 51.08 (C), 42.99 (CH2), 31.16 (CH3), 27.31
(2 × CH3), 27.09 (2 × CH3), 26.65 (CH2), 15.74 (CH2); m/z (ESI+, H2O:MeOH): 535 ([M+]+,
100%). 1H and 13C spectroscopic data in good agreement with literature.10
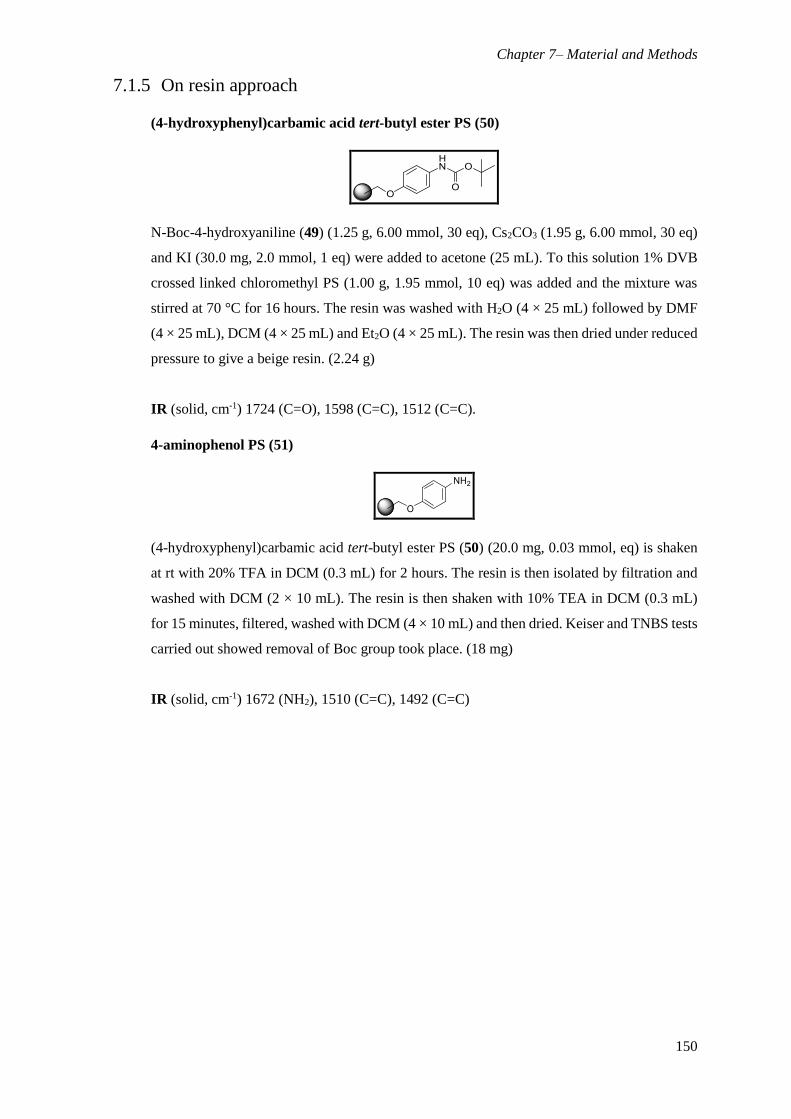
Chapter 7– Material and Methods
150
7.1.5 On resin approach
(4-hydroxyphenyl)carbamic acid tert-butyl ester PS (50)
N-Boc-4-hydroxyaniline (49) (1.25 g, 6.00 mmol, 30 eq), Cs2CO3 (1.95 g, 6.00 mmol, 30 eq)
and KI (30.0 mg, 2.0 mmol, 1 eq) were added to acetone (25 mL). To this solution 1% DVB
crossed linked chloromethyl PS (1.00 g, 1.95 mmol, 10 eq) was added and the mixture was
stirred at 70 °C for 16 hours. The resin was washed with H2O (4 × 25 mL) followed by DMF
(4 × 25 mL), DCM (4 × 25 mL) and Et2O (4 × 25 mL). The resin was then dried under reduced
pressure to give a beige resin. (2.24 g)
IR (solid, cm-1) 1724 (C=O), 1598 (C=C), 1512 (C=C).
4-aminophenol PS (51)
(4-hydroxyphenyl)carbamic acid tert-butyl ester PS (50) (20.0 mg, 0.03 mmol, eq) is shaken
at rt with 20% TFA in DCM (0.3 mL) for 2 hours. The resin is then isolated by filtration and
washed with DCM (2 × 10 mL). The resin is then shaken with 10% TEA in DCM (0.3 mL)
for 15 minutes, filtered, washed with DCM (4 × 10 mL) and then dried. Keiser and TNBS tests
carried out showed removal of Boc group took place. (18 mg)
IR (solid, cm-1) 1672 (NH2), 1510 (C=C), 1492 (C=C)
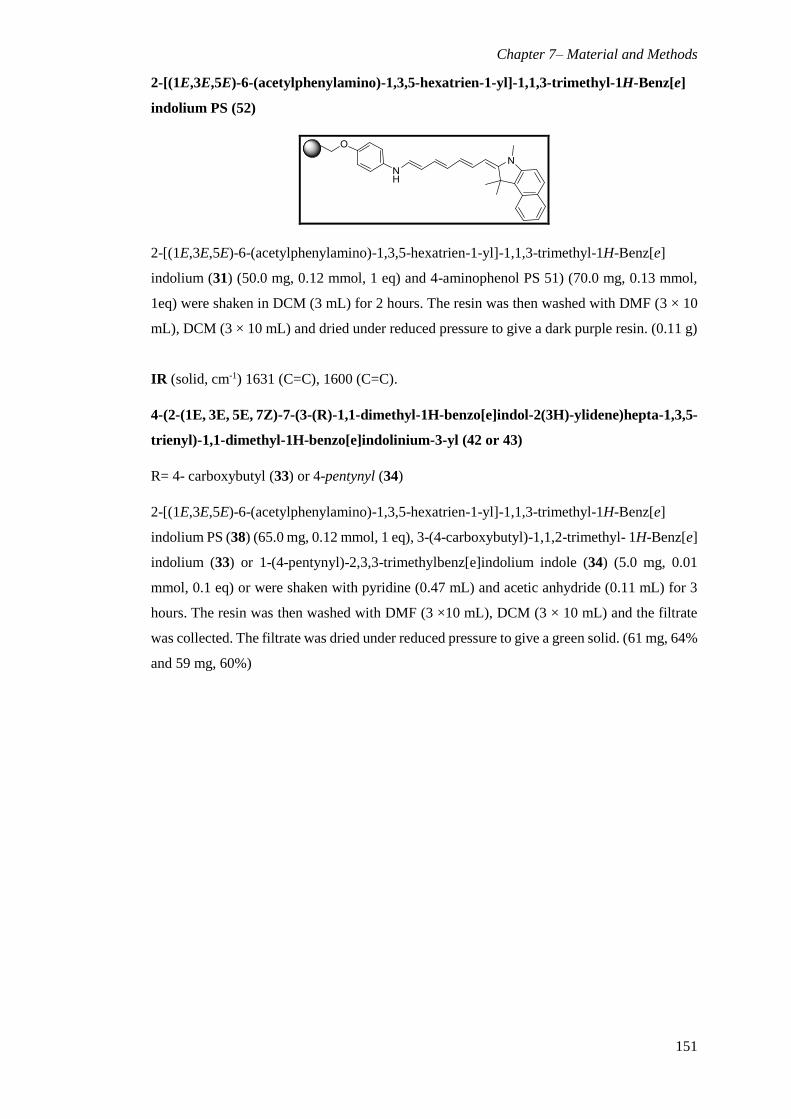
Chapter 7– Material and Methods
151
2-[(1E,3E,5E)-6-(acetylphenylamino)-1,3,5-hexatrien-1-yl]-1,1,3-trimethyl-1H-Benz[e]
indolium PS (52)
2-[(1E,3E,5E)-6-(acetylphenylamino)-1,3,5-hexatrien-1-yl]-1,1,3-trimethyl-1H-Benz[e]
indolium (31) (50.0 mg, 0.12 mmol, 1 eq) and 4-aminophenol PS 51) (70.0 mg, 0.13 mmol,
1eq) were shaken in DCM (3 mL) for 2 hours. The resin was then washed with DMF (3 × 10
mL), DCM (3 × 10 mL) and dried under reduced pressure to give a dark purple resin. (0.11 g)
IR (solid, cm-1) 1631 (C=C), 1600 (C=C).
4-(2-(1E, 3E, 5E, 7Z)-7-(3-(R)-1,1-dimethyl-1H-benzo[e]indol-2(3H)-ylidene)hepta-1,3,5-
trienyl)-1,1-dimethyl-1H-benzo[e]indolinium-3-yl (42 or 43)
R= 4- carboxybutyl (33) or 4-pentynyl (34)
2-[(1E,3E,5E)-6-(acetylphenylamino)-1,3,5-hexatrien-1-yl]-1,1,3-trimethyl-1H-Benz[e]
indolium PS (38) (65.0 mg, 0.12 mmol, 1 eq), 3-(4-carboxybutyl)-1,1,2-trimethyl- 1H-Benz[e]
indolium (33) or 1-(4-pentynyl)-2,3,3-trimethylbenz[e]indolium indole (34) (5.0 mg, 0.01
mmol, 0.1 eq) or were shaken with pyridine (0.47 mL) and acetic anhydride (0.11 mL) for 3
hours. The resin was then washed with DMF (3 ×10 mL), DCM (3 × 10 mL) and the filtrate
was collected. The filtrate was dried under reduced pressure to give a green solid. (61 mg, 64%
and 59 mg, 60%)
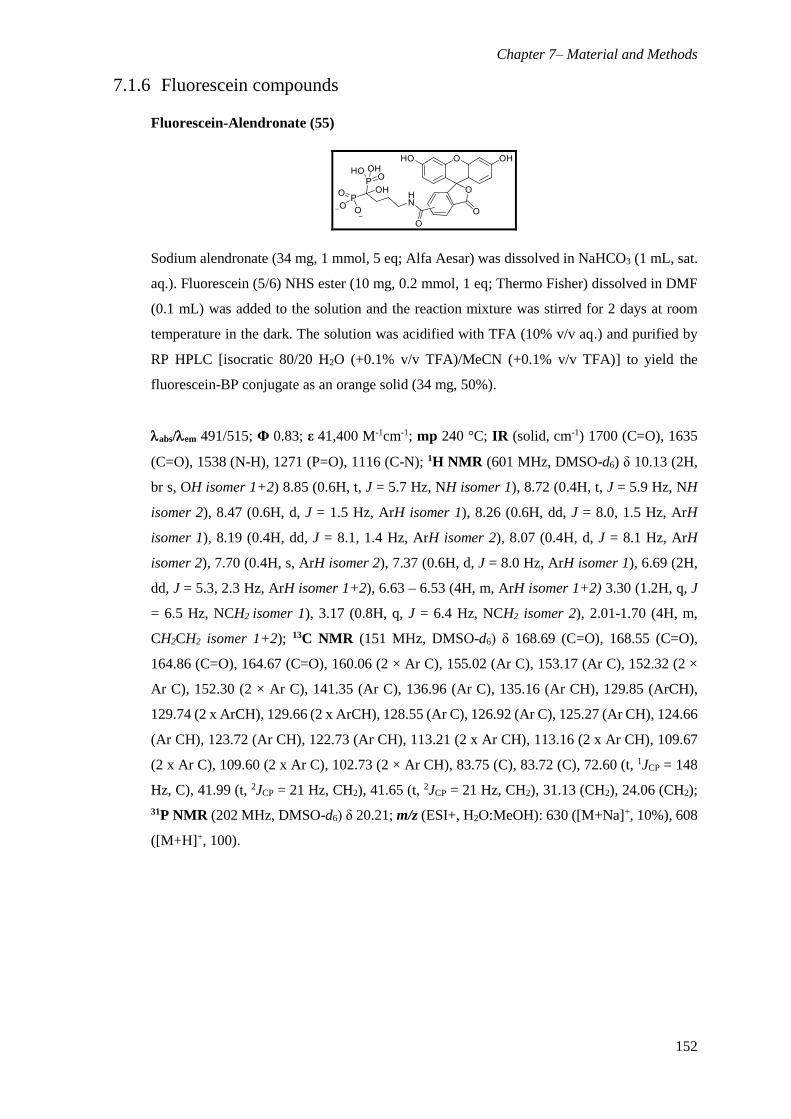
Chapter 7– Material and Methods
152
7.1.6 Fluorescein compounds
Fluorescein-Alendronate (55)
Sodium alendronate (34 mg, 1 mmol, 5 eq; Alfa Aesar) was dissolved in NaHCO3 (1 mL, sat.
aq.). Fluorescein (5/6) NHS ester (10 mg, 0.2 mmol, 1 eq; Thermo Fisher) dissolved in DMF
(0.1 mL) was added to the solution and the reaction mixture was stirred for 2 days at room
temperature in the dark. The solution was acidified with TFA (10% v/v aq.) and purified by
RP HPLC [isocratic 80/20 H2O (+0.1% v/v TFA)/MeCN (+0.1% v/v TFA)] to yield the
fluorescein-BP conjugate as an orange solid (34 mg, 50%).
abs/em 491/515; Φ 0.83; ε 41,400 M-1cm-1; mp 240 °C; IR (solid, cm-1) 1700 (C=O), 1635
(C=O), 1538 (N-H), 1271 (P=O), 1116 (C-N); 1H NMR (601 MHz, DMSO-d6) δ 10.13 (2H,
br s, OH isomer 1+2) 8.85 (0.6H, t, J = 5.7 Hz, NH isomer 1), 8.72 (0.4H, t, J = 5.9 Hz, NH
isomer 2), 8.47 (0.6H, d, J = 1.5 Hz, ArH isomer 1), 8.26 (0.6H, dd, J = 8.0, 1.5 Hz, ArH
isomer 1), 8.19 (0.4H, dd, J = 8.1, 1.4 Hz, ArH isomer 2), 8.07 (0.4H, d, J = 8.1 Hz, ArH
isomer 2), 7.70 (0.4H, s, ArH isomer 2), 7.37 (0.6H, d, J = 8.0 Hz, ArH isomer 1), 6.69 (2H,
dd, J = 5.3, 2.3 Hz, ArH isomer 1+2), 6.63 – 6.53 (4H, m, ArH isomer 1+2) 3.30 (1.2H, q, J
= 6.5 Hz, NCH2 isomer 1), 3.17 (0.8H, q, J = 6.4 Hz, NCH2 isomer 2), 2.01-1.70 (4H, m,
CH2CH2 isomer 1+2); 13C NMR (151 MHz, DMSO-d6) δ 168.69 (C=O), 168.55 (C=O),
164.86 (C=O), 164.67 (C=O), 160.06 (2 × Ar C), 155.02 (Ar C), 153.17 (Ar C), 152.32 (2 ×
Ar C), 152.30 (2 × Ar C), 141.35 (Ar C), 136.96 (Ar C), 135.16 (Ar CH), 129.85 (ArCH),
129.74 (2 x ArCH), 129.66 (2 x ArCH), 128.55 (Ar C), 126.92 (Ar C), 125.27 (Ar CH), 124.66
(Ar CH), 123.72 (Ar CH), 122.73 (Ar CH), 113.21 (2 x Ar CH), 113.16 (2 x Ar CH), 109.67
(2 x Ar C), 109.60 (2 x Ar C), 102.73 (2 × Ar CH), 83.75 (C), 83.72 (C), 72.60 (t, 1JCP = 148
Hz, C), 41.99 (t, 2JCP = 21 Hz, CH2), 41.65 (t, 2JCP = 21 Hz, CH2), 31.13 (CH2), 24.06 (CH2);
31P NMR (202 MHz, DMSO-d6) δ 20.21; m/z (ESI+, H2O:MeOH): 630 ([M+Na]+, 10%), 608
([M+H]+, 100).
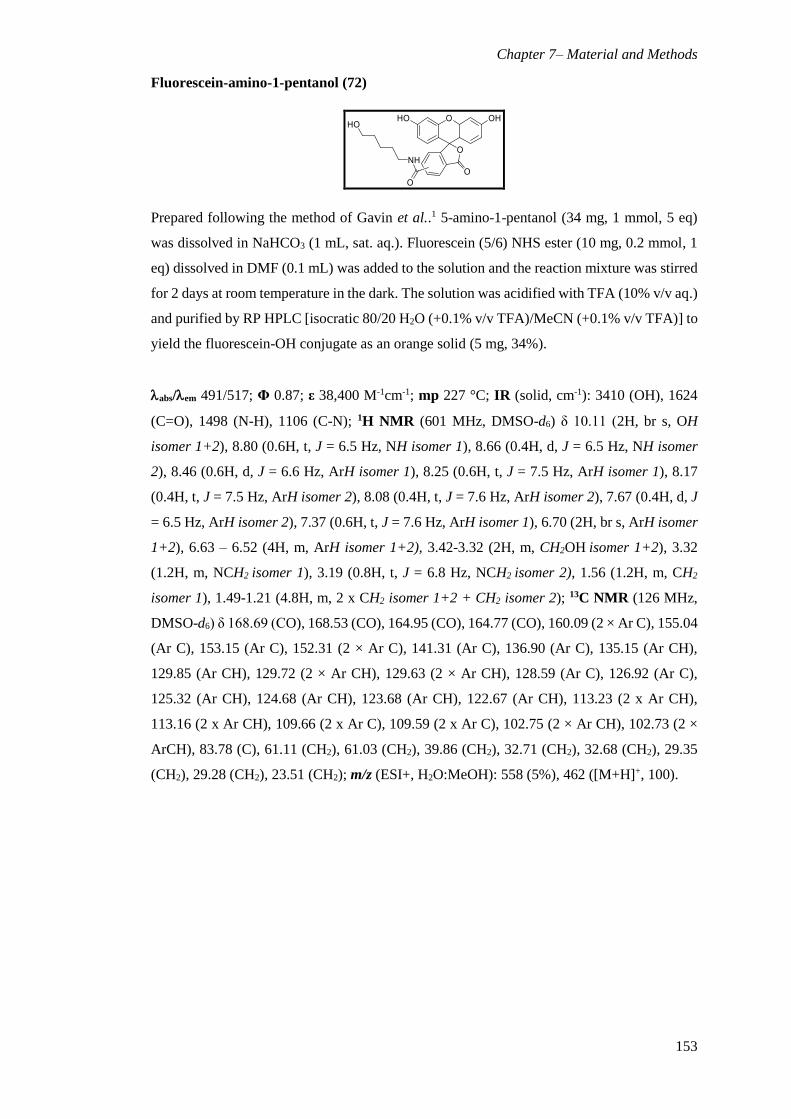
Chapter 7– Material and Methods
153
Fluorescein-amino-1-pentanol (72)
Prepared following the method of Gavin et al..1 5-amino-1-pentanol (34 mg, 1 mmol, 5 eq)
was dissolved in NaHCO3 (1 mL, sat. aq.). Fluorescein (5/6) NHS ester (10 mg, 0.2 mmol, 1
eq) dissolved in DMF (0.1 mL) was added to the solution and the reaction mixture was stirred
for 2 days at room temperature in the dark. The solution was acidified with TFA (10% v/v aq.)
and purified by RP HPLC [isocratic 80/20 H2O (+0.1% v/v TFA)/MeCN (+0.1% v/v TFA)] to
yield the fluorescein-OH conjugate as an orange solid (5 mg, 34%).
abs/em 491/517; Φ 0.87; ε 38,400 M-1cm-1; mp 227 °C; IR (solid, cm-1): 3410 (OH), 1624
(C=O), 1498 (N-H), 1106 (C-N); 1H NMR (601 MHz, DMSO-d6) δ 10.11 (2H, br s, OH
isomer 1+2), 8.80 (0.6H, t, J = 6.5 Hz, NH isomer 1), 8.66 (0.4H, d, J = 6.5 Hz, NH isomer
2), 8.46 (0.6H, d, J = 6.6 Hz, ArH isomer 1), 8.25 (0.6H, t, J = 7.5 Hz, ArH isomer 1), 8.17
(0.4H, t, J = 7.5 Hz, ArH isomer 2), 8.08 (0.4H, t, J = 7.6 Hz, ArH isomer 2), 7.67 (0.4H, d, J
= 6.5 Hz, ArH isomer 2), 7.37 (0.6H, t, J = 7.6 Hz, ArH isomer 1), 6.70 (2H, br s, ArH isomer
1+2), 6.63 – 6.52 (4H, m, ArH isomer 1+2), 3.42-3.32 (2H, m, CH2OH isomer 1+2), 3.32
(1.2H, m, NCH2 isomer 1), 3.19 (0.8H, t, J = 6.8 Hz, NCH2 isomer 2), 1.56 (1.2H, m, CH2
isomer 1), 1.49-1.21 (4.8H, m, 2 x CH2 isomer 1+2 + CH2 isomer 2); 13C NMR (126 MHz,
DMSO-d6) δ 168.69 (CO), 168.53 (CO), 164.95 (CO), 164.77 (CO), 160.09 (2 × Ar C), 155.04
(Ar C), 153.15 (Ar C), 152.31 (2 × Ar C), 141.31 (Ar C), 136.90 (Ar C), 135.15 (Ar CH),
129.85 (Ar CH), 129.72 (2 × Ar CH), 129.63 (2 × Ar CH), 128.59 (Ar C), 126.92 (Ar C),
125.32 (Ar CH), 124.68 (Ar CH), 123.68 (Ar CH), 122.67 (Ar CH), 113.23 (2 x Ar CH),
113.16 (2 x Ar CH), 109.66 (2 x Ar C), 109.59 (2 x Ar C), 102.75 (2 × Ar CH), 102.73 (2 ×
ArCH), 83.78 (C), 61.11 (CH2), 61.03 (CH2), 39.86 (CH2), 32.71 (CH2), 32.68 (CH2), 29.35
(CH2), 29.28 (CH2), 23.51 (CH2); m/z (ESI+, H2O:MeOH): 558 (5%), 462 ([M+H]+, 100).
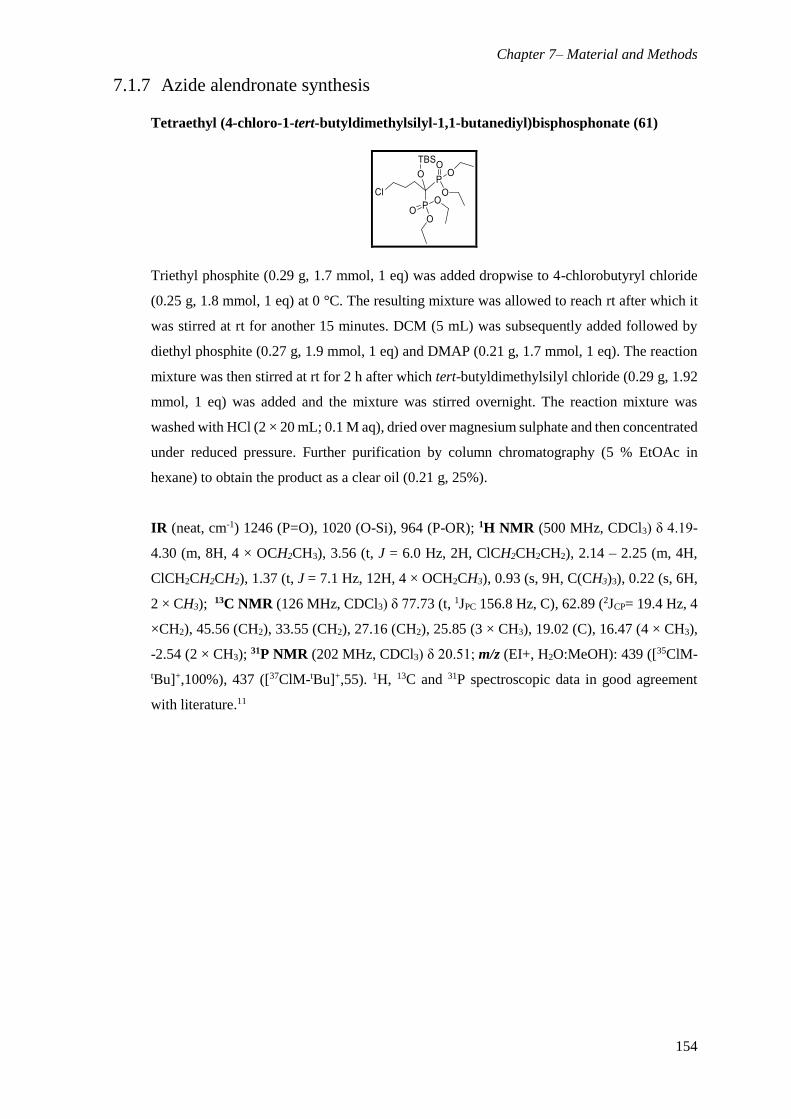
Chapter 7– Material and Methods
154
7.1.7 Azide alendronate synthesis
Tetraethyl (4-chloro-1-tert-butyldimethylsilyl-1,1-butanediyl)bisphosphonate (61)
Triethyl phosphite (0.29 g, 1.7 mmol, 1 eq) was added dropwise to 4-chlorobutyryl chloride
(0.25 g, 1.8 mmol, 1 eq) at 0 °C. The resulting mixture was allowed to reach rt after which it
was stirred at rt for another 15 minutes. DCM (5 mL) was subsequently added followed by
diethyl phosphite (0.27 g, 1.9 mmol, 1 eq) and DMAP (0.21 g, 1.7 mmol, 1 eq). The reaction
mixture was then stirred at rt for 2 h after which tert-butyldimethylsilyl chloride (0.29 g, 1.92
mmol, 1 eq) was added and the mixture was stirred overnight. The reaction mixture was
washed with HCl (2 × 20 mL; 0.1 M aq), dried over magnesium sulphate and then concentrated
under reduced pressure. Further purification by column chromatography (5 % EtOAc in
hexane) to obtain the product as a clear oil (0.21 g, 25%).
IR (neat, cm-1) 1246 (P=O), 1020 (O-Si), 964 (P-OR); 1H NMR (500 MHz, CDCl3) δ 4.19-
4.30 (m, 8H, 4 × OCH2CH3), 3.56 (t, J = 6.0 Hz, 2H, ClCH2CH2CH2), 2.14 – 2.25 (m, 4H,
ClCH2CH2CH2), 1.37 (t, J = 7.1 Hz, 12H, 4 × OCH2CH3), 0.93 (s, 9H, C(CH3)3), 0.22 (s, 6H,
2 × CH3); 13C NMR (126 MHz, CDCl3) δ 77.73 (t, 1JPC 156.8 Hz, C), 62.89 (2JCP= 19.4 Hz, 4
×CH2), 45.56 (CH2), 33.55 (CH2), 27.16 (CH2), 25.85 (3 × CH3), 19.02 (C), 16.47 (4 × CH3),
-2.54 (2 × CH3); 31P NMR (202 MHz, CDCl3) δ 20.51; m/z (EI+, H2O:MeOH): 439 ([35ClM-
tBu]+,100%), 437 ([37ClM-tBu]+,55). 1H, 13C and 31P spectroscopic data in good agreement
with literature.11
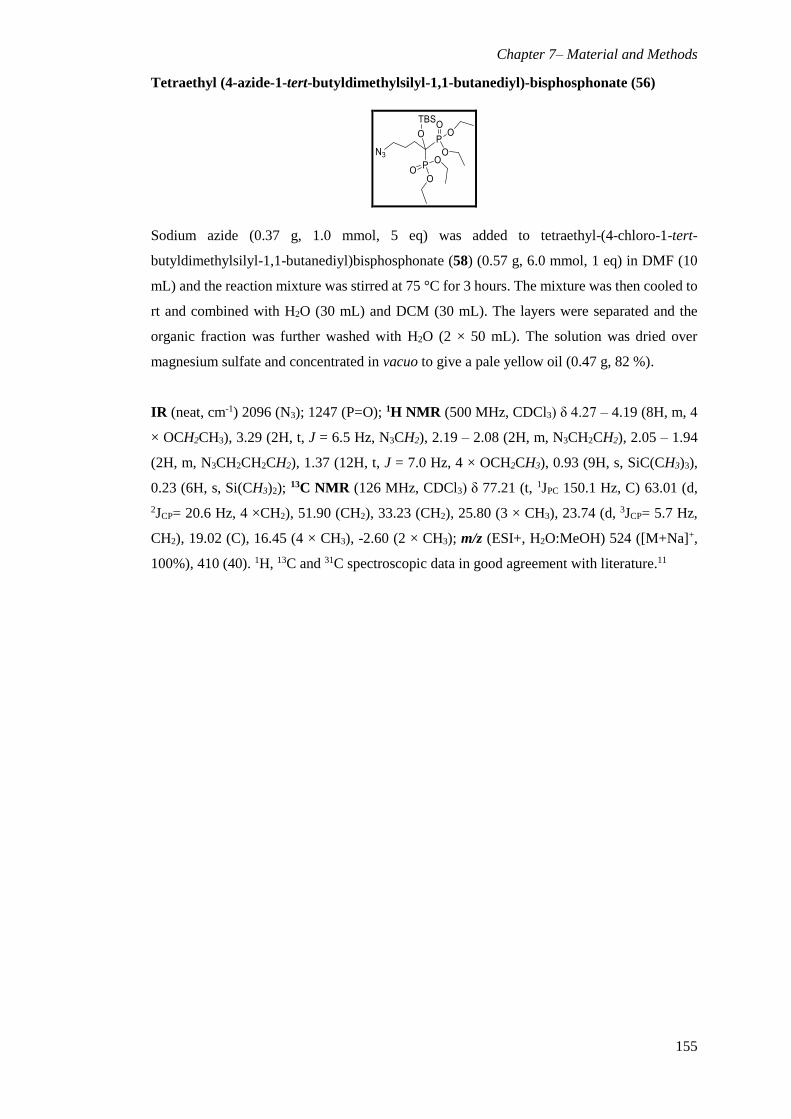
Chapter 7– Material and Methods
155
Tetraethyl (4-azide-1-tert-butyldimethylsilyl-1,1-butanediyl)-bisphosphonate (56)
Sodium azide (0.37 g, 1.0 mmol, 5 eq) was added to tetraethyl-(4-chloro-1-tert-
butyldimethylsilyl-1,1-butanediyl)bisphosphonate (58) (0.57 g, 6.0 mmol, 1 eq) in DMF (10
mL) and the reaction mixture was stirred at 75 °C for 3 hours. The mixture was then cooled to
rt and combined with H2O (30 mL) and DCM (30 mL). The layers were separated and the
organic fraction was further washed with H2O (2 × 50 mL). The solution was dried over
magnesium sulfate and concentrated in vacuo to give a pale yellow oil (0.47 g, 82 %).
IR (neat, cm-1) 2096 (N3); 1247 (P=O); 1H NMR (500 MHz, CDCl3) δ 4.27 – 4.19 (8H, m, 4
× OCH2CH3), 3.29 (2H, t, J = 6.5 Hz, N3CH2), 2.19 – 2.08 (2H, m, N3CH2CH2), 2.05 – 1.94
(2H, m, N3CH2CH2CH2), 1.37 (12H, t, J = 7.0 Hz, 4 × OCH2CH3), 0.93 (9H, s, SiC(CH3)3),
0.23 (6H, s, Si(CH3)2); 13C NMR (126 MHz, CDCl3) δ 77.21 (t, 1JPC 150.1 Hz, C) 63.01 (d,
2JCP= 20.6 Hz, 4 ×CH2), 51.90 (CH2), 33.23 (CH2), 25.80 (3 × CH3), 23.74 (d, 3JCP= 5.7 Hz,
CH2), 19.02 (C), 16.45 (4 × CH3), -2.60 (2 × CH3); m/z (ESI+, H2O:MeOH) 524 ([M+Na]+,
100%), 410 (40). 1H, 13C and 31C spectroscopic data in good agreement with literature.11

Chapter 7– Material and Methods
156
7.1.8 Peptide synthesis
HAP Selective peptide (67)
Ac-Ser-Val-Ser-Val-Gly-Met-Lys-Pro-Ser-Pro-Arg-Pro-Gly-Gly-Gly-Lys(N3)-Ac
Produced using Rink Amide AM Resin (500 mg, 0.345 mmol), standard Fmoc SPPS protocols
described below and RP HPLC ([isocratic 60/40 H2O (+0.1% v/v TFA)/MeCN (+0.1% v/v
TFA)] to give a colourless solid (180 mg, 51%).
IR (solid, cm-1) 3273 (OH), 2962 (C-H), 2098 (N3), 1624 (C=O), 1527 (CH), 1431 (CH); m/z
(ESI+, H2O:MeOH) 826 ([M+2Na]2+, 100%), 815 ([M+H+Na]2+, 80, 805 ([M+2H]2+, 40).
Standard Procedure for Solid Phase peptide synthesis
Method A – Swelling
Rink amide AM resin (150 mg, 104 μmol, 690 μmol g-1) was placed in an empty reservoir (6
mL) and swelled in DCM (5 mL) for 30 minutes, before washing the resin with DMF (3 × 4
mL) and DCM (3 × 4 mL).
Method B – Fmoc Deprotection
A solution of piperidine (20% in DMF, 4 mL) was added to the resin and the mixture was
agitated for 10 minutes, the solution was drained into a vacuum box and washed with DMF (3
× 4 mL) and DCM (3 × 4 mL), before repeating the process again. Method C was used to
check for successful deprotection.
Method C – Chloranil Test
To verify a successful coupling or deprotection, a chloranil test was used to check for the
presence or absence of primary or secondary amines. Chloranil test requires two solutions;
Solution A acetaldehyde (2% in DMF) and Solution B chloranil (2% in DMF). The test was
carried out by placing a small number of beads in an Eppendorf tube and adding 5-6 drops of
each solution. The mixture was then agitated for 5 minutes. If free amines were present the
beads would turn blue and if no free amines were present no colour change would be observed
on the beads.
Method D – Coupling of Amino acids
The appropriate amino acid (3 eq) was pre-activated by dissolving it with Oxyma (3 eq) in
DMF (1 mL), the solution was agitated for 3 minutes whereupon DCC (3 eq) was added and
Chapter 7– Material and Methods
157
the solution was agitated for a further 2 min. The highly activated complex was then added to
the resin and agitated for 40 minutes. Once the coupling was complete the solution was drained
and the resin was washed with DMF (3 × 4 mL) and DCM (3 × 4 mL). Method C was then
used to check for complete coupling.
Method E – Capping
Once the final amino acid was successfully coupled, the peptide was acetylated by agitating
the resin with a solution of Ac2O (20 eq), DIPEA (20 eq) in DMF (1 mL) for 40 minutes.
Method C was used to check for complete acetylation.
Method F – Cleavage
After successfully capping of the peptide, the resin was washed with DMF (3 x 4 mL), DCM
(5 × 4 mL) and dried under vacuum. Peptide cleavage was carried out by agitating the resin in
TFA:H2O:EDT:TIS (94:2.5:2.5:1).
The TFA liquor was collected in a Falcon tube (50 mL) and the resin was washed with more
of the cocktail liquor (5 × 3 mL) before concentrating the solution under a stream of N2. Cold
Et2O (20 mL) was then added to the precipitate and the solution was sonicated before being
centrifuged at 3500 rpm for 2 minutes, the supernatant was decanted, and the process was
repeated again for up to a maximum of 4 times. The precipitated crude peptide was then
lyophilized by dissolving it in H2O and MeCN.
Cy5.5-HAP selective peptide (71)
Cy5.5 (47) (100 mg, 0.96 mmol, 1.2 eq) and HAP selective peptide (67) (130 mg, 0.84 mmol,
1 eq) were dissolved in DMF (10 mL). To this Cu(MeCN)4BF4 (10 mol %) was added. The
reaction was left stirring for 24 hours at rt in the dark. The solution was concentrated under
reduced pressure and purified by RP HPLC [isocratic 65/35 H2O (+0.1% v/v TFA)/MeCN
(+0.1% v/v TFA)] to yield a blue solid (150 mg, 90%).
abs/em 660/695; Φ 0.73; ε 110,000 M-1cm-1; IR (solid, cm-1): 3410 (OH), 3000 (NH), 2924
(CH), 1654 (C=O), 1436 (CH), 1406 (CH); m/z (ESI+, H2O:MeOH) 1075 ([M+2H]2+, 10%),
715 ([M+3H]3+).

Chapter 7– Material and Methods
158
7.1.9 Incorporation of probes in calcium minerals
Fluorescein-BP (42), Cy-Pep (53) and Alizarin S incorporation in calcium minerals
Aqueous suspension of calcium species (HAP, CaOx, CaPi, CaPyr, Sigma Aldrich and Fisher
Scientific) (50 mg) were incubated with either Fluorescein-BP (42) (5 µM) or CyPep (53) (5
µM) or Alizarin S (1%) for 2 hours. Unbound probe was removed after a series of
centrifugation steps and washing steps which involved: resuspension of the solid in H2O ( 3 ×
15 minutes). Fluorescence analysis of the combined aqueous extracts was performed using
Synergy HT Multi Mode Microplate reader at 488 nm (Fluorescein-BP), 530 nm (Alizarin S)
and using Fluoromax-3 at 630 nm (Cy-Pep).
Na18F incorporation in calcium minerals
Aqueous suspension of calcium species (HAP, CaOx, CaPi, CaPyr, WTK Sigma Aldrich and
Fisher Scientific) (50 mg) were incubated with Na18F solution (100kBq/mL) for 20 minutes.
Unbound probe was removed after a series of centrifugation steps and three washing steps
which involved: resuspension of the solid in H2O. Calcium solids were scanned using high-
resolution micro-positron emission tomography and non-contrast computed tomography
[50kVp tube voltage, 300msec exposure time] (Mediso nanoScan PET/CT).
Fluorescein-BP (55), Cy-Pep (71) and Alizarin S incorporation in calcium mineral
phantoms
Calcium species (HAP, CaOx, CaPi, CaPyr (50 mg) were suspended in 2% agarose in H2O (2
mL) and left to set. Upon hardening, agarose phantoms were incubated with either
Fluorescein-BP (55) (5 µM) or CyPep (71) (5 µM) or Alizarin S (1%) for 2 hours. Phantoms
were subsequently washed with H2O (3 × 5 minutes) and then imaged using Zeiss Axiovert 25
inverted microscope (Fluorescein-BP and Cy-Pep) or photographed (Alizarin S).

Chapter 7– Material and Methods
159
Biology
7.2.1 General procedures
Chemicals used were purchased from Sigma-Aldrich, and tissue culture media and buffers
were purchased from Thermo Fisher unless otherwise specified. All animals were culled by
cervical dislocation in accordance with the Home Office Schedule 1 guidelines in the U.K.
The dissections took place in a ventilated hood and all tools were sterilised by autoclaving
prior to dissection.
7.2.2 Tissue culture
Wash buffer consisted of Hank's Balanced Salt Solution (HBSS, Life Technologies)
containing 1% gentamicin (Life Technologies). For cell detachment, TrypLE Express Enzyme
(Life Technologies), a trypsin replacement, was used. Cell culture media consisted of
Dulbecco's Modified Eagle Media F-12 (DMEM/F, Life Technologies) or Minimum Essential
Media (α-MEM, Life Technologies) containing 1% gentamicin and 10% heat inactivated
foetal bovine serum (FBS, Life Technologies) which was sterilised by passaging through a
0.22 µm filter. All tissue culture procedures were completed in a ventilated tissue culture hood
to ensure sterile conditions, at 37°C in 95% air/5% CO2.
7.2.2.1 Cell types
Primary mouse VSMC and rat aortic VICs were obtained from either 5 week old male Sprague
Dawley rats or C57BL6 mice (Charles River Laboratories). The mouse VSMC cell line
(MOVAS-1) previously described by Afroze,12 was purchased from ATCC, was stored at a
density of 2.7×10⁶/mL and frozen to -150 ºC until needed. MOVAS-1 is a cell line isolated
from aortic smooth muscle tissue which had been immortalized with SV40 large T antigen
which has been employed previously to investigate the VSMC cell cycle.12–15 MC3T3 cell line,
was purchased from ATCC and stored at a density of 2.7×10⁶/mL and frozen to -150 ºC until
needed. The MC3T3 is an osteoblast precursor cell line derived from mouse calvaria and has
been widely used to study bone biology.16,17 When required, the cells were warmed to 37 ºC
in a water bath and immediately added to 20 mL of DMEM/F (MOVAS-1) or α-MEM
(MC3T3) cultured media. The cell suspension was then centrifuged at 670 g for 5 minutes to
remove any cell debris and DMSO which had been used in the freezing media. The cell pellet
was then re-suspended in culture media and transferred to a T175 flask to propagate.
Chapter 7– Material and Methods
160
7.2.2.2 Primary mouse VSMC isolation and culture
Primary aortic VSMCs were isolated from five week old mice (Charles River Laboratories) as
previously described.18–20 Mice were euthanized by cervical dislocation the aorta was then
dissected and the adventitia removed. After washing with HBSS the aorta was cut
longitudinally to expose the endothelial layer. Eight aortae were pooled together and incubated
for 10 minutes at 37 °C in 1 mg/mL trypsin to remove any remaining adventitia and
endothelium. Aortae were washed and incubated overnight at 37 °C in α-MEM culture media.
Tissues were then washed and then incubated in 100 µL Collagenase type II (425 UI/mL,
Worthington Biochemical Corporation) for 4 hours at 37 °C. The resulting cell suspension was
centrifuged at 320 g for 5 minutes. VSMC pellets were resuspended in α-MEM culture media
and cultured for two passages in T25 tissue culture flasks (Corning) coated with 0.25 μg/cm2
laminin to promote maintenance of the contractile differentiation state.21
7.2.2.3 Primary rat VIC isolation and culture
Primary aortic VICs were isolated from aortic valve leaflets, dissected from the hearts of 5
weeks old male Sprague Dawley rats (Charles River Laboratories) as previously described.22
The animal was placed supine, and the abdomen skin, ribcage, fatty tissue and lungs removed
to expose the heart. The latter was extracted and placed in cold HBSS until all dissections were
complete. To extract the heart valves, cardiac muscle was trimmed to expose the aorta and the
aortic root. The artery was then cut open and the valve leaflets were carefully dissected. To
clean and release the VICs from the leaflets, the following digestions were performed. The
leaflets were centrifuged at 100 g, for 1 minute to pellet and remove HBSS and then digested
in 100 µL of Collagenase type II (425 U/mL) for 5 minutes at 37 °C to release valve endothelial
cells (VECs). Following digestions, the leaflets were subjected to another 30 seconds
centrifugation at 100 g. The supernatant, which contained the digested VECs, was discarded
subsequently. A wash with 500 µL of HBSS was applied to rinse off any remaining VECs and
the leaflets were pelleted with a 30 seconds 100 g centrifugation. The supernatant was
discarded. To digest the VICs, the leaflets were incubated with 100 µL of Collagenase II (425
U/mL) for 2 hours, at 37 °C. At the end of the incubation, VICs were removed from the leaflets
by forceful pipetting. The VICs were spun at 670 g for 5 minutes and relocated to a suitable
sized flask, T75, and left to propagate.
7.2.2.4 Cell expansion and calcification
Cells were cultured until 90-100% confluent, at which point culture media was replaced as
necessary. For cell expansion, the culture media was initially removed, and the monolayer was
rinsed with HBSS. For cell detachment, the HBSS was discarded and the monolayer was
Chapter 7– Material and Methods
161
incubated at 37 °C for 3-5 minutes in the presence of TypLE. The reaction was deactivated by
adding double the volume of culture media. The cells were then pelleted at 670 g for 5 minutes.
The supernatant was discarded, and the cells were re-suspended in 1 mL of fresh culture media
and transferred to a suitable sized flask with pre-warmed culture media. To count the number
of viable cells, a haemocytometer was used. The cells were then transferred to a new flask and
left to propagate until 90-100% confluent.
For calcification experiments, cells were seeded and then were left to propagate at 37 °C, in a
humidified incubator.
7.2.2.5 Aortae isolation and culture
Aortic rings were dissected from eight-week-old Fischer rats. Rats were euthanized by cervical
dislocation; the aorta was then dissected, and the adventitia removed. After washing with
HBSS the aortae were cut into ~4 mm thick rings and cultured in α-MEM culture media.
7.2.2.6 ApoE-/- Mice
Male atherosclerosis-prone apolipoprotein E-deficient (ApoE-/-) mice were obtained from Dr
Hadoke. Mice started a high cholesterol diet (D12336,23–25 Research Diets, Inc. Cholesterol:
1.25%) at 12-14 weeks old and were kept on the diet for 12 weeks. The mice were subsequently
culled and aortic arch harvested for further investigations. Tissue was section into 5 µm
sections. For OPT imaging, ApoE-/- mice were culled at age of 15 months, thoracic aorta were
carefully dissected and fixed in 10% NBF.
7.2.2.7 Induction of calcification
Cells were seeded in culture medium for 2 days and then switched to calcification medium,
which was prepared by adding; 1 M inorganic phosphate (Pi, mixture of NaH2PO4 and
Na2HPO4, pH=7.4) and 1M CaCl2 (Ca). Cells were always compared to the control, DMEM/F
contains 1.05 mM of Ca and 0.95 mM of Pi while α-MEM contains 1.8 mM of Ca and 1.01
mM Pi.
For MOVAS-1, cells were grown in DMEM/F culture media to confluence before treatment
with DMEM/F calcification medium; phosphate alone (3 mM and 5 mM) or phosphate and
calcium rich (1.4 mM Pi and 2.4 mM Ca or, 2.5 mM Pi and 2.7 mM Ca). Cells were incubated
for 7 days and the medium was changed every 2-3 days.
For VICS, cells were grown in DMEM/F culture media to confluence before treatment with
DMEM/F calcification medium; phosphate and calcium rich (1.4 mM Pi and 2.4 mM Ca or,
2.5 mM Pi and 2.7 mM Ca). Cells were incubated for 7 days and the medium was changed
every 2-3 days.

Chapter 7– Material and Methods
162
For VSMCs, cells were grown in α-MEM culture media until confluent and switched to α-
MEM calcification medium; phosphate rich (1.8 mM, 2.6 mM and 3 mM). Cells were
incubated for 7 days and the medium was changed every 2-3 days.
For MC3T3, cells were grown in α-MEM culture media switched to α-MEM calcification
medium, which was prepared by adding 2.5 mM β-glycerophosphate (β-GP) and 50 μg/ml
ascorbic acid (aa). Cells were incubated for 21 days in 95% air/5% CO2 and the medium was
changed every 2-3 days.
For aortic rings, rings were cultured in α-MEM culture media. After 1 day, the media was
changed to α-MEM calcifying media of the following Pi concentrations; 1.8 mM, 2.6 mM, 3
mM for 7 days with media change on alternative days.
7.2.3 Imaging of cell and tissue cultures
7.2.3.1 Tissue processing and embedding
Tissue was either embedded in wax or in OCT. For OCT,26 sectioned into 5 µm thick slices
and placed on slides. For waxed samples, NBF fixed tissues were slowly dehydrated, following
a technique previously described,20 using a series of alcohol incubations as follows: PBS (2 ×
5 minutes), followed by EtOH (70%, 1 h), EtOH (4 × 95% for 1 hour), EtOH (100%, 1 hour),
EtOH:xylene (50:50 1 hour), xylene (2 × 1 hour) and transferred into wax embedding cassettes
in paraffin wax at 60 °C for 4 hour. The wax blocks were embedded in plastic moulds and
trimmed using an Ernst Leitz AG microtome to expose sample surface. The paraffin wax-
embedded samples were then cooled on ice for 30 minutes and sectioned at 4 µm thickness.
They were then floated in a 40 °C water bath for 1 minute before carefully transferring onto
electrostatically charged slides. The slides were dried overnight at 37 °C.
7.2.3.2 Staining with Fluorescein-BP
Culture media was removed, and the cell monolayer was subsequently washed with HBSS
then incubated with appropriate media containing Fluorescein-BP (42) (1 μM) for 2 hours.
For staining with Fluorescein-BP (42) alone; the media was then discarded, and the cell
monolayer was washed with HBSS (2 × 2 mL), fixed with 10% NBF for 15 minutes and
washed with phosphate buffer saline (PBS, 2 × 2 mL) and with H2O (1 × 2 mL).
For dual imaging with Cell Mask Orange; monolayers were washed with HBSS (2 × 2 mL)
and fresh HBSS containing Cell Mask Orange (0.5x, Life Technologies) was added for 5
minutes. Monolayers were washed with HBSS (2 × 2 mL), fixed with 10% neutral-buffered
formalin (NBF, CellPath) for 15 minutes and subsequently washed with PBS (2 × 2 mL) and
Chapter 7– Material and Methods
163
H2O. Glass coverslips were mounted onto slides with Prolong Gold Anti-Fade Reagent (Life
Technologies).
For dual imaging with DAPI; monolayers were subsequently washed with HBSS (2 × 2 mL).
Monolayer was incubated with DAPI (300 nM, Life Technologies) for 5 minutes followed by
washing with HBSS (2 × 2 mL), fixed and mounted as described above.
For ApoE-/- Mice Sections, WT rats and human sections; sections were de-waxed in xylene
and incubated with Fluorescein-BP (1 µM) for 2 hours, washed in H2O (2 × 500 µL) followed
by incubation with 2% Alizarin S (250 µL) for 5 minutes. Sections were washed in H2O (3 ×
500 µL) and subsequently incubated with DAPI (500 nM) for 5 minutes. Sections were washed
with H2O (1 × 500 µL) and then mounted as described above.
Fluorescence images were captured using a Leica DMBL-2 upright fluorescent microscope
and/or Zeiss Confocal LSM 710 and/or Leica DMRB fluorescence microscope. Fluorescence
intensity detected on Synergy HT Multi Mode Microplate reader at 488 nm.
7.2.3.3 Alizarin S staining
For the cell monolayers, cells were fixed with 10% NBF for 15 minutes before washing with
PBS (2 × 2 mL). The cells were then stained with 2% Alizarin Red (500 µL) for 10 minutes at
rt, supernatant discarded and the cell monolayer was subsequently washed with H2O (3 × 2
mL).
For the aortic rings, after Fluorescein-BP (42) rings were fixed with 10% NBF for 15 minutes
then permeabilised with 1% KOH for 1 hour followed by overnight staining with 0.00005%
Alizarin S in 1% potassium hydroxide (KOH). Residual Alizarin S was removed by washing
H2O (3 × 2 mL).
For human tissue, sections were de-waxed in xylene and stained with 2% Alizarin red for 5
minutes, washed with H2O (3 × 500 µL) and dehydrated to visualize calcium deposition.
7.2.3.4 Von Kossa staining
For ApoE -/- and human tissues; sections were de-waxed in xylene and stained with 1% silver
nitrate (150 µL) under a UV lamp for 20 minutes.27 Sections were rinsed with H2O (3 × 500
µL) then incubated with 5% sodium thiosulfate (150 µL) for 5 minutes. Subsequently, sections
were washed with H2O (2 × 500 µL) and then counterstained with 0.1% neutral red (150 µL)
for 2 minutes. Sections were dehydrated, with three changes of absolute ethanol and cleared
with three changes of xylene and mounted using DePex. Images were obtained using a Nikon
Ni1 Brightfield microscope.

Chapter 7– Material and Methods
164
7.2.3.5 Immunofluorescence on aortic rings
5 µm rat aortae sections on slides were incubated with Tris-Buffered Saline and Tween 20
(TBS/T) for 15 minutes then permeabilised with 0.1% Triton-X in 1x TBS for 30 minutes at
rt. Sections were washed with TBS/T (3 × 500 µL; 5 minutes per wash) and then incubated
with blocking buffer (TBS/T and 5% BSA, 200 µl) for 1 hour. After 1 hour, the blocking
buffer was removed by washing with TBS/T (3 × 500 µL; 5 minutes per wash), slides were
then incubated with anti-α-smooth muscle action (α-SMA, 1:100, 200 µL)28 and CD31 (1:100,
200 µL)26 overnight at 4 °C. Negative control consisted of the same concentration of IgG from
the same animal species as primary antibody. On day 2, after washing with TBS/T (3 × 500
µL; 5 minutes per wash), sections were incubated with Alexa Fluor® 496 goat-anti-rabbit
antibody (1:250, 200 µL, Thermo Fisher) in blocking buffer for 1 hour in the dark. Following
removal of excess antibody with TBS/T (3 × 500 µL; 5 minutes per wash) sections are then
incubated with DAPI (300nM) for 5 minutes, washed with TBS/T (1 × 500 µL; 2 minutes per
wash) and mounted with ProLong Gold Antifade. Care was taken to remove any air bubbles
and the slides were left to dry for 24 hours at 4 °C before imaging. Fluorescence signal was
detected under a Leica DMRB fluorescence microscope.
7.2.3.6 OPT imaging of ApoE-/- Mice
The aorta were washed in PBS for 3 hour and then immediately immersed in Fluorescein-BP
(1 µM) overnight. The aorta were washed in PBS (1 × for 1 hour) and then processed for OPT
imaging. Aorta were embedded in a 1% solution of low-melting agarose and then dehydrated
three times in 100% ethanol overnight. Once the aortae were completely dehydrated, ethanol
was replaced with BABB solution and clear for 2 days. The embedded aortae were then glued
on a mount and left to dry for 2 hour. Specimens are then scanned using an OPT scanner.
7.2.3.7 Immunohistochemistry (IHC) of human tissue
IHC was performed using the Vectastain ABC Kit (mouse IgG) (Vector Labs, Peterborough,
UK) according to manufacturer’s instructions. Before IHC sections were de-waxed in xylene.
Immunohistochemical analysis of OPN (1:00 dilution, anti-human mouse clone OPN
(AKm2A1), Santa Cruz Biotechnology) or OPG (1:00 dilution, anti-human mouse clone OPG
(E-10), Santa Cruz Biotechnology),29 was conducted after heat-induced epitope retrieval using
a 10 mM citrate buffer (pH 6) for 1 hour at 70 ºC. Endogenous peroxidase was blocked by
soaking in 0.3% H2O2 in TBS/T at rt for 30 minutes, followed by non-specific antibody
blocking with serum for another 30 minutes. Sections were then incubated with the specific
primary anti-human antibodies overnight at 4 °C. All incubation steps were followed by
washing in TBS/T. The sections were then washed in TBS/T and then incubated with diluted
Chapter 7– Material and Methods
165
biotinylated secondary antibody (1:100) for 30 minutes at rt. After washing in TBS/T for
5 minutes, the sections were then incubated for 30 minutes with ABC reagent (avidin and
horse radish peroxidase (HPR)). The reaction was developed using premixed 3,3’-
diaminobenzidine (DAB; 0.06% DAB, 0.1% hydrogen peroxide, in PBS) solution (Vector
Labs) until the desired stain intensity developed (5 minutes). The sections were rinsed and
counterstained with haematoxylin and eosin (H&E).27 Dehydration through graded alcohols,
cleared using xylene in a Leica Autostainer XL and then mounted in DePex. IgG
Control sections were incubated with mouse IgG (1:100) in place of OPN or OPG or RUNX-
2 antibody. Images were obtained using a Nikon Ni1 Brightfield microscope.
7.2.3.8 PET/CT analysis human tissue
Atherosclerotic layers of left main coronary arteries were obtained with ethical approval and
informed relative authorisation from the next of kin at autopsy from victims of sudden death
(National Health Service South East Scotland 14/SS/1090). The tissue was immediately frozen
at -80 °C. Thawed non-decalcified coronary artery specimens were incubated for 20 minutes
in 18F-sodium fluoride 100kBq/mL solution (10.5MBq 18F-NaF in 99.5mL 0.9% NaCl).
Samples were washed in 10mLs 0.9% NaCl (2 × 5 minutes) to remove unbound 18F-fluoride.
Coronary artery specimens were scanned using high-resolution micro-positron emission
tomography and non-contrast computed tomography [50kVp tube voltage, 300msec exposure
time] (Mediso nanoScan PET/CT). After whole specimen imaging, the coronary arteries were
fixed in 10% buffered formaldehyde before being dehydrated, embedded in paraffin wax and
sectioned (5 μm thickness).30
7.2.4 Biochemical assays
7.2.4.1 Calcium leaching assay
Initially, the culture media was discarded, and the cells were washed with PBS. The cell
monolayer was incubated with an appropriate volume of 0.6M HCl and left to leach for 24
hours at 4 °C. Subsequently, a Calcium Assay Kit (Randox) was used to measure the calcium
deposition in the cells. The assay depends on a binding mechanism between O-cresolphthalein
complexone and calcium ions in an alkaline media. A negative control (0.6 M of HCl) and a
calcium standard are required to determine the calcium concentration. 5.5 µL of standard,
negative control and the sample were added to a 96-well plate, in duplicate. 250 µL of 1:1
ratio of 2-amino-2-methyl-propan-l-ol (R1) and O-cresolphthalein complexone, 8-
Hydoxyquinoline, HCl (R2) were added to each well. The ODs were determined on a Synergy
HT Multi Mode Microplate reader at 570 nm. Calcium concentration of each sample was
determined using the following equation:
Chapter 7– Material and Methods
166
𝐶𝑜𝑛𝑐𝑒𝑛𝑡𝑟𝑎𝑡𝑖𝑜𝑛 (𝑚𝑚𝑜𝑙
𝐿) = (
𝑠𝑎𝑚𝑝𝑙𝑒 𝑂𝐷
𝑠𝑡𝑎𝑛𝑑𝑎𝑟𝑑 𝑂𝐷) ∗ 𝑠𝑡𝑎𝑛𝑑𝑎𝑟𝑑 𝑐𝑜𝑛𝑐𝑒𝑛𝑡𝑟𝑎𝑡𝑖𝑜𝑛(
mmol
L)
Calcium concentration was then standardised using total protein concentration described
below.
7.2.4.2 Protein Concentration Assay
The cellular proteins were denatured using 0.1M NaOH + 0.1% sodium dodecyl sulphate
(SDS). Protein content of the cell was measured using Bio-Rad DC protein assay. Bovine γ–
globulin protein standards (0.125 - 2 mg/mL) were prepared in the solution: 0.1 M NaOH +
0.1% SDS. 5 µL of sample or standards were transferred to a 96-well plate, in duplicate. To
each well, 25 µL of alkaline copper tartrate solution and 200 µL of dilute folin reagent were
added. The plate was incubated at rt for 20 minutes. The optical densities (OD) were obtained
on a Synergy HT Multi Mode Microplate reader at 690 nm. The protein concentration was
resolved from the standard curve.
7.2.4.3 Alamar Blue assay
All wells were washed with HBSS (2 × 2 mL) and then incubated Alamar Blue (10 µL per 100
µL of media, Life Technologies) for 4 hours. Results were recorded using Synergy HT Multi
Mode Microplate reader at 570 nm.
7.2.5 Raman Spectroscopy
7.2.5.1 Raman on cell pellet
MOVAS-1 cells were grown, in a T75 flask, in DMEM/F culture media to confluence (day 0)
and switched to calcification medium or control media. On day 7, MOVAS-1 monolayer was
washed with PBS (3 × 2 mL) after which the monolayer was incubated with TrypLE Express
Enzyme (1 mL) for 2 minutes at 37 °C. DMEM/F culture media (10 mL) was added and the
cells were centrifuged at 100 g, for 5 minutes. The supernatant was removed and the pellet
was washed with PBS (10 mL). The pellet was resuspended in PBS and subsequently
centrifuged again. The supernatant was discarded and the pellet kept in PBS (100 µL) until
imaging. Raman imaging was carried out using a InVia Renishaw Microscope with a 785 nm
laser excitation source which was used to excite the sample through a 50, N.A. 0.75 objective.
The total data acquisition was performed during 30 s for spectra with a 50% laser power using
the WiRE software. All of the spectra acquired were background subtracted using a
background correction algorithm present on WiRE software. For the purpose of this work, all
peaks were normalised the phenylalanine which should not be altered in the presence or
absence of calcification media.

Chapter 7– Material and Methods
167
7.2.5.2 Raman assessment of cell monolayer
MOVAS-1, VICS, mouse VSMCs were grown and calcified on CaF2 slides as described under
the induction of calcification section. On day 7, the monolayers were fixed in 10% NBF for
15 minutes and then imaged. Raman imaging was carried out in the same manner as mentioned
under the cell pellet section.
7.2.5.3 Raman analysis of agarose embedded aortic rings
Aortic rings were dissected from eight-week-old Fischer rats. Rats were euthanized by cervical
dislocation; the aorta was then dissected, and the adventitia removed. After washing with
HBSS the aortae were filled and embedded in 8 % UltraPureTM Low Melting Point Agarose.
The aortae were then cut into 10 µm sections using a VF-300-07 CompressotomeTM
(Precisionary) and subsequently cultured in α-MEM. The agarose rings were calcified for 7
days and then fixed in 10 % NBF for 15 minutes. The agarose was subsequently removed upon
gentle heating in PBS to allow for Raman imaging. The conditions used for Raman imaging
were the same as mentioned under the cell pellet section.
7.2.5.4 Raman on human Sections
Sections were de-waxed in xylene (15 minutes), EtOH (100%, 15 minutes), EtOH (95%, 15
minutes), followed by EtOH (70%, 15 minutes). Stored at rt until imaging using the Renishaw
InVia, 785 nm laser, 60 second, 100% laser power. Spectra obtained were subtracted from
paraffin spectra using the same parameters mentioned above.
References
1 R. Liu, Y. Gao, Q. Zhang, X. Yang, X. Lu, Z. Ke, W. Zhou and J. Qu, New J. Chem.,
2014, 38, 2941.
2 S. Ghosh, M. A. Alam, A. Ganguly, S. Dalapati and N. Guchhait, Inorganica Chim.
Acta, 2015, 429, 39–45.
3 W. M. Chang, M. Dakanali, C. C. Capule, C. J. Sigurdson, J. Yang and E. A.
Theodorakis, ACS Chem. Neurosci., 2011, 2, 249–255.
4 G. Sivaraman and D. Chellappa, J. Mater. Chem. B, 2013, 1, 5768.
5 J. Wang, W. F. Cao, J. H. Su, H. Tian, Y. H. Huang and Z. R. Sun, Dye. Pigment.,
2003, 57, 171–179.
6 M. Lopalco, E. N. Koini, J. K. Cho and M. Bradley, Org. Biomol. Chem., 2009, 7, 856–
9.

Chapter 7– Material and Methods
168
7 H. Langhals, A. Varja, P. Laubichler, M. Kernt, K. Eibl and C. Haritoglou, J. Med.
Chem., 2011, 54, 3903–3925.
8 D. M. Mizrahi, O. Ziv-Polat, B. Perlstein, E. Gluz and S. Margel, Eur. J. Med. Chem.,
2011, 46, 5175–83.
9 M. Gerowska, L. Hall, J. Richardson, M. Shelbourne and T. Brown, Tetrahedron, 2012,
68, 857–864.
10 K. Kiyose, K. Hanaoka, D. Oushiki, T. Nakamura, M. Kajimura, M. Suematsu, H.
Nishimatsu, T. Yamane, T. Terai, Y. Hirata and T. Nagano, J. Am. Chem. Soc., 2010,
132, 15846–8.
11 T. Eisner, Charles University, Prague, 2014.
12 T. Afroze, L. L. Yang, C. Wang, R. Gros, W. Kalair, A. N. Hoque, I. N. Mungrue, Z.
Zhu and M. Husain, AJP Cell Physiol., 2003, 285, C88–C95.
13 MacRae, Int. J. Mol. Med., 2011, 27, 663–8.
14 J. A. Chalmers, T. A. Martino, N. Tata, M. R. Ralph, M. J. Sole and D. D. Belsham,
Am. J. Physiol. Regul. Integr. Comp. Physiol., 2008, 295, R1529-38.
15 T. Afroze and M. Husain, J. Biol. Chem., 2000, 275, 9062–9069.
16 Y.-K. Lee, J. Song, S.-B. Lee, K.-M. Kim, S.-H. Choi, C.-K. Kim, R. Z. LeGeros and
K.-N. Kim, J. Biomed. Mater. Res., 2004, 69A, 188–195.
17 K. Hiura, K. Sumitani, T. Kawata, K. Higashino, M. Okawa, T. Sato, Y. Hakeda and
M. Kumegawa, Endocrinology, 1991, 128, 1630–1637.
18 D. Zhu, N. C. W. Mackenzie, J. L. Millán, C. Farquharson and V. E. MacRae, PLoS
One, 2011, 6, e19595.
19 D. Zhu, N. A. Rashdan, K. E. Chapman, P. W. Hadoke and V. E. MacRae, Vascul.
Pharmacol., 2016, 86, 87–93.
20 M. J. Berridge, P. Lipp and M. D. Bootman, Nat. Rev. Mol. Cell Biol., 2000, 1, 11–21.
21 K. A. Johnson, M. Polewski and R. A. Terkeltaub, Circ. Res., 2008, 102, 529–537.
22 L. Cui, N. A. Rashdan, D. Zhu, E. M. Milne, P. Ajuh, G. Milne, M. H. Helfrich, K.
Lim, S. Prasad, D. A. Lerman, A. T. Vesey, M. R. Dweck, W. S. Jenkins, D. E. Newby,
C. Farquharson and V. E. Macrae, J. Cell. Physiol., 2017, 232, 2985–2995.

Chapter 7– Material and Methods
169
23 F. Usui, H. Kimura, T. Ohshiro, K. Tatsumi, A. Kawashima, A. Nishiyama, Y. ichiro
Iwakura, S. Ishibashi and M. Takahashi, Biochem. Biophys. Res. Commun., 2012, 420,
72–77.
24 A. E. Jääskeläinen, S. Seppälä, T. Kakko, U. Jaakkola and J. Kallio, Neuropeptides,
2013, 47, 67–73.
25 D. Weiss, J. J. Kools and W. R. Taylor, Circulation, 2001, 103, 448–54.
26 P. Menon and E. A. Fisher, in Methods in Molecular Biology, NIH Public Access,
2015, vol. 1339, pp. 131–148.
27 W. Bloch and Y. Korkmaz, in Practical Methods in Cardiovascular Research,
Springer-Verlag, Berlin/Heidelberg, 2005, pp. 485–499.
28 U. Raaz, I. N. Schellinger, E. Chernogubova, C. Warnecke, Y. Kayama, K. Penov, J.
K. Hennigs, F. Salomons, S. Eken, F. C. Emrich, W. H. Zheng, M. Adam, A. Jagger,
F. Nakagami, R. Toh, K. Toyama, A. Deng, M. Buerke, L. Maegdefessel, G. Hasenfuß,
J. M. Spin and P. S. Tsao, Circ. Res., 2015, 117, 513–24.
29 K. D. O’Brien, J. Kuusisto, C. E. Reichenbach, Dennis D. Ferguson, Marina Giachelli,
Cecilia Charles E. Alpers and C. M. Otto, Circulation, 1995, 92, 2163–2168.
30 A. Irkle, A. T. Vesey, D. Y. Lewis, J. N. Skepper, J. L. E. Bird, M. R. Dweck, F. R.
Joshi, F. A. Gallagher, E. A. Warburton, M. R. Bennett, K. M. Brindle, D. E. Newby,
J. H. Rudd and A. P. Davenport, Nat. Commun., 2015, 6, 7495.

Chapter 7– Material and Methods
170
Chapter 8– Abbreviations
170
Chapter 8- Abbreviations
# number
µM micro molar
18F-FDG fluorodeoxyglucose
18F-NaF sodium fluoride
2D two dimensional
3D three dimensional
AA ascorbic acid
Ac2O acetic anhydride
ACP amorphous calcium phosphate
ALK alkaline phosphate
ApoE-/- apolipoprotein E knockout mouse
AU arbitrary units
BL basal lamina
BMP bone matrix protein
Boc tert-butyloxycarbonyl
BP bisphosphonate
Ca calcium
CAC coronary artery calcium scoring
CaCO3 calcium carbonate
CaOx calcium oxalate
CaPi calcium phosphate
CaPyr calcium phyrophosphate
Chapter 8– Abbreviations
171
CD31 platelet endothelial cell adhesion molecule-1
CKD chronic kidney disease
CT computed tomography
CVD cardiovascular disease
Cy cyanine dye
DCB dichlorobenzene
DCC N,N’-dicyclohexylcarbodiimide
DCM dichloromethane
DCU dicyclohexylurea
DMAP 4-dimethylaminopyridine
DMF dimethylformamide
DTT 1,4-dithiothreitol
DVB divinylbenzene
EC endothelial cells
ECM extracellular matrix
EDCI 1-Ethyl-3-(3-dimethylaminopropyl)carbodiimide
ENPP1 ectonucleotide pyrophosphatase/phosphodiesterase 1
Et2O diethyl ether
FAM Fluorescein
FC foam cells
FDA Food and Drug Administration
f-HAP fluorinated hydroxyapatite
G glycine
GFP green fluorescent protein
h hour
Chapter 8– Abbreviations
172
HAP hydroxyapatite
HCl hydrochloric acid
ICA independent component analysis
IF immunofluorescence
IGG immunoglobulin G
IHC immunohistochemistry
IR infrared
IVUS intravascular ultrasonography
K lysine
Ki inhibitory constant
KI potassium iodide
LDLR-/- low density lipoprotein receptor deficient mouse
LOD limit of detection
M methionine
M molar
Mac macrophages
MC3T3 mouse calvaria osteoblast precursor cell line
Me methyl
MeCN acetonitrile
MeI methyl iodide
MeOH methanol
MESA multi-ethnic study of atherosclerosis
MGP Matrix Gla Protein
MLp modified lipoproteins
mM millimolar
Chapter 8– Abbreviations
173
MMP Matrix Metalloproteinases
Mon blood monocytes
MOVAS-1 mouse vascular smooth muscle cells
MRI magnetic resonance imaging
MW microwave
N normal
n number of replicates
NaN3 sodium azide
NBF neutral buffer formalin
NHS n-hydroxysuccinimide
NIR near infrared
NIRF near-infrared fluorescence
NIRS near-infrared spectroscopy
ºC degrees Celsius
OCP octacalcium phosphate
OCT optimal cutting temperature
OCT optical coherence tomography
OPG Osteoprotegerin
OPN Osteopontin
OPT optical projection tomography
P proline
P P-value
P2-Et phosphazene base
PET positron emission tomography
Pi phosphate

Chapter 8– Abbreviations
174
PLS partial least squares
pM pico molar
PS polystyrene
R arginine
S serine
S.E.M. standard error mean
Sat. saturated
SPPS solid phase peptide synthesis
Sulfo sulfonated
TBAF tetrabutylamminium fluoride
TBDMS-Cl tert-butyldimethylsilyl chloride
TFA trifluoroacetic acid
THF tetrahydrofuran
UV ultraviolet
V valine
VECs vascular endothelial cells
VICs vascular interstitial cells
VIS visible
VSMCs vascular smooth muscle cells
WT wild type
WTK whitlockite
α-SMA alpha-smooth muscle actin
β-GP β-glycerolphosphate
β-TCP beta-tricalcium phosphate
ε extinction coefficient

Chapter 8– Abbreviations
175
λabs absorption wavelength
λEm emission wavelength
λEx excitation wavelength
Φ quantum yield

Chapter 9– Permissions
176
Chapter 9- Permissions
1.1 Chapter 1
Figure 1.3 and 1.6

Chapter 9– Permissions
177
Figure 1.7
Chapter 9– Permissions
178
Figure 1.9
Chapter 9– Permissions
179
Figure 1.10

Chapter 9– Permissions
180
Figure 1.12
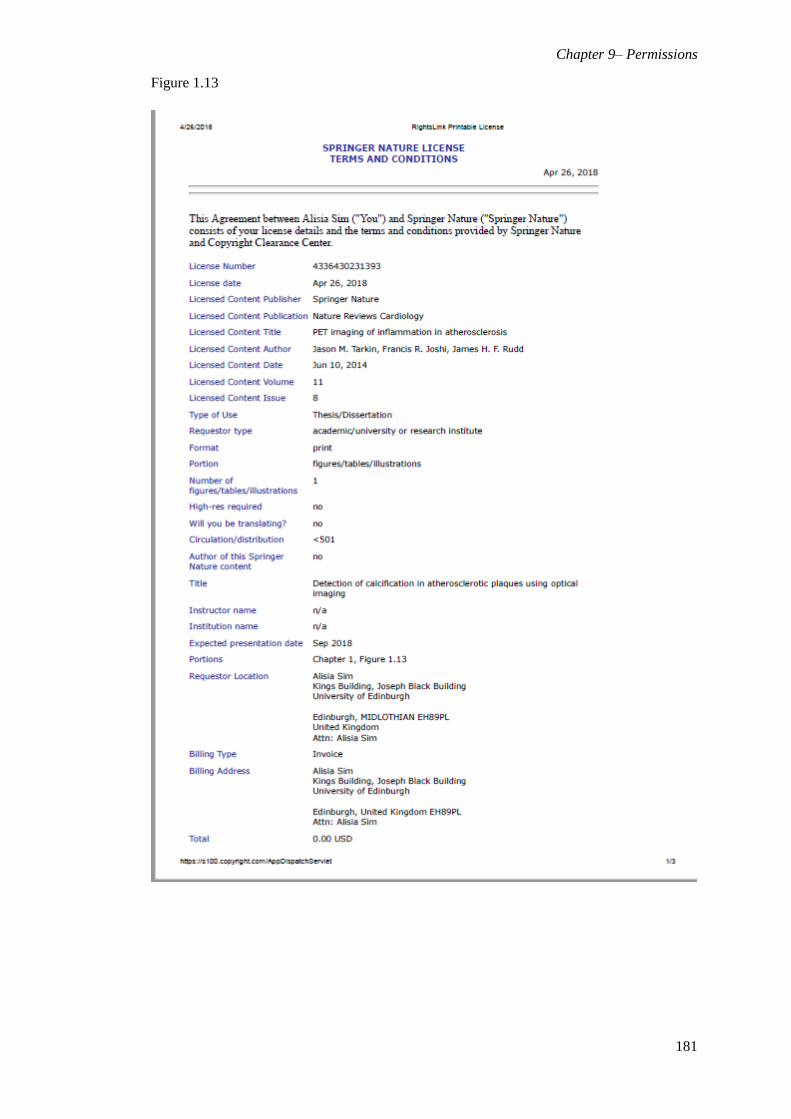
Chapter 9– Permissions
181
Figure 1.13
Chapter 9– Permissions
182
1.2 Chapter 2
Figure 2.4
Chapter 9– Permissions
183
Figure 2.5
Chapter 9– Permissions
184
Figure 2.9
Chapter 9– Permissions
185
Figure 2.12
Chapter 9– Permissions
186
1.3 Chapter 3
Chapter 9– Permissions
187
1.4 Chapter 5
Figure 5.2
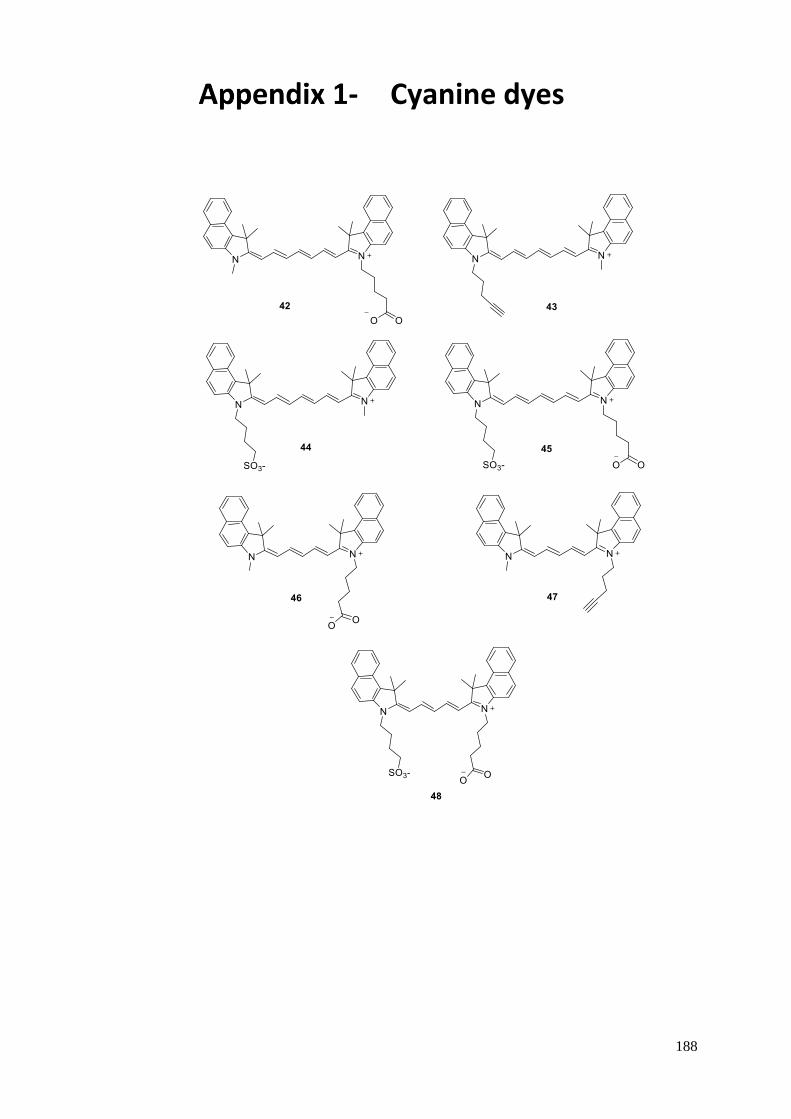
188
Cyanine dyes
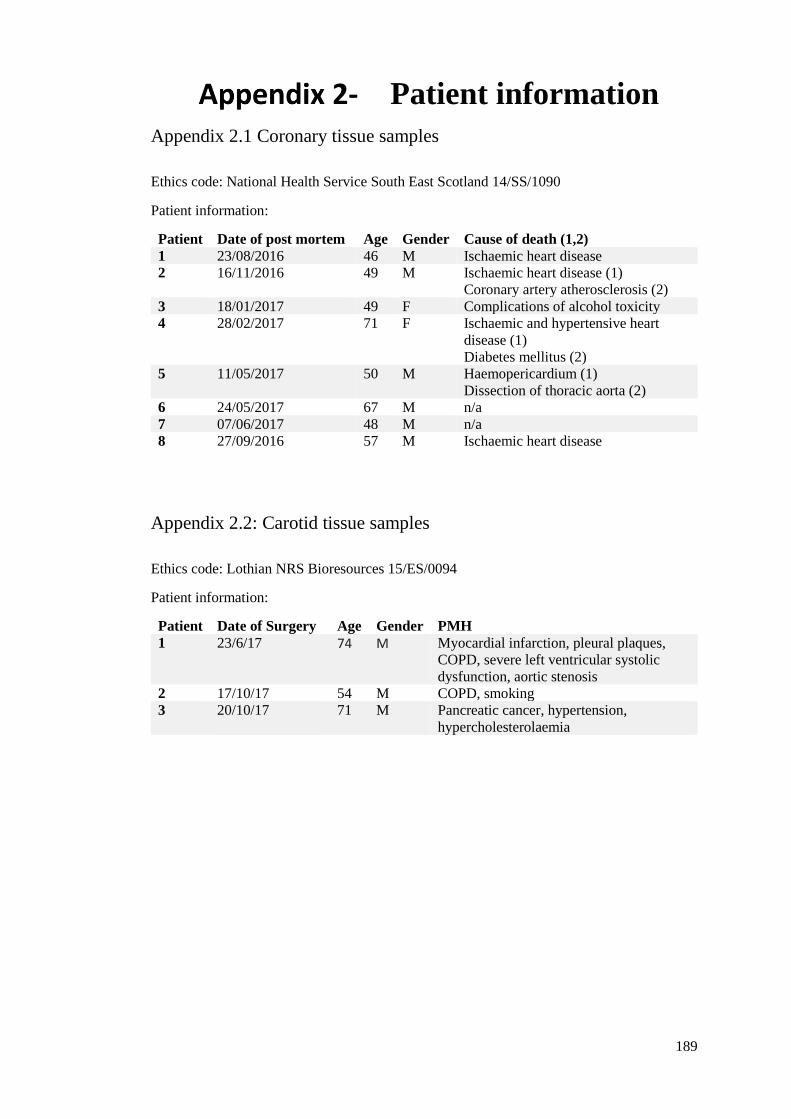
189
Patient information
Appendix 2.1 Coronary tissue samples
Ethics code: National Health Service South East Scotland 14/SS/1090
Patient information:
Patient Date of post mortem Age Gender Cause of death (1,2)
1 23/08/2016 46 M Ischaemic heart disease
2 16/11/2016 49 M Ischaemic heart disease (1)
Coronary artery atherosclerosis (2)
3 18/01/2017 49 F Complications of alcohol toxicity
4 28/02/2017 71 F Ischaemic and hypertensive heart
disease (1)
Diabetes mellitus (2)
5 11/05/2017 50 M Haemopericardium (1)
Dissection of thoracic aorta (2)
6 24/05/2017 67 M n/a
7 07/06/2017 48 M n/a
8 27/09/2016 57 M Ischaemic heart disease
Appendix 2.2: Carotid tissue samples
Ethics code: Lothian NRS Bioresources 15/ES/0094
Patient information:
Patient Date of Surgery Age Gender PMH
1 23/6/17 74 M Myocardial infarction, pleural plaques,
COPD, severe left ventricular systolic
dysfunction, aortic stenosis
2 17/10/17 54 M COPD, smoking
3 20/10/17
71 M Pancreatic cancer, hypertension,
hypercholesterolaemia
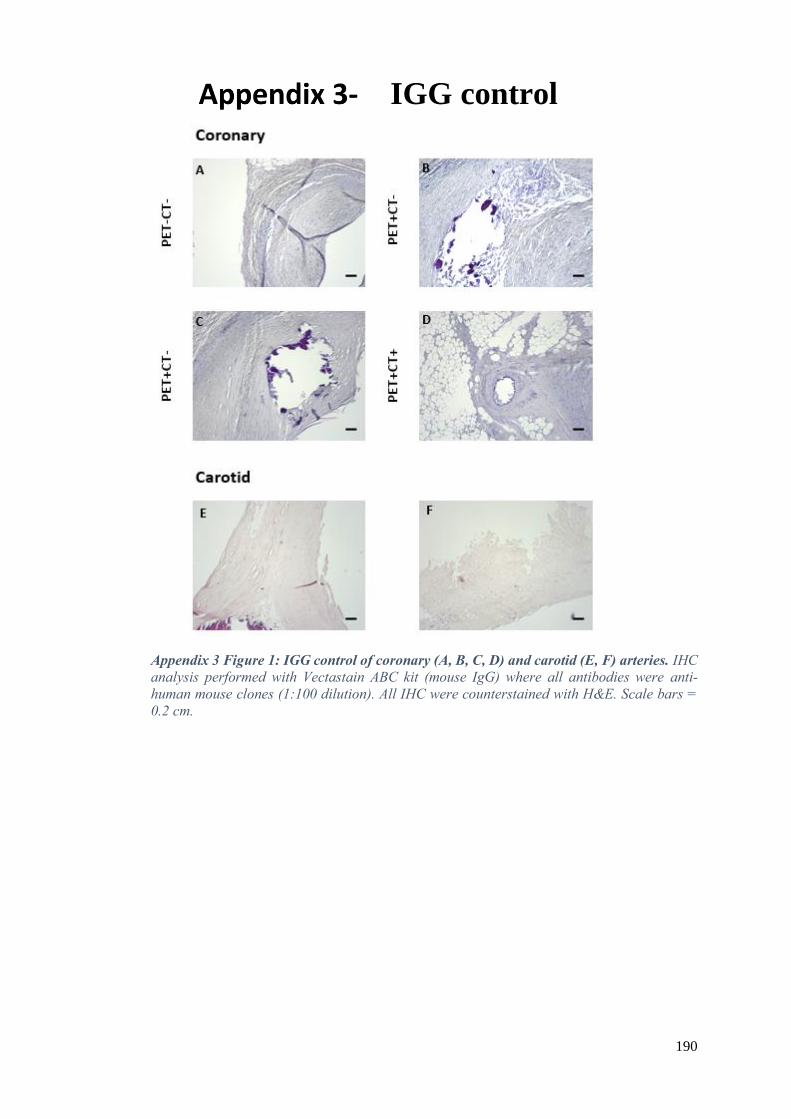
190
IGG control
Appendix 3 Figure 1: IGG control of coronary (A, B, C, D) and carotid (E, F) arteries. IHC
analysis performed with Vectastain ABC kit (mouse IgG) where all antibodies were anti-
human mouse clones (1:100 dilution). All IHC were counterstained with H&E. Scale bars =
0.2 cm.

191
Staining solutions
Wiegert’s Iron Haematoxylin
Haematoxylin (1 gr) was dissolved in 95% alcohol (100 mL). 29% Ferric Chloride in H2O (4
mL) was dissolved in distilled H2O (95 mL) containing HCl (conc., 1 mL). The haematoxylin
solution was combined to the Ferric Chloride solution in a 1:1 ratio.
1% Acetic H2O
Acetic acid (glacial, 1 mL) was dissolved in distilled H2O (99 mL).
2% Alizarin Red
Alizarin Red (2.00 g) was dissolved in distilled H2O (100 mL). The pH was adjusted to 4.1-
4.3.
1% Silver nitrate solution
Silver nitrate (1.00 g) was dissolved in distilled H2O (100 mL).
5% Sodium thiosulfate solution
Sodium thiosulfate (5.00 g) was dissolved in distilled H2O (100 mL).
0.1% Nuclear fast red solution
Aluminium sulfate (5.00 g) was dissolved in distilled H2O (100 mL). The solution was
stirred and subsequently nuclear fast red (0.10 g) is added.
2% Acidic H2O
HCl (conc., 1 mL) was added to 70% ethanol (99 mL).