michalchuk2019.pdf - edinburgh research archive
TRANSCRIPT
This thesis has been submitted in fulfilment of the requirements for a postgraduate degree
(e.g. PhD, MPhil, DClinPsychol) at the University of Edinburgh. Please note the following
terms and conditions of use:
This work is protected by copyright and other intellectual property rights, which are
retained by the thesis author, unless otherwise stated.
A copy can be downloaded for personal non-commercial research or study, without
prior permission or charge.
This thesis cannot be reproduced or quoted extensively from without first obtaining
permission in writing from the author.
The content must not be changed in any way or sold commercially in any format or
medium without the formal permission of the author.
When referring to this work, full bibliographic details including the author, title,
awarding institution and date of the thesis must be given.

Mechanochemical Processes in
Energetic Materials: A
Computational and Experimental
Investigation
Adam Alexander Leon Michalchuk
Submitted for the Degree of Doctor of Philosophy
University of Edinburgh
August 2018
ii
Abstract
Energetic materials (explosives, propellants and pyrotechnics; EMs)
encompass a broad range of materials. These materials are used across a
wide spectrum of applications, including civil and defence. For example, HMX,
RDX and TNT are well known EMs with defence applications. Silver fulminate
is instead used in house-hold Christmas crackers and ammonium nitrate is
used for numerous industrial applications. Common to all EMs is their
propensity to rapidly release energy upon external perturbation. The amount
and type of energy that is required to initiate an EM can vary across orders of
magnitude. Some materials (e.g. triaminotriperoxide, TATP) initiate with < 1 J
of impact energy, while others (e.g. triaminotrinitrobenzene, TATB) cannot be
initiated without > 100 J of impact energy. Understanding which materials can
be handled safely is therefore of critical importance for maintaining the safe
use of EMs across all sectors.
Current trends in EM research include a drive to develop new materials with
decreased sensitivities. While it is relatively straightforward to selectively
modify some properties (e.g. environmental impact), very little is understood
about what constitutes a sensitive material. At present, a new EM must be
synthesised and its sensitivity tested. However, with no a priori knowledge of
the potential sensitivity of a novel EM, synthesis is accompanied by substantial
hazard, as well as time and financial costs. It is therefore pressing to develop
a fundamental understanding of what dictates a sensitive material, and hence
develop a mechanism to predict these properties. A particularly promising
model to explore impact sensitivity of EMs is based on vibrational up-pumping,
i.e. the up-conversion of vibrational energy. This thesis explores the
application of this model to a set of azide, organic molecular and polymorphic
materials.
Azide-based EMs share the common N3− explosophore. The electronic
structure of this anion was followed as a function of its normal modes of
iii
vibration. It was found that excitation of the bending mode is sufficient to induce
athermal electronic excitation of the molecule, and spontaneous
decomposition. This is valid both in the gas and solid states. It is therefore
suggested that this vibrational mode is largely responsible for decomposition
of the azide materials. Based on calculations of the complete phonon
dispersion curves, the various pathways to vibrational energy up-pumping
were explored, namely via overtone and combination pathways. In particular,
the relative rates of up-pumping into the N3− bending mode were investigated.
Remarkable agreement is found between these up-pumping rates and the
relative ordering of the impact sensitivity of these azides.
The calculated vibrational structures of organic molecular EMs were first
compared with experimental inelastic neutron scattering spectra and found to
provide accurate representation of the low temperature vibrational structure of
these complex crystals. The decomposition pathways for organic EMs are not
known and hence no target frequency could be unambiguously identified.
Instead, the up-pumping model was developed for these materials by
investigating the total rate of energy conversion into the internal vibrational
manifold. A number of qualitative trends were identified, which may provide a
mechanism for the rapid classification of EMs from limited vibrational
information. The overtone pathways were found to offer a good agreement with
experimental impact sensitivities of these compounds. However, the increased
complexity of the vibrational structure of the organic EMs as compared to the
azides required a more thorough treatment of the up-pumping mechanism to
correctly reflect experimental sensitivities. The effects of temperature on up-
pumping were also explored.
The sensitivity of organic EMs is known to differ across polymorphic forms.
Most notable are the HMX polymorphs. The calculated vibrational structure of
two HMX polymorphs was confirmed by inelastic neutron scattering
spectroscopy. The up-pumping model developed for molecular organic EMs
was therefore extended to a comparison of these two HMX polymorphs. The
polymorphic forms of FOX-7 were also investigated under the premise of the
iv
up-pumping model. Upon heating, FOX-7 undergoes two polymorphic
transformations, which increases the layering of the materials. It therefore
offered an opportunity to explore the widely-held hypothesis that layered
materials are less sensitive than non-layered materials. The metastable γ-form
was successfully recovered, and its experimental impact sensitivity
investigated by BAM drop-hammer method. However, upon impact, the γ-
polymorph appeared to convert to the α-form and initiate at the same input
energy. Hence a considerable deficiency of experimental methods is identified
when studying polymorphic materials. FOX-7 was therefore explored within the
framework of the up-pumping model. The inelastic neutron scattering spectrum
was collected for γ-FOX-7, which confirmed the calculated vibrational structure.
It was shown that within the up-pumping model, the layered γ-polymorph is
predicted to be less sensitive than the α-form, and results from a decrease in
the maximum phonon-bath frequency. Hence a new mechanism is proposed
to describe the insensitivity of layered compounds.
The work presented in this thesis explores the applications of vibrational up-
pumping to rationalise and predict the relative impact sensitivities of a range
of EMs. Despite the approximations employed in construction of the model, it
leads to excellent correlation with experimental results in all cases. This work
therefore opens the door to a new fully ab initio approach to designing new
EMs based solely on knowledge of the solid-state structure.
v
Lay Summary
The term energetic material (EM) describe a range of compounds, which can
be broadly classified as explosives, propellants and pyrotechnics. While it is
most common to think of these materials as having military-based applications,
their use is far more widespread. Christmas crackers contain a primary
explosive known as silver fulminate, fireworks contain both pyrotechnics and
propellants, and many automobile airbags are based on a range of EMs. Many
industries are also dependent on the use of EMs, including the mining and oil
industries. Common to all EMs is their propensity to explode when physically
struck, heated or subjected to an electric shock. The amount of energy that is
required depends strongly on the material. This is a critical physical parameter
for ensuring the safe use of EMs across any sector.
With growing pressures to produce new EMs (e.g. for environmental purposes),
effort is being placed on ensuring new EMs exhibit low sensitivities, i.e. are
safer. It is relatively straightforward to design new materials with better
environmental compatibility. For example, by removing lead or other heavy
metals. However, there is no definitive understanding for what dictates the
sensitivity of EMs. Any new EM must be fully synthesised in relatively large
quantities, and tested. With no preceding knowledge of the physical properties
of a new EM, this can be very dangerous. There is therefore considerable
interest in developing computational methods to rationalise and predict the
sensitivity of EMs.
When a material is struck by a physical blow, it introduces a large amount of
energy into the material. Analogous to water, an impact leads to formation of
waves, which dissipate through the medium. In a solid material, this translates
into the vibrations of the molecules. This energy subsequently dissipates
through the material and activates a chemical bond whose rupture leads to
initiation and explosion. This thesis explores this mechanism as an underlying
model for the rationalisation and prediction of impact (mechanical) sensitivity

vi
of a range of EMs, include N3− -based materials and organic molecular
materials.
The bond which ruptures in N3− -based materials is an N-N bond. A series of
quantum mechanical calculations demonstrated that if the linear N3− molecule
is bent, dissociation becomes favourable. Therefore, impact sensitivity of these
materials was investigated by considering the rate of vibrational energy
dissipation into the bending vibrational mode. This led to excellent correlation
with experimental result. A similar approach was taken to investigate organic
molecular EMs. However, given the complex molecular structures of these
compounds, it was not possible to identify a single vibration that is responsible
for dissociation. Instead, predictions were based on the total rate at which
energy dissipates into the molecule. Again, excellent agreement is obtained
with experimental results.
Many organic molecules can crystallise into different crystalline forms.
Composed of the same molecule, these solid forms have different
intermolecular interactions, which can lead to considerably different physical
properties. Different polymorphic forms of EMs are also known to exhibit
different sensitivities, most notably HMX. The vibrational energy transfer model
was therefore applied to HMX polymorphs, and shown to offer successful
differentiation of two polymorphic forms. The polymorphs of FOX-7 were
therefore also investigated. It is typically accepted that crystals that contain
layers of molecules (e.g. TATB) are very insensitive. On heating, the
polymorphic forms of FOX-7 exhibit increased layering, and the high
temperature form is therefore expected to be less sensitive. However, when
the high temperature form was tested, it was found to convert to the ambient
temperature form upon impact. Experiment is therefore not able to measure
the sensitivities of these forms, and may in fact produce erroneous results for
other polymorphic materials. The vibrational energy conversion model,
however, does predict that the layered (high temperature) compound should
be less sensitive than the ambient temperature (non-layered) form, and offers
a new mechanism for rationalising why layered materials are insensitive.

vii
The work in this thesis develops a new approach for understanding the
mechanical impact sensitivity of a range of EMs. Based purely on
computational methods, this work demonstrates that it may in fact be possible
to predict the sensitivity properties of new EMs without the need for potentially
dangerous synthetic procedures.

viii
Declaration
I declare that this thesis was written by myself and that the work detailed in this thesis
is my own, or I have contributed substantially to such work, except where specific
reference is made to the work of another.
Adam A. L. Michalchuk

ix
“I am just a child who has never grown up. I still keep
asking these ‘how’ and ‘why’ questions… Occasionally, I
find an answer’’
-Prof. Stephen Hawking

x
Acknowledgements
There are very many people I must thank, without whom this would not have
been possible.
First and foremost, to my supervisors Prof. Colin Pulham and Dr Carole
Morrison. I could not have asked for a better team of mentors to guide me
through my PhD. To Colin, who accepted my transfer into the School of
Chemistry many years ago, sent me to Siberia time and again, gave me the
opportunity to pursue my PhD and introduced me to the world of energetic
materials. To Carole, for adopting me as her student when my project moved
towards computational chemistry and for teaching me so much about the field.
To you both for your enthusiasm and encouragement: thank you.
My sincerest thanks to all of the members of the Pulham group, past and
present, for making the office feel like a family. To Dan, Emily, Hayleigh, Nisa,
Oleg, Rowan, Stuart, Sumit, Xiaojiao– you have all made the last four years
amazing, from laughs around the office to pub quizzes, games nights and a
get-away to Arran. Special thanks to Karl, for our many cross-country (and
indeed cross-continental!) synchrotron road trips, and for not getting too
distracted by trains while driving. To Rowan, Hayleigh and Xiaojiao for
welcoming me to the group four years ago. And thanks to Nilgun and Stuart
for hilarious trips to the Cavendish Laboratory. My thanks also to Prof. Adam
Cumming for his guidance. I am also very grateful for the friendship of the
Boldyreva group (Novosibirsk, Russia) for their warm hospitality during my
many stays in Novosibirsk. A special thanks to Prof Elena Boldyreva for her
guidance and mentorship, to Academician Prof. Vladimir Boldyrev for many
stimulating discussions and Prof Andrei Arzhannikov for his hospitality and
friendship.
xi
I must also thank the EPSRC Centre for Continuous Manufacturing and
Crystallisation (CMAC) and an Edinburgh Global Research Scholarship for
funding my PhD studies. Thank you to my fellow CMAC cohort (Alex, Alice,
Antonia, Arabella, Bilal, Bruce, Carlotta, Lauren, Meifen, Ravi, Sara, Vaclav)
and the rest of CMAC for making these years so enjoyable.
Further thanks to Dr. Svemir Rudić (STFC ISIS) for allowing me to put
explosives on the TOSCA beamline, for his enthusiasm and for teaching me
much about inelastic neutron scattering. Thanks to Dr Steven Hunter
(University of Edinburgh) for helping me get started in computational chemistry.
Additional thanks to Dr David Williamson (Cavendish Laboratory, University of
Cambridge) for access to the BAM fall hammer.
Thank you to Dom for your friendship over the past four years, and for always
being ready for a good laugh. To my fellow Canadian, Paul, thank you for your
friendship and of course for the Canadian care packages. Darren, my sincerest
thanks for putting up with my constant questions about Molpro, and for helping
me so much with its use.
And to everyone else who has made my nine years in Edinburgh so
unforgettable, my deepest thanks.
Finally, to my family back in Canada – this would not have been possible
without you. Thank you.
- Adam

xii
Abbreviations
ABT 1,1’-Azobistetrazole
BOA Born-Oppenheimer Approximation
CASTEP Cambridge Serial Total Energy Package
CI Configurational Interaction
CL-20 Hexanitrohexaazaisowurtzitane (HNIW)
DFPT Density Functional Perturbation Theory
DFT Density Functional Theory
D2 Grimme’s D2 dispersion correction
EM Energetic Material
FC Frank-Condon
FOX-7 1,1-diaminio-2,2-dinitroethene (DADNE)
GGA Generalised Gradient Approximation
G06 Grimme’s D2 dispersion correction
HBT 5,5’-Hydrazinebistetrazole
HF Hartree-Fock
HK Hohenberg-Kohn
HMX 1,3,5,7-Tetranitro-1,3,5,7-tetrazocane (Octagen)
HNB Hexanitrobenzene
INS Inelastic Neutron Scattering Spectroscopy
KS Kohn-Sham
LBS Localised Basis Set
LDA Local Density Approximation
MP Monkhorst-Pack
NTO Nitrotriazolone
PETN Pentaerythritoltetranitrate
PW Plane Wave
pwDFT Plane Wave Density Functional Theory
TATB Triamino-trinitrobenzene
TATP Triacetone-triperoxide
TNT 2,4,6-trinitrotoluene
TS Tkachenko-Scheffler dispersion correction
xiii
Contents
INTRODUCTION ................................................................................................................................ 1
1.1 ENERGETIC MATERIALS ....................................................................................................................... 1
1.1.1 Energetic Materials: A Brief History ...................................................................................... 1
1.1.2 Insensitive Munitions ............................................................................................................ 3
1.1.3 Energetic Materials: Definitions and Classifications ............................................................. 4
1.2 INITIATION OF ENERGETIC MATERIALS ................................................................................................... 8
1.2.1 Hot Spot Models .................................................................................................................... 8
1.2.2 Vibrational Up-Pumping ...................................................................................................... 11
1.3 PREDICTION AND RATIONALISATION OF ENERGETIC MATERIAL SENSITIVITY ................................................. 15
1.3.1 Isolated Molecule Methods ................................................................................................ 15 1.3.1.1 Empirical Fitting of Molecular Descriptors ................................................................................... 16 1.3.1.2 Oxygen Balance ............................................................................................................................ 17 1.3.1.3 NMR Chemical Shift ...................................................................................................................... 19 1.3.1.4 Bond Energies and Dissociation .................................................................................................... 20
1.3.2 Solid State Methods ............................................................................................................ 22 1.3.2.1 Crystal Packing and Non-Covalent Interactions ............................................................................ 23 1.3.2.2 Electronic Band Gap Criterion and Band Gap Dynamics ............................................................... 26
1.3.3 Kinetic Models ..................................................................................................................... 27
1.3.4 Vibrational Up-pumping: A Tool for Prediction ................................................................... 29
1.4 RESEARCH CONCEPT AND AIMS .......................................................................................................... 34
1.5 REFERENCES ................................................................................................................................... 35
EXPERIMENTAL AND COMPUTATIONAL METHODS ........................................................................ 43
2.1 COMPUTATIONAL METHODS ............................................................................................................. 43
2.1.1 The Schrödinger Equation ................................................................................................... 43
2.1.2 Hartree-Fock Theory ........................................................................................................... 45
2.1.3 Multi-Reference Methods ................................................................................................... 48
2.1.4 Density Functional Theory ................................................................................................... 51 2.1.4.1 Hohenberg-Kohn Theorems ......................................................................................................... 51 2.1.4.2 Kohn-Sham Equations................................................................................................................... 52 2.1.4.3 Exchange-Correlation Functionals ................................................................................................ 55
2.1.5 Basis Sets ............................................................................................................................. 57 2.1.5.1 Localised Basis Set – Isolated Molecules ...................................................................................... 58 2.1.5.2 Condensed Matter, Delocalised Basis Sets and Bloch Theorem ................................................... 59 2.1.5.3 Pseudopotentials .......................................................................................................................... 62
2.1.6 Phonon Calculations ............................................................................................................ 64
2.2 EXPERIMENTAL METHODS ................................................................................................................. 68
2.2.1 X-ray Diffraction .................................................................................................................. 68 2.2.1.1 X-ray Powder Diffraction .............................................................................................................. 70

xiv
2.2.2 Inelastic Neutron Scattering Spectroscopy ......................................................................... 72 2.2.2.1 Generation of Neutrons................................................................................................................ 74 2.2.2.2 The TOSCA Instrument ................................................................................................................. 75 2.2.2.3 Neutron Scattering ...................................................................................................................... 76
2.2.3 BAM fall Hammer ................................................................................................................ 79
2.3 REFERENCES ................................................................................................................................... 82
VIBRATIONAL UP-PUMPING: PREDICTING IMPACT SENSITIVITY OF SOME ENERGETIC AZIDES ....... 87
3.1 INTRODUCTION ............................................................................................................................... 87
3.2 AIMS ............................................................................................................................................. 91
3.3 TEST SET OF ENERGETIC AZIDES .......................................................................................................... 92
3.4 METHODS ...................................................................................................................................... 94
3.5 RESULTS AND DISCUSSION ................................................................................................................. 99
3.5.1 Bond Rupture of Explosophoric N3− ..................................................................................... 99
3.5.1.1 Dissociation of N3− ...................................................................................................................... 103
3.5.2 Metallisation in the Azides: Case Study of 𝛼-NaN3 ........................................................... 109 3.5.2.1 Band gap dependence on external lattice modes in α-NaN3 ...................................................... 114 3.5.2.2 Band gap dependence on internal vibrational modes in α-NaN3 ............................................... 118
3.5.3 Up-Pumping and Impact Sensitivity .................................................................................. 123 3.5.3.1 Partitioning of the Vibrational Structure .................................................................................... 127 3.5.3.2 Coupling Pathways and Impact Sensitivity ................................................................................. 131
3.6 CONCLUSIONS ............................................................................................................................... 140
3.7 SUGGESTIONS FOR FUTURE WORK .................................................................................................... 142
3.8 REFERENCES ................................................................................................................................. 143
VIBRATIONAL UP-PUMPING IN SOME MOLECULAR ENERGETIC MATERIALS ................................ 151
4.1 INTRODUCTION ............................................................................................................................. 151
4.2 AIMS ........................................................................................................................................... 153
4.3 MODEL SYSTEMS ........................................................................................................................... 153
4.4 METHODS .................................................................................................................................... 156
4.5 RESULTS AND DISCUSSION ............................................................................................................... 160
4.5.1 Electronic Structure ........................................................................................................... 160
4.5.2 Vibrational Structure of Some Organic Energetic Materials ............................................. 161
4.5.3 Vibrational Up-Pumping in the Molecular Energetic Materials ........................................ 167 4.5.3.1 Overtone Pathways .................................................................................................................... 173 4.5.3.2 Combination Pathways ............................................................................................................... 178 4.5.3.3 Two-Layer Combination Pathways ............................................................................................. 182 4.5.3.4 Temperature Dependent Up-Pumping ....................................................................................... 185 4.5.3.5 Up-Pumping from Zone-Centre Frequencies .............................................................................. 199
4.6 CONCLUSIONS ............................................................................................................................... 202
4.7 SUGGESTIONS FOR FURTHER WORK .................................................................................................. 204
4.8 REFERENCES ................................................................................................................................. 205
VIBRATIONAL UP-PUMPING IN POLYMORPHIC MATERIALS ......................................................... 210
5.1 INTRODUCTION ............................................................................................................................. 210
5.2 AIMS ........................................................................................................................................... 214
5.3 MATERIALS .................................................................................................................................. 215
5.4 RESULTS AND DISCUSSION ............................................................................................................... 218
5.4.1 Polymorphism of HMX ...................................................................................................... 218
xv
5.4.1.1 Electronic Structure of HMX Polymorphs ................................................................................... 218 5.4.1.2 Vibrational Structure of HMX Polymorphs ................................................................................. 219
5.4.2 Polymorphism of FOX-7..................................................................................................... 224 5.4.2.1 Experimental Impact Sensitivity ................................................................................................. 224 5.4.2.2 Electronic Structure .................................................................................................................... 227 5.4.2.3 Vibrational Up-Pumping in FOX-7 Polymorphs ........................................................................... 227
5.5 CONCLUSIONS ............................................................................................................................... 233
5.6 SUGGESTIONS FOR FURTHER WORK .................................................................................................. 235
5.7 REFERENCES ................................................................................................................................. 235
GENERAL CONCLUSIONS AND FUTURE DIRECTIONS ..................................................................... 239
6.1 GENERAL CONCLUSIONS ................................................................................................................. 239
6.2 FUTURE DIRECTIONS ...................................................................................................................... 245
6.3 REFERENCES ................................................................................................................................. 247
APPENDIX A ................................................................................................................................. 249
APPENDIX B ................................................................................................................................. 251
1
Chapter 1
INTRODUCTION
1.1 Energetic Materials
1.1.1 Energetic Materials: A Brief History
Energetic materials (explosives, propellants and pyrotechnics; EMs) contain
stored chemical energy which is rapidly released on initiation. EMs have
proved to be of great value for industrial, commercial and military applications.1
The origin of EMs is often ascribed to the accidental discovery of black powder
(a mixture of KNO3, S8 and charcoal) ca. 220 BCE in China. Their development
in Europe began much later, when the English monk Roger Bacon began
further studies of black powder in 1249 CE, described in his letter ‘On the
Marvellous Power of Art and Nature and on the Nullity of Magic’.2 This led to
the adoption by western nations of black powder for military applications by
the end of the 13th century. Despite these early discoveries, EMs were not
used industrially until some time later, with the first documented use of black
powder in England in the 1670s.3 Black powder quickly became notorious for
its propensity to accidentally initiate, despite numerous attempts at
desensitising the material using additives, including paraffin and starch.
However, it remained the primary industrial EM until the 1870s.3
It was not until the late 19th century that substantial progress was made on EM
technologies.3,4 The Nobel family made enormous strides with the
development of nitroglycerine (NG) based materials, including a variety of
dynamite compositions.5 A mixture of NG with clay (Guhr dynamite) proved
sufficiently stable for industrial application, and mixtures of NG with
nitrocellulose (NC) led to formation of gelatine dynamite. Both dynamite forms
2
remain in use today. The Nobel family also introduced mercury fulminate as
an alternative detonator to replace black powder. Ammonium nitrate also
became a popular additive to enhance explosive compositions.
Throughout the development of EMs, safety remained a top concern.
Accidental, explosive-related casualties remained very high across industry,
and it was finally recognised that government-regulated standards should be
imposed to ensure explosives were fit for purpose. Both dynamite and black
powder were barred from use, and ammonium nitrate-based compositions
became favoured for industrial application.3
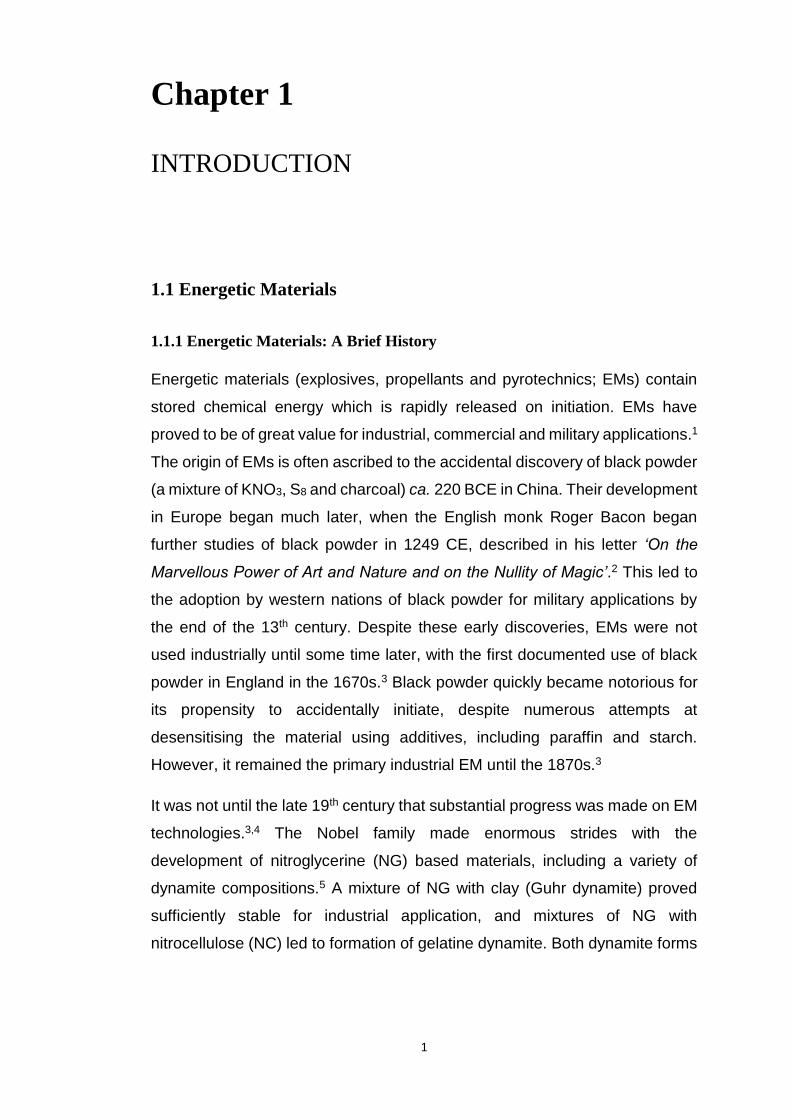
Figure 1.1: Chemical structure diagrams for common molecular energetic compounds.
Alongside the development of industrial EMs was the production of new
military-grade materials. Picric acid, Figure 1.1, was an early favourite towards
the end of the 19th century. However, when loaded into munitions, it had a
tendency to react with the metallic shell walls, leading to highly sensitive metal
salts.6 This was largely overcome at the turn of the 20th century with the
introduction of trinitrotoluene (TNT), Figure 1.1. This became a widely used
explosive during the first World War. A number of other EMs were developed
prior to the second World War, including pentaerythritoltetranitrate (PETN),
1,3,5,7-tetranitro-1,3,5,7-tetrazocane (Octogen or HMX) and 1,3,5-
Trinitroperhydro-1,3,5-triazine (RDX). The latter two were favoured for military
use due to their lower impact sensitivity, Figure 1.1.
The sensitivity of RDX and HMX remained a problem, and safety concerns
persisted. Rather than developing new EMs, it was instead found that the
3
sensitivity of energetic crystals could be reduced by embedding into polymer
matrices to produce polymer-bonded explosives (PBXs). Semtex is a well-
known PBX containing PETN and RDX, although very many PBXs are known
and used today.7
1.1.2 Insensitive Munitions
While the early development of EMs was slow, the latter half of the 20th century
has seen rapid development of many new EMs. Generally, new molecules are
desired that can be more safely handled and which exhibit more powerful
energetics properties.8,9 The need for safe EMs was finally recognised globally
in the 1970s with the establishment of outlines for insensitive munitions (IMs).10
An IM describes any EM that will not initiate under any condition other than its
intended use, and has been made to include explosive formulations (e.g. PBXs)
as well as insensitive explosive molecules. For example, HMX and RDX only
meet IM regulations when formulated as PBXs. A variety of replacement EMs
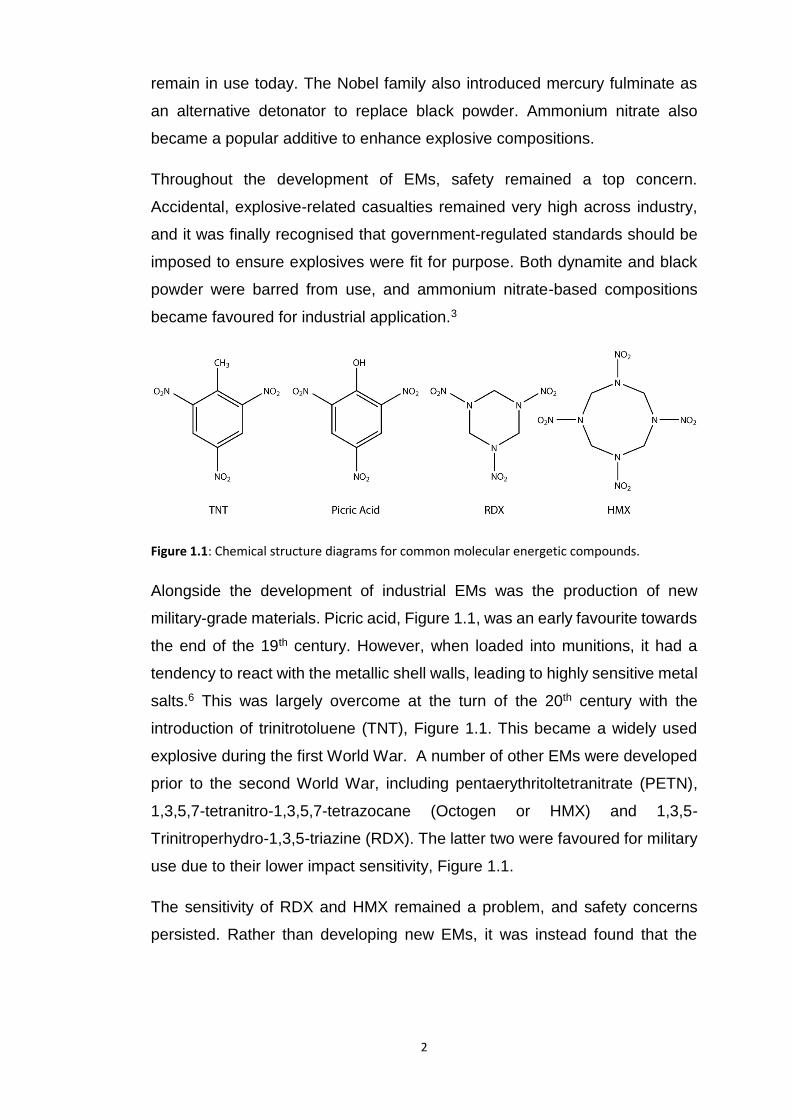
have been proposed, Figure 1.2. For example, hexanitrostilbene (HNS) and
triaminotrinitrobenzene (TATB) are insensitive materials which exhibit high
thermal stability. Nitro-1,2,4-triazol-3-one (NTO) is a high-energy, low-
sensitivity material that has been suggested as a replacement for TNT and has
found commercial applications (e.g. in automobile airbags). 1,1-diamino-2,2-
dinitroethylene (FOX-7) has also become a popular EM, exhibiting excellent
energetic properties and low sensitivity.
Figure 1.2: Molecular structure of new insensitive EMs.
An alternative to developing new molecules has been to generate multi-
component materials: co-crystals and salts. The potential to tune EM
properties by multi-component crystallisation was noted early by T. Brill, who,
4
while studying solvates of HMX, noted that ‘the physical and chemical
properties of HMX might be tailored systematically by such dopants’.11 Very
many examples of multi-component EM crystals are now known (with both
energetic and non-energetic co-formers), and in many cases exhibit drastically
different sensitivity properties when compared to the pure EM.12,13 Notable
examples include co-crystals of TNT14, including a co-crystal with the highly
sensitive EM hexanitrohexaazaisowurtzitane (CL-20 or HNIW), CL-20●TNT.14
This co-crystal exhibits substantially reduced impact sensitivity as compared
to either pure EM. A number of co-crystals are also known based on HMX15,
including HMX●2-bromoaniline and HMX●2-pyrrolidone and 2CL-20●HMX.16
All of these co-crystals exhibit notably different impact sensitivities than pure
HMX. However, despite the possibility to develop new molecules and multi-
component crystals, there remains very limited understanding of what
constitutes a sensitive EM. Hence any new EM requires synthesis and
thorough testing, at great cost and risk to safety.
Despite the enormous libraries of known explosive materials, safety and
performance remain of utmost importance. The testing required to validate the
safety and performance of new EMs is extensive. As such, very few of these
new candidate molecules make their way into practical application. Instead, it
has been more common to utilize EMs with well-characterised safety
parameters, and vary the composition to which they are added.
1.1.3 Energetic Materials: Definitions and Classifications
Explosions caused by EMs are chemical explosions and are the result of a
rapid chemical reaction that releases large amounts of energy and gas. The
chemical transformation occurs so rapidly that gas products do not instantly
expand out of the reaction zone. This leads to immense pressurisation within
the material and formation of a shock wave.17
An EM can be any material that contains both a fuel and an oxidiser. These
can be single component (e.g. TNT or HMX), or multi-component (e.g. black
powder) systems. When the material ignites and reacts without the formation

5
of additional pressure (i.e. a slow burn), it is said to combust. If, however,
pressure is generated in the material, the material is instead said to deflagrate.
A deflagration is characterised by a sub-sonic burn rate. Under very particular
circumstances – pressure build-up, confinement or very rapid reaction –
deflagration can instead change to a detonation. This transition, known as the
deflagration-to-detonation (DDT) transition, results from adiabatic heating,
i.e. that that temperature increases with pressure. Hence, if sufficient pressure
is accumulated within the material during its burn, or an intense shock is
applied to the material, the propagation of the chemical reaction front
accelerates due to increased temperature. In a detonation, the reaction front
propagates at supersonic speeds, and is associated with the propagation of a
shock front.
Figure 1.3: Schematic representation of the structure of a detonation front in an energetic
material. Unreacted material has pressure of 𝑝0, and the shock front is exposed to a pressure, 𝑝1.
The Chapman-Jouguet plane is indicated as 𝑅𝐶𝐽. Figure adapted from Ref. 4
During the propagation of a shock front into the unreacted material, a thin layer
(ca. 10-100 Å)18 of material is compressed, Figure 1.3. The pressure
associated with the shock front leads to an increase in temperature of the
material, and initiation of the reaction. As the shock front passes, the pressure
6
(and temperature) of the material behind the front decrease along the shock
adiabat (Hugoniot adiabat). At a characteristic point, the Chapman-Jouguet
Point ( 𝑅𝐶𝐽 ), the chemical reaction reaches an equilibrium, the shock
propagation reaches Mach 1 and the detonation process stops. The rate of
shock propagation depends on the rate at which the chemical reaction can
occur, with typical values of 1500-9000 ms-1.19 Hence, any model aimed at
predicting this phenomenon must include processes no slower than this. The
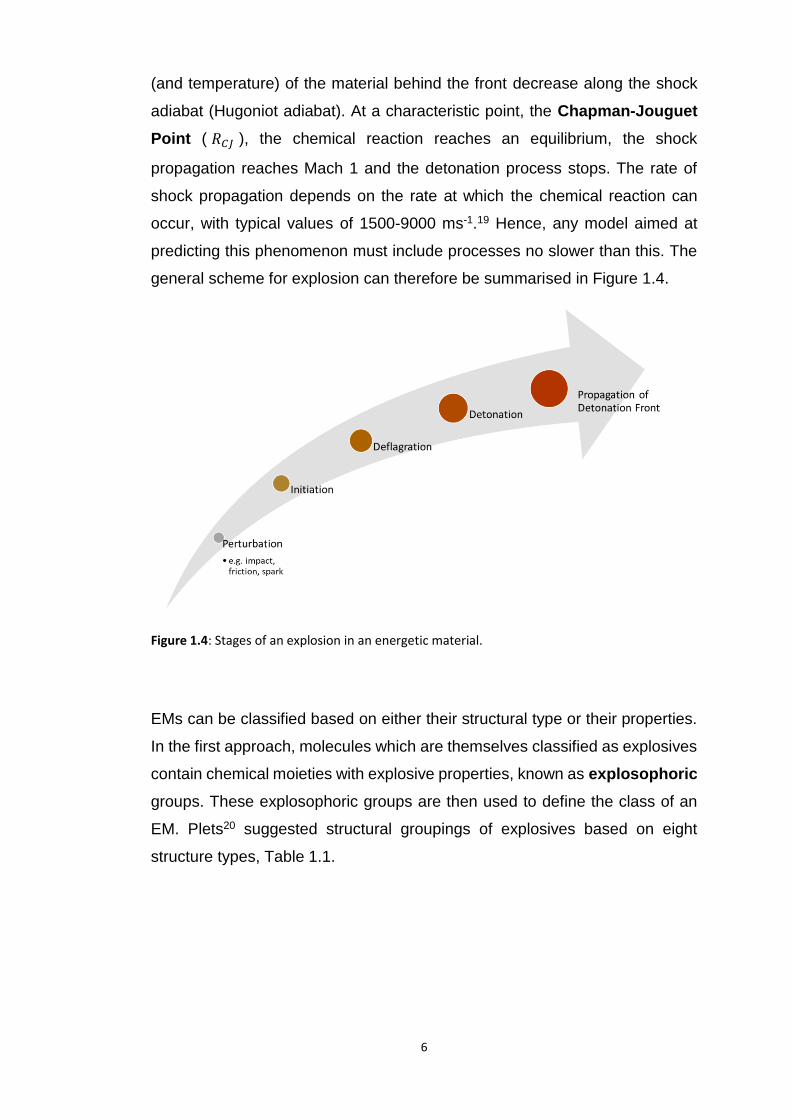
general scheme for explosion can therefore be summarised in Figure 1.4.
Figure 1.4: Stages of an explosion in an energetic material.
EMs can be classified based on either their structural type or their properties.
In the first approach, molecules which are themselves classified as explosives
contain chemical moieties with explosive properties, known as explosophoric
groups. These explosophoric groups are then used to define the class of an
EM. Plets20 suggested structural groupings of explosives based on eight
structure types, Table 1.1.
7
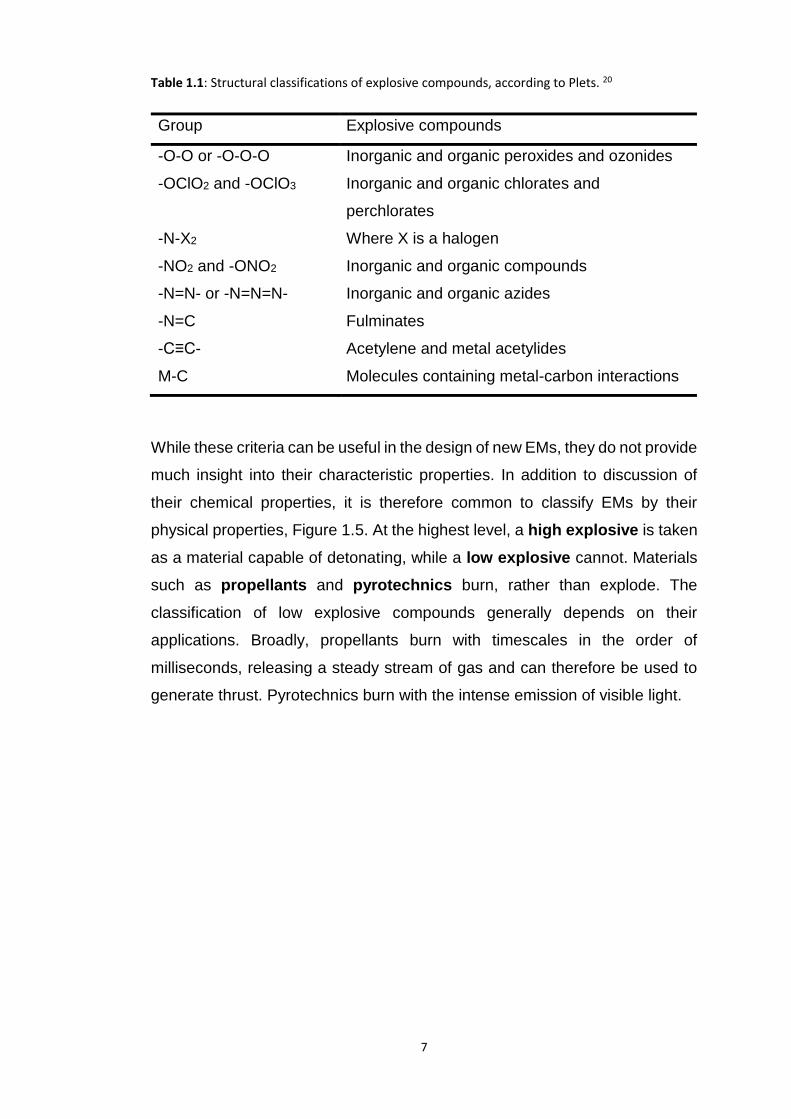
Table 1.1: Structural classifications of explosive compounds, according to Plets. 20
Group Explosive compounds
-O-O or -O-O-O Inorganic and organic peroxides and ozonides
-OClO2 and -OClO3 Inorganic and organic chlorates and
perchlorates
-N-X2 Where X is a halogen
-NO2 and -ONO2 Inorganic and organic compounds
-N=N- or -N=N=N- Inorganic and organic azides
-N=C Fulminates
-C≡C- Acetylene and metal acetylides
M-C Molecules containing metal-carbon interactions
While these criteria can be useful in the design of new EMs, they do not provide
much insight into their characteristic properties. In addition to discussion of
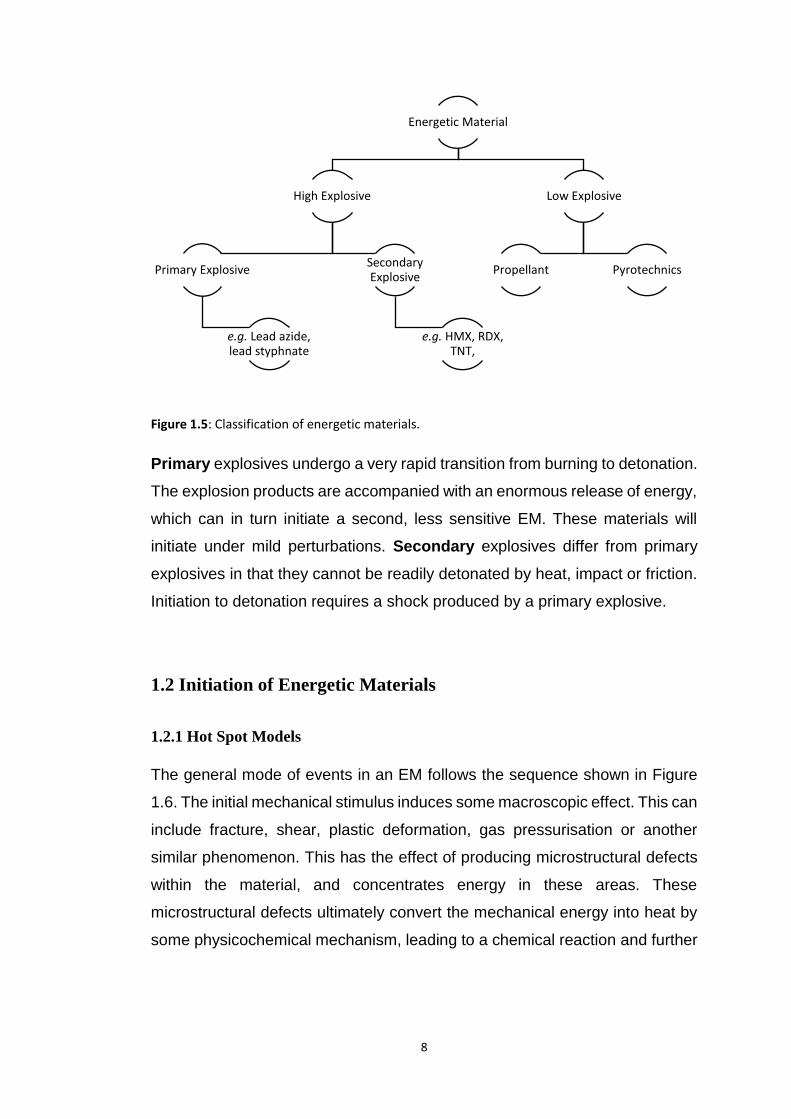
their chemical properties, it is therefore common to classify EMs by their
physical properties, Figure 1.5. At the highest level, a high explosive is taken
as a material capable of detonating, while a low explosive cannot. Materials
such as propellants and pyrotechnics burn, rather than explode. The
classification of low explosive compounds generally depends on their
applications. Broadly, propellants burn with timescales in the order of
milliseconds, releasing a steady stream of gas and can therefore be used to
generate thrust. Pyrotechnics burn with the intense emission of visible light.
8
Figure 1.5: Classification of energetic materials.
Primary explosives undergo a very rapid transition from burning to detonation.
The explosion products are accompanied with an enormous release of energy,
which can in turn initiate a second, less sensitive EM. These materials will
initiate under mild perturbations. Secondary explosives differ from primary
explosives in that they cannot be readily detonated by heat, impact or friction.
Initiation to detonation requires a shock produced by a primary explosive.
1.2 Initiation of Energetic Materials
1.2.1 Hot Spot Models
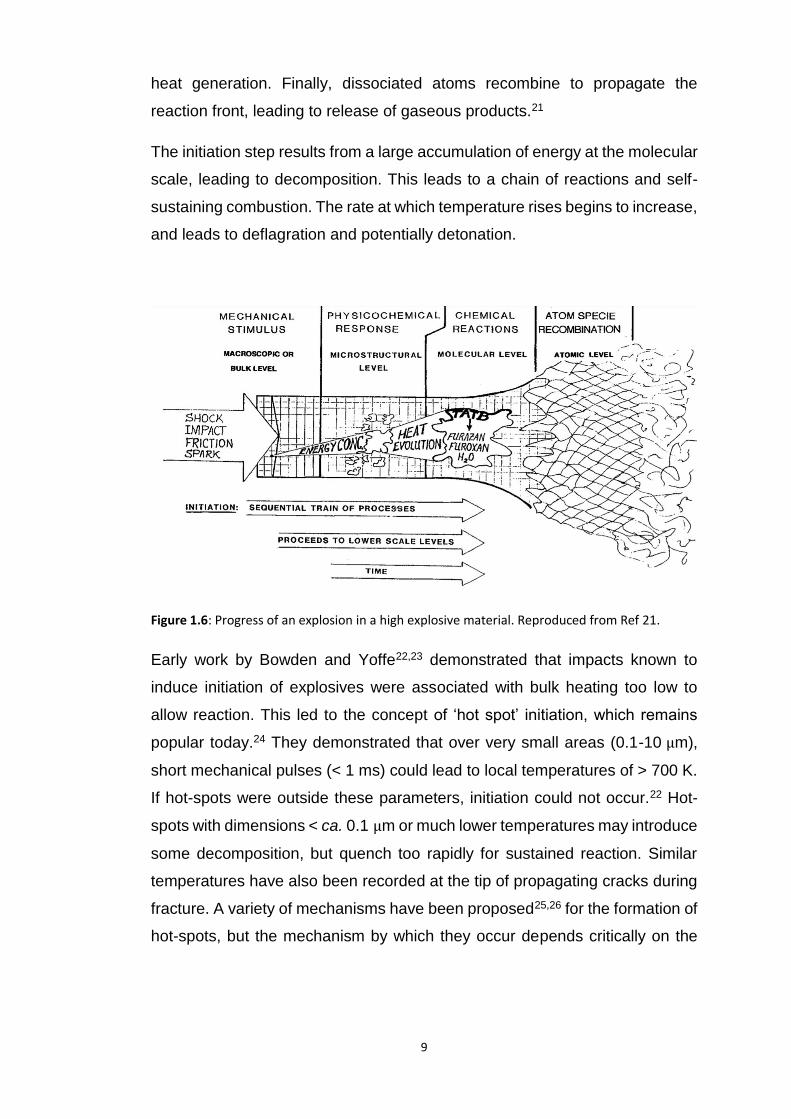
The general mode of events in an EM follows the sequence shown in Figure
1.6. The initial mechanical stimulus induces some macroscopic effect. This can
include fracture, shear, plastic deformation, gas pressurisation or another
similar phenomenon. This has the effect of producing microstructural defects
within the material, and concentrates energy in these areas. These
microstructural defects ultimately convert the mechanical energy into heat by
some physicochemical mechanism, leading to a chemical reaction and further
Energetic Material
High Explosive
Primary Explosive
e.g. Lead azide, lead styphnate
Secondary Explosive
e.g. HMX, RDX, TNT,
Low Explosive
Propellant Pyrotechnics
9
heat generation. Finally, dissociated atoms recombine to propagate the
reaction front, leading to release of gaseous products.21
The initiation step results from a large accumulation of energy at the molecular
scale, leading to decomposition. This leads to a chain of reactions and self-
sustaining combustion. The rate at which temperature rises begins to increase,
and leads to deflagration and potentially detonation.
Figure 1.6: Progress of an explosion in a high explosive material. Reproduced from Ref 21.
Early work by Bowden and Yoffe22,23 demonstrated that impacts known to
induce initiation of explosives were associated with bulk heating too low to
allow reaction. This led to the concept of ‘hot spot’ initiation, which remains
popular today.24 They demonstrated that over very small areas (0.1-10 μm),
short mechanical pulses (< 1 ms) could lead to local temperatures of > 700 K.
If hot-spots were outside these parameters, initiation could not occur.22 Hot-
spots with dimensions < ca. 0.1 μm or much lower temperatures may introduce
some decomposition, but quench too rapidly for sustained reaction. Similar
temperatures have also been recorded at the tip of propagating cracks during
fracture. A variety of mechanisms have been proposed25,26 for the formation of
hot-spots, but the mechanism by which they occur depends critically on the

10
nature of the material. Some hot-spots (critical hot-spots) will lead to self-
propagating initiation of an EM, while others (non-critical hot-spots) will lead to
local heating, without initiation of the material. Hence, within the hot-spot
theory for EM initiation, understanding the corresponding hot-spot mechanism
is crucial. Field26 studied the initiation events by high-speed photography, and
concluded that there are only a few mechanisms that are responsible for critical
hot-spot formation as a result of mechanical perturbation. In solids, these are
adiabatic gas heating, friction, adiabatic shear and viscoplastic work.26
Within an explosive composition, gases trapped within defects (on the order of
0.1-10 μm) are adiabatically compressed from an initial pressure, 𝑃𝑖, to some
final pressure, 𝑃𝑓. The temperature of this gas rises according to23
𝑇𝑓 = 𝑇𝑖 (𝑃𝑓
𝑃𝑖)γ−1 / γ
Equation 1.1
where 𝑇𝑖 is the initial temperature, 𝑇𝑓 is the final temperature and γ represents
the specific heat capacities of the phase. Numerical calculations have
suggested hot-spot temperatures to rise in excess of 700-1000 K.27
Frictional heating, resulting from the interaction of explosive particles or with
grit, has also been suggested as an important hot-spot forming mechanism.
The maximum temperature is determined by the lowest melting component at
the contact. In accordance with this effect, Bowden and Gurton28 demonstrated
a method to indirectly measure hot-spot temperatures due to friction by using
grits with different melting temperatures. They determined 700 K to be the
lowest hot-spot temperature required for initiation of PETN (the most sensitive
secondary explosive in common use). The physical base for frictional heating
remains largely debated, but has been suggested to result from accumulation
of stress at the contact surfaces.29 Frictional heating is largely an equilibrium
phenomenon, however, and ignition temperatures tend to be much higher than
the melting temperatures of typical explosive materials. Friction can therefore
lead to melting and local decomposition.30 In many cases it is therefore

11
believed that frictional heating acts in concert with other hotspot
mechanisms.25
Solid compositions contain void space. As a mechanical force is imparted into
a system, material is forced into these voids and are necessarily plastically
deformed. This has been suggested as the principal mechanism for hot-spot
formation in many materials.31
The final principal mechanism for hot-spot formation in solids is via localised
adiabatic shear. This phenomenon stems from the anisotropic deformation of
materials that are exposed to impact or shock. Plastic deformation can localize
into bands, on the order of > 1μm. This is generally the case when thermal
softening exceeds work hardening in a material. In such cases, deformation in
a plane leads to further deformation in the same plane and thus a build-up of
heat.31 This phenomenon was first described by Recht for metals,32 but was
subsequently observed in inorganic explosives by Winter and Field33 and later
in organic explosives, PETN and HMX.26
A microscopic hot-spot model has also been suggested. This model is based
on the concept of dislocation pile-ups.29 Upon mechanical stimulation, the
contact layer undergoes immense plastic deformation and generation of
extended defects (dislocations) that extend into the bulk.29 At any temperature
𝑇 > 0 K, these defects rapidly migrate through the sample and collide
(generally at existing defects), leading to local accumulations of energy within
a crystallite. However, these pile-ups occur over length scales of 10s of
nanometres.34 Hence this mechanism does not produce sufficiently large hot-
spots, and the accumulated energy quickly dissipates to the surrounding bulk.
Hence dislocation pile-ups have been suggested as a non-critical hot-spot
phenomenon.
1.2.2 Vibrational Up-Pumping
While the hot-spot mechanisms describe the generation of large amounts of
energy in localised areas, they do not go so far as to describe localisation of
this energy into a molecular response. An additional model, dubbed vibrational
12
up-pumping was therefore proposed by Coffey and Toton35 in an attempt to
describe the processes occurring immediately behind a shock front. This
model was subsequently developed by Dlott and Fayer.36
The process of vibrational cooling was well established both experimentally
and theoretically through the late 20th century.37 This phenomenon describes
the mechanism by which excess molecular vibrational energy relaxes within a
crystal. However, when mechanical energy is inserted instead into the low
frequency vibrational modes, the reverse process is observed.
Vibrational modes are inherently anharmonic, and the potential energy term of
the Hamiltonian takes the form36
𝑉 = 1/2 ∑𝜕2𝑉({𝜑})
𝜕2𝜑𝜑
𝜑2 + 1/3! ∑𝜕3𝑉({𝜑})
𝜕 𝜑𝜕 𝜑′𝜕 𝜑′′× 𝜑𝜑′𝜑′′
𝜑𝜑′𝜑′′
+. ..
Equation 1.2
where 𝑉(𝜑) is the potential energy surface of the solid, and { 𝜑} is a full set of
normal coordinates, 𝜑 . Previous work demonstrated that in solids, where
displacements are small compared to intermolecular distances, truncation of
𝑉 after the cubic term is valid.38 Hence, noting that mechanical perturbation
directly excites phonon states in a crystal (mainly acoustic modes),35 this
model describes a process whereby the excited phonon state could transfer
energy to an internal vibrational mode by coupling to a third normal mode with
intermediate frequency: vibrational up-pumping.
The rate at which this up-pumping occurs between any set of three modes
depends on the strength of their anharmonic coupling, i.e. the second term of
𝑉 . Because the intermolecular potential is more anharmonic than the
intramolecular potential, coupling processes that include higher numbers of
external modes (q) are dominant over processes that contain higher numbers
of internal modes (Q). Calculations on naphthalene39 suggested the coupling
to decrease by an order of magnitude with inclusion of Q terms, hence 𝑞1𝑞2𝑞3
> 𝑄1𝑞2𝑞3 > 𝑄1𝑄2𝑞3. It follows that upon mechanical perturbation, the phonon
13
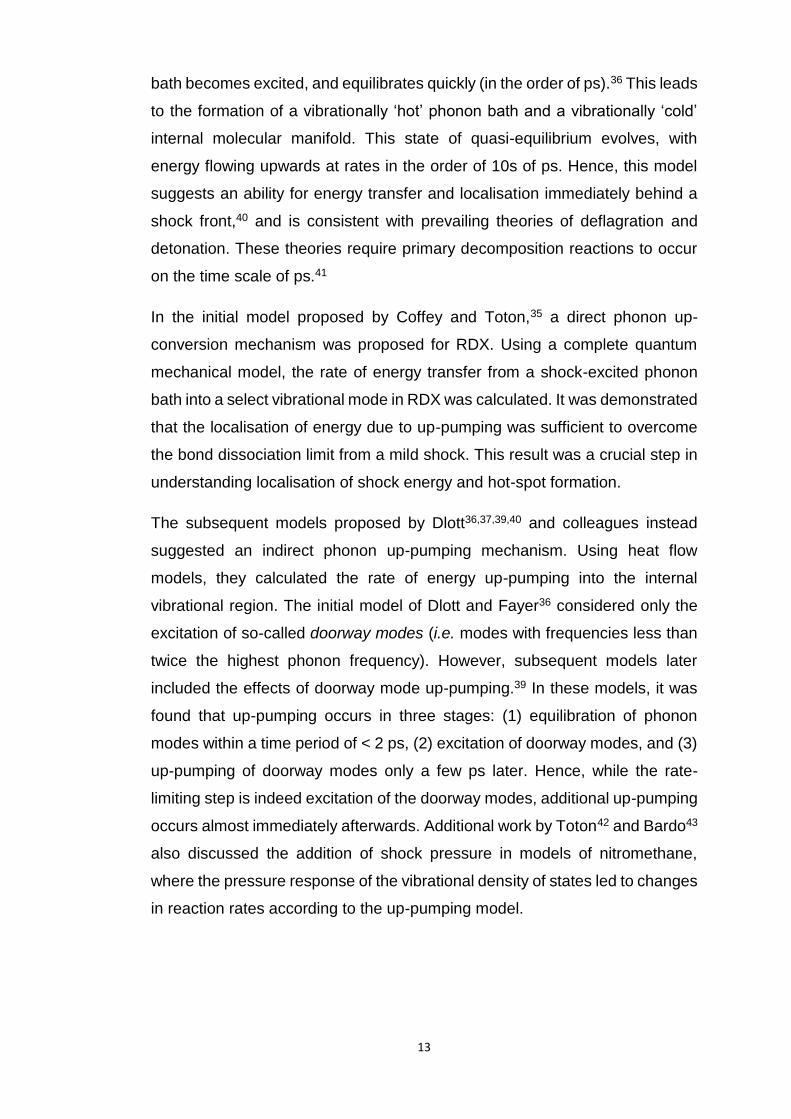
bath becomes excited, and equilibrates quickly (in the order of ps).36 This leads
to the formation of a vibrationally ‘hot’ phonon bath and a vibrationally ‘cold’
internal molecular manifold. This state of quasi-equilibrium evolves, with
energy flowing upwards at rates in the order of 10s of ps. Hence, this model
suggests an ability for energy transfer and localisation immediately behind a
shock front,40 and is consistent with prevailing theories of deflagration and
detonation. These theories require primary decomposition reactions to occur
on the time scale of ps.41
In the initial model proposed by Coffey and Toton,35 a direct phonon up-
conversion mechanism was proposed for RDX. Using a complete quantum
mechanical model, the rate of energy transfer from a shock-excited phonon
bath into a select vibrational mode in RDX was calculated. It was demonstrated
that the localisation of energy due to up-pumping was sufficient to overcome
the bond dissociation limit from a mild shock. This result was a crucial step in
understanding localisation of shock energy and hot-spot formation.
The subsequent models proposed by Dlott36,37,39,40 and colleagues instead
suggested an indirect phonon up-pumping mechanism. Using heat flow
models, they calculated the rate of energy up-pumping into the internal
vibrational region. The initial model of Dlott and Fayer36 considered only the
excitation of so-called doorway modes (i.e. modes with frequencies less than
twice the highest phonon frequency). However, subsequent models later
included the effects of doorway mode up-pumping.39 In these models, it was
found that up-pumping occurs in three stages: (1) equilibration of phonon
modes within a time period of < 2 ps, (2) excitation of doorway modes, and (3)
up-pumping of doorway modes only a few ps later. Hence, while the rate-
limiting step is indeed excitation of the doorway modes, additional up-pumping
occurs almost immediately afterwards. Additional work by Toton42 and Bardo43
also discussed the addition of shock pressure in models of nitromethane,
where the pressure response of the vibrational density of states led to changes
in reaction rates according to the up-pumping model.
14
Both Coffey35 and Dlott36,40 noted a particularly intriguing feature of this model.
Defect sites within the crystalline lattice introduce points of extreme vibrational
anharmonicity. Hence, the strength of anharmonic coupling in the vicinity of a
defect is larger and the corresponding rate of up-pumping to these sites is
greater, Figure 1.7. This offered a mechanism for the localisation of energy
near defect sites, and thus the role of internal defects in generating hot-
spots.25,26 However, the exact anharmonic enhancement introduced by defect
sites remains unknown.
Hence, with these early fundamental developments, vibrational up-pumping
appeared to offer a complete mechanism for the introduction, propagation and
localisation of energy, capable of describing initiation of EMs. The
phenomenon has been validated both experimentally and based on theoretical
molecular dynamics simulations.44–47
Figure 1.7: Time dependent vibrational quasi-temperatures for the phonon bath (θ𝑝 ), bulk
vibrational manifold (θ𝑣) and defect sites (θ𝑑). Figure adapted from Ref. 36
15
1.3 Prediction and Rationalisation of Energetic Material Sensitivity
The initiation of energetic materials has been known for centuries. However, a
consistent fundamental mechanism that underpins this phenomenon has not
yet been established. Materials chemistry is now a well-developed field, with
structure-property relations in many materials being thoroughly understood.
Shock-wave physics is also well established. Hence, while tangential
phenomena are largely understood, an understanding of the link between
structure and detonation – i.e. initiation – remains elusive. A detailed
understanding of the factors that govern the sensitivity of a material to the
initiation of chemical reactions that occur under mechanical perturbation has
yet to be obtained. More than most other criteria, the inability to target low-
sensitivity compounds has placed one of the greatest limitations on the
potential for selective and rational development of new energetic technologies.
This problem has attracted considerable attention in recent decades,48–50 with
much interest in discovering the single (or set of) physical parameters that can
be used to rationalise and predict a potential material’s sensitivity. This is a
particularly challenging problem on account of the complex interplay of
chemical and physical events spanning many scales of time and length,51 as
well as the poor consistency of experimentally reported impact sensitivities.52
Correspondingly, many models have been developed to predict and rationalise
the sensitivity properties of EMs. Broadly, these can be grouped into three
approaches, based (1) on the properties of the isolated molecule, (2) on the
properties of the solid state, and (3) on macroscopic descriptors. Typically,
correlations are made against impact sensitivity data reported as the height at
which a drop hammer test will induce initiation with 50% probability, dubbed
ℎ50. For the purpose of the following, discussion will be limited to the main
models that are aimed at predicting sensitivity to mechanical stimulation.
1.3.1 Isolated Molecule Methods
Much of the work that has attempted to rationalise the impact sensitivity of EMs
is based on the study of isolated molecules. Initially, this was a consequence

16
of limited access to crystal structures of these compounds as well as limitations
on computational methods. Numerous models were developed, and the
relative simplicity of models based on isolated molecules keeps their
development an ongoing area of research still today. Broadly, they can be
classified into methods based on structural parameters and those based on
quantum-mechanical properties.
1.3.1.1 Empirical Fitting of Molecular Descriptors
Many attempts have been made to develop fully empirical fits between
molecular descriptors and sensitivities. These methods have been particularly
popular for large-scale screening programmes, and indeed amongst the most
powerful, although they offer no physical mechanism for their success. For
example, Keshavarz53 proposed a general equation based on chemical
composition that was able to fit the impact sensitivities of EM compounds with
formula Ca’ Hb’ Nc’ Od’,
log(ℎ50) = 𝑐1𝑎′ + 𝑐2𝑏
′ + 𝑐3𝑐′ + 𝑐4𝑑
′
Equation 1.3
where 𝑐1 − 𝑐4 are adjustable fitting parameters. It was found that by adjusting
the relative coefficients, a broad range of structural types could be analysed.
However, this fitting remains limited to families of compounds. A variety of
similar equations have also been proposed,54–56 and have generally offered an
excellent and rapid means to assess impact sensitivity of large libraries of
materials.
In a similar fashion, empirical models based on molecular descriptors have
become a popular approach, known as the Quantitative Structure-Property
Relation (QSPR) methods. In these methods, a large number of molecular
descriptors are chosen, including ionisation potentials, electrostatic potentials,
oxygen balance, molecular orbital energies, bond lengths, and many others.
Regression models are subsequently established on large databases and
empirical equations established. Early QSPR-based models employed

17
structural descriptors, with Fayet57,58 being amongst the first to employ
quantum-mechanical descriptors for EMs.
Based on a series of 300 quantum-mechanical molecular descriptors, Fayet58
investigated the impact sensitivity of a total of 161 nitro compounds, separated
into three structural classes, using the QSPR approach. For each class of
materials, this proved very promising, with R2 > 0.8 in each case. The inability
to produce stronger correlations was largely ascribed to poor experimental
data.58,59 A similar approach was also based on 61 non-quantum mechanical
descriptors.59 Other authors have employed considerably smaller numbers of
descriptors. Badder and co-workers,60 for example, built a QSPR model for 10
nitro compounds based on eight quantum-mechanical descriptors, with Shu61
employing as few as two (nitro group charge and oxygen balance) descriptors.
In both cases, reasonable models were obtained for the small test set of nitro-
based compounds studied.
While these empirical methods are promising as screening tools, they offer no
physical insight into sensitivity properties.
1.3.1.2 Oxygen Balance
Based on the assumption that structurally related compounds should undergo
similar decomposition pathways, Kamlet62 and subsequently Kamlet and
Adolph63 proposed a comparison of the impact sensitivity of a compound
against its oxygen balance (OB). The OB was suggested to be relevant as it
describes the ability of a molecule to oxidise itself. That is, compounds that
contain sufficient oxygen to convert all nitrogen to NO2, all carbon to CO2 and
all H to H2O. For C-H-N-O molecules, this is defined as63
𝑂𝐵100 =100(2𝑛𝑜 − 𝑛ℎ − 2𝑛𝑐 − 2𝑛𝑐𝑜𝑜)
𝑀𝑤
Equation 1.4
Across a series of over 70 compounds,62 a logarithmic correlation between the
50% impact heights (ℎ50) and OB. However, the compounds were found to
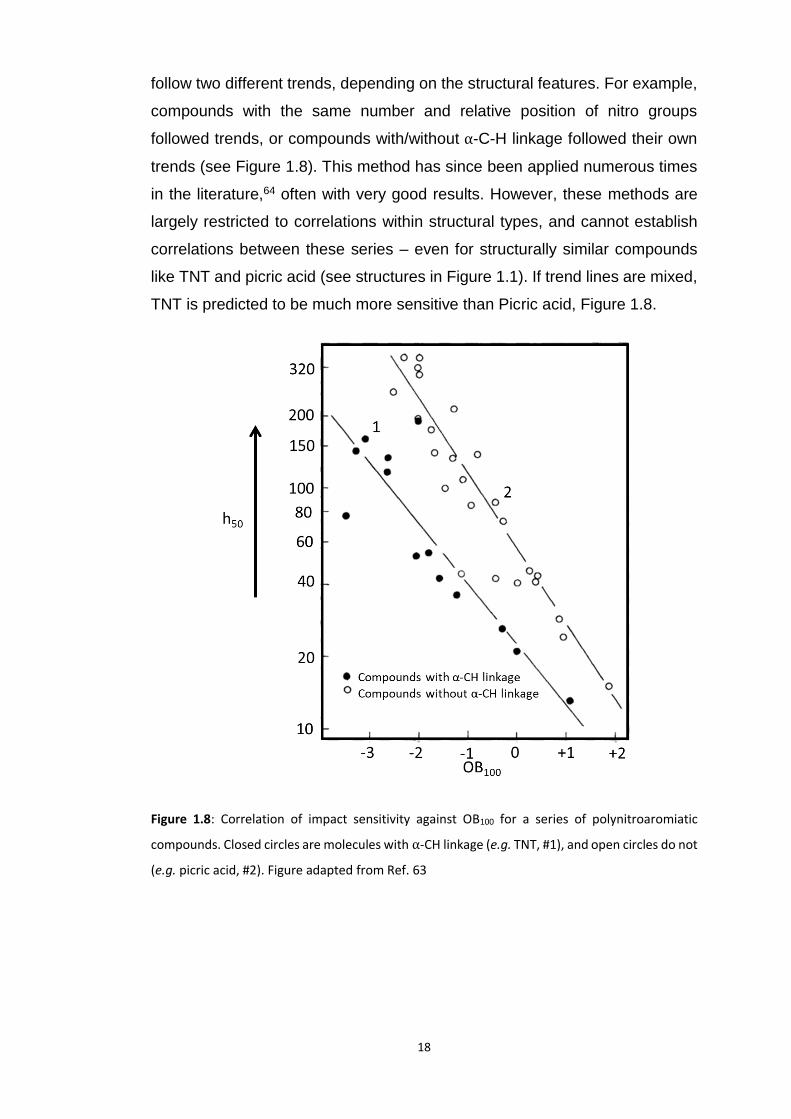
18
follow two different trends, depending on the structural features. For example,
compounds with the same number and relative position of nitro groups
followed trends, or compounds with/without α-C-H linkage followed their own
trends (see Figure 1.8). This method has since been applied numerous times
in the literature,64 often with very good results. However, these methods are
largely restricted to correlations within structural types, and cannot establish
correlations between these series – even for structurally similar compounds
like TNT and picric acid (see structures in Figure 1.1). If trend lines are mixed,
TNT is predicted to be much more sensitive than Picric acid, Figure 1.8.
Figure 1.8: Correlation of impact sensitivity against OB100 for a series of polynitroaromiatic
compounds. Closed circles are molecules with α-CH linkage (e.g. TNT, #1), and open circles do not
(e.g. picric acid, #2). Figure adapted from Ref. 63

19
1.3.1.3 NMR Chemical Shift
The chemical shifts obtained in NMR are strongly dependent on the electronic
structure of the molecule. It was therefore proposed that these chemical shifts
should reflect the relative bond strength of a structural moiety to the molecule
backbone, and thus give an indication of the stability of the structure.
Correlations were initially made by Owens65 between the 1H NMR chemical
shifts and the impact sensitivity of trinitroarene compounds. A similar model
was subsequently extended based on 15N and 13C NMR chemical shifts by
Zeman.66–68 It has also been extended to the investigation of friction
sensitivities.69 While this has not yet become a widespread approach, it has
demonstrated itself as a powerful method for predicting impact sensitivities of
related compounds, Figure 1.9. However, it is evident that no reliable
information can be obtained by this method if structurally unrelated compounds
are compared.
Figure 1.9: Comparison of impact drop energy (Edr) against 15N NMR chemical shifts of the aza
nitrogen atoms to which -NO2 groups are attached. These are chosen as they are believed to be
involved in the initial step of initiation. Figure from Ref. 67
20
1.3.1.4 Bond Energies and Dissociation
A very popular method to investigate impact sensitivity (as well as thermal
stability) of EMs has been based on the ab initio study of bond dissociation
energies. The first ab initio results to this effect were performed at the Hartree-
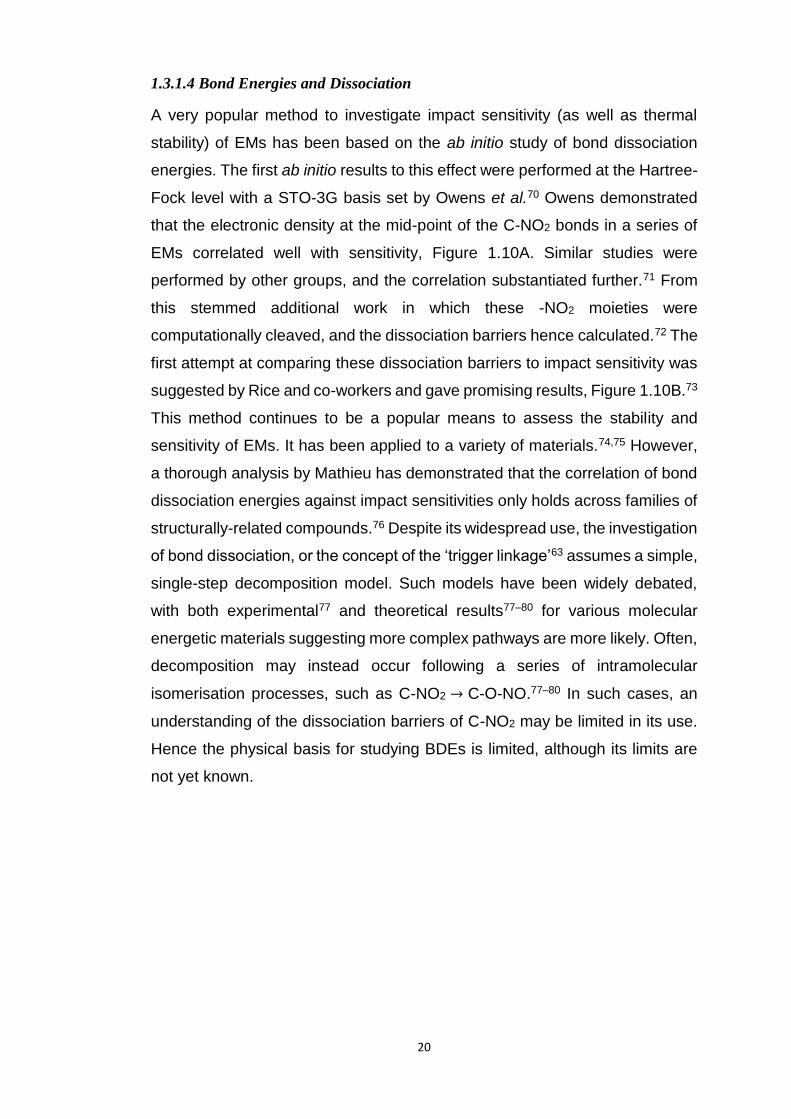
Fock level with a STO-3G basis set by Owens et al.70 Owens demonstrated
that the electronic density at the mid-point of the C-NO2 bonds in a series of
EMs correlated well with sensitivity, Figure 1.10A. Similar studies were
performed by other groups, and the correlation substantiated further.71 From
this stemmed additional work in which these -NO2 moieties were
computationally cleaved, and the dissociation barriers hence calculated.72 The
first attempt at comparing these dissociation barriers to impact sensitivity was
suggested by Rice and co-workers and gave promising results, Figure 1.10B.73
This method continues to be a popular means to assess the stability and
sensitivity of EMs. It has been applied to a variety of materials.74,75 However,
a thorough analysis by Mathieu has demonstrated that the correlation of bond
dissociation energies against impact sensitivities only holds across families of
structurally-related compounds.76 Despite its widespread use, the investigation
of bond dissociation, or the concept of the ‘trigger linkage’63 assumes a simple,
single-step decomposition model. Such models have been widely debated,
with both experimental77 and theoretical results77–80 for various molecular
energetic materials suggesting more complex pathways are more likely. Often,
decomposition may instead occur following a series of intramolecular
isomerisation processes, such as C-NO2 → C-O-NO.77–80 In such cases, an
understanding of the dissociation barriers of C-NO2 may be limited in its use.
Hence the physical basis for studying BDEs is limited, although its limits are
not yet known.
21
Figure 1.10: Correlations of C-NO2 bond energies and impact sensitivity. (A) Correlation of the
electron density at the C-NO2 bond mid-point against sensitivity. From Ref 65 (B) Correlation of
C-NO2 bond dissociation energy and impact sensitivity. From Ref 73.
Largely based on the early findings by Owens et al,70 it has been suggested
that much of the information regarding bond dissociation energies can be
obtained from a much simpler calculation: the electrostatic potential.81 This
methodology has been largely pioneered by Politzer and co-workers,82 and
has been applied to molecular and ionic energetic species.83 Qualitative
analysis of the electrostatic potential surfaces has been used to rank impact
sensitivity, noting that molecules with more positive potentials tend to be more
sensitive, Figure 1.11.82,84 This can largely be rationalised by a lower electron
density and hence decreased stabilisation of the molecule. However, Politzer
suggested use of a set of descriptors – the first to describe the average
deviation of the electrostatic potential across a bond, and a second to indicate
the maximum value of the potential.84 The former is taken to describe the
charge separation, and hence the covalency of the bond, with the latter a
measure of the maximum interaction strength, noting that the interaction
energy is proportional to charge density.85–87 Numerous studies have
employed investigation of the electrostatic potential to rationalise impact
sensitivities.88–93 However, many of these investigations tend to conduct such

22
studies on small subsets of molecules, and therefore the wider applicability of
this approach is unknown. However, it is reasonable to assume that it will also
be limited to subsets of molecules that exhibit similar electronic structures.
Figure 1.11: Electrostatic potential surfaces for polynitroaromatic molecules. Surfaces were
calculated at B3LYP/6-31G* level and coloured according to the legend at the top of the figure.
The experimental drop heights (h50) are given below. Figure and values from Ref 88.
1.3.2 Solid State Methods
Despite the progress made in predicting properties of materials from isolated
molecules, such models are limited. For example, description of the isolated
molecule cannot rationalise the effects of polymorphism16,94 or multi-
component crystallisation12 on sensitivity properties. This has led many
researchers to move towards investigating mechanisms based on the
crystalline state.

23
1.3.2.1 Crystal Packing and Non-Covalent Interactions
A number of authors have suggested structural arguments to rationalise
impact sensitivity. The instantaneous, adiabatic compression of a solid leads
to an increase in its final equilibrium temperature. The more compressible is
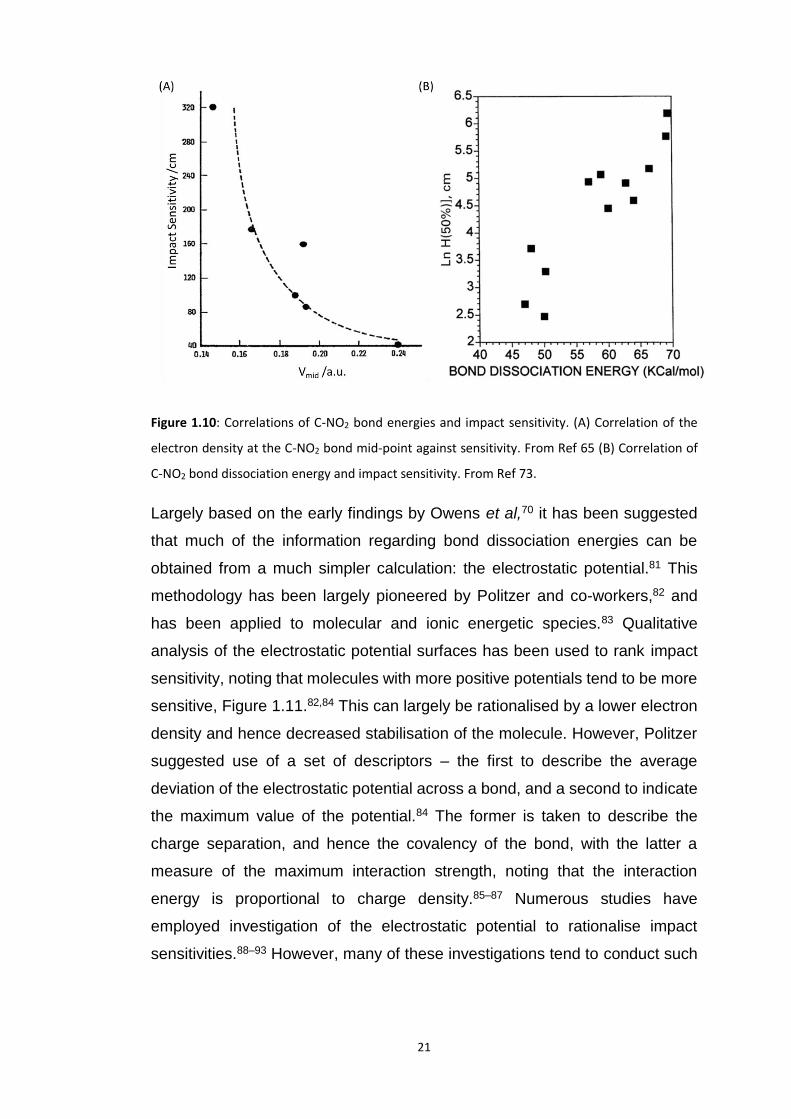
the material, the higher the final temperature. Politzer and co-workers95,96
therefore suggested that a simple trend for impact sensitivity could be sought
in calculation of the free volume per molecule within the unit cell,
Δ𝑉 = 𝑆/𝑍
Equation 1.5
where Z is the number of molecules and 𝑆 is the free space
𝑆 = 𝑉𝑐𝑒𝑙𝑙(1 − packing coefficient)
Equation 1.6
Very simple in its approach, this method appeared to offer reasonable results,
Figure 1.12. However, these results proved to be highly system dependent,
with different types of EMs following considerably different trends.
The crystalline state is characterised by the type of intermolecular interactions
it contains. This has led many authors to seek sensitivity arguments based on
a study of these intermolecular interactions. Cartwright and Wilkinson97 for
example, suggested that compression of solids leads to formation of new
intermolecular contacts, permitting bimolecular reactions to occur. Their
investigation of a series of inorganic azides therefore focused on correlating
impact sensitivity against the distance between nearest non-bonded nitrogen
atoms. A number of authors have also attempted to correlate the type and
strength of intermolecular interactions with sensitivity,16,93,98,99 with findings
that larger numbers of strong intermolecular interactions tend to reduce the
sensitivity of EMs.
24
Figure 1.12: Experimental impact sensitivity (h50) against free space per molecule in the unit cell,
ΔV. Data are shown for (green) nitramines, (blue) nitroaromatics and (red) other EMs that do not
fit these categories. Figure from Ref 95.
Analysis of the crystal packing arrangements in crystalline materials has been
suggested as an alternative method to rationalise impact sensitivity. Early work
by Coffey100 suggested that the rate of plastic deformation in EMs could be
linked to sensitivity. This was recently developed somewhat tangentially by
Zhang,101 as well as Shreeve and co-workers92 who constructed a model
based on the accumulation of energy due to mechanical strain. They
suggested that studying the deformation potential associated with different
lattice structures could therefore help to rationalise impact sensitivity. For a
pair of multi-component crystals, it was found that packing which included non-
layered components had substantially larger deformation potentials than the
herringbone structure, Figure 1.13A. The material with larger deformation
potential (and hence stored strain energy) was indeed found to be more
sensitive. The same analysis was performed for RDX (a sensitive secondary
25
explosive) and compared to a layered compound, Figure 1.13B.102 Again, it
was shown that in the layered material, lower deformation potentials arose.
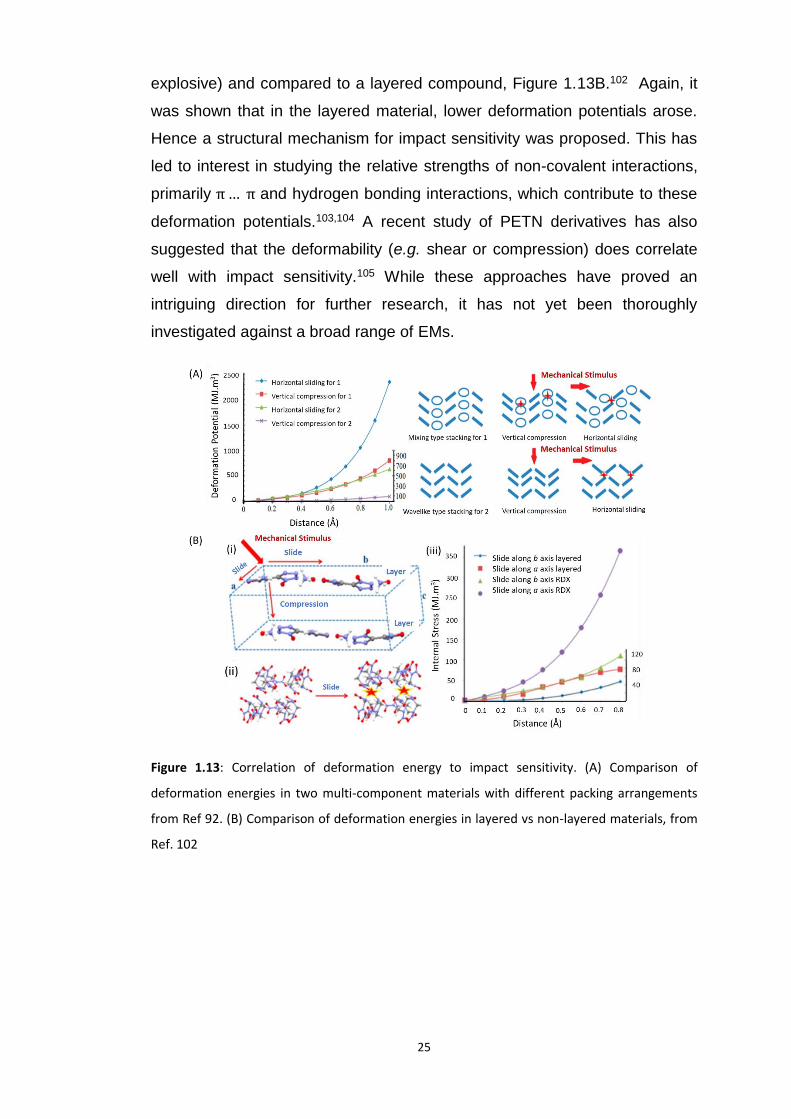
Hence a structural mechanism for impact sensitivity was proposed. This has
led to interest in studying the relative strengths of non-covalent interactions,
primarily π… π and hydrogen bonding interactions, which contribute to these
deformation potentials.103,104 A recent study of PETN derivatives has also
suggested that the deformability (e.g. shear or compression) does correlate
well with impact sensitivity.105 While these approaches have proved an
intriguing direction for further research, it has not yet been thoroughly
investigated against a broad range of EMs.
Figure 1.13: Correlation of deformation energy to impact sensitivity. (A) Comparison of
deformation energies in two multi-component materials with different packing arrangements
from Ref 92. (B) Comparison of deformation energies in layered vs non-layered materials, from
Ref. 102

26
1.3.2.2 Electronic Band Gap Criterion and Band Gap Dynamics
Amongst the most popular solid state criteria for assessing impact sensitivity
is the ‘band-gap criterion’.106,107 Noting that bond dissociation requires
population of anti-bonding states, this simple analysis is based on
consideration of the energy gap between the valence and conduction bands.
Within this approach, materials with larger band gaps (i.e. those whose
electronic transitions are less probable) are less sensitive. While extensive
investigation of this band gap criterion is limited, it has been applied with
varying success. Perhaps the largest drawback to this approach is the
unreliable calculation of electronic band gaps within most commonly available
computational methods,108 and the lack of experimental band gap data.
Several authors have expanded this concept to dynamic phenomena. In a
similar spirit to the work of Shreeve and co-workers,92 Kuklja109–111 investigated
the electronic structure of both α-FOX-7 and TATB as a function of different
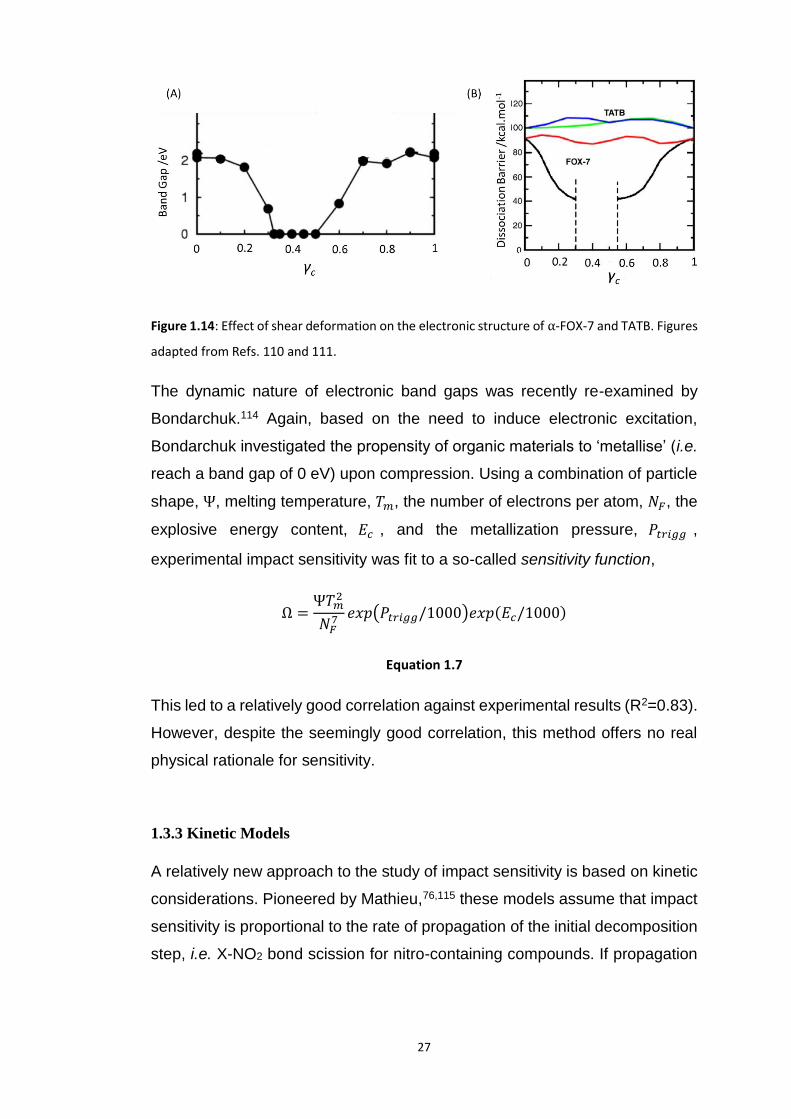
lattice deformations. Rather than focussing on the deformation potential itself,
Kuklja studied the resulting changes in the electronic band gap and bond
dissociation energy at the interface between sheared planes, Figure 1.14A and
1.14B. Under sufficient shear the band gap of FOX-7 dropped to zero, and the
dissociation energy of -NO2 dropped considerably. In contrast, shear
deformation had no notable influence on the dissociation energy of the -NO2
moieties of TATB,111 Figure 1.14B, although Manaa112 did identify a large
reduction (albeit not to metallisation) in its electronic band gap. This was
suggested as a rationale for the different sensitivities of these compounds.
The effect of shear in α-FOX-7 is particularly noteworthy. The decomposition
of FOX-7 is generally believed to pass via -NO2 → -ONO isomerisation.77 This
renders comparison of -NO2 dissociation energies largely irrelevant (Section
1.3.1.4). However, it was found113 that under shear strain, direct -NO2 scission
at the interface of shear planes becomes more favourable than isomerisation.
Hence, if shear deformation is considered, a comparison of -NO2 dissociation
energies again become important. This offers an excellent example of the
complex interplay of physical and chemical phenomena in the initiation of EMs.
27
Figure 1.14: Effect of shear deformation on the electronic structure of α-FOX-7 and TATB. Figures
adapted from Refs. 110 and 111.
The dynamic nature of electronic band gaps was recently re-examined by
Bondarchuk.114 Again, based on the need to induce electronic excitation,
Bondarchuk investigated the propensity of organic materials to ‘metallise’ (i.e.
reach a band gap of 0 eV) upon compression. Using a combination of particle
shape, Ψ, melting temperature, 𝑇𝑚, the number of electrons per atom, 𝑁𝐹, the
explosive energy content, 𝐸𝑐 , and the metallization pressure, 𝑃𝑡𝑟𝑖𝑔𝑔 ,
experimental impact sensitivity was fit to a so-called sensitivity function,
Ω =Ψ𝑇𝑚
2
𝑁𝐹7 𝑒𝑥𝑝(𝑃𝑡𝑟𝑖𝑔𝑔/1000)𝑒𝑥𝑝(𝐸𝑐/1000)
Equation 1.7
This led to a relatively good correlation against experimental results (R2=0.83).
However, despite the seemingly good correlation, this method offers no real
physical rationale for sensitivity.
1.3.3 Kinetic Models
A relatively new approach to the study of impact sensitivity is based on kinetic
considerations. Pioneered by Mathieu,76,115 these models assume that impact
sensitivity is proportional to the rate of propagation of the initial decomposition
step, i.e. X-NO2 bond scission for nitro-containing compounds. If propagation
28
is too slow, localised energy dissipates away from the reactive sites, and self-
sustained decomposition does not occur. This model states that the impact
sensitivity (ℎ50) is given by116,117
ℎ50 = (kc/𝑘𝑝𝑟 )
𝑛
Equation 1.8
where 𝑘𝑝𝑟 is the rate constant for the propagation of the primary
decomposition pathway, 𝑘𝑐 is a fitted parameter, and n is the order of the
reaction and must be > 0. The rate constant is subsequently constructed as a
function of the number of atoms in a molecule 𝑁𝐴, bond dissociation energies,
𝐷𝑖, the energy released due to decomposition of the first molecule, 𝐸𝑐, and a
set of scaling parameters, c and 𝑍𝑖. This yields
𝑘𝑝𝑟 = 𝑁𝐴−1 ∑𝑍𝑖
𝑖
𝑒𝑥𝑝 (−𝑐𝐷𝑖𝑁𝐴
𝐸𝑐)
Equation 1.9
where the sum is over all possible X-NO2 scission pathways, i, with additional
summation terms required for each identify of X (i.e. O-NO2 vs C-NO2).116
Based on a limited set of input parameters, a QSPR-type regression is
subsequently performed to obtain values of c and 𝑍𝑖. Despite the mathematical
similarity to QSPR methods, the physical basis used in developing this model
has allowed a reduction in the number of required parameters (from hundreds
to only three), and better correlations to large datasets.118
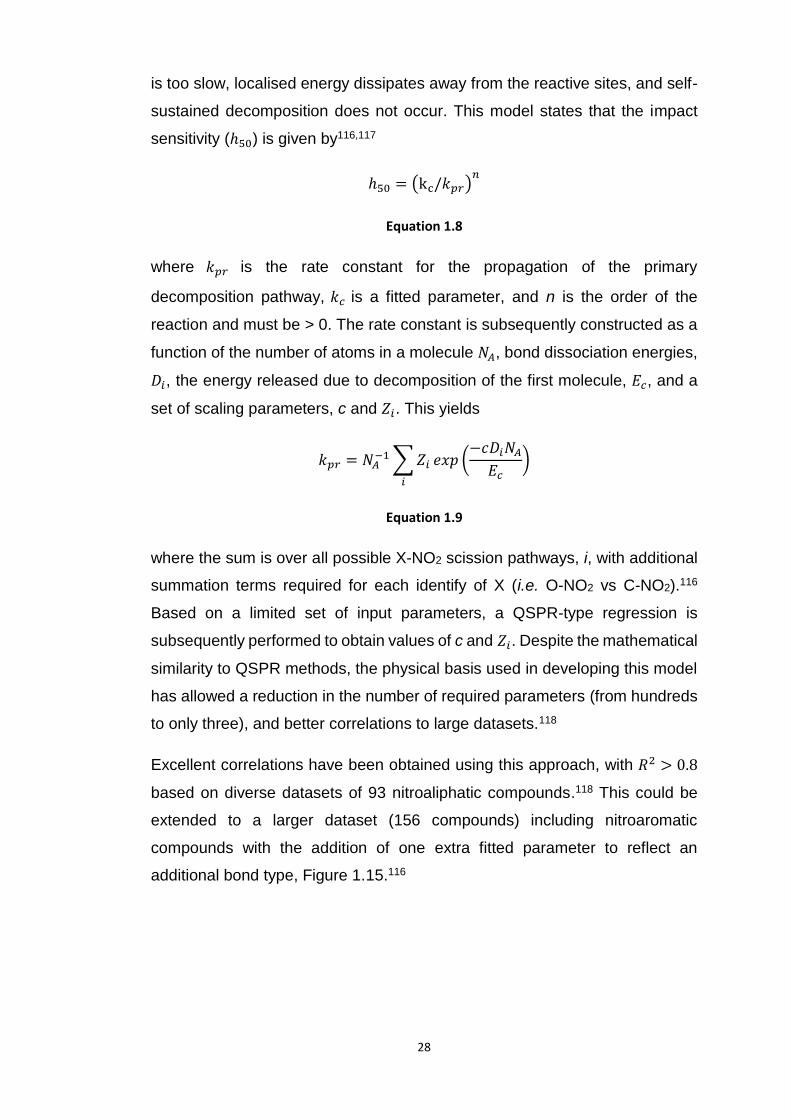
Excellent correlations have been obtained using this approach, with 𝑅2 > 0.8
based on diverse datasets of 93 nitroaliphatic compounds.118 This could be
extended to a larger dataset (156 compounds) including nitroaromatic
compounds with the addition of one extra fitted parameter to reflect an
additional bond type, Figure 1.15.116
29
Based on a physical model of impact-induced reactions, these semi-empirical
methods have proved very powerful for the rationalisation and prediction of
impact sensitivities.
Figure 1.15: Correlation of experimental sensitivity against 𝑘𝑝𝑟. Test set includes a diverse range
of molecules with -NO2 based explosophores. Grey circles include carbonyl moieties. Figure from
Ref 116
1.3.4 Vibrational Up-pumping: A Tool for Prediction
While many of the models discussed above describe decomposition processes,
none are based on the relative rates of energy localisation and subsequent
formation of hot-spots in EMs. To this end, models based on vibrational up-
pumping (Section 1.2.2) have been considered.
Since its conceptual development in the 1980/90s,36,39,40 and experimental
validation44 of the up-pumping phenomenon by Dlott and colleagues, there
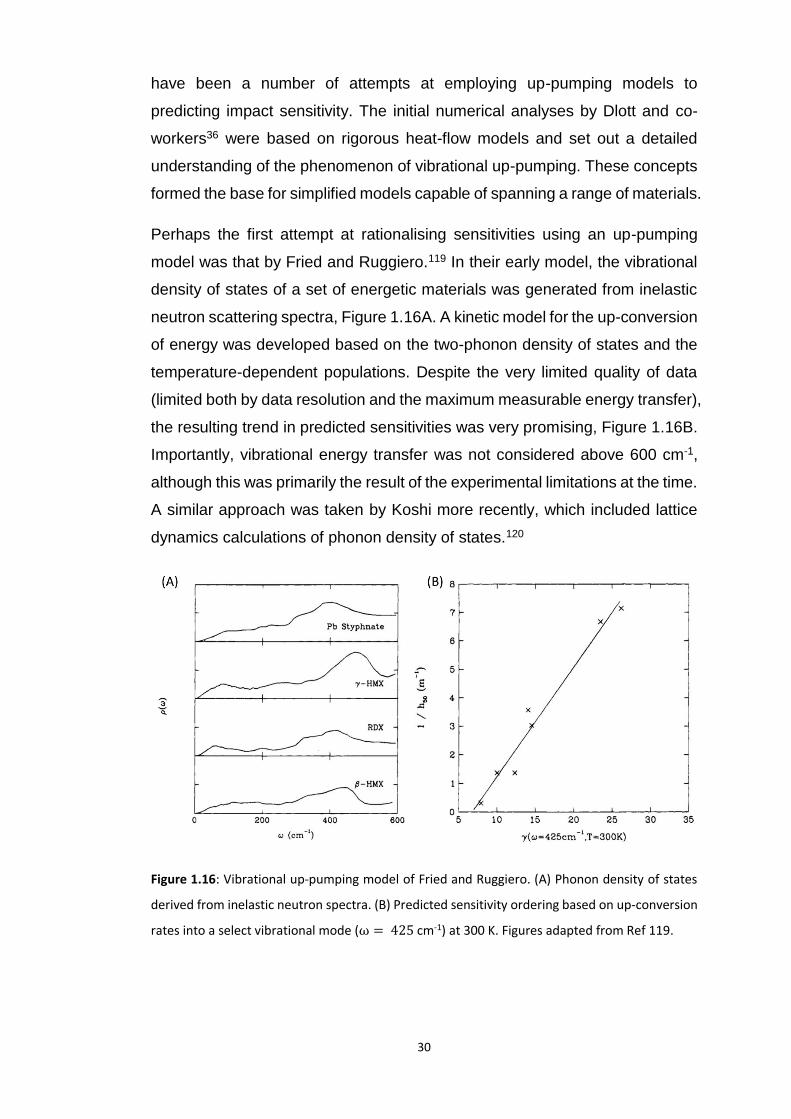
30
have been a number of attempts at employing up-pumping models to
predicting impact sensitivity. The initial numerical analyses by Dlott and co-
workers36 were based on rigorous heat-flow models and set out a detailed
understanding of the phenomenon of vibrational up-pumping. These concepts
formed the base for simplified models capable of spanning a range of materials.
Perhaps the first attempt at rationalising sensitivities using an up-pumping
model was that by Fried and Ruggiero.119 In their early model, the vibrational
density of states of a set of energetic materials was generated from inelastic
neutron scattering spectra, Figure 1.16A. A kinetic model for the up-conversion
of energy was developed based on the two-phonon density of states and the
temperature-dependent populations. Despite the very limited quality of data
(limited both by data resolution and the maximum measurable energy transfer),
the resulting trend in predicted sensitivities was very promising, Figure 1.16B.
Importantly, vibrational energy transfer was not considered above 600 cm-1,
although this was primarily the result of the experimental limitations at the time.
A similar approach was taken by Koshi more recently, which included lattice
dynamics calculations of phonon density of states.120
Figure 1.16: Vibrational up-pumping model of Fried and Ruggiero. (A) Phonon density of states
derived from inelastic neutron spectra. (B) Predicted sensitivity ordering based on up-conversion
rates into a select vibrational mode (ω = 425 cm-1) at 300 K. Figures adapted from Ref 119.

31
McNesby and Coffey121 subsequently built a model based on experimental
Raman spectroscopy. In their model, the assumption was made that the rate-
determining step in vibrational up-pumping is the transfer of energy from the
phonon manifold to the doorway region, consistent with prevailing theory. The
phonon bath was arbitrarily defined as modes with 𝜔 < 250 cm-1. Following
on from the work by Fried and Ruggiero,119 all up-pumping into the region with
ω < 700 cm-1 was considered, based on a kinetic analysis of the harmonic
overtones. Following from Fermi’s Golden Rule, overtone modes that were off-
resonance with a doorway mode scattered more slowly. Despite the
assumptions made, this proved promising in predicting the relative ordering of
impact sensitivities, Figure 1.17.
Figure 1.17: Relative rate of energy up-conversion to the doorway region for a series of energetic
materials. Note the exponential trend. Figure from Ref 121
Koshi122 was subsequently first to employ an approach based on ab initio
quantum mechanical calculations, and on a rate equation proposed by Dlott,36
κ =𝑗ℏΩ
𝜏1(0)𝜃𝑒
Equation 1.10
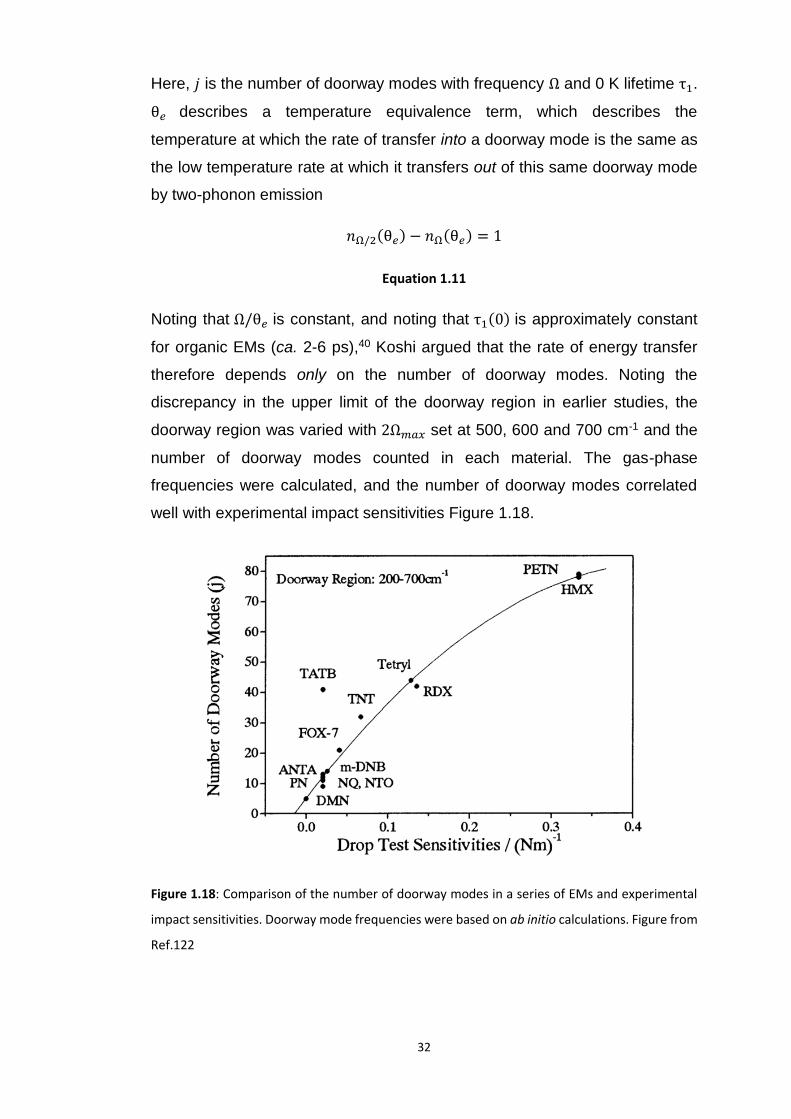
32
Here, 𝑗 is the number of doorway modes with frequency Ω and 0 K lifetime τ1.
θ𝑒 describes a temperature equivalence term, which describes the
temperature at which the rate of transfer into a doorway mode is the same as
the low temperature rate at which it transfers out of this same doorway mode
by two-phonon emission
𝑛Ω/2(θ𝑒) − 𝑛Ω(θ𝑒) = 1
Equation 1.11
Noting that Ω/θ𝑒 is constant, and noting that τ1(0) is approximately constant
for organic EMs (ca. 2-6 ps),40 Koshi argued that the rate of energy transfer
therefore depends only on the number of doorway modes. Noting the
discrepancy in the upper limit of the doorway region in earlier studies, the
doorway region was varied with 2Ω𝑚𝑎𝑥 set at 500, 600 and 700 cm-1 and the
number of doorway modes counted in each material. The gas-phase
frequencies were calculated, and the number of doorway modes correlated
well with experimental impact sensitivities Figure 1.18.
Figure 1.18: Comparison of the number of doorway modes in a series of EMs and experimental
impact sensitivities. Doorway mode frequencies were based on ab initio calculations. Figure from
Ref.122

33
Very recently, Bernstein123 has expanded on this method. The frequencies of
crystalline materials were calculated by ab initio methods, and the harmonic
overtones extrapolate. Bernstein subsequently correlated the number of
overtone frequencies that were ‘near resonant’ (i.e. ω ± 10) with fundamental
doorway modes in the region 200 < ω < 700 cm-1. Again, this led to good
correlation with experiment.
The major drawback to these studies has been an inability to directly calculate
the anharmonic coupling constants, which depend on the material and
associated vibrational frequencies. While it is in principle possible to calculate
these from ab initio methods, computational approaches are currently too
intensive. Most studies have assumed these to be constant for all materials,
while some have attempted to approximate them based on simple force-field
potentials.120 Most recently, McGrane124,125 considered vibrational up-pumping
in HMX, TATB and PETN by extracting the anharmonic potentials from high
resolution Raman spectra. All three materials were found to exhibit similar
average anharmonicities, and therefore lends validation to previous models in
which this term is neglected.
These models have proved very promising. The rather limited application of
these models in the last 20 years can only be ascribed to their difficulty.
Calculation of the vibrational structure is a long, arduous task that has only
recently become computationally feasible. Furthermore, the quality of
spectroscopic data, and in particular inelastic neutron scattering data, has only
reached sufficiently high resolution in recent years.126 Moreover, previous
models have varied largely in their assumptions and no thorough analysis has
yet been undertaken. It is therefore very timely to re-examine this model as a
physical basis from which to understand mechanically-induced reactions in
EMs.
34
1.4 Research Concept and Aims
The development of new EMs is an active area of fundamental research.
Amongst the main target characteristics of new EMs, ensuring low sensitivity
to mechanical perturbation is simultaneously a top priority and notoriously
difficult. This difficulty is largely due to the fact that no underlying mechanism
for EM sensitivity is yet known.
It is generally accepted that initiation of an EM requires localisation of energy
within the material. This localisation can be described by hot-spots. The origin
of these hot-spots remains widely debated, although a number of mechanisms
(Section 1.2) have been proposed. Some theories suggest hot-spots to be
rooted in equilibrium temperature increases, while others describe non-
equilibrium, athermal processes.
Many models (Section 1.3) have been proposed in an attempt to identify a set
of physical parameters to understand and describe the impact sensitivity of
EMs. The ‘band gap criterion’ remains the most popular amongst solid state
models. While many models are promising, they often lack a physical basis
and are restricted to subsets of energetic materials. A particularly promising
physical model is rooted in the so-called up-pumping of vibrational energy
(Section 1.2.2). This model describes the transfer of energy from an initial
mechanical impulse, and the mechanism by which it transitions into localised
molecular energy. Importantly, the up-pumping model is not isolated from
previous hot-spot models, as the initial energy can originate via any
phenomenon, including adiabatic compression, fracture, plastic deformation,
contact stresses, amongst others. Hence, it offers a physical basis for
converting hot-spot generation mechanisms into a chemical reaction.
Considerable experimental work has validated the up-pumping phenomenon,
and numerical modelling has been used to rationalise many of its general
features. However, only very limited work has focused on applying these
concepts to test sets of EMs for the prediction of impact sensitivity. Those that
have done so have been based on low resolution inelastic neutron scattering

35
spectra,119,120 or very limited consideration of vibrational structure from
calculation,123,124 or on Raman spectroscopy.121 The models employed in
these studies have been limited to very simple (and often different) energy-
transfer models and typically require the inclusion of additional experimental
data. Before a model based on up-pumping based model can therefore be
employed to predict impact sensitivity, a fully ab initio model must be
developed.
This work therefore conducted with the following aims:
• Investigate the vibrational properties of a range of energetic materials.
• Consider possible target vibrational modes for simple EMs.
• Consider the ‘band-gap criterion’ for a range of EMs.
• Investigate the development and use of an up-pumping based ab initio
model to predict the relative impact sensitivities of a range of energetic
materials.
• Validate potential models against available experimental impact
sensitivities.
• Unify previously proposed predictive up-pumping models into a single
model.
1.5 References
(1) Agrawal, J. P. High Energy Materials; Agrawal, J. P., Ed.; Wiley-VCH: Weinheim, 2010.
(2) Davis, T. L. Roger Bacon’s Gunpowder and His Secret Wisdom. Ind. Eng. Chem. 1928, 20 (7), 772–774.
(3) Akhavan, J. The Chemistry of Explosives, 3rd ed.; Akhavan, J., Ed.; Royal Society of Chemistry: Cambridge, UK, 2011.
(4) Klapötke, T. M. Chemistry of High-Energy Materials, 2nd ed.; Klapötke, T. M., Ed.; De Gruyter: Berlin, 2012.
(5) Nobel, A. Alfred Nobel, Inventor of Dynamite. J. Chem. Educ. 1928, 5 (11), 1480.
36
(6) Medard, L. A. Accidental Explosions Volume 2: Types of Explosive Substances; Medard, L., Ed.; Wiley & Sons, Ltd.: New York, USA, 1989.
(7) Elbeih, A.; Jungová, M.; Zeman, S.; Vávra, P.; Akštein, Z. Explosive Strength and Impact Sensitivity of Several PBXs Based on Attractive Cyclic Nitramines. Propellants, Explos. Pyrotech. 2012, 37 (3), 329–334.
(8) Cumming, A. S. New Trends in Advanced High Energy Materials. J. Aerosp. Technol. Manag. 2009, 1 (2), 161–166.
(9) Doherty, R. M. Emerging Trends in Energetic Materials. In Insensitive Munitions & Energetic Materials Technology Symposium (IMEMTS); Miami, Fl. USA, 2007.
(10) Powell, I. J. Insensitive Munitions – Design Principles and Technology Developments. Propellants, Explos. Pyrotech. 2016, 41 (3), 409–413.
(11) Haller, T. M.; Rheingold, A. L.; Brill, T. B. Structure of the 1/1 Complex between HMX and NMP. Acta. Cryst. 1985, C41, 963–965.
(12) Kennedy, S. R.; Pulham, C. R. Co-Crystallization of Energetic Materials. In Co-crystals: Preparation, Characterization and Applications; Aakeröy, C. B., Sinha, A. S., Eds.; Royal Society of Chemistry: Cambridge, UK, 2018; pp 231–266.
(13) Zhang, J.; Shreeve, J. M. Time for Pairing: Cocrystals as Advanced Energetic Materials. CrystEngComm 2016, 18 (33), 6124–6133.
(14) Landenberger, K. B.; Matzger, A. J. Cocrystal Engineering of a Prototype Energetic Material: Supramolecular Chemistry of 2,4,6-Trinitrotoluene. Cryst. Growth Des. 2010, 10 (12), 5341–5347.
(15) Landenberger, K. B.; Matzger, A. J. Cocrystals of 1,3,5,7-Tetranitro-1,3,5,7-Tetrazacyclooctane (HMX). Cryst. Growth Des. 2012, 12 (7), 3603–3609.
(16) Bolton, O.; Simke, L. R.; Pagoria, P. F.; Matzger, A. J. High Power Explosive with Good Sensitivity: A 2:1 Cocrystal of CL-20:HMX. Cryst. Growth Des. 2012, 12 (9), 4311–4314.
(17) Chemistry and Physics of Energetic Materials; Bulusu, S. N., Ed.; Kluwer Academic Publishers: Netherlands, 1990.
(18) Harris, P.; Presles, H. N. The Shock Induced Electrical Polarization of Water. J. Chem. Phys. 1982, 77 (10), 5157–5164.
(19) Meyer, R.; Köhler, J.; Homburg, A. Explosives, 6th ed.; Meyer, R., Köhler, J., Homburg, A., Eds.; Wiley-VCH: Weinheim, 2007.
(20) Plets, V. Zh. Obs. Khim. 1953, 5, 173.
(21) Shackelford, S. A. A General Concept Concerning Energetic Material Sensitivity and Initiation. J. Phys. IV 1995, 5 (C4), 485–499.
(22) Bowden, F. P.; Yoffe, A. D. Initiation and Growth of Explosion in Liquids and Solids; Cambridge University Press: Cambridge, UK, 1952.
(23) Bowden, F. P.; Yoffe, A. Hot Spots and the Initiation of Explosion. Symp. Combust. Flame Explos. Phenom. 1949, 3 (1), 551–560.
(24) Balaz, P. Mechanochemistry and Nanoscience. In Mechanochemistry in Nanoscience and Minerals Engineering; Balaz, P., Ed.; Springer-Verlag: Berling Heidelberg, 2008; pp 1–102.
37
(25) Field, J. E.; Bourne, N. K.; Palmer, S. J. P.; Walley, S. M.; Sharma, J.; Beard, B. C. Hot-Spot Ignition Mechanisms for Explosives and Propellants. Philos. Trans. R. Soc. A Math. Phys. Eng. Sci. 1992, 339 (1654), 269–283.
(26) Field, E. J. Hot Spot Ignition Mechanisms for Explosives. Acc. Chem. Res. 1992, 25 (11), 489–496.
(27) Mader, C. L. Shock and Hot Spot Initiation of Homogeneous Explosives. Phys. Fluids 1963, 6 (3), 375–381.
(28) Bowden, F. P.; Gurton, O. A. Birth and Growth of Explosion in Liquids and Solids Initiated by Impact and Friction. Proc. R. Soc. London. Ser. A Math. Phys. Sci. 1949, 198 (1054), 350.
(29) Heinicke, G.; Sigrist, K. Heinicke, G. Z. Chem. 1971, 11, 226.
(30) Dickson, P. M.; Parker, G. R.; Smilowitz, L. B.; Zucker, J. M.; Asay, B. W. Frictional Heating and Ignition of Energetic Materials. AIP Conf. Proc. 2006, 845 II, 1057–1060.
(31) Frey, R. B. The Initiation of Explosive Charges by Rapid Shear; Aberdeen Proving Ground, MD, 1980.
(32) Recht, R. F. Catastrophic Thermoplastic Shear. J. Appl. Mech. 1964, 31 (2), 189.
(33) Winter, R. E.; Field, J. E. The Role of Localized Plastic Flow in the Impact Initiation of Explosives. Proc. R. Soc. London, Ser. A. Math. Eng. Phys. Sci. 1975, 343 (1634), 399–413.
(34) Mohan, V. .; Bhasu, V. C. J.; Field, J. E. Role of Adiabatic Shear Bands in Initiation of Explosives by Drop-Weight Impact. In Ninth Symposium on Detonatino; Portland, OR., 1989; pp 1276–1283.
(35) Coffey, C. S.; Toton, E. T. A Microscopic Theory of Compressive Wave-Induced Reactions in Solid Explosives. J. Chem. Phys. 1982, 76 (2), 949–954.
(36) Dlott, D. D.; Fayer, M. D. Shocked Molecular Solids: Vibrational up Pumping, Defect Hot Spot Formation, and the Onset of Chemistry. J. Chem. Phys. 1990, 92 (6), 3798–3812.
(37) Dlott, D. D. Ultrafast Vibrational Energy Transfer in the Real World: Laser Ablation, Energetic Solids, and Hemeproteins. J. Opt. Soc. Am. B 1990, 7 (8), 1638.
(38) Hill, J. R.; Chronister, E. L.; Chang, T. C.; Kim, H.; Postlewaite, J. C.; Dlott, D. D. Vibrational Relaxation of Guest and Host in Mixed Molecular Crystals. J. Chem. Phys. 1988, 88 (4), 2361–2371.
(39) Kim, H.; Dlott, D. D. Theory of Ultrahot Molecular Solids: Vibrational Cooling and Shock-Induced Multiphonon up Pumping in Crystalline Naphthalene. J. Chem. Phys. 1990, 93 (3), 1695–1709.
(40) Tokmakoff, A.; Fayer, M. D.; Dlott, D. D. Chemical Reaction Initiation and Hot-Spot Formation in Shocked Energetic Molecular Materials. J. Phys. Chem. 1993, 97 (9), 1901–1913.
(41) Walker, F. E. Physical Kinetics. J. Appl. Phys. 1988, 63 (11), 5548–5554.
(42) Zerilli, F. J.; Toton, E. T. Shock-Induced Molecular Excitation in Solids. Phys. Rev. B 1984, 29 (10), 5891–5902.
(43) Bardo, R. D. Theoretical Calculations of Rate-Determining Steps for Ignition of Shocked, Condensed Nitromethane. Int. J. Quantum Chem. 1986, 30 (20 S), 455–469.
38
(44) Chen, S.; Tolbert, W. A.; Dlott, D. D. Direct Measurement of Ultrafast Multiphonon Up-Pumping in High Explosives. J. Phys. Chem. 1994, 98 (32), 7759–7766.
(45) Joshi, K.; Losada, M.; Chaudhuri, S. Intermolecular Energy Transfer Dynamics at a Hot-Spot Interface in RDX Crystals. J. Phys. Chem. A 2016, 120 (4), 477–489.
(46) Kraczek, B.; Chung, P. W. Investigation of Direct and Indirect Phonon-Mediated Bond Excitation in α-RDX. J. Chem. Phys. 2013, 138 (7).
(47) Dlott, D. D. Multi-Phonon up-Pumpng in Energetic Materials. In Overview of Recent Research on Energetic Materials; Shaw, R. W., Brill, T. B., Thompson, D. L., Eds.; World Scientific, 2005; pp 303–333.
(48) Tsyshevsky, R. V.; Sharia, O.; Kuklja, M. M. Molecular Theory of Detonation Initiation: Insight from First Principles Modeling of the Decomposition Mechanisms of Organic Nitro Energetic Materials. Molecules 2016, 21 (2).
(49) Zeman, S.; Jungová, M. Sensitivity and Performance of Energetic Materials. Propellants, Explos. Pyrotech. 2016, 41 (3), 426–451.
(50) Yan, Q.-L.; Zeman, S. Theoretical Evaluation of Sensitivity and Thermal Stability for High Explosives Based on Quantum Chemistry Methods: A Brief Review. Int. J. Quantum Chem. 2013, 113 (8), 1049–1061.
(51) Rice, B. M. A Perspective on Modeling the Multiscale Response of Energetic Materials. AIP Conf. Proc. 2017, 1793.
(52) Storm, C. B.; Stine, J. R.; Kramer, J. F. Sensitivity Relationships in Energetic Materials. In Chemistry and Physics of Energetic Materials; Bulusu, S. N., Ed.; Springer, Dordrecht, 1990; pp 605–639.
(53) Keshavarz, M. H.; Pouretedal, H. R. Simple Empirical Method for Prediction of Impact Sensitivity of Selected Class of Explosives. J. Hazard. Mater. 2005, 124 (1–3), 27–33.
(54) Keshavarz, M. H.; Zali, A.; Shokrolahi, A. A Simple Approach for Predicting Impact Sensitivity of Polynitroheteroarenes. J. Hazard. Mater. 2009, 166 (2–3), 1115–1119.
(55) Keshavarz, M. H. A New General Correlation for Predicting Impact Sensitivity of Energetic Compounds. Propellants, Explos. Pyrotech. 2013, 38 (6), 754–760.
(56) Keshavarz, M. H. Simple Relationship for Predicting Impact Sensitivity of Nitroaromatics, Nitramines, and Nitroaliphatics. Propellants, Explos. Pyrotech. 2010, 35 (2), 175–181.
(57) Fayet, G.; Rotureau, P.; Joubert, L.; Adamo, C. Predicting Explosibility Properties of Chemicals from Quantitative Structure-Property Relationships. Process Saf. Prog. 2010, 29 (4), 359–371.
(58) Fayet, G.; Rotureau, P.; Prana, V.; Adamo, C. Global and Local QSPR Models to Predict the Impact Sensitivity of Nitro Compounds. Glob. Congr. Process Saf. 2012 - Top. Conf. 2012 AIChE Spring Meet. 8th Glob. Congr. Process Saf. 2012, 1 (April), 254–270.
(59) Fayet, G.; Rotureau, P. Development of Simple QSPR Models for the Impact Sensitivity of Nitramines. J. Loss Prev. Process Ind. 2014, 30 (1), 1–8.
(60) Badders, N. R.; Wei, C.; Aldeeb, A. A.; Rogers, W. J.; Mannan, M. S. Predicting the Impact Sensitivities of Polynitro Compounds Using Quantum Chemical Descriptors. J. Energ. Mater. 2006, 24 (1), 17–33.
(61) Shuo, G. A QSPR Model for Prediction of the Impact Sensitivities of Some Nitro Compounds.

39
Adv. Mater. Res. 2013, 641–642, 109–112.
(62) Sixth Symposium on Detonation; Edwards, D. J., Jacobs, S. ., Eds.; Office of Naval Research-Department of the Navy: Coronado, California, 1976.
(63) Kamlet, M. J.; Adolph, H. G. The Relationship of Impact Sensitivity with Structure of Organic High Explosives. II. Polynitroaromatic Explosives. Propellants, Explos. Pyrotech. 1979, 4 (2), 30–34.
(64) Skare, D.; Suceska, M. Study of Detonation Parameters of Polynitroadamantanes , Potential New Explosives . I . Molecular Mass / Density and Oxygen Content / Sensitivity Relationships . Croat. Chem. Acta 1998, 71 (3), 765–776.
(65) Owens, F. J. Relationship between Impact Induced Reactivity of Trinitroaromatic Molecules and Their Molecular Structure. J. Mol. Struct. THEOCHEM 1985, 22 (1–5), 213–220.
(66) Zeman, S. Relationship between Detonation Characteristics and 15n Nmr Chemical Shifts of Nitramines. J. Energ. Mater. 1999, 17 (4), 305–329.
(67) Jungová, M.; zeman, S.; yan, Q.-L. Recent Advances in the Study of the Initiation of Nitramines by Impact Using Their 15N NMR Chemical Shifts. Cent. Eur. J. Energ. Mater. 2014, 11 (3), 383–393.
(68) Zeman, S. A Study of Chemical Micromechanism of the Organic Polynitro Compounds Initiation. In Theoretical and Computational Chemistry, Energetic Materials. Part 2: Detonation, Combustion.; Politzer, P., Murray, J. S., Eds.; Elsevier B.V.: Amsterdam, 2003; pp 25–52.
(69) Keshavarz, M. H.; Hayati, M.; Ghariban-Lavasani, S.; Zohari, N. A New Method for Predicting the Friction Sensitivity of Nitramines. Cent. Eur. J. Energ. Mater. 2015, 12 (2), 215–227.
(70) Owens, F. J.; Jayasuriya, K.; Abrahmsen, L.; Politzer, P. Computational Analysis of Some Properties Associated With the Nitro Groups in Polynitroaromatic Molecules. Chem. Phys. Lett. 1985, 116 (5), 434.
(71) Murray, J. S.; Politzer, P. Structure-Sensitivity Relationships in Energetic Compounds. In Chemistry and Physics of Energetic Materials; Bulusu, S. N., Ed.; Kluwer Academic Publishers: Netherlands, 1990; pp 157–158.
(72) Owens, F. J. Some Energetic Molecules. J. Mol. Struct. 1996, 370, 11–16.
(73) Rice, B. M.; Sahu, S.; Owens, F. J. Density Functional Calculations of Bond Dissociation Energies for NO 2 Scission in Some Nitroaromatic Molecules. J. Mol. Struct. THEOCHEM 2002, 583 (1), 69–72.
(74) Li, J. Relationships for the Impact Sensitivities of Energetic C-Nitro Compounds Based on Bond Dissociation Energy. J. Phys. Chem. B 2010, 114 (6), 2198–2202.
(75) Li, X.-H.; Han, D.-F.; Zhang, X.-Z. Investigation of Correlation between Impact Sensitivities and Bond Dissociation Energies in Benzenoid Nitro Compounds. J. Struct. Chem. 2013, 54 (3), 499–504.
(76) Mathieu, D. Toward a Physically Based Quantitative Modeling of Impact Sensitivities. J. Phys. Chem. A 2013, 117 (10), 2253–2259.
(77) Yuan, B.; Yu, Z.; Bernstein, E. R. Initial Decomposition Mechanism for the Energy Release from Electronically Excited Energetic Materials: FOX-7 (1,1-Diamino-2,2-Dinitroethene, C2H4N4O4). J. Chem. Phys. 2014, 140 (7).
40
(78) Booth, R. S.; Butler, L. J. Thermal Decomposition Pathways for 1,1-Diamino-2,2-Dinitroethene (FOX-7). J. Chem. Phys. 2014, 141 (13).
(79) Chakraborty, D.; Muller, R. P.; Dasgupta, S.; Goddard, W. A. Mechanism for Unimolecular Decomposition of HMX (1,3,5,7-Tetranitro-1,3,5,7-Tetrazocine), an Ab Initio Study. J. Phys. Chem. A 2001, 105 (8), 1302–1314.
(80) Cohen, R.; Zeiri, Y.; Wurzberg, E.; Kosloff, R. Mechanism of Thermal Unimolecular Decomposition of TNT (2,4,6- Trinitrotoluene): A DFT Study. J. Phys. Chem. A 2007, 111 (43), 11074–11083.
(81) Politzer, P.; Murray, J. S. Relationships between Dissociation Energies and Electrostatic Potentials of C-NO2 Bonds: Applications to Impact Sensitivities. J. Mol. Struct. 1996, 376 (1–3), 419–424.
(82) Murray, J. S.; Concha, M. C.; Politzer, P. Links between Surface Electrostatic Potentials of Energetic Molecules, Impact Sensitivities and C-NO2/N-NO2bond Dissociation Energies. Mol. Phys. 2009, 107 (1), 89–97.
(83) Politzer, P.; Lane, P.; Murray, J. S. Sensitivities of Ionic Explosives. Mol. Phys. 2017, 115 (5), 497–509.
(84) Murray, J. S.; Lane, P.; Politzer, P. Relationships between Impact Sensitivities and Molecular Surface Electrostatic Potentials of Nitroaramatic and Nitroheterocyclic Molecules. Mol. Phys. 1995, 85 (1), 1–8.
(85) Bankiewicz, B.; Matczak, P.; Palusiak, M. Electron Density Characteristics in Bond Critical Point (QTAIM) versus Interaction Energy Components (SAPT): The Case of Charge-Assisted Hydrogen Bonding. J. Phys. Chem. A 2012, 116 (1), 452–459.
(86) Espinosa, E.; Souhassou, M.; Lachekar, H.; Lecomte, C. Topological Analysis of the Electron Density in Hydrogen Bonds. Acta Crystallogr. Sect. B Struct. Sci. 1999, 55 (4), 563–572.
(87) Grabowski, S. J. Hydrogen Bonding Strength—measures Based on Geometric and Topological Parameters. J. Phys. Org. Chem. 2004, 17 (1), 18–31.
(88) Rice, B. M.; Hare, J. J. A Quantum Mechanical Investigation of the Relation between Impact Sensitivity and the Charge Distribution in Energetic Molecules. J. Phys. Chem. A 2002, 106 (9), 1770–1783.
(89) Hammerl, A.; Klapötke, T. M.; Nöth, H.; Warchhold, M.; Holl, G. Synthesis, Structure, Molecular Orbital and Valence Bond Calculations for Tetrazole Azide, CHN7. Propellants, Explos. Pyrotech. 2003, 28 (4), 165–173.
(90) Gökçinar, E.; Klapötke, T. M.; Bellamy, A. J. Computational Study on 2,6-Diamino-3,5-Dinitropyrazine and Its 1-Oxide and 1,4-Dioxide Derivatives. J. Mol. Struct. THEOCHEM 2010, 953 (1–3), 18–23.
(91) Politzer, P.; Lane, P.; Murray, J. S. Tricyclic Polyazine N-Oxides as Proposed Energetic Compounds. Cent. Eur. J. Energ. Mater. 2013, 10 (3), 305–324.
(92) Zhang, J.; Zhang, Q.; Vo, T. T.; Parrish, D. A.; Shreeve, J. M. Energetic Salts with Stacking and Hydrogen-Bonding Interactions Lead the Way to Future Energetic Materials. J. Am. Chem. Soc. 2015, 137 (4), 1697–1704.
(93) Ma, Y.; Meng, L.; Li, H.; Zhang, C. Enhancing Intermolecular Interactions and Their Anisotropy to Build Low-Impact-Sensitivity Energetic Crystals. CrystEngComm 2017, 19 (23), 3145–3155.
41
(94) Asay, B. W.; Henson, B. F.; Smilowitz, L. B.; Dickson, P. M. On the Difference in Impact Sensitivity of Beta and Delta Hmx. J. Energ. Mater. 2003, 21 (4), 223–235.
(95) Politzer, P.; Murray, J. S. Impact Sensitivity and Crystal Lattice Compressibility/Free Space. J. Mol. Model. 2014, 20 (5).
(96) Pospisil, M.; Vavra, P.; Concha, M. C.; Murray, J. S.; Politzer, P. A Possible Crystal Volume Factor in the Impact Sensitivities of Some Energetic Compounds. J. Mol. Model. 2010, 16 (5), 895–901.
(97) Cartwright, M.; Wilkinson, J. Correlation of Structure and Sensitivity in Inorganic Azides i Effect of Non-Bonded Nitrogen Nitrogen Distances. Propellants, Explos. Pyrotech. 2010, 35 (4), 326–332.
(98) Taylor, D. E. Prediction of the Impact Sensitivity of Energetic Molecules Using Symmetry Adapted Perturbation Theory. 2011.
(99) Jones, T. E. Role of Inter- and Intramolecular Bonding on Impact Sensitivity. J. Phys. Chem. A 2012, 116 (45), 11008–11014.
(100) Coffey, C. S.; Sharma, J. Plastic Deformation, Energy Dissipation, and Initiation of Crystalline Explosives. Phys. Rev. B - Condens. Matter Mater. Phys. 1999, 60 (13), 9365–9371.
(101) Zhang, C.; Wang, X.; Huang, H. π-Stacked Interactions in Explosive Crystals: Buffers against External Mechanical Stimuli. J. Am. Chem. Soc. 2008, 130 (26), 8359–8365.
(102) Zhang, J.; Mitchell, L. A.; Parrish, D. A.; Shreeve, J. M. Enforced Layer-by-Layer Stacking of Energetic Salts towards High-Performance Insensitive Energetic Materials. J. Am. Chem. Soc. 2015, 137 (33), 10532–10535.
(103) Ma, Y.; Zhang, A.; Zhang, C.; Jiang, D.; Zhu, Y.; Zhang, C. Crystal Packing of Low-Sensitivity and High-Energy Explosives. Cryst. Growth Des. 2014, 14 (9), 4703–4713.
(104) Tian, B.; Xiong, Y.; Chen, L.; Zhang, C. Relationship between the Crystal Packing and Impact Sensitivity of Energetic Materials. CrystEngComm 2018, 20 (6), 837–848.
(105) Manner, V. W.; Cawkwell, M. J.; Kober, E. M.; Myers, T. W.; Brown, G. W.; Tian, H.; Snyder, C. J.; Perriot, R.; Preston, D. N. Examining the Chemical and Structural Properties That Influence the Sensitivity of Energetic Nitrate Esters. Chem. Sci. 2018, 9 (15), 3649–3663.
(106) Zhu, W.; Xiao, H. First-Principles Band Gap Criterion for Impact Sensitivity of Energetic Crystals: A Review. Struct. Chem. 2010, 21 (3), 657–665.
(107) Zhang, H.; Cheung, F.; Zhao, F.; Cheng, X. Band Gaps and the Possible Effect on Impact Sensitivity for Some Nitro Aromatic Explosive Materials. Int. J. Quantum Chem. 2009, 109, 1547–1552.
(108) Crowley, J. M.; Tahir-Kheli, J.; Goddard, W. A. Resolution of the Band Gap Prediction Problem for Materials Design. J. Phys. Chem. Lett. 2016, 7 (7), 1198–1203.
(109) Kuklja, M. M.; Rashkeev, S. N.; Zerilli, F. J. Shear-Strain Induced Decomposition of 1,1-Diamino-2,2-Dinitroethylene. Appl. Phys. Lett. 2006, 89 (7), 2004–2007.
(110) Kuklja, M. M.; Rashkeev, S. N. Shear-Strain-Induced Structural and Electronic Modifications of the Molecular Crystal 1,1-Diamino-2,2-Dinitroethylene: Slip-Plane Flow and Band Gap Relaxation. Phys. Rev. B - Condens. Matter Mater. Phys. 2007, 75 (10), 1–10.
(111) Kuklja, M. M.; Rashkeev, S. N. Shear-Strain-Induced Chemical Reactivity of Layered Molecular
42
Crystals. Appl. Phys. Lett. 2007, 90 (15).
(112) Manaa, M. R. Shear-Induced Metallization of Triamino-Trinitrobenzene Crystals. Appl. Phys. Lett. 2003, 83 (7), 1352–1354.
(113) Kuklja, M. M.; Rashkeev, S. N. Interplay of Decomposition Mechanisms at Shear-Strain Interface. J. Phys. Chem. C 2009, 113 (1), 17–20.
(114) Bondarchuk, S. V. Quantification of Impact Sensitivity Based on Solid-State Derived Criteria. J. Phys. Chem. A 2018, 122, 5455–5463.
(115) Mathieu, D. Theoretical Shock Sensitivity Index for Explosives. J. Phys. Chem. A 2012, 116 (7), 1794–1800.
(116) Mathieu, D.; Alaime, T. Predicting Impact Sensitivities of Nitro Compounds on the Basis of a Semi-Empirical Rate Constant. J. Phys. Chem. A 2014, 118 (41), 9720–9726.
(117) Mathieu, D.; Alaime, T. Impact Sensitivities of Energetic Materials: Exploring the Limitations of a Model Based Only on Structural Formulas. J. Mol. Graph. Model. 2015, 62 (2), 81–86.
(118) Mathieu, D. Physics-Based Modeling of Chemical Hazards in a Regulatory Framework: Comparison with Quantitative Structure-Property Relationship (QSPR) Methods for Impact Sensitivities. Ind. Eng. Chem. Res. 2016, 55 (27), 7569–7577.
(119) Fried, L. E.; Ruggiero, a J. Energy-Transfer Rates in Primary, Secondary, and Insensitive Explosives. J. Phys. Chem. 1994, 98 (39), 9786–9791.
(120) Ye; Koshi, M. Theoretical Studies of Energy Transfer Rates of Secondary Explosives. J. Phys. Chem. B 2006, 110 (37), 18515–18520.
(121) McNesby, K. L.; Coffey, C. S. Spectroscopic Determination of Impact Sensitivities of Explosives. J. Phys. Chem. B 1997, 101 (16), 3097–3104.
(122) Ye, S.; Tonokura, K.; Koshi, M. Energy Transfer Rates and Impact Sensitivities of Crystalline Explosives. Combust. Flame 2003, 132 (1–2), 240–246.
(123) Bernstein, J. Ab Initio Study of Energy Transfer Rates and Impact Sensitivities of Crystalline Explosives. J. Chem. Phys. 2018, 148 (8), 084502.
(124) McGrane, S. D.; Barber, J.; Quenneville, J. Anharmonic Vibrational Properties of Explosives from Temperature-Dependent Raman. J. Phys. Chem. A 2005, 109 (44), 9919–9927.
(125) Piryatinski, A.; Tretiak, S.; Sewell, T. D.; McGrane, S. D. Vibrational Spectroscopy of Polyatomic Materials: Semiempirical Calculations of Anharmonic Couplings and Infrared and Raman Linewidths in Naphthalene and PETN Crystals. Phys. Rev. B - Condens. Matter Mater. Phys. 2007, 75 (21), 1–9.
(126) Colognesi, D.; Celli, M.; Cilloco, F.; Newport, R. J.; Parker, S. F.; Rossi-Albertini, V.; Sacchetti, F.; Tomkinson, J.; Zoppi, M. TOSCA Neutron Spectrometer: The Final Configuration. Appl. Phys. A Mater. Sci. Process. 2002, 74 , 64–66.

43
Chapter 2
Experimental and Computational Methods
2.1 Computational Methods
2.1.1 The Schrödinger Equation
The ultimate goal of common quantum chemical approaches is to reach a
(approximate) solution of the time independent, non-relativistic Schrödinger
equation,1,2
��Ψ(𝑥1 , 𝑥2 , . . . 𝑥𝑁 , 𝑅1 , 𝑅2
, . . . 𝑅𝑀 ) = 𝐸Ψ(𝑥1 , 𝑥2 , . . . 𝑥𝑁 , 𝑅1
, 𝑅2 , . . . 𝑅𝑀
)
Equation 2.1
for a system of M nuclei and N electrons, where �� is the Hamilton operator (or
Hamiltonian) and Ψ is the wavefunction that describes the system. Note that
Equation 2.1 combines the electron spatial coordinate ( 𝑟 , xyz) and spin
coordinate (𝑠𝑖 , either α or β) into a single term (𝑥 ), and the nuclear spatial
coordinates are denoted �� . The Hamiltonian (here defined in atomic units) is
a differential operator that describes the total energy,
�� = −1
2∑∇𝑖
2
𝑁
𝑖=1
−1
2∑
1
𝑀𝐴
∇𝑖2
𝑀
𝐴=1
− ∑ ∑𝑍𝐴
𝑟𝑖𝐴
𝑀
𝐴=1
𝑁
𝑖=1
+ ∑∑1
𝑟𝑖𝑗
𝑁
𝑗>𝑖
𝑁
𝑖=1
+ ∑ ∑𝑍𝐴𝑍𝐵
𝑅𝐴𝐵
𝑀
𝐵>1
𝑀
𝐴=1
Equation 2.2
In Equation 2.2, the terms i and j are electron indices, and run over all N
electrons, A and B are the nuclear indices, running over all M nuclei with
charge Z and mass MA. The five terms in Equation 2.2 thus describe:

44
1. Electron kinetic energy
2. Nuclear kinetic energy
3. Attractive electron-nucleus electrostatic interaction
4. Repulsive electron-electron electrostatic interaction
5. Repulsive nuclear-nuclear electrostatic interaction
Terms 3-5 depend on the spatial separation between electron and nuclear
spatial coordinates 𝑟𝑖 and 𝑅𝐴 , respectively; hence 𝑟𝑖𝐴 = |𝑟𝑖 − 𝑅𝐴
|.
The Schrödinger equation therefore ‘simply’ states that using the
mathematical formulation of the Hamiltonian, the energy of a system can be
extracted from its wavefunction. Unfortunately, due to the infamous many-
body problem, the Schrödinger equation cannot be solved exactly for multi-
electron systems, and a variety of approximations must be made.
Arguably the most important approximation in quantum chemistry is the Born-
Oppenheimer approximation (BOA).3 Within the BOA, the significant
difference in mass between a nucleus and an electron is considered (ca. 1800
times greater in 1H, and > 20000 times greater in 14C). The electrons can
therefore be taken as moving in a field of fixed nuclear geometry, hence term
2 of Equation 2.2 disappears and term 5 becomes a constant described by
Coulomb’s law. The Hamiltonian (and wavefunction) can therefore be split into
electronic and nuclear components, to be solved independently. The
electronic Hamiltonian, ��𝑒𝑙𝑒𝑐 becomes,
��𝑒𝑙𝑒𝑐 = −1
2∑∇𝑖
2
𝑁
𝑖=1
− ∑ ∑𝑍𝐴
𝑟𝑖𝐴
𝑀
𝐴=1
𝑁
𝑖=1
+ ∑∑1
𝑟𝑖𝑗
𝑁
𝑗>𝑖
𝑁
𝑖=1
= �� + ��𝑁𝑒 + ��𝑒𝑒
Equation 2.3
The total energy therefore comes from the sum of electronic energy, 𝐸𝑒𝑙𝑒𝑐 and
the constant nuclear repulsion term 𝐸𝑡𝑜𝑡 = 𝐸𝑒𝑙𝑒𝑐 + 𝐸𝑛𝑢𝑐𝑙, where
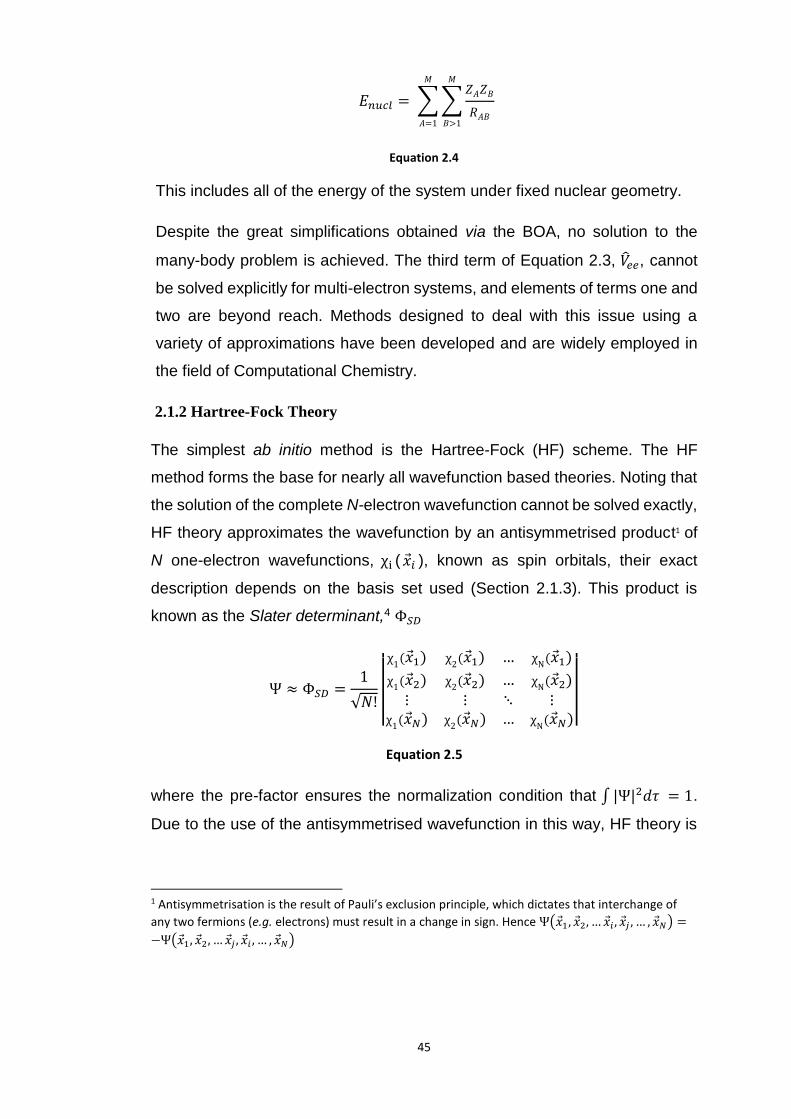
45
𝐸𝑛𝑢𝑐𝑙 = ∑∑𝑍𝐴𝑍𝐵
𝑅𝐴𝐵
𝑀
𝐵>1
𝑀
𝐴=1
Equation 2.4
This includes all of the energy of the system under fixed nuclear geometry.
Despite the great simplifications obtained via the BOA, no solution to the
many-body problem is achieved. The third term of Equation 2.3, ��𝑒𝑒, cannot
be solved explicitly for multi-electron systems, and elements of terms one and
two are beyond reach. Methods designed to deal with this issue using a
variety of approximations have been developed and are widely employed in
the field of Computational Chemistry.
2.1.2 Hartree-Fock Theory
The simplest ab initio method is the Hartree-Fock (HF) scheme. The HF
method forms the base for nearly all wavefunction based theories. Noting that
the solution of the complete N-electron wavefunction cannot be solved exactly,
HF theory approximates the wavefunction by an antisymmetrised product1 of
N one-electron wavefunctions, χi (𝑥 𝑖 ), known as spin orbitals, their exact
description depends on the basis set used (Section 2.1.3). This product is
known as the Slater determinant,4 Φ𝑆𝐷
Ψ ≈ Φ𝑆𝐷 =1
√𝑁!||
χ1(𝑥 1) χ
2(𝑥 1) … χ
N(𝑥 1)
χ1(𝑥 2) χ
2(𝑥 2) … χ
N(𝑥 2)
⋮ ⋮ ⋱ ⋮χ1(𝑥 𝑁) χ
2(𝑥 𝑁) … χ
N(𝑥 𝑁)
||
Equation 2.5
where the pre-factor ensures the normalization condition that ∫ |Ψ|2𝑑𝜏 = 1.
Due to the use of the antisymmetrised wavefunction in this way, HF theory is
1 Antisymmetrisation is the result of Pauli’s exclusion principle, which dictates that interchange of
any two fermions (e.g. electrons) must result in a change in sign. Hence Ψ(𝑥 1, 𝑥 2, … 𝑥 𝑖 , 𝑥 𝑗 , … , 𝑥 𝑁) =
−Ψ(𝑥 1, 𝑥 2, … 𝑥 𝑗 , 𝑥 𝑖 , … , 𝑥 𝑁)
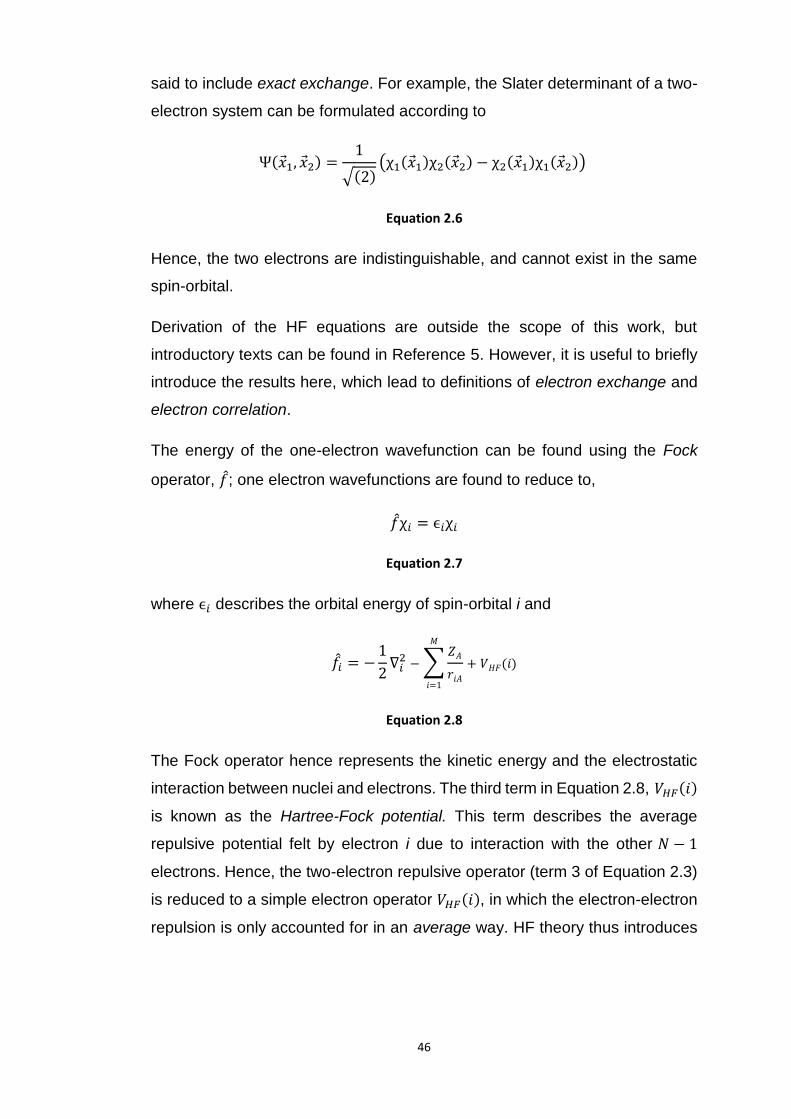
46
said to include exact exchange. For example, the Slater determinant of a two-
electron system can be formulated according to
Ψ(𝑥 1, 𝑥 2) =1
√(2)(χ1(𝑥 1)χ2(𝑥 2) − χ2(𝑥 1)χ1(𝑥 2))
Equation 2.6
Hence, the two electrons are indistinguishable, and cannot exist in the same
spin-orbital.
Derivation of the HF equations are outside the scope of this work, but
introductory texts can be found in Reference 5. However, it is useful to briefly
introduce the results here, which lead to definitions of electron exchange and
electron correlation.
The energy of the one-electron wavefunction can be found using the Fock
operator, 𝑓; one electron wavefunctions are found to reduce to,
𝑓χ𝑖 = ϵ𝑖χ𝑖
Equation 2.7
where ϵ𝑖 describes the orbital energy of spin-orbital i and
𝑓𝑖 = −1
2∇𝑖
2 − ∑𝑍𝐴
𝑟𝑖𝐴
𝑀
𝑖=1
+ 𝑉𝐻𝐹(𝑖)
Equation 2.8
The Fock operator hence represents the kinetic energy and the electrostatic
interaction between nuclei and electrons. The third term in Equation 2.8, 𝑉𝐻𝐹(𝑖)
is known as the Hartree-Fock potential. This term describes the average
repulsive potential felt by electron i due to interaction with the other 𝑁 − 1
electrons. Hence, the two-electron repulsive operator (term 3 of Equation 2.3)
is reduced to a simple electron operator 𝑉𝐻𝐹(𝑖), in which the electron-electron
repulsion is only accounted for in an average way. HF theory thus introduces
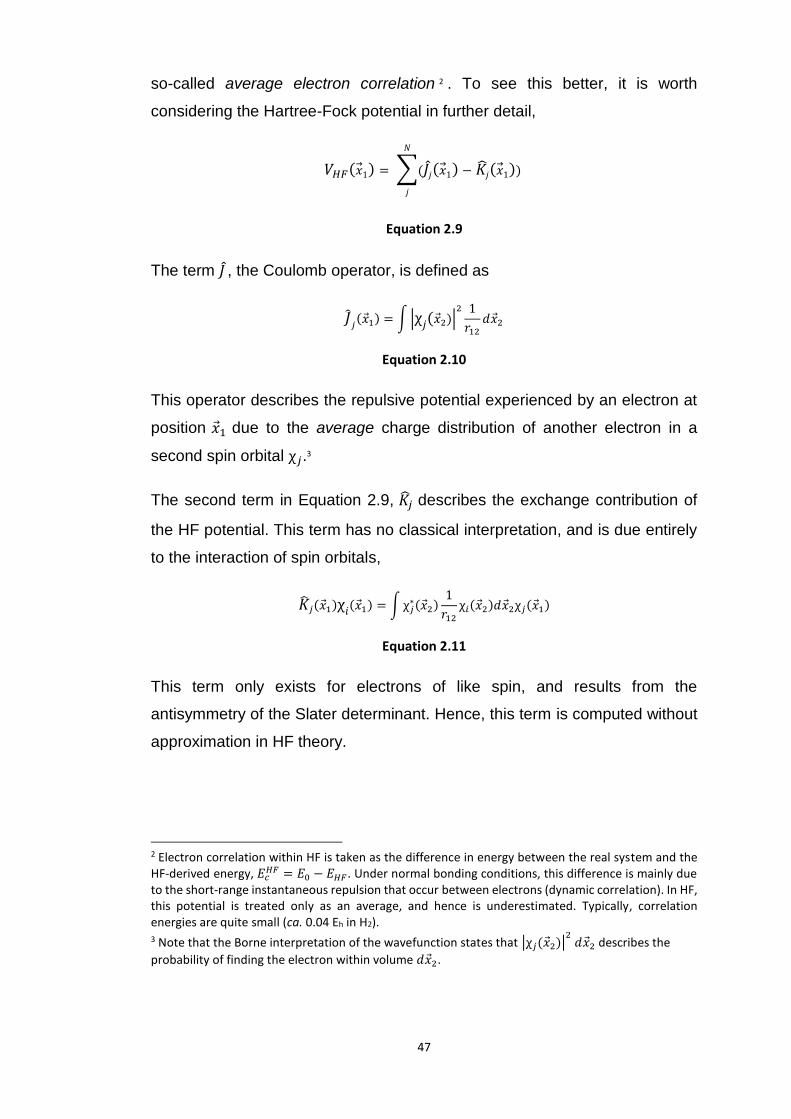
47
so-called average electron correlation 2 . To see this better, it is worth
considering the Hartree-Fock potential in further detail,
𝑉𝐻𝐹(𝑥 1) = ∑(𝐽𝑗(𝑥 1)
𝑁
𝑗
− ��𝑗(𝑥 1))
Equation 2.9
The term 𝐽 , the Coulomb operator, is defined as
��𝑗(𝑥 1) = ∫ |χ𝑗(𝑥 2)|
2 1
𝑟12
𝑑𝑥 2
Equation 2.10
This operator describes the repulsive potential experienced by an electron at
position 𝑥 1 due to the average charge distribution of another electron in a
second spin orbital χ𝑗.3
The second term in Equation 2.9, ��𝑗 describes the exchange contribution of
the HF potential. This term has no classical interpretation, and is due entirely
to the interaction of spin orbitals,
��𝑗(𝑥 1)χ𝑖(𝑥 1) = ∫χ𝑗∗(𝑥 2)
1
𝑟12
χ𝑖(𝑥 2)𝑑𝑥 2χ𝑗(𝑥 1)
Equation 2.11
This term only exists for electrons of like spin, and results from the
antisymmetry of the Slater determinant. Hence, this term is computed without
approximation in HF theory.
2 Electron correlation within HF is taken as the difference in energy between the real system and the HF-derived energy, 𝐸𝑐
𝐻𝐹 = 𝐸0 − 𝐸𝐻𝐹. Under normal bonding conditions, this difference is mainly due to the short-range instantaneous repulsion that occur between electrons (dynamic correlation). In HF, this potential is treated only as an average, and hence is underestimated. Typically, correlation energies are quite small (ca. 0.04 Eh in H2). 3 Note that the Borne interpretation of the wavefunction states that |χ𝑗(𝑥 2)|
2 𝑑𝑥 2 describes the
probability of finding the electron within volume 𝑑𝑥 2.
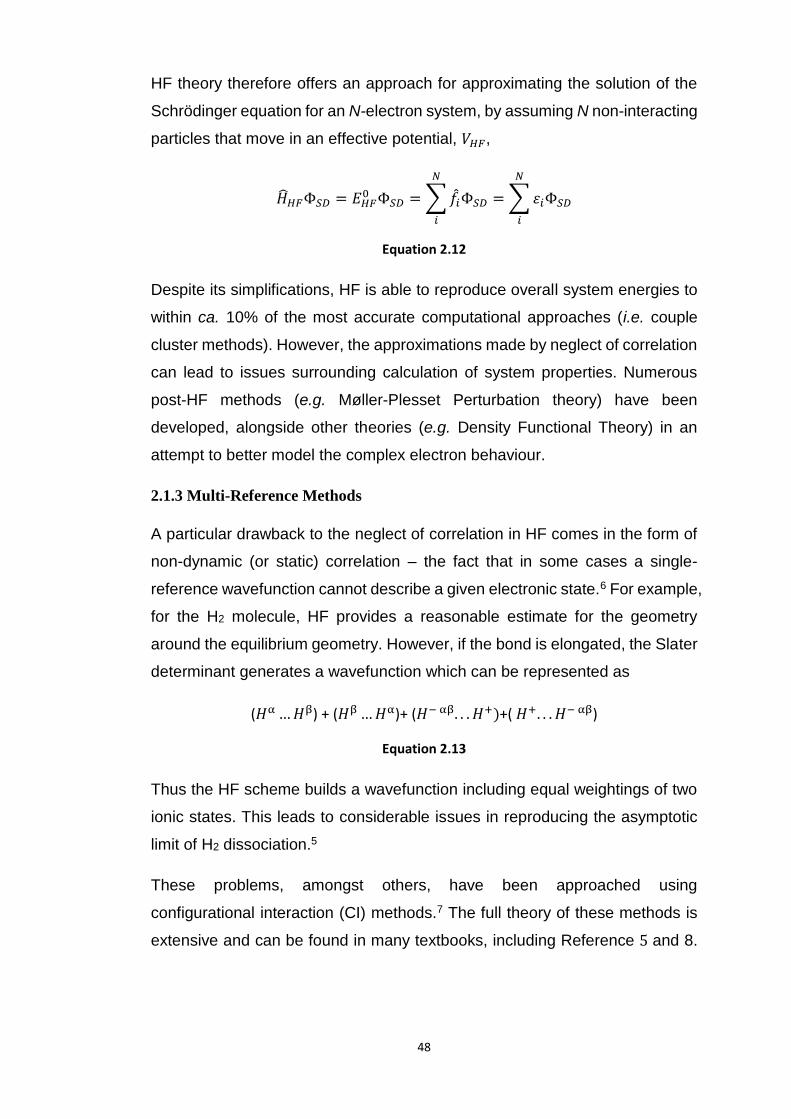
48
HF theory therefore offers an approach for approximating the solution of the
Schrödinger equation for an N-electron system, by assuming N non-interacting
particles that move in an effective potential, 𝑉𝐻𝐹,
��𝐻𝐹Φ𝑆𝐷 = 𝐸𝐻𝐹0 Φ𝑆𝐷 = ∑𝑓𝑖Φ𝑆𝐷
𝑁
𝑖
= ∑휀𝑖Φ𝑆𝐷
𝑁
𝑖
Equation 2.12
Despite its simplifications, HF is able to reproduce overall system energies to
within ca. 10% of the most accurate computational approaches (i.e. couple
cluster methods). However, the approximations made by neglect of correlation
can lead to issues surrounding calculation of system properties. Numerous
post-HF methods (e.g. Møller-Plesset Perturbation theory) have been
developed, alongside other theories (e.g. Density Functional Theory) in an
attempt to better model the complex electron behaviour.
2.1.3 Multi-Reference Methods
A particular drawback to the neglect of correlation in HF comes in the form of
non-dynamic (or static) correlation – the fact that in some cases a single-
reference wavefunction cannot describe a given electronic state.6 For example,
for the H2 molecule, HF provides a reasonable estimate for the geometry
around the equilibrium geometry. However, if the bond is elongated, the Slater
determinant generates a wavefunction which can be represented as
(𝐻α …𝐻β) + (𝐻β …𝐻α)+ (𝐻− αβ. . . 𝐻+)+( 𝐻+. . . 𝐻− αβ)
Equation 2.13
Thus the HF scheme builds a wavefunction including equal weightings of two
ionic states. This leads to considerable issues in reproducing the asymptotic
limit of H2 dissociation.5
These problems, amongst others, have been approached using
configurational interaction (CI) methods.7 The full theory of these methods is
extensive and can be found in many textbooks, including Reference 5 and 8.
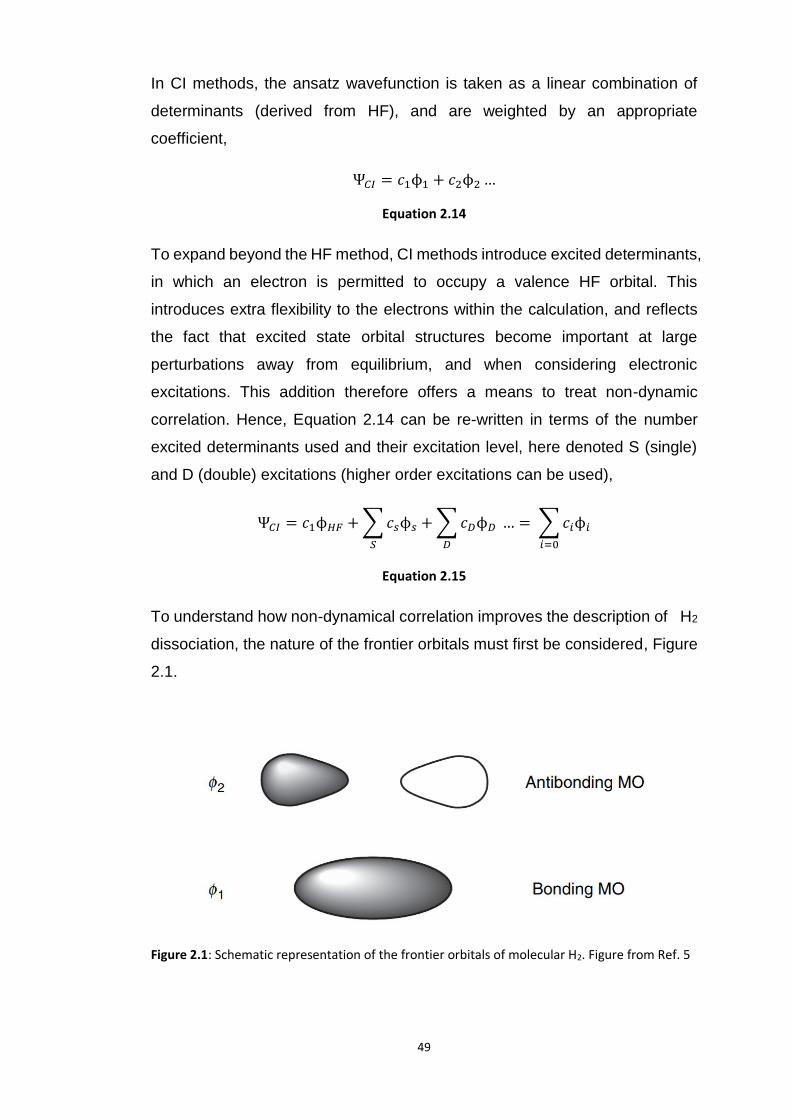
49
In CI methods, the ansatz wavefunction is taken as a linear combination of
determinants (derived from HF), and are weighted by an appropriate
coefficient,
Ψ𝐶𝐼 = 𝑐1ϕ1 + 𝑐2ϕ2 …
Equation 2.14
To expand beyond the HF method, CI methods introduce excited determinants,
in which an electron is permitted to occupy a valence HF orbital. This
introduces extra flexibility to the electrons within the calculation, and reflects
the fact that excited state orbital structures become important at large
perturbations away from equilibrium, and when considering electronic
excitations. This addition therefore offers a means to treat non-dynamic
correlation. Hence, Equation 2.14 can be re-written in terms of the number
excited determinants used and their excitation level, here denoted S (single)
and D (double) excitations (higher order excitations can be used),
Ψ𝐶𝐼 = 𝑐1ϕ𝐻𝐹 + ∑𝑐𝑠ϕ𝑠
𝑆
+ ∑𝑐𝐷ϕ𝐷
𝐷
… = ∑𝑐𝑖ϕ𝑖
𝑖=0
Equation 2.15
To understand how non-dynamical correlation improves the description of H2
dissociation, the nature of the frontier orbitals must first be considered, Figure
2.1.
Figure 2.1: Schematic representation of the frontier orbitals of molecular H2. Figure from Ref. 5
50
The HF method constricts both electrons to the bonding (𝜙1) orbital, whereas
inclusion of the 𝜙2 antibonding orbital in the CI-based approach permits these
electrons to occupy different sides of the nodal plane. Hence, on dissociation,
CI methods have the flexibility to employ a large weighting to the 𝜙2 orbital on
dissociation, and to suppress the contribution of the 𝜙1 ion states. This
therefore eliminates the so-called ‘left-right’ correlation that hindered the HF
approach.
Truncations of Equation 2.15 formed the base for early CI approaches, such
as CIS and CID. As these methods lead to large imbalance of electron
correlation to the minimal excitations used, they are rarely used today. It is
instead common to employ a multi-configurational approach, such as the
complete active space, CASSCF. In these methods, all excitations are
permitted within a defined ‘active’ space, which includes occupied and un-
occupied HF orbitals. For each excitation, the orbitals are re-optimised. If an
appropriate active space is selected, this limits bias in the correlation energy.
Hence, these methods allow for flexibility in electron energies as a result of
changing the electronic configuration. It follows that multi-reference methods
are particularly adept at treating excited states.
While many multi-reference methods do an excellent job at treating non-
dynamic correlation (e.g. CASSCF), treatment of dynamic correlation remains
limited. The multi-reference configurational interaction (MRCI) method,
however, employ a series of multi-reference wave functions, on which
additional CI calculations are performed (and orbitals optimized).9 This is
amongst the best approaches for including dynamic correlation effects.
In this work, the electronic structure of isolated molecules was monitored as a
function of bond perturbations. Hence non-dynamic correlation can prove
problematic. Further, this work was interested in monitoring the relative
energies of the excited states along these perturbations. Thus, it was
particularly appropriate to employ multi-reference CI methods. Given the small
size of the systems studied here, it was possible to perform full MRCI
51
calculations. Hence, both dynamic and non-dynamic correlation was
accounted for. This was done using the Molpro 2012 software10 in this work.
2.1.4 Density Functional Theory
An alternative approach to handling the Schrödinger equation is Density
Functional Theory (DFT). In contrast to HF-based methods, DFT is not based
on explicit calculation of Ψ. Rather, the energy is extracted directly from the
electron density, 𝜌. This is a particularly attractive approach, since the electron
density is experimentally observable, while a wavefunction is not. An excellent
introduction to DFT can be found in Reference 11 and 12, and more detailed
derivations can be found in dedicated texts.5
2.1.4.1 Hohenberg-Kohn Theorems
Rooted in the BOA Hamiltonian, Equation 2.3, the development of DFT began
with the seminal theories proposed by Hohenberg and Kohn: the Hohenberg-
Kohn Theorems (HK). According to the HK theorems:13
1. The external potential, 𝑽𝒆𝒙𝒕(�� ) is uniquely defined by 𝝆(�� )
Since the Hamiltonian is fixed by this term, Equation 2.3, this suggests that the
energy of the system is uniquely defined by 𝜌(𝑟 ). In addition, this posits that
the 3N spatial coordinates required to define a system in the HF equations can
be reduced to only 3 spatial coordinates.
Conceptually, this theorem stems from the fact that the electron density
(whose integral is the total number of electrons in the system) depends on the
number, charge and position of nuclei. It can be shown14 that because the total
energy is a function of the electron density, so too must its components, and
thus Equation 2.3 can be recast as,
𝐸0[𝜌0] = 𝑇[𝜌0] + 𝐸𝑒𝑒[𝜌0] + 𝐸𝑁𝑒[𝜌0]
Equation 2.16

52
This equation is conveniently separated into the system-dependent term
(𝐸𝑁𝑒[𝜌0] = ∫ 𝜌0(𝑟 )𝑉𝑁𝑒 𝑑𝑟 ) and the terms which are universal, (i.e. their form is
independent of N, RA and ZA),
𝐹𝐻𝐾[𝜌] = 𝑇[𝜌] + 𝐸𝑒𝑒[𝜌] = 𝑇[ρ] + 𝐽[ρ] + 𝐸𝑛𝑐𝑙[ρ]
Equation 2.17
where the electron-electron energy is decomposed into the Coulombic
component (𝐽) and a non-classical component, 𝐸𝑛𝑐𝑙, which includes correlation
and exchange effects. And thus the total energy is defined by
𝐸0[𝜌0] = 𝐹𝐻𝐾[𝜌] + ∫𝜌0(𝑟 )𝑉𝑁𝑒 𝑑𝑟
Equation 2.18
Hence, it appears that the first HK theorem offers a direct link between density
and energy. Despite the immense simplicity of these equations, the problem
again arises that, due to the effects of electron correlation and exchange, no
explicit form for 𝑇[𝜌] or 𝐸𝑒𝑒[𝜌] are known.
2. Variational Principle
This theorem states that the functional that returns the ground state energy of
a system will deliver the lowest energy only if the input electron density is the
true ground state density. Hence, there should exist a universal function,
��[𝜌(𝒓)], that could be used to obtain the exact ground state density and energy.
The only problem is that its actual form is not known.
2.1.4.2 Kohn-Sham Equations
Whilst the theories proposed by Hohenberg and Kohn suggest the existence
of a universal functional, they offer no means to determine what form this
functional should take. Following from Equation 2.18, Kohn and Sham15 made
further developments to render a more tractable form of DFT which enjoys
widespread use today.
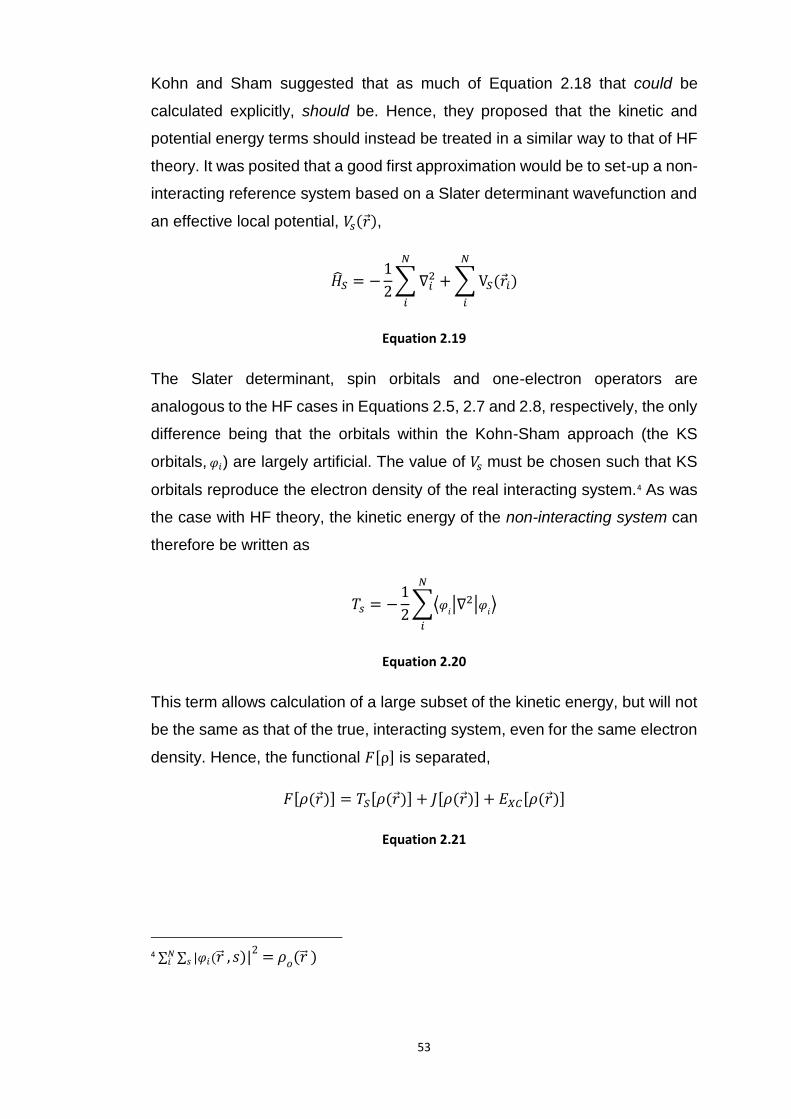
53
Kohn and Sham suggested that as much of Equation 2.18 that could be
calculated explicitly, should be. Hence, they proposed that the kinetic and
potential energy terms should instead be treated in a similar way to that of HF
theory. It was posited that a good first approximation would be to set-up a non-
interacting reference system based on a Slater determinant wavefunction and
an effective local potential, 𝑉𝑠(𝑟 ),
��𝑆 = −1
2∑∇𝑖
2
𝑁
𝑖
+ ∑V𝑆(𝑟 𝑖)
𝑁
𝑖
Equation 2.19
The Slater determinant, spin orbitals and one-electron operators are
analogous to the HF cases in Equations 2.5, 2.7 and 2.8, respectively, the only
difference being that the orbitals within the Kohn-Sham approach (the KS
orbitals, 𝜑𝑖) are largely artificial. The value of 𝑉𝑠 must be chosen such that KS
orbitals reproduce the electron density of the real interacting system.4 As was
the case with HF theory, the kinetic energy of the non-interacting system can
therefore be written as
𝑇𝑠 = −1
2∑⟨𝜑
𝑖|∇
2|𝜑𝑖⟩
𝑁
𝑖
Equation 2.20
This term allows calculation of a large subset of the kinetic energy, but will not
be the same as that of the true, interacting system, even for the same electron
density. Hence, the functional 𝐹[ρ] is separated,
𝐹[𝜌(𝑟 )] = 𝑇𝑆[𝜌(𝑟 )] + 𝐽[𝜌(𝑟 )] + 𝐸𝑋𝐶[𝜌(𝑟 )]
Equation 2.21
4 ∑ ∑ |𝜑𝑖(�� , 𝑠)|2= 𝜌𝑜(�� )𝑠
𝑁𝑖
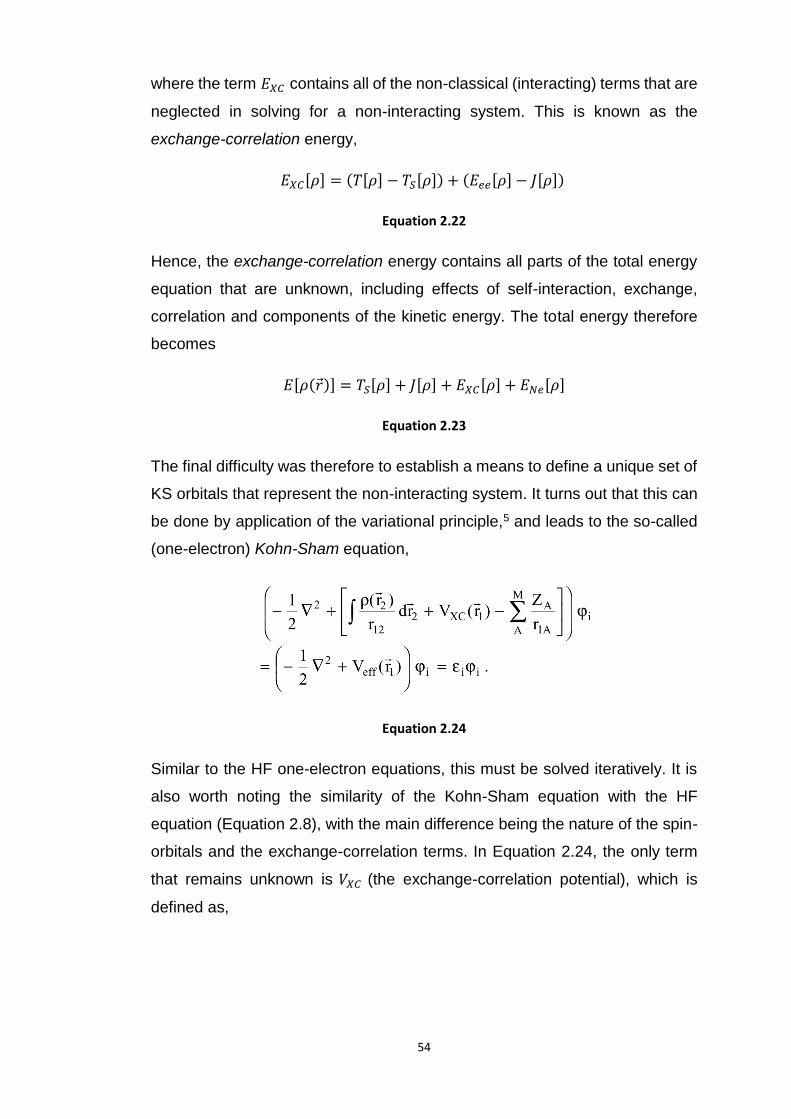
54
where the term 𝐸𝑋𝐶 contains all of the non-classical (interacting) terms that are
neglected in solving for a non-interacting system. This is known as the
exchange-correlation energy,
𝐸𝑋𝐶[𝜌] = (𝑇[𝜌] − 𝑇𝑆[𝜌]) + (𝐸𝑒𝑒[𝜌] − 𝐽[𝜌])
Equation 2.22
Hence, the exchange-correlation energy contains all parts of the total energy
equation that are unknown, including effects of self-interaction, exchange,
correlation and components of the kinetic energy. The total energy therefore
becomes
𝐸[𝜌(𝑟 )] = 𝑇𝑆[𝜌] + 𝐽[𝜌] + 𝐸𝑋𝐶[𝜌] + 𝐸𝑁𝑒[𝜌]
Equation 2.23
The final difficulty was therefore to establish a means to define a unique set of
KS orbitals that represent the non-interacting system. It turns out that this can
be done by application of the variational principle,5 and leads to the so-called
(one-electron) Kohn-Sham equation,
Equation 2.24
Similar to the HF one-electron equations, this must be solved iteratively. It is
also worth noting the similarity of the Kohn-Sham equation with the HF
equation (Equation 2.8), with the main difference being the nature of the spin-
orbitals and the exchange-correlation terms. In Equation 2.24, the only term
that remains unknown is 𝑉𝑋𝐶 (the exchange-correlation potential), which is
defined as,

55
𝑉𝑋𝐶 =δ𝐸𝑋𝐶
δρ
Equation 2.25
Thus, if the form of 𝑉𝑋𝐶 were known, the KS approach would lead to an exact
solution of the Schrödinger equation.
2.1.4.3 Exchange-Correlation Functionals
The most active area of research in DFT development surrounds developing
approximate forms for 𝑉𝑋𝐶. A number of approaches have been made, with
varying complexities. A full discussion of these approaches is outside the
scope of this thesis, but an excellent introduction is provided in Reference 16
and 17. The most basic form of 𝑉𝑋𝐶 is based on the work of Thomas and
Fermi18,19 and known as the Local Density Approximation (LDA).15 It makes
the assumption that the electron density can be treated as a uniform electron
gas and thus the exchange-correlation at a point 𝒓 with density 𝜌(𝒓) should be
the same as that of a uniform gas of the same density.20 Physically, this is
similar to the electronic structure of solid metals, for which LDA works quite
well. However, when molecular solids are considered, this approximation
becomes rather poor. Electrons in such systems are not delocalised, but are
confined to the spaces occupied by the molecules. Therefore, for molecular
systems like those studied in this thesis, the Generalised Gradient
Approximation (GGA) becomes more appropriate. The GGA
approximation21,22 accounts for rapidly changing properties of the electron
density by considering both the charge density at a point, and the gradient of
the charge density to account for local deviations. The most common GGA
functionals are the PBE23 (Perdew, Burke and Ernzerhof), PW9124,25 (Perdew
and Wang) and BLYP (Beck 88 exchange functional26 with the correlation
functional of Lee, Yang and Parr27). PBE is particularly popular for modelling
of molecular crystals, and has been previously demonstrated to perform well
for structural and vibrational properties of molecular energetic materials.28–31 It
has therefore been used in this thesis.
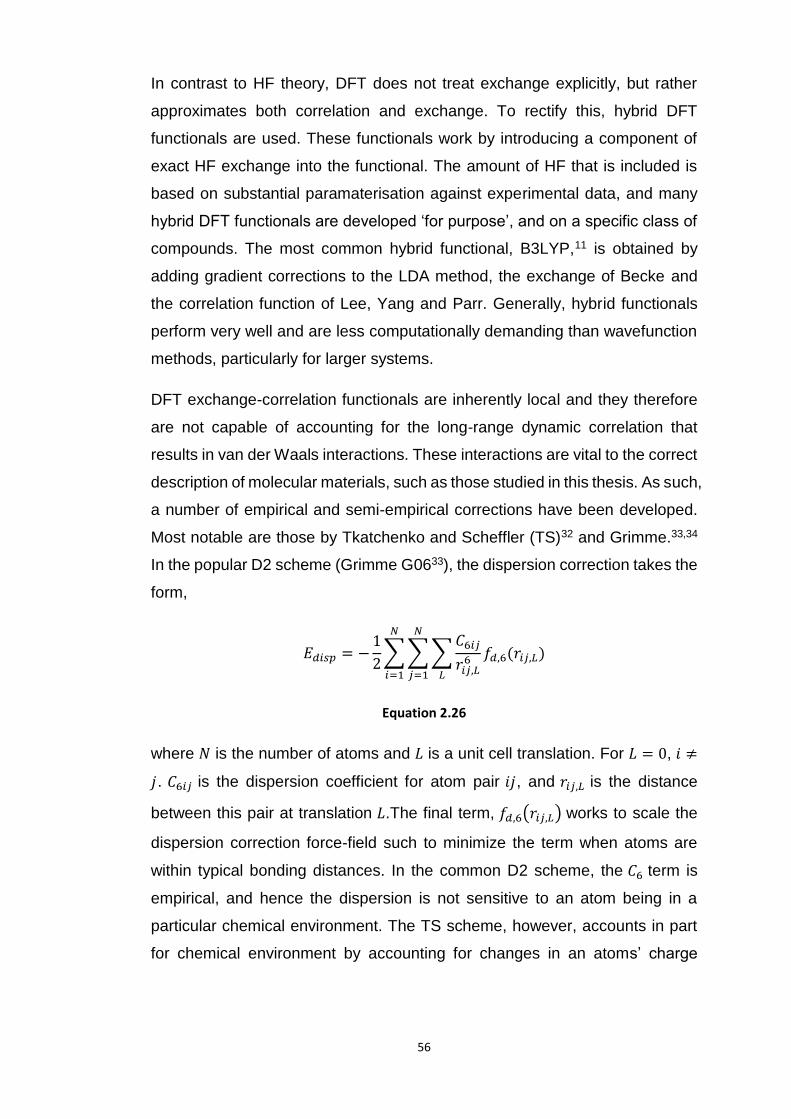
56
In contrast to HF theory, DFT does not treat exchange explicitly, but rather
approximates both correlation and exchange. To rectify this, hybrid DFT
functionals are used. These functionals work by introducing a component of
exact HF exchange into the functional. The amount of HF that is included is
based on substantial paramaterisation against experimental data, and many
hybrid DFT functionals are developed ‘for purpose’, and on a specific class of
compounds. The most common hybrid functional, B3LYP,11 is obtained by
adding gradient corrections to the LDA method, the exchange of Becke and
the correlation function of Lee, Yang and Parr. Generally, hybrid functionals
perform very well and are less computationally demanding than wavefunction
methods, particularly for larger systems.
DFT exchange-correlation functionals are inherently local and they therefore
are not capable of accounting for the long-range dynamic correlation that
results in van der Waals interactions. These interactions are vital to the correct
description of molecular materials, such as those studied in this thesis. As such,
a number of empirical and semi-empirical corrections have been developed.
Most notable are those by Tkatchenko and Scheffler (TS)32 and Grimme.33,34
In the popular D2 scheme (Grimme G0633), the dispersion correction takes the
form,
𝐸𝑑𝑖𝑠𝑝 = −1
2∑∑∑
𝐶6𝑖𝑗
𝑟𝑖𝑗,𝐿6 𝑓𝑑,6(𝑟𝑖𝑗,𝐿)
𝐿
𝑁
𝑗=1
𝑁
𝑖=1
Equation 2.26
where 𝑁 is the number of atoms and 𝐿 is a unit cell translation. For 𝐿 = 0, 𝑖 ≠
𝑗. 𝐶6𝑖𝑗 is the dispersion coefficient for atom pair 𝑖𝑗, and 𝑟𝑖𝑗,𝐿 is the distance
between this pair at translation 𝐿.The final term, 𝑓𝑑,6(𝑟𝑖𝑗,𝐿) works to scale the
dispersion correction force-field such to minimize the term when atoms are
within typical bonding distances. In the common D2 scheme, the 𝐶6 term is
empirical, and hence the dispersion is not sensitive to an atom being in a
particular chemical environment. The TS scheme, however, accounts in part
for chemical environment by accounting for changes in an atoms’ charge

57
density. Other DFT functionals have also been developed which attempt to
include non-local correlation explicitly within the ab initio calculation. A
particularly promising non-local correlation functional is rVV10,35 which has
proven to perform very well for structural and vibrational calculations of
molecular materials. Unfortunately, due to the complexity of the non-local
correlation functionals, they become increasingly expensive with the size of
the unit cell.36
A second issue surrounding the intrinsic localised nature of DFT correlation is
that DFT functionals tend to over delocalise electrons due to their intrinsic self-
interaction. 5 This introduces problems with calculation of electronic band gaps,
where typical GGA functionals tend to grossly underestimate these gaps.37
While there is some improvement with the introduction of HF exchange in the
hybrid functionals, there remain problematic effects with long-range HF
exchange, although cancellation of errors in hybrid methods can solve many
of these problems.38 Development of so-called screened hybrid DFT
functionals has therefore appeared. These methods separate the Coulomb
operator within the HF exchange into short- and long-range effects. The
definition of the range (and thus the length-scale of HF exchange) is varied
with an empirically fit parameter. The HSE0639 (Heyd, Scuseria and Ernzerhof)
functional is one such screened hybrid functional, and has proved particularly
promising for the calculation of electronic band gaps. It was therefore selected
for this purpose in this thesis.
2.1.5 Basis Sets
Solution of the Schrödinger equation, Equation 2.2, requires two components,
the Hamiltonian (i.e. how to evaluate the energy) and the wavefunction (i.e.
what to evaluate the energy of). The former is considered within the theories
of HF and DFT, while the latter depends on the so-called basis set.5 The basis
set is a set of functions whose linear combination represents a wavefunction.
Generally, the larger the basis set, the more accurately the wavefunction will
be described. While it is therefore tempting to use large basis sets, a larger
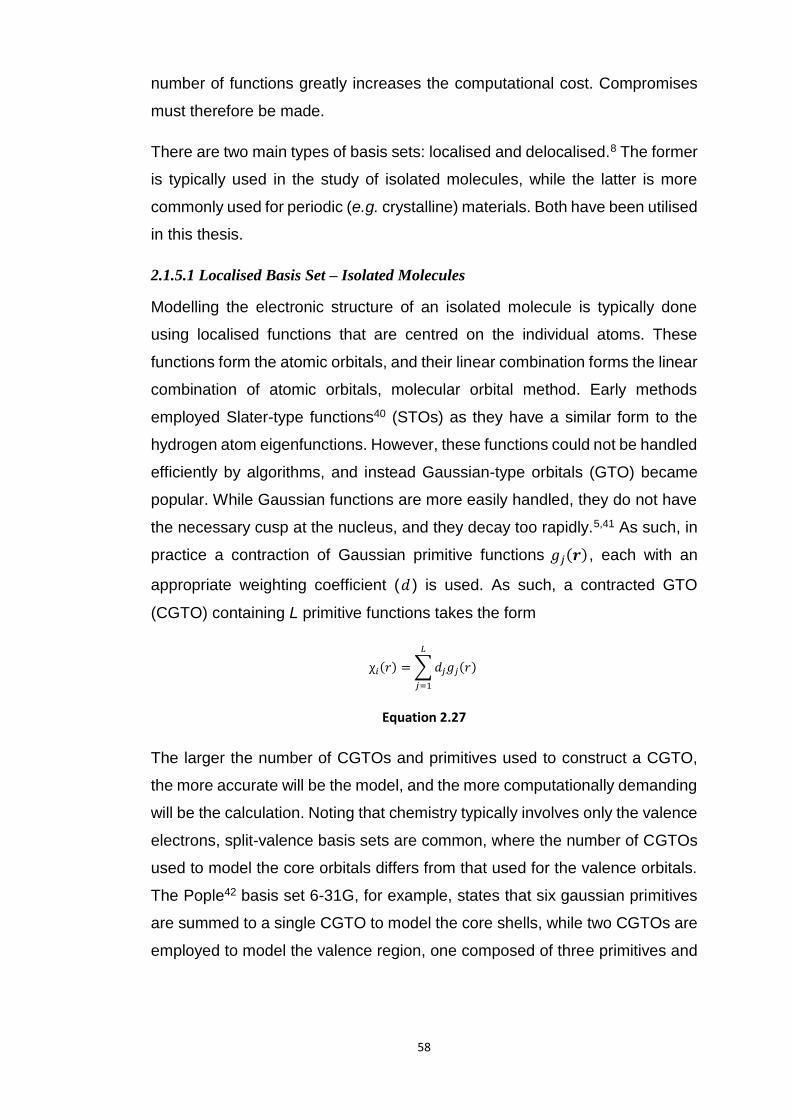
58
number of functions greatly increases the computational cost. Compromises
must therefore be made.
There are two main types of basis sets: localised and delocalised.8 The former
is typically used in the study of isolated molecules, while the latter is more
commonly used for periodic (e.g. crystalline) materials. Both have been utilised
in this thesis.
2.1.5.1 Localised Basis Set – Isolated Molecules
Modelling the electronic structure of an isolated molecule is typically done
using localised functions that are centred on the individual atoms. These
functions form the atomic orbitals, and their linear combination forms the linear
combination of atomic orbitals, molecular orbital method. Early methods
employed Slater-type functions40 (STOs) as they have a similar form to the
hydrogen atom eigenfunctions. However, these functions could not be handled
efficiently by algorithms, and instead Gaussian-type orbitals (GTO) became
popular. While Gaussian functions are more easily handled, they do not have
the necessary cusp at the nucleus, and they decay too rapidly.5,41 As such, in
practice a contraction of Gaussian primitive functions 𝑔𝑗(𝒓), each with an
appropriate weighting coefficient (𝑑 ) is used. As such, a contracted GTO
(CGTO) containing L primitive functions takes the form
χ𝑖(𝑟) = ∑𝑑𝑗𝑔𝑗(𝑟)
𝐿
𝑗=1
Equation 2.27
The larger the number of CGTOs and primitives used to construct a CGTO,
the more accurate will be the model, and the more computationally demanding
will be the calculation. Noting that chemistry typically involves only the valence
electrons, split-valence basis sets are common, where the number of CGTOs
used to model the core orbitals differs from that used for the valence orbitals.
The Pople42 basis set 6-31G, for example, states that six gaussian primitives
are summed to a single CGTO to model the core shells, while two CGTOs are
employed to model the valence region, one composed of three primitives and
59
one of a single primitive function. This offers additional flexibility to the valence
electrons and permits more accurate representation of perturbations to these
electron orbitals. Additional functions can be added to further enhance the
flexibility of these valence states: polarisation and diffuse functions. The former
describes addition of higher angular momentum functions onto an atom (e.g.
a p-orbital onto an s-orbital), and assists in capturing changes in the shape of
electron density on bonding. Diffuse functions add higher principle quantum
number orbitals (e.g. a larger orbital of the same angular momentum).
Polarisation functions are crucial for accurate capture of anions, polarizable
atoms, excited states and long range interactions. A number of different
families of GTOs exist, and differ mainly in their optimization of the primitive
Gaussian exponents. The most common families5 are the Dunning43 and
Pople42 basis sets.
In this thesis, GTOs are used to study bond elongation and excited state
potential energy surfaces of anions. This requires accurate modelling of the
atom-atom bonding interactions, as well as permitting sufficient flexibility to
capture the excited state. Hence in this work both polarization and diffuse
functions are incorporated. However, due to the computational expense of the
calculation, only a limited number of these functions could be used.
2.1.5.2 Condensed Matter, Delocalised Basis Sets and Bloch Theorem
Treating electrons in a solid, which is essentially an infinite array of periodic
unit cells, brings the additional challenge of solving the Schrödinger equation
for an infinite number of electrons. This problem can be solved by considering
Bloch’s theorem, which states that due to the periodicity of a crystalline
material, it is necessary to consider only the electrons that reside within the
primitive unit cell. Bloch’s theorem states that the wavefunction of an electron
within a perfectly periodic potential can be written as44
ψ𝑗,𝒌(𝒓) = 𝑢𝑗,𝒌(𝒓)𝑒𝑖𝒌.𝐫
Equation 2.28
60
In this equation, 𝑢𝑗(𝒓) describes a function with the periodicity of the potential,
such that 𝑢𝑗(𝒓 + 𝒈) = 𝑢𝑗(𝒓), where 𝒈 is the translational length of the crystal.
The term j describes the band index, and k a wave vector within the first
Brillouin zone. In a typical calculation, k is sampled at a discrete number of
points. This is often done using a Monkhorst-Pack grid,45 which is an unbiased
means of selecting a subset of k points to sample based on a rectangular grid
of points, spaced evenly throughout the Brillouin zone. Appropriate dimensions
for this grid require convergence testing on a system-by-system basis,46 and
depends on complexities in the underlying electronic structure.
As 𝑢𝑗 of Equation 2.28 is periodic, it can be expressed as a Fourier series,
𝑢𝑗,𝑘(𝒓) = ∑𝑐𝑗,𝑮𝑒𝑥𝑝(𝑖𝑮 ⋅ 𝒓)
𝐺
Equation 2.29
where G is a reciprocal lattice vector and 𝑐𝑗,𝑮 are expansion coefficients for
each plane wave. It follows that the electron wavefunctions can be constructed
as a linear combination of these plane waves,
𝑢𝑗,𝑘(𝒓) = ∑𝑐𝑗,𝒌+𝑮𝑒𝑥𝑝(𝑖(𝒌 + 𝑮) ⋅ 𝒓
𝑮
Equation 2.30
Similar to the GTO, a DFT calculation therefore aims to minimize the energy
of this function by optimizing the expansion coefficients through self-consistent
field cycles.
Electronic wavefunctions represented by plane waves are fast to compute, and
further, the set of plane waves is universal and does not depend on the position
or type of atoms in the unit cell.5 Hence, in contrast to localised basis sets, all
systems can be treated with the same set of functions. In principle, the plane
wave series is infinite. However, this is clearly not computationally tractable,
and a truncation must be made. This is done by setting an upper energy limit
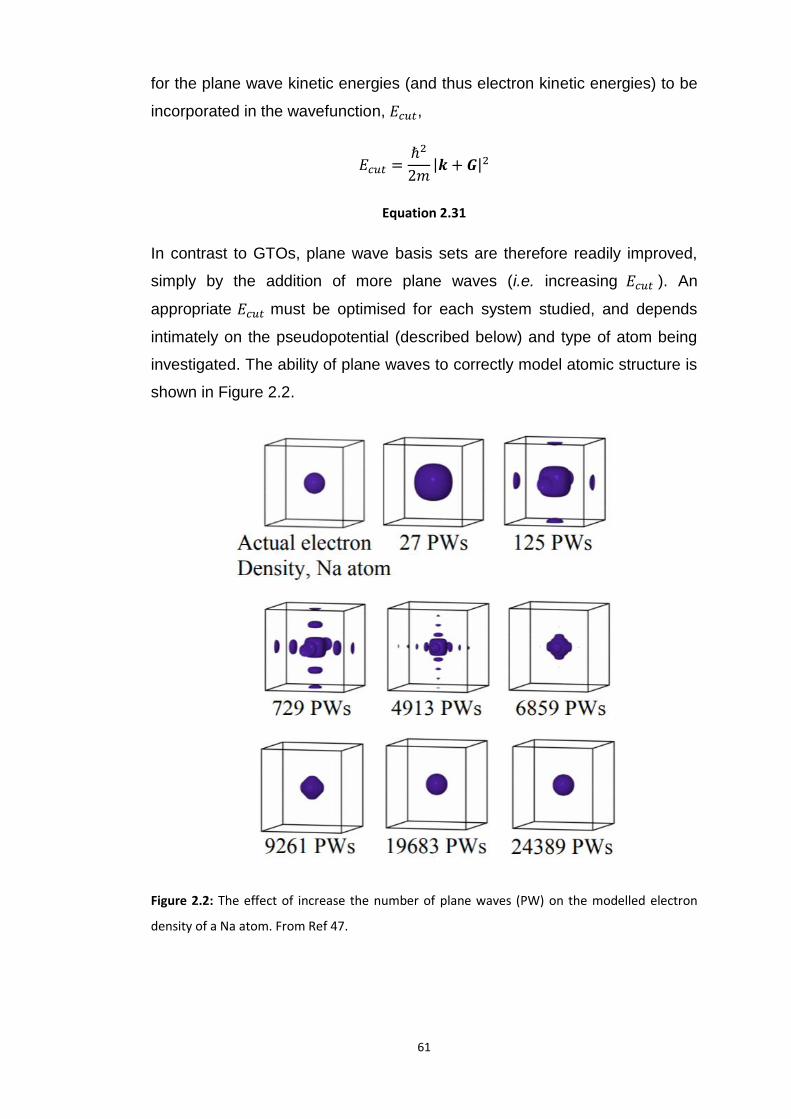
61
for the plane wave kinetic energies (and thus electron kinetic energies) to be
incorporated in the wavefunction, 𝐸𝑐𝑢𝑡,
𝐸𝑐𝑢𝑡 =ℏ2
2𝑚|𝒌 + 𝑮|2
Equation 2.31
In contrast to GTOs, plane wave basis sets are therefore readily improved,
simply by the addition of more plane waves (i.e. increasing 𝐸𝑐𝑢𝑡 ). An
appropriate 𝐸𝑐𝑢𝑡 must be optimised for each system studied, and depends
intimately on the pseudopotential (described below) and type of atom being
investigated. The ability of plane waves to correctly model atomic structure is
shown in Figure 2.2.
Figure 2.2: The effect of increase the number of plane waves (PW) on the modelled electron
density of a Na atom. From Ref 47.

62
It is also possible (albeit less common) to build Bloch functions of Equation
2.28 based on GTOs. For an N-electron system, this is done by expanding the
unknown crystalline orbitals, i, as a set of m Bloch functions that are
constructed from local atom-centred Gaussian functions, χ,48
ψ𝒌𝑖(𝒓) = 𝑁 ∑𝑎𝑗𝑖(𝒌) (∑χ𝑮,𝑖(𝒓)𝑒𝑥𝑝(𝑖𝒌 ⋅ 𝑮)
𝑮
)
𝑚
𝑗=1
Equation 2.32
where G is again a reciprocal lattice vector, and terms aji are the scaling
coefficients. The main advantage of using GTOs for periodic systems comes
in the study of the electron density, which is more carefully reproduced by
GTOs. Further, the use of GTOs greatly reduces the number of basis functions
used to describe the system and hence are favoured for use with hybrid
functionals, which have explicit consideration of the Fock matrix (and which
scales directly with the number of basis functions employed). Hence the
electronic band structures calculated in this work were performed almost
exclusively using periodic Gaussian-type Bloch functions, along with the
screened hybrid DFT functional, HSE06. The major disadvantage is that there
is no systematic and unique approach to enhancing the basis set quality as
there is with plane waves, and hence the basis sets used in this work were
obtained from previous works in which they were successfully employed in
similar systems.
2.1.5.3 Pseudopotentials
The Pauli exclusion principle2 dictates that higher electronic states are
orthogonal with all states of lower energy. It follows that the electronic
wavefunction becomes highly oscillating in the core region. The expansion of
the electronic wavefunction in a plane wave basis set requires very large
numbers of plane waves to capture this feature. Fortunately, the core electrons
of an atom are only negligibly affected by the chemical environment, and can
be treated as being frozen. It is therefore possible to replace the ionic potential
with a weaker pseudopotential that mimics the screening effect of the core
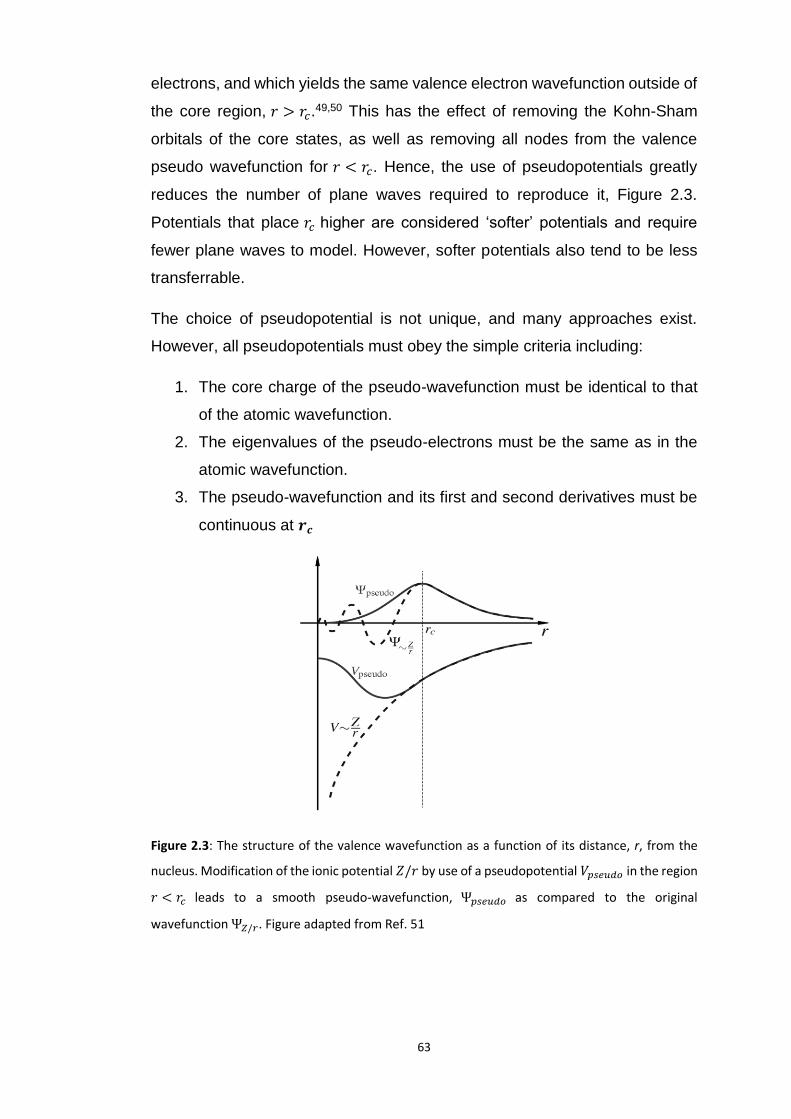
63
electrons, and which yields the same valence electron wavefunction outside of
the core region, 𝑟 > 𝑟𝑐.49,50 This has the effect of removing the Kohn-Sham
orbitals of the core states, as well as removing all nodes from the valence
pseudo wavefunction for 𝑟 < 𝑟𝑐. Hence, the use of pseudopotentials greatly
reduces the number of plane waves required to reproduce it, Figure 2.3.
Potentials that place 𝑟𝑐 higher are considered ‘softer’ potentials and require
fewer plane waves to model. However, softer potentials also tend to be less
transferrable.
The choice of pseudopotential is not unique, and many approaches exist.
However, all pseudopotentials must obey the simple criteria including:
1. The core charge of the pseudo-wavefunction must be identical to that
of the atomic wavefunction.
2. The eigenvalues of the pseudo-electrons must be the same as in the
atomic wavefunction.
3. The pseudo-wavefunction and its first and second derivatives must be
continuous at 𝒓𝒄
Figure 2.3: The structure of the valence wavefunction as a function of its distance, r, from the
nucleus. Modification of the ionic potential 𝑍/𝑟 by use of a pseudopotential 𝑉𝑝𝑠𝑒𝑢𝑑𝑜 in the region
𝑟 < 𝑟𝑐 leads to a smooth pseudo-wavefunction, Ψ𝑝𝑠𝑒𝑢𝑑𝑜 as compared to the original
wavefunction Ψ𝑍/𝑟. Figure adapted from Ref. 51
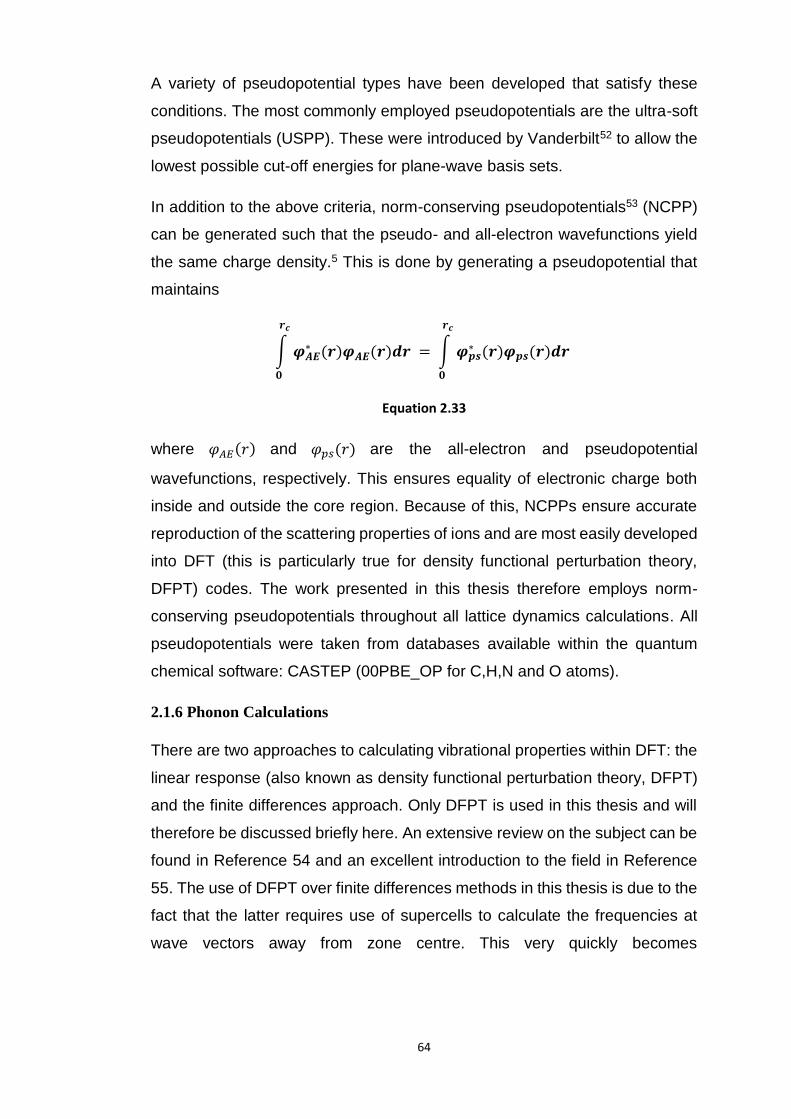
64
A variety of pseudopotential types have been developed that satisfy these
conditions. The most commonly employed pseudopotentials are the ultra-soft
pseudopotentials (USPP). These were introduced by Vanderbilt52 to allow the
lowest possible cut-off energies for plane-wave basis sets.
In addition to the above criteria, norm-conserving pseudopotentials53 (NCPP)
can be generated such that the pseudo- and all-electron wavefunctions yield
the same charge density.5 This is done by generating a pseudopotential that
maintains
∫ 𝝋𝑨𝑬∗ (𝒓)𝝋𝑨𝑬
(𝒓)𝒅𝒓
𝒓𝒄
𝟎
= ∫ 𝝋𝒑𝒔∗ (𝒓)𝝋𝒑𝒔
(𝒓)𝒅𝒓
𝒓𝒄
𝟎
Equation 2.33
where 𝜑𝐴𝐸 (𝑟) and 𝜑𝑝𝑠
(𝑟) are the all-electron and pseudopotential
wavefunctions, respectively. This ensures equality of electronic charge both
inside and outside the core region. Because of this, NCPPs ensure accurate
reproduction of the scattering properties of ions and are most easily developed
into DFT (this is particularly true for density functional perturbation theory,
DFPT) codes. The work presented in this thesis therefore employs norm-
conserving pseudopotentials throughout all lattice dynamics calculations. All
pseudopotentials were taken from databases available within the quantum
chemical software: CASTEP (00PBE_OP for C,H,N and O atoms).
2.1.6 Phonon Calculations
There are two approaches to calculating vibrational properties within DFT: the
linear response (also known as density functional perturbation theory, DFPT)
and the finite differences approach. Only DFPT is used in this thesis and will
therefore be discussed briefly here. An extensive review on the subject can be
found in Reference 54 and an excellent introduction to the field in Reference
55. The use of DFPT over finite differences methods in this thesis is due to the
fact that the latter requires use of supercells to calculate the frequencies at
wave vectors away from zone centre. This very quickly becomes
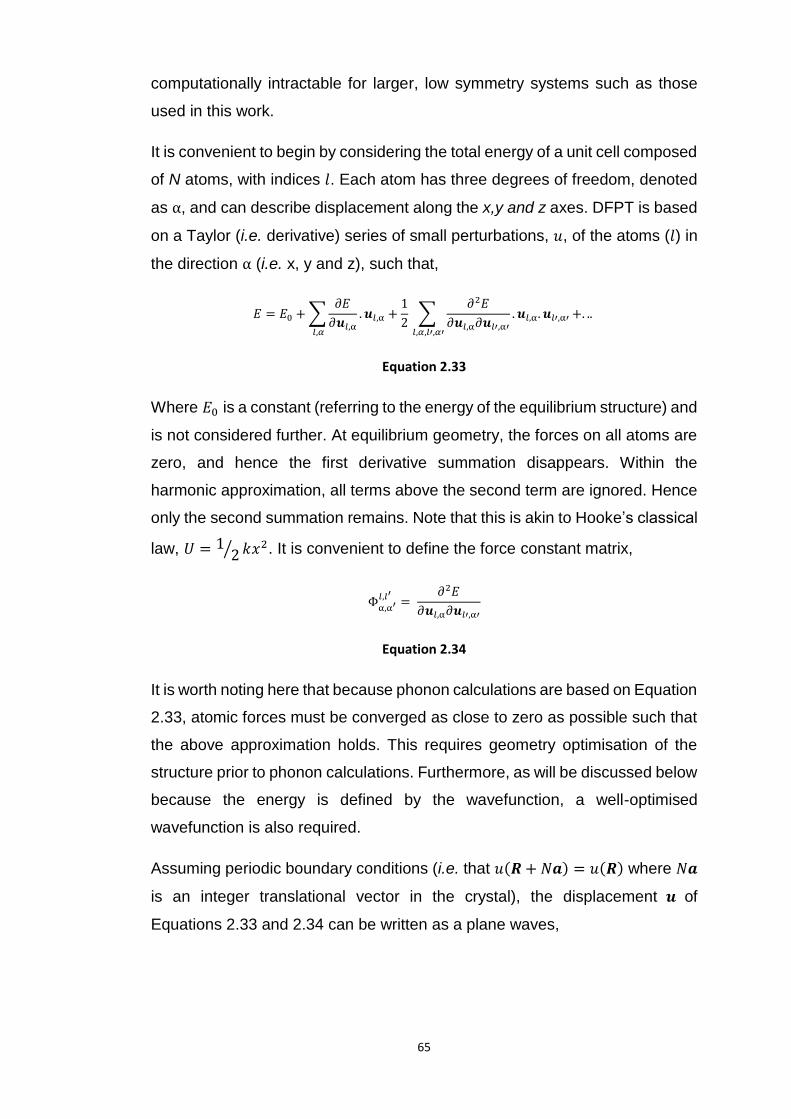
65
computationally intractable for larger, low symmetry systems such as those
used in this work.
It is convenient to begin by considering the total energy of a unit cell composed
of N atoms, with indices 𝑙. Each atom has three degrees of freedom, denoted
as α, and can describe displacement along the x,y and z axes. DFPT is based
on a Taylor (i.e. derivative) series of small perturbations, 𝑢, of the atoms (𝑙) in
the direction α (i.e. x, y and z), such that,
𝐸 = 𝐸0 + ∑𝜕𝐸
𝜕𝒖𝑙,α
. 𝒖𝑙,α
𝑙,𝛼
+1
2∑
𝜕2𝐸
𝜕𝒖𝑙,α𝜕𝒖𝑙′,α′
. 𝒖𝑙,α. 𝒖𝑙′,α′
𝑙,𝛼,𝑙′,𝛼′
+. ..
Equation 2.33
Where 𝐸0 is a constant (referring to the energy of the equilibrium structure) and
is not considered further. At equilibrium geometry, the forces on all atoms are
zero, and hence the first derivative summation disappears. Within the
harmonic approximation, all terms above the second term are ignored. Hence
only the second summation remains. Note that this is akin to Hooke’s classical
law, 𝑈 = 12⁄ 𝑘𝑥2. It is convenient to define the force constant matrix,
Φα,α′𝑙,𝑙′ =
𝜕2𝐸
𝜕𝒖𝑙,α𝜕𝒖𝑙′,α′
Equation 2.34
It is worth noting here that because phonon calculations are based on Equation
2.33, atomic forces must be converged as close to zero as possible such that
the above approximation holds. This requires geometry optimisation of the
structure prior to phonon calculations. Furthermore, as will be discussed below
because the energy is defined by the wavefunction, a well-optimised
wavefunction is also required.
Assuming periodic boundary conditions (i.e. that 𝑢(𝑹 + 𝑁𝒂) = 𝑢(𝑹) where 𝑁𝒂
is an integer translational vector in the crystal), the displacement 𝒖 of
Equations 2.33 and 2.34 can be written as a plane waves,
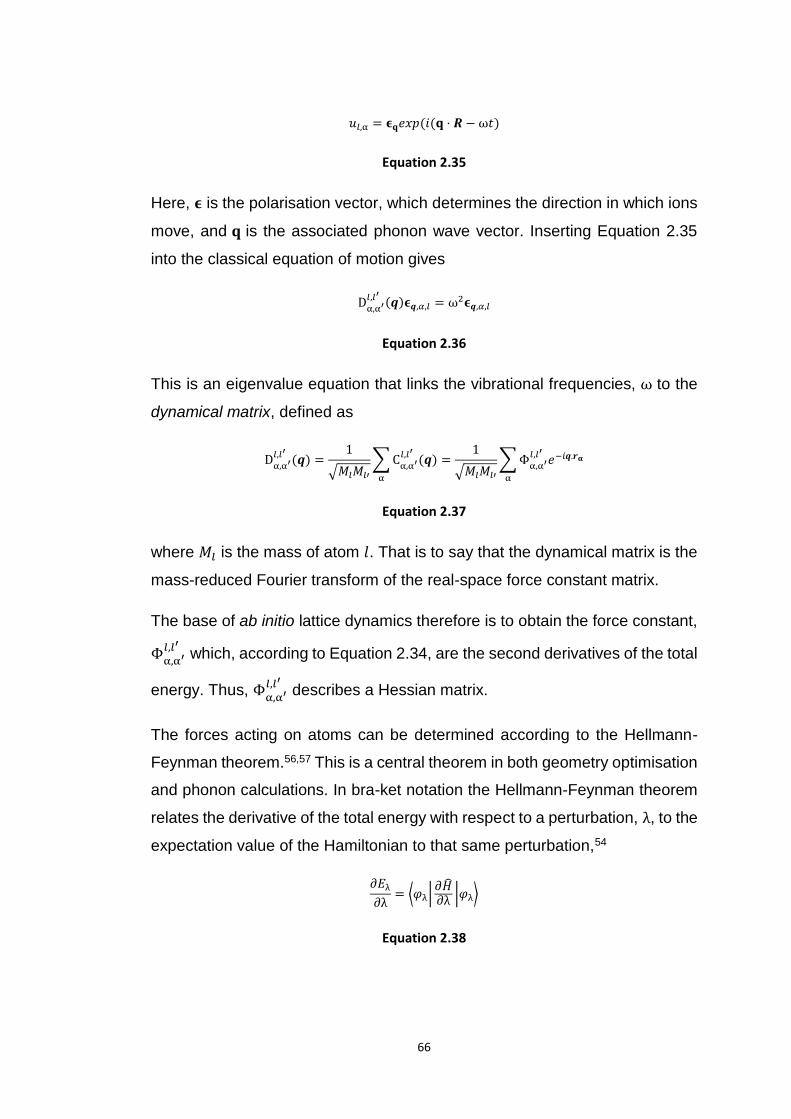
66
𝑢𝑙,α = 𝛜𝐪𝑒𝑥𝑝(𝑖(𝐪 ⋅ 𝑹 − ω𝑡)
Equation 2.35
Here, 𝛜 is the polarisation vector, which determines the direction in which ions
move, and 𝐪 is the associated phonon wave vector. Inserting Equation 2.35
into the classical equation of motion gives
Dα,α′𝑙,𝑙′ (𝒒)𝛜𝒒,𝛼,𝑙 = ω2𝛜𝒒,𝛼,𝑙
Equation 2.36
This is an eigenvalue equation that links the vibrational frequencies, ω to the
dynamical matrix, defined as
Dα,α′𝑙,𝑙′ (𝒒) =
1
√𝑀𝑙𝑀𝑙′
∑Cα,α′𝑙,𝑙′ (𝒒)
α
=1
√𝑀𝑙𝑀𝑙′
∑Φα,α′𝑙,𝑙′ 𝑒−𝑖𝒒.𝒓𝛂
α
Equation 2.37
where 𝑀𝑙 is the mass of atom 𝑙. That is to say that the dynamical matrix is the
mass-reduced Fourier transform of the real-space force constant matrix.
The base of ab initio lattice dynamics therefore is to obtain the force constant,
Φα,α′𝑙,𝑙′
which, according to Equation 2.34, are the second derivatives of the total
energy. Thus, Φα,α′𝑙,𝑙′
describes a Hessian matrix.
The forces acting on atoms can be determined according to the Hellmann-
Feynman theorem.56,57 This is a central theorem in both geometry optimisation
and phonon calculations. In bra-ket notation the Hellmann-Feynman theorem
relates the derivative of the total energy with respect to a perturbation, λ, to the
expectation value of the Hamiltonian to that same perturbation,54
𝜕𝐸λ
𝜕λ= ⟨𝜑λ|
𝜕��𝜕λ
|𝜑λ⟩
Equation 2.38

67
It follows from Equation 2.38 that for displacement of the ith nucleus, 𝑹𝒊,
𝐹𝐴 = −𝜕𝐸
𝜕𝑹𝐴
= ⟨𝜑 |𝜕��𝜕𝑹𝐴
|𝜑 ⟩
Equation 2.39
Equation 2.39 is known as the electrostatic force theorem, and is used to
minimise ionic positions during geometry optimisation (hence the need for a
good approximation of the wavefunction). For phonon calculations, however,
it is the Hessian of the Born-Oppenheimer energy surface that is required. This
comes from differentiating the Hellmann-Feynman forces (Equation 2.39) with
respect to nuclear coordinates and noting that from the BOA Hamiltonian in
Equation 2.4 the Hamiltonian depends on nuclear coordinates via the electron-
ion interactions (𝑉𝑹(𝒓)) and the charge density, 𝑛(𝒓). Hence,54
𝜕2𝐸(𝑹)
𝜕𝑅𝑖𝜕𝑅𝑗
= −𝜕𝐅𝒊
𝜕𝐑𝒋
= ∫𝜕𝑛𝑅(𝒓)
𝜕𝐑𝒋
𝜕𝑉𝑅(𝒓)
𝜕𝐑𝑰
𝑑𝒓 + ∫𝑛𝑹(𝒓)𝜕2𝑉𝑅(𝒓)
𝜕𝐑𝑰𝜕𝐑𝑱
𝑑𝒓 +𝜕2𝐸𝑁(𝑹)
𝜕𝐑𝑰𝜕𝐑𝑱
Equation 2.40
and the Hessian matrix of the Born-Oppenheimer energy depends on the
ground state electron density, 𝑛𝑹(𝒓) , and its linear response to nuclear
perturbation, ∂𝑛𝑅(𝑟)/ ∂𝑹𝐼 . The final term in Equation 2.40 describes the
second force imposed by one nucleus on another as a function of the
perturbation (i.e. the second derivative of the nuclear-nuclear interaction
energy).
In a DFPT (or linear response) calculation, the Hessian matrix is generated
according to Equation 2.40 for a select subset of wave vectors and the
dynamical matrix attained via Equation 2.37. These can be subsequently
Fourier interpolated onto other wave vectors, and hence a small number of
explicitly calculated dynamical matrices can yield a complete dispersion curve.
This allows access not only to dispersion relations along high symmetry lines,
but also to generation of phonon density of states, which require consideration
of a large number of wave vectors for accurate production. This assumes that
the calculated wave vectors capture the nature of the force constant along the
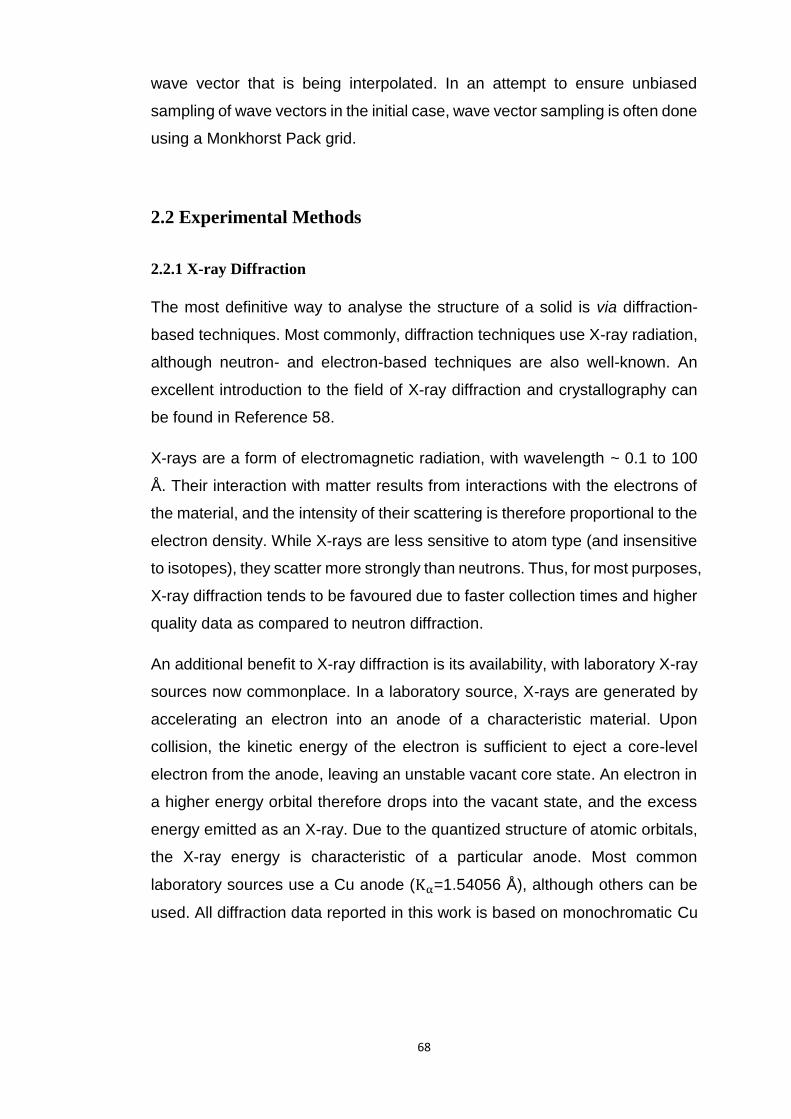
68
wave vector that is being interpolated. In an attempt to ensure unbiased
sampling of wave vectors in the initial case, wave vector sampling is often done
using a Monkhorst Pack grid.
2.2 Experimental Methods
2.2.1 X-ray Diffraction
The most definitive way to analyse the structure of a solid is via diffraction-
based techniques. Most commonly, diffraction techniques use X-ray radiation,
although neutron- and electron-based techniques are also well-known. An
excellent introduction to the field of X-ray diffraction and crystallography can
be found in Reference 58.
X-rays are a form of electromagnetic radiation, with wavelength ~ 0.1 to 100
Å. Their interaction with matter results from interactions with the electrons of
the material, and the intensity of their scattering is therefore proportional to the
electron density. While X-rays are less sensitive to atom type (and insensitive
to isotopes), they scatter more strongly than neutrons. Thus, for most purposes,
X-ray diffraction tends to be favoured due to faster collection times and higher
quality data as compared to neutron diffraction.
An additional benefit to X-ray diffraction is its availability, with laboratory X-ray
sources now commonplace. In a laboratory source, X-rays are generated by
accelerating an electron into an anode of a characteristic material. Upon
collision, the kinetic energy of the electron is sufficient to eject a core-level
electron from the anode, leaving an unstable vacant core state. An electron in
a higher energy orbital therefore drops into the vacant state, and the excess
energy emitted as an X-ray. Due to the quantized structure of atomic orbitals,
the X-ray energy is characteristic of a particular anode. Most common
laboratory sources use a Cu anode (Kα=1.54056 Å), although others can be
used. All diffraction data reported in this work is based on monochromatic Cu
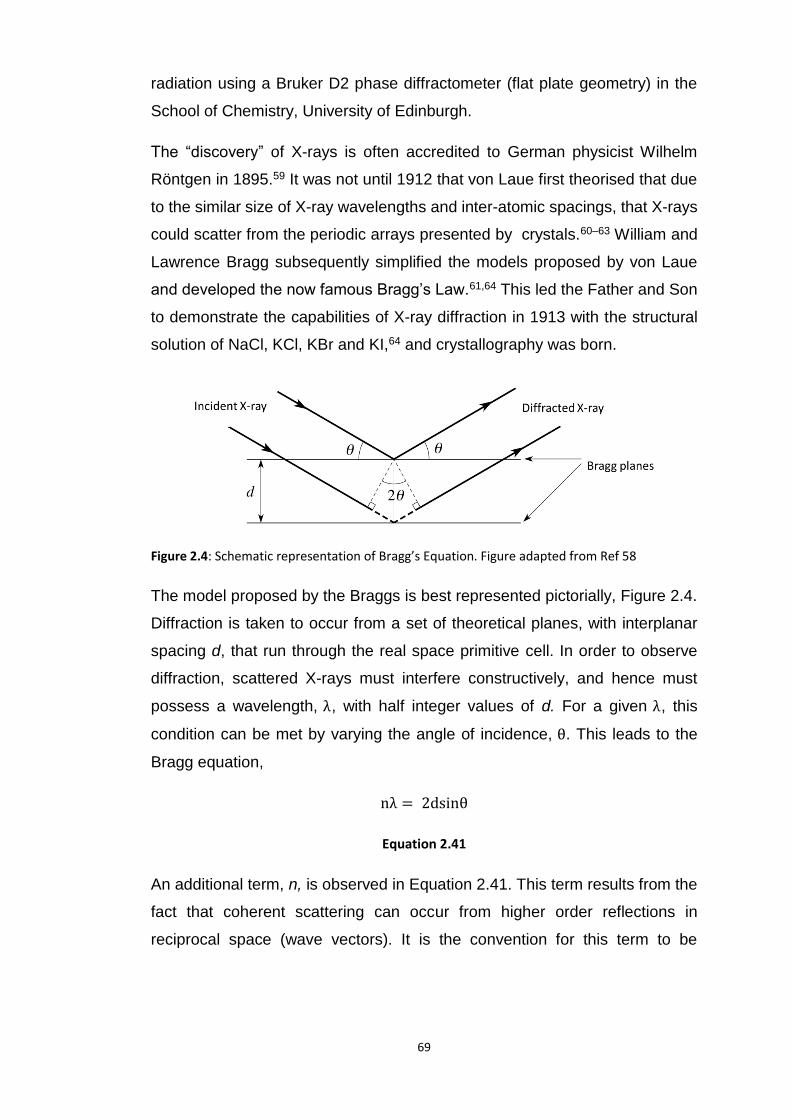
69
radiation using a Bruker D2 phase diffractometer (flat plate geometry) in the
School of Chemistry, University of Edinburgh.
The “discovery” of X-rays is often accredited to German physicist Wilhelm
Röntgen in 1895.59 It was not until 1912 that von Laue first theorised that due
to the similar size of X-ray wavelengths and inter-atomic spacings, that X-rays
could scatter from the periodic arrays presented by crystals.60–63 William and
Lawrence Bragg subsequently simplified the models proposed by von Laue
and developed the now famous Bragg’s Law.61,64 This led the Father and Son
to demonstrate the capabilities of X-ray diffraction in 1913 with the structural
solution of NaCl, KCl, KBr and KI,64 and crystallography was born.
Figure 2.4: Schematic representation of Bragg’s Equation. Figure adapted from Ref 58
The model proposed by the Braggs is best represented pictorially, Figure 2.4.
Diffraction is taken to occur from a set of theoretical planes, with interplanar
spacing d, that run through the real space primitive cell. In order to observe
diffraction, scattered X-rays must interfere constructively, and hence must
possess a wavelength, λ, with half integer values of d. For a given λ, this
condition can be met by varying the angle of incidence, θ. This leads to the
Bragg equation,
nλ = 2dsinθ
Equation 2.41
An additional term, n, is observed in Equation 2.41. This term results from the
fact that coherent scattering can occur from higher order reflections in
reciprocal space (wave vectors). It is the convention for this term to be

70
absorbed into d, and to describe sets of planes using the real space Miller
indices, (hkl). These indices describe the number of times a set of planes
intersect with the crystallographic a, b and c axes, respectively. Due to the
intimate relation between d and θ, the positions of the peaks in the diffraction
pattern is indicative of the structure of the unit cell, and hence the
crystallographic parameters that describe the size and shape of the
crystallographic unit cell: a, b, c 𝛼 , 𝛽 and 𝛾 . Coupled to knowledge of the
quantity of electron density located along each plane (by the intensity of
diffraction), X-ray scattering therefore contains the required information to
determine the relative positions of the atoms, and to identify them, within a
crystalline material
2.2.1.1 X-ray Powder Diffraction
If a single crystal scatters monochromatic X-rays, a set of well-defined
diffraction spots are observed according to58
𝐹(ℎ𝑘𝑙) = ∫dV ρ(xyz)exp(2πi(hx + ky + lz)
𝐼(ℎ𝑘𝑙) ∝ |𝐹(ℎ𝑘𝑙)|2
Equation 2.42
Thus, the angle of scattering for a set of Miller indices depends on Braggs law,
Equation 2.41, and their intensities on the relative position of atoms in real
space (electron density, ρ(𝑥𝑦𝑧)), with respect to that set of diffracting planes.
In powder diffraction techniques, however, monochromatic radiation is incident
on a bulk sample, containing many, randomly oriented crystals. This has the
effect of smearing the single diffraction spots into concentric cones, known as
the Debye-Scherrer cones, Figure 2.5.
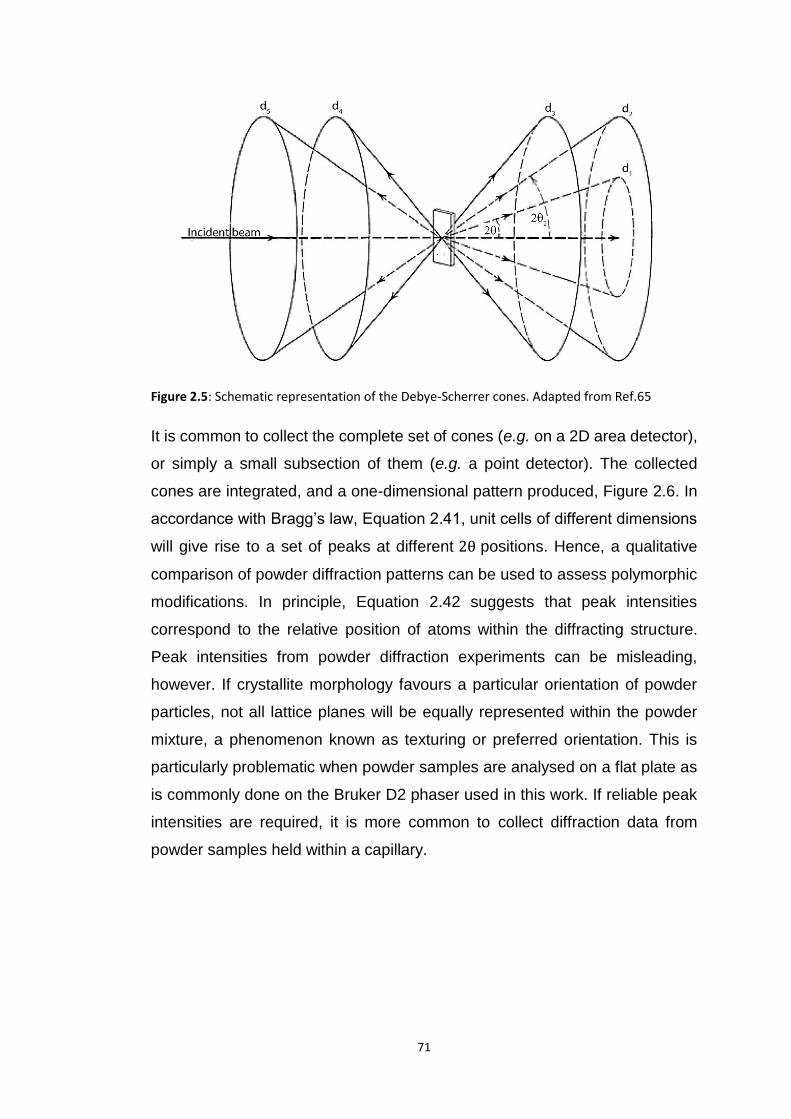
71
Figure 2.5: Schematic representation of the Debye-Scherrer cones. Adapted from Ref.65
It is common to collect the complete set of cones (e.g. on a 2D area detector),
or simply a small subsection of them (e.g. a point detector). The collected
cones are integrated, and a one-dimensional pattern produced, Figure 2.6. In
accordance with Bragg’s law, Equation 2.41, unit cells of different dimensions
will give rise to a set of peaks at different 2θ positions. Hence, a qualitative
comparison of powder diffraction patterns can be used to assess polymorphic
modifications. In principle, Equation 2.42 suggests that peak intensities
correspond to the relative position of atoms within the diffracting structure.
Peak intensities from powder diffraction experiments can be misleading,
however. If crystallite morphology favours a particular orientation of powder
particles, not all lattice planes will be equally represented within the powder
mixture, a phenomenon known as texturing or preferred orientation. This is
particularly problematic when powder samples are analysed on a flat plate as
is commonly done on the Bruker D2 phaser used in this work. If reliable peak
intensities are required, it is more common to collect diffraction data from
powder samples held within a capillary.
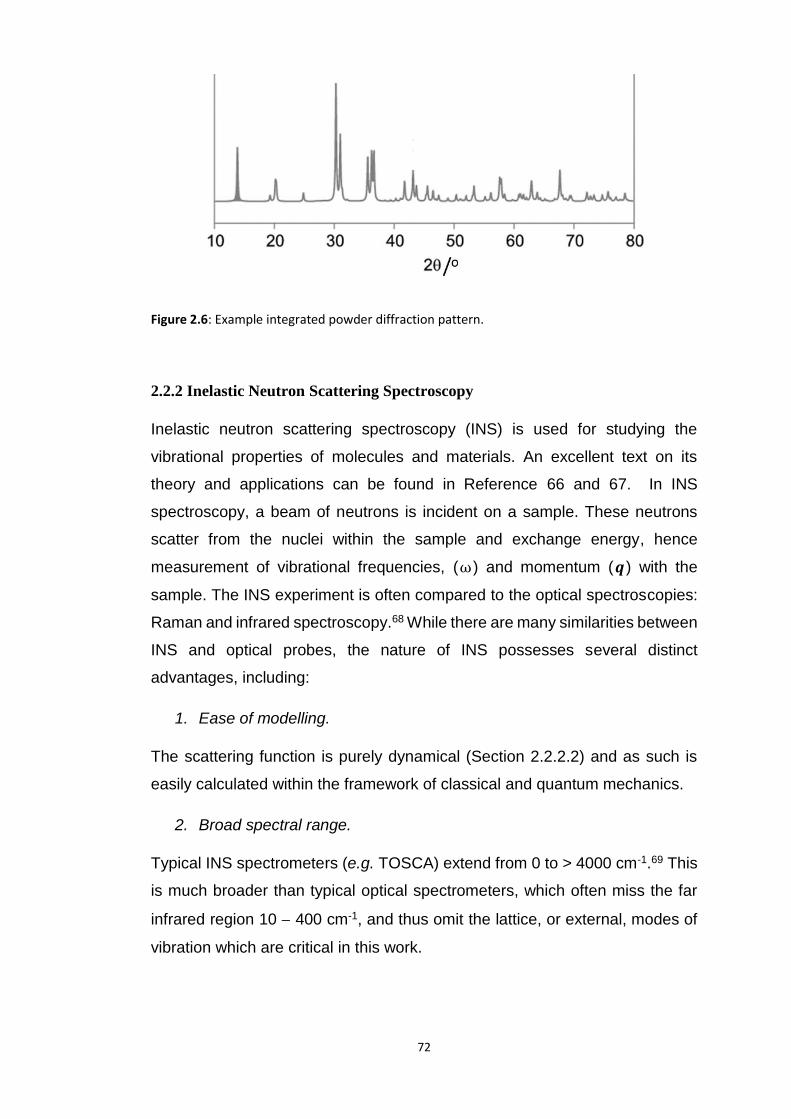
72
Figure 2.6: Example integrated powder diffraction pattern.
2.2.2 Inelastic Neutron Scattering Spectroscopy
Inelastic neutron scattering spectroscopy (INS) is used for studying the
vibrational properties of molecules and materials. An excellent text on its
theory and applications can be found in Reference 66 and 67. In INS
spectroscopy, a beam of neutrons is incident on a sample. These neutrons
scatter from the nuclei within the sample and exchange energy, hence
measurement of vibrational frequencies, (ω) and momentum (𝒒) with the
sample. The INS experiment is often compared to the optical spectroscopies:
Raman and infrared spectroscopy.68 While there are many similarities between
INS and optical probes, the nature of INS possesses several distinct
advantages, including:
1. Ease of modelling.
The scattering function is purely dynamical (Section 2.2.2.2) and as such is
easily calculated within the framework of classical and quantum mechanics.
2. Broad spectral range.
Typical INS spectrometers (e.g. TOSCA) extend from 0 to > 4000 cm-1.69 This
is much broader than typical optical spectrometers, which often miss the far
infrared region 10 − 400 cm-1, and thus omit the lattice, or external, modes of
vibration which are critical in this work.
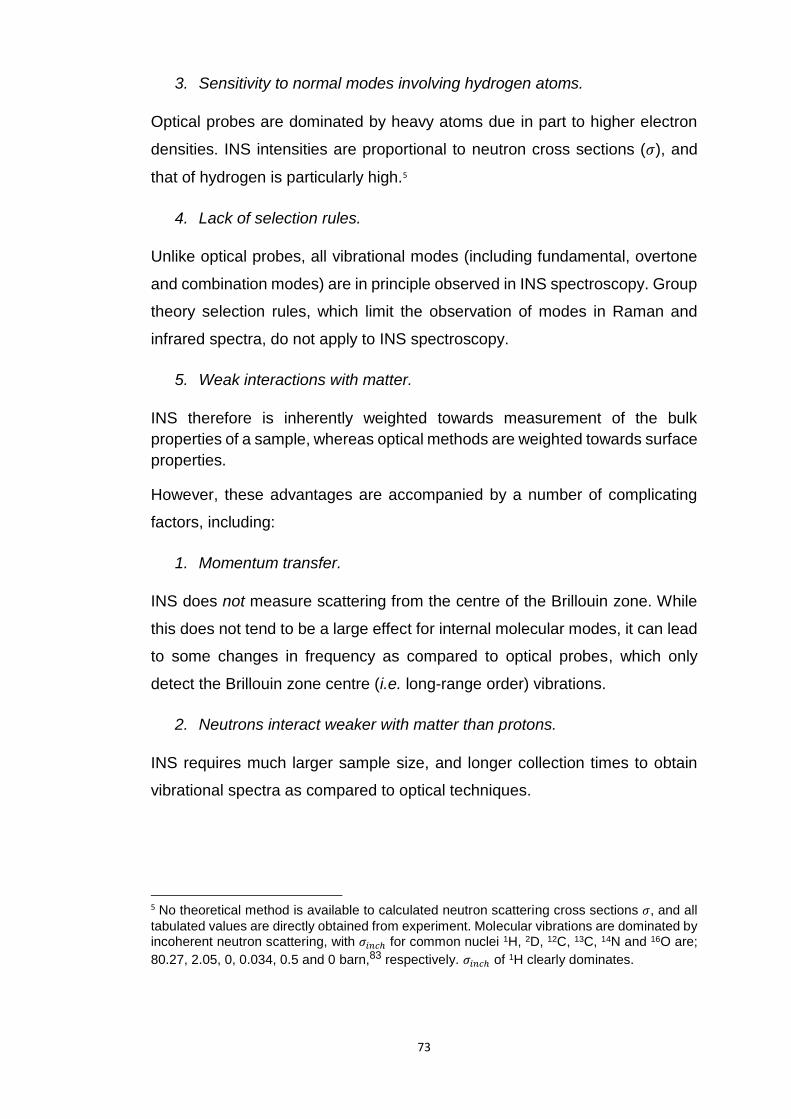
73
3. Sensitivity to normal modes involving hydrogen atoms.
Optical probes are dominated by heavy atoms due in part to higher electron
densities. INS intensities are proportional to neutron cross sections (𝜎), and
that of hydrogen is particularly high.5
4. Lack of selection rules.
Unlike optical probes, all vibrational modes (including fundamental, overtone
and combination modes) are in principle observed in INS spectroscopy. Group
theory selection rules, which limit the observation of modes in Raman and
infrared spectra, do not apply to INS spectroscopy.
5. Weak interactions with matter.
INS therefore is inherently weighted towards measurement of the bulk
properties of a sample, whereas optical methods are weighted towards surface
properties.
However, these advantages are accompanied by a number of complicating
factors, including:
1. Momentum transfer.
INS does not measure scattering from the centre of the Brillouin zone. While
this does not tend to be a large effect for internal molecular modes, it can lead
to some changes in frequency as compared to optical probes, which only
detect the Brillouin zone centre (i.e. long-range order) vibrations.
2. Neutrons interact weaker with matter than protons.
INS requires much larger sample size, and longer collection times to obtain
vibrational spectra as compared to optical techniques.
5 No theoretical method is available to calculated neutron scattering cross sections 𝜎, and all
tabulated values are directly obtained from experiment. Molecular vibrations are dominated by incoherent neutron scattering, with 𝜎𝑖𝑛𝑐ℎ for common nuclei 1H, 2D, 12C, 13C, 14N and 16O are;
80.27, 2.05, 0, 0.034, 0.5 and 0 barn,83 respectively. 𝜎𝑖𝑛𝑐ℎ of 1H clearly dominates.

74
3. Availability
INS is only possible at dedicated beamlines, located at neutron sources.
4. Temperature Range
Neutron scattering is much more sensitive to temperature than optical probes.
Typical INS spectra are therefore obtained at ca. 10 K.
2.2.2.1 Generation of Neutrons
Neutrons can be produced from a variety of nuclear reactions:67 fusion,
photofission, fission, and spallation. The latter two are most common for
scattering experiments. In a fission reactor (such as the ILL in Grenoble),
neutrons are produced by thermal fission of fissionable isotopes, typically 235U.
Thermal fission of this 235U generates a continuous stream of high energy
neutrons, which can be moderated to produce thermal neutrons. At a spallation
source, high energy protons are generated using a synchrotron. These protons
bombard a metal target (e.g. tungsten or tantalum), which triggers emission of
a cascade of high energy neutrons. As the protons are generated in pulses, so
too are the neutrons at a spallation source. All of the INS spectra used in this
thesis were obtained at a spallation source: the ISIS Neutron and Muon Facility,
STFC Rutherford Appleton Laboratory, UK. Hence this process will be
considered further.
At the ISIS Neutron Facility, high energy protons are generated using a
synchrotron, and are directed at a tantalum coated tungsten target (at Target
Station 1, where the INS beamline is located). These protons have immense
energy (ca. 800 MeV), which excites nuclei in the target. This induces an
intranuclear cascade, which in turn leads to emission of high energy neutrons
(approximately 15 per proton) Hence, an intense neutron pulse is generated.
The neutrons that result from this process have energies on the order of ~ 2
MeV, termed epithermal neutrons. However, these are too energetic for most
practical applications. To reduce the energy of these neutrons, they are

75
therefore passed through a moderator. For the TOSCA beamline, this is
ambient temperature (300 K) water.70 The neutrons undergo numerous
inelastic collisions with the water molecules, and their energy is therefore
subdued. The resulting neutrons (known as thermal neutrons) adhere to a
Maxwell-Boltzmann distribution of energies, about a peak flux that is
characteristic of the moderator. For water, the peak flux is approximately 200
cm-1. It is these thermal neutrons that are finally passed to the instrument and
used for INS.
2.2.2.2 The TOSCA Instrument
The TOSCA instrument was used for collection of INS spectra in this work.69–
71 TOSCA is an indirect geometry time-of-flight (ToF) neutron spectrometer
with resolution Δω/ω ≈ 2 − 3% . As an indirect instrument, the experiment
works by fixing the final energy of the detected neutrons that are scattered
from the sample, and scans the incident energies. As described above, the
incident neutron beam contains a distribution of neutron energies (i.e. it is a
white beam), which are characterised by their kinetic energy and hence the
rate at which they reach the sample. To maximise signal, TOSCA utilises both
forward and backward scattering detectors. Only the neutrons which scatter at
fixed angles (45o or 135o) will impinge on the analyser crystals (the (002) plane
of pyrolytic graphite). It follows from Bragg’s law, Equation 2.41 that since the
scattering Bragg plane is fixed, only a single wavelength (and its higher orders)
of neutron will be passed from the analyser crystal to the detector. All
remaining neutrons will pass through the analyser crystal and are absorbed by
the spectrometer shield. The neutrons that are scattered by the analyser are
passed through a beryllium filter, scattering away neutrons with multiples of
the fundamental wavelength. Finally the remaining neutrons are detected by a
bank of 3He filled detector tubes. The result of using both the graphite analyser
in parallel with the beryllium filters is to create a narrow band-pass filter.
Because neutrons can be treated as both particle and wave, it is possible to
define the kinetic energy of a neutron based on its velocity, v, and its mass,
𝑚𝑛,
76
𝐸 =1
2𝑚𝑛𝒗
2 ⟹ 𝒗 = √(2𝐸
𝑚𝑛)
Equation 2.43
The energy that is transferred between the incident neutron and the sample,
𝐸𝑡𝑟, is defined by the difference in energy of the initial (𝐸𝑖) and final (𝐸𝑓) neutron
energies. For a ToF instrument, the total time, 𝑡𝑡𝑜𝑡, travelled by the neutron is
defined as the time taken to travel from moderator to sample (distance 𝑙1, time
𝑡1), and the time taken for the scattered neutron to travel from the sample to
the detector (distance 𝑙𝑓, time 𝑡2). It therefore follows that
𝑡𝑡𝑜𝑡 =𝑙1𝑣1
+𝑙2𝑣2
=𝑙1
√2𝐸𝑖
𝑚𝑛
+𝑙2
√2𝐸𝑓
𝑚𝑛
Equation 2.44
In Equation 2.44, 𝐸𝑓, 𝑙1 and 𝑙2 are all fixed by the geometry of the instrument.
Hence, the time taken to travel to the detector uniquely defines the incident
energy of the neutron, and correspondingly, 𝐸𝑡𝑟.
2.2.2.3 Neutron Scattering
In a neutron scattering experiment, an incident beam of neutrons (neutral
subatomic particles with mass, 𝑚𝑛, approximately equal to that of a proton) is
scattered from a sample. This scattering can be the result of magnetic
interactions, or due to nuclear interactions. Scattering due to magnetic
interactions is outside the scope of this work, and will not be discussed here;
an introduction can be found in Ref 72.
The total nuclear scattering is defined by the differential scattering cross
section,
77
𝑑σ
𝑑Ω= 𝑏2 =
σ𝑡
4π
Equation 2.45
which describes the amount of total scattering, σt into the elementary
scattering cone of solid angle 𝑑Ω per unit time. This depends on the nuclear
scattering length, 𝑏. The scattering according to Equation 2.45 forms the base
for diffraction experiments.
As was discussed Section 2.2.1.2, INS is an inelastic process, and the
detected neutrons depend both on the solid angle at which they are scattered,
and also on their energy. This is captured in the partial differential cross-
section for a system of 𝑁 atoms, which must therefore be considered as,
𝑑2σ
𝑑Ω𝑑𝐸𝑓= 𝑏2
𝑘𝑓
𝑘𝑖𝑁𝑆(𝑸,ω)
Equation 2.46
where 𝑘 =2𝜋
𝜆 is the wave vector for the incident (𝑘𝑖) and final (𝑘𝑓) neutron.
The term 𝑆(𝑸,ω) is the scattering function, and describes the probability that
the scattering process will change the energy of the system by an amount ω,
and its momentum by ℏ𝑸 = ℏΔ𝒌. Because both the energy and angle of the
final scattered neutron are fixed on TOSCA, this also fixes 𝒌𝑓. The value of 𝑸
is therefore dependent on 𝐸𝑡𝑟, and TOSCA probes a narrow stripe in (Q,ω) of
kinematic space.70
The scattering described in Equations 2.45 and 2.46 account for the elastic
and inelastic scattering processes. However, due to nuclear effects (isotope
and spin effects), the scattering cross section in both cases requires
consideration of coherent and incoherent processes. The former describes the
in-phase scattering and results in interference effects. Hence, coherent
scattering is required for diffraction and vibrational spectroscopy of collective
motions (e.g. phonon dispersion). The incoherent scattering describes motion
78
of single particles, in which no correlation exists between different molecules
or atoms. These motions are particularly important for studying internal
molecular vibrations. In an INS spectrum, both coherent and incoherent
scattering processes are observed, and the dominating scattering mechanism
depends largely on the scattering cross-sections of the atoms involved.
Incoherent scattering dominates in hydrogen-containing compounds.
The absolute intensity of an INS spectrum is difficult to interpret, and so only
the relative spectral intensities are considered. The calculated relative intensity
(the scaled scattering factor, 𝑆∗(𝑸,ω𝑖) ) of the 𝑖𝑡ℎ vibrational mode with
momentum transfer 𝑸 and neutron energy loss 𝐸𝑡𝑟 = ω𝑖 is defined as73
𝑆∗(𝑸,ω𝑖)𝑚𝑛 = 𝑦σ𝑚
[(𝑸 ∙ 𝑖𝒖𝑚)2]𝑛
𝑛!𝑒𝑥𝑝(−(𝑸 ∙ ∑ 𝑢
𝑖𝑚
𝑖
)
2
)
Equation 2.47
In Equation 2.47, 𝑖𝒖𝑚 is the displacement vector for atom m of mode i, y is a
linear factor (units barn cm), which acts to convert the actual units of 𝑆∗(𝑸,ω𝑖))
into scaled dimensionless units. The final variable, n, indicates the final state
of the excited mode. So, an elastic process has n=0, a fundamental n=1, the
first overtone n=2, etc. The pre-exponential term of Equation 2.47 increases
with increasing momentum transfer and vibrational amplitude. The exponential
term (known as the Debye-Waller factor), however, decreases more rapidly
with 𝑸2𝒖2. Hence, there is an overall decrease in vibrational amplitude with
increasing temperature. As such, it is typical to collect INS spectra at cryogenic
temperatures, although (as done in this thesis) higher temperature
measurements are still possible.
Equation 2.47 is surprisingly simple, and depends on the momentum
transferred, the scattering cross section and the magnitude of the atomic
displacement. Hence, the observed INS intensity is purely dynamic and can
be easily calculated: frequencies are obtained from normal mode eigenvalues
79
and the displacements from the eigenvectors. Thus INS is an excellent
technique against which to validate calculated vibrational spectra.31,74.
2.2.3 BAM fall Hammer
A number of tests have been developed to measure the impact sensitivity of
energetic materials (EMs). These include the Picatinnany Arsenal apparatus,
the Bureau of Mines Machine, the Rotter Impact Machine, and the BAM fall
hammer.75,76 The standard procedures and device depend largely on
geography.77 Some devices, such as the Rotter Impact Machine, define a
successful initiation based on the production of gas products. For other
methods, such as in the BAM fall hammer, a successful initiation is determined
by the user, and is generally based on sound or visual inspection of the sample.
It follows that the reported impact sensitivities that result from different testing
methods can vary substantially.78 Further difficulties in the experimental
validation of impact sensitivity stems from sample and environmental factors,79
which include particle size, crystallinity, purity, temperature, and humidity,
amongst others. These factors are not regularly controlled, and their effects on
impact sensitivity are poorly understood. These all contribute to the extreme
variability in reported impact sensitivities for materials.

80
Figure 2.7: BAM fall hammer device used for impact sensitivity testing. (A) The BAM BFH-12
apparatus. (B) Sample anvil. Figure adapted from Ref. 80
This work makes use of the BAM fall hammer (BFH-12), based at the
Cavendish Laboratories, University of Cambridge, Figure 2.7A. This device
has been accepted as the NATO qualification testing method, described in the
United Nations recommendations for the Transport of Dangerous Goods.76
The BFH procedure requires a sample of 40 mm3 to be enclosed in an anvil
setup, composed of two coaxial steel cylinders and a guide ring, Figure 2.7B.
To apply the impact, a load mass of 10, 5, 2, 1 or 0.5 kg is dropped onto a
sample, from heights ranging 20 – 100 cm. The energy is therefore calculated
as, e.g. 1 kg from 50 cm = 5 J.

81
Figure 2.8: Probability of initiation of energetic materials to impact. Figure from Ref. 81
There are two testing protocols typically used for assessing the impact
sensitivity of EMs. The Limiting Impact Energy Test (known also as the 1-in-6
method) is outlined in the United Nations testing requirements for the transport
of explosives.76 According to this method, the impact energy is lowered step-
wise until an impact energy is reached at which six consecutive trials result in
a ‘No Go’ (that is, no explosion, discolouration, flash or loud noise is observed
upon impact). This is taken as the highest drop height at which impact will not
induce initiation of the sample, ℎ0 , Figure 2.8. This method is good for
assessing the safe handling of materials, and for testing small sample sizes.
The Bruceton up-down method also leads to measurement of a sample’s ℎ50
value, Figure 2.8 (i.e. the drop height at which 50% of tested samples will
initiate). It has a corresponding energy denoted 𝐸50. In this method, the drop
height is varied depending on the outcome of a previous measurement. If the
sample initiates at a particular energy, the subsequent test is performed at a
lower stimulus energy. Instead if the sample does not initiate, the new test is
performed at higher energy. This method assumes a normal response to input
energy and has been criticised,82 although it remains widely used.

82
Both methods are indicative of the impact sensitivity of a material. However,
their values are clearly not directly comparable. Moreover, the fall hammer
method used is often not described in the literature alongside the numerical
data, and this further contributes to the large discrepancy of sensitivity reported
in literature. Where possible, this work seeks to compare its models against
reported ℎ50 values, unless otherwise stated.
2.3 References (1) Schrödinger, E. An Undulatory Theory of the Mechanics of Atoms and
Molecules. Phys. Rev. 1926, 28 (6), 1049–1070.
(2) Atkins, P.; Friedman, R. Molecular Quantum Mechanics, 4th editio.; Oxford University Press: New York, 2005.
(3) Born, M.; Oppenheimer, R. Zur Quantentheorie Der Molekeln. Ann. Phys. 1927, 389 (20), 457–484.
(4) Slater, J. C. The Theory of Complex Spectra. Phys. Rev. 1929, 34 (10), 1293.
(5) Jensen, F. Introduction to Computatinoal Chemistry, 2nd ed.; John Wiley & Sons, Ltd: Chichester, UK, 2007.
(6) Dawes, R.; Ndengué, S. A. Single- and Multireference Electronic Structure Calculations for Constructing Potential Energy Surfaces. Int. Rev. Phys. Chem. 2016, 35 (3), 441–478.
(7) Bartlett, R. J. To Multireference or Not to Multireference: That Is the Question? Int. J. Mol. Sci. 2002, 3 (6), 579–603.
(8) Namboori, K.; Ramachandran, K. I.; Deepa, G. Computational Chemistry and Molecular Modeling; Springer-Verlag: Berling Heidelberg, 2008.
(9) Werner, H. J.; Knowles, P. J. Molpro: Getting Started with Molpro V 2015.1; 2015.
(10) Werner, H. J.; Knowles, P. J.; Knizia, G.; Manby, F. R.; Schütz, M. Molpro: A General-Purpose Quantum Chemistry Program Package. Wiley Interdiscip. Rev. Comput. Mol. Sci. 2012, 2 (2), 242–253.
(11) Burke, K. Perspective on Density Functional Theory. J. Chem. Phys. 2012, 136 (15), 150901.
(12) Baseden, K. A.; Tye, J. W. Introduction to Density Functional Theory: Calculations by Hand on the Helium Atom. J. Chem. Educ. 2014, 91 (12), 2116–2123.
(13) Hohenberg, P.; Kohn, W. Inhomogeneous Electron Gas. Phys. Rev. 1964, 136 (3B), 864.
(14) Koch, W.; Holthausen, M. C. A Chemist’s Guide to Density Functional Theory, 2nd ed.; Wiley-VCH: Weinheim, 2001.
(15) Kohn, W.; Sham, L. J. Self-Consistent Equations Including Exchange and Correlation Effects. Phys. Rev. 1965, 140 (4A), 1133–1138.
83
(16) Perdew, J. P. Jacob’s Ladder of Density Functional Approximations for the Exchange-Correlation Energy. AIP Conf. Proc. 2001, 577 (2001), 1–20.
(17) Peverati, R.; Truhlar, D. G. Quest for a Universal Density Functional : The Accuracy of Density Functionals across a Broad Spectrum of Databases in Chemistry and Physics. Phil. Trans. R. Soc A. 2014, 372, 20120476.
(18) Thomas, L. H. The Calculation of Atomic Fields. Math. Proc. Cambridge Philos. Soc. 1927, 23, 542–548.
(19) Fermi, E. Eine Statistische Methode Zur Bestimmung Einiger Eigenschaften Des Atoms Und Ihre Anwendung Auf Die Theorie Des Periodischen Systems Der Elemente. Z. Phys. A Hadron. Nucl. 1928, 48, 73–79.
(20) Becke, A. D. Density-Functional Thermochemistry. III. The Role of Exact Exchange. J. Chem. Phys. 1993, 98 (7), 5648–5652.
(21) Langreth, D. C.; Mehl, M. J. Beyond the Local-Density Approximation in Calculations of Ground-State Electronic Properties. Phys. Rev. B 1983, 28 (4), 1809–1834.
(22) Perdew, J. P. Accurate Density Functional for the Energy: Real-Space Cutoff of the Gradient Expansion for the Exchange Hole. Phys. Rev. Lett. 1985, 55 (16), 1665–1668.
(23) Perdew, J. P.; Burke, K.; Ernzerhof, M. Generalized Gradient Approximation Made Simple. Phys. Rev. Lett. 1996, 77 (18), 3865–3868.
(24) Burke, K.; Perdew, J. P.; Wang, Y. Derivation of a Generalized Gradient Approximation: The PW91 Density Functional. In Electronic Density Functional Theory; Dobson, J. F., Vignale, G., Das, M. P., Eds.; Springer-Verlag: Boston, 1998; pp 81–111.
(25) Perdew, J.; Chevary, J.; Vosko, S.; Jackson, K.; Pederson, M.; Singh, D.; Fiolhais, C. Atoms, Molecules, Solids, and Surfaces: Applications of the Generalized Gradient Approximation for Exchange and Correlation. Phys. Rev. B 1992, 46 (11), 6671–6687.
(26) Becke, A. D. Density-Functional Exchange-Energy Approximation with Correct Asymptotic Behavior. Phys. Rev. A 1988, 38 (6), 3098–3100.
(27) Lee, C.; Yang, W.; Parr, R. G. Development of the Colle-Salvetti Correlation-Energy Formula into a Functional of the Electron Density. Phys. Rev. B 1988, 37 (2), 785–789.
(28) Campbell, R.; Konar, S.; Hunter, S.; Pulham, C.; Portius, P. Labile Low-Valent Tin Azides: Syntheses, Structural Characterization, and Thermal Properties. Inorg. Chem. 2018, 57, 400–411.
(29) Hunter, S.; Davidson, A. J.; Morrison, C. A.; Pulham, C. R.; Richardson, P.; Farrow, M. J.; Marshall, W. G.; Lennie, A. R.; Gould, P. J. Combined Experimental and Computational Hydrostatic Compression Study of Crystalline Ammonium Perchlorate. J. Phys. Chem. C 2011, 115 (38), 18782–18788.
(30) Hunter, S.; Coster, P. L.; Davidson, A. J.; Millar, D. I. A.; Parker, S. F.; Marshall, W. G.; Smith, R. I.; Morrison, C. A.; Pulham, C. R. High-Pressure Experimental and DFT-D Structural Studies of the Energetic Material FOX-7. J. Phys. Chem. C 2015, 119 (5), 2322–2334.

84
(31) Hunter, S.; Sutinen, T.; Parker, S. F.; Morrison, C. A.; Williamson, D. M.; Thompson, S.; Gould, P. J.; Pulham, C. R. Experimental and DFT-D Studies of the Molecular Organic Energetic Material RDX. J. Phys. Chem. C 2013, 117 (16), 8062–8071.
(32) Tkatchenko, A.; Scheffler, M. Accurate Molecular van Der Waals Interactions from Ground-State Electron Density and Free-Atom Reference Data. Phys. Rev. Lett. 2009, 102 (7), 6–9.
(33) Grimme, S. Semiempirical GGA-Type Density Functional Constructed with a Long-Range Dispersion Correction. J. Comput. Chem. 2006, 27, 1787–1799.
(34) Grimme, S.; Antony, J.; Ehrlich, S.; Krieg, H. A Consistent and Accurate Ab Initio Parametrization of Density Functional Dispersion Correction (DFT-D) for the 94 Elements H-Pu. J. Chem. Phys. 2010, 132 (15), 154104.
(35) Mardirossian, N.; Ruiz Pestana, L.; Womack, J. C.; Skylaris, C. K.; Head-Gordon, T.; Head-Gordon, M. Use of the RVV10 Nonlocal Correlation Functional in the B97M-V Density Functional: Defining B97M-RV and Related Functionals. J. Phys. Chem. Lett. 2017, 8 (1), 35–40.
(36) Sabatini, R.; Küçükbenli, E.; Pham, C. H.; De Gironcoli, S. Phonons in Nonlocal van Der Waals Density Functional Theory. Phys. Rev. B 2016, 93 (23), 1–7.
(37) Crowley, J. M.; Tahir-Kheli, J.; Goddard, W. A. Resolution of the Band Gap Prediction Problem for Materials Design. J. Phys. Chem. Lett. 2016, 7 (7), 1198–1203.
(38) Benjamin G. Janesko, Thomas M. Henderson, and G. E. S. Screened Hybrid Density Functionals for Solid-State Chemistry and Physics. Phys. Chem. Chem. Phys. 2009, 11 (3), 443–454.
(39) Heyd, J.; Peralta, J. E.; Scuseria, G. E.; Martin, R. L. Energy Band Gaps and Lattice Parameters Evaluated with the Heyd-Scuseria-Ernzerhof Screened Hybrid Functional. J. Chem. Phys. 2005, 123 (17), 174101.
(40) Slater, J. C. Atomic Shielding Constants. Phys. Rev. 1930, 36 (1), 57–64.
(41) Magalhães, A. L. Gaussian-Type Orbitals versus Slater-Type Orbitals: A Comparison. J. Chem. Educ. 2014, 91 (12), 2124–2127.
(42) Hehre, W. J.; Stewart, R. F.; Pople, J. A. Self-Consistent Molecular-Orbital Methods. I. Use of Gaussian Expansions of Slater-Type Atomic Orbitals. J. Chem. Phys. 1969, 51 (6), 2657–2664.
(43) Dunning, T. H. Gaussian Basis Sets for Use in Correlated Molecular Calculations. I. The Atoms Boron through Neon and Hydrogen. J. Chem. Phys. 1989, 90 (2), 1007–1023.
(44) Martin, R. M. Electronic Structure: Basic Theory and Practical Methods, by Richard M. Martin; Cambridge University Press: Cambridge, UK, 2004.
(45) Pack, J. D.; Monkhorst, H. J. Special Points for Brillouin-Zone Integrations. Phys. Rev. B 1976, 13 (12), 5188–5192.
(46) Binns, J.; Healy, M. R.; Parsons, S.; Morrison, C. A. Assessing the Performance of Density Functional Theory in Optimizing Molecular Crystal Structure Parameters. Acta Crystallogr. Sect. B Struct. Sci. Cryst. Eng. Mater.
85
2014, 70 (2), 259–267.
(47) Kochman, M. Private Communication. University of Edinburgh.
(48) Towler, M. D.; Zupan, A.; Causà, M. Density Functional Theory in Periodic Systems Using Local Gaussian Basis Sets. Comput. Phys. Commun. 1996, 98 (1–2), 181–205.
(49) Heine, V. The Pseudopotential Concept. Solid State Phys. - Adv. Res. Appl. 1970, 24 (C), 1–36.
(50) Schwerdtfeger, P. The Pseudopotential Approximation in Electronic Structure Theory. ChemPhysChem 2011, 12 (17), 3143–3155.
(51) Castep Guide; San Diego, USA, 2014.
(52) Vanderbilt, D. Soft Self-Consistent Pseudopotentials in a Generalized Eigenvalue Formalism. Phys. Rev. B 1990, 41 (11), 7892–7895.
(53) Kleinman, L.; Bylander, D. M. Efficacious Form of Model Pseudopotentials. Phys. Rev. Lett. 1982, 48 (20), 1425–1428.
(54) Baroni, S.; De Gironcoli, S.; Dal Corso, A.; Giannozzi, P. Phonons and Related Crystal Properties from Density-Functional Perturbation Theory. Rev. Mod. Phys. 2001, 73 (2), 515–562.
(55) Dove, M. T. Introduction to Lattice Dynamics; Cambridge University Press: Cambridge, UK, 1993.
(56) Hellmann, H. Einführung in Die Quantenchemie. Angew. Chemie 1937, 54 (11), 156.
(57) Feynman, R. P. Forces in Molecules. Phys. Rev. 1939, 56 (4), 340–343.
(58) Hammond, C. The Basics of Crystallography and Diffraction., 4th ed.; Oxford University Press: Oxford, UK, 2015.
(59) Rontgen, W. C. A New Kind of Rays. Nature 1896, 53, 1369.
(60) Laue, M. X-Rays. Sitz. ber Bayer. Akad. D. Wiss. 1912, 8, 363–373.
(61) Thomas, J. M. William Lawrence Bragg: The Pioneer of X-Ray Crystallography and His Pervasive Influence. Angew. Chemie - Int. Ed. 2012, 51 (52), 12946.
(62) Friedrich, W.; Knipping, P.; Laue, M. Interferenzerscheinungen Bei Rontgenstrahlen. Ann. Phys. 1913, 346 (10), 971–988.
(63) Laue, M.; Friedrich, W.; Knipping, P. Xrays. Sitz. ber Bayer. Akad. D. Wiss. 1912, 88, 303–322.
(64) Bragg, P. W. H.; Bragg, W. L. The Structure of Some Crystals as Indicated by Their Diffraction. Proceeds R. Soc. 1913, 17, 428–438.
(65) Klug, H. P.; Alexander, L. E. X-Ray Diffraction Procedures for Polycrystalline and Amorphous Materials; John Wiley & Sons, Ltd: New York-Sydney-Toronto, 1974.
(66) Mitchell, P. C.; Parker, S. F.; Ramirez-Cuesta, A. J.; Tomkinson, J. Vibrational Spectroscopy with Neutrons; World Scientific, 2005.

86
(67) Willis, B. T. M.; Carlile, C. J. Experimental Neutron Scattering; Oxford University Press: Oxford, UK, 2009.
(68) Luczynska, K.; Druzbicki, K.; Lyczko, K.; Starosta, W. Complementary Optical and Neutron Vibrational Spectroscopy Study of Bromanilic Acid: 2,3,5,6-Tetramethylpyrazine (1:1) Cocrystal. Vib. Spectrosc. 2014, 75, 26–38.
(69) Parker, S. F.; Fernandez-Alonso, F.; Ramirez-Cuesta, A. J.; Tomkinson, J.; Rudic, S.; Pinna, R. S.; Gorini, G.; Fernández Castañon, J. Recent and Future Developments on TOSCA at ISIS. J. Phys. Conf. Ser. 2014, 554 (1), 012003.
(70) Colognesi, D.; Celli, M.; Cilloco, F.; Newport, R. J.; Parker, S. F.; Rossi-Albertini, V.; Sacchetti, F.; Tomkinson, J.; Zoppi, M. TOSCA Neutron Spectrometer: The Final Configuration. Appl. Phys. A Mater. Sci. Process. 2002, 74, 64–66.
(71) Pinna, R. S.; Rudić, S.; Parker, S. F.; Armstrong, J.; Zanetti, M.; Škoro, G.; Waller, S. P.; Zacek, D.; Smith, C. A.; Capstick, M. J.; et al. The Neutron Guide Upgrade of the TOSCA Spectrometer. Nucl. Instruments Methods Phys. Res. Sect. A Accel. Spectrometers, Detect. Assoc. Equip. 2018, 896, 68–74.
(72) Zaliznyak, I. A.; Lee, S.-H. Magnetic Neutron Scattering and Recent Developments in the Triple Axis Spectrometer. In Magnetic Neutron Scattering; Brookhaven National Laboratory, 2004.
(73) Mitchell, P. C.; Parker, S. F.; Ramirez-Cuesta, A. J.; Tomkinson, J. The Theory of Inelastic Neutron Scattering Spectroscopy. In Vibrational Spectroscopy with Neutrons; World Scientific, 2005; pp 13–65.
(74) Parker, S. F.; Refson, K.; Williams, K. P. J.; Braden, D. a; Hudson, B. S.; Yvon, K. Spectroscopic and Ab Initio Characterization of the [ReH9]2- Ion. Inorg. Chem. 2006, 45 (26), 10951–10957.
(75) Test Method Standard Safety and Performance Tests for the Qualification of Explosives (High Explosives, Propellants and Pyrotechnics); Indian Head, MD., 1999.
(76) Recommendations on the Transport of Dangerous Goods. Manual of Tests and Criteria, 5th ed.; United Nations: New York & Geneva, 2009; Vol. 39.
(77) Eriksen, J. H. Manual of Data Requirements and Tests for the Qualification of Explosive Materials for Military Use; 2003.
(78) Meyer, R.; Köhler, J.; Homburg, A. Explosives, 6th ed.; Meyer, R., Köhler, J., Homburg, A., Eds.; Wiley-VCH: Weinheim, 2007.
(79) Matyáš, R.; Pachman, J. Primary Explosives; Springer-Verlag: Berlin, 2013.
(80) OZM. BAM Fall Hammer; Hrochuv Tynec.
(81) Suceska, M. Test Methods for Explosives; Springer-Verlag: New York, 1995.
(82) Preston, D. N.; Brown, G. W.; Skidmore, C. B.; Reardon, B. L.; Parkinson, D. A. Small-Scale Explosives Sensitivity Saftey Testing: A Departure from Bruceton. AIP Conf. Proc. 2012, 1426, 713–716.
(83) Munter, A. Neutron scattering lengths and cross sections https://www.ncnr.nist.gov/resources/n-lengths/ (accessed Aug 1, 2018).
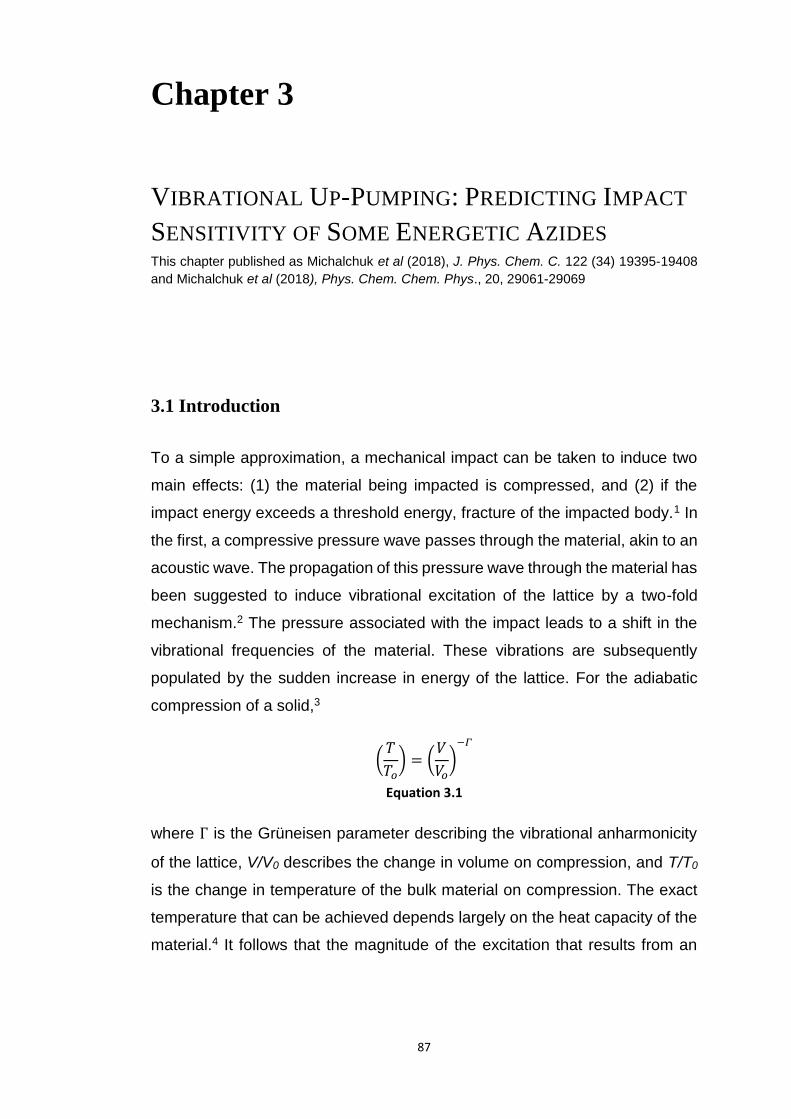
87
Chapter 3
VIBRATIONAL UP-PUMPING: PREDICTING IMPACT
SENSITIVITY OF SOME ENERGETIC AZIDES This chapter published as Michalchuk et al (2018), J. Phys. Chem. C. 122 (34) 19395-19408
and Michalchuk et al (2018), Phys. Chem. Chem. Phys., 20, 29061-29069
3.1 Introduction
To a simple approximation, a mechanical impact can be taken to induce two
main effects: (1) the material being impacted is compressed, and (2) if the
impact energy exceeds a threshold energy, fracture of the impacted body.1 In
the first, a compressive pressure wave passes through the material, akin to an
acoustic wave. The propagation of this pressure wave through the material has
been suggested to induce vibrational excitation of the lattice by a two-fold
mechanism.2 The pressure associated with the impact leads to a shift in the
vibrational frequencies of the material. These vibrations are subsequently
populated by the sudden increase in energy of the lattice. For the adiabatic
compression of a solid,3
(𝑇
𝑇𝑜) = (
𝑉
𝑉𝑜)−𝛤
Equation 3.1
where Г is the Grüneisen parameter describing the vibrational anharmonicity
of the lattice, V/V0 describes the change in volume on compression, and T/T0
is the change in temperature of the bulk material on compression. The exact
temperature that can be achieved depends largely on the heat capacity of the
material.4 It follows that the magnitude of the excitation that results from an
88
impact is proportional to the magnitude of the impact pressure, and the
response of the material to this pressure.5–7
Previous work found that for the model organic material naphthalene, a modest
impact (4 GPa) is associated with a total increase in internal energy, ΔU, of 37
000 cm-1 per molecule.4 However, as ΔU = H + W, the increase in internal
energy will distribute between heat (𝐻) and work (𝑊). The proportion of ΔU
that converts to 𝐻 follows from Equation 3.1, and therefore increase with the
anharmonicity of the material through Γ. For naphthalene, V/Vo = 0.793 at 4
GPa, while for α-NaN3 this value is ca. 0.860,8 and ca. 0.915 for AgN3.9 Thus
the values of Γ(NaN3)10 ≈ Γ(AgN3)11, whilst Γ(naphthalene) is nearly 2.5-fold
higher.4 The proportion of impact energy that is converted to heat is therefore
expected to be lower for the inorganic azide materials. The energy that is
introduced into the material affects only the lattice vibrations, which equilibrate
very rapidly. This leads to a highly excited phonon region, or bath.5,6,12 Noting
that the heat capacity of the phonon bath is much lower than for the bulk
material, it was found that the phonon quasi-temperatures reach approximately
2300 K, corresponding to ca. 1.2 eV per molecule in napthalene.4
In addition to the impact-induced heating of the material, a second process,
fracture, can occur.1 Within the contact surface, stresses build beyond the
elastic limit of the material. This leads to plastic deformation in the form of
dislocations or fracture.13 Analogous to the rupture of a loaded spring, the
sudden rupture of non-covalent (or covalent) interactions along a fracture
surface leads to rapid excitation of lattice vibrations associated with the
ruptured interaction.14 Rapid equilibration again leads to formation of a ‘hot’
phonon bath.
The hot phonon bath produced by both mechanisms is bound by a maximum
frequency, defined as Ωmax, Figure 3.1.15–17 Vibrational modes that sit above
the phonon bath are not directly excited by the impact, and remain vibrationally
‘cold’. The excess vibrational energy of the phonon bath can either dissipate
outwards, or upwards; the latter is substantially faster and hence vibrational
89
energy continues to scatter upwards. The general process of up-conversion
occurs in two stages:15
1. Scattering of the phonon bath modes leads to excitation of intermediate
librational modes, known as doorway modes.
2. The ‘hot’ doorway mode subsequently scatters with additional phonon
bath modes.
This process ultimately allows up-conversion of energy from the initially excited
phonon region into the localised molecular modes, Figure 3.1. Experiment has
found such energy conversion processes to occur on the order of
picoseconds,16 and occur more rapidly around defects.4,18 These processes
therefore occur considerably faster than the thermally-induced chemical
decomposition in energetic materials (EM).12 The rate of vibrational energy
transfer is on the same time scale as the primary events associated with an
explosion,6 and has prompted interest in this model to explain mechanically-
induced initiation of EMs.19,20
Figure 3.1: Schematic representation of the vibrational energy ladder traversed by mechanical
(shock) impact energy. Injected energy begins in the delocalised phonon bath, up-converting to
the localised molecular-based target modes via intermediate doorway modes. Figure adapted
from Ref. 21.
90
The initial stage of a chemical explosion involves the rupture of a covalent
bond. Within the proposed vibrational energy transfer model,21,22 it follows that
the vibrational energy must ultimately localise into a particular molecular
vibration, the target mode, 𝑄𝑇. When this target mode is sufficiently populated,
distortion along its eigenvector reduces the energy separation of the frontier
orbitals, and athermal bond rupture ensues.23–25
The apparent structural simplicity of azide-based EMs, where only a single
covalent bond (N-N bond) exists for initiation, offer a particularly interesting
challenge for understanding impact sensitivity. Azides have been known for
over a century,27 and their initiation mechanism has been the subject of
research for nearly three-quarters of a century.28 Despite this apparent
simplicity, the sensitivity of these materials span orders of magnitude. For
example, NaN3 is completely insensitive to impact, while Pb(N3)2 is a common
primary explosive used in detonators.13 Broadly, the azide materials can be
classified into three structural types: ionic, polymeric and molecular.29 The
ionic materials have been reported to be less sensitive than the polymeric or
molecular materials.30 The existence of covalent bonds in the latter two
material types has been used to rationalise a decrease in N-N bond strengths
and hence increase sensitivity, although the change in N-N dissociation
energies typically varies only slightly.29 This rationale is therefore insufficient
to explain the range of sensitivities observed, both within and between
structural classifications, or between polymorphic forms.31
The breadth of physical and chemical characteristics displayed by azide-based
EMs is vast, which in conjunction with the relative simplicity of azide-based
chemistry,32 continues to keep the development of azide-based materials an
active area of research.32–35 However, without a means to predict the relative
sensitivity of new materials a priori, the preparation of new azide materials
remains very hazardous.
91
3.2 Aims
Simple inorganic azide energetic materials display a huge variation in impact
sensitivity behaviour, and development of new azide-based materials is of high
interest to the energetics community. A physical basis for their initiation has
not yet been elucidated, although some qualitative trends, including bond
lengths, cation ionization potentials and symmetry breaking of azide vibrational
modes with energetic behaviour have been noted.36,37 More physical models
have also been proposed, noting that crack propagation rates may be linked
to sensitivity,13 based on formation of hot-spots at crack tips or deformation
pile-ups. However, no unified mechanism has yet been proposed to explain
the sensitivity relationships observed for these compounds. The sensitivity of
energetic materials is a complex phenomenon, and the underlying mechanism
can differ. For example, initiation may occur due to hot-spot formation in a bulk
composition, or at extended defects within single crystallites (Chapter 1.2).
Which mechanism dominates (and thus the type and magnitude of hot-spot
that forms) depends on the nature of the prepared sample and is largely
irreproducible. Regardless of the mechanism by which the energy is generated,
its localisation can be sought in terms of the vibrational up-pumping
mechanism (Chapter 1.2.2). At the most fundamental level is the intrinsic
sensitivity of a material. This describes the propensity of the ideal material (i.e.
defect-free) to react under mechanical perturbation and will form the basis for
the work presented here.
This chapter aims to build a model for ideal crystalline materials, based on a
vibrational up-pumping approach, in order to rationalise and predict the relative
sensitivity ordering of a test set of azide-based EMs. To that end, the work
presented here sought to:
1. Identify a vibrational mode (target mode, 𝑸𝑻) that is responsible for the
initial decomposition of the explosophoric azido anion.
2. Investigate the pathways to vibrational up-pumping.
3. Correlate the relative rate of vibrational up-pumping to impact sensitivity.

92
3.3 Test Set of Energetic Azides
The model presented here is constructed from a selected series of crystalline
energetic azides, Table 3.1 and Figure 3.2, selected to cover a range of
reported experimental sensitivities and cover the three main structural types.
Of the ionic species selected, two are based on molecular cations:
triaminoguananidinium azide (TAGZ) and ammonium azide (NH4N3). The
experimental measurement of EM sensitivity is highly unreliable, with many
conflicting reports in the literature.38 In many cases, conflicting reports are due
to crystal size, purity, defect concentration, as well as both environmental and
experimental conditions.39–41
Literature discrepancies are particularly prevalent across the azide materials,
most notably for the ordering of the more sensitive materials. Due to these
large discrepancies, exact values are not quoted in developing the model in
this chapter, but instead the relative ordering is considered. The sensitivity
classifications given in Table 3.1 are based on the following:
1. Ba(N3)2, is quoted by some as being more sensitive than AgN3,36 and
by others as less sensitive.36,42 Its impact sensitivity has been measured
to be between 4-10 J and shown to be highly dependent on temperature,
particle size and impurities.30,43,44
2. AgN3 is generally accepted to be somewhat less sensitive than
Pb(N3)2.44
3. Zn(N3)2 in its pure form remains poorly characterized. Unquantified
reports indicate that it explodes on minimal mechanical provocation,34
with mixtures of zinc with Pb(N3)2 forming dangerously sensitive azide
products.45 Literature reports that state “zinc azide” to be insensitive are
likely inadvertently discussing the sensitivity of hydrated form, given the
extreme hygroscopicity of the anhydrous form.46,47,30
4. LiN3 has been measured to have an impact sensitivity of ca. 22 J,30 with
some sources stating it to be completely insensitive.36

93
5. Sn(N3)2 is believed to have a similar sensitivity as its structural
homologue, Pb(N3)2. 33 (ca. 1.7 J 44).
6. NaN3 and NH4N3 are known to exhibit very low sensitivity.48 However,
recent work has suggested that impacts of ca. 25 J can induce chemical
decomposition in NaN3 without the visible burn that is typically used as
the main criterion for experimental impact sensitivity testing.49
7. TAGZ has been found to have impact sensitivity of ca. 34 J.50
8. Both liquid and gaseous HN3 are known to be highly sensitive,30
although no sensitivity studies on crystalline51 HN3 are known.
The work presented in this chapter therefore compare against a general
experimental ordering of NaN3 ≈ TAGZ ≈ NH4N3 < LiN3 < Ba(N3)2< AgN3 <
Sn(N3)2, with the exact positions of HN3 and Zn(N3)2 remaining unknown.
Table 3.1: Test set of energetic azides used in this work, listed in approximate order of increasing
sensitivity.
Material Sensitivity Class* Bond Type# Ref.
NaN3 I I 42
TAGZ LS I 50
NH4N3 LS I 48
LiN3 LS I 30
HN3 S M 30
Ba(N3)2 S P 30,42,43
AgN3 S P 31
Zn(N3)2 S P 34
Sn(N3)2 S P 33
*Experimental sensitivity class according to indicated references. Sensitivity reported as
insensitive (I), low sensitivity (LS), sensitive (S). #Classification of bonding type: molecular (M), ionic
(I) or polymeric (P)
94
Figure 3.2: Conventional crystallographic cells of the energetic azides used in this work. The space
group (SG) is given for each cell, along with an indication of the crystallographic axes. The azides
are given in approximate order of impact sensitivity according to literature reports. In all cases,
atoms are coloured as: blue- N; grey- metal; white- hydrogen; black- carbon. The structure of the
triaminoguanidinium (TAG) cation is shown above its unit cell.
3.4 Methods
Gas phase calculations. Calculations of isolated molecules were performed in
vacuo using Molpro 2012.52 Geometry optimisation and subsequent vibrational
frequency calculation was performed to ensure equilibrium geometry was
obtained. The electronic structure was built upon a CAS(8,8)/6-31+G*
calculation, on which a MRCI calculation was added for the same active space
95
and basis set. The highest atomic orbital was chosen to ensure inclusion of
frontier bonding orbitals, while also ensuring that the orbital occupation of the
highest unoccupied orbital was no more than 0.02.53
Condensed Matter Calculations: Input unit cell geometries were taken from the
experimentally determined structures deposited in the Inorganic Crystal
Structural Database (ICSD, FIZ Karlsruhe), Table 3.2. Geometry optimisation
was performed using plane wave Density Functional Theory (PW-DFT) as
implemented in CASTEP v16.54 Where appropriate pseudopotentials were not
available in CASTEP, calculations were performed using the
QuantumEspresso v6.1 software. For CASTEP calculations, the GGA
functional of Perdew-Burke-Ernzerhof (PBE)55 was applied, while
QuantumEspresso calculations used the rVV10 non-local functional, which
performs very similarly to the PBE+D scheme.56 For CASTEP calculations,
dispersion correction leading to the best structural agreement with experiment
was chosen: Grimme’s D257 dispersion correction, PBE-D2, or that of
Tkatchenko-Scheffler (TS), PBE-TS.58 The use of PBE + dispersion has
previously performed well for these materials.33,59 Convergence criteria for
electronic structure calculations are given in Table 3.2. In all cases, the
electronic structure was sampled on a Monkhorst-Pack k-point grid60 with
spacing no greater than 0.05 Å-1. Note that tighter convergence was required
for the Zn structure to remove imaginary phonon frequencies. Norm-
conserving pseudopotentials were used throughout. The optimised structural
parameters are given in Table 3.3.
Phonon calculations were performed on the optimised structures, using the
same computational packages as for structural optimisation, within the
framework of linear response theory. Dynamical matrices were initially
calculated on a regular grid of q-points and subsequently Fourier interpolated
onto a finer grid. Phonon dispersion curves were generated along the high
symmetry paths as suggested by SeeKPath61.The dynamical matrix was
subsequently calculated across a regular set of q-points. Density of states
(DoS, 𝑔(ω) ) were generated using Gaussian line broadening of 10 cm-1.

96
Phonon density of states were normalised to 3N, where N is the number of
atoms, such that the resulting curves represent the number of available
coupling pathways within each unit cell. Note that phonon dispersion curves
were generated for the primitive cells in all cases except for AgN3, for which
imaginary frequencies could only be removed by use of the conventional cell.
This does not affect the structure of 𝑔(ω), but only the factor of 3𝑁, which can
be accounted for by re-normalisation.
Band structures were generated along high symmetry paths. As GGA based
band gaps are known to provide poor agreement with experiment, further band
structures were generated in CRYSTAL1763 using the HSE0664 hybrid DFT
functional (with localised basis sets available from the CRYSTAL17 database:
N- N_m-6-311G(d)_Heyd_200565; Na, Li, C; H-TZVP65; Ba-HAYWSC-
3111(2d)G 66; Ag-From Ref 67; and Sn- DURAND-21G*68) which has been
demonstrated to offer reasonable agreement with experimental band gaps for
a broad range of materials.69 Those presented here can therefore be regarded
as accurate to within a reasonable level of confidence. The wavefunction was
converged to < 10-8, and convergence criteria TOLINTEG 7 7 7 19 30, as
recommended for this functional and basis set65. The electronic structure was
calculated at 172 k-points across a 7 x 7 x 7 Monkhorst-Pack grid.60 Analysis
of the crystal overlap Hamilton populations (COHP) were performed using the
properties code, as implemented in the CRYSTAL17 suite. A minimal basis set
(STO-6G) was used to avoid spurious overlap of basis functions, which were
found to contaminate the calculation. COHP were calculated for directly
bonded N atoms in the azido anion.
Inelastic Neutron Scattering Spectroscopy. All spectra were collected on the
TOSCA spectrometer at the ISIS Neutron and Muon source.94-96 A sample of
NaN3 (ca. 1.5) was placed in an aluminium sample holder and cooled to ca. 10
K. Data were collected for a total of ca. 400 μAh. Both forward and back-
scattered data were summed and corrected for scattering from the sample
holder and background. All data processing was done using Mantid.72
Simulated spectrum was generated using ABINS,97 as implemented in Mantid.

97
Table 3.2: Optimisation criteria for the energetic azides. The quantum chemical code (QuantumEspresso; Q, or Castep; C), is shown alongside the applied
exchange correlation scheme (XC).
Azide ICSD Code
Code XC 𝚫𝑬 /eV.atom-1
Max. Force / eV Å -1
Max. Atomic Disp. /Å
Max. Stress/ GPa
𝑬𝒄𝒖𝒕 /eV
NaN3 29370 C PBE + D2 2x10⁻⁶ 0.001 0.001 0.005 1800
NH4N3 2236 C PBE +TS 2x10⁻⁶ 0.001 0.001 0.005 1800
TAGZ Ref 62 C PBE + TS 2x10⁻⁶ 0.001 0.001 0.005 1800
HN3 261955 C PBE + TS 2x10⁻⁶ 0.001 0.001 0.005 1800
LiN3 34675 Q rVV10 1x10⁻⁹ 1.0 x 10⁻⁸ Ry/Bohr 0.0001 5x10⁻⁶ 2312
Zn(N3)2 430428 C PBE+D2 2x10⁻⁹ 0.0005 0.0005 0.0005 1800
Ba(N3)2 26202 Q rVV10 1x10⁻⁹ 1.0 x 10⁻⁸ Ry/Bohr 0.0001 5x10⁻⁶ 2312
AgN3 88335 Q rVV10 1x10⁻⁹ 1.0 x 10⁻⁸ Ry/Bohr 0.0001 5x10⁻⁶ 1768
Sn(N3)2 433812 C PBE + TS 2x10⁻⁶ 0.001 0.001 0.005 1800
98
Table 3.3: Comparison of experimental (exp) and computed (calc) unit cell geometries. Low temperature experimental data are used where available
Azide a b c α β γ V 𝚫V /%
AgN3 (Exp) 5.60 5.98 5.99 90.00 90.00 90.00 200.86 +1.5
AgN3 (Calc) 5.71 5.96 5.98 90.00 90.00 90.00 203.81
BaN3 (Exp) 9.59 4.39 5.42 90.00 99.75 90.00 224.89 +6
BaN3 (Calc) 9.83 4.44 5.53 90.00 99.14 90.00 238.50
HN3 (Exp) 8.21 8.21 6.78 110.42 110.42 90.01 397.42 +5.9
HN3 (Calc) 8.38 8.38 6.90 110.51 110.51 90.00 421.18
NH4N3 (Exp) 8.93 3.81 8.66 90.00 90.00 90.00 294.62 +0.1
NH4N3 (Calc) 9.02 3.81 8.57 90.00 90.00 90.00 294.80
LiN3 (Exp) 5.63 3.32 4.98 90.00 107.40 90.00 88.73 -0.5
LiN3 (Calc) 5.59 3.32 4.91 90.00 104.80 90.00 88.25
NaN3 (Exp) 3.61 3.61 5.41 105.36 105.36 60.96 57.30 +1.1
NaN3 (Calc) 3.59 3.59 5.20 101.81 101.82 61.76 57.94
SnN3 (Exp) 6.78 11.06 6.23 90.00 94.67 90.00 465.51 +0.7
SnN3 (Calc) 6.69 11.80 5.95 90.00 91.41 90.00 468.93
TAGZ (Exp) 6.68 7.72 13.14 90.00 95.44 13.14 674.80 +0.5
TAGZ (Calc) 6.69 7.74 13.16 90.00 95.76 90.00 678.39
ZnN3 (Exp) 3.46 16.26 6.93 90.0 95.90 90.0 387.80 +1.5 ZnN3 (Calc) 3.44 16.47 6.99 90.0 96.42 90.0 393.84

99
3.5 Results and Discussion
3.5.1 Bond Rupture of Explosophoric 𝐍𝟑−
The initiation of an energetic material involves rapid release of chemical
potential energy. This process must therefore involve rupture of a covalent
bond within the explosophoric moiety of the material. Within the azide
materials, this is rupture of an N-N bond. In their ground state structures, the
azide materials contain a closed-shell N3− molecule. It is therefore necessary
to understand the reactivity of this molecule. Due to the delocalised nature of
electronic states in solids, however, there is an intimate interaction between
the electronic states of the counter-ion and the azido anion. Further, with the
unavoidable presence of intrinsic defects (e.g. vacancies), the electronic band
structures will likely include some additional states within the band gap that
may influence sensitivity.70,71 A variety of pathways are therefore available for
the reduction or oxidation of the azido anion species within the solid state. Only
those in the ideal crystal are considered through this chapter.
Figure 3.3: Electronic structure of the azido anion by HSE06 in a periodic box, N3-. (A) Projected
Crystal Overlap Hamilton population (pCOHP) for a TZVP (blue) and STO-6G (black) basis set. A
high-level basis set leads to spurious results,72 hence use of a minimal basis set (B) The ‘density
of states’ for the azido anion, alongside visualisation of the associated molecular orbitals. Figure
from Ref. 21
The electronic structure of the azido anion, present in all the energetic azides
studied here, is given in Figure 3.3. The Projected Crystal Overlap Hamilton
100
Population (pCOHP) weights each orbital by the overlap matrix component
associated with neighbouring N atoms. Hence, it identifies orbitals in which
directly bonded N atoms are stabilised or not. The first excited state associated
with the azido anion involves excitation of an electron from a non-bonding πg
orbital (i.e. –pCOHP close to zero) to an antibonding πu molecular orbital (i.e.
–pCOHP is negative). Hence excitation should yield considerable weakening
of the N-N covalent bonds. Analysis of the crystalline band structures in Figure
3.4 suggests that for all azides, the top of the conduction band and bottom of
the valence bands are both primarily azide in character. This suggests that
direct excitation of the N3− molecule is the dominant transition mechanism.
This concept has led to the ‘band gap criterion’ for predicting impact sensitivity
in some materials Chapter 1.3.2.2).73 Despite interest in the energetic azides,
no data on the experimental band gaps could be found. As such, band gaps
presented here are compared against literature calculated values, where
possible, Table 3.4. The electronic band structure was calculated for each of
the nine crystalline azide materials listed in Figure 3.1 using the PBE and
HSE06 (Shown in Figure 3.4) DFT functionals. It is first worth noting that all of
the crystalline materials have smaller band gaps than the isolated molecule.74
This is expected and due to the periodicity of the former. It is generally found
that the ionic azide materials (NaN3, TAGZ, NH4N3, LiN3 and BaN6) exhibit
larger band gaps than the polymeric (SnN6, AgN3, ZnN6) or molecular (HN3)
systems. Noting that the ionic azide materials are typically less sensitive to
mechanically-induced initiation than the polymeric and molecular systems
(Section 3.3), the trend in PBE band gaps generally agree with the band gap
criterion. However, it is worth noting a discrepancy in this trend, where the
sensitivity of BaN6 >> NaN3 despite their band gaps being similar.
As expected, the magnitude of the band gap for each of the materials
increases on moving to the screened hybrid HSE06 functional, Table 3.4.
Comparison to previously calculated band gaps, based on various functionals,
for some of the azide materials agree well with the HSE06 values. A notable
exception is NH4N3, for which earlier works have suggested a direct band gap
101
of ca. 0.7 eV lower than that calculated here.75 Other theoretical studies
support the present findings that NH4N3 is an indirect band gap material.76
Experimental validation is therefore required. The band gap of Ba(N3)2 is also
considerably larger by HSE06 than previously reported based on PW91 GGA
DFT calculations. Despite this GGA functional performing relatively well for
other azides, it appears to fail in the case of Ba(N3)2. Instead, the PW91 result
for Ba(N3)2 is much closer to the PBE band gap.
Table 3.4: Calculated band gaps for the crystalline azide materials by PBE (PBE and LBS) and HSE06
(LBS). The band gaps are labelled as being direct (D) or indirect (ID). Comparison of energies are
shown with literature and discrepancy in momentum conservation is shown.
Material PBE HSE06 D/ID Literature
N3− 5.64 7.06 -- --
α-NaN3 4.02 5.34 D 5.38҂a ; 5.03ⱽb
TAGZ 4.48 5.82 ID --
NH4N3 4.36 5.75 ID 5.08 (D) ҂b
LiN3 3.56 4.75 D 4.98҂a ; 4.68ⱽb
HN3 3.78 5.20 ID --
Ba(N3)2 4.12 5.32 D 3.65ⱽc
AgN3 1.57 2.77 D 1.72٣a ; 2.5ⱽa
Zn(N3)2 3.41 4.78 ID --
Sn(N3)2 0.66 1.51 ID --
҂ TB-mBJ band gaps from (a) Ref. 59 (b) Ref. 75 ; ٣ PBE band gap from (a) Ref 77 ; ⱽPW91 band gap
from (a) Ref 78 (b) Ref 79 (c) Ref 80
Interestingly, while the band gap criterion holds relatively well across the PBE-
based band gaps, it is less prominent for the higher-level functional HSE06.
Noting that the latter is expected to be much more accurate, this suggests that
the correlation with the lower level functional was largely fortuitous. Some
earlier works also show discrepancy between sensitivity and band gap.81 No
obvious trend is seen between the sensitivity and a material having a direct or
indirect electronic band gap.

102
Figure 3.4: Electronic band structures (HSE06) for the energetic azides. Band dispersions are plotted along high symmetry lines. The partial density of states
are plotted for each, decomposed as (blue) N3− channel and (green) cation channel.

103
3.5.1.1 Dissociation of 𝑵𝟑−
Throughout the following discussion, the symmetric N-N bonds are denoted 𝑅1
and 𝑅2, with the electronic state given as a preceding superscript. The 𝑆𝑜 bond
length of 𝑅1 is thus denoted 𝑆𝑜𝑅1.
In the closed-shell ground state of the N3− anion, the optimised geometry
(CAS(8,8)/6-31+G*) of the molecule shows two equivalent N-N bonds ( R1 S0 =
R2 S0 = 1.1865 Å), with the bond angle θ𝑁𝑁𝑁 = 180o. This value is in very good
agreement with the experimentally-observed gas-phase equilibrium bond
length of 1.188 Å, as obtained from rotational spectroscopy.82 If the
optimisation is performed with a full valence active space, CAS(16,12), the N-
N bonds elongate, with R1 S0 = R2
S0 = 1.2002 Å. This is only slightly longer
than the experimental bond length in the gas phase molecule, and for the
molecule in the ionic azide materials (ca. 1.17-1.18 Å). Optimisation of the first
triplet state, 𝑇1, leads to an increase in the N-N bond lengths, with R1 T1 = R2
T1 =
1.2607 Å using a CAS(8,8) active space, increasing to 1.2855 Å when
optimised at CAS(16,12). The 𝑇1 state remains linear in all cases. Similarly,
the bond lengths of the first singlet state, 𝑆1, expand from 1.2243 Å to 1.2475
Å when moving from a CAS(8,8) to CAS(16,12) calculation.
Importantly, when the active space is increased, the relative energies of the
equilibrium structures change only slightly with E𝑆1 − 𝐸𝑆0 < -0.3 eV, E𝑇1 − 𝐸𝑆0,
< +0.03 eV. The same holds for comparison of structures with R2 = 2.5 Å, i.e.
beyond the dissociation limit of the azido anion. The effect of increasing the
active space is therefore small relative to the additional computational costs,
and as such the smaller active space was used for the remainder of this work.
To assess the effect of vibrational normal coordinates on the relative stabilities
of the electronic states of N3−, all excitations were performed as Frank-Condon
(FC) transitions from perturbations to the ground state (𝑆0) optimised geometry.
Hence, rupture of bond 𝑅2 along the excited state PESs are investigated
based on 𝑅1 fixed at the optimised length of the 𝑆1 state.
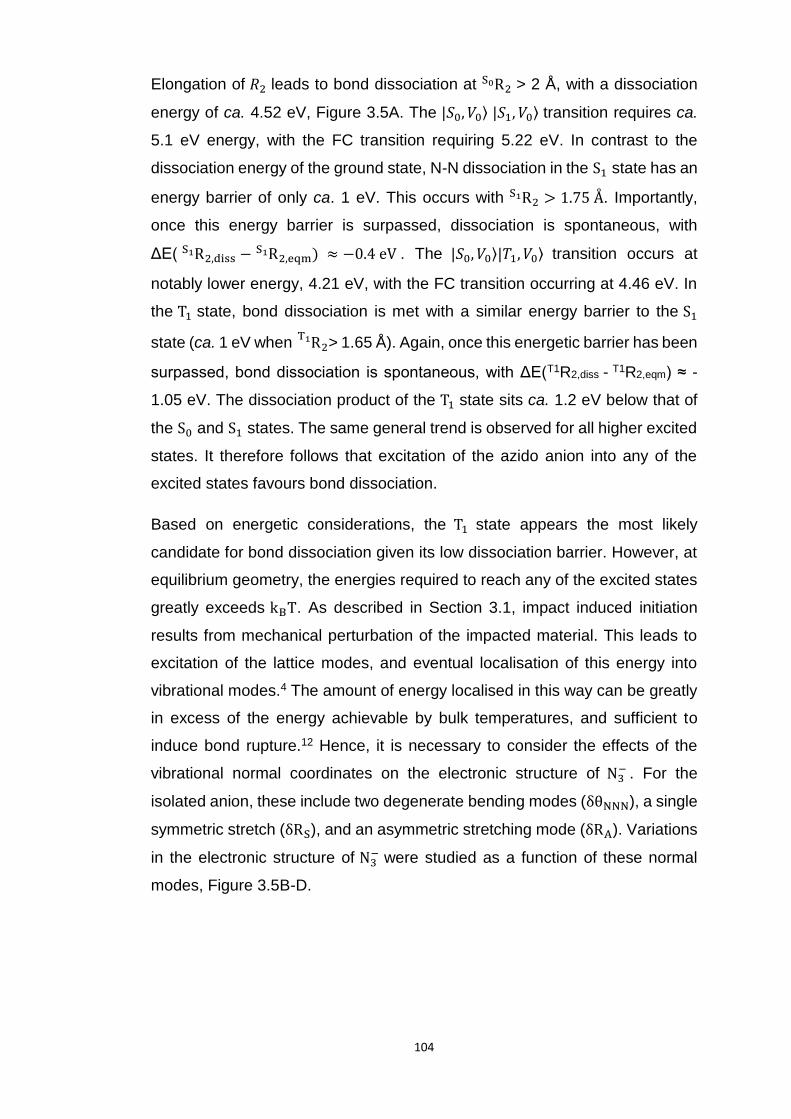
104
Elongation of 𝑅2 leads to bond dissociation at R2 S0 > 2 Å, with a dissociation
energy of ca. 4.52 eV, Figure 3.5A. The |𝑆0, 𝑉0⟩ |𝑆1, 𝑉0⟩ transition requires ca.
5.1 eV energy, with the FC transition requiring 5.22 eV. In contrast to the
dissociation energy of the ground state, N-N dissociation in the S1 state has an
energy barrier of only ca. 1 eV. This occurs with R2 S1 > 1.75 Å. Importantly,
once this energy barrier is surpassed, dissociation is spontaneous, with
ΔE( R2,diss S1 − R2,eqm
S1 ) ≈ −0.4 eV . The |𝑆0, 𝑉0⟩|𝑇1, 𝑉0⟩ transition occurs at
notably lower energy, 4.21 eV, with the FC transition occurring at 4.46 eV. In
the T1 state, bond dissociation is met with a similar energy barrier to the S1
state (ca. 1 eV when R2T1 > 1.65 Å). Again, once this energetic barrier has been
surpassed, bond dissociation is spontaneous, with ΔE(T1R2,diss - T1R2,eqm) ≈ -
1.05 eV. The dissociation product of the T1 state sits ca. 1.2 eV below that of
the S0 and S1 states. The same general trend is observed for all higher excited
states. It therefore follows that excitation of the azido anion into any of the
excited states favours bond dissociation.
Based on energetic considerations, the T1 state appears the most likely
candidate for bond dissociation given its low dissociation barrier. However, at
equilibrium geometry, the energies required to reach any of the excited states
greatly exceeds kBT. As described in Section 3.1, impact induced initiation
results from mechanical perturbation of the impacted material. This leads to
excitation of the lattice modes, and eventual localisation of this energy into
vibrational modes.4 The amount of energy localised in this way can be greatly
in excess of the energy achievable by bulk temperatures, and sufficient to
induce bond rupture.12 Hence, it is necessary to consider the effects of the
vibrational normal coordinates on the electronic structure of N3− . For the
isolated anion, these include two degenerate bending modes (δθNNN), a single
symmetric stretch (δRS), and an asymmetric stretching mode (δRA). Variations
in the electronic structure of N3− were studied as a function of these normal
modes, Figure 3.5B-D.
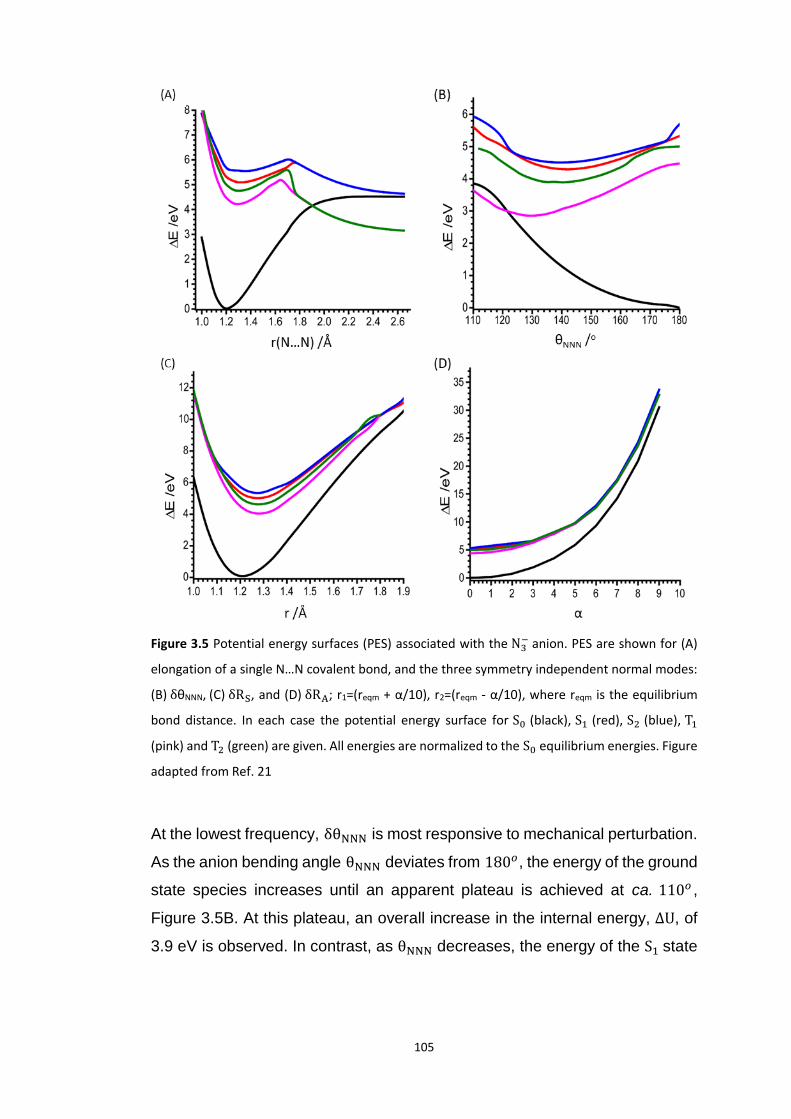
105
Figure 3.5 Potential energy surfaces (PES) associated with the N3
− anion. PES are shown for (A)
elongation of a single N…N covalent bond, and the three symmetry independent normal modes:
(B) δθNNN, (C) δRS, and (D) δRA; r1=(reqm + α/10), r2=(reqm - α/10), where reqm is the equilibrium
bond distance. In each case the potential energy surface for S0 (black), S1 (red), S2 (blue), T1
(pink) and T2 (green) are given. All energies are normalized to the S0 equilibrium energies. Figure
adapted from Ref. 21
At the lowest frequency, δθNNN is most responsive to mechanical perturbation.
As the anion bending angle θNNN deviates from 180𝑜, the energy of the ground
state species increases until an apparent plateau is achieved at ca. 110𝑜 ,
Figure 3.5B. At this plateau, an overall increase in the internal energy, ΔU, of
3.9 eV is observed. In contrast, as θNNN decreases, the energy of the S1 state
106
decreases, reaching its minimum energy at approximately 140𝑜 , with
𝑆1𝐸(θ𝑁𝑁𝑁 = 180𝑜) − 𝑆1𝐸(θ𝑁𝑁𝑁 = 140𝑜) ≈ 1.1eV. At this angle, the energy
separation between the S0 and S1 state decreases from ca. 5.3 eV to only ca.
3.0 eV. This energy gap decreases further as θNNN continues to decrease,
reaching a minimum energy separation of 1.5 eV at 115𝑜.
The energy of 𝑇1 also decreases with 𝜃𝑁𝑁𝑁. An energetic minimum is observed
at ca. 𝜃𝑁𝑁𝑁 = 1300, where 𝑇1𝐸(θ𝑁𝑁𝑁 = 180𝑜) − 𝑇1𝐸(θ𝑁𝑁𝑁 = 130𝑜) ≈ 1.7 eV.
At this angle, the energy separation between 𝑆0 and 𝑇1 reduces from 4.2 eV to
only 0.7 eV. This energy is less than the energy associated with the second
overtone of 𝛿𝑅𝐴. As 𝜃𝑁𝑁𝑁 is compressed further, a conical intersection (CI) is
reached, with an 𝑆0/𝑇1 crossing at 𝜃𝑁𝑁𝑁 ≈ 1200. The 𝑇1 state remains more
energetically favourable than 𝑆0 over a small range of 𝜃𝑁𝑁𝑁 in this region,
Figure 3.5B. Thus, the bending mode of N3− appears to offer a mechanism for
the athermal electronic excitation of the molecule.
Discussion of the PES associated with δRS is done with respect to the
symmetric N-N bond lengths, Figure 3.5C. Across the eigenvector of this mode,
the T1 state remains lowest in energy amongst the excited states. In contrast
to the bending mode, however, extending the eigenvectors of this mode does
not lead to a CI, even up to a bond stretch of 2.0 Å and an associated ΔU ≈
11 eV. Similarly, discussion of the PES of δRA requires definition of a distortion
parameter α. This dimensionless value represents the degree to which the
eigenvector is perturbed, with R1 = Reqm + α/10 and R2 = Reqm − α/10 in
Figure 3.5D. Due to contraction of R2 as the eigenvector is imposed on
equilibrium geometries, the energy is found to rise considerably faster than for
the symmetric mode. Again, no CI is observed below Δ𝑈 ≈ 30 eV along this
eigenvector.
It follows from the above that a CI is only attainable through the bending motion
of N3− . However, the geometry of a real molecule results from the time-
dependent superposition of all vibrational normal modes. The combination of
δθNNN with δRS and δRA are therefore of interest. At relatively low energies,

107
the excitation energies between the So and excited states decreases
substantially further in δRS as compared to δRA, Figure 3.5. Hence, only the
combination of δθNNN + δRS is considered here. At θNNN = 1500 (Δ𝑈 ≈ 0.7
eV according to Figure 3.5B), the PES of δRS is found to deviate from that
observed in the linear molecule, Figure 3.6A in comparison to Figure 3.5C.
Most notably, with only a small distortion of θNNN , the T1/S0 CI becomes
accessible via δRS, with the CI observed at RS ≈1.65 Å. However, this pathway
is clearly not most energetically favourable. The total ΔU (i.e.
ΔU(δθNNN)+ΔU(δRS)) associated with this CI is over twice that required to
achieve the CI by bending alone. As θNNN is decrease to 130o (Δ𝑈 ≈2 eV
according to Figure 3.5B), it is instead possible to access the CI along the δRS
eigenvector (at RS ≈ 1.5 Å) with a total ΔU ≈ 4 eV, Figure 3.6B. The total
energy required to achieve the CI by this pathway is therefore comparable to
that required to access it by bending alone, but requires a smaller distortion of
the molecule within the confinements of a crystal lattice.
Figure 3.6: The PES for the symmetric stretch at (A) θNNN = 1500 and (B) θNNN = 1300. In each case
the potential energy surface for S0 (black), S1 (red), S2 (blue), T1 (pink) and T2 (green) are given.
The T1 state is accessible by extending the normal modes of the N3− molecule.
For the linear geometry in this state, the N3− dissociation barrier was found to
be ca. 1 eV. When θNNN is bent to 150𝑜, the S0 dissociation energy decreases
from 4.5 to 3.6 eV, with the dissociation barrier on the T1 PES decreasing to
0.67 eV, Figure 3.7A. As compared to the linear geometry, however, the
108
energetic drive to dissociation at this angle decreases considerably, and is only
-0.2 eV at this angle. At θNNN = 1500, the dissociation barrier on the S1 PES
also decreases, albeit minimally (from 1 eV to 0.88 eV). However, at this angle,
dissociation on the S1 surface is no longer energetically favourable. If θNNN is
reduced further to 1200 (i.e. the geometry of the CI), the barrier to dissociation
on the T1 PES remains approximately the same as at θNNN = 1500, 0.69 eV,
although that on the S0 surface drops drastically, from 3.6 eV to 1.6 eV, Figure
3.7b. The dissociation barrier on the T1 PES decreases to 0.34 eV at θNNN =
1100 , and is completely absent at θNNN = 1000 . At both 𝜃𝑁𝑁𝑁 =
1100 and 𝜃𝑁𝑁𝑁 = 1000 , dissociation on the T1 PES is overall exothermic,
Figure 3.7c-d. It follows that, near the T1/S0 CI, dissociation of N3− is more
accessible than under equilibrium, linear geometry.
The energies required to reach the CI for the pure azido anion are larger than
are generally considered attainable by measurement of temperatures under
mild impacts (typically < 3000 K). However, this energy translates into orders
of 1.5 eV/molecule, increasing with stronger impacts.15 Furthermore, it has
been shown that localisation of up-pumped energy in the region of defects can
be substantially higher,4 and sufficient to overcome bond dissociation
barriers.12 It is also worth mentioning that the periodicity of the crystalline state
leads to a reduction in the energy separation between ground and excited
states, particularly in the sensitive azide materials. Thus, smaller energies will
be required to achieve this excitation in these materials. The interaction of
cations with the azido anion in polymeric and molecular systems also reduces
the frequency of the bending vibrational mode. The ΔU associated with these
bends therefore decrease further. Critically, it is evident that electronic
excitation of the azido anion can be achieved by a purely mechanical route,
via the bending motion of the molecule.
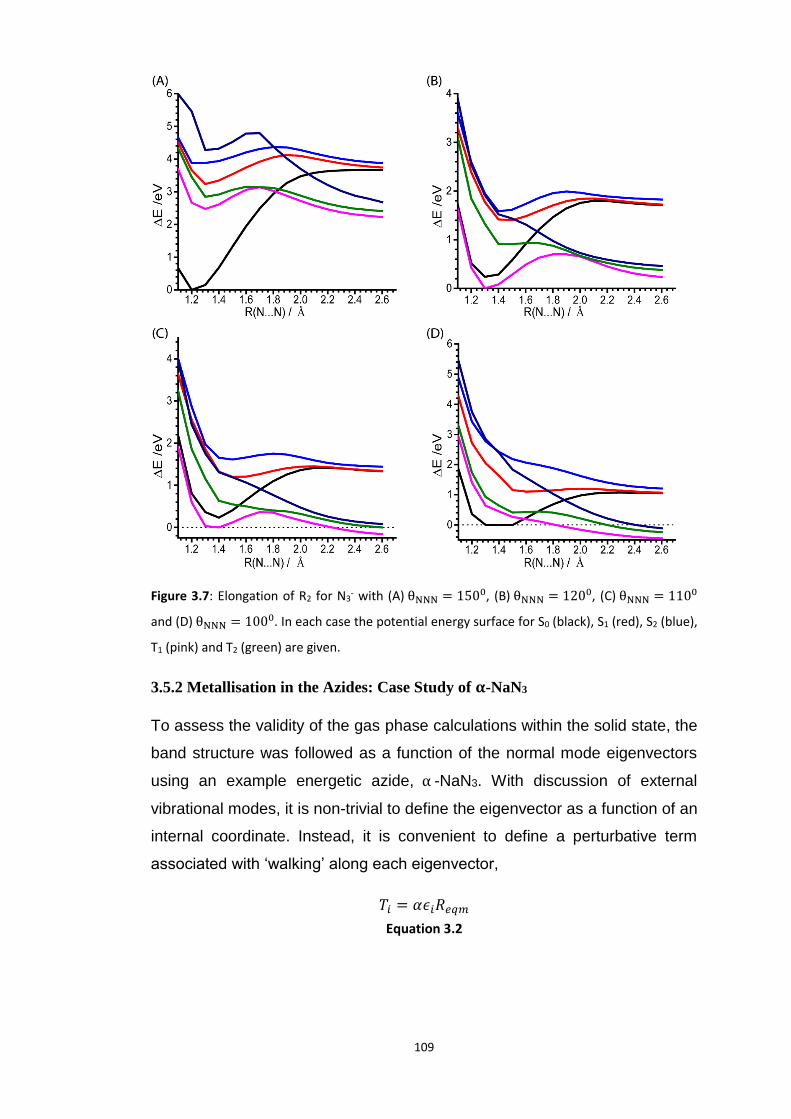
109
Figure 3.7: Elongation of R2 for N3- with (A) θNNN = 1500, (B) θNNN = 1200, (C) θNNN = 1100
and (D) θNNN = 1000. In each case the potential energy surface for S0 (black), S1 (red), S2 (blue),
T1 (pink) and T2 (green) are given.
3.5.2 Metallisation in the Azides: Case Study of 𝛂-NaN3
To assess the validity of the gas phase calculations within the solid state, the
band structure was followed as a function of the normal mode eigenvectors
using an example energetic azide, α -NaN3. With discussion of external
vibrational modes, it is non-trivial to define the eigenvector as a function of an
internal coordinate. Instead, it is convenient to define a perturbative term
associated with ‘walking’ along each eigenvector,
𝑇𝑖 = 𝛼𝜖𝑖𝑅𝑒𝑞𝑚
Equation 3.2
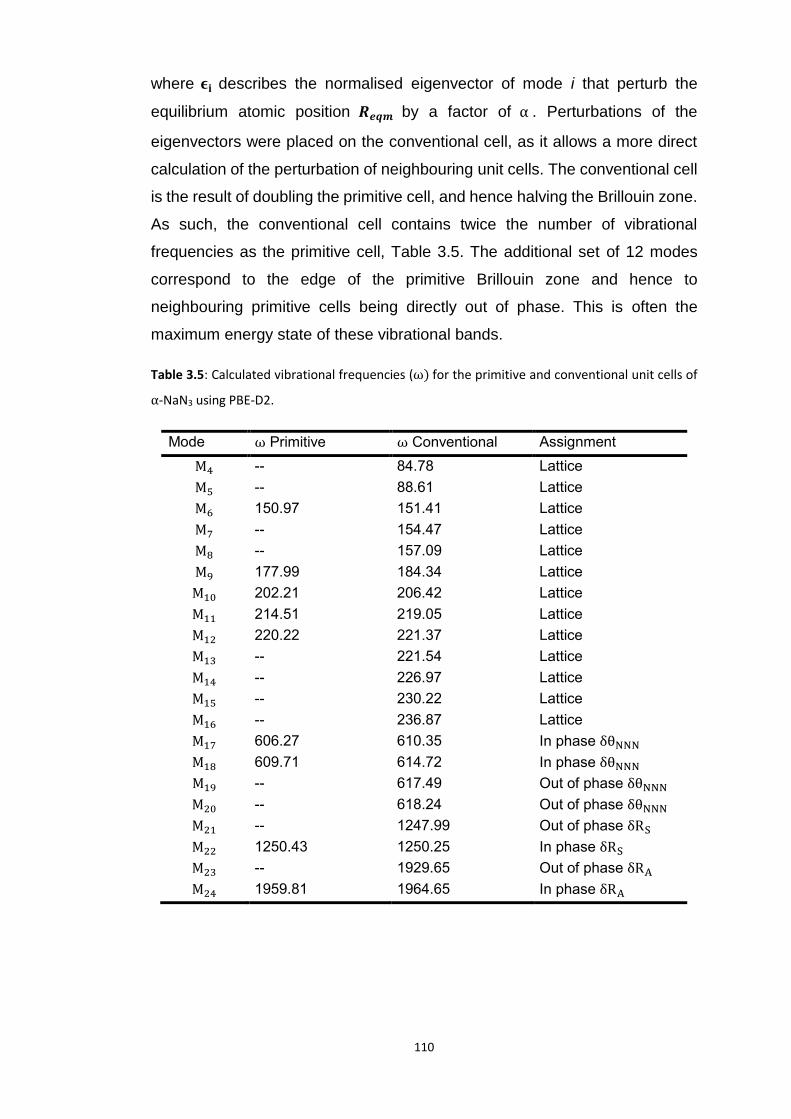
110
where 𝛜𝐢 describes the normalised eigenvector of mode i that perturb the
equilibrium atomic position 𝑹𝒆𝒒𝒎 by a factor of α . Perturbations of the
eigenvectors were placed on the conventional cell, as it allows a more direct
calculation of the perturbation of neighbouring unit cells. The conventional cell
is the result of doubling the primitive cell, and hence halving the Brillouin zone.
As such, the conventional cell contains twice the number of vibrational
frequencies as the primitive cell, Table 3.5. The additional set of 12 modes
correspond to the edge of the primitive Brillouin zone and hence to
neighbouring primitive cells being directly out of phase. This is often the
maximum energy state of these vibrational bands.
Table 3.5: Calculated vibrational frequencies (ω) for the primitive and conventional unit cells of
α-NaN3 using PBE-D2.
Mode ω Primitive ω Conventional Assignment
M4 -- 84.78 Lattice
M5 -- 88.61 Lattice
M6 150.97 151.41 Lattice
M7 -- 154.47 Lattice
M8 -- 157.09 Lattice
M9 177.99 184.34 Lattice
M10 202.21 206.42 Lattice
M11 214.51 219.05 Lattice
M12 220.22 221.37 Lattice
M13 -- 221.54 Lattice
M14 -- 226.97 Lattice
M15 -- 230.22 Lattice
M16 -- 236.87 Lattice
M17 606.27 610.35 In phase δθNNN
M18 609.71 614.72 In phase δθNNN
M19 -- 617.49 Out of phase δθNNN
M20 -- 618.24 Out of phase δθNNN
M21 -- 1247.99 Out of phase δRS
M22 1250.43 1250.25 In phase δRS
M23 -- 1929.65 Out of phase δRA
M24 1959.81 1964.65 In phase δRA

111
Experimental data regarding the lowest frequency modes (i.e. lattice modes)
is sparse. To explore the validity of DFT to model lattice modes in ionic azides,
the inelastic neutron scattering spectrum (INS) of α-NaN3 was obtained, Figure
3.8. Unlike Raman and infrared spectroscopy, INS is not limited by quantum
selection rules, and therefore all vibrational modes are in principle visible. The
INS spectrum reveals the five lattice modes, the three highest with observed
frequencies ~220 cm-1, 210 cm-1 and 196 cm-1. The calculated frequencies
agree well with these experimental values, occurring at 220 cm-1, 214 cm-1 and
202 cm-1. Two additional features are observed at ~160 cm-1 and 130 cm-1 in
the INS spectrum, which appear to be somewhat lower in frequency than the
calculated frequencies of 177 cm-1 and 150 cm-1 using the D2 dispersion
correction. Low frequency vibrations are extremely sensitive to the weak
underlying potential of the surrounding crystal. The zone-centre vibrational
modes were therefore re-calculated using a second common dispersion
correction scheme, TS, which is somewhat less empirical than the D2 scheme.
The optimised primitive unit cell obtained under the DFT-TS scheme had a
volume ca. 1.2% below the experimental volume (as compared to DFT-D2,
which overestimated the volume by 1.1%). The frequencies that result from
the DFT-TS scheme show poorer agreement with the higher frequency lattice
modes (226 cm-1, 189 cm-1 and 187 cm-1), although it did lead to slight
improvements of the lowest frequency lattice modes (127 cm-1 and 174 cm-1).
The DFT-D2 scheme was therefore selected for further use. The internal
vibrational modes are modelled less accurately. The bending frequency (DFT-
D2) is calculated to be ~606/610 cm-1, ca. 4.5% lower than the measured INS
frequency of 639 cm-1. The symmetric stretching mode is modelled even more
poorly at 1250 cm-1, ca. 8% lower than the INS value of 1358 cm-1. However,
the calculated δ𝑅𝑆 frequency does agree well with previous simulations and
suggests an inherent inability of the PBE scheme to capture this mode.59 Note
that the band corresponding to δ𝑅𝑎𝑠 was not observed in the INS spectrum
likely due to the low scattering cross section of 14N and the low amplitude of
the asymmetric stretching mode. The calculated ν(δ𝑅𝑎𝑠) can therefore be
compared to literature Raman spectra.83 The frequency of δ𝑅𝑎𝑠 is better

112
reproduced by the PBE-D2 than δ𝑅𝑠, simulated to occur at 2037 cm-1 (1959.98
cm-1 without LO-TO correction) and the experimental Raman83 frequency at
2043 cm-1, a 0.2% underestimation). Overall, it therefore appears that the
PBE-D2 based scheme leads to a good correlation with experimental
frequencies in the external mode region and δθ𝑁𝑁𝑁. The latter is particularly
important as it is the target frequency identified in Section 3.5.1.1
Despite the agreement between zone-centre simulated low-frequency bands
and the INS spectrum, there are two striking differences:
• A well-defined band is observed at ca. 100 cm-1 in the INS spectrum
• The experimental intensities are poorly reproduced by simulation.
Both effects can be explained by noting that the TOSCA spectrometer does
not probe the Brillouin zone centre, Chapter 2.2.2.2, but spans a broad range
of momentum transfer.84 As scattering from both N and Na are dominated by
coherent scattering, vibration dispersion through the Brillouin zone becomes
important.
Despite the high frequency associated with the top external bands near 𝒌 = 0,
these frequencies represent only a small subset of the Brillouin zone, Figure
3.9. By comparison with the simulated INS spectra in Figure 3.8, it can be
inferred that these frequencies are diluted (e.g. by powder averaging85) as they
are not observed when simulated scattering from the full Brillouin zone is
considered. Instead, the highest feature observed in the simulated INS band
occurs at ca. 240 cm-1, consistent with the average frequency of these external
bands. This is only slightly higher than the experimentally observed highest
frequency (ca. 230 cm-1). This explains why the zone-centre calculation of α-
NaN3 without LO-TO correction offered a good starting point in Figure 3.8. In
fact, inclusion of the LO-TO correction for the zone centre calculation leads to
gross overestimation of the INS frequencies of the external modes.
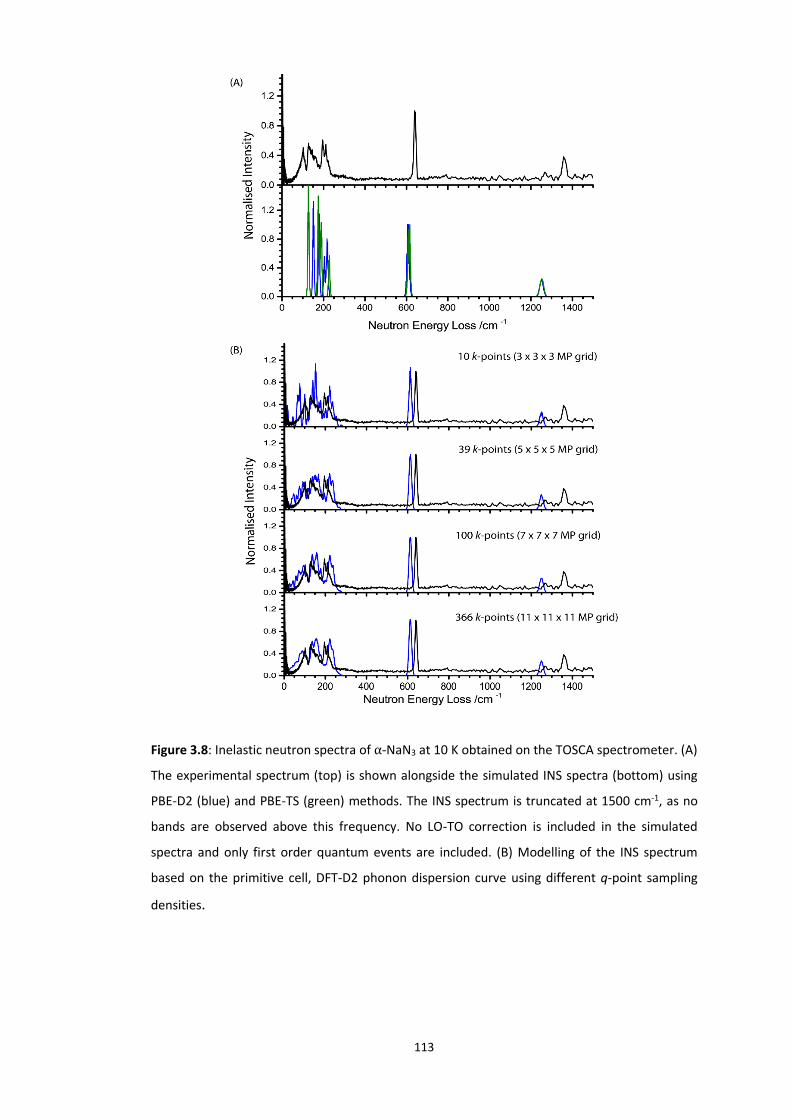
113
Figure 3.8: Inelastic neutron spectra of α-NaN3 at 10 K obtained on the TOSCA spectrometer. (A)
The experimental spectrum (top) is shown alongside the simulated INS spectra (bottom) using
PBE-D2 (blue) and PBE-TS (green) methods. The INS spectrum is truncated at 1500 cm-1, as no
bands are observed above this frequency. No LO-TO correction is included in the simulated
spectra and only first order quantum events are included. (B) Modelling of the INS spectrum
based on the primitive cell, DFT-D2 phonon dispersion curve using different q-point sampling
densities.

114
Figure 3.9: Phonon dispersion curve calculated using PBE-D2 for the primitive cell of 𝛼-NaN3. The
zone centre frequencies calculated with LO-TO correction are highlighted as pink dots.
3.5.2.1 Band gap dependence on external lattice modes in 𝜶-NaN3
The DFT-D2 scheme leads to reliable calculation of the external vibrational
modes and hence can be used for further investigation. It is convenient to
begin with discussion of the external vibrational modes that contain no Na
character, M6, M8, M9 and M16 (Table 3.5). These four modes correspond to
tilting of the N3− molecules. In the first, azide molecules tilt in phase, polarized
primarily along the crystallographic b-axis. The second corresponds to a tilt
along this same axis, with each of the azido anions tilting out of phase with one
another. Hence, these modes correspond to the zone centre and primitive
Brillouin zone edge, respectively. Modes 𝑀9 and 𝑀16 describe the same
motion polarized primarily along the crystallographic a-axis.
As M6 and M8 are followed, the band gap is found to decrease dramatically (i.e.
towards metallisation), Figure 3.10A and 3.10B. However, this appears to be
an artefact of the rectilinear nature of the imposed eigenvectors. Indeed, if N-
N bond lengths are corrected to the equilibrium bond lengths, this trend
towards metallisation is lost. Only a small reduction in the bad gap is observed
at very large perturbations from the equilibrium geometry. The large difference

115
observed between rectilinear and corrected distortions clearly shows that the
addition of internal molecular modes may be promising to induce metallisation.
Figure 3.10: Tilting of the azido anion molecule showing (A) M6 (B) M8 , (C) M9 and (D) M16 .
Closed symbols are derived from rectilinear application of eigenvectors, and open symbols result
from correction to the N-N bond lengths. The band gap is initially a direct band gap (D), but
becomes indirect (I) on perturbation. Inset graphics show the distortion (green molecule) with
respect to the unperturbed (purple) molecular position. Band gap based on HSE06 calculation.
Along M9 , the band gap is seen to decrease very slightly before returning
towards its equilibrium band gap at higher distortions, Figure 3.10C. In stark
contrast, however, the band gap decreases markedly along M16, Figure 3.10D.
Imposing very large perturbations along this eigenvector (to a factor of 8)
decreases the band gap asymptotically to ca. 0.15 eV, but does not reach
metallisation, Figure 3.11. This is associated with ΔU ≈ 5.6 eV.
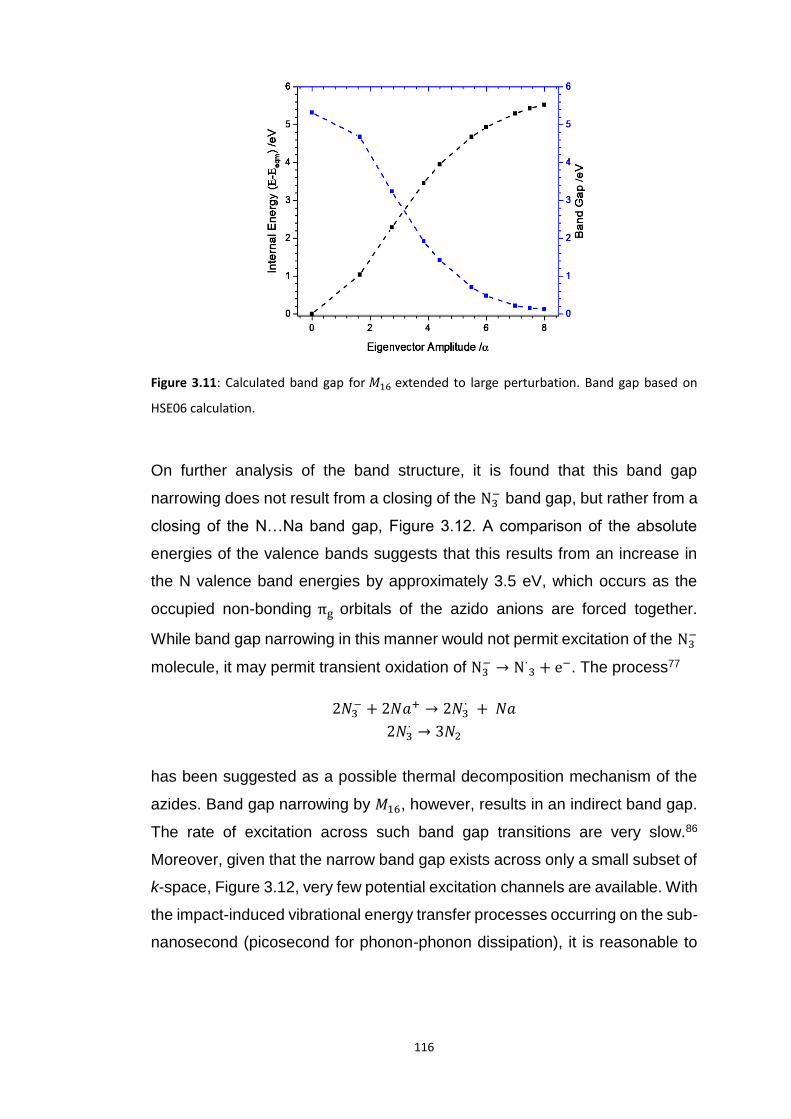
116
Figure 3.11: Calculated band gap for 𝑀16 extended to large perturbation. Band gap based on
HSE06 calculation.
On further analysis of the band structure, it is found that this band gap
narrowing does not result from a closing of the N3− band gap, but rather from a
closing of the N…Na band gap, Figure 3.12. A comparison of the absolute
energies of the valence bands suggests that this results from an increase in
the N valence band energies by approximately 3.5 eV, which occurs as the
occupied non-bonding πg orbitals of the azido anions are forced together.
While band gap narrowing in this manner would not permit excitation of the N3−
molecule, it may permit transient oxidation of N3− → N∙
3 + e−. The process77
2𝑁3− + 2𝑁𝑎+ → 2𝑁3
∙ + 𝑁𝑎
2𝑁3∙ → 3𝑁2
has been suggested as a possible thermal decomposition mechanism of the
azides. Band gap narrowing by 𝑀16, however, results in an indirect band gap.
The rate of excitation across such band gap transitions are very slow.86
Moreover, given that the narrow band gap exists across only a small subset of
k-space, Figure 3.12, very few potential excitation channels are available. With
the impact-induced vibrational energy transfer processes occurring on the sub-
nanosecond (picosecond for phonon-phonon dissipation), it is reasonable to
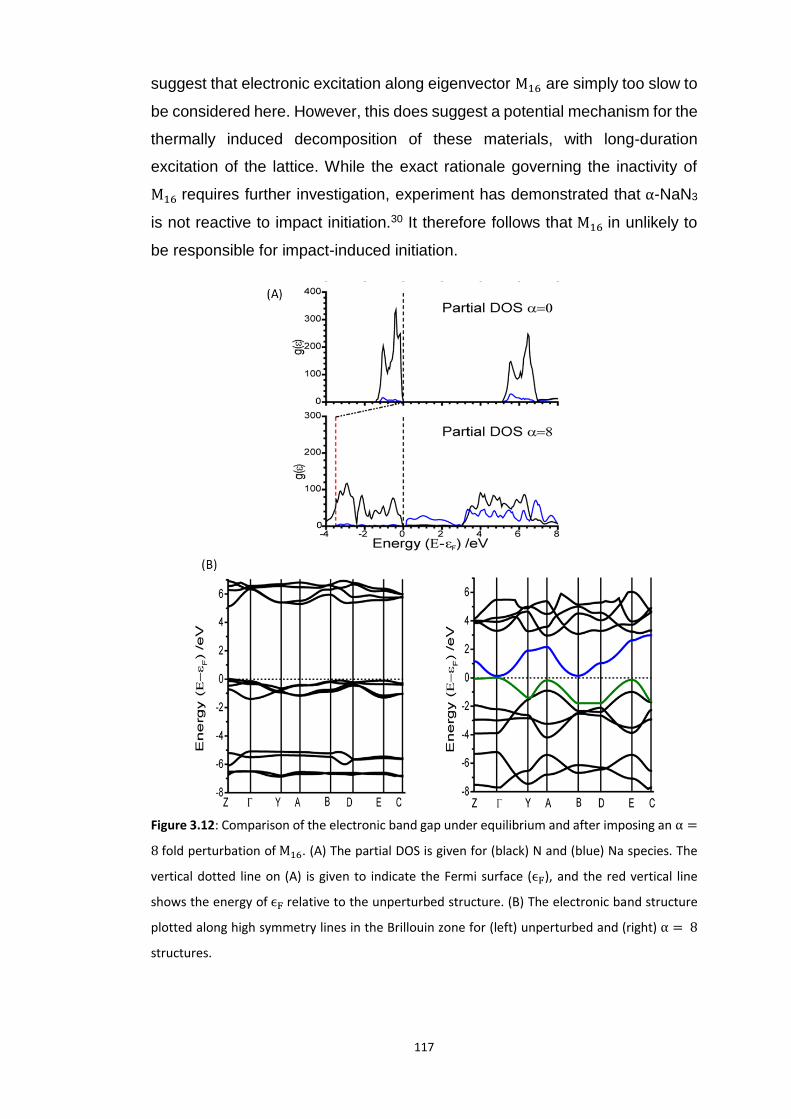
117
suggest that electronic excitation along eigenvector M16 are simply too slow to
be considered here. However, this does suggest a potential mechanism for the
thermally induced decomposition of these materials, with long-duration
excitation of the lattice. While the exact rationale governing the inactivity of
M16 requires further investigation, experiment has demonstrated that α-NaN3
is not reactive to impact initiation.30 It therefore follows that M16 in unlikely to
be responsible for impact-induced initiation.
Figure 3.12: Comparison of the electronic band gap under equilibrium and after imposing an α =
8 fold perturbation of M16. (A) The partial DOS is given for (black) N and (blue) Na species. The
vertical dotted line on (A) is given to indicate the Fermi surface (ϵF), and the red vertical line
shows the energy of ϵF relative to the unperturbed structure. (B) The electronic band structure
plotted along high symmetry lines in the Brillouin zone for (left) unperturbed and (right) α = 8
structures.
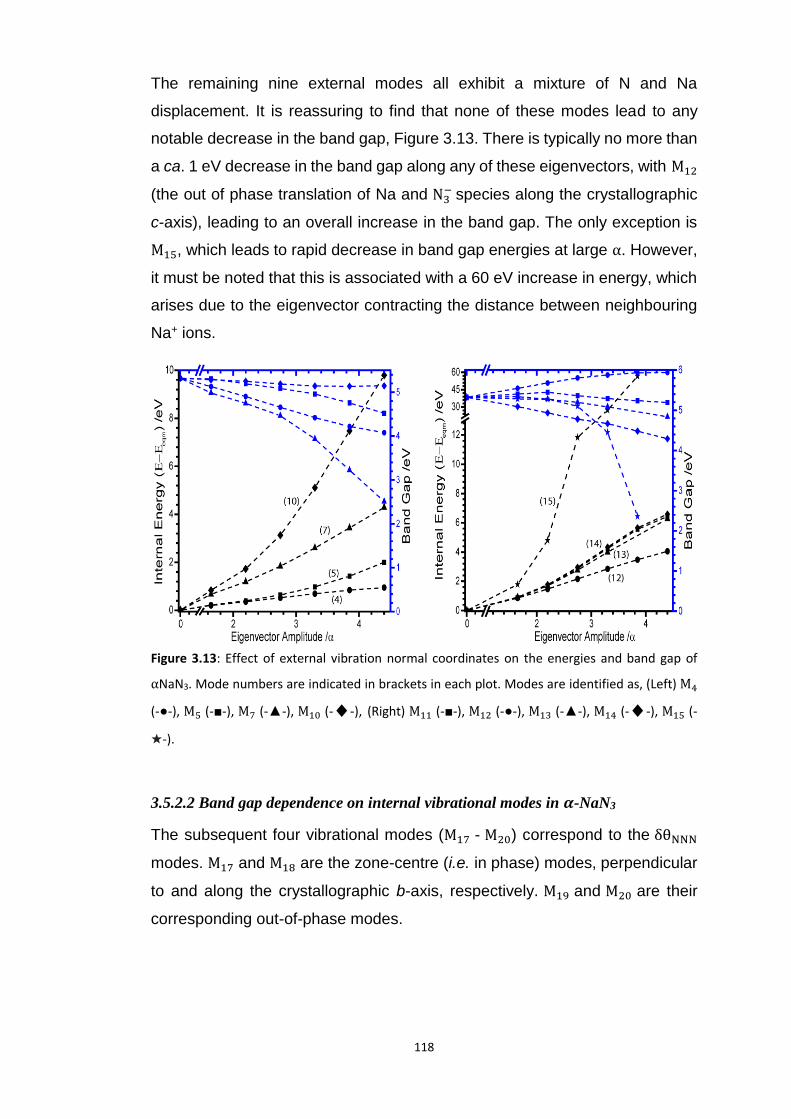
118
The remaining nine external modes all exhibit a mixture of N and Na
displacement. It is reassuring to find that none of these modes lead to any
notable decrease in the band gap, Figure 3.13. There is typically no more than
a ca. 1 eV decrease in the band gap along any of these eigenvectors, with M12
(the out of phase translation of Na and N3− species along the crystallographic
c-axis), leading to an overall increase in the band gap. The only exception is
M15, which leads to rapid decrease in band gap energies at large α. However,
it must be noted that this is associated with a 60 eV increase in energy, which
arises due to the eigenvector contracting the distance between neighbouring
Na+ ions.
Figure 3.13: Effect of external vibration normal coordinates on the energies and band gap of
αNaN3. Mode numbers are indicated in brackets in each plot. Modes are identified as, (Left) M4
(-●-), M5 (-■-), M7 (-▲-), M10 (-♦-), (Right) M11 (-■-), M12 (-●-), M13 (-▲-), M14 (-♦-), M15 (-
★-).
3.5.2.2 Band gap dependence on internal vibrational modes in 𝜶-NaN3
The subsequent four vibrational modes (M17 - M20) correspond to the δθNNN
modes. M17 and M18 are the zone-centre (i.e. in phase) modes, perpendicular
to and along the crystallographic b-axis, respectively. M19 and M20 are their
corresponding out-of-phase modes.

119
Figure 3.14: Effect of M17 (left) and M19 (right) on the band gaps and energies of α-NaN3. Band
gap momentum conservation is indicated as direct (D) or indirect (I). The arrow indicates
continuation of an indirect band gap. Band gaps from HSE06 calculation. To reflect perturbation
of two azido anions (in the conventional cell), energy is given per molecule.
To follow the band gaps associated with 𝑀17 - 𝑀20, the rectilinear perturbation
was applied according to Equation 3.2, and the N-N bond lengths were
restored to equilibrium lengths. This was done to ensure only the isolated
normal coordinates were investigated. As the azido anion was perturbed along
the bending mode, 𝛿𝜃𝑁𝑁𝑁, the band gap was found to decrease steadily with
angle. The band gap reaches approximately half of its original value at θNNN ≈
130o, and continues to decrease on further bending. By 110o, the band gap
drops to 0 eV, and the material is found to have metallised, Figure 3.14. This
metallisation is of particular interest as it corresponds to a crossing of the 𝑆0/𝑆1
PES, which was not observed in the isolated gas-phase molecule. This can be
suggested to result from the band gap narrowing that occurs when a molecule
is introduced into a periodic crystal.74 Note as the calculations performed here
were single-reference ground state, closed shell simulations, the triplet states
observed in the multi-references CI calculations (Section 3.5.1.1) were not
considered here. However, given that the multi-reference calculations suggest
that the T1 state should exist ca. 1 eV lower in energy than the S1 state, it is
reasonable to propose that the T1/𝑆0 CI may be accessible in the crystalline

120
lattice model at θNNN ≈ 115 − 1200, and Δ𝑈 ≈ 4-4.5 eV.molecule-1. As both
the in- and out-of-phase modes exhibit the same behaviour modes 𝑀18 and
𝑀20 are not reported here.
Unlike for M16, the metallisation that is observed along M17 − M20 is not the
result of a decreasing N…Na band gap. Instead, it occurs by a decrease in the
N3− conduction/valence band gap. While comparison of the absolute energies
does suggest partial increase in the energy of the valence band as a function
of this bend, the major effect results from a lowering in the conduction band
energies, Figure 3.15. While the band gap is again indirect, it is worth noting
how flat the band gap is compared to Figure 3.12 and therefore the existence
of many more available transition channels. Thus, a potential 𝑆0/𝑆1 CI exists
in the solid state and again permits excitation of the azido anion. The lowering
of the conduction band to such considerable degrees also offers a role for local
electronic defects within these structures (e.g. holes or dopant states), which
sit within the band gap of the pure crystalline material. These defects have
previously been suggested as being crucial for the initiation of energetic
compounds, although no mechanism for their athermal influence has been
proposed.71,87 It can be suggested that their interaction with the electronic
structure, and its dynamics as a result of normal mode perturbation, may be
crucial to understanding their mechanism of action.
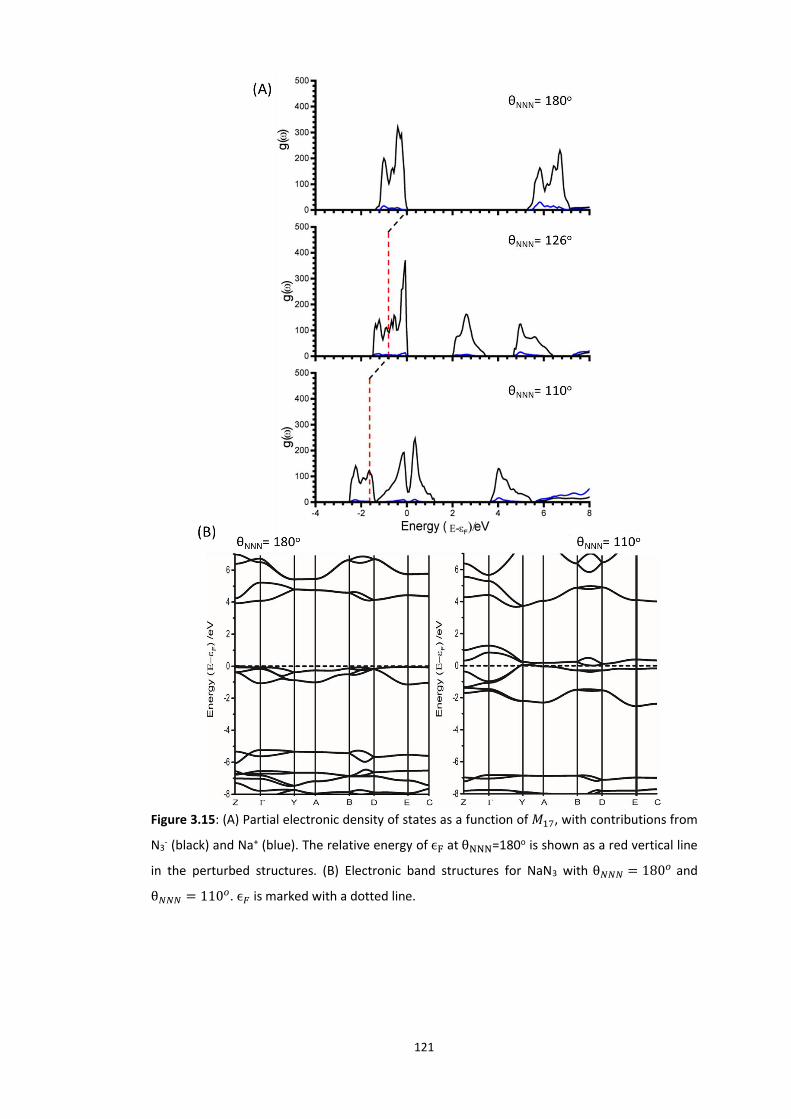
121
Figure 3.15: (A) Partial electronic density of states as a function of 𝑀17, with contributions from
N3- (black) and Na+ (blue). The relative energy of ϵF at θNNN=180o is shown as a red vertical line
in the perturbed structures. (B) Electronic band structures for NaN3 with θ𝑁𝑁𝑁 = 180𝑜 and
θ𝑁𝑁𝑁 = 110𝑜. ϵ𝐹 is marked with a dotted line.
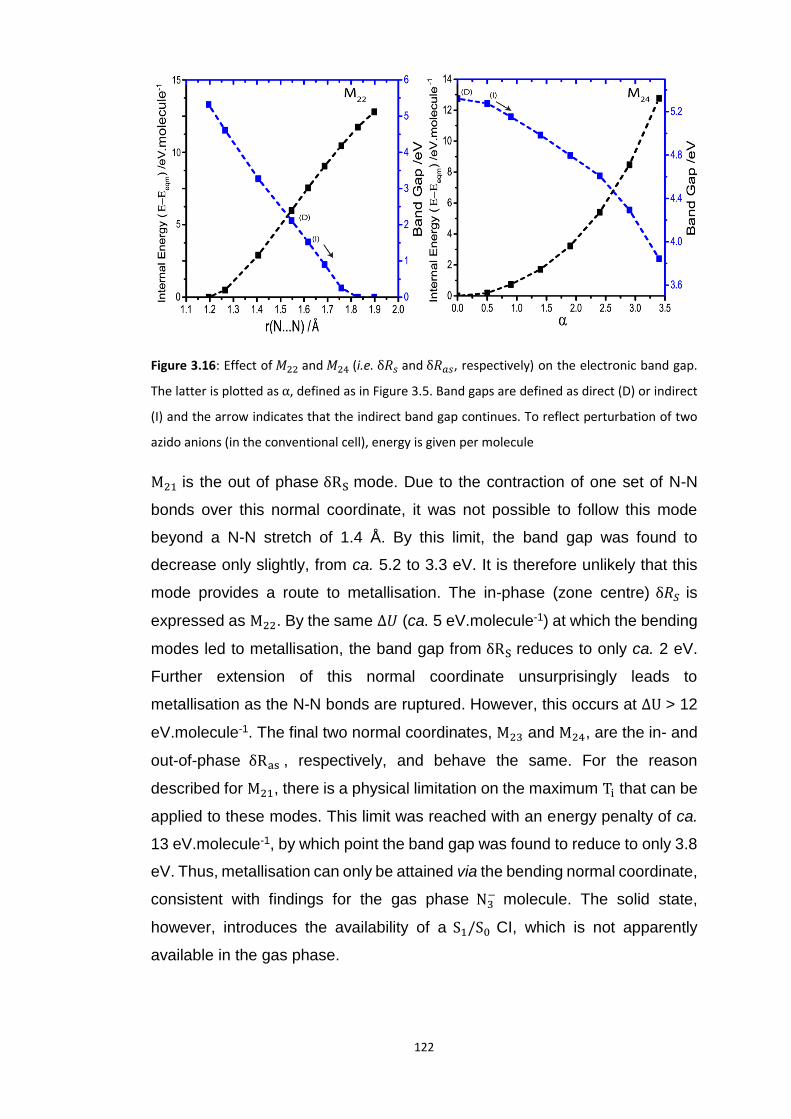
122
Figure 3.16: Effect of 𝑀22 and 𝑀24 (i.e. δ𝑅𝑠 and δ𝑅𝑎𝑠, respectively) on the electronic band gap.
The latter is plotted as α, defined as in Figure 3.5. Band gaps are defined as direct (D) or indirect
(I) and the arrow indicates that the indirect band gap continues. To reflect perturbation of two
azido anions (in the conventional cell), energy is given per molecule
M21 is the out of phase δRS mode. Due to the contraction of one set of N-N
bonds over this normal coordinate, it was not possible to follow this mode
beyond a N-N stretch of 1.4 Å. By this limit, the band gap was found to
decrease only slightly, from ca. 5.2 to 3.3 eV. It is therefore unlikely that this
mode provides a route to metallisation. The in-phase (zone centre) δ𝑅𝑆 is
expressed as M22. By the same Δ𝑈 (ca. 5 eV.molecule-1) at which the bending
modes led to metallisation, the band gap from δRS reduces to only ca. 2 eV.
Further extension of this normal coordinate unsurprisingly leads to
metallisation as the N-N bonds are ruptured. However, this occurs at ΔU > 12
eV.molecule-1. The final two normal coordinates, M23 and M24, are the in- and
out-of-phase δRas , respectively, and behave the same. For the reason
described for M21, there is a physical limitation on the maximum Ti that can be
applied to these modes. This limit was reached with an energy penalty of ca.
13 eV.molecule-1, by which point the band gap was found to reduce to only 3.8
eV. Thus, metallisation can only be attained via the bending normal coordinate,
consistent with findings for the gas phase N3− molecule. The solid state,
however, introduces the availability of a S1/S0 CI, which is not apparently
available in the gas phase.
123
Thus to summarise, two sets of modes have been identified that lead to a
narrowing of the band gap in α-NaN3. The first is a phonon mode, M16 which
suggests that a route to N3− → N3 might be possible under the application of a
long-duration vibrational excitation but does not occur under mechanical
impact. Modes M17 − M20 support the gas-phase calculations, identifying the
bending mode as being a probable target mode for initiation of explosions in
azide materials.
3.5.3 Up-Pumping and Impact Sensitivity
Note the phonon dispersion curves for Sn(N3)2, NH4N3, TAGZ and HN3 were calculated by Dr. Carole
Morrison (School of Chemistry, University of Edinburgh)
The discussions presented in Sections 3.5.1 and 3.5.2 suggest that vibronic
processes may be responsible for the spontaneous electronic excitation of the
explosophoric N3− species. These processes are driven by the normal
coordinate eigenvector of δθNNN, but require perturbations that are larger than
are typical under thermal equilibrium. Hence, to reach the CIs that appear
along the PES of N3− , the molecule must be promoted to a highly excited
vibrational state. This can be achieved by phonon up-pumping. This process
is given in Equation 3.3, which describes the vibrational lifetime of a mode with
branch index j and wave vector, 𝒒,88
γ𝐪,j =𝜋
ℏ2𝑁𝑞∑ |𝑉
𝒒𝑗,𝒒′𝑗′,𝒒"𝑗"
(3)|2
𝒒′,𝑗′,𝑗"
× [(1 + 𝑛𝒒′𝑗′ + 𝑛𝒒"𝑗")𝛿(𝜔𝒒𝑗 − 𝜔𝒒′𝑗′ − 𝜔𝒒"𝑗")
+ 2(𝑛𝒒′𝑗′ − 𝑛𝒒"𝑗")𝛿(𝜔𝒒𝑗 + 𝜔𝒒′𝑗′ − 𝜔𝒒"𝑗")]
Equation 3.3
Equation 3.3 restricts discussion to within the first anharmonic approximation.
This is a reasonable restriction as higher order terms occur too slowly in most
cases.4 The phonon lifetime can be understood by two sets of scattering
processes, which are displayed in the square brackets. The first term
describes the down-conversion process, where vibration 𝜔𝒒𝑗 decomposes into
two lower-frequency modes, 𝜔𝒒′𝑗′ and 𝜔𝒒′′𝑗′′. The second term describes the
124
combination of two phonons, 𝜔𝒒𝑗 and 𝜔𝒒′𝑗′, to create a third, 𝜔𝒒′′𝑗′′. Where
𝜔𝒒′′𝑗′′ > 𝜔𝒒𝑗, this process is known as up-conversion. At finite temperature,
the scattering processes described in each event depend on the Bose-Einstein
statistical occupations (nq,j), Equation 3.4, and a third-order anharmonic
coupling constant,𝑉(3) . The magnitude of the latter term depends on the
relative polarisation and anharmonic character of the three coupling phonon
modes. As both up- and down-conversion processes are possible, excess
energy is rapidly equilibrated through the molecule via the available vibrational
relaxation mechanisms. Thus, to achieve a highly excited state of a target
mode (δθNNN in the case of the azides) it is important to achieve rapid
conversion into the corresponding branch, j. The slower the conversion into
the branch, the more the required input energy to achieve sufficient excitation.
nω = [𝑒(ℏ𝜔/𝑘B𝑇) − 1]−1
Equation 3.4
It follows from Equations 3.3 and 3.4 that energy transfer rates will be faster
when including low frequency modes, which at temperature, 𝑇, will exhibit
higher populations, and are typically more anharmonic.4 As described in
Section 3.1, a mechanical impact can be treated as instantaneous heating of
the lowest frequency vibrational modes.12 This therefore leads to highly
populated phonon states, which rapidly reach a quasi-equilibrium state. For
simplicity, the model employed here chooses this initial equilibrated phonon
bath as a starting point.
At this starting point, it is convenient to construct a temperature-independent
model, by extending Equation 3.3 to the low temperature limit of T = 0 K.
Under this limit,
γ𝐪,j =𝜋
ℏ2𝑁𝑞∑ |𝑉
𝒒𝑗,𝒒′𝑗′,𝒒"𝑗"
(3)|2× [𝛿(𝜔𝒒𝑗 − 𝜔𝒒′𝑗′ − 𝜔𝒒"𝑗")]
𝒒′,𝑗′,𝑗"
Equation 3.5

125
Here the bracketed term represents the two-phonon density of states, Ω(2). In
the absence of temperature considerations, microscopic reversibility dictates
that the number of down-conversion pathways must equal the number of up-
conversion pathways. Hence, Equation 3.5 describes the total number of
scattering pathways that can transfer energy into mode 𝜔𝒒𝑗. In this form, 𝜔𝒒𝑗
is defined as the target frequency (herein labelled 𝜔𝑻, the N3− δθNNN mode),
with 𝜔𝒒′𝑗′ and 𝜔𝒒"𝑗" denoting lower frequency modes. The Dirac 𝛿 ensures
conservation of energy, and momentum is conserved by setting 𝒒 = −𝒒′ − 𝒒′′.
Energy transfer to 𝜔𝑻 is then largely dependent on the number of pathways
defined by Ω(2).
By imposing the Einstein approximation (that ω is 𝐪 -independent) for the
internal vibrational modes, it is possible to consider only the phonon density of
states (PDOS), rather than the full phonon dispersion curves. The latter are
shown in Figure 3.17. This is based on the following:
1. To a good approximation, there is a continuum of vibrational states
within the phonon bath.
2. For phonon-phonon coupling involving two phonons with the same
branch index, j1 = j2 , momentum conservation and phase matching
dictate that 𝒒𝟏 = −𝒒𝟐, such that ωj,𝐪 + ωj,−𝐪 = 𝜔𝑇 ,𝒒=0. Thus, 𝜔𝑇 is only
accessible at the zone centre and only the absolute frequency of the
low frequency modes is important.
3. For phonon-phonon coupling involving two phonons with different
branch index, j1 ≠ j2, the 𝐪-independence of ωT imposes that for any
combination of (𝜔𝒒𝑗, ωT) , there will be a 𝜔𝒒′𝑗′ at the appropriate
momentum and frequency to satisfy Equation 3.5. The same holds
under the assumption that one of the phonon modes is a doorway mode,
regardless of its 𝐪-dependence.
4. In the absence of explicit consideration of 𝑉(3), coupling between all
sets of phonons can be taken to be approximately the same, provided
they comprise distortion of the same set of interacting atoms (i.e. are of
the same molecule or strongly bonding intermolecular atoms).89,90
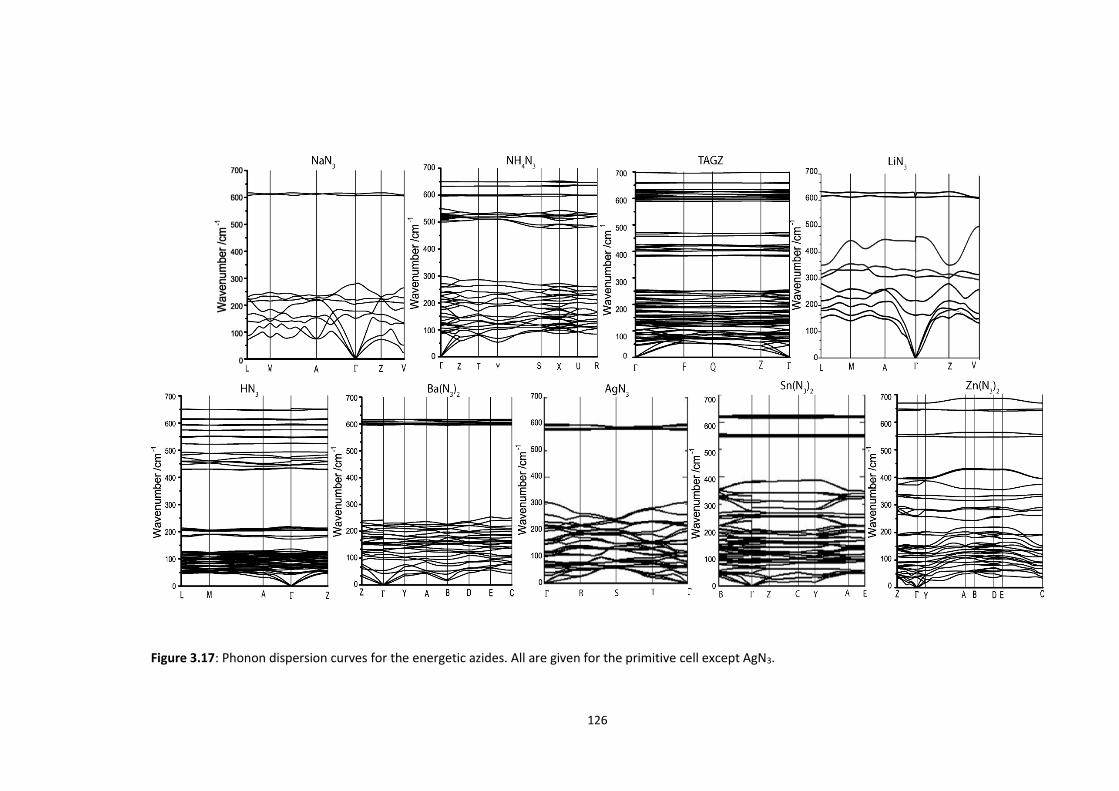
126
Figure 3.17: Phonon dispersion curves for the energetic azides. All are given for the primitive cell except AgN3.
127
3.5.3.1 Partitioning of the Vibrational Structure
Following from the three terms contained in Ω(2) of Equation 3.5, the PDOS
can be segmented into a series of physically meaningful regions, Figure 3.18.16
The first mode, 𝜔𝒒′𝑗′, generally exhibits lattice character, and is held within the
phonon bath, which has an upper limit defined by Ωmax. While this value is not
rigorously defined, it can be qualitatively described as the highest lattice-based
mode. Due to the high anharmonicity of these lattice modes, and the high
density of vibrational states, the thermalisation of vibrational energy occurs
very rapidly in this region. This imposes a crude definition of Ω𝑚𝑎𝑥 as being the
first point in which the phonon density of states drops to zero. The second
frequency, 𝜔𝒒"𝑗", generally sits somewhere between Ω𝑚𝑎𝑥 and 2Ω𝑚𝑎𝑥, and is
termed the ‘doorway mode’. The upper limit of 2Ω𝑚𝑎𝑥 is significant as it defines
the highest frequency attainable by coupling of two phonon bath modes. The
third mode, 𝜔𝑇 is the target vibrational frequency. It must fall within 3Ω𝑚𝑎𝑥 to
be accessed by coupling of a phonon mode with a doorway mode. The identity
of 𝜔𝑇 was determined in Section 3.5.1 as being 𝛿𝜃𝑁𝑁𝑁. Within the Einstein
approximation, the frequency of 𝛿𝜃𝑁𝑁𝑁 can be identified from the Γ-point
eigenvectors. This was done by artificially extending the eigenvectors of each
zone-centre normal coordinate and led to easy identification of 𝜔𝑇, Figure 3.19.
Note that due to factor group splitting and symmetry independent azido anions,
multiple distinct δθ𝑁𝑁𝑁 frequencies can exist in the same crystal. The covalent
compounds exhibit a more extensive spread in 𝛿𝜃𝑁𝑁𝑁 frequencies. While a
cluster of δθNNN exists around 600 cm-1 in all of the azides (with the exception
of HN3), the covalent (more sensitive) compounds exhibit additional δθNNN at
lower frequency. Within the framework of the up-pumping model of impact
initiation, this may be indicative of their higher sensitivity and offer a design
target for novel materials.
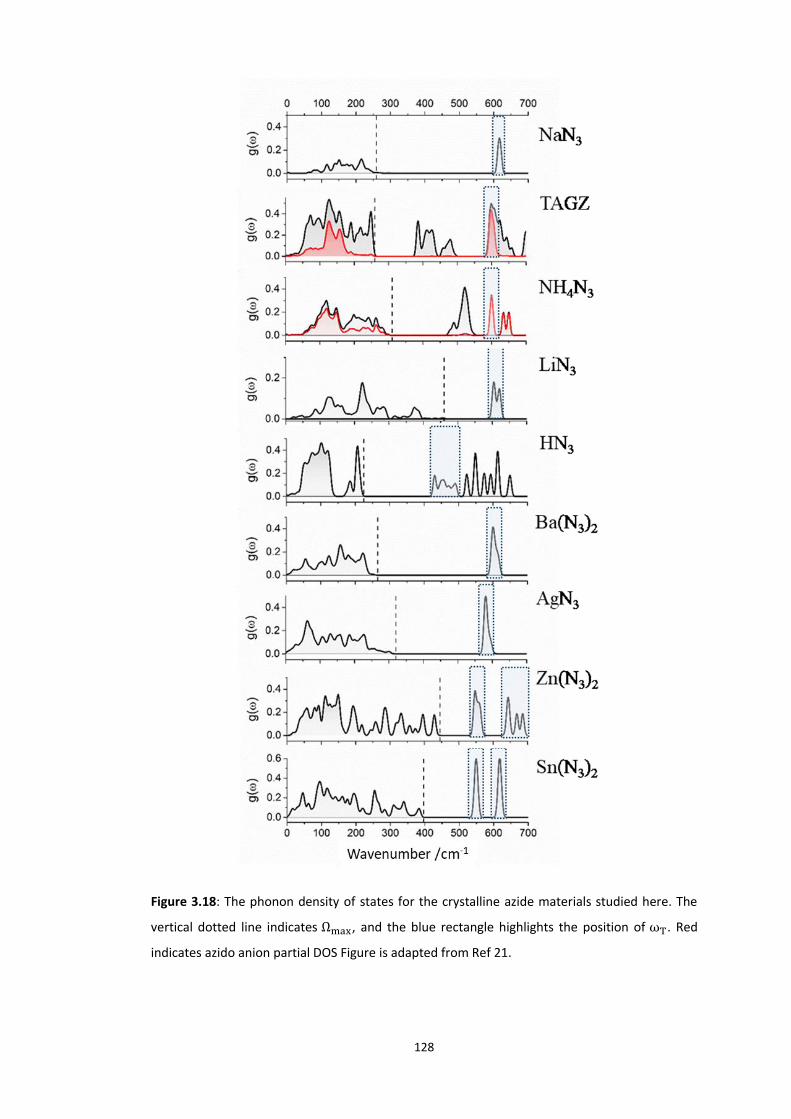
128
Figure 3.18: The phonon density of states for the crystalline azide materials studied here. The
vertical dotted line indicates Ωmax, and the blue rectangle highlights the position of ωT. Red
indicates azido anion partial DOS Figure is adapted from Ref 21.
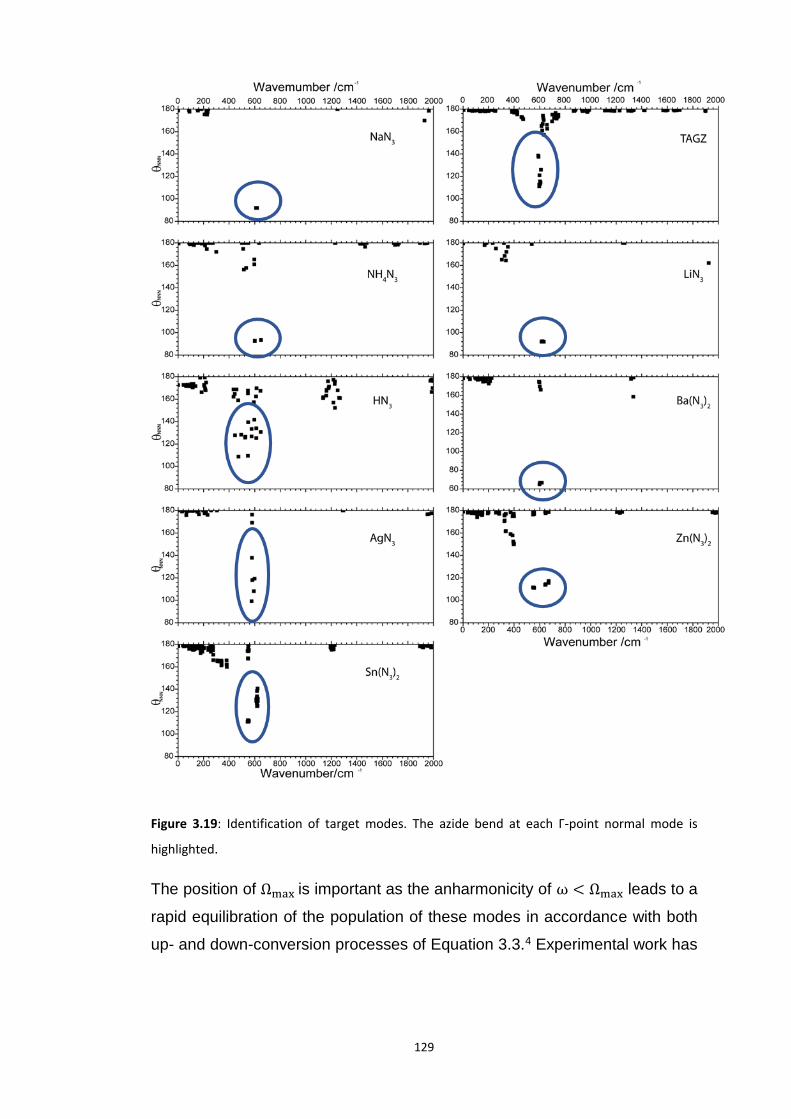
129
Figure 3.19: Identification of target modes. The azide bend at each Γ-point normal mode is
highlighted.
The position of Ωmax is important as the anharmonicity of ω < Ωmax leads to a
rapid equilibration of the population of these modes in accordance with both
up- and down-conversion processes of Equation 3.3.4 Experimental work has
130
suggested that this equilibration occurs at least an order of magnitude faster
than any up-conversion beyond Ωmax.4 The up-conversion of this energy then
occurs in two stages:
1. coupling of two modes with ω𝑗 < Ω𝑚𝑎𝑥 to excite a mode with Ω𝑚𝑎𝑥 <
ω < 2Ω𝑚𝑎𝑥, and
2. further up-pumping to modes with 2Ω𝑚𝑎𝑥 < ω < 3Ω𝑚𝑎𝑥.17
It is from this sequence that vibrational modes with Ω𝑚𝑎𝑥 < ω < 2Ω𝑚𝑎𝑥 derive
their name: doorway modes. While step (1) is first, step (2) occurs only
picoseconds afterwards17 and hence these processes may become important.
This sequence of steps also limits primary up-pumping steps to a maximum of
3Ω𝑚𝑎𝑥.
The probability (℘) of phonon-phonon coupling processes is governed by
Fermi’s Golden rule,91
℘(𝑖 → 𝑓) ∝ |⟨𝜑𝑓|𝐻3|𝜑𝑖⟩|2𝐷𝑓(𝐸)
Equation 3.6
where Df(E) is the density of final states and H3 is the third order anharmonic
Hamiltonian. Thus, the probability of scattering is a maximum when the initial
and final scattering states, |𝜑𝑖⟩ and |𝜑𝑓⟩ , respectively, are coherent.14
Qualitatively, it follows that the greater the total change in the PDOS, the less
probable the transition will be. Within the nomenclature introduced above, it
might therefore be expected that energy transfer to 𝜔𝑇 will occur more quickly
given a smaller ∆𝜔 = 𝜔𝑇 − Ω𝑚𝑎𝑥 . This is because more combinations of
phonon modes will be resonant with ω𝑇 as Δω → 0. Generally, more sensitive
materials are found to exhibit higher Ωmax values, and analysis of Δω does
suggest some merit to this qualitative approach, Table 3.6, although
discrepancies do arise. This is most notable with LiN3 and Ba(N3)2, which
appear in different sensitivity classifications according to this method.
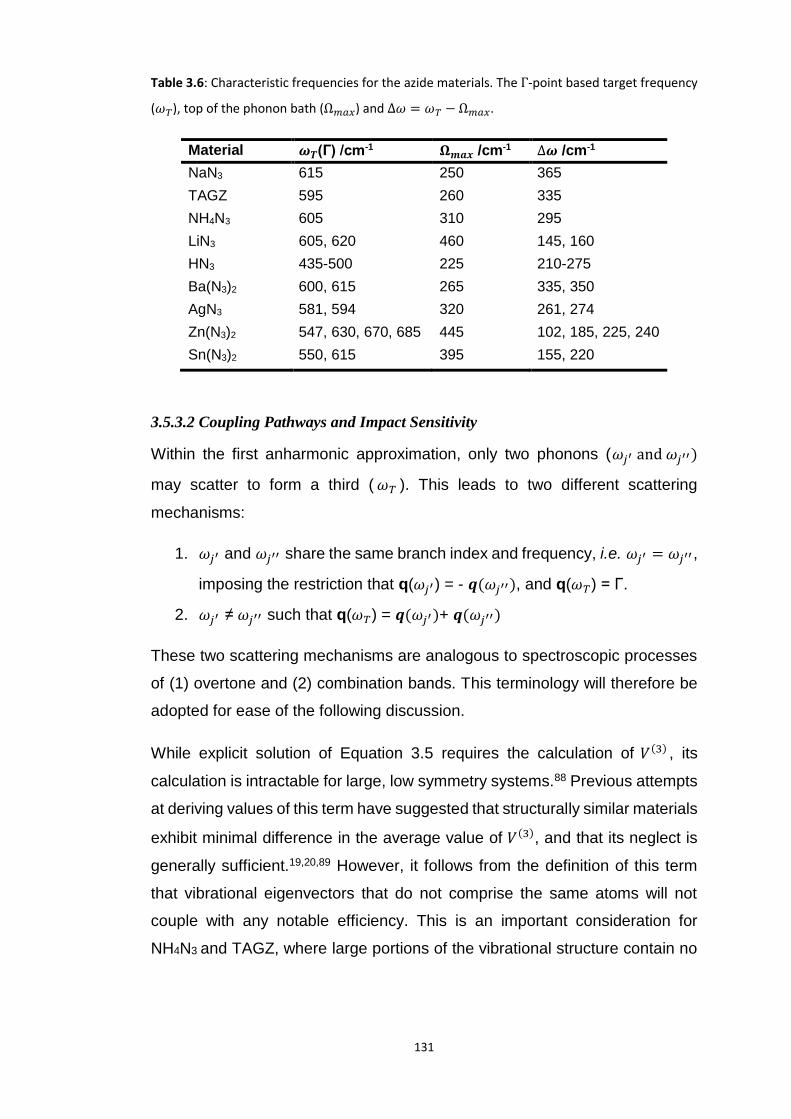
131
Table 3.6: Characteristic frequencies for the azide materials. The Γ-point based target frequency
(𝜔𝑇), top of the phonon bath (Ω𝑚𝑎𝑥) and Δ𝜔 = 𝜔𝑇 − Ω𝑚𝑎𝑥.
Material 𝝎𝑻(Г) /cm-1 𝛀𝒎𝒂𝒙 /cm-1 ∆𝝎 /cm-1
NaN3 615 250 365
TAGZ 595 260 335
NH4N3 605 310 295
LiN3 605, 620 460 145, 160
HN3 435-500 225 210-275
Ba(N3)2 600, 615 265 335, 350
AgN3 581, 594 320 261, 274
Zn(N3)2 547, 630, 670, 685 445 102, 185, 225, 240
Sn(N3)2 550, 615 395 155, 220
3.5.3.2 Coupling Pathways and Impact Sensitivity
Within the first anharmonic approximation, only two phonons (𝜔𝑗′ and 𝜔𝑗′′)
may scatter to form a third ( 𝜔𝑇 ). This leads to two different scattering
mechanisms:
1. 𝜔𝑗′ and 𝜔𝑗′′ share the same branch index and frequency, i.e. 𝜔𝑗′ = 𝜔𝑗′′,
imposing the restriction that q(𝜔𝑗′) = - 𝒒(𝜔𝑗′′), and q(𝜔𝑇) = Γ.
2. 𝜔𝑗′ ≠ 𝜔𝑗′′ such that q(𝜔𝑇) = 𝒒(𝜔𝑗′)+ 𝒒(𝜔𝑗′′)
These two scattering mechanisms are analogous to spectroscopic processes
of (1) overtone and (2) combination bands. This terminology will therefore be
adopted for ease of the following discussion.
While explicit solution of Equation 3.5 requires the calculation of 𝑉(3) , its
calculation is intractable for large, low symmetry systems.88 Previous attempts
at deriving values of this term have suggested that structurally similar materials
exhibit minimal difference in the average value of 𝑉(3), and that its neglect is
generally sufficient.19,20,89 However, it follows from the definition of this term
that vibrational eigenvectors that do not comprise the same atoms will not
couple with any notable efficiency. This is an important consideration for
NH4N3 and TAGZ, where large portions of the vibrational structure contain no
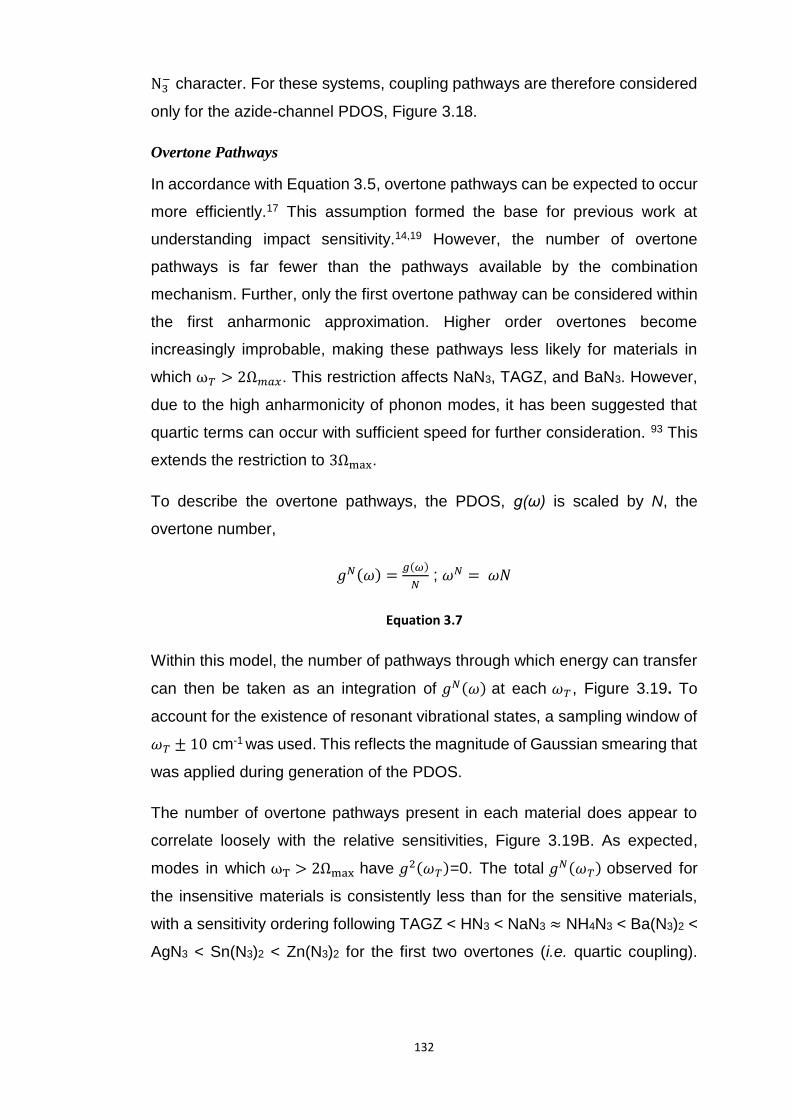
132
N3− character. For these systems, coupling pathways are therefore considered
only for the azide-channel PDOS, Figure 3.18.
Overtone Pathways
In accordance with Equation 3.5, overtone pathways can be expected to occur
more efficiently.17 This assumption formed the base for previous work at
understanding impact sensitivity.14,19 However, the number of overtone
pathways is far fewer than the pathways available by the combination
mechanism. Further, only the first overtone pathway can be considered within
the first anharmonic approximation. Higher order overtones become
increasingly improbable, making these pathways less likely for materials in
which ω𝑇 > 2Ω𝑚𝑎𝑥. This restriction affects NaN3, TAGZ, and BaN3. However,
due to the high anharmonicity of phonon modes, it has been suggested that
quartic terms can occur with sufficient speed for further consideration. 93 This
extends the restriction to 3Ωmax.
To describe the overtone pathways, the PDOS, g(ω) is scaled by N, the
overtone number,
𝑔𝑁(𝜔) =𝑔(𝜔)
𝑁 ; 𝜔𝑁 = 𝜔𝑁
Equation 3.7
Within this model, the number of pathways through which energy can transfer
can then be taken as an integration of 𝑔𝑁(𝜔) at each 𝜔𝑇 , Figure 3.19. To
account for the existence of resonant vibrational states, a sampling window of
𝜔𝑇 ± 10 cm-1 was used. This reflects the magnitude of Gaussian smearing that
was applied during generation of the PDOS.
The number of overtone pathways present in each material does appear to
correlate loosely with the relative sensitivities, Figure 3.19B. As expected,
modes in which ωT > 2Ωmax have 𝑔2(𝜔𝑇)=0. The total 𝑔𝑁(𝜔𝑇) observed for
the insensitive materials is consistently less than for the sensitive materials,
with a sensitivity ordering following TAGZ < HN3 < NaN3 ≈ NH4N3 < Ba(N3)2 <
AgN3 < Sn(N3)2 < Zn(N3)2 for the first two overtones (i.e. quartic coupling).

133
While many of the materials are correctly ordered, the overtone pathways
alone are clearly incapable of fully describing the sensitivity ordering of these
materials. This deficiency is particularly notable for the low sensitivity materials
and HN3. However, in developing the up-pumping model, interest rests in the
localisation of energy. Hence, it is worth recasting these values based on the
number of molecules present in the unit cell (this also has the effect of
correcting for the use of conventional cells in some cases), Figure 3.19C.
Renormalisation in this manner highlights even further the deficiencies of
considering only overtone pathways in the up-pumping model, with HN3 in
particular being substantially underestimated in its sensitivity. The general
trend remains with sensitive compounds exhibiting higher integrated overtone
densities than the less sensitive compounds.

134
Figure 3.19: Overtone pathways for phonon up-pumping. (A) Example of overtone coupling in
AgN3, showing the (black) PDOS, (blue) N=2 overtone, (green) N=3 overtone and (pink) N=4
overtone. (B) Integration over 𝜔𝑇 ± 10 cm-1 for the overtone pathways available in the crystalline
azide materials, arranged in approximate order of increasing sensitivity. Values are given as sums
across all target modes. Overtones N=2 (black), N=3 (red) and N=4 (blue) are shown, alongside
N2+N3 (green), as well as N2+N3+N4 (orange). (C) Renormalisation of the N2+N3 overtone curve
by the number of N3− molecules in the unit cell.
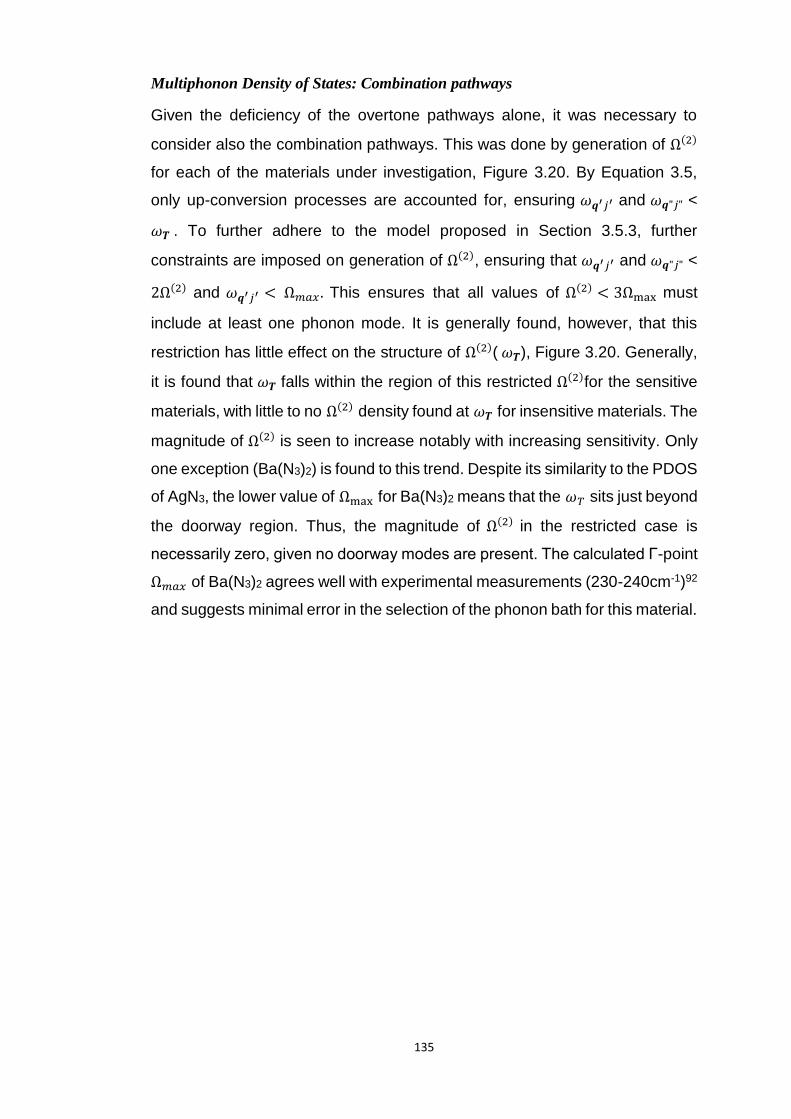
135
Multiphonon Density of States: Combination pathways
Given the deficiency of the overtone pathways alone, it was necessary to
consider also the combination pathways. This was done by generation of Ω(2)
for each of the materials under investigation, Figure 3.20. By Equation 3.5,
only up-conversion processes are accounted for, ensuring 𝜔𝒒′𝑗′ and 𝜔𝒒"𝑗" <
𝜔𝑻 . To further adhere to the model proposed in Section 3.5.3, further
constraints are imposed on generation of Ω(2), ensuring that 𝜔𝒒′𝑗′ and 𝜔𝒒"𝑗" <
2Ω(2) and 𝜔𝒒′𝑗′ < Ω𝑚𝑎𝑥 . This ensures that all values of Ω(2) < 3Ωmax must
include at least one phonon mode. It is generally found, however, that this
restriction has little effect on the structure of Ω(2)( 𝜔𝑻), Figure 3.20. Generally,
it is found that 𝜔𝑻 falls within the region of this restricted Ω(2)for the sensitive
materials, with little to no Ω(2) density found at 𝜔𝑻 for insensitive materials. The
magnitude of Ω(2) is seen to increase notably with increasing sensitivity. Only
one exception (Ba(N3)2) is found to this trend. Despite its similarity to the PDOS
of AgN3, the lower value of Ωmax for Ba(N3)2 means that the 𝜔𝑇 sits just beyond
the doorway region. Thus, the magnitude of Ω(2) in the restricted case is
necessarily zero, given no doorway modes are present. The calculated Г-point
Ω𝑚𝑎𝑥 of Ba(N3)2 agrees well with experimental measurements (230-240cm-1)92
and suggests minimal error in the selection of the phonon bath for this material.
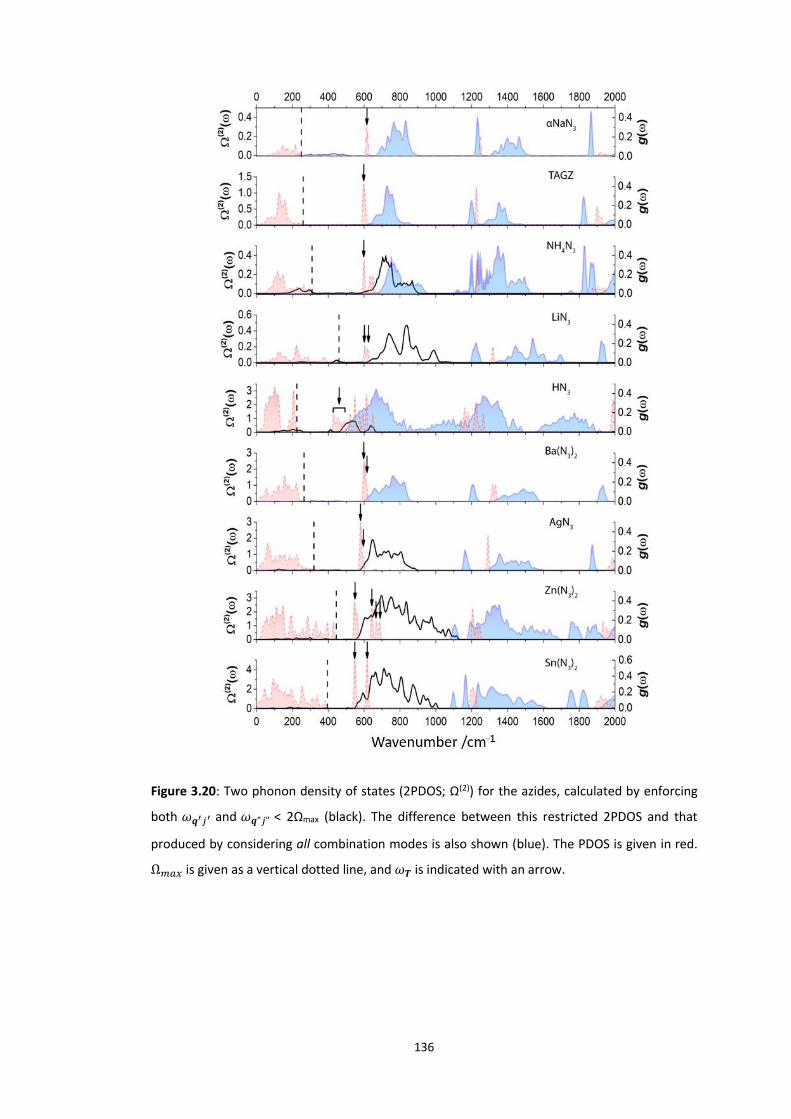
136
Figure 3.20: Two phonon density of states (2PDOS; Ω(2)) for the azides, calculated by enforcing
both 𝜔𝒒′𝑗′ and 𝜔𝒒"𝑗" < 2Ωmax (black). The difference between this restricted 2PDOS and that
produced by considering all combination modes is also shown (blue). The PDOS is given in red.
Ω𝑚𝑎𝑥 is given as a vertical dotted line, and 𝜔𝑻 is indicated with an arrow.
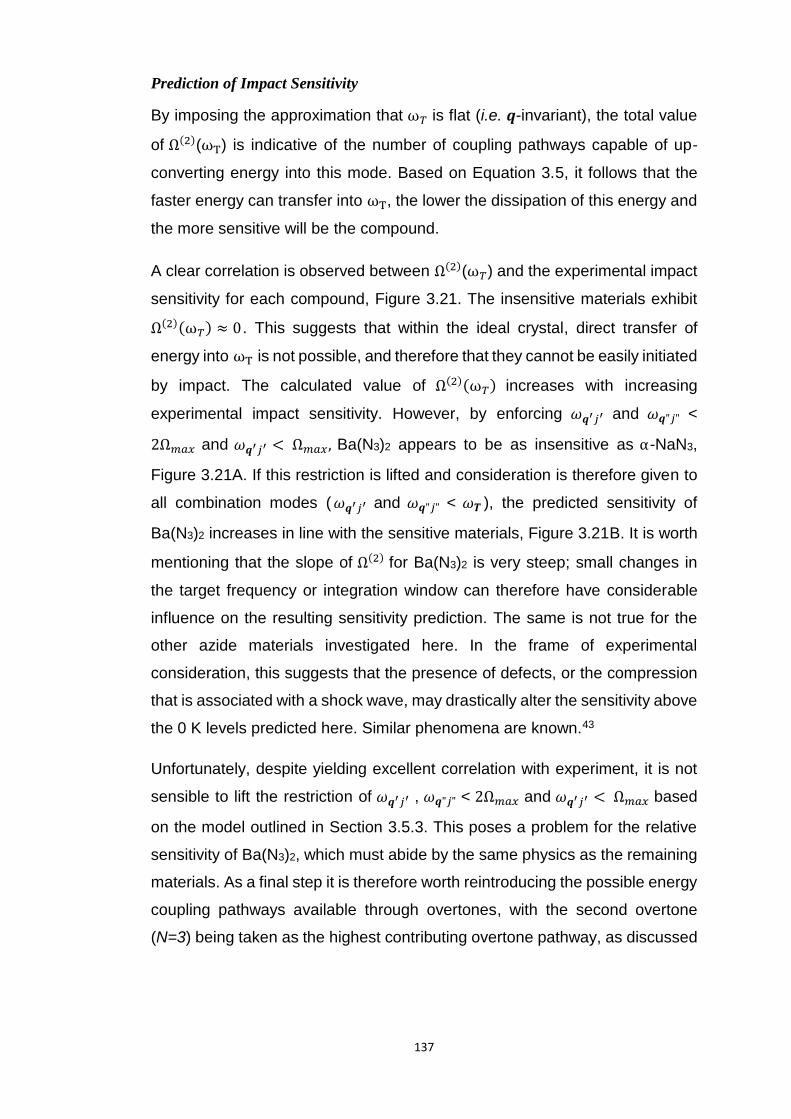
137
Prediction of Impact Sensitivity
By imposing the approximation that ω𝑇 is flat (i.e. 𝒒-invariant), the total value
of Ω(2)(ωT) is indicative of the number of coupling pathways capable of up-
converting energy into this mode. Based on Equation 3.5, it follows that the
faster energy can transfer into ωT, the lower the dissipation of this energy and
the more sensitive will be the compound.
A clear correlation is observed between Ω(2)(ω𝑇) and the experimental impact
sensitivity for each compound, Figure 3.21. The insensitive materials exhibit
Ω(2)(ω𝑇) ≈ 0. This suggests that within the ideal crystal, direct transfer of
energy into ωT is not possible, and therefore that they cannot be easily initiated
by impact. The calculated value of Ω(2)(ω𝑇) increases with increasing
experimental impact sensitivity. However, by enforcing 𝜔𝒒′𝑗′ and 𝜔𝒒"𝑗" <
2Ω𝑚𝑎𝑥 and 𝜔𝒒′𝑗′ < Ω𝑚𝑎𝑥, Ba(N3)2 appears to be as insensitive as α-NaN3,
Figure 3.21A. If this restriction is lifted and consideration is therefore given to
all combination modes (𝜔𝒒′𝑗′ and 𝜔𝒒"𝑗" < 𝜔𝑻 ), the predicted sensitivity of
Ba(N3)2 increases in line with the sensitive materials, Figure 3.21B. It is worth
mentioning that the slope of Ω(2) for Ba(N3)2 is very steep; small changes in
the target frequency or integration window can therefore have considerable
influence on the resulting sensitivity prediction. The same is not true for the
other azide materials investigated here. In the frame of experimental
consideration, this suggests that the presence of defects, or the compression
that is associated with a shock wave, may drastically alter the sensitivity above
the 0 K levels predicted here. Similar phenomena are known.43
Unfortunately, despite yielding excellent correlation with experiment, it is not
sensible to lift the restriction of 𝜔𝒒′𝑗′ , 𝜔𝒒"𝑗" < 2Ω𝑚𝑎𝑥 and 𝜔𝒒′𝑗′ < Ω𝑚𝑎𝑥 based
on the model outlined in Section 3.5.3. This poses a problem for the relative
sensitivity of Ba(N3)2, which must abide by the same physics as the remaining
materials. As a final step it is therefore worth reintroducing the possible energy
coupling pathways available through overtones, with the second overtone
(N=3) being taken as the highest contributing overtone pathway, as discussed
138
above. If these pathways are considered, the predicted ordering becomes very
promising, Figure 3.21C-D. In the final ordering, Ba(N3)2 is predicted to be
slightly less sensitive than AgN3. LiN3 is found to sit at the interface between
the low and high sensitivity compounds. Both of these predicted orderings are
in agreement with experiment. Based on the results in Figure 3.21C, the
predicted sensitivity ordering of the azides follows as NaN3 ≈ TAGZ < NH4N3
< LiN3 < Ba(N3)2 < AgN3 < HN3 < Sn(N3)2 < Zn(N3)2. This appears to be
consistent with experimental reports.
Figure 3.21: Integrated Ω(2)(ωT) for the azides. (A) Based on Ω(2) generated under the restriction
of 𝜔𝒒′𝑗′ and 𝜔𝒒"𝑗" < 2Ωmax and 𝜔𝒒′𝑗′ < Ω𝑚𝑎𝑥 . (B) Based on Ω(2) with 𝜔𝒒′𝑗′ and 𝜔𝒒"𝑗" < 𝜔𝑻. (C)
Recasting of (A) with addition of 𝑔𝑁(𝜔𝑇) for N=2,3; and (D) recasting of (B) with addition of
𝑔𝑁(𝜔𝑇) for N=2,3.
139
As with overtone modelling, it becomes necessary to consider localisation of
this energy per molecule, Figure 3.22. When this is done, the same general
trend is observed as in Figure 3.21C, although the scale is recast. Only a
change in the ordering of HN3 and AgN3 is observed. Based on the molecule-
normalised up-pumping rates in Figure 3.22B, the final ordering is therefore
predicted as NaN3 ≈ TAGZ < NH4N3 < LiN3 < Ba(N3)2 < HN3 ≈ AgN3 < Sn(N3)2
< Zn(N3)2.
Figure 3.22: Recasting of Figure 3.21 (C-D) normalising by the number of azido anions in the unit
cell.
As highlighted in Section 3.3, the ordering of impact sensitivities of the
energetic azides is widely debated in literature. For example, the relative
ordering of Ba(N3)2 and AgN3 is contested, with most recent reports suggesting
AgN3 > Ba(N3)2.36 The sensitivity of Zn(N3)2 is also inconsistently reported in
literature, with some reports stating that is more sensitive than Pb(N3)2, acting
as a sensitizer.45 It is likely that these discrepancies result from variations in
experimental conditions (particle size, crystallinity, impurities, etc). However,
the model presented here does appear to correlate well with the majority of
literature reports. This model may therefore be helpful in clarifying the ordering
140
of azide materials, or highlight areas for deeper experimental investigation,
where reports are drastically different.
3.6 Conclusions
Azides represent a broad class of energetic compounds, covering a wide
range of structural chemistry and impact sensitivity. To understand the
initiation of a chemical explosion, it is necessary to understand the
decomposition of the explosophoric moiety. For the simple azides, this is
rupture of an N-N covalent bond. The electronic structure of the N3− molecule
was therefore investigated. Bond dissociation was found to be possible via an
athermal mechanism, provided sufficient excitation of the bending vibrational
mode of N3− . At sufficient perturbation of the nuclear geometry, a conical
intersection (CI) was observed between the S0 and T1 electronic states. The
potential energy surface of the latter readily facilitates N-N bond dissociation.
The existence of this CI was verified in the solid state.
Noting that mechanical impact leads to rapid excitation of lattice vibrations, the
up-pumping model was explored as a mechanism for impact initiation. Based
on the electronic structure calculations, the bending motion was selected as
the target vibration into which vibrational energy must up-convert to initiate an
explosion. Considering both overtone and combination up-conversion
pathways, it was found that the relative rate of up-pumping into this target
vibration led to excellent correlation with experimental impact sensitivities.
Thus, the work presented in this chapter demonstrates the first fully ab initio
approach to the prediction of the relative impact sensitivities of energetic azide
materials, without the need for any empirical correlations.
The rate of up-conversion was found to be largely dependent on two key
vibrational frequencies: 1) the maximum phonon frequency, Ω𝑚𝑎𝑥, and 2) the
frequency of the N3− bending mode, 𝜔𝑻 . This therefore offers targets and
rationales for the design of novel materials:
141
1. Ω𝑚𝑎𝑥. This value depends on the nature of the external lattice modes
and crystal packing. As such, a model based on vibrational energy
transfer includes potential for understanding the different sensitivities of
polymorphic and multi-component materials (co-crystals and salts).
Stronger bonding of the N3− anion within the lattice (i.e. polymeric or
molecular structures) was found to correlate with higher Ω𝑚𝑎𝑥. It also
follows that more compressible materials will exhibit a higher Ω𝑚𝑎𝑥
when subject to a mechanical perturbation. As such, materials based
on weaker non-covalent interactions between energetic molecules may
be more sensitive
2. 𝜔𝑇. This value depends on the bonding nature of the N3− anion within
the crystal lattice. Higher covalent character leads to a decrease in 𝜔𝑇,
and thus enhanced sensitivity. The increased covalent character
between the N3− molecule and a cation also appear to weaken the N-N
bond. Initiation may therefore be easier.
A particular strength of the model presented in this chapter is the fact that it
encompasses many aspects of earlier models reported in the literature. For
example, within the framework of this chapter, there are clear rationales for a
correlation of band gap and bond dissociation energy with impact sensitivity.
Further, effects such as packing density and crystal packing can all find a
physical basis within this model, via compressibility and the capability of
molecules to undergo necessary geometric perturbations. This work therefore
makes strides towards an overarching understanding of initiation in energetic
materials.
Despite its promise, the present model is based on idealised crystalline
structures, which do not exist in reality. The model therefore only offers insight
into the intrinsic potential of a material to initiate under mechanical perturbation.
Further work will be required to introduce non-ideal features, such as defects
and surfaces. Further, while the model here can justify the relative sensitivity
of energetic materials, it is not yet able to determine whether a material will be
energetic in the first place. This is to say, the model describes the propensity
142
of a material to react under mechanical perturbation, but it does not determine
what that reaction will be. That aside, the present contribution offers a powerful
platform from which novel materials can be designed in silico and offers novel
insight into the structure-property relationships of common energetic materials.
3.7 Suggestions for Future Work
The material presented in this chapter clearly identifies the up-pumping model
as a powerful tool to understanding the impact sensitivity of the crystalline
energetic azides. This offers a starting point for numerous follow-up
investigations.
• The decomposition pathway of the azido anion within the crystal structure
would offer important validation of this model. While the CI was identified
in the 𝛼 -NaN3 lattice, it would be interesting to investigate how this
translates across the azides. In particular, how the PES associated with the
bending mode changes as the covalent bond character of the metal-anion
increases. It will also be important to further investigate the role of lattice-
based eigenvectors in the reactivity of these materials. As was
demonstrated for 𝛼-NaN3, the highest frequency lattice mode does permit
formation of a reactive N3∙ species. However, this pathway is unlikely to be
responsible for impact-induced initiation, given that α-NaN3 is well known
to be insensitive to this form of mechanical stimulation.
• A lattice mode in α-NaN3 was found to be sufficient to induce metallisation
at large eigenvector displacement. However, α-NaN3 is not known to be
sensitive to impact. Further insight into why this vibrational mode does not
lead to impact-induced initiation is therefore required.
• Investigating the initial stages of lattice excitation by dynamics simulations
would offer considerable insight into the up-pumping model. In particular,
understanding how the initial energy is inserted into the crystalline material,
and how this initial excitation varies as a function of material structural type.

143
• The model employed in the present contribution is based on T=0 K. Hence,
it does not offer a mechanism for understanding the temperature
dependence of impact sensitivity. The introduction of temperature by
means of thermal populations into the scattering equations would offer a
new direction for the application of this model.
• Many initiation models suggest that local defects are crucial to the process.
It would therefore be of interest to introduce computationally tractable
models for defects. Initially, this could be done by introduction of electronic
defects into the band structure calculations.
• It is clear that the dissociation energy cannot be neglected in a complete
model of initiation. Introducing a correlation term between the relative
dissociation energy of the azido anion and the quantity of up-pumped
vibrational energy at Ωmax would offer an important step forward in
generalization of this model.
3.8 References
(1) Heinicke, G. Tribochemistry; Akademic-Verlag: Berlin, GDR, 1984.
(2) Dlott, D. D. Ultrafast Vibrational Energy Transfer in the Real World: Laser Ablation, Energetic Solids, and Hemeproteins. J. Opt. Soc. Am. B 1990, 7 (8), 1638.
(3) Zel’dovich, Y. B.; Raizer, Y. P. Physics of Shock Waves and High-Temperature Hydrodynamic Phenomena, Vol II, Ch.; Academic: New York, 1967.
(4) Dlott, D. D.; Fayer, M. D. Shocked Molecular Solids: Vibrational up Pumping, Defect Hot Spot Formation, and the Onset of Chemistry. J. Chem. Phys. 1990, 92 (6), 3798–3812.
(5) Walker, F. E. Physical Kinetics. J. Appl. Phys. 1988, 63 (11), 5548–5554.
(6) Zerilli, F. J.; Toton, E. T. Shock-Induced Molecular Excitation in Solids. Phys. Rev. B 1984, 29 (10), 5891–5902.
(7) Bardo, R. D. Theoretical Calculations of Rate-Determining Steps for Ignition of Shocked, Condensed Nitromethane. Int. J. Quantum Chem. 1986, 30 (20 S), 455–469.
(8) Millar, D. I. A.; Barry, C.; Marshall, W. G.; Pulham, C. R. Structural
144
Characterization of Sodium Azide and Sodium Bifluoride at High Pressures. Zeitschrift fur Krist. 2014, 229 (3), 259–275.
(9) Hou, D.; Zhang, F.; Ji, C.; Hannon, T.; Zhu, H.; Wu, J.; Levitas, V. I.; Ma, Y. Phase Transition and Structure of Silver Azide at High Pressure. J. Appl. Phys. 2011, 110 (2).
(10) Simonis, G. J.; Hathaway, C. E. Raman Spectrum and Phase Transition in Sodium Azide. Phys. Rev. B 1974, 10 (10), 4419–4433.
(11) Zhuravlyov, Y. N.; Lisitsyn, V. M. The Gruneisen Parameter for Silver Azide. Russ. Phys. J. 2011, 54 (7), 35–41.
(12) Coffey, C. S.; Toton, E. T. A Microscopic Theory of Compressive Wave-Induced Reactions in Solid Explosives. J. Chem. Phys. 1982, 76 (2), 949–954.
(13) Fox, P. G. The Explosive Sensitivity of the Metal Azides to Impact. J. Solid State Chem. 1970, 2 (4), 491–502.
(14) McNesby, K. L.; Coffey, C. S. Spectroscopic Determination of Impact Sensitivities of Explosives. J. Phys. Chem. B 1997, 101 (16), 3097–3104.
(15) Kim, H.; Dlott, D. D. Theory of Ultrahot Molecular Solids: Vibrational Cooling and Shock-Induced Multiphonon up Pumping in Crystalline Naphthalene. J. Chem. Phys. 1990, 93 (3), 1695–1709.
(16) Hill, J. R.; Chronister, E. L.; Chang, T.; Kim, H.; Postlewaite, J. C.; Dlott, D. D. Vibrational Relaxation and Vibrational Cooling in Low Temperature Molecular Crystals. J. Chem. Phys. 1988, 88 (2), 949–967.
(17) Dlott, D. D. Optical Phonon Dynamics in Molecular Crystals. Ann. Rev. Phys. Chem. 1986, 37, 157–187.
(18) Hooper, J. Vibrational Energy Transfer in Shocked Molecular Crystals. J. Chem. Phys. 2010, 132 (1), 014507.
(19) Bernstein, J. Ab Initio Study of Energy Transfer Rates and Impact Sensitivities of Crystalline Explosives. J. Chem. Phys. 2018, 148 (8), 084502.
(20) McGrane, S. D.; Barber, J.; Quenneville, J. Anharmonic Vibrational Properties of Explosives from Temperature-Dependent Raman. J. Phys. Chem. A 2005, 109 (44), 9919–9927.
(21) Michalchuk, A. A. L.; Fincham, P. T.; Portius, P.; Pulham, C. R.; Morrison, C. A. A Pathway to the Athermal Impact Initiation of Energetic Azides. J. Phys. Chem. C 2018, acs.jpcc.8b05285.
(22) Coffey, C. S. The Localization of Energy and Plastic Deformation in Crystalline Solids during Shock or Impact. J. Appl. Phys. 1991, 70 (8), 4248–4254.
(23) Coffey, C. S. Energy Localization in Rapidly Deforming Crystalline Solids. Phys. Rev. B 1985, 32 (8), 5335–5341.
145
(24) Manaa, M. R. Shear-Induced Metallization of Triamino-Trinitrobenzene Crystals. Appl. Phys. Lett. 2003, 83 (7), 1352–1354.
(25) Kuklja, M. M.; Aduev, B. P.; Aluker, E. D.; Krasheninin, V. I.; Krechetov, A. G.; Mitrofanov, A. Y. Role of Electronic Excitations in Explosive Decomposition of Solids. J. Appl. Phys. 2001, 89 (7), 4156–4166.
(26) Kuklja, M. M.; Rashkeev, S. N. Shear-Strain-Induced Chemical Reactivity of Layered Molecular Crystals. Appl. Phys. Lett. 2007, 90 (15), 2005–2008.
(27) Grieß, P. On a New Class of Compounds Containing Nitrogen, in Which Hydrogen Is Replaced by Nitrogen. Philos. Trans. R. Soc. London 1864, 13, 377.
(28) Bowden, F. P.; Williams, H. T. Initiation and Propagation of Explosion in Azides and Fulminates. Proc. R. Soc. London. Ser. A Math. Phys. Sci. 1951, 208 (1093), 176–188.
(29) Tornieporth‐Oetting, I. C.; Klapötke, T. M. Covalent Inorganic Azides. Angew. Chemie Int. Ed. English 1995, 34 (5), 511–520.
(30) Fair, H. D.; Walker, R. F. Energetic Materials 1: Physics and Chemistry of the Inoganic Azides; Fair, H. D., Walker, R. F., Eds.; Plenum Press: New York, 1977.
(31) Zhang, G.; Weeks, B. L. A Device for Testing Thermal Impact Sensitivity of High Explosives. Propellants, Explos. Pyrotech. 2010, 35 (5), 440–445.
(32) Müller, T. G.; Karau, F.; Schnick, W.; Kraus, F. A New Route to Metal Azides. Angew. Chemie - Int. Ed. 2014, 53 (50), 13695–13697.
(33) Campbell, R.; Konar, S.; Hunter, S.; Pulham, C.; Portius, P. Labile Low-Valent Tin Azides: Syntheses, Structural Characterization, and Thermal Properties. Inorg. Chem. 2018, 57, 400–411.
(34) Schulz, A.; Villinger, A. Binary Zinc Azides. Chem. - A Eur. J. 2016, 22 (6), 2032–2038.
(35) Martin, W. R.; Ball, D. W. Small Organic Azides as High Energy Materials: Perazidoacetylene, -Ethylene, and -Allene. ChemistrySelect 2018, 3 (25), 7222–7225.
(36) Cartwright, M.; Wilkinson, J. Correlation of Structure and Sensitivity in Inorganic Azides i Effect of Non-Bonded Nitrogen Nitrogen Distances. Propellants, Explos. Pyrotech. 2010, 35 (4), 326–332.
(37) Gray, P.; Waddington, T. . Fundamental Vibration Frequencies and Force Constants in the Azide Ion. Trans. Faraday Soc. 1957, 53, 901–908.
(38) Meyer, R.; Köhler, J.; Homburg, A. Explosives, 6th ed.; Meyer, R., Köhler, J., Homburg, A., Eds.; Wiley-VCH: Weinheim, 2007.
(39) Kamlet, M. J.; Adolph, H. G. The Relationship of Impact Sensitivity with Structure of Organic High Explosives. II. Polynitroaromatic Explosives.

146
Propellants, Explos. Pyrotech. 1979, 4 (2), 30–34.
(40) Oxley, J.; Smith, J.; Buco, R.; Huang, J. A Study of Reduced-Sensitivity RDX. J. Energ. Mater. 2007, 25 (3), 141–160.
(41) Johansen, Ø. H.; Kristiansen, J. D.; Gjersøe, R.; Berg, A.; Halvorsen, T.; Smith, K. T.; Nevstad, G. O. RDX and HMX with Reduced Sensitivity towards Shock Initiation-RS-RDX and RS-HMX. Propellants, Explos. Pyrotech. 2008, 33 (1), 20–24.
(42) Marinkas, P. L. A Method of Growing Anhydrous Single Crystals of Barium Azide. Nature 1966, 211, 1288–1289.
(43) Verneker, V. R. P.; Avrami, L. Explosive Behavior of Barium Azide. J. Phys. Chem. 1968, 72 (3), 778–783.
(44) Avrami, L.; Hutchinson, R. The Sensitivity to Impact and Friction. In Energetic Materials 2: Technology of the Inorganic Azides; Fair, H. ., Walker, R. F., Eds.; 1977; pp 111–159.
(45) Shaneyfelt, W. Complexities of Lead Azide; 21st DDESB Explosives Safety Seminar, 1984.
(46) Wohler, L.; Martin, F. New Fulminates and Azides; Chemische Berichte, 1917.
(47) Bresien, J.; Ott, H.; Rosenstengel, K.; Schulz, A.; Thiele, P.; Villinger, A. Binary Polyazides of Zinc. Eur. J. Inorg. Chem. 2016, 2016 (36), 5594–5609.
(48) Yakovleva, G. .; Kurbangalina, R. K.; Stesik, L. N. Detonation Properties of Ammonium Azide. Combust. Explos. Shock Waves 1977, 13, 405–407.
(49) Denisaev, A. A.; Assovskii, I. G.; Berlin, A. A. A. Study of the Impact Sensitivity of Sodium Azide and Its Mixtures with Water. Dokl. Phys. Chem. 2013, 453 (1), 261–263.
(50) Damse, R. S. Studies on the Decomposition Chemistry of Triaminoguanidine Azide and Guanidine Nitrate. J. Hazard. Mater. 2009, 172 (2–3), 1383–1387.
(51) Evers, J.; Göbel, M.; Krumm, B.; Martin, F.; Medvedyev, S.; Oehlinger, G.; Steemann, F. X.; Troyan, I.; Klapötke, T. M.; Eremets, M. I. Molecular Structure of Hydrazoic Acid with Hydrogen-Bonded Tetramers in Nearly Planar Layers. J. Am. Chem. Soc. 2011, 133 (31), 12100–12105.
(52) Werner, H. J.; Knowles, P. J.; Knizia, G.; Manby, F. R.; Schütz, M. Molpro: A General-Purpose Quantum Chemistry Program Package. Wiley Interdiscip. Rev. Comput. Mol. Sci. 2012, 2 (2), 242–253.
(53) Veryazov, V.; Malmqvist, P. A.; Roos, B. O. How to Select Active Space for Multiconfigurational Quantum Chemistry? Int. J. Quantum Chem. 2011, 111, 3329–3338.
(54) Clark, S. J.; Segall, M. D.; Pickard, C. J.; Hasnip, P. J.; Probert, M. I. J.; Refson, K.;

147
Payne, M. C. First Principles Methods Using CASTEP. Zeitschrift für Krist. 2005, 220, 567–570.
(55) Perdew, J. P.; Burke, K.; Ernzerhof, M. Generalized Gradient Approximation Made Simple. Phys. Rev. Lett. 1996, 77 (18), 3865–3868.
(56) Sabatini, R.; Gorni, T.; De Gironcoli, S. Nonlocal van Der Waals Density Functional Made Simple and Efficient. Phys. Rev. B - Condens. Matter Mater. Phys. 2013, 87 (4), 4–7.
(57) Grimme, S. Semiempirical GGA-Type Density Functional Constructed with a Long-Range Dispersion Correction. J. Comput. Chem. 2006, 27, 1787–1799.
(58) Tkatchenko, A.; Scheffler, M. Accurate Molecular van Der Waals Interactions from Ground-State Electron Density and Free-Atom Reference Data. Phys. Rev. Lett. 2009, 102 (7), 6–9.
(59) Ramesh Babu, K.; Vaitheeswaran, G. Lattice Dynamics and Electronic Structure of Energetic Solids LiN3and NaN3: A First Principles Study. Chem. Phys. Lett. 2013, 586, 44–50.
(60) Pack, J. D.; Monkhorst, H. J. Special Points for Brillouin-Zone Integrations. Phys. Rev. B 1976, 13 (12), 5188–5192.
(61) Hinuma, Y.; Pizzi, G.; Kumagai, Y.; Oba, F.; Tanaka, I. Band Structure Diagram Paths Based on Crystallography. Comput. Mater. Sci. 2017, 128, 140–184.
(62) Bracuti, A. J.; Extine, M. W. 1,2,3-Triaminoguanidinium Azide (TAZ) Structure. J. Crystallogr. Spectrosc. Res. 1990, 20 (1), 31–35.
(63) Dovesi, R.; Orlando, R.; Erba, A.; Zicovich-Wilson, C. M.; Civalleri, B.; Casassa, S.; Maschio, L.; Ferrabone, M.; De La Pierre, M.; D’Arco, P.; et al. CRYSTAL14: A Program for the Ab Initio Investigation of Crystalline Solids. Int. J. Quantum Chem. 2014, 114 (19), 1287–1317.
(64) Krukau, A. V.; Vydrov, O. A.; Izmaylov, A. F.; Scuseria, G. E. Influence of the Exchange Screening Parameter on the Performance of Screened Hybrid Functionals. J. Chem. Phys. 2006, 125 (22).
(65) Peintinger, M. F.; Oliveira, D. V.; Bredow, T. Consistent Gaussian Basis Sets of Triple-Zeta Valence with Polarization Quality for Solid-State Calculations. J. Comput. Chem. 2013, 34 (6), 451–459.
(66) Zagorac, D.; Doll, K.; Schön, J. C.; Jansen, M. Sterically Active Electron Pairs in Lead Sulfide? An Investigation of the Electronic and Vibrational Properties of Pbs in the Transition Region between the Rock Salt and the α-GeTe-Type Modifications. Chem. - A Eur. J. 2012, 18 (35), 10929–10936.
(67) Doll, K.; Pyykkö, P.; Stoll, H. Closed-Shell Interaction in Silver and Gold Chlorides. J. Chem. Phys. 1998, 109 (6), 2339–2345.
(68) Causà, M.; Dovesi, R.; Roetti, C. Pseudopotential Hartree-Fock Study of
148
Seventeen III-V and IV-IV Semiconductors. Phys. Rev. B 1991, 43 (14), 11937–11943.
(69) Garza, A. J.; Scuseria, G. E. Predicting Band Gaps with Hybrid Density Functionals. 2016, 7, 5–10.
(70) Aduev, B. P.; Aluker, É. D.; Belokurov, G. M.; Zakharov, Y. a.; Krechetov, a. G. Explosive Decomposition of Heavy-Metal Azides. J. Exp. Theor. Phys. 1999, 89 (5), 906–915.
(71) Aduev, B. P.; Aluker, E. D.; Kriger, V. G.; Zakharov, Y. A. Study of Silver Azide Explosive Decomposition by Stpectroscopic Methods with High Temporal Resolution. Solid State Ionics 1997, 101–103, 33–36.
(72) Grechnev, A.; Ahuja, R.; Eriksson, O. Balanced Crystal Orbital Overlap Population - A Tool for Analysing Chemical Bonds in Solids. J. Phys. Condens. Matter 2003, 15 (45), 7751–7761.
(73) Zhu, W.; Xiao, H. First-Principles Band Gap Criterion for Impact Sensitivity of Energetic Crystals: A Review. Struct. Chem. 2010, 21 (3), 657–665.
(74) Droghetti, A.; Rungger, I.; Das Pemmaraju, C.; Sanvito, S. Fundamental Gap of Molecular Crystals via Constrained Density Functional Theory. Phys. Rev. B 2016, 93 (19), 1–8.
(75) Yedukondalu, N.; Ghule, V. D.; Vaitheeswaran, G. Computational Study of Structural, Electronic and Optical Properties of Crystalline NH4N3. 2013.
(76) Liu, Q. J.; Zeng, W.; Liu, F. S.; Liu, Z. T. First-Principles Study of Hydronitrogen Compounds: Molecular Crystalline NH4N3and N2H5N3. Comput. Theor. Chem. 2013, 1014, 37–42.
(77) Zhu, W.; Xiao, H. Ab Initio Study of Electronic Structure and Optical Properties of Heavy Metal Azides: TlN3, AgN3 and CuN3. J. Comput. Chem. 2007, 29 (2), 176–184.
(78) Zhu, W.; Xiao, H. First-Principles Study of Structural and Vibrational Properties of Crystalline Silver Azide under High Pressure. J. Solid State Chem. 2007, 180 (12), 3521–3528.
(79) Zhu, W.; Xiao, J.; Xiao, H. Comparative First-Principles Study of Structural and Optical Properties of Alkali Metal Azides. J. Phys. Chem. B 2006, 110 (20), 9856–9862.
(80) Zhu, W.; Xu, X.; Xiao, H. Electronic Structure and Optical Properties of Crystalline Strontium Azide and Barium Azide by Ab Initio Pseudopotential Plane-Wave Calculations. J. Phys. Chem. Solids 2007, 68 (9), 1762–1769.
(81) Zhang, H.; Cheung, F.; Zhao, F.; Cheng, X. Band Gaps and the Possible Effect on Impact Sensitivity for Some Nitro Aromatic Explosive Materials. Int. J. Quantum Chem. 2009, 109, 1547–1552.
149
(82) Polak, M.; Gruebele, M.; Saykally, R. . Velocity Modulation Laser Spectroscopy of Negative Ions: The v3 Band of Azide (N3-). J. Am. Chem. Soc. 1987, 109 (10), 2884–2887.
(83) Bryant, J. I. Vibrational Spectrum of Sodium Azide Single Crystals. J. Chem. Phys. 1964, 40 (11), 3195–3203.
(84) Parker, S. F.; Refson, K.; Williams, K. P. J.; Braden, D. a; Hudson, B. S.; Yvon, K. Spectroscopic and Ab Initio Characterization of the [ReH9]2- Ion. Inorg. Chem. 2006, 45 (26), 10951–10957.
(85) Mitchell, P. C.; Parker, S. F.; Ramirez-Cuesta, A. J.; Tomkinson, J. The Theory of Inelastic Neutron Scattering Spectroscopy. In Vibrational Spectroscopy with Neutrons; World Scientific, 2005; pp 13–65.
(86) Kirchartz, T.; Rau, U. Decreasing Radiative Recombination Coefficients via an Indirect Band Gap in Lead Halide Perovskites. J. Phys. Chem. Lett. 2017, 8 (6), 1265–1271.
(87) Aduev, B. P.; Aluker, É. D.; Belokurov, G. M.; Drobchik, A. N.; Zakharov, Y. A.; Krechetov, A. G.; Mitrofanov, A. Y. Preexplosion Phenomena in Heavy Metal Azides. Combust. Explos. Shock Waves 2000, 36 (5), 622–632.
(88) Paulatto, L.; Mauri, F.; Lazzeri, M. Anharmonic Properties from a Generalized Third-Order Ab Initio Approach: Theory and Applications to Graphite and Graphene. Phys. Rev. B - Condens. Matter Mater. Phys. 2013, 87 (21), 1–18.
(89) Fried, L. E.; Ruggiero, a J. Energy-Transfer Rates in Primary, Secondary, and Insensitive Explosives. J. Phys. Chem. 1994, 98 (39), 9786–9791.
(90) Ye; Koshi, M. Theoretical Studies of Energy Transfer Rates of Secondary Explosives. J. Phys. Chem. B 2006, 110 (37), 18515–18520.
(91) Aynajian, P. Electron-Phonon Interaction in Conventional and Unconventional Superconductors; Springer-Verlag: Berlin, 2010.
(92) Bryant, J. I. Vibrational Spectrum of Barium Azide Single Crystals. J. Chem. Phys. 1970, 52, 4867.
(93) Dlott, D. D. Multi-Phonon up-Pumpng in Energetic Materials. In Overview of Recent Research on Energetic Materials; Shaw, R. W., Brill, T. B., Thompson, D. L., Eds.; World Scientific, 2005; pp 303–333.
(94) Colognesi, D.; Celli, M.; Cilloco, F.; Newport, R. J.; Parker, S. F.; Rossi-Albertini, V.; Sacchetti, F.; Tomkinson, J.; Zoppi, M. TOSCA Neutron Spectrometer: The Final Configuration. Appl. Phys. A Mater. Sci. Process. 2002, 74, 64–66.
(95) Pinna, R. S.; Rudić, S.; Parker, S. F.; Armstrong, J.; Zanetti, M.; Škoro, G.; Waller, S. P.; Zacek, D.; Smith, C. A.; Capstick, M. J.; et al. The Neutron Guide Upgrade of the TOSCA Spectrometer. Nucl. Instruments Methods Phys. Res. Sect. A Accel. Spectrometers, Detect. Assoc. Equip. 2018, 896, 68–74.
150
(96) Arnold, O.; Bilheux, J. C.; Borreguero, J. M.; Buts, A.; Campbell, S. I.; Chapon, L.; Doucet, M.; Draper, N.; Ferraz Leal, R.; Gigg, M. A.; et al. Mantid - Data Analysis and Visualization Package for Neutron Scattering and μ SR Experiments. Nucl. Instruments Methods Phys. Res. Sect. A Accel. Spectrometers, Detect. Assoc. Equip. 2014, 764, 156–166.
(97) Dymkowski, K.; Parker, S. F.; Fernandez-Alonso, F.; Mukhopadhyay, S. AbINS: The Modern Software for INS Interpretation. Phys. B Condens. Matter 2018, In Press, 1–6.
151
Chapter 4
Vibrational Up-Pumping in Some Molecular
Energetic Materials
4.1 Introduction
Many commonly used energetic materials (EM) are composed of organic
molecules, with well-known examples including 1,3,5,7-tetranitro-1,3,5,7-
tetrazocane (HMX), 2,4,6-trinitrotoluene (TNT) and triaminotrinitrobenzene
(TATB). These compounds are typically based on similar structural moieties
(explosophores), often -NO2 functionality, or numerous N-N, N-O or C-N bonds.
However, despite these structural similarities, organic EMs exhibit a broad
range of impact sensitivities. For example, ϵ-CL-20 (HNIW) initiates with only
ca. 3 J of impact energy,1 while TATB requires > 122 J for impact initiation.2
Particularly striking is the difference in impact sensitivity of TNT and picric acid,
whose structures differ only in a single substituent on their aromatic rings. Yet,
while TNT initiates at ca. 40 J,3 the initiation of picric acid requires
approximately half the energy, ca. 22 J.3 As organic EMs are metal-free, they
are particularly promising materials from an environmental perspective.
Consequently, there has been considerable interest in developing new organic
EMs with a broad range of energetic properties, and large libraries of such
molecules now exist. The synthesis of novel organic EMs can require very
complex and harsh experimental procedures. With no a priori knowledge of
the physical properties of the final (or indeed intermediate) products, the
process is both expensive and potentially very dangerous.
152
A number of theoretical approaches have so far been developed in an attempt
to rationalise the sensitivity of organic EMs (Chapter 1.3).4 Briefly, these have
included the study of electrostatic potentials,5,6 bond dissociation energies,7–10
large-scale empirical fitting11,12 as well as consideration of static and dynamic
band gaps.9,13,14 These methods have offered rationalisation of the impact
sensitivity of organic EMs to varying degrees. However, these models do not
typically include a physical underlying mechanism to link a mechanical impact
and the subsequent conversion of energy into a chemical reaction. Thus, the
reasons for a material displaying a particular impact sensitivity remain elusive.
The concept of vibrational up-pumping has been demonstrated experimentally
and theoretically for a range of molecular compounds.15–17 This has led to
scattered analyses of energy transfer rates in molecular EMs based on
inelastic neutron scattering spectra,18,19 or bench-top Raman spectra.20,21
While these early works did suggest strong correlation between sensitivity and
energy transfer rates, the data on which they were based was limited, and the
models inconsistent. Most notably, the mechanism of up-pumping (overtone20
or combination18,19 pathways) and the target region into which up-pumped
energy is considered, differ considerably between these models. Up-pumping
phenomena have demonstrated capable of localising energy,17,22 i.e.
producing ‘hot-spots’, and therefore offer a fundamental approach to
understanding the impact and shock-induced chemistry of EMs.17
The theoretical and experimental techniques required to enhance the
fundamental understanding of up-pumping models in solids have only recently
become available. A very recent study successfully attempted to correlate
zone-centre overtone structure with the impact sensitivity of a selection of
organic EMs.23 Having constructed a more complete picture of these
processes from first principles in Chapter 3, it is therefore of interest to further
develop and apply the model to a more challenging series of organic systems.
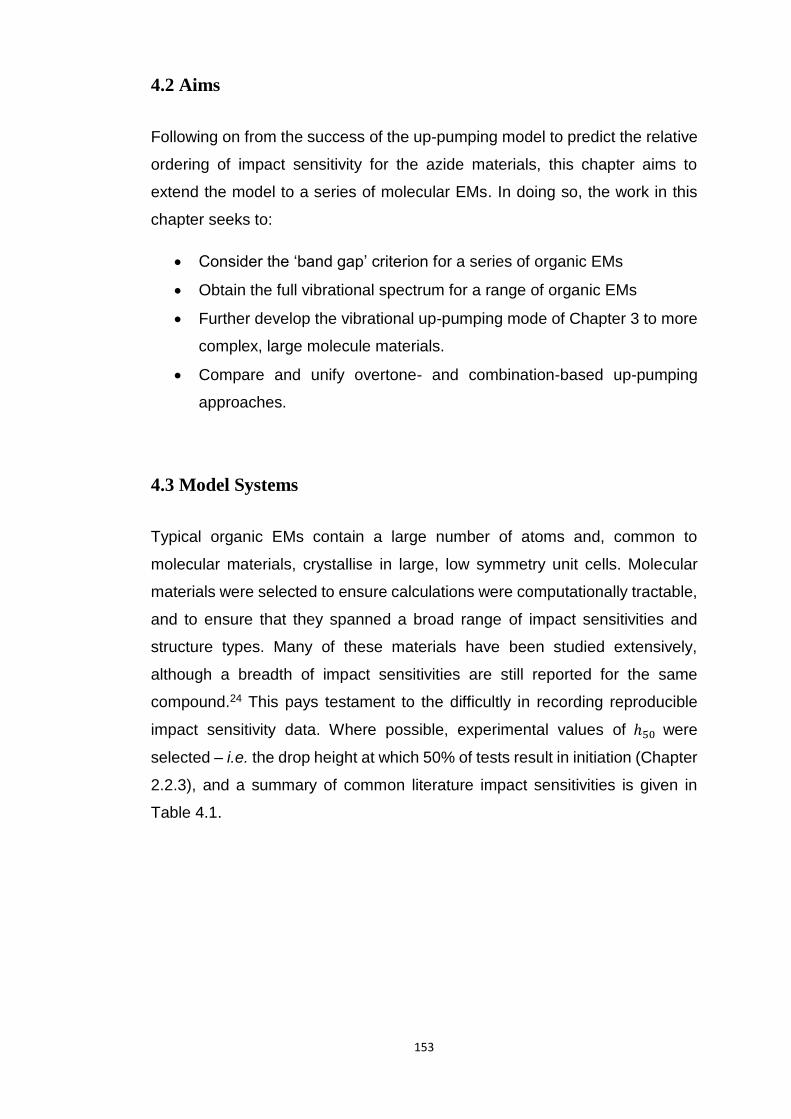
153
4.2 Aims
Following on from the success of the up-pumping model to predict the relative
ordering of impact sensitivity for the azide materials, this chapter aims to
extend the model to a series of molecular EMs. In doing so, the work in this
chapter seeks to:
• Consider the ‘band gap’ criterion for a series of organic EMs
• Obtain the full vibrational spectrum for a range of organic EMs
• Further develop the vibrational up-pumping mode of Chapter 3 to more
complex, large molecule materials.
• Compare and unify overtone- and combination-based up-pumping
approaches.
4.3 Model Systems
Typical organic EMs contain a large number of atoms and, common to
molecular materials, crystallise in large, low symmetry unit cells. Molecular
materials were selected to ensure calculations were computationally tractable,
and to ensure that they spanned a broad range of impact sensitivities and
structure types. Many of these materials have been studied extensively,
although a breadth of impact sensitivities are still reported for the same
compound.24 This pays testament to the difficultly in recording reproducible
impact sensitivity data. Where possible, experimental values of ℎ50 were
selected – i.e. the drop height at which 50% of tests result in initiation (Chapter
2.2.3), and a summary of common literature impact sensitivities is given in
Table 4.1.
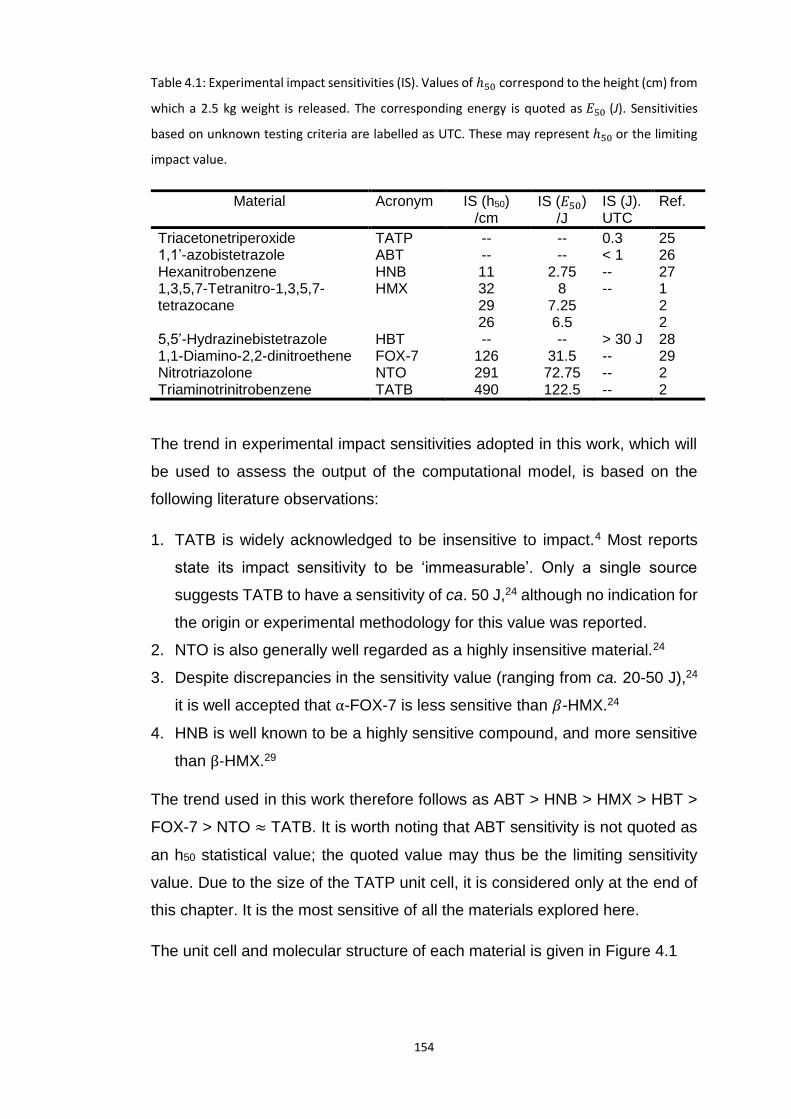
154
Table 4.1: Experimental impact sensitivities (IS). Values of ℎ50 correspond to the height (cm) from
which a 2.5 kg weight is released. The corresponding energy is quoted as 𝐸50 (J). Sensitivities
based on unknown testing criteria are labelled as UTC. These may represent ℎ50 or the limiting
impact value.
Material Acronym IS (h50) /cm
IS (𝐸50) /J
IS (J). UTC
Ref.
Triacetonetriperoxide TATP -- -- 0.3 25 1,1’-azobistetrazole ABT -- -- < 1 26 Hexanitrobenzene HNB 11 2.75 -- 27 1,3,5,7-Tetranitro-1,3,5,7-tetrazocane
HMX 32 29 26
8 7.25 6.5
-- 1 2 2
5,5’-Hydrazinebistetrazole HBT -- -- > 30 J 28 1,1-Diamino-2,2-dinitroethene FOX-7 126 31.5 -- 29 Nitrotriazolone NTO 291 72.75 -- 2 Triaminotrinitrobenzene TATB 490 122.5 -- 2
The trend in experimental impact sensitivities adopted in this work, which will
be used to assess the output of the computational model, is based on the
following literature observations:
1. TATB is widely acknowledged to be insensitive to impact.4 Most reports
state its impact sensitivity to be ‘immeasurable’. Only a single source
suggests TATB to have a sensitivity of ca. 50 J,24 although no indication for
the origin or experimental methodology for this value was reported.
2. NTO is also generally well regarded as a highly insensitive material.24
3. Despite discrepancies in the sensitivity value (ranging from ca. 20-50 J),24
it is well accepted that α-FOX-7 is less sensitive than 𝛽-HMX.24
4. HNB is well known to be a highly sensitive compound, and more sensitive
than β-HMX.29
The trend used in this work therefore follows as ABT > HNB > HMX > HBT >
FOX-7 > NTO ≈ TATB. It is worth noting that ABT sensitivity is not quoted as
an h50 statistical value; the quoted value may thus be the limiting sensitivity
value. Due to the size of the TATP unit cell, it is considered only at the end of
this chapter. It is the most sensitive of all the materials explored here.
The unit cell and molecular structure of each material is given in Figure 4.1
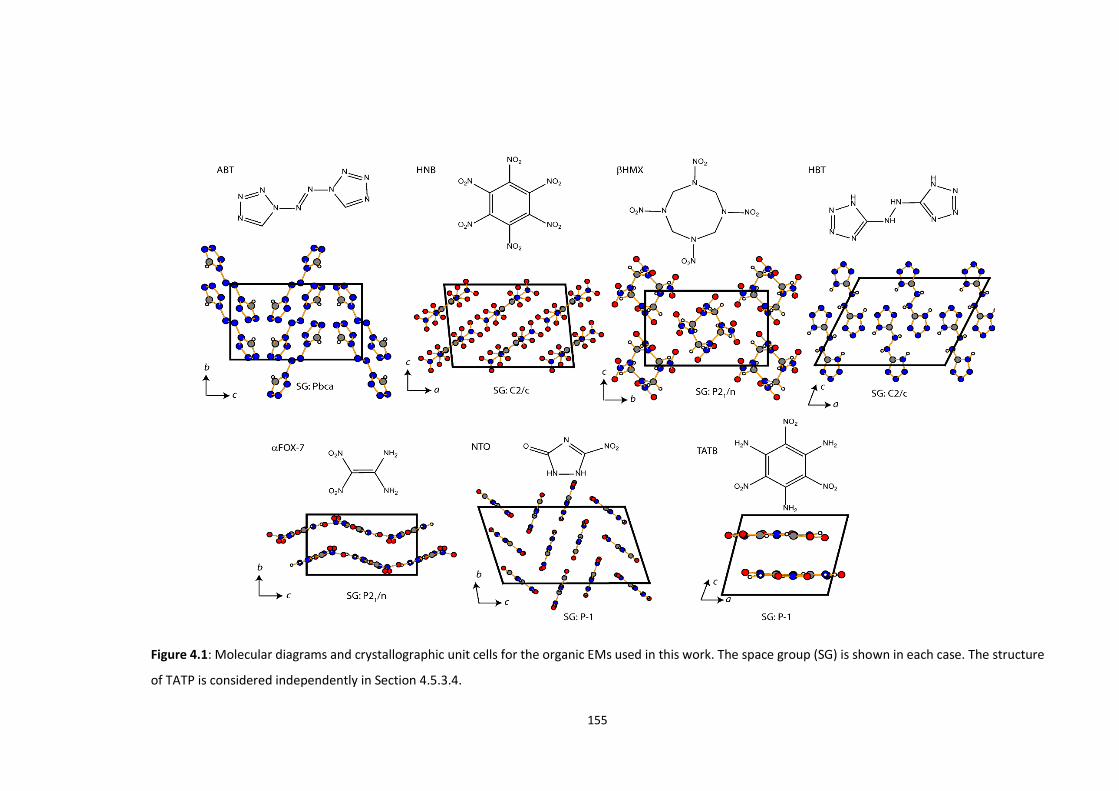
155
Figure 4.1: Molecular diagrams and crystallographic unit cells for the organic EMs used in this work. The space group (SG) is shown in each case. The structure
of TATP is considered independently in Section 4.5.3.4.
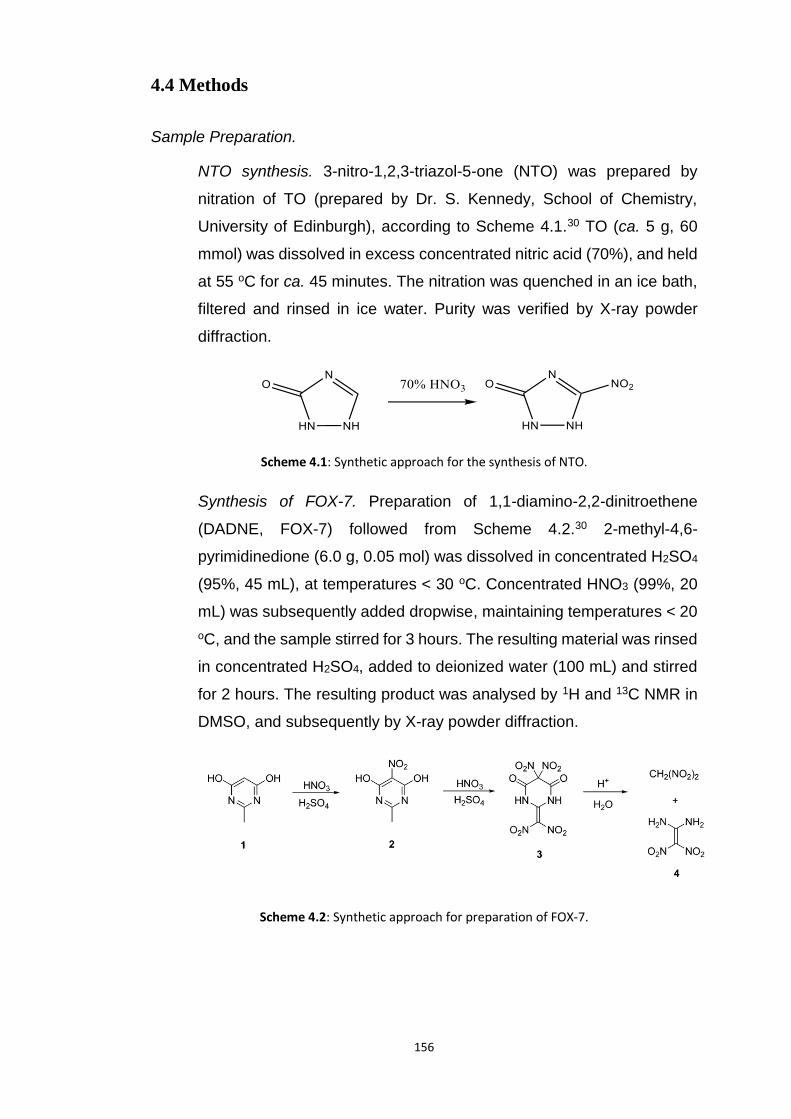
156
4.4 Methods
Sample Preparation.
NTO synthesis. 3-nitro-1,2,3-triazol-5-one (NTO) was prepared by
nitration of TO (prepared by Dr. S. Kennedy, School of Chemistry,
University of Edinburgh), according to Scheme 4.1.30 TO (ca. 5 g, 60
mmol) was dissolved in excess concentrated nitric acid (70%), and held
at 55 oC for ca. 45 minutes. The nitration was quenched in an ice bath,
filtered and rinsed in ice water. Purity was verified by X-ray powder
diffraction.
Scheme 4.1: Synthetic approach for the synthesis of NTO.
Synthesis of FOX-7. Preparation of 1,1-diamino-2,2-dinitroethene
(DADNE, FOX-7) followed from Scheme 4.2.30 2-methyl-4,6-
pyrimidinedione (6.0 g, 0.05 mol) was dissolved in concentrated H2SO4
(95%, 45 mL), at temperatures < 30 oC. Concentrated HNO3 (99%, 20
mL) was subsequently added dropwise, maintaining temperatures < 20
oC, and the sample stirred for 3 hours. The resulting material was rinsed
in concentrated H2SO4, added to deionized water (100 mL) and stirred
for 2 hours. The resulting product was analysed by 1H and 13C NMR in
DMSO, and subsequently by X-ray powder diffraction.
Scheme 4.2: Synthetic approach for preparation of FOX-7.

157
TATB and 𝛽 -HMX. Samples of these materials were taken from
available stock. β-HMX was provided by the Cavendish Laboratories,
University of Cambridge. TATB was synthesised by C. Henderson
(School of Chemistry, University of Edinburgh). Samples were used as
provided, without further purification.
Condensed Matter Calculations.
The PBE-D2 scheme has been previously demonstrated to work very well for
molecular energetic materials.31–33 It was therefore chosen as a starting point
for the calculations presented here. All input structures were taken from the
Cambridge Crystallographic Database (CCDC): β-HMX (Ref: OCHTET1534),
α -FOX-7 (Ref: SEDTUQ0335), NTO (Ref: QOYJOD0636), HNB (Ref:
HNOBEN37), ABT (EWEYEL26), HBT (TIPZAU28), TATB (TATNBZ38) and
TATP (HMHOCN0739). Optimisation was performed using plane wave DFT as
implemented in CASTEP v16.40 The electronic wavefunction was expanded in
plane waves to a kinetic energy of 1800 eV for all systems, except HBT (cut-
off 1600 eV), and β-HMX, TATB and TATP (cut-off 1300 eV). Forces were
converged to < 5 × 10⁻⁴ eV/ Å, and stresses to < 5 × 10⁻⁴ GPa. The energy
change per atom was converged to < 1 × 10⁻⁹ eV/atom. The resulting unit cell
parameters are given in Table 4.2. In all cases, norm-conserving
pseudopotentials were used, as were available within the CASTEP v16
software package. All phonon calculations were based on the primitive unit
cells. Phonon calculations were performed using the linear response method
to calculate the dynamical matrices on a regular grid of wave vectors, and
Fourier interpolated to a fine grid of > 150 points for generation of phonon
density of states (DOS, 𝑔(ω)). Phonon dispersion curves were generated by
Fourier interpolation of the computed dynamical matrices along high symmetry
paths as proposed by SeeKPath41 and labelled by IUPAC convention. For
TATP, only the zone-centre phonons were calculated.
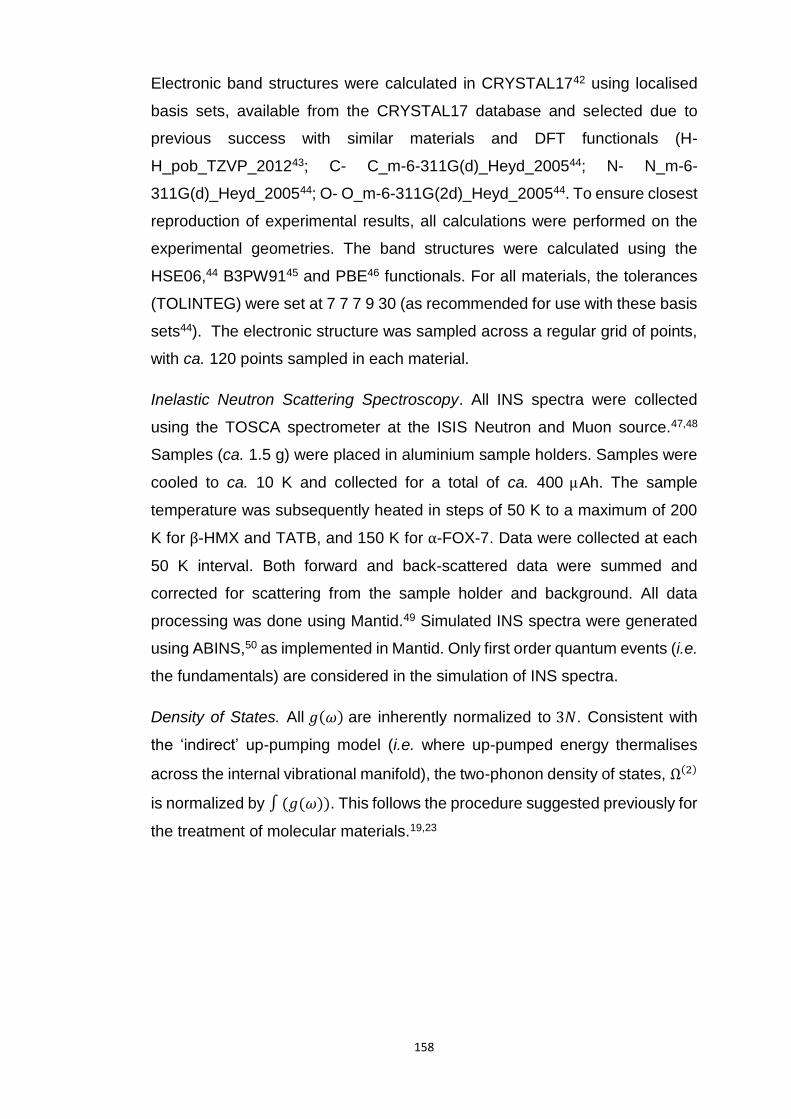
158
Electronic band structures were calculated in CRYSTAL1742 using localised
basis sets, available from the CRYSTAL17 database and selected due to
previous success with similar materials and DFT functionals (H-
H_pob_TZVP_201243; C- C_m-6-311G(d)_Heyd_200544; N- N_m-6-
311G(d)_Heyd_200544; O- O_m-6-311G(2d)_Heyd_200544. To ensure closest
reproduction of experimental results, all calculations were performed on the
experimental geometries. The band structures were calculated using the
HSE06,44 B3PW9145 and PBE46 functionals. For all materials, the tolerances
(TOLINTEG) were set at 7 7 7 9 30 (as recommended for use with these basis
sets44). The electronic structure was sampled across a regular grid of points,
with ca. 120 points sampled in each material.
Inelastic Neutron Scattering Spectroscopy. All INS spectra were collected
using the TOSCA spectrometer at the ISIS Neutron and Muon source.47,48
Samples (ca. 1.5 g) were placed in aluminium sample holders. Samples were
cooled to ca. 10 K and collected for a total of ca. 400 μAh. The sample
temperature was subsequently heated in steps of 50 K to a maximum of 200
K for β-HMX and TATB, and 150 K for α-FOX-7. Data were collected at each
50 K interval. Both forward and back-scattered data were summed and
corrected for scattering from the sample holder and background. All data
processing was done using Mantid.49 Simulated INS spectra were generated
using ABINS,50 as implemented in Mantid. Only first order quantum events (i.e.
the fundamentals) are considered in the simulation of INS spectra.
Density of States. All 𝑔(𝜔) are inherently normalized to 3𝑁. Consistent with
the ‘indirect’ up-pumping model (i.e. where up-pumped energy thermalises
across the internal vibrational manifold), the two-phonon density of states, Ω(2)
is normalized by ∫ (𝑔(𝜔)). This follows the procedure suggested previously for
the treatment of molecular materials.19,23
159
Table 4.2: Optimised unit cell parameters for the molecular EMs studied here using the PBE-D2 functional. The error in total volume is given with respect to
the experimental volume. Low temperature data are used where available. Where conventional cells are non-primitive, the primitive cell is also displayed.
a b c 𝛼 𝛽 𝛾 V dV/%
ABTexp Pbca 8.352 6.793 11.614 90 90 90 658.962
ABTcalc 8.354 6.789 11.618 90 90 90 658.931 -0.004%
HNBexp C2/c 13.220 9.130 9.680 90 95.500 90 581.490
HNBexp P(C2/c) 9.046 9.046 9.680 62.280 62.280 60.620 581.492
HNBcalc 9.028 9.028 9.771 62.444 62.444 59.981 582.977 +0.26%
𝛽-HMXexp P21/c 6.525 11.024 7.362 90 102.642 90 516.675
𝛽-HMXcalc 6.624 11.256 7.373 90 102.222 90 537.299 +4.00%
HBTexp C2/c 12.401 5.513 9.835 90 115.570 90 606.565
HBTexp P(C2/c) 6.786 6.786 9.835 113.230 113.230 47.940 303.283
HBTcalc 6.706 6.706 9.724 111.837 111.837 49.440 303.075 -0.07%
𝛼-FOX7exp P21/n 6.934 6.622 11.312 90 90.065 90 519.470
𝛼-FOX7calc 7.089 6.623 11.440 90 91.273 90 530.898 +2.20%
NTOexp P-1 5.123 10.314 17.998 106.610 97.810 90.130 902.060
NTOcalc 5.159 10.461 17.686 107.247 97.777 90.056 902.450 +0.04%
TATBexp P-1 9.010 9.028 6.812 108.580 91.820 119.970 442.524
TATB 9.128 9.142 6.767 109.012 92.097 119.936 448.784 +1.41%
TATPexp P21/c 11.964 14.038 15.595 90 117.270 90 2327.700
TATPcalc 11.913 13.811 15.415 90 117.243 90 2255.047 -3.12%
160
4.5 Results and Discussion
4.5.1 Electronic Structure
For large systems, the use of high level functionals such as HSE06 are
computationally demanding. It has been shown that the hybrid GGA functional
B3PW91 is somewhat cheaper, and offers excellent agreement with
experimental results for electronic band gap (𝐸𝑔) prediction across a broad
range of inorganic materials.51,52 It was therefore of interest to consider these
two methods for application to molecular materials, and compare to a standard
GGA functional, PBE. Only limited experimental data is available for 𝐸𝑔 for the
materials studied here. Experimental UV-Vis spectra have been documented
for 𝛽-HMX.53 While the fundamental band gap (i.e. the difference between the
ionization potential and electron affinities) is in principles different to the optical
band gap (which is stabilized by electron-hole interactions), the discrepancy is
often small in solid state materials,54 and hence the UV-Vis spectra should
offer a good indication as to the validity of the calculated 𝐸𝑔 values.
Furthermore, it should be noted that α-FOX-7 and TATB are both yellow
powders, with the former being more strongly coloured. This indicates an
optical transition in the region of ca. 2.6 eV for both materials.
The values of 𝐸𝑔 calculated for the series of molecular energetic compounds
are given in Table 4.3 (Note TATP was omitted from this part of the study as
the large unit cell renders the band structure calculation intractable). The
B3PW91 functional consistently predicts values of 𝐸𝑔 that are slightly higher
than HSE06 results, ranging from 𝐸𝑔(HSE06)+0.24 eV to 𝐸𝑔(HSE06)+0.32 eV.
Hence it appears that on average, the B3PW91 results should be within the
same approximate accuracy as the HSE06 results for related systems. As is
expected, the PBE calculations return considerably lower 𝐸𝑔 values than the
higher level functionals. Literature values for PBE-based calculations in Table
4.3 differ only slightly from those calculated here. This is most notable for β-
HMX, although literature reports are based on plane-wave basis sets (which
contrasts with the localised basis sets used in this work). In all cases, the G0W0
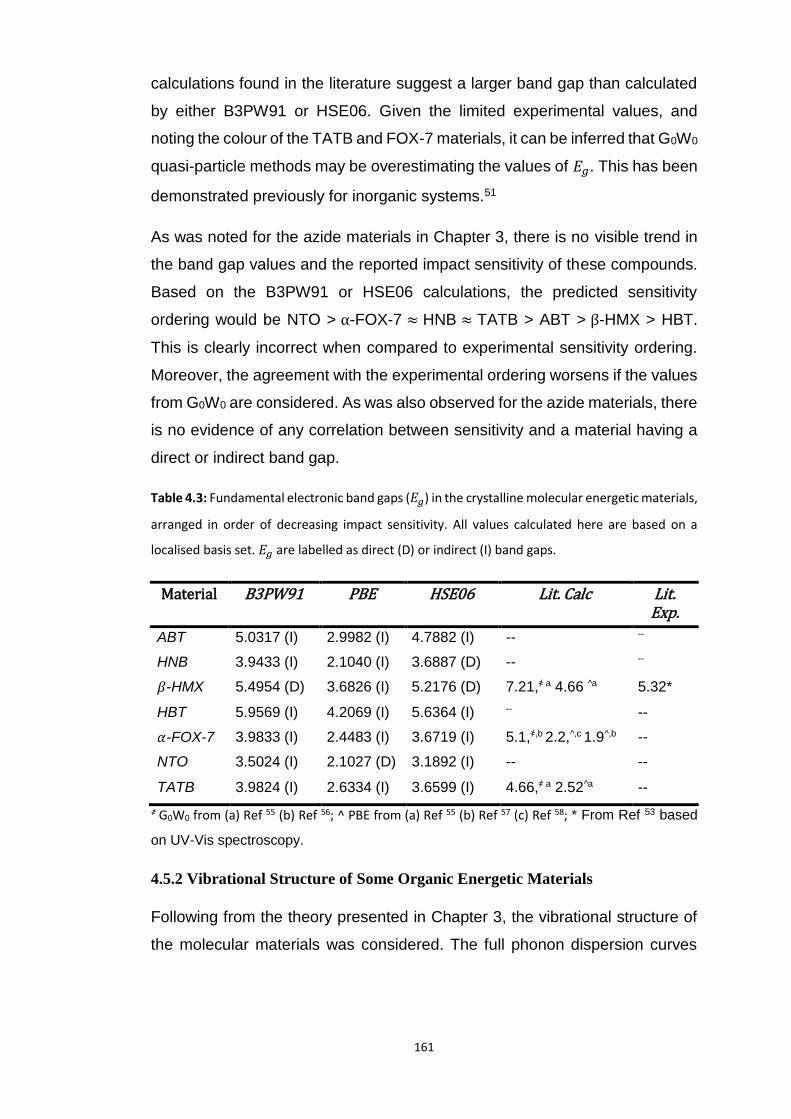
161
calculations found in the literature suggest a larger band gap than calculated
by either B3PW91 or HSE06. Given the limited experimental values, and
noting the colour of the TATB and FOX-7 materials, it can be inferred that G0W0
quasi-particle methods may be overestimating the values of 𝐸𝑔. This has been
demonstrated previously for inorganic systems.51
As was noted for the azide materials in Chapter 3, there is no visible trend in
the band gap values and the reported impact sensitivity of these compounds.
Based on the B3PW91 or HSE06 calculations, the predicted sensitivity
ordering would be NTO > α-FOX-7 ≈ HNB ≈ TATB > ABT > β-HMX > HBT.
This is clearly incorrect when compared to experimental sensitivity ordering.
Moreover, the agreement with the experimental ordering worsens if the values
from G0W0 are considered. As was also observed for the azide materials, there
is no evidence of any correlation between sensitivity and a material having a
direct or indirect band gap.
Table 4.3: Fundamental electronic band gaps (𝐸𝑔) in the crystalline molecular energetic materials,
arranged in order of decreasing impact sensitivity. All values calculated here are based on a
localised basis set. 𝐸𝑔 are labelled as direct (D) or indirect (I) band gaps.
Material B3PW91 PBE HSE06 Lit. Calc Lit. Exp.
ABT 5.0317 (I) 2.9982 (I) 4.7882 (I) -- --
HNB 3.9433 (I) 2.1040 (I) 3.6887 (D) -- --
𝛽-HMX 5.4954 (D) 3.6826 (I) 5.2176 (D) 7.21,҂ a 4.66 ^a 5.32*
HBT 5.9569 (I) 4.2069 (I) 5.6364 (I) -- --
𝛼-FOX-7 3.9833 (I) 2.4483 (I) 3.6719 (I) 5.1,҂,b 2.2,^,c 1.9^,b --
NTO 3.5024 (I) 2.1027 (D) 3.1892 (I) -- --
TATB 3.9824 (I) 2.6334 (I) 3.6599 (I) 4.66,҂ a 2.52^a --
҂ G0W0 from (a) Ref 55 (b) Ref 56; ^ PBE from (a) Ref 55 (b) Ref 57 (c) Ref 58; * From Ref 53 based
on UV-Vis spectroscopy.
4.5.2 Vibrational Structure of Some Organic Energetic Materials
Following from the theory presented in Chapter 3, the vibrational structure of
the molecular materials was considered. The full phonon dispersion curves
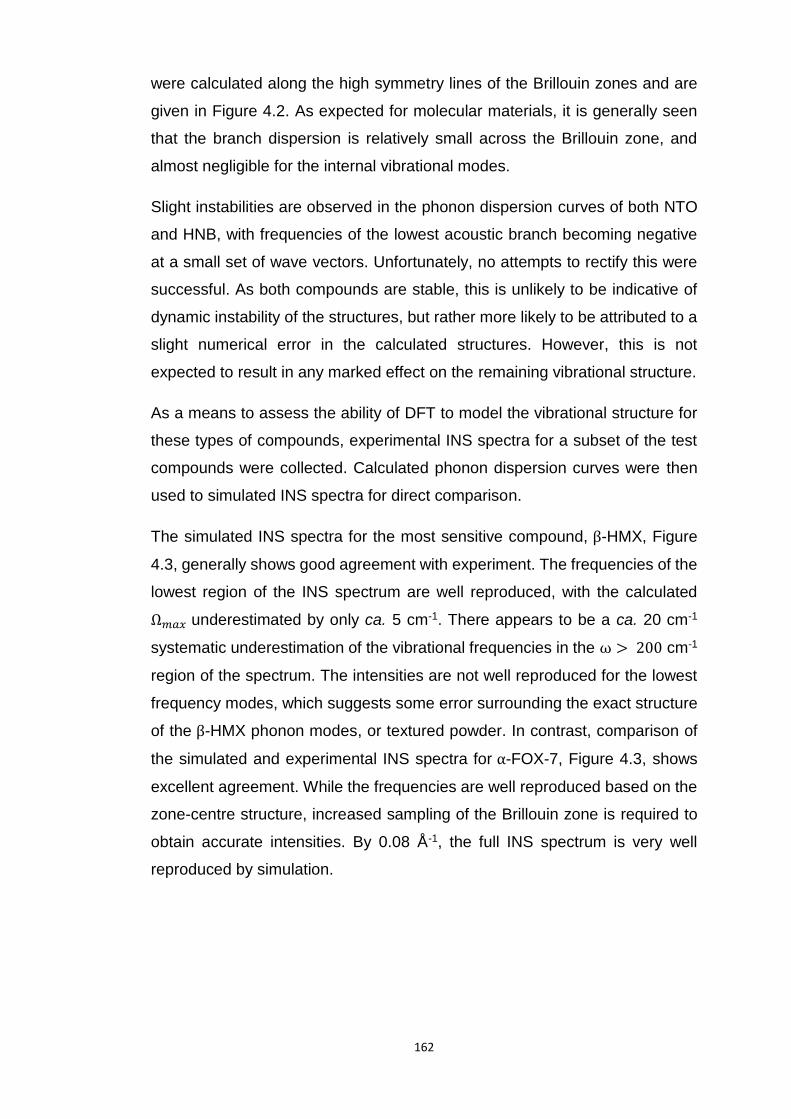
162
were calculated along the high symmetry lines of the Brillouin zones and are
given in Figure 4.2. As expected for molecular materials, it is generally seen
that the branch dispersion is relatively small across the Brillouin zone, and
almost negligible for the internal vibrational modes.
Slight instabilities are observed in the phonon dispersion curves of both NTO
and HNB, with frequencies of the lowest acoustic branch becoming negative
at a small set of wave vectors. Unfortunately, no attempts to rectify this were
successful. As both compounds are stable, this is unlikely to be indicative of
dynamic instability of the structures, but rather more likely to be attributed to a
slight numerical error in the calculated structures. However, this is not
expected to result in any marked effect on the remaining vibrational structure.
As a means to assess the ability of DFT to model the vibrational structure for
these types of compounds, experimental INS spectra for a subset of the test
compounds were collected. Calculated phonon dispersion curves were then
used to simulated INS spectra for direct comparison.
The simulated INS spectra for the most sensitive compound, β-HMX, Figure
4.3, generally shows good agreement with experiment. The frequencies of the
lowest region of the INS spectrum are well reproduced, with the calculated
Ω𝑚𝑎𝑥 underestimated by only ca. 5 cm-1. There appears to be a ca. 20 cm-1
systematic underestimation of the vibrational frequencies in the ω > 200 cm-1
region of the spectrum. The intensities are not well reproduced for the lowest
frequency modes, which suggests some error surrounding the exact structure
of the β-HMX phonon modes, or textured powder. In contrast, comparison of
the simulated and experimental INS spectra for α-FOX-7, Figure 4.3, shows
excellent agreement. While the frequencies are well reproduced based on the
zone-centre structure, increased sampling of the Brillouin zone is required to
obtain accurate intensities. By 0.08 Å-1, the full INS spectrum is very well
reproduced by simulation.
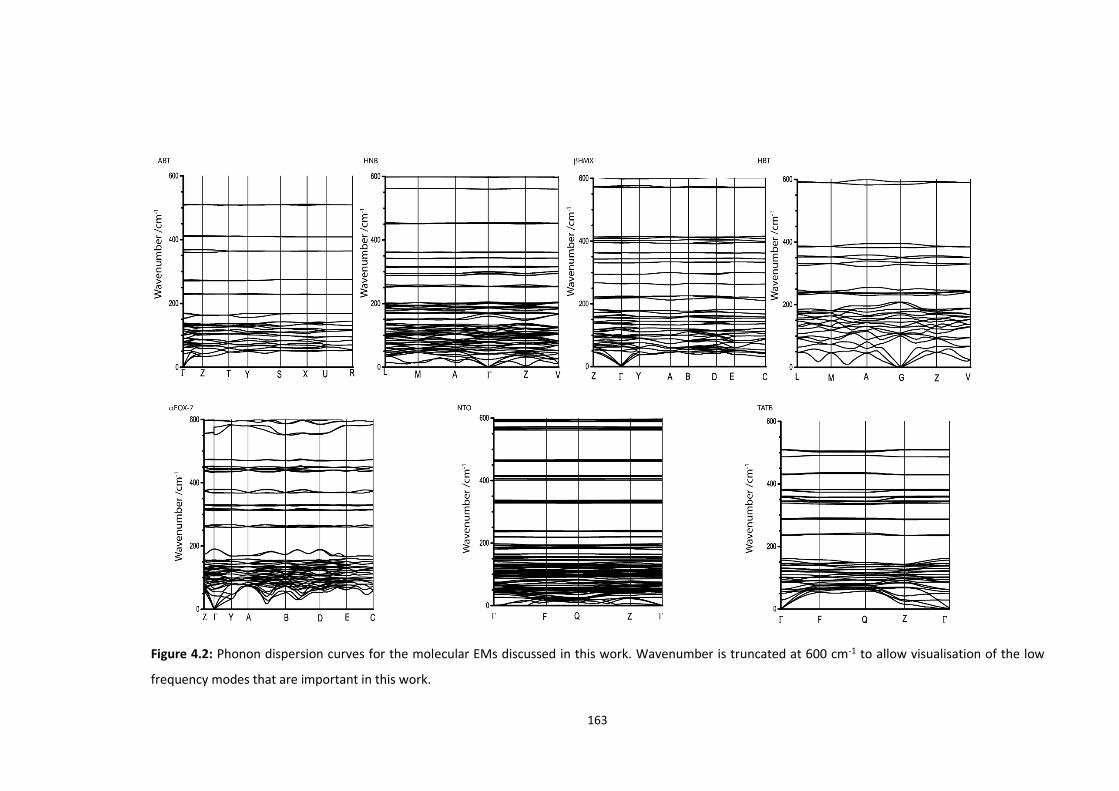
163
Figure 4.2: Phonon dispersion curves for the molecular EMs discussed in this work. Wavenumber is truncated at 600 cm-1 to allow visualisation of the low
frequency modes that are important in this work.
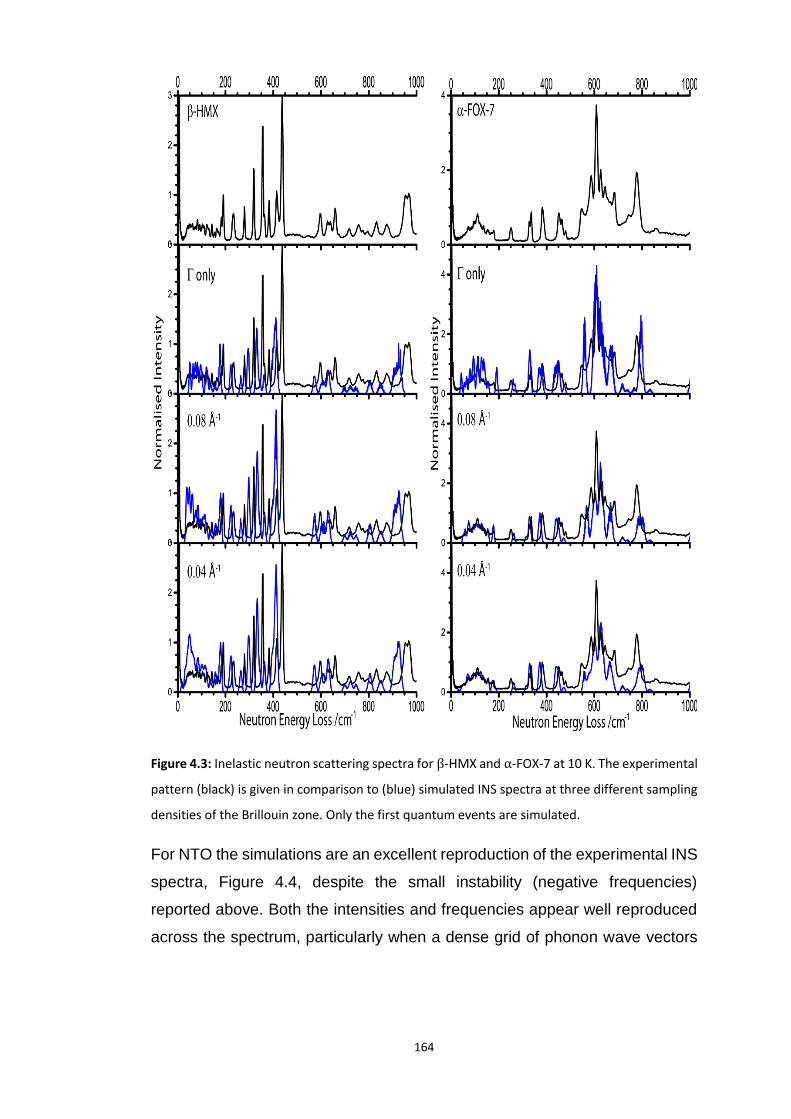
164
Figure 4.3: Inelastic neutron scattering spectra for β-HMX and α-FOX-7 at 10 K. The experimental
pattern (black) is given in comparison to (blue) simulated INS spectra at three different sampling
densities of the Brillouin zone. Only the first quantum events are simulated.
For NTO the simulations are an excellent reproduction of the experimental INS
spectra, Figure 4.4, despite the small instability (negative frequencies)
reported above. Both the intensities and frequencies appear well reproduced
across the spectrum, particularly when a dense grid of phonon wave vectors
165
is used. This strongly suggests that this minor instability has negligible
influence on the vibrational structure. The INS spectrum of TATB is also well
reproduced, Figure 4.4, but there does appear to be a slight disagreement
between the higher frequency vibrational modes at ca. 800 cm-1. Internal
modes in this region are primarily NH2 twisting modes. Overall, however, the
spectrum is very well reproduced in both frequencies and intensities.
In contrast to the case of α -NaN3 presented in Chapter 3, INS spectra
simulated from zone-centre calculations generally perform well in reproducing
both the frequencies and relative intensities observed in the experimental INS
spectra of the organic molecular materials. The notable exceptions to this are
the lowest frequency lattice modes, which appear to converge to the
experimental spectra when the Brillouin zone is sampled at ca. 0.04 Å-1.
Increasing the density of q-point sampling for simulation of the INS spectra has
negligible effect on frequencies above ca. 200 cm-1. These features are
presumably due to both the minimal dispersion observed across the Brillouin
zone (Figure 4.2), as well as the dominant incoherent scattering of the
hydrogen in these materials. Overall, it does appear that the vibrational
structure of these molecular materials is well reproduced by the simulations,
particularly in the low frequency regions. DFT therefore appears capable of
producing an accurate description of not only the zone-centre frequencies, but
of the dispersion relationship through the Brillouin zone for these types of
materials. The vibrational structures used herein can therefore be taken as
representative of the true materials.
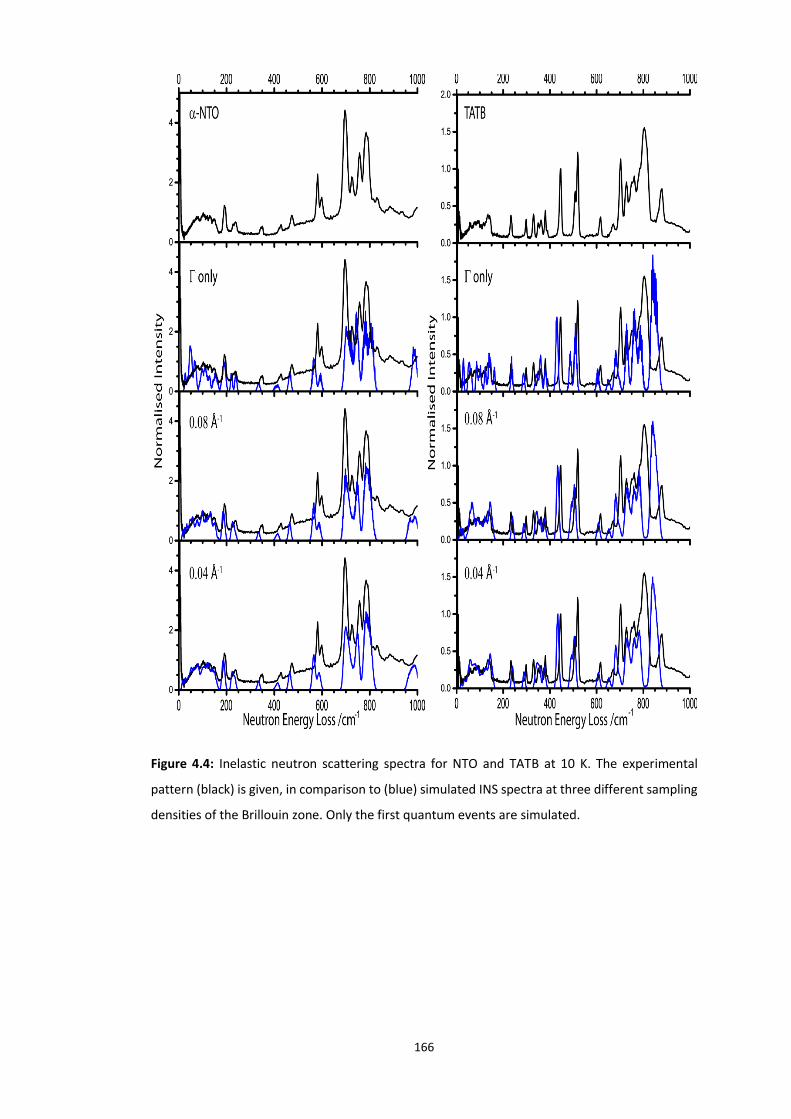
166
Figure 4.4: Inelastic neutron scattering spectra for NTO and TATB at 10 K. The experimental
pattern (black) is given, in comparison to (blue) simulated INS spectra at three different sampling
densities of the Brillouin zone. Only the first quantum events are simulated.

167
4.5.3 Vibrational Up-Pumping in the Molecular Energetic Materials
Prior to considering the vibrational up-pumping in the molecular EMs, it is again
necessary to segment the vibrational spectra into sections based on integer
values of Ω𝑚𝑎𝑥. The definition of Ω𝑚𝑎𝑥 stated in Chapter 3 is somewhat less
clearly defined when considering the molecular materials. A good example of
this is NTO. Across the phonon density of states (DOS, 𝑔(ω)) there are clear
minima near the top of the phonon region which, when compared to the
phonon dispersion curves in Section 4.5.2, do correlate to regions of gaps,
albeit small, in phonon density. The non-zero values of 𝑔(ω) result from the
applied Gaussian broadening on generation of the DOS. Previous works have
suggested that in such cases, the top of the phonon bath should be taken to
include (nearly) amalgamated NO2 rocking modes,19,20,23 and therefore act as
the upper limit of the phonon region. For NO2 containing compounds, these
modes are shown in Table 4.4. However, the DOS and phonon dispersion
bands clearly indicate a frequency gap between the top of a semi-continuum
and the highest -NO2 rocking modes at ca. 230 cm-1. These highest rocking
modes therefore do not fit within the continuum criteria for defining the phonon
bath. Where appropriate, consideration is given for Ω𝑚𝑎𝑥 placed in both
locations for NTO. Note that the potential Ω𝑚𝑎𝑥 at 170 cm-1 indicated by the
INS spectra is not considered further as it is lost due to the addition of
Gaussian broadening in the calculated spectra, which is added to reflect
resonant states.20,23 This leads to the placement of Ω𝑚𝑎𝑥 as highlighted in
Figure 4.5 and reported in Table 4.4.
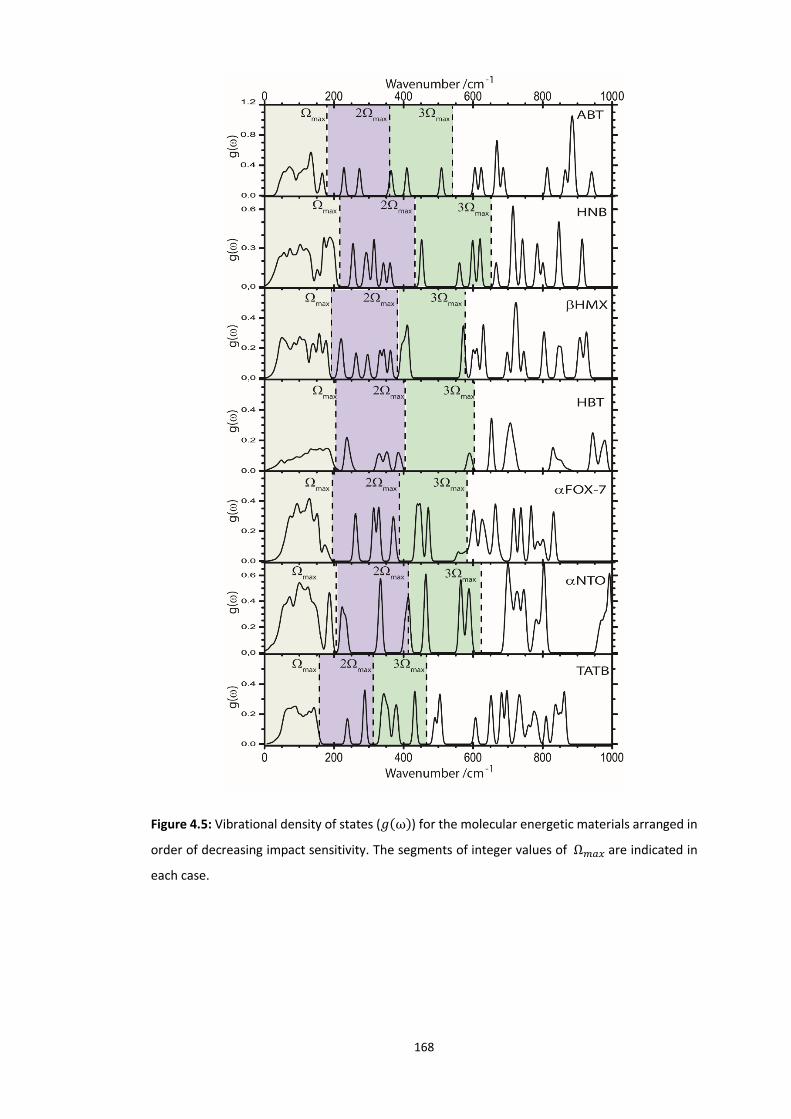
168
Figure 4.5: Vibrational density of states (𝑔(ω)) for the molecular energetic materials arranged in
order of decreasing impact sensitivity. The segments of integer values of Ω𝑚𝑎𝑥 are indicated in
each case.

169
Table 4.4: Vibrational structure (cm-1) of the molecular energetic compounds. The top of the
phonon bath Ω𝑚𝑎𝑥, first doorway mode ω𝑑, and frequency gap (Δω𝑑 = ω𝑑 − Ω𝑚𝑎𝑥).
NO2 rock max
𝛀𝒎𝒂𝒙 (INS)
𝛀𝒎𝒂𝒙 (CALC)
𝝎𝒅 𝚫𝝎𝒅
ABT -- -- 175 220 45
HNB 200 -- 210 245 35
𝛽-HMX 166 195 193 210 15
HBT -- -- 200 225 25
𝛼-FOX-7 155 183 185 255 70
NTO 240 170,202,245 200/240 220 / 325 20/85
TATB 155 155 160 234 74
The decomposition pathways of molecular energetic materials are complex59,60
and remain largely unknown. Compared to the structurally simpler azide
compounds discussed in Chapter 3, it is highly probable that many normal
modes are simultaneously required to initiate the decomposition of these large
molecules. It is therefore unlikely that a direct up-pumping mechanism (i.e.
energy localisation into a single vibration, and immediate bond rupture) occurs.
Rather, it is more likely that an indirect (or thermal)61 mechanism occurs,
whereby the excited molecule reacts at some point following evolution of the
highly excited vibrational state.17 The redistribution of vibrational energy within
the internal molecular vibrational manifold is relatively quick, and once energy
reaches this manifold it can quickly redistribute. In contrast to the azide
systems, the rate determining step is instead taken to be the transfer of energy
from the phonon manifold into the internal vibrational manifold.20,23 This occurs
in two steps: (1) population of the doorway modes (i.e. modes with Ω𝑚𝑎𝑥 <
ω < 2Ω𝑚𝑎𝑥) and (2) population of higher-lying modes.61
The concept of the ‘target’ frequency, ω𝑇, is therefore no longer meaningful,
as there is not a single (or known subset) of vibrational modes into which shock
wave energy must be localised to induce a chemical response. Hence, it is no
longer appropriate to consider the ‘frequency gap’ criterion based on Δω =
ω𝑇 − Ω𝑚𝑎𝑥. Instead, this simple criterion can be recast as Δω = ω𝑑 − Ω𝑚𝑎𝑥,
where ω𝑑 is the first doorway mode. If this assessment is made based on the

170
full phonon dispersion curves, the resulting sensitivity ordering follows that
shown in Figure 4.6. If Ω𝑚𝑎𝑥 for NTO is taken to be 238 cm-1 (i.e. the top of the
-NO2 rocking modes) only a very weak correlation is observed. The more
sensitive compounds tend to have smaller values of Δω than the less sensitive
materials. This trend is more apparent if the energetic materials with
explosophoric -NO2 moieties are instead considered in isolation, and may
therefore suggest additional electronic factors may be important in determining
sensitivity ordering (red symbols in Figure 4.6). However, while this correlation
may be indicative from an initial screening perspective, it is greatly limited
beyond a very rough energy classification perspective.
Figure 4.6: Predicted sensitivity order based on the vibrational frequency ‘energy gap’ criterion,
distinguishing between compounds containing -NO2 groups (red squares) and those that do not
(black squares).
Noting that the up-pumping model relies initially on the rate of excitation of the
doorway frequencies, an alternative qualitative correlation can be sought
between the doorway density and impact sensitivity. If this is instead
considered, there does appear to be a good overall correlation with sensitivity,

171
Figure 4.7. The more sensitive compounds contain a higher density of doorway
modes in the range Ω𝑚𝑎𝑥 → 2Ω𝑚𝑎𝑥 , with the less sensitive compounds
exhibiting lower densities of states within this region. The notable exception to
this rule is ABT. The chemical structure of ABT is considerably different from
the remaining compounds studied here, and again it can be suggested that
electronic effects dominate in dictating the different sensitivity of this
compound.
While this method does not offer high resolution of the sensitivity ordering (that
is, that α-FOX-7 is predicted to be more sensitive than β-HMX), it does offer a
relatively rapid, qualitative approach to the general classification of these
materials once vibrational frequencies have been obtained (by calculation or
experimental means).
Figure 4.7: Comparison of doorway density of states and experimental impact sensitivities.
Doorway densities are normalized by 3N to account for variations in the normalization of the DOS.
While the qualitative trends suggested above do display some promise in their
ordering of the impact sensitivity of these molecular compounds, they do not
offer much by means of a physical mechanism. Hence, it is worthwhile
172
returning to discussion of the up-pumping methodology employed in Chapter
3.
The major difference in the present case, compared to the azide series, is the
lack of a well-defined target frequency, ω𝑇 . For the present, ignoring any
explicit consideration of temperature, the model in this section makes the
following assumptions:
1. Overtone pathways are responsible for the initial transfer of energy.61
Energy transfer via the first overtone is considerably faster than by
higher order overtones, and hence the region up to 2Ω𝑚𝑎𝑥 quickly
becomes populated. This leads to the definition of the doorway modes
as having frequencies, Ω𝑚𝑎𝑥 < ω < 2Ωmax.
2. Initial energy transfer that results from overtone up-pumping into the
doorway modes can subsequently up-pump via combination pathways.
3. It follows from (2) that combination pathways are limited to the excitation
of modes below a maximum of 3Ω𝑚𝑎𝑥 . That is to say that mode
combinations can further populate other, higher frequency doorway
modes, or they can populate higher frequency internal modes.
Secondary combination pathways, including vibrational cooling, are not
considered.
4. The energy up-pumping model is based on the total number of available
pathways.
5. Overtone pathways lead to initial excitation of the vibrational manifold
to a maximum of 2Ω𝑚𝑎𝑥 from the first set of overtones. The second
overtone can excite to a maximum of 3Ω𝑚𝑎𝑥 albeit at a slower rate.
Higher order processes may occur at even lower rates, but are not
competitive. This is due to the rapidly decreasing probability of higher
order scattering events.22
6. The population of the phonon bath is assumed to remain constant, and
the contributions of overtones and combinations are taken as being fully
separable: i.e. they do not compete. This holds approximately for the
initial energy transfer step.61

173
Hence, the total energy transfer into the molecular vibrational region is again
dominated by the fastest combination and overtone processes.
Due to the markedly different molecular and crystallographic structures of
these materials, the two phonon density of states is recast as:
Ω(2) = ρ(ω)−1 ∫𝑑ωδ(ω1 − ω2 − ω3)
Equation 4.1
where ρ(ω) is the total density of states. This has the effect of normalising the
up-pumping contribution by 3𝑁 and reflects the dissipation of up-pumped
energy into the internal vibrational manifold. Furthermore, noting that up-
pumped energy is only meaningful if a real vibrational state exists at the
resulting energy, Ω(2) is projected onto ρ(ω), generating the projected two-
phonon density of states, P(Ω(2)). As the latter was generated with a Gaussian
broadening of 10 cm-1, this process accounts for potential resonance
pathways.20,23
4.5.3.1 Overtone Pathways
It has been previously suggested that overtone pathways are sufficient to
model the relative up-pumping rates in molecular energetic compounds.20,23
Most recently, based solely on zone-centre vibrational frequencies (i.e. not
accounting for the varying density of states across the Brillouin zone),
Bernstein suggested that Ω𝑚𝑎𝑥 should be placed at 200 cm-1 for all molecular
compounds, and up-pumping into the region 200-700 cm-1 should be
considered. Earlier suggestions have imposed the restriction of Ω𝑚𝑎𝑥 at 250
cm-1.20 The suggestion of a 700 cm-1 cap appears to have propagated from
early experimental work (which placed a limit at 600 cm-1).19 However, this
experimental work employed this limit artificially, as it was the upper limit of
experimental resolution at the time. No alternative explanation has yet been
provided for this upper boundary limit. Within the framework of the model
proposed in Chapter 3, these previous works exhibit two major flaws:
174
1. Table 4.4 shows that the limiting value of the phonon bath cannot
always be taken to be 200 cm-1. This is particularly notable in cases
such as TATB, with a well-defined Ωmax at 160 cm-1.
2. There is no physical rationale for limiting up-pumping to 700 cm-1,
particularly when higher order overtones are considered, as has
previously been done.23 Given the conservation of energy, the
maximum overtone contribution from up-pumping should scale as
𝑁Ω𝑚𝑎𝑥, where N is the order of the overtone.
At low overtone numbers (N) (see Equation 3.7) the arbitrary maximum of 700
cm-1 is in fact meaningless. For example, consider the two dominant overtone
pathways, N=2 and N=3. For a system with Ω𝑚𝑎𝑥 = 200 cm-1 the maximum
overtone frequency is 400 (for N=2) or 600 cm-1 for (N=3). Hence no density
will exist above 𝑁Ω𝑚𝑎𝑥 in these cases. Despite these deficiencies, if the criteria
set out by Bernstein are followed (Ω𝑚𝑎𝑥 = 200 cm-1 overtone vibrational up-
pumping and projection onto the 200-700 cm-1 region), remarkable correlation
is made against experimental impact sensitivity, Figure 4.8. If only the first
overtone is considered (i.e. the most rapid excitation) there is a seemingly
exponential fit between the integrated overtone contributions to P(Ω(2)) as a
function of the proposed experimental impact sensitivity. This is to say that
𝑃(Ω(2)) is higher for more sensitive compounds. This is in particularly excellent
agreement if the materials which contain explosophoric -NO2 groups are
considered in isolation (red points on Figure 4.8). As N is increased, this
correlation holds quite well, with the notable exception of α-FOX-7, Figure 4.8.
When the second overtone contributions are considered (N=3), the total P(Ω(2))
for α-FOX-7 and β-HMX become nearly equal, with the latter appearing to fall
short of the exponential trend. However, consideration of Figure 4.5 for β-HMX
(which agrees well with INS data) shows that very little density sits within the
region ω = 2Ω𝑚𝑎𝑥 → 3Ω𝑚𝑎𝑥. It is therefore not surprising to find that the value
of P(Ω(2)) falls as N increases.
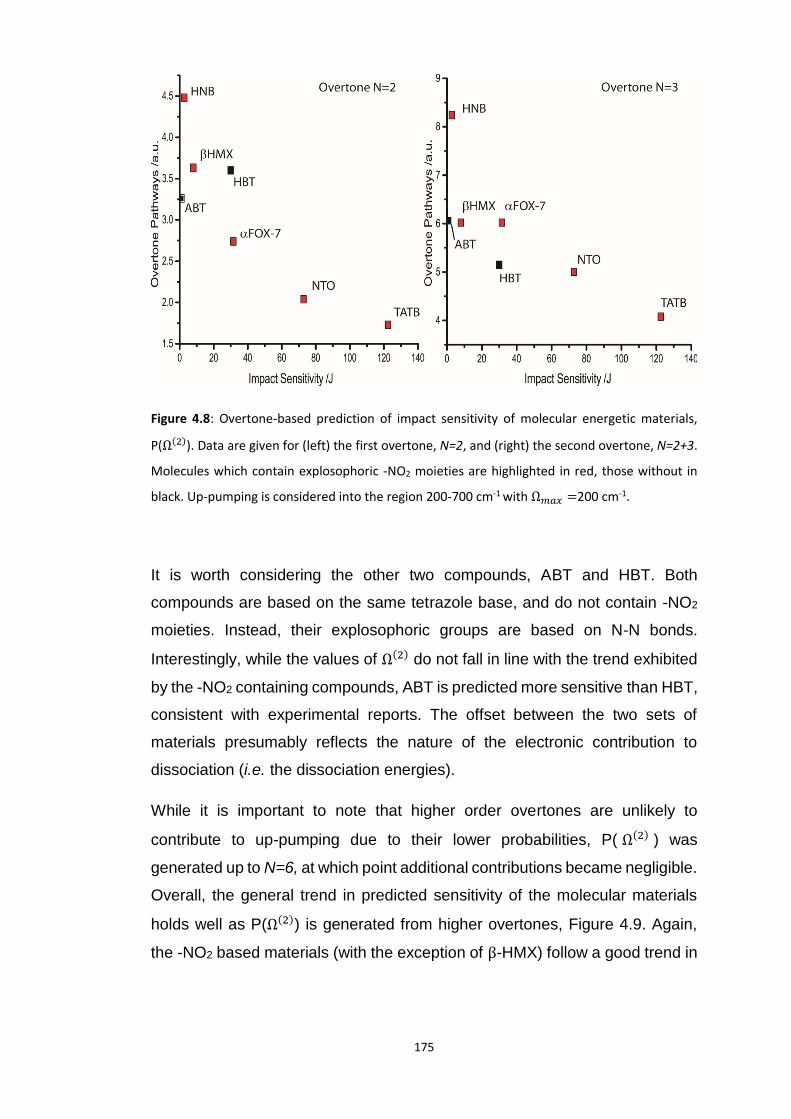
175
Figure 4.8: Overtone-based prediction of impact sensitivity of molecular energetic materials,
P(Ω(2)). Data are given for (left) the first overtone, N=2, and (right) the second overtone, N=2+3.
Molecules which contain explosophoric -NO2 moieties are highlighted in red, those without in
black. Up-pumping is considered into the region 200-700 cm-1 with Ω𝑚𝑎𝑥 =200 cm-1.
It is worth considering the other two compounds, ABT and HBT. Both
compounds are based on the same tetrazole base, and do not contain -NO2
moieties. Instead, their explosophoric groups are based on N-N bonds.
Interestingly, while the values of Ω(2) do not fall in line with the trend exhibited
by the -NO2 containing compounds, ABT is predicted more sensitive than HBT,
consistent with experimental reports. The offset between the two sets of
materials presumably reflects the nature of the electronic contribution to
dissociation (i.e. the dissociation energies).
While it is important to note that higher order overtones are unlikely to
contribute to up-pumping due to their lower probabilities, P( Ω(2) ) was
generated up to N=6, at which point additional contributions became negligible.
Overall, the general trend in predicted sensitivity of the molecular materials
holds well as P(Ω(2)) is generated from higher overtones, Figure 4.9. Again,
the -NO2 based materials (with the exception of β-HMX) follow a good trend in

176
Ω(2) as compared to impact sensitivity. The second structural class of
energetic materials, based on N-N explosophores, follow their own trend, but
are still in line with experiment.
Figure 4.9: Integration of Ω(2) generated from overtone pathways from N=2-6. Materials with
explosophoric -NO2 moieties are highlighted red, those without in black. Up-pumping is
considered into the region 200-700 cm-1 with Ω𝑚𝑎𝑥 =200 cm-1.
As a final consideration for the overtone pathways, the limits placed on Ω𝑚𝑎𝑥
and the upper end of integration were lifted. The upper limit of integration
therefore sits at 𝑁Ω𝑚𝑎𝑥. Upon lifting this restriction, the correlation between
impact sensitivity and P(Ω(2)) holds until a value of N=4, after which point the
sensitivity of α-FOX-7 surpasses that of β-HMX, and eventually that of HNB by
N=6. Hence, this is purely an effect of high order overtones and the result of a
markedly higher DOS in the high frequency region of α-FOX-7, (see the DOS

177
in Figure 4.5). However, it is worth remembering that these scattering
processes are highly improbable.
It can therefore be suggested that the seemingly arbitrary upper limit of
integration previously suggested (700 cm-1) was in fact a fortunate choice. This
limit effectively places the restriction on overtones to N=3, with higher order
terms contributing a negligible amount, should they be considered (as in the
case by Bernstein23). If only the first two overtone pathways are considered
(as in Chapter 3), and Ω𝑚𝑎𝑥 defined as in Table 4.4, the predicted ordering
follows as in Figure 4.10. This is in excellent agreement with experimental
sensitivities, noting the two independent sets of materials: -NO2 (red squares)
and N-N (black squares) based.
Figure 4.10: Integration of Ω(2) generated from the overtone pathways for N=2-3. The -NO2
containing materials are highlighted in red, those without in black. No restrictions are placed on
Ω𝑚𝑎𝑥 or the upper frequency bound for the doorway modes.
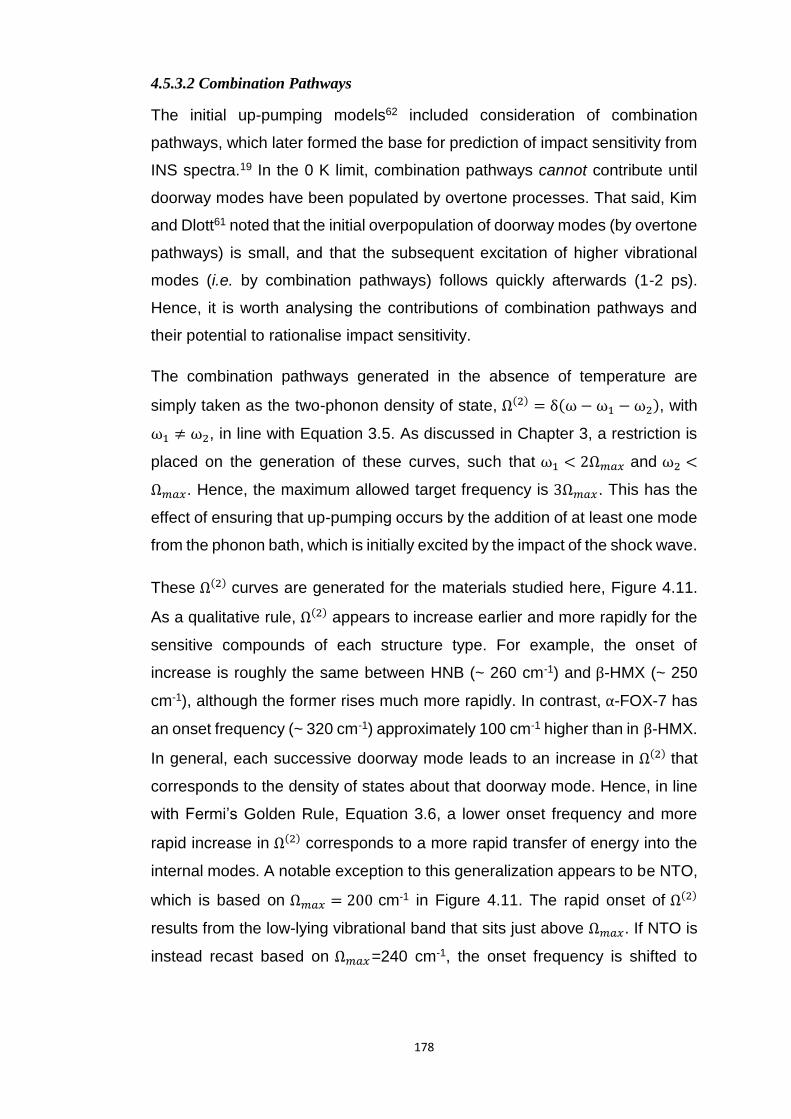
178
4.5.3.2 Combination Pathways
The initial up-pumping models62 included consideration of combination
pathways, which later formed the base for prediction of impact sensitivity from
INS spectra.19 In the 0 K limit, combination pathways cannot contribute until
doorway modes have been populated by overtone processes. That said, Kim
and Dlott61 noted that the initial overpopulation of doorway modes (by overtone
pathways) is small, and that the subsequent excitation of higher vibrational
modes (i.e. by combination pathways) follows quickly afterwards (1-2 ps).
Hence, it is worth analysing the contributions of combination pathways and
their potential to rationalise impact sensitivity.
The combination pathways generated in the absence of temperature are
simply taken as the two-phonon density of state, Ω(2) = δ(ω − ω1 − ω2), with
ω1 ≠ ω2, in line with Equation 3.5. As discussed in Chapter 3, a restriction is
placed on the generation of these curves, such that ω1 < 2Ω𝑚𝑎𝑥 and ω2 <
Ω𝑚𝑎𝑥. Hence, the maximum allowed target frequency is 3Ω𝑚𝑎𝑥. This has the
effect of ensuring that up-pumping occurs by the addition of at least one mode
from the phonon bath, which is initially excited by the impact of the shock wave.
These Ω(2) curves are generated for the materials studied here, Figure 4.11.
As a qualitative rule, Ω(2) appears to increase earlier and more rapidly for the
sensitive compounds of each structure type. For example, the onset of
increase is roughly the same between HNB (~ 260 cm-1) and β-HMX (~ 250
cm-1), although the former rises much more rapidly. In contrast, α-FOX-7 has
an onset frequency (~ 320 cm-1) approximately 100 cm-1 higher than in β-HMX.
In general, each successive doorway mode leads to an increase in Ω(2) that
corresponds to the density of states about that doorway mode. Hence, in line
with Fermi’s Golden Rule, Equation 3.6, a lower onset frequency and more
rapid increase in Ω(2) corresponds to a more rapid transfer of energy into the
internal modes. A notable exception to this generalization appears to be NTO,
which is based on Ω𝑚𝑎𝑥 = 200 cm-1 in Figure 4.11. The rapid onset of Ω(2)
results from the low-lying vibrational band that sits just above Ω𝑚𝑎𝑥. If NTO is
instead recast based on Ω𝑚𝑎𝑥=240 cm-1, the onset frequency is shifted to
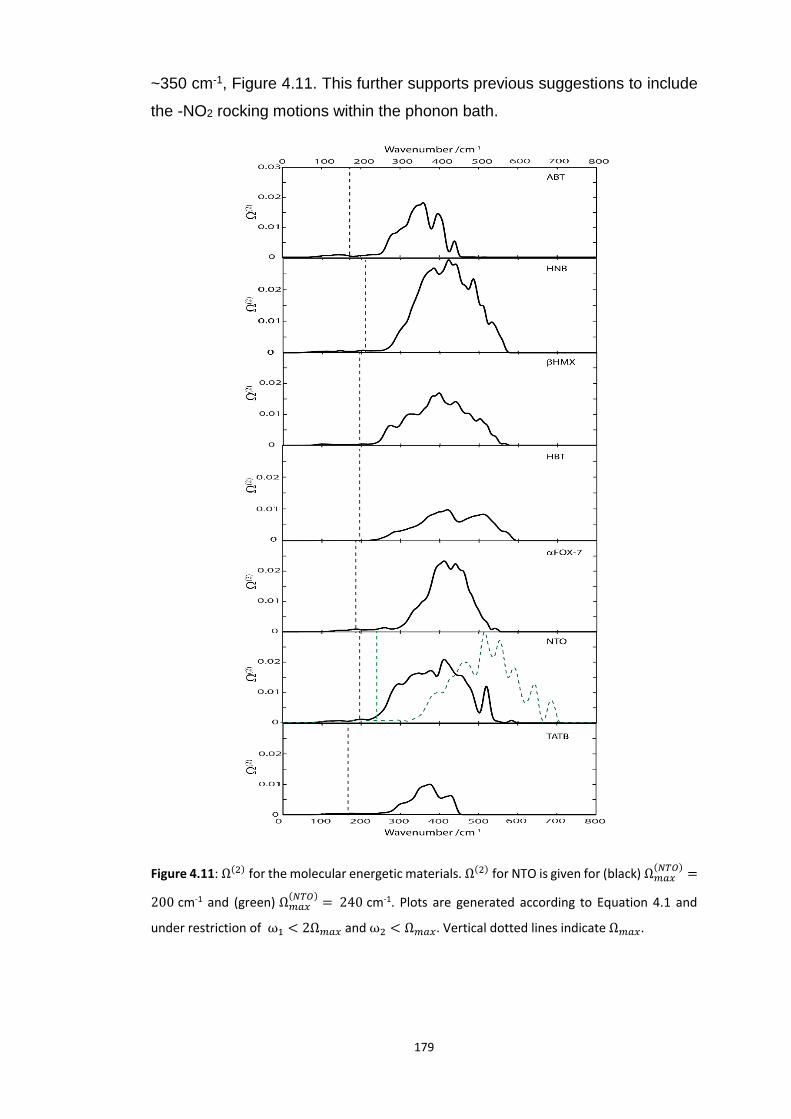
179
~350 cm-1, Figure 4.11. This further supports previous suggestions to include
the -NO2 rocking motions within the phonon bath.
Figure 4.11: Ω(2) for the molecular energetic materials. Ω(2) for NTO is given for (black) Ω𝑚𝑎𝑥(𝑁𝑇𝑂)
=
200 cm-1 and (green) Ω𝑚𝑎𝑥(𝑁𝑇𝑂)
= 240 cm-1. Plots are generated according to Equation 4.1 and
under restriction of ω1 < 2Ω𝑚𝑎𝑥 and ω2 < Ω𝑚𝑎𝑥. Vertical dotted lines indicate Ω𝑚𝑎𝑥.

180
Raw integration of Ω(2) results in largely meaningless quantities, noting that
up-pumped energy again only contributes to the excitation of the internal
modes if an internal mode exists at a particular frequency. Hence, Ω(2) are
again projected onto the DOS curves, and P(Ω(2)) are generated. An example
is given for ABT in Figure 4.12. As is observed for ABT, and indeed holds
across the energetic materials, the large majority of Ω(2) sits between existing
vibrational states and can therefore be discarded.
Figure 4.12: The full Ω(2) for ABT (black), alongside the single phonon DOS g(ω) (orange) and the
projection of Ω(2) onto the DOS, P(Ω(2)) (blue).
With these preparations in mind, it is possible to analyse the combination mode
contributions to the energy transfer of the molecular EMs within the 0 K model.
In the first instance, this simply corresponds to an integration of the P(Ω(2))
curves generated above.
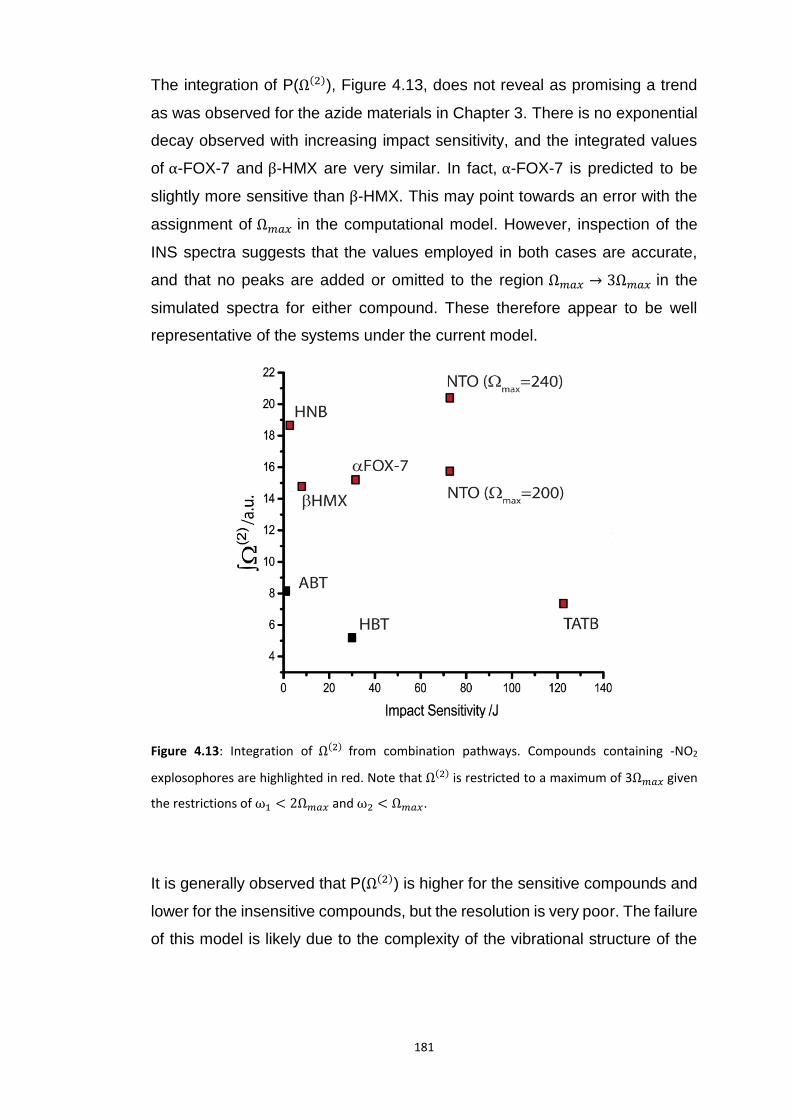
181
The integration of P(Ω(2)), Figure 4.13, does not reveal as promising a trend
as was observed for the azide materials in Chapter 3. There is no exponential
decay observed with increasing impact sensitivity, and the integrated values
of α-FOX-7 and β-HMX are very similar. In fact, α-FOX-7 is predicted to be
slightly more sensitive than β-HMX. This may point towards an error with the
assignment of Ω𝑚𝑎𝑥 in the computational model. However, inspection of the
INS spectra suggests that the values employed in both cases are accurate,
and that no peaks are added or omitted to the region Ω𝑚𝑎𝑥 → 3Ω𝑚𝑎𝑥 in the
simulated spectra for either compound. These therefore appear to be well
representative of the systems under the current model.
Figure 4.13: Integration of Ω(2) from combination pathways. Compounds containing -NO2
explosophores are highlighted in red. Note that Ω(2) is restricted to a maximum of 3Ω𝑚𝑎𝑥 given
the restrictions of ω1 < 2Ω𝑚𝑎𝑥 and ω2 < Ω𝑚𝑎𝑥.
It is generally observed that P(Ω(2)) is higher for the sensitive compounds and
lower for the insensitive compounds, but the resolution is very poor. The failure
of this model is likely due to the complexity of the vibrational structure of the
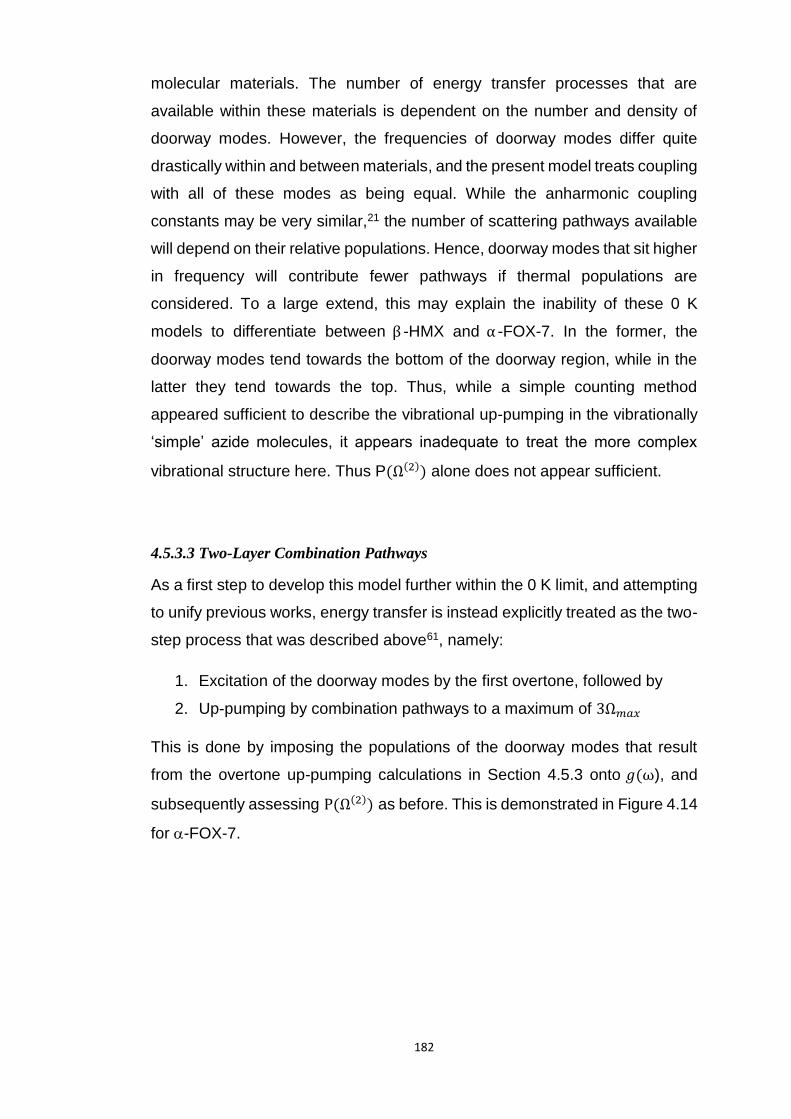
182
molecular materials. The number of energy transfer processes that are
available within these materials is dependent on the number and density of
doorway modes. However, the frequencies of doorway modes differ quite
drastically within and between materials, and the present model treats coupling
with all of these modes as being equal. While the anharmonic coupling
constants may be very similar,21 the number of scattering pathways available
will depend on their relative populations. Hence, doorway modes that sit higher
in frequency will contribute fewer pathways if thermal populations are
considered. To a large extend, this may explain the inability of these 0 K
models to differentiate between β -HMX and α -FOX-7. In the former, the
doorway modes tend towards the bottom of the doorway region, while in the
latter they tend towards the top. Thus, while a simple counting method
appeared sufficient to describe the vibrational up-pumping in the vibrationally
‘simple’ azide molecules, it appears inadequate to treat the more complex
vibrational structure here. Thus P(Ω(2)) alone does not appear sufficient.
4.5.3.3 Two-Layer Combination Pathways
As a first step to develop this model further within the 0 K limit, and attempting
to unify previous works, energy transfer is instead explicitly treated as the two-
step process that was described above61, namely:
1. Excitation of the doorway modes by the first overtone, followed by
2. Up-pumping by combination pathways to a maximum of 3Ω𝑚𝑎𝑥
This is done by imposing the populations of the doorway modes that result
from the overtone up-pumping calculations in Section 4.5.3 onto 𝑔(ω), and
subsequently assessing P(Ω(2)) as before. This is demonstrated in Figure 4.14
for -FOX-7.
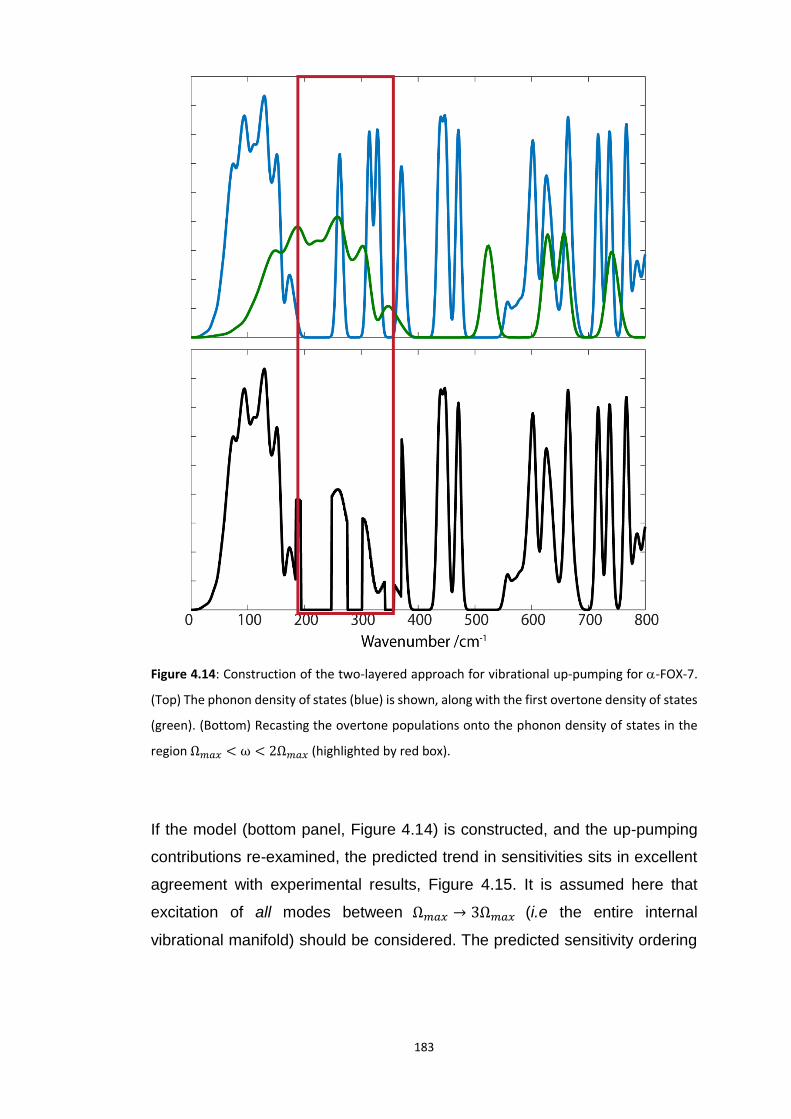
183
Figure 4.14: Construction of the two-layered approach for vibrational up-pumping for -FOX-7.
(Top) The phonon density of states (blue) is shown, along with the first overtone density of states
(green). (Bottom) Recasting the overtone populations onto the phonon density of states in the
region Ω𝑚𝑎𝑥 < ω < 2Ω𝑚𝑎𝑥 (highlighted by red box).
If the model (bottom panel, Figure 4.14) is constructed, and the up-pumping
contributions re-examined, the predicted trend in sensitivities sits in excellent
agreement with experimental results, Figure 4.15. It is assumed here that
excitation of all modes between Ω𝑚𝑎𝑥 → 3Ω𝑚𝑎𝑥 (i.e the entire internal
vibrational manifold) should be considered. The predicted sensitivity ordering
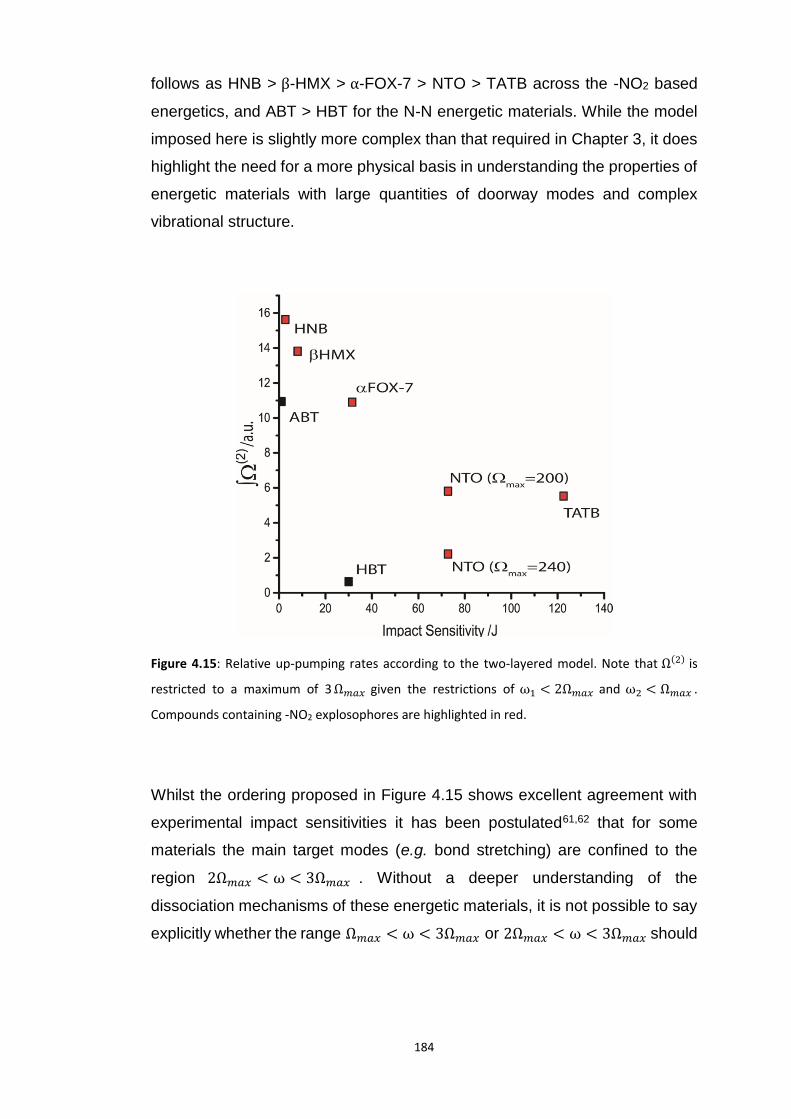
184
follows as HNB > β-HMX > α-FOX-7 > NTO > TATB across the -NO2 based
energetics, and ABT > HBT for the N-N energetic materials. While the model
imposed here is slightly more complex than that required in Chapter 3, it does
highlight the need for a more physical basis in understanding the properties of
energetic materials with large quantities of doorway modes and complex
vibrational structure.
Figure 4.15: Relative up-pumping rates according to the two-layered model. Note that Ω(2) is
restricted to a maximum of 3Ω𝑚𝑎𝑥 given the restrictions of ω1 < 2Ω𝑚𝑎𝑥 and ω2 < Ω𝑚𝑎𝑥 .
Compounds containing -NO2 explosophores are highlighted in red.
Whilst the ordering proposed in Figure 4.15 shows excellent agreement with
experimental impact sensitivities it has been postulated61,62 that for some
materials the main target modes (e.g. bond stretching) are confined to the
region 2Ω𝑚𝑎𝑥 < ω < 3Ω𝑚𝑎𝑥 . Without a deeper understanding of the
dissociation mechanisms of these energetic materials, it is not possible to say
explicitly whether the range Ω𝑚𝑎𝑥 < ω < 3Ω𝑚𝑎𝑥 or 2Ω𝑚𝑎𝑥 < ω < 3Ω𝑚𝑎𝑥 should
185
be considered. However, it is worth highlighting that if the integration from
Figure 4.15 is restricted to the upper range, Figure 4.16 is the result. This leads
to truly excellent agreement with experimental impact sensitivity ordering,
including the positioning of ABT. Now only HBT remains as an outlier. Further
information as to which bonds require activation is therefore of great
importance in developing this model further.
Figure 4.16: Relative up-pumping rates according to the two-layered model. Only the up-pumping
contribution to 2Ω𝑚𝑎𝑥 < ω < 3Ω𝑚𝑎𝑥 is considered here.
4.5.3.4 Temperature Dependent Up-Pumping
It follows from Section 4.5.3.2 that simple counting of the number of up-
pumping pathways is not the best indicator to describe the relative sensitivities
of the molecular energetic materials. Instead, it is likely that an understanding
of the rate of this up-pumping may be more indicative. This will be examined
here within the purview of temperature.

186
It is well known that temperature can have a marked impact on the sensitivities
of energetic materials.63 With variation over relatively small temperature
ranges, two mechanisms can be proposed for the effect of temperature on the
models presented in this thesis:
1. Induce a change in the phonon bath populations, and
2. Induce a large anisotropic shift in vibrational frequencies
Temperature Effects: Phonon Bath Populations
In the absence of a thorough understanding of the three-phonon scattering
probabilities for an arbitrary set of phonons, Dlott22 noted that the relative rates
of energy up-pumping varies with:
𝑟𝑎𝑡𝑒 ∝ 𝑛𝑝 − 𝑛𝑡
Equation 4.2
That is, it decreases as the difference between the Bose-Einstein populations
of the lower (phonon, 𝑛𝑝) and upper (target, 𝑛𝑡) frequencies narrows. This is
analogous to describing the ‘heat flow’ associated with phonon up-pumping
from a vibrationally ‘hot’ phonon continuum to a vibrationally ‘cold’ internal
vibrational manifold – the closer in ‘temperature’ the initial and final states, the
slower the energy transfer.
With the addition of temperature, a two-stage model is no longer explicitly
required. The initial up-pumping of vibrational energy follows the quickest
routes, which are presumably the first overtone and combination pathways.
These both occur within the first anharmonic approximation. With addition of
temperature:
1. The initial contribution from the doorway modes no longer requires
population from the overtone pathway, as it rises due to thermally
populated states.
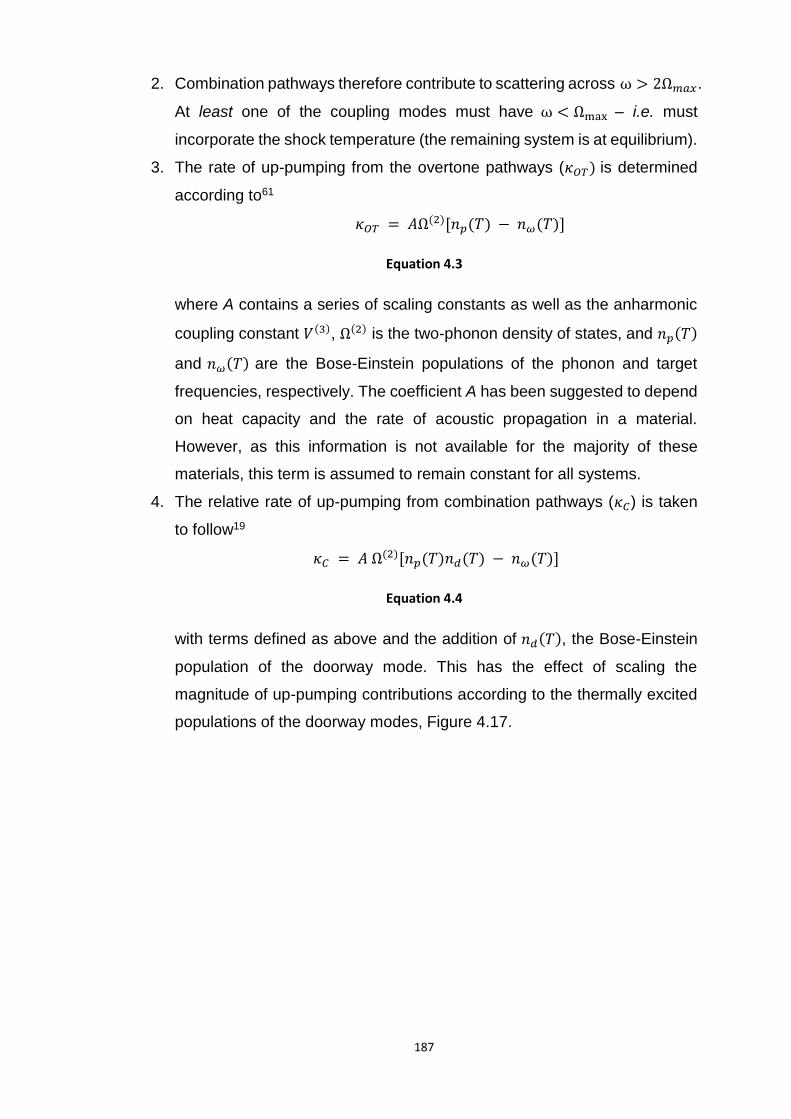
187
2. Combination pathways therefore contribute to scattering across ω > 2Ω𝑚𝑎𝑥.
At least one of the coupling modes must have ω < Ωmax – i.e. must
incorporate the shock temperature (the remaining system is at equilibrium).
3. The rate of up-pumping from the overtone pathways (𝜅𝑂𝑇) is determined
according to61
𝜅𝑂𝑇 = 𝐴Ω(2)[𝑛𝑝(𝑇) − 𝑛𝜔(𝑇)]
Equation 4.3
where A contains a series of scaling constants as well as the anharmonic
coupling constant 𝑉(3), Ω(2) is the two-phonon density of states, and 𝑛𝑝(𝑇)
and 𝑛𝜔(𝑇) are the Bose-Einstein populations of the phonon and target
frequencies, respectively. The coefficient A has been suggested to depend
on heat capacity and the rate of acoustic propagation in a material.
However, as this information is not available for the majority of these
materials, this term is assumed to remain constant for all systems.
4. The relative rate of up-pumping from combination pathways (𝜅𝐶) is taken
to follow19
𝜅𝐶 = 𝐴 Ω(2)[𝑛𝑝(𝑇)𝑛𝑑(𝑇) − 𝑛𝜔(𝑇)]
Equation 4.4
with terms defined as above and the addition of 𝑛𝑑(𝑇), the Bose-Einstein
population of the doorway mode. This has the effect of scaling the
magnitude of up-pumping contributions according to the thermally excited
populations of the doorway modes, Figure 4.17.
188
Figure 4.17: Bose-Einstein populations as a function of frequency at (blue) 300 K, (red) 500 K and
(green) 1000 K.
Because combination bands can now result from thermally populated states,
it is first worth considering the full Ω(2) curves that are obtained on lifting the
restriction of ω1 < 2Ω𝑚𝑎𝑥 (whilst maintaining ω2 < Ω𝑚𝑎𝑥 ), Figure 4.18. This
therefore allows the excited phonon bath to interact with any thermally-
populated vibrational mode. In contrast to the phonon density of states, Ω(2)
rarely falls to zero, and only does so when neighbouring frequencies have
Δω > Ω𝑚𝑎𝑥. Thus, above such regions, rapid redistribution of energy cannot
occur within the first anharmonic approximation, and these frequencies can be
largely eliminated from a thermal (non-direct) up-pumping model.22 This is
because the thermal up-pumping model requires up-pumped energy to
dynamically redistribute into vibrational modes that are responsible for
assisting in bond rupture. Therefore the up-pumping is either limited by this
point in Ω(2) or intrinsically by the highest vibrational frequency (via generation
of P( Ω(2) ). Across the Ω(2) for these compounds, none of the sensitive
compounds contain regions of Ω(2) = 0. It is worth highlighting that α-FOX-7
does have such a point at ca. 1000 cm-1, which corresponds to the large
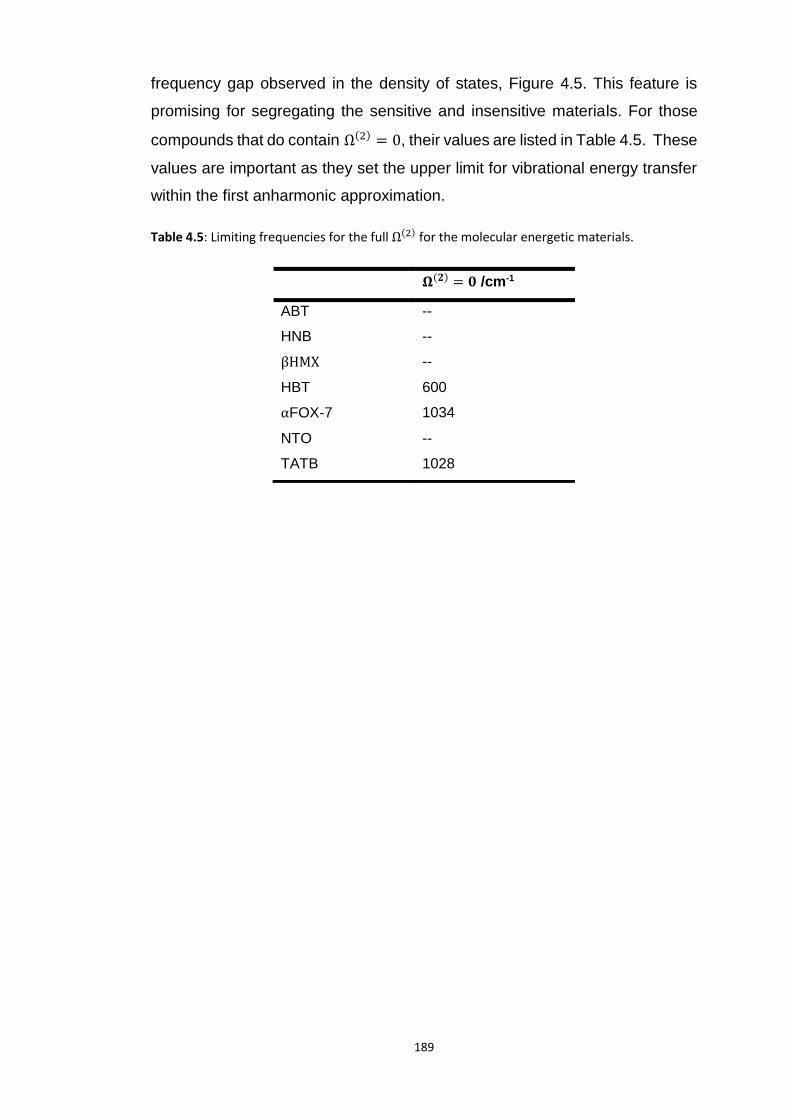
189
frequency gap observed in the density of states, Figure 4.5. This feature is
promising for segregating the sensitive and insensitive materials. For those
compounds that do contain Ω(2) = 0, their values are listed in Table 4.5. These
values are important as they set the upper limit for vibrational energy transfer
within the first anharmonic approximation.
Table 4.5: Limiting frequencies for the full Ω(2) for the molecular energetic materials.
𝛀(𝟐) = 𝟎 /cm-1
ABT --
HNB --
βHMX --
HBT 600
αFOX-7 1034
NTO --
TATB 1028

190
Figure 4.18: Complete temperature independent Ω(2) for the molecular energetic materials,
generated under the single restriction of ω2 < Ω𝑚𝑎𝑥. For NTO, the curves are shown for Ω𝑚𝑎𝑥 of
(green) 240 and (black) 200 cm-1. It is encouraging to find that apart from the onset frequency,
little changes as a function of Ω𝑚𝑎𝑥.

191
It is convenient to begin discussion based only on the combination pathways.
This is the result of integrating 𝑃(Ω(2)), with Ω(2) generated from a thermally
populated 𝑔(ω). If the system is first set at equilibrium temperature, T = 300 K,
the predicted order of sensitivities, Figure 4.19, are generally consistent with
the pure combination pathway prediction. Note that the absolute values plotted
on the Y-axis have markedly increased compared to the earlier T = 0 K models.
Thus, only the trends can be compared. However, the resolution between
sensitivities of β-HMX and α-FOX-7 improves. Again, the two material types
are separated, with up-pumping in the -NO2 based materials being higher and
exhibiting an exponential trend. NTO is unfortunately grossly overestimated
using this simple method. Numerically, this results from the high phonon
density of states of the NTO phonon bath, as compared to the other materials.
This is logical as it reflects the higher heat capacity of the phonon bath, given
the larger number of molecules in the primitive cell.
Figure 4.19: Predicted sensitivity based on T = 300 K, based purely on combination pathways (i.e.
integration of 𝑃(Ω(2))). Ω(2) are generated under the restriction ω2 < Ω𝑚𝑎𝑥 and integration
restricted by where Ω(2) = 0.
192
Further development of the model is clearly required to resolve this situation.
In the first instance, three physical suggestions can be proposed to account
for this:
1. The thermal expansion of the material leads to softening of the phonon
bath modes, and hence a decrease in Ω𝑚𝑎𝑥
2. The bond dissociation energy of NTO is considerably higher than for
the more sensitive compounds, and electronic effects become dominant
in this compound.
3. A considerably different anharmonic constant occurs for this compound
as compared with the others in the test set.
While the two-level model may not explicitly be required, it has been observed
that up-pumping rates of overtones greatly exceed those of combination bands,
by an order of magnitude in some materials.61 Hence it is worth re-examining
the temperature effects under the construction of the two-level model of
Section 4.5.3.3 (i.e. population of doorway states by the first overtone, followed
by combination mode up-pumping). This is accomplished by first thermally
exciting 𝑔(ω) and projecting the first overtone (i.e. N=2) onto the doorway
frequencies as in Figure 4.14. The remaining 𝑔(ω) remains thermally
populated, and the combination pathways (i.e. Ω(2) ) are calculated,
maintaining ω2 < Ω𝑚𝑎𝑥 . For the purpose of this discussion, the equilibrium
temperature is set at 300 K. Compared to the model built upon thermally
populated combination bands alone (i.e. Figure 4.19), as well as in comparison
to the temperature-independent two-layered model (Figure 4.16), the addition
of temperature leads to a remarkable comparison with experimental results,
Figure 4.20. All of the sensitive materials exhibit large values of Ω(2), with the
insensitive materials having very low values. In fact, the separation between
system types is no longer as obvious. NTO is again an exception, and depends
very strongly on the choice of Ω𝑚𝑎𝑥. If the -NO2 rocking modes are placed
within the phonon bath, Ω(2) comes in line with other materials in its sensitivity
class. However, it falls in line with the highly sensitive compounds if Ω𝑚𝑎𝑥 =
200 cm-1 is used. This once again suggests that these modes should be
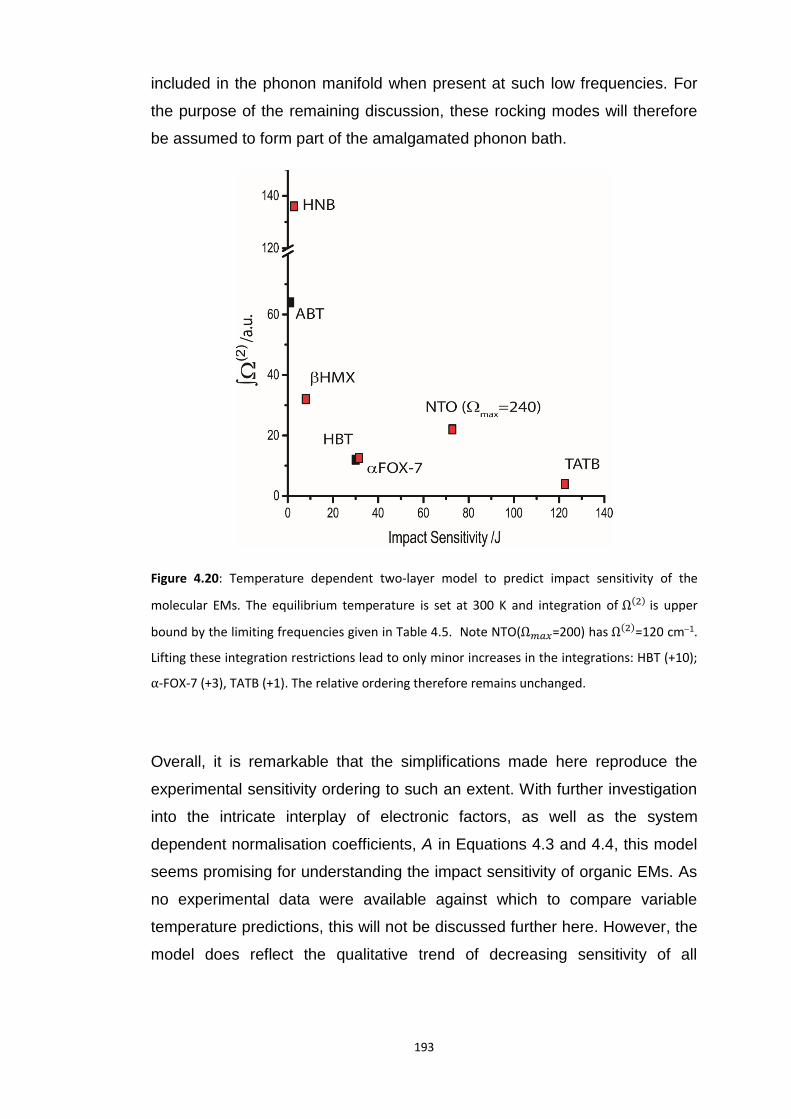
193
included in the phonon manifold when present at such low frequencies. For
the purpose of the remaining discussion, these rocking modes will therefore
be assumed to form part of the amalgamated phonon bath.
Figure 4.20: Temperature dependent two-layer model to predict impact sensitivity of the
molecular EMs. The equilibrium temperature is set at 300 K and integration of Ω(2) is upper
bound by the limiting frequencies given in Table 4.5. Note NTO(Ω𝑚𝑎𝑥=200) has Ω(2)=120 cm−1.
Lifting these integration restrictions lead to only minor increases in the integrations: HBT (+10);
α-FOX-7 (+3), TATB (+1). The relative ordering therefore remains unchanged.
Overall, it is remarkable that the simplifications made here reproduce the
experimental sensitivity ordering to such an extent. With further investigation
into the intricate interplay of electronic factors, as well as the system
dependent normalisation coefficients, A in Equations 4.3 and 4.4, this model
seems promising for understanding the impact sensitivity of organic EMs. As
no experimental data were available against which to compare variable
temperature predictions, this will not be discussed further here. However, the
model does reflect the qualitative trend of decreasing sensitivity of all

194
compounds as 𝑇 → 0 K, and hence convergence of intrinsic material
sensitivities.
The addition of temperature effects introduces the ability to investigate which
modes can become activated upon initial excitation of the lattice. This is done
by separating the initial temperatures of the phonon bath modes, Tp, to be
different from the remaining modes. In the two-stage construction, this leads
to construction of the doorway mode populations based on initial Tp excitation.
While limited experimental results are available which provide a thorough
study of temperature-dependent sensitivities, it is worth considering a single
example briefly. Due to its popularity 𝛽 -HMX was chosen. In line with
experimental reports for organic molecular crystals, a model phonon ‘shock’
temperature of 2000 K is chosen, Figure 4.21. As can be seen, the relative
rates of up-pumping depend strongly on the frequency in question. Generally,
the doorway modes with Ω𝑚𝑎𝑥 < ω < 2Ω𝑚𝑎𝑥 are (as expected) most highly
excited. Fine-tuning of the model proposed here requires a more fundamental
knowledge of which frequencies are in fact responsible for decomposition
processes.
Figure 4.21: Variable temperature P(Ω(2)) for β-HMX. The initial excitation temperature for the
phonon bath modes (below Ω𝑚𝑎𝑥 = 195 cm-1) is taken to be 2000 K. The temperature of the
remaining states is then plotted over the temperature range 10-300K. Note the phonon bath has
been omitted from the x-axis.
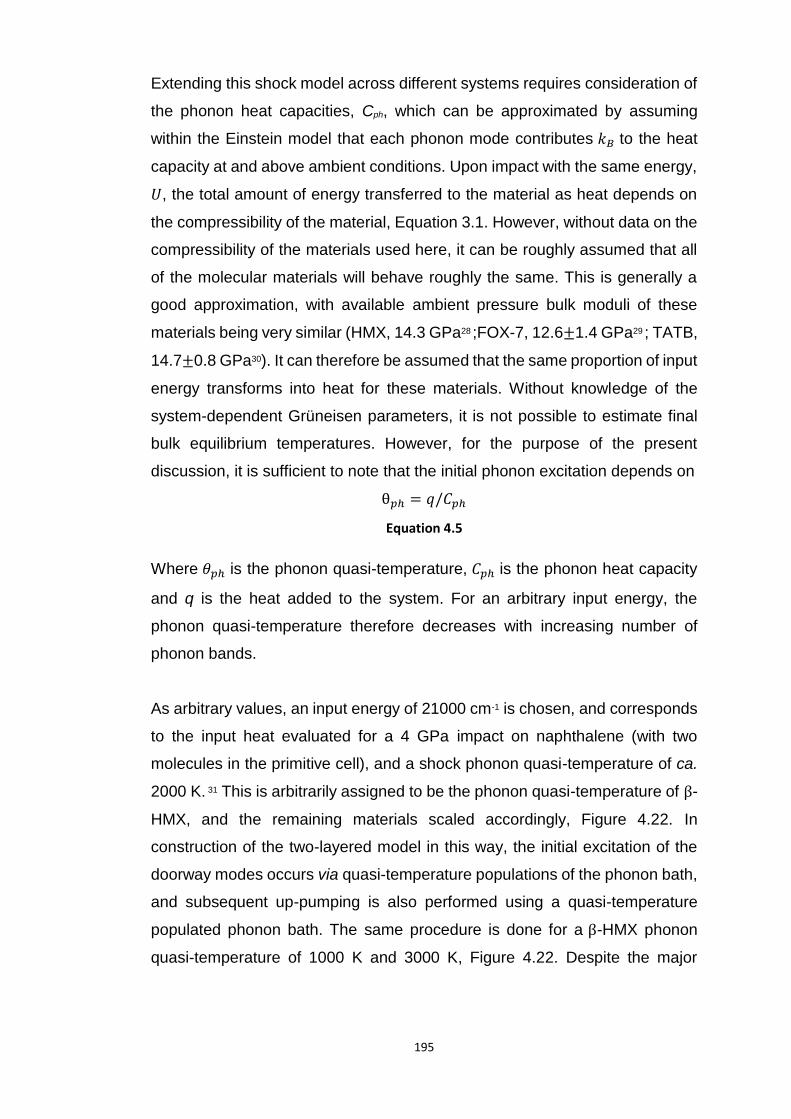
195
Extending this shock model across different systems requires consideration of
the phonon heat capacities, Cph, which can be approximated by assuming
within the Einstein model that each phonon mode contributes 𝑘𝐵 to the heat
capacity at and above ambient conditions. Upon impact with the same energy,
𝑈, the total amount of energy transferred to the material as heat depends on
the compressibility of the material, Equation 3.1. However, without data on the
compressibility of the materials used here, it can be roughly assumed that all
of the molecular materials will behave roughly the same. This is generally a
good approximation, with available ambient pressure bulk moduli of these
materials being very similar (HMX, 14.3 GPa28 ;FOX-7, 12.6±1.4 GPa29 ; TATB,
14.7±0.8 GPa30). It can therefore be assumed that the same proportion of input
energy transforms into heat for these materials. Without knowledge of the
system-dependent Grüneisen parameters, it is not possible to estimate final
bulk equilibrium temperatures. However, for the purpose of the present
discussion, it is sufficient to note that the initial phonon excitation depends on
θ𝑝ℎ = 𝑞/𝐶𝑝ℎ
Equation 4.5
Where 𝜃𝑝ℎ is the phonon quasi-temperature, 𝐶𝑝ℎ is the phonon heat capacity
and q is the heat added to the system. For an arbitrary input energy, the
phonon quasi-temperature therefore decreases with increasing number of
phonon bands.
As arbitrary values, an input energy of 21000 cm-1 is chosen, and corresponds
to the input heat evaluated for a 4 GPa impact on naphthalene (with two
molecules in the primitive cell), and a shock phonon quasi-temperature of ca.
2000 K. 31 This is arbitrarily assigned to be the phonon quasi-temperature of β-
HMX, and the remaining materials scaled accordingly, Figure 4.22. In
construction of the two-layered model in this way, the initial excitation of the
doorway modes occurs via quasi-temperature populations of the phonon bath,
and subsequent up-pumping is also performed using a quasi-temperature
populated phonon bath. The same procedure is done for a β-HMX phonon
quasi-temperature of 1000 K and 3000 K, Figure 4.22. Despite the major

196
approximations, there is again an excellent agreement observed between the
predicted sensitivity ordering, and very similar to that conducted under
equilibrium temperature in Figure 4.20. The same exponential trend is
observed in all cases and suggests consistency within the model. This model
may therefore offer a means to begin to probe the effects of different
experimental conditions across a range of materials. Additional data, including
accurate heat capacities and compressibility (and associated changes in
frequencies), can be added for further refinement of the model.
Figure 4.22: Predicting impact sensitivity using the two-layered model at ambient temperature
of 300 K. The phonon modes are initially excited to shock temperature Tsh. In all cases Ω𝑚𝑎𝑥 for
NTO is 240 cm-1. The y-axes are comparable and reflect an increase in reactivity with increased
shock temperature (and hence stronger impact).
Temperature Effects: Variable Temperature Frequencies
While the introduction of a temperature effect does lead to insight into
interesting phenomena, further parameters are clearly required for its
development. Most crucially is the validity of the underlying vibrational model
that is used in each case. To begin to analyse the underlying vibrational
structure, INS spectra were collected across a range of temperatures as

197
documented in Section 4.4. This offered particular insight into the position of
Ω𝑚𝑎𝑥. Due to time restrictions this was only possible for β-HMX, TATB and α-
FOX-7. However, these represent compounds showing a reasonably broad
range of structural types (e.g. layered, hydrogen bonded, or no directional
intermolecular contacts), and therefore offer a good indication of temperature
effects on vibrational frequencies in molecular materials in general. An overlay
of the INS spectra across the temperatures clearly suggests no notable shift
in the vibrational frequencies of the model organic materials at ω < 800 cm-1
(i.e. within the region of interest for up-pumping calculations), Figures 4.23 and
4.24. Most importantly in terms of the present discussion, the values of Ω𝑚𝑎𝑥,
the relative positions of the major peaks with respect to Ω𝑚𝑎𝑥, and the number
of peaks within the region of interest (< 3Ω𝑚𝑎𝑥) remains unchanged. In β-HMX,
Figure 4.23A, Ω𝑚𝑎𝑥 does not shift between 10-200 K, and the largest shift in
frequency is just ±3 cm-1 on comparing the 200 K and 10 K frequencies. TATB,
Figure 4.23B, however, exhibits a ca. 15 cm-1 decrease in Ω𝑚𝑎𝑥 on heating
from 0 to 200 K. The eigenvector of Ω𝑚𝑎𝑥 reveals this mode to be a rocking
motion of the molecules, perpendicular to the TATB layers. These layers,
stabilised by weak van der Waals interactions, are most susceptible to thermal
expansion. It is therefore logical that this mode should soften on increasing
temperature. The higher frequency modes in TATB do not shift by more than
ca. 4-5 cm-1 on heating from 10 to 200 K. Thus, overall, this imposes two
effects on TATB:
1. The maximum window into which overtone and combination modes can
couple in the first instance decreases by 𝟑 × 𝚫𝛀𝒎𝒂𝒙 (i.e. the change in
𝛀𝒎𝒂𝒙 observed due to thermal heating/cell volume change). This leads
to a change in the upper limit from 𝟑𝛀𝒎𝒂𝒙 ≈ 𝟒𝟔𝟓 → 𝟒𝟐𝟎 cm-1, and
hence exclusion of the vibrational band at ca. 450 cm-1.
2. The rate of up-pumping into these modes will decrease, due to larger
energy separations.
A similar effect can be expected for NTO, which is constructed from a similar
layering motif, Figure 4.1.
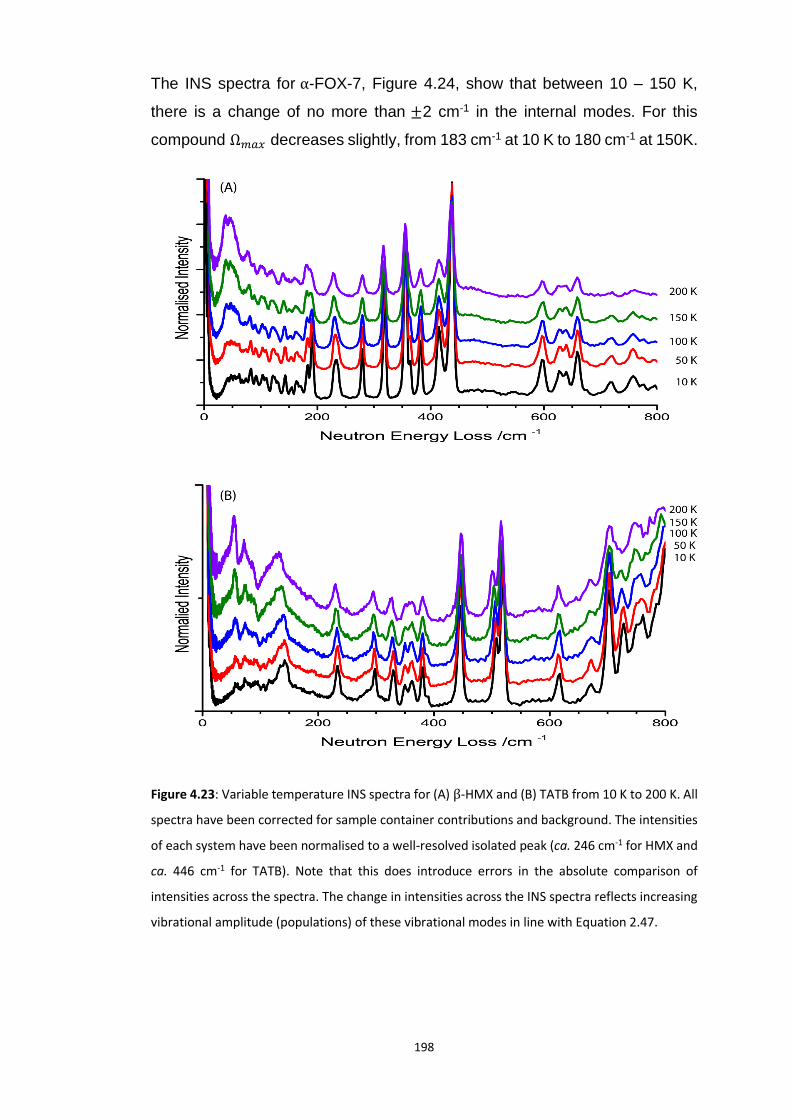
198
The INS spectra for α-FOX-7, Figure 4.24, show that between 10 – 150 K,
there is a change of no more than ±2 cm-1 in the internal modes. For this
compound Ω𝑚𝑎𝑥 decreases slightly, from 183 cm-1 at 10 K to 180 cm-1 at 150K.
Figure 4.23: Variable temperature INS spectra for (A) β-HMX and (B) TATB from 10 K to 200 K. All
spectra have been corrected for sample container contributions and background. The intensities
of each system have been normalised to a well-resolved isolated peak (ca. 246 cm-1 for HMX and
ca. 446 cm-1 for TATB). Note that this does introduce errors in the absolute comparison of
intensities across the spectra. The change in intensities across the INS spectra reflects increasing
vibrational amplitude (populations) of these vibrational modes in line with Equation 2.47.

199
Figure 4.24: Variable temperature INS spectra for α-FOX-7 from 10 K to 150 K. All spectra have
been normalised to the peak at ca. 385 cm-1.
It therefore appears that over a broad temperature range, there can be
expected to be only slight changes in the vibrational structure of these
compounds. Hence, the up-pumping model build throughout this chapter can
be expected to largely reflect ambient temperature phenomena. The most
important factor in considering the up-pumping calculations is the placement
of Ω𝑚𝑎𝑥 , which appears to decrease to a notable extent for the layered
compounds. This is expected to affect NTO, and may partially indicate the
inability of this model to accurately reproduce NTO sensitivity. While this may
contribute to the temperature variation in the sensitivity of these compounds,
further work is required to fully understand this phenomenon.
4.5.3.5 Up-Pumping from Zone-Centre Frequencies
It is clear from Section 4.5.2 that negligible band dispersion is observed across
the Brillouin zone of the molecular energetic materials. As many organic
energetic materials are composed of very large molecules in large, low
symmetry unit cells, the approach described above is limited by computational
resources. Much more tractable, however, is the calculation of zone-centre
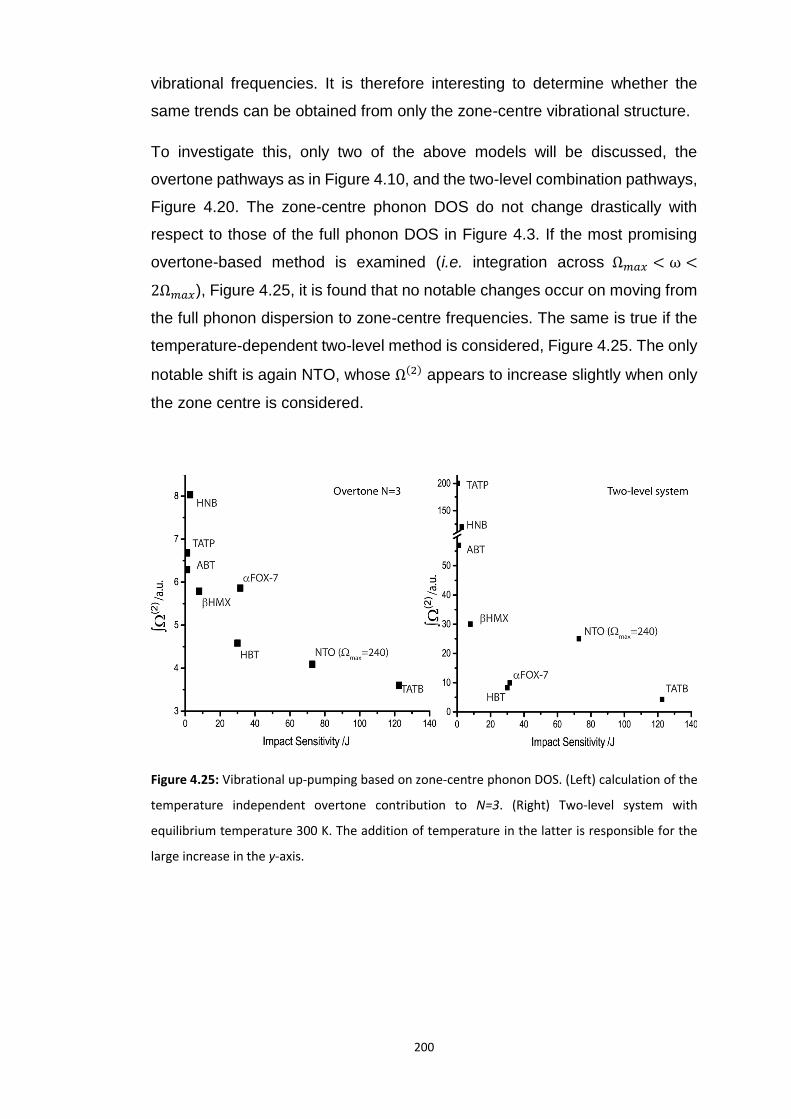
200
vibrational frequencies. It is therefore interesting to determine whether the
same trends can be obtained from only the zone-centre vibrational structure.
To investigate this, only two of the above models will be discussed, the
overtone pathways as in Figure 4.10, and the two-level combination pathways,
Figure 4.20. The zone-centre phonon DOS do not change drastically with
respect to those of the full phonon DOS in Figure 4.3. If the most promising
overtone-based method is examined (i.e. integration across Ω𝑚𝑎𝑥 < ω <
2Ω𝑚𝑎𝑥), Figure 4.25, it is found that no notable changes occur on moving from
the full phonon dispersion to zone-centre frequencies. The same is true if the
temperature-dependent two-level method is considered, Figure 4.25. The only
notable shift is again NTO, whose Ω(2) appears to increase slightly when only
the zone centre is considered.
Figure 4.25: Vibrational up-pumping based on zone-centre phonon DOS. (Left) calculation of the
temperature independent overtone contribution to N=3. (Right) Two-level system with
equilibrium temperature 300 K. The addition of temperature in the latter is responsible for the
large increase in the y-axis.
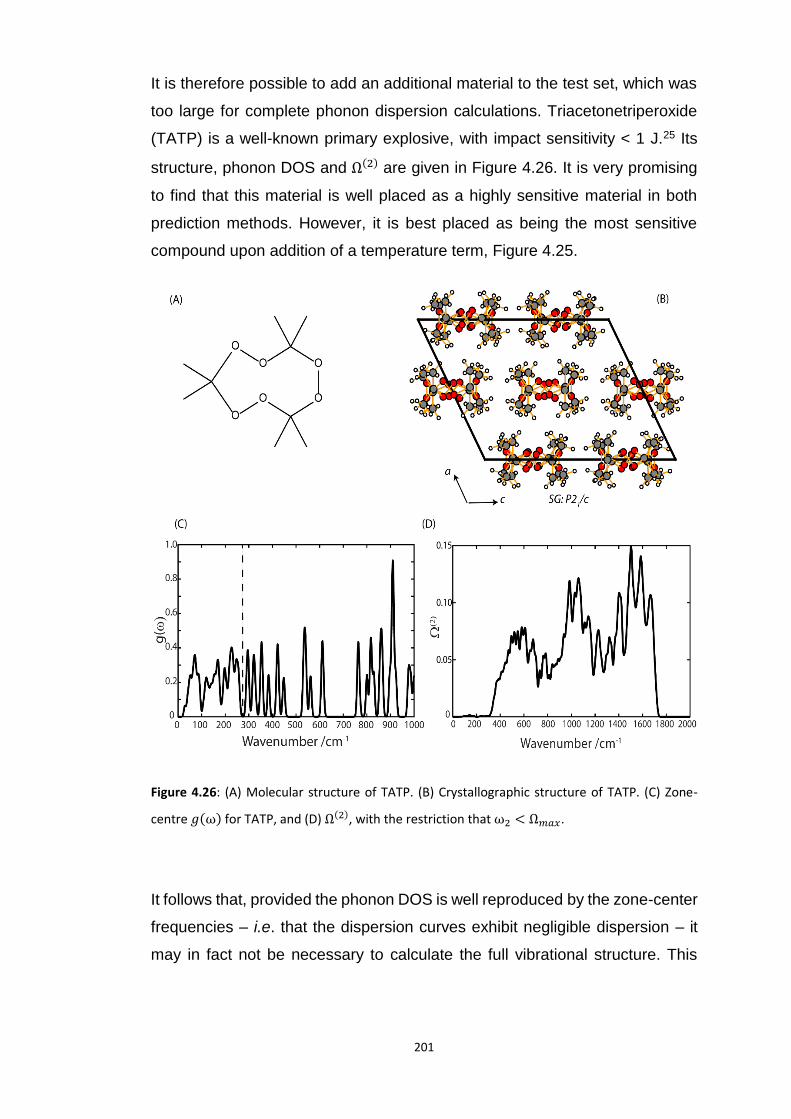
201
It is therefore possible to add an additional material to the test set, which was
too large for complete phonon dispersion calculations. Triacetonetriperoxide
(TATP) is a well-known primary explosive, with impact sensitivity < 1 J.25 Its
structure, phonon DOS and Ω(2) are given in Figure 4.26. It is very promising
to find that this material is well placed as a highly sensitive material in both
prediction methods. However, it is best placed as being the most sensitive
compound upon addition of a temperature term, Figure 4.25.
Figure 4.26: (A) Molecular structure of TATP. (B) Crystallographic structure of TATP. (C) Zone-
centre 𝑔(ω) for TATP, and (D) Ω(2), with the restriction that ω2 < Ω𝑚𝑎𝑥.
It follows that, provided the phonon DOS is well reproduced by the zone-center
frequencies – i.e. that the dispersion curves exhibit negligible dispersion – it
may in fact not be necessary to calculate the full vibrational structure. This
202
opens the door to examining very many organic molecular materials, which
may be too large for such expensive calculations. Moreover, it also opens up
the possibility of using standard lab-based Raman or terahertz spectrometers,
to probe the Brillouin zone-centre modes with sufficient detail to offer insights
into impact sensitivity behaviour.
4.6 Conclusions
The organic molecular energetic compounds studied in this chapter span a
broad range of both molecular and crystallographic structure types. From
highly sensitive compounds like TATP, to highly insensitive compounds such
as TATB, the organic EMs exhibit immense diversity in their sensitivity
properties. Analysis of the electronic band structure suggests that no
correlation exists between the size of the electronic band gap and the
sensitivity of these compounds. Hence, the ‘band gap criterion’ fails across the
subset of EMs investigated here.
The full phonon dispersion curves were generated for a series of seven organic
EMs: ABT, HNB, β-HMX, HNT, α-FOX-7, NTO and TATB. Comparison of β-
HMX, α-FOX-7, NTO and TATB to INS spectra suggest that DFT methods
produce excellent agreement with the experimental vibrational structure of
these types of materials.
Based on the vibrational up-pumping model, several qualitative correlations
could be found. Of the rapid, qualitative approaches, the most promising
appears to be simple correlation between the density of doorway modes with
the impact sensitivity. Physically, this can be related to the rate with which the
initial energy can transfer from the excited phonon bath into the internal
vibration manifold. Indeed, if the overtone pathways are considered and
projected onto the doorway region, an excellent correlation is observed with
impact sensitivity.

203
Consideration of the combination pathways by means of the two-phonon
density of states leads to rather poor correlation with experimental sensitivities.
However, this can be largely rectified by implementing a two-layered model.
That is, if explicit consideration is given for the initial excitation of the doorway
modes by the first overtone, and the combination pathways considered
subsequently, then the overall correlation with experiment becomes promising.
However, clear deficiencies remain. As a final step, it is found that the
distribution of doorway modes (i.e clustered at the upper or lower end of the
doorway region) requires some consideration for the relative contribution of
each doorway mode to up-pumping. This was treated by the addition of a
temperature term, populating vibrational states by the Bose-Einstein
populations. If this term is considered, the predicted trend in impact
sensitivities matches very well with experimental values. Hence, the work in
this chapter has developed a fully ab initio approach to ranking the impact
sensitivity of EMs based on a vibrational up-pumping model. In doing so, the
work in this chapter has successfully unified and expanded on competing
models that have been reported in the literature.
Reproducing the models based on zone-centre frequency calculations leads
to the same conclusions. This is presumably due to the low wave vector
dispersion that is exhibited for these materials. Hence, the zone centre
frequencies provide a good representation of the total vibrational structure.
This opens the door to implementing this model to large molecular materials,
such as TATP, for which the task of obtaining complete phonon dispersion
curves is simply too large.
It is remarkable to find that this simple mechanism of up-pumping appears to
provide a means to predict the relative impact sensitivity of a wide range of
structural types. The minor discrepancies that remain are likely due to the
intricacies that surround the differences in phonon scattering rates (i.e.
anharmonic coupling strengths) rates of phonon propagation in these materials,
as well as the dissociation energies of the different molecules.

204
4.7 Suggestions for Further Work
The method presented here has been a first approach at understanding the
up-pumping structure in EMs. Foremost, the work presented here includes
only seven molecular EMs, and therefore a larger number of systems is a clear
direction for additional work. On this subset of organic EMs, the model has
proved promising, despite the numerous simplifications and assumptions that
have been made. Enhancing this model by reducing the significance of these
assumptions is also a clear direction for further work, namely:
• It is clear that these methods perform well at ordering materials with
structurally similar explosophoric moieties. However, better
understanding of the electronic structure and decomposition pathways
is required to compare across different structure types.
• Explicit consideration of anharmonicity constants may prove important
in further resolving differences in predicted sensitivities.
• In this model, the phonon bath has been assumed to remain unchanged
by up-pumping. This is clearly not a realistic assumption. Further work
is required to include this consideration.
• Further investigation is required to unambiguously define the phonon
bath region, particularly in cases such as NTO.
The addition of temperature opens the door to very many possibilities within
the model presented in this chapter. In particular in its ability to introduce a
shock temperature to model the effects of different input energies. However,
an impact is associated with compression of the sample, which has been
neglected in this work. Explicit consideration for the effect of pressure on the
vibrational structure will therefore be a great asset to developing this model
further.
205
4.8 References
(1) Simpson, R. L.; Urtiew, P. A.; Ornellas, D. L.; Moody, G. L.; Scribner, K. J.; Hoffman, D. M. CL-20 Performance Exceeds That of HMX and Its Sensitivity Is Moderate. Propellants, Explos. Pyrotech. 1997, 22, 249–255.
(2) Storm, C. B.; Stine, J. R.; Kramer, J. F. Sensitivity Relationships in Energetic Materials. In Chemistry and Physics of Energetic Materials; Bulusu, S. N., Ed.; Springer, Dordrecht, 1990; pp 605–639.
(3) Kamlet, M. J.; Adolph, H. G. The Relationship of Impact Sensitivity with Structure of Organic High Explosives. II. Polynitroaromatic Explosives. Propellants, Explos. Pyrotech. 1979, 4 (2), 30–34.
(4) Tsyshevsky, R. V.; Sharia, O.; Kuklja, M. M. Molecular Theory of Detonation Initiation: Insight from First Principles Modeling of the Decomposition Mechanisms of Organic Nitro Energetic Materials. Molecules 2016, 21 (236).
(5) Murray, J. S.; Lane, P.; Politzer, P. Relationships between Impact Sensitivities and Molecular Surface Electrostatic Potentials of Nitroaramatic and Nitroheterocyclic Molecules. Mol. Phys. 1995, 85 (1), 1–8.
(6) Zhang, J.; Zhang, Q.; Vo, T. T.; Parrish, D. A.; Shreeve, J. M. Energetic Salts with Stacking and Hydrogen-Bonding Interactions Lead the Way to Future Energetic Materials. J. Am. Chem. Soc. 2015, 137 (4), 1697–1704.
(7) Rice, B. M.; Sahu, S.; Owens, F. J. Density Functional Calculations of Bond Dissociation Energies for NO 2 Scission in Some Nitroaromatic Molecules. J. Mol. Struct. THEOCHEM 2002, 583 (1), 69–72.
(8) Song, X. S.; Cheng, X. L.; Yang, X. D.; He, B. Relationship between the Bond Dissociation Energies and Impact Sensitivities of Some Nitro-Explosives. Propellants, Explos. Pyrotech. 2006, 31 (4), 306–310.
(9) Kuklja, M. M.; Rashkeev, S. N.; Zerilli, F. J. Shear-Strain Induced Decomposition of 1,1-Diamino-2,2-Dinitroethylene. Appl. Phys. Lett. 2006, 89 (7), 071904.
(10) Kuklja, M. M.; Rashkeev, S. N. Shear-Strain-Induced Chemical Reactivity of Layered Molecular Crystals. Appl. Phys. Lett. 2007, 90 (15).
(11) Mathieu, D. Physics-Based Modeling of Chemical Hazards in a Regulatory Framework: Comparison with Quantitative Structure-Property Relationship (QSPR) Methods for Impact Sensitivities. Ind. Eng. Chem. Res. 2016, 55 (27), 7569–7577.
(12) Fayet, G.; Rotureau, P. Development of Simple QSPR Models for the Impact Sensitivity of Nitramines. J. Loss Prev. Process Ind. 2014, 30 (1), 1–8.
(13) Bondarchuk, S. V. Quantification of Impact Sensitivity Based on Solid-State Derived Criteria. J. Phys. Chem. A 2018, 122, 5455–5463.
(14) Zhu, W.; Xiao, H. First-Principles Band Gap Criterion for Impact Sensitivity of Energetic Crystals: A Review. Struct. Chem. 2010, 21 (3), 657–665.

206
(15) Chen, S.; Tolbert, W. A.; Dlott, D. D. Direct Measurement of Ultrafast Multiphonon Up-Pumping in High Explosives. J. Phys. Chem. 1994, 98 (32), 7759–7766.
(16) Joshi, K.; Losada, M.; Chaudhuri, S. Intermolecular Energy Transfer Dynamics at a Hot-Spot Interface in RDX Crystals. J. Phys. Chem. A 2016, 120 (4), 477–489.
(17) Dlott, D. D. Multi-Phonon up-Pumpng in Energetic Materials. In Overview of Recent Research on Energetic Materials; Shaw, R. W., Brill, T. B., Thompson, D. L., Eds.; World Scientific, 2005; pp 303–333.
(18) Ye; Koshi, M. Theoretical Studies of Energy Transfer Rates of Secondary Explosives. J. Phys. Chem. B 2006, 110 (37), 18515–18520.
(19) Fried, L. E.; Ruggiero, J. Energy-Transfer Rates in Primary, Secondary, and Insensitive Explosives. J. Phys. Chem. 1994, 98 (39), 9786–9791.
(20) McNesby, K. L.; Coffey, C. S. Spectroscopic Determination of Impact Sensitivities of Explosives. J. Phys. Chem. B 1997, 101 (16), 3097–3104.
(21) McGrane, S. D.; Barber, J.; Quenneville, J. Anharmonic Vibrational Properties of Explosives from Temperature-Dependent Raman. J. Phys. Chem. A 2005, 109 (44), 9919–9927.
(22) Dlott, D. D.; Fayer, M. D. Shocked Molecular Solids: Vibrational up Pumping, Defect Hot Spot Formation, and the Onset of Chemistry. J. Chem. Phys. 1990, 92 (6), 3798–3812.
(23) Bernstein, J. Ab Initio Study of Energy Transfer Rates and Impact Sensitivities of Crystalline Explosives. J. Chem. Phys. 2018, 148 (8), 084502.
(24) Meyer, R.; Köhler, J.; Homburg, A. Explosives, 6th ed.; Meyer, R., Köhler, J., Homburg, A., Eds.; Wiley-VCH: Weinheim, 2007.
(25) Gamage, N. D. H.; Stiasny, B.; Stierstorfer, J.; Martin, P. D.; Klapötke, T. M.; Winter, C. H. Less Sensitive Oxygen-Rich Organic Peroxides Containing Geminal Hydroperoxy Groups. Chem. Commun. 2015, 51 (68), 13298–13300.
(26) Klapötke, T. M.; Piercey, D. G. 1,1′-Azobis(Tetrazole): A Highly Energetic Nitrogen-Rich Compound with a N10 Chain. Inorg. Chem. 2011, 50 (7), 2732–2734.
(27) Wilson, W. S.; Bliss, D. E.; Christian, S. L.; Knight, D. J. Explosive Properties of Polynitroaromatics; China Lake, CA, USA, 1990.
(28) Klapötke, T. M.; Sabaté, C. M. 5,5′-Hydrazinebistetrazole: An Oxidation-Stable Nitrogen-Rich Compound and Starting Material for the Synthesis of 5,5′- Azobistetrazolates. Zeitschrift fur Anorg. und Allg. Chemie 2007, 633 (15), 2671–2677.
(29) Rice, B. M.; Hare, J. J. A Quantum Mechanical Investigation of the Relation between Impact Sensitivity and the Charge Distribution in Energetic Molecules. J. Phys. Chem. A 2002, 106 (9), 1770–1783.
(30) Ledgard, J. The Preparatory Manual of Explosives, Third Edition, 3rd ed.; Jared Ledgard, 2007.

207
(31) Hunter, S.; Davidson, A. J.; Morrison, C. A.; Pulham, C. R.; Richardson, P.; Farrow, M. J.; Marshall, W. G.; Lennie, A. R.; Gould, P. J. Combined Experimental and Computational Hydrostatic Compression Study of Crystalline Ammonium Perchlorate. J. Phys. Chem. C 2011, 115 (38), 18782–18788.
(32) Hunter, S.; Sutinen, T.; Parker, S. F.; Morrison, C. A.; Williamson, D. M.; Thompson, S.; Gould, P. J.; Pulham, C. R. Experimental and DFT-D Studies of the Molecular Organic Energetic Material RDX. J. Phys. Chem. C 2013, 117 (16), 8062–8071.
(33) Hunter, S.; Coster, P. L.; Davidson, A. J.; Millar, D. I. A.; Parker, S. F.; Marshall, W. G.; Smith, R. I.; Morrison, C. A.; Pulham, C. R. High-Pressure Experimental and DFT-D Structural Studies of the Energetic Material FOX-7. J. Phys. Chem. C 2015, 119 (5), 2322–2334.
(34) Deschamps, J. R.; Frisch, M.; Parrish, D. Thermal Expansion of HMX. J. Chem. Crystallogr. 2011, 41 (7), 966–970.
(35) Evers, J.; Klapötke, T. M.; Mayer, P.; Oehlinger, G.; Welch, J. α- and β-FOX-7, Polymorphs of a High Energy Density Material, Studied by X-Ray Single Crystal and Powder Investigations in the Temperature Range from 200 to 423 K. Inorg. Chem. 2006, 45 (13), 4996–5007.
(36) Bolotina, N. B.; Hardie, M. J.; Speer Jr, R. L.; Pinkerton, A. A. Energetic Materials: Variable-Temperature Crystal Structures of {γ}- and {\varepsilon}-HNIW Polymorphs. J. Appl. Crystallogr. 2004, 37, 808–814.
(37) Akopyan, Z. A.; Struchkov, Y. T.; Dashevskii, V. G. Crystal And Molecular Structure of Hexanitrobenzene. Zh. Strukt. Khim. 1966, 7, 408.
(38) Cady, H. H.; Larson, A. C. The Crystal Structure of 1,3,5-Triamino-2,4,6-Trinitrobenzene. Acta Crystallogr. 1965, 18 (3), 485–496.
(39) Reany, O.; Kapon, M.; Botoshansky, M.; Keinan, E. Rich Polymorphism in Triacetone-Triperoxide. Cryst. Growth Des. 2009, 9 (8), 3661–3670.
(40) Clark, S. J.; Segall, M. D.; Pickard, C. J.; Hasnip, P. J.; Probert, M. I. J.; Refson, K.; Payne, M. C. First Principles Methods Using CASTEP. Zeitschrift für Krist. 2005, 220, 567–570.
(41) Hinuma, Y.; Pizzi, G.; Kumagai, Y.; Oba, F.; Tanaka, I. Band Structure Diagram Paths Based on Crystallography. Comput. Mater. Sci. 2017, 128, 140–184.
(42) Dovesi, R.; Orlando, R.; Erba, A.; Zicovich-Wilson, C. M.; Civalleri, B.; Casassa, S.; Maschio, L.; Ferrabone, M.; De La Pierre, M.; D’Arco, P.; et al. CRYSTAL14: A Program for the Ab Initio Investigation of Crystalline Solids. Int. J. Quantum Chem. 2014, 114 (19), 1287–1317.
(43) Peintinger, M. F.; Oliveira, D. V.; Bredow, T. Consistent Gaussian Basis Sets of Triple-Zeta Valence with Polarization Quality for Solid-State Calculations. J. Comput. Chem. 2013, 34 (6), 451–459.
(44) Heyd, J.; Peralta, J. E.; Scuseria, G. E.; Martin, R. L. Energy Band Gaps and Lattice Parameters Evaluated with the Heyd-Scuseria-Ernzerhof Screened Hybrid Functional. J. Chem. Phys. 2005, 123 (17), 174101.

208
(45) Tran, F.; Blaha, P.; Schwarz, K.; Novák, P. Hybrid Exchange-Correlation Energy Functionals for Strongly Correlated Electrons: Applications to Transition-Metal Monoxides. Phys. Rev. B - Condens. Matter Mater. Phys. 2006, 74 (15), 155108.
(46) Perdew, J. P.; Burke, K.; Ernzerhof, M. Generalized Gradient Approximation Made Simple. Phys. Rev. Lett. 1996, 77 (18), 3865–3868.
(47) Colognesi, D.; Celli, M.; Cilloco, F.; Newport, R. J.; Parker, S. F.; Rossi-Albertini, V.; Sacchetti, F.; Tomkinson, J.; Zoppi, M. TOSCA Neutron Spectrometer: The Final Configuration. Appl. Phys. A Mater. Sci. Process. 2002, 74, 64–66.
(48) Pinna, R. S.; Rudić, S.; Parker, S. F.; Armstrong, J.; Zanetti, M.; Škoro, G.; Waller, S. P.; Zacek, D.; Smith, C. A.; Capstick, M. J.; et al. The Neutron Guide Upgrade of the TOSCA Spectrometer. Nucl. Instruments Methods Phys. Res. Sect. A Accel. Spectrometers, Detect. Assoc. Equip. 2018, 896, 68–74.
(49) Arnold, O.; Bilheux, J. C.; Borreguero, J. M.; Buts, A.; Campbell, S. I.; Chapon, L.; Doucet, M.; Draper, N.; Ferraz Leal, R.; Gigg, M. A.; et al. Mantid - Data Analysis and Visualization Package for Neutron Scattering and μ SR Experiments. Nucl. Instruments Methods Phys. Res. Sect. A Accel. Spectrometers, Detect. Assoc. Equip. 2014, 764, 156–166.
(50) Dymkowski, K.; Parker, S. F.; Fernandez-Alonso, F.; Mukhopadhyay, S. AbINS: The Modern Software for INS Interpretation. Phys. B Condens. Matter 2018, In Press, 1–6.
(51) Crowley, J. M.; Tahir-Kheli, J.; Goddard, W. A. Resolution of the Band Gap Prediction Problem for Materials Design. J. Phys. Chem. Lett. 2016, 7 (7), 1198–1203.
(52) Garza, A. J.; Scuseria, G. E. Predicting Band Gaps with Hybrid Density Functionals. 2016, 7, 5–10.
(53) Cooper, J. K.; Grant, C. D.; Zhang, J. Z. Experimental and TD-DFT Study of Optical Absorption of Six Explosive Molecules: RDX, HMX, PETN, TNT, TATP, and HMTD. J. Phys. Chem. A 2013, 117 (29), 6043–6051.
(54) Bredas, J.-L. Mind the Gap! Mater. Horiz. 2014, 1 (1), 17–19.
(55) Appalakondaiah, S.; Vaitheeswaran, G.; Lebègue, S. Dispersion Corrected Structural Properties and Quasiparticle Band Gaps of Several Organic Energetic Solids. J. Phys. Chem. A 2015, 119 (24), 6574–6581.
(56) Appalakondaiah, S.; Vaitheeswaran, G.; Lebègue, S. Structural, Vibrational, and Quasiparticle Band Structure of 1,1-Diamino-2,2-Dinitroethelene from Ab Initio Calculations. J. Chem. Phys. 2014, 140 (1).
(57) Hu, A.; Larade, B.; Abou-Rachid, H.; Lussier, L. S.; Guo, H. A First Principles Density Functional Study of Crystalline FOX-7 Chemical Decomposition Process under External Pressure. Propellants, Explos. Pyrotech. 2006, 31 (5), 355–360.
(58) Kuklja, M. M.; Rashkeev, S. N. Shear-Strain-Induced Structural and Electronic Modifications of the Molecular Crystal 1,1-Diamino-2,2-Dinitroethylene: Slip-Plane Flow and Band Gap Relaxation. Phys. Rev. B - Condens. Matter Mater. Phys. 2007, 75 (10), 104111.

209
(59) Yuan, B.; Yu, Z.; Bernstein, E. R. Initial Decomposition Mechanism for the Energy Release from Electronically Excited Energetic Materials: FOX-7 (1,1-Diamino-2,2-Dinitroethene, C2H4N4O4). J. Chem. Phys. 2014, 140 (7).
(60) Chakraborty, D.; Muller, R. P.; Dasgupta, S.; Goddard, W. A. Mechanism for Unimolecular Decomposition of HMX (1,3,5,7-Tetranitro-1,3,5,7-Tetrazocine), an Ab Initio Study. J. Phys. Chem. A 2001, 105 (8), 1302–1314.
(61) Kim, H.; Dlott, D. D. Theory of Ultrahot Molecular Solids: Vibrational Cooling and Shock-Induced Multiphonon up Pumping in Crystalline Naphthalene. J. Chem. Phys. 1990, 93 (3), 1695–1709.
(62) Coffey, C. S.; Toton, E. T. A Microscopic Theory of Compressive Wave-Induced Reactions in Solid Explosives. J. Chem. Phys. 1982, 76 (2), 949–954.
(63) Zhang, G.; Weeks, B. L. A Device for Testing Thermal Impact Sensitivity of High Explosives. Propellants, Explos. Pyrotech. 2010, 35 (5), 440–445.
210
Chapter 5
Vibrational Up-Pumping in Polymorphic Materials
5.1 Introduction
Due to the flexibility of molecules and the low directionality of their weak
intermolecular interactions, molecules can adopt a variety of packing
arrangements upon crystallisation. Hence, the same compound can exist in
different crystal forms, or polymorphs. This phenomenon is widespread across
molecular materials, with Walter McCrone famously stating that “every
compound has different polymorphic forms and the number of forms known for
a given compound is proportional to the time and energy spend in research on
that compound.”1 Different polymorphic forms can be obtained during
crystallization, for example by controlling the speed, temperature or pressure
under which nucleation occurs.2,3 Alternatively, polymorphs can interconvert
upon heating or application of external pressure.4,5 Polymorphic forms are
known to exhibit drastically different physical properties. This phenomenon has
therefore been strongly monitored by the pharmaceutical industry, where
polymorphs can exhibit, for example, different solubilities6 and
compressibilities.7 Hence, a drug composition that is prepared based on one
polymorph can behave differently than that based on another polymorphic form.
Energetic materials (EMs) are also highly prone to polymorphism. Some of the
most well-known EMs exhibit rich polymorphism. For example, RDX is known
to exist in at least two polymorphic forms under ambient conditions, the α- and
β-forms, and two additional forms can be obtained under hydrostatic pressures,
211
γ-RDX at ca. 5.2 GPa8 and δ-RDX at ca. 17.8 GPa. A fifth form, ϵ-RDX, has
also been identified on simultaneous application of heat and pressure.9 Other
well-known EMs, such as CL-20, TNT, ammonium perchlorate and ammonium
nitrate, also exhibit rich polymorphism. As polymorphic transformations often
occur when a material is exposed to extremes of temperature and pressure,
their occurrence is crucial to understanding the detonation pathways of EMs.
Despite knowledge of their existence, most EM literature does not explicitly
consider polymorphic modifications during impact testing. A notable exception
is HMX, Figure 5.1. Under ambient conditions HMX exists in the monoclinic β-
form. The orthorhombic α-form can be obtained from recrystallisation under
elevated temperatures and is stable between 377 and 429 K, and can be
recovered to ambient conditions.10 The δ-form is obtained by heating the β-
form, and is stable above 429 K.11 While highly metastable, the δ-form can be
recovered to ambient conditions upon quench cooling.10 A fourth form, a
hydrate (often denoted γ-HMX) is also known to be readily prepared under
ambient conditions on rapid recrystallisation of β -HMX from aqueous
solutions.10
The absolute sensitivity of the δ-form is open to debate, although it is accepted
to be considerably more sensitive to impact than the β-form.12 A thorough
analysis of reported sensitivities by Cady and Smith,10 and subsequent work
by Scott,13 suggests δ -HMX to have a comparable impact sensitivity to
pentaerythritol tetranitrate (PETN), the highest sensitivity secondary explosive
(ca. 3 J)14 in common use. Other reports have suggested δ-HMX to be as
sensitive as lead azide (< 1 J)15 or other primary explosives.16 While the exact
level to which δ-HMX is more sensitive than the β-form remains uncertain, it is
clear that they do exhibit very different sensitivity properties. The available
literature therefore suggests the impact sensitivity ordering for HMX as δ >
γ > α > β.10
To date, no high-pressure forms of HMX have been structurally characterised.
However, some experiments do suggest two potential high-pressure
transitions under quasi-hydrostatic conditions.17,18 A conformational transition
212
(i.e. associated with a small change in the molecular geometry, without a large
change in the crystallographic structure) was observed at ca. 12 GPa, with an
abrupt phase transition observed above 27 GPa. 18
Figure 5.1: Structure of HMX. (A) Schematic representation of the HMX molecule. (B) Crystal
structure of 𝛽-HMX 𝑃21/𝑐 (CCDC Ref: OCHTET01). (C) Crystal structure of 𝛿-HMX 𝑃61 (CCDC Ref:
OCHTET03). Atoms are coloured as (red) oxygen, (blue) nitrogen, (grey) carbon, and (white)
hydrogen.
FOX-7 is also well known to be polymorphic. Under ambient conditions, FOX-
7 is stable as the monoclinic 𝛼-phase. Upon heating, two phase transitions
occur, first to β-FOX-7 at 111 °C, and subsequently to γ-FOX-7 at 173 °C.19
These transitions correspond to an increased layering of the FOX-7 molecules,
Figure 5.2. Spectroscopic investigations and thermal analysis have suggested
a fourth high-temperature phase (δ-FOX-7) to exist immediately prior to the
decomposition temperatures (i.e. at T > 230 oC), although no crystal structure

213
has yet been obtained. Some reports suggest that the δ-phase is simply a
decomposition product of the γ-phase.20 The application of pressure has also
been demonstrated to yield a variety of polymorphic transformations, including
formation of two new phases on compression of α-FOX-7 to ca. 2 GPa and 5
GPa,19,21 denoted the α ’ and ϵ phases, respectively. The latter has been
suggested to play a role in the shock-induced processes of FOX-7.20
It is generally accepted that energetic materials that adopt layered crystal
packing (e.g. TATB) display lower sensitivities, although no underlying
mechanism for this effect has been deduced. Two common theories include:
1 Increased hydrogen bonding, which forms upon layering, leads to
dissipation of energy through the layers22
2 Slip planes associated with layered materials23,24
Some have also proposed that a higher inter-layer compressibility of layered
materials effectively decreases the energy input from an impact. However, in
accordance with Equation 3.1, a larger compressibility in fact does quite the
opposite, and leads to a larger proportion of the impact energy converting into
heat, rather than work. This has the effect of enhancing the direct excitation of
the molecules in the system. In line with the theory proposed in Chapter 4,
higher compressibility also leads to hardening of vibrational modes and thus
enhances up-pumping. Instead, the lower compressibility of hydrogen-bonded
layers has instead been proposed to account for the lower sensitivity of layered
materials. 22
The polymorphs of FOX-7 therefore offer an opportunity to test the up-pumping
model developed in this thesis, on the effects of how layered structures
influence impact sensitivity.

214
Figure 5.2: Structure of FOX-7. (A) Schematic representation of the FOX-7 molecular structure. (B)
Crystal structure of α -FOX-7 𝑃21/𝑛 (CCDC Ref: SEDTUQ03). (C) Crystal structure of β -FOX-7
𝑃212121(CCDC Ref: SEDTUQ06). (C) Crystal structure of γ-FOX-7 𝑃21/𝑛 (From Crawford et al 25).
The angle between FOX-7 molecules (∠(FOX-7)) is given in each case. Atoms are coloured as (red)
oxygen, (blue) nitrogen, (grey) carbon and (white) hydrogen.
5.2 Aims
The work in this chapter seeks to use the model employed in Chapters 3 and
4 to investigate two polymorphic systems: HMX and FOX-7. The former
contains two polymorphs that are well-known to exhibit very different impact
sensitivities, while the impact sensitivities of the latter have yet to be
experimentally reported. This chapter therefore aims to:
• Determine whether the up-pumping model is sensitive to polymorphic
modifications
215
• Experimentally determine the impact sensitivity of the 𝛾-polymorph of
FOX-7
• Explore the effects of increased layering on the sensitivity of energetic
materials
• Rationalise the sensitivity of FOX-7 polymorphs based on the up-
pumping model.
5.3 Materials
Synthesis of FOX-7. Preparation of 1,1-diamino-2,2-dinitroethene (DADNE,
FOX-7) followed from Scheme 5.1.26 2-methyl-4,6-pyrimidinedione (6.0 g, 0.05
mol) was dissolved in concentrated H2SO4 (95%, 45 mL), at temperatures <
30 oC. Concentrated HNO3 (99%, 20 mL) was subsequently added dropwise
maintaining temperatures < 20 oC, and the sample stirred for 3 hours. The
resulting material was rinsed in concentrated H2SO4, added to deionized water
(100 mL) and stirred for 2 hours. The resulting product was analysed by 1H
and 13C NMR, and subsequently by X-ray powder diffraction.
Scheme 5.1: Synthetic approach for preparation of FOX-7.
Preparation of 𝛾-FOX-7. The metastable 𝛾-form was prepared by heating the
𝛼-form to 180 oC for approximately 2 hours, and quench cooling the material
to ambient conditions. The phase purity was confirmed by X-ray powder
diffraction.
216
Preparation of 𝛿-HMX. A sample of β-HMX was slowly heated in a furnace to
190 oC,27 and held at this temperature for ca. 12 hours. The sample was
quench cooled with an ice bath, and the polymorphic phase verified by X-ray
powder diffraction. The sample was stored under an N2 atmosphere for
approximately 1 day prior to INS analysis.
BAM Drop Hammer Testing. BAM fall hammer testing (BFH-12) was
conducted at the Cavendish Laboratory, University of Cambridge. A sample of
ca. 40 mm3 was placed in an anvil device and sealed between two co-axial
steel cylinders. The anvil components were disposed of between each sample
test. In this work, the Limiting Energy (1-in-6) go/no-go criterion was used;28 a
‘go’ was considered when a flash, audible explosion or discolouration of the
sample (black) or scorch marks on the anvil was observed.
X-ray Powder Diffraction. All solid samples were analysed by powder X-ray
diffraction using a D2 PHASER diffractometer, with Cu 𝐾𝛼 radiation (𝜆 =
1.5406 Å). Data were collected in Bragg-Brentano geometry over the range 2𝜃
= 5-500 (d-spacing ≈ 1.8-17 Å).
Inelastic Neutron Scattering Spectroscopy. Inelastic neutron scattering spectra
were collected on the TOSCA29,30 spectrometer at the ISIS Neutron and Muon
Facility. Samples (ca. 1.5 g) were placed in aluminium sample holders. The
samples were cooled to ca. 10 K and spectra collected for a total of ca. 400
μAh. Data from the forward- and backward-scattering detectors were summed
and corrected for scattering from the sample container and background. Data
processing was performed using the Mantid software.31 Simulated INS spectra
were generated using ABINS32 as implemented in Mantid.
Condensed Matter Calculations. All condensed matter vibrational calculations
were based on experimental crystal structures. Structures for δ -HMX
(OCHTET03) and β-FOX-7 (SEDTUQ06) were sourced from the Cambridge
Crystallographic Data Centre (CCDC). The input structure for γ-FOX-7 was
taken from Crawford et al.25 Data for β-HMX and α-FOX-7 were taken from
Chapter 4. All structures were optimised using plane-wave DFT (pw-DFT) as
217
implemented in CASTEP v16.33 The GGA functional of Perdew-Burke-
Ernzerhof34 (PBE) was used along with Grimme’s D2 dispersion correction
scheme,35 PBE-D2. This scheme has previously been demonstrated to
perform well for these materials.21,36 The electronic wavefunction was
expanded in plane waves to a kinetic energy cut-off of 1800 eV (α-FOX-7),
1300 eV (β-HMX, δ-HMX and β-FOX-7) and 950 eV (γ-FOX-7). All forces were
converged to < 5 × 10⁻⁴ eV/Å and stresses to < 5 × 10⁻⁴ GPa. γ-FOX-7 was
converged to less stringent parameters, forces < 1 × 10⁻³ eV/ Å and stresses
to < 1 × 10⁻³ GPA. The energy change per atom was accepted after
convergence < 5 × 10⁻⁹ eV/atom for all cases except γ-FOX-7, for which a
convergence was accepted < 1 × 10⁻⁸ eV/atom. The electronic structure was
sampled on a k-point Monkhorst-Pack37 (MP) grid with spacing no more than
0.05 Å-1. Norm-conserving pseudopotentials were used throughout. Optimised
geometries are summarized in Table 5.1.
Table 5.1: Optimisation Parameters for the HMX and FOX-7 materials investigated here.
a b c 𝛂 𝛃 𝛄 V 𝚫𝐕
β-HMXexp 6.525 11.024 7.362 90 102.642 90 516.675 +4.00%
β-HMXcalc 6.624 11.256 7.373 90 102.222 90 537.299
δ-HMXexp 7.711 7.711 32.553 90 90 120 1676.270 +0.57%
δ-HMXcalc 7.670 7.670 33.091 90 90 120 1685.860
α-FOX-7exp 6.934 6.622 11.312 90 90.065 90 519.470 +2.20%
α-FOX-7calc 7.089 6.623 11.440 90 91.273 90 530.898
β-FOX-7exp 6.974 6.635 11.648 90 90 90 538.943 +1.12%
β-FOX-7calc 7.093 6.495 11.830 90 90 90 544.967
γ-FOX-7exp 13.354 6.895 12.050 90 111.102 90 1035.110 +5.02%
γ-FOX-7calc 13.565 7.084 12.224 90 112.247 90 1087.170
Phonon calculations were performed using the linear response method as
implemented in CASTEP v16 at either the -point or sampled across the
Brillouin zone on a regular grid of wave vectors and subsequently Fourier
interpolated onto a finer grid. Electronic band structures were calculated using
localized basis sets (H- H_pob_TZVP_201238; C- C_m-6-
311G(d)_Heyd_200539; N- N_m-6-311G(d)_Heyd_200539; O- O_m-6-
311G(2d)_Heyd_200539) within the CRYSTAL17 code,40 based on
218
experimental structures. Band structures were generated using the HSE06,39
B3PW9141 and PBE34 functionals. Electronic structure was calculated across
no less than 120 k-points, evenly spaced across an MP grid. The wavefunction
was accepted after the absolute change in SCF cycle energies was < 10-8. For
all materials, the tolerances (TOLINTEG) were set at 7 7 7 9 30 (as
recommended for use with these basis sets39).
5.4 Results and Discussion
5.4.1 Polymorphism of HMX
5.4.1.1 Electronic Structure of HMX Polymorphs
The calculated band gaps for both β - and δ -HMX were found to be
approximately the same, with the δ-form exhibiting a slightly larger band gap
than the β-form, Table 5.2. Furthermore, δ-HMX exhibits an indirect band gap
for all three functionals, while two of the three functionals suggest that β-HMX
has a direct band gap. Any correlation to the ‘band gap criterion’42 (i.e. that the
more sensitive material has the smaller band gap) therefore does not hold
when considering these two polymorphs of HMX.
With no notable electronic differences in the solid state, it is therefore worth
considering a vibrational basis to rationalise the sensitivity differences.
Table 5.2: Band gaps for δ-HMX as compared to those for β-HMX. Band gaps are indicated as
direct (D) or indirect (I).
B3PW91 PBE HSE06
β-HMX 5.4954 (D) 3.6826 (I) 5.2176 (D)
δ-HMX 5.7422 (I) 3.7011 (I) 5.4745 (I)

219
5.4.1.2 Vibrational Structure of HMX Polymorphs
The primitive unit cell of 𝛿-HMX is considerably larger than that of 𝛽-HMX, and
it was therefore not possible to obtain a full phonon dispersion curve for the
former. However, as demonstrated in Section 4.5.3.5, for the materials which
exhibit negligible dispersion, the zone-centre frequencies are sufficient for
consideration of the vibrational up-pumping model. Given the low dispersion
of the 𝛽-polymorph (see Chapter 4.5.2), it is reasonable to expect a similar
character in the 𝛿-form.
Figure 5.3: Inelastic neutron scattering spectra of δ-HMX at ca. 10 K. (Top) The experimental
pattern and (Bottom) simulated patterns are given. The latter is generated from Γ -point
frequencies only. The vertical dotted line indicates Ω𝑚𝑎𝑥 in each case.
The zone-centre vibrational structure for 𝛿-HMX was therefore calculated, and
compared to experimental INS data, Figure 5.3. There is generally very good
agreement between the simulated and experimental frequencies. The value of
Ω𝑚𝑎𝑥 sits only ca. 5 cm-1 lower in the experimental pattern as compared to the
simulated pattern, with the close comparison suggesting little band dispersion
exists at the top of the phonon bath. The frequencies are very well reproduced

220
across the INS spectrum, underestimated by only 2-3% across most modes,
Table 5.3. A notable exception is 𝑀5, which is underestimated by ca. 6% in the
simulated pattern. This corresponds to the deformation modes of the HMX ring,
and suggests that PBE-D2 may struggle in reproducing some internal modes
of these materials, which is also apparent when the higher frequency modes
with ω > 1000 cm-1 are considered. This was also noted in Chapters 3 and 4
for the internal frequencies of other materials. Overall, however, it appears that
the model used is in general a good reproduction of the experimental
vibrational structure for δ-HMX.
Table 5.3: Comparison of simulated (-point only) and experimental INS frequencies for well-
resolved peaks. The difference is given as a percentage over the experimental value.
INS Calc. Δω /%
Ω𝑚𝑎𝑥 178 177 -0.56%
𝑀1 201 198 -1.49%
𝑀2 222 218 -1.80%
𝑀3 238 230 -3.48%
𝑀4 253 250 -1.19%
𝑀5 331 312 -5.74%
𝑀6 374 367 -1.87%
𝑀7 390 382 -2.05%
𝑀8 404 388 -3.96%
𝑀9 418 405 -3.01%
𝑀10 448 436 -2.68%
𝑀11 471 461 -2.12%
𝑀12 587 561 -4.43%
𝑀13 649 631 -2.77%
𝑀14 710 688 -3.10%
𝑀15 735 703 -4.35%
𝑀16 753 730 -3.05%
𝑀17 837 820 -2.03%
𝑀18 924 908 -1.73%
𝑀19 1026 970 -5.46%
221
The phonon density of states, 𝑔(ω), and two-phonon density of states, Ω(2) =
𝛿(𝜔 − 𝜔1 − 𝜔2), are given in Figure 5.4, under the restriction 𝜔2 < Ω𝑚𝑎𝑥. The
value of Ω𝑚𝑎𝑥 is placed at 160 cm-1 in δ-HMX, which agrees well with both the
theory and INS spectra. Based on analysis of the 𝑔(ω), an alternative would
be to place it at 260 cm-1, above the ring deformation modes that span the
region 160 < ω < 260 cm-1. However, no evidence exists to suggest this is a
more appropriate placement of Ω𝑚𝑎𝑥, and the former will subsequently be used.
While Ω𝑚𝑎𝑥 is found to be lower for δ-HMX (160 cm-1) than in the β-form (195
cm-1), the doorway region (Ω𝑚𝑎𝑥 < ω < 2Ω𝑚𝑎𝑥) is notably denser in the former
(7.1 vs 4.4 states per atom). Hence it can already be suggested that the δ-form
will be more readily excited by vibrational up-pumping. Furthermore, the onset
of Ω(2) occurs approximately 50 cm-1 earlier in δ-HMX, and grows much more
rapidly than for β-HMX. Qualitatively, all of these factors suggest the δ-form to
be more sensitive according to the up-pumping model.
To compare the two polymorphs, vibrational up-pumping was considered in
line with the two most promising models from Chapter 4, but now applied to -
point data only: (1) the contribution of the first two overtones to the region
Ω𝑚𝑎𝑥 → 3Ω𝑚𝑎𝑥, and (2) the two-level model under an equilibrium temperature
of 300 K. Note that as in Chapter 4, the lack of a specific target frequency
requires consideration of an ‘indirect’ phonon up-conversion mechanism.43
Hence up-pumped values are normalised by ∫𝑔(ω).
In the first model, the two lowest order overtones (i.e. the fastest coupling
pathways) are generated, Figure 5.5, and their projection onto 𝑔(ω) are
considered, i.e. 𝑃(𝑔(ω)), which is then normalized by ∫𝑔(ω). As only the first
two overtones are included, this restricts the upper value for integration to
3Ω𝑚𝑎𝑥, with the resulting ∫𝑃(𝑔(ω)) for δ-HMX (~6.62 a.u.) > β-HMX (~5.85
a.u.). Thus the overtone up-pumping model suggests more pathways exist for
the δ-form. As such δ-HMX is therefore predicted to be more sensitive to
impact than the β-form, and ranks the sensitivities as HNB > δ-HMX ≈ TATP >
ABT > β-HMX according to Figure 4.25.

222
Figure 5.4: Comparison of the vibrational structure of two HMX polymorphs. (Top) 𝑔(ω) and Ω(2)
for β-HMX, and (bottom) 𝑔(ω) and Ω(2) for δ-HMX. 0→ Ω𝑚𝑎𝑥 and Ω𝑚𝑎𝑥→ 2Ω𝑚𝑎𝑥 are identified
in 𝑔(ω) by yellow and purple, respectively. Note that Ω(2) have been normalised by ∫𝑔(ω) to
account for a different number of atoms (and hence vibrational modes) in the unit cell according
to the indirect up-pumping mechanism.

223
Figure 5.5: Overtone contributions to vibrational up-pumping in HMX polymorphs. The overtones
are shown for (blue) 𝑁 = 2 and (green) 𝑁 = 3, and overlain by 𝑔(ω) (black).
Within the two-layer model, the populations from the first overtone (with T =
300 K) are projected onto the doorway region, and up-pumped with the
underlying phonon modes via combination pathways. As Ω(2) (see Figure 5.4)
does not drop to zero < 1800 cm-1 for either polymorph, up-pumping
contributions to ω < 1800 cm-1 are considered for both. This results in ∫Ω(2)
for δ -HMX (~200 a.u.) > β -HMX (~32 a.u.), which again reproduces the
experimental observation that δ-HMX is more sensitive than the β-form. For
the two-layer model the sensitivity ordering is TATP ≈ δ-HMX > HNB > ABT >
β -HMX according to Figure 4.25, which does appear to place δ -HMX
somewhat higher in sensitivity than expected experimentally. However, it
clearly places it in line with the other highly impact-sensitive compounds.
To summarise, it is clear that both up-pumping models predict that the δ-form
should be notably more sensitive to impact than the β-form, consistent with
experimental reports. Thus, while this is a limited test set, it does suggest that
the vibrational up-pumping model is sensitive not only to different molecular
materials, but also to different crystallographic forms of the same energetic
molecule.
224
5.4.2 Polymorphism of FOX-7
Having demonstrated the ability of the up-pumping model to distinguish
between different polymorphic forms of HMX, the three temperature-related
FOX-7 polymorphs were considered next.
5.4.2.1 Experimental Impact Sensitivity
Samples of both α- and γ-FOX-7 were subjected to impact sensitivity testing
using the BAM fall-hammer with ‘go/no-go’ criteria. A sample of α-FOX-7 was
first subjected to testing, Table 5.4, with an impact sensitivity of ca. 8 J
according to the 1/6 Limiting Impact sensitivity criteria. This is clearly more
sensitive than is reported based on the ℎ50 statistics (𝐸50 ≈ 24-30 J)44. The
1/6 method indicates the lower end of the sensitivity sigmoidal curve shown in
Chapter 2, and hence is always lower than the ℎ50 value. Moreover, it is known
that FOX-7 sensitivity increases with decreasing particle size, with a limiting
value of ca. 10-11 J having been reported in literature.44
Table 5.4: BAM impact sensitivity results for α-FOX-7. A ‘go’ is indicated as ✓ and ‘no-go’ by .
Trial Number
Mass /kg Height /cm Energy /J 1 2 3 4 5 6
5 22.4 11.20 ✓
17.8 8.90 ✓
1 89.1 8.91 ✓
79.4 7.94 ✓
70.8 7.08
A sample of α-FOX-7 was subsequently heated to convert it to γ-FOX-7. The
α → γ phase transition is a single-crystal to single-crystal transformation.25
Hence, the particle size distribution can be taken to be the same across the
two polymorphic forms, on the basis that no reconstructive phase transition
occurs. When this sample was subjected to BAM hammer testing, the impact
sensitivity was found to be the same to within the experimental error of the
measurement, Table 5.5. This was unexpected given the extreme insensitivity
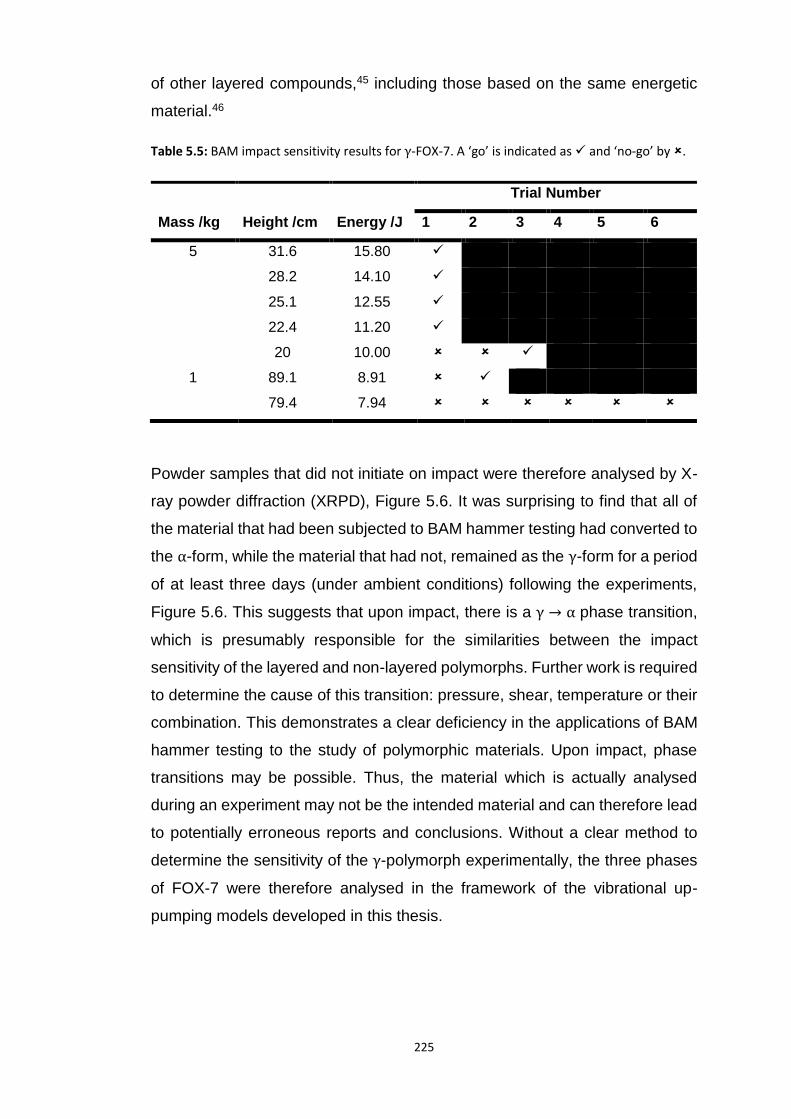
225
of other layered compounds,45 including those based on the same energetic
material.46
Table 5.5: BAM impact sensitivity results for γ-FOX-7. A ‘go’ is indicated as ✓ and ‘no-go’ by .
Trial Number
Mass /kg Height /cm Energy /J 1 2 3 4 5 6
5 31.6 15.80 ✓
28.2 14.10 ✓
25.1 12.55 ✓
22.4 11.20 ✓
20 10.00 ✓
1 89.1 8.91 ✓
79.4 7.94
Powder samples that did not initiate on impact were therefore analysed by X-
ray powder diffraction (XRPD), Figure 5.6. It was surprising to find that all of
the material that had been subjected to BAM hammer testing had converted to
the α-form, while the material that had not, remained as the γ-form for a period
of at least three days (under ambient conditions) following the experiments,
Figure 5.6. This suggests that upon impact, there is a γ → α phase transition,
which is presumably responsible for the similarities between the impact
sensitivity of the layered and non-layered polymorphs. Further work is required
to determine the cause of this transition: pressure, shear, temperature or their
combination. This demonstrates a clear deficiency in the applications of BAM
hammer testing to the study of polymorphic materials. Upon impact, phase
transitions may be possible. Thus, the material which is actually analysed
during an experiment may not be the intended material and can therefore lead
to potentially erroneous reports and conclusions. Without a clear method to
determine the sensitivity of the γ-polymorph experimentally, the three phases
of FOX-7 were therefore analysed in the framework of the vibrational up-
pumping models developed in this thesis.
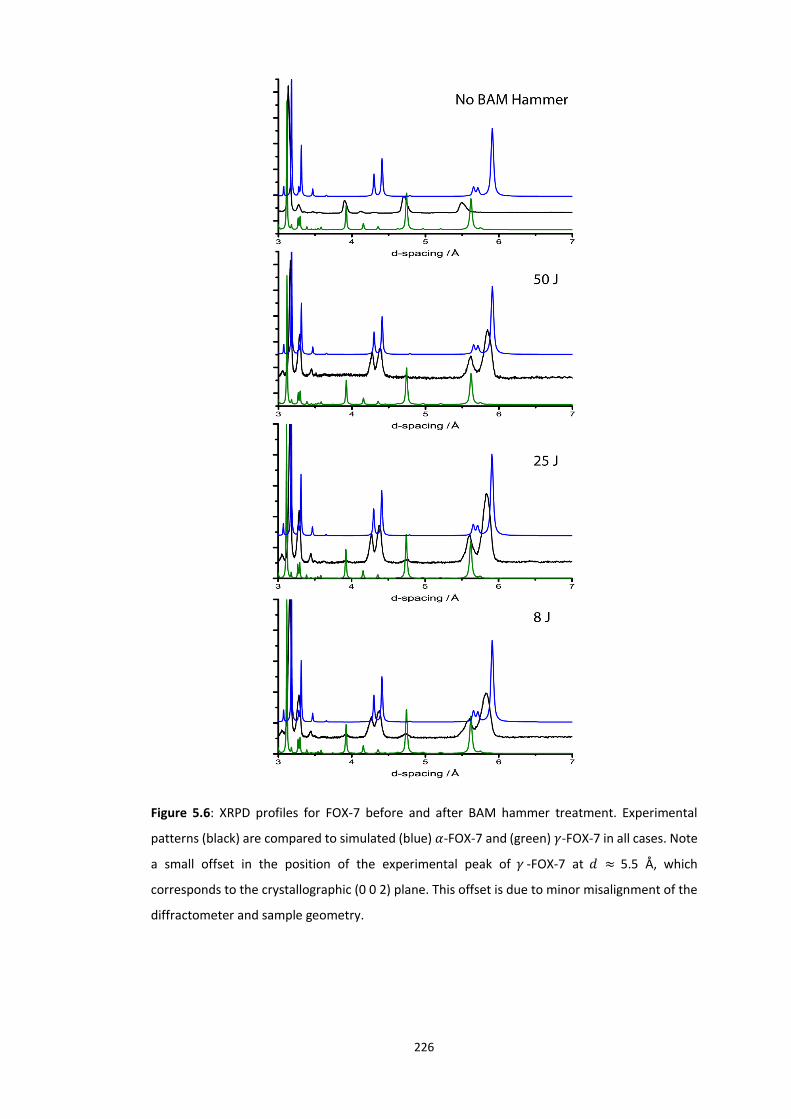
226
Figure 5.6: XRPD profiles for FOX-7 before and after BAM hammer treatment. Experimental
patterns (black) are compared to simulated (blue) 𝛼-FOX-7 and (green) 𝛾-FOX-7 in all cases. Note
a small offset in the position of the experimental peak of 𝛾 -FOX-7 at 𝑑 ≈ 5.5 Å, which
corresponds to the crystallographic (0 0 2) plane. This offset is due to minor misalignment of the
diffractometer and sample geometry.
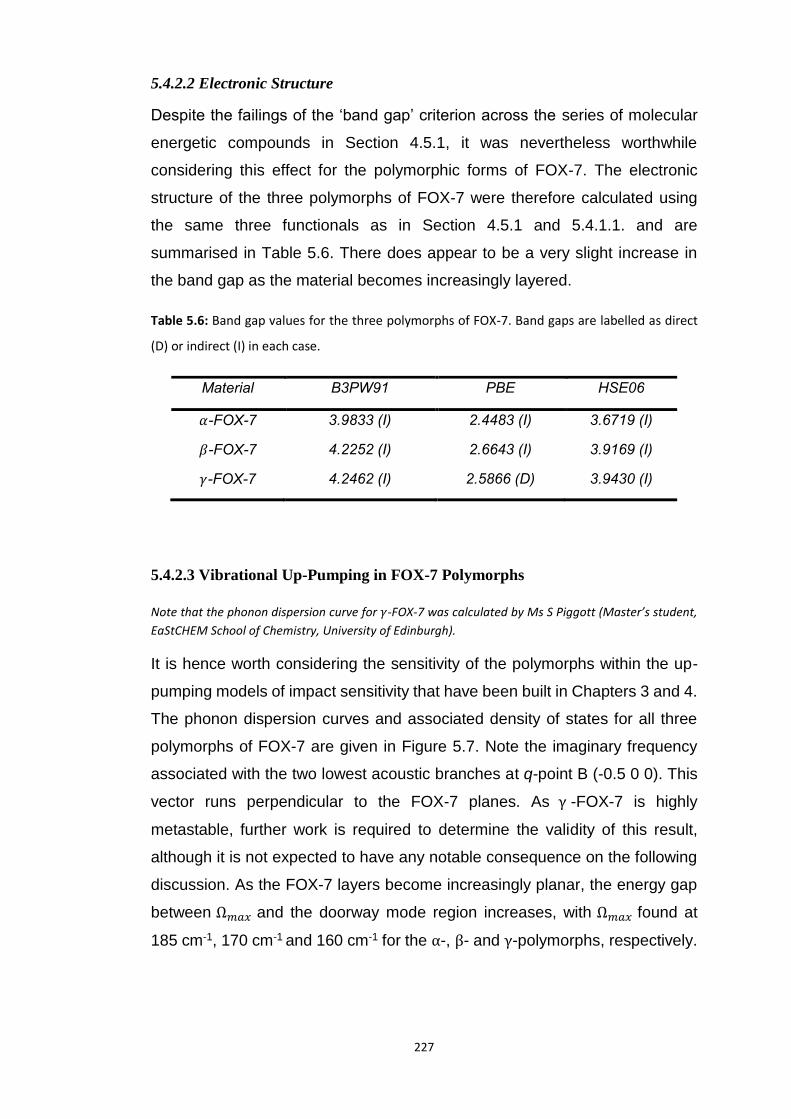
227
5.4.2.2 Electronic Structure
Despite the failings of the ‘band gap’ criterion across the series of molecular
energetic compounds in Section 4.5.1, it was nevertheless worthwhile
considering this effect for the polymorphic forms of FOX-7. The electronic
structure of the three polymorphs of FOX-7 were therefore calculated using
the same three functionals as in Section 4.5.1 and 5.4.1.1. and are
summarised in Table 5.6. There does appear to be a very slight increase in
the band gap as the material becomes increasingly layered.
Table 5.6: Band gap values for the three polymorphs of FOX-7. Band gaps are labelled as direct
(D) or indirect (I) in each case.
Material B3PW91 PBE HSE06
𝛼-FOX-7 3.9833 (I) 2.4483 (I) 3.6719 (I)
𝛽-FOX-7 4.2252 (I) 2.6643 (I) 3.9169 (I)
𝛾-FOX-7 4.2462 (I) 2.5866 (D) 3.9430 (I)
5.4.2.3 Vibrational Up-Pumping in FOX-7 Polymorphs
Note that the phonon dispersion curve for 𝛾-FOX-7 was calculated by Ms S Piggott (Master’s student,
EaStCHEM School of Chemistry, University of Edinburgh).
It is hence worth considering the sensitivity of the polymorphs within the up-
pumping models of impact sensitivity that have been built in Chapters 3 and 4.
The phonon dispersion curves and associated density of states for all three
polymorphs of FOX-7 are given in Figure 5.7. Note the imaginary frequency
associated with the two lowest acoustic branches at q-point B (-0.5 0 0). This
vector runs perpendicular to the FOX-7 planes. As γ -FOX-7 is highly
metastable, further work is required to determine the validity of this result,
although it is not expected to have any notable consequence on the following
discussion. As the FOX-7 layers become increasingly planar, the energy gap
between Ω𝑚𝑎𝑥 and the doorway mode region increases, with Ω𝑚𝑎𝑥 found at
185 cm-1, 170 cm-1 and 160 cm-1 for the α-, β- and γ-polymorphs, respectively.
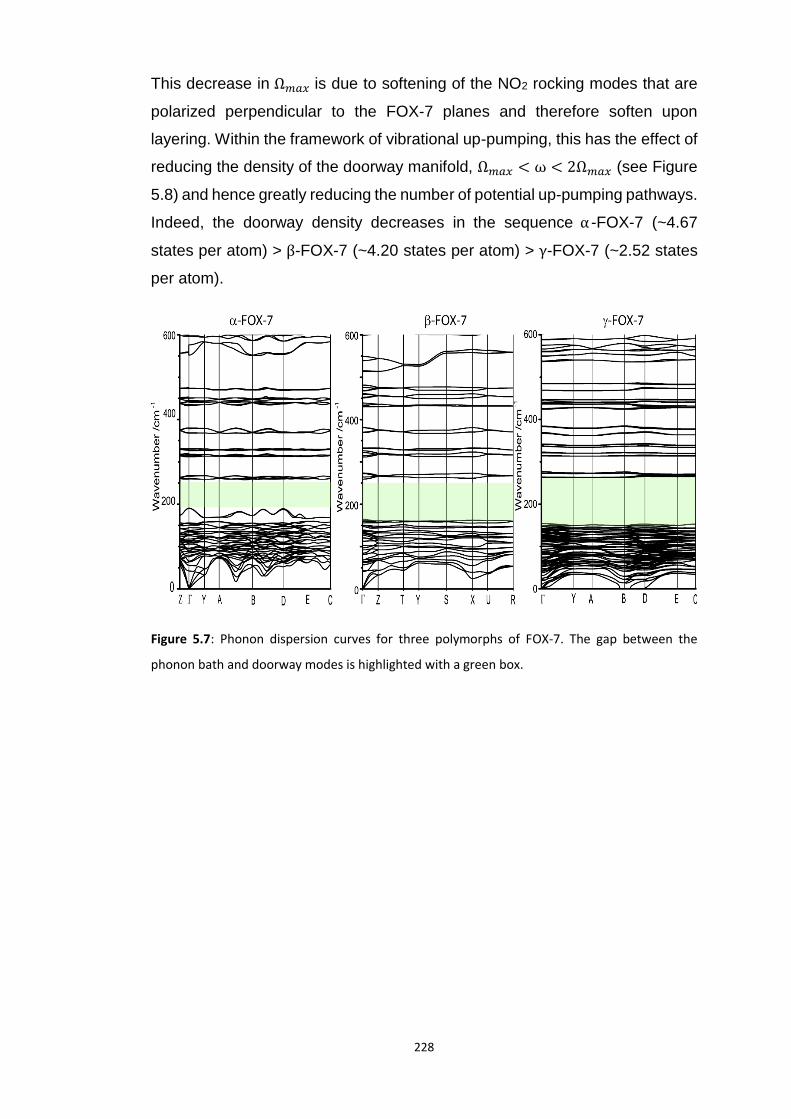
228
This decrease in Ω𝑚𝑎𝑥 is due to softening of the NO2 rocking modes that are
polarized perpendicular to the FOX-7 planes and therefore soften upon
layering. Within the framework of vibrational up-pumping, this has the effect of
reducing the density of the doorway manifold, Ω𝑚𝑎𝑥 < ω < 2Ω𝑚𝑎𝑥 (see Figure
5.8) and hence greatly reducing the number of potential up-pumping pathways.
Indeed, the doorway density decreases in the sequence α -FOX-7 (~4.67
states per atom) > β-FOX-7 (~4.20 states per atom) > γ-FOX-7 (~2.52 states
per atom).
Figure 5.7: Phonon dispersion curves for three polymorphs of FOX-7. The gap between the
phonon bath and doorway modes is highlighted with a green box.

229
Figure 5.8: Comparison of (left) 𝑔(ω) and (right) Ω(2) for the three polymorphs of FOX-7. The
phonon bath and doorway mode regions in 𝑔(ω) are indicated in yellow and purple, respectively.
Note that Ω(2) have been normalized by ∫𝑔(ω) to account for a different number of atoms (and
hence vibrational modes) in the unit cell according to the indirect up-pumping mechanism.
230
Figure 5.9: INS spectrum (10 K) for γ-FOX-7. The (black) experimental spectrum is given alongside
the (blue) simulated spectra using increasing densities of wave vectors for the phonon
calculations. Note that only first order quantum events are simulated.

231
While it was not possible to isolate the β-form, the γ-form could be quench
cooled, and analysed by INS spectroscopy, Figure 5.9. The calculated
vibrational structure for γ -FOX-7 yields a simulated INS spectrum that
generally agrees well with the experimental spectrum. The most notable
difference is the underestimation of Ω𝑚𝑎𝑥 in the simulated spectrum (Ω𝑚𝑎𝑥 is
160 cm-1 from simulation, and 171 cm-1 from INS). While this is likely to have
some consequence on the calculation of the up-pumping model, it is important
to note that the experimental Ω𝑚𝑎𝑥 is still approximately 20 cm-1 lower than the
experimental Ω𝑚𝑎𝑥 value for α-FOX-7 presented in Chapter 4. The remainder
of the INS spectra exhibit the same expected features, with discrepancies in
the calculated frequencies < 6%. While this does suggest some difficulty with
reproducing the vibrational structure of γ-FOX-7, it is overall representative of
the experimental frequencies and is therefore carried forward for data
processing in the up-pumping model.
As described for the HMX polymorphs, the FOX-7 polymorphs were analysed
within the framework of the two most successful models of Chapter 4. This first
required generation of 𝑔(ω) (for this system, sampling could be obtained from
across the Brillouin zone) and Ω(2) for the three polymorphs, Figures 5.8,
respectively. Across all three polymorphs, Ω(2)adopts a very similar structure.
The onset wavenumber is approximately 270 cm-1 in each case, which reflects
the generally similar structure of the doorway modes. Furthermore, all three
polymorphs exhibit Ω(2) = 0 just above 1000 cm-1, and feature the same
groupings of density. With very similar vibrational structures, it follows that the
main difference in understanding the up-pumping between these polymorphs
will be Ω𝑚𝑎𝑥 and the relative rates at which energy can up-pump into these
nearly identical structures.
If the three FOX-7 polymorphs are analysed first using the overtone-based
model, built on the first two overtones, Figure 5.10, the relative sensitivity
ordering that was determined by doorway density is recovered: α-FOX-7 ≈ β-
FOX-7 > γ-FOX-7, with the overtone up-pumped density equal to ~ 6.0, ~ 6.1
and ~ 4.9, respectively. This places the two FOX-7 polymorphs that exhibit

232
herringbone packing at approximately the same sensitivity, with the layered γ-
form predicted to have a lower sensitivity.
Figure 5.10: Overtone contributions to vibrational up-pumping in FOX-7 polymorphs. The
overtones are shown for (blue) 𝑁 = 2 and (green) 𝑁 = 3, and overlain by 𝑔(ω) (black). Plots are
shown for (A) α-FOX-7, (B) β-FOX-7 and (c) γ-FOX-7.
It is finally worth considering the three FOX-7 polymorphs using the two-
layered model, and an equilibrium temperature of 300 K. Despite the projection
of the overtone pathways onto the doorway modes leading to considerably
fewer doorway contributions for γ-FOX-7, Figure 5.8, the larger number of
populated modes available in the phonon bath for this polymorph greatly
reduces this effect. According to discussions in Chapter 4, all three polymorphs
exhibit Ω(2) = 0 at approximately 1000 cm-1 (Figure 5.8). Hence, this is taken
233
to be the upper limit for integration in the two-layered model. The values of
∫Ω(2) for the three polymorphs are found to be 14.5, 12.6 and 12.2 a.u. for the
α-, β- and γ-polymorphs, respectively. The results of Chapter 4 (Figure 4.20)
suggest that this corresponds to a sizeable difference in predicted sensitivity
between the α- and γ-forms, with the latter being less sensitive.
Both the overtone and the two-layered models therefore suggest that flattening
the crystal layers of an energetic compound should decrease the impact
sensitivity. The models point towards the sensitivity decrease being purely the
result of a decrease in Ω𝑚𝑎𝑥 , given that the remaining 𝑔(ω) are largely
unchanged, Figure 5.8. Hence, a new mechanism for the decreased sensitivity
of layered materials is therefore proposed based on the decreased ability of
these materials to up-pump vibrational energy. Without a larger dataset it is
not yet possible to correlate the change in predicted impact sensitivity to an
absolute change in initiation energy. However, based on the datasets in
Chapter 4, it is predicted that γ-FOX-7 should be notably less sensitive than
the α -form. Thus this model suggests a major deficiency in the current
experimental approach to studying impact sensitivity of polymorphic materials.
Furthermore, this demonstrates the importance of considering mechanically-
induced structural transformations that may occur immediately before, or
during, initiation events.
5.5 Conclusions
Polymorphism is very prevalent amongst energetic materials, and can lead to
drastic changes in a material’s sensitivity to impact. Most notable are the 𝛿-
and 𝛽-polymorphs of HMX. The former has been reported to be as sensitive
to impact as a primary explosive material, while the latter exhibits much lower
sensitivity to impact. Application of the up-pumping model was able to
reproduce these experimental findings and assessed δ-HMX as being a highly
sensitive material. This therefore demonstrates that the up-pumping model is

234
sensitive to polymorphic modifications. It was therefore applied to a second
polymorphic energetic material, FOX-7.
Under ambient conditions, FOX-7 exists in the α -form, which adopts a
herringbone-type structure. When heated, these layers flatten, and are nearly
flat in the γ-form. This form was recovered to ambient conditions and its impact
sensitivity measured using a BAM fall hammer. This suggested that the
layered γ-form had the same impact sensitivity as the α-form, despite the
general principle that layered materials are insensitive. X-ray powder
diffraction, however, revealed that the γ-form undergoes transformation to the
α-form on impact, and hence it is not known which polymorphic phase was in
fact tested. The mechanism for this impact-induced transformation is not yet
known, and may be the result of pressure, temperature or their combination.
The up-pumping model was therefore applied to the FOX-7 polymorphs. Both
the overtone-based model and the temperature-dependent two-layered model
suggested that the layered γ-form should be notably less sensitive than the α-
form. It is suggested that the reduction in sensitivity is the result of a decrease
in Ω𝑚𝑎𝑥 (an observation noted in both the INS spectra and simulated phonon
density of states plots) that results from the increased layering. This reduction
in Ω𝑚𝑎𝑥 is observed across all layered materials studied thus far. Hence, a new
structurally-based mechanism for the decreased sensitivity of layered
materials has been proposed.
Due to the γ → α transition, BAM hammer testing appears incapable of directly
measuring the impact sensitivity of the γ -form. Current experimental
approaches are inadequate for the investigation of polymorphic materials.
Furthermore, this transition demonstrates the importance of considering
structural transformations during the initiation process of EMs, and the ability
of the up-pumping model to assist in the interpretation of experimental results.
235
5.6 Suggestions for Further Work
It is clear from this chapter that the up-pumping models can be applied to
polymorphic series. However, the sample size used here is limited. It is
therefore of great interest to extend this work to a broader set of polymorphic
materials. To do this, it will be necessary to conduct experimental
investigations on the sensitivity of polymorphic materials, many of which have
yet to be thoroughly analysed.
A more detailed analysis of the impact-induced polymorphism of γ-FOX-7 can
also be suggested, with the aim of identifying the mechanism for the γ → α
transition. This can be done by monitoring the material during impact by
spectroscopic or X-ray techniques. Understanding this transformation may be
critical to fully rationalise the transformation that was observed in this work.
Additionally, it will be worth considering the role of the ϵ-form (which forms
when FOX-7 is exposed to pressure21) in this transformation, and its impact
sensitivity relative to the α- and γ-forms.
Furthermore, it is apparent that a deeper correlation between the predicted
impact sensitivity and experimental values must be sought. This can only be
obtained by expanding the set of compounds studied using these models.
However, this also requires accurate capture of the experimental impact
sensitivities of EMs, which can prove difficult in many cases.
5.7 References
(1) McCrone, W. C. Polymorphism. In Polymorphism in Physics and Chemistry of the Organic Solid State; Fox, D., Labes, M. M., Weissenberg, A. A., Eds.; Interscience: New York, 1965; p 726.
(2) Fabbiani, F. P. A.; Pulham, C. R. High-Pressure Studies of Pharmaceutical Compounds and Energetic Materials. Chem. Soc. Rev. 2006, 35 (10), 932–942.
(3) Bernstein, J. Polymorphism in Molecular Crystals; Claredon Press, OUP, 2002.
(4) Bishop, M. M.; Chellappa, R. S.; Liu, Z.; Preston, D. N.; Sandstrom, M. M.; Dattelbaum, D. M.; Vohra, Y. K.; Velisavljevic, N. High Pressure-Temperature Polymorphism of 1,1-

236
Diamino-2,2-Dinitroethylene. J. Phys. Conf. Ser. 2014, 500 (5), 052005.
(5) Boldyreva, E. V. Non-Ambient Conditions in the Investigation and Manufacturing of Drug Forms. Curr. Pharm. Des. 2016, 22, 1–20.
(6) Pudipeddi, M.; Serajuddin, A. T. M. Trends in Solubility of Polymorphs. J. Pharm. Sci. 2005, 94 (5), 929–939.
(7) Joiris, E.; Di Martino, P.; Berneron, C.; Guyot-Hermann, A.-M.; Guyot, J.-C. Compressive Behaviour of Orthorhombic Paracetamol. Pharm. Res. 1998, 15 (7), 1122–1130.
(8) Davidson, A. J.; Oswald, I. D. H.; Francis, D. J.; Lennie, A. R.; Marshall, W. G.; Millar, D. I. A.; Pulham, C. R.; Warren, J. E.; Cumming, A. S. Explosives under Pressure—the Crystal Structure of γ-RDX as Determined by High-Pressure X-Ray and Neutron Diffraction. CrystEngComm 2008, 10 (2), 162–165.
(9) Millar, D. I. A.; Oswald, I. D. H.; Barry, C.; Francis, D. J.; Marshall, W. G.; Pulham, C. R.; Cumming, A. S. Pressure-Cooking of Explosives—the Crystal Structure of ε-RDX as Determined by X-Ray and Neutron Diffraction. Chem. Commun. 2010, 46 (31), 5662–5664.
(10) Howard, C.; Smith, L. . Studies on the Polymorphs of HMX. Los Alamos 1961.
(11) Soni, P.; Sarkar, C.; Tewari, R.; Sharma, T. D. HMX Polymorphs: Gamma to Beta Phase Transformation. J. Energ. Mater. 2011, 29 (3), 261–279.
(12) Asay, B. W.; Henson, B. F.; Smilowitz, L. B.; Dickson, P. M. On the Difference in Impact Sensitivity of Beta and Delta Hmx. J. Energ. Mater. 2003, 21 (4), 223–235.
(13) Scott, P. D. Impact Sensitivity Testing; Los Alamos, 1998.
(14) Rice, B. M.; Hare, J. J. A Quantum Mechanical Investigation of the Relation between Impact Sensitivity and the Charge Distribution in Energetic Molecules. J. Phys. Chem. A 2002, 106 (9), 1770–1783.
(15) Matyáš, R.; Pachman, J. Primary Explosives; Springer-Verlag: Berlin, 2013.
(16) Herrmann, M.; Engel, W.; Eisenreich, N. Thermal Expansion, Transitions, Sensitivities and Burning Rates of HMX. Propellants, Explos. Pyrotech. 1992, 17, 190–195.
(17) Yoo, C. S.; Cynn, H. Equation of State, Phase Transition, Decomposition of β-HMX (Octahydro-1,3,5,7-Tetranitro-1,3,5,7-Tetrazocine) at High Pressures. J. Chem. Phys. 1999, 111 (22), 10229–10235.
(18) Gump, J. C.; Stoltz, C. A.; Mason, B. P.; Freedman, B. G.; Ball, J. R.; Peiris, S. M. Equations of State of 2,6-Diamino-3,5-Dinitropyrazine-1-Oxide. J. Appl. Phys. 2011, 110 (7), 3–10.
(19) Bishop, M. M.; Velisavljevic, N.; Chellappa, R.; Vohra, Y. K. High Pressure–Temperature Phase Diagram of 1,1-Diamino-2,2-Dinitroethylene (FOX-7). J. Phys. Chem. A 2015, 119 (37), 9739–9747.
(20) Dreger, Z. A.; Tao, Y.; Gupta, Y. M. Phase Diagram and Decomposition of 1,1-Diamino-2,2-Dinitroethene Single Crystals at High Pressures and Temperatures. J. Phys. Chem. C 2016, 120 (20), 11092–11098.
237
(21) Hunter, S.; Coster, P. L.; Davidson, A. J.; Millar, D. I. A.; Parker, S. F.; Marshall, W. G.; Smith, R. I.; Morrison, C. A.; Pulham, C. R. High-Pressure Experimental and DFT-D Structural Studies of the Energetic Material FOX-7. J. Phys. Chem. C 2015, 119 (5), 2322–2334.
(22) Politzer, P.; Murray, J. S. Energetic Materials (Part2. Detonation, Combustion). 2003.
(23) Zhang, J.; Mitchell, L. A.; Parrish, D. A.; Shreeve, J. M. Enforced Layer-by-Layer Stacking of Energetic Salts towards High-Performance Insensitive Energetic Materials. J. Am. Chem. Soc. 2015, 137 (33), 10532–10535.
(24) Kuklja, M. M.; Rashkeev, S. N.; Zerilli, F. J. Shear-Strain Induced Decomposition of 1,1-Diamino-2,2-Dinitroethylene. Appl. Phys. Lett. 2006, 89 (7), 071904.
(25) Crawford, M. J.; Evers, J.; Göbel, M.; Klapötke, T. M.; Mayer, P.; Oehlinger, G.; Welch, J. M. G-FOX-7: Structure of a High Energy Density Material Immediately Prior to Decomposition. Propellants, Explos. Pyrotech. 2007, 32 (6), 478–495.
(26) Ledgard, J. The Preparatory Manual of Explosives, Third Edition, 3rd ed.; Jared Ledgard, 2007.
(27) Weese, R. K.; Burnham, A. K. Coefficient of Thermal Expansion of the Beta and Delta Polymorphs of HMX. Propellants, Explos. Pyrotech. 2005, 5 (5), 344–350.
(28) NATO. Classification Procedures, Test Methods and Criteria Relating to Explosives of Class 1; 2009.
(29) Colognesi, D.; Celli, M.; Cilloco, F.; Newport, R. J.; Parker, S. F.; Rossi-Albertini, V.; Sacchetti, F.; Tomkinson, J.; Zoppi, M. TOSCA Neutron Spectrometer: The Final Configuration. Appl. Phys. A Mater. Sci. Process. 2002, 74, 64–66.
(30) Parker, S. F.; Fernandez-Alonso, F.; Ramirez-Cuesta, A. J.; Tomkinson, J.; Rudic, S.; Pinna, R. S.; Gorini, G.; Fernández Castañon, J. Recent and Future Developments on TOSCA at ISIS. J. Phys. Conf. Ser. 2014, 554 (1), 012003.
(31) Arnold, O.; Bilheux, J. C.; Borreguero, J. M.; Buts, A.; Campbell, S. I.; Chapon, L.; Doucet, M.; Draper, N.; Ferraz Leal, R.; Gigg, M. A.; et al. Mantid - Data Analysis and Visualization Package for Neutron Scattering and μ SR Experiments. Nucl. Instruments Methods Phys. Res. Sect. A Accel. Spectrometers, Detect. Assoc. Equip. 2014, 764, 156–166.
(32) Dymkowski, K.; Parker, S. F.; Fernandez-Alonso, F.; Mukhopadhyay, S. AbINS: The Modern Software for INS Interpretation. Phys. B Condens. Matter 2018, In Press, 1–6.
(33) Clark, S. J.; Segall, M. D.; Pickard, C. J.; Hasnip, P. J.; Probert, M. I. J.; Refson, K.; Payne, M. C. First Principles Methods Using CASTEP. Zeitschrift für Krist. 2005, 220, 567–570.
(34) Perdew, J. P.; Burke, K.; Ernzerhof, M. Generalized Gradient Approximation Made Simple. Phys. Rev. Lett. 1996, 77 (18), 3865–3868.
(35) Grimme, S. Semiempirical GGA-Type Density Functional Constructed with a Long-Range Dispersion Correction. J. Comput. Chem. 2006, 27, 1787–1799.
(36) Hunter, S.; Sutinen, T.; Parker, S. F.; Morrison, C. A.; Williamson, D. M.; Thompson, S.; Gould, P. J.; Pulham, C. R. Experimental and DFT-D Studies of the Molecular Organic Energetic Material RDX. J. Phys. Chem. C 2013, 117 (16), 8062–8071.
238
(37) Pack, J. D.; Monkhorst, H. J. Special Points for Brillouin-Zone Integrations. Phys. Rev. B 1976, 13 (12), 5188–5192.
(38) Peintinger, M. F.; Oliveira, D. V.; Bredow, T. Consistent Gaussian Basis Sets of Triple-Zeta Valence with Polarization Quality for Solid-State Calculations. J. Comput. Chem. 2013, 34 (6), 451–459.
(39) Heyd, J.; Peralta, J. E.; Scuseria, G. E.; Martin, R. L. Energy Band Gaps and Lattice Parameters Evaluated with the Heyd-Scuseria-Ernzerhof Screened Hybrid Functional. J. Chem. Phys. 2005, 123 (17), 174101.
(40) Dovesi, R.; Orlando, R.; Erba, A.; Zicovich-Wilson, C. M.; Civalleri, B.; Casassa, S.; Maschio, L.; Ferrabone, M.; De La Pierre, M.; D’Arco, P.; et al. CRYSTAL14: A Program for the Ab Initio Investigation of Crystalline Solids. Int. J. Quantum Chem. 2014, 114 (19), 1287–1317.
(41) Tran, F.; Blaha, P.; Schwarz, K.; Novák, P. Hybrid Exchange-Correlation Energy Functionals for Strongly Correlated Electrons: Applications to Transition-Metal Monoxides. Phys. Rev. B - Condens. Matter Mater. Phys. 2006, 74 (15), 155108.
(42) Zhu, W.; Xiao, H. First-Principles Band Gap Criterion for Impact Sensitivity of Energetic Crystals: A Review. Struct. Chem. 2010, 21 (3), 657–665.
(43) Dlott, D. D. Multi-Phonon up-Pumpng in Energetic Materials. In Overview of Recent Research on Energetic Materials; Shaw, R. W., Brill, T. B., Thompson, D. L., Eds.; World Scientific, 2005; pp 303–333.
(44) Trzciński, W. A.; Belaada, A. 1,1-Diamino-2,2-Dinitroethane (DADNE,FOX-7) - Properties and Formulations. 2016, 13 (2), 527–544.
(45) Storm, C. B.; Stine, J. R.; Kramer, J. F. Sensitivity Relationships in Energetic Materials. In Chemistry and Physics of Energetic Materials; Bulusu, S. N., Ed.; Springer, Dordrecht, 1990; pp 605–639.
(46) Kennedy, S. R.; Pulham, C. R. Co-Crystallization of Energetic Materials. In Co-crystals: Preparation, Characterization and Applications; Aakeröy, C. B., Sinha, A. S., Eds.; Royal Society of Chemistry: Cambridge, UK, 2018; pp 231–266.
239
Chapter 6
General Conclusions and Future Directions
6.1 General Conclusions
The work in this thesis has explored the development and application of a
model to predict the relative impact sensitivity of a range of EMs. This model
is based on the concept of vibrational up-pumping, which was developed to
rationalise the localisation (and hence intensification) of energy resulting from
mechanical perturbation of a solid. In contrast to previous attempts, the model
in this thesis is based purely on ab initio input. Hence, this work provides a
new approach to predict relative impact sensitivities of EMs.
A model was first constructed for a series of nine azide-based EMs, selected
for investigation on the basis of their diverse structural types and range of
experimental impact sensitivities. Based on literature reports, the relative
sensitivities of these compounds should follow the order: NaN3 ≈ TAGZ
(triaminoguanidinium azide) ≈ NH4N3 < LiN3 < Ba(N3)2< AgN3 < Sn(N3)2, with
the exact position of HN3 and Zn(N3)2 within this order being unknown, except
that they are sensitive to impact. Due to the simplicity of the N3− explosophore,
it was possible to investigate these systems within the framework of a ‘direct’
up-pumping mechanism. Hence, the vibrational normal coordinates of the
explosophore were followed and its electronic structure was monitored. It was
found that the bending modes (δθNNN) led to crossing of the ground-state (𝑆0)
and first triplet-state (𝑇1) potential energy surfaces (PES). Dissociation of the
N-N bond of N3− is favourable for the 𝑇1 PES, and hence δθ𝑁𝑁𝑁 is suggested
240
as the target vibrational mode. This was confirmed in the solid state by
monitoring the evolution of the electronic band structure as a function of the
normal coordinates associated with crystalline NaN3. Based on ab initio
phonon dispersion curves, the vibrational up-pumping into the target mode
within each system was considered. In line with previous consideration of the
up-pumping model, the overtone and combination pathway contributions were
isolated. Using only the overtone contributions (which is the method proposed
in previous work1,2), the sensitivity ordering was not well reproduced. While the
prediction does generally place the insensitive compounds at lower sensitivity
than the sensitive compounds, a number of notable exceptions occurred. This
was largely rectified by consideration of the combination contributions (the
method applied in other previous work3–5), although there are again notable
exceptions. It was found that only by considering both mechanisms could the
sensitivity ordering be reproduced.
An up-pumping model was subsequently considered for a series of molecular
energetic materials: 1,1’-azobistetrazole (ABT), hexanitrobenzene (HNB),
1,3,5,7-tetranitro-1,3,5,7-tetrazocane (HMX), 5,5’-hydrazinebistetrazole, 1,1-
Diamino-2,2-dinitroethene (FOX-7), nitrotriazolone (NTO), and
triaminotrinitrobenzene (TATB). However, due to the complexity associated
with dissociation of these molecules, no target vibrational mode could be
identified. Instead, the sensitivity of these materials was explored within the
framework of an ‘indirect’ (or thermal) vibrational up-pumping mechanism. The
calculated vibrational spectra for a subset of the materials (𝛼-FOX-7, NTO,
TATB and 𝛽-HMX) were verified by comparison to inelastic neutron scattering
spectra. A number of models were explored based on ab initio calculation of
the full phonon dispersion curves and are summarised in Table 6.1. The first
two models listed in Table 6.1 can be assessed purely from spectroscopic data.
This may prove useful for rapid screening of newly synthesised materials.
241
Table 6.1: Summary of the up-pumping models considered for the treatment of the organic EMs in Chapter 4.
Model Concept Performance Remarks
Vibrational frequency gap
Correlation of the gap in vibrational frequencies between the top of the phonon bath (Ω𝑚𝑎𝑥) and the first doorway mode.
Broad classification of EMs as ‘sensitive’ or ‘insensitive’. Fails to predict sensitivity ordering within each classification. (Figure 4.6)
Doorway mode density Correlate the density of doorway mode states against impact sensitivity
Good agreement with relative sensitivity ordering. Minor mis-ordering. (Figure 4.7)
Overtone Excitation Correlate overtone up-pumping and projection onto doorway modes.
Most successful based on N=2,3 (i.e. two fastest) overtones (Figure 4.10). Excellent agreement with experiment across structurally similar compounds.
Combination Excitation Correlate combination up-pumping of all frequencies < 3Ω𝑚𝑎𝑥 .
Very poor. No notable correlation (Figure 4.13)
Two-layer Model Explicitly consider the two stages of up-pumping: (1) overtone population and projection onto doorway frequencies, and (2) combination up-pumping of PDOS resulting from step (1).
Good correlation across structurally similar compounds (Figure 4.15). Excellent correlation if up-pumping is restricted to 2Ω𝑚𝑎𝑥 → 3Ω𝑚𝑎𝑥 (Figure 4.16)
Two-layer Model + T The two-layer model considering all up-pumping based on thermally-populated vibrational bands.
Excellent correlation across all EMs investigated (Figure 4.20).

242
Unlike with the azide-based materials, consideration of the combination
pathways performed very poorly at predicting the impact sensitivity ordering
for these materials. Instead, the sensitivity of these EMs appears to correlate
best with the structure of the doorway region, since:
(1) overtone up-pumping of the doorway region performed well on its own;
(2) The two-layered approach led to significant improvements over the pure
combination-based model.
While the model based on the overtone up-pumping of the doorway
frequencies (the model chosen by Bernstein2 and Coffey1) performed well, the
most successful model was that based on the temperature-dependent
construction of the two-layered model. The difference between the
performance of the temperature-independent and temperature-dependent
two-layer models demonstrates the importance of considering more closely the
rate rather than purely the number of up-pumping pathways. This new two-
layered model is constructed from a mixture of the two independent models
that have previously been proposed in the literature, and therefore represents
the first unified approach to predicting the relative impact sensitivities of EMs.
The largest barrier to the successful application of this model is the simulation
of the full phonon dispersion curves, particularly for large organic EMs. It was
promising to find that (due to low vibrational dispersion) the same trends were
observed when only the zone-centre vibrational frequencies were used for the
input. Hence it was possible to add TATP (a highly sensitive material) to the
model. Applying both the overtone up-pumping model and the temperature-
dependent two-layer model, TATP was successfully identified as being the
most sensitive compound in the test set.
In the final chapter of this thesis, the up-pumping model was tested on two
HMX polymorphs: δ - and β -HMX. The δ -form is well known to be more
sensitive to impact than the β-form. The calculated vibrational structure of δ-
HMX was verified by comparison to inelastic neutron scattering spectroscopy.
Consideration of the overtone up-pumping (third model, Table 6.1) and the
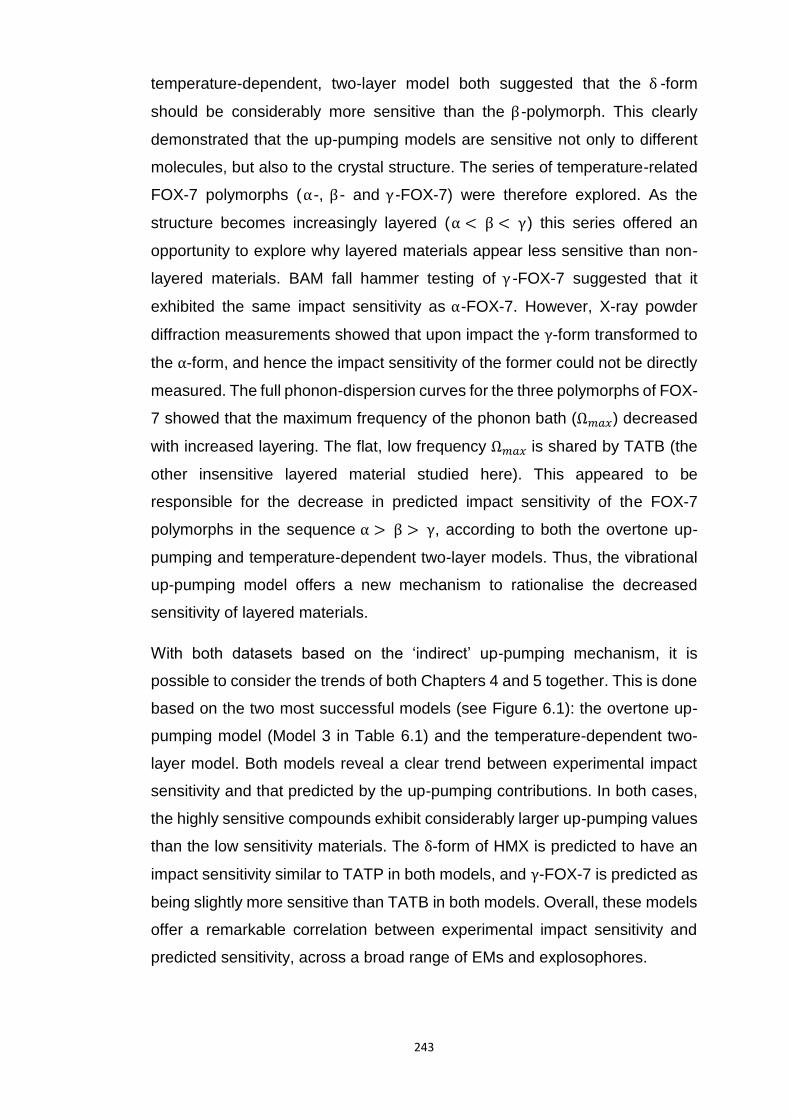
243
temperature-dependent, two-layer model both suggested that the δ -form
should be considerably more sensitive than the β -polymorph. This clearly
demonstrated that the up-pumping models are sensitive not only to different
molecules, but also to the crystal structure. The series of temperature-related
FOX-7 polymorphs (α-, β- and γ-FOX-7) were therefore explored. As the
structure becomes increasingly layered (α < β < γ) this series offered an
opportunity to explore why layered materials appear less sensitive than non-
layered materials. BAM fall hammer testing of γ -FOX-7 suggested that it
exhibited the same impact sensitivity as α-FOX-7. However, X-ray powder
diffraction measurements showed that upon impact the γ-form transformed to
the α-form, and hence the impact sensitivity of the former could not be directly
measured. The full phonon-dispersion curves for the three polymorphs of FOX-
7 showed that the maximum frequency of the phonon bath (Ω𝑚𝑎𝑥) decreased
with increased layering. The flat, low frequency Ω𝑚𝑎𝑥 is shared by TATB (the
other insensitive layered material studied here). This appeared to be
responsible for the decrease in predicted impact sensitivity of the FOX-7
polymorphs in the sequence α > β > γ, according to both the overtone up-
pumping and temperature-dependent two-layer models. Thus, the vibrational
up-pumping model offers a new mechanism to rationalise the decreased
sensitivity of layered materials.
With both datasets based on the ‘indirect’ up-pumping mechanism, it is
possible to consider the trends of both Chapters 4 and 5 together. This is done
based on the two most successful models (see Figure 6.1): the overtone up-
pumping model (Model 3 in Table 6.1) and the temperature-dependent two-
layer model. Both models reveal a clear trend between experimental impact
sensitivity and that predicted by the up-pumping contributions. In both cases,
the highly sensitive compounds exhibit considerably larger up-pumping values
than the low sensitivity materials. The δ-form of HMX is predicted to have an
impact sensitivity similar to TATP in both models, and γ-FOX-7 is predicted as
being slightly more sensitive than TATB in both models. Overall, these models
offer a remarkable correlation between experimental impact sensitivity and
predicted sensitivity, across a broad range of EMs and explosophores.
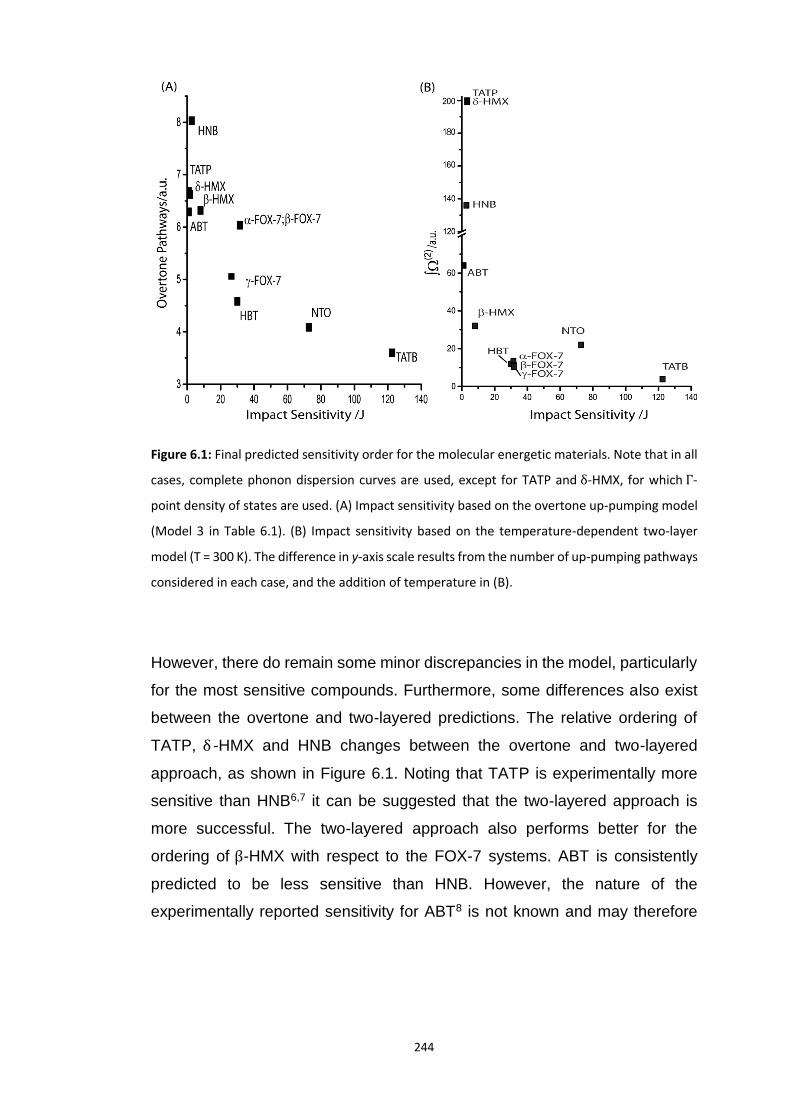
244
Figure 6.1: Final predicted sensitivity order for the molecular energetic materials. Note that in all
cases, complete phonon dispersion curves are used, except for TATP and δ-HMX, for which Γ-
point density of states are used. (A) Impact sensitivity based on the overtone up-pumping model
(Model 3 in Table 6.1). (B) Impact sensitivity based on the temperature-dependent two-layer
model (T = 300 K). The difference in y-axis scale results from the number of up-pumping pathways
considered in each case, and the addition of temperature in (B).
However, there do remain some minor discrepancies in the model, particularly
for the most sensitive compounds. Furthermore, some differences also exist
between the overtone and two-layered predictions. The relative ordering of
TATP, δ -HMX and HNB changes between the overtone and two-layered
approach, as shown in Figure 6.1. Noting that TATP is experimentally more
sensitive than HNB6,7 it can be suggested that the two-layered approach is
more successful. The two-layered approach also performs better for the
ordering of β-HMX with respect to the FOX-7 systems. ABT is consistently
predicted to be less sensitive than HNB. However, the nature of the
experimentally reported sensitivity for ABT8 is not known and may therefore

245
represent the limiting impact energy. In this case, the ordering of ABT would
not be anomalous.
In summary, the work in this thesis has demonstrated that a vibrational up-
pumping model, based solely on ab initio input, can predict the relative
sensitivity of EMs across a range of materials and explosophores. Within the
direct vibrational up-pumping model (based on a target frequency) used for the
azide materials, a combination of both literature models was required to obtain
a successful prediction of impact sensitivity, hence unifying the literature
discrepancy. Description of the more complex organic EMs required
development of a variety of new models within the framework of an indirect up-
pumping mechanism. Of these models, the newly developed temperature-
dependent two-layered approach appears to be the most successful. This
model comprises aspects of both up-pumping models previously described in
the literature and successfully unifies them into a highly successful approach.
This two layered model proved capable of successfully ordering the impact
sensitivity of a range of materials, as well as of polymorphic systems.
6.2 Future Directions
The individual challenges associated with further development of the up-
pumping model presented in this thesis are presented in each chapter. In these
closing remarks, it is instead worth considering some of the ‘real-world’
applications and new research directions to which this thesis may lead.
There is currently considerable effort being devoted to the development of new
EMs. While the aim is always to develop EMs with enhanced performance, it
is no longer sufficient to consider performance in isolation. New constraints are
now in place, with particular emphasis on the development of insensitive
munitions (IMs). The development of IMs, however, is particularly challenging
as there remains no fundamental insight into what physical or chemical
parameters define sensitivity. Thus, current methods in EM research require

246
(often lengthy) synthesis of new EMs and experimental testing of their
sensitivity properties. However, without a priori insight into the physical
properties of a new EM, its synthesis is not only a financial risk, but is
accompanied by potentially serious risks to health and safety.
Modern quantum chemical methods are able to correctly predict molecular and
crystalline structure, vibrational and thermodynamic properties, interaction
energies, amongst a plethora of other properties. Typically, these calculations
run over the period of days to weeks, can be run in parallel, and are
comparatively cheap as an alternative to experiment. Thus, if a method were
known that was capable of predicting sensitivity properties, one could in
principle design an IM in silico, with a full assessment of its sensitivity
properties, without ever needing to set foot in the laboratory until a promising
candidate was found.
The vibrational up-pumping model developed in this thesis is one such model.
It was demonstrated to be capable of predicting the relative sensitivity ordering
of a broad range of EMs based on knowledge of the crystal structure. In its
current form, this model makes it possible to predict the sensitivity of materials
which may be difficult to obtain in large quantities. High-pressure phases are
of particular note. During a detonation, immense pressures are experienced at
the shock front, which are well above the pressures typically required to induce
structural phase transitions in organic EMs.9–11 The reactivity of a material to
mechanical perturbation may therefore change during detonation. Thus,
understanding the relative sensitivity of pressure-related polymorphs may
prove crucial for understanding the detonation properties of polymorphic EMs.
An excellent example of this is RDX, which undergoes numerous high-
pressure phase transitions.11–13 In other cases, new polymorphic forms may
crystallise under pressure,14 and thus it may not be possible to easily prepare
large quantities for testing. The model developed in this thesis can therefore
be applied to predict the sensitivity of a new phase, and make judgement as
to whether purification of this phase should be pursued further. Alternatively,
polymorphic phases may appear as non-isolable impurities within a powder. If
247
this impurity acts to sensitise the mixture (e.g. δ-HMX impurities in β-HMX
samples15) additional work must be done to remove it. Hence, the up-pumping
model offers a means to new validation methods for material composition.
Finally, as demonstrated in this thesis, the experimental impact sensitivity
testing of polymorphic materials can prove very challenging, and perhaps
impossible in some cases. The up-pumping model can therefore be used in
parallel with experimental results to assist in their interpretation.
A particularly promising application of the model developed in this thesis is in
parallel with crystal structure prediction. It is now possible to predict the
potential crystal structures of complex organic molecules to a good degree of
accuracy.16 The combination of crystal structure prediction with sensitivity
prediction truly offers the way to a new paradigm in EM research. New
molecules could be completely designed in silico, their crystal structures
predicted, and the up-pumping model applied to generate a list of sensitivities.
In doing so, the work in this thesis would open the door to a complete
restructuring of the way EM research is performed. As further developments
are made on the up-pumping model (e.g. inclusion of electronic effects,
vibrational response to pressure, defects, etc.), its performance will surely
improve. As it does, the reality of making in silico EM design a reality becomes
closer.
6.3 References
(1) McNesby, K. L.; Coffey, C. S. Spectroscopic Determination of Impact Sensitivities of Explosives. J. Phys. Chem. B 1997, 101 (16), 3097–3104.
(2) Bernstein, J. Ab Initio Study of Energy Transfer Rates and Impact Sensitivities of Crystalline Explosives. J. Chem. Phys. 2018, 148 (8), 084502.
(3) Ye; Koshi, M. Theoretical Studies of Energy Transfer Rates of Secondary Explosives. J. Phys. Chem. B 2006, 110 (37), 18515–18520.
(4) Ye, S.; Tonokura, K.; Koshi, M. Energy Transfer Rates and Impact Sensitivities of Crystalline Explosives. Combust. Flame 2003, 132 (1–2), 240–246.
248
(5) Fried, L. E.; Ruggiero, a J. Energy-Transfer Rates in Primary, Secondary, and Insensitive Explosives. J. Phys. Chem. 1994, 98 (39), 9786–9791.
(6) Storm, C. B.; Stine, J. R.; Kramer, J. F. Sensitivity Relationships in Energetic Materials. In Chemistry and Physics of Energetic Materials; Bulusu, S. N., Ed.; Springer, Dordrecht, 1990; pp 605–639.
(7) Gamage, N. D. H.; Stiasny, B.; Stierstorfer, J.; Martin, P. D.; Klapötke, T. M.; Winter, C. H. Less Sensitive Oxygen-Rich Organic Peroxides Containing Geminal Hydroperoxy Groups. Chem. Commun. 2015, 51 (68), 13298–13300.
(8) Klapötke, T. M.; Piercey, D. G. 1,1′-Azobis(Tetrazole): A Highly Energetic Nitrogen-Rich Compound with a N10 Chain. Inorg. Chem. 2011, 50 (7), 2732–2734.
(9) Klapötke, T. M. Chemistry of High-Energy Materials, 2nd ed.; Klapötke, T. M., Ed.; De Gruyter: Berlin, 2012.
(10) Millar, D. I. A.; Maynard-Casely, H. .; Kleppe, A. .; Marshall, W. G.; Pulham, C. .; Cumming, A. . Putting the Squeeze on Energetic Materials - Structural Characterisation of High-Pressure Phase of CL-20. CrystEngComm 2010, 12, 2524–2527.
(11) Millar, D. I. A.; Oswald, I. D. H.; Barry, C.; Francis, D. J.; Marshall, W. G.; Pulham, C. R.; Cumming, A. S. Pressure-Cooking of Explosives—the Crystal Structure of ε-RDX as Determined by X-Ray and Neutron Diffraction. Chem. Commun. 2010, 46 (31), 5662–5664.
(12) Davidson, A. J.; Oswald, I. D. H.; Francis, D. J.; Lennie, A. R.; Marshall, W. G.; Millar, D. I. A.; Pulham, C. R.; Warren, J. E.; Cumming, A. S. Explosives under Pressure—the Crystal Structure of γ-RDX as Determined by High-Pressure X-Ray and Neutron Diffraction. CrystEngComm 2008, 10 (2), 162–165.
(13) Millar, D. I. A.; Oswald, I. D. H.; Francis, D. J.; Marshall, W. G.; Pulham, C. R.; Cumming, A. S. The Crystal Structure of Beta-RDX-an Elusive Form of an Explosive Revealed. Chem. Commun. 2009, No. 5, 562–564.
(14) Fabbiani, F. P. A.; Pulham, C. R. High-Pressure Studies of Pharmaceutical Compounds and Energetic Materials. Chem. Soc. Rev. 2006, 35 (10), 932–942.
(15) Achuthan, C. P.; Jose, C. . Studies on HMX Polymorphism. Propellants, Explos. Pyrotech. 1990, 275, 271–275.
(16) Price, S. L. Predicting Crystal Structures of Organic Compounds. Chem. Soc. Rev. 2014, 43 (7), 2098–2111.

249
Appendix A
Publications
In This Thesis
Published
1. Michalchuk, A.A.L., Fincham, P.T., Portius, P., Pulham, C.R., and Morrison, C.A., A Pathway
to the Athermal Impact Initiation of Energetic Azides, J Phys. Chem. C. 2018, 122(34), 19395-
19408
2. Michalchuk, A.A.L. Rudic, S., Pulham, C.R., and Morrison, C.A., Vibrationally Induced
Metallisation of the Energetic Azide α-NaN3, Phys Chem Chem Phys, 2018 , 20, 29061-29069
In Preparation
3. Michalchuk, A.A.L., Piggott, S., Rudic, S., Pulham, C.R., and Morrison, C.A. Impact
Sensitivity of Polymorphic Energetic Materials: The Curious Case of FOX-7. In preparation
4. Michalchuk, A.A.L., Triestman, M., Rudic, S., Pulham, C.R. and Morrison, C.A, Vibrational
up-pumping in molecular energetic materials. In preparation
5. Michalchuk, A.A.L., Rudic, S., Pulham, C.R. and Morrison, C.A. Predicting Impact Sensitivity
from Inelastic Neutron Scattering Spectroscopy. In preparation
Not In This Thesis
Published
1. Michalchuk, A.A.L., Tumanov, I.A., Boldyreva, E.V., Complexities of Mechanochemistry,
Elucidation of Processes Occurring in Mechanical Activators via Implementation of a Simple
Organic System, CrystEngComm, 2013 15, 6403. Hot Article
2. Michalchuk, A.A.L., Tumanov, I.A., Drebushchak, V.A. and Boldyreva, E.V., Advances in
elucidating mechanochemical complexities via implementation of a simple organic system,
Faraday Disucss, 2014, 170, 311
3. Bell, N.G.A., Michalchuk, A.A.L., Blackburn, J.W., Graham, M.C., and Uhrin, D., Isotope-
filtered 4D NMR spectroscopy for structure determination of humic substances, Angew. Chem.
Int. Ed., 2015, 54, 8382
4. Tumanov, I.A., Michalchuk, A.A.L., Politov, A.A, Boldyreva, E.V., and Boldyrev V.V.,
Inadvertent liquid assisted grinding: a key to ‘dry’ organic mechano-co-crystallisation?
CrystEngComm, 2017 19, 2830
5. Tumanov, I.A., Michalchuk, A.A.L., Politov, A.A., Boldyreva, E.V., and Boldyrev, V.V,
Inhibition of organic mechanochemical synthesis by water vapor, Doklady Chem., 2017 472.
6. Michalchuk, A.A.L., Tumanov, I.A., Konar, S. Kimber, S.A.J., Pulham, C.R. and Boldyreva,
E.V. Challenges of Mechanochemistry: Is In Situ Real‐Time Quantitative Phase Analysis
Always Reliable? A Case Study of Organic Salt Formation, Adv. Sci., 2017, 4, 1700132
250
7. Bouvart, N., Palix, R.-M., Arkhipov, S.A., Tumanov, I.A., Michalchuk, A.A.L., and Boldyreva,
E.V. Polymorphism of chlorpropamide on liquid assisted mechanical treatment: choice of
liquid and type of mechanical treatment matter, CrystEngComm, 2018, 20, 1797
8. Michalchuk, A.A.L., Hope, K.S., Kennedy, S.R., Blanco, M.V., Boldyreva E.V. and Pulham,
C.R., Ball-free mechanochemistry: In situ real time monitoring of pharmaceutical co-crystal
formation by resonant acoustic mixing, Chem. Commun. 2018, 54, 4033.
9. Michalchuk, A.A.L., Tumanov, I.A., and Boldyreva, E.V. The effect of ball mass on the
mechanochemical transformation of a single-component organic system: anhydrous caffeine,
J. Mat. Sci, 2018, 53 (19), 13380-13389.
10. Zakharov, B.A., Michalchuk, A.A.L., Morrison, C.A. and Boldyreva, E.V. Anisotropic Lattice
softening near the structural phase transition in the thermosalient crystal 1,2,4,5-
tetrabromobenzene, Phys Chem Chem Phys, 2018, 20, 8523 Hot Article
11. Tantardini, C. and Michalchuk, A.A.L. Dess-martin periodinane: The reactivity of a λ5-iodane
catalyst explained by topological analysis Int. J. Quantum Chem. 2019, Accepted.
In Preparation
1. Konar, S, Michalchuk, A.A.L., Sen, N., Bull, C., Morrison, C.A., Pulham, C.R. High pressure
neutron diffraction and DFT-D study of TNT polymorphs. In preparation

251
Appendix B
Conferences and Courses
Year 1
This year was dedicated to training under the EPSRC Doctoral Training Centre
in Innovative Manufacturing in Continuous Manufacturing and Crystallisation.
Training included 11 training weeks from Oct 2014 – May 2015 distributed
across the centre partner institutions.
Conferences
1. MechChem, July 2015. Montpelier, France. Poster Presentation:
‘To beat or not to beat. The role of impact frequency on
mechanochemical transformations’
Workshops
1. Resodyn Technical Exchange. Aug 2015. Butte, Montana, USA.
Courses (University of Edinburgh)
1. Electronic Structure Theory and Classical Simulation Methods
2. Computational Modelling of Materials
3. Computer-Aided Drug Design
Year 2
Conferences
1. Hot Topics in Solid State Chemistry: All Russian (with international
participants) Conference. Novosibirsk, Russian Federation. October
2015. Oral Presentation: ‘In situ real time monitoring of
mechanochemical transformations’
2. International Research Conference on Expanding Frontiers of RNA
Chemistry and Biology, Novosibirsk, Russian Federation. Nov 2016.
Oral Presentation: ‘Mechanochemical methods for organic systems’
252
3. 31st European Crystallographic Conference. Basel, Switzerland. Aug.
2016. Oral Presentation (on behalf of E Boldyreva): ‘Crystallography
in Education’
4. 31st European Crystallographic Conference. Basel, Switzerland. Aug.
2016. Poster Presentation: ‘In situ real-time monitoring of
mechanochemical salt formation’
Workshops
1. ISIS Neutron Training Course, 12-21 Apr 2016
Year 3
Conferences
1. Crystal Forms, University of Bologna, Italy. 4-6 June 2017
2. 24th IUCr, Aug 2017. Hyderabad, India. Poster Presentation: ‘The Big
Bang Theory. Towards Predicting Impact Sensitivity of Energetic
Materials’
Year 4
Conferences
1. 49th Conference of the Fraunhofer ICT. June 2018. Oral
Presentation: ‘The Big Bang Theory. Towards Predicting Impact
Sensitivity of Energetic Materials’