altschul2018.pdf - edinburgh research archive
TRANSCRIPT
This thesis has been submitted in fulfilment of the requirements for a postgraduate degree
(e.g. PhD, MPhil, DClinPsychol) at the University of Edinburgh. Please note the following
terms and conditions of use:
This work is protected by copyright and other intellectual property rights, which are
retained by the thesis author, unless otherwise stated.
A copy can be downloaded for personal non-commercial research or study, without
prior permission or charge.
This thesis cannot be reproduced or quoted extensively from without first obtaining
permission in writing from the author.
The content must not be changed in any way or sold commercially in any format or
medium without the formal permission of the author.
When referring to this work, full bibliographic details including the author, title,
awarding institution and date of the thesis must be given.
Chimpanzee personality and its relations with cognition and health: a comparative
perspective
Drew Altschul
Thesis submitted in fulfilment of the requirements for the degree of
Doctor of Philosophy in Psychology
to
The University of Edinburgh
July 2017
i
Declaration
I hereby declare that this thesis is of my own composition, and that it contains no
material previously submitted for the award of any other degree. The work reported in
this thesis has been executed by myself, except where due acknowledgement is made in
the text.
Signed,
Drew Altschul
ii
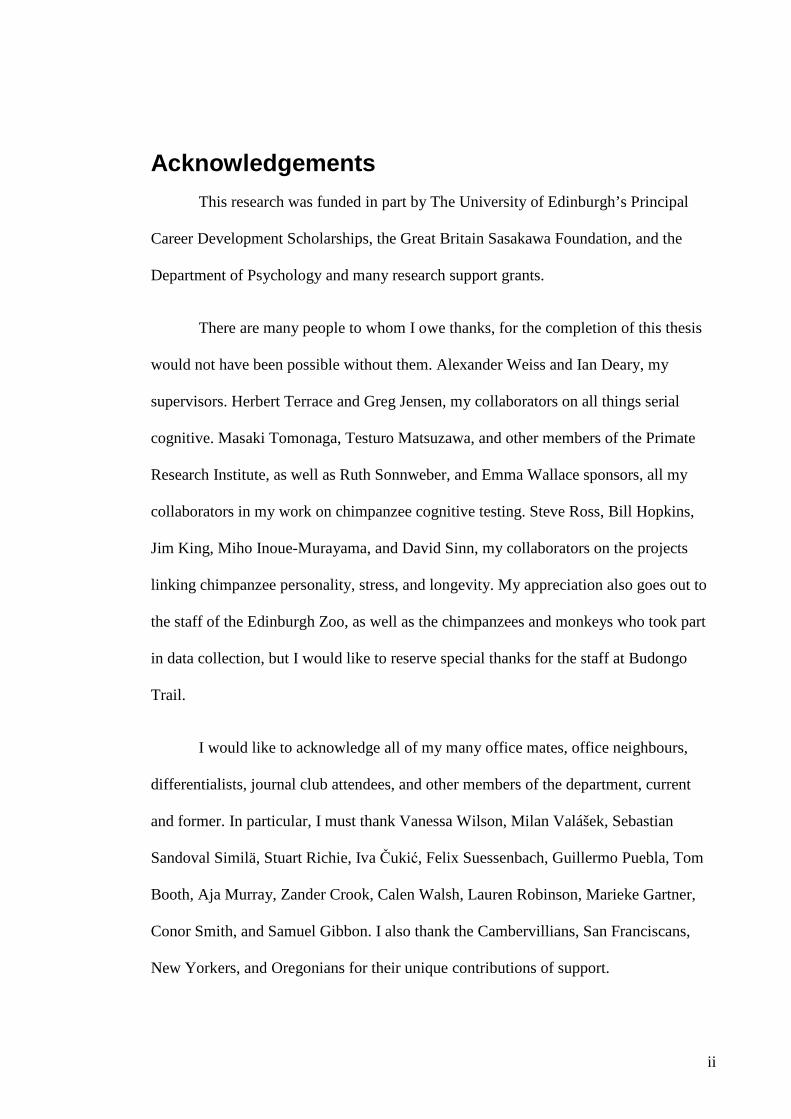
Acknowledgements This research was funded in part by The University of Edinburgh’s Principal
Career Development Scholarships, the Great Britain Sasakawa Foundation, and the
Department of Psychology and many research support grants.
There are many people to whom I owe thanks, for the completion of this thesis
would not have been possible without them. Alexander Weiss and Ian Deary, my
supervisors. Herbert Terrace and Greg Jensen, my collaborators on all things serial
cognitive. Masaki Tomonaga, Testuro Matsuzawa, and other members of the Primate
Research Institute, as well as Ruth Sonnweber, and Emma Wallace sponsors, all my
collaborators in my work on chimpanzee cognitive testing. Steve Ross, Bill Hopkins,
Jim King, Miho Inoue-Murayama, and David Sinn, my collaborators on the projects
linking chimpanzee personality, stress, and longevity. My appreciation also goes out to
the staff of the Edinburgh Zoo, as well as the chimpanzees and monkeys who took part
in data collection, but I would like to reserve special thanks for the staff at Budongo
Trail.
I would like to acknowledge all of my many office mates, office neighbours,
differentialists, journal club attendees, and other members of the department, current
and former. In particular, I must thank Vanessa Wilson, Milan Valášek, Sebastian
Sandoval Similä, Stuart Richie, Iva Čukić, Felix Suessenbach, Guillermo Puebla, Tom
Booth, Aja Murray, Zander Crook, Calen Walsh, Lauren Robinson, Marieke Gartner,
Conor Smith, and Samuel Gibbon. I also thank the Cambervillians, San Franciscans,
New Yorkers, and Oregonians for their unique contributions of support.

iii
Finally, I would like to thank my family, my parents, brothers, and sister. My
most gracious thanks go to Ella, for always being there, putting up with my displays,
and encouraging me when I needed it the most.

iv
A Note on Personal Pronouns
This thesis is based to a large extent on published work and work under review. In order
to maintain consistency with the published literature, and to acknowledge the
collaborative nature of the work, “we” rather than “I” is used throughout.
v
Abstract This thesis aimed to address two main questions. First, considering that
personality is frequently associated with cognitive abilities in humans, do chimpanzees’
personalities and cognitive capacities covary in ways similar to what is observed in
humans, as well as older evolutionary cousins, rhesus macaques? Second, given that
human and animal personality have previously been shown to relate to health and
longevity, does personality in chimpanzees also relate to various measures of health?
Chapter 1 provides an introduction to and brief history of comparative
personality psychology, particularly in the context of intelligence research and
psychosomatic medicine.
Chapter 2 describes three studies with a group of 19 zoo-housed chimpanzees
who interacted with touchscreen tasks over the course of 3 years of research. We found
that high Conscientious chimpanzees were more likely to stick with the tasks, and
performed better as a results, but once their extra experience was taken into account,
their performance advantage disappeared. However, we also found associations between
better interest and performance with high Openness, high Extraversion, and low
Agreeableness.
In Chapter 3 we examine performance in conjunction with personality, with 9
rhesus macaques. The macaques also engaged with touchscreen tasks, but were expert
subjects and displayed plateau performance. We found consistent associations between
many measures of performance and both high Openness and high Friendliness (which is
similar to Extraversion).

vi
With Chapter 4 we transition to our studies of personality and health. Chapter 4
examines personality and longevity in a sample of 538 personality rated, captive
chimpanzees. These chimpanzees were followed for between 6 and 23 years after being
rated. We found that high Agreeableness chimpanzees were more likely to live longer,
but no other personality traits had a significant impact on longevity.
In Chapter 5, we compared biomarkers from samples of 177 chimpanzees
housed at the Yerkes National Primate Research Centre, and 29,314 humans from the
National Health and Nutrition Examination Survey. Both samples had been tested for
the most common haematological and metabolic blood biomarkers, and we used these
to assess stress in the form of allostatic load, between species. We found a similar
structure of biomarkers in across humans and chimpanzees.
In Chapter 6, we took our allostatic load measure from chapter 5 and looked at
how it was associated with personality, in the same chimpanzee sample from the Yerkes
Primate Centre, and in the longitudinal Midlife in the United States and Midlife in Japan
biomarker study samples, which consisted of 993 and 382 individuals, respectively. We
found that Agreeableness was associated with allostatic load in both human samples,
whereas Dominance was associated with allostatic load in chimpanzees.
Finally, Chapter 7 summarises the results presented in these five empirical
chapters, and places our findings in the context of the existing literature. We discuss the
limitations of the research, and offer some suggestions for future study.
vii
Lay Summary This thesis made two particular inquiries into the field of comparative
personality psychology. First, are the dimensions of primate personality and cognitive
ability associated with one another? If so, how? Considering the extensive positive
evidence that has been reported in the human literature, we predicted that we would find
similar associations in chimpanzees, and also macaques, though to a lesser extent. We
studied both chimpanzee and rhesus macaque groups, collecting data on personality,
cognitive performance, and participation in tasks, ultimately finding similarities in the
relationships between personality, participation, and performance across species.
Second, given that human and animal personality have previously been shown to relate
to health and longevity, we investigated whether personality in chimpanzees is related
to both mortality and stress, the latter of which we assessed using the results of several
different blood tests. We found little consistency between the personality dimensions
predicting higher stress and earlier mortality, but robust associations between several
different personality dimensions and individual life outcomes. In these associations, we
found some consistency with what has been reported for humans, as well as some
effects that are distinctly chimpanzee. Overall, this thesis demonstrates the utility of
personality to these types of experiments and analyses, particularly in large, well-
powered studies.
viii
Contents Declaration ........................................................................................................................ i
Acknowledgements .......................................................................................................... ii
A Note on Personal Pronouns ....................................................................................... iv
Abstract ............................................................................................................................ v
Lay Summary............................................................................................................... vii
1 Individual differences in comparison .................................................................... 1
1.1 The development of a differential psychology of primates .............................. 1
1.1.1 Intelligence .................................................................................................... 2
1.1.1.1 The primate perspective ........................................................................ 4
1.1.1.2 Social cognition and chimpanzees ........................................................ 5
1.1.1.3 Physical cognition of chimpanzees ....................................................... 7
1.1.1.4 Can chimpanzee intelligence be explained by a general domain? ........ 8
1.1.2 Personality ................................................................................................... 11
1.1.2.1 Foundations in animals ....................................................................... 11
1.1.2.2 Development in humans ...................................................................... 13
1.1.2.3 A refocusing on animals ...................................................................... 16
1.1.3 Covariation in animal personality and intelligence ..................................... 17
1.2 Relationships between psychology and health: psychosomatic medicine ...... 20
1.2.1 Origins ......................................................................................................... 20
1.2.2 Empirical beginnings .................................................................................. 21
1.2.3 Eysenck and biological theory .................................................................... 26
1.2.4 Associations with health in the FFM .......................................................... 27
1.2.5 Cognitive Epidemiology ............................................................................. 30

ix
1.2.6 Hypothesized mechanisms linking personality with health ........................ 31
1.2.6.1 Direct Influence ................................................................................... 31
1.2.6.2 Unhealthy behavior ............................................................................. 32
1.2.6.3 Third Variables .................................................................................... 33
1.2.6.4 The body as a system .......................................................................... 33
1.2.7 Connections to nonhumans ......................................................................... 34
1.2.7.1 Subjective well-being .......................................................................... 35
1.2.7.2 Mechanistic hints ................................................................................ 36
1.3 The comparative approach .............................................................................. 38
1.3.1 Comparing across species and measures .................................................... 38
1.3.2 The present study ........................................................................................ 41
2 Personality, motivation, and performance on touchscreen tasks in zoo-housed
chimpanzees ................................................................................................................... 43
2.1 The synchronous study of personality and cognition ...................................... 43
2.2 Multiple associations between personality, participation, and performance .. 57
3 Rhesus macaque personality and performance on a serial cognitive
touchscreen task ............................................................................................................ 62
3.1 Extending the framework ................................................................................ 62
3.2 Personality and cognition, macaques and chimpanzees .................................. 84
4 Personality and longevity in captive chimpanzees ............................................. 89
4.1 Introduction ..................................................................................................... 89
4.2 Methods ........................................................................................................... 95
4.2.1 Sample ......................................................................................................... 95
4.2.2 Personality assessments .............................................................................. 97
x
4.2.3 Survival Analyses ..................................................................................... 100
4.3 Results ........................................................................................................... 103
4.3.1 Relationships between age and personality .............................................. 103
4.3.2 Relationships between personality and longevity ..................................... 107
4.4 Discussion ..................................................................................................... 115
5 Comparing blood biomarkers of stress between chimpanzees and humans . 119
5.1 Introduction ................................................................................................... 119
5.2 Methods ......................................................................................................... 124
5.2.1 Subjects ..................................................................................................... 124
5.2.1.1 Chimpanzees ..................................................................................... 124
5.2.1.2 Humans ............................................................................................. 125
5.2.2 Biomarkers ................................................................................................ 125
5.2.3 Analyses .................................................................................................... 125
5.3 Results ........................................................................................................... 128
5.3.1 Suitability of data ...................................................................................... 128
5.3.2 Exploratory Analyses ................................................................................ 128
5.3.3 Confirmatory Analyses ............................................................................. 134
5.3.4 Associations of biomarkers with age and sex ........................................... 140
5.4 Discussion ..................................................................................................... 143
6 Personality and allostatic load biomarkers in Japanese and American
humans, and chimpanzees .......................................................................................... 148
6.1 Introduction ................................................................................................... 148
6.2 Methods ......................................................................................................... 152
6.2.1 Study Subjects ........................................................................................... 152
xi
6.2.1.1 American Humans ............................................................................. 152
6.2.1.2 Japanese Humans .............................................................................. 152
6.2.1.3 American Chimpanzees .................................................................... 152
6.2.2 Personality ................................................................................................. 153
6.2.2.1 Humans ............................................................................................. 153
6.2.2.2 Chimpanzees ..................................................................................... 153
6.2.3 Biomarkers ................................................................................................ 153
6.2.3.1 Corrections for medication use ......................................................... 155
6.2.3.2 AL scoring ......................................................................................... 155
6.2.4 Control variables ....................................................................................... 155
6.2.5 Standardization .......................................................................................... 156
6.3 Results ........................................................................................................... 156
6.3.1 Suitability of data ...................................................................................... 156
6.3.2 Structural Equation Modelling .................................................................. 157
6.3.3 Linear Regression Modelling .................................................................... 158
6.4 Discussion ..................................................................................................... 161
7 Summary and general discussion ...................................................................... 168
7.1 Insights into chimpanzee personality ............................................................ 169
7.1.1 Conscientiousness ..................................................................................... 170
7.1.2 Agreeableness ........................................................................................... 172
7.1.3 Extraversion .............................................................................................. 174
7.1.4 Openness ................................................................................................... 176
7.1.5 Dominance ................................................................................................ 177
7.1.6 Neuroticism ............................................................................................... 179
xii
7.2 Limitations and open questions ..................................................................... 180
7.3 Future Directions and Conclusions ............................................................... 185
8 References ............................................................................................................ 188
Appendices
A Publication list...…………………………………………………………...... 213
B Published supplemental materials from chapter 2..…………………………. 215
C The 54-item Hominoid Personality Questionnaire.…...…………………..... 233
1
1 Individual differences in comparison
1.1 The development of a differential psychology of primates
Personality and intelligence are the two most studied individual psychological
differences, and research on these individual differences have produced results which
are arguably the most reproducible in psychology (Chamorro-Premuzic & Furnham,
2006). Intelligence and personality share more features in common as well. Both
describe cognitive, behavioral, and affective individual differences, which are
quantified using standard psychometrics (Funder, 2001). Both intelligence and
personality are, to differing extents, genetically influenced (Spinath & Johnson,
2011). Intelligence and personality also tend to be stable over an individual’s lifetime
(Caspi, 2000; Deary, Whalley, Lemmon, Crawford, & Starr, 2000), and both are
associated with differences in outcomes, such as education (Poropat, 2009), health,
and longevity (Calvin, Batty, & Deary, 2011).
Nevertheless, there are key differences between intelligence and personality.
Intelligence is usually defined by maximal performance on tasks (see section 1.1.1),
whereas personality captures broad tendencies in behavior (Cronbach, 1949). Put
simply, intelligence is what an individual can do, and personality is what they
typically do. Thus, intelligence and personality are assessed with quite different
instruments, and validated using different criteria. In this section, we will begin with
an overview of the evolution of these constructs, to understand their
interrelationships, in humans, and in other species.
2
1.1.1 Intelligence
The empirical study of intelligence arguably began with Binet and Simon
(1905), who described a set of higher order mental tests that could be administered to
children of various ages in an effort to predict academic success or failure. Their goal
was to provide an estimate of individual differences in intellectual ability, as opposed
to ability gained through experience, social privilege, or other confounds of
socioeconomic status (Binet & Simon, 1908). Their method employed a large battery
of tests that focused on attention, memory, and other cognitive abilities (Binet &
Simon, 1916). Their paradigm, which became foundational for the study of
intelligence, rested on several crucial principles (Terman, 1916):
1. Tests should tap higher order cognitive abilities.
2. The effects of past experience and knowledge on test performance should be
minimized as much as possible.
3. Participants should be instructed or otherwise compelled to exert maximal
effort on tests.
4. Test performance should be validated. Typically, this is done by relating
performance to academic achievement.
Binet and Simon’s scales were designed for children, but later studies took
inspiration from their work, and developed intelligence tests for adults. Some of the
first adult intelligence tests were designed and applied by Robert Yerkes and his
colleagues. Yerkes, Bridges, and Hardwick (1915) developed adult mental tests for
use by the US military. These were the Army Alpha and Beta Examinations, and
they were used to assess more than 1,700,000 men, making their effort the first adult

3
intelligence survey of this scale. Yerkes was a researcher with broad interests, and
we will return to his work later.
Intelligence tests saw greater use in subsequent decades, particularly in
educational contexts. Thorndike (1920) developed College Entrance Tests, which
changed over time, but eventually found their way into higher educational systems
(e.g. Scholastic Aptitude Test, American College Test). Standardized testing, though
controversial, is now widely used at many levels of education, throughout the world
(Haney, 1981), and have shown to effectively measure intelligence (Koenig, Frey, &
Detterman, 2008).
As the field of intelligence research developed over the course of the 20th
century, a consensus emerged on the structure of cognitive abilities. These abilities
display a ‘positive manifold’, that is, scoring high on one test tends to indicate that an
individual will score high on others (Spearman, 1925). This is true across virtually all
cognitive tests, indicating the presence of a general intelligence factor, also known as
g (Carroll, 1993; Spearman, 1925), that influences the entire span of human cognitive
abilities. However, the best model for these many abilities is hierarchical with g
sitting at the top (Holzinger & Swineford, 1939). Beneath g, second and third order
factors reside, such as visual perception and mathematical reasoning (Gustafsson,
1984). These factors allow for individual variation in specific abilities, but they are
oblique, i.e. correlated, which maintains the presence of an overall intelligence
captured by g.
4
1.1.1.1 The primate perspective
Much primate cognition research is focused on understanding the highest
achievements of apes and monkeys, and involve studying only a few subjects.
Researchers train their subjects rigorously and extensively, driving them to learn and
display abilities, which are impressive, and occasionally unmatchable. For example,
Ayumu and other members of Project Ai display numeral chaining abilities that no
human could perform (Inoue & Matsuzawa, 2007). If the goal is to show that a
species is capable of mastering a particular task, then studying the extreme aptitudes
of select individuals can be informative. However, the conclusions of these studies
rely on the assumption that the task is a valid indicator of an underlying cognitive
ability, and that the ability exists in the species in the first place. What we have
established from test theory is that a single test is not likely to be reliable, hence the
use of batteries in human intelligence testing. If the goal is to understand the average
or range of capacities in a species, then the issues inherent to studies of small
samples are compounded.
To study the variation of cognitive ability in animals, we need to determine
how to operationalize this ability. Can cognitive ability be captured with one central
domain, or many? Do many domains tap into a common, shared aptitude? As
mentioned, research in humans (Carroll, 1993) supports this model with multiple
correlated domains. However, evidence from other species is mixed, and even within
chimpanzees, the structure of intelligence is not yet clear (Herrmann, Hernández-
Lloreda, Call, Hare, & Tomasello, 2010; Hopkins, Russell, & Schaeffer, 2014).
Researchers and theorists have often posited that two domains of intelligence
exist in apes: social and physical (Bluff, Weir, Rutz, Wimpenny, & Kacelnik, 2007;
5
Cheney, Seyfarth, & Silk, 1995; Penn, Holyoak, & Povinelli, 2008; Penn &
Povinelli, 2007; Povinelli & Vonk, 2004; Tomasello & Call, 1997). Some
investigations of the social domain involve observing and interpreting another’s
behavior, such as one’s ability to follow another’s gaze, and understand cues
communicated by another to indicate the location of a reward (Tomasello, Call, &
Hare, 1998). With the physical domain, researchers have questioned subjects’
understanding of causality, quantity, and space. Relevant studies have required that
subjects implement a variety of problem solving tasks, e.g., tasks which necessitate
tool use to retrieve an out of reach object or keep track of a reward after the location
has been changed (Albiach‐Serrano, Call, & Barth, 2010; Povinelli, 2000).
Chimpanzee social cognitive abilities and tool-use abilities were the focus of
a particular study, and compared directly with the performance of bonobos,
orangutans, and young children (Herrmann, Call, Hernández-Lloreda, Hare, &
Tomasello, 2007; Herrmann, Hare, Call, & Tomasello, 2010; Herrmann, Hernández-
Lloreda, et al., 2010) Chimpanzees in particular are an important candidate for these
investigations, for they are one of humanity’s closest living relatives, and display
impressive comprehension of physical and social relations. However, the structure of
chimpanzee reasoning is controversial (Penn et al., 2008); this will be discussed in
the following sections.
1.1.1.2 Social cognition and chimpanzees
In the wild, chimpanzees must be able to recognize group members after
being apart for long periods; this is because of the high rate of fission-fusion within
groups. When groups reunite, it is crucial for individuals to be able to recognize and
6
remember other group members, as opposed to non-group members. It is also
essential for individuals to be able to recognize fluctuations in dominance rank
among group members, which may have occurred during a period of separation.
Inaccurate inference of group membership or asymmetrically hierarchical
relationships could result in stressful conflict. When individuals of different groups
do come into contact, violent acts of aggression often occur (Wilson et al., 2014)
wherein group members gang up on non-members, and attack and sometimes kill the
non-member (Goodall, 1986). Social awareness and recognition is crucial for
chimpanzees, so they do not needlessly kill known, or even related individuals.
Tracking and monitoring conspecifics’ interactions is also useful for primate
survival (Jolly, 1966). As suggested above, chimpanzees are adept at inferring rank
and relationship fluctuations from observing conspecifics’ behavior (Kendal et al.,
2015; Pika & Mitani, 2006; Subiaul, Vonk, Okamoto-Barth, & Barth, 2008).
Chimpanzees also appear to be skilled in deception: subordinate males will mate
with fertile females when the alpha or other dominant males are absent (Mitani,
Watts, & Muller, 2002). This behavior suggests that the chimpanzees understand the
risks of their actions and know when to take advantage of the absence of dominant
individuals.
In captivity, researchers have found that chimpanzees can predict the actions
of individuals based on physical signals (i.e., hair standing up, swaying, body
orientation), follow the gaze of humans and conspecifics, and they can assist a
human to achieve a clear goal such as obtaining an out of reach object (Barth, Reaux,
& Povinelli, 2005; Hare, Call, & Tomasello, 2001; Warneken & Tomasello, 2006)

7
Gaze following is of particular note, as it allows individuals to extract information
from one another. This information may concern social relations within the group, or
activity of outsiders, including conspecifics and predators. And yet, not all
chimpanzees are proficient at following gaze or gestures, so in other words,
individual differences are present.
1.1.1.3 Physical cognition of chimpanzees
Problem solving, especially concerning tool-use, is of primary interest for
investigators of chimpanzee physical cognition, for chimpanzees naturally use tools
in the wild. Moreover, researchers have argued that tool-use reflects causal
understanding of the relationship between the tool, the target, and the actions
required to put tool the tool into use to obtain the target reward (Deaner, van Schaik,
& Johnson, 2006; Visalberghi, Fragaszy, & Savage-Rumbaugh, 1995). Chimpanzee
tool-use, such as using a twig to extract termites from a colony mound, has been
studied in the wild (Boesch & Boesch, 1990) and in captivity (Celli, Tomonaga,
Udono, Teramoto, & Nagano, 2003). Goodall (1964) first observed chimpanzees
using tools to feed on insects in this way, and since then, observations of this
behavior have been frequent and widespread in wild populations (Boesch & Boesch,
1990; McGrew, 1974; Nishida, 1973). The materials and methods of tool-use had
been found to vary among wild chimpanzee populations (McGrew, 1992) Wild
chimpanzees modify sticks for use as tools, but the modification depends on the
purpose of the tool. For instance, chimpanzees fashion tools from sticks of two
different sizes: longer, thicker sticks used to probe for ants and honey, and smaller
sticks for picking out and eating bone marrow. In almost all instances, the
chimpanzees modified the sticks for the task before making any attempts to use the
8
stick, which suggests that chimpanzees understood the relationship between these
tools and the task (Boesch & Boesch, 1990).
In captivity, the strengths and limitations of chimpanzee tool-use has been the
subject of much research (Köhler, 1925; Mulcahy & Call, 2006; Murray, Lonsdorf,
Eberly, & Pusey, 2009; Povinelli, 2000; Visalberghi et al., 1995). To enhance
understanding of the limitations governing chimpanzees’ reasoning skills regarding
tool use, many researchers have used tasks wherein subjects must select the correct
tool from a set of tools, some of which are functional for solving the task, and some
of which are not (Povinelli, Reaux, Theall, & Giambrone, 2000; Yocom & Boysen,
2011). Other researchers have employed tasks which require that their subjects
modify the tool to solve the task (Visalberghi et al., 1995).
In the early study by Visalberghi et al. (1995), chimpanzees (and other apes,
and capuchins) were tested with a perspex tube containing a food reward in the
centre. The researchers provided the chimpanzees with a varying selection of tools,
some of which could be easily used to solve the problem, and others which required
modification. The chimpanzees were able to solve both types of problems, but small
individual differences in performance were present, which the researchers did not
interpret. In a later variant of the test, even stronger differences in performance were
apparent, but the researchers chose to focus on the number of errors that each subject
made, rather than examining overall performance, which varied considerably.
1.1.1.4 Can chimpanzee intelligence be explained by a general domain?
Researchers disagree as to whether the evolution of primate cognition was
driven by physical, i.e. ecological, pressures arising from the environment, or by the
9
social pressures of group living. Some argue for the social intelligence hypothesis
(Byrne & Whiten, 1989): that the complexity of a species’ intelligence depends on
social effects; since group-living species are constantly engaging with social
strategies and updating social information, these species are, all else being equal,
more intelligent (Holekamp, Sakai, & Lundrigan, 2007; Humphrey, 1976; Jolly,
1966). This theory has come under increasing fire in recent years (DeCasien,
Williams, & Higham, 2017; Holekamp, 2007). Some researchers argue that
ecological pressures are equally if not more important to understanding the evolution
of intelligence (Rosati, 2017). Another group of researchers argue that the evolution
of cognition was driven by a general intelligence factor which encompasses the
domains of both the social and physical worlds of animals (Burkart, Schubiger, &
van Schaik, 2016).
Though we have defined general intelligence in humans, how to describe
analogous aptitudes in primates, or other animals, is not obvious. Researchers usually
define domain-general intelligence in animals as the ability to excel in a multitude of
contexts and on a wide variety of cognitive tasks (Burkart et al., 2016). A species or
individual that performs well consistently would provide straight-forward support for
the theory of general intelligence.
Until recently, comparative research placed little focus on domain-general
intelligence within species, yet some studies investigated domain-generality of
intelligence across species. Deaner et al. (2006) meta-analysed 30 studies of non-
social cognition in nonhuman primates, and found evidence for general intelligence,
as well as significant differences in general intelligence between taxa, with hominids
10
outperforming all others. They aimed to restrict statistical comparisons to subjects
with similar backgrounds and ages, and to tests which used similar procedures.
Though the researchers were conservative and tried to compare performance only on
tasks with high degrees of similarity, procedural differences were present, and
perhaps most notably, tests of social cognition were excluded.
Deaner et al. (2006) argue that greater individual differences exist between
species than tend to occur within species. That is, the least intelligent individual from
an intelligent species will likely perform better the most intelligent of a less
intelligent species. However, their meta-analysis could not comment on within-
species variation in intelligence.
Herrmann et al. (2007) followed with a study of chimpanzees, orangutans,
and human children, all of whom were tested with a battery of cognitive tests which
assessed both their social and physical intelligence. The resultant Primate Cognition
Test Battery (PCTB) was composed of three sub-categories of physical tests and
three sub-categories of social tests, totalling 16 tasks. The physical tasks were chosen
for their ability to investigate spatial reasoning, numerical cognition, and causality
(for example, object permanence, adding numbers, and tool-use ability, respectively).
The social tasks assessed theory of mind, communication, and social learning.
Herrmann et al. (2007) found that apes and human children displayed similar
aptitudes for the physical tests, but children outperformed apes on social tasks. The
researchers argued that their results contradicted the general intelligence hypothesis
because the children demonstrated advanced skill in one, but not both, of the
domains tested.
11
Subsequent analyses of these data by Herrmann, Hernández-Lloreda, et al.
(2010) found inconsistencies in the assortment of their tests under their theoretical
latent variables, e.g., children’s performance was best modelled with 3 factors:
social, physical, and spatial, yet the chimpanzee data supported an unintuitive two-
factor structure: a spatial domain, and a combined physical-social domain. Some
critiques have suggested that these discrepancies in structure may be attributable to
some of their measures having low reliabilities (Bouchard, 2014). On the other hand,
another large study of chimpanzees that used the PCTB found clear evidence for a
general intelligence factor (Hopkins et al., 2014). Similarly a recent, large and
comprehensive study found a general intelligence factor in dogs (Arden & Adams,
2016). These findings join a significant body of research which has found evidence
of general intelligence in species as distant as mice (Matzel et al., 2003) and robins
(Shaw, Boogert, Clayton, & Burns, 2015).
Much of the recent work on chimpanzees’ general cognitive ability has been
studied in conjunction with other individual differences, especially personality. We
will return to these studies after introducing personality.
1.1.2 Personality
1.1.2.1 Foundations in animals
Animal personality is the study of behaviors that are repeatable across time
and contexts (Réale, Reader, Sol, McDougall, & Dingemanse, 2007). The modern
empirical study of personality – both human and nonhuman – began with dogs. From
the behaviorist tradition, Ivan Pavlov (1908/1941) postulated a typology that was
perhaps the first system for measuring personality types in animals. Pavlov’s
12
typology mixed three properties: Force, the ability to endure stimulation;
Equilibrium, the balance between the excitable and the inhibited; Mobility, an
individual’s flexibility in alternating between excitable and inhibited. Mixing these
three properties produced four personality types, such as Lively (high Force,
moderate Equilibrium, high Mobility) and Quiet (high Force, moderate Equilibrium,
moderate Mobility). Pavlov always assessed these personality types as
representations of different associative learning characteristics in his dogs.
After the dogs came chimpanzees. Robert Yerkes’ (1939) study of primates
led him to argue that personality existed among chimpanzees (Pan troglodytes),
though he did not refer to personality types or identify specific dimensions. Yerkes
and collaborators relied on scales that independent raters completed (Crawford,
1938). The ratings were consistent between raters, and particularly those raters who
had more experience with that sample of chimpanzees; moreover, these personality
traits could be aligned along “group factors”. Groupings of variables, such as
Crawford’s, are now known as factors, components, or, when studied by behavioral
ecologists, behavioral syndromes (Sih, Bell, Johnson, & Ziemba, 2004). In the same
group of chimpanzees, Hebb (1946a) looked to emotions to describe individual
differences, and used pre-specified ethograms to code behaviors, in response to a
range of test conditions (Hebb, 1946b, 1949). Early observations of nonhuman
primate personality were not restricted to studies of captive chimpanzees. For
example, Junichiro Itani (1957) and Jane Goodall (1990) commented on and
described the personalities of wild Japanese macaques and wild chimpanzees,
respectively.
13
1.1.2.2 Development in humans
Around the same time as Yerkes and Crawford were studying chimpanzees,
Allport and Odbert (1936) inspired by Francis Galton’s Lexical Hypothesis (Galton,
1884), identified nearly 18,000 terms from Webster‘s New International Dictionary
that could be used to describe personality and behavior in humans. Norman (1963)
removed archaic, redundant, offensive and obsolete terms from the list, reducing it to
a mere 2,797 unique terms, which could be used to describe human personality.
Efforts to use systematic descriptors derived from natural language
powerfully influenced researchers in subsequent decades. Cattell, a pioneer of factor
analysis, identified sixteen primary and eight secondary personality dimensions
(Cattell, 1946). However, Cattell’s structure was too complex for other researchers to
replicate. They argued that Cattell’s interpretation of the correlational structure of the
data was too liberal, and fewer dimensions would better represent personality. Fiske,
notably, argued that five factors were enough to describe personality (Fiske, 1949).
However, the next major step in personality research may have been a leap
too far. Hans Eysenck recognized a need for reducing the abundance of constructs
and theories into as few as possible. He factor analyzed personality descriptors,
reducing them to basic dimensions, which he referred to as traits. Eysenck defined
traits as “observed constellations of individual action-tendencies” (Eysenck, 1944),
or in other words, habits or repeated behaviors that consistently group together form
a trait.
Eysenck conducted his first major study with seven hundred soldiers
(Eysenck, 1944). They rated themselves on thirty-nine descriptive items, and
14
Eysenck factor analyzed these data. His second major study vastly increased in scale;
Eysenck conducted a similar analysis on almost 10,000 individuals. From these
studies, Eysenck concluded that human personality was composed of two basic
dimensions: Neuroticism and Extraversion.
Eysenck defined Neuroticism as the tendency to experience negative
emotions and Extraversion as the tendency to enjoy positive, and in particular social,
events. Eysenck also drew inspiration from Pavlov’s typologies, and in later work
added a third dimension, psychoticism, after extensive observations of psychiatric
patients (Eysenck, 1950). Eysenck’s influence on the study of individual differences
in health will be discussed in more detail in section 1.2.
Researchers have debated whether three or more personality dimensions are
the best model for human behavioral differences, and ultimately Eysenck’s three
dimensional model has failed to overcome recent empirical challenges (Costa &
McCrae, 1992a, 1992b). Instead, the Five-Factor Model (FFM) emerged as the
dominant model of personality in modern psychological science.
First suggested by McDougall (1932), and later (Fiske, 1949), these factors
were not verified until Tupes and Christal (1961) re-analyzed Cattell’s personality
data and found five factors similar to McDougall’s factors. Yet, the FFM did not see
widespread adoption because Tupes and Cristal published their findings in an
obscure American military technical report. Nevertheless, over the remaining
decades of the 20th century, the FFM was increasingly shown to be robust (McCrae
& Costa, 1987). The FFM is also known as the “Big Five” because each factor is
broad (John & Srivastava, 1999). The FFM does not suggest that five factors and five
15
factors alone encompass the full range of personality; rather, the five factors
represent personality at its most abstract, and each factor summarizes many distinct
and specific characteristics. Each factor remains partly ambiguous, in that no single
label, or even collection of labels, can capture every aspect of each personality
dimension (Digman, 1990). However, the name of each factor represents a center
point, and these names - Neuroticism, Extraversion, Openness to experience,
Agreeableness, and Conscientiousness - have become ubiquitous.
In the FFM, Neuroticism captures an individual’s propensity for negative
affect, which is why Neuroticism is sometimes referred to as Negative Emotionality,
or just Emotionality. Extraversion describes an individual’s tendencies toward active,
sociable behaviors. Openness to experience (hereafter Openness) is sometimes called
Intellect, and has been repeatedly associated with intelligence. In its own right,
Openness is described by an individual’s creativity, inquisitiveness, flexibility of
thought, and receptivity to new ideas. Agreeableness encompasses altruistic
nurturing, caring and supporting tendencies; an individual low in Agreeableness
would be selfish, spiteful, and indifferent to others. Finally, Conscientiousness
describes an individual’s dependability, prudence, and willpower (Digman, 1990).
As each personality dimension is broad, each encompasses many facets
(McAdams & Pals, 2006). In different species and populations, the broadness of each
dimension may cover slightly different arrangements of facets (Weiss, Adams,
Widdig, & Gerald, 2011). The overall center of the dimension may not differ
substantially, though in some species, names have been changed to better reflect the
differences in personality across species.

16
1.1.2.3 A refocusing on animals
Animal personality had remained largely unstudied until the 1970s. In 1971
van Hoof used principal components analysis (PCA) and found four personality
dimensions in chimpanzees: Affinitive, Aggressive, Play, and Submissive. Chamove,
Eysenck, and Harlow (1972) used factor analysis with a large group of rhesus
macaques (Macaca mulatta), finding three dimensions: Affiliative, Hostile, and
Fearful. Stevenson-Hinde and Zunz (1978) followed with the publication of a rating
instrument for assessing rhesus macaque personality, along with results. Observer
ratings were gathered; each observer rated each monkey on various traits. These
observations were analyzed with PCA to identify personality dimensions that they
named Confident, Excitable, and Sociable. These studies strongly suggest that
primate personality traits are organized along distinct dimensions. Furthermore,
knowing which dimension describes a set of traits helps ascertain the function of
traits and fitness trade-offs that maintain genetic variation among traits.
The FFM was adapted for chimpanzees in the form of the Chimpanzee
Personality Questionnaire (CPQ) by King and Figueredo (1997). As hypothesized,
they found what appeared to be homologues of the FFM factors. They also found a
sixth factor that they labeled Dominance, which accounted for the most variance.
Subsequent studies of nonhuman primates that used the CPQ and its successors,
notably the Hominoid Personality Questionnaire (HPQ), also found factors or
components corresponding to Dominance (e.g., Konečná et al., 2008; Weiss, Inoue-
Murayama, et al., 2009; Weiss, King, & Perkins, 2006). These studies have identified
human-like personality dimensions in bonobos (Weiss et al., 2015), orangutans
17
(Weiss et al., 2006), and macaques (Weiss, Adams, Widdig, et al., 2011), among
others.
1.1.3 Covariation in animal personality and intelligence
Pavlov assumed that personality could predict performance outcomes of
training and testing, and defined his typology with the goals of the behaviorists in
mind. By definition, personality is behavioral variability, making it a prerequisite for
natural selection (Dingemanse & Réale, 2005). When one also considers that
personality and cognition are linked in humans (Ackerman & Heggestad, 1997), one
might expect that personality and cognition evolved in concert. Modern models of
animal personality little resemble Pavlov’s, and the question has yet to be answered:
Is personality linked with differences in cognitive abilities?
In humans, there are multiple mechanisms whereby personality might be
linked to intelligence. The clearest connection is between Openness and g, where as
much as 40% of the true variance of Openness could be attributed to g (Chamorro-
Premuzic & Furnham, 2014). One reason for the overlap might be due to self-report
of personal cognitive ability, a subjective measure, but which is at least somewhat
accurately tapped into by the questions posed by Openness inventories. Nevertheless,
in factor analyses, the ability items are part of the same factor as other items relating
to openness to fantasy, aesthetics, values, and feelings (McCrae, Terracciano, & 79
Members of the Personality Profiles of Cultures Project, 2005), suggesting that
higher Openness individuals are generally more intelligent. However, the
relationships between the other personality dimensions and g are smaller, and not
strongly believed to be the result of cognitive overlap.

18
Meta-analyses have also linked Extraversion to intelligence, but particularly
test-taking characteristics and behaviors. For example, high Extraversion individuals
display better short term memory retrieval, are more resistant against distraction, and
better at timed tasks, but low Extraversion individuals appears to have better long-
term memory and reflective problem solving abilities (Matthews, 1999). Given this
divide, estimates of a correlation between Extraversion and g have varied from
positive to negative.
Neuroticism relates to intelligence scores in a similar fashion as Extraversion.
Higher Neuroticism individuals perform more poorly under stressful test-taking
conditions. Neuroticism has a negative correlation with intelligence across multiple
studies (Zeidner & Matthews, 2000); the conclusion often drawn from these results
is that negative affective attributes such as anxiety and worry interfere with cognitive
processes, such as memory and attention, that are required to succeed on tests
(Chamorro-Premuzic & Furnham, 2014).
Agreeableness appears to be the least related to cognitive ability. Although,
some researchers argue that these relationships have not been sufficiently studied for
this dimension (Chamorro-Premuzic & Furnham, 2014). Conscientiousness, on the
other hand, may be as weakly related to cognitive ability as Agreeableness, but has
major positive associations with life outcomes, such as academic and job
performance (Hurtz & Donovan, 2000; Poropat, 2009), which, all else being equal,
are outcomes also linked to intelligence.
However, a fundamental problem with describing relationships between
personality and cognitive abilities, particularly in animals, is selection bias. Animals
19
that are more likely to participate in tasks tend to represent particular personality
profiles (Morton, Lee, & Buchanan-Smith, 2013); other individuals may choose not
to participate, or their data may be discarded for a variety of reasons
(incompleteness, messiness, etc.). Even in studies where animals are subjects rather
than participants, distractibility can impact performance, making it difficult to assess
pure cognitive ability.
Much research has focused on the connection between exploratory behavior
and task acquisition. In general, more exploratory monkeys, mice, and corvids learn
more quickly (e.g., Coleman, Tully, & McMillan, 2005; Guenther, Brust, Dersen, &
Trillmich, 2014; Matzel et al., 2003) and innovate more frequently (e.g., Stöwe,
Bugnyar, Heinrich, & Kotrschal, 2006). In social species, an individual’s
connectedness and/or dominance within the group could impact the effectiveness of
learning (e.g., Herrelko, Vick, & Buchanan-Smith, 2012; Stöwe et al., 2006).
As ever in animal cognition research, transfer is the gold standard cognition;
compelling work would show that different personalities are repeatedly associated
with performance on a variety of tasks. For example, although more conscientious
individuals may acquire initial tasks faster and be rewarded more reliably, if the
reward contingency changes, more open individuals might be able to adjust more
effectively. Teasing apart contributions from multiple personality dimensions would
allow us to understand the structure and complexity of animal intelligence, or
intelligences.
20
1.2 Relationships between psychology and health: psychosomatic medicine
The study of animal cognition has a long and storied history, and while
animal personality research did not gain traction until more recently, animal
personality research has exploded in the last two decades. In contrast, the study of
psychosomatic health in animals is very small. Thus, we must first turn to the rich
history of behavioral medicine and psychosomatic research in human beings.
1.2.1 Origins
The role psychological factors play in the pathogenesis of somatic ailments
became widely accepted during the heyday of psychoanalysis. Psychoanalytic theory
was itself a response to the mechanistic medicine of the 19th century. Psychoanalysis
treated the human organism as a single, functional unit; the body’s functional
systems, which included the mind, impacted each other in powerful, but often
negative ways. Freud himself was interested in psychosomatic ailments, an interest
which developed out of a correspondence with notable medical researcher Georg
Groddeck (Freud, 1974).
Franz Alexander (1957), a contemporary and collaborator of Freud’s, viewed
personality as “…the expression of the unity of the organism. As a machine can only
be understood from its function and purpose, the understanding of the synthetic unit
which we call the body can only be fully understood from the point of view of the
personality, the needs of which are served by all parts of the body in an intelligible
coordination.” (p. 34). In other words, Alexander saw perturbations of organs or
systems as a consequence of the aforementioned “unity”. Alexander and Dunbar thus
21
proposed that emotions that are not openly expressed will result in somatic illness
(Alexander, 1957). Dunbar and Alexander went so far as to identify seven ailments
that, according to them, had psychological origins, and called them psychosomatic
diseases (Dunbar, 1947). These diseases were: asthma, hypertension, ulcerative
colitis, Graves’ disease, arthritis, stomach ulcers, and neurodermatitis.
The early body of research in psychosomatic medicine had many
methodological issues. They often used retrospective analyses, and relied on samples
of psychiatric patients. Because the studies were driven by theory alone, and
possessed little empirically grounding, their findings failed to replicate, and their
theories were later abandoned. But, these theories paved the way for evidence-based
medicine to develop psychosomatic medicine into a fully empirical field.
1.2.2 Empirical beginnings
Friedman and Rosenman (1959) were the first to discover an association
between behavioral factors and coronary heart disease. They linked these health
outcomes to three ‘types’ of observable behavior in relation to work characteristics
and performance.
Type A individuals are characterized as intense, and possessing of a need for
achievement, a sense of urgency, and a strong desire to compete. Type B is the
opposite of Type A, and thus refers to individuals who lack drive, ambition and
competitiveness. Type C is similar to B, but adds chronic anxiety. Friedman and
Rosenman compared serum cholesterol levels, clotting times, and presence of
coronary heart disease in males divided into three groups defined by the A, B, and C
behavioral patterns. They found that serum cholesterol levels were significantly
22
higher in the type A group (253 mg per 100 ml) than in either the type B (215 mg per
100 ml) or type C (210 mg per 100 ml) groups. Moreover, the Type A group
displayed significantly quicker blood coagulation, and a higher incidence of coronary
heart disease than either of the other groups. These differences could not be
explained by differences in diet, exercise, alcohol intake, or smoking (Friedman &
Rosenman, 1959).
Researchers concluded that the Type A behavioral pattern was a “coronary-
prone personality” (Price & Clarke, 1978). This assertion marked the beginning of
evidence based psychosomatic medicine. From here, the field was propelled towards
studying personality characteristics in relation to health and particularly
cardiovascular diseases (CVDs).
In many future studies, the definition of Type A behavior was expanded to
include characteristics such as hostility and anger. Three decades after the Type A
behavior pattern was introduced, the first quantitative review of the literature was
published (Booth-Kewley & Friedman, 1987). This review included measures of
anger, hostility, aggression, depression, anxiety, extraversion, and the Type A
behavior pattern as predictors, and CVDs such as coronary heart disease,
atherosclerosis, myocardial infarction, angina, and combinations of the preceding, as
outcomes. In the 55 published reports, the Type A behavioral pattern was associated
with combined heart disease outcomes. This relationship was undoubtedly
significant, but the effects size was small (r = .14), and the component of Type A
behavior - competitiveness/hard driving/aggressiveness - was most strongly related
to coronary heart disease. However, other personality variables associated with

23
negative affect were also significantly related to CVDs, including anger, hostility,
depression, and anxiety. The strongest predictor was hostility (r = .21); the combined
effect size was stronger than that for Type A behavior.
Booth-Kewley and Friedman (1987) concluded that cardiovascular risk was
not associated with impatient, hectic, workaholic tendencies, but by negative
emotions. That is, individuals who were, to name a few examples, depressed,
aggressive, anxious, or easily frustrated were at higher risk. Among these items one
can see pathological descriptors, like depressed or anxious, which in part led the
reviewers to posit that although this maladapted personality is one that is prone to
developing CVDs, it may also increase the hazard of developing other diseases. The
reviewers proposed that ‘disease-prone personality’ may be a causal factor in disease
ontogeny (Friedman & Booth-Kewley, 1987).
This construct co-emerged from another meta-analysis conducted by the same
authors, but on the literature surrounding personality correlates of five
psychosomatic diseases: asthma, arthritis, ulcers, and headaches, along with
aforementioned coronary heart disease. Prior literature suggested that the asthma-
prone personality was anxious, dependent, aggressive, and neurotic. Headaches had
been linked with stress, anger, repressed hostility, and emotional tension. Peptic
ulcers were also associated with chronic exposure to stress, and rheumatoid arthritis
was associated with depressed, perfectionistic, and repressed personality. Given that
these diseases had been associated with (albeit a wide range of) negative affective
traits, Friedman and Booth-Kewley (1987) conducted a meta-analysis to test the
proposed associations between personality and disease. Personality variables were
24
grouped into following categories: anxiety, depression, extraversion, one combining
anger and hostility, and one combining anger, hostility, and aggression. The meta-
analysis included 101 published studies.
Overall, the reviewers found consistent associations between personality and
diseases. However, they found no specific arthritic or coronary-prone personality, as
no independent associations between any specific personality traits and any
particular disease were found. The magnitude of the correlations were the same as
those described for CVD, ranging between approximately .1 and .2 for specific
outcomes. Taken as a whole these results supported the existence of a generic disease
prone personality typified by tendencies to experience negative affect, e.g., anxiety,
depression, hostility, anger, and aggressiveness (Friedman & Booth-Kewley, 1987).
It was unclear what mechanism or mechanisms were underlying the associations;
negative affective experiences might have been causing health issues, but negative
emotions like these are often reactions to a negative life event, or the result of
external stress, which could be the root cause of poor health.
Independently of Type A and disease-prone personality research, but around
the same time, endocrinologist Hans Selye proposed the General Adaptation
Syndrome theory of stress (Selye, 1956). If stress is defined as a sum effect of bodily
processes reacting to a real or imagined stressor, the General Adaptation Syndrome
model describes the body’s reaction to stressors, characterized in three phases.
Phase 1 is a nonspecific mobilization phase. There are two stages within this
phase. An initial shock reaction to a stressor induces physiological changes, such as
decreased blood volume and levels of electrolytes and sugar in the blood. When the
25
stressor is identified, the body then starts to respond as to a state of emergency: the
sympathetic nervous system activates, epinephrine is produced and released. This
second stage of responses result in increased muscle tone, blood glucose, blood
pressure, and heart rate.
Phase 2 is called the resistance phase, and is characterized by increased
secretion of glucocorticoids, which augment the body’s ability to cope with stressors.
During this phase, glucose, fat, and protein in the blood increases, and potassium
levels decrease. These effects are unsustainable, as the body’s resources will deplete.
Depending on the extent to which the resources are lost, the final stage of the stress
response will be either exhaustion or recovery. If the body successfully copes with
the stressor during the resistance phase, then a recovery phase will occur; levels of
glucose, fat and protein in the blood will decrease and return to normal, restoring
homeostasis.
If the body is exposed to the stressor for a prolonged period during the
resistance phase and unable to eliminate the stressor, once resources are depleted, the
body will be unable to maintain normal function and an exhaustion phase will occur.
If an exhaustion stage is sustained for too long, tissue damage, or even death, may
occur. Prolonged and/or repeated overactivation of the sympathetic nervous system
and exhaustion of the immune system has been shown to result in the digestive tract
disturbances, diabetes, and cardiovascular issues (Taylor & Sirois, 1995). A useful
variable for measuring prolonged or repeated exposure to stress is known as
allostatic load (McEwen & Stellar, 1993). Allostatic load will be discussed in greater
detail in chapters 5 and 6.
26
Friedman and Booth-Kewley’s (1987) idea of the disease-prone personality
meshed well with the General Adaptation Syndrome model, rather than with the
earlier psychosomatic theories of unresolved psychological conflicts offered by
Alexander, Dunbar, and other advocates of the psychodynamic approach. Rather than
affecting specific organs, psychological disturbances appear to impact the autonomic
nervous system, immune system, and metabolic processes. Disrupting these systems
can lead to any number of negative health outcomes. The General Adaptation
Syndrome model suggested a biological mechanism through which excessive
exposure to stress would lead to disease.
However, recognizing the presence of a particular stressor is insufficient to
explain the myriad of potential negative resultant health outcomes. A range of
individual differences exists in how stress is perceived, and the lasting effects of the
same stressful events (Watson, 1988; Watson & Pennebaker, 1989). This variation
suggests that there is a trait-like tendency within individuals, which affects how they
experience and react to negative affect. Thus, researchers proposed that negative
affect was a possible mediator of the associations between physiological stress and
psychological variables.
1.2.3 Eysenck and biological theory
Eysenck’s personality dimensions were strongly rooted in his arousal theory
of personality (Claridge & Eysenck, 1967). According to the arousal theory,
individual differences in Extraversion reflect individual differences in response
thresholds of the ascending reticular activating system, a set of sub-cortical structure
within the brain. Introverts have lower stimulation thresholds, and consequently are
27
more reactive to environmental stimulation of all kinds and, somewhat unintuitively,
have higher baseline levels of cortical arousal. Extraverts are the opposite: they
require more external stimulation to reach equivalent levels of arousal as introverts.
In the arousal theory, Neuroticism is rooted in a different set of brain
structures: the limbic system. Individual differences in the activation of the limbic
system could produce differing degrees of either emotional stability and instability
(Claridge & Eysenck, 1967; Corr, 2004). The proposed biological link between
Neuroticism and the limbic system provided an easy explanation for Neuroticism’s
relationship with health, namely as the limbic system was, in turn, linked to
unhealthy activation in the autonomic nervous system, which is itself in turn related
to cardiovascular disease (Matthews & Gilliland, 1999),
As mentioned previously, Eysenck’s theories did not stand the test of time.
Nevertheless, they were influential for many years, and drove a great amount of
research towards the study of the biological basis for personality, particularly in
relation to psychosomatic health, including some specific health outcomes, e.g.,
stress and cardiovascular disease.
1.2.4 Associations with health in the FFM
As previously mentioned, CVD is often related to hostility and Type A
behavior; how are these association reflected by the FFM? Hostility and antagonism
are most closely tied to low Agreeableness, but to a lesser extent, high Neuroticism
(Deary, Weiss, & Batty, 2010; Dembroski & Costa, 1987) as well. These findings
make sense, as Agreeableness and Neuroticism are the FFM traits most strongly
28
related to negative affect. Either trait, or both in combination, could lead to poorer
health generally, as well as CVD and early mortality.
Some studies have found that Neuroticism is associated with health outcomes
in people with multiple diseases, which is additional indication that Neuroticism may
be tied to a general susceptibility to ill health rather than any specific disease
(Matthews, Deary, & Whiteman, 2009) Neuroticism has become recognized in the
field of public health as a major contributor to excess healthcare costs (Lahey, 2009),
which for highly neurotic individuals are approximately 2.5 times higher than those
brought on by common mental health disorders (Cuijpers et al., 2010). However, the
mechanisms through which Neuroticism influences health are not fully understood.
Openness has also been linked to CVD. Specifically, facets of Openness, including
Openness to feelings, aesthetics, ideas, and actions have all linked to reduced risk for
cardiac (Jonassaint et al., 2007) and all-cause (Ferguson & Bibby, 2011) mortality.
The Framingham Heart Study had a profound influence on large, longitudinal
studies of human health. As a consequence of this foundation study, research tended
to focus on cardiovascular health during the 20th century. However, more recent
work has emphasized the impact of personality on other dimensions of health.
Goodwin and Friedman (2006) found that Conscientiousness and Neuroticism were
related to several self-reported diseases in a national representative sample.
Individuals who reported having diabetes, hernia, hypertension, or bone and joint
problems were lower in Conscientiousness. Individuals with ulcers, bronchitis,
asthma, and other respiratory problems were higher in Neuroticism. Furthermore,
individuals who reported having chronic skin conditions, urinary–bladder problems,
29
stroke, or tuberculosis were more likely to have both lower Conscientiousness and
high Neuroticism (Goodwin & Friedman, 2006).
Personality traits have also been linked to mortality, or length of survival.
Meta-analysis (Roberts, Kuncel, Shiner, Caspi, & Goldberg, 2007) showed that low
Conscientiousness, Extraversion and Agreeableness, and high Neuroticism were all
associated with higher risk of all-cause mortality. Conscientiousness was the
strongest and most consistent predictor of survival time in this meta-analysis, while
the associations between Neuroticism and survival were inconsistent. Some studies
found that Neuroticism was associated with an increased, and in some cases with a
reduced risk of death (Deary et al., 2010). A more recent metasynthesis that
examined the FFM’s relationship with mental, physical, and overall health, as well as
health behaviors (Strickhouser, Zell, & Krizan, 2017) found that Agreeableness and
Conscientiousness were positively, and Neuroticism negatively, associated with
mental and general health, plus health behaviors. No personality dimension was
consistently associated with physical health, however. Of all the FFM dimensions,
Conscientiousness is the most frequently and strongly linked to mortality and health,
and this has been consistently replicated across reviews and meta-analyses (Bogg &
Roberts, 2004, 2013; Kern & Friedman, 2008).
Lastly, personality traits have been associated with disease precursors. High
Conscientiousness and low Openness have been linked to low levels of inflammatory
markers, specifically C-reactive protein and interleukin-6 (Luchetti, Barkley,
Stephan, Terracciano, & Sutin, 2014). It also appears that individuals high in both
30
Conscientiousness and Neuroticism tend to have the lowest levels of interleukin-6
(Turiano, Mroczek, Moynihan, & Chapman, 2013).
1.2.5 Cognitive Epidemiology
Cognitive epidemiology is the study of how intelligence relates to health
outcomes, including disease ontogeny and mortality (Calvin et al., 2011). The
evidence to support intelligence-health associations is strong, though cognitive
epidemiology as a field, despite having grown precipitously, is young compared to
the field surrounding personality. The first study was by Maller (1933), who found
an inverse association between childhood test scores and mortality risk. A second
study followed 55 years later (O'Toole, Adena, & Jones, 1988). Finally, 13 years
further on, Whalley and Deary (2001) confirmed the same negative correlation in a
population representative sample, which was also subject to long-term follow up (65
years). The publication of these findings in a mainstream medical journal led to the
rapid development of the new field of cognitive epidemiology. The core finding has
since been replicated in many other large samples (Calvin et al., 2011).
As we have implied, large-scale studies of primate intelligence are few
compared to studies of personality. As such, the studies described in this document
will investigate relationships in primates between personality and intelligence, and
between personality and health, but not directly between intelligence and health.
Therefore, a discussion of the theory and proposed mechanisms underlying cognitive
epidemiology is beyond the scope of this document.

31
1.2.6 Hypothesized mechanisms linking personality with health
As established, considerable, convincing evidence exists that the personality
traits of the FFM are associated with CVD, mortality, and health. However, if one
proposes that personality plays a pivotal role in disease development, what are the
mechanisms through which personality exerts its influence? We will describe several
major possibilities.
1.2.6.1 Direct Influence
Personality might causally contribute to disease onset by directly influencing
a physiological mechanism that causes disease. If a personality dimension is
characterized by an underlying pattern of emotional response, then an individual who
rates highly on that dimension would have a corresponding physiological response,
either beneficial or detrimental to health, when coping with challenges that arise
from interactions with the environment. For example, higher Neuroticism individuals
might react more strongly to stressful events, and their corresponding physiological
responses would cause more damage to the body than in lower Neuroticism
individuals. Excess damage caused by physiological stress is known to lead to a
number of major ailments (Assies et al., 2014; Austin, Crack, Bozinovski, Miller, &
Vlahos, 2016; Martin-Subero, Anderson, Kanchanatawan, Berk, & Maes, 2016).
If this hypothesis was true, then changing an individual’s personality would
change their risk for developing disease (Allen, Magee, Vella, & Laborde, 2017;
Chow, Wagner, Lüdtke, Trautwein, & Roberts, 2017; Roberts et al., 2017). However,
this hypothesis does not imply that personality is the only cause of a disease
(Friedman & Booth-Kewley, 1987). Rather, personality is one risk factor that makes
32
an individual more or less prone to develop that disease. Identifying a direct
influence is difficult in practice because it requires eliminating the possibility of
reverse causation and third variables, discussed below.
1.2.6.2 Unhealthy behavior
Since personality dimensions incorporate broad patterns of behavior, it might
be that some of these behaviors increase an individual’s risk of developing a disease.
For example, experiencing negative emotions might lead to binge eating, which leads
to weight gain, and obesity, which significantly contributes to the development of
diabetes and CVD. In this case, personality traits associated with frequent experience
of negative affect, which is associated with Neuroticism, would indirectly be a
source of these health conditions.
Substantial evidence has demonstrated that personality traits are related to
health-related behaviors. For example, a combination of high Neuroticism, low
Conscientiousness, and low Agreeableness has been linked to alcohol abuse
(Malouff, Thorsteinsson, Rooke, & Schutte, 2007) and high rates of smoking
(Terracciano & Costa, 2004). High Conscientiousness, high Extraversion, and low
Neuroticism are associated with more physical activity (Rhodes & Smith, 2006;
Wilson & Dishman, 2015), which is protective against a variety of health conditions.
High Openness, high Conscientiousness, low Agreeableness, and low Neuroticism
are associated with active healthcare decision making (Flynn & Smith, 2007).
Mounting evidence also suggests that individuals low in Conscientiousness and high
in Extraversion engage in riskier behaviors (Atherton, Robins, Rentfrow, & Lamb,
2014). Yet Friedman and Booth-Kewley (1987) observed that changes in personality
will not necessarily cure a disease, unless the specific mediating behavior is affected
33
by the change. Thus, focusing on personality dimensions may be most useful in
preventing disease from taking hold and as a tool for identifying and directing
therapies to at-risk individuals.
1.2.6.3 Third Variables
A biological third variable might cause both a certain personality dimension
to manifest, as well as a related disease (Friedman, 2008). There exist a wide variety
of biological third variables. For example, anxiety-prone individuals tend to have
higher rates of heart disease; however, if a hyper-responsive nervous system is the
cause of the anxiety disorder, and the cause of the heart disease, then the hyper-
responsiveness is a third variable, a physiological response that causes both the
outward appearance of anxiety and the development of heart disease. The appearance
of anxiety would not itself influence heart disease. Common genetic influences
which shape personality traits could also serve as risk factors for a disease. In these
examples, the observed associations between personality and disease are purely
correlational, but this is non-obvious if researchers are not aware of the third
variable.
Friedman and Booth-Kewley (1987) note that biological third variables do
not preclude causal personality models. If a biological system allows for feedback to
and changes in the biological variable, as a function of personality influenced
physiological responding, then both could be simultaneously in play.
1.2.6.4 The body as a system
As suggested above, these theories are not mutually exclusive. It is in fact
most probable that a disease will not be caused by a single factor, but will be the

34
result of a host of processes and feedback loops that often jointly affect health in
negative ways. For example, anxiety could cause an individual to smoke more, which
can in turn trigger changes in autonomic nervous activity and heart rate, which could
then increase anxiety further, and contribute directly to CVD risk. For this reason, it
is important not to oversimplify models.
Recently, Deary et al. (2010) suggested that the mechanisms linking
personality and health outcomes can be broadly lumped into two clusters: health
behaviors, and socioeconomic status (SES). They describe health behaviors as links
to health outcomes as previously described (Friedman & Booth-Kewley, 1987), but
their recognition of the role of SES is novel. SES is a well-known independent
predictor of health outcomes (Frank, Cohen, Yen, Balfour, & Smith, 2003), and
personality dimensions are also related to SES indicators, such as educational
achievement and income (Deary et al., 2010; Jonassaint, Siegler, Barefoot, Edwards,
& Williams, 2011). Deary et al. (2010) suggest two paths by which health behaviors
and socioeconomic status could influence health outcomes: by mediating the effects
of personality dimensions on health outcomes; and by modifying and moderating
other risk factors, e.g., genetic predisposition. A third possibility also exists: that
personality itself could moderate the existing effects of genetic risk on later health
outcomes (Čukić et al., 2015)
1.2.7 Connections to nonhumans
Many primate species, notably chimpanzees and macaques, have long been
used model organisms in biomedical research. These studies use animals as models
for humans, to study the course of a disease, the effect of a medication, or the
35
physiology of the brain. Psychosomatic health in animals has received less attention
in its own right (Mendoza, Capitanio, & Mason, 2000).
1.2.7.1 Subjective well-being
A large proportion of studies on animal health have examined welfare, or
subjective well-being, which is one way to operationalize happiness or contentment.
The study of subjective well-being originated in humans and has been studied by
psychologists, sociologists, and medical practitioners (DeNeve & Cooper, 1998;
Diener, Suh, & Oishi, 1997; Huebner, 1991; Lucas, Diener, & Suh, 1996).
In humans, there are at least two theoretical components to subjective well-
being, one emotional, one cognitive (Huebner, 1991; Lucas et al., 1996). Perhaps the
most commonly used measures of subjective well-being, the Satisfaction with Life
Scale, measures three domains: satisfaction with life (a cognitive element), positive
affect, and negative affect (Diener et al., 1997).
Subjective well-being has been consistently found to be associated with
personality traits. Specifically, subjective well-being is known to be positively
correlated with Extraversion and negatively correlated with Neuroticism, both in
primary analyses (DeNeve, 1999; Diener, 1998) and meta-analyses (DeNeve &
Cooper, 1998; Steel, Schmidt, & Shultz, 2008), though the magnitude of these
relationships is still uncertain. Subjective well-being is also positively, but more
modestly, correlated with Agreeableness, Conscientiousness, and Openness.
Subjective well-being is associated with other characteristics, too, including
social relationships and genetics (Camfield, Choudhury, & Devine, 2009; Helliwell
& Putnam, 2004; Weiss et al., 2016; Weiss, Bates, & Luciano, 2008), and health
36
(Okun, Stock, Haring, & Witter, 1984). Subjective well-being is strongly associated
with self-reported positive health (DeNeve, 1999; Diener, Suh, Lucas, & Smith,
1999; Helliwell & Putnam, 2004). Lower subjective well-being is reported by
individuals with poor health, but the direction of causality, or alternatively, the
common exogenous variable, is not clear (Diener et al., 1999). As indicated, social
characteristics, especially strong, healthy, positive social bonds, and robust social
networks, are associated with higher subjective well-being (DeNeve, 1999).
Very much like personality, subjective well-being can be assessed in
nonhuman primates, using observer ratings (King & Landau, 2003). Across ape
species, low Neuroticism, high Agreeableness, and high Extraversion are associated
with higher subjective well-being (King & Landau, 2003; Schaefer & Steklis, 2014;
Weiss, Inoue-Murayama, et al., 2009; Weiss et al., 2006). Similar results have been
found in rhesus macaques, with higher subjective well-being being related to high
Confidence, high Friendliness, and low Anxiety (Weiss, Adams, Widdig, et al.,
2011).
1.2.7.2 Mechanistic hints
Research has revealed that both personality and subjective well-being are
linked to longevity in apes. Gorillas rated higher on Extraversion (Weiss, Gartner,
Gold, & Stoinski, 2013) and orangutans rated as higher on well-being, live longer
(Weiss, Adams, & King, 2011). It might be that more extraverted individuals benefit
from socializing with others. Socialization behaviors could alleviate stress by
mediating physiological stress, which could increase life span. An alternative is that
Extraversion is an indicator of immune function or cardiovascular risk (Weiss et al.,
2013).
37
Personality may influence animal health in two ways, similar to the pathways
previously discussed in the context of humans. Personality could explain tendencies
to engage in unhealthy behaviors, e.g., highly impulsive rhesus macaques are
excessively aggressive and get into many fights (Gerald & Higley, 2002). Personality
could also affect directly influence physiology, and consequently health (Capitanio,
2011). Indeed, neurobiology work points to associations between personality,
physiology, and well-being (Burdina & Melikhova, 1961; Koolhaas et al., 1999;
Shively et al., 2008).
Both approaches ask questions about stress and coping with stress. Some
work (Koolhaas, De Boer, Coppens, & Buwalda, 2010; Sapolsky, 1982, 1990)
suggests that personality and environmental factors, in concert, modulate the
physiological stress response. However, the correlational nature of much of the
evidence makes causal linkage ambiguous, and so does not rule out the possibility
that personality and the stress response could have co-evolved, or may be genetically
correlated. These possibilities would fit a model that might incorporate causal links
as well as third variables, such as a hyper-responsive nervous system (see discussion
above). In all cases, the role of the environment is paramount, as the social and
ecological landscape produces stressors that interact with an animal’s personal
predilections to stress.
For additional examples, wild female baboons who tended to spend time
alone had higher glucocorticoid levels, even when adjusting for dominance rank
(Seyfarth, Silk, & Cheney, 2012). Personality is associated with autonomic nervous
system activity in goats (Briefer, Oxley, & McElligott, 2015). Rhesus macaque
38
personality has been linked to immune system function in monkeys infected with
simian immunodeficiency virus (Capitanio et al., 2008).
While the extent of research in nonhuman primates is limited compared to
what exists in humans, overall, the results from primates reflect what has been found
in humans. This suggests that the links between personality and well-being are not
human-specific, but part of an ancestral link between psychology and health.
1.3 The comparative approach
1.3.1 Comparing across species and measures
Research into the similarities and differences between human and
chimpanzee cognition has tended to revolve around comparisons of performance
between populations and species (Boesch & Tomasello, 1998; McGrew, Tutin, &
Baldwin, 1979). These studies can be informative for researchers looking to identify
cognitive abilities that are evolutionarily conserved (e.g. gaze following), as opposed
to abilities that are believed to be unique to humans (e.g. Theory of Mind).
Nevertheless, the study of individual differences is crucial for understanding the
underlying structure of human and primate cognition. Researchers have noted
individual differences within species’ performance, but little research has focused on
the implications of these individual differences in nonhuman cognition (Thornton &
Lukas, 2012). Building on the literature concerning chimpanzees, this study with
chimpanzees can facilitate our understanding of the evolutionary development of the
human mind and primate intelligence. An investigation of individual differences
within a species has the potential to demonstrate whether reasoning in the social and
physical domains are strongly correlated (i.e. relational knowledge is domain
39
general) or whether reasoning in these domains is compartmentalized (i.e. domain-
specific). Current comparative investigations reveal contrasting results, leaving
uncertainty as to the generality of primate intelligence (Deaner et al., 2006;
Herrmann et al., 2007; Herrmann, Hernández-Lloreda, et al., 2010; Reader, Hager, &
Laland, 2011).
Comparative researchers also tend to rely on data from few subjects as
ambassadors for an entire species. For example, Project Nim (Terrace, 1987) hinged
on data from a single chimpanzee to make sweeping conclusions about the hard
limitations on chimpanzees’ capacity for language. On the other hand, exceptional
individuals such as Kanzi the bonobo, have lead researchers to speculate that
bonobos are superior to chimpanzees in their ability to acquire human-like language
(Savage-Rumbaugh et al., 1993). These and other small sample studies are
informative for understanding specific, exceptionally trained abilities, but to
understand what nonhumans tend to do, rather than what they can do, we must
examine larger samples.
The expansion of inventory-based personality studies across many primate
species is an excellent example of what we can learn from adequately sized
comparative studies. In the case of chimpanzee personality, the six dimensional
structure (King & Figueredo, 1997) has been mostly replicated (Weiss, Inoue-
Murayama, et al., 2009; Weiss, King, & Hopkins, 2007) extended to bonobos (Weiss
et al., 2015), and compared phylogenetically to orangutans (Weiss & King, 2015;
Weiss et al., 2006), rhesus macaques (Weiss, Adams, Widdig, et al., 2011), and
humans (King, Weiss, & Sisco, 2008). These comparisons not only help us to put
40
human personality into context, allowing us to consider how and why certain traits
occur, and which traits humans share with other species, they also allow us to
examine species-specific selection pressures, e.g. differences in social structure,
which could contribute to the evolution and diversity of personality structure.
To understand why variance in personality dimensions exists, and how these
dimensions are linked to health, evolutionary psychologists consider the ancestral
environment. One possible theory is that optimal personality dimensions varied with
environment (Nettle, 2006). For example, neurotic traits, which evoke vigilant and
wary behaviors, could be beneficial in hazardous environments, where caution is
rewarded with survival. Nevertheless, the same neurotic traits might be maladaptive
in environments where there are few risks (Nettle, 2006). This theory suggests that
differences in localised selection pressures have maintained heterogeneity across
personality dimensions in humans.
However, other theories could account for sources of environmental variation
in alternative ways. For example, selective migration and settler effects may cause
local differences, within populations, in trait expression (Rentfrow, Gosling, &
Potter, 2008). Additionally, trait variation could result from cost-benefit trade-offs,
e.g., an extravert who takes multiple sexual partners is likely to increase the number
of their offspring, relative to the average, but having more offspring brings potential
costs for individual offspring survival (Nettle, 2007). Thus, understanding the costs
and benefits related to particular traits could improve our understanding of how
personality seems to be so intrinsically linked to cognitive capacities, health, and
well-being. Research with nonhuman animals could also benefit from our

41
understanding not only of the origins of personality, but also of their roles of
different dimensions in individual fitness.
1.3.2 The present study
This document describes several studies which have aimed to elucidate the
ancestral relationships between personality and two major individual differences:
cognitive ability and health. Given that a rich literature exists among these variables
in humans, we wished to evaluate these associations in a close relative of humans,
chimpanzees, and orient our findings in an evolutionary context.
Chapters 2 and 3 address personality and cognitive ability. Chapter 2
describes three studies with a group of 19 zoo-housed chimpanzees who interacted
with touchscreen tasks over the course of 3 years of research. We found that high
Conscientious chimpanzees were more likely to stick with the tasks, and performed
better as a result, but once their extra experience was taken into account, their
performance advantage disappeared. However, we also found associations between
interest and performance with high Openness, high Extraversion, and low
Agreeableness. Having established these associations in chimpanzees, with Chapter 3
we extend our inquiry to a more distant common relative of humans and
chimpanzees: rhesus macaques. We examined serial cognitive ability in conjunction
with personality, with 9 rhesus macaques. The macaques also engaged with
touchscreen tasks, but were expert subjects and displayed plateau performance.
Nonetheless we found consistent associations between many measures of
performance and both high Openness and high Friendliness (which is similar to
Extraversion).
42
In chapters 4 through 6, we transition to our studies of personality and health.
Chapter 4 examines personality and longevity in a sample of 538 personality rated,
captive chimpanzees. These chimpanzees were followed for between 6 and 23 years
after being rated. We found that high Agreeableness was associated with longer life,
but no other personality traits had a significant impact on longevity. In Chapter 5, we
compared biomarkers from samples of 177 chimpanzees housed at the Yerkes
National Primate Research Centre, and 29,314 humans from wave 3 of the National
Health and Nutrition Examination Survey. Both samples had been tested for the most
common haematological and metabolic blood biomarkers, and we used these to
assess stress in the form of allostatic load, between species. We found a similar
structure of biomarkers in across humans and chimpanzees. In Chapter 6, we took
our allostatic load measure from chapter 5 and looked at how it was associated with
personality, in the same chimpanzee sample from the Yerkes Primate Centre, and in
the longitudinal Midlife in the United States and Midlife in Japan biomarker study
samples, which consisted of 993 and 382 individuals, respectively. We found that
Agreeableness was associated with allostatic load in both human samples, but
Dominance was associated with allostatic load in chimpanzees.
Finally, Chapter 7 summarises the results presented in these empirical
chapters, and places our findings in the context of the literature. We discuss the
limitations of the research, and offer suggestions for future study.
43
2 Personality, motivation, and performance on touchscreen tasks in zoo-housed chimpanzees
2.1 The synchronous study of personality and cognition
This thesis builds on a foundation of comparative psychology of cognition and
personality to a considerably greater extent than it relies on the related literature in
behavioral ecology, but the two disciplines ought to be viewed as complementary
approaches. Given this, we will briefly discuss the collective relevance of the
behavioral ecology and comparative psychology literature, which will serve to
introduce chapters 2 and 3, as both these studies contribute directly to our
understanding of covariation of cognition and personality in primates.
A wide range of species show consistent, within-species individual differences
in behavior. Particular sets of individual behaviors can be clustered together
amongst broad dimensions, which we call personality dimensions (Weinstein,
Capitanio, & Gosling, 2008). This body of research has grown rapidly in the field of
animal behavior. Specific cognitive capacities are well studied in some species and
on some tasks, however, consistent, within-species individual differences in
cognition are comparatively understudied (Griffin, Guillette, & Healy, 2015).
Why are researchers interested in studying animal personality and animal
cognition in conjunction? For cognitive researchers, a question of special importance
44
is whether an understanding of personality dimensions and the biological correlates
of personality (Koolhaas et al., 2010) is relevant for understanding cognition (Carere
& Locurto, 2011). For personality researchers, especially behavioral ecologists
interested in the proximate bases and evolutionary origins of personality dimensions,
the specific extent of covariation between cognitive abilities and individual
personalities (Sih et al., 2004) is a matter of significant uncertainty.
A major issue with researchers’ inquiries is that consistent relationships
between personality dimensions and cognitive abilities are rare to find across species.
For relevant examples in primate research, Morton, Lee, and Buchanan-Smith (2013)
found high Openness capuchins to be better learners on one associative learning task,
but not a second. Similarly, Hopper et al. (2013) studied chimpanzees exposed to two
different types of foraging puzzle boxes, and also found associations between
Openness and success on the first type of box, but not the second. What are we to
make of inconsistent associations? Whether in birds (Guillette, Reddon, Hurd, &
Sturdy, 2009), rodents (Guenther et al., 2014; Matzel et al., 2003) or primates
(Herrmann, Hare, et al., 2010; Massen, Antonides, Arnold, Bionda, & Koski, 2013),
studies of personality and cognition are inherently correlational, capturing the
associations between a limited number of tests, usually among small samples.
Another important issue with prior studies is sampling bias (Biro &
Dingemanse, 2009). As discussed in chapter 1, these biases can have a powerful
influence on the associations which researchers may observe between personality
and ability (Morton, Lee, & Buchanan-Smith, 2013). Individuals who are more
persistent may perform better on a task, but it is difficult to determine if these
45
individuals are innately more intelligent, or if persistence leads to greater experience,
which could confer benefits to performance. Few studies have been designed which
give insight into these mechanisms.
In a review of the nonhuman primate personality literature, (Freeman and
Gosling (2010), personality dimensions reflecting persistence, or Conscientiousness,
were some of the least reliable, least identified dimensions in the literature. Whether
or not Conscientiousness is a valid dimension of personality in animals is beyond the
scope of this document, but a recent review (Delgado & Sulloway, 2017) suggests
that many aspects of Conscientiousness are in fact present in birds and mammals.
Chapter 2 utilizes the HPQ, which attempts to capture the full range of
behavioral variation among nonhuman primate (Weiss, Inoue-Murayama, et al.,
2009). Compared to a similar questionnaire instrument which was designed from the
bottom-up, the HPQ produces more reliable, distinct dimensions of personality
(Freeman et al., 2013), which are not anthropomorphic projections (Weiss, Inoue-
Murayama, King, Adams, & Matsuzawa, 2012). With an existing, validated structure
of chimpanzee personality, we aimed to investigate how cognitive abilities covaried
with personality, with emphasis on several understudied elements. Thus, a major aim
of this study was to investigate, and possibly replicate, the associations between
cognitive abilities and the six personality dimensions of the HPQ.
While the chimpanzee personality dimensions generated by the HPQ includes
Conscientiousness, as mentioned above, the other five dimensions all align with
some of the most common personality dimensions identified among primates by
Freeman and Gosling (2010). Dominance and Agreeableness were found in 20 and
46
14 other primate studies, respectively. Extraversion is most similar to Freeman and
Gosling’s Sociability dimension, which is the most commonly identified personality
dimensions, found in 69 studies. Chimpanzee Neuroticism overlaps most clearly with
Freeman and Gosling’s Excitability, which was found in 32 studies. And Openness,
which is arguably most similar to Freeman and Gosling’s Curiosity, was found in 37
studies. Thus, the dimensions of the HPQ generally align clearly with well-
established dimensions of primate personality.
Another principle aim was to track chimpanzees’ performance on a variety of
tasks over time, making this a longitudinal study of chimpanzee cognition. Using
touchscreen apparatuses and in a controlled zoo environment large volumes of high
quality data were produced, contributing crucial statistical power.
A third aim was to vary the tasks systematically, with respect to both difficulty
and the cognitive faculties that were tested. The degree to which we succeeded in
these aims is described in the following published paper, and in the discussion
afterwards. Several additional predictions which follow from these aims are
described in the paper as well.
In three studies, we assessed different aspects of cognitive ability and
motivation in chimpanzees housed at the Edinburgh Zoo, and related these individual
differences to personality. In study 1, we used a 2-alternative forced choice paradigm
to test participants’ flexibility and proficiency with arbitrary associative and feature-
based matching rules. In study 2, we used a delayed match-to-sample paradigm to
test participants’ performance on a more difficult task. In study 3, we tested whether
47
participants’ behavior and interest changed when rewards were no longer given out
by the touchscreen apparatus.
The following content has been published as:
Altschul, D. M., Wallace, E. K., Sonnweber, R., Tomonaga, M., & Weiss, A. (2017).
Chimpanzee intellect: personality, performance and motivation with touchscreen
tasks. Royal Society Open Science, 4(5), 170169.
The supplementary materials of this publication can be found in the appendix.
rsos.royalsocietypublishing.org
ResearchCite this article: Altschul DM, Wallace EK,Sonnweber R, Tomonaga M, Weiss A. 2017Chimpanzee intellect: personality,performance and motivation with touchscreentasks. R. Soc. open sci. 4: 170169.http://dx.doi.org/10.1098/rsos.170169
Received: 27 February 2017Accepted: 3 April 2017
Subject Category:Psychology and cognitive neuroscience
Subject Areas:cognition/psychology
Keywords:personality, animal learning, intelligence,cognitive testing, chimpanzees, primates
Author for correspondence:DrewM. Altschule-mail: [email protected]
Electronic supplementary material is availableonline at https://doi.org/10.6084/m9.figshare.c.3744353.
Chimpanzee intellect:personality, performanceand motivation withtouchscreen tasksDrewM. Altschul1,2, Emma K. Wallace2,3,
Ruth Sonnweber4, Masaki Tomonaga5 and
Alexander Weiss1,21Department of Psychology, School of Philosophy, Psychology and Language Sciences,The University of Edinburgh, Edinburgh, UK2Scottish Primate Research Group3Department of Psychology, University of York, York, UK4Department of Cognitive Biology, University of Vienna, Vienna, Austria5Primate Research Institute, Kyoto University, Inuyama, Japan
DMA, 0000-0001-7053-4209
Human intellect is characterized by intercorrelatedpsychological domains, including intelligence, academicperformance and personality. Higher openness is associatedwith higher intelligence and better academic performance, yethigh performance among individuals is itself attributableto intelligence, not openness. High conscientiousnessindividuals, although not necessarily more intelligent, arebetter performers. Work with other species is not as extensive,yet animals display similar relationships between exploration-and persistence-related personality traits and performance oncognitive tasks. However, previous studies linking cognitionand personality have not tracked learning, performanceand dropout over time—three crucial elements of cognitiveperformance. We conducted three participatory experimentswith touchscreen cognitive tasks among 19 zoo-housedchimpanzees, whose personalities were assessed 3 years priorto the study. Performance and participation were recordedacross experiments. High conscientiousness chimpanzeesparticipated more, dropped out less and performed better,but their performance could be explained by their experiencewith the task. High openness chimpanzees tended to bemore interested, perform better and continue to participatewhen not rewarded with food. Our results demonstrate thatchimpanzees, like humans, possess broad intellectual capacitiesthat are affected by their personalities.
2017 The Authors. Published by the Royal Society under the terms of the Creative CommonsAttribution License http://creativecommons.org/licenses/by/4.0/, which permits unrestricteduse, provided the original author and source are credited.
on December 13, 2017http://rsos.royalsocietypublishing.org/Downloaded from
48
2
rsos.royalsocietypublishing.orgR.Soc.opensci.4:170169
................................................1. IntroductionIntellect is highly valued among human societies, and believed to be responsible for advances in allfields of arts and sciences [1]. Intellectual individuals are characterized as intelligent, creative, perceptive,curious, competent, quick to grasp new concepts [2] and strong academic performers [3].
These constituents of human intellect are captured by personality traits [4]. In particular, theOpenness and Conscientiousness domains of the human Five-Factor Model [5] are associated with higherachievement [3]; in combination, high scores on these two domains characterize ‘good students’ [5]. Theassociation between Conscientiousness and achievement stems from the fact that individuals high inConscientiousness possess greater will and motivation to perform, whether it is in the workplace orclassroom, despite not necessarily having higher cognitive ability. The association between Opennessand achievement is partly explained by the former’s moderate correlation with general intelligence(r = 0.33) [4].
Openness also overlaps with curiosity [6], need for cognition (individual attraction to tasks thatrequire thinking) [7] and typical intellectual engagement (a mixed construct of personality andintelligence) [8]. These constructs are intercorrelated, and while they are not the same thing as cognitiveability, they are all associated with it [9].
Non-human animal personality, in addition to describing behavioural traits, is associated withcognitive ability [10]. Mice have a general learning ability that is related to exploratory tendencies [11].Slow-exploring chickadees are more accurate on an instrumental discrimination task, but no quickerto acquire the initial task than fast-explorers [12]. Chimpanzees who explored novel features of andobjects in their environment also tended to obtain more rewards from puzzles than less exploratoryindividuals [13]. Assertive capuchins [14] and friendly macaques [15] were more successful withcognitive tasks, compared with less assertive or friendly conspecifics.
Overall, evidence for an association between personality and cognitive ability in animals hasaccumulated. Extensive work in great apes, particular chimpanzees, demonstrates that performance candepend on an individual’s development, specifically, their experiential history with cognitive tasks [16].However, researchers lack an analogue for human academic performance. In other species, ‘achievement’is measured primarily in terms of reproductive fitness, not grade-point average or job performance.Nevertheless, the rudiments of the ‘good student’ are present: chimpanzees that spend more time withpuzzles and persist at tool manipulation have greater success in receiving rewards than less persistentindividuals [13]. While it is not clear whether the human desire to achieve can be equated with ananimal’s drive to receive food rewards, animals do possess an intrinsic need for exploration [17].Clarifying these relationships between personality and performance requires a paradigm in which anyindividual animal can participate in and depart from the experiment at any time. Learning and dropoutamong freely participating animals must be tracked and evaluated alongside personality.
Personality traits like those of humans have been found in other primate species [18]. Some of thesetraits describe individual differences in interest and engagement, but associations with performanceon cognitive tasks have been weak. Chimpanzees’ interest in a touchscreen task was associated withOpenness [19], as was interest in puzzle box tasks [20]. Capuchin monkey participation in two spatialcognition tasks was correlated with Openness, but while performance on the first task was alsocorrelated with Openness, performance on both was negatively correlated with Assertiveness [14].Rhesus macaques’ accuracy on a serial cognition touchscreen task has been associated with Opennessand Friendliness [15], but that study could not report on participation. Participation in cognitive tasksappears to be biased by personality [14] and may confound results, e.g. individuals with exploratorytendencies may spend more time around and manipulating an experimental apparatus [13], which mayenhance learning simply because these individuals spend more time with the task, rather than becausethey exhibit greater cognitive ability.
Overall, these earlier findings suggest that intellect’s relationship with personality has deepevolutionary roots. To test whether this was the case, we conducted three studies using touchscreentasks among 19 zoo-housed chimpanzees to determine the degree to which chimpanzee personalitydomains, particularly Conscientiousness and Openness, are related to engagement and cognitive ability.Personality was measured independently in 2010, 3 years before these studies began. Intellectualengagement was tracked by amount of participation in the tasks; cognitive ability was measured viastandard performance metrics for touchscreen tasks: accuracy and response time (RT).
We advance five predictions. First, we expect to replicate previous associations between Openness andgreater participation. Second, we would expect individuals (rated as being) high in Conscientiousness to(i) participate for longer periods of time and (ii) show fewer dropouts. Third, we expect that if experience
on December 13, 2017http://rsos.royalsocietypublishing.org/Downloaded from
49

3
rsos.royalsocietypublishing.orgR.Soc.opensci.4:170169
................................................on the cognitive tasks drives the relationships between personality and performance, then the effectsof any personality factor would be reduced by controlling for experience on these tasks. Fourth, ifperformance is not driven by experience, then we would expect that, like in humans, Openness wouldbe associated with better performance. Fifth, we predict that in conditions where food reinforcers are notprovided by the task, individuals higher in Openness will still participate.
2. Study 12.1. MethodsUnless otherwise indicated, methods were the same across studies. Participants were a socially housedgroup of 19 chimpanzees (11 females, 8 males; between 14 and 50 years of age) at the Royal ZoologicalSociety of Scotland’s (RZSS) Budongo Trail exhibit at the Edinburgh Zoo. During RZSS pre-specifiedresearch blocks, the full group was given simultaneous access to a computer touchscreen set-up inthe off-show bedding area of the enclosure. During research times, individuals were free to approachand engage with the apparatus, and could stop participating at any time. Individuals were limited inthe number of trials they could complete per day before they were no longer allowed to participatefor the rest of that day. Although there were a few cases of individuals stealing rewards from others,this behaviour was rare, and the majority of the time, the chimpanzees took turns interacting with theapparatus without conflict.
Personality was assessed prior to this research, as part of an earlier study [19] by independentresearchers and raters. Chimpanzees were rated using the Hominoid Personality Questionnaire(HPQ) [21]1 by keepers and researchers who were working at the Budongo Trail exhibit at the time.Chimpanzees were rated by two or three independent raters, all of whom had at least two years ofexperience with the individuals they rated. The electronic supplementary materials provide full detailson personalities, apparatus and enclosure.
Chimpanzees were trained and tested using a two-alternative forced choice task [22]. Participants hadto choose one of two visual stimuli presented on the touch-sensitive screen, which required the use ofa feature-based or arbitrary associative rule. Each stimulus was composed of a series of square framed,abstract geometrical shapes. Depending on the phase of the study, between two and seven such shapeswould be linearly concatenated to form each stimulus. With a few exceptions, the salient shapes of eachstimulus were the first and last shapes in each concatenation. All stimuli were procedurally generatedand trial unique. During the training phases, all shapes were black, while colour was added for thetesting phase.
Participants were randomly selected into one of two groups. Chimpanzees in the first group learnedfeature-based rules; correct discriminations required that the animal choose the concatenation with thesame shaped images at the ends of each concatenation, while ignoring distracting discrepancies, e.g.the colour of different shapes, the length of the concatenations or the incorporation of novel shapes.In the final test, these individuals had to transfer to a new dimension for matching: shape ceased tobe salient and the correct choice became the stimulus with matching colours for the last two shapes ofthe concatenation. Chimpanzees in the second group learned associative rules. Having first learned toassociate five pairs of shapes, these chimpanzees also needed to choose the stimulus with the first shapeof a pair in the first position of the concatenation, and the second of the pair in the last position, whileignoring distractions such as mismatched colour, incorrect positioning or inverted pairs.
Each training or testing session consisted of 12 trials, and within one daily research block, anindividual could engage in up to four sessions. During training sessions, if a chimpanzee chose thecorrect stimulus, they received acoustic reinforcement, a ‘clicker’ sound familiar to the chimpanzees fromhusbandry training, and a food reward, then the task would advance to the next trial. Food rewardsvaried depending on the preferences of the individuals and availability during any given day, butrewards were chosen so as to provide maximal incentive to the chimpanzee using the apparatus. If thechimpanzee chose incorrectly, an unappealing, irregular series of sounds was played, and a time-outpenalty screen was displayed for 3 s. The same trial would then be repeated until the individual chosethe correct stimulus.
To proceed1 to the next stage of training, an individual had to correctly complete 33 of 48 consecutivetrials. When an individual reached the testing phase, half of the trials would be stimuli pairings fromearlier training stages, and the other half would be novel stimuli pairings: test stimuli that were neither
1The HPQ is available online at http://extras.springer.com/2011/978-1-4614-0175-9/weiss_chimpanzee_personality.pdf.
on December 13, 2017http://rsos.royalsocietypublishing.org/Downloaded from
50

4
rsos.royalsocietypublishing.orgR.Soc.opensci.4:170169
................................................
Dominance Extraversion Conscientiousness Agreeableness Neuroticism Openness
personality dimension
participant
* * * *
no
yes
2
4
6
aver
age
ratin
g
Figure 1. Filled black circles represent non-participants, hollow triangles represent participants. Non-participants did not engage withthe tasks at all, while participants did to varying degrees; an analysis of dropout among these individuals can be found in table 1. Asterisksrepresent statistically significant differences between the groups.
fed back nor rewarded. Depending on which of two experimental groups the individuals were assignedto, the chimpanzees would have access to at most seven or 10 different tests within the testing phase. Eachtest consisted of a fixed number of trials—between 30 and 60. Although chimpanzees were encouragedto continue working through training and testing, they could stop participating at any time during theexperiments (see Sonnweber et al. [22] for full details of all experimental conditions and stimuli).
2.2. ResultsTo assess differences in participation, we first compared the personalities of 11 individuals whoparticipated and eight individuals who did not participate (figure 1). To be considered a participant, achimpanzee must have completed at least a session worth of trials in one sitting. The difference betweenparticipants and non-participants was clear, as the chimpanzees who did participate all completedbetween 224 and 3829 trials.
Participating individuals were (rated as being) higher in Dominance (t = 2.31, d.f. = 11.44, d = 1.14,p = 0.04), Conscientiousness (t = 3.61, d.f. = 15.84, d = 1.67, p = 0.002) and Openness (t = 2.39, d.f. = 10.98,d = 1.19, p = 0.04), and lower in Neuroticism (t = −2.69, d.f. = 10.22, d = 1.36, p = 0.02). These differencessurvived Benjamini–Hochberg correction for multiple tests.
Of the 11 participating chimpanzees, individuals showed differing amounts of participation. Somechimpanzees stayed with the tasks longer than others, e.g. six chimpanzees progressed to the testingphase and only three completed testing. To examine the effect of personality on dropout over the courseof training and testing, we fitted a Cox proportional hazards regression model with Gaussian frailtyeffects to the training and testing data (table 1). Chimpanzees higher in Conscientiousness were 16 timesless likely to drop out; chimpanzees higher in Agreeableness were nine times more likely to drop out.
We then modelled associations between personality and learning speed using another Cox model topredict the total number of stages completed and a Poisson mixed model to predict the number of trials
on December 13, 2017http://rsos.royalsocietypublishing.org/Downloaded from
51

5
rsos.royalsocietypublishing.orgR.Soc.opensci.4:170169
................................................Table 1. Regression analyses from Study 1. Bold text indicates significant variables, where confidence intervals do not overlap with 0.
dropout from study accuracy
parameter β 95% CI β 95% CI
Dominance 1.12 [−1.38, 3.62] −0.15 [−0.48, 0.15]. . . . . . . . . . . . . . . . . . . . . . . . . . . . . . . . . . . . . . . . . . . . . . . . . . . . . . . . . . . . . . . . . . . . . . . . . . . . . . . . . . . . . . . . . . . . . . . . . . . . . . . . . . . . . . . . . . . . . . . . . . . . . . . . . . . . . . . . . . . . . . . . . . . . . . . . . . . . . . . . . . . . . . . . . . . . . . . . . . . . . . . . . . . . . . . . . . . . . . . . . . . . . . . . . . . . . . . . .
Conscientiousness −2.80 [−4.50,−1.11] 0.25 [−0.45, 0.52]. . . . . . . . . . . . . . . . . . . . . . . . . . . . . . . . . . . . . . . . . . . . . . . . . . . . . . . . . . . . . . . . . . . . . . . . . . . . . . . . . . . . . . . . . . . . . . . . . . . . . . . . . . . . . . . . . . . . . . . . . . . . . . . . . . . . . . . . . . . . . . . . . . . . . . . . . . . . . . . . . . . . . . . . . . . . . . . . . . . . . . . . . . . . . . . . . . . . . . . . . . . . . . . . . . . . . . . . .
Openness −0.98 [−2.47, 0.50] 0.13 [−0.03, 0.41]. . . . . . . . . . . . . . . . . . . . . . . . . . . . . . . . . . . . . . . . . . . . . . . . . . . . . . . . . . . . . . . . . . . . . . . . . . . . . . . . . . . . . . . . . . . . . . . . . . . . . . . . . . . . . . . . . . . . . . . . . . . . . . . . . . . . . . . . . . . . . . . . . . . . . . . . . . . . . . . . . . . . . . . . . . . . . . . . . . . . . . . . . . . . . . . . . . . . . . . . . . . . . . . . . . . . . . . . .
Neuroticism 1.66 [−0.98, 4.29] 0.04 [−0.34, 0.42]. . . . . . . . . . . . . . . . . . . . . . . . . . . . . . . . . . . . . . . . . . . . . . . . . . . . . . . . . . . . . . . . . . . . . . . . . . . . . . . . . . . . . . . . . . . . . . . . . . . . . . . . . . . . . . . . . . . . . . . . . . . . . . . . . . . . . . . . . . . . . . . . . . . . . . . . . . . . . . . . . . . . . . . . . . . . . . . . . . . . . . . . . . . . . . . . . . . . . . . . . . . . . . . . . . . . . . . . .
Agreeableness 2.21 [0.83, 3.59] −0.06 [−0.29, 0.18]. . . . . . . . . . . . . . . . . . . . . . . . . . . . . . . . . . . . . . . . . . . . . . . . . . . . . . . . . . . . . . . . . . . . . . . . . . . . . . . . . . . . . . . . . . . . . . . . . . . . . . . . . . . . . . . . . . . . . . . . . . . . . . . . . . . . . . . . . . . . . . . . . . . . . . . . . . . . . . . . . . . . . . . . . . . . . . . . . . . . . . . . . . . . . . . . . . . . . . . . . . . . . . . . . . . . . . . . .
Extraversion −1.00 [−2.21, 0.21] 0.22 [0.01, 0.43]. . . . . . . . . . . . . . . . . . . . . . . . . . . . . . . . . . . . . . . . . . . . . . . . . . . . . . . . . . . . . . . . . . . . . . . . . . . . . . . . . . . . . . . . . . . . . . . . . . . . . . . . . . . . . . . . . . . . . . . . . . . . . . . . . . . . . . . . . . . . . . . . . . . . . . . . . . . . . . . . . . . . . . . . . . . . . . . . . . . . . . . . . . . . . . . . . . . . . . . . . . . . . . . . . . . . . . . . .
Date — — 0.30 [0.22, 0.38]. . . . . . . . . . . . . . . . . . . . . . . . . . . . . . . . . . . . . . . . . . . . . . . . . . . . . . . . . . . . . . . . . . . . . . . . . . . . . . . . . . . . . . . . . . . . . . . . . . . . . . . . . . . . . . . . . . . . . . . . . . . . . . . . . . . . . . . . . . . . . . . . . . . . . . . . . . . . . . . . . . . . . . . . . . . . . . . . . . . . . . . . . . . . . . . . . . . . . . . . . . . . . . . . . . . . . . . . .
it took to reach criterion during training stages (electronic supplementary material, table S3). None of thepersonality predictors were consistently related to learning speed.
Accuracy across the task was generally good (M = 61%). Although individuals displayed overallaccuracy as high as 69%, two participants did not perform above chance (the lowest average accuracywas 46%). Accuracy across the training and testing stages was analysed with generalized linearmixed models (GLMM). When personality alone was used to predict trial accuracy, Extraversionand Conscientiousness were positively associated with accuracy. However, when date (representingexperience with the task) was added as a predictor, only Extraversion remained significant (table 1).
RTs in all studies were calculated as the time difference between stimulus onset and the chimpanzee’sfirst touch response to the screen, which initiated a visual and sometimes auditory stimulus change.GLMMs of RTs per trial revealed associations between faster RTs and higher Conscientiousness(β = −0.53, 95% CI [−0.92, −0.14]), Openness (β = −0.38, 95% CI [−0.76, −0.01]) and Extraversion(β = −0.39, 95% CI [−0.67, −0.10]) (electronic supplementary material, table S5). Chimpanzees can besloppy performers, on a trial-by-trial basis, and so we tracked how many touches to the screen it tookfor an individual to select its intended target. A GLMM of the number of touches per trial indicatedthat higher Conscientiousness (β = −0.38, 95% CI [−0.76, −0.00]) was associated with fewer touches(electronic supplementary material, table S6).
3. Study 23.1. MethodsThe chimpanzees had free access to the experimental apparatus in the research areas, or pods, of theenclosure. Unlike the bedding area where Study 1 was conducted, the research pods were viewable tothe public. Otherwise, the procedure was very similar; during research times, individuals were free toapproach and engage with the apparatus, and could stop participating at any time. After completing apre-specified number of trials, an individual would no longer be allowed to participate in the task.
Study 2 used a delayed match-to-sample (DMTS) task (electronic supplementary material, figure S1):participants were shown a start stimulus which had to be touched to continue, after a 0.5 s delay a sampleimage was displayed in a randomly assigned location on a 3 × 3 grid. The sample also needed to betouched, and after another 0.5 s delay, two images, the sample, which again had to be chosen, and adistractor, were presented on the 3 × 3 grid. All samples and distractors were selected randomly froma large bank of colour photographic images. If a chimpanzee chose correctly, they received acousticreinforcement and a food reward. If the chimpanzee chose incorrectly, an unappealing acoustic signalwas played, and a time-out penalty screen was displayed for 2 s. After correct and incorrect trials, therewas a 0.5 s intertrial interval, and no repetition of trials, i.e. no correction procedure was used to amendincorrect responses by the chimpanzees.
We also collected ordinal data on the chimpanzees’ daily engagement in the research areas. Everyday, individuals were each assigned to one of three escalating levels: 0—the individual did not enter theresearch area or did not show any interest in the touchscreen, 1—the individual showed interest in andapproached the touchscreen, but did not complete any trials and 2—the individual interacted with thetouchscreen and completed as least one trial.
on December 13, 2017http://rsos.royalsocietypublishing.org/Downloaded from
52
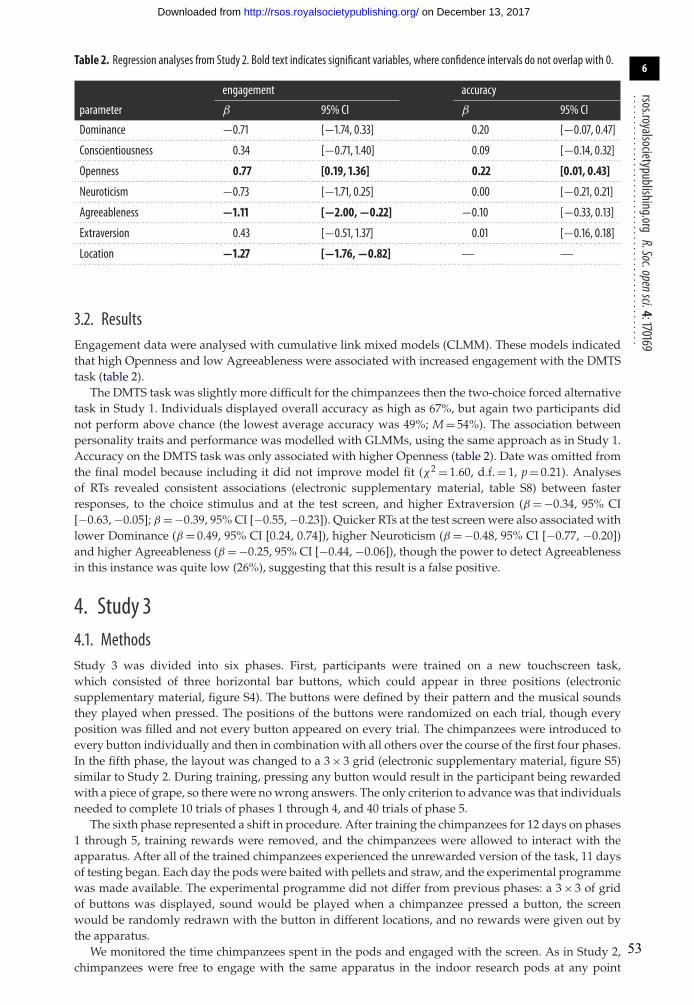
6
rsos.royalsocietypublishing.orgR.Soc.opensci.4:170169
................................................Table 2. Regression analyses from Study 2. Bold text indicates significant variables, where confidence intervals do not overlap with 0.
engagement accuracy
parameter β 95% CI β 95% CI
Dominance −0.71 [−1.74, 0.33] 0.20 [−0.07, 0.47]. . . . . . . . . . . . . . . . . . . . . . . . . . . . . . . . . . . . . . . . . . . . . . . . . . . . . . . . . . . . . . . . . . . . . . . . . . . . . . . . . . . . . . . . . . . . . . . . . . . . . . . . . . . . . . . . . . . . . . . . . . . . . . . . . . . . . . . . . . . . . . . . . . . . . . . . . . . . . . . . . . . . . . . . . . . . . . . . . . . . . . . . . . . . . . . . . . . . . . . . . . . . . . . . . . . . . . . . .
Conscientiousness 0.34 [−0.71, 1.40] 0.09 [−0.14, 0.32]. . . . . . . . . . . . . . . . . . . . . . . . . . . . . . . . . . . . . . . . . . . . . . . . . . . . . . . . . . . . . . . . . . . . . . . . . . . . . . . . . . . . . . . . . . . . . . . . . . . . . . . . . . . . . . . . . . . . . . . . . . . . . . . . . . . . . . . . . . . . . . . . . . . . . . . . . . . . . . . . . . . . . . . . . . . . . . . . . . . . . . . . . . . . . . . . . . . . . . . . . . . . . . . . . . . . . . . . .
Openness 0.77 [0.19, 1.36] 0.22 [0.01, 0.43]. . . . . . . . . . . . . . . . . . . . . . . . . . . . . . . . . . . . . . . . . . . . . . . . . . . . . . . . . . . . . . . . . . . . . . . . . . . . . . . . . . . . . . . . . . . . . . . . . . . . . . . . . . . . . . . . . . . . . . . . . . . . . . . . . . . . . . . . . . . . . . . . . . . . . . . . . . . . . . . . . . . . . . . . . . . . . . . . . . . . . . . . . . . . . . . . . . . . . . . . . . . . . . . . . . . . . . . . .
Neuroticism −0.73 [−1.71, 0.25] 0.00 [−0.21, 0.21]. . . . . . . . . . . . . . . . . . . . . . . . . . . . . . . . . . . . . . . . . . . . . . . . . . . . . . . . . . . . . . . . . . . . . . . . . . . . . . . . . . . . . . . . . . . . . . . . . . . . . . . . . . . . . . . . . . . . . . . . . . . . . . . . . . . . . . . . . . . . . . . . . . . . . . . . . . . . . . . . . . . . . . . . . . . . . . . . . . . . . . . . . . . . . . . . . . . . . . . . . . . . . . . . . . . . . . . . .
Agreeableness −1.11 [−2.00,−0.22] −0.10 [−0.33, 0.13]. . . . . . . . . . . . . . . . . . . . . . . . . . . . . . . . . . . . . . . . . . . . . . . . . . . . . . . . . . . . . . . . . . . . . . . . . . . . . . . . . . . . . . . . . . . . . . . . . . . . . . . . . . . . . . . . . . . . . . . . . . . . . . . . . . . . . . . . . . . . . . . . . . . . . . . . . . . . . . . . . . . . . . . . . . . . . . . . . . . . . . . . . . . . . . . . . . . . . . . . . . . . . . . . . . . . . . . . .
Extraversion 0.43 [−0.51, 1.37] 0.01 [−0.16, 0.18]. . . . . . . . . . . . . . . . . . . . . . . . . . . . . . . . . . . . . . . . . . . . . . . . . . . . . . . . . . . . . . . . . . . . . . . . . . . . . . . . . . . . . . . . . . . . . . . . . . . . . . . . . . . . . . . . . . . . . . . . . . . . . . . . . . . . . . . . . . . . . . . . . . . . . . . . . . . . . . . . . . . . . . . . . . . . . . . . . . . . . . . . . . . . . . . . . . . . . . . . . . . . . . . . . . . . . . . . .
Location −1.27 [−1.76,−0.82] — —.. . . . . . . . . . . . . . . . . . . . . . . . . . . . . . . . . . . . . . . . . . . . . . . . . . . . . . . . . . . . . . . . . . . . . . . . . . . . . . . . . . . . . . . . . . . . . . . . . . . . . . . . . . . . . . . . . . . . . . . . . . . . . . . . . . . . . . . . . . . . . . . . . . . . . . . . . . . . . . . . . . . . . . . . . . . . . . . . . . . . . . . . . . . . . . . . . . . . . . . . . . . . . . . . . . . . . . . .
3.2. ResultsEngagement data were analysed with cumulative link mixed models (CLMM). These models indicatedthat high Openness and low Agreeableness were associated with increased engagement with the DMTStask (table 2).
The DMTS task was slightly more difficult for the chimpanzees then the two-choice forced alternativetask in Study 1. Individuals displayed overall accuracy as high as 67%, but again two participants didnot perform above chance (the lowest average accuracy was 49%; M = 54%). The association betweenpersonality traits and performance was modelled with GLMMs, using the same approach as in Study 1.Accuracy on the DMTS task was only associated with higher Openness (table 2). Date was omitted fromthe final model because including it did not improve model fit (χ2 = 1.60, d.f. = 1, p = 0.21). Analysesof RTs revealed consistent associations (electronic supplementary material, table S8) between fasterresponses, to the choice stimulus and at the test screen, and higher Extraversion (β = −0.34, 95% CI[−0.63, −0.05]; β = −0.39, 95% CI [−0.55, −0.23]). Quicker RTs at the test screen were also associated withlower Dominance (β = 0.49, 95% CI [0.24, 0.74]), higher Neuroticism (β = −0.48, 95% CI [−0.77, −0.20])and higher Agreeableness (β = −0.25, 95% CI [−0.44, −0.06]), though the power to detect Agreeablenessin this instance was quite low (26%), suggesting that this result is a false positive.
4. Study 34.1. MethodsStudy 3 was divided into six phases. First, participants were trained on a new touchscreen task,which consisted of three horizontal bar buttons, which could appear in three positions (electronicsupplementary material, figure S4). The buttons were defined by their pattern and the musical soundsthey played when pressed. The positions of the buttons were randomized on each trial, though everyposition was filled and not every button appeared on every trial. The chimpanzees were introduced toevery button individually and then in combination with all others over the course of the first four phases.In the fifth phase, the layout was changed to a 3 × 3 grid (electronic supplementary material, figure S5)similar to Study 2. During training, pressing any button would result in the participant being rewardedwith a piece of grape, so there were no wrong answers. The only criterion to advance was that individualsneeded to complete 10 trials of phases 1 through 4, and 40 trials of phase 5.
The sixth phase represented a shift in procedure. After training the chimpanzees for 12 days on phases1 through 5, training rewards were removed, and the chimpanzees were allowed to interact with theapparatus. After all of the trained chimpanzees experienced the unrewarded version of the task, 11 daysof testing began. Each day the pods were baited with pellets and straw, and the experimental programmewas made available. The experimental programme did not differ from previous phases: a 3 × 3 of gridof buttons was displayed, sound would be played when a chimpanzee pressed a button, the screenwould be randomly redrawn with the button in different locations, and no rewards were given out bythe apparatus.
We monitored the time chimpanzees spent in the pods and engaged with the screen. As in Study 2,chimpanzees were free to engage with the same apparatus in the indoor research pods at any point
on December 13, 2017http://rsos.royalsocietypublishing.org/Downloaded from
53

7
rsos.royalsocietypublishing.orgR.Soc.opensci.4:170169
................................................Table 3. Regression analyses of engagement data from Study 3. Bold text indicates significant variables, where confidence intervals donot overlap with 0.
time spent in pods approaches to screen time spent at screen
parameter β 95% CI β 95% CI β 95% CI
Dominance −0.14 [−1.60, 1.31] −0.19 [−1.67, 1.15] 0.26 [−0.20, 0.73]. . . . . . . . . . . . . . . . . . . . . . . . . . . . . . . . . . . . . . . . . . . . . . . . . . . . . . . . . . . . . . . . . . . . . . . . . . . . . . . . . . . . . . . . . . . . . . . . . . . . . . . . . . . . . . . . . . . . . . . . . . . . . . . . . . . . . . . . . . . . . . . . . . . . . . . . . . . . . . . . . . . . . . . . . . . . . . . . . . . . . . . . . . . . . . . . . . . . . . . . . . . . . . . . . . . . . . . . .
Conscientiousness −0.25 [−1.13, 0.63] 1.09 [0.15, 2.16] 0.21 [−0.17, 0.59]. . . . . . . . . . . . . . . . . . . . . . . . . . . . . . . . . . . . . . . . . . . . . . . . . . . . . . . . . . . . . . . . . . . . . . . . . . . . . . . . . . . . . . . . . . . . . . . . . . . . . . . . . . . . . . . . . . . . . . . . . . . . . . . . . . . . . . . . . . . . . . . . . . . . . . . . . . . . . . . . . . . . . . . . . . . . . . . . . . . . . . . . . . . . . . . . . . . . . . . . . . . . . . . . . . . . . . . . .
Openness −0.06 [−0.79, 0.66] 0.46 [−0.43, 1.46] 0.52 [0.21, 0.83]. . . . . . . . . . . . . . . . . . . . . . . . . . . . . . . . . . . . . . . . . . . . . . . . . . . . . . . . . . . . . . . . . . . . . . . . . . . . . . . . . . . . . . . . . . . . . . . . . . . . . . . . . . . . . . . . . . . . . . . . . . . . . . . . . . . . . . . . . . . . . . . . . . . . . . . . . . . . . . . . . . . . . . . . . . . . . . . . . . . . . . . . . . . . . . . . . . . . . . . . . . . . . . . . . . . . . . . . .
Neuroticism −0.61 [−2.08, 0.85] 0.10 [−1.43, 1.48] 0.41 [−0.10, 0.91]. . . . . . . . . . . . . . . . . . . . . . . . . . . . . . . . . . . . . . . . . . . . . . . . . . . . . . . . . . . . . . . . . . . . . . . . . . . . . . . . . . . . . . . . . . . . . . . . . . . . . . . . . . . . . . . . . . . . . . . . . . . . . . . . . . . . . . . . . . . . . . . . . . . . . . . . . . . . . . . . . . . . . . . . . . . . . . . . . . . . . . . . . . . . . . . . . . . . . . . . . . . . . . . . . . . . . . . . .
Agreeableness −0.28 [−0.96, 0.42] −0.93 [−1.63,−0.28] 0.19 [−0.04, 0.43]. . . . . . . . . . . . . . . . . . . . . . . . . . . . . . . . . . . . . . . . . . . . . . . . . . . . . . . . . . . . . . . . . . . . . . . . . . . . . . . . . . . . . . . . . . . . . . . . . . . . . . . . . . . . . . . . . . . . . . . . . . . . . . . . . . . . . . . . . . . . . . . . . . . . . . . . . . . . . . . . . . . . . . . . . . . . . . . . . . . . . . . . . . . . . . . . . . . . . . . . . . . . . . . . . . . . . . . . .
Extraversion 0.78 [0.06, 1.51] 0.69 [−0.19, 1.70] −0.36 [−0.66,−0.05]. . . . . . . . . . . . . . . . . . . . . . . . . . . . . . . . . . . . . . . . . . . . . . . . . . . . . . . . . . . . . . . . . . . . . . . . . . . . . . . . . . . . . . . . . . . . . . . . . . . . . . . . . . . . . . . . . . . . . . . . . . . . . . . . . . . . . . . . . . . . . . . . . . . . . . . . . . . . . . . . . . . . . . . . . . . . . . . . . . . . . . . . . . . . . . . . . . . . . . . . . . . . . . . . . . . . . . . . .
during the research times, during all phases. All chimpanzees could participate, regardless of whetherthey had previously participated, and how many phases they might have completed.
4.2. ResultsSeven chimpanzees participated in the five training phases. The differences in personality betweenthe chimpanzees who did and did not complete training are shown in electronic supplementarymaterial, figure S5. Tests of Conscientiousness (t = 2.285, d = 1.05, p = 0.04), Neuroticism (t = −1.487,d = −0.73, p = 0.16) and Openness (t = 2.295, d = 1.11, p = 0.04) revealed that the trained group washigher in Conscientiousness and Openness, but the results were not significant after Benjamini–Hochberg correction.
The results of our analyses of engagement are shown in table 3. We first regressed personality ontothe amount of time that each chimpanzee spent in the pods over the course of every research block.A negative binomial GLMM indicated that chimpanzees rated higher in Extraversion spent more timein the pods (β = 0.78, 95% CI [0.06, 1.51]) during these blocks. All chimpanzees spent a majority of theirtime foraging for pellets, collecting straw and grooming, so to assess their interest in the touchscreenwe regressed personality onto the number of approaches to the touchscreen, again using a negativebinomial model. Chimpanzees higher in Conscientiousness (β = 1.09, 95% CI [0.15, 2.16]) and lowerin Agreeableness (β = −0.93, 95% CI [−1.63, −0.28]) made more approaches to the screen. Finally, weregressed personality onto the amount of time the chimpanzees spent physically engaged with the screenusing a Poisson GLMM. Chimpanzees higher in Openness (β = 0.52, 95% CI [0.21, 0.83]) and lower inExtraversion (β = −0.36, 95% CI [−0.66, −0.05]) spent more time engaged with the screen, despite notbeing rewarded with food.
5. Power analysesWhere appropriate and feasible, we carried out power analysis simulations on our reported regressionmodels to determine the power of the significant effects of personality that we found. The results of theseanalyses are shown in table 4. Mean power is reported instead of median power because the mean wasmore conservative. The mean power of all our results fell between 67% and 89%, indicating adequate togood power [23].
6. DiscussionThese studies suggest that chimpanzees, like humans, possess intellectual capacities (e.g. engagement,curiosity) and non-intellectual capacities (e.g. reward seeking, precision in touch responses) that aretied to different aspects of personality and performance. Chimpanzees higher in Conscientiousnesswere more likely to participate; however, when rewards were removed they abandoned the task. Thesechimpanzees would frequently approach the apparatus, presumably to check if rewards had beenreinstated, but in spite of this, they did not spend more time in front of the screen than individualslower in Conscientiousness. Chimpanzees higher in Conscientiousness were also less likely to dropout, but when we controlled for the effects of training, Conscientiousness did not predict accuracy.
on December 13, 2017http://rsos.royalsocietypublishing.org/Downloaded from
54
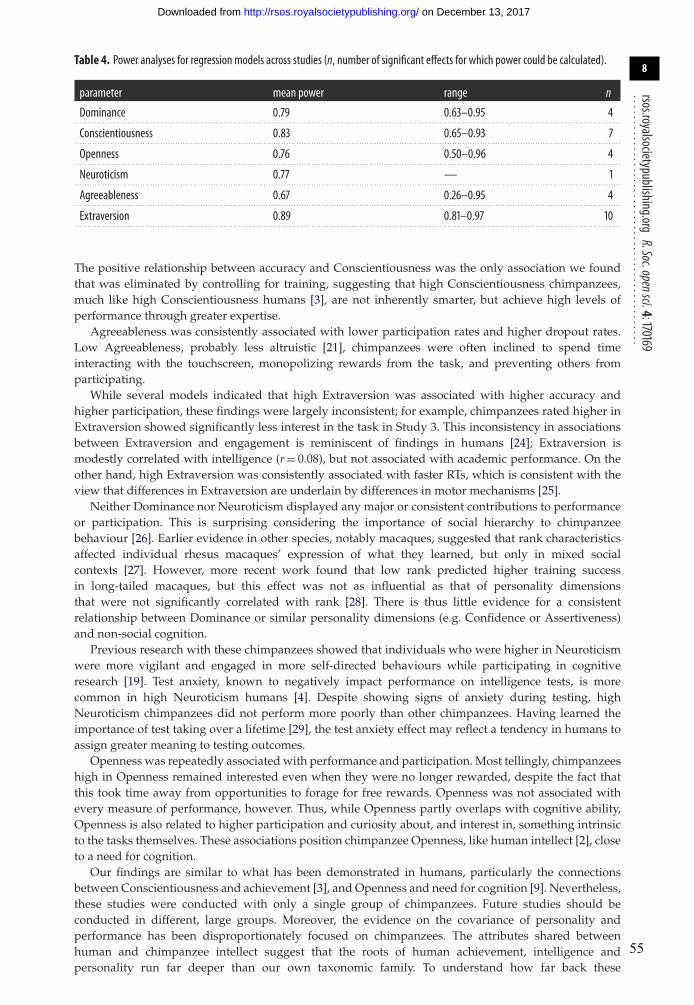
8
rsos.royalsocietypublishing.orgR.Soc.opensci.4:170169
................................................Table 4. Power analyses for regression models across studies (n, number of significant effects for which power could be calculated).
parameter mean power range n
Dominance 0.79 0.63–0.95 4. . . . . . . . . . . . . . . . . . . . . . . . . . . . . . . . . . . . . . . . . . . . . . . . . . . . . . . . . . . . . . . . . . . . . . . . . . . . . . . . . . . . . . . . . . . . . . . . . . . . . . . . . . . . . . . . . . . . . . . . . . . . . . . . . . . . . . . . . . . . . . . . . . . . . . . . . . . . . . . . . . . . . . . . . . . . . . . . . . . . . . . . . . . . . . . . . . . . . . . . . . . . . . . . . . . . . . . . .
Conscientiousness 0.83 0.65–0.93 7. . . . . . . . . . . . . . . . . . . . . . . . . . . . . . . . . . . . . . . . . . . . . . . . . . . . . . . . . . . . . . . . . . . . . . . . . . . . . . . . . . . . . . . . . . . . . . . . . . . . . . . . . . . . . . . . . . . . . . . . . . . . . . . . . . . . . . . . . . . . . . . . . . . . . . . . . . . . . . . . . . . . . . . . . . . . . . . . . . . . . . . . . . . . . . . . . . . . . . . . . . . . . . . . . . . . . . . . .
Openness 0.76 0.50–0.96 4. . . . . . . . . . . . . . . . . . . . . . . . . . . . . . . . . . . . . . . . . . . . . . . . . . . . . . . . . . . . . . . . . . . . . . . . . . . . . . . . . . . . . . . . . . . . . . . . . . . . . . . . . . . . . . . . . . . . . . . . . . . . . . . . . . . . . . . . . . . . . . . . . . . . . . . . . . . . . . . . . . . . . . . . . . . . . . . . . . . . . . . . . . . . . . . . . . . . . . . . . . . . . . . . . . . . . . . . .
Neuroticism 0.77 — 1. . . . . . . . . . . . . . . . . . . . . . . . . . . . . . . . . . . . . . . . . . . . . . . . . . . . . . . . . . . . . . . . . . . . . . . . . . . . . . . . . . . . . . . . . . . . . . . . . . . . . . . . . . . . . . . . . . . . . . . . . . . . . . . . . . . . . . . . . . . . . . . . . . . . . . . . . . . . . . . . . . . . . . . . . . . . . . . . . . . . . . . . . . . . . . . . . . . . . . . . . . . . . . . . . . . . . . . . .
Agreeableness 0.67 0.26–0.95 4. . . . . . . . . . . . . . . . . . . . . . . . . . . . . . . . . . . . . . . . . . . . . . . . . . . . . . . . . . . . . . . . . . . . . . . . . . . . . . . . . . . . . . . . . . . . . . . . . . . . . . . . . . . . . . . . . . . . . . . . . . . . . . . . . . . . . . . . . . . . . . . . . . . . . . . . . . . . . . . . . . . . . . . . . . . . . . . . . . . . . . . . . . . . . . . . . . . . . . . . . . . . . . . . . . . . . . . . .
Extraversion 0.89 0.81–0.97 10. . . . . . . . . . . . . . . . . . . . . . . . . . . . . . . . . . . . . . . . . . . . . . . . . . . . . . . . . . . . . . . . . . . . . . . . . . . . . . . . . . . . . . . . . . . . . . . . . . . . . . . . . . . . . . . . . . . . . . . . . . . . . . . . . . . . . . . . . . . . . . . . . . . . . . . . . . . . . . . . . . . . . . . . . . . . . . . . . . . . . . . . . . . . . . . . . . . . . . . . . . . . . . . . . . . . . . . . .
The positive relationship between accuracy and Conscientiousness was the only association we foundthat was eliminated by controlling for training, suggesting that high Conscientiousness chimpanzees,much like high Conscientiousness humans [3], are not inherently smarter, but achieve high levels ofperformance through greater expertise.
Agreeableness was consistently associated with lower participation rates and higher dropout rates.Low Agreeableness, probably less altruistic [21], chimpanzees were often inclined to spend timeinteracting with the touchscreen, monopolizing rewards from the task, and preventing others fromparticipating.
While several models indicated that high Extraversion was associated with higher accuracy andhigher participation, these findings were largely inconsistent; for example, chimpanzees rated higher inExtraversion showed significantly less interest in the task in Study 3. This inconsistency in associationsbetween Extraversion and engagement is reminiscent of findings in humans [24]; Extraversion ismodestly correlated with intelligence (r = 0.08), but not associated with academic performance. On theother hand, high Extraversion was consistently associated with faster RTs, which is consistent with theview that differences in Extraversion are underlain by differences in motor mechanisms [25].
Neither Dominance nor Neuroticism displayed any major or consistent contributions to performanceor participation. This is surprising considering the importance of social hierarchy to chimpanzeebehaviour [26]. Earlier evidence in other species, notably macaques, suggested that rank characteristicsaffected individual rhesus macaques’ expression of what they learned, but only in mixed socialcontexts [27]. However, more recent work found that low rank predicted higher training successin long-tailed macaques, but this effect was not as influential as that of personality dimensionsthat were not significantly correlated with rank [28]. There is thus little evidence for a consistentrelationship between Dominance or similar personality dimensions (e.g. Confidence or Assertiveness)and non-social cognition.
Previous research with these chimpanzees showed that individuals who were higher in Neuroticismwere more vigilant and engaged in more self-directed behaviours while participating in cognitiveresearch [19]. Test anxiety, known to negatively impact performance on intelligence tests, is morecommon in high Neuroticism humans [4]. Despite showing signs of anxiety during testing, highNeuroticism chimpanzees did not perform more poorly than other chimpanzees. Having learned theimportance of test taking over a lifetime [29], the test anxiety effect may reflect a tendency in humans toassign greater meaning to testing outcomes.
Openness was repeatedly associated with performance and participation. Most tellingly, chimpanzeeshigh in Openness remained interested even when they were no longer rewarded, despite the fact thatthis took time away from opportunities to forage for free rewards. Openness was not associated withevery measure of performance, however. Thus, while Openness partly overlaps with cognitive ability,Openness is also related to higher participation and curiosity about, and interest in, something intrinsicto the tasks themselves. These associations position chimpanzee Openness, like human intellect [2], closeto a need for cognition.
Our findings are similar to what has been demonstrated in humans, particularly the connectionsbetween Conscientiousness and achievement [3], and Openness and need for cognition [9]. Nevertheless,these studies were conducted with only a single group of chimpanzees. Future studies should beconducted in different, large groups. Moreover, the evidence on the covariance of personality andperformance has been disproportionately focused on chimpanzees. The attributes shared betweenhuman and chimpanzee intellect suggest that the roots of human achievement, intelligence andpersonality run far deeper than our own taxonomic family. To understand how far back these
on December 13, 2017http://rsos.royalsocietypublishing.org/Downloaded from
55

9
rsos.royalsocietypublishing.orgR.Soc.opensci.4:170169
................................................commonalities stretch, we need to study personality in concert with engagement and performance inother intelligent species.
Ethics. Prior to conducting this work, D.M.A. obtained ethical approval from the University of Edinburgh BiologicalServices Ethical Review Committee (AWERB no: OS04-14) and the Budongo Trail Scientific Committee.Data accessibility. The datasets supporting this article are available on the Dryad Digital Repository at http://dx.doi.org/10.5061/dryad.2v075 [30].Authors’ contributions. D.M.A. conceived of the study, participated in the design of the study, collected data and carriedout the statistical analyses; E.K.W. and R.S. participated in the design of the study, collected data and providedmaterials; M.T. provided materials; A.W. conceived of the study, participated in the design of the study and providedmaterials. All authors helped draft the manuscript and gave final approval for publication.Competing interests. The authors declare that they have no competing interests.Funding. D.M.A. received funding from the University of Edinburgh School of Philosophy, Psychology and LanguageSciences Research Support Grants, and the Great Britain Sasakawa Foundation. M.T. received funding from theMEXT/JSPS KAKENHI (grant nos 23220006, 24000001, 15H05709 and 16H06283), JSPS-CCSN and JSPS-LGP-U04.R.S. received funding from the ERC Advanced Grant SOMACCA (no. 230604) (awarded to W. Tecumseh Fitch).Acknowledgements. The authors acknowledge Vanessa Wilson and Yannick Glady for sharing research time, the BudongoTrail Scientific Committee: Katie Slocombe, Amanda Seed and Sophie Pearson, and the Budongo Trail Keeper Teamfor their invaluable support.
References1. Murray C. 2003 Human accomplishment: the pursuit
of excellence in the arts and sciences, 800 BC to 1950.New York, NY: Harper Collins.
2. DeYoung CG. 2014 Openness/intellect: a dimensionof personality reflecting cognitive exploration. InAPA handbook of personality and social psychology:personality processes and individual differences, vol.4 (eds ML Cooper, RJ Larsen), pp. 369–399.Washington, DC: American PsychologicalAssociation.
3. Poropat AE. 2009 A meta-analysis of the five-factormodel of personality and academic performance.Psychol. Bull. 135, 322–338. (doi:10.1037/a0014996)
4. Chamorro-Premuzic T, Furnham A. 2006 Intellectualcompetence and the intelligent personality: a thirdway in differential psychology. Rev. Gen. Psychol. 10,251–267. (doi:10.1037/1089-2680.10.3.251)
5. Costa PT, McCrae RR. 1998 Manual supplement forthe NEO 4. Psychological assessment resources.
6. Kashdan TB, Rose P, Fincham FD. 2004 Curiosity andexploration: facilitating positive subjectiveexperiences and personal growth opportunities.J. Pers. Assess. 82, 291–305. (doi:10.1207/s15327752jpa8203_05)
7. Powell C, Nettelbeck T, Burns NR. 2016Deconstructing intellectual curiosity. Pers. Individ.Dif. 95, 147–151. (doi:10.1016/j.paid.2016.02.037)
8. von Stumm S, Hell B, Chamorro-Premuzic T. 2011The hungry mind: intellectual curiosity is the thirdpillar of academic performance. Perspect. Psychol.Sci. 6, 574–588. (doi:10.1177/1745691611421204)
9. Mussel P. 2010 Epistemic curiosity and relatedconstructs: lacking evidence of discriminantvalidity. Pers. Individ. Dif. 49, 506–510.(doi:10.1016/j.paid.2010.05.014)
10. Griffin A, Healy SD, Guillette LM. 2015 Cognition andpersonality: an analysis of an emerging field. TrendsEcol. Evol. 30, 207–214. (doi:10.1016/j.tree.2015.01.012)
11. Matzel LD, Han YR, Grossman H, Karnik MS, Patel D,Scott N, Specht SM, Gandhi CC. 2003 Individual
differences in the expression of a ‘general’ learningability in mice. J. Neurosci. 23, 6423–6433.
12. Guillette LM, Hahn AH, Hoeschele M, PrzyslupskiAM, Sturdy CB. 2014 Individual differences inlearning speed, performance accuracy andexploratory behaviour in black-capped chickadees.Anim. Cogn. 18, 165–178. (doi:10.1007/s10071-014-0787-3)
13. Massen JJM, Antonides A, Arnold AMK, Bionda T,Koski SE. 2013 A behavioral view on chimpanzeepersonality: exploration tendency, persistence,boldness, and tool-orientation measured withgroup experiments. Am. J. Primatol. 75, 947–958.(doi:10.1002/ajp.22159)
14. Morton FB, Lee PC, Buchanan-Smith HM. 2013Taking personality selection bias seriously in animalcognition research: a case study in capuchinmonkeys (Sapajus apella). Anim. Cogn. 16, 677–684.(doi:10.1007/s10071-013-0603-5)
15. Altschul DM, Terrace HS, Weiss A. 2016 Serialcognition and personality in macaques. Anim.Behav. Cognit. 3, 46–64. (doi:10.12966/abc.02.04.2016)
16. Matsuzawa T, Tomonaga M, Tanaka M. (eds). 2006Cognitive development in chimpanzees. Tokyo,Japan: Springer.
17. Hughes RN. 1997 Intrinsic exploration in animals:motives and measurement. Behav. Process. 41,213–226. (doi:10.1016/S0376-6357(97)00055-7)
18. Freeman HD, Gosling SD. 2010 Personality innonhuman primates: a review and evaluation ofpast research. Am. J. Primatol. 72, 653–671.(doi:10.1002/ajp.20833)
19. Herrelko ES, Vick S-J, Buchanan-Smith HM. 2012Cognitive research in zoo-housed chimpanzees:influence of personality and impact on welfare. Am.J. Primatol. 74, 828–840. (doi:10.1002/ajp.22036)
20. Hopper LM, Price SA, Freeman HD, Lambeth SP,Schapiro SJ, Kendal RL. 2014 Influence ofpersonality, age, sex, and estrous state onchimpanzee problem-solving success. Anim. Cogn.17, 835–847. (doi:10.1007/s10071-013-0715-y)
21. Weiss A, Inoue-Murayama M, Hong K-W, Inoue E,Udono T, Ochiai T, Matsuzawa T, Hirata S, King JE.2009 Assessing chimpanzee personality andsubjective well-being in Japan. Am. J. Primatol. 71,283–292. (doi:10.1002/ajp.20649)
22. Sonnweber R, Ravignani A, Fitch WT. 2015Non-adjacent visual dependency learning inchimpanzees. Anim. Cogn. 18, 733–745.(doi:10.1007/s10071-015-0840-x)
23. Cohen J. 1988 Statistical power analysis for thebehavioural sciences. Hillside, NJ: LawrenceEarlbaum Associates.
24. Wolf MB, Ackerman PL. 2005 Extraversion andintelligence: a meta-analytic investigation. Pers.Individ. Dif. 39, 531–542. (doi:10.1016/j.paid.2005.02.020)
25. Doucet C, Stelmack RM. 1997 Movement timedifferentiates extraverts from introverts. Pers.Individ. Dif. 23, 775–786. (doi:10.1016/S0191-8869(97)00104-9)
26. De Waal F. 2007 Chimpanzee politics: power and sexamong apes. Baltimore, MD: John HopkinsUniversity Press.
27. Drea CM, Wallen K. 1999 Low-status monkeys ‘playdumb’ when learning in mixed social groups. Proc.Natl Acad. Sci. USA 96, 12 965–12 969. (doi:10.1073/pnas.96.22.12965)
28. Wergård EM, Westlund K, Spångberg M, Fredlund H,Forkman B. 2016 Training success in group-housedlong-tailed macaques (Macaca fascicularis) is betterexplained by personality than by social rank. Appl.Anim. Behav. Sci. 177, 52–58. (doi:10.1016/j.applanim.2016.01.017)
29. McDonald AS. 2001 The prevalence andeffects of test anxiety in school children. Educ.Psychol. 21, 89–101. (doi:10.1080/01443410020019867)
30. Altschul DM, Wallace EK, Sonnweber R, TomonagaM, Weiss A. 2017 Data from: chimpanzee intellect:personality, performance, and motivation withtouchscreen tasks. Data Dryad Repository. (http://dx.doi.org/10.5061/dryad.2v075)
on December 13, 2017http://rsos.royalsocietypublishing.org/Downloaded from
48
56

57
2.2 Multiple associations between personality, participation, and performance
In these studies, we found that high Conscientiousness chimpanzees were
more likely to remain as participants in touchscreen testing experiments, more likely
to attempt to interact with the touchscreen, and more precise in their touch responses.
In study 1, high Conscientiousness individuals were faster and more accurate, but
their accuracy was no better after controlling for experience. These associations with
performance were also not found in study 2. These conditional associations between
Conscientiousness and accuracy in these chimpanzees are similar to what we would
expect to see among high Conscientiousness humans, as well: greater diligence, more
self-control, and higher achievement which is not due to greater inherent intelligence.
Extraversion was also frequently associated with the variables in these tasks,
though the associations between Extraversion and both performance and
participation were not always consistent, or present where we would have expected
to find them. High Extraversion chimpanzees were faster to respond, in all speed
measures of both study 1 and study 2, which is consistent with the literature in
humans (Chamorro-Premuzic & Furnham, 2006). Additionally, Extraversion was
associated with higher accuracy in study 1 (when experience was controlled for), and
also associated with spending more time in the research areas in study 3. However,
Extraversion’s relevance was not always apparent, as there was no association
between Extraversion and accuracy in study 2, and it was the low Extraversion
individuals who spent the most time interacting with the touchscreen in study 3.
58
Extraversion appears to be related to performance, particularly speed, but while it has
been suggested that Extraversion is linked to motor mechanisms of the underlying
biological substrate, insufficient evidence exists to support this claim, and this
explanation should be viewed as a theory. Finally, why high Extraversion individuals
were interested in some aspects of these tasks but not others is difficult to explain
with these data.
The personality dimensions of Openness, Agreeableness, and Dominance
were also implicated. Openness was repeatedly associated with interest and
performance when the tasks gave rewards, though not in every model. In study 1,
Openness was associated with higher participation and faster response times, but not
accuracy. In study 2, Openness was associated with accuracy and greater
engagement, but not response time. Moreover, high Openness was associated with
unrewarded interest in the touchscreen apparatus, though only as measured through
time spent at the screen.
Low Agreeableness individuals had faster response times in study 2, but
otherwise the dimensions was not associated with performance. High Agreeableness
individuals were less likely to drop out in study 1, and more likely to make
individual approaches to the screen in study 3, despite the frequent presence of other
chimpanzees in the research pods during this part of the study. Dominance was
implicated in a few analyses: higher Dominance individuals participated more in
study 1 and showed slower response times in study 2, but no interpretable pattern
emerged. Similarly, Neuroticism was only associated with reduced engagement in
study 1 and faster response times in study 2. Ultimately, there were not enough
59
significant results to interpret the role that either Dominance or Neuroticism might
have played.
Comparing this study to other work in the literature, our results compare
favourably to what others have found. High Openness primates appear to be more
interested in novel objects (Massen et al., 2013), problem solving (Hopper et al.,
2013), learning (Morton, Lee, & Buchanan-Smith, 2013), and now a variety of
touchscreen tasks. Openness could be seen as strongly related to a need for cognition,
and both have been related to general intelligence in humans (Von Stumm, Hell, &
Chamorro-Premuzic, 2011), but Openness itself should not be viewed as a proxy for
general intelligence.
Conscientiousness (or persistence (Massen et al., 2013) or attentiveness
(Morton, Lee, & Buchanan-Smith, 2013)), has not been clearly linked to better
performance in other studies and species. The strength of our study’s longitudinal
approach is most easily visible in this light. On the other hand, Hopper et al. (2013)
found more consistent, strong associations between problem solving success and a
chimpanzee personality domain not identified in this study: Methodical. From the
name, the reader would be inclined to associate Methodical with Conscientiousness.
But, this dimension was composed of two items, ‘methodical’ and ‘self-caring’, and
it was not certain that the dimension was distinct enough to extract as a separate
factor (Freeman et al., 2013). In both name and constituent items, methodical has
similarities with Conscientiousness, and considering our results, the most
parsimonious explanation is that Methodical taps into many of the same
psychological substrates as Conscientiousness.

60
As indicated, many of our remaining results are difficult to interpret, and we
hesitate to make unjustifiable extrapolations. Our results concerning Extraversion
may be the most tempting to over interpret. It may be that high Extraversion
individuals were biased by the social-spatial environment of the research areas to
participate more during certain phases. A reviewer of this paper suggested we discuss
the social environment surrounding the experiments. As described in the final
revision of the paper, there was no manipulation of the environment, and due to the
nature of the enclosure, individuals were always tested as part of a group. So while
many chimpanzees moved in and out of the research areas during testing, and
sometimes these areas were full of chimpanzees, there were only a few instances
when more than one participant tried to interact with the touchscreen at a time.
Manipulation of social circumstances are a heavily researched area of study in
chimpanzee cognition, and it is likely that situational social factors do interact with
personality. Unfortunately, grappling with this question in the context of this study
would require high-resolution location data along with social network data, which we
did not have access to.
However, we wish to emphasize that even in large humans sample and meta-
analyses, studies of covariation between intelligence, personality, and achievement
are not always consistent (Chamorro-Premuzic & Furnham, 2014). Our results are
broadly in agreement with the human literature and the existing literature on
nonhuman primates. However, our sample sizes were small compared to what one
might see in the human literature, and while repeated observations leant additional
power to the study, it is likely that we did not have the power to detect smaller
effects.
61
An additional issue with this study and others is the use of overly specific
and/or under validated tasks. As mentioned, Morton, Lee, and Buchanan-Smith
(2013) used tasks which relied on associative learning, a specific, simple capability.
On the other hand, Hopper et al. (2013) and Massen et al. (2013) used “puzzle
boxes” that assessed chimpanzees’ problem solving abilities. These tasks require
intelligence to solve, but it is not clear whether these tap into general intelligence or
specific domains, and if they do tap into specific domains, which ones.
Overall, this study is not an exception. While validity was improved by testing
a variety of relations in study 1, the precise breadth of intelligence tested during this
study remains an open question, unknowable from these data alone. In study 2, our
task initially relied on associative learning, and though plans had been drawn up to
extend the paradigm, the participants did not show sufficient proficiency to progress
to a non-associative version of the task. All these tasks are testing intelligence, but
there were not designed to test any specific domain, for example, numerical
competence. A superior battery would be one which was designed to test all the
known domains of primate intelligence. One of the most widely used instruments,
the Primate Cognition Test Battery (Herrmann et al., 2007) is a strong model, but
does fall short if one wants to study learning over time. Quick and reliable
assessment is very important, but our study demonstrates that significant individual
differences in performance and motivation over time exist in chimpanzees, and these
differences should not be neglected.
62
3 Rhesus macaque personality and performance on a serial cognitive touchscreen task
3.1 Extending the framework
This chapter presents work which complements our work in chapter 2; the
background and motivations for the two chapters were very similar. However, the
experiment under study in this chapter benefits from much greater control. The
laboratory setting of this work allowed us to fix several degrees of freedom that are
not frequently under experimenter control, at least not at the same time.
All animals in this study were highly trained, beyond the point where we
would see any noticeable improvement in performance over the course of the study.
The macaques were thus experts with the particular task, the Simultaneous Chaining
(SimChain) paradigm (Terrace, 2005) and would display peak performance by the
end of each experimental session. Expert participants are used in human perceptual
research (Tanaka & Curran, 2001) and some animal cognition work (Matsuzawa,
Tomonaga, & Tanaka, 2006), but infrequently found in animal personality research
because of difficulties with sample size and power. To the best of our knowledge, no
study of animal personality and cognition has worked with expert participants.
Confounding social circumstances were eliminated as possible influences on
these individuals. While the macaques lived in a social colony setting, the macaques
were isolated from one another while in the operant testing chambers. No external
63
stimuli could influence their performance. Sex was also ruled out as a confound
because the sample was entirely male.
A key difference between this study and others (notably, the others in this
manuscript), is that the animals under study were rhesus macaques. The rhesus
macaque diverged from the common ancestor of chimpanzees and humans around 25
million years ago (Gibbs et al., 2007). Macaques are some of the most common
research subjects found in biomedical labs because they are seen as useful surrogates
for humans in neuroscience, epidemiology, drug development, and other fields of
research. Consequently, macaques have also been studied in hundreds if not
thousands of animal behavior and animal cognition projects, and their cognitive
abilities are well-known.
Similarly, macaque personality has been repeatedly described throughout the
development of the animal personality literature (Capitanio, 1999; Chamove et al.,
1972; Figueredo, Cox, & Rhine, 1995; Stevenson-Hinde & Zunz, 1978), although
arguably the most complete, and certainly the most relevant to this study, structure of
rhesus macaque personality posits six dimensions: Confidence, Openness,
Dominance, Friendliness, Activity, and Anxiety (Weiss, Adams, Widdig, et al.,
2011).
Having described the advantages of this sample, we had two major goals in this
study. First, we wished to further extend the work on cognition and personality to
macaques. Unsurprisingly, covariation in rhesus macaque cognition and personality
is not entirely unstudied (Stevenson-Hinde, Stillwell-Barnes, & Zunz, 1980), but the
64
present study benefits from our use of comprehensive scores derived from the HPQ
and the SimChain task, which is difficult by animal cognition standards.
Second, we wished to use the granularity of our data and existing, validated
models of learning (Jensen, Altschul, Danly, & Terrace, 2013; Thurstone, 1918) to
test for specific differences in performance, and determine if these differences were
associated with personality. Thus, nine macaques were rated for personality, and
using modelling techniques which could assess both rate of learning and plateau
accuracy, we related these personality dimensions to individual differences in
performance on a 4-item SimChain task.
The following content has been published as:
Altschul, D. M., Terrace, H. S., & Weiss, A. (2016). Serial cognition and personality
in macaques. Animal Behavior and Cognition, 3(1), 46.
ABC 2016, 3(1):46-64Animal Behavior and Cognition DOI: 10.12966/abc.02.04.2016 ©Attribution 3.0 Unported (CC BY 3.0)
Serial Cognition and Personality in Macaques Drew M. Altschul1, 2, *, Herbert S. Terrace 3, & Alexander Weiss 1, 2
1The University of Edinburgh 2Scottish Primate Research Group 3Columbia University
*Corresponding author (Email: [email protected])
Citation – Altschul, D. M., Terrace, H. S., & Weiss, A., (2016). Serial cognition and personality in macaques. Animal Behavior and Cognition, 3(1), 46–64. doi: 10.12966/abc.02.04.2016
Abstract - We examined the associations between serial cognition and personality in rhesus macaques (Macaca mulatta). Nine macaques were tested on a simultaneous chaining task to assess their cognitive abilities. They were also rated for personality traits and scored according to a previously extracted six component structure derived from free-ranging rhesus macaques. Friendliness and Openness were positively associated with good performance on three measures of accuracy on the serial learning task: Progress, Error, and Rewarded (i.e., correctly completed) Trials. Faster Reaction Times were associated with lower Friendliness and higher Confidence, as well as higher Openness when only correct responses were analyzed. We also used regularized exploratory factor analysis to extract two, three, four, five, and six factor structures, and found consistent associations between accuracy and single factors within each of these structures. Prior results on intelligence in other nonhuman primate species have focused on basic intelligence tests; this study demonstrates that more complex, abstract cognitive tasks can be used to assess intelligence and personality in nonhuman primates.
Keywords - Primates, Rhesus macaques, Personality, Individual differences, Serial cognition, Comparative cognition
The study of individual psychological differences in animals originated with Pavlov, who classified personality as learning characteristics among his dogs (Pavlov, 1908/1941). In primates, Yerkes (1939), Crawford (1938), and Hebb (1946) all worked with the same group of chimpanzees, and all three found evidence for personality, from both observer ratings and behavioral codings. Early researchers did not restrict their studies to captive animals; free-ranging Japanese macaques (Itani, 1957) and chimpanzees (Goodall, 1990) were also described as having distinct personalities.
Personality describes individual differences in behavior that are stable over time and across different contexts (Réale, Reader, Sol, McDougall, & Dingemanse, 2007). Individual differences in cognitive abilities differ in that they rely on quantifying performance (Griffin, Guillette, & Healy, 2015), e.g., percentage correct out of a set number of trials, or average reaction time. Serial cognition is onefaculty that has been studied as a means of understanding how animals learn and manipulate complexinformation (D’Amato & Colombo, 1990). However, few studies of serial cognition, as well as animalcognition more broadly (Griffin et al., 2015), have addressed where individual differences in performancecome from, as the focus has typically been on the abilities of the species and not those of individuals(Herrmann, Call, Hernández-Lloreda, Hare, & Tomasello, 2007; Terrace, 1993). The exceptions includeVonk and Povinelli (2011), who found that different chimpanzees excelled in social and physical tasks,except for one individual who performed well at both, and Herrmann, Hernández-Lloreda, Call, Hare, and
65

Altschul, Terrace, & Weiss 47
Tomasello (2010), who reanalyzed their earlier data to assess individual differences with factor analytic techniques. The majority of these studies have focused on a single species: the common chimpanzee.
The study of animal personality, on the other hand, has flourished in the last two decades. One way in which species personalities can be described is by quantifying traits along a small number of dimensions. In humans this gave rise to the “Big Five” or “Five-Factor Model,” which incorporates dimensions usually named Neuroticism, Extraversion, Openness to experience, Agreeableness, and Conscientiousness (McCrae & John, 1992). Chimpanzees, which share a recent common ancestor with humans, possess six dimensions, five resembling the human personality dimensions, plus the dimension Dominance (King & Figueredo, 1997). On the other hand, rhesus macaques, representatives of an older ancestor, also have six personality dimensions, that differ some from the chimpanzee and human dimensions: Anxiety, Activity, Openness, Friendliness, Confidence, and Dominance (Weiss, Adams, Widdig, & Gerald, 2011).
Within-species personality variation may drive the variability within cognitive capacities. Female rhesus macaques with a tendency towards exploratory behaviors acquired operant responses 50% more often than less adventurous subjects (Coleman, Tully, & McMillan, 2005); exploratory behaviors in mice covaried with learning differences (Matzel et al., 2003), and chickadees that were slow to explore were more accurate during testing, but did not learn the experimental task more quickly than other chickadees (Guillette, Hahn, Hoeschele, Przyslupski, & Sturdy, 2015). The common attribute of these studies – ‘exploration’ – calls to mind two human personality dimensions: Extraversion and Openness. However, most research has associated animal personality with behavior (e.g., Capitanio, 1999; Konečná et al., 2008; Pederson, King, & Landau, 2005), rather than cognitive ability. Moreover, prior research has been largely observational (Konečná et al., 2008; Pederson et al., 2005), not experimental. Meanwhile, complex, repeatable tasks have been realized in captive environments thanks to modern computing power and equipment (Fagot, Gullstrand, Kemp, Defilles, & Mekaouche, 2014). These tasks provide rich data that permit stronger inference about cognitive function than earlier operant techniques.
Recent studies have begun bridging the gaps between cognitive and personality psychology (Herrelko, Vick, & Buchanan-Smith, 2012; Morton, Lee, & Buchanan-Smith, 2013) with factor analytic approaches common to personality and intelligence research (Herrmann et al., 2010; Hopkins, Russell, & Schaeffer, 2014). Intelligence is a general cognitive ability that underlies individual differences in performance on mental tests, such as Raven’s Standard Progressive Matrices and the National Adult Reading Test (Deary, 2001). This general factor of intelligence or ‘g’ factor is widely used in individual differences research, and moderately sized relationships have been found between measures of g and the Five-Factor Model in humans (Austin, Deary, & Gibson, 1997). In particular, high Openness to experience has been repeatedly linked to high g factor scores (DeYoung, 2014).
The majority of studies on general primate intelligence have been meta-analyses (Deaner, Van Schaik, & Johnson, 2006; Reader, Hager, & Laland, 2011; Schmitt, Pankau, & Fischer, 2012) that identify intelligence differences between species. Herrmann et al. (2010) compared chimpanzees with human children; principal components analyses indicated that a ‘Spatial’ and a ‘Physical-Social’ factor best explained the structure of differences in chimpanzee performance. Subsequently, Hopkins et al. (2014) used the Primate Cognition Test Battery (Herrmann et al., 2010) modeled performance on the task as arising from a single g factor, with four constructs beneath. The chimpanzee g factor was heritable (Hopkins et al., 2014), as has been shown in humans (Davies et al., 2011; Deary, Spinath, & Bates, 2006).
Serial cognition has been studied in many species with many paradigms; varying demonstrations of proficiency have been displayed across studies (McGonigle & Chalmers, 2006). The Simultaneous Chaining (SimChain) paradigm is one of the most difficult tests of serial cognition: the commonly used serial cognition paradigm, Transitive Inference (TI), only requires binary responses, whereas SimChain requires multiple successive, correct responses for an animal to be rewarded. Monkeys’ behavior in completing SimChain trials is known for defying traditional chaining theory (Ebbinghaus, 1913/2014). Instead of learning associations between successive items, monkeys learn the ordinal positions of individual items, encoding them in a spatial representation (Chen, Swartz, & Terrace, 1997).
66

Altschul, Terrace, & Weiss 48
Serial intelligence is a broadly applied, flexible ability: despite their differences in difficulty, the SimChain and TI paradigms share a common mental representation (Jensen, Altschul, Danly, & Terrace, 2013). Transitive reasoning is in turn linked to symbolic manipulation (D’Amato & Colombo, 1990), social dominance and navigation in primate hierarchies (Paxton et al., 2010), and language (Jensen et al., 2013). These links make SimChain a strong candidate for testing general cognitive ability in animals.
While the evolution of serial cognition is well documented (McGonigle & Chalmers, 2006), why individual personalities have been selected for remains an open question (Bouchard & Loehlin, 2001). Moreover, the evolutionary genetics underlying individual differences in intelligence and personality need not be very similar. If the contributions of gene and environment differ between personality and intelligence (Penke, Denissen, & Miller, 2007), then how should we expect animals’ personalities to vary with cognitive abilities? In nine rhesus macaques, we collected cognitive and personality data, and in a series of exploratory analyses we examined connections between personality and serial cognition, with the expectation that Openness, and possibly other macaque personality dimensions, would be associated with performance on the SimChain task.
Method
Subjects
Nine male captive-born rhesus macaques, aged 12 to 16 years, and housed at the New York State Psychiatric Institute, performed a SimChain task and were evaluated for personality. The colony was maintained in accordance with guidelines issued by the National Institutes of Health and the Institutional Animal Care and Use Committees at the New York State Psychiatric Institute and Columbia University. Macaques were individually housed in adjoining cages at the time of the study, but had been pair housed previously. Macaques were given water ad libitum, and fed commercial primate biscuits and varied fresh fruits and vegetables daily, in addition to any pellets they received as rewards in experimental tasks.
Apparatus
The apparatus was identical to that used in prior studies (Jensen et al., 2013). Testing took place in chambers housed in sound-attenuated booths. Chambers were equipped with speakers, and a pellet dispenser (Med Associates; pellets by BioServ, 190 mg). A computer with a touch-sensitive monitor presented stimuli and detected responses.
Procedure
The SimChain paradigm presents an ordered list as a simultaneously displayed set of images on a touchscreen monitor. A trial is completed by selecting each stimulus in the correct order (see Figure 1; Terrace, 1993). In this experiment, subjects had to learn a novel four-item list composed of arbitrary color images, each day. Subjects were given 40 trials to learn each list, which could only be accomplished through trial and error. On successful trials, subjects were rewarded with a banana pellet. On unsuccessful trials they received a 4 s timeout. We gathered 20 days of data, that is, 20 sessions of 40 trials each.
Because subjects had been extensively trained on SimChain tasks, no task learning effects were expected to confound results. Subjects could be expected to display their asymptotic level of performance.
Personality Ratings
Subjects were independently rated by 10 animal care volunteers using the Hominoid Personality Questionnaire (Weiss et al., 2009). The questionnaire consisted of 54 adjectives followed by 1 to 3 sentences defining adjectives in terms of everyday nonhuman primate behaviors. Items were rated on a 7-point scale. Raters were familiar with subjects prior to evaluating them, but unaware of the details of
67
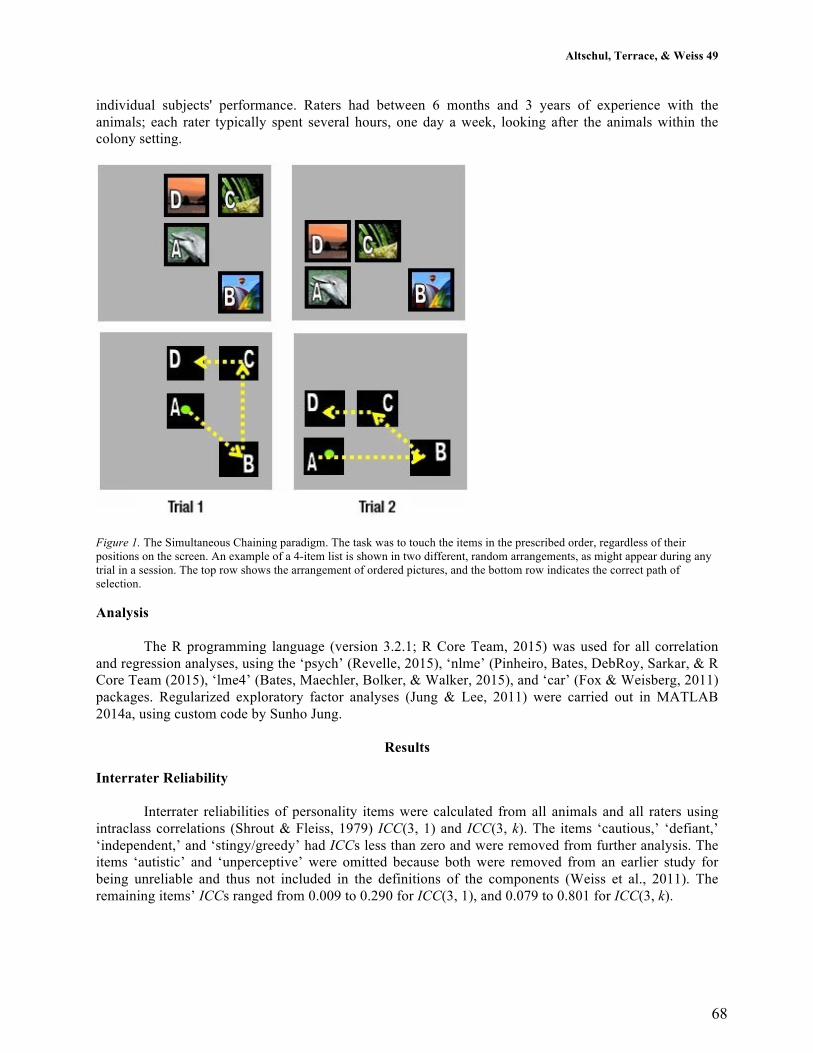
Altschul, Terrace, & Weiss 49
individual subjects' performance. Raters had between 6 months and 3 years of experience with the animals; each rater typically spent several hours, one day a week, looking after the animals within the colony setting.
Figure 1. The Simultaneous Chaining paradigm. The task was to touch the items in the prescribed order, regardless of their positions on the screen. An example of a 4-item list is shown in two different, random arrangements, as might appear during any trial in a session. The top row shows the arrangement of ordered pictures, and the bottom row indicates the correct path of selection.
Analysis
The R programming language (version 3.2.1; R Core Team, 2015) was used for all correlation and regression analyses, using the ‘psych’ (Revelle, 2015), ‘nlme’ (Pinheiro, Bates, DebRoy, Sarkar, & R Core Team (2015), ‘lme4’ (Bates, Maechler, Bolker, & Walker, 2015), and ‘car’ (Fox & Weisberg, 2011) packages. Regularized exploratory factor analyses (Jung & Lee, 2011) were carried out in MATLAB 2014a, using custom code by Sunho Jung.
Results
Interrater Reliability
Interrater reliabilities of personality items were calculated from all animals and all raters using intraclass correlations (Shrout & Fleiss, 1979) ICC(3, 1) and ICC(3, k). The items ‘cautious,’ ‘defiant,’ ‘independent,’ and ‘stingy/greedy’ had ICCs less than zero and were removed from further analysis. The items ‘autistic’ and ‘unperceptive’ were omitted because both were removed from an earlier study for being unreliable and thus not included in the definitions of the components (Weiss et al., 2011). The remaining items’ ICCs ranged from 0.009 to 0.290 for ICC(3, 1), and 0.079 to 0.801 for ICC(3, k).
68
Altschul, Terrace, & Weiss 50
Personality and Performance
Average questionnaire ratings were used to compute domain scores from the unit-weighted matrix based on previously derived component loadings (Weiss et al., 2011; Table 1). Performance was measured using three measures of trial-by-trial accuracy. Rewarded trials reflect the binary successes and failures across each subject’s trial-by-trial performances: to be rewarded, a subject must complete a full SimChain trial without error. Progress quantifies how far into the list the subject made it on any given trial, before either making an error or completing the trial. Error is defined as the amount of deviation, from the next correct response, in a subject’s terminal choice. Error can be either positive or negative: If the subject makes forwards error, jumping ahead in the chain, the Error is positive. If the subject makes a backwards Error, it is negative. If the subject presses each item in the correct order and completes a trial successfully, the Error is 0. Error and Progress for each of the nine monkeys is shown in Figures 2 and 3, respectively.
Reaction time (RT) is the natural logarithm of the interval between the onset of the visual stimuli and the first response. SimChain completion utilizes a series of planned responses (Scarf, Danly, Morgan, Colombo, & Terrace, 2011), but apart from the pause before the initial response, wherein the chain planning pauses occur depends on the individual animal. We analyzed the first response RT for only correct responses, as well as the RT for all first responses, to search for speed-accuracy trade-offs (Prinzmetal, McCool, & Park, 2005).
Correlations between personality and performance (averaged across trials and sessions) are shown in Table 1. Friendliness was significantly positively correlated with Rewarded trials and Progress; negatively correlated with Error. Openness was significantly correlated with Progress and Error, in the same directions as with Friendliness. No significant correlations were found between personality domains and either RT measure.
Table 1
Correlations among Personality and Averaged Performance Variable
Anx Act Frd Dom Opn Con Rwd Err Prg RT
Act 0.57
Frd -0.12 0.49
Dom 0.70 0.85 0.08
Opn 0.79 0.63 0.33 0.50
Con -0.53 0.31 0.57 0.15 0.26
Rwd 0.21 0.55 0.71 0.26 0.65 0.38
Err -0.25 0.53 -0.70 -0.28 -0.67 -0.34 -0.99
Prg 0.24 0.56 0.73 0.27 0.67 0.35 1.00 -0.99
RT 0.07 0.24 0.28 0.14 -0.07 -0.09 -0.09 0.03 0.05
RT1 -0.12 0.19 0.17 0.09 -0.25 0.08 -0.07 0.02 0.03 0.91 Note. Correlations of | r | > 0.66 are significant at the α = 0.05 level. Anx = Anxiety, Act = Activity, Frd = Friendliness, Dom = Dominance, Opn = Openness, Con = Confidence, Rwd = Rewarded trials, Err = Error, Prg = Progress, RT = all reaction times, RT1 = reaction times on trials which were correctly completed.
Regression Analyses
Simple correlations between averages fail to capture the nuance in individuals’ performance. For example, both Error (Figure 2) and Progress (Figure 3) demonstrate learning curves and asymptotic plateaus in performance, which differ between animals. To explore personality’s relationship with
69

Altschul, Terrace, & Weiss 51
performance in more detail, we modeled each performance metric including personality predictors based on the strength of associations seen in the correlation matrix.
Figure 2. Average Error data from 20 sessions of 40 trial SimChain, from 9 monkeys. Bars indicate standard errors.
Error
If one wishes to model Error with linear regression, the Error data must first be transformed, because they are non-linear (Figure 2). This poses a challenge because Error can be both positive and negative, thus log-transformation is not appropriate. Fortunately, Yeo-Johnson transformation, which was designed for and tested on cases such as ours, handles negative values (Yeo & Johnson, 2000). We constructed a series of linear mixed models, using a forward selection approach, starting with a null model which included a trial number variable and intercept. Results of our model selection are shown in Table 2.
Log-likelihood indicated that model 7 was the best fit to the data, while the small-sample corrected Akaike Information Criterion (AICc) indicated that model 6 was the best fit. The Bayesian Information Criterion (BIC) indicated that the null model was the best fit, which was a consistent prediction across all our models. The BIC is more strongly biased towards models with fewer degrees of freedom, for as the sample size increases, the probability that BIC selects the correct model approaches 1 (Vrieze, 2012). For smaller sample sizes, BIC necessarily performs less well on average, so while we continued to calculate it for all models for diagnostic purposes, we did not factor it into our selection procedures.
The details of models 6 and 7 are shown in Table 3. Both models consistently show that higher Openness was significantly associated with a smaller starting error, itself an indicator of better performance. The interaction between Friendliness and Trial was also significant in both models, similarly suggesting that Friendliness was associated with smaller error as sessions progressed. Outside of the interaction, Friendliness was not a significant predictor, though it did appear to marginally improve
70
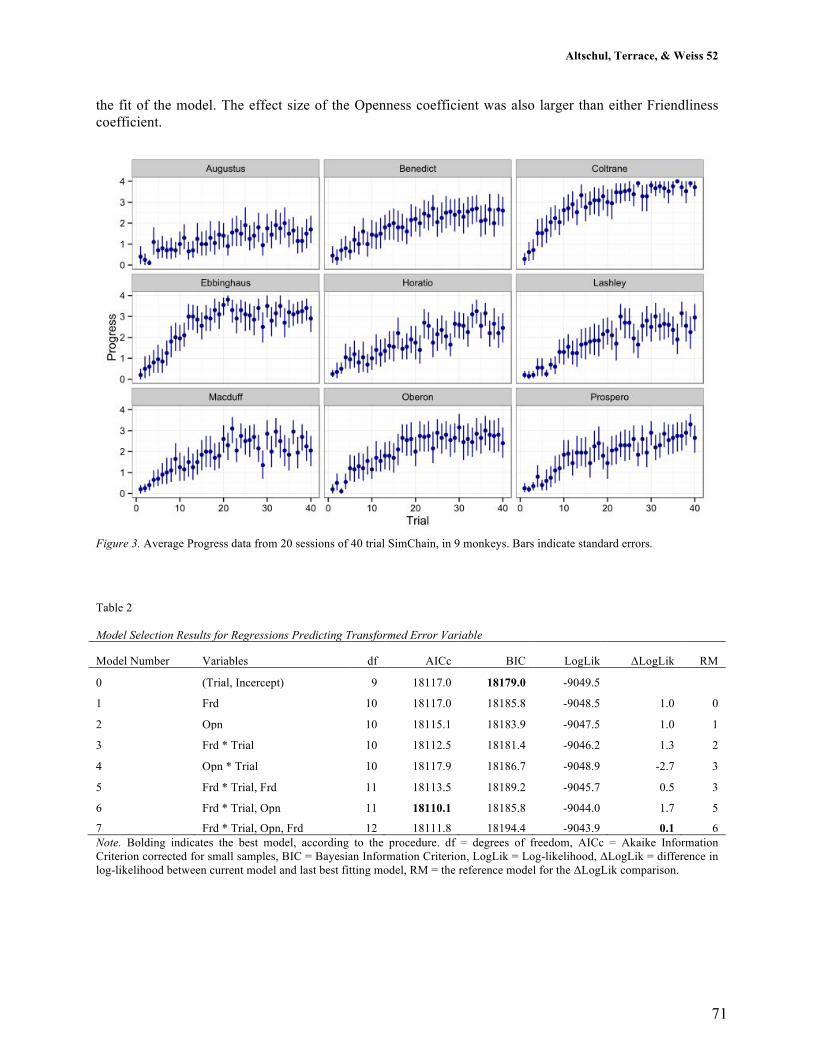
Altschul, Terrace, & Weiss 52
the fit of the model. The effect size of the Openness coefficient was also larger than either Friendliness coefficient.
Figure 3. Average Progress data from 20 sessions of 40 trial SimChain, in 9 monkeys. Bars indicate standard errors.
Table 2
Model Selection Results for Regressions Predicting Transformed Error Variable
Model Number Variables df AICc BIC LogLik ΔLogLik RM
0 (Trial, Incercept) 9 18117.0 18179.0 -9049.5
1 Frd 10 18117.0 18185.8 -9048.5 1.0 0
2 Opn 10 18115.1 18183.9 -9047.5 1.0 1
3 Frd * Trial 10 18112.5 18181.4 -9046.2 1.3 2
4 Opn * Trial 10 18117.9 18186.7 -9048.9 -2.7 3
5 Frd * Trial, Frd 11 18113.5 18189.2 -9045.7 0.5 3
6 Frd * Trial, Opn 11 18110.1 18185.8 -9044.0 1.7 5
7 Frd * Trial, Opn, Frd 12 18111.8 18194.4 -9043.9 0.1 6 Note. Bolding indicates the best model, according to the procedure. df = degrees of freedom, AICc = Akaike Information Criterion corrected for small samples, BIC = Bayesian Information Criterion, LogLik = Log-likelihood, ΔLogLik = difference in log-likelihood between current model and last best fitting model, RM = the reference model for the ΔLogLik comparison.
71
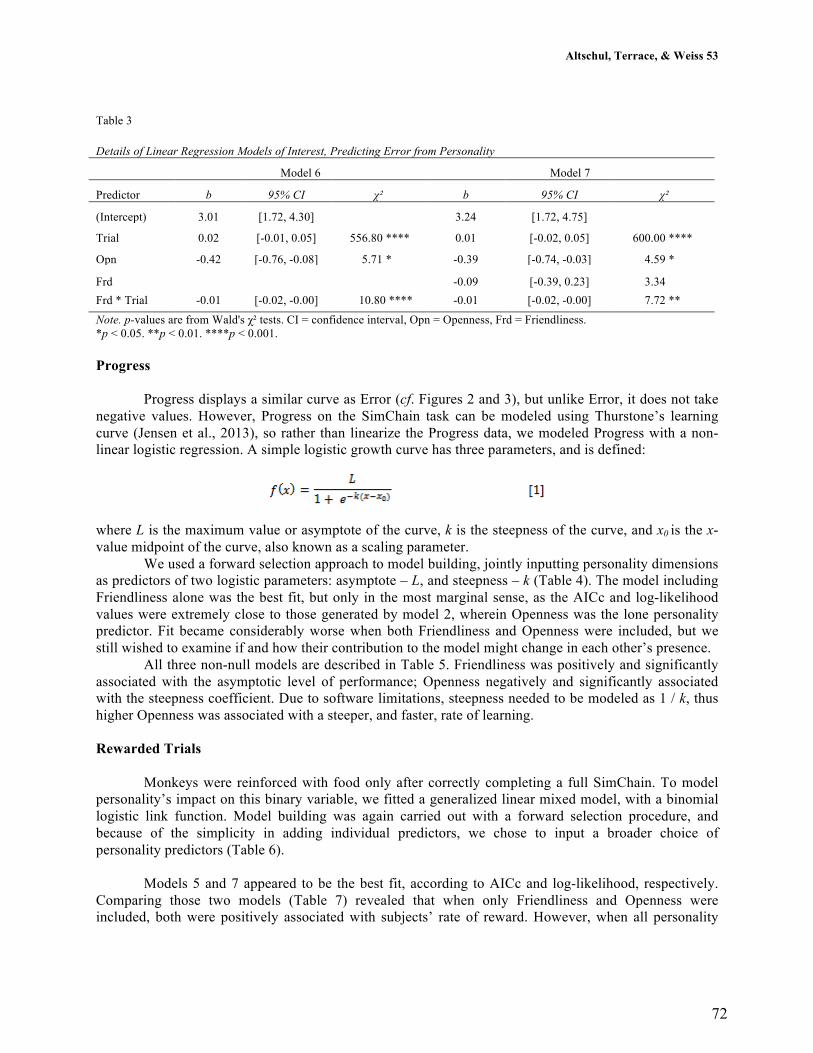
Altschul, Terrace, & Weiss 53
Table 3
Details of Linear Regression Models of Interest, Predicting Error from Personality Model 6 Model 7
Predictor b 95% CI χ² b 95% CI χ²
(Intercept) 3.01 [1.72, 4.30] 3.24 [1.72, 4.75]
Trial 0.02 [-0.01, 0.05] 556.80 **** 0.01 [-0.02, 0.05] 600.00 ****
Opn -0.42 [-0.76, -0.08] 5.71 * -0.39 [-0.74, -0.03] 4.59 *
Frd -0.09 [-0.39, 0.23] 3.34 Frd * Trial -0.01 [-0.02, -0.00] 10.80 **** -0.01 [-0.02, -0.00] 7.72 **
Note. p-values are from Wald's χ² tests. CI = confidence interval, Opn = Openness, Frd = Friendliness. *p < 0.05. **p < 0.01. ****p < 0.001.
Progress
Progress displays a similar curve as Error (cf. Figures 2 and 3), but unlike Error, it does not take negative values. However, Progress on the SimChain task can be modeled using Thurstone’s learning curve (Jensen et al., 2013), so rather than linearize the Progress data, we modeled Progress with a non-linear logistic regression. A simple logistic growth curve has three parameters, and is defined:
where L is the maximum value or asymptote of the curve, k is the steepness of the curve, and x0 is the x-value midpoint of the curve, also known as a scaling parameter.
We used a forward selection approach to model building, jointly inputting personality dimensions as predictors of two logistic parameters: asymptote – L, and steepness – k (Table 4). The model including Friendliness alone was the best fit, but only in the most marginal sense, as the AICc and log-likelihood values were extremely close to those generated by model 2, wherein Openness was the lone personality predictor. Fit became considerably worse when both Friendliness and Openness were included, but we still wished to examine if and how their contribution to the model might change in each other’s presence.
All three non-null models are described in Table 5. Friendliness was positively and significantly associated with the asymptotic level of performance; Openness negatively and significantly associated with the steepness coefficient. Due to software limitations, steepness needed to be modeled as 1 / k, thus higher Openness was associated with a steeper, and faster, rate of learning.
Rewarded Trials
Monkeys were reinforced with food only after correctly completing a full SimChain. To model personality’s impact on this binary variable, we fitted a generalized linear mixed model, with a binomial logistic link function. Model building was again carried out with a forward selection procedure, and because of the simplicity in adding individual predictors, we chose to input a broader choice of personality predictors (Table 6).
Models 5 and 7 appeared to be the best fit, according to AICc and log-likelihood, respectively. Comparing those two models (Table 7) revealed that when only Friendliness and Openness were included, both were positively associated with subjects’ rate of reward. However, when all personality
72
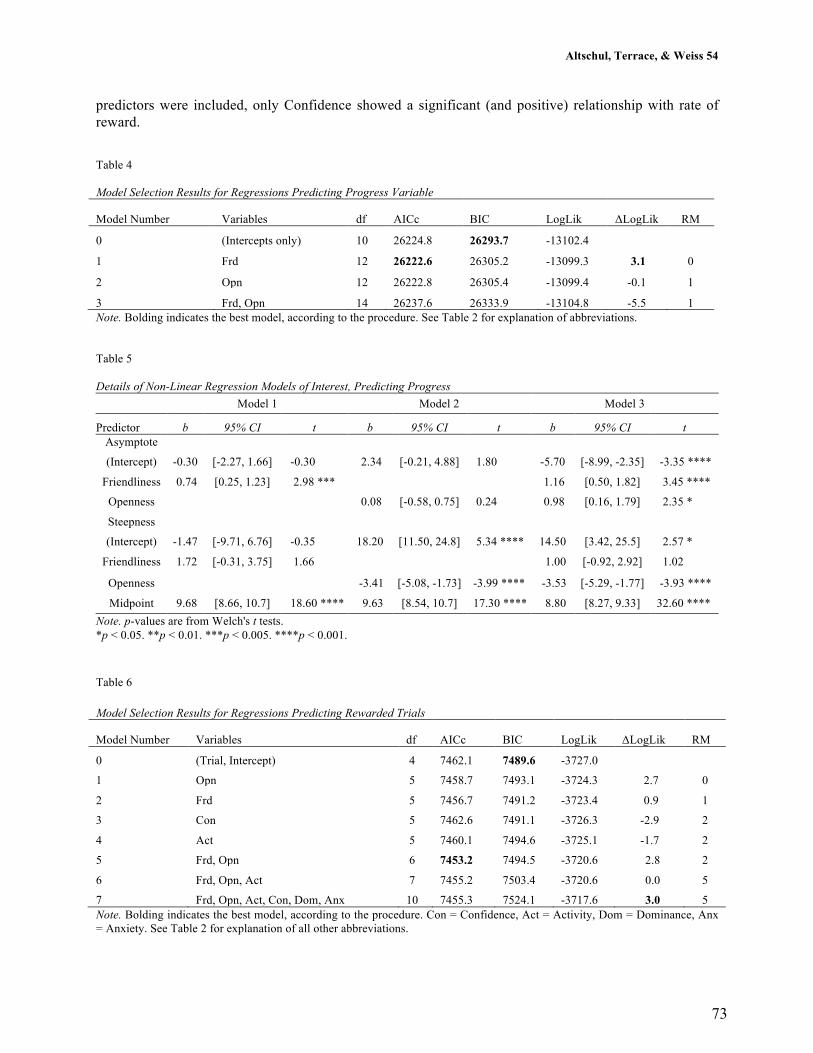
Altschul, Terrace, & Weiss 54
predictors were included, only Confidence showed a significant (and positive) relationship with rate of reward.
Table 4
Model Selection Results for Regressions Predicting Progress Variable
Model Number Variables df AICc BIC LogLik ΔLogLik RM
0 (Intercepts only) 10 26224.8 26293.7 -13102.4
1 Frd 12 26222.6 26305.2 -13099.3 3.1 0
2 Opn 12 26222.8 26305.4 -13099.4 -0.1 1
3 Frd, Opn 14 26237.6 26333.9 -13104.8 -5.5 1 Note. Bolding indicates the best model, according to the procedure. See Table 2 for explanation of abbreviations.
Table 5
Details of Non-Linear Regression Models of Interest, Predicting Progress Model 1 Model 2 Model 3
Predictor b 95% CI t b 95% CI t b 95% CI t Asymptote
(Intercept) -0.30 [-2.27, 1.66] -0.30 2.34 [-0.21, 4.88] 1.80 -5.70 [-8.99, -2.35] -3.35 ****
Friendliness 0.74 [0.25, 1.23] 2.98 *** 1.16 [0.50, 1.82] 3.45 ****
Openness 0.08 [-0.58, 0.75] 0.24 0.98 [0.16, 1.79] 2.35 *
Steepness
(Intercept) -1.47 [-9.71, 6.76] -0.35 18.20 [11.50, 24.8] 5.34 **** 14.50 [3.42, 25.5] 2.57 *
Friendliness 1.72 [-0.31, 3.75] 1.66 1.00 [-0.92, 2.92] 1.02
Openness -3.41 [-5.08, -1.73] -3.99 **** -3.53 [-5.29, -1.77] -3.93 ****
Midpoint 9.68 [8.66, 10.7] 18.60 **** 9.63 [8.54, 10.7] 17.30 **** 8.80 [8.27, 9.33] 32.60 **** Note. p-values are from Welch's t tests. *p < 0.05. **p < 0.01. ***p < 0.005. ****p < 0.001.
Table 6
Model Selection Results for Regressions Predicting Rewarded Trials
Model Number Variables df AICc BIC LogLik ΔLogLik RM
0 (Trial, Intercept) 4 7462.1 7489.6 -3727.0
1 Opn 5 7458.7 7493.1 -3724.3 2.7 0
2 Frd 5 7456.7 7491.2 -3723.4 0.9 1
3 Con 5 7462.6 7491.1 -3726.3 -2.9 2
4 Act 5 7460.1 7494.6 -3725.1 -1.7 2
5 Frd, Opn 6 7453.2 7494.5 -3720.6 2.8 2
6 Frd, Opn, Act 7 7455.2 7503.4 -3720.6 0.0 5
7 Frd, Opn, Act, Con, Dom, Anx 10 7455.3 7524.1 -3717.6 3.0 5 Note. Bolding indicates the best model, according to the procedure. Con = Confidence, Act = Activity, Dom = Dominance, Anx = Anxiety. See Table 2 for explanation of all other abbreviations.
73
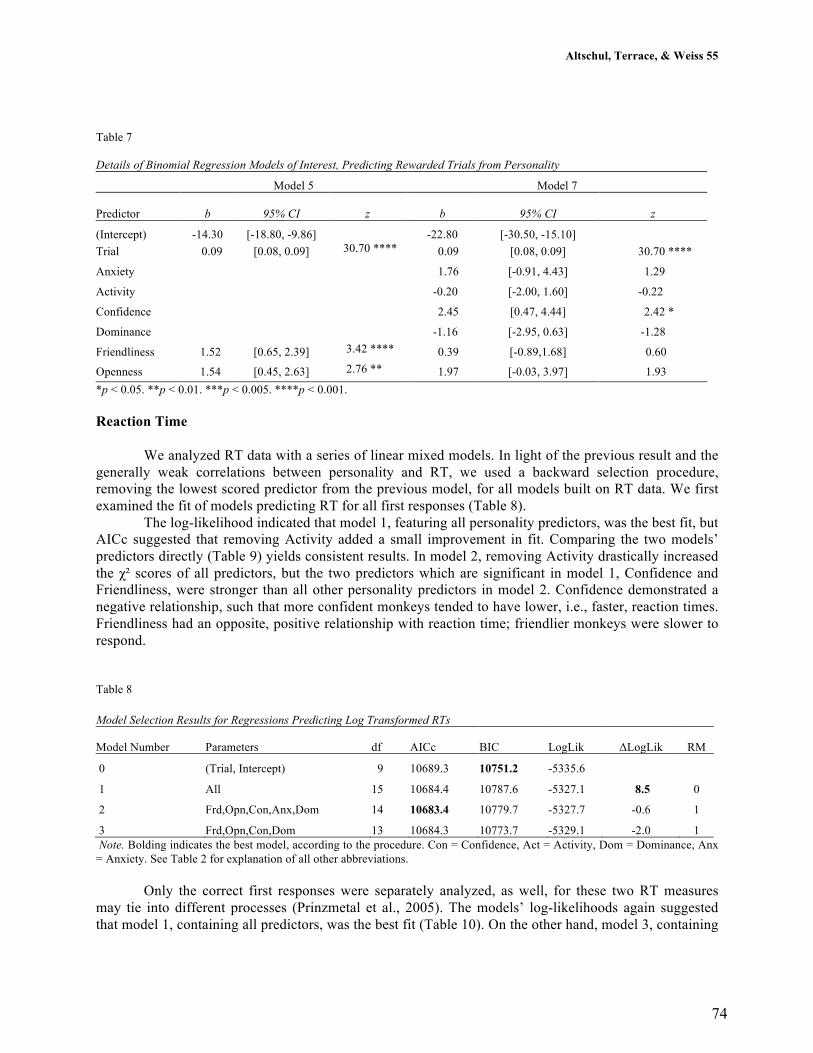
Altschul, Terrace, & Weiss 55
Table 7
Details of Binomial Regression Models of Interest, Predicting Rewarded Trials from Personality
Model 5 Model 7
Predictor b 95% CI z b 95% CI z
(Intercept) -14.30 [-18.80, -9.86] -22.80 [-30.50, -15.10] Trial 0.09 [0.08, 0.09] 30.70 **** 0.09 [0.08, 0.09] 30.70 ****
Anxiety 1.76 [-0.91, 4.43] 1.29
Activity -0.20 [-2.00, 1.60] -0.22
Confidence 2.45 [0.47, 4.44] 2.42 *
Dominance -1.16 [-2.95, 0.63] -1.28
Friendliness 1.52 [0.65, 2.39] 3.42 **** 0.39 [-0.89,1.68] 0.60
Openness 1.54 [0.45, 2.63] 2.76 ** 1.97 [-0.03, 3.97] 1.93*p < 0.05. **p < 0.01. ***p < 0.005. ****p < 0.001.
Reaction Time
We analyzed RT data with a series of linear mixed models. In light of the previous result and the generally weak correlations between personality and RT, we used a backward selection procedure, removing the lowest scored predictor from the previous model, for all models built on RT data. We first examined the fit of models predicting RT for all first responses (Table 8).
The log-likelihood indicated that model 1, featuring all personality predictors, was the best fit, but AICc suggested that removing Activity added a small improvement in fit. Comparing the two models’ predictors directly (Table 9) yields consistent results. In model 2, removing Activity drastically increased the χ² scores of all predictors, but the two predictors which are significant in model 1, Confidence and Friendliness, were stronger than all other personality predictors in model 2. Confidence demonstrated a negative relationship, such that more confident monkeys tended to have lower, i.e., faster, reaction times. Friendliness had an opposite, positive relationship with reaction time; friendlier monkeys were slower to respond.
Table 8
Model Selection Results for Regressions Predicting Log Transformed RTs
Model Number Parameters df AICc BIC LogLik ΔLogLik RM
0 (Trial, Intercept) 9 10689.3 10751.2 -5335.6
1 All 15 10684.4 10787.6 -5327.1 8.5 0
2 Frd,Opn,Con,Anx,Dom 14 10683.4 10779.7 -5327.7 -0.6 1
3 Frd,Opn,Con,Dom 13 10684.3 10773.7 -5329.1 -2.0 1 Note. Bolding indicates the best model, according to the procedure. Con = Confidence, Act = Activity, Dom = Dominance, Anx = Anxiety. See Table 2 for explanation of all other abbreviations.
Only the correct first responses were separately analyzed, as well, for these two RT measures may tie into different processes (Prinzmetal et al., 2005). The models’ log-likelihoods again suggested that model 1, containing all predictors, was the best fit (Table 10). On the other hand, model 3, containing
74
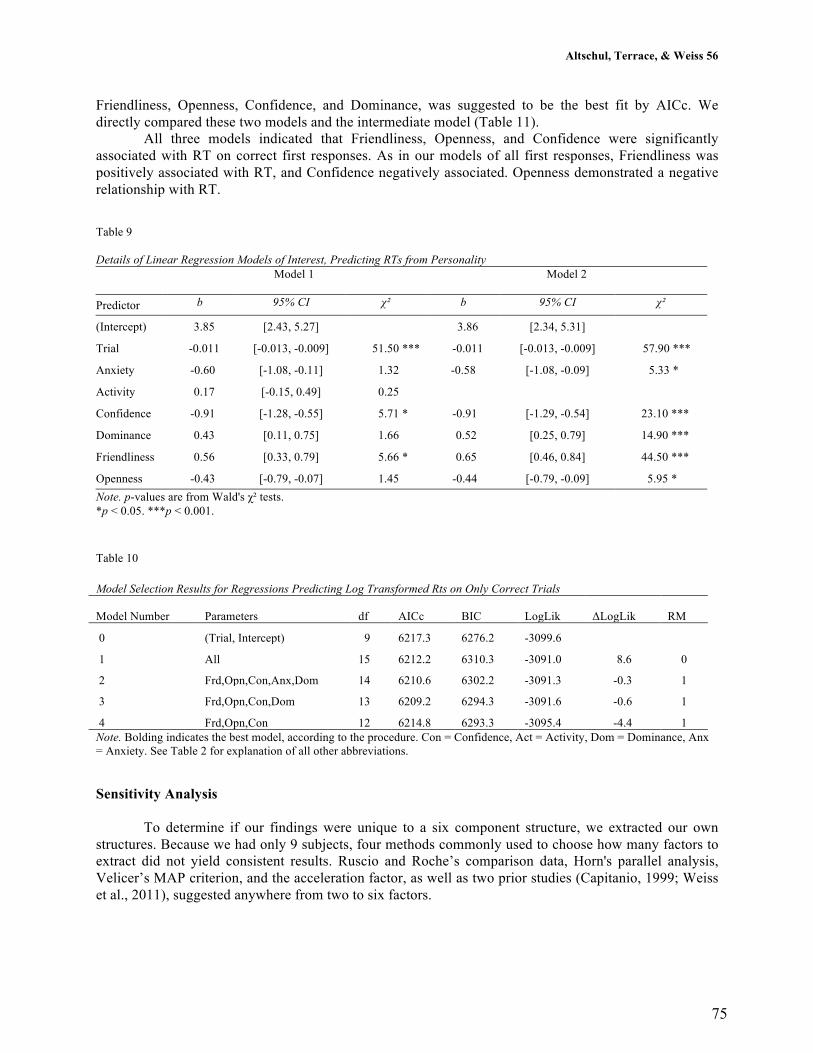
Altschul, Terrace, & Weiss 56
Friendliness, Openness, Confidence, and Dominance, was suggested to be the best fit by AICc. We directly compared these two models and the intermediate model (Table 11).
All three models indicated that Friendliness, Openness, and Confidence were significantly associated with RT on correct first responses. As in our models of all first responses, Friendliness was positively associated with RT, and Confidence negatively associated. Openness demonstrated a negative relationship with RT.
Table 9
Details of Linear Regression Models of Interest, Predicting RTs from Personality Model 1 Model 2
Predictor b 95% CI χ² b 95% CI χ²
(Intercept) 3.85 [2.43, 5.27] 3.86 [2.34, 5.31]
Trial -0.011 [-0.013, -0.009] 51.50 *** -0.011 [-0.013, -0.009] 57.90 ***
Anxiety -0.60 [-1.08, -0.11] 1.32 -0.58 [-1.08, -0.09] 5.33 *
Activity 0.17 [-0.15, 0.49] 0.25
Confidence -0.91 [-1.28, -0.55] 5.71 * -0.91 [-1.29, -0.54] 23.10 ***
Dominance 0.43 [0.11, 0.75] 1.66 0.52 [0.25, 0.79] 14.90 ***
Friendliness 0.56 [0.33, 0.79] 5.66 * 0.65 [0.46, 0.84] 44.50 ***
Openness -0.43 [-0.79, -0.07] 1.45 -0.44 [-0.79, -0.09] 5.95 * Note. p-values are from Wald's χ² tests. *p < 0.05. ***p < 0.001.
Table 10
Model Selection Results for Regressions Predicting Log Transformed Rts on Only Correct Trials
Model Number Parameters df AICc BIC LogLik ΔLogLik RM
0 (Trial, Intercept) 9 6217.3 6276.2 -3099.6
1 All 15 6212.2 6310.3 -3091.0 8.6 0
2 Frd,Opn,Con,Anx,Dom 14 6210.6 6302.2 -3091.3 -0.3 1
3 Frd,Opn,Con,Dom 13 6209.2 6294.3 -3091.6 -0.6 1
4 Frd,Opn,Con 12 6214.8 6293.3 -3095.4 -4.4 1 Note. Bolding indicates the best model, according to the procedure. Con = Confidence, Act = Activity, Dom = Dominance, Anx = Anxiety. See Table 2 for explanation of all other abbreviations.
Sensitivity Analysis
To determine if our findings were unique to a six component structure, we extracted our own structures. Because we had only 9 subjects, four methods commonly used to choose how many factors to extract did not yield consistent results. Ruscio and Roche’s comparison data, Horn's parallel analysis, Velicer’s MAP criterion, and the acceleration factor, as well as two prior studies (Capitanio, 1999; Weiss et al., 2011), suggested anywhere from two to six factors.
75
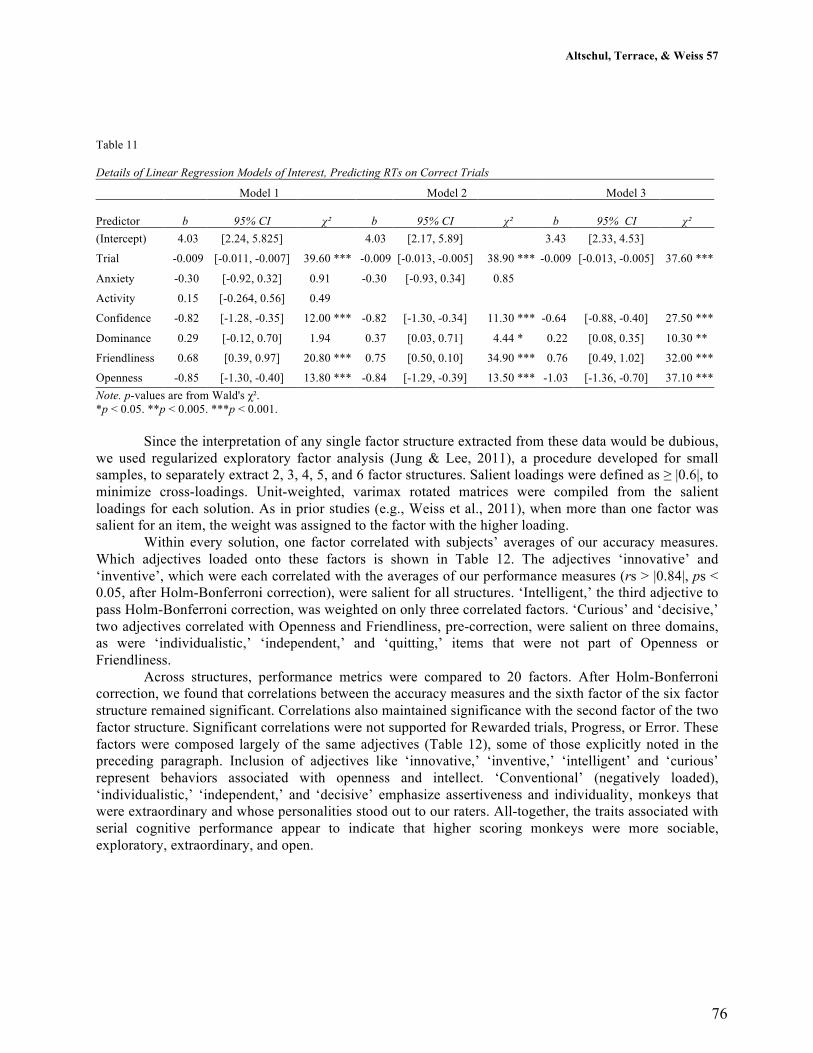
Altschul, Terrace, & Weiss 57
Table 11
Details of Linear Regression Models of Interest, Predicting RTs on Correct Trials
Model 1 Model 2 Model 3
Predictor b 95% CI χ² b 95% CI χ² b 95% CI χ² (Intercept) 4.03 [2.24, 5.825] 4.03 [2.17, 5.89] 3.43 [2.33, 4.53]
Trial -0.009 [-0.011, -0.007] 39.60 *** -0.009 [-0.013, -0.005] 38.90 *** -0.009 [-0.013, -0.005] 37.60 ***
Anxiety -0.30 [-0.92, 0.32] 0.91 -0.30 [-0.93, 0.34] 0.85
Activity 0.15 [-0.264, 0.56] 0.49
Confidence -0.82 [-1.28, -0.35] 12.00 *** -0.82 [-1.30, -0.34] 11.30 *** -0.64 [-0.88, -0.40] 27.50 ***
Dominance 0.29 [-0.12, 0.70] 1.94 0.37 [0.03, 0.71] 4.44 * 0.22 [0.08, 0.35] 10.30 **
Friendliness 0.68 [0.39, 0.97] 20.80 *** 0.75 [0.50, 0.10] 34.90 *** 0.76 [0.49, 1.02] 32.00 ***
Openness -0.85 [-1.30, -0.40] 13.80 *** -0.84 [-1.29, -0.39] 13.50 *** -1.03 [-1.36, -0.70] 37.10 ***Note. p-values are from Wald's χ². *p < 0.05. **p < 0.005. ***p < 0.001.
Since the interpretation of any single factor structure extracted from these data would be dubious, we used regularized exploratory factor analysis (Jung & Lee, 2011), a procedure developed for small samples, to separately extract 2, 3, 4, 5, and 6 factor structures. Salient loadings were defined as ≥ |0.6|, to minimize cross-loadings. Unit-weighted, varimax rotated matrices were compiled from the salient loadings for each solution. As in prior studies (e.g., Weiss et al., 2011), when more than one factor was salient for an item, the weight was assigned to the factor with the higher loading.
Within every solution, one factor correlated with subjects’ averages of our accuracy measures. Which adjectives loaded onto these factors is shown in Table 12. The adjectives ‘innovative’ and ‘inventive’, which were each correlated with the averages of our performance measures (rs > |0.84|, ps < 0.05, after Holm-Bonferroni correction), were salient for all structures. ‘Intelligent,’ the third adjective to pass Holm-Bonferroni correction, was weighted on only three correlated factors. ‘Curious’ and ‘decisive,’ two adjectives correlated with Openness and Friendliness, pre-correction, were salient on three domains, as were ‘individualistic,’ ‘independent,’ and ‘quitting,’ items that were not part of Openness or Friendliness.
Across structures, performance metrics were compared to 20 factors. After Holm-Bonferroni correction, we found that correlations between the accuracy measures and the sixth factor of the six factor structure remained significant. Correlations also maintained significance with the second factor of the two factor structure. Significant correlations were not supported for Rewarded trials, Progress, or Error. These factors were composed largely of the same adjectives (Table 12), some of those explicitly noted in the preceding paragraph. Inclusion of adjectives like ‘innovative,’ ‘inventive,’ ‘intelligent’ and ‘curious’ represent behaviors associated with openness and intellect. ‘Conventional’ (negatively loaded), ‘individualistic,’ ‘independent,’ and ‘decisive’ emphasize assertiveness and individuality, monkeys that were extraordinary and whose personalities stood out to our raters. All-together, the traits associated with serial cognitive performance appear to indicate that higher scoring monkeys were more sociable, exploratory, extraordinary, and open.
76
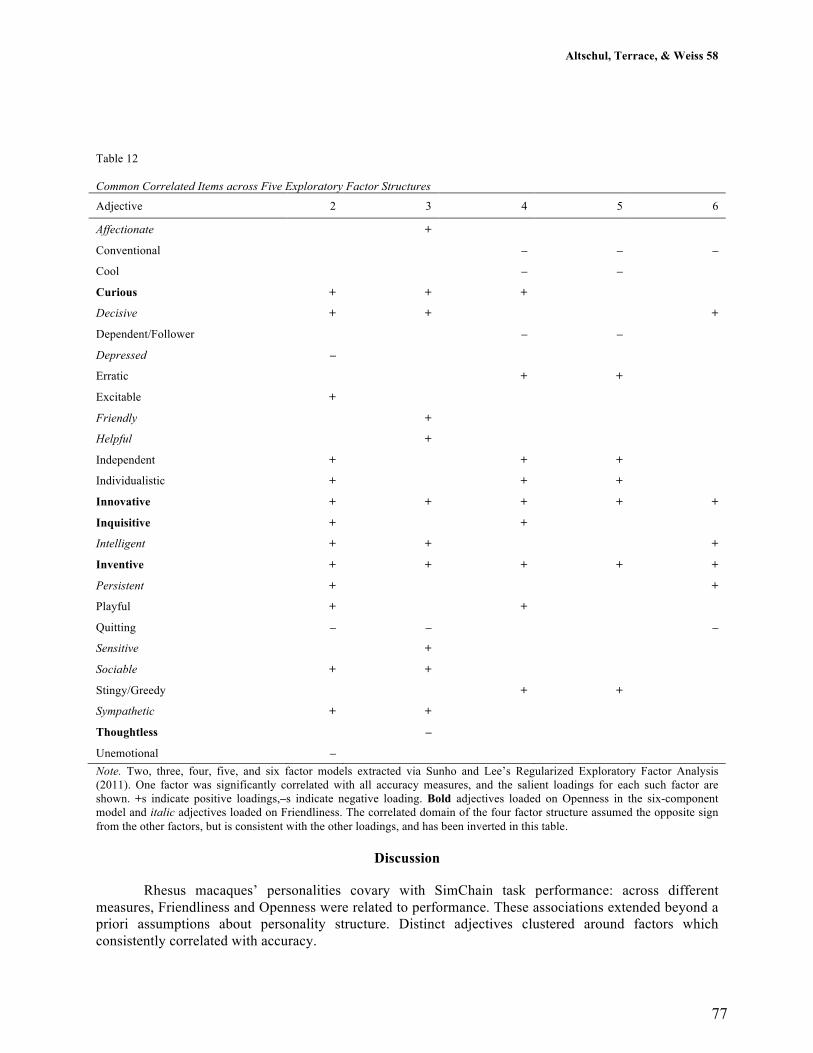
Altschul, Terrace, & Weiss 58
Table 12
Common Correlated Items across Five Exploratory Factor Structures Adjective 2 3 4 5 6
Affectionate +
Conventional – – –
Cool – –
Curious + + +
Decisive + + +
Dependent/Follower – –
Depressed –
Erratic + +
Excitable +
Friendly +
Helpful +
Independent + + +
Individualistic + + +
Innovative + + + + +
Inquisitive + +
Intelligent + + +
Inventive + + + + +
Persistent + +
Playful + +
Quitting – – –
Sensitive +
Sociable + +
Stingy/Greedy + +
Sympathetic + +
Thoughtless –
Unemotional – Note. Two, three, four, five, and six factor models extracted via Sunho and Lee’s Regularized Exploratory Factor Analysis (2011). One factor was significantly correlated with all accuracy measures, and the salient loadings for each such factor are shown. +s indicate positive loadings,–s indicate negative loading. Bold adjectives loaded on Openness in the six-component model and italic adjectives loaded on Friendliness. The correlated domain of the four factor structure assumed the opposite sign from the other factors, but is consistent with the other loadings, and has been inverted in this table.
Discussion
Rhesus macaques’ personalities covary with SimChain task performance: across different measures, Friendliness and Openness were related to performance. These associations extended beyond a priori assumptions about personality structure. Distinct adjectives clustered around factors which consistently correlated with accuracy.
77
Altschul, Terrace, & Weiss 59
Openness and Friendliness drive distinct aspects of SimChain performance. Friendliness was consistently related to performance over time: the magnitude of asymptotic performance under the Progress metric, and the linear slope of the transformed Error variable, approaching zero (Figure 2). Openness was related to the rate of learning: the steepness of the Progress curve, and the starting point of the Error curve.
The Error models are not clearly interpretable because we needed to model a transformed Error variable in order to cope with Error’s inherent non-linearity. Nevertheless, the contributions of Friendliness and Openness are also distinct in these models. The distinction between the effects of different personality dimensions is lost in our models of Rewarded trials and RTs, and considering that the averages of all accuracy measures are very highly correlated, it may be that a single latent variable drives the relationships between performance and both Openness and Friendliness. This is consistent with the observation that the g factor predicts performance across diverse mental tasks, while being consistently related to personality (Ackerman & Heggestad, 1997).
Confidence, while not strongly correlated with any performance measure (rs = 0.08 to 0.38), repeatedly appeared as a significant predictor, particularly in models of RT. Researchers of general intelligence recognize that external variables, such as speed-accuracy trade-off strategies and assessment anxiety, can affect assessment (Chamorro-Premuzic & Furnham, 2014). Confidence appears to be one such variable, being more closely associated with RTs than accuracy; suggesting that it may play a similar role as Extraversion and Neuroticism, associated with speed-accuracy trading-off and test-taking anxiety respectively, in humans. This is consistent with the fact that Confidence captures situational and social fear (Weiss et al., 2011).
Our results compare favorably to those of Morton et al. (2013), who found correlations between Openness and both task participation and response error in capuchin monkeys. Similarly, chimpanzee participation and performance (Herrelko et al., 2012; Hopper et al., 2014), has been tied to the Openness dimension of that species. However, Morton et al. warn against over-extensive comparisons between studies, as neither personality dimensions nor cognitive tasks tend to be directly analogous to one another. Even if personality dimensions have been assigned the same descriptive names post-hoc, they will never represent quite the same capacities. Similarly, while all cognitive tasks will tap into general and more specific domains of intelligence, for researchers to understand the psychological differences underlying individual and species level differences in performance, task implementation must be as consistent as possible.
While animal studies have only begun to explore the associations between personality and cognitive abilities, the literature on humans is more developed, and ought to be used as one reference point for the formulation of hypotheses and interpretation of results. Openness in humans is modestly to moderately correlated with g (Ackerman & Heggestad, 1997), particularly with typical intellectual engagement and crystalized intelligence. Macaque Friendliness does not have a clear analog among the Big Five; it is mostly constituted by adjectives associated with the human domain of Extraversion and Agreeableness, and perhaps crucially, the item ‘intelligent’, which positively loads on human Openness (DeYoung, 2014). Monkeys scoring high on Friendliness have been described as “sociable and cooperative” (Weiss et al., 2011, p. 77), and it is likely the cooperative aspect of the domain that makes friendly monkeys strong performers.
In humans, RT has been repeatedly correlated with g (Jensen, 2006). The fact that correct RTs are predicted by Openness and Friendliness is consistent with a general factor among this species. However, the association between Friendliness and RT is positive (i.e., Friendlier monkeys are slower to respond), in contrast to Openness, which has a negative relationship with RT. Friendliness and Openness mirror each other in predicting accuracy. This divergence is curious, but consistent with the hypothesis that RT and accuracy require different mechanisms (Prinzmetal et al., 2005), and suggests that the mechanism underlying the association between RT and g ought to be studied further. RT measures within the human species have proven to be robust, and this study suggests that RT differences could be useful among other primates, but only as a within-species measure. Washburn and Rumbaugh (1997) previously discussed the
78

Altschul, Terrace, & Weiss 60
comparative flaws in using RT; to grasp the magnitude and significance of cognitive differences between species, researchers must take care when choosing their measures.
Cognitive and neurological evidence indicates that RT and accuracy rely on different architectures (Landau, Esterman, Robertson, Bentin, & Prinzmetal, 2007). What evidence we found reinforces this theory; our results imply that RT can be predicted by personality domains that are not related to accuracy. Our findings strengthen the need for comprehensive, unified testing of primate intelligence, particularly in the context of personality, and we reiterate Morton et al.’s (2013) call for caution when studying animal cognition and personality with small samples.
The Primate Cognition Test Battery (Herrmann et al., 2010) is perhaps the best known collection of cognitive tests for primates, but its assessment of physical and spatial cognition is limited to basic, concrete tests; it contains no test of symbolic reasoning, of which SimChain is but one. The SimChain paradigm has been used in several species (Terrace, 1993; Wagner, Hopper, & Ross, 2015), with immature and adult individuals (Inoue & Matsuzawa, 2009); the task is repeatable and informative. Distinct cognitive tasks are likely to tap into general or domain specific intelligences to varying degrees, and since it is not known how many factors are best for modeling macaque intelligence, it remains an open question which domains SimChain performance draws on. However, even in models of intelligence with more than a general factor, there tends to be significant overlap between specific domains and g (Danner, Hagemann, Schankin, Hager, & Funke, 2011). While SimChain is likely representative of g, the task is at very least a strong indicator of symbolic reasoning. Additionally, our monkeys had achieved mastery with the SimChain task when tested for this study, so task learning effects would not affect results (Vonk & Povinelli, 2011); this is beneficial since it removes a confound, but it would also be interesting to investigate associations between personality and task acquisition.
More research is needed to determine how tests of serial cognition relate to other tasks, like numerical addition or object transposition (Herrmann et al., 2010). Once relationships between tasks are established, tests of more advanced cognitive faculties could be incorporated into batteries that assess comparable abilities in primates and adult humans. Regardless of whether general intelligence correlates with one of more primate personality dimensions, individual tests - representative of physical, social, or other cognitive proficiencies - might be tied to different personality dimensions, as is suggested in the human literature (Austin et al., 1997; Chamorro-Premuzic & Furnham, 2014). Additionally, factor models of primate intelligence have been investigated (Herrmann et al., 2010; Hopkins et al., 2014), and the results have been favorable.
Complex cognitive tasks, like Raven’s Progressive Matrices, are extensively used in human intelligence testing because of their strong associations with general intelligence and specific abilities (Austin et al., 1997). Raven’s Matrices is also a difficult task, which is a major reason why it is an effective test (Raven, 2000). Our study demonstrates that nonhuman primates are capable of completing complex cognitive tasks that have meaningful associations with personality and intelligence, and other, difficult tasks need not be ruled out as being too challenging for primates.
Our study is not without limitations. SimChain tests serial cognition, and consequently only assesses a portion of a monkey’s cognitive repertoire. For instance, while SimChain allows us to capture characteristics about accuracy, it is not as well-suited for studying RTs – we could only model the latency between stimuli onset and the first response. Our sample of monkeys also contained only males, and while a representative sample ought to of course include females, evidence from multiple tasks showed no sex differences in any performance metrics among a group of six male and seven female long-tailed macaques (Schmitt et al., 2012). However, Hopper et al. (2014) found differing contributions from personality to male and female chimpanzees’ problem solving success, so we ought not to rule out the possibility that performance in female macaques may have a different relationship with personality.
A comprehensive study using large samples would be the best way to tackle task consistency, sex differences, and other sources of variability. Different primate species, all of whom have been rigorously trained and tested in a diverse range of cognitive tasks, ought to be rated for personality, which would allow us to address questions concerning the evolution of general and specific types of intelligence, and the common origins of intelligence and personality. Even a broad study such as this would likely suffer
79
Altschul, Terrace, & Weiss 61
from a drawback that our work suffers from as well: these results rely on captive animals, and captive animals may not be representative of the wider population.
Nevertheless, captive animals are useful models. Rhesus macaques are the gold standard for primate research in neuroscience, genetics, and medicine and our results have implication for these fields. Subjective well-being and personality are heritable and phenotypically and genetically correlated in nonhuman primates (e.g., Adams, King, & Weiss, 2012). Moreover, Friendliness, which is correlated with subjective well-being in macaques (Weiss et al., 2011), is associated with serial intelligence. Subsequent research is needed to determine if the six macaque domains and subjective well-being are heritable, but in humans and chimpanzees, both well-being and personality are heritable, and genetically correlated (Weiss, Bates, & Luciano, 2008; Weiss, King, & Enns, 2002); intelligence too is heritable in both ape species (Davies et al., 2011; Hopkins et al., 2014). The existing monkey literature supports the heritability of personality (Brent et al., 2014; Williamson et al., 2003), though as of yet, no substantive evidence supports the heritability of subjective well-being and intelligence in rhesus macaques. More research needs to investigate these questions, for if individual psychological differences are heritable in macaques, artificial breeding and the research coming out of macaque colonies might be improved by selecting for friendly, intelligent, and mentally healthy phenotypes.
Intelligence and personality are the two pillars of differential psychology. Intelligence has for some time been a major subject of study for evolutionary biologists, and personality has recently gained traction among behavioral ecologists and comparative psychologists (Griffin et al., 2015; Weiss & Altschul, in press). Deeper investigations into primate cognition and personality will enrich both comparative and differential psychology.
Acknowledgements
This research was supported by National Institute of Mental Health (NIMH) grant R01 MH051153. The authors would like to thank Greg Jensen and all other members of the Columbia University Primate Cognition Lab for providing the personality ratings in this study.
References
Ackerman, P. L., & Heggestad, E. D. (1997). Intelligence, personality, and interests: Evidence for overlapping traits. Psychological Bulletin, 121, 219. doi: 10.1037/0033-2909.121.2.219
Adams, M. J., King, J. E., & Weiss, A. (2012). The majority of genetic variation in orangutan personality and subjective well-being is nonadditive. Behavior Genetics, 42, 675–686. doi: 10.1007/s10519-012-9537-y
Austin, E. J., Deary, I. J., & Gibson, G. J. (1997). Relationships between ability and personality: Three hypotheses tested. Intelligence, 25, 49–70. doi: 10.1016/S0160-2896(97)90007-6
Bates, D., Maechler, M., Bolker, B., & Walker, S. (2015). lme4: Linear mixed-effects models using Eigen and S4 (Version 1.1–9) [Software]. Available from https://CRAN.R-project.org/package=lme4
Bouchard, T. J., Jr., & Loehlin, J. C. (2001). Genes, evolution, and personality. Behavior Genetics, 31, 243–273. doi: 10.1023/A:1012294324713
Brent, L. J., Semple, S., MacLarnon, A., Ruiz-Lambides, A., Gonzalez-Martinez, J., & Platt, M. L. (2014). Personality traits in rhesus macaques (Macaca mulatta) are heritable but do not predict reproductive output. International Journal of Primatology, 35, 188–209. doi: 10.1007/s10764-013-9724-6
Capitanio, J. P. (1999). Personality dimensions in adult male rhesus macaques: Prediction of behaviors across time and situation. American Journal of Primatology, 47, 299–320. doi: 10.1002/(SICI)1098-2345(1999)47:4<299::AID-AJP3>3.0.CO;2-P
Chamorro-Premuzic, T., & Furnham, A. (2014). Personality and intellectual competence. New York, NY: Psychology Press.
Chen, S., Swartz, K. B., & Terrace, H. S. (1997). Knowledge of the ordinal position of list items in rhesus monkeys. Psychological Science, 8, 80-86. doi: 10.1111/j.1467–9280.1997.tb00687.x
Coleman, K., Tully, L. A., & McMillan, J. L. (2005). Temperament correlates with training success in adult rhesus macaques. American Journal of Primatology, 65, 63–71. doi: 10.1002/ajp.20097
80
Altschul, Terrace, & Weiss 62
Crawford, M. P. (1938). A behavior rating scale for young chimpanzees. Journal of Comparative Psychology, 26, 79–91. doi: 10.1037/h0054503
D’Amato, M. R., & Colombo, M. (1990). The symbolic distance effect in monkeys (Cebus apella). Animal Learning & Behavior, 18, 133–140. doi: 10.3758/BF03205250
Danner, D., Hagemann, D., Schankin, A., Hager, M., & Funke, J. (2011). Beyond IQ: A latent state-trait analysis of general intelligence, dynamic decision making, and implicit learning. Intelligence, 39, 323–334. doi: 10.1016/j.intell.2011.06.004
Davies, G., Tenesa, A., Payton, A., Yang, J., Harris, S. E., Liewald, D., ...Deary, I. J. (2011). Genome-wide association studies establish that human intelligence is highly heritable and polygenic. Molecular psychiatry, 16, 996–1005. doi: 10.1038/mp.2011.85
Deaner, R. O., Van Schaik, C. P., & Johnson, V. (2006). Do some taxa have better domain-general cognition than others? A meta-analysis of nonhuman primate studies. Evolutionary Psychology, 5, 235–240. doi: 10.1177/147470490600400114
Deary, I. J. (2001). Intelligence: A very short introduction. Oxford, UK: Oxford University Press. doi:10.1093/actrade/9780192893215.001.0001
Deary, I. J., Spinath, F. M., & Bates, T. C. (2006). Genetics of intelligence. European Journal of Human Genetics, 14, 690–700. doi: 10.1038/sj.ejhg.5201588
DeYoung, C. G. (2014). Openness/Intellect: A dimension of personality reflecting cognitive exploration. APA Handbook of Personality and Social Psychology: Personality Processes and Individual Differences, 4, 369–399. doi: 10.1037/14343-017
Ebbinghaus, H. (1913/2014). Memory: A contribution to experimental psychology. Annals of Neurosciences, 20. doi: 10.5214/ans.0972.7531.200408
Fagot, J., Gullstrand, J., Kemp, C., Defilles, C., & Mekaouche, M. (2014). Effects of freely accessible computerized test systems on the spontaneous behaviors and stress level of Guinea baboons (Papio papio). American Journal of Primatology, 76, 56–64. doi: 10.1002/ajp.22193
Fox, J., & Weisberg, S. (2011). An R companion to applied regression (2nd edition) [Software]. Available from http://socserv.socsci.mcmaster.ca/jfox/Books/Companion
Goodall, J. (1990). Through a window: 30 years of observing the Gombe chimpanzees. London, England: Weidenfeld & Nicolson.
Griffin, A. S., Guillette, L. M., & Healy, S. D. (2015). Cognition and personality: An analysis of an emerging field. Trends in Ecology & Evolution, 30, 207–214. doi: 10.1016/j.tree.2015.01.012
Guillette, L. M., Hahn, A. H., Hoeschele, M., Przyslupski, A., & Sturdy, C. B. (2015). Individual differences in learning speed, performance accuracy and exploratory behaviour in black-capped chickadees. Animal Cognition, 18, 165–178. doi: 10.1007/s10071-014-0787-3
Hebb, D. O. (1946). Emotion in man and animal: An analysis of the intuitive process of recognition. Psychological Review, 53, 88–106. doi: 10.1037/h0063033
Herrelko, E. S., Vick, S., & Buchanan-Smith, H. M. (2012). Cognitive research in zoo-housed chimpanzees: Influence of personality and impact on welfare. American Journal of Primatology, 74, 828–840. doi: 10.1002/ajp.22036
Herrmann, E., Call, J., Hernández-Lloreda, M. V., Hare, B., & Tomasello, M. (2007). Humans have evolved specialized skills of social cognition: The cultural intelligence hypothesis. Science, 317, 1360–1366. doi: 10.1126/science.1146282
Herrmann, E., Hernández-Lloreda, M. V., Call, J., Hare, B., & Tomasello, M. (2010). The structure and individual differences in the cognitive abilities of children and chimpanzees. Psychological Science 21, 102–110. doi: 10.1177/0956797609356511
Hopkins, W. D., Russell, J. L., & Schaeffer, J. (2014). Chimpanzee intelligence is heritable. Current Biology, 24, 1649–1652. doi: 10.1016/j.cub.2014.05.076
Hopper, L. M., Price, S. A., Freeman, H. D., Lambeth, S. P., Schapiro, S. J., & Kendal, R. L. (2014). Influence of personality, age, sex, and estrous state on chimpanzee problem-solving success. Animal Cognition, 17, 835–847. doi: 10.1007/s10071-013-0715-y
Inoue, S., & Matsuzawa, T. (2009). Acquisition and memory of sequence order in young and adult chimpanzees (Pan troglodytes). Animal cognition,12, 59-69. doi: 10.1007/s10071-009-0274-4
Itani, J. (1957). Personality of Japanese monkeys. Iden, 11, 29–33. Jensen, A. R. (2006). Clocking the mind: Mental chronometry and individual differences. Oxford, UK: Elsevier.
81
Altschul, Terrace, & Weiss 63
Jensen, G., Altschul, D., Danly, E., & Terrace, H. (2013). Transfer of a serial representation between two distinct tasks by rhesus macaques. PLoS one, 8, e70285. doi: 10.1371/journal.pone.0070285
Jung, S., & Lee, S. (2011). Exploratory factor analysis for small samples. Behavior Research Methods, 43, 701–709. doi: 10.3758/s13428-011-0077-9
King, J. E., & Figueredo, A. J. (1997). The five-factor model plus dominance in chimpanzee personality. Journal of Research in Personality, 31, 257–271. doi: 10.1006/jrpe.1997.2179
Konečná, M., Lhota, S., Weiss, A., Urbánek, T., Adamová, T., & Pluháček, J. (2008). Personality in free-ranging Hanuman langur (Semnopithecus entellus) males: Subjective ratings and recorded behavior. Journal of Comparative Psychology, 122, 379–389. doi: 10.1037/a0012625
Landau, A. N., Esterman, M., Robertson, L. C., Bentin, S., & Prinzmetal, W. (2007). Different effects of voluntary and involuntary attention on EEG activity in the gamma band. The Journal of Neuroscience, 27, 11986–11990. doi: 10.1523/JNEUROSCI.3092-07.2007
Matzel, L. D., Han, Y. R., Grossman, H., Karnik, M. S., Patel, D., Scott, N., …Gandhi, C. C. (2003). Individual differences in the expression of a “general” learning ability in mice. The Journal of Neuroscience, 23, 6423–6433. Retrieved from: http://www.ncbi.nlm.nih.gov/pubmed/12878682.
McCrae, R. R., & John, O. P. (1992). An introduction to the five-factor model and its applications. Journal of Personality, 60, 172–215. doi: 10.1111/j.1467-6494.1992.tb00970.x
McGonigle, B., & Chalmers, M. (2006). Ordering and executive functioning as a window on the evolution and development of cognitive systems. International Journal of Comparative Psychology, 19, 241–267. Retrieved from: http://escholarship.org/uc/item/21m346kb.
Morton, F. B., Lee, P. C., & Buchanan-Smith, H. M. (2013). Taking personality selection bias seriously in animal cognition research: A case study in capuchin monkeys (Sapajus apella). Animal Cognition, 16, 677–684. doi: 10.1007/s10071-013-0603-5
Pavlov, I. P. (1908/1941). Lectures on conditioned reflexes: Conditioned reflexes and psychiatry (Vol. 2) (W. H. Gantt, Trans.). London: Lawrence and Wishart Limited.
Paxton, R., Basile, B. M., Adachi, I., Suzuki, W. A., Wilson, M. E., & Hampton, R. R. (2010). Rhesus monkeys (Macaca mulatta) rapidly learn to select dominant individuals in videos of artificial social interactions between unfamiliar conspecifics. Journal of Comparative Psychology, 124, 395–401. doi: 10.1037/a0019751
Pederson, A. K., King, J. E., & Landau, V. I. (2005). Chimpanzee (Pan troglodytes) personality predicts behavior. Journal of Research in Personality, 39, 534–549. doi: 10.1016/j.jrp.2004.07.002
Penke, L., Denissen, J. J., & Miller, G. F. (2007). Evolution, genes, and inter-‐‑disciplinary personality research. European Journal of Personality, 21, 639–665. doi: 10.1002/per.657
Pinheiro, J., Bates, D., DebRoy, S., Sarkar, D., & R Core Team (2015). nlme: Linear and nonlinear mixed effects models (Version 3.1–120) [Software]. Available from: http://CRAN.R-project.org/package=nlme
Prinzmetal, W., McCool, C., & Park, S. (2005). Attention: Reaction time and accuracy reveal different mechanisms. Journal of Experimental Psychology, 134, 73. doi: 10.1037/0096-3445.134.1.73
R Core Team (2013). R: A language and environment for statistical computing [Software]. Vienna, Austria: R Foundation for Statistical Computing. Available from: http://www.R-project.org/.
Raven, J. (2000). The Raven's progressive matrices: Change and stability over culture and time. Cognitive Psychology, 41, 1–48. doi:10.1006/cogp.1999.0735
Réale, D., Reader, S. M., Sol, D., McDougall, P. T., & Dingemanse, N. J. (2007). Integrating animal temperament within ecology and evolution. Biological Reviews, 82, 291–318. doi: 10.1111/j.1469-185X.2007.00010.x
Revelle, W. (2015). Psych: Procedures for personality and psychological research (Version 1.5.8) [Software]. Available from: http://CRAN.R-project.org/package=psych
Reader, S. M., Hager, Y., & Laland, K. N. (2011). The evolution of primate general and cultural intelligence. Philosophical Transactions of the Royal Society B: Biological Sciences, 366, 1017–1027. doi: 10.1098/rstb.2010.0342
Scarf, D., Danly, E., Morgan, G., Colombo, M., & Terrace, H. S. (2011). Sequential planning in rhesus monkeys (Macaca mulatta). Animal cognition, 14, 317–324. doi: 10.1007/s10071-010-0365-2
Schmitt, V., Pankau, B., & Fischer, J. (2012). Old World monkeys compare to apes in the primate cognition test battery. PLoS one, 7, e32024. doi: 10.1371/journal.pone.0032024
Shrout, P. E., & Fleiss, J. L. (1979). Intraclass correlations: Uses in assessing rater reliability. Psychological Bulletin, 86, 420–28. doi: 10.1037/0033-2909.86.2.420
82
Altschul, Terrace, & Weiss 64
Terrace, H. S. (1993). The phylogeny and ontogeny of serial memory: List learning by pigeons and monkeys. Psychological Science, 4, 162–169. doi: 10.1111/j.1467-9280.1993.tb00481.x
Vonk, J., & Povinelli, D. (2011). Individual differences in long-term cognitive testing in a group of captive chimpanzees. International Journal of Comparative Psychology, 24, 137–167.
Vrieze, S. I. (2012). Model selection and psychological theory: A discussion of the differences between the Akaike information criterion (AIC) and the Bayesian information criterion (BIC). Psychological Methods, 17, 228. doi: 10.1037/a0027127
Wagner, K., Hopper, L., & Ross, S. (2015). Asymmetries in the production of self-directed behavior by chimpanzees and gorillas during a computerized cognitive test. Animal Cognition, 1–8. doi: 10.1007/s10071-015-0937-2
Washburn, D. A., & Rumbaugh, D. M. (1997). Faster is smarter, so why are we slower? A comparative perspective on intelligence and processing speed. American Psychologist, 52, 1147–1148. doi:10.1037/0003-066X.52.10.1147
Weiss, A., Adams, M. J., Widdig, A., & Gerald, M. S. (2011). Rhesus macaques (Macaca mulatta) as living fossils of hominoid personality and subjective well-being. Journal of Comparative Psychology, 125, 72–83. doi: 10.1037/a0021187
Weiss, A., & Altschul, D. M. (in press). Methods and applications of animal personality research. APA Handbook of Comparative Psychology.
Weiss, A., Bates, T. C., & Luciano, M. (2008). Happiness is a personal(ity) thing: the genetics of personality and well-being in a representative sample. Psychological Science, 19, 205–210. doi: 10.1111/j.1467-9280.2008.02068.x
Weiss, A., Inoue-Murayama, M., Hong, K.-W., Inoue, E., Udono, T., Ochiai, T., …King, J. E. (2009). Assessing chimpanzee personality and subjective well-being in Japan. American Journal of Primatology, 71, 283–292. doi: 10.1002/ajp.20649
Weiss, A., King, J. E., & Enns, R. M. (2002). Subjective well-being is heritable and genetically correlated with dominance in chimpanzees (Pan troglodytes). Journal of Personality and Social Psychology, 83, 1141. doi: 10.1037/0022-3514.83.5.1141
Williamson, D. E., Coleman, K., Bacanu, S. A., Devlin, B. J., Rogers, J., Ryan, N. D., & Cameron, J. L. (2003). Heritability of fearful-anxious endophenotypes in infant rhesus macaques: A preliminary report. Biological Psychiatry, 53, 284–291. doi: 10.1016/S0006-3223(02)01601-3
Yeo, I. K., & Johnson, R. A. (2000). A new family of power transformations to improve normality or symmetry. Biometrika, 87, 954–959. doi: 10.1093/biomet/87.4.954
Yerkes, R. M. (1939). The life history and personality of the chimpanzee. The American Naturalist, 73, 97–112. doi: 10.1086/280820
83
84
3.2 Personality and cognition, macaques and chimpanzees
This study reports differential effects in the rate at which each individual
learned serial lists, and the peak performance of each individual, once a list had been
learned. These individual differences in learning and performance were related to
personality, most notably, Openness and Friendliness.
Openness was most closely related to the rate of acquisition. High Openness
macaques were more likely to have steeper progress curves, indicating faster
learning, and lower intercept of the error curves, indicating that fewer mistakes at an
early point in the list. Higher Openness individuals also completed entire lists and
received rewards more frequently, and displayed faster response times.
Friendliness most closely related to asymptotic accuracy. That is, higher
Friendliness subjects, on average, correctly picked a greater number of items in a list,
after the individual had learned a given list and performance had stabilized. It ought
to be noted that in these macaques, learning a list did not confer perfect accuracy, but
as mentioned, performance was visibly asymptotic. Friendliness was also negatively
associated with error as the subjects gained experience; higher Friendliness
individuals were more successful at completing full trials, as well. However, higher
Friendliness individuals took significantly longer to make responses.
Friendliness does not have a direct analogue in chimpanzee or human
personality. Friendliness is a mix of items which load on chimpanzee Agreeableness
and Extraversion (King & Figueredo, 1997; Weiss, Inoue-Murayama, et al., 2009),
plus three items from chimpanzee Dominance: ‘intelligent’, ‘persistent’, and
85
‘decisive’. If one considers where the items load on human personality dimensions,
Agreeableness is the most strongly represented (6 items), but Friendliness also draws
from 3 items from human Extraversion, 2 from Conscientiousness, and 1 from
Openness (Weiss, Adams, Widdig, et al., 2011). It was difficult to make predictions
for what relationship might exist between Friendliness and performance. Overall, the
association was positive. Given the links to Extraversion, we might expect high
Friendliness macaques to have faster response times, but the effect we found was the
opposite of this.
As mentioned, these data represent expert subjects: macaques that were
performing at the peak of their abilities. Our results suggest that previous
associations between performance and personality dimensions like Openness are not
solely the result of greater interest in the tasks on the part of high Openness
individuals – our results showed a positive association between performance and
Openness even though the macaques performed this task as part of their daily
regimen and were not learning anything new about how the task functioned.
On the other hand, the context in which the macaques performed this task can
and should be viewed in an alternative light: these were expert subjects, thus the
learning capabilities described should not be extrapolated to task acquisition. This
sample was already the subject of some selection bias, as more behaviorally difficult
macaques are not often used in research that requires the macaques be extensively
trained. Naïve macaques at a breeding colony, for example, might display different
associations between personality and how quickly they completed basic training
tasks.

86
Rhesus macaques do not have a dimension of personality that is easily
comparable to Conscientiousness. The adjective items that constitute chimpanzee
Conscientiousness are evenly spread across the dimensions of macaque personality,
with the exception of Friendliness, which has none. Yet, Friendliness is loaded with
two items of human Conscientiousness, ‘persistent’ and ‘decisive’, both of which are
among the strongest of the Friendliness items correlated with performance in the
sensitivity analysis. Macaque Openness contains ‘thoughtless’ and ‘impulsive’, two
chimpanzee Conscientiousness items, which in our sensitivity analyses were not
major contributors to predicting performance. It may be that Conscientiousness,
though not strong enough to form a distinct dimension in rhesus macaques, does play
a role in performance via Friendliness. A longitudinal regimen of training and
testing, like that conducted in chapter 2, would likely elucidate any additional role
that Friendliness or Openness might play in learning.
It is also difficult to disentangle serial cognitive ability from test performance,
or rather, it is possible that the best performing individuals might have the most
favorable personality types for spending time in the experimental chambers. If this
were the case, we would have expected that the Anxiety dimension of macaque
personality would have been implicated in performance, and items like ‘persistent’,
‘cool’, and ‘quitting’ would have been more influential. These items were important
in our factor analyses, but not as important as items like ‘inventive’ and ‘innovative’,
which are less obviously linked to how well an individual might have adjusted to
working in the experimental chambers. However, with this limited set of data, no
firm conclusion can be reached.
87
Sample size is an issue for this study, though we took steps to verify our
findings. As demonstrated in chapter 2, including many trials per individual can help
alleviate the issues of insufficient power in small sample sizes. We gathered 800
trials with each macaque in this study, which was comparable to the number of trials
we gathered per individual in studies 1 and 2 of chapter 2. We analysed and reported
several measures to avoid falling prey to isolated false-positives. In all models and in
a sensitivity analysis, the results were remarkably similar.
Chapters 2 and 3 present results that are in many ways complementary, but
the direct comparison of differential psychological results from different species is
problematic (Morton, Lee, & Buchanan-Smith, 2013). Careful, consistent test and
test battery design will be crucial to the success of future research in comparative
differential psychology.
Test batteries ought to clearly target a wide range of domains, and if there are
logistical limitations that prevent this, then single domains ought to be targeted, as
using fewer, more similar tasks makes individual projects more achievable (Shaw &
Schmelz, 2017). As the time of writing, test batteries have tended to focus on overall
cognitive ability, and the study lower order domain abilities, such as serial cognition,
has been neglected. Regardless of whether or not a general factor of intelligence is
present in some, most, or even all animal species, understanding the hierarchical
structure of intelligence is crucial to understanding how cognition evolved.
Good test batteries alone are not enough, however. Researchers must ensure
that their samples are large enough, and also diverse enough. Non-cognitive factors,
such as prior experience and personality, can introduce biases that will distort finding
88
on cognitive ability, as demonstrated in chapter 2 and elsewhere (Morton, Lee, &
Buchanan-Smith, 2013). Some of these biases can be reduced through good test
battery design, but bias reduction approaches must also consider the testing
environment, e.g. whether animals feel comfortable and safe, and will not be
distracted. In general, identifying and measuring non-cognitive variables will allow
researchers to adjust for these effects, both experimentally and analytically.
At the time of writing, phylogenetic statistical approaches that allow for direct
comparison between species are becoming viable (MacLean et al., 2014; MacLean et
al., 2012), much of what we lack is sufficient data. Chapters 2 and 3, when viewed in
the context of the literature, suggest that there are consistent associations between
personality and cognitive abilities across primate species. To understand the
evolutionary underpinnings of differential psychology, we need to explore these
associations in more species.
This document now turns to the psychosomatic correlates of primate
personality. Chapters 4 through 6 will investigate the associations between
chimpanzee personality, health and longevity.
89
4 Personality and longevity in captive chimpanzees
4.1 Introduction
As organisms age, mortality risk increases due to the gradual deterioration of
vital functions. This accumulation of harmful effects in an aging organism, known as
biological senescence, impacts fitness as it makes organisms more likely to die from
predation, disease, or natural causes (Williams, 1957), and, consequently, in insects
(James & Warren, 1991), birds (Newton, 1989), and mammals (Kjellander, Gaillard,
Hewison, & Liberg, 2004; Silk et al., 2010), leave fewer surviving offspring.
Converging evidence from studies of Old World monkeys, great apes, and
humans, show that several aspects of individuals' social lives are linked to survival
and possible proxies of survival, such as allostatic load and inflammation (Uchino,
Cacioppo, & Kiecolt-Glaser, 1996). For instance, the social standing of a monkey,
ape, or human affects physiological stress responses (Sapolsky, 2005). Among male
olive baboons, submissive, isolated individuals have higher levels of cortisol,
suggesting increased allostatic load (Virgin & Sapolsky, 1997). In chimpanzees,
high-ranking individuals are generally less stressed, but when the hierarchy is
destabilized, for example, when a coalition of low-ranking males challenge a high-
ranking male in order to advance in social rank, the high-ranking individual becomes
more stressed; instability and reorganization can be common in wild chimpanzee
groups (Mitani et al., 2002; Sapolsky, 2005). Additionally, rhesus macaque immune
function and gene expression is known to respond to changes in social status

90
(Snyder-Mackler et al., 2016), and in humans, chronic stress associated with low
socioeconomic status has wide-ranging, consistent negative effects on health and
longevity (Eikemo et al., 2014).
The strength of social bonds is also associated with survival and fitness. For
example, the overall level of affiliative interaction among female savannah baboons
is associated with survival (Silk et al., 2010). Similar associations between
sociability and survival have been found for the closeness of bonds between male
Assamese macaques (Schülke, Bhagavatula, Vigilant, & Ostner, 2010), high network
centrality within coalitions among male chimpanzees (Gilby et al., 2013), and for
social relationship strength in humans (Holt-Lunstad, Smith, & Layton, 2010).
Differences in the quantity, quality, and hierarchical asymmetry of social
interactions, which affect survival, are expressions of personality differences. For
example, female chacma baboons characterized as nice or aloof retained a stable set
of social partners over several years, and nice baboons demonstrated higher overall
sociality (Seyfarth et al., 2012); both higher social stability and sociality are linked to
survival (Silk et al., 2010). Moreover, western lowland gorillas higher in
Extraversion, i.e., gorillas that were more sociable, playful, active, popular, and
curious, and less solitary and slow (Kuhar, Stoinski, Lukas, & Maple, 2006), were
more likely to still be alive nearly 19 years later in comparison to individuals that
were rated lower in Extraversion (Weiss et al., 2013).
The personality traits and other individual differences that affect survival in
nonhuman primates and humans extend beyond traits that reflect one’s place in a
social hierarchy or one’s behavior in the social world. Personality traits related to
91
self-control, exploration, emotional reactivity, and vigilance are also related to
survival. Across a variety of nonhuman animal species, including primates,
individuals lower in boldness and higher in exploratory behavior and aggressiveness
in novel environments, survived longer (Smith & Blumstein, 2008).
Personality traits are also associated with survival in humans. These studies
typically use a set of five personality dimensions, known as the “Big Five” or “Five-
Factor Model” (Digman, 1990). These dimensions include social traits (Extraversion
and Agreeableness) like those described in the previous paragraph, but also traits
related to self-control (Conscientiousness), exploration (Openness to experience),
and emotional reactivity and vigilance (Neuroticism). However, personality
dimensions related to social standing have not been identified in human personality
models (Digman, 1990). Broadly speaking, Extraversion and Agreeableness
characterize how often and how well we navigate our social world, respectively
(Leary & Hoyle, 2009). Although aspects of Extraversion, namely positive emotions,
are associated with survival (Roberts et al., 2007), the association between survival
and Agreeableness is more consistent and robust (Strickhouser et al., 2017).
Some of the remaining non-social traits are also associated with longer life in
humans. Higher Conscientiousness, reflecting self-control and persistence, is most
commonly and usually most strongly associated with increased longevity (Jokela et
al., 2013; Roberts et al., 2007). Higher Neuroticism, reflecting higher reactivity, is
often associated with decreased longevity (Roberts et al., 2007). However, Openness,
which reflects exploratory behavior, does not appear to have a consistent or strong
92
association with longevity (Turiano, Spiro III, & Mroczek, 2012; Weiss & Costa,
2005) or general health (Strickhouser et al., 2017).
Social rank is most often operationalized through socioeconomic status (SES)
in humans (Sapolsky, 2004); while low SES is associated with reduced longevity
(Eikemo et al., 2014; Lynch, Smith, Kaplan, & House, 2000), the effect size of SES
is less than the effect size imparted by personality (Roberts et al., 2007). Broadly
speaking, rank, dominance, or SES can often have an effect on longevity and health,
but species or even population specific circumstances can moderate or eliminate
these effects (Sapolsky, 2004).
Chimpanzees and humans share a recent common ancestor, and thus studying
chimpanzees enables us to identify behaviors present in our common ancestor. This
research has found, for example, that culture and intragroup aggression are not
characteristics exclusive to modern humans (Whiten et al., 1999; Wilson et al.,
2014). Similar studies found that chimpanzees possess five personality dimensions
like those of humans, plus a dimension termed Dominance (Freeman & Gosling,
2010) that reflects competitive prowess, social competence, and fearlessness (King &
Figueredo, 1997).
The question, then, is whether associations between human personality traits
and longevity were present in our common ancestor or whether they reflect modern,
and perhaps ancestral, humans’ ability to have some control over their health, e.g., by
exercising voluntarily, or taking steps to eliminate health threats, such as smoking?
To these ends, we studied associations between personality traits and mortality,
assessed during a 6 to 23 year follow-up period, in a large, comprehensive sample of
93
chimpanzees living in zoological parks, research facilities, and sanctuaries located in
the United States, the United Kingdom, Australia, and Japan.
A Kaplan-Meier plot (Figure 4.1) shows the survival functions for our captive
chimpanzees, as well a wild sample. Unlike wild chimpanzees, where many
individuals die when they are young (Bronikowski et al., 2011), in this population,
individuals survive longer with mortality accelerating in older ages. Similar
observations have been used to argue that captive chimpanzee populations have
undergone a demographic transition (Hawkes, Smith, & Robson, 2009), such as
human populations have undergone in the post-industrial age.
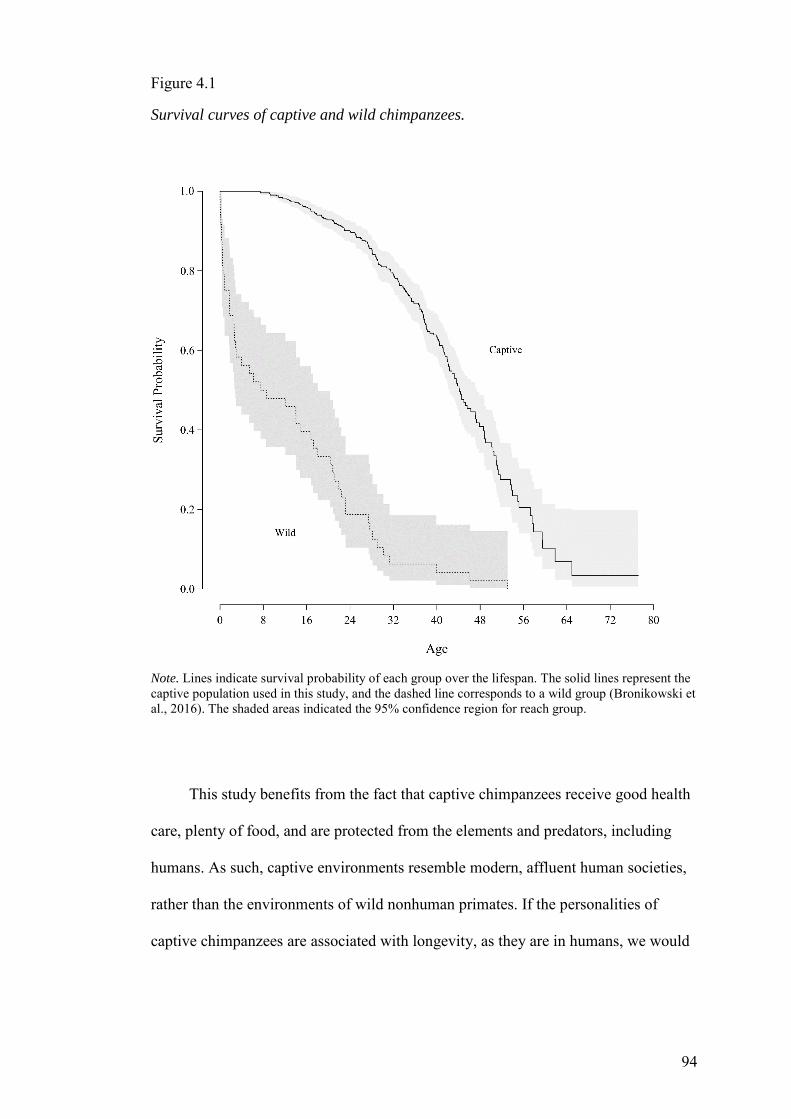
94
Figure 4.1
Survival curves of captive and wild chimpanzees.
Note. Lines indicate survival probability of each group over the lifespan. The solid lines represent the captive population used in this study, and the dashed line corresponds to a wild group (Bronikowski et al., 2016). The shaded areas indicated the 95% confidence region for reach group.
This study benefits from the fact that captive chimpanzees receive good health
care, plenty of food, and are protected from the elements and predators, including
humans. As such, captive environments resemble modern, affluent human societies,
rather than the environments of wild nonhuman primates. If the personalities of
captive chimpanzees are associated with longevity, as they are in humans, we would
95
expect to find that chimpanzees higher in Agreeableness, Conscientiousness, and
lower in Neuroticism would live longer (Strickhouser et al., 2017). These findings
would strongly suggest that the associations between survival and these personality
dimensions in humans are not just mediated by health-related behaviors (Turiano,
Chapman, Gruenewald, & Mroczek, 2015), but also reflect deeper biological causes.
If, however, the personality-mortality association in chimpanzees follows the
patterns found in other nonhuman primates, we would expect to find that Dominance
and Extraversion are related to longer life. This finding would also be consistent with
the personality-survival association in humans being derived and/or attributable to
the consequences of certain behaviors in modern human societies.
4.2 Methods
4.2.1 Sample
556 chimpanzees were assessed for personality between 1993 and 2010.
Eighteen chimpanzees had to be removed from the sample due to incompatibilities
with the study design (e.g., personality was assessed after death). Of the 538
remaining chimpanzees, 175 came from American zoos, 164 came from the Yerkes
National Primate Research Center (USA), 156 came from zoos, a sanctuary, and a
research centre in Japan, 21 came from the Taronga Zoo in Australia, and 22 came
from the Edinburgh Zoo (UK).
Vital status was recorded throughout 2016, yielding follow-up times ranging
from 6 to 23 years, approximately equivalent of 9 to 35 human years (Napier &
Napier, 1967). A total of 187 chimpanzees died during the follow-up period. Our
analytic approach treated the remaining 353 chimpanzees as right-censored at the
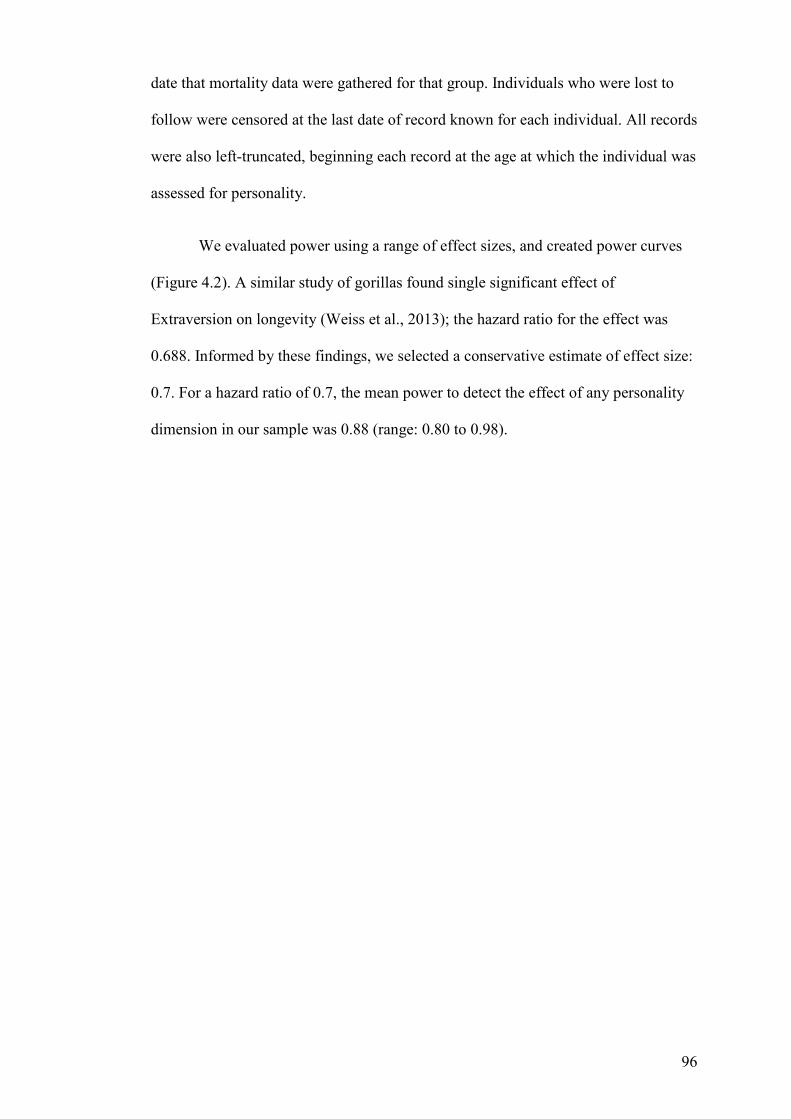
96
date that mortality data were gathered for that group. Individuals who were lost to
follow were censored at the last date of record known for each individual. All records
were also left-truncated, beginning each record at the age at which the individual was
assessed for personality.
We evaluated power using a range of effect sizes, and created power curves
(Figure 4.2). A similar study of gorillas found single significant effect of
Extraversion on longevity (Weiss et al., 2013); the hazard ratio for the effect was
0.688. Informed by these findings, we selected a conservative estimate of effect size:
0.7. For a hazard ratio of 0.7, the mean power to detect the effect of any personality
dimension in our sample was 0.88 (range: 0.80 to 0.98).
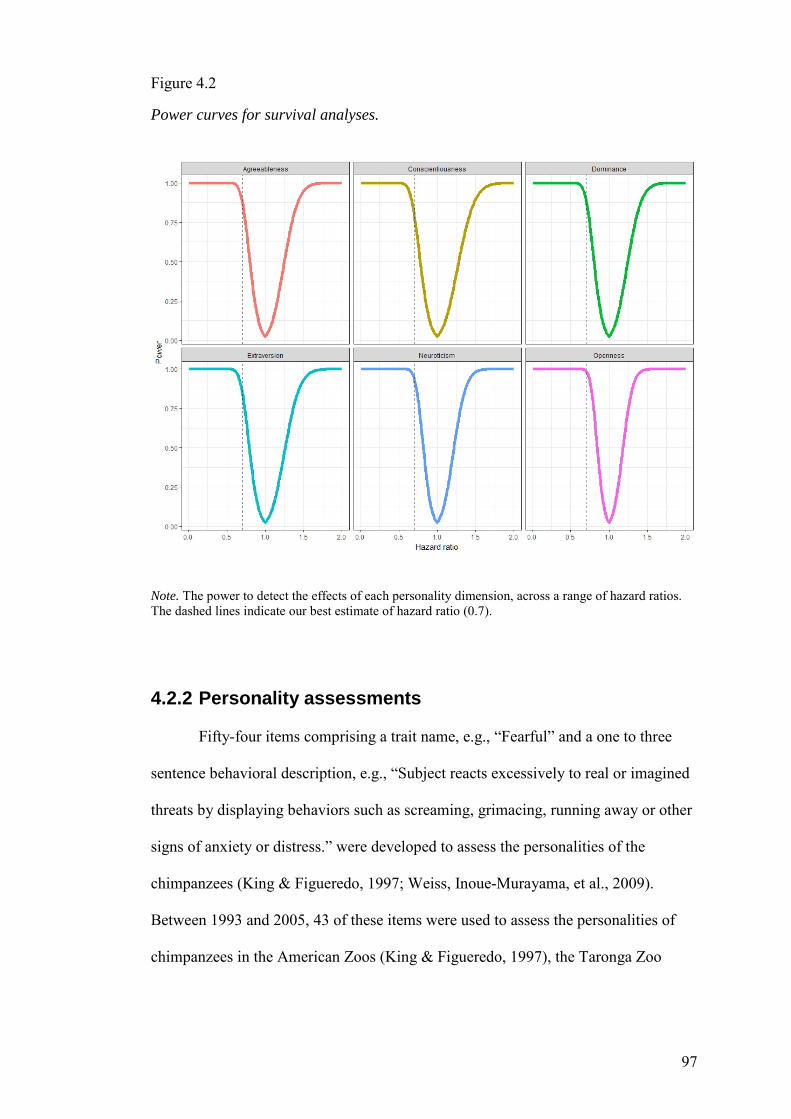
97
Figure 4.2
Power curves for survival analyses.
Note. The power to detect the effects of each personality dimension, across a range of hazard ratios. The dashed lines indicate our best estimate of hazard ratio (0.7).
4.2.2 Personality assessments
Fifty-four items comprising a trait name, e.g., “Fearful” and a one to three
sentence behavioral description, e.g., “Subject reacts excessively to real or imagined
threats by displaying behaviors such as screaming, grimacing, running away or other
signs of anxiety or distress.” were developed to assess the personalities of the
chimpanzees (King & Figueredo, 1997; Weiss, Inoue-Murayama, et al., 2009).
Between 1993 and 2005, 43 of these items were used to assess the personalities of
chimpanzees in the American Zoos (King & Figueredo, 1997), the Taronga Zoo
98
(King & Figueredo, 1997), and chimpanzees living at the Yerkes National Primate
Research Center (Weiss et al., 2007). Starting in 2007, all 54 items were used to
assess the personality of the chimpanzees living in Japan (Weiss, Inoue-Murayama,
et al., 2009) and at the Edinburgh Zoo (Herrelko et al., 2012).
The personalities of the chimpanzees in this study were assessed via ratings
on questionnaires by multiple keepers and researchers who knew the individual
chimpanzees, sometimes for decades (Weiss, Inoue-Murayama, et al., 2009; Weiss et
al., 2007). In addition to showing that the interrater reliabilities are comparable to
those found in human studies of personality, previous studies have shown that
chimpanzee personality, measured this way, yields measures that are more reliable
than behavioral codings (Vazire, Gosling, Dickey, & Schapiro, 2007), heritable
(Latzman, Freeman, Schapiro, & Hopkins, 2015; Weiss, King, & Figueredo, 2000;
Wilson et al., 2017), stable over time (King et al., 2008), and that generalize across
samples (King, Weiss, & Farmer, 2005; Weiss, Inoue-Murayama, et al., 2009; Weiss
et al., 2007), and are not adversely affected by anthropomorphic attributions on the
part of the raters (Weiss et al., 2012). Finally, these measures have been related to
observed behaviors (Pederson, King, & Landau, 2005), the brain (Blatchley &
Hopkins, 2010; Latzman, Hecht, Freeman, Schapiro, & Hopkins, 2015), and genetic
polymorphisms (Hong et al., 2011; Hopkins, Donaldson, & Young, 2012; Wilson et
al., 2017). Beanplots of all six personality dimensions are shown in Figure 4.3. Each
personality dimension was scaled and centered for all analyses.
Chimpanzee personality is known to change over time (King et al., 2008;
Weiss & King, 2015) and these effects could bias the results of our analyses. For
99
example, chimpanzees who are older tend to have lower Extraversion. In an analysis
which uses data from individuals rated at the same point in life, this should not be an
issue, but our data were taken from individuals across the lifespan. So in this
example, an analysis might spuriously associate low Extraversion with longer life
because it happens that aging is also associated with a lowering of Extraversion.
These two processes are not easily disentangled, but we can adjust confounded
personality covariates if we understand their relationship with age. Our sample
includes individuals at every stage of life, so we could model these associations and
extract age-adjusted covariates for later analysis. These analyses are presented in
section 4.3.1, and the resultant adjusted personality domains are used in 4.3.2, though
always alongside the original unadjusted personality data.
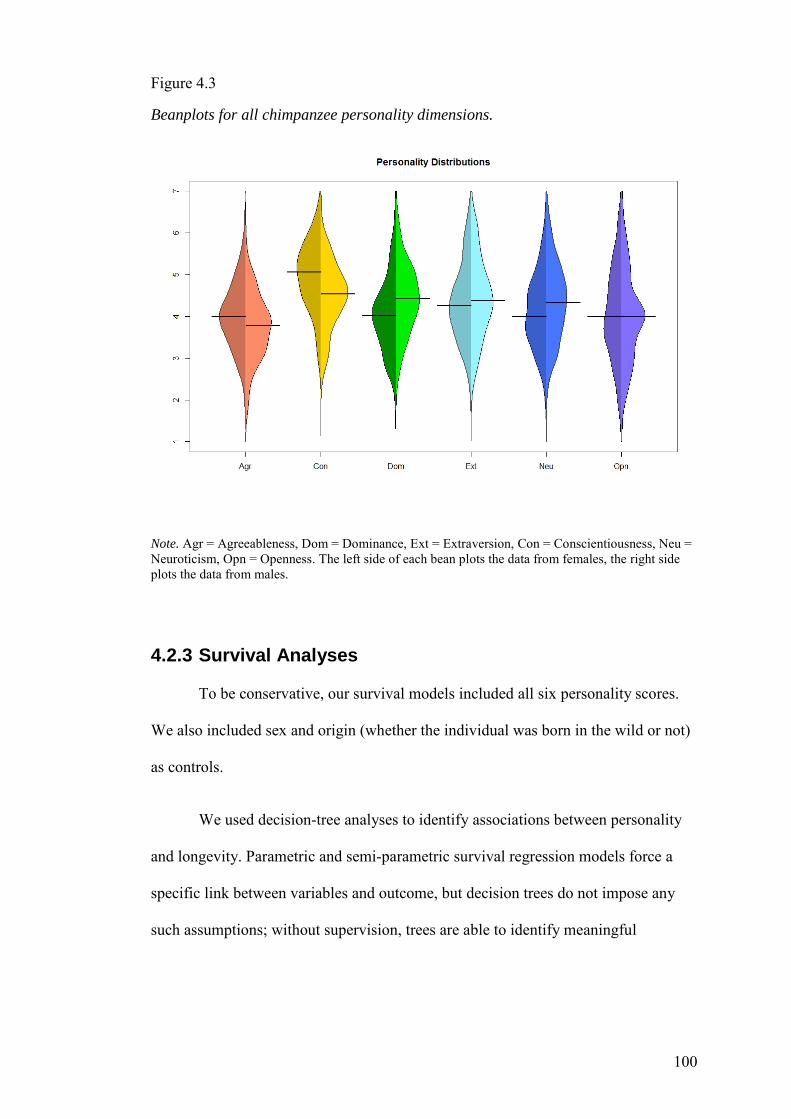
100
Figure 4.3
Beanplots for all chimpanzee personality dimensions.
Note. Agr = Agreeableness, Dom = Dominance, Ext = Extraversion, Con = Conscientiousness, Neu = Neuroticism, Opn = Openness. The left side of each bean plots the data from females, the right side plots the data from males.
4.2.3 Survival Analyses
To be conservative, our survival models included all six personality scores.
We also included sex and origin (whether the individual was born in the wild or not)
as controls.
We used decision-tree analyses to identify associations between personality
and longevity. Parametric and semi-parametric survival regression models force a
specific link between variables and outcome, but decision trees do not impose any
such assumptions; without supervision, trees are able to identify meaningful
101
variables and even some interactions without prior specification (Bou-Hamad,
Larocque, & Ben-Ameur, 2011). As our power analyses indicated, we had good
power (greater than 0.8) to detect effects on this scale, however, we needed to be
able to include many variables in our analyses, and many possible linking
distributions could be used. In order to reduce multiple testing, we preferred
decision-tree analyses as they do not require parameterization and are able to identify
potential interactions.
Survival trees have other advantages over traditional techniques. In
simulation studies of left-truncated right-censored decision trees with data much like
ours, i.e., a large sample with (N > 500) many censored observations (> 50%),
relative risk and conditional inference trees identified the correct predictors 94% and
93% of the time, respectively (Fu & Simonoff, 2016). These methods can handle
binary and continuous variables, and are robust to the effects of time-dependent
covariates, e.g., several of our chimpanzees’ personality dimensions.
Nevertheless, to maintain a balanced, conservative approach, we grew trees
with both unadjusted and adjusted covariates, as indicated by the previous section.
Adjusted covariates were residualized versions drawn from the linear or quadratic
regression models fitted to model the effects of age on personality (see section 4.3).
Using adjusted covariates had no effect on the growth of our trees; they did not grow
past the inclusion of Agreeableness (which was unconfounded by time) with either
set of variables, thus the outputs of our tree analyses were identical.
We validated our decision-tree analyses with multiple fully parametric hazard
regression models. Again, to reduce risks brought on my multiple testing, we did not
102
analyse individual models, but rather, followed an information theoretical approach
which allowed us to pool and average model estimates across a wide-range of
possible choices of error distribution and variables to include (Burnham, Anderson,
& Huyvaert, 2011). For example, one could specify a model for which there are two
possible variables (A & B) to include, and two reasonable error distributions (C &
D). The variables are not mutually exclusive, so there are three possible variable
specifications: only A, only B, and A + B. Error distributions are mutually exclusive,
so there are only two options, C or D. In this example, there are thus six
specifications that combine all possibilities.
The information theoretical approach starts weighting each model based on its
fit, as assessed by the Akaike Information Criteria (AIC). The weighting will give
more influence in the overall aggregated model to models with better fit. To continue
our example, if variable A happens to have a true relationship with the outcome
variable, and error distribution C happens to accurately capture the outcome’s
distribution, then specifications featuring A will have a higher weight, specifications
modelling with C will have a higher weight, and specifications which use both A and
C will have still higher weights. In this way, the estimates and confidence intervals
of coefficients within each aggregated model are meaningfully informed by many
specifications, producing more robust, interpretable results (Wagenmakers & Farrell,
2004).
We first built two sets of models, again, with unadjusted covariates and
without adjusted covariates. Adjustment creates a different, alternative dataset which
cannot be directly compared to the unadjusted data, so our evaluations of these
103
models were necessarily kept separate. The linking distributions we used included
the Weibull, Gompertz (Klein & Moeschberger, 2005), exponential piecewise-
equidistant and piecewise percentile (Goodman, Li, & Tiwari, 2011) survival
functions. The parametric hazard models were also fit with Gamma (except where
noted) distributed frailty (random) effects, to control for any influence that the
different sample groups might have on survival. We also built models including and
excluding the demographic covariates of sex and origin.
4.3 Results
4.3.1 Relationships between age and personality
Inspection of the six chimpanzee personality dimensions (Figure 4.4), as well
as prior studies (King et al., 2008), indicated that personalities changed as individuals
aged, making it possible that an association between personality and longer life
might be confounded. To determine whether any personality dimension was so-
confounded, we tested for associations between date of birth and each personality
dimension. The Kendall tau-b correlations between date of birth and Dominance (τ =
-0.15, p < 0.001), Extraversion (τ = 0.35, p < 0.001), Neuroticism (τ = 0.09, p <
0.036), and Openness (τ = 0.25, p < 0.001), but neither Conscientiousness (τ = -0.07,
p < 0.12) nor Agreeableness (τ = -0.08, p < 0.077), were significant.
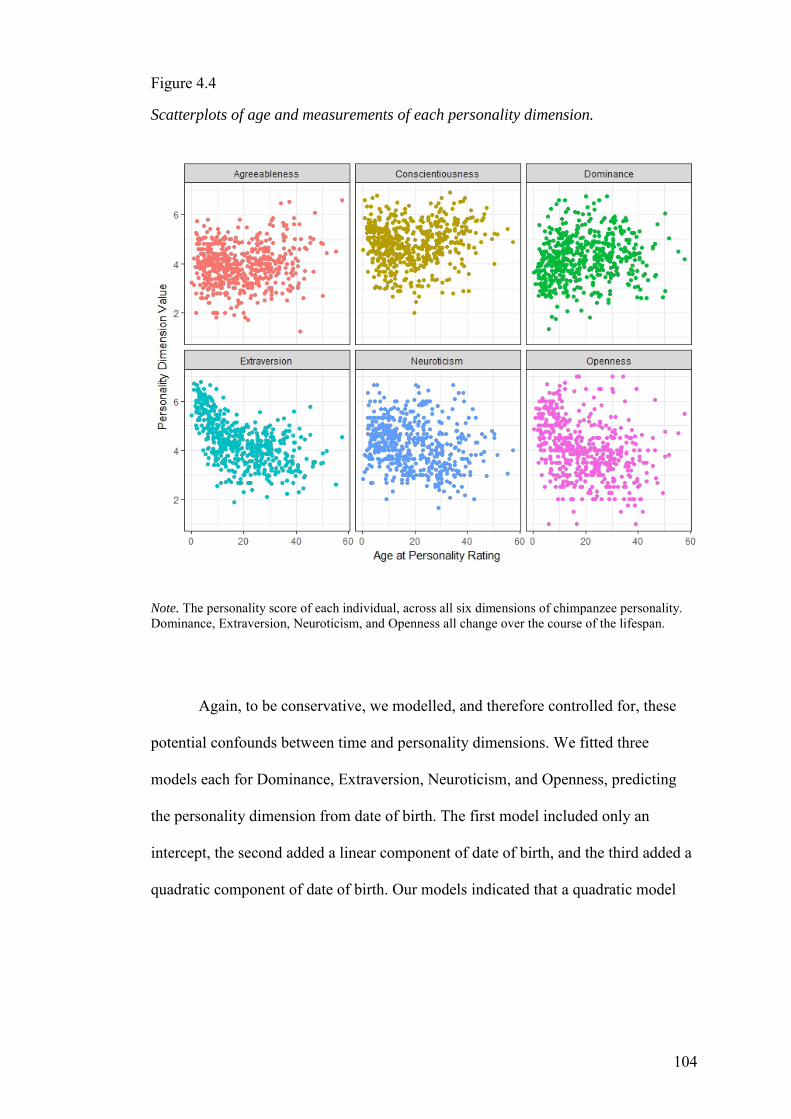
104
Figure 4.4
Scatterplots of age and measurements of each personality dimension.
Note. The personality score of each individual, across all six dimensions of chimpanzee personality. Dominance, Extraversion, Neuroticism, and Openness all change over the course of the lifespan.
Again, to be conservative, we modelled, and therefore controlled for, these
potential confounds between time and personality dimensions. We fitted three
models each for Dominance, Extraversion, Neuroticism, and Openness, predicting
the personality dimension from date of birth. The first model included only an
intercept, the second added a linear component of date of birth, and the third added a
quadratic component of date of birth. Our models indicated that a quadratic model

105
was the best fit for Dominance, Extraversion, and Openness, and a linear model was
the best fit for Neuroticism (Table 4.1).
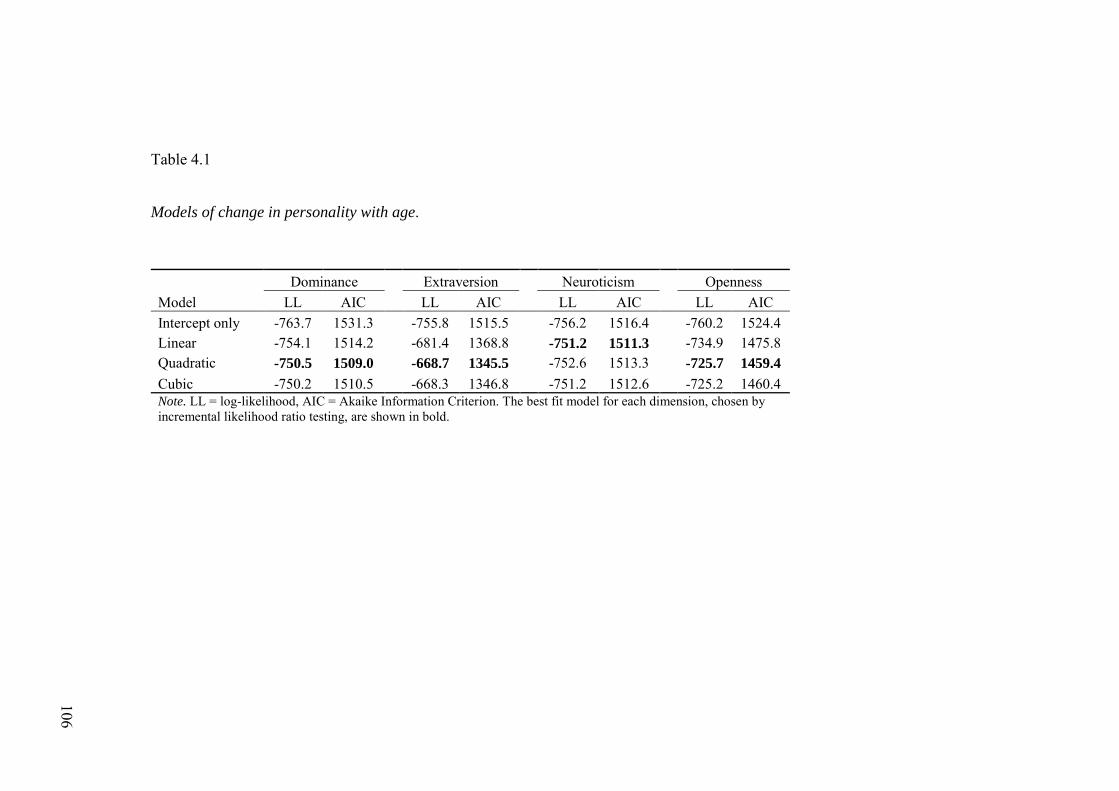
Table 4.1
Models of change in personality with age.
Dominance Extraversion Neuroticism Openness Model LL AIC LL AIC LL AIC LL AIC Intercept only -763.7 1531.3 -755.8 1515.5 -756.2 1516.4 -760.2 1524.4Linear -754.1 1514.2 -681.4 1368.8 -751.2 1511.3 -734.9 1475.8Quadratic -750.5 1509.0 -668.7 1345.5 -752.6 1513.3 -725.7 1459.4Cubic -750.2 1510.5 -668.3 1346.8 -751.2 1512.6 -725.2 1460.4Note. LL = log-likelihood, AIC = Akaike Information Criterion. The best fit model for each dimension, chosen by incremental likelihood ratio testing, are shown in bold.
106
107
4.3.2 Relationships between personality and longevity
We fit decision tree models to test whether sex, origin, or any personality dimensions
were related to longevity. A relative risk survival tree indicated that the dimension of
Agreeableness was associated with survival. More than half of the individuals with
Agreeableness scores lower than 1.3 standard deviations below the mean (23 out of 45) had died,
whereas individuals above this threshold faced a reduced risk of mortality (164 out of 493). An
extension of the relative risk tree analysis, which applied conditional inference to the tree,
demonstrated that the effect was more pronounced in males than in females (Figure 4.5).
Specifically, males with Agreeableness scores less than 0.069 standard deviations below the
mean were at significantly higher risk than other males (p < 0.024).

108
Figure 4.5
Conditional inference tree diagram indicating variables influencing survival.
Note. Bottom panes indicate the survival curves of and number of chimpanzees in each sub-group. Sub-groups were split based on the growth of the tree, and decision criteria are indicated below each node.
In our parametric hazards models we found the expected significant effect of sex –
females live longer than males (Table 4.2). We also found a notable, but non-significant effect of
Agreeableness. The full set of models is used to calculate averaged estimates and confidence
intervals is shown in Table 4.3.

109
Table 4.2
Survival model estimates of personality and demographic variables related to longevity.
Unadjusted Adjusted for date of birth Variable Hazard Ratio 95% C.I. Hazard Ratio 95% C.I.Sex 1.58 [1.15, 2.19] 1.60 [1.16, 2.21] Wild-born 1.29 [0.89, 1.85] 1.28 [0.89, 1.83] Agreeableness 0.84 [0.67, 1.04] 0.82 [0.67, 1.02] Dominance 1.07 [0.90, 1.27] 1.05 [0.88, 1.25] Extraversion 1.17 [0.91, 1.50] 1.18 [0.91, 1.52] Conscientiousness 1.10 [0.89, 1.37] 1.09 [0.88, 1.35] Neuroticism 0.99 [0.83, 1.19] 0.97 [0.81, 0.17] Openness 0.85 [0.70, 1.04] 0.87 [0.71, 1.07]
Note. Estimates and confidence intervals are computed as weighted averages from the set of models in Table 4.3.

Table 4.3
Individual regression estimates and information criteria for whole sample models used in weighted averages.
Wild-born Sex Agr Dom Ext Con Neu Opn K ΔAIC Weight
Unadjusted Weibull 0.32 0.48 -0.18 0.01 0.18 0.10 -0.02 -0.13 11 7.61 0.01
0.33 -0.18 0.08 0.21 0.08 0.00 -0.20 10 8.18 0.01 0.46 -0.16 0.06 0.13 0.13 0.00 -0.13 10 3.61 0.08
-0.16 0.11 0.19 0.09 0.01 -0.19 9 9.39 0.00 Piecewise-equidistant 0.36 0.43 -0.11 0.09 0.10 0.13 0.04 -0.21 12 24.67 0.00
0.39 -0.12 0.13 0.16 0.09 0.05 -0.26 11 29.49 0.00 0.45 -0.08 0.12 0.06 0.14 0.05 -0.20 11 26.35 0.00
-0.09 0.16 0.12 0.11 0.06 -0.25 10 31.86 0.00 Piecewise-percent 0.23 0.45 -0.13 0.09 0.12 0.11 0.04 -0.20 12 21.40 0.00
0.27 -0.13 0.13 0.17 0.08 0.04 -0.26 11 26.81 0.00 0.47 -0.11 0.10 0.10 0.12 0.04 -0.19 11 20.74 0.00
-0.11 0.15 0.15 0.08 0.05 -0.25 10 26.85 0.00 Gompertz 0.24 0.45 -0.19 0.06 0.16 0.10 -0.01 -0.16 11 0.36 0.39
0.29 -0.19 0.10 0.22 0.06 0.00 -0.22 10 5.73 0.03 0.47 -0.17 0.08 0.15 0.10 -0.01 -0.15 10 0.00 0.46
-0.17 0.12 0.21 0.07 0.00 -0.21 9 6.10 0.02 Adjusted Weibull 0.30 0.49 -0.16 0.01 0.14 0.09 -0.02 -0.12 11 7.60 0.01
0.33 -0.17 0.06 0.21 0.06 -0.01 -0.19 10 14.31 0.00 0.50 -0.15 0.03 0.15 0.10 -0.02 -0.11 10 8.27 0.01
-0.17 0.10 0.20 0.09 0.00 -0.18 9 8.96 0.01 Piecewise-equidistant 0.37 0.44 -0.15 0.05 0.17 0.11 0.02 -0.19 12 24.96 0.00
0.40 -0.16 0.09 0.22 0.08 0.03 -0.24 11 30.01 0.00 0.45 -0.12 0.08 0.15 0.13 0.03 -0.18 11 27.01 0.00
-0.13 0.12 0.21 0.09 0.04 -0.23 10 32.64 0.00 110

Piecewise-percent 0.23 0.46 -0.15 0.05 0.16 0.10 0.02 -0.17 12 21.66 0.00 0.27 -0.16 0.10 0.22 0.06 0.03 -0.24 11 27.38 0.00
0.47 -0.14 0.07 0.15 0.11 0.02 -0.17 11 21.06 0.00 -0.15 0.11 0.22 0.07 0.03 -0.23 10 27.43 0.00
Gompertz 0.24 0.46 -0.19 0.04 0.16 0.08 -0.03 -0.13 11 0.42 0.42 0.28 -0.20 0.09 0.15 0.05 -0.02 -0.20 10 6.15 0.02
0.48 -0.18 0.05 0.16 0.09 -0.03 -0.13 10 0.00 0.51 -0.19 0.10 0.22 0.05 -0.02 -0.19 9 6.44 0.02
Note. Agr = Agreeableness, Dom = Dominance, Ext = Extraversion, Con = Conscientiousness, Neu = Neuroticism, Opn = Openness, K = numbers of parameters in the model, AIC = Akaike Information Criterion. Weightings for wild-born and sex estimates do not include all models, thus their weights differ slightly but not substantially, and are not shown. As a binary variable, a 1 for sex indicates a male.
111

112
Because our conditional inference tree suggested that the effect of
Agreeableness was especially pronounced among males, we split our sample by sex,
and re-fit our regression models. These models confirmed that the protective effect of
Agreeableness does exist in males; the effect in females goes in the opposite
direction (Table 4.4). However, we did find a protective effect of Openness in female
chimpanzees only. These effects were consistent across all constituent models, the
estimates of which can be seen in Table 4.5.
Table 4.4
Survival model estimates of personality and demographic variables related to longevity.
Unadjusted Adjusted for date of birth
Variable Hazard Ratio 95% C.I. Hazard Ratio 95% C.I.
Male (n = 216) Wild-born 1.41 [0.69, 2.90] 1.39 [0.69, 2.81] Agreeableness 0.66 [0.47, 0.89] 0.65 [0.48, 0.89] Dominance 0.98 [0.74, 1.29] 0.97 [0.73, 1.28] Extraversion 1.04 [0.71, 1.52] 1.02 [0.67, 1.53] Conscientiousness 1.12 [0.78, 1.60] 1.11 [0.78, 1.58] Neuroticism 0.91 [0.66, 1.26] 0.89 [0.65, 1.24] Openness 1.09 [0.76, 1.56] 1.12 [0.78, 1.61] Female (n = 322) Wild-born 1.20 [0.75, 1.91] 1.20 [0.75, 1.92] Agreeableness 1.10 [0.82, 1.48] 1.09 [0.81, 1.46] Dominance 1.05 [0.84, 1.31] 1.02 [0.81, 1.28] Extraversion 1.17 [0.81, 1.71] 1.19 [0.82, 1.72] Conscientiousness 1.00 [0.75, 1.34] 0.99 [0.74, 1.33] Neuroticism 0.92 [0.72, 1.17] 0.91 [0.71, 1.16] Openness 0.75 [0.59, 0.97] 0.77 [0.60, 0.99] Note. Values are model averaged parameter estimates and unconditional confidence intervals calculated from weighted estimates shown in Table 4.5
.

Table 4.5
Individual regression estimates and information criteria for sex split models used in weighted averages.
Wild-born Agr Dom Ext Con Neu Opn K ΔAIC Weight
Male Unadjusted Weibull 0.46 -0.42 -0.07 0.06 0.10 -0.11 0.09 10 2.59 0.13
-0.39 0.00 0.04 0.13 -0.09 0.06 9 2.65 0.13 Piecewise 0.31 -0.44 0.03 -0.05 0.20 -0.03 0.12 11 8.62 0.01
-0.41 0.08 -0.06 0.21 -0.01 0.10 10 7.40 0.01 Gompertz 0.26 -0.43 -0.01 0.04 0.10 -0.10 0.10 10 1.46 0.23
-0.42 -0.01 0.03 0.11 -0.09 0.08 9 0.00 0.49 Adjusted Weibull 0.46 -0.43 -0.08 0.05 0.10 -0.12 0.11 10 2.66 0.13
-0.40 -0.03 0.06 0.11 -0.11 0.08 9 3.22 0.10 Piecewise 0.34 -0.44 0.01 -0.07 0.18 -0.05 0.16 11 8.53 0.01
-0.42 0.05 -0.06 0.20 -0.04 0.13 10 7.49 0.01 Gompertz 0.26 -0.43 -0.05 0.01 0.10 -0.12 0.13 10 1.46 0.24
-0.43 -0.02 0.02 0.11 -0.11 0.11 9 0.00 0.50
Female Unadjusted Weibull -0.09 -0.22 -0.06 0.69 0.01 -0.15 -0.22 10 106.23† 0.00
-0.19 0.03 0.12 0.02 -0.07 -0.24 9 108.08† 0.00 Piecewise 0.17 0.14 0.08 0.14 0.00 -0.03 -0.35 11 16.69 0.00
0.16 0.08 0.12 0.00 -0.03 -0.34 10 15.15 0.00 Gompertz 0.18 0.09 0.05 0.17 0.00 -0.08 -0.29 10 1.45 0.33
113

0.10 0.05 0.16 0.00 -0.08 -0.28 9 0.00 0.67 Adjusted Weibull 0.18 0.11 0.04 0.11 0.02 -0.07 -0.25 10 2.29 0.17
0.10 0.03 0.16 0.02 -0.08 -0.20 9 8.77 0.01 Piecewise 0.17 0.09 0.01 0.23 -0.02 -0.07 -0.31 11 17.80 0.00
0.10 0.01 0.22 -0.02 -0.07 -0.29 10 16.26 0.00 Gompertz 0.18 0.07 0.02 0.19 -0.01 -0.10 -0.27 10 1.43 0.27
0.08 0.02 0.19 -0.01 -0.11 -0.25 9 0.00 0.55 Note. Agr = Agreeableness, Dom = Dominance, Ext = Extraversion, Con = Conscientiousness, Neu = Neuroticism, Opn = Openness, K = numbers of parameters in the model, AIC = Akaike Information Criterion. Weightings for wild-born and sex estimates do not include all models, thus their weights differ slightly but not substantially, and are not shown. As a binary variable, a 1 for sex indicates a male. † indicates models for which frailty could not be estimate with the Gamma distribution; the Log-Normal distribution was used instead.
114
115
4.4 Discussion
In this study of captive chimpanzees, we found clear connections between
personality and longevity, but generally not those we expected. Despite social
standings being implicated in stress and health in many primate species (Sapolsky,
2005), we found no effect of Dominance on longevity in captive chimpanzees.
Dominance may not play a major role in influencing longevity in captive populations
because fission-fusion dynamics are not as influential, thus group stability will be
greater, and stressful disruption less of a concern. Moreover, in captivity there is less
need to contest with other chimpanzees for resources; ultimately, all individuals will
be sufficiently fed and otherwise provided for in captivity, except in extreme
circumstances. Thus, traits such as Dominance, which are related to rank, would
have less of an impact in this regard as well.
Among the domains of personality which chimpanzees and humans share, we
were surprised to find no association between Extraversion and longevity. Studies in
humans (Roberts et al., 2007) and other primates (Seyfarth et al., 2012; Silk et al.,
2010) have shown positive, protective effects of high sociality. Of particular note, a
positive effect was found in similar a study of gorillas, which were also kept in
captivity, and assessed for personality by means of ratings (Weiss et al., 2013). Like
their close chimpanzee cousins, captive gorillas show evidence for strong age-related
declines in Extraversion (Kuhar et al., 2006), yet an Extraversion effect remained in
gorillas.
Similarly, neither Conscientiousness nor Neuroticism appeared to be
associated with longevity in chimpanzees. This difference between chimpanzees and
116
humans is probably attributable to the fact that associations between
Conscientiousness and Neuroticism, and human mortality, may be attributable to the
associations between these personality traits and health risk factors, e.g., because low
Conscientiousness and high Neuroticism are related to cigarette smoking and alcohol
consumption (Booth-Kewley & Vickers, 1994; Turiano et al., 2015). The present
findings concerning chimpanzee Conscientiousness and Neuroticism support this
account of Conscientiousness-mortality and Neuroticism-mortality associations in
humans.
Although the other social dimensions of personality – Dominance and
Extraversion – were not related to longevity, Agreeableness was, at very least in
male chimpanzees. In other words, long-living captive male chimpanzees tend to be
those who engage in positive social interactions characterized by cooperation,
geniality, and being protective. The degree to which captive male chimpanzees are
characterized by a preference for interacting with others, their competitive prowess
and fearlessness, and, consequently, the ability to enjoy the spoils of rank, have no
bearing on how long they live. This result can also be contrasted with the findings of
Gilby et al. (2013) who found that male chimpanzees with the strongest degree of
betweenness in their social network connections, i.e. males who tended to form
coalitions with other males who themselves did not form many coalitions, derived
the most fitness benefits. Though fitness and longevity have been linked and sociality
appears to be relevant to both in male chimpanzees, the precise nature of the
associations between fitness and longevity remains undetermined.

117
Female chimpanzees showed a different, unpredicted relationship between
personality and longevity. High Openness female chimpanzees are those who were
more curious, inventive, and inquisitive; these chimpanzees tended to live longer
than low Openness counterparts. These findings are in line with meta-analytic
results: a modest, positive effect of ‘exploration’ on survival, which was not
significant in males or wild animals (Smith & Blumstein, 2008). Additionally,
exploration did not have a significant effect on fitness in this meta-analysis.
Smith and Blumstein (2008) suggest that the effect of exploration is driven by
directional selection, and these captive populations are becoming higher in
Openness. Captive chimpanzees are protected from most acute environmental
threats, e.g. predators. High Openness chimpanzees, who might be killed or mortally
wounded while exploring wild environments, will no longer be selected out of the
population in captivity. This is not the only possibility: Openness in both humans
(Chamorro-Premuzic & Furnham, 2006) and chimpanzees (see chapter 2) is
correlated with intelligence, which is well-known to be one of the most powerful
predictors of survival in humans (Calvin et al., 2011). The effect of Openness in this
sample may be tapping into the same underlying, much debated common sources of
intelligence’s correlation with longevity. However, despite its correlation with
intelligence, Openness is not associated with longevity in humans, so without also
studying intelligence, personality, and longevity together in chimpanzees, we are
unable to derive further conclusions.
It is noteworthy that while longevity is a major life history variable, it does
not directly represent the fitness of the animal. An individual may have higher fitness
118
because they live longer, simply due to having more time to produce offspring. The
link might be subtler as well; longer living individuals may provide more for related
offspring, improving personal fitness by increasing the fitness of others. However,
there is no guarantee that longevity must lead to either of these effects in
chimpanzees. A clear link between personality and these behaviors has yet to be
established as well.
A trivial account could argue that all personality dimensions must affect
fitness under some circumstance in some ways but not others, otherwise there would
be no variation in personality. Many researchers focus on reproductive success as
measure of fitness, and while this is arguably the most important life history trait, the
presence of many differential psychological traits in chimpanzees suggests that each
personality dimension came about due to different life history strategies (Nettle,
2006). In chimpanzees, our results suggest that Openness and Agreeableness were
maintained in chimpanzees, at least partially, through their association with
longevity.
Nevertheless, it remains an open question why Openness is specifically
important for female longevity, and Agreeableness is only associated with male
longevity. Ultimately, this study is a reminder of the complex, multifaceted nature of
social relationships and rank; behavior and fitness in chimpanzees (de Waal, 2007).
Moreover, whereas a large portion of research focuses on either males or females,
working with a large sample of both sexes can give insight into common processes,
or in our case, sex differences in how personality relates to longevity.
119
5 Comparing blood biomarkers of stress between chimpanzees and humans
5.1 Introduction
Like humans and other animals, both wild and captive primates experience
stress, brought on by acute, challenging situations and problems (Edes, Wolfe, &
Crews, 2016). These ‘stressors’, in addition to inducing behavioral changes, generate
physiological responses (Cavigelli & Caruso, 2015).
The physiological response to stress is designed to promote survival of the
organism (Edes et al., 2016), and it does this by activating the brain’s neuroendocrine
systems (Edes, 2017). When stressed, an animal’s physiology is disrupted, and the
stress response is designed to bring the organism’s physiology back to non-stressful
homeostasis (Nelson, 2005). This process is crucial to improving survival, and
allowing individuals to continue to reproduce (McEwen & Lasley, 2002; Sterling,
2012). The physiological stress response inhibits both proceptive and receptive
sexual behavior in both sexes (Sapolsky, Romero, & Munck, 2000), and upregulates
the sympathetic nervous system, which while always active at a base level to
maintain homeostasis, constricts blood flow necessary for fighting, fleeing, or sexual
activity (Korte, Koolhaas, Wingfield, & McEwen, 2005).
Deviation from homeostasis thus occurs regularly, possibly many times a day
(Edes & Crews, 2017). The normal variance that occurs in an animal’s somatic
systems is known as allostasis (Edes & Crews, 2017; McEwen & Stellar, 1993).

120
Allostasis reduces the costs of stressors, pushing the body toward recovery rather
than exhaustion. This is an evolved adaptation for reducing the cost of stress, that
also promotes reproduction, survival, well-being, and health, generally (Sterling,
2012). Nevertheless, repeated and/or prolonged exposure to stressors exacts a toll
organisms, which is referred to as allostatic load (AL) (McEwen & Stellar, 1993).
Exposure to even minor stressors accumulate, eventually damaging tissues, cells, and
DNA (McEwen, 1998), and increasing an individual’s risk of early mortality.
AL is not the property of a single system, but a process that develops
throughout the entire body. As a result, assessing the amount of AL has been
challenging, particularly as researchers must collect multiple physiological
biomarkers and construct a composite from these data (Leahy & Crews, 2012). The
most common biomarkers represent the states of the neuroendocrine, metabolic, and
cardiovascular systems. The more biomarkers an individual has in dysregulation, i.e.
observed to be outside the normal range for that marker, the higher their allostatic
load.
The majority of AL research has been conducted in humans, in which AL has
been linked to many mental and physical outcomes. Humans with higher allostatic
load have poorer baseline physical performance, and are at greater risk for
immunological disorder (McEwen, 1998), CVD (Seeman, Singer, Rowe, Horwitz, &
McEwen, 1997), cognitive decline (Karlamangla et al., 2014), and early mortality
(Gruenewald, Seeman, Ryff, Karlamangla, & Singer, 2006). As AL represents
accumulation of negative effects over time, AL should increase with age, and
biomarkers of AL match this hypothesis (Crimmins, Johnston, Hayward, & Seeman,

121
2003). Yet, demographic variables, including gender (Seeman, Singer, Ryff, Love, &
Levy-Storms, 2002; Yang & Kozloski, 2011) and social or economic adversity
(McEwen, 2012) are also related to allostatic load. Additionally, the extent of social
support that one receives is associated with lower allostatic load (Seeman et al.,
2002).
Animal researchers have studied allostatic load in nonhuman primates (see
Edes and Crews (2017) for a review). An important early study estimated the costs of
high and low social status in different species, and used this as a proxy for AL
(Goymann & Wingfield, 2004). Goymann and Wingfield (2004) assessed five social
characteristics of each species to determine the AL of relatively dominant and
subordinate individuals. Rank acquisition and rank maintenance are costly to
dominant individuals. Regularity and magnitude of threat from dominants and lack
opportunities for subordinates to avoid dominant threats are costly to subordinates.
The final criteria, food resource control and availability, can be costly to either
dominants, subordinates, or both.
For example, in chimpanzees, it is costly to acquire and even costlier to
maintain a dominant position in the social hierarchy, so dominant individuals were
assigned high AL estimates. For subordinate chimpanzees, coping costs were
estimated to be low and threats from dominants estimated to be modest, so
subordinate chimpanzees were assigned lower AL (Mitani et al., 2002). In contrast,
among savannah baboons, maintaining dominance is less costly, and threats from
dominant individuals are more costly to subordinates, so dominant baboons had
lower AL estimates relative to subordinate baboons (Sapolsky, 1982).
122
Goymann and Wingfield (2004), having estimated AL for individuals among
many species, related AL to glucocorticoid concentration. In this study they
examined six free-ranging, wild primate species - chimpanzees, mountain gorillas,
long tailed macaques, savannah baboons, tufted capuchins, and ringtailed lemurs -
and found that the ratio of dominant to subordinate AL estimates was positively
associated with the ratio of glucocorticoid levels in dominant vs submissive
individuals. So again, in chimpanzees, this indicated that dominant individuals, who
were estimated to have higher AL than subordinate individuals, also had higher
glucocorticoid levels.
Maestripieri and Hoffman (2011) later found impacts from many AL
markers, including glucocorticoids, cytokines, proteins, and cholesterols, on the
health and reproductive fitness of free-ranging rhesus macaques. Most recently, Edes
and colleagues (2016) examined allostatic load markers in captive gorillas. These
researchers gathered a comprehensive set of biomarkers, including albumin,
cholesterol, cortisol, creatinine, glucose, and triglycerides, and performed a principle
components analysis of the markers. The second component, which was composed of
albumin, glucose and interleukin-6, was lower in females, higher in older gorillas,
and associated with high triglyceride levels and earlier mortality (Edes et al., 2016).
A few studies have examined AL biomarkers in chimpanzees, yet most have
measured only cortisol (Anestis, 2005; Anestis, Bribiescas, & Hasselschwert, 2006;
Goymann & Wingfield, 2004; Muller & Wrangham, 2004; Whitten, Stavisky, Aureli,
& Russell, 1998). Lambeth, Hau, Perlman, Martino, and Schapiro (2006) were
notable for examining the effects of positive reinforcement training on glucose,

123
haematocrit, neutrophil, and white blood cell levels. Among chimpanzees exposed to
a stressful procedure (injection), those who were trained and familiar with the
procedure also showed lower glucose, neutrophil, and white blood cells levels than
untrained individuals. Also in chimpanzees, high levels of non-physiological AL
biomarkers such as body mass index (BMI) (Videan, Fritz, & Murphy, 2007) and
blood pressure (Ely, Zavaskis, & Lammey, 2013) have also been linked to the ageing
process in chimpanzees.
Videan et al. (2009) sampled biomarkers related to oxidative stress and
cardiovascular risk, and produced the most comprehensive report on chimpanzee
biomarkers to date. By comparing ten male chimpanzees with ten male humans, they
found that the chimpanzees had significantly higher levels of insulin, insulin-like
growth factor, fibrinogen, lipoprotein, and white blood cells, all cardiovascular risk
factors in humans. These differences were attributed to chimpanzees’ high risk for
cardiovascular disease, and especially cardiomyopathy, which is the leading cause of
death in chimpanzees (Chilton, Wilcox, Lammey, & Meyer, 2016; Lammey, Lee,
Ely, & Sleeper, 2008; Laurence et al., 2017). However, although heart conditions are
also common in humans, the major cause of heart disease differs between these two
species. Humans tend to develop heart conditions as a result of atherosclerosis, or
clogged arteries, whereas chimpanzees are much more likely to suffer from
myocardial fibrosis, a thickening and stiffening of heart tissue, which can cause
death through cardiac arrhythmia (Varki et al., 2009).
Although Videan et al.’s (2009) study compared chimpanzees and humans,
their small sample size, which included only males, limited the generalizability of
124
their findings. We thus sought to examine a much larger sample of both male and
female chimpanzees. Additionally, as most prior studies of stress and AL in primates
have only looked at a few targeted physiological markers, we decided to take a
bottom-up approach. We did not select biomarkers based on findings from prior
research, but drew our measures from a complement of physical and blood tests
which were available in humans and in chimpanzees. We wished to examine the
entire system of biomarkers, since many of these markers and their relationships with
one another have not yet been explored in chimpanzees.
The present study’s aims were thus to examine the emergent structure of AL,
as determined from an opportunistic sample of physical health characteristics and
blood biomarkers, and to test whether structure and correlates of AL are similar in
chimpanzees and humans. We advance three predictions. First, given what we know
about AL in gorillas and humans (Edes et al., 2016), we would expect to find that the
same biomarkers relate to allostatic load in chimpanzees. Second, we expect AL to
be higher in older chimpanzees. Third, sex also relates to AL in both humans and
gorillas (Edes & Crews, 2017), though males and females appear to have different
weakness when it comes to different biomarkers (Juster, McEwen, & Lupien, 2010).
We predict that in chimpanzees, sex will also have an effect on AL biomarkers.
5.2 Methods
5.2.1 Subjects
5.2.1.1 Chimpanzees
Physiological data were collected between 1996 and 2004 from 177
chimpanzees living at the Yerkes National Primate Research Centre (YNPRC). Both

125
blood chemistry and haematological panels were obtained. Up to four samples were
taken over the course of the study period. Physical measurements, including BMI
and blood pressure were measured up to three times between 2005 and 2011.
Chimpanzees’ ages during the study period ranged from 3 to 48 years.
5.2.1.2 Humans
Human participants were drawn from the National Health and Nutrition
Examination Survey (NHANES), a study of men and women living in the USA.
Participants’ ages ranged between 1 and 90 years. 29,314 individuals were involved
in the biomarker collection wave, during which a variety of blood serum panels were
collected from participants; blood pressure and BMI were also measured.
5.2.2 Biomarkers
Test results from standard complete blood, comprehensive metabolic, lipid
profile, and liver panels were available in both samples. We also used body mass
index (BMI), and diastolic and systolic blood pressures measurements from both
samples. A summary of overlapping biomarkers is shown in Table 5.1. Variables
were scaled and centered prior to analyses, all biomarkers except for BMI were
scaled across the entire human and chimpanzee sample. BMI was scaled
independently for humans and chimpanzees.
5.2.3 Analyses
To explore the structure of our biomarker data, we used principal components
analysis (PCA) and exploratory factor analysis (EFA). To confirm our exploratory
findings, we used confirmatory factor analysis (CFA), and compared structure
between groups with measurement invariance testing.

126
Measurement invariance tests the extent to which model structure, in our case
CFA model structure, is invariant across groups. In other words, measurement
invariance tests whether the best fitting model constrains loadings (slopes),
intercepts, residuals, and other parameters to be the same across groups. The level of
invariance is determined by the type of parameter which is fixed between the groups;
with ‘strong’ invariance, loadings and intercepts are both fixed, and one can directly
compare path coefficients between groups (Sass, 2011).
Standard measurement invariance testing assesses all parameters of a certain
type at once, e.g., a model wherein all intercepts were fixed across groups would be
compared to an identical model except that all these intercepts would be allowed to
be estimated within rather than across groups. Partial measurement invariance
provides a framework for testing invariance of individual parameters (Millsap,
Olivera-Aguilar, & Hoyle, 2012); to extend the last example, partial measurement
invariance testing of intercepts would indicate which individual intercept would
improve model fit the most by being freed, i.e. estimated separately within groups.
Using a step-wise ‘tear-down’ strategy, starting with all parameters of interest
included and testing if freeing individual parameters improve fit, partial invariance
identifies weak parameters. Subsequent rounds of partial invariance testing allow one
to determine which parameters are invariant across groups.

127
Table 5.1
Descriptive statistics for both chimpanzee and human biomarker samples
Chimpanzees Humans Biomarker N M SD N M SD WBC 171 12.08 4.30 26372 7.39 2.35 RBC 171 5.18 0.45 26370 4.63 0.46 HCT 171 42.25 3.70 26370 40.16 4.24 HGB 171 13.95 1.50 26372 13.48 1.52 MCV 171 81.60 4.16 26371 86.99 6.30 MCH 171 26.87 1.58 26369 29.20 2.41 MCHC 171 32.99 0.79 26369 33.55 0.91 Lymphocytes 171 39.23 17.77 8150 37.30 13.50 Monocytes 171 2.39 1.41 8150 5.59 3.10 Eosinophils 171 2.01 1.46 8150 2.95 3.23 Glucose 171 101.27 14.99 18719 99.10 36.21 BUN 171 12.72 6.68 18723 14.06 5.86 Creatinine 171 1.09 0.45 18723 1.07 0.37 Protein 171 7.65 1.39 18723 7.41 0.47 Albumin 171 3.59 0.36 18723 4.16 0.39 Bilirubin 171 0.23 0.11 18723 0.59 0.34 ALP 171 171.10 156.95 18721 100.99 64.81 SGPT 171 32.94 11.64 18723 17.24 16.00 SGOT 171 26.30 14.48 18723 22.10 14.88 Cholesterol 171 198.92 38.96 23561 193.23 44.77 Calcium 171 9.91 2.54 18722 9.31 0.44 Phosphates 171 3.03 1.07 18723 3.56 0.58 Sodium 171 140.20 4.28 18723 141.27 2.48 Potassium 171 3.80 2.23 18723 4.06 0.33 Chloride 171 100.80 4.06 18723 104.46 3.34 Globulins 171 3.96 0.65 14056 3.30 0.47 Triglycerides 171 108.32 42.39 23515 130.25 103.42 GGTP 171 30.77 28.84 14549 31.53 49.39 Osmolality 171 278.38 5.46 14056 279.56 6.52 BMI 60 95.07 15.16 27830 23.80 6.78 Systolic BP 91 136.23 20.95 23756 118.58 21.15 Diastolic BP 91 74.01 15.98 23044 68.95 14.27 Note. WBC = white blood cells, RBC = red blood cells, HCT = hematocrit, HGB = hemoglobin, MCV = mean corpuscular volume, MCH = mean corpuscular hemoglobin, MCHC = mean corpuscular hemoglobin concentration, BUN = blood urea nitrogen, ALP = alkaline phosphatase, SGPT = serum glutamate-pyruvate transaminase, SGOT = serum glutamic axaloacetic transaminase, GGTP = gamma-glutamyltransferase, BMI = body mass index, BP = blood pressure
128
5.3 Results
Because our samples did not contain cortisol, interleukin-6, and other
common AL biomarkers, we wished to establish which biomarkers, out of those
available, might effectively measure AL in this sample. We also wanted to duly
consider the markers that would be most likely to be associated with AL, based on
earlier work in primates (Edes & Crews, 2017).
We therefore randomly divided the NHANES sample into exploratory and
confirmatory subsamples of 9000 participants each. Our exploratory analyses were
exclusively based on the first subsample. Our confirmatory analyses were confined
to the second human subsample and to the chimpanzee sample.
5.3.1 Suitability of data
To check whether the data were suitably factorable, we applied Bartlett’s test
of sphericity to the correlation matrices of the both the exploratory human sample
and chimpanzee sample. The chimpanzee data (χ2 = 1740, p < 0.001, df = 496) and
the human data (χ2 = 147700, p < 0.001, df = 496) contained sufficient correlations
for us to proceed with further analyses.
5.3.2 Exploratory Analyses
We used the ‘fa.parallel’ and ‘nfactors’ function of the R ‘psych’ package
(Revelle, 2015) to investigate the number of factors (Figure 5.1). Parallel analysis
suggested 10 components (and factors); Ruscio & Roche’s Comparison Data
suggested 9; Velicer’s Map Criterion reached a local minimum at 5; Very Simple
Structure reached a local maximum at 7, and the scree plot did not indicate any
obvious cut-off. In general, the methods used to determine the number of
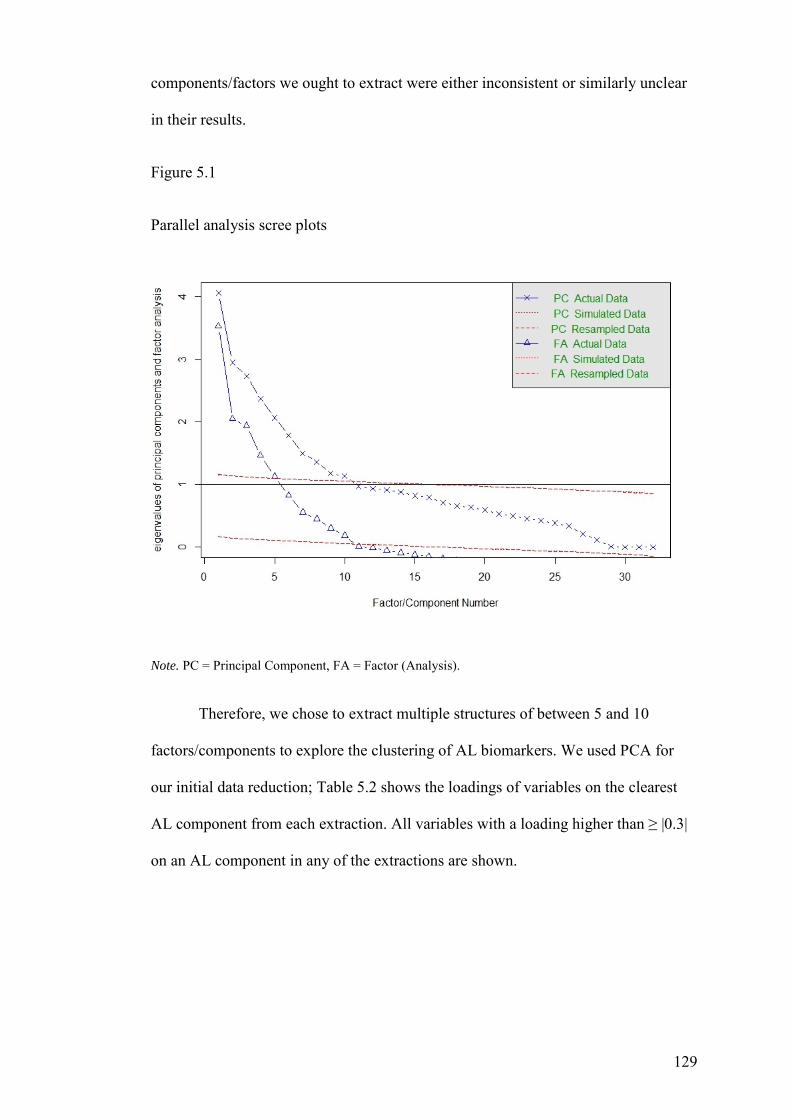
129
components/factors we ought to extract were either inconsistent or similarly unclear
in their results.
Figure 5.1
Parallel analysis scree plots
Note. PC = Principal Component, FA = Factor (Analysis).
Therefore, we chose to extract multiple structures of between 5 and 10
factors/components to explore the clustering of AL biomarkers. We used PCA for
our initial data reduction; Table 5.2 shows the loadings of variables on the clearest
AL component from each extraction. All variables with a loading higher than ≥ |0.3|
on an AL component in any of the extractions are shown.
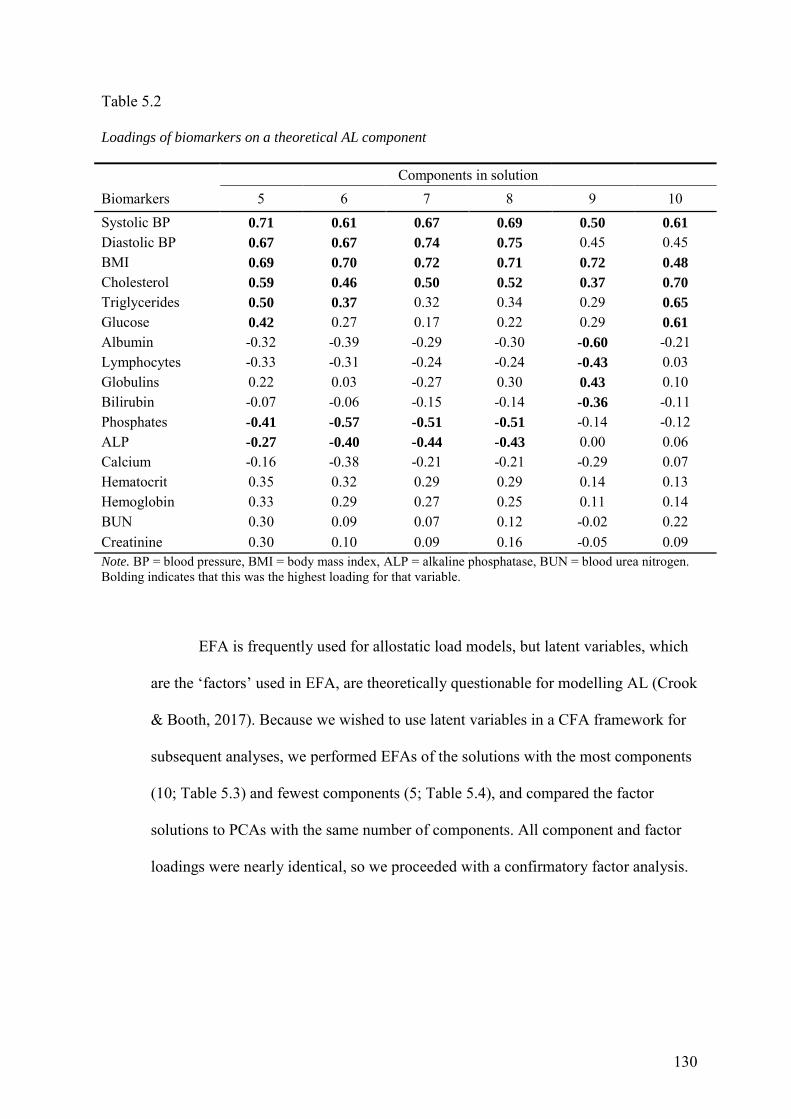
130
Table 5.2
Loadings of biomarkers on a theoretical AL component
Components in solution Biomarkers 5 6 7 8 9 10 Systolic BP 0.71 0.61 0.67 0.69 0.50 0.61 Diastolic BP 0.67 0.67 0.74 0.75 0.45 0.45 BMI 0.69 0.70 0.72 0.71 0.72 0.48 Cholesterol 0.59 0.46 0.50 0.52 0.37 0.70 Triglycerides 0.50 0.37 0.32 0.34 0.29 0.65 Glucose 0.42 0.27 0.17 0.22 0.29 0.61 Albumin -0.32 -0.39 -0.29 -0.30 -0.60 -0.21Lymphocytes -0.33 -0.31 -0.24 -0.24 -0.43 0.03Globulins 0.22 0.03 -0.27 0.30 0.43 0.10Bilirubin -0.07 -0.06 -0.15 -0.14 -0.36 -0.11Phosphates -0.41 -0.57 -0.51 -0.51 -0.14 -0.12ALP -0.27 -0.40 -0.44 -0.43 0.00 0.06Calcium -0.16 -0.38 -0.21 -0.21 -0.29 0.07Hematocrit 0.35 0.32 0.29 0.29 0.14 0.13Hemoglobin 0.33 0.29 0.27 0.25 0.11 0.14BUN 0.30 0.09 0.07 0.12 -0.02 0.22Creatinine 0.30 0.10 0.09 0.16 -0.05 0.09Note. BP = blood pressure, BMI = body mass index, ALP = alkaline phosphatase, BUN = blood urea nitrogen. Bolding indicates that this was the highest loading for that variable.
EFA is frequently used for allostatic load models, but latent variables, which
are the ‘factors’ used in EFA, are theoretically questionable for modelling AL (Crook
& Booth, 2017). Because we wished to use latent variables in a CFA framework for
subsequent analyses, we performed EFAs of the solutions with the most components
(10; Table 5.3) and fewest components (5; Table 5.4), and compared the factor
solutions to PCAs with the same number of components. All component and factor
loadings were nearly identical, so we proceeded with a confirmatory factor analysis.
Table 5.3
PCA solution for 10 extracted components of human biomarkers
Loadings 1 2 3 4 5 6 7 8 9 10 RBC 0.90 -0.36 0.07 0.07 -0.02 -0.00 0.02 0.08 0.00 0.00 HCT 0.90 0.30 0.13 0.08 0.03 0.04 -0.07 0.05 0.01 0.06 HGB 0.87 0.41 0.14 0.10 0.02 0.02 -0.04 0.07 -0.03 0.02MCV 0.05 0.91 0.10 0.03 0.07 0.06 -0.14 -0.07 0.00 0.09MCH 0.08 0.97 0.11 0.06 0.04 0.03 -0.09 -0.02 -0.06 0.04MCHC 0.10 0.56 0.06 0.08 -0.04 -0.06 0.10 0.09 -0.18 -0.14Glucose 0.02 -0.10 0.61 0.07 0.17 -0.15 0.16 -0.07 -0.13 0.10Cholesterol 0.00 0.17 0.70 -0.03 0.03 -0.02 -0.12 0.05 0.09 -0.08Triglycerides 0.06 0.06 0.65 0.17 0.04 -0.08 0.05 -0.00 -0.11 -0.25Systolic BP 0.12 0.14 0.61 0.01 0.21 0.06 -0.32 -0.12 0.19 0.06BMI 0.24 0.13 0.48 0.02 -0.12 0.09 -0.23 -0.45 0.22 -0.04SGPT 0.18 0.02 0.03 0.83 -0.03 0.03 -0.03 0.01 0.04 -0.07SGOT 0.03 0.07 -0.03 0.89 0.02 -0.02 0.01 0.04 0.11 0.02 GGTP -0.02 0.04 0.18 0.74 -0.01 -0.01 0.06 -0.05 0.06 0.09BUN -0.07 0.04 0.22 -0.03 0.82 0.08 -0.05 0.04 -0.08 -0.03Creatinine 0.04 0.01 0.09 0.03 0.81 -0.04 -0.17 0.04 0.02 0.01 Potassium 0.06 0.07 -0.09 -0.03 0.43 0.13 0.28 -0.12 0.13 0.15Sodium 0.11 0.04 -0.05 0.00 0.13 0.89 0.02 0.13 0.01 -0.01Chloride -0.12 0.02 -0.21 -0.02 -0.10 0.72 -0.08 -0.08 -0.15 -0.06Osmolality 0.09 -0.12 0.28 0.05 0.47 0.60 0.14 -0.07 -0.02 0.08ALP 0.07 -0.08 0.06 0.13 -0.07 -0.01 0.73 0.01 0.00 0.14 Phosphates 0.06 0.07 -0.09 -0.03 0.43 0.13 0.28 -0.12 0.13 0.15
130 131
Diastolic BP 0.27 0.13 0.45 0.10 0.02 0.09 -0.50 -0.11 0.22 0.06Lymphocytes -0.26 -0.34 0.03 0.17 -0.17 0.07 -0.04 0.56 -0.03 0.19Albumin 0.39 0.14 -0.21 -0.07 0.00 0.01 0.04 0.72 0.02 -0.08Calcium 0.22 0.10 0.07 -0.09 0.06 0.04 0.31 0.58 0.28 -0.13Protein 0.16 -0.08 -0.06 0.12 0.03 -0.11 0.07 0.39 0.82 -0.03Globulins -0.16 -0.21 0.10 0.19 0.01 -0.11 0.04 -0.18 0.82 0.03WBC 0.1 -0.05 0.01 -0.02 0.08 -0.14 0.18 -0.26 0.05 -0.74Monocytes 0.12 0.01 -0.10 0.04 0.13 -0.15 0.00 -0.17 0.08 0.56Eosinophils 0.03 -0.05 -0.02 0.00 0.02 -0.01 0.24 -0.04 -0.05 0.46Bilirubin 0.28 0.09 -0.11 0.24 0.16 -0.15 -0.11 0.26 -0.27 0.05Note. Variables sorted by primary loading. Loadings are bolded for all values ≥ |0.4|.
234
132
133
Table 5.4
PCA solution for 5 extracted components of human biomarkers Loadings 1 2 3 4 5 Cholesterol 0.59 0.00 0.04 0.05 0.07 BMI 0.69 -0.02 0.08 0.05 -0.04 Systolic BP 0.71 0.01 0.05 0.07 0.21 Diastolic BP 0.67 0.12 0.12 0.12 0.06 Triglycerides 0.50 0.03 0.01 0.17 0.05 Phosphates -0.41 0.10 -0.15 0.07 0.06 Glucose 0.42 -0.02 -0.16 0.12 0.15 Lymphocytes -0.33 -0.01 -0.29 0.20 0.01 ALP -0.27 0.16 -0.18 0.24 0.05 RBC 0.19 0.81 -0.21 0.00 0.01 HCT 0.35 0.78 0.38 0.07 0.04 HGB 0.33 0.76 0.48 0.09 0.02 Albumin -0.32 0.69 0.15 -0.05 0.01 Calcium -0.16 0.54 -0.08 0.04 0.12 Protein -0.02 0.45 -0.39 0.32 -0.09 MCH 0.25 -0.01 0.82 0.10 0.05 MCV 0.22 0.03 0.88 0.11 0.02 MCHC 0.03 0.12 0.54 0.08 -0.08 Globulins 0.22 -0.10 -0.54 0.38 -0.11 SGOT -0.02 0.03 0.08 0.87 -0.03 SGPT 0.06 0.14 0.09 0.77 -0.03 GGTP 0.11 -0.06 0.03 0.74 0.01 Osmolality 0.15 0.03 -0.07 0.08 0.80 Sodium -0.19 0.12 0.17 -0.01 0.68 BUN 0.30 -0.06 -0.01 -0.03 0.67 Creatinine 0.30 0.05 -0.04 0.02 0.55 Potassium -0.06 0.06 -0.03 0.04 0.41 Chloride -0.28 -0.20 0.21 -0.09 0.36 Eosinophils -0.14 0.02 -0.05 0.08 0.09 Bilirubin -0.07 0.30 0.22 0.15 0.02 Monocytes 0.03 0.03 -0.00 0.11 0.04 WBC 0.17 0.04 -0.12 -0.10 -0.12 Note. Variables sorted by primary loading. Loadings are bolded for all values ≥ |0.4|.

134
5.3.3 Confirmatory Analyses
We modelled the 10 and 5 factor solutions to obtain model fits with our
confirmatory dataset, using three common measures: Comparative Fit Index (CFI),
an incremental fit index based on model non-centrality; Root Mean Square Error of
Approximation (RMSEA), an absolute index based on non-centrality; Standardized
Root Mean Residual (SRMR), an absolute index with no penalty for model
complexity (Hu & Bentler, 1999). Model fits for these solutions were poor (Table
5.5), and the 10 factor model was unable to compute standard errors for the
chimpanzee data.
Table 5.5
CFA model fit statistics for models containing all variables
CFA model
χ2
df
CFI
RMSEA
SRMR.
10 factors
Human
Chimpanzee
155709
1394
433
0.417
0.482
0.201
0.201
0.137
0.174
5 factors
Human
Chimpanzee
152344
1230
274
0.417
0.550
0.250
0.140
0.144
0.157
Note. df = degrees of freedom, CFI = Comparative Fit Index, RMSEA = Root Mean Squared Error of Approximation, SRMR = Standardized Root Mean square Residual
The poor fit of these models indicated that interpreting the entire system of
biomarkers in CFA would be problematic in both chimpanzees and humans, despite
our sizable samples. Thus, we constrained our models to the biomarkers associated
with AL, and examined CFAs with a single AL factor.

135
We fit our first model with the broadest set of biomarkers which had at least 4
primary loadings across our exploratory factor analyses. This model included
cholesterol, triglycerides, phosphates, alkaline phosphatase, BMI, and systolic and
diastolic blood pressure (Table 5.2). According to the absolute fit indices RMSEA,
and SRMR, the fit of this model was considerably better than our models of all
biomarkers (compare Tables 5.5 and 5.6).
We sought to improve the model further by eliminating biomarkers which
less frequently loaded with the other relevant markers, and looking for improvements
in model fit (Table 5.6). First, we removed alkaline phosphatase, which improved
CFI, RMSEA, and SRMR in models of the chimpanzee sample, and improved CFI
and SRMR in the human sample. The RMSEA of the human models increased by a
small amount (0.02), but otherwise, removing alkaline phosphatase improved model
fit. Second, we removed phosphates, which did not obviously improve model fit, so
we returned phosphates to the model. As the CFI of our phosphates-inclusive model
was greater than 0.9, we chose to proceed with measurement invariance testing
(Millsap et al., 2012) to compare model fit among the two species groups.

136
Table 5.6 Fit statistics for single AL CFA models Model containing χ2 df CFI RMSEA SRMR D, S, T, C, P, BMI, ALP 20
Human 1797 0.833 0.101 0.066 Chimpanzee 60.97 0.763 0.108 0.108 D, S, T, C, P, BMI 9
Human 831.3 0.911 0.103 0.050 Chimpanzee 14.02 0.958 0.056 0.066 Both (jointly estimated) 846.6 0.910 0.103 0.051 D, S, T, C, BMI 14
Human 897.2 0.907 0.085 0.049 Chimpanzee 26.88 0.898 0.072 0.085 Note. df = Degrees of Freedom, CFI = Comparative Fit Index, RMSEA = Root Mean Squared Error of Approximation, SRMR = Standardized Root Mean Residual, D = Diastolic blood pressure, S = Systolic blood pressure, T = Triglycerides, C = Cholesterol, P = Phosphates, BMI = Body Mass Index, ALP = Alkaline Phosphatase.
We first tested for the degree of measurement invariance between the
NHANES and YNPRC samples. Across all six variables, the model with factor
loadings estimated across both groups was a significantly poorer fit than the base
model, wherein all parameters were freely estimated within the two groups (χ2 =
54.9, df = 5, p < 0.001), indicating that measurement invariance would not hold for
all these variables at once.
We thus proceeded with partial measurement invariance testing, beginning
with tests of metric invariance, where we tested if the loadings of each variable on
the AL factor were the same across groups (Table 5.7). The highest χ2 value was for
diastolic BP, so we freed its loading on the AL variable. On the second pass, systolic BP
emerged with the highest χ2, so we freed it as well. In the next iteration, no χ2 values were
significant, so we left the remaining parameters fixed.

137
Table 5.7 Metric partial invariance tests of single AL CFA model Model 1 Model 2 Model 3
Fixed parameters χ2 p χ2 p χ2 p
Cholesterol 0.77 0.38 3.22 0.12 0.15 0.70 Triglycerides 17.05 0.002 19.23 < 0.001 0.38 0.70 Systolic BP 3.29 0.13 31.71 < 0.001
Diastolic BP 17.56 0.002
BMI 2.65 0.13 1.89 0.21 0.53 0.70 Phosphates 2.57 0.13 1.52 0.22 4.93 0.11 Note. BP = Blood pressure, all degrees of freedom were equal to 1. All p-values were adjusted for multiple comparisons using Benjamini and Hochberg's False Discovery Rate. Bolding indicates parameters which were found to be invariant.
We followed the same approach to assess our model’s partial scalar
invariance, where we individually tested if the intercepts on each observed variable
could be fixed across groups (Table 5.8). Testing scalar invariance was not strictly
necessary to be able to compare association patterns between groups, but is
nevertheless informative of the presence of measurement bias or developmental
differences (Byrne & Watkins, 2003). We freed systolic BP, then phosphates, and
finally triglycerides. The remaining parameters were fixed. We also attempted to
establish strict partial invariance, that is, invariance in the residuals of our observed
variables, but were unable to establish that residuals were invariant between these
two groups.
With these particulars of invariance established, we fit a model that included
partial invariance in intercepts and loadings, as indicated. We compared the fit of this
model to a model in which all parameters were jointly estimated across the groups
and a model in which parameters were freely estimated within groups (Table 5.9).
Overall, the CFI and SRMR indicated that all the models had good fits (Hu &
138
Bentler, 1999), but neither CFI nor SRMR pointed to any model having clearly better
fit than another. However, the RMSEAs of both models which do not take into
account partial invariance, were above the ‘unacceptable’ threshold of 0.1 (Chen,
Curran, Bollen, Kirby, & Paxton, 2008). As such, we concluded that the model
which includes partially invariant fixed parameters was the best of the three. This
final model is presented in Table 5.10.
Tabl
e 5.
8
Scal
ar p
artia
l inv
aria
nce
test
s of s
ingl
e AL
CFA
mod
el
Mod
el 1
Mod
el 2
Mod
el 3
Mod
el 4
Fixe
d pa
ram
eter
s χ2
p
χ2
p
χ2
p
χ2
p
C
hole
ster
ol
0.19
0.
66
2.
14
0.18
2.79
0.
13
0.
02
0.89
Trig
lyce
rides
32
.90
< 0.
001
12
.06
0.00
1
8.30
0.
009
Syst
olic
BP
44.4
9 <
0.00
1
D
iast
olic
BP
2.60
0.
13
6.
95
0.14
8.07
0.
009
2.
07
0.23
BM
I 3.
19
0.11
1.56
0.
21
1.
29
0.26
4.23
0.
12
Ph
osph
ates
34
.57
< 0.
001
36
.79
< 0.
001
N
ote.
BP
= B
lood
pre
ssur
e, a
ll de
gree
s of f
reed
om w
ere
equa
l to
1. A
ll p-
valu
es w
ere
adju
sted
for m
ultip
le c
orre
ctio
ns
usin
g B
enja
min
i and
Hoc
hber
g's F
alse
Dis
cove
ry R
ate.
Bol
ding
indi
cate
s par
amet
ers w
hich
wer
e fo
und
to b
e in
varia
nt.
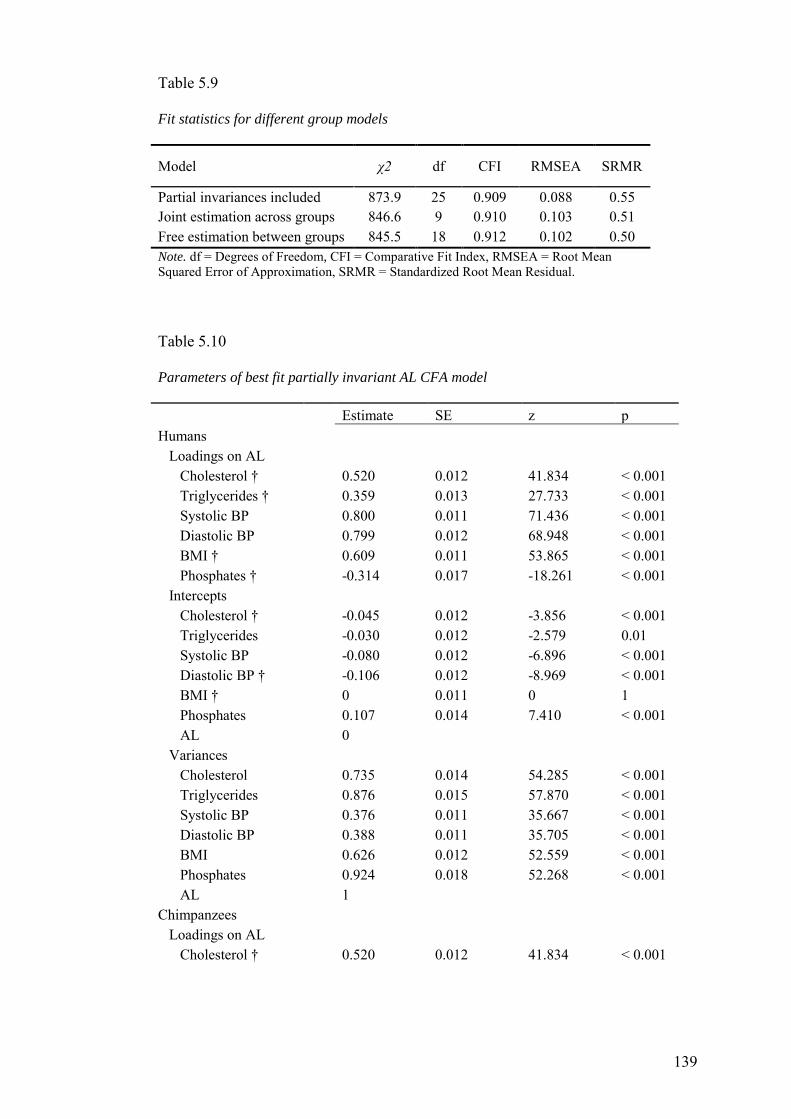
139
Table 5.9 Fit statistics for different group models
Model χ2 df CFI RMSEA SRMR
Partial invariances included 873.9 25 0.909 0.088 0.55 Joint estimation across groups 846.6 9 0.910 0.103 0.51 Free estimation between groups 845.5 18 0.912 0.102 0.50 Note. df = Degrees of Freedom, CFI = Comparative Fit Index, RMSEA = Root Mean Squared Error of Approximation, SRMR = Standardized Root Mean Residual.
Table 5.10 Parameters of best fit partially invariant AL CFA model
Estimate SE z p Humans Loadings on AL Cholesterol † 0.520 0.012 41.834 < 0.001 Triglycerides † 0.359 0.013 27.733 < 0.001 Systolic BP 0.800 0.011 71.436 < 0.001 Diastolic BP 0.799 0.012 68.948 < 0.001 BMI † 0.609 0.011 53.865 < 0.001 Phosphates † -0.314 0.017 -18.261 < 0.001 Intercepts Cholesterol † -0.045 0.012 -3.856 < 0.001 Triglycerides -0.030 0.012 -2.579 0.01 Systolic BP -0.080 0.012 -6.896 < 0.001 Diastolic BP † -0.106 0.012 -8.969 < 0.001 BMI † 0 0.011 0 1 Phosphates 0.107 0.014 7.410 < 0.001 AL 0 Variances Cholesterol 0.735 0.014 54.285 < 0.001 Triglycerides 0.876 0.015 57.870 < 0.001 Systolic BP 0.376 0.011 35.667 < 0.001 Diastolic BP 0.388 0.011 35.705 < 0.001 BMI 0.626 0.012 52.559 < 0.001 Phosphates 0.924 0.018 52.268 < 0.001 AL 1 Chimpanzees Loadings on AL Cholesterol † 0.520 0.012 41.834 < 0.001
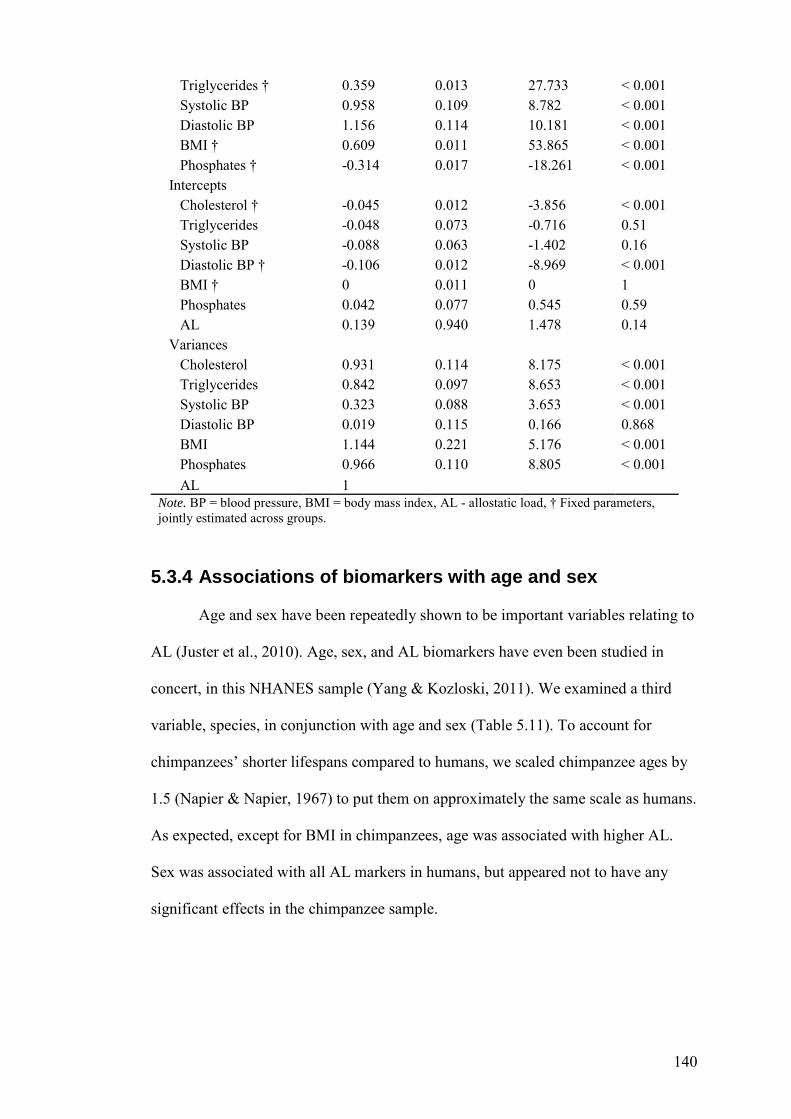
140
Triglycerides † 0.359 0.013 27.733 < 0.001 Systolic BP 0.958 0.109 8.782 < 0.001 Diastolic BP 1.156 0.114 10.181 < 0.001 BMI † 0.609 0.011 53.865 < 0.001 Phosphates † -0.314 0.017 -18.261 < 0.001 Intercepts Cholesterol † -0.045 0.012 -3.856 < 0.001 Triglycerides -0.048 0.073 -0.716 0.51 Systolic BP -0.088 0.063 -1.402 0.16 Diastolic BP † -0.106 0.012 -8.969 < 0.001 BMI † 0 0.011 0 1 Phosphates 0.042 0.077 0.545 0.59 AL 0.139 0.940 1.478 0.14 Variances Cholesterol 0.931 0.114 8.175 < 0.001 Triglycerides 0.842 0.097 8.653 < 0.001 Systolic BP 0.323 0.088 3.653 < 0.001 Diastolic BP 0.019 0.115 0.166 0.868 BMI 1.144 0.221 5.176 < 0.001 Phosphates 0.966 0.110 8.805 < 0.001 AL 1 Note. BP = blood pressure, BMI = body mass index, AL - allostatic load, † Fixed parameters, jointly estimated across groups.
5.3.4 Associations of biomarkers with age and sex
Age and sex have been repeatedly shown to be important variables relating to
AL (Juster et al., 2010). Age, sex, and AL biomarkers have even been studied in
concert, in this NHANES sample (Yang & Kozloski, 2011). We examined a third
variable, species, in conjunction with age and sex (Table 5.11). To account for
chimpanzees’ shorter lifespans compared to humans, we scaled chimpanzee ages by
1.5 (Napier & Napier, 1967) to put them on approximately the same scale as humans.
As expected, except for BMI in chimpanzees, age was associated with higher AL.
Sex was associated with all AL markers in humans, but appeared not to have any
significant effects in the chimpanzee sample.
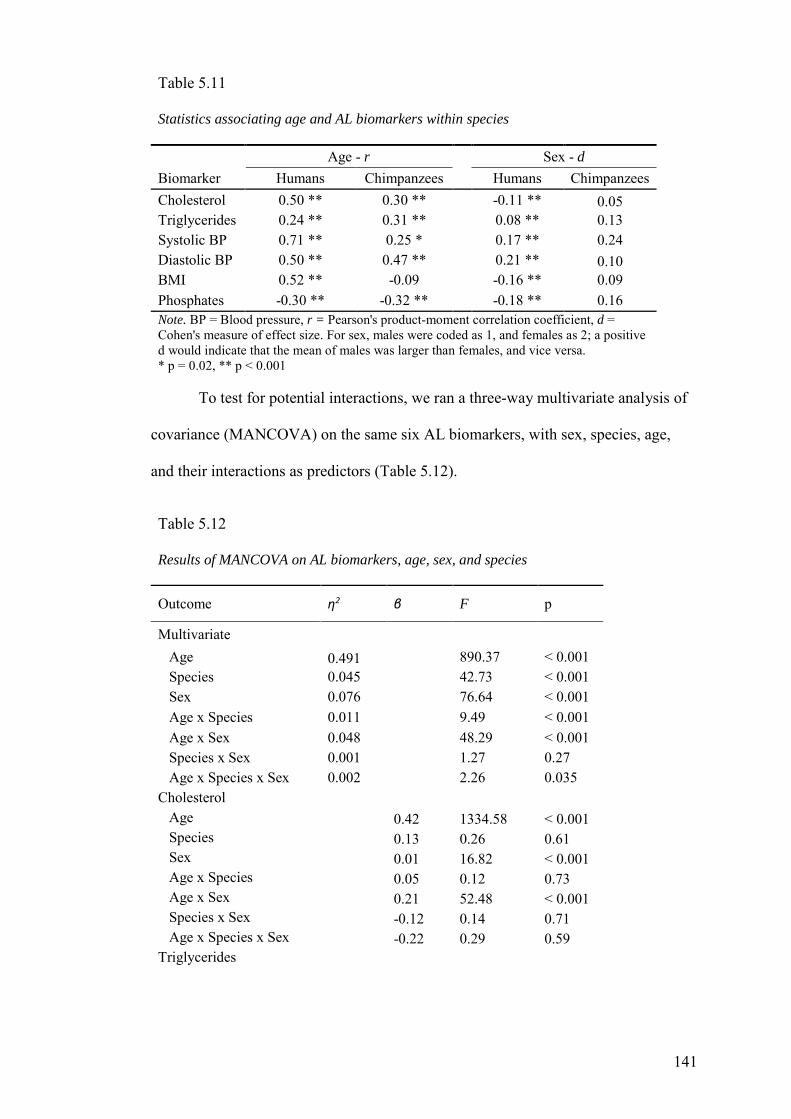
141
Table 5.11
Statistics associating age and AL biomarkers within species
Age - r Sex - d Biomarker Humans Chimpanzees Humans Chimpanzees Cholesterol 0.50 ** 0.30 ** -0.11 ** 0.05 Triglycerides 0.24 ** 0.31 ** 0.08 ** 0.13 Systolic BP 0.71 ** 0.25 * 0.17 ** 0.24 Diastolic BP 0.50 ** 0.47 ** 0.21 ** 0.10 BMI 0.52 ** -0.09 -0.16 ** 0.09 Phosphates -0.30 ** -0.32 ** -0.18 ** 0.16 Note. BP = Blood pressure, r = Pearson's product-moment correlation coefficient, d = Cohen's measure of effect size. For sex, males were coded as 1, and females as 2; a positive d would indicate that the mean of males was larger than females, and vice versa. * p = 0.02, ** p < 0.001
To test for potential interactions, we ran a three-way multivariate analysis of
covariance (MANCOVA) on the same six AL biomarkers, with sex, species, age,
and their interactions as predictors (Table 5.12).
Table 5.12
Results of MANCOVA on AL biomarkers, age, sex, and species
Outcome η2 β F p
Multivariate Age 0.491 890.37 < 0.001 Species 0.045 42.73 < 0.001 Sex 0.076 76.64 < 0.001 Age x Species 0.011 9.49 < 0.001 Age x Sex 0.048 48.29 < 0.001 Species x Sex 0.001 1.27 0.27 Age x Species x Sex 0.002 2.26 0.035 Cholesterol Age 0.42 1334.58 < 0.001 Species 0.13 0.26 0.61 Sex 0.01 16.82 < 0.001 Age x Species 0.05 0.12 0.73 Age x Sex 0.21 52.48 < 0.001 Species x Sex -0.12 0.14 0.71 Age x Species x Sex -0.22 0.29 0.59 Triglycerides
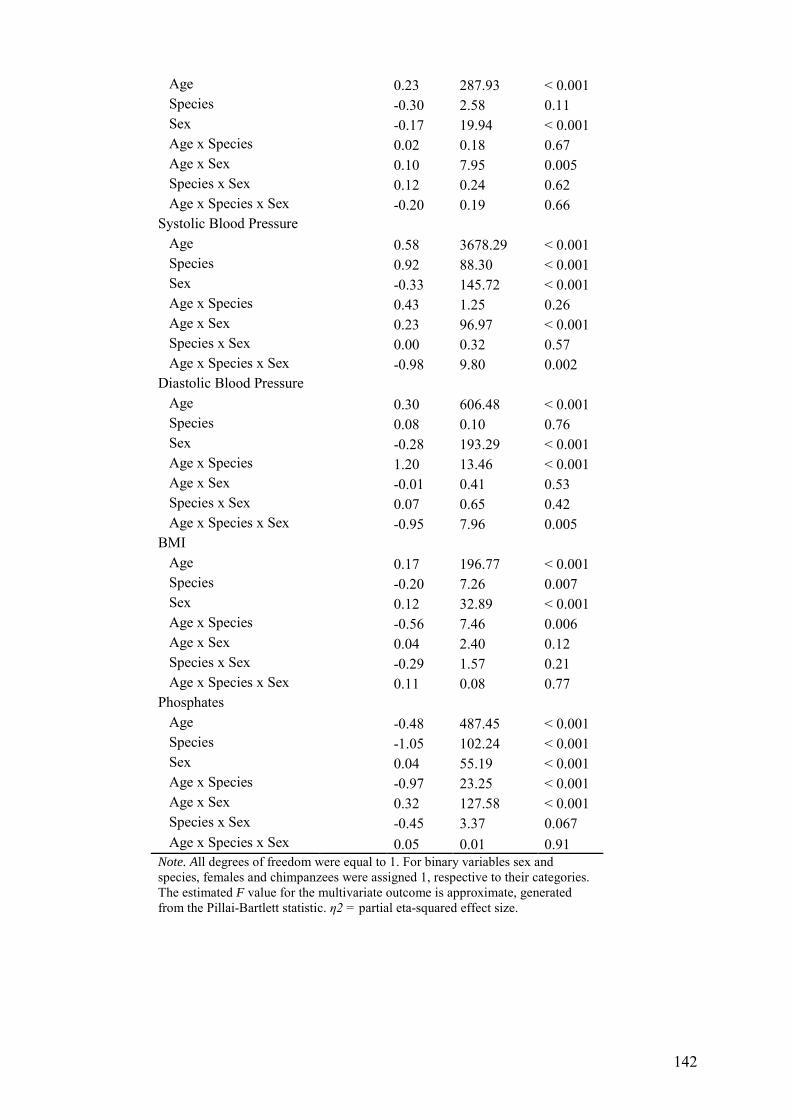
142
Age 0.23 287.93 < 0.001 Species -0.30 2.58 0.11 Sex -0.17 19.94 < 0.001 Age x Species 0.02 0.18 0.67 Age x Sex 0.10 7.95 0.005 Species x Sex 0.12 0.24 0.62 Age x Species x Sex -0.20 0.19 0.66 Systolic Blood Pressure
Age 0.58 3678.29 < 0.001 Species 0.92 88.30 < 0.001 Sex -0.33 145.72 < 0.001 Age x Species 0.43 1.25 0.26 Age x Sex 0.23 96.97 < 0.001 Species x Sex 0.00 0.32 0.57 Age x Species x Sex -0.98 9.80 0.002 Diastolic Blood Pressure
Age 0.30 606.48 < 0.001 Species 0.08 0.10 0.76 Sex -0.28 193.29 < 0.001 Age x Species 1.20 13.46 < 0.001 Age x Sex -0.01 0.41 0.53 Species x Sex 0.07 0.65 0.42 Age x Species x Sex -0.95 7.96 0.005 BMI
Age 0.17 196.77 < 0.001 Species -0.20 7.26 0.007 Sex 0.12 32.89 < 0.001 Age x Species -0.56 7.46 0.006 Age x Sex 0.04 2.40 0.12 Species x Sex -0.29 1.57 0.21 Age x Species x Sex 0.11 0.08 0.77 Phosphates
Age -0.48 487.45 < 0.001 Species -1.05 102.24 < 0.001 Sex 0.04 55.19 < 0.001 Age x Species -0.97 23.25 < 0.001 Age x Sex 0.32 127.58 < 0.001 Species x Sex -0.45 3.37 0.067 Age x Species x Sex 0.05 0.01 0.91 Note. All degrees of freedom were equal to 1. For binary variables sex and species, females and chimpanzees were assigned 1, respective to their categories. The estimated F value for the multivariate outcome is approximate, generated from the Pillai-Bartlett statistic. η2 = partial eta-squared effect size.
143
For the multivariate AL outcome, we found unambiguously significant
differences for age, species, sex, and the interactions of age with species and sex. At
the univariate level, age and sex were associated with every biomarker; older
individuals had higher AL, and females had lower AL, which agrees with the
correlational results in Table 5.11. We found a significant effect of species for some
biomarkers, but the directions of the relationships were not consistent. Similarly,
some species x age effects were significant, and a significant difference was found
overall, but again, the direction of effects was inconsistent. Age x sex effects were
significant overall, and reliably indicated that females tend to have more of each
biomarker measure as they age, regardless of species. However, except for age,
effect sizes were generally medium (< 0.13) to small (< 0.02) (Miles & Shevlin,
2001).
5.4 Discussion
When examining the component and factor structures of human and
chimpanzee blood, cardiovascular, hepatorenal, and metabolic biomarkers, we found
evidence that allostatic load could be modelled from multisystem markers in both
species. We were unable to find models with adequate fit that incorporated our entire
panel of biomarkers. However, by incorporating only biomarkers which we believed
might be relevant to AL, we constructed a model with good fit for both chimpanzees
and humans. In these two samples, our results suggest that systolic and diastolic
blood pressure, cholesterol, triglycerides, and BMI are positively associated with
higher AL, and that phosphates are negatively associated with AL, in both humans
and chimpanzees.
144
With the exception of phosphates, all of these markers have been used to
calculate allostatic load in humans and in nonhuman primates (Edes & Crews, 2017).
Indeed, our selection of models and latent variables (Table 5.2) relied a on pre-
existing understanding of AL biomarkers in chimpanzees (Lambeth et al., 2006;
Videan et al., 2009) and other primate species (Edes & Crews, 2017). Phosphates are
not well- represented in the AL literature, but allostasis in phosphate regulation has
been noted in the cardiovascular and renal systems of aging mammals (Ohnishi &
Razzaque, 2010), and so the relevance of phosphates in our models is not surprising.
Some biomarkers did not appear to contribute to AL in our PCAs with the
human sample. Glucose is commonly used in AL models because of its connection to
diabetes and metabolic processes (Stumvoll, Tataranni, Stefan, Vozarova, &
Bogardus, 2003), but while it twice assumed a primary loading with other AL
biomarkers (Table 5.2), in the majority of our PCAs it did not. Creatinine is another
common AL marker (Juster et al., 2010), and it also did not assume a primary
loading with the other AL variables. Instead, creatinine tended to cluster with blood
urea nitrogen, potassium, and osmolality (Tables 5.3, 5.4). These markers are
associated with dietary sodium intake and subsequent renal health issues (Berge-
Landry & James, 2004). However, Berge-Landry and James (2004) did not find that
cholesterol or triglycerides were associated with dietary differences in sodium
consumption, so it may be that creatinine captures particular renal or hepatorenal
allostasis, but not cardiovascular allostasis.
The structure of the associations between AL and these biomarkers differed
slightly between chimpanzees and humans. Both systolic and diastolic blood pressure
145
loaded more strongly on the latent AL variable in chimpanzees than in humans, but
otherwise the loadings were invariant across species. The blood pressure differences
may be the result of the anatomical differences between humans and chimpanzees,
such as changes in muscular and vascular tissues, which were necessary to support
humans’ upright locomotion (Diogo, Molnar, & Wood, 2017); the pathological
differences in cardiovascular diseases between species may also be relevant (Varki et
al., 2009). However, the association between BMI, a direct anatomical measurement,
and the AL factor was the same between species, which suggests that anatomical
differences may not be relevant to the pathogenic differences between chimpanzee
and human cardiovascular disease. The intercepts of various biomarkers differed as
well, but these differences were small compared to the influences of the variables’
loadings on AL (e.g., cholesterol: b = 0.520, c = -0.045), and for the variables where
intercepts did differ, the differences were not large (e.g. systolic BP: human c = -
0.080, chimpanzee c = -0.088).
In both species, our AL measures were strongly associated with age. As AL is
defined as an accumulation of the effects of stress over time, this is unsurprising.
Nevertheless, with a novel species it is important to verify the validity of the
measure. A surprising finding concerned BMI: in chimpanzees, BMI was the only
AL biomarker not associated with age, suggesting that some chimpanzees are
overweight throughout the course of their lives, while others are not. Why this effect
differs from what we observed in humans, where individuals tend to gain weight
over time, is an interesting question for future research, but beyond the scope of this
study.
146
With respect to biological sex, female humans are known to have lower AL
than males (Juster et al., 2010), but the evidence for this in chimpanzees was not as
strong, as there were no statistically significant differences in biomarker levels
between sexes. However, a MANCOVA demonstrated that there was no significant
species x sex interaction, which we would have expected to find if females had lower
AL in humans, but not in chimpanzees. Taking into account all possible interactions
within the MANCOVA, including significant age x sex and age x sex x species,
might have better explained the group differences we observed between species and
sex in Table 5.11.
This study faced several limitations. The chimpanzee sample was taken
opportunistically, so we were unable to manipulate what ages measurements were
taken at within individuals, and we were also unable to collect biomarkers like
interleukin-6 or cortisol. The biomarkers we used appeared to be valid, but the
interpretations of a biomarker like phosphate is not as well understood as others
(again, e.g., interleukin-6). Whether factor or principal components analyses are
viable methods for assessing the structure of biomarkers remains an open question
(Crook & Booth, 2017), although the structure of our analyses did not depend on our
choice of data reduction method. Similarly, because we wanted to compare the
structural composition of an AL factor between species, we did not use cut-points. It
is another open question what is the best method for aggregating dysregulation
measures over time, and to understand AL in chimpanzees more completely,
different aggregation methods (sum scores, weighted sums, binary cut-points) ought
to be explored further.
147
In summary, our results suggest that a meaningful measure of AL can be
calculated for individual chimpanzees using physical and blood biomarkers. As
individuals age, physiological dysregulation grows and AL increases. That the
structures of AL are similar between humans and chimpanzees suggests that the
physiological underpinnings of stress have deep evolutionary roots. Future work
ought to investigate a greater variety of biomarkers in other primate species such as
bonobos and capuchins, and link AL with a wider range of health influences and
outcomes. These studies add much to our understanding of captive animal
management and the evolution of stress.

148
6 Personality and allostatic load biomarkers in Japanese and American humans, and chimpanzees
6.1 Introduction
Stress can come from many sources, both environmental and psychosocial,
but allostatic load (AL) is affected by virtually all stressors (McEwen, 2000). As
described in chapter 5, AL operationalizes the accumulation stress over time, as
measured by physiological dysregulation in multiple bodily systems. Over the course
of a lifetime, this accumulation can have far-reaching consequences for mental and
physical health. Individuals with high AL are physically weaker (Mori et al., 2014),
and more likely to become disabled (Juster et al., 2010); they also suffer from higher
rates of cognitive decline (Karlamangla et al., 2014) and depression (Kobrosly,
Seplaki, Cory‐Slechta, Moynihan, & Wijngaarden, 2013). Ultimately, high AL is
associated with increased all-cause mortality risk (Seeman, McEwen, Rowe, &
Singer, 2001).
While the effects of AL are far ranging, and include psychological outcomes,
the impact of psychological variables on AL has come under study as well. Both
personality and AL are major predictors of mortality (Roberts et al., 2007; Seeman et
al., 1997); moreover, both personality and AL are broad measures with known
connections to a myriad of other systems and outcomes. For example, the personality
trait of hostility, frequently associated with higher development of CVD (Friedman,
149
Tucker, & Reise, 1995), is also linked to higher allostatic load (Kubzansky, Kawachi,
& Sparrow, 1999). In this way, single personality traits are implicated in the
development of multiple disorders, but a single disorder can also result from the
effects of multiple distinct vulnerabilities (Beauchaine, Klein, Crowell, Derbidge, &
Gatzke-Kopp, 2009), in this case, different dimensions of the FFM.
Of the dimensions in the FFM, Conscientiousness and Neuroticism are the
two most frequently associated with biomarkers of health, including metabolic
(Human et al., 2013), cardiovascular (Terracciano et al., 2014), and inflammatory
(Luchetti et al., 2014) markers. Conscientiousness and Neuroticism are also notable
for being associated with mortality (Roberts et al., 2007), mental health (Strickhouser
et al., 2017), and health behaviors, particularly non-social behaviors, such as
prevalence of smoking or alcohol consumption (Turiano et al., 2015). Focusing on
relationships with a multisystem AL construct, high Neuroticism, low Extraversion,
and low Conscientiousness tend to have higher AL (Stephan, Sutin, Luchetti, &
Terracciano, 2016).
However, the effects of personality on AL are often inconsistent between
samples (Allen & Laborde, 2017). This could come down to a range of factors, but
culture is possibly the most powerful, least understood of these moderators (Ryff et
al., 2015). Investigators are increasingly searching for cross-cultural effects, that is,
effects that are or are not the product of differences in cultural environments. If an
association is consistent across samples from different cultures, this is strong
evidence that the effect is robust. If an association is consistent across cultures and in
a closely-related species, such as chimpanzees, then this would be even stronger
150
evidence for the robustness of the effect. AL has been assessed and studied in many
populations (Juster et al., 2010), but the specific relationships between AL and
personality, across cultures, has been little studied.
In chapter 4, we established links between Agreeableness and mortality in
chimpanzees, and in chapter 5, we explored biomarker data from a chimpanzees,
guided by a human dataset. We found that the types of biomarkers that contributed to
an emergent AL latent variable were similar between humans and chimpanzees.
Some notably differences emerged, for instance, there were fewer significant sex
differences in biomarkers among chimpanzees, and BMI appeared not to change with
age in chimpanzees. However, the overall findings support the presence of a cross-
taxonomic tribe (Hominini) AL construct in chimpanzees and humans.
Although AL has been provisionally studied in some nonhuman primates
(Edes & Crews, 2017), and personality and mortality has been studied in a few
species (Seyfarth et al., 2012; Weiss et al., 2013), only two studies have touched on
these issues in chimpanzees. Both examined behavioral measures of personality and
cortisol levels in captive chimpanzees, but neither found consistent associations
between cortisol levels and personality (Anestis, 2005; Anestis et al., 2006).
American chimpanzees benefit from the advantages of western civilization,
but also experience several of the same downsides. Chimpanzees living in captivity
in the US tend to lead largely sedentary lives, where food is plentiful, but made from
processed materials, and health care is readily available. Of particular note, captive
chimpanzees, and indeed all captive great apes, including sedentary humans, suffer
from disproportionately high rates of CVD (Varki et al., 2009), compared to wild
151
chimpanzees (Hill et al., 2001). In these ways, captive chimpanzees’ life trajectories
resemble those of modern, post-industrial humans.
Personality is posited to be associated with AL through three main paths, as
introduced in chapter 1: health behaviors associated with specific personality
dimensions, causative influences of personality on physiology, and biological third
variables, e.g., common genes. As demonstrated, captive chimpanzee mortality more
closely resembles post-industrial human mortality than mortality among wild
chimpanzees. Thus, captive chimpanzees provide a powerful means of controlling
for the importance of health behaviors. Possessing a similar personality structure to
humans (King & Figueredo, 1997) and living in similar environments, chimpanzees
differ in a key respect: chimpanzees do not have the ability and do not possess
sufficient knowledge to alter their behavior to reduce unhealthy or increase healthy
habits. In this way, the captive chimpanzee population allows us to carry out a
natural experiment, wherein our chimpanzee sample allows us to control for the
effects of health mediating behaviors.
However, human environments vary even between developed nations;
cultural differences might also affect how psychology and health are related (Boylan,
Tsenkova, Miyamoto, & Ryff, 2017; Miyamoto et al., 2013). For example,
Americans and Japanese humans are members of the same species, but captive
chimpanzees living in the US arguably share a culture with American humans.
Which might be more relevant to the effects of personality on AL, species or culture?
To investigate these contrasts, we identified two human samples – the Midlife in the
United States (MIDUS) study and the analogous Midlife in Japan (MIDJA) study –
152
which had a high degree of overlap in variables, and our chimpanzee sample,
allowing us to make direct comparisons across groups. To the best of our knowledge,
no previous researchers have had access to nonhuman individuals who have been
both comprehensively rated for personality and assayed for biomarker levels. In this
chapter, we explore the effects of personality on AL, as informed by our examination
of AL biomarkers in chapter 5, and compare the chimpanzees to these two distinct,
culturally representative samples of humans.
6.2 Methods
6.2.1 Study Subjects
6.2.1.1 American Humans
Personality and biomarker data were drawn from the MIDUS study, which
included a subsample in which biomarkers were drawn from select members the
MIDUS II sample (Dienberg Love, Seeman, Weinstein, & Ryff, 2010). 993
individuals participated in the MIDUS II biomarker survey.
6.2.1.2 Japanese Humans
The sister project to MIDUS, Midlife in Japan (MIDJA), began in 2008. By
design, the variables gathered during the MIDJA study have a high degree of overlap
with those from the MIDUS study, including personality, most blood biomarkers,
blood pressure, and BMI measurements. 382 individuals participated in the MIDJA
biomarker survey.
6.2.1.3 American Chimpanzees
The sample of and data from chimpanzees was the same as that used in
chapter 5.

153
6.2.2 Personality
6.2.2.1 Humans
Both American and Japanese humans were assessed for personality using the
Midlife Development Inventory (MIDI), developed in English and translated into
Japanese (Lachman & Weaver, 1997). Participants were asked to rate how well 31
adjectives described themselves using a four-point scale ranging from 1 (not at all) to
4 (a lot). The 31 items represent the standard dimensions of the FFM, as well as a
sixth dimension, referred to as ‘agency’ by the MIDI. Agency consists of five items:
‘self-confident’, ‘forceful’, ‘assertive’, ‘outspoken’, and ‘dominant’. Because of the
strong conceptual overlap with the chimpanzee Dominance dimension, we referred to
agency as Dominance and treated the score as we would a chimpanzee Dominance
personality score.
Four items assessed Neuroticism, five items assessed Extraversion, seven
items assessed Openness, five items assessed Agreeableness, and five items assessed
Conscientiousness. The reliability of the MIDI dimensions in both samples was
adequate to strong (Figueredo et al., 2005; Lachman & Weaver, 1997; Sutin et al.,
2015).
6.2.2.2 Chimpanzees
Personality was assessed with the CPQ, as described in (Weiss et al., 2007),
and elaborated on in the preceding chapters.
6.2.3 Biomarkers
Previous studies have examined many biomarkers in these humans samples
(Boylan et al., 2017; Ryff et al., 2015). To maintain comparisons that were as direct
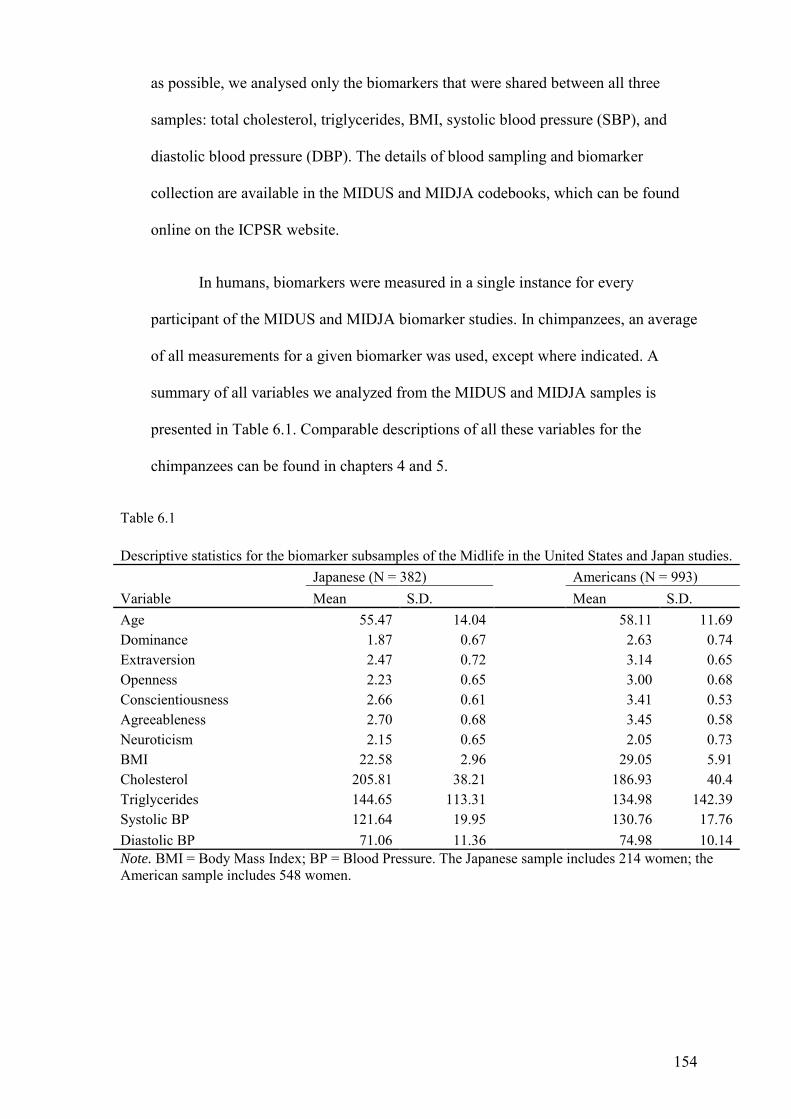
154
as possible, we analysed only the biomarkers that were shared between all three
samples: total cholesterol, triglycerides, BMI, systolic blood pressure (SBP), and
diastolic blood pressure (DBP). The details of blood sampling and biomarker
collection are available in the MIDUS and MIDJA codebooks, which can be found
online on the ICPSR website.
In humans, biomarkers were measured in a single instance for every
participant of the MIDUS and MIDJA biomarker studies. In chimpanzees, an average
of all measurements for a given biomarker was used, except where indicated. A
summary of all variables we analyzed from the MIDUS and MIDJA samples is
presented in Table 6.1. Comparable descriptions of all these variables for the
chimpanzees can be found in chapters 4 and 5.
Table 6.1 Descriptive statistics for the biomarker subsamples of the Midlife in the United States and Japan studies. Japanese (N = 382) Americans (N = 993) Variable Mean S.D. Mean S.D. Age 55.47 14.04 58.11 11.69 Dominance 1.87 0.67 2.63 0.74 Extraversion 2.47 0.72 3.14 0.65 Openness 2.23 0.65 3.00 0.68 Conscientiousness 2.66 0.61 3.41 0.53 Agreeableness 2.70 0.68 3.45 0.58 Neuroticism 2.15 0.65 2.05 0.73 BMI 22.58 2.96 29.05 5.91 Cholesterol 205.81 38.21 186.93 40.4 Triglycerides 144.65 113.31 134.98 142.39 Systolic BP 121.64 19.95 130.76 17.76 Diastolic BP 71.06 11.36 74.98 10.14 Note. BMI = Body Mass Index; BP = Blood Pressure. The Japanese sample includes 214 women; the American sample includes 548 women.
155
6.2.3.1 Corrections for medication use
The chimpanzees living at YNPRC had access to good healthcare, but the
targets of medical treatments differed from human populations. Specifically, humans
are often treated for heart conditions, which can affect biomarker measurements.
The MIDUS and MIDJA studies recorded the most common medications
used to treat CVD and high cholesterol. Relevant to the biomarkers we analysed
were blood pressure lowering medications, and statins, which lower cholesterol
levels. Individuals taking blood pressure medications had 10 and 5 mmHg added to
their SBP and DBP, accordingly (Law, Wald, Morris, & Jordan, 2003). Individuals
taking statins had 21.24 mg/dL added to their total cholesterol levels (Law, Wald, &
Rudnicka, 2003). All adjustments were made prior to standardization.
6.2.3.2 AL scoring
After standardization, AL scores were calculated by averaging all of an
individual’s biomarkers. Some individuals were missing data, thus, this did not
downward bias the AL scores of these individuals as a straightforward sum-score
would.
To achieve this effect in our SEMs, AL was defined as a latent variable
composed of equally weighted, standardized (z-scored) variables. Full information
maximum likelihood estimation was used to account for missing values.
6.2.4 Control variables
Age and sex are frequently included in allostatic load and wider
epidemiological studies as control variables. Age2 is also frequently included in
156
studies of older individuals to control for the increasing rate of allostatic load
accumulation in older age groups. Our models included all of these variables.
6.2.5 Standardization
Where possible, variables were standardized across all three samples. MIDI
personality scores ranged from 1 to 4, while CPQ scores ranged from 1 to 7, so the
chimpanzees’ scores were rescaled to range from 1 to 4, and then all personality
dimensions were standardized across the samples. Blood and blood pressure
biomarker measurements overlapped and did not appear to differ substantively
between the samples (Figure 6.1), so all were standardized across the three groups.
The physical dimensions of chimpanzees are considerably different from those of
humans, so BMI was scaled within species groups, that is, we standardized the
chimpanzees’ measurements separately from all of the humans’ measurements.
Chimpanzees’ life histories are faster than humans. To make age and age2
variables informative in all group comparisons, we transformed chimpanzee age. The
chimpanzee growth rate is approximately 50% faster higher than humans’ (Napier &
Napier, 1967), thus we multiplied chimpanzee age by 1.5 (King et al., 2008) before
also squaring and standardizing across all groups.
6.3 Results
6.3.1 Suitability of data
To check whether the data were suitable for multivariate analyses, we applied
Bartlett’s test of sphericity to the correlation matrices of each dataset. The MIDUS
data (χ2 = 6972, p < 0.001, df = 91), MIDJA data (χ2 = 3293, p < 0.001, df = 91), and
YNPRC data (χ2 = 1535, p < 0.001, df = 91) were all indicated to be suitable.

157
6.3.2 Structural Equation Modelling
Our SEMs featured sex, age, and age2 as control regression paths, and the
Dominance, Extraversion, Conscientiousness, Neuroticism, Agreeableness, and
Openness scores as regression paths of interest. As described in the methods, AL was
formed by defining it as a latent variable with equal loadings from all of our
biomarkers, which had been standardized prior to our analyses.
Because we were primarily interested in species and culture differences, we
hypothesized four possible groupings of our three samples:
1. All samples were modelled together, belonging to one group. Parameters
were jointly estimated for all personality regressions on AL.
2. Humans vs. Chimpanzees: Regression parameters were jointly estimated for
MIDJA and MIDUS, and separately for YNPRC.
3. Americans vs. Japanese: Regression parameters were jointly estimated for
MIDUS and YNPRC, and separately for MIDJA.
4. All parameters were estimated separately, each sample belonging to its own
grouping.
In all models, age and sex control variables were estimated freely across all three
samples. The fit statistics for these models are shown in table 6.2.
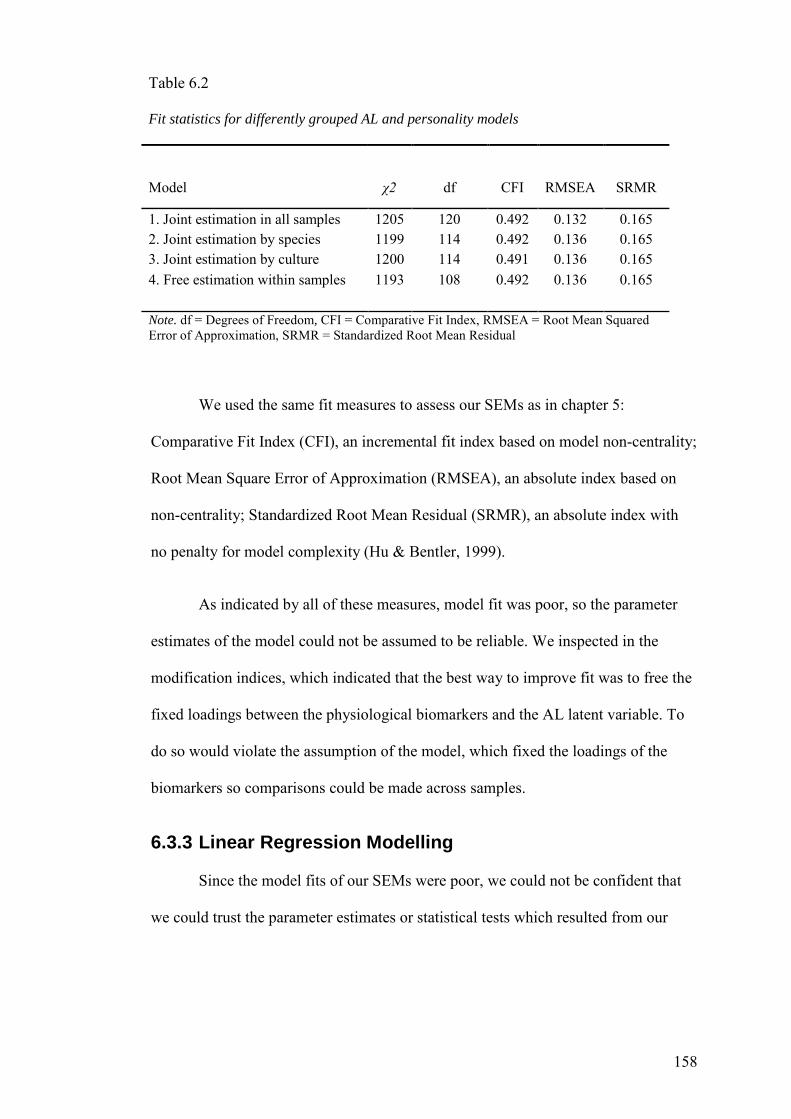
158
Table 6.2 Fit statistics for differently grouped AL and personality models
Model χ2 df CFI RMSEA SRMR
1. Joint estimation in all samples 1205 120 0.492 0.132 0.165 2. Joint estimation by species 1199 114 0.492 0.136 0.165 3. Joint estimation by culture 1200 114 0.491 0.136 0.165 4. Free estimation within samples 1193 108 0.492 0.136 0.165 Note. df = Degrees of Freedom, CFI = Comparative Fit Index, RMSEA = Root Mean Squared Error of Approximation, SRMR = Standardized Root Mean Residual
We used the same fit measures to assess our SEMs as in chapter 5:
Comparative Fit Index (CFI), an incremental fit index based on model non-centrality;
Root Mean Square Error of Approximation (RMSEA), an absolute index based on
non-centrality; Standardized Root Mean Residual (SRMR), an absolute index with
no penalty for model complexity (Hu & Bentler, 1999).
As indicated by all of these measures, model fit was poor, so the parameter
estimates of the model could not be assumed to be reliable. We inspected in the
modification indices, which indicated that the best way to improve fit was to free the
fixed loadings between the physiological biomarkers and the AL latent variable. To
do so would violate the assumption of the model, which fixed the loadings of the
biomarkers so comparisons could be made across samples.
6.3.3 Linear Regression Modelling
Since the model fits of our SEMs were poor, we could not be confident that
we could trust the parameter estimates or statistical tests which resulted from our
159
analyses. Thus, to compare the effects of personality on AL across the three samples,
we shifted to a simpler, linear modelling approach.
We built three separate models, one for reach sample. In the human samples,
AL scores were predicted using general linear models. In chimpanzees, because we
had multiple measurements of biomarkers from each individual, we used mixed
models to introduce a random effect for the individual, which is a more powerful
method than averaging the measurements (Robinson, 1991) as we did in chapter 5.
Introducing a random effect for an individual adds an extra term to the linear
regression equation that essentially modifies the intercept. The equation differs for
each individual, so all observations from the same individual will have the same
intercept, which is a different from other individuals’ intercepts. A general intercept
term for the equation still exists, but the random effect modifies the intercept value
from the starting point that is the general intercept. The term is called random
because it is uncorrelated with the independent variables. Despite differences in
estimation approach, regression coefficients between linear and linear mixed models
are directly comparable when mixed model coefficients are calculated using
maximum likelihood estimation, as opposed to restricted maximum likelihood
estimation (Oehlert, 2014). All three models contained the same predictors (Table
6.3).
Our models reveal close consistency between the human samples. The
dominant demographic variables, sex, age, and age2, all had similar estimates in
Americans and Japanese, though in the chimpanzee model, none of these variables
were significant. The impact of personality was not as strong as demographics, but
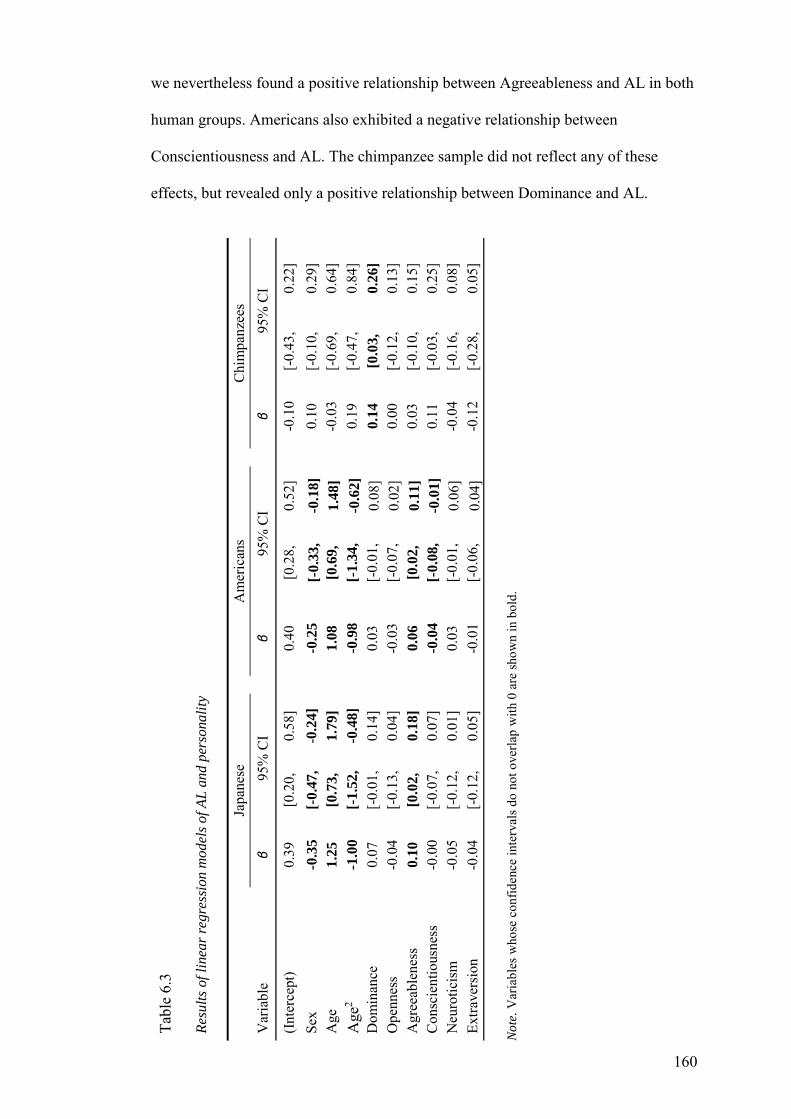
160
we nevertheless found a positive relationship between Agreeableness and AL in both
human groups. Americans also exhibited a negative relationship between
Conscientiousness and AL. The chimpanzee sample did not reflect any of these
effects, but revealed only a positive relationship between Dominance and AL.
Tabl
e 6.
3
Resu
lts o
f lin
ear r
egre
ssio
n m
odel
s of A
L an
d pe
rson
ality
Japa
nese
Am
eric
ans
C
him
panz
ees
Var
iabl
e
β 95
% C
I
β 95
% C
I
β 95
% C
I
(Inte
rcep
t)
0.39
[0
.20,
0.
58]
0.
40
[0.2
8,
0.52
]
-0.1
0 [-0
.43,
0.
22]
Sex
-0
.35
[-0.
47,
-0.2
4]
-0
.25
[-0.
33,
-0.1
8]
0.
10
[-0.1
0,
0.29
] A
ge
1.
25
[0.7
3,
1.79
]
1.08
[0
.69,
1.
48]
-0
.03
[-0.6
9,
0.64
] A
ge2
-1
.00
[-1.
52,
-0.4
8]
-0
.98
[-1.
34,
-0.6
2]
0.
19
[-0.4
7,
0.84
] D
omin
ance
0.07
[-0
.01,
0.
14]
0.
03
[-0.0
1,
0.08
]
0.14
[0
.03,
0.
26]
Ope
nnes
s
-0.0
4 [-0
.13,
0.
04]
-0
.03
[-0.0
7,
0.02
]
0.00
[-0
.12,
0.
13]
Agr
eeab
lene
ss
0.
10
[0.0
2,
0.18
]
0.06
[0
.02,
0.
11]
0.
03
[-0.1
0,
0.15
] C
onsc
ient
ious
ness
-0.0
0 [-0
.07,
0.
07]
-0
.04
[-0.
08,
-0.0
1]
0.
11
[-0.0
3,
0.25
] N
euro
ticis
m
-0
.05
[-0.1
2,
0.01
]
0.03
[-0
.01,
0.
06]
-0
.04
[-0.1
6,
0.08
] Ex
trave
rsio
n
-0.0
4 [-0
.12,
0.
05]
-0
.01
[-0.0
6,
0.04
]
-0.1
2 [-0
.28,
0.
05]
N
ote.
Var
iabl
es w
hose
con
fiden
ce in
terv
als d
o no
t ove
rlap
with
0 a
re sh
own
in b
old.

161
Finding an association between high Agreeableness and high AL and poor
health was unexpected (Stephan et al., 2016), but in the MIDUS sample, similar
analyses were able to explain some of this effect by including an interaction between
Agreeableness and Conscientiousness in regression models of mortality: individuals
who were highly agreeable and highly conscientious tended to live longer (Chapman,
Fiscella, Kawachi, & Duberstein, 2010). Since we were using the exact same
MIDUS data, and the same scales and biomarker measures in the MIDJA, we added
an Agreeableness x Conscientiousness interaction to all of our models and refit them.
In none of our models did the inclusion of this interaction improve the fit of the
model (Table 6.4), nor did it greatly affect any of estimates of the other variables.
Table 6.4 Comparison of models with and without Agreeableness x Conscientiousness Japanese Americans Chimpanzees Variable LL df AICc LL df AICc LL df AICc Without A x C interaction -314.6 11 651.8 -814.5 11 1651.2 -400.9 12 826.6 Including A x C interaction -314.1 12 653.1 -814.4 12 1653.1 -400.0 13 826.9 Note. LL = log-likelihood, df = degrees of freedom, AICc = corrected Akaike Information Criterion
6.4 Discussion
In these analyses of three samples with similar variables on demographics,
personality, and allostatic load, we found significant relationships between
personality and allostatic in all samples. However, the relationships between
personality and AL were consistent between the American and Japanese human
samples, but these similarities did not extend to the sample of American chimps.
162
These results are evidence that the relationships between personality and AL differ
between species, and not strongly determined by cultural factors.
What do these contrasts tell us about the mechanisms that drive the
associations between personality and AL? By studying captive chimpanzees and
comparing them with modern post-industrial humans, we were able to rule out many
third variables, which could be giving rise to individual differences in personality
and AL, and in particular, variables which are environmental, such as diet, and
availability of modern medicine and health-care.
The other main class of biological third variable is genetics. Personality is
known to be heritable in both humans (Bouchard & Loehlin, 2001; Jang, Livesley, &
Vemon, 1996) and chimpanzees (Weiss et al., 2000; Wilson et al., 2017), and in
humans, personality has been genetically linked to several mental and physical
disorders (Gale et al., 2016), as well as broader measures of health (Figueredo,
Vásquez, Brumbach, & Schneider, 2004). Of note, subjective well-being, which is
positively correlated with health and lower risk of mortality (Diener & Chan, 2011;
Okun et al., 1984), is genetically correlated with personality in humans (Weiss et al.,
2008), chimpanzees (Weiss, King, & Enns, 2002), and orangutans (Adams, King, &
Weiss, 2012). Considering the high levels of similarity in personality, genetics, and
even genetic correlations between humans and chimpanzees, we do not believe that
genetic third variables are a substantial source of difference in the relationships
between AL and personality in humans and chimpanzees.
For much of the same reasons that we do not believe that differing genetics
could play a role as a third variable, the evidence does not support an explanation in
163
which personality has different direct effects on health, which might vary by species.
Again, humans and chimpanzees are very closely related and the ways in which
chimpanzees and humans differ from a biomedical perspective largely have to do
with susceptibility to infectious diseases (Olson & Varki, 2003). This is consistent
with the most rapidly diverging gene clusters between humans and chimpanzees,
which are predominantly immunological, sensory, and epidermal (Chimpanzee
Sequencing and Analysis Consortium, 2005). Moreover, as shown in chapter 5, the
biological markers of AL, the system in question, are remarkably similar in humans
and chimpanzees. For all these reasons, it is unlikely that the relevant physiological
systems differ between humans and chimpanzees. It is also unlikely that these
systems in humans and chimpanzees living in the same environments would be
differently effected by personality.
Our results are consistent with the behavioral account of the relationship
between personality and health (Turiano et al., 2015). For example, high
Conscientiousness humans tend to engage in healthier behaviors: they smoke less,
drink less, and exercise more. 42% of the association between Conscientiousness and
mortality was mediated by health characteristics in the MIDUS sample. As also
shown by the MIDUS sample, these individuals have lower AL. High
Conscientiousness chimpanzee do show remarkably similar behaviors to humans, as
described in chapter 2, but captive chimpanzees simply do not have the ability to
engage in health promoting behaviors, at least not to nearly the same extent as
humans.
164
However, while chimpanzees do not engage in the same behaviors as humans
regarding health habits, this does not mean that chimpanzees do not engage in
personality-linked behaviors that affect their health. Chimpanzees rated high in
Dominance engage in more aggressive, confrontation behaviors (Pederson et al.,
2005), such as displaying, intervening, and copulation (Freeman et al., 2013). These
are stressful, often high-risk behaviors. Much has been written on the effects of
Dominance on stress, health, fitness, and longevity (Sapolsky, 1994, 2004), and this
research has largely been conducted in the wild. That Dominance remains the crucial
personality variable for predicting captive chimpanzee stress, via AL, suggests that
captive chimpanzees are engaging in the same health affecting behaviors as wild
chimpanzees, but humans no longer share these behaviors with our closest
evolutionary relatives. It could be that with regards to AL, humans more closely
resemble our other closest relative, the bonobo. Bonobos are notable for having less
violent, matriarchal societies (Stumpf, 2007), though their personalities are similar to
those of humans and chimpanzees (Weiss et al., 2015), so comparable personality
relationships could be investigated if AL data were available for bonobos.
The effect of Dominance stands in contrast to our findings in chapter 4,
where we found no effect of Dominance on longevity in captive chimpanzees, but
did find a protective effect of Agreeableness. AL is known to be associated with
mortality in humans (McEwen & Seeman, 1999); this study was unable to test this
association in chimpanzees, but given the consistency in AL structure found in
chapter 5, it is unlikely that AL is not related to lifespan in chimpanzees as well.
Why, then, did we not find similar associations with chimpanzee personality in
chapters 4 and 6? It may be that while AL is associated with mortality risk, enough

165
variation exists that personality differences could emerge between individuals who at
high risk of dying and individuals who experience more stress over their lifespan.
Additionally, the issues of age confounding that became apparent in chapter 4 could
also be affecting these analyses, even though they are not survival analyses. Another
possible explanation is that we did not possess sufficient power to detect the effects
of Agreeableness in this study or Dominance in chapter 4. To the best of our
knowledge, there is no precedent for this sort of study in chimpanzees, so any
estimate of an effect size is not likely to be accurate.
With respect to human Agreeableness, our results are unusual in that high
Agreeableness, which is widely associated with good health (Strickhouser et al.,
2017) and positive life outcomes (Roberts et al., 2007), was associated with high AL,
and consequent poor health, in both of our human samples. There are several
possible reasons for this. As mentioned, there is evidence for a protective effect of an
Agreeableness x Conscientiousness interaction on mortality (Chapman et al., 2010),
but we found no evidence to support the effect of any such interaction in any of our
samples. Sensitivity analyses previously demonstrated that the Agreeableness
association with mortality is eliminated by controlling for age. This is consistent with
Stephan et al. (2016), who found that a 4-year decrease in Agreeableness was
associated with higher AL. However, we controlled for both age and age2 in our
models, and yet in these human samples the effect persists. A final caveat to, and
possible explanation for, these results lies in the scales themselves. The MIDI
composite for Agreeableness has poor convergent validity with the Agreeableness
domain from the NEO short form (0.42), while also being significantly correlated
with both Extraversion (0.38) and Conscientiousness (0.27) on the NEO short form
166
(Lachman, 2005). Overlap with other personality domains could bias the estimates in
regression models one or way or other, though with several issues in play, it is very
difficult to determine the impact that the lack of quality in MIDI Agreeableness may
have had.
Whatever the reason, it seems clear from our results and repeated
demonstrations in earlier studies with the MIDUS (Chapman et al., 2010; Turiano et
al., 2015) that the MIDI Agreeableness measure is associated with poor health. We
note that, to best of our knowledge, the MIDI Agreeableness measure has not
previously been used to assess health in the MIDJA sample, so our finding adds
additional credence to the idea that MIDI Agreeableness is tapping into some aspect
of negative health, which Agreeableness is not usually associated with (Jokela et al.,
2013; Jokela, Pulkki-Råback, Elovainio, & Kivimäki, 2014). Considering the
constituent items of MIDI Agreeableness - ‘warm’, ‘sympathetic’, ‘softhearted’,
‘caring’, and ‘helpful’ – the origins are likely in social behavior. Whatever these
particular behaviors are, they appear to have consistent effects across human
cultures.
Another possible explanation for this abnormality is that the effect may be
driven from the opposite direction. That is, unhealthy individuals’ personalities may
change, their poor health may make them less happy, and lower their Agreeableness.
However, this explanation suffers from the same issues as the previous account,
notably, why has this effect been disproportionately found with the MIDI instrument
and not with other measures of Agreeableness? These weakness in both explanations
highlights the danger in inferring a causative explanation for the association between
167
Agreeableness and AL. Further research is required to understand the mechanisms
and true direction of these effects.
Although a naturalistic experiment can never control for all confounding
variables, and certainly not for all the differences between two species, no matter
how closely related they are, our results nevertheless have clear implications.
Chimpanzee stress is related to Dominance, which is consistent with the large body
of work on hierarchy and health in wild primates (Sapolsky, 2005). Dominance is not
normally studied in human systems of personality because it does not naturally
emerge from comprehensive human personality data (Latzman, Sauvigné, &
Hopkins, 2016). This change in human personality is consistent with our finding no
effect of Dominance in the human samples. Instead, Agreeableness appears to be the
most important personality variable associated with this measure of human
physiological stress, which likely reflects major changes in social organization that
have occurred since humans diverged from chimpanzees.
Additional work is necessary, therefore, to understand the mechanisms that
link Dominance and Agreeableness to stress, in chimpanzees and humans,
respectively. It seems most likely that specific behaviors are at work, as they have
been found to be for Conscientiousness (Turiano et al., 2015) but corresponding
behaviors have not been identified for Agreeableness or Dominance. Future
comparative studies will benefit from the vast existing literature on psychosomatic
health, but to understand the evolution of psychosomatic health, more samples must
be collected, most importantly, in species other than chimpanzees and humans.
168
7 Summary and general discussion
This thesis had two main lines of investigation: the associations between
primate personality and cognition, and the associations between personality and
health. These investigations centered on chimpanzees, though two other highly
studied primate species were also examined: rhesus macaques and humans.
The opening chapter of this thesis presented a brief overview of the history
and development of the conceptual frameworks for the study of primate personality,
cognition, and health, particularly within the field of psychology. In following
empirical chapters, we took a broad view to understanding how personality,
cognition, and health relate to one another. Based on the results presented in these
chapters, we concluded that many meaningful associations exist between personality,
cognition, and health, some expected and some unexpected, or at least, not predicted.
A summary of our findings is presented in Table 7.1.
As such, personality assessments are a useful technique for understanding
how and why individual primates’ cognitive abilities and health outcomes differ.
This final chapter discusses the findings of the present thesis, highlights notable
limitations of our work, and offers some recommendations and implications for
future research.

Table 7.1 Summary table of major findings on personality from empirical chapters Chapter Species Conscientiousness Agreeableness Extraversion Openness Dominance Neuroticism
2 Chimpanzee Less likely to drop out; learn
tasks better.
More likely to drop out, less engaged with
tasks.
Faster RTs.
Faster RTs; higher accuracy, more interest in participating.
Slower RTs. None.
3 Macaque No comparable dimension.
Higher overall performance after learning a list; slower
RTs.
Faster list acquisition; faster RTs.
Slower RTs. None.
4 Chimpanzee None.
Lower mortality in
male chimpanzees
None. Lower mortality
in female chimpanzees
None. None.
6 Chimpanzeeand Human
Lower AL in American humans.
Higher AL in humans. None. None. Higher AL in
chimpanzees. None.
Note. Chapter 5 has been omitted from this table as it contains no results pertaining to personality. In chapter 3, Agreeableness and Extraversion are merged to reflect the overlap that macaque Friendliness has with these two dimensions.
169
170
7.1 Insights into chimpanzee personality
7.1.1 Conscientiousness
Conscientiousness is not frequently identified in factor or component models
of primate personality (Freeman & Gosling, 2010), but studies that have used
comprehensive questionnaires have found Conscientiousness in chimpanzees
(Freeman et al., 2013; King & Figueredo, 1997; Weiss, Inoue-Murayama, et al.,
2009). In chimpanzees and primates more generally, Conscientiousness tends to be
lost among other dimensions of personality, such as Freeman et al.’s (2013)
‘Reactivity-undependability’ and Massen et al.’s (2013) ‘Exploration-persistence’.
Nevertheless, a recent meta-analysis of the animal personality literature suggests that
distinct aspects of Conscientiousness can be found in many other primate and
nonprimate species (Delgado & Sulloway, 2017).
As Conscientiousness is infrequently identified, there have been comparatively
few attempts to study it, even exploratorily. In a study correlating the CPQ to
behavior among a sample of zoo housed chimpanzees, Conscientiousness was linked
to reduced occurrence of aggressive displays and no other behaviors (Pederson et al.,
2005). In the study that extracted ‘Reactivity-undependability’, that dimension was
associated with higher rates of sexual behavior, social intervention, and less post-
conflict aggression (Freeman et al., 2013). However, this dimension mixes items
normally associated with Dominance and Neuroticism, in addition to
Conscientiousness, so it is difficult to conclude which of these behaviors might
specifically be related to chimpanzee Conscientiousness.
171
In this light, chapter 2 greatly expands our understanding of chimpanzee
Conscientiousness. Our results demonstrate that in the context of experimental
testing, more Conscientious chimpanzees will participate in testing for longer,
dropping out less, across multiple phases of an experiment. These individuals
perform better on average, but this can be explained by their greater experience.
Conscientiousness was also associated with other variables like response time and
number of touches to the screen per trial, and these associations fit with our
understanding of Conscientiousness as a measure of dependability and self-control
(King & Figueredo, 1997).
We did not find any associations between chimpanzee Conscientiousness and
either mortality or AL. According to the behavioral hypothesis of personality and
health, high Conscientiousness individuals engage in more health promoting
behaviors (Hagger-Johnson & Whiteman, 2007), such as taking prescribed
medication and abstaining from drinking alcohol. This is reflected in chapter 6,
where we found an association between high Conscientiousness and low AL in the
MIDUS sample. Chimpanzees do not drink alcohol and medication is administered
to them so that they do not have a choice in the matter. Thus, it is not surprising that
we found no associations between Conscientiousness and health in chimpanzees
given that the effects of Conscientiousness are known to be mediated by specific
behaviors (Turiano et al., 2015). Our findings serve to bolster the behavioral
explanation for the Conscientiousness-mortality link.
On the other hand, all of the chimpanzees under study lived in captivity, and in
a captive setting, chimpanzees may not be able to exercise their conscientious
172
tendencies to the fullest. For example, wild chimpanzees are known to eat specific
plants for the purposes of self-medication (Huffman, 1997); high Conscientiousness
individuals might be more diligent about seeking out and consuming these plants in
the wild, but if they do not have access to medicinal plants in captivity, then the
association would not be reflected in captive data.
7.1.2 Agreeableness
Agreeableness was found to play a number of important roles in several of
our studies. This was somewhat unexpected, as Agreeableness is not typically
associated with cognitive abilities or intellectual achievement in humans (Chamorro-
Premuzic & Furnham, 2006). Nevertheless, we found that high Agreeableness
chimpanzee were more likely to drop out of testing and less likely to be engaged in
testing. In the social setting of these tasks, it is tempting to suggest that the high
Agreeableness chimpanzees were more deferential to other chimpanzees, the thus the
low Agreeableness individuals spent more time interacting with the touchscreen.
However, this is essentially describing Dominance, not Agreeableness.
As discussed in the context of Conscientiousness, two studies have looked at
the behavioral correlates of chimpanzee personality dimensions. One found that high
Agreeableness was associated with fewer aggressive displays and more solitary
grooming (Pederson et al., 2005), while the other found Agreeableness to be
associated with fewer displacing actions and more general affiliative behavior
(Freeman et al., 2013). The items that constitute chimpanzee Agreeableness –
‘sympathetic’, ‘helpful’, ‘sensitive’, ‘protective’, ‘gentle’, and ‘conventional’ – have
also been described as ‘altruistic’ (Weiss, Adams, Widdig, et al., 2011). A better
173
explanation for high Agreeableness chimpanzees’ lack of interest in the task might
be that in this social setting, these chimpanzees were more interested in affiliating
with and being around conspecifics. Low Agreeableness individuals, less interested,
were likely less inclined to care about the presence or interests of the other
chimpanzees.
As discussed at the end of chapter 3, macaque Friendliness incorporates
aspects of both Agreeableness and Extraversion. In particular, individuals rated
higher on ‘helpful’, ‘sensitive’, and ‘sympathetic’ tended to perform better on the
serial cognition tasks. These item level associations were consistent, but not
especially strong. However, these associations are the opposite of the associations we
observed between Agreeableness and performance in chimpanzees. Inconsistencies
at several levels indicate that further investigation is required to understand the
associations between Agreeableness and cognition.
With regards to health, our results agree with much of the literature. Although
Agreeableness is not as consistent a predictor of mortality in humans (Jokela et al.,
2013), there do appear to be relationships between Agreeableness and both mental
and overall health (Strickhouser et al., 2017), and studies which used more
comprehensive assessments of Agreeableness found that Agreeableness and its facets
were consistently associated with longevity (Costa, Weiss, Duberstein, Friedman, &
Siegler, 2014; Weiss & Costa, 2005). Notably, these studies did not divide their
samples by gender, so we cannot discuss whether there are specific sex based effects
of personality on longevity, as we found in chapter 4. The associations between
Agreeableness and longevity in chimpanzees did not appear to extend to AL.
174
7.1.3 Extraversion
Extraversion, like Agreeableness, is primarily a social dimension of
personality: Extraversion represents how frequently an individual engages in social
interaction, whereas Agreeableness represents how well an individual interacts with
others (Wilt & Revelle, 2008). Again, somewhat surprisingly, Extraversion was
found to be important in our cognitive experiments, but not in our studies of health.
Extraversion was related to higher accuracy in study 1 of chapter 2, and
associated with faster response times in studies 1 and 2, suggesting a link between
Extraversion and cognitive abilities, particular motor processes such as those
involved in processing time. Extraversion was not positively related to interest or
participation in the computer tasks during these studies. However, reflecting
Extraversion’s measure of sociality, when free rewards were available in the research
pods and many chimpanzees entered and stayed in the pods to forage, those who
spent the longest amount of time in the pods, around other chimpanzees, were higher
in Extraversion.
In addition to the adjectives discussed in the previous section on
Agreeableness, specific items of macaque Friendliness which were related to
performance were ‘decisive’, ‘sociable’, ‘persistent’, and ‘intelligent’, where the
description of intelligence specifically defines it as a measure of social intelligence.
The mix of Friendliness items that associate with performance make it difficult to
further deconstruct what particular aspect of macaque social personality are markers
for high performance in the context of the non-social testing setting of chapter 3.
175
Sociality has been linked to longevity in other primates (Brent, Ruiz-
Lambides, & Platt, 2017; Silk et al., 2010), and Extraversion specifically has been
linked to greater longevity in captive gorillas (Weiss et al., 2013). In light of the
similarities between that sample of gorillas and our sample of chimpanzees, it was
surprising that we did not find an association between Extraversion and longevity in
captive chimpanzees. Chimpanzees’ dynamic fission-fusion social system (Aureli et
al., 2008), compared to gorillas’ stable harem system (Robbins, 1999), may go some
distance to explaining why Extraversion does not relate to longevity the same way
between these two species.
In many species (Goymann & Wingfield, 2004), AL is frequently linked to
rank and social status (see Dominance, below), and in humans, AL is associated with
many aspects of the social environment, though these associations change with age
(Brooks et al., 2014). Specifically, low Extraversion and declines in Extraversion
were related to higher AL (Stephan et al., 2016). We did not observe any associations
between Extraversion and AL in either human sample, or the chimpanzee sample.
This could be due to basic sample differences or lack of statistical power, as well as
several other factors. Our study used slightly different biomarkers to operationalize
AL; we did not have access to more specific markers such as glycated hemoglobin
and C-reactive protein. Without some of the more commonly used biomarkers, we
may have found less strong associations, or not had sufficient power to detect as
many associations. However, the association we did find are likely to be more
generalizable.

176
On the other hand, both Brooks et al. and Stephan et al. used the Midlife
Development Inventory, which was designed for and used in both the MIDUS and
MIDJA studies, though our study is one of the few to use the inventory’s unique
measures of Dominance, which in the FFM is incorporated into Extraversion
(McCrae & Costa, 1989).
7.1.4 Openness
Openness has been frequently linked to interest and participation in studies of
animal personality and cognition (Herrelko et al., 2012; Massen et al., 2013; Morton,
Lee, & Buchanan-Smith, 2013), a finding which we replicated in chimpanzees. Less
clear evidence has been advanced that Openness also relates to intelligence in
primates (Hopper et al., 2013). Chapters 2 and 3 suggest that Openness is related to
performance, both accuracy and response time, in both chimpanzees and macaques.
The associations were generally reliable, but not exceptionally strong. This suggests
that Openness taps into an aspect of intelligence across primate species.
Moreover, chimpanzees that score higher on Openness appear to be more
interested in experimental tasks. This preference cannot be purely explained by a
desire to maximize rewards, for as we demonstrated in chapter 2, chimpanzees
higher in Openness spent more time with the experimental apparatus, even when the
apparatus did not give out any rewards. Some aspect of participating in experiments
is inherently desirable for high Openness chimpanzees.
Openness is not typically associated with health, despite being associated
with general intelligence, which is strongly related to overall health and longevity
(Calvin et al., 2011). We found only one association between Openness and health:
177
female chimpanzees with higher Openness lived longer. This finding is consistent
with the theory that higher Openness is selected for in captive populations (Smith &
Blumstein, 2008).
7.1.5 Dominance
In factor and component models of chimpanzee personality, Dominance
repeatedly emerged first, with the highest eigenvalue (King & Figueredo, 1997;
Weiss et al., 2007; Weiss, Sutin, et al., 2009). Despite not emerging as an
independent dimension of personality in humans, distinct Dominance-like
personality dimensions are found in orangutans (Weiss et al., 2006), bonobos (Weiss
et al., 2015), gorillas (Gold & Maple, 1994), macaques (Adams et al., 2015; Weiss,
Adams, Widdig, et al., 2011), and brown capuchins (Morton, Lee, Buchanan-Smith,
et al., 2013).
All-together, this evidence suggests that Dominance is an important
dimension of personality for primates. It was thus not surprising to find that
Dominance is associated with higher AL in chimpanzees, which confirms the
theories of Goymann and Wingfield (2004): being a high ranked chimpanzees has
more costs associated with it than being a low ranked chimpanzee, thus high ranking
individuals experience more stress and have higher AL. Every social challenge will
likely cause a physiological deviation from homeostasis in the challenged
chimpanzee. Dominant individuals frequently initiate displays of physical prowess
and respond to others’ aggression with displays of their own and even physical
contact. While minor displays may have almost zero effect on AL, more significant
social conflicts will activate the stress response and increase AL. Dominance, as a

178
personality dimension, does not necessarily measure rank, but earlier work (Freeman
et al., 2013; Pederson et al., 2005) as well as our own results suggest that higher
Dominance chimpanzees do indeed assume a higher rank in their social groups.
On the other hand, Dominance was not associated with longevity in captive
chimpanzees. We would expect more stressed individuals to die younger, but it
appears that AL, at least in so far as it is influenced by Dominance, does not lead to
early mortality.
In the cognitive testing settings of chapters 2 and 3, we found little influence
from Dominance. In our experiments with chimpanzees, higher Dominance
individuals were more likely participate in the first series of experimental tasks. This
is likely due to the uncontrolled social setting of the research areas: higher
Dominance individuals have greater agency to go where they wish and participate to
the fullest extent that they desire. These results are consistent with our findings
relating Agreeableness and participation. However, this effect did not extend to
studies 2 and 3. However, we did find a positive association between Dominance and
response time, although only in study 2.
In our experiment with macaques, Dominance did not appear to be relevant to
any of our models of accuracy. We did find a positive association between
Dominance and response times, i.e., higher Dominance individuals were slower to
respond. It should be noted that in those models, most personality variables that were
included in the best fit models were significant. It is understandable that we would
not find many associations between Dominance and performance in this study, as we

179
eliminated all social components, and our task directly tapped into the cognitive
representation of serial information (Jensen et al., 2013).
Nevertheless, the response time findings between species match, suggesting
that higher Dominance individuals may be less pressured to act quickly, in both
social and non-social settings. This implies that Dominance is tapping into an
underlying cognitive ability which is drawn out during testing, such as processing
speed (Kail & Salthouse, 1994).
7.1.6 Neuroticism
This research found little evidence for a role of Neuroticism in performance
or health. This was not especially surprising among our studies of cognition – a
previous study with the Edinburgh Zoo chimpanzee sample suggested that
Neuroticism was associated with higher vigilance and more self-directed behaviors
during research (Herrelko et al., 2012), but this did not impact interest research in
that study, nor did it appear to relate to performance in ours.
However, we were surprised not to find associations between Neuroticism and
either mortality or AL in chimpanzees. In humans, Neuroticism is frequently linked
to poorer health (Strickhouser et al., 2017). In the sample of Japanese chimpanzees,
Neuroticism was strongly linked to subjective well-being (Weiss, Inoue-Murayama,
et al., 2009), although the American zoos sample did not find this association (King
& Landau, 2003). The absence of a Neuroticism effect on either mortality or AL
suggests that while there may be greater psychological impacts for high Neuroticism
chimpanzees, it does not appear to be associated with physical health.
180
On the other hand, a Neuroticism effect may have been too weak to detect with
our sample. For example, in chapter 6, our slightly unusual AL construct may not
have strongly overlapped with health factors related to Neuroticism. After all, we did
not find an association between AL and Neuroticism in either human sample.
Ultimately, given the lack of associations, we are limited to speculation.
7.2 Limitations and open questions
The interpretation of this work is limited by a number of drawbacks. First, our
studies of cognition used 19 and 9 chimpanzees and macaques, respectively. As our
power analyses show, when an adequate number of trials are collected, even a
smaller pool of subjects can yield meaningful, significant results in differential
research. However, simply increasing the number of trials is not a panacea for having
a small number of subjects. Studies that use small samples are more susceptible to
the influence of extreme observations (Cohen, 1990), and mixed modelling requires
random effects structures which in principle should be maximal (Barr, Levy,
Scheepers, & Tily, 2013), but in practice maximal models often do not converge
(Bates, Kliegl, Vasishth, & Baayen, 2015). Larger sample sizes and both conceptual
and direct replication efforts are necessary to corroborate our findings.
Our studies of health are considerably better powered, e.g. in chapter 4, we
determined that we possessed a mean power of 0.88, above the gold standard of 0.8.
However, associations between personality and health are often modest (Roberts et
al., 2007) and effect sizes may be inflated (Ioannidis, 2008). As such, we may not
have been able to detect some effects with our samples. These issues are especially
salient for difficult to model variables like AL (Crook & Booth, 2017).
181
Our studies of cognition were also limited by our choice of tasks. The 2AFC,
DMTS, and SimChain paradigms are all widely used, but we did not assess all
cognitive faculties with our implementations of these paradigms. For example, all of
these paradigms are equipped to assess different and overlapping aspects of
numerical cognition (Brannon & Terrace, 1998; Jordan & Brannon, 2006; Shepherd,
Hautus, & Hutchinson, 2008), but we did not have an opportunity to test this across
the entirety of either nonhuman primate sample.
Chapters 2 and 3, while producing complementary results, do not directly
overlap. Personality was collected via expert ratings in both studies, but the structure
of personality differs between macaques and chimpanzees. Although many
analogous dimensions are present, the presence of macaque Friendliness, a mixture
of items which in chimpanzees load on Extraversion and Agreeableness, exemplifies
the issues with direct comparisons when personality dimensions do not neatly align.
The cognitive tasks themselves also differed, and while all cognitive tasks vary
in the extent to which they are g-loaded, our results do not suggest that these
cognitive tasks lack meaningful associations with intelligence. Nevertheless, the
broader structure of the primate intelligence domains requires further investigation in
the context of individual personality differences.
The setting and subjects under study in chapters 2 and 3 also differed. In
chapter 2 we had little control over the testing environment, in particular, we could
not manipulate any social variables. Under the best of circumstances, these variables
ought not to affect our results, but might inject noise into our results. Since we were
evaluating the effects of personality, including social dimensions of personality,
182
social variables would be controlled for, to an extent. At very least, the associations
we found between personality and participation are informative. However, in chapter
3 we had much greater control over the testing environment, and still found
associations between performance and both Openness and Friendliness. While this
suggests that the similar effects we found in chapter 2 were not solely attributable to
the environment, some environmental and social factors were no doubt in effect, and
we are unable to entirely tease apart the influences of internal and external variables
in chapter 2.
In our direct comparisons of personality and health, we were able to maintain
control over our selections of biomarkers in both chimpanzee and humans, so that
exactly the same demographic, physical, and physiological variables were included
in our models. However, while the personality dimensions we used were the same on
the surface, they differed between humans and chimpanzees in several ways.
All three samples in chapter 6 contained data for us to construct six analogous
dimensions of personality. Constructs of personality do not need to use the same
items to tap the same underlying psychological substrates (Donnellan, Oswald,
Baird, & Lucas, 2006), but this is not guaranteed. Steps must be taken to ensure that
inventories overlap.
In the case of the MIDI, several dimensions, notably Agreeableness, do not
display good convergent validity with Agreeableness as measured by the NEO short
form (Lachman, 2005). Of the MIDI Agreeableness items, ‘warm’ is more often
associated with Extraversion, and in factor analyses of the MIDUS data, it loads on
both Agreeableness and Extraversion (Iveniuk, Laumann, Waite, McClintock, &

183
Tiedt, 2014). Thus, the personality dimensions we used for analyses with the MIDUS
and MIDJA data may not represent the big 5 personality dimensions especially well.
This might not be an issue if we wished to only compare MIDI personality
scores. However, we also wished to compare MIDI and HPQ scores, and while some
items overlap between the MIDI and the HPQ, there are issues in making direct
comparisons. For example, take Agreeableness again. HPQ Agreeableness is
composed of ‘sympathetic’, ‘helpful’, ‘sensitive’, ‘protective’, ‘gentle’, and
‘conventional’. MIDI Agreeableness is composed of ‘helpful’, ‘warm’, ‘softhearted’,
‘caring’, and ‘sympathetic’. Of these items, ‘helpful’ and ‘sympathetic’ overlap, but
even at this level, the overlap is not perfect. The HPQ asks for a rating between 1 and
7, and provides two or three sentences of explanation (King & Figueredo, 1997;
Weiss, Inoue-Murayama, et al., 2009), whereas the MIDI presents the word and asks
the individual how well the adjectives describes them on a scale from 1 to 4
(Zimprich, Allemand, & Lachman, 2012).
As mentioned above, personality theory indicates assessment can be robust to
these sorts of issues. Thus, these differences will not necessarily affect our results,
but they do limit our ability to compare results between species. Between the human
MIDUS and MIDJA samples, there were linguistic differences, and there may be
different connotations to equivalent words in English and Japanese. These
differences may actually be captured by the cultural influences we hypothesized in
chapter 6, and in this light, discrepancies in meaning are not an issue. Moreover, in
chapter 6, our results from the two human cultures were quite similar, suggesting that
cultural and linguistic differences may not play a major role studies of these

184
particular variables. Ultimately, without a detailed linguistic analysis of the
translations from English to Japanese, for both the MIDI and HPQ, further
interpretation of cultural differences is limited.
Issues may have arisen from chimpanzee personality being other-assessed,
while human personality was self-assessed. In principle, other and self ratings do not
yield substantially different results (McCrae & Costa, 1987), but this difference
could have altered results when viewed in conjunction with other sources of
variation.
With regard to biomarkers and AL measures, our decision to use the same
biomarkers in all compared samples is a strength, but we must acknowledge issues
inherent in any attempt to measure AL. Sum scoring, used in chapter 6, is one
method for aggregating AL, but there are many others. We have no reason to believe
that our results would change significantly if we calculated AL using a different
method, for the many AL scoring systems generally have good convergent validity
with one another (Edes & Crews, 2017).
Yet at the core of the AL concept is the assumption that AL is not measuring
a single system within an organism, but integrity across systems within the organism.
The complex interrelations within and between systems poses problems, for
example, BMI, a metabolic marker, is known to have causative effects on other
markers, such as blood pressure, a cardiovascular marker (Millard et al., 2015).
Complex network relationships such as those observed between physiological
biomarkers can produce observed correlations between variables, which factor
185
analytic methods will be affected by, even though the correlated variables do not
have a common cause (Crook & Booth, 2017).
We sought to ameliorate these concerns by using sum scores rather than
factor or component scores, in chapter 6. The models we used in chapter 6 were
derived from structures developed in chapter 5, where we used PCA for our
exploratory analyses, though compared the results with EFA to find negligible
differences. In our confirmatory analyses, we used CFA, which was not ideal, given
the issues noted in the previous paragraph, but not unjustified given the limitations of
contemporary analytic methods and the current standards in the field (Wiley,
Gruenewald, Karlamangla, & Seeman, 2017).
Our analyses of AL physiology confirmed an anthropocentric structure of
biomarkers. Humans and nonhuman primates have shown the same types of
associations between physiological and external stress variables (Edes & Crews,
2017), although previous studies generally have not had access to the number of
subjects and biomarkers at the same time, as we had access to in our sample. We
would not expect to see major underlying physiological differences between
chimpanzees and humans, but small differences may exist, and our analyses were not
designed to capture them. Further analyses of this biomarker sample, and ideally,
others like it, could answer questions intended to assess specific differences, rather
than similarities.
7.3 Future Directions and Conclusions
The future is promising for personality research in chimpanzees and other
nonhuman primates. Personality has been shown to be a meaningful predictive tool,

186
in this thesis and in other research. For example, Capitanio, Blozis, Snarr, Steward,
and McCowan (2017) found that female rhesus macaques with similar personalities
were more likely to be successfully pair-housed. Additionally, personality traits are
associated with self-injurious behavior in chimpanzees (Herrelko et al., 2012). This
work demonstrates that chimpanzee personality is related to interest in and
performance with research tasks, which may be of use to experimental psychologists
who work with chimpanzees or macaque. Our work also shows that chimpanzee
Agreeableness and Openness are related to mortality, and Dominance is related to
stress; both of these outcomes are of interest to those who work in captive
management with chimpanzees. Thus, this thesis meaningfully contributes new
applications for the use of primate personality measures in captivity.
In application, personality-health or personality-cognition associations should
nonetheless be independently verified for every species. This thesis focused on
chimpanzees, which, along with humans, are two of the most studied of all primates.
Rhesus macaques are not far behind. To understand the evolution of personality,
health, and cognition, we need to look at more species, such as other apes, and new
world monkeys.
Perhaps the greatest challenge in applying the comparative approach in
individual differences research is grappling with the diverse theoretical viewpoints
and approaches. The combined effect of small sample sizes, small numbers of
studies, and a dearth of replications have left large gaps in the literature. In human
work, replications and extensions can often be carried out by single labs because of
the accessibility of experimental participants. Generating new samples for every
187
study is simply not feasible in primatology and animal cognition research. However,
researchers in these fields could take inspiration from the similar “many labs”
approach (Klein et al., 2014). The “many labs” approach brings together multiple
research groups to generate reproducible and replicable results. Studies are typically
pre-registered, and all participating labs contribute participants to the overall pool,
lending added generalizability to the results. Labs will run the same tasks, discussed
and designed in advance of data collection, and the overall results will open be
apparent after the final pooled analysis, which will be more robust and powerful than
results generated by traditional research. Comparative psychology’s close academic
cousin, developmental psychology, faces many similar data collections issues, and
have taken some initial, informative steps toward addressing these issues with a
many labs approach (Frank et al., 2017).
Taken together, the chapters of this thesis contribute novel empirical findings,
corroborate understood associations among personality, cognition, and health, and
present multiple avenues for further research. It is no longer contentious to say that
animals have either personality or cognition, and these psychological capacities can
be quantified meaningfully and reliably. The increasing acceptance of nonhumans’
advanced psychological capacities provides an opportunity to address the
interrelationships between individual differences in psychology, as well as with
differences in fitness and health. Rigorous continued investigation in these areas has
the potential to yield results that both illuminate the evolutionary pathways of the
primate lineage and offer practical applications for psychological science.
188
8 References
Ackerman, P., & Heggestad, E. (1997). Intelligence, personality, and interests: Evidence for overlapping traits. Psychological bulletin, 121, 219-245. doi:10.1037/0033-2909.121.2.219
Adams, M. J., King, J. E., & Weiss, A. (2012). The majority of genetic variation in orangutan personality and subjective-well being is nonadditive. Behavior Genetics, 42, 675-686. doi:10.1007/s10519-012-9537-y
Adams, M. J., Majolo, B., Ostner, J., Schuelke, O., De Marco, A., Thierry, B., . . . Weiss, A. (2015). Personality structure and social style in macaques. Journal of Personality and Social Psychology, 109(2), 338-353. doi:10.1037/pspp0000041
Albiach‐Serrano, A., Call, J., & Barth, J. (2010). Great apes track hidden objects after changes in the objects' position and in subject's orientation. American Journal of Primatology, 72(4), 349-359.
Alexander, F. (1957). Psychosomatic Medicine. New York, 1950. WW Norton & Company, Inc. Badal, Daniel W., Driscol, Thomas E., and Maultsby, Maxie: The Role of Symptoms in Psychosomatic Disease, Am. J. Psychiat, 113, 1081.
Allen, M. S., & Laborde, S. (2017). Five factor personality traits and inflammatory biomarkers in the English longitudinal study of aging. Personality and individual differences, 111, 205-210.
Allen, M. S., Magee, C. A., Vella, S. A., & Laborde, S. (2017). Bidirectional associations between personality and physical activity in adulthood. Health Psychology, 36(4), 332.
Allport, G. W., & Odbert, H. S. (1936). Trait-names, a Psycho-lexical study. Psychological Monographs, 47, 1-171.
Altschul, D. M., Terrace, H. S., & Weiss, A. (2016). Serial cognition and personality in macaques. Animal behavior and cognition, 3(1), 46.
Altschul, D. M., Wallace, E. K., Sonnweber, R., Tomonaga, M., & Weiss, A. (2017). Chimpanzee intellect: personality, performance and motivation with touchscreen tasks. Royal Society Open Science, 4(5). doi:10.1098/rsos.170169
Anestis, S. F. (2005). Behavioral style, dominance rank, and urinary cortisol in young chimpanzees (Pan troglodytes). Behaviour, 142, 1245-1268. doi:10.1163/156853905774539418
Anestis, S. F., Bribiescas, R. G., & Hasselschwert, D. L. (2006). Age, rank, and personality effects on the cortisol sedation stress response in young chimpanzees. Physiology & Behavior, 89(2), 287-294.
Arden, R., & Adams, M. J. (2016). A general intelligence factor in dogs. Intelligence, 55, 79-85.
Assies, J., Mocking, R. J., Lok, A., Ruhé, H. G., Pouwer, F., & Schene, A. H. (2014). Effects of oxidative stress on fatty acid‐and one‐carbon‐metabolism in psychiatric and cardiovascular disease comorbidity. Acta Psychiatrica Scandinavica, 130(3), 163-180.
Atherton, O. E., Robins, R. W., Rentfrow, P. J., & Lamb, M. E. (2014). Personality correlates of risky health outcomes: Findings from a large Internet study. Journal of Research in Personality, 50, 56-60.

189
Aureli, F., Schaffner, C. M., Boesch, C., Bearder, S. K., Call, J., Chapman, C. A., . . . van Schaick, C. P. (2008). Fission-fusion dynamics new research frameworks. Current Anthropology, 49, 627-654. doi:10.1086/586708
Austin, V., Crack, P. J., Bozinovski, S., Miller, A. A., & Vlahos, R. (2016). COPD and stroke: are systemic inflammation and oxidative stress the missing links? Clinical Science, 130(13), 1039-1050.
Barr, D. J., Levy, R., Scheepers, C., & Tily, H. J. (2013). Random effects structure for confirmatory hypothesis testing: Keep it maximal. Journal of memory and language, 68(3), 255-278.
Barth, J., Reaux, J. E., & Povinelli, D. J. (2005). Chimpanzees’(Pan troglodytes) use of gaze cues in object-choice tasks: different methods yield different results. Animal cognition, 8(2), 84-92.
Bates, D., Kliegl, R., Vasishth, S., & Baayen, H. (2015). Parsimonious mixed models. arXiv preprint arXiv:1506.04967.
Beauchaine, T. P., Klein, D. N., Crowell, S. E., Derbidge, C., & Gatzke-Kopp, L. (2009). Multifinality in the development of personality disorders: A Biology× Sex× Environment interaction model of antisocial and borderline traits. Development and psychopathology, 21(3), 735-770.
Berge-Landry, H. v., & James, G. D. (2004). Serum electrolyte, serum protein, serum fat and renal responses to a dietary sodium challenge: allostasis and allostatic load. Annals of human biology, 31(4), 477-487.
Binet, A., & Simon, T. (1905). New methods for the diagnosis of the intellectual level of subnormals. L’annee Psychologique, 12, 191-244.
Binet, A., & Simon, T. (1908). Le dévelopment de lintelligence chez les enfants. LAnée Psychologique, 14, 1-94.
Binet, A., & Simon, T. (1916). The development of intelligence in children: The Binet-Simon Scale: Williams & Wilkins Company.
Biro, P. A., & Dingemanse, N. J. (2009). Sampling bias resulting from animal personality. Trends in Ecology & Evolution, 24(2), 66-67.
Blatchley, B. J., & Hopkins, W. D. (2010). Subgenual cingulate cortex and personality in chimpanzees (Pan troglodytes). Cognitive, Affective and Behavioral Neuroscience, 10, 414-421. doi:10.3758/CABN.10.3.414
Bluff, L. A., Weir, A. A., Rutz, C., Wimpenny, J. H., & Kacelnik, A. (2007). Tool-related cognition in New Caledonian crows. Comparative Cognition & Behavior Reviews, 2.
Boesch, C., & Boesch, H. (1990). Tool use and tool making in wild chimpanzees. Folia Primatologica, 54(1-2), 86-99.
Boesch, C., & Tomasello, M. (1998). Chimpanzee and human cultures. Current anthropology, 39(5), 591-614.
Bogg, T., & Roberts, B. W. (2004). Conscientiousness and health-related behaviors: A meta-analysis of the leading behavioral contributors to mortality. Psychological bulletin, 130, 887-919.
Bogg, T., & Roberts, B. W. (2013). The case for conscientiousness: Evidence and implications for a personality trait marker of health and longevity Annals of Behavioral Medicine, 45, 278-288. doi:10.1007/s12160-012-9454-6
Booth-Kewley, S., & Friedman, H. S. (1987). Psychological predictors of heart disease: a quantitative review. Psychological bulletin, 101, 343-362.
190
Booth-Kewley, S., & Vickers, R. R., Jr. (1994). Associations between Major Domains of Personality and Health Behaviour. Journal of Personality, 62, 281- 298.
Bou-Hamad, I., Larocque, D., & Ben-Ameur, H. (2011). A review of survival trees. Statistics Surveys, 5, 44-71.
Bouchard, T. J. (2014). Genes, evolution and intelligence. Behavior genetics, 44(6), 549-577.
Bouchard, T. J., Jr., & Loehlin, J. C. (2001). Genes, evolution, and personality. Behavior Genetics, 31, 243-273. doi:10.1023/A:1012294324713
Boylan, J. M., Tsenkova, V. K., Miyamoto, Y., & Ryff, C. D. (2017). Psychological Resources and Glucoregulation in Japanese Adults: Findings From MIDJA.
Brannon, E. M., & Terrace, H. S. (1998). Ordering of the numerosities 1 to 9 by monkeys. Science, 282(5389), 746-749.
Brent, L., Ruiz-Lambides, A., & Platt, M. (2017). Family network size and survival across the lifespan of female macaques. Paper presented at the Proc. R. Soc. B.
Briefer, E. F., Oxley, J. A., & McElligott, A. G. (2015). Autonomic nervous system reactivity in a free-ranging mammal: effects of dominance rank and personality. Animal Behaviour, 110, 121-132.
Bronikowski, A. M., Altmann, J., Brockman, D. K., Cords, M., Fedigan, L. M., Pusey, A., . . . Alberts, S. C. (2011). Aging in the natural world: Comparative data reveal similar mortality patterns across primates. Science, 331, 1325-1328.
Bronikowski, A. M., Cords, M., Alberts, S. C., Altmann, J., Brockman, D. K., Fedigan, L. M., . . . Morris, W. F. (2016). Female and male life tables for seven wild primate species. Scientific Data, 3(160006). doi:10.1038/sdata.2016.6
Brooks, K. P., Gruenewald, T., Karlamangla, A., Hu, P., Koretz, B., & Seeman, T. E. (2014). Social relationships and allostatic load in the MIDUS study. Health Psychology, 33(11), 1373.
Burdina, V. N., & Melikhova, E. F. (1961). The importance of the type of the nervous system in the body's response to injurious factors. Bulletin of Experimental Biology and Medicine, 51, 413-417.
Burkart, J. M., Schubiger, M. N., & van Schaik, C. P. (2016). The evolution of general intelligence. Behavioral and Brain Sciences, 1-65.
Burnham, K. P., Anderson, D. R., & Huyvaert, K. P. (2011). AIC model selection and multimodel inference in behavioral ecology: some background, observations, and comparisons. Behavioral Ecology and Sociobiology, 65(1), 23-35.
Byrne, B. M., & Watkins, D. (2003). The issue of measurement invariance revisited. Journal of Cross-Cultural Psychology, 34(2), 155-175.
Byrne, R., & Whiten, A. (1989). Machiavellian intelligence: social expertise and the evolution of intellect in monkeys, apes, and humans (oxford science publications).
Calvin, C. M., Batty, G. D., & Deary, I. J. (2011). Cognitive epidemiology. The Wiley-Blackwell Handbook of Individual Differences, 427-460.
191
Camfield, L., Choudhury, K., & Devine, J. (2009). Well-being, happiness and why relationships matter: Evidence from Bangladesh. Journal of Happiness Studies, 10(1), 71-91.
Capitanio, J. P. (1999). Personality dimensions in adult male rhesus macaques: Prediction of behaviors across time and situation. American Journal of Primatology, 47, 299-320. doi:10.1002/(SICI)1098-2345(1999)47:4<299::AID-AJP3>3.0.CO;2-P
Capitanio, J. P. (2011). Nonhuman primate personality and immunity: Mechanisms of health and disease. In A. Weiss, J. E. King, & L. E. Murray (Eds.), Personality, temperament, and behavioral syndromes in nonhuman primates (pp. 233-255). New York: Springer.
Capitanio, J. P., Abel, K., Mendoza, S. P., Blozis, S. A., McChesney, M. B., Cole, S. W., & Mason, W. A. (2008). Personality and serotonin transporter genotype interact with social context to affect immunity and viral set-point in simian immunodeficiency virus disease. Brain, Behavior, and Immunity, 22, 676-689.
Capitanio, J. P., Blozis, S. A., Snarr, J., Steward, A., & McCowan, B. J. (2017). Do “birds of a feather flock together” or do “opposites attract”? Behavioral responses and temperament predict success in pairings of rhesus monkeys in a laboratory setting. American journal of primatology, 79(1).
Carere, C., & Locurto, C. (2011). Interaction between animal personality and animal cognition. Current Zoology, 57, 491-498.
Carroll, J. B. (1993). Human cognitive abilities: A survey of factor-analytic studies: Cambridge University Press.
Caspi, A. (2000). The child is father of the man: personality continuities from childhood to adulthood. Journal of personality and social psychology, 78(1), 158.
Cattell, R. B. (1946). The description and measurement of personality. London: George G. Harap & Co. Ltd.
Cavigelli, S. A., & Caruso, M. J. (2015). Sex, social status and physiological stress in primates: the importance of social and glucocorticoid dynamics. Phil. Trans. R. Soc. B, 370(1669), 20140103.
Celli, M. L., Tomonaga, M., Udono, T., Teramoto, M., & Nagano, K. (2003). Tool use task as environmental enrichment for captive chimpanzees. Applied Animal Behaviour Science, 81(2), 171-182.
Chamorro-Premuzic, T., & Furnham, A. (2006). Intellectual competence and the intelligent personality: A third way in differential psychology. Review of General Psychology, 10(3), 251.
Chamorro-Premuzic, T., & Furnham, A. (2014). Personality and intellectual competence: Psychology Press.
Chamove, A. S., Eysenck, H. J., & Harlow, H. F. (1972). Personality in monkeys: Factor analyses of rhesus social behavior. Quarterly Journal of Experimental Psychology, 24, 496-504. doi:10.1080/14640747208400309
Chapman, B. P., Fiscella, K., Kawachi, I., & Duberstein, P. R. (2010). Personality, socioeconomic status, and all-cause mortality in the United States. American Journal of Epidemiology, 171, 83-92. doi:10.1093/aje/kwp323

192
Chen, F., Curran, P. J., Bollen, K. A., Kirby, J., & Paxton, P. (2008). An empirical evaluation of the use of fixed cutoff points in RMSEA test statistic in structural equation models. Sociological methods & research, 36(4), 462-494.
Cheney, D. L., Seyfarth, R. M., & Silk, J. B. (1995). The responses of female baboons (Papio cynocephalus ursinus) to anomalous social interactions: evidence for causal reasoning? Journal of Comparative Psychology, 109(2), 134.
Chilton, J., Wilcox, A., Lammey, M., & Meyer, D. (2016). Characterization of a Cardiorenal-like Syndrome in Aged Chimpanzees (Pan troglodytes). Veterinary Pathology, 53(2), 417-424.
Chimpanzee Sequencing and Analysis Consortium. (2005). Initial sequence of the chimpanzee genome and comparison with the human genome. Nature, 437, 69-87.
Chow, P. I., Wagner, J., Lüdtke, O., Trautwein, U., & Roberts, B. W. (2017). Therapy experience in naturalistic observational studies is associated with negative changes in personality. Journal of Research in Personality, 68, 88-95.
Claridge, G. S., & Eysenck, H. (1967). Personality and arousal: Pergamon. Cohen, J. (1990). Things I have learned (so far). American Psychologist, 45, 1304-
1312. Coleman, K., Tully, L. A., & McMillan, J. L. (2005). Temperament correlates with
training success in adult rhesus macaques. American Journal of Primatology, 65, 63-71. doi:10.1002/ajp.20097
Corr, P. J. (2004). Reinforcement sensitivity theory and personality. Neuroscience & Biobehavioral Reviews, 28(3), 317-332.
Costa, P. T., Jr., & McCrae, R. R. (1992a). Four ways five factors are basic. Personality and individual differences, 13(6), 653-665. doi:10.1016/0191-8869(92)90236-I
Costa, P. T., Jr., & McCrae, R. R. (1992b). Reply to Eysenck. Personality and individual differences, 13(8), 861-865. doi:10.1016/0191-8869(92)90002-7
Costa, P. T., Jr., Weiss, A., Duberstein, P. R., Friedman, B., & Siegler, I. C. (2014). Personality facets and all-cause mortality among Medicare patients aged 66 to 102 years: A follow-on study of Weiss and Costa (2005). Psychosomatic Medicine, 76, 370-378.
Crawford, M. P. (1938). A behavior rating scale for young chimpanzees. Journal of Comparative Psychology, 26, 79-91. doi:10.1037/h0054503
Crimmins, E. M., Johnston, M., Hayward, M., & Seeman, T. (2003). Age differences in allostatic load: an index of physiological dysregulation. Experimental gerontology, 38(7), 731-734.
Cronbach, L. J. (1949). Essentials of psychological testing. Crook, Z., & Booth, T. (2017). Considering the appropriateness of the factor analytic
operationalization of allostatic load. Psychosomatic Medicine, 79(1), 117-119.
Cuijpers, P., Smit, F., Penninx, B. W., de Graaf, R., ten Have, M., & Beekman, A. T. (2010). Economic costs of neuroticism: a population-based study. Archives of General Psychiatry, 67(10), 1086-1093.
193
Čukić, I., Mõttus, R., Luciano, M., Starr, J. M., Weiss, A., & Deary, I. J. (2015). Do personality traits moderate the manifestation of type 2 diabetes genetic risk? Journal of psychosomatic research, 79(4), 303-308.
de Waal, F. B. M. (2007). Chimpanzee politics: Power and sex among apes. Baltimore, MD: Johns Hopkins University Press.
Deaner, R. O., van Schaik, C. P., & Johnson, V. E. (2006). Do some taxa have better domain-general cognition than others? A meta-analysis of nonhuman primate studies. Evolutionary Psychology, 4, 149-196.
Deary, I. J., Weiss, A., & Batty, G. D. (2010). Intelligence and personality as predictors of illness and death: How researchers in differential psychology and chronic disease epidemiology are collaborating to understand and address health inequalities. Psychological Science in the Public Interest, 11, 53-79. doi:10.1177/1529100610387081
Deary, I. J., Whalley, L. J., Lemmon, H., Crawford, J., & Starr, J. M. (2000). The stability of individual differences in mental ability from childhood to old age: follow-up of the 1932 Scottish Mental Survey. Intelligence, 28(1), 49-55.
DeCasien, A. R., Williams, S. A., & Higham, J. P. (2017). Primate brain size is predicted by diet but not sociality. Nat Ecol Evol, 1, 0112.
Delgado, M., & Sulloway, F. (2017). Attributes of Conscientiousness Throughout the Animal Kingdom: An Empirical and Evolutionary Overview. Psychological bulletin.
Dembroski, T. M., & Costa, P. T., Jr. (1987). Coronary prone behavior: Components of the type A pattern and hostility. Journal of Personality, 55, 211-235.
DeNeve, K. M. (1999). Happy as an extraverted clam? The role of personality for subjective well-being. Current Directions in Psychological Science, 8(5), 141-144.
DeNeve, K. M., & Cooper, H. (1998). The happy personality: A meta-analysis of 137 personality traits and subjective well-being. Psychological bulletin, 124, 197-229.
Dienberg Love, G., Seeman, T. E., Weinstein, M., & Ryff, C. D. (2010). Bioindicators in the MIDUS national study: protocol, measures, sample, and comparative context. Journal of Aging and Health, 22(8), 1059-1080.
Diener, E. (1998). Subjective well-being and personality. In D. F. Barone, M. Herson, & V. B. v. Hasselt (Eds.), Advanced Personality (pp. 311-334). New York: Plenum Press.
Diener, E., & Chan, M. Y. (2011). Happy people live longer: Subjective well-being contributes to health and longevity. Applied Psychology: Health and Well-Being, 3, 1-43.
Diener, E., Suh, E., & Oishi, S. (1997). Recent findings on subjective well-being. Indian journal of clinical psychology, 24, 25-41.
Diener, E., Suh, E. M., Lucas, R. E., & Smith, H. L. (1999). Subjective well-being: Three decades of progress. Psychological bulletin, 125, 276-302.
Digman, J. M. (1990). Personality structure: Emergence of the Five-Factor Model. Annual Review of Psychology, 41, 417-440. doi:10.1146/annurev.ps.41.020190.002221
Dingemanse, N. J., & Réale, D. (2005). Natural selection and animal personality. Behaviour, 142, 1159-1184. doi:10.1163/156853905774539445

194
Diogo, R., Molnar, J. L., & Wood, B. (2017). Bonobo anatomy reveals stasis and mosaicism in chimpanzee evolution, and supports bonobos as the most appropriate extant mode l for the common ancestor of chimpanzees and humans. Scientific Reports, 7(1), 608.
Donnellan, M. B., Oswald, F. L., Baird, B. M., & Lucas, R. E. (2006). The mini-IPIP scales: tiny-yet-effective measures of the Big Five factors of personality. Psychological assessment, 18(2), 192.
Dunbar, H. (1947). Body and mind: psychosomatic medicine: New York: Random House.
Edes, A. N. (2017). Dehydroepiandrosterone-sulfate (DHEA-S), sex, and age in zoo-housed western lowland gorillas (Gorilla gorilla gorilla). Primates, 1-8.
Edes, A. N., & Crews, D. E. (2017). Allostatic load and biological anthropology. American Journal of Physical Anthropology, 162(S63), 44-70.
Edes, A. N., Wolfe, B. A., & Crews, D. E. (2016). Rearing history and allostatic load in adult western lowland gorillas (Gorilla gorilla gorilla) in human care. Zoo Biology.
Eikemo, T. A., Hoffmann, R., Kulik, M. C., Kulhánová, I., Toch-Marquardt, M., Menvielle, G., . . . Lundberg, O. (2014). How can inequalities in mortality be reduced? A quantitative analysis of 6 risk factors in 21 European populations. PLoS One, 9(11), e110952. doi:10.1371/journal.pone.0110952
Ely, J. J., Zavaskis, T., & Lammey, M. L. (2013). Hypertension increases with aging and obesity in chimpanzees (Pan troglodytes). Zoo Biology, 32(1), 79-87.
Eysenck, H. J. (1944). Types of personality: a factorial study of seven hundred neurotics. The British Journal of Psychiatry, 90(381), 851-861.
Eysenck, H. J. (1950). Dimensions of personality (Vol. 5): Transaction Publishers. Ferguson, E., & Bibby, P. A. (2011). Openness to experience and all-cause mortality:
A meta-analysis and requivalent from risk ratios and odds ratios. British Journal of Health Psychology, 17, 85-102.
Figueredo, A. J., Cox, R. L., & Rhine, R. J. (1995). A generalizability analysis of subjective personality assessments in the stumptail macaque and the zebra finch. Multivariate Behavioral Research, 30, 167-197. doi:10.1207/s15327906mbr3002_3
Figueredo, A. J., Vásquez, G., Brumbach, B. H., & Schneider, S. M. R. (2004). The heritability of life history strategy: The K-factor, covitality, and personality. Social Biology, 51, 121-143.
Figueredo, A. J., Vasquez, G., Brumbach, B. H., Sefcek, J. A., Kirsner, B. R., & Jacobs, W. J. (2005). The K-factor: Individual differences in life history strategy. Personality and individual differences, 39, 1349-1360. doi:10.1016/j.paid.2005.06.009
Fiske, D. W. (1949). Consistency of the factorial structures of personality ratings from different sources. The Journal of Abnormal and Social Psychology, 44(3), 329.
Flynn, K. E., & Smith, M. A. (2007). Personality and health care decision-making style. Journals of Gerontology. Series B, Psychological Sciences and Social Sciences, 62B, P261-P267.
Frank, J. W., Cohen, R., Yen, I., Balfour, J., & Smith, M. (2003). Socioeconomic gradients in health status over 29 years of follow-up after midlife: the Alameda county study. Social science & medicine, 57(12), 2305-2323.
195
Frank, M. C., Bergelson, E., Bergmann, C., Cristia, A., Floccia, C., Gervain, J., . . . Levelt, C. (2017). A Collaborative Approach to Infant Research: Promoting Reproducibility, Best Practices, and Theory‐Building. Infancy.
Freeman, H. D., Brosnan, S. F., Hopper, L. M., Lambeth, S. P., Schapiro, S. J., & Gosling, S. D. (2013). Developing a comprehensive and comparative questionnaire for measuring personality in chimpanzees using a simultaneous top-down/bottom-up design. American Journal of Primatology, 75(10), 1042-1053. doi:10.1002/ajp.22168
Freeman, H. D., & Gosling, S. D. (2010). Personality in nonhuman primates: A review and evaluation of past research. American Journal of Primatology, 72, 653-671. doi:10.1002/ajp.20833
Freud, S. (1974). Correspondencia Freud-Groddeck. Friedman, H. S. (2008). The multiple linkages of personality and disease. Brain,
Behavior, and Immunity, 22(5), 668-675. Friedman, H. S., & Booth-Kewley, S. (1987). The" disease-prone personality": A
meta-analytic view of the construct: American Psychological Association. Friedman, H. S., & Rosenman, R. H. (1959). Association of specific overt behavior
pattern with blood and cardiovascular findings: Blood cholesterol level, blood clotting time, incidence of arcus senilis, and clinical coronary artery disease. Journal of the American Medical Association, 169, 1286-1296.
Friedman, H. S., Tucker, J. S., & Reise, S. P. (1995). Personality dimensions and measures potentially relevant to health - a focus on hostility. Annals of Behavioral Medicine, 17, 245-253.
Fu, W., & Simonoff, J. S. (2016). Survival trees for left-truncated and right-censored data, with application to time-varying covariate data. Biostatistics. doi:10.1093/biostatistics/kxw047
Funder, D. C. (2001). Accuracy in personality judgment: Research and theory concerning an obvious question.
Gale, C., Hagenaars, S. P., Davies, G., Hill, W. D., Liewald, D. C., Cullen, B., . . . McIntosh, A. (2016). Pleiotropy between neuroticism and physical and mental health: findings from 108 038 men and women in UK Biobank. Translational psychiatry, 6(4), e791.
Galton, F. (1884). Measurement of character. Fortnightly Review, 36, 179-185. Gerald, M. S., & Higley, J. D. (2002). Evolutionary underpinnings of excessive
alcohol consumption. Addiction, 97, 415-425. doi:10.1046/j.1360-0443.2002.00023.x
Gibbs, R. A., Rogers, J., Katze, M. G., Bumgarner, R., Weinstock, G. M., Mardis, E. R., . . . Wilson, R. K. (2007). Evolutionary and biomedical insights from the rhesus macaque genome. science, 316(5822), 222-234.
Gilby, I. C., N., B. L. J., Wroblewski, E. E., Rudicell, R. S., Hahn, S. H., Goodall, J., & Pusey, A. E. (2013). Fitness benefits of coalitionary aggression in male chimpanzees. Behavioral Ecology and Sociobiology, 67, 373-381. doi:10.1007/s00265-012-1457-6
Gold, K. C., & Maple, T. L. (1994). Personality assessment in the gorilla and its utility as a management tool. Zoo Biology, 13(5), 509-522. doi:10.1002/zoo.1430130513
Goodall, J. (1964). Tool-using and aimed throwing in a community of free-living chimpanzees. Nature, 201(4926), 1264-1266.

196
Goodall, J. (1986). The chimpanzees of Gombe: Patterns of behavior. Cambridge, MA: Belknap Press of Harvard University.
Goodall, J. (1990). Through a window: 30 years of observing the Gombe chimpanzees. London: Weidenfeld & Nicolson.
Goodman, M. S., Li, Y., & Tiwari, R. C. (2011). Detecting multiple change points in piecewise constant hazard functions. Journal of applied statistics, 38(11), 2523-2532.
Goodwin, R. D., & Friedman, H. S. (2006). Health status and the five-factor personality traits in a nationally representative sample. Journal of Health Psychology, 11, 643-654.
Goymann, W., & Wingfield, J. C. (2004). Allostatic load, social status and stress hormones: the costs of social status matter. Animal Behaviour, 67(3), 591-602.
Griffin, A. S., Guillette, L. M., & Healy, S. D. (2015). Cognition and personality: an analysis of an emerging field. Trends in Ecology & Evolution, 30(4), 207-214.
Gruenewald, T. L., Seeman, T. E., Ryff, C. D., Karlamangla, A. S., & Singer, B. H. (2006). Combinations of biomarkers predictive of later life mortality. Proceedings of the National Academy of Sciences, 103(38), 14158-14163.
Guenther, A., Brust, V., Dersen, M., & Trillmich, F. (2014). Learning and personality types are related in cavies (Cavia aperea). Journal of Comparative Psychology, 128, 74-81. doi:10.1037/a0033678
Guillette, L. M., Reddon, A. R., Hurd, P. L., & Sturdy, C. B. (2009). Exploration of a novel space is associated with individual differences in learning speed in black-capped chickadees, Poecile atricapillus. Behavioural Processes, 82(3), 265-270.
Gustafsson, J.-E. (1984). A unifying model for the structure of intellectual abilities. Intelligence, 8(3), 179-203.
Hagger-Johnson, G. E., & Whiteman, M. C. (2007). Conscientiousness facets and health behaviors: A latent variable modeling approach. Personality and individual differences, 43, 1235-1245. doi:10.1016/j.paid.2007.03.014
Haney, W. (1981). Validity, vaudeville, and values: A short history of social concerns over standardized testing. American Psychologist, 36(10), 1021.
Hare, B., Call, J., & Tomasello, M. (2001). Do chimpanzees know what conspecifics know? Animal Behaviour, 61(1), 139-151.
Hawkes, K., Smith, K. R., & Robson, S. L. (2009). Mortality and fertility rates in humans and chimpanzees: How within‐species variation complicates cross‐species comparisons. American Journal of Human Biology, 21(4), 578-586. doi:10.1002/ajhb.20890
Hebb, D. O. (1946a). Emotion in man and animal: An analysis of the intuitive process of recognition. Psychological Review, 53, 88-106. doi:10.1037/h0063033
Hebb, D. O. (1946b). On the nature of fear. Psychological Review, 53, 259-276. doi:10.1037/h0061690
Hebb, D. O. (1949). Temperament in chimpanzees: I. Method of analysis. Journal of Comparative and Physiological Psychology, 42, 192-206. doi:10.1037/h0056842
197
Helliwell, J. F., & Putnam, R. D. (2004). The social context of well-being. Philosophical Transactions of the Royal Society B: Biological Sciences, 359(1449), 1435.
Herrelko, E. S., Vick, S.-J., & Buchanan-Smith, H. M. (2012). Cognitive research in zoo-housed chimpanzees: Influence of personality and impact on welfare. American Journal of Primatology, 74(9), 828-840. doi:10.1002/ajp.22036
Herrmann, E., Call, J., Hernández-Lloreda, M. V., Hare, B., & Tomasello, M. (2007). Humans have evolved specialized skills of social cognition: The cultural intelligence hypothesis. science, 317(5843), 1360-1366.
Herrmann, E., Hare, B., Call, J., & Tomasello, M. (2010). Differences in the cognitive skills of bonobos and chimpanzees. PloS one, 5, e12438. doi:10.1371/journal.pone.0012438
Herrmann, E., Hernández-Lloreda, M. V., Call, J., Hare, B., & Tomasello, M. (2010). The structure of individual differences in the cognitive abilities of children and chimpanzees. Psychological Science, 21(1), 102-110.
Hill, K., Boesch, C., Goodall, J., Pusey, A. E., Williams, J. M., & Wrangham, R. W. (2001). Mortality rates among wild chimpanzees. Journal of Human Evolution, 40, 437-450.
Holekamp, K. E. (2007). Questioning the social intelligence hypothesis. Trends in cognitive sciences, 11(2), 65-69.
Holekamp, K. E., Sakai, S. T., & Lundrigan, B. L. (2007). Social intelligence in the spotted hyena (Crocuta crocuta). Philosophical Transactions of the Royal Society of London B: Biological Sciences, 362(1480), 523-538.
Holt-Lunstad, J., Smith, T. B., & Layton, J. B. (2010). Social relationships and mortality risk: a meta-analytic review. PLoS Medicine, 7(7), e1000316. doi:10.1371/journal.pmed.1000316
Holzinger, K. J., & Swineford, F. (1939). A study in factor analysis: the stability of a bi-factor solution. Supplementary Educational Monographs.
Hong, K.-W., Weiss, A., Morimura, N., Udono, T., Hayasaka, I., Humle, T., . . . Inoue-Murayama, M. (2011). Polymorphism of the tryptophan hydroxylase 2 (TPH2) gene Is associated with chimpanzee neuroticism. PloS one, 6, e22144. doi:10.1371/journal.pone.0022144
Hopkins, W. D., Donaldson, Z. R., & Young, L. J. (2012). A polymorphic indel containing the RS3 microsatellite in the 5′ flanking region of the vasopressin V1a receptor gene is associated with chimpanzee (Pan troglodytes) personality. Genes, Brain, and Behavior, 11(5), 552-558. doi:10.1111/j.1601-183X.2012.00799.x
Hopkins, W. D., Russell, J. L., & Schaeffer, J. (2014). Chimpanzee intelligence is heritable. Current Biology, 24(14), 1649-1652.
Hopper, L. M., Price, S. A., Freeman, H. D., Lambeth, S. P., Schapiro, S. J., & Kendal, R. L. (2013). Influence of personality, age, sex and estrous state on chimpanzee problem-solving success. Animal cognition. doi:10.1007/s10071-013-0715-y
Hu, L. t., & Bentler, P. M. (1999). Cutoff criteria for fit indexes in covariance structure analysis: Conventional criteria versus new alternatives. Structural Equation Modeling: A Multidisciplinary Journal, 6(1), 1-55.
Huebner, E. S. (1991). Correlates of life satisfaction in children. School psychology quarterly, 6(2), 103-111.

198
Huffman, M. A. (1997). Current evidence for self‐medication in primates: A multidisciplinary perspective. American Journal of Physical Anthropology, 104(S25), 171-200.
Human, L. J., Biesanz, J. C., Miller, G. E., Chen, E., Lachman, M. E., & Seeman, T. E. (2013). Is change bad? Personality change is associated with poorerpsychological health and greater metabolic syndrome in midlife. Journal ofPersonality, 81(3), 249-260.
Humphrey, N. K. (1976). The social function of intellect Growing points in ethology (pp. 303-317): Cambridge University Press.
Hurtz, G. M., & Donovan, J. J. (2000). Personality and job performance: The Big Five revisited. Journal of applied psychology, 85(6), 869-879.
Inoue, S., & Matsuzawa, T. (2007). Working memory of numerals in chimpanzees. Current Biology, 17(23), R1004-R1005.
Ioannidis, J. P. (2008). Why most discovered true associations are inflated. Epidemiology, 19(5), 640-648.
Itani, J. (1957). Personality of Japanese monkeys. Iden, 11, 29-33. Iveniuk, J., Laumann, E. O., Waite, L. J., McClintock, M. K., & Tiedt, A. (2014).
Personality Measures in the National Social Life, Health, and Aging Project. Journals of Gerontology Series B: Psychological Sciences and Social Sciences, 69(Suppl_2), S117-S124.
James, D. G., & Warren, G. N. (1991). Effect of temperature on development, survival, longevity and fecundity of Trissolcus oenone Dodd (Hymenoptera: Scelionidae). Austral Entomology, 30(4), 303-306. doi:10.1111/j.1440-6055.1991.tb00441.x
Jang, K. L., Livesley, W. J., & Vemon, P. A. (1996). Heritability of the big five personality dimensions and their facets: a twin study. Journal of Personality, 64(3), 577-592.
Jensen, G., Altschul, D., Danly, E., & Terrace, H. (2013). Transfer of a serial representation between two distinct tasks by rhesus macaques. PloS one, 8(7), e70285.
John, O. P., & Srivastava, S. (1999). The Big Five trait taxonomy: History, measurement, and theoretical perspectives. In L. A. Pervin & O. P. John (Eds.), Handbook of personality: Theory and research (Vol. 2, pp. 102-138). New York: The Guilford Press.
Jokela, M., Batty, G. D., Nyberg, S. T., Virtanen, M., Nabi, H., Singh-Manoux, A., & Kivimäki, M. (2013). Personality and all-cause mortality: Individual-participant meta-analysis of 3,947 deaths in 76,150 adults. American Journal of Epidemiology, 178(5), 667-675. doi:10.1093/aje/kwt170
Jokela, M., Pulkki-Råback, L., Elovainio, M., & Kivimäki, M. (2014). Personality traits as risk factors for stroke and coronary heart disease mortality: pooled analysis of three cohort studies. Journal of behavioral medicine, 37(5), 881-889.
Jolly, A. (1966). Lemur social behavior and primate intelligence. Science, 153(3735), 501-506.
Jonassaint, C. R., Boyle, S. H., Williams, R. B., Mark, D. B., Siegler, I. C., & Barefoot, J. C. (2007). Facets of openness predict mortality in patients with cardiac disease. Psychosomatic Medicine, 69(4), 319-322. doi:10.1097/PSY.0b013e318052e27d

199
Jonassaint, C. R., Siegler, I. C., Barefoot, J. C., Edwards, C. L., & Williams, R. B. (2011). Low life course socioeconomic status (SES) is associated with negative NEO PI-R personality patterns. International journal of behavioral medicine, 18(1), 13-21.
Jordan, K. E., & Brannon, E. M. (2006). Weber's Law influences numerical representations in rhesus macaques (Macaca mulatta). Animal cognition, 9(3), 159-172.
Juster, R.-P., McEwen, B. S., & Lupien, S. J. (2010). Allostatic load biomarkers of chronic stress and impact on health and cognition. Neuroscience & Biobehavioral Reviews, 35(1), 2-16.
Kail, R., & Salthouse, T. A. (1994). Processing speed as a mental capacity. Acta psychologica, 86(2), 199-225.
Karlamangla, A. S., Miller-Martinez, D., Lachman, M. E., Tun, P. A., Koretz, B. K., & Seeman, T. E. (2014). Biological correlates of adult cognition: Midlife in the United States (MIDUS). Neurobiology of Aging, 35(2), 387-394.
Kendal, R., Hopper, L. M., Whiten, A., Brosnan, S. F., Lambeth, S. P., Schapiro, S. J., & Hoppitt, W. (2015). Chimpanzees copy dominant and knowledgeable individuals: implications for cultural diversity. Evolution and Human Behavior, 36(1), 65-72.
Kern, M. L., & Friedman, H. S. (2008). Do conscientious individuals live longer? A quantitative review. Health Psychology, 27(5), 505-512. doi:10.1037/0278-6133.27.5.505
King, J. E., & Figueredo, A. J. (1997). The Five-Factor Model plus Dominance in chimpanzee personality. Journal of Research in Personality, 31, 257-271. doi:10.1006/jrpe.1997.2179
King, J. E., & Landau, V. I. (2003). Can chimpanzee (Pan troglodytes) happiness be estimated by human raters? Journal of Research in Personality, 37, 1-15. doi:10.1016/S0092-6566(02)00527-5
King, J. E., Weiss, A., & Farmer, K. H. (2005). A chimpanzee (Pan troglodytes) analogue of cross-national generalization of personality structure: Zoological parks and an African sanctuary. Journal of Personality, 73, 389-410. doi:10.1111/j.1467-6494.2005.00313.x
King, J. E., Weiss, A., & Sisco, M. M. (2008). Aping humans: Age and sex effects in chimpanzee (Pan troglodytes) and human (Homo sapiens) personality. Journal of Comparative Psychology, 122, 418-427. doi:10.1037/a0013125
Kjellander, P., Gaillard, J., Hewison, M., & Liberg, O. (2004). Predation risk and longevity influence variation in fitness of female roe deer (Capreolus capreolus L.). Proceedings of the Royal Society of London B: Biological Sciences, 271(Suppl 5), S338-S340. doi:10.1098/rsbl.2004.0177
Klein, J. P., & Moeschberger, M. L. (2005). Survival analysis: techniques for censored and truncated data: Springer Science & Business Media.
Klein, R. A., Ratliff, K. A., Vianello, M., Adams Jr, R. B., Bahník, Š., Bernstein, M. J., . . . Brumbaugh, C. C. (2014). Investigating variation in replicability. Social psychology.
Kobrosly, R. W., Seplaki, C. L., Cory‐Slechta, D. A., Moynihan, J., & Wijngaarden, E. (2013). Multisystem physiological dysfunction is associated with depressive symptoms in a population‐based sample of older adults. International journal of geriatric psychiatry, 28(7), 718-727.
200
Koenig, K. A., Frey, M. C., & Detterman, D. K. (2008). ACT and general cognitive ability. Intelligence, 36(2), 153-160.
Köhler, W. (1925). The mentality of apes (E. Winter, Trans.). New York, NY: Harcourt, Brace and Company.
Konečná, M., Lhota, S., Weiss, A., Urbánek, T., Adamová, T., & Pluháček, J. (2008). Personality in free-ranging Hanuman langur (Semnopithecus entellus) males: Subjective ratings and recorded behavior. Journal of Comparative Psychology, 122, 379-389. doi:10.1037/a0012625
Koolhaas, J. M., De Boer, S. F., Coppens, C. M., & Buwalda, B. (2010). Neuroendocrinology of coping styles: towards understanding the biology of individual variation. Frontiers in Neuroendocrinology, 31, 307-321. doi:10.1016/j.yfrne.2010.04.001
Koolhaas, J. M., Korte, S. M., De Boer, S. F., Van Der Vegt, B. J., Van Reenen, C. G., Hopster, H., . . . Blokhuis, H. J. (1999). Coping styles in animals: current status in behavior and stress-physiology. Neuroscience and Biobehavioral Reviews, 23, 925-935. doi:10.1016/S0149-7634(99)00026-3
Korte, S. M., Koolhaas, J. M., Wingfield, J. C., & McEwen, B. S. (2005). The Darwinian concept of stress: benefits of allostasis and costs of allostatic load and the trade-offs in health and disease. Neuroscience and Biobehavioral Reviews, 29(1), 3-38. doi:10.1016/j.neubiorev.2004.08.009
Kubzansky, L. D., Kawachi, I., & Sparrow, D. (1999). Socioeconomic status, hostility, and risk factor clustering in the Normative Aging Study: any help from the concept of allostatic load? Annals of Behavioral Medicine, 21(4), 330-338.
Kuhar, C. W., Stoinski, T. S., Lukas, K. E., & Maple, T. L. (2006). Gorilla Behavior Index revisited: Age, housing and behavior. Applied Animal Behaviour Science, 96(3), 315-326. doi:10.1016/j.applanim.2005.06.004
Lachman, M. E. (2005). Addendum for MIDI personality scales: MIDUS II version. Retrieved from Walthman, MA: http://www.brandeis.edu/departments/psych/lachman/pdfs/revised-midi-scales.pdf
Lachman, M. E., & Weaver, S. L. (1997). The Midlife Development Inventory (MIDI) personality scales: Scale construction and scoring. Retrieved from Walthman, MA:
Lahey, B. B. (2009). Public health significance of neuroticism. American Psychologist, 64(4), 241.
Lambeth, S. P., Hau, J., Perlman, J. E., Martino, M., & Schapiro, S. J. (2006). Positive reinforcement training affects hematologic and serum chemistry values in captive chimpanzees (Pan troglodytes). American Journal of Primatology, 68(3), 245-256.
Lammey, M. L., Lee, D. R., Ely, J. J., & Sleeper, M. M. (2008). Sudden cardiac death in 13 captive chimpanzees (Pan troglodytes). Journal of medical primatology, 37(s1), 39-43.
Latzman, R. D., Freeman, H. D., Schapiro, S. J., & Hopkins, W. D. (2015). The contribution of genetics and early rearing experiences to hierarchical personality dimensions in chimpanzees (Pan troglodytes). Journal of Personality and Social Psychology, 109(5), 889-900. doi:10.1037/pspp0000040
201
Latzman, R. D., Hecht, L. K., Freeman, H. D., Schapiro, S. J., & Hopkins, W. D. (2015). Neuroanatomical correlates of personality in chimpanzees (Pan troglodytes): Associations between personality and frontal cortex. NeuroImage, 123, 63-71. doi:10.1016/j.neuroimage.2015.08.041
Latzman, R. D., Sauvigné, K. C., & Hopkins, W. D. (2016). Translating chimpanzee personality to humans: Investigating the transportability of chimpanzee‐derived personality scales to humans. American Journal of Primatology, 78(6), 601-609.
Laurence, H., Kumar, S., Owston, M. A., Lanford, R. E., Hubbard, G. B., & Dick, E. J. (2017). Natural mortality and cause of death analysis of the captivechimpanzee (Pan troglodytes): A 35‐year review. Journal of MedicalPrimatology.
Law, M., Wald, N., Morris, J., & Jordan, R. (2003). Value of low dose combination treatment with blood pressure lowering drugs: analysis of 354 randomised trials. Bmj, 326(7404), 1427.
Law, M., Wald, N. J., & Rudnicka, A. (2003). Quantifying effect of statins on low density lipoprotein cholesterol, ischaemic heart disease, and stroke: systematic review and meta-analysis. Bmj, 326(7404), 1423.
Leahy, R., & Crews, D. E. (2012). Physiological dysregulation and somatic decline among elders: modeling, applying and re-interpreting allostatic load. Collegium antropologicum, 36(1), 11-22.
Leary, M. R., & Hoyle, R. H. (2009). Handbook of individual differences in social behavior. New York: Guilford Press.
Lucas, R. E., Diener, E., & Suh, E. (1996). Discriminant validity of well-being measures. Journal of personality and social psychology, 71(3), 616.
Luchetti, M., Barkley, J. M., Stephan, Y., Terracciano, A., & Sutin, A. R. (2014). Five-factor model personality traits and inflammatory markers: New data and a meta-analysis. Psychoneuroendocrinology, 50, 181-193.
Lynch, J. W., Smith, G. D., Kaplan, G. A., & House, J. S. (2000). Income inequality and mortality: importance to health of individual income, psychosocial environment, or material conditions. BMJ: British Medical Journal, 320(7243), 1200.
MacLean, E. L., Hare, B., Nunn, C. L., Addessi, E., Amici, F., Anderson, R. C., . . . Zhao, Y. N. (2014). The evolution of self-control. Proceedings of the National Academy of Sciences of the United States of America, 111(20), E2140-E2148. doi:10.1073/pnas.1323533111
MacLean, E. L., Matthews, L. J., Hare, B. A., Nunn, C. L., Anderson, R. C., Aureli, F., . . . Emery, N. J. (2012). How does cognition evolve? Phylogenetic comparative psychology. Animal cognition, 15(2), 223-238.
Maestripieri, D., & Hoffman, C. L. (2011). Chronic stress, allostatic load, and aging in nonhuman primates. Development and psychopathology, 23(04), 1187-1195.
Maller, J. B. (1933). Vital indices and their relation to psychological and social factors. Human Biology, 5(1), 94.
Malouff, J. M., Thorsteinsson, E. B., Rooke, S. E., & Schutte, N. S. (2007). Alcohol involvement and the Five-Factor Model of personality: A meta-analysis. Journal of Drug Education, 37, 277-294.
202
Martin-Subero, M., Anderson, G., Kanchanatawan, B., Berk, M., & Maes, M. (2016). Comorbidity between depression and inflammatory bowel disease explained by immune-inflammatory, oxidative, and nitrosative stress; tryptophan catabolite; and gut–brain pathways. CNS spectrums, 21(2), 184-198.
Massen, J. J. M., Antonides, A., Arnold, A.-M. K., Bionda, T., & Koski, S. E. (2013). A behavioral view on chimpanzee personality: Exploration tendency, persistence, boldness, and tool-orientation measured with group experiments. American Journal of Primatology, 75, 947-958. doi:10.1002/ajp.22159
Matsuzawa, T., Tomonaga, M., & Tanaka, M. (2006). Development in Chimpanzees: Springer.
Matthews, G. (1999). Personality and skill: A cognitive-adaptive framework. Matthews, G., Deary, I. J., & Whiteman, M. (2009). Personality traits (3 ed.).
Cambridge: Cambridge University Press. Matthews, G., & Gilliland, K. (1999). The personality theories of HJ Eysenck and JA
Gray: A comparative review. Personality and individual differences, 26(4), 583-626.
Matzel, L. D., Han, Y. R., Grossman, H., Karnik, M. S., Patel, D., Scott, N., . . . Gandhi, C. C. (2003). Individual differences in the expression of a "general" learning ability in mice. Journal of Neuroscience, 23, 6423-6433.
McAdams, D. P., & Pals, J. L. (2006). A new Big Five: fundamental principles for an integrative science of personality. American psychologist, 61(3), 204.
McCrae, R. R., & Costa, P. T. (1989). The structure of interpersonal traits: Wiggins's circumplex and the five-factor model. Journal of personality and social psychology, 56(4), 586.
McCrae, R. R., & Costa, P. T., Jr. (1987). Validation of the five-factor model of personality across instruments and observers. Journal of Personality and Social Psychology, 52, 81-90. doi:10.1037/0022-3514.52.1.81
McCrae, R. R., Terracciano, A., & 79 Members of the Personality Profiles of Cultures Project. (2005). Personality profiles of cultures: Aggregate personality traits. Journal of Personality and Social Psychology, 89, 407-425. doi:10.1037/0022-3514.89.3.407
McDougall, W. (1932). Of the words character and personality. Journal of Personality, 1, 3-16. doi:10.1111/j.1467-6494.1932.tb02209.x
McEwen, B. S. (1998). Stress, adaptation, and disease - Allostasis and allostatic load. Neuroimmunomodulation, 840, 33-44.
McEwen, B. S. (2000). Allostasis and allostatic load: Implications for neuropsychopharmacology. Neuropsychopharmacology, 22, 108-124.
McEwen, B. S. (2012). Brain on stress: how the social environment gets under the skin. Proceedings of the National Academy of Sciences, 109(Supplement 2), 17180-17185.
McEwen, B. S., & Lasley, E. N. (2002). The end of stress as we know it: Joseph Henry Press.
McEwen, B. S., & Seeman, T. (1999). Protective and damaging effects of mediators of stress - Elaborating and testing the concepts of allostasis and allostatic load. Socioeconomic Status and Health in Industrial Nations, 896, 30-47.
McEwen, B. S., & Stellar, E. (1993). Stress and the individual: mechanisms leading to disease. Archives of internal medicine, 153(18), 2093-2101.
203
McGrew, W. C. (1974). Tool use by wild chimpanzees in feeding upon driver ants. Journal of Human Evolution, 3(6), 501-508.
McGrew, W. C. (1992). Tool-use by free-ranging chimpanzees: the extent of diversity. Journal of Zoology, 228(4), 689–694. doi:10.1111/j.1469-7998.1992.tb04469.x
McGrew, W. C., Tutin, C. E., & Baldwin, P. (1979). Chimpanzees, tools, and termites: cross-cultural comparisons of Senegal, Tanzania, and Rio Muni. Man, 185-214.
Mendoza, S., Capitanio, J., & Mason, W. (2000). Chronic social stress: studies in non-human primates. Biology of animal stress: Basic principles and implications for animal welfare, 227-247.
Miles, J., & Shevlin, M. (2001). Applying regression and correlation: A guide for students and researchers: Sage.
Millard, L. A., Davies, N. M., Timpson, N. J., Tilling, K., Flach, P. A., & Smith, G. D. (2015). MR-PheWAS: hypothesis prioritization among potential causaleffects of body mass index on many outcomes, using Mendelianrandomization. Scientific reports, 5.
Millsap, R. E., Olivera-Aguilar, M., & Hoyle, R. (2012). Investigating measurement invariance using confirmatory factor analysis. Handbook of structural equation modeling, 380-392.
Mitani, J. C., Watts, D. P., & Muller, M. N. (2002). Recent developments in the study of wild chimpanzee behavior. Evolutionary Anthropology: Issues, news, and reviews, 11(1), 9-25.
Miyamoto, Y., Boylan, J. M., Coe, C. L., Curhan, K. B., Levine, C. S., Markus, H. R., . . . Karasawa, M. (2013). Negative emotions predict elevated interleukin-6 in the United States but not in Japan. Brain, Behavior, and Immunity, 34, 79-85.
Mori, T., Karlamangla, A. S., Merkin, S. S., Crandall, C. J., Binkley, N., Greendale, G. A., & Seeman, T. E. (2014). Multisystem dysregulation and bone strength:Findings from the study of midlife in the United States. The Journal ofClinical Endocrinology & Metabolism, 99(5), 1843-1851.
Morton, F. B., Lee, P. C., & Buchanan-Smith, H. M. (2013). Taking personality selection bias seriously in animal cognition research: a case study in capuchin monkeys (Sapajus apella). Animal cognition, 16, 677-684. doi:10.1007/s10071-013-0603-5
Morton, F. B., Lee, P. C., Buchanan-Smith, H. M., Brosnan, S. F., Thierry, B., Paukner, A., . . . Weiss, A. (2013). Personality structure in brown capuchin monkeys (Sapajus apella): Comparisons with chimpanzees (Pan troglodytes), orangutans (Pongo spp.), and rhesus macaques (Macaca mulatta). Journal of Comparative Psychology, 127, 282-298. doi:10.1037/a0031723
Mulcahy, N. J., & Call, J. (2006). Apes save tools for future use. Science, 312(5776), 1038-1040.
Muller, M. N., & Wrangham, R. W. (2004). Dominance, cortisol and stress in wild chimpanzees (Pan troglodytes schweinfurthii). Behavioral Ecology and Sociobiology, 55(4), 332-340.
Murray, C. M., Lonsdorf, E. V., Eberly, L. E., & Pusey, A. E. (2009). Reproductive energetics in free-living female chimpanzees (Pan troglodytes schweinfurthii). Behavioral Ecology, 20(6), 1211-1216.
204
Napier, J. R., & Napier, P. H. (1967). A handbook of living primates: Morphology, ecology and behavior of nonhuman primates. London: Acaemic Press.
Nelson, R. J. (2005). An introduction to behavioral endocrinology: Sinauer Associates.
Nettle, D. (2006). The evolution of personality variation in humans and other animals. American Psychologist, 61(6), 622-631. doi:10.1037/0003-066X.61.6.622
Nettle, D. (2007). An evolutionary approach to the extraversion continuum. Evolution and Human Behavior, 26, 363-373.
Newton, I. (1989). Lifetime reproduction in birds. London: Academic Press. Nishida, T. (1973). The ant-gathering behaviour by the use of tools among wild
chimpanzees of the Mahali Mountains. Journal of Human Evolution, 2(5), 357IN1365-1364IN8370.
Norman, W. T. (1963). Toward an adequate taxonomy of personality attributes: Replicated factor structure in peer nomination personality ratings. The Journal of Abnormal and Social Psychology, 66(6), 574-583. doi:10.1037/h0040291
O'Toole, B., Adena, M., & Jones, M. (1988). Risk factors for mortality in Australian Vietnam-era national servicemen: a case-control study. Community health studies, 12(4), 408.
Oehlert, G. W. (2014). A few words about REML. Ohnishi, M., & Razzaque, M. S. (2010). Dietary and genetic evidence for phosphate
toxicity accelerating mammalian aging. The FASEB Journal, 24(9), 3562-3571.
Okun, M. A., Stock, W. A., Haring, M. J., & Witter, R. A. (1984). Health and Subjective Well-Being: A Meta-Analyis. The International journal of aging and human development, 19(2), 111-132.
Olson, M. V., & Varki, A. (2003). Sequencing the chimpanzee genome: insights into human evolution and disease. Nature Reviews Genetics, 4(1), 20-28.
Pavlov, I. P. (1908/1941). Lectures on conditioned reflexes. Volume two: Conditioned reflexes and psychiatry (W. H. Gantt, Trans.). London: Lawrence and Wishart Limited.
Pederson, A. K., King, J. E., & Landau, V. I. (2005). Chimpanzee (Pan troglodytes) personality predicts behavior. Journal of Research in Personality, 39, 534-549.
Penn, D. C., Holyoak, K. J., & Povinelli, D. J. (2008). Darwin's mistake: Explaining the discontinuity between human and nonhuman minds. Behavioral and Brain Sciences, 31(2), 109-130.
Penn, D. C., & Povinelli, D. J. (2007). Causal cognition in human and nonhuman animals: A comparative, critical review. Annual review of psychology, 58.
Pika, S., & Mitani, J. (2006). communication in wild chimpanzees (Pan troglodytes). Current Biology, 16(6), R192.
Poropat, A. E. (2009). A meta-analysis of the five-factor model of personality and academic performance. Psychological bulletin, 135(2), 322.
Povinelli, D. J. (2000). Folk physics for apes: The chimpanzee's theory of how the world works.
Povinelli, D. J., Reaux, J. E., Theall, L. A., & Giambrone, S. (2000). The support problem: physical connection revisited. Folk physics for apes: the

205
chimpanzee’s theory of how the world works. Oxford University Press, New York, 254-270.
Povinelli, D. J., & Vonk, J. (2004). We don’t need a microscope to explore the chimpanzee's mind. Mind & Language, 19(1), 1-28.
Price, K. P., & Clarke, L. K. (1978). Behavioral and psychophysiological correlates of the coronary-prone personality: New data and unanswered questions. Journal of Psychosomatic Research, 22(5), 409-417.
Reader, S. M., Hager, Y., & Laland, K. N. (2011). The evolution of primate general and cultural intelligence. Philosophical Transactions of the Royal Society of London B: Biological Sciences, 366(1567), 1017-1027.
Réale, D., Reader, S. M., Sol, D., McDougall, P. T., & Dingemanse, N. J. (2007). Integrating animal temperament within ecology and evolution. Biological Reviews, 82, 291-318. doi:10.1111/j.1469-185X.2007.00010.x
Rentfrow, P. J., Gosling, S. D., & Potter, J. (2008). A theory of the emergence, persistence, and expression of geographic variation in psychological characteristics. Perspectives on Psychological Science, 3, 339-369.
Revelle, W. (2015). psych: Procedures for personality and psychological research (Version 1.2.12). Evanston, IL: Northwestern University. Retrieved from http://personality-project.org/r/psych.manual.pdf
Rhodes, R. E., & Smith, N. E. I. (2006). Personality correlates of physical activity: A review and meta-analysis. British Journal of Sports Medicine, 40, 958-965.
Robbins, M. M. (1999). Male mating patterns in wild multimale mountain gorilla groups. Animal Behaviour, 57(5), 1013-1020.
Roberts, B. W., Kuncel, N. R., Shiner, R., Caspi, A., & Goldberg, L. R. (2007). The power of personality: The comparative validity of personality traits, socioeconomic status, and cognitive ability for predicting important life outcomes. Perspectives on Psychological Science, 2(4), 313-345. doi:10.1111/j.1745-6916.2007.00047.x
Roberts, B. W., Luo, J., Briley, D. A., Chow, P. I., Su, R., & Hill, P. L. (2017). A systematic review of personality trait change through intervention.
Robinson, G. K. (1991). That BLUP is a good thing: the estimation of random effects. Statistical Science, 6, 15-32.
Rosati, A. G. (2017). Foraging Cognition: Reviving the Ecological Intelligence Hypothesis. Trends in cognitive sciences.
Ryff, C. D., Miyamoto, Y., Boylan, J. M., Coe, C. L., Karasawa, M., Kawakami, N., . . . Markus, H. R. (2015). Culture, inequality, and health: evidence from the MIDUS and MIDJA comparison. Culture and brain, 3(1), 1-20.
Sapolsky, R. M. (1982). The endocrine stress-response and social status in the wild baboon. Hormones and Behavior, 16, 279-292. doi:10.1016/0018-506X(82)90027-7
Sapolsky, R. M. (1990). Adrenocortical function, social rank, and personality among wild baboons. Biological Psychiatry, 28, 862-878. doi:10.1016/0006-3223(90)90568-M
Sapolsky, R. M. (1994). Individual differences and the stress response. Seminars in Neuroscience, 6, 261-269.
Sapolsky, R. M. (2004). Social status and health in humans and other animals. Annual Review of Anthropology, 33, 393-418.
206
Sapolsky, R. M. (2005). The influence of social hierarchy on primate health. Science, 308, 648-652.
Sapolsky, R. M., Romero, L. M., & Munck, A. U. (2000). How do glucocorticoids influence stress responses? Integrating permissive, suppressive, stimulatory, and preparative actions 1. Endocrine Reviews, 21(1), 55-89.
Sass, D. A. (2011). Testing measurement invariance and comparing latent factor means within a confirmatory factor analysis framework. Journal of Psychoeducational Assessment, 29(4), 347-363.
Savage-Rumbaugh, E. S., Murphy, J., Sevcik, R. A., Brakke, K. E., Williams, S. L., Rumbaugh, D. M., & Bates, E. (1993). Language comprehension in ape and child. Monographs of the society for research in child development, i-252.
Schaefer, S. A., & Steklis, H. D. (2014). Personality and subjective well‐being in captive male western lowland gorillas living in bachelor groups. American Journal of Primatology, 76, 879-889. doi:10.1002/ajp.22275
Schülke, O., Bhagavatula, J., Vigilant, L., & Ostner, J. (2010). Social bonds enhance reproductive success in male macaques. Current Biology, 20(24), 2207-2210. doi:10.1016/j.cub.2010.10.058
Seeman, T. E., McEwen, B. S., Rowe, J. W., & Singer, B. H. (2001). Allostatic load as a marker of cumulative biological risk: MacArthur studies of successful aging. Proceedings of the National Academy of Sciences of the United States of America, 98(8), 4770-4775.
Seeman, T. E., Singer, B. H., Rowe, J. W., Horwitz, R. I., & McEwen, B. S. (1997). Price of adaptation—allostatic load and its health consequences: MacArthur studies of successful aging. Archives of internal medicine, 157(19), 2259-2268.
Seeman, T. E., Singer, B. H., Ryff, C. D., Love, G. D., & Levy-Storms, L. (2002). Social relationships, gender, and allostatic load across two age cohorts. Psychosomatic Medicine, 64(3), 395-406.
Selye, H. (1956). The stress of life. Seyfarth, R. M., Silk, J. B., & Cheney, D. L. (2012). Variation in personality and
fitness in wild baboons. Proceedings of the National Academy of Sciences of the United States of America, 109(42), 16980-16985. doi:10.1073/pnas.1210780109
Shaw, R. C., Boogert, N. J., Clayton, N. S., & Burns, K. C. (2015). Wild psychometrics: evidence for ‘general’cognitive performance in wild New Zealand robins, Petroica longipes. Animal Behaviour, 109, 101-111.
Shaw, R. C., & Schmelz, M. (2017). Cognitive test batteries in animal cognition research: evaluating the past, present and future of comparative psychometrics. Animal cognition, 20(6), 1003-1018.
Shepherd, D., Hautus, M. J., & Hutchinson, H. (2008). Psychometric functions for hybrid difference discrimination/increment detection tasks. The Journal of the Acoustical Society of America, 124(5), EL302-EL307.
Shively, C. A., Register, T. C., Adams, M. R., Golden, D. L., Willard, S. L., & Clarkson, T. B. (2008). Depressive behavior and coronary artery atherogenesis in adult female cynomolgus monkeys. Psychosomatic Medicine, 70, 637-645.
207
Sih, A., Bell, A. M., Johnson, J. C., & Ziemba, R. E. (2004). Behavioral syndromes: An integrative overview. Quarterly Review of Biology, 79, 241-277. doi:10.1086/422893
Silk, J. B., Beehner, J. C., Bergman, T. J., Crockford, C., Engh, A. L., Moscovice, L. R., . . . Cheney, D. L. (2010). Strong and consistent social bonds enhance the longevity of female baboons. Current Biology, 20, 1359-1361. doi:10.1016/j.cub.2010.05.067
Smith, B. R., & Blumstein, D. T. (2008). Fitness consequences of personality: a meta-analysis. Behavioral Ecology, 19, 448-455. doi:10.1093/beheco/arm144
Snyder-Mackler, N., Sanz, J., Kohn, J. N., Brinkworth, J. F., Morrow, S., Shaver, A. O., . . . Wilson, M. E. (2016). Social status alters immune regulation and response to infection in macaques. Science, 354(6315), 1041-1045. doi:10.1126/science.aah3580
Spearman, C. (1925). Some Issues in the Theory of``g''(including the Law of Diminishing Returns). Nature, 116, 436-439.
Spinath, F. M., & Johnson, W. (2011). Behavior genetics. The Wiley-Blackwell handbook of individual differences, 269-304.
Steel, P., Schmidt, J., & Shultz, J. (2008). Refining the relationship between personality and subjective well-being. Psychological bulletin, 134, 138-161. doi:10.1037/0033-2909.134.1.138
Stephan, Y., Sutin, A. R., Luchetti, M., & Terracciano, A. (2016). Allostatic load and personality: A 4-year longitudinal study. Psychosomatic Medicine, 78(3), 302-310.
Sterling, P. (2012). Allostasis: a model of predictive regulation. Physiology & Behavior, 106(1), 5-15.
Stevenson-Hinde, J., Stillwell-Barnes, R., & Zunz, M. (1980). Individual differences in young rhesus monkeys: Consistency and change. Primates, 21, 498-509. doi:10.1007/BF02373838
Stevenson-Hinde, J., & Zunz, M. (1978). Subjective assessment of individual rhesus monkeys. Primates, 19, 473-482. doi:10.1007/BF02373309
Stöwe, M., Bugnyar, T., Heinrich, B., & Kotrschal, K. (2006). Effects of group size on approach to novel objects in ravens (Corvus corax). Ethology, 112, 1079-1088. doi:10.1111/j.1439-0310.2006.01273.x
Strickhouser, J. E., Zell, E., & Krizan, Z. (2017). Does Personality Predict Health and Well-Being? A Metasynthesis. Health Psychology, No Pagination Specified. doi:10.1037/hea0000475
Stumpf, R. M. (2007). Chimpanzees and bonobos: diversity within and between species. In C. J. Campbell, A. Fuentes, K. C. MacKinnon, M. Panger, & S. K. Bearder (Eds.), Primates in Perspective (pp. 321-344). Oxford: Oxford University Press.
Stumvoll, M., Tataranni, P. A., Stefan, N., Vozarova, B., & Bogardus, C. (2003). Glucose allostasis. Diabetes, 52(4), 903-909.
Subiaul, F., Vonk, J., Okamoto-Barth, S., & Barth, J. (2008). Do chimpanzees learn reputation by observation? Evidence from direct and indirect experience with generous and selfish strangers. Animal cognition, 11(4), 611-623.
Sutin, A. R., Stephan, Y., Wang, L., Gao, S., Wang, P., & Terracciano, A. (2015). Personality traits and body mass index in Asian populations. Journal of Research in Personality, 58, 137-142.
208
Tanaka, J. W., & Curran, T. (2001). A neural basis for expert object recognition. Psychological Science, 12(1), 43-47.
Taylor, S. E., & Sirois, F. M. (1995). Health psychology: McGraw-Hill New York. Terman, L. M. (1916). The measurement of intelligence: An explanation of and a
complete guide for the use of the Stanford revision and extension of the Binet-Simon intelligence scale: Houghton Mifflin.
Terracciano, A., & Costa, P. T., Jr. (2004). Smoking and the Five-Factor Model of personality. Addiction, 99, 472-481. doi:10.1111/j.1360-0443.2004.00687.x
Terracciano, A., Strait, J., Scuteri, A., Meirelles, O., Sutin, A. R., Tarasov, K., . . . Pilia, M. G. (2014). Personality traits and circadian blood pressure patterns: A seven year prospective study. Psychosomatic Medicine, 76(3), 237.
Terrace, H. S. (1987). Nim: A chimpanzee who learned sign language: Columbia University Press.
Terrace, H. S. (2005). The simultaneous chain: A new approach to serial learning. Trends in cognitive sciences, 9(4), 202-210.
Thorndike, E. L. (1920). Intelligence examinations for college entrance. The Journal of Educational Research, 1(5), 329-337.
Thornton, A., & Lukas, D. (2012). Individual variation in cognitive performance: developmental and evolutionary perspectives. Philosophical Transactions of the Royal Society of London B: Biological Sciences, 367(1603), 2773-2783.
Thurstone, L. (1918). Variability in learning. Psychological bulletin, 15(6), 210. Tomasello, M., & Call, J. (1997). Primate cognition: Oxford University Press, USA. Tomasello, M., Call, J., & Hare, B. (1998). Five primate species follow the visual
gaze of conspecifics. Animal Behaviour, 55(4), 1063-1069. Tupes, E. C., & Christal, R. E. (1961). Recurrent personality factors based on trait
ratings (USAF ASD Tech. Rep. No. 61-97). Lackland Air Force Base, TX: U.S. Air Force. Lackland Air Force Base, TX: United States Air Force.
Turiano, N. A., Chapman, B. P., Gruenewald, T. L., & Mroczek, D. K. (2015). Personality and the leading behavioral contributors of mortality. Health Psychology, 34, 51-60. doi:10.1037/hea0000038
Turiano, N. A., Mroczek, D. K., Moynihan, J., & Chapman, B. P. (2013). Big 5 personality traits and interleukin-6: Evidence for “healthy Neuroticism” in a US population sample. Brain, Behavior, and Immunity, 28, 83-89.
Turiano, N. A., Spiro III, A., & Mroczek, D. K. (2012). Openness to experience and mortality in men: Analysis of trait and facets. Journal of Aging and Health, 24(4), 654-672.
Uchino, B. N., Cacioppo, J. T., & Kiecolt-Glaser, J. K. (1996). The relationship between social support and physiological processes: a review with emphasis on underlying mechanisms and implications for health. Psychological bulletin, 119(3), 488.
Van Hooff, J. A. R. A. M. (1971). Aspects of the social behaviour and communication in human and higher non-human primates. Rotterdam: Bronder-Offset.
Varki, N., Anderson, D., Herndon, J. G., Pham, T., Gregg, C. J., Cheriyan, M., . . . Else, J. G. (2009). Heart disease is common in humans and chimpanzees, but is caused by different pathological processes. Evolutionary Applications, 2(1), 101-112.

209
Vazire, S., Gosling, S. D., Dickey, A. S., & Schapiro, S. J. (2007). Measuring personality in nonhuman animals. In R. W. Robins, R. C. Fraley, & R. F. Krueger (Eds.), Handbook of Research Methods in Personality Psychology (pp. 190-206). New York, NY: The Guilford Press.
Videan, E. N., Fritz, J., & Murphy, J. (2007). Development of guidelines for assessing obesity in captive chimpanzees (Pan troglodytes). Zoo Biology, 26(2), 93-104.
Videan, E. N., Heward, C. B., Chowdhury, K., Plummer, J., Su, Y., & Cutler, R. G. (2009). Comparison of biomarkers of oxidative stress and cardiovascular disease in humans and chimpanzees (Pan troglodytes). Comparative medicine, 59(3), 287-296.
Virgin, C. E., & Sapolsky, R. M. (1997). Styles of male social behavior and their endocrine correlates among low‐ranking baboons. American Journal of Primatology, 42(1), 25-39.
Visalberghi, E., Fragaszy, D. M., & Savage-Rumbaugh, S. (1995). Performance in a tool-using task by common chimpanzees (Pan troglodytes), bonobos (Pan paniscus), an orangutan (Pongo pygmaeus), and capuchin monkeys (Cebus apella). Journal of Comparative Psychology, 109(1), 52.
Von Stumm, S., Hell, B., & Chamorro-Premuzic, T. (2011). The hungry mind: Intellectual curiosity is the third pillar of academic performance. Perspectives on Psychological Science, 6(6), 574-588.
Wagenmakers, E.-J., & Farrell, S. (2004). AIC model selection using Akaike weights. Psychonomic bulletin & review, 11(1), 192-196.
Warneken, F., & Tomasello, M. (2006). Altruistic helping in human infants and young chimpanzees. Science, 311, 1301-1303.
Watson, D. (1988). Intraindividual and interindividual analyses of positive and negative affect: their relation to health complaints, perceived stress, and daily activities. Journal of personality and social psychology, 54(6), 1020.
Watson, D., & Pennebaker, J. W. (1989). Health complaints, stress, and distress: Exploring the central role of negative affectivity. Psychological Review, 96, 234-254. doi:10.1037/0033-295X.96.2.234
Weinstein, T. A., Capitanio, J. P., & Gosling, S. D. (2008). Personality in animals. Handbook of personality: Theory and research, 3, 328-348.
Weiss, A., Adams, M. J., & King, J. E. (2011). Happy orang-utans live longer lives. Biology Letters, 7, 872-874.
Weiss, A., Adams, M. J., Widdig, A., & Gerald, M. S. (2011). Rhesus macaques (Macaca mulatta) as living fossils of hominoid personality and subjective well-being. Journal of Comparative Psychology, 125, 72-83. doi:10.1037/a0021187
Weiss, A., Baselmans, B. M. L., Hofer, E., Yang, J., Okbay, A., Lind, P. A., . . . Luciano, M. (2016). Personality Polygenes, Positive Affect, and Life Satisfaction. Twin Research and Human Genetics, 19(5), 407-417. doi:10.1017/thg.2016.65
Weiss, A., Bates, T. C., & Luciano, M. (2008). Happiness is a personal(ity) thing: The genetics of personality and well-being in a representative sample. Psychological Science, 19, 205-210. doi:10.1111/j.1467-9280.2008.02068.x

210
Weiss, A., & Costa, P. T., Jr. (2005). Domain and facet personality predictors of all-cause mortality among Medicare patients aged 65 to 100. Psychosomatic Medicine, 67(5), 724-733. doi:10.1097/01.psy.0000181272.58103.18
Weiss, A., Gartner, M. C., Gold, K. C., & Stoinski, T. S. (2013). Extraversion predicts longer survival in gorillas: An 18-year longitudinal study. Proceedings of the Royal Society B-Biological Sciences, 280, 20122231. doi:10.1098/rspb.2012.2231
Weiss, A., Inoue-Murayama, M., Hong, K.-W., Inoue, E., Udono, S., Ochiai, T., . . . King, J. E. (2009). Assessing chimpanzee personality and subjective well-being in Japan. American Journal of Primatology, 71, 283-292. doi:10.1002/ajp.20649
Weiss, A., Inoue-Murayama, M., King, J. E., Adams, M. J., & Matsuzawa, T. (2012). All too human? Chimpanzee and orang-utan personalities are not anthropomorphic projections. Animal Behaviour, 83, 1355-1365. doi:10.1016/j.anbehav.2012.02.024
Weiss, A., & King, J. E. (2015). Great ape origins of personality maturation and sex differences: A study of orangutans and chimpanzees. Journal of Personality and Social Psychology, 108, 648-664. doi:10.1037/pspp0000022
Weiss, A., King, J. E., & Enns, R. M. (2002). Subjective well-being is heritable and genetically correlated with dominance in chimpanzees (Pan troglodytes). Journal of Personality and Social Psychology, 83, 1141-1149. doi:10.1037//0022-3514.83.5.1141
Weiss, A., King, J. E., & Figueredo, A. J. (2000). The heritability of personality factors in chimpanzees (Pan troglodytes) Behavior Genetics, 30, 213-221. doi:10.1023/A:1001966224914
Weiss, A., King, J. E., & Hopkins, W. D. (2007). A cross-setting study of chimpanzee (Pan troglodytes) personality structure and development: Zoological parks and Yerkes National Primate Research Center. American Journal of Primatology, 69, 1264-1277. doi:10.1002/ajp.20428
Weiss, A., King, J. E., & Perkins, L. (2006). Personality and subjective well-being in orangutans (Pongo pygmaeus and Pongo abelii). Journal of Personality and Social Psychology, 90, 501-511. doi:10.1037/0022-3514.90.3.501
Weiss, A., Staes, N., Pereboom, J. J. M., Inoue-Murayama, M., Stevens, J. M. G., & Eens, M. (2015). Personality in bonobos. Psychological Science, 26(9), 1430-1439. doi:10.1177/0956797615589933
Weiss, A., Sutin, A. R., Duberstein, P. R., Friedman, B., Bagby, R. M., & Costa P.T., J. (2009). The personality domains and styles of the Five-Factor Model predict incident depression in Medicare recipients aged 65 to 100. American Journal of Geriatric Psychiatry, 17, 591-601.
Whalley, L. J., & Deary, I. J. (2001). Longitudinal cohort study of childhood IQ and survival up to age 76. Bmj, 322(7290), 819.
Whiten, A., Goodall, J., McGrew, W. C., Nishida, T., Reynolds, V., Sugiyama, Y., . . . Boesch, C. (1999). Cultures in chimpanzees. Nature, 399, 682-685. doi:10.1038/21415
Whitten, P. L., Stavisky, R., Aureli, F., & Russell, E. (1998). AJP 360. American Journal of Primatology, 44, 57-69.
211
Wiley, J. F., Gruenewald, T. L., Karlamangla, A. S., & Seeman, T. E. (2017). The Authors Reply: Pursuing the Optimal Operationalization of Allostatic Load. Psychosomatic Medicine, 79(1), 119-121.
Williams, G. C. (1957). Pleiotropy, natural selection, and the evolution of senescence. Evolution, 11(4), 398-411. doi:10.2307/2406060
Wilson, K. E., & Dishman, R. K. (2015). Personality and physical activity: A systematic review and meta-analysis. Personality and individual differences, 72, 230-242.
Wilson, M. L., Boesch, C., Fruth, B., Furuichi, T., Gilby, I. C., Hashimoto, C., . . . Wrangham, R. W. (2014). Lethal aggression in Pan is better explained by adaptive strategies than human impacts. Nature, 513, 414-417. doi:10.1038/Nature13727
Wilson, V. A. D., Weiss, A., Morimura, N., Idani, G., Matsuzawa, T., & Inoue-Murayama, M. (2017). Chimpanzee personality and the arginine vasopressin receptor 1a genotype. Behavior Genetics, 47(2), 215-226. doi:10.1007/s10519-016-9822-2
Wilt, J., & Revelle, W. (2008). Extraversion. Yang, Y., & Kozloski, M. (2011). Sex differences in age trajectories of physiological
dysregulation: inflammation, metabolic syndrome, and allostatic load. The Journals of Gerontology Series A: Biological Sciences and Medical Sciences, 66(5), 493-500.
Yerkes, R. M. (1939). The life history and personality of the chimpanzee. The American Naturalist, 73, 97-112.
Yerkes, R. M., Bridges, J. W., & Hardwick, R. S. (1915). A point scale for measuring mental ability. Baltimore: Warwick & York. Inc. Pp. 2I8.$ I, 25.
Yocom, A. M., & Boysen, S. T. (2011). Comprehension of functional support by enculturated chimpanzees Pan troglodytes. Current Zoology, 57(4), 429-440.
Zeidner, M., & Matthews, G. (2000). Intelligence and personality. Zimprich, D., Allemand, M., & Lachman, M. E. (2012). Factorial structure and age-
related psychometrics of the MIDUS personality adjective items across the life span. Psychological assessment, 24(1), 173.

212
213
Appendix A: Publication list
Material included in this work has appeared in published form:
• Altschul, D. M., Terrace, H. S., & Weiss, A. (2016). Serial cognition and
personality in macaques. Animal behavior and cognition, 3(1), 46. (Chapter 3).
• Weiss, A., & Altschul, D. M. (2017). Methods and applications of animal
personality research. (Chapter 1).
• Altschul, D. M., Wallace, E. K., Sonnweber, R., Tomonaga, M., & Weiss, A.
(2017). Chimpanzee intellect: personality, performance and motivation with
touchscreen tasks. Royal Society Open Science, 4(5), 170169. (Chapter 2).
Material included in this work currently in preparation, review, or revision:
• Altschul, D.M., Morton, F.B. (2017). Guidelines for using extraction methods
in data reduction analyses of social relationship structures. (Chapter 1).
• Altschul, D.M., Inoue-Murayama, M., Matsuzawa, T., King, J.E., Ross, S.R.,
Weiss, A. (2017). The personality and lifespan of chimpanzees. (Chapter 4).
• Altschul, D.M., Hopkins, W.D., Weiss, A. (2017). Comparing measures of
allostatic load in chimpanzees and humans. (Chapter 5).
• Altschul, D.M., Sinn, D., Hopkins, W.D., Weiss, A. (2017). Psychological
and physiological stress across cultures and species: personality’s impact on
allostatic load in American and Japanese humans, and chimpanzees.
(Chapter 6).
214
Articles published during the period in which this thesis was written, but not featured
in this document:
• Avdagic, E., Jensen, G., Altschul, D., Terrace, H. (2014). Rapid cognitive
flexibility of rhesus macaques performing psychophysical task-switching.
Animal Cognition, 17 (3), 619-631.
• Jensen, G., Altschul, D. (2015). Two perils of binary categorization: why the
study of concepts can’t afford true/false testing. Frontiers in psychology, 6.
• Wallace, E.K., Altschul, D.M., Pavonetti, S.P., Benti, B., Koerfer, K., Waller,
B., Slocombe, K.S. (2017). Is music enriching for group-housed captive
chimpanzees? PLoS One, 12 (3), e0172672.
• Robinson, L. M., Altschul, D. M., Wallace, E. K., Úbeda, Y., Llorente, M.,
Machanda, Z., ... & Weiss, A. (2017). Chimpanzees with positive welfare are
happier, extraverted, and emotionally stable. Applied Animal Behaviour
Science, 191, 90-97.
• Altschul, D.M., Jensen, G., Terrace, H. S. (2017). Perceptual category
learning of photographic and painterly stimuli in rhesus macaques (Macaca
mulatta) and humans. PLoS One, accepted.
215
Appendix B: Published supplemental materials
from chapter 2
Chimpanzee Intellect: Personality, Performance, and Motivation with
Touchscreen Tasks: Supplemental Materials
Drew M Altschul1,2, Emma K Wallace2,3, Ruth Sonnweber4, Masaki Tomonaga5, &
Alexander Weiss1,2
1. The University of Edinburgh, Department of Psychology 2. Scottish Primate Research Group 3. University of York, Department of Psychology 4. University of Vienna, Department of Cognitive Biology 5. Primate Research Institute, Kyoto University
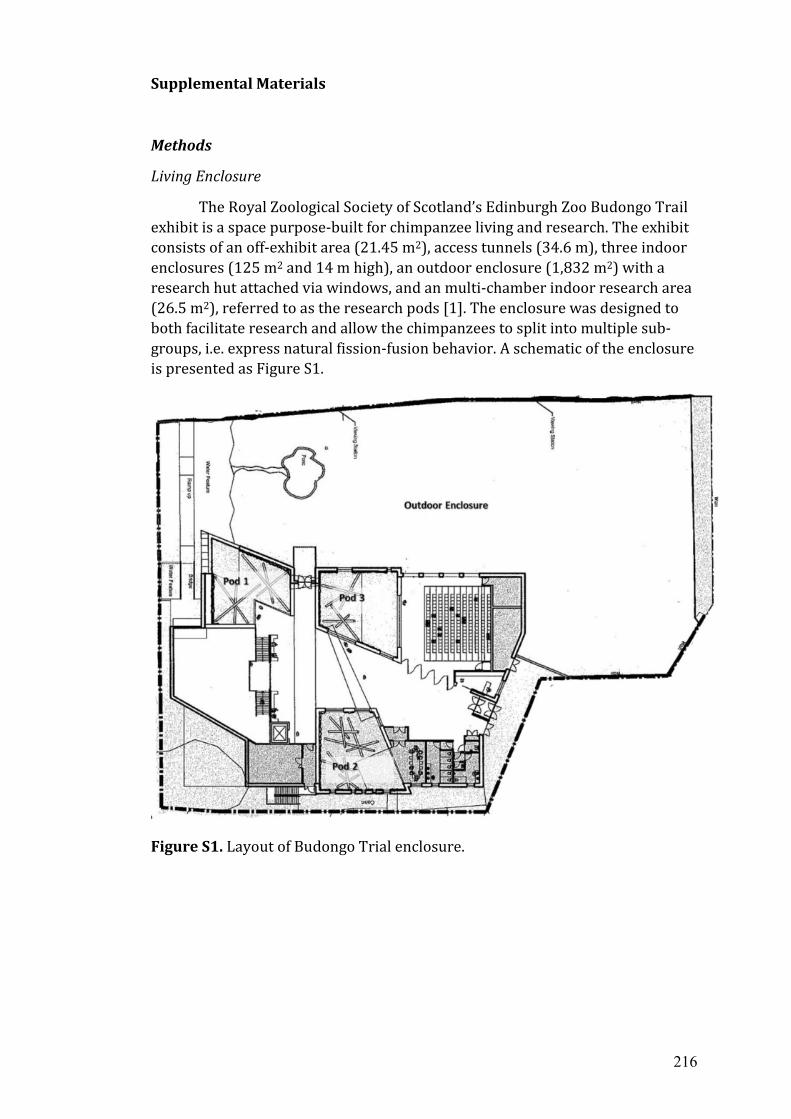
216
Supplemental Materials
Methods
Living Enclosure
The Royal Zoological Society of Scotland’s Edinburgh Zoo Budongo Trail exhibit is a space purpose-built for chimpanzee living and research. The exhibit consists of an off-exhibit area (21.45 m2), access tunnels (34.6 m), three indoor enclosures (125 m2 and 14 m high), an outdoor enclosure (1,832 m2) with a research hut attached via windows, and an multi-chamber indoor research area (26.5 m2), referred to as the research pods [1]. The enclosure was designed to both facilitate research and allow the chimpanzees to split into multiple sub-groups, i.e. express natural fission-fusion behavior. A schematic of the enclosure is presented as Figure S1.
Figure S1. Layout of Budongo Trial enclosure.
217
Water was available ad libitum. The chimpanzees were fed via scatter feeding at least four times a day.
Participant Demographics
The study group consisted of 19 chimpanzees (eleven females, eight males; between 14 and 50 years of age). One chimpanzee died between the end of study 1 and the start of study 2. Ethical approval was obtained from the University of Edinburgh Biological Services Ethical Review Committee, and the Budongo Trail Scientific Committee.
Personality Assessment
In 2010, all chimpanzees were rated by between two and four zoo caretakers using the 54-item Hominoid Personality Questionnaire, an instrument composed of adjective items, each accompanied by two or three sentences of explanation and a 1 – 7 Likert scale [2]. Raters were instructed to rate individuals using the full spectrum of the scale, and not discuss their ratings with others. Intraclass correlations (ICCs)[3] were calculated for all items, and are showing in Table 1. Items with ICCs below zero were excluded from further analysis, and aggregate personality scores were calculated without them. In this manner, ‘impulsive’, ‘predictable’, and ‘clumsy’ were removed.
Table S1. Intraclass correlations of personality items
Item ICC(3,1) ICC(3,k) Personality Loadinga
Fearful 0.530 0.772 -D Dominant 0.822 0.933 +D Persistent 0.242 0.489 +D Cautious 0.220 0.458 -D Stable 0.270 0.526 -N Autistic 0.699 0.874 +N Curious 0.313 0.577 +O Thoughtless 0.126 0.301 -C Stingy 0.440 0.702 +D Jealous 0.232 0.476 -C Individualistic 0.031 0.087 -E Reckless 0.464 0.722 -C Social 0.320 0.585 +E Distractible 0.500 0.750 -C Timid 0.708 0.879 -D Sympathetic 0.439 0.701 +A Playful 0.477 0.732 +E Solitary 0.766 0.907 -E Vulnerable 0.350 0.618 -D
218
Innovative 0.566 0.797 +OActive 0.660 0.853 +EHelpful 0.188 0.409 +ABullying 0.650 0.848 +DAggressive 0.726 0.888 -CManipulative 0.392 0.659 +DGentle 0.623 0.832 +AAffectionate 0.199 0.427 +EExcitable 0.331 0.597 +NImpulsive -0.051 -0.172 -CInquisitive 0.456 0.716 +OSubmissive 0.780 0.914 -DCool 0.381 0.649 -NDependent 0.495 0.746 -DIrritable 0.218 0.455 -CUnperceptive 0.373 0.641 -CPredictable -0.011 -0.035 +CDecisive 0.470 0.727 +DDepressed 0.442 0.703 -EConventional 0.170 0.381 +ASensitive 0.017 0.051 +ADefiant 0.533 0.774 -CIntelligent 0.489 0.742 +OProtective 0.619 0.830 +AQuitting 0.504 0.753 -CInventive 0.626 0.834 +OClumsy -0.012 -0.036 -CErratic 0.438 0.700 -CFriendly 0.062 0.165 +EAnxious 0.633 0.838 -DLazy 0.428 0.692 -EDisorganized 0.313 0.578 -CUnemotional 0.496 0.747 -NImitative 0.470 0.727 +EIndependent 0.519 0.764 +D
a D, Dominance; C, Conscientiousness; O, Openness; N, Neuroticism; A, Agreeableness; E, Extraversion.
Prior Experience
All chimpanzees had been habituated to the research facilities. 14 chimpanzees had received some training on a two-alternative forced choice (2AFC) task. 11 participated on a regular basis [2].
219
Apparatus & Access
In study 1, the apparatus consisted of a 15” touch-screen, an Apple Mac Mini, a second monitor for the experimenter, a keyboard, optical mouse, and speakers. This equipment was all mounted on a rolling table so that the apparatus could be moved around the off-exhibit areas, to where the chimpanzees could interact with it.
In study 2, the apparatus was mounted to a research window, opening onto either the indoor research pods, or the outdoor enclosure, depending on the day. In study 3, the apparatus was only used indoors. In both studies, the apparatus consisted of a 17” touchscreen monitor, a customized PC running Linux Mint, a monitor for the experimenter, a keyboard, optical mouse, speakers, and Bio-Medica Ltd. Universal Feeder [4].
All studies were participatory; the chimpanzees were free to come and go from the research areas at any time during the research sessions. When reinforcement was in place for correct trials, individuals would be given a food reward for every correct trial (e.g. half of a grape).
Experimental Programs
All programs were written in Python, and studies 2 and 3 used additional Kivy libraries. The details of the experimental approach of study 1 can be found in Sonnweber et al. [5]. Figure S2 shows the procedure for a sample trial in study 2.
Stimuli in study 1 were generated ad-hoc by the experimental program. Stimuli in study 2 were gathered in advance. Stimulus banks were sufficiently large and disparate that they could not be memorized, so all stimuli were treated as trial unique. Stimuli in study 3 did not change, as rewards were not contingent on any stimulus attributes.
220
Figure S2. Procedure for task used in Study 2.
Engagement
In study 2, we collected ordinal data intended to quantify the chimpanzees’ differential levels of interest in the touchscreen task, on a daily basis. No presence in the research area at any time during a research slot was coded as 0. Presence without interaction with the apparatus was coded as 1. Presence and interaction was coded as 2.
In study 3, we kept track of when individual chimpanzees progressed through different stages of training. During testing, we used audio and video recorders to keep track of when every chimpanzee entered and exited the research pods, as well as when they approached and withdrew from the touchscreen apparatus.
Results
All data analyses used standardized, centred variables, following the recommendations of Gelman [6]. To make predictors comparable in regression models, continuous variables were centred and divided by 2 standard deviations, and dichotomous variables were centred.
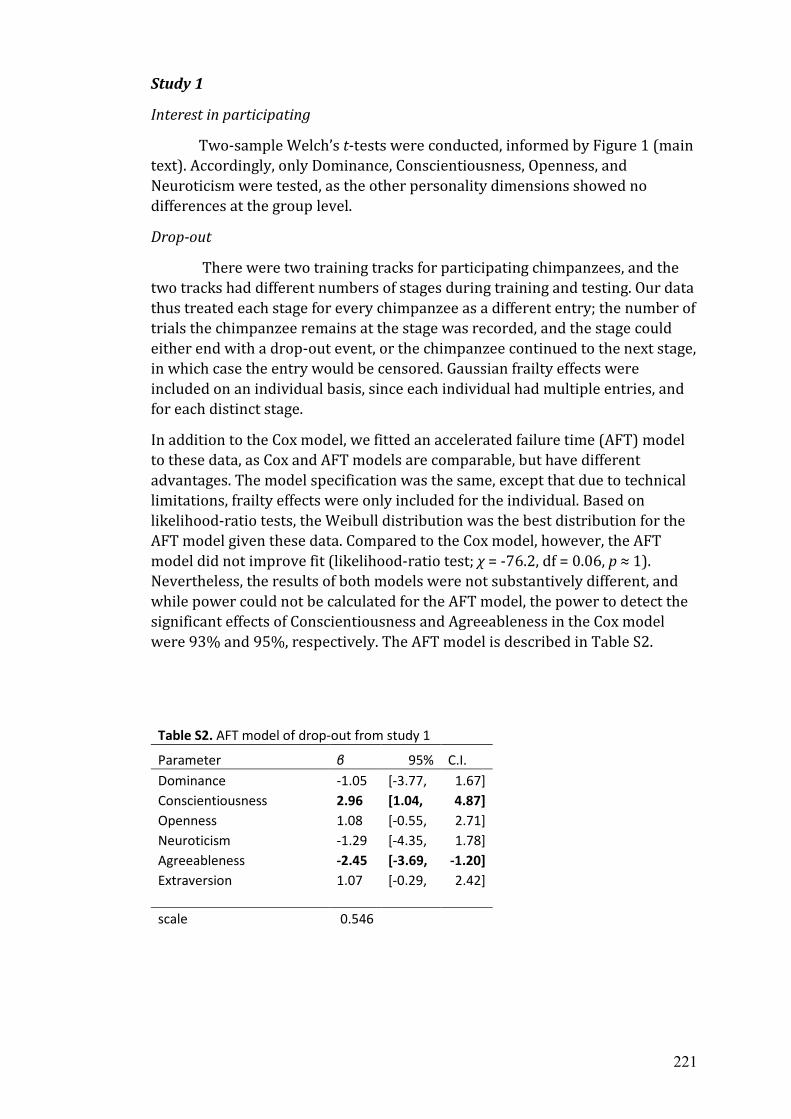
221
Study 1
Interest in participating
Two-sample Welch’s t-tests were conducted, informed by Figure 1 (main text). Accordingly, only Dominance, Conscientiousness, Openness, and Neuroticism were tested, as the other personality dimensions showed no differences at the group level.
Drop-out
There were two training tracks for participating chimpanzees, and the two tracks had different numbers of stages during training and testing. Our data thus treated each stage for every chimpanzee as a different entry; the number of trials the chimpanzee remains at the stage was recorded, and the stage could either end with a drop-out event, or the chimpanzee continued to the next stage, in which case the entry would be censored. Gaussian frailty effects were included on an individual basis, since each individual had multiple entries, and for each distinct stage.
In addition to the Cox model, we fitted an accelerated failure time (AFT) model to these data, as Cox and AFT models are comparable, but have different advantages. The model specification was the same, except that due to technical limitations, frailty effects were only included for the individual. Based on likelihood-ratio tests, the Weibull distribution was the best distribution for the AFT model given these data. Compared to the Cox model, however, the AFT model did not improve fit (likelihood-ratio test; χ = -76.2, df = 0.06, p ≈ 1). Nevertheless, the results of both models were not substantively different, and while power could not be calculated for the AFT model, the power to detect the significant effects of Conscientiousness and Agreeableness in the Cox model were 93% and 95%, respectively. The AFT model is described in Table S2.
Table S2. AFT model of drop-out from study 1
Parameter β 95% C.I.Dominance -1.05 [-3.77, 1.67] Conscientiousness 2.96 [1.04, 4.87] Openness 1.08 [-0.55, 2.71] Neuroticism -1.29 [-4.35, 1.78] Agreeableness -2.45 [-3.69, -1.20]Extraversion 1.07 [-0.29, 2.42]
scale 0.546
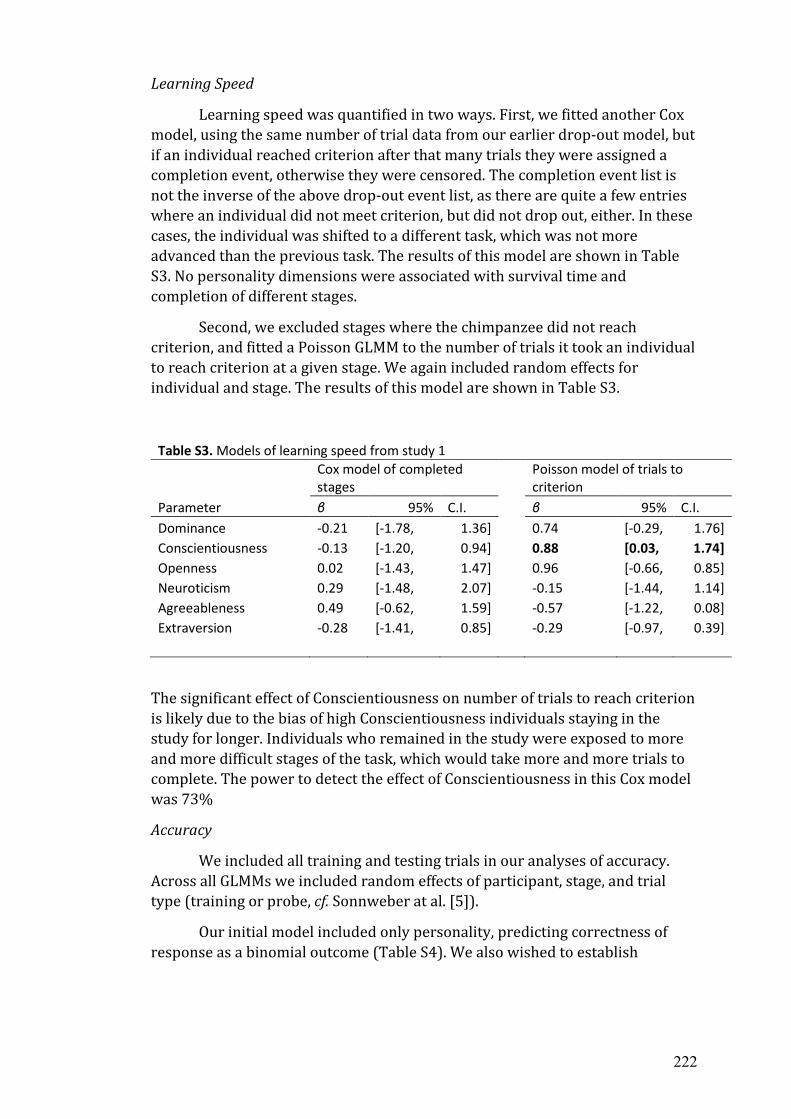
222
Learning Speed
Learning speed was quantified in two ways. First, we fitted another Cox model, using the same number of trial data from our earlier drop-out model, but if an individual reached criterion after that many trials they were assigned a completion event, otherwise they were censored. The completion event list is not the inverse of the above drop-out event list, as there are quite a few entries where an individual did not meet criterion, but did not drop out, either. In these cases, the individual was shifted to a different task, which was not more advanced than the previous task. The results of this model are shown in Table S3. No personality dimensions were associated with survival time and completion of different stages.
Second, we excluded stages where the chimpanzee did not reach criterion, and fitted a Poisson GLMM to the number of trials it took an individual to reach criterion at a given stage. We again included random effects for individual and stage. The results of this model are shown in Table S3.
Table S3. Models of learning speed from study 1
Cox model of completed stages
Poisson model of trials to criterion
Parameter β 95% C.I. β 95% C.I. Dominance -0.21 [-1.78, 1.36] 0.74 [-0.29, 1.76] Conscientiousness -0.13 [-1.20, 0.94] 0.88 [0.03, 1.74] Openness 0.02 [-1.43, 1.47] 0.96 [-0.66, 0.85] Neuroticism 0.29 [-1.48, 2.07] -0.15 [-1.44, 1.14] Agreeableness 0.49 [-0.62, 1.59] -0.57 [-1.22, 0.08] Extraversion -0.28 [-1.41, 0.85] -0.29 [-0.97, 0.39]
The significant effect of Conscientiousness on number of trials to reach criterion is likely due to the bias of high Conscientiousness individuals staying in the study for longer. Individuals who remained in the study were exposed to more and more difficult stages of the task, which would take more and more trials to complete. The power to detect the effect of Conscientiousness in this Cox model was 73%
Accuracy
We included all training and testing trials in our analyses of accuracy. Across all GLMMs we included random effects of participant, stage, and trial type (training or probe, cf. Sonnweber at al. [5]).
Our initial model included only personality, predicting correctness of response as a binomial outcome (Table S4). We also wished to establish
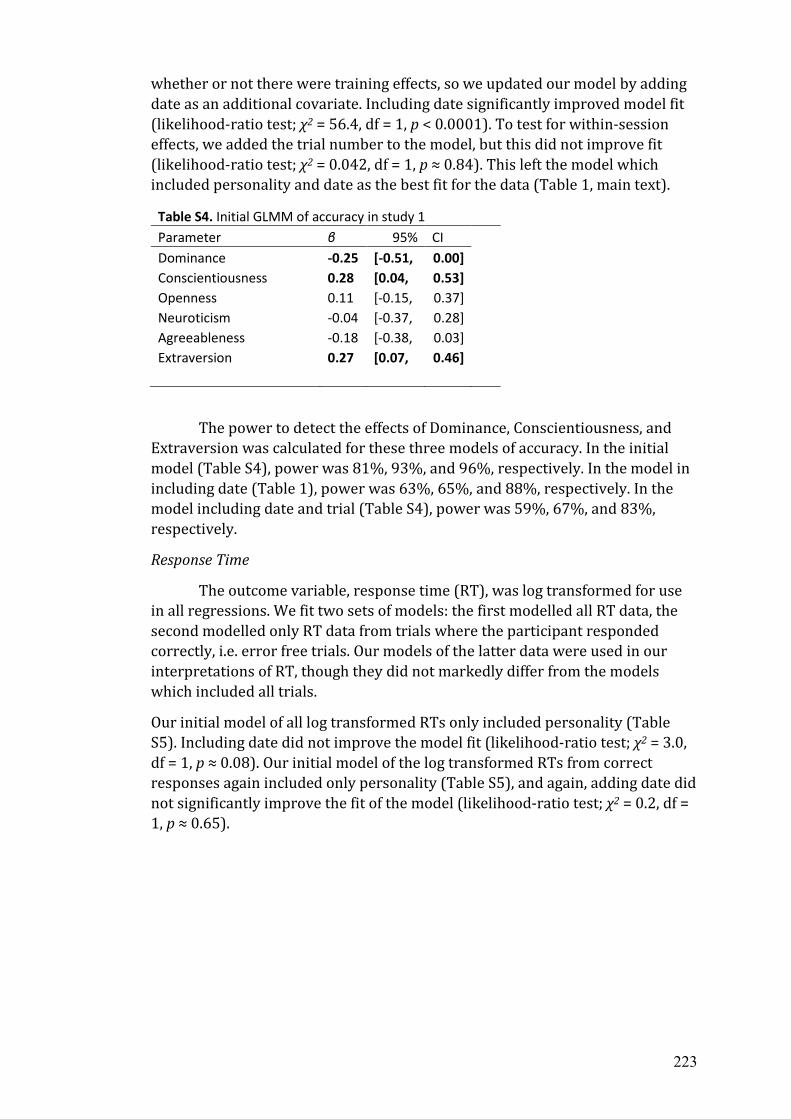
223
whether or not there were training effects, so we updated our model by adding date as an additional covariate. Including date significantly improved model fit (likelihood-ratio test; χ2 = 56.4, df = 1, p < 0.0001). To test for within-session effects, we added the trial number to the model, but this did not improve fit (likelihood-ratio test; χ2 = 0.042, df = 1, p ≈ 0.84). This left the model which included personality and date as the best fit for the data (Table 1, main text).
Table S4. Initial GLMM of accuracy in study 1 Parameter β 95% CI Dominance -0.25 [-0.51, 0.00]Conscientiousness 0.28 [0.04, 0.53] Openness 0.11 [-0.15, 0.37] Neuroticism -0.04 [-0.37, 0.28]Agreeableness -0.18 [-0.38, 0.03]Extraversion 0.27 [0.07, 0.46]
The power to detect the effects of Dominance, Conscientiousness, and Extraversion was calculated for these three models of accuracy. In the initial model (Table S4), power was 81%, 93%, and 96%, respectively. In the model in including date (Table 1), power was 63%, 65%, and 88%, respectively. In the model including date and trial (Table S4), power was 59%, 67%, and 83%, respectively.
Response Time
The outcome variable, response time (RT), was log transformed for use in all regressions. We fit two sets of models: the first modelled all RT data, the second modelled only RT data from trials where the participant responded correctly, i.e. error free trials. Our models of the latter data were used in our interpretations of RT, though they did not markedly differ from the models which included all trials.
Our initial model of all log transformed RTs only included personality (Table S5). Including date did not improve the model fit (likelihood-ratio test; χ2 = 3.0, df = 1, p ≈ 0.08). Our initial model of the log transformed RTs from correct responses again included only personality (Table S5), and again, adding date did not significantly improve the fit of the model (likelihood-ratio test; χ2 = 0.2, df = 1, p ≈ 0.65).
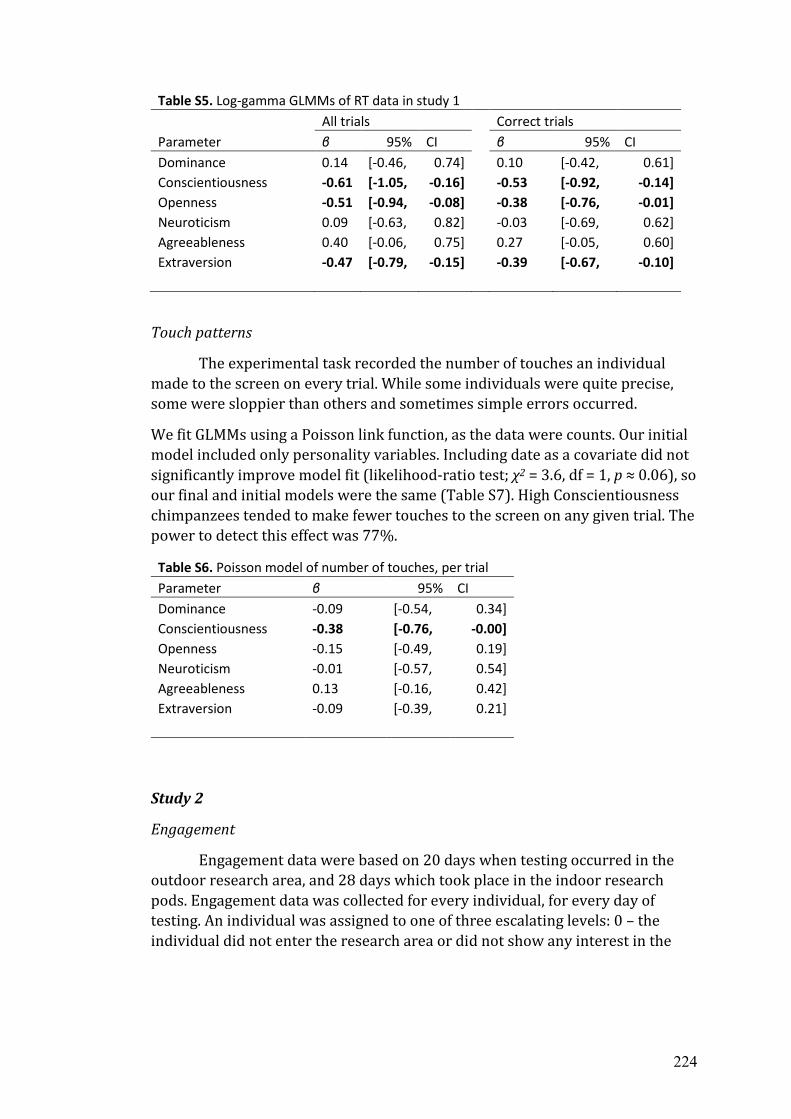
224
Table S5. Log-gamma GLMMs of RT data in study 1 All trials Correct trials Parameter β 95% CI β 95% CI Dominance 0.14 [-0.46, 0.74] 0.10 [-0.42, 0.61] Conscientiousness -0.61 [-1.05, -0.16] -0.53 [-0.92, -0.14] Openness -0.51 [-0.94, -0.08] -0.38 [-0.76, -0.01] Neuroticism 0.09 [-0.63, 0.82] -0.03 [-0.69, 0.62] Agreeableness 0.40 [-0.06, 0.75] 0.27 [-0.05, 0.60] Extraversion -0.47 [-0.79, -0.15] -0.39 [-0.67, -0.10]
Touch patterns
The experimental task recorded the number of touches an individual made to the screen on every trial. While some individuals were quite precise, some were sloppier than others and sometimes simple errors occurred.
We fit GLMMs using a Poisson link function, as the data were counts. Our initial model included only personality variables. Including date as a covariate did not significantly improve model fit (likelihood-ratio test; χ2 = 3.6, df = 1, p ≈ 0.06), so our final and initial models were the same (Table S7). High Conscientiousness chimpanzees tended to make fewer touches to the screen on any given trial. The power to detect this effect was 77%.
Table S6. Poisson model of number of touches, per trial Parameter β 95% CI Dominance -0.09 [-0.54, 0.34] Conscientiousness -0.38 [-0.76, -0.00] Openness -0.15 [-0.49, 0.19] Neuroticism -0.01 [-0.57, 0.54] Agreeableness 0.13 [-0.16, 0.42] Extraversion -0.09 [-0.39, 0.21]
Study 2
Engagement
Engagement data were based on 20 days when testing occurred in the outdoor research area, and 28 days which took place in the indoor research pods. Engagement data was collected for every individual, for every day of testing. An individual was assigned to one of three escalating levels: 0 – the individual did not enter the research area or did not show any interest in the
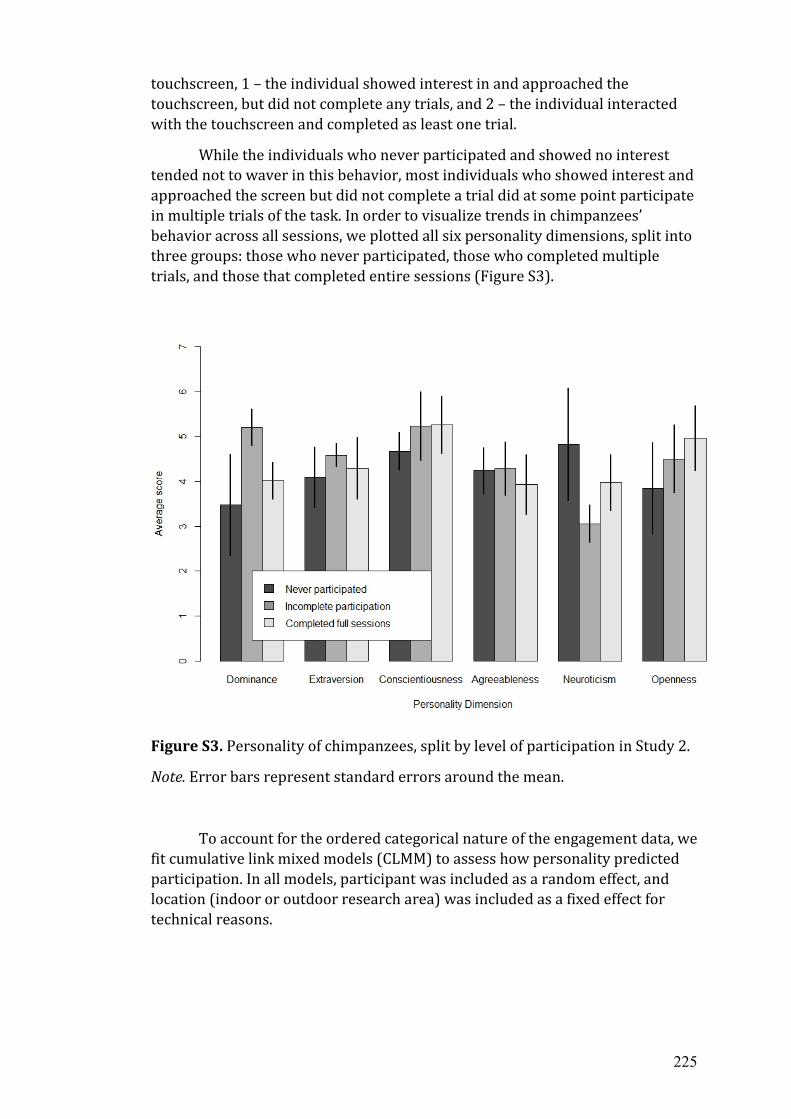
225
touchscreen, 1 – the individual showed interest in and approached the touchscreen, but did not complete any trials, and 2 – the individual interacted with the touchscreen and completed as least one trial.
While the individuals who never participated and showed no interest tended not to waver in this behavior, most individuals who showed interest and approached the screen but did not complete a trial did at some point participate in multiple trials of the task. In order to visualize trends in chimpanzees’ behavior across all sessions, we plotted all six personality dimensions, split into three groups: those who never participated, those who completed multiple trials, and those that completed entire sessions (Figure S3).
Figure S3. Personality of chimpanzees, split by level of participation in Study 2.
Note. Error bars represent standard errors around the mean.
To account for the ordered categorical nature of the engagement data, we fit cumulative link mixed models (CLMM) to assess how personality predicted participation. In all models, participant was included as a random effect, and location (indoor or outdoor research area) was included as a fixed effect for technical reasons.

226
Our base model included only personality and location as predictors. Because of what appeared to be non-linear relationships between participation and both Dominance and Neuroticism (Figure S3), we added quadratic effects for both predictors. Neither quadratic Dominance (likelihood-ratio test; χ2 = 1.4, df = 1, p ≈ 0.24), nor quadratic Neuroticism (likelihood-ratio test; χ2 = 0.2, df = 1, p ≈ 0.65) improved fit, so the final model only included linear personality predictors (Table 2, main text).
Accuracy
Performance analyses were based on a total of 1870 trials from 14 chimpanzees. As in study 1, our first model included only personality predictors, and we fit a second model which included date as an additional covariate, to probe for training effects. Including date did not significantly improve the fit of the model (likelihood-ratio test; χ2 = 1.6, df = 1, p ≈ 0.20). Our initial and final models were thus the same (Table 2, main text). The power to detect the effect of Openness in this model was 50%.
Response Time
Two RT periods were available for analysis: the time between presentation of the sample screen and response, and the time between presentation of the test screen and response. We labelled the first of these “processing time” (PT) and the second “inspection time” (IT). PT and IT were both log-transformed before being regressed.
As in previous models, we entered date as an additional predictor and evaluated its effect on fit, and found a significant improvement (likelihood-ratio tests; PT: χ2 = 287.6, df = 1, p < 0.0001; IT: χ2 = 127.8, df = 1, p < 0.0001). We then entered trial to the model, which also significantly improved the IT model (χ2 = 40.0, df = 1, p < 0.0001), but the PT model wold not converge when trial was included, so we settled on the PT model including date as our final model. In the final models (Table S7), date and trial showed significant, negative associations with RT measures, indicating that within and across training days, RTs became faster over time. We also found a significant relationship between Extraversion and both PT (power: 88%) and IT (power: 97%), indicating that higher Extraversion individuals responded faster.

227
Table S7. RT models from study 2 Processing Time Inspection Time
Parameter β 95% CI β 95% CI Dominance 0.44 [-0.34, 1.10] 0.38 [-0.02, 0.77] Conscientiousness -0.20 [-0.72, 0.52] -0.14 [-0.44, 0.15] Openness -0.22 [-0.74, 0.13] -0.14 [-0.43, 0.15] Neuroticism -0.49 [-1.52, 0.53] -0.41 [-0.91, 0.09] Agreeableness 0.02 [-0.47, 0.51] 0.03 [-0.23, 0.30] Extraversion -0.54 [-0.98, -0.10] -0.36 [-0.60, -0.13]Date -0.42 [-0.47, -0.37] -0.42 [-0.48, -0.37]Trial -0.18 [-0.22, -0.14]
We also analysed PT and IT including only correct trials. The models featuring date and trial were the best fit (PT: χ2 = 133.8, df = 2, p < 0.0001; IT: 167.8, df = 2, p < 0.0001). The final models are shown in Table S8; the models differed from those which analysed all trials: faster PT was associated with lower Dominance, and higher Extraversion (power: 95%, 84%), while faster IT was associated with lower Dominance, and higher Extraversion, Agreeableness, and Neuroticism (power: 77%, 86%, 26%, 77%). Date and trial continued to have similar effects. As in study 1, we used the final models of the correct trials for interpretation.
Table S8. RT models of correct responses from study 2 Processing Time Inspection Time
Parameter β 95% CI β 95% CI Dominance 0.54 [0.07, 1.01] 0.49 [0.24, 0.74] Conscientiousness -0.13 [-0.47, 0.20] -0.01 [-0.22, 0.19] Openness -0.18 [-0.16, 0.53] -0.11 [-0.10, 0.31] Neuroticism -0.49 [-1.09, 0.09] -0.49 [-0.77, -0.20]Agreeableness -0.03 [-0.34, 0.28] -0.25 [-0.44, -0.06]Extraversion -0.34 [-0.63, -0.05] -0.39 [-0.55, -0.23]Date -0.38 [-0.45, -0.30] -0.39 [-0.47, -0.32]Trial -0.12 [-0.18, -0.06] -0.18 [-0.24, -0.13]
Study 3
Progression of training
The first four phases presented combinations of horizontal buttons. The buttons were randomly placed on the screen, and each was associated with a
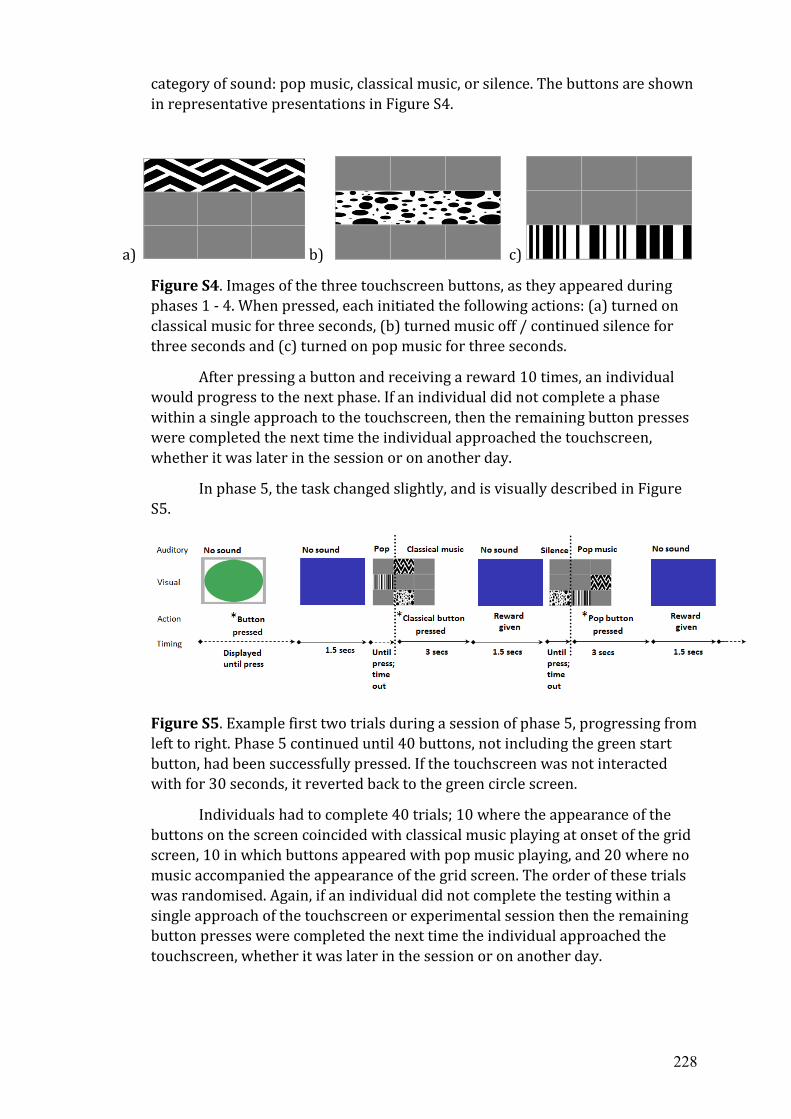
228
category of sound: pop music, classical music, or silence. The buttons are shown in representative presentations in Figure S4.
a) b) c)
Figure S4. Images of the three touchscreen buttons, as they appeared during phases 1 - 4. When pressed, each initiated the following actions: (a) turned on classical music for three seconds, (b) turned music off / continued silence for three seconds and (c) turned on pop music for three seconds.
After pressing a button and receiving a reward 10 times, an individual would progress to the next phase. If an individual did not complete a phase within a single approach to the touchscreen, then the remaining button presses were completed the next time the individual approached the touchscreen, whether it was later in the session or on another day.
In phase 5, the task changed slightly, and is visually described in Figure S5.
Figure S5. Example first two trials during a session of phase 5, progressing from left to right. Phase 5 continued until 40 buttons, not including the green start button, had been successfully pressed. If the touchscreen was not interacted with for 30 seconds, it reverted back to the green circle screen.
Individuals had to complete 40 trials; 10 where the appearance of the buttons on the screen coincided with classical music playing at onset of the grid screen, 10 in which buttons appeared with pop music playing, and 20 where no music accompanied the appearance of the grid screen. The order of these trials was randomised. Again, if an individual did not complete the testing within a single approach of the touchscreen or experimental session then the remaining button presses were completed the next time the individual approached the touchscreen, whether it was later in the session or on another day.
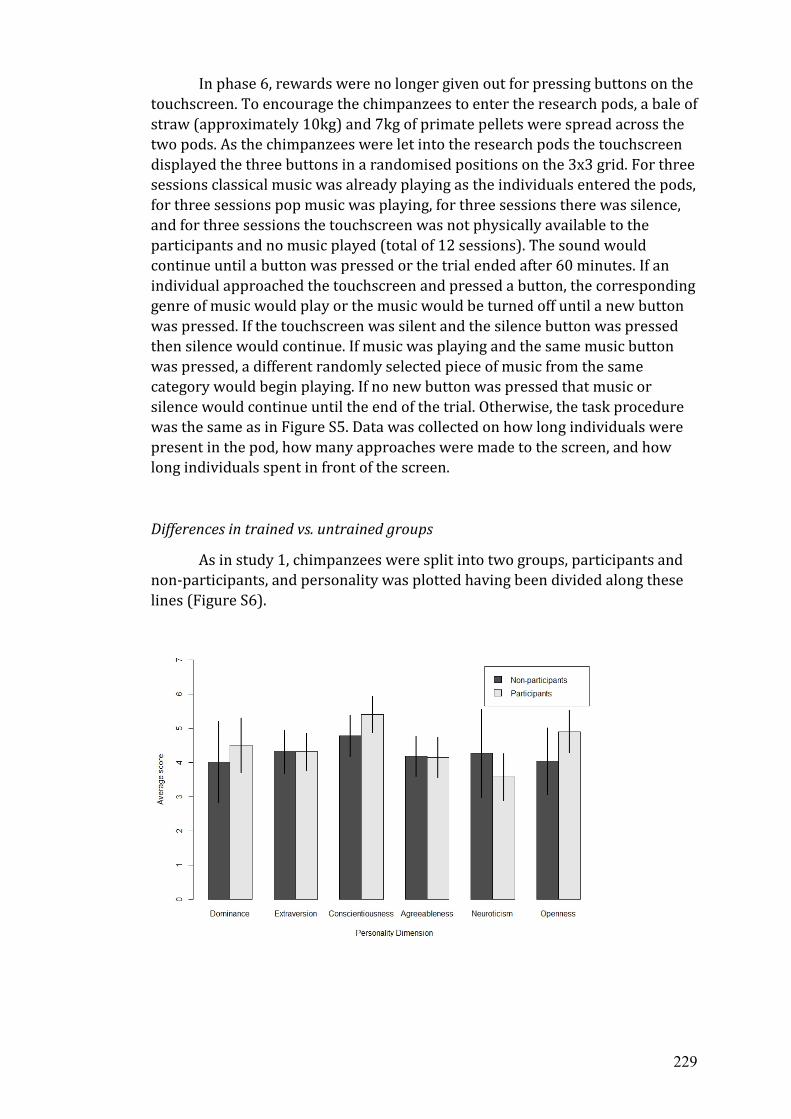
229
In phase 6, rewards were no longer given out for pressing buttons on the touchscreen. To encourage the chimpanzees to enter the research pods, a bale of straw (approximately 10kg) and 7kg of primate pellets were spread across the two pods. As the chimpanzees were let into the research pods the touchscreen displayed the three buttons in a randomised positions on the 3x3 grid. For three sessions classical music was already playing as the individuals entered the pods, for three sessions pop music was playing, for three sessions there was silence, and for three sessions the touchscreen was not physically available to the participants and no music played (total of 12 sessions). The sound would continue until a button was pressed or the trial ended after 60 minutes. If an individual approached the touchscreen and pressed a button, the corresponding genre of music would play or the music would be turned off until a new button was pressed. If the touchscreen was silent and the silence button was pressed then silence would continue. If music was playing and the same music button was pressed, a different randomly selected piece of music from the same category would begin playing. If no new button was pressed that music or silence would continue until the end of the trial. Otherwise, the task procedure was the same as in Figure S5. Data was collected on how long individuals were present in the pod, how many approaches were made to the screen, and how long individuals spent in front of the screen.
Differences in trained vs. untrained groups
As in study 1, chimpanzees were split into two groups, participants and non-participants, and personality was plotted having been divided along these lines (Figure S6).
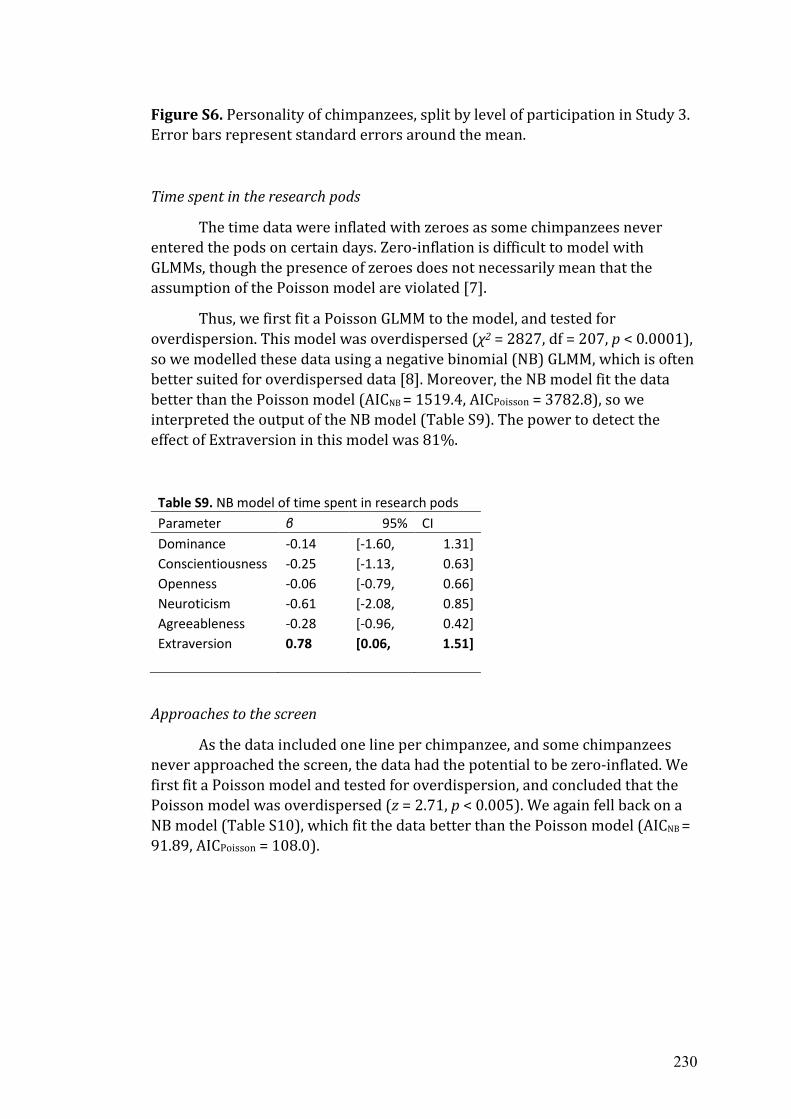
230
Figure S6. Personality of chimpanzees, split by level of participation in Study 3. Error bars represent standard errors around the mean.
Time spent in the research pods
The time data were inflated with zeroes as some chimpanzees never entered the pods on certain days. Zero-inflation is difficult to model with GLMMs, though the presence of zeroes does not necessarily mean that the assumption of the Poisson model are violated [7].
Thus, we first fit a Poisson GLMM to the model, and tested for overdispersion. This model was overdispersed (χ2 = 2827, df = 207, p < 0.0001), so we modelled these data using a negative binomial (NB) GLMM, which is often better suited for overdispersed data [8]. Moreover, the NB model fit the data better than the Poisson model (AICNB = 1519.4, AICPoisson = 3782.8), so we interpreted the output of the NB model (Table S9). The power to detect the effect of Extraversion in this model was 81%.
Table S9. NB model of time spent in research pods Parameter β 95% CI Dominance -0.14 [-1.60, 1.31] Conscientiousness -0.25 [-1.13, 0.63] Openness -0.06 [-0.79, 0.66] Neuroticism -0.61 [-2.08, 0.85] Agreeableness -0.28 [-0.96, 0.42] Extraversion 0.78 [0.06, 1.51]
Approaches to the screen
As the data included one line per chimpanzee, and some chimpanzees never approached the screen, the data had the potential to be zero-inflated. We first fit a Poisson model and tested for overdispersion, and concluded that the Poisson model was overdispersed (z = 2.71, p < 0.005). We again fell back on a NB model (Table S10), which fit the data better than the Poisson model (AICNB = 91.89, AICPoisson = 108.0).

231
Table S10. NB model of number of approaches to screen
Parameter β 95% CI Dominance -0.19 [-1.67, 1.15] Conscientiousness 1.09 [0.15, 2.16] Openness 0.46 [-0.43, 1.46] Neuroticism 0.10 [-1.43, 1.48] Agreeableness -0.93 [-1.63, -0.28]Extraversion 0.69 [-0.19, 1.70]
Time spent at the screen
Every time a chimpanzee approached the experimental apparatus, we timed how long the individual spent in front of and interacting with the touchscreen. Since the time spent at the screen was always at least a second, there were no zeroes in the data, and no need to accommodate inflation. 1 outlier greater than 3 standard deviations from the mean was removed. A Poisson GLMM was fit with personality covariates (Table S11). The power to detect the effects of Openness and Extraversion was 96% and 87%.
Table S11. Poisson model of time spent at screen Parameter β 95% CI Dominance 0.26 [-0.20, 0.73] Conscientiousness 0.21 [-0.17, 0.59] Openness 0.52 [0.21, 0.83] Neuroticism 0.41 [-0.10, 0.91] Agreeableness 0.19 [-0.04, 0.43] Extraversion -0.36 [-0.66, -0.05]
232
References
1. Herrelko, E. S., Vick, S.-J. & Buchanan-Smith, H. M. 2012 Cognitiveresearch in zoo-housed chimpanzees: influence of personality andimpact on welfare. Am. J. Primatol. 74, 828–40. (doi:10.1002/ajp.22036)
2. Weiss, A., Inoue-Murayama, M., Hong, K.-W., Inoue, E., Udono, T., Ochiai,T., Matsuzawa, T., Hirata, S. & King, J. E. 2009 Assessing chimpanzeepersonality and subjective well-being in Japan. Am. J. Primatol. 71, 283–92. (doi:10.1002/ajp.20649)
3. Shrout PE, Fleiss JL. 1979 Intraclass correlations: uses in assessing raterreliability. Psychological bulletin. 86(2):420.
4. Tomonaga, M. & Imura, T. 2015 Efficient search for a face bychimpanzees (Pan troglodytes). Sci. Rep. 5, 11437.(doi:10.1038/srep11437)
5. Sonnweber, R., Ravignani, A. & Fitch, W. T. 2015 Non-adjacent visualdependency learning in chimpanzees. Anim. Cogn. (doi:10.1007/s10071-015-0840-x)
6. Gelman A. Scaling regression inputs by dividing by two standarddeviations. Statistics in medicine. 2008 Jul 10;27(15):2865-73.
7. Warton, D. I. 2005 Many zeros does not mean zero inflation: Comparingthe goodness-of-fit of parametric models to multivariate abundance data.Environmetrics 16, 275–289. (doi:10.1002/env.702)
8. Lindén, A. & Mäntyniemi, S. 2011 Using the negative binomialdistribution to model overdispersion in ecological count data. Ecology92, 1414–1421. (doi:10.1890/10-1831.1)
233
Appendix C: The 54-item Hominoid Personality
Questionnaire
CHIMPANZEE PERSONALITY TRAIT ASSESSMENT
Chimpanzee personality assessments can be made with this questionnaireby assigning a numerical score for all of the personality traits listed on the fol-lowing pages. Make your judgments on the basis of your own understandingof the trait guided by the short clarifying definition following each trait. Thechimpanzee’s own behaviors and interactions with other chimpanzees shouldbe the basis for your numerical ratings. Use your own subjective judgmentof typical chimpanzee behavior to decide if the chimpanzee you are scoring isabove, below, or average for a trait. The following seven point scale shouldbe used to make your ratings.
1. Displays either total absence or negligible amounts of thetrait.
2. Displays small amounts of the trait on infrequent occasions.
3. Displays somewhat less than average amounts of the trait.
4. Displays about average amounts of the trait.
5. Displays somewhat greater than average amounts of the trait.
6. Displays considerable amounts of the trait on frequent occa-sions.
7. Displays extremely large amounts of the trait.
Please give a rating for each trait even if your judgment seems to be based on a purely subjective impression of the chimpanzee and you are somewhat unsure about it. Indicate your rating by placing a cross in the box under-
neath the chosen number. ×
Finally, do not discuss your rating of any particular chimpanzee with anyone else. As explained in the handout accompanying this questionnaire, this restriction is necessary in order to obtain valid reliability coefficients for the traits.
234
CHIMPANZEE PERSONALITY TRAIT ASSESSMENT
Chimpanzee’s full name:
Rater’s full name:
Date (Mon/Day/Yr):
FEARFUL: Subject reacts excessively to real or imagined threats bydisplaying behaviors such as screaming, grimacing, running away or othersigns of anxiety or distress.
least most1 2 3 4 5 6 7
¤ ¤ ¤ ¤ ¤ ¤ ¤
DOMINANT: Subject is able to displace, threaten, or take food fromother chimpanzees. Or subject may express high status by decisivelyintervening in social interactions.
least most1 2 3 4 5 6 7
¤ ¤ ¤ ¤ ¤ ¤ ¤
PERSISTENT: Subject tends to continue in a course of action, task, orstrategy for a long time or continues despite opposition from otherchimpanzees.
least most1 2 3 4 5 6 7
¤ ¤ ¤ ¤ ¤ ¤ ¤
CAUTIOUS: Subject often seems attentive to possible harm or dangerfrom its actions. Subject avoids risky behaviors.
least most1 2 3 4 5 6 7
¤ ¤ ¤ ¤ ¤ ¤ ¤
235
STABLE: Subject reacts to its environment including the behavior ofother chimpanzees in a calm, equable, way. Subject is not easily upset bythe behaviors of other chimpanzees.
least most1 2 3 4 5 6 7
¤ ¤ ¤ ¤ ¤ ¤ ¤
AUTISTIC: Subject often displays repeated, continuous, and stereotypedbehaviors such as rocking or self clasping.
least most1 2 3 4 5 6 7
¤ ¤ ¤ ¤ ¤ ¤ ¤
CURIOUS: Subject has a desire to see or know about objects, devices, orother chimpanzees. This includes a desire to know about the affairs of otherchimpanzees that do not directly concern the subject.
least most1 2 3 4 5 6 7
¤ ¤ ¤ ¤ ¤ ¤ ¤
THOUGHTLESS: Subject often behaves in a way that seems imprudentor forgetful.
least most1 2 3 4 5 6 7
¤ ¤ ¤ ¤ ¤ ¤ ¤
236
STINGY/GREEDY: Subject is excessively desirous or covetous of food,favored locations, or other resources in the enclosure. Subject is unwillingto share these resources with others.
least most1 2 3 4 5 6 7
¤ ¤ ¤ ¤ ¤ ¤ ¤
JEALOUS: Subject is often troubled by others who are in a desirable oradvantageous situation such as having food, a choice location, or access tosocial groups. Subject may attempt to disrupt activities of advantagedchimpanzees.
least most1 2 3 4 5 6 7
¤ ¤ ¤ ¤ ¤ ¤ ¤
INDIVIDUALISTIC: Subject’s behavior stands out compared to that ofthe other individuals in the group. This does not mean that it does not fitor is incompatible with the group.
least most1 2 3 4 5 6 7
¤ ¤ ¤ ¤ ¤ ¤ ¤
RECKLESS: Subject is rash or unconcerned about the consequences of itsbehaviors.
least most1 2 3 4 5 6 7
¤ ¤ ¤ ¤ ¤ ¤ ¤
237
SOCIABLE: Subject seeks and enjoys the company of other chimpanzeesand engages in amicable, affable, interactions with them.
least most1 2 3 4 5 6 7
¤ ¤ ¤ ¤ ¤ ¤ ¤
DISTRACTIBLE: Subject is easily distracted and has a short attentionspan.
least most1 2 3 4 5 6 7
¤ ¤ ¤ ¤ ¤ ¤ ¤
TIMID: Subject lacks self confidence, is easily alarmed and is hesitant toventure into new social or non-social situations.
least most1 2 3 4 5 6 7
¤ ¤ ¤ ¤ ¤ ¤ ¤
SYMPATHETIC: Subject seems to be considerate and kind towardsothers as if sharing their feelings or trying to provide reassurance.
least most1 2 3 4 5 6 7
¤ ¤ ¤ ¤ ¤ ¤ ¤
PLAYFUL: Subject is eager to engage in lively, vigorous, sportive, oracrobatic behaviors with or without other chimpanzees.
least most1 2 3 4 5 6 7
¤ ¤ ¤ ¤ ¤ ¤ ¤
238

SOLITARY: Subject prefers to spend considerable time alone not seekingor avoiding contact with other chimpanzees.
least most1 2 3 4 5 6 7
¤ ¤ ¤ ¤ ¤ ¤ ¤
VULNERABLE: Subject is prone to be physically or emotionally hurt asa result of dominance displays, highly assertive behavior, aggression, orattack by another chimpanzee.
least most1 2 3 4 5 6 7
¤ ¤ ¤ ¤ ¤ ¤ ¤
INNOVATIVE: Subject engages in new or different behaviors that mayinvolve the use of objects or materials or ways of interacting with others.
least most1 2 3 4 5 6 7
¤ ¤ ¤ ¤ ¤ ¤ ¤
ACTIVE: Subject spends little time idle and seems motivated to spendconsiderable time either moving around or engaging in some overt,energetic behavior.
least most1 2 3 4 5 6 7
¤ ¤ ¤ ¤ ¤ ¤ ¤
HELPFUL: Subject is willing to assist, accommodate, or cooperate withother chimpanzees.
least most1 2 3 4 5 6 7
¤ ¤ ¤ ¤ ¤ ¤ ¤
239
BULLYING: Subject is overbearing and intimidating towards younger orlower ranking chimpanzees.
least most1 2 3 4 5 6 7
¤ ¤ ¤ ¤ ¤ ¤ ¤
AGGRESSIVE: Subject often initiates fights or other menacing andagonistic encounters with other chimpanzees.
least most1 2 3 4 5 6 7
¤ ¤ ¤ ¤ ¤ ¤ ¤
MANIPULATIVE: Subject is adept at forming social relationships forits own advantage, especially using alliances and friendships to increase itssocial standing. Chimpanzee seems able and willing to use others.
least most1 2 3 4 5 6 7
¤ ¤ ¤ ¤ ¤ ¤ ¤
GENTLE: Subject responds to others in an easy-going, kind, andconsiderate manner. Subject is not rough or threatening.
least most1 2 3 4 5 6 7
¤ ¤ ¤ ¤ ¤ ¤ ¤
AFFECTIONATE: Subject seems to have a warm attachment orcloseness with other chimpanzees. This may entail frequently grooming,touching, embracing, or lying next to others.
least most1 2 3 4 5 6 7
¤ ¤ ¤ ¤ ¤ ¤ ¤
240
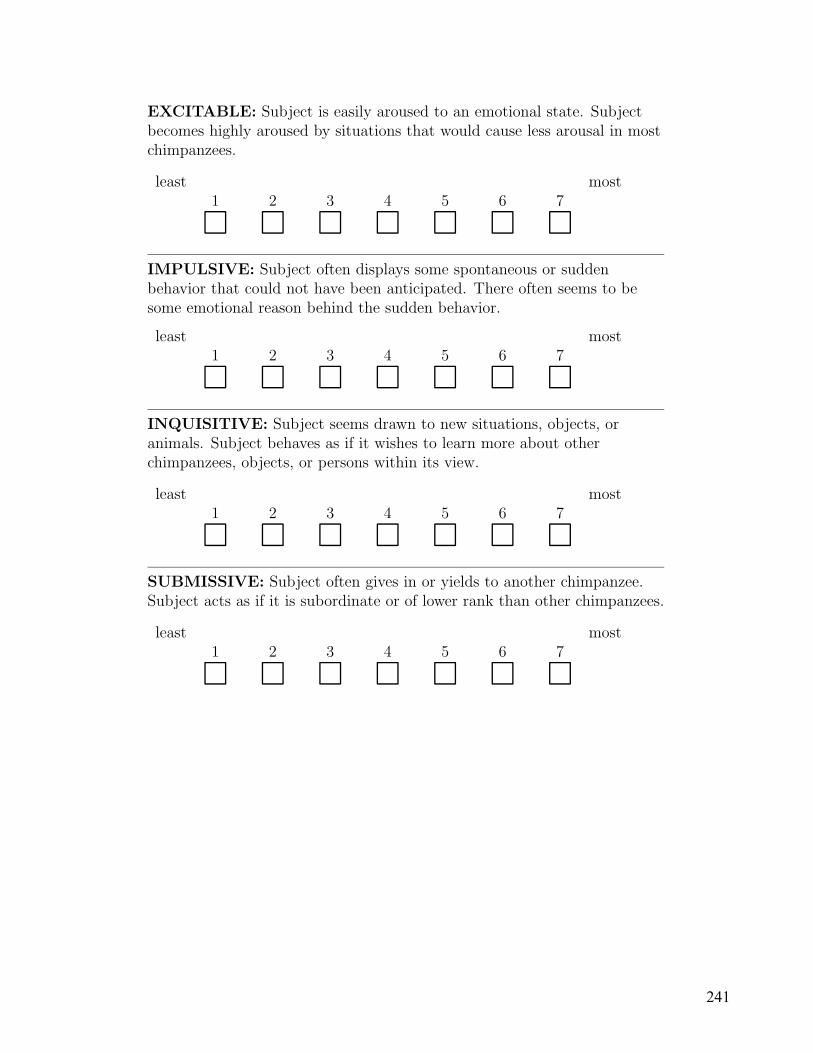
EXCITABLE: Subject is easily aroused to an emotional state. Subjectbecomes highly aroused by situations that would cause less arousal in mostchimpanzees.
least most1 2 3 4 5 6 7
¤ ¤ ¤ ¤ ¤ ¤ ¤
IMPULSIVE: Subject often displays some spontaneous or suddenbehavior that could not have been anticipated. There often seems to besome emotional reason behind the sudden behavior.
least most1 2 3 4 5 6 7
¤ ¤ ¤ ¤ ¤ ¤ ¤
INQUISITIVE: Subject seems drawn to new situations, objects, oranimals. Subject behaves as if it wishes to learn more about otherchimpanzees, objects, or persons within its view.
least most1 2 3 4 5 6 7
¤ ¤ ¤ ¤ ¤ ¤ ¤
SUBMISSIVE: Subject often gives in or yields to another chimpanzee.Subject acts as if it is subordinate or of lower rank than other chimpanzees.
least most1 2 3 4 5 6 7
¤ ¤ ¤ ¤ ¤ ¤ ¤
241
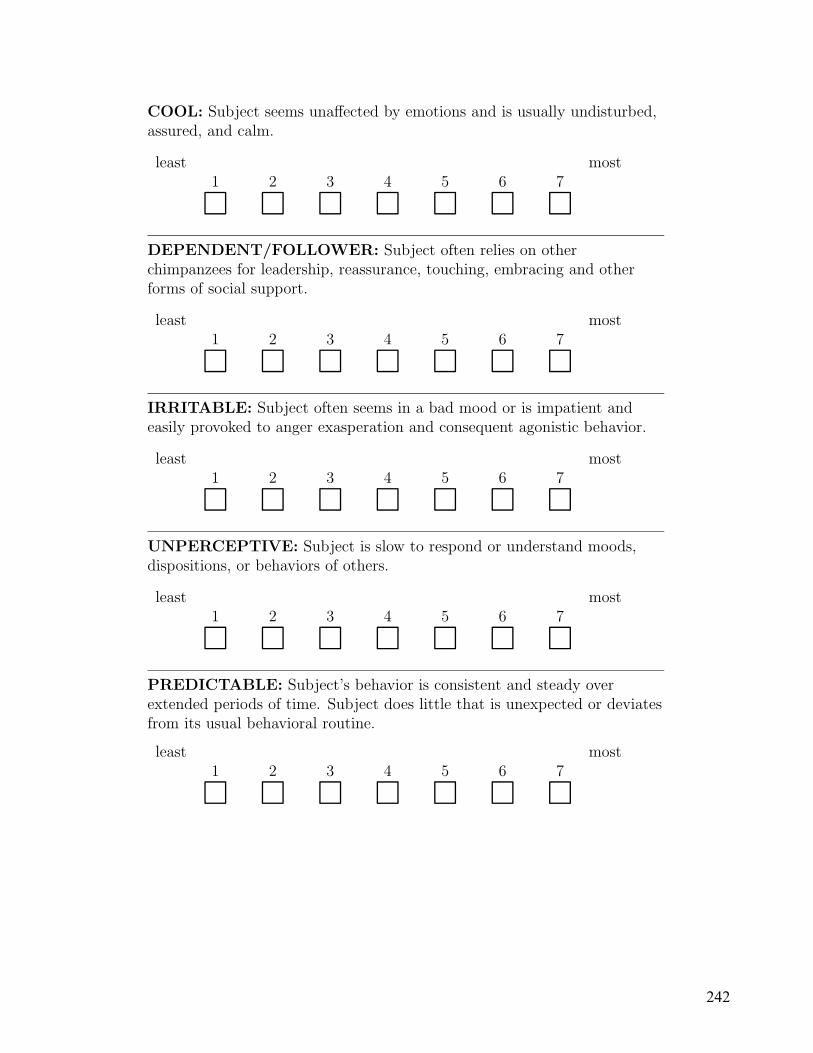
COOL: Subject seems unaffected by emotions and is usually undisturbed,assured, and calm.
least most1 2 3 4 5 6 7
¤ ¤ ¤ ¤ ¤ ¤ ¤
DEPENDENT/FOLLOWER: Subject often relies on otherchimpanzees for leadership, reassurance, touching, embracing and otherforms of social support.
least most1 2 3 4 5 6 7
¤ ¤ ¤ ¤ ¤ ¤ ¤
IRRITABLE: Subject often seems in a bad mood or is impatient andeasily provoked to anger exasperation and consequent agonistic behavior.
least most1 2 3 4 5 6 7
¤ ¤ ¤ ¤ ¤ ¤ ¤
UNPERCEPTIVE: Subject is slow to respond or understand moods,dispositions, or behaviors of others.
least most1 2 3 4 5 6 7
¤ ¤ ¤ ¤ ¤ ¤ ¤
PREDICTABLE: Subject’s behavior is consistent and steady overextended periods of time. Subject does little that is unexpected or deviatesfrom its usual behavioral routine.
least most1 2 3 4 5 6 7
¤ ¤ ¤ ¤ ¤ ¤ ¤
242

DECISIVE: Subject is deliberate, determined, and purposeful in itsactivities.
least most1 2 3 4 5 6 7
¤ ¤ ¤ ¤ ¤ ¤ ¤
DEPRESSED: Subject does not seek out social interactions with othersand often fails to respond to social interactions of other chimpanzees.Subject often appears isolated, withdrawn, sullen, brooding, and hasreduced activity.
least most1 2 3 4 5 6 7
¤ ¤ ¤ ¤ ¤ ¤ ¤
CONVENTIONAL: Subject seems to lack spontaneity or originality.Subject behaves in a consistent manner from day to day and stays wellwithin the social rules of the group.
least most1 2 3 4 5 6 7
¤ ¤ ¤ ¤ ¤ ¤ ¤
SENSITIVE: Subject is able to understand or read the mood, disposition,feelings, or intentions of other chimpanzees often on the basis of subtle,minimal cues.
least most1 2 3 4 5 6 7
¤ ¤ ¤ ¤ ¤ ¤ ¤
243
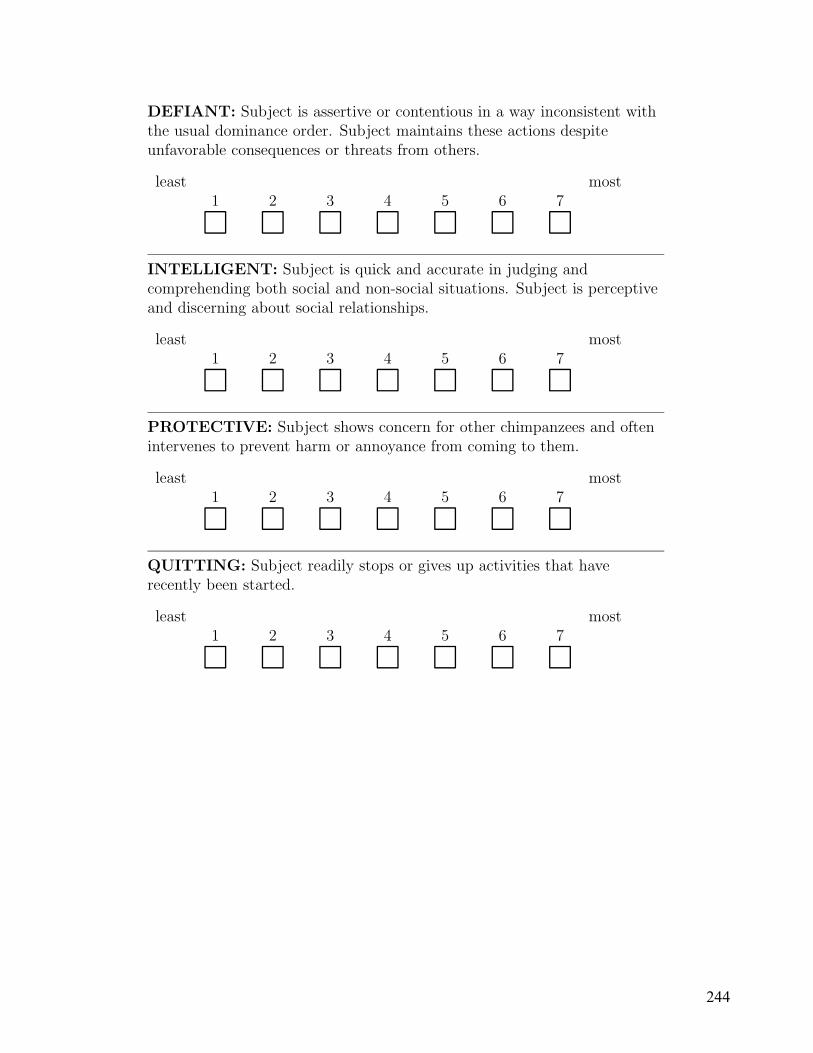
DEFIANT: Subject is assertive or contentious in a way inconsistent withthe usual dominance order. Subject maintains these actions despiteunfavorable consequences or threats from others.
least most1 2 3 4 5 6 7
¤ ¤ ¤ ¤ ¤ ¤ ¤
INTELLIGENT: Subject is quick and accurate in judging andcomprehending both social and non-social situations. Subject is perceptiveand discerning about social relationships.
least most1 2 3 4 5 6 7
¤ ¤ ¤ ¤ ¤ ¤ ¤
PROTECTIVE: Subject shows concern for other chimpanzees and oftenintervenes to prevent harm or annoyance from coming to them.
least most1 2 3 4 5 6 7
¤ ¤ ¤ ¤ ¤ ¤ ¤
QUITTING: Subject readily stops or gives up activities that haverecently been started.
least most1 2 3 4 5 6 7
¤ ¤ ¤ ¤ ¤ ¤ ¤
244
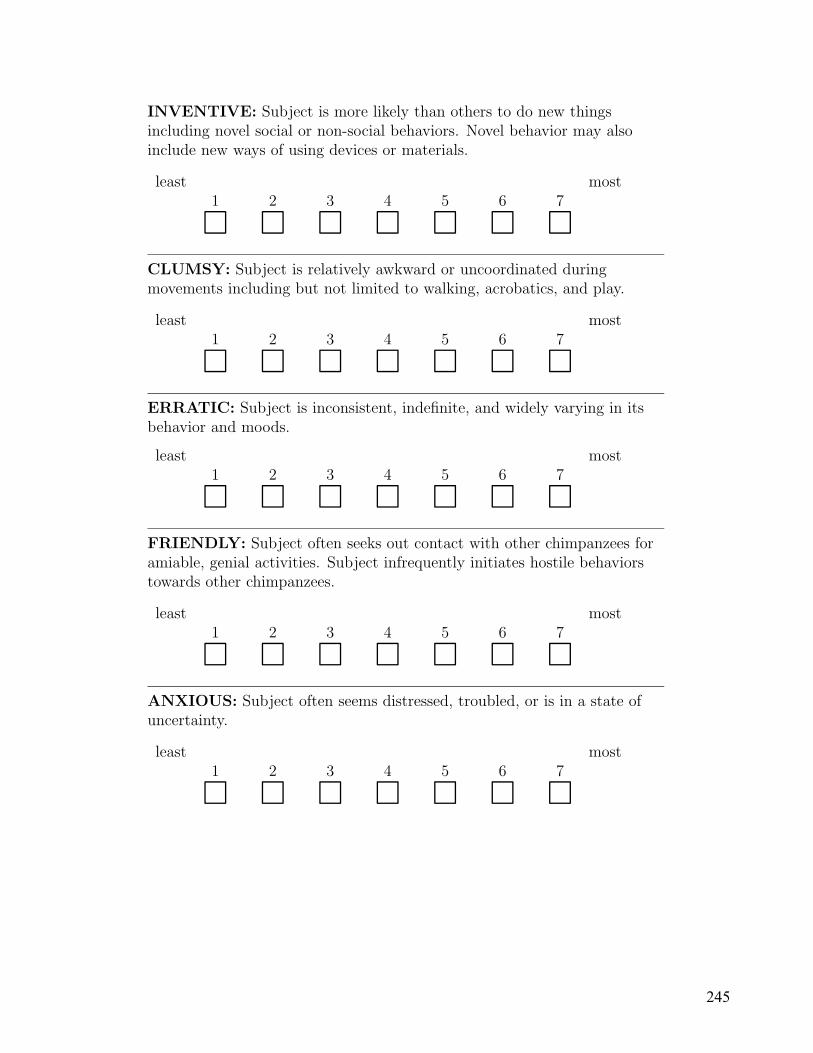
INVENTIVE: Subject is more likely than others to do new thingsincluding novel social or non-social behaviors. Novel behavior may alsoinclude new ways of using devices or materials.
least most1 2 3 4 5 6 7
¤ ¤ ¤ ¤ ¤ ¤ ¤
CLUMSY: Subject is relatively awkward or uncoordinated duringmovements including but not limited to walking, acrobatics, and play.
least most1 2 3 4 5 6 7
¤ ¤ ¤ ¤ ¤ ¤ ¤
ERRATIC: Subject is inconsistent, indefinite, and widely varying in itsbehavior and moods.
least most1 2 3 4 5 6 7
¤ ¤ ¤ ¤ ¤ ¤ ¤
FRIENDLY: Subject often seeks out contact with other chimpanzees foramiable, genial activities. Subject infrequently initiates hostile behaviorstowards other chimpanzees.
least most1 2 3 4 5 6 7
¤ ¤ ¤ ¤ ¤ ¤ ¤
ANXIOUS: Subject often seems distressed, troubled, or is in a state ofuncertainty.
least most1 2 3 4 5 6 7
¤ ¤ ¤ ¤ ¤ ¤ ¤
245
LAZY: Subject is relatively inactive, indolent, or slow moving and avoidsenergetic activities.
least most1 2 3 4 5 6 7
¤ ¤ ¤ ¤ ¤ ¤ ¤
DISORGANIZED: Subject is scatterbrained, sloppy, or haphazard in itsbehavior as if not following a consistent goal.
least most1 2 3 4 5 6 7
¤ ¤ ¤ ¤ ¤ ¤ ¤
UNEMOTIONAL: Subject is relatively placid and unlikely to becomearoused, upset, happy, or sad.
least most1 2 3 4 5 6 7
¤ ¤ ¤ ¤ ¤ ¤ ¤
IMITATIVE: Subject often mimics, or copies behaviors that it hasobserved in other chimpanzees.
least most1 2 3 4 5 6 7
¤ ¤ ¤ ¤ ¤ ¤ ¤
INDEPENDENT: Subject is individualistic and determines its owncourse of action without control or interference from other chimpanzees.
least most1 2 3 4 5 6 7
¤ ¤ ¤ ¤ ¤ ¤ ¤
246