revi2018.pdf - edinburgh research archive
TRANSCRIPT
This thesis has been submitted in fulfilment of the requirements for a postgraduate degree
(e.g. PhD, MPhil, DClinPsychol) at the University of Edinburgh. Please note the following
terms and conditions of use:
This work is protected by copyright and other intellectual property rights, which are
retained by the thesis author, unless otherwise stated.
A copy can be downloaded for personal non-commercial research or study, without
prior permission or charge.
This thesis cannot be reproduced or quoted extensively from without first obtaining
permission in writing from the author.
The content must not be changed in any way or sold commercially in any format or
medium without the formal permission of the author.
When referring to this work, full bibliographic details including the author, title,
awarding institution and date of the thesis must be given.

NOVEL APPROACH TO CANCER
THERAPEUTICS USING
COMPARATIVE CANCER BIOLOGY
Bhindu Revi
Doctor of philosophy
The University of Edinburgh
December 2017

ii
DECLARATION
I hereby declare that I am the author of this thesis. The work described in this thesis is
my own and any contribution by others has been clearly indicated and acknowledged. I
can also confirm that no part of this thesis has been previously submitted for any other
degree or professional qualification.
Bhindu Revi
December 2017

iii
“Dream, Dream Dream.
Dreams transform into thoughts
And thoughts result in action.”
- A.P.J. Abdul Kalam

iv
Acknowledgements
My PhD would have been impossible without the invaluable help from many people and no
words can express my gratitude to all. First and foremost my appreciation goes to Prof David
argyle for giving me this opportunity and always providing me with great support, it was
indeed great honour to work and get guidance from you throughout my PhD. Many thanks are
due to Kathryn for believing in me, for introducing me into the beautiful world of MDM2 and
IRF-1. I am very grateful to her for giving me the opportunity to join her research group and
sharing her passion for science with me in endless discussions. Thank you for all your patience
during the 3 years in supervising me and also in proof reading my thesis. Thank you for always
giving me the freedom to explore and plan my own experiment and refining me into a better
scientist. Thanks are also due to Ted for his brilliant ideas and his ability to always see the
positives in all experimental data. Thanks for all the proof reading and for being very
approachable for any doubts. Many thanks goes to Lisa for proof reading my thesis chapter.
Borek for all his help while my trip to Brno. Many thanks to everyone in my thesis committee
especially Donald Yool for all the support.
Finally, none of this would have been possible without the continuous support and
encouragement from my ever inspiring husband Hari and also the cuddles of my little daughter
Jia which acted like stress buster for all the bad science days. A big thanks to my fav 3 ☺ my
Mother, Father and mother in law who helped out in looking after Jia throughout my PhD, I
owe a lot to them. Many thanks to my dear sisters Ragi and Smitha who have always been a
great support throughout the PhD and always trusting in me. My best friend Ambily even
though she’s miles away she made sure she was always there for me when I needed her the
most. Many thanks to Philip for all the help with his expertise in chaperone and always being
a silent reminder for my thesis. Thanks to all the members of Hupp ball group especially Maria
Gil, Maria Gomez, Aiman, and Ashita. Jia, thanks for always keeping me company in lab and
in trips. Many thanks to Moon and her mom for all the delicious meals and time we spend
together in Edinburgh. Many thanks to Liz and Kalai for being there in lab and out of Lab
Company.
v
Abbreviations
aa Amino acid
ARF alternate reading frame protein
AMP Adenosine monophosphate
ATP Adenosine triphosphate
Bp Base pair
BSA Bovine serum albumin
CHIP C-terminus of Hsc70-interacting protein
Co-IP Co-immunoprecipitation
CNVs copy number variations
DAPI 4’, 6-diamino-2-phenylindole
DMSO Dimethyl sulphoxide
DNA Deoxyribonucleic acid
DTT Dithiothreitol
E.coli Escherichia coli
EGFR Epidermal growth factor receptor
EDTA Ethylenediaminetetraacetic acid
FBS Foetal bovine serum
FACS Fluorescence-Activated Cell Sorting
FASP Filter-Aided Sample Preparation
GAPDH Glyceraldehyde-3-Phosphate Dehydrogenase
HEPES 4-(2-hydroxyethyl)-1-piperazineethanesulfonic acid
HSP heat shock protein
His Histidine
vi
HRP Horse radish peroxidase
IFN Interferon
ITPG Isopropyl-β-thio-galactoside
INDELS insertions or deletions
IF Immunofluorescence
IR Ionising radiation
kDa Kilodalton
mAb Monoclonal antibody
mRNA Messenger RNA
NGS: next-generation sequencing
OD Optical density
ORF Open reading frame
OSA Osteosarcoma
pAb Polyclonal antibody
p53 Tumour suppressor protein 53
PAGE Polyacrylamide gel electrophoresis
PD1 programmed cell death protein 1
PDL-1 programmed death ligand 1
RNA Ribonucleic acid
rpm Revolutions per minute
SBP Streptavidin-Binding Peptide
SNVs single nucleotide variants
STS soft tissue sarcomas
SDS Sodium dodecyl sulphate
siRNA Short interfering RNA

vii
Tris 2-amino-2-hydroxymethyl-propane-1, 3-diol
TMT Tandem Mass Tagging
wt Wild type
WES whole exome sequence
WGS whole genome sequence

viii
Abstract
Developing personalized cancer therapies based on cancer genomics methodologies forms the
basis for future cancer therapeutics. A genomics platform was developed based on canine
cancer to produce a proof-of-concept for personalized genomics led therapeutic choices but
also developing personalized therapeutics for canine cancer patients themselves. The platform
identified the genetic state of a canine cancer patient within two drugable pathways; p53 and
HSP90/IRF1. The former gene was wild-type p53 thus directing the use of p53 activating
molecules. The latter mutations in both HSP90 and IRF1 suggested an investigation into
HSP90 and interferon signalling molecules as drug leads. Drugs that target both of these
pathways were subsequently used to measure drug effects in cell line models but also to
identify novel biomarkers of drug responses.
My study focused on the effect of the HSP90-inhibitor Ganetespib had on its client proteins,
particularly IRF-1. Briefly my results indicated the following:(i) Ganetespib
downregulated IRF-1 protein levels in A375 cell lines and this attenuation was not mediated
by either MDM2 or CHIP (E3 ligase). IFNγ- induced IRF-1 was also observed to be
downregulated when Ganetespib was used in combination therapy.(ii) Insitu proximity
ligation assay showed induced HSC70 upregulation upon HSP90 inhibition by Ganetespib and
HSC70/MDM2 complexes were seen to be stabilized compared to the usage of MDM2/p53
inhibitor-nutlin. I hypothesize that MDM2/HSC70 complex might chaperon IRF-1 into
lysosome for degradation via chaperon mediated autophagy pathway. (iii) My results also
indicate that Ganetespib can downregulate IFN γ- induced PDL-1 expression in melanoma cell
lines. Pre-sensitizing the cells with Ganetespib prior to the addition of IFNγ could attenuate
PDL-1 to basal levels. (iv) My results also showed that the downregulation of PDL-1 by
Ganetespib is an IRF-1 dependent mechanism. Therefore, my results suggest that
HSP90 represents an important emerging target for cancer therapy because its inactivation
results in the simultaneous blockade of multiple signalling pathways and can also sensitize
tumor cells to other anticancer agents. Targeting HSP90 could also help to disrupt PD1/PDL-
1 interaction and activate immune system to recognise tumor cells. I conclude that HSP90 and
IRF-1 play a critical role in types II interferon pathways and these findings establish a novel
basis for the design of future Ganetespib-based combinatorial approaches to improve patient
outcomes in this disease. These approaches finally demonstrate that cancer genomics can
stratify choice of cancer drugs used on patients but also provide evidence that cancer patient
samples can be used for the specific stratification of cancer drug choice based on cancer
genomics data.
ix
Lay summary
Melanoma is the deadliest form of skin cancer. Although it comprises less than 5% of skin
cancer cases, melanoma accounts for the great majority of skin cancer-related deaths. HSP90
is protein that assists in the maintenance of several essential proteins in human body and aids
in protein degradation. It also stabilisers proteins which are required for cancer (tumor
growth). Hence drugs that target (inhibit) HSP90 is of great value for cancer therapeutics and
has been widely studied in the past 20 years. My project comprises the study of one such novel
HSP90 inhibitor drug called Ganetespib in melanoma cell lines. My results indicated that using
this drug in cancer cell lines decreased a protein called PDL-1(also known as immune
checkpoint target) which is usually seen elevated in patients with this cancer type. Hence by
lowering this protein, it is possible to enable the body’s own immune system to fight cancer.
My results also indicated that using Ganetespib in combination with other anticancer drugs
may provide a more powerful and effective method to treat melanoma patients.
x
Contents
DECLARATION.................................................................................................................... ii
Acknowledgements ............................................................................................................... iv
Abbreviations ......................................................................................................................... v
Abstract ................................................................................................................................ viii
1.1 Chapter 1 Introduction ............................................................................................ 1
1.1 Molecular Chaperone proteins ................................................................................ 1
1.1.1 Chaperone machinery ......................................................................................... 3
1.1.2 The HSP90 family and their subcellular localization ......................................... 5
1.1.3 The HSP90 machinery ....................................................................................... 7
1.1.3.1 Structure .................................................................................................... 7
1.1.3.2 Function ..................................................................................................... 7
1.1.4 HSP70 ................................................................................................................ 9
1.1.5 HSF1 .................................................................................................................. 9
1.2 Chaperones and cancer ......................................................................................... 10
1.2.1 Targeting HSP90 in cancer therapy ................................................................. 10
1.2.1.1 Escaping Antigrowth Signals .................................................................. 11
1.2.1.2 Limitless Proliferation and Avoidance of Senescence ............................ 11
1.2.1.3 Angiogenesis ........................................................................................... 12
1.3 HSP90 drugs in clinics ......................................................................................... 14
1.3.1 RETASPIMYCIN ............................................................................................ 17
1.3.2 NVP-AUY922 .................................................................................................. 17
1.3.3 AT13387 .......................................................................................................... 18
1.3.4 Ganetespib ........................................................................................................ 18
1.4 Combination Phase I/II trial ................................................................................. 21
1.5 Clients of HSP90 .................................................................................................. 24
1.5.1 The IRF family ................................................................................................. 24
1.5.2 Evolution of the IRF family ............................................................................. 25
1.5.3 Interferons and the interferon signalling pathway ........................................... 25
1.5.4 Overview of the human IRF family members .................................................. 28
1.5.4.1 IRF-1........................................................................................................ 28
xi
1.5.4.2 IRF-2........................................................................................................ 28
1.6 SARCOMA .......................................................................................................... 30
1.6.1 P53 ................................................................................................................... 32
1.6.2 MDM2 .............................................................................................................. 32
1.6.3 Mutations of TP53, expression levels of MDM2 ............................................. 32
1.7 Comparative oncology .......................................................................................... 33
1.8 Canine Model ....................................................................................................... 33
1.9 Canine Sarcoma .................................................................................................... 34
1.9.1.1 Osteosarcoma .......................................................................................... 36
1.9.1.2 Genetic Heterogeneity ............................................................................. 36
1.9.1.3 Chromosomal Abnormalities ................................................................... 36
1.9.2 Tumour Suppressors ......................................................................................... 37
1.9.2.1 Rb Pathway .............................................................................................. 37
1.9.2.2 p53 Pathway ............................................................................................ 37
1.9.3 Other Tumour Suppressors .............................................................................. 38
1.9.3.1 Oncogenes ............................................................................................... 38
1.9.4 Advantages over other models ......................................................................... 39
1.9.5 Limitations of the dog model ........................................................................... 40
1.9.6 Current Drugs on clinics .................................................................................. 42
1.10 Bioinformatics in comparative oncology .............................................................. 44
1.11 THESIS AIMS ..................................................................................................... 45
2 Methods and materials................................................................................................ 46
2.1 Plasmids, chemicals and reagents ......................................................................... 46
2.2 General microbiological techniques ..................................................................... 46
2.2.1 Maintaining bacterial cultures .......................................................................... 46
2.2.2 Glycerol stocks ................................................................................................. 47
2.2.3 Preparation of competent cells by heat shock method ..................................... 47
2.2.4 Transforming bacterial cells ............................................................................. 48
2.3 General molecular biology techniques ................................................................. 48
2.3.1 Plasmid DNA amplification, extraction and quantification ............................. 48
2.3.2 Agarose gel electrophoresis of DNA ............................................................... 49
2.4 General biochemical techniques ........................................................................... 49
2.4.1 Protein quantification ....................................................................................... 49
2.4.2 SDS-PAGE ....................................................................................................... 50
2.4.3 Coomassie staining of SDS-PAGE gels ........................................................... 51
xii
2.4.4 Western blotting ............................................................................................... 52
2.4.5 Stripping nitrocellulose blots ........................................................................... 55
2.5 Cell culture ........................................................................................................... 56
2.5.1 Cell lines .......................................................................................................... 56
2.5.2 Sub-culturing of cells ....................................................................................... 58
2.5.3 Freezing and thawing cells ............................................................................... 58
2.5.4 Transient transfection of DNA and siRNA ...................................................... 59
2.5.5 Harvesting cells ................................................................................................ 59
2.5.6 Mammalian cell lysis ....................................................................................... 60
2.5.7 Drug treatments ................................................................................................ 61
2.6 Microscopy ........................................................................................................... 63
2.6.1 Proximity ligation assay (PLA) ........................................................................ 63
2.7 Other assays .......................................................................................................... 64
2.7.1 Co-immunoprecipitation (Co- IP) .................................................................... 64
2.7.2 SBP-tagged pull down ...................................................................................... 64
2.8 Immunofluorescence ............................................................................................ 65
2.9 Sample Preparation for Mass Spectrometry and result Analysis .......................... 66
2.9.1 Mass Spectrometry ........................................................................................... 66
2.9.1.1 Sample preparation for mass‐spectrometry ............................................. 66
2.9.1.2 Lysis of cell pellets .................................................................................. 66
2.9.1.3 FASP digestion ........................................................................................ 67
2.9.1.4 TMT labelling .......................................................................................... 68
2.9.1.5 Peptide purification ................................................................................. 69
2.9.2 Flow Cytometry ............................................................................................... 70
2.10 General Biochemical Techniques ......................................................................... 71
2.10.1 Bradford Assay for Protein quantification ................................................... 71
2.11 Cell-based assays .................................................................................................. 71
2.11.1 Cell cytotoxicity Assay ................................................................................ 71
2.12 Bioinformatics ...................................................................................................... 71
2.12.1 Canine Osteosarcoma DNA and RNA purification ..................................... 71
2.12.2 Sequencing of OSA31 DNA ........................................................................ 72
2.12.3 Sequencing of OSA31 RNA ........................................................................ 72
2.12.4 Data analysis ................................................................................................ 72
2.12.4.1 Input files into CLC workbench .............................................................. 72
2.12.4.2 Downloading the canine reference .......................................................... 72
xiii
....................................................................................................................................... 73
2.12.4.3 Map reads to contig and variant detections for OSA31 tumor DNA and
Normal DNA ............................................................................................................. 76
2.12.4.4 Compare Normal to OSA31 seq data ...................................................... 76
....................................................................................................................................... 81
2.12.4.5 Detection of expressed somatic mutations in the RNAseq ...................... 83
3 Results: Comparative oncology: canine model ......................................................... 87
3.1 The use of a Canine Osteosarcoma cancer cell as a model for personalizing anti-
cancer therapeutics ............................................................................................................ 87
3.1.1 Cell models used for nucleic acid sequencing. ................................................ 88
3.1.2 DNA seq analysis of the OSA31 genome. ....................................................... 89
3.1.3 Non-synonymous mutations and types of mutations by comparing tumour to
normal tissue ................................................................................................................. 89
3.1.4 Identifying expressed mutations by comparing tumour RNA to tumour DNA 91
3.1.5 Defining the commonly mutated genes ............................................................ 95
3.2 Characterization of a canine osteosarcoma cell as a model for developing next
generation proteogenomics ................................................................................................ 99
3.2.1 Characterisation of canine osteosarcoma cell lines for p53 activation in response
to Nutlin-3 ..................................................................................................................... 99
3.2.2 Characterisation of canine osteosarcoma cell lines for HSP70 responsiveness to
HSP90 inhibitors. ........................................................................................................ 101
3.2.3 Characterisation of canine osteosarcoma cell lines for IRF1 response to HSP90
inhibition. .................................................................................................................... 103
3.2.4 Proteomics on drug-treated canine osteosarcoma cell lines to develop biomarkers
of drug responsiveness ................................................................................................ 106
3.2.5 Summary of the Ganetespib treatment responses........................................... 108
3.2.6 Upregulated proteins with Ganetespib treatment ........................................... 108
3.2.7 Downregulated proteins upon treatment with Ganetespib ............................. 115
3.2.8 Proteomic changes upon Nutlin-3 treatment. ................................................. 119
3.2.9 Summary of characterisation of the OAS31 cell line as a model for drug testing.
125
4 MDM2 interactome ................................................................................................... 128
4.1 Introduction ........................................................................................................ 128
4.2 Results ................................................................................................................ 131
4.2.1 MDM2 interactome and p53 ubiquitination ................................................... 131
xiv
4.2.2 Ewing sarcoma and HSP90 inhibitors ............................................................ 135
4.2.3 Characterisation of osteosarcoma cell lines in association with MDM2
expression .................................................................................................................... 137
4.2.4 Ganetespib stabilises HSP/C 70 and MDM2 interaction ............................... 139
4.2.5 Validation of HSC/P70 and MDM2 interaction ............................................. 142
4.2.6 Combinatorial treatment of Ganetespib with nutlin ....................................... 145
4.2.7 Cell viability with Ganetespib and nutlin treatments ..................................... 149
4.2.8 Discussion ...................................................................................................... 151
5 Mechanism of downregulation of IRF-1 with ganetespib ...................................... 152
5.1 Introduction ........................................................................................................ 152
5.1.1 IRF-1 .............................................................................................................. 152
5.1.2 Molecular chaperons and IRF-1 ..................................................................... 152
5.2 Results ................................................................................................................ 154
5.2.1 Inhibition of HSP90 leads of reduction of client protein levels ..................... 154
5.2.2 Attenuation of IRF-1 is p53-independent....................................................... 158
5.2.3 Downregulation of IRF-1 is affected by proteasome inhibitors ..................... 160
5.2.4 Role of E3 ligases in IRF-1 downregulation .................................................. 162
5.2.5 CHIP and MDM2 Knock-down ..................................................................... 168
5.2.6 Chaperone mediated autophagy ..................................................................... 172
5.2.7 HSP90 inhibitors and autophagy .................................................................... 176
5.2.8 Proteomic screen ............................................................................................ 182
5.2.8.1 Effects of Ganetespib treatment on A375 proteome .............................. 184
5.2.8.2 Effects of Nutlin treatment on the A375 proteome ............................... 188
5.2.8.3 Effects of combinatorial treatment on the A375 proteome ................... 193
5.2.8.4 UBA 3 analysis ...................................................................................... 198
5.3 Discussion ........................................................................................................... 200
6 HSP90 inhibitors in immune surveillance ............................................................... 202
6.1 Introduction ........................................................................................................ 202
6.1.1 The Interferon system .................................................................................... 202
6.1.1.1 Interferon γ ............................................................................................ 202
..................................................................................................................................... 205
6.1.2 Therapeutic targets for cancer immunotherapy .............................................. 205
6.1.2.1 Immune checkpoints .............................................................................. 205
6.1.2.2 Combined therapies ............................................................................... 207
6.1.3 HSP90 and the immune system ...................................................................... 209

xv
6.2 Aim ..................................................................................................................... 209
6.3 Results ................................................................................................................ 210
6.3.1 Ganetespib downregulates IFNγ -induced IRF-1 expression ......................... 210
6.3.2 Upregulation in IRF-1 expression with IFNγ is dose and time dependent..... 212
6.3.3 Downregulation of IFNγ-induced PD-L1 expression by Ganetespib............. 216
6.3.4 Ganetespib inhibits PD-L1 expression induced by INFγ pre-treatment ......... 220
6.3.5 Loss of PD-L1 is via an IRF-1-dependent pathway ....................................... 222
6.3.6 The dose dependency of PD-L1 expression on Ganetespib depends on cell type
225
6.3.7 PD-L1 expression is regulated by the autophagy protein ATG5 ................... 227
6.3.8 HSP90 inhibitors in IFNα signalling .............................................................. 230
6.4 Discussion ........................................................................................................... 233
7 Conclusion and future work ..................................................................................... 239
8 Bibliography .............................................................................................................. 245
List of Figures
FIGURE 1 CHAPERONE PROTEINS .................................................................................................................... 2
FIGURE 2 CHAPERONE MACHINERY ................................................................................................................. 4
FIGURE 3HSP90 SUB-FAMILY ........................................................................................................................ 6
FIGURE 4 HSP90 STRUCTURE ........................................................................................................................ 8
FIGURE 5 HALLMARKS OF CANCER ................................................................................................................ 13
FIGURE 6 FIRST AND SECOND GENERATION HSP90 INHIBITORS ....................................................................... 15
FIGURE 7 CLINICAL TRIALS ........................................................................................................................... 16
FIGURE 8 STRUCTURE AND MECHANISM OF ACTION OF GANETESPIB .................................................................... 20
FIGURE 9 ONGOING COMBINATION TRIALS OF GANETESPIB WITH OTHER THERAPEUTIC AGENTS ................................ 23
FIGURE 10 IFN SIGNALLING PATHWAYS ......................................................................................................... 27
FIGURE 11 CLASSIFICATION OF SARCOMA ...................................................................................................... 31
FIGURE 12 INTEGRATED AND COMPARATIVE DRUG TRIAL MODEL ....................................................................... 35
FIGURE 13 HUMAN AND CANINE CANCER CELLS ARE SIMILARLY SENSITIVE TO CHEMOTHERAPY .................................. 41
FIGURE 14 NUTLIN ACTION ON MDM2-P53 COMPLEX .................................................................................... 43
FIGURE 15IMPORTING FILES TO WORKBENCH .................................................................................................. 73
FIGURE 16 DOWNLOADING THE CANINE REFERENCE GENOME ............................................................................ 74
FIGURE 17 DOWNLOADING CANINE REFERENCE GENOME CONTINUED ................................................................. 75
FIGURE 18 MAP READS TO CONTIGS/REFERENCE .............................................................................................. 77
xvi
FIGURE 19BASIC VARIANT DETECTION............................................................................................................ 78
FIGURE 20VARIANT DETECTION CONTINUED ................................................................................................... 79
FIGURE 21COMPARE TUMOR OSA31 TO NORMAL TISSUE ................................................................................ 80
FIGURE 22ANNOTATE ................................................................................................................................ 81
FIGURE 23AMINOACID CHANGES .................................................................................................................. 82
FIGURE 24 COMPARE VARIANT DNA AND RNA SEQ FROM OSA31 .................................................................... 84
FIGURE 25COMPARE VARIANT DNA AND RNA SEQ FROM OSA31 CONTINUED .................................................... 85
FIGURE 26 CREATING TRACKS ...................................................................................................................... 86
FIGURE 27MUTATION SIGNATURE ................................................................................................................ 90
FIGURE 28 BROWER EXAMPLE FOR MUTATION SIGNATURES OBSERVED IN OSA31 GENOME .................................... 93
FIGURE 29KEY GENES MUTATED IN OSTEOSARCOMA ........................................................................................ 94
FIGURE 30 HIGHEST GENES FOUND BOTH IN DNA AND RNA TUMOUR ................................................................ 96
FIGURE 31 PROGNOSTIC BIOMARKERS ........................................................................................................... 97
FIGURE 32 POTENTIAL CANINE VACCINE LIST ................................................................................................... 98
FIGURE 33 PANEL OF CANINE CANCER OSTEOSARCOMA CELL LINES TESTED FOR LEVELS OF HSP70, HSP90, P53, AND
MDM2 PROTEINS. ......................................................................................................................... 100
FIGURE 34 CHARACTERISATION OF P53 AND HSP70....................................................................................... 102
FIGURE 35OSA AND D17 TREATED WITH GANETESPIB AND NUTLIN .................................................................. 104
FIGURE 36 PLA SYSTEM DETECTS CANINE HSP/C70/MDM2 INTERACTIONS ..................................................... 105
FIGURE 37 WESTERN BLOT ANALYSIS OF PROTEOMICS SAMPLES ....................................................................... 107
FIGURE 38 SCATTER PLOT INDICATING PROTEINS UPREGULATED/DOWNREGULATED WITH GANETESPIB TREATMENT ... 111
FIGURE 39 UPREGULATED PROTEINS IN A CANINE OSTEOSARCOMA CELL LINE TREATED WITH GANETESPIB ................ 113
FIGURE 40 UPREGULATED PROTEINS WITH GANETESPIB .................................................................................. 114
FIGURE 41 DOWNREGULATED PROTEINS IN OSA31 CELLS WITH GANETESPIB TREATMENT .................................... 117
FIGURE 42 DOWNREGULATED PROTEINS IN OSA31 CELLS WITH GANETESPIB TREATMENT .................................... 118
FIGURE 43 SCATTER PLOT INDICATING GENES UPREGULATED/DOWNREGULATED WITH NUTLIN TREATMENT .............. 121
FIGURE 44 UPREGULATED GENES WITH NUTLIN TREATMENT IN OSA31 CELLS ..................................................... 122
FIGURE 45 UPREGULATED PROTEINS IN OSA31 CELLS WITH NUTLIN TREATMENT ................................................ 123
FIGURE 46 DOWNREGULATED GENES WITH NUTLIN IN OSA31 CELLS ................................................................. 124
FIGURE 47 MDM2 INTERACTOME AND P53 UBIQUITINATION ......................................................................... 132
FIGURE 48 COMPONENTS REGULATING P53 UBIQUITINATION .......................................................................... 134
FIGURE 49 EWING SARCOMA AND HSP90 INHIBITORS ................................................................................... 136
FIGURE 50 CELL DENSITY INFLUENCES MDM2 PROTEIN EXPRESSION LEVELS ....................................................... 138
FIGURE 51 GANETESPIB STABILISES HSP/C70 AND MDM2 COMPLEXES. .......................................................... 140
FIGURE 52 MDM2 AND HSP70 LOCALISATION WITH DRUG TREATMENTS ......................................................... 141
FIGURE 53 VALIDATION OF HSC/P 70 AND MDM2 INTERACTION ................................................................... 144
FIGURE 54 COMBINATORIAL EFFECTS OF NUTLIN AND GANETESPIB ON IRF-1 DEPLETION ...................................... 147
xvii
FIGURE 55 EFFECT OF COMBINATORIAL TREATMENT ON IRF-1 LOCALISATION ..................................................... 148
FIGURE 56 CELL VIABILITY WITH NUTLIN AND GANETESPIB TREATMENTS. ........................................................... 150
FIGURE 57 HSP90 INHIBITOR DOWNREGULATES CLIENT PROTEINS.................................................................... 156
FIGURE 58 HSP90 LOCALISATION IN A375 CELL LINES ................................................................................... 157
FIGURE 59 LOSS OF IRF-1 IS A P53 INDEPENDENT MECHANISM ....................................................................... 159
FIGURE 60 ATTENUATION OF IRF-1 IS POST-TRANSLATIONAL .......................................................................... 161
FIGURE 61PROXIMITY LIGATION ASSAY SYSTEM DETECTS INDUCED HSP70 AND MDM2 INTERACTION WITH GANETESPIB
................................................................................................................................................... 164
FIGURE 62 PROXIMITY LIGATION ASSAY SYSTEM DETECTS HSP70 AND CHIP INTERACTION WITH GANETESPIB AND NUTLIN
TREATMENT ................................................................................................................................... 165
FIGURE 63 PLA SYSTEM DETECTS MDM2 AND CHIP INTERACTION WITH GANETESPIB AND NUTLIN TREATMENT ...... 166
FIGURE 64 LOCALISATION OF MDM2 AND CHIP WITH GANETESPIB AND NUTLIN TREATMENT .............................. 167
FIGURE 65 ROLE OF CHIP AND MDM2 IN DOWNREGULATION OF IRF-1 WITH GANETESPIB TREATMENT ................ 170
FIGURE 66 PROXIMITY LIGATION ASSAY DETECTS INDUCED HSC70/MDM2 INTERACTION WITH GANETESPIB TREATMENT
................................................................................................................................................... 171
FIGURE 67 IRF-1 AND HSP70 INTERACTIONS WITH GANETESPIB TREATMENT .................................................... 174
FIGURE 68 CHAPERONE MEDIATED AUTOPHAGY ............................................................................................ 179
FIGURE 69 PROXIMITY LIGATION ASSAY DETECTION OF HSC70/MDM2 WITH AUTOPHAGY AND PROTEASOME INHIBITORS
................................................................................................................................................... 181
FIGURE 70 TMT MASS SPECTROMETRY ....................................................................................................... 183
FIGURE 71 SCATTER PLOT INDICATING GENES UPREGULATED/DOWNREGULATED WITH GANETESPIB TREATMENT ....... 185
FIGURE 72UPREGULATED GENES WITH GANETESPIB ....................................................................................... 186
FIGURE 73 DOWNREGULATED GENES WITH GANETESPIB ................................................................................ 187
FIGURE 74 SCATTER PLOT INDICATING GENES UPREGULATED/DOWNREGULATED WITH NUTLIN TREATMENT .............. 190
FIGURE 75 UPREGULATED GENES WITH NUTLIN ............................................................................................ 191
FIGURE 76 DOWNREGULATED GENES WITH NUTLIN ....................................................................................... 192
FIGURE 77 SCATTER PLOT INDICATING GENES UPREGULATED/DOWNREGULATED WITH COMBINATORIAL TREATMENT .. 195
FIGURE 78 UPREGULATED GENES WITH COMBINATORIAL TREATMENT ............................................................... 196
FIGURE 79 DOWNREGULATED GENES WITH COMBINATORIAL TREATMENT .......................................................... 197
FIGURE 80 WESTERN BLOT ANALYSIS OF THE ROLE OF UBA-3 AS POTENTIAL E1 LIGASE ........................................ 199
FIGURE 81 CYTOKINES INDUCE JANUS KINASE/SIGNAL TRANSDUCERS AND ACTIVATORS OF TRANSCRIPTION (JAK/STAT)
PATHWAY ACTIVATION ..................................................................................................................... 204
FIGURE 82 IMMUNE CHECKPOINT PATHWAYS ............................................................................................... 208
FIGURE 83 GANETESPIB DOWNREGULATES IFNΓ-INDUCED IRF-1 EXPRESSION IN MELANOMA CELLS. ....................... 211
FIGURE 84 IRF-1 ACTIVATION VIA IFNΓ IS DOSE AND TIME DEPENDENT ............................................................. 214
FIGURE 85 IRF-1 LOCALISATION WITH IFNΓ TIME COURSE .............................................................................. 215
FIGURE 86 GANETESPIB DOWNREGULATES IFNΓ INDUCED PD-L1 EXPRESSION. ................................................... 218
xviii
FIGURE 87 LOCALISATION OF PD-L1........................................................................................................... 219
FIGURE 88 GANETESPIB DOWNREGULATES PRE-TREATED IFNΓ-INDUCED PD-L1 EXPRESSION. ................................ 221
FIGURE 89 IFNΓ-INDUCED EXPRESSION OF PD-L1 IS IRF-1 DEPENDENT ............................................................. 223
FIGURE 90 IRF-1 LOCALISATION AFTER IFNΓ STIMULATION ............................................................................. 224
FIGURE 91 ATTENUATION OF IFN-INDUCED PD-L1 IS CELL TYPE DEPENDENT ...................................................... 226
FIGURE 92 DOWNREGULATION OF IFNΓ-INDUCED PD-L1 BY GANETESPIB IS REGULATED VIA THE ATG5 GENE .......... 229
FIGURE 93 IFNΑ INDUCED PD-L1 DOWNREGULATION BY GANETESPIB .............................................................. 232
FIGURE 94 SUMMARY FOR POTENTIAL EFFECTS OF GANETESPIB ON TUMOUR CELLS .............................................. 238
FIGURE 95CHAPERON MEDIATED AUTPHAGY ................................................................................................ 244
FIGURE 96 UPREGULATED WITH GANETESPIB ................................................................................................ 270
FIGURE 97 UPREGULATED WITH NUTLIN....................................................................................................... 272
FIGURE 98 DOWNREGULATED WITH GANETESPIB .......................................................................................... 273
FIGURE 99DOWNREGULATED WITH NUTLIN .................................................................................................. 274
FIGURE 100GAN+NUT UPREGULATED ......................................................................................................... 275
FIGURE 101NUTLIN+GAN DOWNREGULATED ................................................................................................ 276

xix
List of Tables
TABLE 1 ANTIBODIES ................................................................................................................................. 55
TABLE 2 CELL LINES AND CULTURE MEDIA ....................................................................................................... 58
TABLE 3 DRUGS: PRINCIPAL EFFECTS AND WORKING CONCENTRATIONS ............................................................. 63
TABLE 4 SAMPLES FOR TMT ........................................................................................................................ 68
1
1.1 Chapter 1 Introduction
1.1 Molecular Chaperone proteins
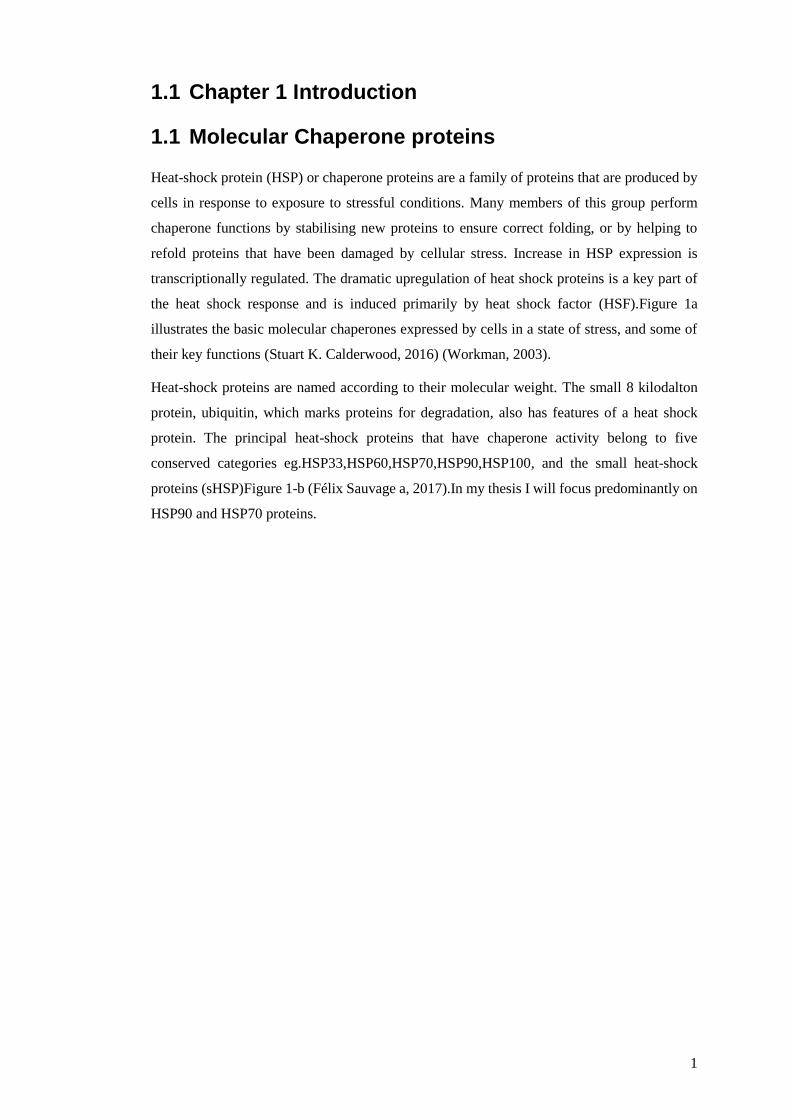
Heat-shock protein (HSP) or chaperone proteins are a family of proteins that are produced by
cells in response to exposure to stressful conditions. Many members of this group perform
chaperone functions by stabilising new proteins to ensure correct folding, or by helping to
refold proteins that have been damaged by cellular stress. Increase in HSP expression is
transcriptionally regulated. The dramatic upregulation of heat shock proteins is a key part of
the heat shock response and is induced primarily by heat shock factor (HSF).Figure 1a
illustrates the basic molecular chaperones expressed by cells in a state of stress, and some of
their key functions (Stuart K. Calderwood, 2016) (Workman, 2003).
Heat-shock proteins are named according to their molecular weight. The small 8 kilodalton
protein, ubiquitin, which marks proteins for degradation, also has features of a heat shock
protein. The principal heat-shock proteins that have chaperone activity belong to five
conserved categories eg.HSP33,HSP60,HSP70,HSP90,HSP100, and the small heat-shock
proteins (sHSP)Figure 1-b (Félix Sauvage a, 2017).In my thesis I will focus predominantly on
HSP90 and HSP70 proteins.

2
Figure 1 Chaperone proteins
(a) Heat shock response pathways and hypoxia adaptive responses; adapted from (Neil C Chi,
2004) (b) These are the major HSPs induced by heat shock. Their roles in cancers of various
morphologies have been reviewed previously. Co-chaperones HSP10, HSP40, Grpe, Bag1, Bag3,
Hip, Hop, CHIP, p23, Aha1FKBP51 and FKBP52, Cyp40, and Cdc37 facilitate interactions of the
primary chaperone with client proteins. (Stuart K. Calderwood, 2016)
(a)
(b)
3
1.1.1 Chaperone machinery
The chaperone machinery consists of HSP90 associated with co-chaperones (including
HSP40, HSP27, HOP, Cdc37, p23 and Aha1) (Figure 2). Each co-chaperone has a specific
role in assisting HSP90 to repair and refold proteins. Many other proteins also play a role in
the chaperone cycle and oncogenesis, including immunophilins and the peptidylprolyl cis-
trans isomerases FKBP1 and 2. Most of the HSP90 co-chaperones are tetratricoprotein repeat
(TPR) proteins and interact with a specific sequence in the C-terminal domain of HSP90
(MEEVD motif). HOP was the first HSP90 ATPase regulatory co-chaperone to be described.
It is responsible for the coupling of HSP70 and HSP90 for the activation of steroid hormone
receptors mediated by HSP90. The Cdc37 adaptor is another kinase-specific co-chaperone that
can arrest the ATPase cycle of HSP90. Its N-terminal region interacts with protein kinases (as
client proteins) and its central and C-terminal domains interact with HSP90. This interaction
maintains an open conformation of HSP90 by preventing N-domain dimerization, and the N-
M domain docking required for ATP hydrolysis. In this way, Cdc37 inhibits ATP hydrolysis
and contributes to the prolonged association of HSP90 dimers with client proteins and to
effective chaperone action. Aha1 is a recently discovered co-chaperone that interacts with
HSP90 at the level of the M- and N-domains in presence or in absence of bound nucleotide.
This interaction stimulates the ATPase activity of HSP90. Aha1 and p23 have opposing effects
on HSP90, as p23 inhibits the ATPase activity, while Aha1 triggers the release of client protein
by stimulating ATP hydrolysis (Rappa F, 2012) (Félix Sauvage a, 2017).
Within the cell, proteins associated with Hp27 are passed on to HSP70–co-chaperone
complexes. Finally, the HSP70-bound clients are passed to HSP90 complexes, which carry
out the finishing touches, producing a folded and functional client protein. Inhibition of any
of these stages prevents the folding reaction. Activation of proteins complexed to HSP90
generally leads to their release; the released client is then transiently functional before it’s
unfolding and deactivation (Rappa F, 2012).
4
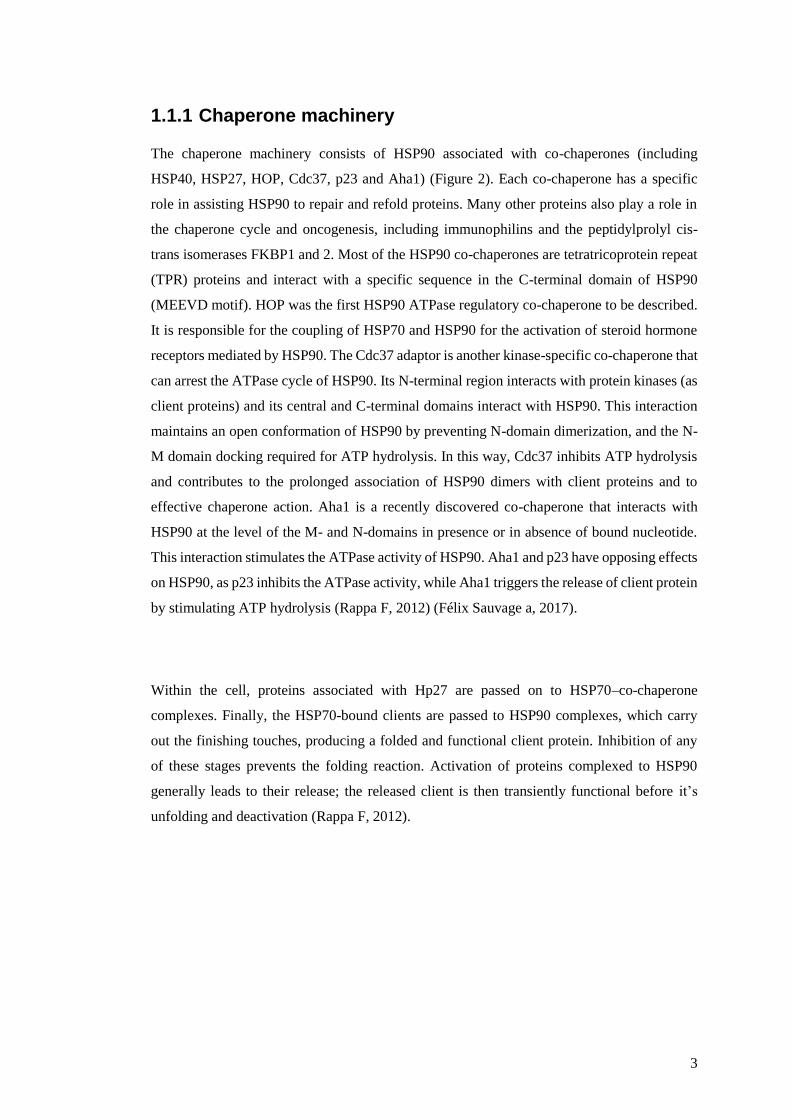
Figure 2 Chaperone machinery
HSP70, HSP40, and a client protein form an early complex. The client protein is transferred from
HSP70 to HSP90 through the adaptor protein HOP (STI1). Binding of HOP is sufficient to stabilise
the open conformation of HSP90. HSP90 adopts the ATPase-active (closed) conformation upon
binding of ATP. P23 (SBA1) stabilises the closed state of HSP90, which weakens the binding of
HOP and promotes its exit from the complex, hydrolysing ATP and liberating one phosphate
molecule (Pi). Potentially, an immunophilin-type protein (FKBP4) associates to form a late
complex, together with HSP90 and P23. After hydrolysis of ATP, P23 and the folded client are
released from HSP90. The cofactors CDC37, HOP, AHA1, and P23 accelerate or slow specific
steps of the cycle (Garcia-Carbonero R, 2013).
5
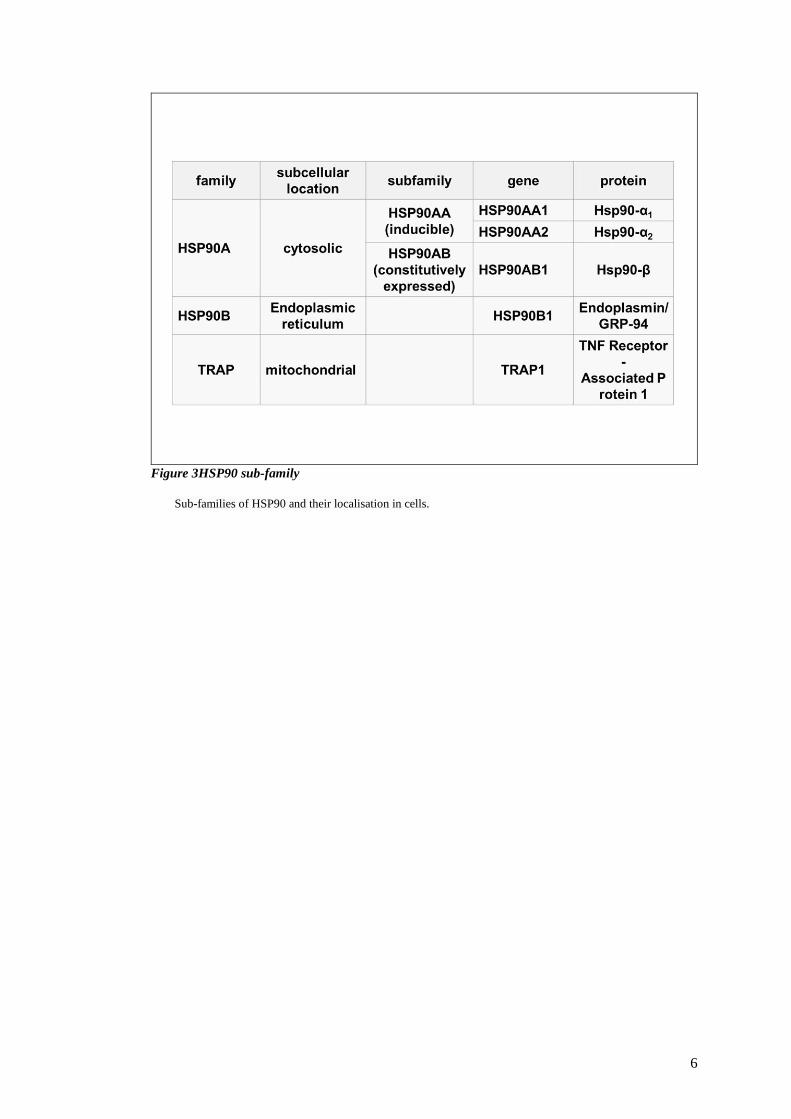
1.1.2 The HSP90 family and their subcellular localization
The HSP90 family in mammalian cells consists of four major homologues (Figure 3) (
(Sreedhar, 2004) (Whitesell L, 2005). HSP90a (inducible form/major form) and HSP90b
(constitutive form/minor form) are mostly found in the cytoplasm and the nucleus. HSP90a
and HSP90b share 86 % amino acid identity and are ubiquitously expressed in all nucleated
cells. In addition to HSP90a and HSP90b, there are two organelle-residing isoforms, the 94
kDa glucose-regulated protein (Grp94) and tumour necrosis factor (TNF) receptor-associated
protein 1 (Trap1). Grp94 is localised to the endoplasmic reticulum while Trap1 resides in the
mitochondrial matrix and the inner membrane space. Additionally, there are cell-surface-
bound or secreted HSP90s residing outside the cytoplasm, generally referred to as extracellular
HSP90 (eHSP90) (Tsutsumi S N. L., 2007). The eHSP90 is not an isoform of the HSP90
family but is actually an HSP90 that is cell-surface-bound or secreted from the cytoplasm.
Each individual isoform possesses a unique biological function, and participates in various
physiological and pathological processes (Sreedhar, 2004).
6
Figure 3HSP90 sub-family
Sub-families of HSP90 and their localisation in cells.
7
1.1.3 The HSP90 machinery
1.1.3.1 Structure
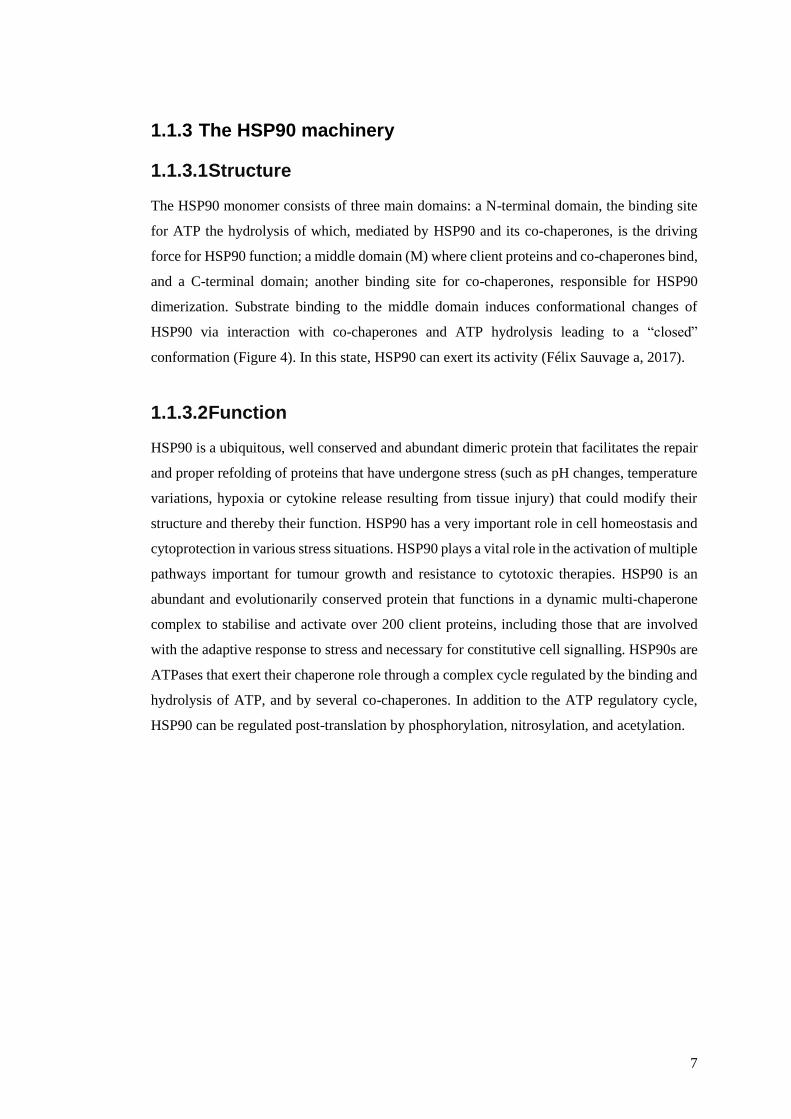
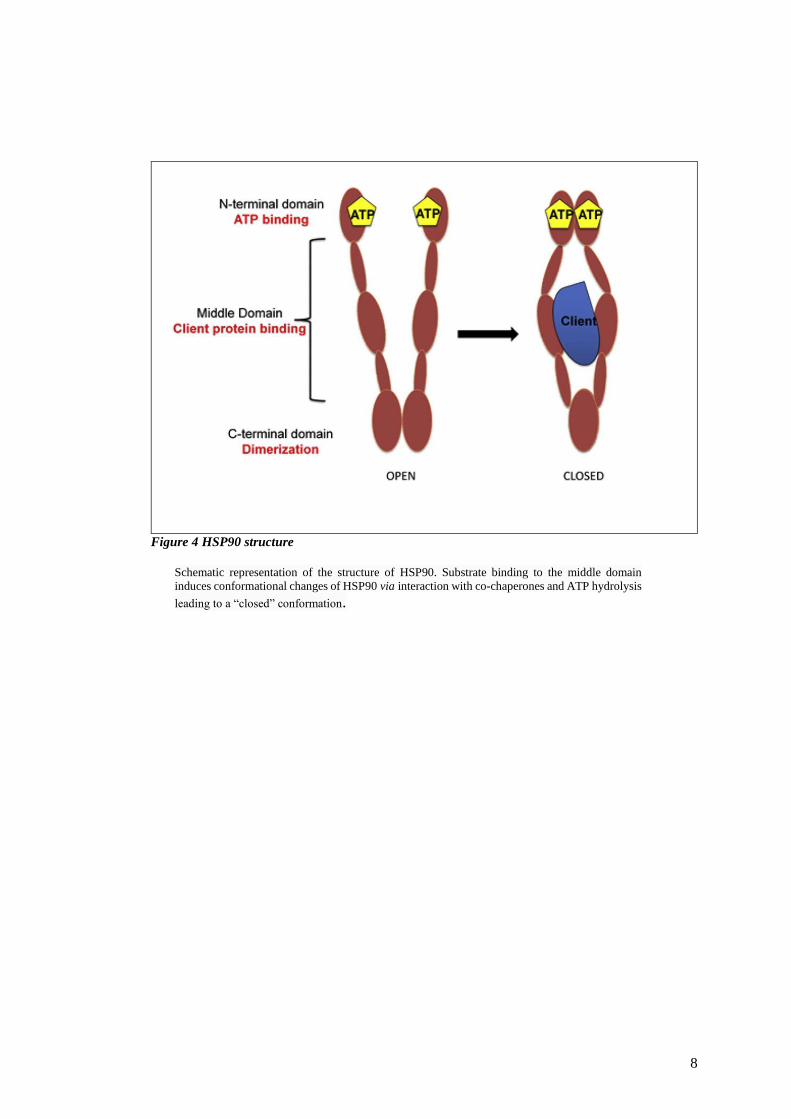
The HSP90 monomer consists of three main domains: a N-terminal domain, the binding site
for ATP the hydrolysis of which, mediated by HSP90 and its co-chaperones, is the driving
force for HSP90 function; a middle domain (M) where client proteins and co-chaperones bind,
and a C-terminal domain; another binding site for co-chaperones, responsible for HSP90
dimerization. Substrate binding to the middle domain induces conformational changes of
HSP90 via interaction with co-chaperones and ATP hydrolysis leading to a “closed”
conformation (Figure 4). In this state, HSP90 can exert its activity (Félix Sauvage a, 2017).
1.1.3.2 Function
HSP90 is a ubiquitous, well conserved and abundant dimeric protein that facilitates the repair
and proper refolding of proteins that have undergone stress (such as pH changes, temperature
variations, hypoxia or cytokine release resulting from tissue injury) that could modify their
structure and thereby their function. HSP90 has a very important role in cell homeostasis and
cytoprotection in various stress situations. HSP90 plays a vital role in the activation of multiple
pathways important for tumour growth and resistance to cytotoxic therapies. HSP90 is an
abundant and evolutionarily conserved protein that functions in a dynamic multi-chaperone
complex to stabilise and activate over 200 client proteins, including those that are involved
with the adaptive response to stress and necessary for constitutive cell signalling. HSP90s are
ATPases that exert their chaperone role through a complex cycle regulated by the binding and
hydrolysis of ATP, and by several co-chaperones. In addition to the ATP regulatory cycle,
HSP90 can be regulated post-translation by phosphorylation, nitrosylation, and acetylation.
8
Figure 4 HSP90 structure
Schematic representation of the structure of HSP90. Substrate binding to the middle domain
induces conformational changes of HSP90 via interaction with co-chaperones and ATP hydrolysis
leading to a “closed” conformation.
9
1.1.4 HSP70
HSP70 contains two major functional domains, including a C-terminal peptide-binding
sequence and an N-terminal ATPase domain that permits the folding of denatured client
proteins. In brief, HSP70 is able to bind to unfolded proteins, and enable their folding. HSP70
is then released from the folded client when ATP bound to the N-terminal domain is
hydrolysed, by utilizing its intrinsic ATPase activity. It should be noted that, within the
environment of the cell, most chaperones require the aid of several co-chaperones to amplify
the rates of client association, ATPase activity, and nucleotide exchange (Félix Sauvage a,
2017) (Gabai, 2015) (Matthias P. Mayer, 2000).
By contrast, HSP70 association was shown to lead to loss of activity in the client protein
partner through partial unfolding and, thus, HSP70 could function as an inhibitor of some
processes. Elevated levels of HSP70 inhibit the apoptotic cascade by such a mechanism. The
coordinate induction of individual HSPs by stress suggested a shared mechanism regulating
their expression (Gabai, 2015).
1.1.5 HSF1
When cells are undergoing stress and in some other situations such as treatment with N-
terminal HSP90 inhibitors, a heat shock response (HSR) is triggered. This phenomenon
involves the induction of several heat shock proteins, including HSP70 and HSP27, and is
regulated at the transcriptional level by heat shock factor 1 (HSF-1), which acts as the
“conductor” of the HSR.
In normal situations, HSF-1 is bound to HSP90 in the form of inactive monomers. Under
stress situations, this complex dissociates and HSF-1 is released, hyperphosphorylated and
binds to DNA in the form of an active trimer, resulting in the transcription of HSP genes.
During recovery periods, when the stress situation is over, activated HSF-1 is repressed by the
pool of chaperones. There are several hypotheses regarding this phenomenon, including that
some chaperones (HSP70, HSP90 and HSP40) act as sensors and are thus able to induce a
negative regulation of the HSR after stress periods. This suggests that accumulated chaperones
may have a repressive activity on transcription to allow a return to homeostasis. Therefore,
HSF-1 plays a central role in the response to inhibitors (Félix Sauvage a, 2017)
10
1.2 Chaperones and cancer
In cancer, growth control is deregulated and proliferation resumes. When growth is required,
normal cells receive instruction for proliferation from secreted growth factors. The factors then
bind to high-affinity receptor proteins that have extracellular binding surfaces as well as
intracellular signalling domains. Thus, receptors accept the growth signal and transmit it into
the interior of the cell. Signals then pass through a series of relay proteins that amplify the
message, leading ultimately to cell proliferation. Deregulation at each of the signal
transduction stages can be oncogenic due to unscheduled proliferation. Most of the receptors
and enzymes that constitute the cascade are oncogenic when expressed at elevated levels or
activated through mutation. Many of these proteins are clients of HSP90; therefore,
amplification of HSP90 is permissive for unrestrained proliferation. Thus, HSP90 chaperone
complexes maintain the signalling circuitry that underlies the capacity of many cancers for
independent growth (Figure 5) (Stuart K. Calderwood, 2016).
1.2.1 Targeting HSP90 in cancer therapy
Among HSP90 client proteins, several are involved in the so-called “hallmarks of cancer”,
first proposed by Hanahan and Weinberg and therefore contribute to tumorigenic cell
stabilization (Hanahan, 2011) Figure 5. These proteins have a major role in cancer, and include
protein kinases, telomerases and steroid hormone receptors as well as transcription factors.
Therefore, proliferation, apoptosis and metabolism pathways are all concerned in the
chaperoning of HSP90. The accumulation of mutated and dysregulated oncoproteins has been
associated with modification of HSP90 properties. Finally, as client oncoproteins display
stable association with HSP90, the latter is more activated in tumour cells hence a higher
affinity for inhibitors. These singular properties make the targeting of HSP90 a highly
promising approach to cancer therapy since the inhibition of a single target can result in
multiple effects on oncogenesis-associated phenomena. When the function of HSP90 is
inhibited, the client protein cannot be properly stabilized and will be targeted to the proteasome
by the ubiquitin-ligase system. The extent and duration of protein degradation with HSP90
inhibition might vary substantially for specific client proteins, with HER2 and ALK–EML4
showing the highest sensitivity. (workman, 2004)
11
As a result, oncogenic proteins involved in the cancer hallmarks are degraded, leading to the
possibility of various anticancer effects such as cell growth arrest and apoptosis induction.
HSP90 inhibition has also been known to be radiation sensitising on tumour cells (Yifan
Wang, 2016)
Some of major roles of chaperones in the tumour environment are mentioned below.
1.2.1.1 Escaping Antigrowth Signals
One of the principal factors that control the development of cancer is p53, a protein with a role
in mediating growth arrest and apoptosis in response to DNA damage. Inactivating mutations
in Tp53 (the gene encoding p53) appear to be dominant to the other, normal allele. Expression
of HSP70 and HSP90 increases to high levels in tumours with mutated p53, and both
chaperones may have roles in stabilising the altered conformation of mutant p53. HSP27
interacts with wild-type p53 in a pathway that leads to functional inactivation and interruption
of senescence (Hanahan, 2011) (Félix Sauvage a, 2017)
1.2.1.2 Limitless Proliferation and Avoidance of Senescence
HSPs are also effective at interrupting another pathway of cell inactivation, in this case by
inhibiting cell senescence. Normal cells resist transformation by having a limited number of
permitted divisions. This system is based on the lack of replication of chromosome ends at
each cell division; the capping structures at the chromosome ends become progressively
shortened, leading to arrest of further division and cell senescence.
Cancer cells evade the senescence programme by deploying the enzyme telomerase, which
replaces the shortening ends of telomeres. HSP90 binds to telomerase and is required for its
efficient function. Thus, HSP90 might deter senescence by chaperoning telomerase and
overcoming the erosion of telomeres over time when expressed to high levels, as in cancer.
Indeed, chemical targeting of HSP90 inhibits telomerase function, confirming a role for the
chaperone in limiting senescence in cancer. In addition, HSP27 and HSP70 inhibit the effector
arm of the senescence pathway by reducing the effectiveness of p53 in promoting cell
senescence. p53 transcriptionally upregulates cell cycle protein p21, which directly arrests
proliferation, and this process is inhibited by high levels of HSP70. Thus, the exaggerated
levels of HSPs in cancer provide an environment that is conducive to maintaining the status of
the potentially immortal cancer cell (Stuart K. Calderwood, 2016).

12
1.2.1.3 Angiogenesis
Growing tumours inevitably outgrow the local blood supply as they increase in size, and begin
to become starved of oxygen. However, tumour cells are able to deploy hypoxia inducible
factors (HIF), proteins that can sense the low oxygen environment and mediate the expression
of growth factors, such as vascular endothelial growth factor (VEGF), which increase the
growth of the tumour capillary network. Recent reports also indicate that HSP27 becomes
proangiogenic when released from tumour cells and can bind to receptors, stimulating VEGF
transcription through an alternative pathway involving the factor NF-kB. Extracellular HSP27
also exerts proangiogenic properties through direct interactions with VEGF in the medium.
(Stuart K. Calderwood, 2016)
13
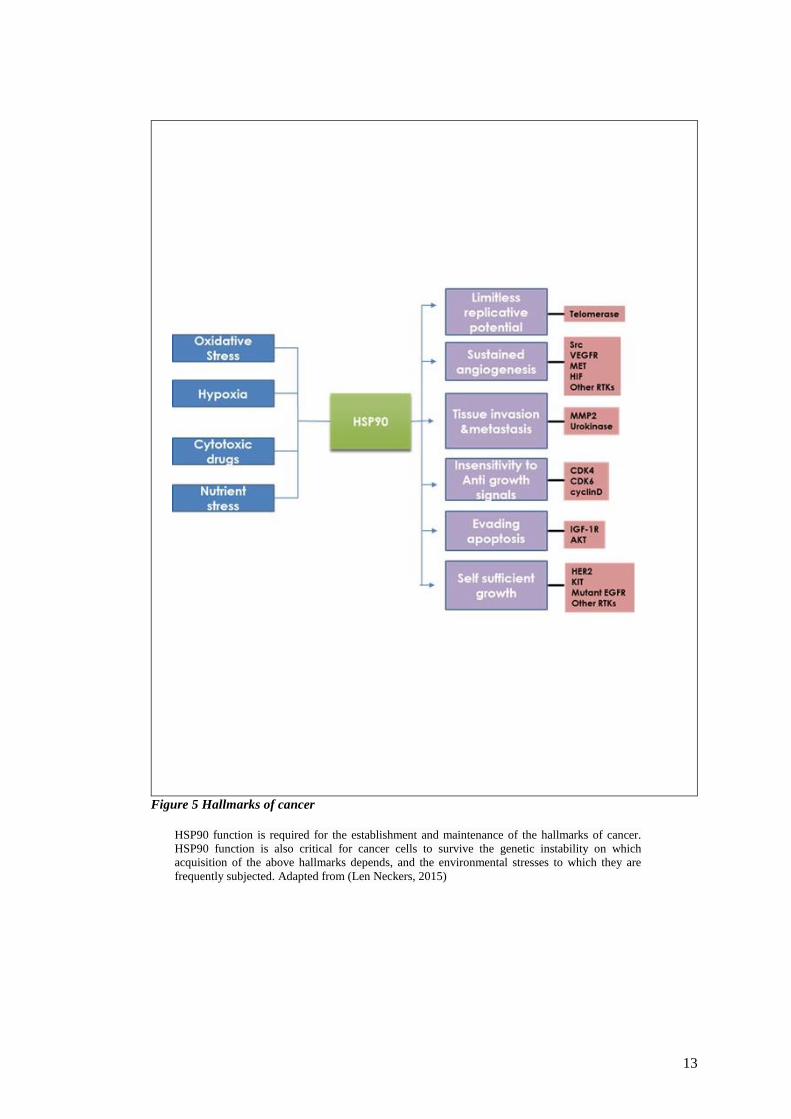
Figure 5 Hallmarks of cancer
HSP90 function is required for the establishment and maintenance of the hallmarks of cancer.
HSP90 function is also critical for cancer cells to survive the genetic instability on which
acquisition of the above hallmarks depends, and the environmental stresses to which they are
frequently subjected. Adapted from (Len Neckers, 2015)
14
1.3 HSP90 drugs in clinics
Compared with normal cells, neoplastic cells exhibit greater dependence on chaperone
proteins, which play a critical role in signal transduction, cell cycle regulation, and apoptosis
(S. Parimi, 2014). As a result, HSP90 represents an attractive target for cancer therapy.
HSP90 can be targeted by different families of inhibitors, which act mainly on the N-terminal
or the C-terminal domain. The N-terminal domain containing the ATP binding site has been
shown to be the binding site of the antitumour antibiotics geldanamycin (GA) and radicicol
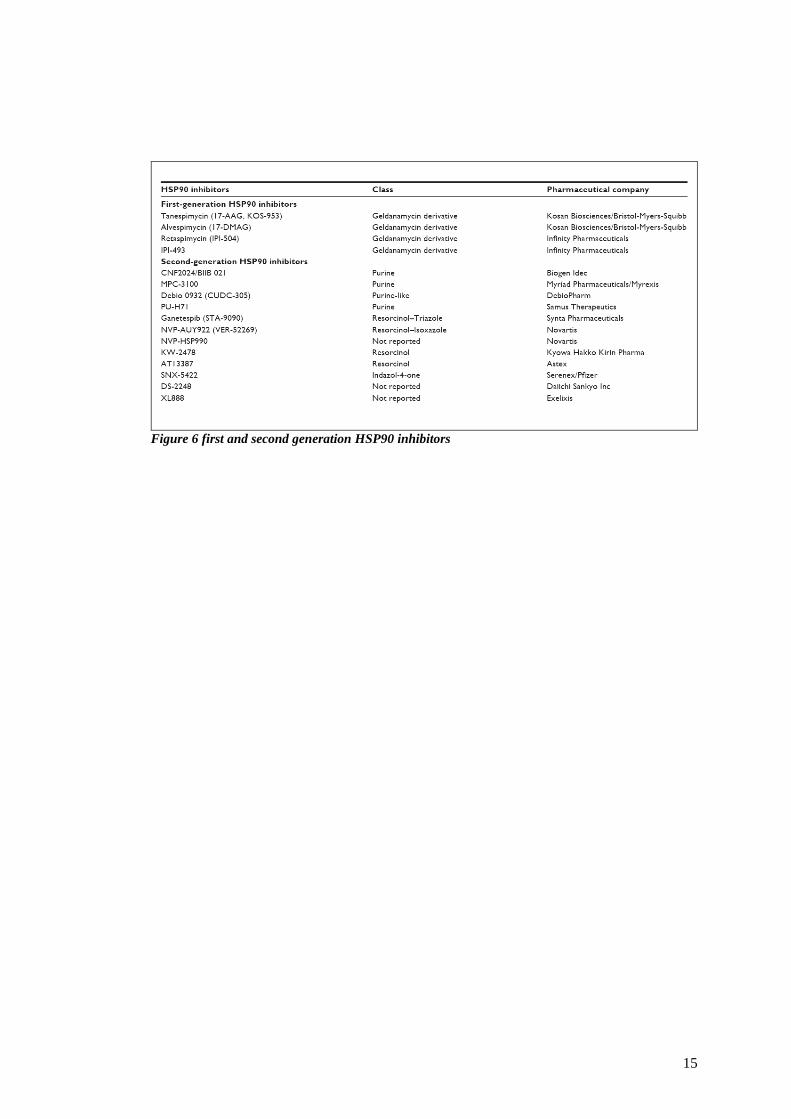
(Félix Sauvage a, 2017) .The first and second generation HSP90 inhibitors are mentioned in
Figure 6.
The prototype HSP90 inhibitor geldanamycin provided proof-of-concept for HSP90
inhibition. However, geldanamycin and its derivatives [17-AAG] and [17-DMAG]) could not
be fully developed due to a number of safety and pharmacological limitations. Consequent
efforts using a variety of different chemical scaffolds have led to the development of highly
potent, second-generation, small molecule HSP90 inhibitors with improved pharmacological
properties and safety profiles (Komal Jhaveri, 2015).
Trials of early-generation HSP90 inhibitors in oncology demonstrated limited efficacy
(especially when administered as monotherapy), poor solubility, and dose-limiting toxicities
(including hepatotoxicity); however, encouraging progress has been made with newer-
generation inhibitors. Here, I focus on some of promising HSP90 inhibitors, retaspimycin,
ganetespib, AT13387 and NVP-AUY922, that are currently under evaluation, either as
monotherapy or in combination therapy, for lung and breast cancers ( Figure 7), and I will
discuss their potential relevance for future clinical practice. (S. Parimi, 2014) (Komal Jhaveri,
2015)
15
Figure 6 first and second generation HSP90 inhibitors
16
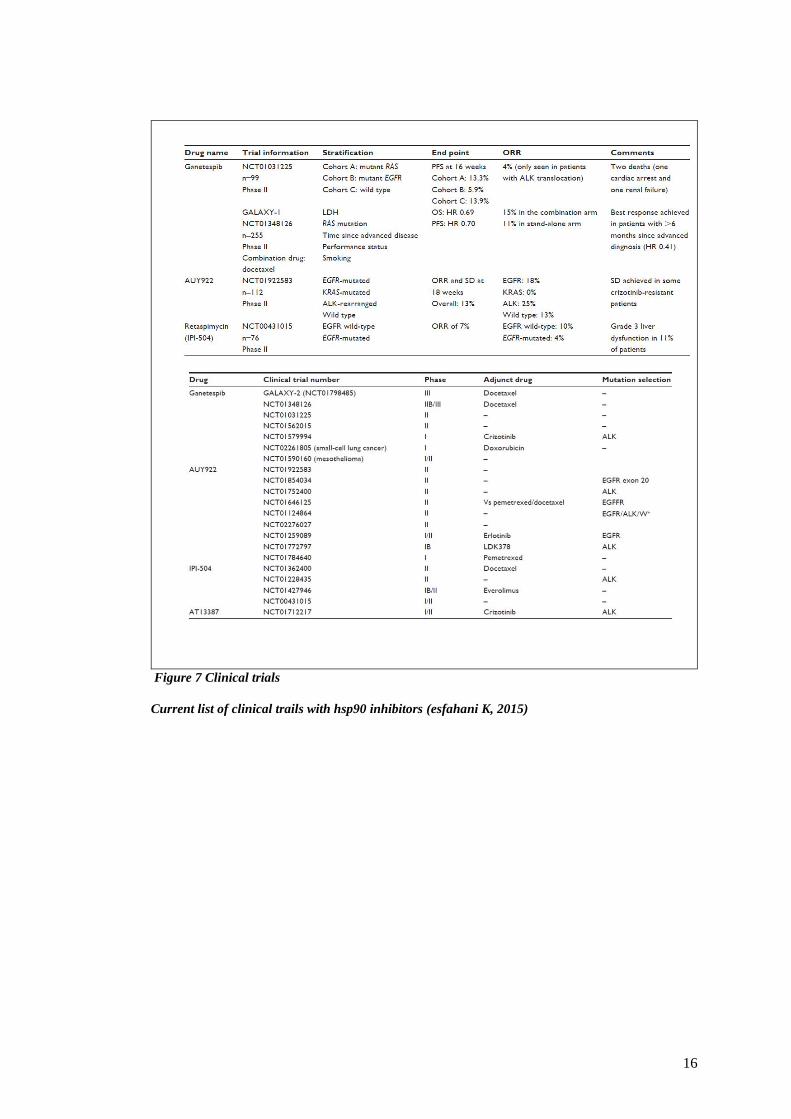
Figure 7 Clinical trials
Current list of clinical trails with hsp90 inhibitors (esfahani K, 2015)
17
1.3.1 RETASPIMYCIN
Retaspimycin (IPI-504) is a benzoquinone ansamycin antibiotic and second-generation (water
soluble) HSP90 inhibitor. Like other HSP90 inhibitors, retaspimycin uses the ubiquitin–
proteasome pathway to break down key client proteins important in oncogenesis. Unlike its
first-generation predecessors (geldanamycin, tanespimycin (17AAG), alvespimycin), which
had disappointing results in clinical trials or were associated with dose-limiting toxicities (or
both), retaspimycin is associated with better water solubility, greater potency, and fewer
toxicities. Nonetheless, as with other second-generation HSP90 inhibitors, retaspimycin is
administered intravenously and poses a risk of hepatotoxicity (S. Parimi, 2014).
Retaspimycin has been evaluated in malignancies such as chronic myelogenous leukemia,
multiple myeloma, gastrointestinal stromal tumour, non-small-cell lung cancer (NSCLC), and
breast cancer. Based on early-phase clinical trial results to date, retaspimycin has demonstrated
the most promise in the NSCLC population, especially for tumours that harbour
the ALK rearrangement. Pre-clinically, antitumour effects were observed for retaspimycin,
both as a single agent and in combination with trastuzumab or lapatinib, in HER2 -positive
disease resistant to standard therapies. Retaspimycin has also been evaluated in combination
with taxanes in patients with metastatic NSCLC in an expansion of a Phase IB trial. (esfahani
K, 2015)
1.3.2 NVP-AUY922
NVP-AUY922 is another resorcinol derivative and second-generation HSP90 inhibitor
currently under clinical investigation. As an isoxazole amide, it is considered one of the most
potent HSP90 inhibitors developed to date. In a phase I trial in 96 patients with advanced solid
tumours, disease stabilisation was observed in 16 patients, the drug was reasonably well
tolerated, with the main adverse effects being diarrhoea, nausea and vomiting, fatigue, and
ocular toxicities (S. Parimi, 2014).
Like other HSP90 inhibitors in development, NVP-AUY922 appears to hold the greatest
promise in NSCLC. In a phase II trial in 112 treatment-refractory patients with
advanced NSCLC , promising clinical activity was observed, with partial responses observed in
13 of 101 patients (13%), including 2 of 8 who were ALK -positive, 6 of 33
with EGFR mutation, and 4 of 30 with wild-type EGFR, KRAS, and ALK (S. Parimi, 2014)
18
In preclinical studies, it has been shown to have clinical activity in lung cancer cells with MET-
and AKL-mediated resistance. AUY922 treatment effectively suppressed proliferation and
induced cell death in both resistant cell lines by downregulating EGFR, MET, and AXL
expression, which led to decreased AKT-pathway activation. AUY922 has also been shown
to act as a radio-sensitiser to cell lines with acquired resistance to EGFR inhibitors. These cell-
line studies have been replicated in animals with NSCLC xenograft tumours with MET- and
AXL-mediated resistance. AUY922 has also been combined with trastuzumab in patients with
HER2-amplified or HER2-mutated NSCLC. (esfahani K, 2015)
1.3.3 AT13387
AT13387 is a potent second-generation nonansamycin HSP90 inhibitor. It has been shown to
have effects in NSCLC cell lines, as well as in mouse xenograft models. Its long duration of
action has enabled once-weekly dosing. AT13387 has also shown clinical efficacy in ALK-
rearranged cell lines, as well as in mouse xenograft models injected with those cells (esfahani
K, 2015).
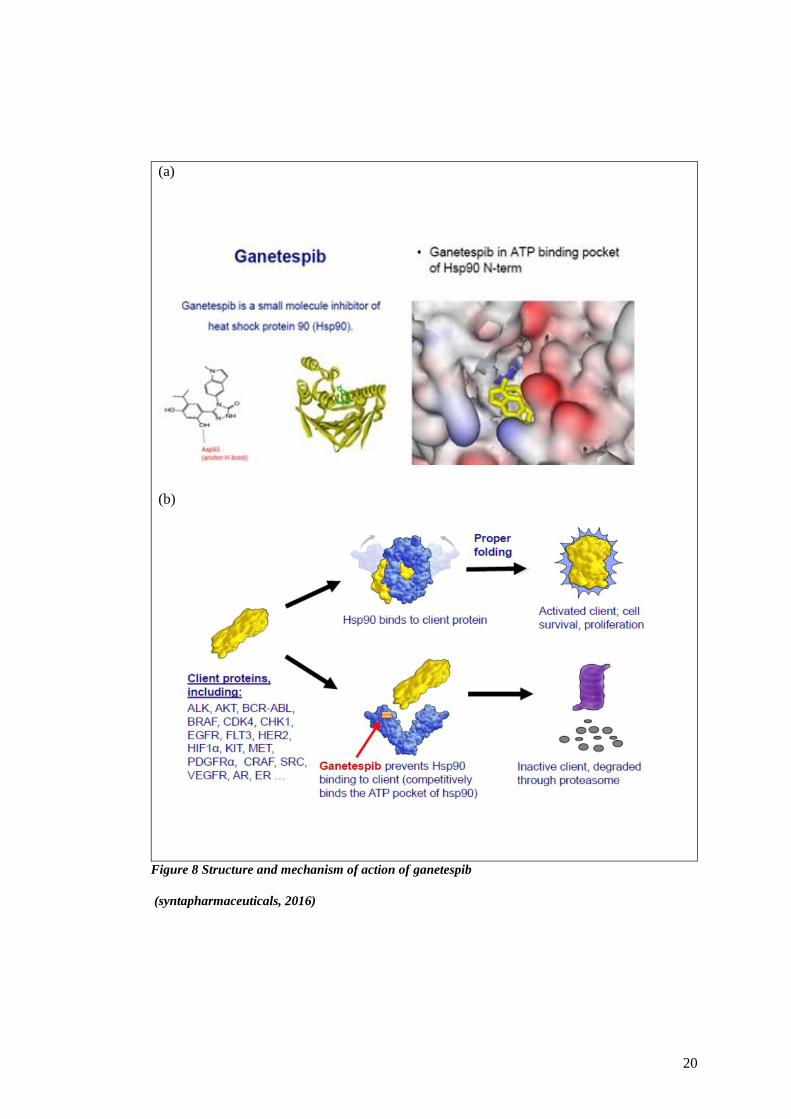
1.3.4 Ganetespib
Ganetespib (STA-9090) is a resorcinol-containing triazole that has shown greater potency,
improved tumour penetration, and a more favourable toxicity profile than tanespimycin in
preclinical models. Ganetespib inhibits HSP90 protein by acting on the ATP-binding domain
at the N-terminus Figure 8a (Ziyan Y. Pessetto, 2017). Overall, ganetespib seems to be well
tolerated, with no reports of severe ocular, cardiac, liver, or renal toxic effects. (Rocio Garcia-
Carbonero, 2013).
Ganetespib has been safely used in thousands of patients in over 60 clinical trials
internationally. Ganetespib has been evaluated in a number of malignancies, including
melanoma, chronic myelogenous leukaemia, gastrointestinal stromal tumour, and colorectal,
lung, and breast cancers. (esfahani K, 2015)
Ganetespib has greater potency and potential efficacy against several NSCLC subsets,
including those harbouring EGFR or ERBB2 mutations. Treatment with ganetespib resulted in
decreased downstream signalling through the PI3K–AKT–mTOR and RAF–MEK–ERK
pathways (Figure 8b). Ganetespib also overcame multiple forms of crizotinib resistance,

19
including secondary ALK mutations. Additionally, ganetespib lacks the ocular toxicity that has
been reported with NVP-AUY922. Taken together, these promising results suggest that
ganetespib may be more potent in its antitumour activity compared with first-generation
inhibitors and has an optimal safety profile that predicts for a superior therapeutic index. This
has provided a compelling rationale to further develop this agent clinically. (Komal Jhaveri,
2015)
20
(a)
(b)
Figure 8 Structure and mechanism of action of ganetespib
(syntapharmaceuticals, 2016)
21
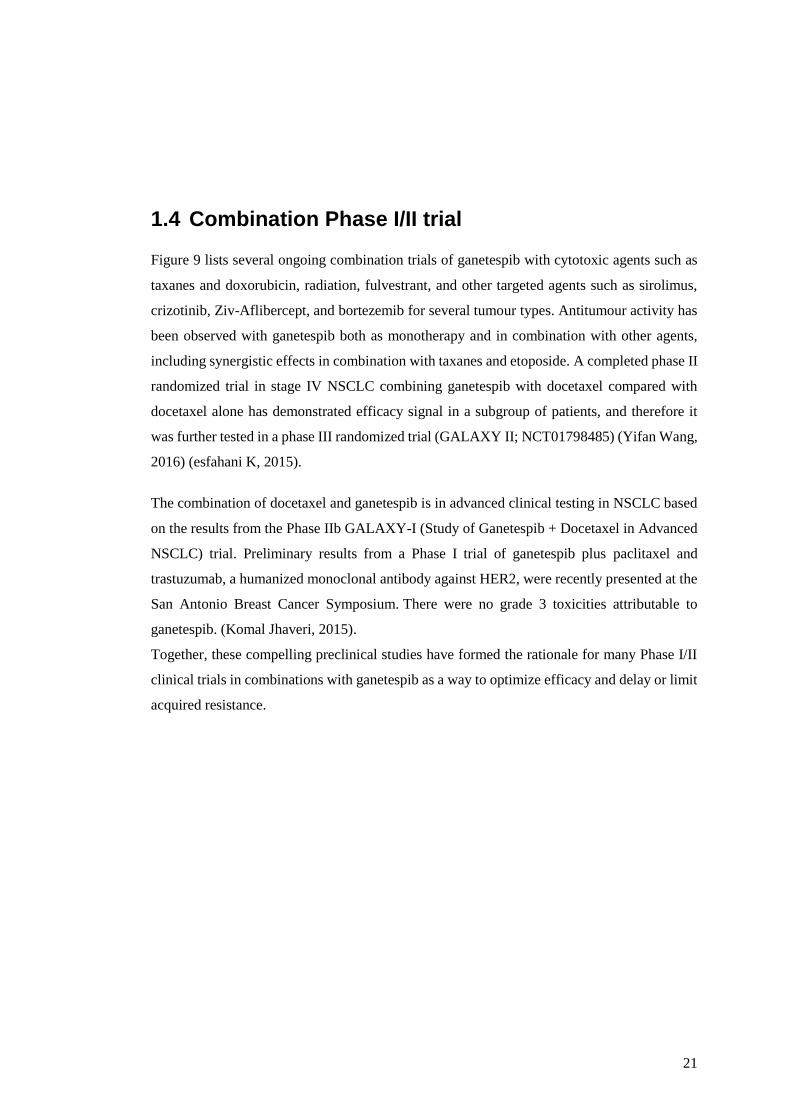
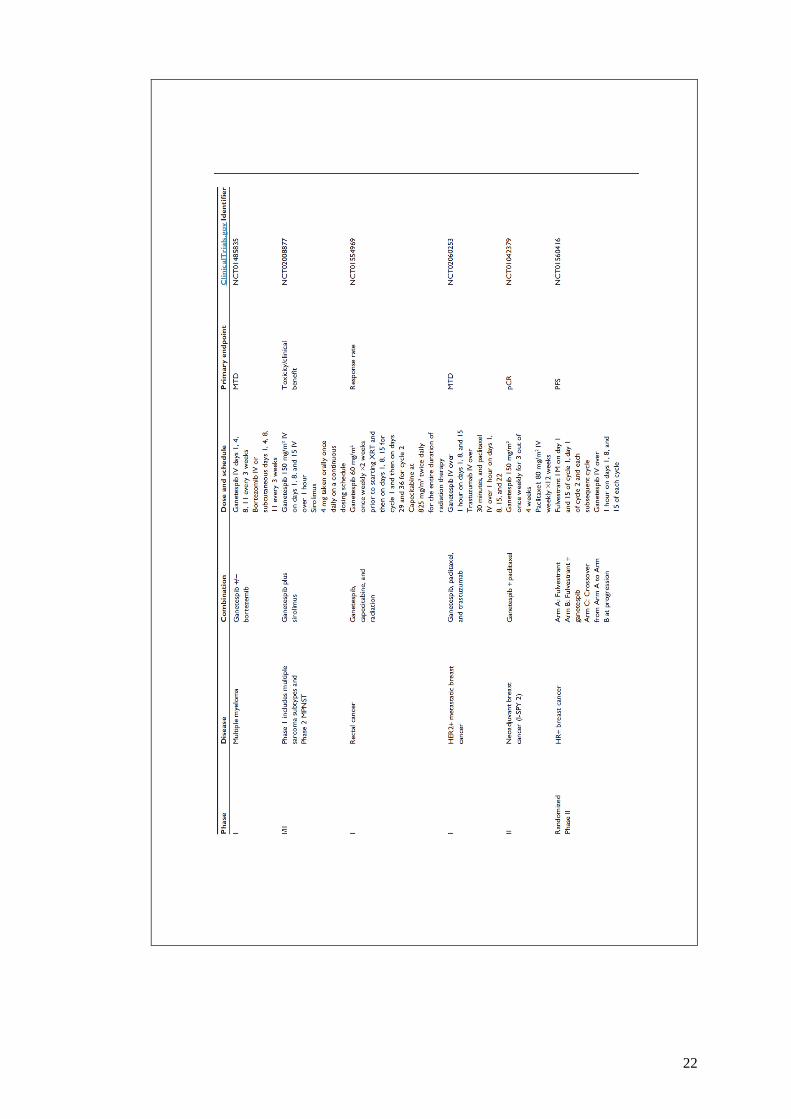
1.4 Combination Phase I/II trial
Figure 9 lists several ongoing combination trials of ganetespib with cytotoxic agents such as
taxanes and doxorubicin, radiation, fulvestrant, and other targeted agents such as sirolimus,
crizotinib, Ziv-Aflibercept, and bortezemib for several tumour types. Antitumour activity has
been observed with ganetespib both as monotherapy and in combination with other agents,
including synergistic effects in combination with taxanes and etoposide. A completed phase II
randomized trial in stage IV NSCLC combining ganetespib with docetaxel compared with
docetaxel alone has demonstrated efficacy signal in a subgroup of patients, and therefore it
was further tested in a phase III randomized trial (GALAXY II; NCT01798485) (Yifan Wang,
2016) (esfahani K, 2015).
The combination of docetaxel and ganetespib is in advanced clinical testing in NSCLC based
on the results from the Phase IIb GALAXY-I (Study of Ganetespib + Docetaxel in Advanced
NSCLC) trial. Preliminary results from a Phase I trial of ganetespib plus paclitaxel and
trastuzumab, a humanized monoclonal antibody against HER2, were recently presented at the
San Antonio Breast Cancer Symposium. There were no grade 3 toxicities attributable to
ganetespib. (Komal Jhaveri, 2015).
Together, these compelling preclinical studies have formed the rationale for many Phase I/II
clinical trials in combinations with ganetespib as a way to optimize efficacy and delay or limit
acquired resistance.
22
23
Figure 9 Ongoing combination trials of Ganetespib with other therapeutic agents
(Komal Jhaveri, 2015)
24
1.5 Clients of HSP90
As mentioned previously HSP90 has over 200 client proteins. In my thesis I will focus
predominantly on IRF-1, which was lately discovered as a client of HSP90 (Narayan, 2009)
The vertebrate immune system comprises two major parts - the innate and adaptive
components. The innate response forms the first line of defence in a vertebrate and is a quick
response that targets a broad range of pathogens. The adaptive response, on the other hand, is
the specific response directed against a foreign particle that is mediated by T- and B-
lymphocytes, and has the remarkable feature of immunological memory. While the adaptive
response is specific to vertebrates, innate defence mechanisms have been observed in some of
the earliest living eukaryotes (Viau, 2005) (Bartl, 2003).
The interferon regulatory factor (IRF) family of transcription factors has been intimately
linked with the vertebrate immune response. Members of the IRF family play a crucial role in
the development of the antiviral state and have been shown to perform a variety of other
functions in host defence, particularly with respect to the innate immune response (Takaoka
A. T., 2008). This thesis focuses on the founding member of this family, IRF-1, and describes
the identification of novel IRF-1 binding proteins in an attempt to better understand how IRF-
1 mediates its cellular functions.
1.5.1 The IRF family
Ten IRF family members (IRF-1 to IRF-10) have been described in vertebrates, with IRF-10
being non-functional in humans and mice. A characteristic feature of IRF-1 family members
is an N-terminal DNA binding domain (DBD) that contains five invariant tryptophan residues
spaced at 10–18 amino acid intervals. Additionally, the IRF family members also contain a C-
terminal IRF association domain (IAD; IAD1 or IAD2) that allows them to interact with other
IRF family members or other transcription factors (Takaoka A. T., 2008).
Based on phylogenetic studies and evolutionary history, the 10 IRF family members have been
divided into two super groups – the IRF-1 and IRF-4 super groups. The IRF-1 super group
contains IRF-1 and IRF-2, which share a C-terminal IAD2 domain that does not structurally
resemble any other known domains. The IRF-4 super group is further divided into three groups
25
– the IRF-3 group consisting of IRF-3 and IRF-7, the IRF-4 group comprising IRF-4, IRF-8,
IRF-9 and IRF-10, and the IRF-5 group containing IRF-5 and IRF-6. The eight members of
the IRF-4 super group share a C-terminal IAD1 domain that resembles the C-terminal MH2
domain of the Smad proteins (Takaoka A. T., 2008).
1.5.2 Evolution of the IRF family
Early studies showed the absence of IRF genes in Drosophila and Caenorhabditis genomes,
and thus the IRF family was thought to have developed in deuterostomes. A recent study,
however, suggests that the origin of the IRF genes coincides with the origin of multicellularity
and underwent a turbulent evolution. The study demonstrates the presence of IRF family genes
in all five major metazoan groups, and traces the evolution of the family up to higher
vertebrates (Nguyen H, 1997).
Based on evolutionary history, although IRFs underwent a massive reduction or were
completely lost or severely mutated in some organisms, the IRF family once again expanded
to four members close to the appearance of the first vertebrate. These four members – the
predecessors of the 4 IRF groups (1, 3, 4 and 5) – then evolved into the 10 vertebrate IRFs
possibly as a result of 2-fold duplication of the entire genome
1.5.3 Interferons and the interferon signalling pathway
Interferons (IFNs) belong to a class of proteins called cytokines, which are secreted by cells
of the immune system and function primarily in cell–cell communication and signalling. IFNs
have been studied in detail in the context of host defence against viral infections and the term
‘interferon’ was coined to reflect their role in interfering with and preventing viral replication
in host cells (Nehyba, 2009).
IFNs are of three types – Type I, II, and III. Type I IFNs are produced by a variety of cells
upon viral infection and include IFN-α, -β, -ω, -ε, and –κ. The sole member of Type II IFNs
is IFN-γ, which is produced by activated T cells and natural killer (NK) cells. The recently-
discovered Type III IFNs, or IFN-λs, (IFN-λ1-3 or IL-28A, IL-28B and IL-29 respectively)
are, like Type I IFNs, produced by virus-infected cells. However, they are structurally different
from Type I IFNs and they bind to their own distinct set of IFN-receptors (Nehyba, 2009).
Classic IFN signalling involves the JAK-STAT pathway. The IFNs bind to their respective
receptors – IFN-α/β receptor or IFNAR for IFN-α/β, IFN-γ receptor or IFNGR for IFN-γ, and
IFN-λR1 or IL-28Rα for IFN-λs (Figure 10). These receptors comprise of at least two distinct
26
subunits, denoted 1 and 2. The binding of the IFN to its respective receptor activates the Janus
protein tyrosine kinases (Jak PTKs) associated with the receptors (Tyk2 and Jak1 for IFNAR,
and Jak1 and Jak2 for IFNGR) through auto and/or trans phosphorylation of specific residues.
The activated Jak PTKs then phosphorylate their downstream targets, namely the signal
transducers and activators of transcription (STAT) family members STAT1 and STAT2.
Activation of the STATs leads to the formation of the transcriptionally active complexes IFN-
α-activated factor (AAF; also called IFN-γ-activated factor or GAF), and/or IFN-stimulated
gene factor 3 (ISGF3). GAF is a homodimer of activated Stat1, while ISGF3 is a heterotrimer
of activated STATs-1 and -2, and IRF-9/p48/ISGF3γ. These activated complexes then move
into the nucleus, where they bind to specific DNA elements, namely the IFN-γ-activated
sequence or GAS for GAF, and the IFN-stimulated regulatory element or ISRE for ISGF3.
This results in the transcriptional activation of the promoter containing the GAS or ISRE
sequence. IRF-1 induction is primarily through the IFN-γ-activated pathway (Takaoka A. a.,
2006) (Nehyba, 2009)

27
Figure 10 IFN signalling pathways
Activation of cardinal Jak-Stat pathway and additional signalling cascades by three types of IFNs. IFNs are categorized into three types on the basis of the type of
receptor. Type I IFNs (only IFN-α and IFN-β are shown for simplicity), type II IFN (IFN-γ) and type III IFNs (IFN-λ1/IL-29, IFN-λ2/IL-28A and IFN-λ3/IL-28B)
bind to their corresponding distinct receptor complex as indicated. All of them activate the canonical Jak-Stat pathway (see text for further explanation).
(Takaoka A. a., 2006)
28
1.5.4 Overview of the human IRF family members
The human IRF family comprises nine members (IRF-1 to IRF-9). Initially identified as
regulators of the interferon system, the IRFs have since been shown to possess a variety of
other cellular functions. A brief description of the human IRF-1 and IRF-2 is given below.
1.5.4.1 IRF-1
The founding member of the IRF family, IRF-1 was initially identified as a positive regulator
of the IFNβ gene. It has subsequently been shown to regulate other IFN and IFN-responsive
genes, and plays a crucial role in host defence [37, 38]. In addition to its role in regulating the
IFN genes and the antiviral response, IRF-1 has important functions in the T cell response, the
DNA damage response, the cell cycle and apoptosis, and tumour suppression (Nehyba, 2009).
1.5.4.2 IRF-2
Cross-hybridisation experiments with the IRF-1 cDNA revealed a structurally similar
molecule, sharing a 62% homology with the N-terminal half of IRF-1; this molecule was
named IRF-2. Further analyses revealed that both IRF-1 and IRF-2 bind to the same DNA
element, the interferon regulatory factor response element or IRF-E with consensus sequence
G (A) AAAG/CT/CGAAAG/CT/C that is almost identical to the interferon-stimulated
response element or ISRE with consensus sequence A/GNGAAANNGAAACT (where N is
any base). Later, the crystal structure of the IRF-2 DNA-binding domain in complex with
DNA was determined (Figure 1.5) [9]. In the structure, IRF-2 was found to specifically contact
the AANNGAA sites on DNA (contact sites are underlined; N is any base) (Harada, 1989).
IRF-2 has been shown to have an antagonistic function to IRF-1 and represses IRF-1 induced
transcriptional activation of IFNβ. The IRF-2 protein is much more stable than IRF-1 (half-
life of > 8 h vs 30 min respectively), and since both IRF-1 and IRF-2 bind to the same DNA
elements with similar affinities this results in a relative repression of promoters under IRFs
(Harada, 1989). However, upon induction by virus, dsRNA, IL-1, IL-6 etc., IRF-1 levels
increase markedly, thereby changing the IRF-1: IRF-2 ratio in favour of IRF-1 and allowing
activation of IRF-1 target genes. Additionally, the C-terminus of the IRF-2 protein contains a
repressor domain, and the deletion of this domain converts IRF-2 into a transcriptional
activator.
29
IRF-2 has also been described as an oncogene, as its over-expression in NIH 3T3 cells results
in oncogenic transformation, which can be reverted by over-expression of IRF-1. The exact
mechanism by which IRF-2 functions in oncogenesis is unknown – it could exert its effects by
perturbing IRF-1 mediated tumour suppression; by competing with other IRFs for binding to
the same IRF-E; or by activating genes such as Histone H4, which have been implicated in
cell cycle progression and oncogenesis. In a recent study using breast cancer tissue
microarrays, tumours were found to maintain expression of IRF-2 if there was coincident
expression of IRF-1, suggesting that IRF-2 blocks the tumour suppressive function of IRF-1
in these cases, thereby promoting oncogenesis (Huang, 2007) (Xi, 1999).
Interestingly, some studies have suggested a tumour suppressive function for IRF-2 in addition
to its role in oncogenesis In one case, IRF-2 and IRF-1 were shown to synergistically activate
the class II transactivator (CIITA) promoter, and a pancreatic tumour cell line expressing a
mutant IRF-2 was identified in which CIITA induction by IFN-ɣ was absent (Xi, 1999).
Thus, while IRFs plays a major role in the innate immune response – particularly in antiviral
defence – they also function in cell differentiation, cell growth inhibition and induction of
apoptosis.
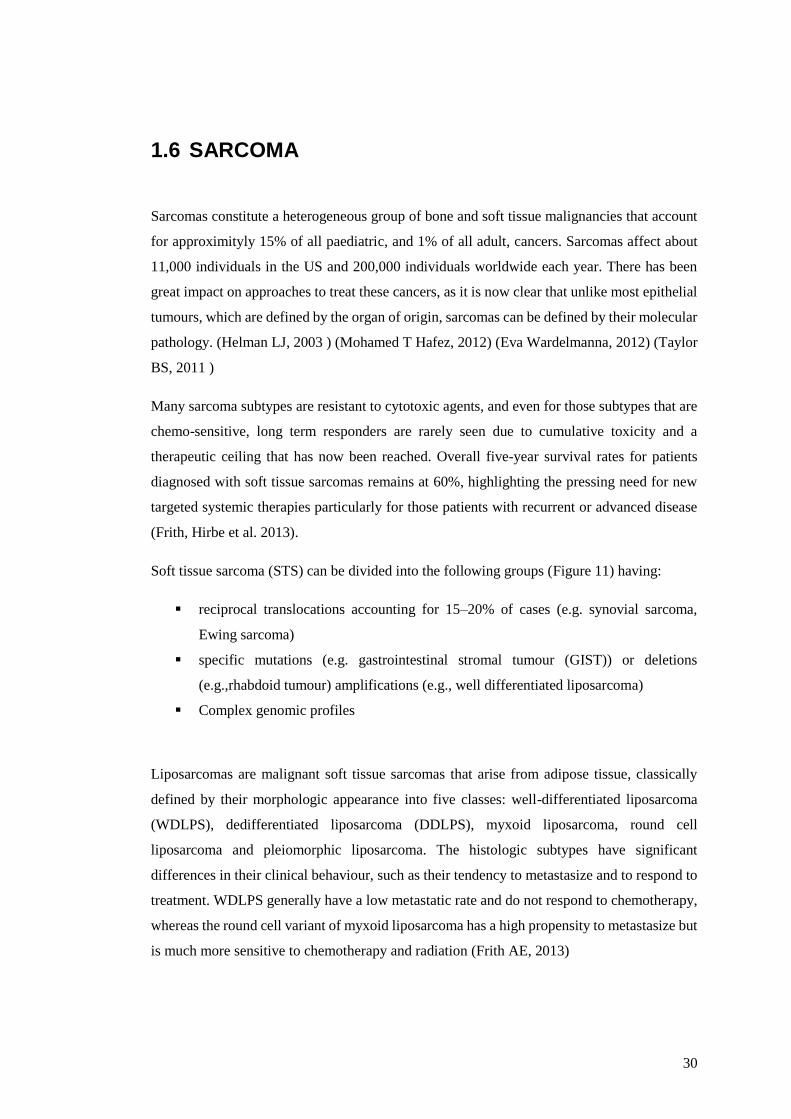
30
1.6 SARCOMA
Sarcomas constitute a heterogeneous group of bone and soft tissue malignancies that account
for approximityly 15% of all paediatric, and 1% of all adult, cancers. Sarcomas affect about
11,000 individuals in the US and 200,000 individuals worldwide each year. There has been
great impact on approaches to treat these cancers, as it is now clear that unlike most epithelial
tumours, which are defined by the organ of origin, sarcomas can be defined by their molecular
pathology. (Helman LJ, 2003 ) (Mohamed T Hafez, 2012) (Eva Wardelmanna, 2012) (Taylor
BS, 2011 )
Many sarcoma subtypes are resistant to cytotoxic agents, and even for those subtypes that are
chemo-sensitive, long term responders are rarely seen due to cumulative toxicity and a
therapeutic ceiling that has now been reached. Overall five-year survival rates for patients
diagnosed with soft tissue sarcomas remains at 60%, highlighting the pressing need for new
targeted systemic therapies particularly for those patients with recurrent or advanced disease
(Frith, Hirbe et al. 2013).
Soft tissue sarcoma (STS) can be divided into the following groups (Figure 11) having:
▪ reciprocal translocations accounting for 15–20% of cases (e.g. synovial sarcoma,
Ewing sarcoma)
▪ specific mutations (e.g. gastrointestinal stromal tumour (GIST)) or deletions
(e.g.,rhabdoid tumour) amplifications (e.g., well differentiated liposarcoma)
▪ Complex genomic profiles
Liposarcomas are malignant soft tissue sarcomas that arise from adipose tissue, classically
defined by their morphologic appearance into five classes: well-differentiated liposarcoma
(WDLPS), dedifferentiated liposarcoma (DDLPS), myxoid liposarcoma, round cell
liposarcoma and pleiomorphic liposarcoma. The histologic subtypes have significant
differences in their clinical behaviour, such as their tendency to metastasize and to respond to
treatment. WDLPS generally have a low metastatic rate and do not respond to chemotherapy,
whereas the round cell variant of myxoid liposarcoma has a high propensity to metastasize but
is much more sensitive to chemotherapy and radiation (Frith AE, 2013)

31
Figure 11 Classification of sarcoma
Schematic classification of the various sub types of sarcoma

32
1.6.1 P53
The tumour suppressor p53 is a potent transcription factor that controls a major pathway
protecting cells from malignant transformation. In response to stress, the cellular level of p53
is elevated by a posttranslational mechanism, leading to cell cycle arrest or apoptosis
(Lyubomir T. Vassilev, 2004). Under non-stressed conditions, p53 is tightly controlled by the
MDM2 protein, through an autoregulatory feedback loop. p53 is also regulated by other gene
products as such ARF. The ARF tumour suppressor is a protein that is transcribed from an
alternate reading frame of the INK4a/ARF locus (CDKN2A). MDM2 inhibits p53 activity,
while ARF inhibits MDM2. Overexpression of MDM2, or loss of ARF/p53, is observed in
many cancers (Wang, 2012).
1.6.2 MDM2
MDM2 (Mouse double minute 2 homologue) encodes a negative regulator of the tumour
suppressor p53, and is a member of the E3 ubiquitin ligases that acts to target p53 for
proteasomal degradation. The MDM2 locus 12q14.3-q15 is part of a frequent focal
amplification peak region in cancers. MDM2 amplification differentiates between benign and
malignant tumour groups and is nearly considered a diagnostic marker for WDLPS or DDLPS
(Frith AE, 2013).
1.6.3 Mutations of TP53, expression levels of MDM2
Relatively few sarcomas harbour TP53 mutations, but in many cases, amplification of MDM2
effectively inactivate p53. The p53 pathway activity can also be affected by normal genetic
variation. Mutations in TP53 are less frequent and more heterogeneous in sarcomas than in
other cancer types and in addition to the amplification and overexpression of MDM2, other
mechanisms, including MDM4 amplification (Ohnstad, Castro et al. 2013). In general, it is
estimated that while p53 inactivating mutations are present in approximityly 50% of all
cancers, the remaining cancers should have other alterations to the pathway, it is seen that
mutations in TP53 are frequent in leiomyosarcomas and osteosarcomas. In contrast to
mutations in the CDKN2A and TP53 genes, amplification of MDM2 was seen frequently in
STS (Ito M, 2011).
33
1.7 Comparative oncology
In the US, cancer is diagnosed in almost one million dogs per year, and the incidence is rising.
Dedicated pet owners strive to provide the highest level of health care to their companion dogs
and actively seek out novel treatment options in the form of experimental therapies and clinical
trials when available. These factors provide a unique opportunity to advance the care and
understanding of cancer in both man and companion dogs. Out of this symbiotic relationship
developed the discipline of comparative oncology, which integrates the study of naturally
occurring tumours in animals into studies of human cancer biology and therapeutics.
Treatment of many tumour types, such as osteosarcoma, lymphoma, melanoma, etc. have
directly benefited from this approach (R. Timothy Bentley, 2016).
During the past four decades, an increased number of similarities between canine tumours and
human cancer have been reported: molecular, histological, morphological, clinical and
epidemiological, which lead to comparative oncological studies. One of the most important
goals in human and veterinary oncology is to discover potential molecular biomarkers that
could detect cancer in an early stage and to develop new effective therapies (VISAN, 2015).
1.8 Canine Model
Domestic dogs are divided into over 175 breeds, with members of each breed sharing
significant phenotypes. The breed barrier enhances the utility of the model, especially for
genetic studies where small numbers of genes are hypothesized to account for the breed cancer
susceptibility. These facts, combined with recent advances in high-throughput sequencing
technologies allows for an unrivalled ability to use pet dog populations to find often subtle
mutations that promote cancer susceptibility and progression in dogs as a whole (Davis, 2014)
(Jin Zhang, 2009).
Most types of cancer observed in humans are found in dogs, suggesting that canines may be
an informative system for the study of cancer genetics. The comparative oncology approach,
specifically referring to the study of pet dogs with spontaneous cancer, offers a potential
34
solution to the lingering questions about cancer drugs, its metabolites, and their accumulation
in tumours (Corey Saba, 2016) (Davis, 2014).
1.9 Canine Sarcoma
A number of haematologic and solid tumour types in humans are also seen in companion
animals such as dogs, including lymphoma, mammary carcinoma, melanoma and soft tissue
sarcoma (STS). In canines, STS is a prevalent disease that comprises 15% of all reported
cancers and, like the human disease, it can arise from several cellular origins and in multiple
body locations including the limbs, trunk or head and neck. The range of STS tumour types
include fibrosarcomas, peripheral nerve sheath tumours, hemangiopericytoomas,
myxosarcomas, perivascular wall tumours, liposarcomas, leiomyosarcomas and other poorly
differentiated tumours. (J. P. Frazier, 2016)
Gemcitabine has been investigated and used in human patients with advanced or metastatic
STS as a single agent or in combination with other drugs. The lack of response in gemcitabine-
treated xenograft tumours is consistent with clinical studies of this drug in canine solid
tumours, in which single agent gemcitabine has demonstrated limited antitumour activity.
Establishment of more canine models will allow researchers to rigorously test hypotheses prior
to the initiation of, and in parallel to, comparative oncology trials in dogs. Frazier and group
demonstrated the feasibility of generating preclinical models of disease from a dog with
cancer, an effort that could be expanded to create larger libraries of canine xenograft models.
The reduced cost and relatively easy access to tissues derived from dogs with cancer provides
a great opportunity for generating a large collection of preclinical models that capture the
heterogeneity of a disease like STS. Such models will be instrumental in supporting
translational work in companion animals and promoting further work to establish and
characterize new laboratory models of disease like STS Figure 12. (J. P. Frazier, 2016)
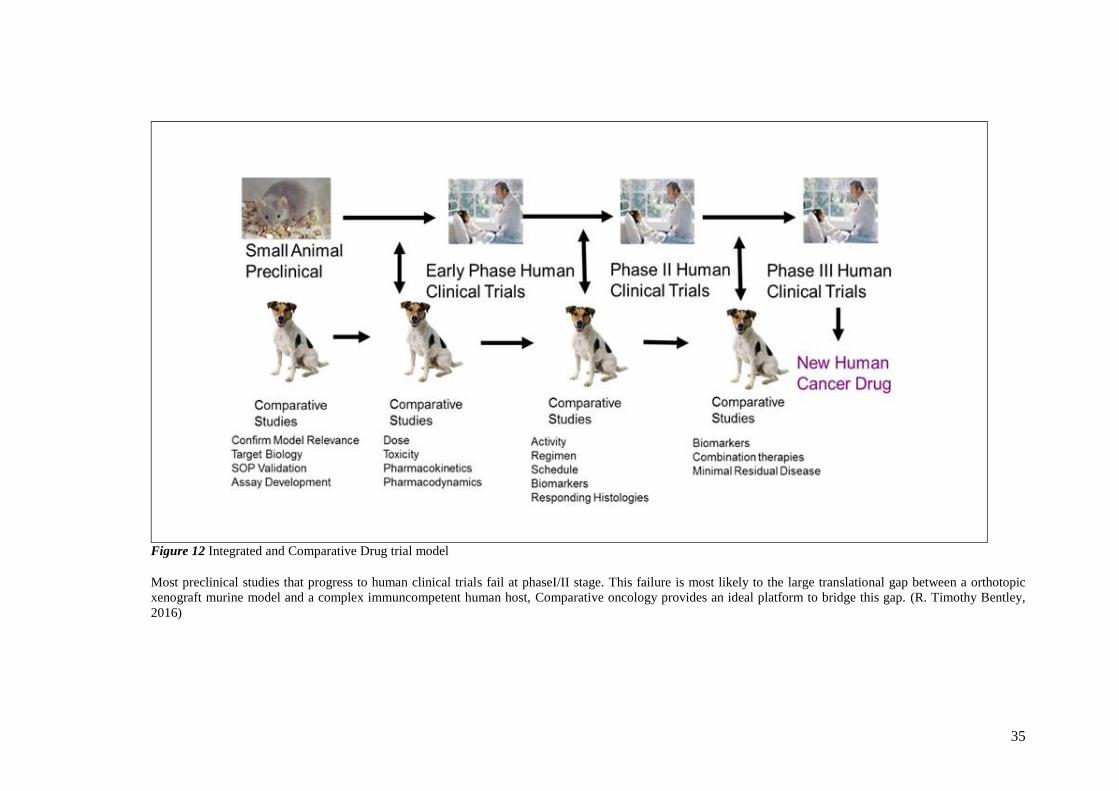
35
Figure 12 Integrated and Comparative Drug trial model
Most preclinical studies that progress to human clinical trials fail at phaseI/II stage. This failure is most likely to the large translational gap between a orthotopic
xenograft murine model and a complex immuncompetent human host, Comparative oncology provides an ideal platform to bridge this gap. (R. Timothy Bentley,
2016)
36
1.9.1.1 Osteosarcoma
Osteosarcoma is the most common primary bone tumour of both children and dogs. It is an
aggressive tumour in both species with a rapid clinical course leading ultimately to metastasis.
Companion studies with dogs especially osteosarcoma have been studied for more than a
decade showing similar p53 mutation in human and canine osteosarcoma. In dogs and
children, distant metastasis occurs in 80% of individuals treated by surgery alone. Both canine
and human osteosarcoma has been shown to contain a sub-population of cancer stem cells
(CSCs), which may drive tumour growth, recurrence and metastasis, suggesting that naturally
occurring canine osteosarcoma could act as a preclinical model for the human disease (Pang,
2014) (Leeuwena, 1997).
1.9.1.2 Genetic Heterogeneity
The mutational landscape of osteosarcoma is highly complex and varies significantly between
tumours. This high degree of inter-tumour heterogeneity confounds our understanding of the
molecular pathogenesis of osteosarcoma and may explain some of the difficulty in identifying
therapeutic agents that are likely to improve outcomes for the spectrum of patients with
osteosarcoma.
1.9.1.3 Chromosomal Abnormalities
A hallmark of osteosarcoma is chromosomal instability (CIN), a form of genome-wide
alteration characterized by a high degree of losses and gains of full chromosomes or
chromosomal segments. CIN has been shown to result from a loss of function in cell cycle
checkpoint and DNA damage response pathways.
Osteosarcoma is a cancer typified by widespread and heterogeneous abnormalities in
chromosomal number and substructure. Osteosarcoma ploidy can range from haploidy to
hexaploidy. While myriad chromosomal losses/gains have been identified, chromosome 1 is
most often gained and chromosomes 9, 10, 13, and 17 are most often lost. The most common
copy number alterations are deletions of portions of chromosomes 3, 6, 9, 10, 13, 17, and 18
and amplifications of portions of chromosomes 1, 6, 8, and 17. These regions encode a number
of tumour suppressors and oncogenes, respectively.
37
1.9.2 Tumour Suppressors
1.9.2.1 Rb Pathway
Retinoblastoma (Rb) is a critical regulator of the G1-to-S cell cycle transition. In the absence
of mitogenic stimuli, Rb remains dephosphorylated and binds to E2F family transcription
factors, preventing their activation of cell cycle progression. During normal mitosis, this is
reversed via Rb phosphorylation by CDK4. Loss-of-function Rb mutations remove this cell
cycle checkpoint. The CDKN2A locus (also known as INK4A) encodes two functionally and
structurally distinct genes via alternative splicing. The first, p16INK4a, is a negative regulator of
CDK4. The second, p14ARF, is a key regulator of p53. Loss of p16INK4a function alleviates
negative regulation of CDK4, resulting in Rb inactivation. Thus, mutations in
the CDKN2A gene can phenocopy loss-of-function Rb mutations.
With pathophysiological similarities to its human counterpart, canine OS represents an ideal
model for comparison of conserved regions of genomic instability that may be disease
associated rather than genomic passengers. Their study used tools to identify disease-
associated genome-wide DNA copy number aberrations in canine and human OS (Angstadt,
2012).
1.9.2.2 p53 Pathway
p53 is a transcription factor that regulates critical genes in DNA damage response, cell cycle
progression, and apoptosis pathways. p53 acts as a tumour suppressor in essentially all tumour
types, and its function can be affected by mutations to the gene itself or by mutations to up- or
downstream mediators of its activity. p53, the most commonly mutated gene in human cancers,
is found to be altered in dog cancers. However, little is known about the role of p53 in dog
tumourigenesis. p53 mutations and MDM2 amplification has been demonstrated in canine
soft-tissue sarcomas. The principle role of mdm2 is to act as a negative regulator of p53
function. The frequency of mdm2 amplifications correlates to that described for human
tumours of similar histological sub-types (Jin Zhang, 2009) (Khanna, 2015).
p14ARF normally acts to sequester the E3 ubiquitin ligase MDM2 in the nucleolus, preventing
it from promoting p53 degradation. p14ARF is expressed from the same CDKN2A locus that
encodes p16INK4a . Loss-of-function mutations in the p14ARFgene can phenocopy mutations
to TP53.
38
Loss-of-function TP53 mutations occur in as many as three-fourths of osteosarcoma cases.
These mutations include allelic loss (75–80%), rearrangements (10–20%), and point mutations
(20–30%).Nasir and group demonstrated that 6 of 30 canine cases had p53 mutations (20%)
(Nasir L. , 2001). Jin Zhang and group demonstrated that, upon exposure to DNA damage
agents or Mdm2 inhibitor nutlin-3, canine p53 is accumulated and capable of inducing its
target genes, MDM2 and p21. Taken together, these results indicate that canine p53 family
proteins have biological activities similar to their human counterparts. These similarities make
the dog as an excellent out-bred spontaneous tumour model and the dog can serve as a
translation model from bench-top to cage-side and then to bedside (Jin Zhang, 2009).
1.9.3 Other Tumour Suppressors
Other tumour suppressors associated with deletions or loss of heterozygosity in osteosarcoma
include: APC, BUB3, FGFR2, LSAMP, RECQL4, and WWOX.
1.9.3.1 Oncogenes
1.9.3.1.1 Rb Pathway
E2F3 and CDK4, both of which counteract Rb control of cell cycle progression, have been
estimated to possess gain-of-function mutations in 60% and 10% of tumours, respectively.
1.9.3.1.2 p53 Pathway
MDM2 is an E3 ubiquitin ligase that acts as a negative regulator of p53 .The MDM2 gene is
amplified in 3–25% of osteosarcoma tumours. COPS3 also promotes proteosomal degradation
of p53 and is estimated to cause gain-of-function mutations in 20–80% of osteosarcomas.
1.9.3.1.3 c-Myc
The transcription factor c-Myc is a key factor that acts as a general amplifier of gene
expression, enhancing the transcription of essentially all genes with active promoters in a given
cell, and is a well-described oncogene with gained function in most tumour types. c-Myc is
amplified in 7–67% of osteosarcoma tumours and overexpressed in at least 34% of tumours.
1.9.3.1.4 Other Oncogenes
Other oncogenes associated with amplifications in osteosarcoma
include: CDC5L, MAPK7, MET, PIM1, PMP22, PRIM1, RUNX2 and VEGFA. Collectively,
the finding that near ubiquitous alterations in the Rb and p53 pathways function in
osteosarcoma through both gain- and loss-of-function mutations indicates that loss of cell
39
cycle control and inappropriate DNA damage response are key drivers of osteosarcoma
development (Khanna, 2015).
1.9.4 Advantages over other models
There is a large “translational gap” between highly artificial, xenograft models in generally
immunodeficient rodents of clonal origin versus spontaneously developing, highly
heterogeneous, and constantly evolving natural human cancer model. Moreover, the small size
of these rodents limits imaging and is prohibitive to testing novel therapeutic strategies in
conjunction with surgical resection, a key component of current standard of care. Pet dogs
share the same environment as their human counterparts and are also susceptible to various
spontaneous malignancies that affect the human population. These naturally occurring
tumours in pet dogs are very similar to their human counterparts regarding their clinical
presentation and pathophysiology. They carry similar natural history and prognosis condensed
into the approximityly seven times shorter overall lifespan of dog (R. Timothy Bentley, 2016).
An ethical advantage of this approach over the experimental rodent model is that treatment
studies do not involve induction of a disease state but rather involves treating a spontaneous
disease and therefore ameliorating suffering and extending survival. Murine models can also
be used for dog cancer xenograft models to parallel the studies of human xenografts and
delineate the molecular biology, including role of specific genes in regulating canine cancer
(R. Timothy Bentley, 2016).Toxicities initially encountered in human phase I/II trials are not
often initially identified in rodent studies, thus utilizing pet dogs may facilitate early detection
of such side effects and save the larger cost associated with failed human clinical trials.
Although canine cancer studies are more expensive and time-consuming compared with rodent
models, they are within the cost range of other large animal toxicity studies necessitated for
investigational new drug applications and may be more cost-effective if the cost of failed
human clinical trials due to weak preclinical data is taken into consideration (R. Timothy
Bentley, 2016). There are several comparative studies recently for example towards a
comparative canine-human model system, Hupp and group developed a novel anti-CD20
monoclonal antibody (NCD1.2) that binds both human and canine CD20 (Saurabh Jain, 2016).
Extensive pedigrees of canine cancer cases may provide a valuable model for human
hereditary cancers. Also due to the unique characteristics of inbred dog populations, a far
smaller number of animals and DNA markers are needed (S. Hugen, 2016).
40
In addition to the similarities in drug metabolism, the large size of pet dogs and their naturally-
occurring, biologically heterogeneous malignancies allow for the collection of repeated blood
and tissue samples to study drug PK and biodistribution. Human and canine cancer cells are
also similarly sensitive to chemotherapy (Figure 13). Such critical questions, when answered
by the tumour-bearing dog model, add value to the current approaches during drug
development (Corey Saba, 2016).
1.9.5 Limitations of the dog model
Limited knowledge of the recorded histories of dog breeds and, more importantly, exercise no
control over their maintenance. Dog breeds are not mouse or rat strains, and the geneticist is
somewhat at the mercy of the breed club for access to phenotypes and DNA samples. One of
the limitations of spontaneous canine cancer is that unlike the transgenic mouse model, it is
not useful for studying the effect of single gene mutations and has limited experimental
manipulation potential. Another limitation of using a canine model for regular oncology
studies is the availability of an adequate number of dogs for the studies on a regular basis (R.
Timothy Bentley, 2016).
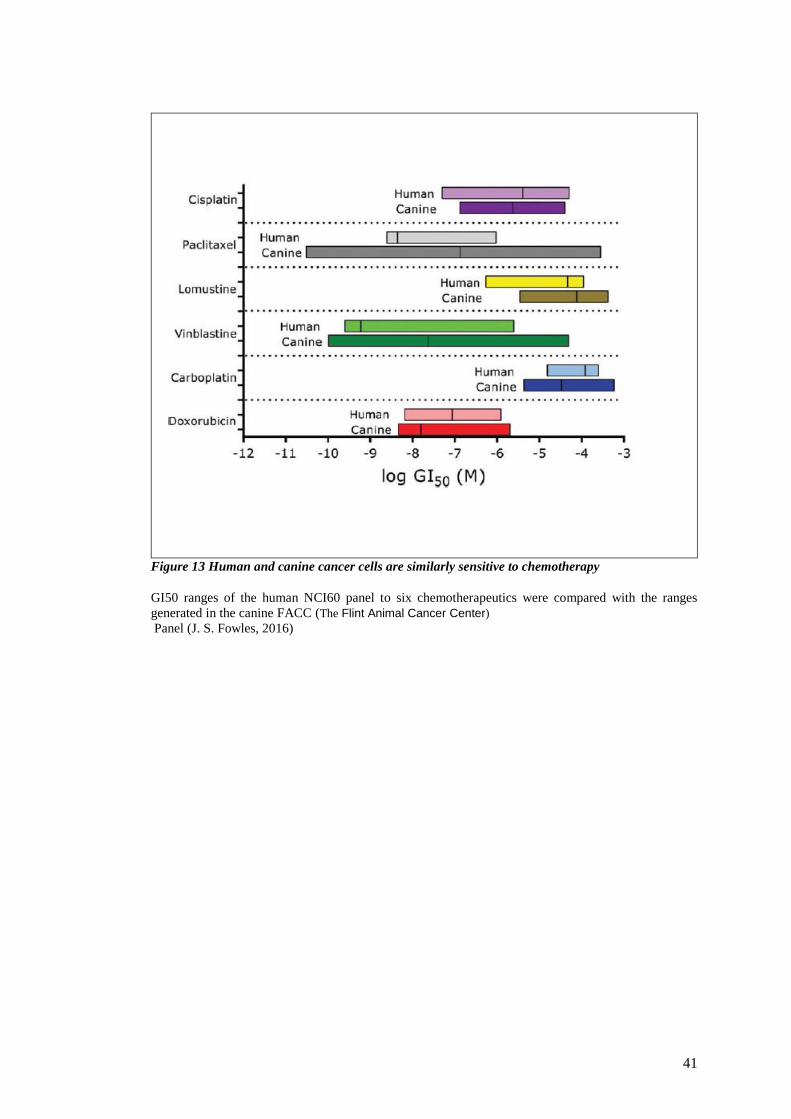
41
Figure 13 Human and canine cancer cells are similarly sensitive to chemotherapy
GI50 ranges of the human NCI60 panel to six chemotherapeutics were compared with the ranges
generated in the canine FACC (The Flint Animal Cancer Center)
Panel (J. S. Fowles, 2016)
42
1.9.6 Current Drugs on clinics
The treatment of sarcoma has relied on cytotoxic chemotherapies with such drugs as
doxorubicin, ifosfamide and dacarbazine in the neoadjuvant, adjuvant and palliative settings
that have low response rates. With the rapid development of targeted agents and better
molecular understanding of the individual subtypes of sarcoma, the development of either
subtype or pathway specific therapies is evolving. (Frith AE, 2013)
Nutlin-3A, an inhibitor of MDM2 (Figure 14) has been shown to induce apoptosis in vitro and
in vivo in the p53 wild-type MDM2-amplified osteosarcoma (OS) cell lines. (Duhamel LA,
2012). Characterizing the relative frequencies of mutations affecting CDKN2A, MDM2, and
TP53 in sarcomas becomes important for the clinical development of MDM2 antagonists such
as Nutlin-3.The crystal structure of MDM2–nutlin complexes revealed that nutlins project
functional groups into the binding pocket that mimic the interaction of the three p53 amino
acids critical for the interaction: Phe19, Trp23 and Leu26Figure 14 (Lyubomir T. Vassilev,
2004). RG7112 is a member of the nutlin family and is the first MDM2 antagonist to be
assessed clinically. It is a potent inhibitor of P53–MDM2 binding that effectively stabilises
P53 protein, activates P53 signalling, and inhibits cancer cell growth. It has an imidazoline
structure and acts by binding to MDM2 resulting in unbound active p53. (Lyubomir T.
Vassilev, 2004).The number of patients with high-grade OS who are likely to benefit from
Nutlin-3A is low, because p53 is mutated in a significant proportion of such tumours. Since
this drug can induce cell cycle arrest in vitro in the non-MDM2-amplified cell line U2OS,
implies that a subset of central OS may benefit from this treatment. (Duhamel LA, 2012)There
has been a proof of mechanism neoadjuvant trial using RG7112 (Roche, Nutley, NJ) in
WDLPS and DDLPS that demonstrated p53 up regulation and reactivation. (Frith AE,
2013).There are additional MDM2 antagonists that are for human use. One is MI-219 (Ascenta
Therapeutics, Malvern, PA) which has a spiro-oxindole structure that also binds to MDM2 to
inhibit p53 binding, which allows for p53 activation in tumour cell lines with wild-type p53.
There is a new class of small molecules (for example RO-5963, Roche, Nutley, NJ) that inhibit
p53 interactions with both MDM2 and MDMX by inducing the dimerisation of MDM2 to
MDMX, which restores p53 activity in cancer cells. It has similar p53-MDM2 inhibitory
activity to Nutlin-3, but has nearly equivalent p53-MDMX inhibitory activity as well. (Frith
AE, 2013)
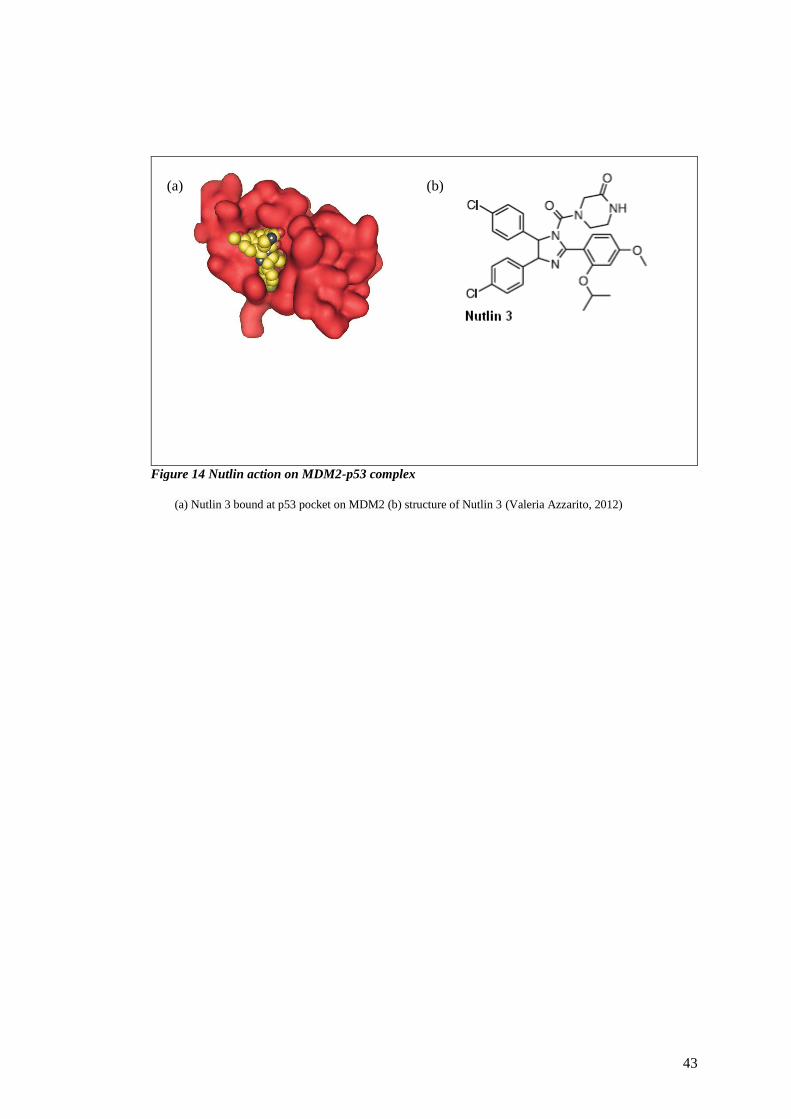
43
Figure 14 Nutlin action on MDM2-p53 complex
(a) Nutlin 3 bound at p53 pocket on MDM2 (b) structure of Nutlin 3 (Valeria Azzarito, 2012)
(a) (b)
44
1.10 Bioinformatics in comparative oncology
In this new genomics era for cancer research, combining genotypic, phenotypic and
pharmacologic data to reveal novel relationships has been essential for the many recent
discoveries that have culminated in improved clinical outcomes. With these new tools, the
possibilities for comparative and translational applications with human cancer research are
becoming readily apparent. Dogs with cancer can potentially benefit from new discoveries
made in human oncology, and conversely, human research can benefit through the integration
of canine cancer models for pre-clinical validation studies. Sequencing would be an invaluable
tool in identifying potential mutations and/or deletions in oncogenes and tumour suppressors
across the entire genome. The integration of multiple types of genomic data will facilitate
identification of the most significant drivers in canine cancer (J. S. Fowles, 2016).
Chi and group demonstrated that canine tumours can provide information generalizable to
human tumours. Spontaneous canine soft tissue sarcomas exhibit inter-tumoural heterogeneity
due to multiple mutations in oncogenes and tumour suppressor genes, varying environmental
conditions, and inherited germline variations. The combination of these factors leads to
immense natural heterogeneity in tumour phenotypes, disease outcomes, and response to
therapies. (Chi, 2012)
Genomics-based predictors of drug response have the potential to improve outcomes
associated with cancer therapy. Osteosarcoma (OS), the most common primary bone cancer
in dogs, is commonly treated with adjuvant doxorubicin or carboplatin following amputation
of the affected limb. Fowles and group demonstrated that gene expression-based modelling
using canine datasets or a combination of human and canine datasets could accurately predict
clinical outcome in canine osteosarcoma patients treated with adjuvant DOX and/or CARBO
therapy. These results are important for human and canine cancer research for two main
reasons:
1. Shows the potential of an advanced animal translational model for testing genomic
methods of personalized cancer treatment in a clinical setting
2. Shows the potential for canine cancer research to expand in this genomic era through
the incorporation of human genomic data into their model development design, which
is currently much more prevalent and available than canine datasets (Fowles, 2016)

45
1.11 THESIS AIMS
The aims of my thesis were first to begin to use next generation sequencing of a canine cancer
(osteosarcoma) to identify potential druggable targets using currently available drugs as a
concept develop in personalized therapies. This led to the focus on pathways where two classic
druggable targets exist: MDM2 and HSP90. Secondly, I characterize inhibitors of these
pathways in a range of cell models to define mode of action and to discover new biomarkers.
Together, my thesis shows the value in genomics-led, personalized drug treatment strategies
in both human and canine cancer cells. The data also reveal how biomarkers can be discovered
whose inhibition can augment such anti-cancer drugs and lead to new drug discovery
platforms.
46
2 Methods and materials
2.1 Plasmids, chemicals and reagents
pcDNA3-IRF-1 WT and Flag IRF-1 WT were from Kathryn Ball; WT and mutant SBP-Hsp70
were from Philip, Brno Czech republic. All general chemicals and reagents were from Sigma
or BDH unless otherwise indicated.
2.2 General microbiological techniques
All microbiological techniques were carried out using sterile apparatus and media under
aseptic conditions.
2.2.1 Maintaining bacterial cultures
Bacterial cultures were grown in Luria-Bertani (LB) broth unless otherwise indicated in an
incubator-shaker maintained at 37°C, 220 rpm. Suitable sterile containers with capacities of at
least 4X the volume of the culture being grown were used to allow for adequate aeration. If
required, selective antibiotics were added to the LB medium at the following final
concentrations: 100 μg/ml ampicillin
Luria-Bertani (LB) broth
25 g LB medium (Miller) was dissolved in 1 litre of distilled water and sterilised by
autoclaving at 121°C for 15-20 min. Final concentrations of the individual components in the
broth were:
1% (w/v) Tryptone
0.5% (w/v) Yeast extract
1% (w/v) NaCl
LB Agar
40 g LB-Agar (Miller) was dissolved in 1 litre of distilled water and sterilised by autoclaving
at 121°C for 15-20 min. Final concentrations of the individual components were:
1% (w/v) Tryptone
47
0.5% (w/v) Yeast extract
1% (w/v) NaCl
1.5% (w/v) Agar
LB-agar plates were prepared by pouring LB-agar that was liquefied by heating (and
subsequently cooled to about 40°C) into 90 mm petridishes (Sterilin). If required, selective
antibiotic was added to the liquefied LB-agar immediately prior to pouring into the petridishes.
The agar was further cooled until it solidified, and the plates were dried at 37°C for up to 1 h
prior to use.
2.2.2 Glycerol stocks
Glycerol stocks for long term storage of bacteria were prepared by adding 200 μl sterile
glycerol to 800 μl mid-log phase bacterial culture in a cryotube (Nunc). The stocks were mixed
by gentle agitation, snap frozen in liquid nitrogen and stored at -80°C.
2.2.3 Preparation of competent cells by heat shock method
Bacterial cells (DH5α or BL21) from glycerol stocks were inoculated into 2 ml of LB medium
(without antibiotic) and incubated overnight in an incubator-shaker at 37oC and 220 rpm. An
aliquot of the overnight culture (250 μl) was added to 50 ml fresh LB and further incubated
until its OD600nm was approximityly 0.4. The culture was centrifuged at 4000 g for 15 min
at 4oC and the pellet resuspended in 16 ml of ice-cold buffer I. Following a 10 min incubation
on ice the cells were centrifuged again as above. The cell pellet was then gently resuspended
in 2 ml of ice-cold buffer II, incubated on ice for 10 min and aliquotted (30 μl) into pre-chilled
sterile microcentrifuge tubes. The aliquots were snap-frozen in liquid nitrogen and stored at -
80oC.
Buffer I
60 mM CH3COOK
100 mM RbCl
10 mM CaCl2
40 mM MgCl2
48
15% (v/v) glycerol
Adjust to pH 5.8 with CH3COOH and sterilise by filtration
Buffer II
10 mM MOPS
10 mM RbCl
75 mM CaCl2
15% (v/v) glycerol
Adjust to pH 6.5 with NaOH and sterilise by filtration
2.2.4 Transforming bacterial cells
Plasmid DNA (50-250 ng; usually 100 ng) was mixed with an aliquot of freshly thawed
competent cells (30 μl) and incubated for 30 min on ice. The cells were then heat shocked at
42ºC for 45 seconds and cooled on ice for 2 min. LB broth without antibiotic (0.2 ml) was
added and the mixture was incubated at 37ºC for 60 min with shaking. Aliquots (10 μl and 50
μl) were plated onto LB-agar plates containing the appropriate selective antibiotic and
incubated overnight at 37ºC.
2.3 General molecular biology techniques
2.3.1 Plasmid DNA amplification, extraction and
quantification
A single bacterial colony from a stock LB-Agar plate was inoculated into 5 ml of LB broth
containing selective antibiotic if required and incubated at 37ºC for 6-8 hours with shaking
(220 rpm). This ‘starter culture’ was then diluted into 250 ml LB broth (containing antibiotic
if necessary) and incubated overnight as above. Cells were collected by centrifuging at 6000
g for 20 min at 4ºC and plasmid DNA extracted using the Qiagen HiSpeed Maxi-prep kit
according to the manufacturer’s instructions. DNA was eluted in 0.5 ml nuclease-free water
and stored at -20ºC. If required, plasmid DNA was extracted directly from the 5 ml starter
culture using the Qiagen Mini-prep kit. DNA was quantified using a NanoDrop ND-1000
spectrophotometer against a nuclease-free water blank.
49
2.3.2 Agarose gel electrophoresis of DNA
Agarose gel electrophoresis was used to separate DNA fragments, to test the purity of DNA
preps, and to purify DNA. 1-2% agarose gels were prepared as required by dissolving
electrophoresis-grade agarose (Invitrogen) in 1X TAE and then allowing the dissolved agarose
to solidify by cooling. To aid in visualising the DNA, the fluorescent intercalating dye sybr
safe was added to the agarose solution at a final concentration of 0.10 μg/ml immediately prior
to pouring. DNA samples were mixed with 5X DNA loading dye at a 4:1 ratio of sample:dye
and loaded onto the agarose gel, which was subsequently run at 75-100 V for approximityly 1
h (12 V/cm x distance between the electrodes in cm).
1X TAE Buffer
40 mM Tris
1 mM EDTA
Adjust pH to 8 with glacial acetic acid
6X DNA Loading Dye
0.25% bromophenol blue
0.25% xylene cyanol
15% glycerol
2.4 General biochemical techniques
2.4.1 Protein quantification
Protein concentration was estimated using Bradford’s reagent (Bio-Rad) as indicated,
according to the manufacturer’s instructions. Absorbance (595 nm) was measured using the
Victor 3 plate reader (Perkin Elmer).
50
2.4.2 SDS-PAGE
10% Separating Gel 12% Separating Gel
Reagent Final conc. Reagent Final conc.
H2O as required H2O as required
30% acrylamide mix# 10% 30% acrylamide mix# 10%
1.5 M Tris (pH 8.8) 0.39 M 1.5 M Tris (pH 8.8) 0.39 M
10% (w/v) SDS 0.1% 10% SDS 0.1%
10% (w/v) APS 0.1% 10% APS 0.1%
TEMED (v/v) 0.04% TEMED (v/v) 0.04%
# Acrylamide Mix (Protogel, National Diagnostics) consists of 30% (w/v) acrylamide and
0.8% (w/v) bis-acrylamide.
5% Stacking Gel 1X Running Buffer
Reagent Final conc. 192 mM Glycine
H2O as required 25 mM Tris
30% acrylamide mix 5% 0.1% (w/v) SDS
1 M Tris (pH 6.8) 0.13 M
10% (w/v) SDS 0.1%
10% (w/v) APS 0.1%
TEMED (v/v) 0.1%
51
Polyacrylamide gels were prepared using the recipes listed above as described by Laemmli
(Laemmli, 1970)using the Bio-Rad Mini-Protean kit. The separating gel was poured first, and
overlaid with water. The purpose of adding the water is two-fold: on the one hand, it evens out
the upper surface of the separating gel as the water now forms the meniscus instead of the gel.
The water overlay also cuts off the oxygen supply, thereby allowing the acrylamide to
polymerise evenly. After polymerisation of the separating gel, the overlay was removed, and
the stacking gel cast. Prior to loading, samples were mixed with an equal volume of 2X sample
buffer or with 5X sample buffer at a 4:1 ratio of sample to buffer. The mix was then heated at
85ºC for 3 minutes, and subsequently loaded onto the gel. Pre-stained protein standards
(Fermentas) were loaded as size markers. Gels were run at 150 V for approximityly 1 h in 1X
running buffer, until the dye front reached the bottom of the gel.
2X Sample Buffer
300 mM Tris (pH 6.8)
5% (w/v) SDS
25% (v/v) glycerol
400 mM DTT
A few grains of bromophenol blue Mix, aliquot and store at -20°C Mix, Final concentrations
when 2X sample buffer is mixed with sample at a 1:1 ratio are 150 mM Tris, 2.5% SDS, 12.5%
glycerol and 200 mM DTT
2.4.3 Coomassie staining of SDS-PAGE gels
Fix
50% (v/v) methanol
10% (v/v) glacial acetic acid
Stain
52
50% (v/v) methanol
10% (v/v) glacial acetic acid
0.2% (w/v) coomassie brilliant blue R-250
Destain
7.5% (v/v) methanol
10% (v/v) glacial acetic acid
To visualise proteins by Coomassie brilliant blue staining, SDS-PAGE gels were fixed for 5-
10 min at room temperature, and stained with coomassie blue stain for 20-30 min. Stained gels
were then destained as required (from 30 min to overnight), washed in water and dried using
a heated vacuum gel dryer (Gel Master Model 1426, Welch Rietschle Thomas).
2.4.4 Western blotting
1X Transfer Buffer
192 mM Glycine
25 mM Tris
20% (v/v) methanol
Proteins separated by SDS-PAGE were transferred onto 0.2 μm nitrocellulose membranes
(Protran, Schleicher & Schuell Biosciences) using Bio-Rad transfer apparatus. The transfer
was carried out in tanks containing agitated transfer buffer and an ice pack to prevent over-
heating at 120 V for 1 h or 15 V overnight.
Post transfer, membranes were rinsed in phosphate-buffered saline (PBS) containing 0.1%
(v/v) Tween-20 (PBST) three times (5-6 min each). The membrane was then blocked using
blocking solution [5% (w/v) semi-skimmed milk powder (Marvel) in PBST] for 1 h, and was
subsequently incubated with the primary antibody in blocking solution for 1 h at room
temperature or overnight at 4ºC. The membrane was then washed as above and incubated with
53
horse radish peroxidise (HRP) conjugated secondary antibody [Dako Cytomation; used at
1:2000 dilution in blocking solution] for 1 h at room temperature. The membrane was again
rinsed three times with PBST and antibody signal detected using enhanced chemiluminescence
(ECL) reagent. Blots were overlaid with a mixture of ECL solutions I and II at a 1:1 ratio
(mixed immediately prior to use) for 2 min, blotted dry, exposed to Hyperfilm ECL
(Amersham) or X-Ray film (SLS) for the required period of time, and then developed using a
Konica Medical Film Processor (Model SRX-101A).
ECL Solution I
100 mM Tris (pH 8.5)
2.5 mM Luminol
0.4 mM p-Coumaric acid
ECL Solution II
100 mM Tris (pH 8.5)
0.02% (v/v) H2O2
The primary antibodies used in this thesis, together with the working dilution and clone (if
known) are listed in Table 1
Antibody to type Clone/N
ame
Supplier/Reference dilution
CHIP Mouse
Monoclonal
v3.1
Gift from B.Vojtesek 1:1000
GAPDH Mouse
Monoclonal
8245 Abcam 1:3000
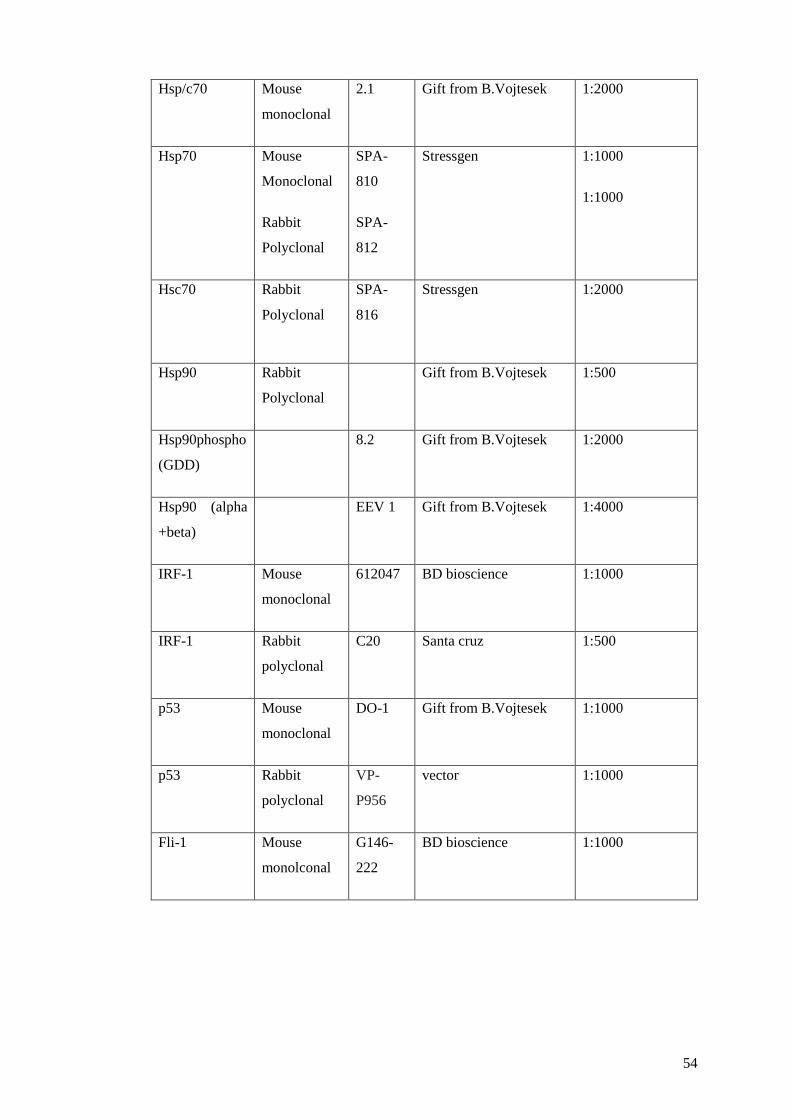
54
Hsp/c70 Mouse
monoclonal
2.1 Gift from B.Vojtesek 1:2000
Hsp70
Mouse
Monoclonal
Rabbit
Polyclonal
SPA-
810
SPA-
812
Stressgen 1:1000
1:1000
Hsc70
Rabbit
Polyclonal
SPA-
816
Stressgen 1:2000
Hsp90 Rabbit
Polyclonal
Gift from B.Vojtesek 1:500
Hsp90phospho
(GDD)
8.2 Gift from B.Vojtesek 1:2000
Hsp90 (alpha
+beta)
EEV 1 Gift from B.Vojtesek 1:4000
IRF-1 Mouse
monoclonal
612047 BD bioscience 1:1000
IRF-1 Rabbit
polyclonal
C20 Santa cruz 1:500
p53 Mouse
monoclonal
DO-1 Gift from B.Vojtesek 1:1000
p53 Rabbit
polyclonal
VP-
P956
vector 1:1000
Fli-1 Mouse
monolconal
G146-
222
BD bioscience 1:1000
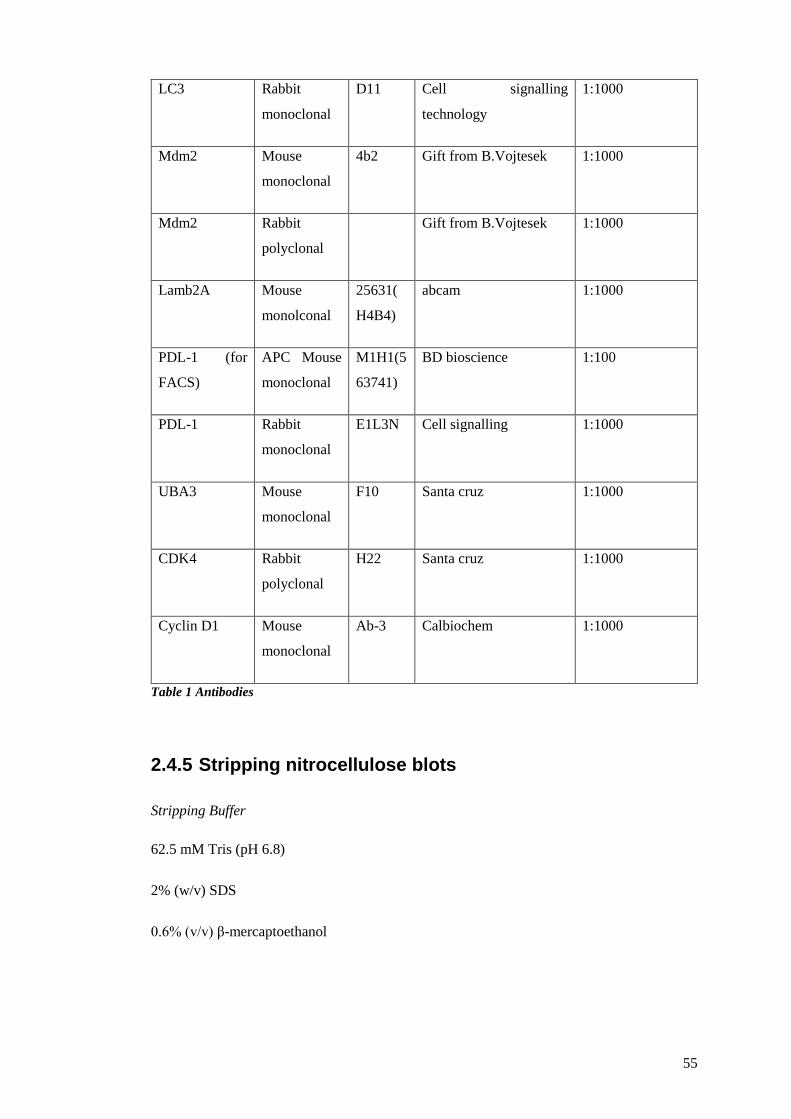
55
LC3 Rabbit
monoclonal
D11 Cell signalling
technology
1:1000
Mdm2 Mouse
monoclonal
4b2 Gift from B.Vojtesek 1:1000
Mdm2 Rabbit
polyclonal
Gift from B.Vojtesek 1:1000
Lamb2A Mouse
monolconal
25631(
H4B4)
abcam 1:1000
PDL-1 (for
FACS)
APC Mouse
monoclonal
M1H1(5
63741)
BD bioscience 1:100
PDL-1 Rabbit
monoclonal
E1L3N Cell signalling 1:1000
UBA3 Mouse
monoclonal
F10 Santa cruz 1:1000
CDK4 Rabbit
polyclonal
H22 Santa cruz 1:1000
Cyclin D1 Mouse
monoclonal
Ab-3 Calbiochem 1:1000
Table 1 Antibodies
2.4.5 Stripping nitrocellulose blots
Stripping Buffer
62.5 mM Tris (pH 6.8)
2% (w/v) SDS
0.6% (v/v) β-mercaptoethanol
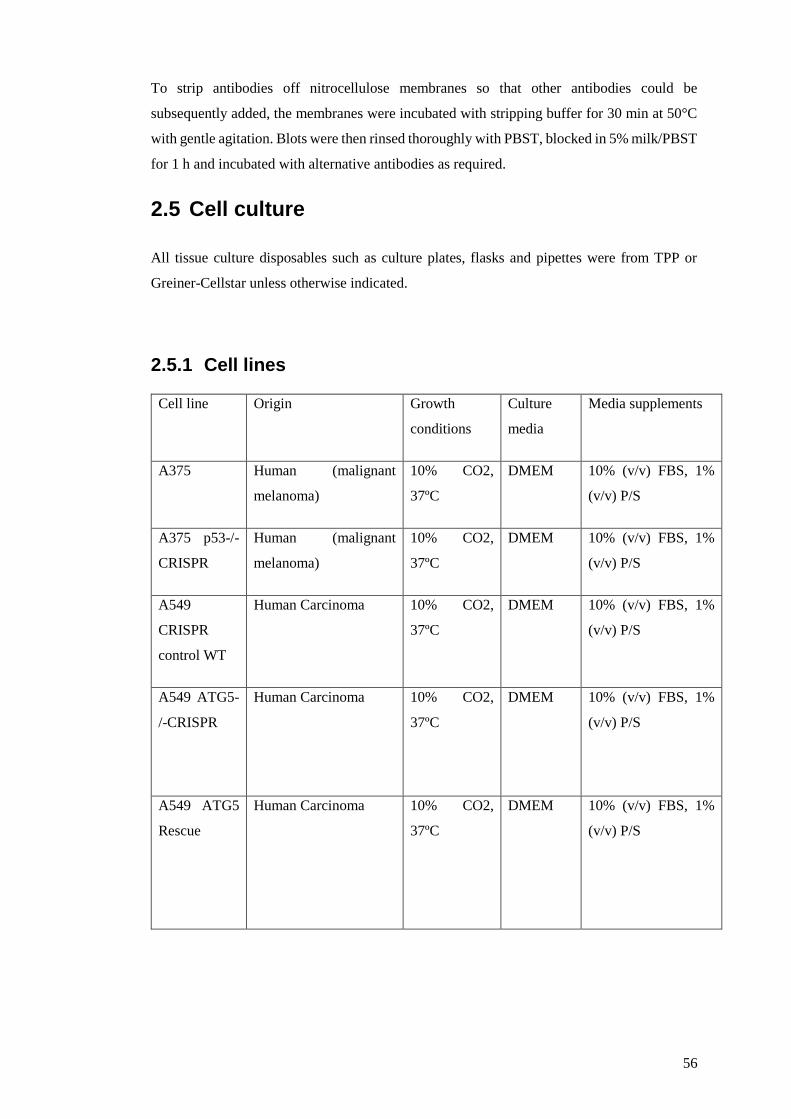
56
To strip antibodies off nitrocellulose membranes so that other antibodies could be
subsequently added, the membranes were incubated with stripping buffer for 30 min at 50°C
with gentle agitation. Blots were then rinsed thoroughly with PBST, blocked in 5% milk/PBST
for 1 h and incubated with alternative antibodies as required.
2.5 Cell culture
All tissue culture disposables such as culture plates, flasks and pipettes were from TPP or
Greiner-Cellstar unless otherwise indicated.
2.5.1 Cell lines
Cell line Origin Growth
conditions
Culture
media
Media supplements
A375 Human (malignant
melanoma)
10% CO2,
37ºC
DMEM 10% (v/v) FBS, 1%
(v/v) P/S
A375 p53-/-
CRISPR
Human (malignant
melanoma)
10% CO2,
37ºC
DMEM 10% (v/v) FBS, 1%
(v/v) P/S
A549
CRISPR
control WT
Human Carcinoma 10% CO2,
37ºC
DMEM 10% (v/v) FBS, 1%
(v/v) P/S
A549 ATG5-
/-CRISPR
Human Carcinoma 10% CO2,
37ºC
DMEM 10% (v/v) FBS, 1%
(v/v) P/S
A549 ATG5
Rescue
Human Carcinoma 10% CO2,
37ºC
DMEM 10% (v/v) FBS, 1%
(v/v) P/S
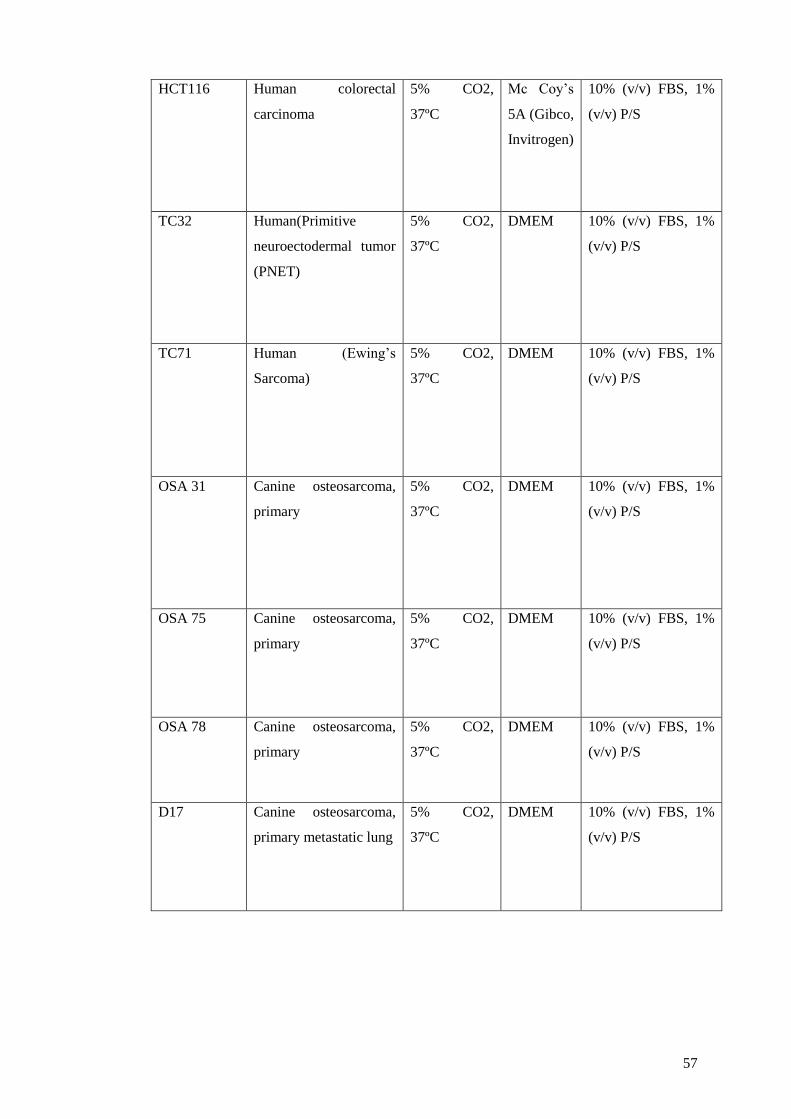
57
HCT116 Human colorectal
carcinoma
5% CO2,
37ºC
Mc Coy’s
5A (Gibco,
Invitrogen)
10% (v/v) FBS, 1%
(v/v) P/S
TC32 Human(Primitive
neuroectodermal tumor
(PNET)
5% CO2,
37ºC
DMEM 10% (v/v) FBS, 1%
(v/v) P/S
TC71 Human (Ewing’s
Sarcoma)
5% CO2,
37ºC
DMEM 10% (v/v) FBS, 1%
(v/v) P/S
OSA 31 Canine osteosarcoma,
primary
5% CO2,
37ºC
DMEM 10% (v/v) FBS, 1%
(v/v) P/S
OSA 75 Canine osteosarcoma,
primary
5% CO2,
37ºC
DMEM 10% (v/v) FBS, 1%
(v/v) P/S
OSA 78 Canine osteosarcoma,
primary
5% CO2,
37ºC
DMEM 10% (v/v) FBS, 1%
(v/v) P/S
D17 Canine osteosarcoma,
primary metastatic lung
5% CO2,
37ºC
DMEM 10% (v/v) FBS, 1%
(v/v) P/S
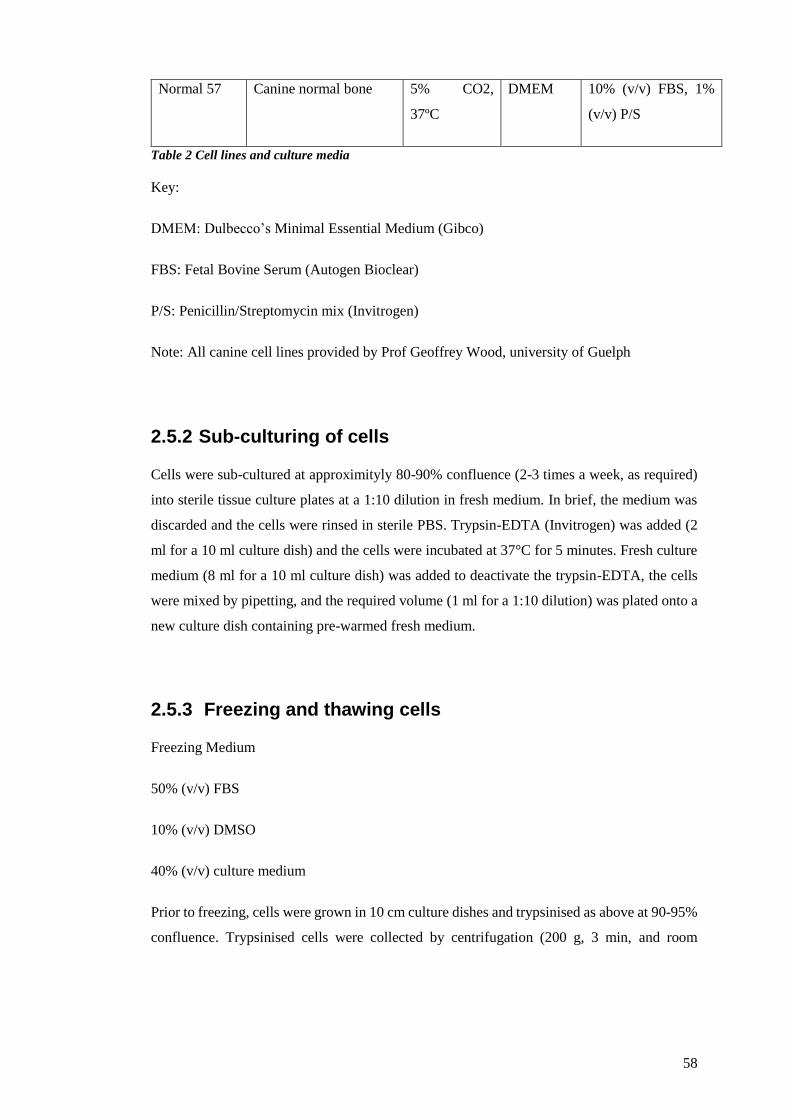
58
Normal 57 Canine normal bone 5% CO2,
37ºC
DMEM 10% (v/v) FBS, 1%
(v/v) P/S
Table 2 Cell lines and culture media
Key:
DMEM: Dulbecco’s Minimal Essential Medium (Gibco)
FBS: Fetal Bovine Serum (Autogen Bioclear)
P/S: Penicillin/Streptomycin mix (Invitrogen)
Note: All canine cell lines provided by Prof Geoffrey Wood, university of Guelph
2.5.2 Sub-culturing of cells
Cells were sub-cultured at approximityly 80-90% confluence (2-3 times a week, as required)
into sterile tissue culture plates at a 1:10 dilution in fresh medium. In brief, the medium was
discarded and the cells were rinsed in sterile PBS. Trypsin-EDTA (Invitrogen) was added (2
ml for a 10 ml culture dish) and the cells were incubated at 37°C for 5 minutes. Fresh culture
medium (8 ml for a 10 ml culture dish) was added to deactivate the trypsin-EDTA, the cells
were mixed by pipetting, and the required volume (1 ml for a 1:10 dilution) was plated onto a
new culture dish containing pre-warmed fresh medium.
2.5.3 Freezing and thawing cells
Freezing Medium
50% (v/v) FBS
10% (v/v) DMSO
40% (v/v) culture medium
Prior to freezing, cells were grown in 10 cm culture dishes and trypsinised as above at 90-95%
confluence. Trypsinised cells were collected by centrifugation (200 g, 3 min, and room
59
temperature) and the cell pellet resuspended in 3 ml freezing medium. The resuspended cells
were then transferred to cryotubes (Nunc; 1 ml per tube) and frozen gradually in a Nalgene
cryo-freezing container overnight. The frozen cells were then transferred to liquid nitrogen for
long-term storage.
Frozen cells were recovered by warming to 37ºC and transferring into a sterile culture dish
containing fresh pre-warmed medium. The medium was replaced with fresh medium the
following day.
2.5.4 Transient transfection of DNA and siRNA
Cells were transfected at approximityly 70-80% confluence using Attractene (Qiagen)
according to the manufacturer’s instructions and harvested 24 h post transfection. Within an
experiment, DNA levels between samples were normalised using empty vector. For
transfection of siRNA (Dharmacon) into cells in 6 well plates, Dharmafect (Dharmacon) was
used according to the manufacturer’s instructions. In brief, 60 nmol siRNA was diluted to 200
μl with serum and antibiotic free medium. In parallel, 6 μl Dharmafect was added to 194 μl
serum and antibiotic free medium in a separate tube and incubated for 5 min at room
temperature. The diluted siRNA and Dharmafect were then mixed (400 μl total volume) and
incubated for 20 min at room temperature. During the incubation, the cells (at approximityly
70% confluence) were rinsed in PBS and fresh medium containing serum but no antibiotic
(1600 μl) was added to each well. Following the incubation, the 400 μl siRNA mix was gently
added to the cells, and the cells were incubated at 37°C for 24-72 h (as required) prior to
harvesting.
2.5.5 Harvesting cells
At the time of harvesting the cells were placed on ice, following which the medium was
discarded. The cells were rinsed with ice-cold PBS (1 ml/well for a 6-well plate and 10 ml for
a 10 cm plate) and then harvested in a further 1 ml ice-cold PBS using a cell scraper. In some
cases, cells in 10 cm plates were scraped directly into 1 ml lysis buffer (see below). Harvested
cells were transferred to a microfuge tube and centrifuged at 2500 g for 5 min at 4ºC. The
supernatant was discarded, and the cell pellet was either snap-frozen in liquid nitrogen (and
then stored at -80ºC) or immediately lysed using the appropriate lysis buffer.
60
2.5.6 Mammalian cell lysis
Approximityly two volumes (with respect to the size of the cell pellet) of lysis buffer were
added to the harvested cell pellet. Alternately, adherent cells were rinsed in ice-cold PBS and
scraped directly into lysis buffer (1 ml per 10 cm plate). Samples were vortexed briefly,
incubated on ice for 20 min, and then centrifuged at 16000 g for 15 min at 4ºC. The supernatant
(lysate) was transferred to a fresh tube, snap-frozen in liquid nitrogen and stored at -80º (or at
-20ºC after addition of sample buffer). The recipes for the lysis buffers used commonly in this
thesis are detailed below:
1% NP40 Lysis Buffer
25 mM HEPES (pH 7.5)
1% (v/v) NP40
150 mM KCl
50 mM NaF
5 mM DTT
1X protease inhibitor mix
61
0.4% Triton X-100 Lysis Buffer Urea Lysis Buffer
50 mM HEPES (pH 7.5) 8 M Urea
0.4% (v/v) Triton X-100 50 mM HEPES (pH 7.6)
150 mM NaCl 5 mM DTT
10 nM NaF 1 mM benzamidine
2 mM DTT 50 nM NaF
0.1 mM EDTA
1XProtease inhibitor Mix
Protease Inhibitor Mix (10X stock)
200 μg/ml leupeptin
10 μg/ml aprotinin
20 μg/ml pepstatin
10 mM benzamidine
100 μg/ml soybean trypsin inhibitor
20 mM pefabloc
10 mM EDTA
2.5.7 Drug treatments
For the experiments described in this thesis, cells were treated with various drugs and
chemicals prior to lysis. Table 3 summarises the drugs used, the concentration and duration of
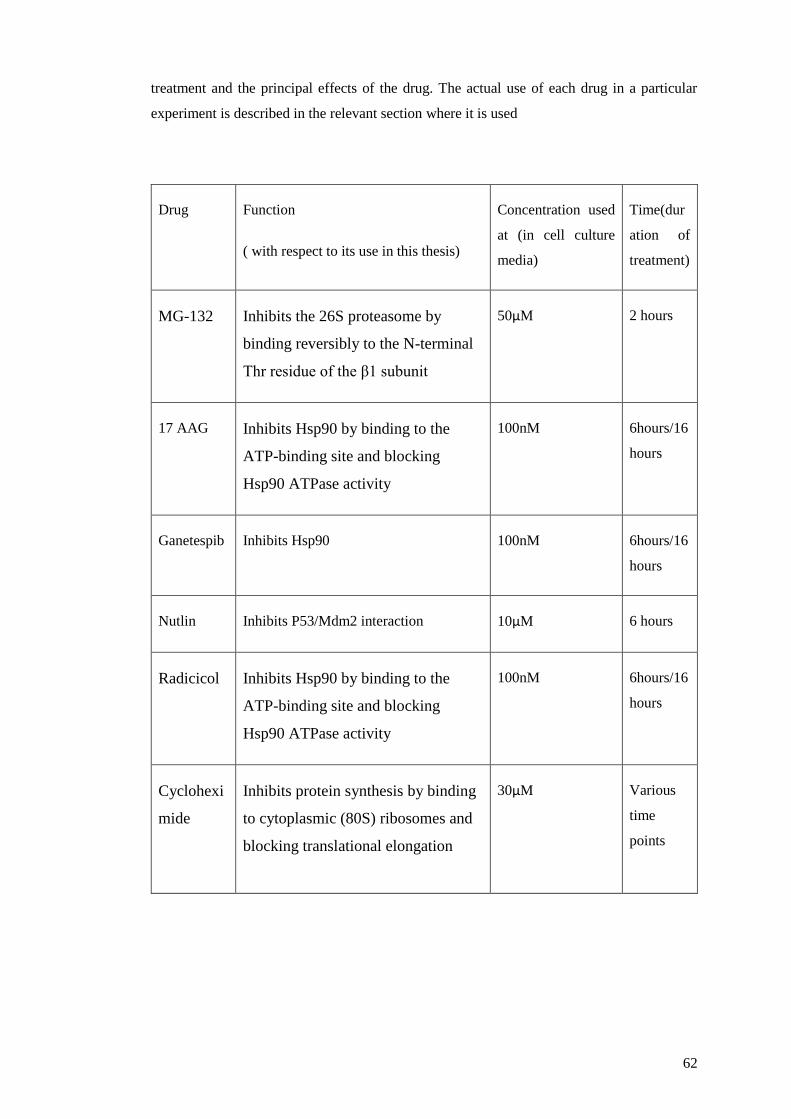
62
treatment and the principal effects of the drug. The actual use of each drug in a particular
experiment is described in the relevant section where it is used
Drug Function
( with respect to its use in this thesis)
Concentration used
at (in cell culture
media)
Time(dur
ation of
treatment)
MG-132
Inhibits the 26S proteasome by
binding reversibly to the N-terminal
Thr residue of the β1 subunit
50µM 2 hours
17 AAG Inhibits Hsp90 by binding to the
ATP-binding site and blocking
Hsp90 ATPase activity
100nM 6hours/16
hours
Ganetespib Inhibits Hsp90 100nM 6hours/16
hours
Nutlin Inhibits P53/Mdm2 interaction 10µM 6 hours
Radicicol
Inhibits Hsp90 by binding to the
ATP-binding site and blocking
Hsp90 ATPase activity
100nM 6hours/16
hours
Cyclohexi
mide
Inhibits protein synthesis by binding
to cytoplasmic (80S) ribosomes and
blocking translational elongation
30µM Various
time
points
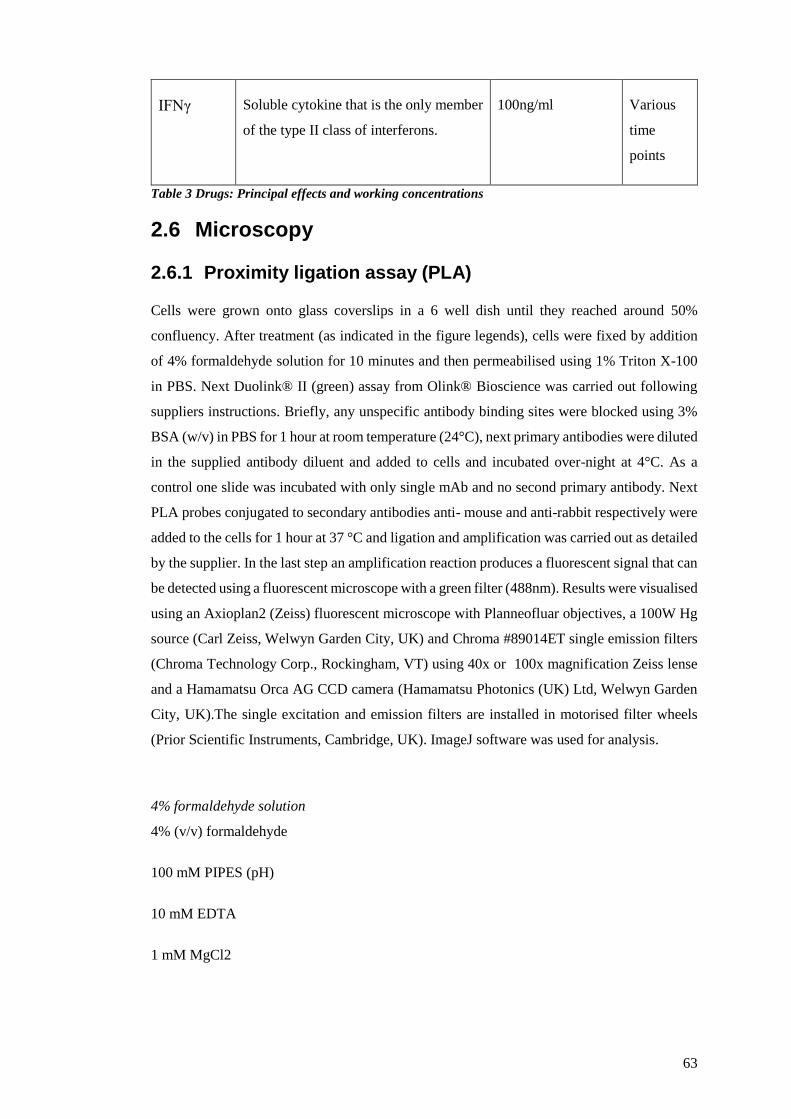
63
IFNγ
Soluble cytokine that is the only member
of the type II class of interferons.
100ng/ml Various
time
points
Table 3 Drugs: Principal effects and working concentrations
2.6 Microscopy
2.6.1 Proximity ligation assay (PLA)
Cells were grown onto glass coverslips in a 6 well dish until they reached around 50%
confluency. After treatment (as indicated in the figure legends), cells were fixed by addition
of 4% formaldehyde solution for 10 minutes and then permeabilised using 1% Triton X-100
in PBS. Next Duolink® II (green) assay from Olink® Bioscience was carried out following
suppliers instructions. Briefly, any unspecific antibody binding sites were blocked using 3%
BSA (w/v) in PBS for 1 hour at room temperature (24°C), next primary antibodies were diluted
in the supplied antibody diluent and added to cells and incubated over-night at 4°C. As a
control one slide was incubated with only single mAb and no second primary antibody. Next
PLA probes conjugated to secondary antibodies anti- mouse and anti-rabbit respectively were
added to the cells for 1 hour at 37 °C and ligation and amplification was carried out as detailed
by the supplier. In the last step an amplification reaction produces a fluorescent signal that can
be detected using a fluorescent microscope with a green filter (488nm). Results were visualised
using an Axioplan2 (Zeiss) fluorescent microscope with Planneofluar objectives, a 100W Hg
source (Carl Zeiss, Welwyn Garden City, UK) and Chroma #89014ET single emission filters
(Chroma Technology Corp., Rockingham, VT) using 40x or 100x magnification Zeiss lense
and a Hamamatsu Orca AG CCD camera (Hamamatsu Photonics (UK) Ltd, Welwyn Garden
City, UK).The single excitation and emission filters are installed in motorised filter wheels
(Prior Scientific Instruments, Cambridge, UK). ImageJ software was used for analysis.
4% formaldehyde solution
4% (v/v) formaldehyde
100 mM PIPES (pH)
10 mM EDTA
1 mM MgCl2
64
2.7 Other assays
2.7.1 Co-immunoprecipitation (Co- IP)
To provide further evidence of MDM2/HSP70 complex formation in cells, I captured
endogenous MDM2 from A375 cells. 1 μg of 4B2 (MDM2 MAb) was added to 2 mg of total
protein in the pre-cleared lysate and, in a final volume of 1 ml, incubated for 1 hour at 4°C
with gentle rotation. Then, 15 μl of protein G SepharoseTM 4 FastFlow (GE Healthcare;
washed 4 times in PBS) was added to the above samples and incubated over-night at 4°C with
gentle rotation. Beads were washed four times with 500 μl of IP buffer. Samples ( before and
after controls) were then eluted by addition of 50 μl of 2X SDS sample buffer and incubation
at 95°C for 5 minutes. The eluate was collected by centrifugation and analyzed by SDS-
PAGE/Immunoblot for HSP70.
IP buffer 5
0.3 M NaCl
1% (v/v) Triton X-100
50 mM HEPES pH 7.6
2.7.2 SBP-tagged pull down
A375 cells were cultured in 10 cm plates and transfected with 2 μg of the SBP-tag vector,
empty, wt HSP70 and mutant HSP70 using attractene. Post transfection cells were treated with
either Nutlin or Ganetespib for further 6 hours and the below described steps was followed.
1. Culture media aspirated, wash cells 2X with PBS
2. Cells lysed using lysis buffer (3X the cell pellet)
3. Sonication (3X 15 sec pulse)
4. Spin down cells 15mins 12000g
5. Streptavidin agarose beads were washed in lysis buffer without (PIM and avidin 1:100)
6. Divide lysates into two, add to beads, one lysate with ATP, one without.
65
7. Precipitate for one hour at room temperature.
8. Wash 3X (200ul) with wash buffer
9. Elute in 35ul elution buffer (wash buffer +2mM Biotin)
10. Spin down and collect 30ul without beads.
Lysis buffer
50mM Hepes (pH 7.6)
150mM KCL
2mM MgCL2
PIM
Avidin (1:100)
+/- Nutlin (10uM) or Ganetespib (100nM)
Wash buffer
50mM Hepes (pH 7.6)
150mM NaCL
50mM KCL
2mM MgCL2
+/- ATP
2.8 Immunofluorescence
Immunostaining of cells was done by growing the mammalian cells in a six well plate
containing a glass coverslip per well. Cells were seeded and treated with appropriate drug for
either 6 or 6 hours. The cells were washed thrice in PBS (five minutes on shaker for each
wash) and then fixed using formaldehyde fixing solution (3.7% formaldehyde, 10mM EGTA
pH-8.0, 100mM PIPES pH-6.8, 1mM MgCl2 and 0.2% Triton X-100) at room temperature,
followed by washing and permeabilisation of cells with 1% Triton x-100. These permeabilised
cells were then washed as before and blocked with 3% BSA for 30 minutes and then probed
with the primary antibodies and left overnight at 4◦C in humidity chamber. Then the chambers
were washed thrice with PBS and secondary antibody (Rabbit anti-mouse 488 nm) diluted
1:1000 in antibody diluent was added to the chambers with an incubation period of 1 hour in
humidity chamber at RT. The chambers were again washed thrice with PBS and were prepared
for mounting. For mounting, 1 μl of DAPI fluorescent stain was made up in 10 drops of
66
mounting medium (DAKO) and placed onto the slides before placing the chambers on it. The
chambers were then placed with cells facing the slides and stored in the dark until dried. Once
the slides containing the chambers had dried, slides were ready for imaging.
2.9 Sample Preparation for Mass Spectrometry and
result Analysis
2.9.1 Mass Spectrometry
2.9.1.1 Sample preparation for mass‐spectrometry
When handling samples for mass spectrometry analysis the utmost care was taken to avoid
contamination of the samples by keratin. The solutions used for the reactions were filtered
before use where possible, gloves and a lab coat were worn at all times and most of the work
was performed in a fume hood. Mass spectrometric analysis by TMT tagging was used to
determine the differential expression of the proteins as TMT mass spectrometric analysis can
give a ratio of proteins in a mixture of samples. A375 cells were grown in a 150mm plates to
reach confluency (1 x10⁶ cells per ml) and treated with either Ganetespib (100nM for 16hours
) or Nutlin (10uM for 6 hours) prior to harvesting. The cells were grown in triplicate set, one
was used to run SDS gel while other two were used as biological replicates for mass
spectrometry. I performed the following steps at Masaryk Memorial Cancer Institute, Brno.
Samples
• DMSO treated
• Ganetespib treated
• Nutlin treated
• N+G( Nutlin+Ganetespib) treated
2.9.1.2 Lysis of cell pellets
Lysis buffer: 8 M urea in 0.1 M Tris-Cl (pH 8)
67
1. Lyse the cells by adding five cell-pellet volumes of Lysis Buffer with protease
inhibitors (i.e., 200 μL of Lysis Buffer for a 20 μL cell pellet).
2. Mix by pipetting and store in freezer at -20 °Cover night.
3. Sonication and centrifugation at 14,000 × g for 30 minutes at 4°C.
4. Carefully separate the supernatant and transfer into a new tube and store at -20 °C.
5. Determine the protein concentration of the supernatant with RCDC kit.
2.9.1.3 FASP digestion
Chemicals and solutions
➢ UA: 8 M Urea in 0.1 M Tris pH 8
➢ ABC: 100 mM NH4HCO3 in H2O ,50 mM NH4HCO3 in H2O
➢ 5 % TFA: 190 ul H2O + 10 ul TFA ( here used about 30% TFA for ph balance 1 to 2
ul)
➢ 100 mM TCEP in deionized water( tris 2 carboxyethyl phosphine hydrochloride-
C4706 sigma)
➢ 300 mM iodacetamid in deionized water
➢ Trypsin
FASP Procedure
1. Add 100 µl UA to the filter unit.
2. Add 50ug – 100 µg of sample to the filter.
3. Mix by pipet tip, do not touch the filter.
4. Centrifuge for 15 min, 14 000 g, 20 °C.
5. Discard the flow-through from the collection tube.
6. Add 100 µl UA and 20 ul 100 mM TCEP, mix by pipet tip.
7. Incubate in thermomixer for 30 min, 600 rpm, 37 °C.
8. Centrifuge for 15 min, 14 000 g, 20 °C.
9. Discard the flow-through from the collection tube.
10. Add 100 µl UA and 20 µl 300 mM IAA, mix by pipet tip.( light sensitive)
11. Incubate in thermo-mixer in dark for 20 min, 20 °C.
12. Centrifuge for 15 min, 14 000 g, 20 °C.
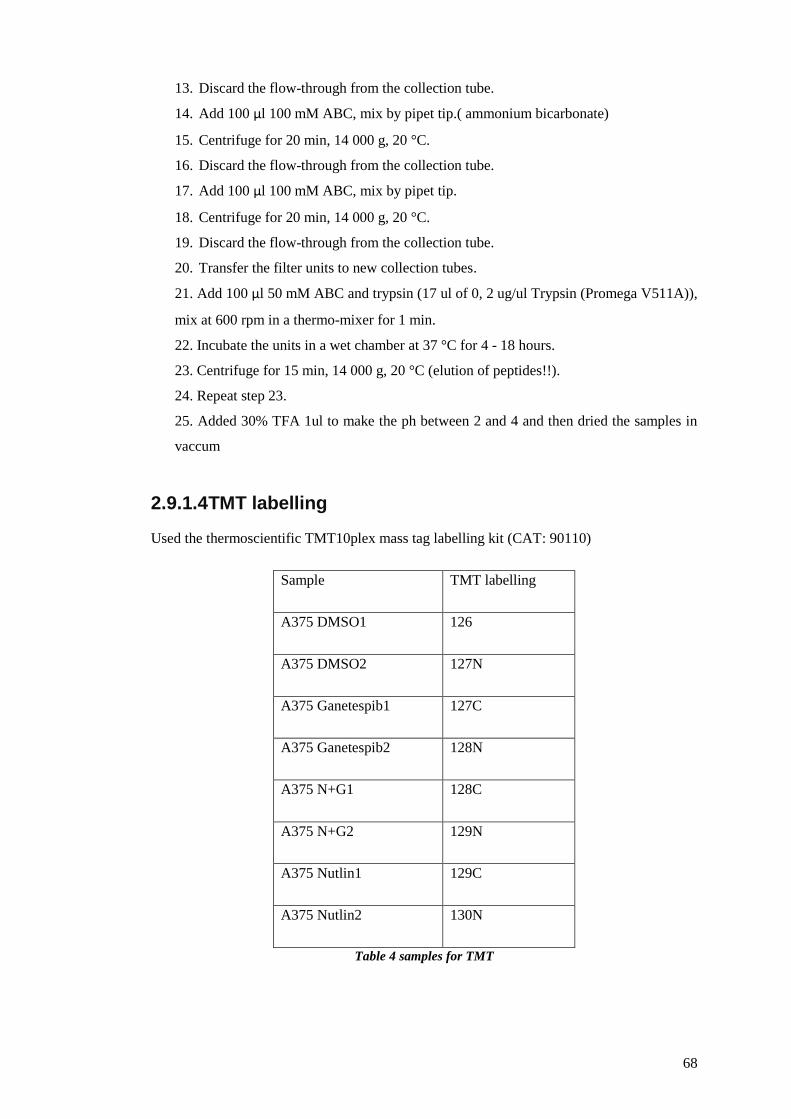
68
13. Discard the flow-through from the collection tube.
14. Add 100 µl 100 mM ABC, mix by pipet tip.( ammonium bicarbonate)
15. Centrifuge for 20 min, 14 000 g, 20 °C.
16. Discard the flow-through from the collection tube.
17. Add 100 µl 100 mM ABC, mix by pipet tip.
18. Centrifuge for 20 min, 14 000 g, 20 °C.
19. Discard the flow-through from the collection tube.
20. Transfer the filter units to new collection tubes.
21. Add 100 µl 50 mM ABC and trypsin (17 ul of 0, 2 ug/ul Trypsin (Promega V511A)),
mix at 600 rpm in a thermo-mixer for 1 min.
22. Incubate the units in a wet chamber at 37 °C for 4 - 18 hours.
23. Centrifuge for 15 min, 14 000 g, 20 °C (elution of peptides!!).
24. Repeat step 23.
25. Added 30% TFA 1ul to make the ph between 2 and 4 and then dried the samples in
vaccum
2.9.1.4 TMT labelling
Used the thermoscientific TMT10plex mass tag labelling kit (CAT: 90110)
Sample TMT labelling
A375 DMSO1 126
A375 DMSO2 127N
A375 Ganetespib1 127C
A375 Ganetespib2 128N
A375 N+G1 128C
A375 N+G2 129N
A375 Nutlin1 129C
A375 Nutlin2 130N
Table 4 samples for TMT
69
1. Immediately before use, equilibrate the TMT Label Reagents to room temperature.
For the 0.8 mg vials, add 41 µL of anhydrous acetonitrile to each tube. Allow the
reagent to dissolve for 5 minutes with occasional vortexing.
2. Briefly centrifuge the tube to gather the solution.
3. Carefully add 41µL of the TMT Label Reagent to each 25-100µg sample.
4. Note: A 100 µL glass syringe or positive displacement pipette may be necessary to
accurately measure and dispense TMT Reagents in volatile acetonitrile solvent.
5. Note: Wash the syringe 3x with miliQ H2O and 3x with anhydrous ACN after each
label
6. Incubate the reaction for 1 hour at room temperature.
7. Add 8 µL of 5% hydroxylamine to the sample and incubate for 15 minutes to quench
the reaction.
8. Combine samples in a new microcentrifuge tube at equal amounts dry at RT in speed
vac and store at -80°C.
2.9.1.5 Peptide purification
Chemicals and solutions
100% acetonitrile (ACN) with 0.1% FA
50% ACN with 0.1% FA
80% ACN with 0.1% FA
deionized water with 0.1% FA
I had 50ug per sample and combined all 8 together so 400ug in total. 20ul of the combined
sample was topped with 80ul 0.1%FA
Procedure
1. use microSpin columns C-18
(https://www.harvardapparatus.com/Guide+to+C18_SpinColumns.pdf)
2. condition the column 2x with 200 ul 100% ACN with 0.1% FA in the microspin
column
3. centrifuge for 3 min, 100 g, 20 °C
4. rinse the column 200 ul water with 0.1% FA
70
5. centrifuge for 3 min, 300 g, 20 °C
6. add 200 ul water with 0.1% FA, hydrated for 15 min
7. centrifuge for 3 min, 300 g, 20 °C
8. discard the flow-through from the collection tube
9. add sample into the microspin column
10. centrifuge for 3 min, 500 g, 20 °C
11. add 3x 200 µl water with 0.1% FA
12. centrifuge for 3 min, 500 g, 20 °C
13. transfer the microspin column to new collection tubes
14. add 200 µl 50% ACN with 0.1% FA
15. centrifuge for 3 min, 500 g, 20 °C
16. add 200 µl 80% ACN with 0.1% FA
17. centrifuge for 3 min, 500 g, 20 °C
18. transfer the microspin column to new collection tubes, discard the flow-through from
the collection tube
19. add 200 µl 100% ACN with 0.1% FA
20. centrifuge for 3 min, 500 g, 20 °C
21. both collection tubes evaporate using SpeedVac
2.9.2 Flow Cytometry
A minimum of 10,000 events were gated to exclude dead cells, and analysis was performed
with BD accuri. A375 or A549 cells were treated with either DMSO, Ganetespib, Nutlin or
IFNγ for 16 hours or as indicated. Post treatment the cells were washed in ice cold PBS. The
cells were trypsinized. The cells were pelleted and 108 cells were gently mixed into 400 μL of
ice cold PBS and washed thrice at 300 g for 3 min at 4°C. The supernatant was discarded and
the cells were resuspended in 100ul PBS and 1ul of PDL-1 antibody (APC conjugated
Antibody) or 6ul of isotype antibody was added and cells incubated for 1 hour at room temp.
The cells were washed thrice at 300 g for 3 min at 4°C and the supernatant was discarded. The
cells were either fixed using PFA (final 2%) or resuspend the pellet in 500ul PBS for FACS
analysis. untreated cell controls were also used. The relative binding affinity of the antibody
was analyzed using the FlowJo7 and the FACSDiva 6 software (BD FACSAria™ II SORP
(BD Biosciences, USA).
71
2.10 General Biochemical Techniques
2.10.1 Bradford Assay for Protein quantification
The protein concentration in the cell lysate was estimated using the Bradford reagent
(#5000006, Bio-Rad) as suggested by the manufacturer’s instructions. The plate was shaken
on a Microplate shaker (Jencons Scientific Ltd, UK) for 5 min at room temperature and the
absorbance was measured 595nmOD using the Victor3 1420 Multilaber Counter
(PerkinElmer, USA). The BSA standards from 0 μg/μL (blank) to 4 μg/μL was used to
generate a linear standard curve. Using the standard values, the readings of the unknown
samples were converted into concentrations in mg/mL for each individual lysate.
2.11 Cell-based assays
2.11.1 Cell cytotoxicity Assay
The assay was carried out in 96 well tissue culture plates. The cells were treated with either
Ganetespib, 17AAG or Nutlin for 16 hours.
1. Add 1/10th volume of alamarBlue® reagent directly to cells in culture medium (10ul
into 100ul )
2. Incubate for 1 to 4 hours at 37°C in a cell culture incubator, protected from direct light.
3. The absorbance was measured at 560 nm using the Victor 3 plate reader. The cell
growth curve was mapped by plotting the absorbance values against time.
2.12 Bioinformatics
2.12.1 Canine Osteosarcoma DNA and RNA purification
OSA31 is a canine osteosarcoma cell line belonging to male Bullmastiff. All the cell lines are
kind gift from Prof Geoffrey Wood from university of Guelph. DNA was extracted from the
OSA31 tumour cell line and their matched normal tissues using the ChargeSwitch gDNA Mini
Tissue kit from Invitrogen following the manufacturer’s protocol. RNA was extracted from

72
tumour OSA31 cell line using RNeasy RNA extraction kit from Qiagen following the
manufacturer’s protocol.
2.12.2 Sequencing of OSA31 DNA
Exome Sequencing was performed using Agilent V5+UTR Exome Capture Kit (75Mb);
Illumina, 100bp paired-end reads using a coverage of Tumour: Normal pairs (100X/30X).
Paired de-multiplexed fastq files were generated using CASAVA software (Illumina) and
initial quality control was performed using FastQC.
2.12.3 Sequencing of OSA31 RNA
RNA sequencing was performed using Illumina HiSeq2500 100bp paired-end reads.
DNA seq and RNA next generation sequencing were performed by otogenetics ltd.
2.12.4 Data analysis
The results from the WES were analysed using bioinformatics software CLC genomics
workbench 8.5.1 (Qiagen).The following steps were involved for the input and analysis of the
next generation sequencing files.
2.12.4.1 Input files into CLC workbench
The schematic steps involved in inputting the fasta files into workbench is described in Figure
15. The illumine option under input files was selected. The files were imported together as
paired-end reads.
2.12.4.2 Downloading the canine reference
As Canine reference is not installed in the software by default, canine reference genome was
downloaded using the steps mentioned in Figure 16 and Figure 17
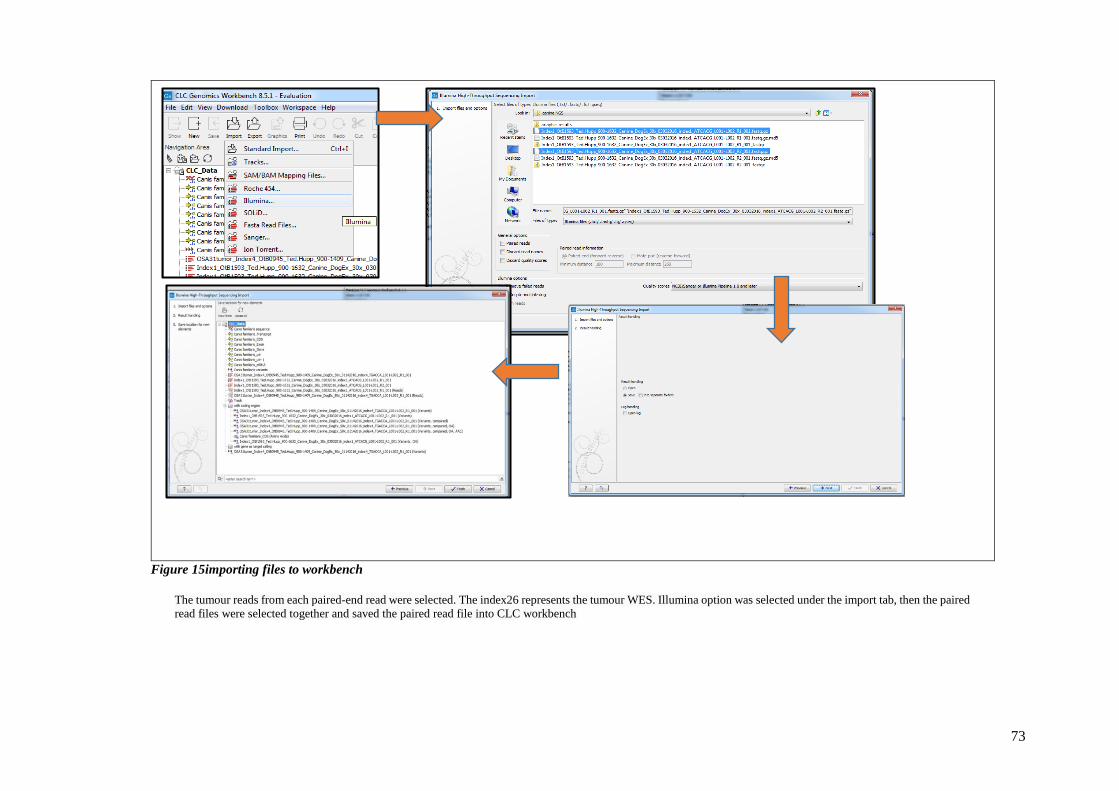
73
Figure 15importing files to workbench
The tumour reads from each paired-end read were selected. The index26 represents the tumour WES. Illumina option was selected under the import tab, then the paired
read files were selected together and saved the paired read file into CLC workbench
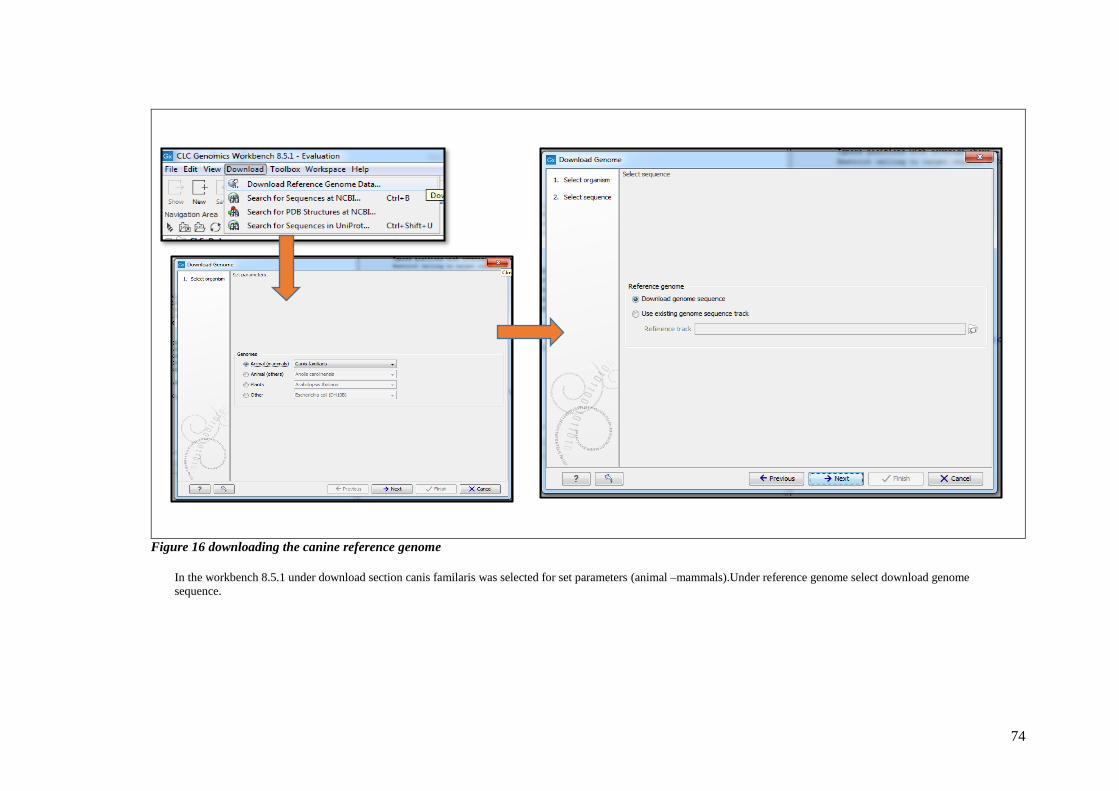
74
Figure 16 downloading the canine reference genome
In the workbench 8.5.1 under download section canis familaris was selected for set parameters (animal –mammals).Under reference genome select download genome
sequence.
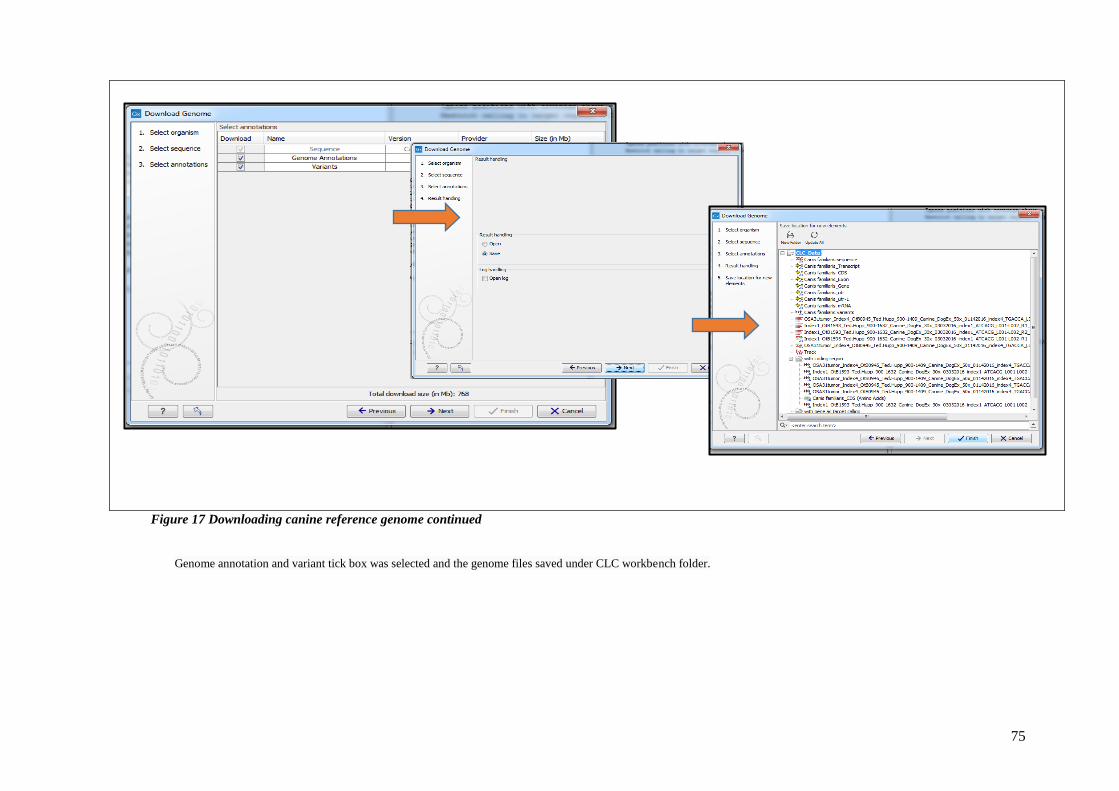
75
Figure 17 Downloading canine reference genome continued
Genome annotation and variant tick box was selected and the genome files saved under CLC workbench folder.
76
2.12.4.3 Map reads to contig and variant detections for OSA31 tumor DNA and Normal DNA
Canis familaris was selected as the contig for mapping the DNA seq file. Each of the Tumor
DNA and Normal DNA is mapped to canis familaris contig. The workflow for mapping is
described in Figure 18. Basic variants is detected in both the tumor and Normal DNA seq file
using the procedure as per Figure and Figure. Variants were detected in the exome data using
the following parameters: Minimum coverage (number of reads) = 5; Minimum frequency =
5%; Minimum number of variants = 2; Variants in normal germline DNA=0, and the coverage
in the germline DNA should be at least 5 reads at the variant site.
2.12.4.4 Compare Normal to OSA31 seq data
The variant file from each of the normal and OSA31 tumor DNA seq file is compared to detect
for somatic mutations. The steps involved are as described in Figure 21. In order to visualise
the aminoacid changes in the tumor and the respective genes, the variant files are annotated
and aminoacid changes added as per Figure 22 and Figure 23 respectively.
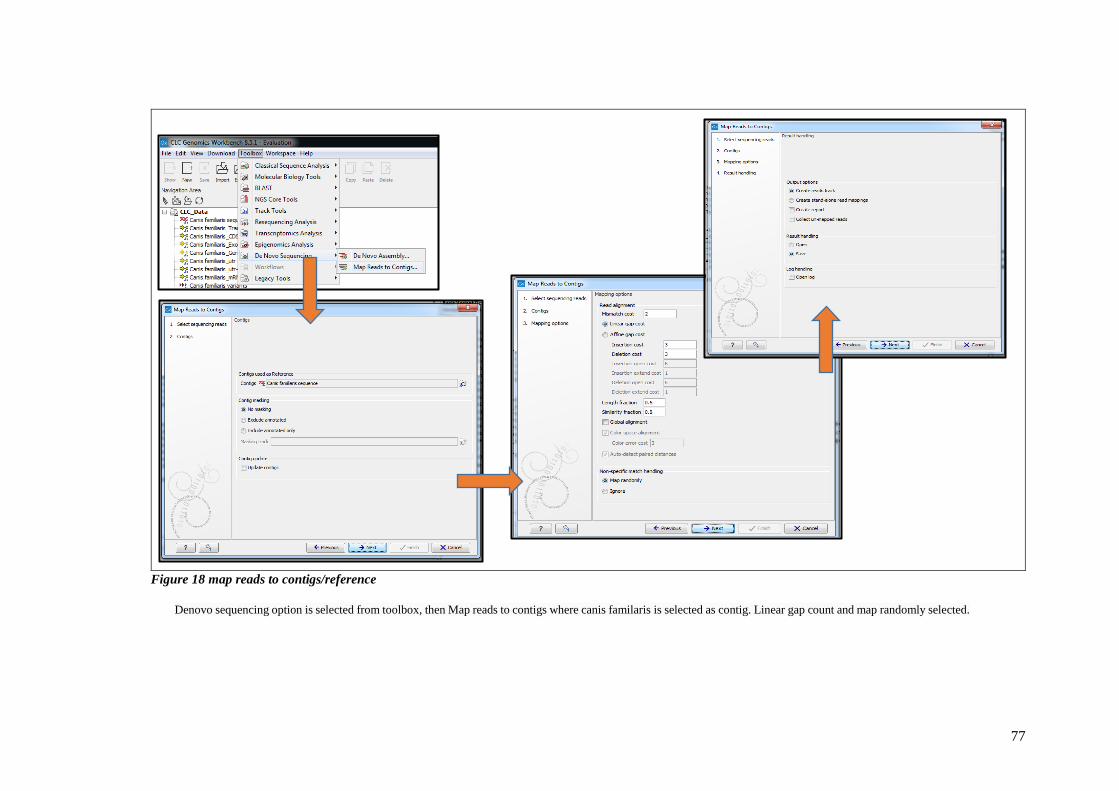
77
Figure 18 map reads to contigs/reference
Denovo sequencing option is selected from toolbox, then Map reads to contigs where canis familaris is selected as contig. Linear gap count and map randomly selected.
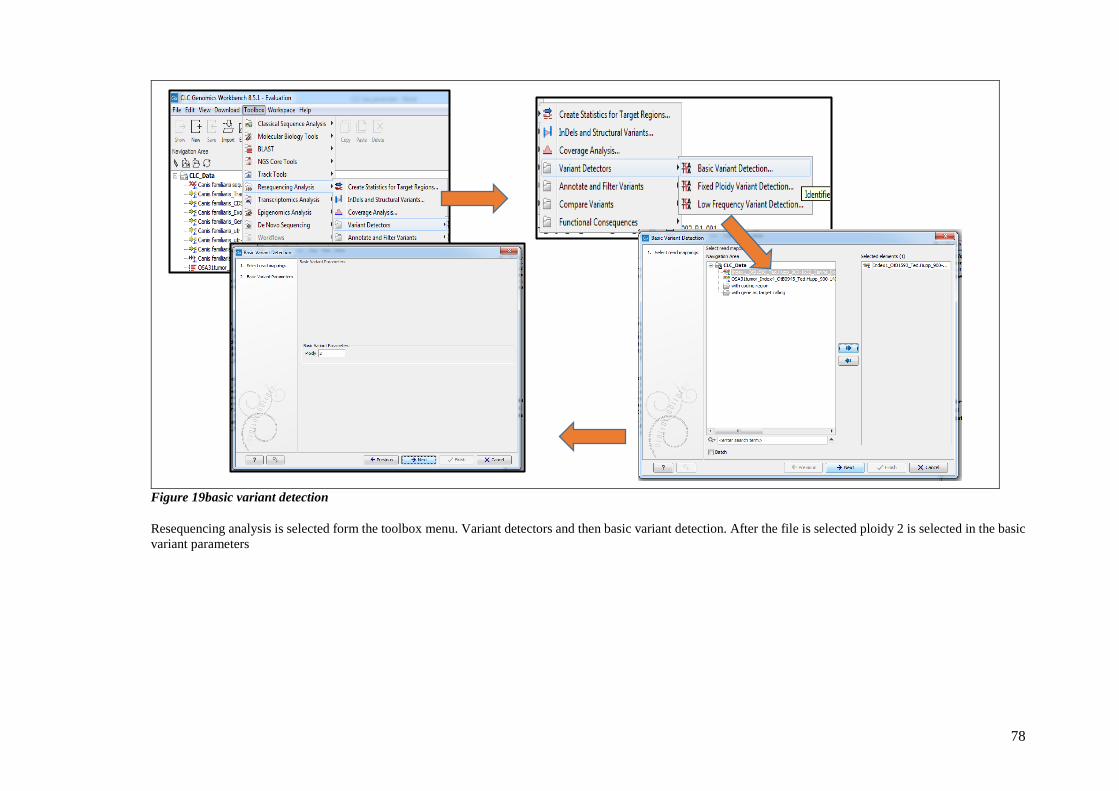
78
Figure 19basic variant detection
Resequencing analysis is selected form the toolbox menu. Variant detectors and then basic variant detection. After the file is selected ploidy 2 is selected in the basic
variant parameters
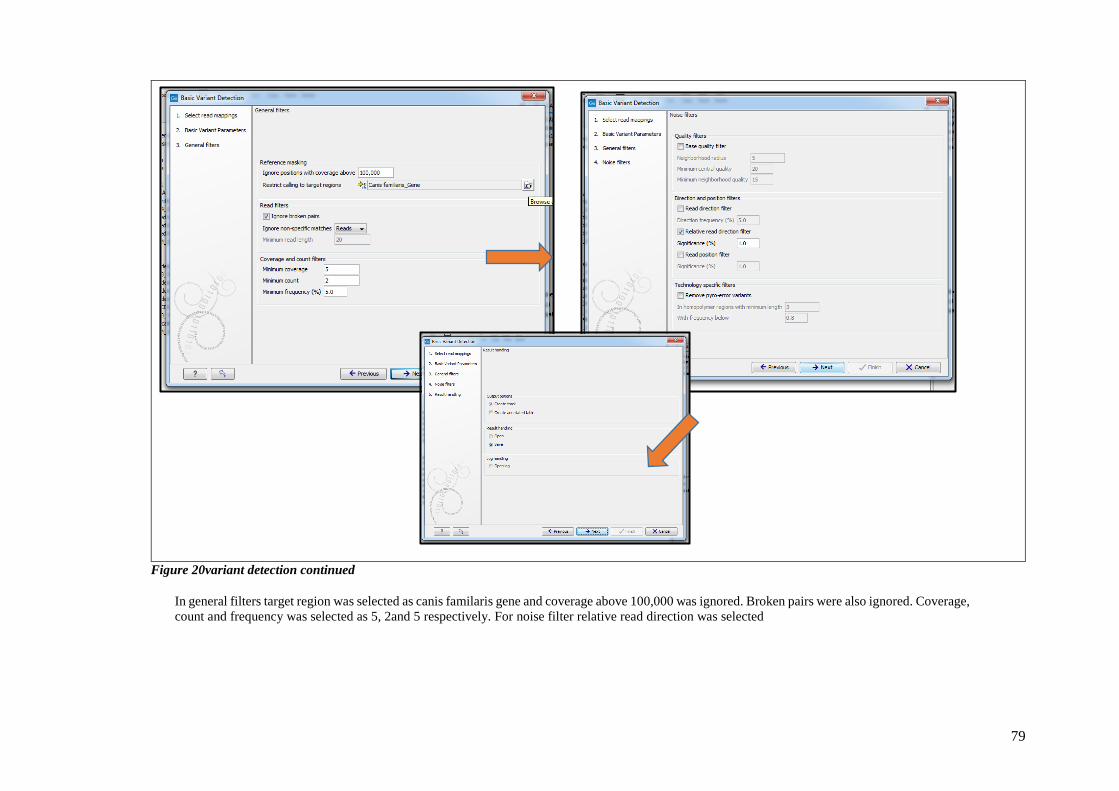
79
Figure 20variant detection continued
In general filters target region was selected as canis familaris gene and coverage above 100,000 was ignored. Broken pairs were also ignored. Coverage,
count and frequency was selected as 5, 2and 5 respectively. For noise filter relative read direction was selected
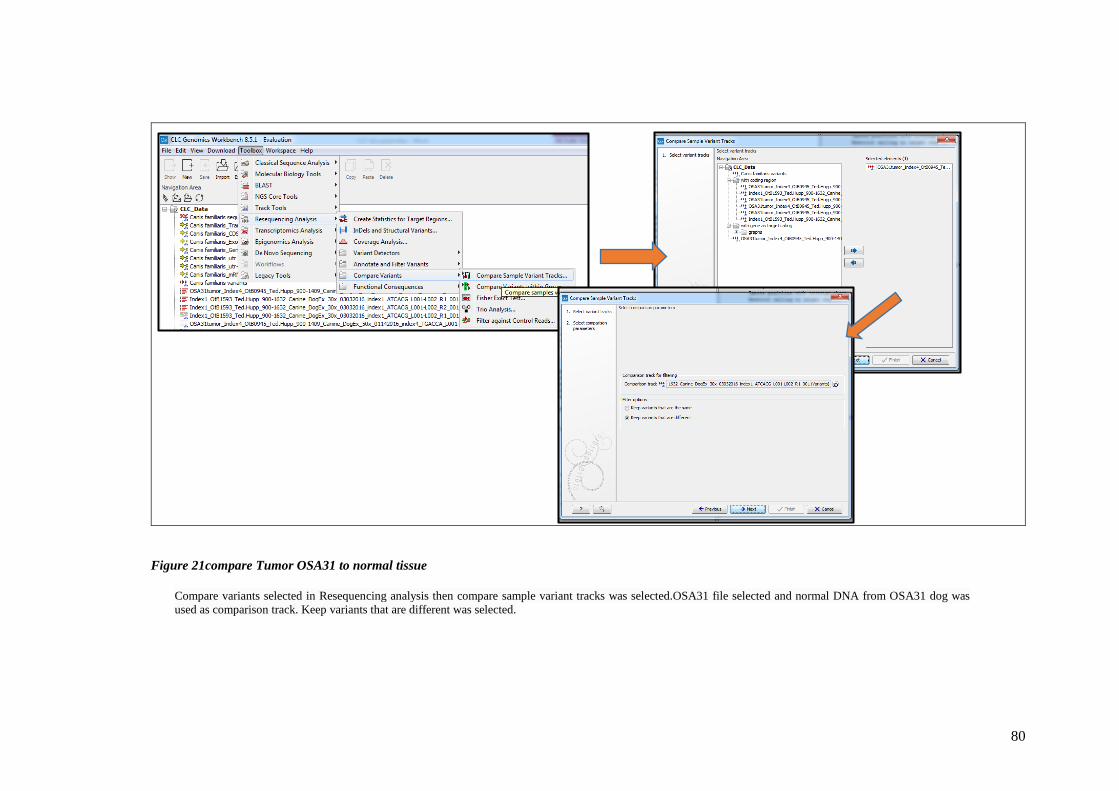
80
Figure 21compare Tumor OSA31 to normal tissue
Compare variants selected in Resequencing analysis then compare sample variant tracks was selected.OSA31 file selected and normal DNA from OSA31 dog was
used as comparison track. Keep variants that are different was selected.
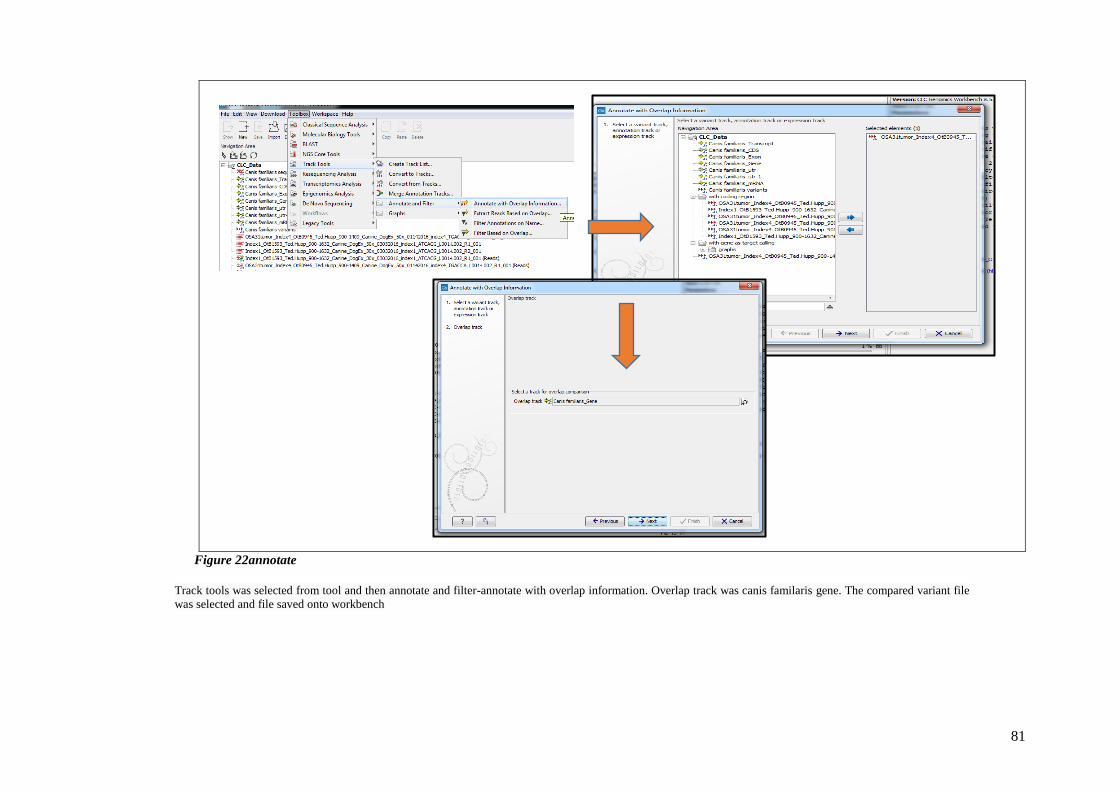
81
Figure 22annotate
Track tools was selected from tool and then annotate and filter-annotate with overlap information. Overlap track was canis familaris gene. The compared variant file
was selected and file saved onto workbench
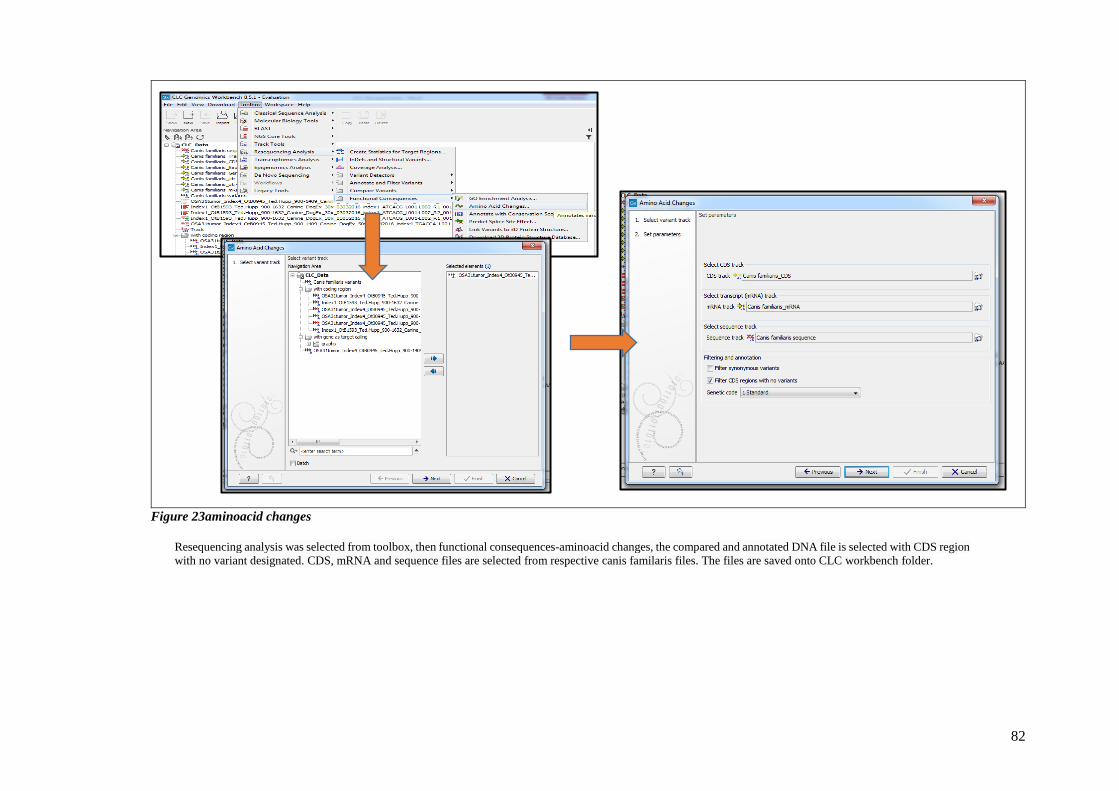
82
Figure 23aminoacid changes
Resequencing analysis was selected from toolbox, then functional consequences-aminoacid changes, the compared and annotated DNA file is selected with CDS region
with no variant designated. CDS, mRNA and sequence files are selected from respective canis familaris files. The files are saved onto CLC workbench folder.
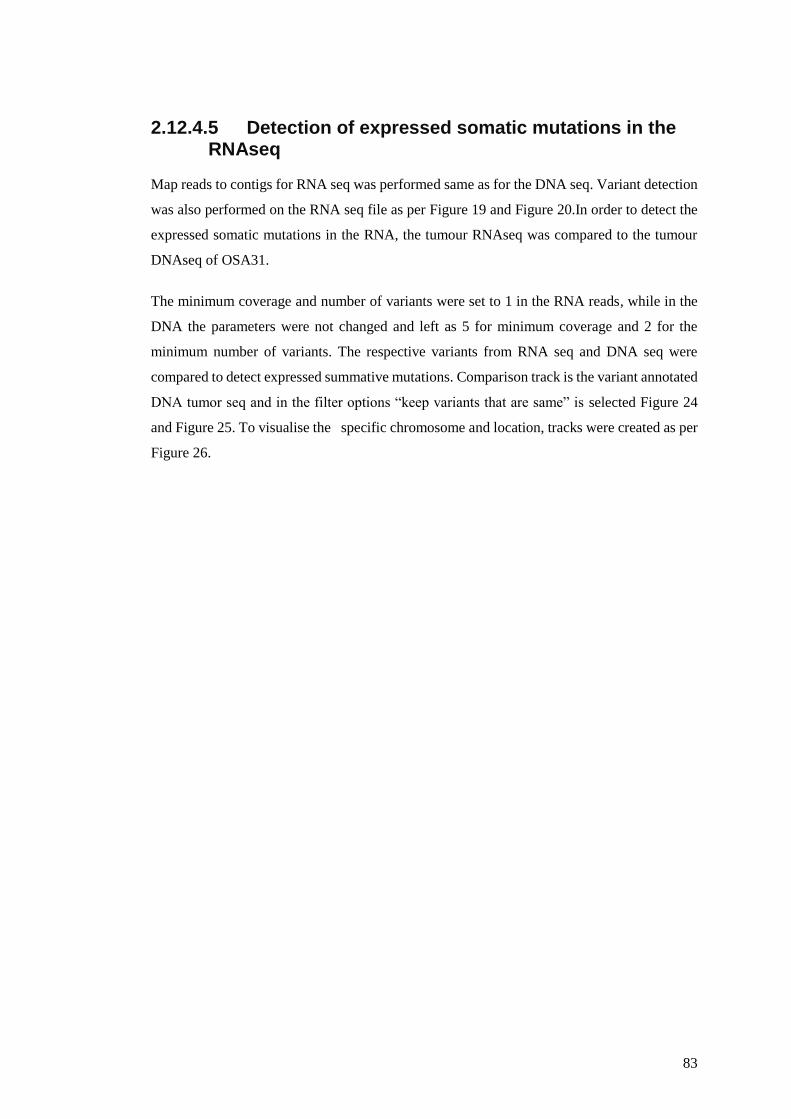
83
2.12.4.5 Detection of expressed somatic mutations in the RNAseq
Map reads to contigs for RNA seq was performed same as for the DNA seq. Variant detection
was also performed on the RNA seq file as per Figure 19 and Figure 20.In order to detect the
expressed somatic mutations in the RNA, the tumour RNAseq was compared to the tumour
DNAseq of OSA31.
The minimum coverage and number of variants were set to 1 in the RNA reads, while in the
DNA the parameters were not changed and left as 5 for minimum coverage and 2 for the
minimum number of variants. The respective variants from RNA seq and DNA seq were
compared to detect expressed summative mutations. Comparison track is the variant annotated
DNA tumor seq and in the filter options “keep variants that are same” is selected Figure 24
and Figure 25. To visualise the specific chromosome and location, tracks were created as per
Figure 26.

84
Figure 24 compare variant DNA and RNA seq from OSA31
Compare variants is selected from resequencing analysis options and compare sample variants is designated. Variant RNA seq file is selected.
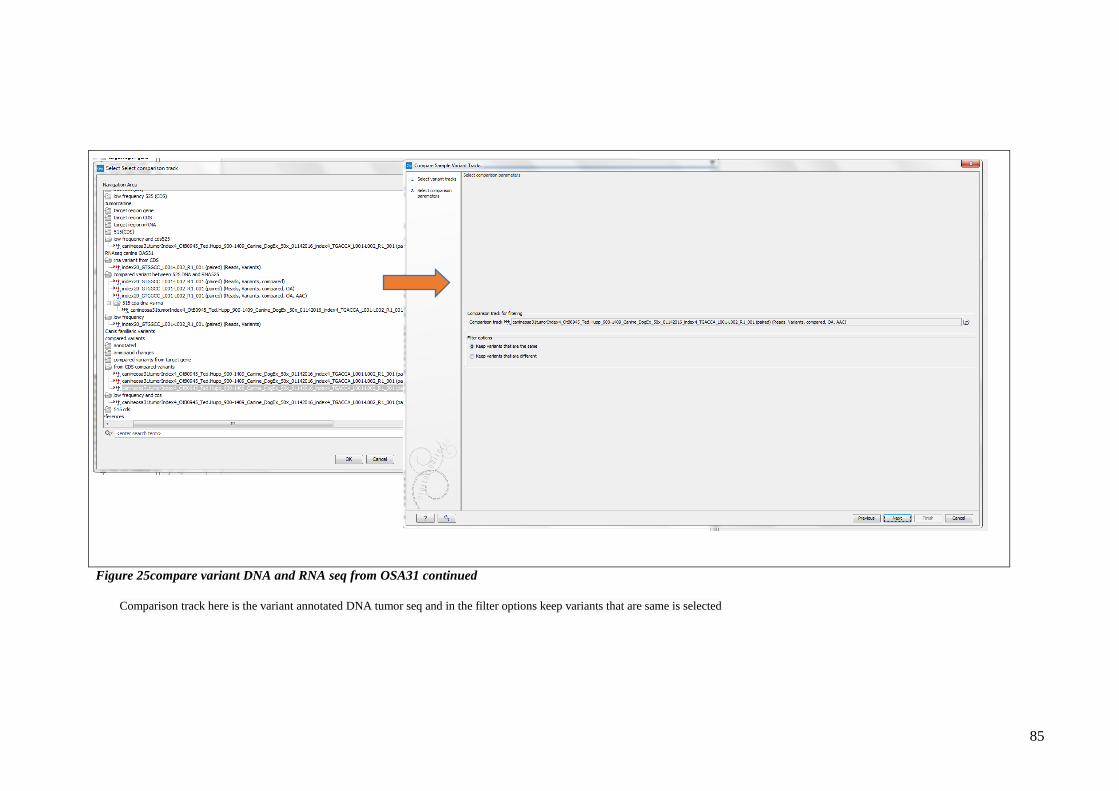
85
Figure 25compare variant DNA and RNA seq from OSA31 continued
Comparison track here is the variant annotated DNA tumor seq and in the filter options keep variants that are same is selected
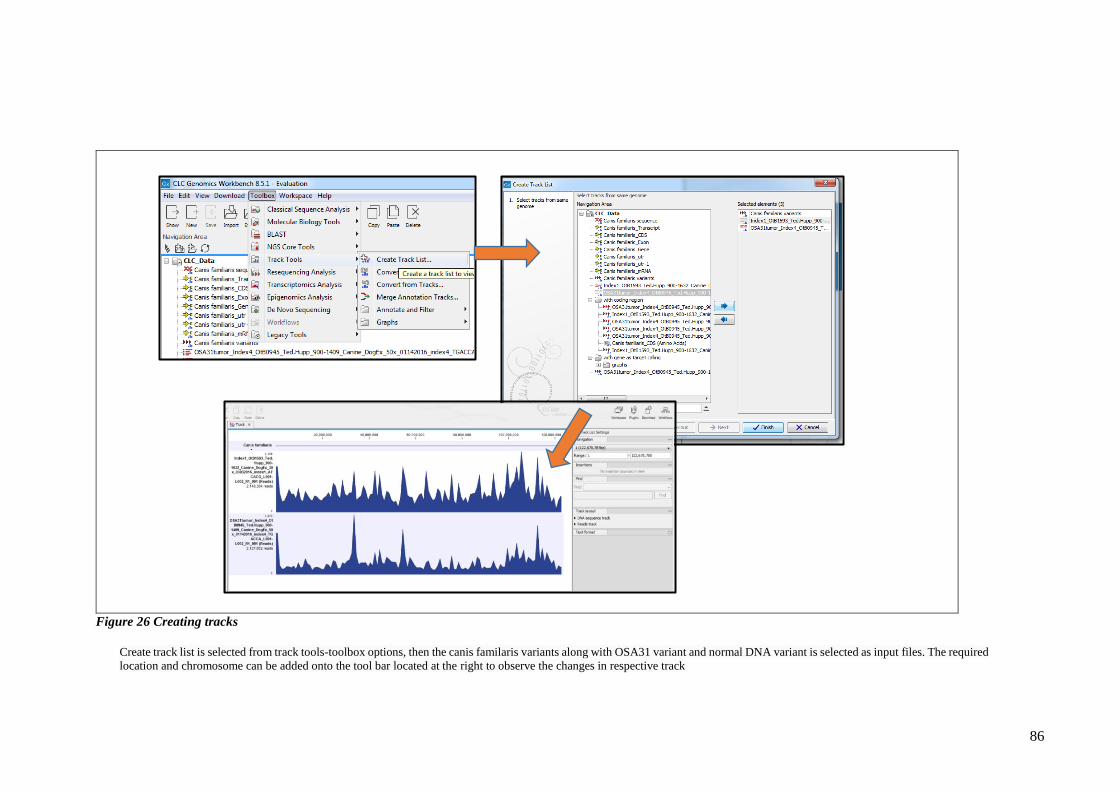
86
Figure 26 Creating tracks
Create track list is selected from track tools-toolbox options, then the canis familaris variants along with OSA31 variant and normal DNA variant is selected as input files. The required
location and chromosome can be added onto the tool bar located at the right to observe the changes in respective track
87
3 Results: Comparative oncology: canine
model
There are relatively few immune competent animal models that can accurately predict drug
responses in human cancer patients. The emerging view is that canine cancers (companion
animal cancers) provide a spontaneous, age-dependent, immune-competent cancer model can
be a test-bed for whether veterinary medicine can produce more accurate models for testing
human cancer drugs. In this chapter, I present a strategy to use and characterize one such cell
model derived from canine osteosarcoma. This cancer type in dogs has been shown to be a
robust physiologically relevant model for the human equivalent. The aim was to use genetic
screening to identify genetically mutated pathways and use this as a strategy to develop cancer
therapeutics.
3.1 The use of a Canine Osteosarcoma cancer cell as
a model for personalizing anti-cancer therapeutics
The past decade has seen immense number of studies seeking to understand how genetic
variability contributes to disease. These population-based studies, known as genome-wide
association studies, aim to detect genetic variants—most commonly single nucleotide
polymorphisms (SNPs)—that are associated with complex traits in populations (e.g.,
susceptibility to cancer). Recent studies of humans and dogs with osteosarcoma revealed
multiple SNPs associated with risk for development of osteosarcoma, and these SNPs have
been linked to biological pathways with known relevance to osteosarcomagenesis, but their
statistical power has been limited by small sample sizes because of the rarity of this cancer
type (Khanna, 2015).
Pet dogs develop osteosarcomas that share many features with the human disease, including
tumour histology, gene expression, response to chemotherapy, and risk for pulmonary
88
metastasis. Accordingly, the dog with osteosarcoma provides a valuable model for the study
of cancer-associated genes, drug development, and prognostic markers. Loss-of-
function Rb mutations occur in up to 70% of osteosarcoma cases. In one study, 70% of patients
possessed deletions or rearrangements in the CDKN2A gene (Khanna, 2015). Nevertheless,
these genetic studies have failed to produce robust therapeutic options for improving survival
of cancer patients.
What has emerged in recent years, however, is the concept that cancer treatment can be
personalized by the identification of mutated proteins produced by the cancer genome. In
addition to identification of “driver” pathways that might impact on drug use, a proportion of
these mutated proteins can be processed to produce peptides that are presented by the MHC
Class I/II system. It is by this process that emerging cancers produce mutated neoantigens,
activation of T-cells through cross-presentation, and tumour rejection. However, tumours
evolve to escape this process either by dampening the T-cells’ themselves or supressing MHC
Class I presentation in the tumour cell. Both concepts will be discussed below. This chapter
will focus on how we can identify mutated genes using next generation sequencing
technologies and how we can use this information for therapeutic approaches. This will help
towards development of canine personalized models to identify and test drug leads or
neoantigen vaccines, based on the patient-specific genetic signatures,
3.1.1 Cell models used for nucleic acid sequencing.
I analysed the whole exome DNA sequence of tumours (canine osteosarcoma OSA31), and
the normal tissue from the same dog as a germline reference, using the CLC genomic
workbench 8.1. Total RNA from the OSA31 cell line was also sequenced and compared to the
tumour DNA sequence to look for expressed mutations in these tumours. Both methods have
advantages and disadvantages, but the combined use of DNAseq and RNAseq is thought to
increase the depth of mutated gene identification.
89
3.1.2 DNA seq analysis of the OSA31 genome.
Genomic DNA and RNA were extracted using commercially available kits. The samples were
processed using an Illumina sequencing platform by Otogenetics Ltd. For the tumour samples
the HiSeq2500 PE100-125 kit was used to sequence the whole exome from gDNA, paired-end
2x100-125 or PE100-125 (read length). The estimated average on-target DNA sequencing
coverage is 100x for the tumour. The estimated average on-target coverage is 30x for the
normal genome. The HiSeq2500 system uses sequencing by synthesis (SBS) technology. The
SBS technology supports massively parallel sequencing using a proprietary fluorescently
labelled reversible terminator method that enables detection of single bases as they are
incorporated into growing DNA strands. A fluorescently labelled terminator is imaged as each
dNTP is added and then cleaved to allow incorporation of the next base. Since all four
reversible terminator-bound dNTPs are present during each sequencing cycle, natural
competition minimizes incorporation bias. SBS technology supports both single read and
paired-end libraries. (https://www.otogenetics.com/, 2017). The DNA and RNA sequences of
OSA31 were imported as fastq files and analysed in the CLC genomics workbench 8.5.1.
3.1.3 Non-synonymous mutations and types of mutations by
comparing tumour to normal tissue
To outline the non-synonymous mutations the variants were detected to identify mutated
protein drivers. Data analysis indicated that the highest rate of mutations was observed in
chromosome 1 followed by chromosomes 2, 3 and 8 respectively (Figure 27a). Figure 27 a
also highlights the number of the somatic non-synonymous mutations detected in OSA31 and
the mutation signature. The majority of the mutations were SNV (single nucleotide variations)
followed by MNV (multiple nucleotide variations), deletions, insertions and replacements
respectively (Figure 27b). Using cut-off thresholds of 5_2_5, meaning there must be 5 reads,
2 of which must be mutated, and with a 5% frequency of mutation, we detected 19,636 non-
synonymous mutations. This is an unusually large number of mutations, relative to the
reference germline and suggests the cell line might be very heterogeneously mutated and/or
that passaging the cell line created additional variants. We changed the cut-off frequency to
40% more of the total reads being a mutation and this produced a more usual number of
mutations-4,653 (data not shown).
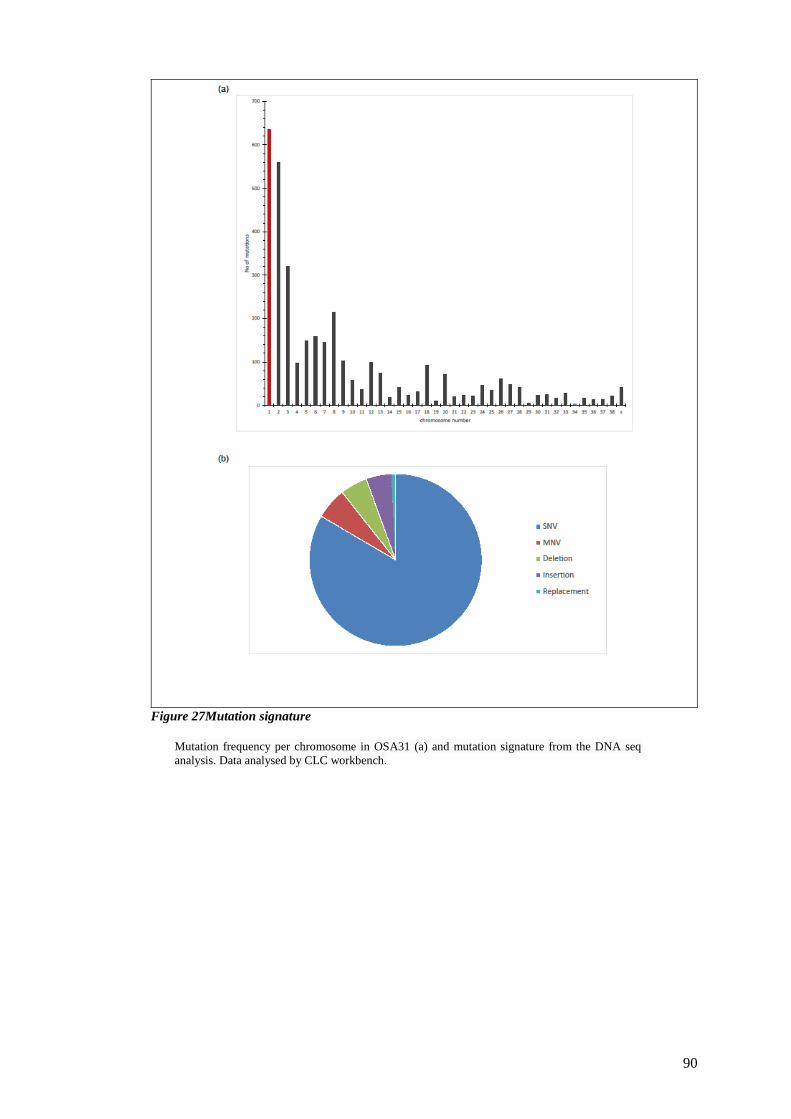
90
Figure 27Mutation signature
Mutation frequency per chromosome in OSA31 (a) and mutation signature from the DNA seq
analysis. Data analysed by CLC workbench.
91
The gene mutations in OSA31 were wide-ranging. The CLC genomics workbench produced
a table containing coverage, count, frequency, chromosome number, variant region, gene name
and amino acid change for each of the variant. An example of the browser view is shown in
(figure 28).PDGFRB (platelet-derived growth receptor) shows an insertion of TGA. One of
the interesting germline mutations observed was in RBM10 (RNA binding motif protein 10),
which acts like a tumour suppressor (Jordi Hernández, 2016). Gene sequencing revealed a
deletion in CCNB1IP1. The study performed by Confalonieri and group indicated that the
levels of Ub ligases such as CCNB1IP1 correlated significantly with relevant prognostic
factors, and with clinical outcome (Confalonieri S, 2009). However, there are so many
mutations identified for this one patient’s tumour that orthogonal assays need to be performed
in order to stratify the mutated genes and to focus on developing potential therapeutic
strategies.
3.1.4 Identifying expressed mutations by comparing tumour
RNA to tumour DNA
DNA sequencing can identify thousands of genomic variants in a single cancer genome,
especially if the sample is heterogeneous. Differentiating a genomic variant that causes a
selective growth or survival advantage to the tumour is a challenging task (Zhang S. J., 2014).
The detected somatic variant frequently occurs in a single allele, and the impact of a
heterozygous mutation will depend on whether the mutation-containing allele is transcribed to
RNA. The mutation detected in the genomic DNA may not be transcribed into RNA if the
wild-type allele is selectively transcribed. Furthermore, the mutation-containing transcript
could activate RNA surveillance mechanisms and cause rapid degradation of the mutation-
containing transcript. Nonsense-mediated decay (NMD) surveillance, for example, scans
transcripts for the presence of premature termination codons before the last exon and, when
found, initiates degradation of such transcripts (Castle, 2014.). Therefore, defining “active”
somatic genome mutations using RNAseq is very important for judging whether or not the
DNA mutation is expressed and/or advantageous to tumour development at the time of disease
presentation.
In order to stratify the 19,636 non-synonymous mutations further, we focused on determining
how many of these genes have detectable mutated mRNA produced at a relatively high
92
frequency. To test for the expressed genomic mutations, I compared the variants between the
tumour DNA and the RNA. In order to detect all the expressed somatic mutations, I set the
parameters of coverage and count of the mutation in the RNAseq to 1. A large number of
mutations were detected. All the germline variants found in normal control were eliminated.
Some of the examples of expressed mutations in key genes are shown in
Figure 29. IRF-1, CDKN2A and HSP90ab1 all expressed with an SNV. These all form
druggable target pathways that could be used in our strategy to match drug leads to mutated
expressed pathways.
When the non-synonymous mutations in the DNA were compared to the expressed mutations
in the RNA seq, I observed that all the expressed RNA mutations were listed within the subset
of DNA mutations (Figure 30a). This might be expected since we kept the thresholds for DNA
sequencing the same and confirms the software output is within the set parameters. The
number of the expressed somatic mutations in OSA31 is very low compared to the number of
somatic mutations detected in the tumour DNA. Shah and group have shown that only 36% of
validated somatic SNVs were observed in the transcriptome sequence when RNAseq data
compared with the genomes/exomes data in breast cancer. However, many variants had been
missed because there were no reads in the RNA at the position of the variants. Alternatively,
these mutant genes might not have been expressed at the time of surgery and resection. (Shah,
2012). Some of the detected expressed somatic non-synonymous mutations with a minimum
of five coverage reads in the DNA reads are listed in Figure 30b-d.

93
Figure 28 Brower example for mutation signatures observed in OSA31 genome
Examples of expressed somatic mutations in (a) insertion of TGA in PDGFRB (b) deletion of C in CCNB1IP1 (c) germline mutation in RBM10 (d) MNV on chromosome
12. The reference canine genome Canis familaris is shown at the top of the image. Colours are: the consensus and reference sequence is black per default; forward reads
(single reads) is green per default; reverse reads (single reads) is red per default; paired reads is blue per default, in this case, because the original fastq files were not
imported together as paired-end reads, then only individual strands are analysed and there is no fusion to produce paired-end reads (blue).
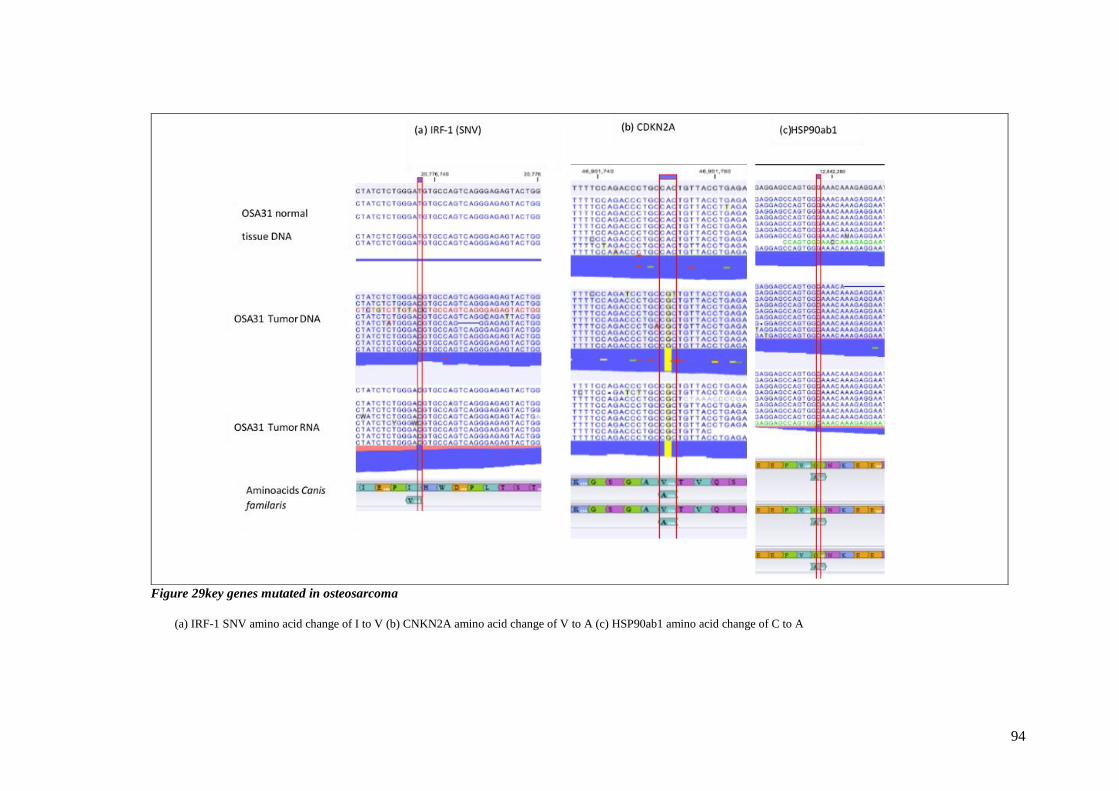
94
Figure 29key genes mutated in osteosarcoma
(a) IRF-1 SNV amino acid change of I to V (b) CNKN2A amino acid change of V to A (c) HSP90ab1 amino acid change of C to A
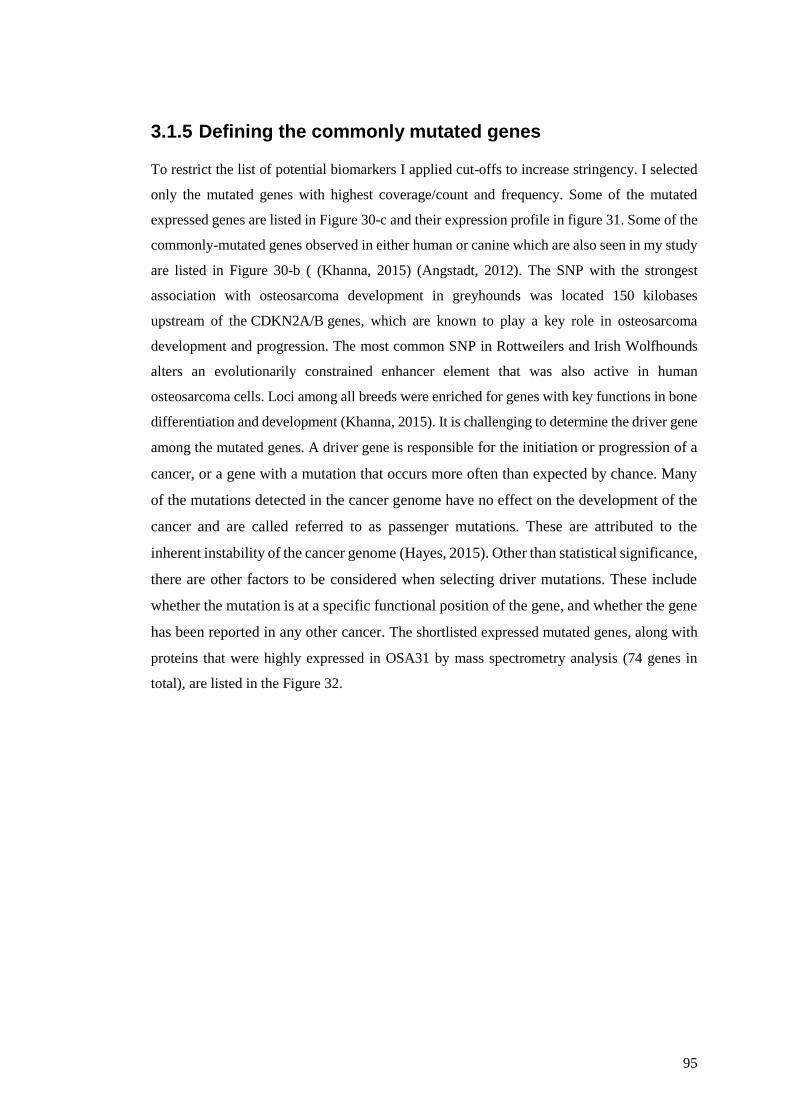
95
3.1.5 Defining the commonly mutated genes
To restrict the list of potential biomarkers I applied cut-offs to increase stringency. I selected
only the mutated genes with highest coverage/count and frequency. Some of the mutated
expressed genes are listed in Figure 30-c and their expression profile in figure 31. Some of the
commonly-mutated genes observed in either human or canine which are also seen in my study
are listed in Figure 30-b ( (Khanna, 2015) (Angstadt, 2012). The SNP with the strongest
association with osteosarcoma development in greyhounds was located 150 kilobases
upstream of the CDKN2A/B genes, which are known to play a key role in osteosarcoma
development and progression. The most common SNP in Rottweilers and Irish Wolfhounds
alters an evolutionarily constrained enhancer element that was also active in human
osteosarcoma cells. Loci among all breeds were enriched for genes with key functions in bone
differentiation and development (Khanna, 2015). It is challenging to determine the driver gene
among the mutated genes. A driver gene is responsible for the initiation or progression of a
cancer, or a gene with a mutation that occurs more often than expected by chance. Many
of the mutations detected in the cancer genome have no effect on the development of the
cancer and are called referred to as passenger mutations. These are attributed to the
inherent instability of the cancer genome (Hayes, 2015). Other than statistical significance,
there are other factors to be considered when selecting driver mutations. These include
whether the mutation is at a specific functional position of the gene, and whether the gene
has been reported in any other cancer. The shortlisted expressed mutated genes, along with
proteins that were highly expressed in OSA31 by mass spectrometry analysis (74 genes in
total), are listed in the Figure 32.
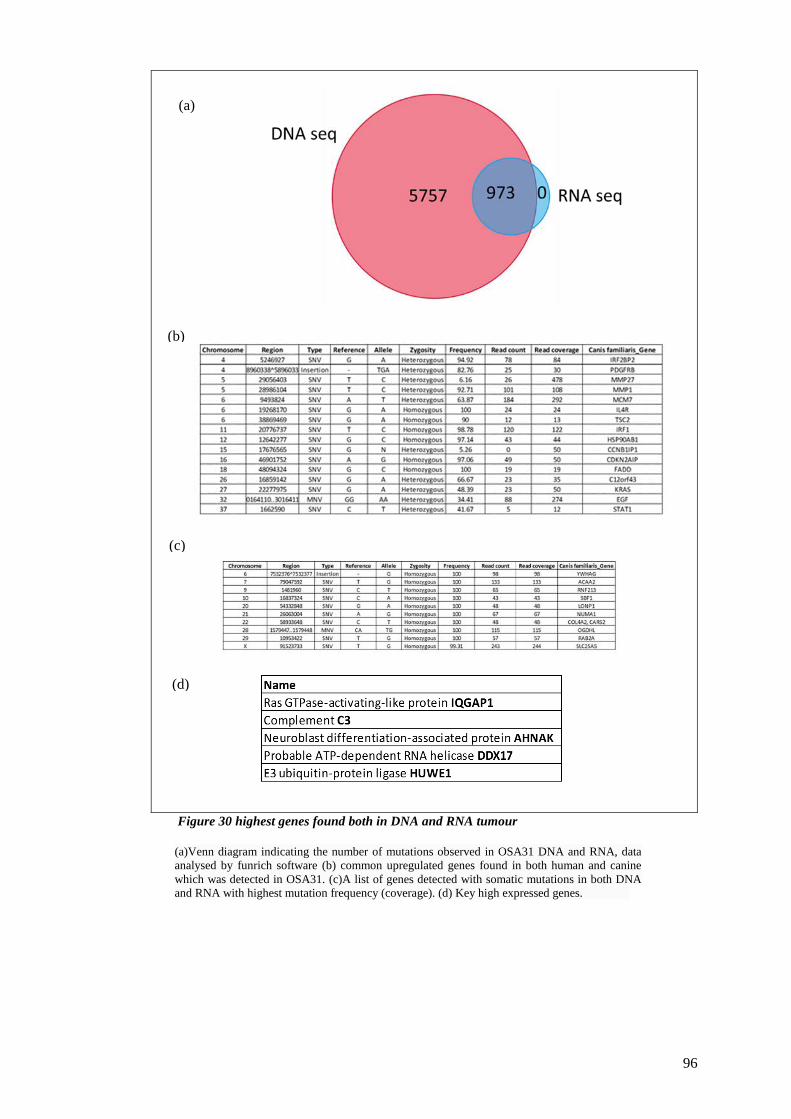
96
Figure 30 highest genes found both in DNA and RNA tumour
(a)Venn diagram indicating the number of mutations observed in OSA31 DNA and RNA, data
analysed by funrich software (b) common upregulated genes found in both human and canine
which was detected in OSA31. (c)A list of genes detected with somatic mutations in both DNA
and RNA with highest mutation frequency (coverage). (d) Key high expressed genes.
(a)
(b)
(c)
(d)
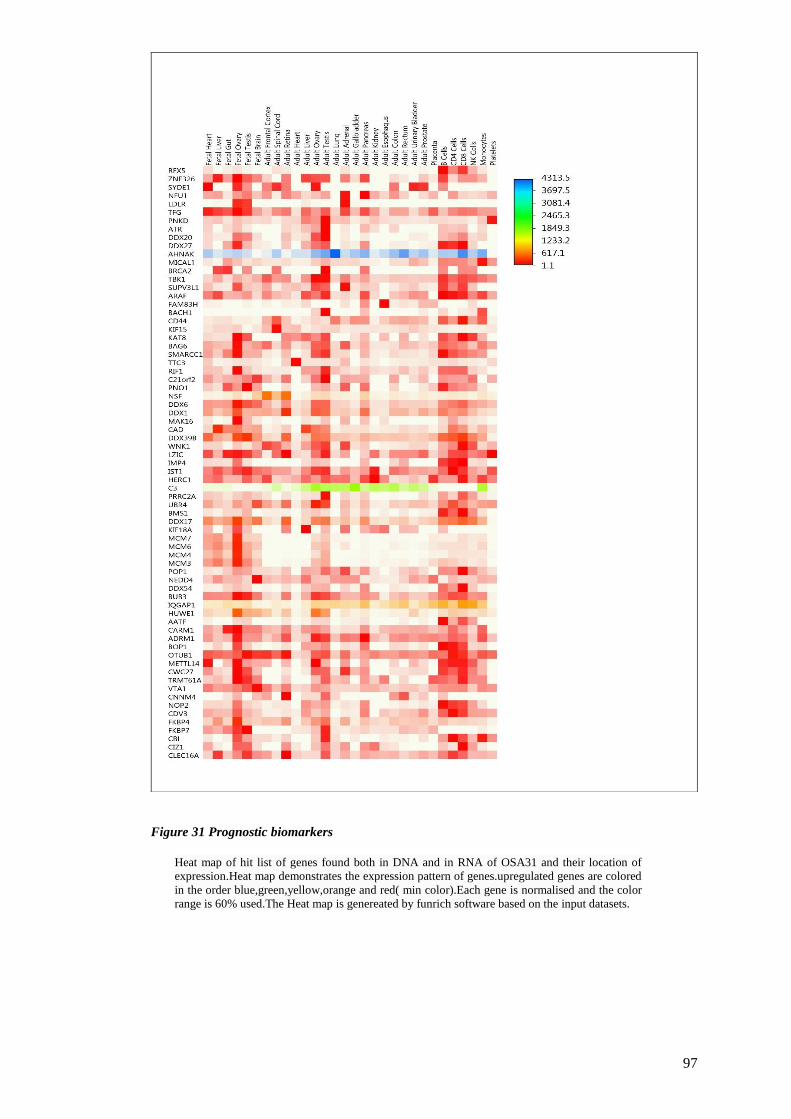
97
Figure 31 Prognostic biomarkers
Heat map of hit list of genes found both in DNA and in RNA of OSA31 and their location of
expression.Heat map demonstrates the expression pattern of genes.upregulated genes are colored
in the order blue,green,yellow,orange and red( min color).Each gene is normalised and the color
range is 60% used.The Heat map is genereated by funrich software based on the input datasets.
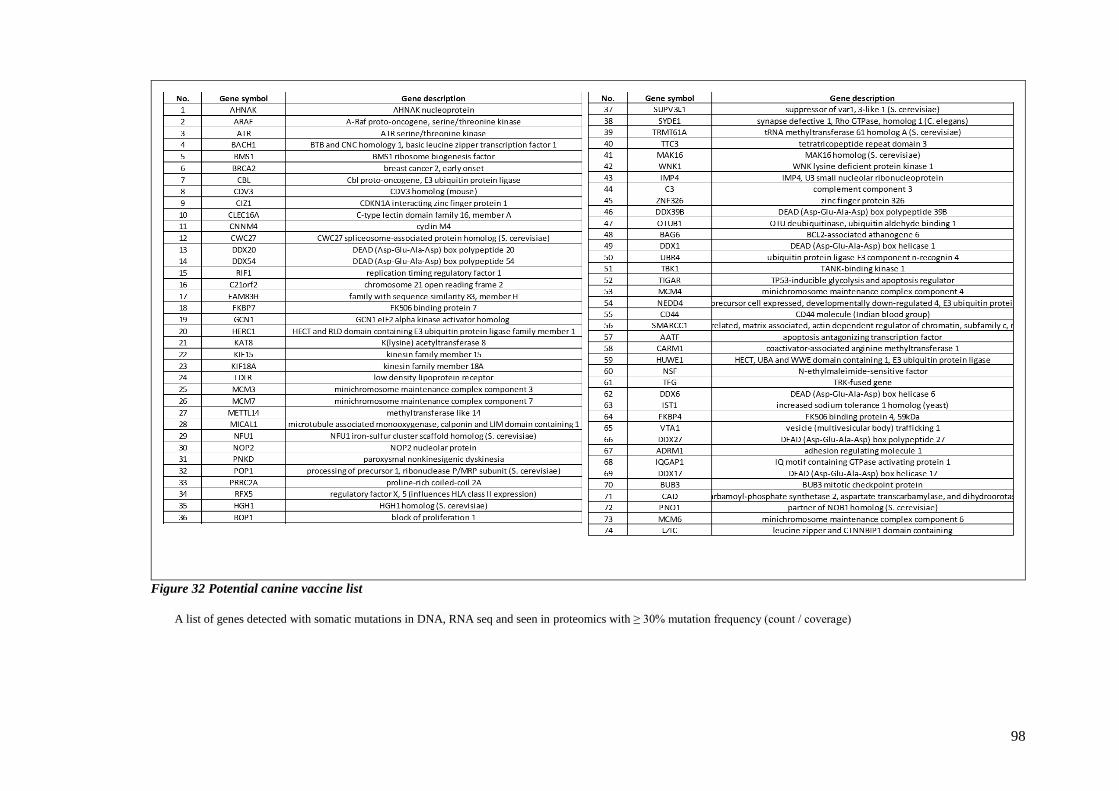
98
Figure 32 Potential canine vaccine list
A list of genes detected with somatic mutations in DNA, RNA seq and seen in proteomics with ≥ 30% mutation frequency (count / coverage)
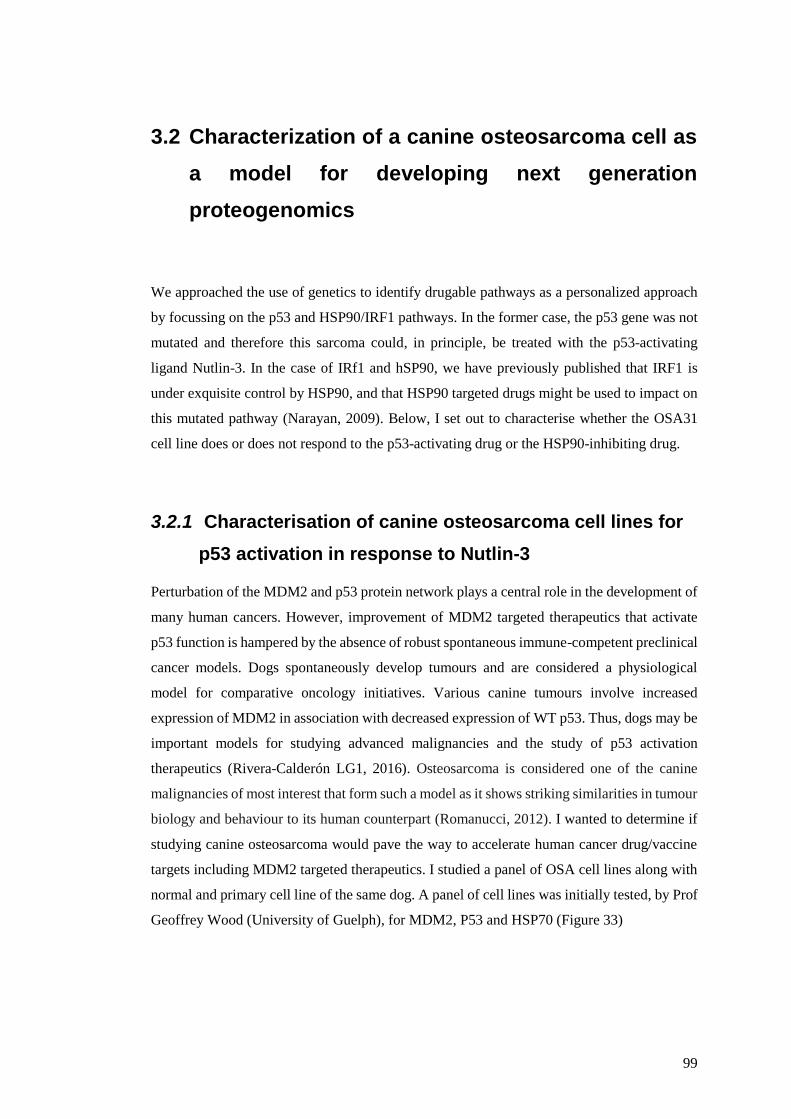
99
3.2 Characterization of a canine osteosarcoma cell as
a model for developing next generation
proteogenomics
We approached the use of genetics to identify drugable pathways as a personalized approach
by focussing on the p53 and HSP90/IRF1 pathways. In the former case, the p53 gene was not
mutated and therefore this sarcoma could, in principle, be treated with the p53-activating
ligand Nutlin-3. In the case of IRf1 and hSP90, we have previously published that IRF1 is
under exquisite control by HSP90, and that HSP90 targeted drugs might be used to impact on
this mutated pathway (Narayan, 2009). Below, I set out to characterise whether the OSA31
cell line does or does not respond to the p53-activating drug or the HSP90-inhibiting drug.
3.2.1 Characterisation of canine osteosarcoma cell lines for
p53 activation in response to Nutlin-3
Perturbation of the MDM2 and p53 protein network plays a central role in the development of
many human cancers. However, improvement of MDM2 targeted therapeutics that activate
p53 function is hampered by the absence of robust spontaneous immune-competent preclinical
cancer models. Dogs spontaneously develop tumours and are considered a physiological
model for comparative oncology initiatives. Various canine tumours involve increased
expression of MDM2 in association with decreased expression of WT p53. Thus, dogs may be
important models for studying advanced malignancies and the study of p53 activation
therapeutics (Rivera-Calderón LG1, 2016). Osteosarcoma is considered one of the canine
malignancies of most interest that form such a model as it shows striking similarities in tumour
biology and behaviour to its human counterpart (Romanucci, 2012). I wanted to determine if
studying canine osteosarcoma would pave the way to accelerate human cancer drug/vaccine
targets including MDM2 targeted therapeutics. I studied a panel of OSA cell lines along with
normal and primary cell line of the same dog. A panel of cell lines was initially tested, by Prof
Geoffrey Wood (University of Guelph), for MDM2, P53 and HSP70 (Figure 33)
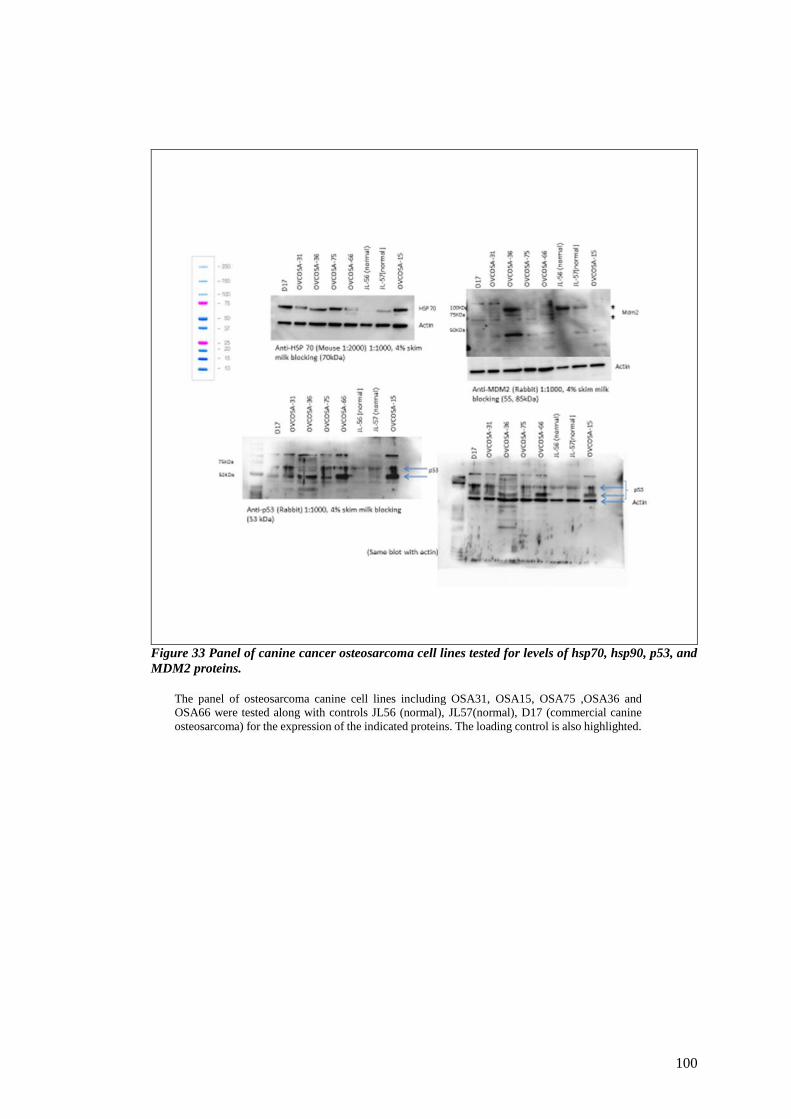
100
Figure 33 Panel of canine cancer osteosarcoma cell lines tested for levels of hsp70, hsp90, p53, and
MDM2 proteins.
The panel of osteosarcoma canine cell lines including OSA31, OSA15, OSA75 ,OSA36 and
OSA66 were tested along with controls JL56 (normal), JL57(normal), D17 (commercial canine
osteosarcoma) for the expression of the indicated proteins. The loading control is also highlighted.
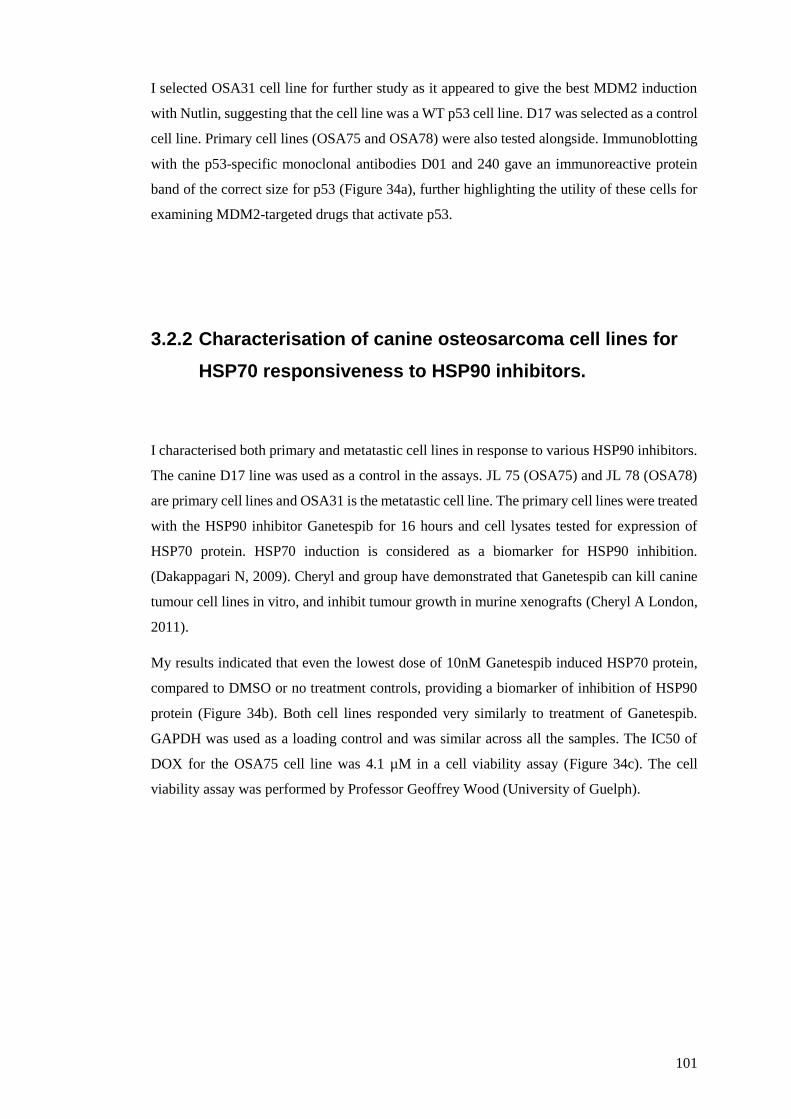
101
I selected OSA31 cell line for further study as it appeared to give the best MDM2 induction
with Nutlin, suggesting that the cell line was a WT p53 cell line. D17 was selected as a control
cell line. Primary cell lines (OSA75 and OSA78) were also tested alongside. Immunoblotting
with the p53-specific monoclonal antibodies D01 and 240 gave an immunoreactive protein
band of the correct size for p53 (Figure 34a), further highlighting the utility of these cells for
examining MDM2-targeted drugs that activate p53.
3.2.2 Characterisation of canine osteosarcoma cell lines for
HSP70 responsiveness to HSP90 inhibitors.
I characterised both primary and metatastic cell lines in response to various HSP90 inhibitors.
The canine D17 line was used as a control in the assays. JL 75 (OSA75) and JL 78 (OSA78)
are primary cell lines and OSA31 is the metatastic cell line. The primary cell lines were treated
with the HSP90 inhibitor Ganetespib for 16 hours and cell lysates tested for expression of
HSP70 protein. HSP70 induction is considered as a biomarker for HSP90 inhibition.
(Dakappagari N, 2009). Cheryl and group have demonstrated that Ganetespib can kill canine
tumour cell lines in vitro, and inhibit tumour growth in murine xenografts (Cheryl A London,
2011).
My results indicated that even the lowest dose of 10nM Ganetespib induced HSP70 protein,
compared to DMSO or no treatment controls, providing a biomarker of inhibition of HSP90
protein (Figure 34b). Both cell lines responded very similarly to treatment of Ganetespib.
GAPDH was used as a loading control and was similar across all the samples. The IC50 of
DOX for the OSA75 cell line was 4.1 µM in a cell viability assay (Figure 34c). The cell
viability assay was performed by Professor Geoffrey Wood (University of Guelph).
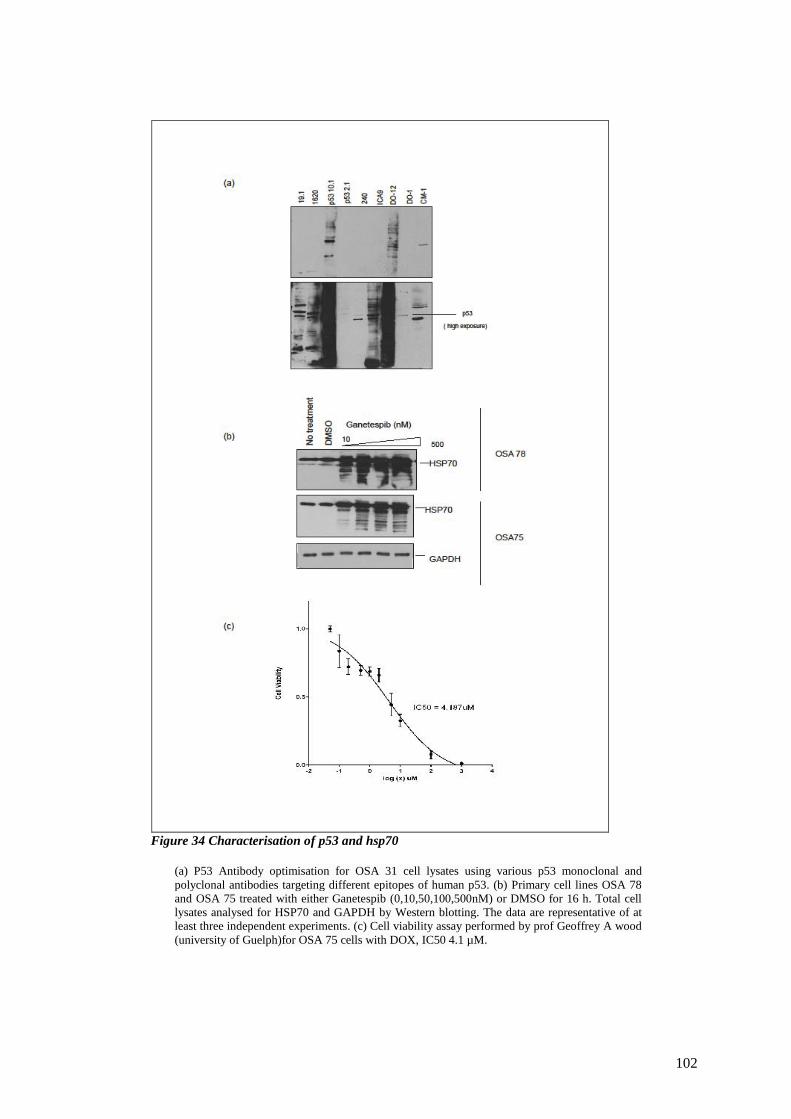
102
Figure 34 Characterisation of p53 and hsp70
(a) P53 Antibody optimisation for OSA 31 cell lysates using various p53 monoclonal and
polyclonal antibodies targeting different epitopes of human p53. (b) Primary cell lines OSA 78
and OSA 75 treated with either Ganetespib (0,10,50,100,500nM) or DMSO for 16 h. Total cell
lysates analysed for HSP70 and GAPDH by Western blotting. The data are representative of at
least three independent experiments. (c) Cell viability assay performed by prof Geoffrey A wood
(university of Guelph)for OSA 75 cells with DOX, IC50 4.1 µM.

103
3.2.3 Characterisation of canine osteosarcoma cell lines for
IRF1 response to HSP90 inhibition.
Having established a baseline of MDM2 or HSP90 inhibition of pathway biomarkers, I next
evaluated the impact of both treatments in parallel. Both the metastatic cell line OSA31and
control D17 lines were treated with a titration of Nutlin for 6 hours. The results indicated that
even the lowest dose of nutlin (5µM), induced MDM2 in both the cell lines as compared to
the DMSO controls (Figure 35a). The two cell lines were also treated with a titration of
Ganetespib for 16 hours. The results indicated that all doses of Ganetespib induced Hsp70 for
both the cell lines (Figure 35b). I wanted to evaluate the effect of Ganetespib on IRF-1 protein.
For this, I probed the cell lysates for IRF-1 and the results indicated that there was loss of IRF-
1 with the higher doses of Ganetespib (100 and 500nM) for both the cell lines, as compared to
the DMSO control. For human cell lines Ganetespib could downregulate IRF-1 even at 50nM,
indicating that sensitivity of the drug might vary with cell lines.
Based on this result I also wanted to determine if Ganetespib could lower IFNγ-induced IRF-
1 in canine cell lines. OSA31 cells were treated with Ganetespib and IFNγ, either alone or in
combination, for 16 hours. The results indicated that IFNγ induced IRF-1 expression levels as
compared to controls and Ganetespib could downregulate this IFNγ-induced IRF-1 expression
(Figure 35c). The IFNγ induction was not as high as that observed in human cancer cell lines
such as A375. Ganetespib alone also downregulated the IRF-1 as compared to DMSO control.
These data also demonstrate that IRF1 suppression forms another biomarker of HSP90
inhibition. Doxorubicin (DOX) is a commonly used chemotherapy in human cancers.
Recently, several clinical trials with doxorubicin were performed on dogs, which helped to
design human phase 1 clinical studies (Jennifer A. MacDiarmid, 2016). OSA31 cell lines were
treated with DOX in a cell viability assay and the IC50 was recorded to be 0.62 uM (Figure
35d).
I then wanted to explore if the canine osteosarcoma cells displayed any interaction with
HSP70/MDM2. To analyse this, OSA31 cell lines were treated with either DMSO or
Ganetespib (100nM) for six hours, followed by a proximal ligation assay (PLA) according to
manufactures instruction. The results indicated that there was strong interaction when the cells
are treated with Ganetespib as compared to the DMSO control (Figure 36).
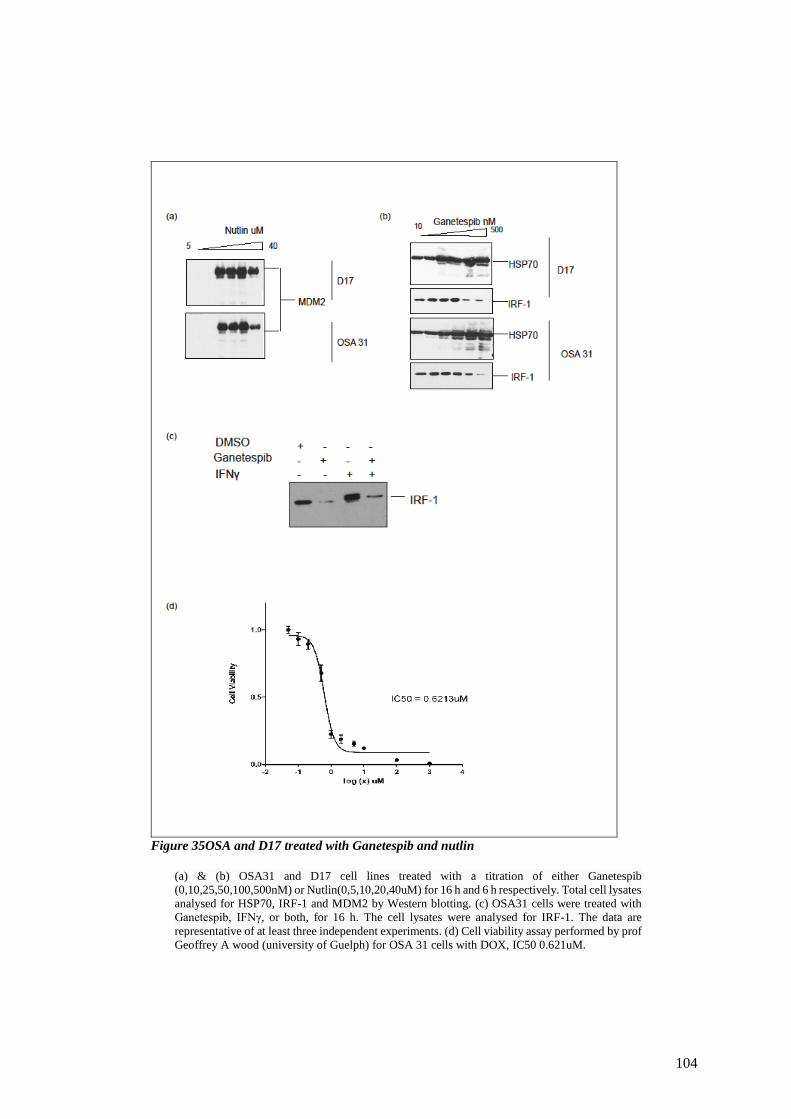
104
Figure 35OSA and D17 treated with Ganetespib and nutlin
(a) & (b) OSA31 and D17 cell lines treated with a titration of either Ganetespib
(0,10,25,50,100,500nM) or Nutlin(0,5,10,20,40uM) for 16 h and 6 h respectively. Total cell lysates
analysed for HSP70, IRF-1 and MDM2 by Western blotting. (c) OSA31 cells were treated with
Ganetespib, IFNγ, or both, for 16 h. The cell lysates were analysed for IRF-1. The data are
representative of at least three independent experiments. (d) Cell viability assay performed by prof
Geoffrey A wood (university of Guelph) for OSA 31 cells with DOX, IC50 0.621uM.
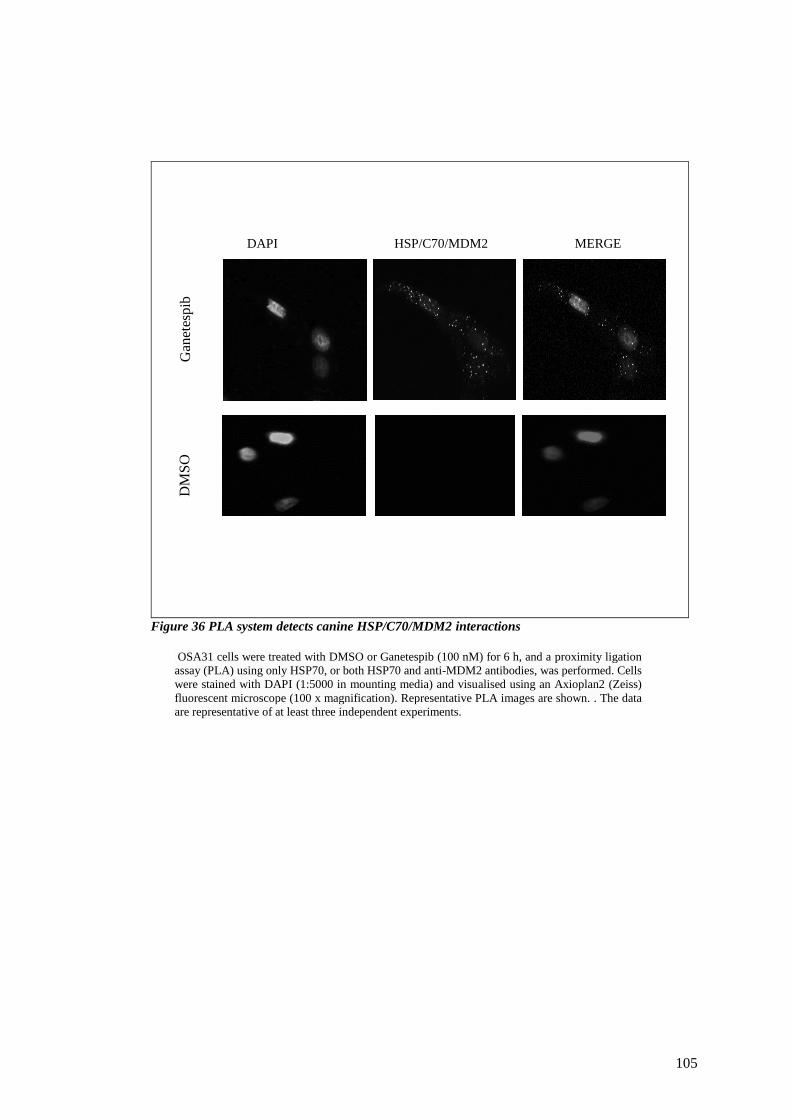
105
DAPI HSP/C70/MDM2 MERGE
Figure 36 PLA system detects canine HSP/C70/MDM2 interactions
OSA31 cells were treated with DMSO or Ganetespib (100 nM) for 6 h, and a proximity ligation
assay (PLA) using only HSP70, or both HSP70 and anti-MDM2 antibodies, was performed. Cells
were stained with DAPI (1:5000 in mounting media) and visualised using an Axioplan2 (Zeiss)
fluorescent microscope (100 x magnification). Representative PLA images are shown. . The data
are representative of at least three independent experiments.
DM
SO
G
anet
esp
ib
106
3.2.4 Proteomics on drug-treated canine osteosarcoma cell
lines to develop biomarkers of drug responsiveness
The data above indicated that the OSA31 cell line shows responsiveness to Nutlin-3 resulting
in activation of p53 and also shows responsiveness to Ganetespib as defined by induction of
HSP70, downregulation of IRF1, and induction of the HSP70-MDM2 protein complex. We
next aimed to define the global mechanism of how these drugs might function in signal
transduction, to identify potential novel biomarkers that could be used to measure drug-
responsiveness in canine cancer biopsies in the future. Proteomics is a very efficient technique
used for the identification of protein pattern changes in a large variety of diseases, including
neoplastic disorders. Using proteomic techniques, a tumour-specific protein expression profile
for certain pathologies can be established, which will increase the discovery of novel
biomarkers with predictive and prognostic value for more accurate diagnoses. In addition,
proteomic techniques could provide an important tool for understanding the tumour’s
pathogenesis. In human neoplasias, proteomics analyses are routinely used, but are rarely used
in the case of canine cancer investigation. In recent years, tumour protein profiling has become
another important focus in cancer research, hence cancer cell lines are regarded as a suitable
tool for proteomics analyses since they hold an important source of protein (VISAN, 2015).
Proteomics study was performed on canine osteosarcoma cell line (OSA31) which was treated
with either Ganetespib, nutlin-3 or DMSO. The cell lines were treated for 6 and 16 hours of
nutlin (10uM) and Ganetespib (100nM) respectively. A test western blot was performed before
the samples were processed for mass-spectrometric analysis (Figure 37). The results indicated
that the 6 hours of nutlin or DMSO didn’t induce HSP70 protein levels while 16hours of
Ganetespib showed high induction of hsp70 (Figure 37). There was also minor induction of
hsp70 with 16hours of DMSO. When the cells were treated with 6 hours of Nutlin a significant
upregulation of MDM2 was observed as compared to DMSO control. On the other hand,
treatment with Ganetespib lowered the MDM2 expression levels after 16 hours which was
similar result observed in human cell lines (chapter 3).Duplicate set for each of the treated
samples were processed for TMT mass-spectrometry analysis.
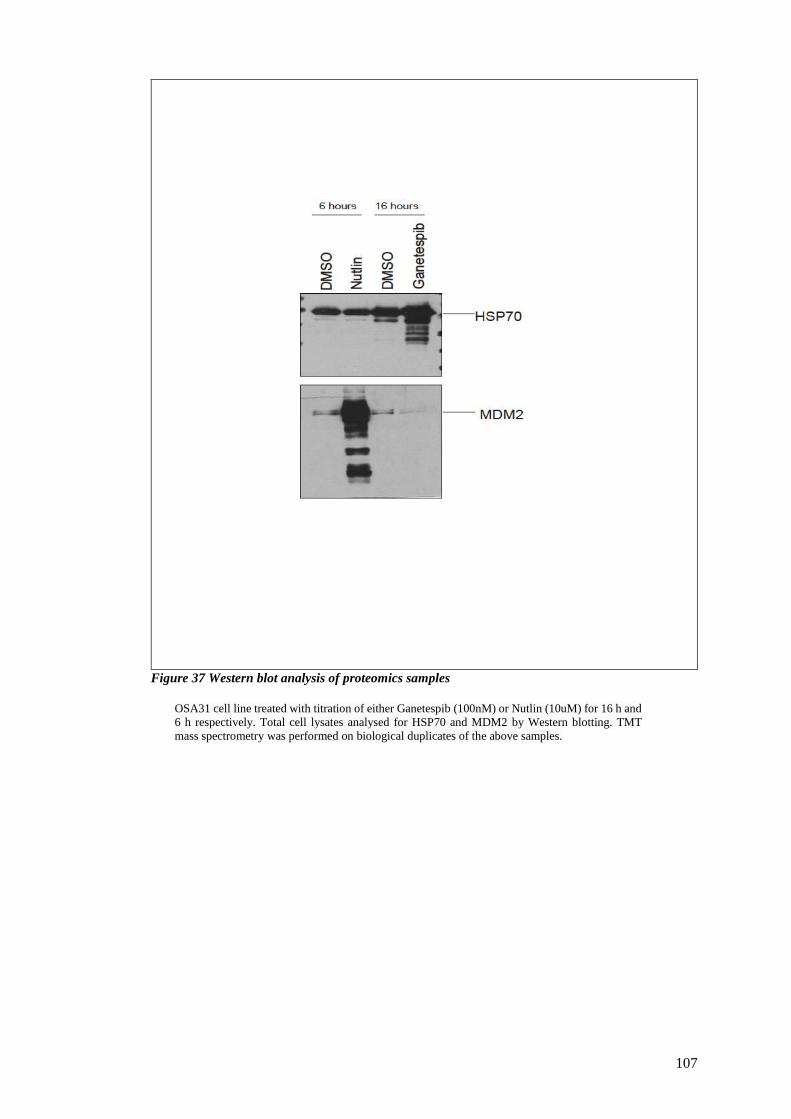
107
Figure 37 Western blot analysis of proteomics samples
OSA31 cell line treated with titration of either Ganetespib (100nM) or Nutlin (10uM) for 16 h and
6 h respectively. Total cell lysates analysed for HSP70 and MDM2 by Western blotting. TMT
mass spectrometry was performed on biological duplicates of the above samples.
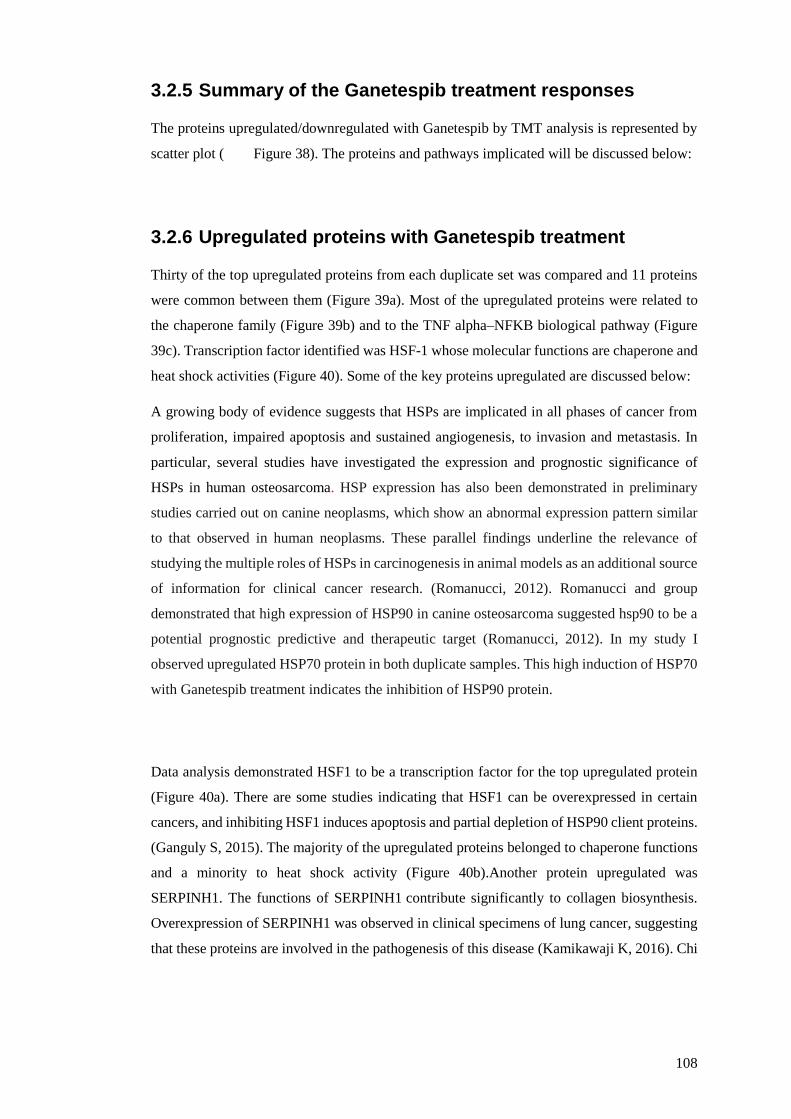
108
3.2.5 Summary of the Ganetespib treatment responses
The proteins upregulated/downregulated with Ganetespib by TMT analysis is represented by
scatter plot ( Figure 38). The proteins and pathways implicated will be discussed below:
3.2.6 Upregulated proteins with Ganetespib treatment
Thirty of the top upregulated proteins from each duplicate set was compared and 11 proteins
were common between them (Figure 39a). Most of the upregulated proteins were related to
the chaperone family (Figure 39b) and to the TNF alpha–NFKB biological pathway (Figure
39c). Transcription factor identified was HSF-1 whose molecular functions are chaperone and
heat shock activities (Figure 40). Some of the key proteins upregulated are discussed below:
A growing body of evidence suggests that HSPs are implicated in all phases of cancer from
proliferation, impaired apoptosis and sustained angiogenesis, to invasion and metastasis. In
particular, several studies have investigated the expression and prognostic significance of
HSPs in human osteosarcoma. HSP expression has also been demonstrated in preliminary
studies carried out on canine neoplasms, which show an abnormal expression pattern similar
to that observed in human neoplasms. These parallel findings underline the relevance of
studying the multiple roles of HSPs in carcinogenesis in animal models as an additional source
of information for clinical cancer research. (Romanucci, 2012). Romanucci and group
demonstrated that high expression of HSP90 in canine osteosarcoma suggested hsp90 to be a
potential prognostic predictive and therapeutic target (Romanucci, 2012). In my study I
observed upregulated HSP70 protein in both duplicate samples. This high induction of HSP70
with Ganetespib treatment indicates the inhibition of HSP90 protein.
Data analysis demonstrated HSF1 to be a transcription factor for the top upregulated protein
(Figure 40a). There are some studies indicating that HSF1 can be overexpressed in certain
cancers, and inhibiting HSF1 induces apoptosis and partial depletion of HSP90 client proteins.
(Ganguly S, 2015). The majority of the upregulated proteins belonged to chaperone functions
and a minority to heat shock activity (Figure 40b).Another protein upregulated was
SERPINH1. The functions of SERPINH1 contribute significantly to collagen biosynthesis.
Overexpression of SERPINH1 was observed in clinical specimens of lung cancer, suggesting
that these proteins are involved in the pathogenesis of this disease (Kamikawaji K, 2016). Chi

109
and group demonstrated that different tumours revealed differences in gene expression. Stress
induced the expression of genes such as MMP-3, SERPIN family members and inflammatory
and immune responses in only one group of tumours. (Chi, 2012) . These results indicate that
Ganetespib could be used based on the gene profiling of group of patients.

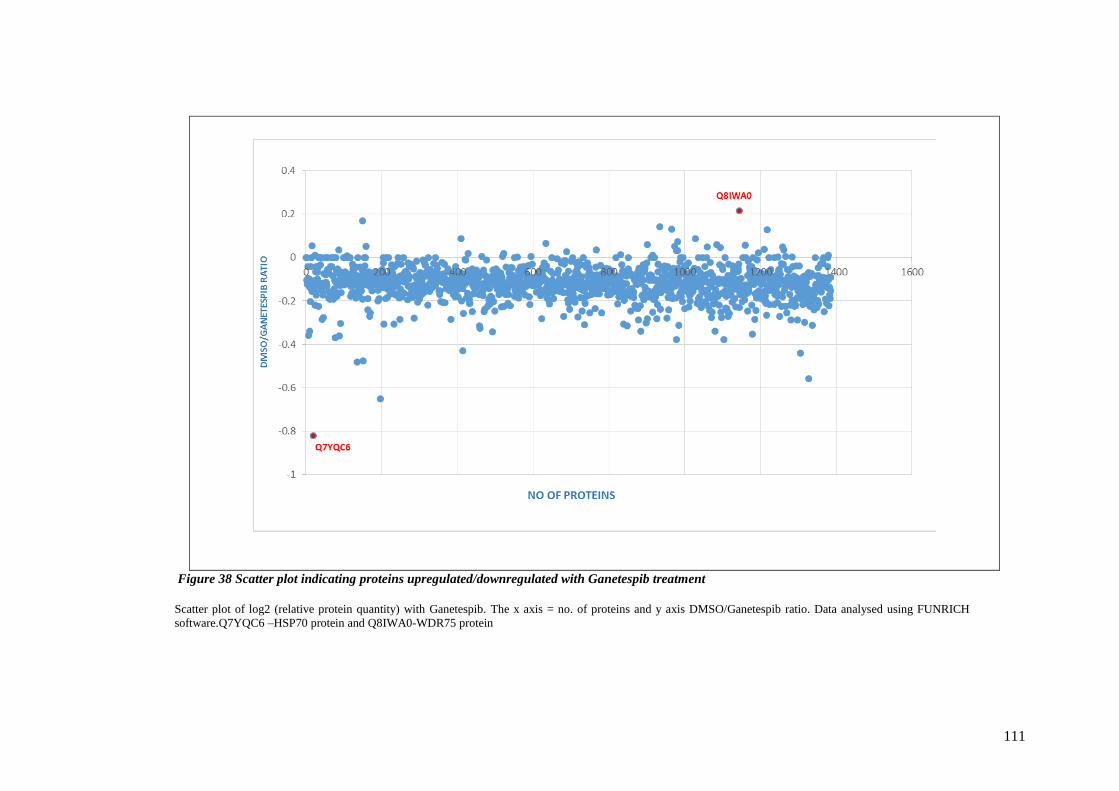
111
Figure 38 Scatter plot indicating proteins upregulated/downregulated with Ganetespib treatment
Scatter plot of log2 (relative protein quantity) with Ganetespib. The x axis = no. of proteins and y axis DMSO/Ganetespib ratio. Data analysed using FUNRICH
software.Q7YQC6 –HSP70 protein and Q8IWA0-WDR75 protein

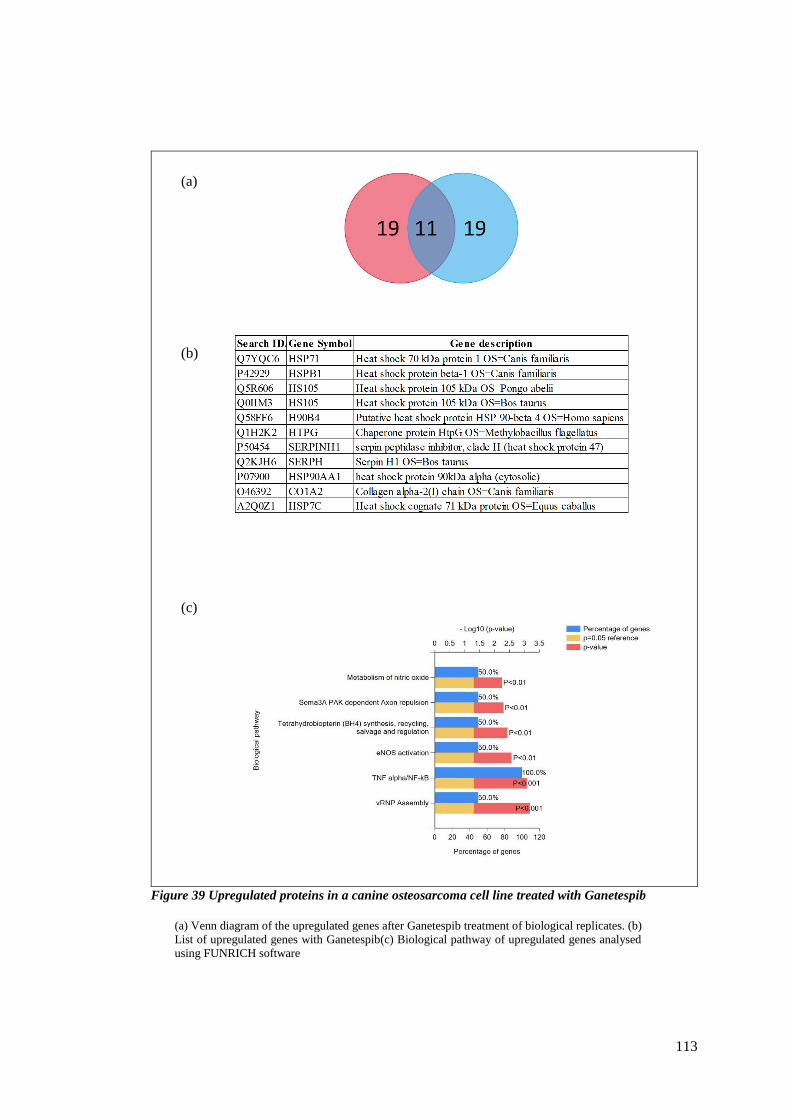
113
Figure 39 Upregulated proteins in a canine osteosarcoma cell line treated with Ganetespib
(a) Venn diagram of the upregulated genes after Ganetespib treatment of biological replicates. (b)
List of upregulated genes with Ganetespib(c) Biological pathway of upregulated genes analysed
using FUNRICH software
(a)
(b)
(c)
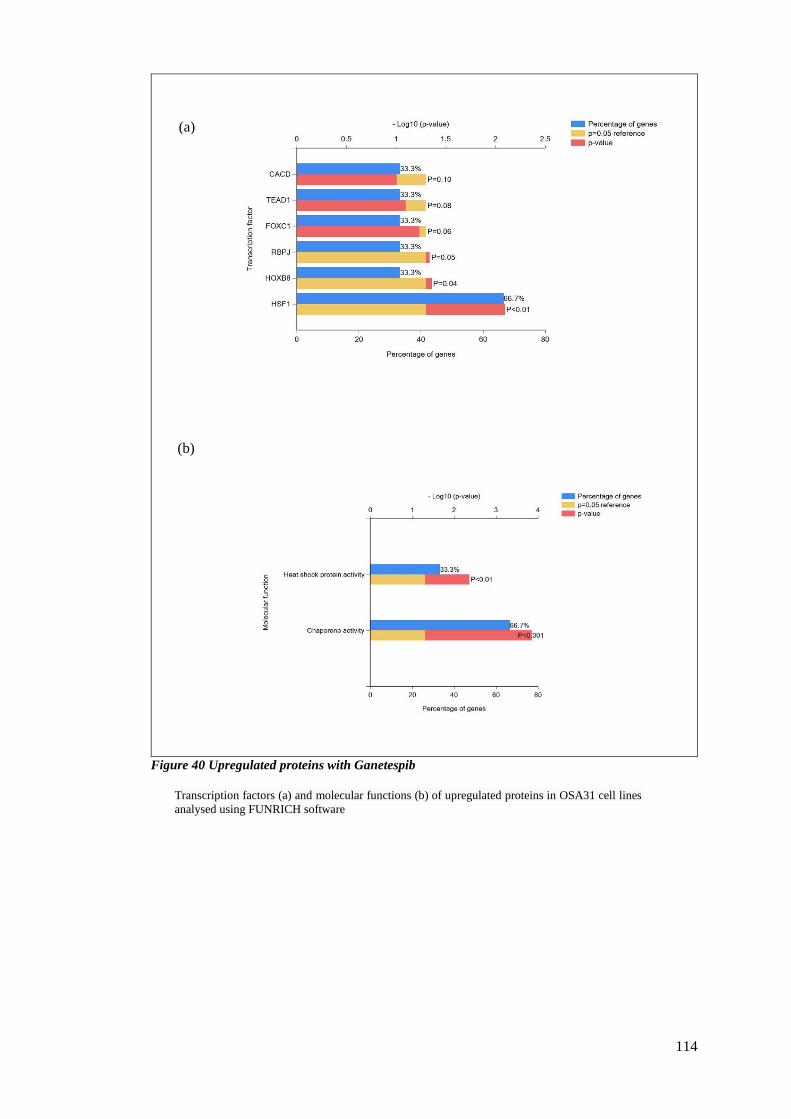
114
Figure 40 Upregulated proteins with Ganetespib
Transcription factors (a) and molecular functions (b) of upregulated proteins in OSA31 cell lines
analysed using FUNRICH software
(a)
(b)
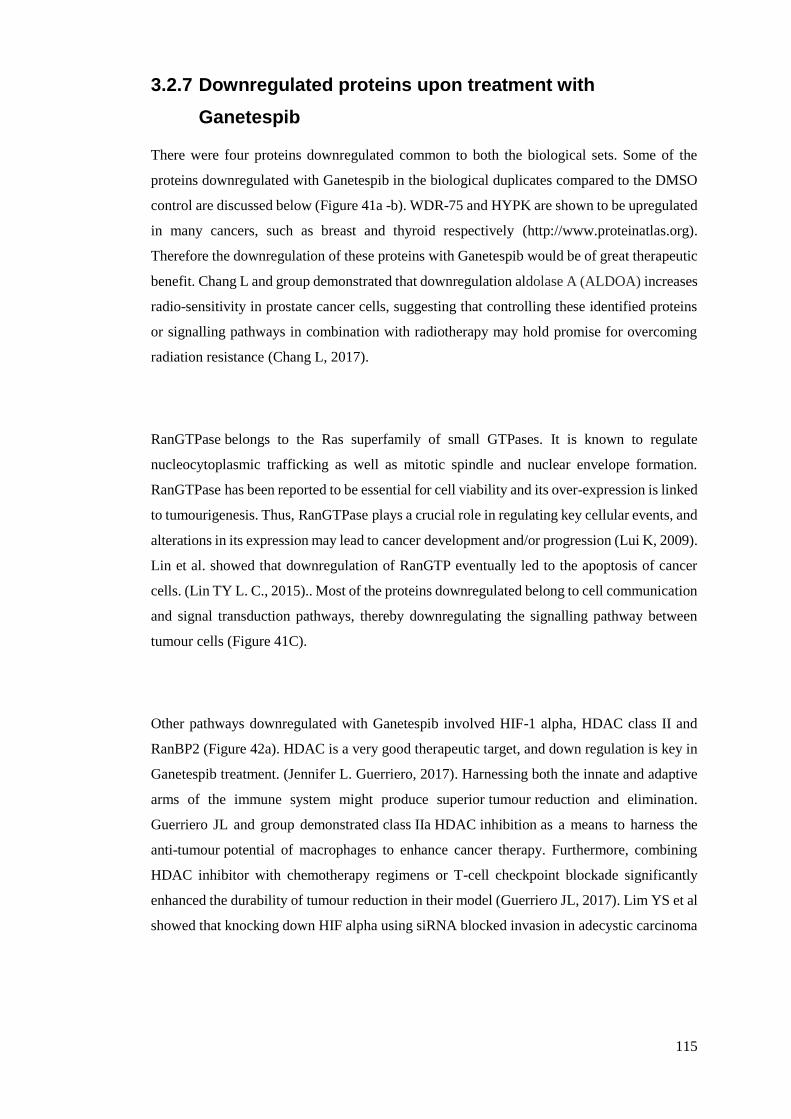
115
3.2.7 Downregulated proteins upon treatment with
Ganetespib
There were four proteins downregulated common to both the biological sets. Some of the
proteins downregulated with Ganetespib in the biological duplicates compared to the DMSO
control are discussed below (Figure 41a -b). WDR-75 and HYPK are shown to be upregulated
in many cancers, such as breast and thyroid respectively (http://www.proteinatlas.org).
Therefore the downregulation of these proteins with Ganetespib would be of great therapeutic
benefit. Chang L and group demonstrated that downregulation aldolase A (ALDOA) increases
radio-sensitivity in prostate cancer cells, suggesting that controlling these identified proteins
or signalling pathways in combination with radiotherapy may hold promise for overcoming
radiation resistance (Chang L, 2017).
RanGTPase belongs to the Ras superfamily of small GTPases. It is known to regulate
nucleocytoplasmic trafficking as well as mitotic spindle and nuclear envelope formation.
RanGTPase has been reported to be essential for cell viability and its over-expression is linked
to tumourigenesis. Thus, RanGTPase plays a crucial role in regulating key cellular events, and
alterations in its expression may lead to cancer development and/or progression (Lui K, 2009).
Lin et al. showed that downregulation of RanGTP eventually led to the apoptosis of cancer
cells. (Lin TY L. C., 2015).. Most of the proteins downregulated belong to cell communication
and signal transduction pathways, thereby downregulating the signalling pathway between
tumour cells (Figure 41C).
Other pathways downregulated with Ganetespib involved HIF-1 alpha, HDAC class II and
RanBP2 (Figure 42a). HDAC is a very good therapeutic target, and down regulation is key in
Ganetespib treatment. (Jennifer L. Guerriero, 2017). Harnessing both the innate and adaptive
arms of the immune system might produce superior tumour reduction and elimination.
Guerriero JL and group demonstrated class IIa HDAC inhibition as a means to harness the
anti-tumour potential of macrophages to enhance cancer therapy. Furthermore, combining
HDAC inhibitor with chemotherapy regimens or T-cell checkpoint blockade significantly
enhanced the durability of tumour reduction in their model (Guerriero JL, 2017). Lim YS et al
showed that knocking down HIF alpha using siRNA blocked invasion in adecystic carcinoma
116
and exhibited therapeutic potential for inhibition of metastasis when used in combination with
HSP90 inhibitors such as 17AAG (Lim YS, 2017).
The majority of the downregulated proteins were GTpase activator or lyase activity in
molecular activity (Figure 42c). The main transcription factors involved in the downregulated
genes were TCF3, NFIC and ZFP161. The transcription factor TCF3/E2A drives p21
expression while repressing PUMA across cancer cell types of multiple origins.
Accordingly, TCF3/E2A depletion impairs the cell cycle arrest response and promotes
apoptosis upon p53 activation by chemotherapeutic agents (Zdenek Andrysik, 2013). Bileck
and group identified previously unrecognized inflammation-associated nuclear translocation
events of proteins such as ZFP161 (Bileck A1, 2017).
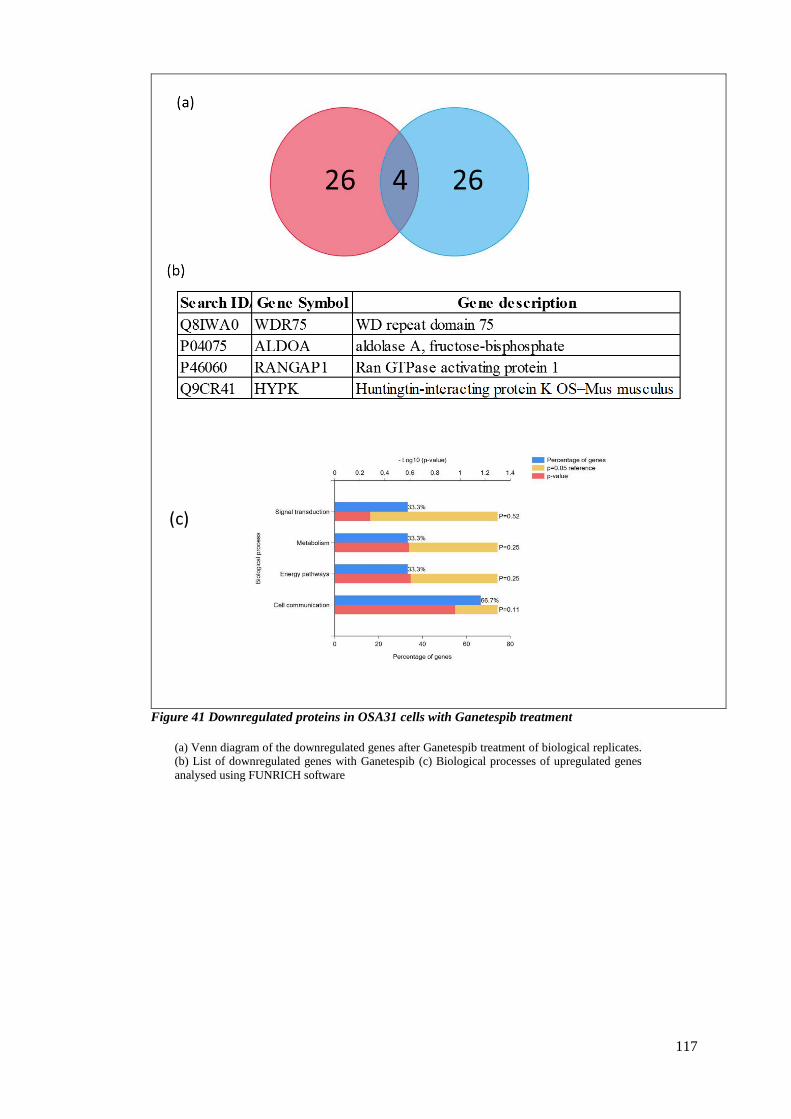
117
Figure 41 Downregulated proteins in OSA31 cells with Ganetespib treatment
(a) Venn diagram of the downregulated genes after Ganetespib treatment of biological replicates.
(b) List of downregulated genes with Ganetespib (c) Biological processes of upregulated genes
analysed using FUNRICH software
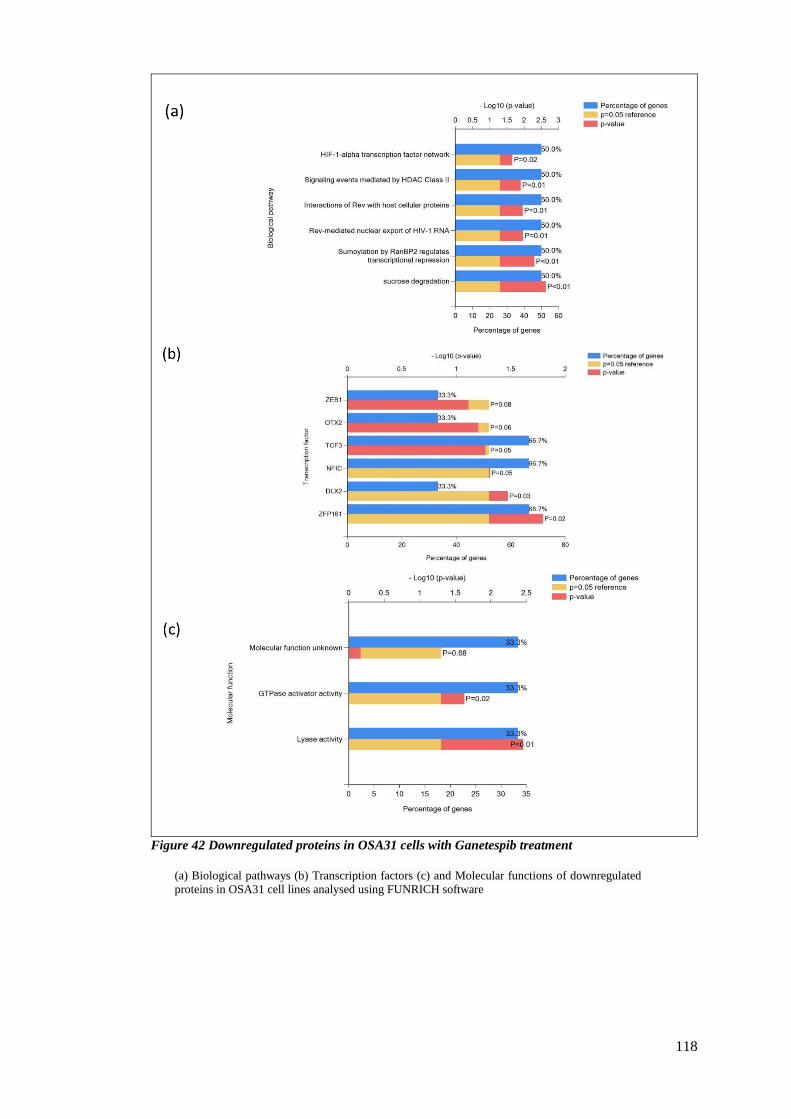
118
Figure 42 Downregulated proteins in OSA31 cells with Ganetespib treatment
(a) Biological pathways (b) Transcription factors (c) and Molecular functions of downregulated
proteins in OSA31 cell lines analysed using FUNRICH software
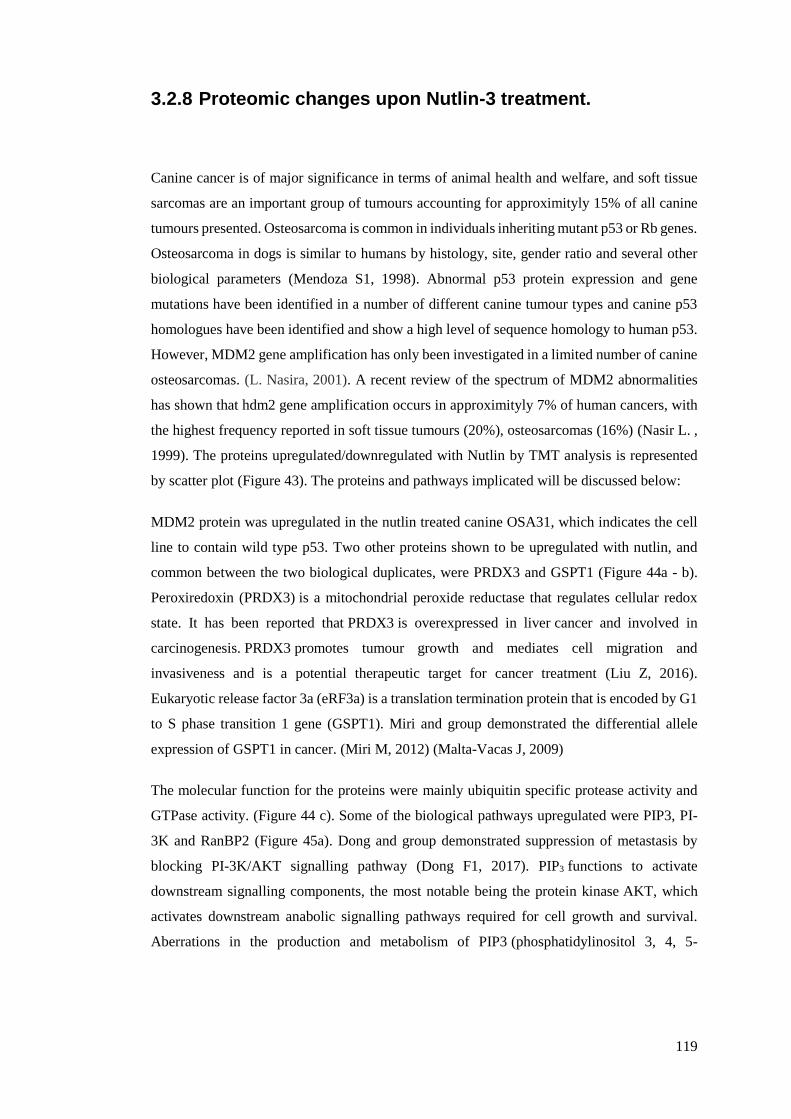
119
3.2.8 Proteomic changes upon Nutlin-3 treatment.
Canine cancer is of major significance in terms of animal health and welfare, and soft tissue
sarcomas are an important group of tumours accounting for approximityly 15% of all canine
tumours presented. Osteosarcoma is common in individuals inheriting mutant p53 or Rb genes.
Osteosarcoma in dogs is similar to humans by histology, site, gender ratio and several other
biological parameters (Mendoza S1, 1998). Abnormal p53 protein expression and gene
mutations have been identified in a number of different canine tumour types and canine p53
homologues have been identified and show a high level of sequence homology to human p53.
However, MDM2 gene amplification has only been investigated in a limited number of canine
osteosarcomas. (L. Nasira, 2001). A recent review of the spectrum of MDM2 abnormalities
has shown that hdm2 gene amplification occurs in approximityly 7% of human cancers, with
the highest frequency reported in soft tissue tumours (20%), osteosarcomas (16%) (Nasir L. ,
1999). The proteins upregulated/downregulated with Nutlin by TMT analysis is represented
by scatter plot (Figure 43). The proteins and pathways implicated will be discussed below:
MDM2 protein was upregulated in the nutlin treated canine OSA31, which indicates the cell
line to contain wild type p53. Two other proteins shown to be upregulated with nutlin, and
common between the two biological duplicates, were PRDX3 and GSPT1 (Figure 44a - b).
Peroxiredoxin (PRDX3) is a mitochondrial peroxide reductase that regulates cellular redox
state. It has been reported that PRDX3 is overexpressed in liver cancer and involved in
carcinogenesis. PRDX3 promotes tumour growth and mediates cell migration and
invasiveness and is a potential therapeutic target for cancer treatment (Liu Z, 2016).
Eukaryotic release factor 3a (eRF3a) is a translation termination protein that is encoded by G1
to S phase transition 1 gene (GSPT1). Miri and group demonstrated the differential allele
expression of GSPT1 in cancer. (Miri M, 2012) (Malta-Vacas J, 2009)
The molecular function for the proteins were mainly ubiquitin specific protease activity and
GTPase activity. (Figure 44 c). Some of the biological pathways upregulated were PIP3, PI-
3K and RanBP2 (Figure 45a). Dong and group demonstrated suppression of metastasis by
blocking PI-3K/AKT signalling pathway (Dong F1, 2017). PIP3 functions to activate
downstream signalling components, the most notable being the protein kinase AKT, which
activates downstream anabolic signalling pathways required for cell growth and survival.
Aberrations in the production and metabolism of PIP3 (phosphatidylinositol 3, 4, 5-
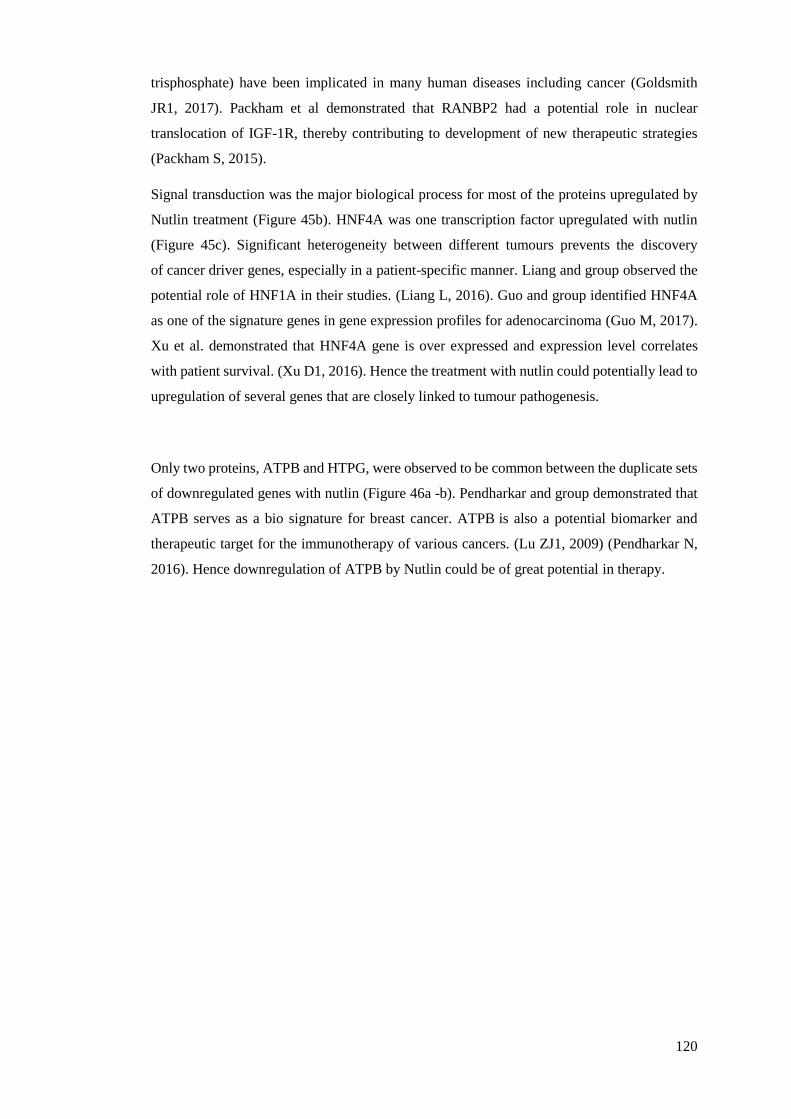
120
trisphosphate) have been implicated in many human diseases including cancer (Goldsmith
JR1, 2017). Packham et al demonstrated that RANBP2 had a potential role in nuclear
translocation of IGF-1R, thereby contributing to development of new therapeutic strategies
(Packham S, 2015).
Signal transduction was the major biological process for most of the proteins upregulated by
Nutlin treatment (Figure 45b). HNF4A was one transcription factor upregulated with nutlin
(Figure 45c). Significant heterogeneity between different tumours prevents the discovery
of cancer driver genes, especially in a patient-specific manner. Liang and group observed the
potential role of HNF1A in their studies. (Liang L, 2016). Guo and group identified HNF4A
as one of the signature genes in gene expression profiles for adenocarcinoma (Guo M, 2017).
Xu et al. demonstrated that HNF4A gene is over expressed and expression level correlates
with patient survival. (Xu D1, 2016). Hence the treatment with nutlin could potentially lead to
upregulation of several genes that are closely linked to tumour pathogenesis.
Only two proteins, ATPB and HTPG, were observed to be common between the duplicate sets
of downregulated genes with nutlin (Figure 46a -b). Pendharkar and group demonstrated that
ATPB serves as a bio signature for breast cancer. ATPB is also a potential biomarker and
therapeutic target for the immunotherapy of various cancers. (Lu ZJ1, 2009) (Pendharkar N,
2016). Hence downregulation of ATPB by Nutlin could be of great potential in therapy.
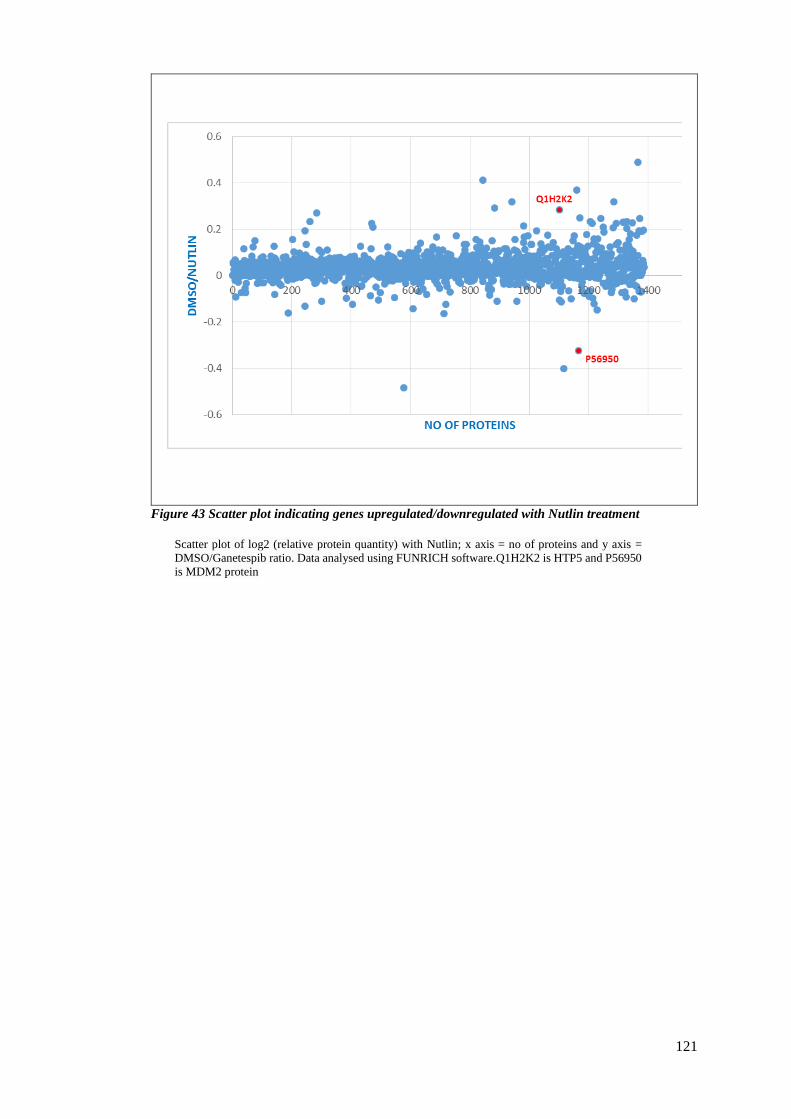
121
Figure 43 Scatter plot indicating genes upregulated/downregulated with Nutlin treatment
Scatter plot of log2 (relative protein quantity) with Nutlin; x axis = no of proteins and y axis =
DMSO/Ganetespib ratio. Data analysed using FUNRICH software.Q1H2K2 is HTP5 and P56950
is MDM2 protein
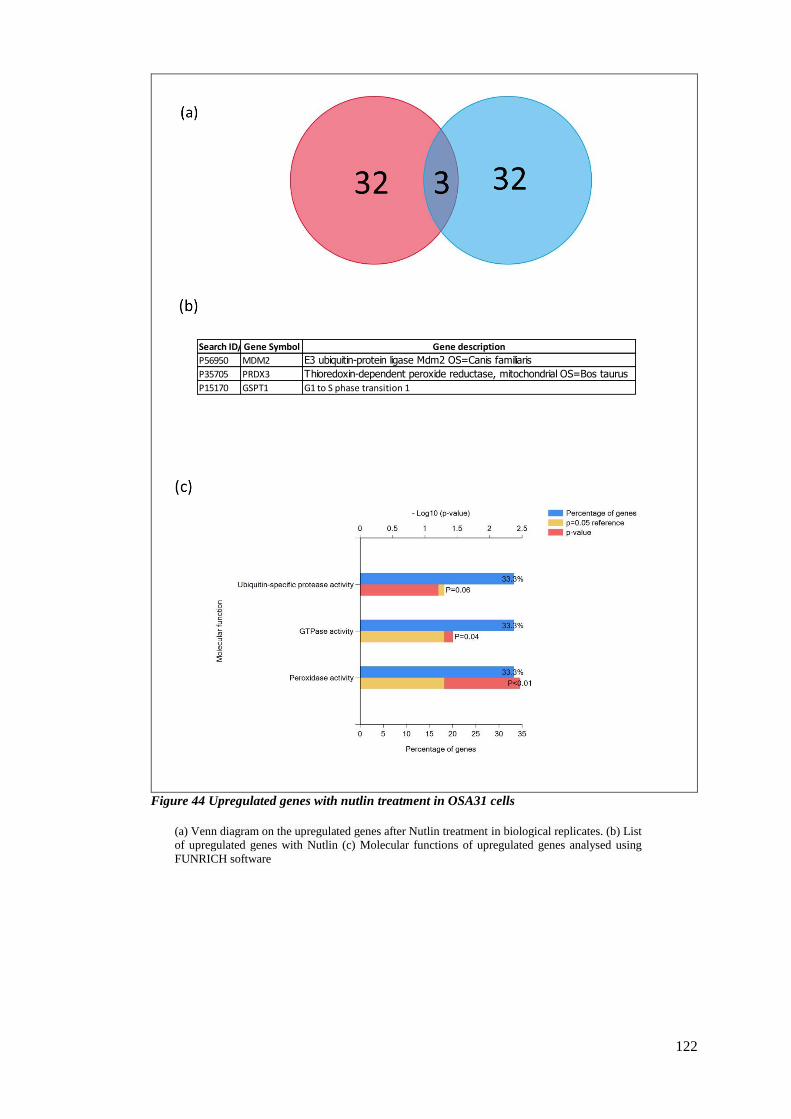
122
Figure 44 Upregulated genes with nutlin treatment in OSA31 cells
(a) Venn diagram on the upregulated genes after Nutlin treatment in biological replicates. (b) List
of upregulated genes with Nutlin (c) Molecular functions of upregulated genes analysed using
FUNRICH software
Search ID/AccessionsGene Symbol Gene description
P56950 MDM2 E3 ubiquitin-protein ligase Mdm2 OS=Canis familiaris
P35705 PRDX3 Thioredoxin-dependent peroxide reductase, mitochondrial OS=Bos taurus
P15170 GSPT1 G1 to S phase transition 1

123
Figure 45 Upregulated proteins in OSA31 cells with Nutlin treatment
Biological pathways (a) Biological process (b) and Transcription factor (c) of upregulated proteins
in OSA31 cell lines analysed using FUNRICH software.
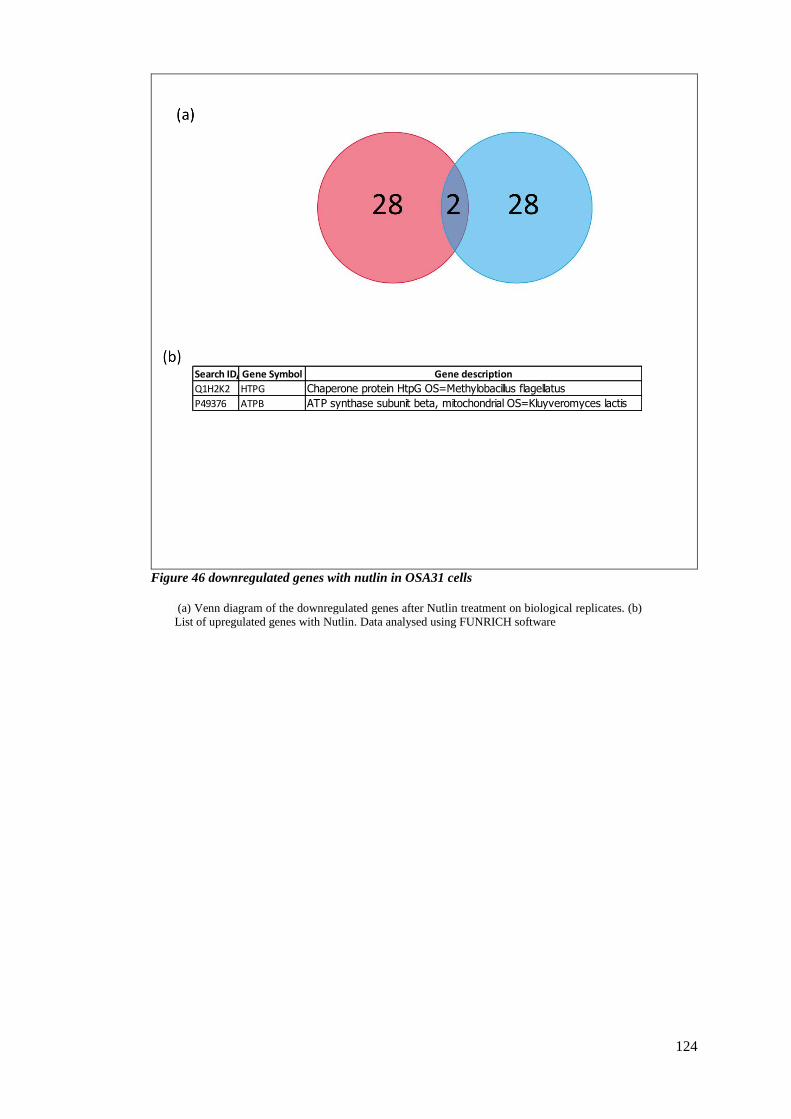
124
Figure 46 downregulated genes with nutlin in OSA31 cells
(a) Venn diagram of the downregulated genes after Nutlin treatment on biological replicates. (b)
List of upregulated genes with Nutlin. Data analysed using FUNRICH software
Search ID/AccessionsGene Symbol Gene description
Q1H2K2 HTPG Chaperone protein HtpG OS=Methylobacillus flagellatus
P49376 ATPB ATP synthase subunit beta, mitochondrial OS=Kluyveromyces lactis
125
3.2.9 Summary of characterisation of the OAS31 cell line as a
model for drug testing.
We have tested two key anti-cancer drugs that affect MDM2-inhibition and HSP90-inhibition
to determine whether pathway biomarkers can be identified in canine cells. Using proteomics
we have identified key responses that provide a pathway drug response signature in this cell
line. We predict that such approaches could be used in future to test new anti-cancer drugs in
vitro, identify biomarkers that can be used in canine cancer in vivo, and to develop better
models for human medicine. For example, Nutlin-3 shows a “cytostatic” response in human
sarcoma patients and the ability to test Nutlin-3 in canine sarcoma cells will open the door to
test MDM2-inhibitors in such sporadic cancer patients, develop biomarkers of resistance or
response, and use this information to stratify future canine, as well as human, cancers.
Osteosarcoma tumours display a compendium of genetic abnormalities with a high degree of
inter-tumour heterogeneity. Classically defined modes of genetic mutation are known to occur
in osteosarcoma (McCleese JK, 2009) (Lin TY B. M., 2008) (Cheryl A London, 2011).
Various studies have demonstrated the selective cytotoxicity of the novel Hsp90 inhibitor
Ganetespib for human and canine OSA cell lines. The widespread expression of HSP90
observed both in primary tumours and in tumour cell lines strongly highlights the possibility
of using a canine model for further testing of Hsp90-targeted cancer therapy. (Romanucci,
2012). Because no gold standard treatments exist for pet animals with cancer, new treatments
can be provided to pet dogs with cancer at earlier stages of progression than can be introduced
in human trials. Cancer progresses at a faster rate in dogs than in humans; accordingly, these
studies can be completed without interrupting the existing development path. The intramural
NCI’s Centre for Cancer Research established the comparative oncology program (COP) to
develop this novel cancer drug development opportunity, address potential risks with this
approach, and establish the organizational infrastructure to undertake translational clinical
trials in pet dogs. (Stroud, 2016)
My study provides evidence that Ganetespib exhibits biological activity in a relevant large
animal model of cancer. Given the similarities of canine and human cancers with respect to
tumour biology and HSP90 activation, it is likely that Ganetespib will demonstrate comparable
anti-cancer activity in human patients. The results also indicate that genes that code for the
126
proteins targets of most successful drugs, or are highly specific for osteosarcoma, are quite
evolutionarily conserved between human and canines.
Stroud and group demonstrated that veterinary and human cancer centres can effectively
collaborate and develop therapeutics which lead to governmental licensure and commercial
success (Stroud, 2016). Dickinson demonstrated that whole genome sequencing of canine
cancers revealed key pathways in human cancers (Dickinson, 2016). For humans, a period of
personalized medicine, which uses genomic data to determine disease risk, select specific and
effective treatment regimens, and predict relapse, is rapidly becoming state of the art,
particularly in the field of cancer. Although the scope and depth of available canine genomic
data pales compared with what is currently available for humans, directed or personalized
treatments will soon become a reality for pets (Davis, 2014). Despite the commonality of
cancer with human medicine, there are still very few experimental models that can effectively
test the metastatic cascade or novel treatments. Cancer occurs twice as frequently in dogs as
in humans and the histological types and biological behaviour of tumours are very similar.
This suggests that the underlying mechanisms in canine carcinogenesis may be similar to those
in humans and may represent a good model for this disease (Nasir L. , 2001).
Collaborative efforts among research scientists, clinician scientists, clinicians, and
veterinarians is essential for building multifaceted trials that systematically progress from
preclinical stages, to canine trials, then to successful human trials. A major proposed benefit
is decreased failure rate in human clinical trials. Spontaneous canine osteosarcoma models can
effectively bridge the translational gap between preclinical mouse studies and human clinical
trials. Developing a systematic and multidisciplinary approach to incorporate this model is
likely to result in speedy development of effective therapies and improved care for both human
and canine cancer patients (R. Timothy Bentley, 2016) (Bray, 2014). For example, the ability
to define the expressed mutated RNA species in cancer facilitates the prediction of mutated
proteins that might be produced. Some of these mutant proteins can be presented by the MHC
Class I/II system and can form future efforts to define mutated neoantigen therapies. Such an
RNAseq driven pipeline has already been performed in syngenic mouse models to drive
concepts of cancer vaccinology in such systems ( (Yadav M, 2014).
In addition to using such cell models to test new anti-cancer drugs, another emerging
therapeutic strategy to treat human cancer will involve immune therapies. It is though that
immune therapies will be augmented, in part, by the use of patient-specific neoantigen

127
vaccines that stimulate tumour rejection. In this chapter, I have used next generation
sequencing of DNA and RNA of canine sarcoma cell model in order to define parameters for
producing peptide lists that might form the basis for neoantigen vaccines. However, the data
on comparative oncology in this chapter could have improved if there wasn’t constraint in time
and canine samples in this project. There should be a much more elaborative comparison with
human models. Canine cancer studies using spontaneous tumour models could potentially
exploit patient-specific information to drive vaccinology.
128
4 MDM2 interactome
4.1 Introduction
In normal cells, p53 is kept inactive through a number of mechanisms, including the activity
of the oncoprotein murine double minute 2 (MDM2), a key negative regulator of p53.
However, MDM2 also functions as an E3 ligase, covalently attaching ubiquitin molecules to
p53, which leads to both the export of p53 to the cytoplasm and its proteasomal degradation.
Although MDM2 plays an important role in regulating p53 stability, a number of other E3
ligases have recently been identified that can promote the degradation of p53 independently
of MDM2. These include Pirh2, Cop1, TOPORS, ARF-BP1, Synoviolin, Carps, and CHIP
(Lukashchuk, 2007).
The p53 gene is mutated in nearly 50% of all human cancers. While wild-type p53 is normally
a rapidly degraded protein, these mutant p53 proteins lose the ability to activate transcription,
and they often become stable and so accumulate to high levels in tumour cells. Since MDM2
has been shown to retain the ability to bind and degrade mutant p53, the inability to
transactivate the expression of MDM2 has been proposed to underlie the stability of mutant
p53 proteins (Lukashchuk, 2007). Kathryn Ball’s group have demonstrated that MDM2-
mediated ubiquitination of the p53 tumour suppressor requires interaction with the ligase at
two distinct binding sites that form general multiprotein docking sites for the p53 protein. The
first MDM2-binding site resides in the transactivation domain of p53 and is an allosteric
effector site for MDM2-mediated p53 ubiquitination; the second site requires the acid domain
of MDM2 to recognize an ‘ubiquitination signal’ within the DNA-binding core of p53
(Susanne Pettersson, 2009).
The aim of the project was to study MDM2 and its interactome in cancer cell lines particularly
in sarcomas, using novel drugs such as nutlin (Ladanyi M, 1995). Sarcomas were chosen as
these are observed to contain many amplifications of the MDM2 gene. Nutlins are cis-
imidazoline analogues that inhibit the interaction between MDM2 and p53. I also focus on
chaperone therapeutics using the heat shock protein 90 (HSP90) inhibitor drug Ganetespib,
studying the mechanism of action of the drug on its client proteins and also investigate whether
the drug has any impact on MDM2 E3 ligase.
129
An HSP90 inhibitor is a substance that inhibits that activity of the HSP90 heat shock protein.
Since HSP90 stabilizes a variety of proteins required for survival of cancer cells, these
inhibitors may have therapeutic benefit in the treatment of various types of malignancies. A
number of HSP90 inhibitors are currently undergoing clinical trials for a variety of
cancers. HSP90 inhibitors include the natural products geldanamycin and radicicol as well as
semisynthetic derivatives 17-N-Allylamino-17-demethoxygeldanamycin (17AAG). Most of
the inhibitors of HSP90 block the N terminal ATP binding pocket and prevent the
conformational changes that are essentially required for the loading of co-chaperones and
client proteins. However several other inhibitors have been reported to disrupt the chaperone
cycle in ways other than binding to the N-terminal ATP binding pocket.
Heat shock protein 90 (HSP90) is one of the most highly conserved and abundant proteins in
mammalian cells, where it serves as a molecular chaperone to maintain the stabilization of
intracellular and extracellular proteins. Hundreds of HSP90 clients have been identified to
date, many of which play critical roles in signal transduction, cell cycle control and DNA
repair including: mutant p53, AKT, ATR, mutant BRAF, BRCA1, CDK1/4, CHK1, EGFR,
EML4-ALK, HER2, HIF1-α, IGF-1R, MET, VEGFR, and steroid receptors . It has recently
been shown that >60% of human kinases are clients of HSP90 ( (Solit DB R. N., 2011);
(Whitesell L, 2005); (Taipale M, 2012). (Haque A, 2016).
HSP90 is overexpressed in a range of cancers (such as breast, lung, colon, prostate, leukaemia
and skin) and may contribute to tumour cell survival and metastasis by stabilizing aberrant
signalling proteins, interfering with apoptosis and promoting migration and invasion ( (Solit
DB C. G., 2008); (Tsutsumi S, 2009); (workman, 2004)).Thus, one unique characteristic of
targeting HSP90 in cancer is that inhibition results in the simultaneous degradation of
hundreds of client proteins and combinatorial blockade of multiple signal transduction
cascades, thereby potentially bypassing pathway redundancies often found in cancer cells
(Friedland JC, 2013); (He S Z. C., 2013); (Proia DA F. K., 2011); (Sang J, 2013); (Shimamura
T, 2012); (Xu W, 2007))
This strategy is quite distinct from other targeted inhibitors (i.e., kinase inhibitors), which
typically are designed to block a single oncoprotein/pathway. Another unique feature of
HSP90 inhibitors is their tumour selectivity. Small molecule inhibitors of HSP90, including
Synta Pharmaceuticals’ drug candidate Ganetespib, are retained in tumours for as much as
twenty-times longer than in blood or normal tissue (Shimamura T, 2012). Recently published
work suggests that cellular transformation is accompanied by a post-translational modification
130
of HSP90 (SUMOylation) which enhances the recognition of HSP90 by ATP competitive
inhibitors, thus providing an explanation for the sensitivity of cancer cells to HSP90 inhibitors
relative to normal cells (Mollapour M, 2014). Ganetespib (formerly called STA-9090) is a
novel, injectable resorcinolic triazolone small molecule inhibitor of HSP90. Ganetespib
inhibits the growth of many tumour types in vitro and in vivo including AML, ALL, CML,
NHL, neuroblastoma, Ewing sarcoma, rhabdoid cancer, rhabdomyosarcoma, melanoma, and
carcinomas of the breast, lung, prostate, bladder and colon (Friedland JC, 2013) (Sang J, 2013)
(Proia DA F. K., 2011) (He S Z. C., 2013)) (Acquaviva J S. D., 2014); (Acquaviva J S. D.,
2012) (Bansal H B. S., 2010) (Bansal H Y. Q., 2014) (Ganji PN, 2013); (He S S. D., 2014);
(Liu H, 2013); (Nagaraju GP, 2013); (Proia D, 2012); (Proia DA Z. C., 2014); (Ying W, 2012);
(Lock RB, 2013).
131
4.2 Results
4.2.1 MDM2 interactome and p53 ubiquitination
MDM2 has been extensively studied in the Ball laboratory. I wanted to further explore the
interactions of MDM2 with other proteins and its role in p53 ubiquitination (Maura wallace,
2006). The A375 cell line has been well characterised and thus I used this line to study the
preliminary responses. To demonstrate p53 ubiquitination, the cells were treated with either
DMSO or 10 µM nutlin for six hours and the cell lysates were analysed by Western blotting.
The results showed that with DMSO treatment, MDM2 and p53 expression was low and only
weak ubiquitination bands observed for p53, whereas nutlin induced MDM2 protein levels
and increased the ubiquitination of p53 (Figure 47a).
I then determined the effect of knockdown of MDM2 on p53 ubiquitination or p53 status. I
used siRNA targeting MDM2 and treated A375 cells for 48 hours prior to the addition of nutlin
or DMSO for further six hours. The results demonstrated that using MDM2 siRNA I was able
to knock down MDM2 by ~65% compared to the no treatment control (Figure 47b). Nutlin
treatment increased the levels of both MDM2 and p53 even when MDM2 siRNA was used.
When nutlin was used along with siRNA against MDM2 there was no significant knockdown
of MDM2; only about 16% reduction of MDM2 expression for nutlin+MDM2siRNA as
compared to nutlin+control siRNA. GAPDH was used as a loading control and the levels were
equal in all the samples.
The data indicate that there is increased expression of MDM2 with nutlin, and p53 is stably
mono-ubiquitinated following activation by nutlin3. My results also suggest that it is
challenging to study p53 ubiquitination using nutlin and MDM2 siRNA and requires an
alternative approach.
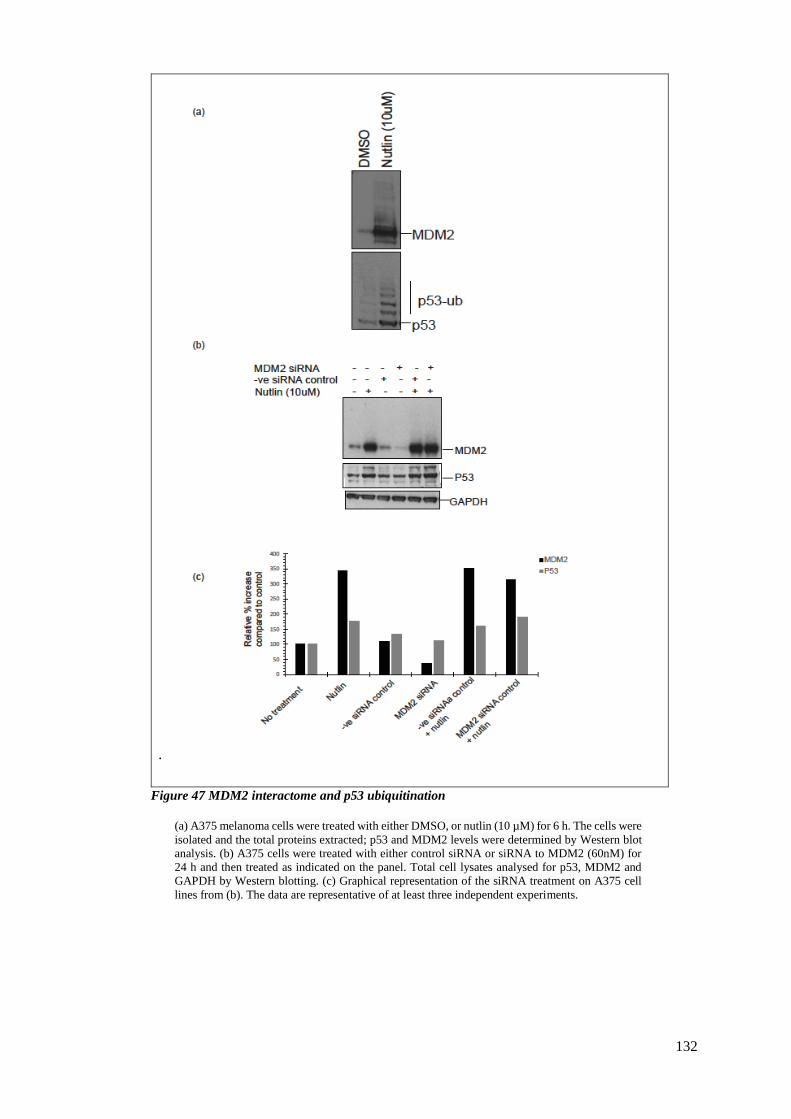
132
.
Figure 47 MDM2 interactome and p53 ubiquitination
(a) A375 melanoma cells were treated with either DMSO, or nutlin (10 µM) for 6 h. The cells were
isolated and the total proteins extracted; p53 and MDM2 levels were determined by Western blot
analysis. (b) A375 cells were treated with either control siRNA or siRNA to MDM2 (60nM) for
24 h and then treated as indicated on the panel. Total cell lysates analysed for p53, MDM2 and
GAPDH by Western blotting. (c) Graphical representation of the siRNA treatment on A375 cell
lines from (b). The data are representative of at least three independent experiments.

133
Since I was unable to prevent significant increase in MDM2 protein levels in response to
nutlin-3 under conditions where about 70% knockdown of MDM2 was achieved in the
controls, I used the MDM2 inhibitor protein p14ARF to determine that ubiquitination of p53
is MDM2-mediated. Hence p14ARF was chosen as a tool instead of knocking down MDM2
by siRNA.
For this experiment I used a p14ARF plasmid vector and transfected a titration of plasmid into
both A375 and HCT 116+/+ cell lines prior to nutlin treatment (Figure 48a). The results
indicated that there was a loss of p53 ubiquitination with increase in p14ARF plasmid in both
nutlin-treated and DMSO-treated cells. This was similar in both the cell lines. The highest
dose of ARF plasmid was 2 µg. The titration also indicated that at least 500 ng of plasmid is
required to show a significant loss of p53 ubiquitination (Vivien Landré, 2017).
The results indicated that p14ARF could overcome the effect of nutlin3 on p53 ubiquitination.
This confirms the hypothesis that nutlin-3 enhances p53 mono-ubiquitination through a
process that involves MDM2 (Vivien Landré, 2017).
I observed that p53 ubiquitination could also be affected by the cell lysis conditions, such as
the type of buffer used to lyse the cells. Duplicate sets of A375 cell lines were treated with
either DMSO or nutlin for 2, 4, 6, 8 and 16 hours, then harvested using PBS. Each of the cell
pellets was lysed using either NP40- or urea-containing lysis buffer. The results indicated that
urea lysed cells contained strongly-ubiquitinated p53 bands with nutlin, and this increased with
nutlin treatment duration, compared to samples lysed with NP40 buffer (Figure 48b). This
difference could be due to composition of the buffer. For example Christoph and group
demonstrated that protein ubiquitination is reversible, and this modification can therefore
easily be lost through the hydrolysis of ubiquitin chain linkages, which is catalysed by protein
ubiquitin hydrolases, termed de-ubiquitylases (DUBs). For this reason it is essential to include
DUB inhibitors in the buffers used for cell lysis, to preserve proteins in the state of
ubiquitination present in the intact cell.
To block DUB activity, EDTA or EGTA must be included in the lysis buffer to remove traces
of heavy metal ions, and iodoacetamide (IAA) or N-ethylmaleimide (NEM) must also be
added to alkylate the active site cysteine residues of DUBs. High concentrations of NEM are
better at preserving K63-Ub chains and M1-Ub chains than high concentrations of IAA,
probably due to the instability of the latter compound. (Christoph H. Emmerich, 2015).
Therefore it is essential to maintain optimal buffer conditions when studying ubiquitination.
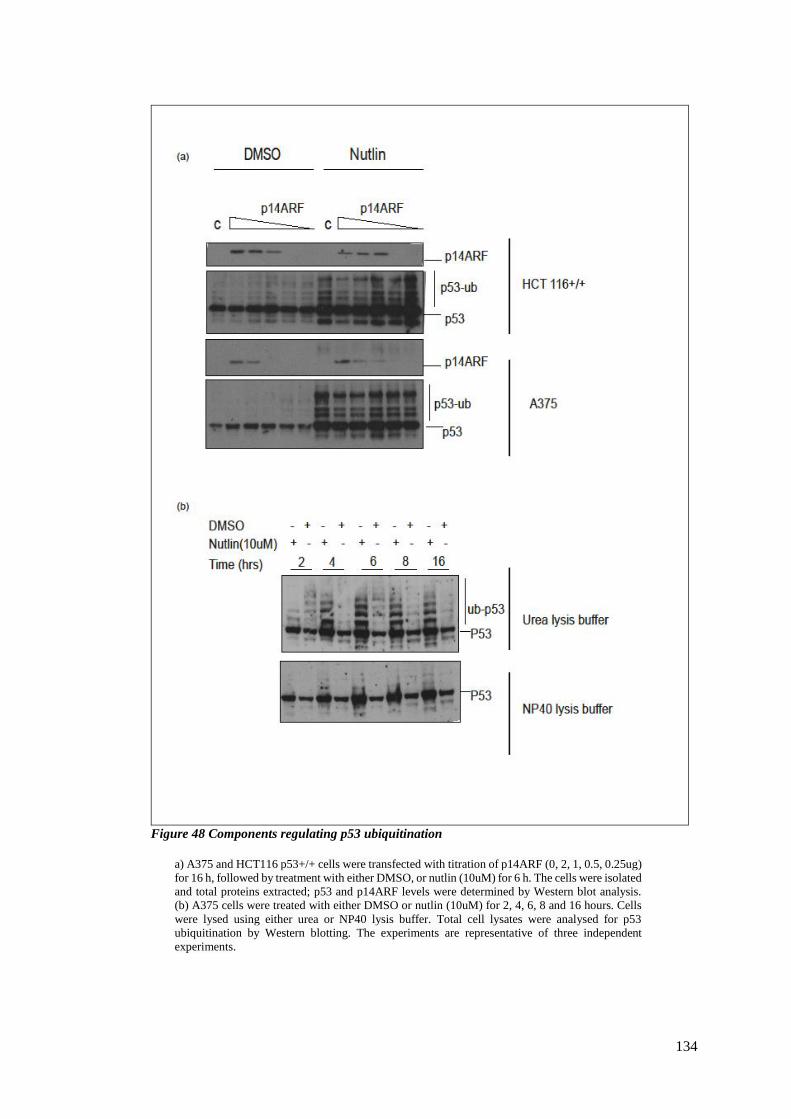
134
Figure 48 Components regulating p53 ubiquitination
a) A375 and HCT116 p53+/+ cells were transfected with titration of p14ARF (0, 2, 1, 0.5, 0.25ug)
for 16 h, followed by treatment with either DMSO, or nutlin (10uM) for 6 h. The cells were isolated
and total proteins extracted; p53 and p14ARF levels were determined by Western blot analysis.
(b) A375 cells were treated with either DMSO or nutlin (10uM) for 2, 4, 6, 8 and 16 hours. Cells
were lysed using either urea or NP40 lysis buffer. Total cell lysates were analysed for p53
ubiquitination by Western blotting. The experiments are representative of three independent
experiments.
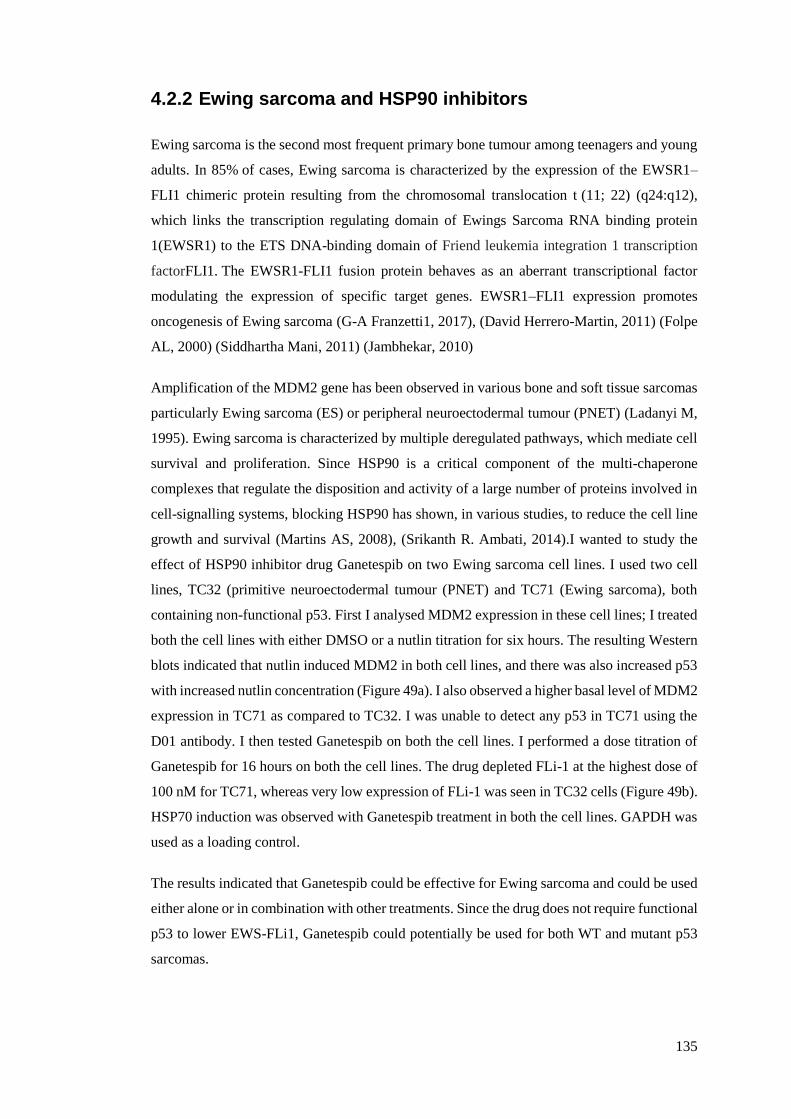
135
4.2.2 Ewing sarcoma and HSP90 inhibitors
Ewing sarcoma is the second most frequent primary bone tumour among teenagers and young
adults. In 85% of cases, Ewing sarcoma is characterized by the expression of the EWSR1–
FLI1 chimeric protein resulting from the chromosomal translocation t (11; 22) (q24:q12),
which links the transcription regulating domain of Ewings Sarcoma RNA binding protein
1(EWSR1) to the ETS DNA-binding domain of Friend leukemia integration 1 transcription
factorFLI1. The EWSR1-FLI1 fusion protein behaves as an aberrant transcriptional factor
modulating the expression of specific target genes. EWSR1–FLI1 expression promotes
oncogenesis of Ewing sarcoma (G-A Franzetti1, 2017), (David Herrero-Martin, 2011) (Folpe
AL, 2000) (Siddhartha Mani, 2011) (Jambhekar, 2010)
Amplification of the MDM2 gene has been observed in various bone and soft tissue sarcomas
particularly Ewing sarcoma (ES) or peripheral neuroectodermal tumour (PNET) (Ladanyi M,
1995). Ewing sarcoma is characterized by multiple deregulated pathways, which mediate cell
survival and proliferation. Since HSP90 is a critical component of the multi-chaperone
complexes that regulate the disposition and activity of a large number of proteins involved in
cell-signalling systems, blocking HSP90 has shown, in various studies, to reduce the cell line
growth and survival (Martins AS, 2008), (Srikanth R. Ambati, 2014).I wanted to study the
effect of HSP90 inhibitor drug Ganetespib on two Ewing sarcoma cell lines. I used two cell
lines, TC32 (primitive neuroectodermal tumour (PNET) and TC71 (Ewing sarcoma), both
containing non-functional p53. First I analysed MDM2 expression in these cell lines; I treated
both the cell lines with either DMSO or a nutlin titration for six hours. The resulting Western
blots indicated that nutlin induced MDM2 in both cell lines, and there was also increased p53
with increased nutlin concentration (Figure 49a). I also observed a higher basal level of MDM2
expression in TC71 as compared to TC32. I was unable to detect any p53 in TC71 using the
D01 antibody. I then tested Ganetespib on both the cell lines. I performed a dose titration of
Ganetespib for 16 hours on both the cell lines. The drug depleted FLi-1 at the highest dose of
100 nM for TC71, whereas very low expression of FLi-1 was seen in TC32 cells (Figure 49b).
HSP70 induction was observed with Ganetespib treatment in both the cell lines. GAPDH was
used as a loading control.
The results indicated that Ganetespib could be effective for Ewing sarcoma and could be used
either alone or in combination with other treatments. Since the drug does not require functional
p53 to lower EWS-FLi1, Ganetespib could potentially be used for both WT and mutant p53
sarcomas.
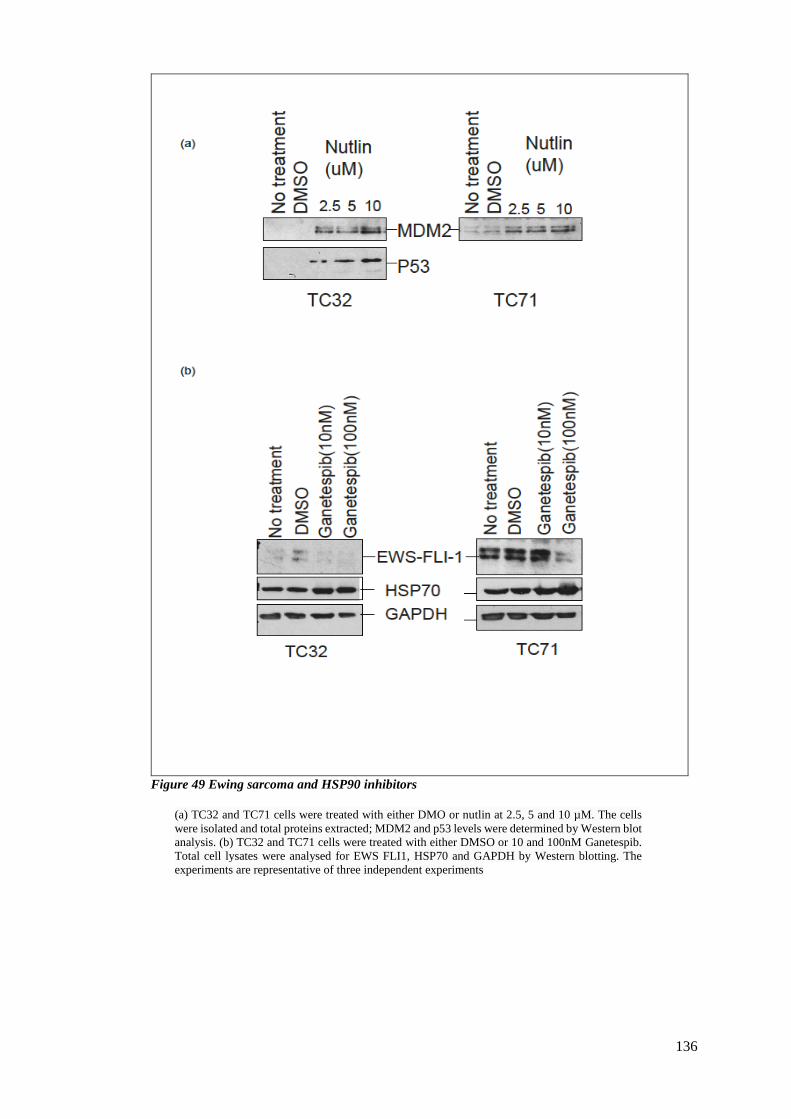
136
Figure 49 Ewing sarcoma and HSP90 inhibitors
(a) TC32 and TC71 cells were treated with either DMO or nutlin at 2.5, 5 and 10 µM. The cells
were isolated and total proteins extracted; MDM2 and p53 levels were determined by Western blot
analysis. (b) TC32 and TC71 cells were treated with either DMSO or 10 and 100nM Ganetespib.
Total cell lysates were analysed for EWS FLI1, HSP70 and GAPDH by Western blotting. The
experiments are representative of three independent experiments
137
4.2.3 Characterisation of osteosarcoma cell lines in
association with MDM2 expression
Since sarcomas, particularly osteosarcomas, have high amplification of the MDM2 gene, I
wanted to characterise osteosarcoma cell lines to determine if cell density had any impact on
the expression levels of MDM2 protein. For this purpose I used three different cell types:
MHM, SJSA (osteosarcoma) and T778 (liposarcoma), which are different categories of
sarcomas. I also analysed the effect of nutlin on these cell types. Cell lines T778 and MHM
were kind gift from Oslo University, and SJSA was from ATCC.
Time course experiments (2, 4 and 6 hours) with 10 µM nutlin were performed on low density
(about 40% confluency and high density (~80% confluency). There was strong induction of
MDM2 in all three lines (Figure 50a). At two hours of nutlin treatment there was low induction
for all the cell lines at both the cell densities. With increased duration of nutlin treatment there
was also an increase in MDM2 induction. I also observed that at low density, T778 cell lines
gave steady MDM2 expression, as compared to the high-density cultures. This supports the
data of the Hupp group, which shows that MDM2 exhibits higher steady state levels at lower
cell densities, after nutlin treatment (Luke Way, 2016), however, this is not true for all the cell
types, as SJSA and MHM behaved similarly for both the cell densities, i.e. higher induction
with higher cell density. The data also showed that four hours of 10 µM nutlin was sufficient
to induce MDM2, for all the cell lines except T778 high density. While for the high density of
T778 requires optimisation for better MDM2 induction. The drug titration was performed for
all three cell lines, at both low and high densities, with concentrations of 2.5, 5 and 10 µM for
six hours. For T778 and MHM, MDM2 expression was steady across the titration range
(Figure 50b), whereas for SJSA, a low cell density gave better induction, compared to a high
density. In general 5 µM for six hours was sufficient for all cell lines and cell densities to
induce high MDM2 expressions.
Ganetespib drug titration was performed for all the three cell lines. The T778 showed a low
basal HSP70 induction whereas MHM and SJSA HSP70 induction even in non-treated
samples (Figure 50c). This suggests that Ganetespib could potentially work better in T778 cell
types than in either of the others, as induction in HSP70 indicates inhibition of HSP90.
These results indicate MDM2 expression after nutlin treatment is determined by two factors:
the cancer cell type and the cell density at which the drug treatment is performed. Hence these
need to be optimised for each experiment.
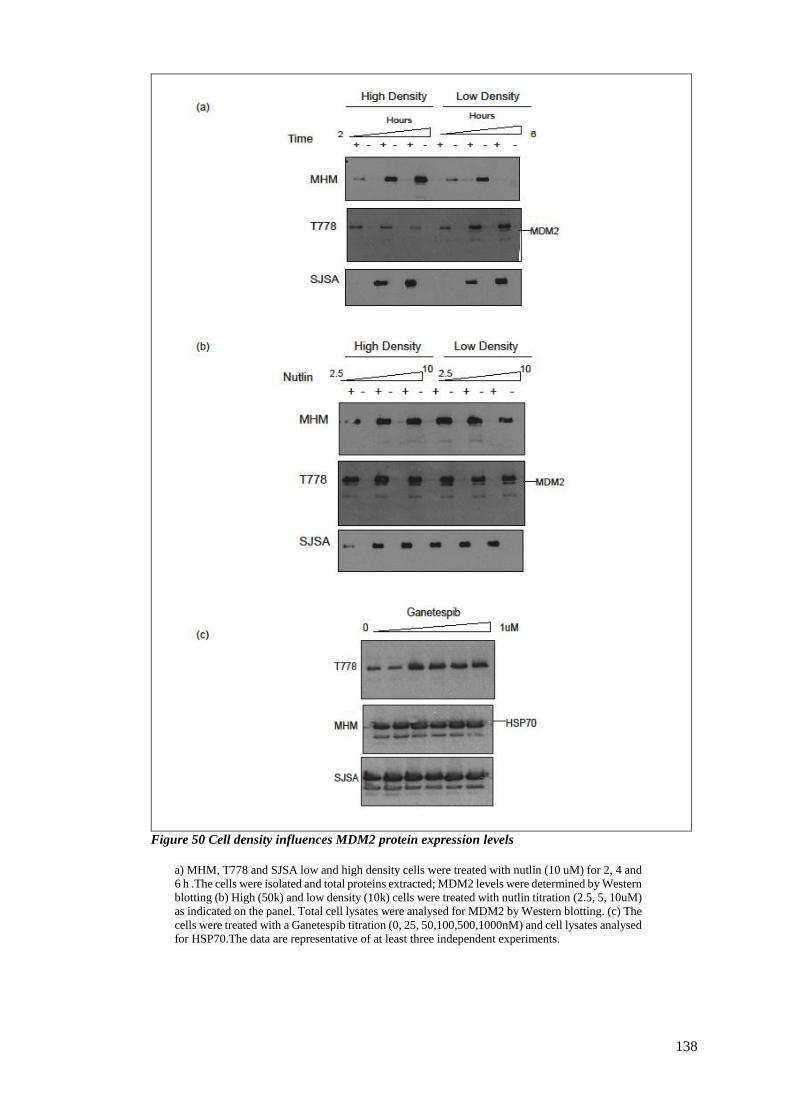
138
Figure 50 Cell density influences MDM2 protein expression levels
a) MHM, T778 and SJSA low and high density cells were treated with nutlin (10 uM) for 2, 4 and
6 h .The cells were isolated and total proteins extracted; MDM2 levels were determined by Western
blotting (b) High (50k) and low density (10k) cells were treated with nutlin titration (2.5, 5, 10uM)
as indicated on the panel. Total cell lysates were analysed for MDM2 by Western blotting. (c) The
cells were treated with a Ganetespib titration (0, 25, 50,100,500,1000nM) and cell lysates analysed
for HSP70.The data are representative of at least three independent experiments.
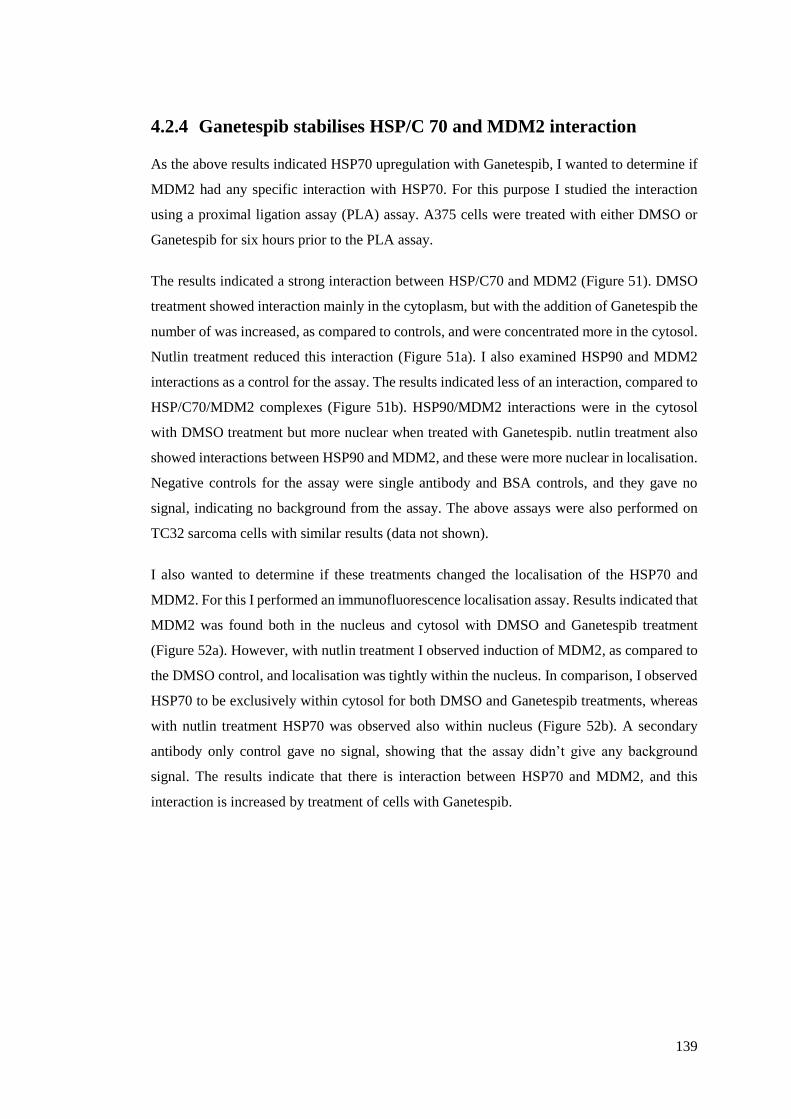
139
4.2.4 Ganetespib stabilises HSP/C 70 and MDM2 interaction
As the above results indicated HSP70 upregulation with Ganetespib, I wanted to determine if
MDM2 had any specific interaction with HSP70. For this purpose I studied the interaction
using a proximal ligation assay (PLA) assay. A375 cells were treated with either DMSO or
Ganetespib for six hours prior to the PLA assay.
The results indicated a strong interaction between HSP/C70 and MDM2 (Figure 51). DMSO
treatment showed interaction mainly in the cytoplasm, but with the addition of Ganetespib the
number of was increased, as compared to controls, and were concentrated more in the cytosol.
Nutlin treatment reduced this interaction (Figure 51a). I also examined HSP90 and MDM2
interactions as a control for the assay. The results indicated less of an interaction, compared to
HSP/C70/MDM2 complexes (Figure 51b). HSP90/MDM2 interactions were in the cytosol
with DMSO treatment but more nuclear when treated with Ganetespib. nutlin treatment also
showed interactions between HSP90 and MDM2, and these were more nuclear in localisation.
Negative controls for the assay were single antibody and BSA controls, and they gave no
signal, indicating no background from the assay. The above assays were also performed on
TC32 sarcoma cells with similar results (data not shown).
I also wanted to determine if these treatments changed the localisation of the HSP70 and
MDM2. For this I performed an immunofluorescence localisation assay. Results indicated that
MDM2 was found both in the nucleus and cytosol with DMSO and Ganetespib treatment
(Figure 52a). However, with nutlin treatment I observed induction of MDM2, as compared to
the DMSO control, and localisation was tightly within the nucleus. In comparison, I observed
HSP70 to be exclusively within cytosol for both DMSO and Ganetespib treatments, whereas
with nutlin treatment HSP70 was observed also within nucleus (Figure 52b). A secondary
antibody only control gave no signal, showing that the assay didn’t give any background
signal. The results indicate that there is interaction between HSP70 and MDM2, and this
interaction is increased by treatment of cells with Ganetespib.
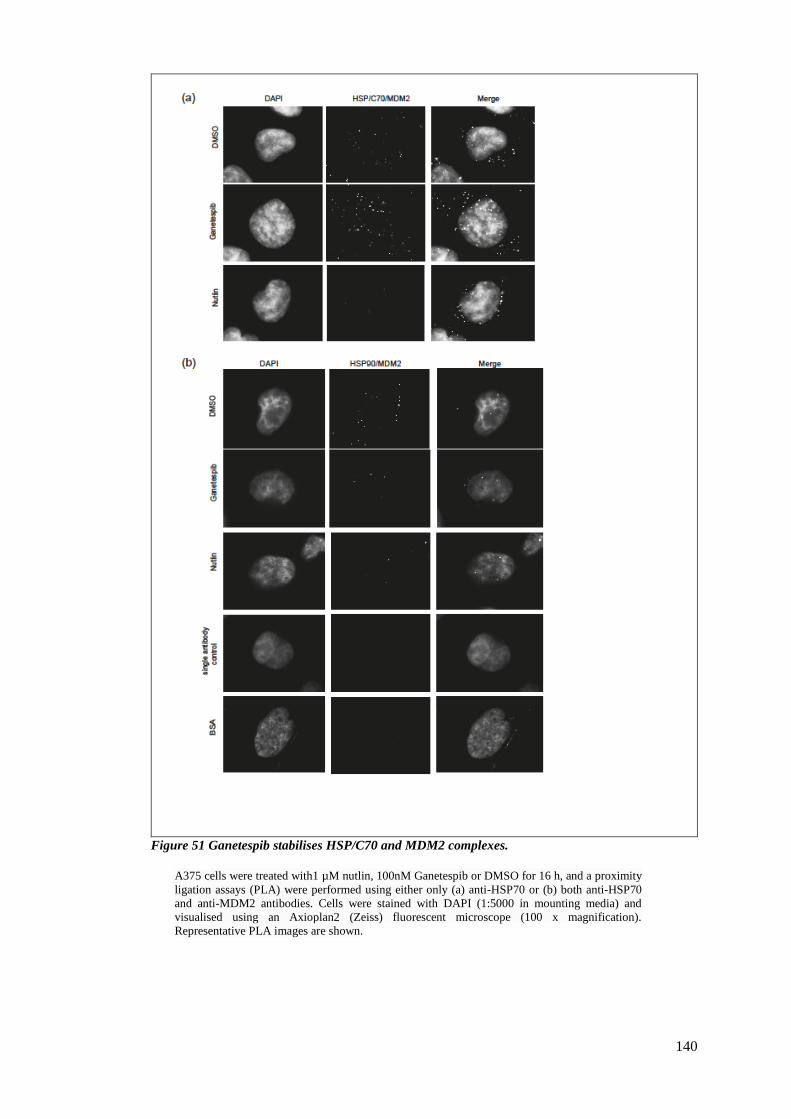
140
Figure 51 Ganetespib stabilises HSP/C70 and MDM2 complexes.
A375 cells were treated with1 µM nutlin, 100nM Ganetespib or DMSO for 16 h, and a proximity
ligation assays (PLA) were performed using either only (a) anti-HSP70 or (b) both anti-HSP70
and anti-MDM2 antibodies. Cells were stained with DAPI (1:5000 in mounting media) and
visualised using an Axioplan2 (Zeiss) fluorescent microscope (100 x magnification).
Representative PLA images are shown.
141
Figure 52 MDM2 and HSP70 localisation with drug treatments
A375 cells were treated with DMSO, nutlin or Ganetespib for 16 h. Cells were fixed, stained with
either anti HSP70 or anti MDM2 antibody and then with secondary Alexa fluor 594 antibody, and
DAPI, and visualised by IF microscopy.

142
4.2.5 Validation of HSC/P70 and MDM2 interaction
To detect and validate the protein–protein interaction of the E3 ligase MDM2 with HSP70, I
initially performed an immunoprecipitation (co-IP) using antibody- coupled Protein G-
sepharose . A375 cells were grown and harvested as per protocol. Cell pellets lysed and the
pre-cleared lysate was incubated with beads bound to anti-MDM2 antibody. The eluate from
the beads was run on a gel and HSP70 detected by Western blotting using anti-HSP70
antibody. There was a significant amount of HSP70 detected by Western blotting (Figure 53).
The same Co-IP was performed with anti-HSP70 bound to beads and detection with MDM2
antibody. This resulted in no pull down of MDM2; this could be due to the low amount of
MDM2 in A375 cells (data not shown).
To check the specificity of this interaction, Streptavidin-Binding Peptide (SBP) constructs
encoding mutant HSP70 proteins were prepared (I164D, T204, D529A, V438F). The mutation
V438F has a phenylalanine sterically blocking the substrate cavity, hence it is a mutant that
doesn’t bind substrate proteins, and thus is vital for distinguishing between specific HSP70
binders and HSP70 substrates. Its allostery and conformational changes are preserved. In
contrast, I164D mutants do not induce ATP-bound HSP70 conformation changes but still bind
to substrates. (Matthias P. Mayer, 2000)
I transfected the constructs into A375 cells and performed SBP pulldowns after either nutlin
or Ganetespib treatment. The results indicated that the mutant proteins had altered affinity for
MDM2, when compared to WT HSP70 protein. In this experiment I could pull down MDM2
with HSP70 bound to beads when cells were transfected with WT HSP70 (Figure 53b),
whereas no pulldown was observed with V438F transfected samples. This mutant is unable to
bind substrate and thus indicated that MDM2 was not able to bind this mutant after the sterical
conformational change. In contrast, the mutants I164D, T204, and D529A, behaved similarly
to the WT HSP70.
Since HSP70 binds to its substrates in the presence of ATP, the pulldown was performed
with/without the presence of ATP. However this made no significant difference in the
pulldown results. With DMSO and Ganetespib treatment I observed less pulldown of MDM2
for WT and I164D mutant HSP70 while high and none for D59V and V438F constructs
respectively. With nutlin treatment I observed high levels of MDM2 expression for WT and
I164D and low levels for D59V.There was no MDM2 pulldown with V438F. These results

143
were in the presence of ATP; in the absence of ATP the pulldown showed similar results but
with lower expression of protein in general. Based on these results, WT HSP70 and I164D
performed very similarly whereas D59V had lower MDM2 pulldown, and V438F indicated it
was unable to bind to MDM2. Lysates for HSP70 and MDM2 showed high induction for all
treatments. I also had two controls for transfection: a non-transfected control (c) and the
pcDNA MDM2 vector control. My results indicate that MDM2 could potentially be a substrate
for HSP70.
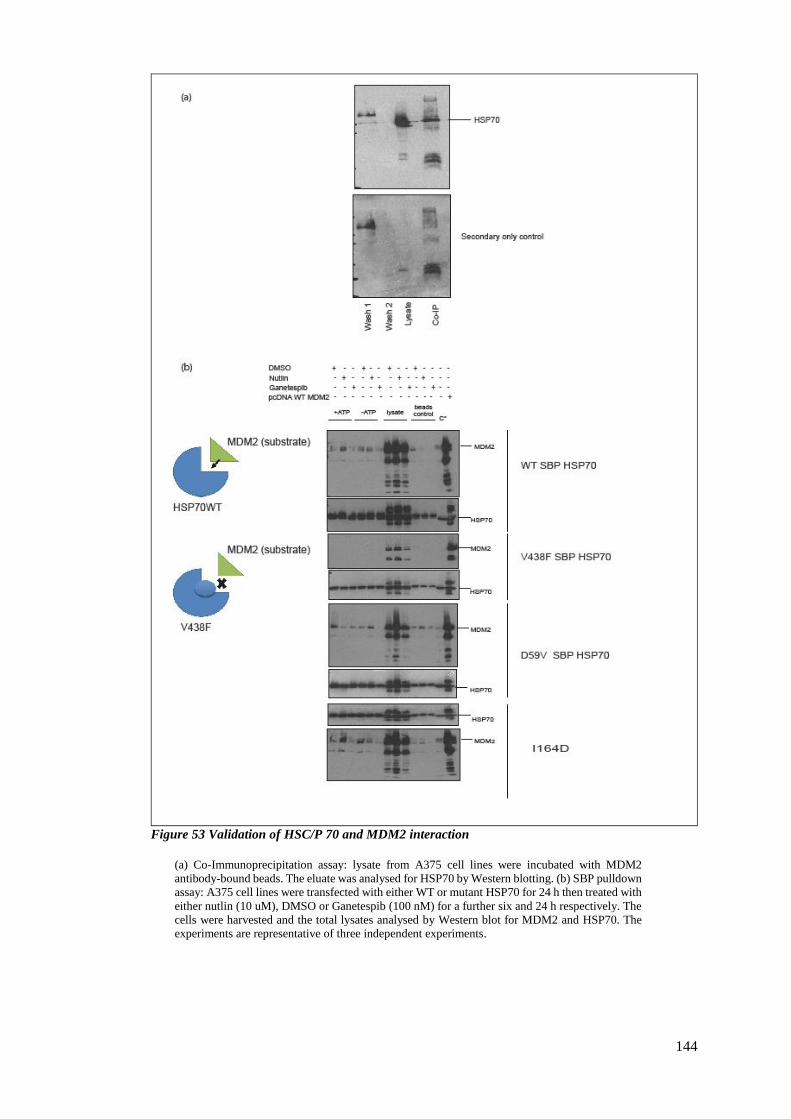
144
Figure 53 Validation of HSC/P 70 and MDM2 interaction
(a) Co-Immunoprecipitation assay: lysate from A375 cell lines were incubated with MDM2
antibody-bound beads. The eluate was analysed for HSP70 by Western blotting. (b) SBP pulldown
assay: A375 cell lines were transfected with either WT or mutant HSP70 for 24 h then treated with
either nutlin (10 uM), DMSO or Ganetespib (100 nM) for a further six and 24 h respectively. The
cells were harvested and the total lysates analysed by Western blot for MDM2 and HSP70. The
experiments are representative of three independent experiments.
145
4.2.6 Combinatorial treatment of Ganetespib with nutlin
I wanted to study whether the HSP70/MDM2 interaction had any synergistic effect with nutlin
and what effect Ganetespib had on its client proteins, such as IRF-1. To determine this, I
treated A375 cells with Ganetespib titration either alone, or in combination with 10uM nutlin
for 16 hours. The results indicated that there was a steady loss of IRF-1 with increase in
Ganetespib drug concentration (Figure 54a). When there was no nutlin treatment, the loss of
IRF-1 was greatest with 100nM and almost 80% loss with doses of 50nM and 25nM and no
loss of IRF-1 with 12.5nM Ganetespib. Interestingly, when nutlin was used in combination
with Ganetespib there was loss of IRF-1 even with the 12.5 nM Ganetespib, compared to the
DMSO control. This indicated a synergistic effect of both the drugs on IRF-1. Another
interesting feature was that Ganetespib increased the total MDM2 level when used alone.
MDM2 level of expression with a combination of nutlin and Ganetespib was also higher than
with nutlin alone. GAPDH was used as a loading control and was similar across in all samples.
I also wanted to test the effect of the drug combination on p53, and if this effect could be seen
with a shorter duration of drug treatment. I treated two sets of A375 cell lines with nutlin,
DMSO or Ganetespib for six or 16 hours. The effect of Ganetespib was shown only at 16 hours
and not much at 6 hours. IRF-1 depletion was seen at 16 hours and none at six hours (Figure
54b). I could also see clear induction of HSP70 with every Ganetespib treatment. At 16 hours
of treatment, a combination of nutlin and Ganetespib completely reduced IRF-1, again
indicating that the combination has a better effect on IRF-1 than the drugs alone. IFNγ
treatment was used as a control for IRF-1 induction. P53 ubiquitination was observed with the
addition of nutlin and interestingly this was attenuated when Ganetespib was used in
combination for 16 hours. Similar results were observed with MDM2: induction with nutlin
treatment and expression of MDM2 also increased with 16 hours of Ganetespib treatment.
I wanted to determine if these treatments changed the localisation of the proteins in the cells.
For this purpose I performed immunofluorescence on A375 cell lines. Cells were treated with
a titration of Ganetespib, either alone or in combination with nutlin. The results showed that
IRF-1 was localised within the cytosol and membrane-bound, and the total amount decreased
with increased concentration of Ganetespib (Figure 55). IRF-1 was also observed to be
granulated in appearance with the drug, as compared to DMSO control. Nutlin treatment
increased the IRF-1 but it was localised within cytosol and nuclear. The combination of nutlin
and Ganetespib localised IRF-1 partially in cytosol and particularly in nucleus. With increased
concentration of Ganetespib along with nutlin, the IRF-1 was re-localised back into the

146
cytosol. A BSA control gave no fluorescence, indicating that there was no background signal
from the secondary antibody.
My results indicate a possible synergic effect on HSP90 client proteins when Ganetespib and
nutlin are used in combination, but further work is required to confirm this conclusion.
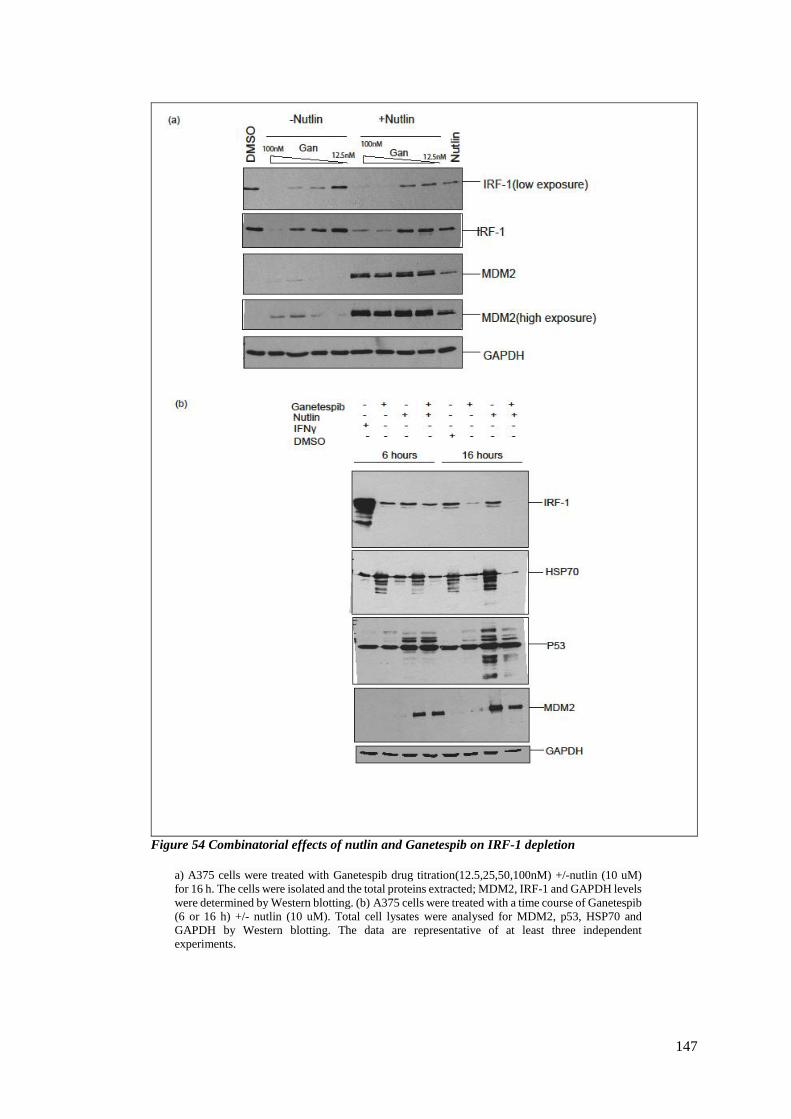
147
Figure 54 Combinatorial effects of nutlin and Ganetespib on IRF-1 depletion
a) A375 cells were treated with Ganetespib drug titration(12.5,25,50,100nM) +/-nutlin (10 uM)
for 16 h. The cells were isolated and the total proteins extracted; MDM2, IRF-1 and GAPDH levels
were determined by Western blotting. (b) A375 cells were treated with a time course of Ganetespib
(6 or 16 h) +/- nutlin (10 uM). Total cell lysates were analysed for MDM2, p53, HSP70 and
GAPDH by Western blotting. The data are representative of at least three independent
experiments.
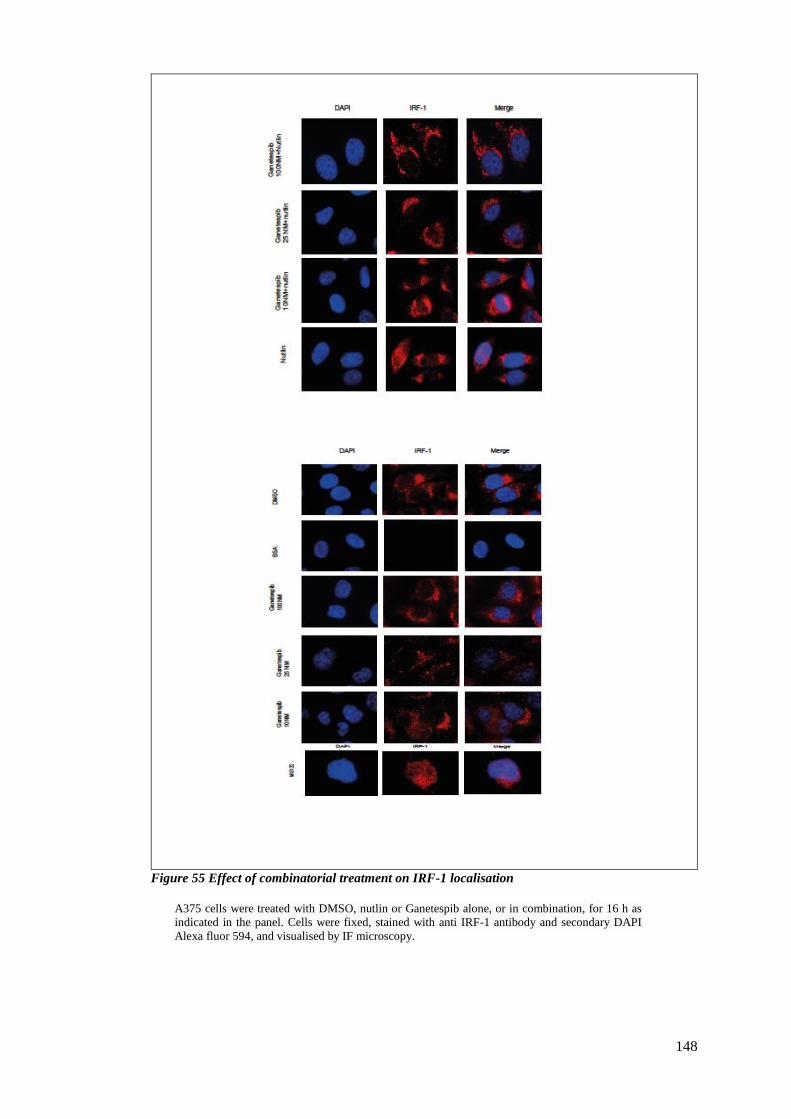
148
Figure 55 Effect of combinatorial treatment on IRF-1 localisation
A375 cells were treated with DMSO, nutlin or Ganetespib alone, or in combination, for 16 h as
indicated in the panel. Cells were fixed, stained with anti IRF-1 antibody and secondary DAPI
Alexa fluor 594, and visualised by IF microscopy.
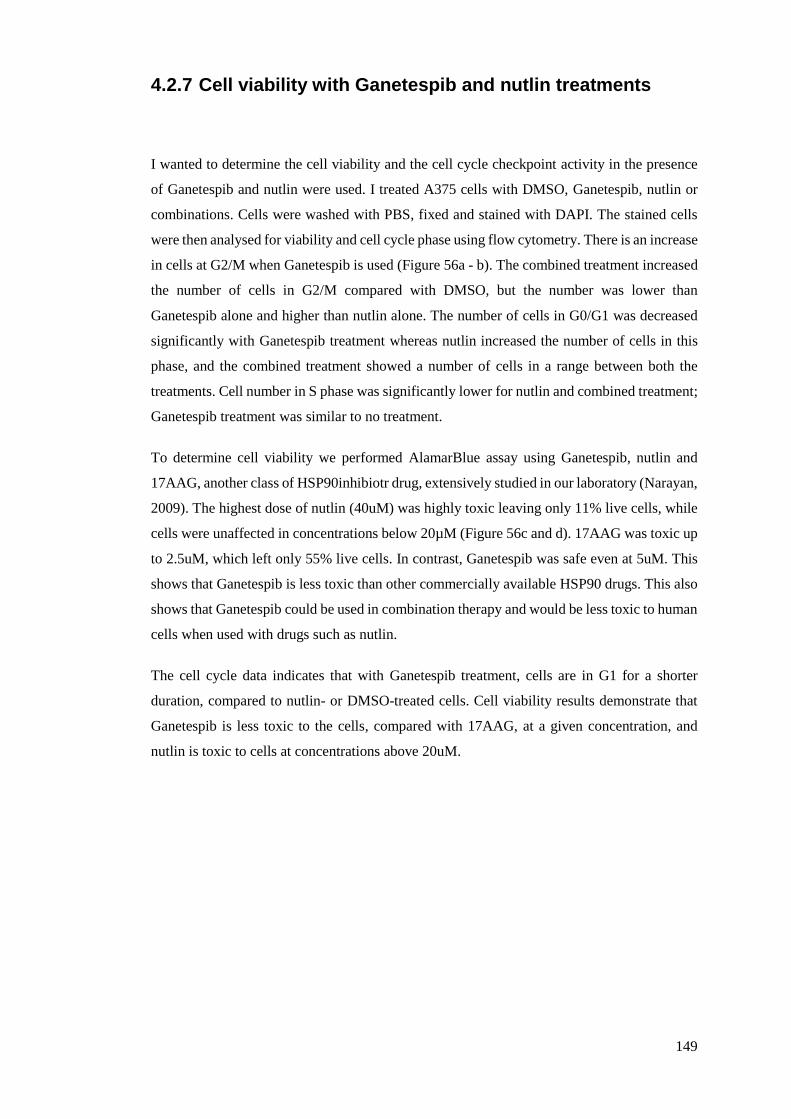
149
4.2.7 Cell viability with Ganetespib and nutlin treatments
I wanted to determine the cell viability and the cell cycle checkpoint activity in the presence
of Ganetespib and nutlin were used. I treated A375 cells with DMSO, Ganetespib, nutlin or
combinations. Cells were washed with PBS, fixed and stained with DAPI. The stained cells
were then analysed for viability and cell cycle phase using flow cytometry. There is an increase
in cells at G2/M when Ganetespib is used (Figure 56a - b). The combined treatment increased
the number of cells in G2/M compared with DMSO, but the number was lower than
Ganetespib alone and higher than nutlin alone. The number of cells in G0/G1 was decreased
significantly with Ganetespib treatment whereas nutlin increased the number of cells in this
phase, and the combined treatment showed a number of cells in a range between both the
treatments. Cell number in S phase was significantly lower for nutlin and combined treatment;
Ganetespib treatment was similar to no treatment.
To determine cell viability we performed AlamarBlue assay using Ganetespib, nutlin and
17AAG, another class of HSP90inhibiotr drug, extensively studied in our laboratory (Narayan,
2009). The highest dose of nutlin (40uM) was highly toxic leaving only 11% live cells, while
cells were unaffected in concentrations below 20µM (Figure 56c and d). 17AAG was toxic up
to 2.5uM, which left only 55% live cells. In contrast, Ganetespib was safe even at 5uM. This
shows that Ganetespib is less toxic than other commercially available HSP90 drugs. This also
shows that Ganetespib could be used in combination therapy and would be less toxic to human
cells when used with drugs such as nutlin.
The cell cycle data indicates that with Ganetespib treatment, cells are in G1 for a shorter
duration, compared to nutlin- or DMSO-treated cells. Cell viability results demonstrate that
Ganetespib is less toxic to the cells, compared with 17AAG, at a given concentration, and
nutlin is toxic to cells at concentrations above 20uM.
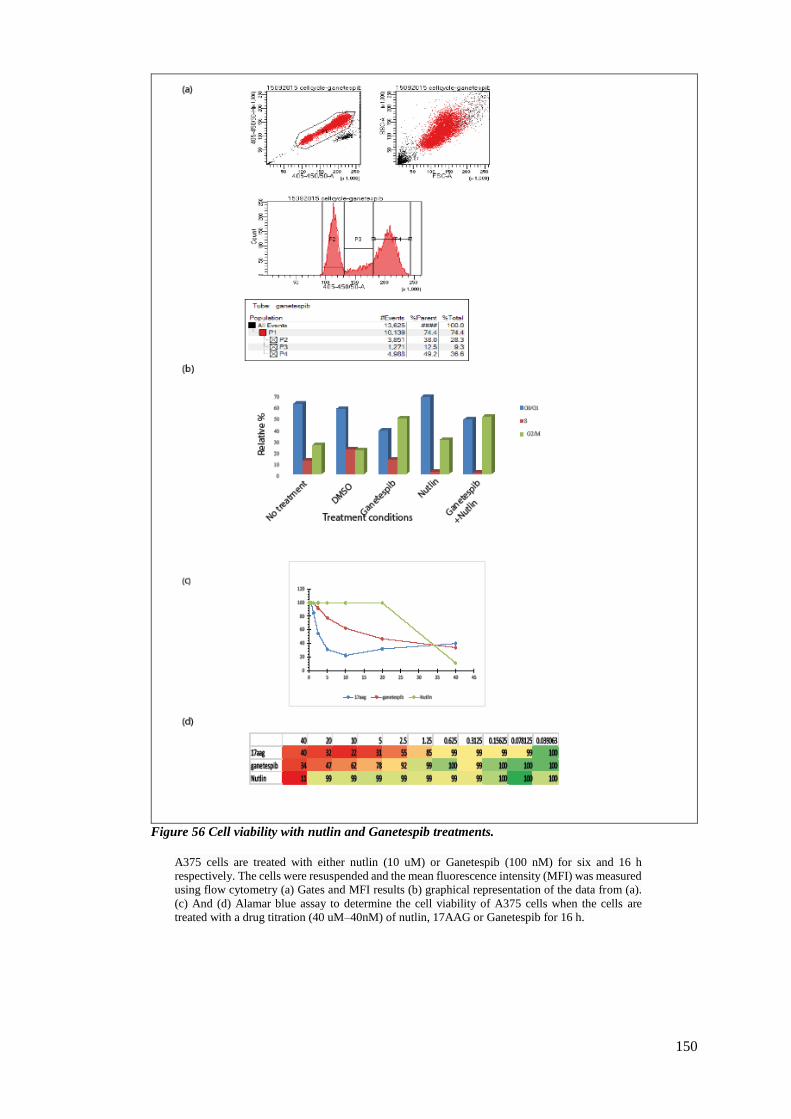
150
Figure 56 Cell viability with nutlin and Ganetespib treatments.
A375 cells are treated with either nutlin (10 uM) or Ganetespib (100 nM) for six and 16 h
respectively. The cells were resuspended and the mean fluorescence intensity (MFI) was measured
using flow cytometry (a) Gates and MFI results (b) graphical representation of the data from (a).
(c) And (d) Alamar blue assay to determine the cell viability of A375 cells when the cells are
treated with a drug titration (40 uM–40nM) of nutlin, 17AAG or Ganetespib for 16 h.
151
4.2.8 Discussion
The results indicated that there is increased expression of MDM2 with nutlin, and p53 is stably
monoubiquitinated, following activation by nutlin-3. My results also suggested using pARF
to overcome the effect of nutlin-3 on p53 ubiquitination through a process that involves
MDM2. I have also discussed the importance of buffer conditions for studying ubiquitination.
My results indicated that the HSP90 inhibitor drug Ganetespib can be effective for Ewing
sarcoma, and could be used either alone or in combination with other treatments. Since the
drug does not require functional p53 to lower EWS-FLi1, Ganetespib could potentially be used
for both WT and mutant p53 sarcomas. The expression of MDM2 with nutlin activation will
be governed by several factors such as the tumour type and cell density at which the drug
treatment is performed and hence each experiment must be optimised based on these
considerations. My results indicate that there is a novel interaction between HSP/C70 and
MDM2, and this interaction is stabilised with Ganetespib. This interaction was also validated
using HSP70 WT and specific mutants lacking substrate-binding capability. Cell viability
results demonstrate that Ganetespib is less toxic to the cells, compared with 17AAG at a given
concentration, and nutlin is toxic to cells at concentrations above 20uM. I have also shown
that there is a potential synergistic effect on HSP90 client proteins when Ganetespib and nutlin
are used in combination.
152
5 Mechanism of downregulation of IRF-1 with
ganetespib
5.1 Introduction
5.1.1 IRF-1
Interferon regulatory factor -1 (IRF-1), is the founding member of the interferon (IFN)
regulatory factor family and was originally identified as a key regulator of type I interferons.
IRF-1 levels are regulated at the transcriptional level in response to various stimuli such as
IFNs (type I and type II), double-stranded RNA, cytokines, and hormones. By virtue of its
affinity for a specific DNA sequence, IRF-1 participates in the transcription of various IRF-1-
inducible genes. Through the activities of its various functional domains, IRF-1 is suggested
to provide a link between innate and adoptive immune systems and plays a critical role in
various physiological and pathological aspects, including viral infection, oncogenesis,
proinflammatory injury, development of immune system and autoimmunity (Dou, 2014)
IRF-1 inactivation by deletion of one or more exons, or loss of one IRF-1 allele, has been
reported in various cancer types. Unlike the classic tumour suppressor genes, loss of IRF-1
alleles alone rarely induces tumour development, however, IRF-1 deficiency significantly
increases the incidence of tumours in combination with other genetic alterations. The
mechanisms by which IRF-1 mediates tumour suppression is thought to be via activation of
target genes associated with regulation of the cell cycle, apoptosis and the immune response
to impact on tumour susceptibility and progression. IRF-1 and p53 regulate DNA damage-
induced apoptosis, both cooperatively and independently, depending on the type and
differentiation stage of the cell (Dou, 2014). In certain cancer types IRF-1 acts as a tumour
promoter rather than tumour suppressor (Gerard M. Doherty, 2001)
5.1.2 Molecular chaperons and IRF-1
The early clinical hypothesis for inhibiting HSP90 in cancers was based on the dependence of
certain key client proteins in malignant cells – including a host of well-characterized
oncoproteins – on the activity of HSP90 for their function and stability. An additional concept
153
that has been established is that cancer cells have heightened dependence on the efficient
maintenance of intracellular proteomic homeostasis, the central components of which are
HSP90 and other heat shock proteins (Travers, 2012). In this chapter I investigate the loss of
IRF-1 using the HSP90 inhibitor Ganetespib to explore if the downregulation of IRF-1 with
Ganetespib is via autophagy and/or the proteosomal degradation pathway.
Autophagy is a highly regulated catabolic pathway responsible for the degradation of long-
lived proteins and damaged intracellular organelles, and thereby maintains cellular
homeostatsis. A key biological marker identifying autophagy in mammalian systems is the
microtubule associated protein 1A/1B-light chain 3 (LC3). During autophagy, cytosolic LC3-
1 is conjugated to phosphatidylethanolamine to form LC3-II. This is then recruited and
incorporated into the autophagosomal membrane. Methods that have traditionally been used
to measure LC3 include Western blot analysis and fluorescence microscopy (Pugsley, 2016)
(Qian, 2016) (Schaaf, 2016). The cargo signals that are selectively recognized by autophagy
receptors are diverse but can be broadly grouped into two classes: ubiquitin-dependent cargo
recognition and ubiquitin-independent recognition. (Mancias, 2016).
Here I investigate the role of IRF-1 as a client of HSP90 and ask what is the mechanism
involved in the downregulation of the protein in response to the HSP90 inhibitor Ganetespib.

154
5.2 Results
5.2.1 Inhibition of HSP90 leads of reduction of client protein
levels
It has been demonstrated previously by various groups that HSP90 inhibitors (HSP90i) can
lead to the loss of HSP90 client proteins (Narayan, 2009) (Seo, 2015). In the previous chapter
I established that there is a downregulation of IRF-1 at the protein level with Ganetespib
treatment and therefore I wanted to compare Ganetespib with previously used HSP90
inhibitors belonging to different classes of drug (for example 17AAG and radicicol). The
rationale behind this was to determine whether the loss of IRF-1 I observed was specific to
Ganetespib or if other inhibitors also had the same effect.
I used two well-studied HSP90 inhibitor drugs, 17AAG and radicicol. 17AAG is a derivative
of the antibiotic geldanamycin, while radicicol is a natural product, which binds to HSP90 and
alters its function (national cancer institute, 2016) (Narayan, 2009). These represent different
classes of HSP90 drugs. The A375 cell line was chosen for these assays and a range of doses
for both drugs was tested, with the highest dose being 100 nM. Cells were treated for six hours
and were tested initially for HSP70 induction, as this is a sensitive indicator of HSP90
inhibition. HSP70 protein was detected by immunoblot and showed there was enhanced
induction with increasing dose for both the drugs (Figure 57a). As both drugs led to a similar
induction of the HSP70 protein, only 17AAG was used in subsequent experiments.
I next directly compared Ganetespib with 17AAG to determine if there was a dose dependent
effect on IRF-1 similar to that previously reported by the Ball group for 17AAG (Narayan,
2009). A dose titration of both drugs was performed in A375 cells for 16 hours. The results
were similar for both of the HSP90 inhibitor drugs; Ganetespib appeared to be more potent as
it could downregulateIRF-1 to a greater extent than 17AAG at a given dose (Figure 57b). A
low dose of Ganetespib (100 nM) could almost completely downregulate IRF-1 while 17AAG,
even the highest dose tested (10 uM), couldn’t downregulate IRF-1 to the same extent. HSP90
protein levels showed a decrease with increased drug concentration when cells were treated
with Ganetespib and probed with anti-HSP90 polyclonal antibody (Figure 57b) to detect total
HSP90 protein. Phosphospecific-HSP90 antibody or anti-HSP90 (alpha+beta isoforms)
showed no significant difference across the titration for either drug. By comparison, HSP70
induction was observed for both drugs, but with Ganetespib the induction occurred across all
155
the concentrations whereas for 17AAG it wasn’t observed for higher doses. There was no
significant change in p53 levels with either drug, suggesting that IRF-1 is much more sensitive
to HSP90 inhibition than p53, which has also been described as an HSP90 client protein.
GAPDH was used as an internal control and was consistent throughout all the samples in both
the drug treatments.
I wanted to investigate other client proteins of HSP90, and the effect of Ganetespib on them.
I selected CDK4 and EGFR, and when A375 cells were treated with (100 nM) Ganetespib for
16 hours both proteins where reduced in level (Figure 57c). In comparison, Nutlin increased
EGFR expression and reduced CDK4 expression when compared to DMSO/no treatment
controls. A combination of Nutlin and Ganetespib reduced CDK4 expression further than did
Ganetespib alone; the same combination increased EGFR when compared to DMSO or
Ganetespib treatment. Again, GAPDH was used a control and was consistent in all the
different treatments.
The above experiments show that IRF-1 is very sensitive to HSP90 inhibition and is down
regulated similarly to the well-characterised HSP90 client proteins like CDK4 and EGFR, at
similar doses of Ganetespib, whereas p53 is less sensitive to HSP90 inhibition in the cells
used.
To extend my study I next investigated the effect Ganetespib on HSP90 in terms of its
localisation within the cell. I performed immunofluorescence microscopy and used three
different antibodies that detect different forms of HSP90: a pan-HSP90 polyclonal serum
detecting all isoforms; a HSP90 isoform alpha + beta specific antibody; and an anti-phospho-
HSP90. In the controls, HSP90 localised in the cytoplasm with all three antibodies. However,
when the cells were treated with Ganetespib (100 nM) for six hours I observed HSP90 shift
from the cytoplasm into the nucleus with all three antibodies, although to a lesser extent for
the phospho-HSP90 isoform (Figure 58). When the cells were treated with Nutlin, the
polyclonal and alpha + beta antibodies showed HSP90 in cytoplasm, whereas the phospho-
HSP90 antibody showed a more nuclear localisation. This suggests phosphorylation may
regulate HSP90 localisation.
These results indicated that Ganetespib performed similarly to other class of HSP90 inhibitors
as a modulator of IRF-1 levels. I also showed that Ganetespib is a more potent effector of IRF-
1 than 17AAG at a given dose in the nM concentration range.
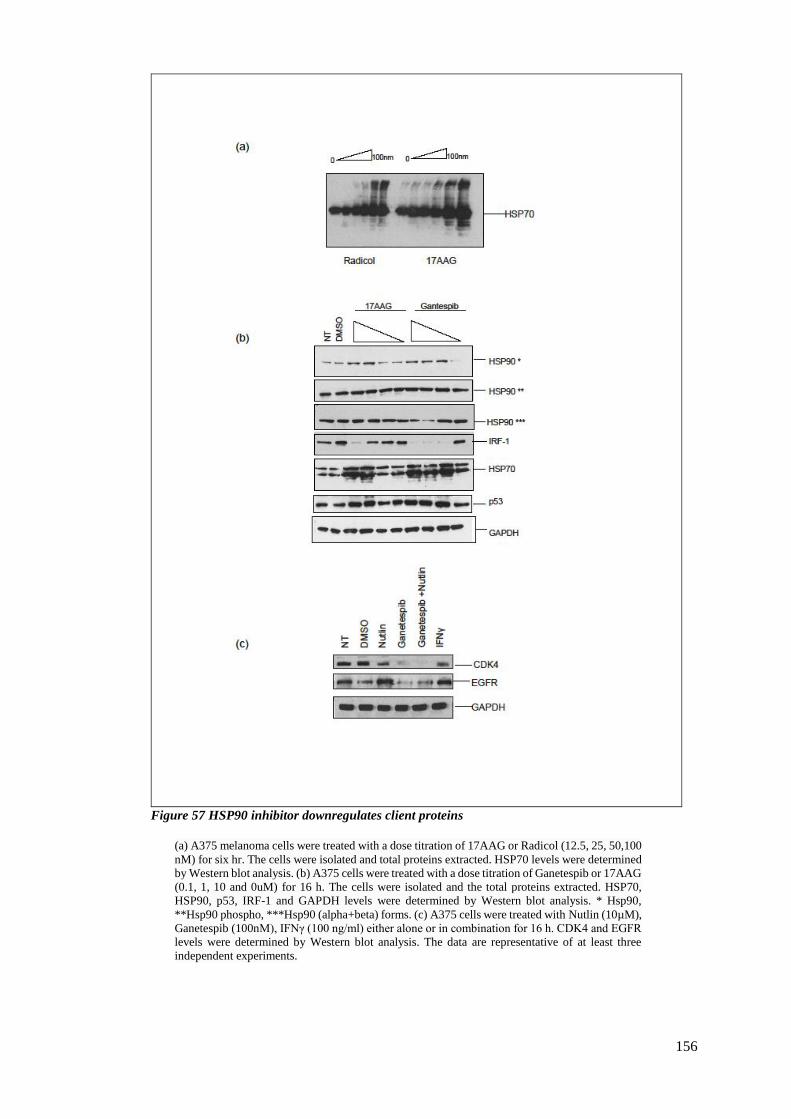
156
Figure 57 HSP90 inhibitor downregulates client proteins
(a) A375 melanoma cells were treated with a dose titration of 17AAG or Radicol (12.5, 25, 50,100
nM) for six hr. The cells were isolated and total proteins extracted. HSP70 levels were determined
by Western blot analysis. (b) A375 cells were treated with a dose titration of Ganetespib or 17AAG
(0.1, 1, 10 and 0uM) for 16 h. The cells were isolated and the total proteins extracted. HSP70,
HSP90, p53, IRF-1 and GAPDH levels were determined by Western blot analysis. * Hsp90,
**Hsp90 phospho, ***Hsp90 (alpha+beta) forms. (c) A375 cells were treated with Nutlin (10µM),
Ganetespib (100nM), IFNγ (100 ng/ml) either alone or in combination for 16 h. CDK4 and EGFR
levels were determined by Western blot analysis. The data are representative of at least three
independent experiments.
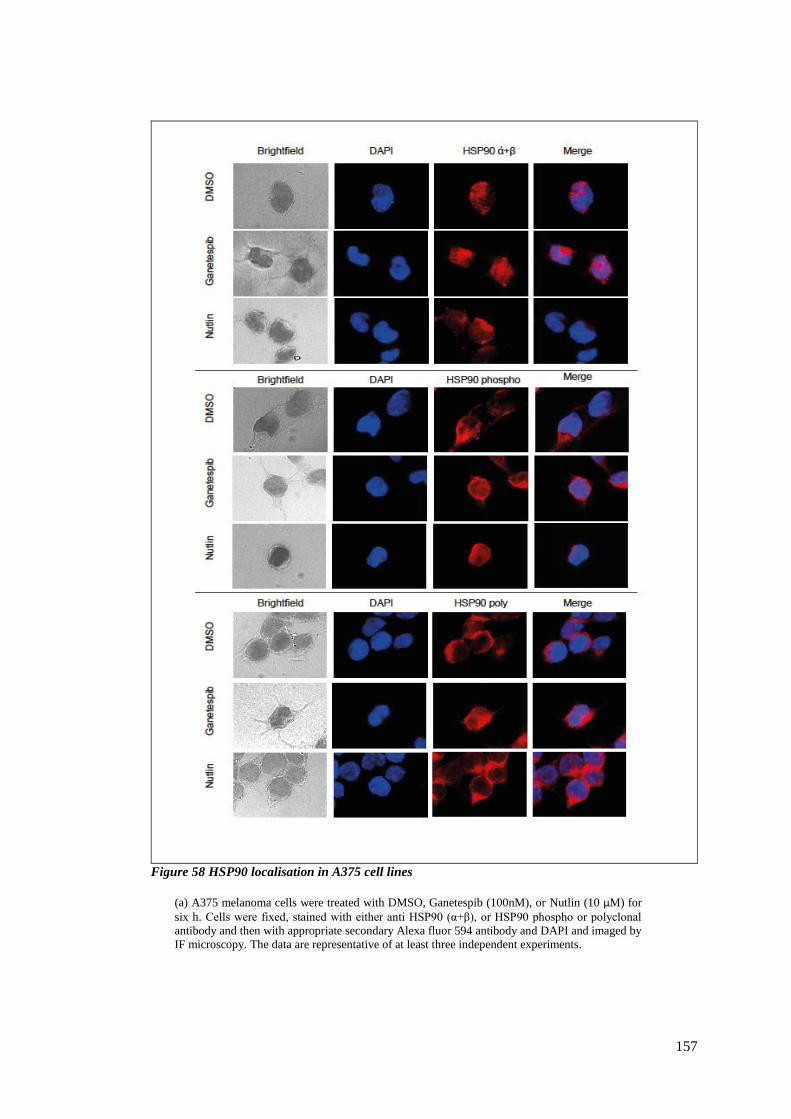
157
Figure 58 HSP90 localisation in A375 cell lines
(a) A375 melanoma cells were treated with DMSO, Ganetespib (100nM), or Nutlin (10 µM) for
six h. Cells were fixed, stained with either anti HSP90 (α+β), or HSP90 phospho or polyclonal
antibody and then with appropriate secondary Alexa fluor 594 antibody and DAPI and imaged by
IF microscopy. The data are representative of at least three independent experiments.
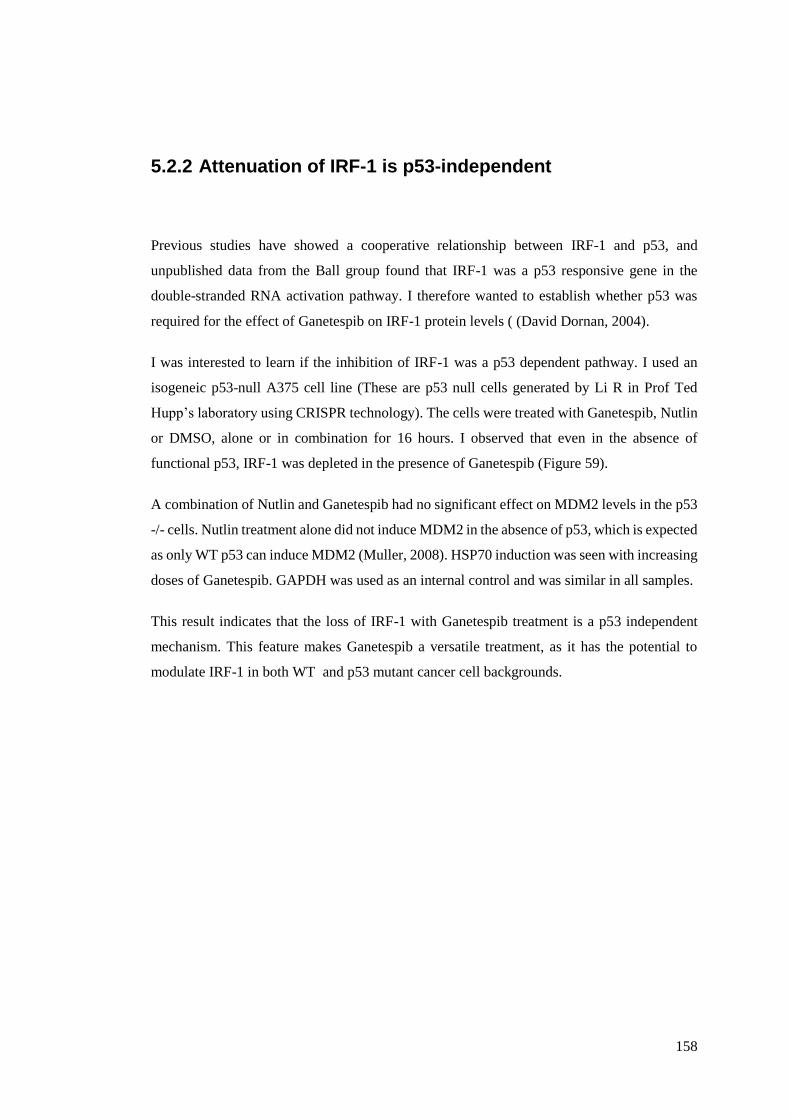
158
5.2.2 Attenuation of IRF-1 is p53-independent
Previous studies have showed a cooperative relationship between IRF-1 and p53, and
unpublished data from the Ball group found that IRF-1 was a p53 responsive gene in the
double-stranded RNA activation pathway. I therefore wanted to establish whether p53 was
required for the effect of Ganetespib on IRF-1 protein levels ( (David Dornan, 2004).
I was interested to learn if the inhibition of IRF-1 was a p53 dependent pathway. I used an
isogeneic p53-null A375 cell line (These are p53 null cells generated by Li R in Prof Ted
Hupp’s laboratory using CRISPR technology). The cells were treated with Ganetespib, Nutlin
or DMSO, alone or in combination for 16 hours. I observed that even in the absence of
functional p53, IRF-1 was depleted in the presence of Ganetespib (Figure 59).
A combination of Nutlin and Ganetespib had no significant effect on MDM2 levels in the p53
-/- cells. Nutlin treatment alone did not induce MDM2 in the absence of p53, which is expected
as only WT p53 can induce MDM2 (Muller, 2008). HSP70 induction was seen with increasing
doses of Ganetespib. GAPDH was used as an internal control and was similar in all samples.
This result indicates that the loss of IRF-1 with Ganetespib treatment is a p53 independent
mechanism. This feature makes Ganetespib a versatile treatment, as it has the potential to
modulate IRF-1 in both WT and p53 mutant cancer cell backgrounds.
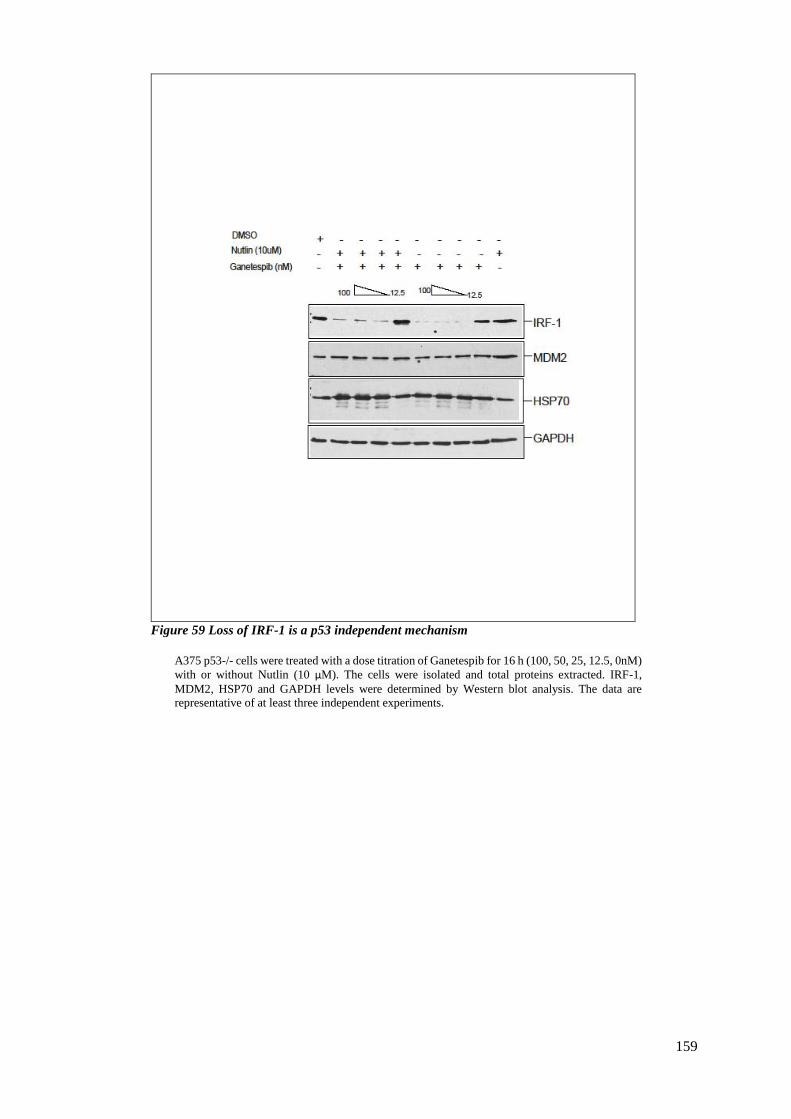
159
Figure 59 Loss of IRF-1 is a p53 independent mechanism
A375 p53-/- cells were treated with a dose titration of Ganetespib for 16 h (100, 50, 25, 12.5, 0nM)
with or without Nutlin (10 µM). The cells were isolated and total proteins extracted. IRF-1,
MDM2, HSP70 and GAPDH levels were determined by Western blot analysis. The data are
representative of at least three independent experiments.
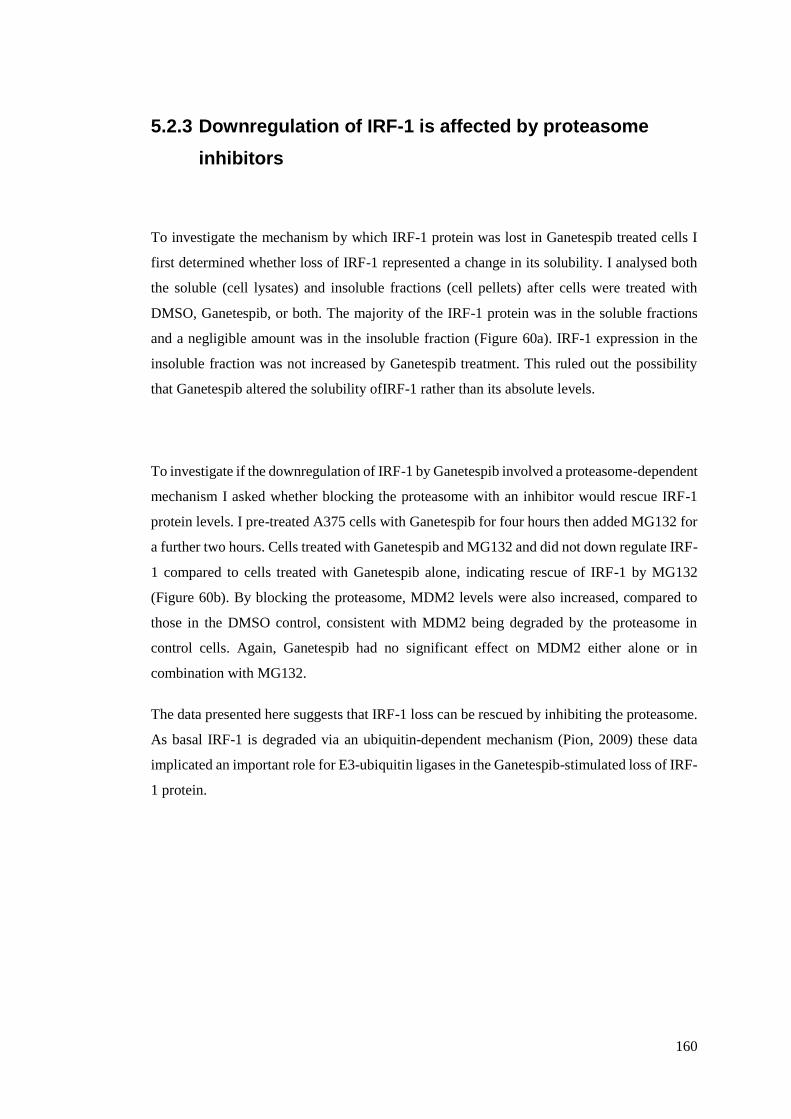
160
5.2.3 Downregulation of IRF-1 is affected by proteasome
inhibitors
To investigate the mechanism by which IRF-1 protein was lost in Ganetespib treated cells I
first determined whether loss of IRF-1 represented a change in its solubility. I analysed both
the soluble (cell lysates) and insoluble fractions (cell pellets) after cells were treated with
DMSO, Ganetespib, or both. The majority of the IRF-1 protein was in the soluble fractions
and a negligible amount was in the insoluble fraction (Figure 60a). IRF-1 expression in the
insoluble fraction was not increased by Ganetespib treatment. This ruled out the possibility
that Ganetespib altered the solubility ofIRF-1 rather than its absolute levels.
To investigate if the downregulation of IRF-1 by Ganetespib involved a proteasome-dependent
mechanism I asked whether blocking the proteasome with an inhibitor would rescue IRF-1
protein levels. I pre-treated A375 cells with Ganetespib for four hours then added MG132 for
a further two hours. Cells treated with Ganetespib and MG132 and did not down regulate IRF-
1 compared to cells treated with Ganetespib alone, indicating rescue of IRF-1 by MG132
(Figure 60b). By blocking the proteasome, MDM2 levels were also increased, compared to
those in the DMSO control, consistent with MDM2 being degraded by the proteasome in
control cells. Again, Ganetespib had no significant effect on MDM2 either alone or in
combination with MG132.
The data presented here suggests that IRF-1 loss can be rescued by inhibiting the proteasome.
As basal IRF-1 is degraded via an ubiquitin-dependent mechanism (Pion, 2009) these data
implicated an important role for E3-ubiquitin ligases in the Ganetespib-stimulated loss of IRF-
1 protein.
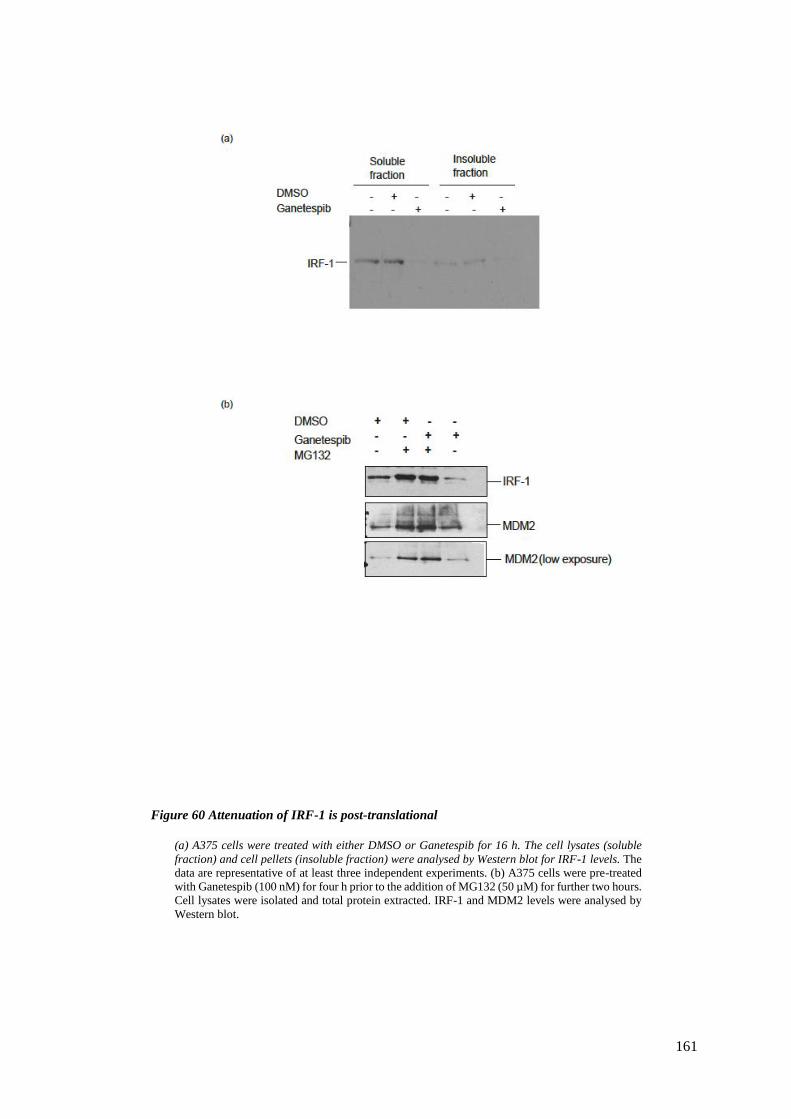
161
Figure 60 Attenuation of IRF-1 is post-translational
(a) A375 cells were treated with either DMSO or Ganetespib for 16 h. The cell lysates (soluble
fraction) and cell pellets (insoluble fraction) were analysed by Western blot for IRF-1 levels. The
data are representative of at least three independent experiments. (b) A375 cells were pre-treated
with Ganetespib (100 nM) for four h prior to the addition of MG132 (50 µM) for further two hours.
Cell lysates were isolated and total protein extracted. IRF-1 and MDM2 levels were analysed by
Western blot.
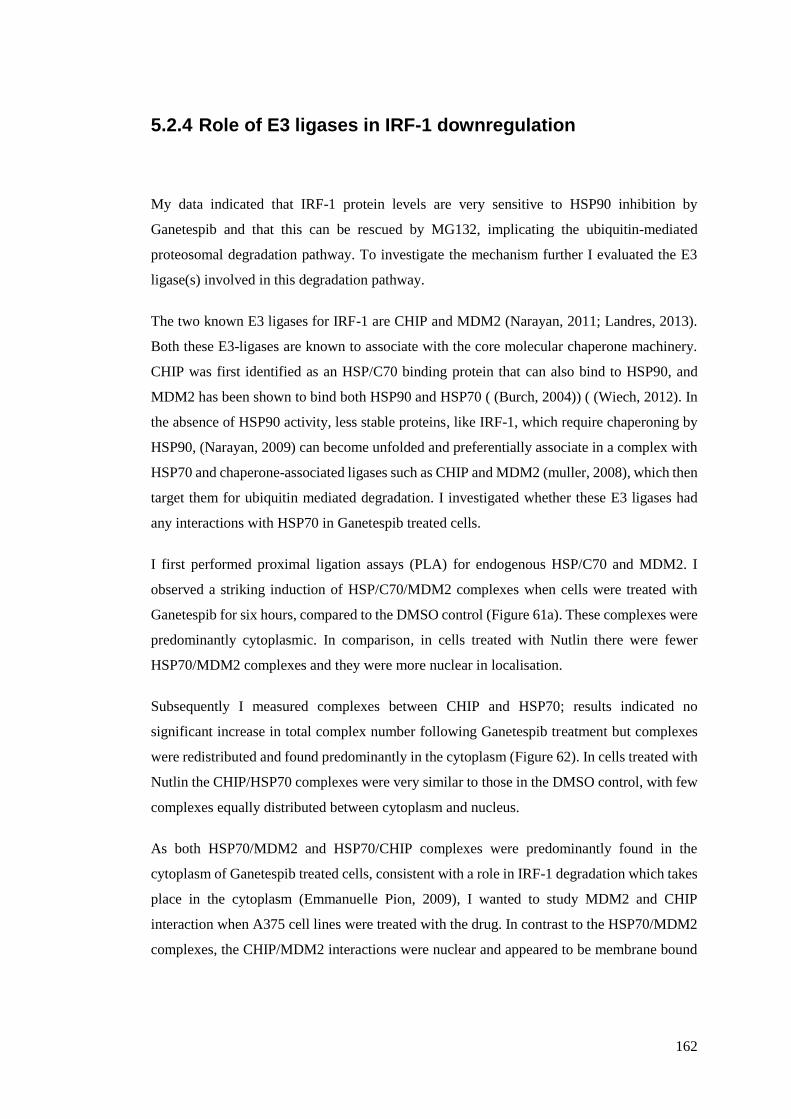
162
5.2.4 Role of E3 ligases in IRF-1 downregulation
My data indicated that IRF-1 protein levels are very sensitive to HSP90 inhibition by
Ganetespib and that this can be rescued by MG132, implicating the ubiquitin-mediated
proteosomal degradation pathway. To investigate the mechanism further I evaluated the E3
ligase(s) involved in this degradation pathway.
The two known E3 ligases for IRF-1 are CHIP and MDM2 (Narayan, 2011; Landres, 2013).
Both these E3-ligases are known to associate with the core molecular chaperone machinery.
CHIP was first identified as an HSP/C70 binding protein that can also bind to HSP90, and
MDM2 has been shown to bind both HSP90 and HSP70 ( (Burch, 2004)) ( (Wiech, 2012). In
the absence of HSP90 activity, less stable proteins, like IRF-1, which require chaperoning by
HSP90, (Narayan, 2009) can become unfolded and preferentially associate in a complex with
HSP70 and chaperone-associated ligases such as CHIP and MDM2 (muller, 2008), which then
target them for ubiquitin mediated degradation. I investigated whether these E3 ligases had
any interactions with HSP70 in Ganetespib treated cells.
I first performed proximal ligation assays (PLA) for endogenous HSP/C70 and MDM2. I
observed a striking induction of HSP/C70/MDM2 complexes when cells were treated with
Ganetespib for six hours, compared to the DMSO control (Figure 61a). These complexes were
predominantly cytoplasmic. In comparison, in cells treated with Nutlin there were fewer
HSP70/MDM2 complexes and they were more nuclear in localisation.
Subsequently I measured complexes between CHIP and HSP70; results indicated no
significant increase in total complex number following Ganetespib treatment but complexes
were redistributed and found predominantly in the cytoplasm (Figure 62). In cells treated with
Nutlin the CHIP/HSP70 complexes were very similar to those in the DMSO control, with few
complexes equally distributed between cytoplasm and nucleus.
As both HSP70/MDM2 and HSP70/CHIP complexes were predominantly found in the
cytoplasm of Ganetespib treated cells, consistent with a role in IRF-1 degradation which takes
place in the cytoplasm (Emmanuelle Pion, 2009), I wanted to study MDM2 and CHIP
interaction when A375 cell lines were treated with the drug. In contrast to the HSP70/MDM2
complexes, the CHIP/MDM2 interactions were nuclear and appeared to be membrane bound
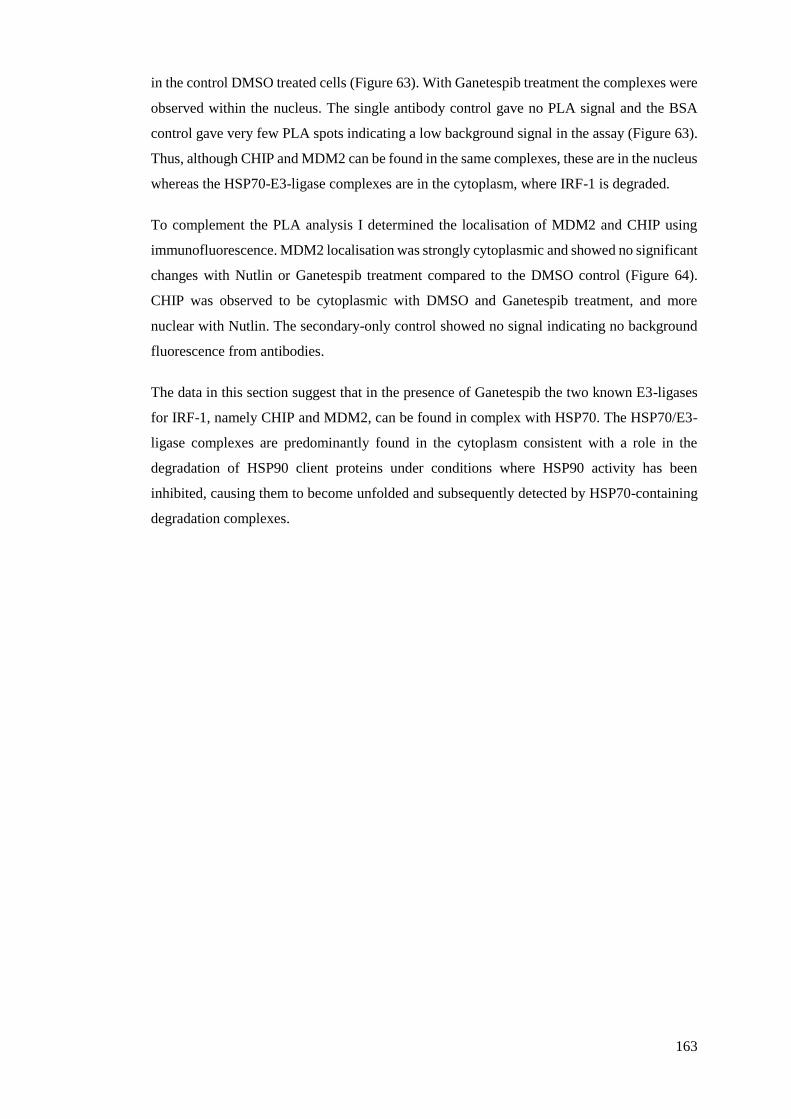
163
in the control DMSO treated cells (Figure 63). With Ganetespib treatment the complexes were
observed within the nucleus. The single antibody control gave no PLA signal and the BSA
control gave very few PLA spots indicating a low background signal in the assay (Figure 63).
Thus, although CHIP and MDM2 can be found in the same complexes, these are in the nucleus
whereas the HSP70-E3-ligase complexes are in the cytoplasm, where IRF-1 is degraded.
To complement the PLA analysis I determined the localisation of MDM2 and CHIP using
immunofluorescence. MDM2 localisation was strongly cytoplasmic and showed no significant
changes with Nutlin or Ganetespib treatment compared to the DMSO control (Figure 64).
CHIP was observed to be cytoplasmic with DMSO and Ganetespib treatment, and more
nuclear with Nutlin. The secondary-only control showed no signal indicating no background
fluorescence from antibodies.
The data in this section suggest that in the presence of Ganetespib the two known E3-ligases
for IRF-1, namely CHIP and MDM2, can be found in complex with HSP70. The HSP70/E3-
ligase complexes are predominantly found in the cytoplasm consistent with a role in the
degradation of HSP90 client proteins under conditions where HSP90 activity has been
inhibited, causing them to become unfolded and subsequently detected by HSP70-containing
degradation complexes.
164
Figure 61Proximity ligation assay system detects induced HSP70 and MDM2 interaction with
Ganetespib
(a) A375 cells were treated with DMSO, Ganetespib (100 nM) or Nutlin (10 µM) for six h, and a
proximity ligation assay (PLA) using only HSP70 or both HSP70 and anti-MDM2 antibodies was
performed. Cells were stained with DAPI (1:5000 in mounting media) and visualised using an
Axioplan2 (Zeiss) fluorescent microscope (100 x magnification). Representative PLA images are
shown. (b) Graphical quantification of the PLA results from (a). The data are representative of at
least three independent experiments and the graphical quantification of PLA results is average of
at least 4 different fields.
165
Figure 62 Proximity ligation assay system detects HSP70 and CHIP interaction with Ganetespib and
Nutlin treatment
(a) A375 cells were treated with DMSO, Ganetespib (100 nM) or Nutlin (10 µM) for six hours,
and a proximity ligation (PLA) assay using either only HSP70 or both HSP70 and anti-CHIP
antibodies were performed. Cells were stained with DAPI (1:5000 in mounting media) and
visualised using an Axioplan2 (Zeiss) fluorescent microscope (100 x magnification).
Representative PLA images are shown. (b) Graphical quantification of the PLA results from (a).
The data are representative of at least three independent experiments and the graphical
quantification of PLA results is average of at least four different fields.
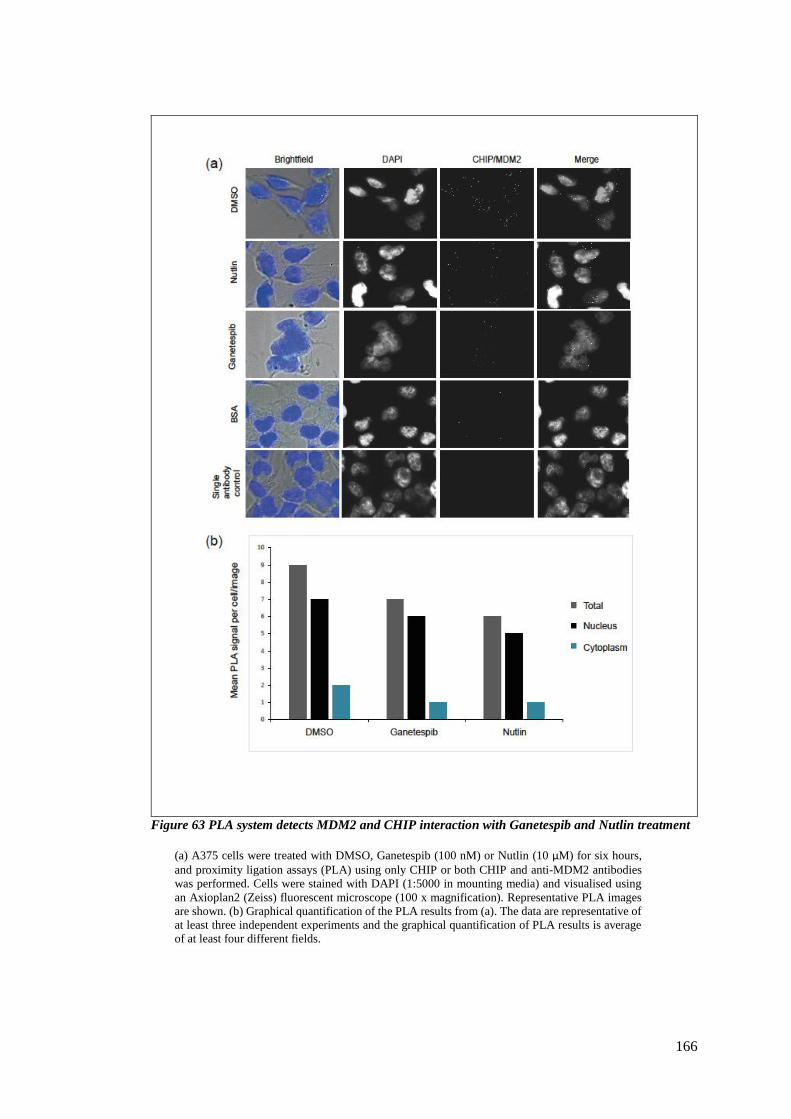
166
Figure 63 PLA system detects MDM2 and CHIP interaction with Ganetespib and Nutlin treatment
(a) A375 cells were treated with DMSO, Ganetespib (100 nM) or Nutlin (10 µM) for six hours,
and proximity ligation assays (PLA) using only CHIP or both CHIP and anti-MDM2 antibodies
was performed. Cells were stained with DAPI (1:5000 in mounting media) and visualised using
an Axioplan2 (Zeiss) fluorescent microscope (100 x magnification). Representative PLA images
are shown. (b) Graphical quantification of the PLA results from (a). The data are representative of
at least three independent experiments and the graphical quantification of PLA results is average
of at least four different fields.
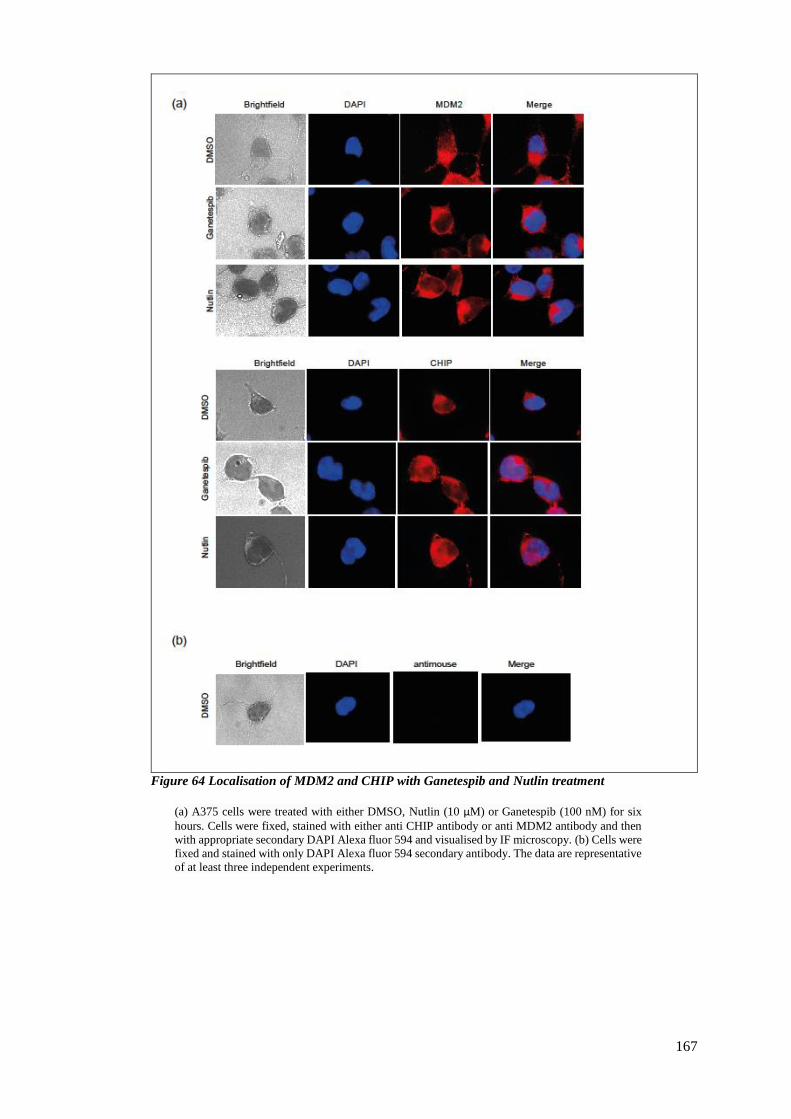
167
Figure 64 Localisation of MDM2 and CHIP with Ganetespib and Nutlin treatment
(a) A375 cells were treated with either DMSO, Nutlin (10 µM) or Ganetespib (100 nM) for six
hours. Cells were fixed, stained with either anti CHIP antibody or anti MDM2 antibody and then
with appropriate secondary DAPI Alexa fluor 594 and visualised by IF microscopy. (b) Cells were
fixed and stained with only DAPI Alexa fluor 594 secondary antibody. The data are representative
of at least three independent experiments.
168
5.2.5 CHIP and MDM2 Knock-down
The data presented above shows that CHIP and MDM2 are found in association with HSP70
in Ganetespib treated cells. To evaluate if these chaperone/E3 ligase complexes where
responsible for the degradation of IRF-1 I wished to knock down these two ligases using
siRNA. First, I treated A375 cells with siRNA targeting MDM2 for 24 hours prior to the
addition of Ganetespib, which was present for a further 24 hours. The siRNA treatment
knocked down MDM2 by at least 50% when compared to the untreated control or the siRNA
negative control. The results indicated that down regulation of MDM2 failed to stimulate
recovery of IRF-1 protein levels after Ganetespib treatment (Figure 65 a), under conditions
where p53 levels where elevated by the down regulation of MDM2. The increase in p53
showed that the 50% decrease in MDM2 was sufficient to affect the levels of its major E3-
ligase activity target. This suggests that MDM2 probably is not the E3-ligase involved in IRF-
1 loss. Rather, loss of MDM2 cooperated with Ganetespib, and IRF-1 protein levels decreased
even further with the combined treatment. This result was consistently reproducible.
The next E3 ligase to study was CHIP; I knocked down CHIP in A375 cells using siRNA. The
cells were treated with siRNA for 24 hours prior to the addition of Ganetespib for a further 24
hours. There was more than a 90% reduction in the expression of CHIP when the cells were
treated with siRNA (Figure 65 b). A negative siRNA control gave the same CHIP expression
of as the DMSO control. Again IRF-1 expression could not be recovered by the down
regulation of CHIP. This indicated that the downregulation of IRF-1 was not under the control
of the CHIP ligase. However, I did observe a small but reproducible effect of combined
Ganetespib and CHIP siRNA treatment, compared with Ganetespib alone, where IRF-1 was
further reduced consistent with CHIP having a positive regulatory role in IRF-1 steady state
levels under some cellular conditions (Narayan, 2011).
Finally, as chaperone associated E3-ligases are thought to be redundant checked if a double
knock-down of MDM2 and CHIP could make any difference to the levels of IRF-1 after
Ganetespib treatment. The cells were treated with both the siRNA to MDM2 and CHIP for 24
hours prior to the addition of Ganetespib for a further 24 hours. The results indicated that
neither the single knock down nor the double knock down of MDM2 and CHIP recovered the
downregulated IRF-1 after Ganetespib treatment (Figure 65 C). There was significant knock
down of CHIP and MDM2 with the respective siRNAs. Downregulation of IRF-1 was
observed with Ganetespib and, as shown above, treatment with both Ganetespib and siRNA
to MDM2 had the greatest effect on IRF-1 levels.
169
The data provide evidence that IRF-1 downregulation was not mediated via CHIP/MDM2 as
E3 ligases. However, the data lent support to the theory that MDM2 can support IRF-1 function
(Landres, 2013) and that this could be through its chaperone activity when working with
HSP90 (Narayan, 2009)( (Burch, 2004)( (Wawrzynow, 2007) In this case the data suggest that
HSP70/MDM2 complexes formed in the cytoplasm are not involved the degradation of IRF-
1 but that, in fact, the complex could be inhibitory for the IRF-1 chaperoning function of
MDM2, and that this in exaggerated when MDM2 activity is further reduced, for example by
using MDM2 targeted siRNA.
To investigate this further I tested whether the HSP70/MDM2 complexes where made up of
classic stress-inducible HSP70 isoforms or the constitutive HSP70 isoform, HSC70. The
HSP70 antibody detects different forms of HSP70 including HSC70. Since I observed a strong
interaction between HSP/C70 and MDM2 with Ganetespib treatment of I wanted to confirm
if this was due to HSC70 or HSP70. I used HSC70 and HSP70 specific antibodies for a PLA.
The results indicated that there was a robust induction of complexes between MDM2 and
HSC70, but not HSP70, when the cells were treated with Ganetespib (Figure 66). Both HSC70
and HSP70 complexes were cytoplasmic with Ganetespib treatment. When cells were treated
with DMSO, HSC70/MDM2 complexes were predominantly nuclear and there were no
detectable complexes for HSP70/MDM2. BSA controls showed no PLA spots, and the single
antibody control gave very few PLA spots.
The above result suggests that MDM2 is specifically associated with HSC70, rather than
HSP70, as expected, in cells where HSP90 has been inhibited. These data may therefore
explain why MDM2 is not involved in IRF-1 degradation despite being found in HSP70
chaperoning complexes after HSP90 inhibition, as it is HSP70 isoforms rather than HSC70
that are usually associated with detecting and mediating the degradation of unfolded proteins
via the proteasome. HSC70, on the other hand, is involved in chaperone-mediated autophagy
( (Chiang HL, 1989).

170
Figure 65 Role of CHIP and MDM2 in downregulation of IRF-1 with Ganetespib treatment
A375 cells were treated with either control siRNA, siRNA to (a) MDM2 (60nM) or (b) CHIP (60
nM) for 24 h and then treated with Ganetespib (100 nM) or DMSO for further 24 h. Total cell
lysates analysed for MDM2, CHIP, HSP70, p53, IRF-1 and GAPDH via Western blotting. (c)
A375 cells were treated with either control siRNA or siRNA to MDM2 (60nM) and CHIP (60 nM)
for 24 h and then treated with Ganetespib (100 nM) or DMSO for further 24 h. Total cell lysates
analysed via Western blot as above. The data are representative of at least three independent
experiments.
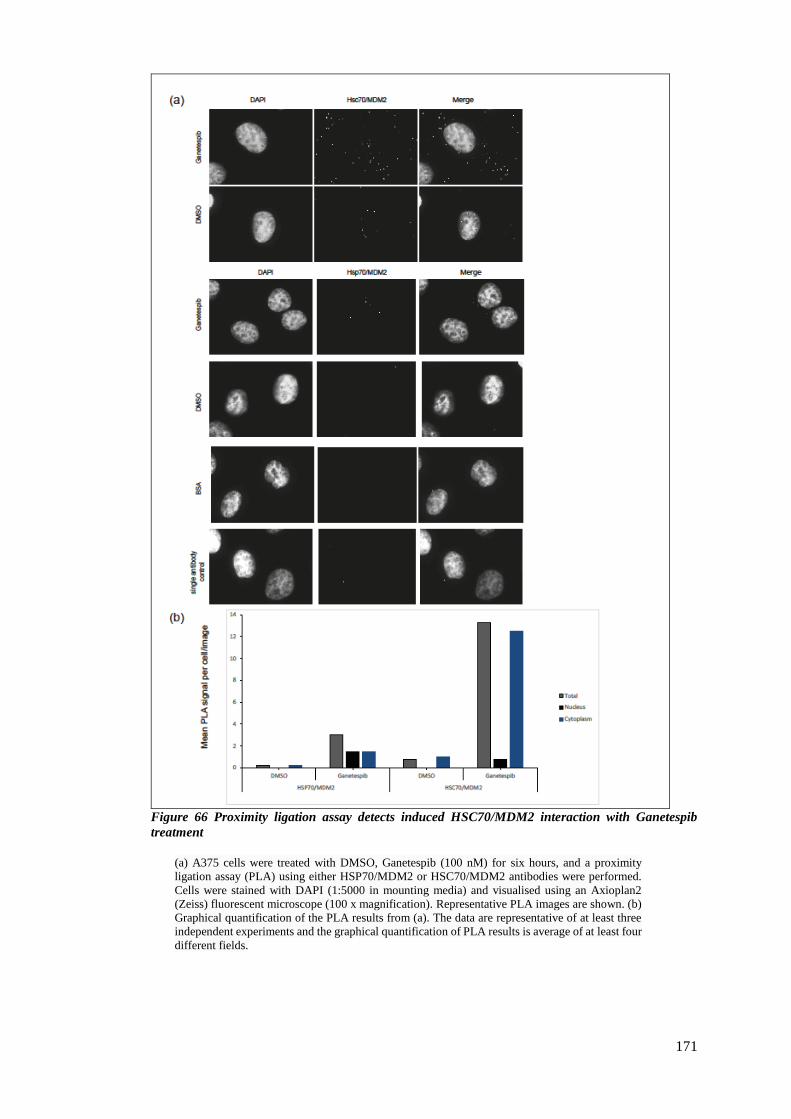
171
Figure 66 Proximity ligation assay detects induced HSC70/MDM2 interaction with Ganetespib
treatment
(a) A375 cells were treated with DMSO, Ganetespib (100 nM) for six hours, and a proximity
ligation assay (PLA) using either HSP70/MDM2 or HSC70/MDM2 antibodies were performed.
Cells were stained with DAPI (1:5000 in mounting media) and visualised using an Axioplan2
(Zeiss) fluorescent microscope (100 x magnification). Representative PLA images are shown. (b)
Graphical quantification of the PLA results from (a). The data are representative of at least three
independent experiments and the graphical quantification of PLA results is average of at least four
different fields.
172
5.2.6 Chaperone mediated autophagy
Data in the previous section suggests that IRF-1 degradation is not mediated by the known
IRF-1 E3-ligases CHIP and MDM2. This was surprising as both of these ligases are known to
mediate the degradation of HSP90 client proteins. This suggests that either a new chaperone
associated IRF-1 E3-ligase is involved, or that a novel degradation pathway for IRF-1 has been
uncovered. Recent studies suggest that proteasome and autophagy pathways for degradation
are highly integrated and interdependent and that inhibition of one pathway can feedback to
the other ( (Lilienbaum, 2013)). In addition, although I observed that MG132 could rescue
IRF-1 loss in some experiments this was not always consistent, and sometimes there was only
a partial rescue, suggesting that additional IRF-1 degradation pathways exist.
Melanomas have high levels of basal autophagosomes suggestive of increased autophagy.
Patients with melanomas with higher levels of autophagosomes have decreased survival
(Amaravadi, 2016). I showed in CHAPTER 6 that PD-L1 was sensitive to autophagy pathway
modulation and above I found that HSC70, the major mediator of chaperone mediated
autophagy (CMA), formed protein complexes (with MDM2) in response to Ganetespib. I
therefore decided to determine if autophagy played a role in the down regulation of IRF-1 as
the Ball group have previously shown that IRF-1 contains an HSC70 specific binding sequence
(Narayan, 2009) and unpublished data)
I investigated if there was any interaction between IRF-1 and HSP70 using PLA to analysis
this. Results indicated induction of IRF-1/HSP70 complexes in Ganetespib treated cells
compared to the DMSO control (Figure 67 a). These complexes were cytoplasmic, consistent
with a role in IRF-1 degradation. As total IRF-1 protein levels are already decreasing at the
time point tested, I wanted to combine Ganetespib with MG132 (to block IRF-1 loss) to get
the real picture for HSP70/IRF-1 complex number under conditions where IRF-1 was not
being degraded. When the cells were treated with MG132 alone to inhibit basal IRF-1
degradation, which is known to occur through the ubiquitin-proteasome pathway (Pion, 2009),
I observed increased number of IRF-1/HSP/C70 complexes but these were more nuclear in
173
localisation. Addition of MG132 to Ganetespib treated cells showed that Ganetespib could
drive IRF-1 into HSP/C70-containing complexes and they were located in the cytoplasm.
DMSO treated cells showed no significant interaction between IRF-1 and HSP70.
The data suggest that IRF-1 is specifically found in complex with HSP/C70 in Ganetespib
treated cells, and these complexes are in the cytoplasm suggesting they could be involved in
IRF-1 degradation. Interestingly, location of HSP/C70/IRF-1 complexes in the cytoplasm in
response to Ganetespib takes precedence over MG132, as complexes formed in response to
proteasome inhibition are mainly found in the nucleus.
I also wanted to investigate if the localisation of the total proteins changed with drug treatment.
For this I performed an immunofluorescence assay. In the DMSO control I observed strong
IRF-1 expression in the cytoplasm towards the cell membrane, whereas with Ganetespib
treatment there was a loss of IRF-1 staining, consistent with the immunoblot results (Figure
67 b). Treatment with Nutlin also reduced IRF-1 expression compared to the DMSO control,
but did not change the localisation. When the cells were treated with Ganetespib along with
Nutlin there was no significant change in IRF-1 expression compared to Ganetespib treated
cells.
HSP/C70 was observed to be cytoplasmic in DMSO treated cells and with Ganetespib
treatment there was induction of HSP/C70 and it was more localised in the nucleus (Figure 67
c). The levels of HSP/C70 with Nutlin treatment were comparable that to DMSO controls. The
BSA control showed no background signal from the secondary antibody.
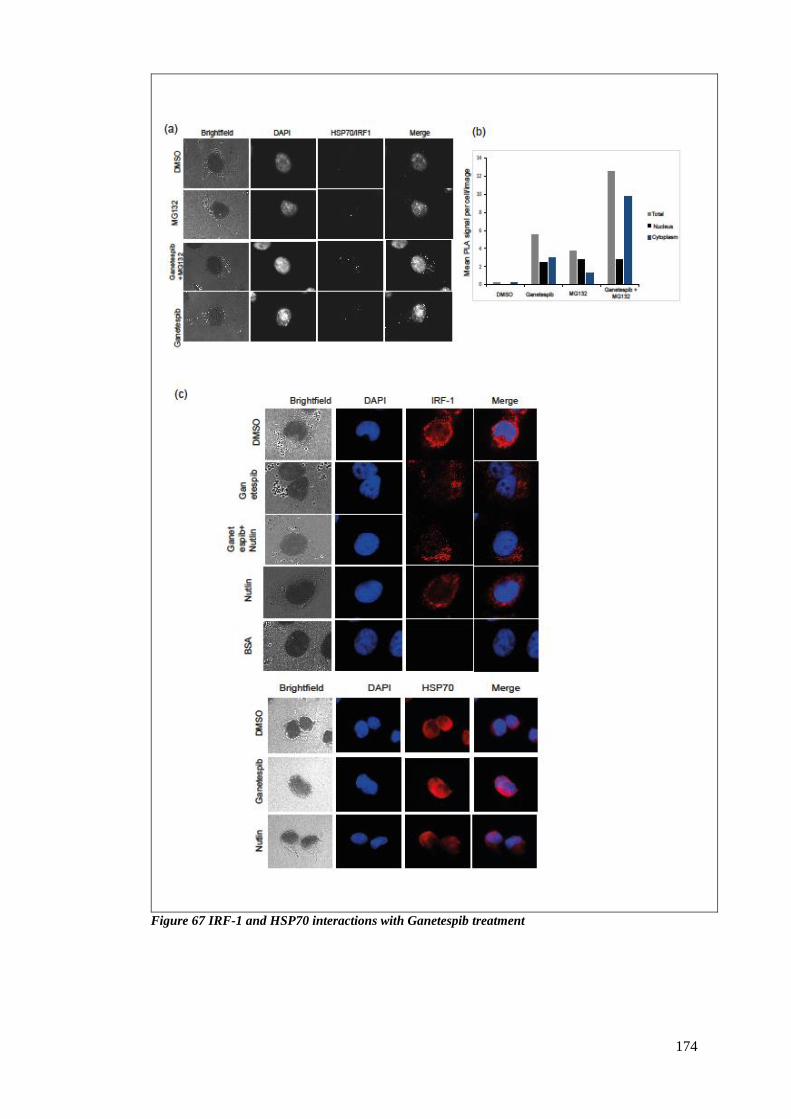
174
Figure 67 IRF-1 and HSP70 interactions with Ganetespib treatment

175
(a) A375 cells were treated with DMSO, Ganetespib (100 nM) for four h and then with MG132
(50 uM) for further two h, and a proximity ligation assay (PLA) using only HSP70 or both HSP70
and anti-IRF-1 antibodies was performed. Cells were stained with DAPI (1:5000 in mounting
media) and examined using an Axioplan2 (Zeiss) fluorescent microscope (100 x magnification).
Representative PLA images are shown. (b) Graphical quantification of results from (a). (c) A375
cells were treated with Ganetespib (100 nM), Nutlin (10µM) or DMSO for six h. Cells were fixed,
stained with either anti IRF-1 or HSP70 antibody and then with appropriate secondary DAPI Alexa
fluor 594 and visualised by IF microscopy. The data are representative of at least three independent
experiments.
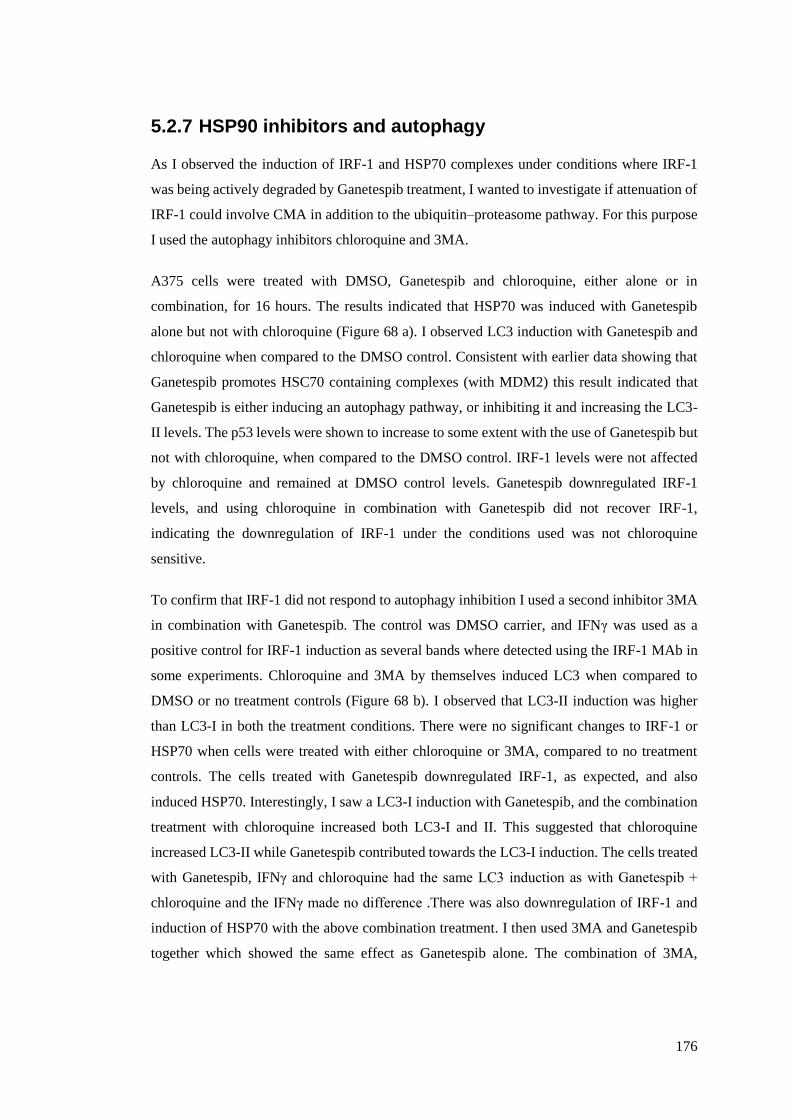
176
5.2.7 HSP90 inhibitors and autophagy
As I observed the induction of IRF-1 and HSP70 complexes under conditions where IRF-1
was being actively degraded by Ganetespib treatment, I wanted to investigate if attenuation of
IRF-1 could involve CMA in addition to the ubiquitin–proteasome pathway. For this purpose
I used the autophagy inhibitors chloroquine and 3MA.
A375 cells were treated with DMSO, Ganetespib and chloroquine, either alone or in
combination, for 16 hours. The results indicated that HSP70 was induced with Ganetespib
alone but not with chloroquine (Figure 68 a). I observed LC3 induction with Ganetespib and
chloroquine when compared to the DMSO control. Consistent with earlier data showing that
Ganetespib promotes HSC70 containing complexes (with MDM2) this result indicated that
Ganetespib is either inducing an autophagy pathway, or inhibiting it and increasing the LC3-
II levels. The p53 levels were shown to increase to some extent with the use of Ganetespib but
not with chloroquine, when compared to the DMSO control. IRF-1 levels were not affected
by chloroquine and remained at DMSO control levels. Ganetespib downregulated IRF-1
levels, and using chloroquine in combination with Ganetespib did not recover IRF-1,
indicating the downregulation of IRF-1 under the conditions used was not chloroquine
sensitive.
To confirm that IRF-1 did not respond to autophagy inhibition I used a second inhibitor 3MA
in combination with Ganetespib. The control was DMSO carrier, and IFNγ was used as a
positive control for IRF-1 induction as several bands where detected using the IRF-1 MAb in
some experiments. Chloroquine and 3MA by themselves induced LC3 when compared to
DMSO or no treatment controls (Figure 68 b). I observed that LC3-II induction was higher
than LC3-I in both the treatment conditions. There were no significant changes to IRF-1 or
HSP70 when cells were treated with either chloroquine or 3MA, compared to no treatment
controls. The cells treated with Ganetespib downregulated IRF-1, as expected, and also
induced HSP70. Interestingly, I saw a LC3-I induction with Ganetespib, and the combination
treatment with chloroquine increased both LC3-I and II. This suggested that chloroquine
increased LC3-II while Ganetespib contributed towards the LC3-I induction. The cells treated
with Ganetespib, IFNγ and chloroquine had the same LC3 induction as with Ganetespib +
chloroquine and the IFNγ made no difference .There was also downregulation of IRF-1 and
induction of HSP70 with the above combination treatment. I then used 3MA and Ganetespib
together which showed the same effect as Ganetespib alone. The combination of 3MA,
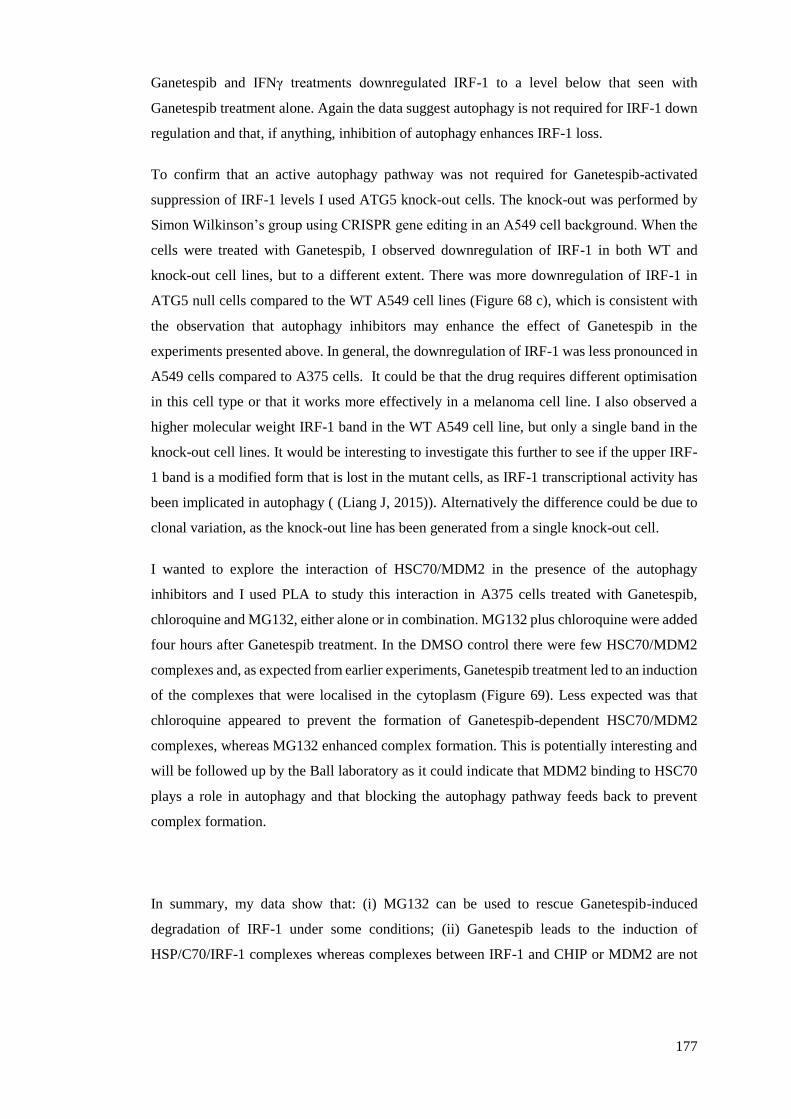
177
Ganetespib and IFNγ treatments downregulated IRF-1 to a level below that seen with
Ganetespib treatment alone. Again the data suggest autophagy is not required for IRF-1 down
regulation and that, if anything, inhibition of autophagy enhances IRF-1 loss.
To confirm that an active autophagy pathway was not required for Ganetespib-activated
suppression of IRF-1 levels I used ATG5 knock-out cells. The knock-out was performed by
Simon Wilkinson’s group using CRISPR gene editing in an A549 cell background. When the
cells were treated with Ganetespib, I observed downregulation of IRF-1 in both WT and
knock-out cell lines, but to a different extent. There was more downregulation of IRF-1 in
ATG5 null cells compared to the WT A549 cell lines (Figure 68 c), which is consistent with
the observation that autophagy inhibitors may enhance the effect of Ganetespib in the
experiments presented above. In general, the downregulation of IRF-1 was less pronounced in
A549 cells compared to A375 cells. It could be that the drug requires different optimisation
in this cell type or that it works more effectively in a melanoma cell line. I also observed a
higher molecular weight IRF-1 band in the WT A549 cell line, but only a single band in the
knock-out cell lines. It would be interesting to investigate this further to see if the upper IRF-
1 band is a modified form that is lost in the mutant cells, as IRF-1 transcriptional activity has
been implicated in autophagy ( (Liang J, 2015)). Alternatively the difference could be due to
clonal variation, as the knock-out line has been generated from a single knock-out cell.
I wanted to explore the interaction of HSC70/MDM2 in the presence of the autophagy
inhibitors and I used PLA to study this interaction in A375 cells treated with Ganetespib,
chloroquine and MG132, either alone or in combination. MG132 plus chloroquine were added
four hours after Ganetespib treatment. In the DMSO control there were few HSC70/MDM2
complexes and, as expected from earlier experiments, Ganetespib treatment led to an induction
of the complexes that were localised in the cytoplasm (Figure 69). Less expected was that
chloroquine appeared to prevent the formation of Ganetespib-dependent HSC70/MDM2
complexes, whereas MG132 enhanced complex formation. This is potentially interesting and
will be followed up by the Ball laboratory as it could indicate that MDM2 binding to HSC70
plays a role in autophagy and that blocking the autophagy pathway feeds back to prevent
complex formation.
In summary, my data show that: (i) MG132 can be used to rescue Ganetespib-induced
degradation of IRF-1 under some conditions; (ii) Ganetespib leads to the induction of
HSP/C70/IRF-1 complexes whereas complexes between IRF-1 and CHIP or MDM2 are not

178
induced under these conditions (not shown) and the HSP/C70/IRF-1 complexes can be
stabilised by the addition of MG132, suggesting they may be involved in targeting IRF-1 for
degradation. However, neither of the known IRF-1 E3-ligases are responsible for IRF-1
degradation and inhibition of the autophagy pathway, if anything, enhances rather than
attenuates the effect of Ganetespib on IRF-1 protein levels. Together the data therefore suggest
that IRF-1 is degraded by a novel Ganetespib-sensitive pathway. As there are approximityly
500 E3-ubiquitin ligases, it is not feasible to take a systematic approach to identify components
of a novel IRF-1 degradation pathway. With only limited time remaining in my PhD I therefore
decided to see if I could narrow down potential regulators of IRF-1 by determining the effect
of Ganetespib on the whole cell proteome by mass spectrometry.
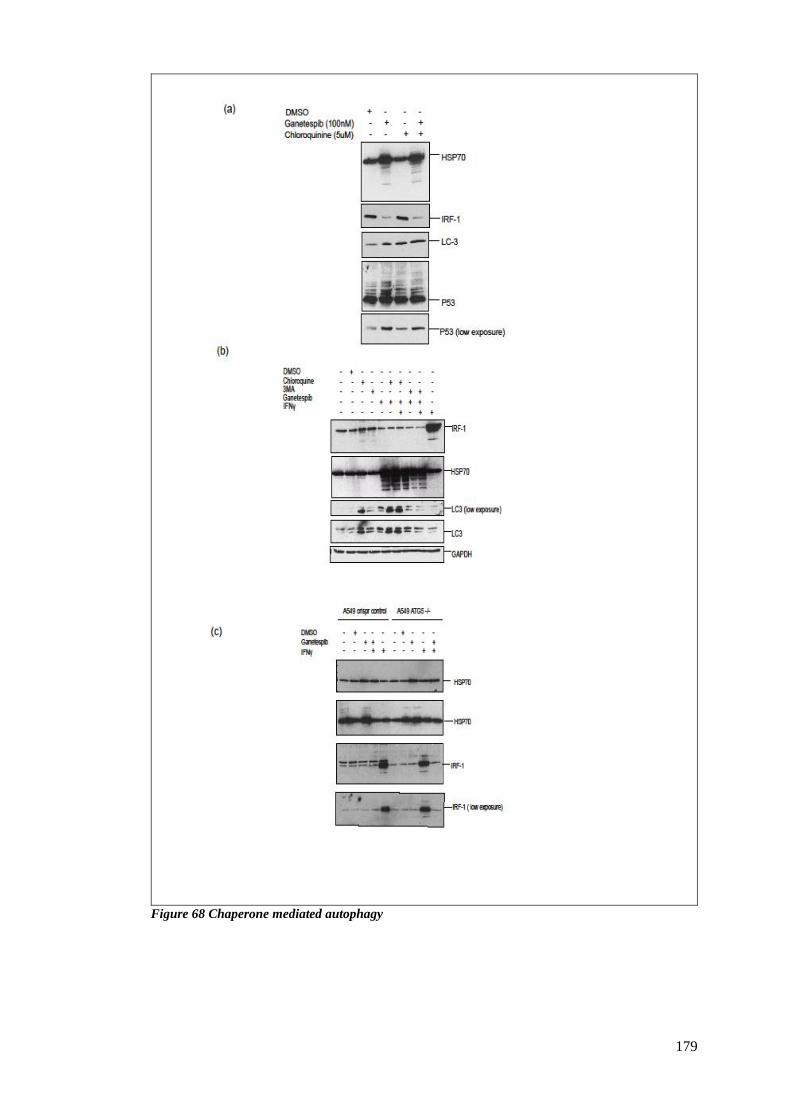
179
Figure 68 Chaperone mediated autophagy

180
(a) A375 cells were treated with DMSO, Ganetespib (100 nM) for six h and then treated with
chloroquine (5µM) alone or in combination for further 16 h. Total cell lysates analysed for HSP70,
p53, IRF-1 and LC-3 via Western blotting. (b) A375 cells were treated with DMSO, Ganetespib
(100 nM) for six h and then treated with chloroquine (5µM) or 3MA (5 mM) alone or in
combination for further 16 h. IFNγ was used as a control for the assay. Total cell lysates analysed
for HSP70, IRF-1, GAPDH and LC-3 via Western blotting. (c) A549 ATG-/- and +/+ cells were
treated with DMSO or Ganetespib (100 nM) for 16 h. Total cell lysates analysed for HSP70 and,
IRF-1 via Western blotting. The data are representative of at least three independent experiments.
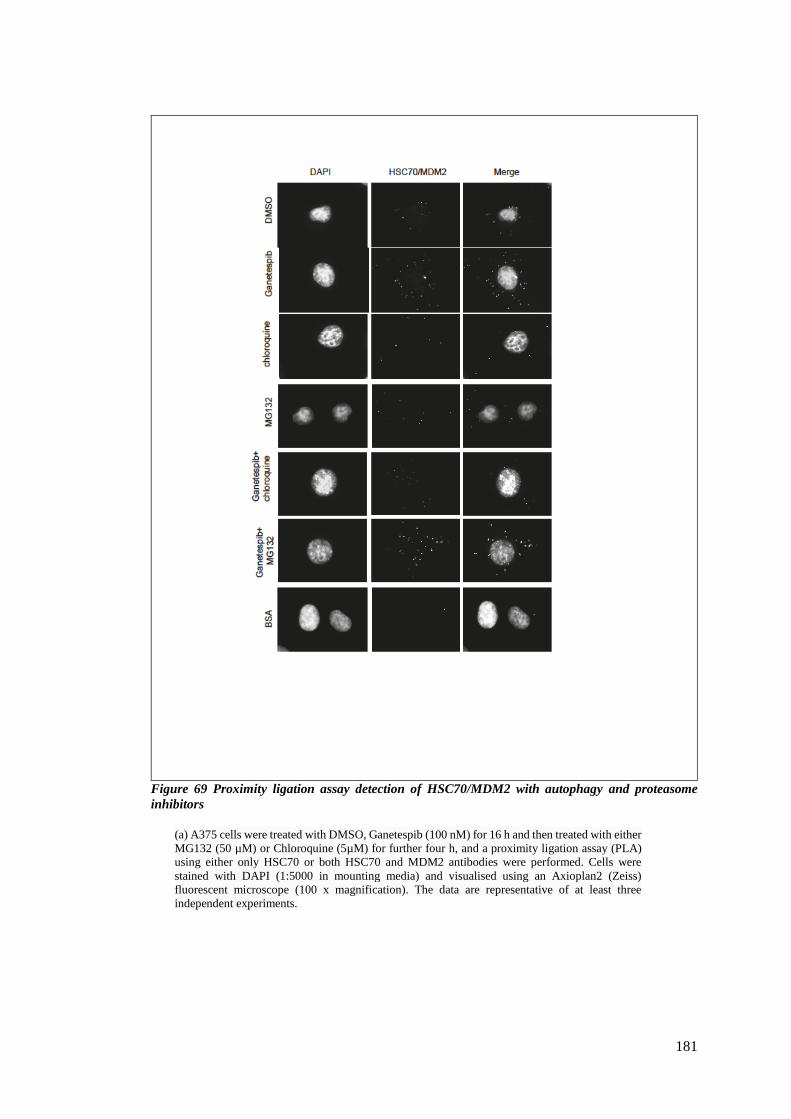
181
Figure 69 Proximity ligation assay detection of HSC70/MDM2 with autophagy and proteasome
inhibitors
(a) A375 cells were treated with DMSO, Ganetespib (100 nM) for 16 h and then treated with either
MG132 (50 µM) or Chloroquine (5µM) for further four h, and a proximity ligation assay (PLA)
using either only HSC70 or both HSC70 and MDM2 antibodies were performed. Cells were
stained with DAPI (1:5000 in mounting media) and visualised using an Axioplan2 (Zeiss)
fluorescent microscope (100 x magnification). The data are representative of at least three
independent experiments.
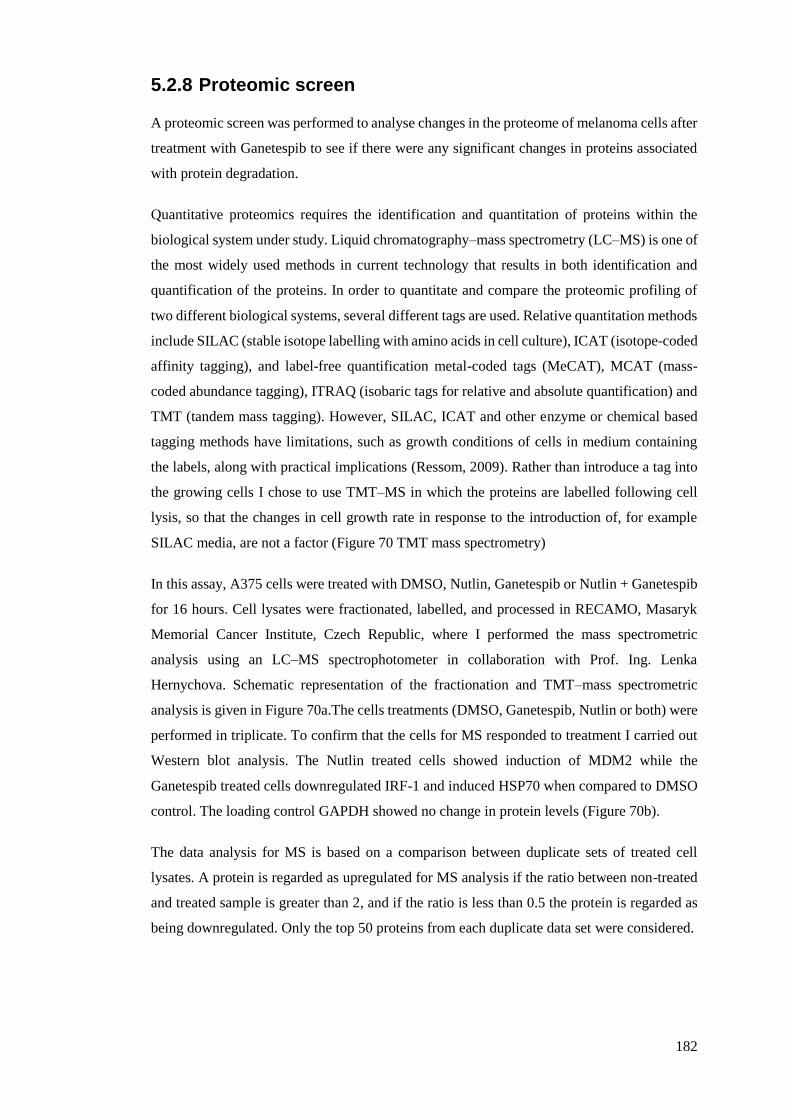
182
5.2.8 Proteomic screen
A proteomic screen was performed to analyse changes in the proteome of melanoma cells after
treatment with Ganetespib to see if there were any significant changes in proteins associated
with protein degradation.
Quantitative proteomics requires the identification and quantitation of proteins within the
biological system under study. Liquid chromatography–mass spectrometry (LC–MS) is one of
the most widely used methods in current technology that results in both identification and
quantification of the proteins. In order to quantitate and compare the proteomic profiling of
two different biological systems, several different tags are used. Relative quantitation methods
include SILAC (stable isotope labelling with amino acids in cell culture), ICAT (isotope-coded
affinity tagging), and label-free quantification metal-coded tags (MeCAT), MCAT (mass-
coded abundance tagging), ITRAQ (isobaric tags for relative and absolute quantification) and
TMT (tandem mass tagging). However, SILAC, ICAT and other enzyme or chemical based
tagging methods have limitations, such as growth conditions of cells in medium containing
the labels, along with practical implications (Ressom, 2009). Rather than introduce a tag into
the growing cells I chose to use TMT–MS in which the proteins are labelled following cell
lysis, so that the changes in cell growth rate in response to the introduction of, for example
SILAC media, are not a factor (Figure 70 TMT mass spectrometry)
In this assay, A375 cells were treated with DMSO, Nutlin, Ganetespib or Nutlin + Ganetespib
for 16 hours. Cell lysates were fractionated, labelled, and processed in RECAMO, Masaryk
Memorial Cancer Institute, Czech Republic, where I performed the mass spectrometric
analysis using an LC–MS spectrophotometer in collaboration with Prof. Ing. Lenka
Hernychova. Schematic representation of the fractionation and TMT–mass spectrometric
analysis is given in Figure 70a.The cells treatments (DMSO, Ganetespib, Nutlin or both) were
performed in triplicate. To confirm that the cells for MS responded to treatment I carried out
Western blot analysis. The Nutlin treated cells showed induction of MDM2 while the
Ganetespib treated cells downregulated IRF-1 and induced HSP70 when compared to DMSO
control. The loading control GAPDH showed no change in protein levels (Figure 70b).
The data analysis for MS is based on a comparison between duplicate sets of treated cell
lysates. A protein is regarded as upregulated for MS analysis if the ratio between non-treated
and treated sample is greater than 2, and if the ratio is less than 0.5 the protein is regarded as
being downregulated. Only the top 50 proteins from each duplicate data set were considered.
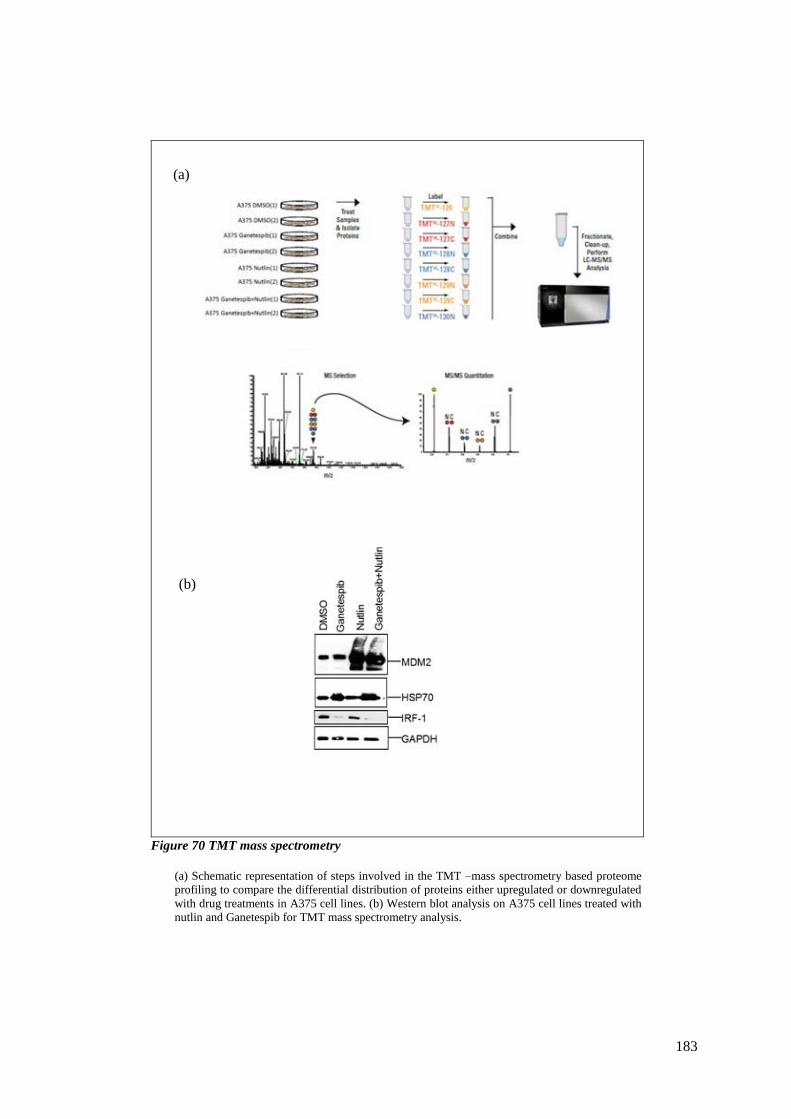
183
Figure 70 TMT mass spectrometry
(a) Schematic representation of steps involved in the TMT –mass spectrometry based proteome
profiling to compare the differential distribution of proteins either upregulated or downregulated
with drug treatments in A375 cell lines. (b) Western blot analysis on A375 cell lines treated with
nutlin and Ganetespib for TMT mass spectrometry analysis.
(a)
(b)
184
5.2.8.1 Effects of Ganetespib treatment on A375 proteome
I wanted to analyse the proteins that were upregulated with the treatment of Ganetespib. From
the proteins common between the duplicate sets I found five proteins that were upregulated
with Ganetespib treatment (Figure 72 a - b). Among these proteins was HSP70, which acted
as an internal control as this was seen to be upregulated in cell assays. Another protein of
interest was UBA3. This is an E1 ubiquitin activating enzyme and is upregulated in the mass
spec. analysis data. The data were also analysed based on molecular function of the proteins
identified, and were mainly enriched in chaperone activity and heat shock proteins (Figure 72
-c). The major transcription factors involved where SP1, HSF1etc (supplement data Figure
96). The cellular components that responded to HSP90 inhibition were mainly cytoplasmic
proteins, whereas the majority of the proteins were involved in protein metabolism
(supplement data Figure 96 b and c).
I studied the proteins that were downregulated in cells treated with Ganetespib. I analysed 50
proteins from each data set and found only one common protein between the duplicate data
sets (Figure 73-b). EPHA2 was the protein downregulated with Ganetespib in both the sets.
This protein has clinical significance in several cancer types. The gene is shown to be
upregulated in various cancers and often leads to poor prognosis (hasegawa, 2016). This could
be of clinical importance especially in combinatorial therapy, as lowering EPHA2 could
provide a treatment for cancers such as bladder cancer, melanoma etc.
The molecular function of the downregulated proteins was mainly shown to be kinase activity
(supplement data Figure 98 - C); the biological process highlighted was cell communication
and signal transduction (supplement data Figure 98 -b); the cellular component was plasma
membrane (supplement data Figure 98-a)
The complete set of upregulated and downregulated proteins are also represented on a scatter
plot where x and y axes are the duplicate sets and the values are represented as log2 of the
ratio of DMSO over Ganetespib treatment (Figure 71)
185
Figure 71 Scatter plot indicating genes upregulated/downregulated with Ganetespib treatment
Scatter plot of log2 (relative protein quantity) with Ganetespib, with x axis DMSO/Ganetespib (A)
and y axis DMSO/Ganetespib (B) Data analysed using FUNRICH software.
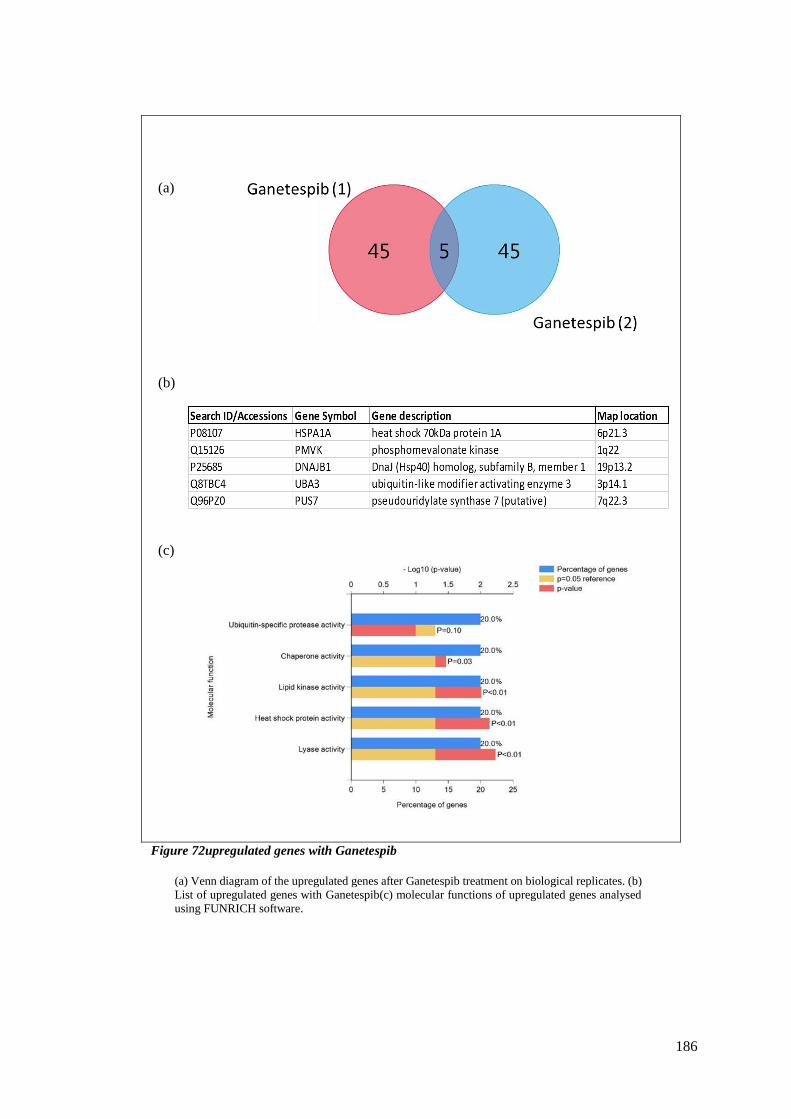
186
Figure 72upregulated genes with Ganetespib
(a) Venn diagram of the upregulated genes after Ganetespib treatment on biological replicates. (b)
List of upregulated genes with Ganetespib(c) molecular functions of upregulated genes analysed
using FUNRICH software.
(a)
(b)
(c)
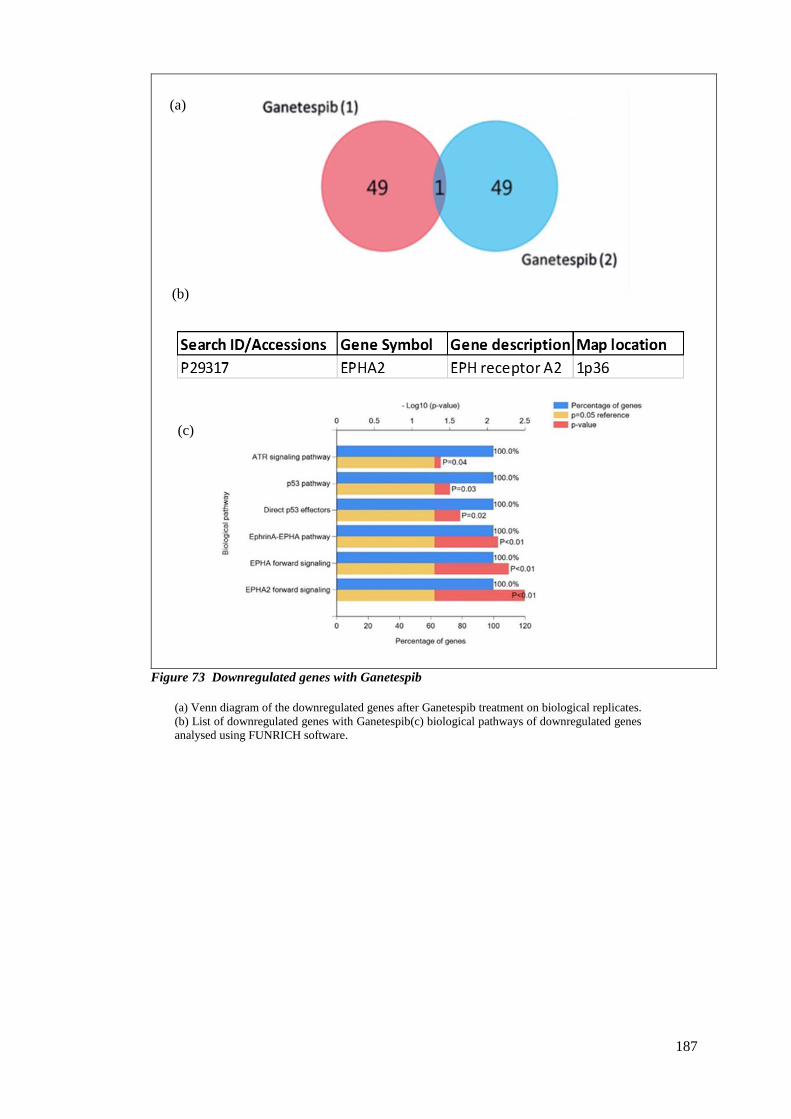
187
Figure 73 Downregulated genes with Ganetespib
(a) Venn diagram of the downregulated genes after Ganetespib treatment on biological replicates.
(b) List of downregulated genes with Ganetespib(c) biological pathways of downregulated genes
analysed using FUNRICH software.
(a)
(b)
(c)
188
5.2.8.2 Effects of Nutlin treatment on the A375 proteome
I extended the proteomic study by determining the proteins up or downregulated when cells
were treated with Nutlin or Nutlin + Ganetespib. With Nutlin treatment I observed several
proteins to be upregulated but, most importantly, some of them were apoptosis/cell death
related, such as annexin. This may indicate that Nutlin treatment primes cells for apoptosis.
One of the interesting proteins upregulated is RPS27L (Figure 75 a - b). This protein is a direct
p53-inducible target. It is mainly localized in the cytoplasm but, upon p53-activating signals,
a portion of RPS27L shuttles to the nucleoplasm where it co-localises with MDM2. Xiong and
group demonstrated that both the cytoplasmic and the nuclear p53, induced by ribosomal
stress, were reduced upon RPS27L silencing, thus describing a multi-level interplay between
RPS27L and the p53-MDM2 axis, with RPS27L functioning as a p53 target, a MDM2
substrate and a p53 regulator (X Xiong, 2011).
Another protein upregulated with Nutlin treatment was TP53I3. The p53-inducible gene 3
(PIG3 or TP53I3) can be involved in apoptosis induced by p53 via the production of reactive
oxygen species (ROS). Xu J and group showed that PIG3 plays an oncogenic role in thyroid
cancer via the regulation of the PI3K/AKT/PTEN pathway and this supports the exploration
of PIG3 as a novel biomarker for patients with thyroid cancer (Xu J, 2015). Herraiz and group
also emphasised the clinical importance of the PIG3 gene in their studies (Herraiz C, 2015).
Biological pathway analysis for the Nutlin upregulated proteins indicated that the majority
belonged to p53 and ATM pathways (Figure 75 c). In addition, the majority of the upregulated
proteins had molecular functions such as ligase activity or aminopeptidase. Major transcription
factors seen to change were HSF1, MYF5 etc. (supplement data Figure 97 a-b). Key
upregulated proteins were localised in the cytoplasm and exosomes. Protein metabolism and
signal transduction were the major biological process for the upregulated proteins in Nultin
treated cells (supplement data Figure 97 c and d).
There were 11 proteins selected between the duplicate sets that were observed to be
downregulated (Figure 76 a-b). One of the key proteins was NFATc2. Ding and group
indicated a reciprocal regulatory relationship between the NFATc1 and p53 pathways. In
patients with colon cancer, expression of nuclear NFATc1 correlated with inferior survival
(Ding W, 2016). Hence downregulation of this protein with Nutlin could improve prognosis
for colon cancers. Some of the transcription factors for the downregulated protein identified

189
in the screen were GABPA and NRF1 (supplement data Figure 99-a). The biological process
highlighted was regulation of nucleotide and nucleic acid metabolism (supplement data
Figure- b).
The complete set of proteins are also represented on a scatter plot where x and y axis are the
duplicates sets and the values are represented as log2 of the ratio of DMSO over Nutlin
treatment (Figure 74).
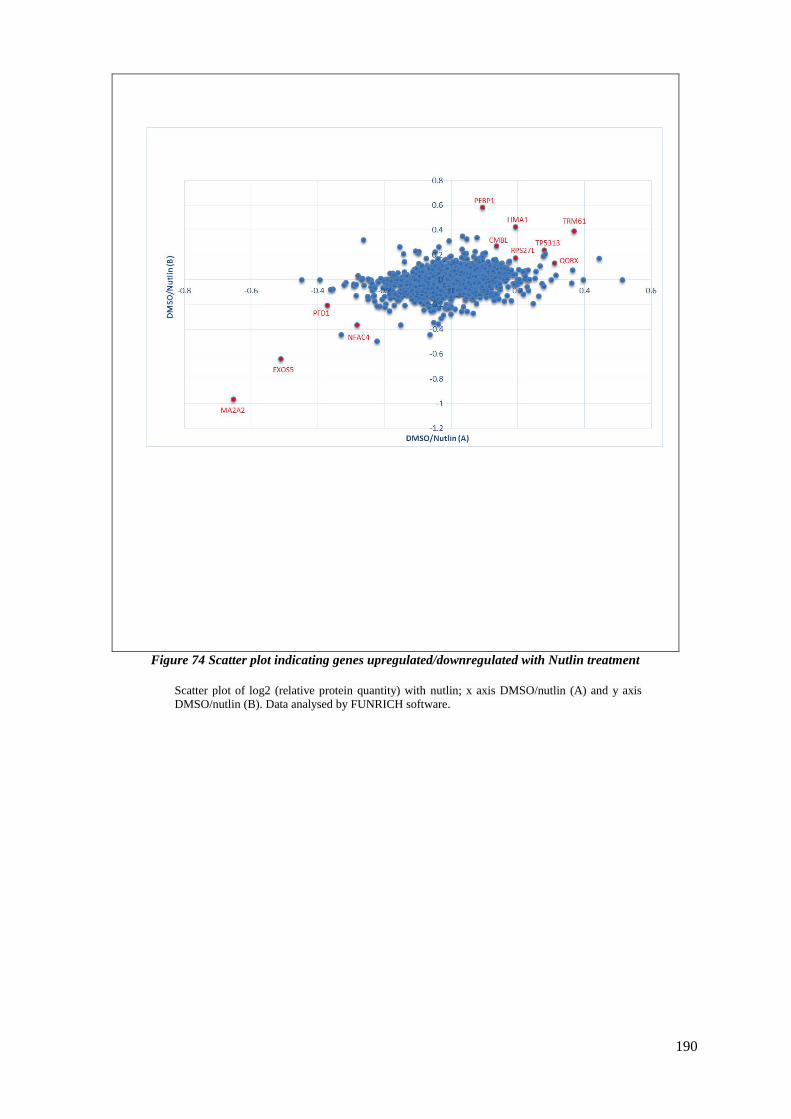
190
Figure 74 Scatter plot indicating genes upregulated/downregulated with Nutlin treatment
Scatter plot of log2 (relative protein quantity) with nutlin; x axis DMSO/nutlin (A) and y axis
DMSO/nutlin (B). Data analysed by FUNRICH software.

191
Figure 75 Upregulated genes with Nutlin
(a) Venn diagram of upregulated genes after Nutlin treatment on biological replicates. (b) List of
upregulated genes with nutlin (c) Biological pathways of upregulated genes analysed using
FUNRICH software.
(a)
(b)
(c)
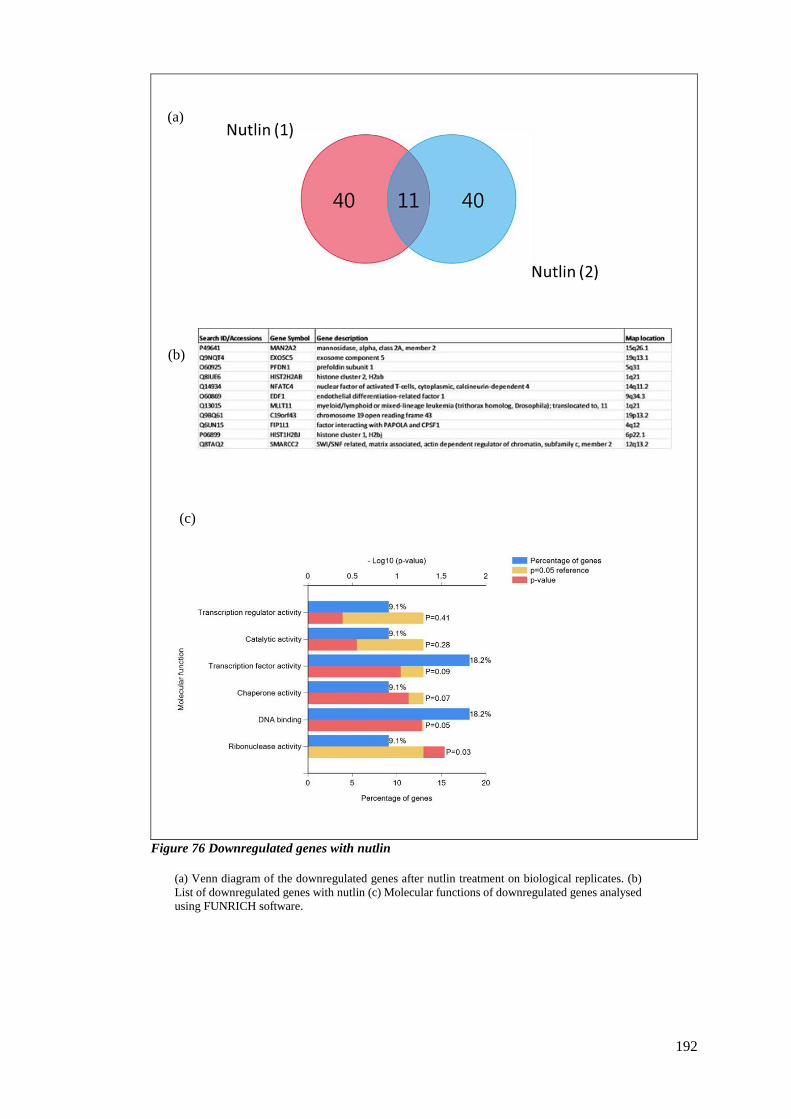
192
Figure 76 Downregulated genes with nutlin
(a) Venn diagram of the downregulated genes after nutlin treatment on biological replicates. (b)
List of downregulated genes with nutlin (c) Molecular functions of downregulated genes analysed
using FUNRICH software.
(a)
(b)
(c)
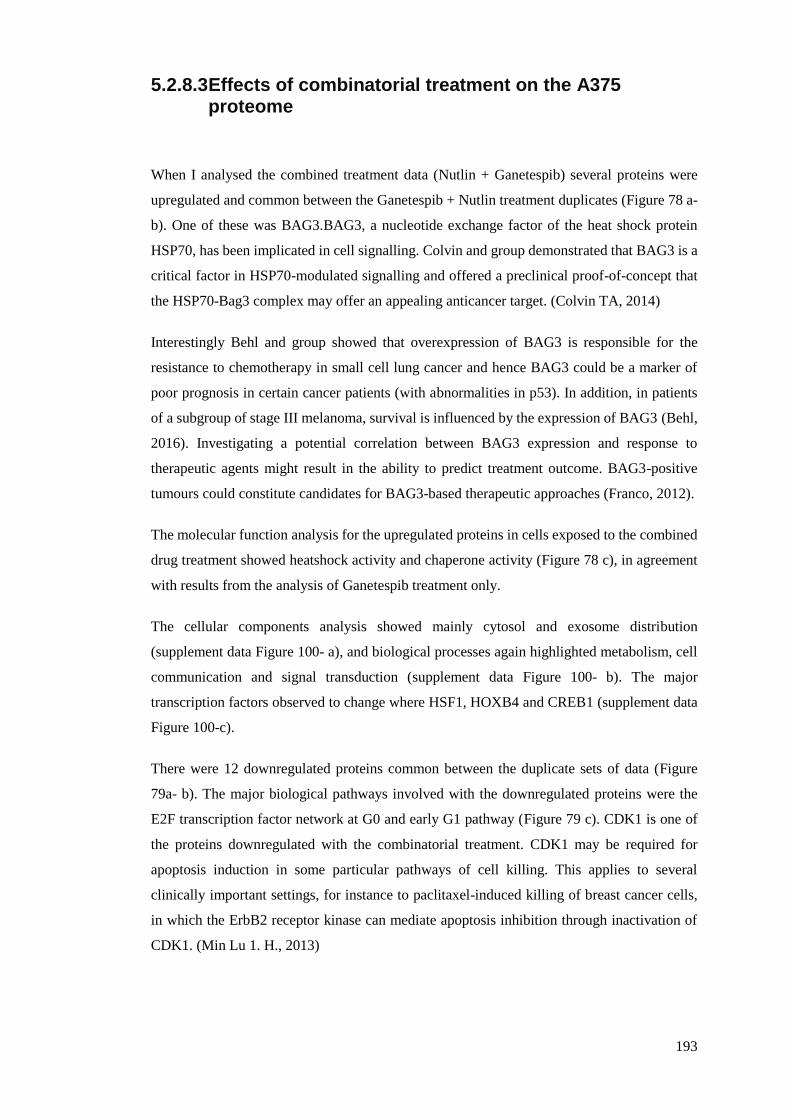
193
5.2.8.3 Effects of combinatorial treatment on the A375 proteome
When I analysed the combined treatment data (Nutlin + Ganetespib) several proteins were
upregulated and common between the Ganetespib + Nutlin treatment duplicates (Figure 78 a-
b). One of these was BAG3.BAG3, a nucleotide exchange factor of the heat shock protein
HSP70, has been implicated in cell signalling. Colvin and group demonstrated that BAG3 is a
critical factor in HSP70-modulated signalling and offered a preclinical proof-of-concept that
the HSP70-Bag3 complex may offer an appealing anticancer target. (Colvin TA, 2014)
Interestingly Behl and group showed that overexpression of BAG3 is responsible for the
resistance to chemotherapy in small cell lung cancer and hence BAG3 could be a marker of
poor prognosis in certain cancer patients (with abnormalities in p53). In addition, in patients
of a subgroup of stage III melanoma, survival is influenced by the expression of BAG3 (Behl,
2016). Investigating a potential correlation between BAG3 expression and response to
therapeutic agents might result in the ability to predict treatment outcome. BAG3-positive
tumours could constitute candidates for BAG3-based therapeutic approaches (Franco, 2012).
The molecular function analysis for the upregulated proteins in cells exposed to the combined
drug treatment showed heatshock activity and chaperone activity (Figure 78 c), in agreement
with results from the analysis of Ganetespib treatment only.
The cellular components analysis showed mainly cytosol and exosome distribution
(supplement data Figure 100- a), and biological processes again highlighted metabolism, cell
communication and signal transduction (supplement data Figure 100- b). The major
transcription factors observed to change where HSF1, HOXB4 and CREB1 (supplement data
Figure 100-c).
There were 12 downregulated proteins common between the duplicate sets of data (Figure
79a- b). The major biological pathways involved with the downregulated proteins were the
E2F transcription factor network at G0 and early G1 pathway (Figure 79 c). CDK1 is one of
the proteins downregulated with the combinatorial treatment. CDK1 may be required for
apoptosis induction in some particular pathways of cell killing. This applies to several
clinically important settings, for instance to paclitaxel-induced killing of breast cancer cells,
in which the ErbB2 receptor kinase can mediate apoptosis inhibition through inactivation of
CDK1. (Min Lu 1. H., 2013)

194
Some of the major transcription factors downregulated in the combinatorial treated samples
were MEF2A, NFYA and PU2F1 (supplement data Figure 101- a) with biological process
mainly being regulation of nucleotide and nucleic acid metabolism (supplement data figure 6
b). The major molecular function for the downregulated proteins is DNA binding (Figure 101-
c).
The complete set of proteins is represented on a scatter plot, where the x and y axes are the
duplicate sets and the values are represented as log2 of the ratio of DMSO over Nutlin +
Ganetespib treatment (Figure 77).
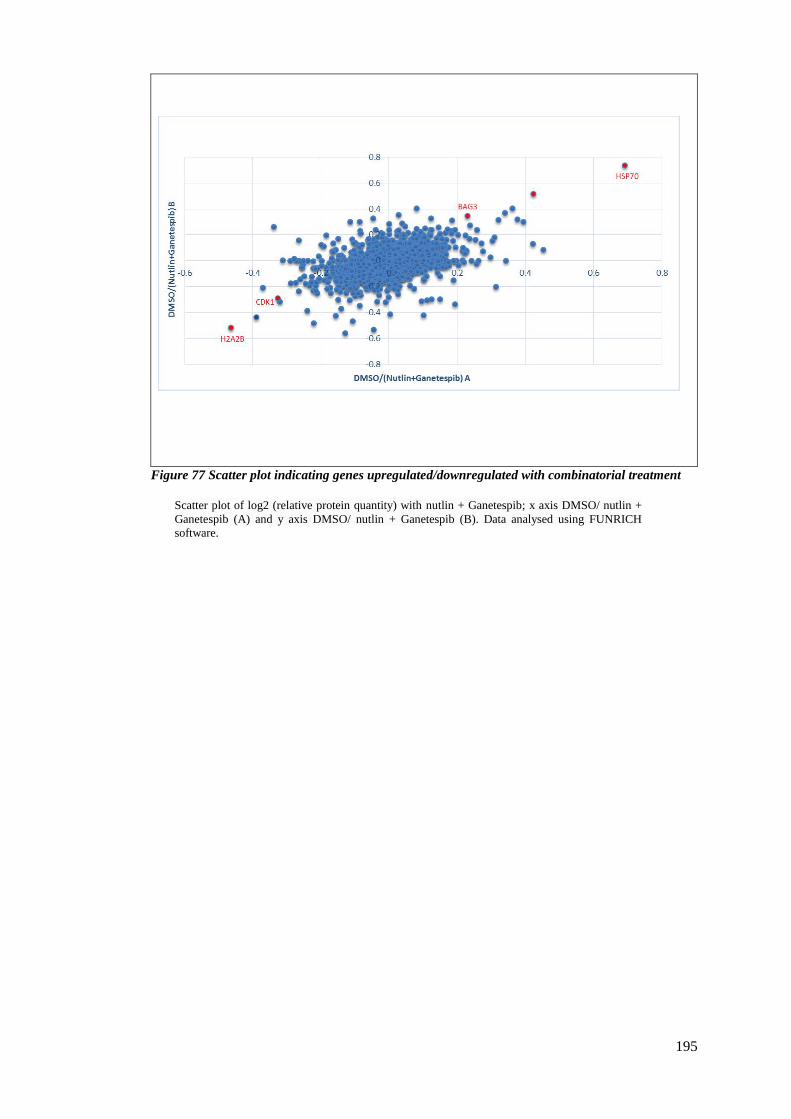
195
Figure 77 Scatter plot indicating genes upregulated/downregulated with combinatorial treatment
Scatter plot of log2 (relative protein quantity) with nutlin + Ganetespib; x axis DMSO/ nutlin +
Ganetespib (A) and y axis DMSO/ nutlin + Ganetespib (B). Data analysed using FUNRICH
software.
196
Figure 78 Upregulated genes with combinatorial treatment
(a) Venn diagram of the upregulated genes after Ganetespib + nutlin treatment on biological
replicates. (b) List of upregulated genes with Ganetespib + nutlin (c) Molecular functions of
upregulated genes analysed using FUNRICH software.
(a)
(b)
(c)
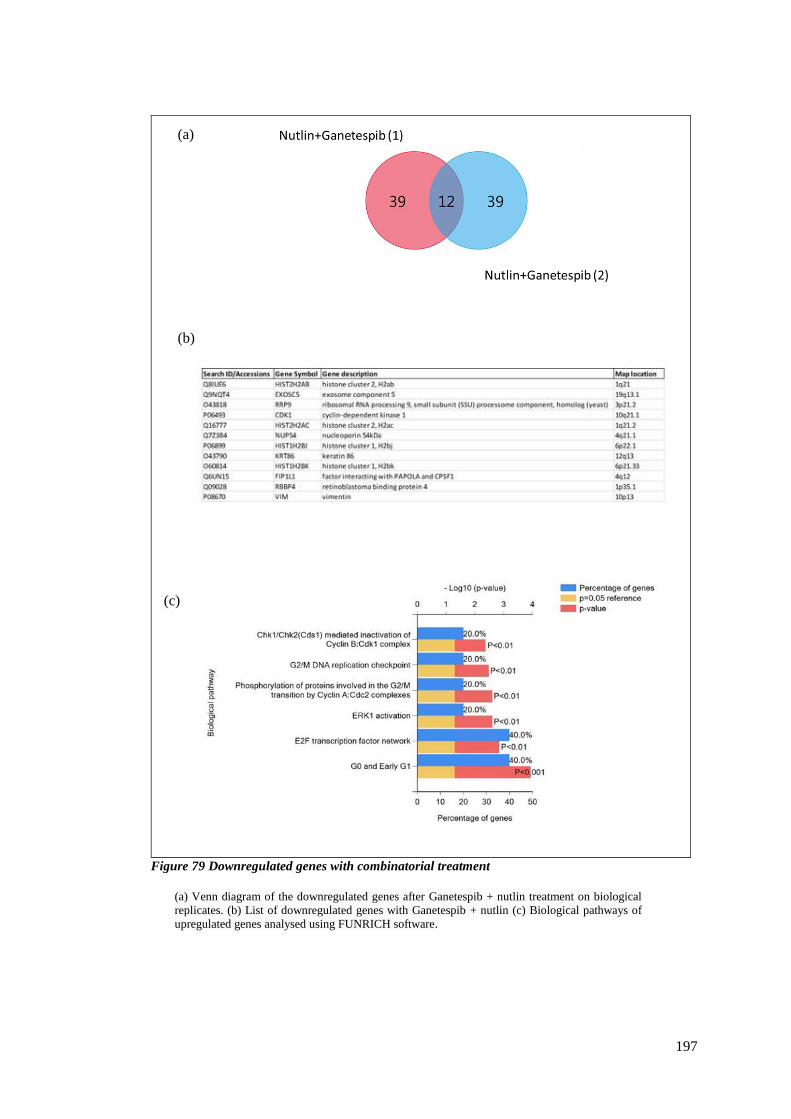
197
Figure 79 Downregulated genes with combinatorial treatment
(a) Venn diagram of the downregulated genes after Ganetespib + nutlin treatment on biological
replicates. (b) List of downregulated genes with Ganetespib + nutlin (c) Biological pathways of
upregulated genes analysed using FUNRICH software.
(a)
(b)
(c)
198
5.2.8.4 UBA 3 analysis
Based on the mass spectrometric analysis data, UBA3 protein was shown to be upregulated in
the Ganetespib treated cells. As UBA3 is a E1-ubiquitin activating enzyme family member
which can also activate NEDD8, I wanted to investigate whether it could be a component of a
novel pathway for down regulation of IRF-1.
Ubiquitination and neddylation are necessary for a number of biological processes and have
been implicated in numerous diseases, particularly in cancer. The process of ubiquitination
has been identified as the mechanism that labels proteins for degradation by the 26s
proteasome. Conjugation of ubiquitin to its substrate requires three enzymes, ubiquitin-
activating enzyme E1, ubiquitin-conjugating enzyme E2 and ubiquitin ligase enzyme E3. The
neural precursor cell-expressed developmentally downregulated (NEDD8) protein is 60%
identical to ubiquitin and also conjugates to target proteins. This process is termed neddylation
and is similar to ubiquitination. NEDD8 is activated by the E1 enzyme (APPBP1/UBA3
heterodimer), whereby a thioester bond is formed with the cysteine residue of the UBA3
subunit (FANG CHENG, 2014). I used siRNA targeting of UBA-3 to knock this down in A375
cell lines. Cells were treated with siRNA for 24 hours prior to the addition of Ganetespib.
The results indicated that loss of UBA3 didn’t rescue the downregulation of IRF-1 and
suggested that probably this E1, and therefore Neddylation are not involved in the degradation
of IRF-1 (Figure 80). I observed more than 80% knockdown of the UBA 3 levels with siRNA
when compared to the controls. The negative siRNA control had no significant effect on UBA
3 when compared to the control and positive knockdown cells. Downregulation of IRF-1 was
observed when cells were treated with Ganetespib either alone or in combination with UBA 3
siRNA.
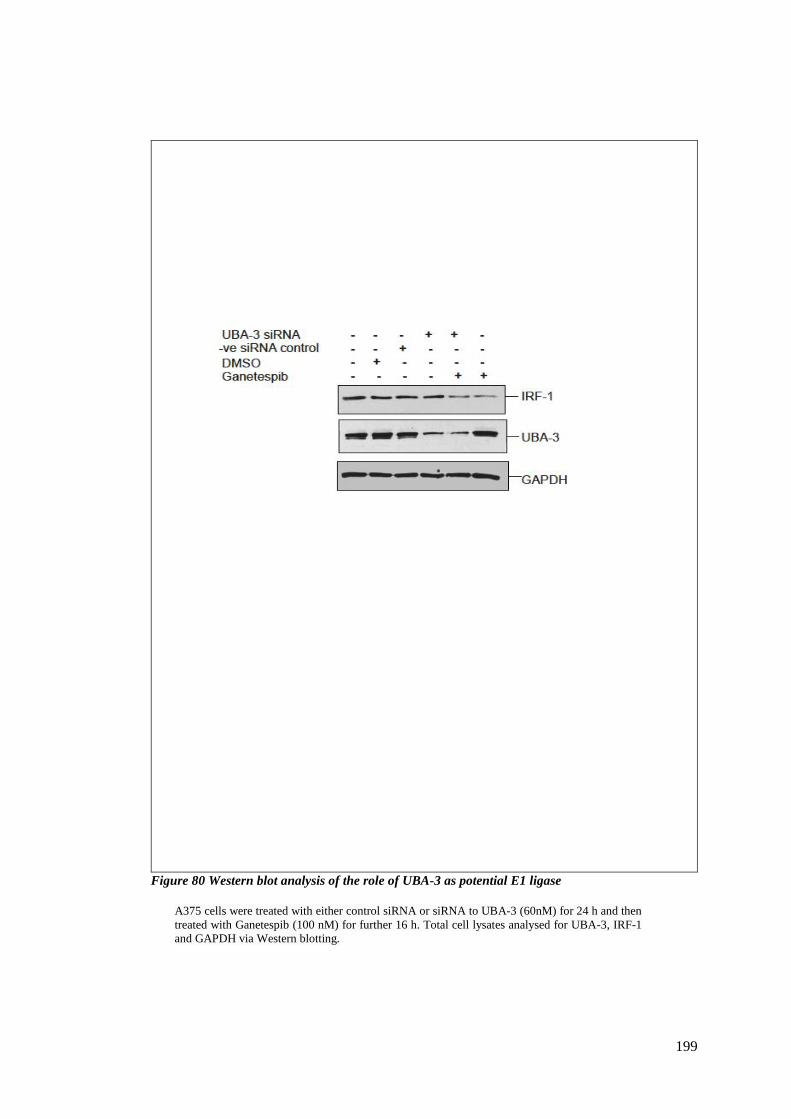
199
Figure 80 Western blot analysis of the role of UBA-3 as potential E1 ligase
A375 cells were treated with either control siRNA or siRNA to UBA-3 (60nM) for 24 h and then
treated with Ganetespib (100 nM) for further 16 h. Total cell lysates analysed for UBA-3, IRF-1
and GAPDH via Western blotting.
200
5.3 Discussion
Some of the key proteins analysed by masspectrometry are detailed below.HSP70 protein was
upregulated with the treatment of Ganetespib which demonstrates the inhibition of
HSP90.EPHA2 was one of the protein downregulated with Ganetespib treatment. As described
earlier EPHA2 protein is shown to be a biomarker for various cancers such as bladder and
melanoma and its downregulation could be beneficial in combinatorial therapy.
RPS27L protein was upregulated with nutlin. It has dual functions in p53 regulation; in a
Trp53⁺/⁺ background, Rps27l disruption triggers ribosomal stress to induce p53 and apoptosis,
whereas in a Trp53⁺/⁻ background, Rps27l disruption triggers genomic instability and Trp53
deletion to promote tumourigenesis (Xiong X, 2014). Elevated RPS27L may improve the
prognoses of certain colorectal cancer (CRC) patients by enhancing the DNA repair capacity
of their colonic cells; it can be measured in faeces. Huang and group demonstrated that by
integrating clinical, molecular, and cellular data, faecal RPS27L may be a useful index for
predicting prognoses and guiding personalized therapeutic strategies, especially in patients
with intermediate-stage CRC (Huang CJ, 2013).
In Combinatorial treatment of Ganetespib and nutlin BAG3 was shown to be
upregulated.BAG3, also known as CAIR-1 or Bis, mediates protein delivery to the proteasome
and modulates apoptosis by interfering with cytochrome c release, apoptosome assembly and
other events in the cellular death programme. Moreover, it takes part in the processes of cell
adhesion and migration. It has been shown that, in human cancer cells including lymphocytic
and myeloblastic leukemic cells, BAG3 sustains cell survival and underlies resistance to
chemotherapy, through down-modulation of apoptosis. Zhu and group described BAG3 in
their studies as a potential therapeutic target of human malignancy (Zhu H, 2012). Guerriero
and group also described the gene as a pro-survival factor in several tumour types including
melanomas (Guerriero, 2014).The discovery of its role in selective autophagy and the
description of BAG3-mediated selective macroautophagy as an adaptive mechanism to
maintain cellular homeostasis, under stress as well as during aging, make BAG3 a highly
interesting target for future pharmacological interventions.
CDK1 was one of the downregulated proteins. Nearly 90% of human melanomas contain
inactivated wild-type p53. Min lu and group showed that cyclin B1/CDK1-phosphorylates
201
iASPP, which leads to the inhibition of iASPP dimerization, promotion of iASPP monomer
nuclear entry, and exposure of its p53 binding sites, leading to increased p53 inhibition.
Nuclear iASPP is enriched in melanoma metastasis and associates with poor patient survival.
Most wild-type p53-expressing melanoma cell lines co-express high levels of phosphorylated
nuclear iASPP, MDM2, and cyclin B1. Inhibition of MDM2, and iASPP phosphorylation,
with small molecules induce p53-dependent apoptosis and growth suppression (Min Lu 1. H.,
2013) (Bresler, 2016). Concurrent p53 reactivation and CDK1 inhibition by combinatorial
therapy could provide alternatives for melanoma therapy.
To conclude this chapter I have identified a new proteasome dependent degradation pathway
for IRF-1 where CHIP and MDM2 are not required and where formation of IRF-1/HSP/C70
complexes in the cytoplasm preceded degradation. . The proteomic analysis using TMT mass
spectrometry emphasised the importance of combinatorial treatment in cancer and how
different proteins respond the drugs used.
202
6 HSP90 inhibitors in immune surveillance
6.1 Introduction
6.1.1 The Interferon system
IFNs belong to the large class of proteins known as cytokines. Interferon signalling pathways
are critical to both innate and adaptive immunity. Interferons (IFNs) provide defence against
viral and bacterial infections, as well as tumour surveillance. IFNs are divided into two main
categories: type I and type II.
The two major members of type I IFNs (IFNα and IFNβ) are universally expressed and signal
through the type I receptor. IFNs are differentiated primarily through their amino
acid sequence. Interferons α and-β, which have relatively similar amino acid sequences, are
classified as type I interferons. Interferon γ is a type II interferon. Interferons of type III signal
through a receptor complex consisting of the interleukin 10 receptor (IL10R2) and the
interferon lambda receptor (IFNLR1) and are predominately important in viral infections.
(Zaidi MR, 2011) (Murtas D, 2013).
6.1.1.1 Interferon γ
Interferon gamma (IFN γ) is the only type II interferon, classified as such because of its unique
amino acid sequence. This interferon is known for its ability to regulate overall immune system
functioning. IFNγ is a cytokine whose biological activity is associated with cytotoxic and
antitumour mechanisms during cell-mediated adaptive immune response. It has been used
clinically to treat a variety of malignancies, although with mixed results and side effects that
can be severe. IFNγ is an important activator of macrophages and inducer of Class II major
histocompatibility complex (MHC) molecule expression. IFNγ is produced predominantly by
natural killer (NK) and natural killer T (NKT) cells as part of the innate immune response, and
by CD4Th1 and CD8 cytotoxic T lymphocyte (CTL) effector T cells once antigen-specific
immunity develops (Zaidi MR, 2011).
IFNγ is structurally and functionally different from the type I IFNs and has its own receptor,
consisting of IFN-gR1 and IFN-gR2 subunits. The intracellular carboxyl termini of IFN-gR1
203
and IFN-gR2 bind the non-receptor tyrosine kinases Janus-activated kinase (JAK) 1 and JAK2,
respectively, which phosphorylate the receptor upon ligand binding. This phosphorylation
forms binding sites for the STAT proteins (Abroun S, 2015).
Activation of the JAK/STAT pathway occurs by binding of ligands to their receptors. These
ligands can activate different JAKs and STATs. In addition to JAKs, other non-receptor
tyrosine kinases (TKs) can be phosphorylated and activated by interaction between ligands
and their receptors in the JAK/STAT pathway. Once activated, JAKs can phosphorylate
additional targets, which include both the receptors and their major substrates, the STATs. In
normal cells, after modulating gene expression, STATs become dephosphorylated by tyrosine
phosphatases and are thus free for subsequent rounds of stimulation (Abroun S, 2015).
IFNγ regulates the differentiation and function of many types of immune cells. It is intimately
involved in all aspects of Th1-mediated immune responses by regulating the differentiation,
activation, and homeostasis of T-cells. One of the major primary response genes transactivated
by IFNɣ–activated JAK/STAT signalling is the transcription factor IFN response factor 1
(IRF-1). IRF-1, in turn, activates a large number of secondary response genes. The antitumour
activity of IFNγ is mediated in part through IRF-1 and may be blocked by IRF-2. The effects
of IFNγ have been shown to involve upregulation of MHC class I genes, which increase
tumour immunogenicity ( (Shang L, 2006); (Connett JM, 2005); (Lowney JK, 1999); (Murtas
D, 2013)).
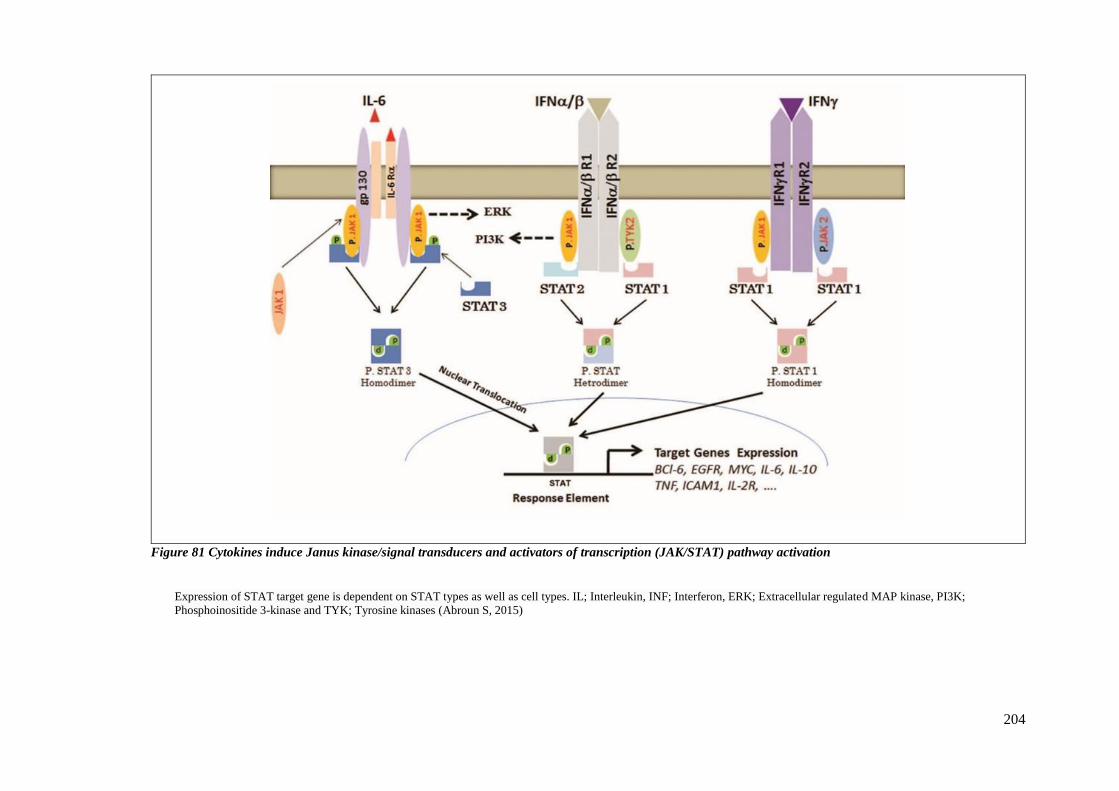
204
Figure 81 Cytokines induce Janus kinase/signal transducers and activators of transcription (JAK/STAT) pathway activation
Expression of STAT target gene is dependent on STAT types as well as cell types. IL; Interleukin, INF; Interferon, ERK; Extracellular regulated MAP kinase, PI3K;
Phosphoinositide 3-kinase and TYK; Tyrosine kinases (Abroun S, 2015)
205
6.1.2 Therapeutic targets for cancer immunotherapy
Recognition of the major histocompatibility complex (MHC) is key in both innate and adaptive
immune recognition. The function of innate immune cells e.g. natural killer (NK) cells and the
adaptive immune cells e.g. T-cells relies on recognition of MHC-1 molecule expression on
aberrant cells (figure82). Tumours escape the immune response by mechanisms such as
inhibition of tumour antigen presentation, secretion of immunosuppressant factors, and
inhibition of attack by immune cells or recruitment of immunosuppressant cell types.
6.1.2.1 Immune checkpoints
Immune checkpoints are molecules in the immune systems that are either stimulatory (turn up
a signal) or inhibitory (turn down signal). Five stimulatory checkpoint molecules are members
of the tumour necrosis factor (TNF) receptor superfamily: CD27, CD40, OX40, GITR and
CD137. Another two stimulatory checkpoint molecules belongs to the B7-CD28 superfamily:
CD28 itself and ICOS (Suzanne L. Topalian, 2016).
6.1.2.1.1 CD28
This molecule is constitutively expressed on almost all human CD4+ T cells and on around
half of all CD8 T cells. Binding with its two ligands CD80 (B7-1) and CD86 (B7-2), expressed
on dendritic cells, prompts T cell expansion (Figure 82).
Many cancers protect themselves from the immune system by inhibiting the T cell signal.
Some of the major inhibitory checkpoint molecules are: A2AR, B7-H3 (CD276), B7-H4,
BTLA (CD272), CTLA-4 (CD152), IDO, KIR, LAG3, PD-1, TIM-3, and VISTA (Suzanne L.
Topalian, 2016).
Inhibitory checkpoint molecules are increasingly considered as new targets for cancer
immunotherapies due to the effectiveness of two checkpoint inhibitor drugs that were initially
indicated for advanced melanoma. Yervoy is a monoclonal antibody targeting CTLA-4,
produced by Bristol-Myers Squibb (Copur MS, 2017), and Keytruda is an anti-PD1 antibody
from Merck (Addeo, 2017).
206
6.1.2.1.2 PD-1
Programmed cell death protein 1 (PD-1) is an immune checkpoint receptor showing great
promise as a therapeutic target. The protein is part of a complex system controlling T-cell
activation in the periphery during an inflammatory response. PD-1 also interacts with other
activated non-T-cell subsets, including B-cells and NK cells, limiting their lytic activity.
Chronic antigen exposure, as seen in cancer, may result in persistently high PD-1 levels,
leading to anergy among antigen-specific T-cells. The PD-1 pathway can also shift the balance
from T-cell activation to tolerance early in the course of the T-cell response to antigens within
secondary lymphoid tissues. In solid tumour cells, PD-ligand 1 (PD-L1) is the major ligand
expressed(figure 82) limiting local antitumour T-cell mediated responses. Thus, it is clear that
blockade of PD-1, and its ligands (PD-L1, PD-L2), is an attractive therapeutic option
(O'Byrne, 2015) (Ting Huyan, 2016)
6.1.2.1.3 CTLA-4
The over proliferation of cytotoxic T-lymphocyte (CTL) A-4 on the surface of T-cells is yet
another mechanism that has not been entirely investigated. This dampens activation of the T-
cells by outcompeting CD28 in binding CD80 and CD86. CTLA-4 also delivers inhibitory
signals to T-cells. Thus, CTLA-4 blockade has emerged as another attractive option for cancer
immunotherapy (O'Byrne, 2015) (Garcia-Carbonero R, 2013).
CD8+ T effector (Teff) cells are thought to be the major type of immune cell affected by the
programmed cell death protein 1 (PD1) immunosuppressive checkpoint pathway. In contrast
CTLA4 predominantly regulates the activity of both effector and regulatory (Treg) CD4+ T cell
subtypes. Priming of T-cells requires the recognition of processed tumour antigens presented
by antigen presenting cells (APCs) such as monocytes and dendritic cells through a unique T-
cell receptor (TCR) that binds to a major histocompatibility complex (MHC) molecule and
tumour-derived peptide antigens (figure 82) (Suzanne L. Topalian, 2016). Such antigens may
be generated from mutant or non-mutated tumour-associated proteins. Priming of T cells
generally occurs in lymphoid tissue, and CD4+ T cells provide help for CD8+ T cell priming
in the form of cytokines. Both CD4+ and CD8+ T cells are then activated through co-
stimulatory pathways such as CD28–B7-1 and CD28–B7-2, causing them to proliferate,
secrete inflammatory cytokines, acquire cytolytic properties and migrate to sites of antigen
display i.e. tumour deposits. Within hours to days, activated T cells also begin to express the
co-inhibitory receptor PD1 (figure 82) (Suzanne L. Topalian, 2016).
207
The recognition that a network of immune checkpoints need to be passed in order for effective
immune responses to proceed has led to a focus on inhibitors of these checkpoints. Tumours
may take over some of these checkpoints, contributing to immune resistance. Targeting
checkpoints is an evolving approach to cancer immunotherapy, designed to foster an immune
response. (Ting Huyan, 2016)
6.1.2.2 Combined therapies
The immune blockade approaches are just emerging as compelling therapeutics. Pathways that
mediate resistance to primary immune blockade antibodies are also emerging. Targeting these
resistance pathways using combination therapies might be promising. Examples of this include
targeting of CDK5 and ATG5, whose inhibition can impact on the efficacy of immune
blockade antibodies. Identification of new targets for combined therapies or resistance factors
will help to improve immune blockade therapies (O'Byrne, 2015).
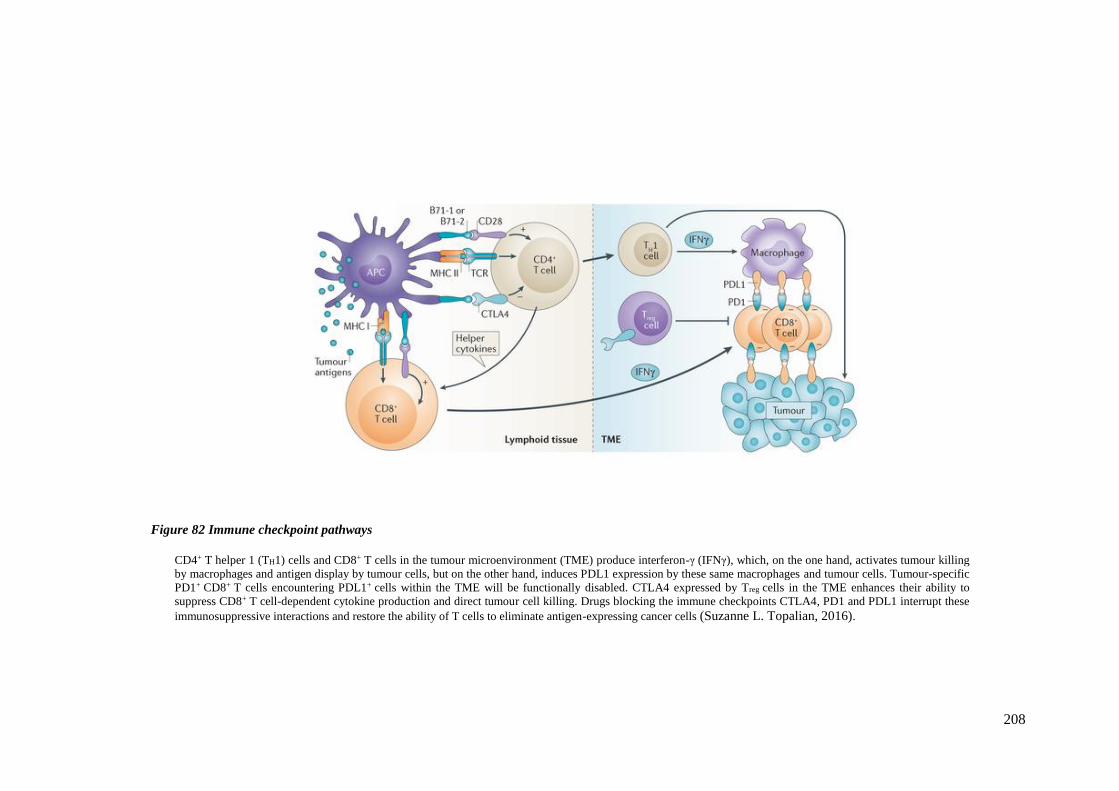
208
Figure 82 Immune checkpoint pathways
CD4+ T helper 1 (TH1) cells and CD8+ T cells in the tumour microenvironment (TME) produce interferon-γ (IFNγ), which, on the one hand, activates tumour killing
by macrophages and antigen display by tumour cells, but on the other hand, induces PDL1 expression by these same macrophages and tumour cells. Tumour-specific
PD1+ CD8+ T cells encountering PDL1+ cells within the TME will be functionally disabled. CTLA4 expressed by Treg cells in the TME enhances their ability to
suppress CD8+ T cell-dependent cytokine production and direct tumour cell killing. Drugs blocking the immune checkpoints CTLA4, PD1 and PDL1 interrupt these
immunosuppressive interactions and restore the ability of T cells to eliminate antigen-expressing cancer cells (Suzanne L. Topalian, 2016).
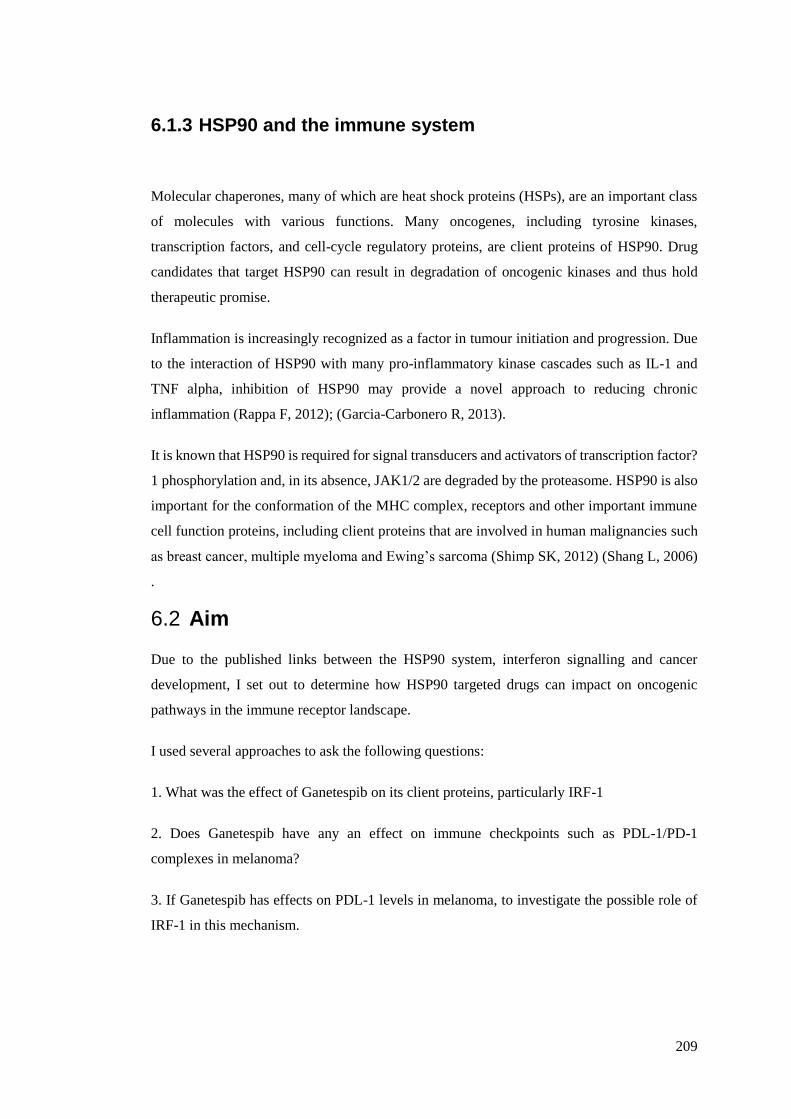
209
6.1.3 HSP90 and the immune system
Molecular chaperones, many of which are heat shock proteins (HSPs), are an important class
of molecules with various functions. Many oncogenes, including tyrosine kinases,
transcription factors, and cell-cycle regulatory proteins, are client proteins of HSP90. Drug
candidates that target HSP90 can result in degradation of oncogenic kinases and thus hold
therapeutic promise.
Inflammation is increasingly recognized as a factor in tumour initiation and progression. Due
to the interaction of HSP90 with many pro-inflammatory kinase cascades such as IL-1 and
TNF alpha, inhibition of HSP90 may provide a novel approach to reducing chronic
inflammation (Rappa F, 2012); (Garcia-Carbonero R, 2013).
It is known that HSP90 is required for signal transducers and activators of transcription factor?
1 phosphorylation and, in its absence, JAK1/2 are degraded by the proteasome. HSP90 is also
important for the conformation of the MHC complex, receptors and other important immune
cell function proteins, including client proteins that are involved in human malignancies such
as breast cancer, multiple myeloma and Ewing’s sarcoma (Shimp SK, 2012) (Shang L, 2006)
.
6.2 Aim
Due to the published links between the HSP90 system, interferon signalling and cancer
development, I set out to determine how HSP90 targeted drugs can impact on oncogenic
pathways in the immune receptor landscape.
I used several approaches to ask the following questions:
1. What was the effect of Ganetespib on its client proteins, particularly IRF-1
2. Does Ganetespib have any an effect on immune checkpoints such as PDL-1/PD-1
complexes in melanoma?
3. If Ganetespib has effects on PDL-1 levels in melanoma, to investigate the possible role of
IRF-1 in this mechanism.
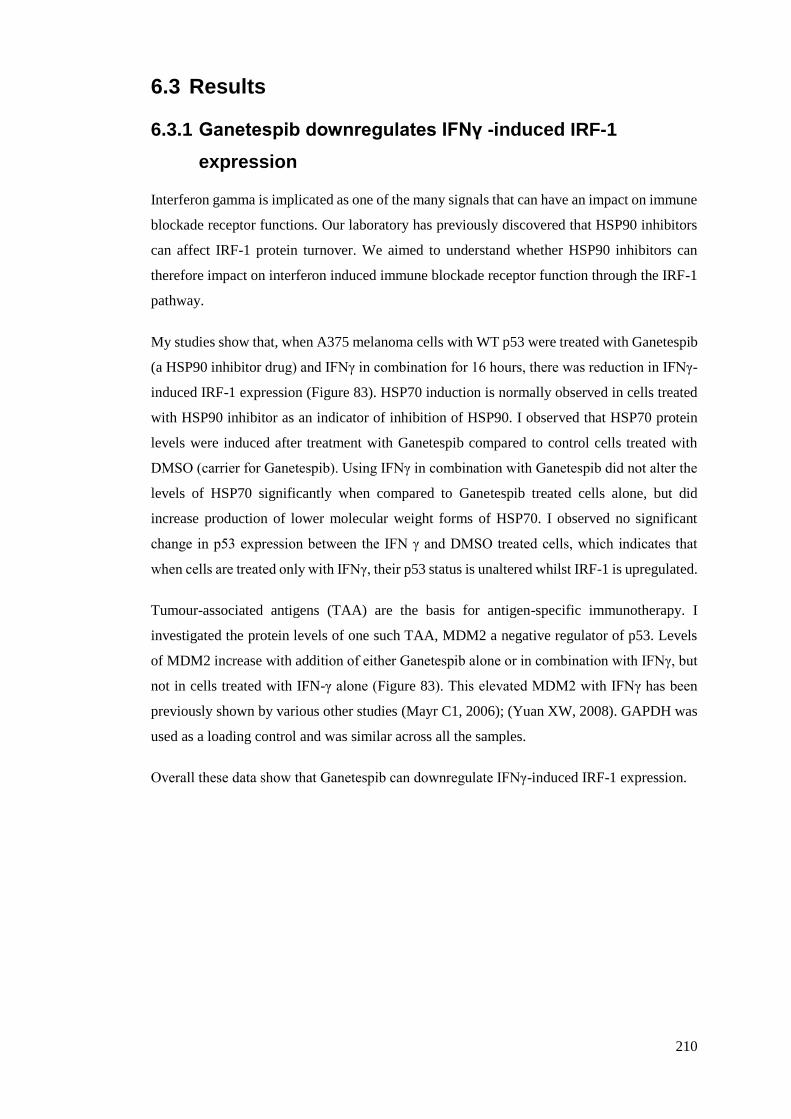
210
6.3 Results
6.3.1 Ganetespib downregulates IFNγ -induced IRF-1
expression
Interferon gamma is implicated as one of the many signals that can have an impact on immune
blockade receptor functions. Our laboratory has previously discovered that HSP90 inhibitors
can affect IRF-1 protein turnover. We aimed to understand whether HSP90 inhibitors can
therefore impact on interferon induced immune blockade receptor function through the IRF-1
pathway.
My studies show that, when A375 melanoma cells with WT p53 were treated with Ganetespib
(a HSP90 inhibitor drug) and IFNγ in combination for 16 hours, there was reduction in IFNγ-
induced IRF-1 expression (Figure 83). HSP70 induction is normally observed in cells treated
with HSP90 inhibitor as an indicator of inhibition of HSP90. I observed that HSP70 protein
levels were induced after treatment with Ganetespib compared to control cells treated with
DMSO (carrier for Ganetespib). Using IFNγ in combination with Ganetespib did not alter the
levels of HSP70 significantly when compared to Ganetespib treated cells alone, but did
increase production of lower molecular weight forms of HSP70. I observed no significant
change in p53 expression between the IFN γ and DMSO treated cells, which indicates that
when cells are treated only with IFNγ, their p53 status is unaltered whilst IRF-1 is upregulated.
Tumour-associated antigens (TAA) are the basis for antigen-specific immunotherapy. I
investigated the protein levels of one such TAA, MDM2 a negative regulator of p53. Levels
of MDM2 increase with addition of either Ganetespib alone or in combination with IFNγ, but
not in cells treated with IFN-γ alone (Figure 83). This elevated MDM2 with IFNγ has been
previously shown by various other studies (Mayr C1, 2006); (Yuan XW, 2008). GAPDH was
used as a loading control and was similar across all the samples.
Overall these data show that Ganetespib can downregulate IFNγ-induced IRF-1 expression.
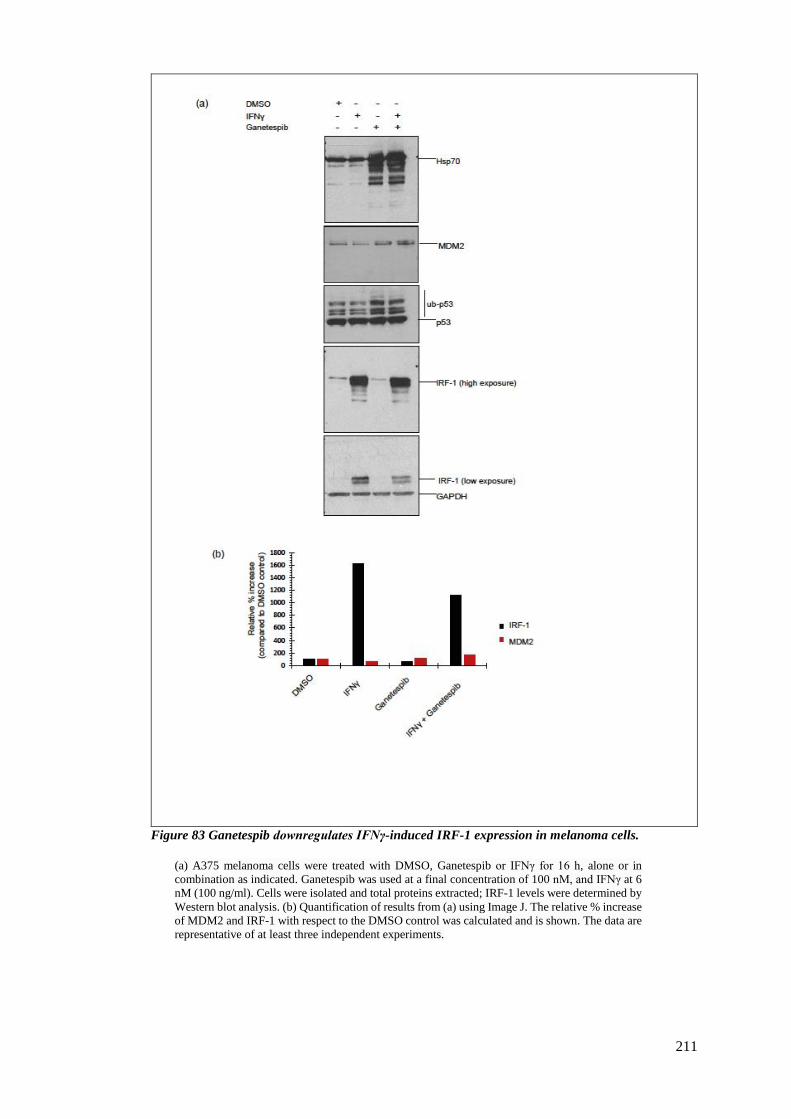
211
Figure 83 Ganetespib downregulates IFNγ-induced IRF-1 expression in melanoma cells.
(a) A375 melanoma cells were treated with DMSO, Ganetespib or IFNγ for 16 h, alone or in
combination as indicated. Ganetespib was used at a final concentration of 100 nM, and IFNγ at 6
nM (100 ng/ml). Cells were isolated and total proteins extracted; IRF-1 levels were determined by
Western blot analysis. (b) Quantification of results from (a) using Image J. The relative % increase
of MDM2 and IRF-1 with respect to the DMSO control was calculated and is shown. The data are
representative of at least three independent experiments.
212
6.3.2 Upregulation in IRF-1 expression with IFNγ is dose and
time dependent
To determine if the combinatorial effect of IFNγ and Ganetespib on IRF-1 was dose or time
dependent, I performed an IFNγ dose titration and time course assay. These treatments were
done without the removal of IFNγ from culture medium prior to the addition of Ganetespib.
Additional experiments were also performed, adding fresh medium before treatment with
Ganetespib and these produced similar results (data not shown). A time course (1, 2 and 4
hours) of IFNγ treatment did not show any significant difference in IRF-1 induction (Figure
84-a), indicating that a one-hour treatment with IFN γ at100 ng/ml is sufficient to induce IRF-
1 and saturate the expression level. In comparison, the time course or IFNγ in combination
with Ganetespib induced a significant decrease in IRF-1 compared to the control of Ganetespib
treatment alone. However, the loss of IRF-1 was again similar in all three of the IFNγ time
course with Ganetespib combinations, suggesting Ganetespib can downregulate the IRF-1
protein even after up to 4 hours of IFNγ treatment prior to the addition of Ganetespib (Figure
84–a).
An IFNγ titration between 100–400 ng/ml was performed to determine whether the effect of
Ganetespib on IRF-1 after IFNγ treatment was dose dependent. The cells were treated with
IFNγ with Ganetespib for 16 hours. The results show that even all concentrations of IFNγ from
100–400 ng/ml produced similar induction of IRF-1 (Figure 84-b). All combinations of IFNγ
and Ganetespib reduced IRF-1 to a level equivalent to control or baseline IRF-1. These results
show that even the lowest dose of IFNγ used here (100 ng/ml) can induce IRF-1 within one
hour, and that this induced IRF-1 can be downregulated with Ganetespib. Induction of IRF-1
suggests that there is de novo synthesis in 1 hour after cytokine stimulation.
To study if the time dependent effect of IFNγ on IRF-1 had any effect on the localisation of
available IRF-1, I performed an immunofluorescence assay. The results showed an
upregulation of IRF-1 over the time course of IFNγ treatment, and that the longer the treatment
with IFNγ, the more intense the signal for IRF-1 (Figure 85-a).
At two hours post IFNγ treatment IRF-1 was detected in both the cytoplasm and the nucleus,
but after four hours IRF-1 protein was detected almost exclusively in the nucleus.

213
When IRF-1 is primarily localised in the cytosol, its ability to regulate gene transcription
would be limited. Treatment with IFNγ appears to induce IRF-1 and its translocation into
nucleus thus enhancing its role in gene transcription. Blocking the activity of the proteasome
with MG132 (a specific, potent and cell permeable proteasome inhibitor) after four and six
hours of IFNγ treatment didn’t change the localisation of IRF-1, compared with treatment with
IFNγ only (Figure85).
Overall these data show that IFNγ has a time and dose dependent effect on both total IRF-1
protein expression and localisation of IRF-1 within the cell.
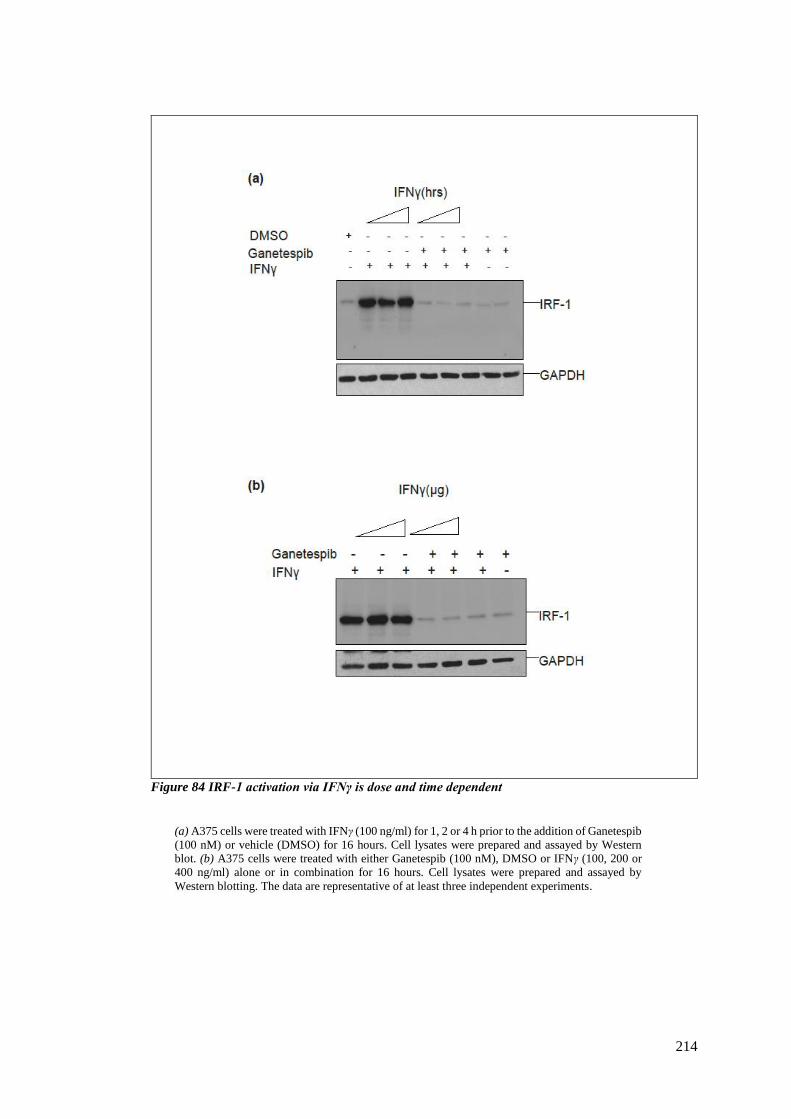
214
Figure 84 IRF-1 activation via IFNγ is dose and time dependent
(a) A375 cells were treated with IFNγ (100 ng/ml) for 1, 2 or 4 h prior to the addition of Ganetespib
(100 nM) or vehicle (DMSO) for 16 hours. Cell lysates were prepared and assayed by Western
blot. (b) A375 cells were treated with either Ganetespib (100 nM), DMSO or IFNγ (100, 200 or
400 ng/ml) alone or in combination for 16 hours. Cell lysates were prepared and assayed by
Western blotting. The data are representative of at least three independent experiments.

215
Figure 85 IRF-1 localisation with IFNγ time course
A375 cells were pre-treated with IFNγ (100 ng/ml) for 2, 4 and 6 h prior to the addition of MG132
(50 µM) for a further 2 h. Cells were fixed, stained with anti IRF-1 polyclonal antibody and then
with secondary goat anti-rabbit Alexa fluor 594 and DAPI, then visualised by IF microscopy. The
data are representative of at least three independent experiments.
216
6.3.3 Downregulation of IFNγ-induced PD-L1 expression by
Ganetespib
In patients treated with IFNs who are immune-compromised as a result of cancer treatment,
there is likely to be an elevated expression of PD-L1 complexes, thereby making their tumours
more susceptible to immune evasion. I show that total PD-L1 levels are significantly elevated
after IFNγ treatment and that inhibition of the IFNγ effect with Ganetespib partially prevented
the induction of PD-L1 (Figure 86). This effect was more noticeable if the cells were pre-
treated with Ganetespib prior to the treatment with IFNγ (Figure 86-a). Pre-treating the cells
with Ganetespib for six hours and then treating with IFNγ reduced the PD-L1 protein level to
that of the vehicle control. There is a small increase in PD-L1 with Ganetespib alone when
compared to untreated samples. These results were analysed by Western blotting of whole cell
lysates, probing for PD-L1.
The above result was confirmed using flow cytometric analysis using APC mouse anti-human
PD-L1 monoclonal antibodies to detect cell surface membrane bound PD-L1. This analysis
also indicated that pre-sensitizing the cells with Ganetespib (six hours in this instance) prior
to treatment with IFNγ decreased the amount of antibody accessible PD-L1 on the membrane
(Figure 86-b). Pre-treating the cells with Ganetespib downregulated the expression of PD-L1
below the level in control samples. When the cells were pre-treated, PD-L1 expression after
IFNγ treatment was reduced by 70% compared to cells treated with Ganetespib and IFNγ at
the same time. Expression levels in the latter were reduced by 50% compared to the IFNγ only
control. An isotype control was included as an indication of nonspecific antibody binding
(Figure 86–b).
To determine if IFNγ-dependent attenuation of PD-L1 was time dependent, I performed a time
course of IFNγ treatment with Ganetespib, where the cells were treated first with IFNγ (30
mins to two hours) prior to the treatment with Ganetespib (six hours). There were no
significant changes in total PD-L1 protein expression levels over the time course (Figure 86-
c), but IRF-1 levels were significantly changed. It is worth noting that as we increase the
duration of cells’ exposure to IFNγ, the action of Ganetespib is overcome by IFNγ. However
a treatment of either 30 mins or 1 hour of IFNγ, along with subsequent 6 hours of Ganetespib,
can still lower the levels of IRF-1 but after two hours there are no significant changes. PD-L1
217
does not increase during a short time-course, suggesting that this mechanism is downstream
of IRF-1, i.e. IRF-1 is induced and activated prior to increased expression of PD-L1.
Comparing these results to those in Figure85, where IFNγ and Ganetespib were added
together and produced substantial IRF-1 downregulation, suggests that pre-treating the cells
with IFNγ reduces the effectiveness of Ganetespib to reduce IRF-1. I also observed that
incubating cells with Ganetespib for 16 hours after the cells were pre-treated with IFNγ had a
greater impact on IRF-1 protein levels compared to 6 hours of Ganetespib treatment. In this
case, PD-L1 is observed as two bands. The higher band is predominant when cells are treated
with Ganetespib alone, whereas both bands are equally intense when cells are treated with
IFNγ. This suggests that the lower form of PD-L1 is lost preferentially and it will be of interest
to determine what causes this difference in molecular mass.
To evaluate whether drug administration with or without IFNγ affected the localisation of PD-
L1 within the cell, immunofluorescence assays were conducted. PD-L1 was shown
cytoplasmic and membrane bound in the Ganetespib and DMSO controls, whereas a more
dense and nuclear localised PD-L1 was observed with IFNγ treatment (Figure 87). When IFNγ
is combined with Ganetespib there was a shift of PD-L1 localisation and it appeared to be
more concentrated in the cytoplasm.
In summary, Ganetespib downregulates IFNγ-induced PD-L1 expression and pre-sensitisation
of the cells with Ganetespib prior to the addition of IFNγ increases the efficacy of the drug. A
16-hour treatment with 100nM of Ganetespib is more effective than a six-hour treatment. IFNγ
treatment re-localises the PD-L1 to the nucleus.

218
Figure 86 Ganetespib downregulates IFNγ induced PD-L1 expression.
(a) A375 cells were treated with either Ganetespib (100nM), DMSO or IFNγ (100 ng/ml) alone or
in combination for 16 hours. Cell lysates were prepared and analysed by Western blot. Total PD-
L1 was detected using rabbit monoclonal anti human PD-L1. (b) The cells were resuspended and
the mean fluorescence intensity (MFI) was measured using flow cytometry. Graphical
representation of MFI. (c) Cells were treated with a time course of IFNγ (100 ng/ml) at 0.5, 1 and
2 h prior to the addition of Ganetespib for 6 h. Total PD-L1 and IRF-1 were determined by Western
blot analysis. *Ganetespib pre-treated for 6 hours prior to the stimulation with IFNγ. The data are
representative of at least three independent experiments.
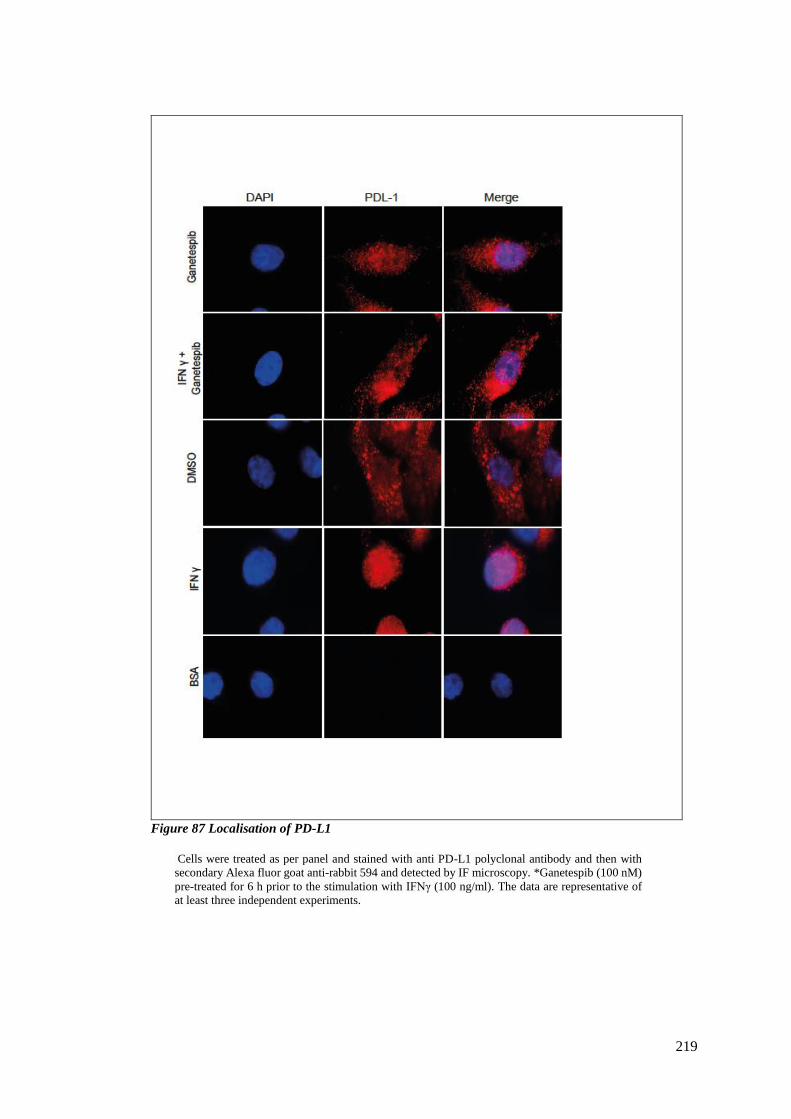
219
Figure 87 Localisation of PD-L1
Cells were treated as per panel and stained with anti PD-L1 polyclonal antibody and then with
secondary Alexa fluor goat anti-rabbit 594 and detected by IF microscopy. *Ganetespib (100 nM)
pre-treated for 6 h prior to the stimulation with IFNγ (100 ng/ml). The data are representative of
at least three independent experiments.
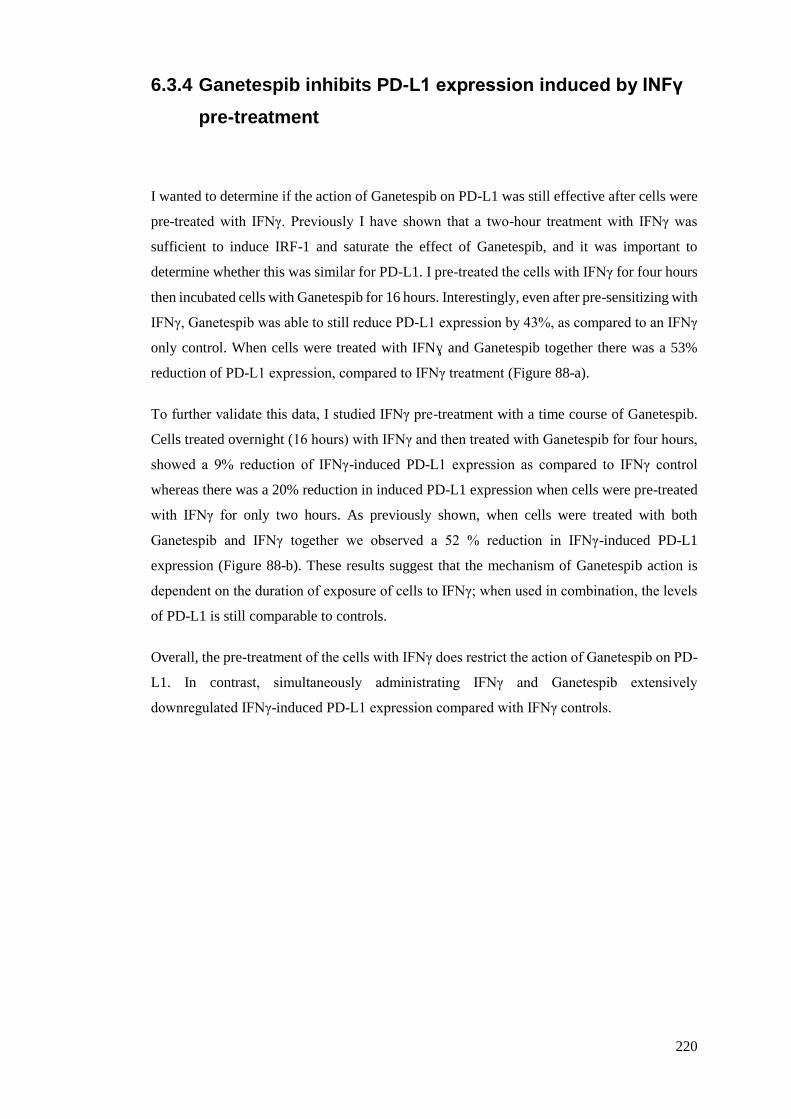
220
6.3.4 Ganetespib inhibits PD-L1 expression induced by INFγ
pre-treatment
I wanted to determine if the action of Ganetespib on PD-L1 was still effective after cells were
pre-treated with IFNγ. Previously I have shown that a two-hour treatment with IFNγ was
sufficient to induce IRF-1 and saturate the effect of Ganetespib, and it was important to
determine whether this was similar for PD-L1. I pre-treated the cells with IFNγ for four hours
then incubated cells with Ganetespib for 16 hours. Interestingly, even after pre-sensitizing with
IFNγ, Ganetespib was able to still reduce PD-L1 expression by 43%, as compared to an IFNγ
only control. When cells were treated with IFNɣ and Ganetespib together there was a 53%
reduction of PD-L1 expression, compared to IFNγ treatment (Figure 88-a).
To further validate this data, I studied IFNγ pre-treatment with a time course of Ganetespib.
Cells treated overnight (16 hours) with IFNγ and then treated with Ganetespib for four hours,
showed a 9% reduction of IFNγ-induced PD-L1 expression as compared to IFNγ control
whereas there was a 20% reduction in induced PD-L1 expression when cells were pre-treated
with IFNγ for only two hours. As previously shown, when cells were treated with both
Ganetespib and IFNγ together we observed a 52 % reduction in IFNγ-induced PD-L1
expression (Figure 88-b). These results suggest that the mechanism of Ganetespib action is
dependent on the duration of exposure of cells to IFNγ; when used in combination, the levels
of PD-L1 is still comparable to controls.
Overall, the pre-treatment of the cells with IFNγ does restrict the action of Ganetespib on PD-
L1. In contrast, simultaneously administrating IFNγ and Ganetespib extensively
downregulated IFNγ-induced PD-L1 expression compared with IFNγ controls.
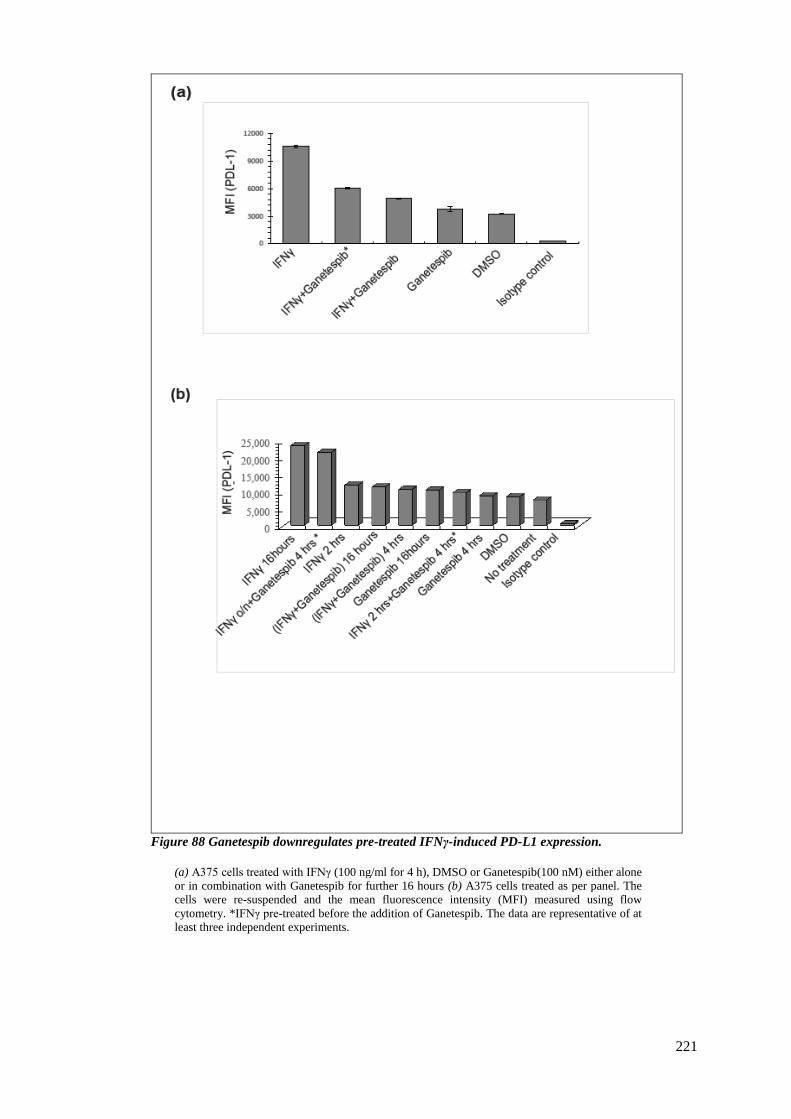
221
Figure 88 Ganetespib downregulates pre-treated IFNγ-induced PD-L1 expression.
(a) A375 cells treated with IFNγ (100 ng/ml for 4 h), DMSO or Ganetespib(100 nM) either alone
or in combination with Ganetespib for further 16 hours (b) A375 cells treated as per panel. The
cells were re-suspended and the mean fluorescence intensity (MFI) measured using flow
cytometry. *IFNγ pre-treated before the addition of Ganetespib. The data are representative of at
least three independent experiments.
222
6.3.5 Loss of PD-L1 is via an IRF-1-dependent pathway
In the previous chapter I have shown that Ganetespib can inhibit IRF-1 expression levels in
cancer cell lines such as A375, and have investigated the mechanism of loss of IRF-1. Here I
wanted to determine if PD-L1 downregulation was an IRF-dependent process.
I addressed this, first by using flow cytometric assays, in which I knocked down IRF-1
expression in cells using siRNA, and analysed membrane bound PD-L1 after IFNγ treatments.
My results indicated that knocking down IRF-1 using siRNA decreased PD-L1 expression by
~61%, compared to that in IFNγ treated control cells (Figure 89-a). This reduction in PD-L1
expression was similar to when IFNγ and Ganetespib were used in combination, indicating
that the loss of IRF-1 by Ganetespib was probably contributing towards the downregulation of
PD-L1. All the controls including the siRNA negative control gave low and similar PD-L1
expression.
Total PD-L1 protein after siRNA treatment was also assessed. The results supported the data
from flow cytometric analysis, indicating that the high levels of induced PD-L1 by IFNγ were
downregulated by the loss of IRF-1, as determined using immunoblotting of whole cell
extracts (Figure 89-b). Using IRF-1 siRNA I was able to knock down IRF-1 by approximityly
93%, compared to the DMSO control. When the cells were treated with Ganetespib after
siRNA treatment, knockdown of IRF-1 was >95%. In cells treated with IFNγ + IRF-1 siRNA,
PD-L1 protein expression was comparable to that in controls. Treatment with Ganetespib and
IRF-1 siRNA together resulted in here was significant loss of IRF-1 when compared to cells
treated with IRF-1 siRNA alone. IFNγ-induced IRF-1 levels were therefore downregulated by
the treatment of Ganetespib. To determine the effect of siRNA on IRF-1 intracellular
localisation I performed immunofluorescence. IFNγ treatment re-localised IRF-1 into the
nucleus, whereas treatment with IFNγ plus Ganetespib reduced the total IRF-1 but it was still
localised within the nucleus (Figure 90). IRF-1 knockdown using siRNA didn’t alter the
localisation of IRF-1, compared with control negative siRNA, DMSO or Ganetespib treated
cells. Although immunoblotting showed a significant effect of IRF-1 siRNA on IRF-1 protein
levels (lanes4 and 5), the difference was less evident by immunofluorescence. This could
reflect that the IRF-1 antibody used for immunofluorescence gave a weak signal and thus a
relatively poor signal to noise ratio. In conclusion, the results suggest that IRF-1 might stabilise
PD-L1 expression and that Ganetespib inhibits IFNγ-induced PD-L1 expression by inhibiting
IRF-1.
223
Figure 89 IFNγ-induced expression of PD-L1 is IRF-1 dependent
(a) A375 cells were treated as per panel. The cells were resuspended and the mean fluorescence
intensity (MFI) was measured using flow cytometry (b) A375 cells were treated with either control
siRNA or siRNA to IRF-1 (60nM) for 24 h and then treated as indicated on the panel. Total cell
lysates were analysed for PD-L1 or IRF-1 via Western blotting. (c) Quantification of results from
(b) using Image J.

224
Figure 90 IRF-1 localisation after IFNγ stimulation
(a) A375 cells were treated with either non-targeting control siRNA or siRNA to IRF-1 (60nM)
for 24 h and then treated as indicated on the panel. Cells were stained with anti-polyclonal IRF-1
antibody and secondary Alexafluor 594 goat anti rabbit and visualised by IF microscopy
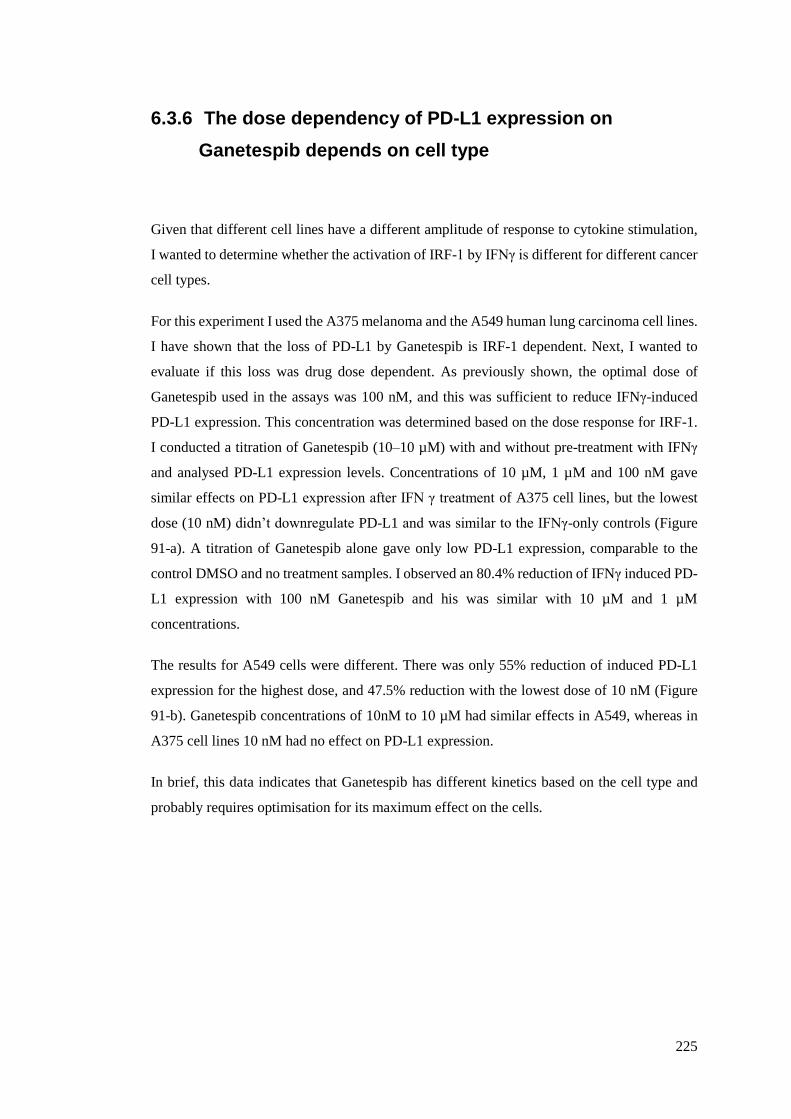
225
6.3.6 The dose dependency of PD-L1 expression on
Ganetespib depends on cell type
Given that different cell lines have a different amplitude of response to cytokine stimulation,
I wanted to determine whether the activation of IRF-1 by IFNγ is different for different cancer
cell types.
For this experiment I used the A375 melanoma and the A549 human lung carcinoma cell lines.
I have shown that the loss of PD-L1 by Ganetespib is IRF-1 dependent. Next, I wanted to
evaluate if this loss was drug dose dependent. As previously shown, the optimal dose of
Ganetespib used in the assays was 100 nM, and this was sufficient to reduce IFNγ-induced
PD-L1 expression. This concentration was determined based on the dose response for IRF-1.
I conducted a titration of Ganetespib (10–10 µM) with and without pre-treatment with IFNγ
and analysed PD-L1 expression levels. Concentrations of 10 µM, 1 µM and 100 nM gave
similar effects on PD-L1 expression after IFN γ treatment of A375 cell lines, but the lowest
dose (10 nM) didn’t downregulate PD-L1 and was similar to the IFNγ-only controls (Figure
91-a). A titration of Ganetespib alone gave only low PD-L1 expression, comparable to the
control DMSO and no treatment samples. I observed an 80.4% reduction of IFNγ induced PD-
L1 expression with 100 nM Ganetespib and his was similar with 10 µM and 1 µM
concentrations.
The results for A549 cells were different. There was only 55% reduction of induced PD-L1
expression for the highest dose, and 47.5% reduction with the lowest dose of 10 nM (Figure
91-b). Ganetespib concentrations of 10nM to 10 µM had similar effects in A549, whereas in
A375 cell lines 10 nM had no effect on PD-L1 expression.
In brief, this data indicates that Ganetespib has different kinetics based on the cell type and
probably requires optimisation for its maximum effect on the cells.
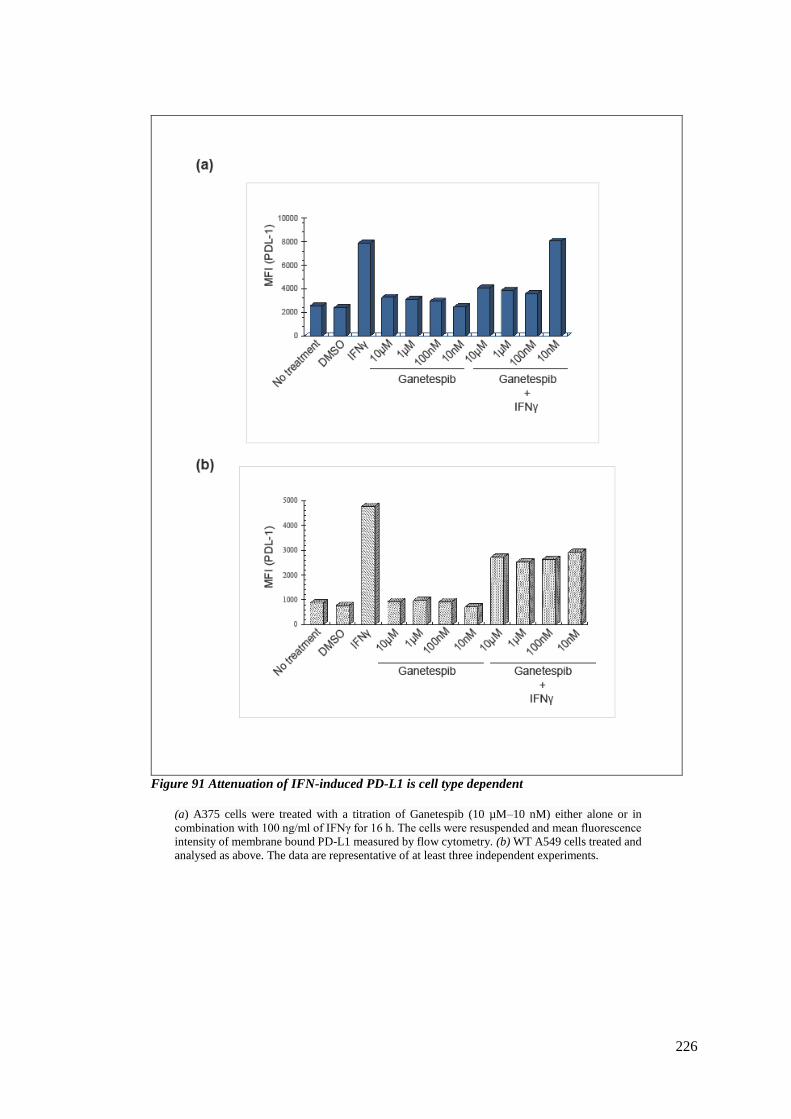
226
Figure 91 Attenuation of IFN-induced PD-L1 is cell type dependent
(a) A375 cells were treated with a titration of Ganetespib (10 µM–10 nM) either alone or in
combination with 100 ng/ml of IFNγ for 16 h. The cells were resuspended and mean fluorescence
intensity of membrane bound PD-L1 measured by flow cytometry. (b) WT A549 cells treated and
analysed as above. The data are representative of at least three independent experiments.
227
6.3.7 PD-L1 expression is regulated by the autophagy
protein ATG5
In the previous chapter I showed that down-regulation of IRF-1 by Ganetespib could be
associated with the proteasome activity. In this chapter I aimed to discover whether loss of
PD-L1 is linked to the autophagy pathway. When cell death is induced, Atg5 (an
E3 ubiquitin ligase) plays a supportive role in the apoptosis process, indicating its role in
autophagy/apoptotic cell death (Chandra B Lebovitz, 2015).
For this purpose I used three A549 cell lines: WT, KO (ATG5 CRISPR) and Rescue (ATG5
rescue) cell lines (Kind gift from Simon Wilkinson’s laboratory). In CRISPR rescue A549 cell
line, the ATG5 gene is replaced back into the cell KO line and there is a partial recovery of
the autophagic capacity of the cell (Wilkinson, personal communication).
In WT A549 cell lines, the levels of membrane surface-expressed PD-L1 was low in untreated
or DMSO treated cells compared to the ATG5 KO cells (Figure 92-a). When the cells were
treated with IFNγ + Ganetespib, the PD-L1 signal was downregulated by 43% in the WT A549
cells compared to the IFNγ-only treated cells. When ATG5 KO cells were treated with IFN γ
+Ganetespib, the cells were able to attenuate the PD-L1 expression by only 24% compared to
the IFNγ-only controls, indicating that Ganetespib inhibition of IFNγ –induced PD-L1
expression is ATG5-dependent. The isotype controls gave low PD-L1 expression levels
indicating very low non-specific binding of the flow cytometric PD-L1 antibody. When treated
with Ganetespib alone each cell lines gave PD-L1 expression comparable to the basal level
and only slight increase in expression as compared to DMSO control.
Downregulation of ATG5 gene expression upregulates PD-L1 in the KO cell lines, compared
to the WT. This indicates that ATG5 deletion might enhance pathways which upregulate PD-
L1 expression. Yang et al also demonstrated that deletion of ATG5 enhanced activation of the
IκB kinase (IKK)-related kinase TBK1 in vivo, which is associated with PD-L1 upregulation
(Yang S, 2016). The mechanism of action of Ganetespib might be via ATG5, hence knocking
the ATG5 gene out reduces the drugs ability to downregulate PD-L1 as compared to the WT
control. PD-L1 expression in the rescue cell lines revealed that when the cells were treated
228
with Ganetespib, PD-L1 expression was reduced by 34% as compared to the IFN γ alone
control .This range is higher than the knockout but still lower than the WT, suggesting there
is probably only partial recovery of ATG5 and hence not enough ATG5 gene in the system to
keep a tight control of regulation of PD-L1 expression.
The results suggest that the basal expression of PD-L1 is enhanced in the KO, suggesting
autophagy plays a role in normal turnover of PD-L1, however the Ganetespib effect could
partly involve autophagy in combination with IRF-1 dependent modulation of PD-L1 gene
expression; this requires further investigation. Therefore this data indicates that expression of
PD-L1 is ATG5 dependent and the loss of PD-L1 by Ganetespib could be via activation of
ATG5 gene.
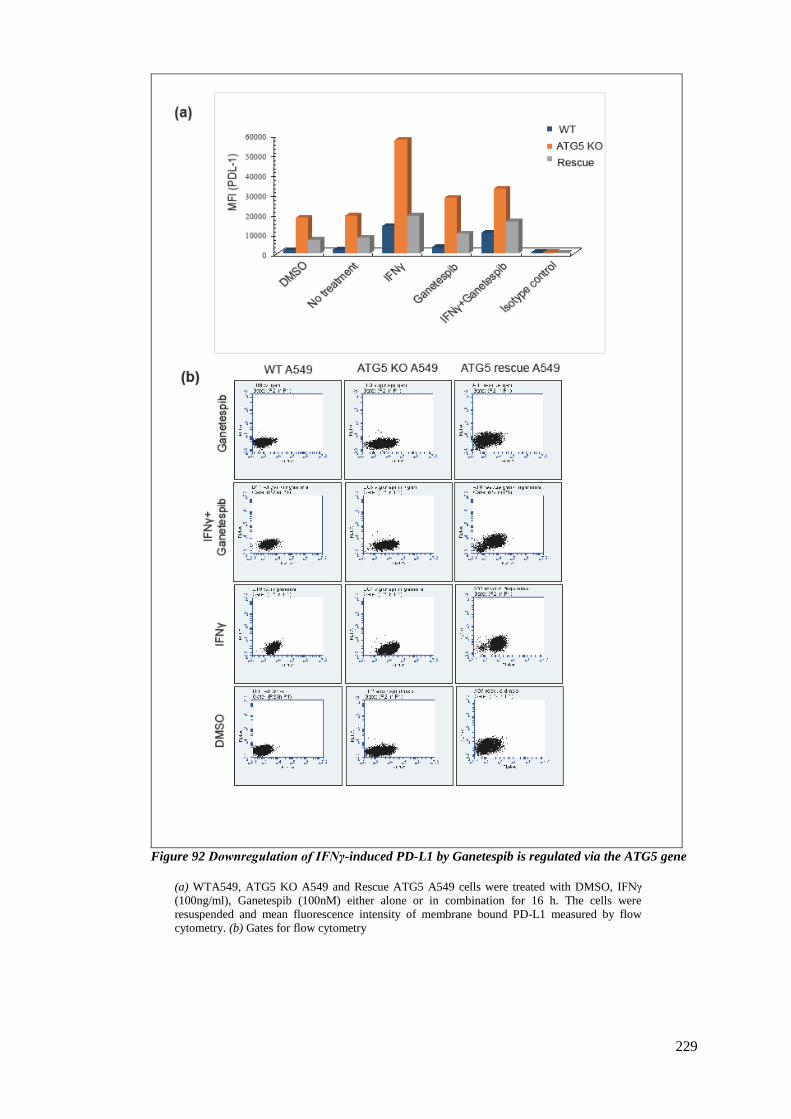
229
Figure 92 Downregulation of IFNγ-induced PD-L1 by Ganetespib is regulated via the ATG5 gene
(a) WTA549, ATG5 KO A549 and Rescue ATG5 A549 cells were treated with DMSO, IFNγ
(100ng/ml), Ganetespib (100nM) either alone or in combination for 16 h. The cells were
resuspended and mean fluorescence intensity of membrane bound PD-L1 measured by flow
cytometry. (b) Gates for flow cytometry
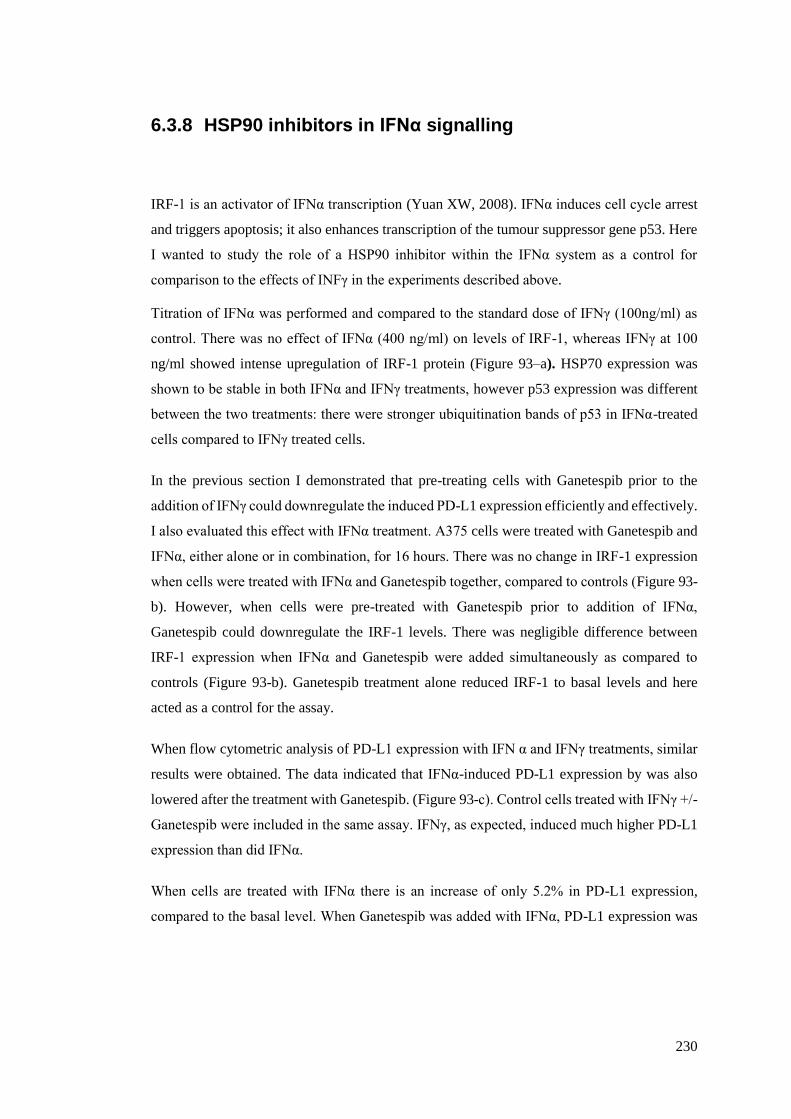
230
6.3.8 HSP90 inhibitors in IFNα signalling
IRF-1 is an activator of IFNα transcription (Yuan XW, 2008). IFNα induces cell cycle arrest
and triggers apoptosis; it also enhances transcription of the tumour suppressor gene p53. Here
I wanted to study the role of a HSP90 inhibitor within the IFNα system as a control for
comparison to the effects of INFγ in the experiments described above.
Titration of IFNα was performed and compared to the standard dose of IFNγ (100ng/ml) as
control. There was no effect of IFNα (400 ng/ml) on levels of IRF-1, whereas IFNγ at 100
ng/ml showed intense upregulation of IRF-1 protein (Figure 93–a). HSP70 expression was
shown to be stable in both IFNα and IFNγ treatments, however p53 expression was different
between the two treatments: there were stronger ubiquitination bands of p53 in IFNα-treated
cells compared to IFNγ treated cells.
In the previous section I demonstrated that pre-treating cells with Ganetespib prior to the
addition of IFNγ could downregulate the induced PD-L1 expression efficiently and effectively.
I also evaluated this effect with IFNα treatment. A375 cells were treated with Ganetespib and
IFNα, either alone or in combination, for 16 hours. There was no change in IRF-1 expression
when cells were treated with IFNα and Ganetespib together, compared to controls (Figure 93-
b). However, when cells were pre-treated with Ganetespib prior to addition of IFNα,
Ganetespib could downregulate the IRF-1 levels. There was negligible difference between
IRF-1 expression when IFNα and Ganetespib were added simultaneously as compared to
controls (Figure 93-b). Ganetespib treatment alone reduced IRF-1 to basal levels and here
acted as a control for the assay.
When flow cytometric analysis of PD-L1 expression with IFN α and IFNγ treatments, similar
results were obtained. The data indicated that IFNα-induced PD-L1 expression by was also
lowered after the treatment with Ganetespib. (Figure 93-c). Control cells treated with IFNγ +/-
Ganetespib were included in the same assay. IFNγ, as expected, induced much higher PD-L1
expression than did IFNα.
When cells are treated with IFNα there is an increase of only 5.2% in PD-L1 expression,
compared to the basal level. When Ganetespib was added with IFNα, PD-L1 expression was
231
reduced by 10.3%, bringing the total PD-L1 levels lower than the basal levels. Ganetespib
reduced the induced PD-L1 by 5.6% as compared to the levels of controls DMSO/no treatment.
In comparison, there was an 86% increase in PD-L1 expression with IFNγ, compared to
control untreated cells. There was about 41% reduction in the IFNγ-induced PD-L1 expression
when Ganetespib is used in combination. Ganetespib + IFNɣ treatment increases only 10% of
the PD-L1 expression when compared to DMSO control.
As shown in the former segment, PD-L1 loss was IRF-1 dependent. I wanted to determine if
IFNα-induced PD-L1 loss with Ganetespib treatment also followed the same pathway. There
was a 41.5% decrease in PD-L1 expression when IRF-1 was knocked down and a further 48%
decrease in IFNα-induced PD-L1 expression when compared to cells treated with IFNα alone
(Figure 93-d). There was only 10% drop in PD-L1 expression when Ganetespib was treated in
combination with IFNα, compared to the IFNα induced PD-L1. A slightly lower reduction was
obtained when IFNα + Ganetespib and siRNA to IRF-1 where used in combination. I observed
only 33.5% reduction of PD-L1 compared to IFN alpha only treated cells.
Overall I have shown that both the IFNα- and IFNγ-dependent pathways could be altered by
Ganetespib treatment, and the PD-L1 expression increased with both IFNs could be reduced
by Ganetespib. The above data demonstrates that HSP90 inhibition by treatment with drugs
such as Ganetespib causes a decrease in IRF-1 protein levels and this effect is not mediated
via inhibition of p53.
232
Figure 93 IFNα induced PD-L1 downregulation by Ganetespib
(a) A375 cells were treated with either titration of IFNα (100, 200 and 400ng/ml) or IFNγ
(100ng/ml) and the total cell protein analysed for IRF-1, p53 and HSP70 by Western blotting. (b)
Cells treated with either DMSO or IFNα with pre-treatment of Ganetespib and total cell lysate
analysed for IRF-1. (c) & (d) The cells were treated as the panel and the cells resuspended and
mean fluorescence intensity (MFI) of membrane bound PD-L1 measured by flow cytometry.
233
6.4 Discussion
HSP90 functions as an immune capacitor and maintains critical immune network components
of the IFNγ pathways. IFNγ has a central role in the immunologically active cancer phenotype
characterised by improved expression of IRF-1, and plays an important role in IFNγ-induced
apoptosis in tumour cells (Murtas D, 2013).HSP90 associates with signalling molecules
implicated in the aberrant survival of tumour cells, such as mutant and WT p53. HSP90 client
proteins that influence p53 stability include MDM2, the E3 ligase that directly ubiquitylates
and promotes the degradation of p53 (Olivier Ayraulta, 2009).
My results show that IRF-1 protein levels are upregulated, in a dose- and time-dependent
manner, when melanoma cells A375 are treated with IFNγ, and that this IFNγ induced IRF-1
expression is downregulated when the cells were treated with an HSP90 inhibitor drug
(Ganetespib). MDM2 expression levels in non-treated A375 cell lines were low, and treatment
with IFNγ did not alter protein levels. The downregulation of IRF-1 increased the expression
levels of MDM2 when the cells were treated with Ganetespib either alone or in combination
with IFNγ. I also observed marginally stronger bands for ubiquitinated p53 in Ganetespib
treated cells. Ganetespib could be altering the interaction between MDM2 and p53, thereby
increasing the total available p53 in the cells.
There was an induction of HSP70 with Ganetespib implying the inhibition of HSP90. Lazenby
et al. have shown that upregulation of HSP70 is a cytoprotective function in response to hp90
inhibition by sustained induction of the HSP transcription factor HSF1 (M. Lazenby,
2015).The IFNγ titration assays have shown that incubating cells with 100ng/ml for 1 hour
induces IRF-1 is sufficient to induce IRF-1, and Ganetespib could downregulate IRF-1 even
after a 4-hour IFNγ induction, at the highest doses of IFNγ, (400ng/ml) at four hours. These
data suggest that Ganetespib activity was potent and robust. However, IFNγ doesn’t suppress
Ganetespib at 400ng/ml for 4 hours or 100ng/ml for 16 hours. Study of the localisation of IRF-
1 with IFNγ titration indicated that IRF-1 expression increased with the duration of IFNγ
treatment and extended duration resulted in IRF-1 localisation from the cytoplasm to the
nucleus. Blocking the proteasome made no difference to the localisation of IRF-1; possibly
the cells required a longer treatment with MG132 for efficient proteasome inhibition.
Blocking checkpoints that allow cancer cells to evade patients’ immune responses holds great
promise for achieving durable antitumour responses. In the tumour microenvironment,
234
research has been focused on blockading the PD-1/PD-L1 pathway, and in the lymph nodes
the focus has been on blocking the CTLA-4 pathway (O'Byrne, 2015). A substantial proportion
of human melanomas harbour IFNγ-producing macrophages, and thereby have upregulated
PD-L1 expression. (Hatem Soliman, 2014) .I have found that Ganetespib downregulated IFNγ-
induced PD-L1 expression, and this was downregulated even further if cells were pre-
sensitised with Ganetespib prior to addition of IFNγ. This could indicate that inhibition of
HSP90 blocks the IFN system. With IFNγ treatment, PD-L1 was localised to the nucleus,
whereas in Ganetespib treated cells PD-L1 was localised to the cytoplasm and membrane. The
IFNγ time course didn’t significantly change the total PD-L1 expression in the cells. Pre-
sensitising cells with IFNγ prior to treatment with Ganetespib also resulted in downregulated
PD-L1 expression but to a lesser extent than when treatments were applied at the same time.
Similar results were obtained from the Ganetespib time course with IFNγ pre-treatment. This
indicates that there is probably a threshold of IFNγ which Ganetespib can endure, beyond
which it suppresses Ganetespib drug action but still lowers PD-L1 to lesser extent. Hence
Ganetespib action depends on how long cells are pre-sensitised with IFNγ prior to drug
treatment for effective downregulation of PD-L1. Su –kil et al. demonstrated that an
antitumour drug can suppress IFNγ-elicited PD-L1 expression by inhibiting IRF-1
transcription via the Jak/STAT signalling pathway (Su-Kil Seo a, 2013).
My results also indicate that downregulation of PD-L1 is regulated by IRF-1. This was
confirmed by knocking down IRF-1 cells and analysing the expression of total and membrane
surface bound PD-L1 by Western blotting and flow cytometry respectively. Knockdown of
IRF-1, by siRNA, downregulated PD-L1 expression, both alone and in combination with IFNγ
treatment, suggesting that downregulation of PD-L1 is in an IRF-1-dependent pathway, or that
IRF-1 could be stabilising PD-L1. Figure 94a demonstrates the effects of interferon on IRF-1
and expression levels of PD-L1, and Figure 94b summaries the potential effects Ganetespib
might have on tumour cells after downregulating PD-L1 expression.
IRF-1 localisation after treatment with IRF-1-targeting siRNA revealed lower expression of
IRF-1, and this effect was increased when cells were treated with both Ganetespib and siRNA
against IRF-1. With siRNA the IRF-1 was more cytoplasmic while with IFN treatment, IRF-
1 was tightly nuclear localised. A high expression of IRF-1 was observed with IFN γ when
compared to DMSO control. IRF-1 is known to have tumour suppressive properties, and IRF-
2 expression correlates with its role opposing IRF-1 effects. Subtle differences in IRF-1/IRF-
2 ratios or posttranslational modification may determine the fate of a cancer cell (JUDITH M.
CONNETT, 2005).
235
To determine if the effects of Ganetespib were cell type dependent we used two different cell
lines: the A375 (melanoma) cell line that has high basal level of PD-L1 and A549 (lung
carcinoma) that has a low PD-L1 expression. Both cell lines have WT-p53. Ganetespib
downregulated PD-L1 at the higher doses in both cell lines. At low doses (10 nM) Ganetespib
downregulated PD-L1 in A375 to a lesser extent than in A549 cell lines. This could be due to
the higher basal levels of PD-L1 in A375 cells. It could also be due to the variable genetic
mutations in the two cancer cell lines, such as higher levels of STAT1 and lower levels of
IRF2 expression. A549 cells also have an activated RAS mutation, which might contribute to
alterations between the melanoma and lung cancer cell line. Both IFNs α and γ are used to
treat cancer patients. p53 plays a pivotal role in IFNα-induced apoptosis through
transcriptional activation of CD95. In contrast, IFNγ induces apoptosis in a p53-independent
manner. CD95 and IRF-1 are directly upregulated by IFNγ, leading to caspase activation and
IFNγ-induced apoptosis. (Porta C, 2005)
I tested the effects of Ganetespib on cell lines treated with IFNα. When A375 cell lines were
treated with IFNα there was no significant induction of IRF-1. Interestingly there was more
ubiquitination of p53 in cells treated with IFNα than with IFNγ. STAT1 is a key mediator of
the IFNα-induced pathway. It can promote elevation of p53 protein levels through
downregulating MDM2 and increasing apoptosis in response to DNA damage. IRF-1 has been
reported to participate in modulating p53 activity in response to DNA damage (Yuan XW,
2008). Pre-sensitising the cells with Ganetespib prior to the addition of IFNα does
downregulate IRF-1 compared to the controls.
From these experiments, both IFNα and IFNγ pathways could be altered using Ganetespib, but
the PD-L1 expression induced by IFNα was reduced by Ganetespib to a lesser extent then that
induced by IFN γ. When A375 cells were treated with nutlin (MDM2 antagonist) there was an
increase in PD-L1 expression compared to the basal level. There was a drop in this expression
level when cells were treated with nutlin together with Ganetespib. This indicated that nutlin
had an Antagonist effect with Ganetespib on PD-L1 expression levels. Vaseva et al. have also
demonstrated that HSP90 inhibitors (17AAG) destabilised MDM2 and synergized with nutlin
to induce apoptosis (A V Vaseva, 2011).
Autophagy is a self-digesting process that is primarily accountable for the eradication and
recycling of long-lived proteins and damaged organelles to maintain the homeostasis of the
cell. Tumour cells employ autophagy to seize and degrade damaged cell contents to provide
energy and promote cell survival. ATG5 is an E3 ubiquitin ligase, which is necessary
236
for autophagy (Takeshi Matsuzawa E. F., 2013). IFNγ induces autophagy through the IRF-1
signalling pathway and the induction of autophagy contributes to the growth-inhibitory effect
of IFNγ with cell death in human cancer cells. (Chandra B Lebovitz, 2015)
To determine whether downregulation of PD-L1 was mediated by autophagy via ATG5 we
used A549 ATG5 null, rescue and WT cell lines. In WT A549 cells the basal PD-L1 expression
is low compared to that in ATG5 KO cell lines. IFNγ induced PD-L1 expression to a greater
extent in KO cells compared to WT cells. In the rescue cell lines, IFNγ-induced PD-
L1expression is lower than in the KO but still higher than in WT cells. This might be due to
the partial, rather than complete rescue of ATG5 gene. Interestingly, the same trend is followed
when all three cell lines were treated with Ganetespib + IFNγ; Ganetespib reduced the induced
PD-L1 expression to a different extent in each line. These results indicate that ATG5 gene
regulates PD-L1 expression and its loss has a synergistic effect on Ganetespib in
downregulating PD-L1 expression. IFNγ-induced expression of PD-L1 is dependent on
ATG5.
Conclusion
The demonstration that immune checkpoint inhibition can meaningfully improve outcomes
for cancer patients has transformed the field of immuno-oncology. Accumulating evidence
suggests that tumour-based HSP90 inhibition can directly influence, and is compatible with,
T-cell–mediated antitumour immunity and may promote enhanced tumour surveillance and
recognition through exploitation of client protein-dependent and -independent mechanisms
(Tsirigotis P, 2016) (Proia DA K. G., 2015).Ganetespib has also shown to have synergistic
effect with other drugs when used in mutant EGFR driven xenograft tumours where the
combination treatment resulted in significant tumour regressions (Proia DA K. G., 2015).
Although HSP90 inhibitors have a high therapeutic value with limited effects on normal cells,
they have been described to inhibit dendritic cell function. Therefore, these observations
demonstrate the need to closely monitor immune function in patients being treated with an
HSP90 inhibitor.HSP70 plays a crucial role in antigen cross-presentation from treated tumour
cells and is normally indicated as a tumour promoter.
As HSP90 inhibitors causes induction of HSP70, using HSP90 inhibitors in combination with
HSP70 inhibitors or blockers could solve this issue. Lin et al. demonstrated that HSP90
inhibitors downregulated overexpressed mutant p53 and upregulated WT p53. The
upregulation of WT p53 was accompanied by downregulation of MDM2.

237
In summary, our findings reveal important consequences of inhibiting HSP90 in cancer cells
and strongly support the therapeutic evaluation of HSP90 inhibitors in poor-prognosis patients
with p53 defects.
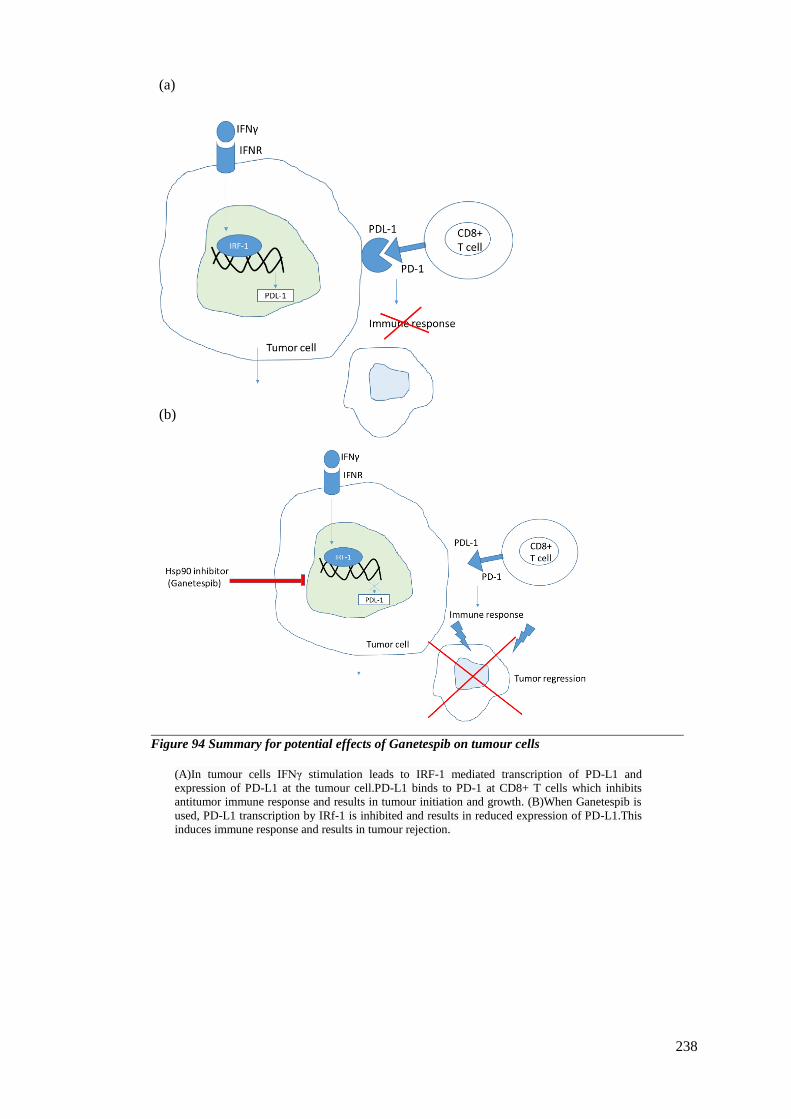
238
(a)
(b)
Figure 94 Summary for potential effects of Ganetespib on tumour cells
(A)In tumour cells IFNγ stimulation leads to IRF-1 mediated transcription of PD-L1 and
expression of PD-L1 at the tumour cell.PD-L1 binds to PD-1 at CD8+ T cells which inhibits
antitumor immune response and results in tumour initiation and growth. (B)When Ganetespib is
used, PD-L1 transcription by IRf-1 is inhibited and results in reduced expression of PD-L1.This
induces immune response and results in tumour rejection.
239
7 Conclusion and future work
Since the early 2000s, there has been renewed interest in the development of Hsp90 inhibitors
in oncology, with more than 15 compounds currently under evaluation in clinical trials. As we
enter the era of targeted therapy and personalised medicine, development of biomarkers to
help select the most appropriate patient population for a specific therapy is key. HSP90 tumour
expression, as the main target of these drugs, might seem a suitable strategy to select patients
most likely to benefit. The advantage of HSP90 inhibitors may lie precisely in their pleiotropic
activity. The dual inactivation cell cycle checkpoints, but not nucleases, by HSP90 inhibition
results in a highly effective chemosensitization. Various HSPs are nowadays considered
biomarkers of carcinogenesis, and their expression is correlated with the degree of
differentiation and aggressiveness of certain tumors(Rappa F, 2012) (Daniela Kramer, 2017)
(esfahani K, 2015).
Canine OSA data analysis indicated that the highest rate of mutations was observed in
chromosome 1 and the majority of the mutations being SNV (single nucleotide variations) .In
canine OSA RBM10, which acts like a tumour suppressor, was observed to be mutated.. Gene
sequencing revealed a deletion in CCNB1IP1 which is correlated significantly with relevant
prognostic factors, and with clinical outcome (Confalonieri S, 2009). IRF-1, CDKN2A and
HSP90ab1 all expressed with an SNV. These all form drugable target pathways that could be
used in our strategy to match drug leads to mutated expressed pathways. There were 74 genes
shortlisted based on expressed mutations and mass spectrometric analysis. We approached the
use of genetics to identify drugable pathways as a personalized approach by focussing on the
p53 and HSP90/IRF1 pathways. I aimed to define the global mechanism of how these drugs
might function in signal transduction, to identify potential novel biomarkers that could be used
to measure drug-responsiveness in canine cancer biopsies in the future. The majority of the
upregulated canine proteins belonged to chaperone functions and a minority to heat shock
activity.
WDR-75 and HYPK are overexpressed in many cancers and hence its downregulation with
Ganetespib is of clinical importance. Therefore the downregulation of these proteins with
Ganetespib proved of great therapeutic benefit. Two proteins, ATPB and HTPG, were
downregulated with nutlin . Pendharkar and group demonstrated that ATPB serves as a bio
signature for breast cancer. ATPB is also a potential biomarker and therapeutic target for the
immunotherapy of various cancers. (Lu ZJ1, 2009) (Pendharkar N, 2016). Hence
downregulation of ATPB by Nutlin could be of great potential in therapy.
240
Zhang F and group also demonstrated that ALDOA could contribute to the progress of cancer,
at least partially through its association with genes relevant to cell cycle independent of
glycolysis. (Zhang F, 2017). Thus ALDOA represents a potential new signature for
development and prognosis in several cancers, and its downregulation with drugs such as
Ganetespib would be advantageous. RanGTP was another protein downregulated with
Ganetespib. Yeun HF and group demonstrated that Ran is required for, and is a potential
therapeutic target of, Myc-driven cancer progression in both breast and lung cancers (Yuen
HF, 2013). Hence Ran downregulation with Ganetespib could be vital in the therapy of various
cancer types. Two other proteins shown to be upregulated with nutlin, and common between
the two biological duplicates, were PRDX3 and GSPT1 .PRDX3 seems to confer increased
treatment resistance and aggressive phenotypes. PRDX3 has substantial clinical impact on the
progression of cancers (Zhang H, 2017) (Pendharkar N, 2016).
As is the case with all targeted therapies, there is a pressing need to develop companion
diagnostics such as canine models or predictive biomarkers to better select patients who might
derive the most benefit from ganetespib therapy. My study provides evidence that Ganetespib
exhibits biological activity in a relevant large animal model of cancer. Given the similarities
of canine and human cancers with respect to tumour biology and HSP90 activation, it is likely
that Ganetespib will demonstrate comparable anti-cancer activity in human patients. In
summary my data indicated that the OSA31 cell line shows responsiveness to Nutlin-3
resulting in activation of p53 and also shows responsiveness to Ganetespib as defined by
induction of HSP70, downregulation of IRF1, and induction of the HSP70-MDM2 protein
complex. The results also indicate that genes that code for the proteins targets of most
successful drugs, or are highly specific for osteosarcoma, are quite evolutionarily conserved
between human and canines.
My results from melanoma cell lines indicated that there is increased expression of MDM2
with Nutlin, and p53 is stably monoubiquitinated, following activation by Nutlin-3. My results
also suggested using pARF inhibition to overcome the effect of nutlin-3 on p53 ubiquitination
through a process that involves MDM2. I have demonstrated that Ganetespib can be effective
for Ewing sarcoma, and could be used either alone or in combination with other treatments.
Since the drug does not require functional p53 to lower EWS-FLi1, Ganetespib could
potentially be used for both WT and mutant p53 sarcomas. My results indicate that there is a
novel interaction between HSP/C70 and MDM2, and this interaction is stabilised with
241
Ganetespib. I have also shown that there is a potential synergistic effect on HSP90 client
proteins when Ganetespib and Nutlin are used in combination.
The proteomic analysis of melanoma cell lines using TMT mass spectrometry emphasised the
importance of combinatorial treatment in cancer and how different proteins respond the drugs
used. Overall I observed the downregulation of EPHA2 protein with Ganetespib which possess
clinical importance in therapy. I also demonstrated the overexpression of RPS27L protein
which is a positive prognosis in tumour regression. Combinatorial treatment using Ganetespib
and Nutlin downregulated CDK1 which would help in the reduction of tumour growth as
CDK1 is associated with tumour proliferation. On the contrary, combinatorial treatment also
increased PIG3 which is regarded a biomarker for certain cancer types such thyroid cancer.
Hence it is essential to regulate and optimise combinatorial treatment for each cancer type and
personalise the treatment as per patient gene and protein profile.
I have showed that Ganetespib is a more potent effector of IRF-1 than 17AAG at a given dose
in the nanomolar concentration range .My result indicates that the loss of IRF-1 with
Ganetespib treatment is a p53 independent mechanism. This feature makes Ganetespib a
versatile treatment, as it has the potential to modulate IRF-1 in both WT and p53 mutant
cancer cell backgrounds. My results suggest that MDM2 is specifically associated with
HSC70, rather than HSP70, as expected, in cells where HSP90 has been inhibited. However,
neither of the known IRF-1 E3-ligases are responsible for IRF-1 degradation and inhibition of
the autophagy pathway, if anything, enhances rather than attenuates the effect of Ganetespib
on IRF-1 protein levels. Together the data therefore suggest that IRF-1 is degraded by a novel
Ganetespib-sensitive pathway.
The immuno-oncology landscape is presently undergoing a major transformation due to
advancements in immunotherapeutic drug development, best exemplified by the clinical
introduction of targeted biologics against the CTLA-4 and PD-1/PD-L1 immune checkpoints.
(David A. Proia 2015).This inhibition of PDL1 is likely responsible for the ability of the MHC
II vaccines to efficiently activate and maintain tumor-specific effector T cells and suggests
new therapeutic avenues for preventing tumor cell PDL1-induced immune suppression (Haile
ST, 2011). Blocking checkpoints that allow cancer cells to evade patients’ immune responses
holds great promise for achieving durable antitumour responses. I have found that Ganetespib
downregulated IFNγ-induced PD-L1 expression, and this was downregulated even further if
cells were pre-sensitised with Ganetespib prior to addition of IFNγ. My results also indicate
that downregulation of PD-L1 is regulated by IRF-1. The results also indicate that ATG5 gene
242
regulates PD-L1 expression and its loss has a synergistic effect on Ganetespib in
downregulating PD-L1 expression. IFNγ-induced expression of PD-L1 is dependent on
ATG5.
Synergistic combinatorial benefit between HSP90 inhibitors and taxanes (antimitotic agents)
has been described in different cancer models, suggesting that their nonoverlapping but
complementary mechanisms of action are conserved across tumor types.(Yifan Wang,
2016).HSP inhibitors could act as potential sensitisers for many anticancer drugs that would
otherwise have limited therapeutic efficacy. Clinically, HSP inhibition will probably have the
greatest effect in tumours addicted to particular driver oncogene products that are sensitive
HSP90 clients. Moreover, studies have suggested that in tumours, HSP90 forms
multichaperone, biochemically distinct complexes that specifically interact with oncogenic
proteins and have higher affinity than HSP90 in normal tissues for specific small-molecule
inhibitors. (Rocio Garcia-Carbonero, 2013) (Ganji Purnachandra Nagaraju, 2016) (Garcia-
Carbonero R, 2013).My results also show beneficial antagonistic activity of Ganetespib and
nutlin when treated together. Melanoma cancer cell lines, though very powerful tools to study
this disease at the molecular and cellular biology levels, are clearly incomplete models.One
cannot be expected to accurately gauge the effect of inhibitors on a complex tumor
microenvironment in a monolayer of cancer cells, or be able to extrapolate the effect of
inhibitors on distal metastatic sites. My data also suggest that using better models suchas
canine would help to develop personalized medicine.(Komal Jhaveri, 2015)
Future work:
For the canine model further experiments have to be performed to validate and confirm the
potential vaccine list. Cell based assays on molecular biology for the selected lead targets
should be conducted to authenticate the DNA and RNA seq data. The validated vaccine list
could potentially be used as vaccine trials on canine. However, there are so many mutations
identified for this one patient’s tumour that orthogonal assays need to be performed in order
to stratify the mutated genes and to focus on developing potential therapeutic strategies.
Although HSP90 inhibitors have a high therapeutic value with limited effects on normal cells,
they have been described to inhibit dendritic cell function. Therefore, these observations
demonstrate the need to closely monitor immune function in patients being treated with an
HSP90 inhibitorThe anticancer effects of Hsp90 inhibitor have been well studied in malignant
cells, but their impact on human effector cells has not been well characterized. Several studies
243
have shown that Hsp90 inhibition leads to a significant and irreversible decrease in expression
of critical Ags on human T lymphocytes at protein and mRNA levels. Therefore, these results
suggest that Hsp90 inhibition disrupts functional activities of both T lymphocytes and NK
cells, and highlights the relevance of potential impact of Hsp90 inhibitors on effector cell
function in cancer patients during clinical trials (Jooeun Bae, 2013).Hence, future experiments
particularly T cell assays to determine the effect of Ganetespib on T cell killing, would be
vital.
Based on the autophagy and Ganetespib data it would be interesting to evaluate if the
downregulation of IRF-1 is via autophagy pathway. For this purpose further experiments such
as to check for the co-localisation of Lamb2A and IRF-1 using immunofluorescence would be
valuable. This would help us to confirm if the downregulation of IRF-1 is via chaperon
mediated autophagy (CMA).The role of lamp2A and HSC70 in CMA is mentioned in Figure
95.Also, repeating the autophagy experiment with alterative autophagy inhibitor such as
bafilomycin which is known to inhibit late phase of autophagy when compared to chloroquine.
While the challenge remains to identify which specific client proteins may ultimately serve as
predictive biomarkers for those cancers likely to respond to HSP90 inhibitor treatment, my
findings underscore the therapeutic potential of Ganetespib for treatment of metastatic disease
in patients with specific biomarkers (David Proia, 2014).In summary, our findings reveal
important consequences of inhibiting HSP90 in cancer cells and strongly support the
therapeutic evaluation of HSP90 inhibitors in poor-prognosis patients with p53 defects.
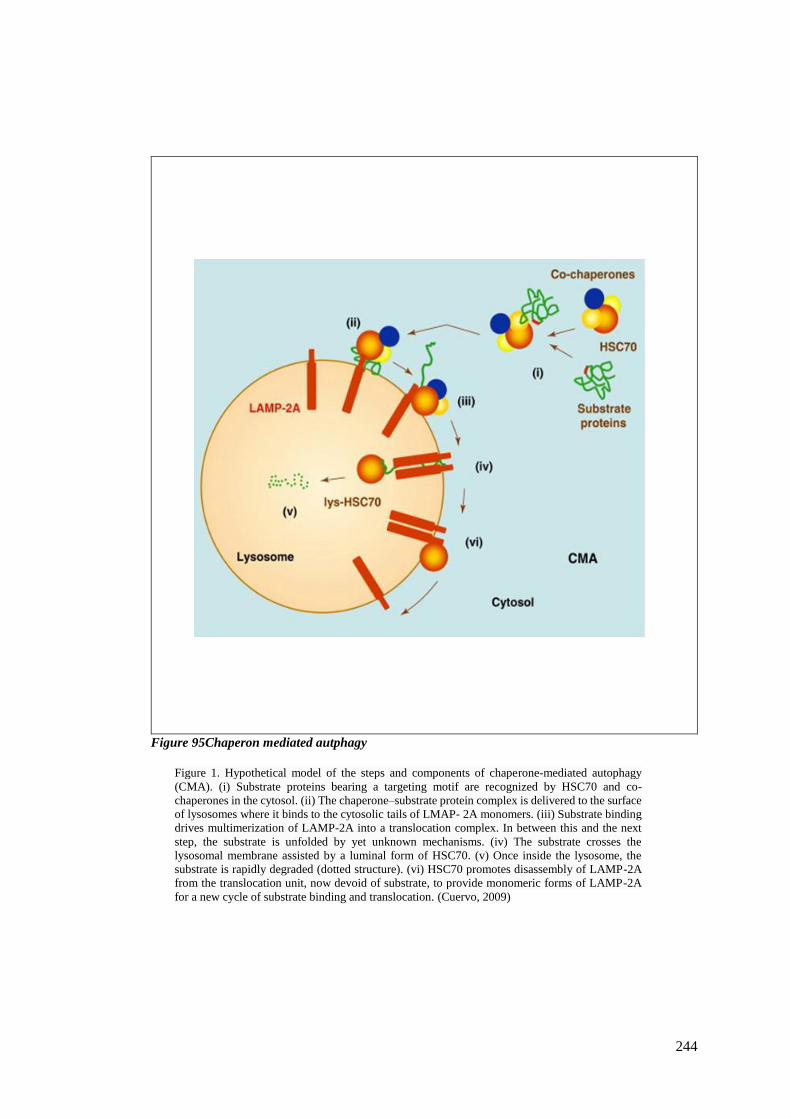
244
Figure 95Chaperon mediated autphagy
Figure 1. Hypothetical model of the steps and components of chaperone-mediated autophagy
(CMA). (i) Substrate proteins bearing a targeting motif are recognized by HSC70 and co-
chaperones in the cytosol. (ii) The chaperone–substrate protein complex is delivered to the surface
of lysosomes where it binds to the cytosolic tails of LMAP- 2A monomers. (iii) Substrate binding
drives multimerization of LAMP-2A into a translocation complex. In between this and the next
step, the substrate is unfolded by yet unknown mechanisms. (iv) The substrate crosses the
lysosomal membrane assisted by a luminal form of HSC70. (v) Once inside the lysosome, the
substrate is rapidly degraded (dotted structure). (vi) HSC70 promotes disassembly of LAMP-2A
from the translocation unit, now devoid of substrate, to provide monomeric forms of LAMP-2A
for a new cycle of substrate binding and translocation. (Cuervo, 2009)
245
8 Bibliography
(2017). Retrieved from https://www.otogenetics.com/.
A V Vaseva, A. R. (2011). Blockade of Hsp90 by 17AAG antagonizes MDMX and synergizes
with Nutlin to induce p53-mediated apoptosis in solid tumors. Cell Death and Disease.
Abroun S, S. N. (2015). STATs: An Old Story, Yet Mesmerizing. cell.
Acquaviva J, H. S. (2014). . mTOR Inhibition Potentiates HSP90 Inhibitor Activity via
Cessation of HSP Synthesis. . Molecular cancer research :.
Acquaviva J, H. S. (2014). FGFR3 Translocations in Bladder Cancer:Differential Sensitivity
to HSP90 Inhibition Based on Drug Metabolism. . Molecular cancer research :.
Acquaviva J, S. D. (2012). Targeting KRAS-Mutant Non-Small Cell Lung Cancer with the
Hsp90 Inhibitor Ganetespib. Molecular cancer therapeutics .
Acquaviva J, S. D. (2014). Overcoming acquired BRAF inhibitor resistance in melanoma via
targeted inhibition of Hsp90 with ganetespib. . Molecular cancer therapeutics .
Addeo, R. (2017). A new frontier for targeted therapy in NSCLC: clinical efficacy of
pembrolizumab in the inhibition of programmed cell death 1 (PD-1). Expert Rev
Anticancer Ther.
Alexandrova, E. M. (2015). Improving survival by exploiting tumour dependence on stabilized
mutant p53 for treatment. nature.
Al-Lazikani, B. (2012). Combinatorial drug therapy for cancer in the post-genomic era. nature
biotechnology.
Amaravadi, R. (2016). Recent insights into the function of autophagy in cancer. GENES &
DEVELOPMENT.
Angstadt, A. Y. (2012). A genome-wide approach to comparative oncology: high-resolution
oligonucleotide aCGH of canine and human osteosarcoma pinpoints shared
microaberrations. cancer genetics.
Ayraulta, O. (2009). Inhibition of Hsp90 via 17-DMAG induces apoptosis in a p53-dependent
manner to prevent medulloblastoma. PNAS.
246
Bae J, M. A. (2013). Heat shock protein 90 is critical for regulation of phenotype and
functional activity of human T lymphocytes and NK cells. journal of immunology.
Ballestar, E. a. (2008). Epigenetic gene regulation in cancer. Adv Genet.
Bansal H, B. S. (2010). Heat shock protein 90 regulates the expression of Wilms tumor 1
protein in myeloid leukemias. Blood .
Bansal H, Y. Q. (2014). WTAP is a novel oncogenic protein in acute myeloid leukemia. .
Leukemia .
Bartl, S. e. (2003). Did the molecules of adaptive immunity evolve from the innate immune
system? Integr Comp Biol , . 43: p. 338–346.
Behl, C. (2016). Breaking BAG: The Co-Chaperone BAG3 in Health and Disease. trends in
pharmacological science.
Beloueche-Babari, M. (2010). Modulation of melanoma cell phospholipid metabolism in
response to heat shock protein 90 inhibition. oncotarget.
Bendle GM, H. A. (2004). Induction of unresponsiveness limits tumor protection by
adoptively transferred MDM2-specific cytotoxic T lymphocytes. Cancer research.
Bileck A1, M. R.-M. (2017). Evaluation of inflammation-related signaling events covering
phosphorylation and nuclear translocation of proteins based on mass spectrometry
data. journal of proteomics.
Bray, J. P. (2014). Canine Soft Tissue Sarcoma Managed in First Opinion Practice: Outcome
in 350 Cases. Veterinary Surgery.
Bresler, S. C. (2016). Gene expression profiling of anti-CTLA4-treated metastatic melanoma
in patients with treatment-induced autoimmunity. Laboratory Investigation.
Bu N, W. H. (2015). Exosome from chaperone-rich cell lysates-loaded dendritic cells
produced by CELLine 1000 culture system exhibits potent immune activity.
biochemical and biophysical research communications.
Buferne M, C. L.-V.-A. (2015). IFNγ producing CD8+ T cells modified to resist major
immune checkpoints induce regression of MHC class I-deficient melanomas.
oncoimmunology.
247
Burch, L. S. (2004). Expansion of protein interaction maps by phage peptide display using
MDM2 as a prototypical conformationally flexible target protein. J Mol Biol ,
337,129-145.
Camicia R, B. S. (2013). BAL1/ARTD9 represses the anti-proliferative and pro-apoptotic
IFNγ-STAT1-IRF1-p53 axis in diffuse large B-cell lymphoma. journaal of cell
science.
Castle, J. e. ( 2014.). Mutated tumor alleles are expressed according to their DNA frequency.
. Sci Rep,.
Chandra B Lebovitz, A. G. (2015). Cross-cancer profiling of molecular alterations within the
human autophagy interaction network. autophagy.
Chang L, N. J. (2017). Identification of protein biomarkers and signaling pathways associated
with prostate cancer radioresistance using label-free LC-MS/MS proteomic approach.
Sci Rep.
Cherukuri Sudhakar, V. V. (2013). IRF-1-binding site in the first intron mediates interferon-
c-induced optineurin promoter activation. Biochemical and Biophysical Research
Communications.
Cheryl A London, M. D. (2011). Phase I Evaluation of STA-1474, a Prodrug of the Novel
HSP90 Inhibitor Ganetespib, in Dogs with Spontaneous cancer. Plos one.
Chi, J.-T. (2012). Comparison of genomics and functional imaging from canine sarcomas
treated with thermoradiotherapy predicts therapeutic response and identifies
combination therapeutics. Clin Cancer Res.
Chiang HL, T. S. (1989). A role for a 70-kilodalton heat shock protein in lysosomal
degradation of intracellular proteins. science.
Chiara Gasparinia, A. T. (2012). The MDM2 inhibitor Nutlin-3 modulates dendritic cell–
induced T cell proliferation. Human Immunology.
Christine Mall, G. D. (2016). Repeated PD-1/PD-L1 monoclonal antibody administration
induces fatal xenogeneic hypersensitivity reactions in a murine model of breast cancer.
OncoImmunology.
248
Christoph H. Emmerich, P. C. (2015). Optimising methods for the preservation, capture and
identification of ubiquitin chains and ubiquitylated proteins by immunoblotting.
Biochemical and Biophysical Research Communications.
Colvin TA, G. V. (2014). Hsp70-Bag3 interactions regulate cancer-related signaling networks.
cancer research .
Confalonieri S, Q. M. (2009). Alterations of ubiquitin ligases in human cancer and their
association with the natural history of the tumor. oncogene.
Connett JM, B. L. (2005). Interferon regulatory factor 1 (IRF-1) and IRF-2 expression in breast
cancer tissue microarrays. journal of interferon and cytokine research.
Copur MS, R. R. (2017). Ipilimumab Adjuvant Therapy in Melanoma. N Engl J Med.
Corey Saba, M. P. (2016). A Comparative Oncology Study of Iniparib Defines Its
Pharmacokinetic Profile and Biological Activity in a Naturally-Occurring Canine
Cancer Model. plos one.
Craig R Brooks, M. Y. (2015). KIM-1-/TIM-1-mediated phagocytosis links ATG5-/ULK1-
dependent clearance of apoptotic cells to antigen presentation. The EMBO journal.
Cuervo, A. M. (2009). Chaperone-mediated autophagy:selectivity pays off. cell.
D Murtas, ,. D. (2013). IRF-1 responsiveness to IFN-c predicts different cancer immune
phenotypes. British Journal of Cancer.
Dakappagari N, N. L. (2009). An investigation into the potential use of serum Hsp70 as a novel
tumour biomarker for Hsp90 inhibitors. Biomarkers.
Daniela Murtas, D. M. (2013). IRF-1 responsiveness to immune cytokines predicts different
cancer phenotypes. Journal for ImmunoTherapy of Cancer.
Davenport, E. (2010). Targeting heat shock protein 72 enhances Hsp90 inhibitor-induced
apoptosis in myeloma. Leukemia.
David A. Proia, G. F. (2015). Targeting Heat-Shock Protein 90 (HSP90) as a Complementary
Strategy to Immune Checkpoint Blockade for Cancer Therapy. cancer immunology
research.
249
David Dornan, M. E. (2004). Interferon Regulatory Factor 1 Binding to p300 Stimulates DNA-
Dependent Acetylation of p53. molecular and cellular biology, 24(22):10083-98.
David Herrero-Martin, A. F. (2011). Factors Affecting EWS-FLI1 Activity in Ewing's
Sarcoma. sarcoma.
David Proia, R. C. (2014). Ganetespib and HSP90: Translating Preclinical Hypotheses into
Clinical Promise. cancer research.
Davis, B. W. (2014). Domestic Dogs and Cancer Research: A Breed-Based Genomics
Approach. ILAR Journal.
Dickinson, P. J. (2016). Chromosomal Aberrations in Canine Gliomas Define Candidate
Genes and Common Pathways in Dogs and Humans. J Neuropathol Exp Neurol.
Ding W, T. Y. (2016). Study of Arsenic Sulfide in Solid Tumor Cells Reveals Regulation of
Nuclear Factors of Activated T-cells by PML and p53. science reports.
Donald L. Smith, J. A. (2015). The HSP90 inhibitor ganetespib potentiates the antitumor
activity of EGFR tyrosine kinase inhibition in mutant and wild-type non-small cell
lung cancer. targeted oncology.
Dong F1, L. T. (2017). Chimaphilin inhibits human osteosarcoma cells invasion and metastasis
through suppressing the TGF-β1-induced epithelial-to-mesenchymal transition
markers via PI-3K/Akt, ERK1/2 and Smad signaling pathways. Can J Physiol
Pharmacol.
Dou, L. (2014). The regulation role of interferon regulatory factor-1 gene and clinical
relevance. Human Immunology.
Duhamel LA, Y. H. (2012). Frequency of Mouse Double Minute 2 (MDM2) and Mouse
Double Minute 4 (MDM4) amplification in parosteal and conventional osteosarcoma
subtypes. histopathology.
Eckhardt, A. W. (2014). Identification of IRF1 as critical dual regulator of Smac mimetic-
induced apoptosis and inflammatory cytokine response. cell death and disease.
250
Eliane C.M. Zeestraten, F. M. (2012). Addition of interferon-a to the p53-SLPVR vaccine
results in increased production of interferon-c in vaccinated colorectalcancer patients:
A phase I/II clinical trial. international journal of cancer.
Emmanuelle Pion, V. N. (2009). Role of the IRF-1 enhancer domain in signalling
polyubiquitination and degradation. Cellular Signalling.
esfahani K, C. V. (2015). HSP90 as a novel molecular target in non-small-cell lung cancer.
Lung Cancer: Targets and Therapy.
Eva Wardelmanna, J. M.-M. (2012). Targeted Therapy of Soft Tissue Sarcomas. Onkologie,
;35(suppl 1):21–27.
Evguenia M Alexandrova, S. X. (2017). Ganetespib synergizes with cyclophosphamide to
improve survival of mice with autochthonous tumors in a mutant p53-dependent
manner. cell death and disease.
FANG CHENG, R. H. (2014). Expression of neddylation-related proteins in melanoma cell
lines and the effect of neddylation on melanoma proliferation. ONCOLOGY
LETTERS.
Félix Sauvage a, S. M.-G. (2017). Heat shock proteins and cancer: How can nanomedicine be
harnessed? journal of controlled release, 133-143.
Flora Zagouri, T. N. (2013). Hsp90 inhibitors in breast cancer: A systematic review. breast.
Folpe AL, H. C. (2000). Immunohistochemical detection of FLI-1 protein expression: a study
of 132 round cell tumors with emphasis on CD99-positive mimics of Ewing's
sarcoma/primitive neuroectodermal tumor. Am J Surg Pathol.
Fowles, J. S. (2016). Intra- and interspecies gene expression models for predicting drug
response in canine osteosarcoma. BMC bioinformatics.
Franco, R. (2012). Expression of the Anti-Apoptotic Protein BAG3 in Human Melanomas .
Journal of Investigative Dermatology.
Friedland JC, S. D. (2013). Targeted inhibition of Hsp90 by ganetespib is effective across a
broad spectrum of breast cancer subtypes. Investigational new drugs.
251
Frith AE, H. A. (2013). Novel pathways and molecular targets for the treatment of sarcoma.
Curr Oncol Rep, 378-85.
G-A Franzetti1, 2. K.-D.-J. (2017). Cell-to-cell heterogeneity of EWSR1-FLI1 activity
determines proliferation/migration choices in Ewing sarcoma cells. oncogene.
Gabai, M. S. (2015). Hsp70 in cancer: back to the future. oncogene.
Ganguly S, H. T. (2015). Targeting HSF1 disrupts HSP90 chaperone function in chronic
lymphocytic leukemia. oncotarget.
Ganji PN, P. W. (2013). Antiangiogenic effects of ganetespib in colorectal cancer mediated
through inhibition of HIF-1alpha and STAT-3. Angiogenesis .
Ganji Purnachandra Nagaraju, A. M. (2016). Targeting the Janus-activated kinase-2-STAT3
signalling pathway in pancreatic cancer using the HSP90 inhibitor ganetespib.
ScienceDirect.
Garcia-Carbonero R, C. A.-A. (2013). Inhibition of HSP90 molecular chaperones: moving into
the clinic. the lancet oncology.
Gavin M. Bendle, 1. A.-K. (2004). Induction of Unresponsiveness Limits Tumor Protection
by Adoptively Transferred MDM2-Specific Cytotoxic T Lymphocytes. cancer
research.
Gerard M. Doherty, M. (2001). Interferon Regulatory Factor Expression in Human Breast
Cancer. annals of surgery.
Gewirtz, D. A. (2016). The Challenge of Developing Autophagy Inhibition as a Therapeutic
Strategy. cancer research.
Goldsmith JR1, C. Y. (2017). Regulation of inflammation and tumorigenesis by the TIPE
family of phospholipid transfer proteins. Cell Mol Immunol.
Guerriero JL, S. A. (2017). Class IIa HDAC inhibition reduces breast tumours and metastases
through anti-tumour macrophages. nature .
Guerriero, L. (2014). BAG3 protein expression in melanoma metastatic. cell death and
disease.
252
Guo M, 2. T.-B. (2017). Gene signature driving invasive mucinous adenocarcinoma of the
lung. EMBO mol med.
Haile ST, B. J.-R. (2011). Tumor cell programmed death ligand 1-mediated T cell suppression
is overcome by coexpression of CD80. journal of immunology.
Hanahan, D. a. ( 2011). Hallmarks of cancer: the next generation. Cell.
Haque A, A. Q. (2016). Current Understanding of HSP90 as a Novel Therapeutic Target: An
Emerging Approach for the Treatment of Cancer. Current Pharmaceutical Design.
Harada, H. e. (1989). Structurally similar but functionally distinct factors, IRF-1 and IRF-2,
bind to the same regulatory elements of IFN and IFN-inducible genes. Cell, 58(4): p.
729-39.
hasegawa, j. (2016). Novel anti-EPHA2 antibody, DS-8895a for cancer treatment. cancer
biology and therapy.
Hatem Soliman, F. K. (2014). PD-L1 Expression Is Increased in a Subset of Basal Type Breast
Cancer Cells. plos one.
Hayes, D. C. (2015). Genetic Landscape of Human Papillomavirus-Associated Head and Neck
Cancer and Comparison to Tobacco-Related Tumors.. J Clin Oncol, .
He S, S. D. (2014). The HSP90 inhibitor ganetespib has chemosensitizer and radiosensitizer
activity in colorectal cancer. . Investigational new drugs .
He S, Z. C. ( 2013). Potent activity of the Hsp90 inhibitor ganetespib in prostate cancer cells
irrespective of androgen receptor status or variant receptor expression. International
journal of oncology.
Helman LJ, M. P. (2003 ). Mechanisms of sarcoma development. Nat Rev Cancer., 3(9):685-
94.
Herraiz C, C. F. (2015). Reactivation of p53 by a Cytoskeletal Sensor to Control the Balance
Between DNA Damage and Tumor Dissemination. J Natl Cancer Inst.
Hiroaki Ikeda, L. J. (2002). Cytokine & Growth Factor.
Hiroaki Ikeda, L. J. (2002). cytokine and growth factor reviews.
253
Hongxing Ye, M. C. (2016). Chloroquine, an autophagy inhibitor,potentiates the
radiosensitivity of gliomainitiating cells by inhibiting autophagy andactivating
apoptosis. BMC neurology.
http://www.proteinatlas.org. (n.d.). Retrieved from http://www.proteinatlas.org:
http://www.proteinatlas.org/ENSG00000242028-HYPK/cancer
http://www.proteinatlas.org. (n.d.). Retrieved from http://www.proteinatlas.org:
http://www.proteinatlas.org/ENSG00000115368-
WDR75/cancer/tissue/breast+cancer
Huang CJ, Y. S. (2013). Ribosomal protein S27-like in colorectal cancer: a candidate for
predicting prognoses. Plos one.
Huang, W. E. (2007). interferon regulatory factor (IRF) 2, and the interferon consensus
sequence-binding protein (ICSBP/IRF8) cooperate to activate NF1 transcription in
differentiating myeloid cells. J Biol Chem, , . 282(9): p. .
Ito M, B. L.-M. (2011). Comprehensive mapping of p53 pathway alterations reveals an
apparent role for both SNP309 and MDM2 amplification in sarcomagenesis. clinical
cancer research.
J Gao, ,. M. (2010). IRF-1 transcriptionally upregulates PUMA, which mediates the
mitochondrial apoptotic pathway in IRF-1-induced apoptosis in cancer cells. Cell
death and differentiation.
J. P. Frazier, E. B. (2016). Establishment and characterization of a canine soft tissue sarcoma
patient-derived xenograft model. veterinary and comparative oncolgy.
J. S. Fowles, D. D. (2016). The Flint Animal Cancer Center (FACC) Canine Tumour Cell Line
Panel: a resource for veterinary drug discovery, comparative oncology and
translationalmedicine. veterinary and comparative oncology.
Jambhekar, S. S. (2010). Pathology of Ewing’s sarcoma/PNET: Current opinion and emerging
concepts. Indian J Orthop.
Janz, M. (2007). Pharmacologic activation of p53-dependent and p53-independent apoptotic
pathways in Hodgkin/Reed-Sternberg cells. Leukemia.
254
Jennifer A. MacDiarmid, V. L. (2016). Targeted Doxorubicin Delivery to Brain Tumors via
Minicells: Proof of Principle Using Dogs with Spontaneously Occurring Tumors as a
Model. plos one.
Jennifer K. Lowney, M. L. (1999). Interferon Regulatory Factor-1 and -2 Expression in Human
Melanoma Specimens. Annals of Surgical Oncology.
Jennifer L. Guerriero, A. S. (2017). Class IIa HDAC inhibition reduces breast tumours and
metastases through anti-tumour macrophages. nature letter.
Jianming Wu, T. L. (2016). Heat Shock Proteins and Cancer. cellpress.
Jin Zhang, X. C. (2009). Establishment of a dog model for the p53 family pathway and
identification of a novel isoform of p21 cyclin-dependent kinase inhibitor. molecular
cancer research.
Joe Antony Jacob, J. M. (2017). Autophagy: An overview and its roles in cancer and obesity.
Clinica Chimica Acta.
Jooeun Bae, A. M. (2013). Heat Shock Protein 90 Is Critical for Regulation of Phenotype and
Functional Activity of Human T Lymphocytes and NK cells. The Journal of
Immunology.
Jooeun Bae, A. M. (2013). Heat Shock Protein 90 Is Critical for Regulation of Phenotype and
Functional Activity of Human T Lymphocytes and NK cells. journal of immunology.
Jordi Hernández, E. B. (2016). Tumor suppressor properties of the splicing regulatory factor
RBM10. RNA biology.
Josephine Salimu1, L. K.-T. (2015). Cross-Presentation of the Oncofetal Tumor Antigen 5T4
from Irradiated Prostate Cancer Cells—A Key Role for Heat-Shock Protein 70 and
Receptor CD91. cancer immunology research.
JUDITH M. CONNETT, L. B. (2005). Interferon Regulatory Factor 1 (IRF-1) and IRF-2
Expression in Breast Cancer Tissue Microarrays. JOURNAL OF INTERFERON &
CYTOKINE RESEARCH.
Kamikawaji K, S. N. (2016). Regulation of LOXL2 and SERPINH1 by antitumor microRNA-
29a in lung cancer with idiopathic pulmonary fibrosis. J Hum Genet.
255
Kämper N, F. S. (2012). γ-Interferon-regulated chaperone governs human lymphocyte antigen
class II expression. FASEB journal.
Karkoulis, P. K. (2016). 17-DMAG induces heat shock protein 90 functional impairment in
human bladder cancer cells: knocking down the hallmark traits of malignancy. Tumor
Biol.
Khanna, J. J. (2015). Osteosarcoma Genetics and Epigenetics: Emerging Biology and
Candidate Therapies. Critical reviews in oncogenesis.
Kim KS, K. K. (2009). Interferon-gamma induces cellular senescence through p53-dependent
DNA damage signaling in human endothelial cells. mechanism of aging and
development.
Komal Jhaveri, S. M. (2015). Ganetespib: research and clinical development. OncoTargets
and Therapy.
Koya T, Y. R. (2017). Interferon-α-inducible Dendritic Cells Matured with OK-432 Exhibit
TRAIL and Fas Ligand Pathway-mediated Killer Activity. science rep.
Kristoffer R. Brandvold, R. I. (2015). The Chemical Biology of Molecular Chaperones—
Implications for Modulation of Proteostasis. science direct.
L. Nasira, ,. ,. (2001). Analysis of p53 mutational events and MDM2 amplification in canine
soft-tissue sarcomas. cancer letters.
Ladanyi M, L. R. (1995). MDM2 and CDK4 gene amplification in Ewing's sarcoma. J Pathol.
Ladanyi M, L. R. (1995). MDM2 and CDK4 gene amplification in Ewing's sarcoma. the
journal of pathology.
Laemmli, U. (1970). Cleavage of structural proteins during the assembly of the head of
bacteriophage T4. nature.
Leeuwena, I. v. (1997). P53 gene mutations in osteosarcomas in the dog. cancer letters.
Lei Wang, L. Y.-Z. (2015). Expression of autophagy-related proteins ATG5 and FIP200
predicts favorable disease-free survival in patients with breast cancer. Biochemical
and Biophysical Research Communications.
256
Len Neckers, M. M. (2015). 56 – Heat Shock Protein 90 and the Proteasome: Housekeeping
Proteins That Are Also Molecular Targets for Cancer Therapy. In M. M. Len Neckers,
The Molecular Basis of Cancer (Fourth Edition) (pp. 779–788.e3).
Liang J, P. Y. (2015). Interferon-regulatory factor-1 (IRF1) regulates bevacizumab induced
autophagy. oncotarget.
Liang L, S. L. (2016). Validation of a multi-omics strategy for prioritizing personalized
candidate driver genes. oncotarget.
Lilienbaum, A. (2013). Relationship between the proteasomal system and autophagy.
biochemistry and molecular biology.
Lim YS, C. W. (2017). HIF1α in Tumorigenesis of Adenoid Cystic Carcinoma. Anticancer
Res.
Lin K, R. N. (2008). Hsp90 inhibition has opposing effects on wild-type and mutant p53 and
induces p21 expression and cytotoxicity irrespective of p53/ATM status in chronic
lymphocytic leukaemia cells. Oncogene.
Lin TY, B. M. (2008). The novel HSP90 inhibitor STA-9090 exhibits activity against Kit-
dependent and -independent malignant mast cell tumors. . Exp Hematol 36: 1266–
1277.
Lin TY, L. C. (2015). Inhibition of RNA transportation induces glioma cell apoptosis via
downregulation of RanGAP1 expression. Chem Biol Interact.
LIN, Z. (2015). 17-ABAG, a novel geldanamycin derivative, inhibits LNCaP-cell proliferation
through heat shock protein 90 inhibition. INTERNATIONAL JOURNAL OF
MOLECULAR MEDICINE.
Liu H, X. F. (2013). Network analysis identifies an HSP90-central hub susceptible in ovarian
cancer. . Clin Cancer Res .
Liu Z, H. Y. (2016). Silencing PRDX3 Inhibits Growth and Promotes Invasion and
Extracellular Matrix Degradation in Hepatocellular Carcinoma Cells. J Proteome Res.
Lock RB, C. H. (2013). Initial testing (stage 1) of ganetespib, an Hsp90 inhibitor, by the
Pediatric Preclinical Testing Program. . Pediatr Blood Cancer .

257
Lopez-Santillan M, I. L.-G.-C.-O. (2017). Review of pharmacogenetics studies of L-
asparaginase hypersensitivity in acute lymphoblastic leukemia points to variants in the
GRIA1 gene. Drug Metab Pers Ther.
Lowney JK, B. L. (1999). Interferon regulatory factor-1 and -2 expression in human melanoma
specimens. Annals of surgical oncology.
Lu M, X. L. (2014). The orally bioavailable MDM2 antagonist RG7112 and pegylated
interferon α 2a target JAK2V617F-positive progenitor and stem cells. Blood.
Lu ZJ1, S. Q. (2009). Identification of ATP synthase beta subunit (ATPB) on the cell surface
as a non-small cell lung cancer (NSCLC) associated antigen. BMC Cancer.
Luengo-Fernandez. (2013). Economic burden of cancer across the European Union: a
population-based cost analysis. Lancet Oncol.
Lui K, H. Y. (2009). RanGTPase: A Key Regulator of Nucleocytoplasmic Trafficking. mol
cell biology.
Luis Gabriel Rivera-Calderón a, ,. C.-A. (2016). Alterations in PTEN,MDM2, TP53 and AR
protein and gene expression are associated with canine prostate carcinogenesis.
Research in Veterinary Science.
Lukashchuk, N. (2007). Ubiquitination and Degradation of Mutant p53. MOLECULAR AND
CELLULAR BIOLOGY.
Luke Way, J. F. (2016). Rearrangement of Mitochondrial Pyruvate Dehydrogenase Subunit
Dihydrolipoamide Dehydrogenase Protein-Protein Interactions by the MDM2 Ligand
Nutlin-3. proteomics.
Lyubomir T. Vassilev, *. B. (2004). In Vivo Activation of the p53 Pathway by Small-Molecule
Antagonists of MDM2. science.
M. Lazenby, R. H. (2015). The HSP90 inhibitor ganetespib: A potential effective agent for
Acute Myeloid Leukemia in combination with cytarabine. Leukemia Research.
Malta-Vacas J, C. C.-J. (2009). eRF3a/GSPT1 12-GGC allele increases the susceptibility for
breast cancer development. Oncology rep .
258
Mancias, J. D. (2016). Mechanisms of Selective Autophagy in Normal Physiology and Cancer.
journal of molecular biology.
Mark R. Woodford, A. M. (2014). Efficacy of the Hsp90 Inhibitors in Prostate Cancer
Therapy. Journal of Urology and Nephrology.
Martins AS, O. J.-S.-G. (2008). A pivotal role for heat shock protein 90 in Ewing sarcoma
resistance to anti-insulin-like growth factor 1 receptor treatment: in vitro and in vivo
study. Cancer Res.
Matthias P. Mayer, H. S. (2000). Multistep mechanism of substrate binding determines
chaperone activity of Hsp70. Nature Structural Biology.
Maura wallace, E. w. (2006). Dual-Site Regulation of MDM2 E3-Ubiquitin Ligase Activity.
Molecular cell.
Mayr C, B. D. (2006). MDM2 is recognized as a tumor-associated antigen in chronic
lymphocytic leukemia by CD8+ autologous T lymphocytes. Experimental
hematology.
Mayr C1, B. D. (2006). MDM2 is recognized as a tumor-associated antigen in chronic
lymphocytic leukemia by CD8+ autologous T lymphocytes. Experimental
Hematology.
McCleese JK, B. M. (2009). The novel HSP90 inhibitor STA-1474 exhibits biologic activity
against osteosarcoma cell lines. nt J Cancer.
Mendoza S1, K. T. (1998). Status of the p53, Rb and MDM2 genes in canine osteosarcoma.
Anticancer Res.
Merlino, M. R. (2011). The Two Faces of Interferon-g in Cancer. Molecular Pathways.
Michel Buferne, L. C. (2015). IFNg producing CD8C T cells modified to resist major immune
checkpoints induce regression of MHC class I-deficient melanomas.
OncoImmunology.
Michel Buferne, L. C. (2015). IFNg producing CD8C T cells modified to resist major immune
checkpoints induce regression of MHC class I-deficient melanomas.
oncoimmunology.
259
Min Lu, 1. H. (2013). Restoring p53 Function in Human Melanoma Cells by Inhibiting MDM2
and Cyclin B1/CDK1-Phosphorylated Nuclear iASPP. cell.
Min Lu, L. X. (2016). The orally bioavailable MDM2 antagonist RG7112 and pegylated
interferon a 2a target JAK2V617F-positive progenitor and stem cells. blood journal.
Miri M, H. S. (2012). GGCn polymorphism of eRF3a/GSPT1 gene and breast cancer
susceptibility. medical oncology.
Mittra, J. a. (2012). Analysing stratified medicine business models and value systems:
innovation-regulation interactions. . N Biotechnol.
Mohamed T Hafez, M. A. (2012). Metastatic rhabdomyosarcoma of the thyroid gland, a case
report. head and neck oncology.
Mollapour M, B. D. (2014). Asymmetric Hsp90 N domain SUMOylation recruits Aha1 and
ATP-competitive inhibitors. mol cell.
Morimoto, K. R. (2015). The Chemical Biology of Molecular Chaperones—Implications for
Modulation of Proteostasis. journal of molecular biology.
Morimoto, K. R. (2015). The Chemical Biology of Molecular Chaperones—Implications for
Modulation of Proteostasis. jounral of molecular biology.
muller, P. (2008). Chaperone-dependent stabilization and degradation of p53 mutants.
Oncogene.
Muller, P. (2008). Chaperone-dependent stabilization and degradation of p53 mutants. nature.
Murtas D, M. D. (2013). IRF-1 responsiveness to IFN-γ predicts different cancer immune
phenotypes. British journal of cancer.
Murtas D, M. D. (2013). IRF-1 responsiveness to IFN-γ predicts different cancer immune
phenotypes. British journal of cancer.
Nagaraju GP, P. W. (2013). Antiangiogenic effects of ganetespib in colorectal cancer mediated
through inhibition of HIF-1alpha and STAT-3. . Angiogenesis .
Nagata, Y. (1999). The stabilization mechanism of mutant-type p53 by impaired
ubiquitination: the loss of wild-type p53 function and the hsp90 association. oncogene.
260
Narayan, V. (2009). Cooperative Regulation of the Interferon Regulatory Factor-1 Tumor
Suppressor Protein by Core Components of the Molecular Chaperone Machinery. jbc.
Narayan, V. (2009). Cooperative Regulation of the Interferon Regulatory Factor-1 Tumor
Suppressor Protein by Core Components of the Molecular Chaperone Machinery. jbc.
Narayan, V. (2009). COOPERATIVE REGULATION OF THE IRF-1 TUMOUR
SUPPRESSOR PROTEIN BY CORE COMPONENTS OF THE MOLECULAR
CHAPERONE MACHINERY. JBC.
Narayan, V. (2015). Protein–Protein Interactions Modulate the Docking-Dependent E3-
Ubiquitin Ligase Activity of Carboxy-Terminus of Hsc70-Interacting Protein (CHIP).
Molecular and Cellular Proteomics.
Nasir, L. (1999). Cloning, sequence analysis and expression of the cDNAs encoding the canine
and equine homologues of the mouse double minute 2 (mdm2) proto-oncogene.
Cancer letter.
Nasir, L. (2001). Analysis of p53 mutational events and MDM2 amplification in canine soft-
tissue sarcomas. cancer letters.
national cancer institute. (2016, april). Retrieved from www.cancer.gov:
https://www.cancer.gov/publications/dictionaries/cancer-drug?cdrid=43635
Nehyba, J. R. ( 2009). , Dynamic evolution of immune system regulators: the history of the
interferon regulatory factor family. Mol Biol Evol,, 26(11): p. 2539-50.
Neil C Chi, J. S. (2004). Molecular determinants of responses to myocardial
ischemia/reperfusion injury: focus on hypoxia-inducible and heat shock factors.
Cardiovascular research.
Nguyen H, J. H. (1997). The growing family of interferon regulatory factors. Cytokine Growth
Factor Rev, 8(4): p. 293-312.
Nicholson, J. (2014). A systems wide mass spectrometric based linear motif screen to identify
dominant in-vivo interacting proteins for the ubiquitin ligase MDM2. Cellular
Signalling.
261
Ning Bu, H. W. (2014). Exosome from chaperone-rich cell lysates-loaded dendritic cells
produced by CELLine 1000 culture system exhibits potent immune activity.
Biochemical and Biophysical Research Communications.
O'Byrne, K. (2015). Stimulating immune responses to fight cancer: Basic biology and
mechanisms. asia- pacific jounral of oncology.
Olivier Ayraulta, ,. M. (2009). Inhibition of Hsp90 via 17-DMAG induces apoptosis in a p53-
dependent manner to prevent medulloblastoma. PNAS.
Packham S, W. D. (2015). Nuclear translocation of IGF-1R via p150(Glued) and an importin-
β/RanBP2-dependent pathway in cancer cells. Oncogene .
Pang, L. Y. (2014). Global Gene Expression Analysis of Canine Osteosarcoma Stem Cells
Reveals a Novel Role for COX-2 in Tumour Initiation. plos one.
Peiyuan Li, Q. D. (2012). Interferon-gamma induces autophagy with growth inhibition and
cell death in human hepatocellular carcinoma (HCC) cells through interferon-
regulatory factor-1 (IRF-1). cancer letters.
Peiyuan Lia, ,. Q. (2012). Interferon-gamma induces autophagy with growth inhibition and
cell death in human hepatocellular carcinoma (HCC) cells through interferon-
regulatory factor-1 (IRF-1). cancer letters.
Peiyuan Lia, Q. D. (2012). Interferon-gamma induces autophagy with growth inhibition and
cell death in human hepatocellular carcinoma (HCC) cells through interferon-
regulatory factor-1 (IRF-1). cancer letters.
Pendharkar N, G. A. (2016). Quantitative tissue proteomic investigation of invasive ductal
carcinoma of breast with luminal B HER2 positive and HER2 enriched subtypes
towards potential diagnostic and therapeutic biomarkers. J Proteomics. .
Porta C, H.-S. R.-A. (2005). Interferons alpha and gamma induce p53-dependent and p53-
independent apoptosis, respectively. oncogene.
Proia D, A. J. (2012). Preclinical activity of the Hsp90 inhibitor, ganetespib, in ALK- and
ROS1-driven cancers. . J Clin Oncol .
262
Proia DA, F. K. (2011). Multifaceted intervention by the Hsp90 inhibitor ganetespib (STA-
9090) in cancer cells with activated JAK/STAT signaling. PloS one .
Proia DA, K. G. (2015). Targeting Heat-Shock Protein 90 (HSP90) as a Complementary
Strategy to Immune Checkpoint Blockade for Cancer Therapy. Cancer immunology
research.
Proia DA, Z. C. (2014). Preclinical activity profile and therapeutic efficacy of the HSP90
inhibitor ganetespib in triple-negative breast cancer. . Clin Cancer Res.
Pugsley, H. R. (2016). Quantifying autophagy: Measuring LC3 puncta and autolysosome
formation in cells using multispectral imaging flow cytometry. methods.
Qian, H.-r. (2016). Functional role of autophagy in gastric cancer. oncotarget.
R. Timothy Bentley, A. U. (2016). Dogs are man’s best friend: in sickness and in health.
Neuro-Oncology.
Ralf Weiskirchen, F. T. (2014). Cellular and molecular functions of hepatic stellate cells in
inflammatory responses and liver immunology. liver immunology.
Rappa F, F. F. (2012). HSP-molecular chaperones in cancer biogenesis and tumor therapy: an
overview. anticancer research.
Ressom, L. T. (2009). LC–MS Based Detection of Differential Protein Expression. journal of
proteomics and bioinformatics.
Rivera-Calderón LG1, F.-A. C.-A. (2016). Alterations in PTEN, MDM2, TP53 and AR protein
and gene expression are associated with canine prostate carcinogenesis. Res Vet Sci.
Rocio Garcia-Carbonero, A. C.-A. (2013). Inhibition of HSP90 molecular chaperones: moving
into the clinic. Lancet Oncol .
Romanucci, M. (2012). Heat shock protein expression in canine osteosarcoma. Cell Stress and
Chaperones .
Rosa Pennisi, P. A. (2015). Hsp90: A New Player in DNA Repair? biomolecules.
263
Rosalba Camicia, S. B. (2013). BAL1/ARTD9 represses the anti-proliferative and pro-
apoptotic IFNc–STAT1–IRF1–p53 axis in diffuse large B-cell lymphoma. journal of
cell science.
S. Hugen, R. E. (2016). Gastric carcinoma in canines and humans,a review. veterinary and
comparaitive oncology .
S. Parimi, M. *. (2014). Hsp90 inhibitors in oncology: ready for prime time? current oncology.
Salimu J, S. L.-T. (2015). Cross-Presentation of the Oncofetal Tumor Antigen 5T4 from
Irradiated Prostate Cancer Cells--A Key Role for Heat-Shock Protein 70 and Receptor
CD91. Cancer immunology research.
Samant, R. S. (2012). The expanding proteome of the molecular chaperone HSP90. cell cycle.
Sang J, A. J. (2013). Targeted inhibition of the molecular chaperone Hsp90 overcomes ALK
inhibitor resistance in non-small cell lung cancer. cancer discovery.
Sasaki, M. (2007). MDM2 Binding Induces a Conformational Change in p53 That Is Opposed
by Heat-shock Protein 90 and Precedes p53 Proteasomal Degradation. THE
JOURNAL OF BIOLOGICAL CHEMISTRY.
Saurabh Jain, L. A. (2016). The Development of a Recombinant scFv Monoclonal Antibody
Targeting Canine CD20 for Use in Comparative Medicine. plos one.
Schaaf, M. B. (2016). LC3/GABARAP family proteins: autophagy-(un)related functions. The
FASEB Journal.
Seo, Y. H. (2015). Organelle-specific Hsp90 inhibitors. Arch. Pharm. Res, 38:1582–1590.
Shah, S. e. (2012). The clonal and mutational evolution spectrum of primary triple-negative
breast cancers. Nature.
Shang L, T. T. (2006). The heat shock protein 90-CDC37 chaperone complex is required for
signaling by types I and II interferons. journal of biological chemistry.
Sharad Verma, S. G. (2016). Hsp90: Friends, clients and natural foes. Biochimie.
264
SHEN-JEU WON, C.-H. Y.-S.-Y. (2015). Justicidin A-Induced Autophagy Flux Enhances
Apoptosis of Human Colorectal Cancer Cells via Class III PI3K and Atg5 pathway.
cell physiology.
Shimamura T, P. S. (2012). Ganetespib (STA-9090), a Non Geldanamycin HSP90 Inhibitor,
has Potent Antitumor Activity in In Vitro and In Vivo Models of Non-Small Cell Lung
Cancer . Clin Cancer Res .
Shimamura, T. (2008). Heat Shock Protein 90 Inhibition in Lung Cancer. J Thorac Oncol.
Shimp SK, P. C. (2012). HSP90 inhibition by 17-DMAG reduces inflammation in J774
macrophages through suppression of Akt and nuclear factor-κB pathways.
Inflammation research.
Shoukath Sulthana, T. B. (2017). Combination Therapy of NSCLC Using Hsp90 Inhibitor and
Doxorubicin Carrying Functional Nanoceria. Molecular pharmaceutics.
Siddhartha Mani, D. D. (2011). Rare Primitive Neuroectodermal Tumor (PNET) of Liver in a
Young Woman. Gastrointest Cancer Res.
Solit DB, C. G. (2008). Development and application of Hsp90 inhibitors. Drug discovery
today .
Solit DB, R. N. (2011). Resistance to BRAF Inhibition in Melanomas. New england journal
of medicine.
Sreedhar, A. S. (2004). Hsp90 isoforms: functions, expression and clinical importance. FEBS
Letters.
Srikanth R. Ambati, a. E. (2014). Pre-clinical efficacy of PU-H71, a novel HSP90 inhibitor,
alone and in combination with bortezomib in Ewing sarcoma. molecular oncology.
Stroikin, Y. (2004). Inhibition of autophagy with 3-methyladenine results in impaired turnover
of lysosomes and accumulation of lipofuscin-like material. cell biology.
Stroud, C. (2016). A One Health overview, facilitating advances in comparative medicine and
translational research. Clin Trans Med.
Stuart K. Calderwood, a. J. (2016). Heat Shock Proteins Promote Cancer: It's a Protection
Racket. cell press.
265
Su C, R. Z. (2012). PIWIL4 regulates cervical cancer cell line growth and is involved in down-
regulating the expression of p14ARF and p53. FEBS lett.
Suiquan Wang, M. Z. (2014). Interferon-γ Induces Senescence in Normal Human
Melanocytes. plos one.
Su-Kil Seo a, ,. D.-I.-K.-S.-G. (2013). Attenuation of IFN-γ-induced B7-H1 expression by 15-
deoxy-delta12,14-prostaglandin J2 via downregulation of the Jak/STAT/IRF-1
signaling pathway. Life sciences.
Su-Kil Seo a, ,. D.-I.-K.-S.-G. (2014). Attenuation of IFN-γ-induced B7-H1 expression by 15-
deoxy-delta12,14-prostaglandin J2 via downregulation of the Jak/STAT/IRF-1
signaling pathway. life sciences.
Susanne Pettersson, M. K. (2009). Role of Mdm2 acid domain interactions in recognition and
ubiquitination of the transcription factor IRF-2. biochemical journal.
Sutter, N. B. (2004). DOG STAR RISING:THE CANINE GENETIC SYSTEM. nature
genetics.
Suzanne L. Topalian, J. M. (2016). Mechanism-driven biomarkers to guide immune
checkpoint blockade in cancer therapy. NATURE REVIEWS CANCER.
syntapharmaceuticals. (2016). Retrieved from syntapharmaceuticals.com.
Taipale M, K. I. (2012). Quantitative analysis of HSP90-client interactions reveals principles
of substrate recognition. Cell.
Takaoka, A. a. ( 2006). Interferon signalling network in innate defence. . Cell Microbiol,, .
8(6): p. 907-22.
Takaoka, A. T. (2008). Interferon regulatory factor family of transcription factors and
regulation of oncogenesis. Cancer Sci, , . 99(3): p. 467-78.
Takeshi Matsuzawa, B.-H. K. (2015). IFN-γ elicits macrophage autophagy via the p38 MAPK
signaling. journal of immunology.
Takeshi Matsuzawa, E. F. (2013). Autophagy activation by interferon-c via the p38 mitogen-
activated protein kinase signalling pathway is involved in macrophage bactericidal
activity. immunology.
266
Tanida, I. (2004). LC3 conjugation system in mammalian autophagy. The International
Journal of Biochemistry & Cell Biology.
Taylor BS, B. J. (2011 ). Advances in sarcoma genomics and new therapeutic targets. Nat Rev
Cancer, 11(8):541-57.
Ting Huyan, Q. L.-D.-S. (2016). Heat shock protein 90 inhibitors induce functional inhibition
of human natural killer cells in a dose dependent manner. Immunopharmacology and
Immunotoxicology.
Tiwari, A. a. (2012). Progress against cancer (1971-2011): how far have we come? J Intern
Med.
Travers, J. (2012). HSP90 inhibition: two-pronged exploitation of cancer dependencies. drug
discovery today.
Tsirigotis P, S. B. (2016). Programmed death-1 immune checkpoint blockade in the treatment
of hematological malignancies. Annals of medicine.
Tsutsumi S, B. K. (2009). Impact of heat-shock protein 90 on cancer metastasis. future
oncology.
Tsutsumi S, N. L. (2007). Extracellular heat shock protein 90: a role for a molecular chaperone
in cell motility and cancer metastasis. cancer science.
Tu, C. X. (2016). Effects of IRF1 and IFN-β interaction on the M1 polarization of
macrophages and its antitumor function. International Journal of molecular medicine.
Valeria Azzarito, K. L. (2012). Inhibition of α-helix-mediated protein–protein interactions
using designed molecules. nature chemistry.
Viau, M. a. (2005). B-lymphocytes, innate immunity, and autoimmunity. . Clin Immunol,
114(1): p. 17-26.
VISAN, S. (2015). IN VITRO COMPARATIVE MODELS FOR CANINE AND HUMAN
BREAST CANCERS. oncology.
Vivien Landré, M. B. (2017). Regulation of Transcriptional Activators by DNA-Binding
Domain Ubiquitination. cell death and differentiation.
267
Vogelstein, B. a. (2004.). Cancer genes and the pathways they control. . Nat Med.
Wang, X. X. (2012). Mdm2 and MdmX partner to regulate p53. FEBS lett, 586(10): 1390-
1396.
Wawrzynow, B. Z. (2007). MDM2 chaperones the p53 tumor suppressor. J Biol Chem , 282,
32603-32612.
Whitesell L, L. S. (2005). HSP90 and the chaperoning of cancer. nature reviews.
Wiech, M. (2012). Molecular Mechanism of Mutant p53 Stabilization: The Role of HSP70
and MDM2. plos one.
Wilkinson, S. (2010). Autophagy: an adaptable modifier of tumourigenesis. genetics and
development.
Workman, P. (2003). Overview: translating Hsp90 biology into Hsp90 drugs. current cancer
drug targets.
workman, P. (2004). Combinatorial attack on multistep oncogenesis by inhibiting the Hsp90
molecular chaperone. cancer letters.
Wu, Y.-T. (2010). Dual Role of 3-Methyladenine in Modulation of Autophagy via Different
Temporal Patterns of Inhibition on Class I and III Phosphoinositide 3-Kinase. THE
JOURNAL OF BIOLOGICAL CHEMISTRY.
X Xiong, Y. Z. (2011). Ribosomal protein S27-like and S27 interplay with p53-MDM2 axis
as a target, a substrate and a regulator. oncogene.
Xi, H. e. ( 1999). , Co-occupancy of the interferon regulatory element of the class II
transactivator (CIITA) type IV promoter by interferon regulatory factors 1 and 2. 3.
Oncogene, 18(43): p. 5889-90.
Xiaodi Su, Y. Y. (2015). Interferon-γ regulates cellular metabolism and mRNA translation to
potentiate macrophage activation. nature immunology.
Xiong X, Z. Y. (2014). Ribosomal protein S27-like is a physiological regulator of p53 that
suppresses genomic instability and tumorigenesis. E life.
268
Xu D1, J. S. (2016). Small-molecule binding sites to explore protein-protein interactions in
the cancer proteome. Mol Biosyst.
Xu J, C. J. (2015). PIG3 plays an oncogenic role in papillary thyroid cancer by activating the
PI3K/AKT/PTEN pathway. oncology reports.
Xu W, N. L. (2007). Targeting the molecular chaperone heat shock protein 90 provides a
multifaceted effect on diverse cell signaling pathways of cancer cells. Clin Cancer Res
.
Yadav M, J. S. (2014). Predicting immunogenic tumour mutations by combining mass
spectrometry and exome sequencing.
Yamada-Kanazawa, S. (2017). inhibtion of HSP90 exerts anti-tumor effect on angiosarcoma:
Involvement of VEGF signaling. Br J Dermatol.
Yang S, I. Y. (2016). Autophagy Inhibition Dysregulates TBK1 Signaling and Promotes
Pancreatic Inflammation. Cancer immunology research.
Yang, a. X. (2014). Effects of suppressor of cytokine signaling 1 silencing on human
melanoma cell proliferation and interferon-γ sensitivity. molecular medicine reports.
Yasukazu Takanezawa, R. N. (2016). Atg5-dependent autophagy plays a protective role
against. Toxicology Letters.
Yifan Wang, H. L. (2016). Hsp90 Inhibitor Ganetespib Sensitizes Non–Small Cell Lung
Cancer to Radiation but Has Variable Effects with Chemoradiation. cancer therapy.
Ying W, D. Z. (2012). Ganetespib, a unique triazolone-containing Hsp90 inhibitor, exhibits
potent antitumor activity and a superior safety profile for cancer therapy. Molecular
cancer therapeutics .
Youlyouz-Marfak I, G. N.-M. (2008). Identification of a novel p53-dependent activation
pathway of STAT1 by antitumour genotoxic agents. cell death and differentiation.
Yu Qiao, E. G.-h. (2013). Synergistic Activation of Inflammatory Cytokine Genes by
Interferon-g-Induced Chromatin Remodeling and Toll-like Receptor Signaling.
immunity.
269
Yuan XW, Z. X. (2008). Interferonalpha enhances etoposide-induced apoptosis in human
osteosarcoma U2OS cells by a p53-dependent pathway. life sciences.
Yuen HF, G. V.-H.-T. (2013). RanGTPase: a candidate for Myc-mediated cancer progression.
J Natl Cancer Inst.
Zaidi MR, M. G. (2011). The two faces of interferon-γ in cancer. clinical cancer research.
Zdenek Andrysik, J. K. (2013). A genetic screen identifies TCF3/E2A and TRIAP1 as
pathway-specific regulators of the cellular response to p53 activation. cell reports.
Zhang DZ, C. B. (2017). Basic Transcription Factor 3 is Required for Proliferation and
Epithelial-Mesenchymal Transition Via Regulation of FOXM1 and JAK2/STAT3
Signaling in Gastric Cancer. Oncol Res. .
Zhang F, L. J. (2017). Elevated transcriptional levels of aldolase A (ALDOA) associates with
cell cycle-related genes in patients with NSCLC and several solid tumors. BioData
Min.
Zhang H, 2. L. (2017). Differential expression of peroxiredoxin 3 in laryngeal squamous cell
carcinoma. Oncotarget.
Zhang, J. (2009). Establishment of a Dog Model for the p53 Family Pathway and Identification
of a Novel Isoform of p21 Cyclin-Dependent Kinase Inhibitor. molecular cancer
research.
Zhang, K. (2015). Endoplasmic reticulum stress response and transcriptional reprogramming.
. Front Genet.
Zhang, S. J. (2014). The Significance of Transcriptome Sequencing in Personalized Cancer
Medicine.
Zhu H, L. P. (2012). BAG3: a new therapeutic target of human cancers? Histol Histopathol.
Ziyan Y. Pessetto, B. C. (2017). In silico and in vitro drug screening identifies new therapeutic
approaches for Ewing sarcoma. oncotarget.
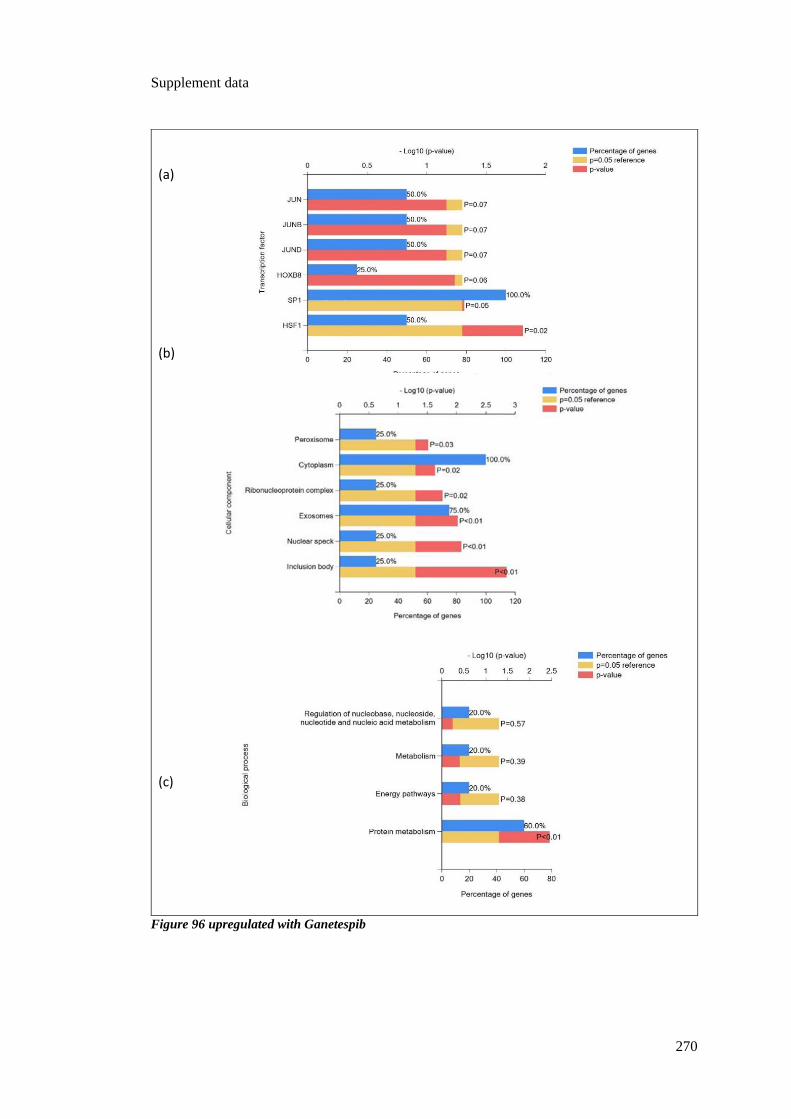
270
Supplement data
Figure 96 upregulated with Ganetespib
(a) (b) (c)
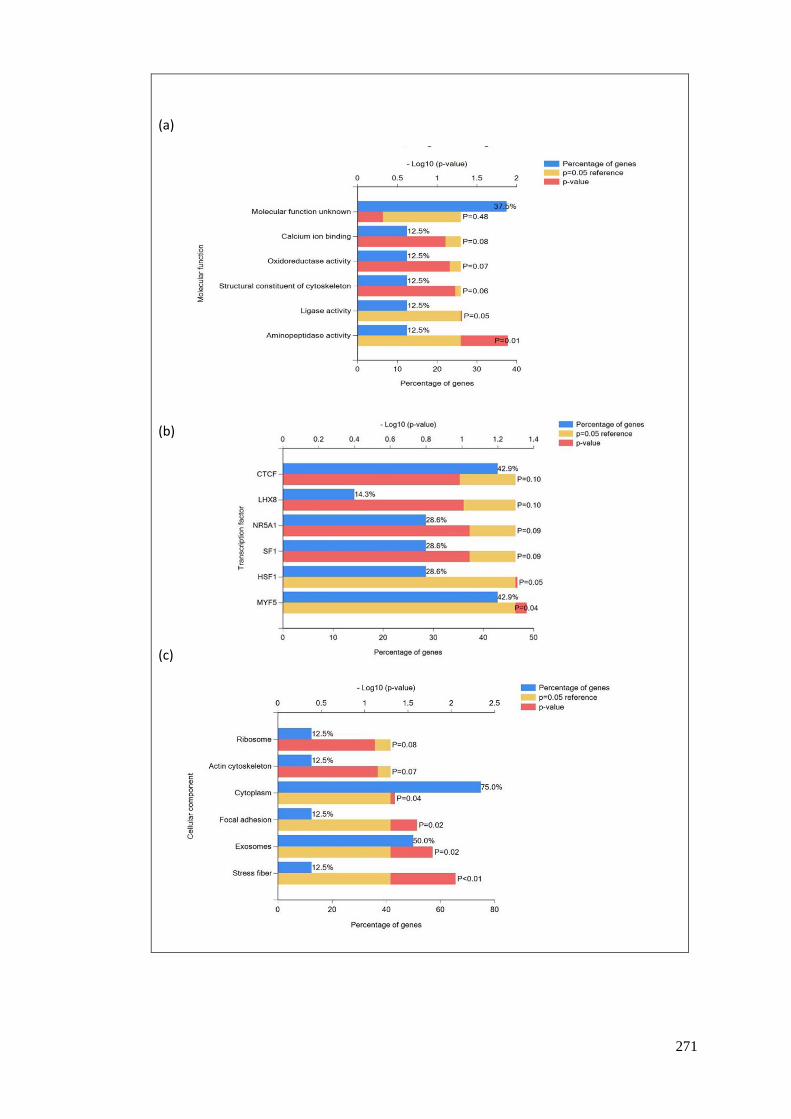
271
(a)
(b)
(c)
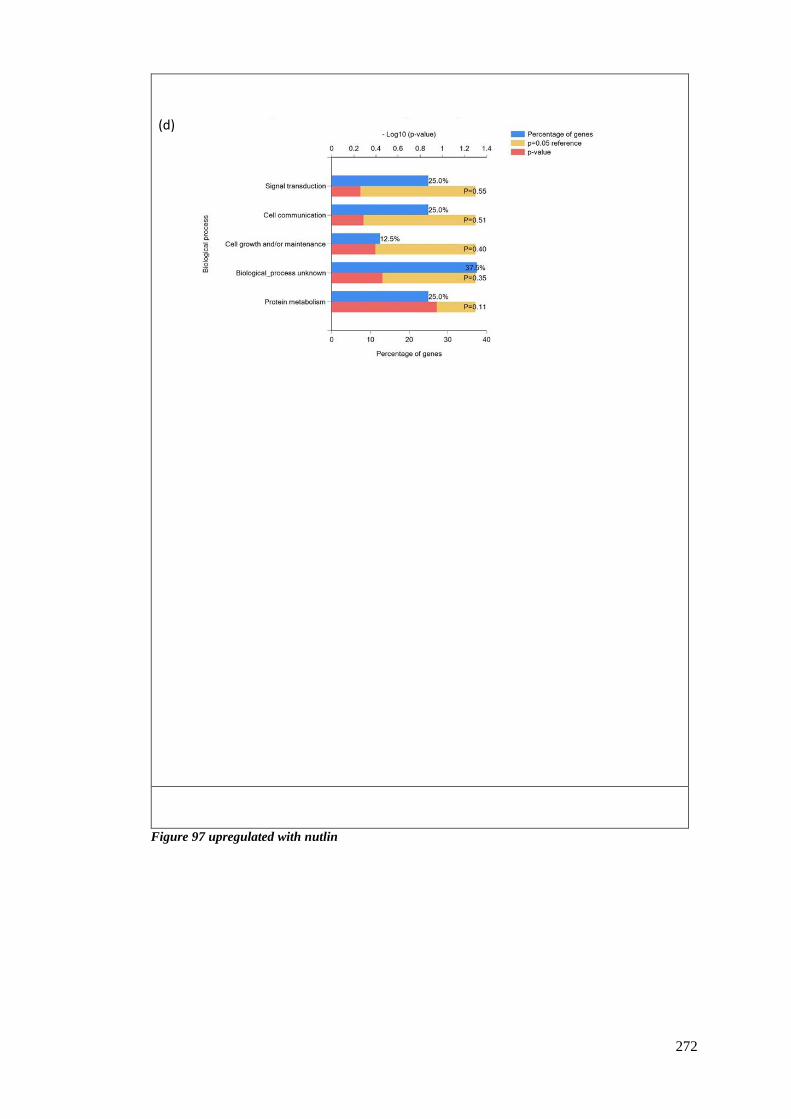
272
(d)
Figure 97 upregulated with nutlin

273
(a)
(b)
(c)
Figure 98 downregulated with Ganetespib
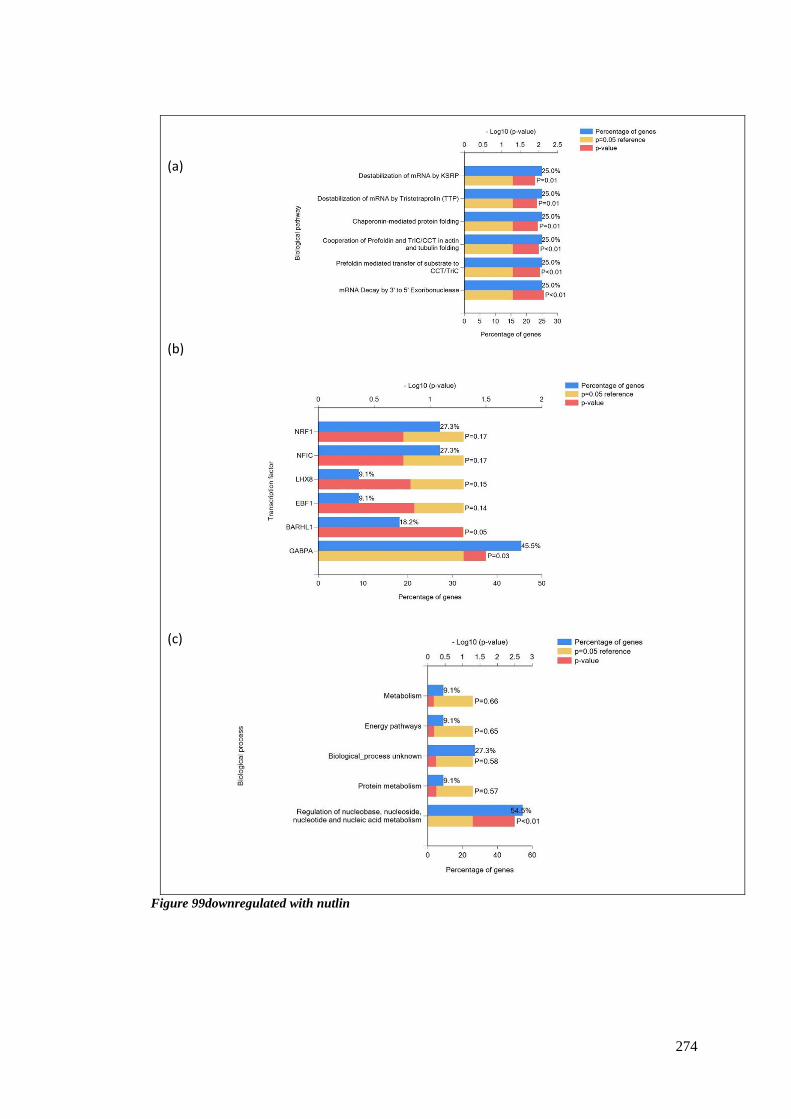
274
(a)
(b)
(c)
Figure 99downregulated with nutlin
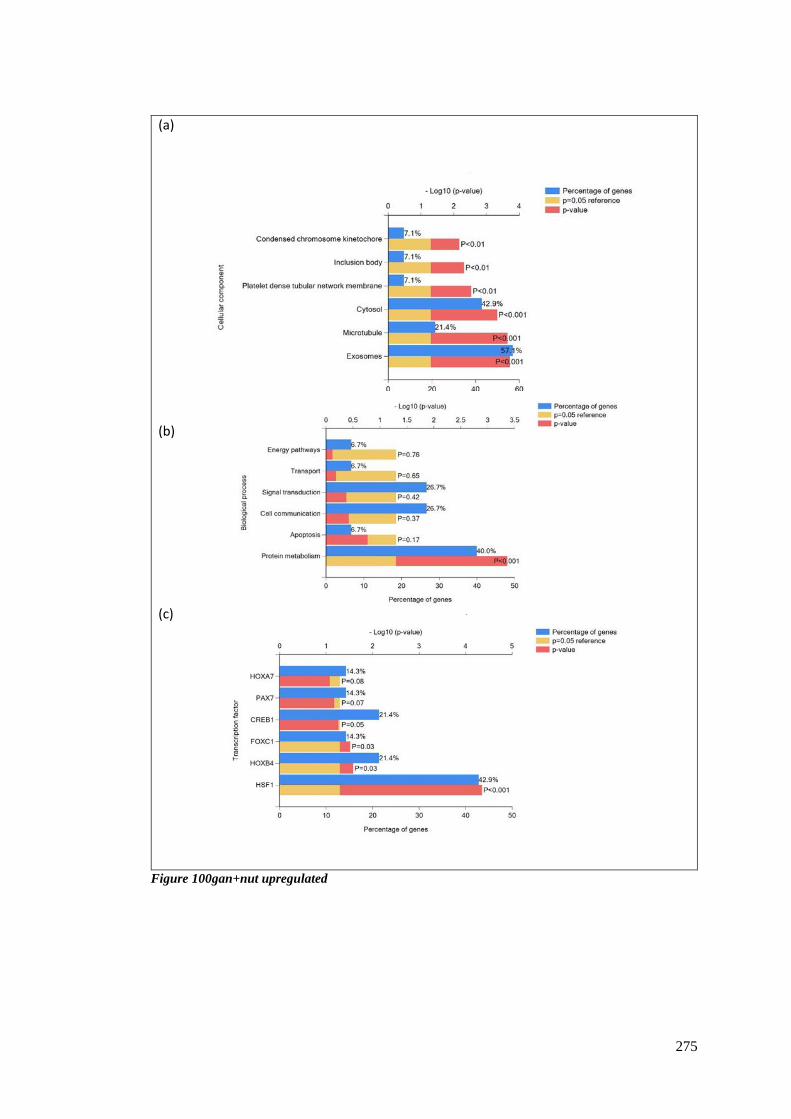
275
(a)
(b)
(c)
Figure 100gan+nut upregulated
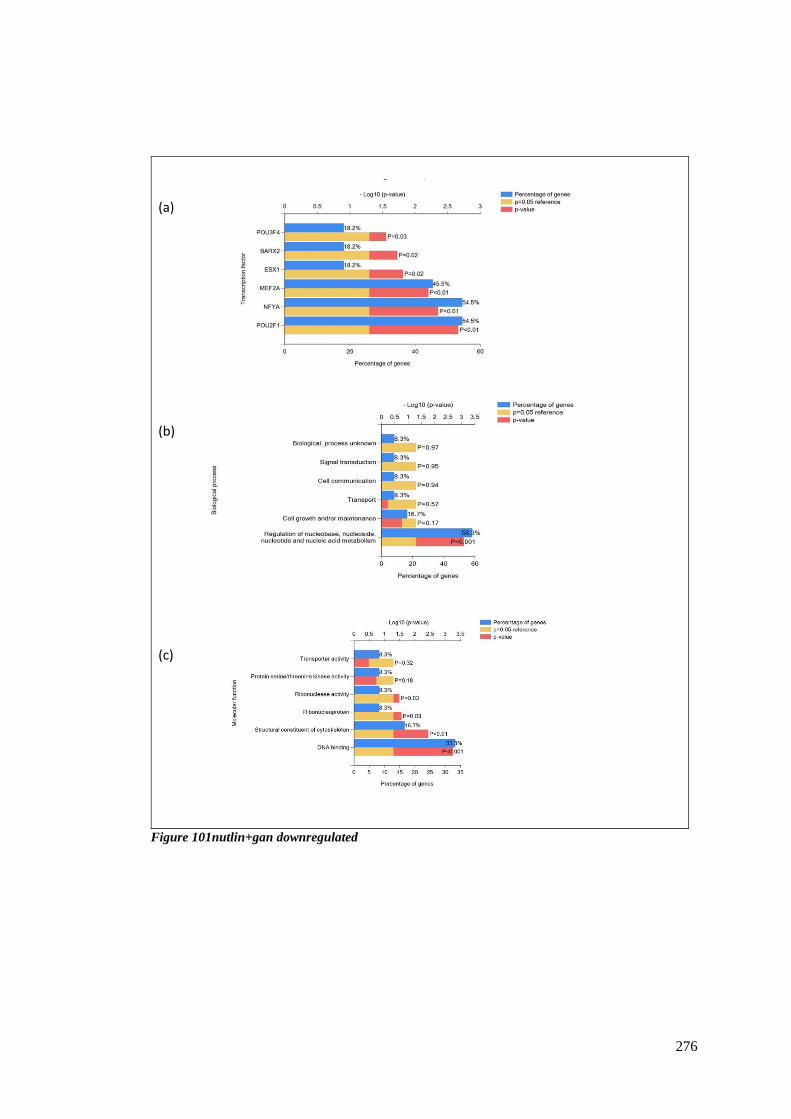
276
(a)
(b)
(c)
Figure 101nutlin+gan downregulated