self-mapping radio maps for location fingerprinting
TRANSCRIPT

1 23
Wireless NetworksThe Journal of Mobile Communication,Computation and Information ISSN 1022-0038 Wireless NetwDOI 10.1007/s11276-014-0864-1
Self-mapping radio maps for locationfingerprinting
Gareth Ayres & Jason Jones

1 23
Your article is protected by copyright and all
rights are held exclusively by Springer Science
+Business Media New York. This e-offprint is
for personal use only and shall not be self-
archived in electronic repositories. If you wish
to self-archive your article, please use the
accepted manuscript version for posting on
your own website. You may further deposit
the accepted manuscript version in any
repository, provided it is only made publicly
available 12 months after official publication
or later and provided acknowledgement is
given to the original source of publication
and a link is inserted to the published article
on Springer's website. The link must be
accompanied by the following text: "The final
publication is available at link.springer.com”.
Self-mapping radio maps for location fingerprinting
Gareth Ayres • Jason Jones
� Springer Science+Business Media New York 2014
Abstract Localisation of a mobile device in Wi-Fi based
indoor environments has received much attention and is an
important area of research, considering the uptake of
devices with built-in Wi-Fi and often blanket coverage in
enterprise. Most localisation techniques in this area require
an off-line calibration phase where a radio map is manually
built using the laborious efforts of administrators. This
radio map is then subject to becoming inaccurate with time
and requires refreshing as the equipment is upgraded and
replaced. We propose a system that can automatically build
and calibrate a radio map for use with location finger-
printing techniques to provide indoor and outdoor locali-
sation with Wi-Fi. This system first uses a self-mapping
technique that makes use of user roaming patterns to build
a weighted undirected graph of Access Point locations. We
then combine this initial map with a map built by users of
smartphones with built-in Wi-Fi and GPS to generate
anchor nodes. We show that the unique combination of
these two techniques provides a zero-configuration cali-
bration map for use with location fingerprinting techniques,
which not only saves time and effort in the calibration
phase, but provides a constantly fine-tuning and self-heal-
ing map.
Keywords Wireless � Localization � Visualization �Graph theory � Force-directed layout
1 Introduction
The recent explosion in popularity of mobile devices such
as the Apple iPhone and Google Android phones has
accelerated the use and deployment of Location Based
Services (LBS). LBS’s require different levels of granu-
larity of location data with some applications working
sufficiently well with low-grained location data such as a
town/city while others require much more fine-grained data
such as room/building.
The problem of localisation while outdoors has been
largely addressed with the use of three technologies, Global
Positioning System (GPS), mobile phone network locali-
sation and Wi-Fi localisation. GPS localisation has proven
very popular with consumers, with GPS chips being
embedded in many personal devices such as traffic navi-
gators, smartphones and sports watches. The GPS system
works through the use of a Global Navigation Satellite
System to provide timing data to devices from multiple
satellites. A device can then use this data to trilaterate its
position on the earth. The GPS system works well in open
spaces, but runs into problems in city centers where the
signal suffers from reflection.
Mobile phone network localisation has become a pop-
ular method to quickly locate a phone on a GSM network,
all be it with significantly less accuracy than GPS. The U.S
FCC 911 (E911) mandate has pushed the development of
these technologies to assist authorities tracking users in
times of an emergency [1].
Wi-Fi data can also usually be obtained from smart-
phones, and as a result this has begun to emerge as a
solution to outdoor localisation. It has become common
place for competing mobile OS providers to build their
own a priori map of Wi-Fi access points that is used to help
assist in the location of smartphones. The smartphone’s
G. Ayres (&) � J. Jones
College of Engineering, Swansea University, Swansea SA28PP,
UK
e-mail: [email protected]
J. Jones
e-mail: [email protected]
123
Wireless Netw
DOI 10.1007/s11276-014-0864-1
Author's personal copy
then contribute new information back to the provider to
improve and add to the map.
Indoor localisation using Wi-Fi on the other hand is an
ongoing problem to which an adequate solution has yet to
be adopted by any mainstream smartphone developers.
There have been many proposed solutions, such as location
fingerprinting, which will be covered in Sect. 2.
In this paper we propose a novel system that augments a
self-mapping and calibrating Wi-Fi radio map derived from
mobile device roaming behavior, with a smartphone vari-
able accuracy radio map, to produce a zero-configuration
self-mapping radio map for use in indoor and outdoor
localisation.
The remainder of this paper is broken down as such:
Sect. 2 covers related work in indoor localisation, location
fingerprinting and zero-configuration radio maps. Section 3
provides an overview of the LocPriS system developed to
implement the concepts and produce results. Section 4
introduces the self-mapping using undirected weighted
graphs technique. Section 5 introduce the smartphone
variable accuracy radio map android application and
technique. Section 6 then brings Sects. 4 and 5 together to
present the Augmented Radio Map. Section 7 provides a
conclusion of the work.
2 Related work
Zero-configuration indoor Wi-Fi localisation is an active
area of research that has its roots in indoor localisation for
mobile sensor networks as well as mobile robotics. Both
these areas of research have a need to build a self-map of a
wireless environment and to locate themselves within it.
These areas of research combined with indoor localisation
in WLAN environments have produced much work. This
section will summarise the work in these areas related to
this paper.
2.1 Indoor localisation
Much work on localisation of mobile devices in an indoor
environment has been undertaken in order to provide
context-aware and location based services. The first areas
of research involved specialist hardware devices that made
use of TOA (time of arrival), TDOA (time difference) and
AOA (angle of arrival). These specialist setups made use of
infrared (Active Badges) [2], ultrasonic (Active Bat) [3]
and beacon based (Cricket) [4] high frequency wireless
communications to determine location. While these sys-
tems worked well, the requirement for specialist hardware
was a hurdle to mainstream adoption [5].
With significant research in localisation techniques and
other issues relevant to LBS’s focusing on indoor systems
with specialist hardware throughout the 1990s until early
2000 the next wave of research was initiated by Microsoft
with a paper they published called RADAR [6], which
details a number of methods of performing localisation
through the use of a emerging technology, wireless LAN’s
(Wi-Fi), without the need of specialist hardware. This
paper is discussed more in Sect. 2.2.
The direction of research began to shift during the early
2000s from using indoor location tags to existing Wi-Fi
infrastructure to provide LBS’s. The increase in popularity
of GPS and smartphones helped drive this change of
direction to focus on Wi-Fi localisation techniques.
2.2 Location fingerprinting
In 2001 Microsoft Research published a paper that detailed
a passive system called RADAR which made use of the
802.11 based Wi-Fi infrastructure for localisation, with
only additional software needed and no additional spe-
cialist hardware. This paper sparked a drive to improve
localisation of indoor devices using the native wireless
equipment used by 802.11b networks at the time.
In the RADAR system, the RF received signal strength
indicator values (RSS) is used as a measure of distance
between an Access Point (AP) and mobile node (MN). An
empirical/deterministic algorithm is described (Nearest
Neighbour in Signal Space NNSS) which is used to store
the RSS of each AP for a specific location in a Vector in a
off line phase. This off-line phase is used to create a radio
map. Each point that RSS values are added to the vector is
called a calibration point (CP). This information is used to
compute the 2D position by triangulation, with both an
empirical method and a signal propagation modelling
method used.
RSS based positioning has developed to generally use
three different techniques: Association/Cell ID based
methods, triangulation (pattern matching and probabilistic
filtering) and fingerprinting. Cell ID based is the simplest,
but yields a very low accuracy equal to that of the total
range of RSS from an AP. Triangulation through lateration
is more accurate with three or more AP’s, but is compu-
tationally demanding and requires knowledge of the exact
position of AP’s, and does not work well when considering
radio propagation/multi-path problems encountered by
non-line of sight (NLOS). However, for indoor positioning,
non-line-of-sight propagation and attenuations caused by
walls, other structures, and even people causes significant
fluctuations to RSS, which makes the simple path loss
models too inaccurate in many real life situations. Location
Fingerprinting has become an established area of further
research as it copes well with the problem of NLOS in Wi-
Fi by modelling the environment and making use of the
propagation characteristics by design.
Wireless Netw
123
Author's personal copy
Typically two phases are required for location finger-
printing; an offline training phase to build a radio map of
calibration points (CPs) for all locations and an online
location determination phase where a radio map is refer-
enced by a device to determine its location.
The radio map, or a priori, is created during a calibration
phase that includes reading RSS values at predetermined
locations for a fixed period of time. RADAR suggested
manual or simulation calibration phases. Manual requires
walking around and taking readings at each CP while
simulation requires a detailed model of a building, both
taking considerable time and effort to achieve. It is also
usual to include building floor plans as images, and require
manually linking location to position on a floor plan
(labelling). It has been suggested that the linking of actual
location to radio map could be achieved through prompting
a user to label locations during the online phase instead of
the calibration phase [7]. This phase of calibrating the
system is also labour intensive and subject to errors when
AP’s move or fail.
The number of CP’s in a radio map, and the time spent
at each [8] has also been the subject of much work, in an
attempt to reduce the burden of the offline calibration
phase. It has been shown that more CP’s result in more
accurate location estimates but a larger search time and
computational cost. While less CP’s result in less accurate
location estimates but a smaller search time and are more
efficient [9].
It has also been reported that different devices report
differing RSS values at the same location as a result of the
different hardware and design properties of Wi-Fi chipsets
[10]. This, along with the fact that the orientation and
direction of devices can also return different readings,
results in a significant possibility of error in a radio map
[11].
Location fingerprinting techniques fall into two cate-
gories, probabilistic or deterministic. In deterministic
techniques typically the estimated location of a MN is
considered static in time and makes use of the Nearest
Neighbor techniques, with the Kth NN and Weighted NN
techniques proven to be successful in early works [6].
Probabilistic Algorithms have proven to be the most
popular technique; they consist of RSS data summarised
into Probability Density Functions (PDF). At each CP, a
radio map has a PDF for each AP approximated using a
Kernel Function or Histograms [12]. Using a random var-
iable to represent location estimation results in a smaller
radio map in memory and less computation time in the
localisation phase [13]. This combined with filtering using
Kalman or Bayesian filtering results in improved location
estimation using continuous random variables. This
approach makes use of previous location data, not just
static calibration points [12].
2.3 Reduced/zero-configuration radio maps
Accurate location estimation using measurements of signal
strength is still a difficult task due to the noisy character-
istics of signal propagation. Physical characteristics such as
reflection, refraction, diffraction and absorption means
signal propagation suffers from multi-path fading effects in
an indoor environment and RSS values frequently change.
With 802.11 techniques such as channel hopping, automatic
equipment and transmission power control and changes in
network layout an up to date radio map for use with location
fingerprinting is a research challenge of its own.
Frequently changing fingerprints result in the time/
labour intensive radio maps becoming inaccurate or
expired quickly, with a new costly offline recalibration
phase necessary. This challenge has been addressed by
projects such as RedPin [14] which make use of RSS fin-
gerprints and manual interaction from clients to continually
update a radio map with actual location on floor plans.
Reducing the size of radio maps and the number of
required CPs has been suggested as a way to speed up the
off line phase. The use of probabilistic estimation tech-
niques has resulted in smaller radio map requirements for
fingerprinting, but still requires linking to a floor plan or
map [15].
The link between a floor plan and a CP on a radio map is
sometimes called labelled data. There has been some work
to reduce the effort of labelling data when building radio
maps by allowing one floor to be manually labelled and
assume the other floors follow a similar layout [16].
Anchor nodes have been proposed as a solution to
provide zero-configuration, along with access points that
monitor each other’s RSS values [17]. The anchor nodes
however need to be manually entered and positioned before
a system is active and AP’s require custom layer 2 soft-
ware. If such an anchor node were to move or be replaced
with different hardware, it would have significant impact
on the reliability of such a system.
3 System overview
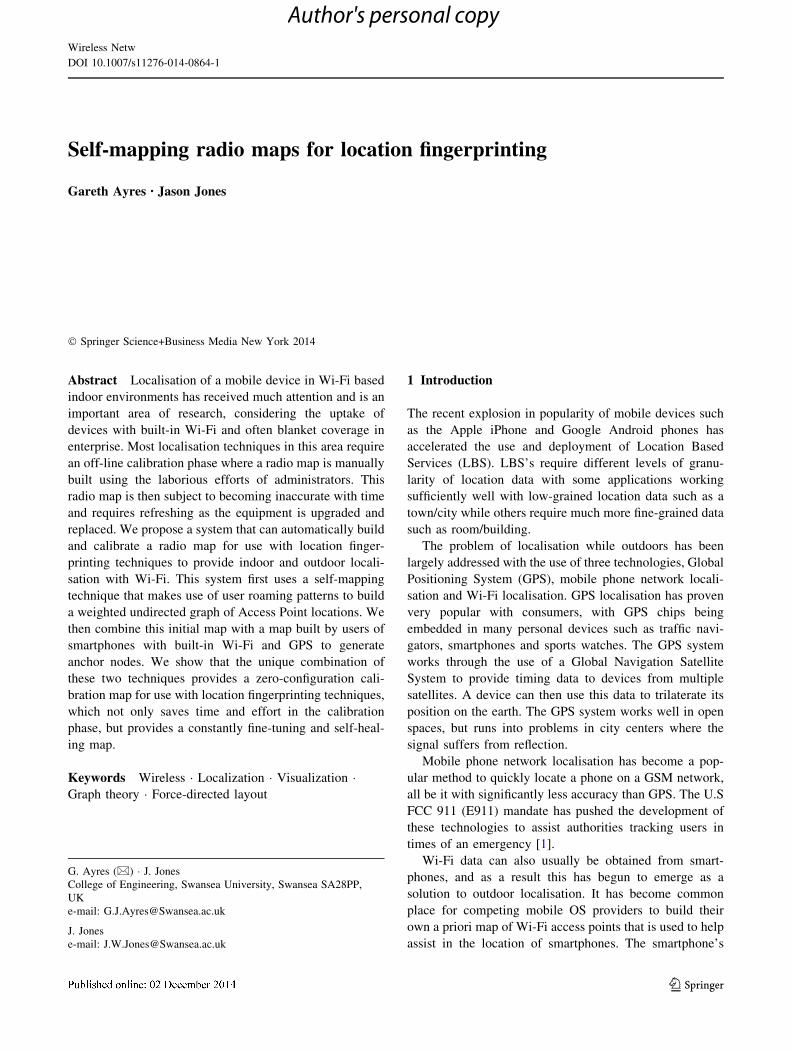
LocPriS is a modular extensible framework [18] that we
are developing to provide tools for the development, ana-
lysis, comparison and visualisation of LBS’s that preserve
privacy and security. The framework will also assist in the
development and testing of Location Based Services
through an exposed API (Fig. 1).
3.1 Visualising roaming with LocPriS
LocPriS can build a model of wireless access points (AP),
mobile nodes (MN) and the movements of the MN’s
Wireless Netw
123
Author's personal copy
between AP’s. This model can then be analysed empiri-
cally or visualised in 2d/3d as in Fig. 2. The visualization is
produced using custom software written in Java, PHP and
Javascript. The D3.js framework is used for all 2d visu-
alisations, and the jME framework used for 3d.
3.1.1 Automatic labelling and grouping
Although trivial, the hostname of each AP can sometimes
be used to automatically label AP’s and group them. This
technique can be useful in enterprise environments where
multiple location/buildings/floors have similar hostnames.
These self-assigned labels or groups can then be used to
help eliminate or speed up the manual calibration phase.
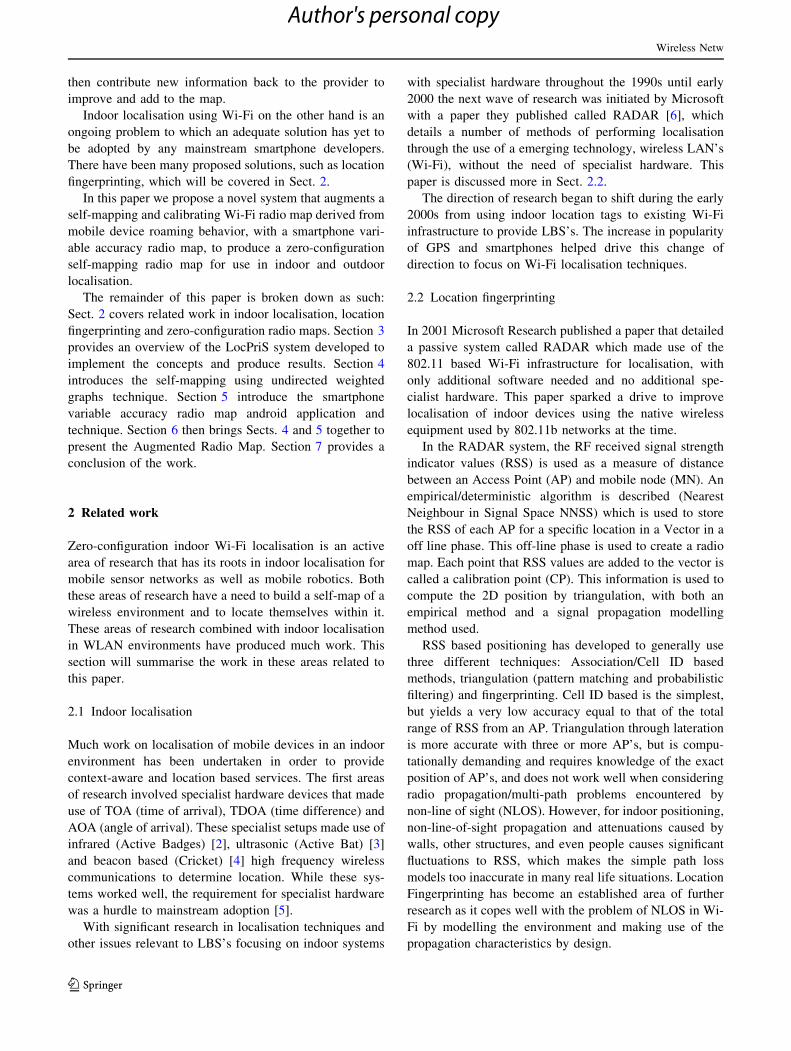
Groups of similar hostnames can be presumed to rep-
resent similar geographic locations. Fulton-AP-F1-2 for
example could be inferred to represent a cluster of AP’s in
the Fulton building. These groups can then be labelled and
visualised instead of individual AP’s in order to present a
visualisation that is simpler to interpret and conceptualise.
This is shown in Fig. 2, where automatic groups for each
building are shown as red circles on a campus map which
are generated in LocPriS using manually entered locations.
The green lines in Fig. 2 represent the roaming between
groupings by a MN as it moves around the campus.
3.1.2 Association/disassociation data
As MN’s roam, they associate to different AP’s. These
associations and disassociations create events (SNMP
traps) in the wireless system which can be sent to LocPriS
and then stored in a database. These events contain addi-
tional information such as time, AP name and MN iden-
tifier. The LocPriS system can pseudo-anonymise this data
to enhance user privacy for use with location fingerprint-
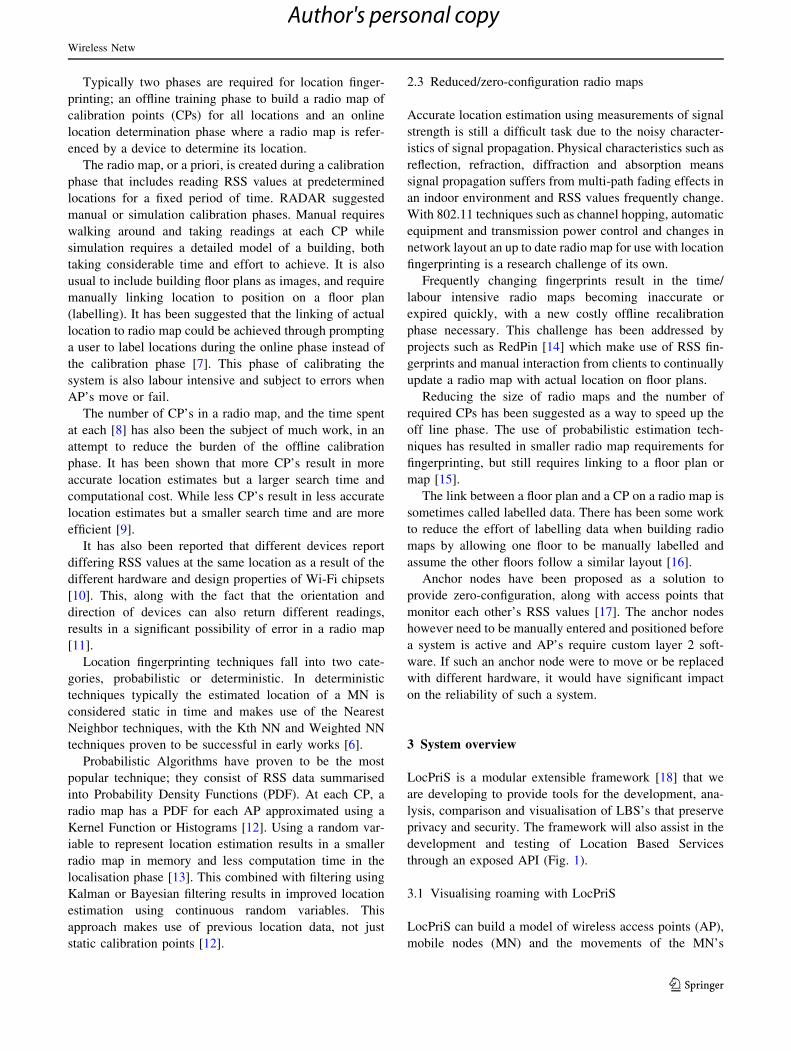
ing. While it is the aim to discover the location of AP’s
using self-mapping, it is possible to set the latitude/longi-
tude of an AP manually in LocPriS. Figure 3 shows the
location of all AP’s at the Student Village mapped using
their lat/long location which was manually entered in order
to evaluate the effectiveness of self-mapping in later
sections.
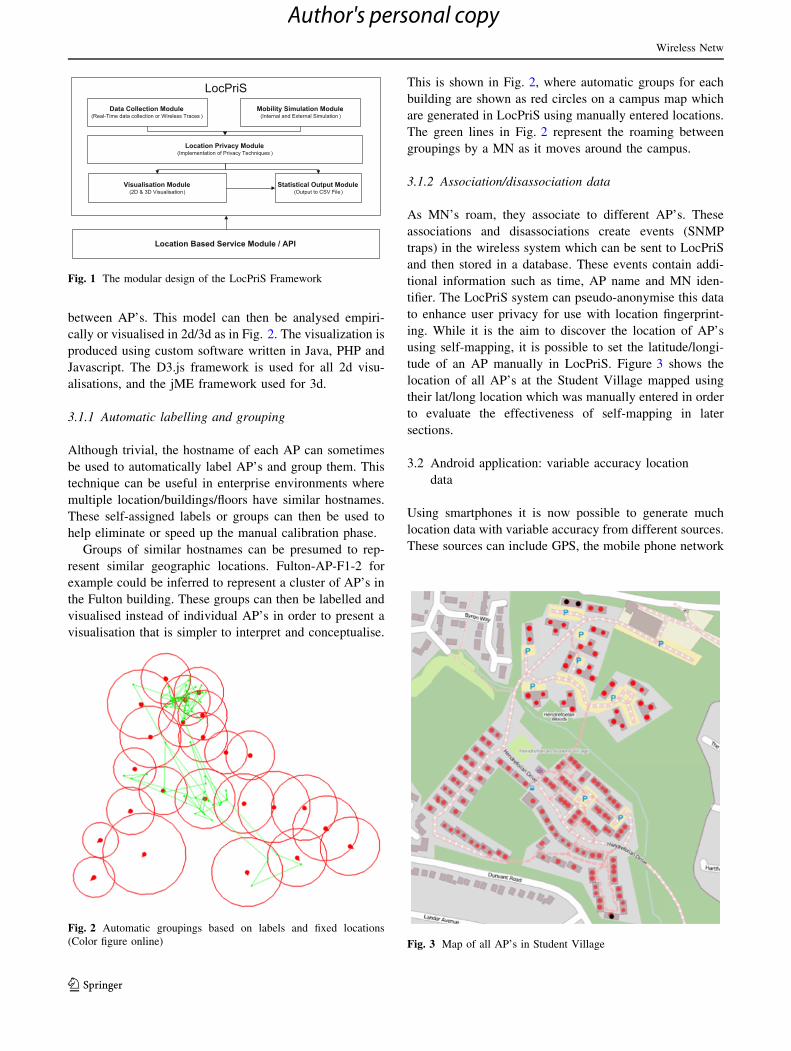
3.2 Android application: variable accuracy location
data
Using smartphones it is now possible to generate much
location data with variable accuracy from different sources.
These sources can include GPS, the mobile phone network
LocPriSData Collection Module
(Real-Time data collection or Wireless Traces )Mobility Simulation Module
(Internal and External Simulation )
Visualisation Module(2D & 3D Visualisation)
Statistical Output Module(Output to CSV File)
Location Based Service Module / API
Location Privacy Module(Implementation of Privacy Techniques )
Fig. 1 The modular design of the LocPriS Framework
Fig. 2 Automatic groupings based on labels and fixed locations
(Color figure online) Fig. 3 Map of all AP’s in Student Village
Wireless Netw
123
Author's personal copy
and Wi-Fi estimation. The specific use of Android and a
custom LocPriS application that has been developed is
discussed in further detail in Sect. 5.
4 Self-mapping using undirected weighted graphs
The LocPriS system receives real time association and
disassociation data about all connected MN’s from wireless
AP’s via the wireless controllers. This data is then for-
warded to the LocPriS server software and stored in two
mySQL database tables.
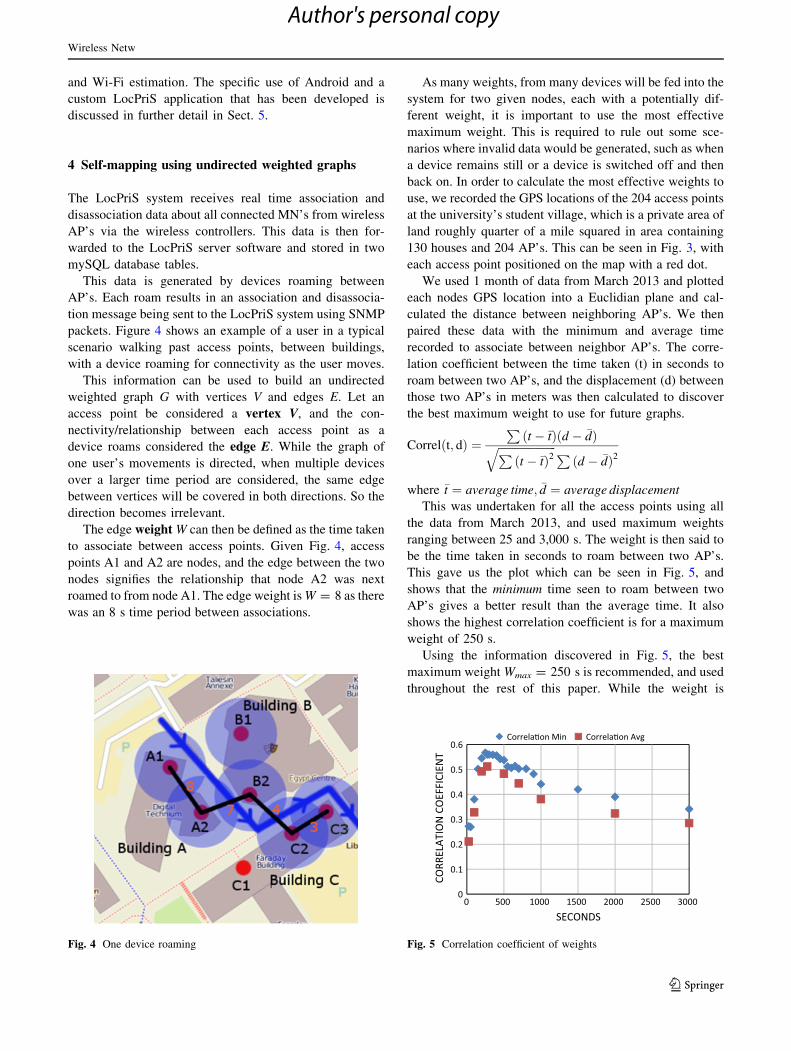
This data is generated by devices roaming between
AP’s. Each roam results in an association and disassocia-
tion message being sent to the LocPriS system using SNMP
packets. Figure 4 shows an example of a user in a typical
scenario walking past access points, between buildings,
with a device roaming for connectivity as the user moves.
This information can be used to build an undirected
weighted graph G with vertices V and edges E. Let an
access point be considered a vertex V, and the con-
nectivity/relationship between each access point as a
device roams considered the edge E. While the graph of
one user’s movements is directed, when multiple devices
over a larger time period are considered, the same edge
between vertices will be covered in both directions. So the
direction becomes irrelevant.
The edge weight W can then be defined as the time taken
to associate between access points. Given Fig. 4, access
points A1 and A2 are nodes, and the edge between the two
nodes signifies the relationship that node A2 was next
roamed to from node A1. The edge weight is W = 8 as there
was an 8 s time period between associations.
As many weights, from many devices will be fed into the
system for two given nodes, each with a potentially dif-
ferent weight, it is important to use the most effective
maximum weight. This is required to rule out some sce-
narios where invalid data would be generated, such as when
a device remains still or a device is switched off and then
back on. In order to calculate the most effective weights to
use, we recorded the GPS locations of the 204 access points
at the university’s student village, which is a private area of
land roughly quarter of a mile squared in area containing
130 houses and 204 AP’s. This can be seen in Fig. 3, with
each access point positioned on the map with a red dot.
We used 1 month of data from March 2013 and plotted
each nodes GPS location into a Euclidian plane and cal-
culated the distance between neighboring AP’s. We then
paired these data with the minimum and average time
recorded to associate between neighbor AP’s. The corre-
lation coefficient between the time taken (t) in seconds to
roam between two AP’s, and the displacement (d) between
those two AP’s in meters was then calculated to discover
the best maximum weight to use for future graphs.
Correlðt; dÞ ¼Pðt � �tÞðd � �dÞ
ffiffiffiffiffiffiffiffiffiffiffiffiffiffiffiffiffiffiffiffiffiPðt � �tÞ2
qPðd � �dÞ2
where �t ¼ average time; �d ¼ average displacement
This was undertaken for all the access points using all
the data from March 2013, and used maximum weights
ranging between 25 and 3,000 s. The weight is then said to
be the time taken in seconds to roam between two AP’s.
This gave us the plot which can be seen in Fig. 5, and
shows that the minimum time seen to roam between two
AP’s gives a better result than the average time. It also
shows the highest correlation coefficient is for a maximum
weight of 250 s.
Using the information discovered in Fig. 5, the best
maximum weight Wmax = 250 s is recommended, and used
throughout the rest of this paper. While the weight is
Fig. 4 One device roaming
0
0.1
0.2
0.3
0.4
0.5
0.6
0 500 1000 1500 2000 2500 3000
CORR
ELAT
ION
CO
EFFI
CIEN
T
SECONDS
Correla�on Min Correla�on Avg
Fig. 5 Correlation coefficient of weights
Wireless Netw
123
Author's personal copy
derived from time, the unit of the weight once the graph is
built is meaningless, as the graph is dimensionless. Once
the graph is anchored in Sect. 6, the weights are used to
scale the graph and keep edges relative.
For the full 12 months of 2013 there were 50,539,780
associations recorded by LocPriS running on the Swansea
University wireless system, for all campuses. During this
time, there were 870 distinct AP’s identified in the system
and 21,382 distinct devices seen.
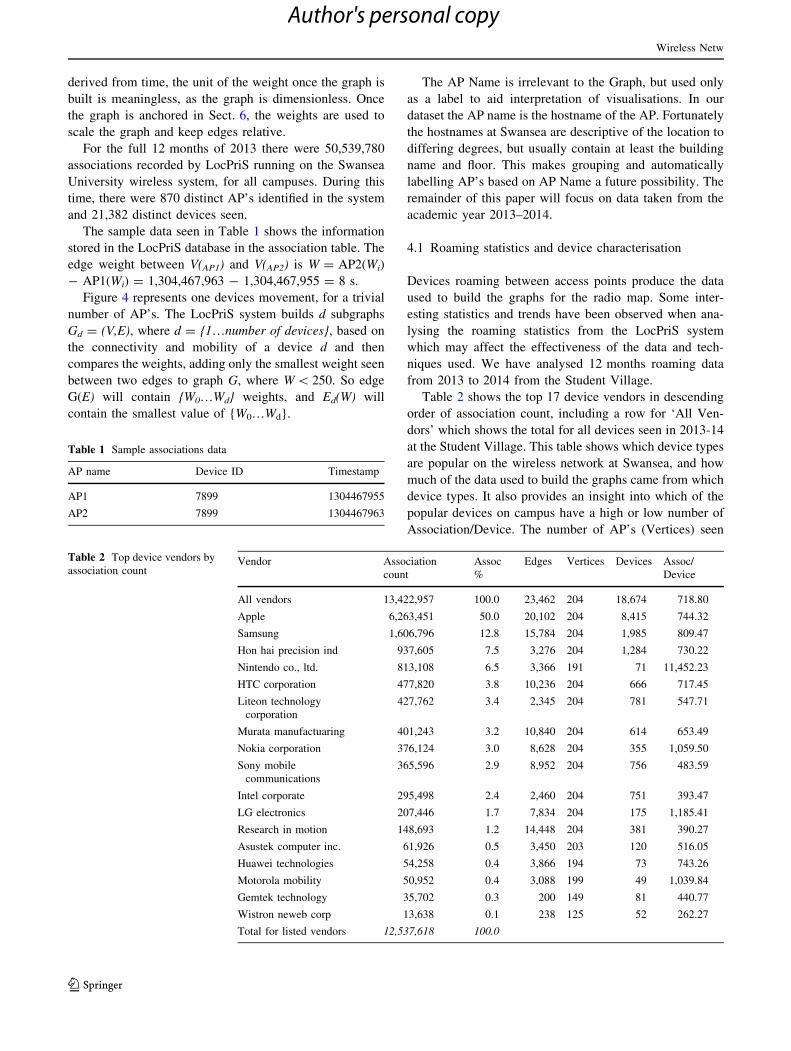
The sample data seen in Table 1 shows the information
stored in the LocPriS database in the association table. The
edge weight between V(AP1) and V(AP2) is W = AP2(Wi)
- AP1(Wi) = 1,304,467,963 - 1,304,467,955 = 8 s.
Figure 4 represents one devices movement, for a trivial
number of AP’s. The LocPriS system builds d subgraphs
Gd = (V,E), where d = {1…number of devices}, based on
the connectivity and mobility of a device d and then
compares the weights, adding only the smallest weight seen
between two edges to graph G, where W \ 250. So edge
G(E) will contain {W0…Wd} weights, and Ed(W) will
contain the smallest value of {W0…Wd}.
The AP Name is irrelevant to the Graph, but used only
as a label to aid interpretation of visualisations. In our
dataset the AP name is the hostname of the AP. Fortunately
the hostnames at Swansea are descriptive of the location to
differing degrees, but usually contain at least the building
name and floor. This makes grouping and automatically
labelling AP’s based on AP Name a future possibility. The
remainder of this paper will focus on data taken from the
academic year 2013–2014.
4.1 Roaming statistics and device characterisation
Devices roaming between access points produce the data
used to build the graphs for the radio map. Some inter-
esting statistics and trends have been observed when ana-
lysing the roaming statistics from the LocPriS system
which may affect the effectiveness of the data and tech-
niques used. We have analysed 12 months roaming data
from 2013 to 2014 from the Student Village.
Table 2 shows the top 17 device vendors in descending
order of association count, including a row for ‘All Ven-
dors’ which shows the total for all devices seen in 2013-14
at the Student Village. This table shows which device types
are popular on the wireless network at Swansea, and how
much of the data used to build the graphs came from which
device types. It also provides an insight into which of the
popular devices on campus have a high or low number of
Association/Device. The number of AP’s (Vertices) seen
Table 1 Sample associations data
AP name Device ID Timestamp
AP1 7899 1304467955
AP2 7899 1304467963
Table 2 Top device vendors by
association countVendor Association
count
Assoc
%
Edges Vertices Devices Assoc/
Device
All vendors 13,422,957 100.0 23,462 204 18,674 718.80
Apple 6,263,451 50.0 20,102 204 8,415 744.32
Samsung 1,606,796 12.8 15,784 204 1,985 809.47
Hon hai precision ind 937,605 7.5 3,276 204 1,284 730.22
Nintendo co., ltd. 813,108 6.5 3,366 191 71 11,452.23
HTC corporation 477,820 3.8 10,236 204 666 717.45
Liteon technology
corporation
427,762 3.4 2,345 204 781 547.71
Murata manufactuaring 401,243 3.2 10,840 204 614 653.49
Nokia corporation 376,124 3.0 8,628 204 355 1,059.50
Sony mobile
communications
365,596 2.9 8,952 204 756 483.59
Intel corporate 295,498 2.4 2,460 204 751 393.47
LG electronics 207,446 1.7 7,834 204 175 1,185.41
Research in motion 148,693 1.2 14,448 204 381 390.27
Asustek computer inc. 61,926 0.5 3,450 203 120 516.05
Huawei technologies 54,258 0.4 3,866 194 73 743.26
Motorola mobility 50,952 0.4 3,088 199 49 1,039.84
Gemtek technology 35,702 0.3 200 149 81 440.77
Wistron neweb corp 13,638 0.1 238 125 52 262.27
Total for listed vendors 12,537,618 100.0
Wireless Netw
123
Author's personal copy

by each manufacturer (from a total of 204) and the number
of distinct associations between AP’s (Edges) are also
shown.
We have also calculated the correlation coefficient
between displacement and time for each device vendor type,
and broken down the two most popular vendors Apple and
Samsung for further analysis. It can be seen in Table 3 that
Apple devices account for 50 % of all wireless devices in the
Student Village, with Samsung making up nearly 13 %.
Students at Swansea can use any make device they wish on
the wireless network, and all are self-bought by students.
By using the wireless registration data it is possible to
brake the Apple vendor down into the known models. The
same applies for Samsung, but we have had to combine all
tablets/phones under Android as this was all that was
possible with the registration data. The totals for ‘All
Apple’ and ‘All Samsung’ is larger than the sum of the sub-
types as not all devices seen on the system were registered,
so these were not included in the granular analysis.
It can be seen from the data in Table 3 that the ‘Apple-
OSX’ and ‘Samsung-Laptop’ have significantly poorer
correlation coefficients than the mobile devices such as the
‘iPhone’. This is presumably a result of the difference in
use of mobile devices such as phones and laptops. It is also
likely a result of the behaviors of such devices, where
smartphones stay connected to wireless in a user’s pocket
as they roam, whereas a laptop would typically be shut
down or suspended when carried.
The devices with a correlation coefficient of less than
0.5 are given in italics, and greater than 0.5 in roman.
Using this information to remove the devices which pro-
vide a low or poor correlation may help improve the overall
accuracy of the map.
Other factors which may also play part in the roaming
decisions of device are badly written wireless drivers
which roam between near access points too aggressively, or
possible infrastructure problems in some locations.
4.2 Visualising roaming using LocPriS
Using the roaming data from LocPriS along with the
grouping of the AP data per building using the automatic
labelling of AP names, it is possible to quickly visualise the
mobility of devices to get an idea of roaming patterns.
Figure 6 shows a visualisation of associations of all devices
during a 1 h period, overlaid onto a Swansea Universiy
Student Village map. The association between two AP’s is
represented by a line. Each AP was manually positioned
using manually collected GPS locations and is represented
by a red circle.
However, removing the dependency of having location
for buildings and access points manually entered and
recorded is the goal of a self-mapping radio map.Table 3 Device type correlation coefficient
Vendor Devices Associations % Correl Coeff
All Vendors 18,674 100.0 0.61
All Apple 8,415 50.0 0.60
Apple-iPhone 4,298 N/A 0.61
Apple-iPad 753 N/A 0.62
Apple-OSX 135 N/A 0.29
All Samsung 1,985 12.8 0.64
Samsung-Android 1,321 N/A 0.65
Samsung-Laptop 90 N/A 0.03
HTC Corporation 666 3.8 0.63
Hon Hai Precision 1,284 7.5 0.45
Murata manufacturing 614 3.2 0.62
Nintendo 71 6.5 0.43
Nokia Corporation 355 3.0 0.63
Liteon Technology 781 3.4 0.26
Intel 751 2.4 0.32
Sony 756 2.9 0.64
RIM 381 0.6 0.51
LG Electronics 175 1.7 0.62
Wistron Neweb 52 0.1 0.27
Asustek Computer inc 120 0.5 0.57
Motorola Mobility 49 0.4 0.61
Huawei Technologies 73 0.4 0.54
Gemtek Technology 81 0.3 0.02 Fig. 6 One hour associations with automatic grouping and manual
entered AP locations (Color figure online)
Wireless Netw
123
Author's personal copy
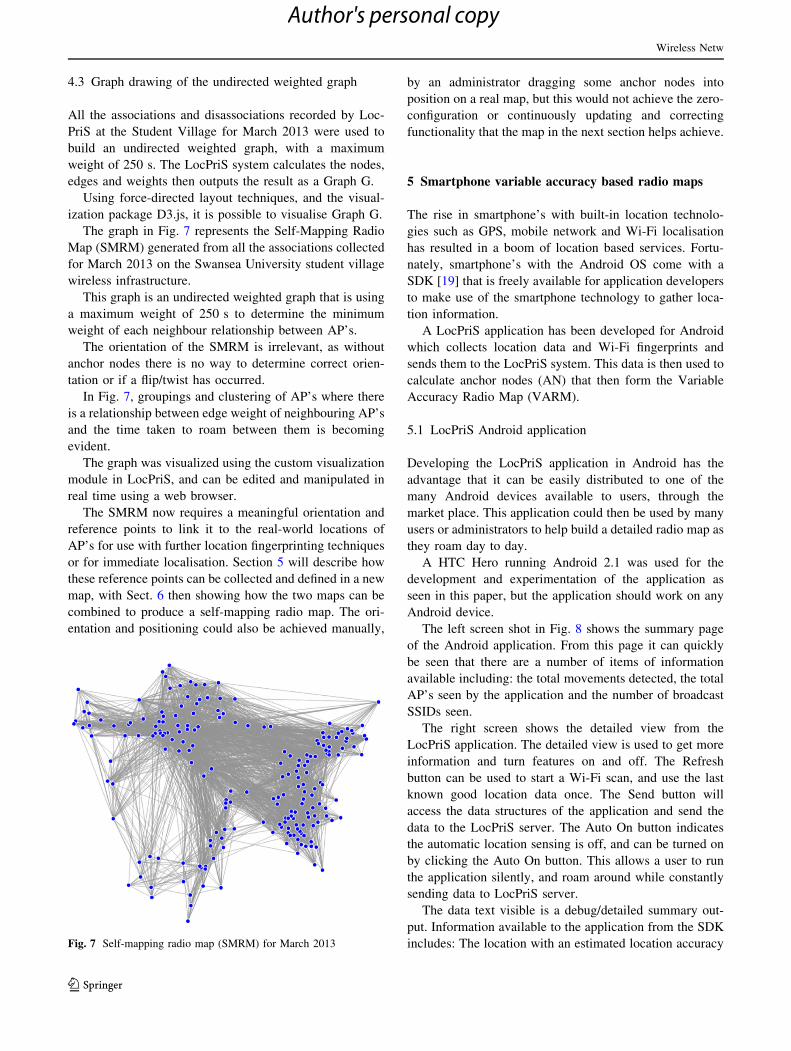
4.3 Graph drawing of the undirected weighted graph
All the associations and disassociations recorded by Loc-
PriS at the Student Village for March 2013 were used to
build an undirected weighted graph, with a maximum
weight of 250 s. The LocPriS system calculates the nodes,
edges and weights then outputs the result as a Graph G.
Using force-directed layout techniques, and the visual-
ization package D3.js, it is possible to visualise Graph G.
The graph in Fig. 7 represents the Self-Mapping Radio
Map (SMRM) generated from all the associations collected
for March 2013 on the Swansea University student village
wireless infrastructure.
This graph is an undirected weighted graph that is using
a maximum weight of 250 s to determine the minimum
weight of each neighbour relationship between AP’s.
The orientation of the SMRM is irrelevant, as without
anchor nodes there is no way to determine correct orien-
tation or if a flip/twist has occurred.
In Fig. 7, groupings and clustering of AP’s where there
is a relationship between edge weight of neighbouring AP’s
and the time taken to roam between them is becoming
evident.
The graph was visualized using the custom visualization
module in LocPriS, and can be edited and manipulated in
real time using a web browser.
The SMRM now requires a meaningful orientation and
reference points to link it to the real-world locations of
AP’s for use with further location fingerprinting techniques
or for immediate localisation. Section 5 will describe how
these reference points can be collected and defined in a new
map, with Sect. 6 then showing how the two maps can be
combined to produce a self-mapping radio map. The ori-
entation and positioning could also be achieved manually,
by an administrator dragging some anchor nodes into
position on a real map, but this would not achieve the zero-
configuration or continuously updating and correcting
functionality that the map in the next section helps achieve.
5 Smartphone variable accuracy based radio maps
The rise in smartphone’s with built-in location technolo-
gies such as GPS, mobile network and Wi-Fi localisation
has resulted in a boom of location based services. Fortu-
nately, smartphone’s with the Android OS come with a
SDK [19] that is freely available for application developers
to make use of the smartphone technology to gather loca-
tion information.
A LocPriS application has been developed for Android
which collects location data and Wi-Fi fingerprints and
sends them to the LocPriS system. This data is then used to
calculate anchor nodes (AN) that then form the Variable
Accuracy Radio Map (VARM).
5.1 LocPriS Android application
Developing the LocPriS application in Android has the
advantage that it can be easily distributed to one of the
many Android devices available to users, through the
market place. This application could then be used by many
users or administrators to help build a detailed radio map as
they roam day to day.
A HTC Hero running Android 2.1 was used for the
development and experimentation of the application as
seen in this paper, but the application should work on any
Android device.
The left screen shot in Fig. 8 shows the summary page
of the Android application. From this page it can quickly
be seen that there are a number of items of information
available including: the total movements detected, the total
AP’s seen by the application and the number of broadcast
SSIDs seen.
The right screen shows the detailed view from the
LocPriS application. The detailed view is used to get more
information and turn features on and off. The Refresh
button can be used to start a Wi-Fi scan, and use the last
known good location data once. The Send button will
access the data structures of the application and send the
data to the LocPriS server. The Auto On button indicates
the automatic location sensing is off, and can be turned on
by clicking the Auto On button. This allows a user to run
the application silently, and roam around while constantly
sending data to LocPriS server.
The data text visible is a debug/detailed summary out-
put. Information available to the application from the SDK
includes: The location with an estimated location accuracyFig. 7 Self-mapping radio map (SMRM) for March 2013
Wireless Netw
123
Author's personal copy

in meters, the RSS value of the AP seen, the latitude and
longitude of the current location along with a timestamp
and the location provider type.
The location data comes from either the built in GPS on
the device, or the estimated location based on the mobile
network localisation technique provided by Android. This
uses the mobile telephony towers to calculate location, and
is generally a less accurate than GPS except for some dense
city centers where GPS is poor and there is a high con-
centration of mobile network towers.
5.2 LocPriS application calibration points and anchor
nodes
The LocPriS application was used around Swansea Uni-
versity Student Village to collect a sample of data. It is
envisaged that the application would only need to be used
by one site administrator, and even only once in order to
collect sufficient anchor nodes. The application could be
built as a service that is running silently on android devices
without user intervention.
A Calibration Point (CP) can be considered the esti-
mated location of a MN (running the LocPriS application)
when a RSS value reading, paired with GPS/Mobile loca-
tion data was taken (Location Fingerprint). A user running
the LocPriS Android Application walked on an anticlock-
wise path around the Student Village. Figure 9 shows the
path taken by the users, along with the CP’s (red pins in left
image) and the AP roaming history obtained by the
LocPriS system (right image). As the exact locations of
APs is already known in Fig. 9, this can be considered the
ground truth for AP locations.
Multiple CP’s with the same AP visible are then used to
compute the Anchor Node location, which is the estimated
location of the AP. This is achieved by using the location
of the CP with the lowest location accuracy error as the
AN. If multiple CP’s with similar location accuracy error
as found then the one with the lowest RSS value is used.
The location of the AN then become the location provided
by the CP, as derived from the android application.
It is possible to use the location of multiple CP’s and
techniques such as those described in RADAR [6] to per-
form trilateration to give a AN with a potentially better
location accuracy, but this is not explored in this paper.
The use of GPS or mobile network localisation to obtain
AN locations results in AN’s that are placed outdoors, or
on the periphery of buildings. Also limiting the maximum
location accuracy error to 5 m (typically GPS) will help
remove the creation of unsuitable AN’s.
The AN seen in Table 4 has had its location determined
by an android device with a GPS lock with an accuracy of
\5 m. This AN can then be used along with other ANs to
orientate and position other radio maps, as discussed in
Sect. 6.
Combining the anchor nodes along with the variable
accuracy location data then provides a Variable Accuracy
Radio Map (VARM) derived from android devices
reporting data back to the LocPriS server.
Fig. 8 Screen shots of LocPriS
application
Wireless Netw
123
Author's personal copy
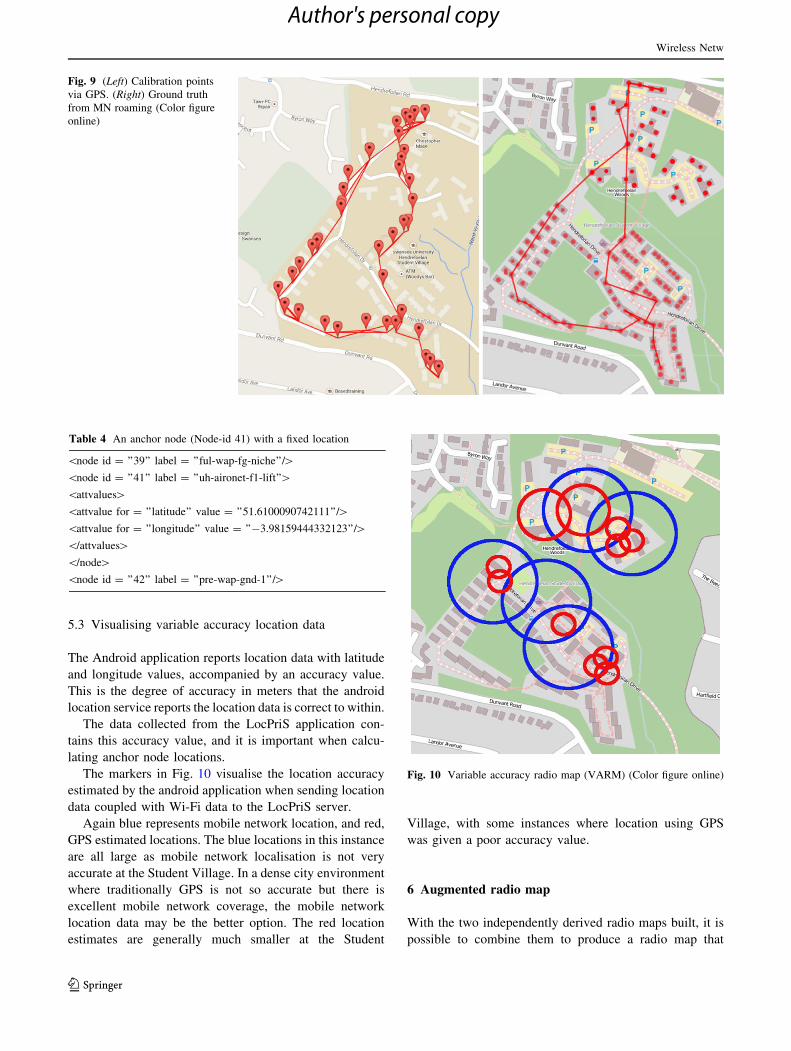
5.3 Visualising variable accuracy location data
The Android application reports location data with latitude
and longitude values, accompanied by an accuracy value.
This is the degree of accuracy in meters that the android
location service reports the location data is correct to within.
The data collected from the LocPriS application con-
tains this accuracy value, and it is important when calcu-
lating anchor node locations.
The markers in Fig. 10 visualise the location accuracy
estimated by the android application when sending location
data coupled with Wi-Fi data to the LocPriS server.
Again blue represents mobile network location, and red,
GPS estimated locations. The blue locations in this instance
are all large as mobile network localisation is not very
accurate at the Student Village. In a dense city environment
where traditionally GPS is not so accurate but there is
excellent mobile network coverage, the mobile network
location data may be the better option. The red location
estimates are generally much smaller at the Student
Village, with some instances where location using GPS
was given a poor accuracy value.
6 Augmented radio map
With the two independently derived radio maps built, it is
possible to combine them to produce a radio map that
Fig. 9 (Left) Calibration points
via GPS. (Right) Ground truth
from MN roaming (Color figure
online)
Table 4 An anchor node (Node-id 41) with a fixed location
\node id = ’’39’’ label = ’’ful-wap-fg-niche’’/[\node id = ’’41’’ label = ’’uh-aironet-f1-lift’’[\attvalues[\attvalue for = ’’latitude’’ value = ’’51.6100090742111’’/[\attvalue for = ’’longitude’’ value = ’’-3.98159444332123’’/[\/attvalues[\/node[\node id = ’’42’’ label = ’’pre-wap-gnd-1’’/[
Fig. 10 Variable accuracy radio map (VARM) (Color figure online)
Wireless Netw
123
Author's personal copy
contains enough information on the location of access
points to perform indoor and outdoor localisation, or to
perform further Location Fingerprinting to improve accu-
racy. We call this an Augmented Radio Map (ARM). The
ARM is equivalent to the a priori map used traditionally in
location fingerprinting techniques.
The SMRM contains information useful to indoor and
outdoor localisation, but it lacks orientation and a link to
the real world locations. The smartphone VARM contains
orientation through the use of anchor nodes and helps
improve accuracy through GPS on buildings periphery
AP’s by linking anchor nodes to the real world locations.
By infusing the anchor node information into the
SMRM, it is possible to correctly orientate and position an
augmented radio map that contains information useful to
indoor and outdoor localisations and more importantly, as a
zero-configuration self-mapping radio map for use with
Location Fingerprint techniques.
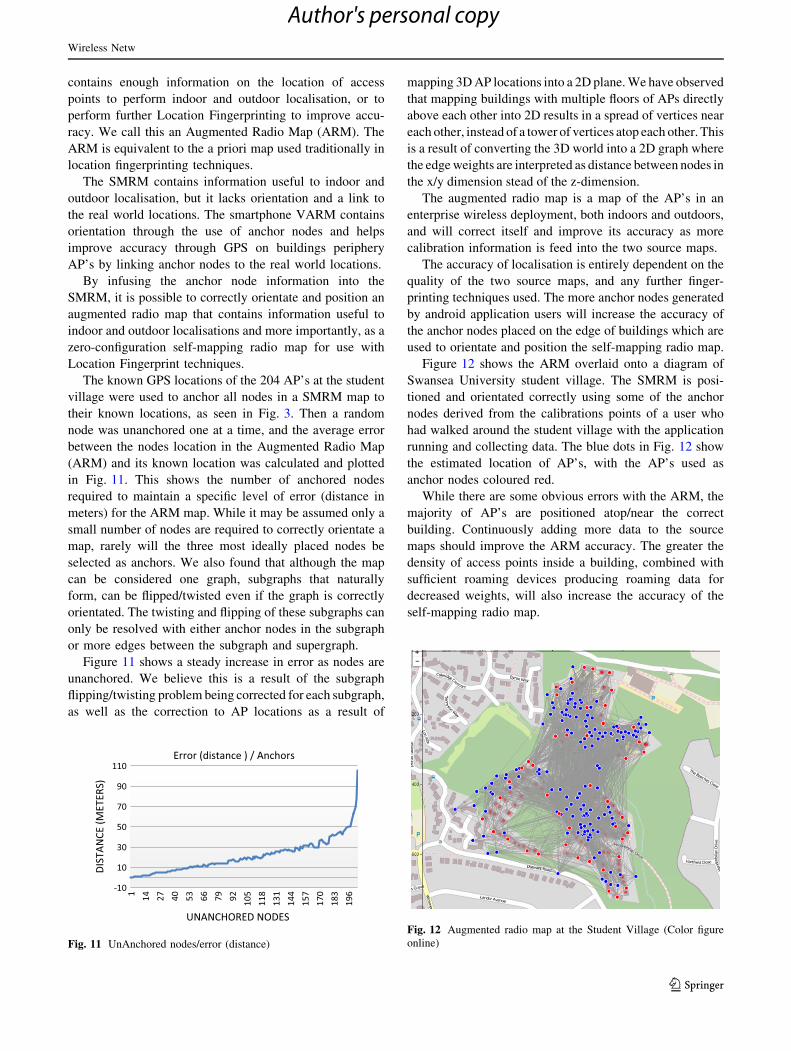
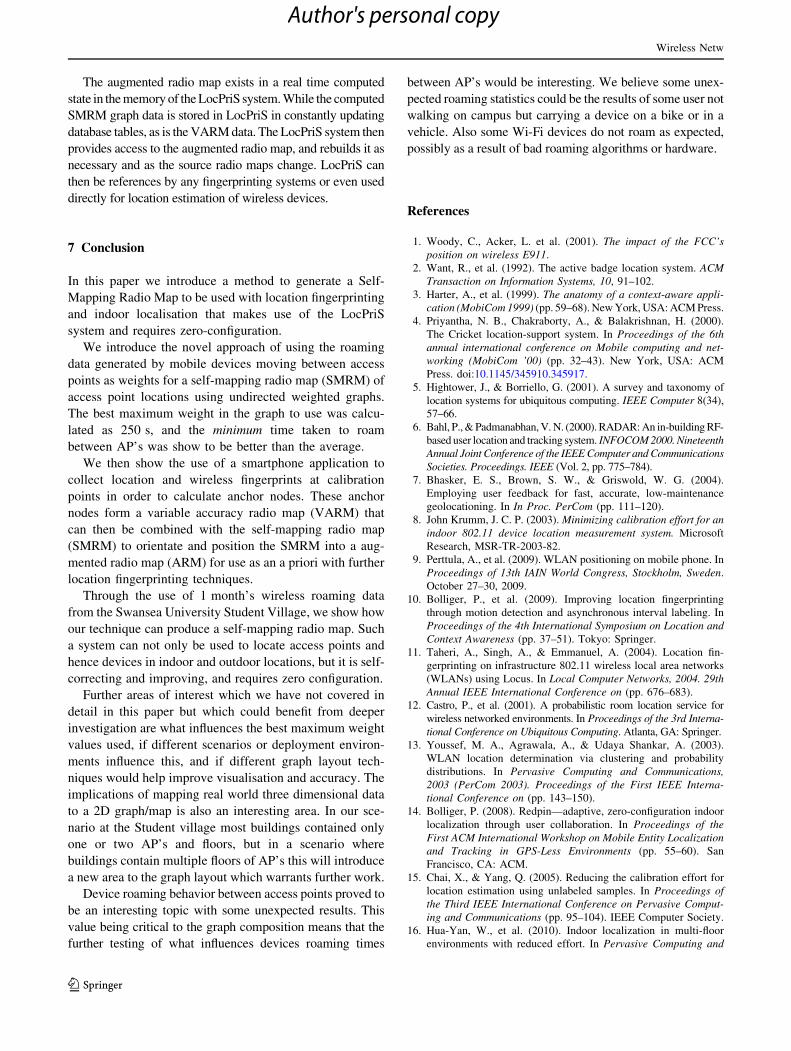
The known GPS locations of the 204 AP’s at the student
village were used to anchor all nodes in a SMRM map to
their known locations, as seen in Fig. 3. Then a random
node was unanchored one at a time, and the average error
between the nodes location in the Augmented Radio Map
(ARM) and its known location was calculated and plotted
in Fig. 11. This shows the number of anchored nodes
required to maintain a specific level of error (distance in
meters) for the ARM map. While it may be assumed only a
small number of nodes are required to correctly orientate a
map, rarely will the three most ideally placed nodes be
selected as anchors. We also found that although the map
can be considered one graph, subgraphs that naturally
form, can be flipped/twisted even if the graph is correctly
orientated. The twisting and flipping of these subgraphs can
only be resolved with either anchor nodes in the subgraph
or more edges between the subgraph and supergraph.
Figure 11 shows a steady increase in error as nodes are
unanchored. We believe this is a result of the subgraph
flipping/twisting problem being corrected for each subgraph,
as well as the correction to AP locations as a result of
mapping 3D AP locations into a 2D plane. We have observed
that mapping buildings with multiple floors of APs directly
above each other into 2D results in a spread of vertices near
each other, instead of a tower of vertices atop each other. This
is a result of converting the 3D world into a 2D graph where
the edge weights are interpreted as distance between nodes in
the x/y dimension stead of the z-dimension.
The augmented radio map is a map of the AP’s in an
enterprise wireless deployment, both indoors and outdoors,
and will correct itself and improve its accuracy as more
calibration information is feed into the two source maps.
The accuracy of localisation is entirely dependent on the
quality of the two source maps, and any further finger-
printing techniques used. The more anchor nodes generated
by android application users will increase the accuracy of
the anchor nodes placed on the edge of buildings which are
used to orientate and position the self-mapping radio map.
Figure 12 shows the ARM overlaid onto a diagram of
Swansea University student village. The SMRM is posi-
tioned and orientated correctly using some of the anchor
nodes derived from the calibrations points of a user who
had walked around the student village with the application
running and collecting data. The blue dots in Fig. 12 show
the estimated location of AP’s, with the AP’s used as
anchor nodes coloured red.
While there are some obvious errors with the ARM, the
majority of AP’s are positioned atop/near the correct
building. Continuously adding more data to the source
maps should improve the ARM accuracy. The greater the
density of access points inside a building, combined with
sufficient roaming devices producing roaming data for
decreased weights, will also increase the accuracy of the
self-mapping radio map.
-10
10
30
50
70
90
110
1 14 27 40 53 66 79 92 105
118
131
144
157
170
183
196
DIST
ANCE
(MET
ERS)
UNANCHORED NODES
Error (distance ) / Anchors
Fig. 11 UnAnchored nodes/error (distance)
Fig. 12 Augmented radio map at the Student Village (Color figure
online)
Wireless Netw
123
Author's personal copy
The augmented radio map exists in a real time computed
state in the memory of the LocPriS system. While the computed
SMRM graph data is stored in LocPriS in constantly updating
database tables, as is the VARM data. The LocPriS system then
provides access to the augmented radio map, and rebuilds it as
necessary and as the source radio maps change. LocPriS can
then be references by any fingerprinting systems or even used
directly for location estimation of wireless devices.
7 Conclusion
In this paper we introduce a method to generate a Self-
Mapping Radio Map to be used with location fingerprinting
and indoor localisation that makes use of the LocPriS
system and requires zero-configuration.
We introduce the novel approach of using the roaming
data generated by mobile devices moving between access
points as weights for a self-mapping radio map (SMRM) of
access point locations using undirected weighted graphs.
The best maximum weight in the graph to use was calcu-
lated as 250 s, and the minimum time taken to roam
between AP’s was show to be better than the average.
We then show the use of a smartphone application to
collect location and wireless fingerprints at calibration
points in order to calculate anchor nodes. These anchor
nodes form a variable accuracy radio map (VARM) that
can then be combined with the self-mapping radio map
(SMRM) to orientate and position the SMRM into a aug-
mented radio map (ARM) for use as an a priori with further
location fingerprinting techniques.
Through the use of 1 month’s wireless roaming data
from the Swansea University Student Village, we show how
our technique can produce a self-mapping radio map. Such
a system can not only be used to locate access points and
hence devices in indoor and outdoor locations, but it is self-
correcting and improving, and requires zero configuration.
Further areas of interest which we have not covered in
detail in this paper but which could benefit from deeper
investigation are what influences the best maximum weight
values used, if different scenarios or deployment environ-
ments influence this, and if different graph layout tech-
niques would help improve visualisation and accuracy. The
implications of mapping real world three dimensional data
to a 2D graph/map is also an interesting area. In our sce-
nario at the Student village most buildings contained only
one or two AP’s and floors, but in a scenario where
buildings contain multiple floors of AP’s this will introduce
a new area to the graph layout which warrants further work.
Device roaming behavior between access points proved to
be an interesting topic with some unexpected results. This
value being critical to the graph composition means that the
further testing of what influences devices roaming times
between AP’s would be interesting. We believe some unex-
pected roaming statistics could be the results of some user not
walking on campus but carrying a device on a bike or in a
vehicle. Also some Wi-Fi devices do not roam as expected,
possibly as a result of bad roaming algorithms or hardware.
References
1. Woody, C., Acker, L. et al. (2001). The impact of the FCC’s
position on wireless E911.
2. Want, R., et al. (1992). The active badge location system. ACM
Transaction on Information Systems, 10, 91–102.
3. Harter, A., et al. (1999). The anatomy of a context-aware appli-
cation (MobiCom 1999) (pp. 59–68). New York, USA: ACM Press.
4. Priyantha, N. B., Chakraborty, A., & Balakrishnan, H. (2000).
The Cricket location-support system. In Proceedings of the 6th
annual international conference on Mobile computing and net-
working (MobiCom ’00) (pp. 32–43). New York, USA: ACM
Press. doi:10.1145/345910.345917.
5. Hightower, J., & Borriello, G. (2001). A survey and taxonomy of
location systems for ubiquitous computing. IEEE Computer 8(34),
57–66.
6. Bahl, P., & Padmanabhan, V. N. (2000). RADAR: An in-building RF-
based user location and tracking system. INFOCOM 2000. Nineteenth
Annual Joint Conference of the IEEE Computer and Communications
Societies. Proceedings. IEEE (Vol. 2, pp. 775–784).
7. Bhasker, E. S., Brown, S. W., & Griswold, W. G. (2004).
Employing user feedback for fast, accurate, low-maintenance
geolocationing. In In Proc. PerCom (pp. 111–120).
8. John Krumm, J. C. P. (2003). Minimizing calibration effort for an
indoor 802.11 device location measurement system. Microsoft
Research, MSR-TR-2003-82.
9. Perttula, A., et al. (2009). WLAN positioning on mobile phone. In
Proceedings of 13th IAIN World Congress, Stockholm, Sweden.
October 27–30, 2009.
10. Bolliger, P., et al. (2009). Improving location fingerprinting
through motion detection and asynchronous interval labeling. In
Proceedings of the 4th International Symposium on Location and
Context Awareness (pp. 37–51). Tokyo: Springer.
11. Taheri, A., Singh, A., & Emmanuel, A. (2004). Location fin-
gerprinting on infrastructure 802.11 wireless local area networks
(WLANs) using Locus. In Local Computer Networks, 2004. 29th
Annual IEEE International Conference on (pp. 676–683).
12. Castro, P., et al. (2001). A probabilistic room location service for
wireless networked environments. In Proceedings of the 3rd Interna-
tional Conference on Ubiquitous Computing. Atlanta, GA: Springer.
13. Youssef, M. A., Agrawala, A., & Udaya Shankar, A. (2003).
WLAN location determination via clustering and probability
distributions. In Pervasive Computing and Communications,
2003 (PerCom 2003). Proceedings of the First IEEE Interna-
tional Conference on (pp. 143–150).
14. Bolliger, P. (2008). Redpin—adaptive, zero-configuration indoor
localization through user collaboration. In Proceedings of the
First ACM International Workshop on Mobile Entity Localization
and Tracking in GPS-Less Environments (pp. 55–60). San
Francisco, CA: ACM.
15. Chai, X., & Yang, Q. (2005). Reducing the calibration effort for
location estimation using unlabeled samples. In Proceedings of
the Third IEEE International Conference on Pervasive Comput-
ing and Communications (pp. 95–104). IEEE Computer Society.
16. Hua-Yan, W., et al. (2010). Indoor localization in multi-floor
environments with reduced effort. In Pervasive Computing and
Wireless Netw
123
Author's personal copy
Communications (PerCom), 2010 IEEE International Conference
on (pp. 244–252).
17. Lim, H., et al. (2006). Zero-configuration, robust indoor locali-
zation: theory and experimentation. In INFOCOM 2006. 25th
IEEE International Conference on Computer Communications.
Proceedings (pp. 1–12).
18. Ayres, G., & Mehmood, R. (2010). LocPriS: A security and
privacy preserving location based services development frame-
work. In Proceedings of the 14th International Conference on
Knowledge-Based and Intelligent Information and Engineering
Systems: Part IV (pp. 566–575). Cardiff: Springer.
19. Google. Android SDK. http://developer.android.com/sdk/index.
html
Gareth Ayres is a Ph.D. student
in the School of Engineering at
Swansea University and also
works as a Wireless Network
Officer for Information Services
and Systems (ISS) at Swansea.
He previously completed an
undergraduate degree at Swan-
sea before working in ISS, and
then completed a master’s
degree in communication sys-
tems before starting his Ph.D.
He now works and researches in
the area of wireless networking
and privacy and enjoys
combining the practical side of his work with ISS with the theoretical
aspect of his Ph.D.
Jason Jones received a B.Sc. in
Computer Science from Swan-
sea University in 1994. He
subsequently moved across to
the College of Engineering and
received his Ph.D. in High Per-
formance Visualisation in 1999.
After that he stayed in Swansea
as a post-doctoral researcher
working on a number of large
European projects involving the
major Aerospace companies in
Europe including BAE Systems,
Airbus and EADS. Dr. Jones
then took up the post of Centre
Manager for a new Virtual Reality Centre in the University for
3 years before finally moving back to the College of Engineering as
their High Performance Computing Research Manager.
Wireless Netw
123
Author's personal copy