reconstructing the development of a gully in the upper kalaus basin, stavropol region(southern...
TRANSCRIPT

RECONSTRUCTING THE STAGES OF GULLY DEVELOPMENT IN RUSSIA 323
Copyright © 2004 John Wiley & Sons, Ltd. Earth Surf. Process. Landforms 29, 323–341 (2004)
Earth Surface Processes and Landforms
Earth Surf. Process. Landforms 29, 323–341 (2004)Published online in Wiley InterScience (www.interscience.wiley.com). DOI: 10.1002/esp.1025
* Correspondence to: P. J. Wallbrink, CSIRO Land and Water, PO Box 1666, ACT 2601, Australia. E-mail: [email protected]
RECONSTRUCTING THE DEVELOPMENT OF A GULLY IN THEUPPER KALAUS BASIN, STAVROPOL REGION (SOUTHERN RUSSIA)
V. R. BELYAEV,1 P. J. WALLBRINK,2* V. N. GOLOSOV,1 A. S. MURRAY,3 AND A. YU. SIDORCHUK1
1 Faculty of Geography, Moscow State University, GSP 3, Moscow 119899, Russia2 CSIRO Land and Water, PO Box 1666, ACT 2601, Australia
3 Nordic Laboratory for Luminescence Dating, Aarhus University, Riso National Laboratory, DK-4000 Roskilde, Denmark
Received 25 September 2002; Revised 28 April 2003; Accepted 21 May 2003
ABSTRACT
The Stavropol region of southern Russia is severely affected by human-induced gully erosion. A lack of detailed informationon the different stages of gully formation resulting from major agricultural expansion c. 100 years ago, is an obstacle formanagement and containment of these systems. In this study we combine measurements of particle-bound radionuclides(137Cs, 210Pbex,
226Ra, 232Th and 40K) and classical geomorphology to investigate and reconstruct the different phases ofdevelopment of a gully during the last c. 100 years. We believe the first phase (1) involved an initial incision into the bottomof a small valley (catchment area c. 1 km2) about 100 years ago. A short period of rapid growth was followed by a longerstage of gully stabilization. Subsequent phases were: (2) the period 1954–1960 – re-incision in the lower gully reach wasinitiated by a high-magnitude rainfall event, and a substantial amount of sediment was delivered to the gully fan; (3) c. 1960–1986 – the knickpoint retreated slowly, sediment was redeposited nearby, and the fan surface became stable; (4) 1986–1987– a dam was built in the gully mouth and breached shortly after construction following 2 days of high rainfall, and substantialsediment accumulated in the gully above the dam and below the spillway channel on the fan surface; (5) 1987–1993 – theknickpoint retreat continued and the lower fan surface was stable until 1993 when the last significant runoff event overlayedit with c. 10 cm of fresh sediment. These detailed reconstructions of gully development stages allow the contribution of high-magnitude events to gully growth and regional sediment delivery to be assessed. They further guide management actions toprevent such dam failures in the future. Copyright © 2004 John Wiley & Sons, Ltd.
KEY WORDS: gully erosion; gully development; radionuclides; sediment accumulation; landscape reconstruction
INTRODUCTION
The problem
Gully erosion is an active and widespread geomorphic process in the upper Kalaus river basin on the Stavropol
upland of southern European Russia. This steppe landscape has some of the highest soil erosion and gullying
rates within European Russia, with mean erosion rates of up to 20–30 t ha−1 a−1 (Zaslavski, 1979). These are
mainly associated with phases of high intensity summer rainfall, which have an average return period of 8–10
years and last for 2–4 years (Ledneva and Mescherskaya, 1977; North Caucasus Hydrometeorological Service
Administration (NCHSA), 1990).
Dense gully networks now occupy many catchments in the region and new flow lines have occurred in
response to anthropogenic activity (Sidorchuk and Golosov, 1995). There has been a substantial loss of produc-
tivity from these lands due to the effects of erosion and sedimentation (Sobolev, 1961) as well as considerable
loss and damage to infrastructure such as roads and bridges. Significant off-site impacts such as eutrophication,
increased turbidity of rivers, substantial aggradation in the upper reaches of drainage network and loss of
perennial watercourses have also been observed (Golosov et al., 1997).
The primary cause of the severe soil and gully erosion is believed to be a combination of intensive grazing on
upland areas (Shul’zhenko et al., 1977) and active cultivation. Both of these became more widespread within the
last 100 years (Tcvetkov, 1957; Golosov, 1996). In particular, because slopes in the region are relatively steep,

324 V. R. BELYAEV ET AL.
Copyright © 2004 John Wiley & Sons, Ltd. Earth Surf. Process. Landforms 29, 323–341 (2004)
serious cultivation in the Upper Kalaus basin only began in 1925–1935 with the introduction of more advanced
agricultural machinery. This took place during the transition period from individual to collective farming in
Russian agriculture (Yasunskii, 1978). Maximum rates of gully erosion were observed in the first half of the 20th
century when cultivation increased to around 40–55 per cent of total land area (Tcvetkov, 1957; Kosov, 1978).
In response to this intensive gully growth, a programme of small dam construction was initiated in the region.
Most of these were built in the upper reaches of small rivers, creeks (balkas) or gullies. The purpose of some
was to buffer runoff, trap sediment and prevent gully growth while others were built to protect roads and
infrastructure (Prytkova, 1972). The sediment accumulated above these dams provides an additional record of
erosion and sediment delivery within the catchments.
However, these counter-measures have not always been successful. Failure of such dams is common and often
results in an increase in gully erosion activity as a wave of incision proceeds from the breach point upstream.
Managing these active gully systems requires quantifying the processes involved in their formation. In particular,
the role of external (rainfall, vegetation, land use) and internal (long profile development controlled by sediment
transport capacity, interaction of erosion and slope processes) factors must be assessed with regard to events of
different magnitude and frequency. There is also a lack of detailed quantitative information about the dynamics
of the different stages of gully development.
Objectives of this study
To address these gaps we aim to reconstruct the phases of development in a gully typical of the Upper Kalaus
river basin. To achieve this we combine different approaches. The first is a conventional geomorphological
description of soil pits, theodolite survey, temporal analysis of maps, rainfall and land use records. The second
involves radionuclide-based tracing techniques, including measurements of fallout caesium-137 (137Cs) and un-
supported (or ‘excess’) lead-210 (210Pbex) as well as lithogenic radium-226 (226Ra), thorium-232 (232Th) and
potassium-40 (40K). The tracer measurements are undertaken on material from detailed depth-incremental and
integral sampling of the gully bottom, banks, fan and erosion source areas in the catchment. The combined data
allow us to reconstruct the temporal stages of incision and infill of this gully over the last c. 100 years and link
them to their likely anthropogenic and natural causes. Further, we assess the inputs of different sediment sources
to and from the gully network and derive sediment accumulation rates on the fan associated with the gully
system. This detailed temporal and process understanding of the gully system is necessary to improve land
management, design and construction of erosion and sedimentation counter-measures for the region.
THE STUDY AREA AND KNOWN HISTORY
The Kalaus river basin and Stavropol region
The Kalaus river basin is located in southern European Russia in the centre of the Stavropol upland
(Figure 1). The upper part of the Kalaus basin is characterized by contrasting relief, with a relative height range
of c. 100–150 m. The slopes are steep, with dominantly convex or convex–concave profiles. Geology of the
upland is characterized by monocline beds of sandstones, clays, limestones and marls overlain by 3–4 m of
Quaternary drifts. Soils are classified as chestnut, according to the Russian soil classification (alfisols by the
USDA soil classification). Cultivation occupies about 45–50 per cent of this territory, mainly on flat interfluves
and gentle slopes. Pastures prevail on steep slopes of river or ephemeral stream (balka) valleys. The climate of
the region is characterized by relatively cold winters with temperatures around zero from November to February
and a hot summer with temperatures up to 40 °C. Mean annual precipitation is about 400 mm (Figure 2). The
high observed annual variability is mostly associated with heavy rainstorms in May–August, which sometimes
exceed 30–60 mm for one event (NCHSA, 1990).
The study area gully system
The study area gully system is located on the western slope of the Kalaus river valley, c. 1·5 km to the south
of the village of Sergeevskoe. The valley slope here is characterized by a convex–concave–convex profile, pre-
sumably reflecting the complicated bedrock geology and presence of the Kalaus river terraces. The topographic

RECONSTRUCTING THE STAGES OF GULLY DEVELOPMENT IN RUSSIA 325
Copyright © 2004 John Wiley & Sons, Ltd. Earth Surf. Process. Landforms 29, 323–341 (2004)
Figure 1. The study area location. The Kalaus river basin is shown in grey; the study area location is marked by a star
Figure 2. Annual and summer (May–August) rainfall record for the Stavropol region Based on averaged information from five to ten monitoringstations. Average annual rainfall for the observation period is represented by a dashed line (data from 1973 to 1982 are unavailable)

326 V. R. BELYAEV ET AL.
Copyright © 2004 John Wiley & Sons, Ltd. Earth Surf. Process. Landforms 29, 323–341 (2004)
Figure 3. (a) General plan of the study area; (b) Geomorphological plan of the middle and lower parts of the study gully and locations ofsampling points

RECONSTRUCTING THE STAGES OF GULLY DEVELOPMENT IN RUSSIA 327
Copyright © 2004 John Wiley & Sons, Ltd. Earth Surf. Process. Landforms 29, 323–341 (2004)
range between the interfluve and the main river is about 120 m, slope gradients decrease from 5–11° in the upper
sections to 0·5–3° in the lower (Figure 3a). The gully catchment area is c. 0·63 km2, with length c. 1·5 km and
width varying from 250 to c. 700 m. The gully occupies about 80 per cent of the catchment length. It is a typical
bottom gully developed within a larger Pleistocene fluvial hollow. It has a few small tributaries in the middle
section. The bottom of the gully itself is filled with recent sediment and partly (in the middle and lower reaches)
cut by the modern incision channel (Figure 4a). Permanent pasture is the predominant landuse in the catchment
area, including the gully banks.
Known phases of development
It is believed the study area gully evolved following the characteristic pattern for the region. This began with
the large-scale agricultural development of the area less than 100 years ago (Tcvetkov, 1957) followed by the
initial stages of very intensive gully growth within the next three to 20 years (Kosov et al., 1978; Schumm
et al., 1987). At this stage the gully probably reached its present length, and the catchment area above the
knickpoint apparently became insufficient to sustain further growth (Belyaev, 2002). Currently the catchment of
the main gully head has an area of c. 0·1 km2 (Figure 3a).
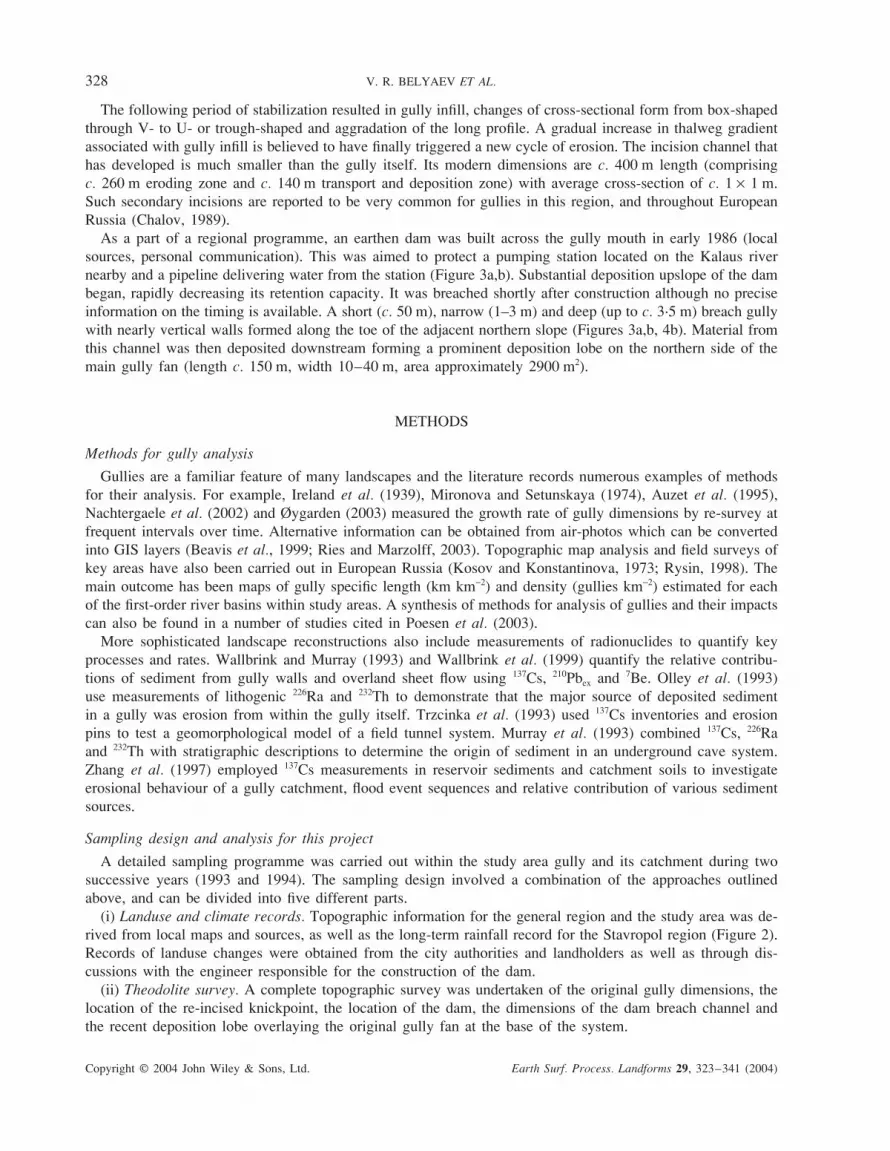
Figure 4. View of the study site showing (i) theodolite survey of lower part of the gully, (ii) wide depositional bottom, transitional partof the re-incision channel (marked by an arrow), (iii) banks modified by small landslides (right side on the foreground) and (iv) rill erosion(left side on the background). (b) View up the gully from its lower end showing (i) dam breach gully, (ii) tamarisk shrub in foreground
(height about 1·5 m) – see text for explanation
328 V. R. BELYAEV ET AL.
Copyright © 2004 John Wiley & Sons, Ltd. Earth Surf. Process. Landforms 29, 323–341 (2004)
The following period of stabilization resulted in gully infill, changes of cross-sectional form from box-shaped
through V- to U- or trough-shaped and aggradation of the long profile. A gradual increase in thalweg gradient
associated with gully infill is believed to have finally triggered a new cycle of erosion. The incision channel that
has developed is much smaller than the gully itself. Its modern dimensions are c. 400 m length (comprising
c. 260 m eroding zone and c. 140 m transport and deposition zone) with average cross-section of c. 1 × 1 m.
Such secondary incisions are reported to be very common for gullies in this region, and throughout European
Russia (Chalov, 1989).
As a part of a regional programme, an earthen dam was built across the gully mouth in early 1986 (local
sources, personal communication). This was aimed to protect a pumping station located on the Kalaus river
nearby and a pipeline delivering water from the station (Figure 3a,b). Substantial deposition upslope of the dam
began, rapidly decreasing its retention capacity. It was breached shortly after construction although no precise
information on the timing is available. A short (c. 50 m), narrow (1–3 m) and deep (up to c. 3·5 m) breach gully
with nearly vertical walls formed along the toe of the adjacent northern slope (Figures 3a,b, 4b). Material from
this channel was then deposited downstream forming a prominent deposition lobe on the northern side of the
main gully fan (length c. 150 m, width 10–40 m, area approximately 2900 m2).
METHODS
Methods for gully analysis
Gullies are a familiar feature of many landscapes and the literature records numerous examples of methods
for their analysis. For example, Ireland et al. (1939), Mironova and Setunskaya (1974), Auzet et al. (1995),
Nachtergaele et al. (2002) and Øygarden (2003) measured the growth rate of gully dimensions by re-survey at
frequent intervals over time. Alternative information can be obtained from air-photos which can be converted
into GIS layers (Beavis et al., 1999; Ries and Marzolff, 2003). Topographic map analysis and field surveys of
key areas have also been carried out in European Russia (Kosov and Konstantinova, 1973; Rysin, 1998). The
main outcome has been maps of gully specific length (km km−2) and density (gullies km−2) estimated for each
of the first-order river basins within study areas. A synthesis of methods for analysis of gullies and their impacts
can also be found in a number of studies cited in Poesen et al. (2003).
More sophisticated landscape reconstructions also include measurements of radionuclides to quantify key
processes and rates. Wallbrink and Murray (1993) and Wallbrink et al. (1999) quantify the relative contribu-
tions of sediment from gully walls and overland sheet flow using 137Cs, 210Pbex and 7Be. Olley et al. (1993)
use measurements of lithogenic 226Ra and 232Th to demonstrate that the major source of deposited sediment
in a gully was erosion from within the gully itself. Trzcinka et al. (1993) used 137Cs inventories and erosion
pins to test a geomorphological model of a field tunnel system. Murray et al. (1993) combined 137Cs, 226Ra
and 232Th with stratigraphic descriptions to determine the origin of sediment in an underground cave system.
Zhang et al. (1997) employed 137Cs measurements in reservoir sediments and catchment soils to investigate
erosional behaviour of a gully catchment, flood event sequences and relative contribution of various sediment
sources.
Sampling design and analysis for this project
A detailed sampling programme was carried out within the study area gully and its catchment during two
successive years (1993 and 1994). The sampling design involved a combination of the approaches outlined
above, and can be divided into five different parts.
(i) Landuse and climate records. Topographic information for the general region and the study area was de-
rived from local maps and sources, as well as the long-term rainfall record for the Stavropol region (Figure 2).
Records of landuse changes were obtained from the city authorities and landholders as well as through dis-
cussions with the engineer responsible for the construction of the dam.
(ii) Theodolite survey. A complete topographic survey was undertaken of the original gully dimensions, the
location of the re-incised knickpoint, the location of the dam, the dimensions of the dam breach channel and
the recent deposition lobe overlaying the original gully fan at the base of the system.

RECONSTRUCTING THE STAGES OF GULLY DEVELOPMENT IN RUSSIA 329
Copyright © 2004 John Wiley & Sons, Ltd. Earth Surf. Process. Landforms 29, 323–341 (2004)
(iii) Sediment stratigraphy investigation. Three soil pits were excavated with depth incremental sampling in
1993; a further two pits were excavated in 1994. Locations of the pits are shown on Figure 3. Depth incremental
samples were taken from a known cross-sectional area for different depth intervals (from 5 to 15 cm), usually
increasing downwards in each pit. A detailed morphological description of grain size, colour and texture was
also undertaken for each sampling increment.
(iv) Reference samples for radionuclide inventories. A series of samples was taken from a relatively gentle
grassed slope on the southern side of the gully catchment (Figure 3b) to determine the reference inventories
of 137Cs and 210Pb. Two different strategies were used. Firstly ten individual depth-integrated cores were taken
from points along a spiral of increasing diameter. The total area covered by this method was about 100 × 100 m.
Secondly, 20 depth-integrated cores were obtained from two plots located upslope and downslope of the spiral
(10 from each). The upper plot had an area of about 100 × 100 m and the lower plot about 100 × 150 m.
The cores from the spiral were measured individually while those from each plot were mixed together, provid-
ing two additional bulk samples for analysis. The dimensions of the corer were 24·5 cm depth and 7·5 cm
diameter.
(v) Erosion source sampling. A series of ‘surface scrape’ samples was taken to characterize various sediment
sources within and around the gully system. The samples were obtained by removing the surface material over
a c. 10 × 10 cm area to a depth of c. 2 cm. The material was then analysed for its tracer properties in order to
match them with the material in the gully deposition zones. The sampling locations were: (a) the surface (top
2 cm) of the catchment topsoil (1 sample); (b) the catchment topsoils averaged to c. 25 cm (reference site
samples); (c) active re-incision channel banks formed in gully sediment (5 samples); (d) actively eroding floor
of the re-incision channel (10 samples amalgamated into one); (e) active re-incision channel banks formed in
parental material (8 samples); and (f) the actively eroding walls of the dam breach channel (10 samples amal-
gamated into one).
Radionuclide preparation and analysis
Representative material from the depth increments of the different pits (and from surface scrapes) were
transported to the CSIRO Land and Water radionuclide laboratory in Australia, where they were oven dried,
ashed at 400 °C, ground in a ring mill, and then analysed by gamma spectrometry for 137Cs, 226Ra, 228Ra 228Th,40K and 210Pb according to methods outlined in Wallbrink et al. (2002). The activity of 232Th was calculated from
the mean of the activities of its two daughters 228Ra and 228Th, assuming secular equilibrium between 228Ra and232Th. Detectors used were two ‘Ortec’ and one ‘Canberra’ HPGe Closed End ‘n’ type Coaxials. Samples were
counted for a minimum of 85 ks.
RESULTS AND DISCUSSION
Rainfall records and theodolite survey
The rainfall data from meteorological stations of the Stavropol region is given in Figure 2. The data cover
the period from 1891 to 1994 (1973–1982 is unavailable), and show that high amounts of annual precipitation
are generally associated with high summer rainfall. This is characterized by high intensity rainstorms with
extreme erosivity and average return interval of c. 8–10 years, although no obvious periodicity can be observed.
The location and dimensions of the gully, incision channel, dam, dam wall, incision breach and catchment study
area are given in Figure 3a and b. They have been overlayed onto contours obtained from the published
topographic map for this area.
Reference inventories of fallout 210Pb and 137Cs
The 137Cs and 210Pbex inventories (Bq m−2) of the reference site samples are given in Table I. The coefficients
of variation are high (28 per cent for 137Cs and 41 per cent for 210Pbex respectively), although both are within
the range reported in the literature (Wallbrink et al., 1994; Owens and Walling, 1996). These values can be used
to determine a range of inventories characterizing the atmospheric influx of both 137Cs and 210Pbex, represented
here by confidence intervals calculated at the 90 per cent significance level (Table I).

330 V. R. BELYAEV ET AL.
Copyright © 2004 John Wiley & Sons, Ltd. Earth Surf. Process. Landforms 29, 323–341 (2004)
Table I. Reference site radionuclide inventories
Average reference Standard Coefficient Confidence intervalinventory deviation of variation (for 90% significance)(Bq m−2) (Bq m−2) (%) (Bq m−2)
137Cs 4910 1360 28 ±410210Pbex 3340 1360 41 ±410
The average annual fallout of 210Pbex can be used to date sediment sequences in deposition sites. It can be
estimated from the reference site inventory (of 210Pbex) if (i) the inventory is assumed to represent the long-term
equilibrium between atmospheric influx and radioactive decay, and (ii) fallout has been constant over time. In
this case, annual fallout of 210PbexIPb can be estimated as:
IPb = ArefPbλPb (1)
where ArefPb is the average 210Pbex reference site inventory, (Bq m−2) and λPb is the 210Pbex radioactive decay
constant, 0·031 a−1.
This yields a value of 104 Bq m−2 (±13 Bq m−2 for 90 per cent significance), which is within the range of
fallout 210Pbex values reported in the literature (Moore and Poet, 1976).
Radionuclide signatures of different sediment sources
The radionuclide signatures of the different sediment sources within the study catchment are given in Table II.
There are differences between the variables for most of the sources considered. The highest fallout nuclide
values are found in the top 2 cm layer of the catchment surface soils, above and outside the gully system
(source a). The lowest values of both 137Cs and 210Pbex have been found on material derived from the banks of
the dam breach (source f). This is not surprising as the banks are vertical and there is no opportunity for
exposure to either fallout radionuclide. The highest 226Ra/232Th ratio (1·17 ± 0·02) was on material from the dam
breach gully walls (source f). The lowest value 0·51 ± 0·01 was on material from the bottom of the re-incision
channel (source d). There were also differences in the 40K/232Th signature between the sources. The lowest was
from the dam breach gully walls (7·0 ± 0·1) (source f), the highest from the channel walls of the re-incision
channel (13·5 ± 0·3) (source c). Other sources considered have intermediate values of the parameters measured.
Analyses of Pit 1 data and determination of Chernobyl 137Cs fallout inventory
Pit 1 was located on a terrace within the gully approximately 1·5 m above its thalweg and c. 10 m down-
stream from the modern knickpoint. Initially it was meant to provide information on structure, radionuclide
content and depositional history of the gully infill sediment. However, careful examination showed that material
observed in Pit 1 (dark laminated clay) differs significantly from modern gully infill sediment (silty and clayey
loam with sandy and gravelly lenses). From this we concluded that the local terrace in the gully bottom sectioned
by Pit 1 is most likely a result of recent slope failure. This is also supported by the morphology of the terrace
Table II. Radionuclide signatures for different sediment sources within the catchment
Catchment Catchment Re-incision Re-incision Re-incision Dam breachtopsoil (surface topsoil (averaged channel channel channel banks gully banks
layer ~2 cm) for layer ~25 cm) (banks) (bottom) (parental material)
(a) (b) (c) (d) (e) (f )137Cs(Bq kg−1) 56·1 ± 1·0 13·2 ± 0·3 1·0 ± 0·2 1·5 ± 0·2 2·6 ± 0·3 0·01 ± 0·1210Pbex(Bq kg−1) 56·2 ± 4·3 8·9 ± 2·6 1·2 ± 2·5 0·00 ± 3·9 3·1 ± 2·8 0·00 ± 2·9226Ra/232Th 0·63 ± 0·02 0·56 ± 0·01 0·59 ± 0·01 0·51 ± 0·01 0·65 ± 0·01 1·17 ± 0·0240K/232Th 12·5 ± 0·3 9·6 ± 0·2 13·5 ± 0·3 7·2 ± 0·1 12·1 ± 0·3 7·0 ± 0·1

RECONSTRUCTING THE STAGES OF GULLY DEVELOPMENT IN RUSSIA 331
Copyright © 2004 John Wiley & Sons, Ltd. Earth Surf. Process. Landforms 29, 323–341 (2004)
itself – its local extent and uneven surface, the reverse gradient from the terrace brow to the main gully bank,
and the curved sheer wall at the back of the terrace. Slope failure here probably resulted from downcutting
by the retreating knickpoint. Knowing its position in 1993 and assuming an average rate of knickpoint pro-
pagation of c. 1 m a−1 (Chalov, 1989; Rysin, 1998), the slope failure at this point can be approximately dated
to 1983.
Fallout radionuclide data also support our suggested origin of the terrace. Inventories of both 137Cs,
c. 1490 Bq m−2 (30 per cent) and 210Pbex, c. 1660 Bq m−2 (50 per cent) are low compared to the reference site.
Depth distributions of both isotopes are similar (Figure 5) – most of the inventory is contained within the top
15 cm, rapidly declining with depth. These profile shapes differ considerably to those in areas of continuous
sediment deposition (normally exhibiting prominent buried activity peaks) and point to stability of the terrace
surface during the length of its exposure to atmospheric fallout (Walling and Woodward, 1992; Wallbrink and
Murray, 1993; Owens et al., 1996). The relatively low organic content within the top layer (Figure 5) implies
that only a short time has elapsed since the terrace formed as no significant soil development has occurred. More
or less constant values of lithogenic radionuclide ratios suggest a uniform origin of sediment (Murray et al.,
1993), i.e. by slumping.
The annual fallout amount of 210Pbex, calculated from Equation 1, can also be used to date the terrace. This
calculation yielded c. 1975–1980, close to the date obtained from the knickpoint retreat rate, taking into account
uncertainty in the latter approach. Importantly, fallout of bomb-derived 137Cs had effectively ceased by that time.
However, the Stavropol region received 137Cs fallout from the Chernobyl accident in 1986. Thus, the entire 137Cs
inventory in Pit 1 can be attributed to Chernobyl fallout and provides an excellent opportunity to independently
assess its contribution to total 137Cs fallout inventory.
For example, according to the former Soviet Union radiation situation map (Izrael, 1998), Chernobyl contrib-
uted an additional 50–100 per cent to the bomb-derived 137Cs in this region. Rainfall record shows that no
runoff-generating rains occurred during April and May of 1986 (when most Chernobyl fallout occurred), and
it can be assumed that no significant redistribution of Chernobyl 137Cs occurred prior to its adsorption to soil
particles in Pit 1. The 137Cs inventory here is equivalent to c. 30 per cent of the total reference amount and is
consistent with estimates presented elsewhere (De Cort et al., 1998). For the purposes of this study Chernobyl
fallout represents an additional unambiguous time mark in depositional sequences. To our knowledge this is the
first such attempt to use Chernobyl 137Cs fallout for reconstructions of recent gully development.
Description and analyses of Pit 2
Pit 2 was excavated in the reservoir infill sediments just upstream of the dam wall (Figure 3b). This was to
establish accumulation rates and the timeframe for pre-dam and post-dam aggradation in the lower part of the
gully system. Due to sampling constraints, only samples from every second depth interval were analysed instead
of the full core (Figure 6). This increases the uncertainty in our reconstruction of events, and our interpretations
at this location should probably be considered tentative at this stage. Nonetheless some important observations
can still be drawn from the available data.
Firstly, the depth of gully sediment at this point is 1·2 m. The material exposed at the pit base below 1·2 m
is similar to that forming the terrace at Pit 1 (dark laminated clay). The gully long profile (described later as
Figure 10) shows that the initial gully thalweg had a convexity at this point. Therefore, no substantial accumu-
lation could have occurred here naturally, without the influence of the dam constructed in the gully mouth in
1986. In terms of the depth distribution of 137Cs two peaks can be observed at depths of c. 1·15 m and c. 0·8 m
(Figure 6). We attribute the first one to the global fallout peak of 1963 (Walling and He, 1992). The low 210Pbex
concentration at this depth infers there was not a stable surface period associated with this sediment layer. A
probable explanation is that re-incision began in this part of the gully prior to 1963, in response to earlier
aggradation increasing the channel gradient. As a result, this location underwent erosion following the first stage
of the bottom cut and the older sediment associated with gully infill and stable period (marked by 210Pbex fallout)
was removed. The initial floor of the bottom cut coincided with the top layer of the parental material. A new
sedimentation cycle is believed to have commenced as the re-incision channel knickpoint retreated up the main
gully. Its lower part began to fill gradually with fresh sediment, and the aggrading surface was marked by peak
bomb-derived 137Cs fallout in 1963.

332
V. R
. BE
LY
AE
V E
T A
L.
Copyrig
ht ©
2004 Jo
hn W
iley &
Sons, L
td.
Earth
Surf. P
rocess. L
andfo
rms 2
9, 3
23
–341 (2
004)
Figure 5. Pit 1 data and interpretation: (a) geological cross-section; (b) landform development reconstruction. Depth distributions of (c) 137Cs (d) 210Pbex (e) 226Ra/232Th (f) 40K/232Th and(g) organic content.

RE
CO
NS
TR
UC
TIN
G T
HE
ST
AG
ES
OF
GU
LL
Y D
EV
EL
OP
ME
NT
IN R
US
SIA
333
Copyrig
ht ©
2004 Jo
hn W
iley &
Sons, L
td.
Earth
Surf. P
rocess. L
andfo
rms 2
9, 3
23
–3
41
(20
04
)
Figure 6. Pit 2 data and interpretation: (a) geological cross-section; (b) landform development reconstruction. Depth distributions of (c) 137Cs, (d) 210Pbex, (e) 226Ra/232Th, (f) 40K/232Th and(g) organic content

334 V. R. BELYAEV ET AL.
Copyright © 2004 John Wiley & Sons, Ltd. Earth Surf. Process. Landforms 29, 323–341 (2004)
As above, the second 137Cs peak probably represents Chernobyl fallout of April–May 1986, and the low 210Pbex
concentrations and lithogenic radionuclide data infer that the main source of material for this layer was from
inside the gully system (Table II, Figure 6). As a consequence the input of additional fallout radionuclides with
incoming sediment was negligible and unable to produce such a significant peak. Furthermore, the concentration
of 137Cs is similar to the surface layer of Pit 1 (c. 15 Bq kg−1) (Figures 5 and 6). This also supports a Chernobyl
origin for this peak, taking into account the absence of runoff events during April–May 1986 and equivalent
depth sampling intervals at both pits.
The deposition between the hypothesized 1963 and 1986 137Cs peak (total layer c. 35 cm) coincides with
gradual re-incision channel growth during this time. Assuming relatively constant aggradation at Pit 2 during
that period, its rate is calculated as c. 1·5 cm a−1.
The dam was built in 1986 blocking the gully mouth just below Pit 2. Its construction was followed soon after
by a period of significant rainfall and runoff, promoting rapid deposition upstream of it. Most likely, the
sediment above 0·8 m depth was largely accumulated during a few high-magnitude events following dam
construction. A sharp boundary in the sediment sequence is observed at 0·45 m. The lithogenic radionuclide
ratios (in particular 40K/ 232Th; Figure 6e,f), also show a boundary at about this depth, coinciding with a rapid
upward decline of 137Cs concentration. It is probable that the lower c. 35 cm (c. 0·8–0·45 m) of this deposit was
associated with the first significant runoff event after the dam construction. Such sedimentation rapidly decreased
the capacity of the dam and ultimately led to its failure.
After failure of the dam, a substantial portion of sediment from upstream began to bypass Pit 2 and was
transported through the dam breach to a fresh deposition lobe that formed below it (Figure 3b). However,
deposition at Pit 2 appeared to continue at a considerable rate, as no peak in 210Pbex concentration is observed
in the profile up to the surface. We surmise that the recent incision channel banks have remained the main
sediment source. This is because of the good match between them and the 137Cs concentration (c. 3 Bq kg−1)
and lithogenic radionuclide signatures (40K/ 232Th, 12·0–13·0; 226Ra/ 232Th, 0·58–0·62) on the Pit 2 sediments
(Figure 6, Table II).
Description and analyses of Pit 3
Pit 3 was excavated in the fresh deposits below the dam breach (Figure 3b) primarily to determine the timing,
extent, and origin of the deposition on the gully fan. Three sedimentation episodes and two major phases of
relative stability can be reconstructed from this sediment sequence (Figure 7).
Only one significant peak in 137Cs between 0·3 and 0·5 m depth was observed. This wide peak most likely
arises from the superimposition of 1986 Chernobyl fallout onto the 1963 peak associated with bomb-derived137Cs. The attenuated nature of this peak also infers that minor surface aggradation occurred between 1963
and 1986. The surface of the fan in 1986 was at c. 0·3 m, supported by the 210Pbex distribution also showing
a peak at the same depth. The down-core distribution of 210Pbex is attenuated by relatively constant sediment
dilution, more than that usually observed at undisturbed locations (Wallbrink et al., 1999). The fan surface
in 1963 is believed to be at c. 0·4 m, with sedimentation between 1963 and 1986 not exceeding a total of
0·1 m.
The layer below c. 0·4 m is attributed to an episode of relatively intense deposition associated with the
development of the recent incision. Concentrations of 137Cs here form a tail reaching c. 1·15 m depth. This depth
of penetration is significant and cannot be due to vertical migration alone (Walling and He, 1992). We believe
that this entire layer was formed after 1953, i.e. the beginning of 137Cs global fallout. No 210Pbex is found below
0·7 m implying that at least the lower 45 cm of this layer has been formed during one sedimentation episode.
If this layer was formed by more than one event, interspersed by periods of stability, then there should have been
measurable 210Pbex concentrations in at least one increment. This was not found.
Using Equation 1, the total inventory of 210Pbex within the 0·3–0·7 m layer (1550 Bq m−2) points to 1955–1960
as the approximate period of that event. The lithogenic radionuclide signatures are similar to those from recent
incision-channel banks, i.e. 226Ra/ 232Th, 0·70 ± 0·05; 40K/ 232Th, 12·0 ± 1·0. We conclude that the initial incision
into the gully bottom began as a single major event. The most likely years from the precipitation record are
1958–1961 (Figure 2). The base of the sediment layer attributed to that event and the position of the older fan
surface is uncertain, as our sampling appeared not to be deep enough to reach it.

RE
CO
NS
TR
UC
TIN
G T
HE
ST
AG
ES
OF
GU
LL
Y D
EV
EL
OP
ME
NT
IN R
US
SIA
335
Copyrig
ht ©
2004 Jo
hn W
iley &
Sons, L
td.
Earth
Surf. P
rocess. L
andfo
rms 2
9, 3
23
–3
41
(20
04
)
Figure 7. Pit 3 data and interpretation: (a) geological cross-section; (b) landform development reconstruction. Depth distributions of (c) 137Cs, (d) 210Pbex, (e) 226Ra/232Th, (f) 40K/232Th and(g) organic content

336 V. R. BELYAEV ET AL.
Copyright © 2004 John Wiley & Sons, Ltd. Earth Surf. Process. Landforms 29, 323–341 (2004)
After this major erosion event, the later deposition rate is calculated to be much slower (c. 3·3 cm a−1 prior
to 1963 and c. 0·4 cm a−1 between 1963 and 1986), presumably as knickpoint growth slowed down to its average
reported linear retreat rate of about 1 m a−1.
Between 1986 and 1993, c. 30 cm of sediment was deposited at Pit 3 (Figure 7). This layer is characterized
by two episodes of sedimentation separated by a period of surface stabilization. The latter period, at 0·1–0·15 m
depth, is evidenced by a thin organic-rich layer and a high 210Pbex peak. The 210Pbex dating gives 1986–1987 as
the beginning of this stable period, although this must be treated as a lower estimate as some isotope influx
associated with incoming sediment may have occurred. The most likely date of a high magnitude event able to
initiate the dam failure is 6–8 July 1987 (c. 30 mm on 6 July followed by c. 60 mm on 8 July). The coincidence
of these dates supports the likelihood that a c. 20 cm layer was deposited quickly, possibly during one event.
Further evidence is provided by the age of a tamarisk shrub found growing in the lower end of the dam breach
(c. 4 years old in 1993) giving 1989 as the upper date for the beginning of the stable period.
The most obvious source of the material in the 0·1–0·3 m layer is the breached dam walls. However, the
lithogenic radionuclide signatures indicate that a significant contribution of eroded material from upstream also
took place, most likely from the banks and floor of the incision channel. Some material may also have come
directly from surface erosion of the adjacent northern slopes of the catchment evidenced by the relatively high137Cs (c. 10 Bq kg−1) and 210Pbex (c. 4 to c. 11 Bq kg−1) concentrations in this layer. This is approximately the
concentration expected if pure eroded topsoil material was mixed with that from the incision-channel and the
dam breach walls (Figure 7, Table II).
Finally, the top layer of about 10 cm has no detectable 210Pbex suggesting that the modern surface is very young
and has not yet been labelled by direct atmospheric fallout prior to sampling (i.e. 24 August 1993). This layer
is therefore attributed to one deposition event, presumably occurring shortly before fieldwork sampling. Accord-
ing to Figure 2, the most likely dates are 6 August 1993 (22·5 mm) and 13 August 1993 (21·2 mm). The
important contribution of the dam breach material to this layer is seen from the 226Ra/ 232Th data. This presum-
ably reflects its active growth directly measured later between field visits in 1993 and 1994. Delivery of sediment
from this source is also supported by the decrease in 40K/232Th ratios (Figure 7e, f ).
Description and analysis of Pits 4 and 5
In order to assess the extent of upstream sedimentation arising from construction of the dam, two pits (Pit 4
and Pit 5) were excavated within the lower reach of the gully, c. 70 and 110 m from the dam respectively
(Figure 3b). The fallout radionuclide inventories in both pits are about 50 per cent lower than the reference
inventory, though sediment properties and depth profile shapes do not indicate substantial erosion. Thus, it is
believed that neither pit was excavated deep enough to capture the entire 137Cs and 210Pbex inventories. In
particular, the 1963 137Cs peak appears not to have been reached in either location. Nevertheless, the data allow
us to evaluate lower estimates of 1963–1986 deposition and derive values of post-1986 deposition.
The significant 137Cs peak at 0·3–0·4 m in Pit 5 (c. 20 Bq kg−1) is most likely attributable to Chernobyl fallout
in 1986 (Figure 8). The layer at c. 30 cm has accumulated in Pit 5 since dam construction. The 210Pbex data show
that c. 20 cm of that sediment was deposited soon after dam construction. This was followed by a period of
relative stability in which the gully bottom was labelled with 210Pbex, forming the peak at 0·1–0·2 m. The
inventory of 210Pbex within this layer (852 Bq m−2) is very similar to the 0·1–0·15 m layer in Pit 3 (814 Bq m−2)
and points to a similar date for the beginning of the stable period: 1986–1987. The absence of any 210Pbex in
the upper 10 cm of Pit 5 indicates freshly deposited sediment, also supporting the information from Pit 3.
As stated above, the sediment below the 1986 137Cs peak at 0·3–0·4 m in Pit 5 was accumulated after 1963.
This gives a lower estimate of average deposition rate of c. 1·5 cm a−1 for the 1963–1986 period. However, it
should be noted that 210Pbex distribution below 0·3 m implies that deposition during this period was not constant, and
that the estimated rate provides only an approximate value of accumulation. The lithogenic radionuclide data sug-
gest that catchment topsoil contributed significantly to sediment deposited before 1986, but that post-dam sediment
largely originated from within-gully sources with a very limited contribution of catchment-derived material.
The data from Pit 4 (Figure 9) however are more difficult to interpret, as its location was likely to experience
deposition from two sources – the main gully and a small tributary gully branch. This branch, in turn, delivers
sediment from its eroding bottom and disturbed surface areas upslope (i.e. associated with pipeline construction).

RECONSTRUCTING THE STAGES OF GULLY DEVELOPMENT IN RUSSIA 337
Copyright © 2004 John Wiley & Sons, Ltd. Earth Surf. Process. Landforms 29, 323–341 (2004)
Figure 8. Pit 5 data. Depth distributions of (a) 137Cs, (b) 210Pbex, (c) 226Ra/232Th and (d) 40K/232Th
Figure 9. Pit 4 data. Depth distributions of (a) 137Cs, (b) 210Pbex, (c) 226Ra/232Th and (d) 40K/232Th
The upper peak in 137Cs concentrations (0·1– 0·2 m) is relatively weak (c. 7 Bq kg−1). However it is believed
that this still represents the Chernobyl fallout (and 1986 date), although it has probably been partly eroded by
the July 1987 event. This implies that only about 10 cm has accumulated after construction of the dam. This
seems reasonable as Pit 4 is located within the concave bend of the main gully southern slope, and is relatively

338 V. R. BELYAEV ET AL.
Copyright © 2004 John Wiley & Sons, Ltd. Earth Surf. Process. Landforms 29, 323–341 (2004)
Figure 10. Long profile of the middle and lower parts of the studied gully and reconstructed volumes of recent erosion and deposition
far from the modern gully channel where most of the recent accumulation has occurred. The inventory of 210Pbex
within the upper layer of the core also supports this conclusion, although the influx of eroded sediment from
catchment topsoil makes interpretation of 210Pbex in this location difficult.
Two other small peaks in 137Cs concentration at 0·4–0·5 m and 0·7–0·8 m cannot be attributed to the 1963
bomb-derived fallout peak because of the low isotope concentrations (Figure 9). With the 210Pbex and lithogenic
radionuclide data they imply that deposition of at least 70 cm of sediment between 1963 and 1986 at the site
probably occurred as a few distinctive episodes of rapid deposition divided by periods of relative stability, rather
than as a continuous process. This highlights the fact that estimates of average erosion and deposition rates
provide only a limited insight into geomorphic processes, at this location at least.
Summarizing the data from Pits 4 and 5, it is evident that deposition associated with the dam construction
was significant and extended more than 110 m upstream from the dam (Figure 10). This implies a high contem-
porary sediment yield from the gully and its catchment. At the same time, substantial irregularities in the
sedimentation pattern within the lower part of the gully bottom are observed. Intensive deposition has taken
place along the channel, whereas other sites have experienced different rates of sedimentation depending on
location and specific geomorphic situation.
Summary of gully evolution at the study site and general study area
Our pit-based analyses of erosion and deposition (covering a time scale of the last c. 50 years) can be
combined with the known history of anthropogenic gully network development for the region, to tentatively
reconstruct the evolution of this gully over the last 100 years.
The first phase involved gully formation in the bottom of the slope depression about 100 years ago. This was
most likely due to vegetation degradation resulting from serious overgrazing, which may have made the initial
hollow bottom more vulnerable to erosion. A short period of rapid growth was then followed by a longer period
of gully stabilization. This was characterized by a decrease in slope gradient, gradual infill of the gully floor and
stabilization. A similar event sequence has been reported by Nachtergaele et al. (2002).
Erosion then recommenced at some point in the gully thalweg, resulting in a relatively small incision
channel being formed. The most likely cause of the new erosion cycle was an internal triggering of erosion by
growth of the thalweg gradient resulting from continuous aggradation. In addition to internal factors, the higher

RECONSTRUCTING THE STAGES OF GULLY DEVELOPMENT IN RUSSIA 339
Copyright © 2004 John Wiley & Sons, Ltd. Earth Surf. Process. Landforms 29, 323–341 (2004)
frequency of heavy rainstorms after the 1950s (NCHSA, 1990) combined with dumping of irrigation water
through the gully from the early 1980s (local authorities, personal communication) might also have had an
effect. The Pit 3 data (Figure 7) imply that a significant portion of this incision channel probably formed during
one event. The most likely timing of this – between 1958 and 1961 – has been derived from a combination of
the 137Cs data (yielding a period 1953–1963), the 210Pbex data (1955–1960) and the rainfall record (Figure 2).
Erosion, deposition and long profile evolution within the gully middle and lower parts since the beginning of
the re-incision are shown in Figure 10.
Following the first rapid phase, growth of the incision channel probably slowed and its knickpoint retreat rate
was approximately equal to that reported elsewhere (c. 1 m a−1) (Chalov, 1989; Rysin, 1998). Most of the eroded
material from the channel did not reach the main part of the gully fan during this period (c. 0·1 m deposited
between 1963 and 1986 at Pit 3), instead accumulating in its apex and the reaches of the lower gully (c. 0·35 m
deposited at Pit 2; at least 0·7 m at Pit 4; and a minimum of 0·4 m at Pit 5; Figures 6–10). The radionuclide
data from Pits 4 and 5 also indicate that sediment deposited within the lower gully reach originated not only
from the incision channel, but also from catchment erosion (Figures 8 and 9). Active retreat of the knickpoint
continued up to the fieldwork period (1993–1994).
The dam construction in 1986 and high magnitude runoff events in 1987–1988 years resulted in rapid
sedimentation upstream (c. 0·8 m at Pit 2; c. 0·3 m at Pit 5; and c. 0·1 m at Pit 4), extending more than 110 m
up the gully (Figures 6, 8–10). The rapid decrease in dam retention capacity resulted in its overspilling and
subsequent failure, most likely during the extreme rainstorms of 6–8 July 1987. A narrow and deep breach-gully
then formed across the northern end of the dam. An increase in its length of c. 1·5 m was observed between the
two successive field visits in 1993 and 1994, caused by headward growth. A fresh deposition lobe formed below
the dam breach, easily distinguishable by texture, colour and vegetation from the underlying older fan surface.
At Pit 3 a sediment layer of c. 0·3 m was deposited after 1986 (Figure 7) although accumulation here has not
been constant. The lower 0·2 m accumulated soon after dam failure, followed by a few years of stable surface
marked by fallout of 210Pbex and high organic content. The last significant erosion event deposited a further 0·1 m
onto that surface, most likely in August 1993. The Pit 5 210Pbex data support this post-1987 event sequence
(Figure 8).
Erosion and deposition volumes and contributions from different sediment sources
We also attempt to calculate approximate volumes of eroded and deposited material within the gully system.
A detailed survey enabled the incision-channel and dam breach volumes to be precisely estimated. However,
volumes of deposited material are less accurate as they are based on intercomparisons between, and extrapola-
tions of, point observations from the pits. The total volume of the incision channel is estimated to be c. 400 m3
(erosion since 1958–1961) and that of the dam breach gully c. 350 m3 (erosion since 1987). Deposition since
1986–1987 only is calculated as c. 450 m3 upstream from the dam and c. 600 m3 below it (Figure 10). Clearly,
the deposition volumes are significantly higher than those of the erosion features. We believe the difference is
due to additional material derived from gully bank failures (see Pit 1 data discussion above). Other investigations
have also shown that the contribution of bank failures to total gully sediment yield can outweigh that of
knickpoint retreat and erosion of the gully floor (Blong et al., 1982; Crouch, 1990).
The radionuclide data show that catchment erosion has also contributed to the gully sediment yield, though
inside-gully sources prevailed throughout the period of our study. Zhang et al. (1997) have drawn a similar
conclusion underlining the important role gullies play in catchment sediment production. Poesen et al. (2002,
2003) also report that sediment yields from catchments increase with gully frequency.
There is not enough information to obtain reliable estimates of pre-1986 deposition. However, it is important
to note that sedimentation generally occurred in the lower gully reach for low-magnitude, high-frequency events
and on the gully fan for relatively rare extreme events. It seems that in the later stages of gully evolution only
extreme events deliver sediment from the catchment. Small runoff episodes prepare material, destabilize gully
banks and redeposit sediment within the gully bottom. Although this conclusion is obvious from a common
sense point of view, the radionuclide technique used here can provide means for a direct quantitative assessment
of this temporal pattern of sediment delivery. Otherwise it would be available only through continuous moni-
toring over many years (Poesen et al., 2003).

340 V. R. BELYAEV ET AL.
Copyright © 2004 John Wiley & Sons, Ltd. Earth Surf. Process. Landforms 29, 323–341 (2004)
CONCLUSIONS
This paper has attempted to reconstruct the recent development phases of a large gully typical for the upper
Kalaus river basin. Although the process has been by deduction, we have attempted to corroborate our inferences
by data from independent approaches and methods. It is believed that the first phase (1) involved an initial gully
formation in the floor of a small valley about 100 years ago. Causes were probably overgrazing and associated
vegetation degradation. A short period of rapid growth was followed by a longer period of gully infill and
stabilization. Subsequent phases were: (2) c. 1958 to c. 1961 – re-incision in the gully bottom began as a result
of increase in thalweg gradient by continuous aggradation, probably triggered by a high-magnitude event; a
substantial amount of sediment was delivered to the gully fan; (3) c. 1961–1986 – the knickpoint of the incision
channel slowly retreated, sediment was mainly redeposited within the gully; fan surface remained nearly stable;
(4) 1986–1987 – a dam was built in the gully mouth and breached shortly after construction by extreme runoff
episode; substantial sediment accumulated in the gully above the dam and on the fan below the breach channel;
(5) 1987–1993 – the slow knickpoint retreat continued; the fan surface was stable until c. 1993 when the last
significant runoff event overlaid it by c. 10 cm of fresh sediment. Similar timeframes for gully initiation and
secondary erosion cycles are available from a number of laboratory and field-based studies (Kosov et al., 1978;
Chalov, 1989; Rysin, 1998; Nachtergaele et al., 2002).
The results show that radionuclide tracers can be a powerful addition to conventional methods for reconstruct-
ing periods of erosion and deposition as well as for sediment sourcing and routing in gullies. An important
overall outcome is the causal link between high-magnitude rainfall events, gully growth and offsite sediment
delivery. Sediment delivery within and from gullies can change abruptly and occur over very short (i.e. event
scale) timeframes (Poesen et al., 2003). Construction and placement of impoundment structures and design of
erosion counter-measures must begin only after careful consideration of the characteristics of each particular
catchment. This approach may avoid such failures as the dam breach reported here. This will have important
downstream benefits in terms of reducing the aggradation of ephemeral streams and loss of watercourses as
outlined by Golosov et al. (1997) in this region.
ACKNOWLEDGEMENTS
This work was jointly funded by the Australian Department of Trade, CSIRO Land and Water, International
Atomic Energy Agency contract holder no. 11406/RO, and Moscow State University.
REFERENCES
Auzet AV, Boiffin J, Ludwig B. 1995. Concentrated flow erosion in cultivated catchments: influence of soil surface state. Earth Surface
Processes and Landforms 20: 759–767.Beavis SG, Zhang L, Jakeman AJ, Gray SD. 1999. Erosional history of the Warrah catchment in the Liverpool Plains, New South Wales.
Hydrological Processes 13: 753–761.Belyaev VR. 2002. Specific features of gully formation under different natural conditions. Geomorphologiya 2: 105–111 (in Russian).Blong RJ, Graham OP, Veness JA. 1982. The role of sidewall processes in gully development; some N.S.W. examples. Earth Surface
Processes and Landforms 7: 381–385.Chalov RS (ed.). 1989. Gully Erosion. MSU: Moscow (in Russian).Crouch RJ. 1990. Erosion Processes and rates for gullies in granitic soils. Bathurst, New South Wales, Australia. Earth Surface Processes
and Landforms 15: 169–173.De Cort M, Dubois G, Fridman ShD, Germenchuk MG, Izrael Yu A, Jones AR, Kelly Kvasnikova EV, Matveenko II, Nazarov IM, Sitak
VA, Stukin ED, Tabachny LYa, Tsaturov YuS, Avdyushin SI. 1998. Atlas of caesium deposition on Europe after the Chernobyl accident.European Commission Report EUR 16733. European Commission: Luxembourg.
Golosov VN. 1996. Redistribution of sediments in small river catchments of temperate zone. In Proceedings of an international symposium
‘Erosion and sediment Yield: Global and Regional Perspectives’. IAHS Publication no. 236: 339–346.Golosov VN, Panin AV, Ivanova NN. 1997. Small river aggradation in European Russia during the period of intensive agriculture. In
Proceedings of the Conference on Managment of Landscapes Disturbed by Channel Incision, Wang SSY, Langendoen EJ, Shields FD(eds). University of Mississippi: 615–620.
Ireland HA, Sharpe CF, Eargle DH. 1939. Principles of gully erosion in the Piedmont of South Carolina. US Department of Agriculture,Technical Bulletin.
Izrael Yu A. 1998. Map of radiation situation on the territory of the European part of the former Soviet Union (1:2 500 000). MoscowInstitute of Global Climate and Ecology under Roshydromet and Russian Academy of Science. Belkartographiya: Minsk.
Kosov BF. 1978. Rel’efoobrazuyuchaya rol’ antropogennoy ovrazhnoy erozii. Vestnik Moskow. Univ., ser. 5, Geography 5: 19–26 (in Russian).

RECONSTRUCTING THE STAGES OF GULLY DEVELOPMENT IN RUSSIA 341
Copyright © 2004 John Wiley & Sons, Ltd. Earth Surf. Process. Landforms 29, 323–341 (2004)
Kosov BF, Konstantinova GS. 1973. Complex map of gullying for the USSR territory. Geomorphologiya 3: 3–9 (in Russian).Kosov BF, Nikolskaja II, Zorina EF. 1978. Experimental research into gully formation. In Experimental Geomorphology. Moscow Univer-
sity Press: Moscow; 113–140 (in Russian).Ledneva KV, Mescherskaya AV. 1977. Mnogoletnie ryady mesyachnyh sum osadkov, osrednennykh po ploschadi, dlya selskokhozyaystvennykh
rayonov SSSR. O.A. Drozdov: Gidrometeoizdat (in Russian).Mironova EA, Setunskaya LE. 1974. Some results of the study of gully growth intensity on the Privolzhskaya Upland. Geomorphologiya
3:74–82 (in Russian).Moore WS, Poet SE. 1976. 210Pb fluxes determined from 210Pb and 226Ra soil profiles. Journal of Geophysical Research, 81(6): 1056–1058.Murray AS, Stanton R, Olley JM, Morton R. 1993. Determining the origins and history of sedimentation in an underground river system
using natural and fallout radionuclides. Journal of Hydrology 146: 341–359.Nachtergaele J, Poesen J, Oostwoud Wijdenes D, Vandekerckhove L. 2002. Medium-term evolution of a gully developed in a loess-derived
soil. Geomorphology 46: 223–239.North-Caucasus Hydrometeorological Service Administration. 1990. Climatological Reference Book of the USSR Vol. 13.Olley JM, Murray AS, Mackenzie DH, Edwards K. 1993. Identifying sediment sources in a gullied catchment using natural and anthropogenic
radioactivity. Water Resources Research 29(4): 1037–1043.Owens PN, Walling DE. 1996. Spatial variability of Caesium-137 inventories at reference sites: an example from two contrasting sites in
England and Zimbabwe. Appl. Radiat. Isot. 47(7): 699–707.Owens PN, Walling DE, He Q. 1996. The behaviour of Bomb-Derived Caesium-137 fallout in catchment soils. Journal of Environmental
Radioactivity 32(3): 169–191.Øygarden L. 2003. Rill and gully development during an extreme winter runoff event in Norway. Catena 50: 217–242.Poesen J, Vandekerckhove L, Nachtergaele J, Oostwoud Wijdenes D, Verstraeten G, van Wesemael B. 2002. Gully erosion in dryland
environments. In Dryland Rivers: Hydrology and Geomorphology of Semi-Arid Channels, Bull LJ, Kirkby MJ (eds). Wiley: Chichester;229–262.
Poesen J, Nachtergaele J, Verstraeten G, Valentin C. 2003. Gully erosion and environmental change: importance and research needs. Catena
50: 91–133; 50(2–4): 87–564.Prytkova M Ya. 1979. Small reservoirs of steppe and forest-steppe zones of the USSR. Nauka: Moscow (in Russian).Ries JB, Marzolff I. 2003. Monitoring of gully erosion in the central Ebro Basin by large scale aerial photography taken from a remotely
controlled blimp. Catena 50: 309–328.Ryabov EI. 1974. Soil asks for protection. Stavropol: (in Russian).Rysin II. 1998. Gully erosion in Udmurtia. Udmurtia Univ: (in Russian).Schumm SA, Mosely MP, Weaver WE. 1987. Experimental Fluvial Geomorphology. Wiley: New York.Shul’zhenko VI, Myagkov AE, Petrova NV. 1977. Opyt vnedreniya pochvozaschitnyh meropriyatii v kolhoze im. Lenina Shpakovskogo
raiona Stavropol’skogo kraya. In Pochvozaschitnoe zemledelie v yuzhnyh raionah Rossii. Stavropol: 64–73 (in Russian).Sidorchuk A Yu, Golosov VN. 1995. The history of erosion on the Northern Ponto-Meotian during the period of intensive agriculture. In
Proceeding of Workshop on Soil Erosion in Semiarid Mediterranean Areas, Roma: 161–173.Sobolev SS. 1961. Protecting soils from erosion and increasing their fertility. Selkhozizdat: (in Russian).Tcvetkov MA. 1957. Izmenenie lesistosti evropeiskoy Rossii s konca XYII stoletiya do 1914 g. USSR Academy of Science: (in Russian).Thomas AW, Welch R, Jordan TR. 1986. Quantifying concentrated-flow erosion on cropland with aerial photogrammetry. Journal of Soil
and Water Conservation 4: 249–252.Trzcinka BW, Loughran RJ, Campbell BL. 1993. The geomorphology of a field tunnel system: a case study from Australia. Zeitschrift für
Geomorphologie N.F. 37(2): 237–247.Veretennikova MV, Belyaev VR. 2000. Results of regular monitoring of the water and sediment runoff from a slope gully. In Proceedings
of the seminar of the Interinstitutional council on soil erosion, river channel and river mouth processes ‘Monitoring and experiment in
investigations of the modern geomorphic processes’. Lviv University: Ukraine: 18–23.Wallbrink PJ, Murray AS. 1993. The use of fallout nuclides as indicators of erosion processes. Hydrological Processes 7: 297–304.Wallbrink PJ, Olley JM, Murray AS. 1994. Measuring soil loss using 137Cs: implications of reference site variability. In Variability in Stream
Erosion and Sediment Transport, Olive LJ, Loughran RJ, Kesby J (eds). IAHS publication no. 224: 95–103.Wallbrink PJ, Murray AS, Olley JM. 1999. Relating suspended sediment to its original soil depth using fallout radionuclides. Soil Science
Society of America Journal 63(2): 369–378.Wallbrink PJ, Walling DE, He Q. 2002. Radionuclide measurement using HpGe gamma spectrometry. In Handbook for the Assessment of
Soil Erosion and Sedimentation Using Environmental Radionuclides, Zapata F (ed.). Kluwer Academic Publishers: Dordrecht: 67–97.Walling DE, He Q. 1992. Interpretation of caesium-137 profiles in lacustrine and other sediments: The role of catchment-derived inputs.
Hydrobiologia 235/236: 219–230.Walling DE, Woodward JC. 1992. Use of radiometric fingerprints to derive information on suspended sediment sources. In Erosion and
Sediment Transport Monitoring Programmes in River Basins, Bogen J, Walling DE, Day T (eds). IAHS Publication no. 210: 153–164.Yasunskii VK. 1978. Izmeneniya v raspredelenii zemlepol’zovaniya v Evropeiskoy Rossii s konca XYIII veka do pervoi mirovoi voiny.
Voprosy sel’skogo hozyaistva, krest’yanstva i revolyucionnyh dvizhenii v Rossii. USSR Academy of Science: 113–149 (in Russian).Zaslavski MN. 1979. Soil Erosion. Mysl: (in Russian).Zhang X, Walling DE, Quine TA, and Wen A. 1997. Use of reservoir deposits and caesium-137 measurements to investigate the erosional
response of a small drainage basin in the rolling Loess Plateau region of China. Land Degradation and Development 8: 1–16.